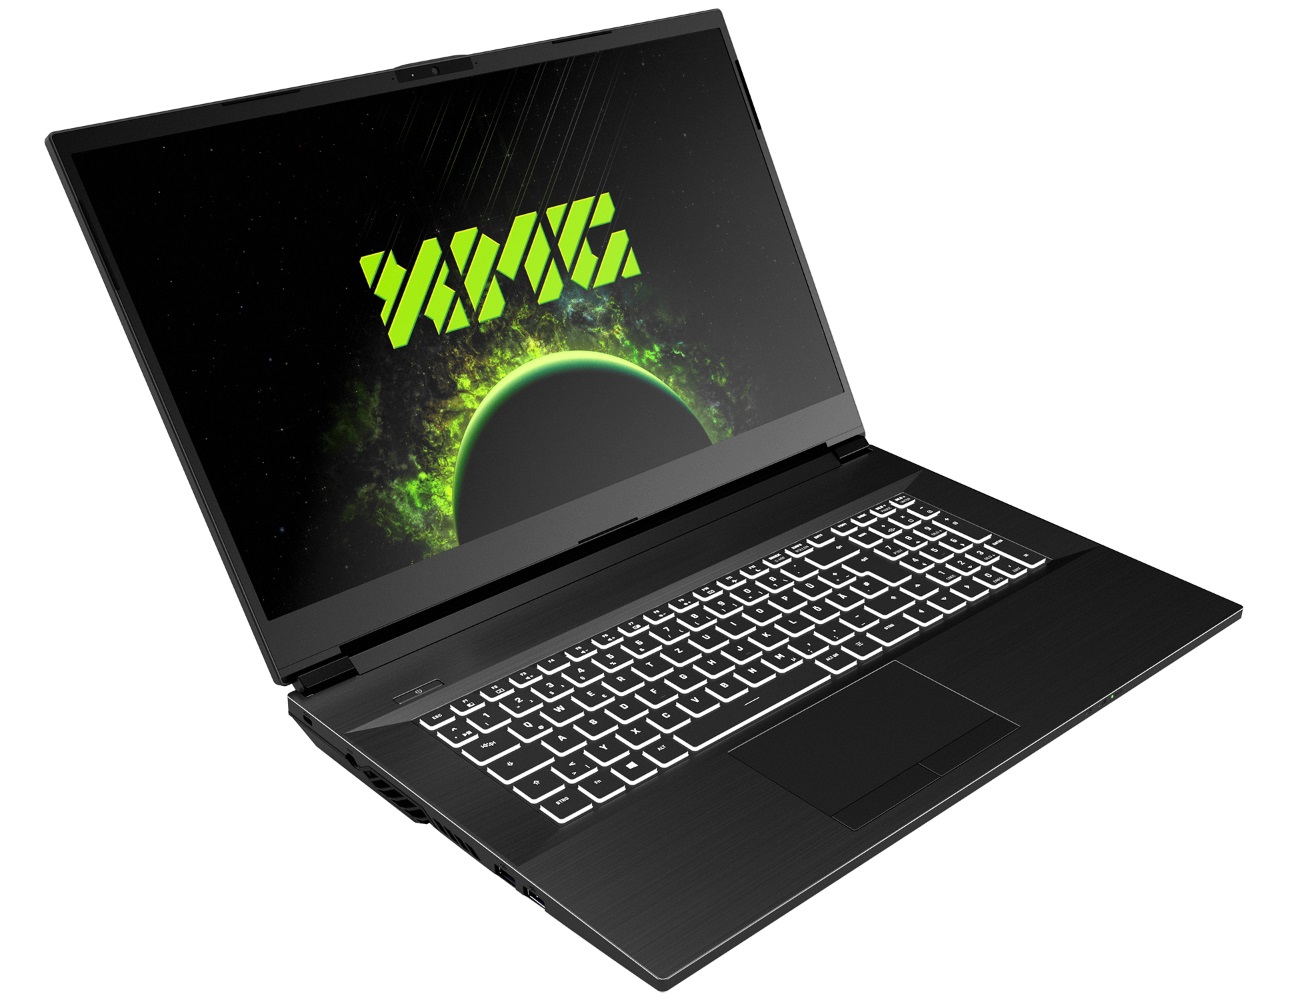
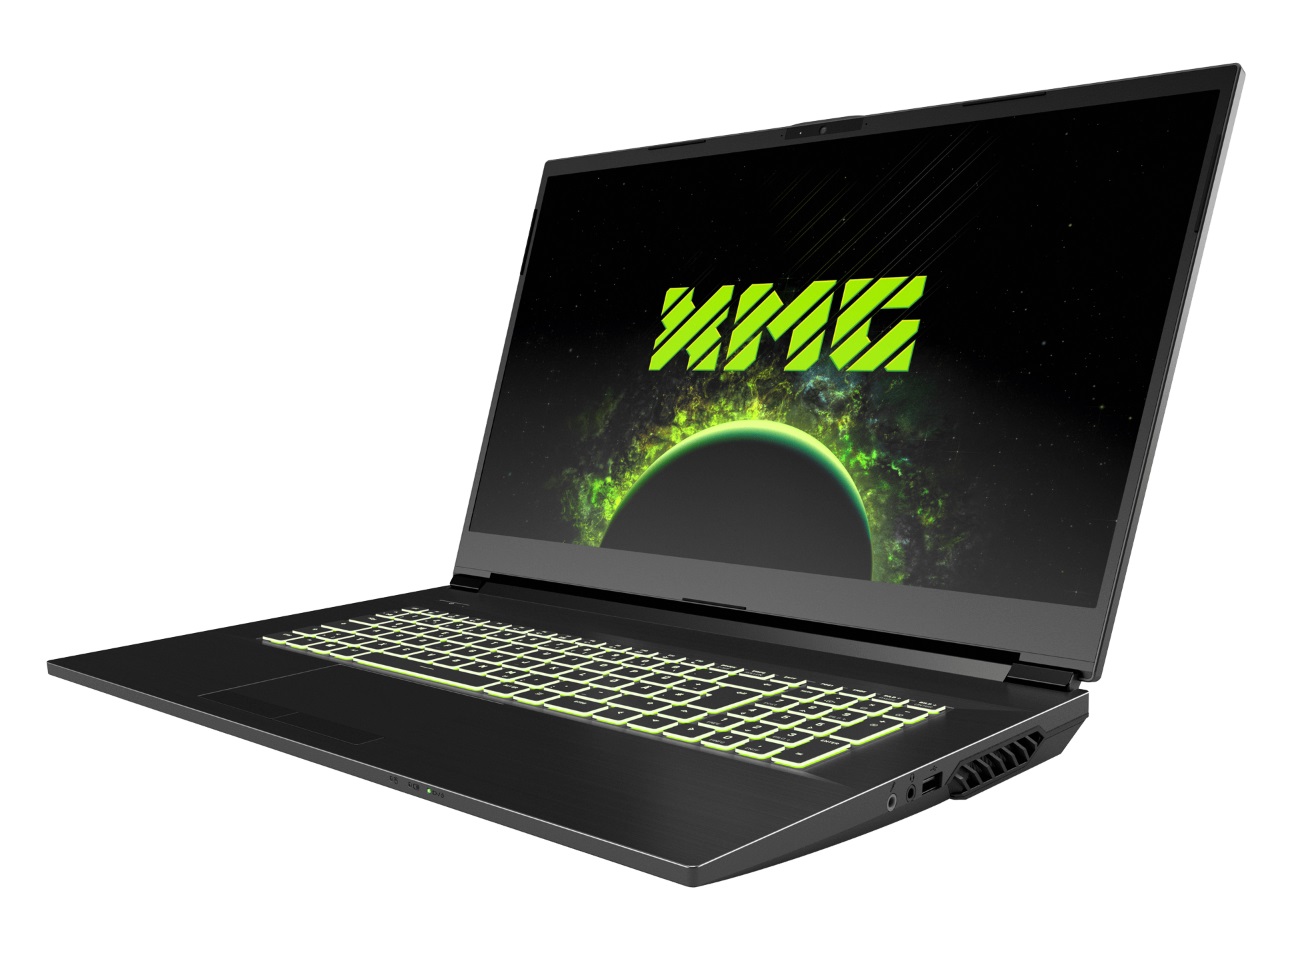
XMG Apex 17 (Clevo NH77ERQ) revisão de laptop: Para jogadores resistentes ao ruído

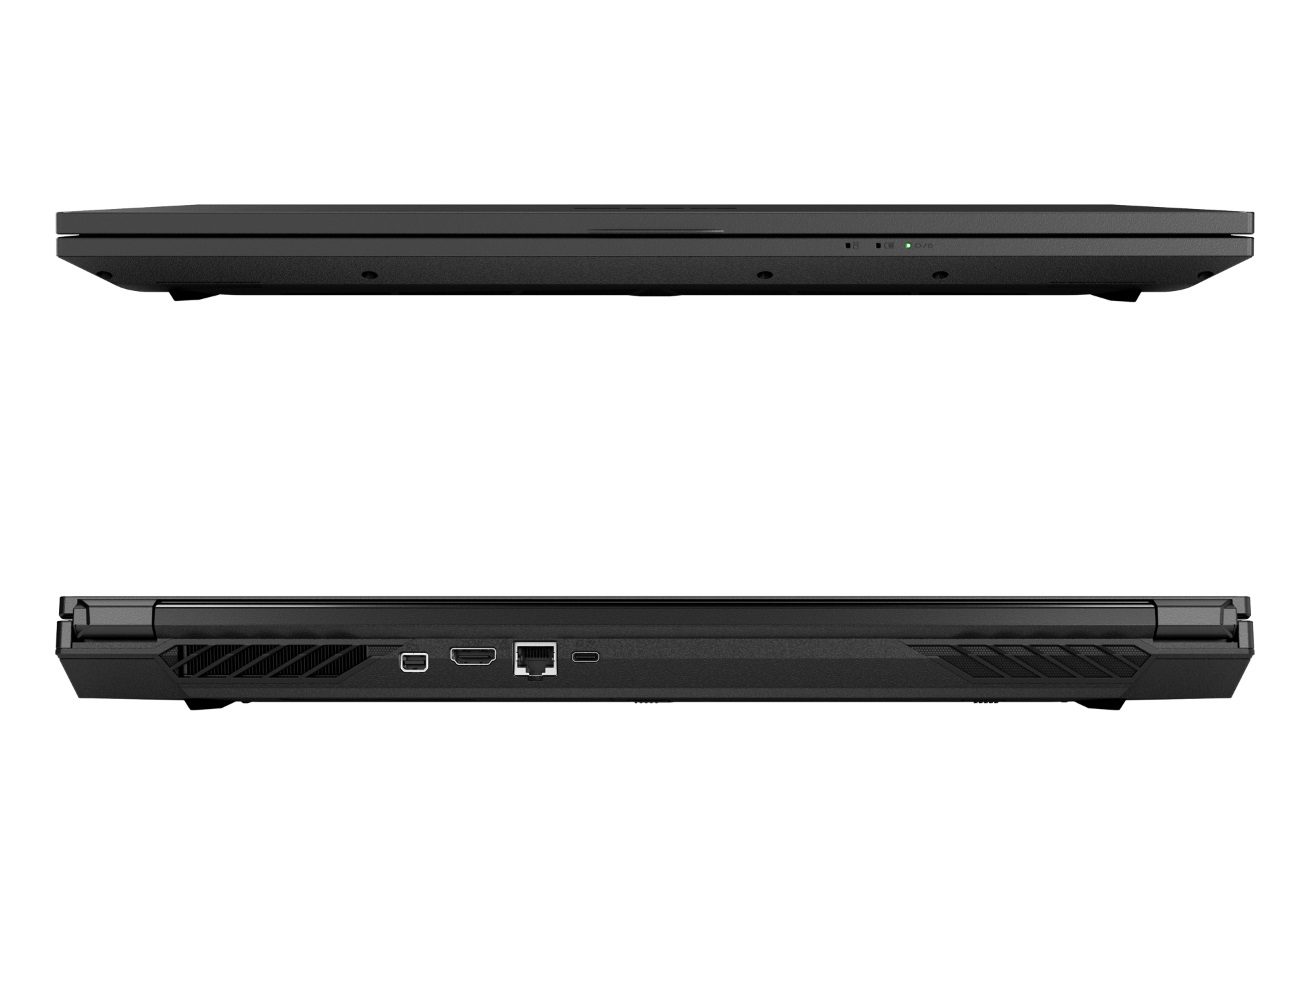
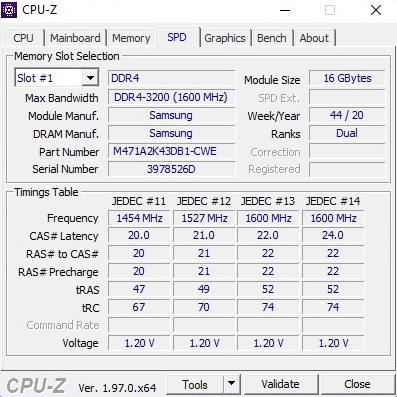
Como é conhecido da Schenker Technologies, o dispositivo pode ser configurado extensivamente na loja virtual interna bestware.com. Enquanto o processador ou é um Ryzen 7 5800H ou um Ryzen 9 5900HXa placa gráfica é uma GeForce RTX 3060 com VRAM de 6 GB ou uma GeForce RTX 3070 com VRAM de 8 GB. Em ambos os casos, um visor IPS mate 144 Hz cuida da reprodução da imagem. A memória de trabalho DDR4 varia de 8 a um máximo de 64 GB (2x SO-DIMM). Caso contrário, a caixa de 17 polegadas acomoda até dois M.2 SSDs (PCIe 3.0 x4). Os compradores também podem influenciar o módulo WLAN, o idioma do teclado e o sistema operacional.
O preço do Apex 17 começa em 1.479 Euros (~$1.692). Nossa configuração de teste com Ryzen 7 5800H, GeForce RTX 3070, 32 GB de duplo canal de RAM e 1 TB SSD custaria atualmente mais de 2.000 Euros (~$2.289).
Os concorrentes do Apex 17 incluem outros notebooks de 17 polegadas com o RTX 3070, como o Lâmina Razer 17o MSI GP76o Acer Nitro 5 AN517 e o interno XMG Neo 17. Todos esses laptops aparecem nas tabelas como dispositivos de comparação
Possible competitors in comparison
Avaliação | Data | Modelo | Peso | Altura | Size | Resolução | Preço |
|---|---|---|---|---|---|---|---|
| 83.4 % v7 (old) | 11/2021 | Schenker XMG Apex 17 M21 R7 5800H, GeForce RTX 3070 Laptop GPU | 2.6 kg | 32.4 mm | 17.30" | 1920x1080 | |
| 85.1 % v7 (old) | 01/2021 | Schenker XMG Neo 17 (Early 2021, RTX 3070, 5800H) R7 5800H, GeForce RTX 3070 Laptop GPU | 2.5 kg | 27 mm | 17.30" | 2560x1440 | |
| 89.4 % v7 (old) | 09/2021 | Razer Blade 17 RTX 3070 i7-11800H, GeForce RTX 3070 Laptop GPU | 2.8 kg | 19.9 mm | 17.30" | 1920x1080 | |
| 85.1 % v7 (old) | 03/2021 | MSI GP76 Leopard 10UG i7-10750H, GeForce RTX 3070 Laptop GPU | 2.9 kg | 26 mm | 17.30" | 1920x1080 | |
| 81.3 % v7 (old) | 08/2021 | Acer Nitro 5 AN517-41-R5Z7 R7 5800H, GeForce RTX 3070 Laptop GPU | 2.7 kg | 24.9 mm | 17.30" | 1920x1080 |
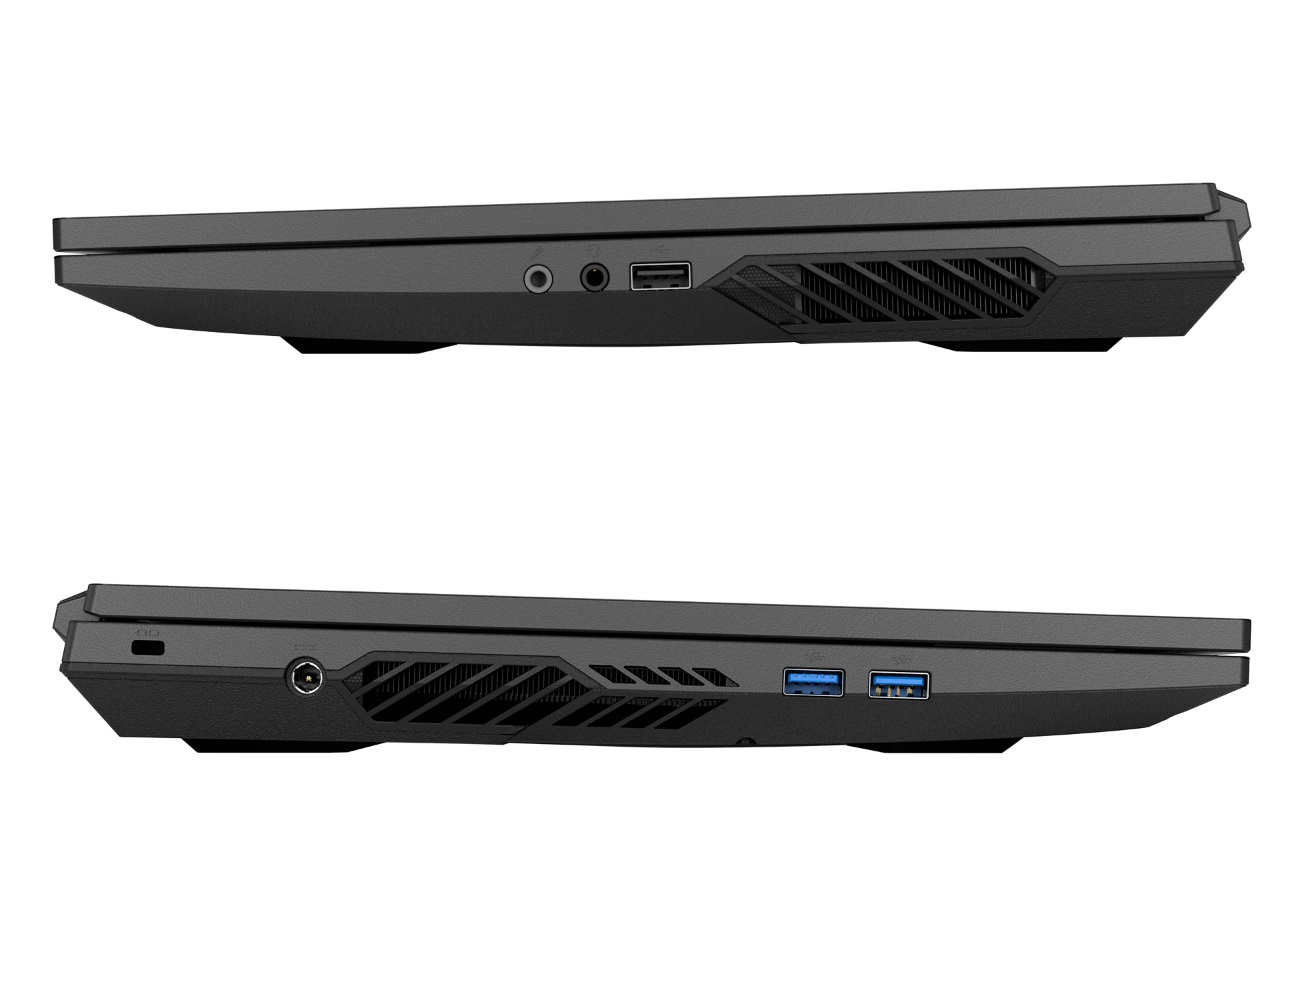
Como o Apex 17 é quase idêntico em construção ao recentemente testado Gigabyte A7 X1 (Clevo barebone), não iremos mais longe no caso, no equipamento e nos dispositivos de entrada deste artigo. Você pode encontrar as informações correspondentes na revisão vinculada.
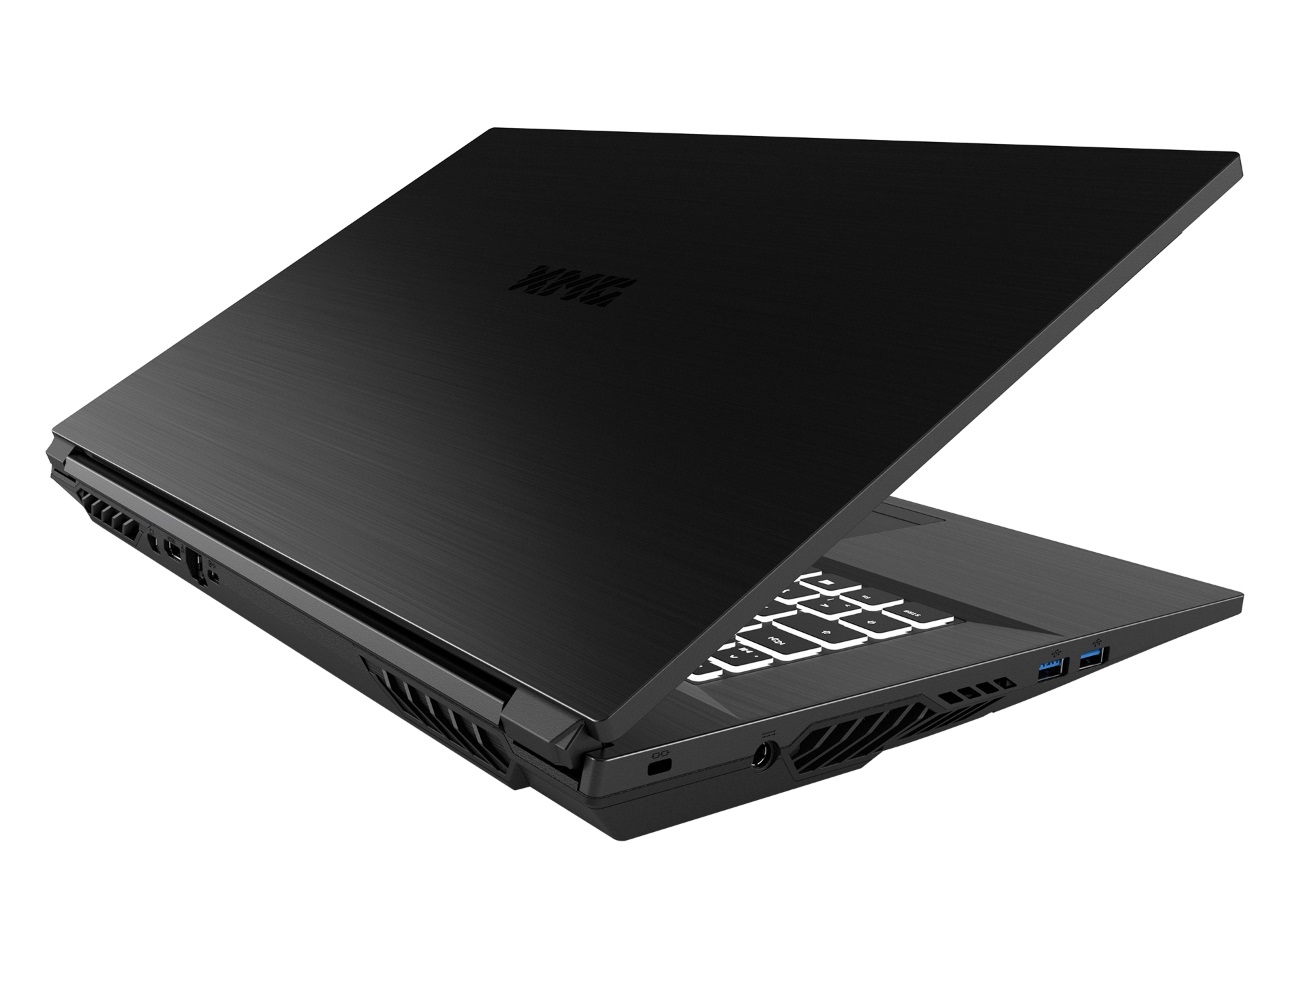
Comunicação
Webcam


Mostrar
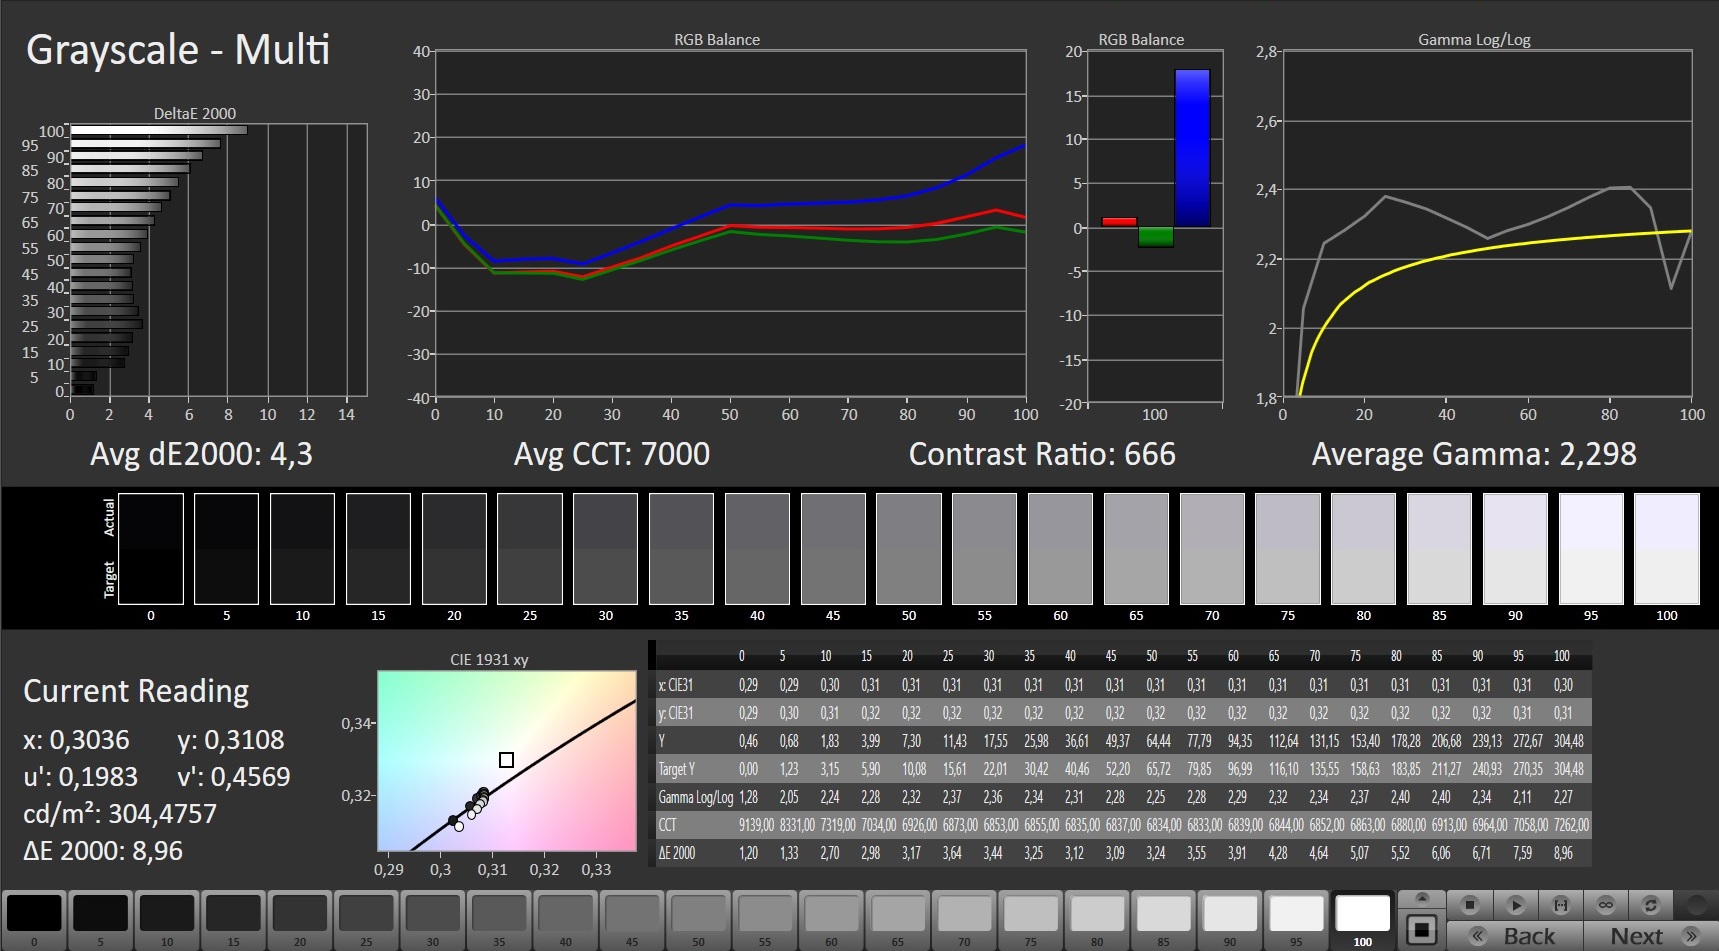
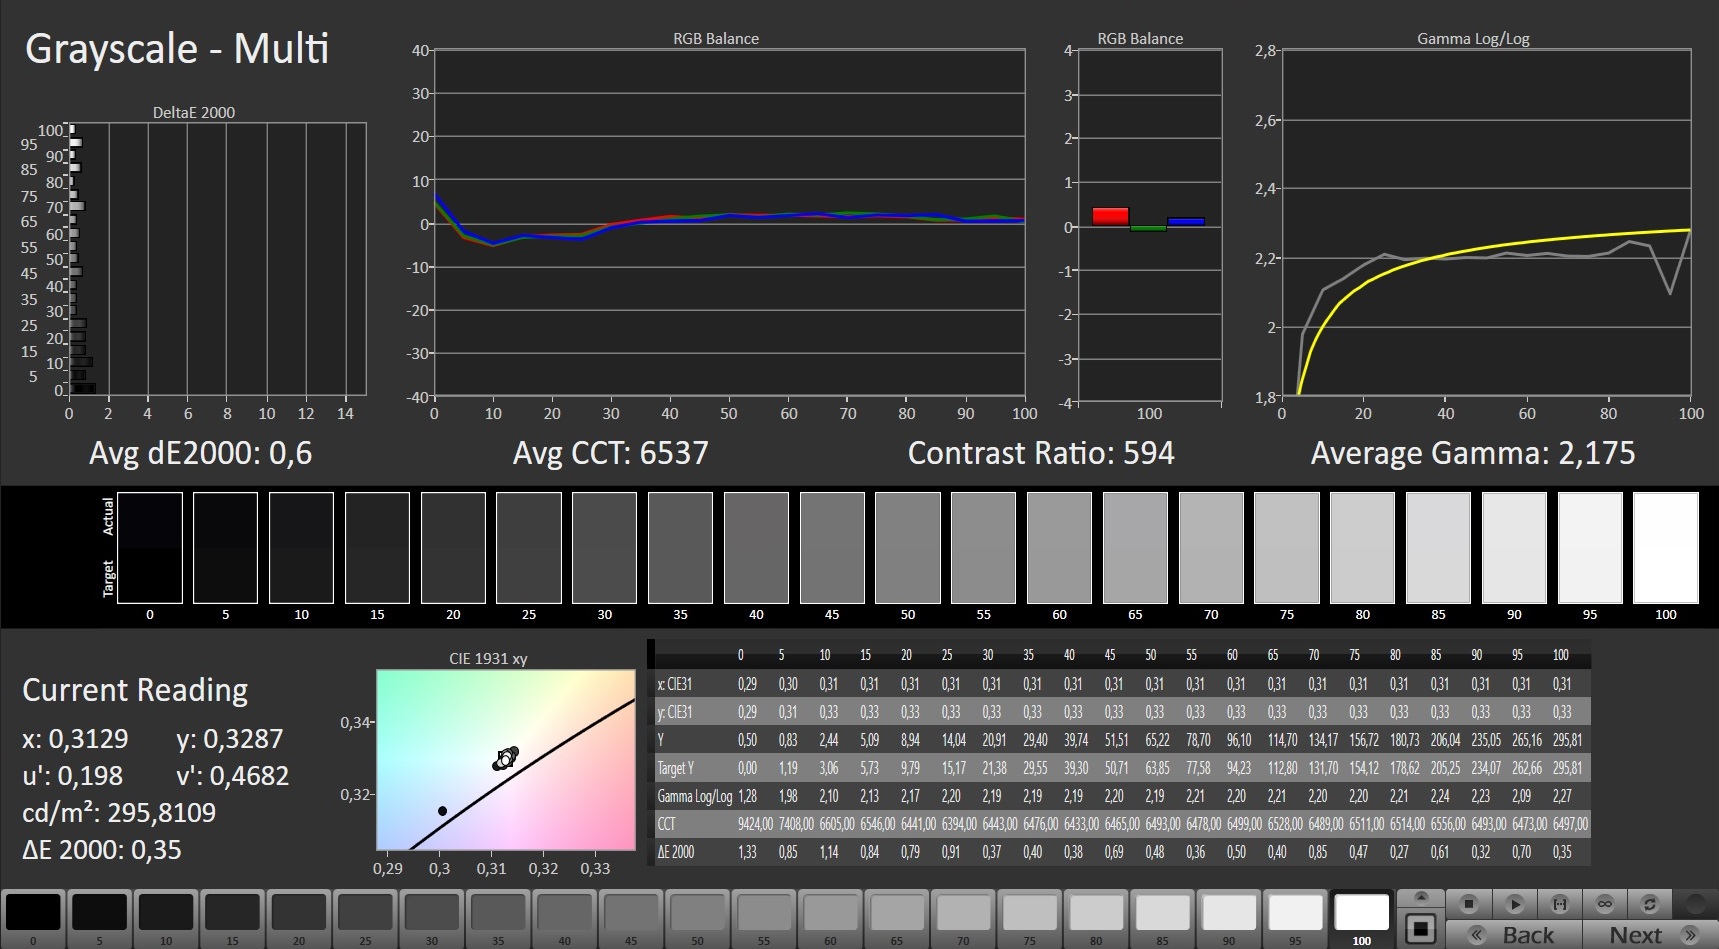
A tela utilizada difere da A7 X1 apesar de especificações básicas idênticas (Full HD, 144 Hz, IPS). Ao invés de um painel AU Optronics, o notebook Schenker utiliza um painel da LG Philips, que infelizmente não corresponde bem ao homólogo Gigabyte. Além da luminosidade, o contraste também é mais fraco. Uma média de 285 cd/m² e 823:1 são bastante baixos na faixa de preço de cerca de 2000 euros (~$2.289). O painel QHD do XMG Neo 17 com 381 cd/m² e 1108:1 mostra como ele pode ser melhor.
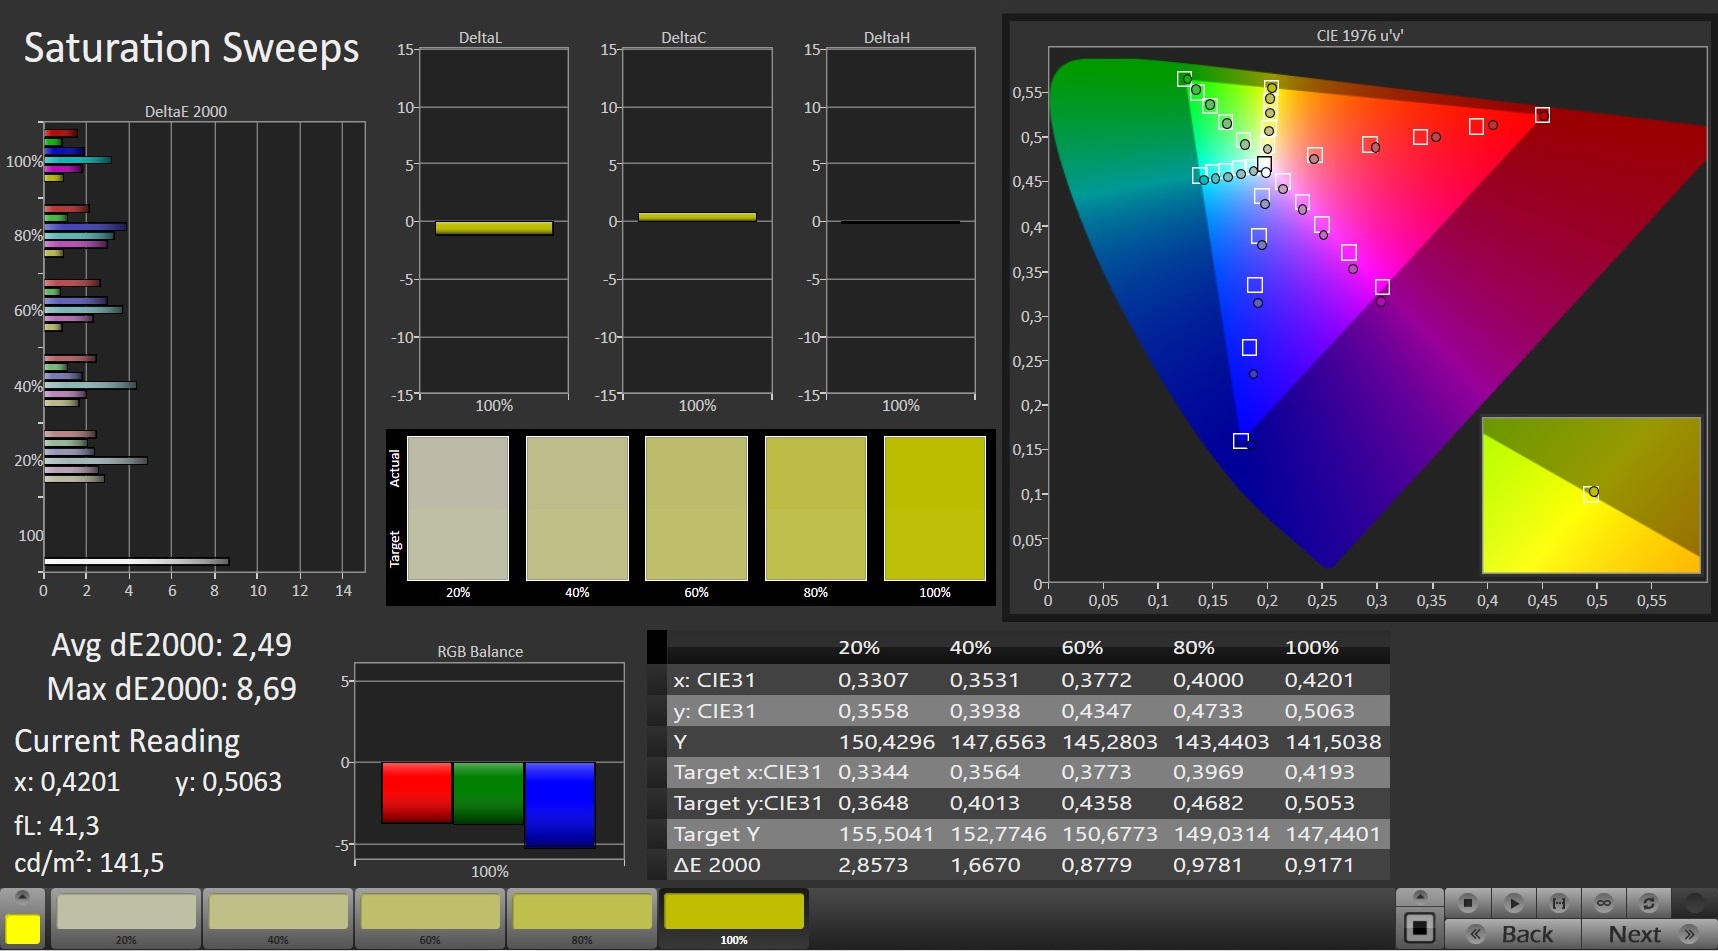
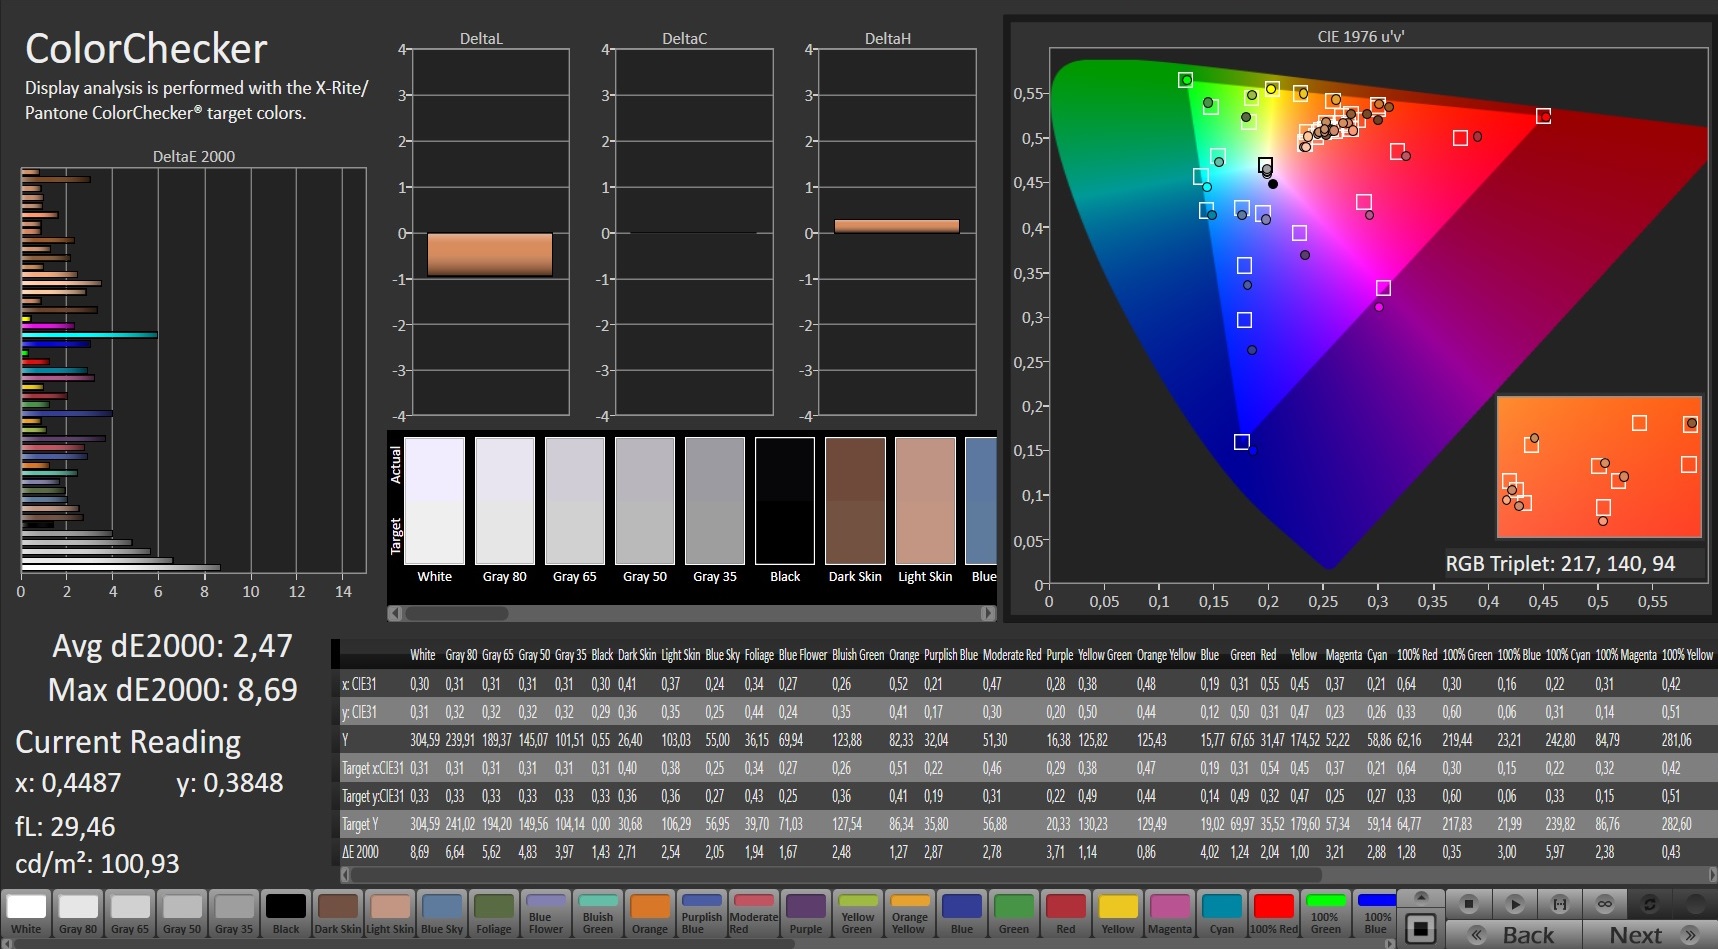
Por outro lado, há mais pontos para o curto tempo de resposta e o espaço de cor decente. 96% sRGB é completamente suficiente para um caderno de jogos. A reprodução de cores também dificilmente pode ser criticada, embora melhorias ainda possam ser alcançadas via calibração (nosso arquivo ICC está vinculado abaixo). A estabilidade do ângulo de visão está no nível típico do IPS, portanto, é boa
| |||||||||||||||||||||||||
iluminação: 94 %
iluminação com acumulador: 292 cd/m²
Contraste: 823:1 (Preto: 0.355 cd/m²)
ΔE ColorChecker Calman: 2.47 | ∀{0.5-29.43 Ø4.71}
calibrated: 0.96
ΔE Greyscale Calman: 4.3 | ∀{0.09-98 Ø4.96}
65.8% AdobeRGB 1998 (Argyll 3D)
95.9% sRGB (Argyll 3D)
65% Display P3 (Argyll 3D)
Gamma: 2.298
CCT: 7000 K
| Schenker XMG Apex 17 M21 LG Philips LP173WFG-SPB3, IPS, 1920x1080, 17.3" | Schenker XMG Neo 17 (Early 2021, RTX 3070, 5800H) BOE NE173QHM-NY2 (BOE0977), IPS, 2560x1440, 17.3" | Razer Blade 17 RTX 3070 AU Optronics B173HAN05.4, IPS, 1920x1080, 17.3" | MSI GP76 Leopard 10UG Chi Mei CMN176E, IPS, 1920x1080, 17.3" | Acer Nitro 5 AN517-41-R5Z7 BOE NV173FHM-NX4, IPS, 1920x1080, 17.3" | |
|---|---|---|---|---|---|
| Display | 7% | 8% | 1% | -43% | |
| Display P3 Coverage (%) | 65 | 70.5 8% | 71.7 10% | 64.7 0% | 36.7 -44% |
| sRGB Coverage (%) | 95.9 | 99.5 4% | 98.8 3% | 96.4 1% | 55.3 -42% |
| AdobeRGB 1998 Coverage (%) | 65.8 | 71.8 9% | 73.6 12% | 66.9 2% | 37.9 -42% |
| Response Times | -4% | 44% | 24% | -27% | |
| Response Time Grey 50% / Grey 80% * (ms) | 15.2 ? | 16.8 ? -11% | 4.2 ? 72% | 7.4 ? 51% | 18 ? -18% |
| Response Time Black / White * (ms) | 10.4 ? | 10 ? 4% | 8.8 ? 15% | 10.8 ? -4% | 14 ? -35% |
| PWM Frequency (Hz) | 24510 ? | ||||
| Screen | 15% | -22% | 22% | -19% | |
| Brightness middle (cd/m²) | 292 | 410 40% | 323.3 11% | 328 12% | 282 -3% |
| Brightness (cd/m²) | 285 | 381 34% | 315 11% | 314 10% | 255 -11% |
| Brightness Distribution (%) | 94 | 88 -6% | 91 -3% | 87 -7% | 85 -10% |
| Black Level * (cd/m²) | 0.355 | 0.37 -4% | 0.33 7% | 0.29 18% | 0.24 32% |
| Contrast (:1) | 823 | 1108 35% | 980 19% | 1131 37% | 1175 43% |
| Colorchecker dE 2000 * | 2.47 | 2.55 -3% | 4.59 -86% | 1.93 22% | 5.91 -139% |
| Colorchecker dE 2000 max. * | 8.69 | 4.33 50% | 10.82 -25% | 4.94 43% | 10.98 -26% |
| Colorchecker dE 2000 calibrated * | 0.96 | 1.28 -33% | 1.4 -46% | 0.68 29% | |
| Greyscale dE 2000 * | 4.3 | 3.4 21% | 7.9 -84% | 2.8 35% | 5.85 -36% |
| Gamma | 2.298 96% | 2.275 97% | 2.28 96% | 2.18 101% | 2.32 95% |
| CCT | 7000 93% | 6637 98% | 5941 109% | 7023 93% | 7372 88% |
| Color Space (Percent of AdobeRGB 1998) (%) | 72 | 67 | 35 | ||
| Color Space (Percent of sRGB) (%) | 95 | 89 | 55 | ||
| Média Total (Programa/Configurações) | 6% /
11% | 10% /
-6% | 16% /
18% | -30% /
-25% |
* ... menor é melhor
Exibir tempos de resposta
| ↔ Tempo de resposta preto para branco | ||
|---|---|---|
| 10.4 ms ... ascensão ↗ e queda ↘ combinadas | ↗ 6 ms ascensão | 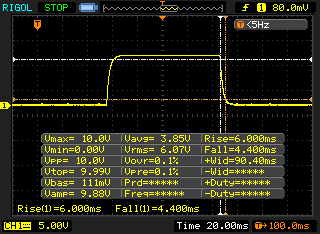 |
| ↘ 4.4 ms queda | ||
| A tela mostra boas taxas de resposta em nossos testes, mas pode ser muito lenta para jogadores competitivos. Em comparação, todos os dispositivos testados variam de 0.1 (mínimo) a 240 (máximo) ms. » 28 % de todos os dispositivos são melhores. Isso significa que o tempo de resposta medido é melhor que a média de todos os dispositivos testados (19.8 ms). | ||
| ↔ Tempo de resposta 50% cinza a 80% cinza | ||
| 15.2 ms ... ascensão ↗ e queda ↘ combinadas | ↗ 7.6 ms ascensão | 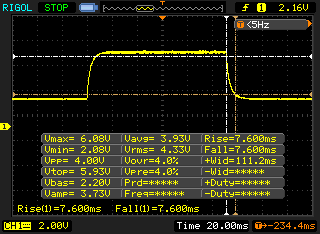 |
| ↘ 7.6 ms queda | ||
| A tela mostra boas taxas de resposta em nossos testes, mas pode ser muito lenta para jogadores competitivos. Em comparação, todos os dispositivos testados variam de 0.165 (mínimo) a 636 (máximo) ms. » 29 % de todos os dispositivos são melhores. Isso significa que o tempo de resposta medido é melhor que a média de todos os dispositivos testados (31 ms). | ||
Cintilação da tela / PWM (modulação por largura de pulso)
| Tela tremeluzindo / PWM não detectado | 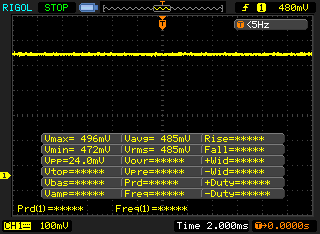 | ||
[pwm_comparison] Em comparação: 52 % de todos os dispositivos testados não usam PWM para escurecer a tela. Se PWM foi detectado, uma média de 7754 (mínimo: 5 - máximo: 343500) Hz foi medida. | |||
Condições de teste
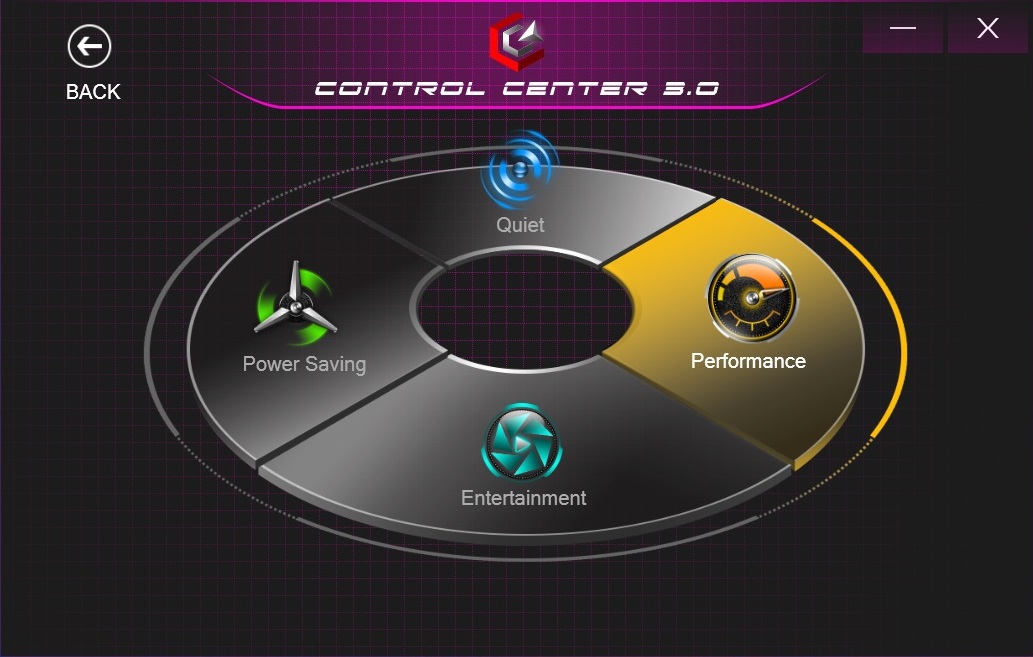
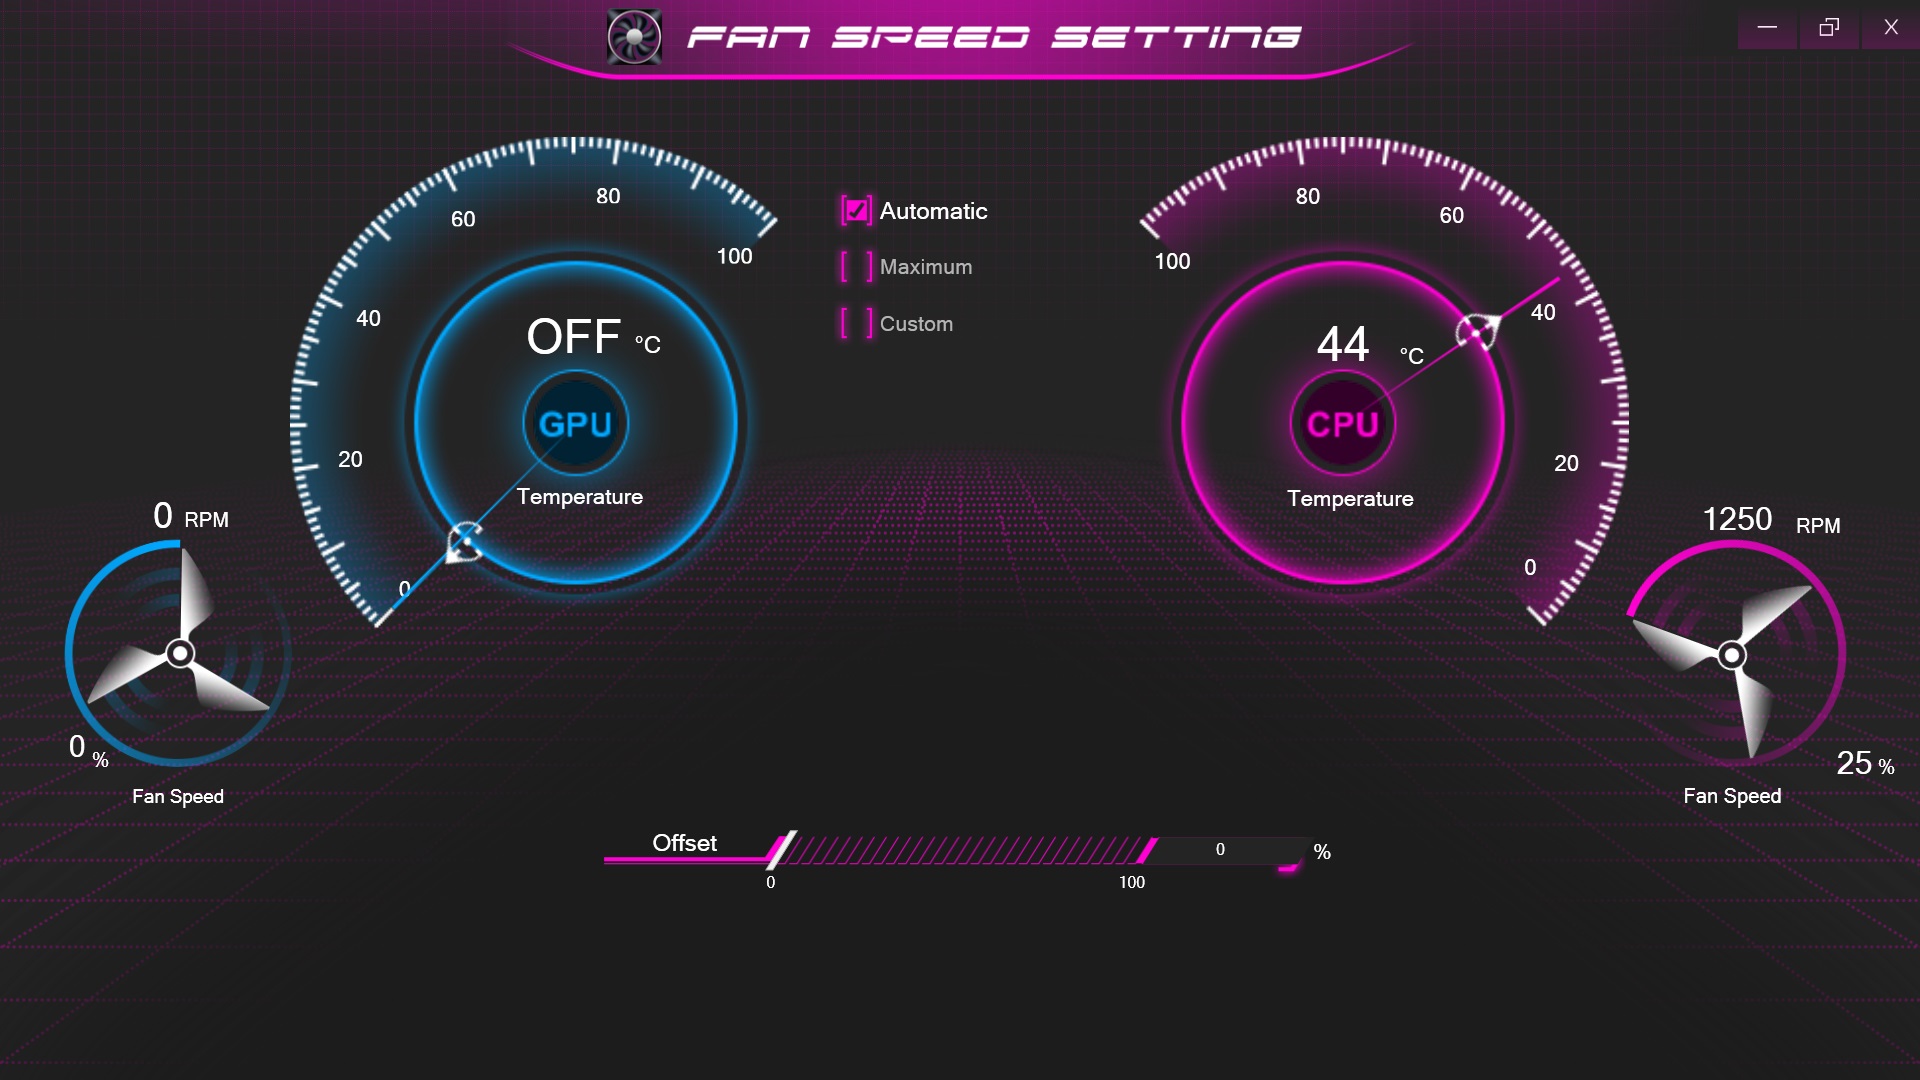
Vários ajustes do sistema podem ser feitos no Centro de Controle pré-carregado, que vem do fabricante de barebone Clevo. Estes incluem o controle do ventilador e o perfil de desempenho. Para obter a máxima potência do Apex 17, usamos o modo Performance para nossos testes (apenas as medições da bateria foram realizadas no modo Entertainment). Deixamos a configuração de velocidade do ventilador na opção padrão Automático.
Nota: Para evitar que o Windows 11, que foi instalado no dispositivo de teste, influenciasse negativamente os resultados do benchmark, aguardamos o mais recente driver da placa mãe da AMD e uma certa atualização da Microsoft (bug no cache L3 da palavra-chave).
Energia
Não importa qual CPU ou GPU você escolher para a configuração: O Apex 17 tende para o segmento high-end. Para estar adequadamente preparado para o futuro, recomendamos 16 GB de RAM e um mínimo de 500 GB de SSD. A configuração básica é extremamente escassa a este respeito (8 GB & 250 GB).
Processador
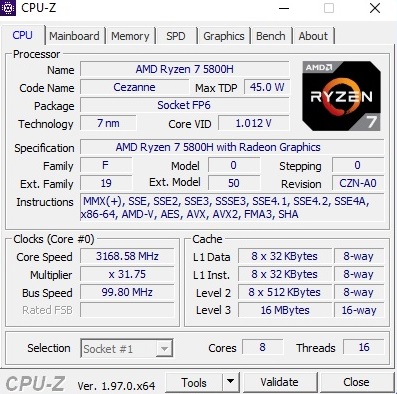
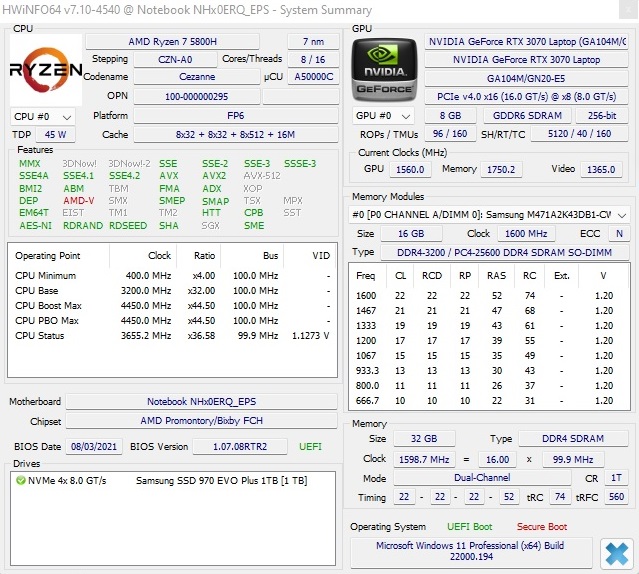
O Ryzen 7 5800H instalado na amostra de revisão é um processador de oito núcleos extremamente rápido que pode processar até 16 roscas em paralelo via SMT. Não houve surpresas desagradáveis em nosso curso de referência. As pontuações do Cinebench estão todas em um alto nível e podem se manter contra a concorrência. O desempenho também se manteve bastante estável no teste Loop (comparar gráfico)
Cinebench R15 Multi Endurance Test
* ... menor é melhor
AIDA64: FP32 Ray-Trace | FPU Julia | CPU SHA3 | CPU Queen | FPU SinJulia | FPU Mandel | CPU AES | CPU ZLib | FP64 Ray-Trace | CPU PhotoWorxx
| Performance rating | |
| Média da turma Gaming | |
| Schenker XMG Apex 17 M21 | |
| Schenker XMG Neo 17 (Early 2021, RTX 3070, 5800H) | |
| Acer Nitro 5 AN517-41-R5Z7 | |
| Média AMD Ryzen 7 5800H | |
| MSI GP76 Leopard 10UG | |
| Razer Blade 17 RTX 3070 -9! | |
| AIDA64 / FP32 Ray-Trace | |
| Média da turma Gaming (10227 - 85542, n=105, últimos 2 anos) | |
| Schenker XMG Apex 17 M21 | |
| Schenker XMG Neo 17 (Early 2021, RTX 3070, 5800H) | |
| Acer Nitro 5 AN517-41-R5Z7 | |
| Média AMD Ryzen 7 5800H (10349 - 15169, n=29) | |
| MSI GP76 Leopard 10UG | |
| AIDA64 / FPU Julia | |
| Média da turma Gaming (51376 - 238426, n=105, últimos 2 anos) | |
| Schenker XMG Apex 17 M21 | |
| Schenker XMG Neo 17 (Early 2021, RTX 3070, 5800H) | |
| Acer Nitro 5 AN517-41-R5Z7 | |
| Média AMD Ryzen 7 5800H (63663 - 95954, n=29) | |
| MSI GP76 Leopard 10UG | |
| AIDA64 / CPU SHA3 | |
| Média da turma Gaming (2180 - 10115, n=105, últimos 2 anos) | |
| Schenker XMG Apex 17 M21 | |
| Schenker XMG Neo 17 (Early 2021, RTX 3070, 5800H) | |
| Acer Nitro 5 AN517-41-R5Z7 | |
| Média AMD Ryzen 7 5800H (2096 - 3287, n=29) | |
| MSI GP76 Leopard 10UG | |
| AIDA64 / CPU Queen | |
| Média da turma Gaming (49785 - 173351, n=90, últimos 2 anos) | |
| Acer Nitro 5 AN517-41-R5Z7 | |
| Schenker XMG Apex 17 M21 | |
| Média AMD Ryzen 7 5800H (91846 - 99215, n=29) | |
| Schenker XMG Neo 17 (Early 2021, RTX 3070, 5800H) | |
| MSI GP76 Leopard 10UG | |
| AIDA64 / FPU SinJulia | |
| Média da turma Gaming (4424 - 33636, n=105, últimos 2 anos) | |
| Acer Nitro 5 AN517-41-R5Z7 | |
| Schenker XMG Apex 17 M21 | |
| Schenker XMG Neo 17 (Early 2021, RTX 3070, 5800H) | |
| Média AMD Ryzen 7 5800H (9962 - 11871, n=29) | |
| MSI GP76 Leopard 10UG | |
| AIDA64 / FPU Mandel | |
| Média da turma Gaming (25115 - 128721, n=105, últimos 2 anos) | |
| Schenker XMG Apex 17 M21 | |
| Schenker XMG Neo 17 (Early 2021, RTX 3070, 5800H) | |
| Acer Nitro 5 AN517-41-R5Z7 | |
| Média AMD Ryzen 7 5800H (36083 - 52732, n=29) | |
| MSI GP76 Leopard 10UG | |
| AIDA64 / CPU AES | |
| Schenker XMG Apex 17 M21 | |
| Schenker XMG Neo 17 (Early 2021, RTX 3070, 5800H) | |
| Acer Nitro 5 AN517-41-R5Z7 | |
| Média AMD Ryzen 7 5800H (50226 - 127832, n=29) | |
| Média da turma Gaming (39258 - 247074, n=105, últimos 2 anos) | |
| MSI GP76 Leopard 10UG | |
| AIDA64 / CPU ZLib | |
| Média da turma Gaming (574 - 2531, n=105, últimos 2 anos) | |
| Schenker XMG Neo 17 (Early 2021, RTX 3070, 5800H) | |
| Schenker XMG Apex 17 M21 | |
| Acer Nitro 5 AN517-41-R5Z7 | |
| Média AMD Ryzen 7 5800H (591 - 828, n=29) | |
| MSI GP76 Leopard 10UG | |
| Razer Blade 17 RTX 3070 | |
| AIDA64 / FP64 Ray-Trace | |
| Média da turma Gaming (5509 - 45446, n=105, últimos 2 anos) | |
| Schenker XMG Apex 17 M21 | |
| Schenker XMG Neo 17 (Early 2021, RTX 3070, 5800H) | |
| Acer Nitro 5 AN517-41-R5Z7 | |
| Média AMD Ryzen 7 5800H (5457 - 7884, n=29) | |
| MSI GP76 Leopard 10UG | |
| AIDA64 / CPU PhotoWorxx | |
| Média da turma Gaming (12271 - 89891, n=105, últimos 2 anos) | |
| Schenker XMG Apex 17 M21 | |
| MSI GP76 Leopard 10UG | |
| Schenker XMG Neo 17 (Early 2021, RTX 3070, 5800H) | |
| Média AMD Ryzen 7 5800H (14445 - 25421, n=29) | |
| Acer Nitro 5 AN517-41-R5Z7 | |
Desempenho do sistema
O desempenho do sistema parece igualmente bom. O Apex 17 também ocupa um dos primeiros lugares aqui, embora os dispositivos concorrentes ainda tenham sido testados com o Windows 10, o que pode significar certos desvios.
| PCMark 10 / Score | |
| Média da turma Gaming (5828 - 12414, n=93, últimos 2 anos) | |
| Razer Blade 17 RTX 3070 | |
| Schenker XMG Neo 17 (Early 2021, RTX 3070, 5800H) | |
| Schenker XMG Apex 17 M21 | |
| Média AMD Ryzen 7 5800H, NVIDIA GeForce RTX 3070 Laptop GPU (6717 - 6983, n=6) | |
| Acer Nitro 5 AN517-41-R5Z7 | |
| MSI GP76 Leopard 10UG | |
| PCMark 10 / Essentials | |
| Razer Blade 17 RTX 3070 | |
| Média da turma Gaming (8810 - 11935, n=97, últimos 2 anos) | |
| Schenker XMG Apex 17 M21 | |
| Acer Nitro 5 AN517-41-R5Z7 | |
| Schenker XMG Neo 17 (Early 2021, RTX 3070, 5800H) | |
| Média AMD Ryzen 7 5800H, NVIDIA GeForce RTX 3070 Laptop GPU (9548 - 10226, n=6) | |
| MSI GP76 Leopard 10UG | |
| PCMark 10 / Productivity | |
| Média da turma Gaming (6845 - 25323, n=95, últimos 2 anos) | |
| Acer Nitro 5 AN517-41-R5Z7 | |
| Razer Blade 17 RTX 3070 | |
| Schenker XMG Apex 17 M21 | |
| Média AMD Ryzen 7 5800H, NVIDIA GeForce RTX 3070 Laptop GPU (8849 - 9514, n=6) | |
| Schenker XMG Neo 17 (Early 2021, RTX 3070, 5800H) | |
| MSI GP76 Leopard 10UG | |
| PCMark 10 / Digital Content Creation | |
| Média da turma Gaming (7602 - 19954, n=95, últimos 2 anos) | |
| Razer Blade 17 RTX 3070 | |
| Schenker XMG Neo 17 (Early 2021, RTX 3070, 5800H) | |
| Schenker XMG Apex 17 M21 | |
| Média AMD Ryzen 7 5800H, NVIDIA GeForce RTX 3070 Laptop GPU (8948 - 10389, n=6) | |
| Acer Nitro 5 AN517-41-R5Z7 | |
| MSI GP76 Leopard 10UG | |
| PCMark 10 Score | 6972 pontos | |
Ajuda | ||
| AIDA64 / Memory Copy | |
| Média da turma Gaming (21750 - 129946, n=105, últimos 2 anos) | |
| Schenker XMG Apex 17 M21 | |
| Schenker XMG Neo 17 (Early 2021, RTX 3070, 5800H) | |
| Média AMD Ryzen 7 5800H (34964 - 44180, n=29) | |
| MSI GP76 Leopard 10UG | |
| AIDA64 / Memory Read | |
| Média da turma Gaming (22956 - 118858, n=105, últimos 2 anos) | |
| Schenker XMG Apex 17 M21 | |
| Schenker XMG Neo 17 (Early 2021, RTX 3070, 5800H) | |
| Média AMD Ryzen 7 5800H (39548 - 47260, n=29) | |
| MSI GP76 Leopard 10UG | |
| AIDA64 / Memory Write | |
| Média da turma Gaming (22297 - 135096, n=105, últimos 2 anos) | |
| Schenker XMG Apex 17 M21 | |
| MSI GP76 Leopard 10UG | |
| Média AMD Ryzen 7 5800H (28456 - 47022, n=29) | |
| Schenker XMG Neo 17 (Early 2021, RTX 3070, 5800H) | |
| AIDA64 / Memory Latency | |
| Média da turma Gaming (75.3 - 259, n=105, últimos 2 anos) | |
| Schenker XMG Neo 17 (Early 2021, RTX 3070, 5800H) | |
| Média AMD Ryzen 7 5800H (76.3 - 105.1, n=29) | |
| Schenker XMG Apex 17 M21 | |
| MSI GP76 Leopard 10UG | |
| Razer Blade 17 RTX 3070 | |
* ... menor é melhor
Latências DPC
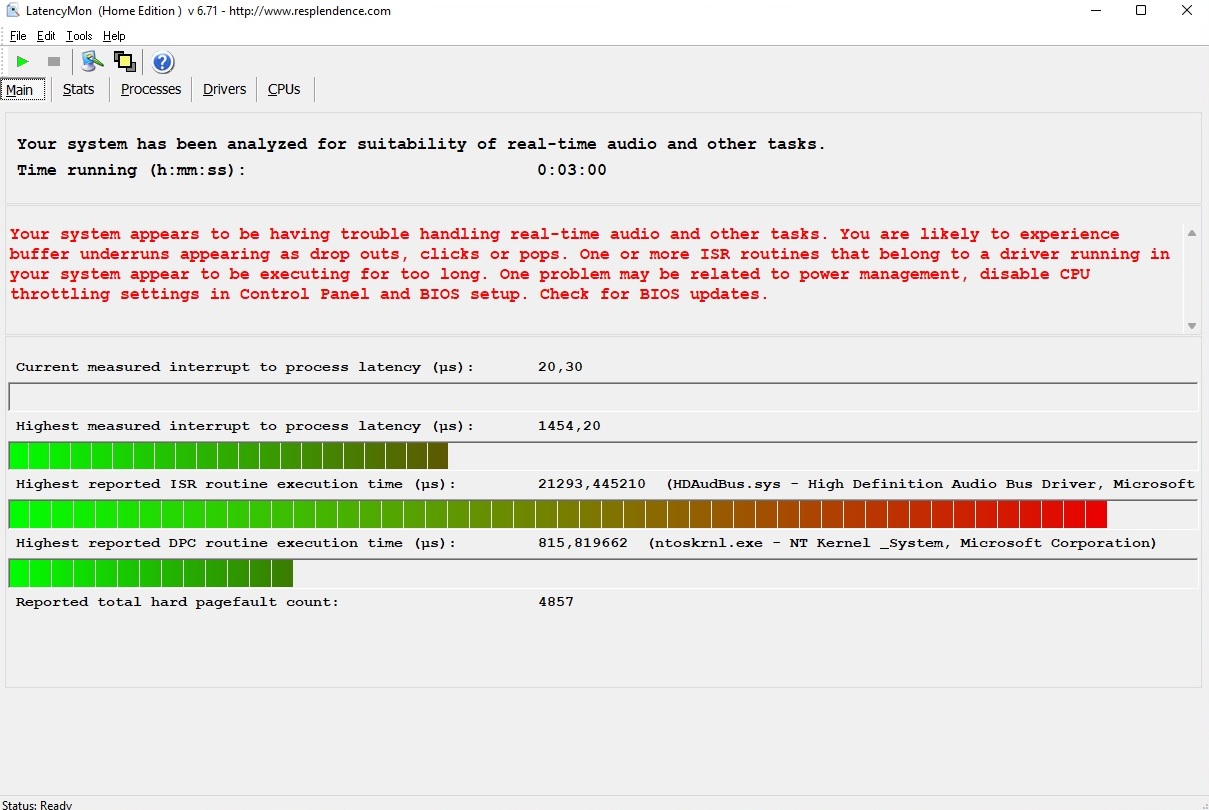
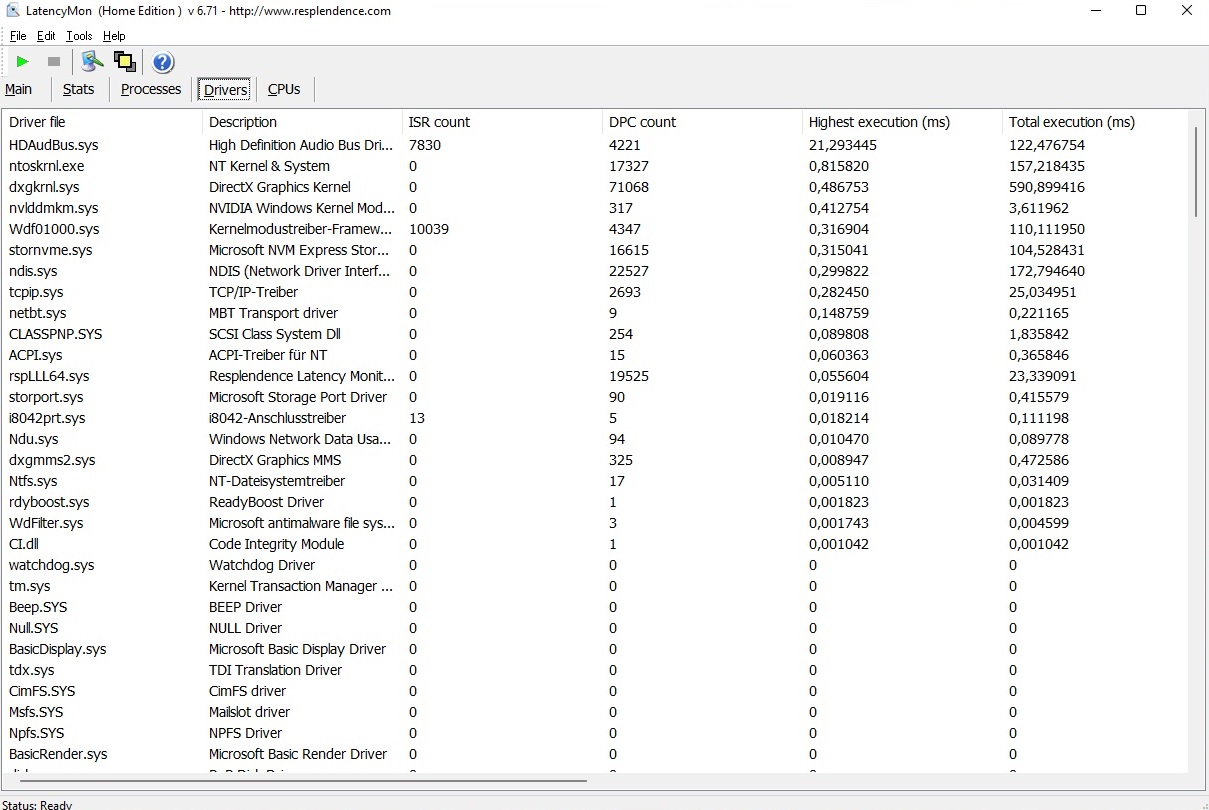
Há espaço para melhorias em termos de latências. De acordo com a ferramenta LatencyMon, o Apex 17 não é realmente adequado para edição de áudio e/ou vídeo em tempo real em seu estado de entrega, se tais cenários de aplicação forem planejados (deve se aplicar apenas a muito poucos compradores)
| DPC Latencies / LatencyMon - interrupt to process latency (max), Web, Youtube, Prime95 | |
| Schenker XMG Neo 17 (Early 2021, RTX 3070, 5800H) | |
| Schenker XMG Apex 17 M21 | |
| Acer Nitro 5 AN517-41-R5Z7 | |
| MSI GP76 Leopard 10UG | |
| Razer Blade 17 RTX 3070 | |
* ... menor é melhor
Armazenamento em massa
Nosso dispositivo de teste tinha a bordo um SSD de 1 TB da Samsung como armazenamento em massa. Como de costume, o 970 Evo Plus proporciona um desempenho de sucesso em todos os sentidos - seja na leitura ou na escrita. Se você quiser expandir o armazenamento mais tarde, há um slot M.2 livre sob o capô

Continuous load read: DiskSpd Read Loop, Queue Depth 8
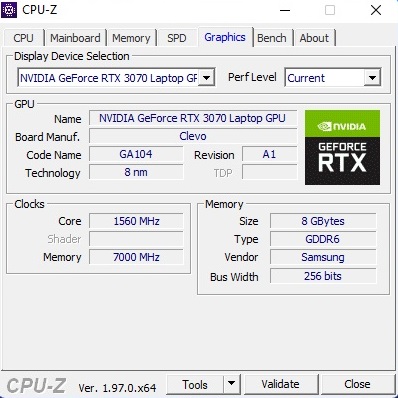
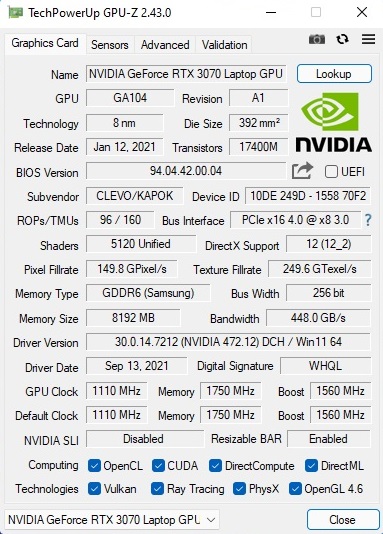
Placa gráfica
O desempenho da geração de amperes da Nvidia depende muito do conjunto TGP. Schenker dá ao RTX 3070 um total de 140 watts em modo de desempenho (incluindo 15 watts de Dynamic Boost), que é o valor máximo para esta GPU. Assim, não é surpreendente que o Apex 17 tenha uma pontuação bastante boa nos benchmarks gráficos. Analógico ao desempenho da CPU e do sistema, o Apex 17 também se torna confortável no terço superior do campo de teste aqui
| 3DMark 11 Performance | 28685 pontos | |
| 3DMark Cloud Gate Standard Score | 47429 pontos | |
| 3DMark Fire Strike Score | 24012 pontos | |
| 3DMark Time Spy Score | 10640 pontos | |
Ajuda | ||
Desempenho do jogo
Na resolução nativa Full HD de 1.920 x 1.080, o RTX 3070 pode exibir sem problemas todos os jogos atuais com o máximo de detalhes. Mesmo jogos particularmente exigentes geralmente chegam a mais de 60 FPS. O Apex 17 ainda se administraria bem com uma tela externa de QHD
| The Witcher 3 | |
| 1920x1080 High Graphics & Postprocessing (Nvidia HairWorks Off) | |
| Média da turma Gaming (341 - 404, n=2, últimos 2 anos) | |
| Razer Blade 17 RTX 3070 | |
| Schenker XMG Neo 17 (Early 2021, RTX 3070, 5800H) | |
| Schenker XMG Apex 17 M21 | |
| Média NVIDIA GeForce RTX 3070 Laptop GPU (122.1 - 207, n=34) | |
| Acer Nitro 5 AN517-41-R5Z7 | |
| 1920x1080 Ultra Graphics & Postprocessing (HBAO+) | |
| Média da turma Gaming (104.7 - 240, n=7, últimos 2 anos) | |
| MSI GP76 Leopard 10UG | |
| Schenker XMG Neo 17 (Early 2021, RTX 3070, 5800H) | |
| Razer Blade 17 RTX 3070 | |
| Schenker XMG Apex 17 M21 | |
| Média NVIDIA GeForce RTX 3070 Laptop GPU (34.9 - 109, n=52) | |
| Acer Nitro 5 AN517-41-R5Z7 | |
Durante o teste de resistência com O Witcher 3 (1 hora @FHD/Ultra) não houve anormalidades. A taxa de quadros permaneceu bastante estável durante todo o período, como deveria.
Witcher 3 FPS-Diagram
| baixo | média | alto | ultra | |
|---|---|---|---|---|
| GTA V (2015) | 172 | 158 | 92.9 | |
| The Witcher 3 (2015) | 262 | 174 | 100 | |
| Dota 2 Reborn (2015) | 148 | 135 | 127 | 122 |
| Final Fantasy XV Benchmark (2018) | 132 | 100 | ||
| X-Plane 11.11 (2018) | 104 | 91.9 | 75 | |
| Far Cry 5 (2018) | 124 | 119 | 110 | |
| Strange Brigade (2018) | 203 | 183 | 173 | |
| Hitman 3 (2021) | 176 | 170 | 162 | |
| Outriders (2021) | 118 | 117 | 117 | |
| Resident Evil Village (2021) | 178 | 176 | 156 | |
| Mass Effect Legendary Edition (2021) | 105 | |||
| Days Gone (2021) | 154 | 140 | 106 | |
| Monster Hunter Stories 2 (2021) | 144 | 143 | ||
| Deathloop (2021) | 117 | 106 | 90.1 | |
| New World (2021) | 96.8 | 92.7 | 86.8 | |
| Alan Wake Remastered (2021) | 82.7 | 79.2 | ||
| Far Cry 6 (2021) | 103 | 91 | 87 | |
| Back 4 Blood (2021) | 220 | 205 | 193 | |
| Guardians of the Galaxy (2021) | 112 | 111 | 110 | |
| Riders Republic (2021) | 136 | 114 | 105 |
Emissões
Emissões sonoras
Uma das fraquezas cruciais de Clevo barebones sempre foi o controle deficiente do ventilador. Embora o Apex 17 permaneça relativamente silencioso com 25 a 31 dB(A) em modo ocioso, os ventiladores aparecem até 57 a 59 dB(A) sob carga quando se usa o modo de desempenho - um nível de ruído irritantemente alto que acaba forçando o uso de um fone de ouvido. Se você quiser que seja mais silencioso, você deve mudar para o modo Entretenimento ou Silencioso quando estiver jogando e especialmente durante tarefas menos exigentes como jogar vídeos
Barulho
| Ocioso |
| 25 / 28 / 31 dB |
| Carga |
| 57 / 59 dB |
 | ||
30 dB silencioso 40 dB(A) audível 50 dB(A) ruidosamente alto |
||
min: | ||
| Schenker XMG Apex 17 M21 R7 5800H, GeForce RTX 3070 Laptop GPU | Schenker XMG Neo 17 (Early 2021, RTX 3070, 5800H) R7 5800H, GeForce RTX 3070 Laptop GPU | Razer Blade 17 RTX 3070 i7-11800H, GeForce RTX 3070 Laptop GPU | MSI GP76 Leopard 10UG i7-10750H, GeForce RTX 3070 Laptop GPU | Acer Nitro 5 AN517-41-R5Z7 R7 5800H, GeForce RTX 3070 Laptop GPU | Média da turma Gaming | |
|---|---|---|---|---|---|---|
| Noise | -3% | 11% | 1% | 0% | 6% | |
| desligado / ambiente * (dB) | 25 | 24 4% | 24.2 3% | 24 4% | 26 -4% | 24.1 ? 4% |
| Idle Minimum * (dB) | 25 | 29 -16% | 24.7 1% | 25 -0% | 26 -4% | 26 ? -4% |
| Idle Average * (dB) | 28 | 32 -14% | 24.7 12% | 32 -14% | 33.1 -18% | 27.4 ? 2% |
| Idle Maximum * (dB) | 31 | 38 -23% | 24.7 20% | 34 -10% | 31.3 -1% | 30.1 ? 3% |
| Load Average * (dB) | 57 | 49 14% | 44.3 22% | 54 5% | 49.8 13% | 43.6 ? 24% |
| Witcher 3 ultra * (dB) | 57 | 53 7% | 56.3 1% | 51 11% | ||
| Load Maximum * (dB) | 59 | 55 7% | 47.7 19% | 54 8% | 49.6 16% | 54.2 ? 8% |
* ... menor é melhor
Temperatura
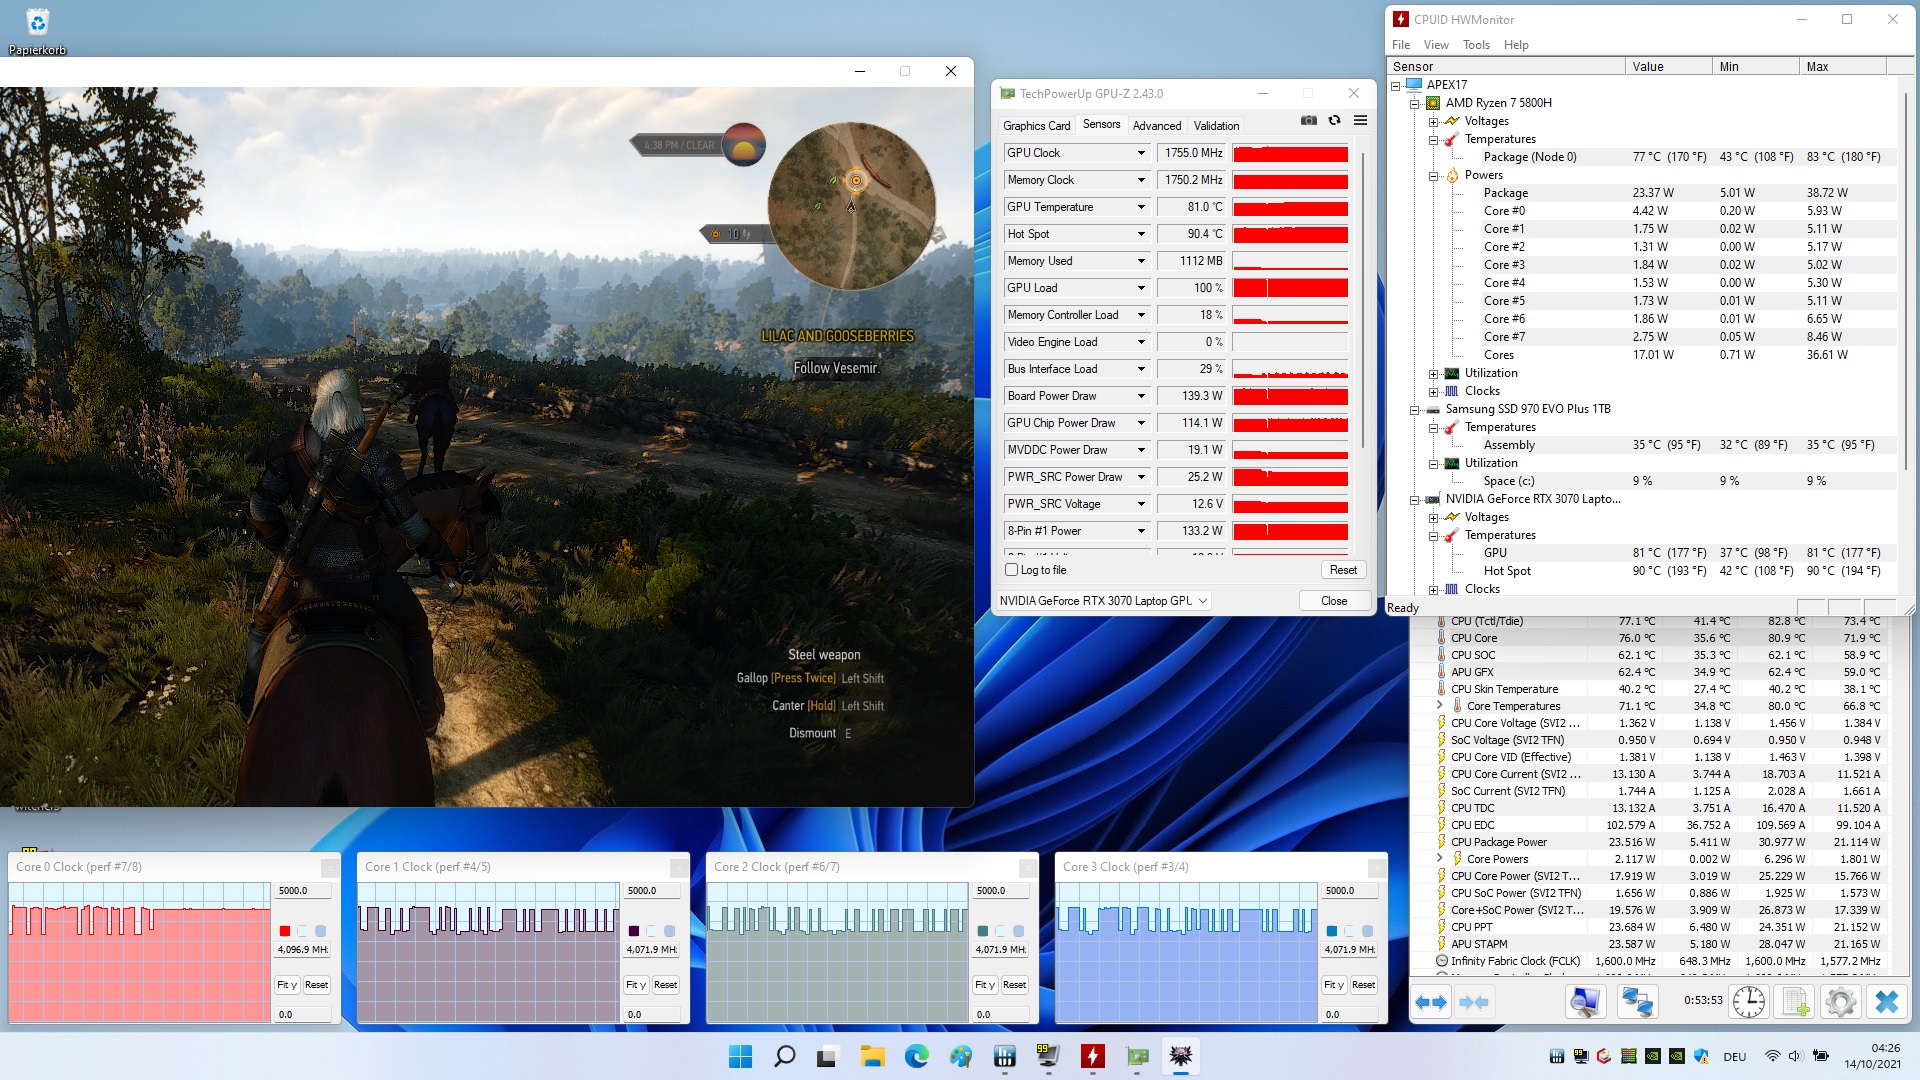
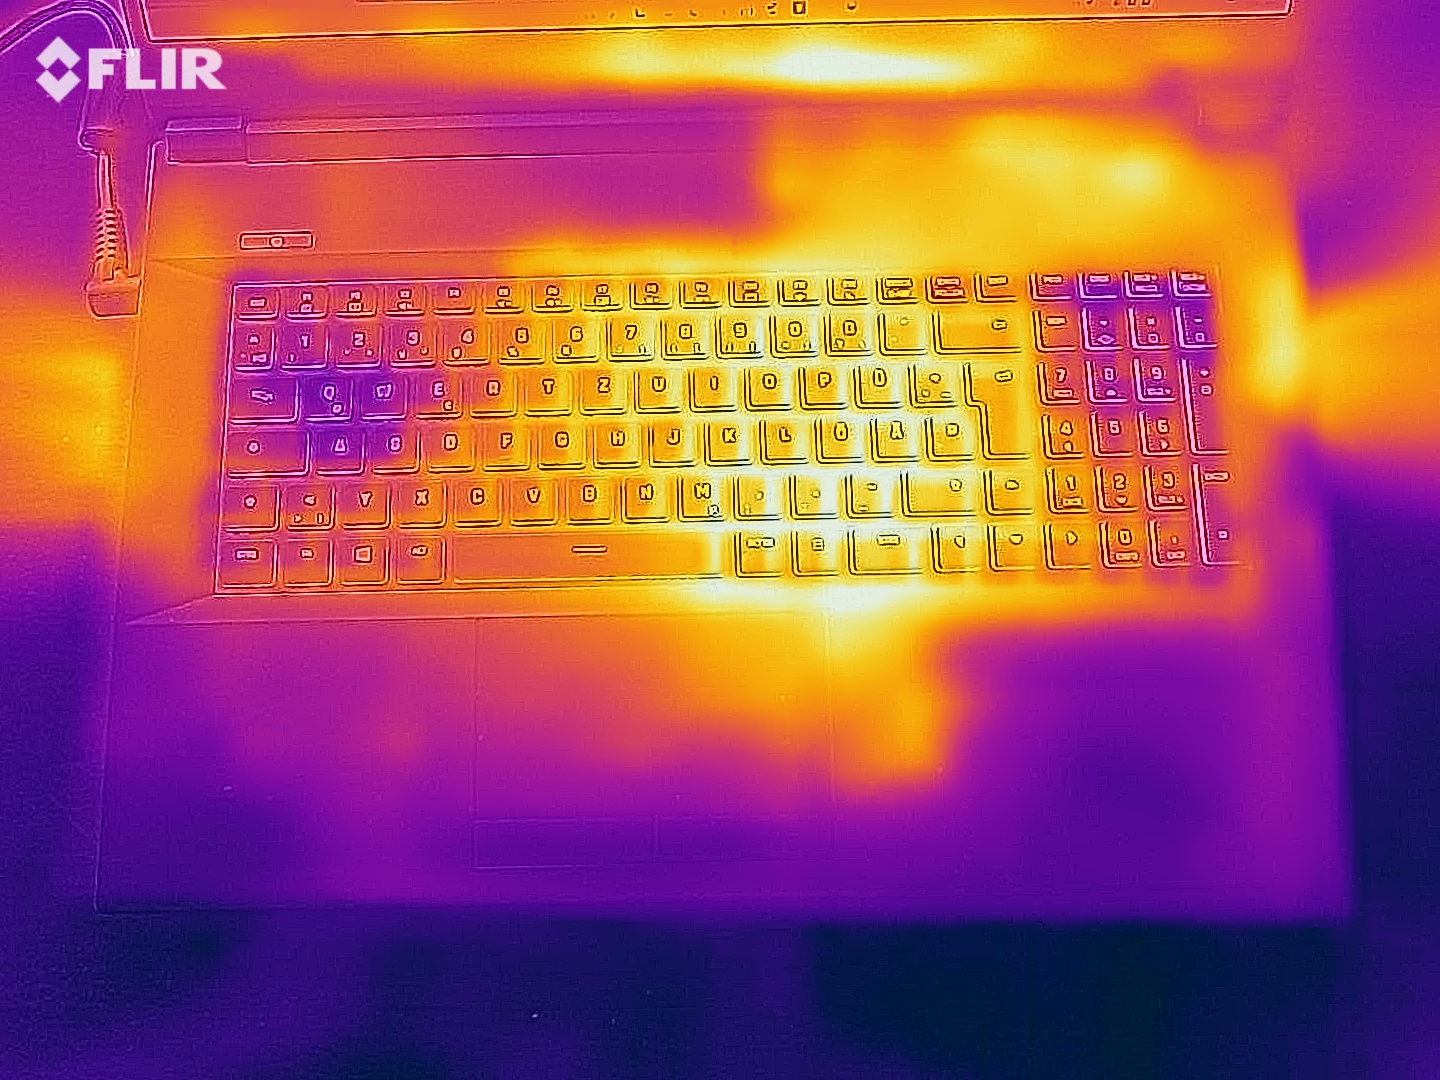
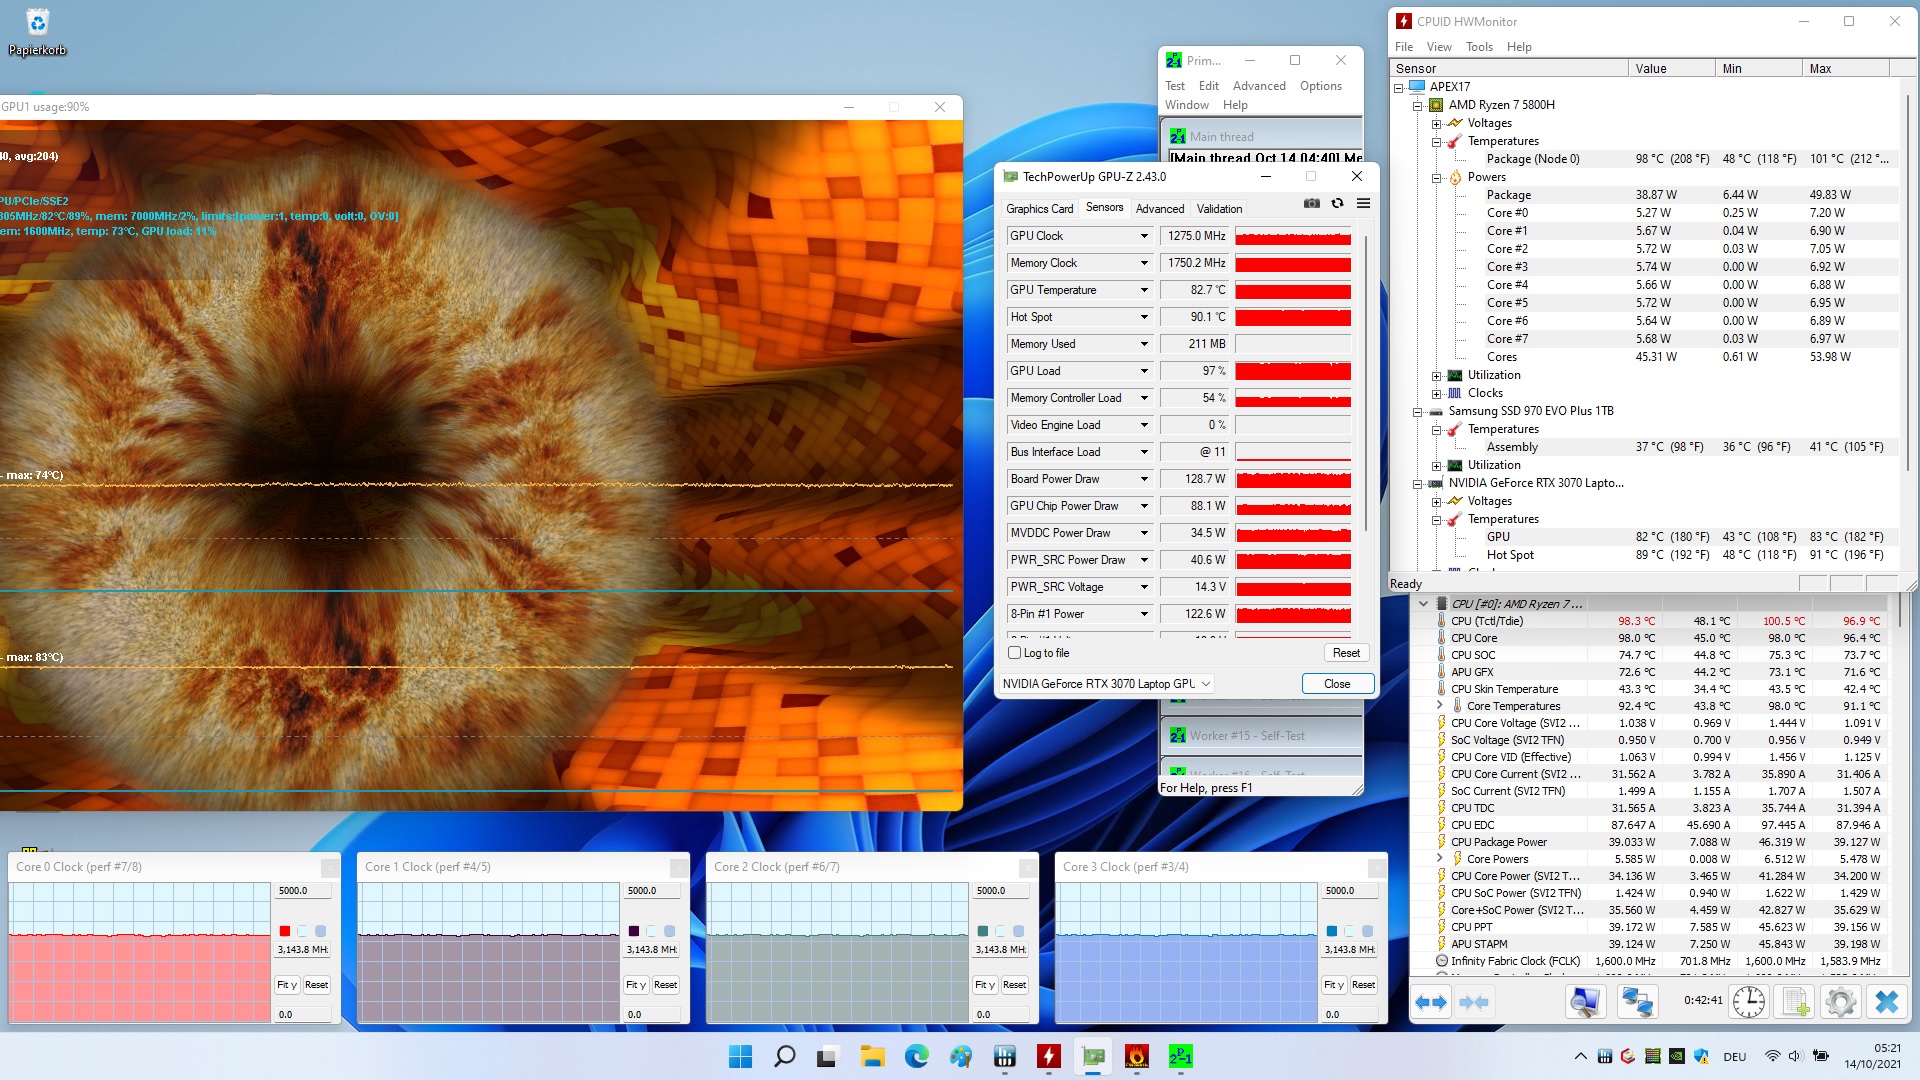
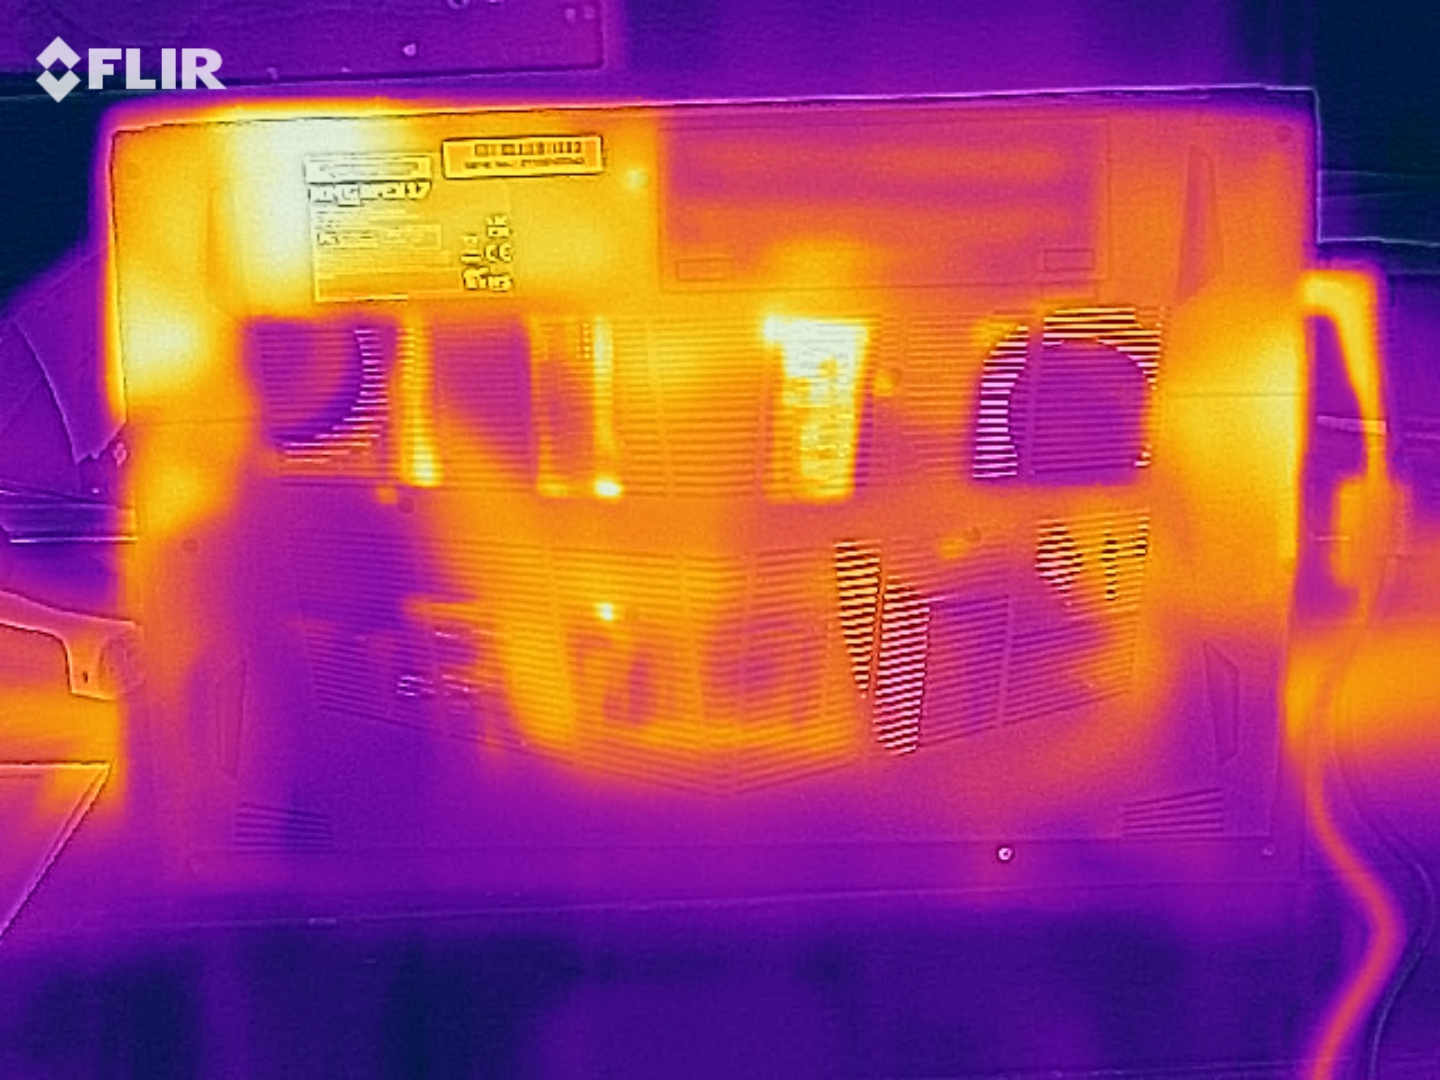
O desenvolvimento da temperatura do Apex 17 está de acordo com a concorrência, apesar do nível de ruído mais elevado. Após uma hora de carga completa com as ferramentas FurMark e Prime95, poderíamos coaxar até 45 °C(113°F) do chassi na parte superior e até 49 °C (120,2°F) na parte inferior. O processador em particular aquece dentro da caixa. Enquanto o RTX 3070 atingiu cerca de 83 °C(181,4°F) durante o teste de esforço, o Ryzen 7 5800H quase rachou a marca de 100 °C(212°F) de acordo com a ferramenta HWMonitor
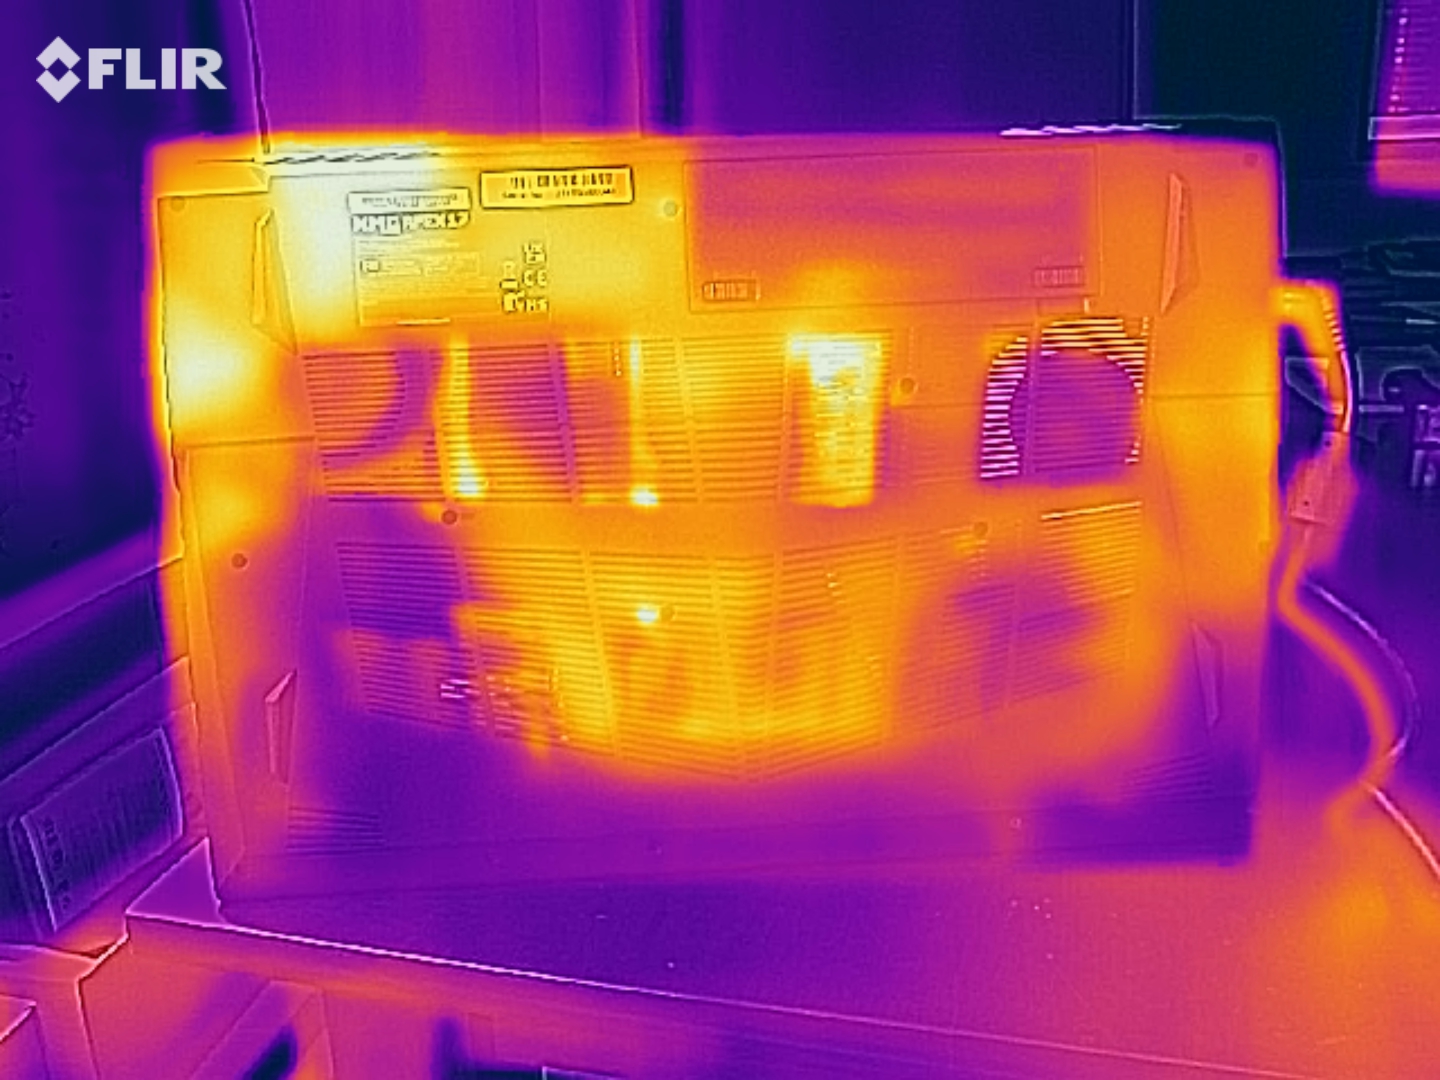
(±) A temperatura máxima no lado superior é 45 °C / 113 F, em comparação com a média de 40.4 °C / 105 F , variando de 21.2 a 68.8 °C para a classe Gaming.
(-) A parte inferior aquece até um máximo de 49 °C / 120 F, em comparação com a média de 43.2 °C / 110 F
(+) Em uso inativo, a temperatura média para o lado superior é 25.9 °C / 79 F, em comparação com a média do dispositivo de 33.9 °C / ### class_avg_f### F.
(±) Jogando The Witcher 3, a temperatura média para o lado superior é 37.6 °C / 100 F, em comparação com a média do dispositivo de 33.9 °C / ## #class_avg_f### F.
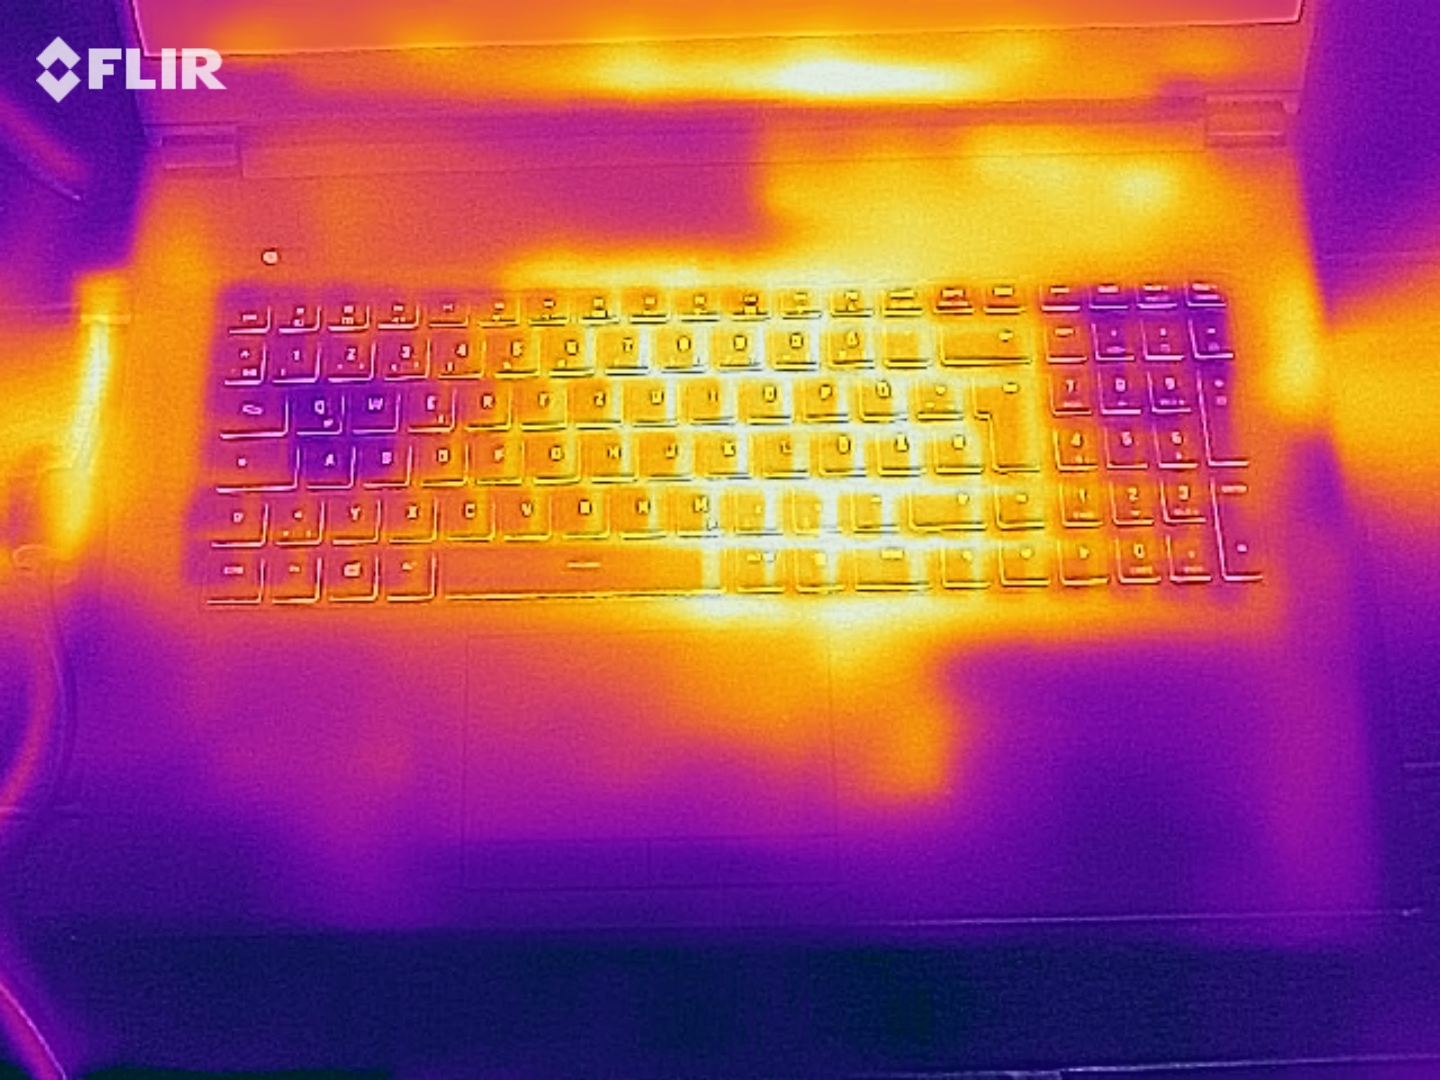
(±) Os apoios para as mãos e o touchpad podem ficar muito quentes ao toque, com um máximo de 37 °C / 98.6 F.
(-) A temperatura média da área do apoio para as mãos de dispositivos semelhantes foi 28.8 °C / 83.8 F (-8.2 °C / -14.8 F).
| Schenker XMG Apex 17 M21 R7 5800H, GeForce RTX 3070 Laptop GPU | Schenker XMG Neo 17 (Early 2021, RTX 3070, 5800H) R7 5800H, GeForce RTX 3070 Laptop GPU | Razer Blade 17 RTX 3070 i7-11800H, GeForce RTX 3070 Laptop GPU | MSI GP76 Leopard 10UG i7-10750H, GeForce RTX 3070 Laptop GPU | Acer Nitro 5 AN517-41-R5Z7 R7 5800H, GeForce RTX 3070 Laptop GPU | Média da turma Gaming | |
|---|---|---|---|---|---|---|
| Heat | -13% | -10% | -3% | -9% | -7% | |
| Maximum Upper Side * (°C) | 45 | 47 -4% | 41 9% | 43 4% | 44 2% | 45.2 ? -0% |
| Maximum Bottom * (°C) | 49 | 51 -4% | 47.2 4% | 47 4% | 52.7 -8% | 48.1 ? 2% |
| Idle Upper Side * (°C) | 27 | 32 -19% | 33.2 -23% | 30 -11% | 32.6 -21% | 31 ? -15% |
| Idle Bottom * (°C) | 30 | 37 -23% | 39 -30% | 33 -10% | 32.1 -7% | 34.2 ? -14% |
* ... menor é melhor
Orador
Schenker XMG Apex 17 M21 análise de áudio
(+) | os alto-falantes podem tocar relativamente alto (###valor### dB)
Graves 100 - 315Hz
(-) | quase nenhum baixo - em média 22.5% menor que a mediana
(±) | a linearidade dos graves é média (12.9% delta para a frequência anterior)
Médios 400 - 2.000 Hz
(±) | médios mais altos - em média 5.5% maior que a mediana
(±) | a linearidade dos médios é média (8.8% delta para frequência anterior)
Altos 2 - 16 kHz
(+) | agudos equilibrados - apenas 3.8% longe da mediana
(+) | os máximos são lineares (5.4% delta da frequência anterior)
Geral 100 - 16.000 Hz
(±) | a linearidade do som geral é média (18.3% diferença em relação à mediana)
Comparado com a mesma classe
» 58% de todos os dispositivos testados nesta classe foram melhores, 9% semelhantes, 33% piores
» O melhor teve um delta de 6%, a média foi 18%, o pior foi 132%
Comparado com todos os dispositivos testados
» 40% de todos os dispositivos testados foram melhores, 8% semelhantes, 52% piores
» O melhor teve um delta de 4%, a média foi 23%, o pior foi 134%
Schenker XMG Neo 17 (Early 2021, RTX 3070, 5800H) análise de áudio
(+) | os alto-falantes podem tocar relativamente alto (###valor### dB)
Graves 100 - 315Hz
(-) | quase nenhum baixo - em média 20.8% menor que a mediana
(±) | a linearidade dos graves é média (12.3% delta para a frequência anterior)
Médios 400 - 2.000 Hz
(+) | médios equilibrados - apenas 2.9% longe da mediana
(+) | médios são lineares (5.1% delta para frequência anterior)
Altos 2 - 16 kHz
(+) | agudos equilibrados - apenas 2.7% longe da mediana
(±) | a linearidade dos máximos é média (7.6% delta para frequência anterior)
Geral 100 - 16.000 Hz
(+) | o som geral é linear (14.5% diferença em relação à mediana)
Comparado com a mesma classe
» 27% de todos os dispositivos testados nesta classe foram melhores, 7% semelhantes, 66% piores
» O melhor teve um delta de 6%, a média foi 18%, o pior foi 132%
Comparado com todos os dispositivos testados
» 18% de todos os dispositivos testados foram melhores, 4% semelhantes, 77% piores
» O melhor teve um delta de 4%, a média foi 23%, o pior foi 134%
Gerenciamento de energia
Consumo de energia
Graças à comutação gráfica (Nvidia Optimus), o Apex 17 não consome muita energia durante tarefas pouco exigentes. O consumo ocioso de 10 a 20 watts é menor do que a concorrência. As diferenças são limitadas sob carga
| desligado | |
| Ocioso | |
| Carga |
|
Key:
min: | |
| Schenker XMG Apex 17 M21 R7 5800H, GeForce RTX 3070 Laptop GPU | Schenker XMG Neo 17 (Early 2021, RTX 3070, 5800H) R7 5800H, GeForce RTX 3070 Laptop GPU | Razer Blade 17 RTX 3070 i7-11800H, GeForce RTX 3070 Laptop GPU | MSI GP76 Leopard 10UG i7-10750H, GeForce RTX 3070 Laptop GPU | Acer Nitro 5 AN517-41-R5Z7 R7 5800H, GeForce RTX 3070 Laptop GPU | Média da turma Gaming | |
|---|---|---|---|---|---|---|
| Power Consumption | -15% | -50% | -8% | -21% | -20% | |
| Idle Minimum * (Watt) | 10 | 13 -30% | 20.9 -109% | 12 -20% | 18.7 -87% | 13 ? -30% |
| Idle Average * (Watt) | 14 | 16 -14% | 25.1 -79% | 16 -14% | 22 -57% | 19 ? -36% |
| Idle Maximum * (Watt) | 20 | 26 -30% | 45 -125% | 28 -40% | 25.2 -26% | 24.6 ? -23% |
| Load Average * (Watt) | 112 | 125 -12% | 102 9% | 92 18% | 134.7 -20% | 110.7 ? 1% |
| Witcher 3 ultra * (Watt) | 202 | 187 7% | 189 6% | 198 2% | 135 33% | |
| Load Maximum * (Watt) | 231 | 259 -12% | 234.8 -2% | 210 9% | 157 32% | 259 ? -12% |
* ... menor é melhor
Energy consumption Witcher 3
Duração da bateria
A capacidade da bateria é modesta. 49 Que não estão mais atualizados em 2021, especialmente tendo em vista o preço. Para comparação: A concorrência oferece 62 a 70 Wh. Felizmente, o tempo de funcionamento não cai completamente devido ao consumo moderado de energia. O Apex 17 durou cerca de 5 horas em nosso teste Wi-Fi com brilho médio - uma taxa decente.
| Schenker XMG Apex 17 M21 R7 5800H, GeForce RTX 3070 Laptop GPU, 49 Wh | Schenker XMG Neo 17 (Early 2021, RTX 3070, 5800H) R7 5800H, GeForce RTX 3070 Laptop GPU, 62 Wh | Razer Blade 17 RTX 3070 i7-11800H, GeForce RTX 3070 Laptop GPU, 70 Wh | MSI GP76 Leopard 10UG i7-10750H, GeForce RTX 3070 Laptop GPU, 65 Wh | Acer Nitro 5 AN517-41-R5Z7 R7 5800H, GeForce RTX 3070 Laptop GPU, 57.5 Wh | Média da turma Gaming | |
|---|---|---|---|---|---|---|
| Duração da bateria | -31% | 17% | -18% | 33% | 38% | |
| Reader / Idle (h) | 7 | 4.7 -33% | 6.7 -4% | 5.6 -20% | 10.1 44% | 8.27 ? 18% |
| WiFi v1.3 (h) | 4.9 | 3.5 -29% | 5.2 6% | 4.2 -14% | 5.6 14% | 7.11 ? 45% |
| Load (h) | 1 | 0.7 -30% | 1.5 50% | 0.8 -20% | 1.4 40% | 1.502 ? 50% |
| H.264 (h) | 7 | 8.32 ? |
Pro
Contra
Veredicto
Se você está procurando um caderno de jogos com boas opções de manutenção, o Apex 17 é a escolha certa.
Uma bateria de acesso externo e removível é raramente encontrada hoje em dia (embora a capacidade da bateria deixe muito a desejar).
Além do desenvolvimento extremamente alto de ruído no modo de desempenho - há diferentes perfis de desempenho - o equipamento de 17 polegadas parece, de outra forma, pouco espetacular. A caixa, os dispositivos de entrada e as interfaces cortam uma figura sólida. Por outro lado, é um pouco lamentável que o fabricante não tenha instalado uma tela melhor. A luminosidade e o contraste só satisfazem as altas exigências de forma limitada.
Em troca, o Apex 17 pontua na categoria de desempenho. O processador e a placa gráfica fornecem taxas de referência acima da média (não menos importante graças ao generoso TDP).
Os fãs da economia que gostariam de ter um RTX 3070 deveriam preferir o Acer Nitro 5 AN517O TGP, que custa alguns 100 euros (~$114) a menos com equipamentos similares (mas também tem um TGP mais baixo).
Preço e disponibilidade
O XMG Apex 17 está disponível na loja do fabricante bestware.com a partir de 1.479 euros (~$1.692)
Schenker XMG Apex 17 M21
- 11/02/2021 v7 (old)
Florian Glaser
Price comparison
