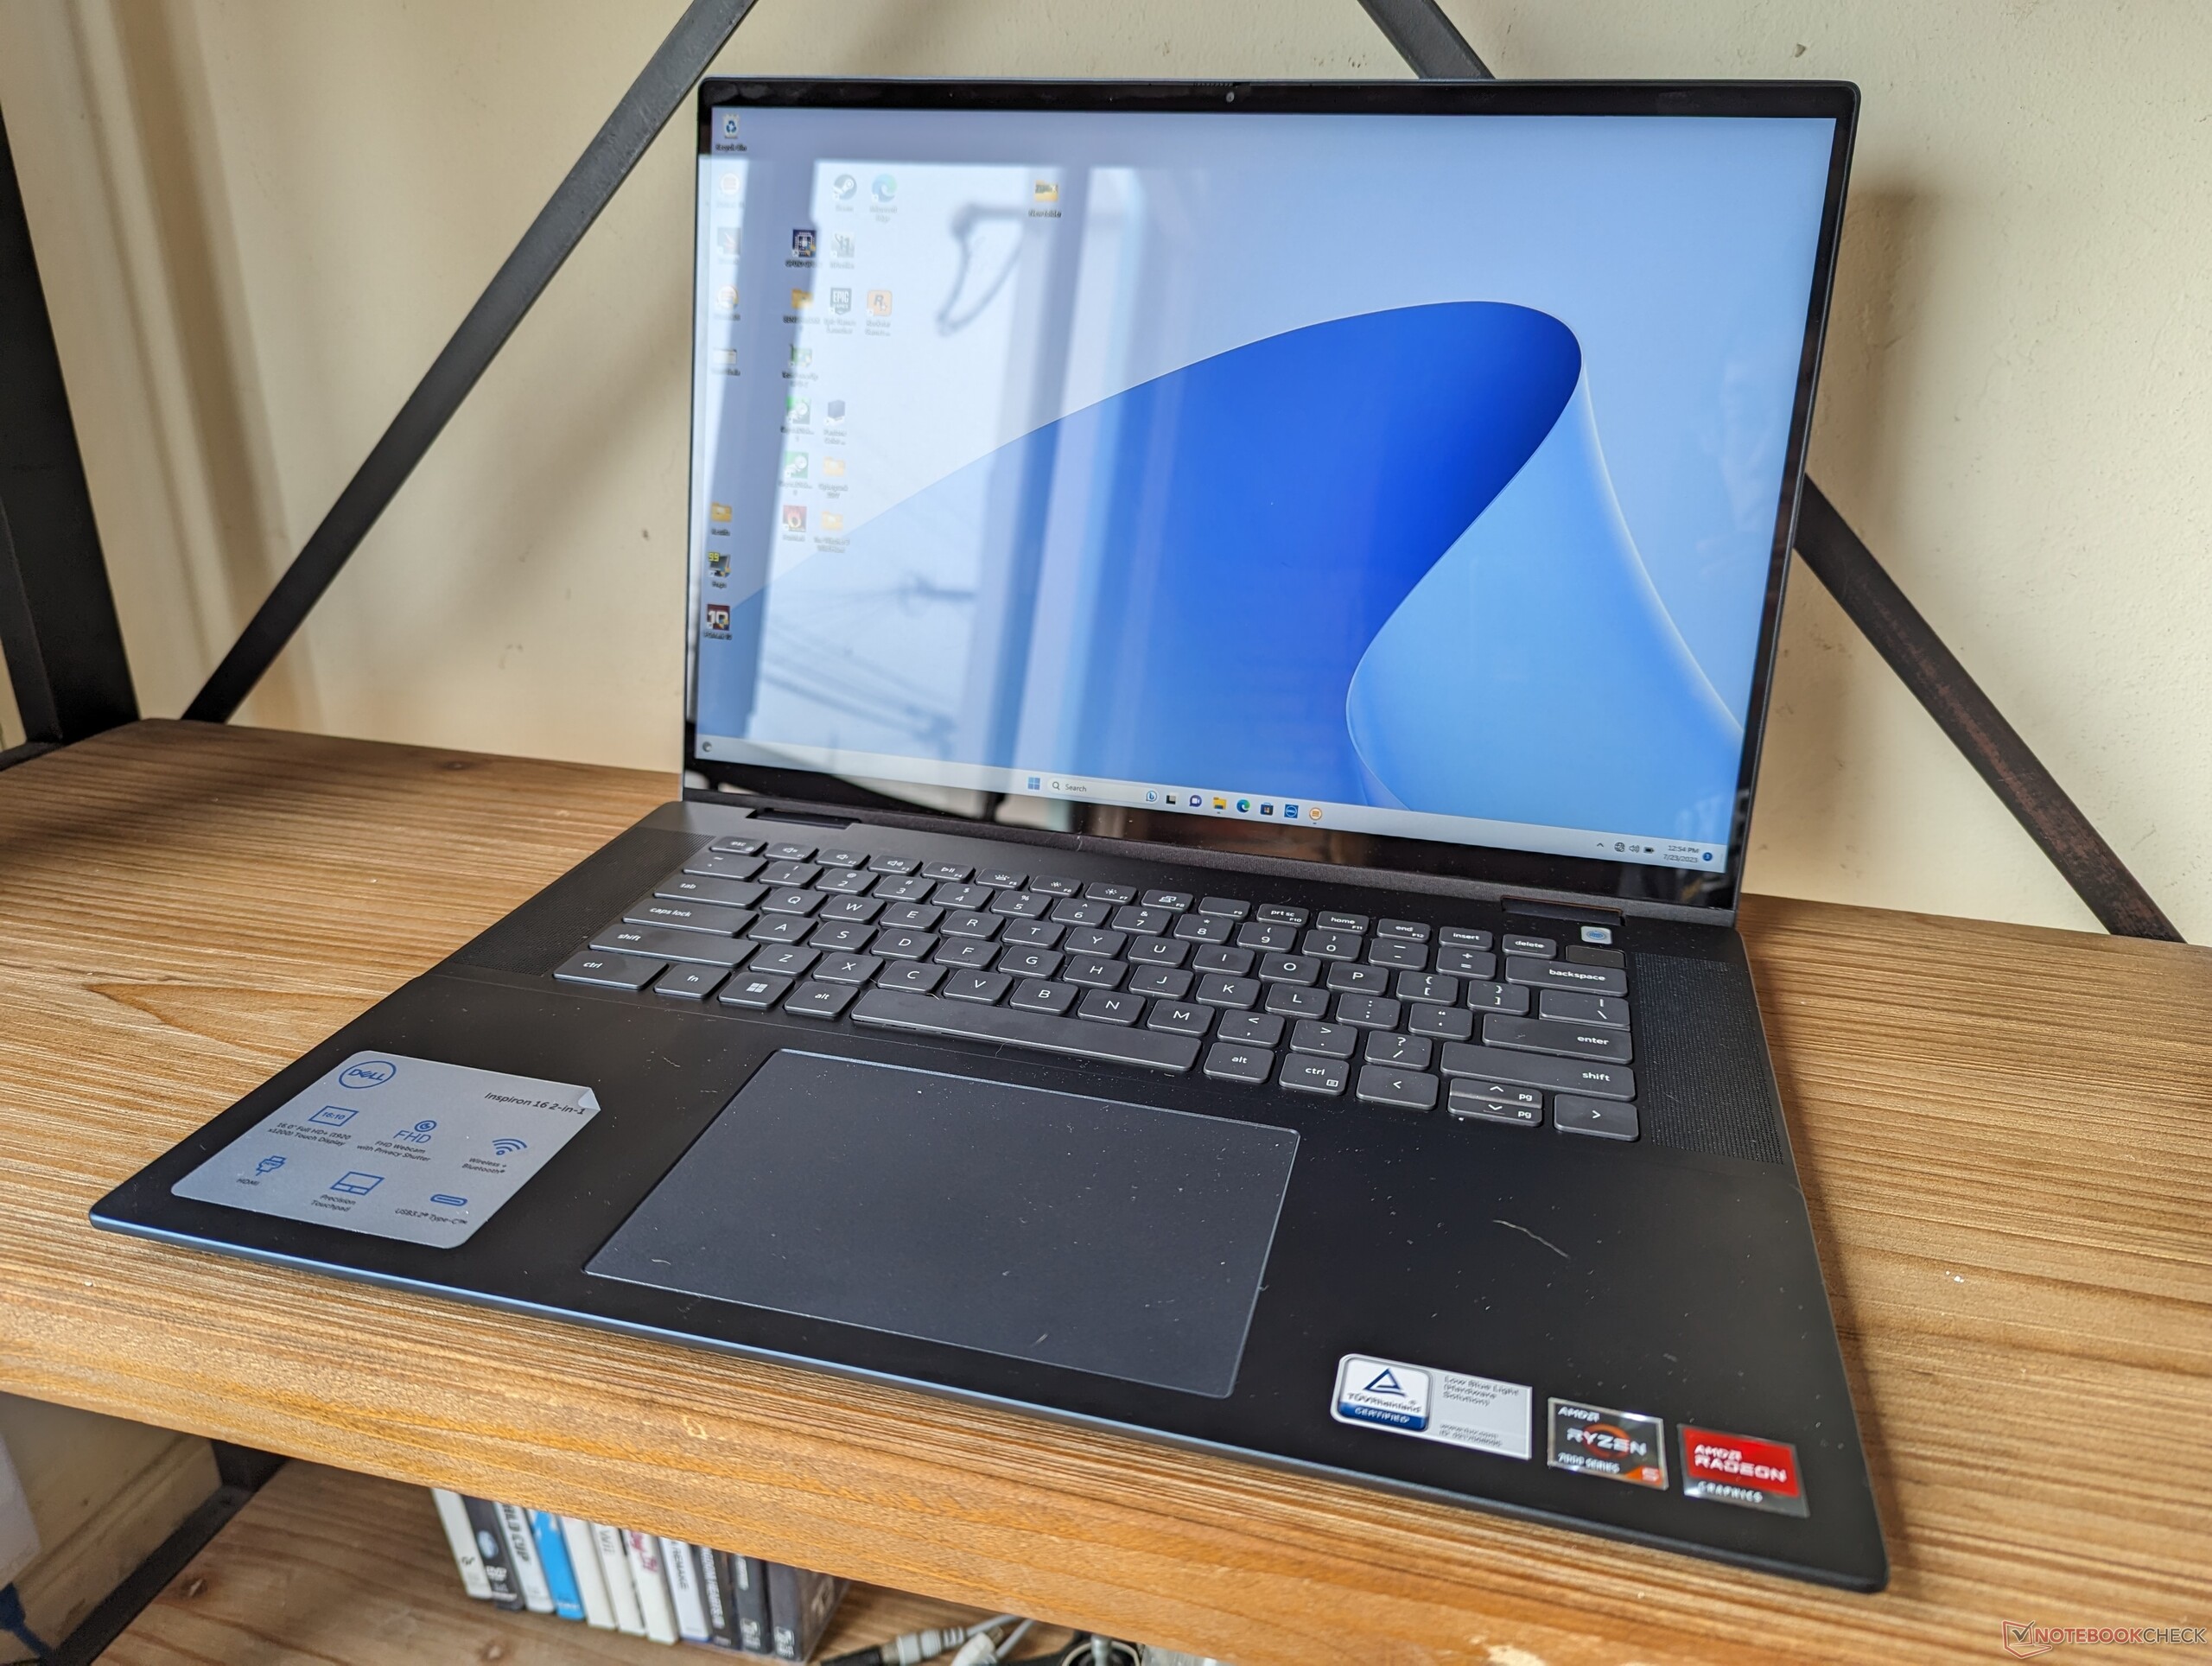
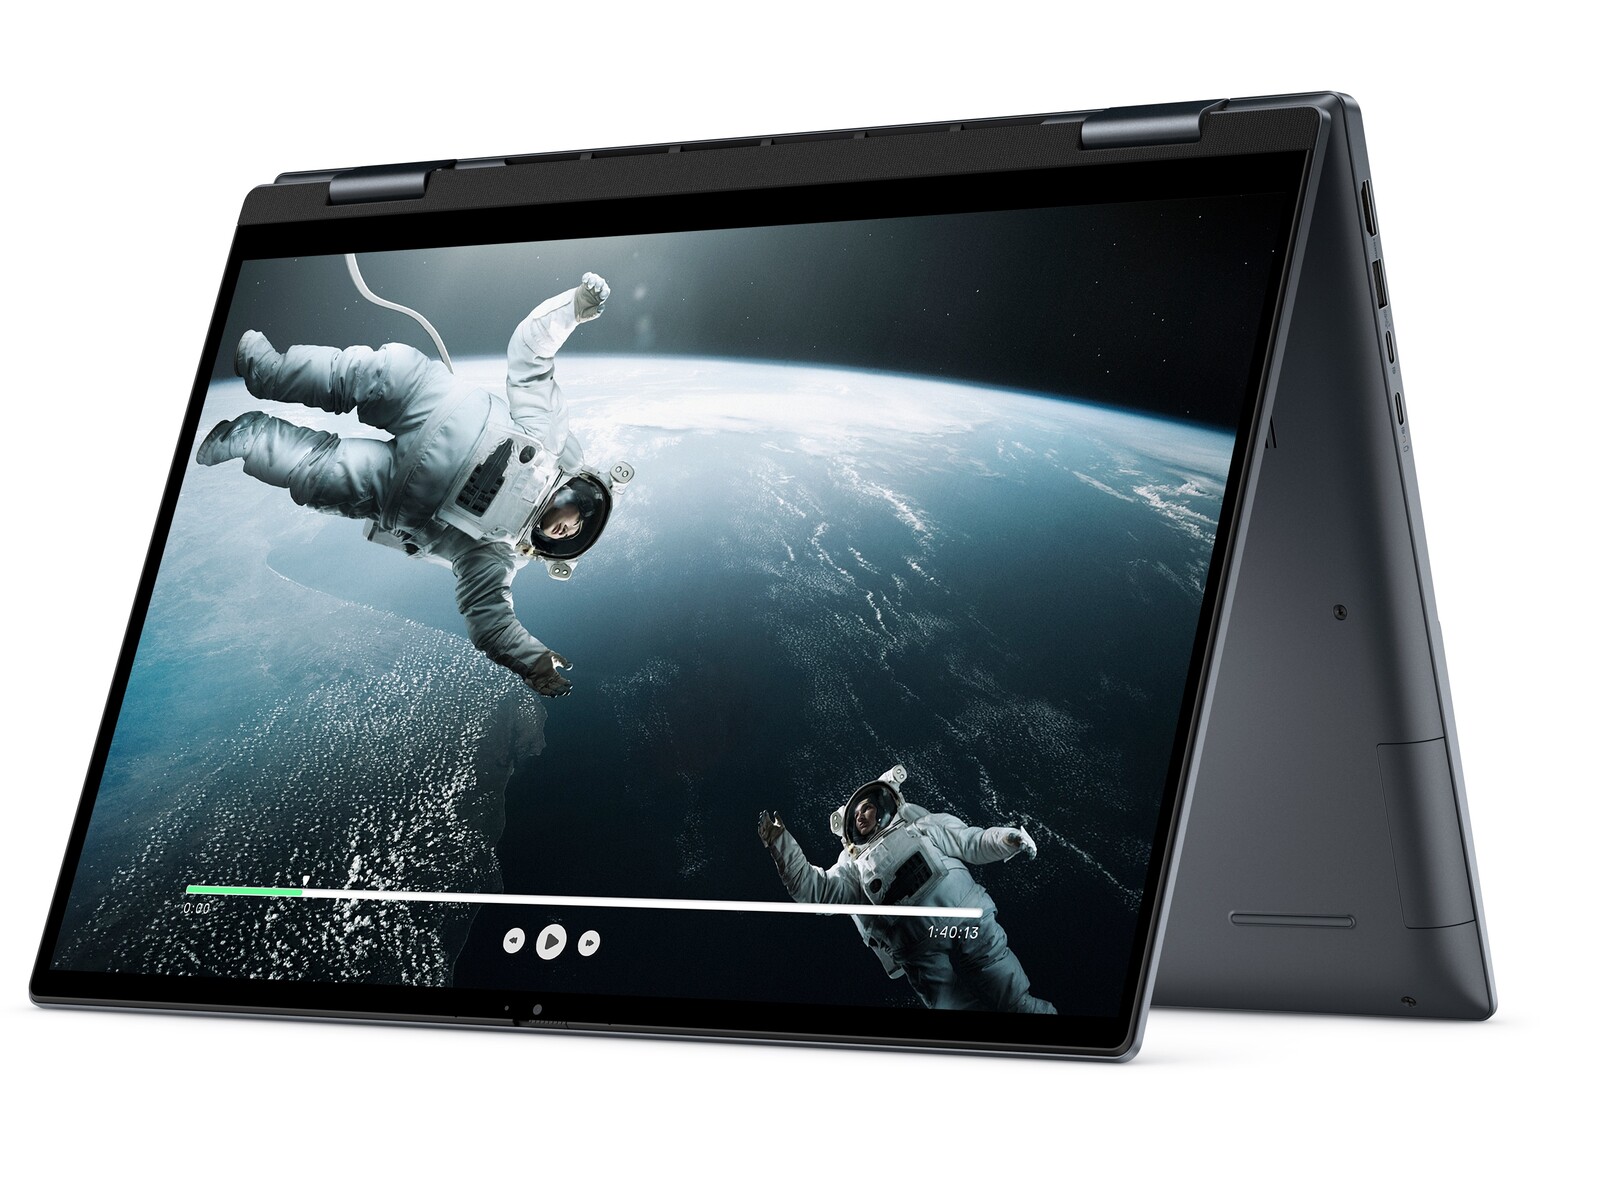
Análise do laptop 2 em 1 Dell Inspiron 16 7635: Um Inspiron 16 7630 com AMD Ryzen

O Inspiron 16 7635 2 em 1 é a versão AMD do Inspiron 16 7630 2 em 1 baseado em Intel. Como outros modelos Inspiron, ele é voltado para a categoria de consumidores de orçamento a médio porte, em contraste com a série Latitude ou a série XPS prosumer, voltada para empresas de ponta. Ele é o sucessor direto do Inspiron 16 7620 2 em 1 do ano passado do ano passado, com novas CPUs e um design externo revisado.
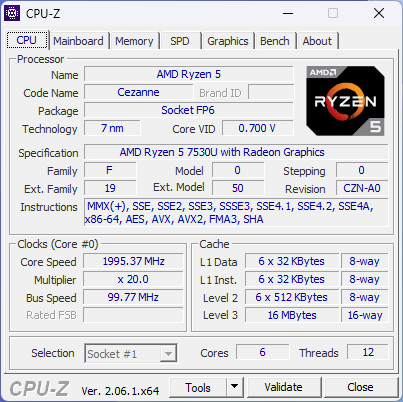
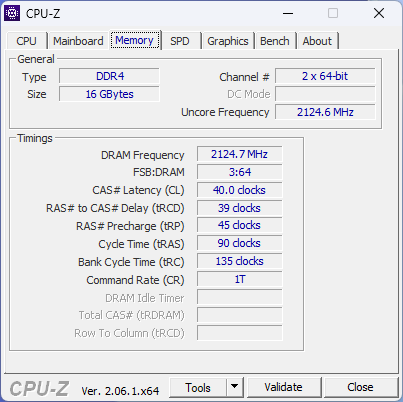
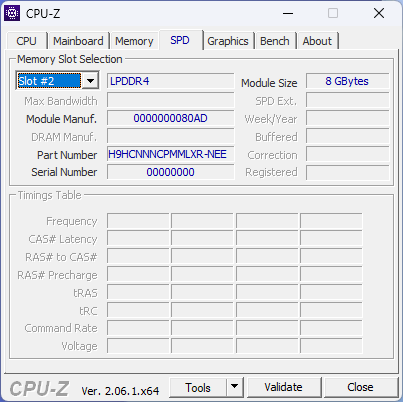
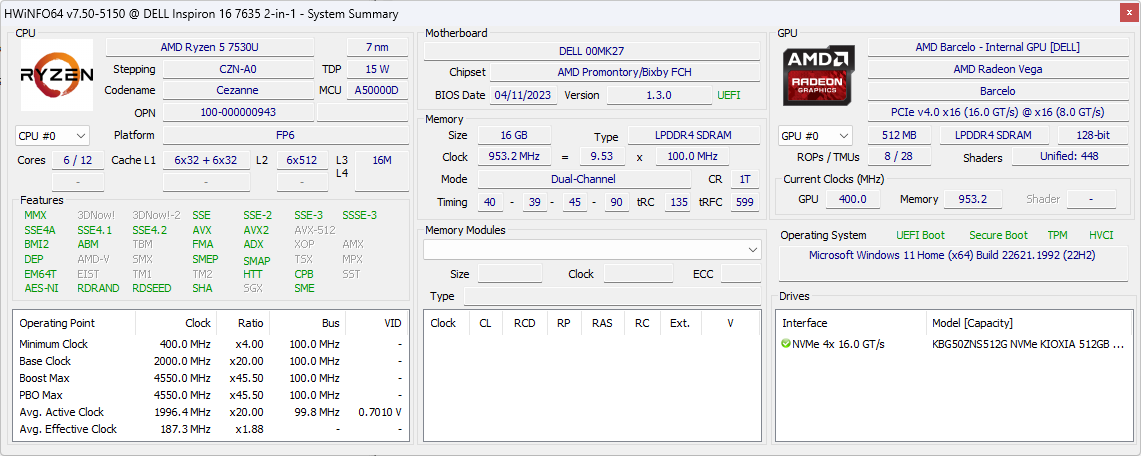
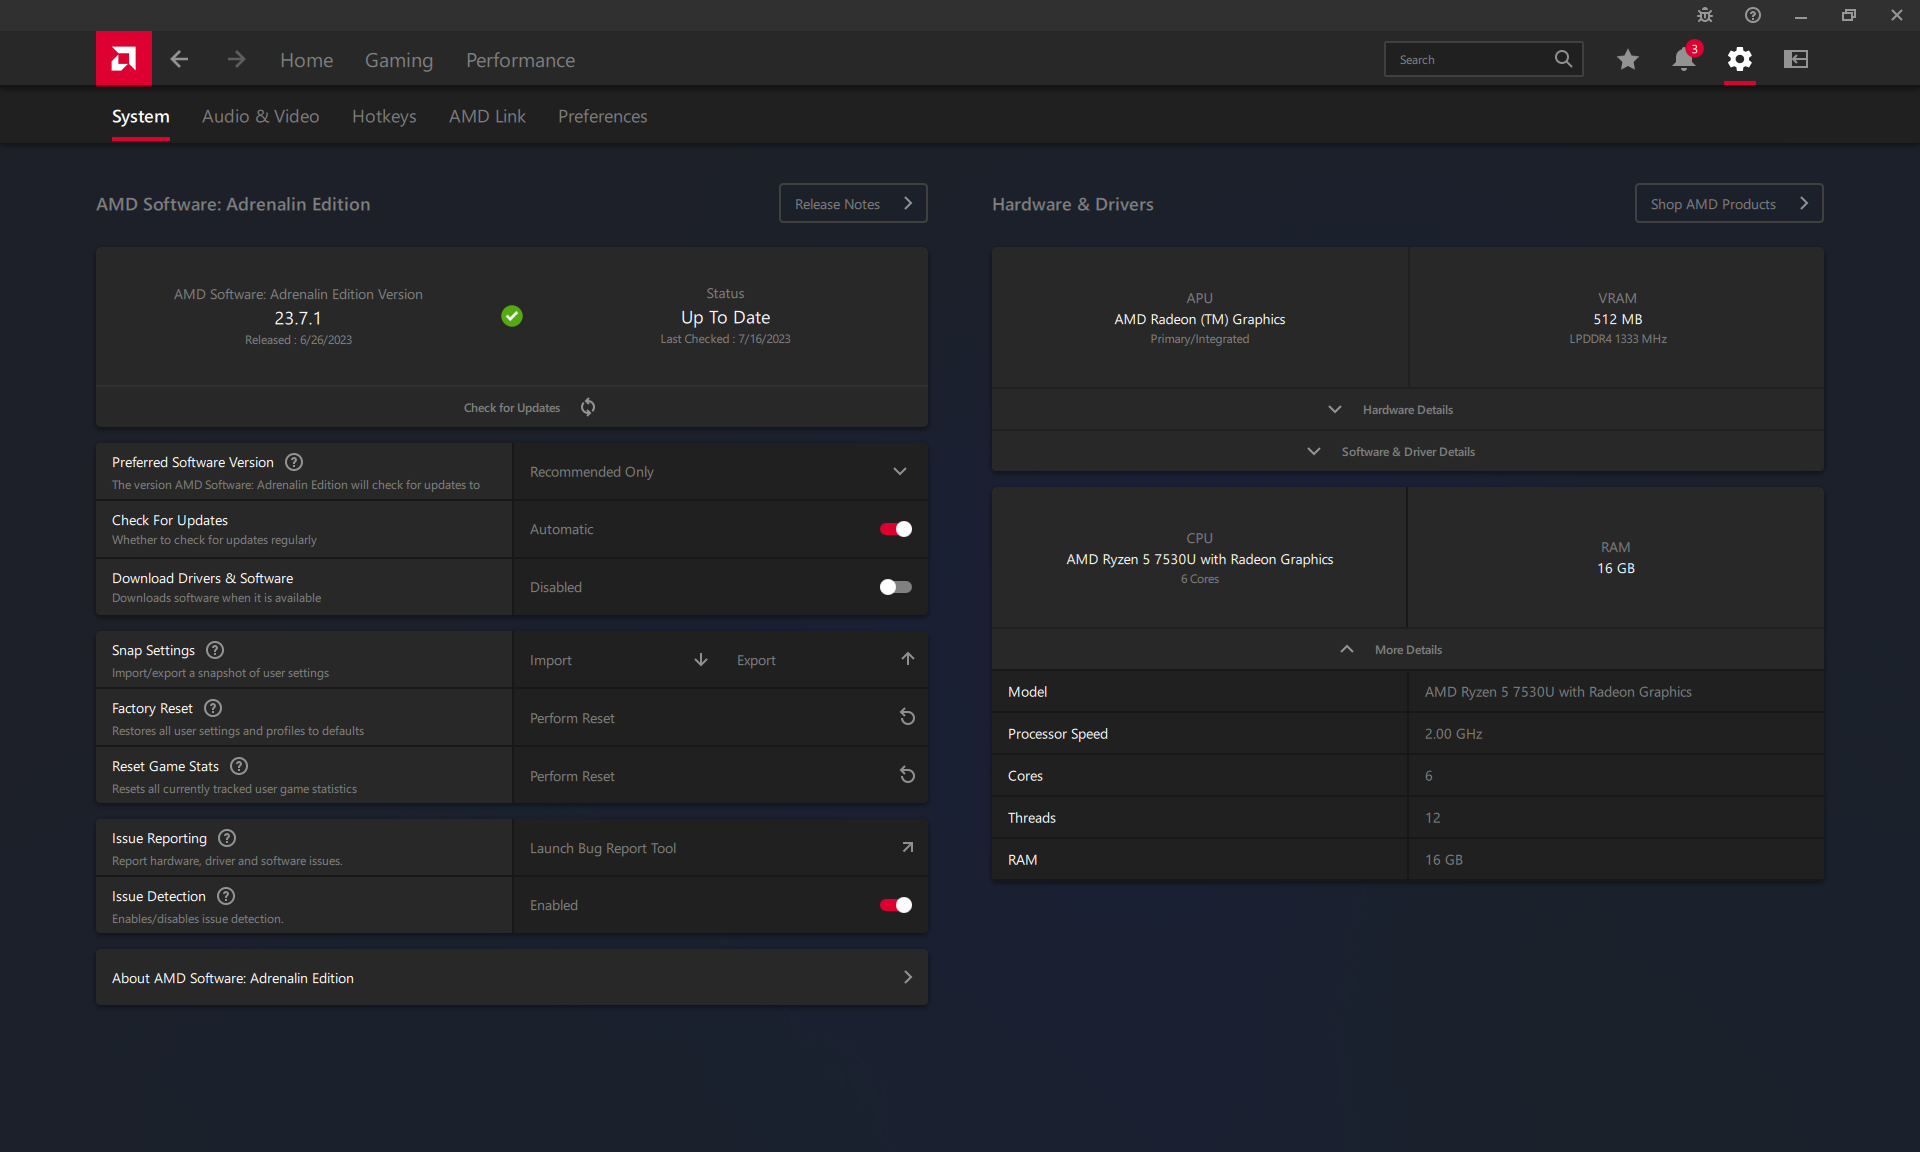
Nossa unidade de teste específica é uma configuração de baixo custo com a CPU Zen 3 Ryzen 5 7530U, 16 GB de RAM LPDDR4x 4266 MHz soldada e SSD NVMe de 512 GB por aproximadamente US$ 900 no varejo. Uma opção mais avançada do Ryzen 7 7730U está disponível, mas todos os SKUs da AMD no momento são fornecidos com o mesmo painel IPS de 1200p, enquanto a versão da Intel tem uma opção OLED de 2400p mais cara.
As alternativas ao Inspiron 16 7635 2 em 1 incluem outros laptops conversíveis grandes, como o Lenovo Flex 5 16 ou o mais potente MSI Summit E16 Flipou o HP Spectre x360 16.
Mais análises da Dell:
Possíveis concorrentes em comparação
Avaliação | Data | Modelo | Peso | Altura | Size | Resolução | Preço |
|---|---|---|---|---|---|---|---|
| 84.6 % v7 (old) | 07/2023 | Dell Inspiron 16 7635 2-in-1 R5 7530U, Vega 7 | 2 kg | 18.99 mm | 16.00" | 1920x1200 | |
| 87.5 % v7 (old) | 06/2023 | Acer Swift Edge SFE16-42-R1GM R7 7735U, Radeon 680M | 1.2 kg | 13.95 mm | 16.00" | 3840x2400 | |
| 85.8 % v7 (old) | 05/2023 | Lenovo Yoga 7 16IRL8 i7-1355U, Iris Xe G7 96EUs | 2 kg | 16.99 mm | 16.00" | 1920x1200 | |
| 85.6 % v7 (old) | 05/2023 | Samsung Galaxy Book3 Pro 16 i5-1340P, Iris Xe G7 80EUs | 1.6 kg | 12.5 mm | 16.00" | 2880x1800 | |
| 80.7 % v7 (old) | 04/2023 | Lenovo IdeaPad Flex 5 16ABR G8 R7 7730U, Vega 8 | 2 kg | 18.7 mm | 16.00" | 1920x1200 | |
| 85.7 % v7 (old) | 06/2022 | Dell Inspiron 16 7620 2-in-1 i7-1260P, Iris Xe G7 96EUs | 2.1 kg | 18.41 mm | 16.00" | 1920x1200 |
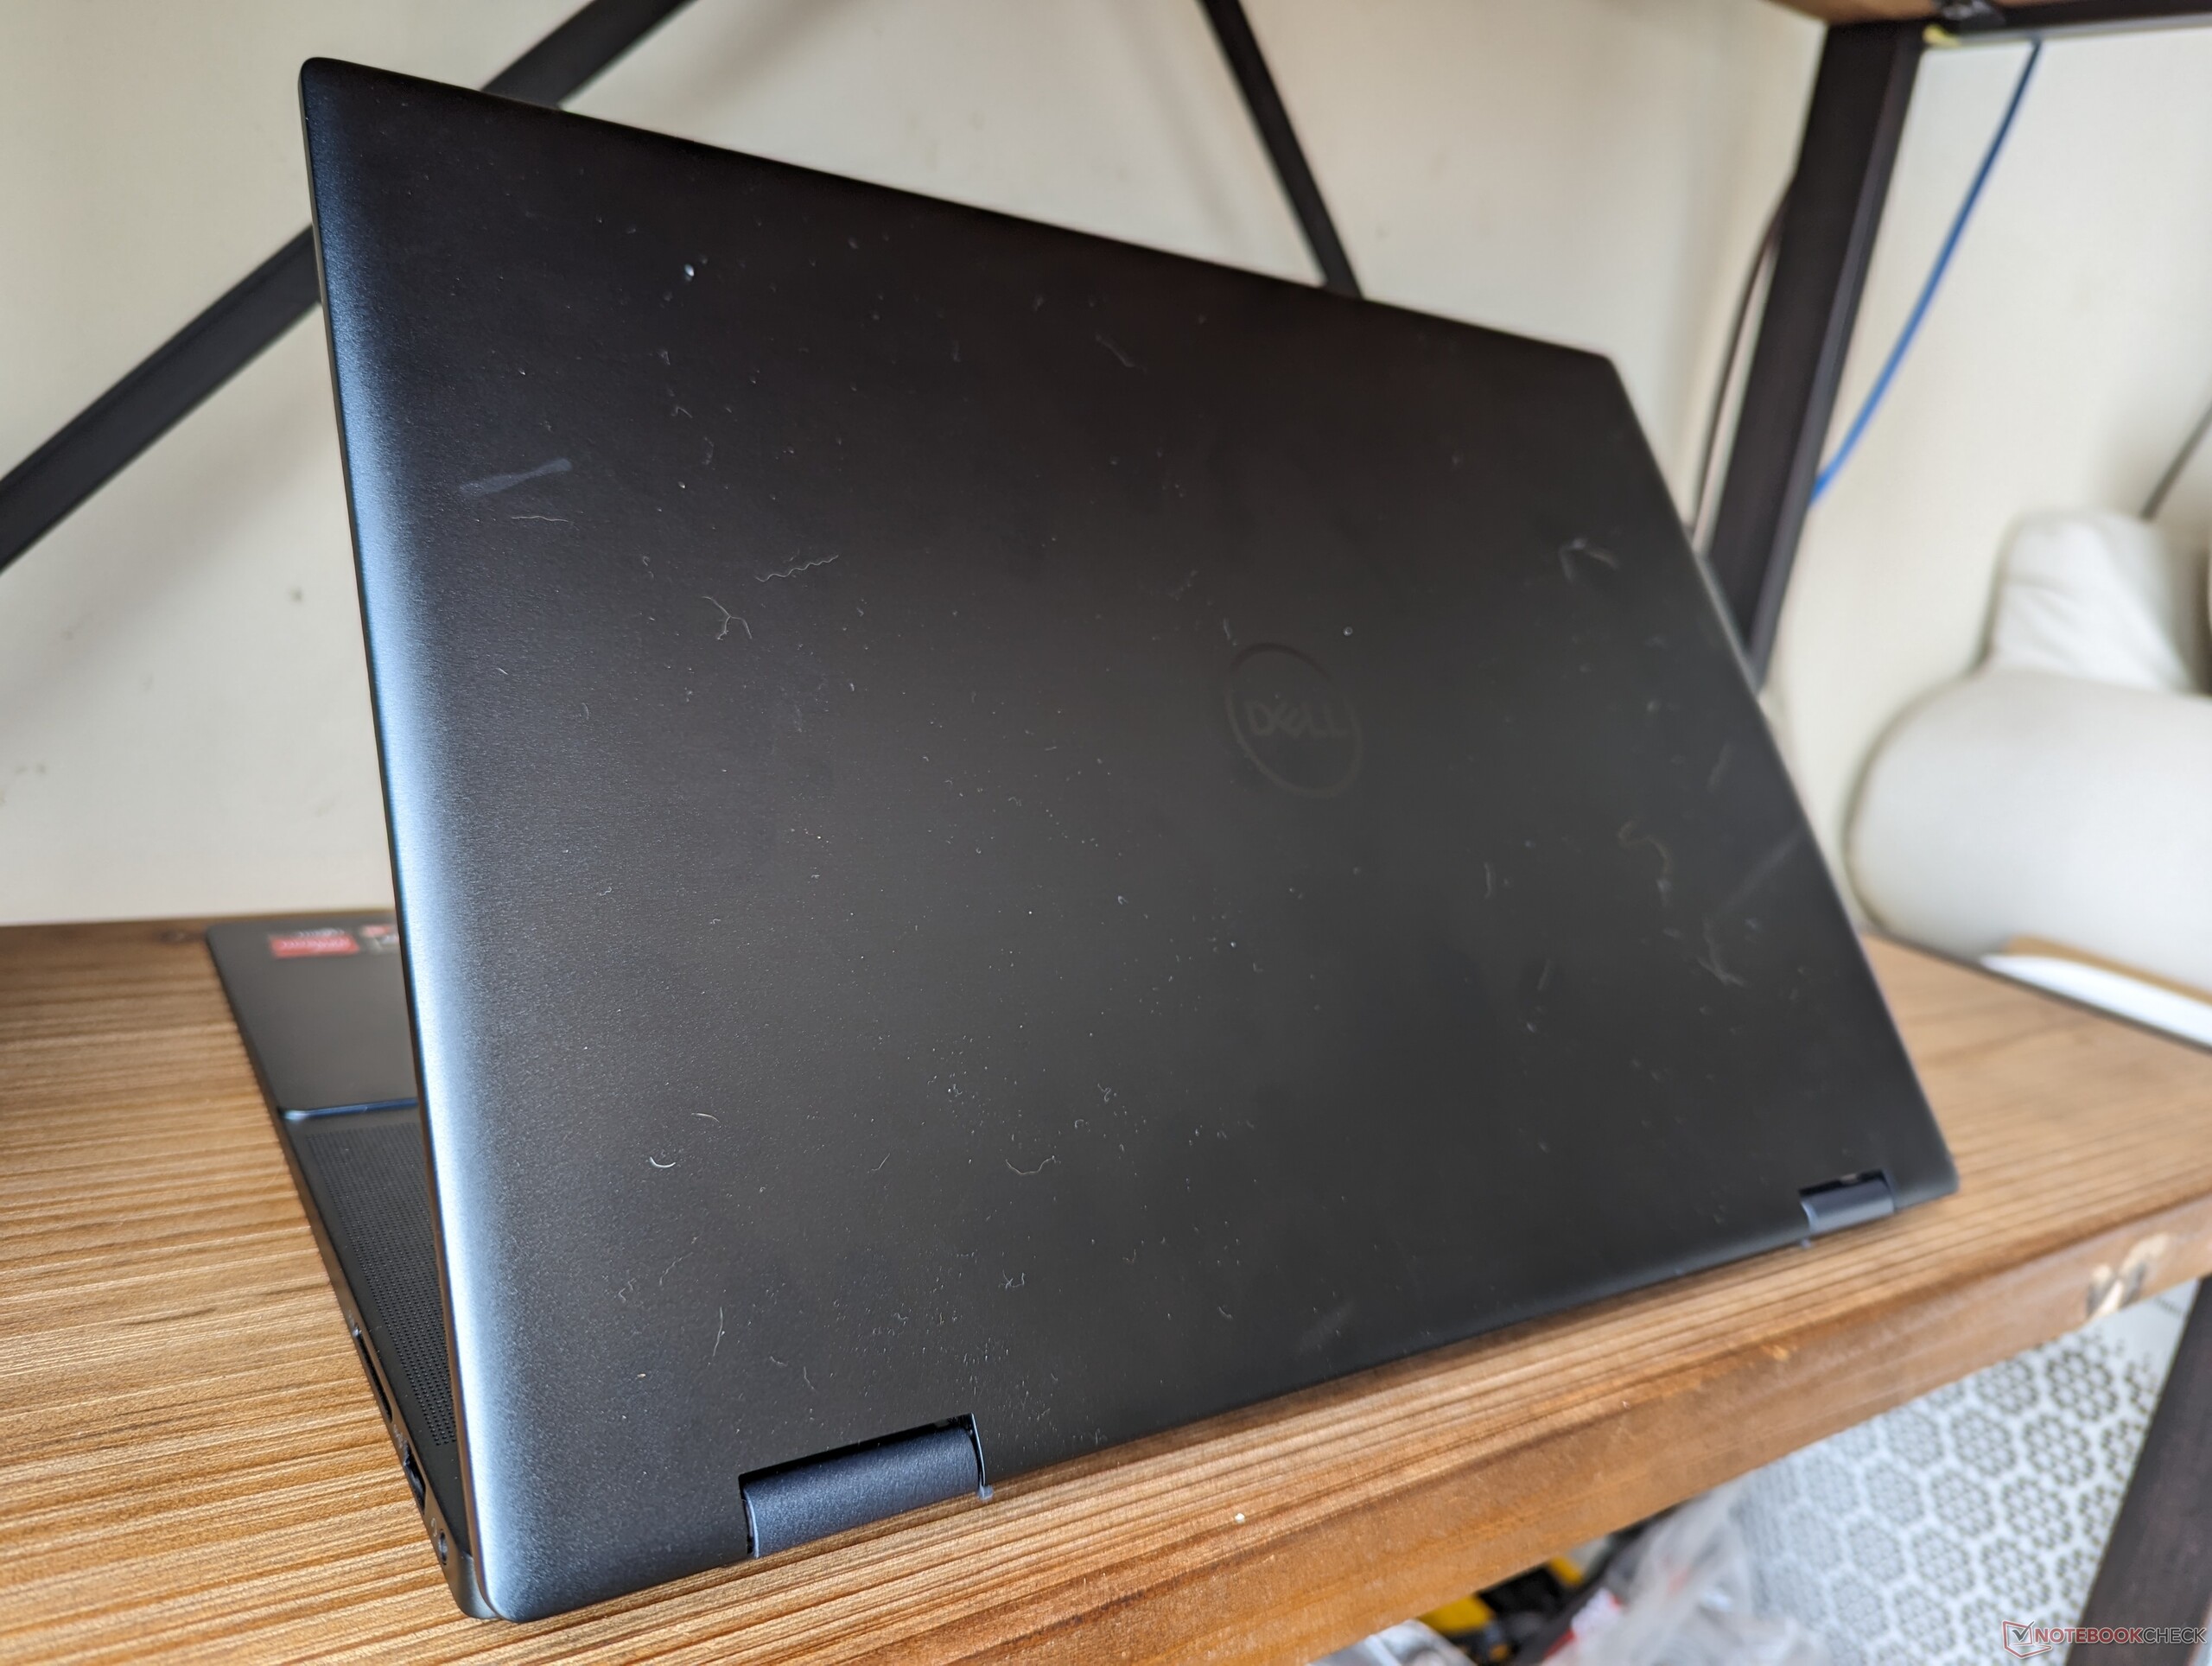
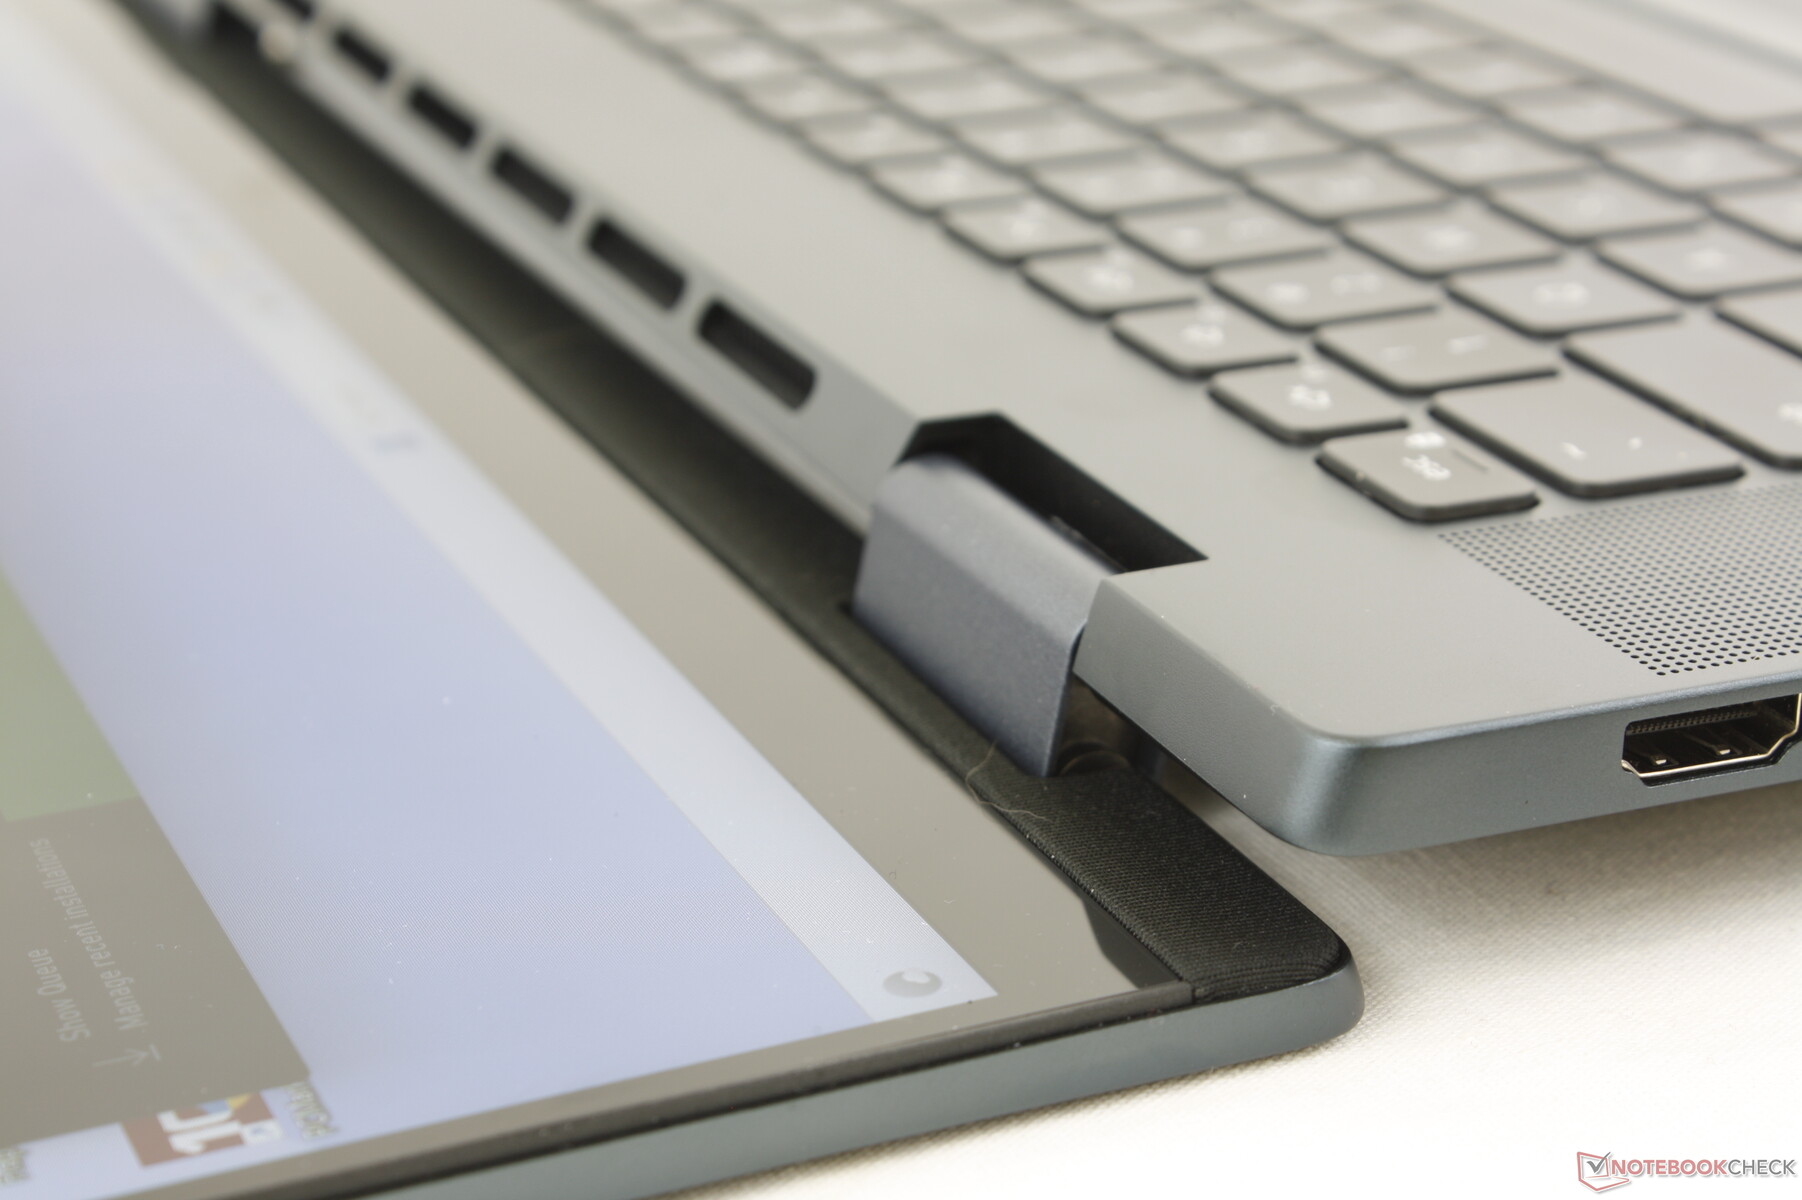
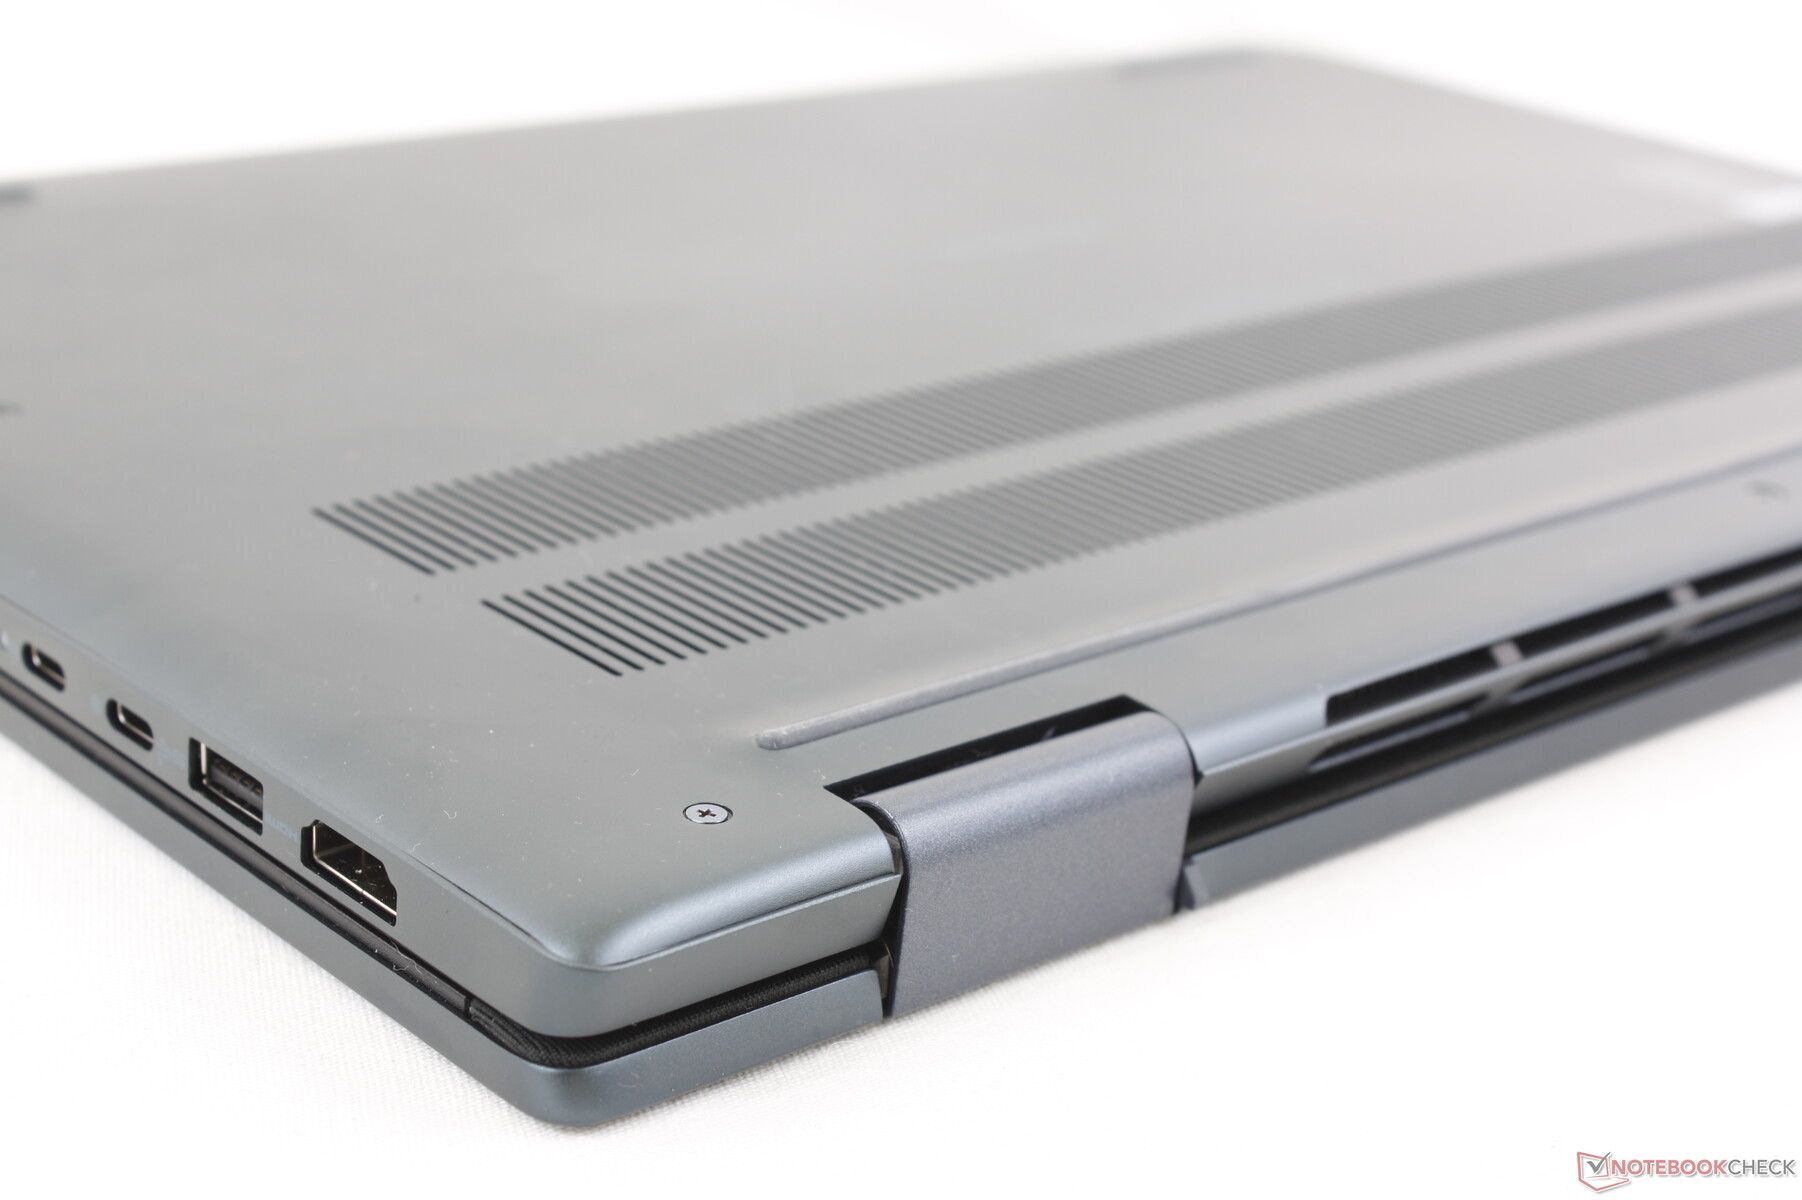
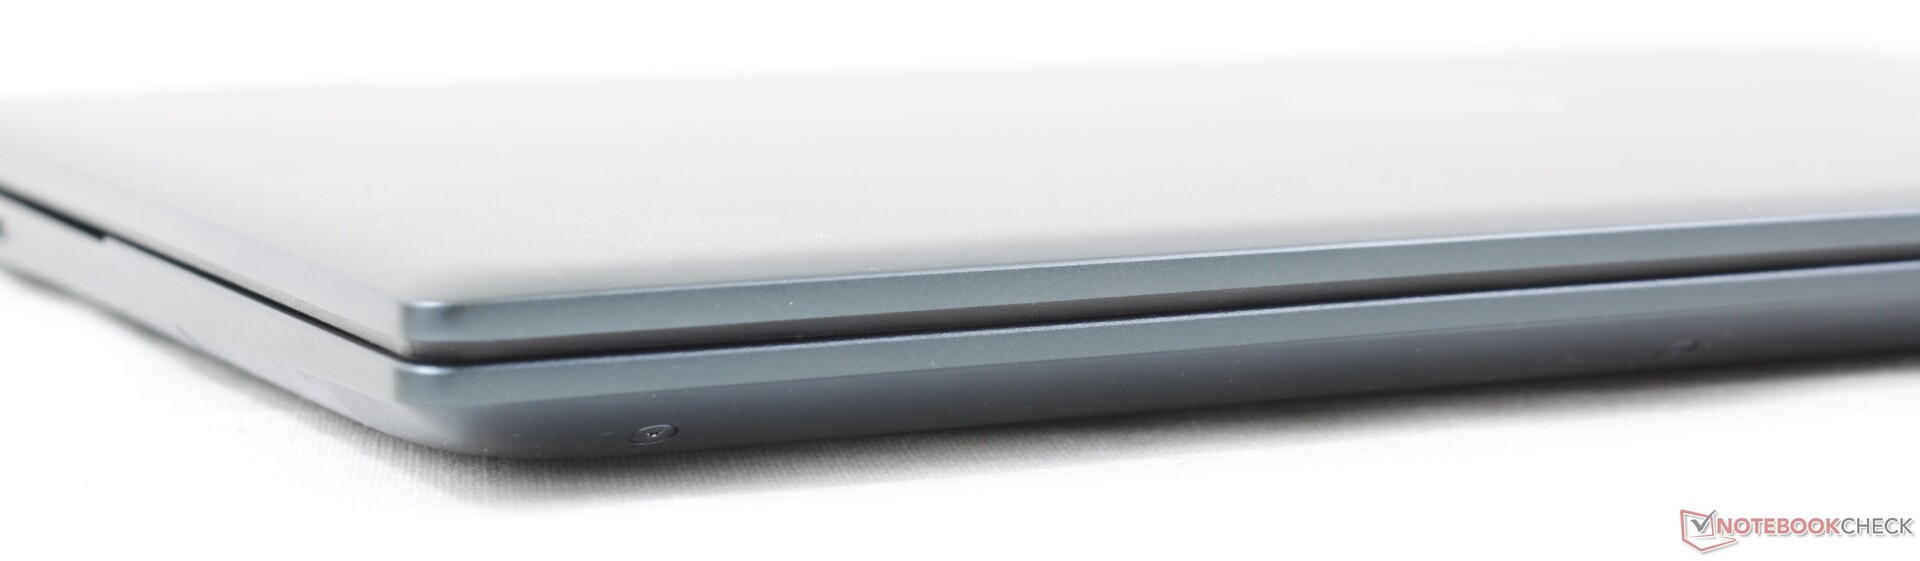
Caso - Mylar de queda silenciosa
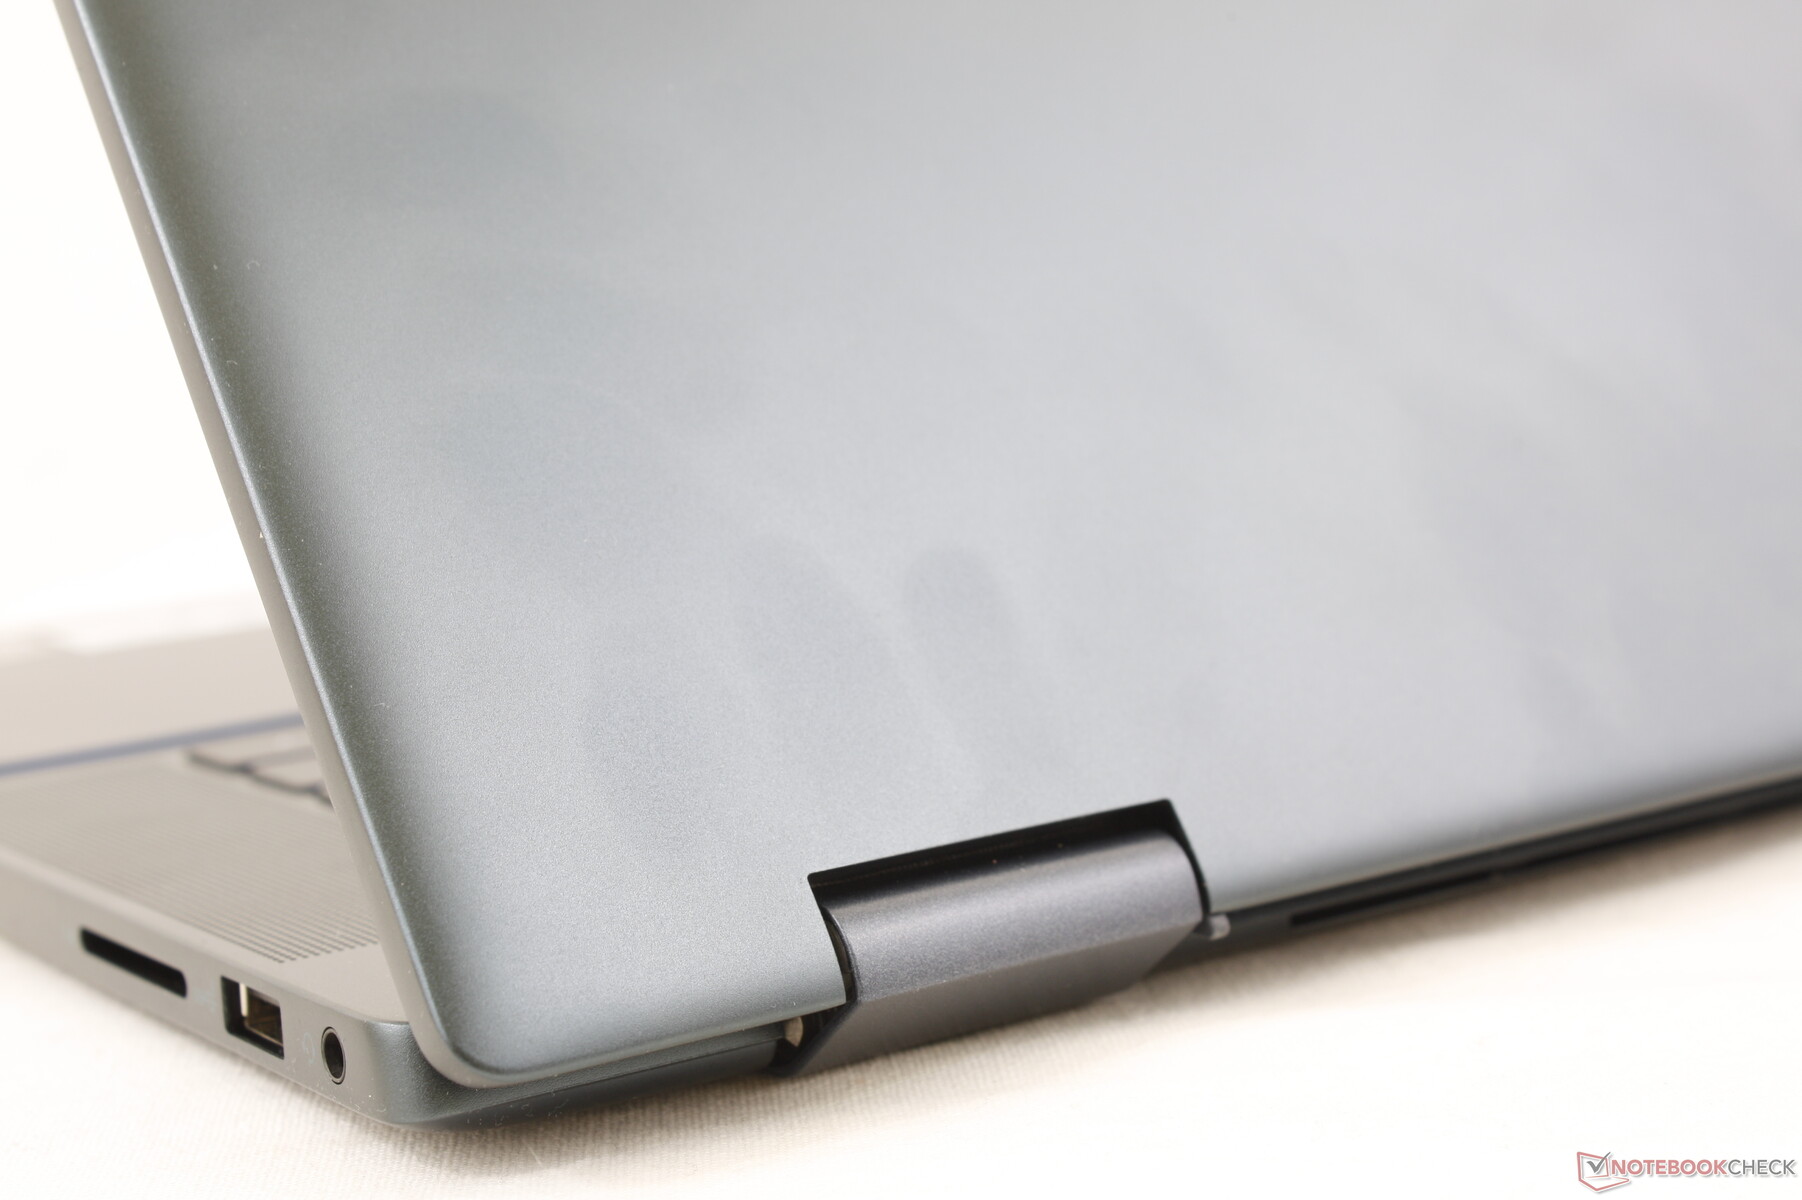
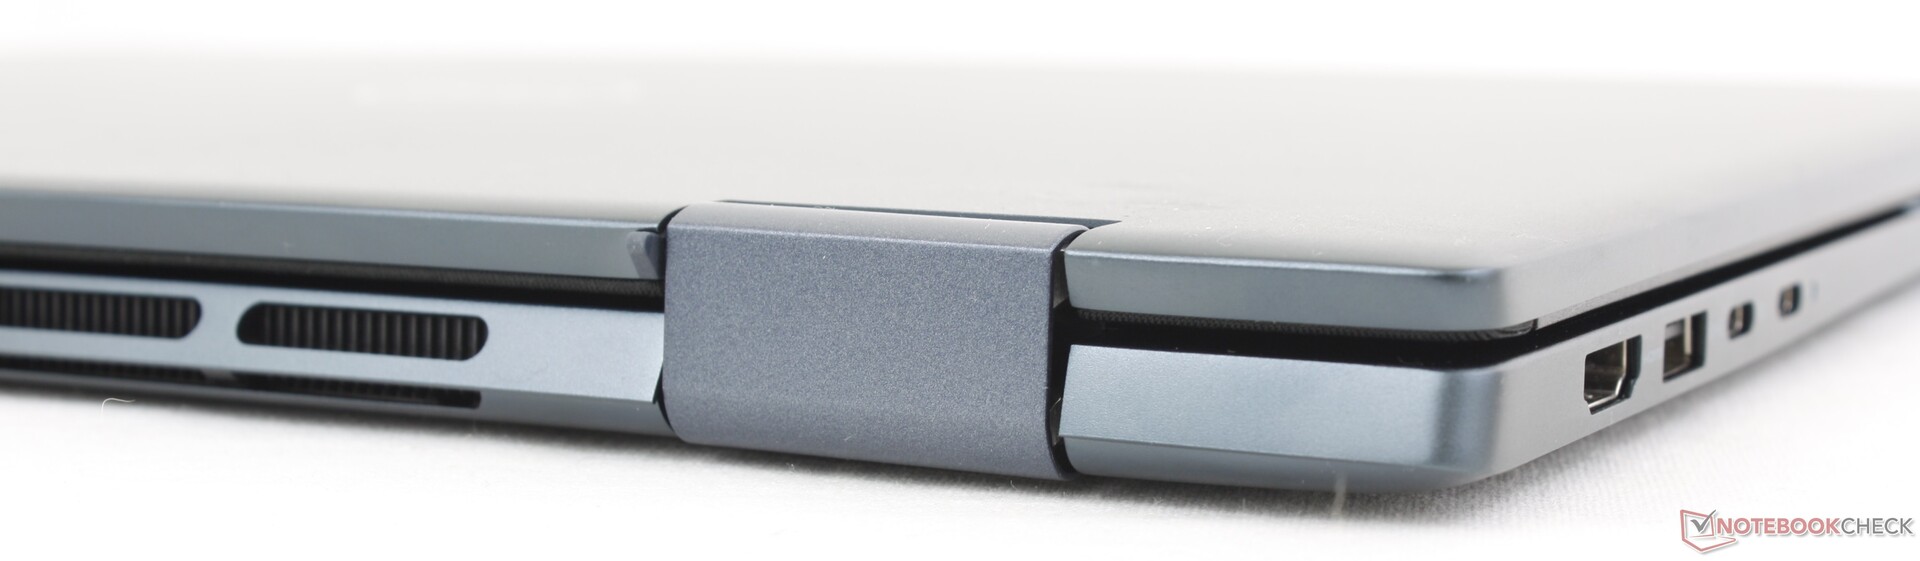
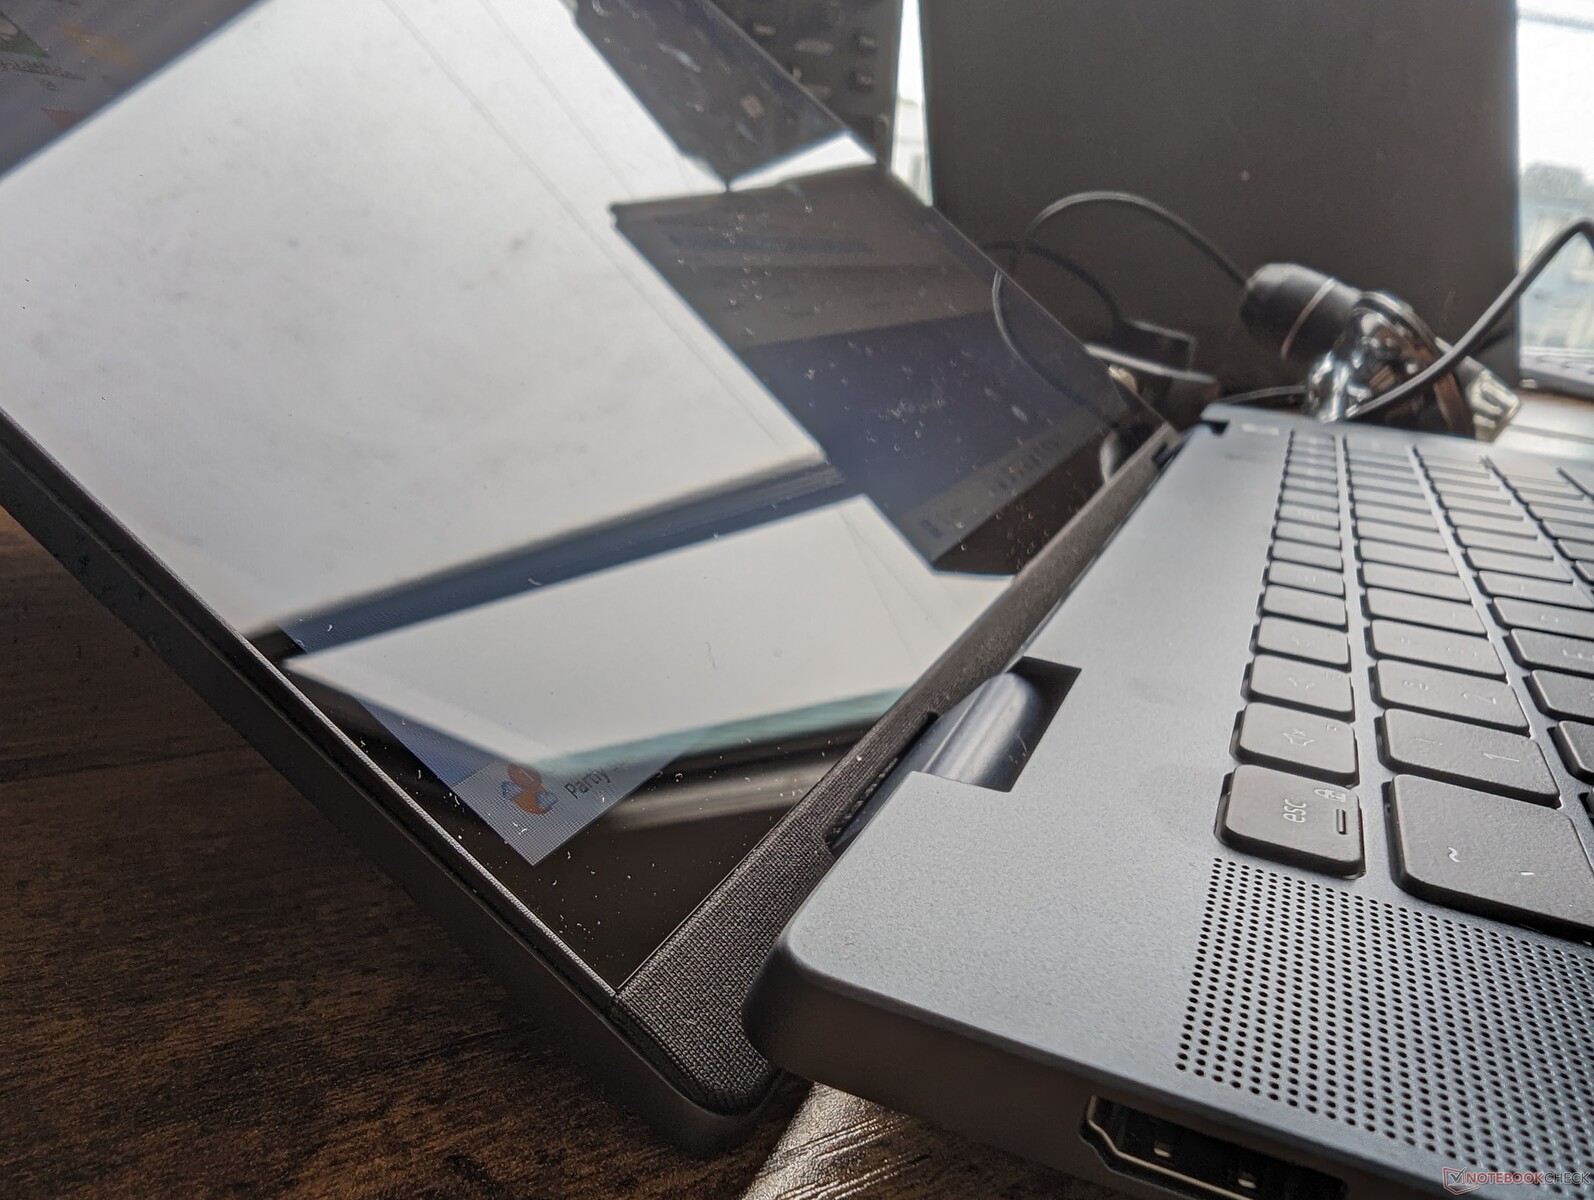
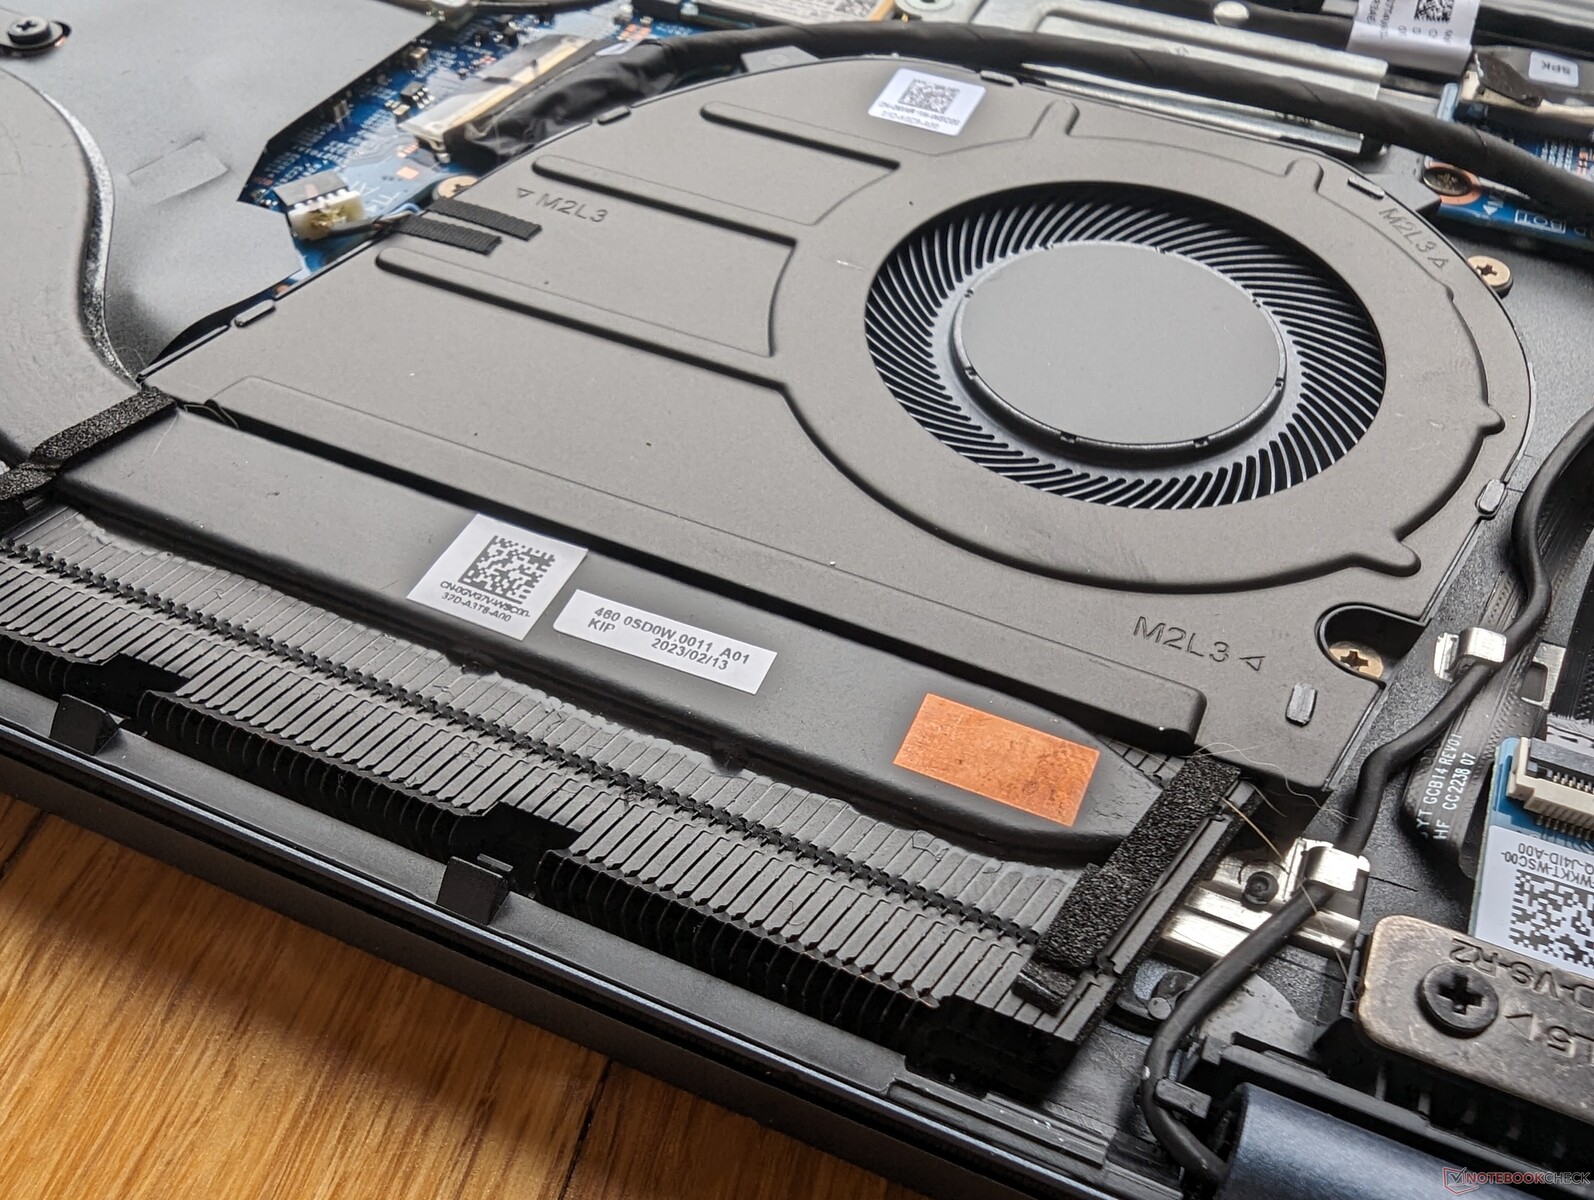
A Dell fez um grande alarde sobre o uso do Mylar no Inspiron 16 7620 2 em 1 do ano passado e, por isso, é um pouco desconcertante vê-lo desaparecer repentinamente na atualização do Inspiron 16 7630/7635 deste ano. Em vez disso, o chassi agora consiste em uma combinação de alumínio e plásticos reciclados para um esquema de cores e aparência mais monótonos. As dobradiças também foram redesenhadas para ficarem mais planas e agora há grades de ventilação adicionais na parte traseira para ajudar no resfriamento.
A qualidade do chassi permanece praticamente a mesma ano após ano, apesar das mudanças externas. O peso denso contribui para uma base inabalável para uma primeira impressão forte que está apenas um ou dois degraus abaixo do muito mais caro e igualmente pesadoHP Spectre x360 16.
Talvez por coincidência, as dimensões e o peso são quase idênticos aos do concorrenteIdeaPad Flex 5 16. Infelizmente, o novo modelo não é menor nem mais leve do que o Inspiron 16 7620 2 em 1 do ano passado e, portanto, continua sendo um laptop relativamente pesado, mesmo para a categoria de tamanho de 16 polegadas.
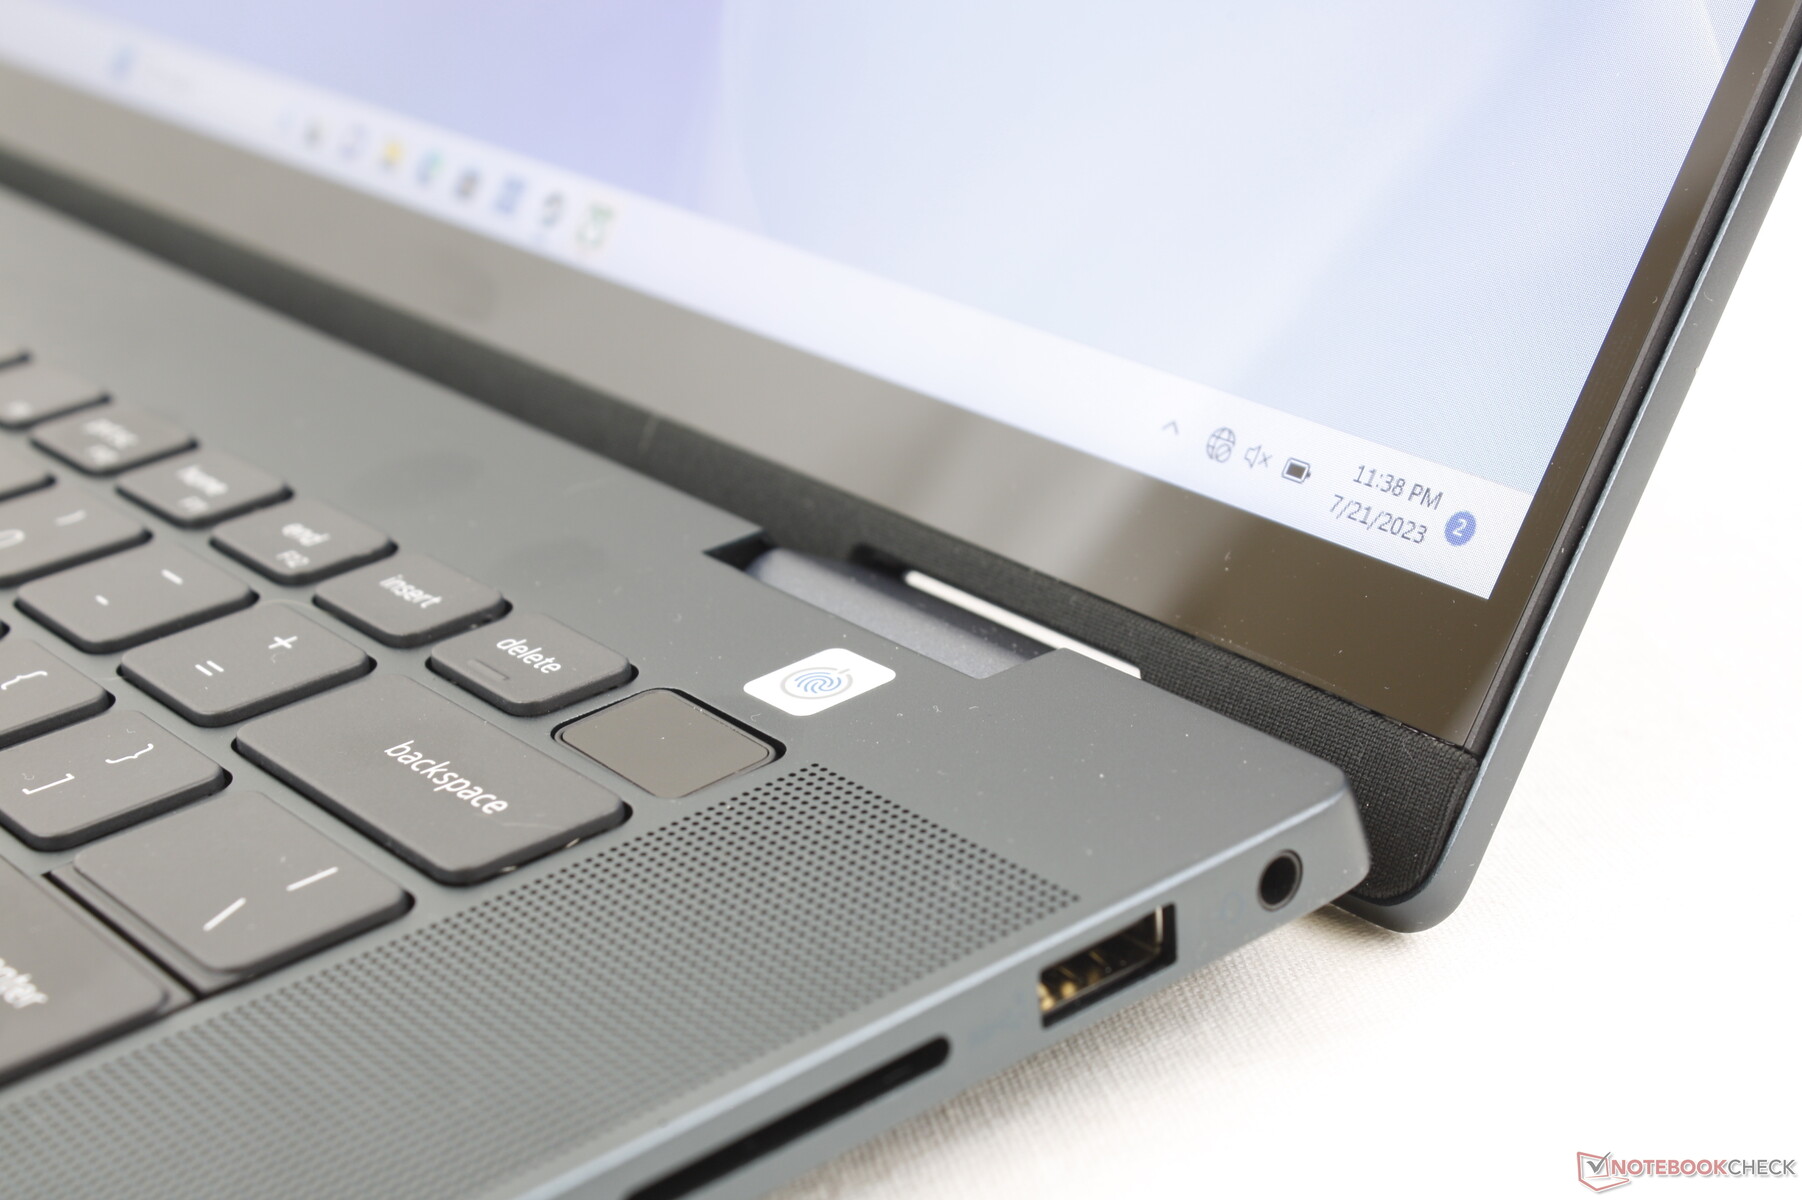
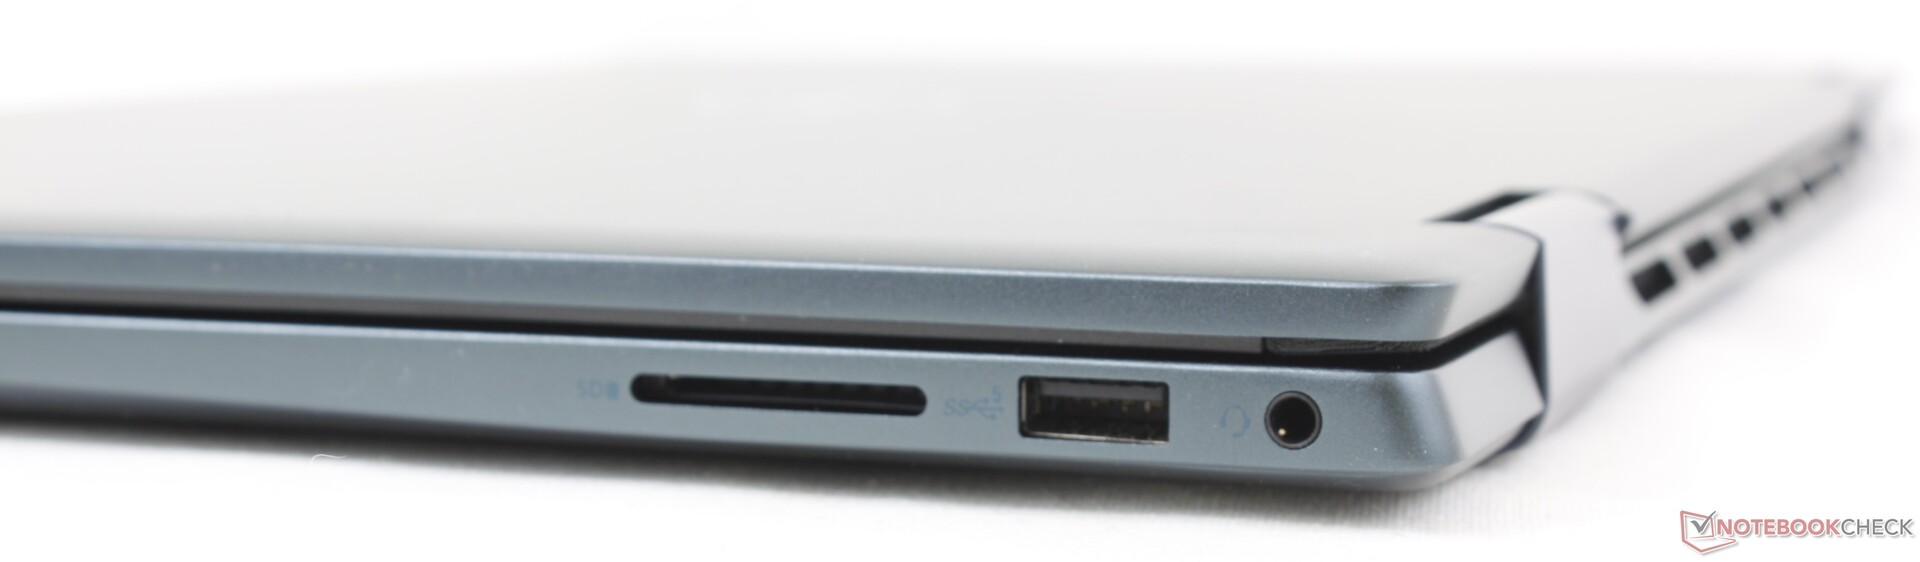
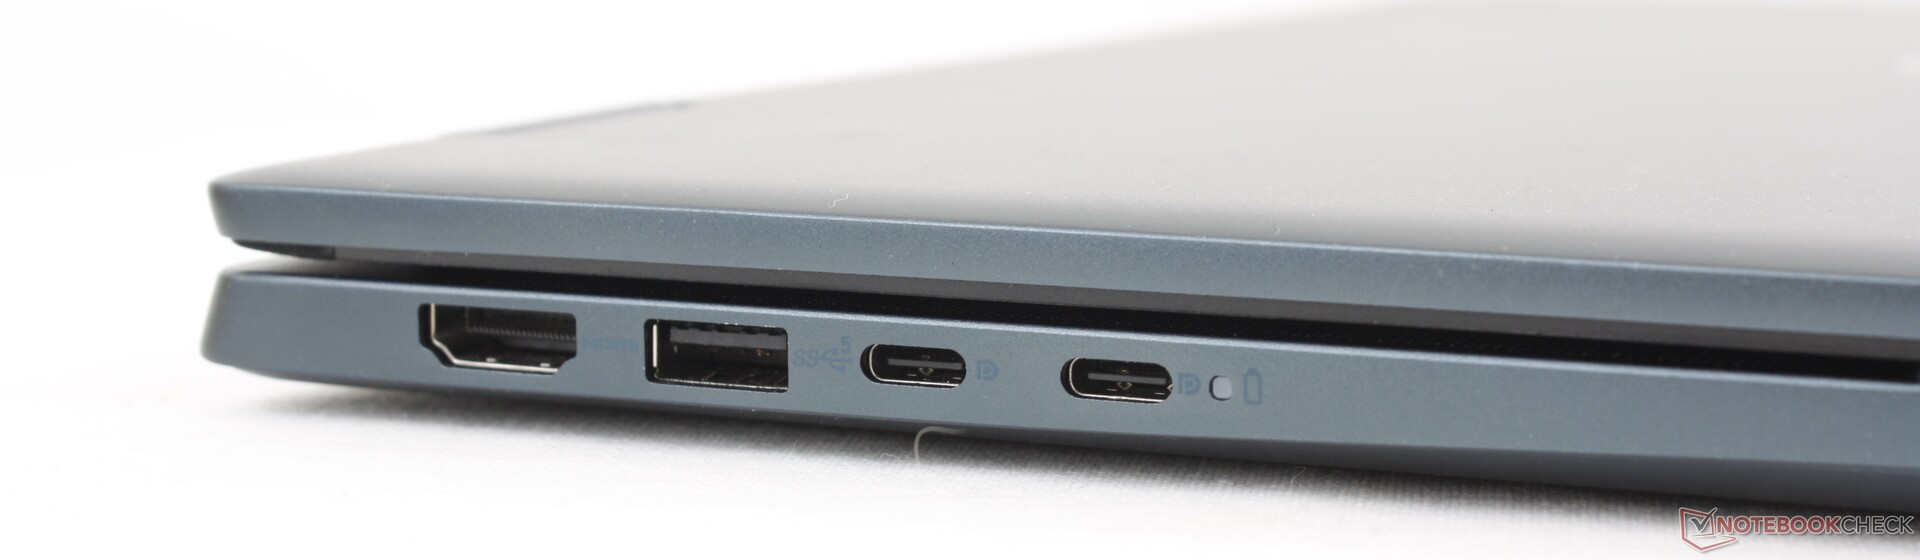
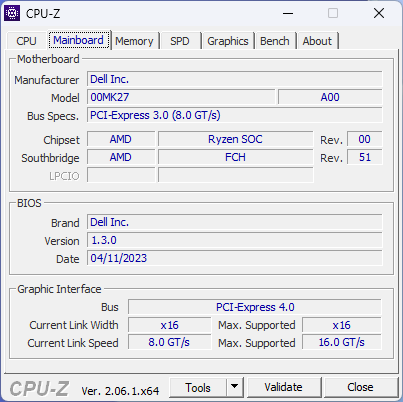
Conectividade - Sem suporte a Thunderbolt
O modelo mantém todas as portas encontradas no Inspiron 16 7620 2 em 1 do ano passado. A principal diferença, no entanto, é que nossa configuração AMD não tem suporte para Thunderbolt. A variedade de portas ainda é comparável à de outros notebooks de 16 polegadas, como o IdeaPad Flex 5 16 ou o Acer Swift Edge SFE16.
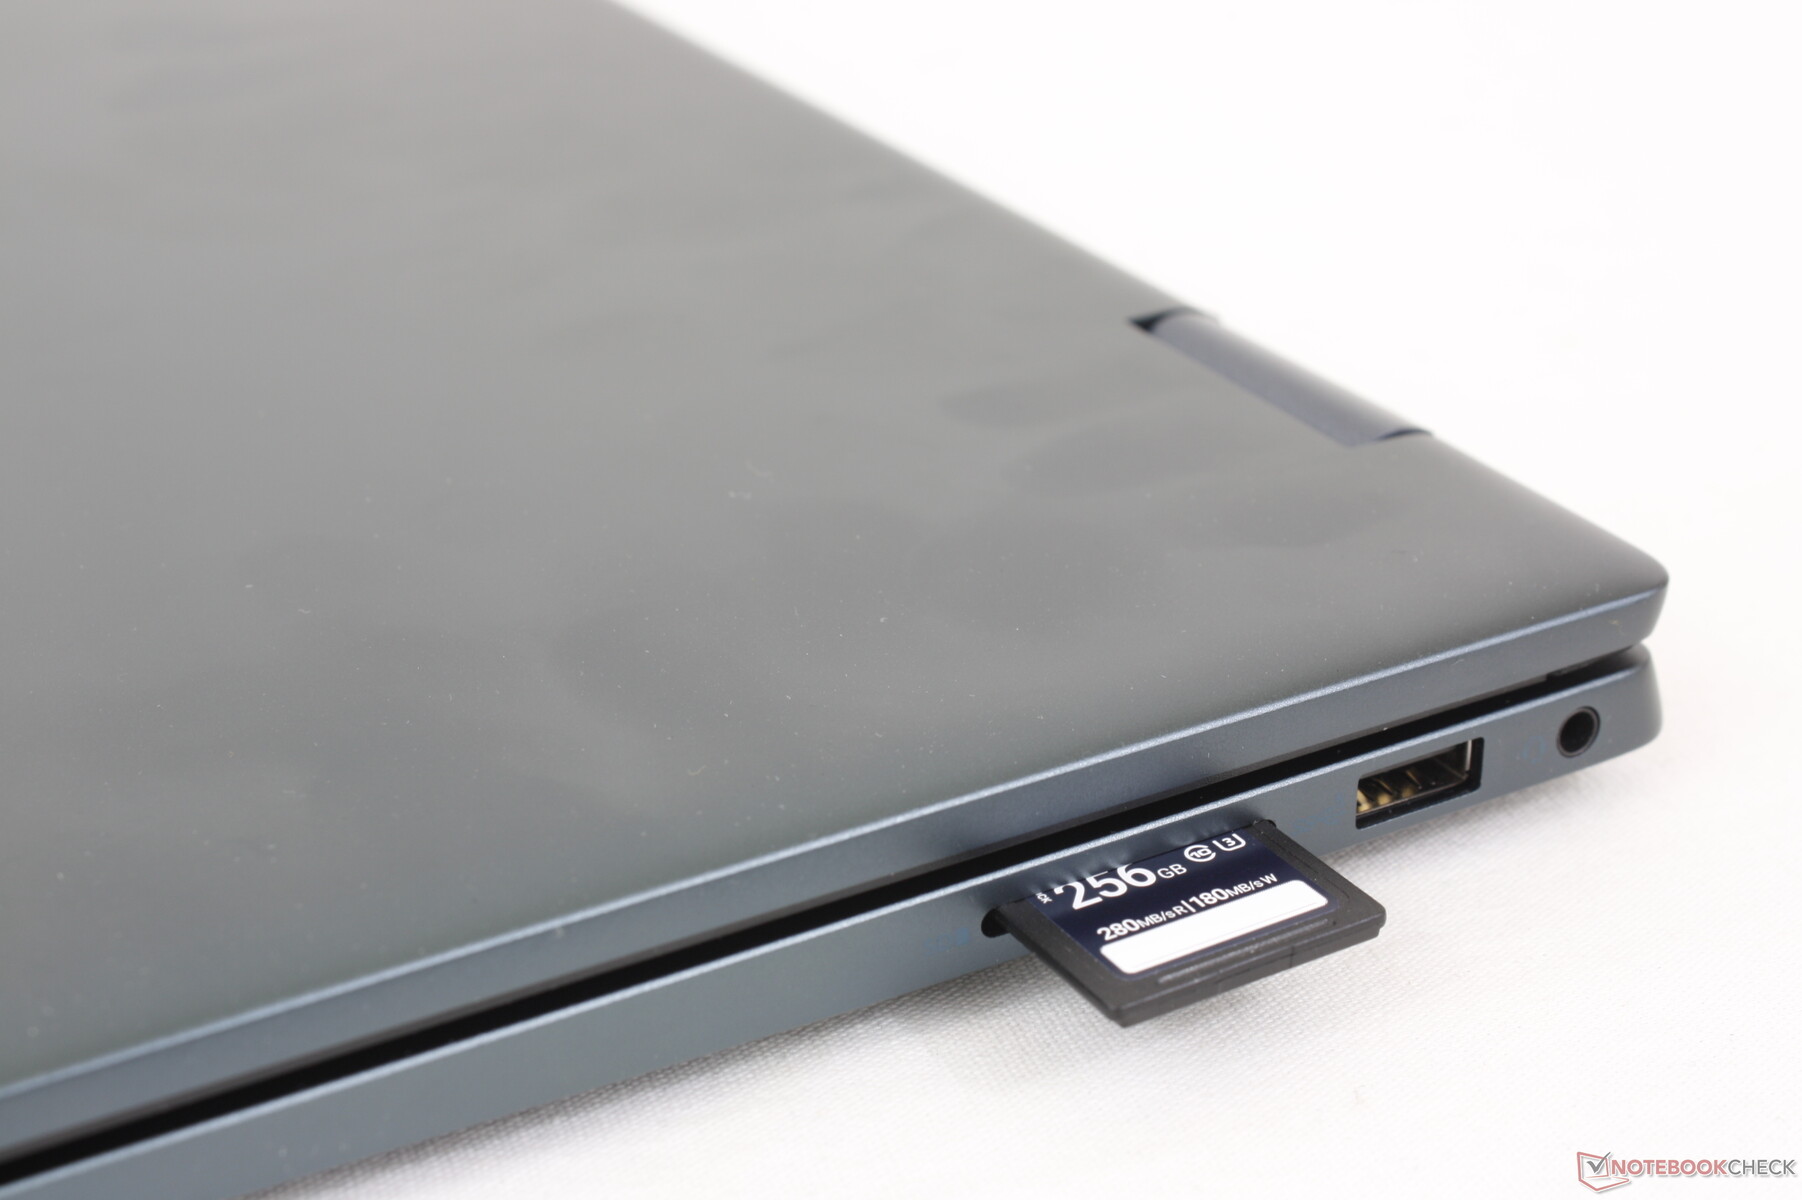
Lembre-se de que a porta HDMI é apenas 1.4 em vez de 2.0. Para o suporte adequado de monitores 4K externos a 60 Hz, certifique-se de usar as portas USB-C.
Leitor de cartão SD
O leitor de cartão integrado tem um desempenho um pouco mais rápido do que antes, mas as taxas de transferência ainda são cerca de metade da velocidade do Lenovo IdeaPad Flex 5 16 ou do Galaxy Book3 Pro 16. A transferência de 1 GB de fotos do nosso cartão de teste PNY UHS-II para a área de trabalho leva cerca de 32 segundos, em comparação com 17 segundos no Lenovo mencionado acima.
| SD Card Reader | |
| average JPG Copy Test (av. of 3 runs) | |
| Lenovo IdeaPad Flex 5 16ABR G8 (Angelibird AV Pro V60) | |
| Samsung Galaxy Book3 Pro 16 | |
| Lenovo Yoga 7 16IRL8 (AV Pro SD microSD 128 GB V60) | |
| Dell Inspiron 16 7635 2-in-1 (PNY EliteX-Pro60 V60 256 GB) | |
| Dell Inspiron 16 7620 2-in-1 (Toshiba Exceria Pro SDXC 64 GB UHS-II) | |
| maximum AS SSD Seq Read Test (1GB) | |
| Lenovo Yoga 7 16IRL8 (AV Pro SD microSD 128 GB V60) | |
| Lenovo IdeaPad Flex 5 16ABR G8 (Angelibird AV Pro V60) | |
| Samsung Galaxy Book3 Pro 16 | |
| Dell Inspiron 16 7635 2-in-1 (PNY EliteX-Pro60 V60 256 GB) | |
| Dell Inspiron 16 7620 2-in-1 (Toshiba Exceria Pro SDXC 64 GB UHS-II) | |
Comunicação
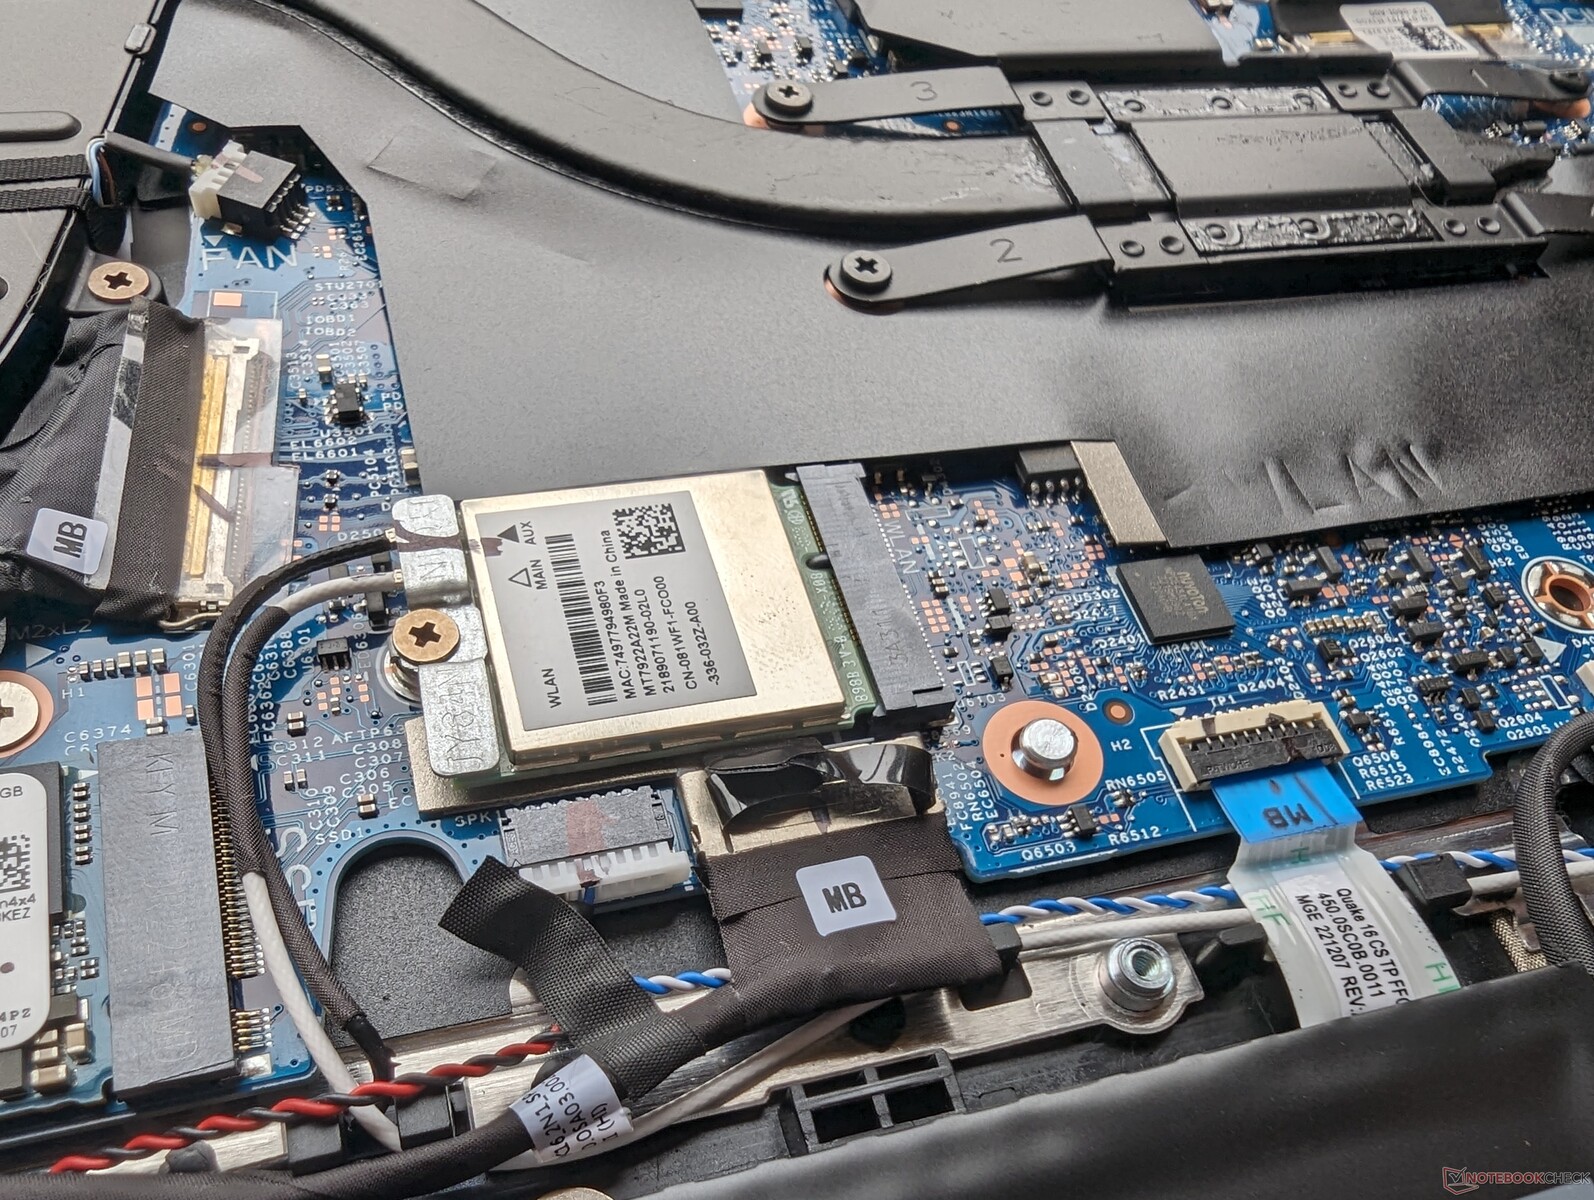
O AMD Inspiron é fornecido com o MediaTek Wi-Fi 6E MT7922, enquanto o Intel Inspiron é fornecido com o AX211. Ambos os módulos são compatíveis com roteadores Wi-Fi 6E ou 6 GHz. O desempenho é estável e sem problemas quando emparelhado com nosso Asus AXE11000.
Webcam
Uma webcam de 1080p e um obturador de privacidade são fornecidos como padrão em todas as configurações para que não haja surpresas em termos de qualidade de imagem. No entanto, somente o modelo Intel vem com um sensor de infravermelho opcional.


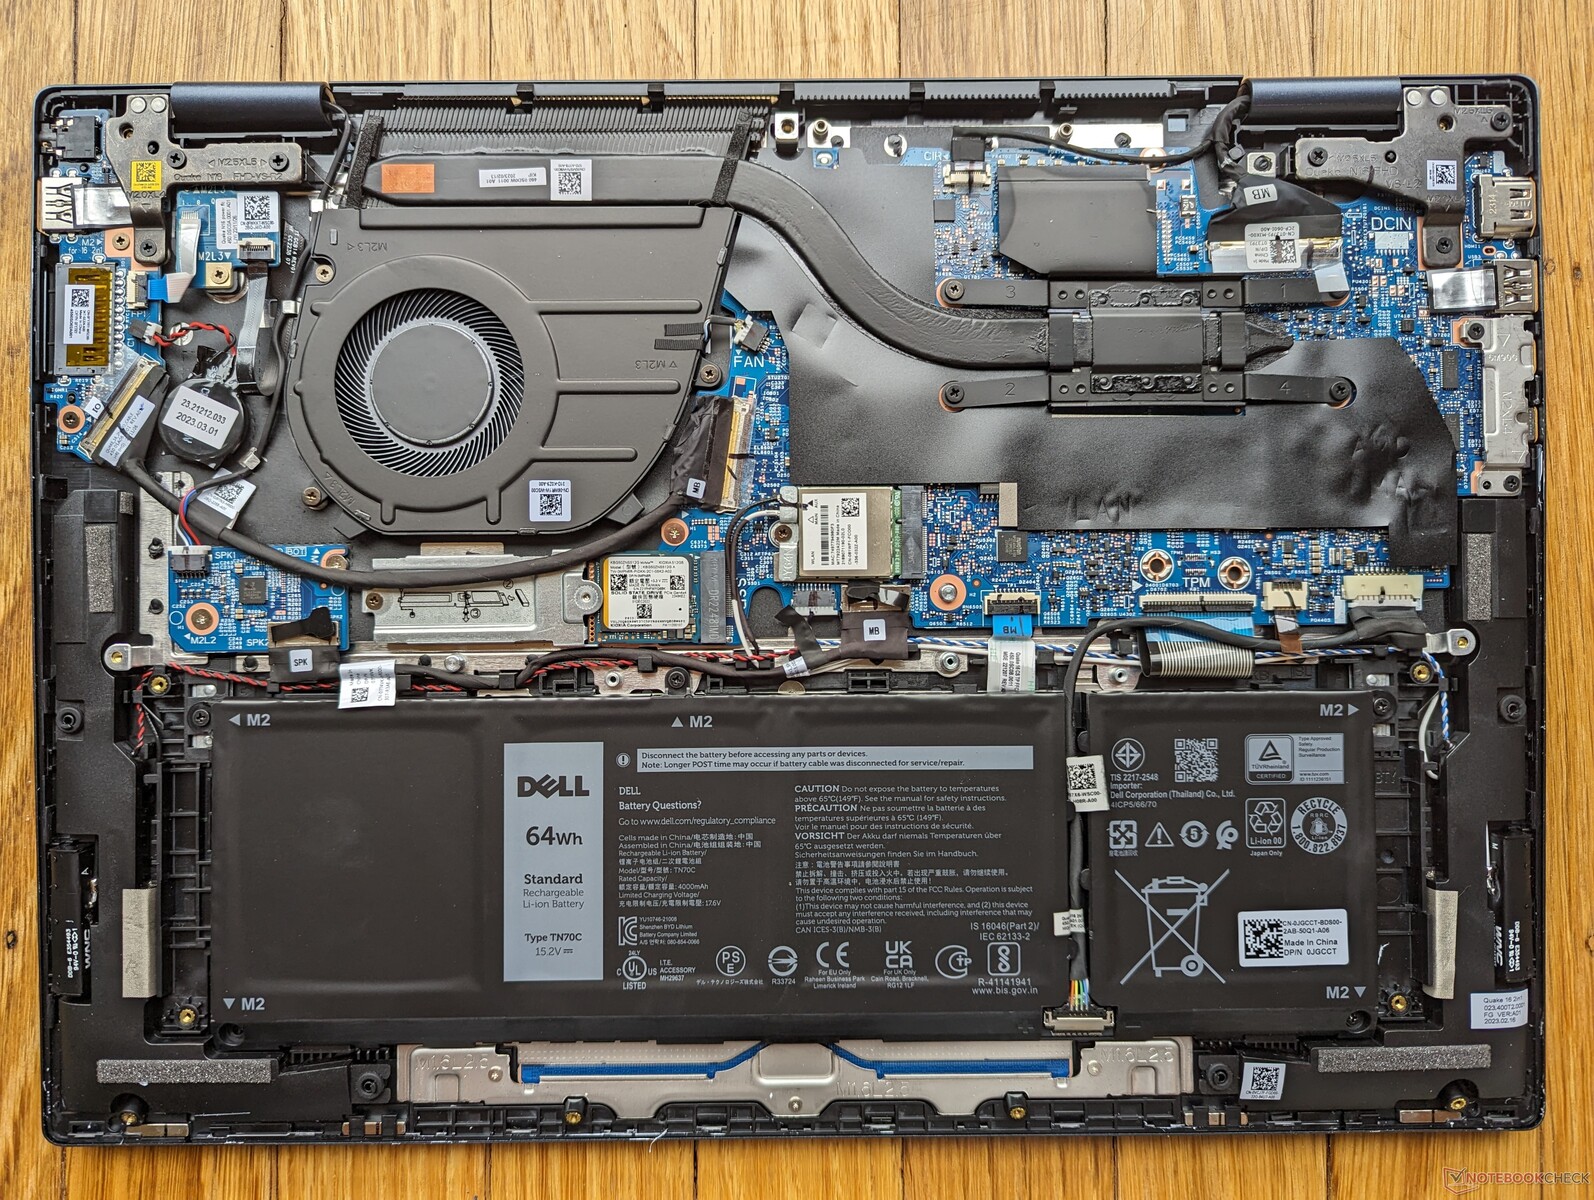
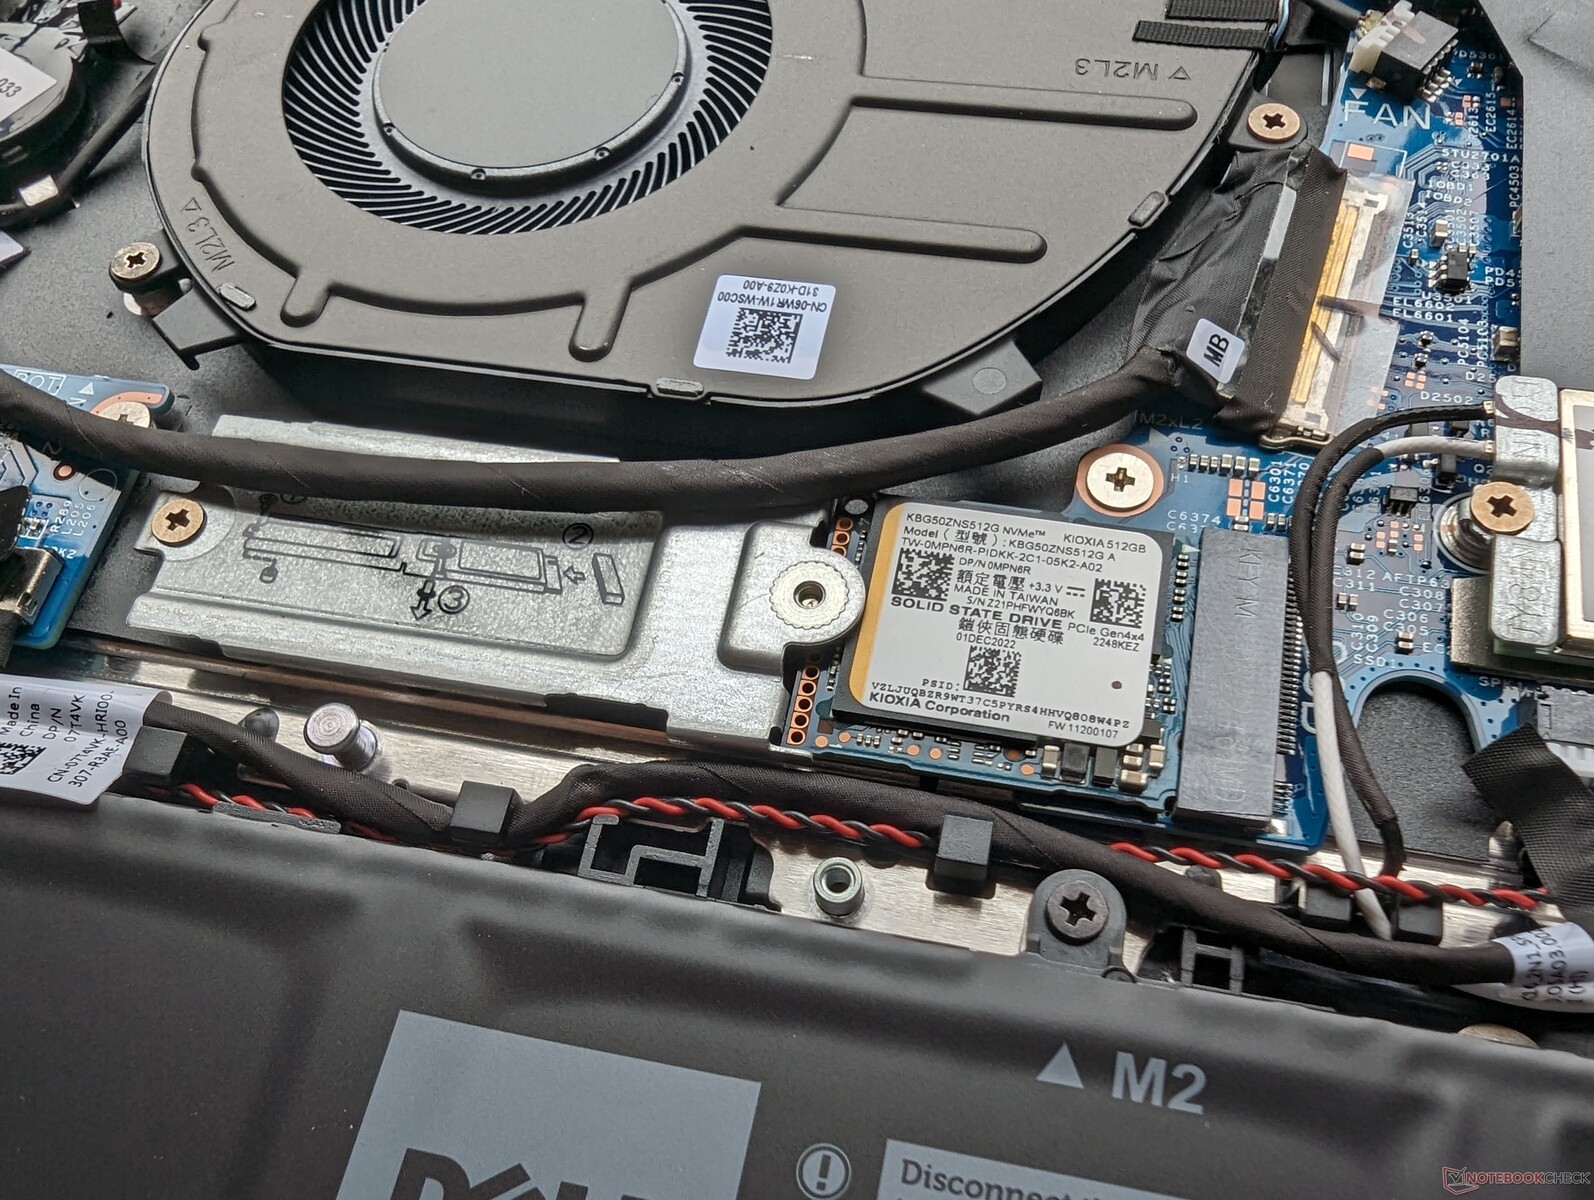
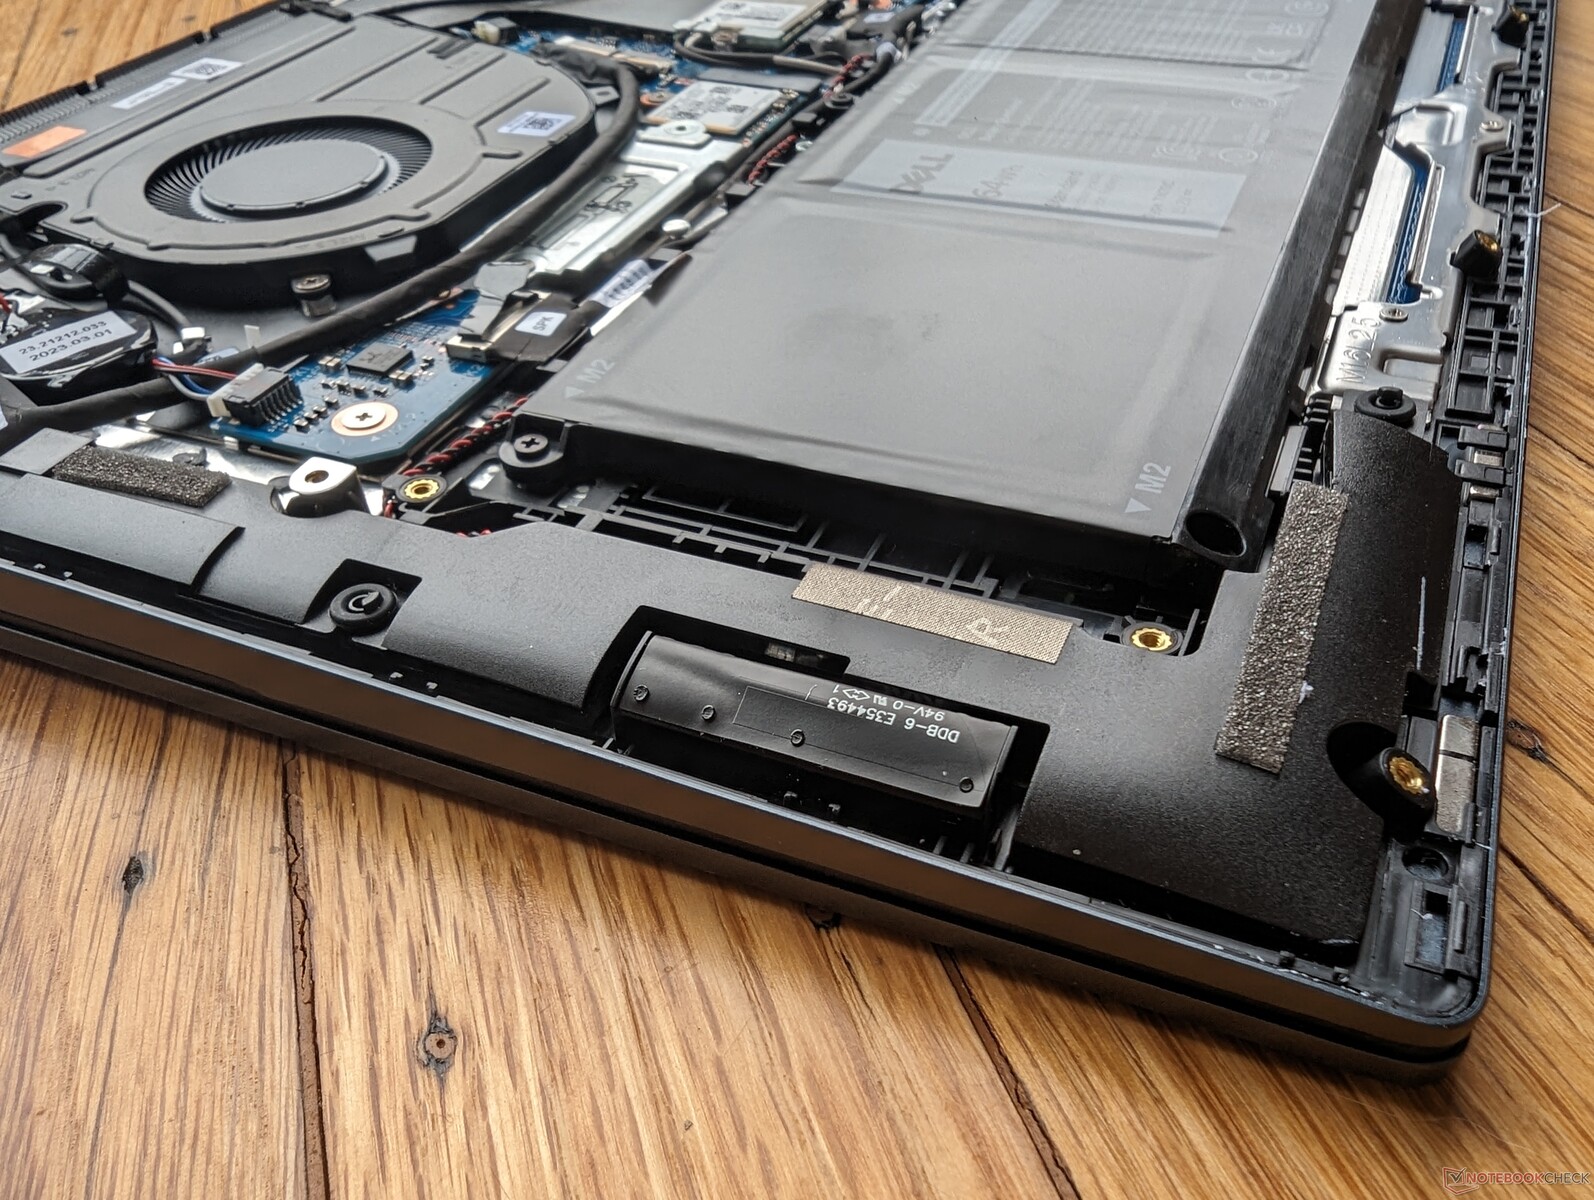
Manutenção
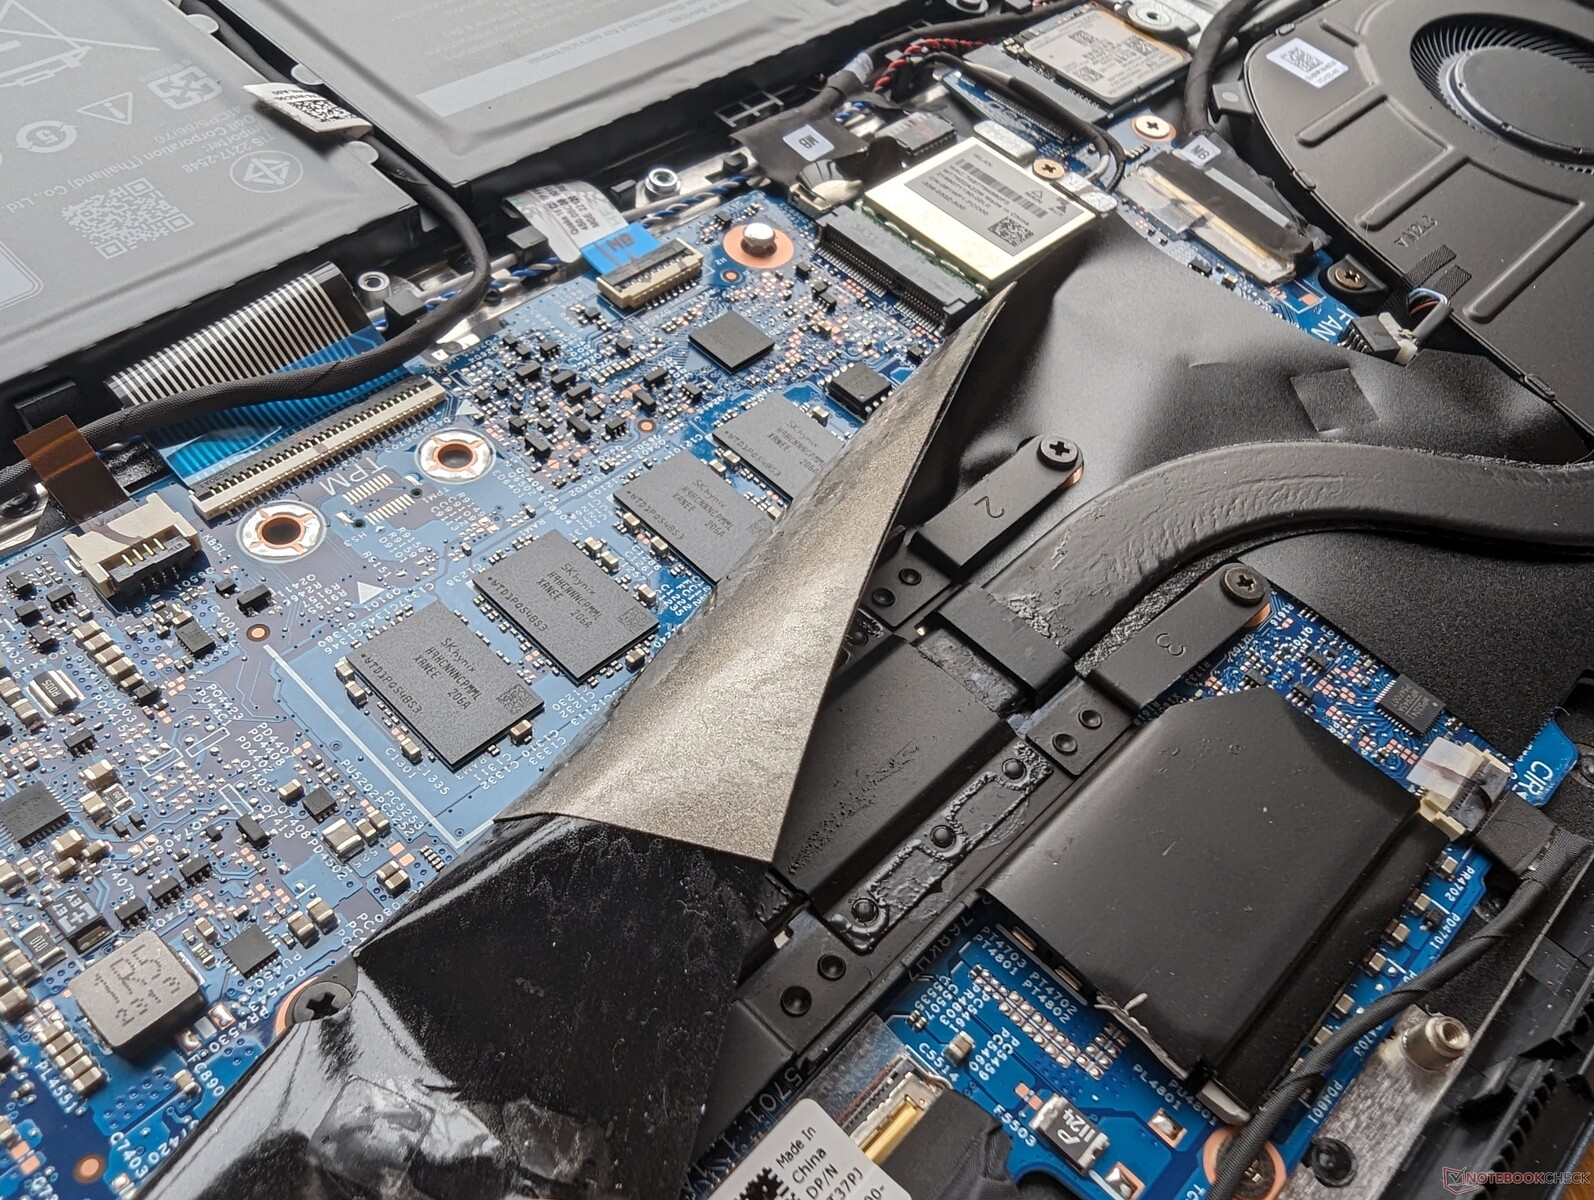
O painel inferior é fixado por nove parafusos Phillips. Observe que as travas ao redor das bordas são muito apertadas e, portanto, recomendamos o uso de uma borda plástica afiada para abrir cuidadosamente o painel, começando pela parte traseira.
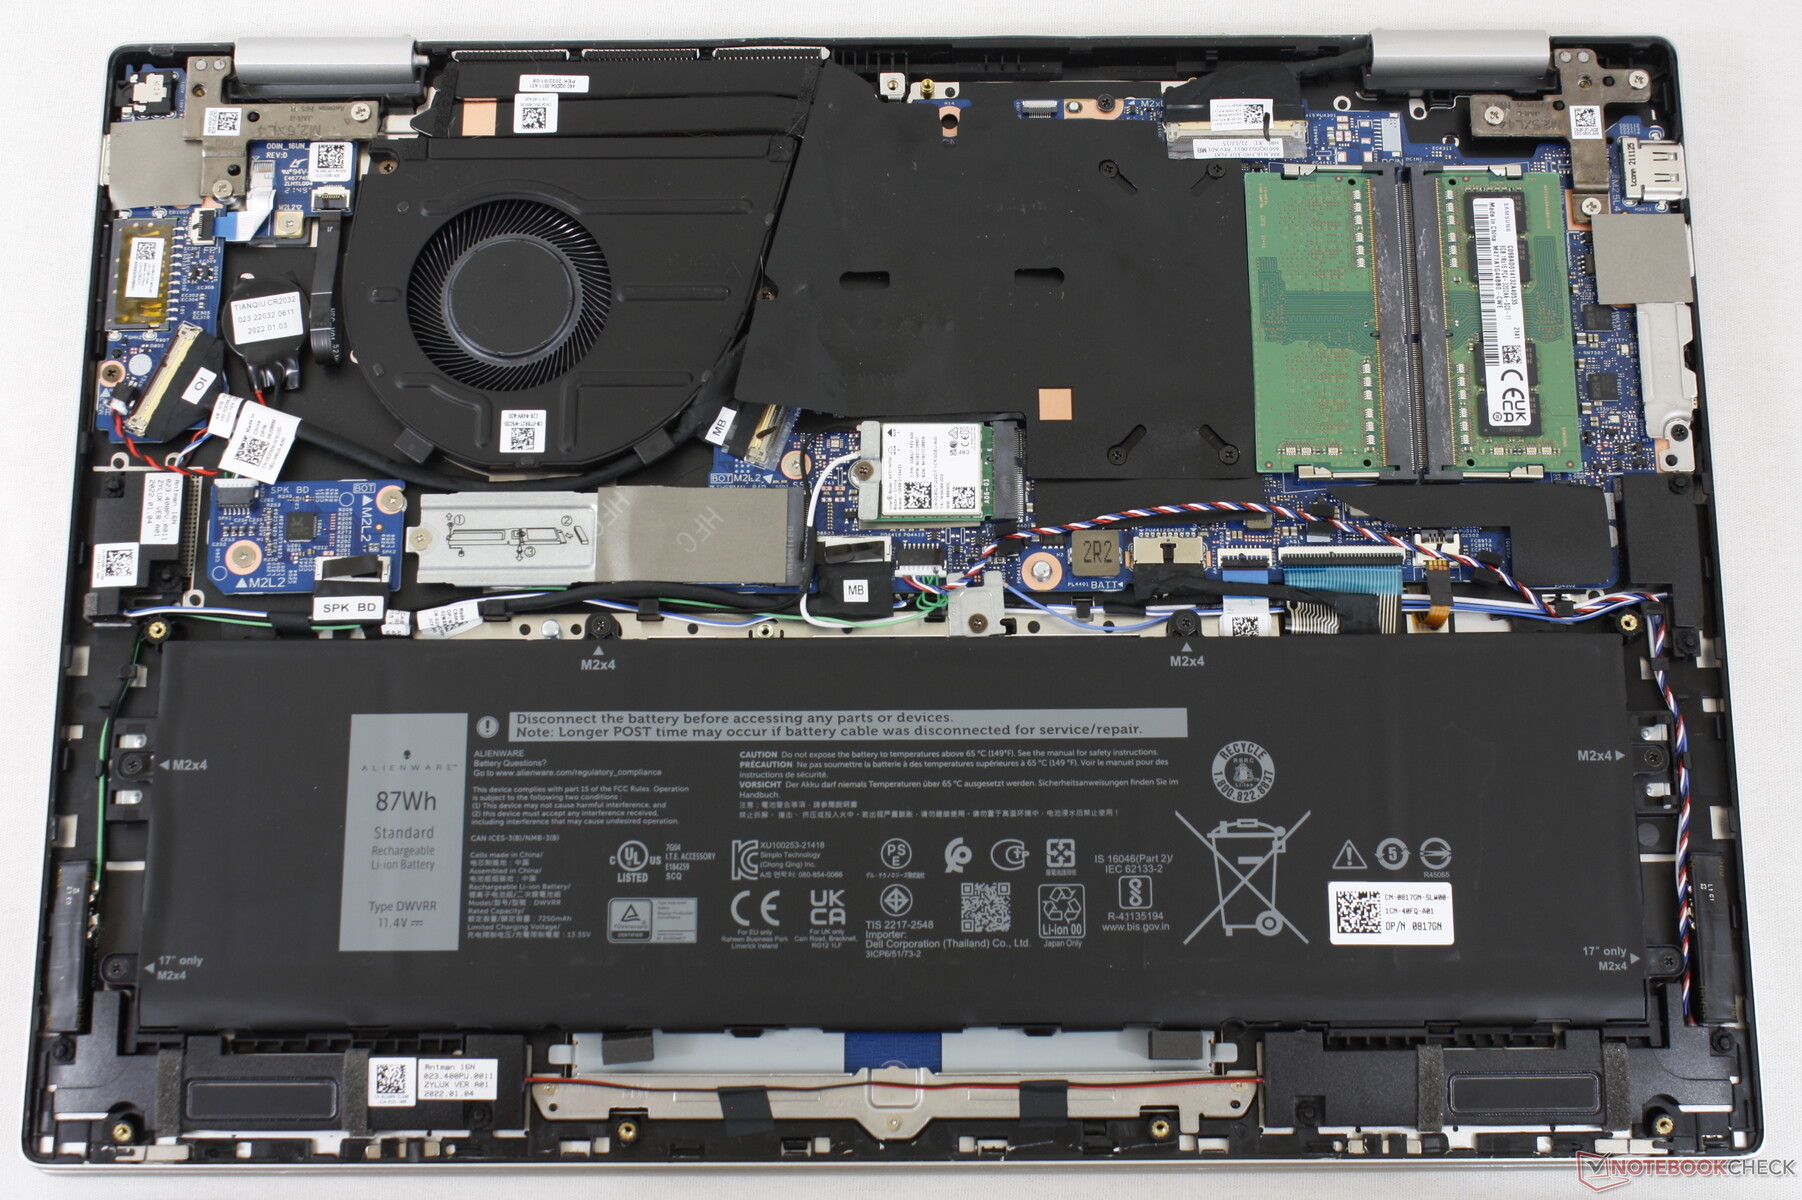
A RAM agora é soldada no modelo 2023, enquanto na versão 2022 era possível fazer o upgrade pelo usuário, como mostram as imagens abaixo.
Acessórios e garantia
Não há extras na caixa além do adaptador CA e da documentação. A garantia limitada de um ano do fabricante se aplica se for comprado nos EUA.
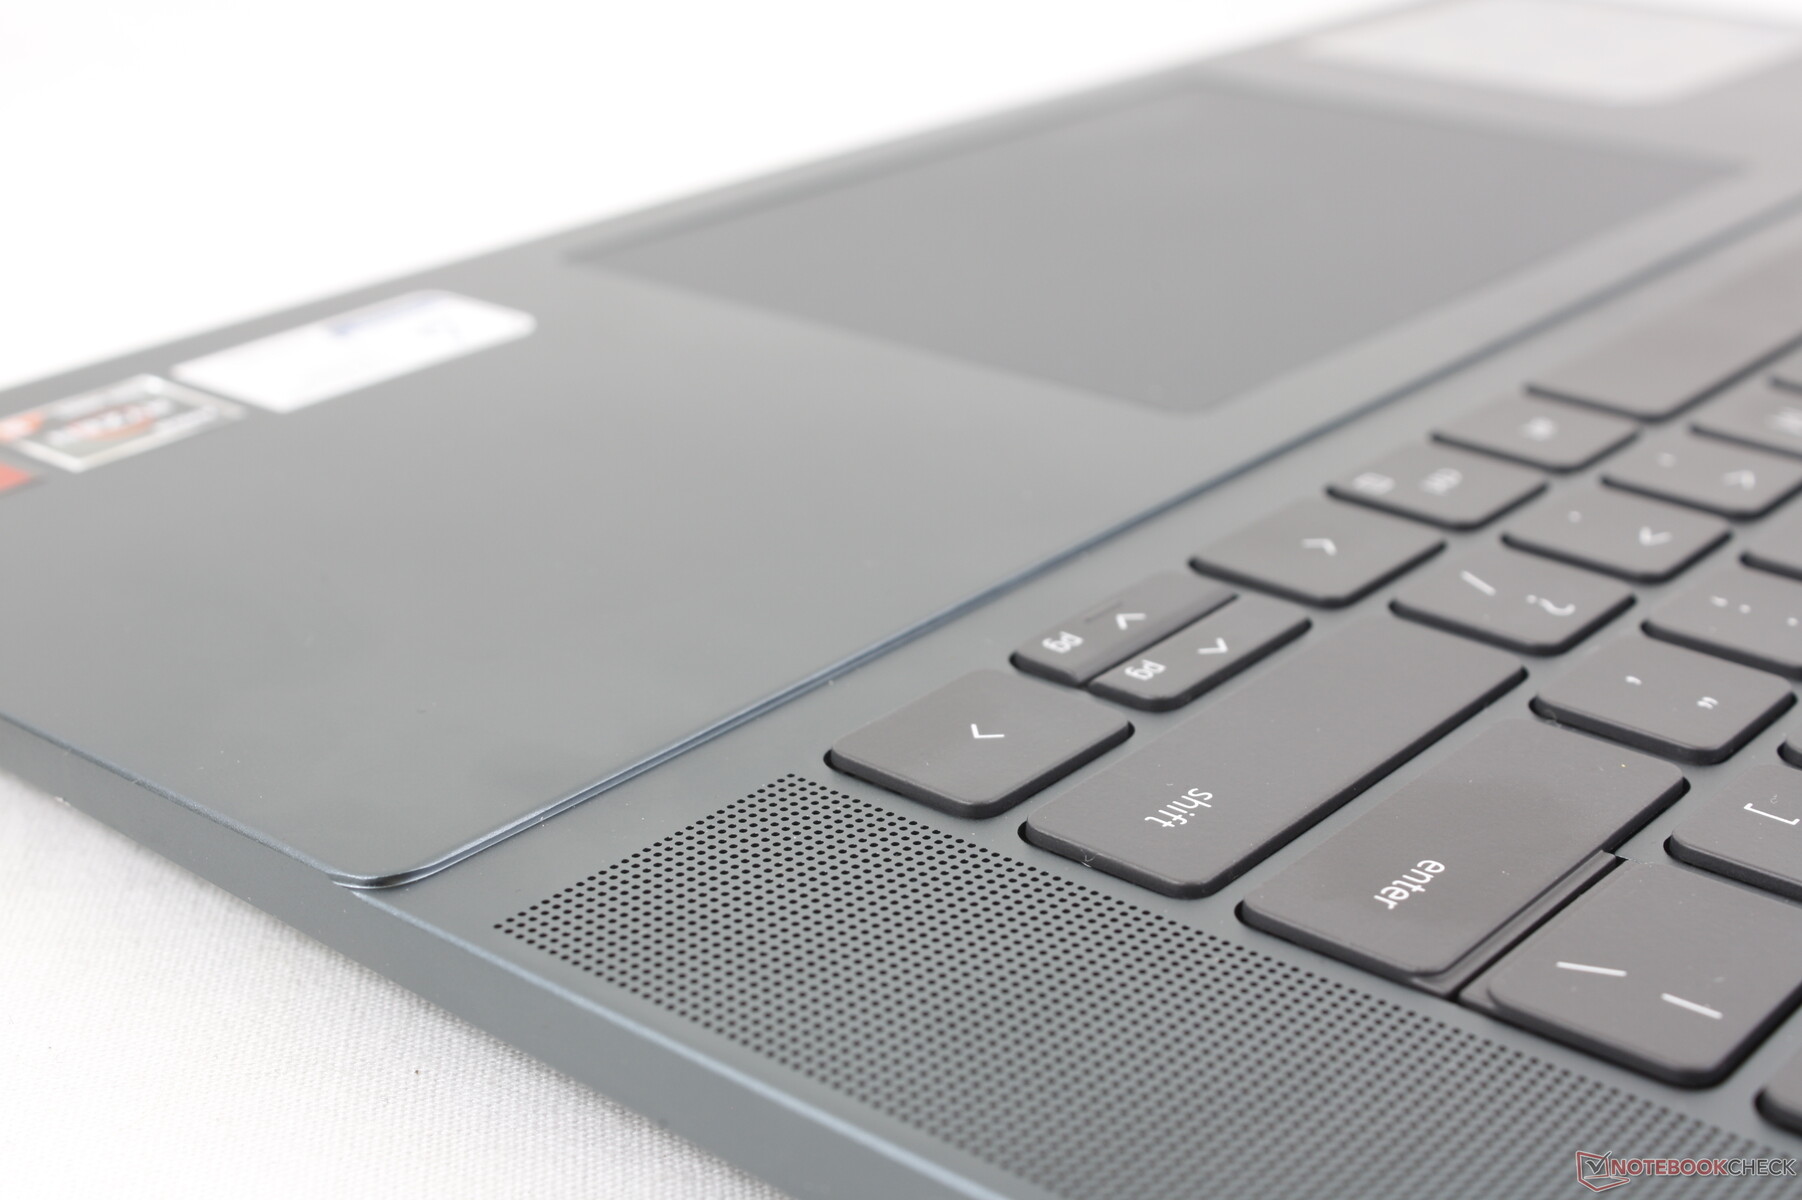
Dispositivos de entrada
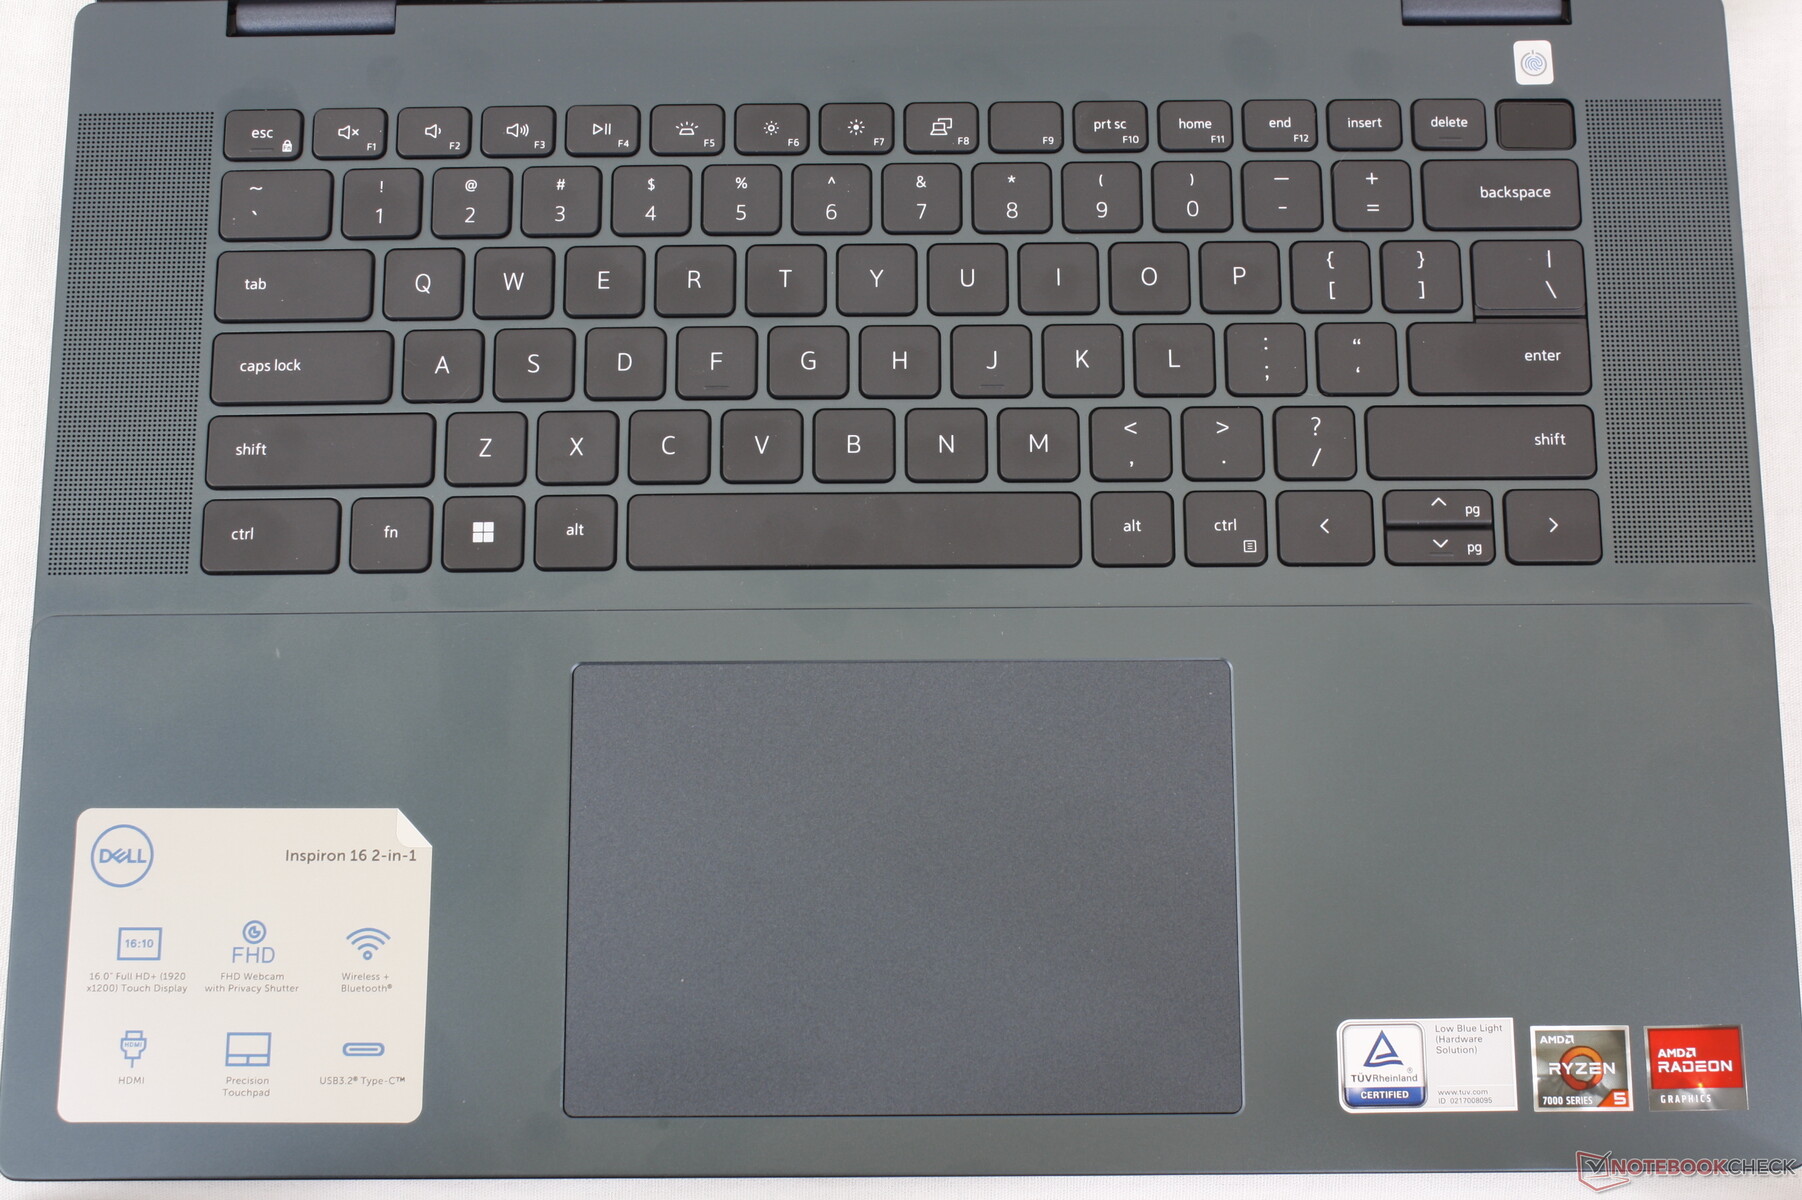
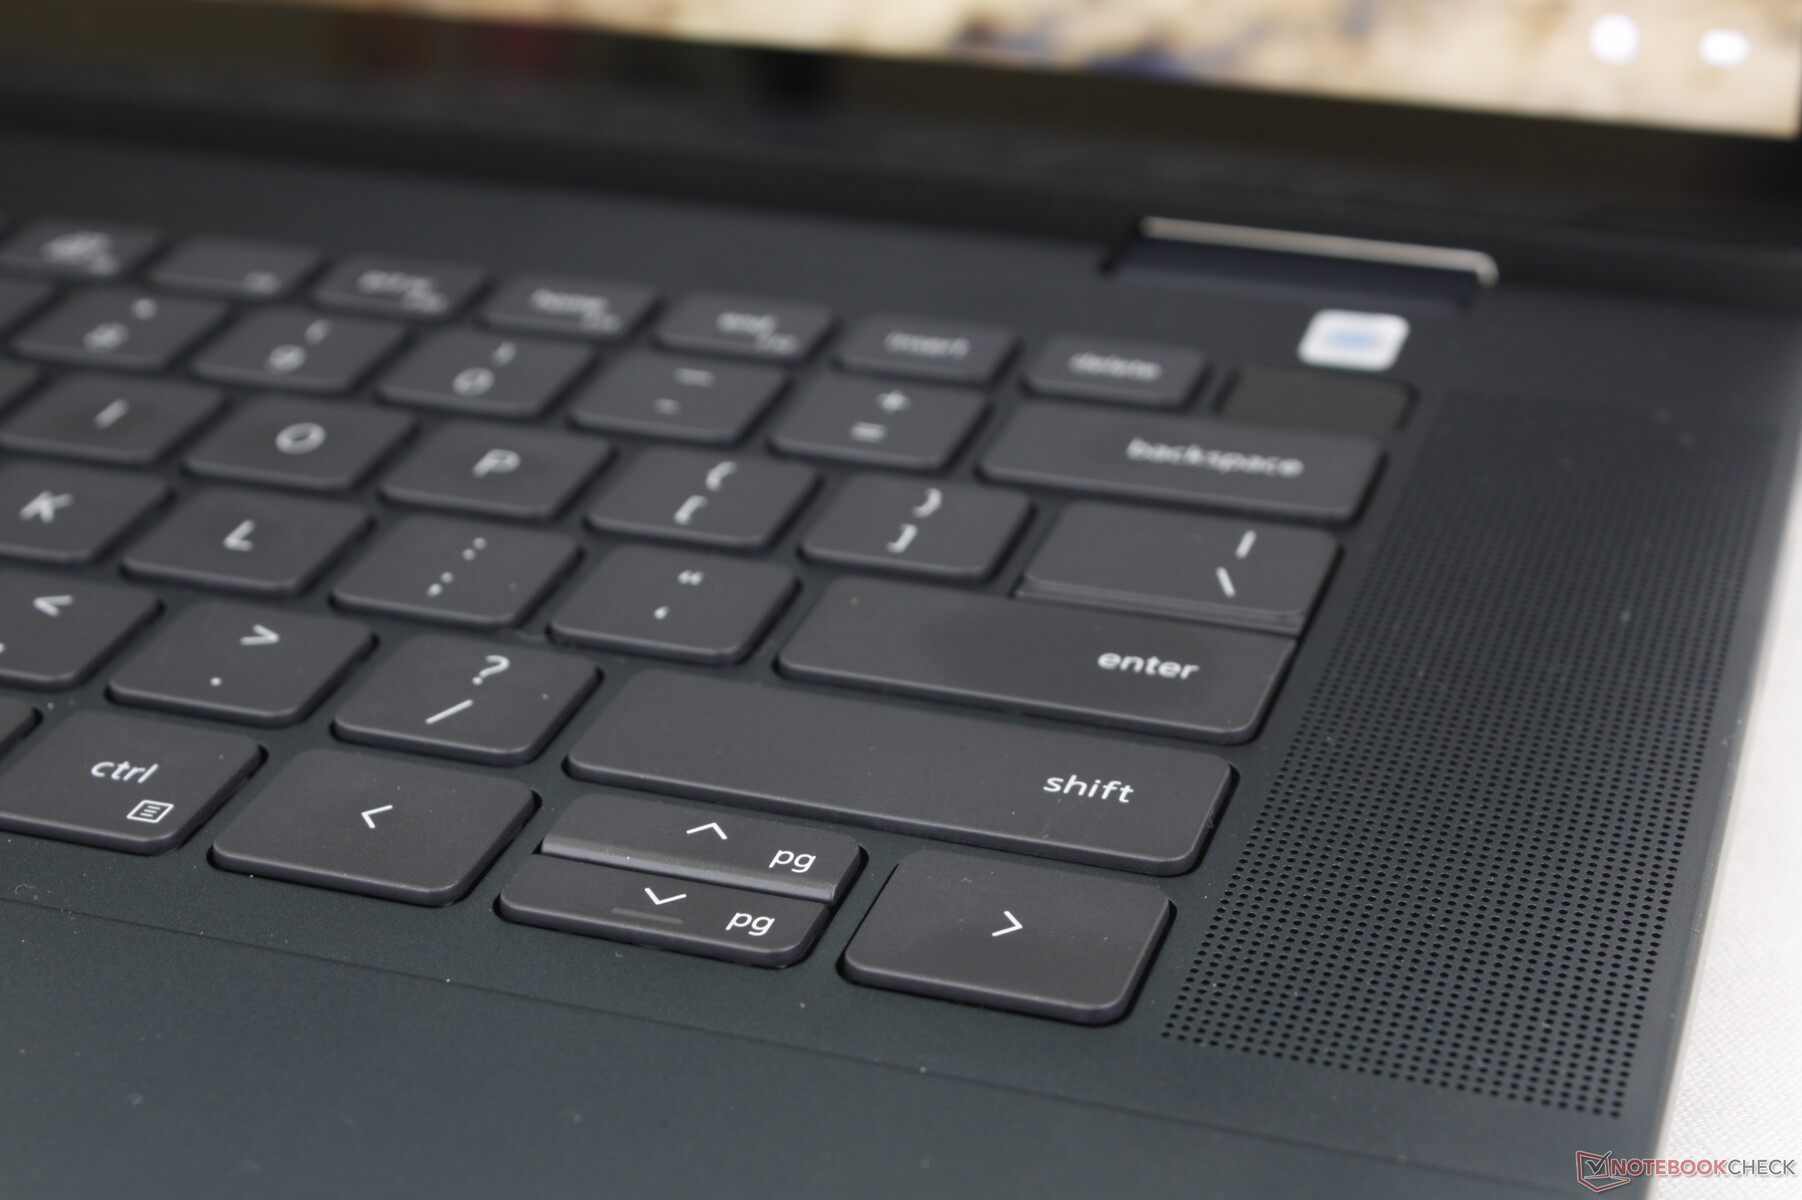
Teclado
A experiência de digitação é bastante consistente em todos os laptops Inspiron e, por isso, as teclas QWERTY permanecem relativamente macias e com curso superficial. Até mesmo o Inspiron 14 de 14 polegadas usa o mesmo teclado do nosso Inspiron 16 de 16 polegadas maior; a única diferença é que o Inspiron 16 integra alto-falantes adicionais nas laterais do teclado. Os alto-falantes adicionais, em vez de um teclado numérico, evidenciam o fato de que o Inspiron 16 7635 2 em 1 é principalmente um PC multimídia.
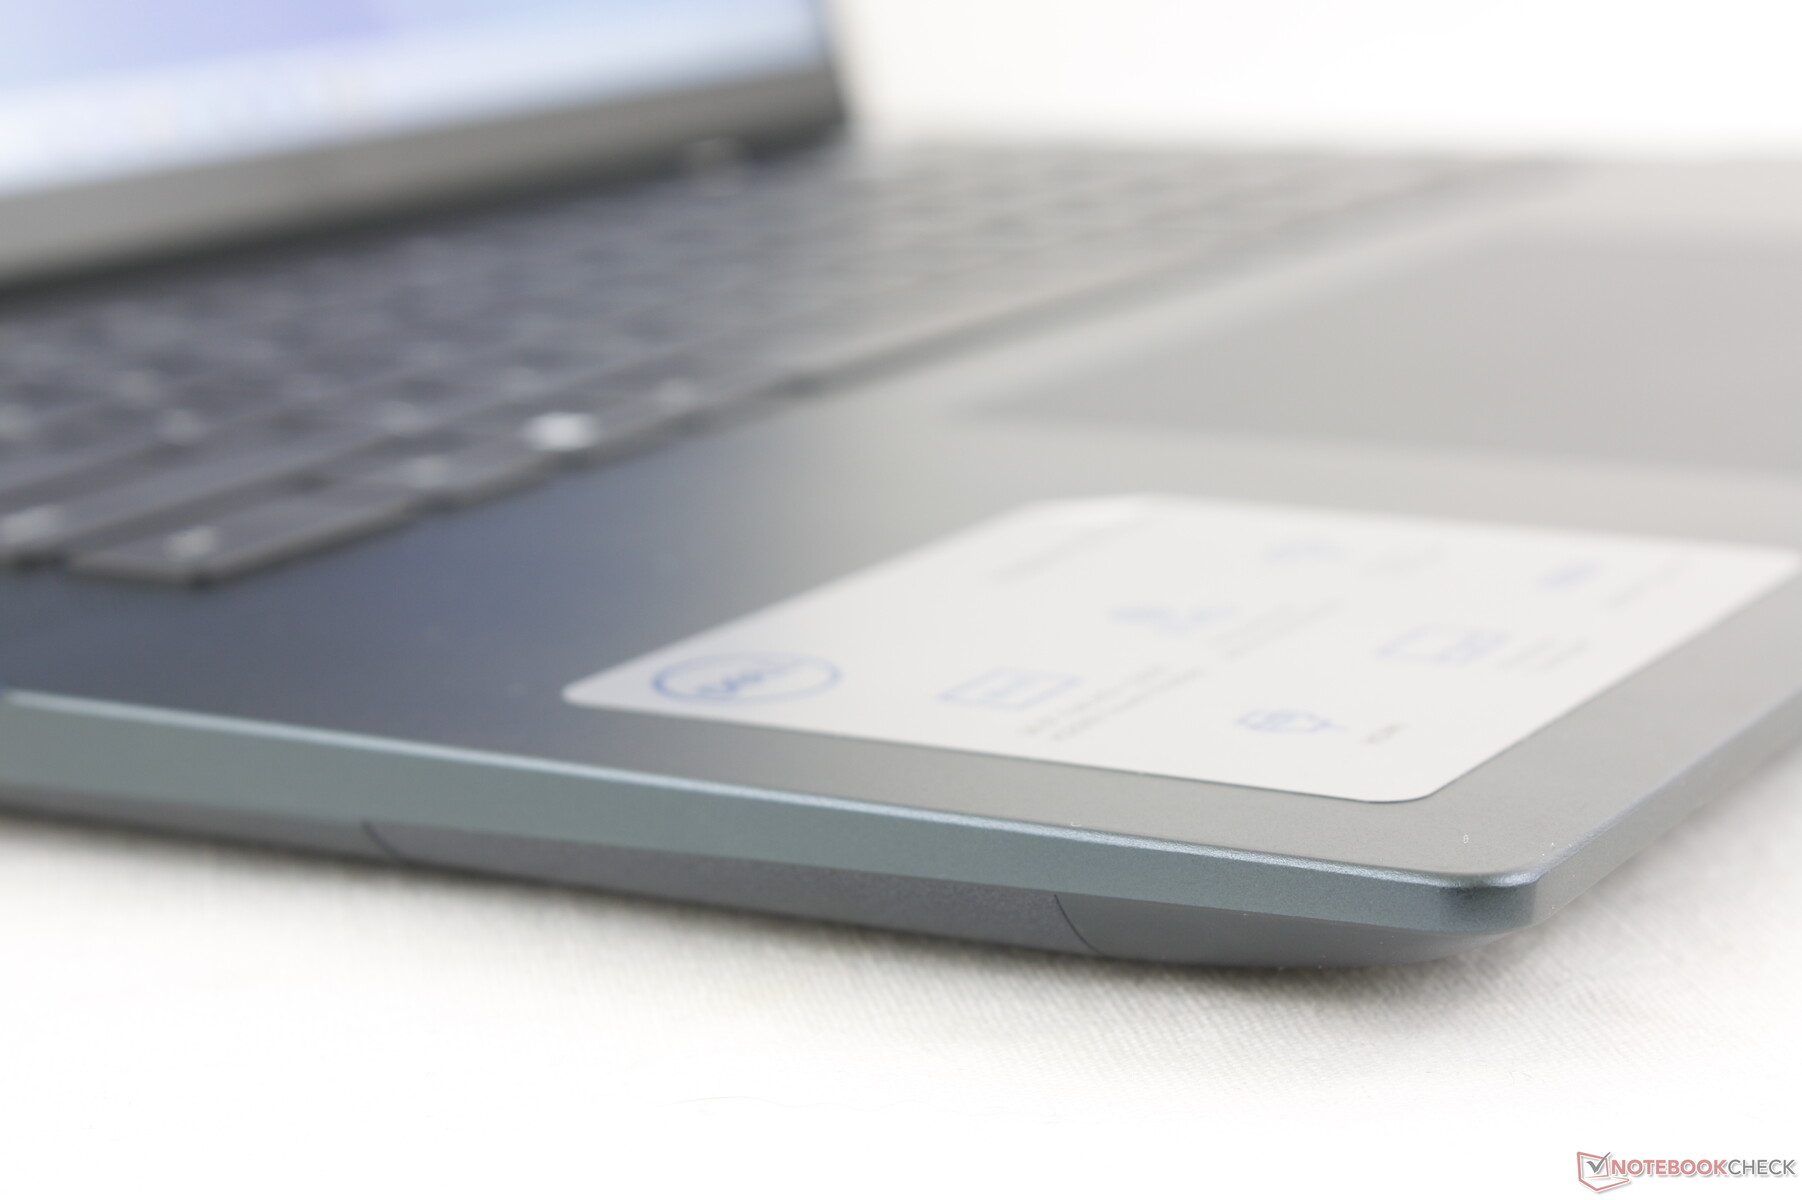
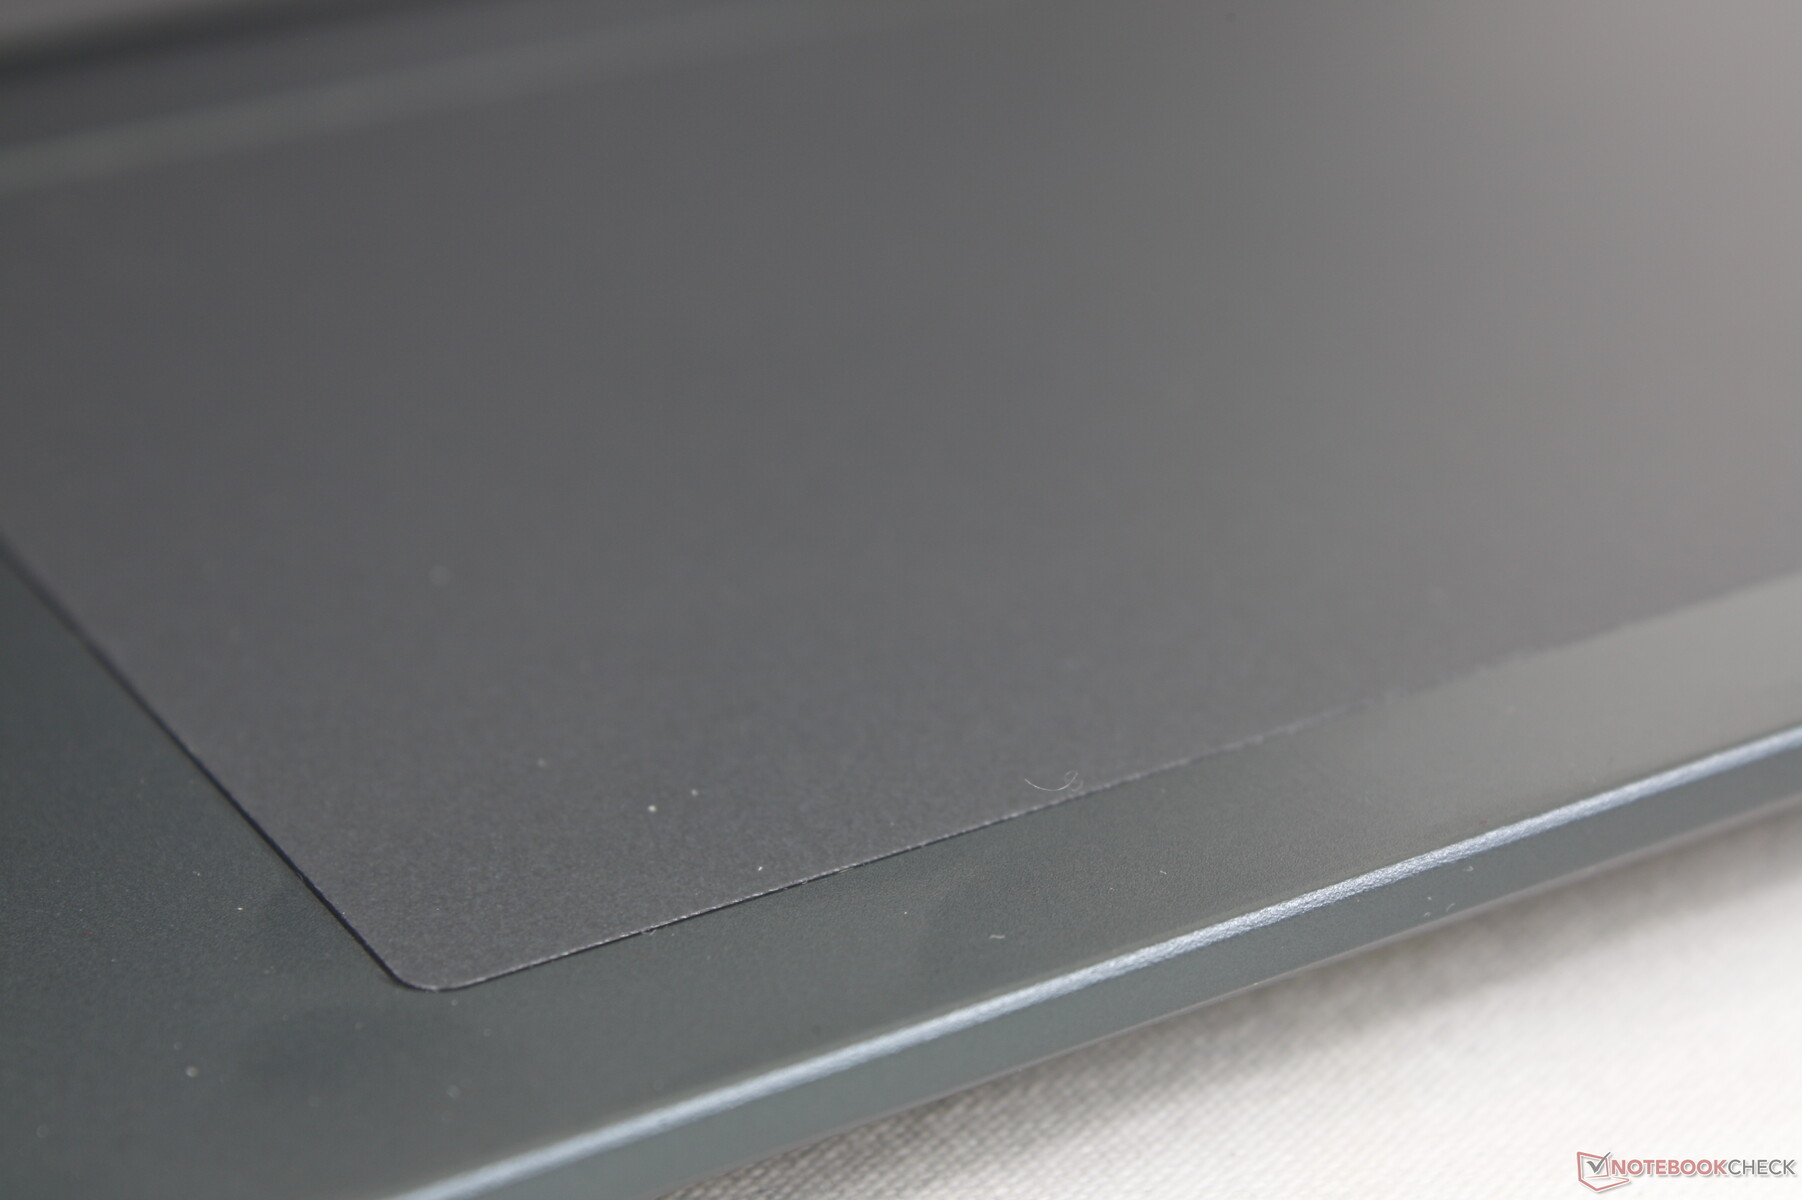
Touchpad
O tamanho do clickpad (13,3 x 9 cm) não mudou em relação ao modelo do ano passado, embora o design visual do clickpad tenha voltado a ter uma aparência mais tradicional. Infelizmente, o feedback ao clicar na superfície não melhorou e, portanto, permanece suave e superficial quando comparado ao clickpad mais firme do HP Spectre clickpad.

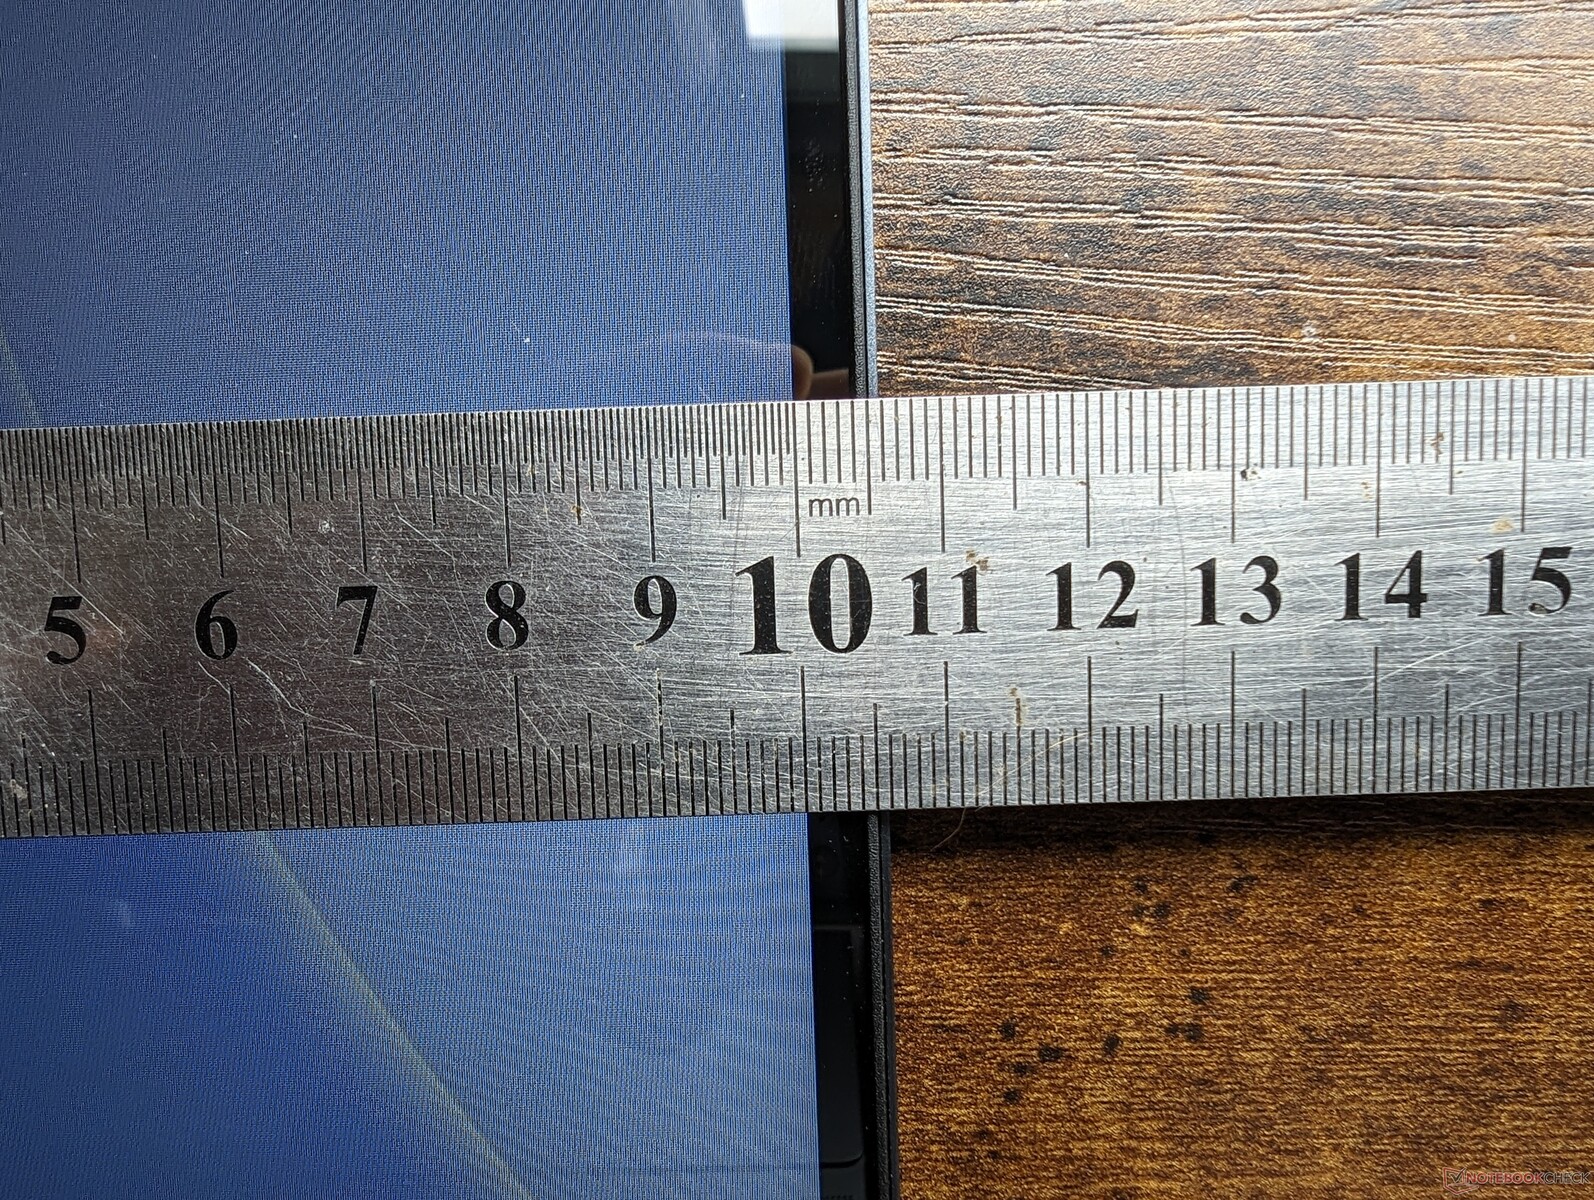
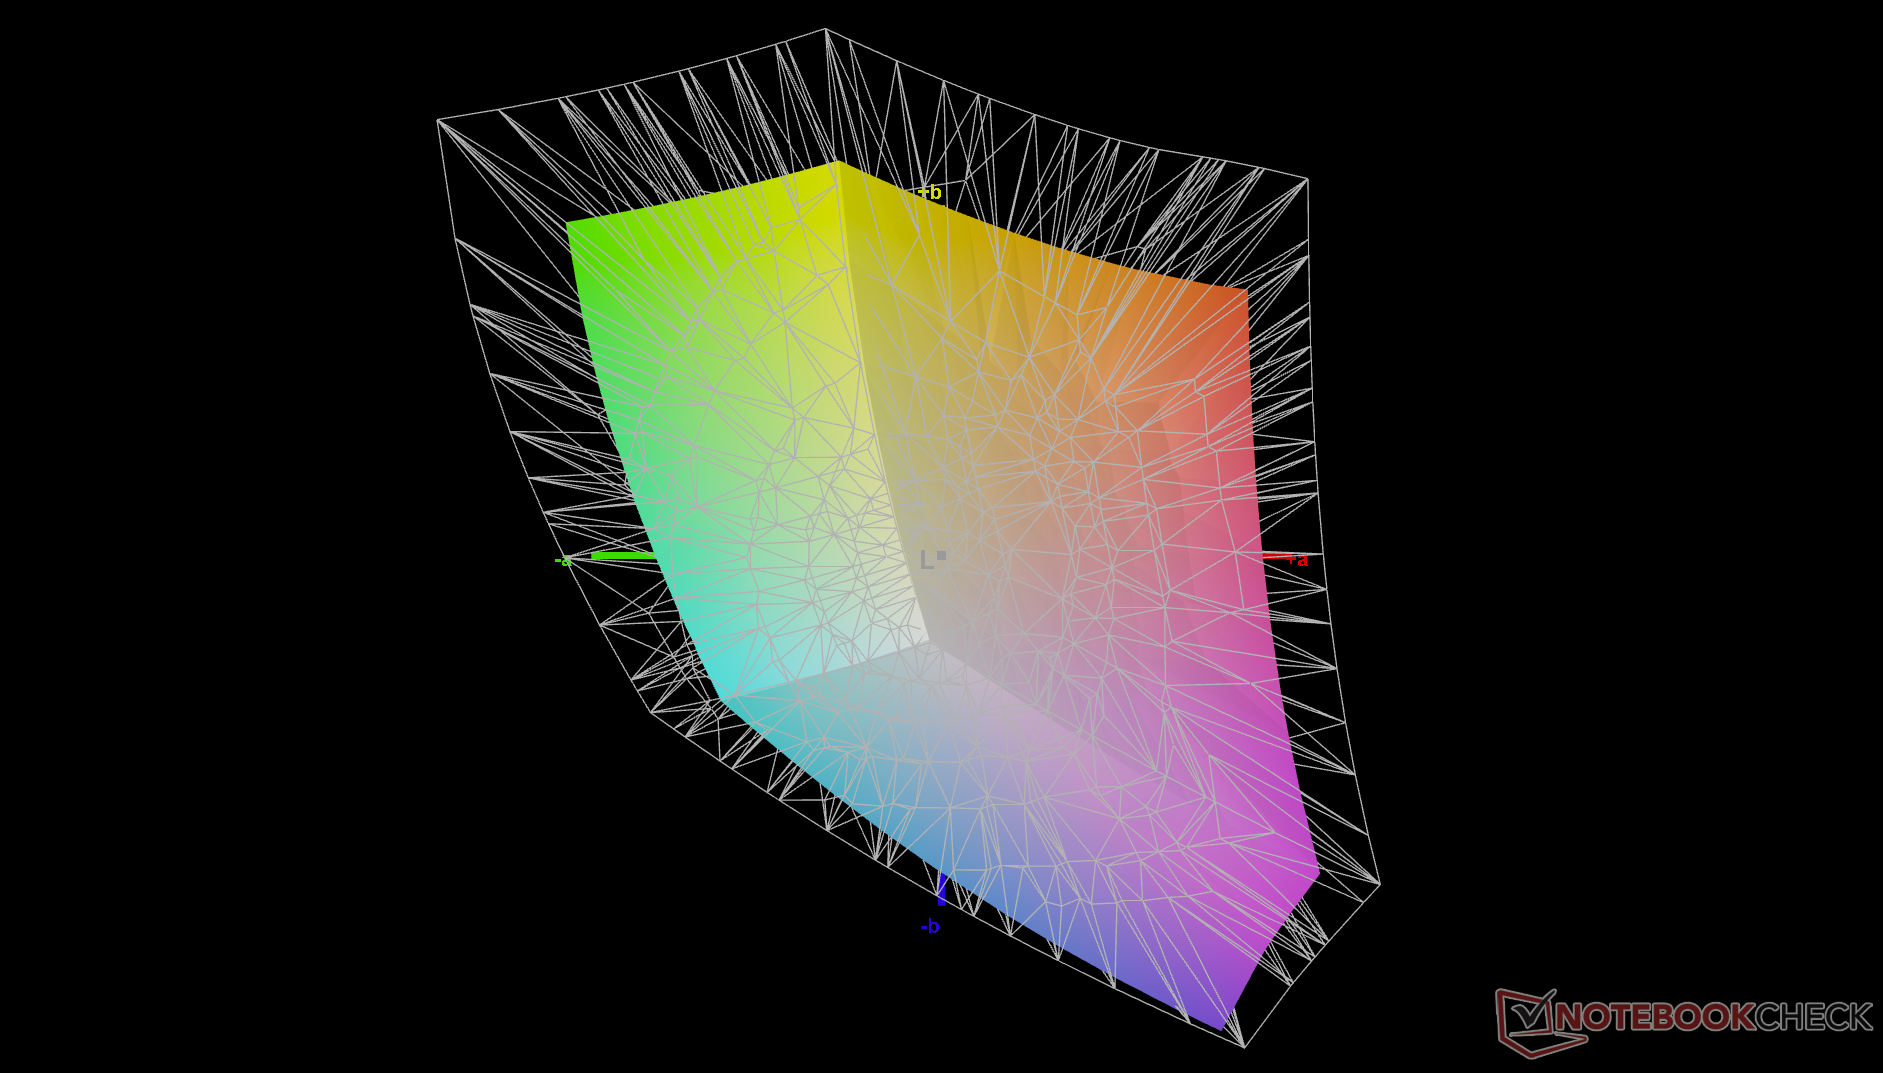
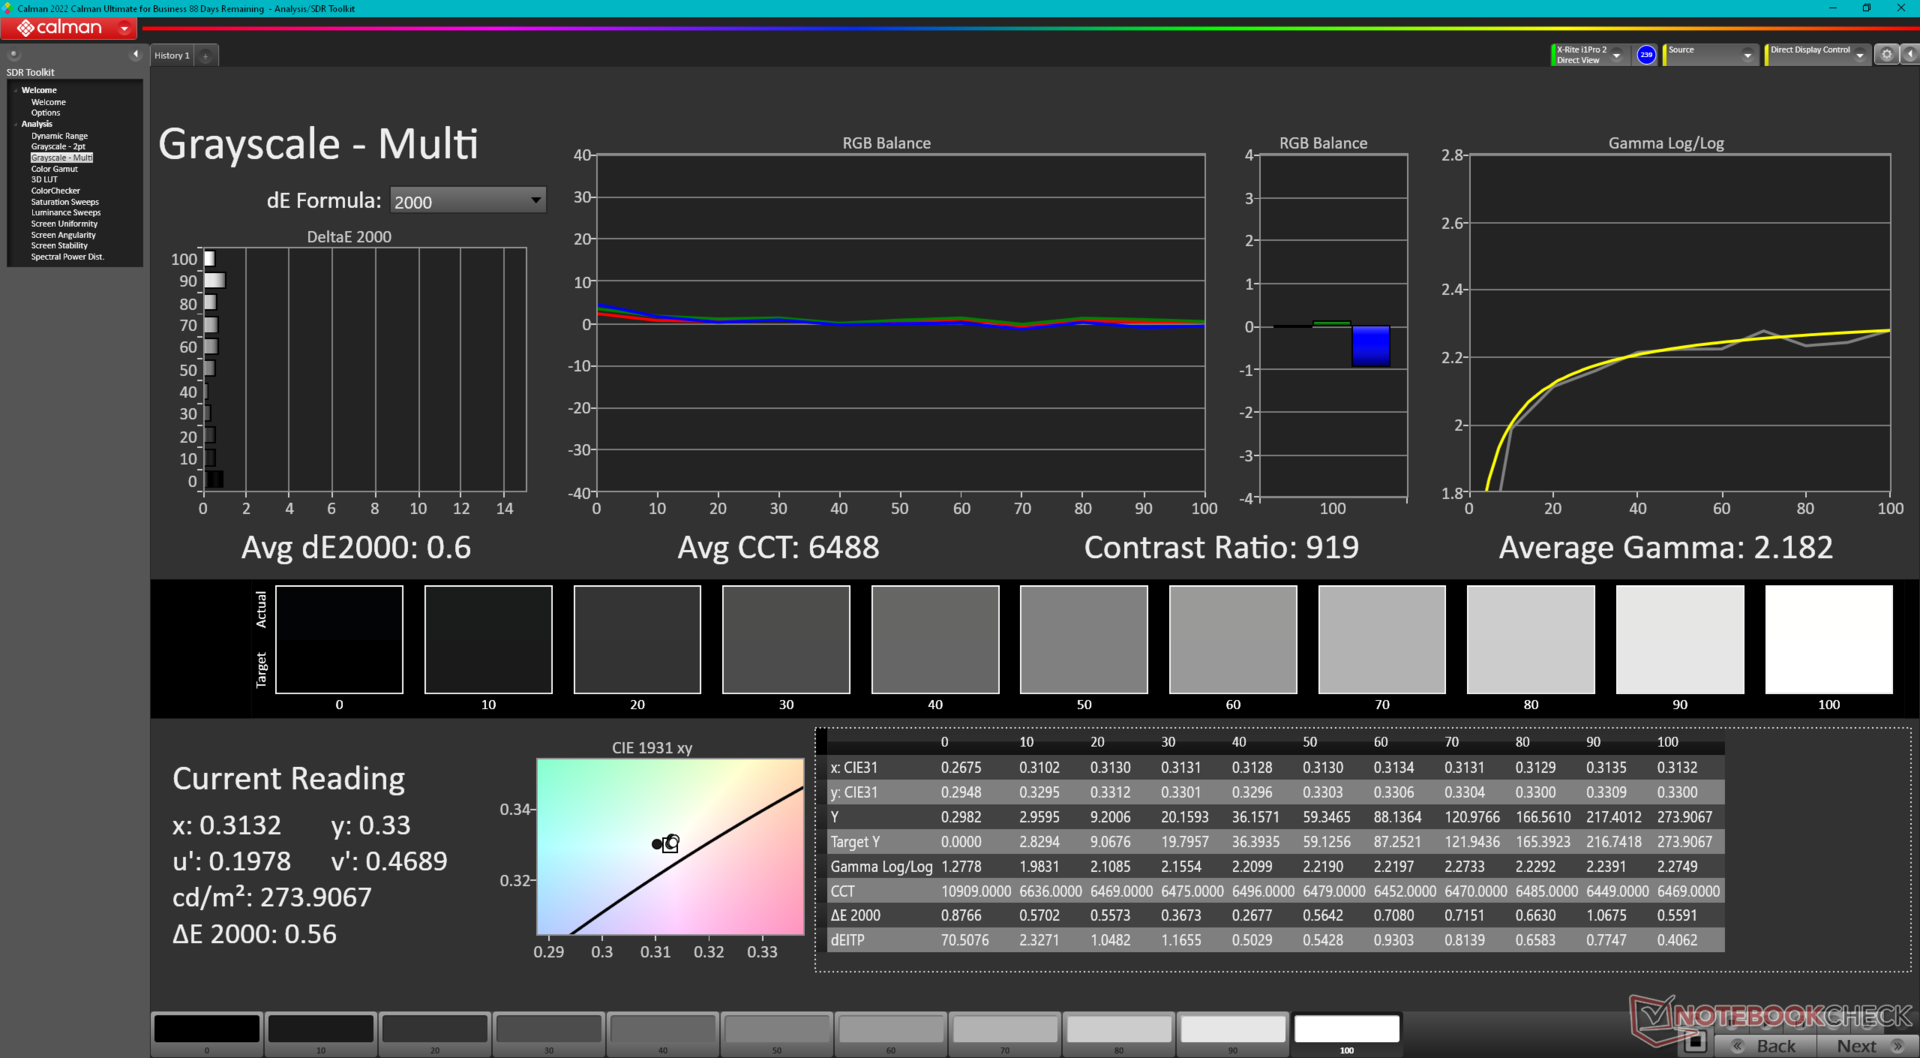
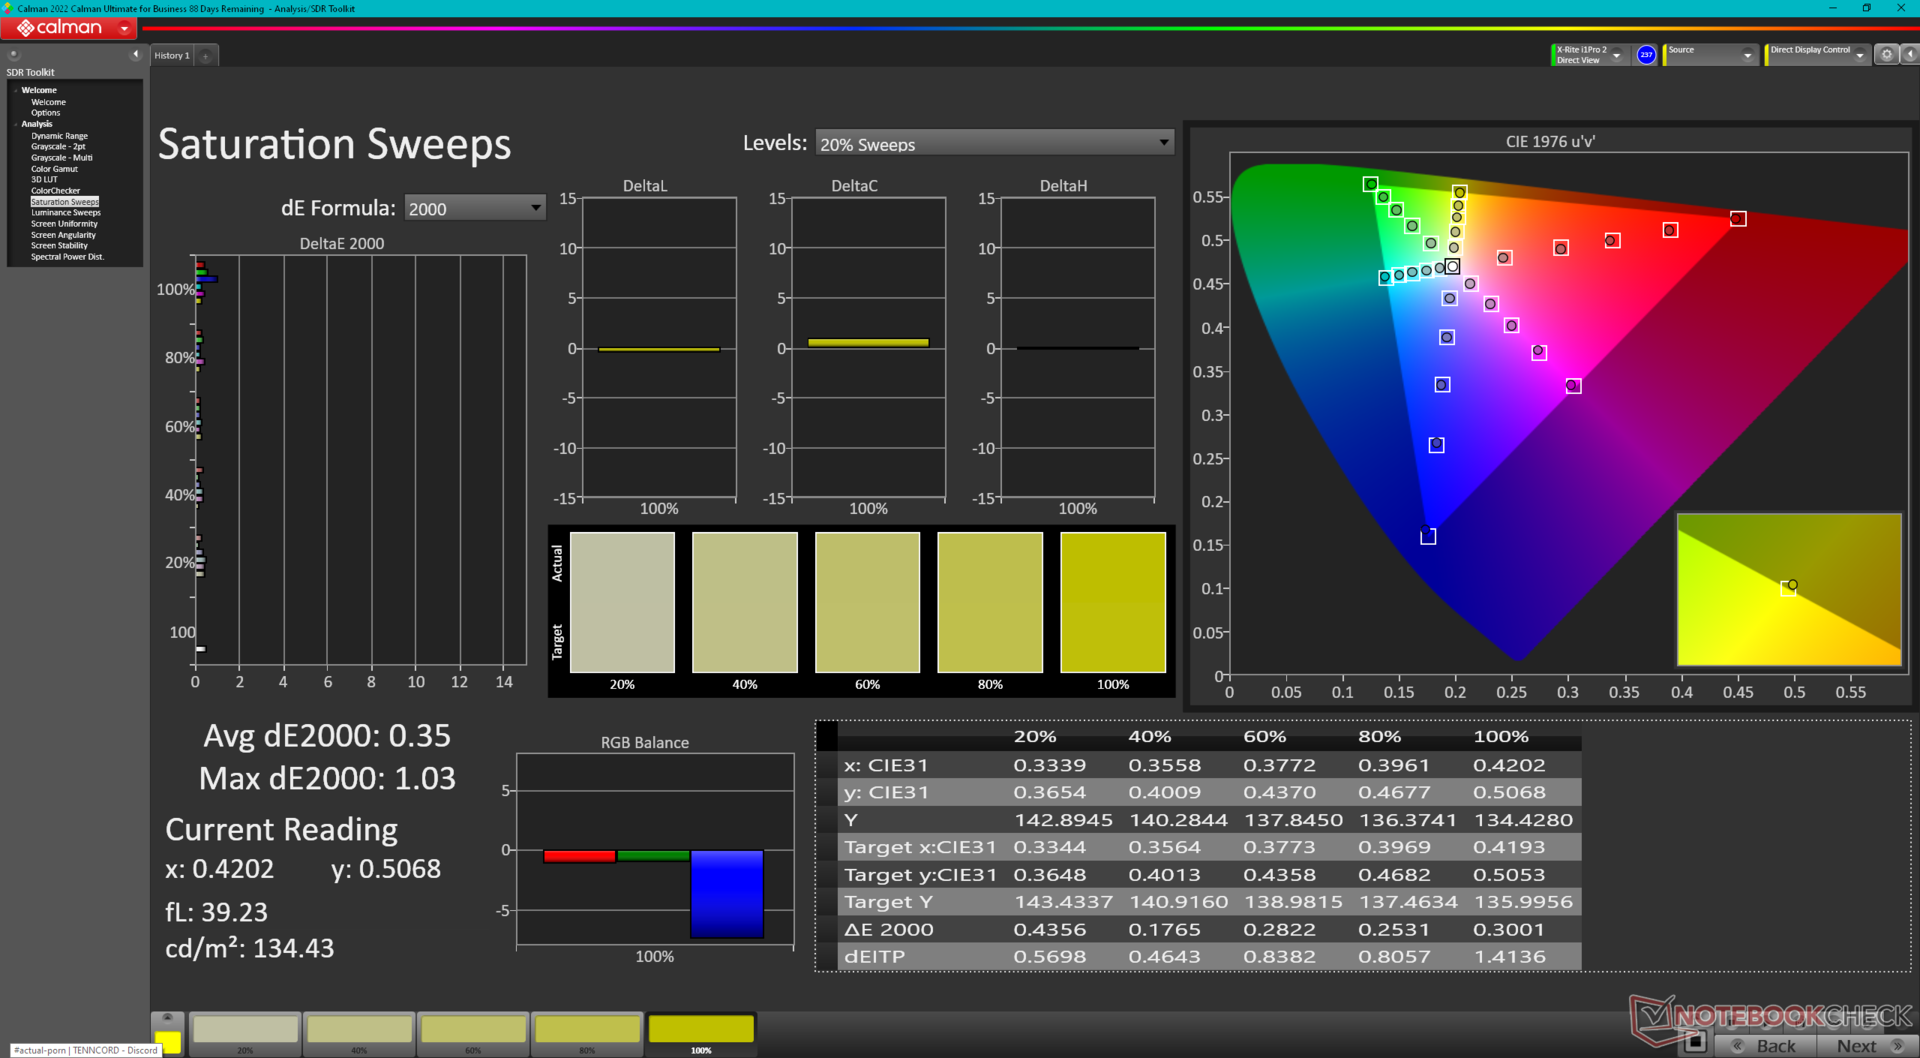
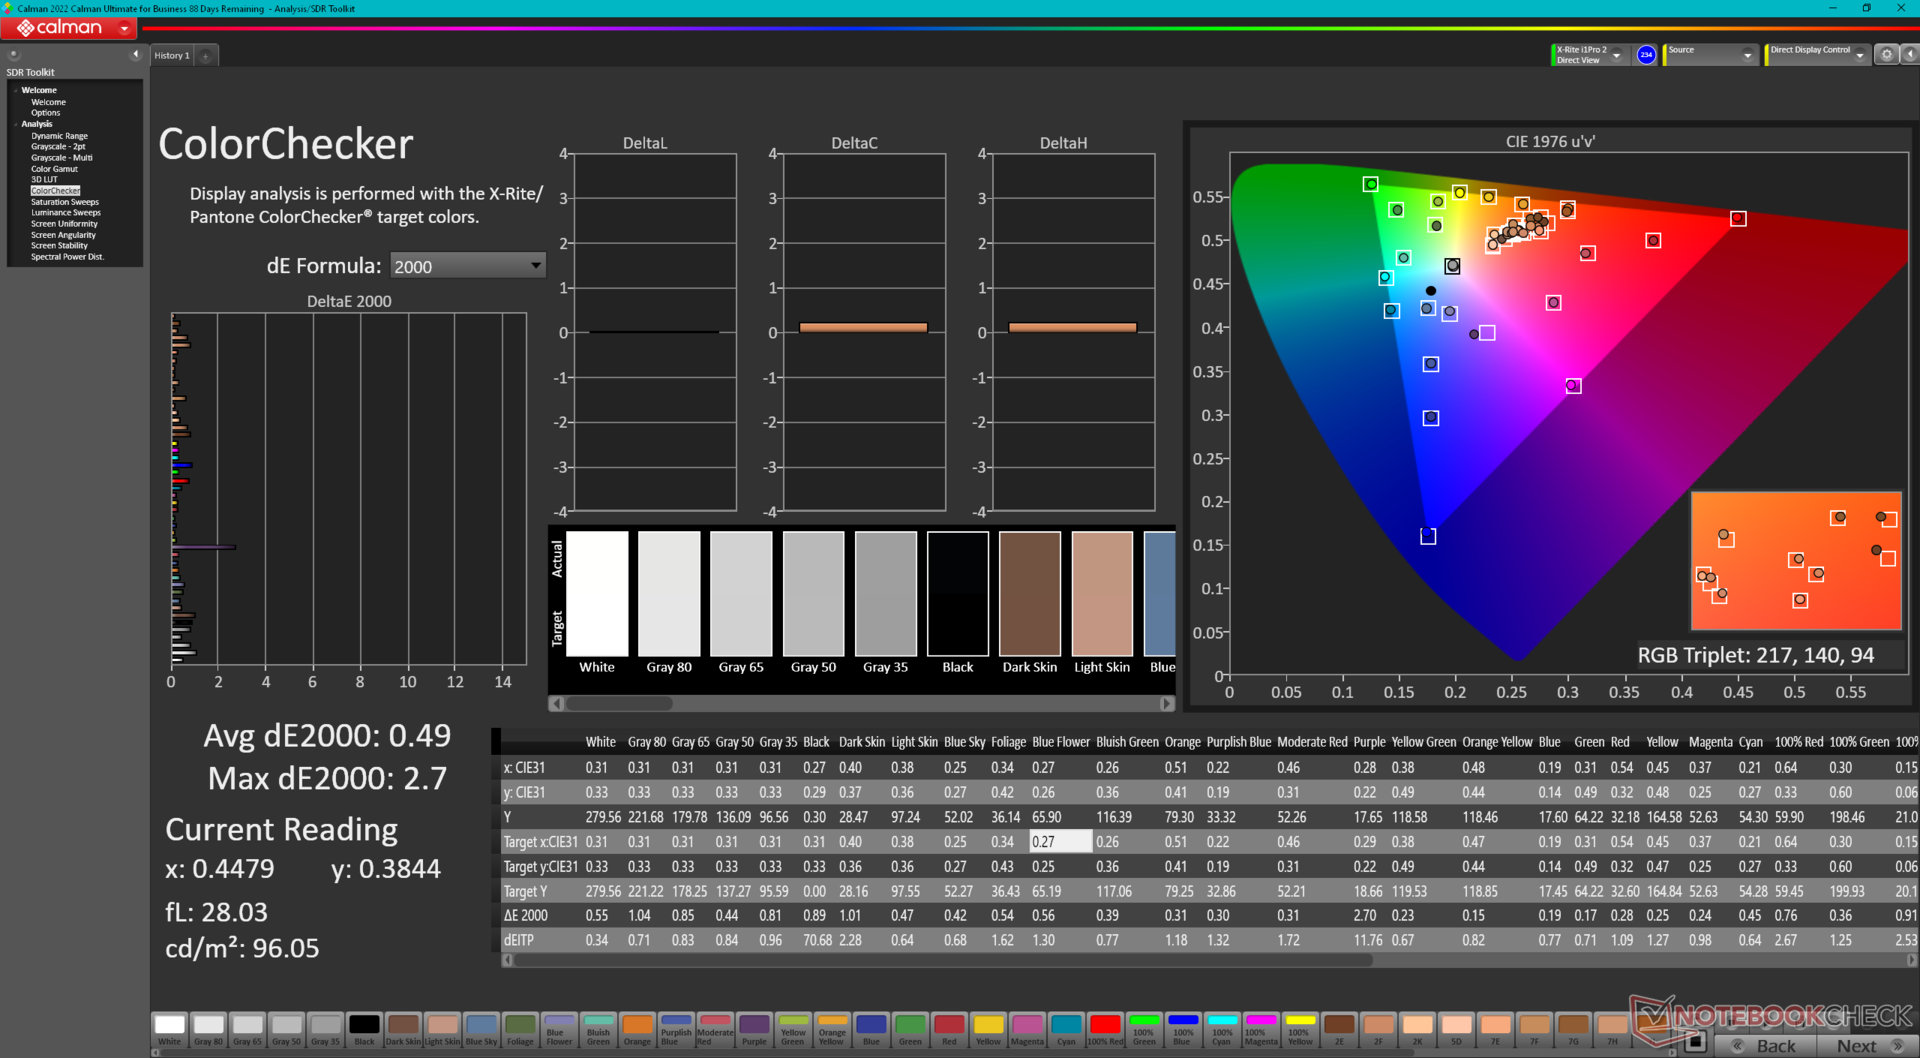
Tela - Cores sRGB completas
O modelo é o primeiro em nosso banco de dados a ser fornecido com o painel IPS Chi Mei 160JCA, enquanto o painel do modelo do ano passado era o BOE NV16N45. Os principais atributos são praticamente idênticos entre os dois painéis, incluindo suas taxas de contraste de ~1000:1, cobertura total de sRGB, taxa de atualização de 60 Hz e tempos médios de resposta. Portanto, a experiência visual é essencialmente a mesma entre os modelos 2022 e 2023, a menos que seja configurada com a opção OLED de 2400p no Inspiron 16 7630 2 em 1 baseado em Intel.
Embora nosso painel Chi Mei seja de maior qualidade do que o LEN160WUXGA doIdeaPad Flex 5 16 em termos de cores, teria sido bom ver a Dell ir além este ano, incluindo opções de taxa de atualização mais rápida de 90 Hz ou 120 Hz para uma interface de usuário mais suave.
| |||||||||||||||||||||||||
iluminação: 79 %
iluminação com acumulador: 301.3 cd/m²
Contraste: 1076:1 (Preto: 0.28 cd/m²)
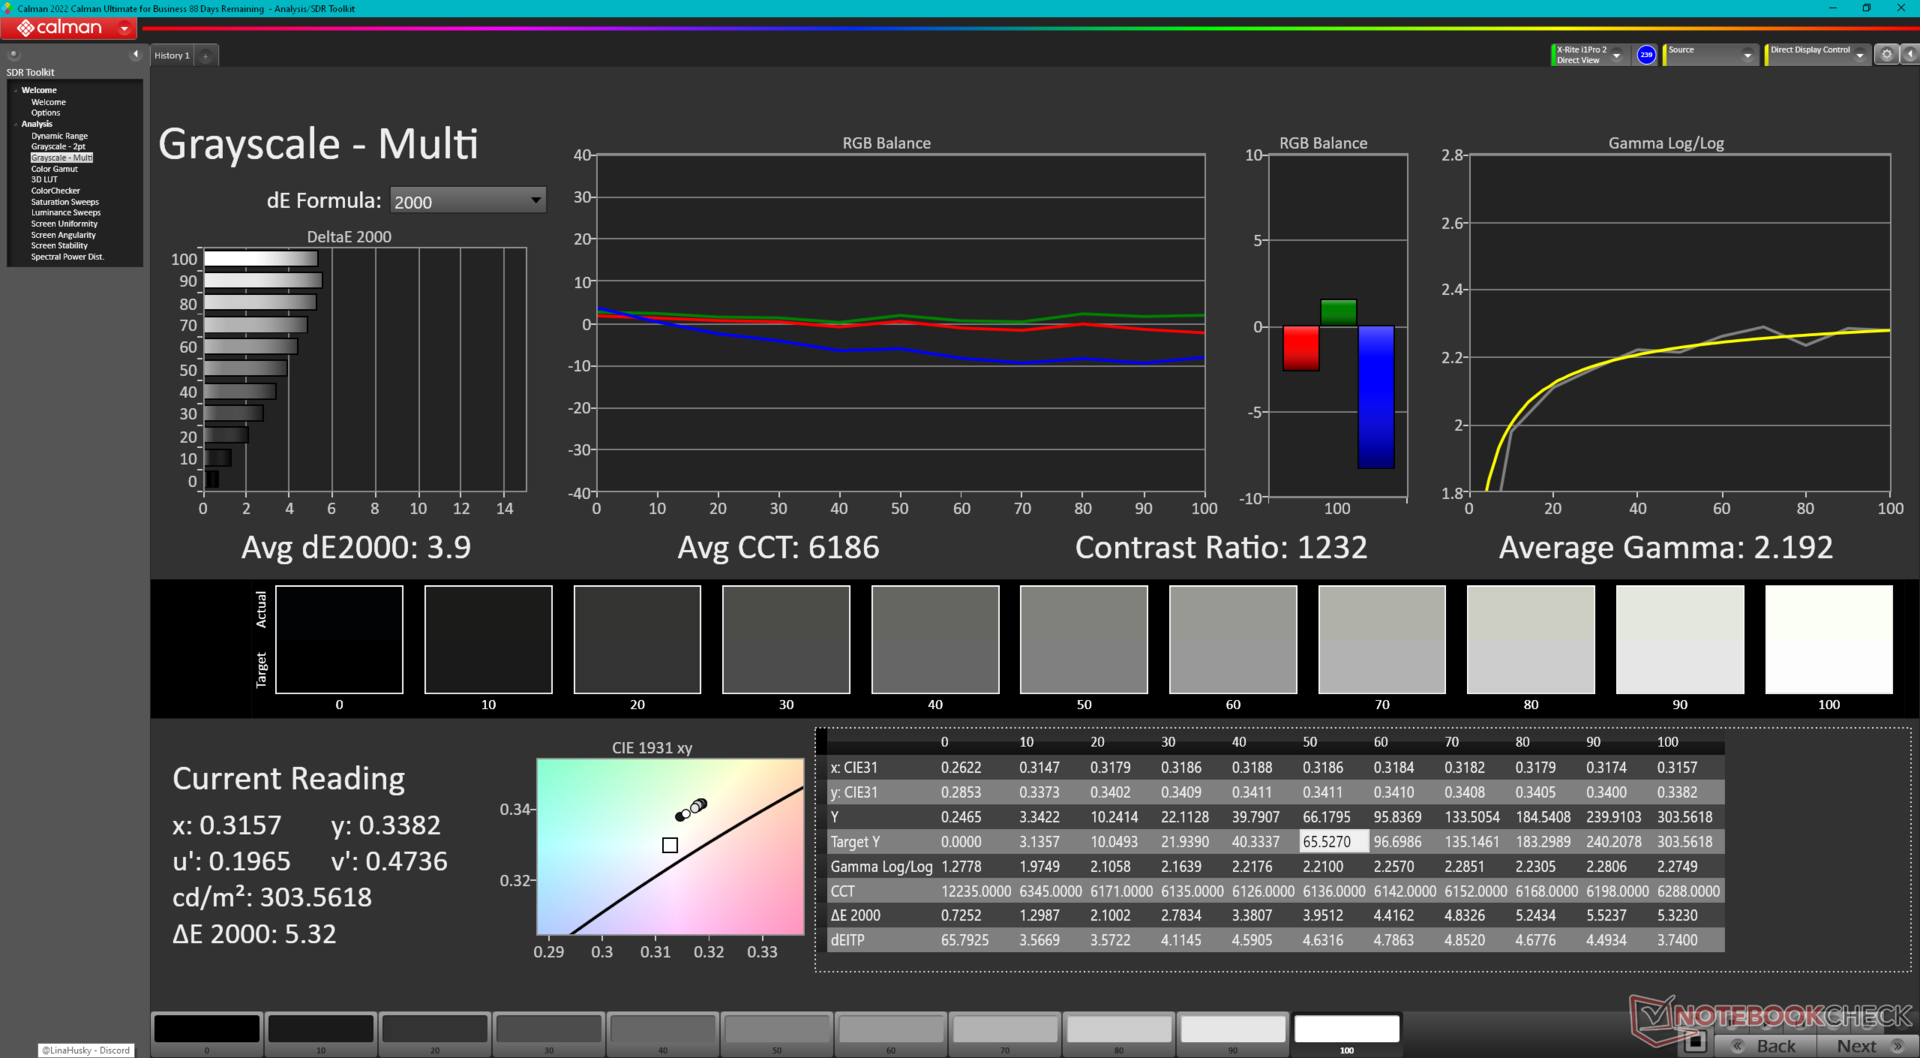
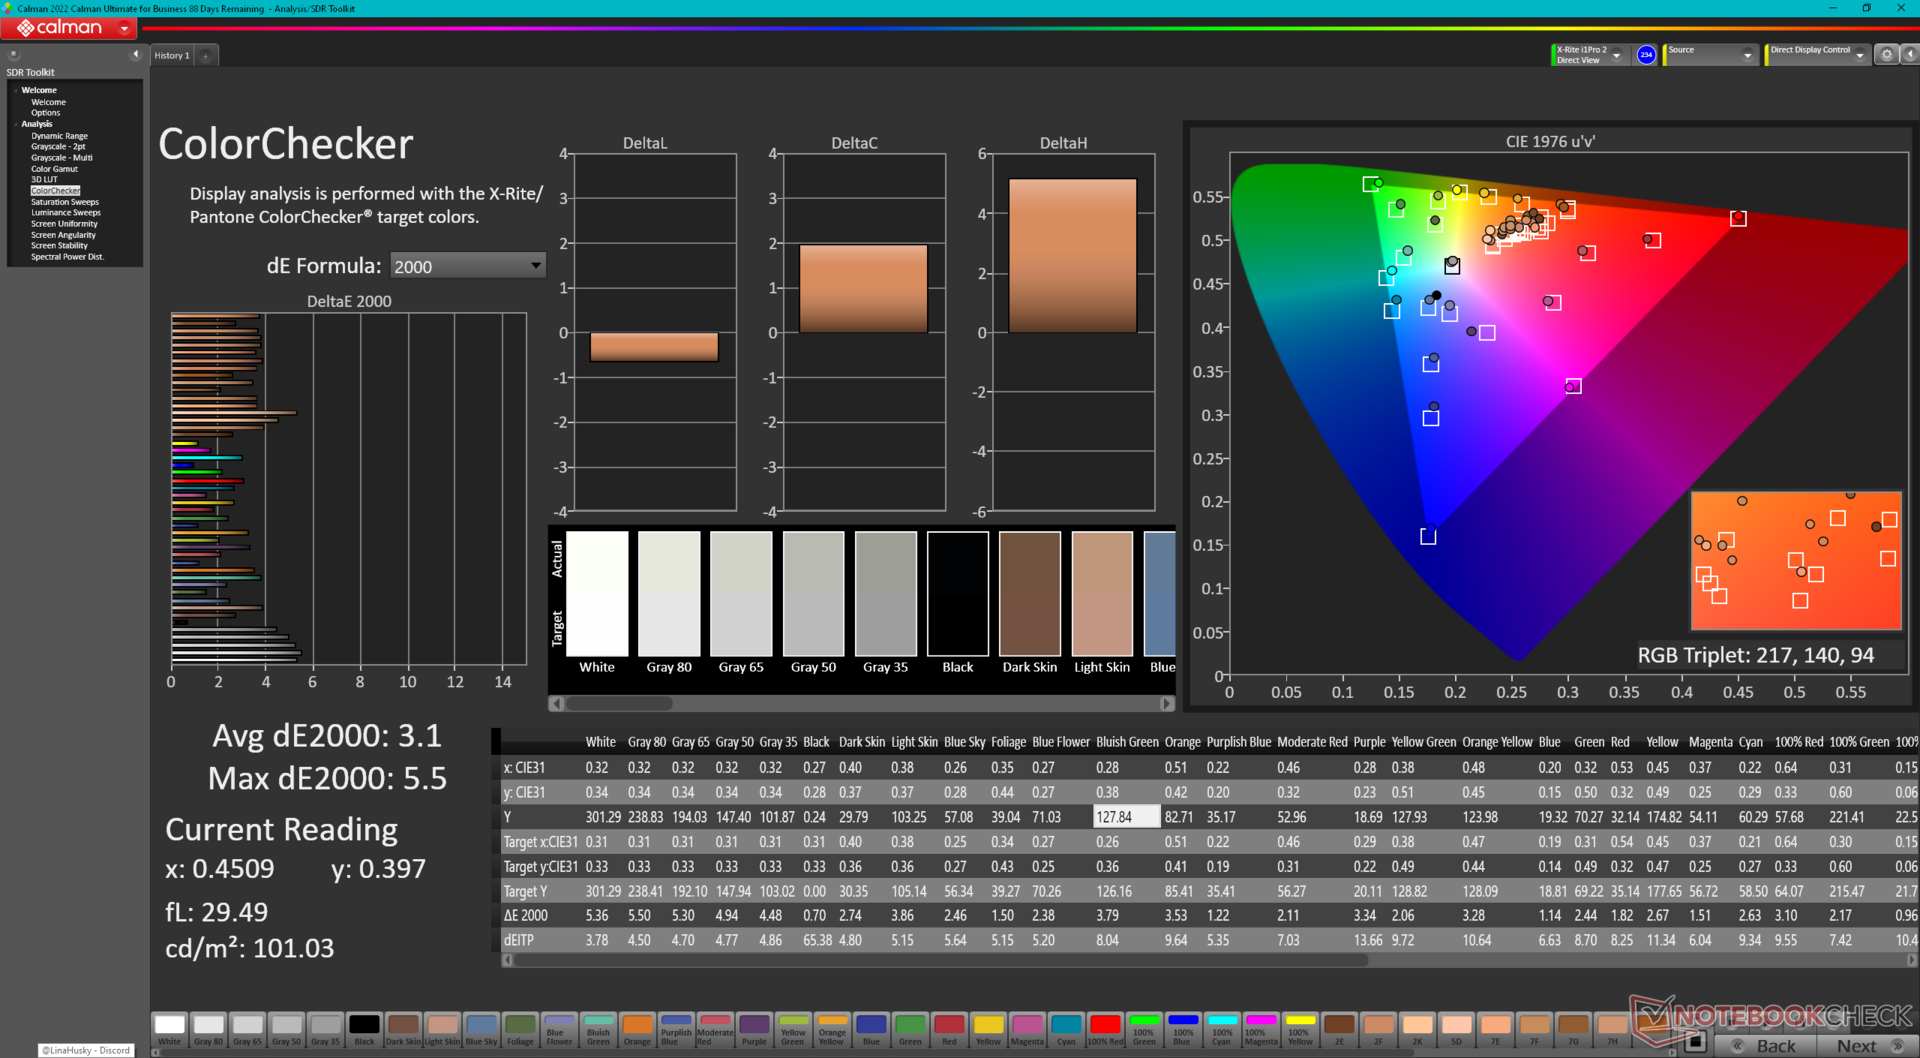
ΔE ColorChecker Calman: 3.1 | ∀{0.5-29.43 Ø4.71}
calibrated: 0.49
ΔE Greyscale Calman: 3.9 | ∀{0.09-98 Ø4.96}
69.5% AdobeRGB 1998 (Argyll 3D)
98.2% sRGB (Argyll 3D)
67.4% Display P3 (Argyll 3D)
Gamma: 2.19
CCT: 6186 K
| Dell Inspiron 16 7635 2-in-1 Chi Mei 160JCA, IPS, 1920x1200, 16" | Acer Swift Edge SFE16-42-R1GM Samsung SDC4168, OLED, 3840x2400, 16" | Lenovo Yoga 7 16IRL8 LEN160FHD, IPS, 1920x1200, 16" | Samsung Galaxy Book3 Pro 16 Samsung ATNA60CL03-0, AMOLED, 2880x1800, 16" | Lenovo IdeaPad Flex 5 16ABR G8 LEN160WUXGA, IPS, 1920x1200, 16" | Dell Inspiron 16 7620 2-in-1 BOE NV16N45, IPS, 1920x1200, 16" | |
|---|---|---|---|---|---|---|
| Display | 30% | -37% | 30% | -41% | -1% | |
| Display P3 Coverage (%) | 67.4 | 99.7 48% | 42 -38% | 99.7 48% | 40 -41% | 67 -1% |
| sRGB Coverage (%) | 98.2 | 100 2% | 62.8 -36% | 100 2% | 57.6 -41% | 95.9 -2% |
| AdobeRGB 1998 Coverage (%) | 69.5 | 97.2 40% | 43.5 -37% | 97 40% | 41.3 -41% | 69.3 0% |
| Response Times | 89% | -15% | 91% | -16% | -15% | |
| Response Time Grey 50% / Grey 80% * (ms) | 27.6 ? | 2 ? 93% | 31.8 ? -15% | 2 ? 93% | 33 ? -20% | 32 ? -16% |
| Response Time Black / White * (ms) | 18.2 ? | 3 ? 84% | 20.9 ? -15% | 2 ? 89% | 20.2 ? -11% | 20.8 ? -14% |
| PWM Frequency (Hz) | 239 ? | |||||
| Screen | -43% | -63% | 250% | -149% | -24% | |
| Brightness middle (cd/m²) | 301.3 | 369 22% | 279.4 -7% | 412 37% | 392 30% | 320.7 6% |
| Brightness (cd/m²) | 269 | 371 38% | 257 -4% | 412 53% | 371 38% | 309 15% |
| Brightness Distribution (%) | 79 | 97 23% | 81 3% | 98 24% | 89 13% | 90 14% |
| Black Level * (cd/m²) | 0.28 | 0.18 36% | 0.015 95% | 0.25 11% | 0.36 -29% | |
| Contrast (:1) | 1076 | 1552 44% | 27467 2453% | 1568 46% | 891 -17% | |
| Colorchecker dE 2000 * | 3.1 | 2.3 26% | 5.12 -65% | 2.34 25% | 7.3 -135% | 4.18 -35% |
| Colorchecker dE 2000 max. * | 5.5 | 4.37 21% | 19.42 -253% | 3.34 39% | 20.8 -278% | 8.48 -54% |
| Colorchecker dE 2000 calibrated * | 0.49 | 2.87 -486% | 1.84 -276% | 2.95 -502% | 5.4 -1002% | 0.77 -57% |
| Greyscale dE 2000 * | 3.9 | 1.83 53% | 5.5 -41% | 2.78 29% | 6.5 -67% | 6.3 -62% |
| Gamma | 2.19 100% | 2.39 92% | 2.22 99% | 2.5 88% | 2.29 96% | 2.21 100% |
| CCT | 6186 105% | 6392 102% | 6407 101% | 6879 94% | 5993 108% | 6258 104% |
| Média Total (Programa/Configurações) | 25% /
-3% | -38% /
-50% | 124% /
180% | -69% /
-107% | -13% /
-18% |
* ... menor é melhor
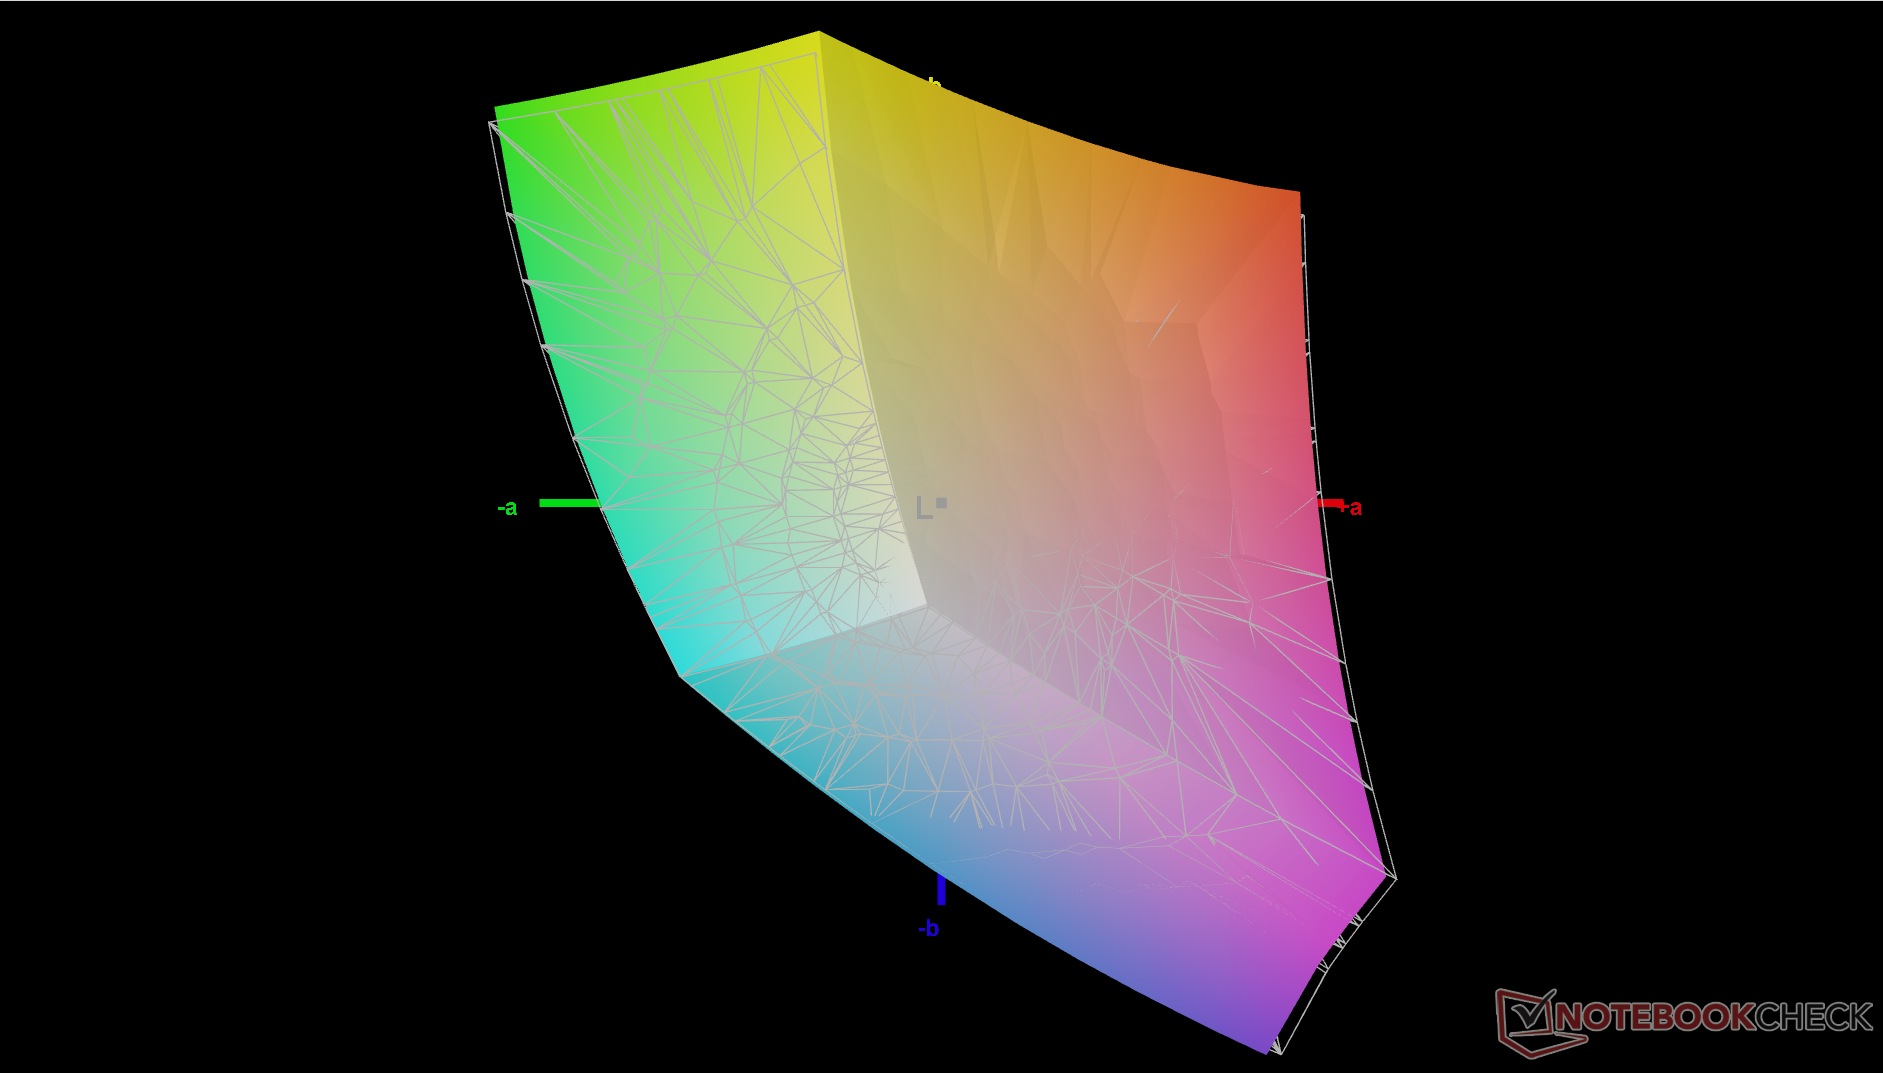
A tela não vem pré-calibrada, o que é de se esperar de uma máquina econômica. No entanto, os valores médios de deltaE em escala de cinza e de cores não são ruins, pois saem da caixa com apenas 3,9 e 3,1, respectivamente. Uma calibração adequada melhoraria ainda mais as médias para apenas 0,6 e 0,49 e, portanto, recomendamos aplicar nosso perfil ICM calibrado acima para explorar melhor as cores sRGB completas do painel.
Exibir tempos de resposta
| ↔ Tempo de resposta preto para branco | ||
|---|---|---|
| 18.2 ms ... ascensão ↗ e queda ↘ combinadas | ↗ 9.6 ms ascensão | 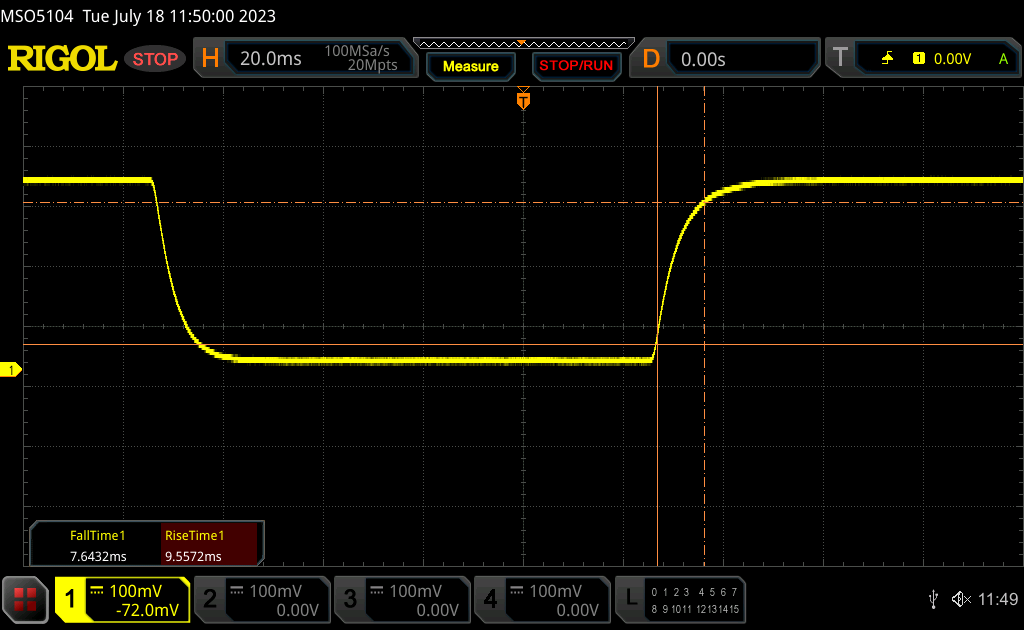 |
| ↘ 7.6 ms queda | ||
| A tela mostra boas taxas de resposta em nossos testes, mas pode ser muito lenta para jogadores competitivos. Em comparação, todos os dispositivos testados variam de 0.1 (mínimo) a 240 (máximo) ms. » 41 % de todos os dispositivos são melhores. Isso significa que o tempo de resposta medido é semelhante à média de todos os dispositivos testados (19.8 ms). | ||
| ↔ Tempo de resposta 50% cinza a 80% cinza | ||
| 27.6 ms ... ascensão ↗ e queda ↘ combinadas | ↗ 13.2 ms ascensão | 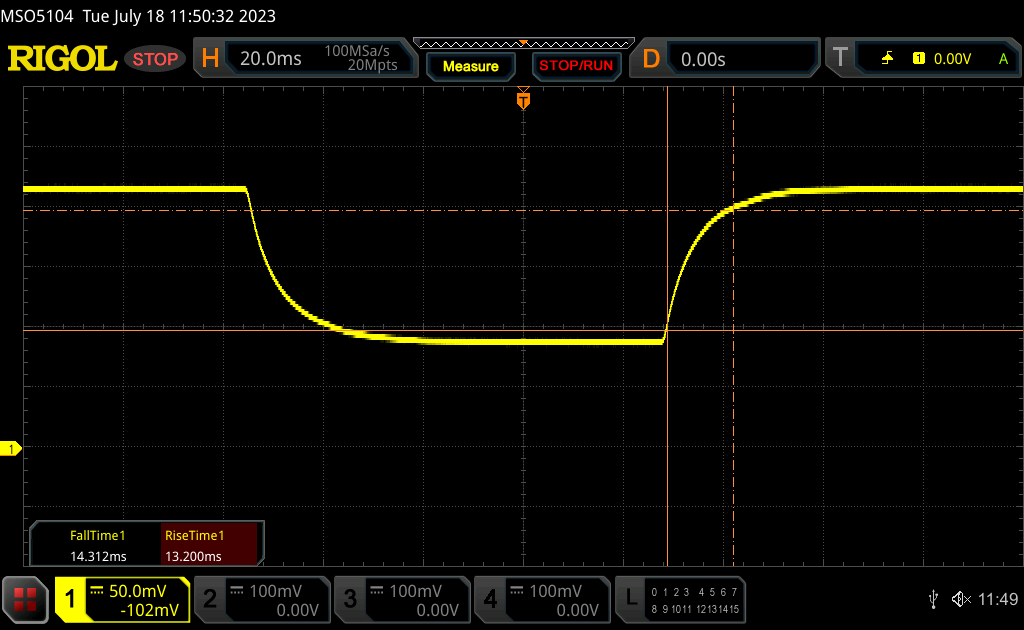 |
| ↘ 14.3 ms queda | ||
| A tela mostra taxas de resposta relativamente lentas em nossos testes e pode ser muito lenta para os jogadores. Em comparação, todos os dispositivos testados variam de 0.165 (mínimo) a 636 (máximo) ms. » 37 % de todos os dispositivos são melhores. Isso significa que o tempo de resposta medido é melhor que a média de todos os dispositivos testados (31 ms). | ||
Cintilação da tela / PWM (modulação por largura de pulso)
| Tela tremeluzindo / PWM não detectado | 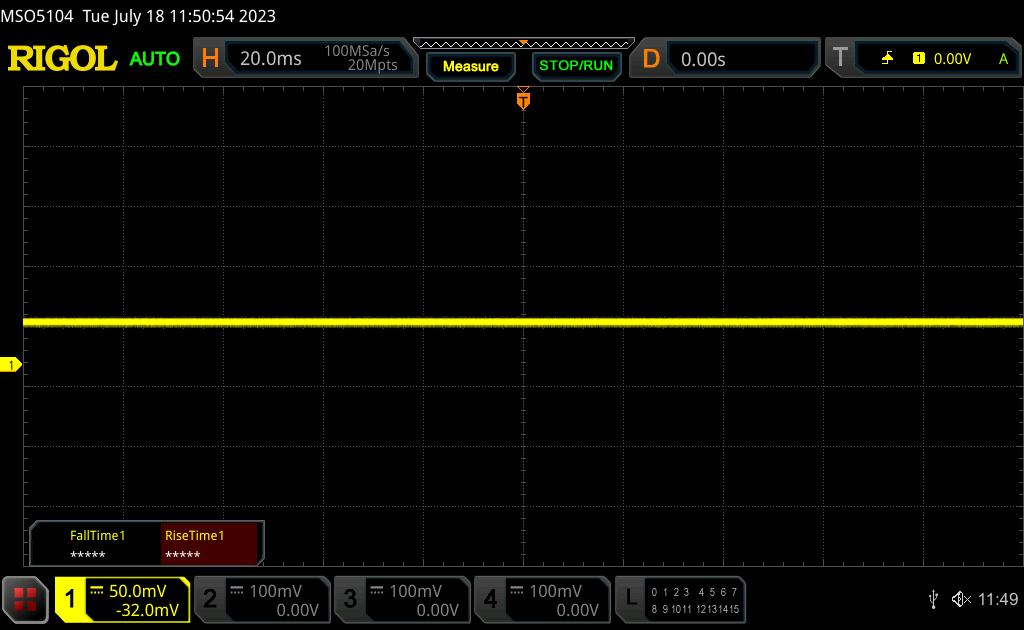 | ||
[pwm_comparison] Em comparação: 52 % de todos os dispositivos testados não usam PWM para escurecer a tela. Se PWM foi detectado, uma média de 7757 (mínimo: 5 - máximo: 343500) Hz foi medida. | |||
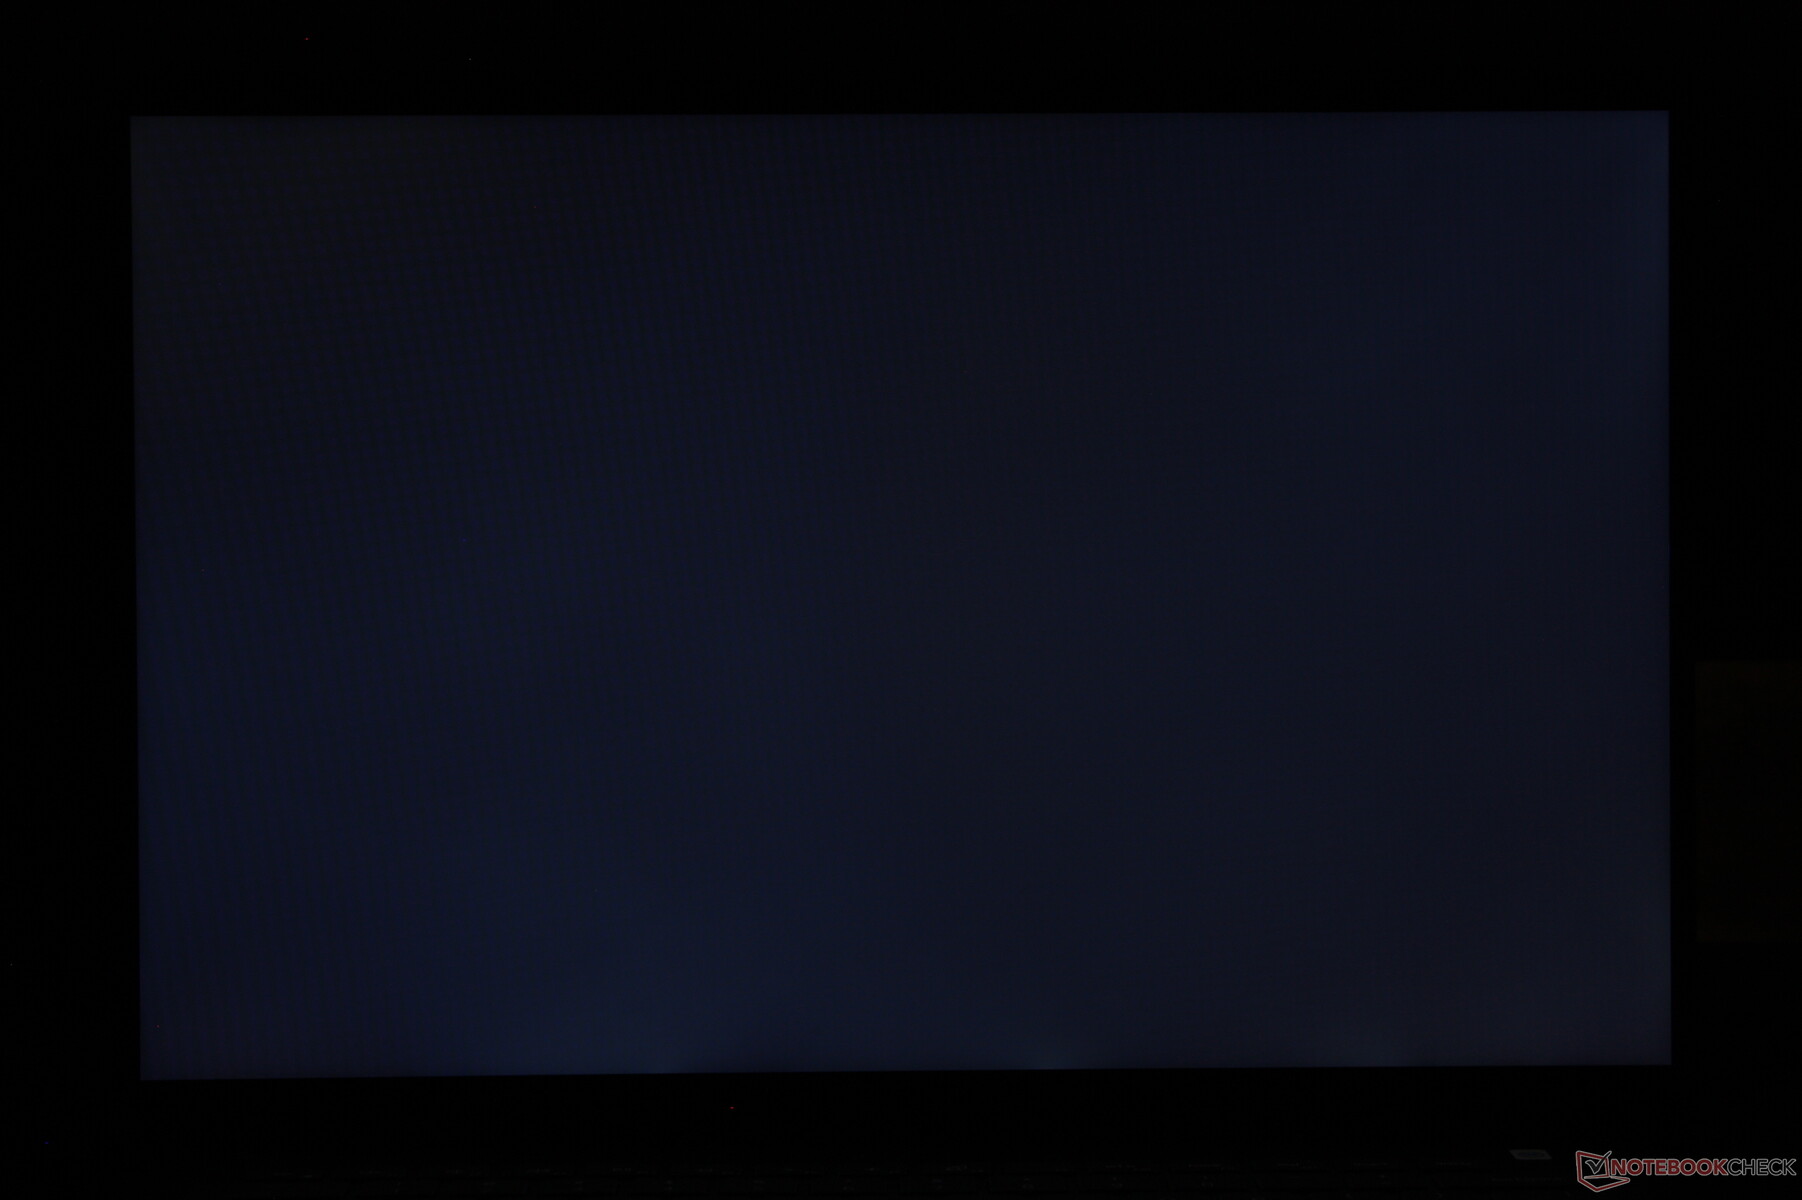
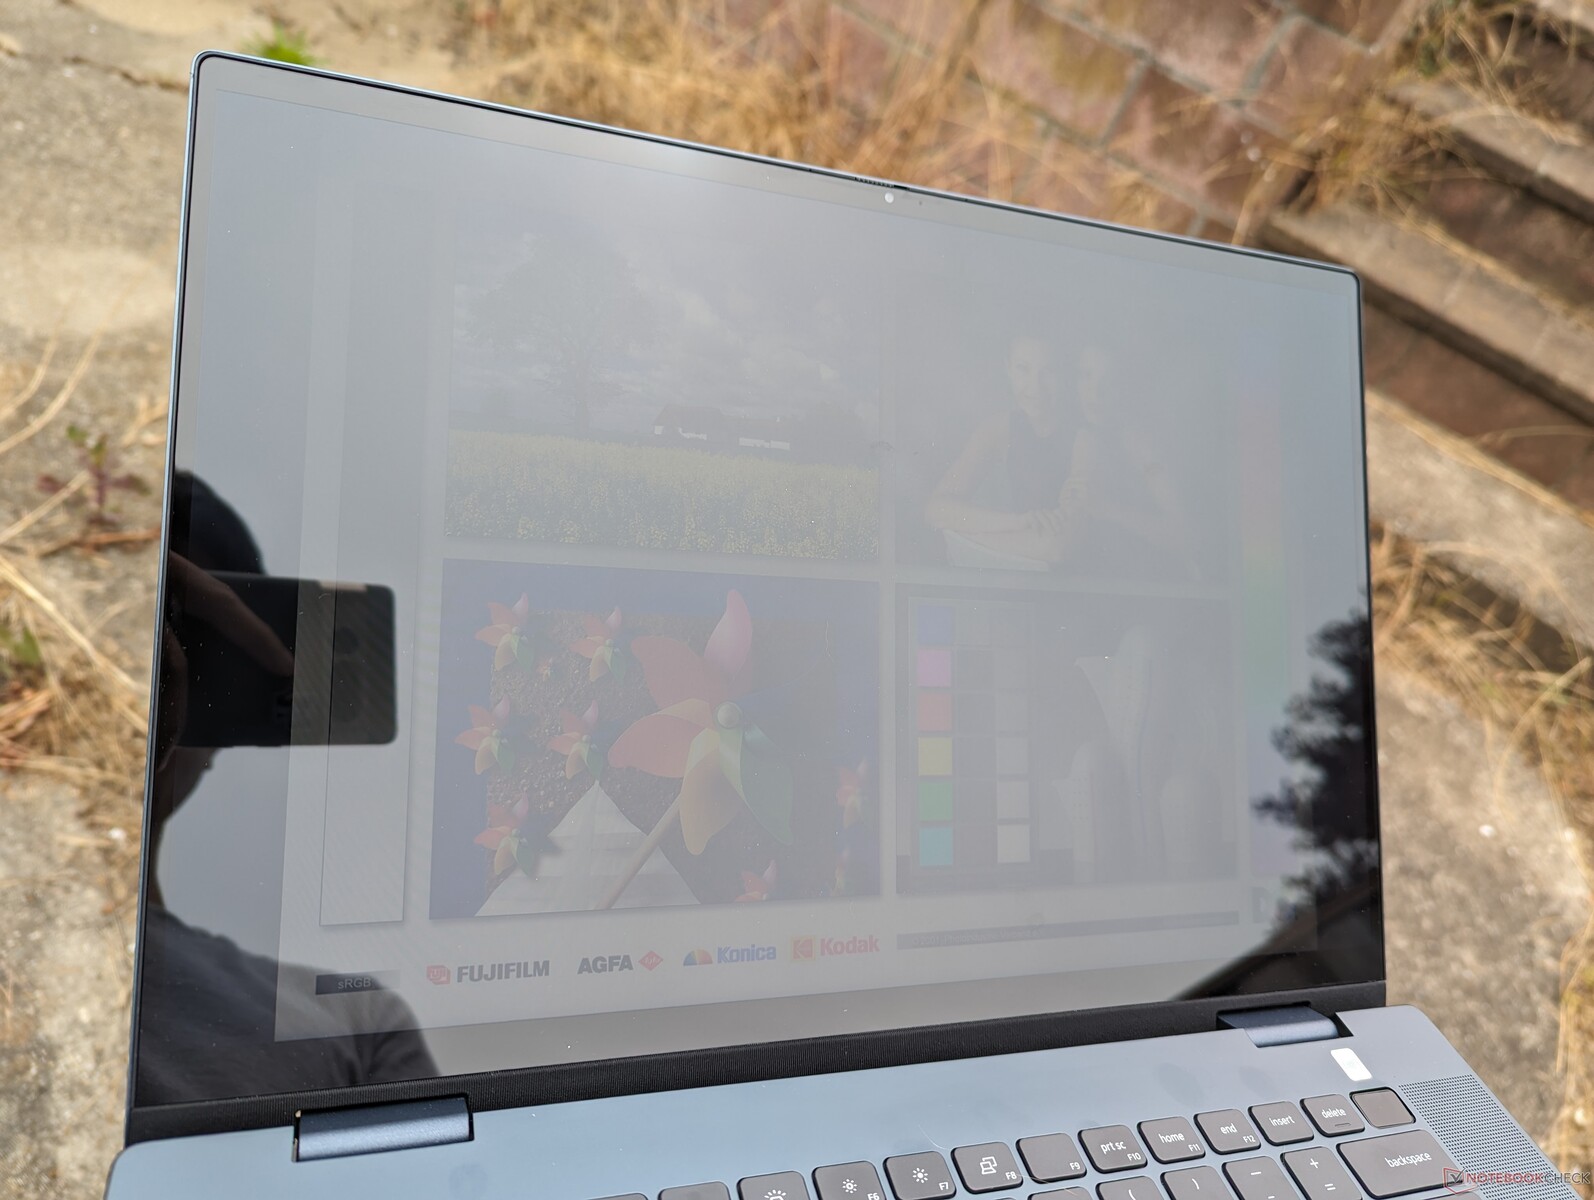
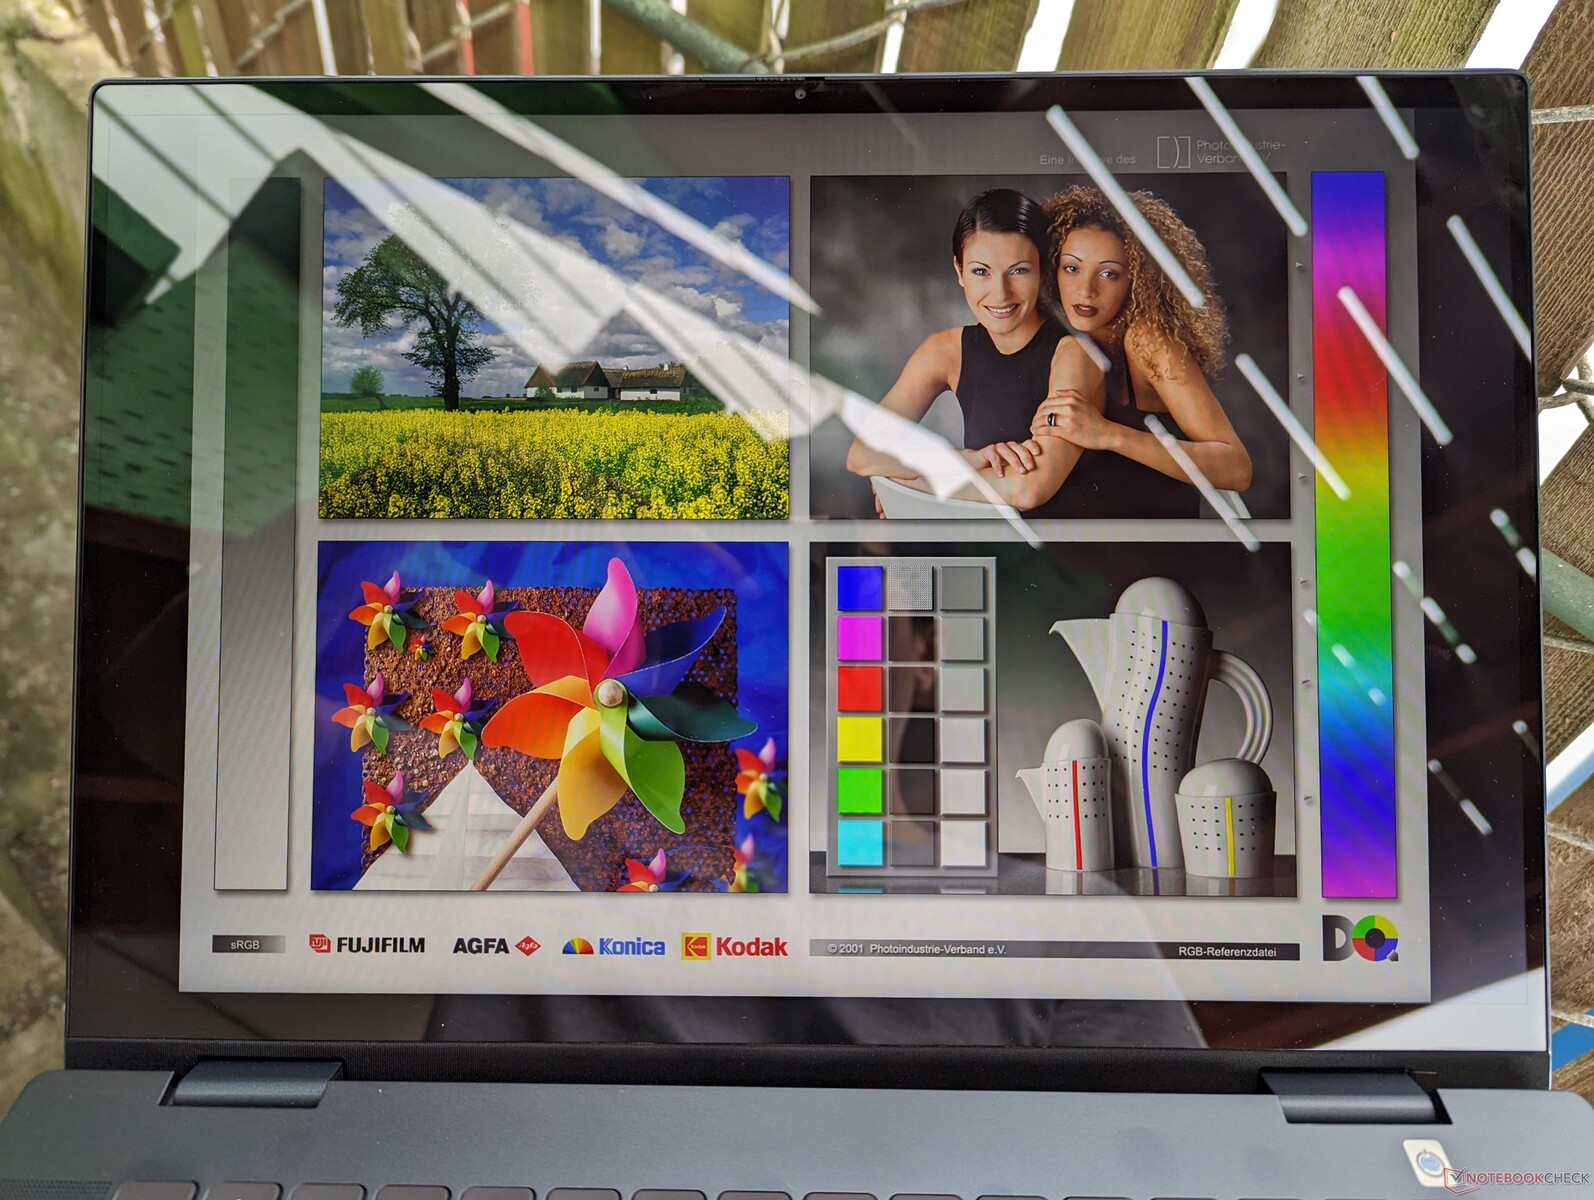
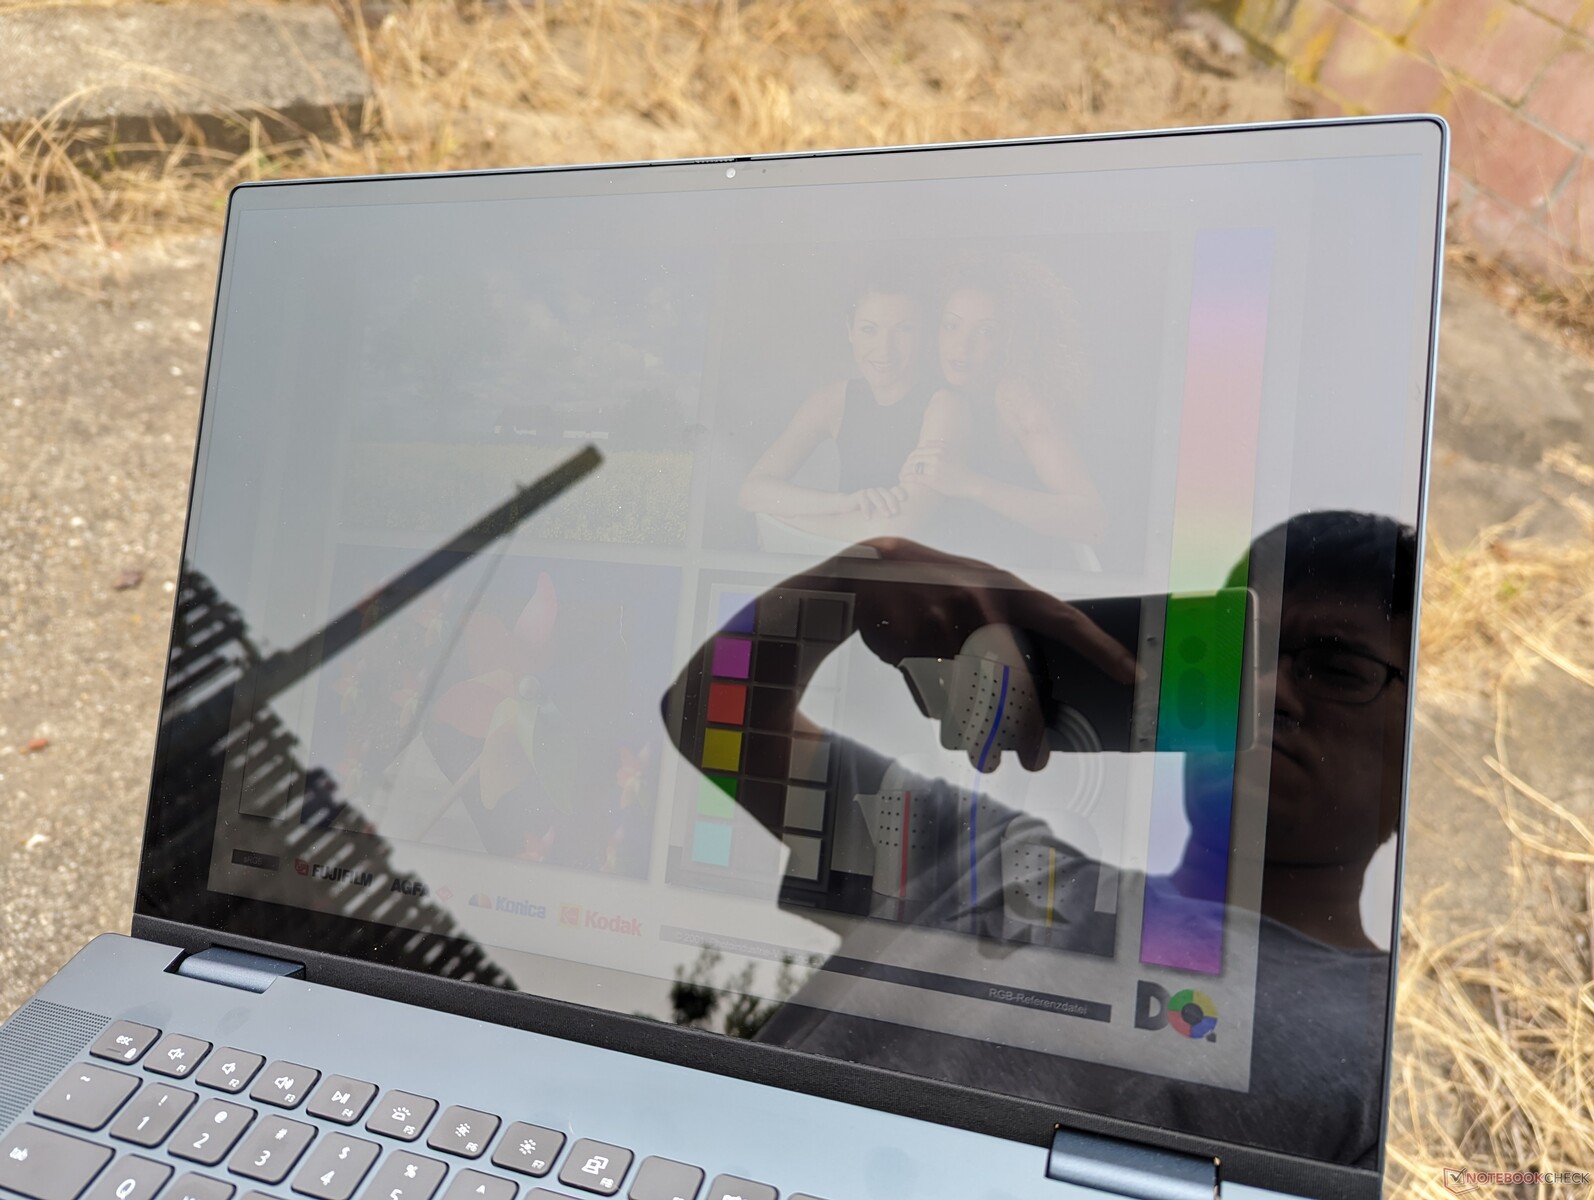
A visibilidade em ambientes externos é mediana, na melhor das hipóteses, pois a tela sensível ao toque de 300 nit não é brilhante o suficiente para reduzir ou superar significativamente o brilho. Tablets como o iPad Pro 12.6 podem ser duas vezes mais brilhantes ou mais. O Dell é, antes de tudo, um conversível multimídia para ambientes internos.
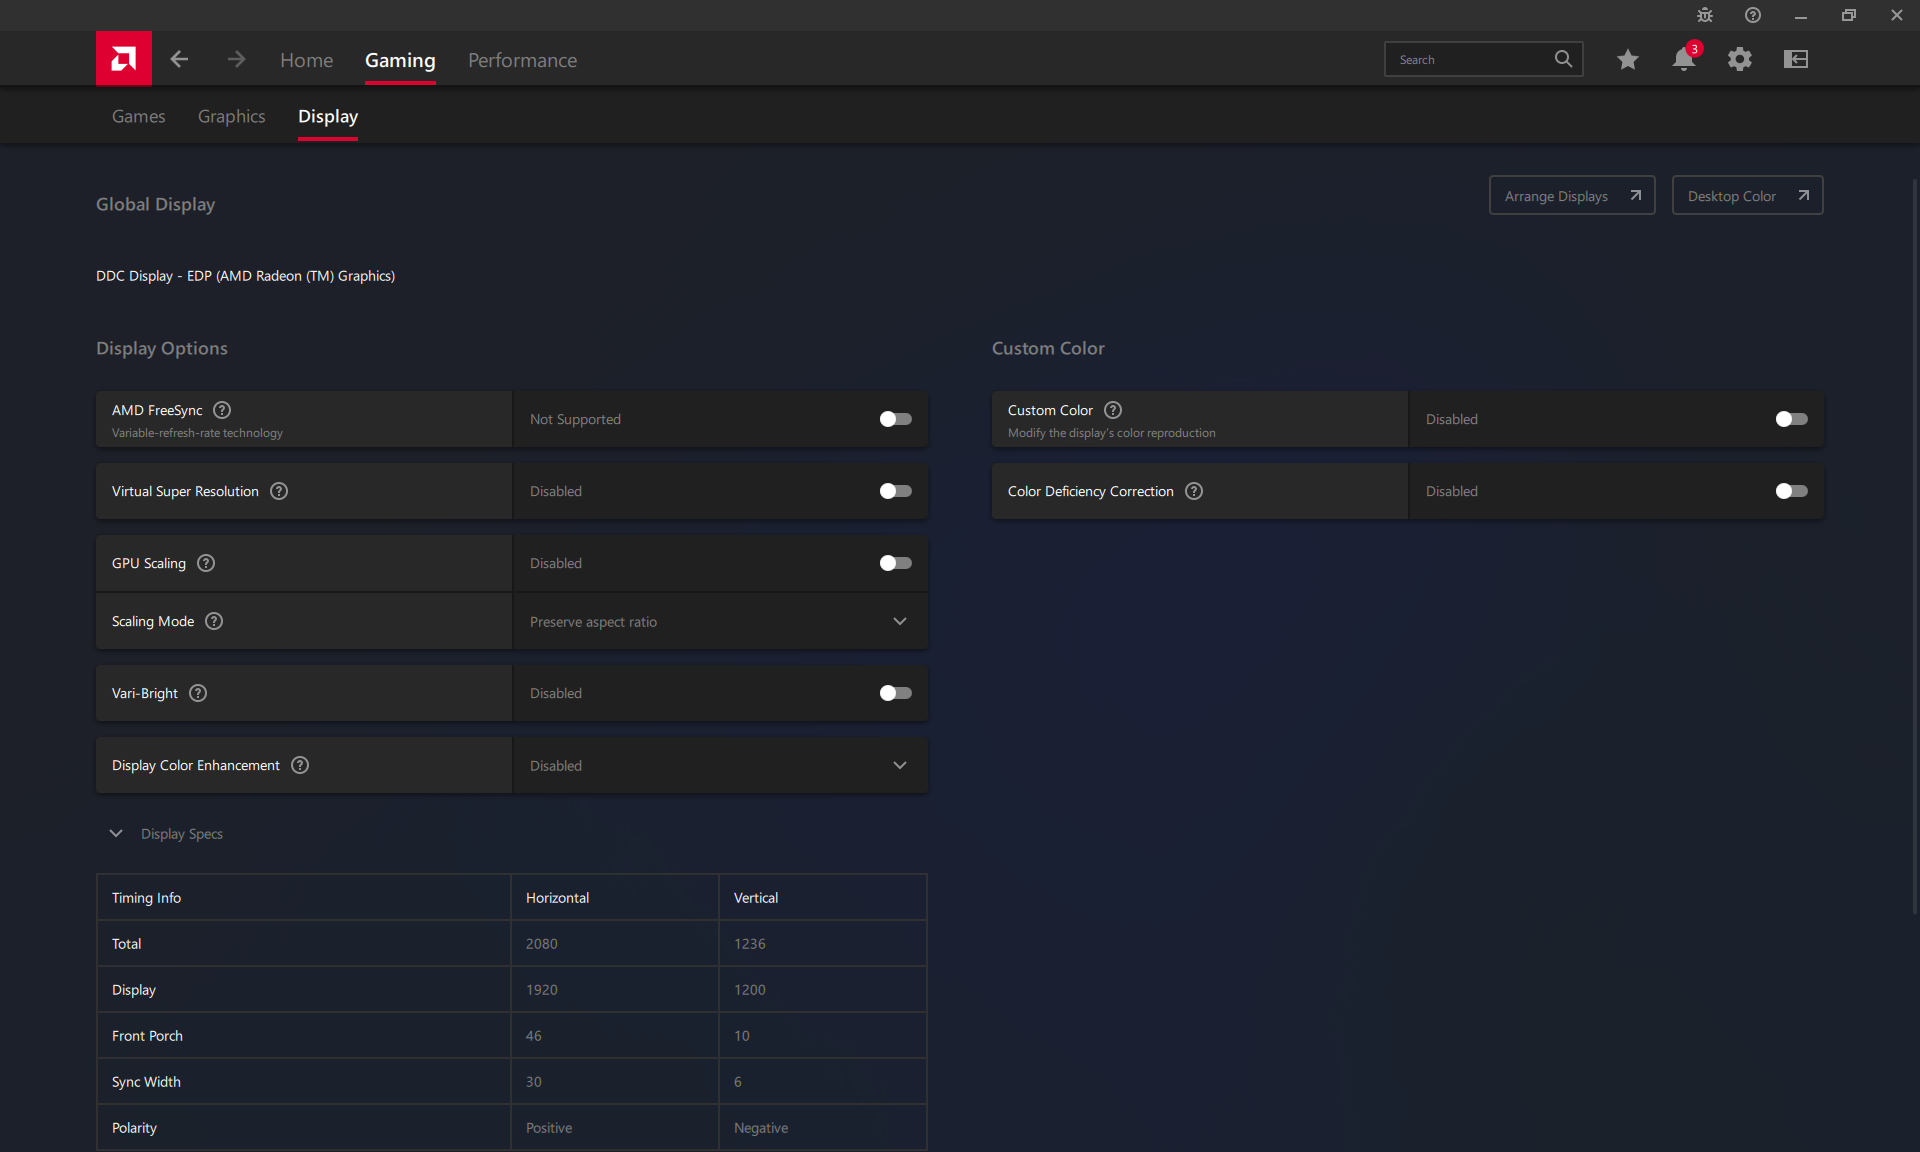
Não se esqueça de desativar o AMD Vari-Bright por meio do AMD Adrenalin, caso contrário, o brilho máximo será reduzido quando estiver funcionando com a bateria.
Desempenho - Nem todas as CPUs Ryzen 7000 são Zen 4
Condições de teste
Configuramos nossa unidade para o modo Desempenho via Windows antes de executar os benchmarks abaixo. Configurações gráficas adicionais estão disponíveis no AMD Adrenalin, que não veio pré-carregado em nossa unidade. Recomendamos instalar a ferramenta de detecção automática da AMD para o Adrenalin e os drivers gráficos mais recentes.
Processador
ORyzen 5 7530U tem um desempenho quase idêntico ao do Ryzen 5 6600H do ano passado, embora em um envelope de energia mais baixo para maior desempenho por watt. Portanto, é uma CPU de médio porte comparável ao concorrente Core i5-1235U ou Core i7-1255U encontrado em muitos Ultrabooks, como ohP Spectre x360 13.5. No entanto, como é típico da AMD, o desempenho de thread único é mais lento em cerca de 15 a 20% do que o dos processadores Intel mencionados acima.
A atualização para o processador de 8 núcleos Ryzen 7 7730U de 6 núcleos, em relação ao Ryzen 5 7530U, deverá aumentar o desempenho multi-thread em cerca de 15 a 35%, com base em nosso tempo com o IdeaPad Flex 5 16. O Core i7-1360P no Intel Inspiron teria um desempenho ainda mais rápido.
Cinebench R15 Multi Loop
Cinebench R23: Multi Core | Single Core
Cinebench R20: CPU (Multi Core) | CPU (Single Core)
Cinebench R15: CPU Multi 64Bit | CPU Single 64Bit
Blender: v2.79 BMW27 CPU
7-Zip 18.03: 7z b 4 | 7z b 4 -mmt1
Geekbench 5.5: Multi-Core | Single-Core
HWBOT x265 Benchmark v2.2: 4k Preset
LibreOffice : 20 Documents To PDF
R Benchmark 2.5: Overall mean
* ... menor é melhor
AIDA64: FP32 Ray-Trace | FPU Julia | CPU SHA3 | CPU Queen | FPU SinJulia | FPU Mandel | CPU AES | CPU ZLib | FP64 Ray-Trace | CPU PhotoWorxx
| Performance rating | |
| Acer Swift Edge SFE16-42-R1GM | |
| Lenovo IdeaPad Flex 5 16ABR G8 | |
| Samsung Galaxy Book3 Pro 16 | |
| Dell Inspiron 16 7635 2-in-1 | |
| Média AMD Ryzen 5 7530U | |
| Lenovo Yoga 7 16IRL8 | |
| Dell Inspiron 16 7620 2-in-1 | |
| AIDA64 / FP32 Ray-Trace | |
| Lenovo IdeaPad Flex 5 16ABR G8 | |
| Acer Swift Edge SFE16-42-R1GM | |
| Dell Inspiron 16 7635 2-in-1 | |
| Média AMD Ryzen 5 7530U (7609 - 10970, n=9) | |
| Samsung Galaxy Book3 Pro 16 | |
| Lenovo Yoga 7 16IRL8 | |
| Dell Inspiron 16 7620 2-in-1 | |
| AIDA64 / FPU Julia | |
| Lenovo IdeaPad Flex 5 16ABR G8 | |
| Acer Swift Edge SFE16-42-R1GM | |
| Dell Inspiron 16 7635 2-in-1 | |
| Média AMD Ryzen 5 7530U (48473 - 68384, n=9) | |
| Samsung Galaxy Book3 Pro 16 | |
| Lenovo Yoga 7 16IRL8 | |
| Dell Inspiron 16 7620 2-in-1 | |
| AIDA64 / CPU Queen | |
| Lenovo IdeaPad Flex 5 16ABR G8 | |
| Acer Swift Edge SFE16-42-R1GM | |
| Samsung Galaxy Book3 Pro 16 | |
| Dell Inspiron 16 7620 2-in-1 | |
| Dell Inspiron 16 7635 2-in-1 | |
| Média AMD Ryzen 5 7530U (66646 - 78105, n=8) | |
| Lenovo Yoga 7 16IRL8 | |
| AIDA64 / FPU SinJulia | |
| Acer Swift Edge SFE16-42-R1GM | |
| Lenovo IdeaPad Flex 5 16ABR G8 | |
| Dell Inspiron 16 7635 2-in-1 | |
| Média AMD Ryzen 5 7530U (7611 - 9248, n=9) | |
| Samsung Galaxy Book3 Pro 16 | |
| Dell Inspiron 16 7620 2-in-1 | |
| Lenovo Yoga 7 16IRL8 | |
| AIDA64 / FPU Mandel | |
| Lenovo IdeaPad Flex 5 16ABR G8 | |
| Acer Swift Edge SFE16-42-R1GM | |
| Dell Inspiron 16 7635 2-in-1 | |
| Média AMD Ryzen 5 7530U (26912 - 37624, n=9) | |
| Samsung Galaxy Book3 Pro 16 | |
| Lenovo Yoga 7 16IRL8 | |
| Dell Inspiron 16 7620 2-in-1 | |
| AIDA64 / CPU ZLib | |
| Samsung Galaxy Book3 Pro 16 | |
| Lenovo Yoga 7 16IRL8 | |
| Acer Swift Edge SFE16-42-R1GM | |
| Lenovo IdeaPad Flex 5 16ABR G8 | |
| Dell Inspiron 16 7620 2-in-1 | |
| Dell Inspiron 16 7635 2-in-1 | |
| Média AMD Ryzen 5 7530U (443 - 612, n=9) | |
| AIDA64 / FP64 Ray-Trace | |
| Lenovo IdeaPad Flex 5 16ABR G8 | |
| Acer Swift Edge SFE16-42-R1GM | |
| Dell Inspiron 16 7635 2-in-1 | |
| Média AMD Ryzen 5 7530U (4008 - 5738, n=9) | |
| Samsung Galaxy Book3 Pro 16 | |
| Lenovo Yoga 7 16IRL8 | |
| Dell Inspiron 16 7620 2-in-1 | |
| AIDA64 / CPU PhotoWorxx | |
| Samsung Galaxy Book3 Pro 16 | |
| Lenovo Yoga 7 16IRL8 | |
| Acer Swift Edge SFE16-42-R1GM | |
| Dell Inspiron 16 7635 2-in-1 | |
| Lenovo IdeaPad Flex 5 16ABR G8 | |
| Dell Inspiron 16 7620 2-in-1 | |
| Média AMD Ryzen 5 7530U (9832 - 19525, n=9) | |
Desempenho do sistema
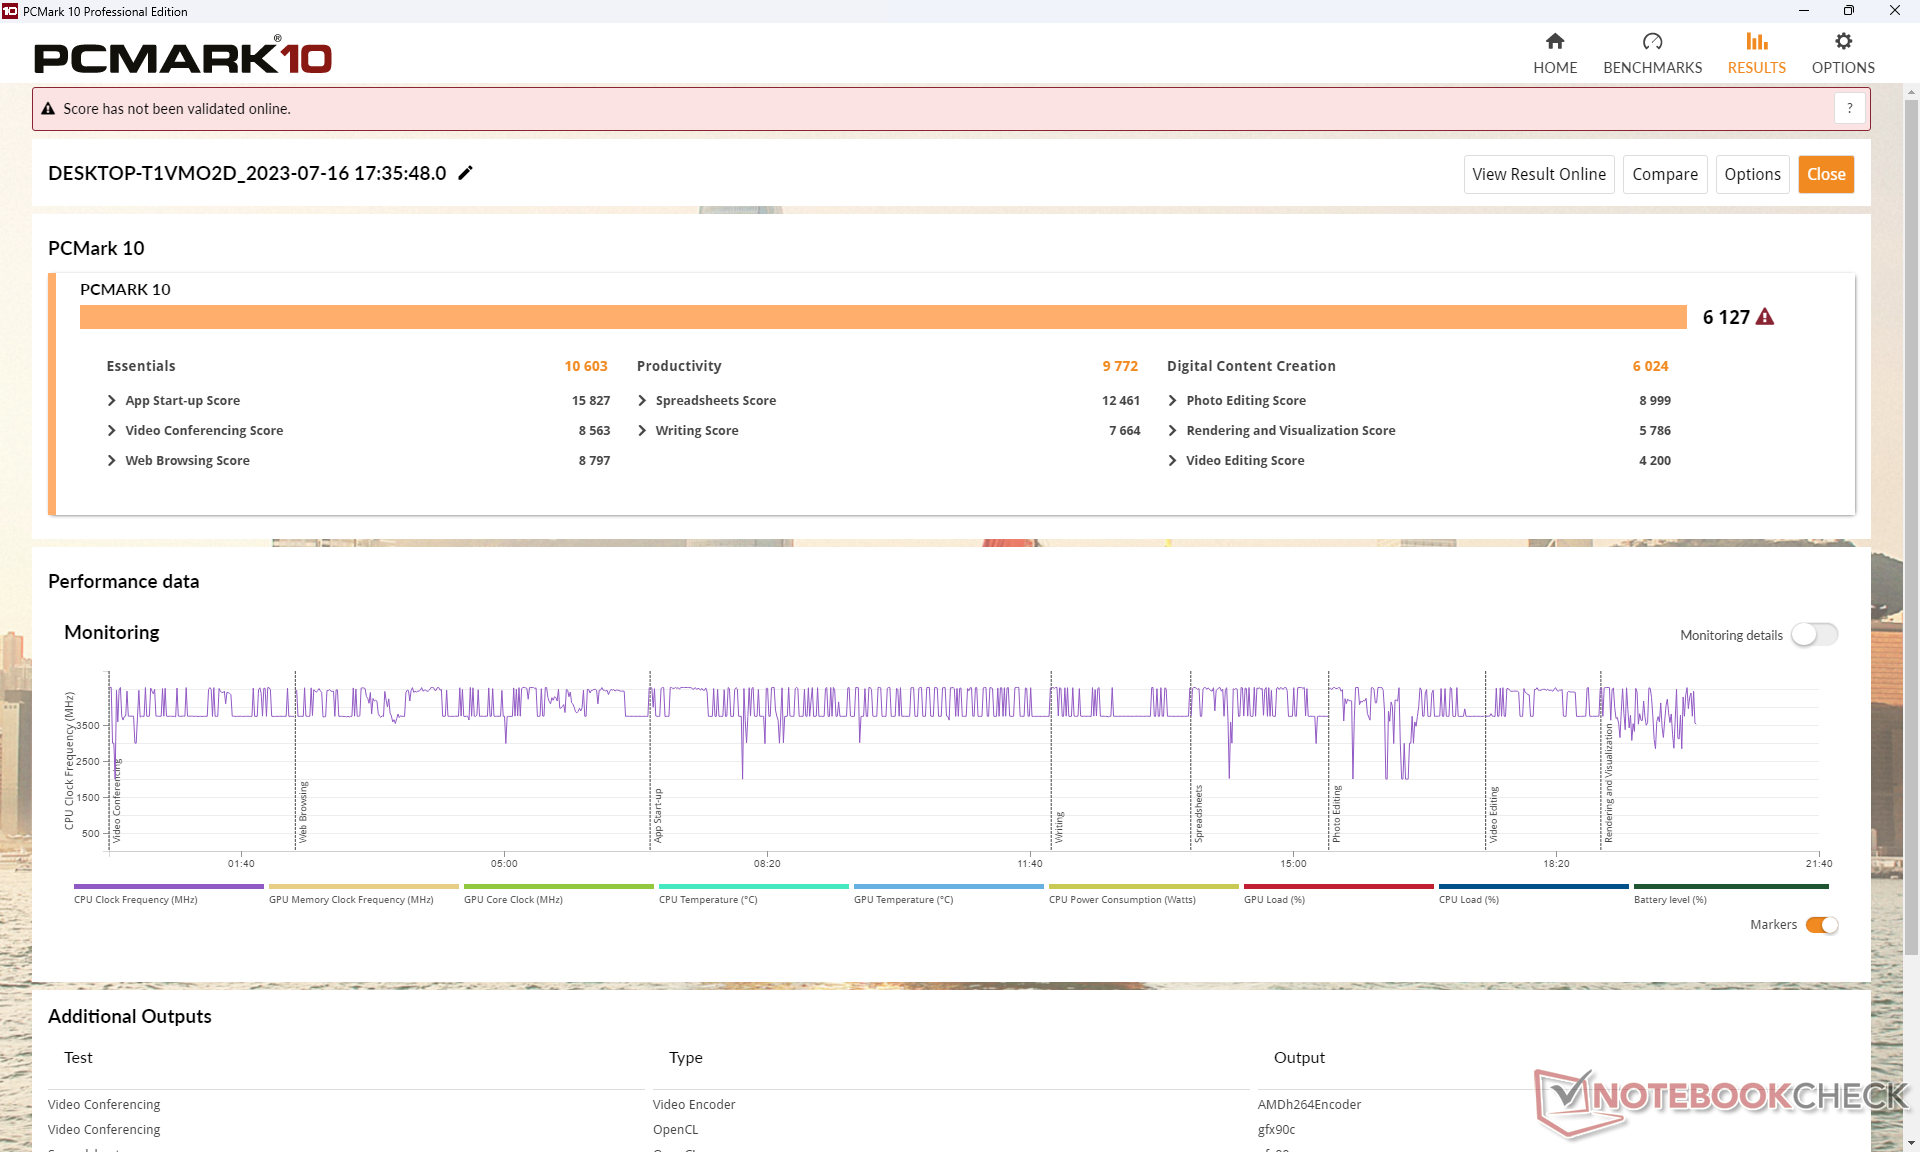
Os resultados do PCMark são comparáveis a alternativas executadas com processadores Core-U e até mesmo Core-P, como o Samsung Galaxy Book3 Pro 16 ou o Dell Inspiron 16 7620 2 em 1 do ano passado. É interessante notar que o subteste Produtividade favorece nosso sistema Dell por margens maiores.
CrossMark: Overall | Productivity | Creativity | Responsiveness
| PCMark 10 / Score | |
| Lenovo IdeaPad Flex 5 16ABR G8 | |
| Acer Swift Edge SFE16-42-R1GM | |
| Dell Inspiron 16 7635 2-in-1 | |
| Média AMD Ryzen 5 7530U, AMD Radeon RX Vega 7 (5686 - 6209, n=8) | |
| Lenovo Yoga 7 16IRL8 | |
| Samsung Galaxy Book3 Pro 16 | |
| Dell Inspiron 16 7620 2-in-1 | |
| PCMark 10 / Essentials | |
| Lenovo Yoga 7 16IRL8 | |
| Lenovo IdeaPad Flex 5 16ABR G8 | |
| Dell Inspiron 16 7635 2-in-1 | |
| Samsung Galaxy Book3 Pro 16 | |
| Média AMD Ryzen 5 7530U, AMD Radeon RX Vega 7 (9183 - 11242, n=8) | |
| Dell Inspiron 16 7620 2-in-1 | |
| Acer Swift Edge SFE16-42-R1GM | |
| PCMark 10 / Productivity | |
| Média AMD Ryzen 5 7530U, AMD Radeon RX Vega 7 (8983 - 14037, n=8) | |
| Dell Inspiron 16 7635 2-in-1 | |
| Lenovo IdeaPad Flex 5 16ABR G8 | |
| Acer Swift Edge SFE16-42-R1GM | |
| Lenovo Yoga 7 16IRL8 | |
| Samsung Galaxy Book3 Pro 16 | |
| Dell Inspiron 16 7620 2-in-1 | |
| PCMark 10 / Digital Content Creation | |
| Acer Swift Edge SFE16-42-R1GM | |
| Lenovo Yoga 7 16IRL8 | |
| Samsung Galaxy Book3 Pro 16 | |
| Lenovo IdeaPad Flex 5 16ABR G8 | |
| Dell Inspiron 16 7635 2-in-1 | |
| Dell Inspiron 16 7620 2-in-1 | |
| Média AMD Ryzen 5 7530U, AMD Radeon RX Vega 7 (4941 - 6093, n=8) | |
| CrossMark / Overall | |
| Lenovo Yoga 7 16IRL8 | |
| Samsung Galaxy Book3 Pro 16 | |
| Dell Inspiron 16 7620 2-in-1 | |
| Acer Swift Edge SFE16-42-R1GM | |
| Lenovo IdeaPad Flex 5 16ABR G8 | |
| Média AMD Ryzen 5 7530U, AMD Radeon RX Vega 7 (1029 - 1336, n=7) | |
| Dell Inspiron 16 7635 2-in-1 | |
| CrossMark / Productivity | |
| Lenovo Yoga 7 16IRL8 | |
| Samsung Galaxy Book3 Pro 16 | |
| Dell Inspiron 16 7620 2-in-1 | |
| Acer Swift Edge SFE16-42-R1GM | |
| Lenovo IdeaPad Flex 5 16ABR G8 | |
| Média AMD Ryzen 5 7530U, AMD Radeon RX Vega 7 (1115 - 1370, n=7) | |
| Dell Inspiron 16 7635 2-in-1 | |
| CrossMark / Creativity | |
| Lenovo Yoga 7 16IRL8 | |
| Samsung Galaxy Book3 Pro 16 | |
| Dell Inspiron 16 7620 2-in-1 | |
| Lenovo IdeaPad Flex 5 16ABR G8 | |
| Acer Swift Edge SFE16-42-R1GM | |
| Dell Inspiron 16 7635 2-in-1 | |
| Média AMD Ryzen 5 7530U, AMD Radeon RX Vega 7 (992 - 1390, n=7) | |
| CrossMark / Responsiveness | |
| Samsung Galaxy Book3 Pro 16 | |
| Lenovo Yoga 7 16IRL8 | |
| Dell Inspiron 16 7620 2-in-1 | |
| Acer Swift Edge SFE16-42-R1GM | |
| Média AMD Ryzen 5 7530U, AMD Radeon RX Vega 7 (900 - 1096, n=7) | |
| Lenovo IdeaPad Flex 5 16ABR G8 | |
| Dell Inspiron 16 7635 2-in-1 | |
| PCMark 10 Score | 6127 pontos | |
Ajuda | ||
| AIDA64 / Memory Copy | |
| Samsung Galaxy Book3 Pro 16 | |
| Lenovo Yoga 7 16IRL8 | |
| Acer Swift Edge SFE16-42-R1GM | |
| Dell Inspiron 16 7635 2-in-1 | |
| Lenovo IdeaPad Flex 5 16ABR G8 | |
| Dell Inspiron 16 7620 2-in-1 | |
| Média AMD Ryzen 5 7530U (20155 - 42853, n=9) | |
| AIDA64 / Memory Read | |
| Samsung Galaxy Book3 Pro 16 | |
| Lenovo Yoga 7 16IRL8 | |
| Acer Swift Edge SFE16-42-R1GM | |
| Dell Inspiron 16 7620 2-in-1 | |
| Dell Inspiron 16 7635 2-in-1 | |
| Lenovo IdeaPad Flex 5 16ABR G8 | |
| Média AMD Ryzen 5 7530U (23068 - 40270, n=9) | |
| AIDA64 / Memory Write | |
| Samsung Galaxy Book3 Pro 16 | |
| Lenovo Yoga 7 16IRL8 | |
| Acer Swift Edge SFE16-42-R1GM | |
| Dell Inspiron 16 7620 2-in-1 | |
| Dell Inspiron 16 7635 2-in-1 | |
| Lenovo IdeaPad Flex 5 16ABR G8 | |
| Média AMD Ryzen 5 7530U (22954 - 41838, n=9) | |
| AIDA64 / Memory Latency | |
| Lenovo IdeaPad Flex 5 16ABR G8 | |
| Dell Inspiron 16 7635 2-in-1 | |
| Acer Swift Edge SFE16-42-R1GM | |
| Média AMD Ryzen 5 7530U (88.1 - 110.8, n=9) | |
| Lenovo Yoga 7 16IRL8 | |
| Samsung Galaxy Book3 Pro 16 | |
* ... menor é melhor
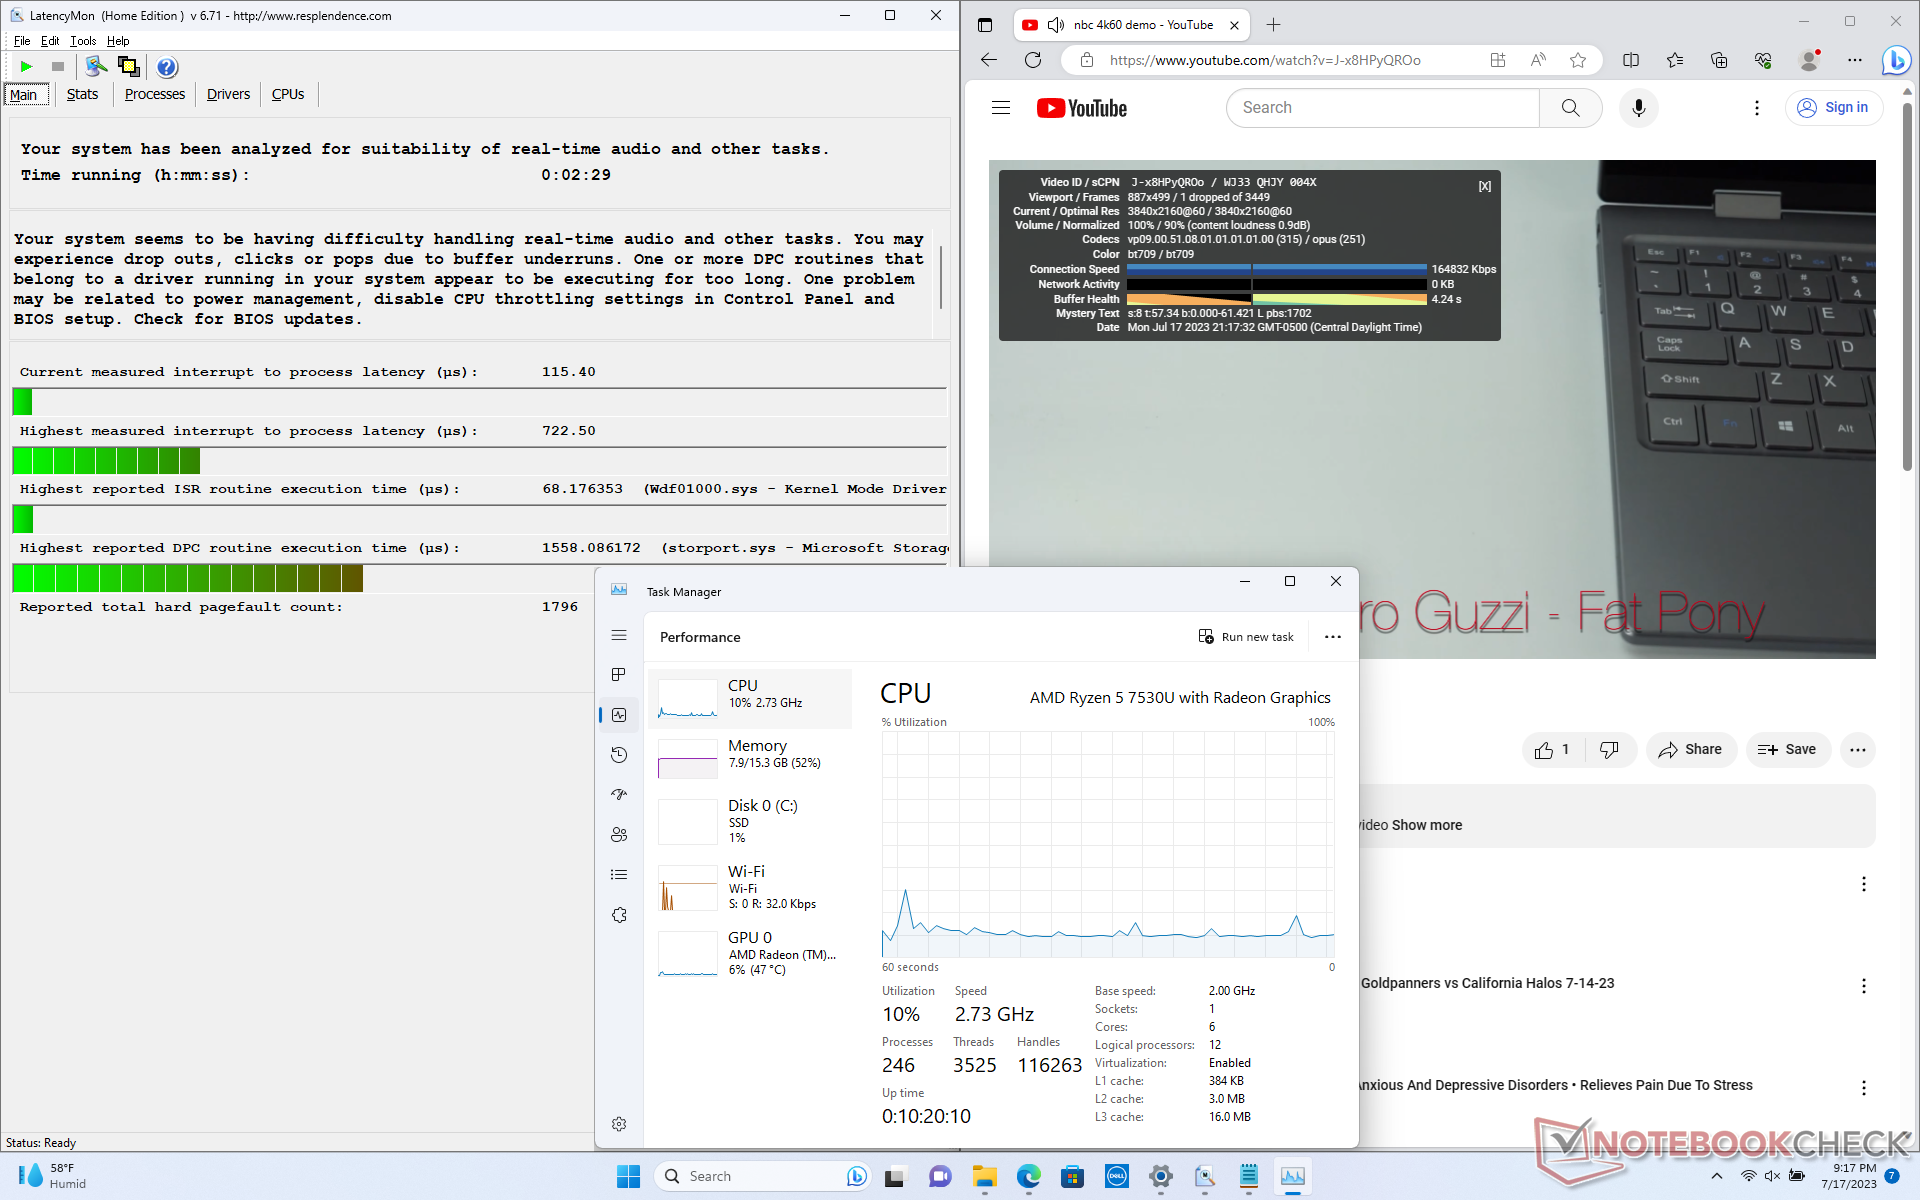
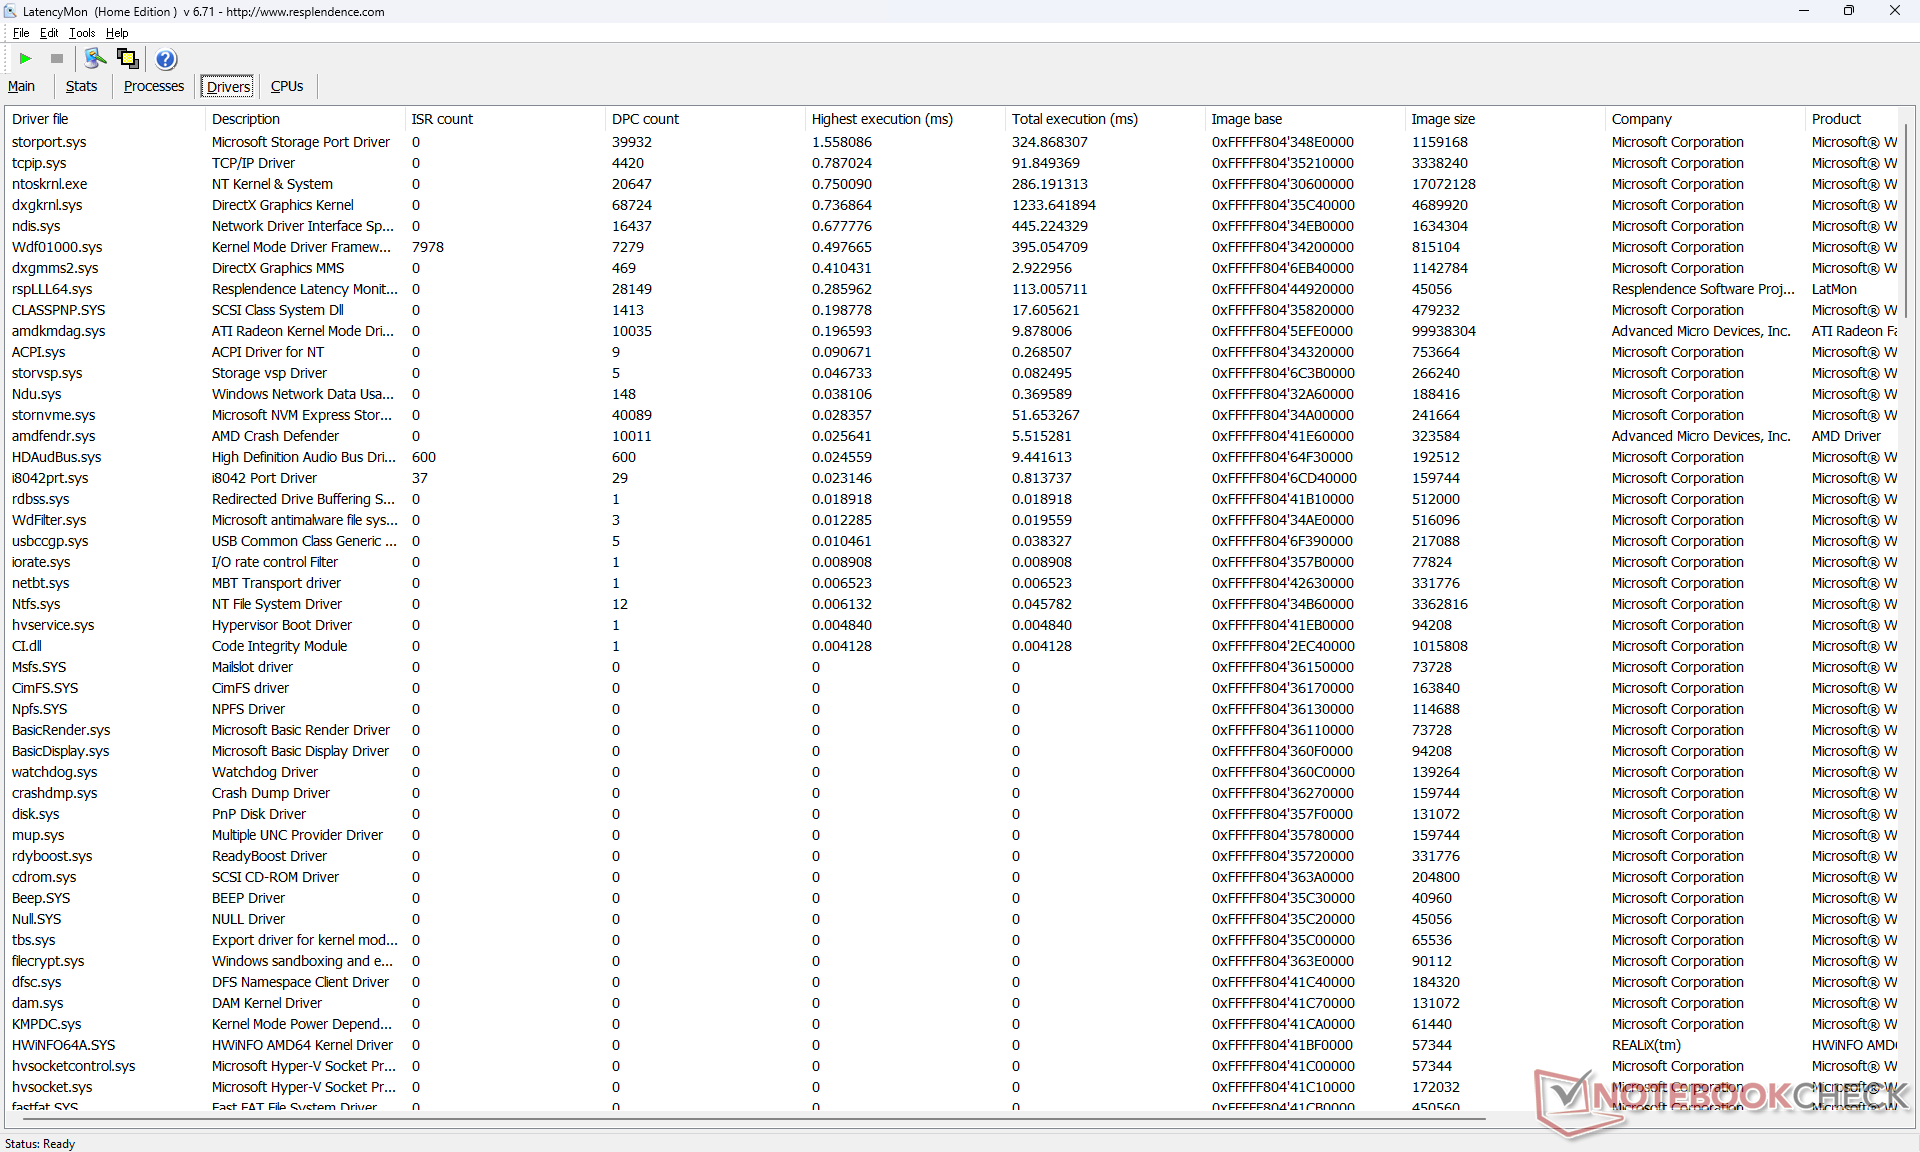
Latência DPC
O LatencyMon relata apenas pequenos problemas de DPC ao abrir várias guias de nossa página inicial. a reprodução de vídeo 4K a 60 FPS é excelente, com apenas um quadro perdido registrado durante nosso vídeo de teste de um minuto.
| DPC Latencies / LatencyMon - interrupt to process latency (max), Web, Youtube, Prime95 | |
| Acer Swift Edge SFE16-42-R1GM | |
| Lenovo IdeaPad Flex 5 16ABR G8 | |
| Lenovo Yoga 7 16IRL8 | |
| Dell Inspiron 16 7635 2-in-1 | |
| Dell Inspiron 16 7620 2-in-1 | |
| Samsung Galaxy Book3 Pro 16 | |
* ... menor é melhor
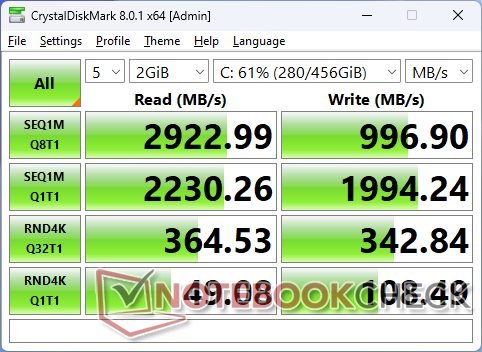
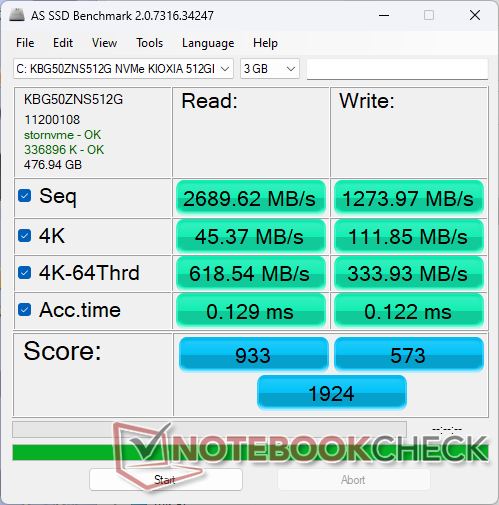
Dispositivos de armazenamento
Nossa unidade de teste vem com um orçamento Kioxia KBG50ZNS512G PCIe4 x4 NVMe, que oferece taxas máximas de leitura e gravação sequenciais de até 3500 MB/s e 2700 MB/s, respectivamente, de acordo com o fabricante. Em nossos testes de estresse, no entanto, só conseguimos atingir pouco mais de 2200 MB/s, mesmo depois de vários retestes, o que sugere que a unidade pode ter problemas para manter as taxas de transferência máximas por períodos prolongados. No entanto, isso geralmente não é um problema para a maioria dos cenários multimídia e cargas de trabalho diárias do navegador.

| Drive Performance rating - Percent | |
| Acer Swift Edge SFE16-42-R1GM | |
| Lenovo Yoga 7 16IRL8 | |
| Samsung Galaxy Book3 Pro 16 | |
| Lenovo IdeaPad Flex 5 16ABR G8 | |
| Dell Inspiron 16 7635 2-in-1 | |
| Dell Inspiron 16 7620 2-in-1 | |
* ... menor é melhor
Disk Throttling: DiskSpd Read Loop, Queue Depth 8
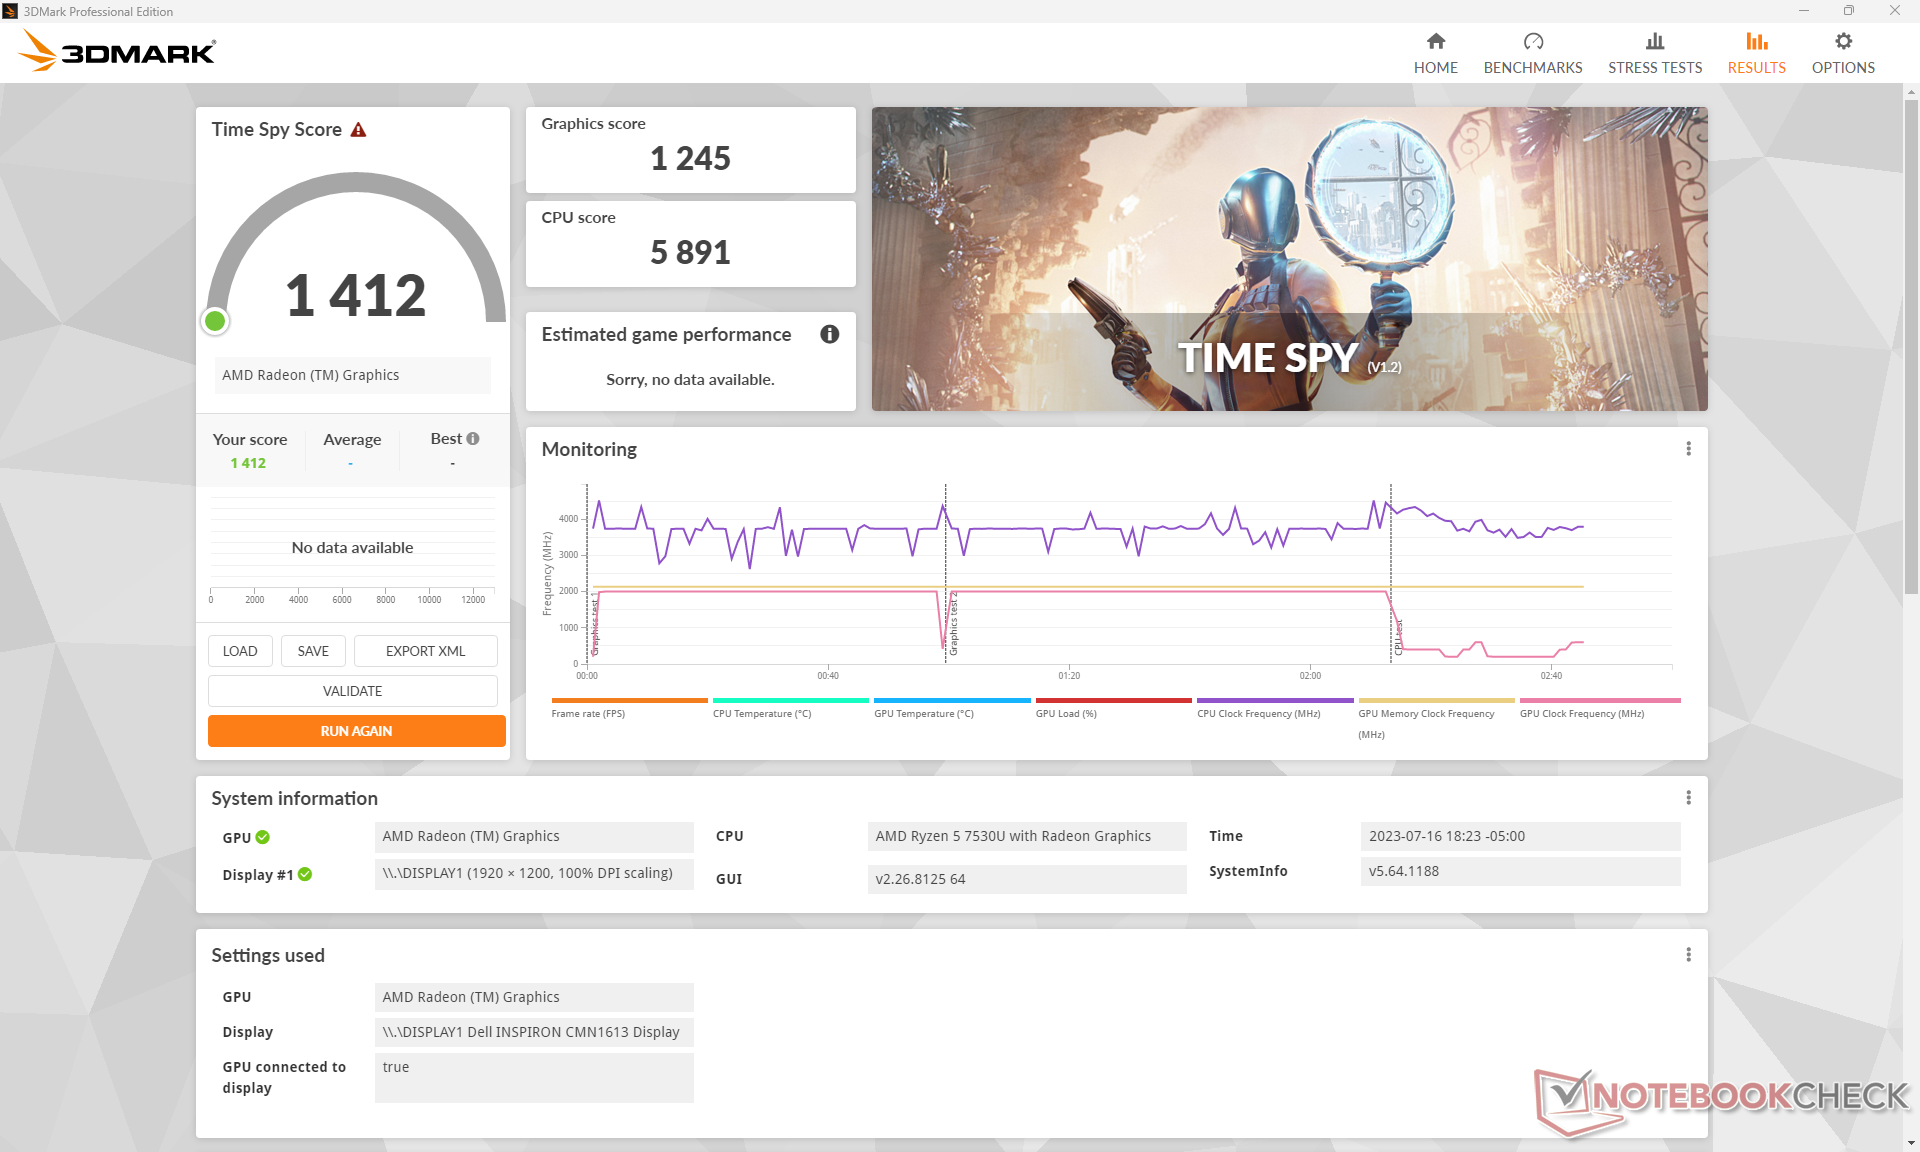
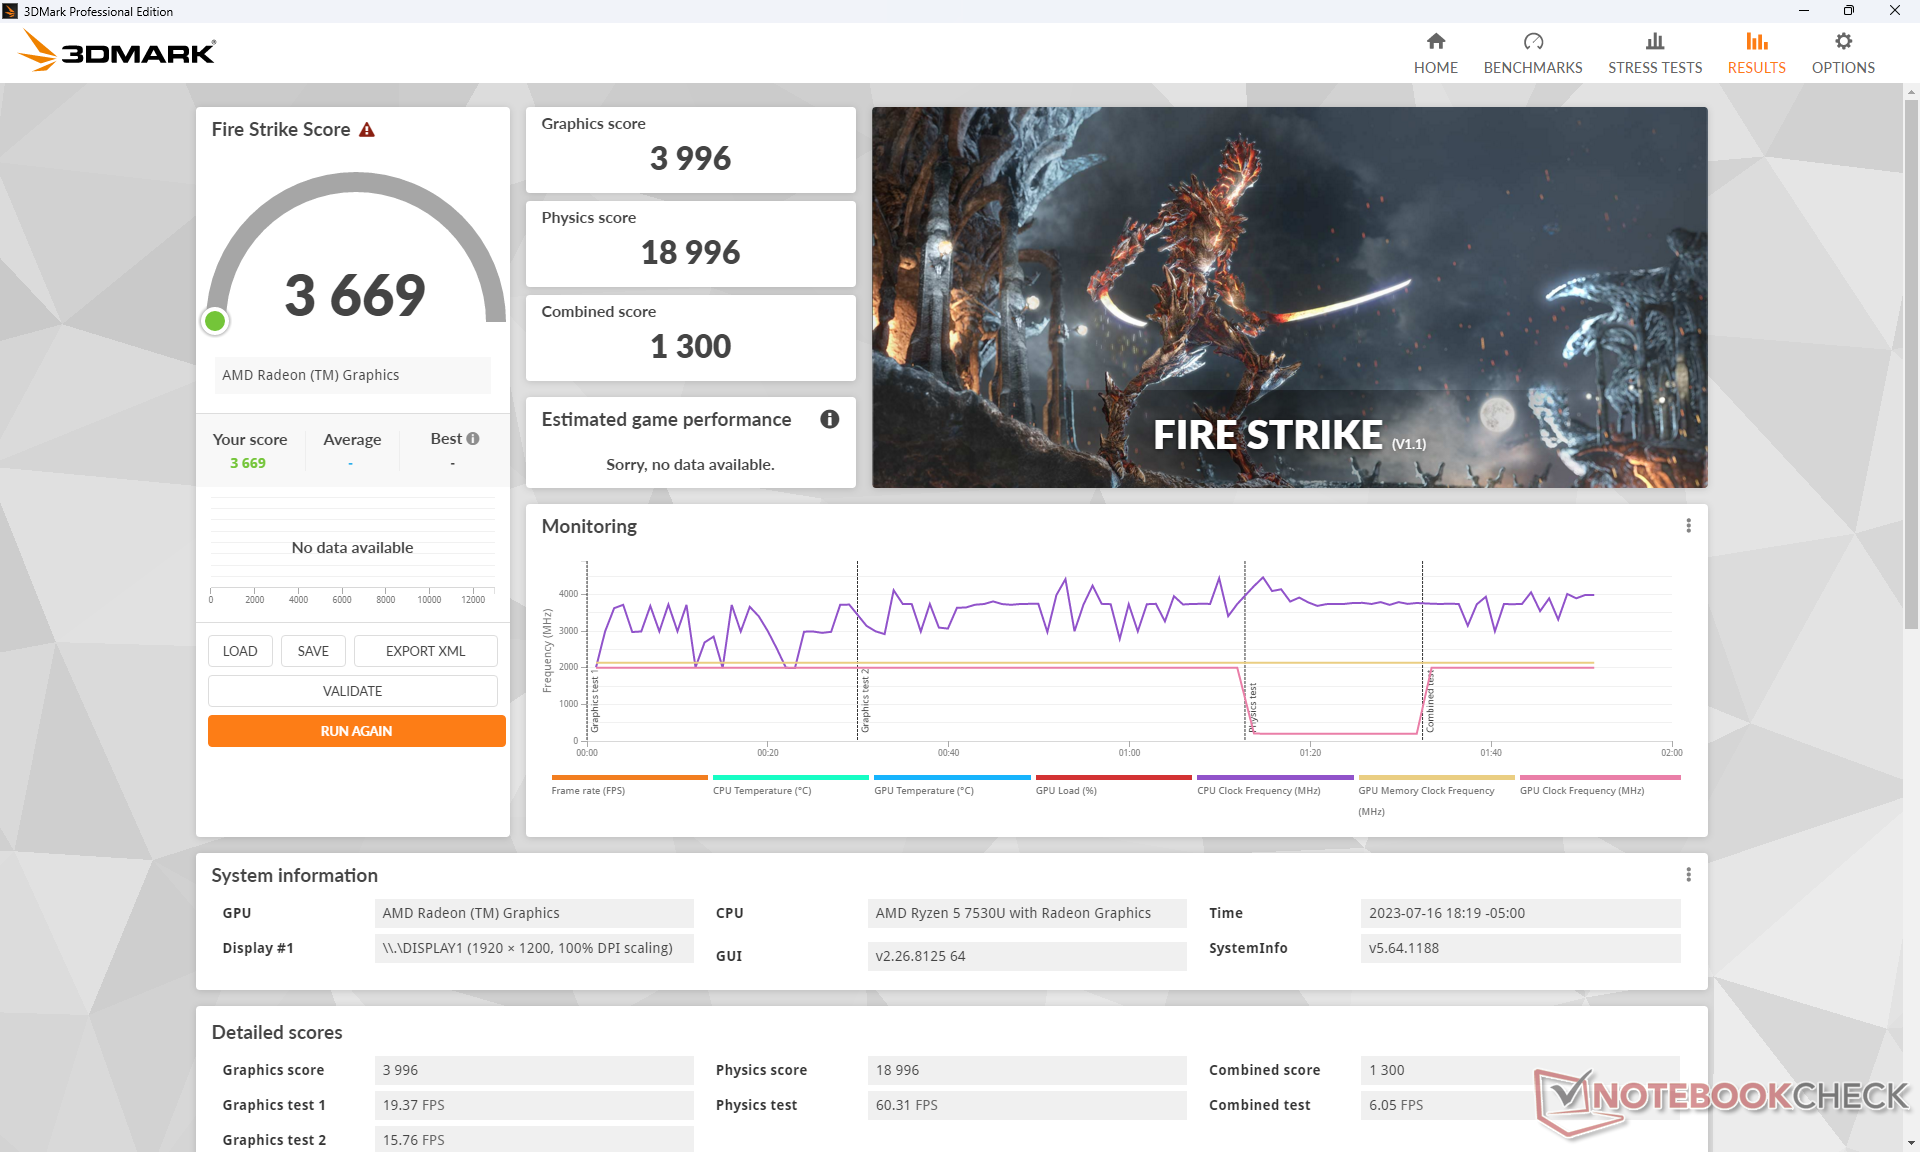
Desempenho da GPU
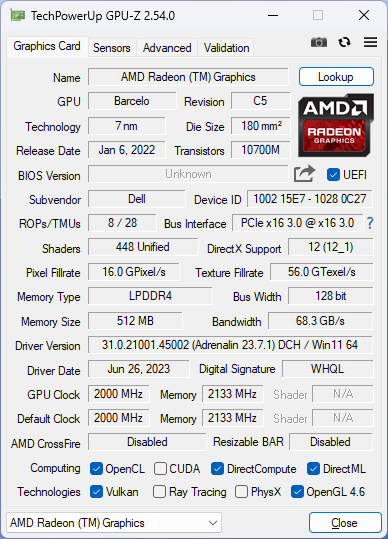
Como um processador Zen 3, o Ryzen 5 7530U utiliza a antiga Radeon RX Vega 7 em vez da mais recente Radeon 680M ou 780M como as encontradas nos processadores Zen 3+ e Zen 4, respectivamente. Isso é lamentável, pois a Radeon 680M teria aumentado significativamente o desempenho gráfico em 70 a 80%, tornando-o mais rápido do que qualquer solução Intel Iris Xe atual. Em vez disso, o desempenho gráfico geral está cerca de 25% atrás dos antigos Iris Xe 96 EUs. Esperamos que o desempenho seja ainda menor se for configurado com apenas 8 GB de RAM de sistema soldada.
A atualização para a Radeon RX Vega 8 na configuração mais avançada do Ryzen 7 7730U deverá aumentar o desempenho gráfico apenas marginalmente em 5%.
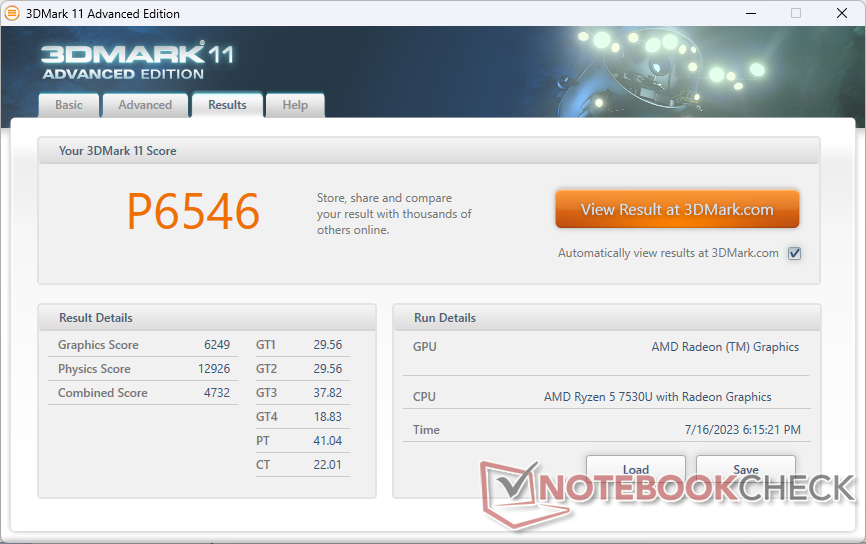
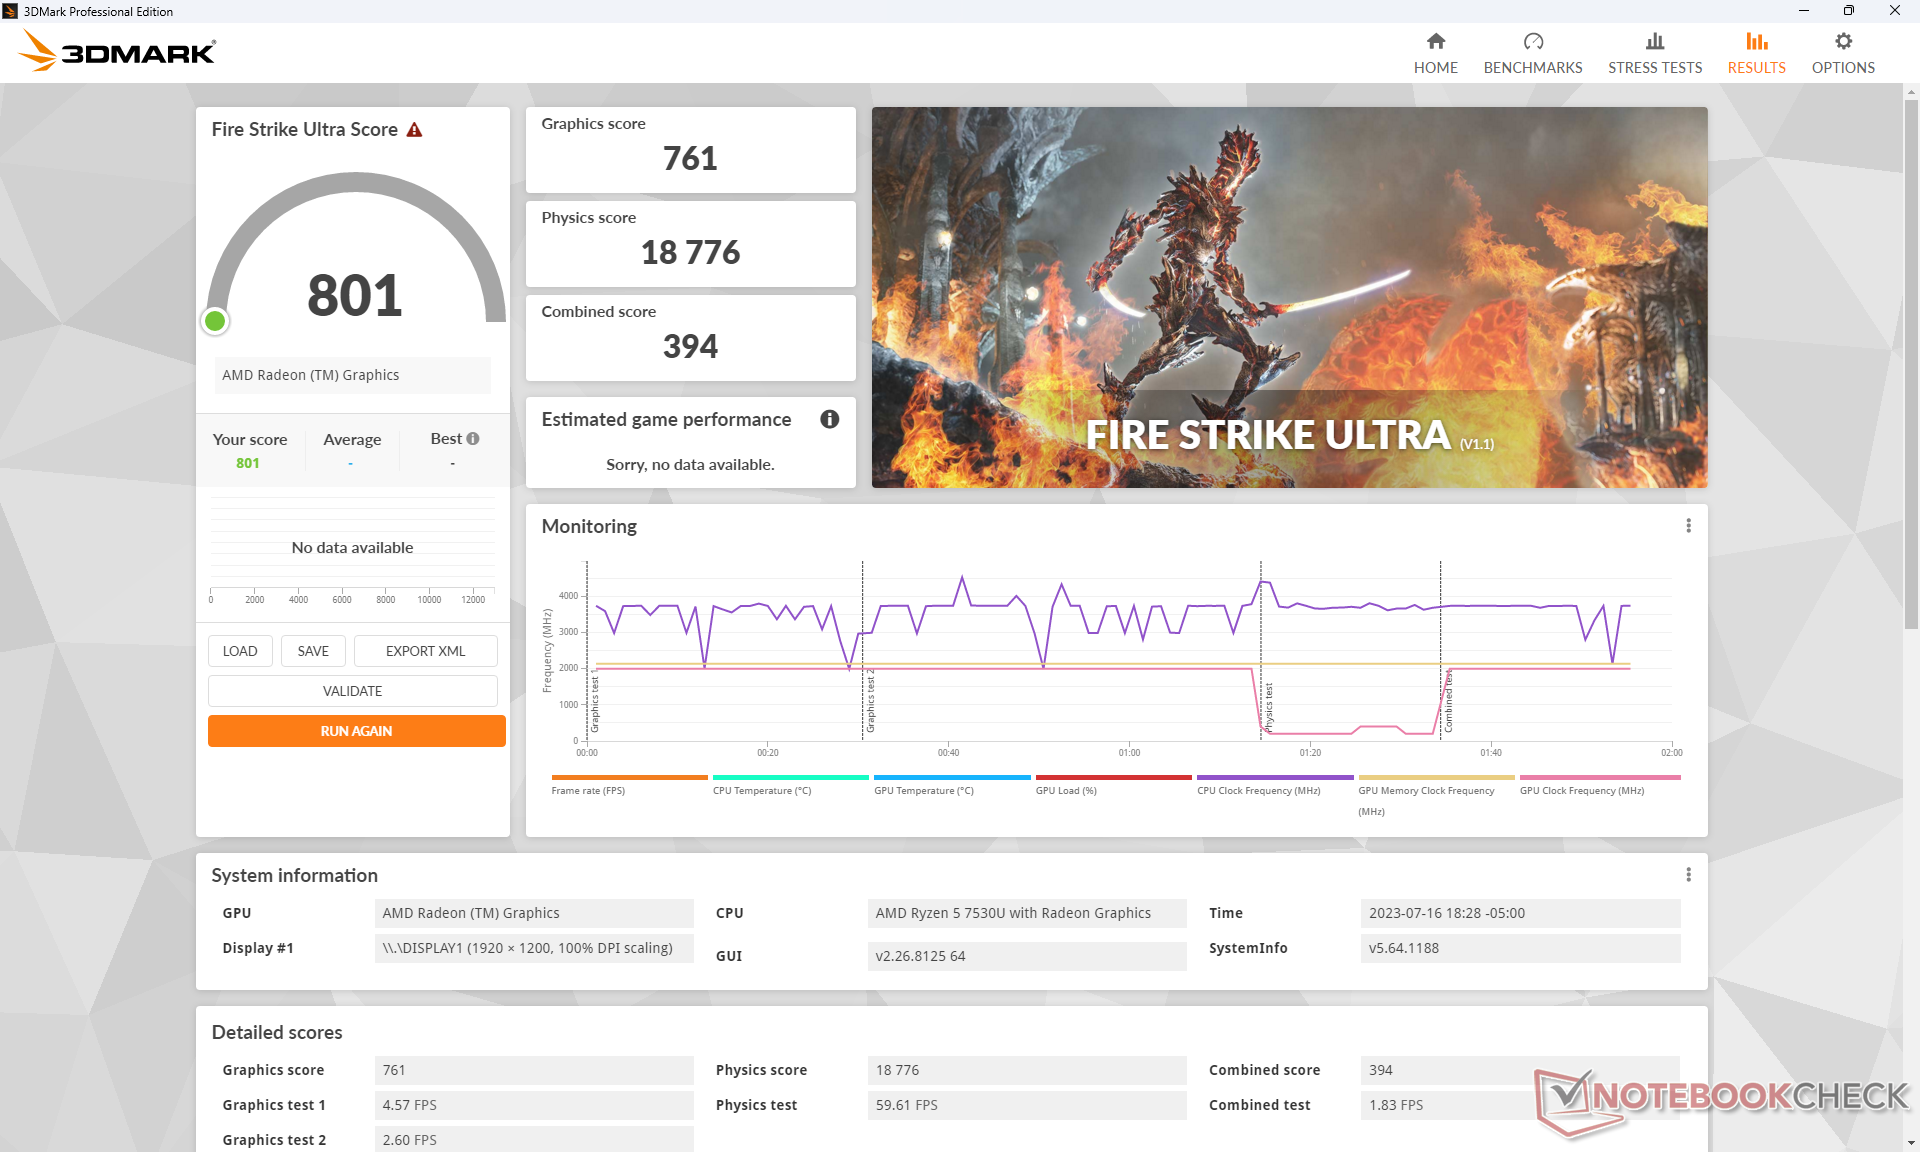
| 3DMark 11 Performance | 6546 pontos | |
| 3DMark Fire Strike Score | 3669 pontos | |
| 3DMark Time Spy Score | 1412 pontos | |
Ajuda | ||
* ... menor é melhor
| Returnal | |
| 1280x720 Low Preset | |
| Beelink GTR7 7840HS | |
| Dell Inspiron 16 7635 2-in-1 | |
| Média AMD Radeon RX Vega 7 (18 - 18, n=2) | |
| 1920x1080 Low Preset | |
| Beelink GTR7 7840HS | |
| Dell Inspiron 16 7635 2-in-1 | |
| Média AMD Radeon RX Vega 7 (12 - 13, n=2) | |
| 1920x1080 Medium Preset | |
| Beelink GTR7 7840HS | |
| Dell Inspiron 16 7635 2-in-1 | |
| Média AMD Radeon RX Vega 7 (11 - 12, n=2) | |
As taxas de quadros quando em marcha lenta no Witcher 3 ocasionalmente, mas de forma consistente, caíam quase 15 FPS por curtos períodos antes de voltar ao normal. Esse comportamento é desfavorável, pois sugere problemas no driver gráfico ou interrupção da atividade em segundo plano no nível do sistema operacional.
Witcher 3 FPS Chart
| baixo | média | alto | ultra | |
|---|---|---|---|---|
| GTA V (2015) | 24.1 | 9.55 | ||
| The Witcher 3 (2015) | 79.6 | 24.5 | 15.7 | |
| Dota 2 Reborn (2015) | 109 | 90.7 | 55.4 | 52.4 |
| Final Fantasy XV Benchmark (2018) | 37.5 | 18.8 | 12.9 | |
| X-Plane 11.11 (2018) | 38.4 | 30.4 | 26.3 | |
| Strange Brigade (2018) | 86.8 | 33.8 | 28.1 | 23.2 |
| Cyberpunk 2077 1.6 (2022) | 20.3 | 15.3 | 10.5 | 8.5 |
| Tiny Tina's Wonderlands (2022) | 28.8 | 21.2 | 12.9 | 9.2 |
| F1 22 (2022) | 36.2 | 32.3 | 23.9 | 17.1 |
| Returnal (2023) | 13 | 12 |
Emissões
Ruído do sistema
Em geral, a ventoinha é silenciosa durante cargas baixas, como navegação ou streaming de vídeo, onde tende a oscilar na faixa de 27 dB(A) contra um fundo silencioso de 23,6 dB(A). No entanto, quando submetido a cargas mais pesadas, como o 3DMark 06, o ruído da ventoinha salta rapidamente para pouco mais de 40 dB(A), mesmo com o perfil de energia balanceado. Conseguimos registrar um ruído máximo da ventoinha de pouco mais de 44 dB(A) ao executar cargas altas, como jogos, ainda mais alto do que o registrado no antigoInspiron 16 7620 2 em 1.
Barulho
| Ocioso |
| 23.6 / 23.6 / 23.6 dB |
| Carga |
| 40.3 / 44.2 dB |
 | ||
30 dB silencioso 40 dB(A) audível 50 dB(A) ruidosamente alto |
||
min: | ||
| Dell Inspiron 16 7635 2-in-1 Vega 7, R5 7530U, Kioxia BG5 KBG50ZNS512G | Acer Swift Edge SFE16-42-R1GM Radeon 680M, R7 7735U, Micron 3400 1TB MTFDKBA1T0TFH | Lenovo Yoga 7 16IRL8 Iris Xe G7 96EUs, i7-1355U, WD PC SN740 512GB SDDPMQD-512G-1101 | Samsung Galaxy Book3 Pro 16 Iris Xe G7 80EUs, i5-1340P, WD PC SN740 256GB SDDPNQD-256G | Lenovo IdeaPad Flex 5 16ABR G8 Vega 8, R7 7730U, Samsung PM9B1 1024GB MZAL41T0HBLB | Dell Inspiron 16 7620 2-in-1 Iris Xe G7 96EUs, i7-1260P, Toshiba KBG40ZNS512G NVMe | |
|---|---|---|---|---|---|---|
| Noise | -10% | -0% | -11% | -0% | 8% | |
| desligado / ambiente * (dB) | 23.6 | 25.7 -9% | 22.8 3% | 25.2 -7% | 24.2 -3% | 23.2 2% |
| Idle Minimum * (dB) | 23.6 | 25.7 -9% | 22.9 3% | 25.2 -7% | 24.2 -3% | 23.5 -0% |
| Idle Average * (dB) | 23.6 | 27 -14% | 22.9 3% | 25.2 -7% | 24.2 -3% | 23.5 -0% |
| Idle Maximum * (dB) | 23.6 | 29.3 -24% | 26.9 -14% | 29.3 -24% | 28.7 -22% | 23.5 -0% |
| Load Average * (dB) | 40.3 | 42.3 -5% | 41.7 -3% | 46.4 -15% | 33.1 18% | 29.4 27% |
| Witcher 3 ultra * (dB) | 44.2 | 41.5 6% | 41.8 5% | 35.6 19% | ||
| Load Maximum * (dB) | 44.2 | 42.7 3% | 43.6 1% | 46.4 -5% | 41.8 5% | 39.7 10% |
* ... menor é melhor
Temperatura
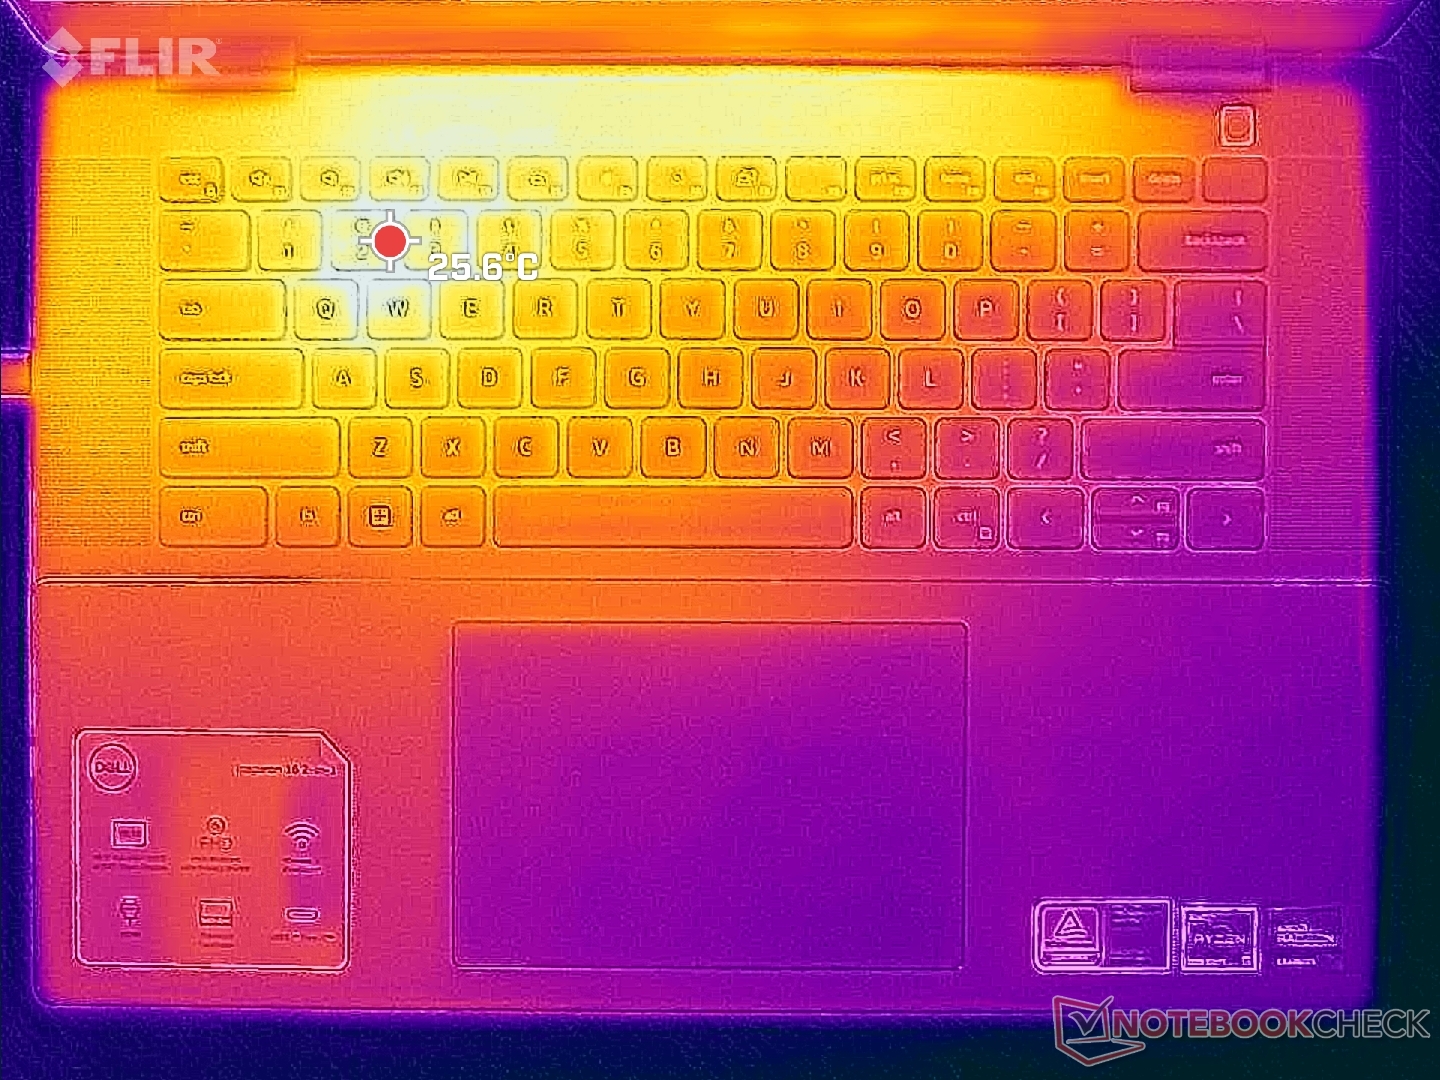
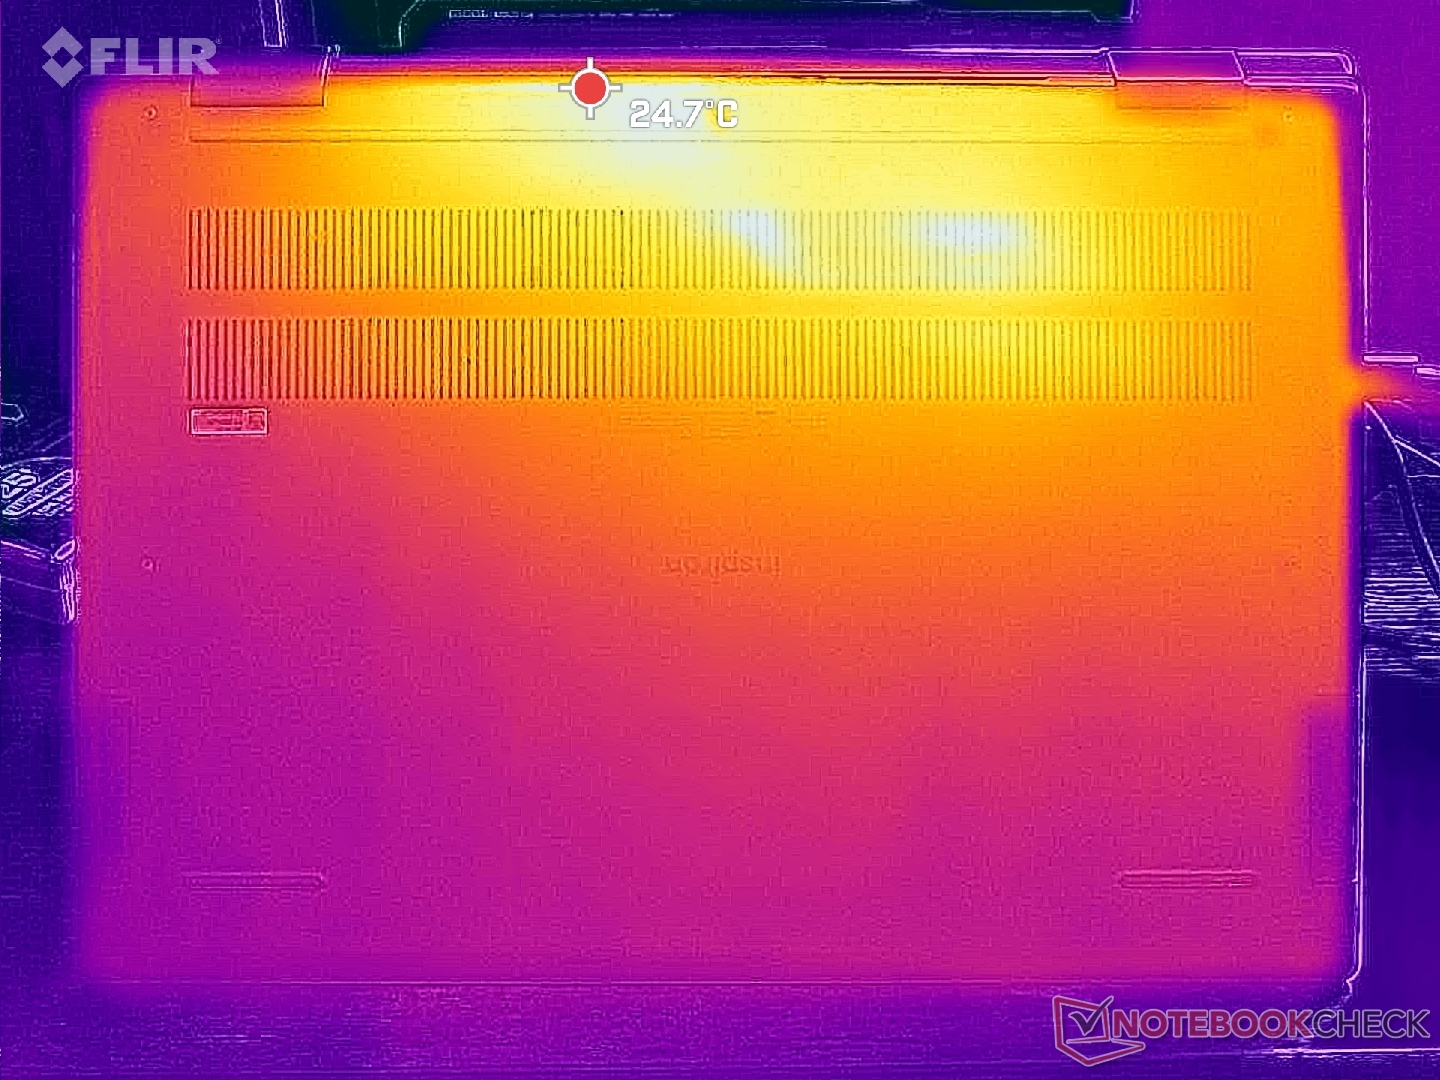
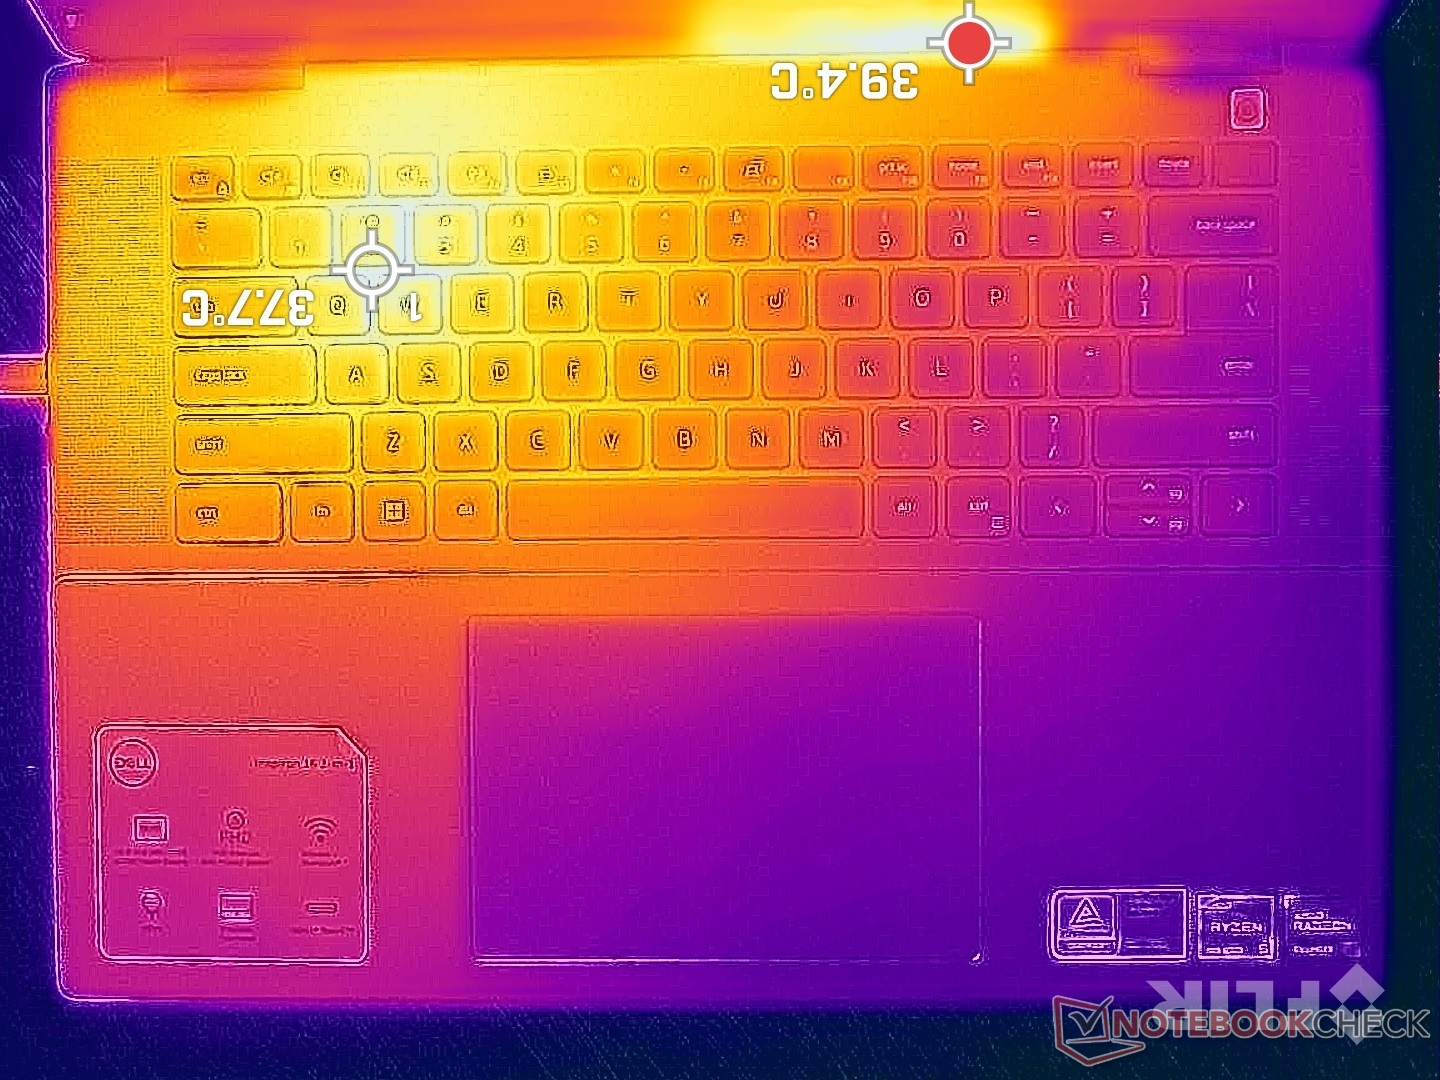
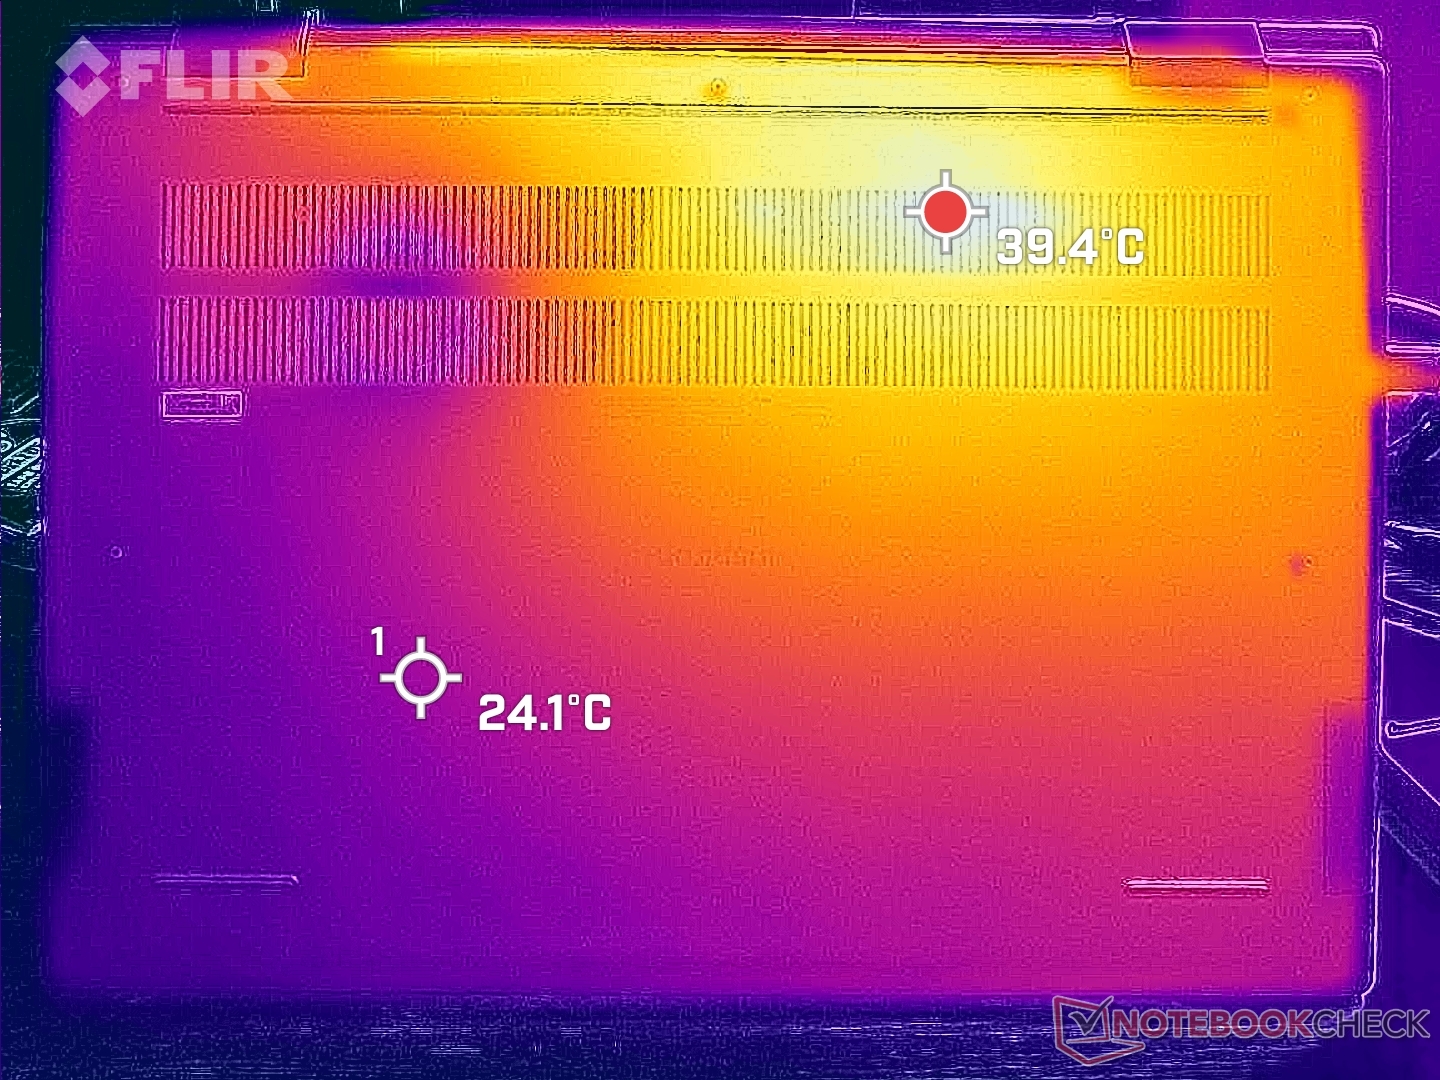
As temperaturas da superfície são mais quentes na metade esquerda do teclado em vez de no centro, pois o posicionamento do processador mudou em relação ao design do ano passado. Os pontos quentes podem chegar a pouco mais de 40 °C nas superfícies superior e inferior, o que ainda é visivelmente mais frio do que noIdeaPad Flex 5 16 ou do antigo Inspiron 16 7620 2 em 1 onde as temperaturas da superfície podem chegar perto de 50 °C quando sob carga. O ruído geralmente mais alto da ventoinha do Inspiron 16 7635 2 em 1 pode ser parcialmente responsável pelas temperaturas mais baixas da superfície.
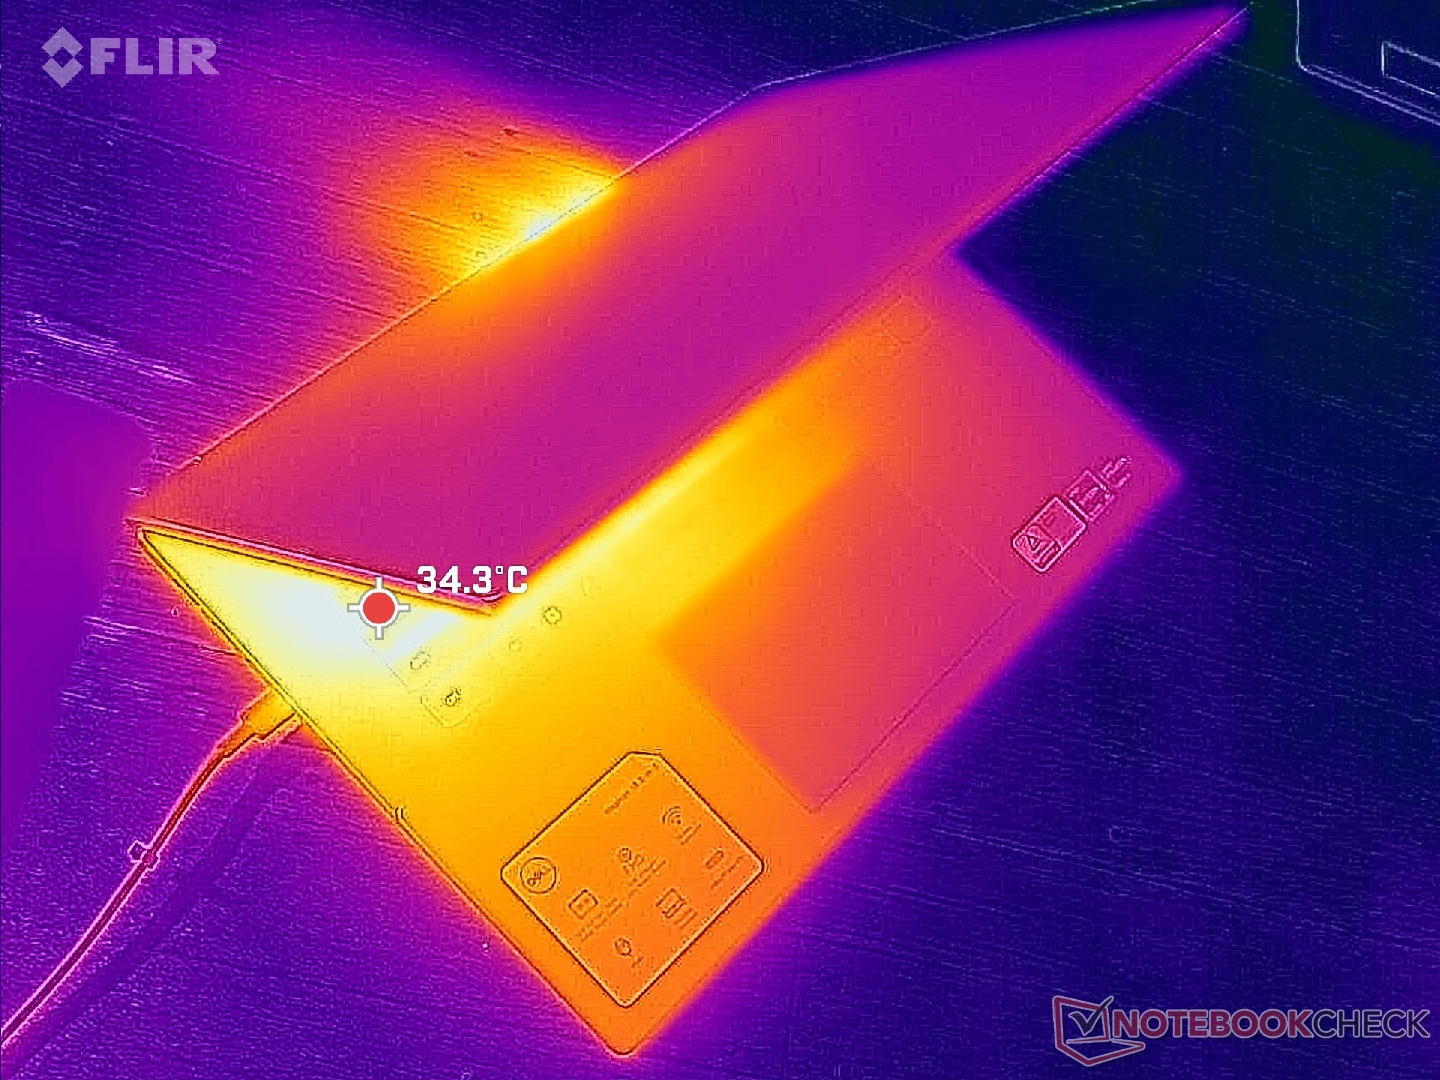
(±) A temperatura máxima no lado superior é 41.6 °C / 107 F, em comparação com a média de 35.4 °C / 96 F , variando de 19.6 a 60 °C para a classe Convertible.
(+) A parte inferior aquece até um máximo de 39 °C / 102 F, em comparação com a média de 36.9 °C / 98 F
(+) Em uso inativo, a temperatura média para o lado superior é 25.8 °C / 78 F, em comparação com a média do dispositivo de 30.3 °C / ### class_avg_f### F.
(+) Os apoios para as mãos e o touchpad são mais frios que a temperatura da pele, com um máximo de 31.4 °C / 88.5 F e, portanto, são frios ao toque.
(-) A temperatura média da área do apoio para as mãos de dispositivos semelhantes foi 28 °C / 82.4 F (-3.4 °C / -6.1 F).
| Dell Inspiron 16 7635 2-in-1 AMD Ryzen 5 7530U, AMD Radeon RX Vega 7 | Acer Swift Edge SFE16-42-R1GM AMD Ryzen 7 7735U, AMD Radeon 680M | Lenovo Yoga 7 16IRL8 Intel Core i7-1355U, Intel Iris Xe Graphics G7 96EUs | Samsung Galaxy Book3 Pro 16 Intel Core i5-1340P, Intel Iris Xe Graphics G7 80EUs | Lenovo IdeaPad Flex 5 16ABR G8 AMD Ryzen 7 7730U, AMD Radeon RX Vega 8 (Ryzen 4000/5000) | Dell Inspiron 16 7620 2-in-1 Intel Core i7-1260P, Intel Iris Xe Graphics G7 96EUs | |
|---|---|---|---|---|---|---|
| Heat | -15% | -1% | -9% | -5% | -13% | |
| Maximum Upper Side * (°C) | 41.6 | 49.4 -19% | 37.6 10% | 41.6 -0% | 51.4 -24% | 42.2 -1% |
| Maximum Bottom * (°C) | 39 | 44.7 -15% | 40 -3% | 45 -15% | 47.8 -23% | 47.4 -22% |
| Idle Upper Side * (°C) | 29.4 | 34 -16% | 30.4 -3% | 31 -5% | 24.8 16% | 32.2 -10% |
| Idle Bottom * (°C) | 28.6 | 31.6 -10% | 30.6 -7% | 33.6 -17% | 24.9 13% | 33.6 -17% |
* ... menor é melhor
Teste de estresse
As taxas de clock do processador, o consumo de energia da placa e a temperatura durante a execução do Prime95 chegavam a 3,4 GHz, 35 W e 81 C, respectivamente. A CPU acabaria se estabilizando em 3 GHz, 28 W e 90 °C depois de apenas um minuto, em comparação com 81 °C no Inspiron 16 7620 2 em 1 com tecnologia Intel do ano passado.
A execução com a energia da bateria reduz um pouco o desempenho. Um teste 3DMark 11 com a bateria retornaria pontuações de física e gráficos de 12497 e 5935 pontos, respectivamente, em comparação com 12926 e 6249 pontos quando ligado à rede elétrica.
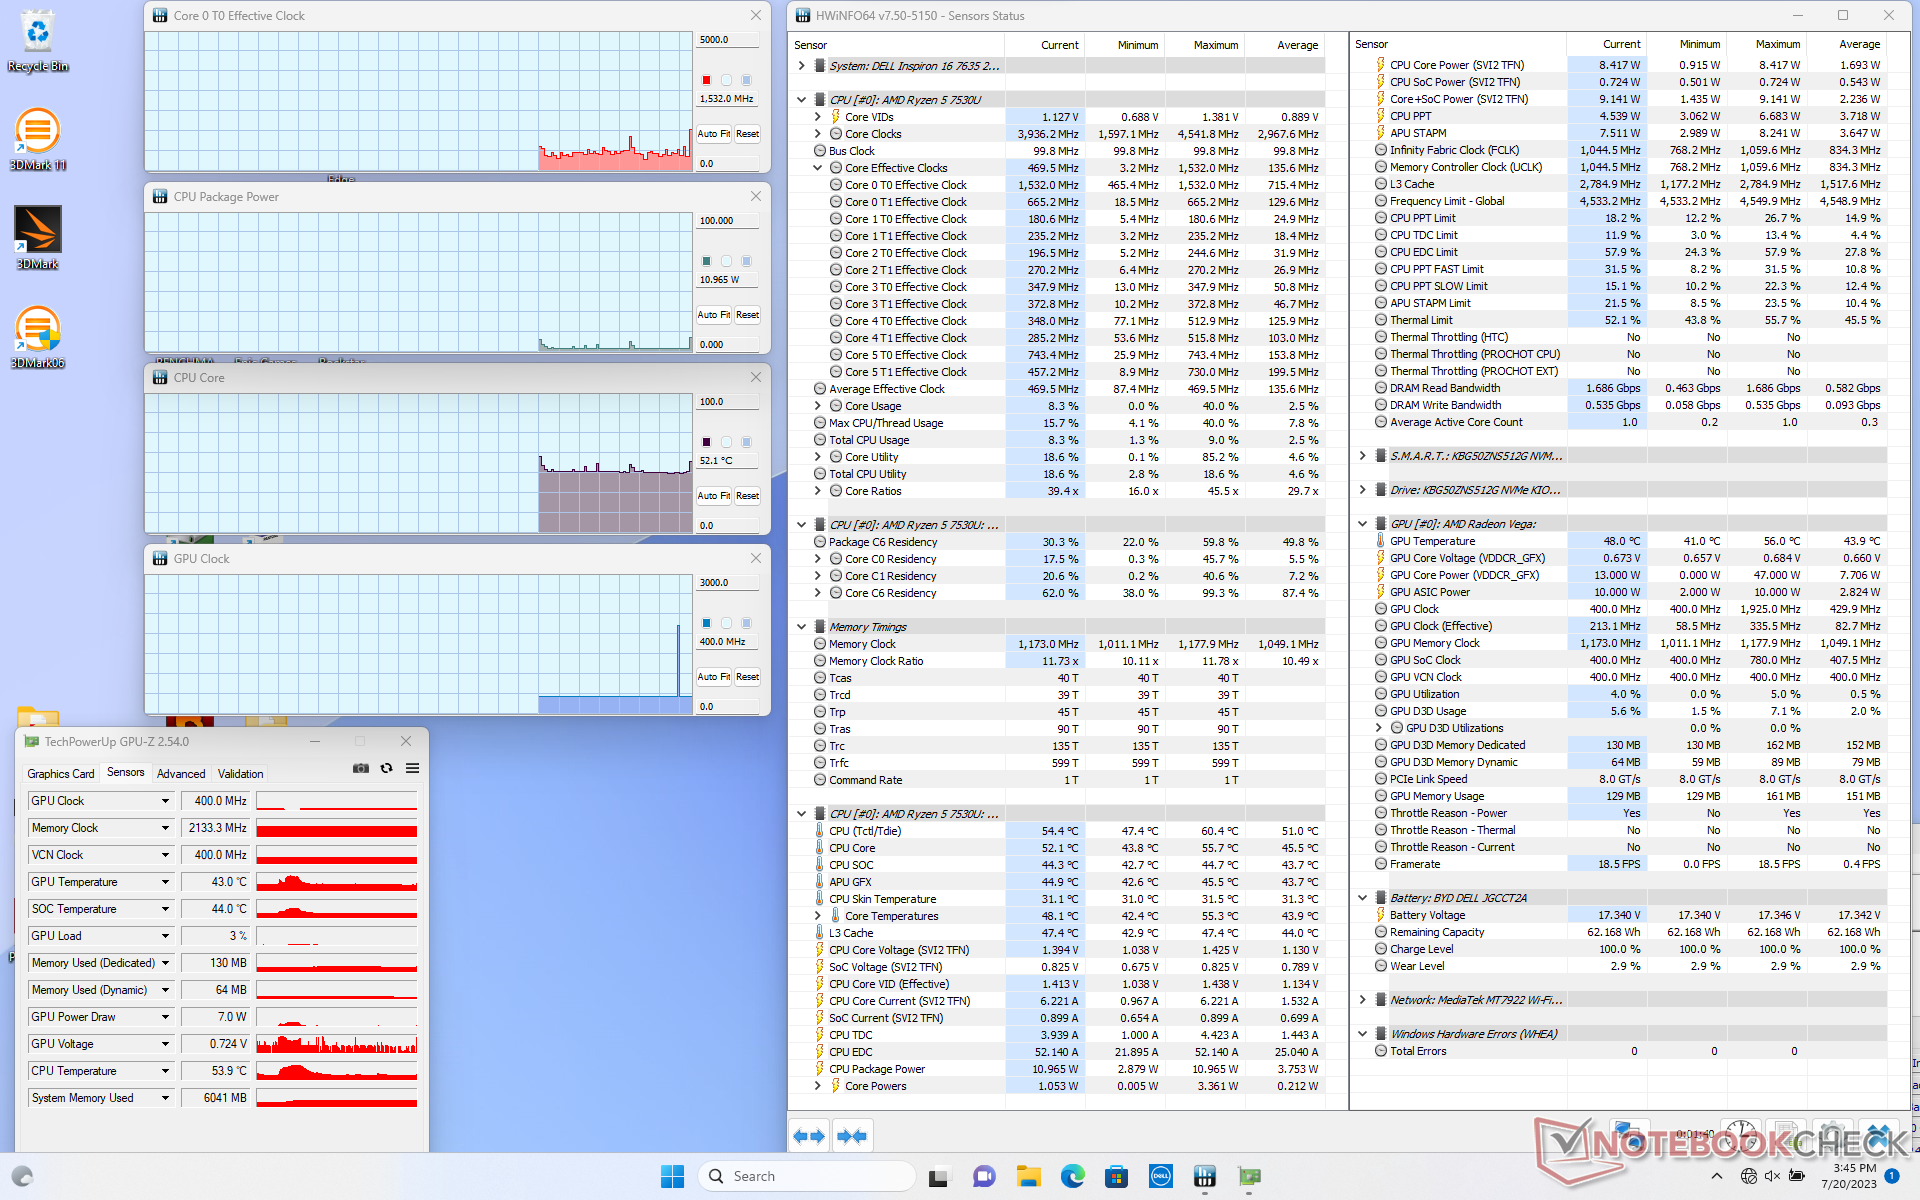
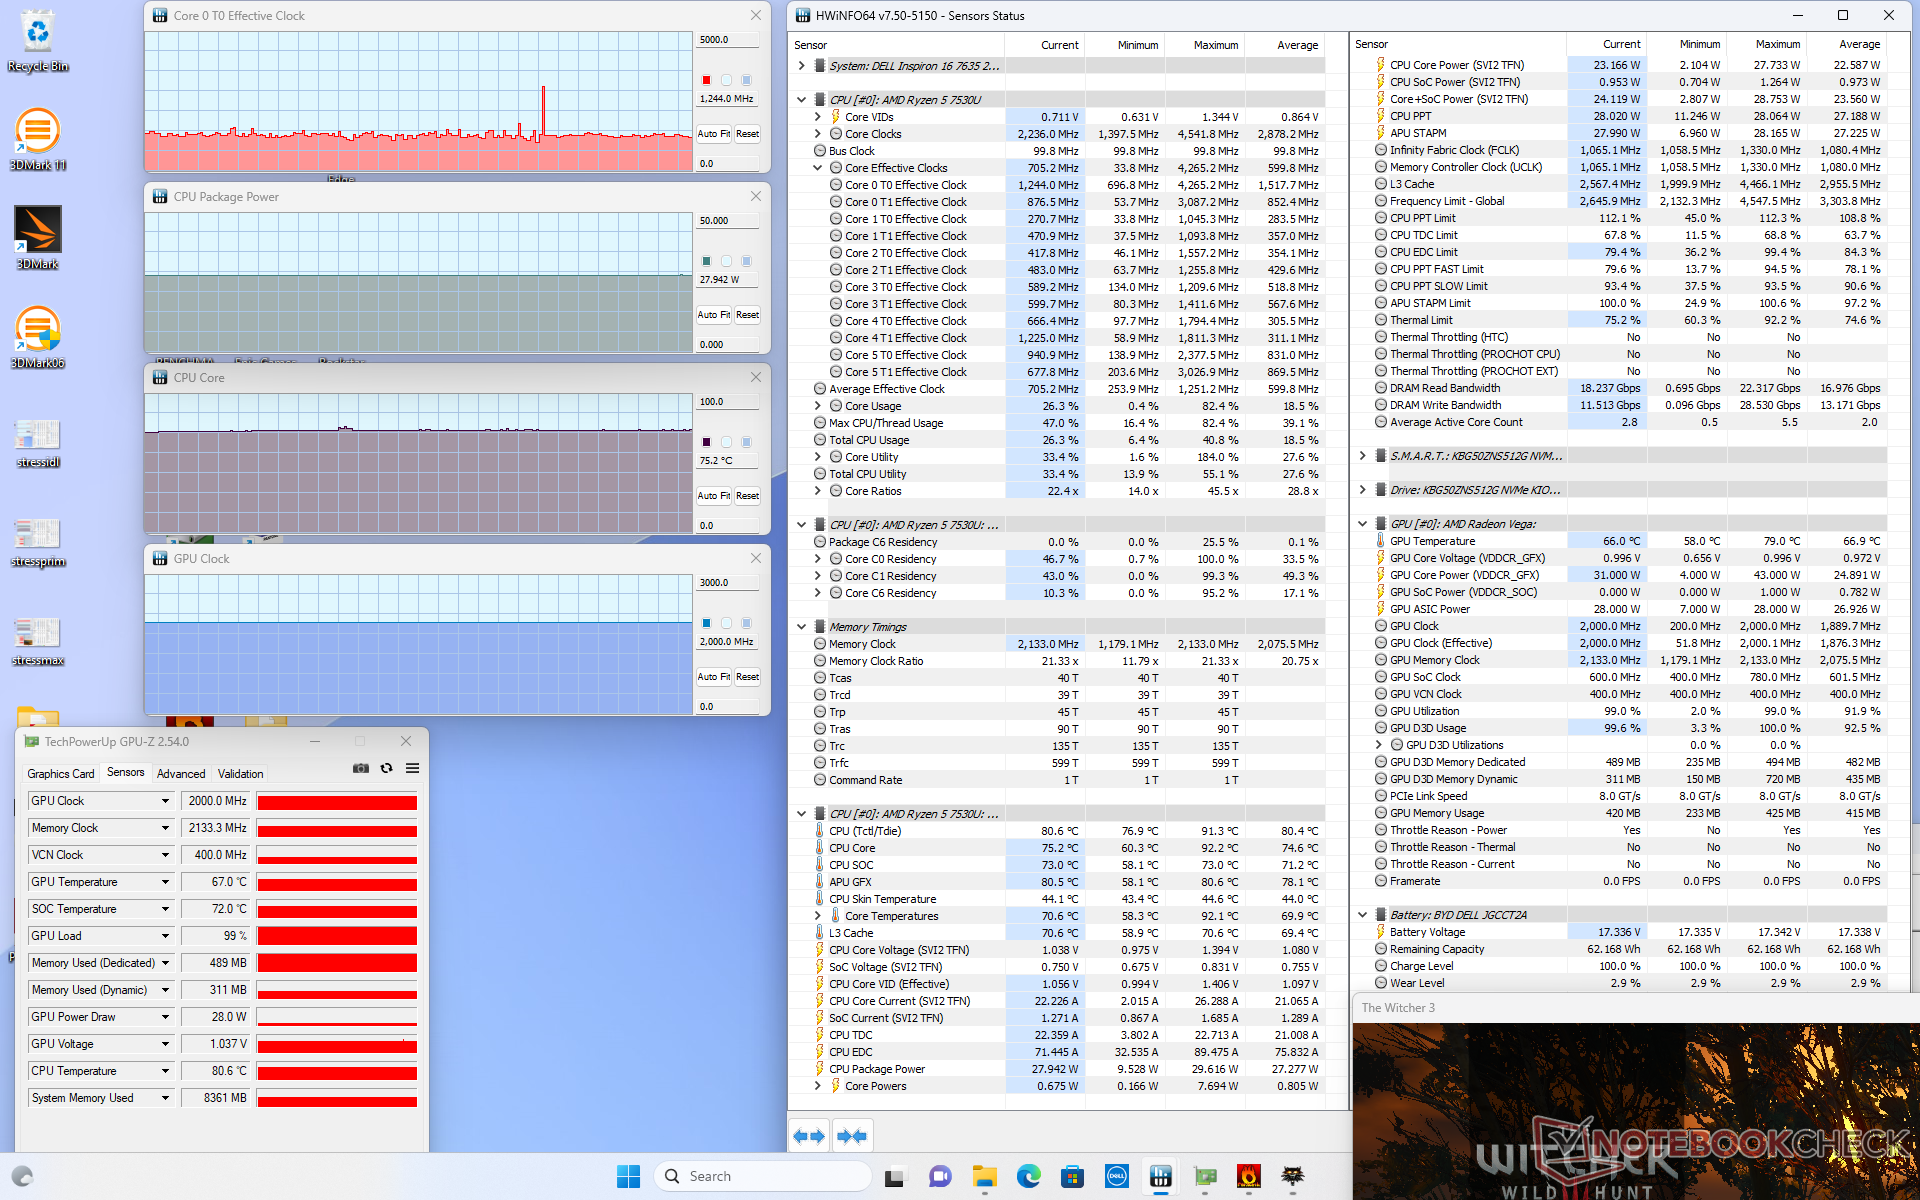
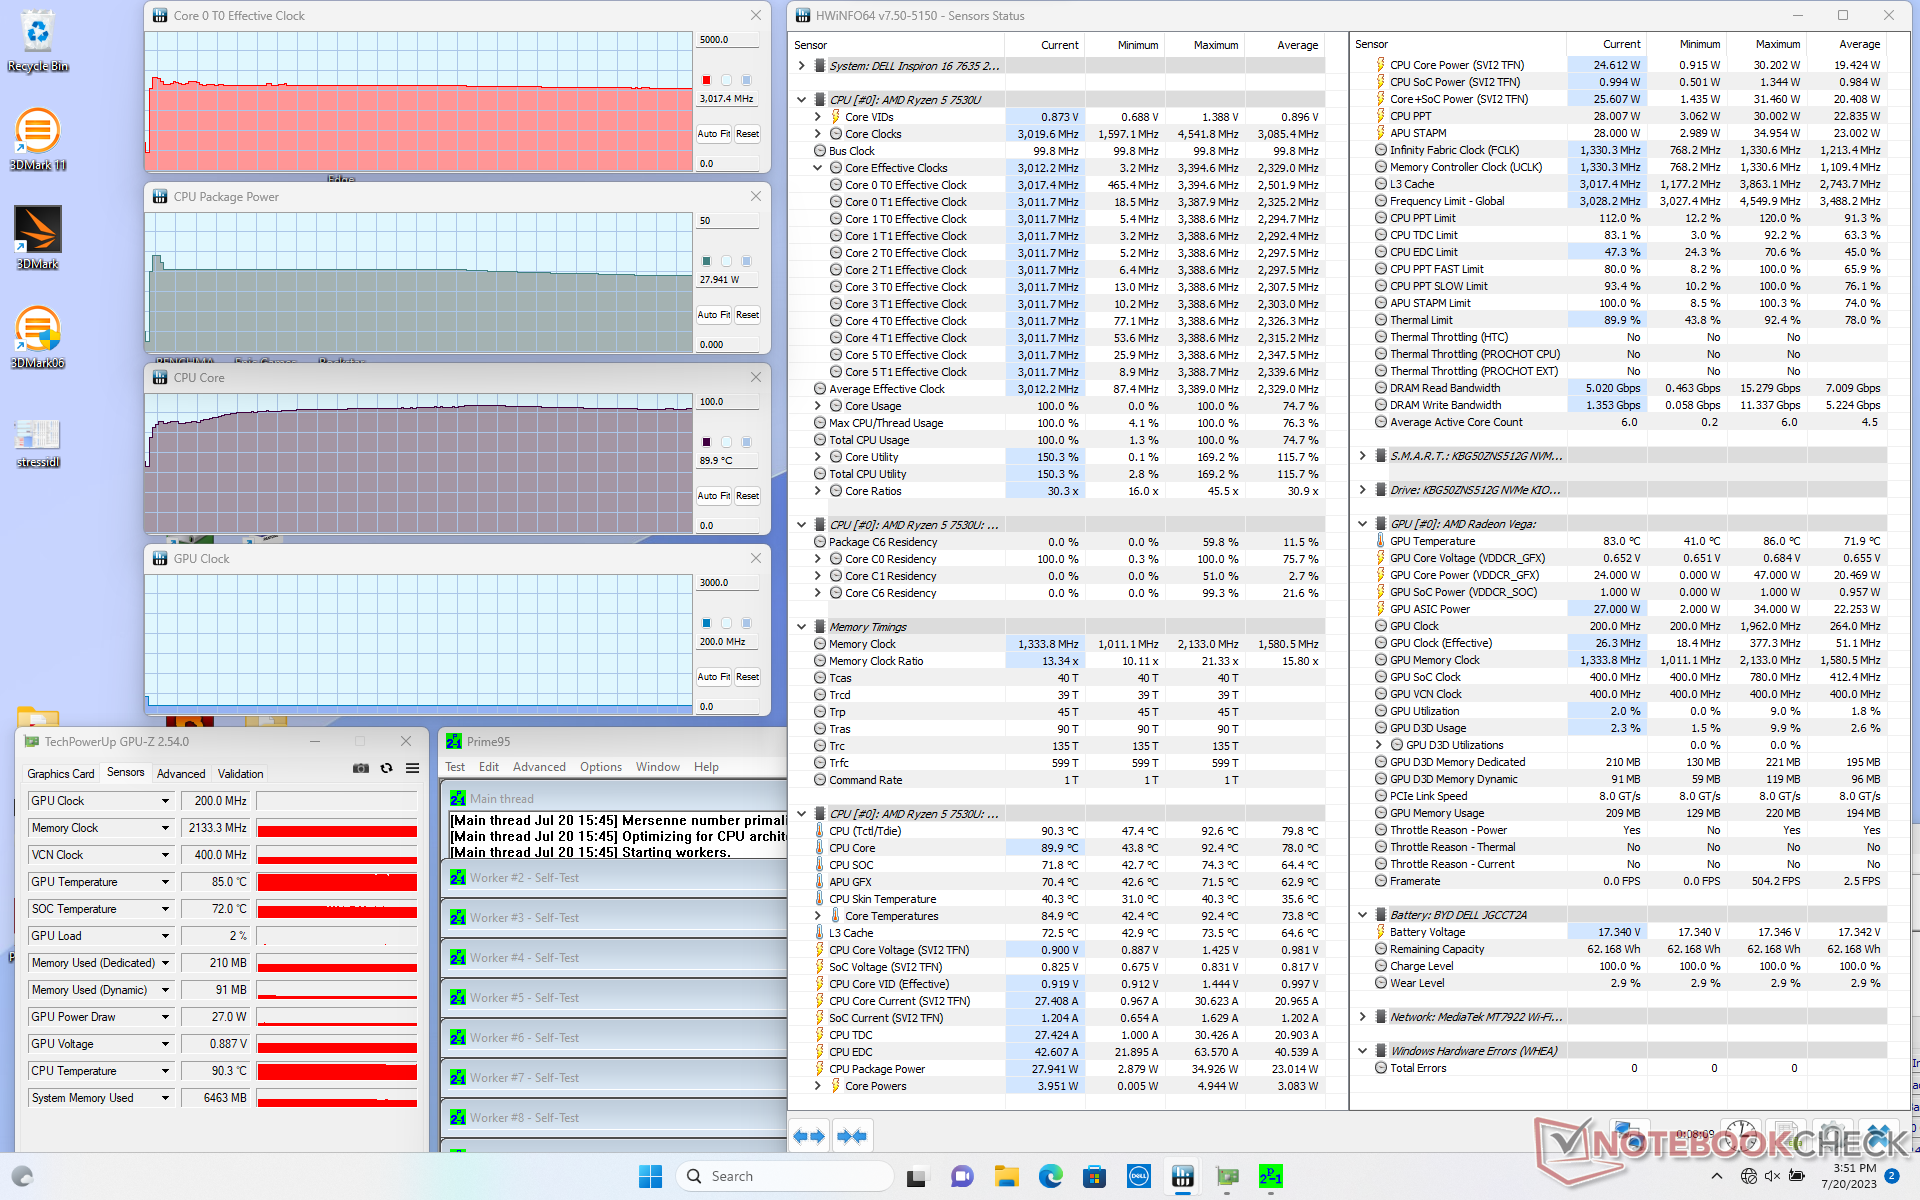
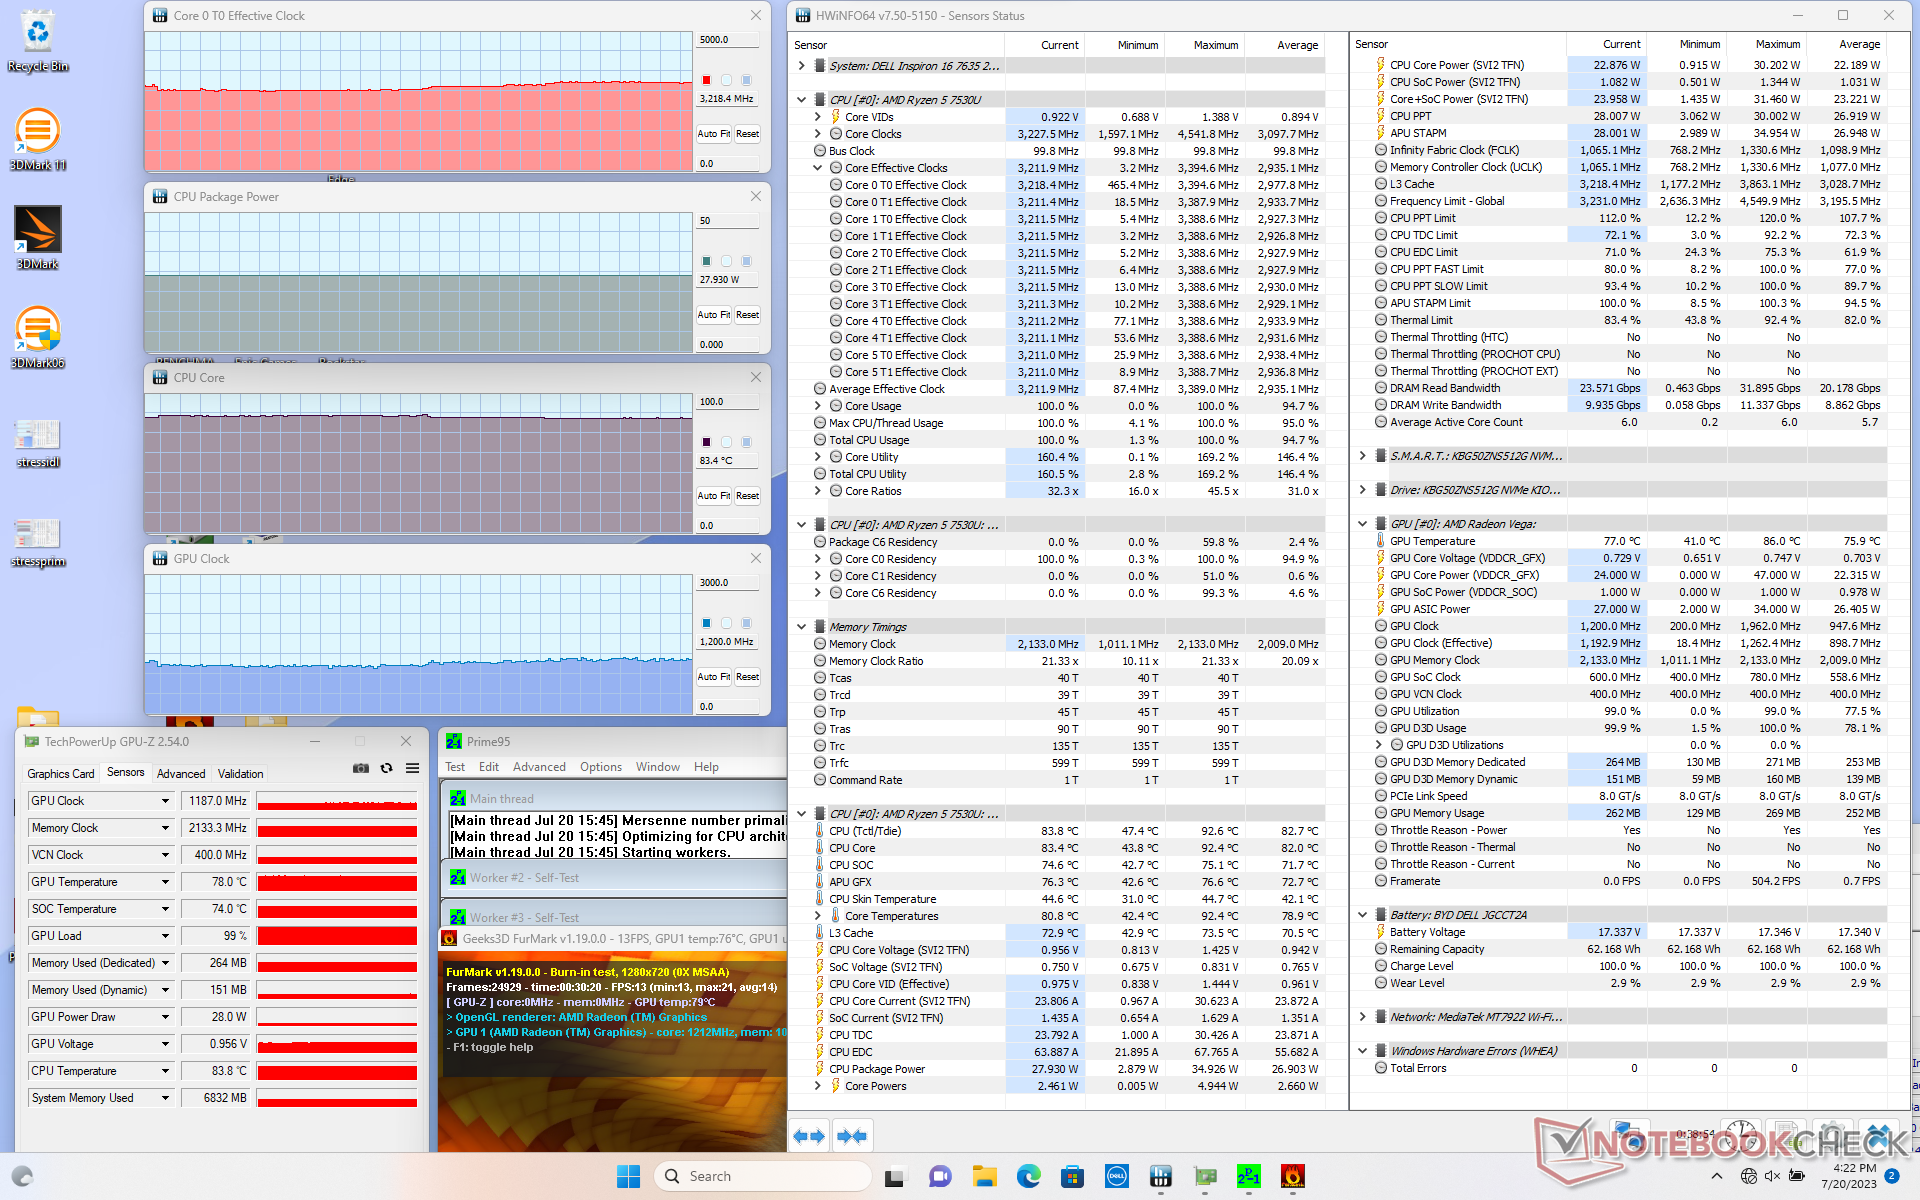
| Clock da CPU (GHz) | Clock da GPU (MHz) | Temperatura média da CPU (°C) | |
| Sistema ocioso | -- | -- | 52 |
| Estresse doPrime95 | 3.0 | -- | 90 |
| Estresse doPrime95 + FurMark | 3.1 - 3.2 | 1187 | 83 |
| Witcher 3 Estresse | 1.2 | 2000 | 75 |
Alto-falantes
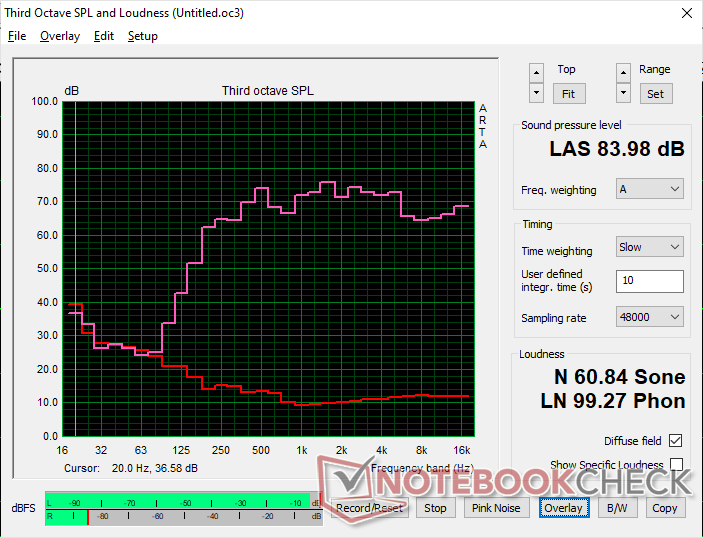
Dell Inspiron 16 7635 2-in-1 análise de áudio
(+) | os alto-falantes podem tocar relativamente alto (###valor### dB)
Graves 100 - 315Hz
(±) | graves reduzidos - em média 14.9% menor que a mediana
(±) | a linearidade dos graves é média (11.9% delta para a frequência anterior)
Médios 400 - 2.000 Hz
(+) | médios equilibrados - apenas 3.5% longe da mediana
(+) | médios são lineares (6.9% delta para frequência anterior)
Altos 2 - 16 kHz
(+) | agudos equilibrados - apenas 4.1% longe da mediana
(+) | os máximos são lineares (3.7% delta da frequência anterior)
Geral 100 - 16.000 Hz
(+) | o som geral é linear (12.2% diferença em relação à mediana)
Comparado com a mesma classe
» 12% de todos os dispositivos testados nesta classe foram melhores, 4% semelhantes, 84% piores
» O melhor teve um delta de 6%, a média foi 20%, o pior foi 57%
Comparado com todos os dispositivos testados
» 10% de todos os dispositivos testados foram melhores, 2% semelhantes, 88% piores
» O melhor teve um delta de 4%, a média foi 23%, o pior foi 134%
Apple MacBook Pro 16 2021 M1 Pro análise de áudio
(+) | os alto-falantes podem tocar relativamente alto (###valor### dB)
Graves 100 - 315Hz
(+) | bons graves - apenas 3.8% longe da mediana
(+) | o baixo é linear (5.2% delta para a frequência anterior)
Médios 400 - 2.000 Hz
(+) | médios equilibrados - apenas 1.3% longe da mediana
(+) | médios são lineares (2.1% delta para frequência anterior)
Altos 2 - 16 kHz
(+) | agudos equilibrados - apenas 1.9% longe da mediana
(+) | os máximos são lineares (2.7% delta da frequência anterior)
Geral 100 - 16.000 Hz
(+) | o som geral é linear (4.6% diferença em relação à mediana)
Comparado com a mesma classe
» 0% de todos os dispositivos testados nesta classe foram melhores, 0% semelhantes, 100% piores
» O melhor teve um delta de 5%, a média foi 17%, o pior foi 45%
Comparado com todos os dispositivos testados
» 0% de todos os dispositivos testados foram melhores, 0% semelhantes, 100% piores
» O melhor teve um delta de 4%, a média foi 23%, o pior foi 134%
Gerenciamento de energia
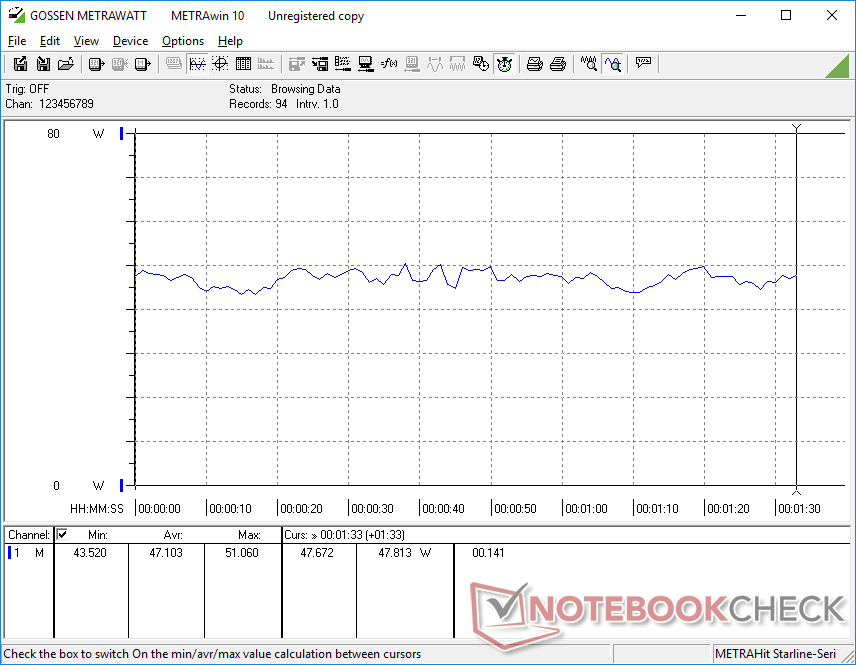
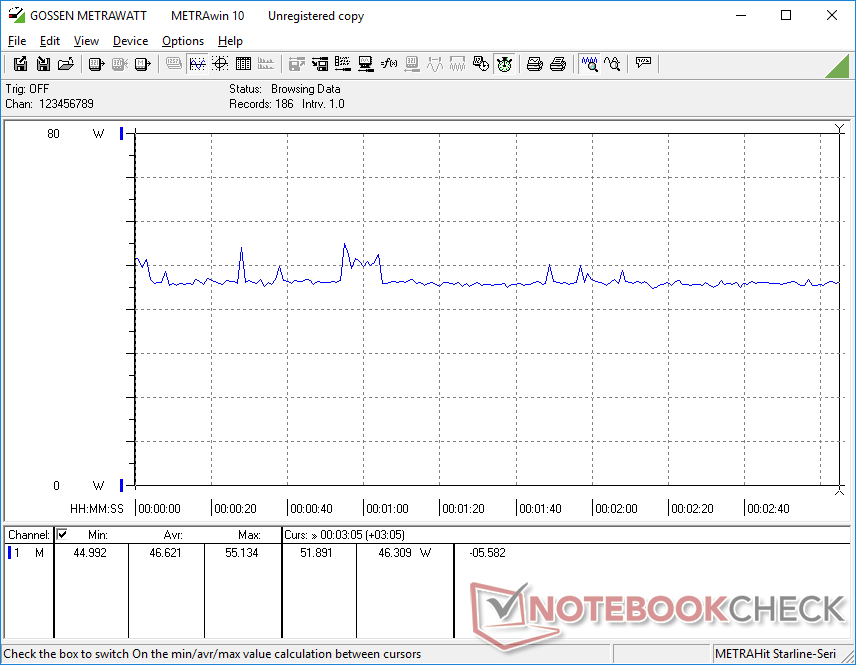
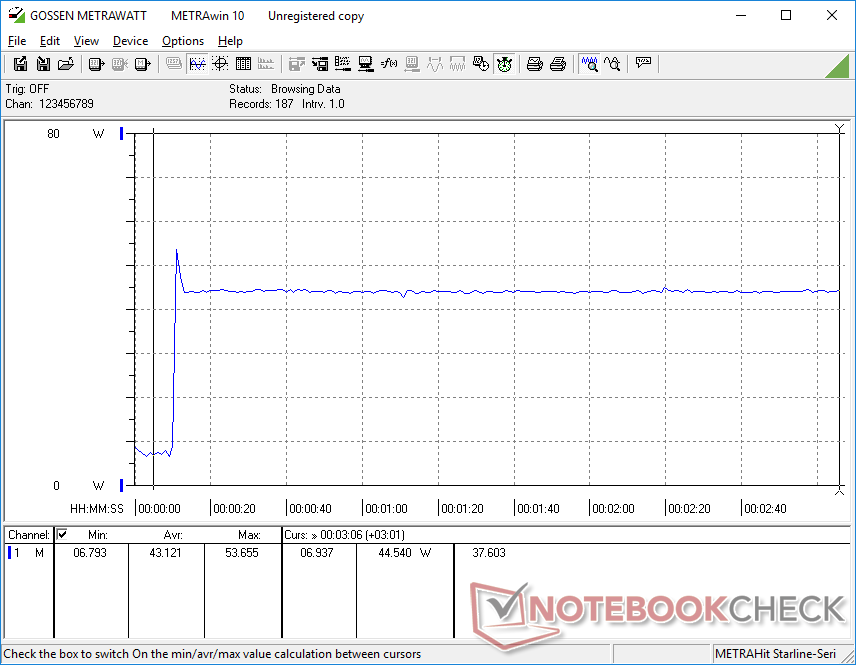
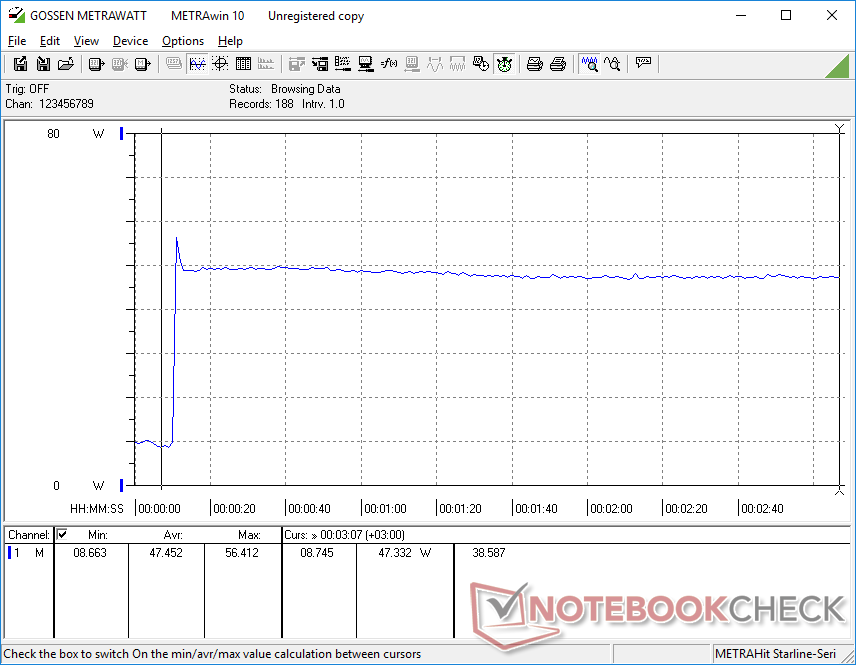
Consumo de energia
O consumo de energia na maioria das condições é consistentemente menor do que o do Inspiron 16 7620 2 em 1 com Core-P do ano passado, o que pode ser responsável pelos bons resultados de duração da bateria na próxima seção. Ele também é menor do que o do Yoga 7 16IRL8 em média, para mostrar um excelente desempenho por watt em relação à concorrência.
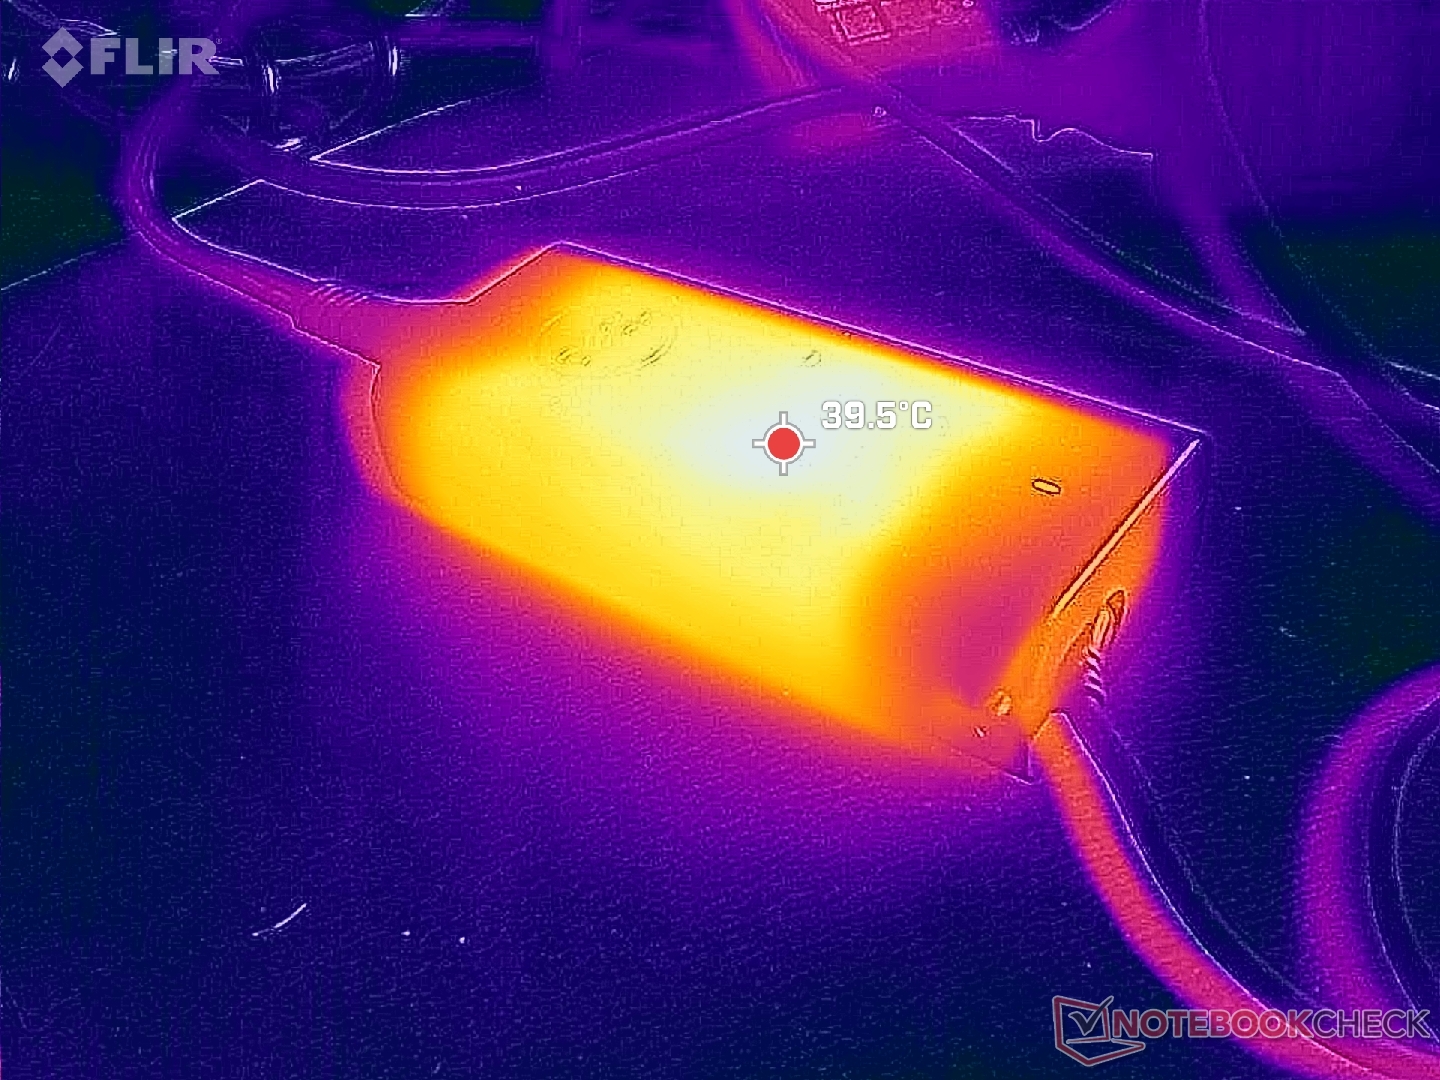
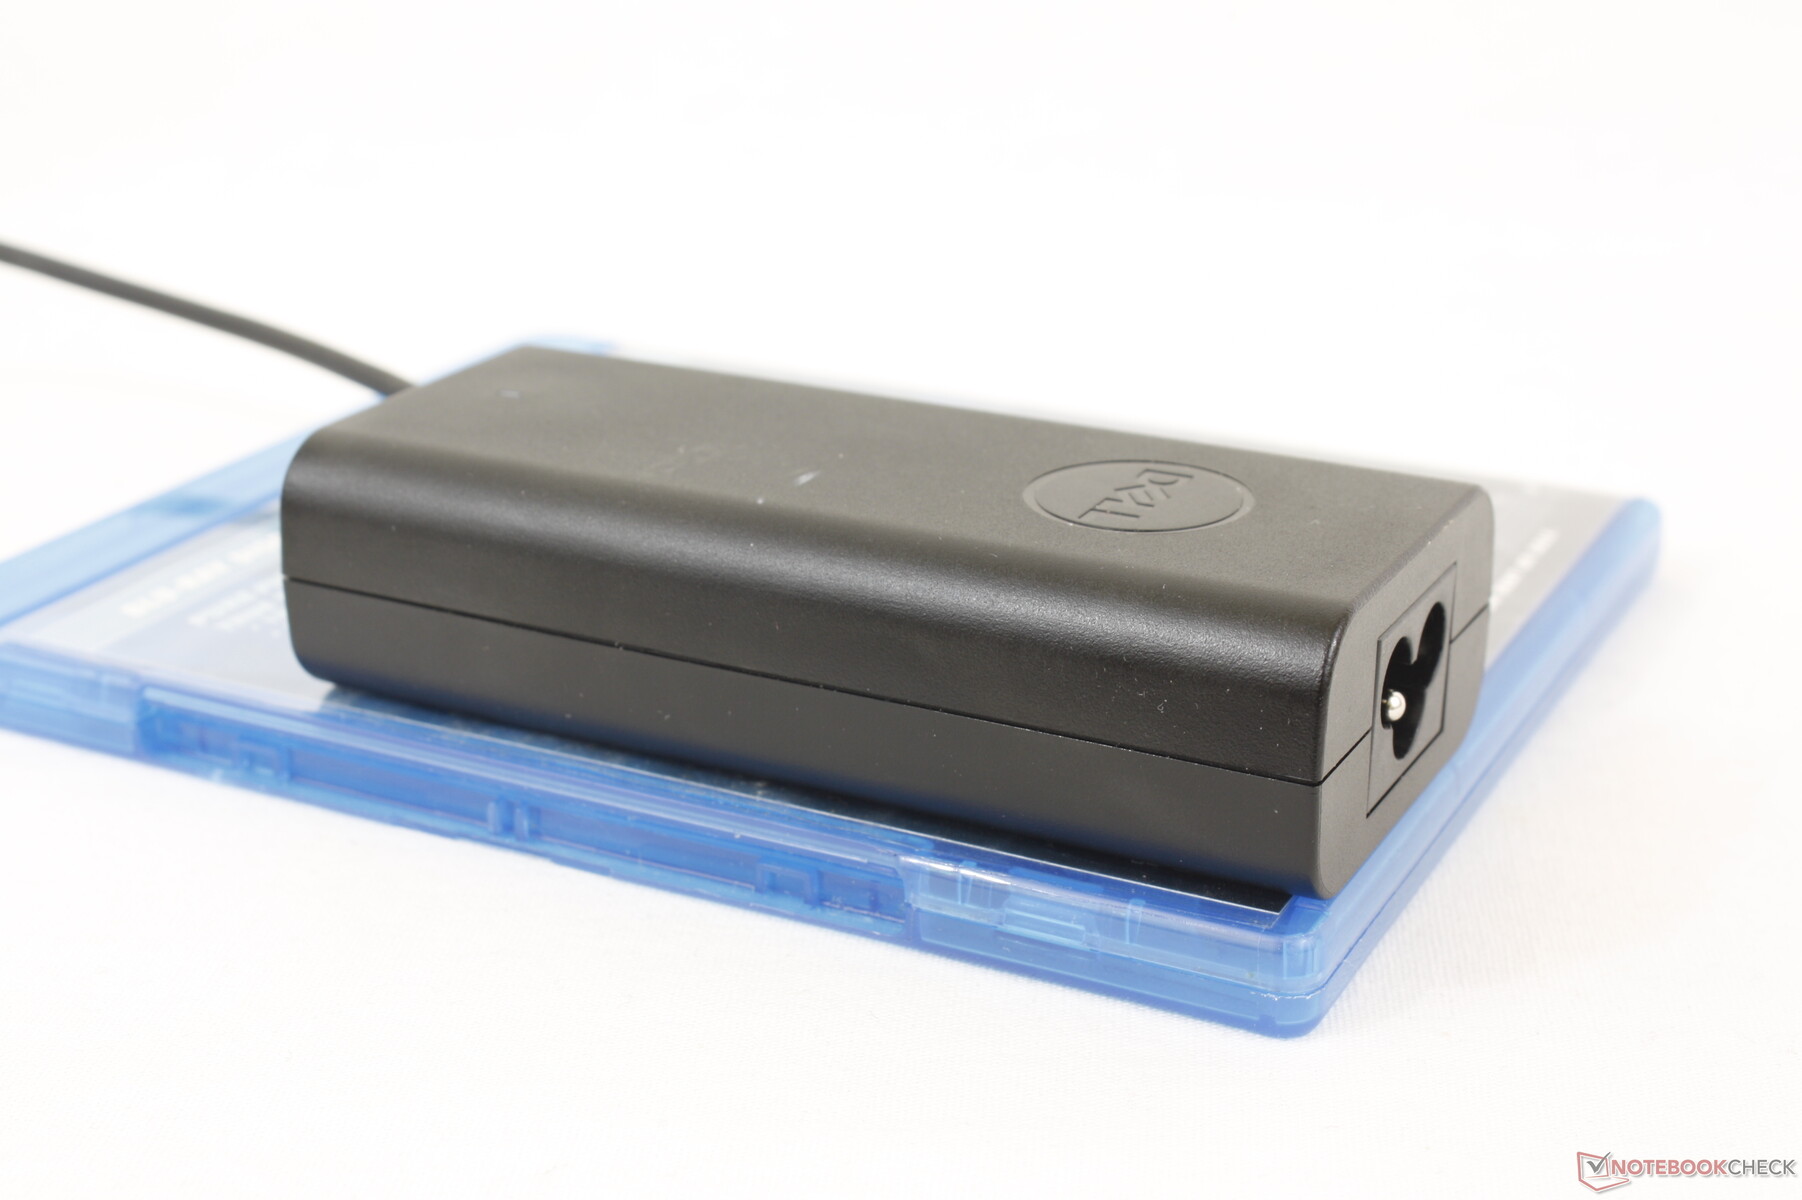
Conseguimos medir um consumo máximo de 57 W do adaptador CA pequeno-médio (~11,2 x 5 x 2,8 cm) de 65 W quando a CPU está com 100% de utilização. A espaçosa sobrecarga garante que o sistema ainda possa carregar quando estiver executando cargas exigentes, mesmo que em uma taxa mais lenta, e que a CPU não seja estrangulada por um adaptador CA de tamanho insuficiente.
| desligado | |
| Ocioso | |
| Carga |
|
Key:
min: | |
| Dell Inspiron 16 7635 2-in-1 R5 7530U, Vega 7, Kioxia BG5 KBG50ZNS512G, IPS, 1920x1200, 16" | Acer Swift Edge SFE16-42-R1GM R7 7735U, Radeon 680M, Micron 3400 1TB MTFDKBA1T0TFH, OLED, 3840x2400, 16" | Lenovo Yoga 7 16IRL8 i7-1355U, Iris Xe G7 96EUs, WD PC SN740 512GB SDDPMQD-512G-1101, IPS, 1920x1200, 16" | Samsung Galaxy Book3 Pro 16 i5-1340P, Iris Xe G7 80EUs, WD PC SN740 256GB SDDPNQD-256G, AMOLED, 2880x1800, 16" | Lenovo IdeaPad Flex 5 16ABR G8 R7 7730U, Vega 8, Samsung PM9B1 1024GB MZAL41T0HBLB, IPS, 1920x1200, 16" | Dell Inspiron 16 7620 2-in-1 i7-1260P, Iris Xe G7 96EUs, Toshiba KBG40ZNS512G NVMe, IPS, 1920x1200, 16" | |
|---|---|---|---|---|---|---|
| Power Consumption | -15% | -8% | 8% | -21% | -10% | |
| Idle Minimum * (Watt) | 4.8 | 8.6 -79% | 3.3 31% | 3.9 19% | 5.4 -13% | 5.3 -10% |
| Idle Average * (Watt) | 7.6 | 7.7 -1% | 10.2 -34% | 4.8 37% | 11.1 -46% | 8.3 -9% |
| Idle Maximum * (Watt) | 8.7 | 9.3 -7% | 10.3 -18% | 10 -15% | 11.6 -33% | 9.6 -10% |
| Load Average * (Watt) | 47.1 | 47.9 -2% | 55.2 -17% | 44 7% | 52.7 -12% | 54.3 -15% |
| Witcher 3 ultra * (Watt) | 46.6 | 46.3 1% | 43.8 6% | 42.3 9% | 47.6 -2% | 43.9 6% |
| Load Maximum * (Watt) | 56.4 | 56 1% | 65.7 -16% | 63 -12% | 67 -19% | 70 -24% |
* ... menor é melhor
Power Consumption Witcher 3 / Stresstest
Power Consumption external Monitor
Duração da bateria
O Inspiron 16 7635 2 em 1 vem com uma bateria de 64 Wh em comparação com a bateria maior de 86 Wh do Inspiron 16 7630 2 em 1 ou 7620 2 em 1. Portanto, os usuários da AMD estão sendo prejudicados, pois a bateria maior é atualmente exclusiva para as configurações da Intel.
No entanto, a duração da bateria ainda é muito boa, apesar da bateria menor em nossa unidade AMD. Conseguimos registrar 14,5 horas de uso de navegação WLAN no mundo real, o que é quase o mesmo que registramos no Inspiron 16 7620 2 em 1 com tecnologia Intel do ano passado. É mais longo do que o IdeaPad Flex 5 16 também equipado de forma semelhante, por várias horas.
O carregamento da capacidade vazia até a capacidade total com o adaptador CA incluído leva cerca de 2 horas.
| Dell Inspiron 16 7635 2-in-1 R5 7530U, Vega 7, 64 Wh | Acer Swift Edge SFE16-42-R1GM R7 7735U, Radeon 680M, 54 Wh | Lenovo Yoga 7 16IRL8 i7-1355U, Iris Xe G7 96EUs, 71 Wh | Samsung Galaxy Book3 Pro 16 i5-1340P, Iris Xe G7 80EUs, 76 Wh | Lenovo IdeaPad Flex 5 16ABR G8 R7 7730U, Vega 8, 52.5 Wh | Dell Inspiron 16 7620 2-in-1 i7-1260P, Iris Xe G7 96EUs, 87 Wh | |
|---|---|---|---|---|---|---|
| Duração da bateria | -43% | -17% | -3% | -37% | 11% | |
| Reader / Idle (h) | 26 | 10.9 -58% | 19 -27% | 30.4 17% | 17 -35% | |
| WiFi v1.3 (h) | 14.5 | 7.3 -50% | 9.4 -35% | 10.2 -30% | 9.8 -32% | 14.6 1% |
| Load (h) | 1.9 | 1.5 -21% | 2.1 11% | 2 5% | 1.1 -42% | 3.2 68% |
| H.264 (h) | 8.6 | 14.4 | 13.1 |
Pro
Contra
Veredicto - Muitos cantos cortados em comparação com o Inspiron 16 7630 2 em 1
O Inspiron 16 7635 2 em 1 com tecnologia AMD é mais do que apenas uma troca de processador quando comparado ao Inspiron 16 7630 2 em 1 com tecnologia Intel. Faltam opções para uma tela sensível ao toque OLED de maior resolução, sensor IR, opções de gráficos discretos, bateria maior e suporte a Thunderbolt, tudo em nome de ser um pouco mais barato. Se você estiver disposto a pagar apenas US$ 100 a mais, recomendamos que considere o Inspiron 16 7630 2 em 1 com Core i7-1360P em vez de nossa configuração Ryzen 5, pois ele oferecerá desempenho mais rápido de CPU e GPU e o dobro da capacidade de armazenamento. Ele é um pouco mais pesado em 100 g, mas ambas as versões do modelo já são bastante pesadas, começando com 2 kg cada.
As cores sRGB mais profundas do Inspiron 16 7635 2 em 1 dão à Dell uma vantagem sobre o concorrente Lenovo Flex 5 16.
Para futuras revisões, gostaríamos de ver opções de processadores Zen 4 ou, pelo menos, Zen 3+ para melhorar o desempenho gráfico medíocre. A opção Ryzen 7 7730U não é recomendada, pois é mais cara, mais lenta e com menos recursos do que a configuração Core i7-1360P. Ainda vale a pena considerar o Inspiron 16 7620 2 em 1 do ano passado, especialmente porque essa última revisão não é mais leve nem mais portátil.
Preço e disponibilidade
O Inspiron 16 7635 2 em 1 e o Inspiron 16 7630 2 em 1 estão sendo enviados diretamente pela Dell a partir de US$ 650 e US$ 800, respectivamente. Nossa configuração específica, conforme analisada, é vendida por US$ 900.
Dell Inspiron 16 7635 2-in-1
- 07/23/2023 v7 (old)
Allen Ngo
Transparência
A seleção dos dispositivos a serem analisados é feita pela nossa equipe editorial. A amostra de teste foi fornecida ao autor como empréstimo pelo fabricante ou varejista para fins desta revisão. O credor não teve influência nesta revisão, nem o fabricante recebeu uma cópia desta revisão antes da publicação. Não houve obrigação de publicar esta revisão. Como empresa de mídia independente, a Notebookcheck não está sujeita à autoridade de fabricantes, varejistas ou editores.
É assim que o Notebookcheck está testando
Todos os anos, o Notebookcheck analisa de forma independente centenas de laptops e smartphones usando procedimentos padronizados para garantir que todos os resultados sejam comparáveis. Desenvolvemos continuamente nossos métodos de teste há cerca de 20 anos e definimos padrões da indústria no processo. Em nossos laboratórios de teste, equipamentos de medição de alta qualidade são utilizados por técnicos e editores experientes. Esses testes envolvem um processo de validação em vários estágios. Nosso complexo sistema de classificação é baseado em centenas de medições e benchmarks bem fundamentados, o que mantém a objetividade.Price comparison

