Revisão de Portáteis Alienware x15 R2: Ultrabook-like UFO dispara com Core i9-12900H e 140 W RTX 3080 Ti
Já faz algum tempo desde que a Dell substituiu o Alienware m15 série com o x15. A série x15 basicamente esportiva a mesma linguagem de design que o chassi do m15 Legend, mas agora é mais fino. Este ano, temos o Alienware x15 R2 e o Alienware x17 R2 disputando uma fatia de sua torta de pêlos duros.
Revisamos anteriormente o Alienware x15 R1 e o Alienware x17 R2, então agora é hora de verificar também o Alienware x15 R2 e ver o que a atualização do Alder Lake-H deste ano tem reservado para nós.
O Alienware x15 R2 deste ano é mais ou menos uma remontagem da última geração x15 R1. Entretanto, vemos algumas melhorias internas muito necessárias, incluindo atualizações para o Intel 12th gen Alder Lake-H, gráficos Nvidia RTX 30 Ti, displays Dolby Vision, e muito mais
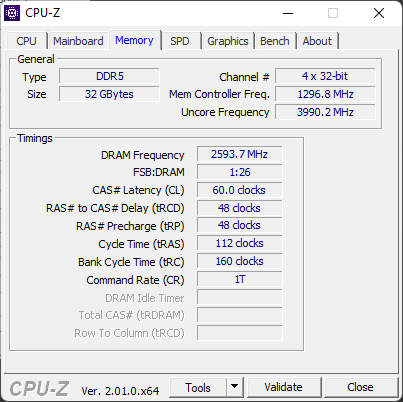
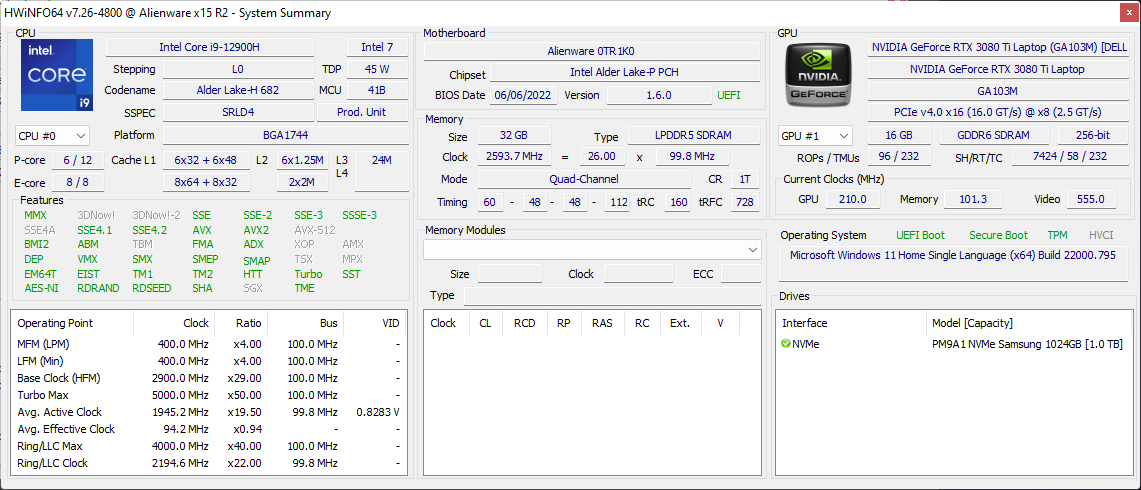
Nosso teste Alienware x15 R2 é equipado com um Intel Core i9-12900H, Nvidia GeForce RTX 3080 Ti GPU Portátil, um display de 1080p 360 Hz, 32 GB LPDDR5-4800 RAM, e um Samsung PM9A1 NVMe SSD de 1 TB. Esta configuração irá retornar por ,68.190 (~US$4.500 ou 4.583 euros) se encomendado online via ₹3 Dell India.
Nesta revisão, nós colocamos o Alienware x15 R2 através de seus passos e vemos se as novas atualizações se somam a uma grande experiência pelo preço pedido.
Possíveis concorrentes em comparação
Avaliação | Data | Modelo | Peso | Altura | Size | Resolução | Preço |
|---|---|---|---|---|---|---|---|
| 87.7 % v7 (old) | 10/2022 | Alienware x15 R2 P111F i9-12900H, GeForce RTX 3080 Ti Laptop GPU | 2.4 kg | 15.9 mm | 15.60" | 1920x1080 | |
| 86.3 % v7 (old) | 06/2022 | Asus ROG Strix Scar 15 G533ZW-LN106WS i9-12900H, GeForce RTX 3070 Ti Laptop GPU | 2.3 kg | 27.2 mm | 15.60" | 2560x1440 | |
| 88.2 % v7 (old) | 05/2022 | Asus ROG Zephyrus Duo 16 GX650RX R9 6900HX, GeForce RTX 3080 Ti Laptop GPU | 2.6 kg | 20.5 mm | 16.00" | 3840x2400 | |
| 87.4 % v7 (old) | 06/2022 | MSI Raider GE66 12UHS i9-12900HK, GeForce RTX 3080 Ti Laptop GPU | 2.4 kg | 23.4 mm | 15.60" | 3840x2160 | |
| 88.3 % v7 (old) | 08/2022 | MSI Titan GT77 12UHS i9-12900HX, GeForce RTX 3080 Ti Laptop GPU | 3.3 kg | 23 mm | 17.30" | 1920x1080 | |
| 86.9 % v7 (old) | 03/2022 | MSI Vector GP66 12UGS i9-12900H, GeForce RTX 3070 Ti Laptop GPU | 2.3 kg | 23.4 mm | 15.60" | 1920x1080 | |
| 88.3 % v7 (old) | 05/2022 | Razer Blade 15 Advanced Model Early 2022 i7-12800H, GeForce RTX 3080 Ti Laptop GPU | 2.1 kg | 16.99 mm | 15.60" | 1920x1080 |
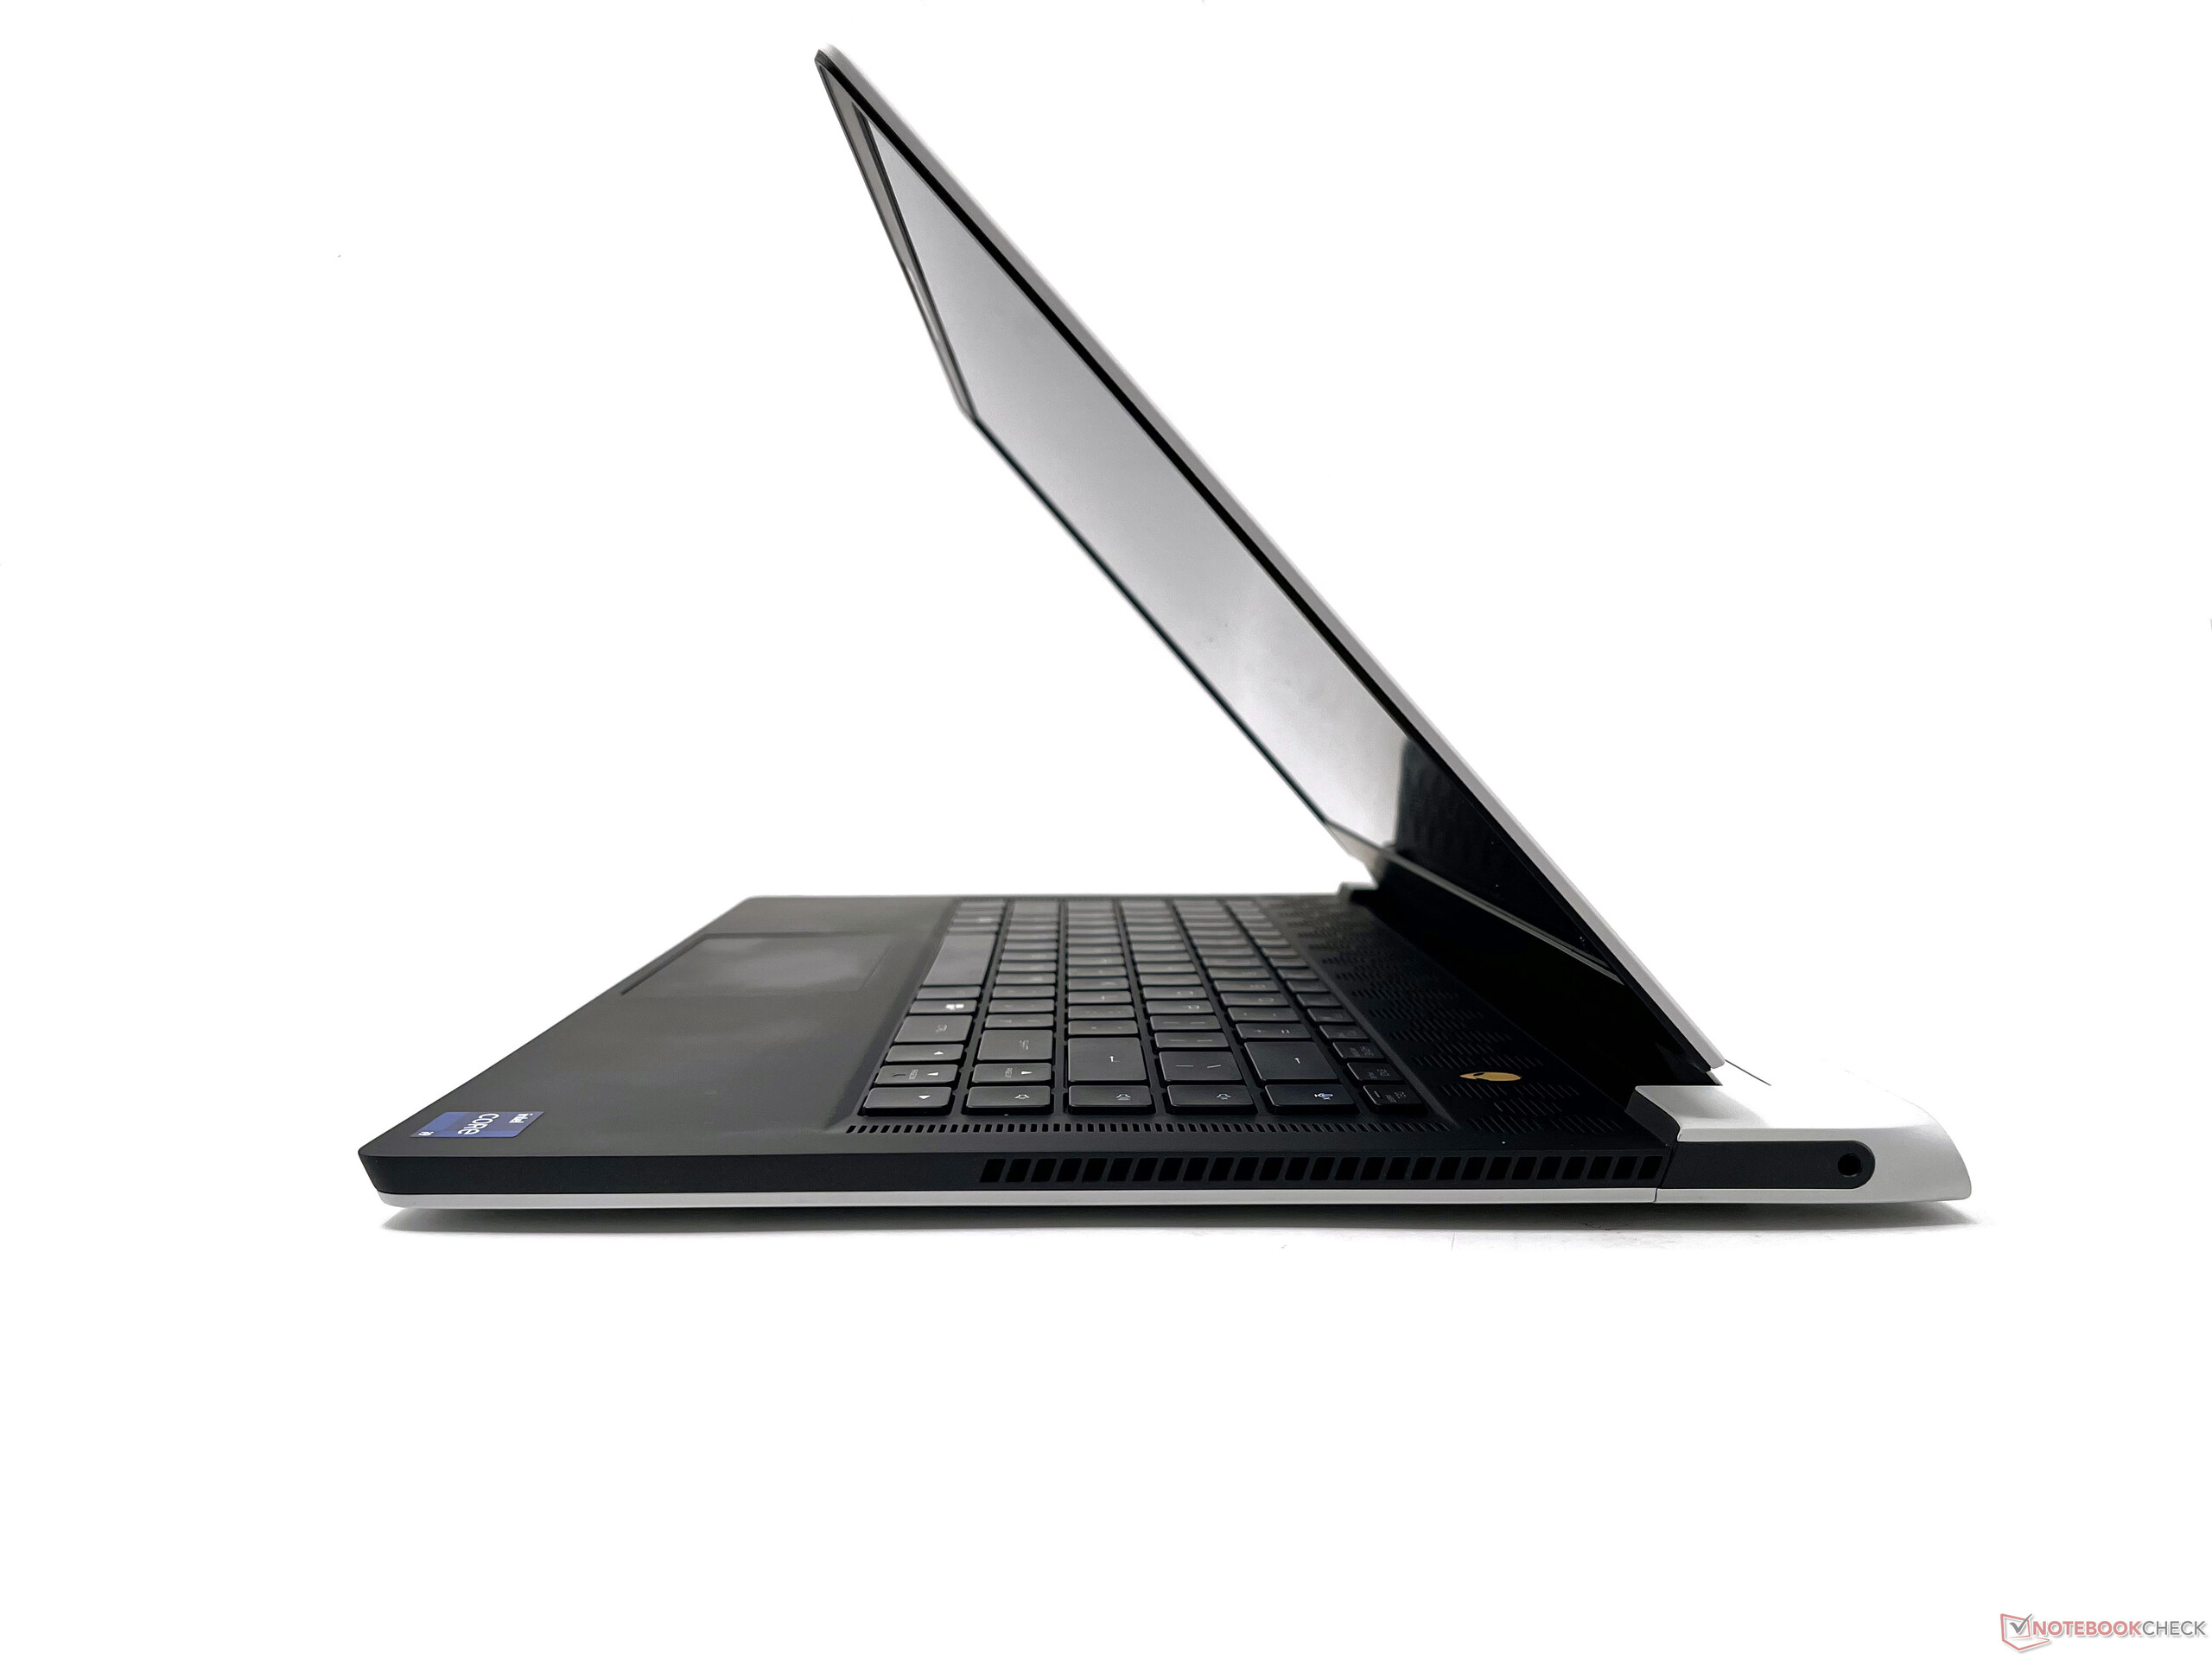
Estojo: Cada centímetro de um Alienware em um chassi de quase um livro de cultura
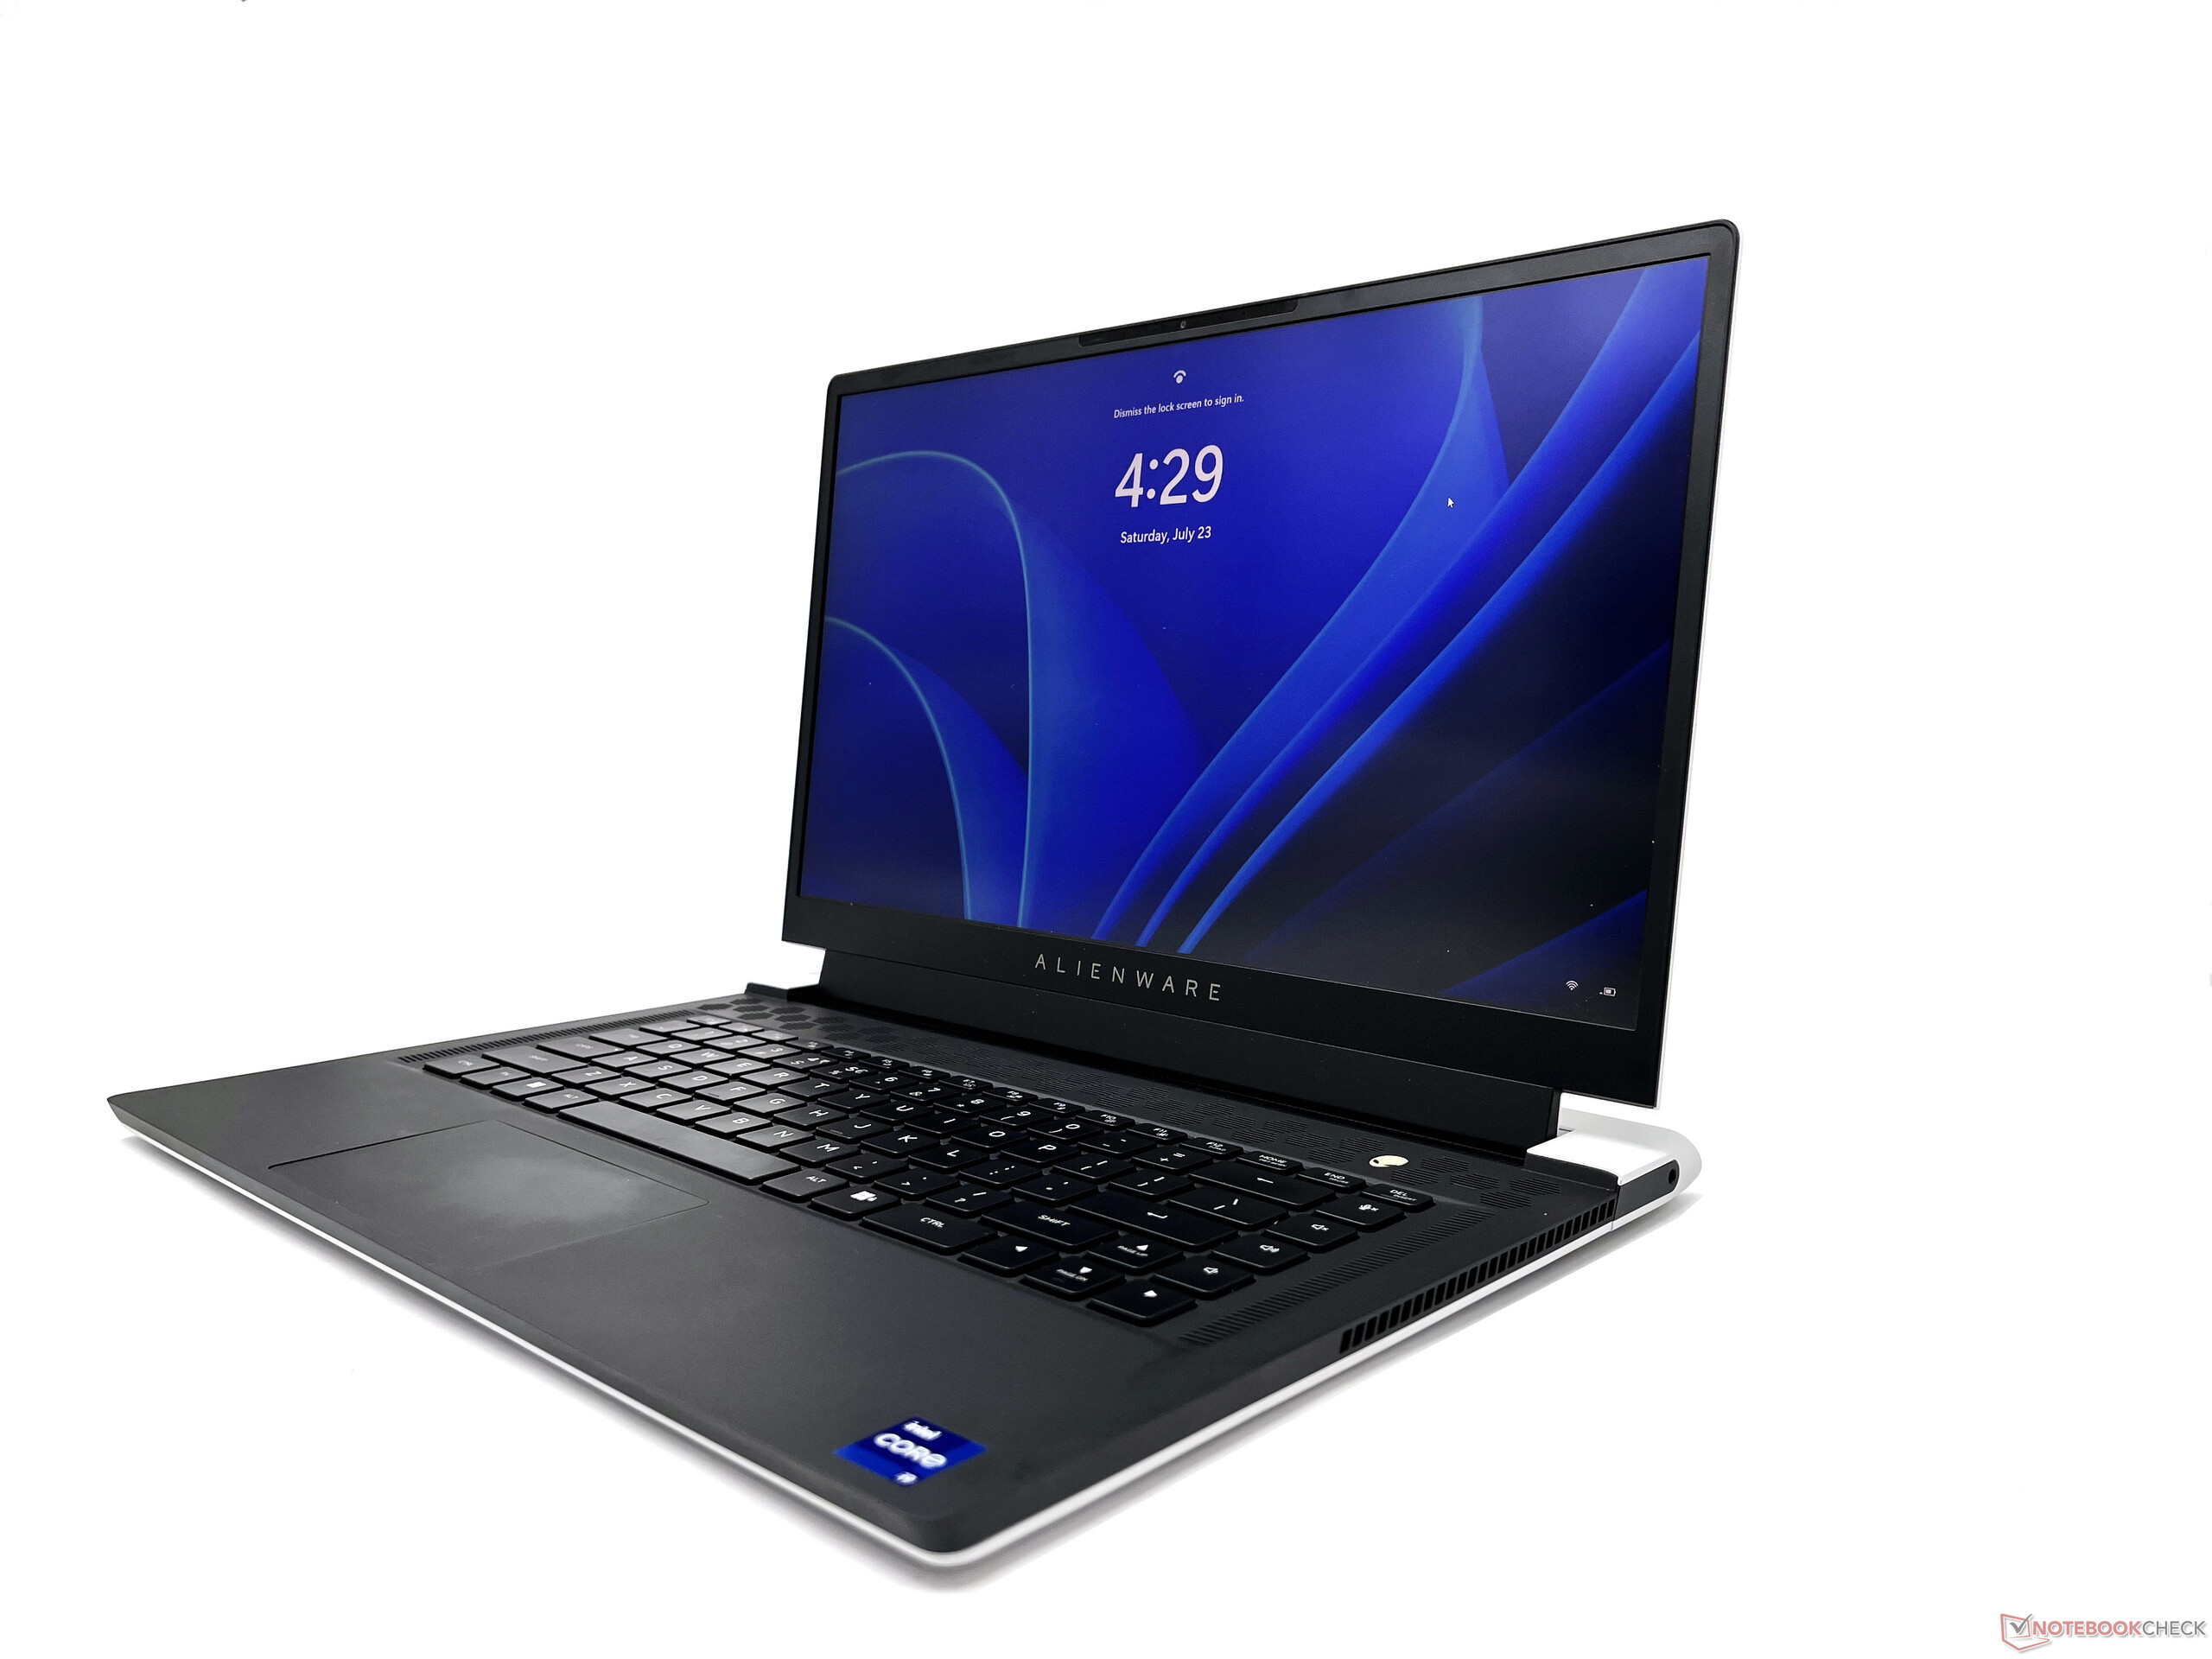
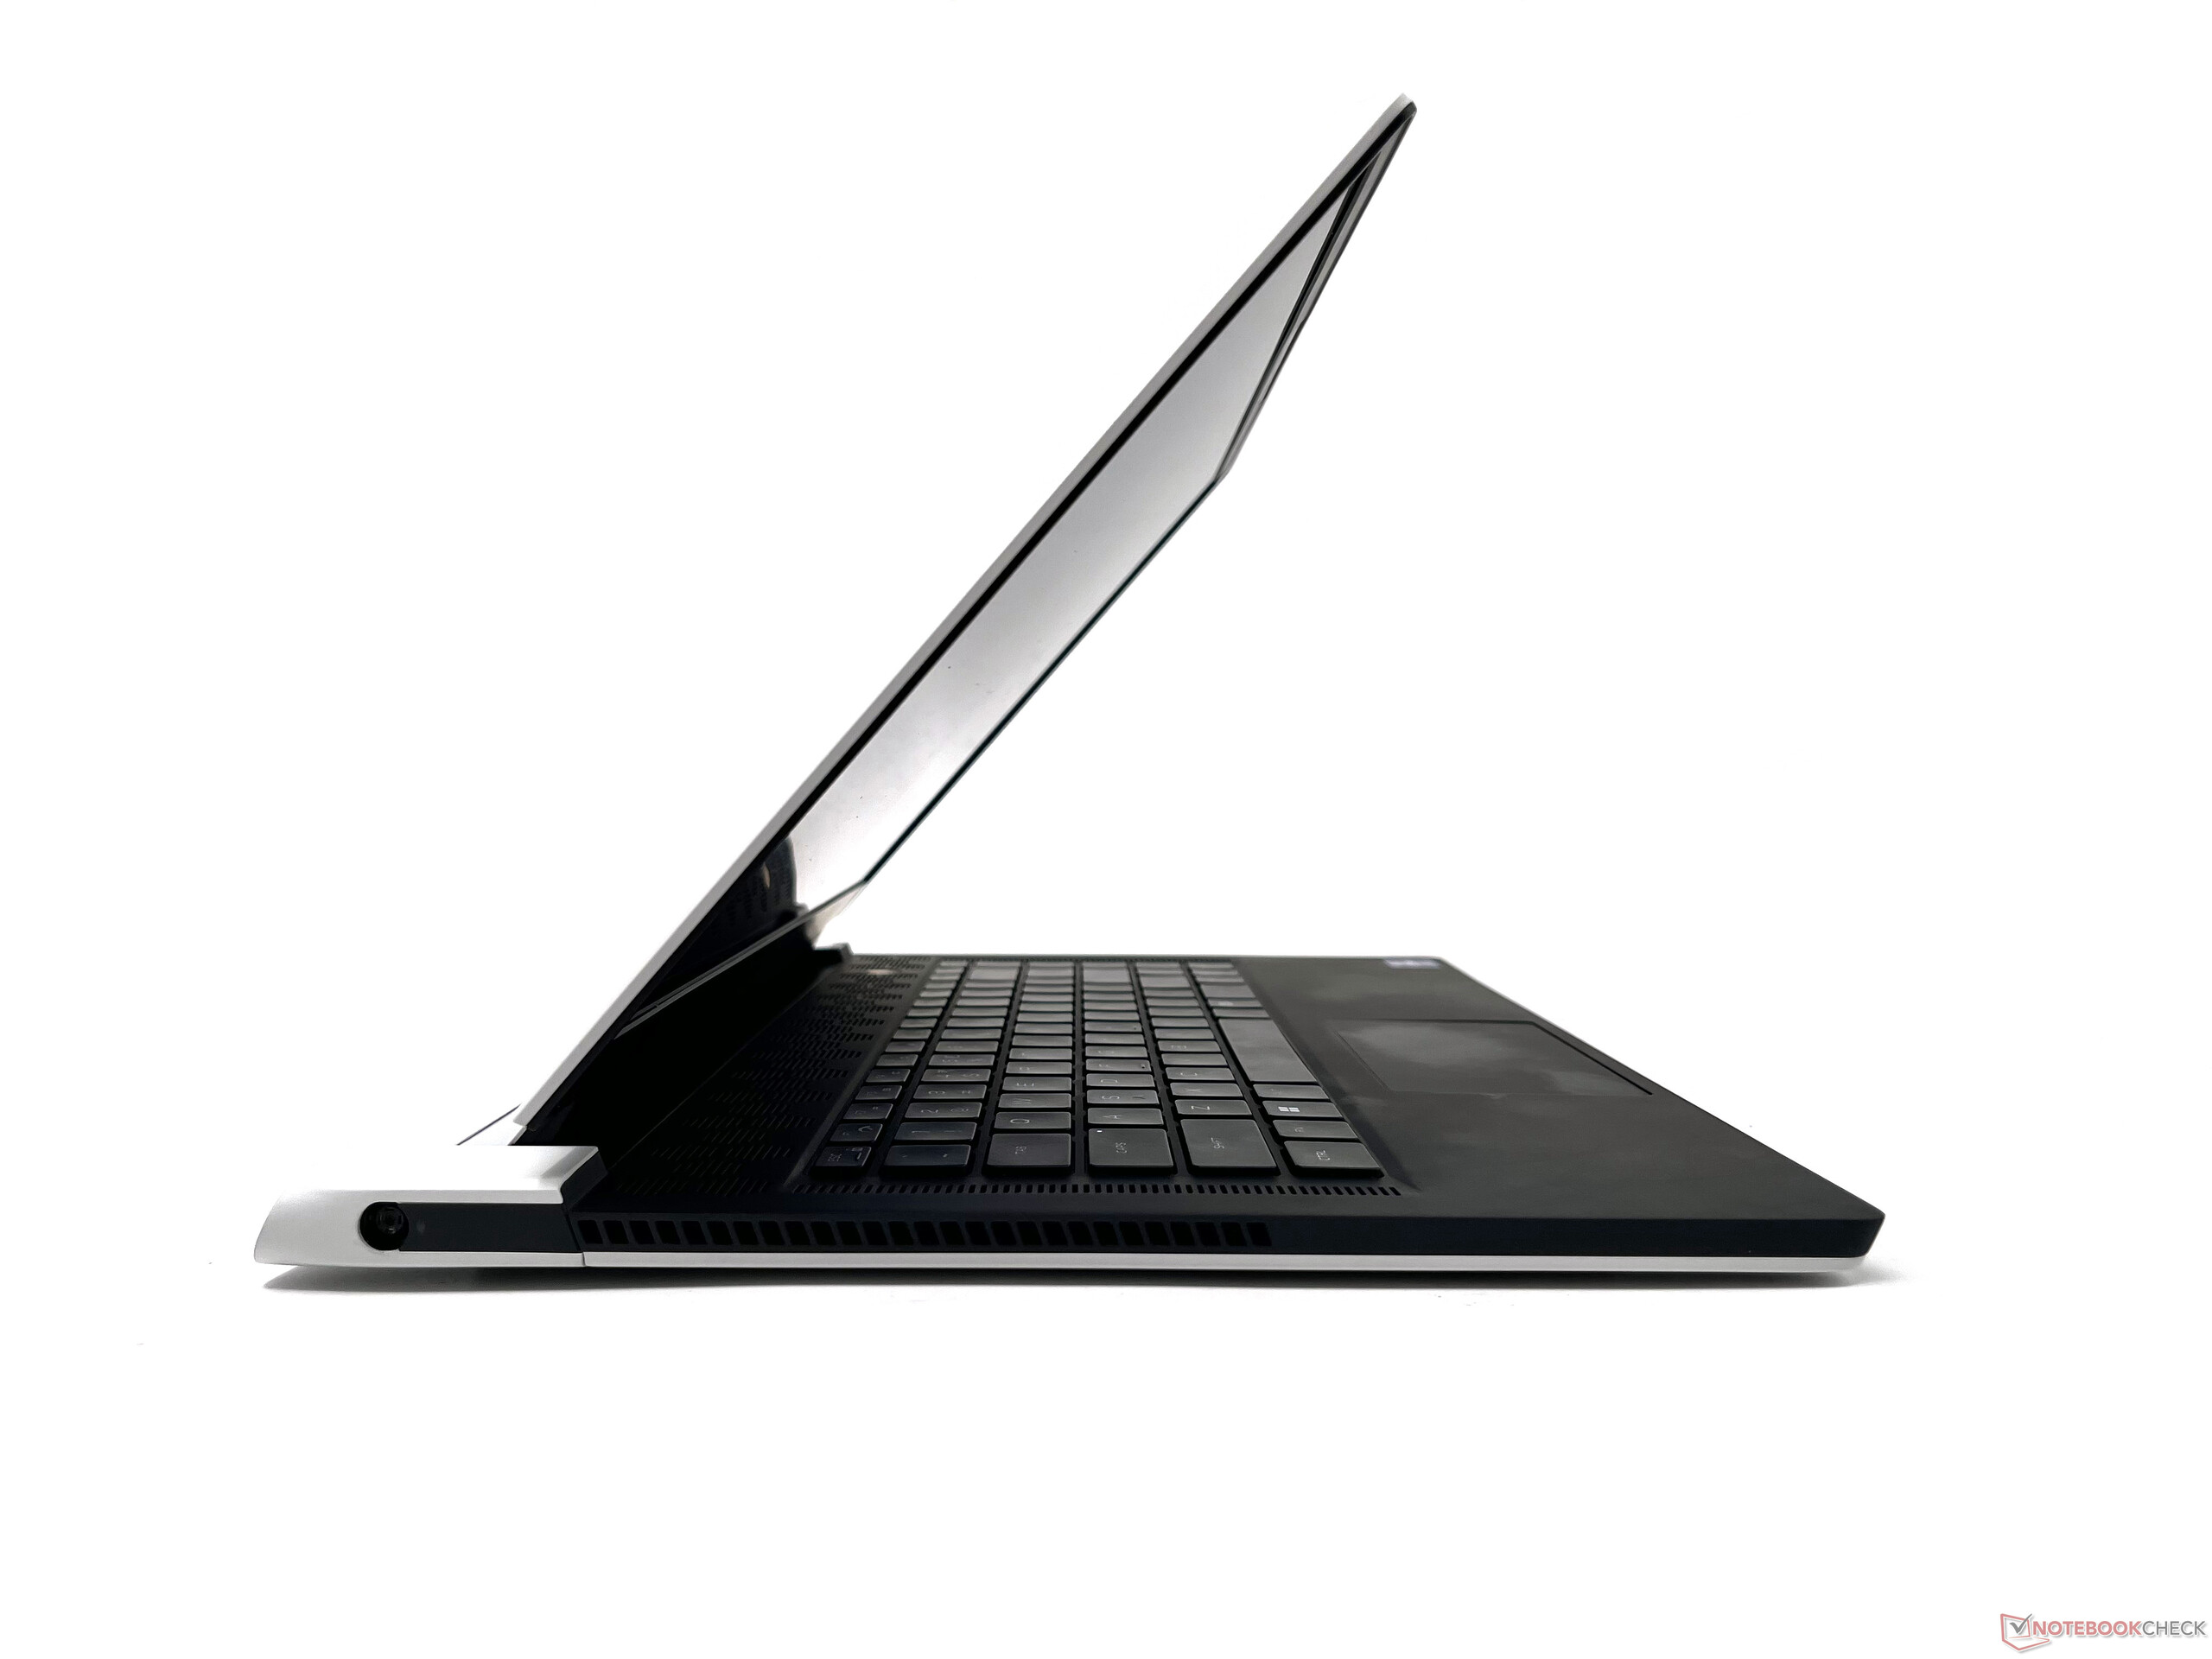
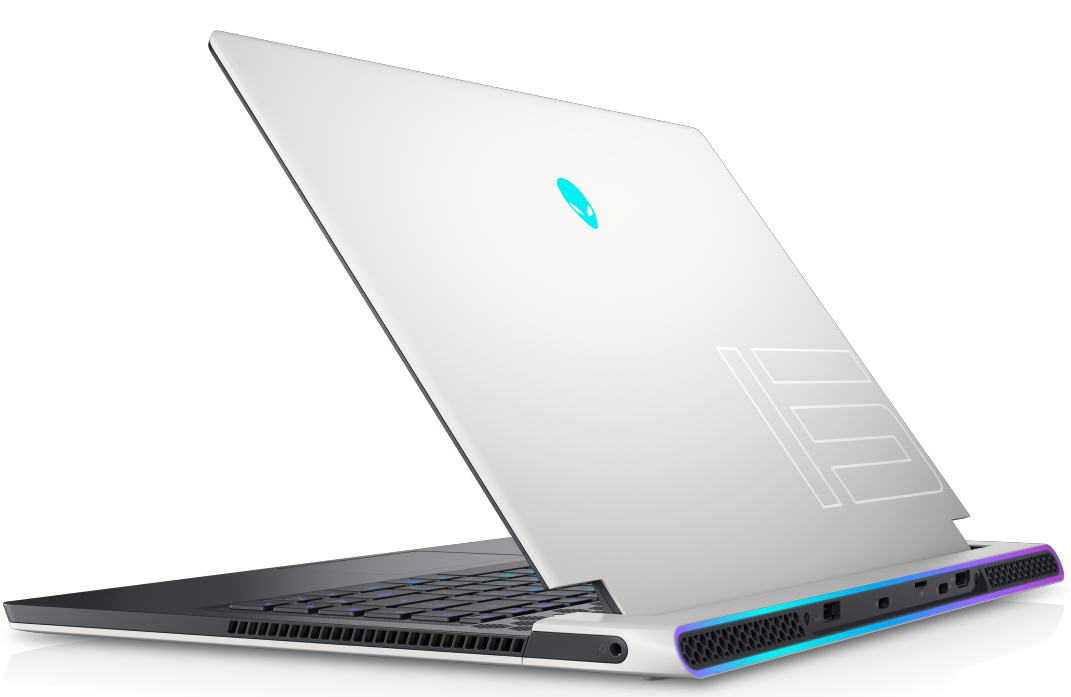
O chassi Legend 2.0 não sofreu grandes alterações em relação ao x15 R1 e é igualmente chamativo. O x15 R2 parece bastante fino para o hardware em oferta, e a Alienware conseguiu obter a mistura de classe e estética de jogo correta.
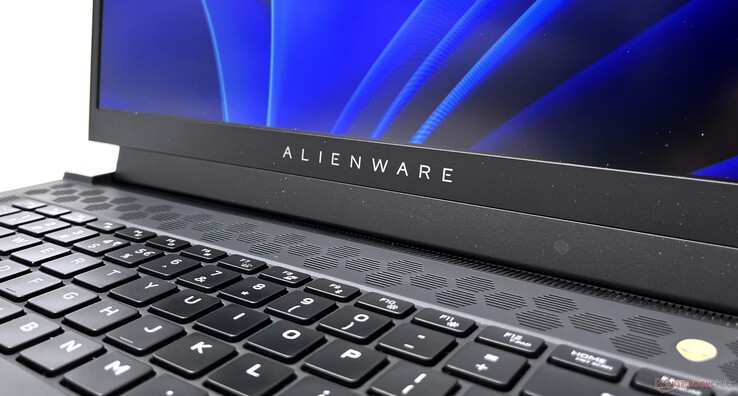
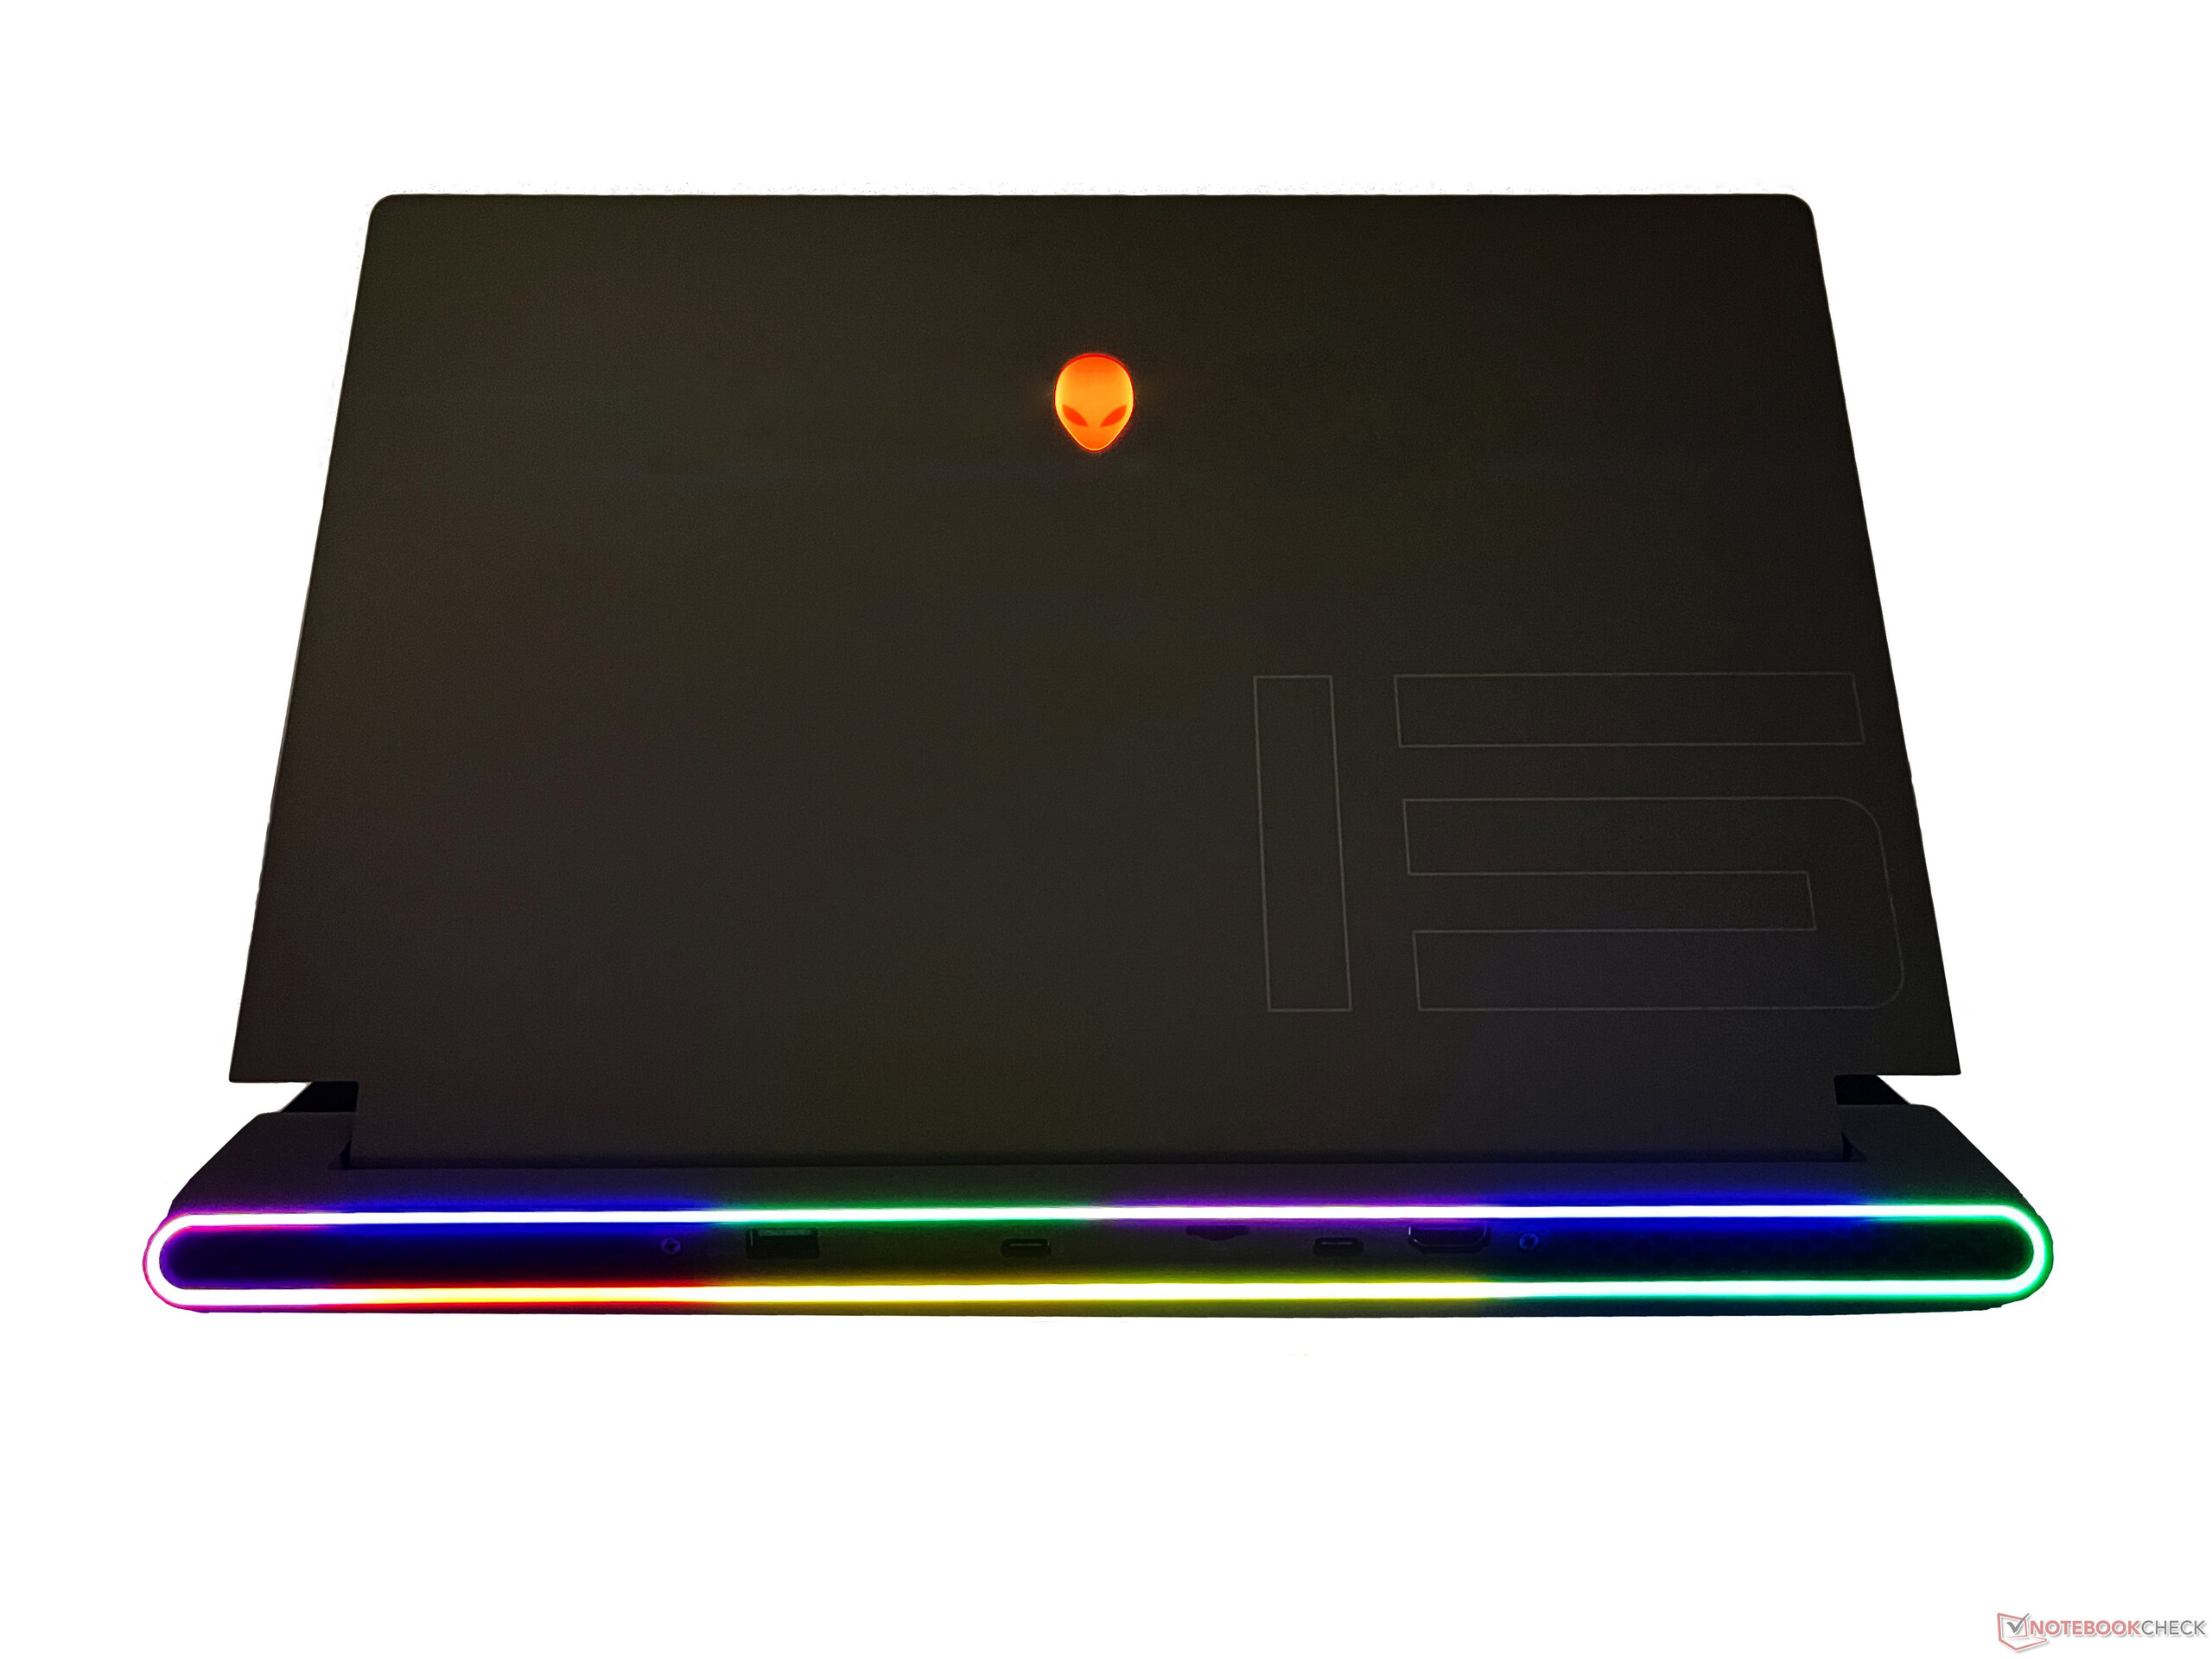
A pintura de dois tons com um chassi branco e um deck de teclado preto parece atraente e suave ao toque. O logotipo da cabeça do alienígena na parte de trás da tampa e o botão de energia brilha em RGB imaculado, assim como as luzes traseiras do estádio RGB feitas de 90 micro-LEDs, todas as quais podem ser totalmente personalizadas ou desligadas no Centro de Comando de Alienígenas
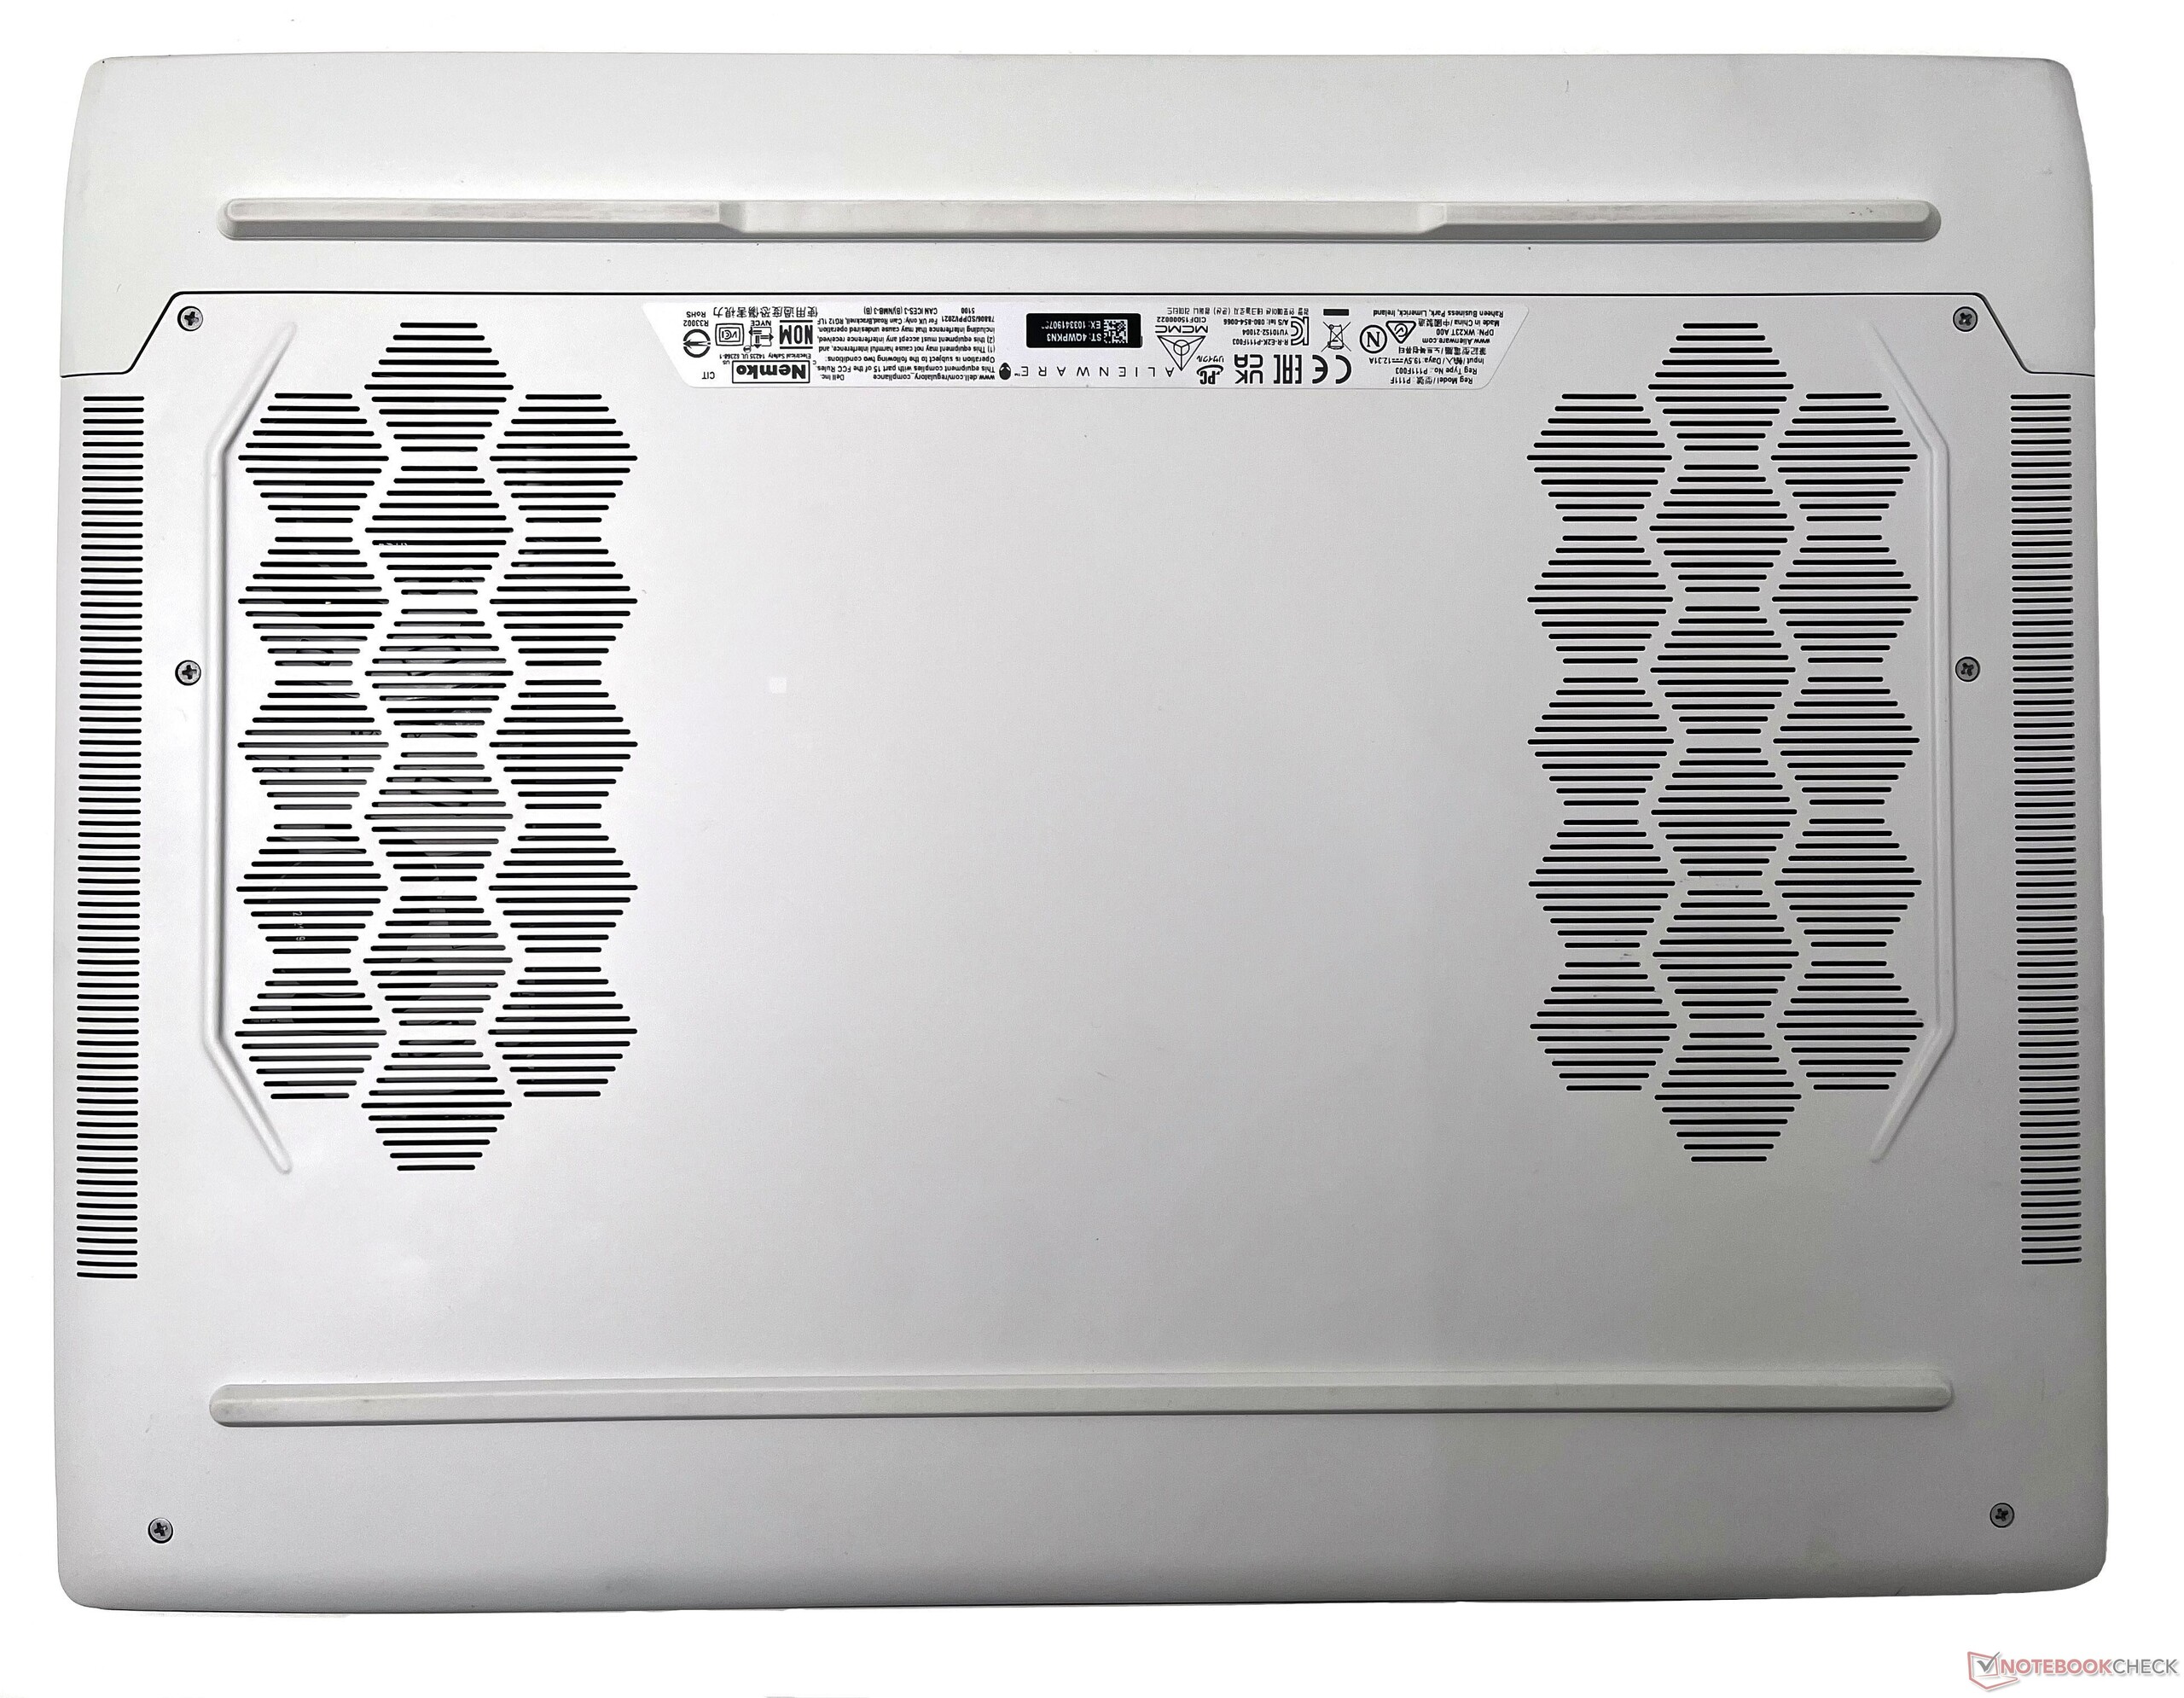
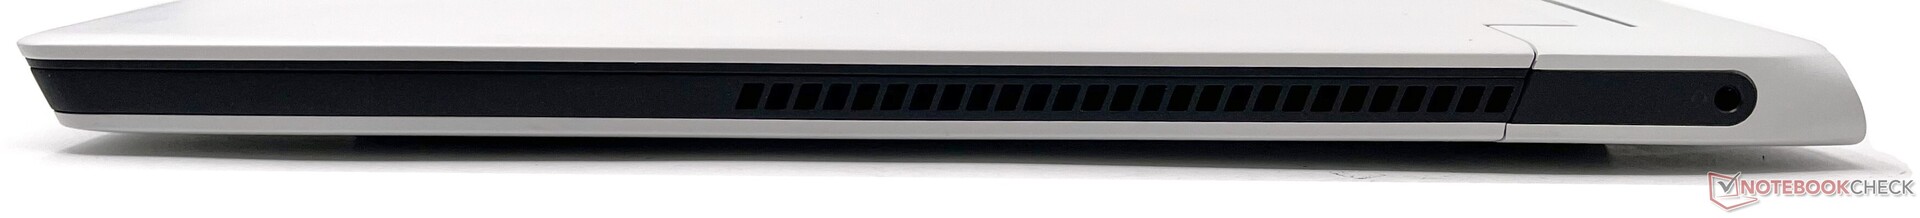
Os respiradouros traseiros possuem um padrão de favo de mel para adicionar um pouco de suavidade. O painel inferior tem também uma construção de plástico e aberturas de entrada com padrão esportivo
Embora a construção da plataforma do teclado seja em grande parte plástica, ela parece bastante superior e uniforme, sem nenhuma aresta afiada ou flexão gratuita - algo pelo qual os Alienwares da geração anterior eram notoriamente famosos. Há alguma
flexão, mas isso só é observado quando se aplica pressão deliberadamente. A tampa do visor é feita de liga de magnésio para rigidez com o número "15" distintamente gravada.
No geral, o Alienware x15 R2 emite grandes vibrações na primeira aparência com seu fator de forma ultra-livre, mantendo as características de assinatura Alienware.

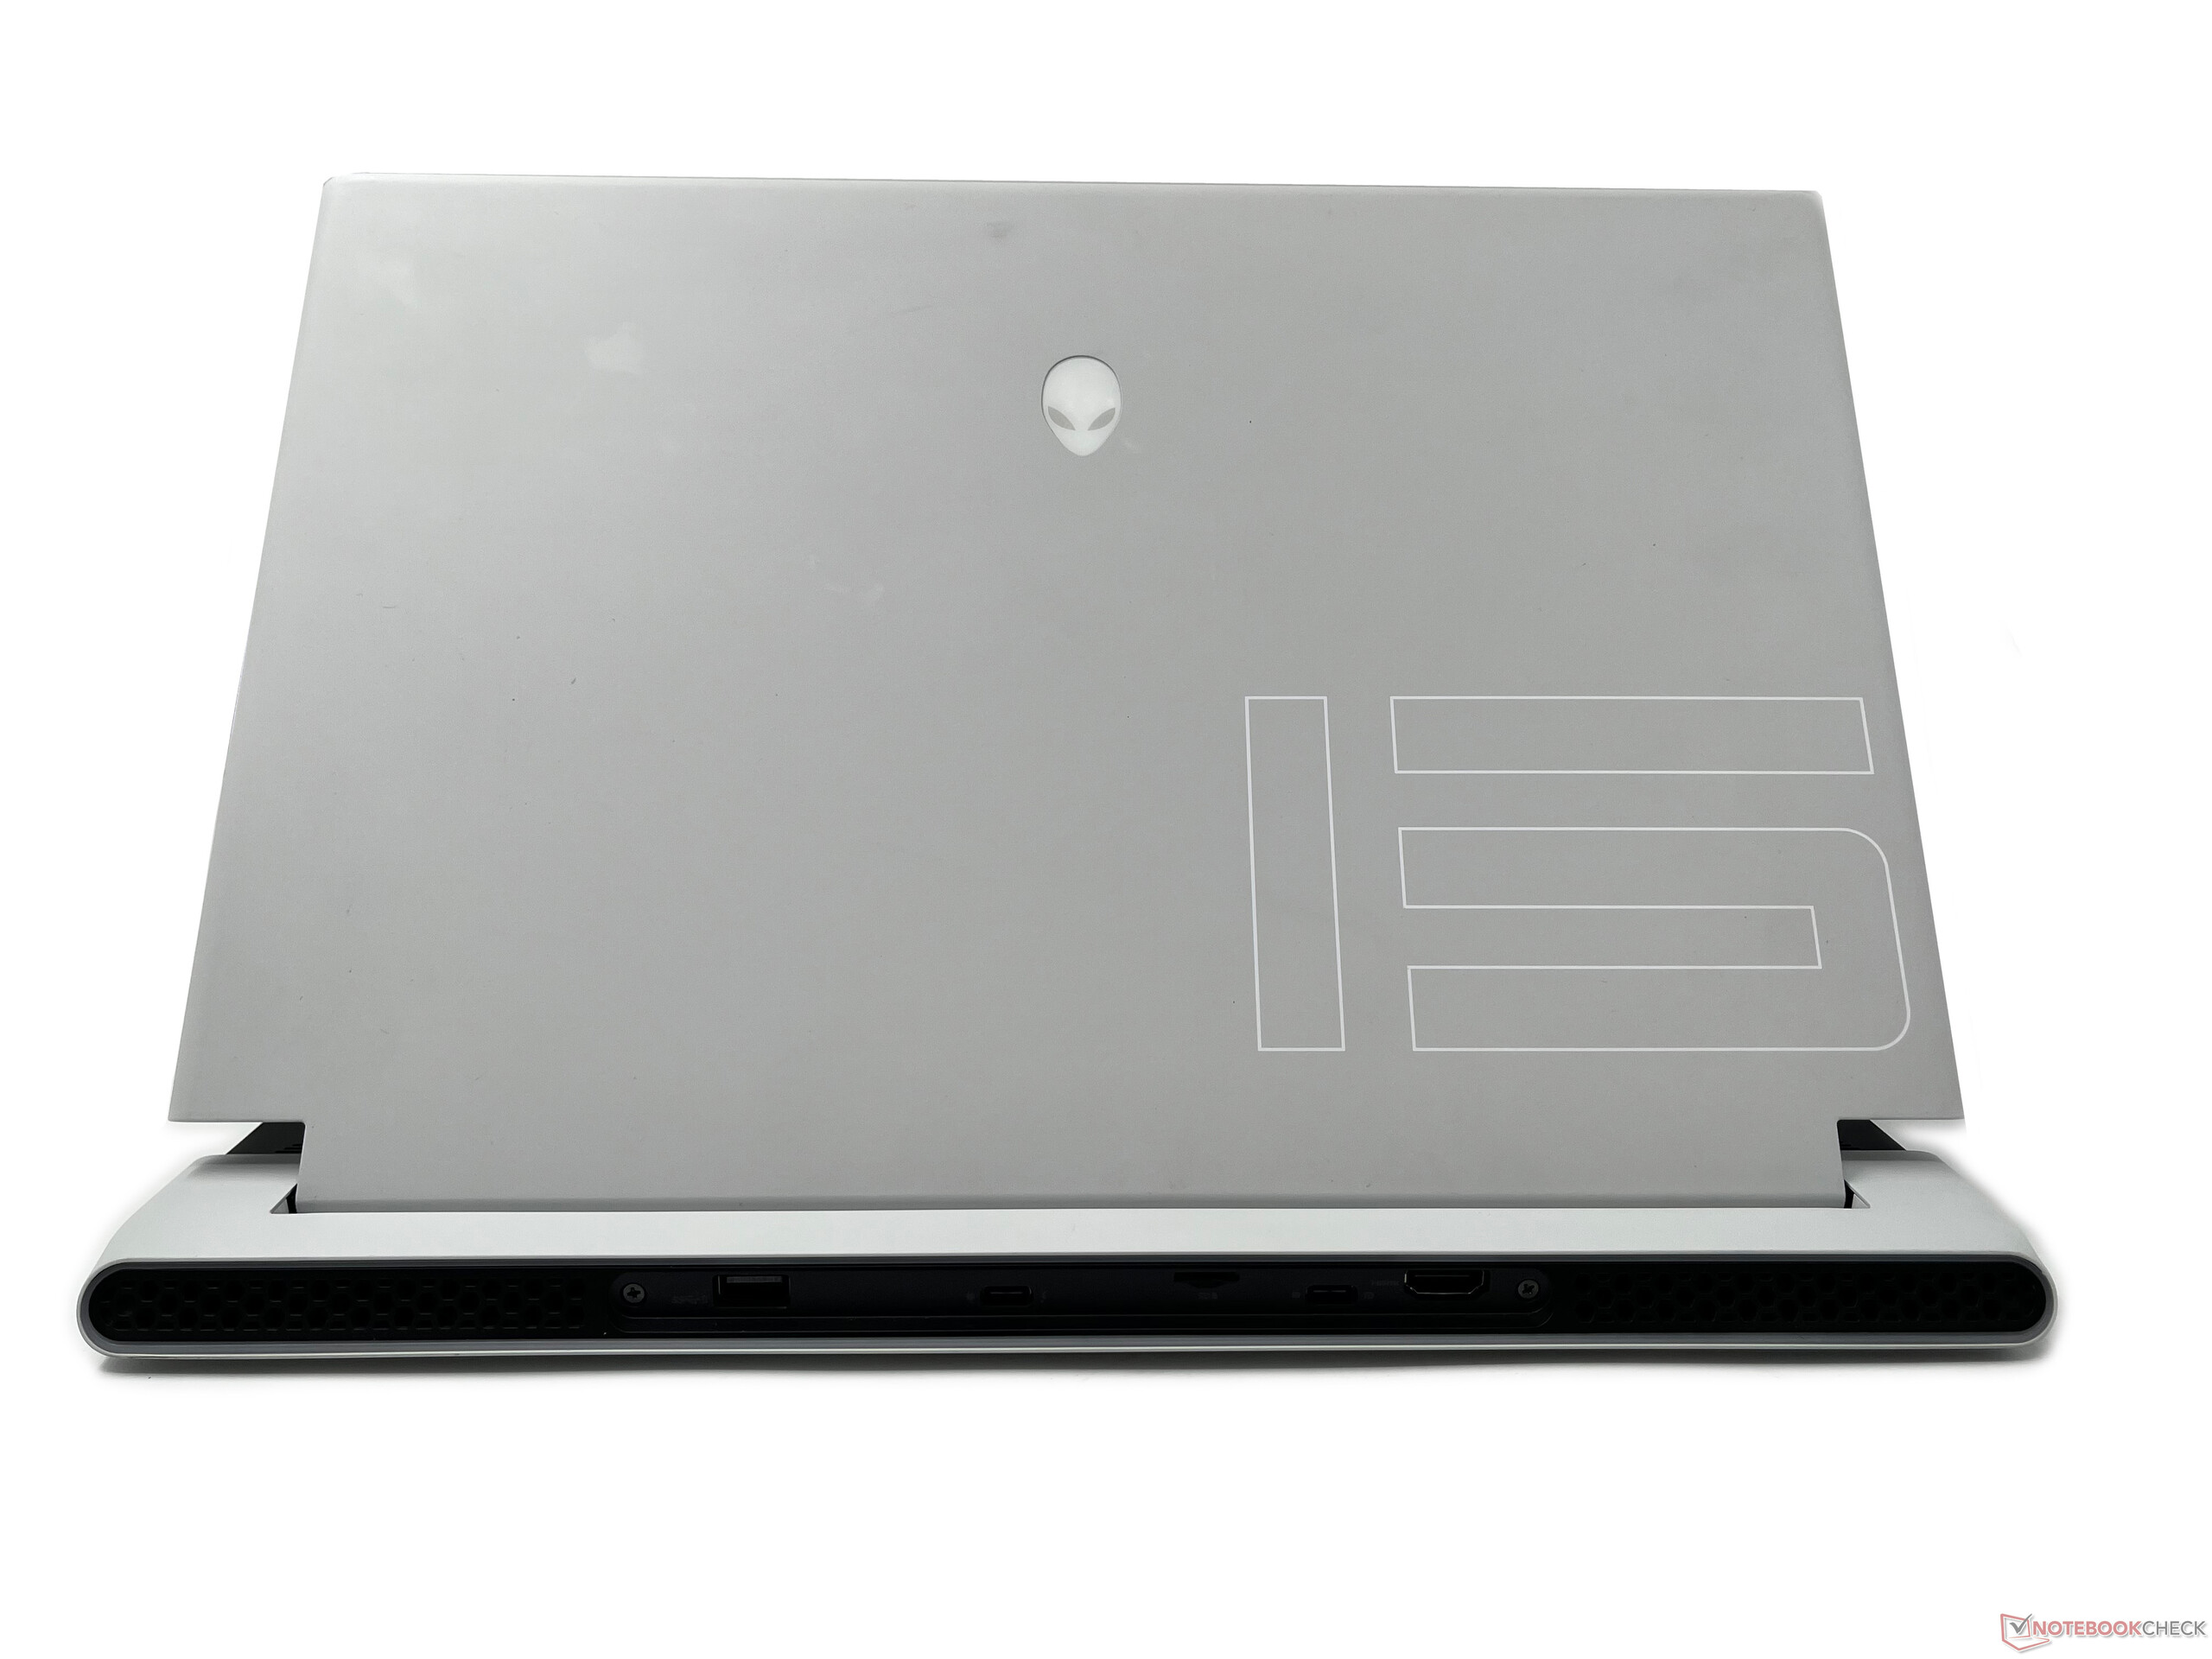
Conectividade: Todas as portas do lado da popa
A disposição dos portos no Alienware x15 R2 é semelhante ao que vimos com o x15 R1
À esquerda, temos uma porta adaptadora de energia enquanto a direita abriga apenas o conector de áudio combinado de 3,5 mm. A tomada de áudio é colocada mais para trás, o que pode ser incômodo se seus fones de ouvido com fio utilizarem cabos mais curtos
A parte traseira abriga uma porta USB 3.2 Gen 1 Tipo A com PowerShare, uma porta USB 3.2 Gen 2 Tipo C, e uma porta Thunderbolt 4. As portas USB Type-C e Thunderbolt 4 suportam o fornecimento de energia. Um leitor de cartões microSD e uma porta HDMI 2.1 de saída completam a seleção de portas. Um slot de trava Kensington e uma tomada RJ-45 não estão disponíveis. No entanto, a Dell embala um dongle USB Type-C para RJ-45 na caixa que oferece conectividade LAN de 2,5 GbE
A colocação da porta não representa nenhum impedimento ao conectar múltiplos periféricos. Dito isto, a colocação unilateral de todas as portas principais na parte traseira pode tornar o acesso a elas um pouco complicado, especialmente se você trocar muito os periféricos.


Leitor de cartões SD
O leitor de cartões microSD tem um desempenho admirável em nossos testes. O desempenho parece um pouco mais lento do que o que tínhamos visto anteriormente com o x15 R1, mas está na mesma liga que o do Asus ROG Zephyrus Duo 16 e o Razer Blade 15 Avançado.
| SD Card Reader | |
| average JPG Copy Test (av. of 3 runs) | |
| Alienware x15 RTX 3070 P111F (AV Pro V60) | |
| Razer Blade 15 Advanced Model Early 2022 (AV PRO microSD 128 GB V60) | |
| Asus ROG Zephyrus Duo 16 GX650RX (AV PRO microSD 128 GB V60) | |
| Alienware x15 R2 P111F (AV PRO microSD 128 GB V60) | |
| Média da turma Gaming (20.9 - 210, n=54, últimos 2 anos) | |
| MSI Raider GE66 12UHS (AV PRO microSD 128 GB V60) | |
| MSI Titan GT77 12UHS (AV PRO microSD 128 GB V60) | |
| maximum AS SSD Seq Read Test (1GB) | |
| Alienware x15 RTX 3070 P111F (AV Pro V60) | |
| Alienware x15 R2 P111F (AV PRO microSD 128 GB V60) | |
| Asus ROG Zephyrus Duo 16 GX650RX (AV PRO microSD 128 GB V60) | |
| Média da turma Gaming (25.5 - 261, n=51, últimos 2 anos) | |
| MSI Titan GT77 12UHS (AV PRO microSD 128 GB V60) | |
Comunicação
O x15 R2 é equipado com um cartão Killer Wi-Fi 6E AX1675i WLAN. O desempenho é decente, mas temos visto um rendimento mais rápido a partir deste cartão em outros laptops. Observamos algumas quedas no teste de transmissão de 5 GHz, mas a conexão em geral foi bastante estável durante o teste com nosso roteador de referência Asus ROG Rapture GT-AXE11000.
Não notamos nenhum benefício tangível na transição para a faixa de 6 GHz, exceto por velocidades médias de recepção ligeiramente mais altas e valores de pico de produção mais altos.
Webcam
Na era das webcams FHD, a Dell inclui um atirador insignificante de 720p no Alienware x15 R2. A câmera web é quase que útil para as chamadas de vídeo ocasionais. As cores mostram grandes desvios e as áreas escuras acabam sendo bastante ruidosas. A nitidez e os detalhes da imagem são subtis, mesmo sob condições adequadas de iluminação ambiente. Não há obturador físico da webcam fornecido.


Segurança
O x15 R2 é uma câmera IR integrada que suporta autenticação biométrica baseada no Windows Hello. Não há um leitor de impressão digital disponível
A câmera infravermelha é fácil de registrar e é bastante responsiva. Um módulo TPM 2.0 também está presente.
Acessórios
Além do adaptador de energia de 240 W e da papelada usual, a Dell também inclui na caixa um adaptador USB Type-C para RJ-45 de 2,5 Gb Ethernet.
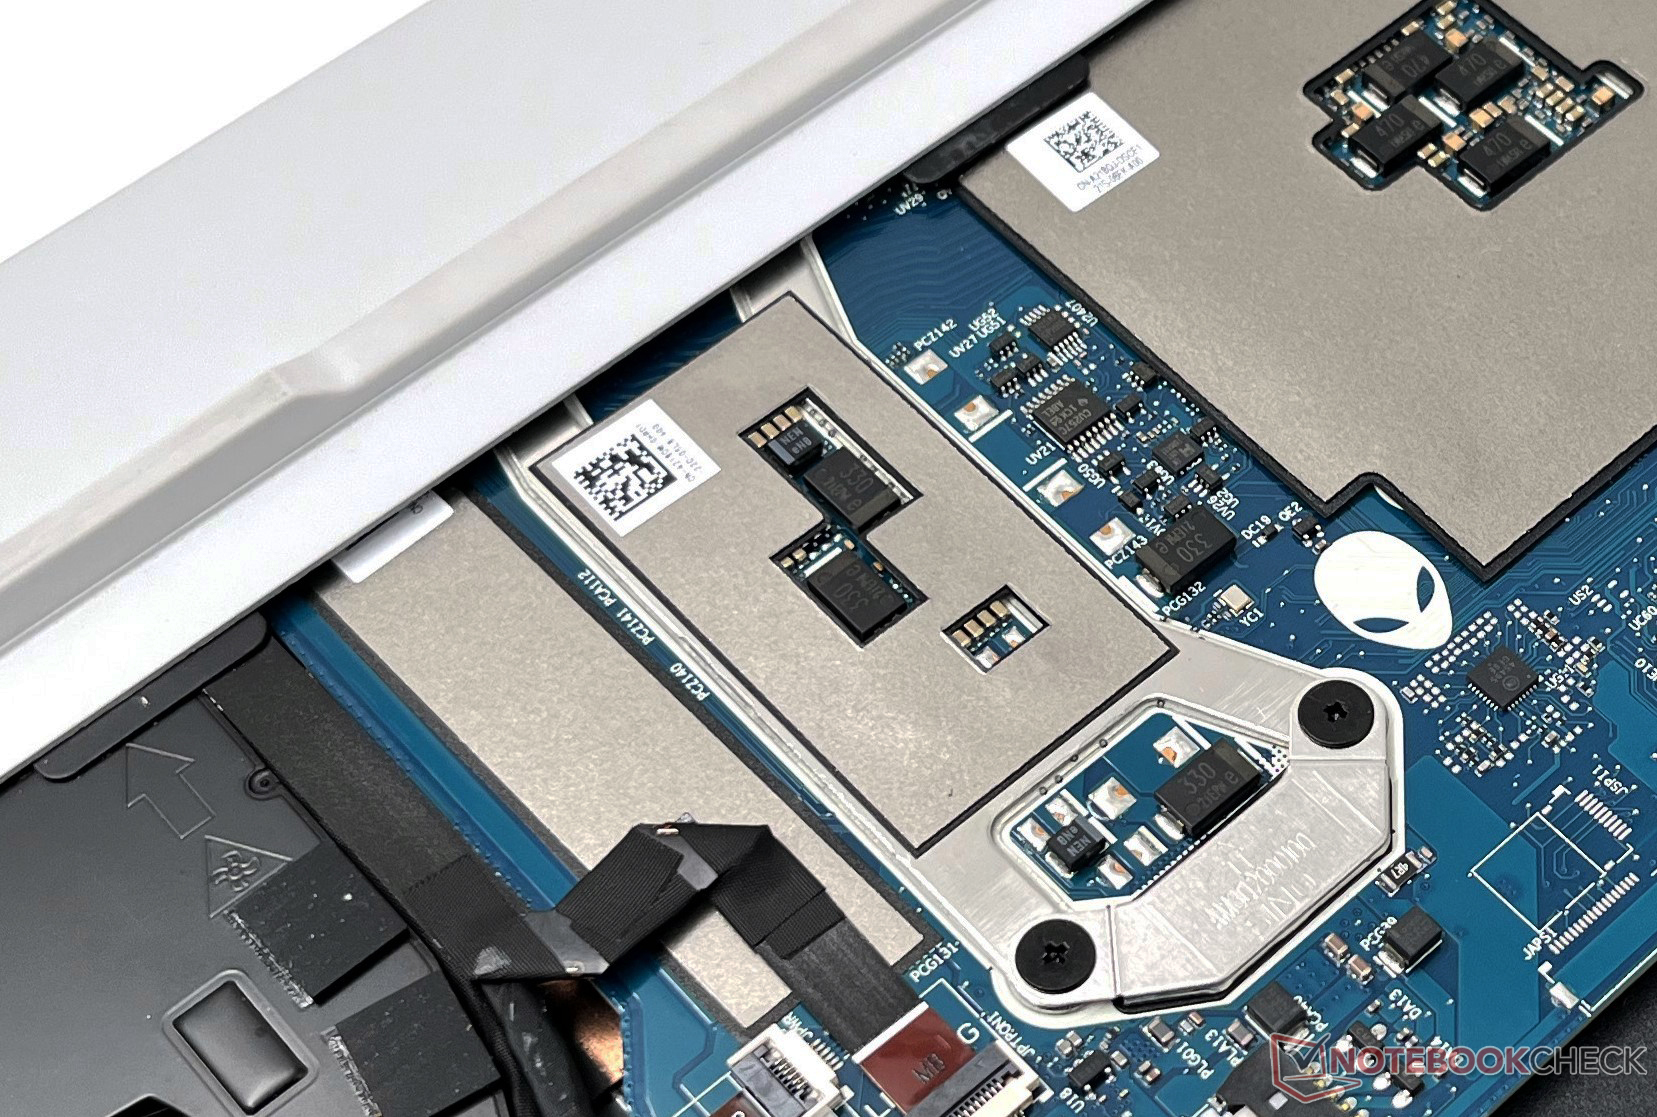
Manutenção
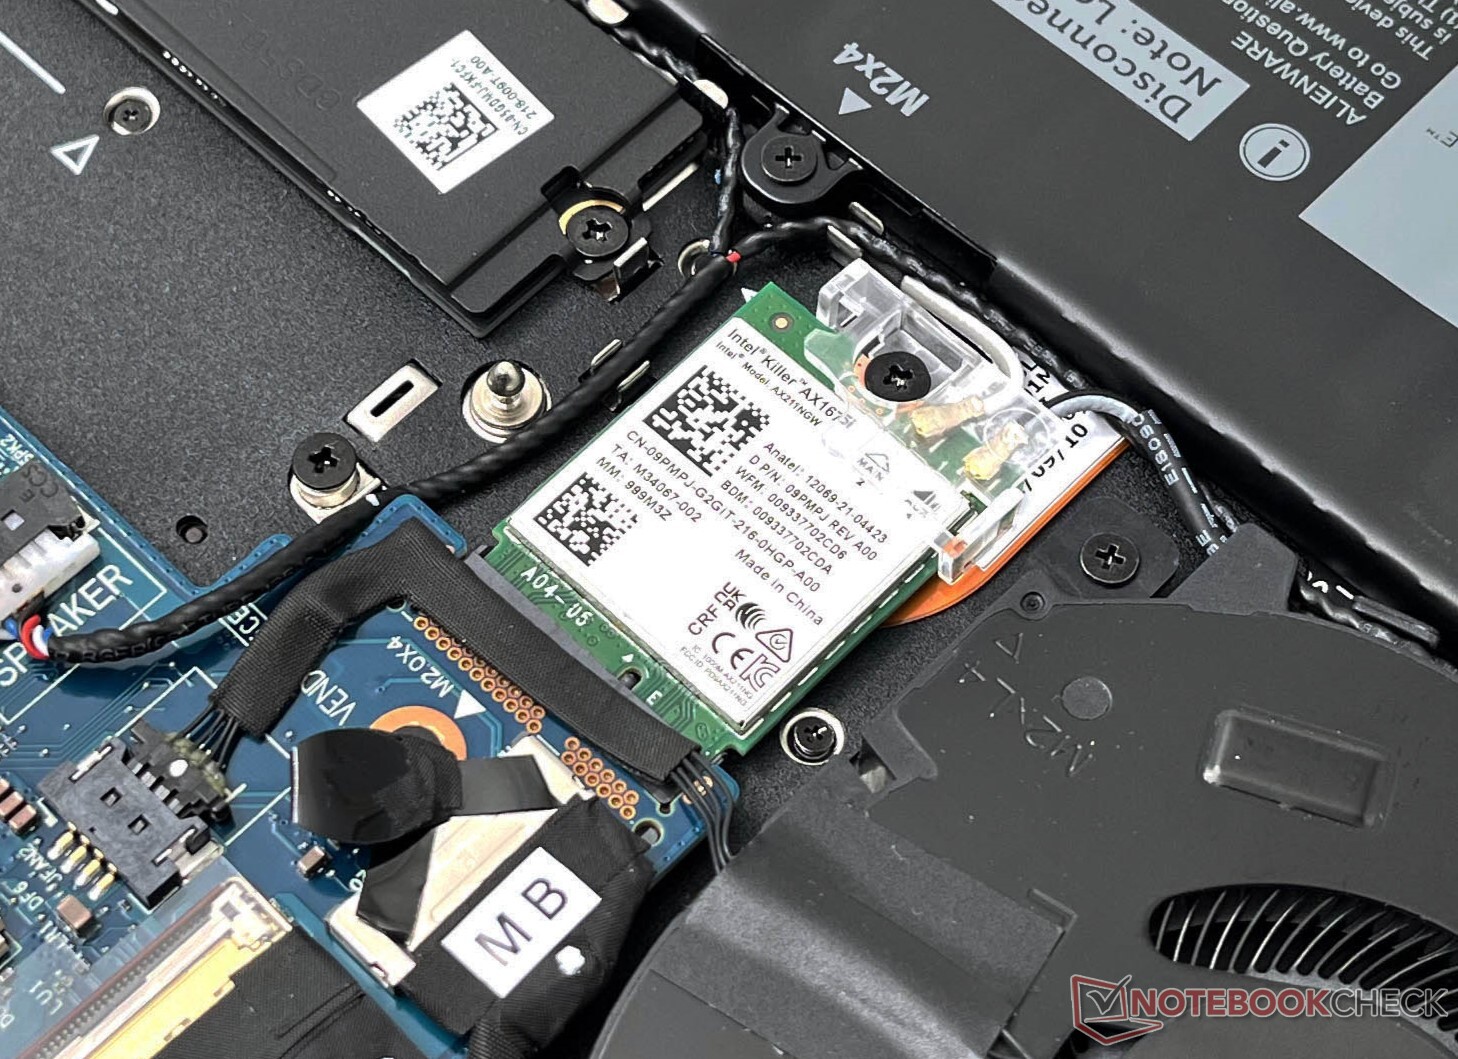
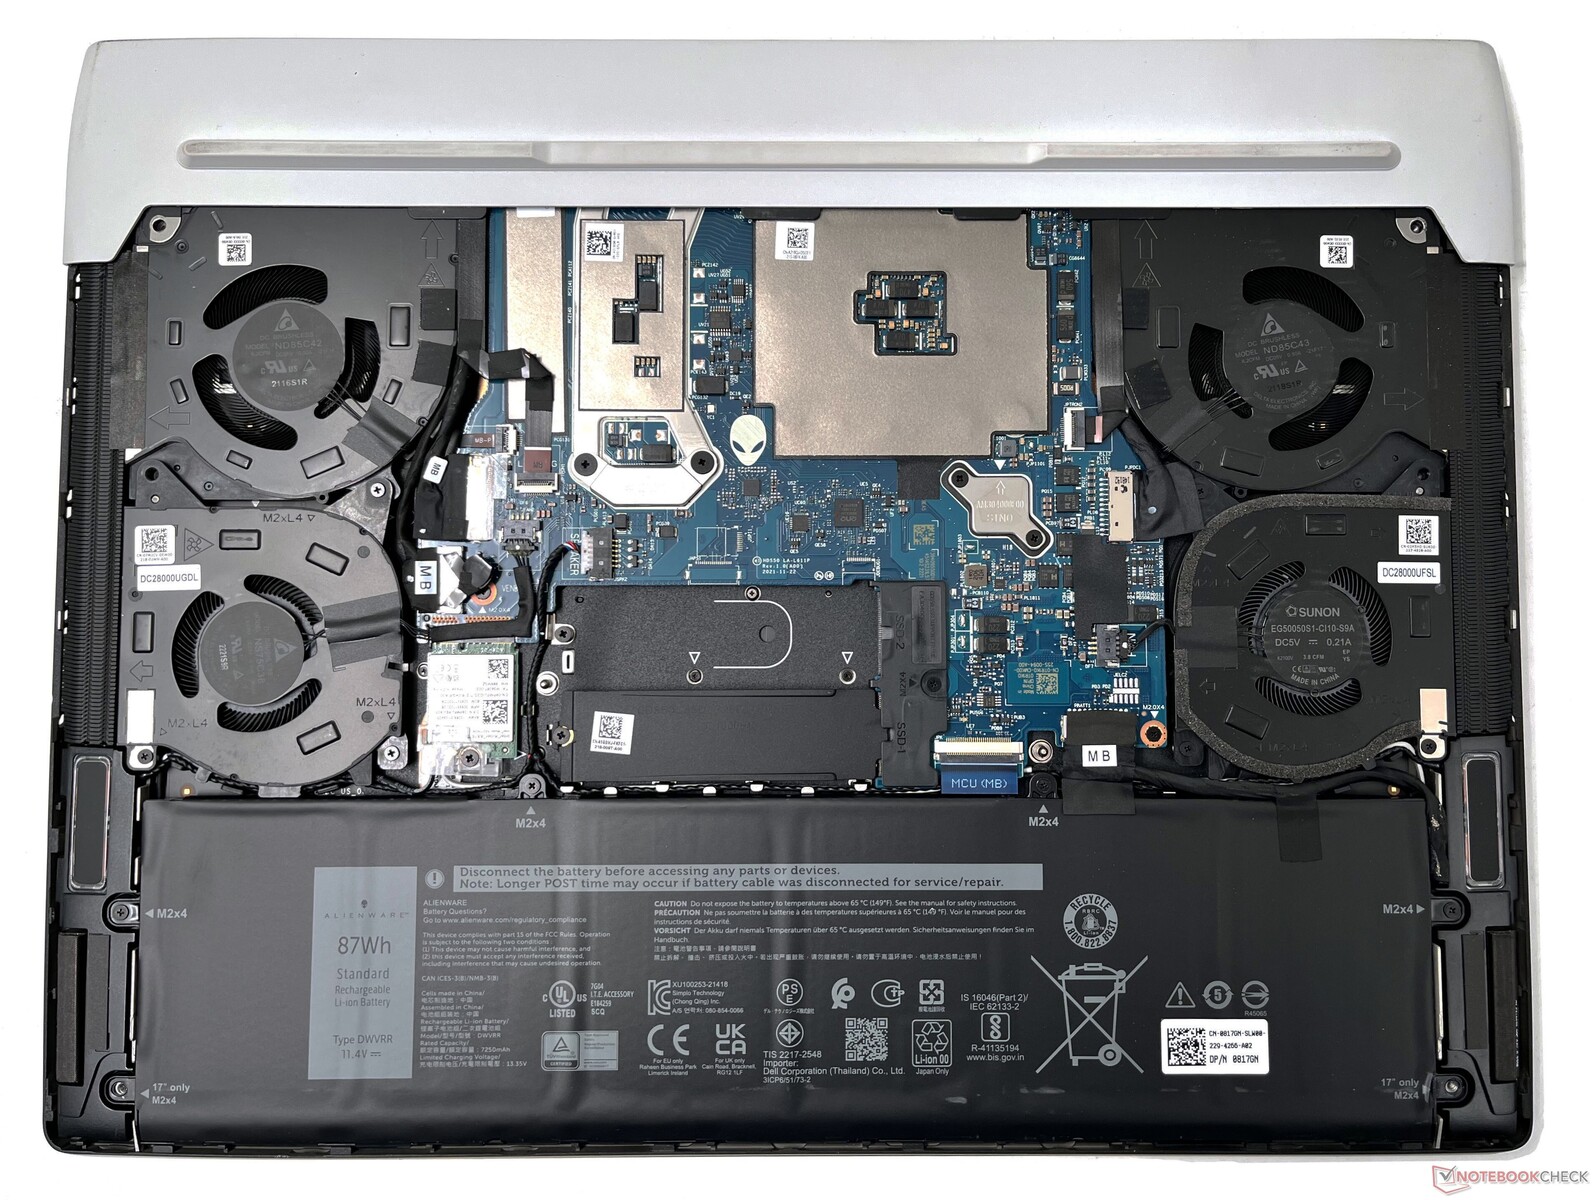
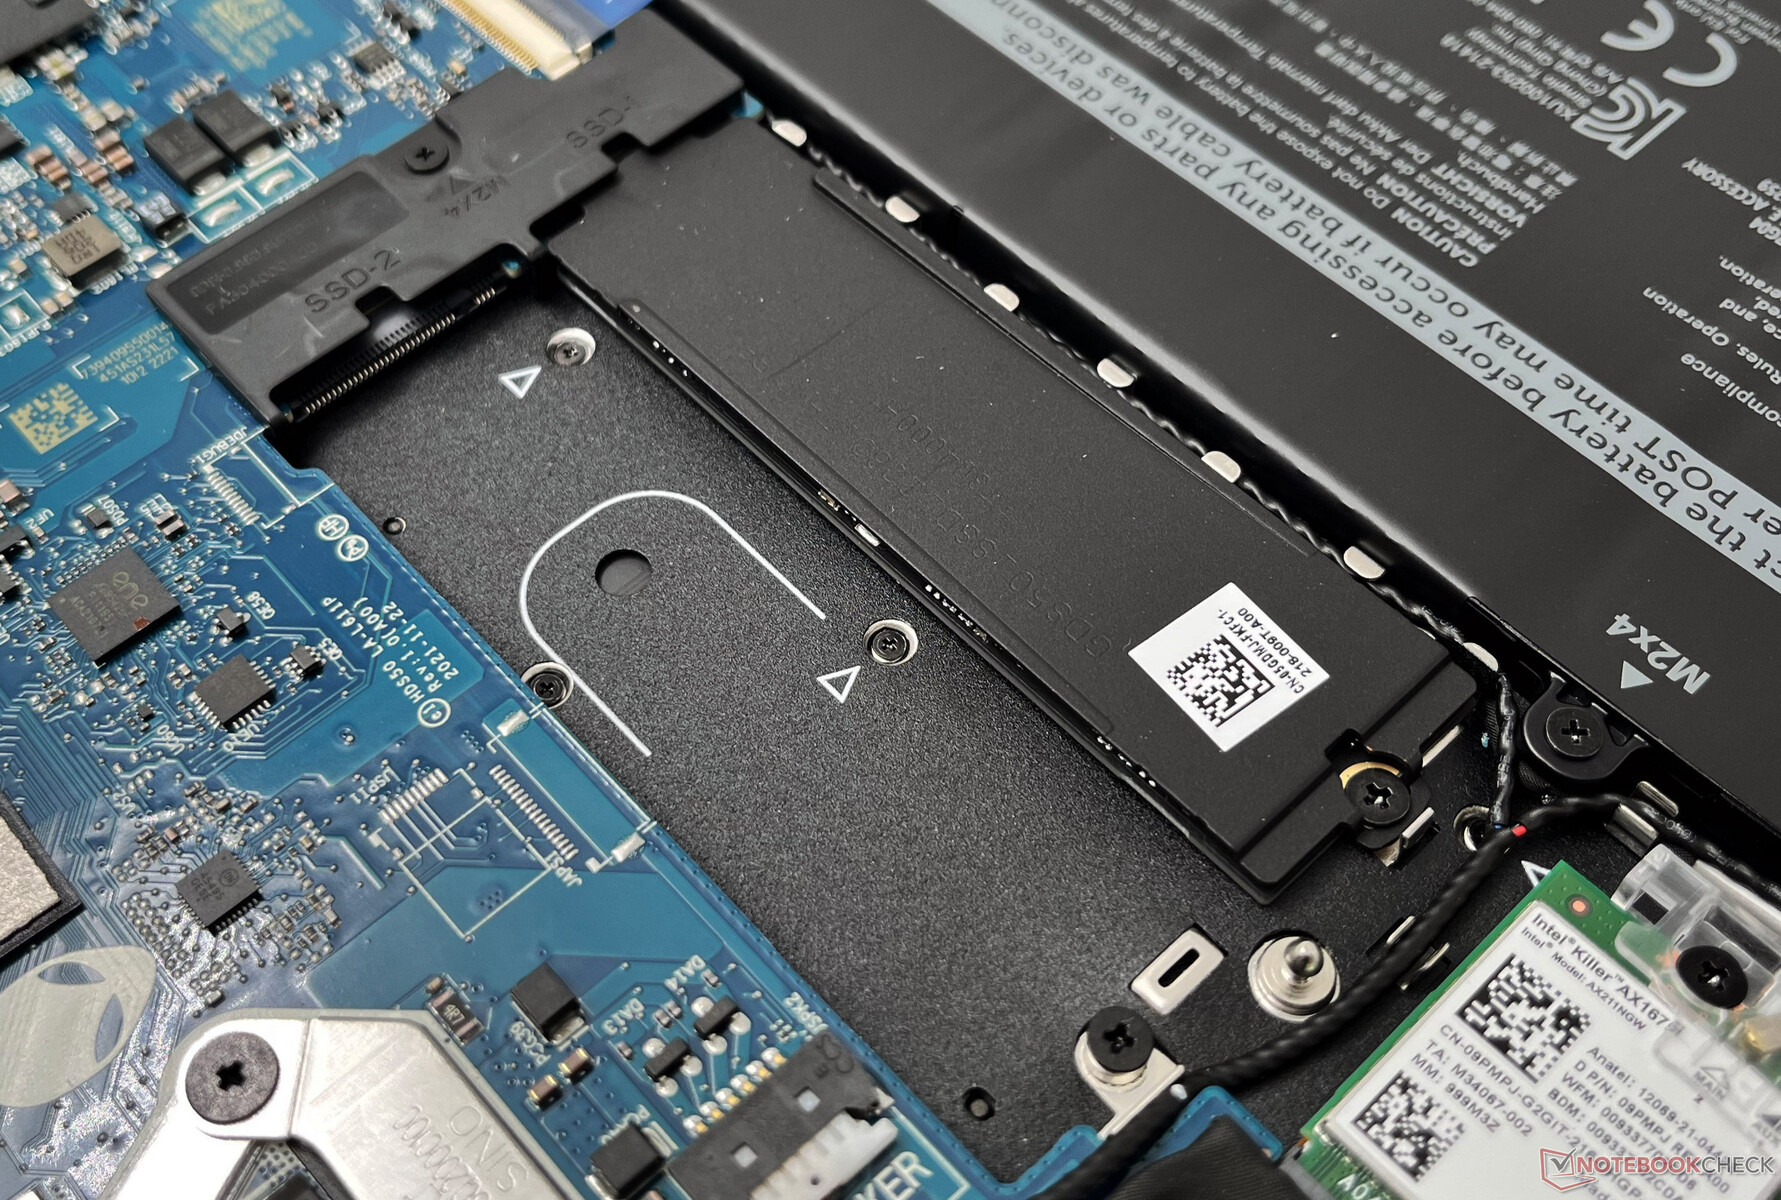
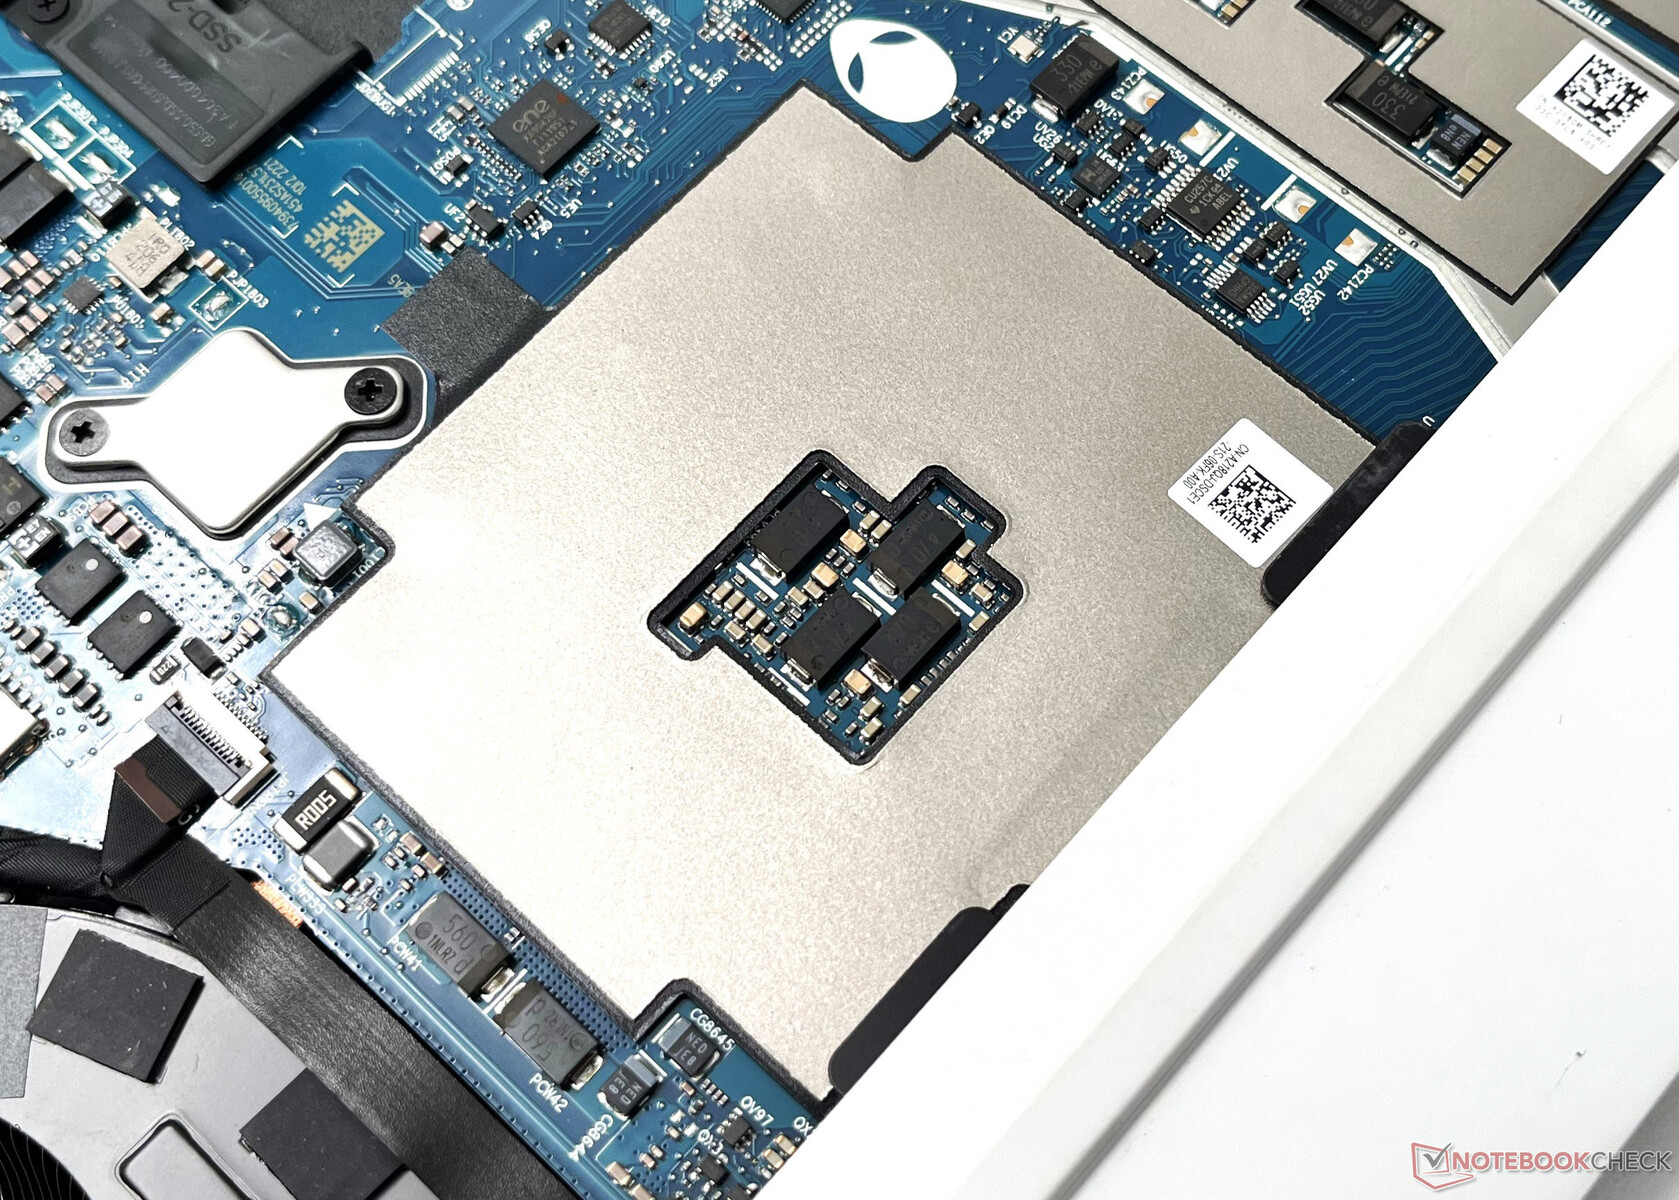
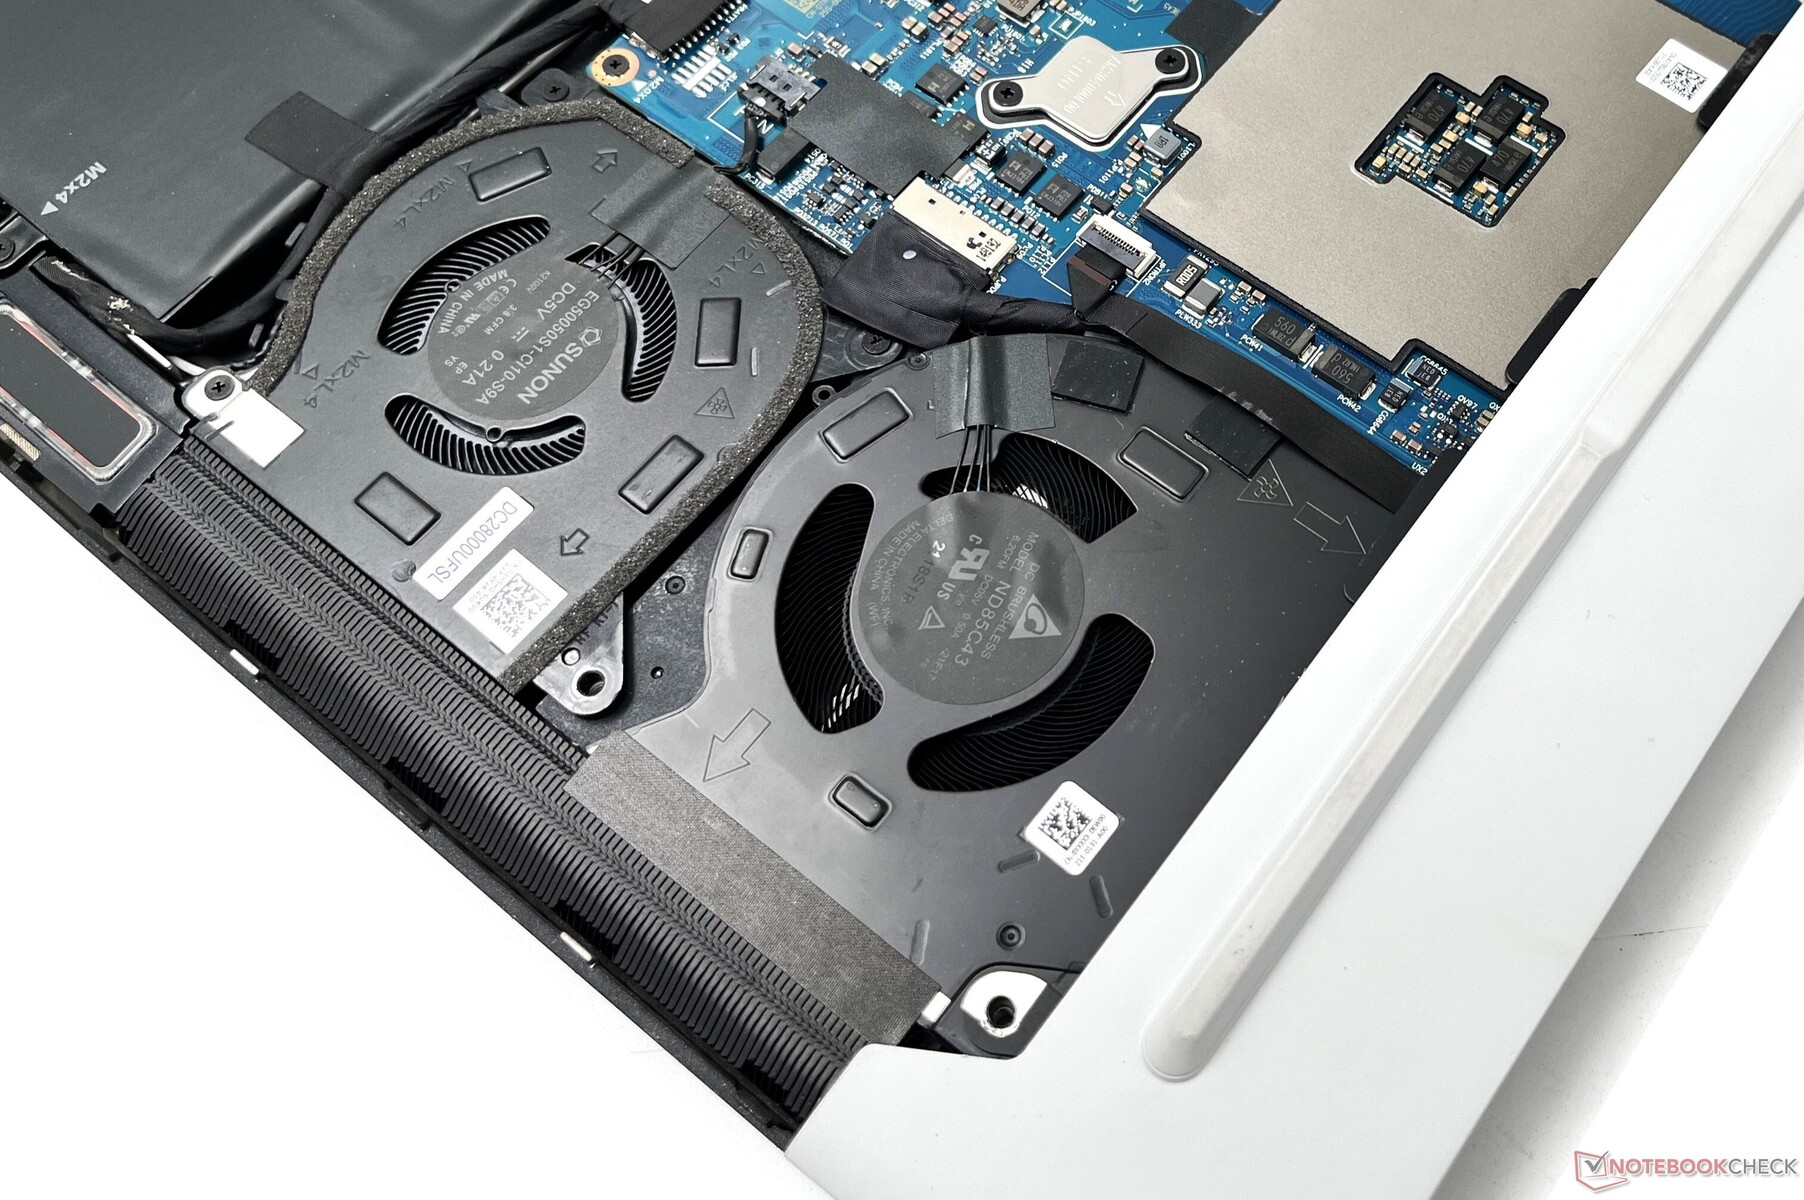
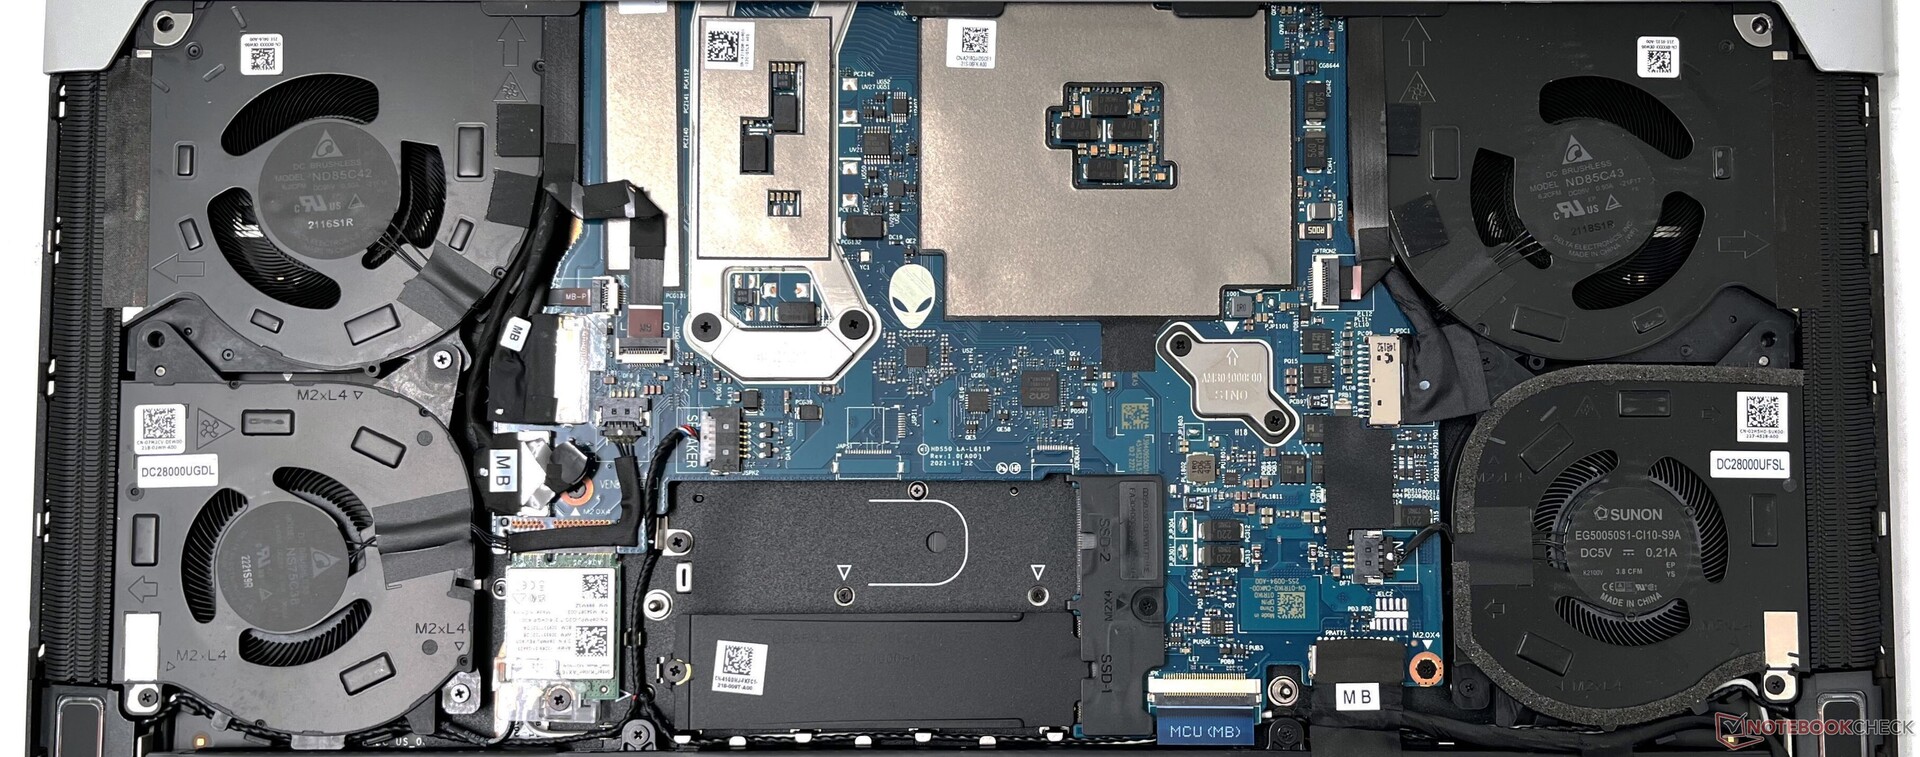
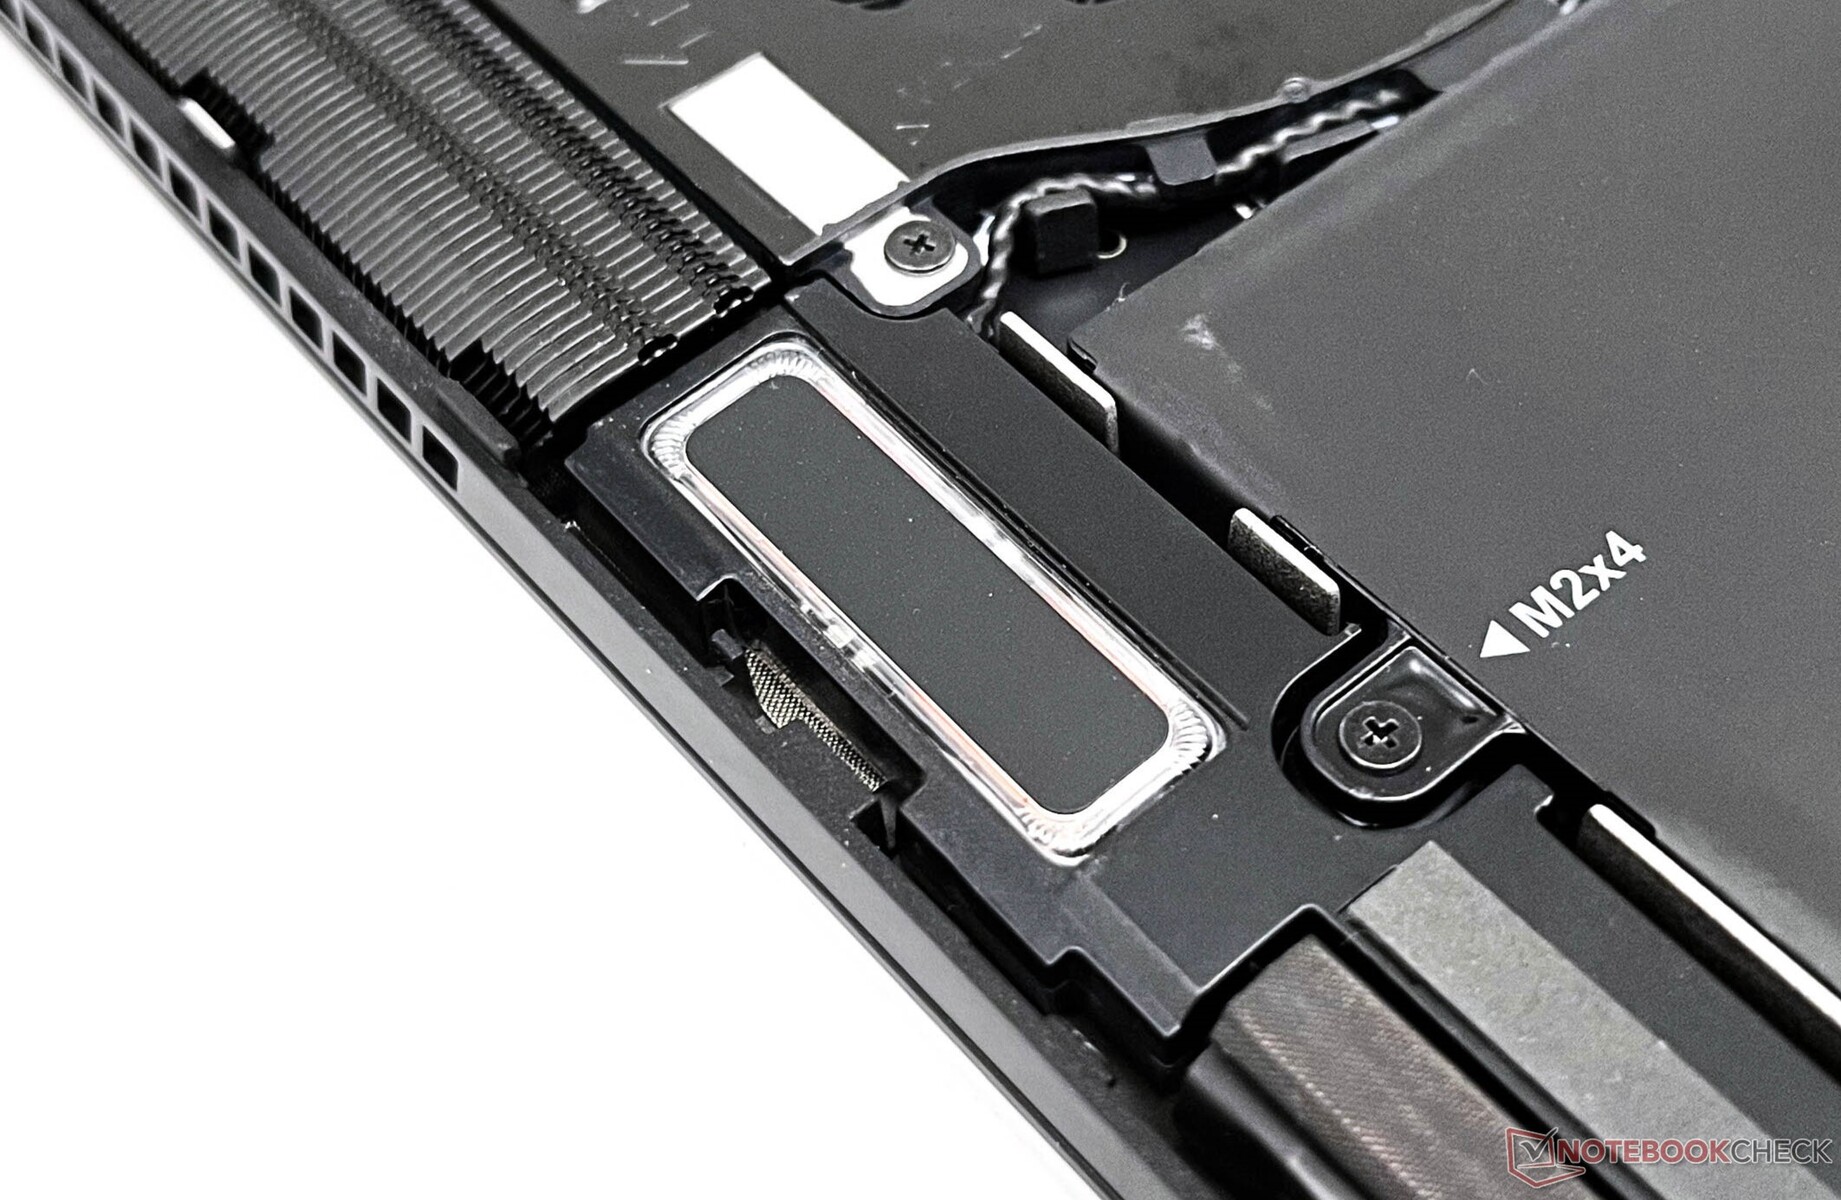
O acesso aos internos pode ser feito simplesmente removendo os seis parafusos Philips no painel inferior. É necessário algum esforço para abrir completamente o painel inferior do chassi. Não há nenhuma escotilha de manutenção fornecida
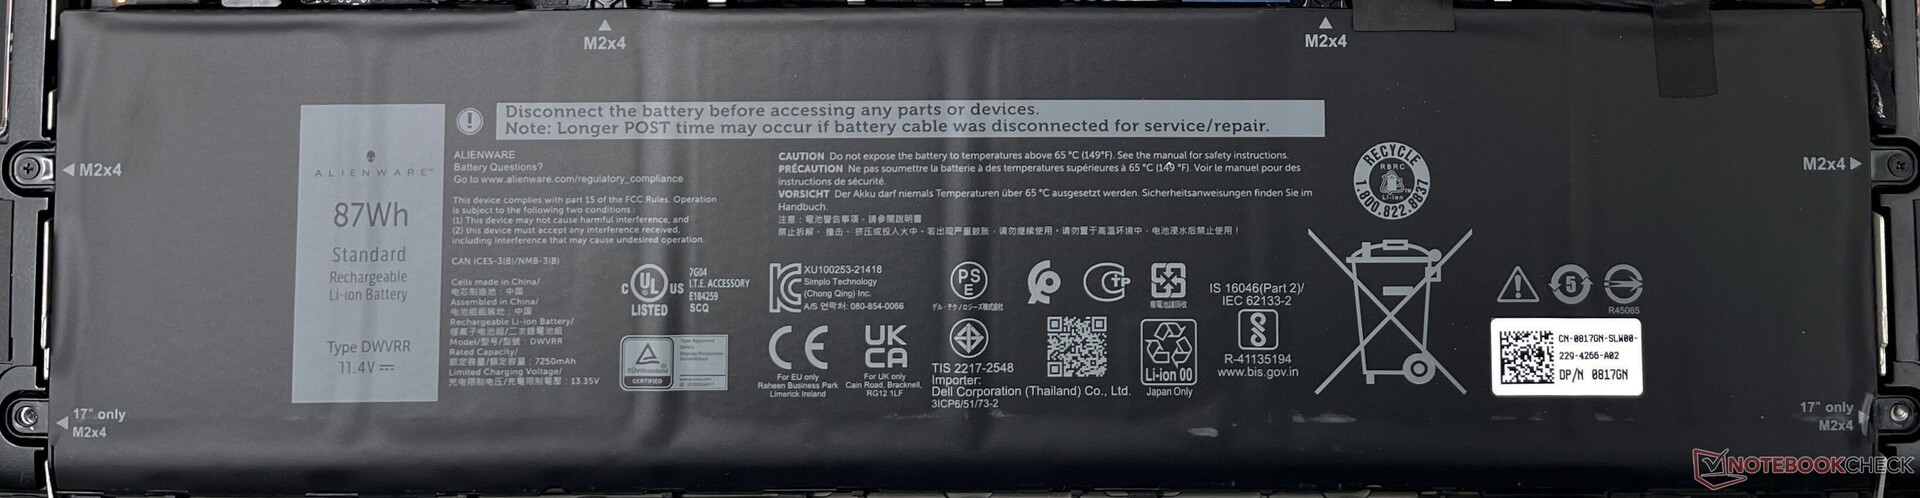
O layout interno não sofreu alterações em relação ao ano passado, o que também significa que, mais uma vez, você tem que suportar RAM soldada. O NVMe SSD, o cartão Killer Wi-Fi e a bateria 87 WHr podem ser substituídos se necessário.
Garantia
O Alienware x15 R2 vem com as instalações Premium Support Plus e Onsite Service da Dell por um ano como padrão. Opções adicionais de garantia e suporte podem ser adicionadas durante o checkout no site Dell.com.
Dispositivos de entrada: As chaves secundárias permanecem apagadas
Teclado
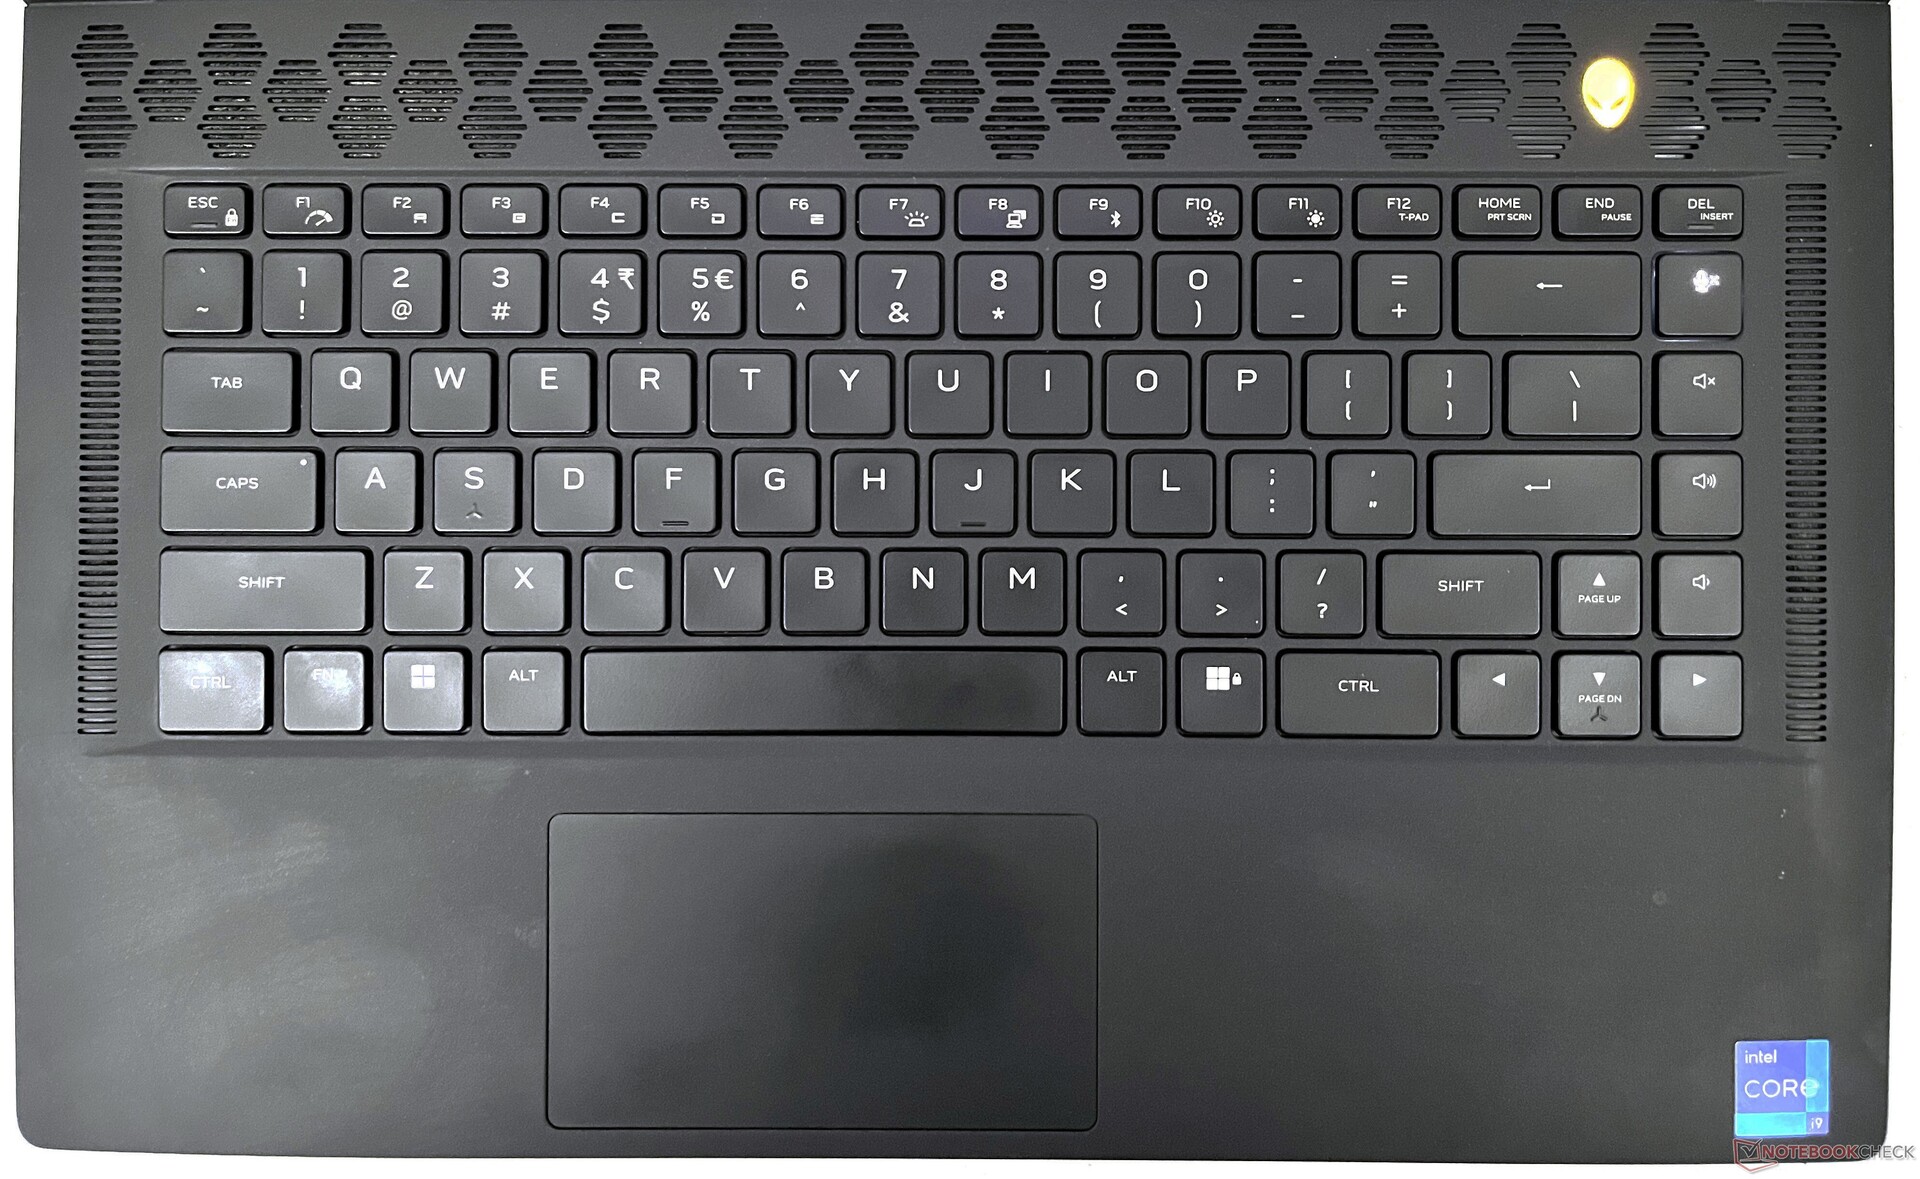
O teclado permanece inalterado em relação ao x15 R1. A Dell emprega um teclado fino Alienware Série X com um curso de 1,5 mm de chave, capotamento N-key, e tecnologia anti-fantasma. Não há teclas mecânicas devido ao chassi fino.
A digitação no teclado do x15 R2 é geralmente uma experiência agradável devido ao bom feedback tátil. As teclas de seta de tamanho normal também são transportadas do x15 R1 e são uma adição bem-vinda. Entretanto, os símbolos secundários nas teclas de função continuam sem iluminação, o que faz com que seja incômodo usá-las no escuro.
Touchpad
O touchpad de 10,5 cm x 6 cm parece um pouco menor em comparação com a concorrência, mas oferece uma experiência de deslizamento suave. Os gestos do Windows Precision são suportados. Clicar requer algum esforço às vezes e também pode se beneficiar de algum feedback adicional
Ao contrário do x15 R1, o esquema de cores do touchpad x15 R2 combina com o resto do deck do teclado, mas ainda é uma impressão digital e um ímã de sujeira.
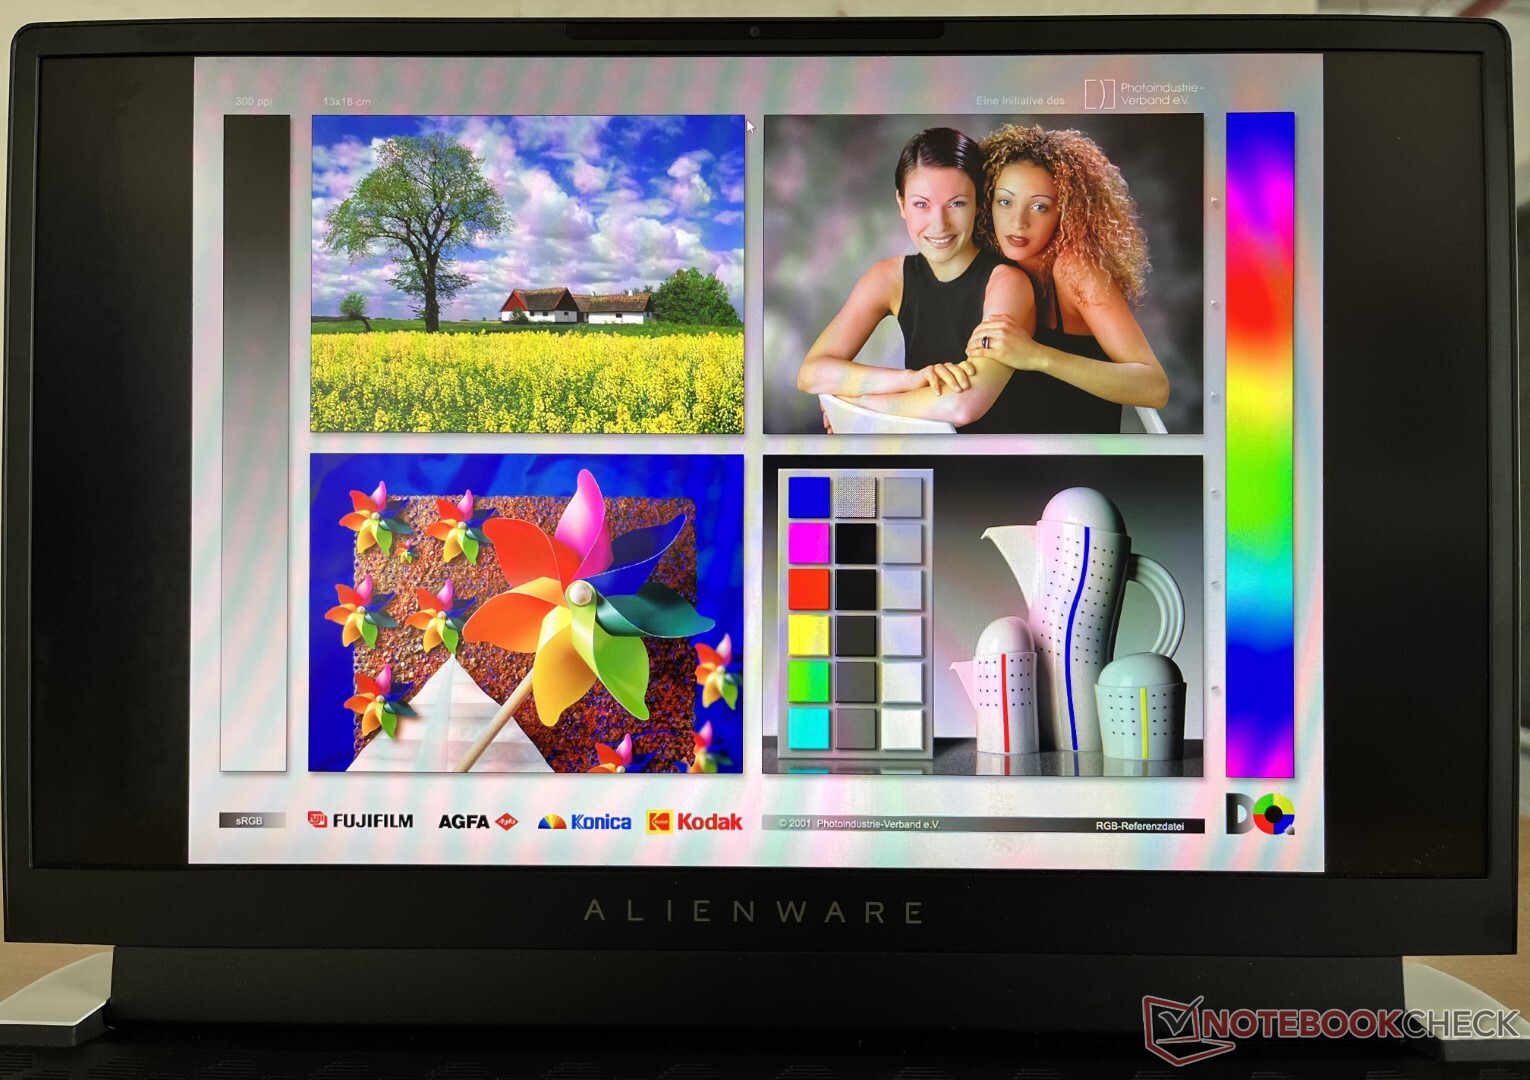
Mostrar: painel G-Sync 360 Hz com Dolby Vision e sem PWM
Nosso Alienware x15 R2 está equipado com um painel de 1080p 360 Hz. Este é um painel Nvidia G-Sync com suporte para Dolby Vision HDR. Os usuários também podem configurar o x15 R2 com opções de painel FHD 165 Hz e QHD 240 Hz com suporte para G-Sync e Dolby Vision.
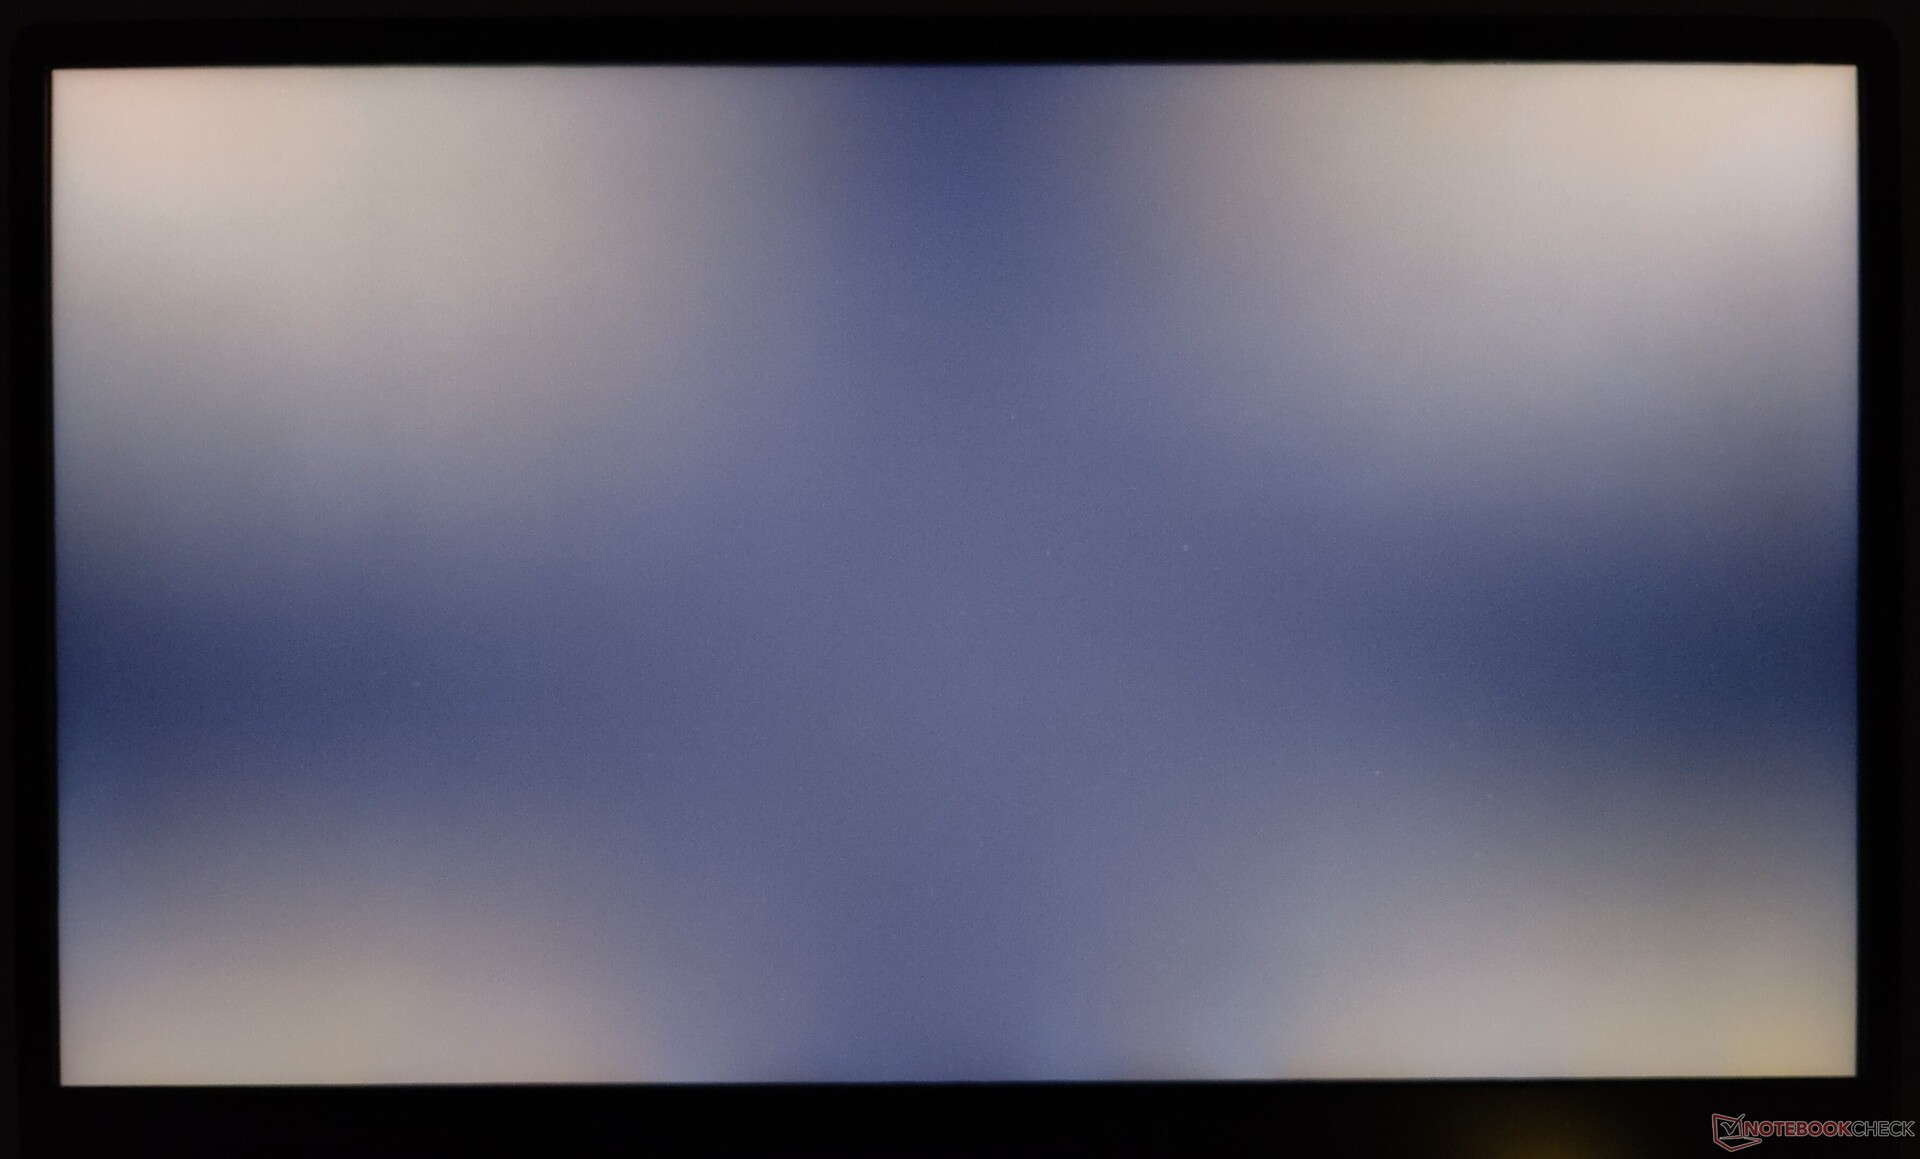
A resolução de 1080p resulta em um tamanho de pixel maior com uma densidade total de 141 PPI. Observamos um sangramento significativo de luz de fundo nos quatro cantos sob longa exposição.
As características do visor x15 R2 são similares às que tínhamos visto antes com o 2020 Alienware m15 R3que também apresenta o mesmo painel. A distribuição de brilho é decente a 82%, e a relação de contraste medida 1033:1 oferece uma boa experiência de visualização subjetiva.

| |||||||||||||||||||||||||
iluminação: 82 %
iluminação com acumulador: 341 cd/m²
Contraste: 1033:1 (Preto: 0.33 cd/m²)
ΔE ColorChecker Calman: 2.96 | ∀{0.5-29.43 Ø4.71}
calibrated: 1.46
ΔE Greyscale Calman: 3.7 | ∀{0.09-98 Ø4.96}
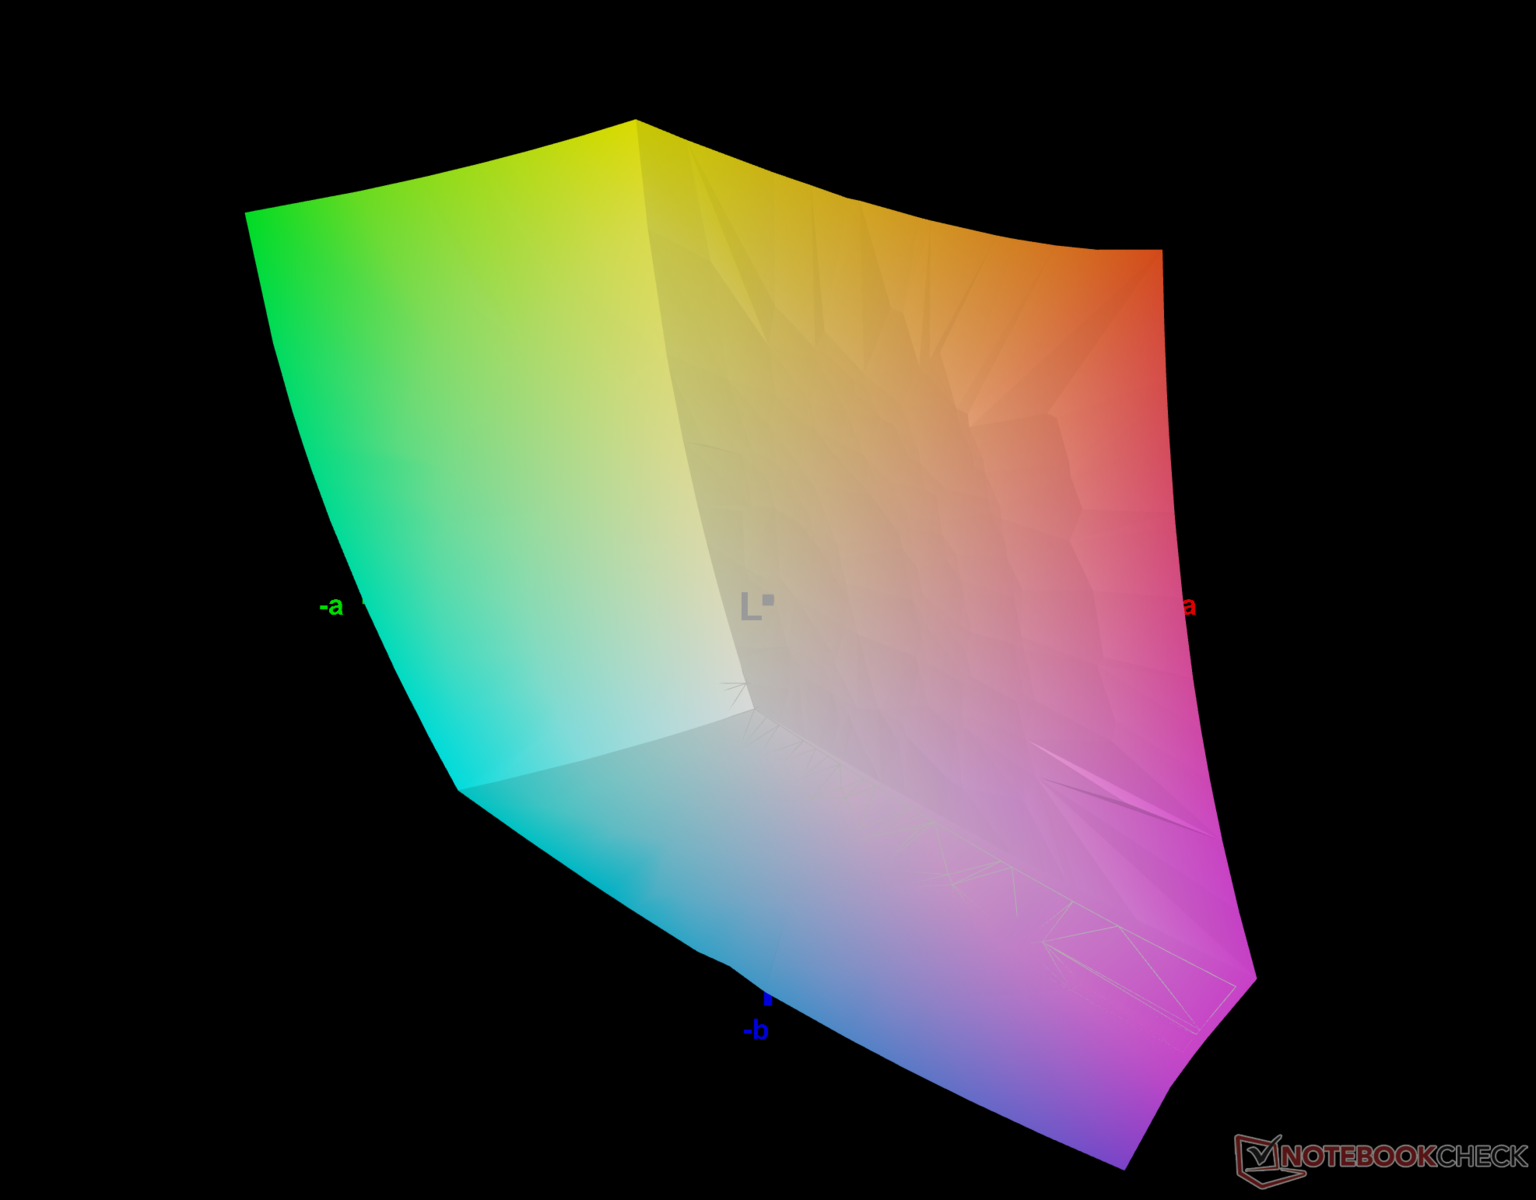
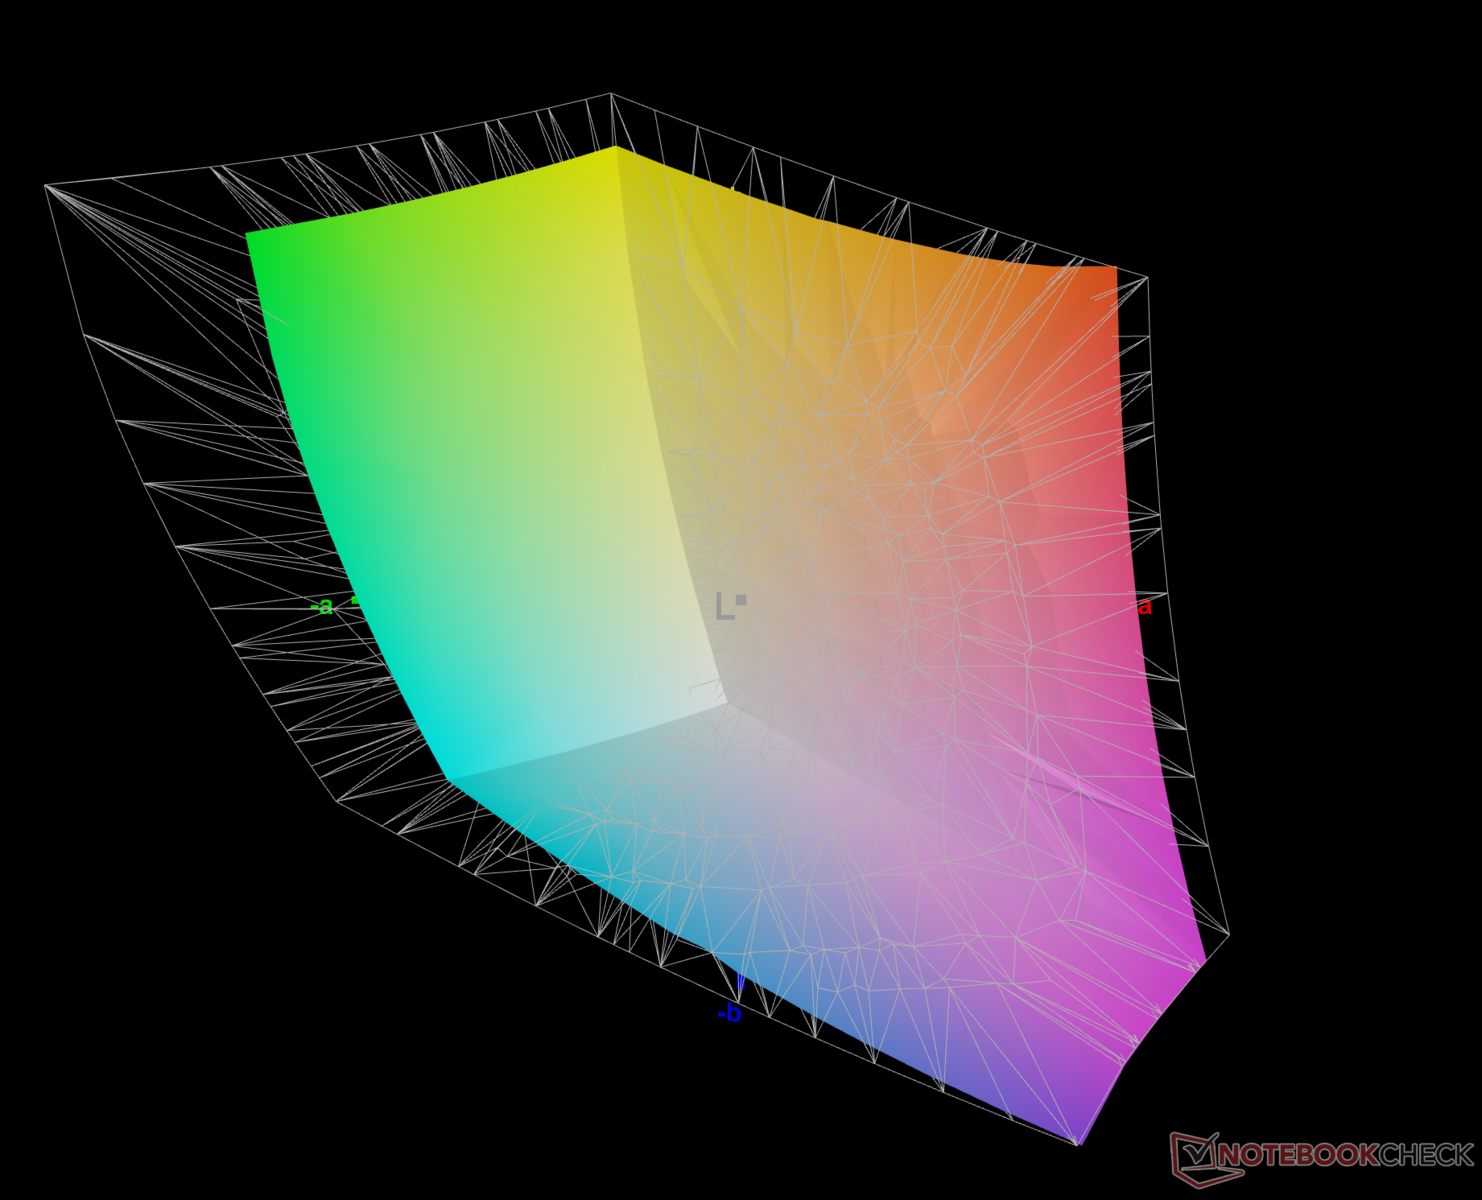
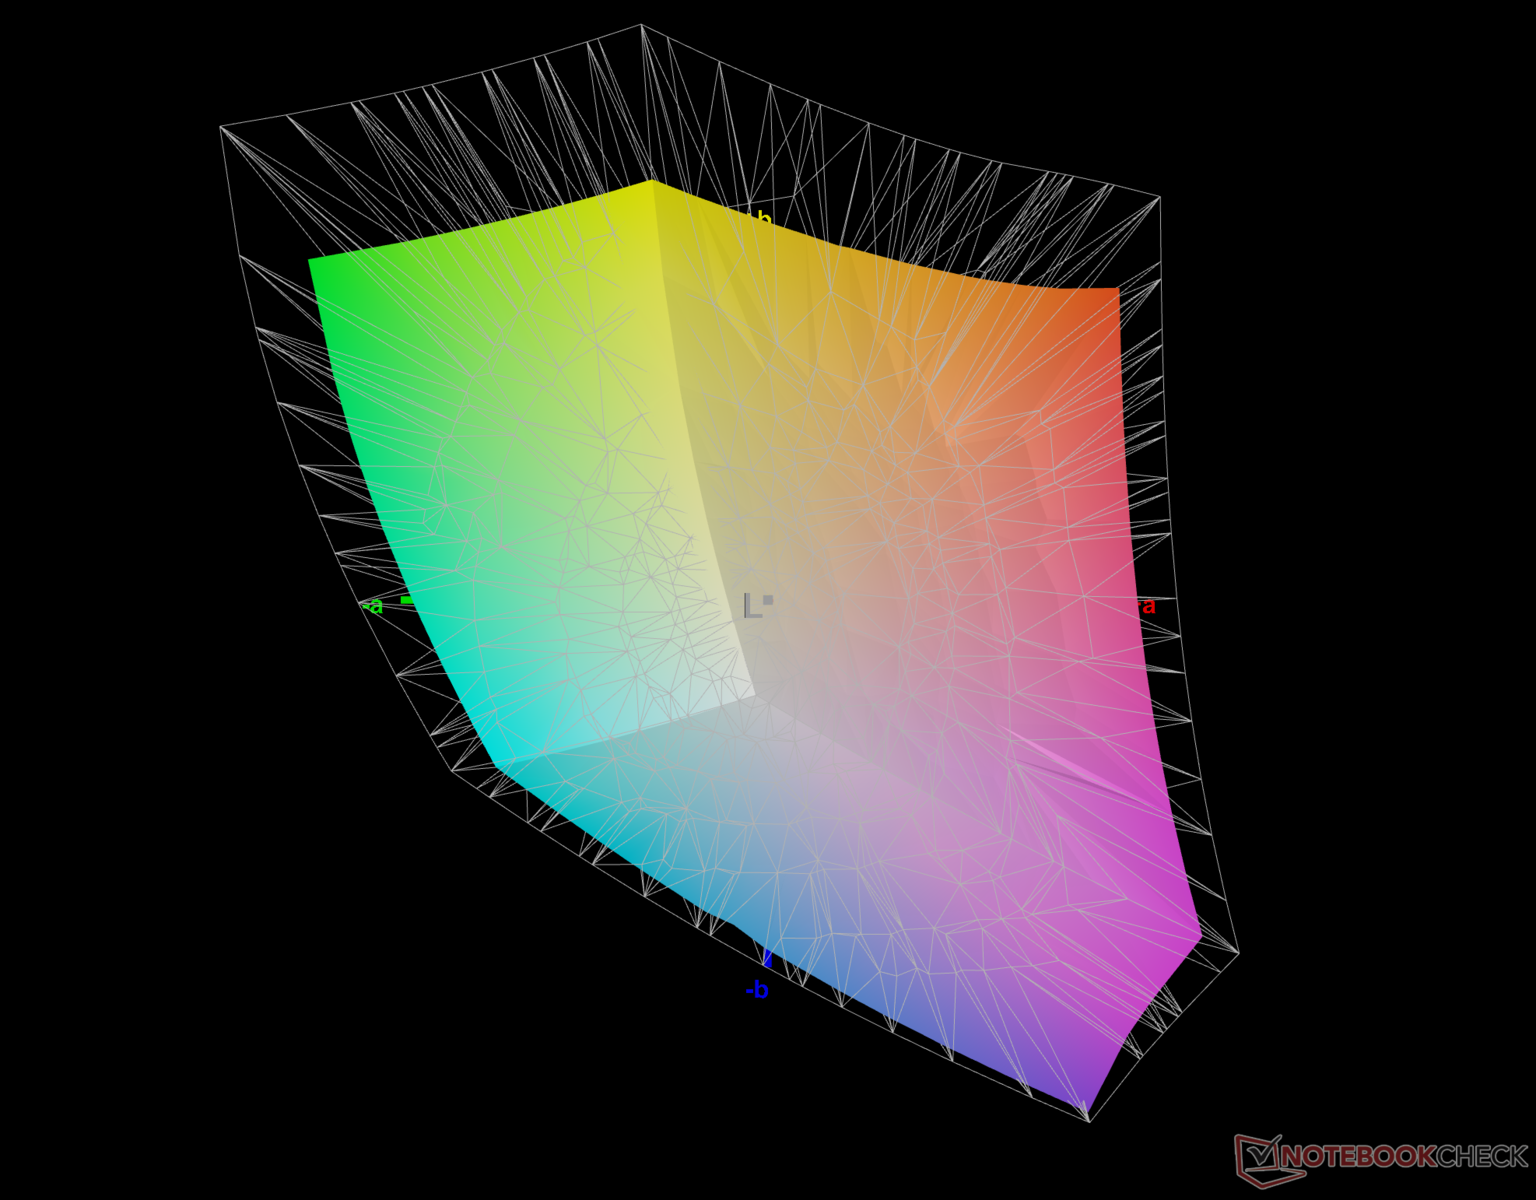
75.7% AdobeRGB 1998 (Argyll 3D)
100% sRGB (Argyll 3D)
74.7% Display P3 (Argyll 3D)
Gamma: 2.15
CCT: 6351 K
| Alienware x15 R2 P111F AU Optronics B156HAN (AUO8092), IPS, 1920x1080, 15.6" | Alienware x15 RTX 3070 P111F LG Philips 156QHG, IPS, 2560x1440, 15.6" | Asus ROG Strix Scar 15 G533ZW-LN106WS BOE CQ NE156QHM-NZ2, IPS-level, 2560x1440, 15.6" | MSI Titan GT77 12UHS Sharp SHP1544 LQ173M1JW08, IPS-Level, 1920x1080, 17.3" | MSI Vector GP66 12UGS BOE NE156FHM-NZ3, IPS, 1920x1080, 15.6" | Razer Blade 15 Advanced Model Early 2022 TL156VDXP02-0, IPS, 1920x1080, 15.6" | |
|---|---|---|---|---|---|---|
| Display | 16% | 14% | -3% | -4% | -13% | |
| Display P3 Coverage (%) | 74.7 | 97.8 31% | 96.2 29% | 70.8 -5% | 70.1 -6% | 65.3 -13% |
| sRGB Coverage (%) | 100 | 99.9 0% | 99.9 0% | 98.9 -1% | 99.5 0% | 85.1 -15% |
| AdobeRGB 1998 Coverage (%) | 75.7 | 84.5 12% | 73 -4% | 72.1 -5% | 67.4 -11% | |
| Response Times | -429% | -232% | -64% | -209% | -168% | |
| Response Time Grey 50% / Grey 80% * (ms) | 1.47 ? | 12 ? -716% | 7.86 ? -435% 4.21 ? -186% | 3.03 ? -106% | 5.8 ? -295% | 4.3 ? -193% |
| Response Time Black / White * (ms) | 4.32 ? | 10.4 ? -141% | 7.5 ? -74% | 5.28 ? -22% | 9.6 ? -122% | 10.5 ? -143% |
| PWM Frequency (Hz) | ||||||
| Screen | -4% | -24% | -7% | 4% | 30% | |
| Brightness middle (cd/m²) | 341 | 409.5 20% | 346 1% | 280 -18% | 353.1 4% | 330 -3% |
| Brightness (cd/m²) | 316 | 390 23% | 329 4% | 275 -13% | 325 3% | 315 0% |
| Brightness Distribution (%) | 82 | 88 7% | 91 11% | 79 -4% | 85 4% | 89 9% |
| Black Level * (cd/m²) | 0.33 | 0.47 -42% | 0.59 -79% | 0.4 -21% | 0.38 -15% | 0.24 27% |
| Contrast (:1) | 1033 | 871 -16% | 586 -43% | 700 -32% | 929 -10% | 1375 33% |
| Colorchecker dE 2000 * | 2.96 | 3.48 -18% | 3.06 -3% | 2.1 29% | 2.24 24% | 1.47 50% |
| Colorchecker dE 2000 max. * | 5.33 | 6.31 -18% | 5.81 -9% | 5.83 -9% | 5 6% | 2.73 49% |
| Colorchecker dE 2000 calibrated * | 1.46 | 0.89 39% | 2.57 -76% | 1.58 -8% | 1.02 30% | 0.63 57% |
| Greyscale dE 2000 * | 3.7 | 5 -35% | 3.3 11% | 4 -8% | 1.8 51% | |
| Gamma | 2.15 102% | 2.16 102% | 2.12 104% | 2.13 103% | 2.24 98% | 2.282 96% |
| CCT | 6351 102% | 6591 99% | 7021 93% | 7060 92% | 6864 95% | 6499 100% |
| Média Total (Programa/Configurações) | -139% /
-67% | -81% /
-61% | -25% /
-15% | -70% /
-28% | -50% /
-7% |
* ... menor é melhor
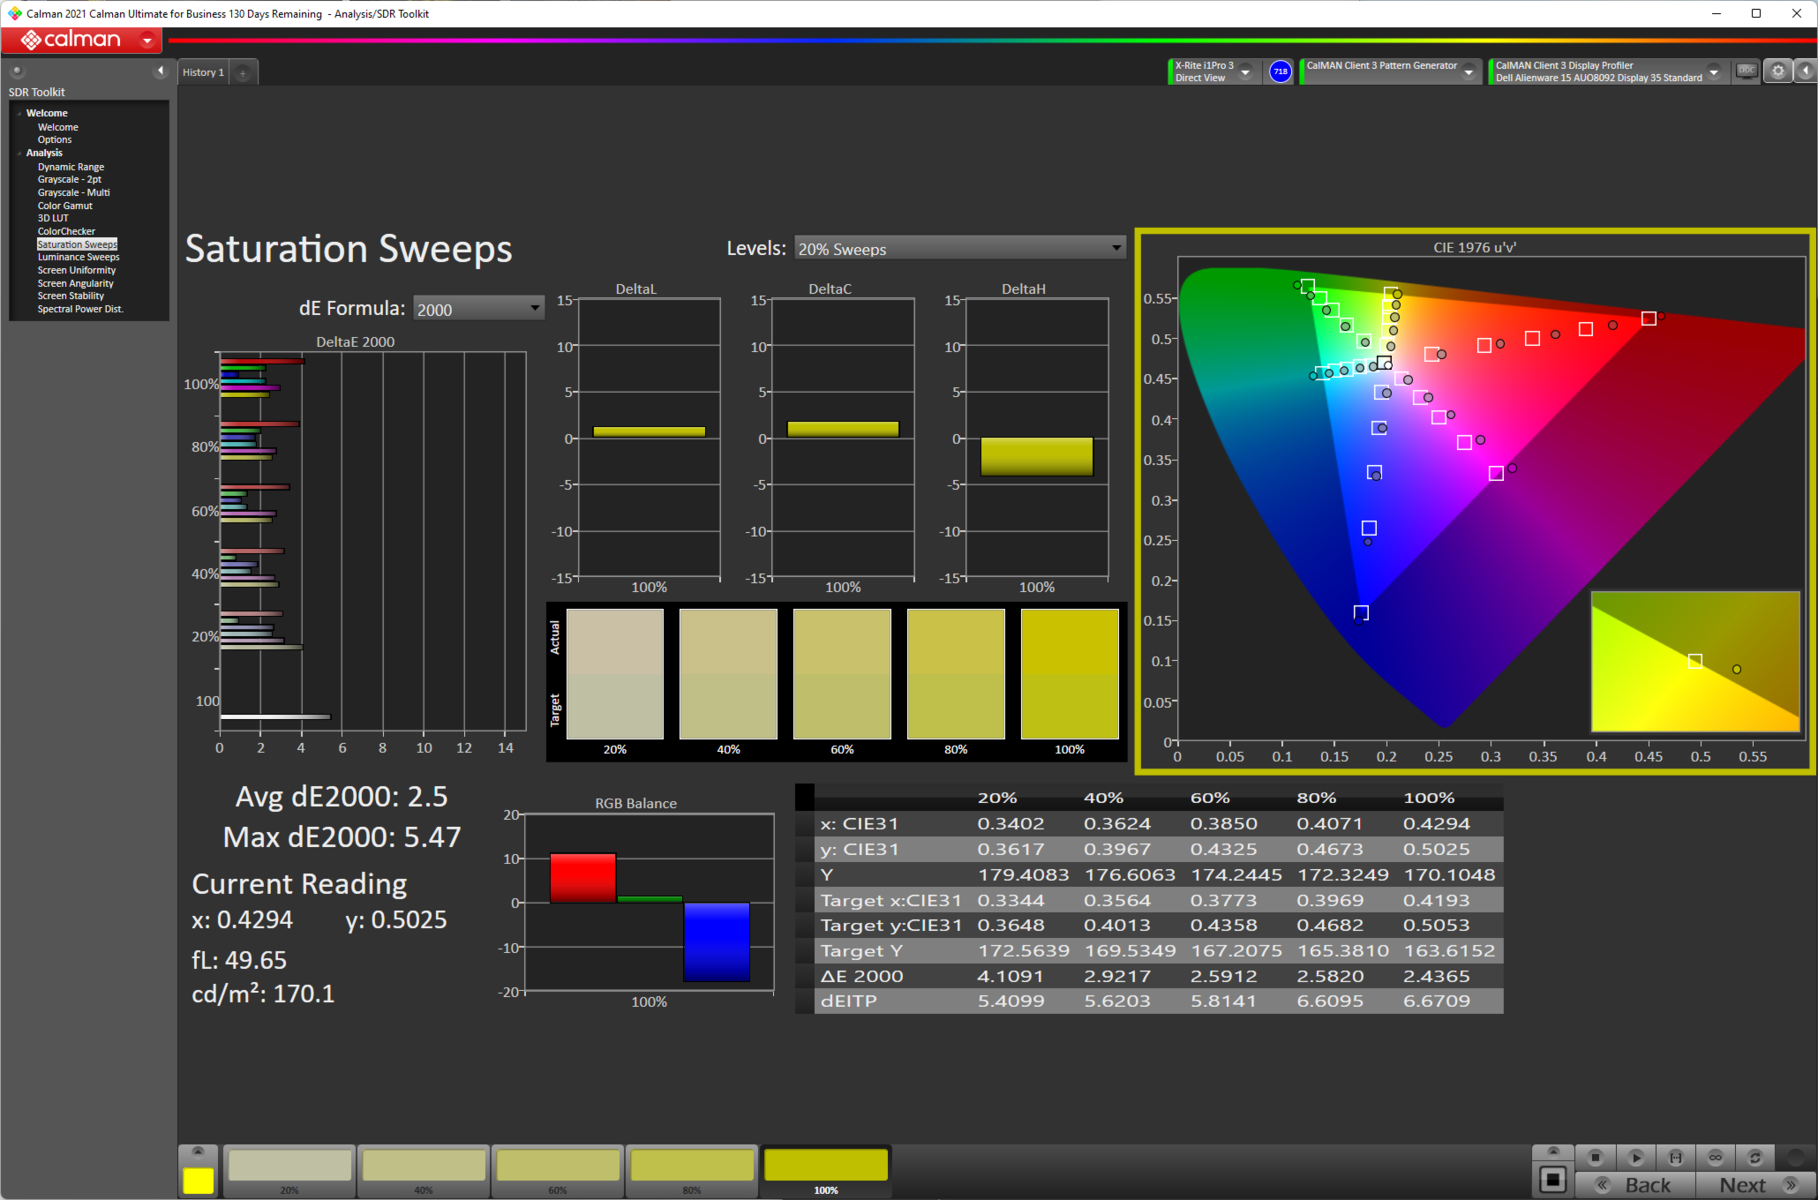
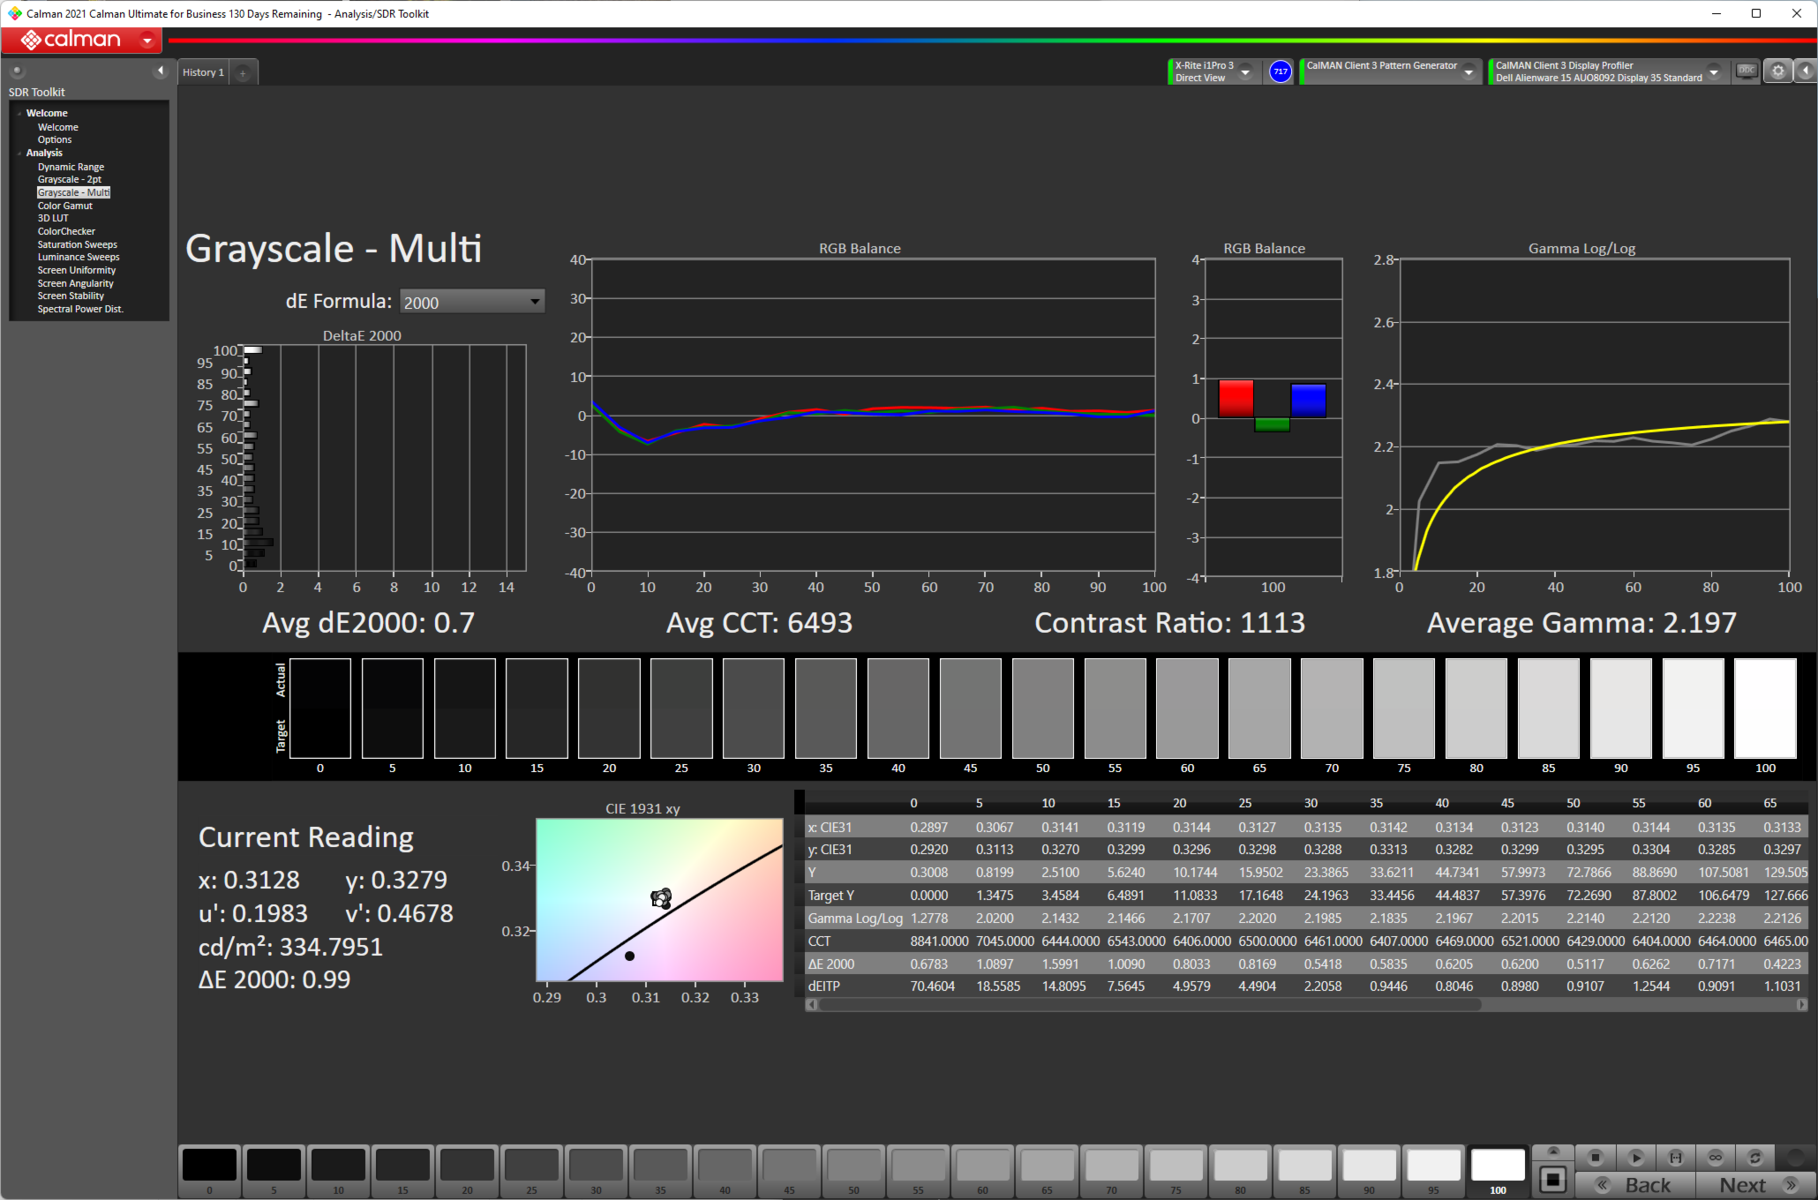
A cobertura de espaço colorido do Alienware x15 R2 é boa considerando que este é principalmente um laptop para jogos. A gama de cores sRGB é totalmente coberta, e a cobertura de 75,7% do AdobeRGB ainda deve ser passível de criação de conteúdo não-profissional. A cobertura da tela P3 também é decente, com 74,7%.
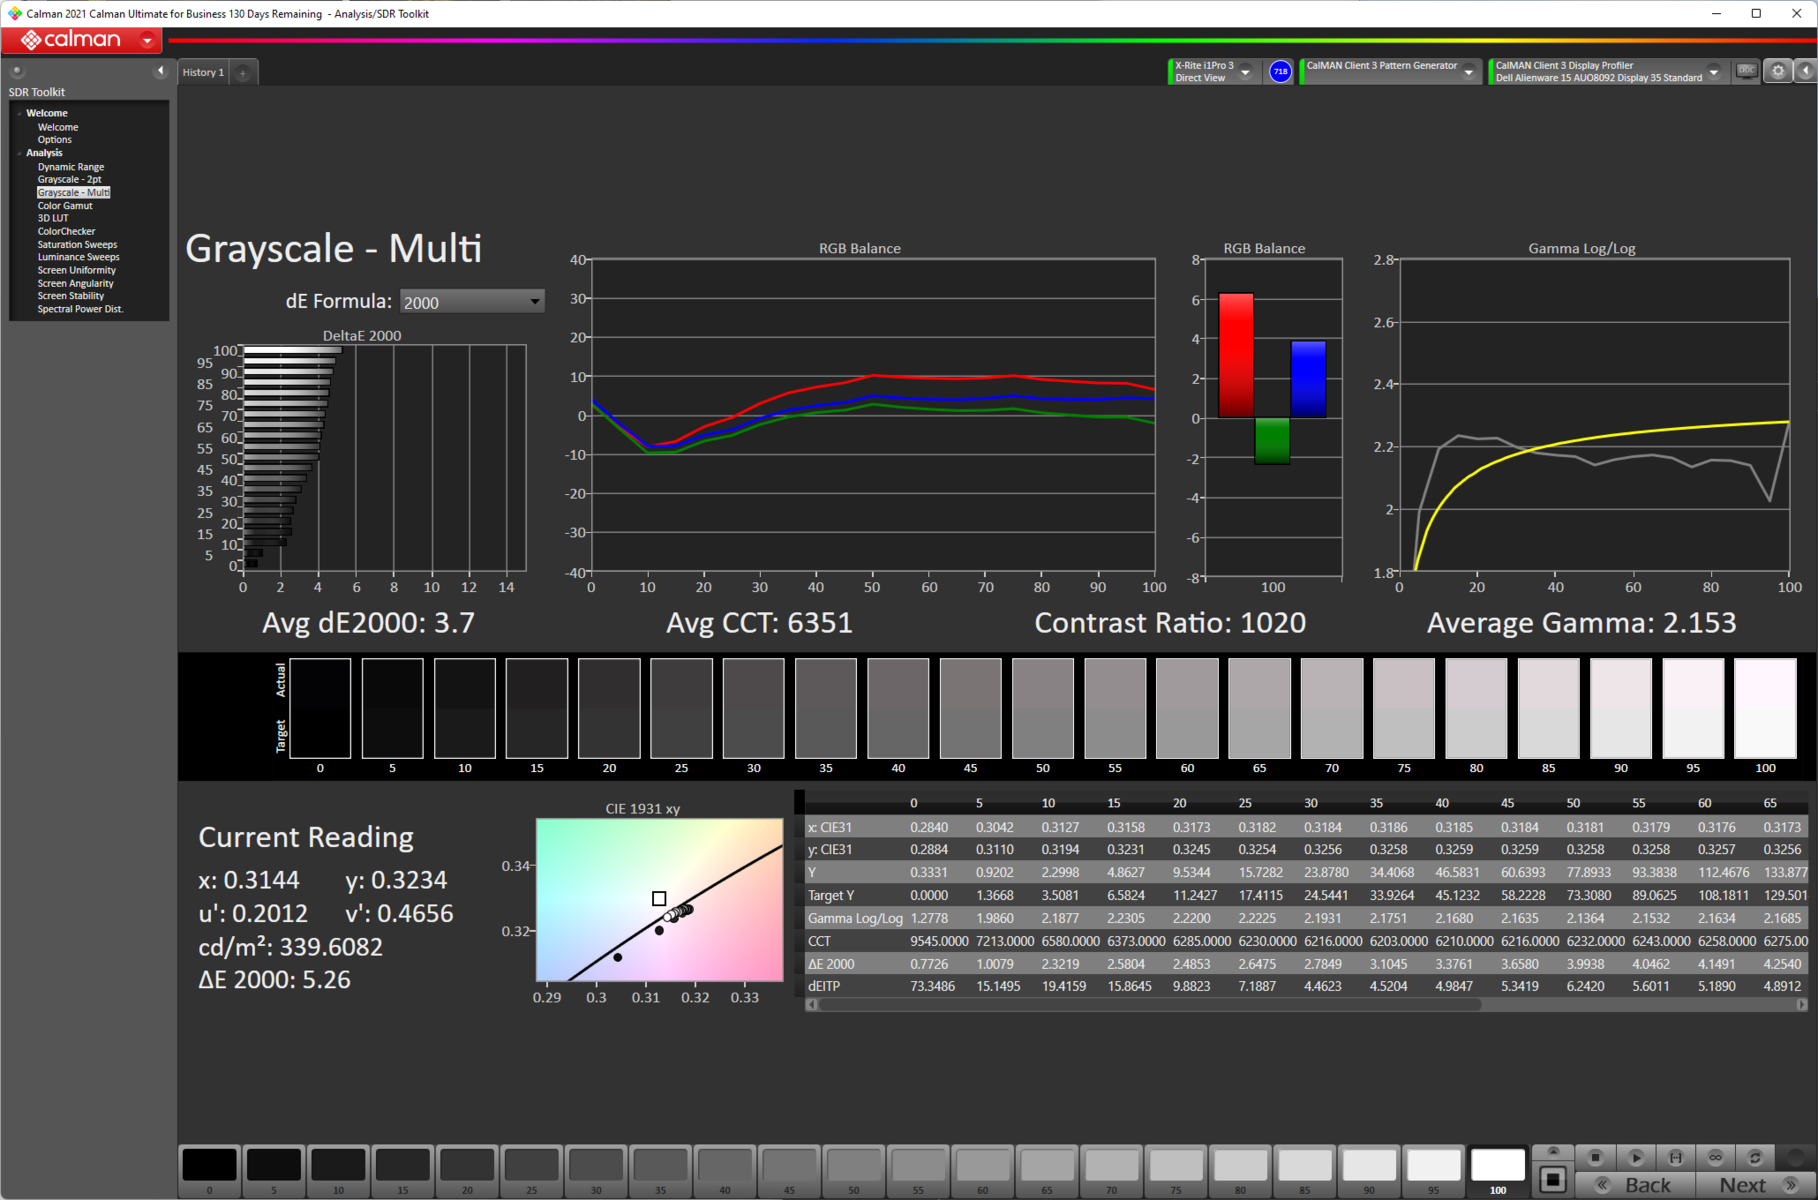
A precisão de cor out-of-the-box não é nada para se escrever em casa, mas é, no entanto, atendida com uma média de Delta E em escala de cinza de 3,7 e uma média de Delta E ColorChecker de 2,96
Nossa rotina padronizada de calibração usando o espectrofotômetro X-rite i1Basic Pro 3 e o software de calibração de cores Calman Ultimate da Portrait Displays ajuda a perceber melhorias na precisão das cores, diminuindo a média da escala de cinza Delta E para 0,7 e a média do ColorChecker Delta E para 1,46. Ainda notamos maiores desvios na cor vermelha
O arquivo ICC calibrado pode ser baixado a partir do link acima.


Exibir tempos de resposta
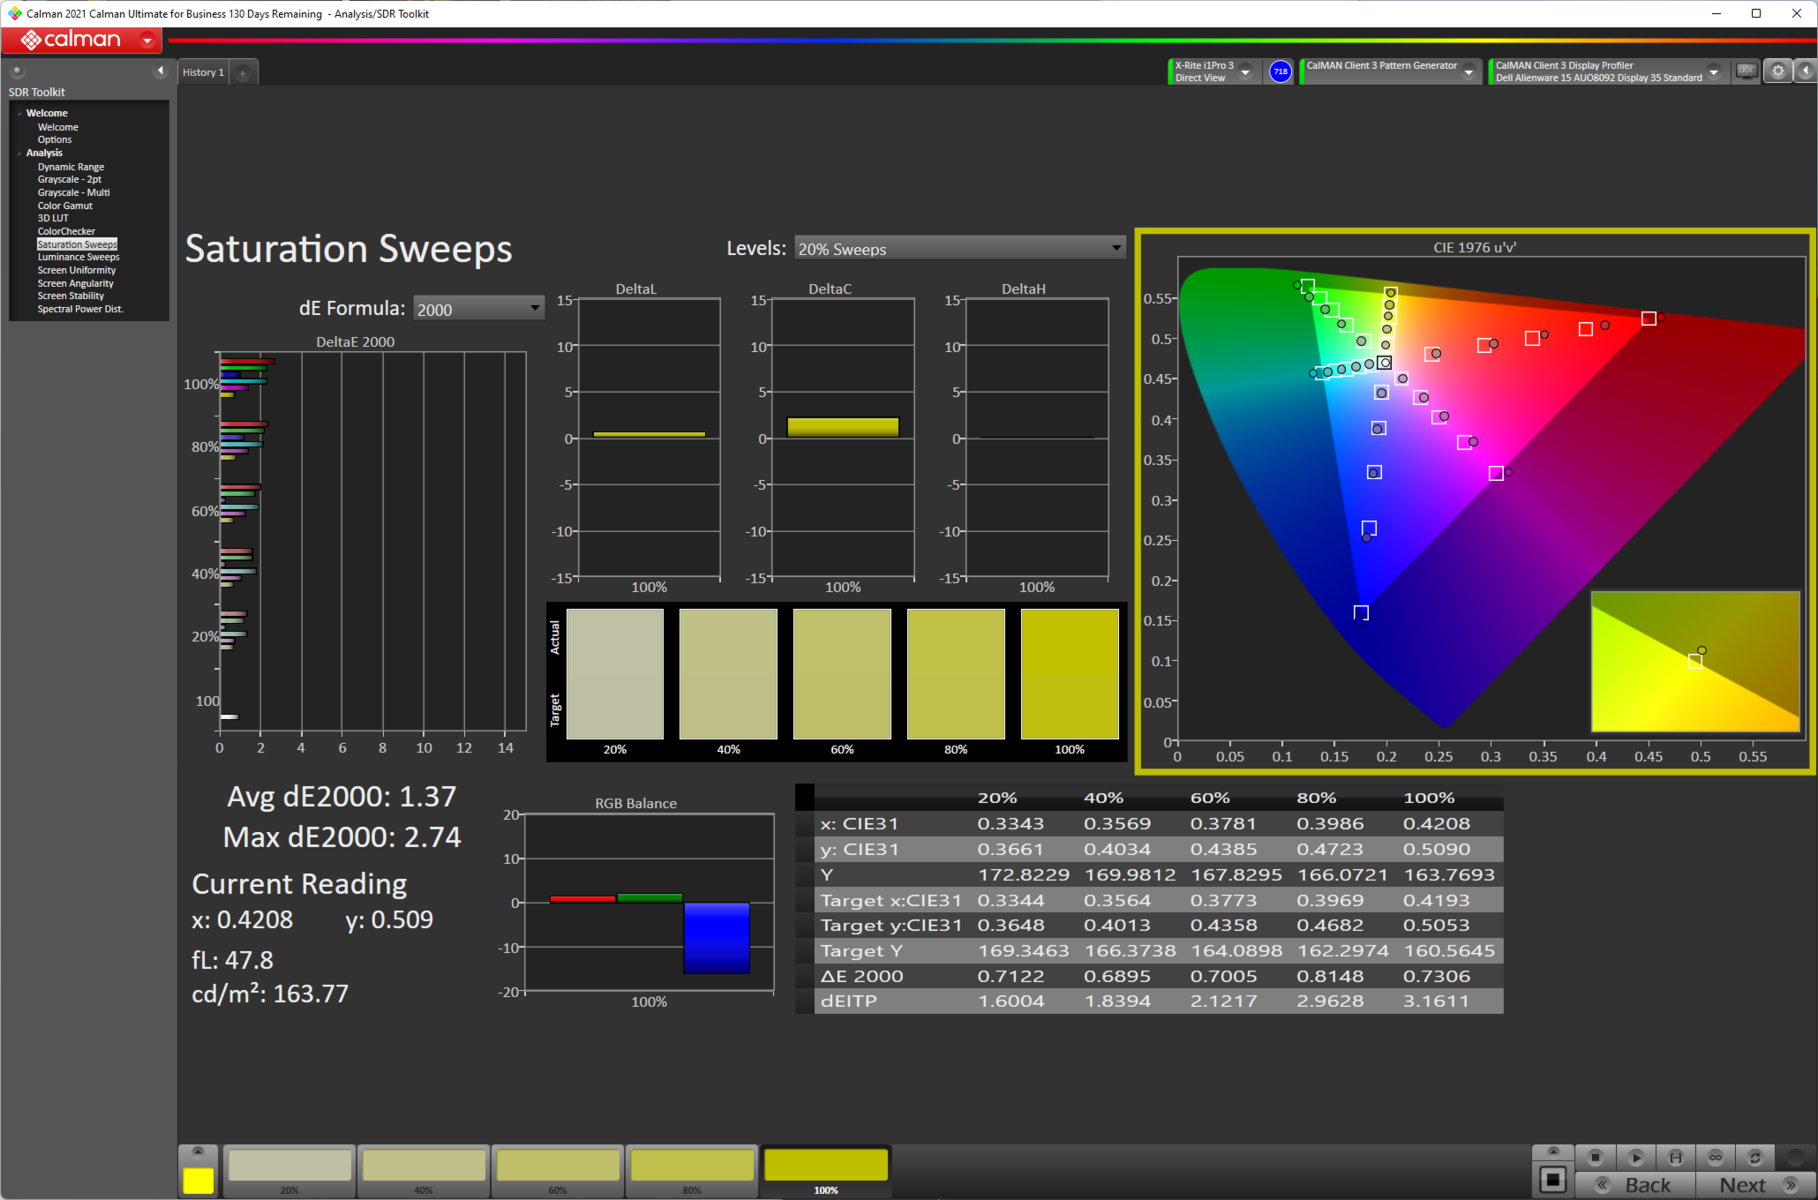
| ↔ Tempo de resposta preto para branco | ||
|---|---|---|
| 4.32 ms ... ascensão ↗ e queda ↘ combinadas | ↗ 2.17 ms ascensão | 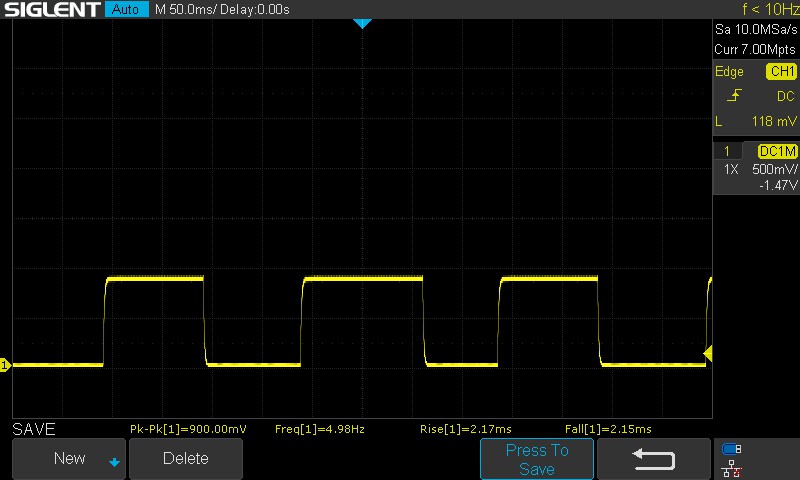 |
| ↘ 2.15 ms queda | ||
| A tela mostra taxas de resposta muito rápidas em nossos testes e deve ser muito adequada para jogos em ritmo acelerado. Em comparação, todos os dispositivos testados variam de 0.1 (mínimo) a 240 (máximo) ms. » 17 % de todos os dispositivos são melhores. Isso significa que o tempo de resposta medido é melhor que a média de todos os dispositivos testados (19.8 ms). | ||
| ↔ Tempo de resposta 50% cinza a 80% cinza | ||
| 1.47 ms ... ascensão ↗ e queda ↘ combinadas | ↗ 0.49 ms ascensão | 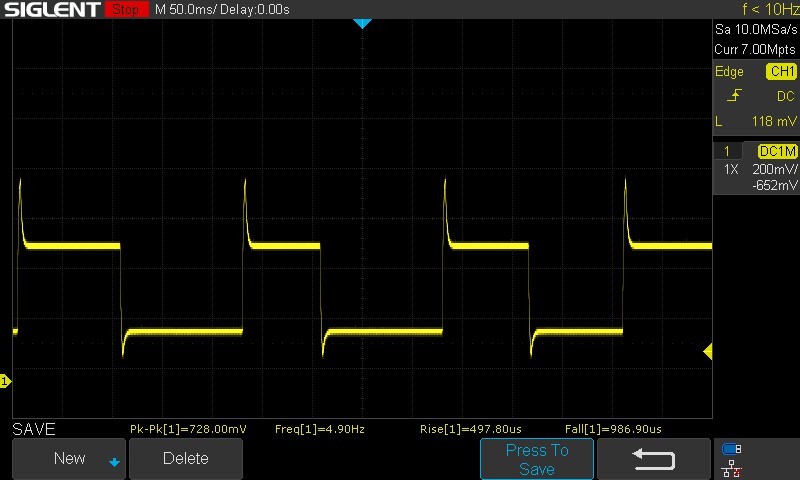 |
| ↘ 0.98 ms queda | ||
| A tela mostra taxas de resposta muito rápidas em nossos testes e deve ser muito adequada para jogos em ritmo acelerado. Em comparação, todos os dispositivos testados variam de 0.165 (mínimo) a 636 (máximo) ms. » 7 % de todos os dispositivos são melhores. Isso significa que o tempo de resposta medido é melhor que a média de todos os dispositivos testados (31 ms). | ||
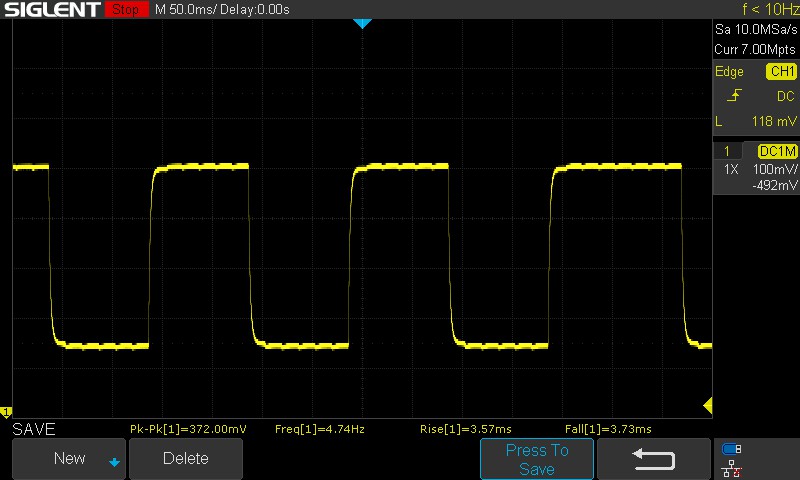
O painel do Alienware x15 R2 usa overdrive por padrão, e isto é visto como uma "buzina" no gráfico de 50% a 80% de cinza no tempo de resposta. Consequentemente, vemos um tempo de resposta combinado muito rápido de 1,47 ms; não é nível OLED, mas deve augurar bem para jogos de ritmo rápido. O tempo de resposta combinado de 100% preto a 100% branco também é decente aos 4,32 ms.
O overdrive do painel é desativado a 60 Hz de atualização e o tempo de resposta combinado de 50% a 80% de cinzas aumenta para 7,3 ms.
Cintilação da tela / PWM (modulação por largura de pulso)
| Tela tremeluzindo / PWM não detectado | 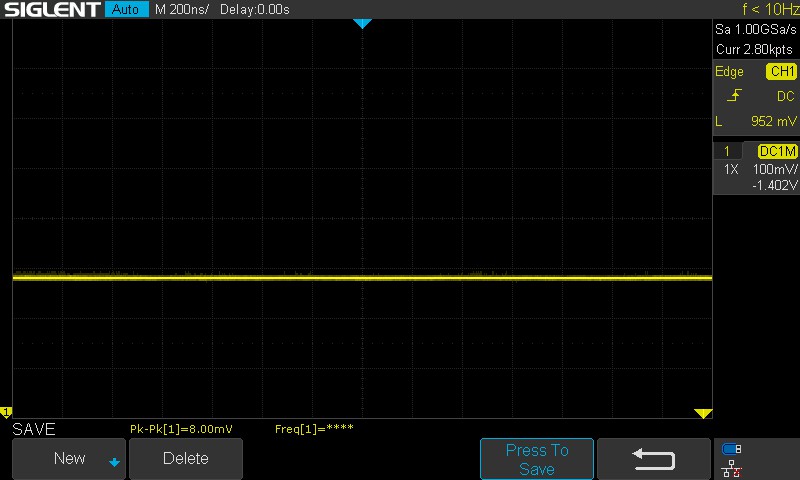 | ||
[pwm_comparison] Em comparação: 52 % de todos os dispositivos testados não usam PWM para escurecer a tela. Se PWM foi detectado, uma média de 7757 (mínimo: 5 - máximo: 343500) Hz foi medida. | |||
Nenhum PWM cintilante foi observado em todos os níveis de brilho testados, o que deve ser um bom presságio para reduzir a tensão ocular durante os jogos
Para mais informações, consulte o nosso artigo "Por que a Modulação da Largura de Pulso (PWM) é uma dor de cabeça tão grande?", e confira também nossoTabela de classificação da PWMpara comparação de freqüência PWM em todos os dispositivos revisados
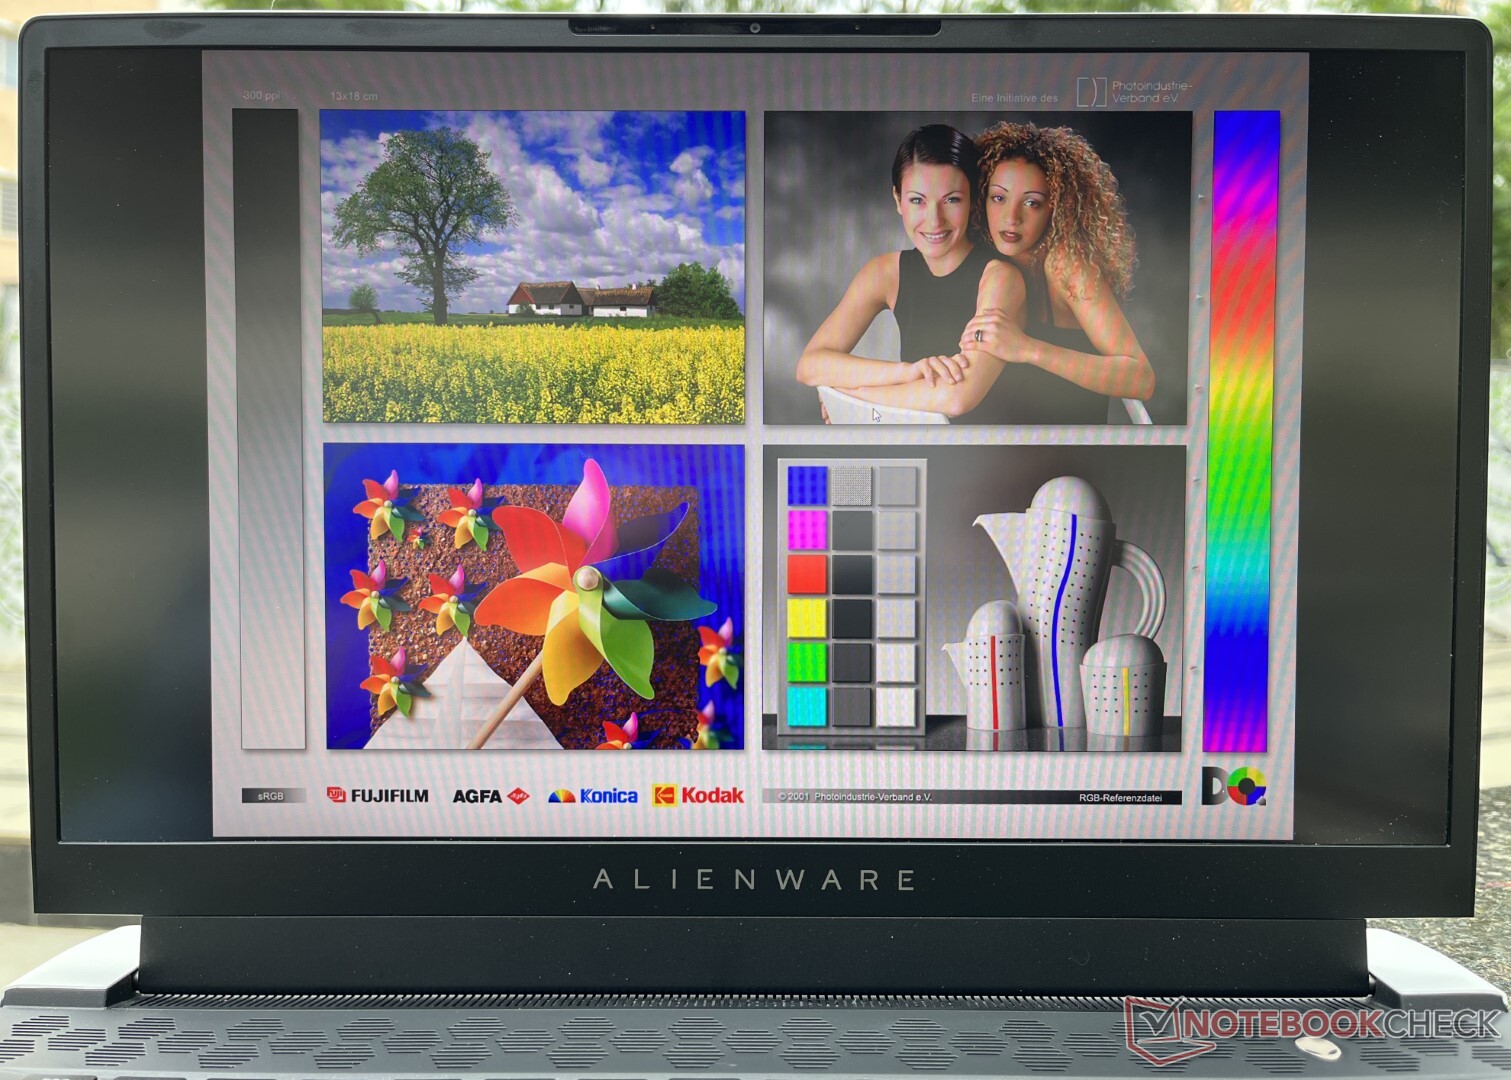
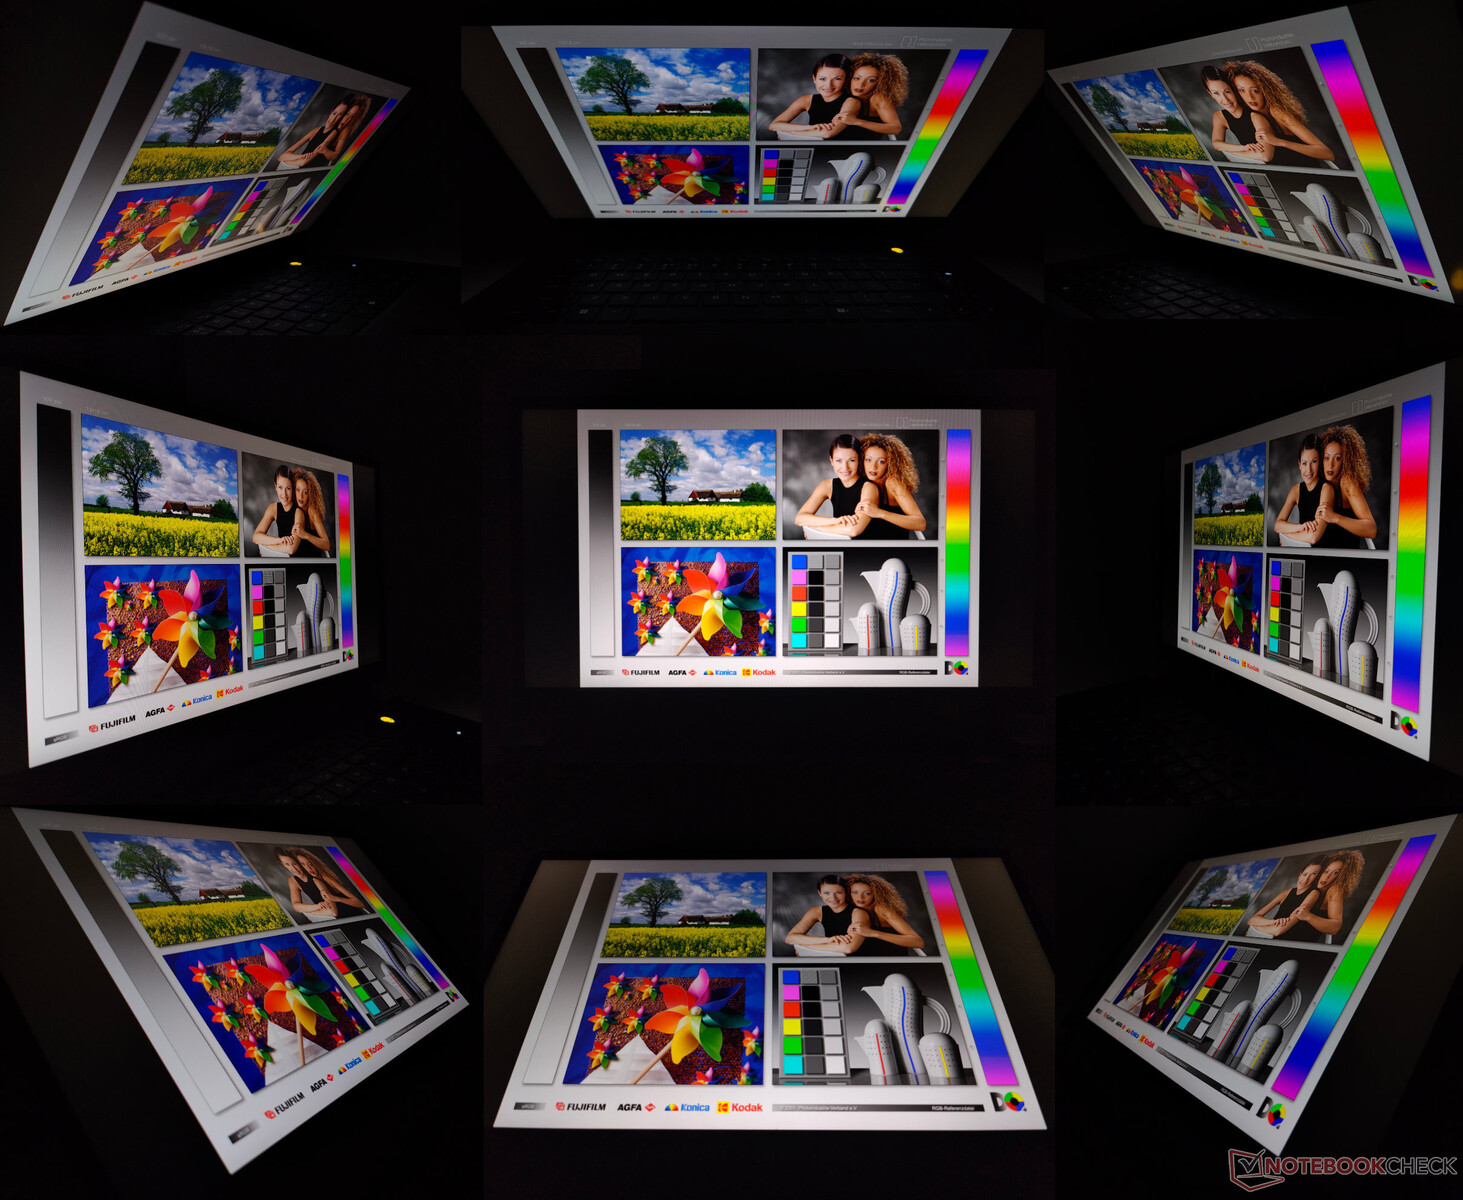
Apesar do brilho de pico um pouco mais baixo, a tela do Alienware x15 R2 é bastante favorável para visualização ao ar livre, desde que não haja luz solar intensa caindo diretamente sobre a tela
Não observamos nenhuma perda significativa de brilho ou de informações de cor em ângulos extremos de visualização.
Desempenho: O núcleo i9-12900H oferece um bom desempenho sustentado
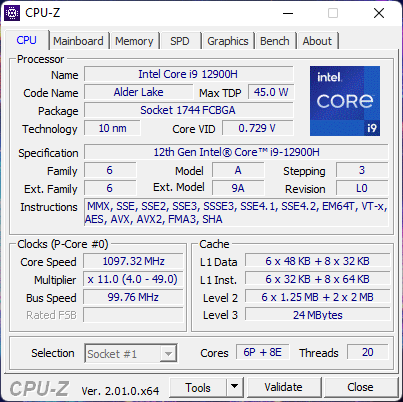
Nosso Alienware x15 R2 é alimentado por um Intel Core i9-12900H e um processador de 140 W Nvidia GeForce RTX 3080 Ti GPU Portátil. Os compradores também podem configurar o x15 R2 com um Núcleo i7-12700H e um RTX 3060 ou GPU para notebook RTX 3070 Ti opções junto com 16 GB ou 32 GB LPDDR5-5200 RAM.
Condições de teste
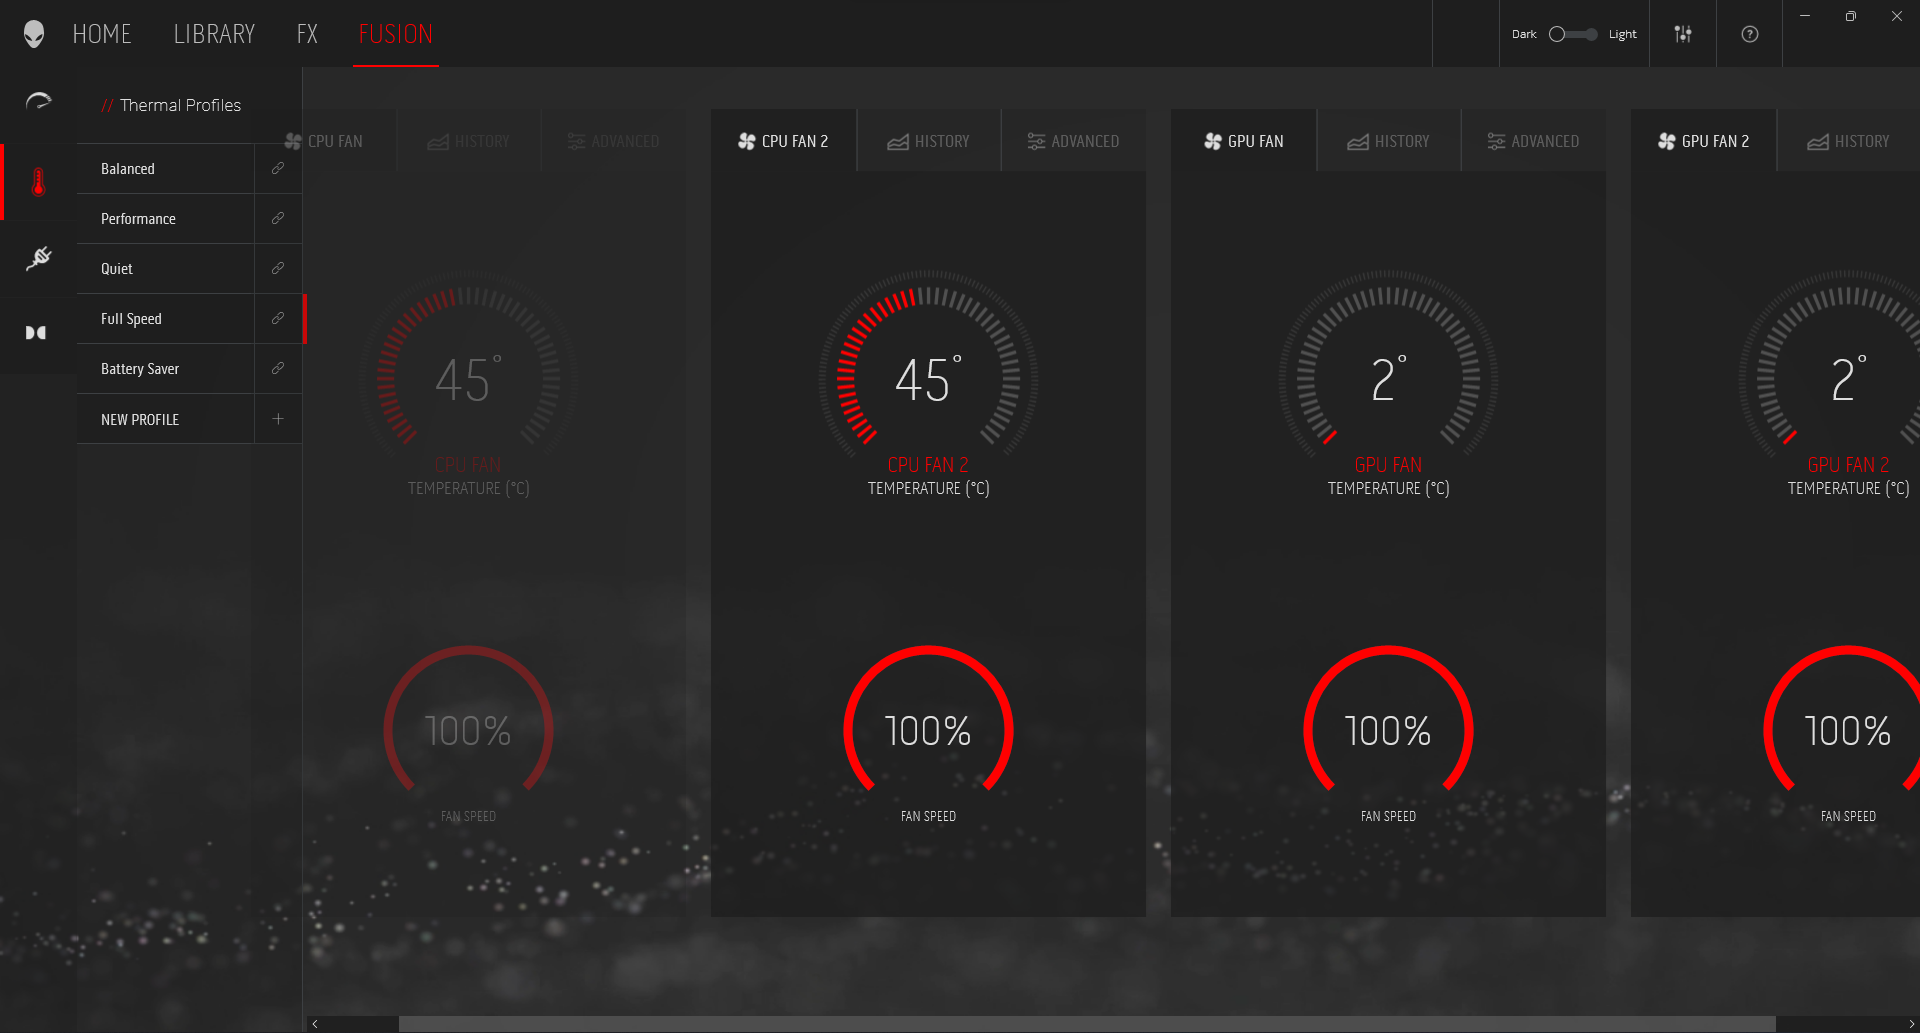
O desempenho do laptop pode ser ajustado usando o Centro de Comando Alienware. Tivemos que instalar o aplicativo manualmente, pois por algum motivo ele não estava presente na imagem padrão de fábrica. Fizemos todos os testes no perfil térmico Full Speed. Isto resulta em uma potência base do processador desbloqueado (PL1) e uma potência turbo máxima (PL2) de 140 W
A maioria dos perfis térmicos, incluindo o PL1 e PL2 Balanceado, usam um PL1/PL2 de 140 W, enquanto os modos Battery Saver e Quiet usam um PL1 de 65 W e um PL2 de 140 W. A escolha do perfil térmico tem um impacto principalmente no ruído do ventilador, ao qual chegaremos em breve.
O Alienware x15 R2 suporta Advanced Optimus. Todos os testes gráficos foram executados no modo MSHybrid, mas é possível mudar o roteamento da GPU através da BIOS ou através do Painel de Controle da Nvidia.
Processador
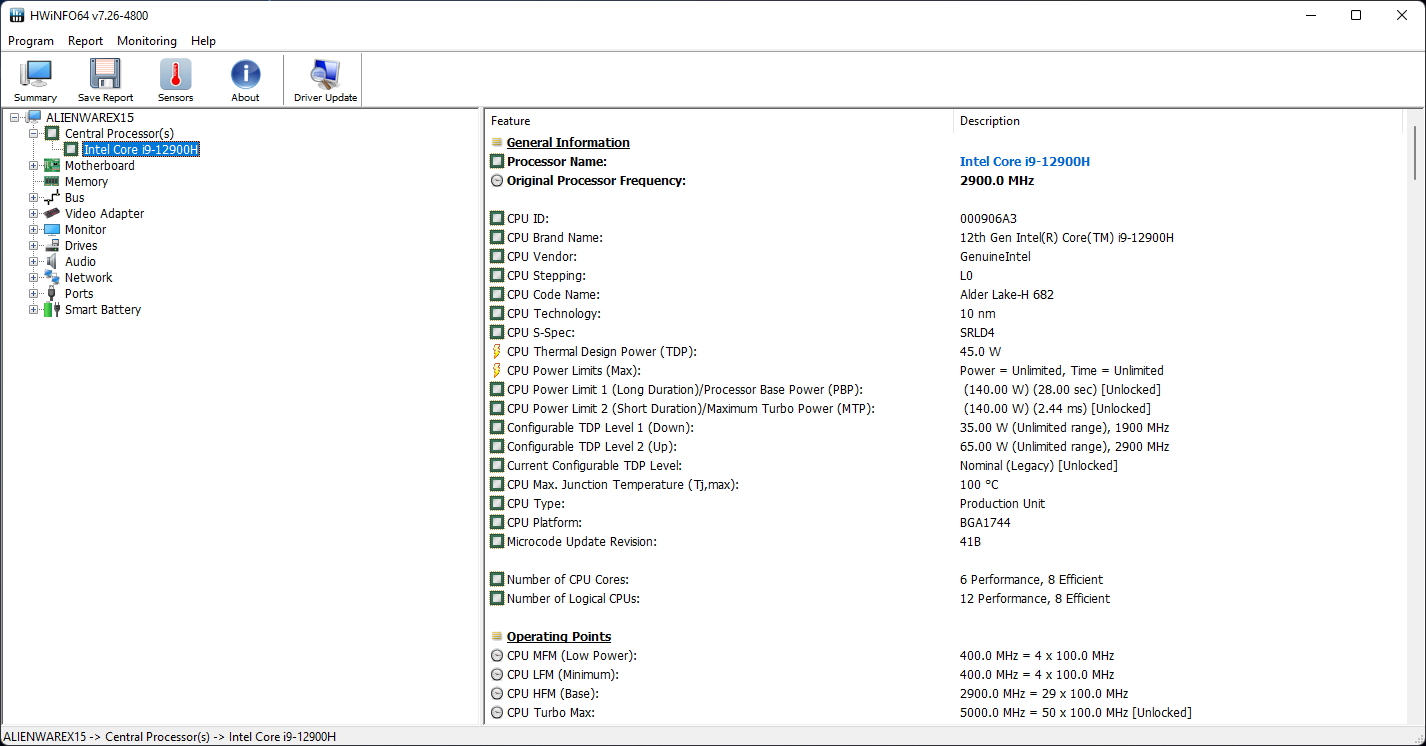
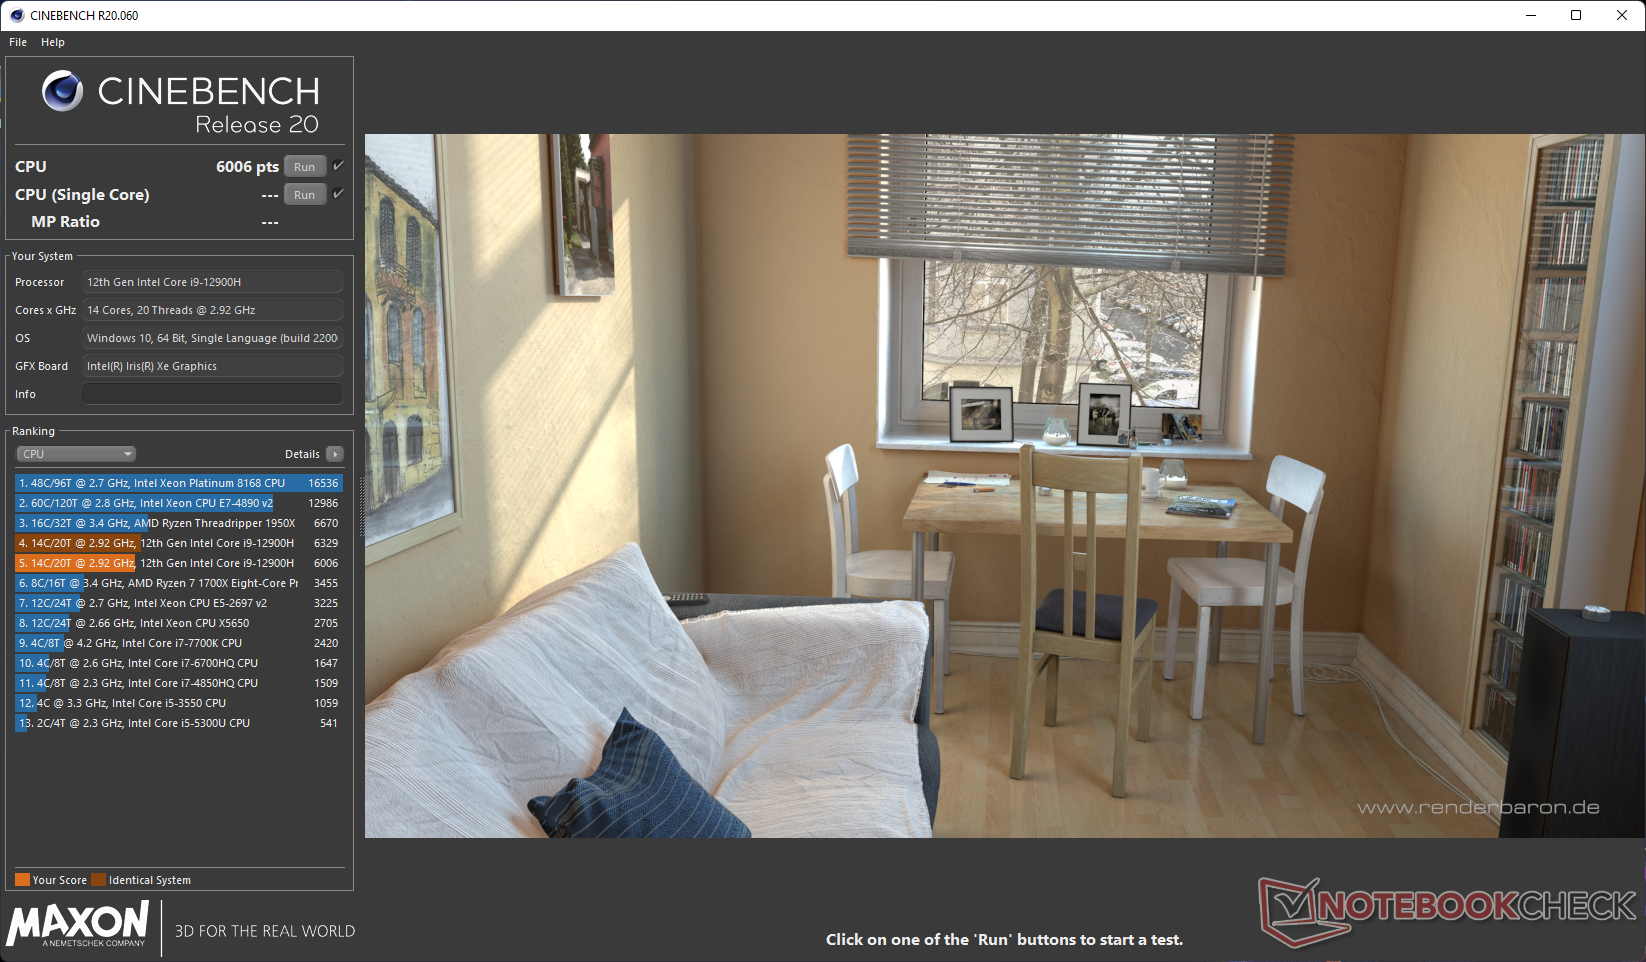
O Core i9-12900H é um processador Alder Lake-H de 14 núcleos com 20 fios, com potências de até 5 GHz. Dos 14 núcleos, oito deles são de desempenho Golden Cove (P) e os seis restantes são de eficiência Gracemont (E). Os núcleos P suportam hyperthreading.
A implementação pela Dell de um Elemento 31 (que a propósito denota gálio na tabela periódica) material de interface térmica gálio-silicone (TIM) parece estar funcionando como anunciado. Observamos um desempenho bem sustentado no teste de loop multi-core Cinebench R15 durante toda a duração da corrida
Dito isto, o Alienware x15 R2 parece ser cerca de 9% mais lento neste teste em comparação com o Asus ROG Strix Scar 15, que também usa o mesmo processador a 135 W
.Cinebench R15 Multi Loop
O desempenho de um só núcleo está no mesmo nível de outros chips do Alder Lake-H e até mesmo do Alder Lake-HXNúcleo i9-12900HXnoMSI Titan GT77. Vemos entre 1% e 21% de liderança em um único núcleo para o Core i9-12900H em comparação com o Core i9-12900H.AMD Ryzen 9 6900HXnoAsus ROG Zephyrus Duo 16dependendo da referência. O Scar 15 é capaz de superar o X15 R2 na maioria dos referenciais multi-core.
Notamos uma queda de 11% no desempenho do Cinebench R20 multi-core na energia da bateria, provavelmente devido à queda do PL1 para 65 W
Em geral, o Alienware x15 R2 não traz nenhuma surpresa em nosso conjunto de referência de CPU e oferece um aumento de 33% no desempenho da CPU em comparação com o x15 R1. O chassi fino pode ter contribuído para as pontuações ligeiramente mais baixas, mas o gerenciamento térmico da Dell é capaz de garantir um bom desempenho sustentado.
Cinebench R23: Multi Core | Single Core
Cinebench R20: CPU (Multi Core) | CPU (Single Core)
Cinebench R15: CPU Multi 64Bit | CPU Single 64Bit
Blender: v2.79 BMW27 CPU
7-Zip 18.03: 7z b 4 | 7z b 4 -mmt1
Geekbench 5.5: Multi-Core | Single-Core
HWBOT x265 Benchmark v2.2: 4k Preset
LibreOffice : 20 Documents To PDF
R Benchmark 2.5: Overall mean
| CPU Performance rating | |
| Média da turma Gaming | |
| MSI Titan GT77 12UHS | |
| Asus ROG Strix Scar 15 G533ZW-LN106WS | |
| Alienware x15 R2 P111F | |
| MSI Raider GE66 12UHS | |
| MSI Vector GP66 12UGS | |
| Média Intel Core i9-12900H | |
| Asus ROG Zephyrus Duo 16 GX650RX | |
| Razer Blade 15 Advanced Model Early 2022 | |
| Alienware x15 RTX 3070 P111F -2! | |
| Cinebench R23 / Multi Core | |
| Média da turma Gaming (10488 - 42661, n=107, últimos 2 anos) | |
| MSI Titan GT77 12UHS | |
| Asus ROG Strix Scar 15 G533ZW-LN106WS | |
| MSI Vector GP66 12UGS | |
| Alienware x15 R2 P111F | |
| MSI Raider GE66 12UHS | |
| Média Intel Core i9-12900H (7359 - 19648, n=28) | |
| Asus ROG Zephyrus Duo 16 GX650RX | |
| Alienware x15 RTX 3070 P111F | |
| Razer Blade 15 Advanced Model Early 2022 | |
| Cinebench R23 / Single Core | |
| Média da turma Gaming (1166 - 2415, n=107, últimos 2 anos) | |
| Asus ROG Strix Scar 15 G533ZW-LN106WS | |
| MSI Titan GT77 12UHS | |
| Alienware x15 R2 P111F | |
| MSI Vector GP66 12UGS | |
| MSI Raider GE66 12UHS | |
| Média Intel Core i9-12900H (1634 - 1930, n=28) | |
| Razer Blade 15 Advanced Model Early 2022 | |
| Asus ROG Zephyrus Duo 16 GX650RX | |
| Alienware x15 RTX 3070 P111F | |
| Cinebench R20 / CPU (Multi Core) | |
| Média da turma Gaming (4029 - 16433, n=106, últimos 2 anos) | |
| MSI Titan GT77 12UHS | |
| Asus ROG Strix Scar 15 G533ZW-LN106WS | |
| Alienware x15 R2 P111F | |
| MSI Vector GP66 12UGS | |
| MSI Raider GE66 12UHS | |
| Média Intel Core i9-12900H (2681 - 7471, n=28) | |
| Asus ROG Zephyrus Duo 16 GX650RX | |
| Alienware x15 RTX 3070 P111F | |
| Razer Blade 15 Advanced Model Early 2022 | |
| Cinebench R20 / CPU (Single Core) | |
| Média da turma Gaming (442 - 913, n=106, últimos 2 anos) | |
| MSI Titan GT77 12UHS | |
| Alienware x15 R2 P111F | |
| MSI Vector GP66 12UGS | |
| Asus ROG Strix Scar 15 G533ZW-LN106WS | |
| MSI Raider GE66 12UHS | |
| Média Intel Core i9-12900H (624 - 738, n=28) | |
| Razer Blade 15 Advanced Model Early 2022 | |
| Asus ROG Zephyrus Duo 16 GX650RX | |
| Alienware x15 RTX 3070 P111F | |
| Cinebench R15 / CPU Multi 64Bit | |
| Média da turma Gaming (1578 - 6330, n=105, últimos 2 anos) | |
| MSI Titan GT77 12UHS | |
| Asus ROG Strix Scar 15 G533ZW-LN106WS | |
| Alienware x15 R2 P111F | |
| MSI Raider GE66 12UHS | |
| Média Intel Core i9-12900H (1395 - 3077, n=28) | |
| MSI Vector GP66 12UGS | |
| Asus ROG Zephyrus Duo 16 GX650RX | |
| Alienware x15 RTX 3070 P111F | |
| Razer Blade 15 Advanced Model Early 2022 | |
| Cinebench R15 / CPU Single 64Bit | |
| Média da turma Gaming (188.8 - 350, n=106, últimos 2 anos) | |
| MSI Titan GT77 12UHS | |
| Asus ROG Strix Scar 15 G533ZW-LN106WS | |
| Alienware x15 R2 P111F | |
| MSI Vector GP66 12UGS | |
| MSI Raider GE66 12UHS | |
| Média Intel Core i9-12900H (235 - 277, n=29) | |
| Asus ROG Zephyrus Duo 16 GX650RX | |
| Razer Blade 15 Advanced Model Early 2022 | |
| Alienware x15 RTX 3070 P111F | |
| Blender / v2.79 BMW27 CPU | |
| Razer Blade 15 Advanced Model Early 2022 | |
| Média Intel Core i9-12900H (160 - 451, n=28) | |
| Alienware x15 RTX 3070 P111F | |
| Asus ROG Zephyrus Duo 16 GX650RX | |
| MSI Vector GP66 12UGS | |
| MSI Raider GE66 12UHS | |
| Alienware x15 R2 P111F | |
| Asus ROG Strix Scar 15 G533ZW-LN106WS | |
| Média da turma Gaming (79 - 330, n=104, últimos 2 anos) | |
| MSI Titan GT77 12UHS | |
| 7-Zip 18.03 / 7z b 4 | |
| Média da turma Gaming (33491 - 148086, n=105, últimos 2 anos) | |
| MSI Titan GT77 12UHS | |
| Alienware x15 R2 P111F | |
| MSI Raider GE66 12UHS | |
| Asus ROG Strix Scar 15 G533ZW-LN106WS | |
| MSI Vector GP66 12UGS | |
| Asus ROG Zephyrus Duo 16 GX650RX | |
| Média Intel Core i9-12900H (34684 - 76677, n=28) | |
| Alienware x15 RTX 3070 P111F | |
| Razer Blade 15 Advanced Model Early 2022 | |
| 7-Zip 18.03 / 7z b 4 -mmt1 | |
| Média da turma Gaming (4199 - 7436, n=105, últimos 2 anos) | |
| MSI Titan GT77 12UHS | |
| MSI Vector GP66 12UGS | |
| MSI Raider GE66 12UHS | |
| Razer Blade 15 Advanced Model Early 2022 | |
| Asus ROG Strix Scar 15 G533ZW-LN106WS | |
| Alienware x15 R2 P111F | |
| Média Intel Core i9-12900H (5302 - 6289, n=28) | |
| Asus ROG Zephyrus Duo 16 GX650RX | |
| Alienware x15 RTX 3070 P111F | |
| Geekbench 5.5 / Multi-Core | |
| Média da turma Gaming (6460 - 28263, n=105, últimos 2 anos) | |
| MSI Titan GT77 12UHS | |
| Asus ROG Strix Scar 15 G533ZW-LN106WS | |
| Alienware x15 R2 P111F | |
| MSI Raider GE66 12UHS | |
| MSI Vector GP66 12UGS | |
| Média Intel Core i9-12900H (8519 - 14376, n=31) | |
| Asus ROG Zephyrus Duo 16 GX650RX | |
| Razer Blade 15 Advanced Model Early 2022 | |
| Geekbench 5.5 / Single-Core | |
| Média da turma Gaming (986 - 2474, n=105, últimos 2 anos) | |
| MSI Titan GT77 12UHS | |
| MSI Vector GP66 12UGS | |
| Alienware x15 R2 P111F | |
| MSI Raider GE66 12UHS | |
| Asus ROG Strix Scar 15 G533ZW-LN106WS | |
| Razer Blade 15 Advanced Model Early 2022 | |
| Média Intel Core i9-12900H (1631 - 1897, n=31) | |
| Asus ROG Zephyrus Duo 16 GX650RX | |
| HWBOT x265 Benchmark v2.2 / 4k Preset | |
| Média da turma Gaming (11.5 - 44.4, n=105, últimos 2 anos) | |
| MSI Titan GT77 12UHS | |
| Asus ROG Strix Scar 15 G533ZW-LN106WS | |
| Alienware x15 R2 P111F | |
| MSI Vector GP66 12UGS | |
| MSI Raider GE66 12UHS | |
| Asus ROG Zephyrus Duo 16 GX650RX | |
| Média Intel Core i9-12900H (8.05 - 22.5, n=28) | |
| Alienware x15 RTX 3070 P111F | |
| Razer Blade 15 Advanced Model Early 2022 | |
| LibreOffice / 20 Documents To PDF | |
| Média da turma Gaming (33.2 - 88.8, n=105, últimos 2 anos) | |
| Alienware x15 RTX 3070 P111F | |
| Alienware x15 R2 P111F | |
| Asus ROG Zephyrus Duo 16 GX650RX | |
| Razer Blade 15 Advanced Model Early 2022 | |
| Média Intel Core i9-12900H (36.8 - 59.8, n=28) | |
| MSI Vector GP66 12UGS | |
| Asus ROG Strix Scar 15 G533ZW-LN106WS | |
| MSI Titan GT77 12UHS | |
| MSI Raider GE66 12UHS | |
| R Benchmark 2.5 / Overall mean | |
| Alienware x15 RTX 3070 P111F | |
| Asus ROG Zephyrus Duo 16 GX650RX | |
| Média Intel Core i9-12900H (0.4218 - 0.506, n=28) | |
| Razer Blade 15 Advanced Model Early 2022 | |
| MSI Raider GE66 12UHS | |
| Alienware x15 R2 P111F | |
| Asus ROG Strix Scar 15 G533ZW-LN106WS | |
| Média da turma Gaming (0.3439 - 0.759, n=106, últimos 2 anos) | |
| MSI Vector GP66 12UGS | |
| MSI Titan GT77 12UHS | |
* ... menor é melhor
AIDA64: FP32 Ray-Trace | FPU Julia | CPU SHA3 | CPU Queen | FPU SinJulia | FPU Mandel | CPU AES | CPU ZLib | FP64 Ray-Trace | CPU PhotoWorxx
| Performance rating | |
| Média da turma Gaming | |
| MSI Titan GT77 12UHS | |
| Asus ROG Zephyrus Duo 16 GX650RX | |
| Alienware x15 R2 P111F | |
| Asus ROG Strix Scar 15 G533ZW-LN106WS | |
| Média Intel Core i9-12900H | |
| MSI Raider GE66 12UHS | |
| MSI Vector GP66 12UGS | |
| Razer Blade 15 Advanced Model Early 2022 | |
| Alienware x15 RTX 3070 P111F -9! | |
| AIDA64 / FP32 Ray-Trace | |
| Média da turma Gaming (10227 - 85542, n=105, últimos 2 anos) | |
| MSI Titan GT77 12UHS | |
| Asus ROG Zephyrus Duo 16 GX650RX | |
| Alienware x15 R2 P111F | |
| Média Intel Core i9-12900H (4074 - 18289, n=29) | |
| Asus ROG Strix Scar 15 G533ZW-LN106WS | |
| MSI Raider GE66 12UHS | |
| MSI Vector GP66 12UGS | |
| Razer Blade 15 Advanced Model Early 2022 | |
| AIDA64 / FPU Julia | |
| Média da turma Gaming (51376 - 238426, n=105, últimos 2 anos) | |
| MSI Titan GT77 12UHS | |
| Asus ROG Zephyrus Duo 16 GX650RX | |
| Alienware x15 R2 P111F | |
| Média Intel Core i9-12900H (22307 - 93236, n=29) | |
| Asus ROG Strix Scar 15 G533ZW-LN106WS | |
| MSI Raider GE66 12UHS | |
| MSI Vector GP66 12UGS | |
| Razer Blade 15 Advanced Model Early 2022 | |
| AIDA64 / CPU SHA3 | |
| Média da turma Gaming (2180 - 10115, n=105, últimos 2 anos) | |
| MSI Titan GT77 12UHS | |
| Alienware x15 R2 P111F | |
| Asus ROG Zephyrus Duo 16 GX650RX | |
| Asus ROG Strix Scar 15 G533ZW-LN106WS | |
| Média Intel Core i9-12900H (1378 - 4215, n=29) | |
| MSI Vector GP66 12UGS | |
| MSI Raider GE66 12UHS | |
| Razer Blade 15 Advanced Model Early 2022 | |
| AIDA64 / CPU Queen | |
| Média da turma Gaming (49785 - 173351, n=90, últimos 2 anos) | |
| Alienware x15 R2 P111F | |
| MSI Vector GP66 12UGS | |
| MSI Raider GE66 12UHS | |
| Asus ROG Zephyrus Duo 16 GX650RX | |
| Asus ROG Strix Scar 15 G533ZW-LN106WS | |
| MSI Titan GT77 12UHS | |
| Média Intel Core i9-12900H (78172 - 111241, n=28) | |
| Razer Blade 15 Advanced Model Early 2022 | |
| AIDA64 / FPU SinJulia | |
| Média da turma Gaming (4424 - 33636, n=105, últimos 2 anos) | |
| MSI Titan GT77 12UHS | |
| Asus ROG Zephyrus Duo 16 GX650RX | |
| Asus ROG Strix Scar 15 G533ZW-LN106WS | |
| Alienware x15 R2 P111F | |
| MSI Vector GP66 12UGS | |
| MSI Raider GE66 12UHS | |
| Média Intel Core i9-12900H (5709 - 10410, n=29) | |
| Razer Blade 15 Advanced Model Early 2022 | |
| AIDA64 / FPU Mandel | |
| Média da turma Gaming (25115 - 128721, n=105, últimos 2 anos) | |
| Asus ROG Zephyrus Duo 16 GX650RX | |
| MSI Titan GT77 12UHS | |
| Alienware x15 R2 P111F | |
| Média Intel Core i9-12900H (11257 - 45581, n=29) | |
| Asus ROG Strix Scar 15 G533ZW-LN106WS | |
| MSI Raider GE66 12UHS | |
| MSI Vector GP66 12UGS | |
| Razer Blade 15 Advanced Model Early 2022 | |
| AIDA64 / CPU AES | |
| MSI Titan GT77 12UHS | |
| Alienware x15 R2 P111F | |
| Asus ROG Zephyrus Duo 16 GX650RX | |
| Média da turma Gaming (39258 - 247074, n=105, últimos 2 anos) | |
| Asus ROG Strix Scar 15 G533ZW-LN106WS | |
| MSI Vector GP66 12UGS | |
| MSI Raider GE66 12UHS | |
| Média Intel Core i9-12900H (31935 - 151546, n=29) | |
| Razer Blade 15 Advanced Model Early 2022 | |
| AIDA64 / CPU ZLib | |
| Média da turma Gaming (574 - 2531, n=105, últimos 2 anos) | |
| MSI Titan GT77 12UHS | |
| Asus ROG Strix Scar 15 G533ZW-LN106WS | |
| Alienware x15 R2 P111F | |
| MSI Vector GP66 12UGS | |
| MSI Raider GE66 12UHS | |
| Média Intel Core i9-12900H (449 - 1193, n=29) | |
| Asus ROG Zephyrus Duo 16 GX650RX | |
| Razer Blade 15 Advanced Model Early 2022 | |
| Alienware x15 RTX 3070 P111F | |
| AIDA64 / FP64 Ray-Trace | |
| Média da turma Gaming (5509 - 45446, n=105, últimos 2 anos) | |
| MSI Titan GT77 12UHS | |
| Asus ROG Zephyrus Duo 16 GX650RX | |
| Alienware x15 R2 P111F | |
| Média Intel Core i9-12900H (2235 - 10511, n=29) | |
| Asus ROG Strix Scar 15 G533ZW-LN106WS | |
| MSI Raider GE66 12UHS | |
| MSI Vector GP66 12UGS | |
| Razer Blade 15 Advanced Model Early 2022 | |
| AIDA64 / CPU PhotoWorxx | |
| Média da turma Gaming (12271 - 89891, n=105, últimos 2 anos) | |
| MSI Titan GT77 12UHS | |
| MSI Raider GE66 12UHS | |
| Asus ROG Strix Scar 15 G533ZW-LN106WS | |
| Alienware x15 R2 P111F | |
| Razer Blade 15 Advanced Model Early 2022 | |
| Média Intel Core i9-12900H (20960 - 48269, n=30) | |
| Asus ROG Zephyrus Duo 16 GX650RX | |
| MSI Vector GP66 12UGS | |
Confira nossos dedicados Intel Core i9-12900H para mais benchmarks e comparações de desempenho.
Desempenho do sistema
O Alienware x15 R2 está apenas 9% atrás do MSI Titan GT77 no desempenho geral do PCMark 10, sendo o maior déficit visto no componente Criação de Conteúdo Digital do benchmark. As pontuações do CrossMark são comparáveis às do Scar 15 e são cerca de 15% maiores que as do Zephyrus Duo 16 acionado por Ryzen 9 6900HX.
Subjetivamente, não tivemos nenhum contratempo na produtividade diária e nas tarefas de navegação na web.
CrossMark: Overall | Productivity | Creativity | Responsiveness
| PCMark 10 / Score | |
| Média da turma Gaming (5828 - 12414, n=93, últimos 2 anos) | |
| MSI Titan GT77 12UHS | |
| MSI Raider GE66 12UHS | |
| MSI Vector GP66 12UGS | |
| Asus ROG Strix Scar 15 G533ZW-LN106WS | |
| Média Intel Core i9-12900H, NVIDIA GeForce RTX 3080 Ti Laptop GPU (7139 - 8083, n=6) | |
| Alienware x15 R2 P111F | |
| Razer Blade 15 Advanced Model Early 2022 | |
| Alienware x15 RTX 3070 P111F | |
| Asus ROG Zephyrus Duo 16 GX650RX | |
| PCMark 10 / Essentials | |
| Alienware x15 R2 P111F | |
| MSI Titan GT77 12UHS | |
| MSI Raider GE66 12UHS | |
| MSI Vector GP66 12UGS | |
| Média Intel Core i9-12900H, NVIDIA GeForce RTX 3080 Ti Laptop GPU (10254 - 11178, n=6) | |
| Asus ROG Strix Scar 15 G533ZW-LN106WS | |
| Média da turma Gaming (8810 - 11935, n=97, últimos 2 anos) | |
| Razer Blade 15 Advanced Model Early 2022 | |
| Alienware x15 RTX 3070 P111F | |
| Asus ROG Zephyrus Duo 16 GX650RX | |
| PCMark 10 / Productivity | |
| Média da turma Gaming (6845 - 25323, n=95, últimos 2 anos) | |
| Asus ROG Strix Scar 15 G533ZW-LN106WS | |
| MSI Raider GE66 12UHS | |
| Alienware x15 R2 P111F | |
| MSI Titan GT77 12UHS | |
| MSI Vector GP66 12UGS | |
| Média Intel Core i9-12900H, NVIDIA GeForce RTX 3080 Ti Laptop GPU (9102 - 11186, n=6) | |
| Razer Blade 15 Advanced Model Early 2022 | |
| Alienware x15 RTX 3070 P111F | |
| Asus ROG Zephyrus Duo 16 GX650RX | |
| PCMark 10 / Digital Content Creation | |
| Média da turma Gaming (7602 - 19954, n=95, últimos 2 anos) | |
| MSI Titan GT77 12UHS | |
| MSI Raider GE66 12UHS | |
| MSI Vector GP66 12UGS | |
| Asus ROG Strix Scar 15 G533ZW-LN106WS | |
| Média Intel Core i9-12900H, NVIDIA GeForce RTX 3080 Ti Laptop GPU (9847 - 12627, n=6) | |
| Alienware x15 RTX 3070 P111F | |
| Razer Blade 15 Advanced Model Early 2022 | |
| Alienware x15 R2 P111F | |
| Asus ROG Zephyrus Duo 16 GX650RX | |
| CrossMark / Overall | |
| MSI Titan GT77 12UHS | |
| Asus ROG Strix Scar 15 G533ZW-LN106WS | |
| Média da turma Gaming (1366 - 2409, n=94, últimos 2 anos) | |
| Alienware x15 R2 P111F | |
| Média Intel Core i9-12900H, NVIDIA GeForce RTX 3080 Ti Laptop GPU (1696 - 1965, n=3) | |
| Razer Blade 15 Advanced Model Early 2022 | |
| Asus ROG Zephyrus Duo 16 GX650RX | |
| CrossMark / Productivity | |
| MSI Titan GT77 12UHS | |
| Asus ROG Strix Scar 15 G533ZW-LN106WS | |
| Alienware x15 R2 P111F | |
| Média da turma Gaming (1386 - 2254, n=94, últimos 2 anos) | |
| Média Intel Core i9-12900H, NVIDIA GeForce RTX 3080 Ti Laptop GPU (1622 - 1870, n=3) | |
| Razer Blade 15 Advanced Model Early 2022 | |
| Asus ROG Zephyrus Duo 16 GX650RX | |
| CrossMark / Creativity | |
| MSI Titan GT77 12UHS | |
| Média da turma Gaming (1343 - 2786, n=94, últimos 2 anos) | |
| Alienware x15 R2 P111F | |
| Asus ROG Strix Scar 15 G533ZW-LN106WS | |
| Média Intel Core i9-12900H, NVIDIA GeForce RTX 3080 Ti Laptop GPU (1855 - 2135, n=3) | |
| Razer Blade 15 Advanced Model Early 2022 | |
| Asus ROG Zephyrus Duo 16 GX650RX | |
| CrossMark / Responsiveness | |
| Asus ROG Strix Scar 15 G533ZW-LN106WS | |
| MSI Titan GT77 12UHS | |
| Alienware x15 R2 P111F | |
| Asus ROG Zephyrus Duo 16 GX650RX | |
| Média da turma Gaming (1226 - 2334, n=94, últimos 2 anos) | |
| Média Intel Core i9-12900H, NVIDIA GeForce RTX 3080 Ti Laptop GPU (1483 - 1777, n=3) | |
| Razer Blade 15 Advanced Model Early 2022 | |
| PCMark 8 Home Score Accelerated v2 | 6653 pontos | |
| PCMark 8 Creative Score Accelerated v2 | 10574 pontos | |
| PCMark 8 Work Score Accelerated v2 | 6944 pontos | |
| PCMark 10 Score | 7496 pontos | |
Ajuda | ||
| AIDA64 / Memory Copy | |
| Média da turma Gaming (21750 - 129946, n=105, últimos 2 anos) | |
| Alienware x15 R2 P111F | |
| MSI Titan GT77 12UHS | |
| MSI Raider GE66 12UHS | |
| Razer Blade 15 Advanced Model Early 2022 | |
| Asus ROG Strix Scar 15 G533ZW-LN106WS | |
| Média Intel Core i9-12900H (34438 - 74264, n=29) | |
| Asus ROG Zephyrus Duo 16 GX650RX | |
| MSI Vector GP66 12UGS | |
| AIDA64 / Memory Read | |
| Média da turma Gaming (22956 - 118858, n=105, últimos 2 anos) | |
| MSI Raider GE66 12UHS | |
| Razer Blade 15 Advanced Model Early 2022 | |
| Alienware x15 R2 P111F | |
| Asus ROG Strix Scar 15 G533ZW-LN106WS | |
| MSI Titan GT77 12UHS | |
| Média Intel Core i9-12900H (36365 - 74642, n=29) | |
| Asus ROG Zephyrus Duo 16 GX650RX | |
| MSI Vector GP66 12UGS | |
| AIDA64 / Memory Write | |
| Média da turma Gaming (22297 - 135096, n=105, últimos 2 anos) | |
| Razer Blade 15 Advanced Model Early 2022 | |
| MSI Raider GE66 12UHS | |
| Asus ROG Strix Scar 15 G533ZW-LN106WS | |
| Alienware x15 R2 P111F | |
| MSI Titan GT77 12UHS | |
| Média Intel Core i9-12900H (32276 - 67858, n=29) | |
| Asus ROG Zephyrus Duo 16 GX650RX | |
| MSI Vector GP66 12UGS | |
| AIDA64 / Memory Latency | |
| Alienware x15 R2 P111F | |
| Média da turma Gaming (75.3 - 259, n=105, últimos 2 anos) | |
| Asus ROG Strix Scar 15 G533ZW-LN106WS | |
| Razer Blade 15 Advanced Model Early 2022 | |
| MSI Raider GE66 12UHS | |
| Asus ROG Zephyrus Duo 16 GX650RX | |
| MSI Vector GP66 12UGS | |
| MSI Titan GT77 12UHS | |
| Média Intel Core i9-12900H (74.7 - 118.1, n=28) | |
| Alienware x15 RTX 3070 P111F | |
* ... menor é melhor
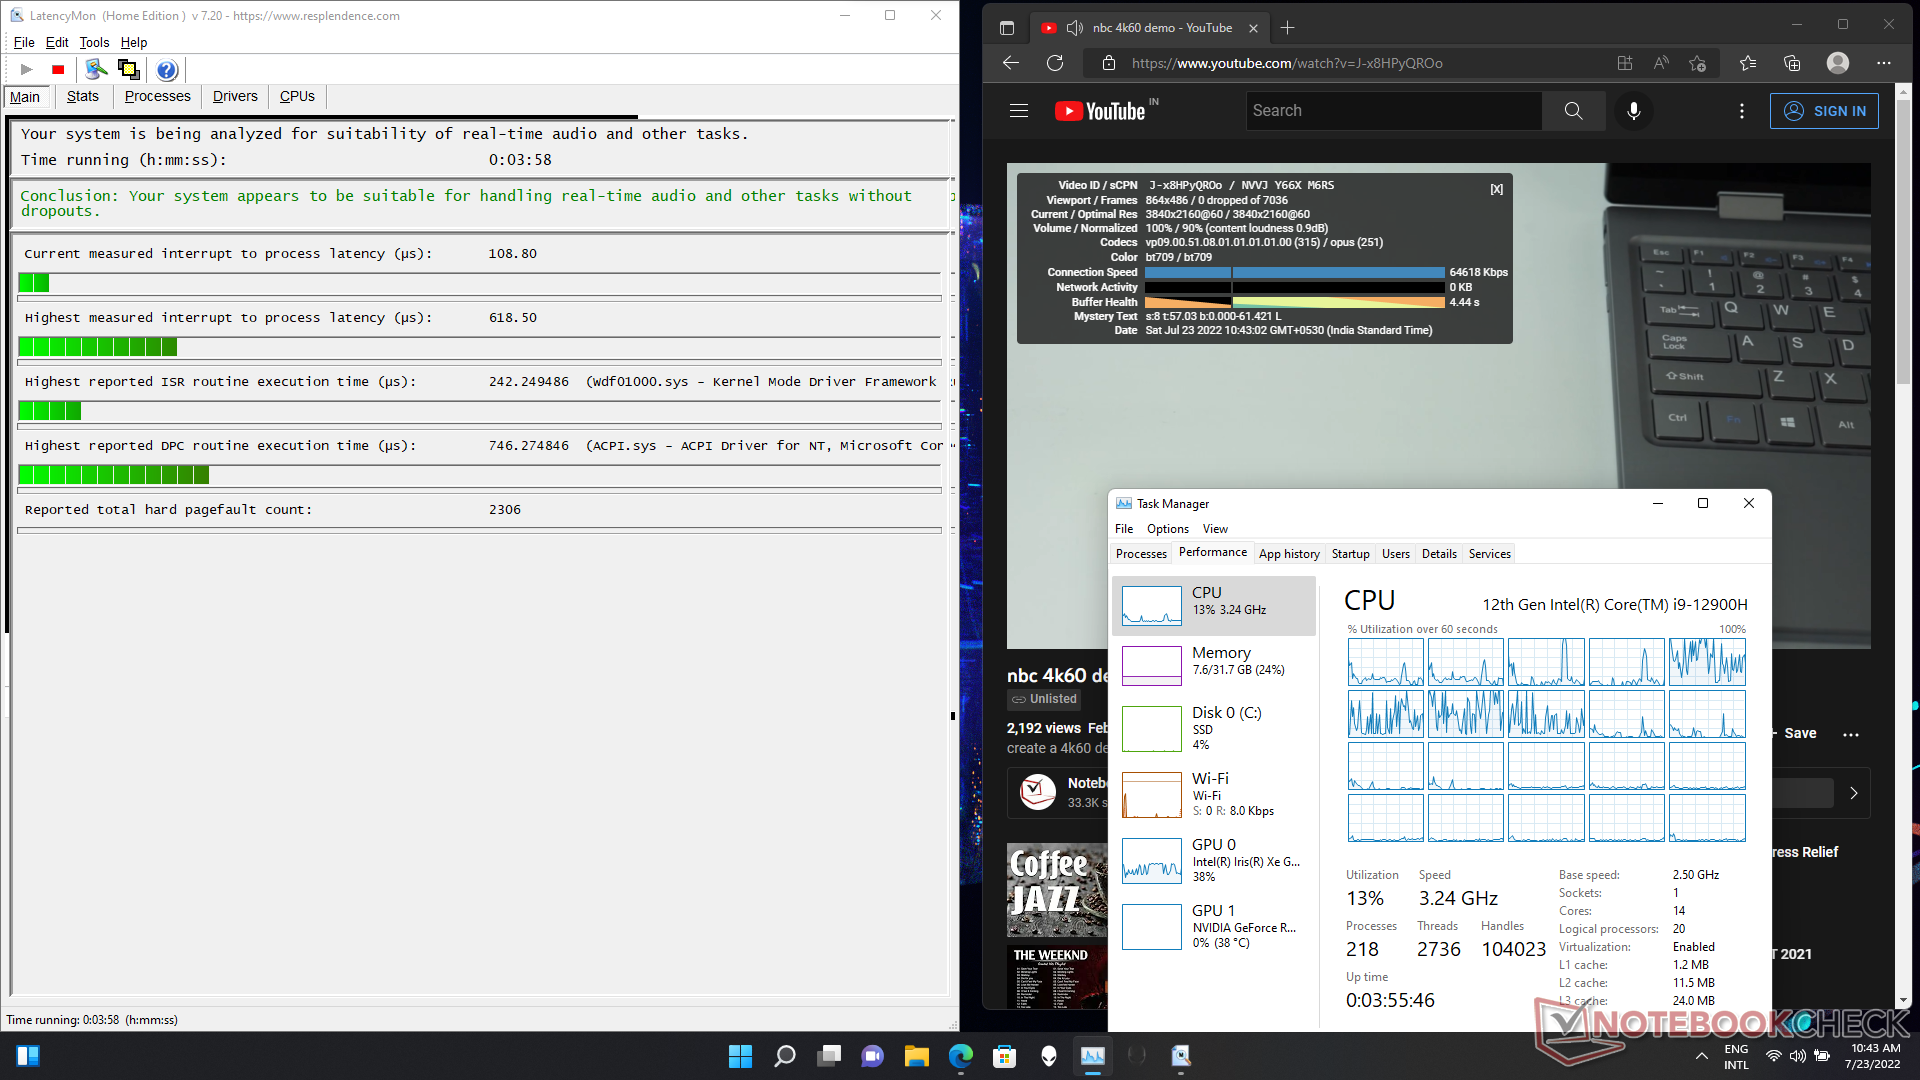
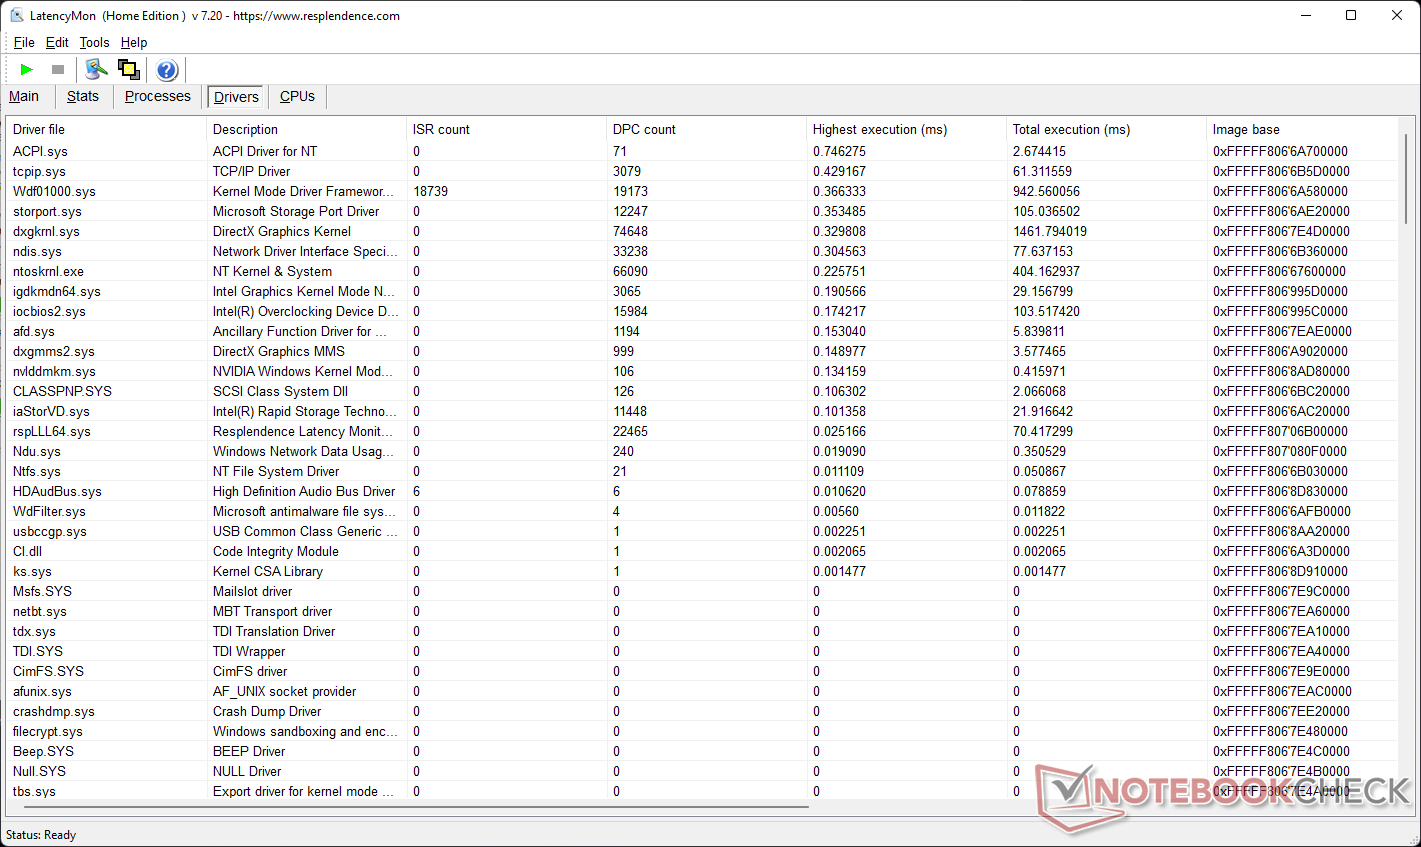
Latência do DPC
A latência DPC do Alienware x15 R2 está um pouco mais alta, mas nossos testes LatencyMon indicam que ele ainda deve ser adequado para fluxos de trabalho de áudio e vídeo em tempo real. O driver do Windows ACPI.sys parece estar contribuindo para a latência observada.
| DPC Latencies / LatencyMon - interrupt to process latency (max), Web, Youtube, Prime95 | |
| MSI Raider GE66 12UHS | |
| Razer Blade 15 Advanced Model Early 2022 | |
| MSI Vector GP66 12UGS | |
| MSI Titan GT77 12UHS | |
| MSI Titan GT77 12UHS | |
| Alienware x15 RTX 3070 P111F | |
| Asus ROG Strix Scar 15 G533ZW-LN106WS | |
| Alienware x15 R2 P111F | |
| Asus ROG Zephyrus Duo 16 GX650RX | |
* ... menor é melhor
Mais comparações entre os dispositivos revisados podem ser encontradas em nosso Ranking de Latência DPC página.
Dispositivos de armazenamento
O subsistema de armazenamento é uma área em que o x15 R2 fica aquém das expectativas - já vimos um melhor desempenho com o drive Samsung PM9A1 antes. Dito isto, a velocidade de leitura e escrita sequencial Q32T1 se aproxima dos valores anunciados para este drive. O x15 R2 deste ano oferece um desempenho de disco 40% melhor em comparação com o SSD x15 R1 da Western Digital SN730.
O estrangulamento do disco foi observado em direção à 43ª corrida do teste de loop de leitura do DiskSpd a uma profundidade de 8 da fila. Não há solução térmica fornecida nem no SSD nem no painel inferior.
Dado o chassi fino, a Dell não oferece espaço para um drive SATA de 2,5 polegadas. Entretanto, há uma disposição para adicionar outro SSD M.2 NVMe.

* ... menor é melhor
Disk Throttling: DiskSpd Read Loop, Queue Depth 8
Nosso dedicadoSSD e HDD Benchmarksoferece mais comparações de desempenho de dispositivos de armazenamento.
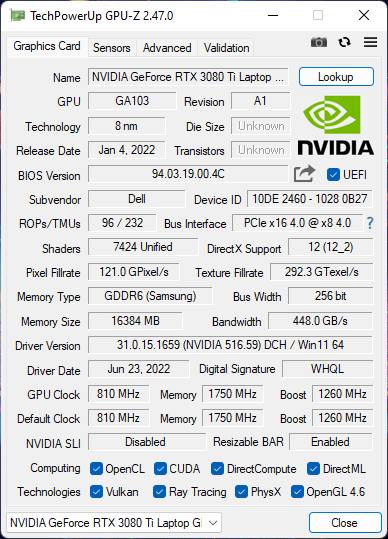
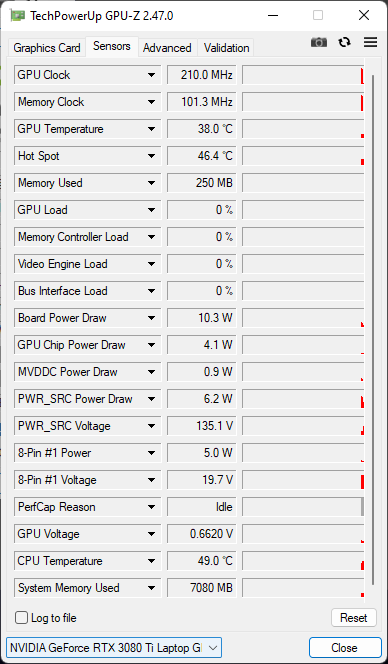
Desempenho da GPU
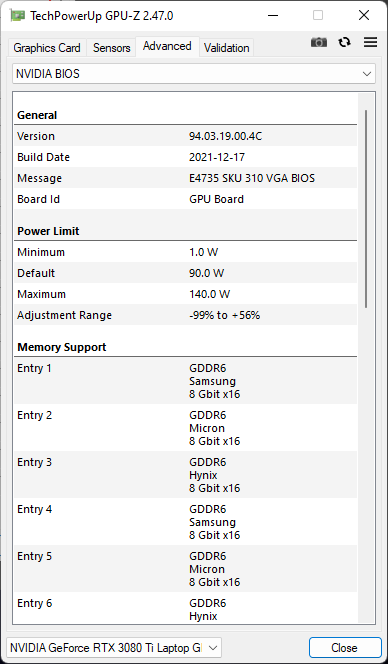
Nossa unidade Alienware x15 R2 apresenta um Nvidia GeForce RTX 3080 Ti GPU Portátil com 16 GB GDDR6 VRAM e uma potência gráfica total (TGP) de 140 W. A Dell não especifica a potência do Dynamic Boost para esta GPU.
O desempenho geral 3DMark do RTX 3080 Ti no x15 R2 é comparável ao do MSI Raider GE66 (150 W) e o MSI Titan GT77 (175 W). A pontuação um pouco mais baixa se deve à menor potência necessária para o chassi fino. O Razer Blade 15 Advanced da Razer Blade RTX 3080 Ti fica atrás, devido à baixa classificação de 110 W.
| 3DMark 11 Performance | 33756 pontos | |
| 3DMark Ice Storm Standard Score | 265376 pontos | |
| 3DMark Cloud Gate Standard Score | 62500 pontos | |
| 3DMark Fire Strike Score | 24365 pontos | |
| 3DMark Fire Strike Extreme Score | 14539 pontos | |
| 3DMark Time Spy Score | 12393 pontos | |
Ajuda | ||
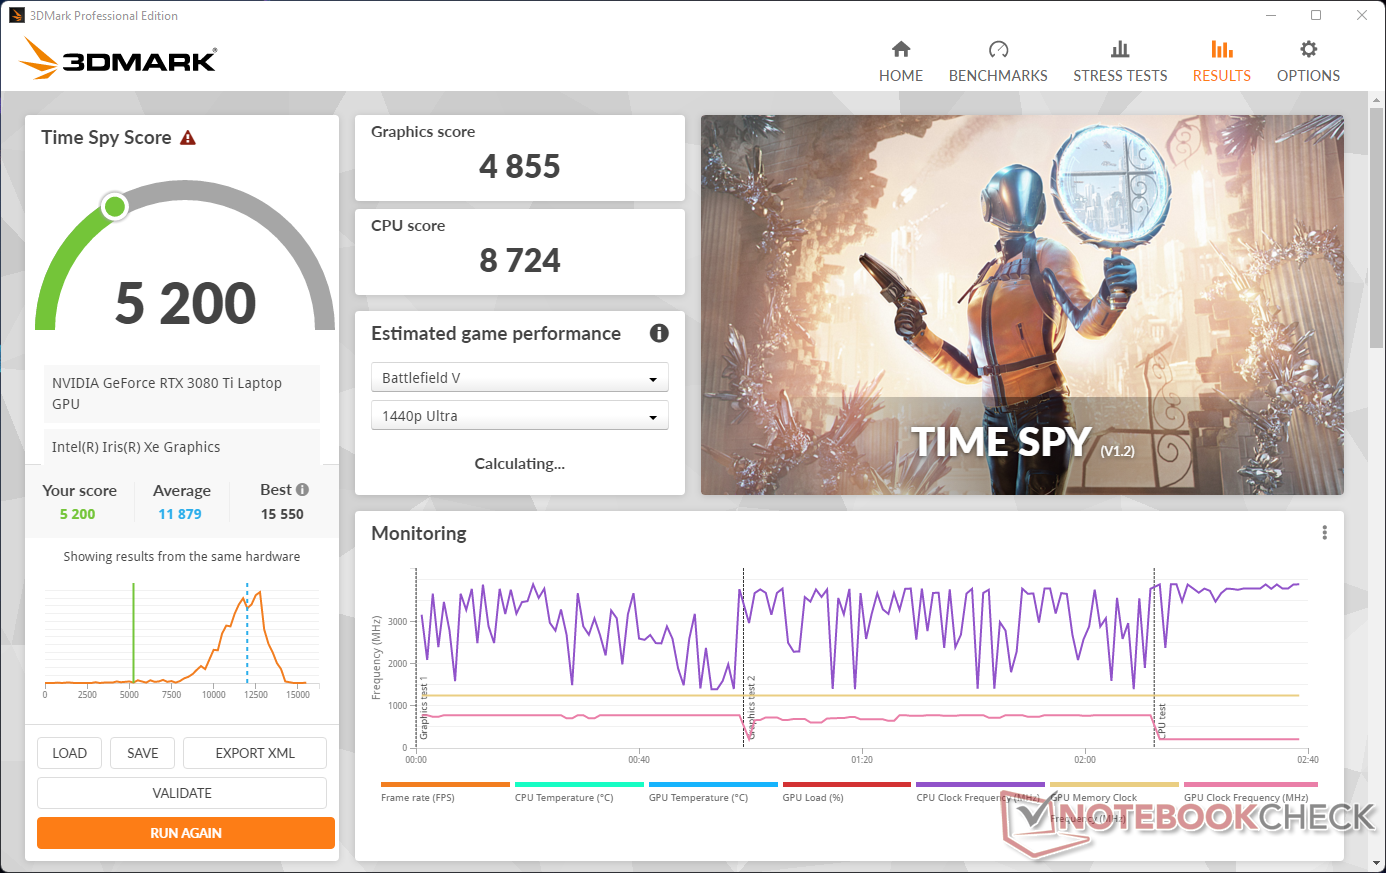
Na energia da bateria, vemos uma queda significativa na pontuação do 3DMark Time Spy. A pontuação geral cai em 58% enquanto que o desempenho gráfico é atingido em 60%
A taxa de atualização da tela muda automaticamente de 360 Hz para 60 Hz quando desconectada da rede elétrica.
Desempenho nos jogos
O desempenho de jogo do Alienware x15 R2 está nas linhas esperadas para o hardware em oferta e geralmente está ao nível de outros laptops RTX 3080 Ti-powered. Ajustes de muito baixa qualidade, veja o Asus ROG Strix Scar 15 liderando com seus 150 W GPU para notebook RTX 3070 Ti em jogos como F1 2021, O Witcher 3 , e Cyberpunk 2077, mas o x15 R2 ganha terreno perdido uma vez que as configurações gráficas são ativadas.
| F1 2021 | |
| 1920x1080 High Preset AA:T AF:16x | |
| MSI Titan GT77 12UHS | |
| MSI Raider GE66 12UHS | |
| Alienware x15 R2 P111F | |
| Média NVIDIA GeForce RTX 3080 Ti Laptop GPU (182.1 - 316, n=17) | |
| Asus ROG Strix Scar 15 G533ZW-LN106WS | |
| Asus ROG Zephyrus Duo 16 GX650RX | |
| 1920x1080 Ultra High Preset + Raytracing AA:T AF:16x | |
| MSI Titan GT77 12UHS | |
| Alienware x15 R2 P111F | |
| MSI Raider GE66 12UHS | |
| Asus ROG Strix Scar 15 G533ZW-LN106WS | |
| Asus ROG Zephyrus Duo 16 GX650RX | |
| Média NVIDIA GeForce RTX 3080 Ti Laptop GPU (30.2 - 160.6, n=30) | |
| Watch Dogs Legion | |
| 1920x1080 Ultra Preset (DX12) | |
| MSI Titan GT77 12UHS | |
| Média NVIDIA GeForce RTX 3080 Ti Laptop GPU (78.2 - 87, n=4) | |
| Alienware x15 R2 P111F | |
| 1920x1080 Ultra Preset + Ultra Ray Tracing (DX12) | |
| Média NVIDIA GeForce RTX 3080 Ti Laptop GPU (50 - 70, n=3) | |
| MSI Titan GT77 12UHS | |
| Alienware x15 R2 P111F | |
| Tiny Tina's Wonderlands | |
| 1920x1080 High Preset (DX12) | |
| Média NVIDIA GeForce RTX 3080 Ti Laptop GPU (123.5 - 137.1, n=4) | |
| Asus ROG Zephyrus Duo 16 GX650RX | |
| Alienware x15 R2 P111F | |
| Média da turma Gaming (72.1 - 203, n=4, últimos 2 anos) | |
| 1920x1080 Badass Preset (DX12) | |
| Média NVIDIA GeForce RTX 3080 Ti Laptop GPU (100.7 - 110.5, n=4) | |
| Asus ROG Zephyrus Duo 16 GX650RX | |
| Alienware x15 R2 P111F | |
| Média da turma Gaming (55 - 159.4, n=4, últimos 2 anos) | |
A Carta de FPS Witcher 3
O desempenho sustentado no The Witcher 3 a 1080p Ultra é decente, embora vejamos flutuações na taxa de quadros. Há um ligeiro mergulho em fps no final da corrida, mas o x15 R2 é capaz de se recuperar rapidamente.
| baixo | média | alto | ultra | |
|---|---|---|---|---|
| The Witcher 3 (2015) | 391 | 345 | 229 | 116 |
| Dota 2 Reborn (2015) | 174.7 | 162.2 | 151.6 | 145.7 |
| Final Fantasy XV Benchmark (2018) | 209 | 156.4 | 120.5 | |
| X-Plane 11.11 (2018) | 146.9 | 137.7 | 105.5 | |
| Far Cry 5 (2018) | 172 | 152 | 143 | 135 |
| Strange Brigade (2018) | 458 | 246 | 200 | 180.5 |
| Watch Dogs Legion (2020) | 133.2 | 122.4 | 107.4 | 78.2 |
| F1 2021 (2021) | 361 | 319 | 248 | 146.9 |
| Cyberpunk 2077 1.6 (2022) | 133.7 | 124.6 | 102.6 | 86.1 |
| Tiny Tina's Wonderlands (2022) | 209 | 178.2 | 126.6 | 100.7 |
| Call of Duty Modern Warfare 2 2022 (2022) | 96 |
Confira nosso Nvidia GeForce RTX 3080 Ti GPU Portátil para mais informações e comparações de referência.
Emissões: Esta vareta quente funciona a quente
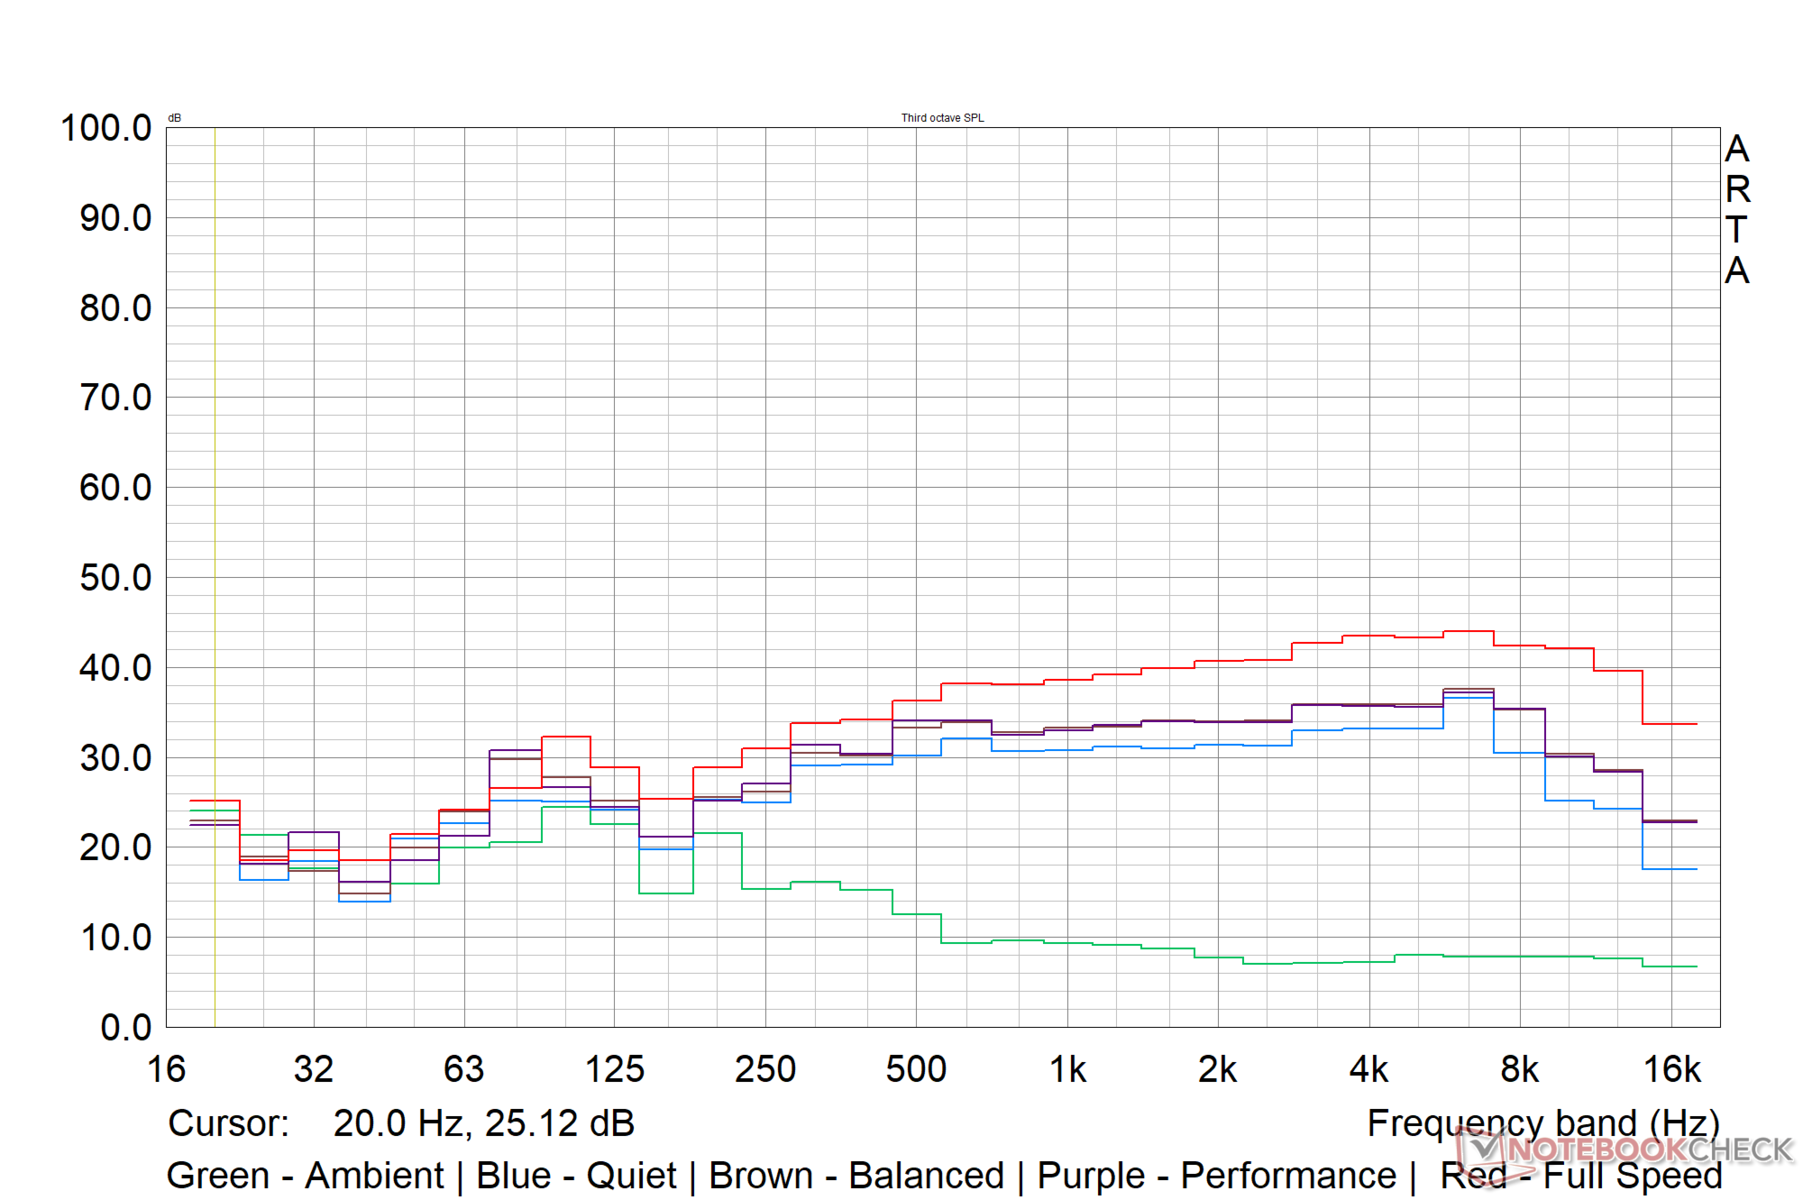
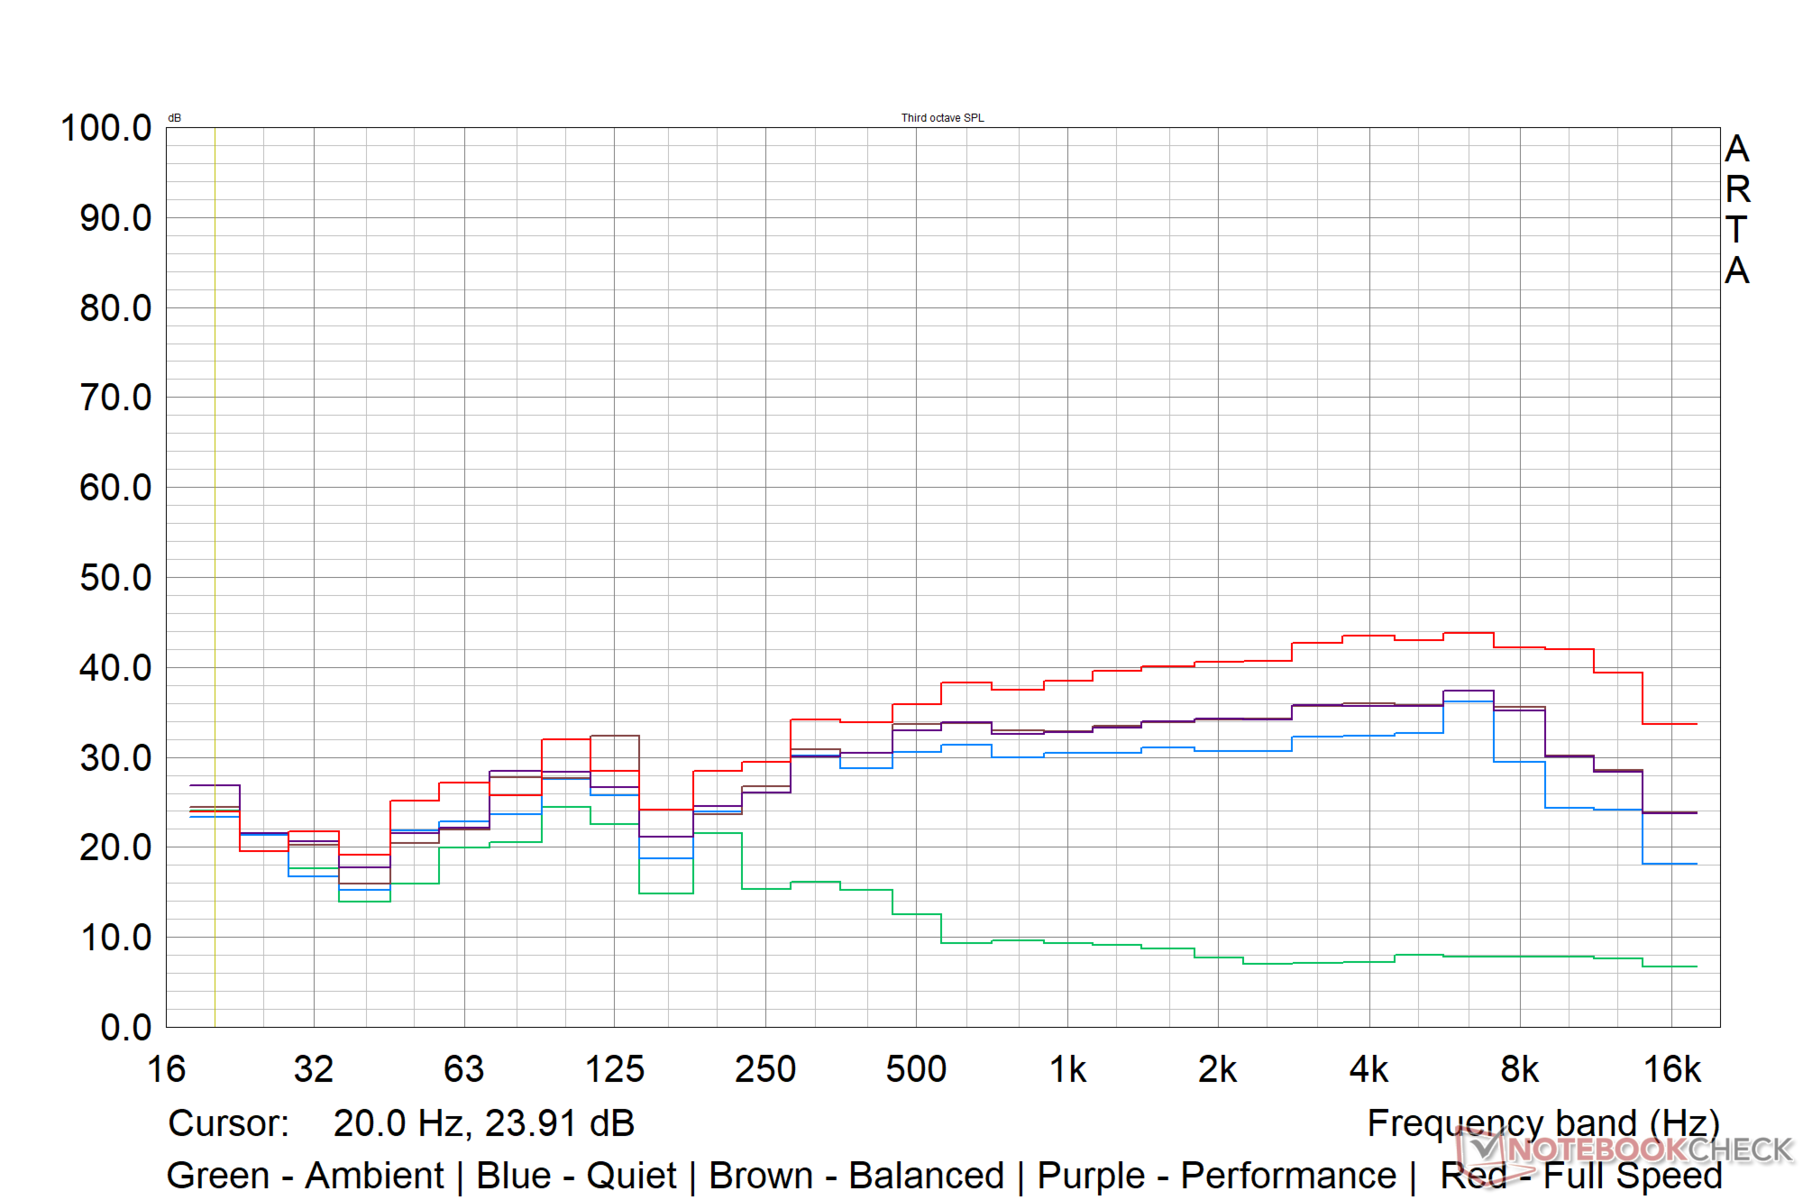
Ruído do sistema
Como discutido anteriormente, a Dell oferece quatro perfis térmicos à sua escolha. Para a maioria das finalidades, os modos Equilibrado e Desempenho fazem o trabalho bem feito. O modo de velocidade total só é necessário se você quiser um resfriamento absolutamente livre de obstáculos.
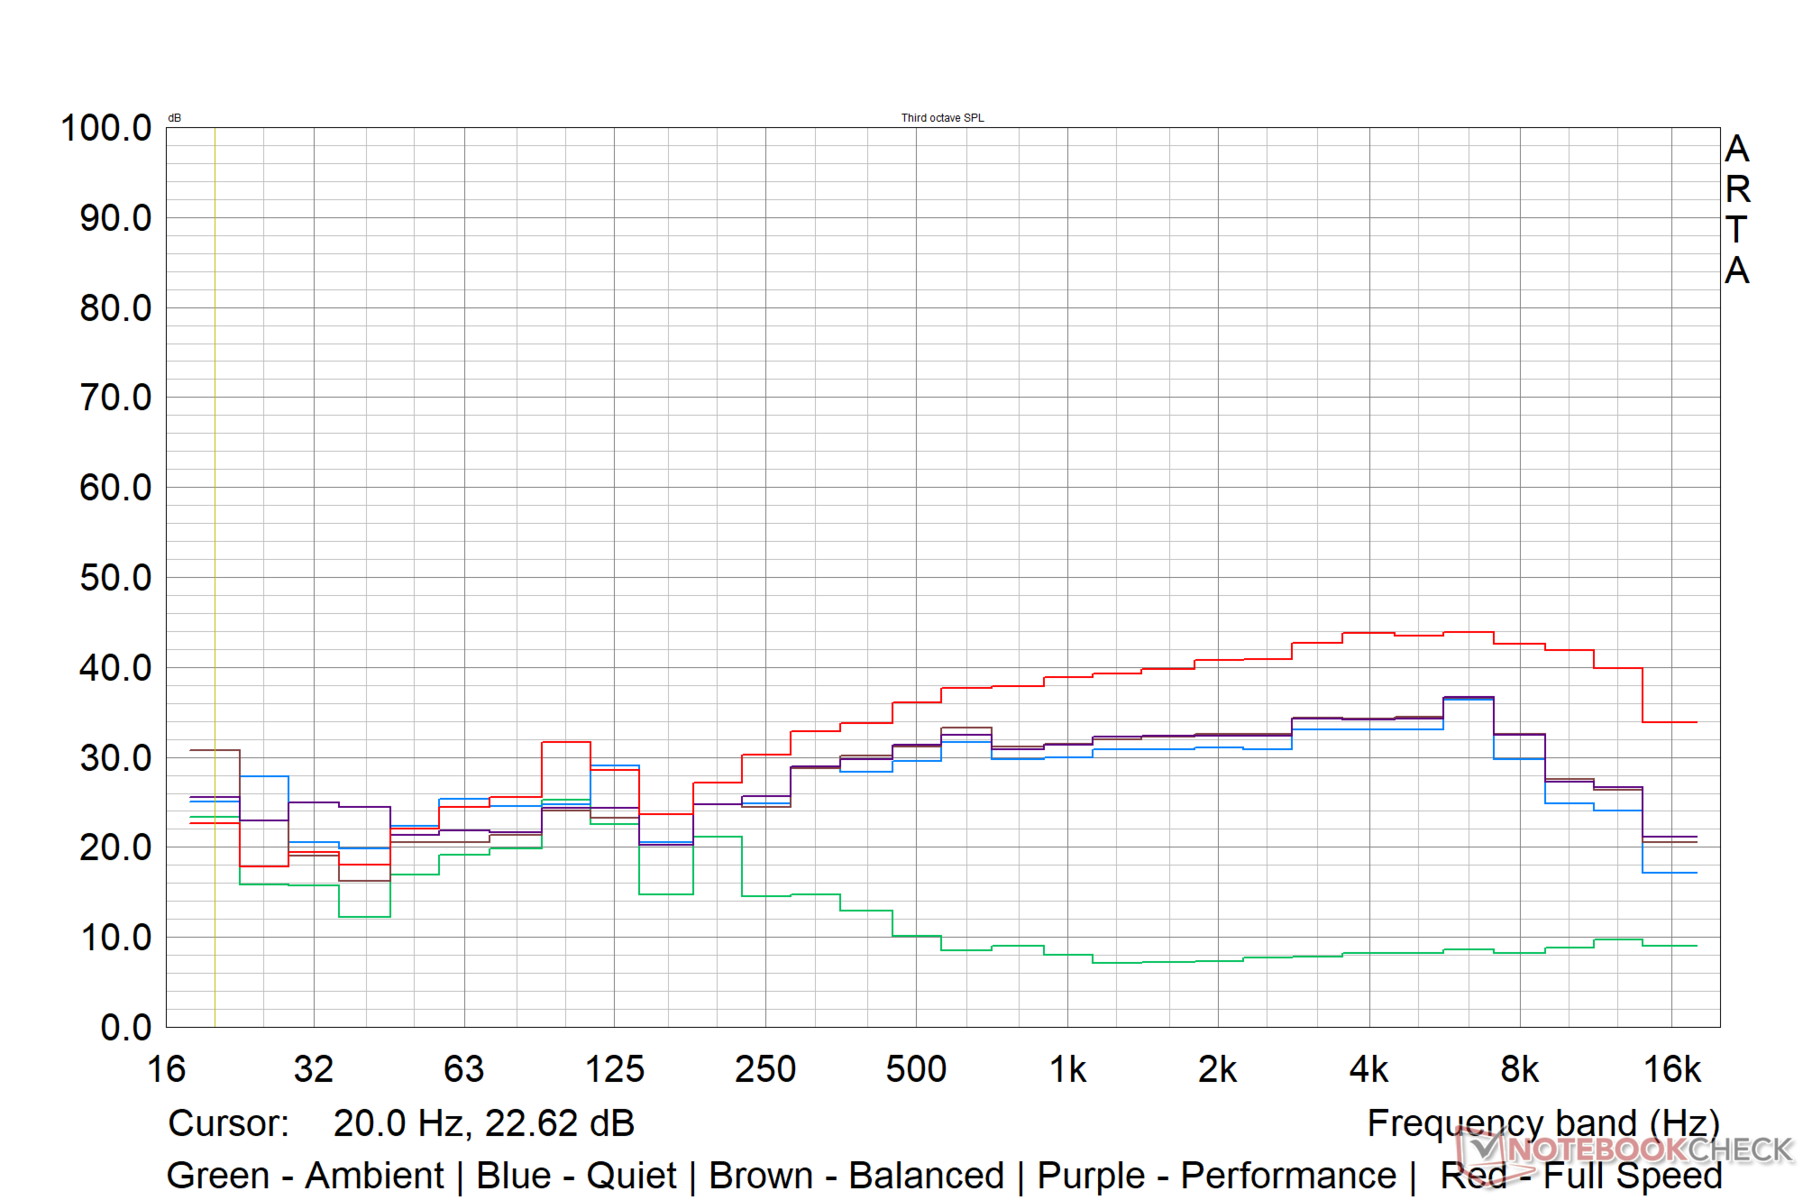
No modo Silencioso, a Dell limita o ruído do ventilador a 45 dB(A), não importando a carga. Gravamos perto de 47 db(A) de ruído do ventilador enquanto operávamos o Witcher 3 em 1080p Ultra tanto no modo Equilibrado como no modo Performance.
Medimos os níveis de ruído do ventilador no modo Equilibrado. A Dell parece ter ajustado o nível de ruído do ventilador na marca de 53 db(A) no modo Full Speed, independentemente da carga e mesmo durante o ralenti.
Barulho
| Ocioso |
| 21.94 / 21.94 / 21.94 dB |
| Carga |
| 45.1 / 45.58 dB |
 | ||
30 dB silencioso 40 dB(A) audível 50 dB(A) ruidosamente alto |
||
min: | ||
| Alienware x15 R2 P111F Intel Core i9-12900H, NVIDIA GeForce RTX 3080 Ti Laptop GPU | Asus ROG Strix Scar 15 G533ZW-LN106WS Intel Core i9-12900H, NVIDIA GeForce RTX 3070 Ti Laptop GPU | Asus ROG Zephyrus Duo 16 GX650RX AMD Ryzen 9 6900HX, NVIDIA GeForce RTX 3080 Ti Laptop GPU | MSI Vector GP66 12UGS Intel Core i9-12900H, NVIDIA GeForce RTX 3070 Ti Laptop GPU | Razer Blade 15 Advanced Model Early 2022 Intel Core i7-12800H, NVIDIA GeForce RTX 3080 Ti Laptop GPU | |
|---|---|---|---|---|---|
| Noise | -46% | -14% | -11% | -10% | |
| desligado / ambiente * (dB) | 21.79 | 26.86 -23% | 26 -19% | 22.9 -5% | 26 -19% |
| Idle Minimum * (dB) | 21.94 | 39.07 -78% | 26 -19% | 23.4 -7% | 26 -19% |
| Idle Average * (dB) | 21.94 | 39.07 -78% | 27 -23% | 23.4 -7% | 27 -23% |
| Idle Maximum * (dB) | 21.94 | 39.07 -78% | 29 -32% | 27.4 -25% | 29 -32% |
| Load Average * (dB) | 45.1 | 53.34 -18% | 41 9% | 36 20% | 37 18% |
| Witcher 3 ultra * (dB) | 46.56 | 56.6 -22% | 48 -3% | 58.2 -25% | 44 5% |
| Load Maximum * (dB) | 45.58 | 56.6 -24% | 50 -10% | 58 -27% | 45 1% |
* ... menor é melhor
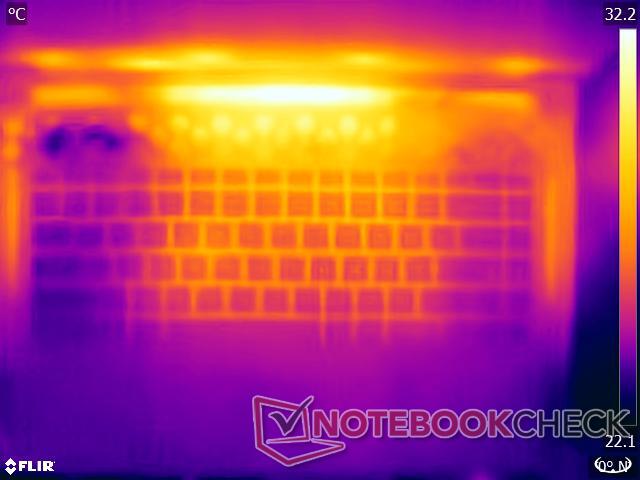
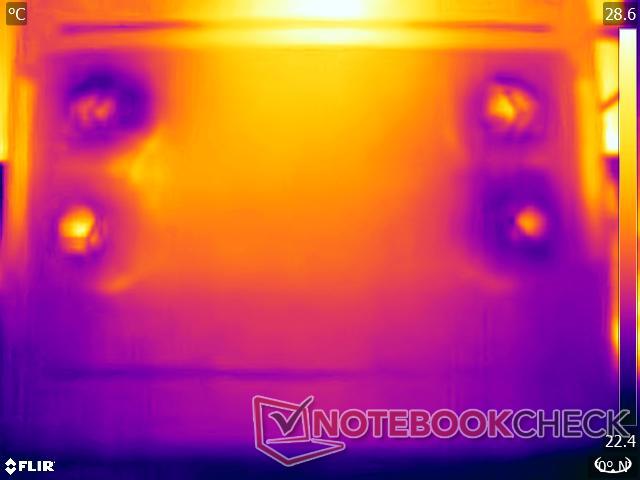
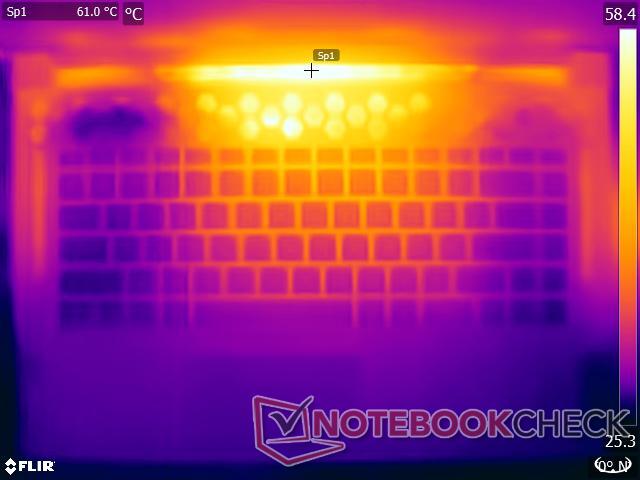
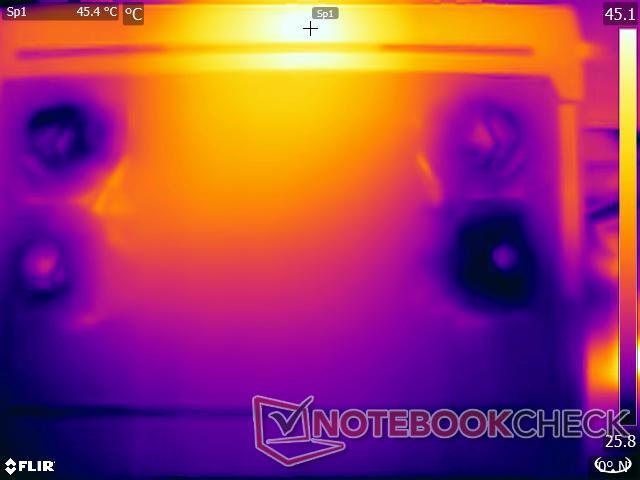
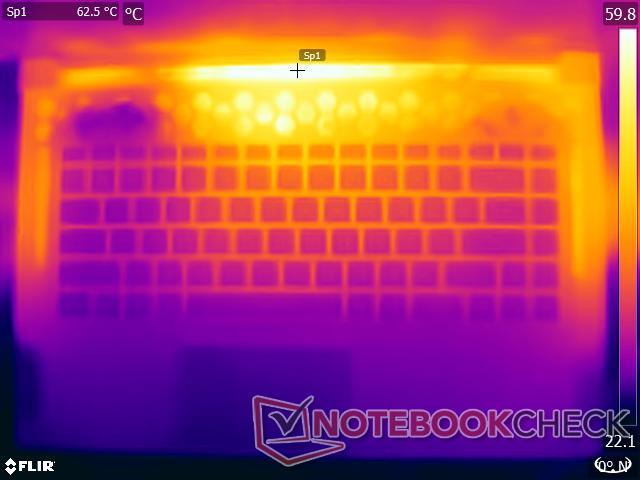
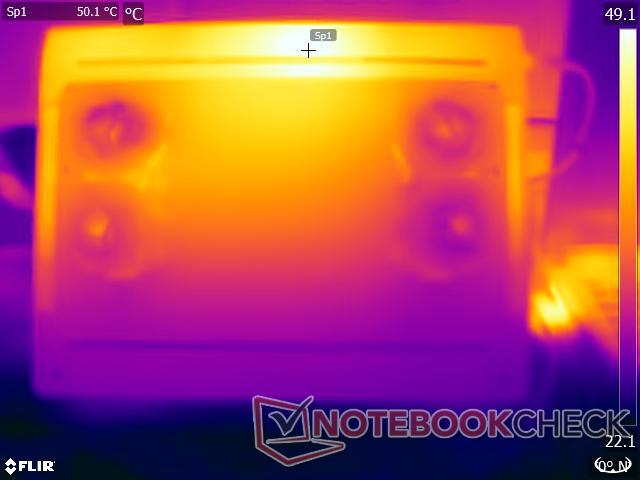
Temperatura
Mesmo com quatro ventiladores controlados independentemente e quatro tubos de calor funcionando no perfil Full Speed, observamos temperaturas de superfície alcançando até 66,2 °C durante o teste de estresse Witcher 3. Dito isto, as áreas de descanso das palmeiras são relativamente frias mesmo sob carga.
(-) A temperatura máxima no lado superior é 58.6 °C / 137 F, em comparação com a média de 40.4 °C / 105 F , variando de 21.2 a 68.8 °C para a classe Gaming.
(-) A parte inferior aquece até um máximo de 51.8 °C / 125 F, em comparação com a média de 43.2 °C / 110 F
(+) Em uso inativo, a temperatura média para o lado superior é 31.4 °C / 89 F, em comparação com a média do dispositivo de 33.9 °C / ### class_avg_f### F.
(-) Jogando The Witcher 3, a temperatura média para o lado superior é 46.9 °C / 116 F, em comparação com a média do dispositivo de 33.9 °C / ## #class_avg_f### F.
(+) Os apoios para as mãos e o touchpad estão atingindo a temperatura máxima da pele (33.4 °C / 92.1 F) e, portanto, não estão quentes.
(-) A temperatura média da área do apoio para as mãos de dispositivos semelhantes foi 28.8 °C / 83.8 F (-4.6 °C / -8.3 F).
Nossos testes de estresse representam cenários extremos, mas recomendamos o uso do x15 R2 na volta somente quando se trabalha com perfis térmicos silenciosos ou equilibrados sem muita tensão para garantir temperaturas de superfície toleráveis.
| Alienware x15 R2 P111F Intel Core i9-12900H, NVIDIA GeForce RTX 3080 Ti Laptop GPU | Asus ROG Strix Scar 15 G533ZW-LN106WS Intel Core i9-12900H, NVIDIA GeForce RTX 3070 Ti Laptop GPU | Asus ROG Zephyrus Duo 16 GX650RX AMD Ryzen 9 6900HX, NVIDIA GeForce RTX 3080 Ti Laptop GPU | MSI Vector GP66 12UGS Intel Core i9-12900H, NVIDIA GeForce RTX 3070 Ti Laptop GPU | Razer Blade 15 Advanced Model Early 2022 Intel Core i7-12800H, NVIDIA GeForce RTX 3080 Ti Laptop GPU | |
|---|---|---|---|---|---|
| Heat | 0% | 7% | 8% | -4% | |
| Maximum Upper Side * (°C) | 58.6 | 42.6 27% | 45 23% | 40.2 31% | 53 10% |
| Maximum Bottom * (°C) | 51.8 | 50.2 3% | 50 3% | 43.8 15% | 53 -2% |
| Idle Upper Side * (°C) | 36.4 | 36.2 1% | 33 9% | 34.8 4% | 36 1% |
| Idle Bottom * (°C) | 31 | 40.2 -30% | 33 -6% | 37 -19% | 38 -23% |
* ... menor é melhor
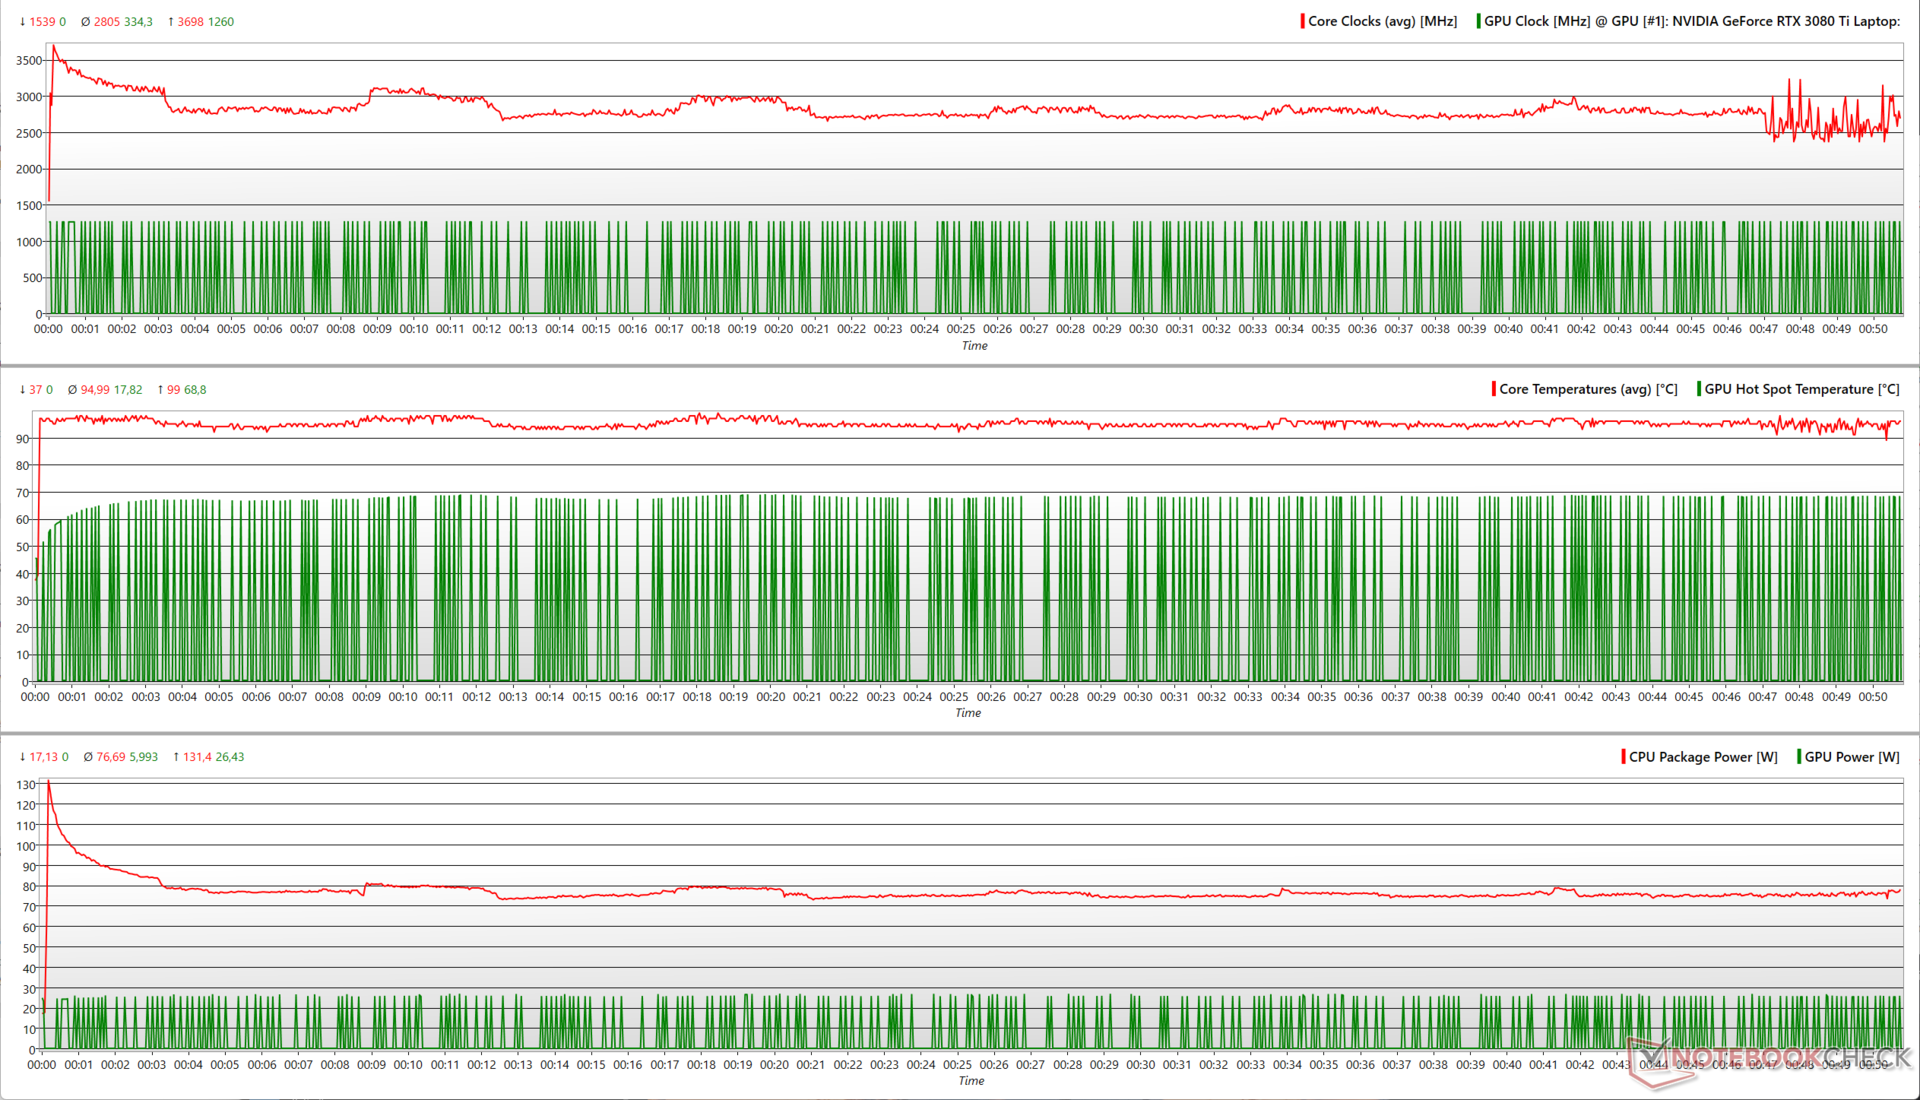
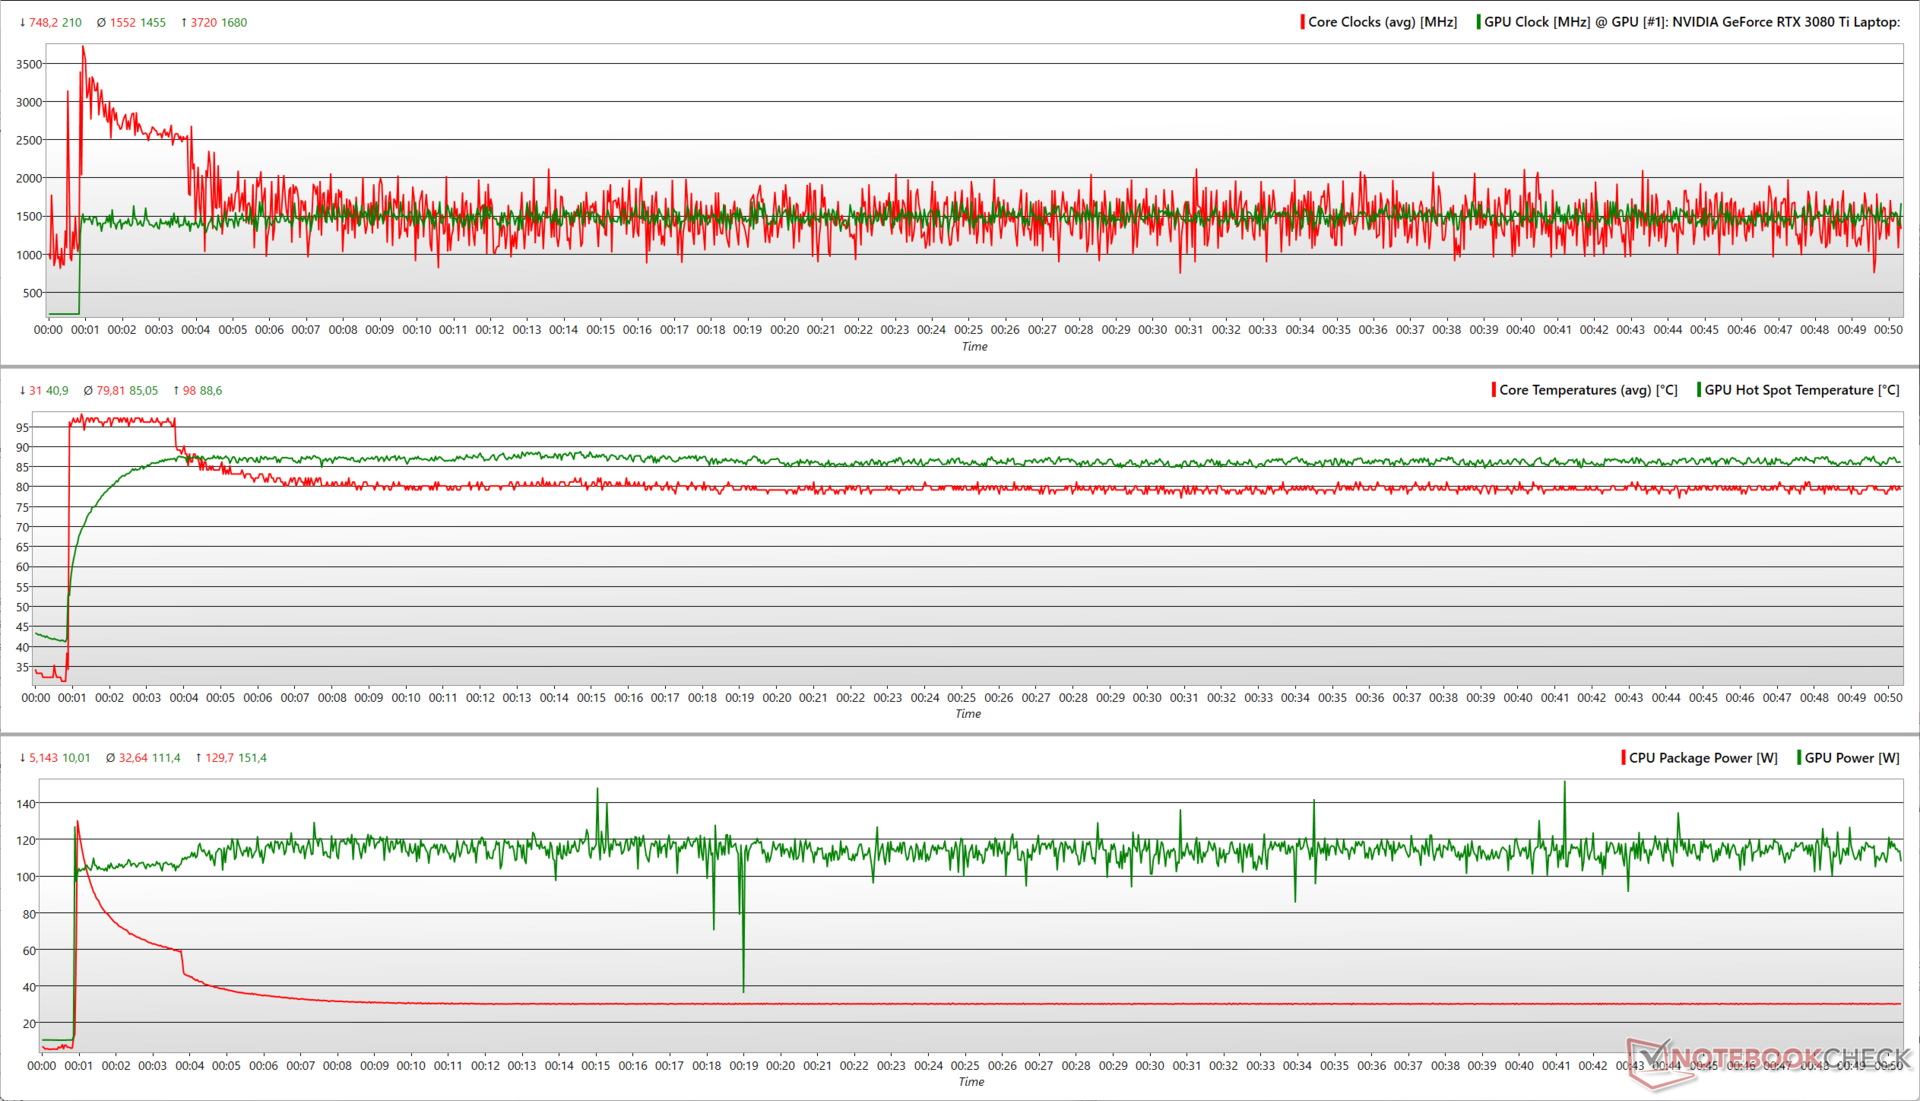
Teste de estresse
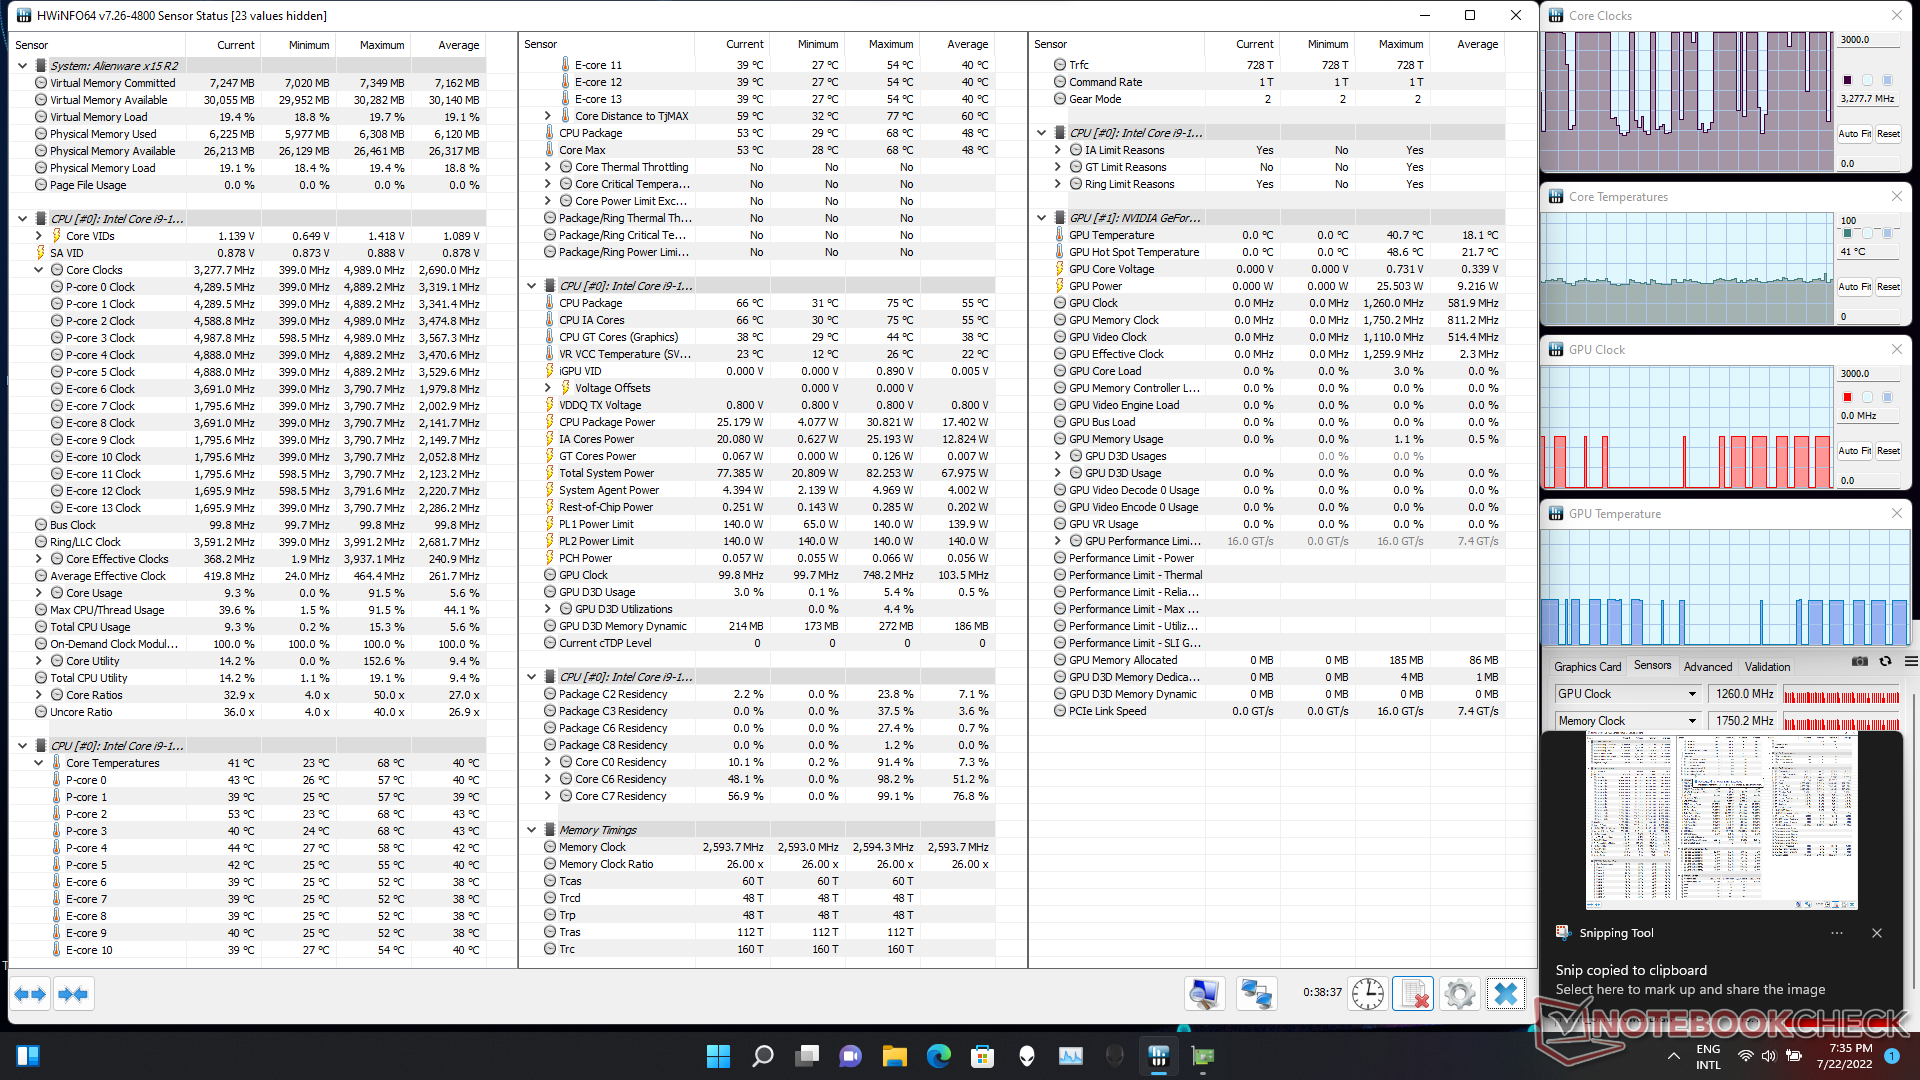
O teste de estresse do Alienware x15 R2 nos diz como vários parâmetros de CPU e GPU variam sob cargas diferentes
Somente com os FFTs Prime95 no lugar, o Core i9-12900H inicialmente atinge um relógio de pico próximo a 3,7 GHz enquanto consome 131 W. Posteriormente, os relógios oscilam entre 2,6 GHz e 3 GHz correspondendo a 75 W e 80 W PL1.
| Teste de estresse | Relógio da CPU (GHz) | Relógio da GPU (MHz) | Temperatura média da CPU (°C) | Temperatura média da GPU (°C) |
| System Idle | 3.2 | - | 40 | - |
| Prime95 | 2.69 | - | 95 | 57.2 |
| Prime95 + FurMark | 1.83 | 1.275 | 79 | 76 |
| O Witcher 3 | 3.35 | 1.672 | 74 | 83 |
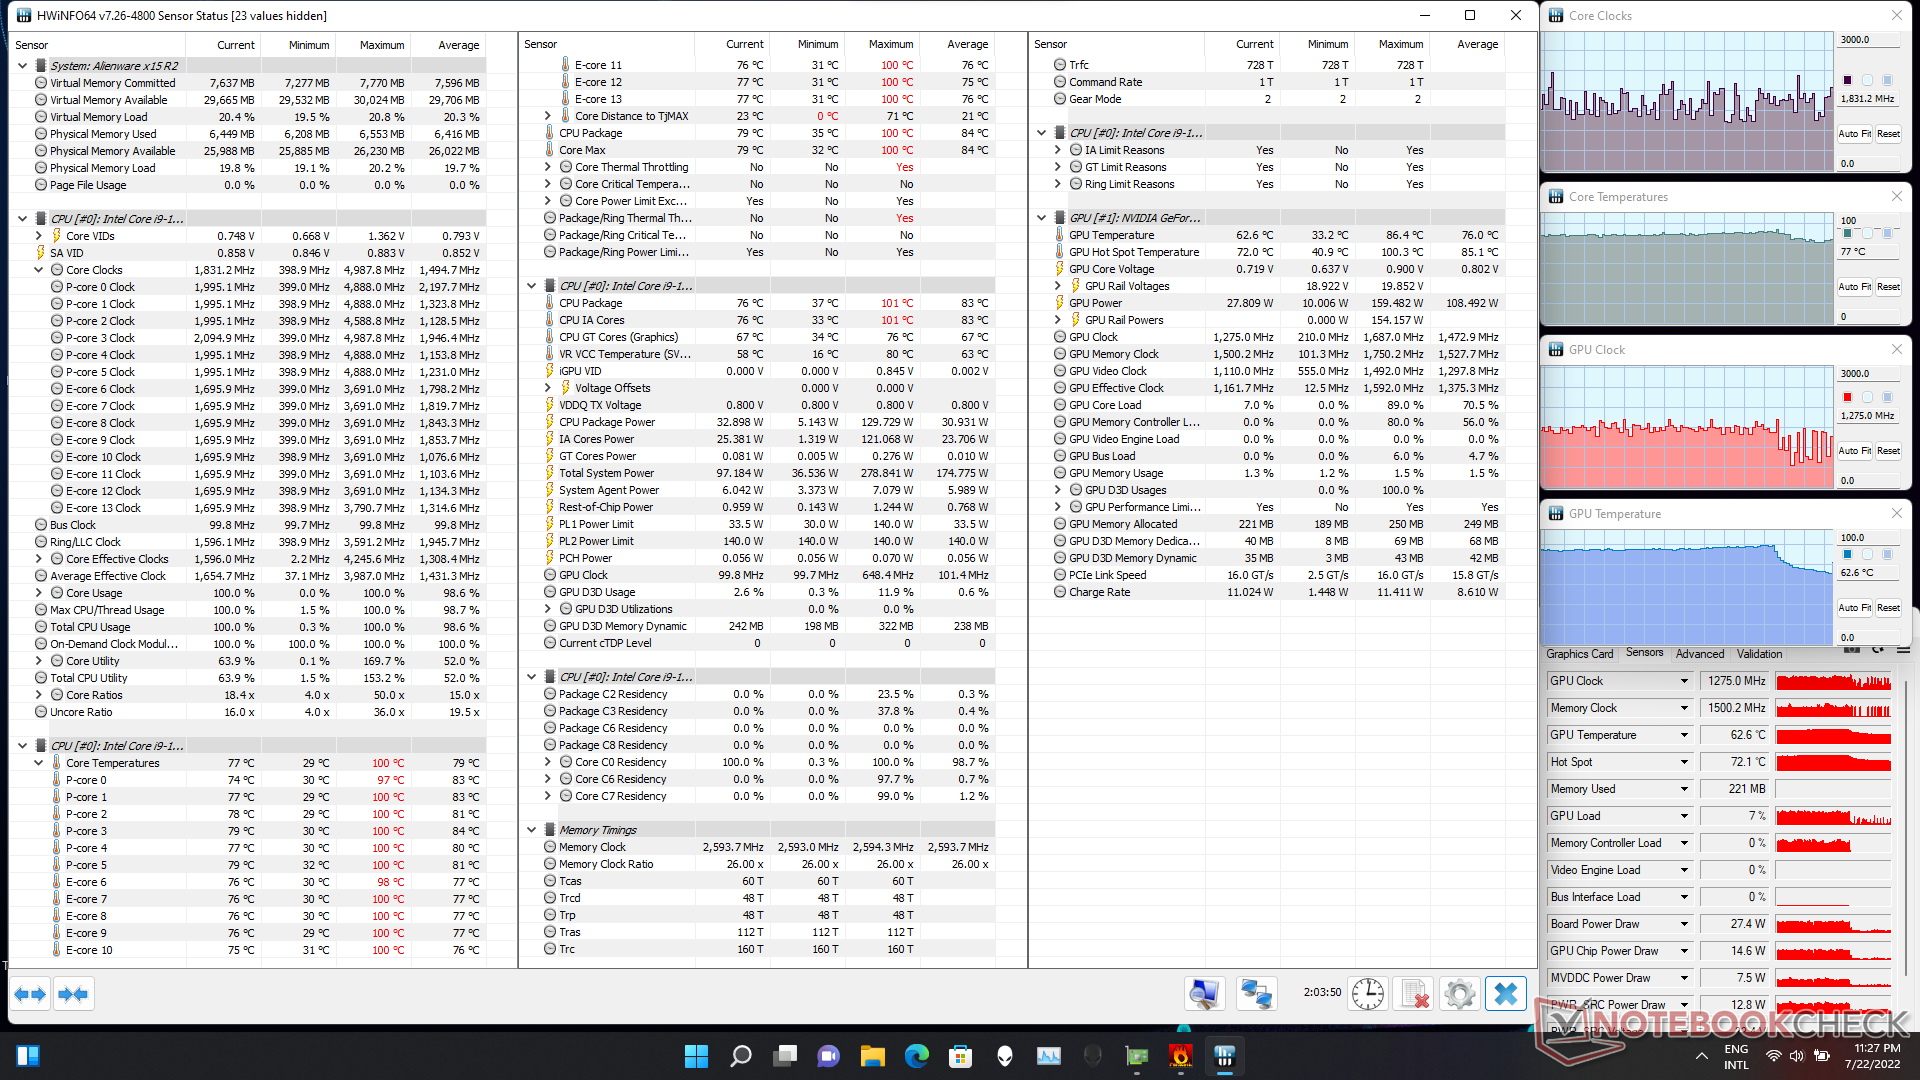
Ao adicionar o FurMark à mistura, vemos que o Core i9-12900H é capaz de atingir 130 W, mas cai rapidamente para 60 W e depois gradualmente para 30 W. Isto é para acomodar a necessidade de energia de 120 W do RTX 3080 Ti que ocasionalmente atinge picos de até 150 W
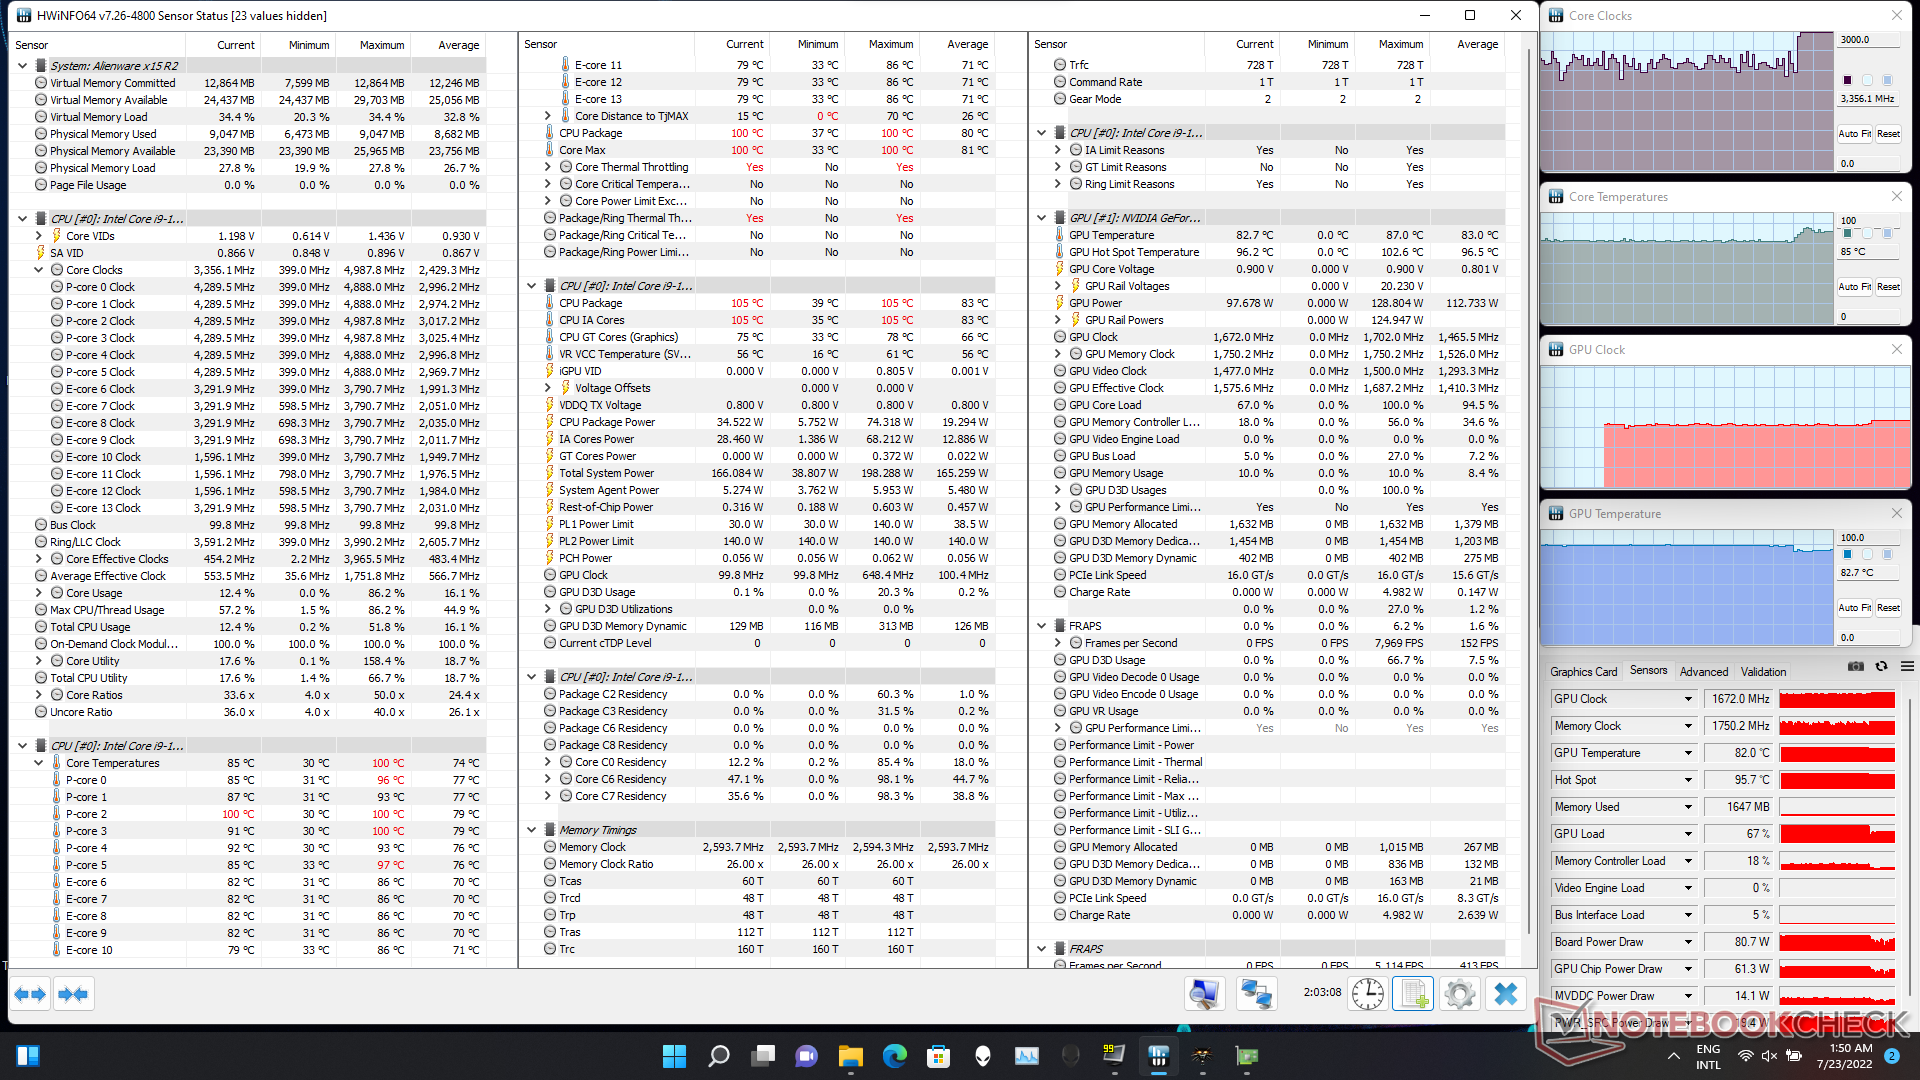
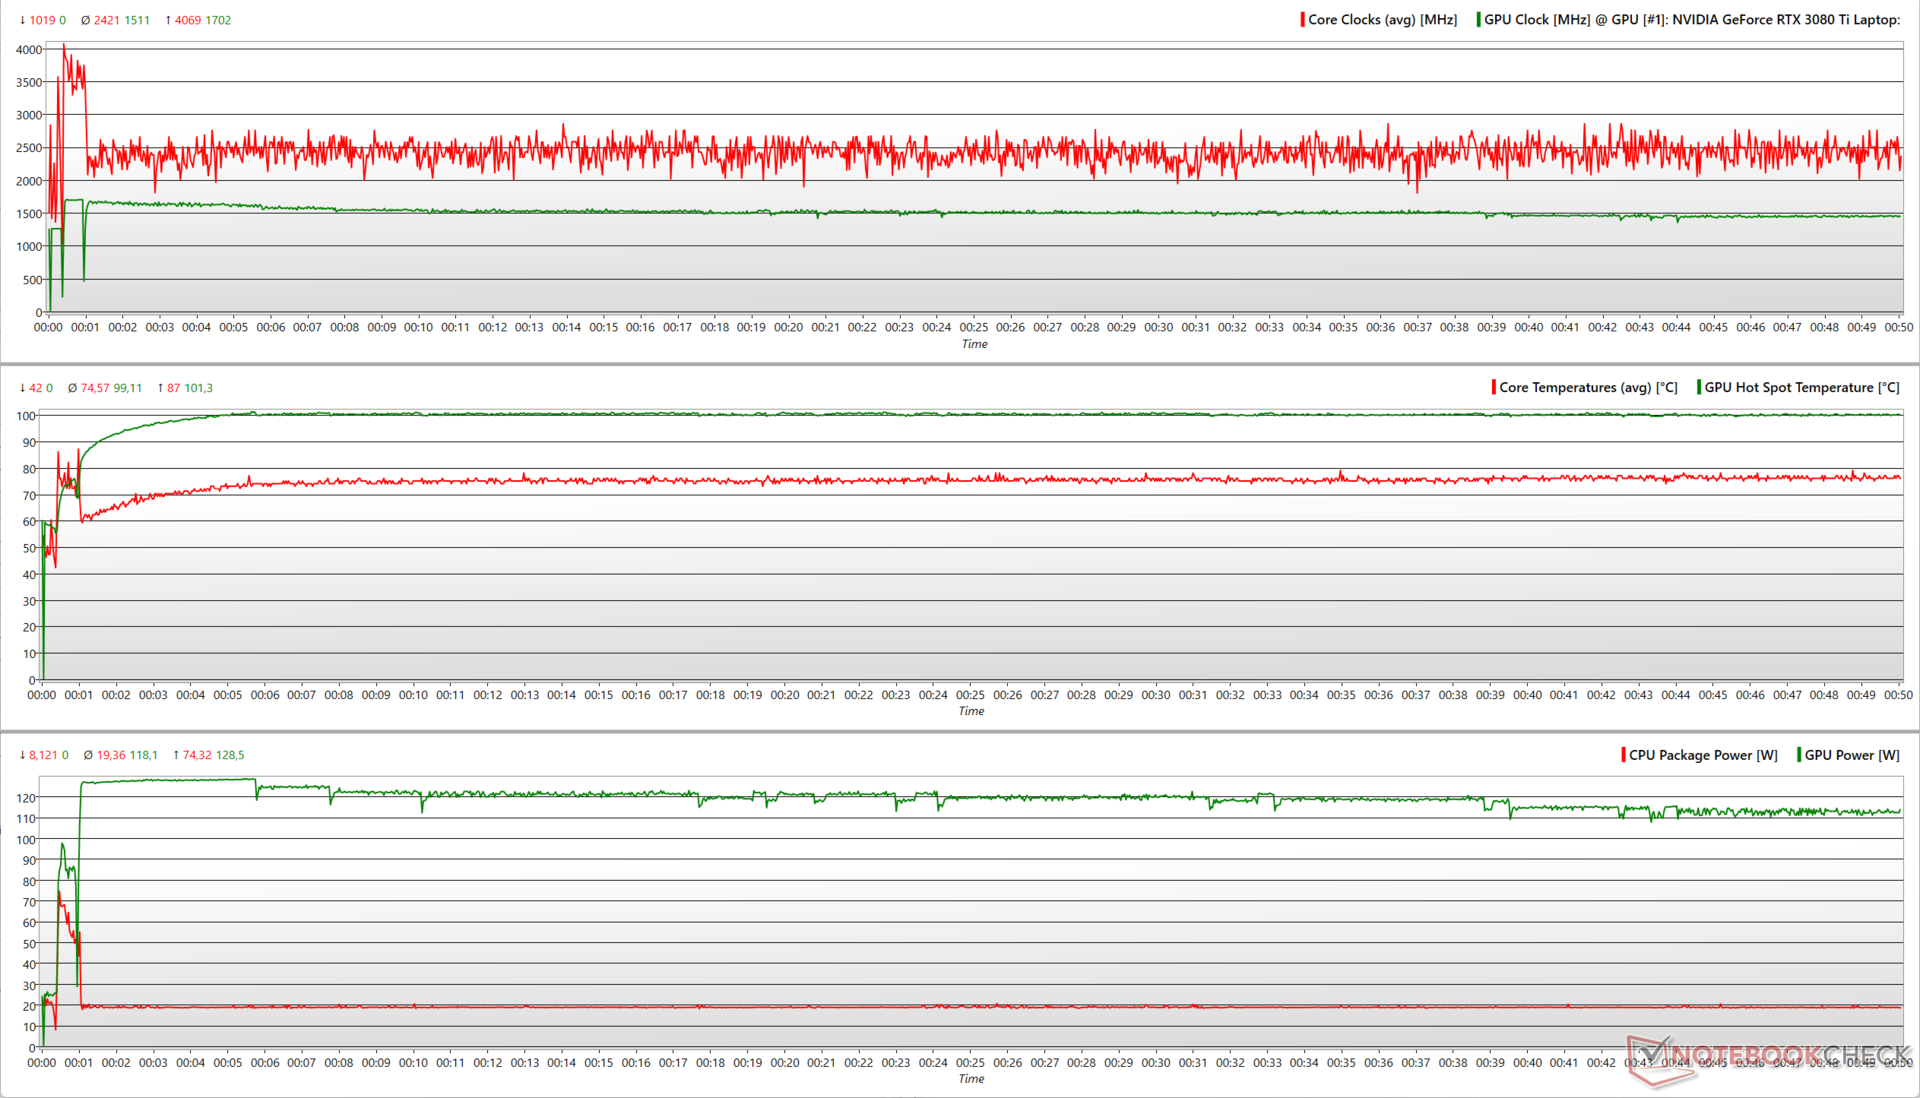
O destaque com The Witcher 3 apresenta um cenário mais real, e encontramos relógios de CPU chegando a 4 GHz e logo se estabelecendo perto da marca de 2,5 GHz enquanto o RTX 3080 Ti cai de uma altura inicial de 1.702 MHz e se estabiliza em torno de 1.500 MHz. O RTX 3080 Ti consome cerca de 130 W inicialmente mas logo cai para 120 W. O Core i9-12900H cai de cerca de 75 W para 20 W durante a corrida.
Oradores
Para um chassi fino, o áudio de bordo do Alienware x15 R2 é bastante decente. Os alto-falantes 2x 2 W produzem uma sonoridade de 80,2 db(A), que deve ser discernível em uma sala de tamanho médio. Todos os lançamentos do Alienware 2022 são certificados pela Dolby Atmos.
A resposta dos graves é estritamente ok, mas as médias e altas são mais claramente definidas. Não há distorção perceptível em volumes mais altos. Subjetivamente, o áudio de bordo pode fazer o trabalho para a maioria dos trabalhos regulares.
Os jogadores podem conectar um par de latas melhor via Bluetooth 5.2 ou o conector de áudio combinado de 3,5 mm.
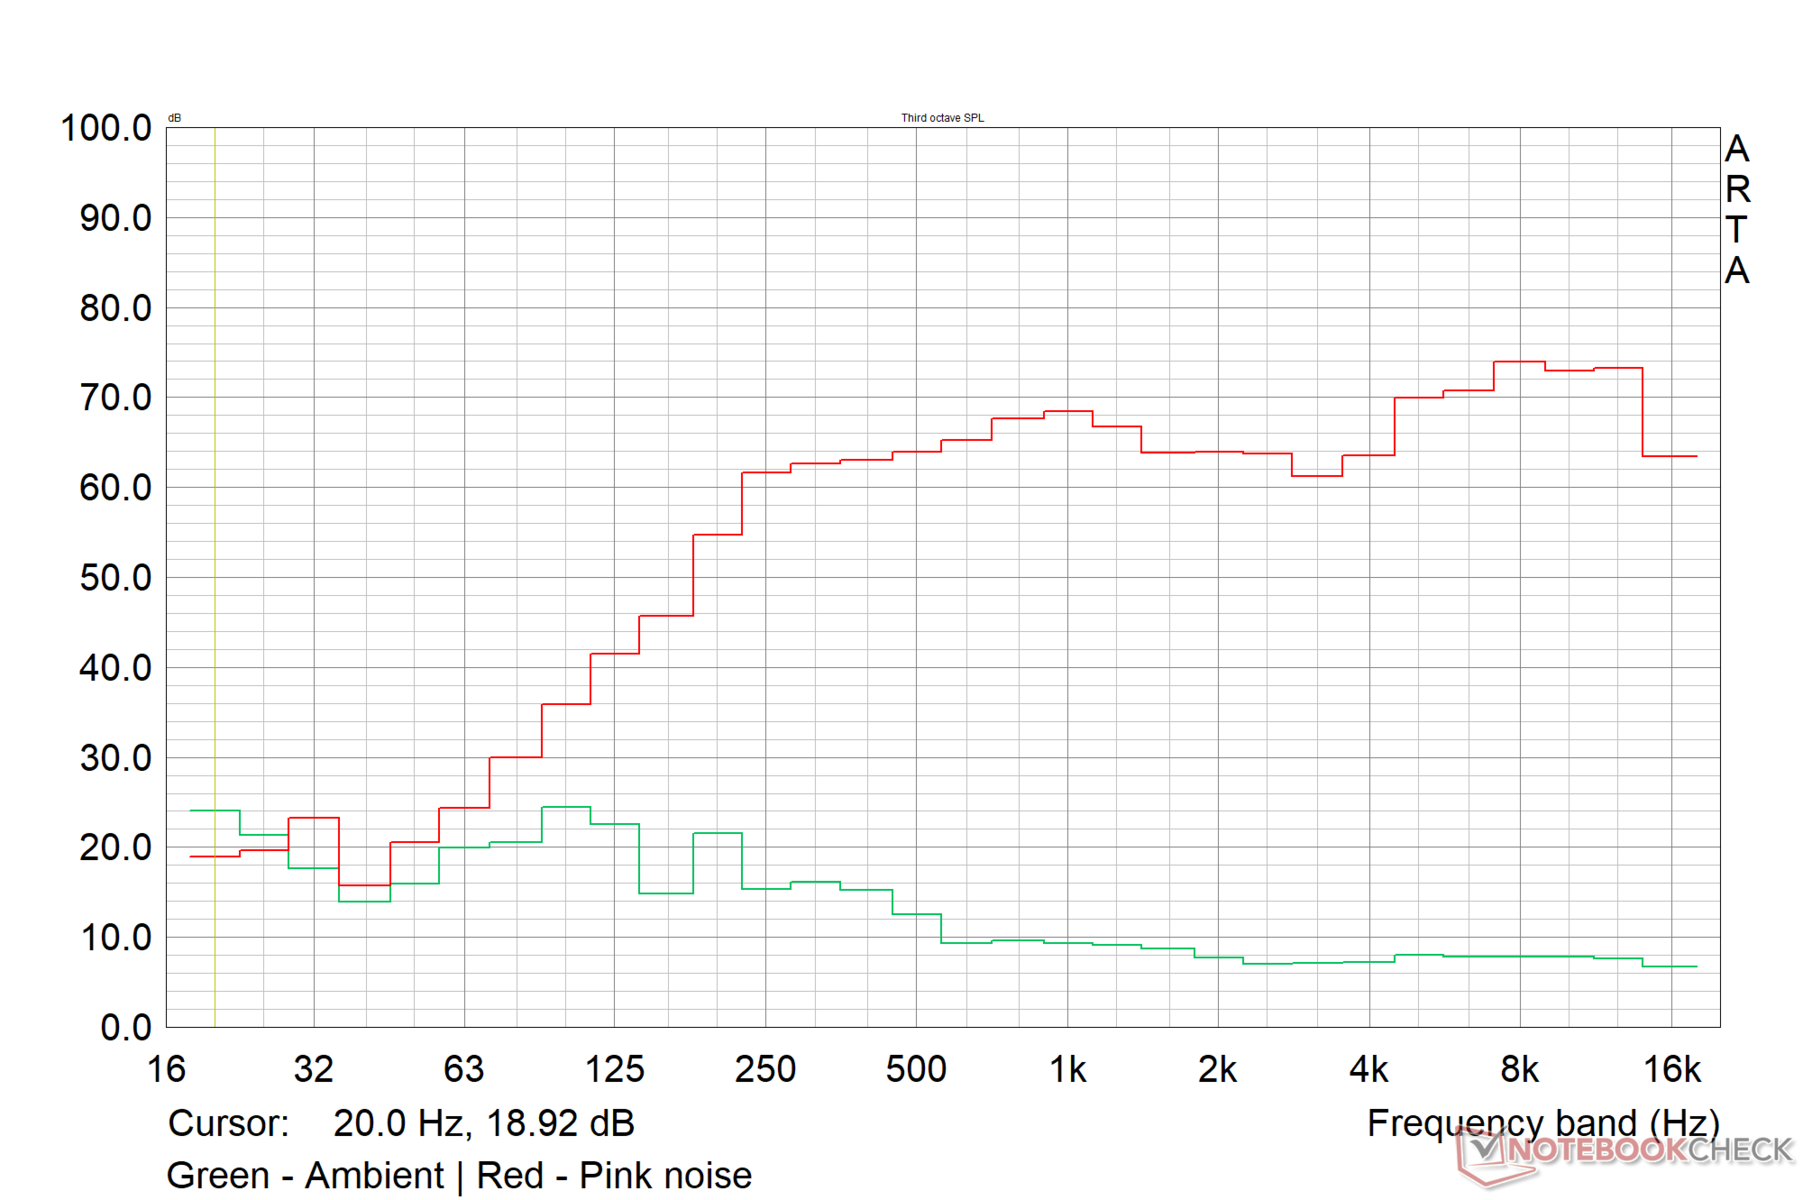
Alienware x15 R2 P111F análise de áudio
(±) | o volume do alto-falante é médio, mas bom (###valor### dB)
Graves 100 - 315Hz
(±) | graves reduzidos - em média 13.5% menor que a mediana
(±) | a linearidade dos graves é média (9.9% delta para a frequência anterior)
Médios 400 - 2.000 Hz
(+) | médios equilibrados - apenas 1.7% longe da mediana
(+) | médios são lineares (2.4% delta para frequência anterior)
Altos 2 - 16 kHz
(±) | máximos mais altos - em média 5% maior que a mediana
(+) | os máximos são lineares (4.3% delta da frequência anterior)
Geral 100 - 16.000 Hz
(+) | o som geral é linear (12.6% diferença em relação à mediana)
Comparado com a mesma classe
» 16% de todos os dispositivos testados nesta classe foram melhores, 4% semelhantes, 81% piores
» O melhor teve um delta de 6%, a média foi 18%, o pior foi 132%
Comparado com todos os dispositivos testados
» 11% de todos os dispositivos testados foram melhores, 3% semelhantes, 86% piores
» O melhor teve um delta de 4%, a média foi 23%, o pior foi 134%
Apple MacBook Pro 16 2021 M1 Pro análise de áudio
(+) | os alto-falantes podem tocar relativamente alto (###valor### dB)
Graves 100 - 315Hz
(+) | bons graves - apenas 3.8% longe da mediana
(+) | o baixo é linear (5.2% delta para a frequência anterior)
Médios 400 - 2.000 Hz
(+) | médios equilibrados - apenas 1.3% longe da mediana
(+) | médios são lineares (2.1% delta para frequência anterior)
Altos 2 - 16 kHz
(+) | agudos equilibrados - apenas 1.9% longe da mediana
(+) | os máximos são lineares (2.7% delta da frequência anterior)
Geral 100 - 16.000 Hz
(+) | o som geral é linear (4.6% diferença em relação à mediana)
Comparado com a mesma classe
» 0% de todos os dispositivos testados nesta classe foram melhores, 0% semelhantes, 100% piores
» O melhor teve um delta de 5%, a média foi 17%, o pior foi 45%
Comparado com todos os dispositivos testados
» 0% de todos os dispositivos testados foram melhores, 0% semelhantes, 100% piores
» O melhor teve um delta de 4%, a média foi 23%, o pior foi 134%
Gestão de energia: Econômico na carga máxima
Consumo de energia
O adaptador de energia de 240 W fornecido é suficiente para alimentar os 15 R2 em várias cargas de trabalho. O consumo de energia está no lado mais alto, mas está nas linhas esperadas dadas as internas. Observamos que o consumo máximo de energia da carga pode aumentar até quase 242 W antes de se assentar próximo à marca de 180 W
No entanto, o consumo de energia do x15 R2 ainda é econômico em comparação com a concorrência, especialmente na carga máxima. O Razer Blade 15 Advanced tem uma menor necessidade de energia em geral, provavelmente devido ao RTX 3080 Ti de 110 W.
| desligado | |
| Ocioso | |
| Carga |
|
Key:
min: | |
| Alienware x15 R2 P111F i9-12900H, GeForce RTX 3080 Ti Laptop GPU, IPS, 1920x1080 | Asus ROG Strix Scar 15 G533ZW-LN106WS i9-12900H, GeForce RTX 3070 Ti Laptop GPU, IPS-level, 2560x1440 | Asus ROG Zephyrus Duo 16 GX650RX R9 6900HX, GeForce RTX 3080 Ti Laptop GPU, IPS-Level, 3840x2400 | MSI Vector GP66 12UGS i9-12900H, GeForce RTX 3070 Ti Laptop GPU, IPS, 1920x1080 | Razer Blade 15 Advanced Model Early 2022 i7-12800H, GeForce RTX 3080 Ti Laptop GPU, IPS, 1920x1080 | Média NVIDIA GeForce RTX 3080 Ti Laptop GPU | Média da turma Gaming | |
|---|---|---|---|---|---|---|---|
| Power Consumption | 15% | -11% | -24% | 8% | -16% | 2% | |
| Idle Minimum * (Watt) | 16.2 | 7.56 53% | 19 -17% | 17.5 -8% | 17 -5% | 17.2 ? -6% | 13 ? 20% |
| Idle Average * (Watt) | 20 | 13.5 32% | 24 -20% | 20.1 -1% | 19 5% | 23.3 ? -17% | 19 ? 5% |
| Idle Maximum * (Watt) | 21.2 | 16.87 20% | 31 -46% | 47.3 -123% | 25 -18% | 30.8 ? -45% | 24.6 ? -16% |
| Load Average * (Watt) | 122.1 | 128.9 -6% | 104 15% | 107.3 12% | 108 12% | 121.2 ? 1% | 110.7 ? 9% |
| Witcher 3 ultra * (Watt) | 207 | 196.2 5% | 186.5 10% | 225 -9% | 150 28% | ||
| Load Maximum * (Watt) | 241.9 | 274.86 -14% | 256 -6% | 277.7 -15% | 179 26% | 276 ? -14% | 259 ? -7% |
* ... menor é melhor
Power Consumption - The Witcher 3 / Stress test
Power Consumption - External monitor
Vida útil da bateria
Usamos nosso roteiro padronizado de página web para avaliar os tempos de funcionamento da bateria tanto em pleno brilho como em configurações de 150 cd/m2. Os testes de tempo de funcionamento da bateria foram realizados no modo MSHybrid a uma taxa de atualização da tela de 60 Hz.
A bateria de 87 WHr do x15 R2 poderia reunir um pouco mais de seis horas a 150 cd/m2. Tempos de execução similares foram observados também em pleno brilho. No modo dGPU, pudemos gerenciar apenas 3 horas e 36 minutos de duração da bateria a 150 cd/m2 de luminosidade.
| Alienware x15 R2 P111F i9-12900H, GeForce RTX 3080 Ti Laptop GPU, 87 Wh | Alienware x15 RTX 3070 P111F i7-11800H, GeForce RTX 3070 Laptop GPU, 87 Wh | Asus ROG Strix Scar 15 G533ZW-LN106WS i9-12900H, GeForce RTX 3070 Ti Laptop GPU, 90 Wh | Asus ROG Zephyrus Duo 16 GX650RX R9 6900HX, GeForce RTX 3080 Ti Laptop GPU, 90 Wh | Razer Blade 15 Advanced Model Early 2022 i7-12800H, GeForce RTX 3080 Ti Laptop GPU, 80 Wh | Média da turma Gaming | |
|---|---|---|---|---|---|---|
| Duração da bateria | 2% | 40% | 30% | -18% | 19% | |
| WiFi v1.3 (h) | 6 | 6.1 2% | 8.4 40% | 7.8 30% | 4.9 -18% | 7.11 ? 19% |
| Reader / Idle (h) | 9.7 | 12.5 | 8.1 | 8.27 ? | ||
| Load (h) | 0.9 | 0.9 | 1 | 2 | 1.502 ? | |
| H.264 (h) | 8.5 | 9.3 | 5.9 | 8.32 ? | ||
| Witcher 3 ultra (h) | 1.2 |
Pro
Contra
Veredicto: Este alienígena marca a maioria das caixas
O Alienware x15 R2 é uma evolução do x15 R1 do ano passado e não traz nenhuma mudança revolucionária à mesa. Há algumas características padrão em todas as configurações do Alienware este ano, como as certificações Dolby Vision e Dolby Atmos, Elemento 31 TIM e Advanced Optimus, para citar algumas
O chassi em forma de ultradivisão se apresenta como sendo distintamente um Alienware com todas as insígnias relevantes. A colocação do porto não é a mais ideal, mas o essencial é coberto. A qualidade da webcam continua a ser um pensamento posterior. O teclado oferece um bom feedback tátil, mas as funções secundárias continuam a não estar iluminadas.
A qualidade de exibição é boa para sua principal aplicação como um laptop para jogos. No entanto, a maioria dos compradores gostaria de optar pela variante QHD, dados os poderosos internos. Não há PWM, e os tempos de resposta são bons quando o overdrive está habilitado a 360 Hz.
O Alienware x15 R2 deve estar no topo de sua lista de mérito se você estiver em busca de um laptop que efetivamente case com um fator de forma ultra-livre com hardware moderno de primeira linha, desde que as maiores emissões de calor e ruído não sejam graves preocupações"
Apesar do chassi fino, a Dell fez um bom trabalho com as térmicas para garantir que não houvesse estrangulamento significativo sob carga. Outros concorrentes, tais como a MSI Vetor GP66 e o Asus ROG Strix Scar 15 com o Core i9-12900H apresentam pontuações um pouco mais altas, mas o x15 R2 mantém sua posição. O aumento do desempenho em relação ao ano passado x15 R1 é bastante significativo
Talvez o maior peeve com o Alienware x15 R2 seja sua alta emissão de calor e ruído. Embora os níveis de ruído dos ventiladores possam ser controlados até certo ponto escolhendo o perfil térmico apropriado, as temperaturas de superfície definitivamente parecem estar no lado mais alto. O consumo de energia e a vida útil da bateria estão nas linhas previstas para esta configuração, embora o Scar 15 e o Razer Blade 15 Avançado são mais econômicos para o consumo de energia
O Alienware x15 R2 oferece uma combinação única de estética e desempenho de porta-bandeira a que muitos outros laptops aspiram. Entretanto, ao preço de ₹3,68.190 (~US$4.500 ou 4.583 euros), o Alienware x15 R2 não tem preço competitivo no mercado indiano, particularmente quando existem opções como o Asus ROG Strix Scar 15 G533.
Preço e Disponibilidade
A configuração revista Alienware x15 R2 está disponível por ~US$4.137 em Amazon Índia, Amazon US, e Dell.com. Uma variante de i7-12700H e RTX 3070 Ti-powered do x15 R2 está disponível em Best Buy por US$ 2.700.
Alienware x15 R2 P111F
- 10/04/2022 v7 (old)
Vaidyanathan Subramaniam
Price comparison

