Revisão do Panasonic Toughbook FZ-55 MK2 para portáteis robustos: Iris Xe faz toda a diferença
Enquanto o FZ-55 MK1 seria enviado com CPUs Intel de 8ª geração, o mais recente FZ-55 MK2 vem com CPUs Intel de 11ª geração. A atualização aparentemente pequena é na verdade bastante significativa em termos de desempenho, como mostrarão nossos gráficos de comparação abaixo
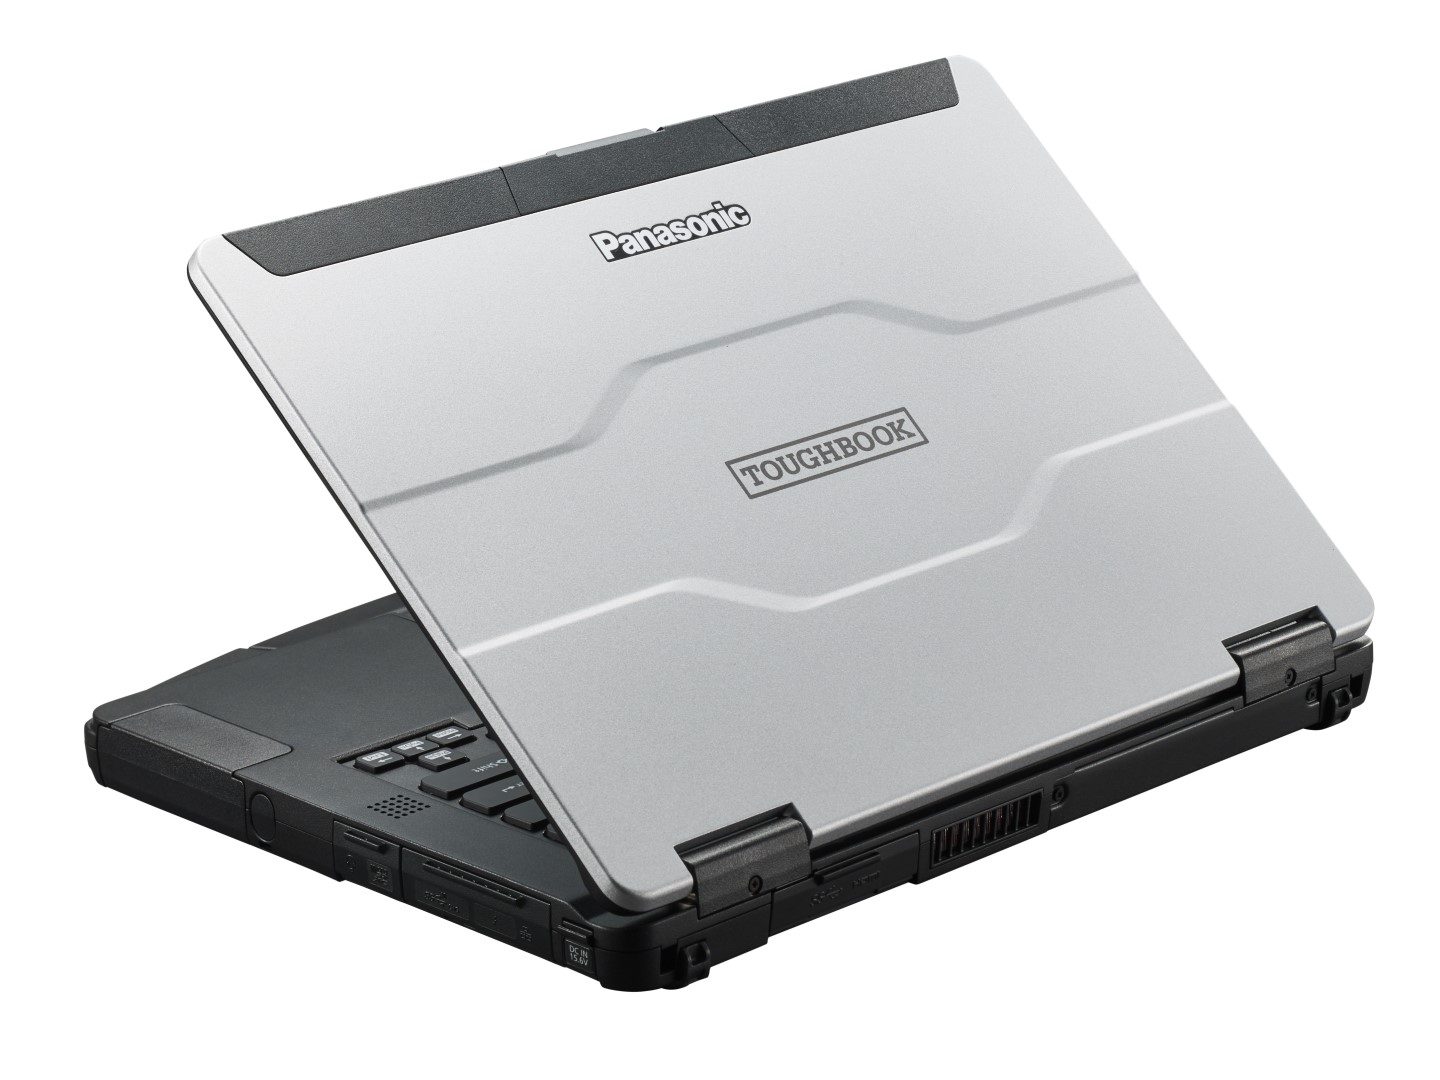
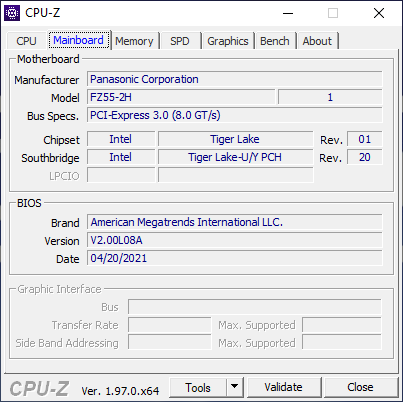
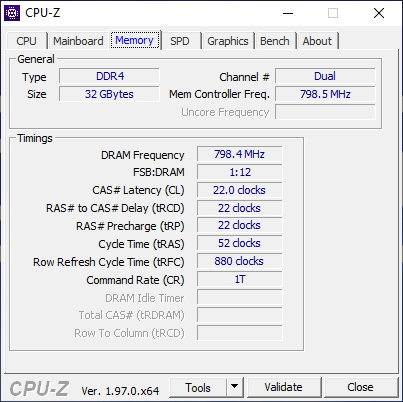
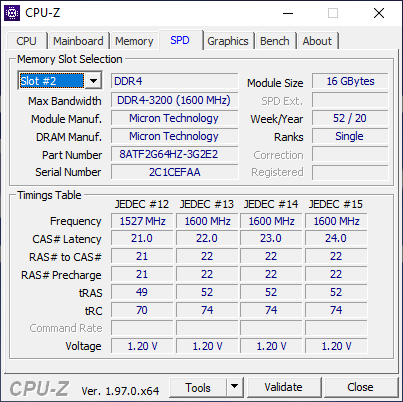
Além da troca de processador, o FZ-55 MK2 vem com outras atualizações auxiliares incluindo suporte a SSDs NVMe/OPAL, RAM 3200 MHz mais rápida, Wi-Fi 6, Thunderbolt 4, e banda 48 CBRS WAN com suporte a SIM duplo. O chassi físico permanece idêntico ao do FZ-55 MK1 e, portanto, recomendamos verificar nosso revisão original aqui para saber mais sobre suas características
Os concorrentes neste espaço incluem outros laptops robustos de 14 polegadas como o Dell Latitude 5420, Durabook S14ou Getac S410
Mais revisão Panasonic
potential competitors in comparison
Avaliação | Data | Modelo | Peso | Altura | Size | Resolução | Preço |
|---|---|---|---|---|---|---|---|
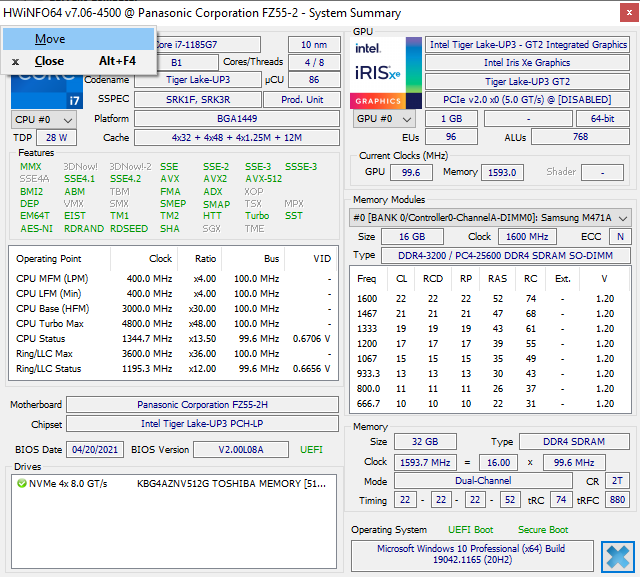
| 83.9 % v7 (old) | 09/2021 | Panasonic Toughbook FZ-55 MK2 i7-1185G7, Iris Xe G7 96EUs | 2.3 kg | 33 mm | 14.00" | 1920x1080 | |
| 80.9 % v7 (old) | 10/2019 | Panasonic Toughbook FZ-55 i5-8365U, UHD Graphics 620 | 2.2 kg | 33 mm | 14.00" | 1920x1080 | |
| 89.2 % v6 (old) | Dell Latitude 5420 Rugged-P85G i7-8650U, Radeon RX 540 | 2.8 kg | 32.9 mm | 14.00" | 1920x1080 | ||
v (old) | 04/2021 | Durabook S14I i7-1165G7, Iris Xe G7 96EUs | 3 kg | 38.1 mm | 14.00" | 1920x1080 | |
| 81.9 % v6 (old) | 10/2018 | Getac S410 i5-8550U, UHD Graphics 620 | 3.2 kg | 34.9 mm | 14.00" | 1366x768 |
Caso
Conectividade
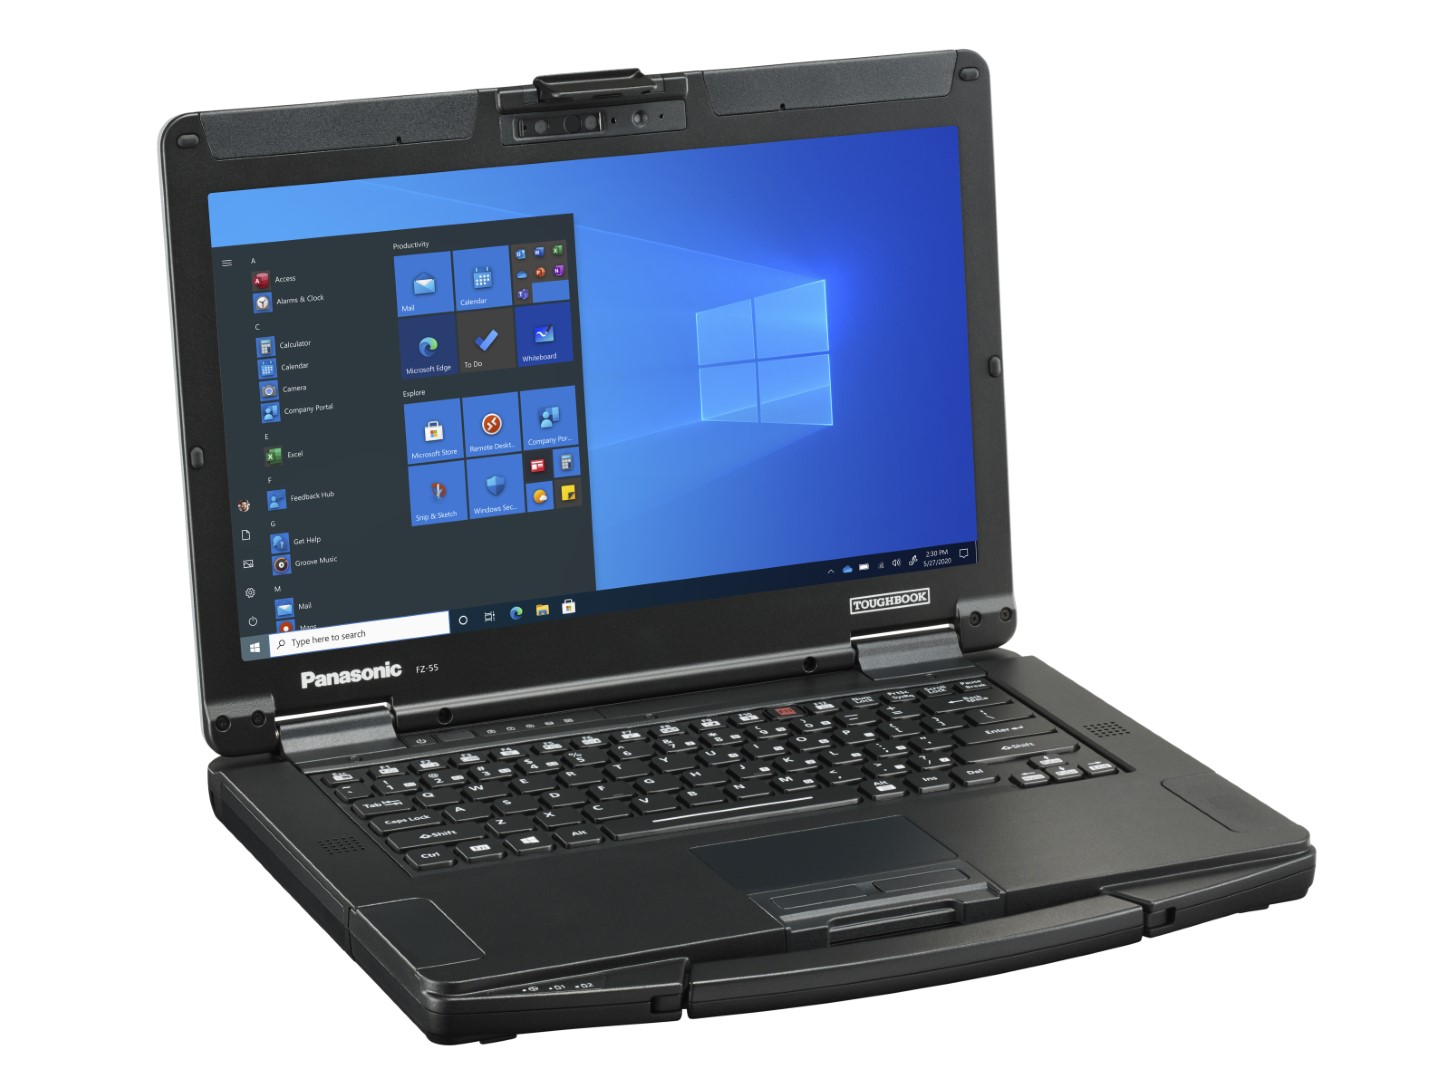
As portas são idênticas à nova adição do Thunderbolt 4 e uma porta USB-A mais rápida de 10 Gbps ao longo da borda direita. Os usuários podem recarregar ou conectar monitores externos e GPUs via USB-C, o que de outra forma era impossível no FZ-55 MK1.
Leitor de cartões SD
Nenhuma alteração foi feita no leitor MicroSD. A transferência de arquivos de nosso cartão de teste UHS-II para o desktop ainda leva de 2 a 3 vezes mais tempo do que o leitor de cartões noDell Latitude 5420 Resistente.
| SD Card Reader | |
| average JPG Copy Test (av. of 3 runs) | |
| Dell Latitude 5420 Rugged-P85G (Toshiba Exceria Pro SDXC 64 GB UHS-II) | |
| Getac S410 (Toshiba Exceria Pro SDXC 64 GB UHS-II) | |
| Panasonic Toughbook FZ-55 MK2 (AV Pro V60) | |
| Panasonic Toughbook FZ-55 (Toshiba Exceria Pro M501 64 GB UHS-II) | |
| Durabook S14I (Angelbird 128GB AV Pro UHS-II) | |
| maximum AS SSD Seq Read Test (1GB) | |
| Dell Latitude 5420 Rugged-P85G (Toshiba Exceria Pro SDXC 64 GB UHS-II) | |
| Panasonic Toughbook FZ-55 MK2 (AV Pro V60) | |
| Getac S410 (Toshiba Exceria Pro SDXC 64 GB UHS-II) | |
| Panasonic Toughbook FZ-55 (Toshiba Exceria Pro M501 64 GB UHS-II) | |
| Durabook S14I (Angelbird 128GB AV Pro UHS-II) | |
Comunicação
Um Intel AX201 vem como padrão para compatibilidade com Wi-Fi 6 para substituir o antigo Wi-Fi 5 Intel 9560.
| Networking | |
| iperf3 transmit AX12 | |
| Panasonic Toughbook FZ-55 MK2 | |
| Durabook S14I | |
| Dell Latitude 5420 Rugged-P85G | |
| Getac S410 | |
| iperf3 receive AX12 | |
| Durabook S14I | |
| Panasonic Toughbook FZ-55 MK2 | |
| Dell Latitude 5420 Rugged-P85G | |
| Getac S410 | |
Webcam
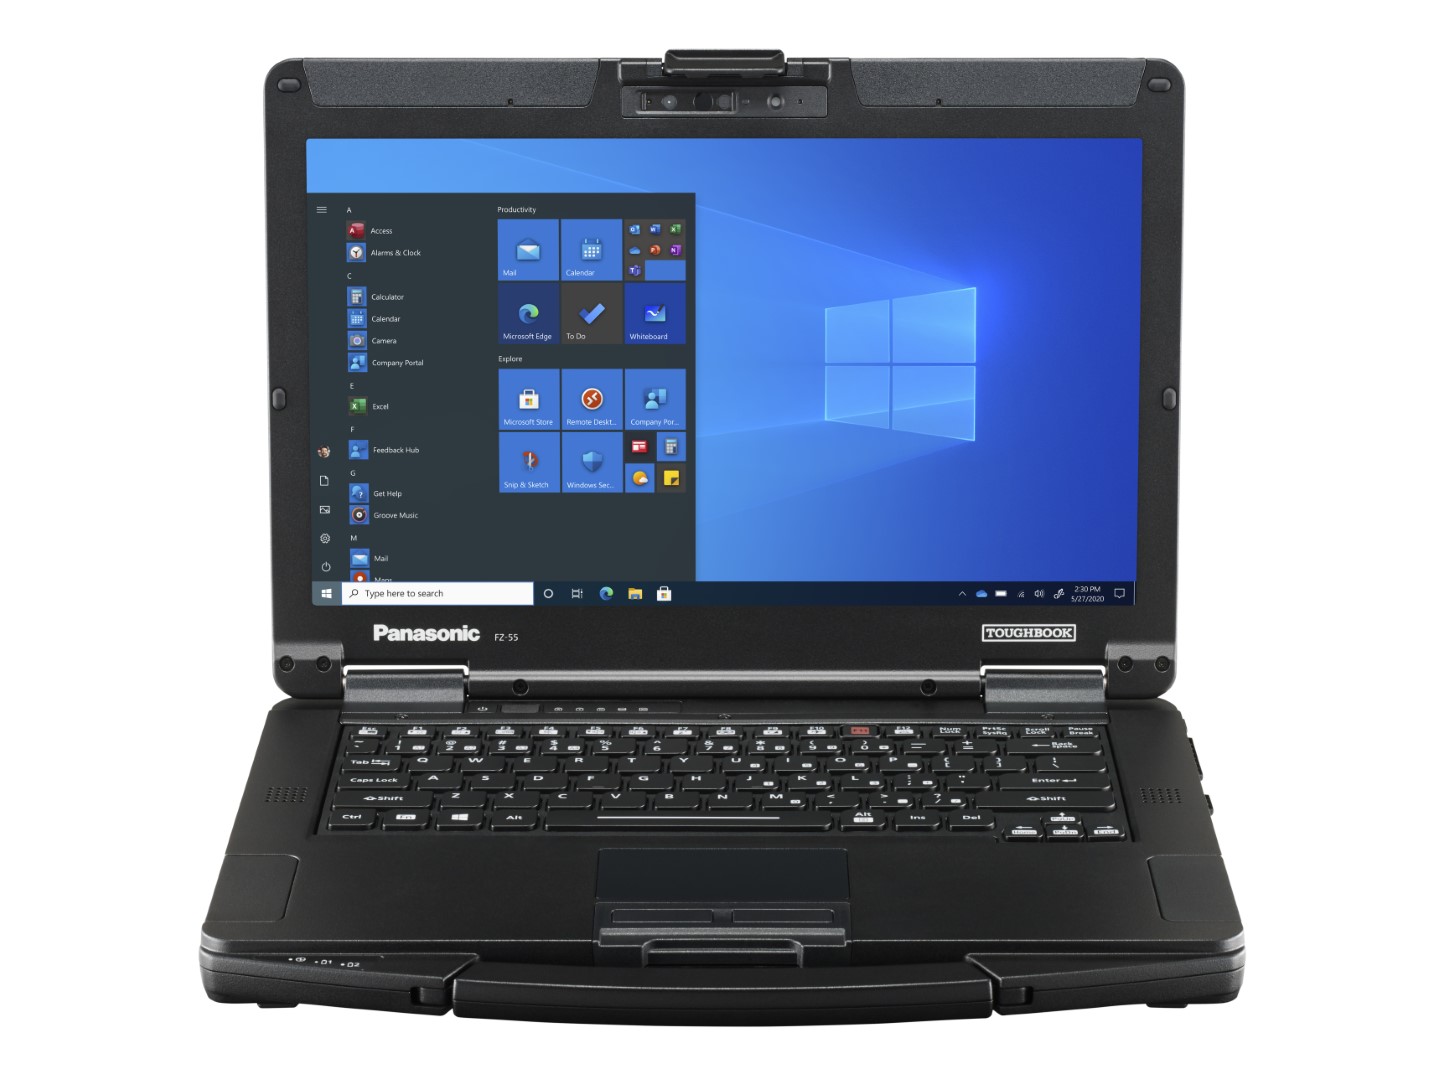
Uma grande fechadura que encaixa a tampa quando fechada pende sobre a webcam, o que infelizmente pode bloquear muita iluminação ambiente. A imagem da webcam pode, portanto, parecer mais escura do que apareceria na maioria dos outros laptops.


Acessórios e Garantia
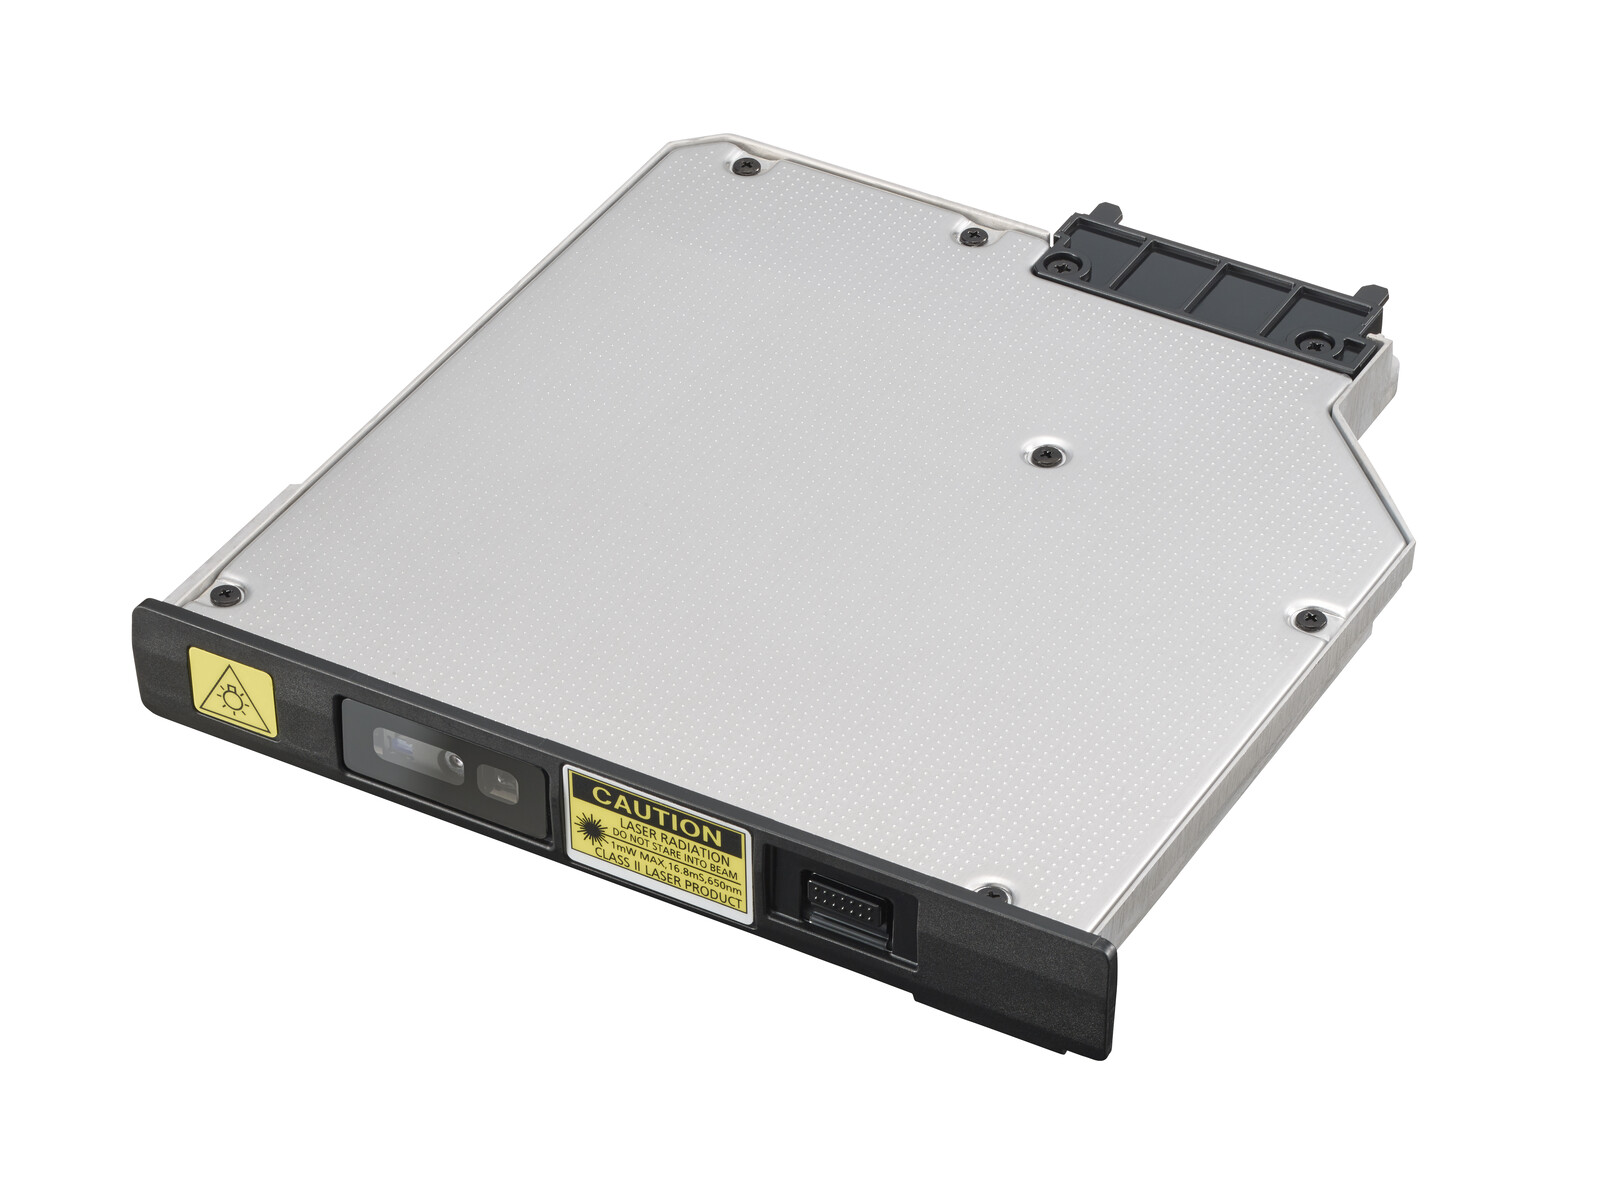
Embora os itens de expansão xPAK removíveis permaneçam compatíveis com as versões anteriores, a Panasonic introduziu novos itens para funcionalidade adicional, se desejado. Um deles será um conjunto Radeon xPAK da próxima geração a ser lançado no final do próximo ano para melhorar o desempenho gráfico que será compatível com nosso FZ-55 MK2
Aplica-se uma garantia padrão de 36 meses.
Mostrar
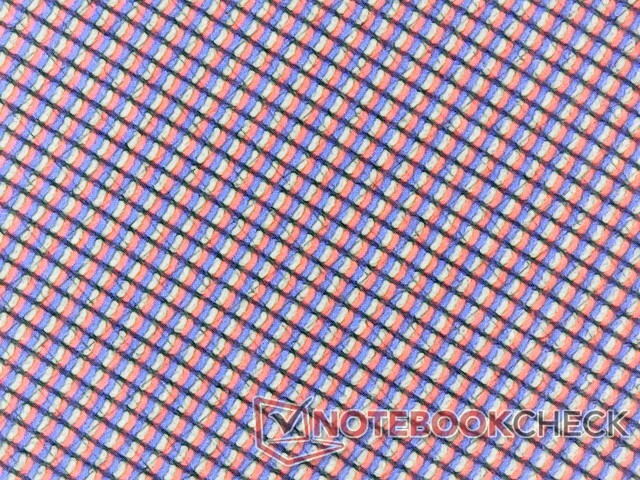
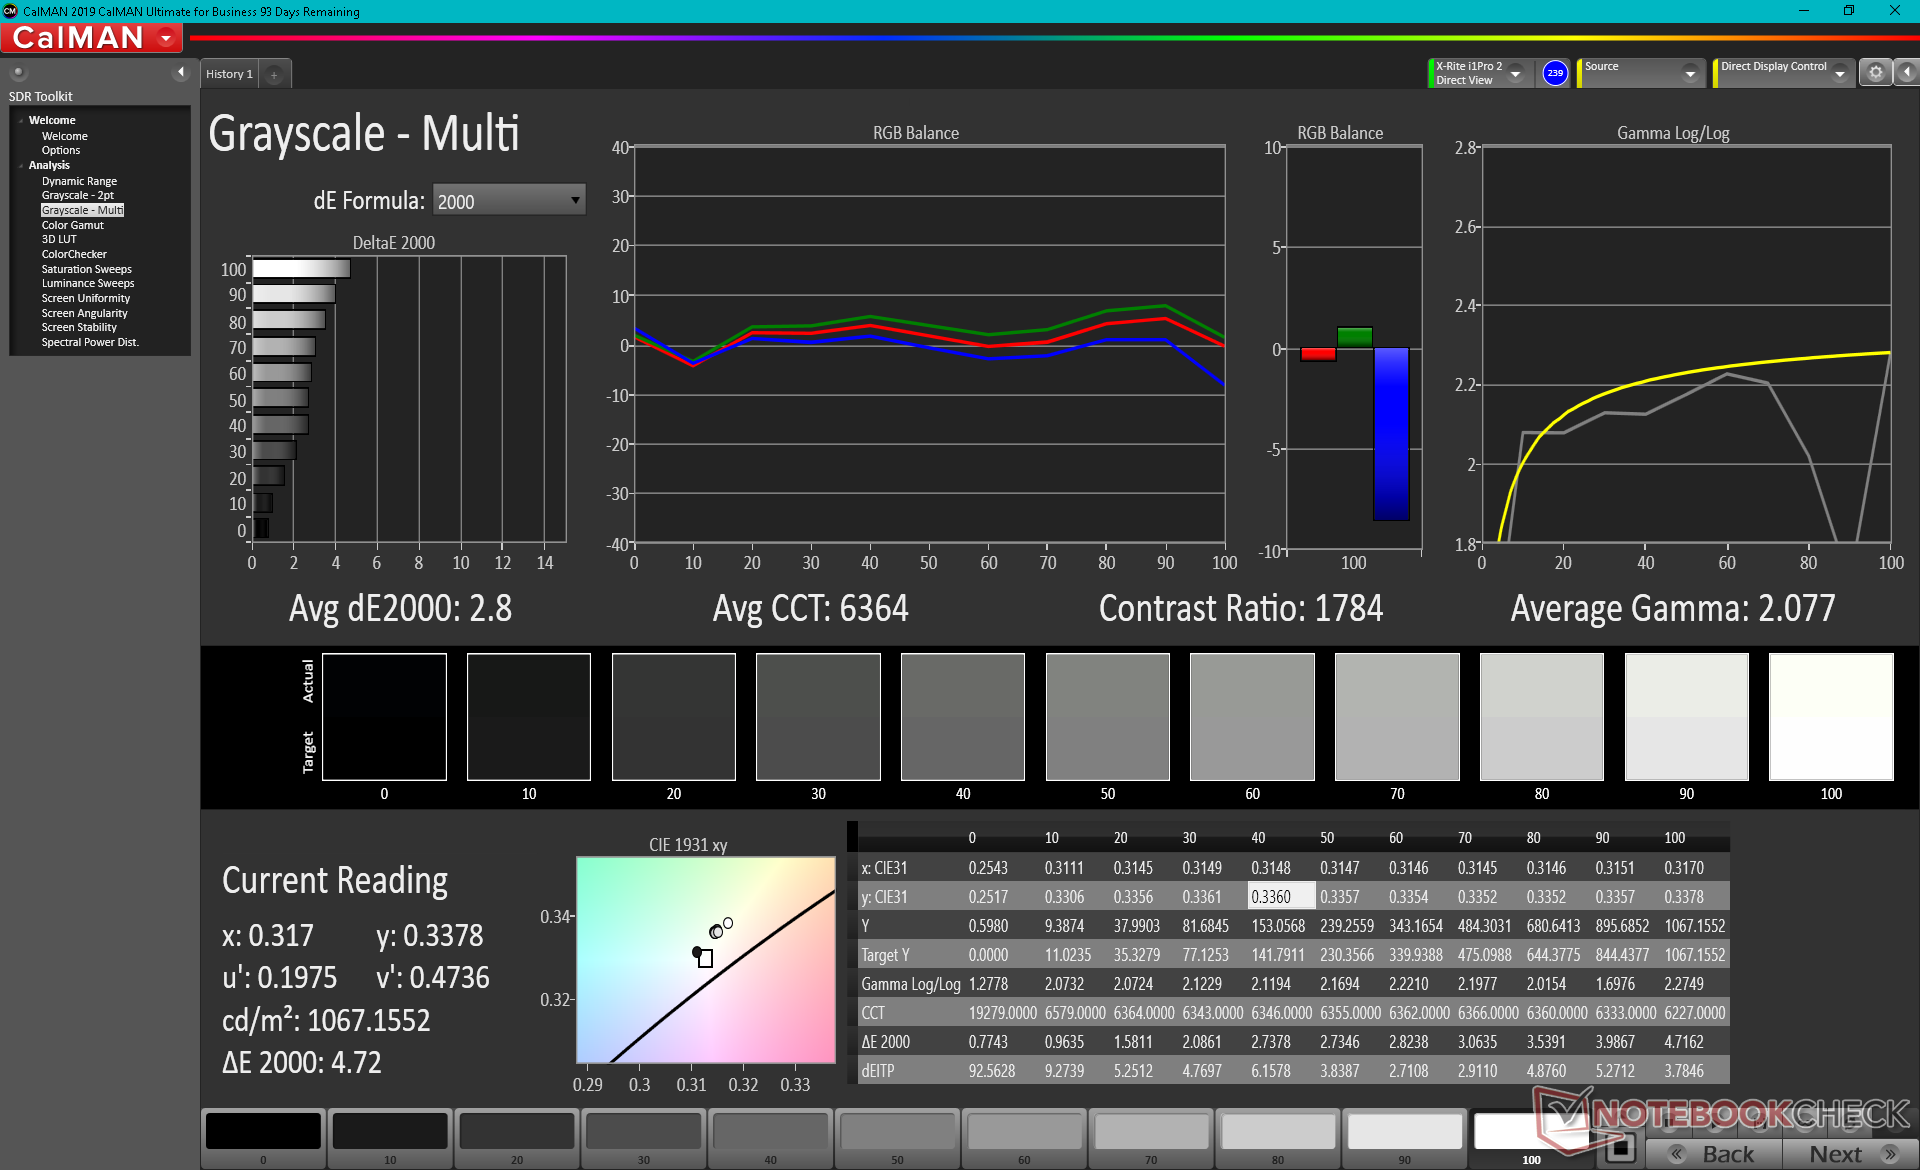
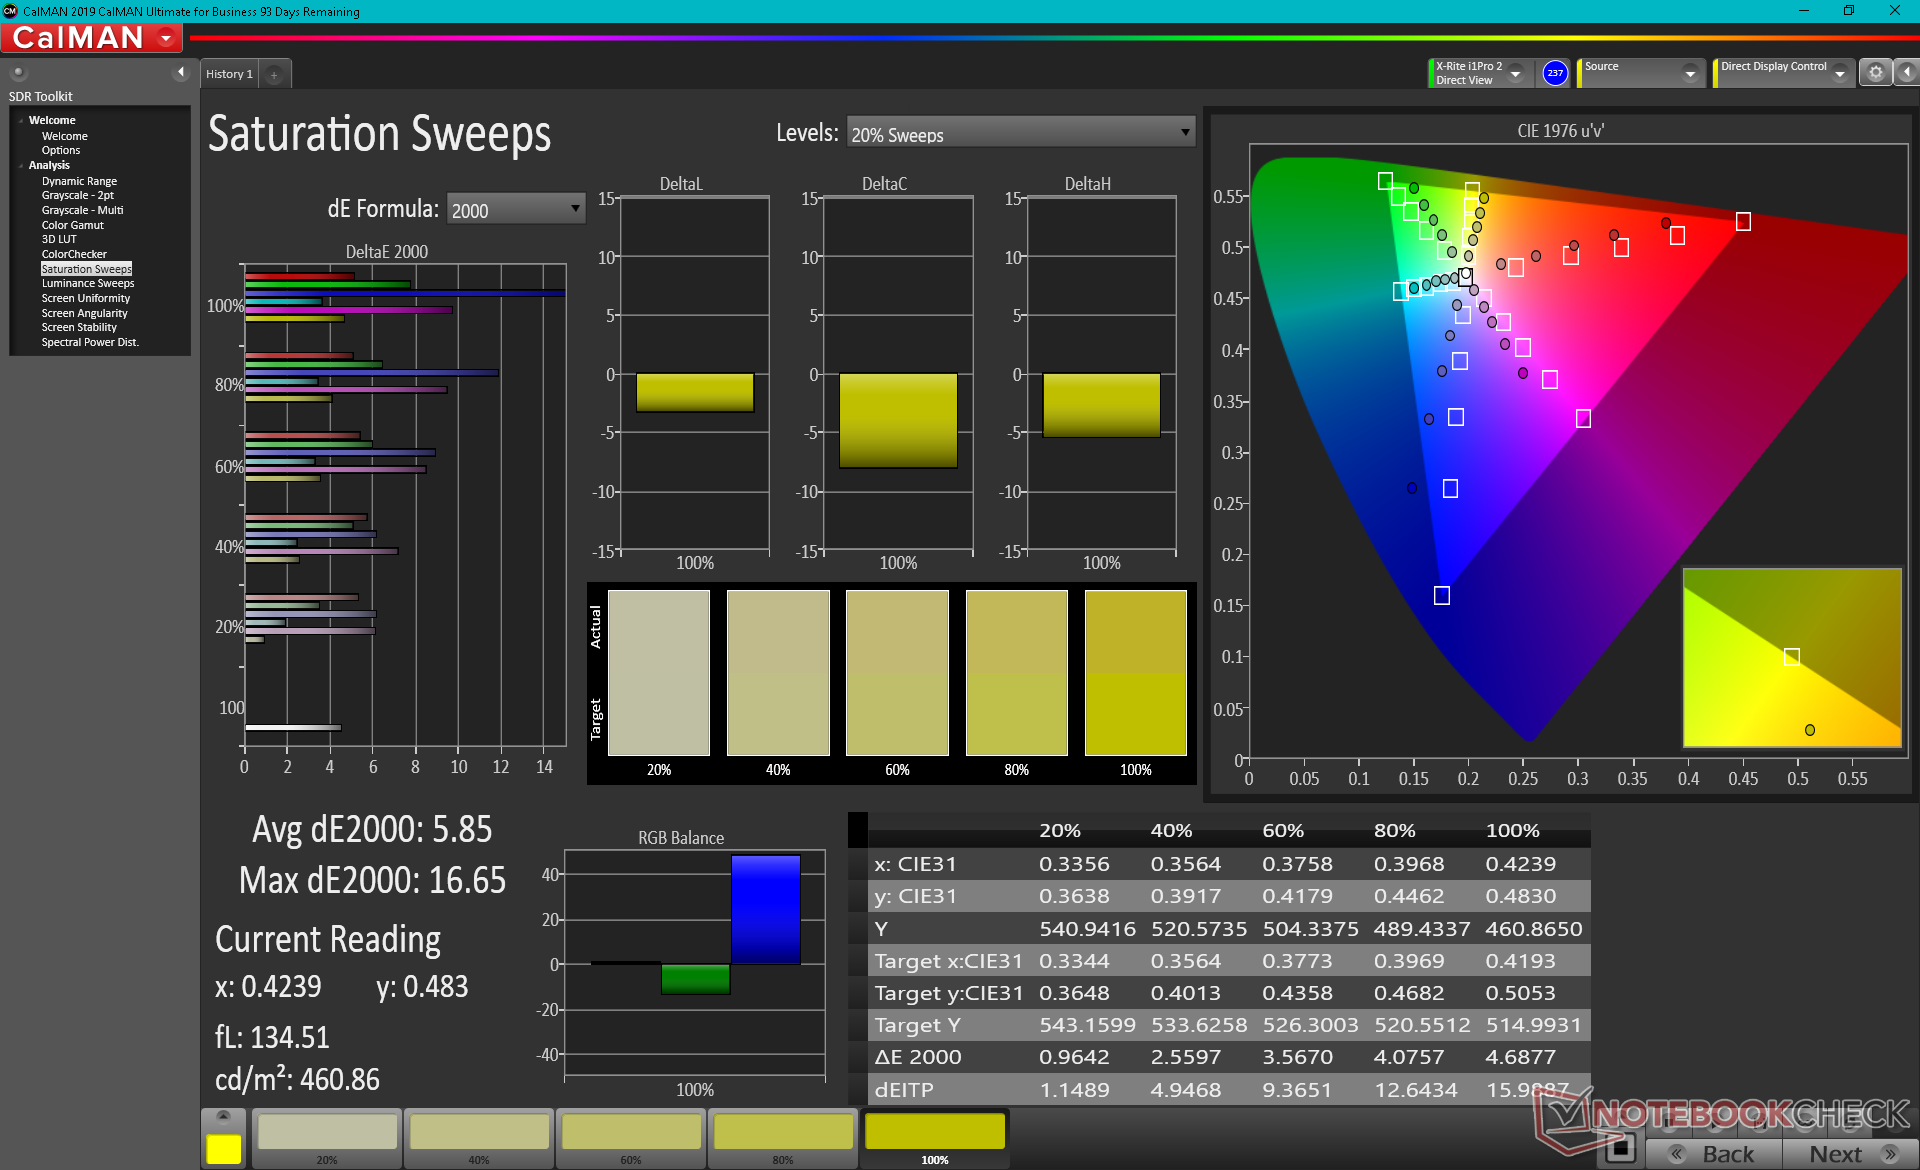
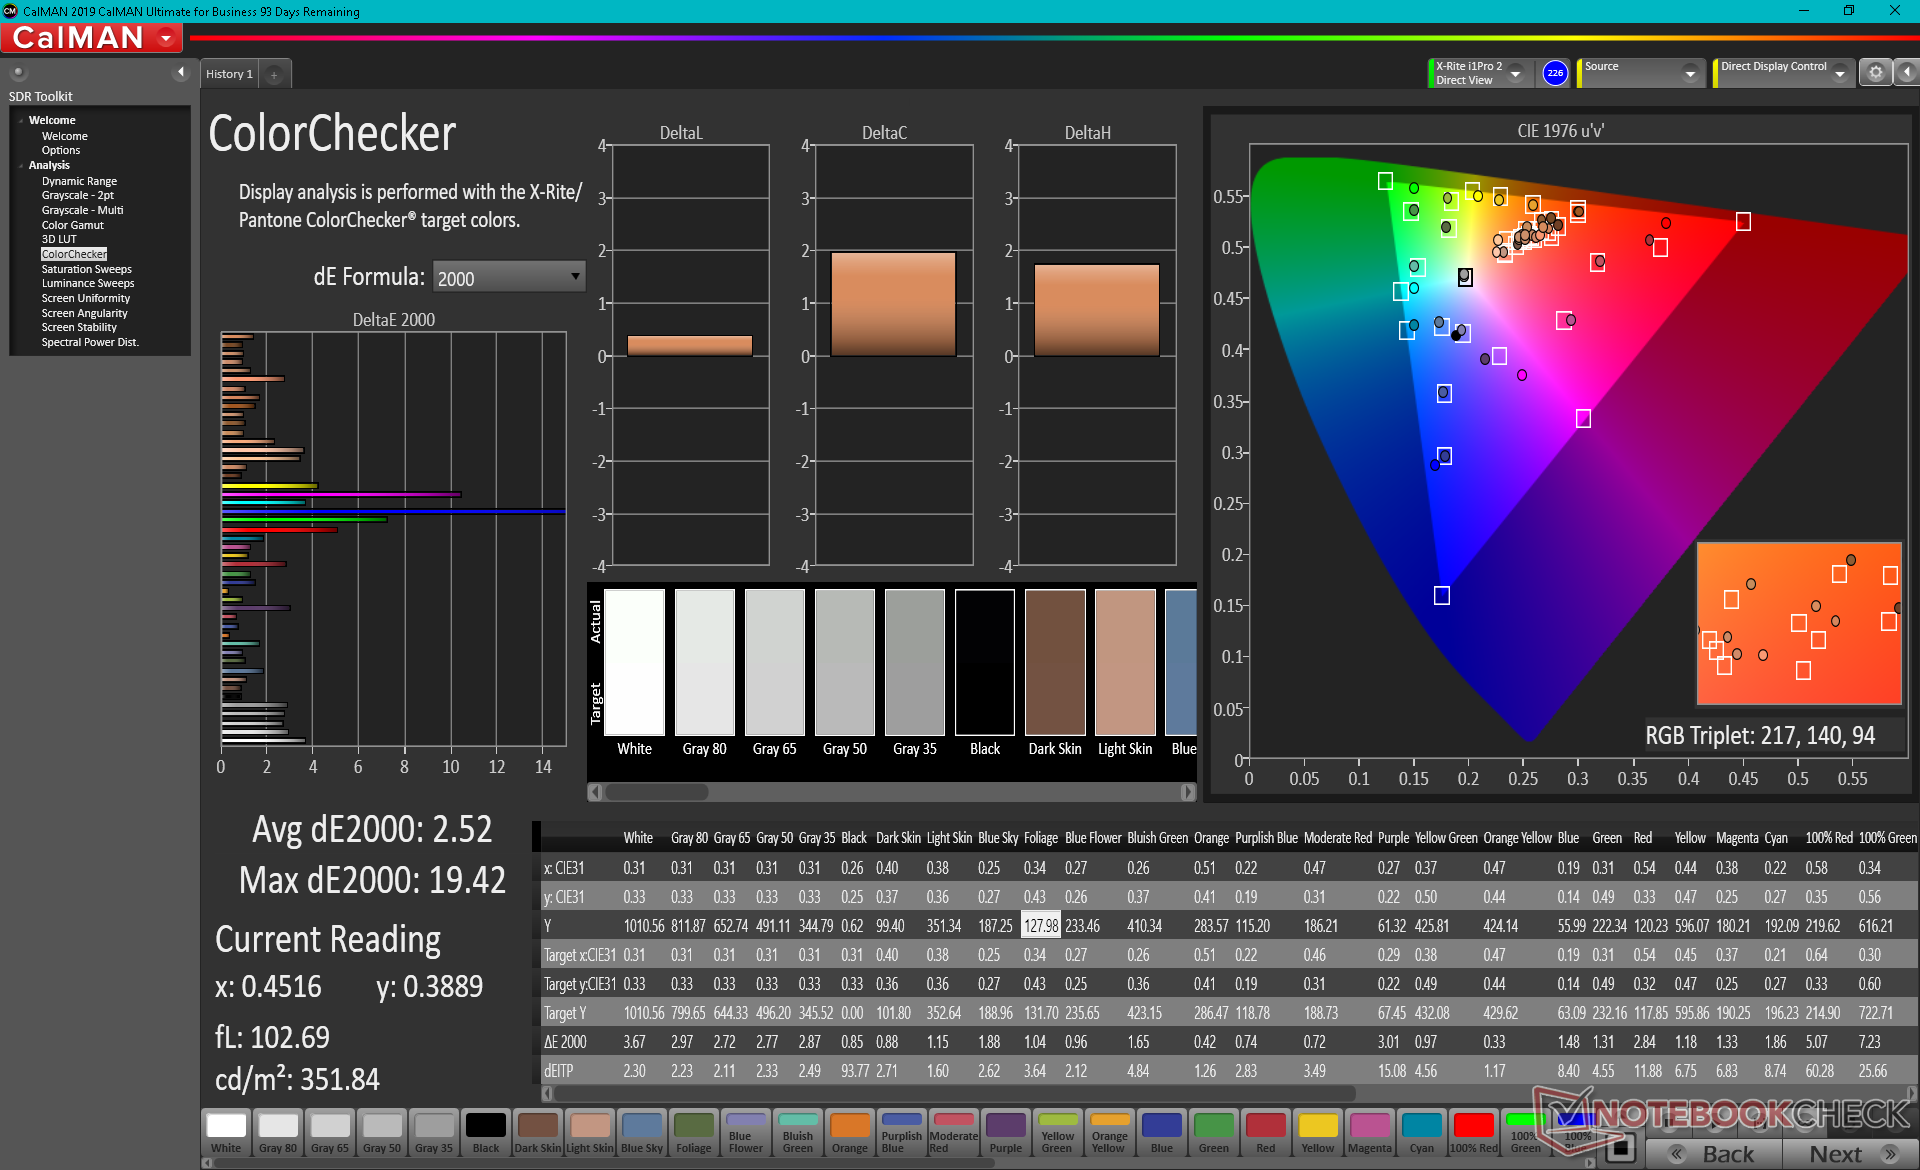
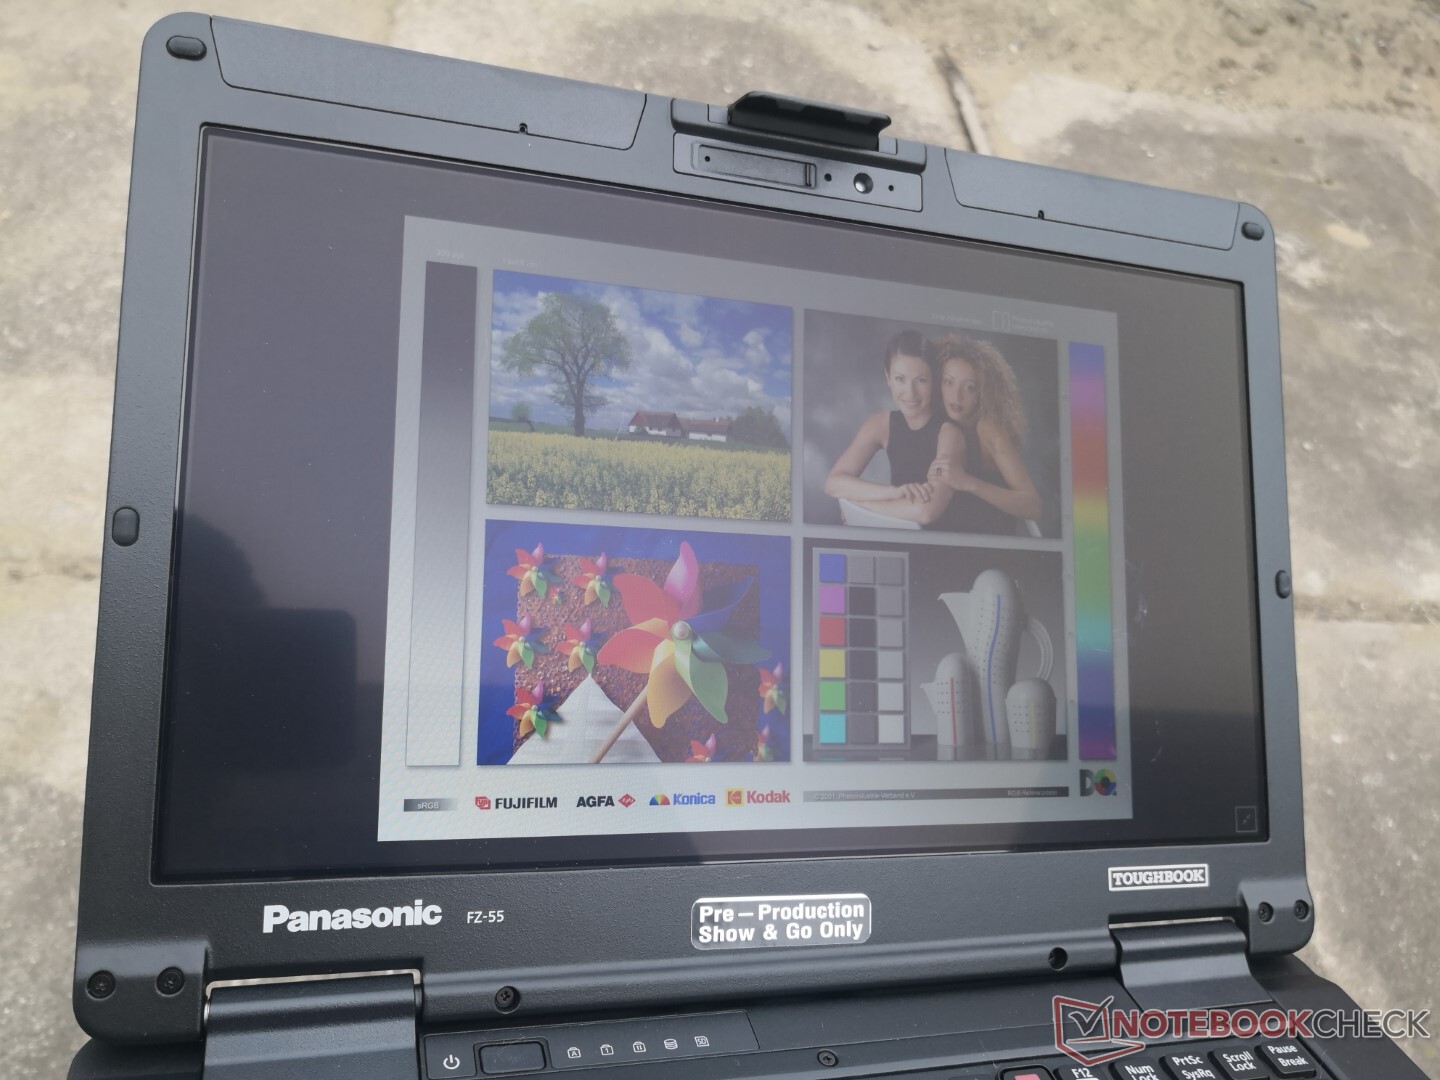
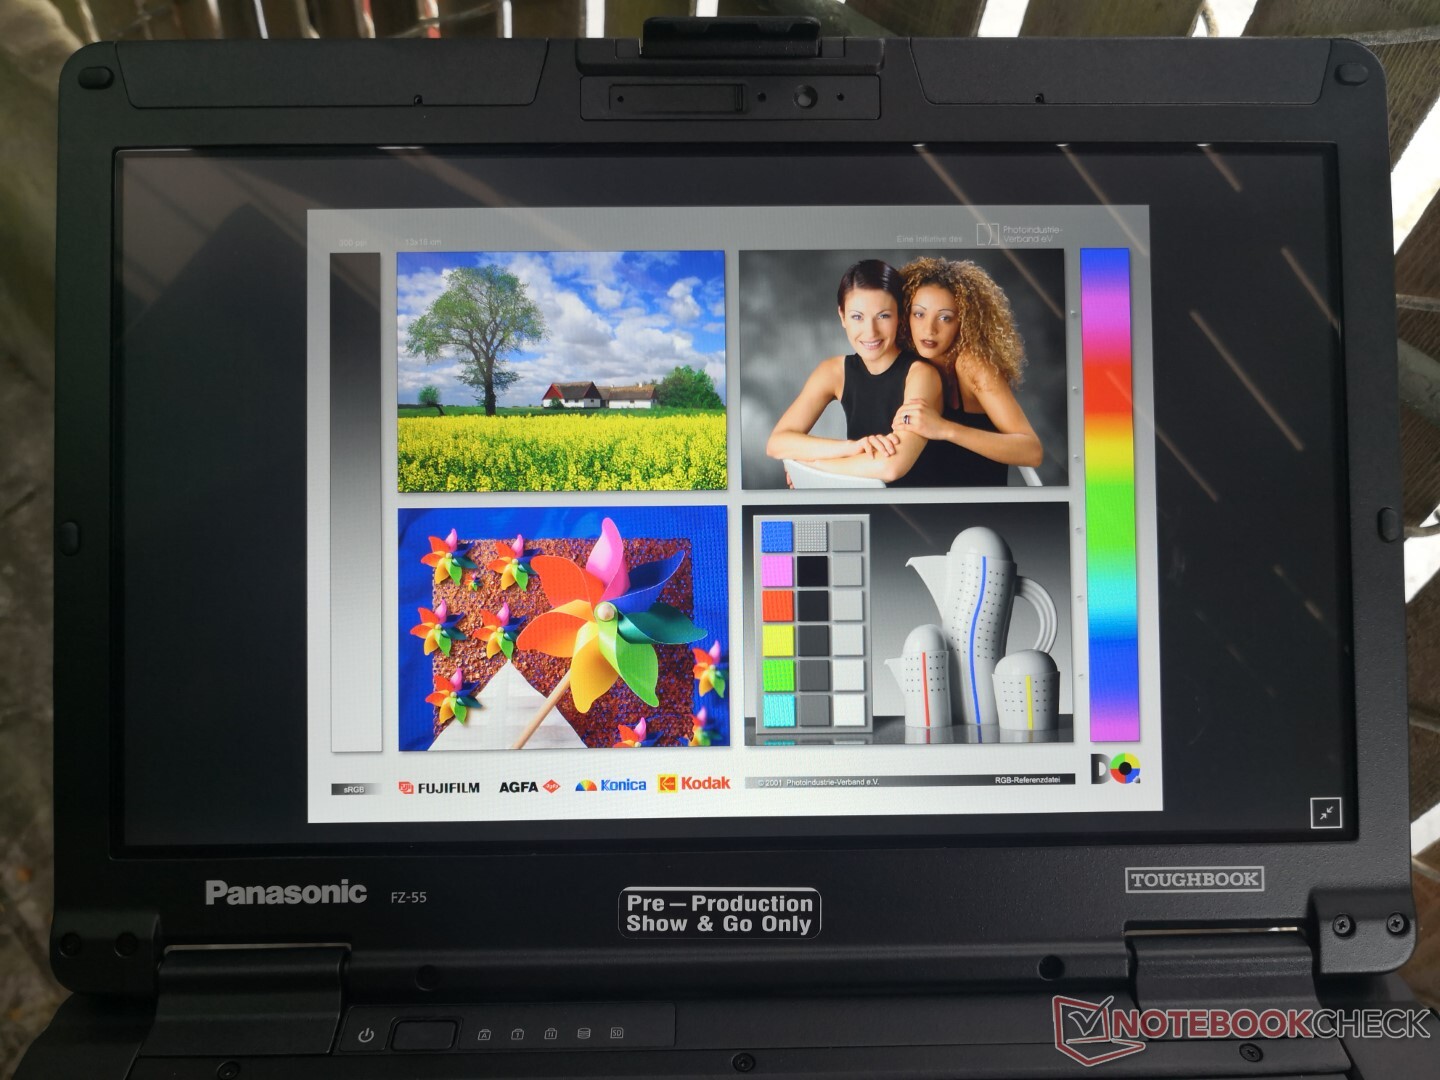
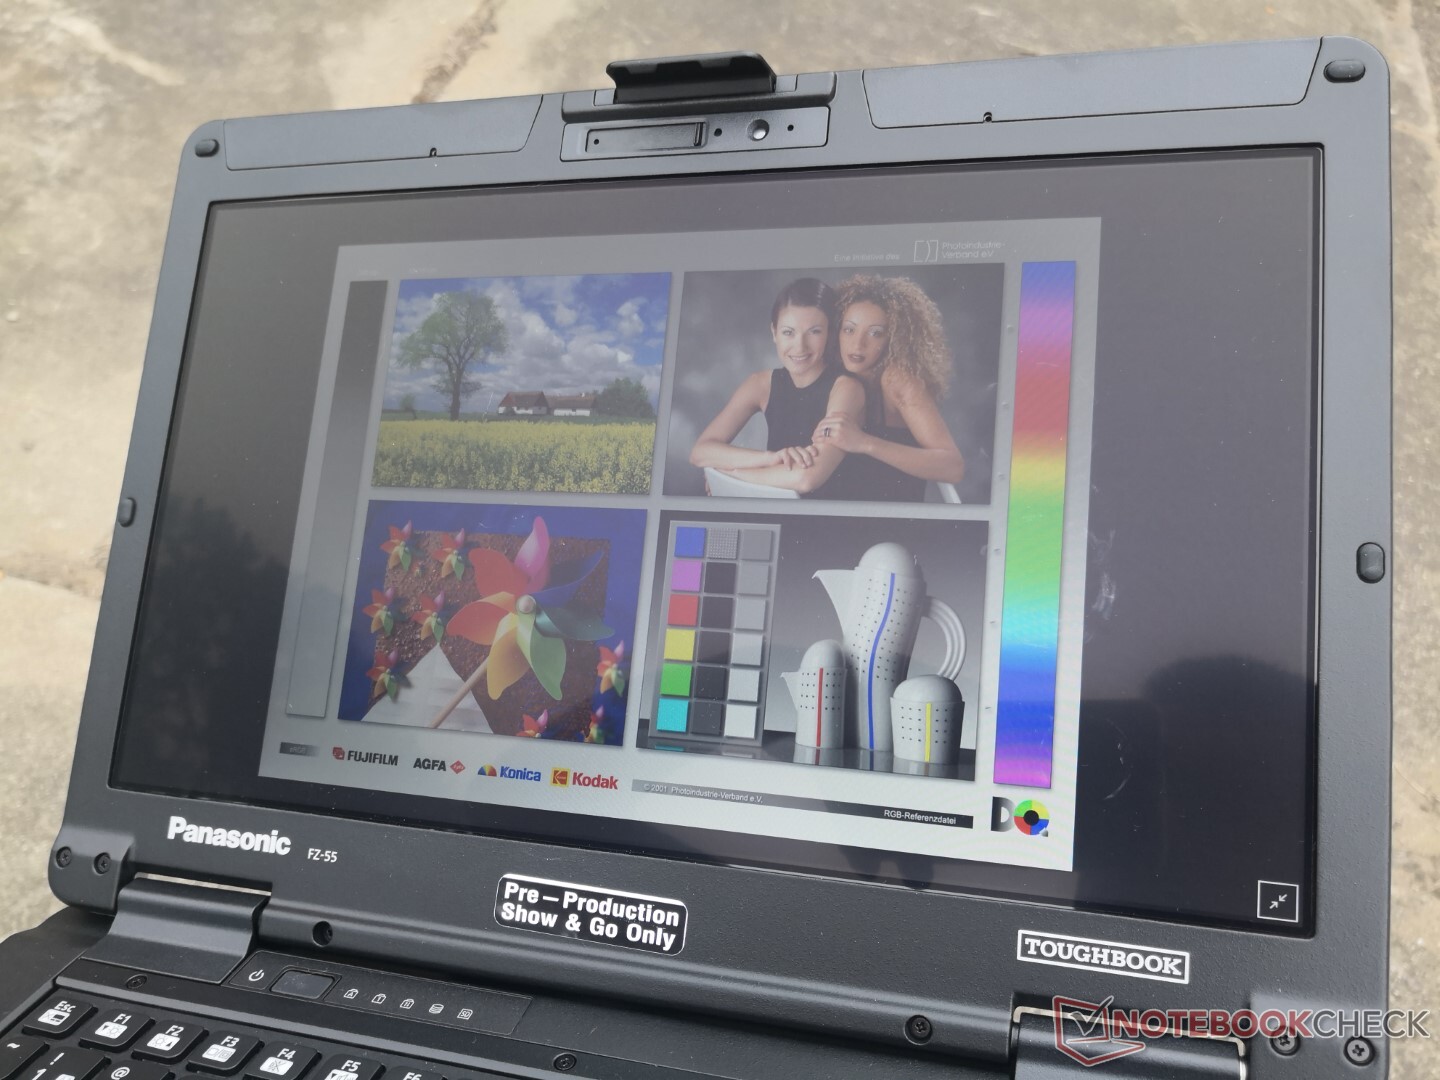
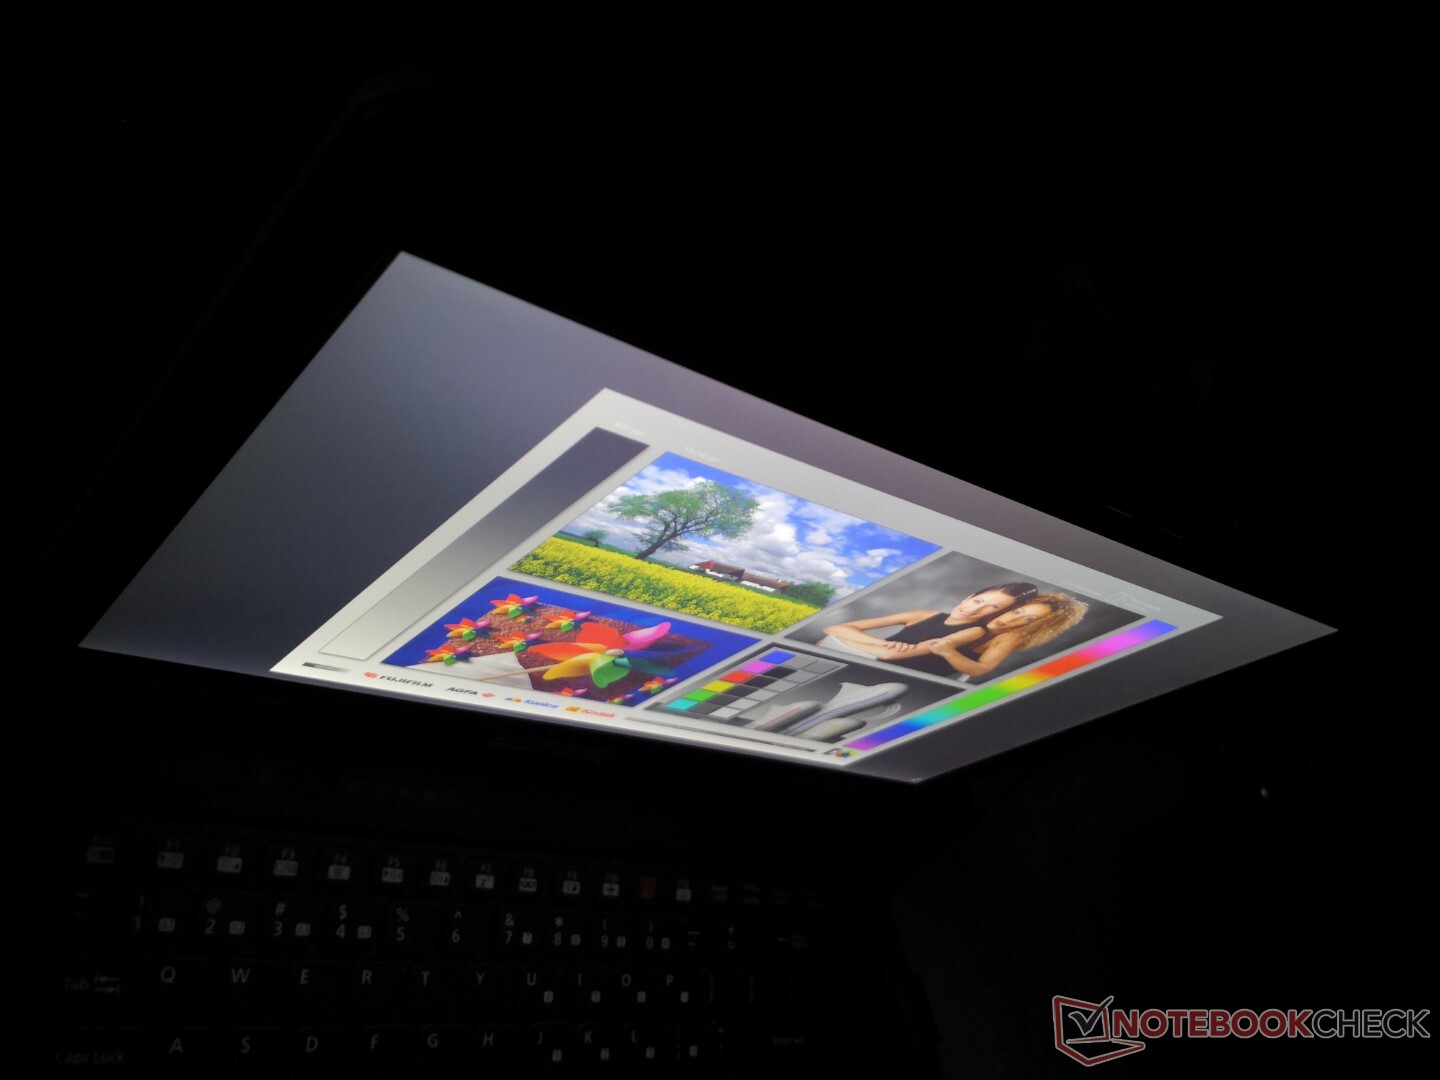
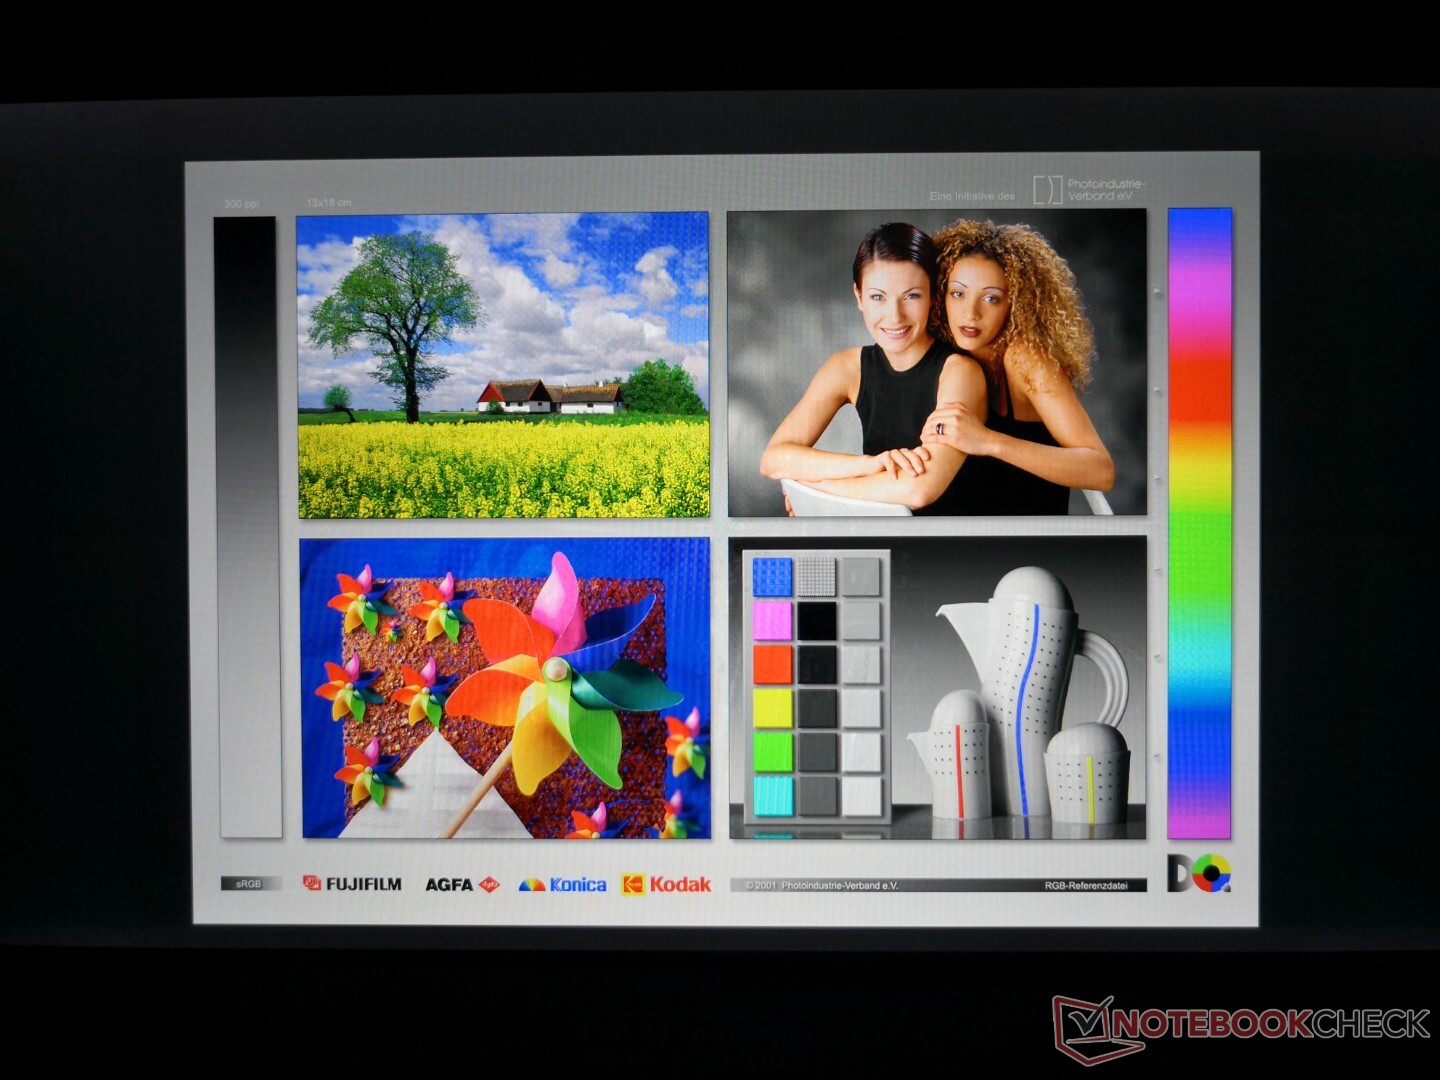
O Toughbook FZ-55 MK2 utiliza o mesmo painel IPS InfoVision M140NWF5 R3 encontrado no FZ-55 MK1, o que significa que a experiência de visualização permanece essencialmente idêntica. O espaço de cores é muito estreito em apenas 52% do sRGB em comparação com >95% nos Ultrabooks tradicionais. Portanto, não espere que as cores apareçam ou sejam suficientemente precisas para uma edição de vídeo séria
| |||||||||||||||||||||||||
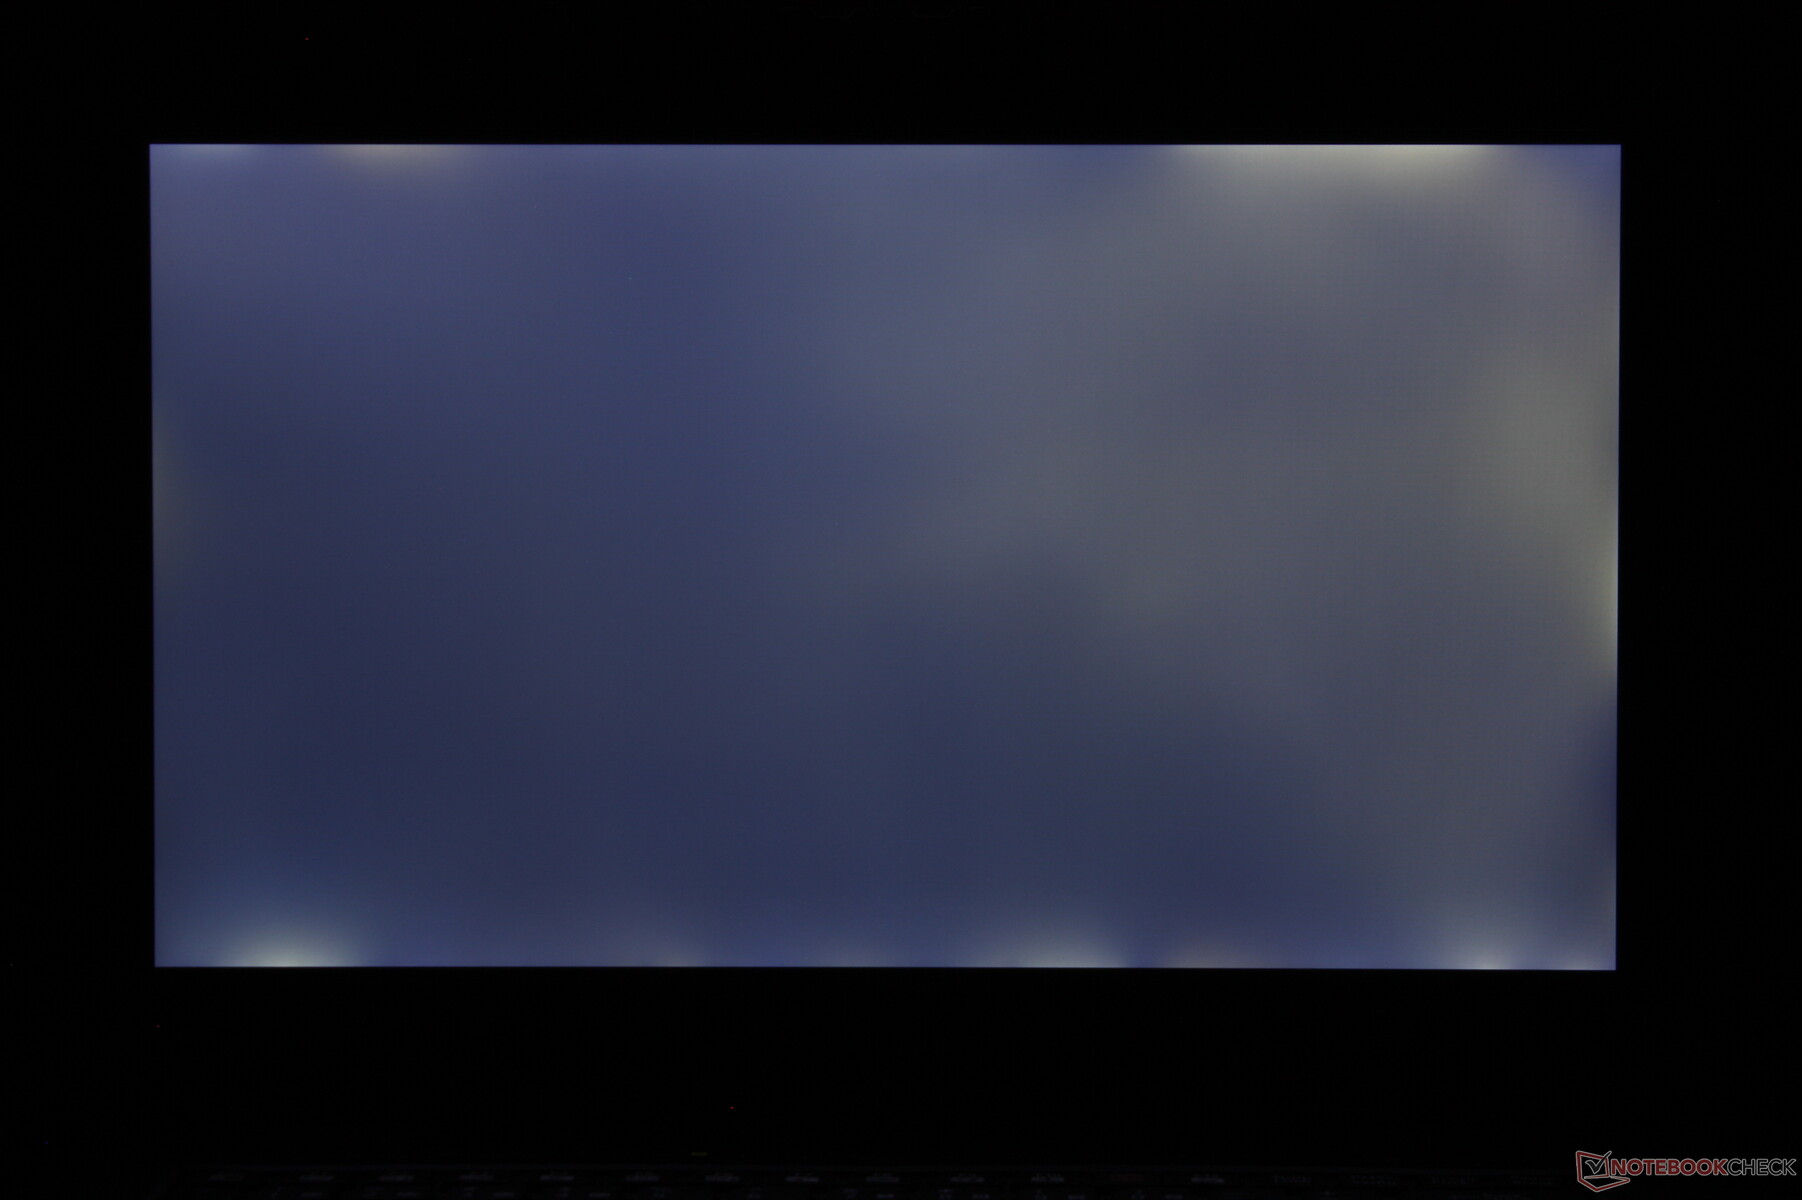
iluminação: 76 %
iluminação com acumulador: 1061.1 cd/m²
Contraste: 1516:1 (Preto: 0.7 cd/m²)
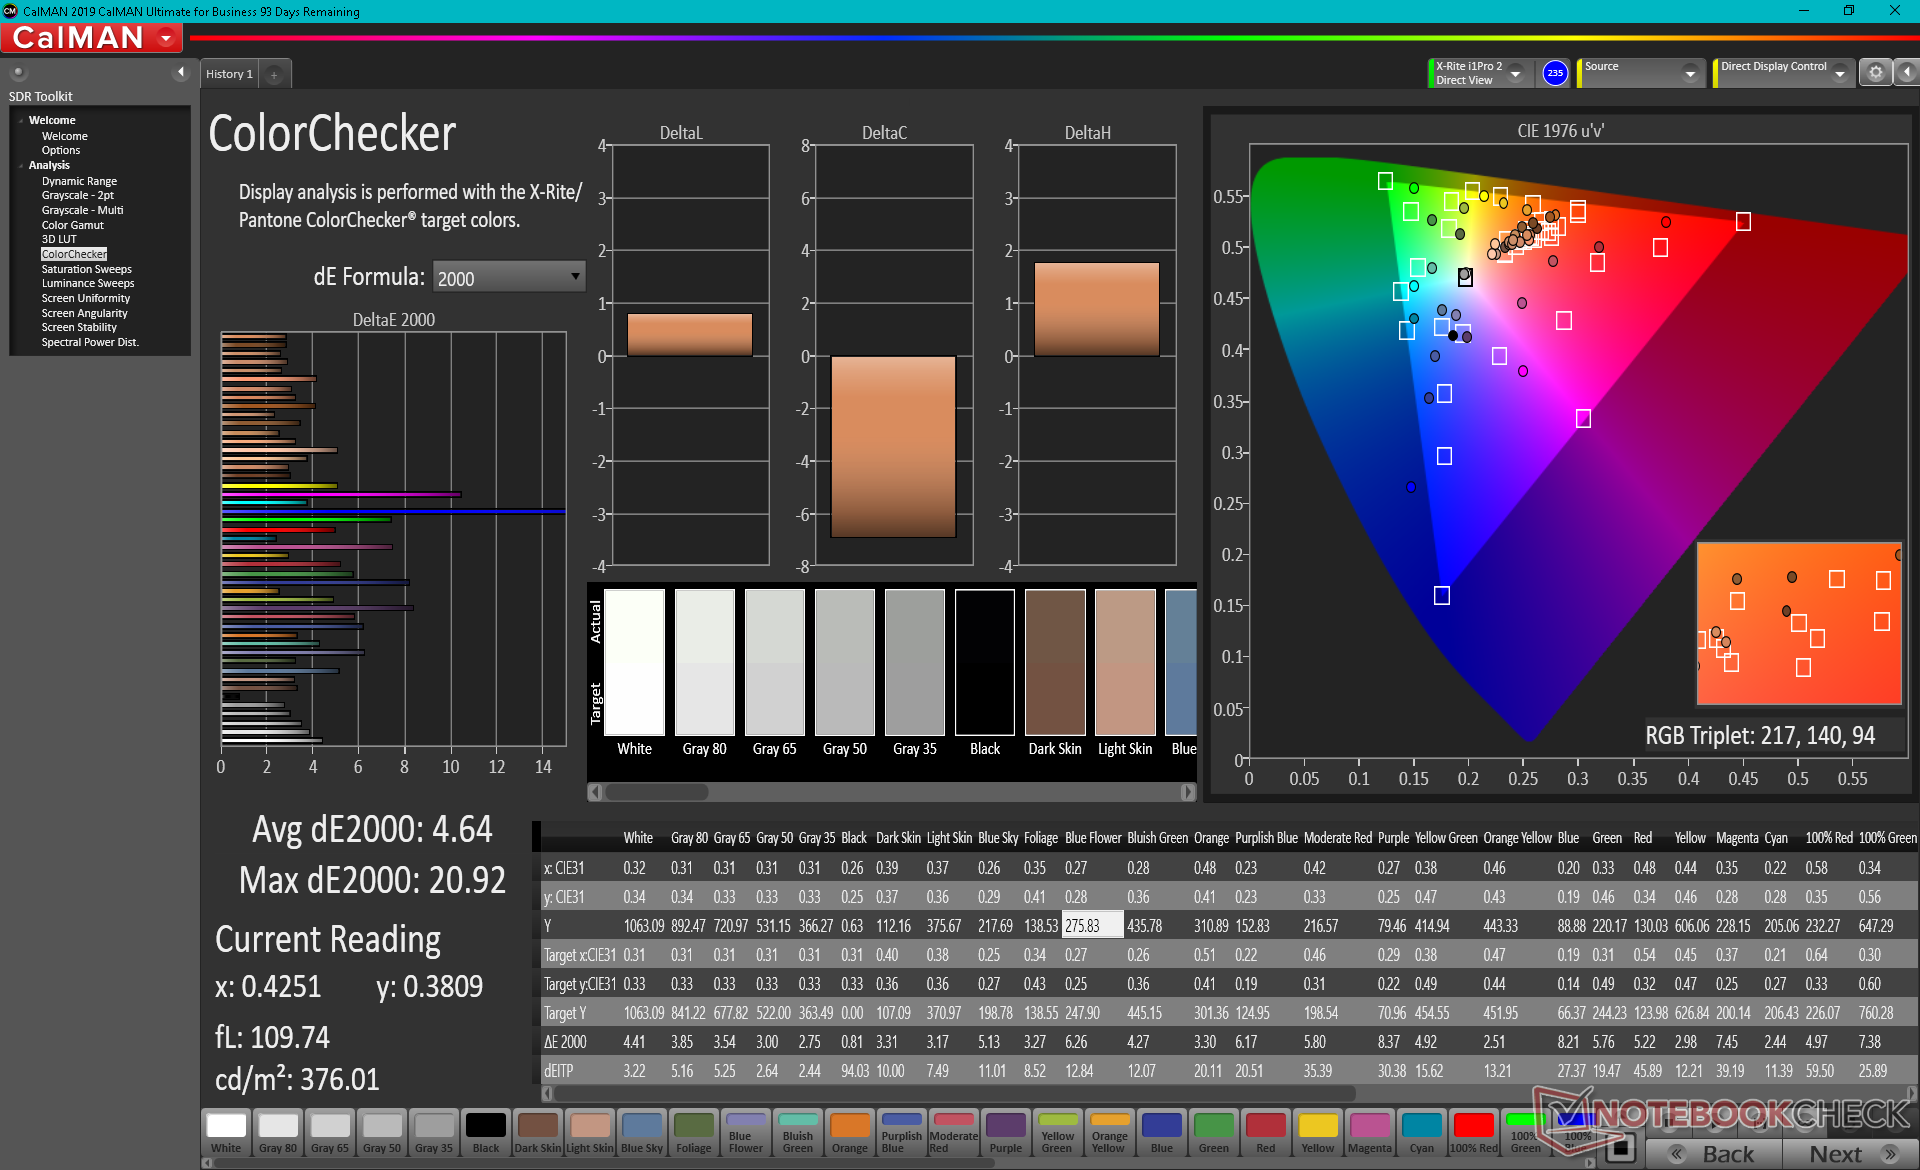
ΔE ColorChecker Calman: 4.64 | ∀{0.5-29.43 Ø4.71}
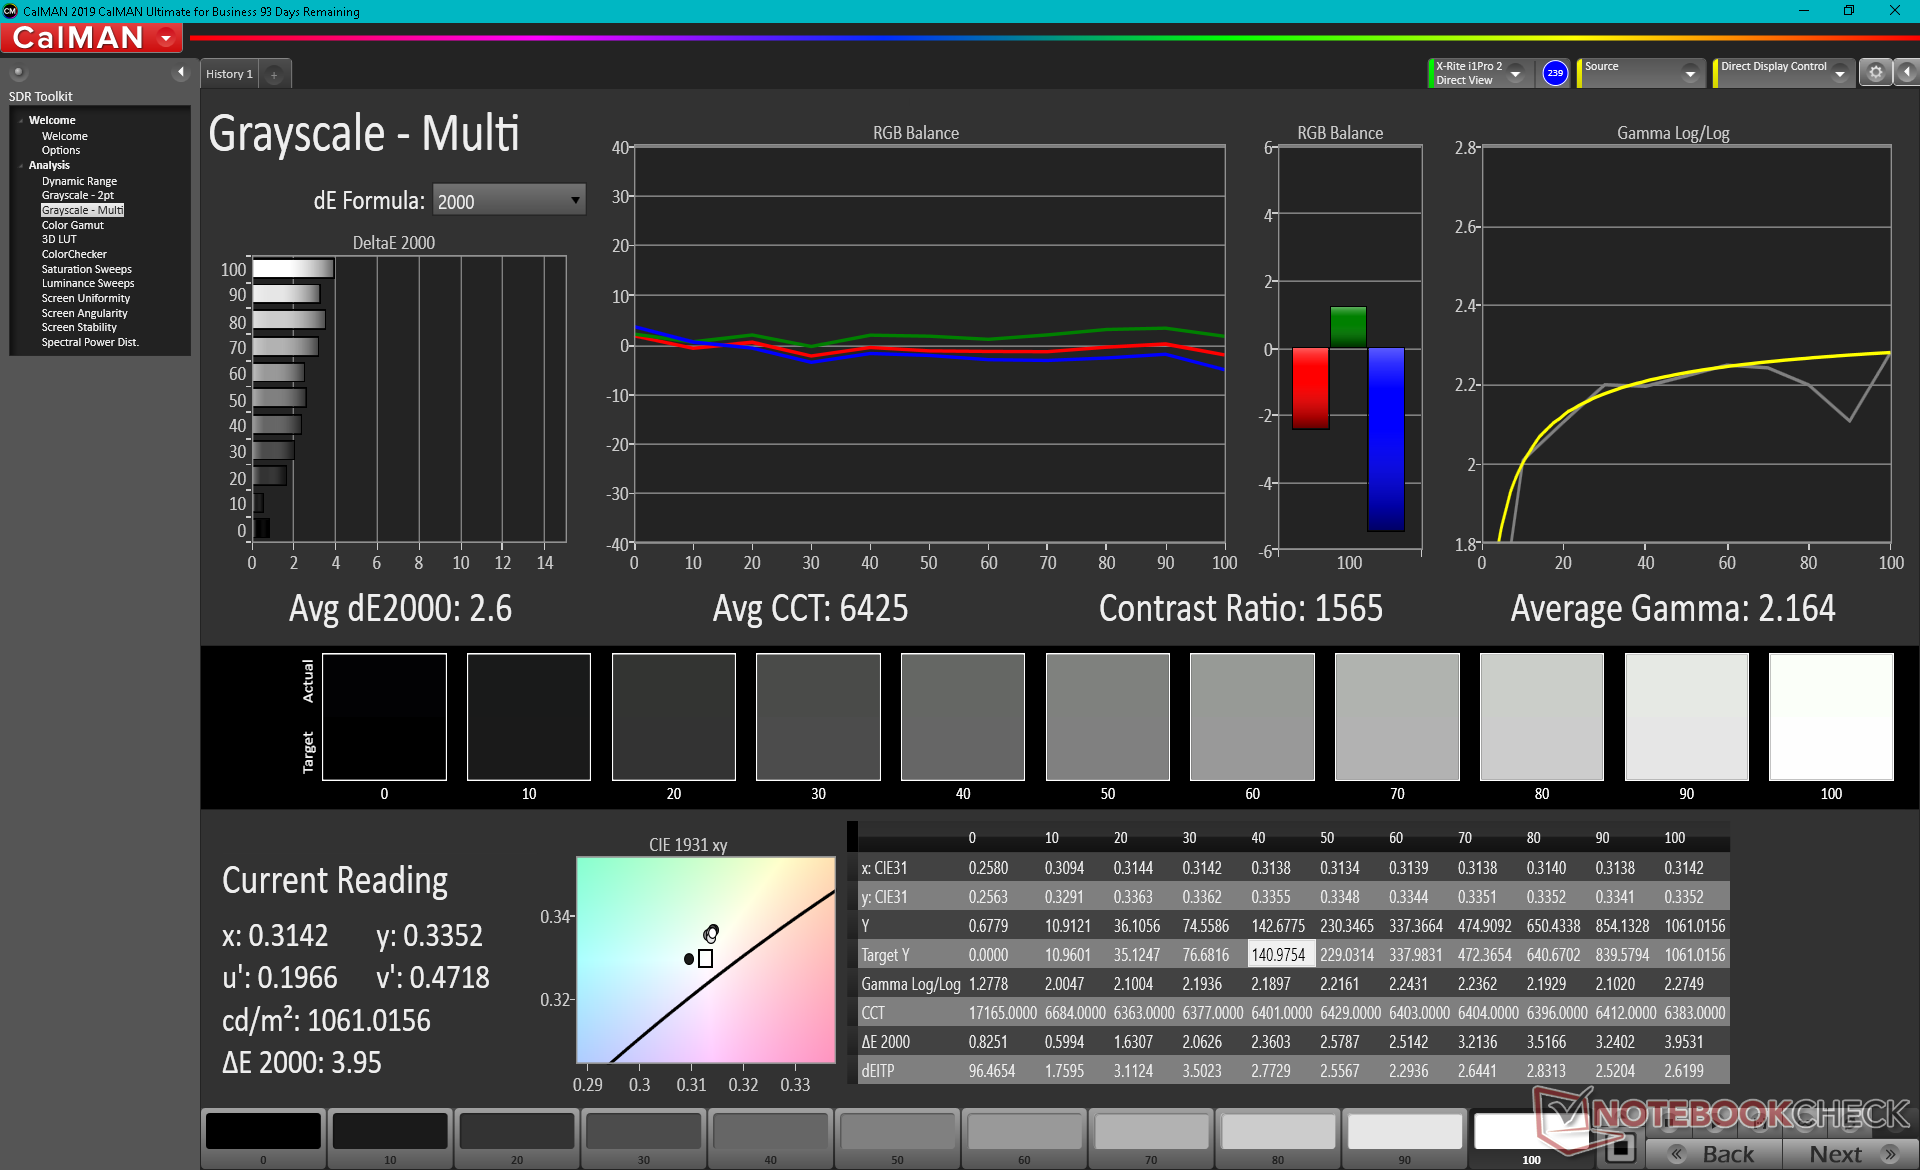
calibrated: 2.52
ΔE Greyscale Calman: 2.8 | ∀{0.09-98 Ø4.96}
36% AdobeRGB 1998 (Argyll 3D)
52.2% sRGB (Argyll 3D)
34.8% Display P3 (Argyll 3D)
Gamma: 2.08
CCT: 6364 K
| Panasonic Toughbook FZ-55 MK2 InfoVision M140NWF5 R3, IPS, 14", 1920x1080 | Panasonic Toughbook FZ-55 InfoVision M140NWF5 R3, IPS, 14", 1920x1080 | Dell Latitude 5420 Rugged-P85G AU Optronics AUO523D, IPS, 14", 1920x1080 | Durabook S14I KD140N0730A01, TN, 14", 1920x1080 | Getac S410 CMN N140BGE-E33, TN PED, 14", 1366x768 | |
|---|---|---|---|---|---|
| Display | 9% | 78% | 25% | 16% | |
| Display P3 Coverage (%) | 34.8 | 38.09 9% | 62.5 80% | 43.55 25% | 40.46 16% |
| sRGB Coverage (%) | 52.2 | 57 9% | 92.4 77% | 65.4 25% | 60.9 17% |
| AdobeRGB 1998 Coverage (%) | 36 | 39.38 9% | 64.2 78% | 45 25% | 41.8 16% |
| Response Times | -24% | -76% | 27% | 4% | |
| Response Time Grey 50% / Grey 80% * (ms) | 28.4 ? | 42 ? -48% | 68 ? -139% | 30.4 ? -7% | 41.2 ? -45% |
| Response Time Black / White * (ms) | 30 ? | 29.6 ? 1% | 33.6 ? -12% | 11.8 ? 61% | 14 ? 53% |
| PWM Frequency (Hz) | 685 ? | 694 ? | 735 ? | 304.9 ? | 877 ? |
| Screen | -22% | -6% | -96% | -99% | |
| Brightness middle (cd/m²) | 1061.1 | 1037 -2% | 1111.7 5% | 1180.7 11% | 265.1 -75% |
| Brightness (cd/m²) | 997 | 1015 2% | 1026 3% | 1102 11% | 246 -75% |
| Brightness Distribution (%) | 76 | 76 0% | 80 5% | 89 17% | 81 7% |
| Black Level * (cd/m²) | 0.7 | 0.6 14% | 0.81 -16% | 1.91 -173% | 0.58 17% |
| Contrast (:1) | 1516 | 1728 14% | 1372 -9% | 618 -59% | 457 -70% |
| Colorchecker dE 2000 * | 4.64 | 5.71 -23% | 3.83 17% | 13.45 -190% | 14.24 -207% |
| Colorchecker dE 2000 max. * | 20.92 | 26.27 -26% | 7.85 62% | 22.52 -8% | 26.66 -27% |
| Colorchecker dE 2000 calibrated * | 2.52 | 4.52 -79% | 2.98 -18% | 3.19 -27% | 3.94 -56% |
| Greyscale dE 2000 * | 2.8 | 5.5 -96% | 5.6 -100% | 15.4 -450% | 14.2 -407% |
| Gamma | 2.08 106% | 2.04 108% | 2.306 95% | 1.97 112% | 2.03 108% |
| CCT | 6364 102% | 5783 112% | 7676 85% | 21134 31% | 17152 38% |
| Color Space (Percent of AdobeRGB 1998) (%) | 36.4 | 59 | 41.6 | 38.7 | |
| Color Space (Percent of sRGB) (%) | 57 | 93 | 65.5 | 61 | |
| Média Total (Programa/Configurações) | -12% /
-15% | -1% /
2% | -15% /
-53% | -26% /
-60% |
* ... menor é melhor
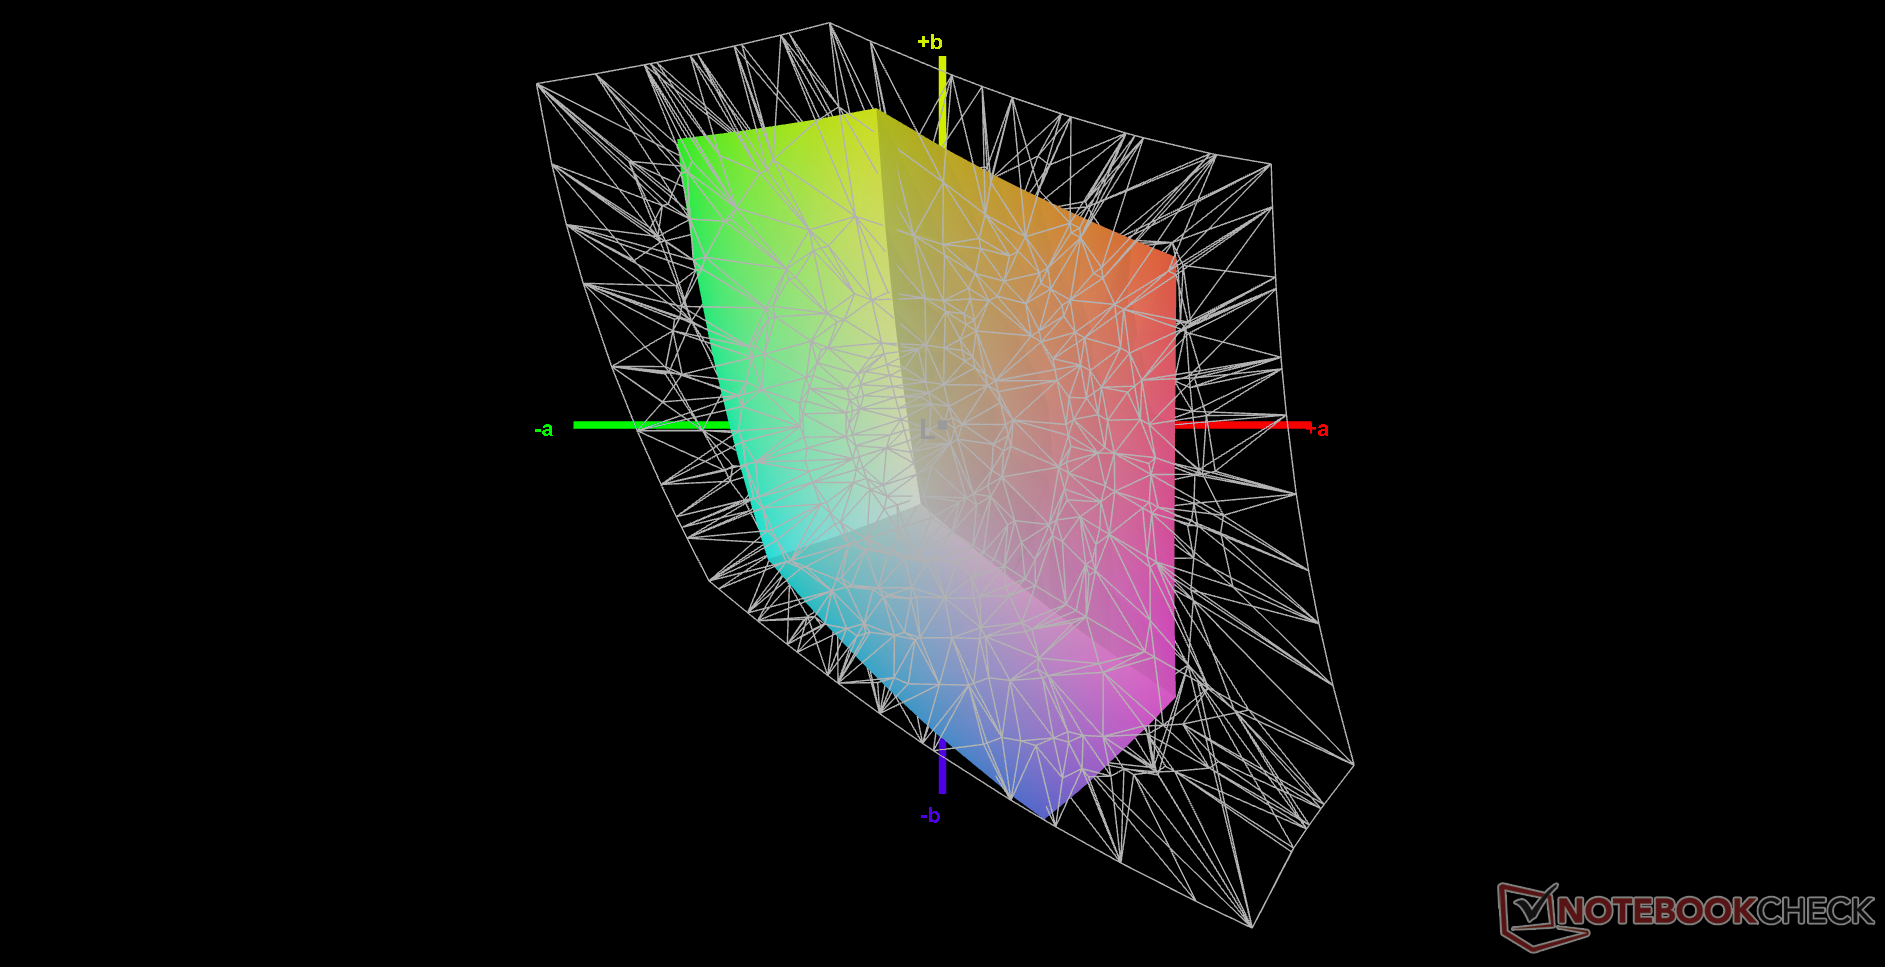
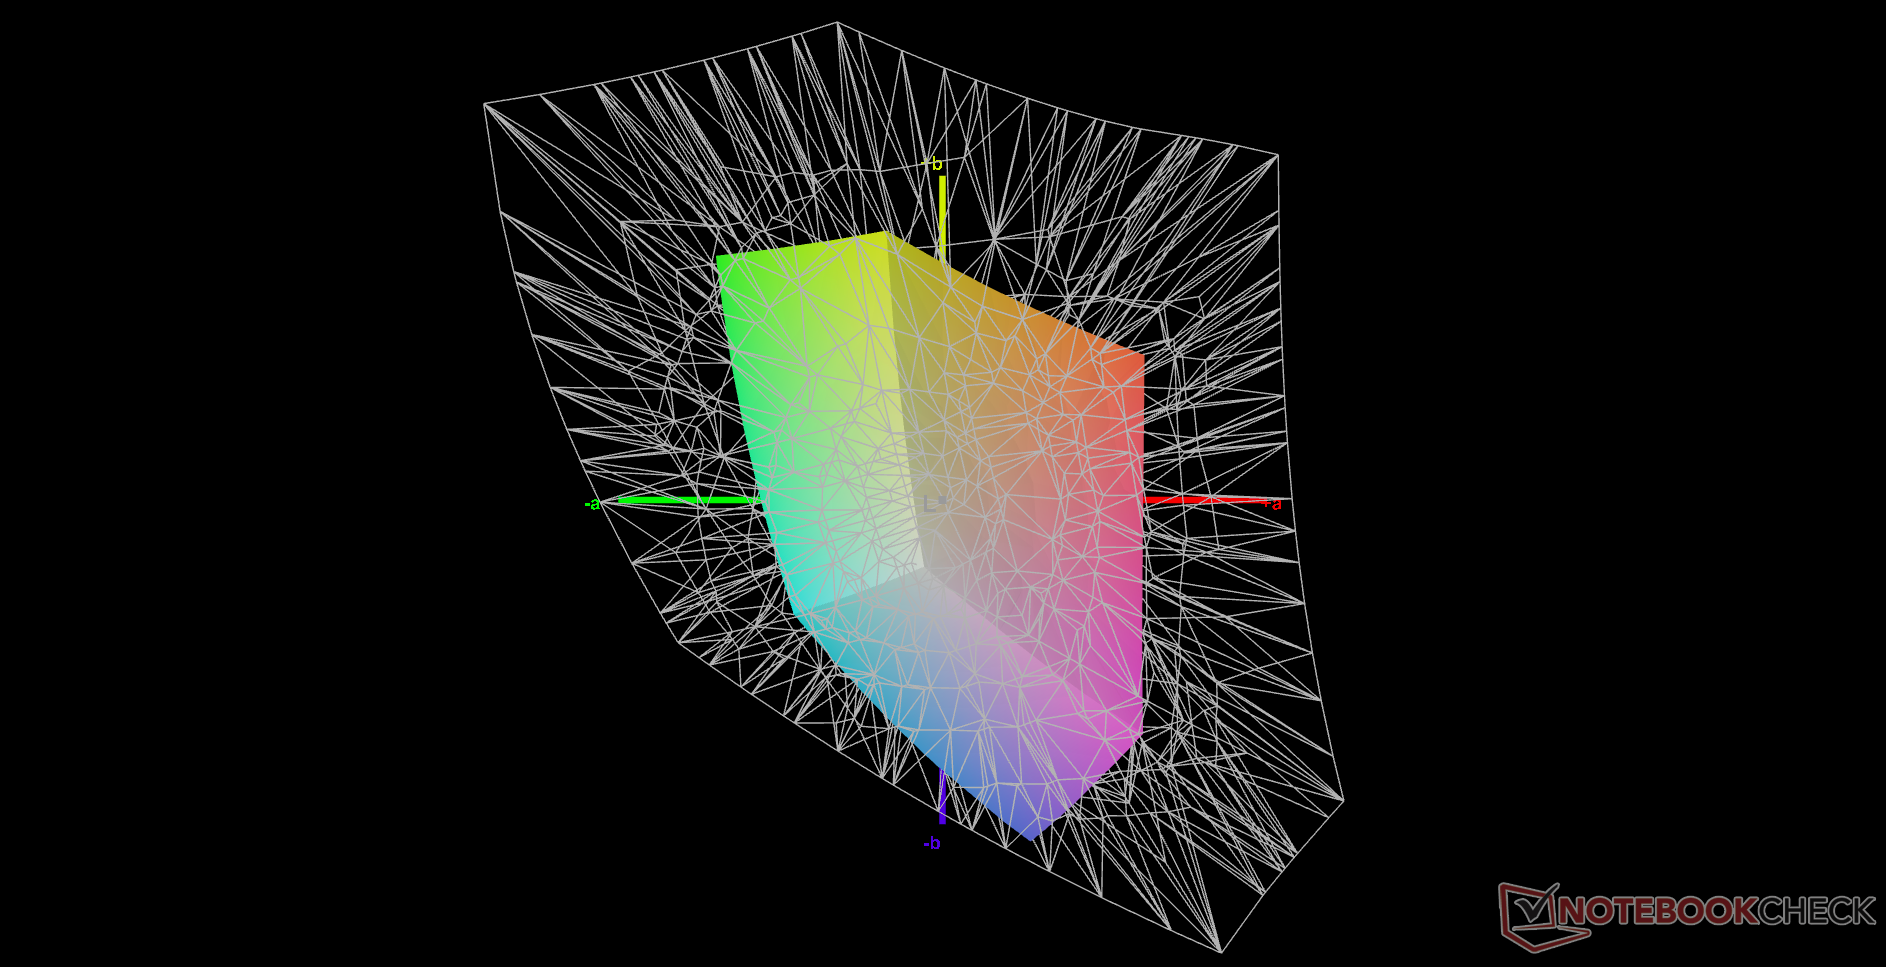
A calibração do visor melhorará a escala de cinza e as cores com níveis de saturação mais baixos, mas o limitado espaço de cores mencionado acima significa que as cores com níveis de saturação mais altos serão sempre relativamente imprecisas em relação ao padrão sRGB.

Exibir tempos de resposta
| ↔ Tempo de resposta preto para branco | ||
|---|---|---|
| 30 ms ... ascensão ↗ e queda ↘ combinadas | ↗ 16 ms ascensão | 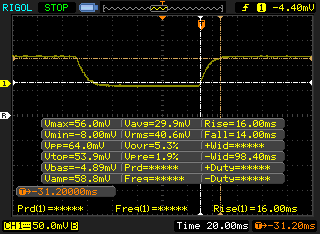 |
| ↘ 14 ms queda | ||
| A tela mostra taxas de resposta lentas em nossos testes e será insatisfatória para os jogadores. Em comparação, todos os dispositivos testados variam de 0.1 (mínimo) a 240 (máximo) ms. » 80 % de todos os dispositivos são melhores. Isso significa que o tempo de resposta medido é pior que a média de todos os dispositivos testados (19.8 ms). | ||
| ↔ Tempo de resposta 50% cinza a 80% cinza | ||
| 28.4 ms ... ascensão ↗ e queda ↘ combinadas | ↗ 14 ms ascensão | 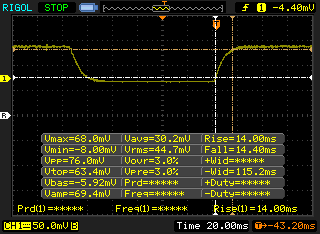 |
| ↘ 14.4 ms queda | ||
| A tela mostra taxas de resposta relativamente lentas em nossos testes e pode ser muito lenta para os jogadores. Em comparação, todos os dispositivos testados variam de 0.165 (mínimo) a 636 (máximo) ms. » 38 % de todos os dispositivos são melhores. Isso significa que o tempo de resposta medido é semelhante à média de todos os dispositivos testados (31 ms). | ||
Cintilação da tela / PWM (modulação por largura de pulso)
| Tela tremeluzindo/PWM detectado | 685 Hz | ≤ 99 % configuração de brilho | 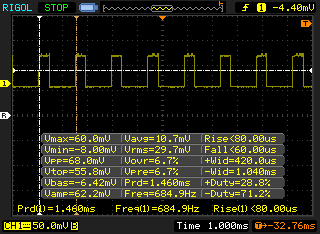 |
A luz de fundo da tela pisca em 685 Hz (pior caso, por exemplo, utilizando PWM) Cintilação detectada em uma configuração de brilho de 99 % e abaixo. Não deve haver cintilação ou PWM acima desta configuração de brilho. A frequência de 685 Hz é bastante alta, então a maioria dos usuários sensíveis ao PWM não deve notar nenhuma oscilação. [pwm_comparison] Em comparação: 52 % de todos os dispositivos testados não usam PWM para escurecer a tela. Se PWM foi detectado, uma média de 7757 (mínimo: 5 - máximo: 343500) Hz foi medida. | |||
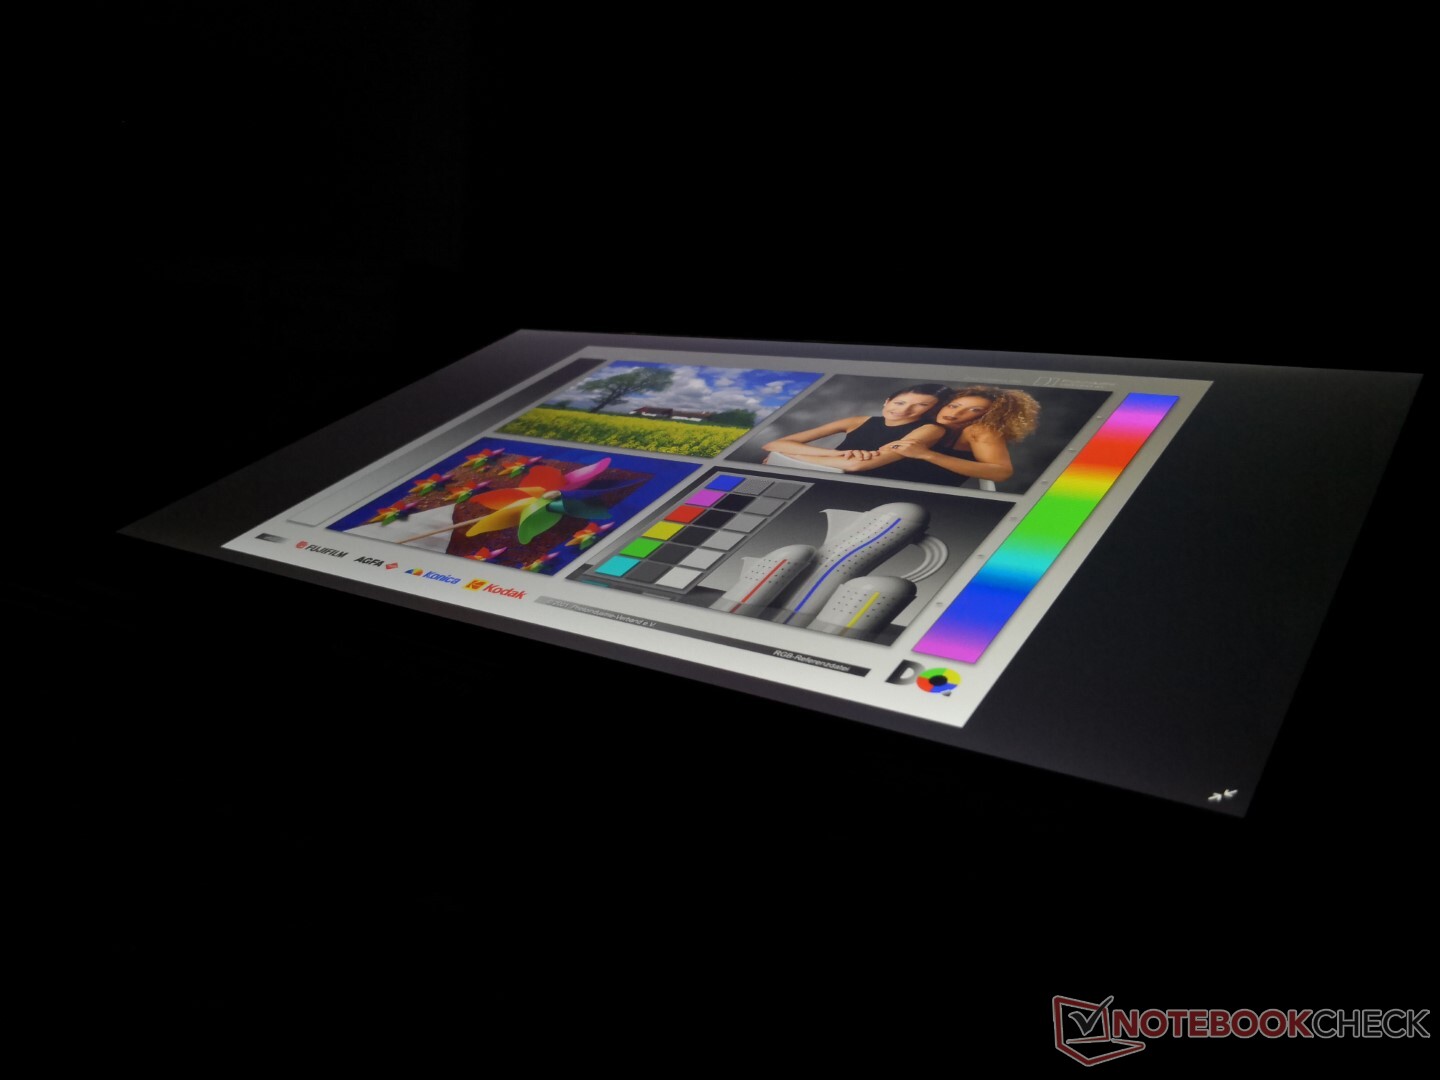
A tela é visível na maioria das condições externas devido à luz de fundo extra brilhante de 1000-nit. No entanto, a luz solar direta ainda deve ser evitada, caso contrário, as cores ainda ficarão apagadas. O brilho é mínimo e mais fácil de controlar do que em um Ultrabook típico.
Desempenho
Processador
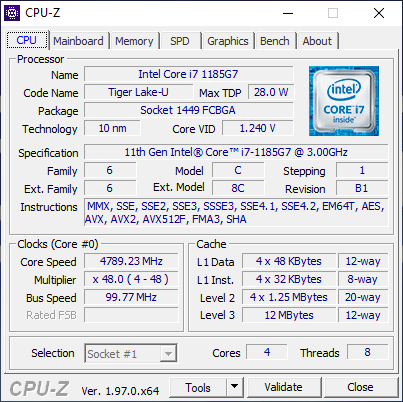
O desempenho da CPU é cerca de 15 por cento mais lento que o da Núcleo i7-1165G7 devido à sobrecarga de desempenho necessária para suportar as características vPro. Quando comparado com outros i7-1185G7 laptops, entretanto, o desempenho está onde esperamos que esteja. Atualização a partir do Núcleo i5-8365 no FZ-55 MK1 original, o aumento líquido de 30 a 40 por cento tanto em cargas de trabalho de uma como de várias roscas.
Cinebench R15 Multi Loop
Cinebench R23: Multi Core | Single Core
Cinebench R15: CPU Multi 64Bit | CPU Single 64Bit
Blender: v2.79 BMW27 CPU
7-Zip 18.03: 7z b 4 -mmt1 | 7z b 4
Geekbench 5.5: Single-Core | Multi-Core
HWBOT x265 Benchmark v2.2: 4k Preset
LibreOffice : 20 Documents To PDF
R Benchmark 2.5: Overall mean
| Cinebench R20 / CPU (Single Core) | |
| ADATA XPG Xenia 14 | |
| Média Intel Core i7-1185G7 (489 - 593, n=28) | |
| Lenovo ThinkPad L14 G2 AMD | |
| Panasonic Toughbook FZ-55 MK2 | |
| Schenker VIA 14 Late 2020 | |
| Lenovo ThinkPad P14s Gen1-20Y10002GE | |
| Infinix INBook X1 Pro | |
| Asus ZenBook 14 UX434FL-DB77 | |
| Acer Spin 3 SP314-54N-56S5 | |
| Asus VivoBook 14 X403FA | |
| Cinebench R23 / Multi Core | |
| Lenovo ThinkPad P14s Gen1-20Y10002GE | |
| Lenovo ThinkPad L14 G2 AMD | |
| ADATA XPG Xenia 14 | |
| Média Intel Core i7-1185G7 (3610 - 6383, n=24) | |
| Panasonic Toughbook FZ-55 MK2 | |
| Schenker VIA 14 Late 2020 | |
| Infinix INBook X1 Pro | |
| Acer Spin 3 SP314-54N-56S5 | |
| Cinebench R23 / Single Core | |
| ADATA XPG Xenia 14 | |
| Média Intel Core i7-1185G7 (1251 - 1532, n=24) | |
| Panasonic Toughbook FZ-55 MK2 | |
| Lenovo ThinkPad L14 G2 AMD | |
| Schenker VIA 14 Late 2020 | |
| Infinix INBook X1 Pro | |
| Lenovo ThinkPad P14s Gen1-20Y10002GE | |
| Acer Spin 3 SP314-54N-56S5 | |
| Geekbench 5.5 / Single-Core | |
| Média Intel Core i7-1185G7 (1398 - 1626, n=21) | |
| Schenker VIA 14 Late 2020 | |
| Lenovo ThinkPad L14 G2 AMD | |
| Acer Spin 3 SP314-54N-56S5 | |
| Asus ZenBook 14 UX434FL-DB77 | |
| Lenovo ThinkPad P14s Gen1-20Y10002GE | |
| Geekbench 5.5 / Multi-Core | |
| Lenovo ThinkPad P14s Gen1-20Y10002GE | |
| Média Intel Core i7-1185G7 (4620 - 5944, n=21) | |
| Lenovo ThinkPad L14 G2 AMD | |
| Schenker VIA 14 Late 2020 | |
| Acer Spin 3 SP314-54N-56S5 | |
| Asus ZenBook 14 UX434FL-DB77 | |
| HWBOT x265 Benchmark v2.2 / 4k Preset | |
| Lenovo ThinkPad L14 G2 AMD | |
| Lenovo ThinkPad P14s Gen1-20Y10002GE | |
| ADATA XPG Xenia 14 | |
| Panasonic Toughbook FZ-55 MK2 | |
| Média Intel Core i7-1185G7 (5.02 - 8.13, n=27) | |
| Infinix INBook X1 Pro | |
| Schenker VIA 14 Late 2020 | |
| Asus ZenBook 14 UX434FL-DB77 | |
| Asus VivoBook 14 X403FA | |
| Acer Spin 3 SP314-54N-56S5 | |
| LibreOffice / 20 Documents To PDF | |
| Asus ZenBook 14 UX434FL-DB77 | |
| Lenovo ThinkPad P14s Gen1-20Y10002GE | |
| Acer Spin 3 SP314-54N-56S5 | |
| Infinix INBook X1 Pro | |
| Lenovo ThinkPad L14 G2 AMD | |
| Média Intel Core i7-1185G7 (41.3 - 61.7, n=26) | |
| Schenker VIA 14 Late 2020 | |
| Panasonic Toughbook FZ-55 MK2 | |
| ADATA XPG Xenia 14 | |
| R Benchmark 2.5 / Overall mean | |
| Asus ZenBook 14 UX434FL-DB77 | |
| Acer Spin 3 SP314-54N-56S5 | |
| Infinix INBook X1 Pro | |
| Schenker VIA 14 Late 2020 | |
| Lenovo ThinkPad P14s Gen1-20Y10002GE | |
| Média Intel Core i7-1185G7 (0.55 - 0.615, n=27) | |
| Panasonic Toughbook FZ-55 MK2 | |
| ADATA XPG Xenia 14 | |
| Lenovo ThinkPad L14 G2 AMD | |
* ... menor é melhor
Desempenho do sistema
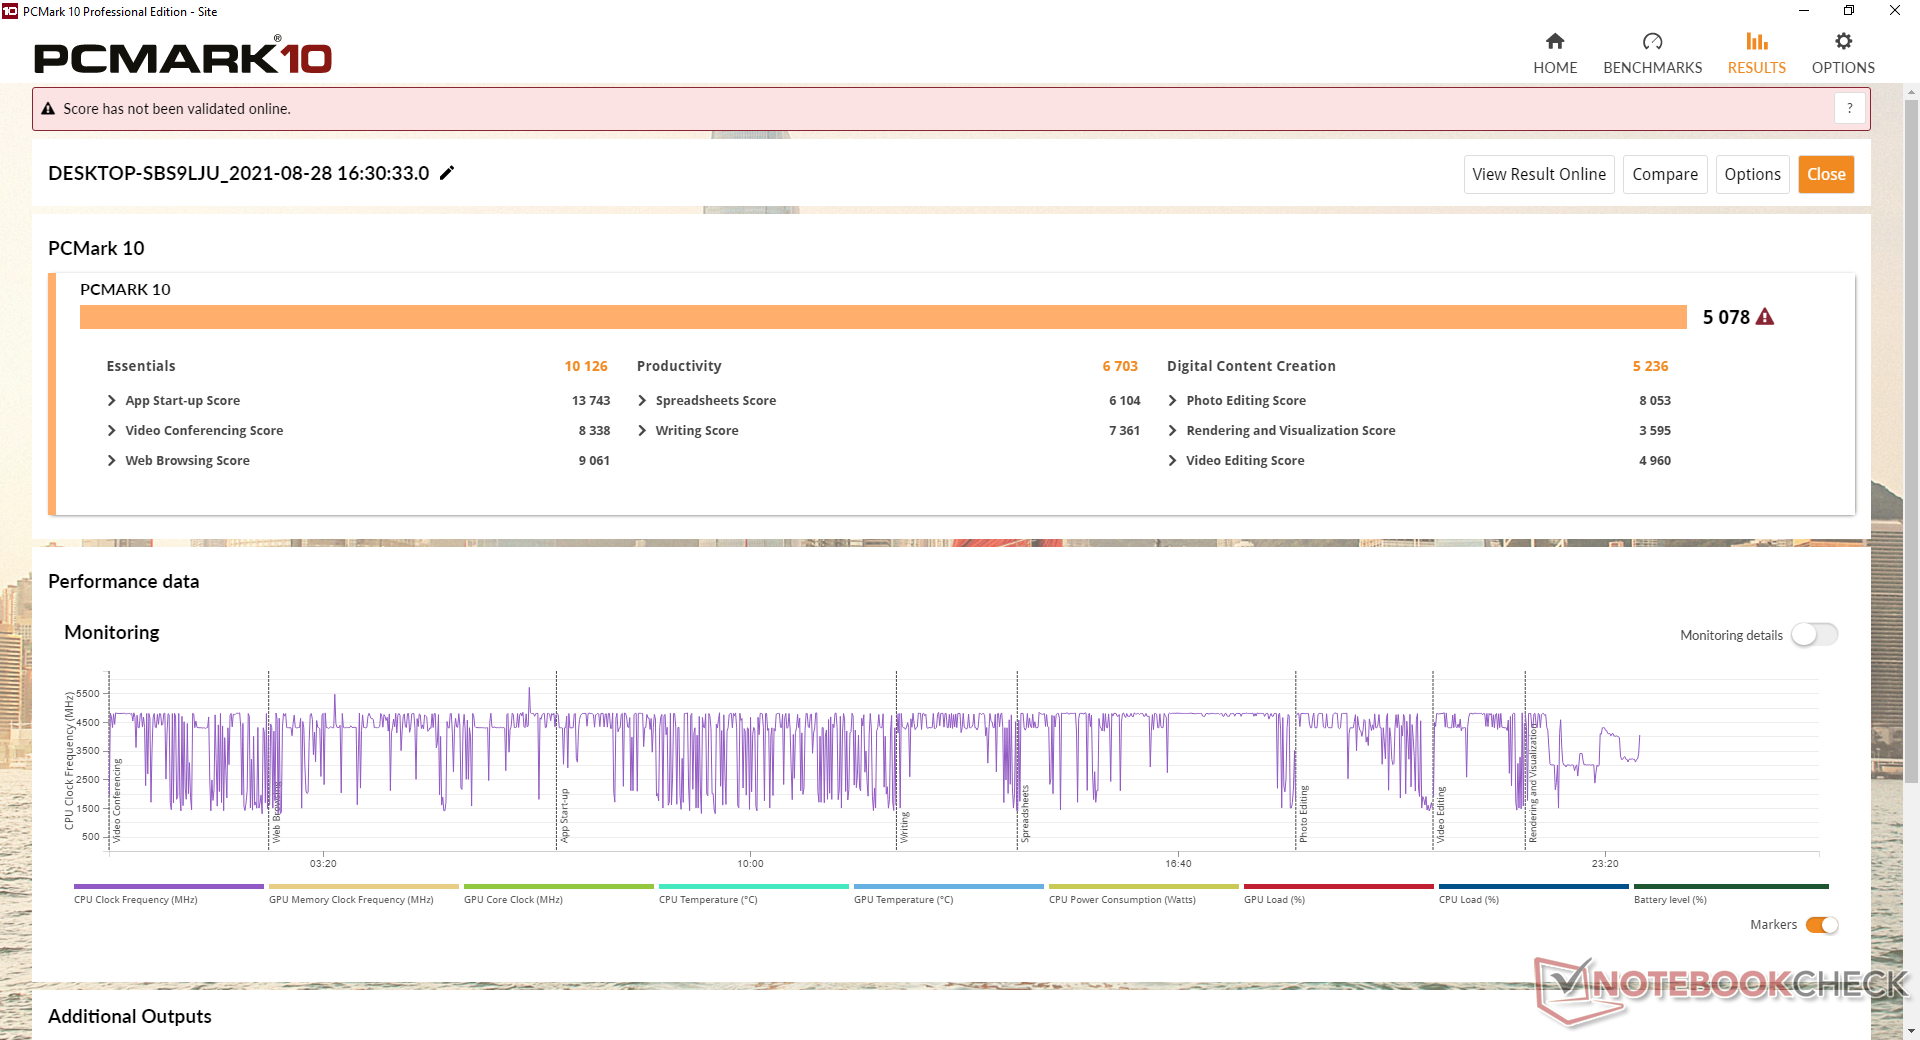
As pontuações PCMark 10 são consistentemente mais altas do que no MK1 original, especialmente na Criação de Conteúdo Digital, onde o desempenho gráfico é mais importante.
| PCMark 10 / Score | |
| Panasonic Toughbook FZ-55 MK2 | |
| Média Intel Core i7-1185G7, Intel Iris Xe Graphics G7 96EUs (4746 - 5561, n=20) | |
| Durabook S14I | |
| Dell Latitude 5420 Rugged-P85G | |
| Getac S410 | |
| Panasonic Toughbook FZ-55 | |
| PCMark 10 / Essentials | |
| Panasonic Toughbook FZ-55 MK2 | |
| Durabook S14I | |
| Média Intel Core i7-1185G7, Intel Iris Xe Graphics G7 96EUs (8279 - 10664, n=20) | |
| Dell Latitude 5420 Rugged-P85G | |
| Getac S410 | |
| Panasonic Toughbook FZ-55 | |
| PCMark 10 / Productivity | |
| Dell Latitude 5420 Rugged-P85G | |
| Durabook S14I | |
| Getac S410 | |
| Média Intel Core i7-1185G7, Intel Iris Xe Graphics G7 96EUs (5799 - 8770, n=20) | |
| Panasonic Toughbook FZ-55 MK2 | |
| Panasonic Toughbook FZ-55 | |
| PCMark 10 / Digital Content Creation | |
| Panasonic Toughbook FZ-55 MK2 | |
| Média Intel Core i7-1185G7, Intel Iris Xe Graphics G7 96EUs (4424 - 5684, n=20) | |
| Durabook S14I | |
| Dell Latitude 5420 Rugged-P85G | |
| Panasonic Toughbook FZ-55 | |
| Getac S410 | |
| PCMark 10 Score | 5078 pontos | |
Ajuda | ||
Latência do DPC
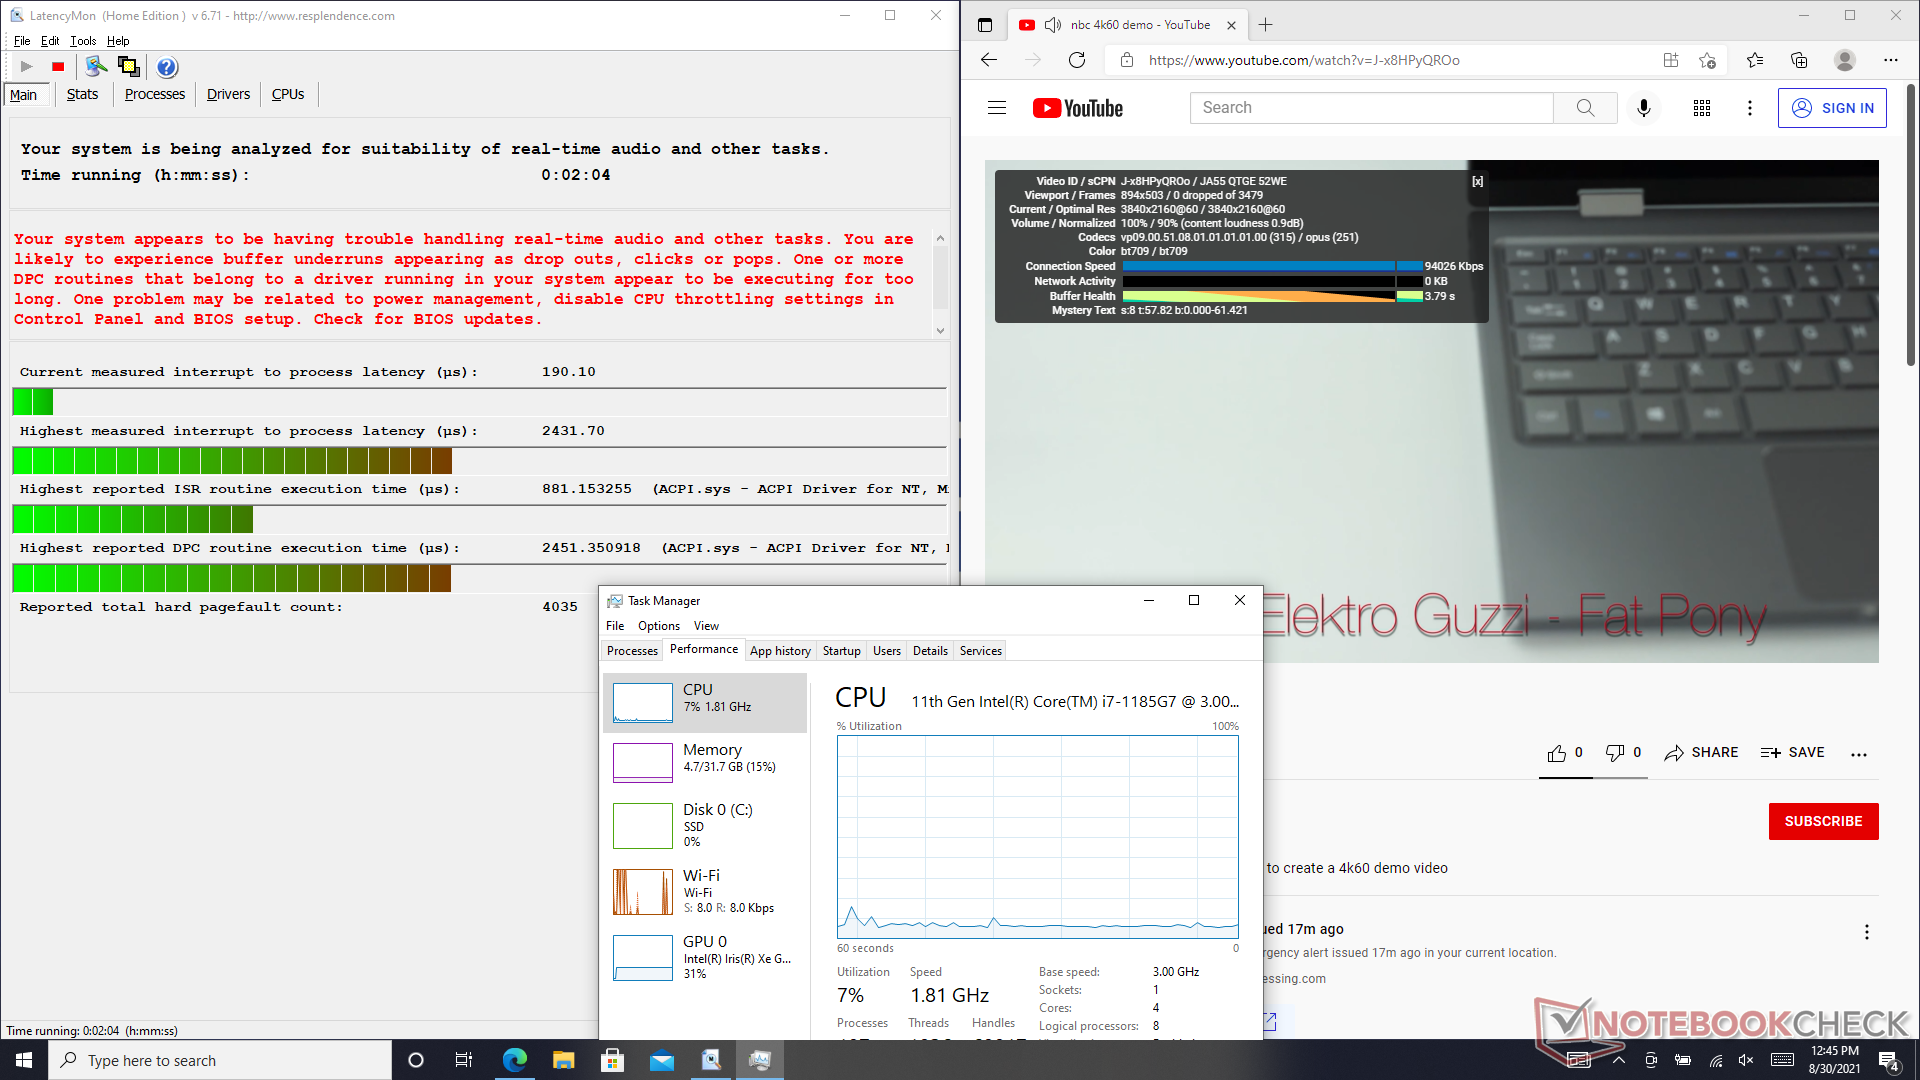
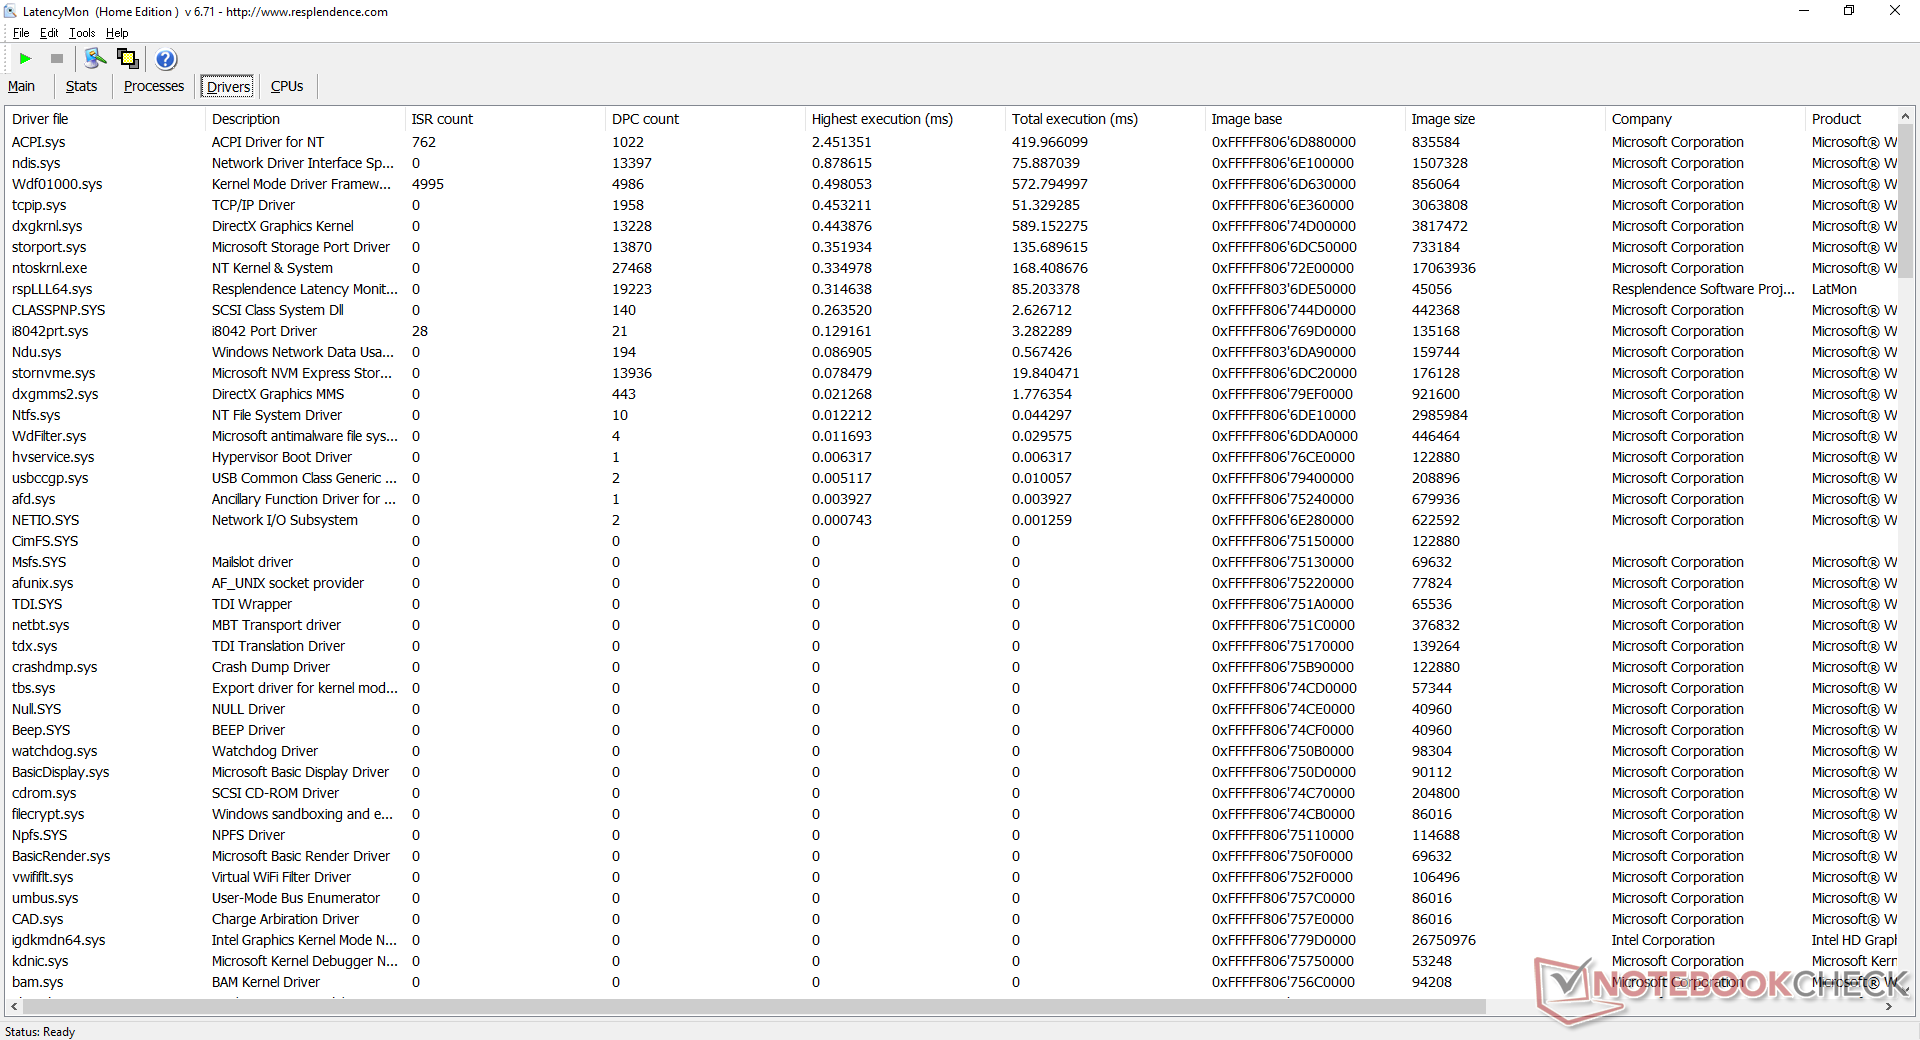
LatencyMon revela problemas de latência ao abrir várias abas do navegador em nossa página inicial. A reprodução de vídeo de 4K a 60 FPS é de outra forma suave e sem queda de quadros.
| DPC Latencies / LatencyMon - interrupt to process latency (max), Web, Youtube, Prime95 | |
| HP EliteBook 840 Aero G8 3E4Q6AA | |
| MSI Prestige 14 Evo A11MO-026US | |
| Panasonic Toughbook FZ-55 MK2 | |
| Dell Latitude 9420 2-in-1 | |
| ADATA XPG Xenia 14 | |
* ... menor é melhor
Dispositivos de armazenamento
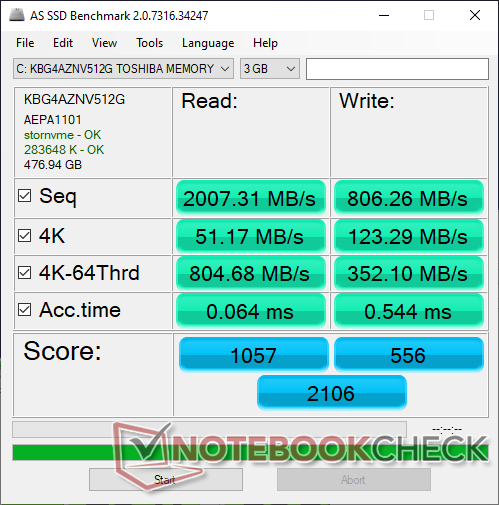
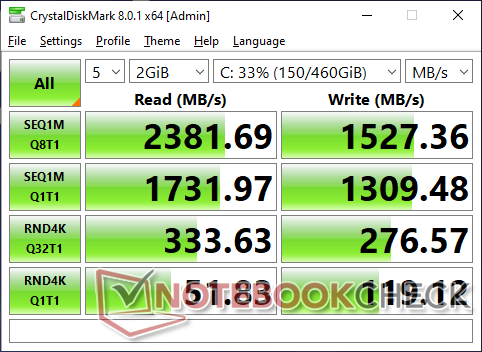
Nossa unidade de teste MK2 vem com um SSD Toshiba série BG4 em vez do Samsung em nossa unidade MK1 original. Esta unidade Toshiba em particular é um SSD NVMe adequado, ao contrário da Samsung SATA III limitada para taxas de leitura e escrita significativamente mais rápidas
Os usuários podem instalar até dois drives: um NVMe M.2 2280 SSD e um segundo SSD SATA cada um com suporte para OPAL e aquecedores.
| Panasonic Toughbook FZ-55 MK2 Toshiba KIOXIA KBG4AZNV512G M.2 2280 OPAL | Panasonic Toughbook FZ-55 Samsung SSD PM871b MZNLN256HAJQ | Dell Latitude 5420 Rugged-P85G SK hynix PC401 NVMe 500 GB | Durabook S14I UDinfo M2P M2P80DE512GBAEP | Getac S410 CUKUSA 1 TB SATA SSD Q0526A | |
|---|---|---|---|---|---|
| AS SSD | -41% | 22% | 37% | -16% | |
| Seq Read (MB/s) | 2007 | 437.7 -78% | 2054 2% | 2184 9% | 484.2 -76% |
| Seq Write (MB/s) | 806 | 387.3 -52% | 653 -19% | 1441 79% | 396.1 -51% |
| 4K Read (MB/s) | 51.2 | 26.18 -49% | 39.34 -23% | 35.98 -30% | 34.9 -32% |
| 4K Write (MB/s) | 123.3 | 60.3 -51% | 96.4 -22% | 260.1 111% | 74.1 -40% |
| 4K-64 Read (MB/s) | 805 | 369.8 -54% | 677 -16% | 396.5 -51% | 382.3 -53% |
| 4K-64 Write (MB/s) | 352.1 | 313.7 -11% | 982 179% | 1057 200% | 329 -7% |
| Access Time Read * (ms) | 0.064 | 0.089 -39% | 0.044 31% | 0.051 20% | 0.058 9% |
| Access Time Write * (ms) | 0.544 | 0.058 89% | 0.051 91% | 0.106 81% | 0.045 92% |
| Score Read (Points) | 1057 | 440 -58% | 921 -13% | 651 -38% | 466 -56% |
| Score Write (Points) | 556 | 413 -26% | 1143 106% | 1461 163% | 443 -20% |
| Score Total (Points) | 2106 | 1083 -49% | 2475 18% | 2418 15% | 1154 -45% |
| Copy ISO MB/s (MB/s) | 1045 | 553 -47% | 1622 55% | 1538 47% | 2151 106% |
| Copy Program MB/s (MB/s) | 854 | 204.7 -76% | 378.1 -56% | 570 -33% | 422.8 -50% |
| Copy Game MB/s (MB/s) | 1127 | 385.9 -66% | 793 -30% | 566 -50% | 1045 -7% |
| CrystalDiskMark 5.2 / 6 | -54% | -18% | 48% | -52% | |
| Write 4K (MB/s) | 117.1 | 55.4 -53% | 98.8 -16% | 260.4 122% | 74 -37% |
| Read 4K (MB/s) | 51.3 | 31.11 -39% | 38.51 -25% | 53 3% | 31.85 -38% |
| Write Seq (MB/s) | 1384 | 460.9 -67% | 843 -39% | 1665 20% | 460.6 -67% |
| Read Seq (MB/s) | 1716 | 481.9 -72% | 1282 -25% | 1541 -10% | 514 -70% |
| Write 4K Q32T1 (MB/s) | 282.6 | 234.6 -17% | 355.5 26% | 638 126% | 211.4 -25% |
| Read 4K Q32T1 (MB/s) | 332 | 181.7 -45% | 241.4 -27% | 683 106% | 203.5 -39% |
| Write Seq Q32T1 (MB/s) | 1519 | 528 -65% | 893 -41% | 1656 9% | 523 -66% |
| Read Seq Q32T1 (MB/s) | 2347 | 548 -77% | 2478 6% | 2490 6% | 554 -76% |
| Média Total (Programa/Configurações) | -48% /
-46% | 2% /
7% | 43% /
41% | -34% /
-29% |
* ... menor é melhor

Disk Throttling: DiskSpd Read Loop, Queue Depth 8
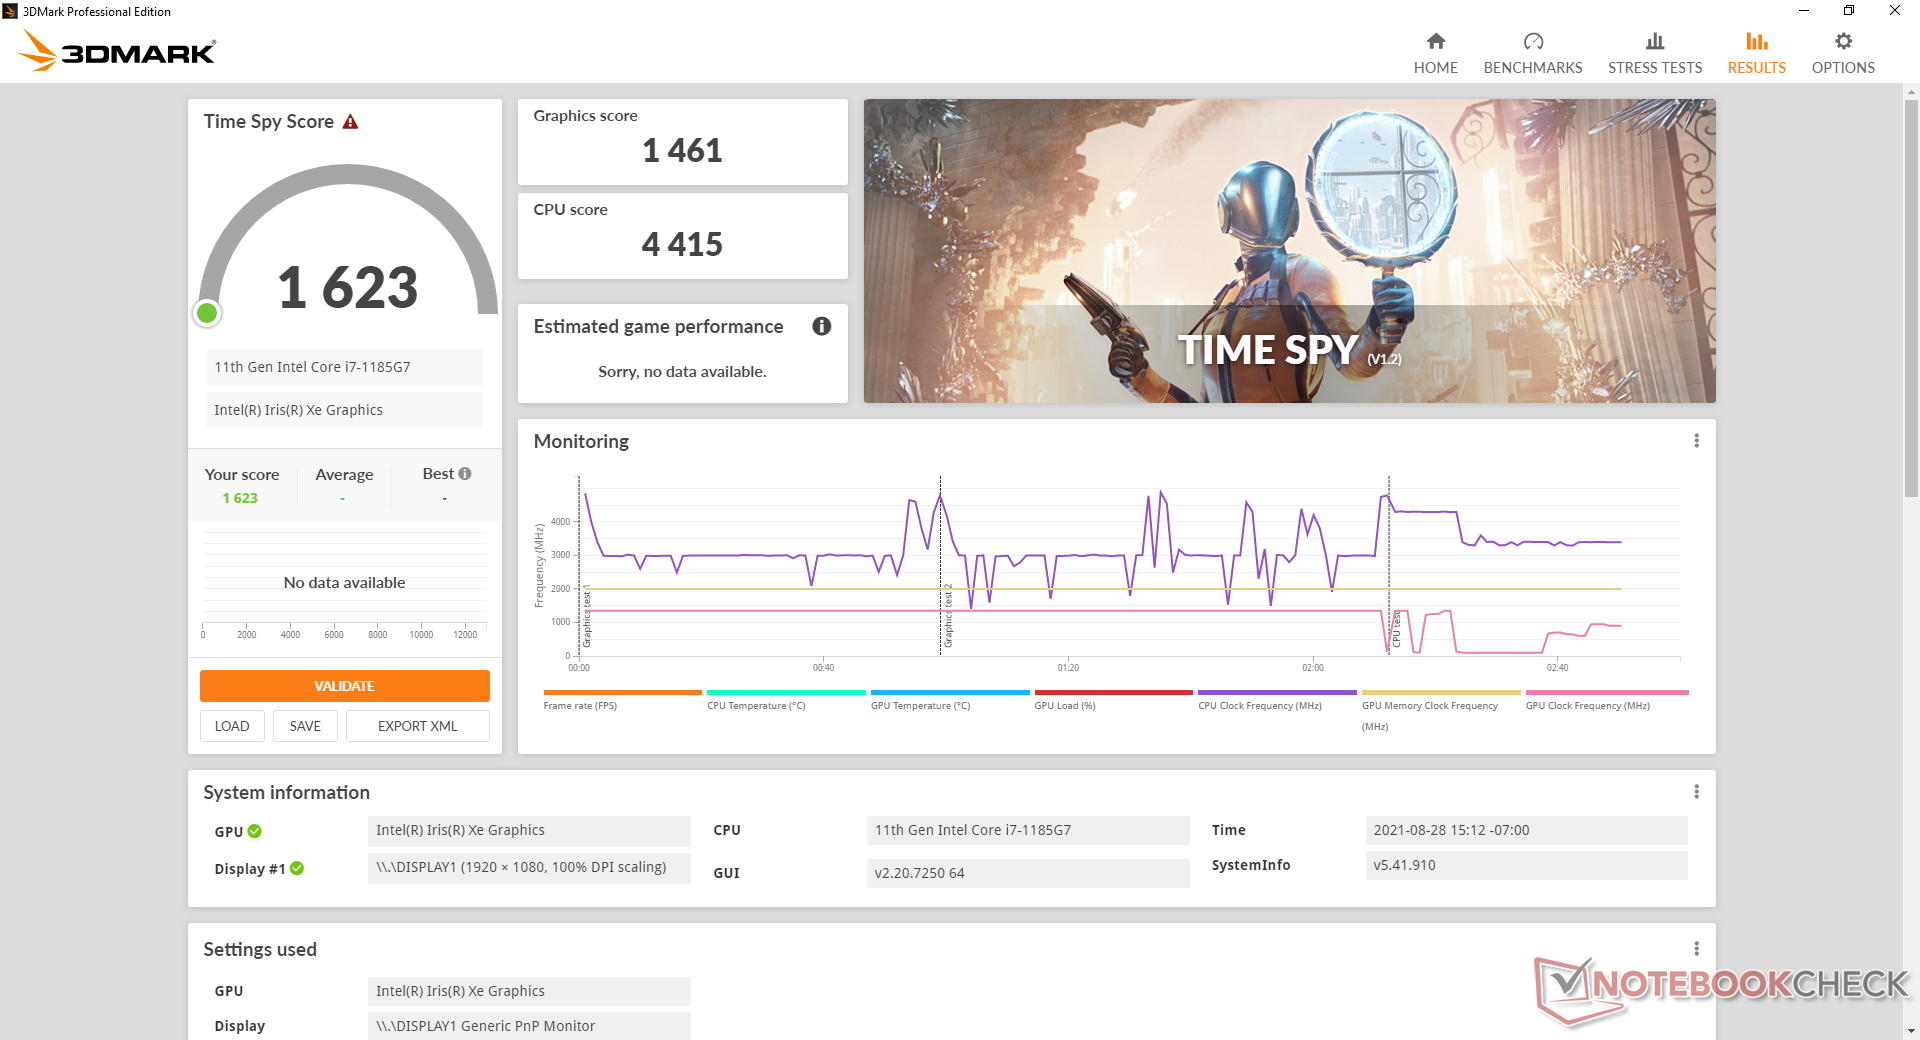
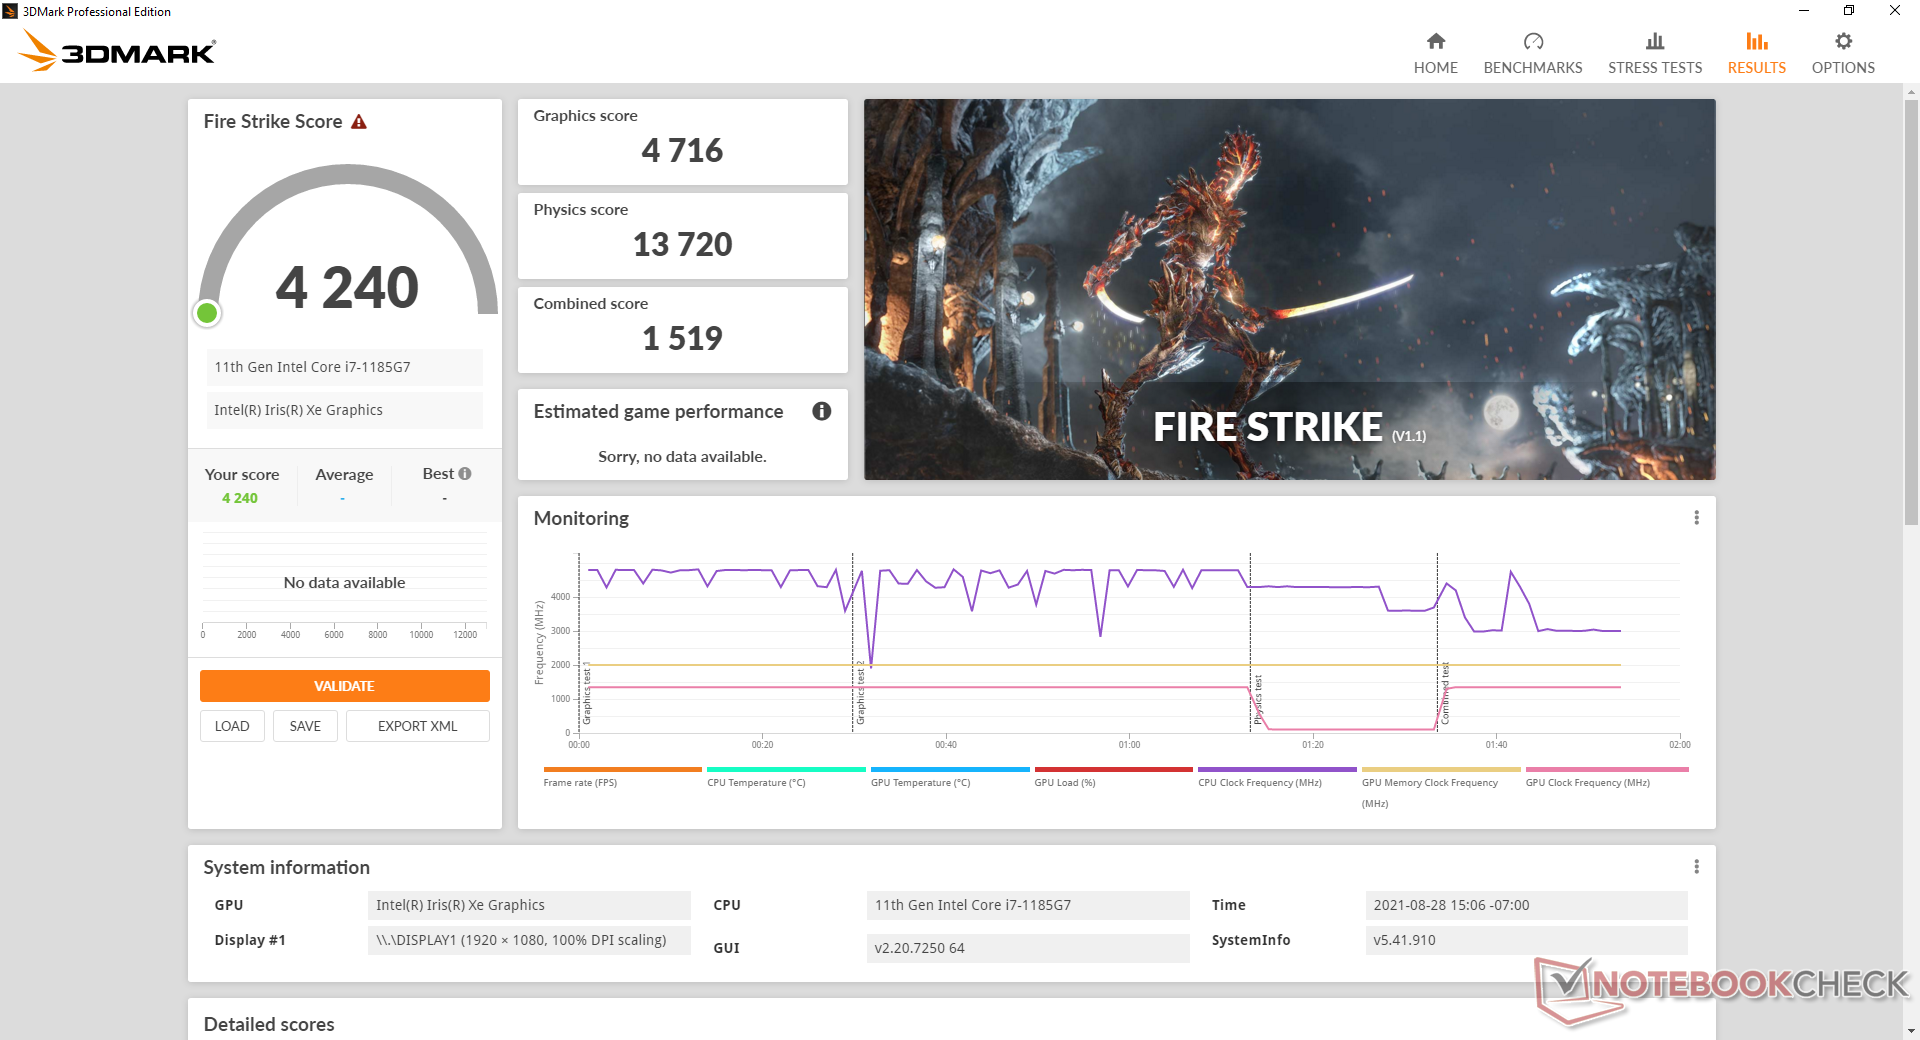
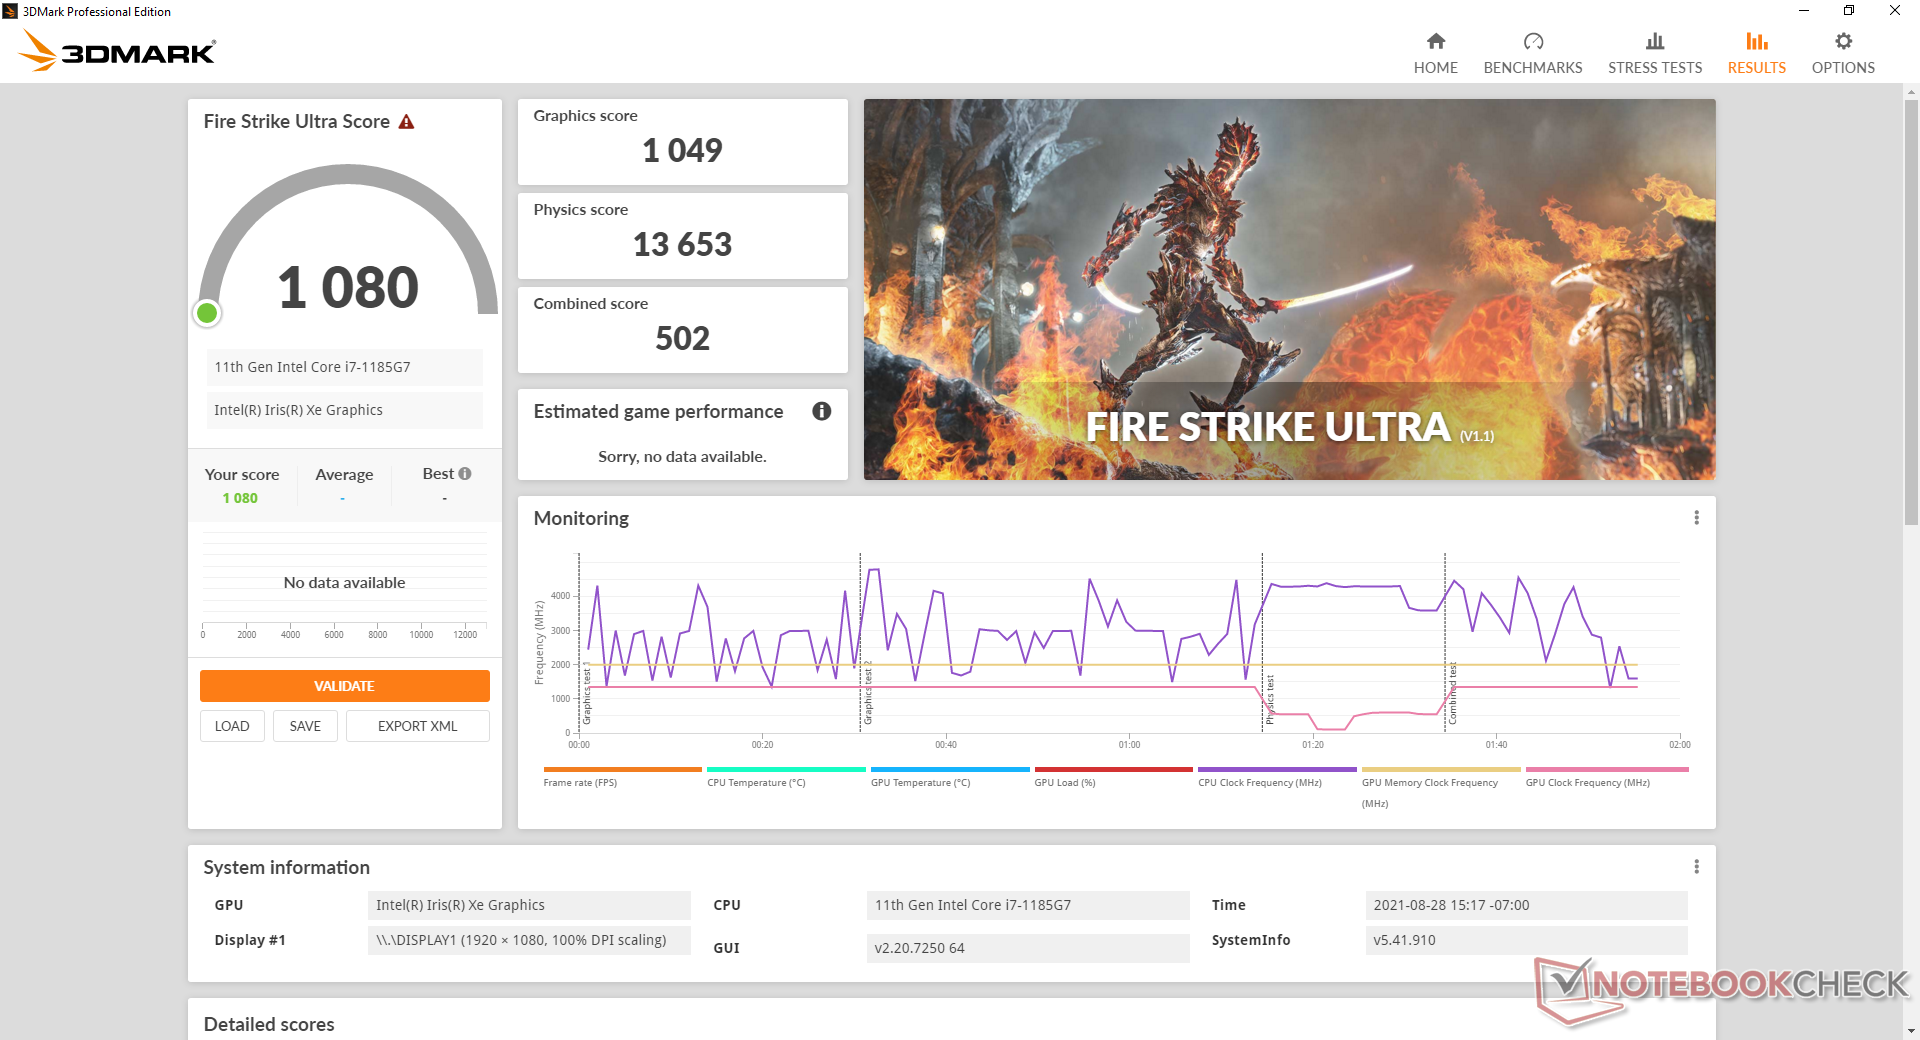
Desempenho da GPU
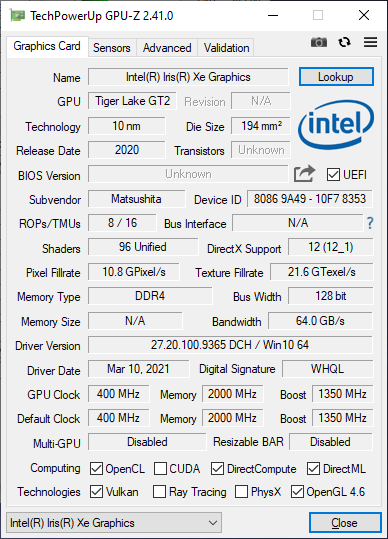
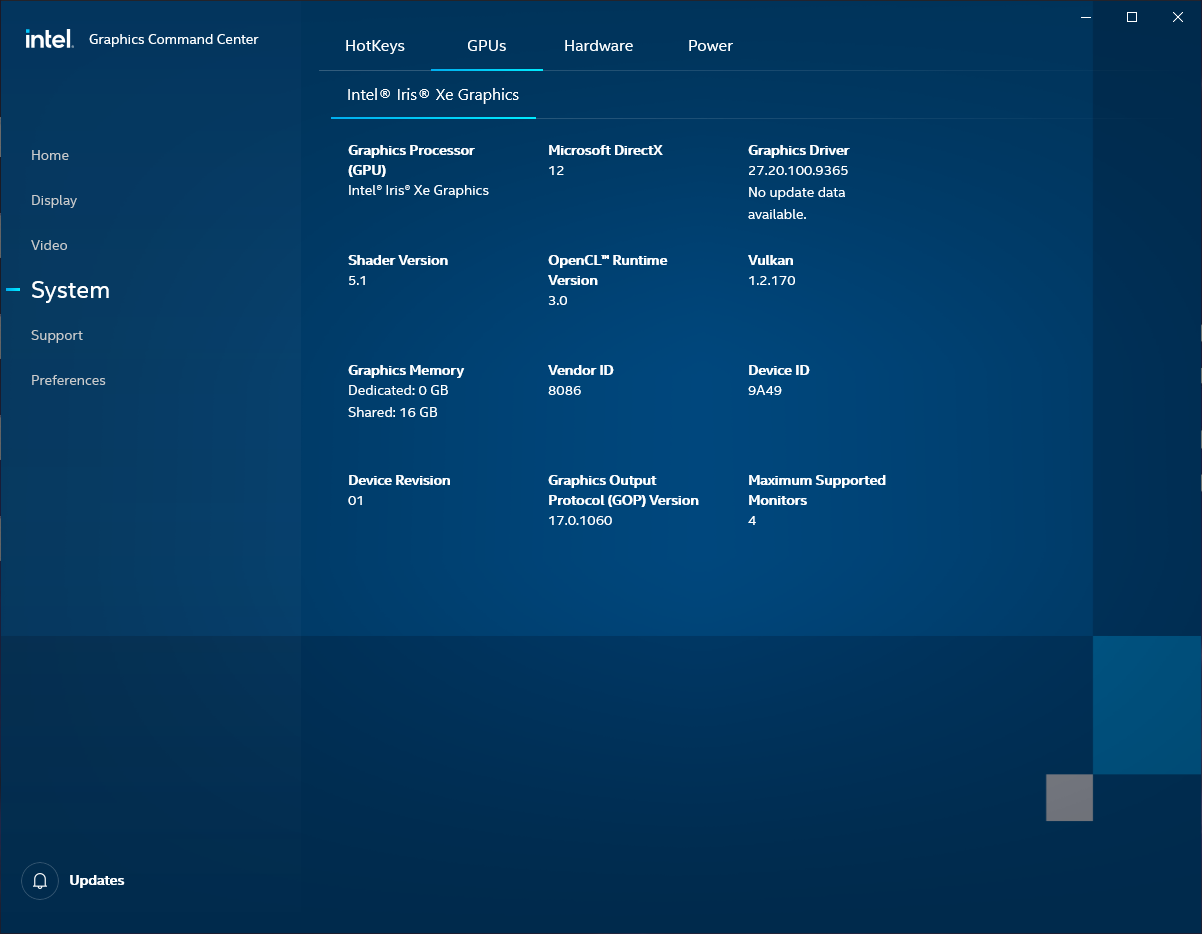
O desempenho gráfico é excelente, com resultados que estão ao nível do média Iris Xe 96 EUs em nosso banco de dados. Os usuários estão recebendo um aumento de 300 a 400 por cento no desempenho gráfico quando comparados com os mais antigos UHD Graphics 620 no Toughbook FZ-55 MK1 de 2019.
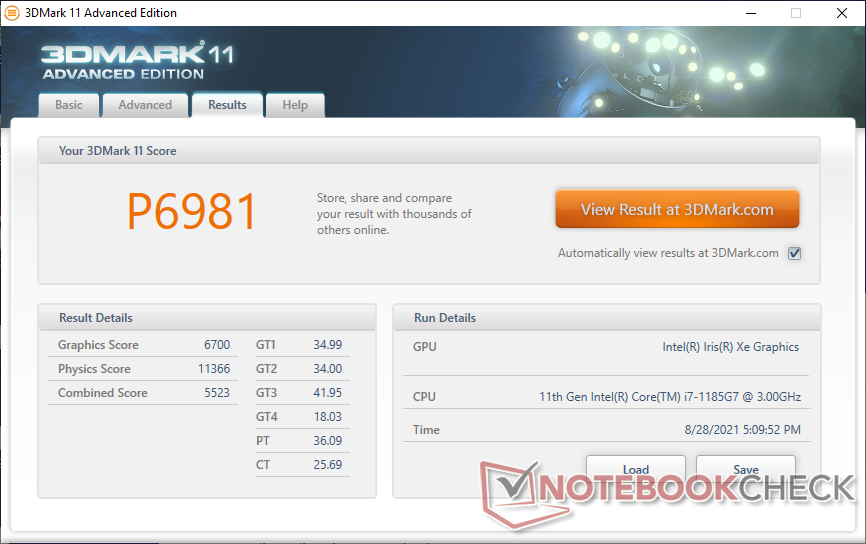
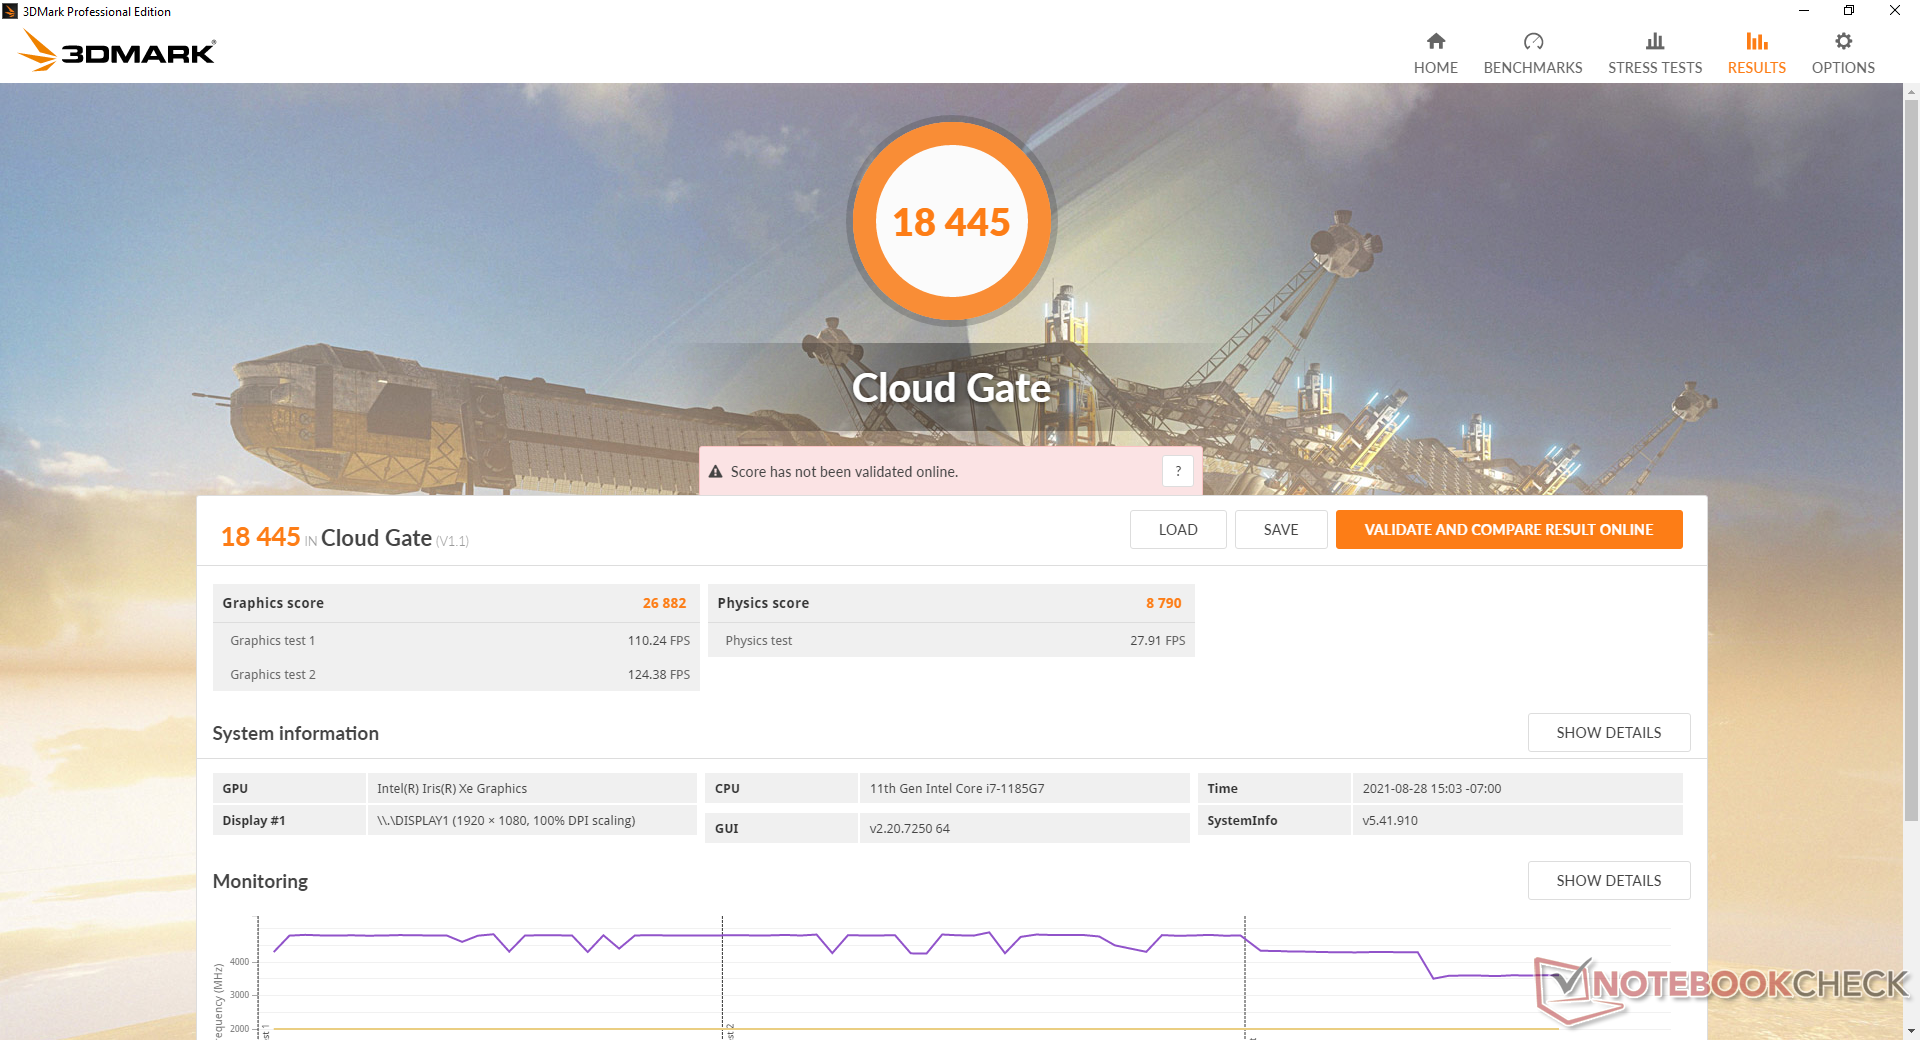
| 3DMark 11 Performance | 6981 pontos | |
| 3DMark Cloud Gate Standard Score | 18445 pontos | |
| 3DMark Fire Strike Score | 4240 pontos | |
| 3DMark Time Spy Score | 1623 pontos | |
Ajuda | ||
Witcher 3 FPS Chart
| baixo | média | alto | ultra | |
|---|---|---|---|---|
| The Witcher 3 (2015) | 94.5 | 56.7 | 30.5 | 15.4 |
| Dota 2 Reborn (2015) | 84.2 | 86.7 | 53.9 | 48.6 |
| Final Fantasy XV Benchmark (2018) | 41.7 | 22 | 15.7 | |
| X-Plane 11.11 (2018) | 27 | 24.8 | 22.3 |
Emissions
Ruído do sistema
O sistema é silencioso sob a maioria das cargas de trabalho diárias, como processamento de texto, navegação na web ou streaming de vídeo. Entretanto, espera-se uma pulsação infrequente de 28,7 dB(A) com duração de apenas um segundo ou mais, antes de cair de volta ao silêncio. Quando sob extrema tensão como Prime95, o ventilador pode ser tão alto quanto 42 dB(A).
| Panasonic Toughbook FZ-55 MK2 Iris Xe G7 96EUs, i7-1185G7, Toshiba KIOXIA KBG4AZNV512G M.2 2280 OPAL | Panasonic Toughbook FZ-55 UHD Graphics 620, i5-8365U, Samsung SSD PM871b MZNLN256HAJQ | Dell Latitude 5420 Rugged-P85G Radeon RX 540, i7-8650U, SK hynix PC401 NVMe 500 GB | Durabook S14I Iris Xe G7 96EUs, i7-1165G7, UDinfo M2P M2P80DE512GBAEP | Getac S410 UHD Graphics 620, i5-8550U, CUKUSA 1 TB SATA SSD Q0526A | |
|---|---|---|---|---|---|
| Noise | -17% | -13% | -13% | -11% | |
| desligado / ambiente * (dB) | 23.8 | 29 -22% | 28.3 -19% | 25.2 -6% | 28.4 -19% |
| Idle Minimum * (dB) | 24 | 29 -21% | 28.3 -18% | 25.2 -5% | 28.4 -18% |
| Idle Average * (dB) | 24 | 29.6 -23% | 28.3 -18% | 25.2 -5% | 28.4 -18% |
| Idle Maximum * (dB) | 24 | 30.5 -27% | 28.3 -18% | 34.5 -44% | 28.4 -18% |
| Load Average * (dB) | 26.7 | 30.3 -13% | 29.9 -12% | 34.5 -29% | 30.3 -13% |
| Load Maximum * (dB) | 41.7 | 39 6% | 38 9% | 36.2 13% | 33.3 20% |
* ... menor é melhor
Barulho
| Ocioso |
| 24 / 24 / 24 dB |
| Carga |
| 26.7 / 41.7 dB |
 | ||
30 dB silencioso 40 dB(A) audível 50 dB(A) ruidosamente alto |
||
min: | ||
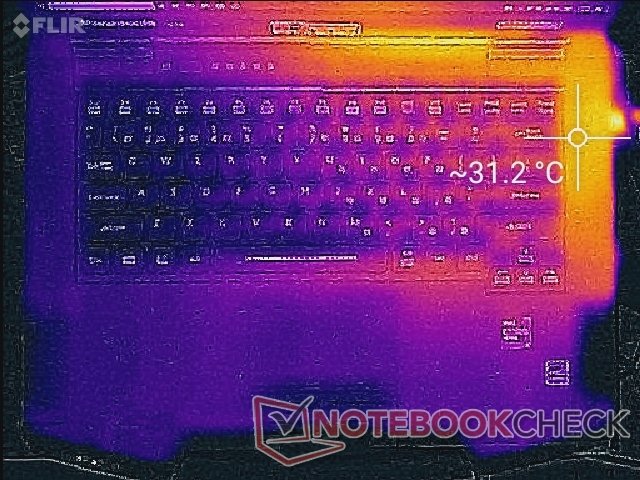
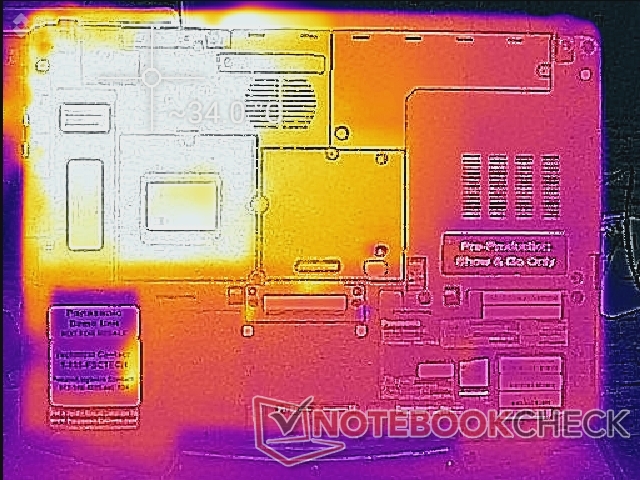
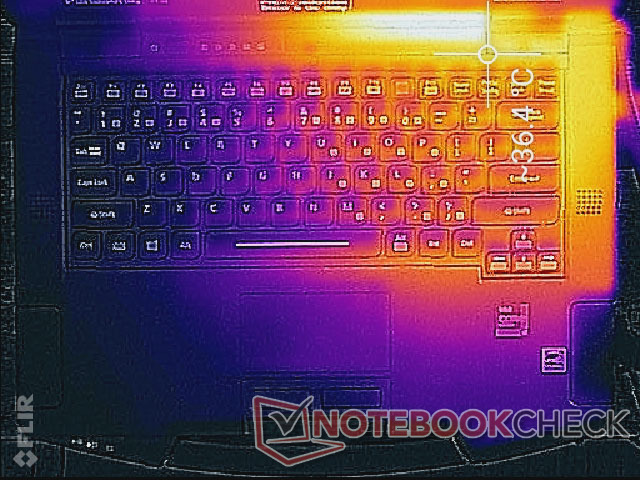
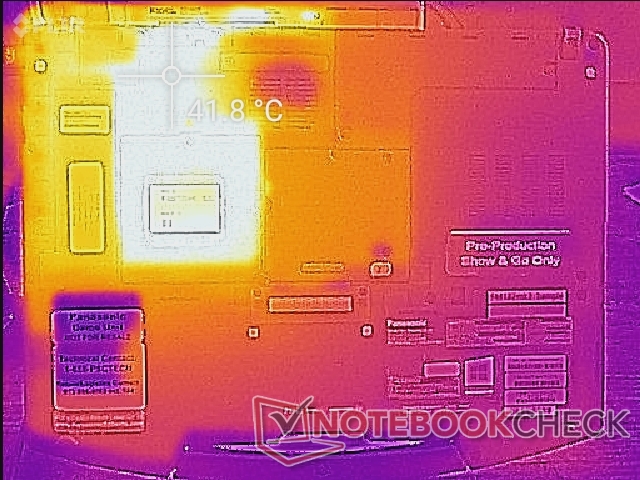
Temperatura
As temperaturas superficiais serão sempre mais quentes na metade direita do laptop do que na esquerda, devido à forma como o processador e a solução de resfriamento estão posicionados dentro dele. Somos capazes de medir um máximo de cerca de 42 C no ponto quente inferior.
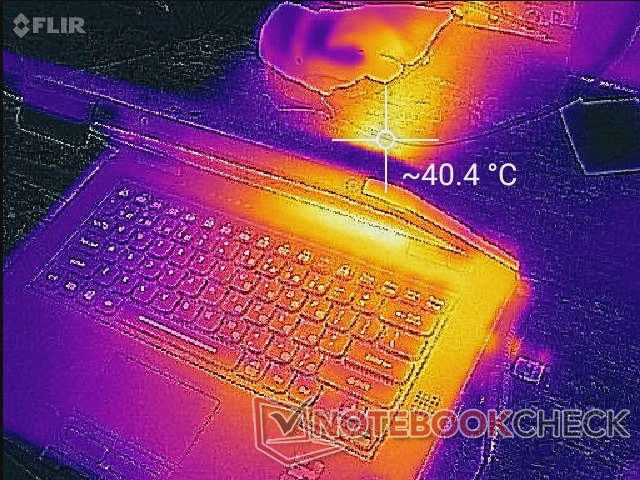
(+) A temperatura máxima no lado superior é 36.2 °C / 97 F, em comparação com a média de 34.3 °C / 94 F , variando de 21.2 a 62.5 °C para a classe Office.
(±) A parte inferior aquece até um máximo de 42.2 °C / 108 F, em comparação com a média de 36.8 °C / 98 F
(+) Em uso inativo, a temperatura média para o lado superior é 29.2 °C / 85 F, em comparação com a média do dispositivo de 29.5 °C / ### class_avg_f### F.
(+) Os apoios para as mãos e o touchpad são mais frios que a temperatura da pele, com um máximo de 29.2 °C / 84.6 F e, portanto, são frios ao toque.
(±) A temperatura média da área do apoio para as mãos de dispositivos semelhantes foi 27.5 °C / 81.5 F (-1.7 °C / -3.1 F).
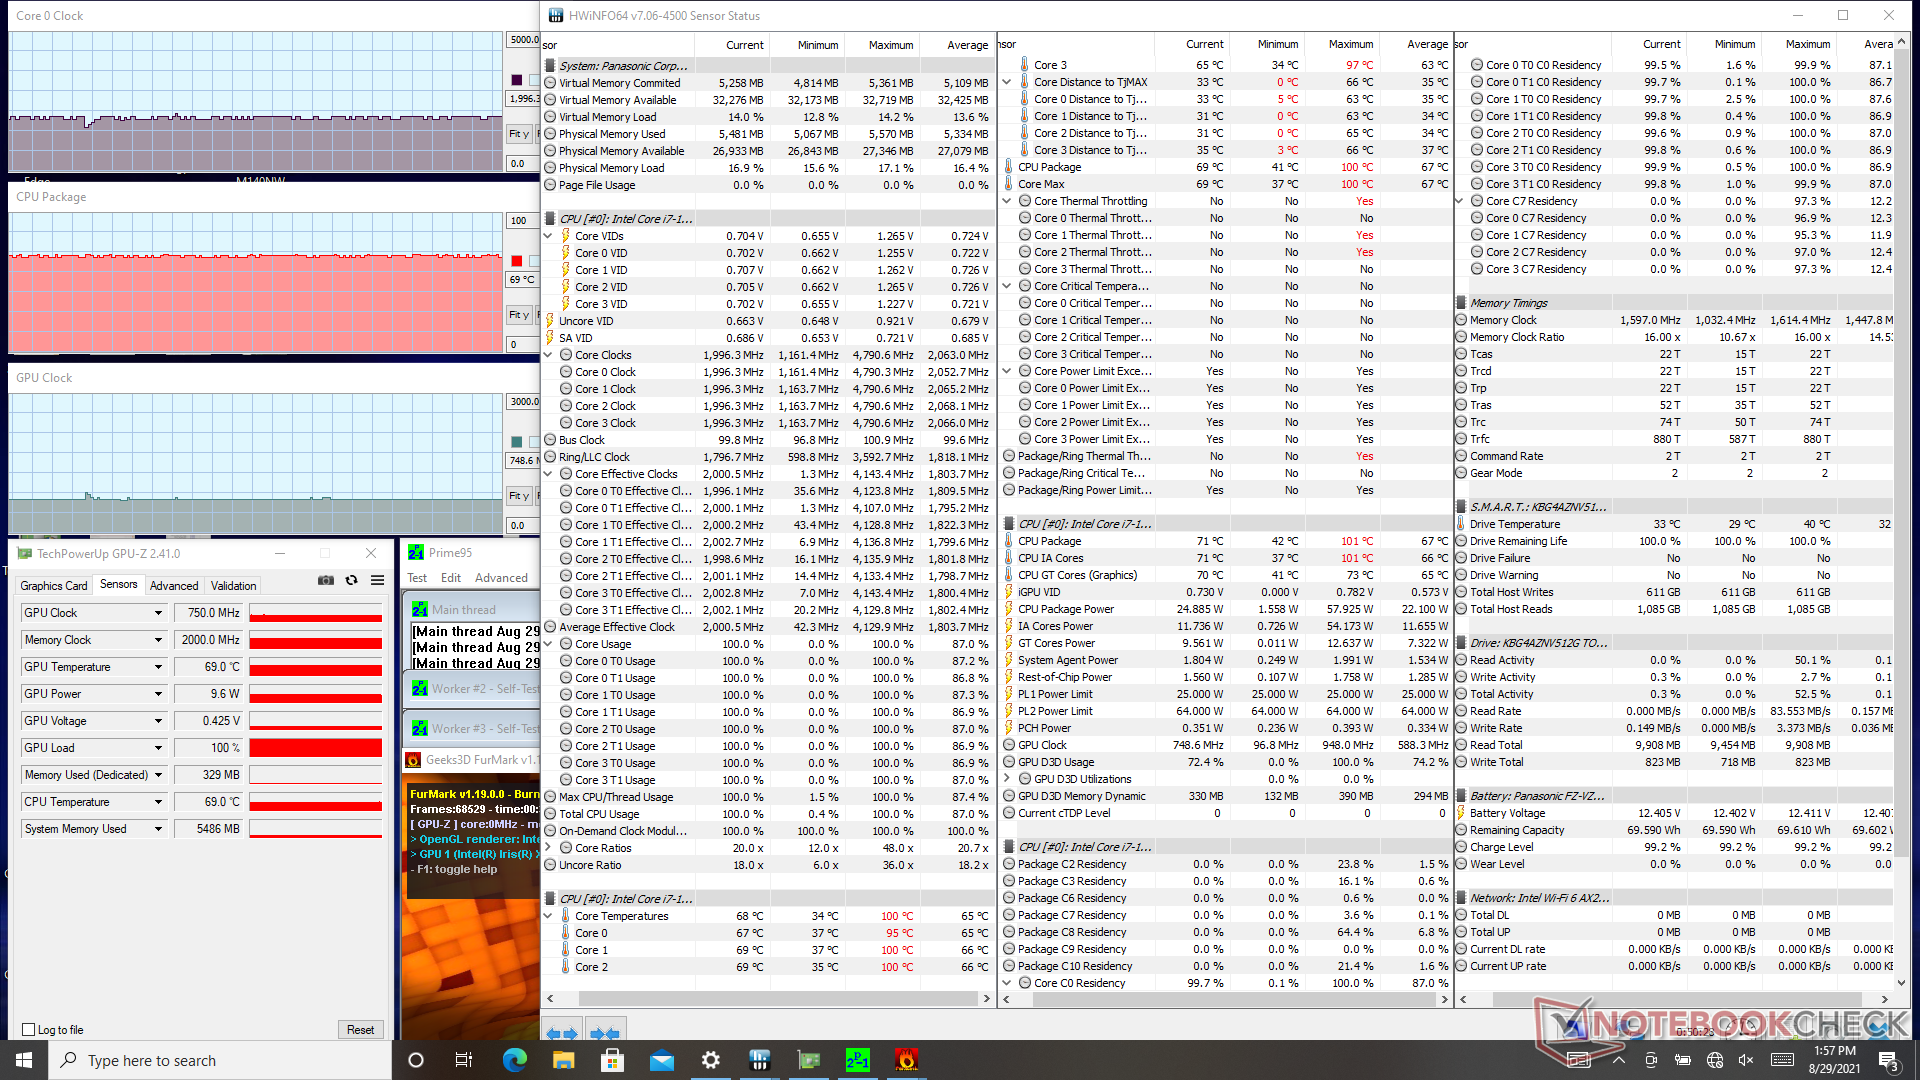
Teste de estresse
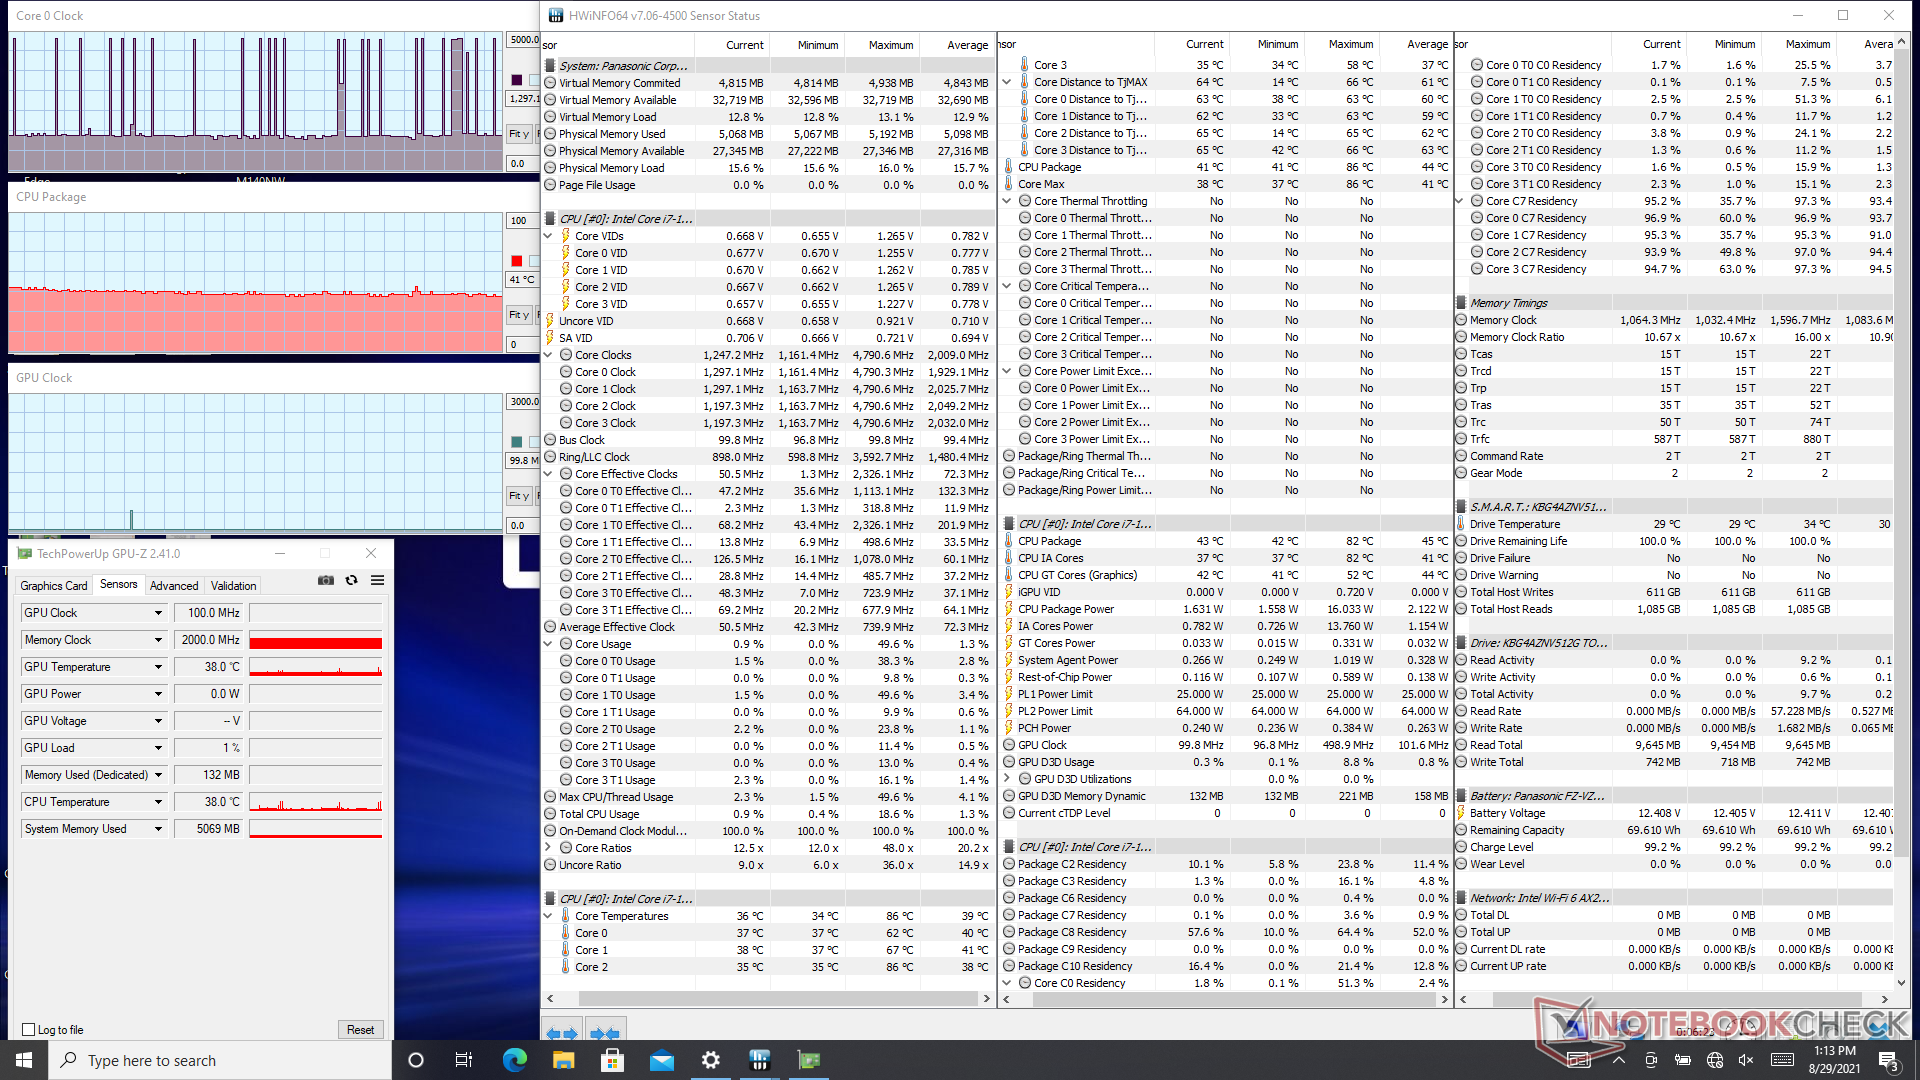
Ao executar Prime95, a CPU aumentaria para 4 GHz e 100 C quase imediatamente, durando apenas alguns segundos, no máximo. As taxas de relógio eventualmente estabilizariam em torno de 2,8 e 81 C após cerca de 18 segundos, como mostram as capturas de tela abaixo.
O funcionamento com energia de bateria não limitará o desempenho. Um teste 3DMark 11 com baterias retornaria pontuações de Física e Gráficos de 11601 e 6450 pontos, respectivamente, em comparação com 11366 e 6700 pontos quando em rede elétrica.
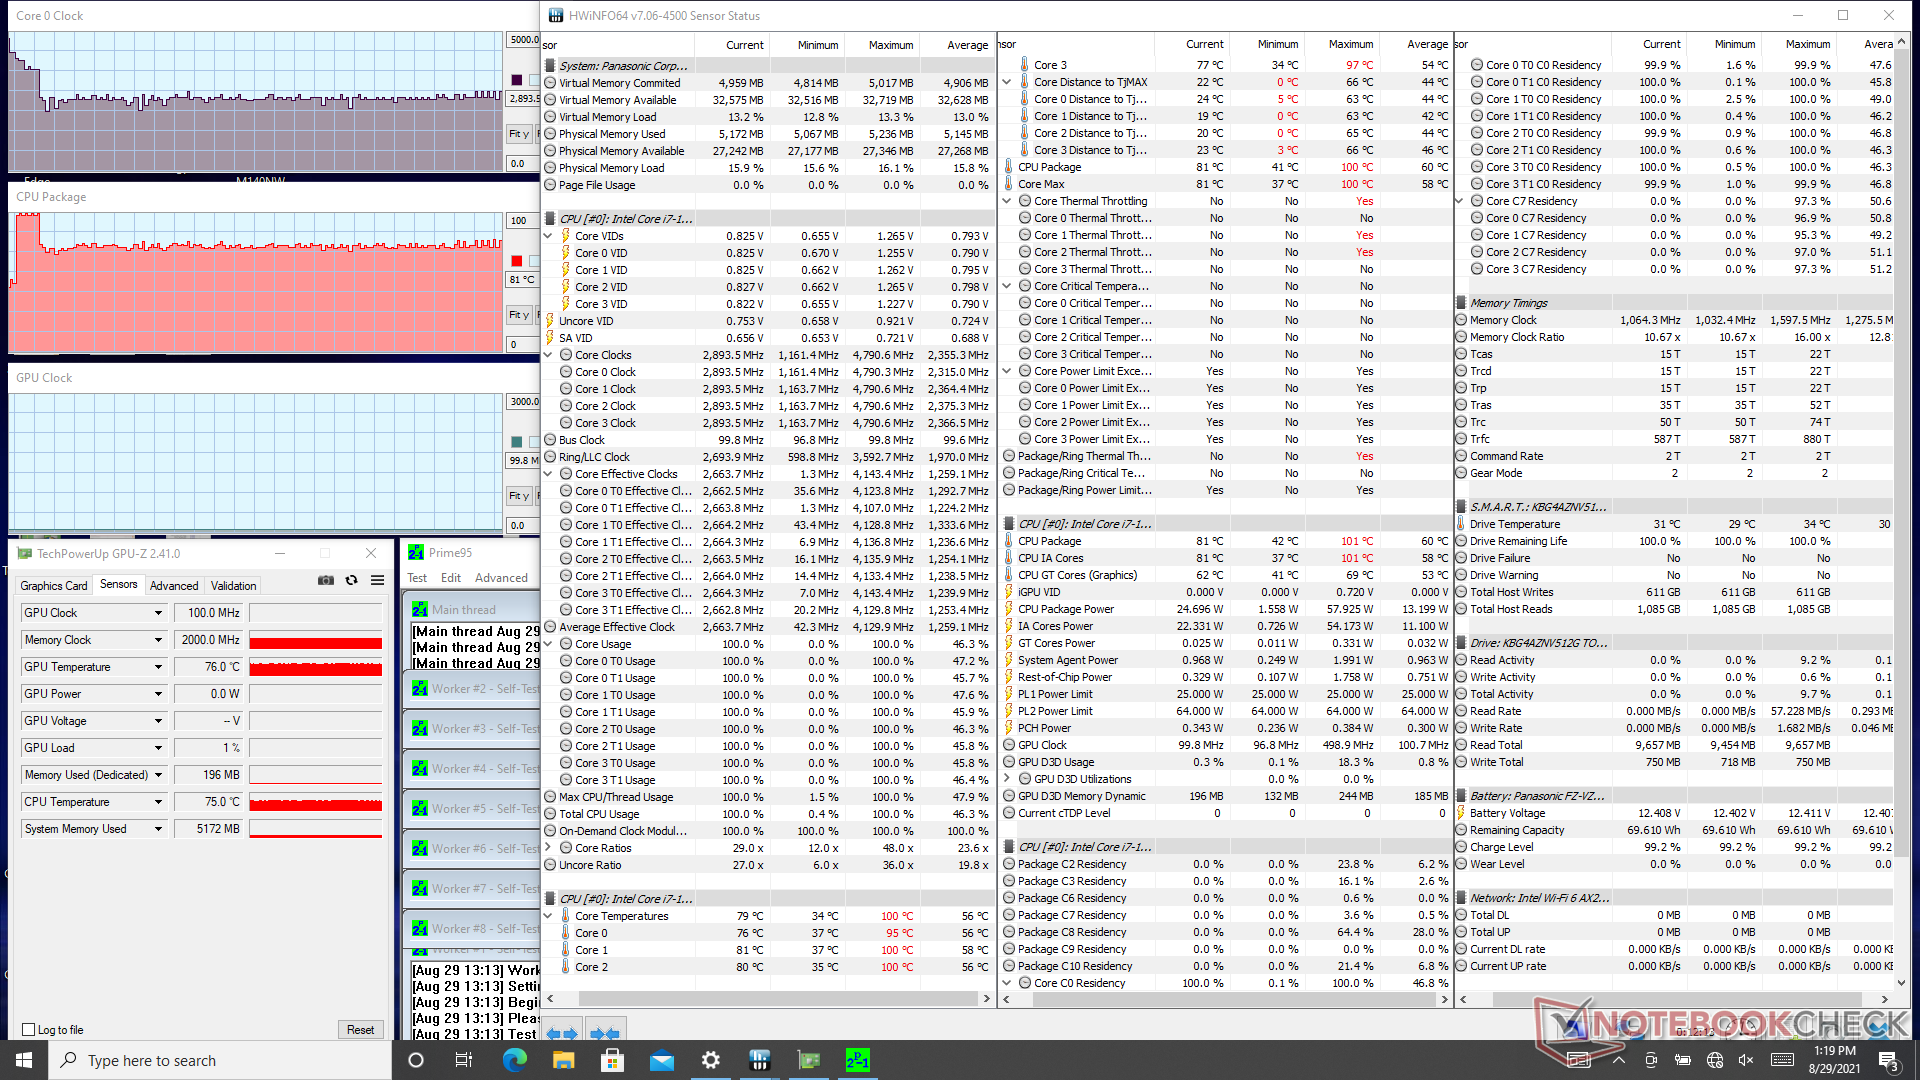
| RelógioCPU (GHz) | RelógioGPU (MHz) | Temperaturamédiada CPU (°C) | |
| System Idle | -- | --41 | |
| Prime95 Stress | 2.8 - 2.9 | --81 | |
| Prime95 + FurMark Stress | 1.9 - 2.0 | 750 | 69 |
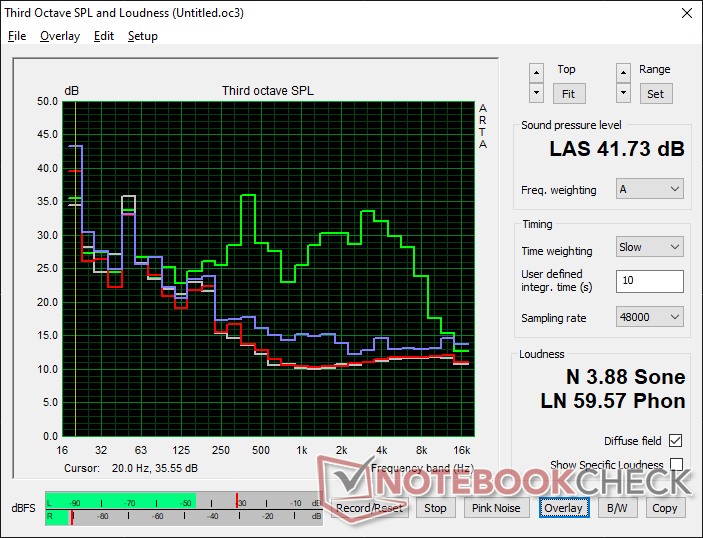
Oradores

Panasonic Toughbook FZ-55 MK2 análise de áudio
(+) | os alto-falantes podem tocar relativamente alto (###valor### dB)
Graves 100 - 315Hz
(-) | quase nenhum baixo - em média 41.6% menor que a mediana
(+) | o baixo é linear (6.8% delta para a frequência anterior)
Médios 400 - 2.000 Hz
(±) | médios reduzidos - em média 9.5% menor que a mediana
(±) | a linearidade dos médios é média (8.9% delta para frequência anterior)
Altos 2 - 16 kHz
(+) | agudos equilibrados - apenas 2.7% longe da mediana
(+) | os máximos são lineares (3% delta da frequência anterior)
Geral 100 - 16.000 Hz
(±) | a linearidade do som geral é média (25.4% diferença em relação à mediana)
Comparado com a mesma classe
» 78% de todos os dispositivos testados nesta classe foram melhores, 6% semelhantes, 17% piores
» O melhor teve um delta de 7%, a média foi 21%, o pior foi 53%
Comparado com todos os dispositivos testados
» 78% de todos os dispositivos testados foram melhores, 5% semelhantes, 17% piores
» O melhor teve um delta de 4%, a média foi 23%, o pior foi 134%
Apple MacBook 12 (Early 2016) 1.1 GHz análise de áudio
(+) | os alto-falantes podem tocar relativamente alto (###valor### dB)
Graves 100 - 315Hz
(±) | graves reduzidos - em média 11.3% menor que a mediana
(±) | a linearidade dos graves é média (14.2% delta para a frequência anterior)
Médios 400 - 2.000 Hz
(+) | médios equilibrados - apenas 2.4% longe da mediana
(+) | médios são lineares (5.5% delta para frequência anterior)
Altos 2 - 16 kHz
(+) | agudos equilibrados - apenas 2% longe da mediana
(+) | os máximos são lineares (4.5% delta da frequência anterior)
Geral 100 - 16.000 Hz
(+) | o som geral é linear (10.2% diferença em relação à mediana)
Comparado com a mesma classe
» 7% de todos os dispositivos testados nesta classe foram melhores, 2% semelhantes, 90% piores
» O melhor teve um delta de 5%, a média foi 18%, o pior foi 53%
Comparado com todos os dispositivos testados
» 5% de todos os dispositivos testados foram melhores, 1% semelhantes, 94% piores
» O melhor teve um delta de 4%, a média foi 23%, o pior foi 134%
Energy Management
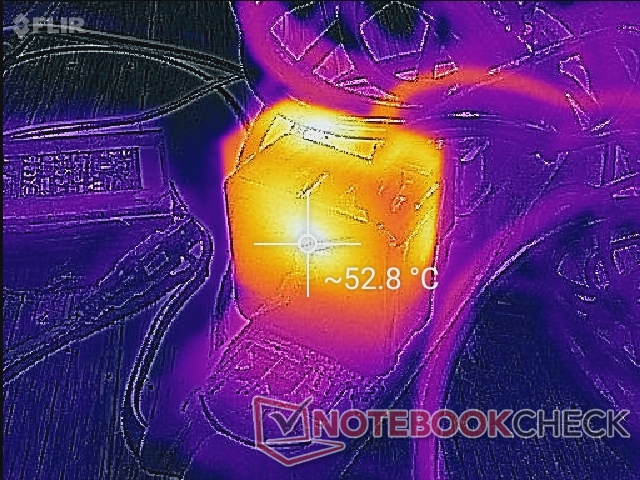
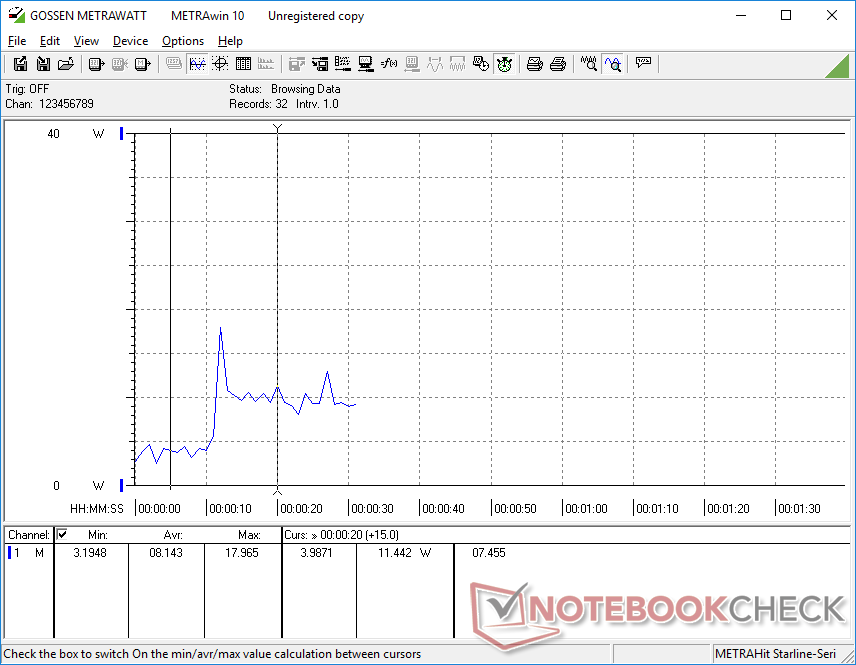
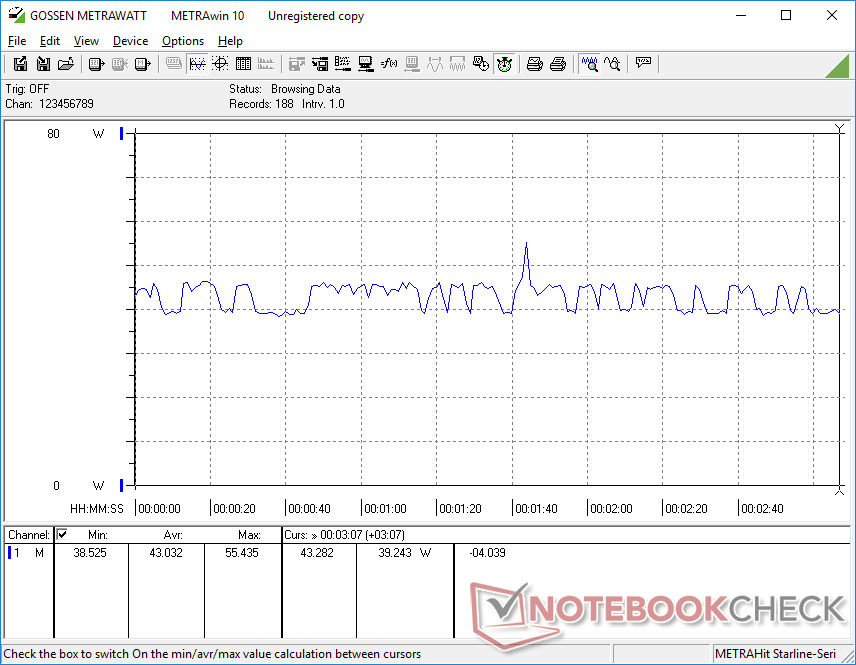
Consumo de energia
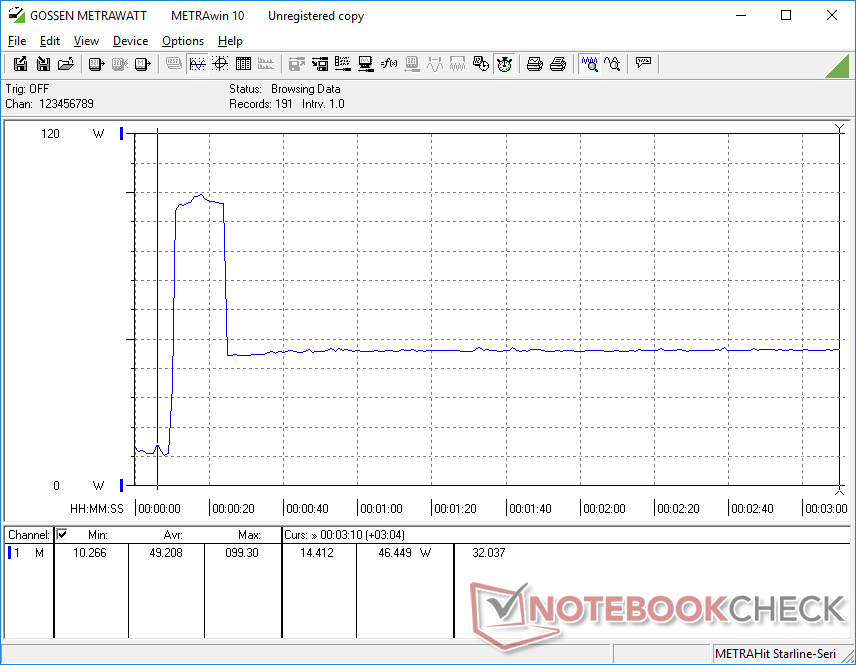
O consumo de energia pode ser maior do que no modelo Whiskey Lake-U de 2019, uma vez que nossa CPU Tiger Lake-U é capaz de aumentar as taxas do relógio Turbo Boost. Na maioria dos casos, entretanto, o sistema é apenas alguns watts mais exigente quando sob cargas médias-altas para mostrar melhorias significativas de desempenho por watts em relação às CPUs Intel mais antigas, especialmente em termos de gráficos
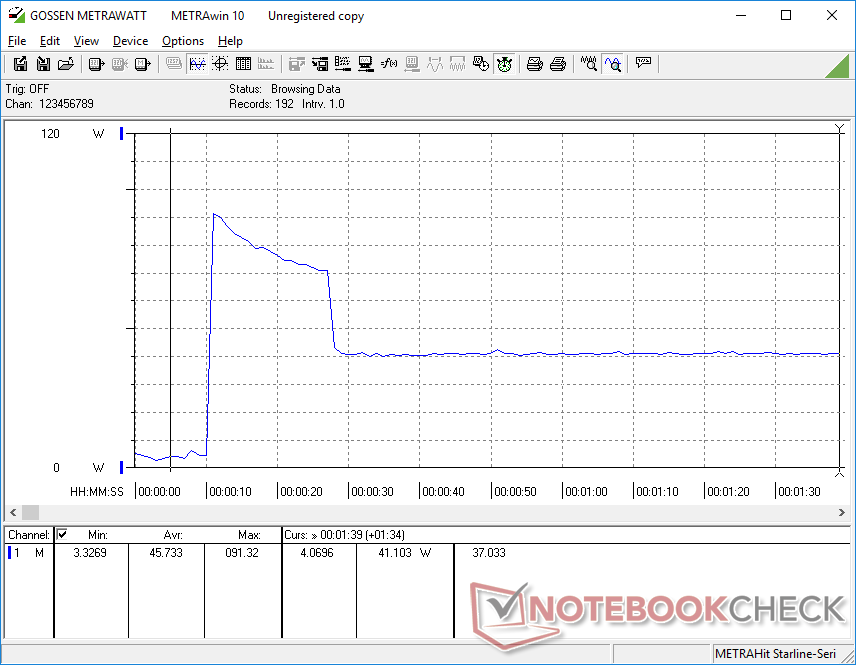
Somos capazes de registrar um consumo máximo temporário de pouco mais de 99 W a partir do adaptador pequeno-médio de 120 W AC ao executar cargas extremas, como mostram as imagens abaixo. O adaptador pode fornecer mais energia do que na maioria dos outros ULV Ultrabooks onde os adaptadores CA de <100 W são mais comuns.
| desligado | |
| Ocioso | |
| Carga |
|
Key:
min: | |
| Panasonic Toughbook FZ-55 MK2 i7-1185G7, Iris Xe G7 96EUs, Toshiba KIOXIA KBG4AZNV512G M.2 2280 OPAL, IPS, 1920x1080, 14" | Panasonic Toughbook FZ-55 i5-8365U, UHD Graphics 620, Samsung SSD PM871b MZNLN256HAJQ, IPS, 1920x1080, 14" | Dell Latitude 5420 Rugged-P85G i7-8650U, Radeon RX 540, SK hynix PC401 NVMe 500 GB, IPS, 1920x1080, 14" | Durabook S14I i7-1165G7, Iris Xe G7 96EUs, UDinfo M2P M2P80DE512GBAEP, TN, 1920x1080, 14" | Getac S410 i5-8550U, UHD Graphics 620, CUKUSA 1 TB SATA SSD Q0526A, TN PED, 1366x768, 14" | |
|---|---|---|---|---|---|
| Power Consumption | 9% | -34% | -35% | 15% | |
| Idle Minimum * (Watt) | 3.5 | 3.7 -6% | 4.8 -37% | 6.8 -94% | 5.6 -60% |
| Idle Average * (Watt) | 10.4 | 9.6 8% | 13.6 -31% | 16.4 -58% | 7.9 24% |
| Idle Maximum * (Watt) | 10.5 | 10.4 1% | 13.8 -31% | 16.9 -61% | 8.4 20% |
| Load Average * (Watt) | 45.4 | 40 12% | 67.8 -49% | 39.2 14% | 32.8 28% |
| Witcher 3 ultra * (Watt) | 43 | 69.1 -61% | |||
| Load Maximum * (Watt) | 99.3 | 71.9 28% | 93.5 6% | 73.1 26% | 34.3 65% |
* ... menor é melhor
Power Consumption Witcher 3 / Stresstest
Vida útil da bateria
Somos capazes de espremer mais de 13,5 horas de uso da WLAN no mundo real a partir da bateria removível 68 Wh. Os usuários podem instalar até duas baterias para potencialmente dobrar o tempo de funcionamento já longo
O carregamento da capacidade vazia à plena leva cerca de 2 horas.
| Panasonic Toughbook FZ-55 MK2 i7-1185G7, Iris Xe G7 96EUs, 71 Wh | Panasonic Toughbook FZ-55 i5-8365U, UHD Graphics 620, 71 Wh | Dell Latitude 5420 Rugged-P85G i7-8650U, Radeon RX 540, 102 Wh | Durabook S14I i7-1165G7, Iris Xe G7 96EUs, 50 Wh | Getac S410 i5-8550U, UHD Graphics 620, 46.6 Wh | |
|---|---|---|---|---|---|
| Duração da bateria | 35% | 19% | -60% | -62% | |
| WiFi v1.3 (h) | 13.6 | 18.4 35% | 16.2 19% | 5.5 -60% | 5.2 -62% |
| Reader / Idle (h) | 31.4 | ||||
| Load (h) | 3.2 |
Pro
Contra
Veredicto
A série Intel 11th gen CPU é facilmente uma das maiores atualizações já feitas para laptops robustos. Embora as externas permaneçam as mesmas, o desempenho da CPU e da GPU aumentou 40% e 350%, respectivamente, todas sob o mesmo envelope de energia ULV que o modelo de última geração. O desempenho de armazenamento também aumentou significativamente. Os laptops de consumo têm desfrutado destas atualizações desde o final do ano passado e, portanto, já é hora de que os laptops robustos e de campo possam ter os mesmos benefícios.
O FZ-55 MK1 original é obsoleto? Não necessariamente. Se você não fizer muito mais do que processar palavras ou planilhas, o modelo original será mais do que suficiente, especialmente porque ele compartilha exatamente as mesmas opções de exibição do FZ-55 MK2. Se suas aplicações envolvem um pouco de renderização gráfica, então o FZ-55 MK2 e suas notáveis atualizações de desempenho valerão a pena investir.
Preço e disponibilidade
Os usuários podem solicitar cotações e comprar diretamente da Panasonic aquijá que o FZ-55 MK2 não está amplamente disponível através de canais de terceiros.
Price comparison

