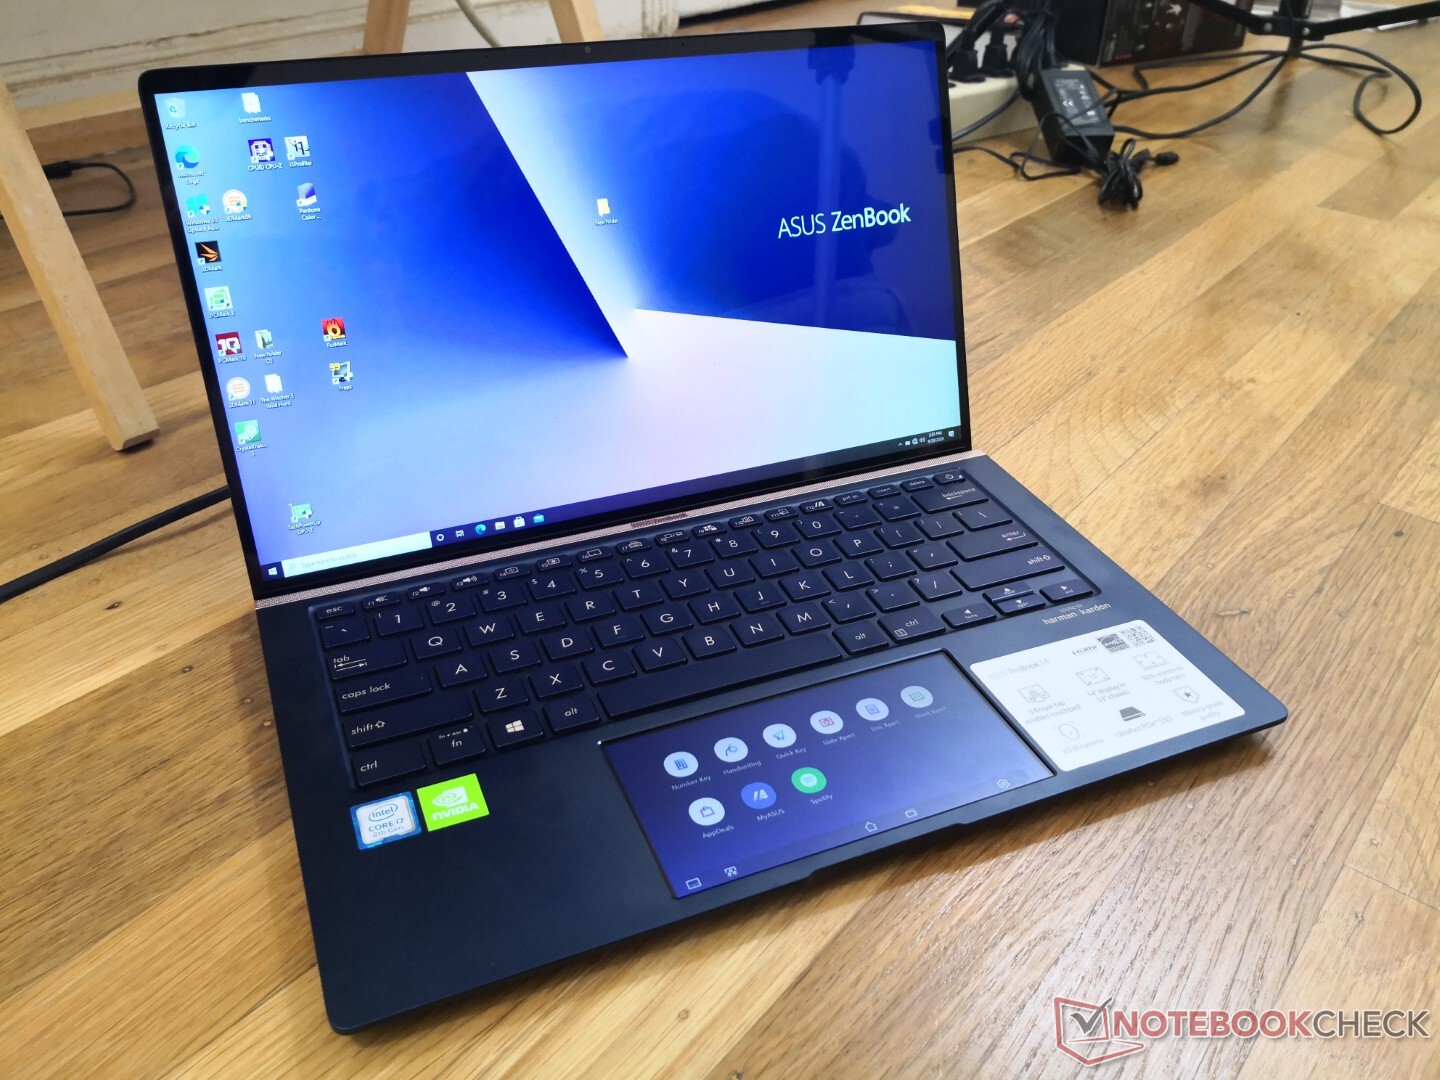
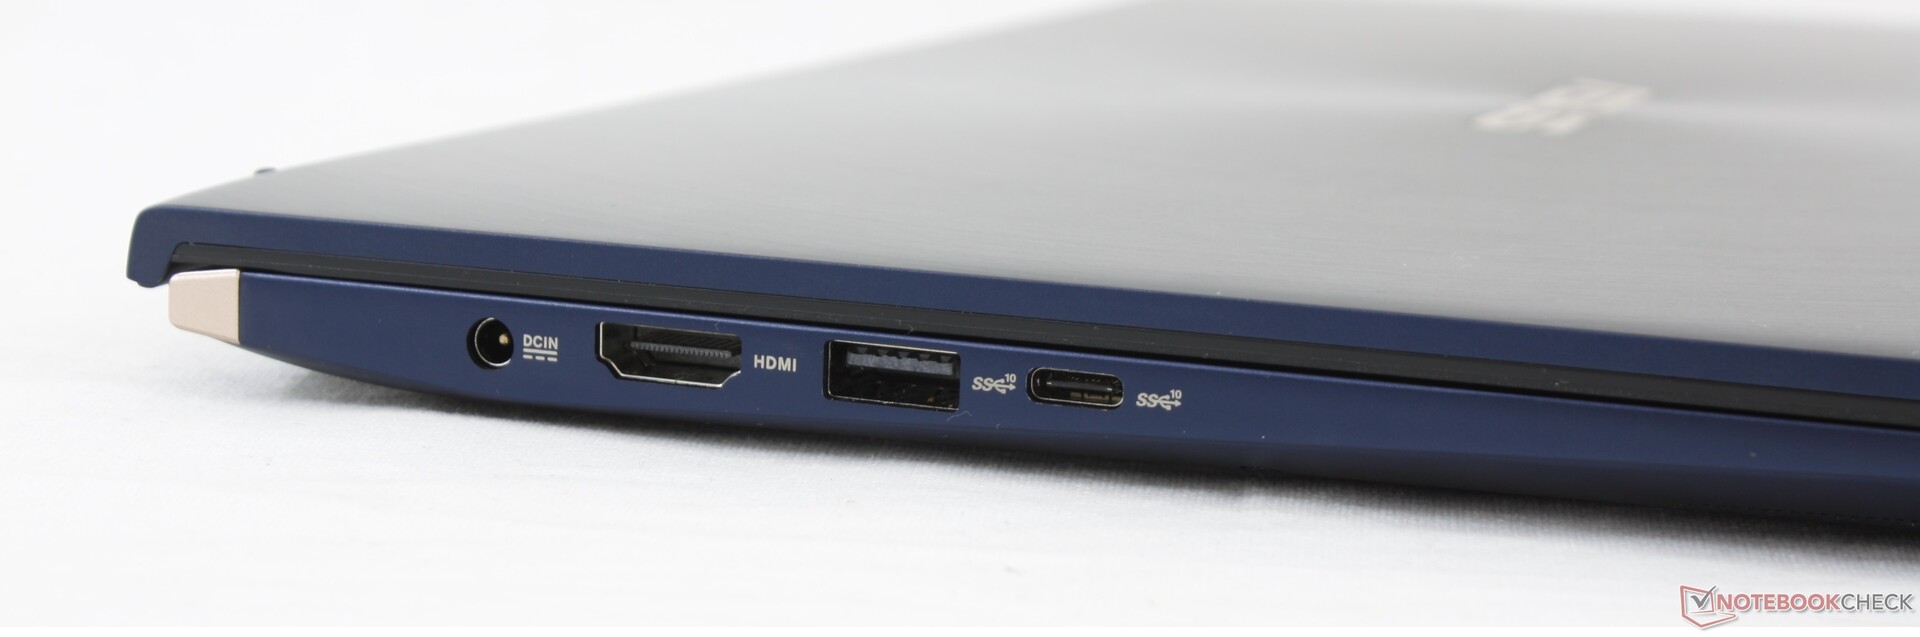
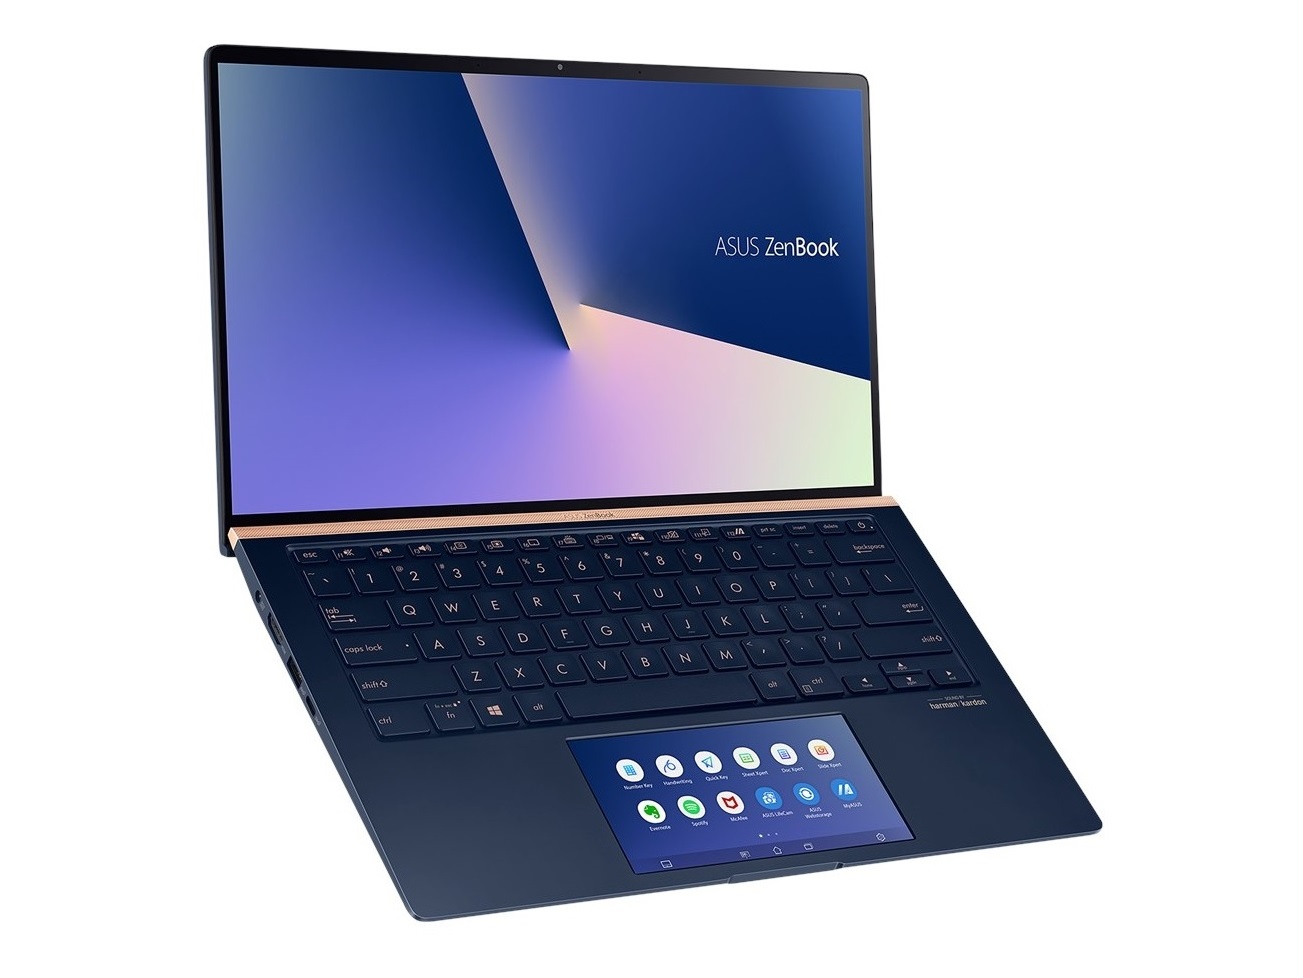
Breve Análise do Portátil Asus ZenBook 14 UX534F: O ScreenPad está aqui para ficar
Avaliação | Data | Modelo | Peso | Altura | Size | Resolução | Preço |
|---|---|---|---|---|---|---|---|
| 82.4 % v7 (old) | 09/2020 | Asus ZenBook 14 UX434FL-DB77 i7-8565U, GeForce MX250 | 1.3 kg | 16.9 mm | 14.00" | 1920x1080 | |
| 86 % v7 (old) | 08/2020 | Lenovo IdeaPad 5 14ARE05 R5 4500U, Vega 6 | 1.4 kg | 16.9 mm | 14.00" | 1920x1080 | |
| 80.7 % v7 (old) | 05/2020 | Asus VivoBook S14 S433FL i7-10510U, GeForce MX250 | 1.4 kg | 16 mm | 14.00" | 1920x1080 | |
| 85.3 % v7 (old) | 05/2020 | LG Gram 14Z90N i7-1065G7, Iris Plus Graphics G7 (Ice Lake 64 EU) | 994 g | 18 mm | 14.00" | 1920x1080 | |
| 85.3 % v7 (old) | 08/2020 | Lenovo Yoga Slim 7-14ARE R7 4800U, Vega 8 | 1.4 kg | 14.9 mm | 14.00" | 1920x1080 | |
| 80.9 % v7 (old) | 01/2020 | MSI Modern 14 A10RB-459US i5-10210U, GeForce MX250 | 1.2 kg | 16 mm | 14.00" | 1920x1080 |
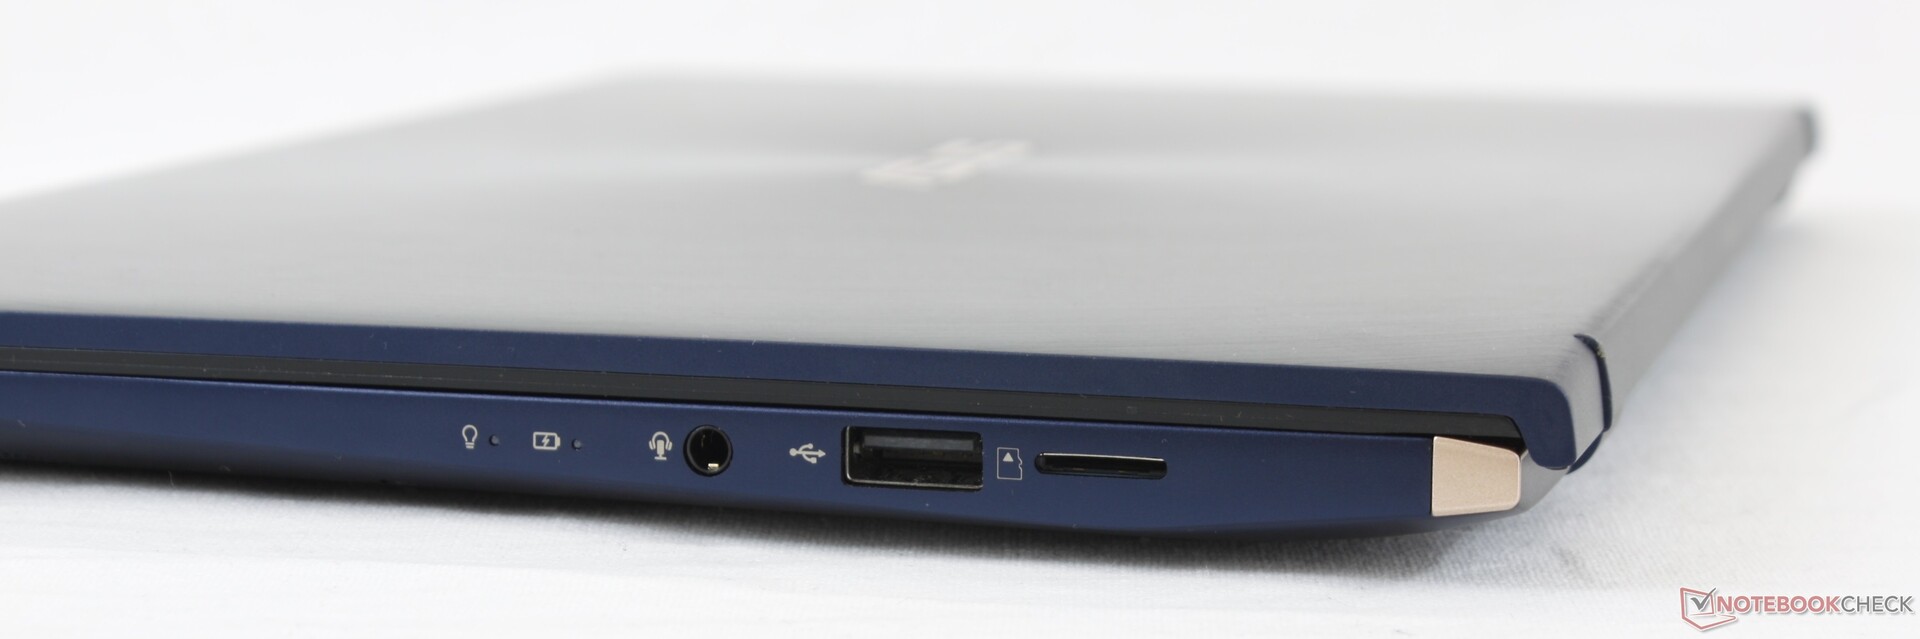
| SD Card Reader | |
| average JPG Copy Test (av. of 3 runs) | |
| LG Gram 14Z90N (Toshiba Exceria Pro M501 64 GB UHS-II) | |
| Lenovo IdeaPad 5 14ARE05 (Toshiba Exceria Pro SDXC 64 GB UHS-II) | |
| Lenovo Yoga Slim 7-14ARE (Toshiba Exceria Pro M501 64 GB UHS-II) | |
| MSI Modern 14 A10RB-459US (Toshiba Exceria Pro SDXC 64 GB UHS-II) | |
| Asus VivoBook S14 S433FL (Toshiba Exceria Pro M501 microSDXC 64GB) | |
| Asus ZenBook 14 UX434FL-DB77 (Toshiba Exceria Pro M501 64 GB UHS-II) | |
| maximum AS SSD Seq Read Test (1GB) | |
| LG Gram 14Z90N (Toshiba Exceria Pro M501 64 GB UHS-II) | |
| Lenovo IdeaPad 5 14ARE05 (Toshiba Exceria Pro SDXC 64 GB UHS-II) | |
| Lenovo Yoga Slim 7-14ARE (Toshiba Exceria Pro M501 64 GB UHS-II) | |
| Asus ZenBook 14 UX434FL-DB77 (Toshiba Exceria Pro M501 64 GB UHS-II) | |
| MSI Modern 14 A10RB-459US (Toshiba Exceria Pro SDXC 64 GB UHS-II) | |
| Asus VivoBook S14 S433FL (Toshiba Exceria Pro M501 microSDXC 64GB) | |


| |||||||||||||||||||||||||
iluminação: 88 %
iluminação com acumulador: 355.8 cd/m²
Contraste: 936:1 (Preto: 0.38 cd/m²)
ΔE ColorChecker Calman: 4.47 | ∀{0.5-29.43 Ø4.73}
calibrated: 2.89
ΔE Greyscale Calman: 6.2 | ∀{0.09-98 Ø4.97}
91.6% sRGB (Argyll 1.6.3 3D)
59.3% AdobeRGB 1998 (Argyll 1.6.3 3D)
65.3% AdobeRGB 1998 (Argyll 3D)
92% sRGB (Argyll 3D)
64% Display P3 (Argyll 3D)
Gamma: 2.27
CCT: 8072 K
| Asus ZenBook 14 UX434FL-DB77 AU Optronics B140HAN03.2, IPS, 14", 1920x1080 | Lenovo IdeaPad 5 14ARE05 AU Optronics B140HAN04.E, IPS, 14", 1920x1080 | Asus VivoBook S14 S433FL Chi Mei CMN14D4, IPS, 14", 1920x1080 | LG Gram 14Z90N LG Philips LP140WF7-SPG1, IPS, 14", 1920x1080 | Lenovo Yoga Slim 7-14ARE AU Optronics B140HAN06.8, IPS, 14", 1920x1080 | MSI Modern 14 A10RB-459US Chi Mei N140HCE-EN2, IPS, 14", 1920x1080 | |
|---|---|---|---|---|---|---|
| Display | -41% | -34% | 2% | 11% | 1% | |
| Display P3 Coverage (%) | 64 | 37.23 -42% | 41.55 -35% | 65 2% | 71.7 12% | 64.2 0% |
| sRGB Coverage (%) | 92 | 55.9 -39% | 62 -33% | 95.5 4% | 99.3 8% | 94.8 3% |
| AdobeRGB 1998 Coverage (%) | 65.3 | 38.46 -41% | 42.99 -34% | 66.1 1% | 72.9 12% | 65.4 0% |
| Response Times | -3% | 14% | -4% | -12% | -14% | |
| Response Time Grey 50% / Grey 80% * (ms) | 37.6 ? | 41 ? -9% | 34 ? 10% | 40.4 ? -7% | 45.6 ? -21% | 39.2 ? -4% |
| Response Time Black / White * (ms) | 28.8 ? | 28 ? 3% | 24 ? 17% | 28.8 ? -0% | 29.6 ? -3% | 35.6 ? -24% |
| PWM Frequency (Hz) | 250 ? | 25000 ? | ||||
| Screen | -11% | -20% | 19% | 17% | 29% | |
| Brightness middle (cd/m²) | 355.8 | 360 1% | 220 -38% | 316.8 -11% | 399.6 12% | 324.1 -9% |
| Brightness (cd/m²) | 341 | 317 -7% | 204 -40% | 298 -13% | 385 13% | 301 -12% |
| Brightness Distribution (%) | 88 | 82 -7% | 68 -23% | 89 1% | 89 1% | 87 -1% |
| Black Level * (cd/m²) | 0.38 | 0.41 -8% | 0.155 59% | 0.33 13% | 0.37 3% | 0.22 42% |
| Contrast (:1) | 936 | 878 -6% | 1419 52% | 960 3% | 1080 15% | 1473 57% |
| Colorchecker dE 2000 * | 4.47 | 4.75 -6% | 5.23 -17% | 1.74 61% | 3.2 28% | 1.63 64% |
| Colorchecker dE 2000 max. * | 9.12 | 7.4 19% | 21.51 -136% | 5.41 41% | 6.44 29% | 4.25 53% |
| Colorchecker dE 2000 calibrated * | 2.89 | 4.86 -68% | 4.4 -52% | 1.37 53% | 1.73 40% | 1.42 51% |
| Greyscale dE 2000 * | 6.2 | 3.75 40% | 3.77 39% | 2.7 56% | 4.7 24% | 2.2 65% |
| Gamma | 2.27 97% | 2.32 95% | 2.35 94% | 2.23 99% | 2.21 100% | 2.26 97% |
| CCT | 8072 81% | 6543 99% | 6666 98% | 6655 98% | 7184 90% | 6887 94% |
| Color Space (Percent of AdobeRGB 1998) (%) | 59.3 | 36 -39% | 40 -33% | 61.3 3% | 66.3 12% | 60.2 2% |
| Color Space (Percent of sRGB) (%) | 91.6 | 56 -39% | 62 -32% | 95.4 4% | 99.5 9% | 95 4% |
| Média Total (Programa/Configurações) | -18% /
-16% | -13% /
-19% | 6% /
13% | 5% /
12% | 5% /
18% |
* ... menor é melhor
Exibir tempos de resposta
| ↔ Tempo de resposta preto para branco | ||
|---|---|---|
| 28.8 ms ... ascensão ↗ e queda ↘ combinadas | ↗ 18 ms ascensão | 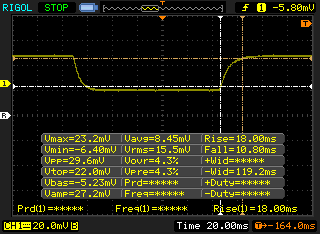 |
| ↘ 10.8 ms queda | ||
| A tela mostra taxas de resposta relativamente lentas em nossos testes e pode ser muito lenta para os jogadores. Em comparação, todos os dispositivos testados variam de 0.1 (mínimo) a 240 (máximo) ms. » 76 % de todos os dispositivos são melhores. Isso significa que o tempo de resposta medido é pior que a média de todos os dispositivos testados (19.9 ms). | ||
| ↔ Tempo de resposta 50% cinza a 80% cinza | ||
| 37.6 ms ... ascensão ↗ e queda ↘ combinadas | ↗ 19.6 ms ascensão | 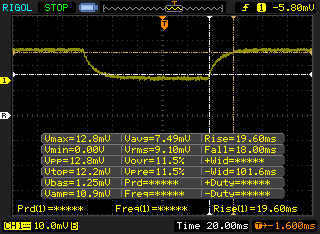 |
| ↘ 18 ms queda | ||
| A tela mostra taxas de resposta lentas em nossos testes e será insatisfatória para os jogadores. Em comparação, todos os dispositivos testados variam de 0.165 (mínimo) a 636 (máximo) ms. » 54 % de todos os dispositivos são melhores. Isso significa que o tempo de resposta medido é pior que a média de todos os dispositivos testados (31.1 ms). | ||
Cintilação da tela / PWM (modulação por largura de pulso)
| Tela tremeluzindo / PWM não detectado | 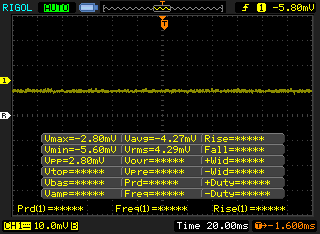 | ||
[pwm_comparison] Em comparação: 52 % de todos os dispositivos testados não usam PWM para escurecer a tela. Se PWM foi detectado, uma média de 7798 (mínimo: 5 - máximo: 343500) Hz foi medida. | |||
Cinebench R15: CPU Multi 64Bit | CPU Single 64Bit
Blender: v2.79 BMW27 CPU
7-Zip 18.03: 7z b 4 -mmt1 | 7z b 4
Geekbench 5.5: Single-Core | Multi-Core
HWBOT x265 Benchmark v2.2: 4k Preset
LibreOffice : 20 Documents To PDF
R Benchmark 2.5: Overall mean
| Cinebench R20 / CPU (Multi Core) | |
| Lenovo Yoga Slim 7-14ARE | |
| Dell XPS 13 7390 Core i7-10710U | |
| Lenovo IdeaPad 5 14ARE05 | |
| Intel Reference Design Laptop 28W | |
| HP Envy x360 15-ee0257ng | |
| Microsoft Surface Laptop 3 13 Core i5-1035G7 | |
| Asus VivoBook S14 S433FL | |
| Acer Swift 3 SF314-42-R27B | |
| Asus ZenBook 14 UX434FL-DB77 | |
| Lenovo ThinkPad T14s-20T00044GE | |
| Asus ZenBook 13 UX325JA | |
| Média Intel Core i7-8565U (954 - 1645, n=20) | |
| MSI Modern 14 A10RB-459US | |
| LG Gram 14Z90N | |
| HP Elite Dragonfly-8MK79EA | |
| Cinebench R20 / CPU (Single Core) | |
| Intel Reference Design Laptop 28W | |
| Lenovo Yoga Slim 7-14ARE | |
| Dell XPS 13 7390 Core i7-10710U | |
| Asus ZenBook 13 UX325JA | |
| Asus VivoBook S14 S433FL | |
| HP Envy x360 15-ee0257ng | |
| Lenovo IdeaPad 5 14ARE05 | |
| Asus ZenBook 14 UX434FL-DB77 | |
| Microsoft Surface Laptop 3 13 Core i5-1035G7 | |
| Acer Swift 3 SF314-42-R27B | |
| MSI Modern 14 A10RB-459US | |
| Lenovo ThinkPad T14s-20T00044GE | |
| Média Intel Core i7-8565U (342 - 472, n=20) | |
| HP Elite Dragonfly-8MK79EA | |
| LG Gram 14Z90N | |
| Cinebench R15 / CPU Multi 64Bit | |
| Lenovo Yoga Slim 7-14ARE | |
| Dell XPS 13 7390 Core i7-10710U | |
| Lenovo IdeaPad 5 14ARE05 | |
| Intel Reference Design Laptop 28W | |
| Intel Reference Design Laptop 28W | |
| HP Envy x360 15-ee0257ng | |
| Microsoft Surface Laptop 3 13 Core i5-1035G7 | |
| Asus ZenBook 13 UX325JA | |
| Asus ZenBook 14 UX434FL-DB77 | |
| Asus VivoBook S14 S433FL | |
| Lenovo ThinkPad T14s-20T00044GE | |
| Média Intel Core i7-8565U (452 - 815, n=52) | |
| MSI Modern 14 A10RB-459US | |
| Acer Swift 3 SF314-42-R27B | |
| HP Elite Dragonfly-8MK79EA | |
| LG Gram 14Z90N | |
| Cinebench R15 / CPU Single 64Bit | |
| Intel Reference Design Laptop 28W | |
| Asus ZenBook 13 UX325JA | |
| Lenovo Yoga Slim 7-14ARE | |
| Dell XPS 13 7390 Core i7-10710U | |
| Asus ZenBook 14 UX434FL-DB77 | |
| Asus VivoBook S14 S433FL | |
| Lenovo IdeaPad 5 14ARE05 | |
| HP Envy x360 15-ee0257ng | |
| Média Intel Core i7-8565U (138.3 - 193, n=51) | |
| Microsoft Surface Laptop 3 13 Core i5-1035G7 | |
| MSI Modern 14 A10RB-459US | |
| LG Gram 14Z90N | |
| Acer Swift 3 SF314-42-R27B | |
| Lenovo ThinkPad T14s-20T00044GE | |
| HP Elite Dragonfly-8MK79EA | |
| Blender / v2.79 BMW27 CPU | |
| HP Elite Dragonfly-8MK79EA | |
| LG Gram 14Z90N | |
| Asus ZenBook 13 UX325JA | |
| Acer Swift 3 SF314-42-R27B | |
| Média Intel Core i7-8565U (687 - 1175, n=22) | |
| Lenovo ThinkPad T14s-20T00044GE | |
| Asus VivoBook S14 S433FL | |
| Microsoft Surface Laptop 3 13 Core i5-1035G7 | |
| Asus ZenBook 14 UX434FL-DB77 | |
| HP Envy x360 15-ee0257ng | |
| Lenovo IdeaPad 5 14ARE05 | |
| Dell XPS 13 7390 Core i7-10710U | |
| Intel Reference Design Laptop 28W | |
| Lenovo Yoga Slim 7-14ARE | |
| 7-Zip 18.03 / 7z b 4 -mmt1 | |
| Intel Reference Design Laptop 28W | |
| Asus VivoBook S14 S433FL | |
| Média Intel Core i7-8565U (2029 - 5923, n=23) | |
| Lenovo Yoga Slim 7-14ARE | |
| Dell XPS 13 7390 Core i7-10710U | |
| HP Envy x360 15-ee0257ng | |
| Asus ZenBook 13 UX325JA | |
| Lenovo IdeaPad 5 14ARE05 | |
| Microsoft Surface Laptop 3 13 Core i5-1035G7 | |
| Lenovo ThinkPad T14s-20T00044GE | |
| LG Gram 14Z90N | |
| Acer Swift 3 SF314-42-R27B | |
| HP Elite Dragonfly-8MK79EA | |
| Asus ZenBook 14 UX434FL-DB77 | |
| HWBOT x265 Benchmark v2.2 / 4k Preset | |
| Lenovo Yoga Slim 7-14ARE | |
| Lenovo IdeaPad 5 14ARE05 | |
| Intel Reference Design Laptop 28W | |
| Dell XPS 13 7390 Core i7-10710U | |
| HP Envy x360 15-ee0257ng | |
| Asus ZenBook 14 UX434FL-DB77 | |
| Média Intel Core i7-8565U (3.24 - 5.5, n=22) | |
| Microsoft Surface Laptop 3 13 Core i5-1035G7 | |
| Lenovo ThinkPad T14s-20T00044GE | |
| Asus VivoBook S14 S433FL | |
| Acer Swift 3 SF314-42-R27B | |
| Asus ZenBook 13 UX325JA | |
| LG Gram 14Z90N | |
| HP Elite Dragonfly-8MK79EA | |
| LibreOffice / 20 Documents To PDF | |
| HP Envy x360 15-ee0257ng | |
| Asus ZenBook 14 UX434FL-DB77 | |
| Média Intel Core i7-8565U (n=1) | |
| Acer Swift 3 SF314-42-R27B | |
| LG Gram 14Z90N | |
| Lenovo IdeaPad 5 14ARE05 | |
| Lenovo Yoga Slim 7-14ARE | |
| Asus VivoBook S14 S433FL | |
| Lenovo ThinkPad T14s-20T00044GE | |
| Asus ZenBook 13 UX325JA | |
| R Benchmark 2.5 / Overall mean | |
| Asus ZenBook 14 UX434FL-DB77 | |
| Média Intel Core i7-8565U (0.682 - 0.851, n=2) | |
| LG Gram 14Z90N | |
| Lenovo ThinkPad T14s-20T00044GE | |
| Acer Swift 3 SF314-42-R27B | |
| Asus ZenBook 13 UX325JA | |
| Lenovo IdeaPad 5 14ARE05 | |
| Asus VivoBook S14 S433FL | |
| HP Envy x360 15-ee0257ng | |
| Lenovo Yoga Slim 7-14ARE | |
| Intel Reference Design Laptop 28W | |
Cinebench R15: CPU Multi 64Bit | CPU Single 64Bit
Blender: v2.79 BMW27 CPU
7-Zip 18.03: 7z b 4 -mmt1 | 7z b 4
Geekbench 5.5: Single-Core | Multi-Core
HWBOT x265 Benchmark v2.2: 4k Preset
LibreOffice : 20 Documents To PDF
R Benchmark 2.5: Overall mean
* ... menor é melhor
| PCMark 8 Home Score Accelerated v2 | 3578 pontos | |
| PCMark 8 Work Score Accelerated v2 | 4844 pontos | |
| PCMark 10 Score | 4202 pontos | |
Ajuda | ||
| DPC Latencies / LatencyMon - interrupt to process latency (max), Web, Youtube, Prime95 | |
| LG Gram 14Z90N | |
| Asus ZenBook 13 UX325JA | |
| Lenovo Yoga Slim 7-14ARE | |
| Lenovo ThinkPad T14s-20T00044GE | |
| Asus ZenBook 14 UX434FL-DB77 | |
| Acer Swift 3 SF314-42-R27B | |
| Asus VivoBook S14 S433FL | |
| HP Envy x360 15-ee0257ng | |
| Lenovo IdeaPad 5 14ARE05 | |
* ... menor é melhor
| Asus ZenBook 14 UX434FL-DB77 WDC PC SN520 SDAPNUW-512G | Lenovo IdeaPad 5 14ARE05 Samsung PM991 MZALQ512HALU | Asus VivoBook S14 S433FL Intel Optane Memory H10 with Solid State Storage 32GB + 512GB HBRPEKNX0202A(L/H) | LG Gram 14Z90N Samsung SSD PM981 MZVLB256HAHQ | Lenovo Yoga Slim 7-14ARE Samsung SSD PM981a MZVLB512HBJQ | MSI Modern 14 A10RB-459US Kingston RBUSNS8154P3512GJ | |
|---|---|---|---|---|---|---|
| AS SSD | 11% | -21% | 33% | 71% | -14% | |
| Seq Read (MB/s) | 1171 | 1970 68% | 957 -18% | 1744 49% | 1658 42% | 1061 -9% |
| Seq Write (MB/s) | 868 | 1268 46% | 353.1 -59% | 1450 67% | 2464 184% | 953 10% |
| 4K Read (MB/s) | 39.06 | 47.13 21% | 62.4 60% | 57.4 47% | 59.5 52% | 35.59 -9% |
| 4K Write (MB/s) | 130.6 | 121.6 -7% | 122.8 -6% | 140.9 8% | 128.6 -2% | 87 -33% |
| 4K-64 Read (MB/s) | 815 | 855 5% | 386.2 -53% | 907 11% | 1576 93% | 769 -6% |
| 4K-64 Write (MB/s) | 709 | 859 21% | 605 -15% | 1372 94% | 1986 180% | 733 3% |
| Access Time Read * (ms) | 0.059 | 0.065 -10% | 0.107 -81% | 0.059 -0% | 0.049 17% | 0.084 -42% |
| Access Time Write * (ms) | 0.077 | 0.032 58% | 0.046 40% | 0.081 -5% | 0.087 -13% | 0.136 -77% |
| Score Read (Points) | 971 | 1100 13% | 544 -44% | 1138 17% | 1802 86% | 911 -6% |
| Score Write (Points) | 926 | 1108 20% | 763 -18% | 1658 79% | 2361 155% | 916 -1% |
| Score Total (Points) | 2387 | 2745 15% | 1581 -34% | 3380 42% | 5133 115% | 2294 -4% |
| Copy ISO MB/s (MB/s) | 1287 | 982 -24% | 1520 18% | 1588 23% | 956 -26% | |
| Copy Program MB/s (MB/s) | 417 | 276.2 -34% | 539 29% | 550 32% | 496.5 19% | |
| Copy Game MB/s (MB/s) | 1017 | 681 -33% | 1070 5% | 1329 31% | 872 -14% | |
| CrystalDiskMark 5.2 / 6 | 10% | 27% | 42% | 72% | -9% | |
| Write 4K (MB/s) | 134.2 | 102.8 -23% | 124.9 -7% | 183.6 37% | 146.1 9% | 107.7 -20% |
| Read 4K (MB/s) | 45.41 | 45.48 0% | 147.9 226% | 48.51 7% | 47.18 4% | 39.73 -13% |
| Write Seq (MB/s) | 1080 | 1255 16% | 753 -30% | 1520 41% | 2896 168% | 926 -14% |
| Read Seq (MB/s) | 1168 | 1434 23% | 1223 5% | 1914 64% | 2754 136% | 1014 -13% |
| Write 4K Q32T1 (MB/s) | 412.5 | 441 7% | 369.2 -10% | 529 28% | 425.8 3% | 343.6 -17% |
| Read 4K Q32T1 (MB/s) | 357.2 | 474.1 33% | 358.1 0% | 560 57% | 514 44% | 499.1 40% |
| Write Seq Q32T1 (MB/s) | 1457 | 1456 0% | 1057 -27% | 1540 6% | 2989 105% | 1033 -29% |
| Read Seq Q32T1 (MB/s) | 1710 | 2085 22% | 2738 60% | 3408 99% | 3568 109% | 1604 -6% |
| Média Total (Programa/Configurações) | 11% /
11% | 3% /
-1% | 38% /
36% | 72% /
72% | -12% /
-12% |
* ... menor é melhor

Disk Throttling: DiskSpd Read Loop, Queue Depth 8
| 3DMark 11 Performance | 3930 pontos | |
| 3DMark Cloud Gate Standard Score | 12886 pontos | |
| 3DMark Fire Strike Score | 2726 pontos | |
| 3DMark Time Spy Score | 990 pontos | |
Ajuda | ||
| baixo | média | alto | ultra | |
|---|---|---|---|---|
| GTA V (2015) | 109 | 95.4 | 35.9 | 16.1 |
| The Witcher 3 (2015) | 59.5 | 33 | 19.4 | 10.3 |
| Dota 2 Reborn (2015) | 113 | 88.6 | 61.3 | 54.1 |
| Final Fantasy XV Benchmark (2018) | 33.7 | 16.4 | 11 | |
| X-Plane 11.11 (2018) | 49.2 | 41.1 | 37.5 | |
| Strange Brigade (2018) | 71.3 | 26.7 | 19.9 | 15.7 |
| Asus ZenBook 14 UX434FL-DB77 GeForce MX250, i7-8565U, WDC PC SN520 SDAPNUW-512G | Lenovo IdeaPad 5 14ARE05 Vega 6, R5 4500U, Samsung PM991 MZALQ512HALU | Asus VivoBook S14 S433FL GeForce MX250, i7-10510U, Intel Optane Memory H10 with Solid State Storage 32GB + 512GB HBRPEKNX0202A(L/H) | LG Gram 14Z90N Iris Plus Graphics G7 (Ice Lake 64 EU), i7-1065G7, Samsung SSD PM981 MZVLB256HAHQ | Lenovo Yoga Slim 7-14ARE Vega 8, R7 4800U, Samsung SSD PM981a MZVLB512HBJQ | MSI Modern 14 A10RB-459US GeForce MX250, i5-10210U, Kingston RBUSNS8154P3512GJ | |
|---|---|---|---|---|---|---|
| Noise | -12% | -11% | 4% | 7% | -2% | |
| desligado / ambiente * (dB) | 26.2 | 30.7 -17% | 30.7 -17% | 28.6 -9% | 26.3 -0% | 28.7 -10% |
| Idle Minimum * (dB) | 26.2 | 30.7 -17% | 31 -18% | 28.6 -9% | 26.5 -1% | 29.5 -13% |
| Idle Average * (dB) | 27.2 | 30.7 -13% | 31 -14% | 29.2 -7% | 26.5 3% | 29.5 -8% |
| Idle Maximum * (dB) | 27.2 | 30.7 -13% | 31.3 -15% | 29.2 -7% | 26.5 3% | 29.5 -8% |
| Load Average * (dB) | 41.5 | 41.3 -0% | 43.4 -5% | 29.2 30% | 31.8 23% | 33.4 20% |
| Witcher 3 ultra * (dB) | 39.7 | 42.8 -8% | 35.9 10% | 37.9 5% | ||
| Load Maximum * (dB) | 41.1 | 41.5 -1% | 29.5 28% | 35.9 13% | 40.5 1% |
* ... menor é melhor
Barulho
| Ocioso |
| 26.2 / 27.2 / 27.2 dB |
| Carga |
| 41.5 / 41.1 dB |
 | ||
30 dB silencioso 40 dB(A) audível 50 dB(A) ruidosamente alto |
||
min: | ||
(-) A temperatura máxima no lado superior é 47.4 °C / 117 F, em comparação com a média de 35.9 °C / 97 F , variando de 21.4 a 59 °C para a classe Subnotebook.
(-) A parte inferior aquece até um máximo de 54.2 °C / 130 F, em comparação com a média de 39.2 °C / 103 F
(+) Em uso inativo, a temperatura média para o lado superior é 30.6 °C / 87 F, em comparação com a média do dispositivo de 30.8 °C / ### class_avg_f### F.
(±) Jogando The Witcher 3, a temperatura média para o lado superior é 33.9 °C / 93 F, em comparação com a média do dispositivo de 30.8 °C / ## #class_avg_f### F.
(±) Os apoios para as mãos e o touchpad podem ficar muito quentes ao toque, com um máximo de 39.4 °C / 102.9 F.
(-) A temperatura média da área do apoio para as mãos de dispositivos semelhantes foi 28.2 °C / 82.8 F (-11.2 °C / -20.1 F).
Asus ZenBook 14 UX434FL-DB77 análise de áudio
(±) | o volume do alto-falante é médio, mas bom (###valor### dB)
Graves 100 - 315Hz
(±) | graves reduzidos - em média 12% menor que a mediana
(±) | a linearidade dos graves é média (14% delta para a frequência anterior)
Médios 400 - 2.000 Hz
(+) | médios equilibrados - apenas 4.3% longe da mediana
(+) | médios são lineares (6.2% delta para frequência anterior)
Altos 2 - 16 kHz
(+) | agudos equilibrados - apenas 1.9% longe da mediana
(+) | os máximos são lineares (6.5% delta da frequência anterior)
Geral 100 - 16.000 Hz
(+) | o som geral é linear (14.6% diferença em relação à mediana)
Comparado com a mesma classe
» 29% de todos os dispositivos testados nesta classe foram melhores, 6% semelhantes, 65% piores
» O melhor teve um delta de 5%, a média foi 18%, o pior foi 53%
Comparado com todos os dispositivos testados
» 19% de todos os dispositivos testados foram melhores, 4% semelhantes, 77% piores
» O melhor teve um delta de 4%, a média foi 24%, o pior foi 134%
Apple MacBook 12 (Early 2016) 1.1 GHz análise de áudio
(+) | os alto-falantes podem tocar relativamente alto (###valor### dB)
Graves 100 - 315Hz
(±) | graves reduzidos - em média 11.3% menor que a mediana
(±) | a linearidade dos graves é média (14.2% delta para a frequência anterior)
Médios 400 - 2.000 Hz
(+) | médios equilibrados - apenas 2.4% longe da mediana
(+) | médios são lineares (5.5% delta para frequência anterior)
Altos 2 - 16 kHz
(+) | agudos equilibrados - apenas 2% longe da mediana
(+) | os máximos são lineares (4.5% delta da frequência anterior)
Geral 100 - 16.000 Hz
(+) | o som geral é linear (10.2% diferença em relação à mediana)
Comparado com a mesma classe
» 7% de todos os dispositivos testados nesta classe foram melhores, 2% semelhantes, 91% piores
» O melhor teve um delta de 5%, a média foi 18%, o pior foi 53%
Comparado com todos os dispositivos testados
» 5% de todos os dispositivos testados foram melhores, 1% semelhantes, 94% piores
» O melhor teve um delta de 4%, a média foi 24%, o pior foi 134%
| desligado | |
| Ocioso | |
| Carga |
|
Key:
min: | |
| Asus ZenBook 14 UX434FL-DB77 i7-8565U, GeForce MX250, WDC PC SN520 SDAPNUW-512G, IPS, 1920x1080, 14" | Lenovo IdeaPad 5 14ARE05 R5 4500U, Vega 6, Samsung PM991 MZALQ512HALU, IPS, 1920x1080, 14" | Asus VivoBook S14 S433FL i7-10510U, GeForce MX250, Intel Optane Memory H10 with Solid State Storage 32GB + 512GB HBRPEKNX0202A(L/H), IPS, 1920x1080, 14" | LG Gram 14Z90N i7-1065G7, Iris Plus Graphics G7 (Ice Lake 64 EU), Samsung SSD PM981 MZVLB256HAHQ, IPS, 1920x1080, 14" | Lenovo Yoga Slim 7-14ARE R7 4800U, Vega 8, Samsung SSD PM981a MZVLB512HBJQ, IPS, 1920x1080, 14" | MSI Modern 14 A10RB-459US i5-10210U, GeForce MX250, Kingston RBUSNS8154P3512GJ, IPS, 1920x1080, 14" | |
|---|---|---|---|---|---|---|
| Power Consumption | -22% | -6% | 14% | -14% | -23% | |
| Idle Minimum * (Watt) | 2.9 | 4.4 -52% | 2.4 17% | 2.6 10% | 4 -38% | 4.2 -45% |
| Idle Average * (Watt) | 6.2 | 7.6 -23% | 4.2 32% | 5.9 5% | 6.3 -2% | 5.9 5% |
| Idle Maximum * (Watt) | 7 | 9.9 -41% | 7.8 -11% | 8 -14% | 7.7 -10% | 7.2 -3% |
| Load Average * (Watt) | 47.1 | 46 2% | 57 -21% | 29.8 37% | 48.3 -3% | 63.4 -35% |
| Witcher 3 ultra * (Watt) | 34.7 | 52 -50% | 30.9 11% | 49 -41% | 53.5 -54% | |
| Load Maximum * (Watt) | 62.8 | 59 6% | 64 -2% | 39.5 37% | 57.6 8% | 67.4 -7% |
* ... menor é melhor
| Asus ZenBook 14 UX434FL-DB77 i7-8565U, GeForce MX250, 50 Wh | Lenovo IdeaPad 5 14ARE05 R5 4500U, Vega 6, 56.5 Wh | Asus VivoBook S14 S433FL i7-10510U, GeForce MX250, 50 Wh | LG Gram 14Z90N i7-1065G7, Iris Plus Graphics G7 (Ice Lake 64 EU), 72 Wh | Lenovo Yoga Slim 7-14ARE R7 4800U, Vega 8, 61 Wh | MSI Modern 14 A10RB-459US i5-10210U, GeForce MX250, 50 Wh | |
|---|---|---|---|---|---|---|
| Duração da bateria | 36% | 18% | 99% | 18% | -6% | |
| Reader / Idle (h) | 16.1 | 45.6 183% | 27.1 68% | 16.4 2% | ||
| WiFi v1.3 (h) | 7.3 | 9.9 36% | 8.6 18% | 14 92% | 10.3 41% | 8.6 18% |
| Load (h) | 2.9 | 3.5 21% | 1.3 -55% | 1.8 -38% |
Pro
Contra
Conforme configurado, nosso ZenBook 14 UX434FL atualmente é vendido por cerca de US$ 1.400 a US$ 1.500 e é mais caro do que outros sistemas de gama média como o Lenovo Yoga Tablet 7 HD+. Muito do preço premium vai para o ScreenPad exclusivo, já que você não encontrará suporte para Thunderbolt 3, carregamento USB-C, DisplayPort, obturador de webcam ou leitor de digitais aqui. A GPU GeForce MX250 de 10 W mais lenta também é uma chatice para jogadores casuais.
Se você frequentemente se encontra em situações em que um segundo monitor não é possível, o ScreenPad seria a próxima melhor solução. Pode ser inestimável para os viajantes, especialmente em voos onde o espaço da mesa é limitado. Mas para usuários domésticos ou de escritório, pode ser mais sensato considerar emparelhar o mais barato ZenBook 14 UX433 sem ScreenPad com um monitor externo.
O ScreenPad é útil em situações onde um monitor externo está fora de alcance. O ScreenPad 2.0 resolve muitas das deficiências do ScreenPad 1.0 por uma experiência do usuário mais suave e uma tela um pouco menos granulada. Se você não espera usar tanto o recurso, então outros subportáteis estão disponíveis com o mesmo, ou melhor desempenho por menos dinheiro.
Asus ZenBook 14 UX434FL-DB77
- 09/21/2020 v7 (old)
Allen Ngo
Price comparison
