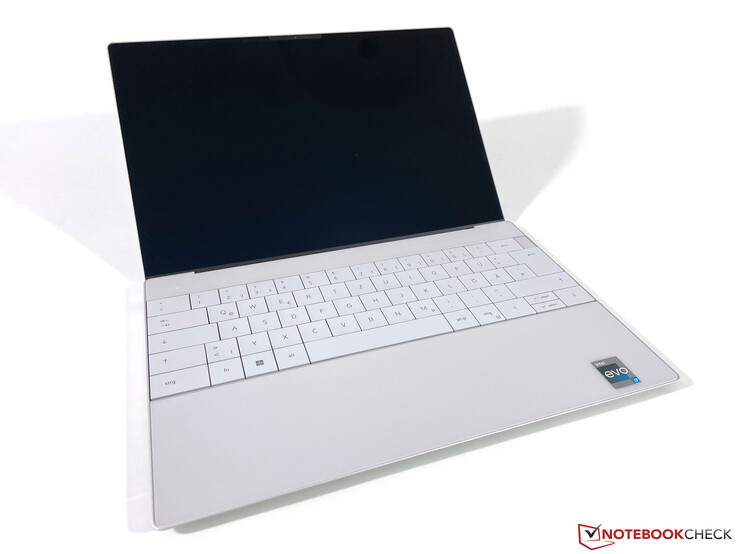
Revisão do laptop Dell XPS 13 Plus: A configuração de base é a melhor escolha?
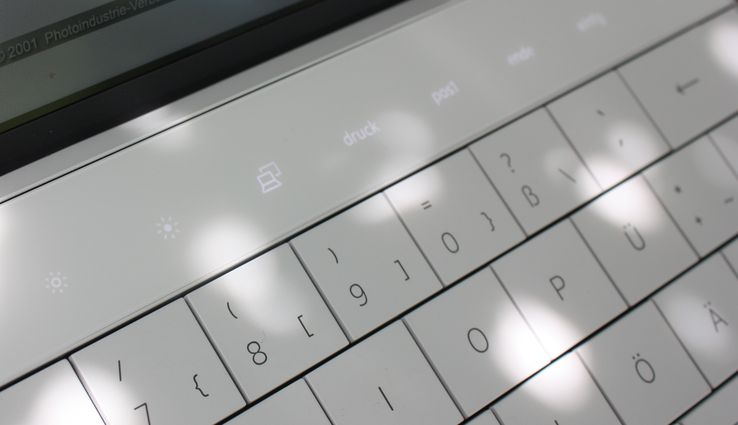
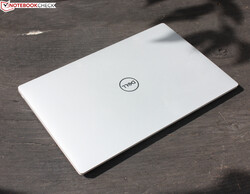
Não podemos nos fartar do XPS. Seguindo o "o XPS 13 mais rápido até agora", um XPS 13 Plus com um Core i7-1260P e um painel 4K, agora temos o modelo básico Plus equipado com um Core i5-1240P, um painel Full HD e um Micron SSD de 512 GB. A entrada no mundo XPS ávido de desempenho custa atualmente 1.350 Euros (~$1.385).
Como um lembrete: A partir deste ano, a Dell oferece o compacto XPS 13 em duas versões: O"normal" XPS 13 com as CPUs Intel Alder Lake da série U, e aXPS 13 Plus com chips mais potentes do Alder Lake P. Já revisamos as duas versões e concluímos que as diferenças de desempenho são substanciais. Isto se aplica não apenas à CPU e ao iGPU, mas também ao dispositivo de armazenamento.
Nesta atualização de revisão, faremos as seguintes perguntas: O custo extra para o Core i7 vale a pena? Qual é a diferença de desempenho em relação ao modelo Alder Lake U (i5)? E quanto à duração da bateria, considerando que o Alder Lake U dobrou o tempo de funcionamento do Alder Lake P?
Como antes, há concorrentes que receberam melhores pontuações gerais em nossas avaliações. Antes de mais nada, oApple Entrada MacBook Air 2020 M1 e o Asus Zenbook S 13 OLEDambos tendem a ser mais baratos do que o nível básico XPS 13 Plus i5.
Outros laptops Dell XPS 13 revisados pelo Notebookcheck
XPS 13 Plus 9320 i7-1260P(4K, Alder Lake P 2022)
XPS 13 9315 i5-1230U(Full HD, Alder Lake U 2022)
XPS 13 9310 Core i7(Full HD, Tiger Lake 2021)
Nesta atualização, não entraremos na mão-de-obra, configuração de portas, dispositivos de entrada ou alto-falantes; em vez disso, consulte nossa revisão doXPS 13 Plus 9320 i7-1260P (4K, Alder Lake P 2022)
Possíveis concorrentes em comparação
Avaliação | Data | Modelo | Peso | Altura | Size | Resolução | Preço |
|---|---|---|---|---|---|---|---|
| 86.1 % v7 (old) | 08/2022 | Dell XPS 13 Plus 9320 i5-1240p i5-1240P, Iris Xe G7 80EUs | 1.2 kg | 15.3 mm | 13.40" | 1920x1200 | |
| 91.1 % v7 (old) | 12/2020 | Apple MacBook Air 2020 M1 Entry M1, M1 7-Core GPU | 1.3 kg | 16.1 mm | 13.30" | 2560x1600 | |
| 90.1 % v7 (old) | 07/2022 | Asus Zenbook S 13 OLED R7 6800U, Radeon 680M | 1.1 kg | 14.9 mm | 13.30" | 2880x1800 | |
| 89.8 % v7 (old) | 02/2021 | Lenovo ThinkPad X1 Nano-20UN002UGE i7-1160G7, Iris Xe G7 96EUs | 946 g | 16 mm | 13.00" | 2160x1350 | |
| 88.8 % v7 (old) | 02/2022 | Huawei MateBook 13s i5 11300H i5-11300H, Iris Xe G7 80EUs | 1.3 kg | 16.5 mm | 13.40" | 2520x1680 | |
| 86.9 % v7 (old) | 07/2022 | Dell XPS 13 Plus 9320 4K i7-1260P, Iris Xe G7 96EUs | 1.2 kg | 15.3 mm | 13.40" | 3840x2400 |
Os Top 10
» Os Top 10 Portáteis Multimídia
» Os Top 10 Portáteis de Jogos
» Os Top 10 Portáteis Leves para Jogos
» Os Top 10 Portáteis Acessíveis de Escritório/Empresariais
» Os Top 10 Portáteis Premium de Escritório/Empresariais
» Os Top 10 dos Portáteis Workstation
» Os Top 10 Subportáteis
» Os Top 10 Ultrabooks
» Os Top 10 Conversíveis
» Os Top 10 Tablets
» Os Top 10 Smartphones
» A melhores Telas de Portáteis Analisadas Pela Notebookcheck
» Top 10 dos portáteis abaixo dos 500 Euros da Notebookcheck
» Top 10 dos Portáteis abaixo dos 300 Euros
Conectividade - Atualizações de SSD somente para o XPS Plus
Comunicação
Conseguimos nos conectar à rede Wi-Fi 6E fornecida por nosso roteador com esta unidade de revisão. Isto não foi possível com a variante 4K/i7 do Plus
Webcam

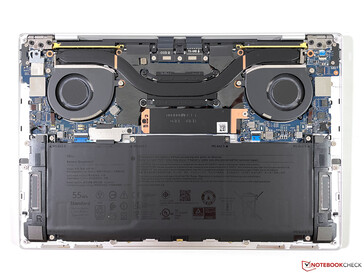
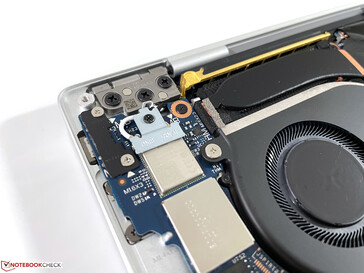
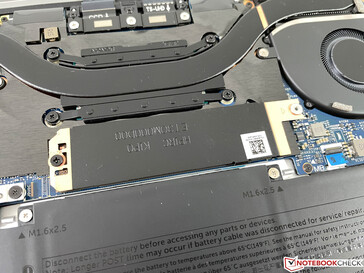
Manutenção
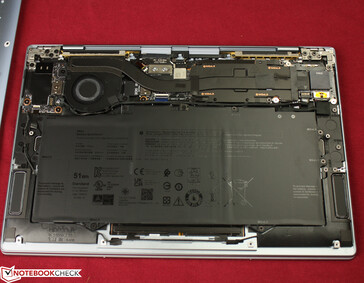
A tampa inferior é fixada com seis parafusos Torx (T5) e é fácil de remover. O interior tem um layout bem organizado, mas os usuários só podem limpar os ventiladores ou substituir o M.2 SSD
Display - Sub-portátil Dell com painel brilhante
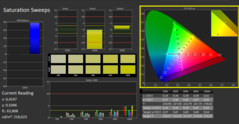
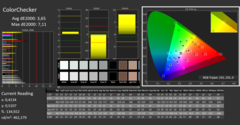
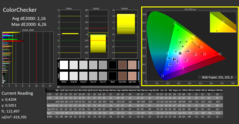
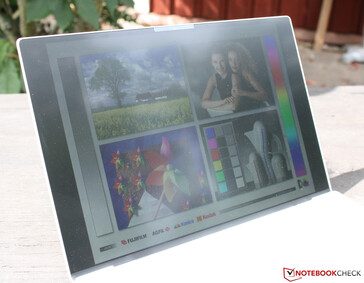
Nosso XPS Plus 9320 tem a variante de painel mais básica a bordo, o LQ134N1 de 1.920x1.200 pixel da Sharp. É o mesmo painel que no Modelo de nível básico XPS 9315e, conseqüentemente, todos os parâmetros que vão do contraste ao brilho e até o espaço de cor são muito semelhantes. O sangramento da tela é marginalmente visível na borda superior esquerda quando se usa um fundo preto e brilho total. O brilho é alto a 460 cd/m² (média), e consideramos que a especificação do fabricante de 500 cd/m² é verdadeira (máx. 498 cd/m²).
O painel de 4K noVersão Plus com o i7 (Sharp LQ134R1) tinha um brilho idêntico de 473 cd/m² (média) em nossas medidas, mas tinha um contraste maior. 1.764:1 ao invés de 940:1; este é um argumento a favor do painel 4K. Há um painel OLED alternativo para a versão Plus, mas ainda não tivemos a oportunidade de revisá-lo.
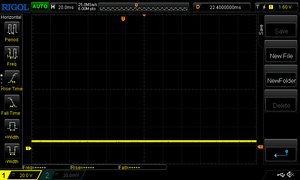
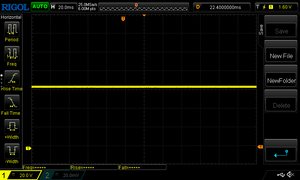
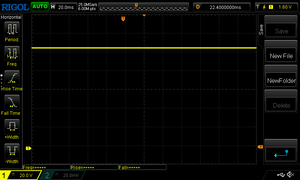
O brilho é ligeiramente diminuído com a energia da bateria, caindo em 78 cd/m² (centro: 420 cd/m²). O XPS 13 Plus não usa PWM para diminuir os níveis de brilho. As três capturas de tela mostram uma linha homogênea com 100%, 50% e 0% de brilho.
| |||||||||||||||||||||||||
iluminação: 85 %
iluminação com acumulador: 420 cd/m²
Contraste: 940:1 (Preto: 0.53 cd/m²)
ΔE ColorChecker Calman: 3.65 | ∀{0.5-29.43 Ø4.77}
calibrated: 2.16
ΔE Greyscale Calman: 4.25 | ∀{0.09-98 Ø5}
71% AdobeRGB 1998 (Argyll 3D)
99% sRGB (Argyll 3D)
69% Display P3 (Argyll 3D)
Gamma: 2.45
CCT: 6690 K
| Dell XPS 13 Plus 9320 i5-1240p Sharp SHP1548 LQ134N1, IPS, 1920x1200, 13.4" | Dell XPS 13 9315, i5-1230U Sharp SHP1548 LQ134N1, IPS, 1920x1200, 13.4" | Dell XPS 13 Plus 9320 4K LQ134R1, IPS, 3840x2400, 13.4" | Apple MacBook Air 2020 M1 Entry IPS, 2560x1600, 13.3" | Asus Zenbook S 13 OLED SDC4172, OLED, 2880x1800, 13.3" | Lenovo ThinkPad X1 Nano-20UN002UGE MND007ZA1-2, IPS, 2160x1350, 13" | Huawei MateBook 13s i5 11300H TL134GDXP02-0, LTPS, 2520x1680, 13.4" | |
|---|---|---|---|---|---|---|---|
| Display | 0% | 6% | 22% | 28% | 1% | -6% | |
| Display P3 Coverage (%) | 69 | 69 0% | 76.5 11% | 98.6 43% | 99.8 45% | 70.4 2% | 65.2 -6% |
| sRGB Coverage (%) | 99 | 100 1% | 100 1% | 100 1% | 100 1% | 99.9 1% | 92 -7% |
| AdobeRGB 1998 Coverage (%) | 71 | 71 0% | 76 7% | 85.9 21% | 97.8 38% | 72 1% | 67.5 -5% |
| Response Times | 3% | 5% | 4% | 94% | -19% | -5% | |
| Response Time Grey 50% / Grey 80% * (ms) | 45 ? | 40 ? 11% | 38.9 ? 14% | 31 ? 31% | 2.1 ? 95% | 46.8 ? -4% | 44.8 ? -0% |
| Response Time Black / White * (ms) | 21 ? | 22 ? -5% | 21.9 ? -4% | 26.1 ? -24% | 1.68 ? 92% | 28 ? -33% | 22.8 ? -9% |
| PWM Frequency (Hz) | 118000 ? | 240.4 ? | 9804 ? | ||||
| Screen | 10% | 28% | 30% | 215% | 39% | 35% | |
| Brightness middle (cd/m²) | 498 | 466 -6% | 494 -1% | 417 -16% | 336 -33% | 460 -8% | 468 -6% |
| Brightness (cd/m²) | 460 | 442 -4% | 474 3% | 395 -14% | 338 -27% | 434 -6% | 450 -2% |
| Brightness Distribution (%) | 85 | 89 5% | 89 5% | 91 7% | 99 16% | 92 8% | 92 8% |
| Black Level * (cd/m²) | 0.53 | 0.4 25% | 0.28 47% | 0.39 26% | 0.02 96% | 0.27 49% | 0.23 57% |
| Contrast (:1) | 940 | 1165 24% | 1764 88% | 1069 14% | 16800 1687% | 1704 81% | 2035 116% |
| Colorchecker dE 2000 * | 3.65 | 3.03 17% | 3.1 15% | 1.12 69% | 1.8 51% | 1.1 70% | 2 45% |
| Colorchecker dE 2000 max. * | 7.11 | 6.68 6% | 4.2 41% | 2.71 62% | 3.8 47% | 4.5 37% | 5.5 23% |
| Colorchecker dE 2000 calibrated * | 2.16 | 2.34 -8% | 1.5 31% | 0.77 64% | 1.8 17% | 1 54% | 1.5 31% |
| Greyscale dE 2000 * | 4.25 | 3.12 27% | 3.2 25% | 1.7 60% | 0.9 79% | 1.6 62% | 2.6 39% |
| Gamma | 2.45 90% | 2.41 91% | 2.41 91% | 2207 0% | 2.22 99% | 2.2 100% | 2.17 101% |
| CCT | 6690 97% | 6418 101% | 6189 105% | 6870 95% | 6580 99% | 6475 100% | 6511 100% |
| Color Space (Percent of AdobeRGB 1998) (%) | 65.7 | ||||||
| Color Space (Percent of sRGB) (%) | 99.9 | ||||||
| Média Total (Programa/Configurações) | 4% /
7% | 13% /
20% | 19% /
25% | 112% /
157% | 7% /
22% | 8% /
20% |
* ... menor é melhor
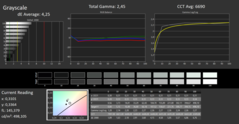
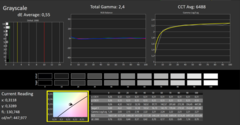
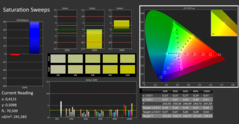
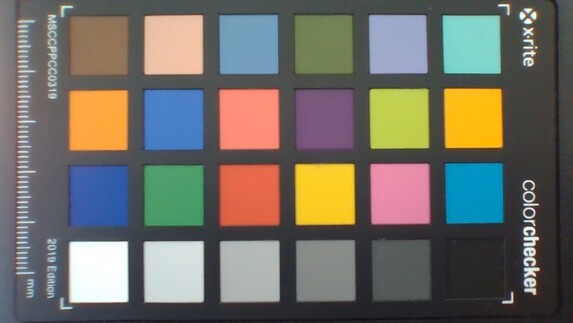
Observamos duas coisas durante nossa análise com o software profissional CalMAN (X-Rite i1 Pro 2): 100% do sRGB é coberto. Além disso, há um Delta E de mais de 4,0 para a escala de cinza e um pouco menos de 4 para as cores. Isto torna uma calibração altamente recomendável, pois elimina o leve impacto da cor com o cinza. O esforço de realizar uma calibração é recompensado com um excelente Delta E de menos de 0,5. Se você tiver a mesma configuração de tela (Sharp LQ134N1), você pode melhorar seu laptop Dell usando o perfil de cor fornecido na caixa acima.
Exibir tempos de resposta
| ↔ Tempo de resposta preto para branco | ||
|---|---|---|
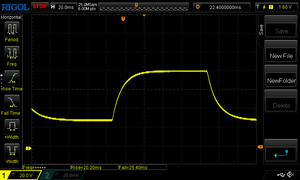
| 21 ms ... ascensão ↗ e queda ↘ combinadas | ↗ 8 ms ascensão | |
| ↘ 13 ms queda | ||
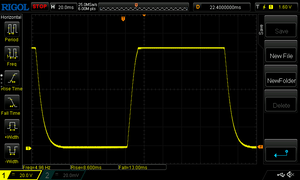
| A tela mostra boas taxas de resposta em nossos testes, mas pode ser muito lenta para jogadores competitivos. Em comparação, todos os dispositivos testados variam de 0.1 (mínimo) a 240 (máximo) ms. » 46 % de todos os dispositivos são melhores. Isso significa que o tempo de resposta medido é semelhante à média de todos os dispositivos testados (20.2 ms). | ||
| ↔ Tempo de resposta 50% cinza a 80% cinza | ||
| 45 ms ... ascensão ↗ e queda ↘ combinadas | ↗ 20 ms ascensão | |
| ↘ 25 ms queda | ||
| A tela mostra taxas de resposta lentas em nossos testes e será insatisfatória para os jogadores. Em comparação, todos os dispositivos testados variam de 0.165 (mínimo) a 636 (máximo) ms. » 76 % de todos os dispositivos são melhores. Isso significa que o tempo de resposta medido é pior que a média de todos os dispositivos testados (31.5 ms). | ||
Cintilação da tela / PWM (modulação por largura de pulso)
| Tela tremeluzindo / PWM não detectado | ≤ 100 % configuração de brilho | ||
[pwm_comparison] Em comparação: 53 % de todos os dispositivos testados não usam PWM para escurecer a tela. Se PWM foi detectado, uma média de 8070 (mínimo: 5 - máximo: 343500) Hz foi medida. | |||
Desempenho - Menos poder sustentado com a Intel i5
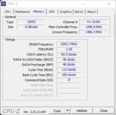
O XPS 13 Plus é equipado exclusivamente com processadores Alder Lake P, ou seja, com oNúcleo i5-1240P e Corei7-1260P (4 núcleos de desempenho e 8 núcleos de eficiência em cada caso), ou alternativamente com o Core i7-1280P que tem dois núcleos de desempenho adicionais. Os usuários podem escolher entre 8, 16 ou 32 GB de RAM (LPDDR5-5200); os 32 GB de RAM só estão disponíveis em combinação com uma das CPUs i7. Nosso dispositivo de teste tem que gerenciar com 8 GB de memória LPDDR5; a RAM é integrada, mas conectada em modo de canal duplo. Um SSD M.2 de 512 GB da Micron completa o pacote. O SSD é encaixado.
Condições de teste
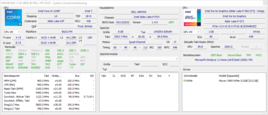
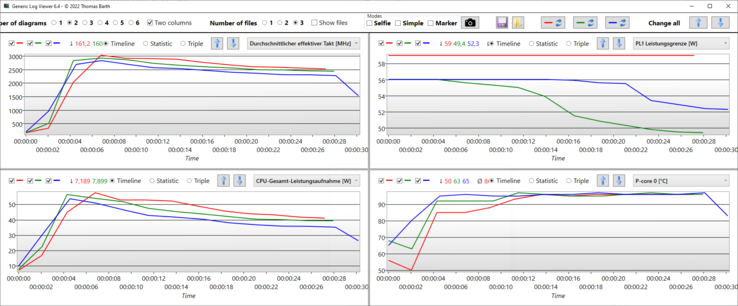
A Dell fornece quatro perfis de desempenho diferentes no Power Manager pré-instalado (Otimizado, Silencioso, Ultra Desempenho e Refrigerado), mas não vamos olhar mais para o perfil Refrigerado. Realizamos os seguintes benchmarks e medições usando o modo Ultra Performance. Com seus dois ventiladores, o desempenho de resfriamento do XPS 13 Plus é muito bom para um dispositivo compacto. No uso diário e durante o pico de carga de curto prazo, o dispositivo é muitas vezes silencioso mesmo neste modo. Os dois ventiladores são um pouco mais altos sob carga máxima da CPU, mas o desempenho também é decente em troca. O processador pode teoricamente consumir até 64 watts nos três modos, mas somente o modo Ultra Performance é capaz de manter o limite de desempenho PL1 (59 watts) começando com o Cinebench R15
Processador
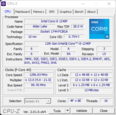
Com seus 4 núcleos de desempenho e 8 núcleos de eficiência, oNúcleo i5-1240P ocupa o primeiro lugar em termos de desempenho, como mostra abaixo nossa classificação de desempenho da CPU. O 1260P está no topo, seguido pelo Ryzen 7 6800U. Os núcleos P funcionam em até 4,4 GHz, mas isto só é conseguido sob carga de um só núcleo. Este é exatamente o tipo de carga que ainda é importante no uso diário, e é por isso que uma olhada nos resultados de um só núcleo é aconselhável. Os chips do Alder Lake P estão ligeiramente à frente aqui (Cinebench), seguidos peloAMD 6800U mais uma vez. Dependendo da referência, porém, há também desvios acentuados em relação a isso, como aApple M1 mostra no teste do liquidificador
Nós executamos o Cinebench R15 Multi benchmark sob os três modos de desempenho. Em Ultra Performance (vermelho), é permitido um PL1 de 59 watts, e a taxa de clock de 3,0 GHz é também a mais alta. O modo Otimizado baixa o PL1 para 56 watts, assim como o modo Silencioso. Entretanto, a velocidade do relógio começa a sofrer uma aceleração gradual após apenas 5 segundos no modo Silencioso, razão pela qual o PL1 cai então para pouco menos de 50 watts (PL2: 48 watts), enquanto a velocidade do relógio cai de acordo com 2,5 GHz.
No Cinebench R15 Multi loop, a velocidade do relógio aumenta para 3,0 GHz antes de cair para 2,5 GHz, juntamente com uma queda no consumo total de energia. Como os núcleos P já estão aquecendo até 95 °C (~203 °F), a velocidade do relógio é continuamente reduzida em todas as corridas subseqüentes do laço R15, e é por isso que as pontuações também caem. A pontuação não é mais de 1.591 pontos após cerca de 20 corridas, mas apenas 1.213 pontos. Esta é uma perda de 24%. Oi5-1230U no xPS de nível básico fica muito atrás em cerca de 500 pontos. Mais uma vez, a competição AMD prova ser sólida e não pode ser derrubada do trono. OAsus Zenbook S13 OLED lidera a tabela R15.
O Multi loop do Cinebench mais uma vez confirma o ponto fraco dos processadores do Alder Lake. No início, o desempenho multi-core está praticamente no mesmo nível da atual AMD Ryzen 7 6800Uque consome significativamente menos energia com um máximo de 30 watts. Posteriormente, o i5/i7 no XPS 13 Plus se instala em 34 watts, mas fornece menos desempenho do que o 6800U noZenBook S 13 a 25 watts.
Cinebench R15 Multi endurance test
Cinebench R15: CPU Single 64Bit | CPU Multi 64Bit
Cinebench R20: CPU (Multi Core) | CPU (Single Core)
Cinebench R23: Multi Core | Single Core
Blender: v2.79 BMW27 CPU
7-Zip 18.03: 7z b 4 | 7z b 4 -mmt1
LibreOffice : 20 Documents To PDF
R Benchmark 2.5: Overall mean
HWBOT x265 Benchmark v2.2: 4k Preset
| CPU Performance rating | |
| Média da turma Subnotebook | |
| Dell XPS 13 Plus 9320 4K | |
| Asus Zenbook S 13 OLED | |
| Dell XPS 13 Plus 9320 i5-1240p | |
| Média Intel Core i5-1240P | |
| Apple MacBook Air 2020 M1 Entry -1! | |
| Huawei MateBook 13s i5 11300H | |
| Lenovo ThinkPad X1 Nano-20UN002UGE -1! | |
| Cinebench R15 / CPU Single 64Bit | |
| Média da turma Subnotebook (72.4 - 322, n=66, últimos 2 anos) | |
| Dell XPS 13 Plus 9320 4K | |
| Asus Zenbook S 13 OLED | |
| Dell XPS 13 Plus 9320 i5-1240p | |
| Apple MacBook Air 2020 M1 Entry | |
| Lenovo ThinkPad X1 Nano-20UN002UGE | |
| Huawei MateBook 13s i5 11300H | |
| Média Intel Core i5-1240P (91.8 - 243, n=18) | |
| Cinebench R15 / CPU Multi 64Bit | |
| Média da turma Subnotebook (327 - 3345, n=66, últimos 2 anos) | |
| Asus Zenbook S 13 OLED | |
| Dell XPS 13 Plus 9320 4K | |
| Dell XPS 13 Plus 9320 4K | |
| Dell XPS 13 Plus 9320 i5-1240p | |
| Média Intel Core i5-1240P (407 - 2007, n=19) | |
| Apple MacBook Air 2020 M1 Entry | |
| Huawei MateBook 13s i5 11300H | |
| Huawei MateBook 13s i5 11300H | |
| Lenovo ThinkPad X1 Nano-20UN002UGE | |
| Cinebench R20 / CPU (Multi Core) | |
| Média da turma Subnotebook (579 - 8541, n=66, últimos 2 anos) | |
| Asus Zenbook S 13 OLED | |
| Dell XPS 13 Plus 9320 4K | |
| Dell XPS 13 Plus 9320 i5-1240p | |
| Média Intel Core i5-1240P (763 - 4456, n=16) | |
| Huawei MateBook 13s i5 11300H | |
| Apple MacBook Air 2020 M1 Entry | |
| Lenovo ThinkPad X1 Nano-20UN002UGE | |
| Cinebench R20 / CPU (Single Core) | |
| Média da turma Subnotebook (128 - 826, n=66, últimos 2 anos) | |
| Dell XPS 13 Plus 9320 4K | |
| Dell XPS 13 Plus 9320 i5-1240p | |
| Asus Zenbook S 13 OLED | |
| Média Intel Core i5-1240P (251 - 653, n=16) | |
| Lenovo ThinkPad X1 Nano-20UN002UGE | |
| Huawei MateBook 13s i5 11300H | |
| Apple MacBook Air 2020 M1 Entry | |
| Cinebench R23 / Multi Core | |
| Média da turma Subnotebook (1555 - 21812, n=71, últimos 2 anos) | |
| Asus Zenbook S 13 OLED | |
| Dell XPS 13 Plus 9320 4K | |
| Dell XPS 13 Plus 9320 i5-1240p | |
| Média Intel Core i5-1240P (277 - 11556, n=20) | |
| Apple MacBook Air 2020 M1 Entry | |
| Lenovo ThinkPad X1 Nano-20UN002UGE | |
| Huawei MateBook 13s i5 11300H | |
| Cinebench R23 / Single Core | |
| Média da turma Subnotebook (358 - 2165, n=72, últimos 2 anos) | |
| Dell XPS 13 Plus 9320 4K | |
| Dell XPS 13 Plus 9320 i5-1240p | |
| Apple MacBook Air 2020 M1 Entry | |
| Asus Zenbook S 13 OLED | |
| Média Intel Core i5-1240P (640 - 1689, n=18) | |
| Huawei MateBook 13s i5 11300H | |
| Blender / v2.79 BMW27 CPU | |
| Apple MacBook Air 2020 M1 Entry | |
| Lenovo ThinkPad X1 Nano-20UN002UGE | |
| Huawei MateBook 13s i5 11300H | |
| Média Intel Core i5-1240P (285 - 1926, n=16) | |
| Dell XPS 13 Plus 9320 i5-1240p | |
| Média da turma Subnotebook (159 - 2271, n=69, últimos 2 anos) | |
| Dell XPS 13 Plus 9320 4K | |
| Asus Zenbook S 13 OLED | |
| 7-Zip 18.03 / 7z b 4 | |
| Asus Zenbook S 13 OLED | |
| Média da turma Subnotebook (11668 - 77867, n=66, últimos 2 anos) | |
| Dell XPS 13 Plus 9320 4K | |
| Dell XPS 13 Plus 9320 i5-1240p | |
| Apple MacBook Air 2020 M1 Entry | |
| Média Intel Core i5-1240P (7254 - 47002, n=16) | |
| Huawei MateBook 13s i5 11300H | |
| Lenovo ThinkPad X1 Nano-20UN002UGE | |
| 7-Zip 18.03 / 7z b 4 -mmt1 | |
| Média da turma Subnotebook (2643 - 6442, n=68, últimos 2 anos) | |
| Apple MacBook Air 2020 M1 Entry | |
| Asus Zenbook S 13 OLED | |
| Dell XPS 13 Plus 9320 4K | |
| Huawei MateBook 13s i5 11300H | |
| Dell XPS 13 Plus 9320 i5-1240p | |
| Lenovo ThinkPad X1 Nano-20UN002UGE | |
| Média Intel Core i5-1240P (2197 - 5320, n=16) | |
| LibreOffice / 20 Documents To PDF | |
| Dell XPS 13 Plus 9320 i5-1240p | |
| Média Intel Core i5-1240P (46.4 - 120.5, n=16) | |
| Média da turma Subnotebook (38.5 - 220, n=65, últimos 2 anos) | |
| Asus Zenbook S 13 OLED | |
| Lenovo ThinkPad X1 Nano-20UN002UGE | |
| Huawei MateBook 13s i5 11300H | |
| Dell XPS 13 Plus 9320 4K | |
| Apple MacBook Air 2020 M1 Entry | |
| R Benchmark 2.5 / Overall mean | |
| Apple MacBook Air 2020 M1 Entry | |
| Lenovo ThinkPad X1 Nano-20UN002UGE | |
| Huawei MateBook 13s i5 11300H | |
| Média Intel Core i5-1240P (0.4987 - 1.236, n=16) | |
| Média da turma Subnotebook (0.403 - 1.456, n=67, últimos 2 anos) | |
| Asus Zenbook S 13 OLED | |
| Dell XPS 13 Plus 9320 i5-1240p | |
| Dell XPS 13 Plus 9320 4K | |
| HWBOT x265 Benchmark v2.2 / 4k Preset | |
| Média da turma Subnotebook (0.97 - 25.1, n=66, últimos 2 anos) | |
| Asus Zenbook S 13 OLED | |
| Dell XPS 13 Plus 9320 4K | |
| Dell XPS 13 Plus 9320 i5-1240p | |
| Média Intel Core i5-1240P (1.99 - 12.9, n=16) | |
| Huawei MateBook 13s i5 11300H | |
| Lenovo ThinkPad X1 Nano-20UN002UGE | |
* ... menor é melhor
AIDA64: FP32 Ray-Trace | FPU Julia | CPU SHA3 | CPU Queen | FPU SinJulia | FPU Mandel | CPU AES | CPU ZLib | FP64 Ray-Trace | CPU PhotoWorxx
| Performance rating | |
| Asus Zenbook S 13 OLED | |
| Média da turma Subnotebook | |
| Huawei MateBook 13s i5 11300H | |
| Dell XPS 13 Plus 9320 4K | |
| Dell XPS 13 Plus 9320 i5-1240p | |
| Média Intel Core i5-1240P | |
| Lenovo ThinkPad X1 Nano-20UN002UGE | |
| AIDA64 / FP32 Ray-Trace | |
| Média da turma Subnotebook (1135 - 32888, n=65, últimos 2 anos) | |
| Asus Zenbook S 13 OLED | |
| Huawei MateBook 13s i5 11300H | |
| Lenovo ThinkPad X1 Nano-20UN002UGE | |
| Média Intel Core i5-1240P (2405 - 9694, n=16) | |
| Dell XPS 13 Plus 9320 4K | |
| Dell XPS 13 Plus 9320 i5-1240p | |
| AIDA64 / FPU Julia | |
| Asus Zenbook S 13 OLED | |
| Média da turma Subnotebook (5218 - 123315, n=65, últimos 2 anos) | |
| Huawei MateBook 13s i5 11300H | |
| Média Intel Core i5-1240P (7407 - 49934, n=16) | |
| Lenovo ThinkPad X1 Nano-20UN002UGE | |
| Dell XPS 13 Plus 9320 4K | |
| Dell XPS 13 Plus 9320 i5-1240p | |
| AIDA64 / CPU SHA3 | |
| Média da turma Subnotebook (444 - 5287, n=65, últimos 2 anos) | |
| Asus Zenbook S 13 OLED | |
| Huawei MateBook 13s i5 11300H | |
| Lenovo ThinkPad X1 Nano-20UN002UGE | |
| Dell XPS 13 Plus 9320 4K | |
| Dell XPS 13 Plus 9320 i5-1240p | |
| Média Intel Core i5-1240P (415 - 2462, n=16) | |
| AIDA64 / CPU Queen | |
| Asus Zenbook S 13 OLED | |
| Dell XPS 13 Plus 9320 4K | |
| Dell XPS 13 Plus 9320 i5-1240p | |
| Média Intel Core i5-1240P (29405 - 76736, n=16) | |
| Média da turma Subnotebook (10579 - 115682, n=65, últimos 2 anos) | |
| Huawei MateBook 13s i5 11300H | |
| Lenovo ThinkPad X1 Nano-20UN002UGE | |
| AIDA64 / FPU SinJulia | |
| Asus Zenbook S 13 OLED | |
| Média da turma Subnotebook (744 - 18418, n=65, últimos 2 anos) | |
| Dell XPS 13 Plus 9320 4K | |
| Dell XPS 13 Plus 9320 i5-1240p | |
| Média Intel Core i5-1240P (2135 - 6540, n=16) | |
| Huawei MateBook 13s i5 11300H | |
| Lenovo ThinkPad X1 Nano-20UN002UGE | |
| AIDA64 / FPU Mandel | |
| Asus Zenbook S 13 OLED | |
| Média da turma Subnotebook (3341 - 65433, n=65, últimos 2 anos) | |
| Huawei MateBook 13s i5 11300H | |
| Lenovo ThinkPad X1 Nano-20UN002UGE | |
| Média Intel Core i5-1240P (5113 - 23992, n=16) | |
| Dell XPS 13 Plus 9320 i5-1240p | |
| Dell XPS 13 Plus 9320 4K | |
| AIDA64 / CPU AES | |
| Asus Zenbook S 13 OLED | |
| Huawei MateBook 13s i5 11300H | |
| Lenovo ThinkPad X1 Nano-20UN002UGE | |
| Média da turma Subnotebook (638 - 124284, n=65, últimos 2 anos) | |
| Média Intel Core i5-1240P (8849 - 90370, n=16) | |
| Dell XPS 13 Plus 9320 i5-1240p | |
| Dell XPS 13 Plus 9320 4K | |
| AIDA64 / CPU ZLib | |
| Média da turma Subnotebook (164.9 - 1379, n=65, últimos 2 anos) | |
| Dell XPS 13 Plus 9320 4K | |
| Dell XPS 13 Plus 9320 i5-1240p | |
| Asus Zenbook S 13 OLED | |
| Média Intel Core i5-1240P (101.6 - 812, n=16) | |
| Huawei MateBook 13s i5 11300H | |
| Lenovo ThinkPad X1 Nano-20UN002UGE | |
| AIDA64 / FP64 Ray-Trace | |
| Média da turma Subnotebook (610 - 17495, n=65, últimos 2 anos) | |
| Asus Zenbook S 13 OLED | |
| Huawei MateBook 13s i5 11300H | |
| Lenovo ThinkPad X1 Nano-20UN002UGE | |
| Média Intel Core i5-1240P (1154 - 5258, n=16) | |
| Dell XPS 13 Plus 9320 4K | |
| Dell XPS 13 Plus 9320 i5-1240p | |
| AIDA64 / CPU PhotoWorxx | |
| Média da turma Subnotebook (6569 - 64588, n=65, últimos 2 anos) | |
| Dell XPS 13 Plus 9320 4K | |
| Dell XPS 13 Plus 9320 i5-1240p | |
| Lenovo ThinkPad X1 Nano-20UN002UGE | |
| Huawei MateBook 13s i5 11300H | |
| Média Intel Core i5-1240P (11873 - 43661, n=16) | |
| Asus Zenbook S 13 OLED | |
Desempenho do sistema
Na prática, o XPS 13 Plus é um computador responsivo, mas ocupa uma posição inferior no campo do PC Mark 10. Por que isso é assim? A razão é a baixa pontuação no Essentials, que poderia ser causada pelo lento SSD Micron - mais sobre isso em breve. O 4K Plus com o SSD da Samsung (1 TB) ganha consideravelmente mais pontos nos subnúmeros. Em qualquer caso, nenhum XPS Plus pode assumir a liderança do Asus Zenbook S 13 OLED.
CrossMark: Overall | Productivity | Creativity | Responsiveness
| PCMark 10 / Score | |
| Média da turma Subnotebook (4920 - 8424, n=53, últimos 2 anos) | |
| Asus Zenbook S 13 OLED | |
| Dell XPS 13 Plus 9320 4K | |
| Média Intel Core i5-1240P, Intel Iris Xe Graphics G7 80EUs (4881 - 5345, n=11) | |
| Huawei MateBook 13s i5 11300H | |
| Dell XPS 13 Plus 9320 i5-1240p | |
| Dell XPS 13 9315, i5-1230U | |
| Lenovo ThinkPad X1 Nano-20UN002UGE | |
| PCMark 10 / Essentials | |
| Asus Zenbook S 13 OLED | |
| Média da turma Subnotebook (8552 - 11406, n=53, últimos 2 anos) | |
| Dell XPS 13 Plus 9320 4K | |
| Média Intel Core i5-1240P, Intel Iris Xe Graphics G7 80EUs (8890 - 10652, n=11) | |
| Dell XPS 13 9315, i5-1230U | |
| Huawei MateBook 13s i5 11300H | |
| Lenovo ThinkPad X1 Nano-20UN002UGE | |
| Dell XPS 13 Plus 9320 i5-1240p | |
| PCMark 10 / Productivity | |
| Média da turma Subnotebook (5435 - 16132, n=53, últimos 2 anos) | |
| Asus Zenbook S 13 OLED | |
| Dell XPS 13 Plus 9320 4K | |
| Dell XPS 13 Plus 9320 i5-1240p | |
| Média Intel Core i5-1240P, Intel Iris Xe Graphics G7 80EUs (6118 - 7058, n=11) | |
| Dell XPS 13 9315, i5-1230U | |
| Huawei MateBook 13s i5 11300H | |
| Lenovo ThinkPad X1 Nano-20UN002UGE | |
| PCMark 10 / Digital Content Creation | |
| Média da turma Subnotebook (5722 - 12442, n=53, últimos 2 anos) | |
| Asus Zenbook S 13 OLED | |
| Dell XPS 13 Plus 9320 4K | |
| Média Intel Core i5-1240P, Intel Iris Xe Graphics G7 80EUs (5169 - 6213, n=11) | |
| Dell XPS 13 Plus 9320 i5-1240p | |
| Huawei MateBook 13s i5 11300H | |
| Lenovo ThinkPad X1 Nano-20UN002UGE | |
| Dell XPS 13 9315, i5-1230U | |
| CrossMark / Overall | |
| Dell XPS 13 Plus 9320 4K | |
| Média da turma Subnotebook (365 - 2038, n=66, últimos 2 anos) | |
| Média Intel Core i5-1240P, Intel Iris Xe Graphics G7 80EUs (1392 - 1553, n=7) | |
| Asus Zenbook S 13 OLED | |
| Dell XPS 13 Plus 9320 i5-1240p | |
| Apple MacBook Air 2020 M1 Entry | |
| Huawei MateBook 13s i5 11300H | |
| Dell XPS 13 9315, i5-1230U | |
| CrossMark / Productivity | |
| Dell XPS 13 Plus 9320 4K | |
| Média da turma Subnotebook (364 - 1918, n=66, últimos 2 anos) | |
| Asus Zenbook S 13 OLED | |
| Média Intel Core i5-1240P, Intel Iris Xe Graphics G7 80EUs (1393 - 1524, n=7) | |
| Huawei MateBook 13s i5 11300H | |
| Dell XPS 13 Plus 9320 i5-1240p | |
| Dell XPS 13 9315, i5-1230U | |
| Apple MacBook Air 2020 M1 Entry | |
| CrossMark / Creativity | |
| Dell XPS 13 Plus 9320 4K | |
| Média da turma Subnotebook (372 - 2396, n=66, últimos 2 anos) | |
| Dell XPS 13 Plus 9320 i5-1240p | |
| Apple MacBook Air 2020 M1 Entry | |
| Média Intel Core i5-1240P, Intel Iris Xe Graphics G7 80EUs (1426 - 1647, n=7) | |
| Asus Zenbook S 13 OLED | |
| Dell XPS 13 9315, i5-1230U | |
| Huawei MateBook 13s i5 11300H | |
| CrossMark / Responsiveness | |
| Huawei MateBook 13s i5 11300H | |
| Dell XPS 13 Plus 9320 4K | |
| Média Intel Core i5-1240P, Intel Iris Xe Graphics G7 80EUs (1267 - 1545, n=7) | |
| Média da turma Subnotebook (312 - 1889, n=66, últimos 2 anos) | |
| Dell XPS 13 Plus 9320 i5-1240p | |
| Asus Zenbook S 13 OLED | |
| Dell XPS 13 9315, i5-1230U | |
| Apple MacBook Air 2020 M1 Entry | |
| PCMark 10 Score | 4903 pontos | |
Ajuda | ||
| AIDA64 / Memory Copy | |
| Média da turma Subnotebook (14554 - 109035, n=65, últimos 2 anos) | |
| Dell XPS 13 Plus 9320 i5-1240p | |
| Média Intel Core i5-1240P (23312 - 70537, n=16) | |
| AIDA64 / Memory Read | |
| Média da turma Subnotebook (15948 - 127174, n=65, últimos 2 anos) | |
| Dell XPS 13 Plus 9320 i5-1240p | |
| Média Intel Core i5-1240P (18989 - 70553, n=16) | |
| AIDA64 / Memory Write | |
| Média da turma Subnotebook (15709 - 117898, n=65, últimos 2 anos) | |
| Dell XPS 13 Plus 9320 i5-1240p | |
| Média Intel Core i5-1240P (23454 - 62496, n=16) | |
Latências DPC
Nosso teste de latência padronizado (navegação na web, 4K YouTube, carga de CPU) revela problemas; o driver ACPI está causando problemas. Este também foi o caso com o XPS 13 Plus i7/4K. Portanto, o XPS 13 Plus só é adequado para usar aplicações de áudio em tempo real de forma limitada com a versão atual da BIOS / configurações do acionador
| DPC Latencies / LatencyMon - interrupt to process latency (max), Web, Youtube, Prime95 | |
| Dell XPS 13 Plus 9320 i5-1240p | |
| Lenovo ThinkPad X1 Nano-20UN002UGE | |
| Huawei MateBook 13s i5 11300H | |
| Dell XPS 13 Plus 9320 4K | |
| Asus Zenbook S 13 OLED | |
* ... menor é melhor
Armazenamento
O Micron 3400 SSD de 512 GB está conectado como um dispositivo M.2. Como lembrete, o XPS 13 Plus usa slots M.2, o que torna possível atualizar o SSD posteriormente. O XPS 13 Plus liso utiliza chips de bordo com solda. Dos 512 GB, cerca de 312 GB estão disponíveis para o usuário após a primeira inicialização.
O Micron 3400 vem em último lugar nos testes. Os chips Phison e Samsung na competição - mas também noXPS 13 Plus (i7 + 1 TB) - são simplesmente mais rápidos. Portanto, nem todo XPS Plus tem o melhor hardware possível a bordo: O 4K XPS 9320 com o SSD Samsung de 1 TB tem melhor desempenho.
Para comparações e benchmarks adicionais, consulte nosso Artigo de Benchmarks HDD/SSD.
* ... menor é melhor
Continuous load read: DiskSpd Read Loop, Queue Depth 8
Placa gráfica
OG7 Iris Xe Graphics 80EUs usados nos processadores Tiger Lake é um velho conhecido; também é usado nas CPUs do Lago Alder. Em geral, o desempenho gráfico é médio com base nos resultados mistos dos 3DMark. O mesmo iGPU mostrou melhores resultados no XPS 13 9305
| 3DMark 11 Performance | 5500 pontos | |
| 3DMark Cloud Gate Standard Score | 10751 pontos | |
| 3DMark Fire Strike Score | 3722 pontos | |
| 3DMark Time Spy Score | 1290 pontos | |
Ajuda | ||
Desempenho do jogo
No entanto, o Iris Xe é bastante poderoso aqui, embora normalmente você esteja limitado a detalhes médios ou altos na melhor das hipóteses, mesmo em títulos simples. No entanto, oRadeon 680M o iGPU é significativamente mais rápido, inclusive nos benchmarks de jogos. O é muito mais rápido.G7 Iris Xe Graphics é uma escolha decente para o uso multimídia diário, uma vez que mesmo vídeos de alta resolução não são um problema. O desempenho gráfico é apenas marginalmente reduzido com a energia da bateria. Outros pontos de referência da GPU são disponível aqui.
| Ghostwire Tokyo - 1280x720 Lowest Settings | |
| Dell XPS 13 Plus 9320 i5-1240p | |
| Média Intel Iris Xe Graphics G7 80EUs (n=1) | |
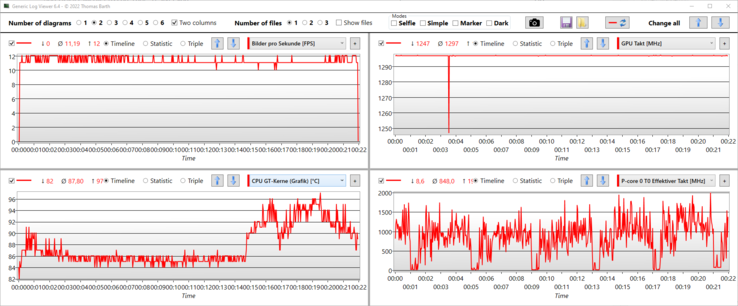
O Witcher 3 funciona sem problemas em Full HD e configurações altas. Usamos a configuração Ultra em Full HD para testar a estabilidade do iGPU sob carga. Embora o FPS 22-23 não seja mais jogável neste caso, ele permanece constante, o que indica uma saída de potência consistente. A taxa de relógio da GPU de 1.300 MHz é mantida
The Witcher 3 FPS diagram
| baixo | média | alto | ultra | |
|---|---|---|---|---|
| GTA V (2015) | 91 | 32 | ||
| The Witcher 3 (2015) | 75.5 | 48.1 | 31.9 | 13.1 |
| Dota 2 Reborn (2015) | 134.4 | 119.5 | 70.9 | 66.1 |
| Final Fantasy XV Benchmark (2018) | 36.3 | 19.7 | 11.7 | |
| X-Plane 11.11 (2018) | 28.5 | 23.7 | 28.8 | |
| Far Cry 5 (2018) | 61 | 28 | ||
| Strange Brigade (2018) | 67.7 | 30.7 | 24.4 | |
| Ghostwire Tokyo (2022) |
Emissões - Mais alto que o lago Alder U
Emissões sonoras
Ao executar tarefas menos exigentes, os dois ventiladores do XPS 13 Plus são normalmente desativados ou estão funcionando no nível mais baixo, no máximo. Isto só é audível em silêncio absoluto. Os ventiladores ligam com mais ou menos freqüência dependendo do modo de potência, com o Ultra desempenho fazendo com que eles funcionem com mais freqüência. No entanto, eles sempre se desligam novamente em uso ocioso, mesmo neste modo. Ao usar o modo Otimizado, o laptop de 13 polegadas é muito silencioso, e pode até ser levado para ambientes sensíveis ao ruído.
As coisas ficam mais barulhentas sob carga, tanto no modo Otimizado como no Ultra Performance, o que se deve aos altos limites de potência. Medimos um máximo de 47 dB(A) no teste de estresse e sob alta carga da CPU. Isso é notável, mas não há freqüências desagradáveis. Se você precisar que o laptop seja menos ruidoso, você pode usar o modo Silencioso, que produz apenas um máximo de 38 dB(A) mesmo sob carga alta.
Se você estiver procurando silêncio, você não precisa necessariamente de um Alder Lake U. OXPS 13 9315 tem apenas um nível máximo de ruído de 40 dB(A). O fator decisivo aqui é utilizar o modo de potência silenciosa correspondente.
Barulho
| Ocioso |
| 26.2 / 26.2 / 26.2 dB |
| Carga |
| 38.4 / 47.1 dB |
 | ||
30 dB silencioso 40 dB(A) audível 50 dB(A) ruidosamente alto |
||
min: | ||
| Dell XPS 13 Plus 9320 i5-1240p Iris Xe G7 80EUs, i5-1240P, Micron 3400 MTFDKBA512TFH 512GB | Asus Zenbook S 13 OLED Radeon 680M, R7 6800U, Samsung PM9A1 MZVL21T0HCLR | Lenovo ThinkPad X1 Nano-20UN002UGE Iris Xe G7 96EUs, i7-1160G7, WDC PC SN530 SDBPNPZ-512G | Huawei MateBook 13s i5 11300H Iris Xe G7 80EUs, i5-11300H, Phison Electronics PS5012 | Dell XPS 13 Plus 9320 4K Iris Xe G7 96EUs, i7-1260P, Samsung PM9A1 MZVL21T0HCLR | Dell XPS 13 9315, i5-1230U Iris Xe G7 80EUs, i5-1230U, Micron 3460 256 GB Soldered | |
|---|---|---|---|---|---|---|
| Noise | 10% | 3% | 6% | 4% | 2% | |
| desligado / ambiente * (dB) | 26 | 24 8% | 24.9 4% | 24.5 6% | 24.4 6% | 26 -0% |
| Idle Minimum * (dB) | 26.2 | 24 8% | 24.9 5% | 24.5 6% | 24.4 7% | 26 1% |
| Idle Average * (dB) | 26.2 | 24 8% | 26.3 -0% | 24.5 6% | 24.4 7% | 26 1% |
| Idle Maximum * (dB) | 26.2 | 24 8% | 31.8 -21% | 28 -7% | 25.5 3% | 27.5 -5% |
| Load Average * (dB) | 38.4 | 33.1 14% | 34.3 11% | 35.9 7% | 40.4 -5% | 39.5 -3% |
| Load Maximum * (dB) | 47.1 | 41.7 11% | 37.5 20% | 38.6 18% | 45.5 3% | 39.6 16% |
| Witcher 3 ultra * (dB) | 40.2 | 34.3 | 35.9 | 45.5 | 39.6 |
* ... menor é melhor
Temperatura
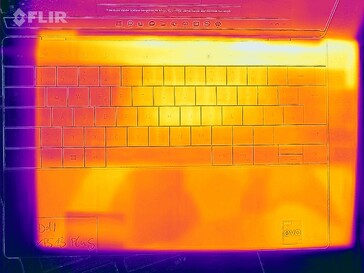
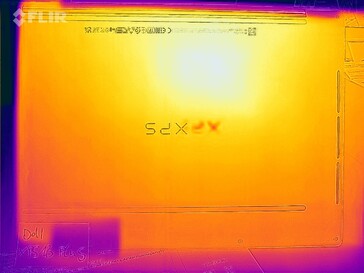
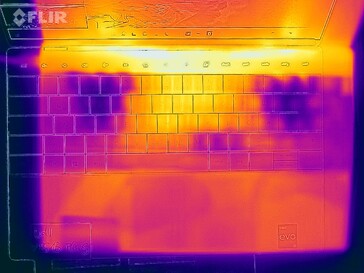
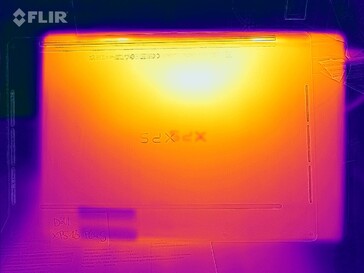
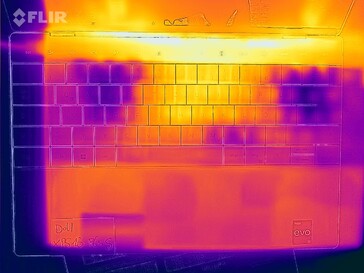
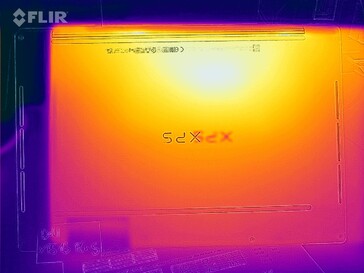
O estojo mantém uma temperatura agradável no uso diário. O equipamento de 13 polegadas pode ser colocado na volta sem problemas quando em movimento. Entretanto, a área inferior e a área superior do teclado em particular aquecem sob carga pesada e contínua ou quando se está jogando. A parte inferior atinge perto de 57 °C (~135 °F) em alguns pontos. Acreditamos que uma superfície plana é aconselhável para a circulação de ar.
O adaptador de energia compacto de 60 watts fica muito quente e atinge 61 °C (~142 °F).
(-) A temperatura máxima no lado superior é 47.6 °C / 118 F, em comparação com a média de 35.9 °C / 97 F , variando de 21.4 a 59 °C para a classe Subnotebook.
(-) A parte inferior aquece até um máximo de 57 °C / 135 F, em comparação com a média de 39.3 °C / 103 F
(±) Em uso inativo, a temperatura média para o lado superior é 34.2 °C / 94 F, em comparação com a média do dispositivo de 30.8 °C / ### class_avg_f### F.
(-) Jogando The Witcher 3, a temperatura média para o lado superior é 39.3 °C / 103 F, em comparação com a média do dispositivo de 30.8 °C / ## #class_avg_f### F.
(±) Os apoios para as mãos e o touchpad podem ficar muito quentes ao toque, com um máximo de 39.8 °C / 103.6 F.
(-) A temperatura média da área do apoio para as mãos de dispositivos semelhantes foi 28.2 °C / 82.8 F (-11.6 °C / -20.8 F).
| Dell XPS 13 Plus 9320 i5-1240p Intel Core i5-1240P, Intel Iris Xe Graphics G7 80EUs | Apple MacBook Air 2020 M1 Entry Apple M1, Apple M1 7-Core GPU | Asus Zenbook S 13 OLED AMD Ryzen 7 6800U, AMD Radeon 680M | Lenovo ThinkPad X1 Nano-20UN002UGE Intel Core i7-1160G7, Intel Iris Xe Graphics G7 96EUs | Huawei MateBook 13s i5 11300H Intel Core i5-11300H, Intel Iris Xe Graphics G7 80EUs | Dell XPS 13 Plus 9320 4K Intel Core i7-1260P, Intel Iris Xe Graphics G7 96EUs | Dell XPS 13 9315, i5-1230U Intel Core i5-1230U, Intel Iris Xe Graphics G7 80EUs | |
|---|---|---|---|---|---|---|---|
| Heat | 24% | 16% | 26% | 25% | 21% | 14% | |
| Maximum Upper Side * (°C) | 47.6 | 44 8% | 47.9 -1% | 42.2 11% | 42.8 10% | 41.1 14% | 42.3 11% |
| Maximum Bottom * (°C) | 57 | 44 23% | 56.1 2% | 47.5 17% | 46.9 18% | 48.8 14% | 44.9 21% |
| Idle Upper Side * (°C) | 38.8 | 27 30% | 26.8 31% | 24.3 37% | 25.2 35% | 28 28% | 32.5 16% |
| Idle Bottom * (°C) | 41 | 27 34% | 27.3 33% | 25.3 38% | 26 37% | 29.3 29% | 38.2 7% |
* ... menor é melhor
Teste de estresse
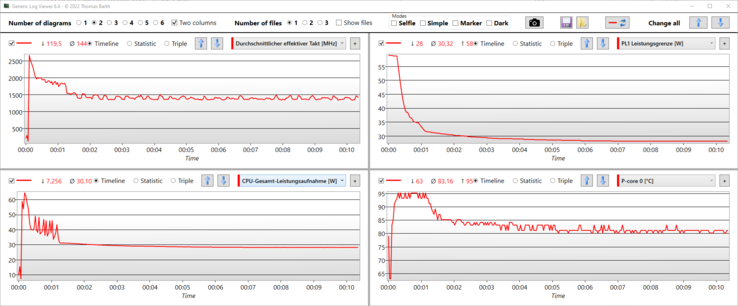
O consumo do processador se fixa em 30 watts no teste de estresse. Antes disso, cerca de 60 watts podem ser alcançados por alguns segundos, mas isto então cai para entre 40 e 30 watts no primeiro minuto. Este estrangulamento é acionado pelo núcleo P atingindo 95 °C (~203 °F). O desempenho não foi afetado após o teste de estresse.
Dell XPS 13 Plus 9320 i5-1240p análise de áudio
(+) | os alto-falantes podem tocar relativamente alto (###valor### dB)
Graves 100 - 315Hz
(±) | graves reduzidos - em média 13.7% menor que a mediana
(±) | a linearidade dos graves é média (9.4% delta para a frequência anterior)
Médios 400 - 2.000 Hz
(+) | médios equilibrados - apenas 2.4% longe da mediana
(+) | médios são lineares (4.9% delta para frequência anterior)
Altos 2 - 16 kHz
(±) | máximos mais altos - em média 6.2% maior que a mediana
(+) | os máximos são lineares (3.3% delta da frequência anterior)
Geral 100 - 16.000 Hz
(+) | o som geral é linear (13.8% diferença em relação à mediana)
Comparado com a mesma classe
» 24% de todos os dispositivos testados nesta classe foram melhores, 6% semelhantes, 70% piores
» O melhor teve um delta de 5%, a média foi 18%, o pior foi 53%
Comparado com todos os dispositivos testados
» 15% de todos os dispositivos testados foram melhores, 4% semelhantes, 81% piores
» O melhor teve um delta de 4%, a média foi 24%, o pior foi 134%
Asus Zenbook S 13 OLED análise de áudio
(±) | o volume do alto-falante é médio, mas bom (###valor### dB)
Graves 100 - 315Hz
(±) | graves reduzidos - em média 12.6% menor que a mediana
(±) | a linearidade dos graves é média (11.1% delta para a frequência anterior)
Médios 400 - 2.000 Hz
(±) | médios mais altos - em média 5.8% maior que a mediana
(+) | médios são lineares (4.7% delta para frequência anterior)
Altos 2 - 16 kHz
(+) | agudos equilibrados - apenas 2.6% longe da mediana
(+) | os máximos são lineares (5.3% delta da frequência anterior)
Geral 100 - 16.000 Hz
(+) | o som geral é linear (14.7% diferença em relação à mediana)
Comparado com a mesma classe
» 30% de todos os dispositivos testados nesta classe foram melhores, 5% semelhantes, 65% piores
» O melhor teve um delta de 5%, a média foi 18%, o pior foi 53%
Comparado com todos os dispositivos testados
» 19% de todos os dispositivos testados foram melhores, 4% semelhantes, 77% piores
» O melhor teve um delta de 4%, a média foi 24%, o pior foi 134%
Gestão de energia
Consumo de energia
Realizamos um teste de estresse com Prime95 e FurMark (Ultra Performance). O sistema tem 63 watts durante um minuto, após o qual a velocidade do relógio é lentamente reduzida; o consumo de energia cai de 56 para 49 watts ao longo do tempo (1:00 para 3:00).
A sobrecarga do adaptador de energia de 60 watts pode ter um impacto sobre o tempo de carga: A bateria só carrega muito lentamente durante um teste de estresse; a energia é racionada aqui. A bateria previamente drenada só foi carregada a 18% após uma hora. Isto dificulta a tensão do dispositivo e também carrega a bateria ao mesmo tempo.
Muitos laptops compactos com CPUs Alder Lake P têm este problema. Entretanto, como esta situação ocorre sempre por um tempo muito curto apenas, os efeitos são menores na prática. A bateria também não drena. O orçamento modelo XPS 13 com Alder Lake U não tem este problema, apesar de seu pequeno adaptador de energia de 45 watts. Embora o teste de estresse também gerencie 47 watts nesse caso, é apenas por alguns segundos. O sistema só precisa de uma constante de 26 watts depois disso e não mais de 40 a 45 watts. O gráfico que mostra o consumo de energia durante o teste de estresse Witcher 3 / apresenta uma comparação com o Alder Lake U XPS, que economiza energia.
| desligado | |
| Ocioso | |
| Carga |
|
Key:
min: | |
| Dell XPS 13 Plus 9320 i5-1240p i5-1240P, Iris Xe G7 80EUs, Micron 3400 MTFDKBA512TFH 512GB, IPS, 1920x1200, 13.4" | Apple MacBook Air 2020 M1 Entry M1, M1 7-Core GPU, Apple SSD AP0256Q, IPS, 2560x1600, 13.3" | Asus Zenbook S 13 OLED R7 6800U, Radeon 680M, Samsung PM9A1 MZVL21T0HCLR, OLED, 2880x1800, 13.3" | Lenovo ThinkPad X1 Nano-20UN002UGE i7-1160G7, Iris Xe G7 96EUs, WDC PC SN530 SDBPNPZ-512G, IPS, 2160x1350, 13" | Huawei MateBook 13s i5 11300H i5-11300H, Iris Xe G7 80EUs, Phison Electronics PS5012, LTPS, 2520x1680, 13.4" | Dell XPS 13 Plus 9320 4K i7-1260P, Iris Xe G7 96EUs, Samsung PM9A1 MZVL21T0HCLR, IPS, 3840x2400, 13.4" | Dell XPS 13 9315, i5-1230U i5-1230U, Iris Xe G7 80EUs, Micron 3460 256 GB Soldered, IPS, 1920x1200, 13.4" | Média Intel Iris Xe Graphics G7 80EUs | Média da turma Subnotebook | |
|---|---|---|---|---|---|---|---|---|---|
| Power Consumption | 56% | 22% | 40% | 23% | 2% | 47% | 30% | 29% | |
| Idle Minimum * (Watt) | 10 | 1.9 81% | 4.8 52% | 3.3 67% | 4.2 58% | 7 30% | 3.6 64% | 4.47 ? 55% | 3.94 ? 61% |
| Idle Average * (Watt) | 12.3 | 6.4 48% | 8.7 29% | 5.7 54% | 8.1 34% | 11 11% | 6.8 45% | 7.37 ? 40% | 6.83 ? 44% |
| Idle Maximum * (Watt) | 15.5 | 7 55% | 10.1 35% | 9.1 41% | 9 42% | 11.4 26% | 6.8 56% | 9.24 ? 40% | 8.41 ? 46% |
| Load Average * (Watt) | 43 | 25 42% | 45.6 -6% | 29.6 31% | 41.7 3% | 59.7 -39% | 24 44% | 36.6 ? 15% | 43.8 ? -2% |
| Witcher 3 ultra * (Watt) | 43.1 | 42.4 2% | 27.7 36% | 40.1 7% | 49.4 -15% | 23.6 45% | |||
| Load Maximum * (Watt) | 62.8 | 30.3 52% | 49.5 21% | 55.1 12% | 68 -8% | 63 -0% | 47 25% | 61.7 ? 2% | 66.7 ? -6% |
* ... menor é melhor
Energy consumption during The Witcher 3 / Stress test
Energy consumption with an external monitor
Duração da bateria
A Dell aumentou a capacidade da bateria para 55 Wh na versão Plus, mas a duração da bateria ainda é menor do que na versão Predecessor do Full HD 9305 devido ao aumento do consumo de energia. Este último poderia durar 554 minutos, mas agora é apenas 480. O XPS 13 Plus fica atrás da concorrência com estas 8 horas: OEntrada MacBook Air 2020 M1 duplica isso, e até mesmo os poderososAsus Zenbook S 13 OLED dura mais de uma hora (550 minutos). Um campeão de bateria-vida da Dell só está disponível na forma doXPS 13 9315 com Alder Lake U.
O tempo de funcionamento da bateria é significativamente reduzido com a luminosidade total. Ao invés de 150 cd/m², é usado 420 cd/m², o que leva a 6 horas. Os altos limites de potência de 59 e 48 watts, respectivamente, são refletidos no curto tempo de execução da carga de 96 minutos (Battery Eater Eater Classic). Neste caso, os 146 minutos doAsus Zenbook S 13 OLED mostram que o R7 6800Ua bateria de 67 Wh, que é tão potente, lida com energia de forma mais eficiente - mas também tem uma bateria mais potente.
As 55 horas de watt levam 1:30 horas para carregar até 80%. Leva 2:40 horas para chegar a 100%.
| Dell XPS 13 Plus 9320 i5-1240p i5-1240P, Iris Xe G7 80EUs, 55 Wh | Apple MacBook Air 2020 M1 Entry M1, M1 7-Core GPU, 49.9 Wh | Asus Zenbook S 13 OLED R7 6800U, Radeon 680M, 67 Wh | Lenovo ThinkPad X1 Nano-20UN002UGE i7-1160G7, Iris Xe G7 96EUs, 48.2 Wh | Huawei MateBook 13s i5 11300H i5-11300H, Iris Xe G7 80EUs, 60 Wh | Dell XPS 13 Plus 9320 4K i7-1260P, Iris Xe G7 96EUs, 55 Wh | Dell XPS 13 9315, i5-1230U i5-1230U, Iris Xe G7 80EUs, 51 Wh | Dell XPS 13 9305 Core i5 FHD i5-1135G7, Iris Xe G7 80EUs, 52 Wh | Média da turma Subnotebook | |
|---|---|---|---|---|---|---|---|---|---|
| Duração da bateria | 100% | 33% | 12% | 9% | -17% | 74% | 48% | 46% | |
| WiFi v1.3 (h) | 8 | 16 100% | 9.2 15% | 9.9 24% | 9.4 18% | 6.9 -14% | 14.8 85% | 9.2 15% | 13.5 ? 69% |
| Load (h) | 1.6 | 2.4 50% | 1.6 0% | 1.6 0% | 1.3 -19% | 2.6 63% | 2.9 81% | 1.948 ? 22% | |
| H.264 (h) | 15.2 | 15.4 | 11 | 11 | 16.9 ? | ||||
| Reader / Idle (h) | 25.4 | 30.7 ? |
Pro
Contra
Veredicto - O i7 juntamente com o SSD Samsung de 1 TB são a melhor escolha para o desempenho
Qual é o XPS 13 certo para mim? Se você está procurando um desempenho de ponta no formato de sub-portáteis, você inevitavelmente gravitará em direção à variante Alder Lake P na forma de um XPS 13 Plus
A escolha do Core i7-1260P promete um aumento de desempenho de bons 10% de acordo com os benchmarks. Isto se aplica ao poder de processamento puro, mas também ao desempenho do sistema. Além disso, o Core i7 oferece uma vantagem de 18% sob carga contínua em comparação com o Core i5, que estrangulou mais visivelmente no loop do Cinebench.
O desempenho do sistema (PCMarks) se beneficia do rápido SSD Samsung de 1 TB no sistema de teste Core i7, enquanto a Dell equipou o modelo i5 Plus com um drive Micron mais lento de 512 GB. Entretanto, os clientes não têm uma palavra a dizer quando se trata do fabricante do SSD. O custo extra para o SSD de um terabyte, o Núcleo i7-1260P e 16 GB de RAM é de 300 Euros (~$307). Isto parece justo
O UHD+ Touchscreen poderia dar a ponta da balança? Provavelmente não, porque além da resolução mais alta e melhor contraste, não cobre o espaço de cor P3, o que pode ser importante para o uso profissional. Além disso, ela pode ser encomendada com qualquer processador, incluindo o Core i5
Em resumo, o Core i7 combinado com o SSD de 1 TB da Samsung é exatamente o produto certo da Dell para os nerds de desempenho
Mas será que o XPS 13 Plus tem uma boa relação preço-desempenho? Os usuários que querem obter o melhor desempenho possível de um laptop de 13 polegadas (PCMark, loop R15 e testes de CPU) - e a um preço atraente - podem querer dar uma olhada no Asus Zenbook S 13 OLEDque deverá estar disponível a partir de 1.300 Euros (~$1.332). Ele vem com o espaço de cor P3, um SSD de 512 GB (Samsung), 16 GB de RAM e, claro, uma tomada de áudio combinada de 3,5 mm. O Zenbook S 13 OLED recebeu uma classificação de 90%. A falta das portas Thunderbolt 4 é provavelmente a maior desvantagem
Não muito atrás e com uma classificação ainda mais alta - embora com um pouco menos de poder de processamento - é a Apple Entrada MacBook Air 2020 M1. Apesar do resfriamento passivo, ele oferece desempenho suficiente enquanto é mais eficiente no processo, mas a tela não suporta HDR. Também revisamos o novo MacBook Air 2022 M2, que é uma versão de nível básico com o processador Apple M2.
Preço e disponibilidade
O Dell XPS 13 Plus 9320 na configuração com o Core i5-1240p, um SSD de 512 GB, 8 GB de RAM e uma tela Full HD pode ser encontrado atualmente em Loja on-line da Dell por US$1.299. A Dell também permite que você personalize o dispositivo de acordo com suas necessidades.
Dell XPS 13 Plus 9320 i5-1240p
- 08/10/2022 v7 (old)
Sebastian Jentsch


