Dell XPS 13 9310 Core i7 Revisão de Laptop: A diferença do 11º Gen Tiger Lake
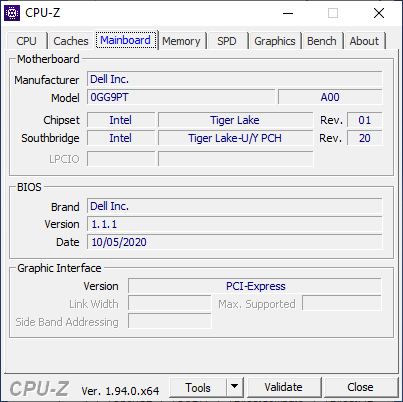
O Dell XPS 13 9300 tem apenas um ano de idade e seu sucessor já está disponível. Chamado de XPS 13 9310, o modelo mais recente substitui a CPU Intel Ice Lake de 10ª geração por opções do 11º gênero Tiger Lake, juntamente com taxas de relógio de memória mais rápidas. Caso contrário, o XPS 13 9310 é visualmente idêntico ao seu predecessor imediato.
Para esta revisão, estaremos comparando o desempenho do 9310 com o 9300 para ver quanto de um ganho de desempenho os usuários podem esperar e como as temperaturas, tempos de execução, qualidade de exibição ou consumo de energia podem ser diferentes entre eles - se é que podem ser diferentes. Mais informações sobre o chassi e outras características físicas podem ser encontradas em nossa revisão existente do XPS 13 9300 aqui.
Mais análises da Dell:
Avaliação | Data | Modelo | Peso | Altura | Size | Resolução | Preço |
|---|---|---|---|---|---|---|---|
| 88.1 % v7 (old) | 11/2020 | Dell XPS 13 9310 Core i7 FHD i7-1165G7, Iris Xe G7 96EUs | 1.3 kg | 14.8 mm | 13.40" | 1920x1200 | |
| 88.9 % v7 (old) | 03/2020 | Dell XPS 13 9300 Core i7-1065G7 i7-1065G7, Iris Plus Graphics G7 (Ice Lake 64 EU) | 1.2 kg | 14.8 mm | 13.40" | 1920x1200 | |
| 92.1 % v7 (old) | 06/2020 | Apple MacBook Pro 13 2020 2GHz i5 10th-Gen i5-1038NG7, Iris Plus Graphics G7 (Ice Lake 64 EU) | 1.4 kg | 15.6 mm | 13.30" | 2560x1600 | |
| 87.4 % v7 (old) | 06/2020 | Huawei MateBook X Pro 2020 i7 i7-10510U, GeForce MX250 | 1.3 kg | 14.6 mm | 13.90" | 3000x2000 | |
| 85.3 % v7 (old) | 08/2020 | Lenovo Yoga Slim 7-14ARE R7 4800U, Vega 8 | 1.4 kg | 14.9 mm | 14.00" | 1920x1080 | |
| 88.4 % v7 (old) | 12/2019 | HP Spectre x360 13-aw0013dx i7-1065G7, Iris Plus Graphics G7 (Ice Lake 64 EU) | 1.2 kg | 16.9 mm | 13.30" | 1920x1080 |
Caso
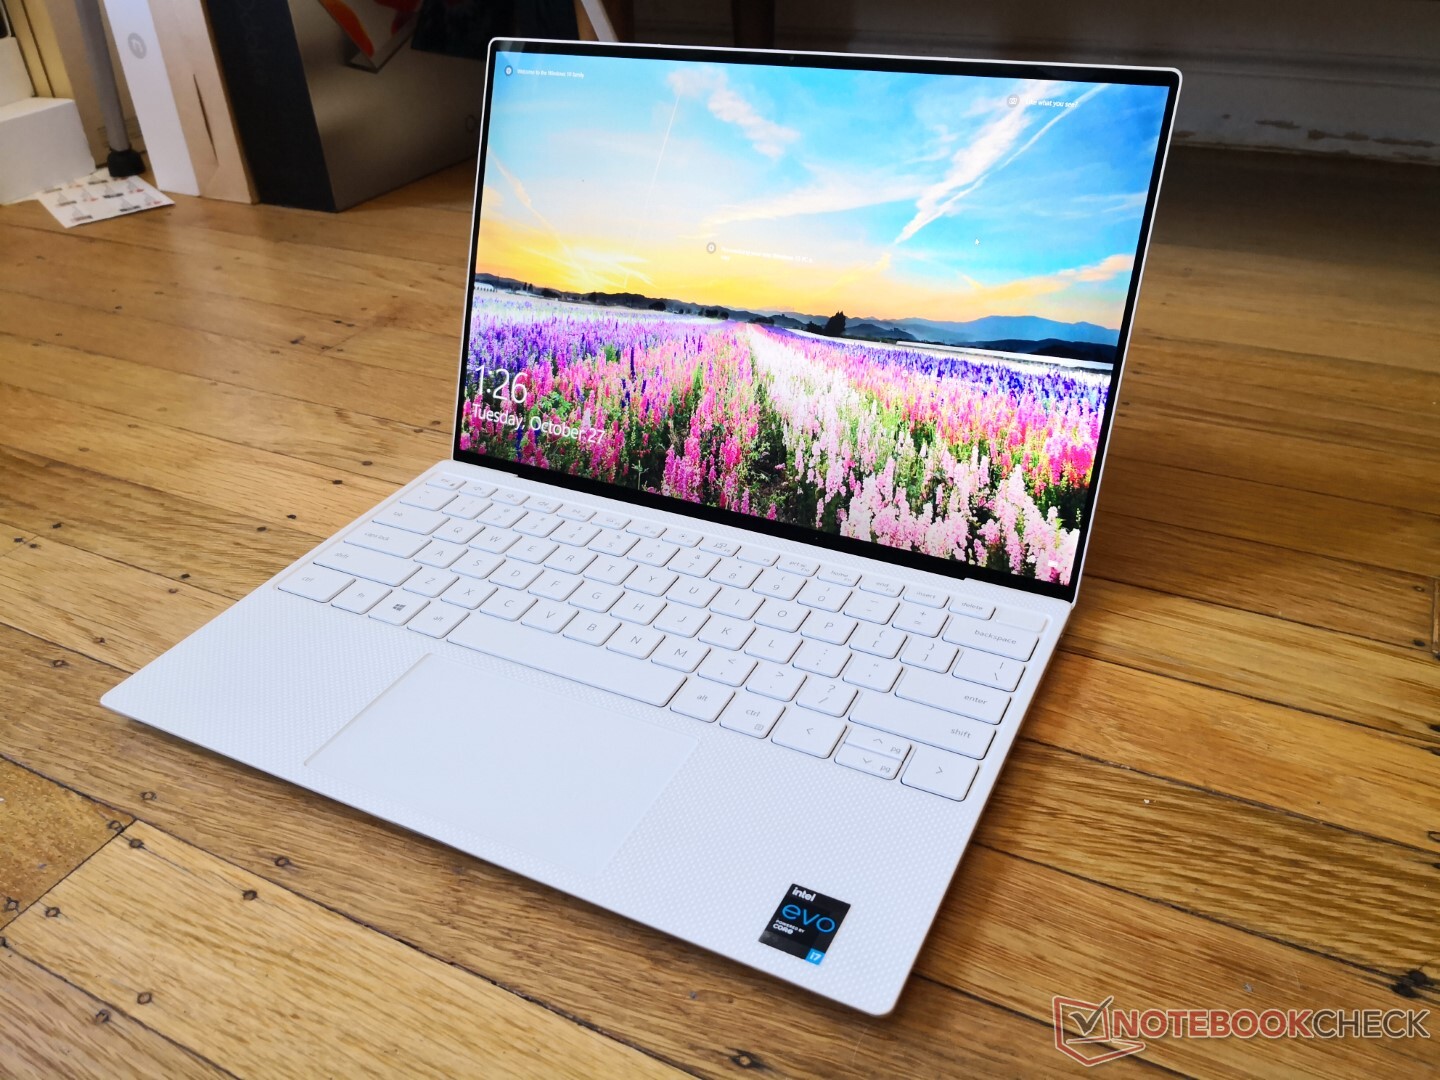
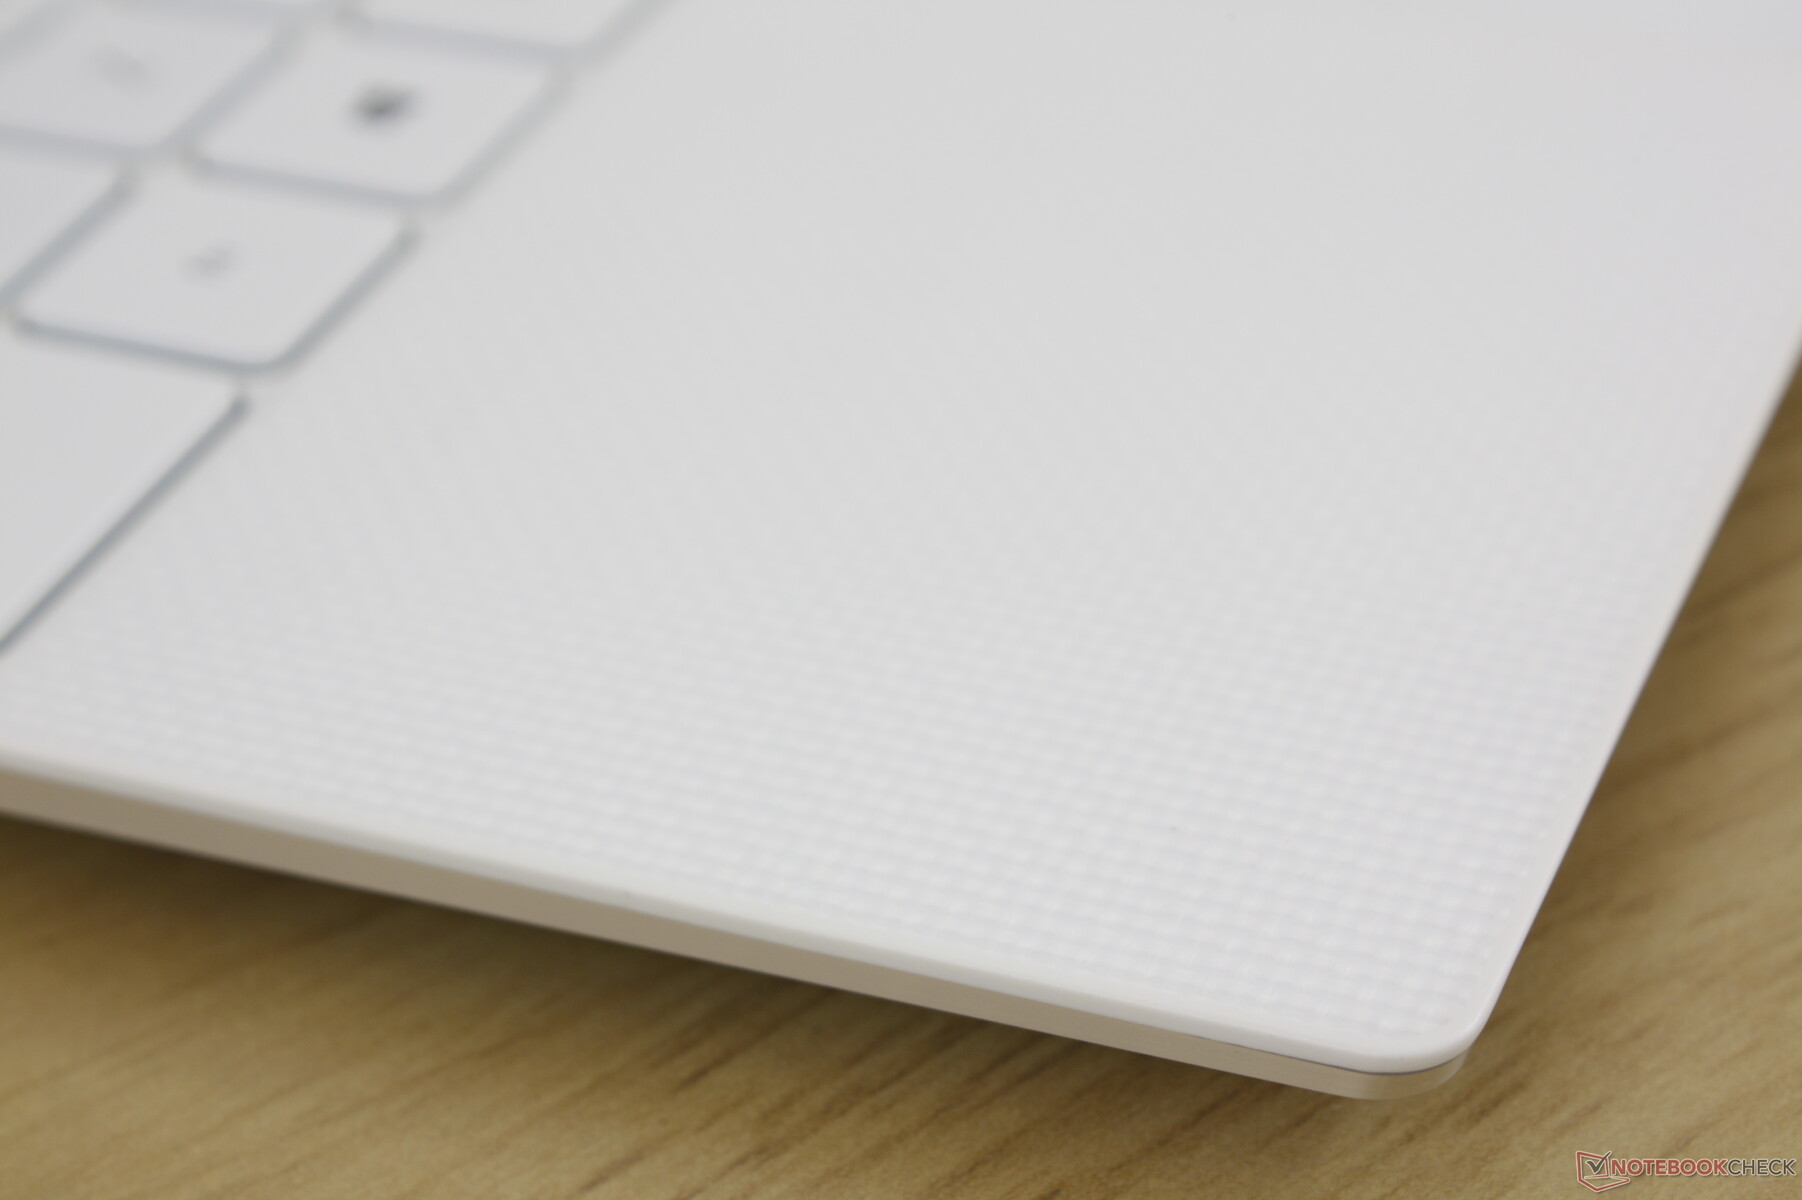
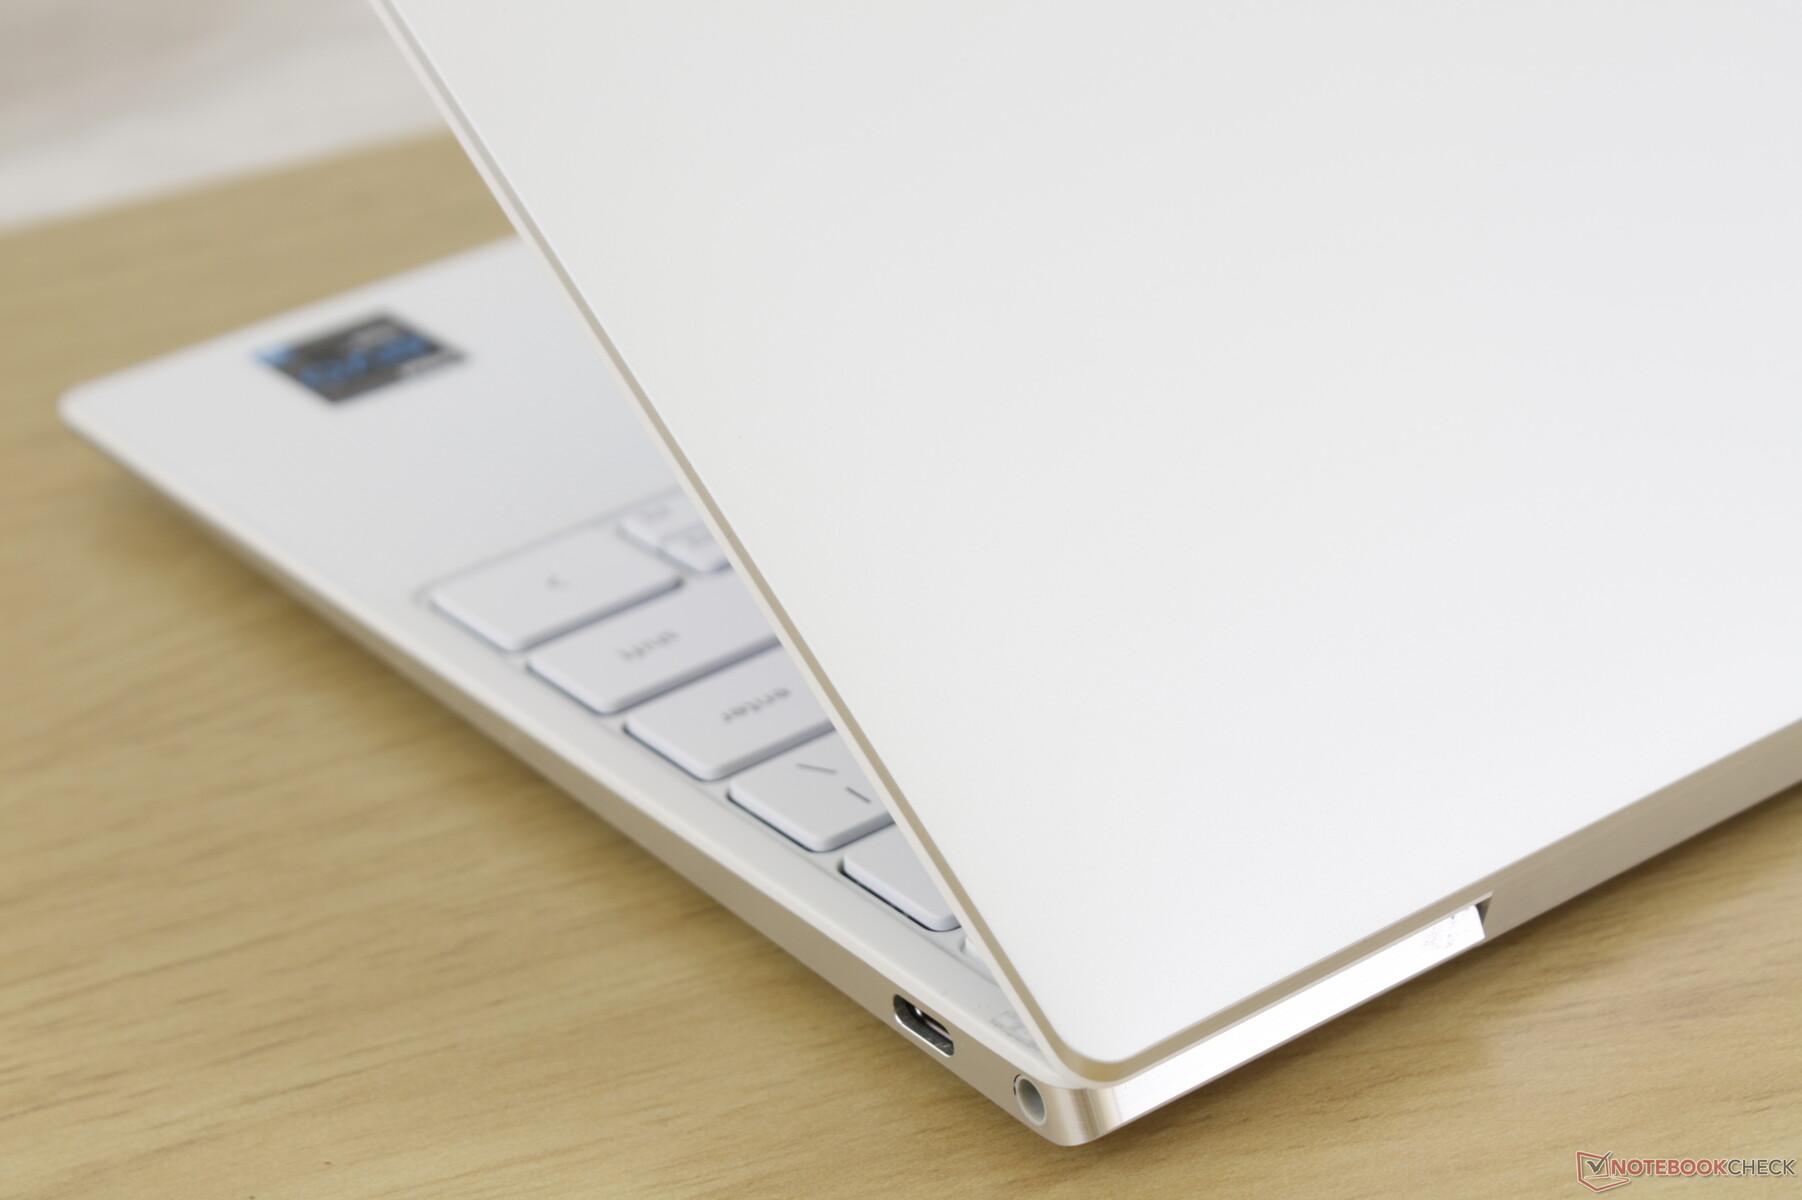
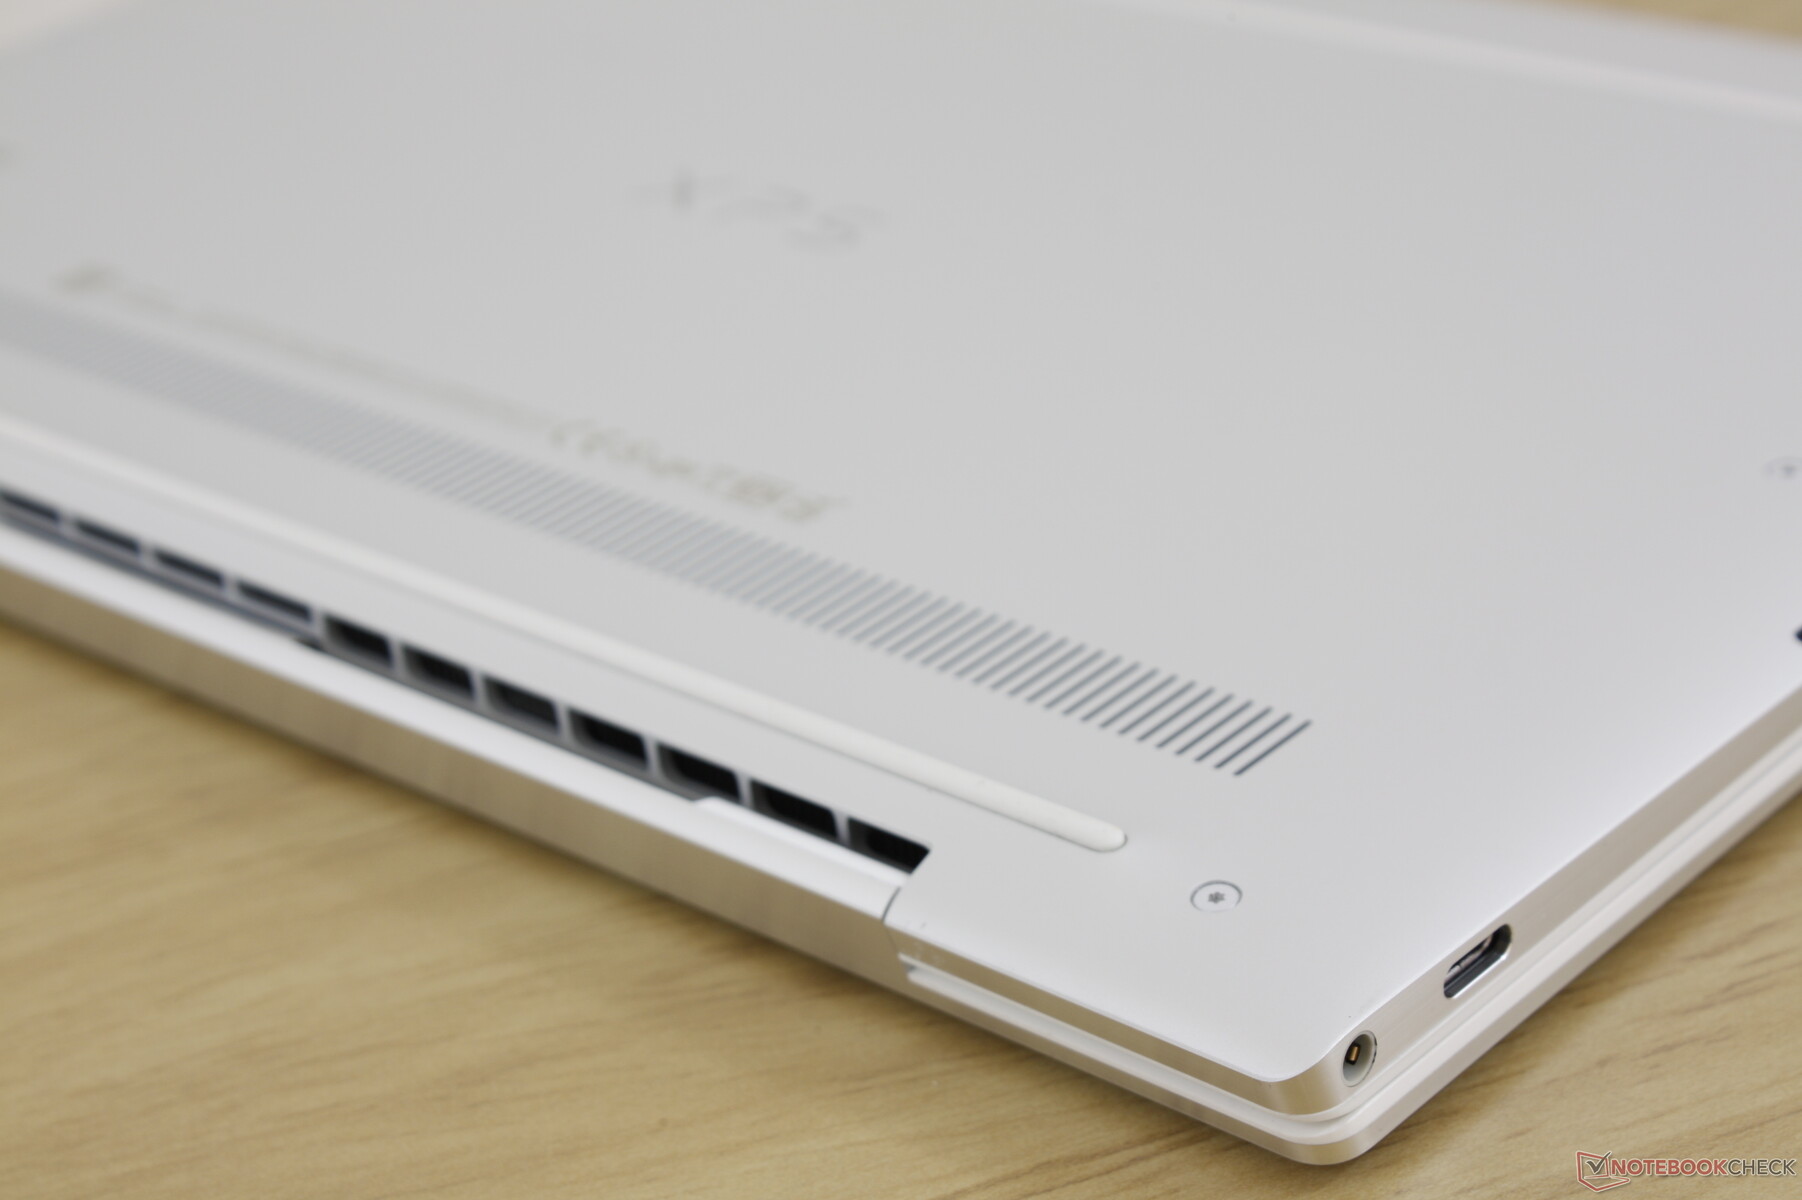
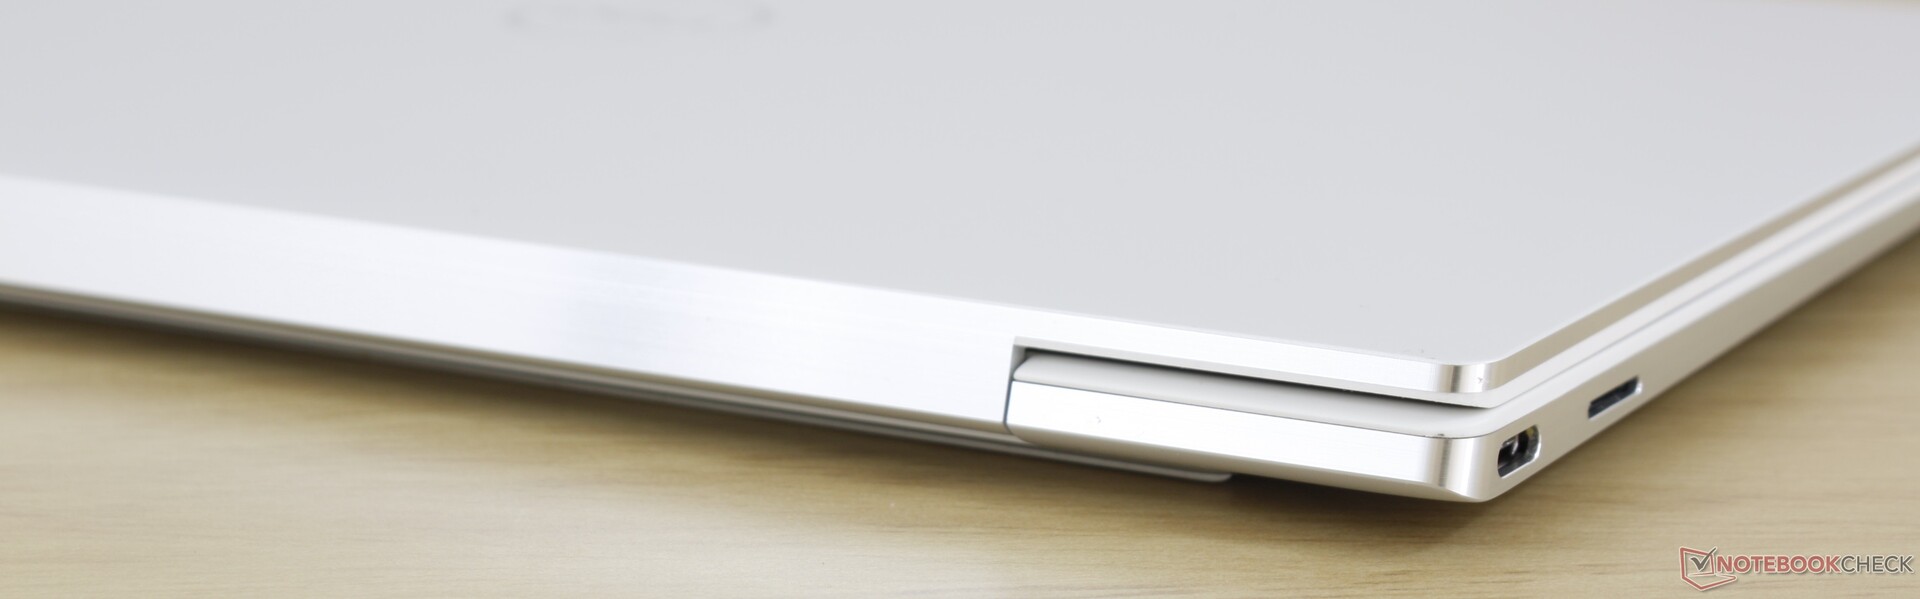
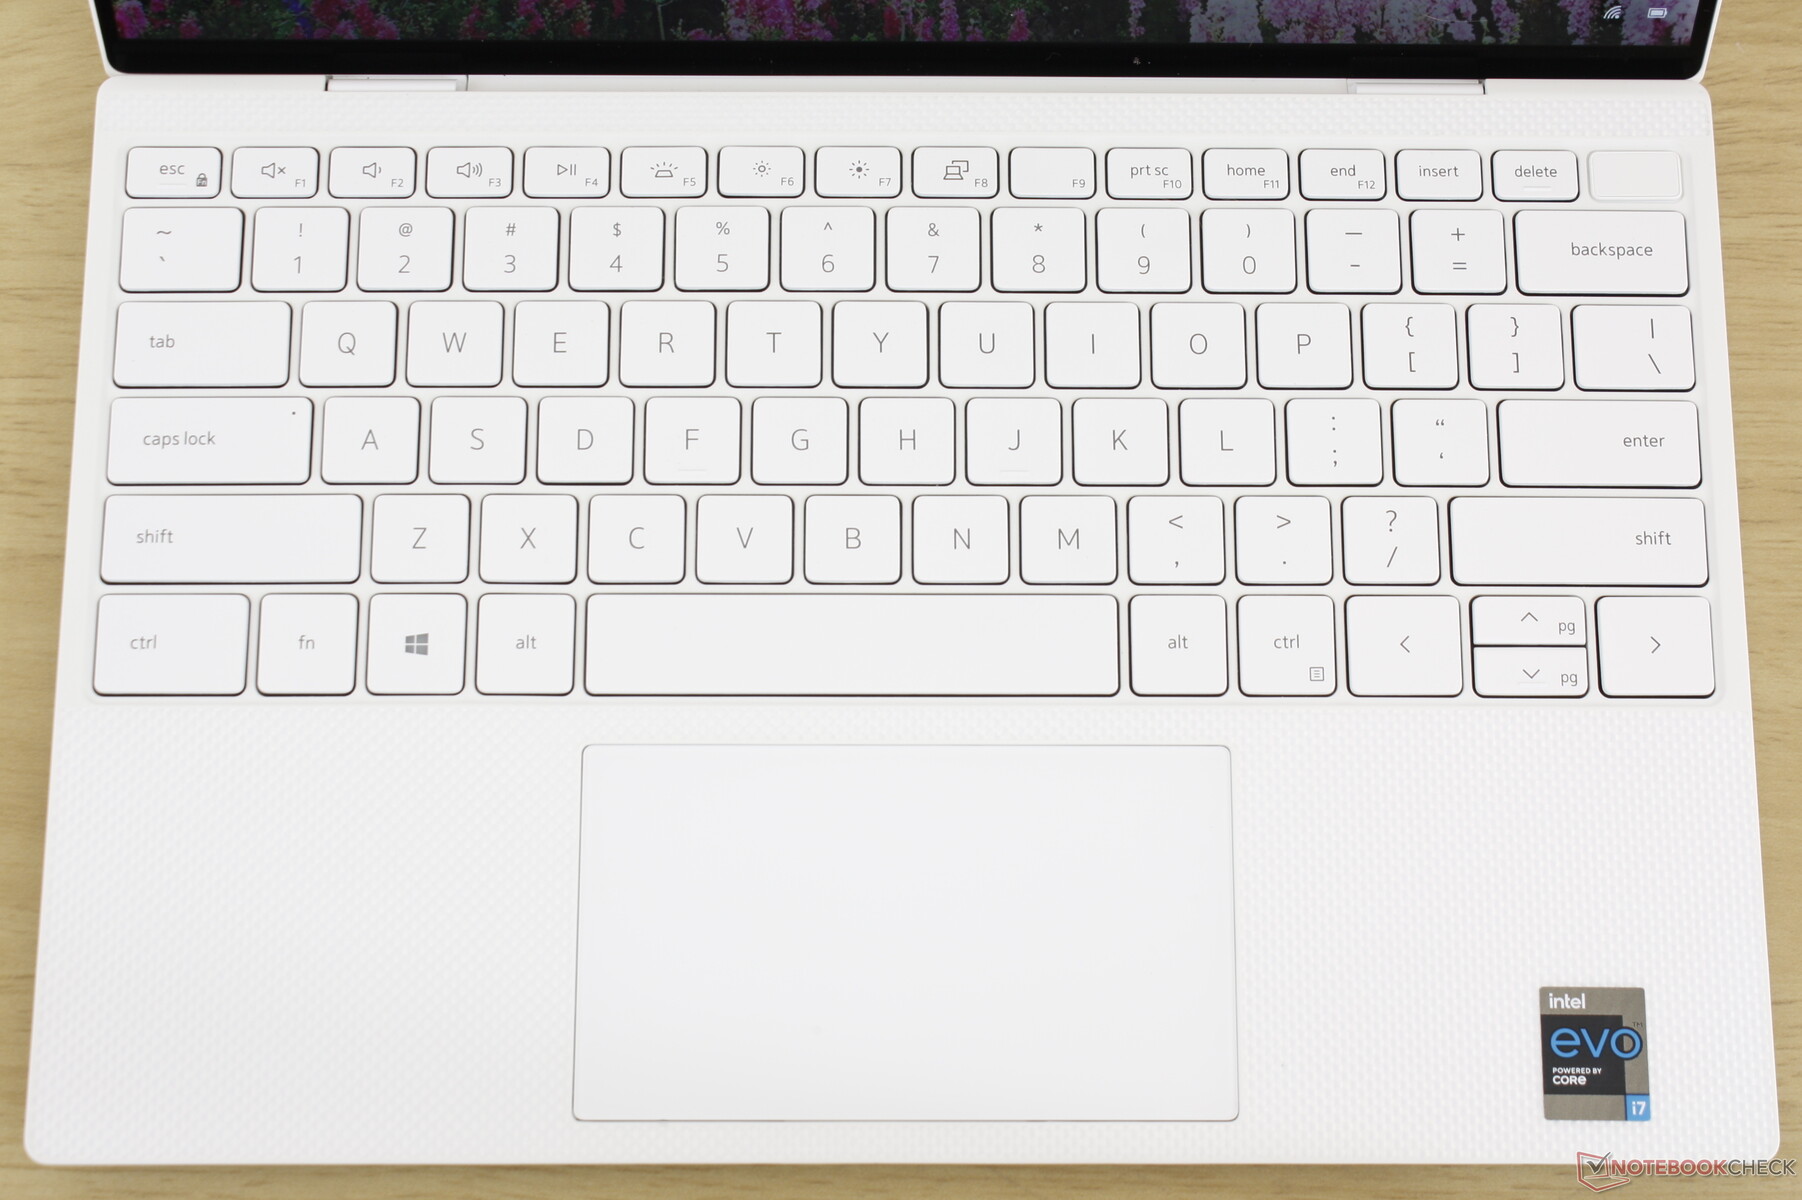
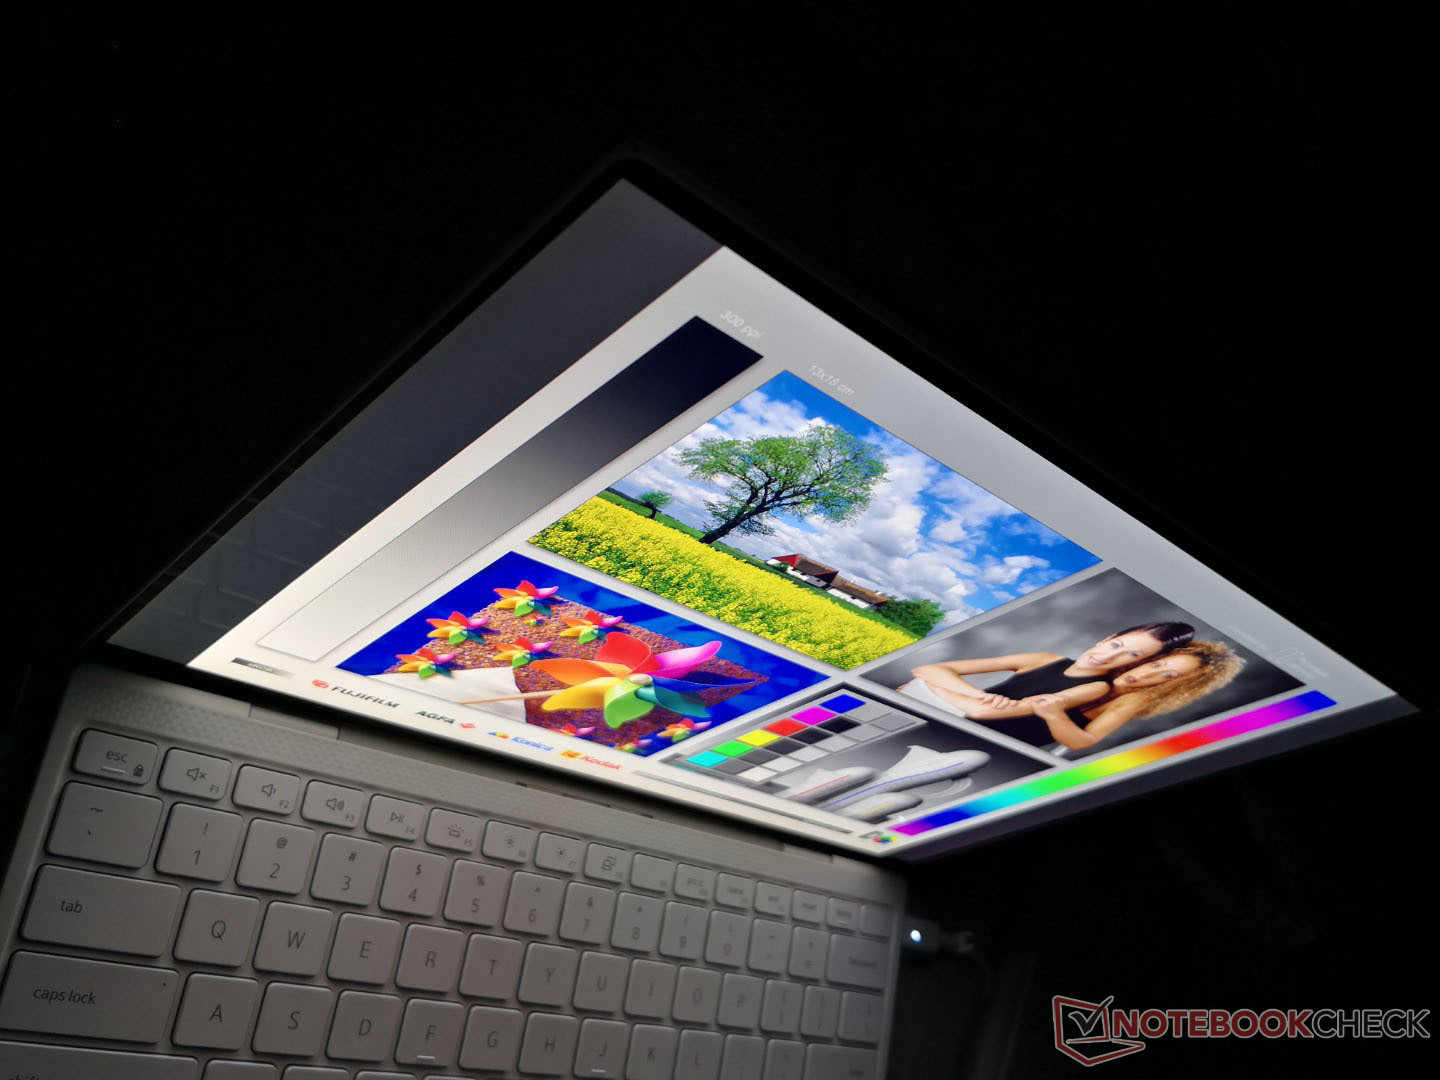
A Dell apresentou o projeto atual 16:10 XPS 13 no início deste ano com o XPS 13 9300 e por isso o XPS 13 9310 ainda é relativamente novo, embora não haja grandes atualizações visuais. Talvez mais notavelmente, a opção de cor branca tecida em vidro da antiga série 16:9 XPS 13 voltou, enquanto o XPS 9300 estava disponível apenas em preto. O principal apelo da opção branca é principalmente estético, já que o acúmulo de impressões digitais desagradáveis não será tão óbvio.


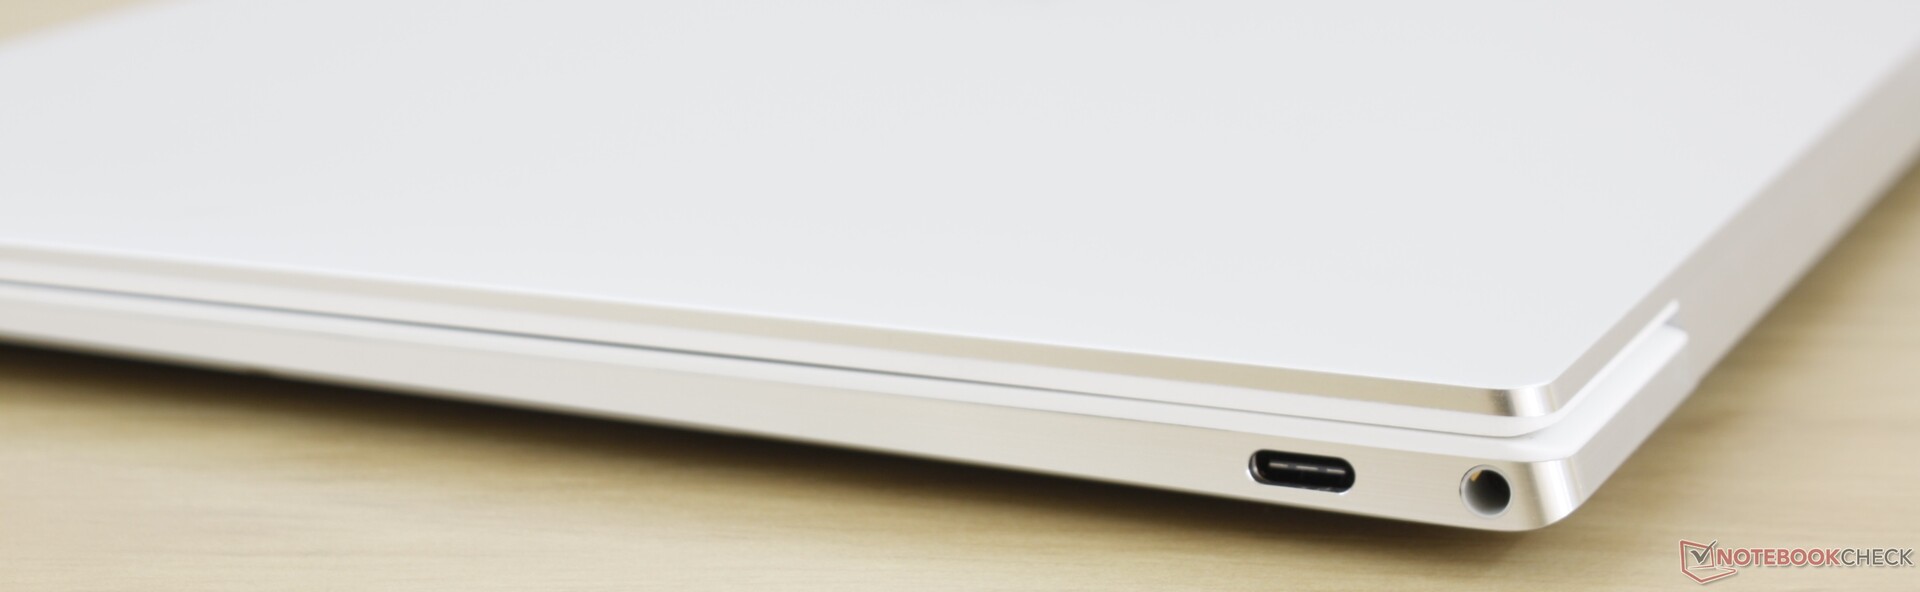
Conectividade

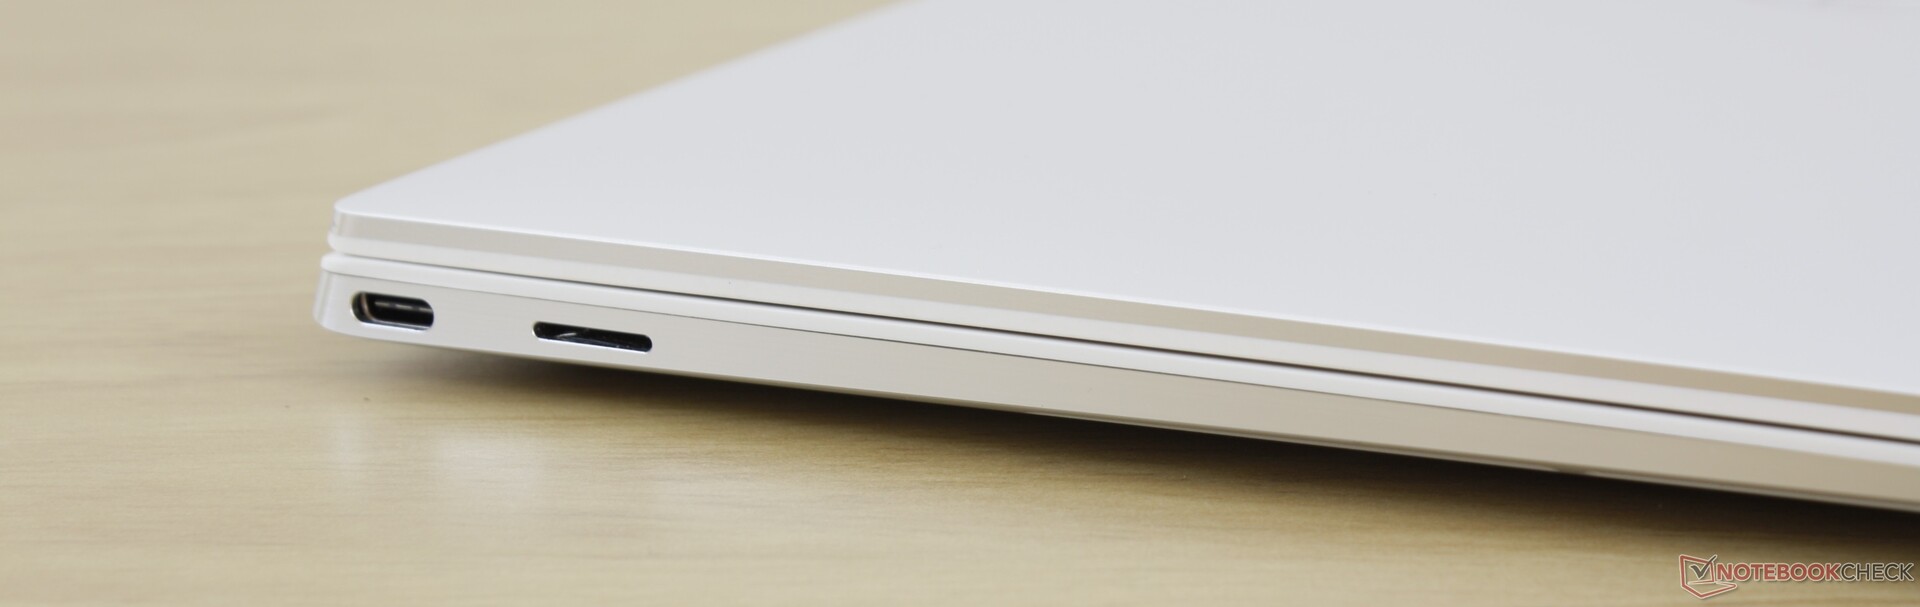
Leitor de cartões SD
| SD Card Reader | |
| average JPG Copy Test (av. of 3 runs) | |
| Dell XPS 13 9310 Core i7 FHD (Toshiba Exceria Pro M501 64 GB UHS-II) | |
| HP Spectre x360 13-aw0013dx (Toshiba Exceria Pro M501 microSDXC 64GB) | |
| Dell XPS 13 9300 Core i7-1065G7 (Toshiba Exceria Pro M501 64 GB UHS-II) | |
| Lenovo Yoga Slim 7-14ARE (Toshiba Exceria Pro M501 64 GB UHS-II) | |
| maximum AS SSD Seq Read Test (1GB) | |
| Dell XPS 13 9310 Core i7 FHD (Toshiba Exceria Pro M501 64 GB UHS-II) | |
| Dell XPS 13 9300 Core i7-1065G7 (Toshiba Exceria Pro M501 64 GB UHS-II) | |
| HP Spectre x360 13-aw0013dx (Toshiba Exceria Pro M501 microSDXC 64GB) | |
| Lenovo Yoga Slim 7-14ARE (Toshiba Exceria Pro M501 64 GB UHS-II) | |
Comunicação
O Intel Killer AX1650s vem mais uma vez como padrão para conectividade Wi-Fi 6 e Bluetooth 5.1. Embora não tenhamos tido nenhum problema de conectividade quando acoplado ao nosso roteador Netgear RAX200, as taxas de transmissão não são tão rápidas quanto as taxas de recepção por um segundo ano consecutivo.

Webcam


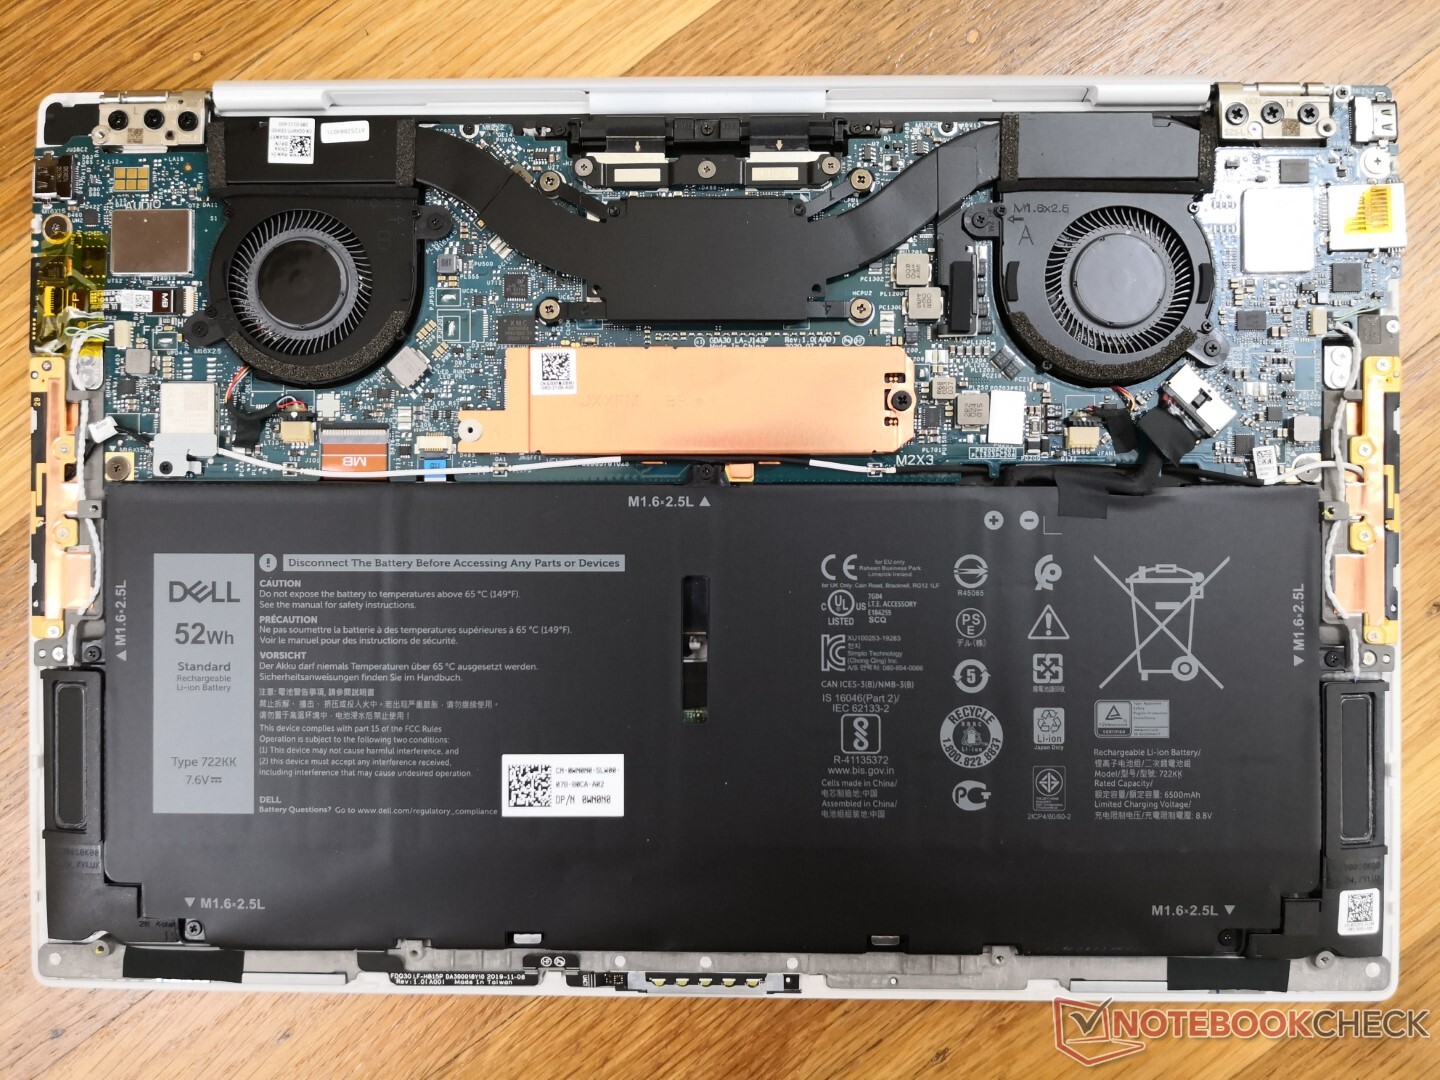
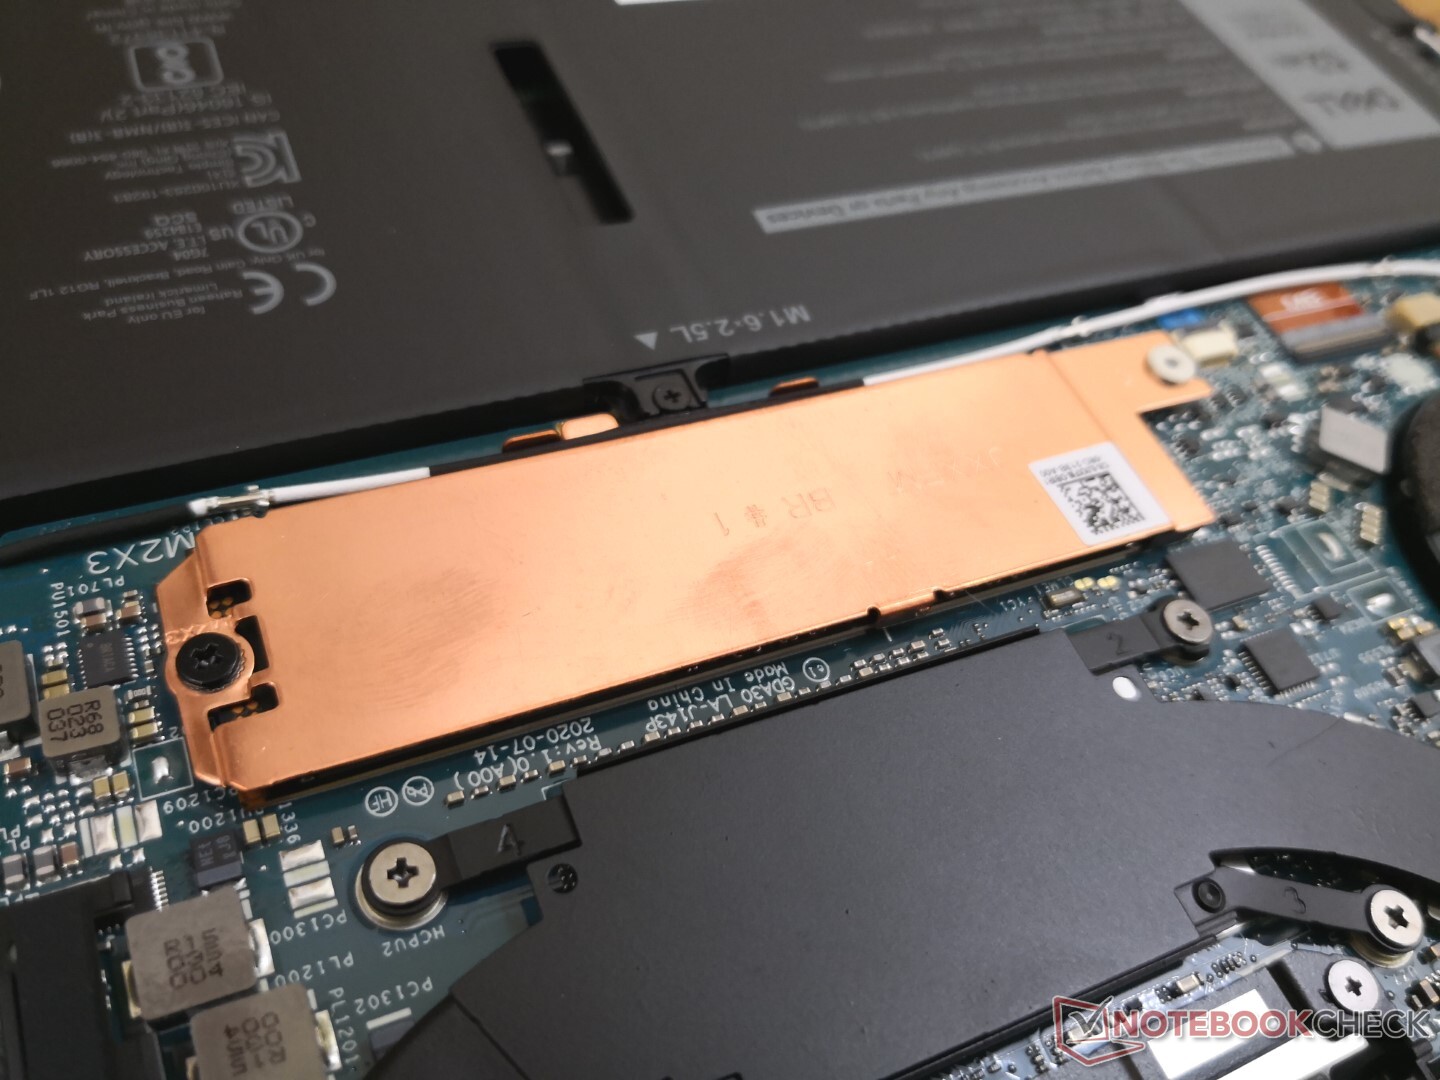
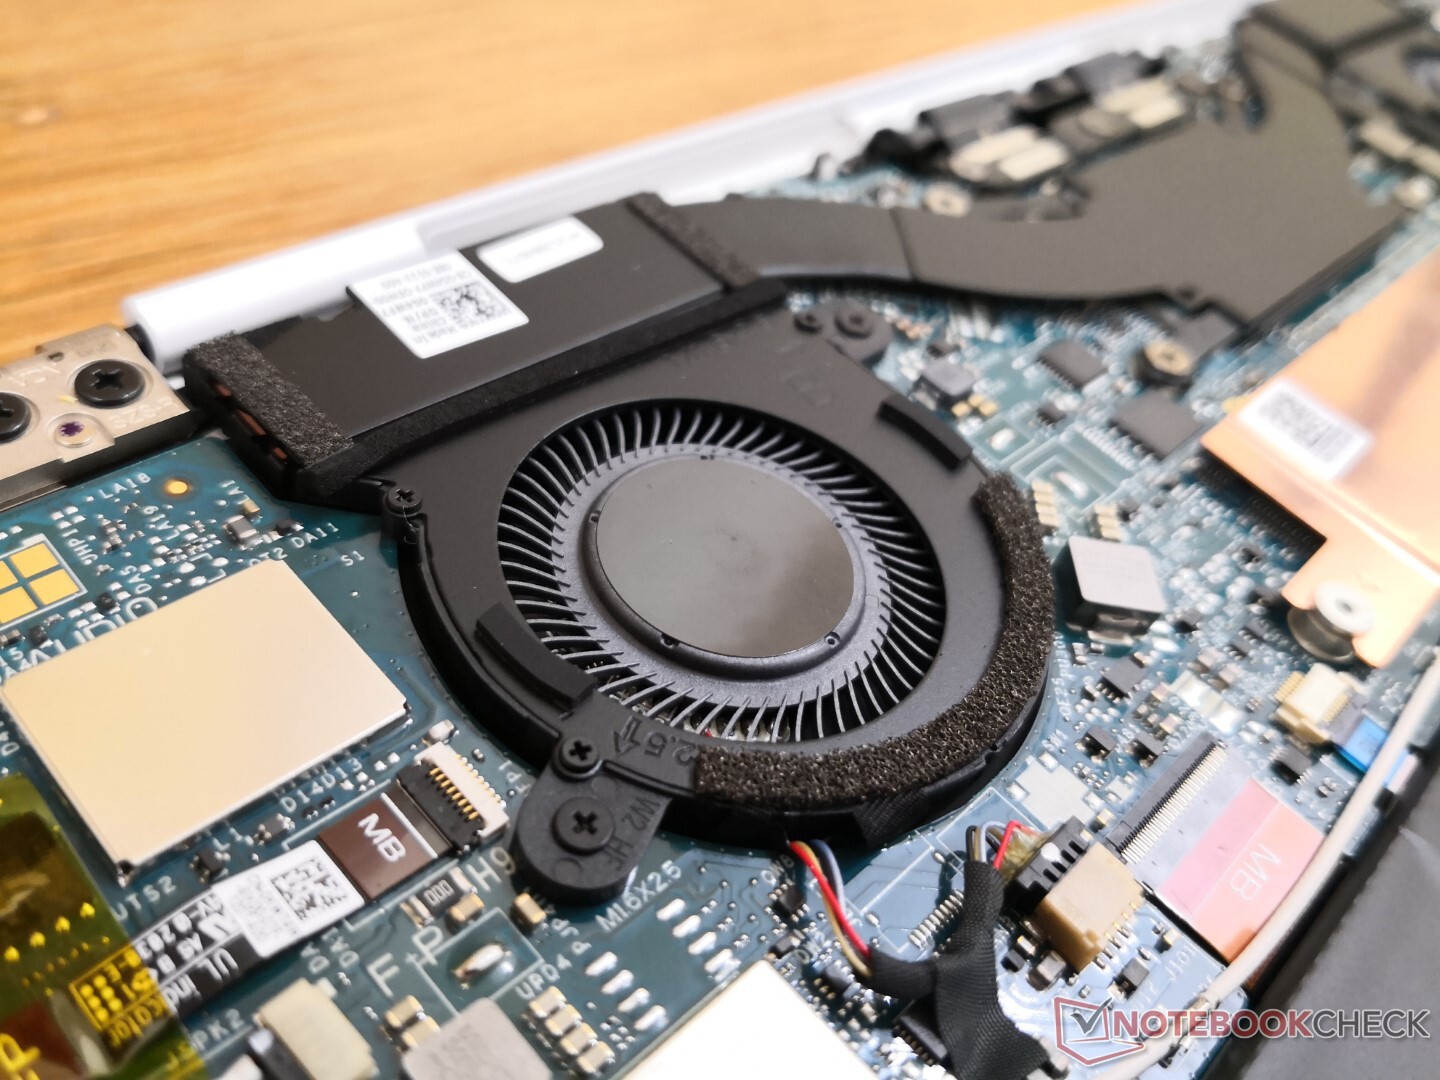
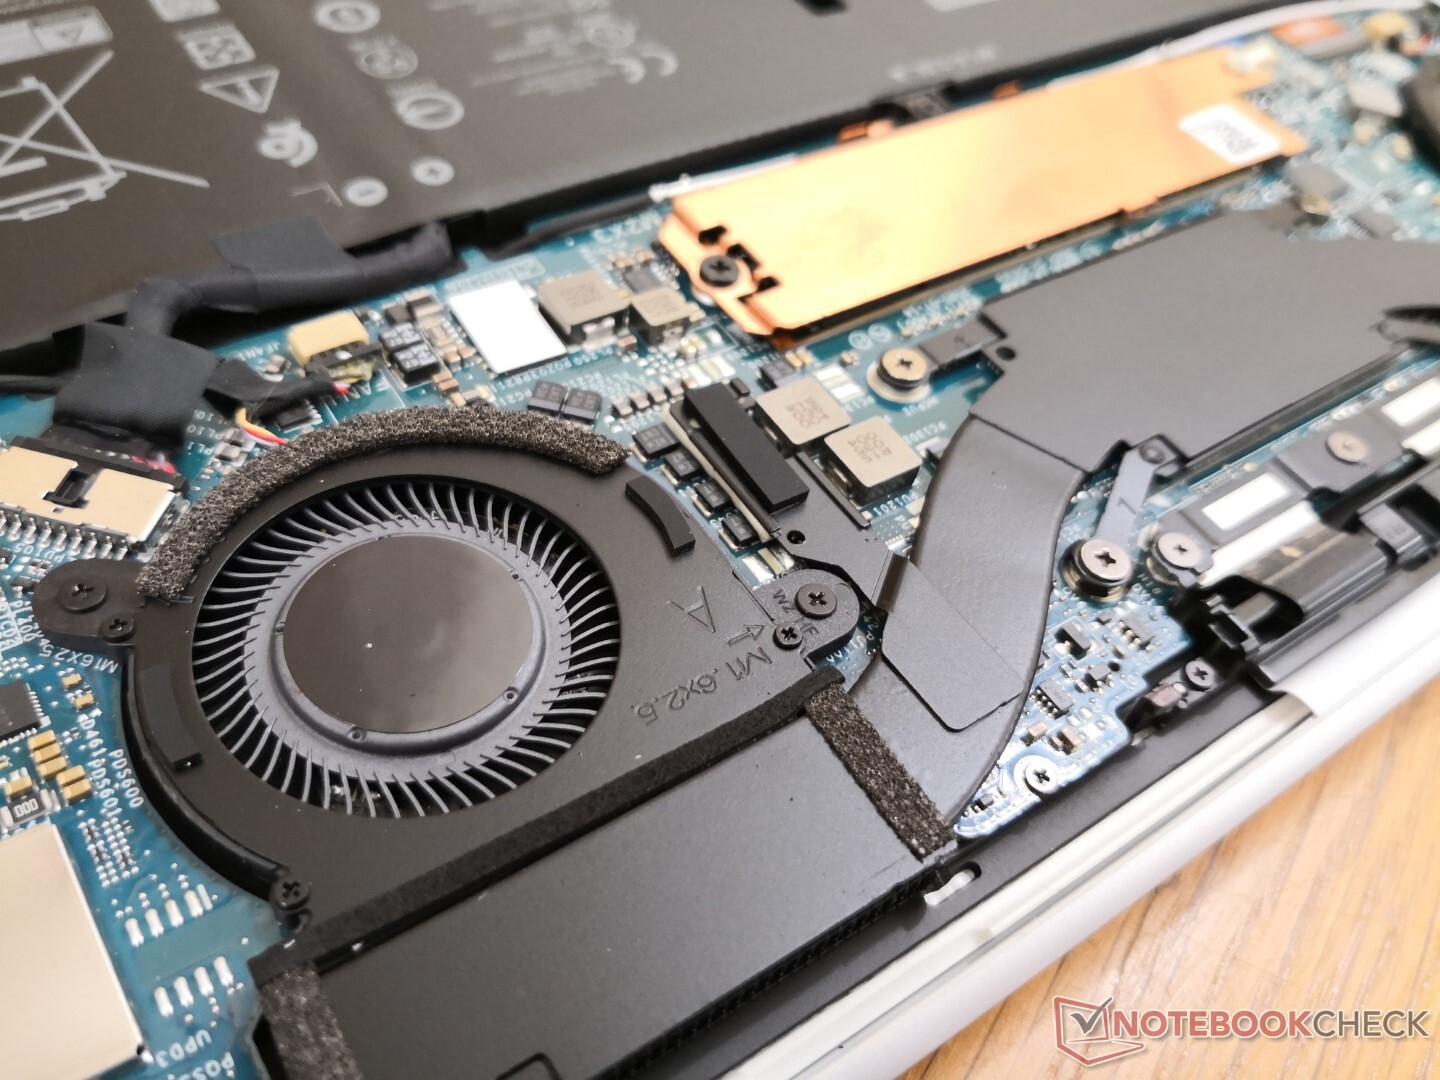
Manutenção
Nenhuma mudança importante nos internos do sistema
Acessórios
A caixa inclui um adaptador USB-C para USB-A e um prático adaptador de cabo de força para que você não precise levar um cabo de força de duas ou três prisões com você aonde quer que vá.
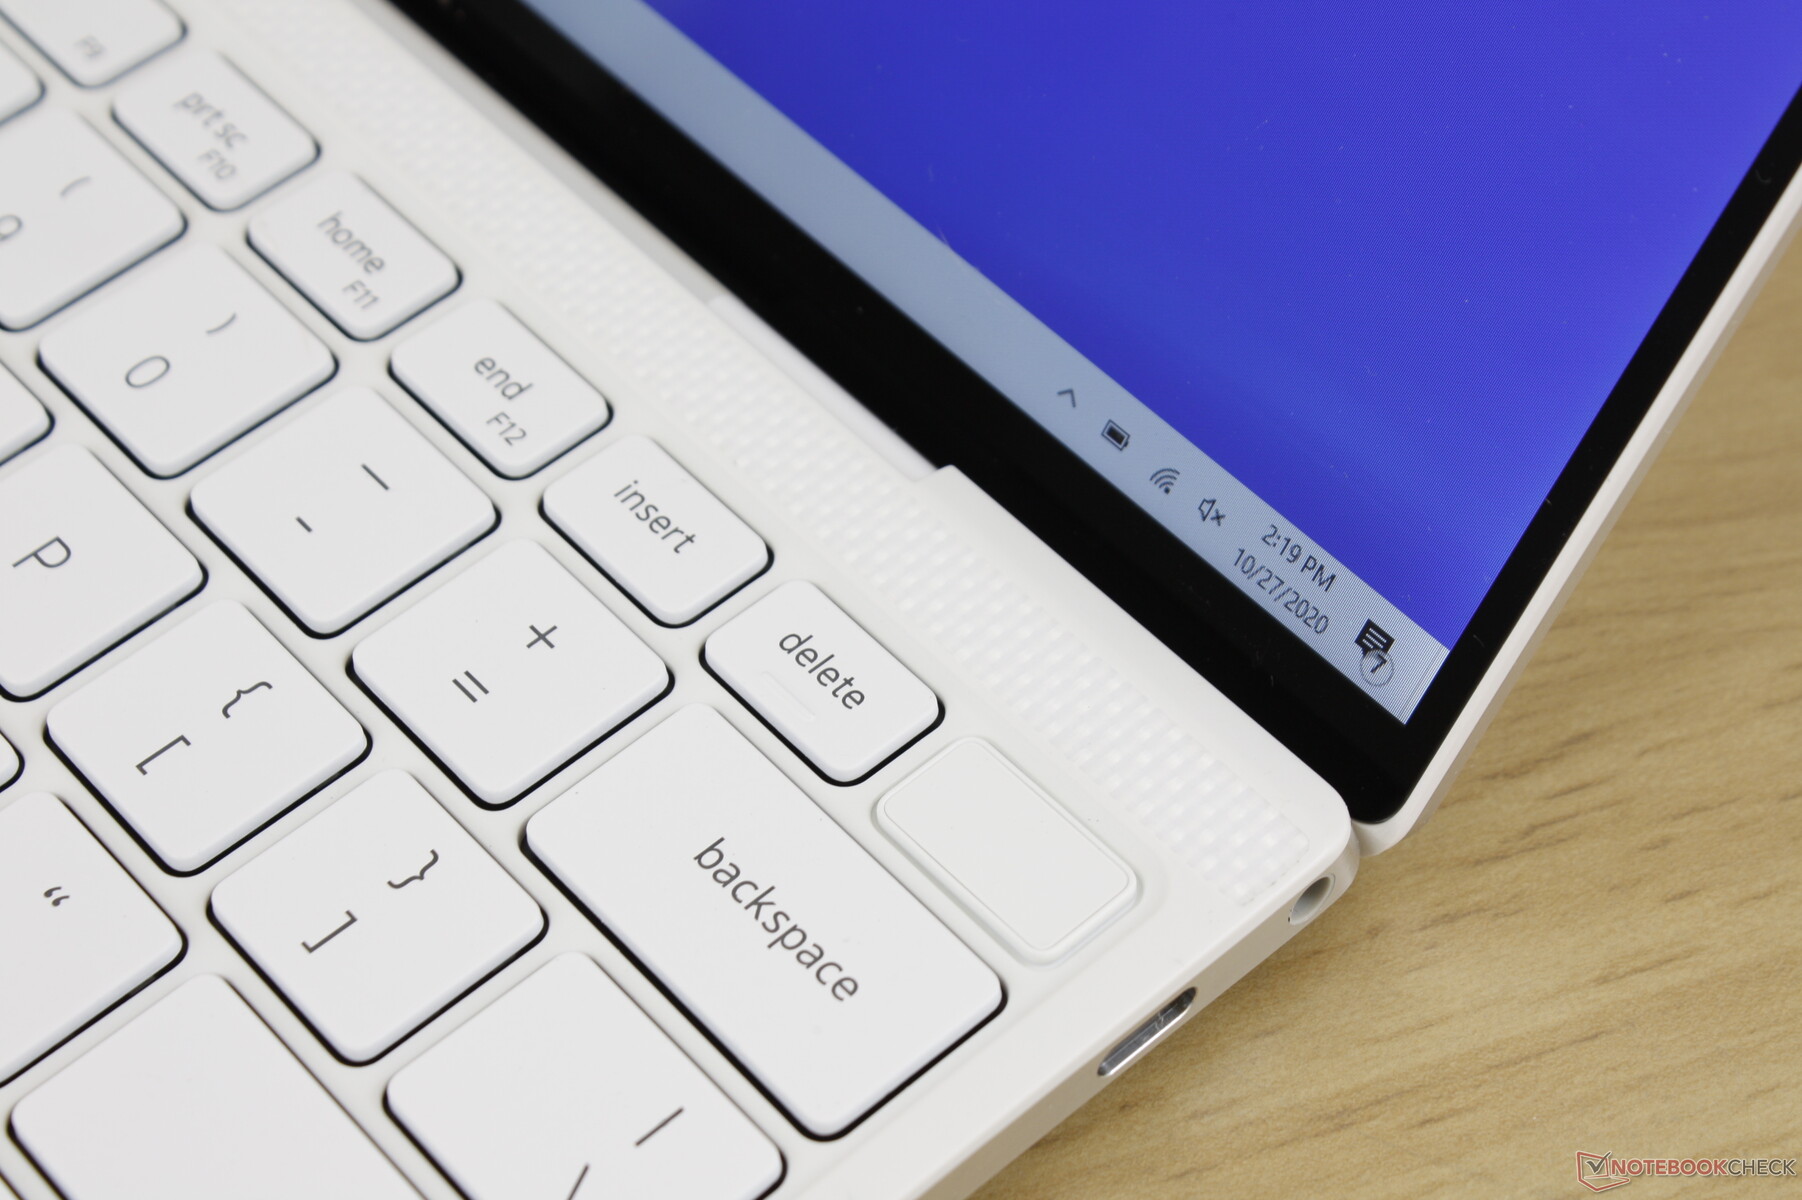
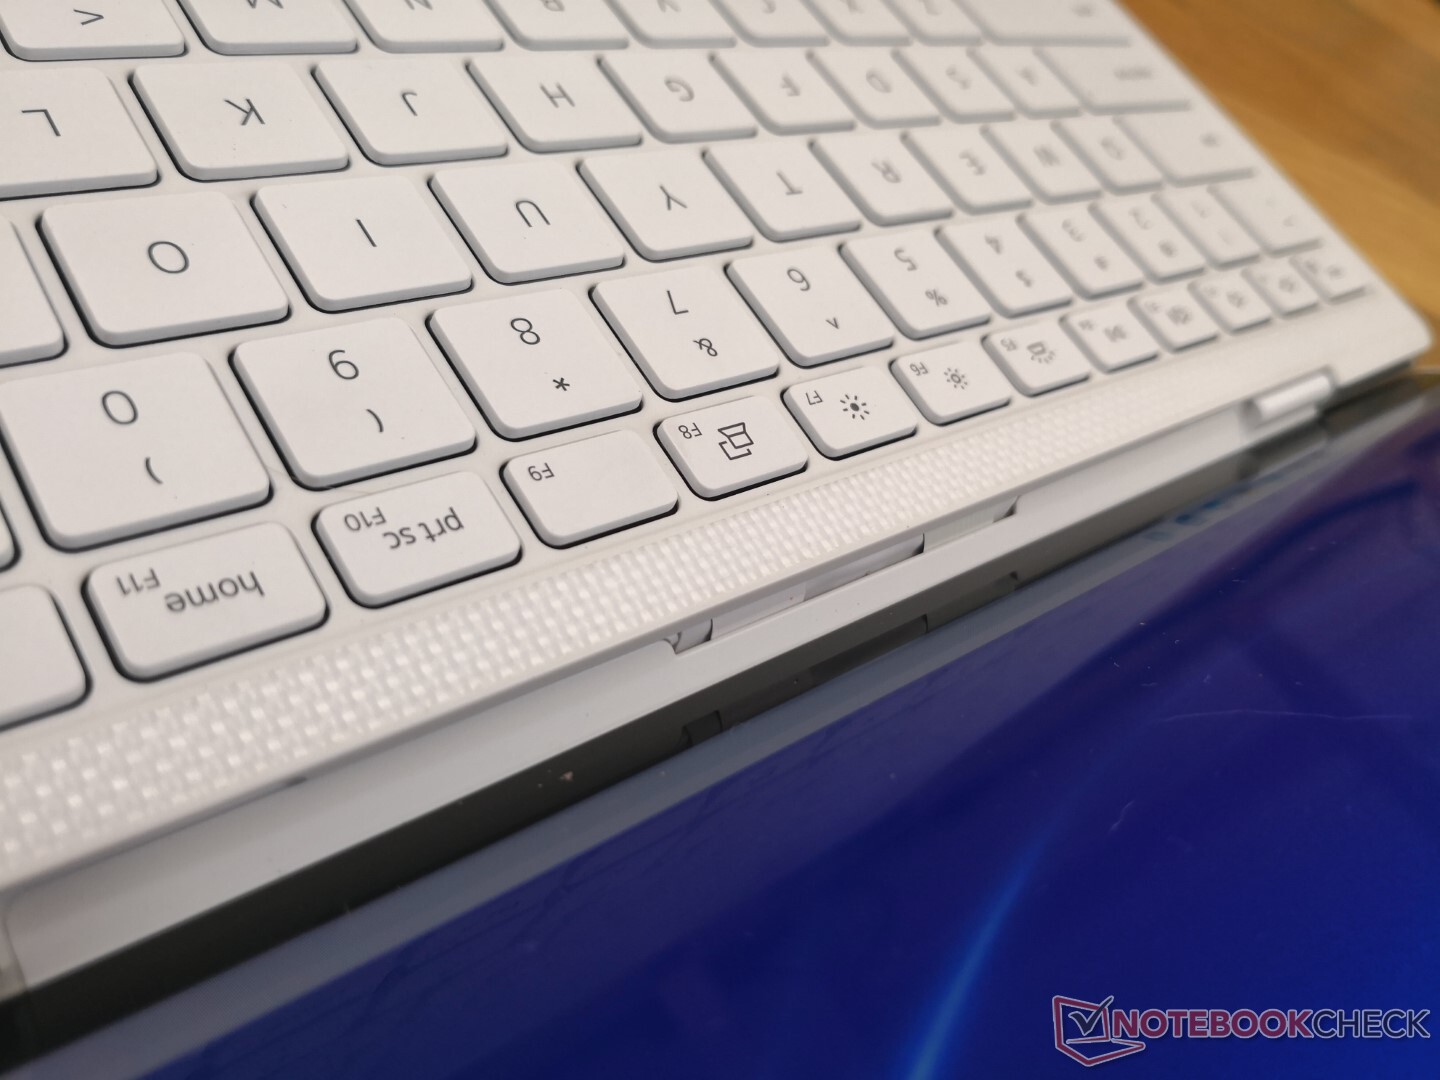
Dispositivos de entrada


Mostrar
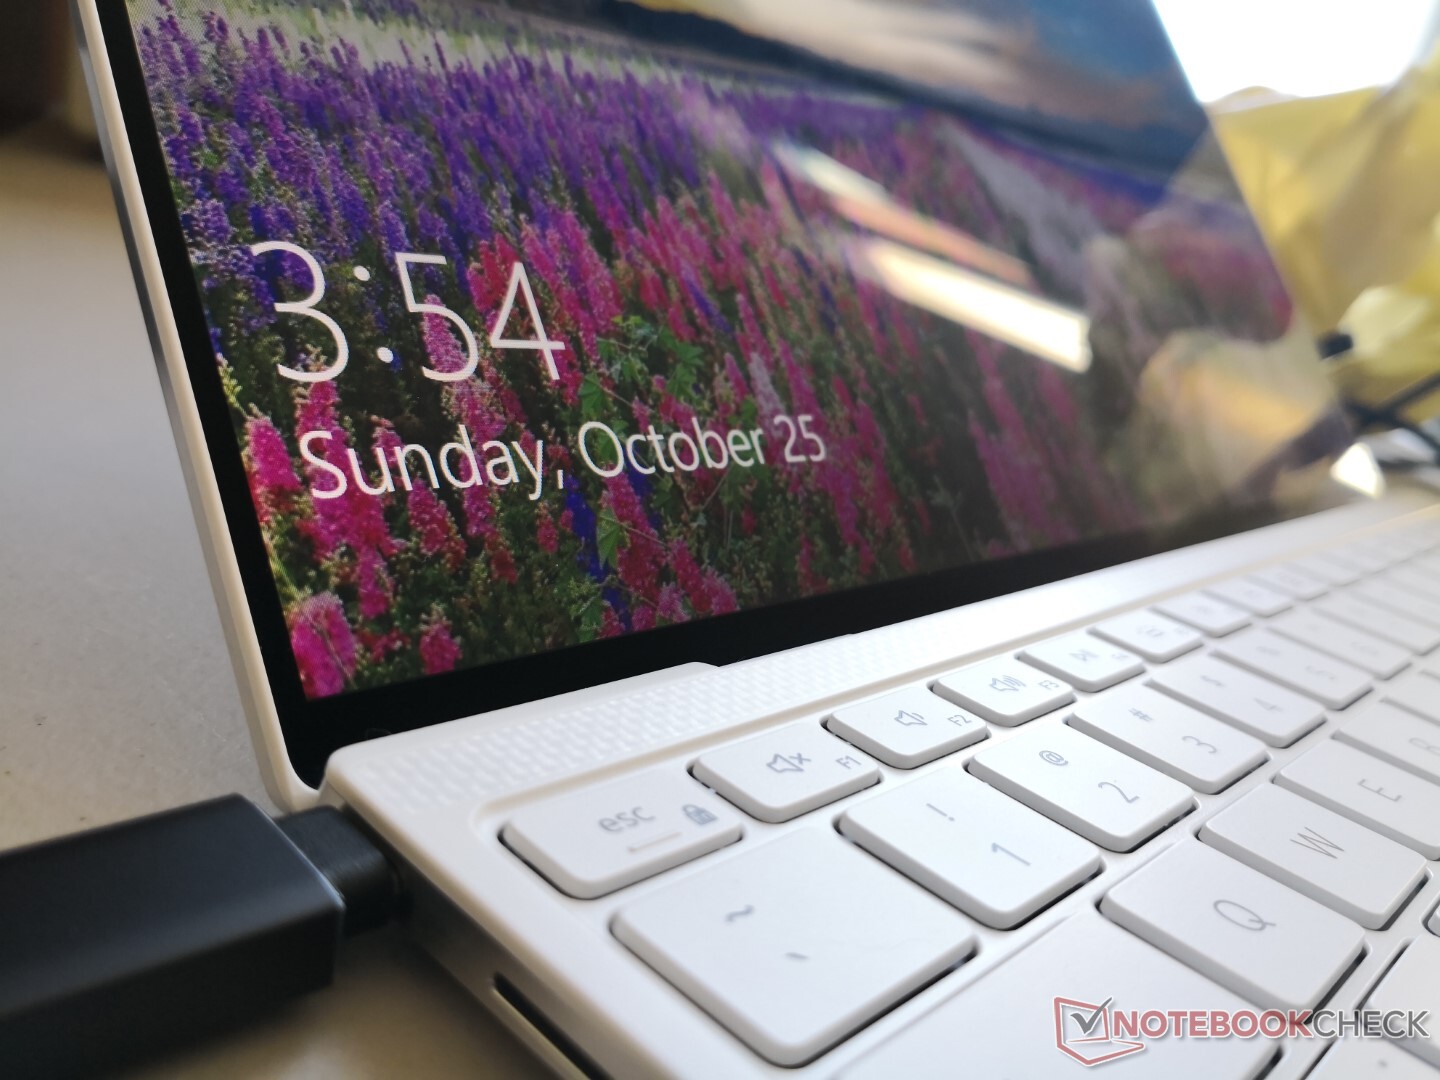
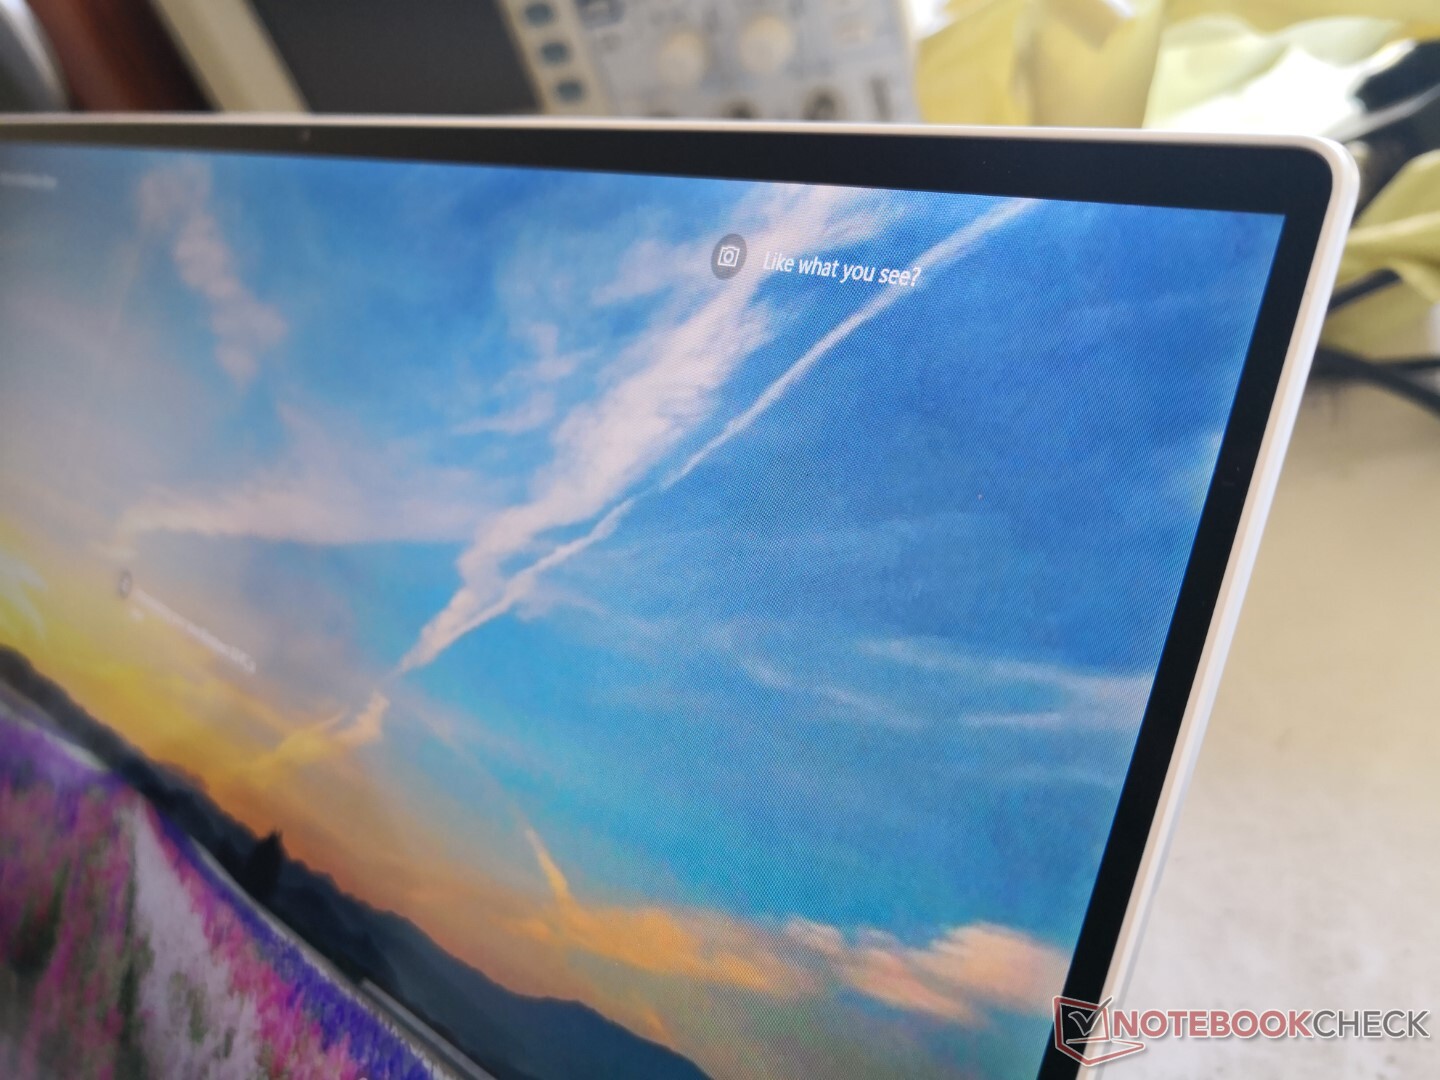
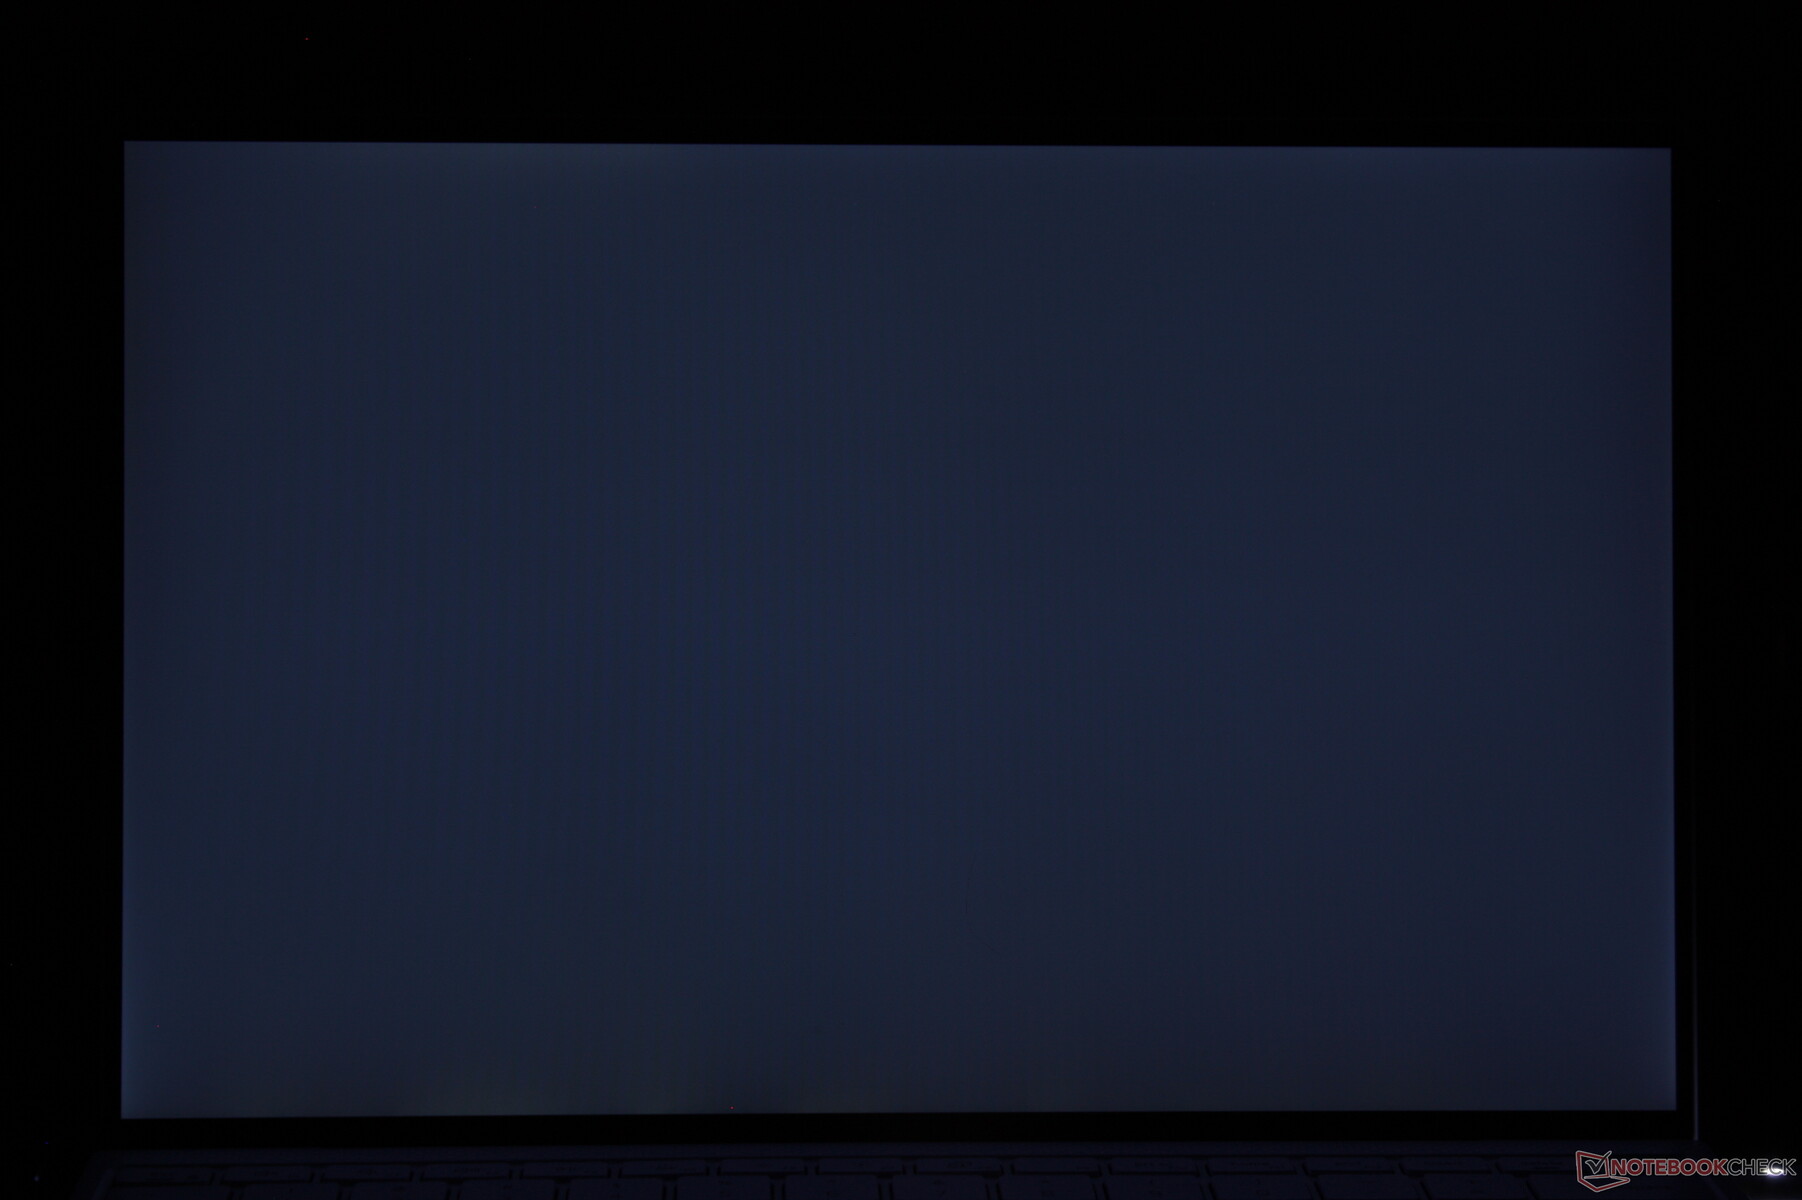
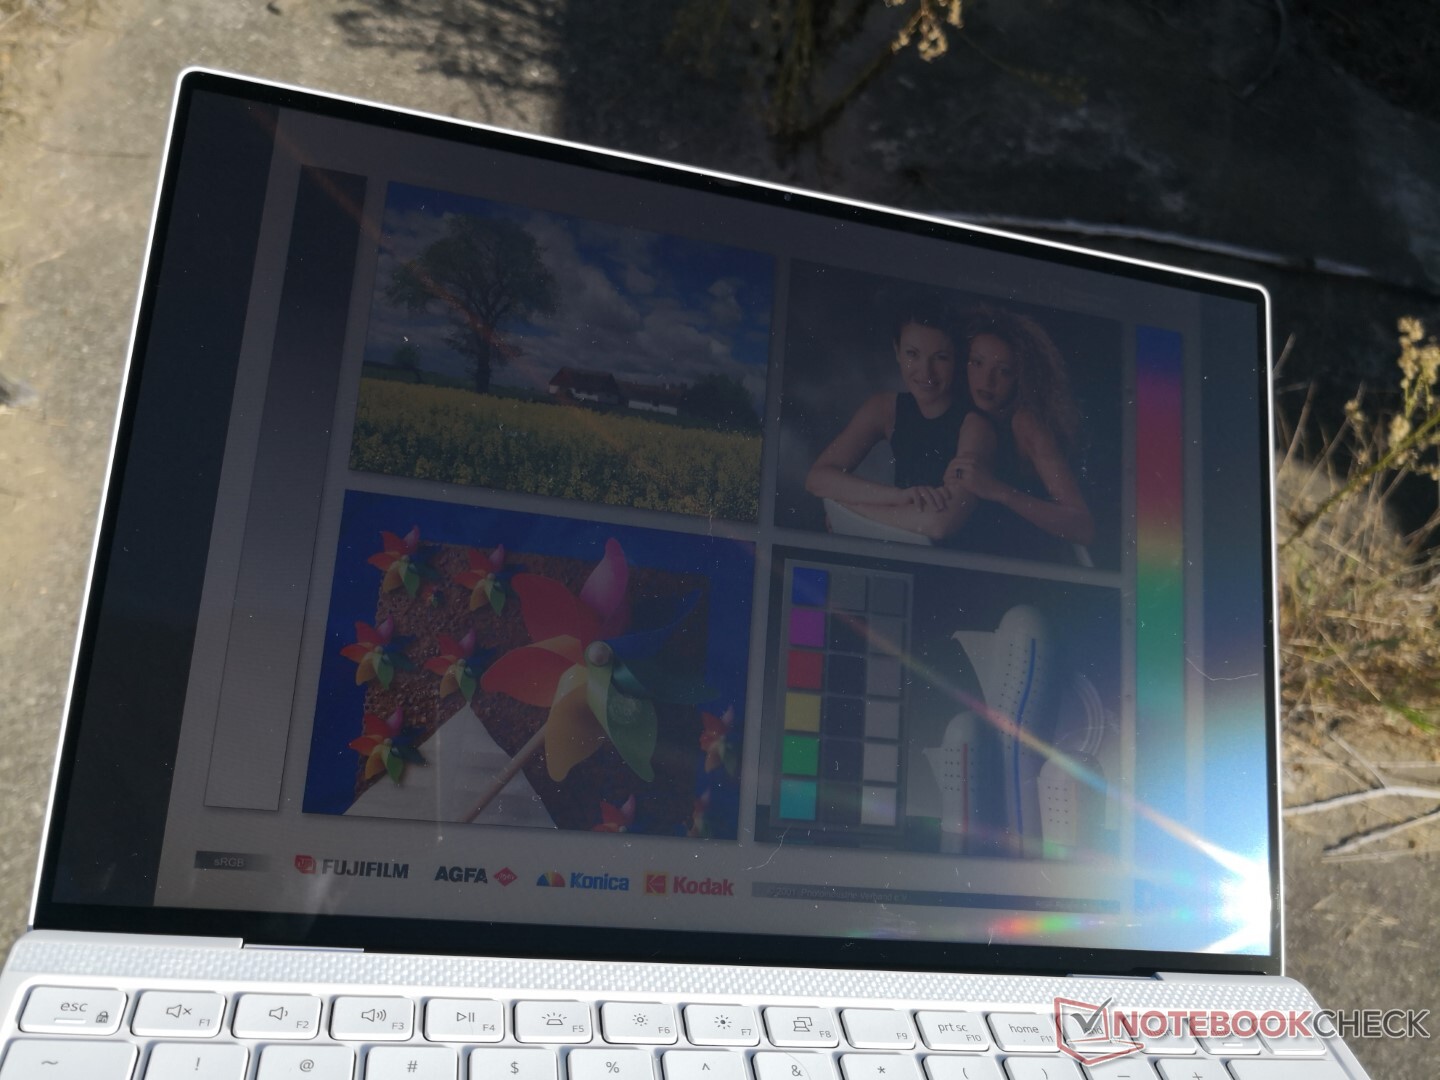
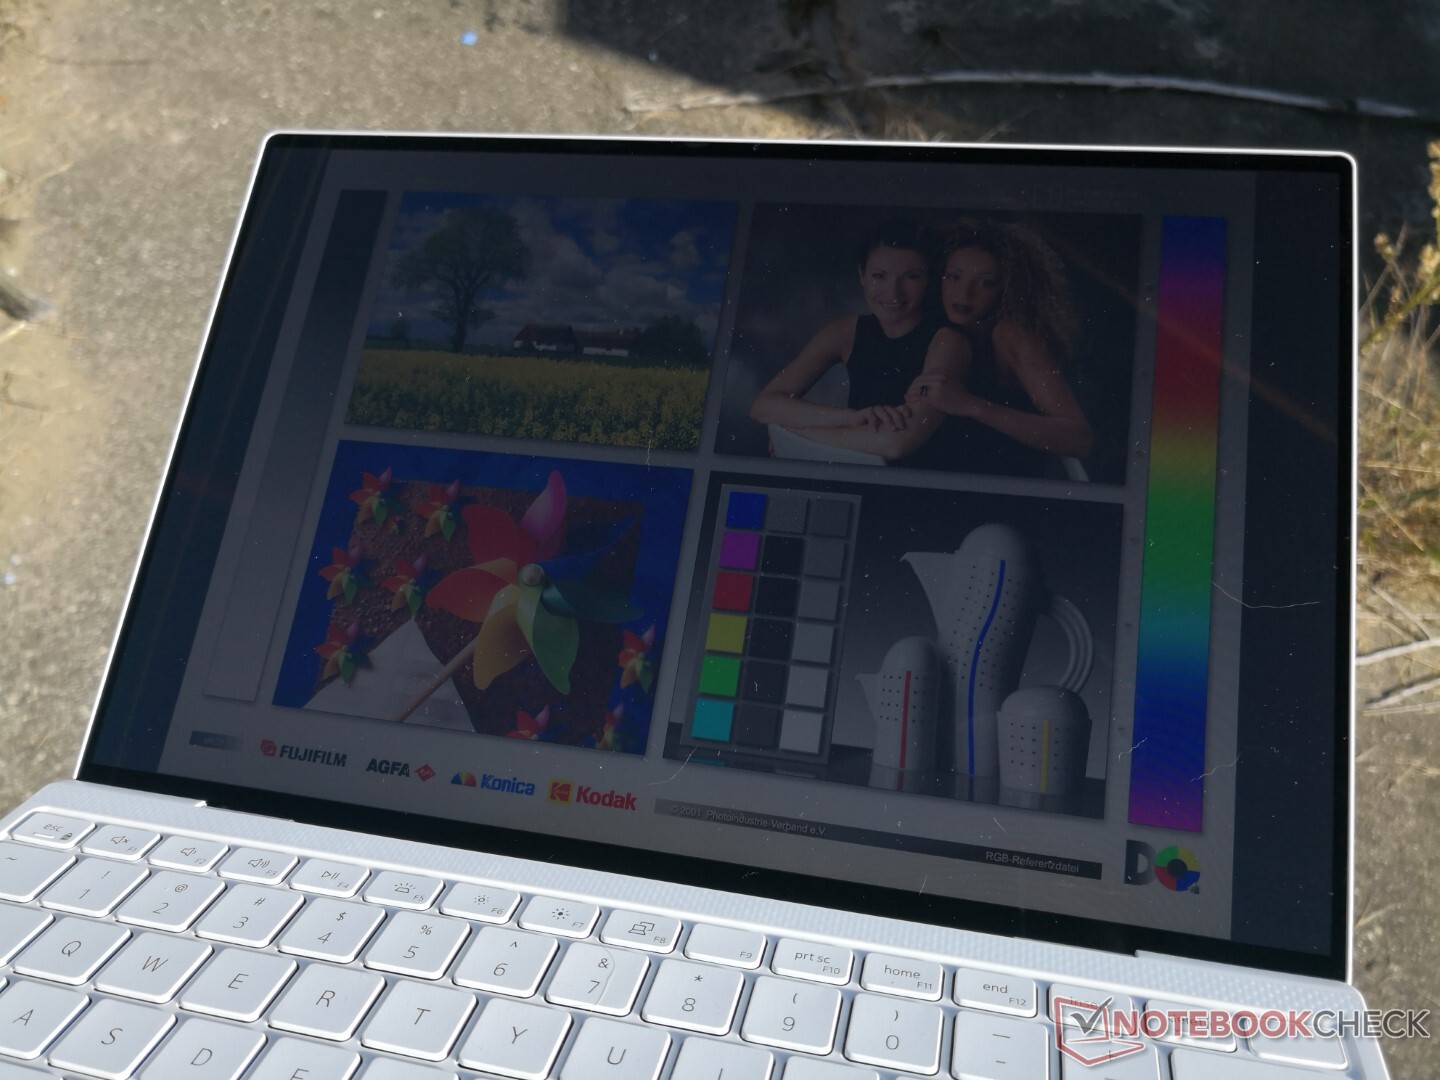
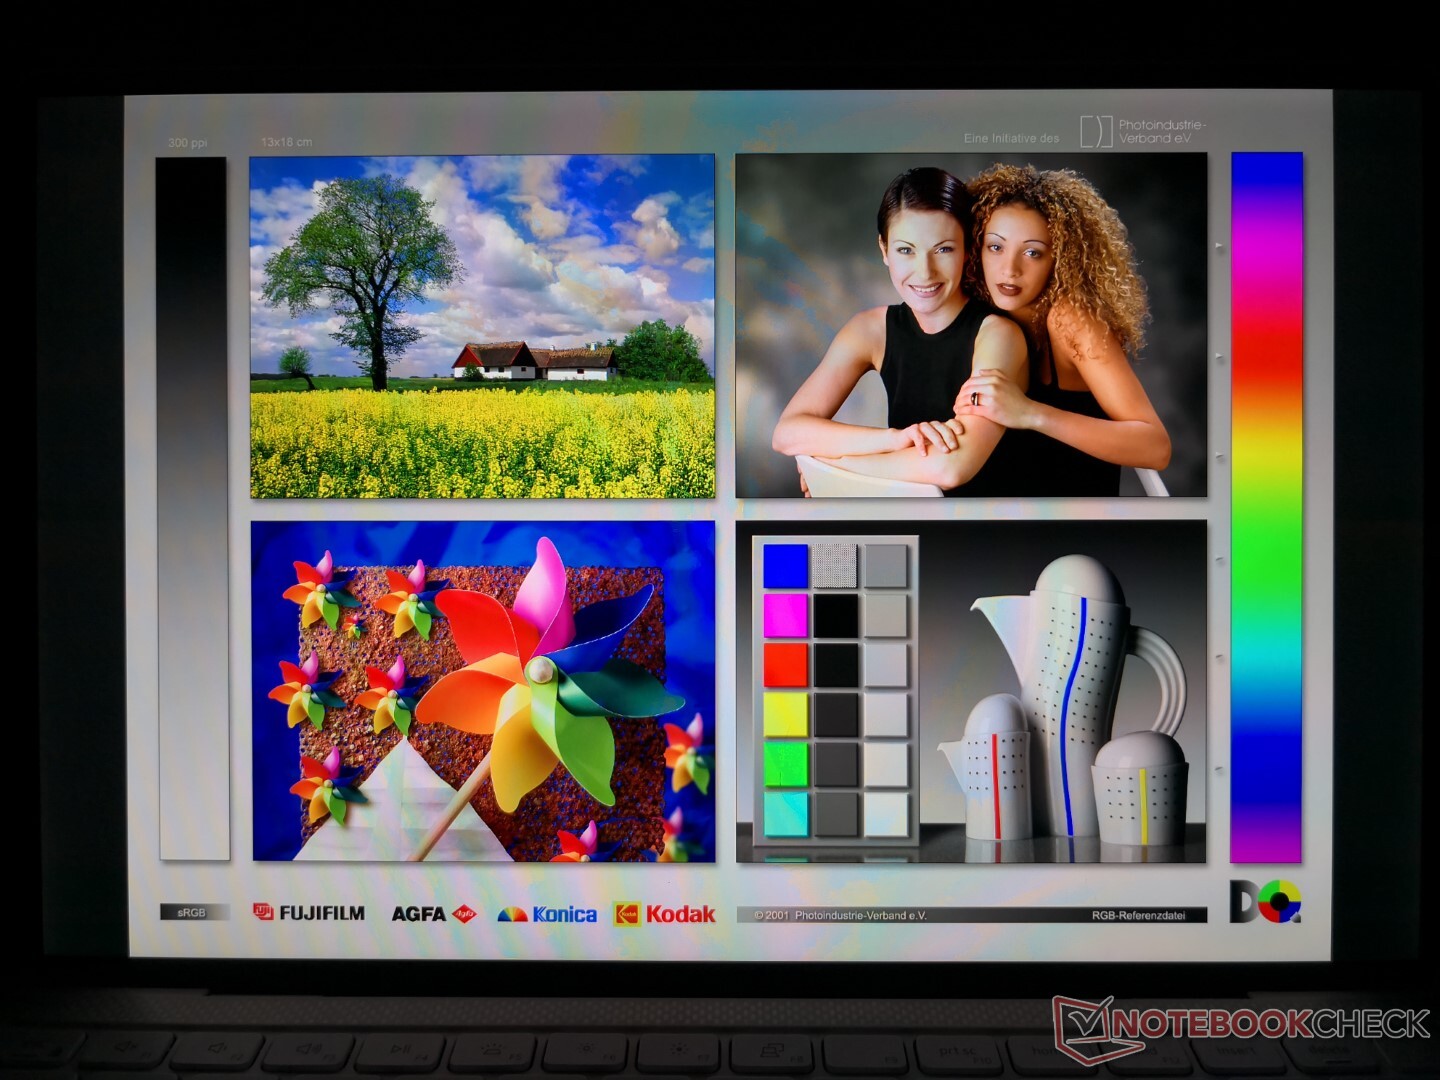
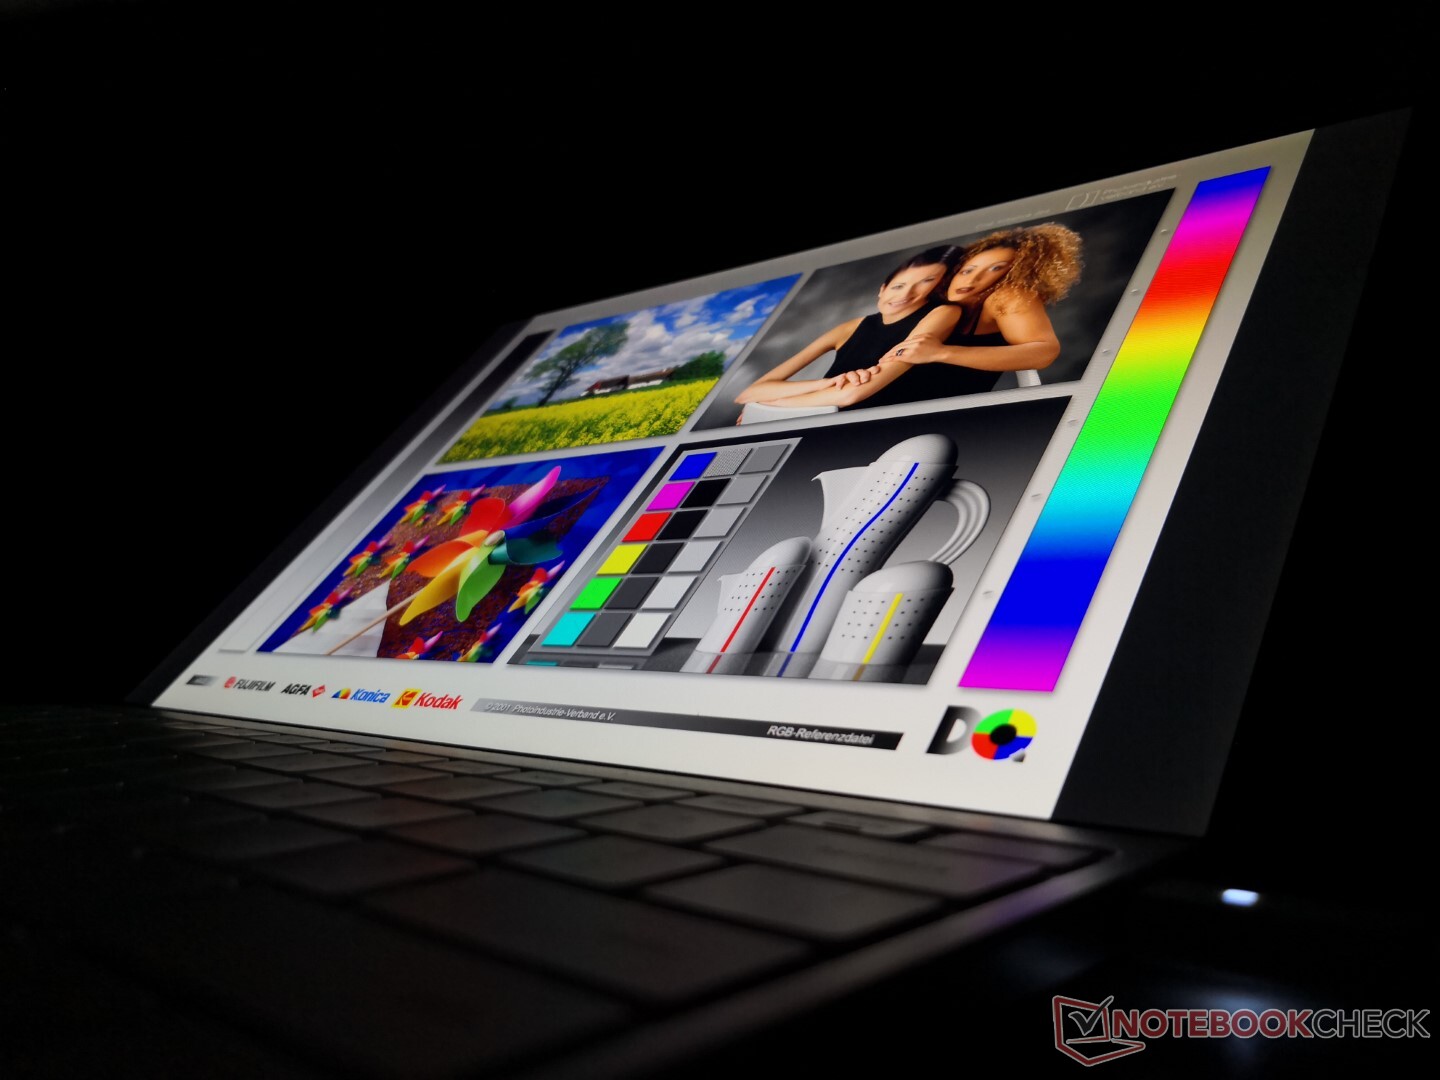
O 9310 usa o mesmo painel IPS Sharp LQ134N1 como encontrado no XPS 13 9300, mas com níveis de brilho e valores de PWM ligeiramente diferentes. Os displays nos laptops XPS sempre foram alguns dos melhores em suas respectivas categorias e isto permanece verdadeiro no 9310. As principais desvantagens continuam sendo os tempos de resposta relativamente lentos e a falta de sincronização adaptativa e de opções OLED. A Lenovo Yoga Slim 7 acionada por AMD, por exemplo, vem com sincronia adaptativa para reduzir o rasgo da tela.
| |||||||||||||||||||||||||
iluminação: 92 %
iluminação com acumulador: 543.3 cd/m²
Contraste: 1430:1 (Preto: 0.38 cd/m²)
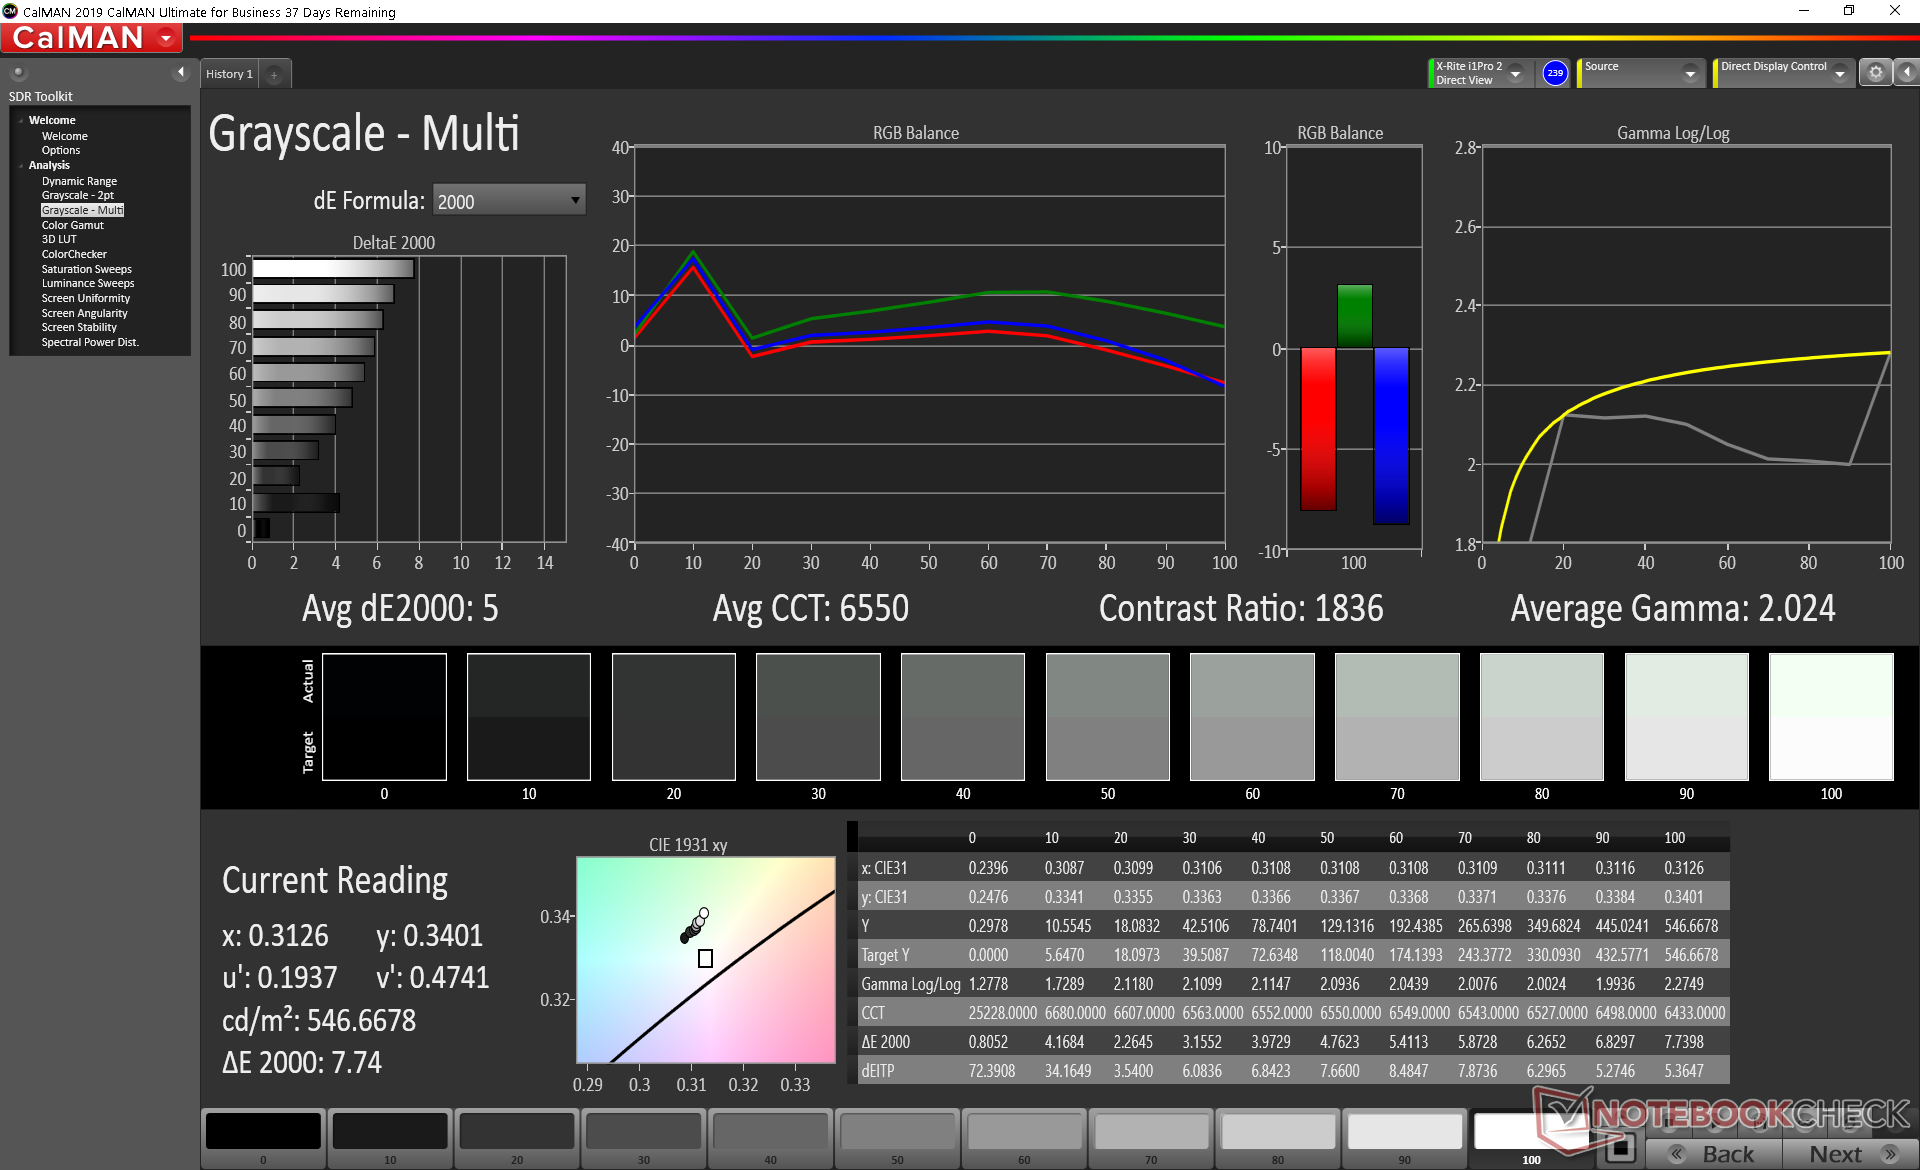
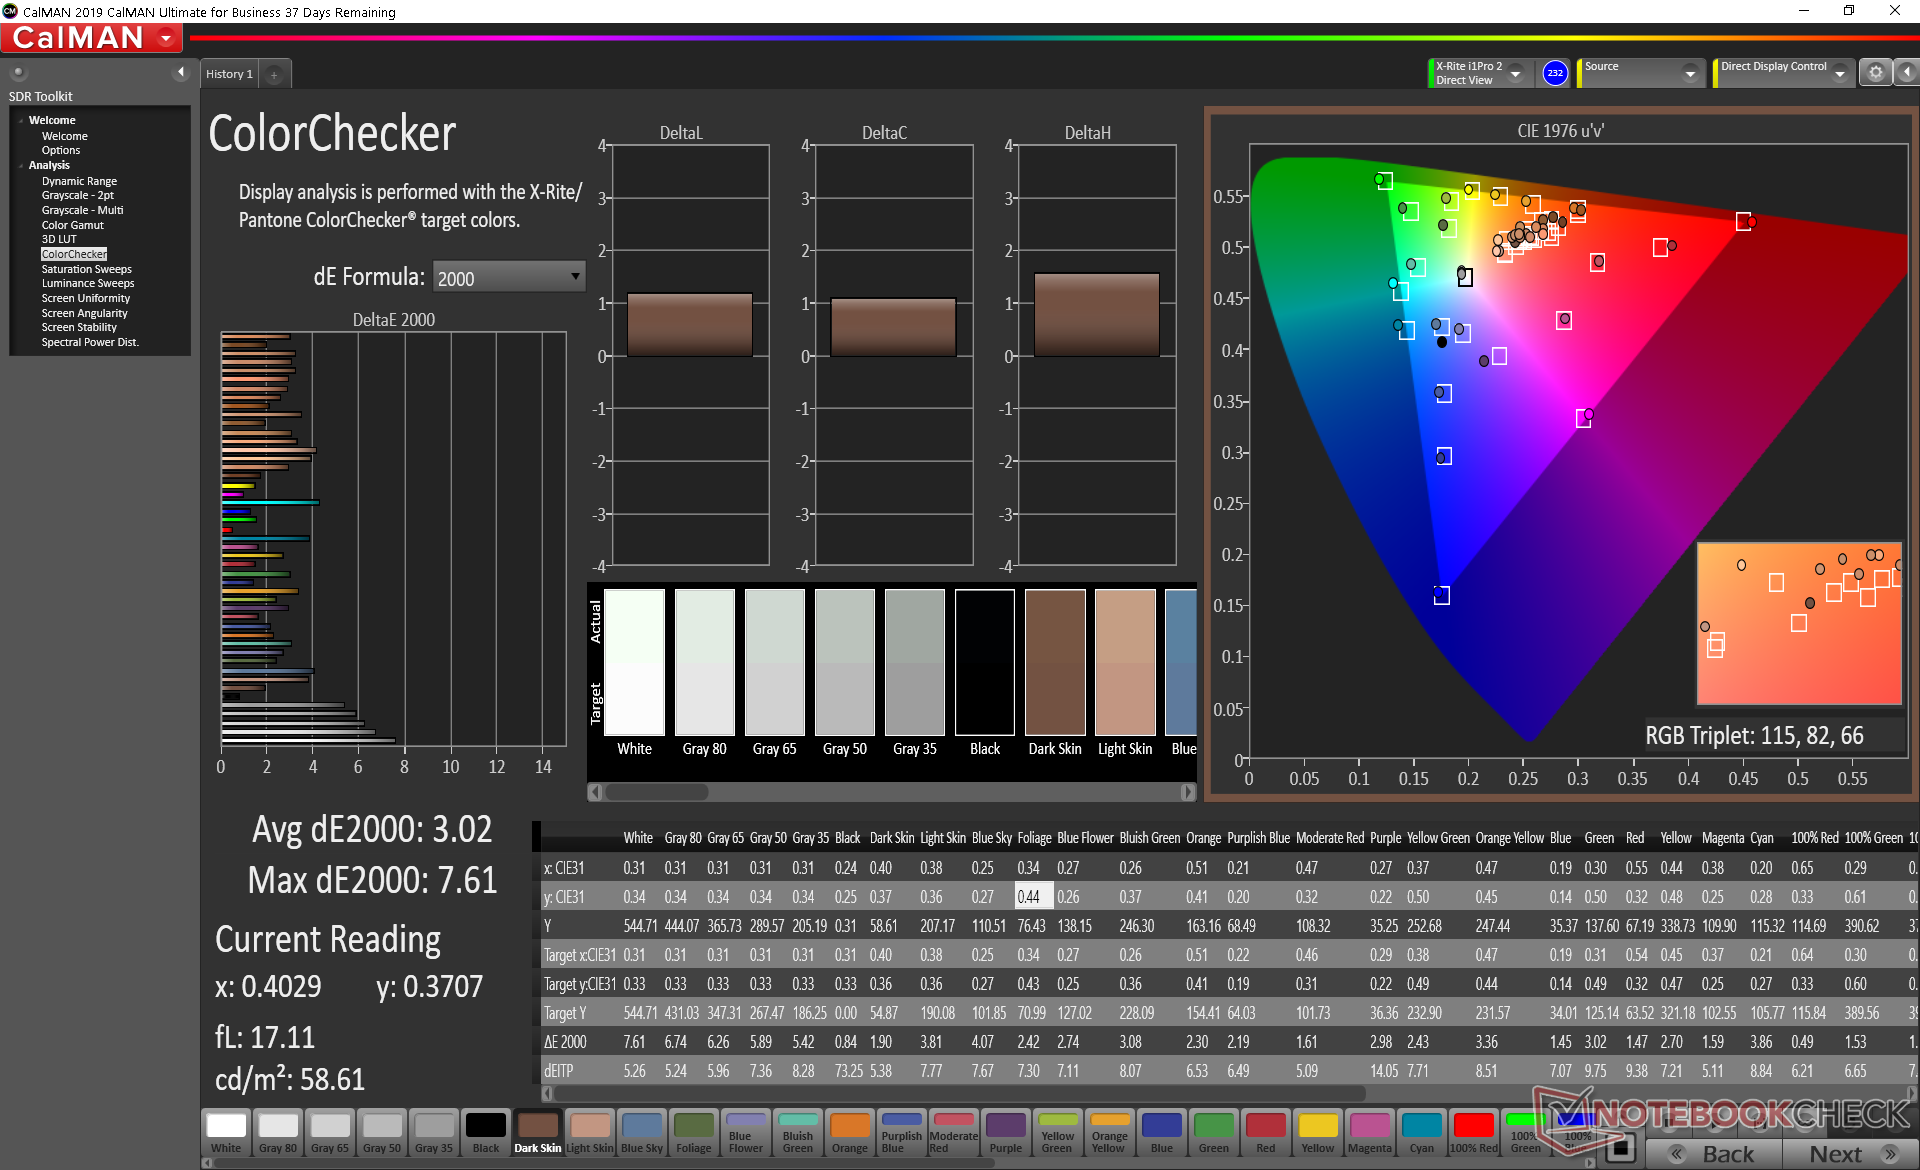
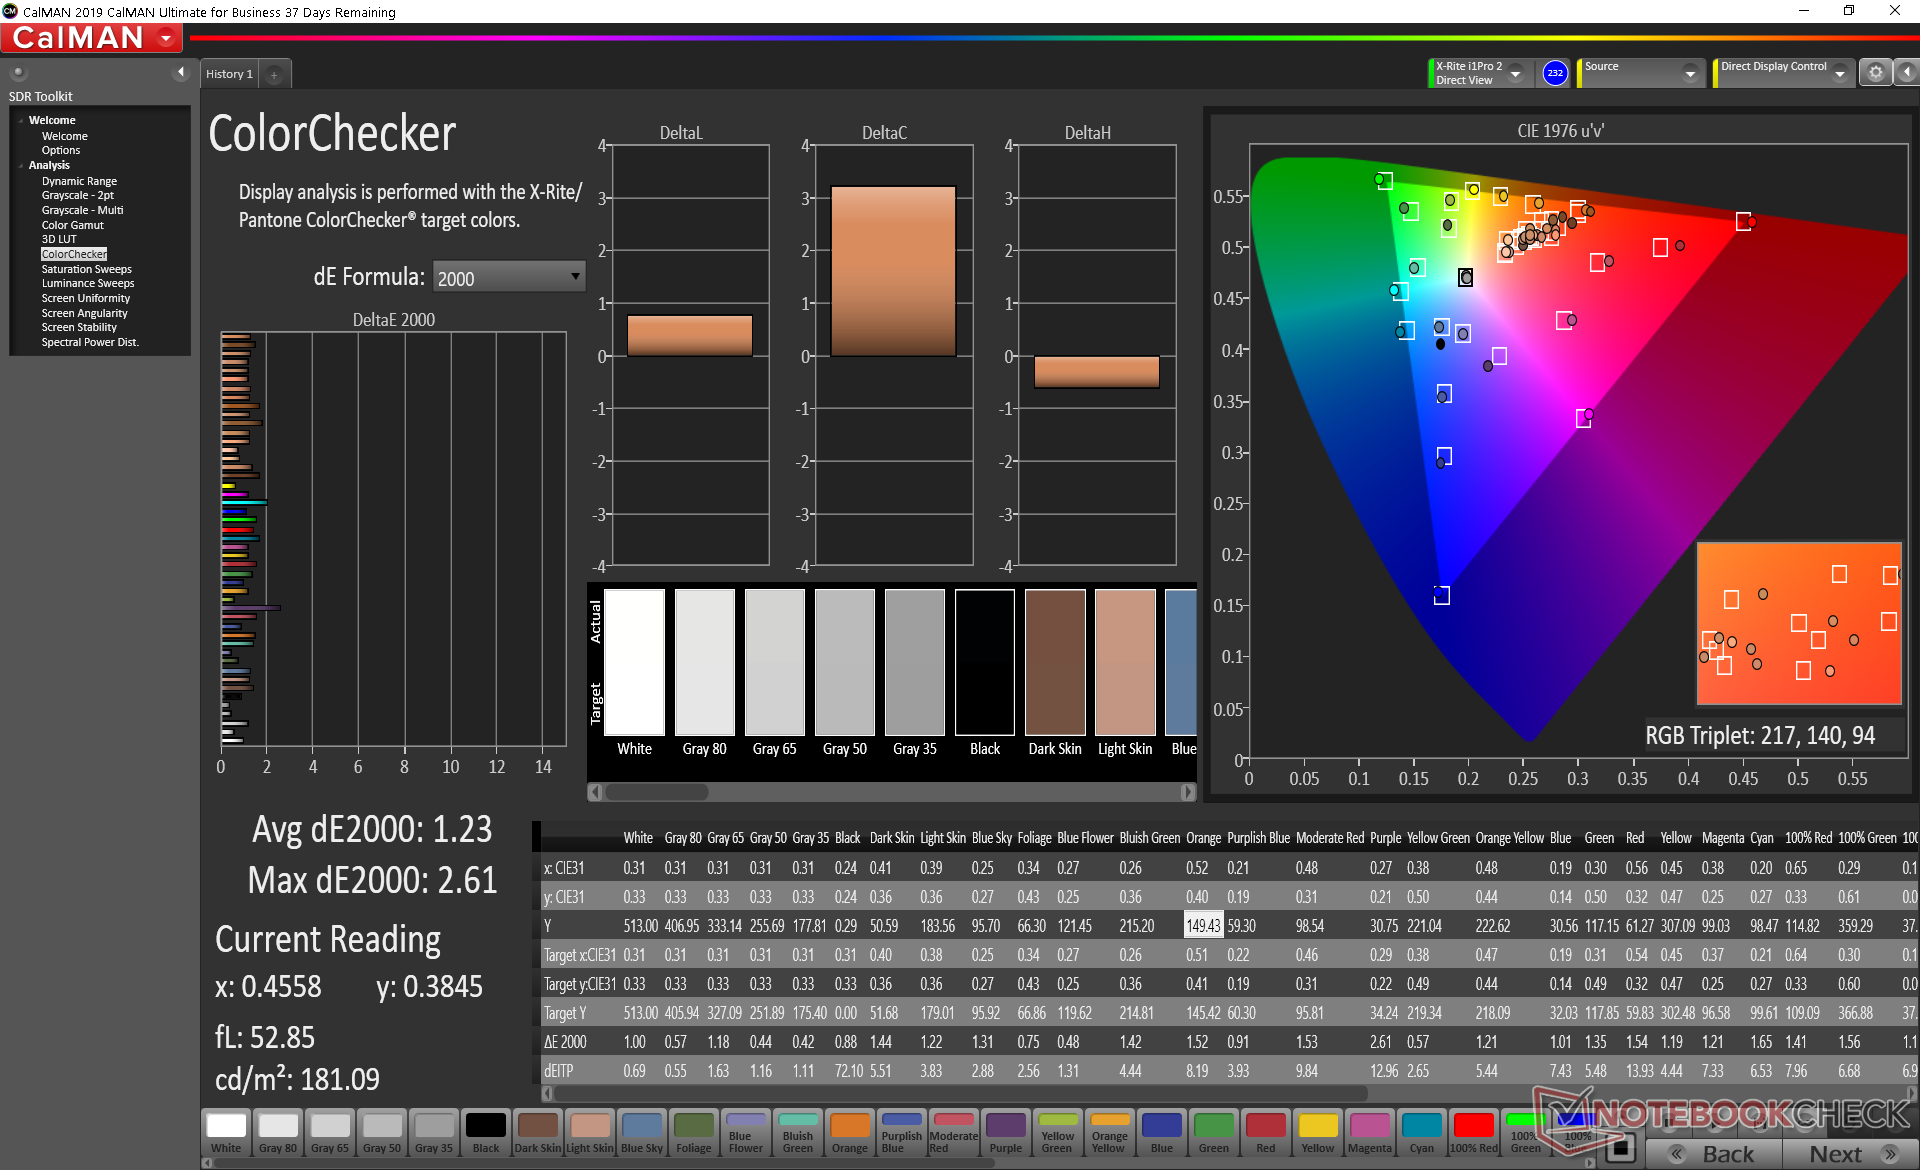
ΔE ColorChecker Calman: 3.02 | ∀{0.5-29.43 Ø4.71}
calibrated: 1.23
ΔE Greyscale Calman: 5 | ∀{0.09-98 Ø4.96}
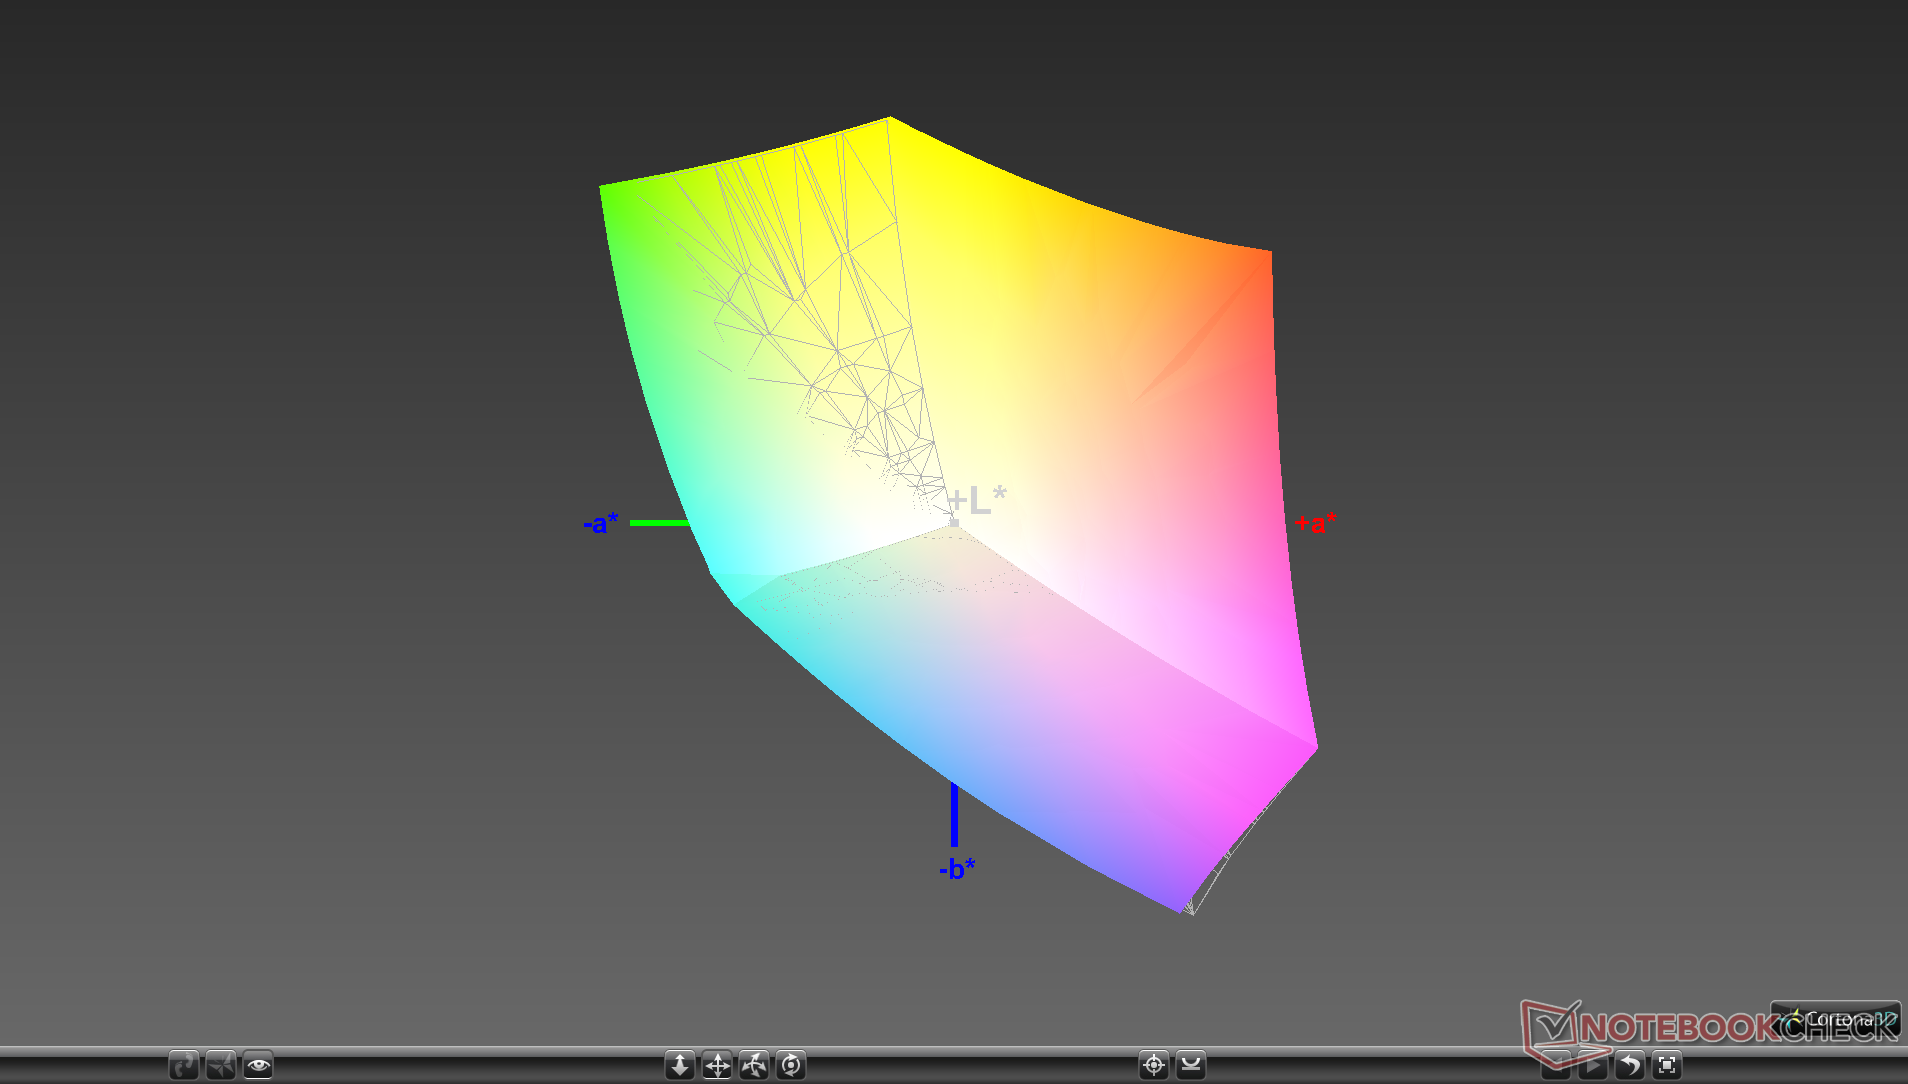
99.6% sRGB (Argyll 1.6.3 3D)
66.8% AdobeRGB 1998 (Argyll 1.6.3 3D)
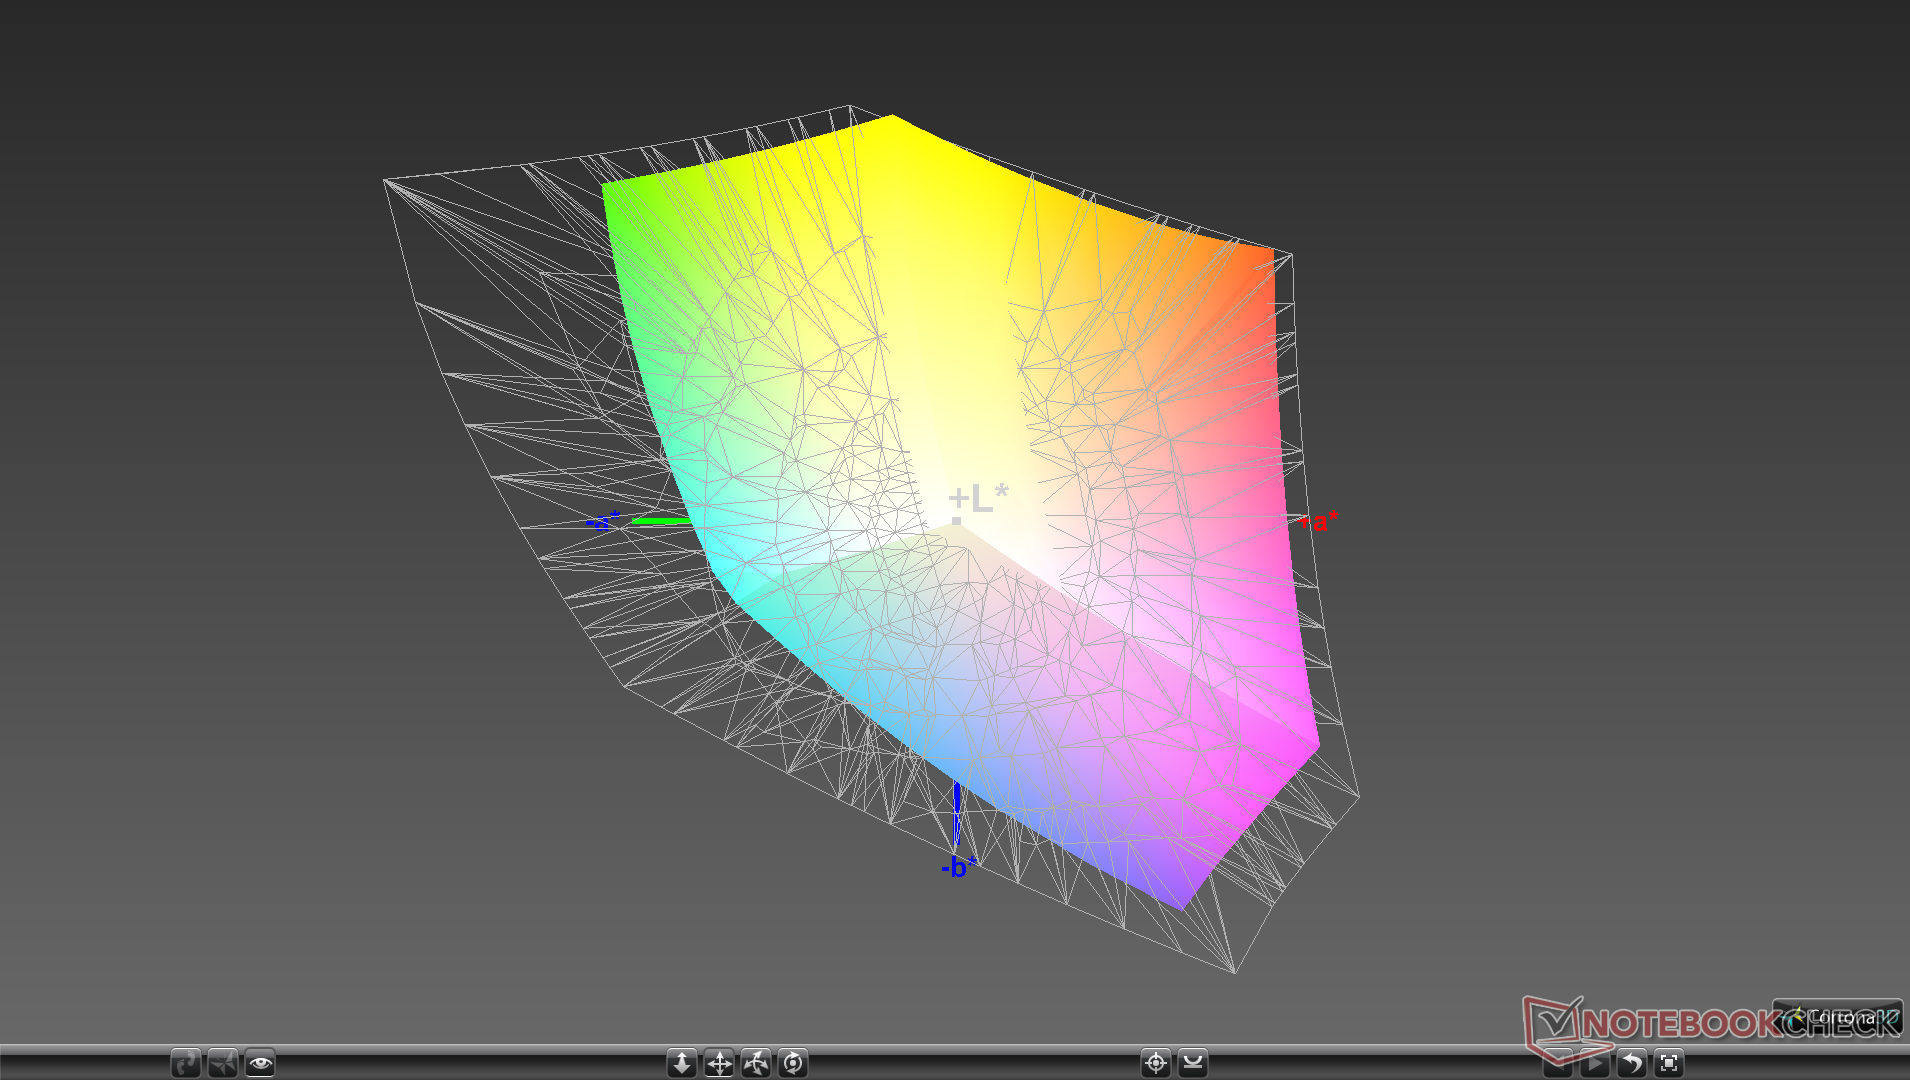
72.9% AdobeRGB 1998 (Argyll 3D)
99.1% sRGB (Argyll 3D)
70.9% Display P3 (Argyll 3D)
Gamma: 2.02
CCT: 6550 K
| Dell XPS 13 9310 Core i7 FHD Sharp LQ134N1, IPS, 13.4", 1920x1200 | Dell XPS 13 9300 Core i7-1065G7 Sharp LQ134N1, IPS, 13.4", 1920x1200 | Apple MacBook Pro 13 2020 2GHz i5 10th-Gen APPA03D, IPS, 13.3", 2560x1600 | Huawei MateBook X Pro 2020 i7 JDI LPM139M422A, LTPS, 13.9", 3000x2000 | Lenovo Yoga Slim 7-14ARE AU Optronics B140HAN06.8, IPS, 14", 1920x1080 | HP Spectre x360 13-aw0013dx AU Optronics AUO5E2D, IPS, 13.3", 1920x1080 | |
|---|---|---|---|---|---|---|
| Display | -5% | 20% | -4% | 0% | -1% | |
| Display P3 Coverage (%) | 70.9 | 66.3 -6% | 98.8 39% | 66.6 -6% | 71.7 1% | 69.6 -2% |
| sRGB Coverage (%) | 99.1 | 97.3 -2% | 99.9 1% | 99.4 0% | 99.3 0% | 98.9 0% |
| AdobeRGB 1998 Coverage (%) | 72.9 | 68.5 -6% | 86.4 19% | 68.6 -6% | 72.9 0% | 71.5 -2% |
| Response Times | 2% | 7% | 6% | 12% | -14% | |
| Response Time Grey 50% / Grey 80% * (ms) | 52 ? | 50 ? 4% | 46 ? 12% | 49.6 ? 5% | 45.6 ? 12% | 60.8 ? -17% |
| Response Time Black / White * (ms) | 33.2 ? | 33.2 ? -0% | 32.4 ? 2% | 30.8 ? 7% | 29.6 ? 11% | 36.8 ? -11% |
| PWM Frequency (Hz) | 2475 ? | 2500 ? | 113600 ? | 29070 ? | ||
| Screen | 1% | 19% | 23% | -9% | -11% | |
| Brightness middle (cd/m²) | 543.3 | 607.6 12% | 512 -6% | 557 3% | 399.6 -26% | 447.4 -18% |
| Brightness (cd/m²) | 524 | 595 14% | 491 -6% | 532 2% | 385 -27% | 420 -20% |
| Brightness Distribution (%) | 92 | 96 4% | 91 -1% | 87 -5% | 89 -3% | 85 -8% |
| Black Level * (cd/m²) | 0.38 | 0.4 -5% | 0.32 16% | 0.33 13% | 0.37 3% | 0.31 18% |
| Contrast (:1) | 1430 | 1519 6% | 1600 12% | 1688 18% | 1080 -24% | 1443 1% |
| Colorchecker dE 2000 * | 3.02 | 3.23 -7% | 1.7 44% | 1.4 54% | 3.2 -6% | 4.23 -40% |
| Colorchecker dE 2000 max. * | 7.61 | 8.67 -14% | 3.4 55% | 2.5 67% | 6.44 15% | 9.34 -23% |
| Colorchecker dE 2000 calibrated * | 1.23 | 1.01 18% | 1 19% | 0.7 43% | 1.73 -41% | 1.32 -7% |
| Greyscale dE 2000 * | 5 | 5.5 -10% | 1.9 62% | 2 60% | 4.7 6% | 6.1 -22% |
| Gamma | 2.02 109% | 2.12 104% | 2.19 100% | 2.14 103% | 2.21 100% | 2.11 104% |
| CCT | 6550 99% | 6413 101% | 6817 95% | 6689 97% | 7184 90% | 6136 106% |
| Color Space (Percent of AdobeRGB 1998) (%) | 66.8 | 63 -6% | 77.4 16% | 62.5 -6% | 66.3 -1% | 64.8 -3% |
| Color Space (Percent of sRGB) (%) | 99.6 | 97.5 -2% | 99.9 0% | 99.5 0% | 99.5 0% | 98.9 -1% |
| Média Total (Programa/Configurações) | -1% /
0% | 15% /
18% | 8% /
16% | 1% /
-5% | -9% /
-10% |
* ... menor é melhor
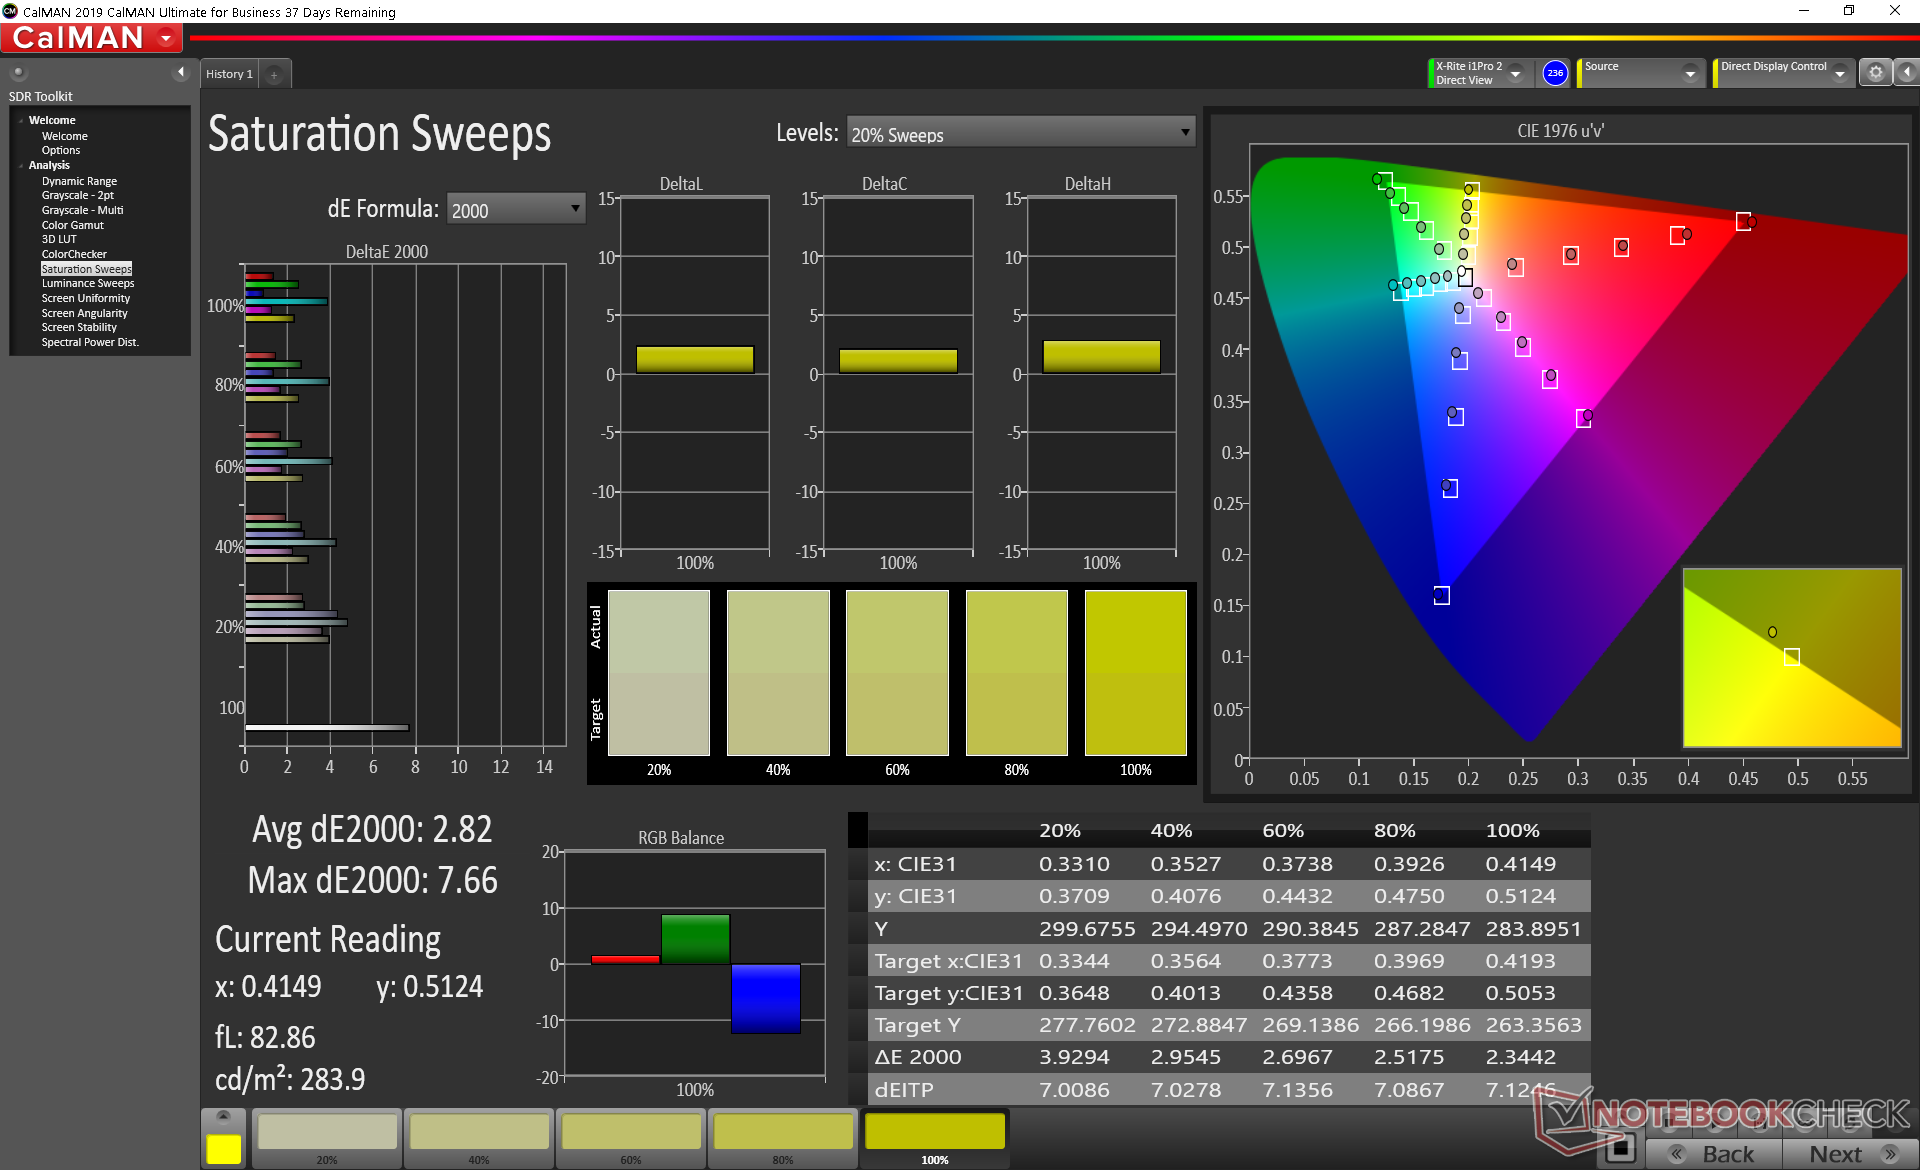
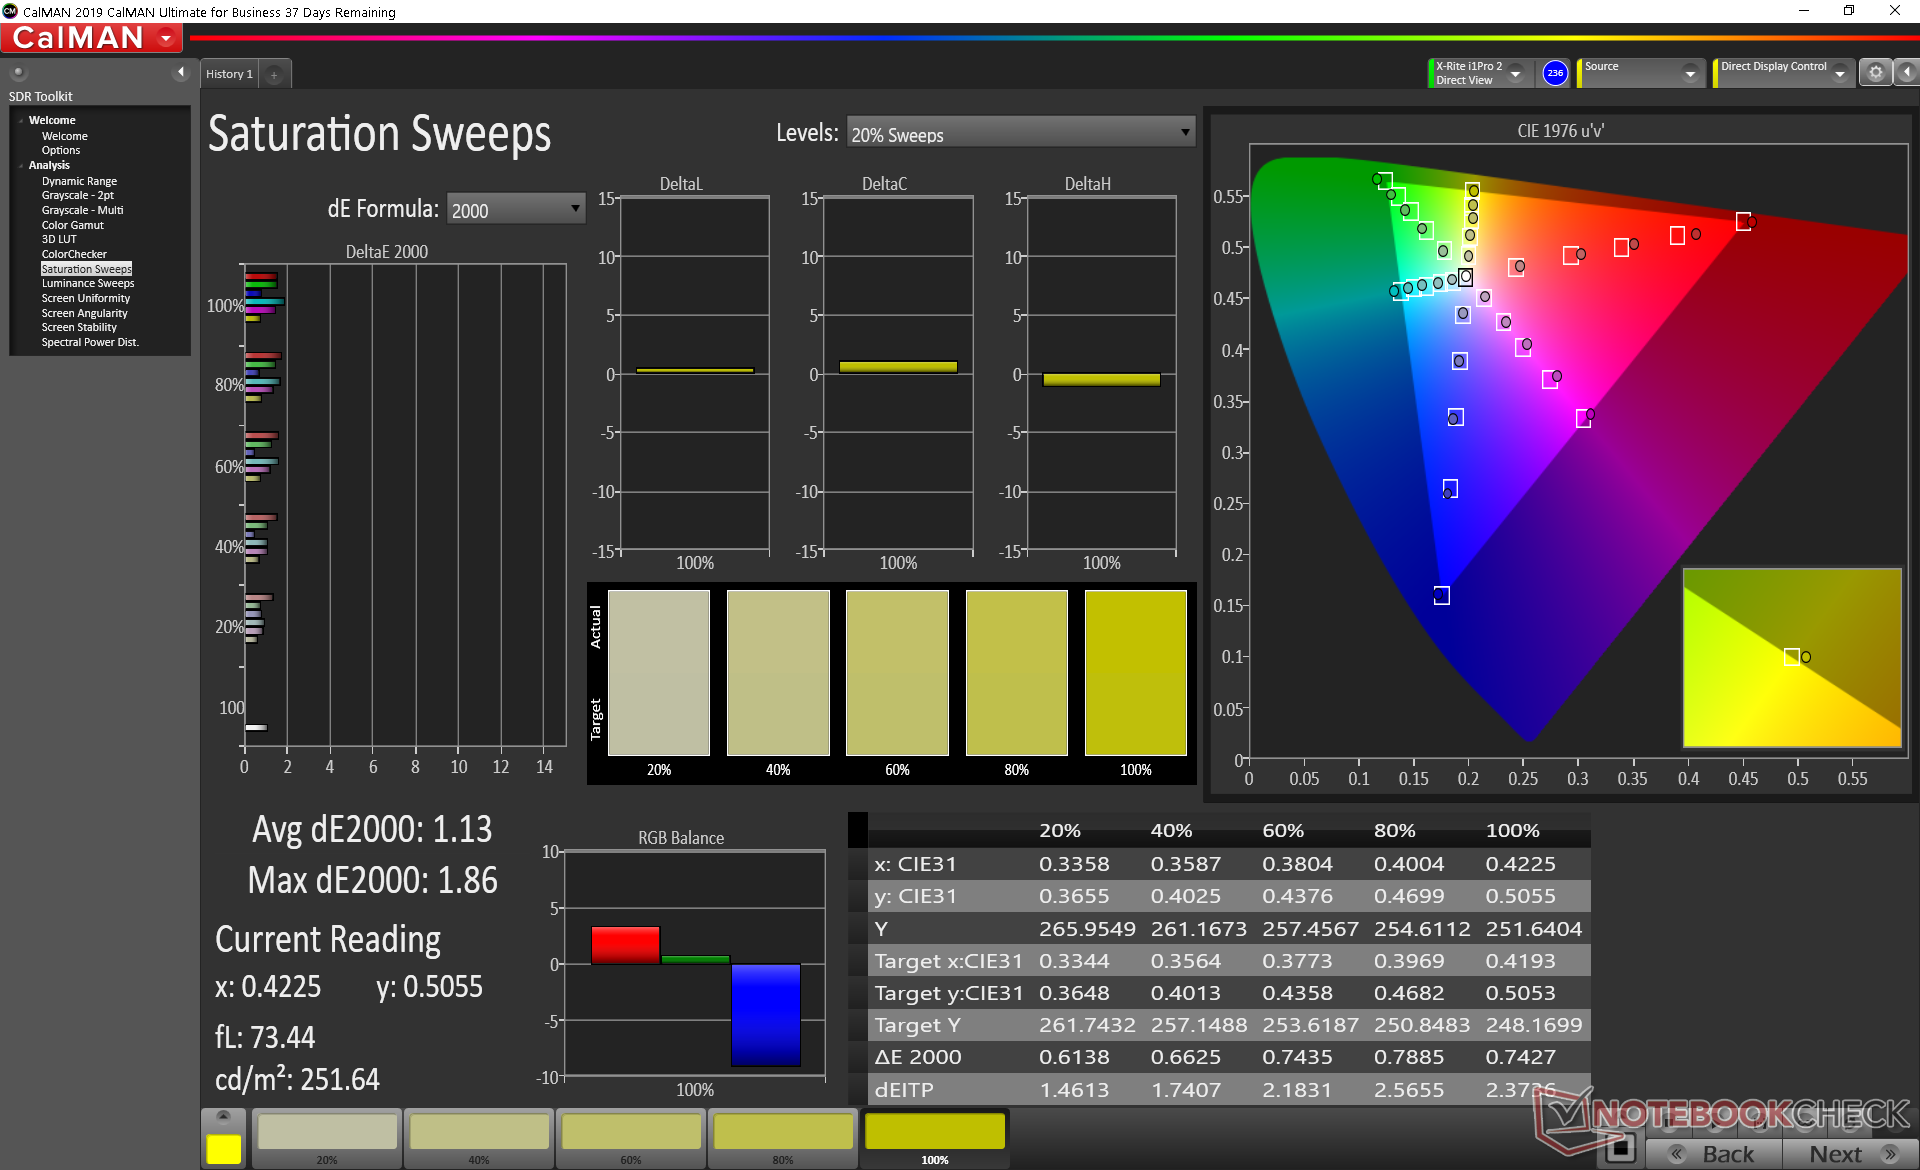
Todos os SKUs XPS 13 9300/9310 têm cobertura 100% sRGB, sem opções para AdobeRGB ou DCI-P3 completos, ao contrário da série XPS 15. Isto não deve ser um problema para ninguém que não seja um editor gráfico profissional.
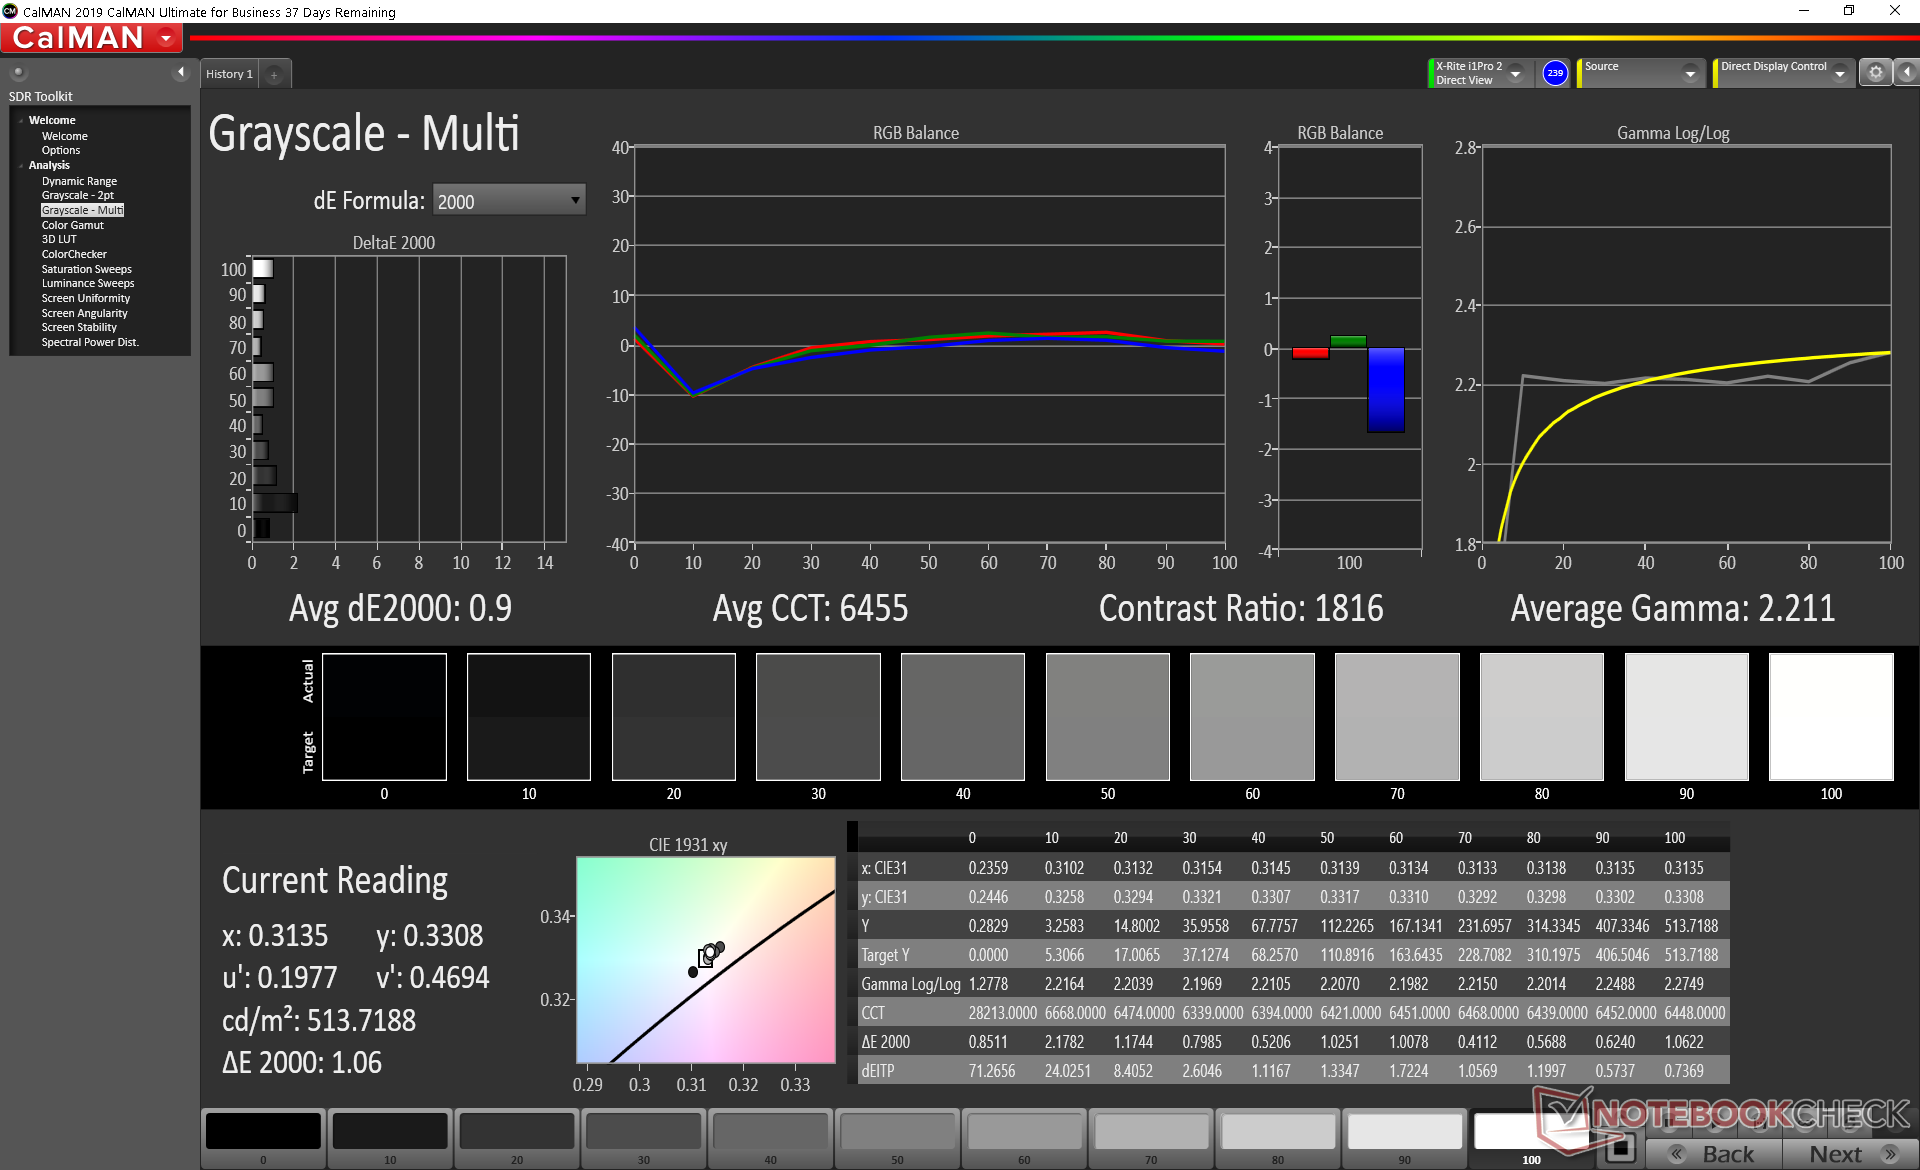
O valor de gama out-of-the-box de 2,0 poderia ter sido melhor. Calibrar a tela nós mesmos com um colorímetro X-Rite aproxima a gama do alvo 2.2 com uma escala de cinza e cores subseqüentemente melhores em toda a linha.
Exibir tempos de resposta
| ↔ Tempo de resposta preto para branco | ||
|---|---|---|
| 33.2 ms ... ascensão ↗ e queda ↘ combinadas | ↗ 19.2 ms ascensão | 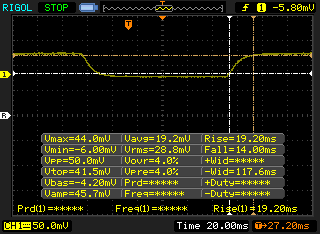 |
| ↘ 14 ms queda | ||
| A tela mostra taxas de resposta lentas em nossos testes e será insatisfatória para os jogadores. Em comparação, todos os dispositivos testados variam de 0.1 (mínimo) a 240 (máximo) ms. » 90 % de todos os dispositivos são melhores. Isso significa que o tempo de resposta medido é pior que a média de todos os dispositivos testados (19.8 ms). | ||
| ↔ Tempo de resposta 50% cinza a 80% cinza | ||
| 52 ms ... ascensão ↗ e queda ↘ combinadas | ↗ 27.6 ms ascensão | 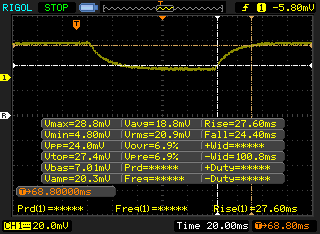 |
| ↘ 24.4 ms queda | ||
| A tela mostra taxas de resposta lentas em nossos testes e será insatisfatória para os jogadores. Em comparação, todos os dispositivos testados variam de 0.165 (mínimo) a 636 (máximo) ms. » 88 % de todos os dispositivos são melhores. Isso significa que o tempo de resposta medido é pior que a média de todos os dispositivos testados (31 ms). | ||
Cintilação da tela / PWM (modulação por largura de pulso)
| Tela tremeluzindo/PWM detectado | 2475 Hz | ≤ 20 % configuração de brilho | 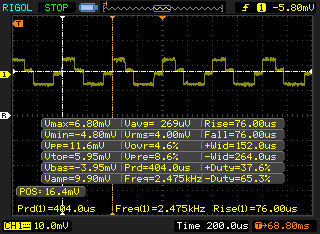 |
A luz de fundo da tela pisca em 2475 Hz (pior caso, por exemplo, utilizando PWM) Cintilação detectada em uma configuração de brilho de 20 % e abaixo. Não deve haver cintilação ou PWM acima desta configuração de brilho. A frequência de 2475 Hz é bastante alta, então a maioria dos usuários sensíveis ao PWM não deve notar nenhuma oscilação. [pwm_comparison] Em comparação: 52 % de todos os dispositivos testados não usam PWM para escurecer a tela. Se PWM foi detectado, uma média de 7754 (mínimo: 5 - máximo: 343500) Hz foi medida. | |||

Desempenho
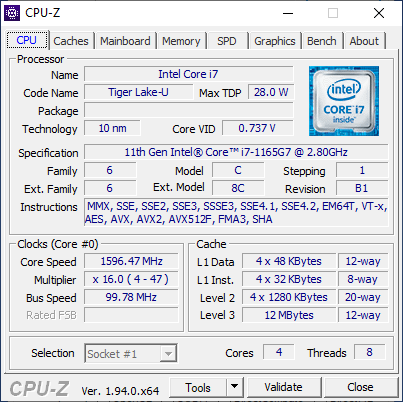
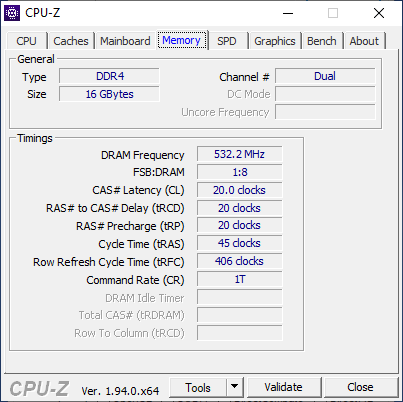
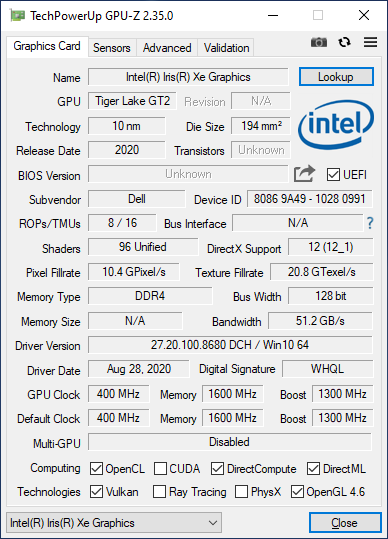
Todas as SKUs XPS 13 9310 vêm com o Core i3-1115G4, Core i5-1135G7, ou CPU Core i7-1165G7 com 8 GB a 32 GB de 4267 MHz de RAM. Os gráficos integrados Iris Xe vêm de série em todas as configurações, mas espera-se que rodem mais lentamente e com menos UEs na opção Core i3-1115G4.
A menos que de outra forma indicado, nossos testes abaixo foram realizados no modo Ultra Performance para as mais altas pontuações possíveis do sistema. Os perfis de potência podem ser todos encontrados dentro do software Dell Power Manager pré-instalado.
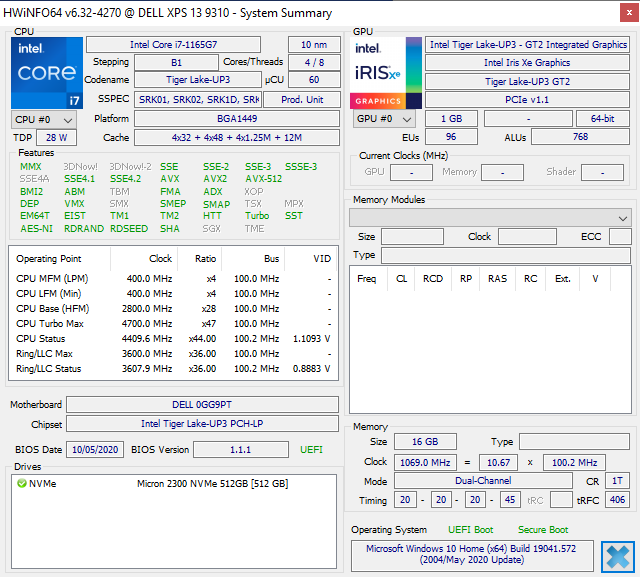
Processador
Como o quarto laptop em nosso banco de dados equipado com o Core i7-1165G7, o XPS 13 9310 está funcionando onde esperamos que esteja dentro de apenas alguns pontos percentuais da média. Infelizmente, isto também significa que qualquer ganho de desempenho bruto em relação ao Core i7-1065G7 do ano passado é relativamente menor
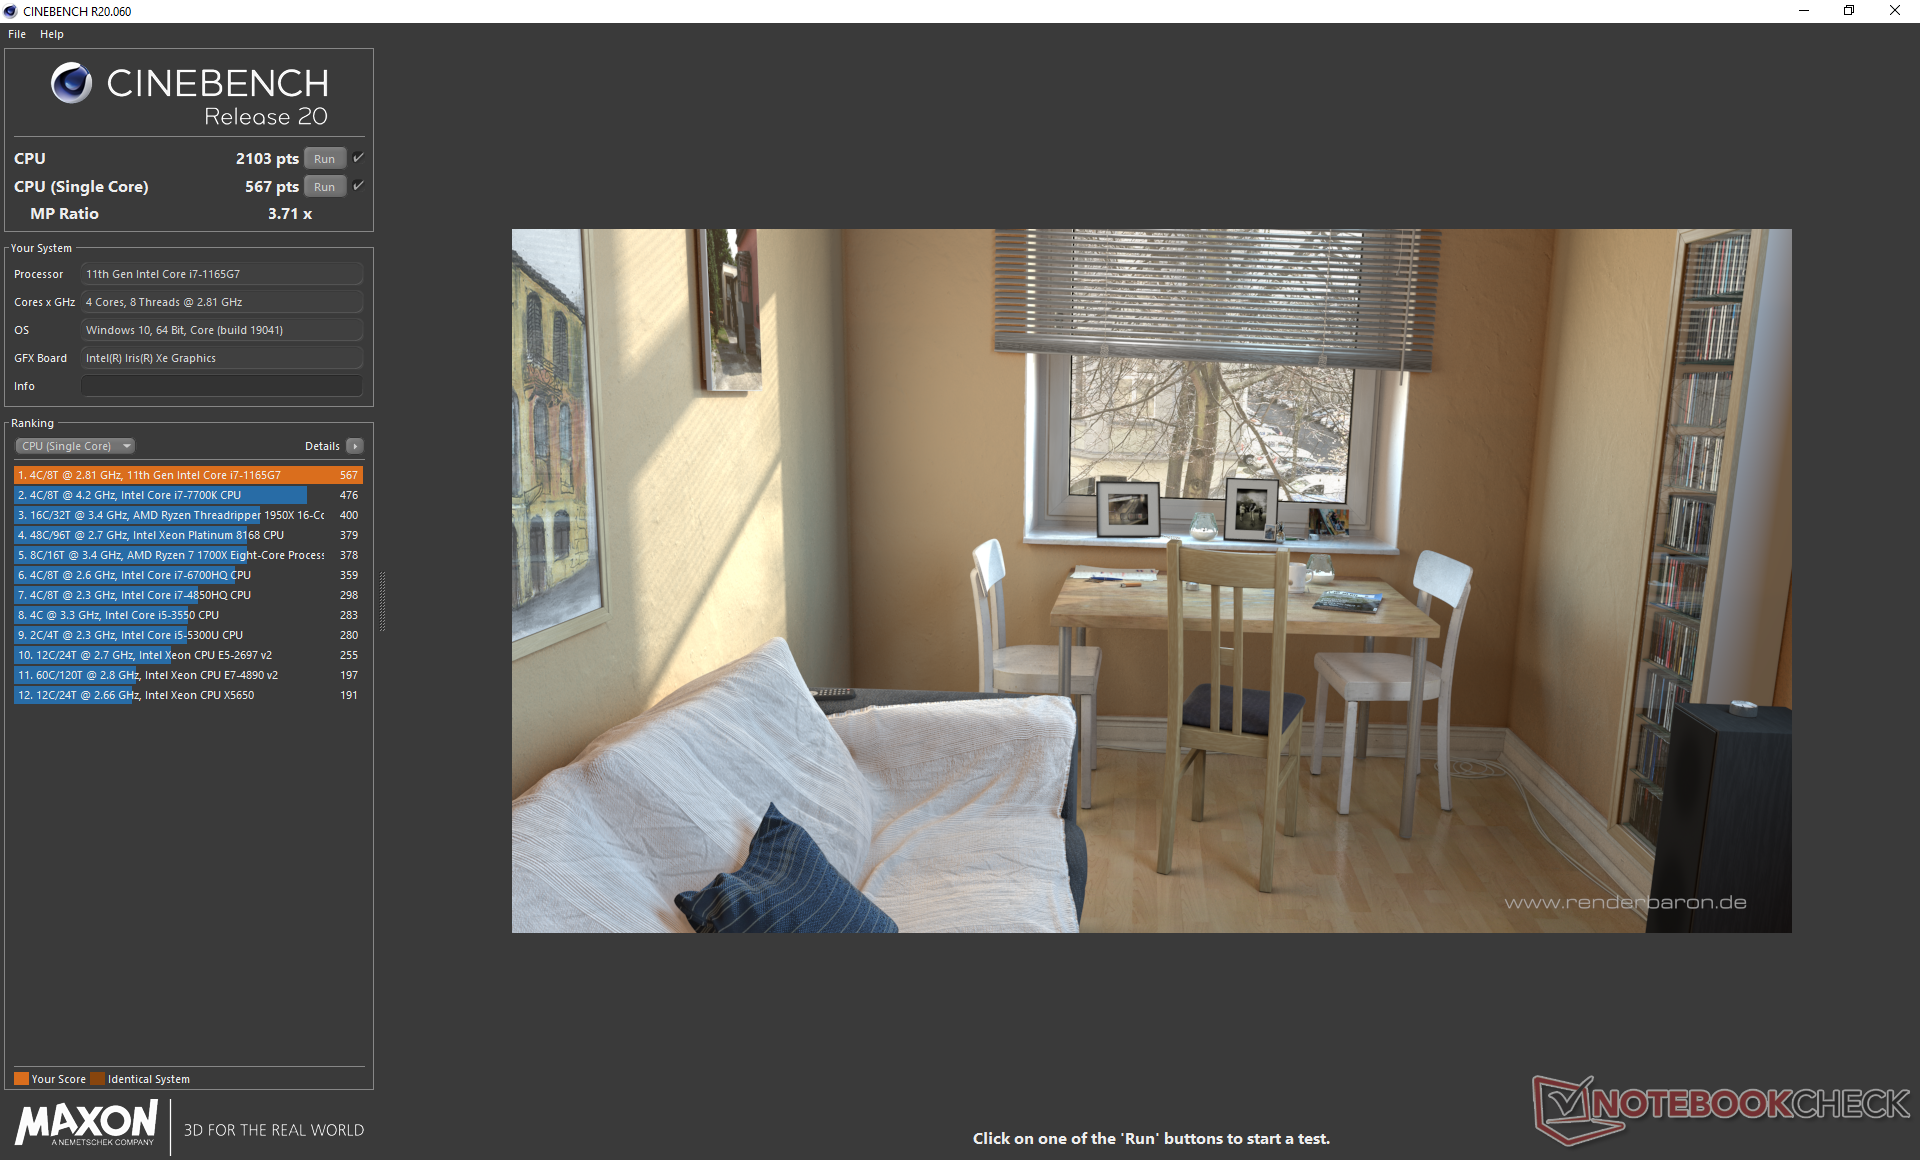
A Dell continua confiando no Dynamic Tuning para extrair o máximo de desempenho possível do processador, dentro das capacidades da solução de resfriamento de sobreposição. Isto é exemplificado pelas pontuações do ciclismo CineBench R15 xT ao executar o benchmark em um loop, como mostra o gráfico abaixo comparado com as pontuações mais planas da série Asus ZenBook 14 rodando na mesma CPU. As pontuações do CineBench R20 no Core i7 XPS 13 9300 podem variar de 1396 pontos a 1883 pontos por causa da variação das taxas de relógio. Exploramos isto mais adiante na seção Teste de Estresse abaixo.
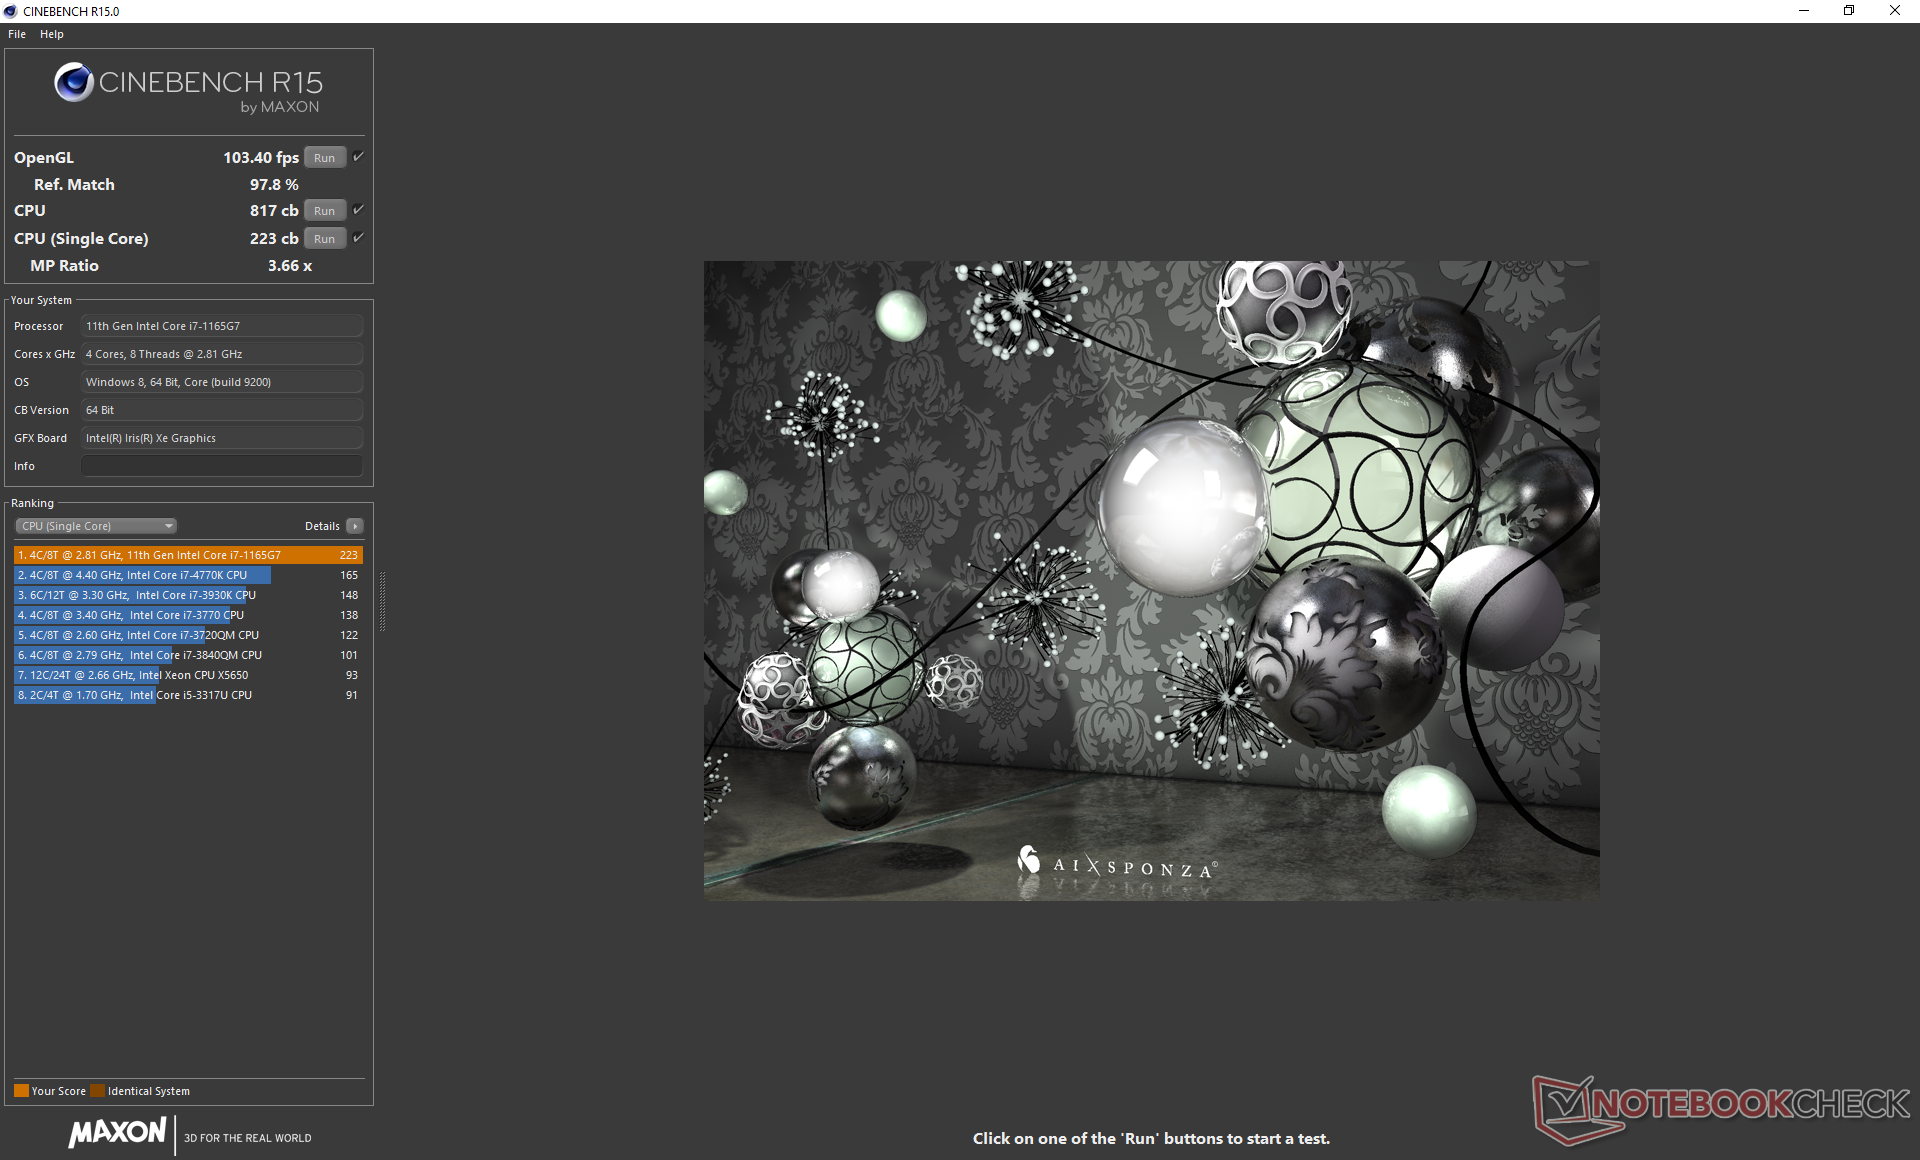
Cinebench R15: CPU Multi 64Bit | CPU Single 64Bit
Blender: v2.79 BMW27 CPU
7-Zip 18.03: 7z b 4 -mmt1 | 7z b 4
Geekbench 5.5: Single-Core | Multi-Core
HWBOT x265 Benchmark v2.2: 4k Preset
LibreOffice : 20 Documents To PDF
R Benchmark 2.5: Overall mean
Cinebench R15: CPU Multi 64Bit | CPU Single 64Bit
Blender: v2.79 BMW27 CPU
7-Zip 18.03: 7z b 4 -mmt1 | 7z b 4
Geekbench 5.5: Single-Core | Multi-Core
HWBOT x265 Benchmark v2.2: 4k Preset
LibreOffice : 20 Documents To PDF
R Benchmark 2.5: Overall mean
* ... menor é melhor
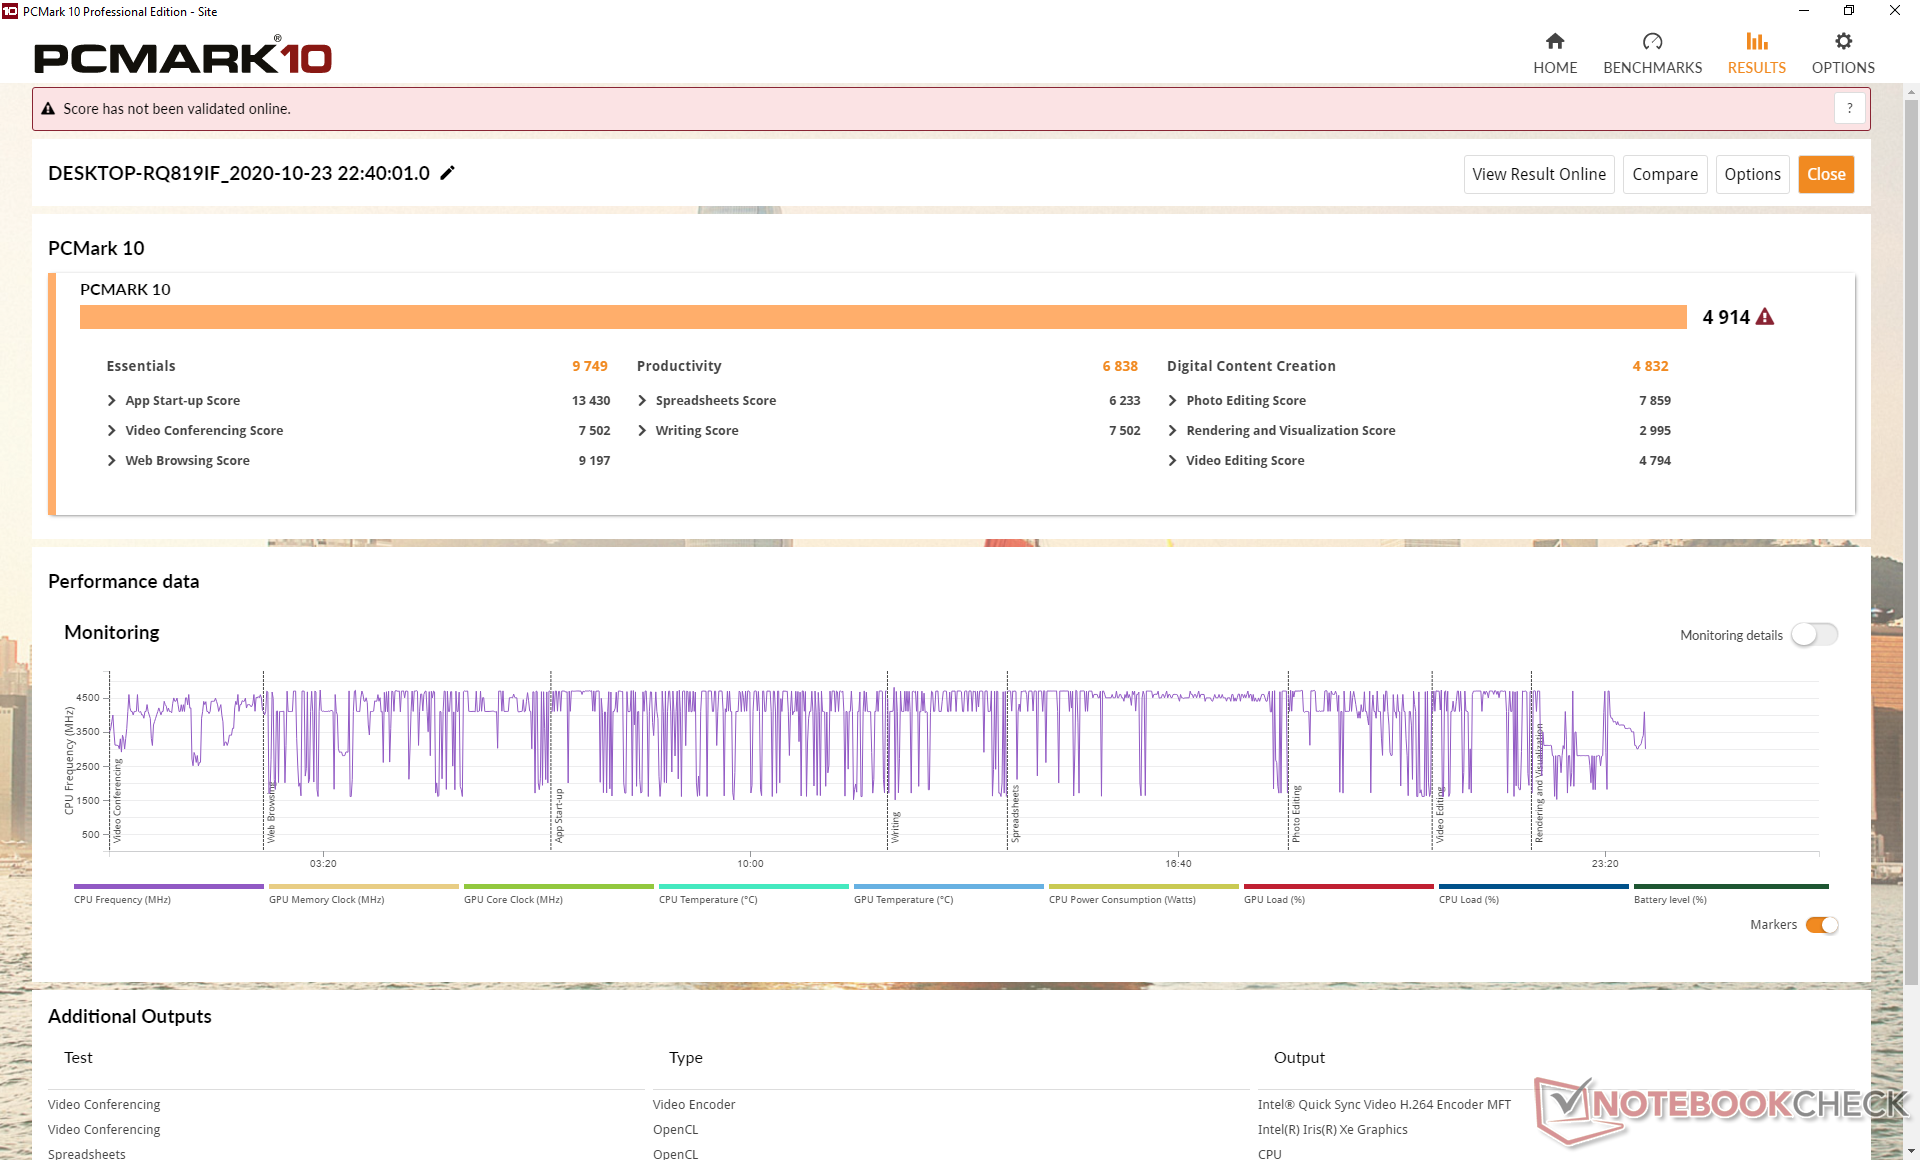
Desempenho do sistema
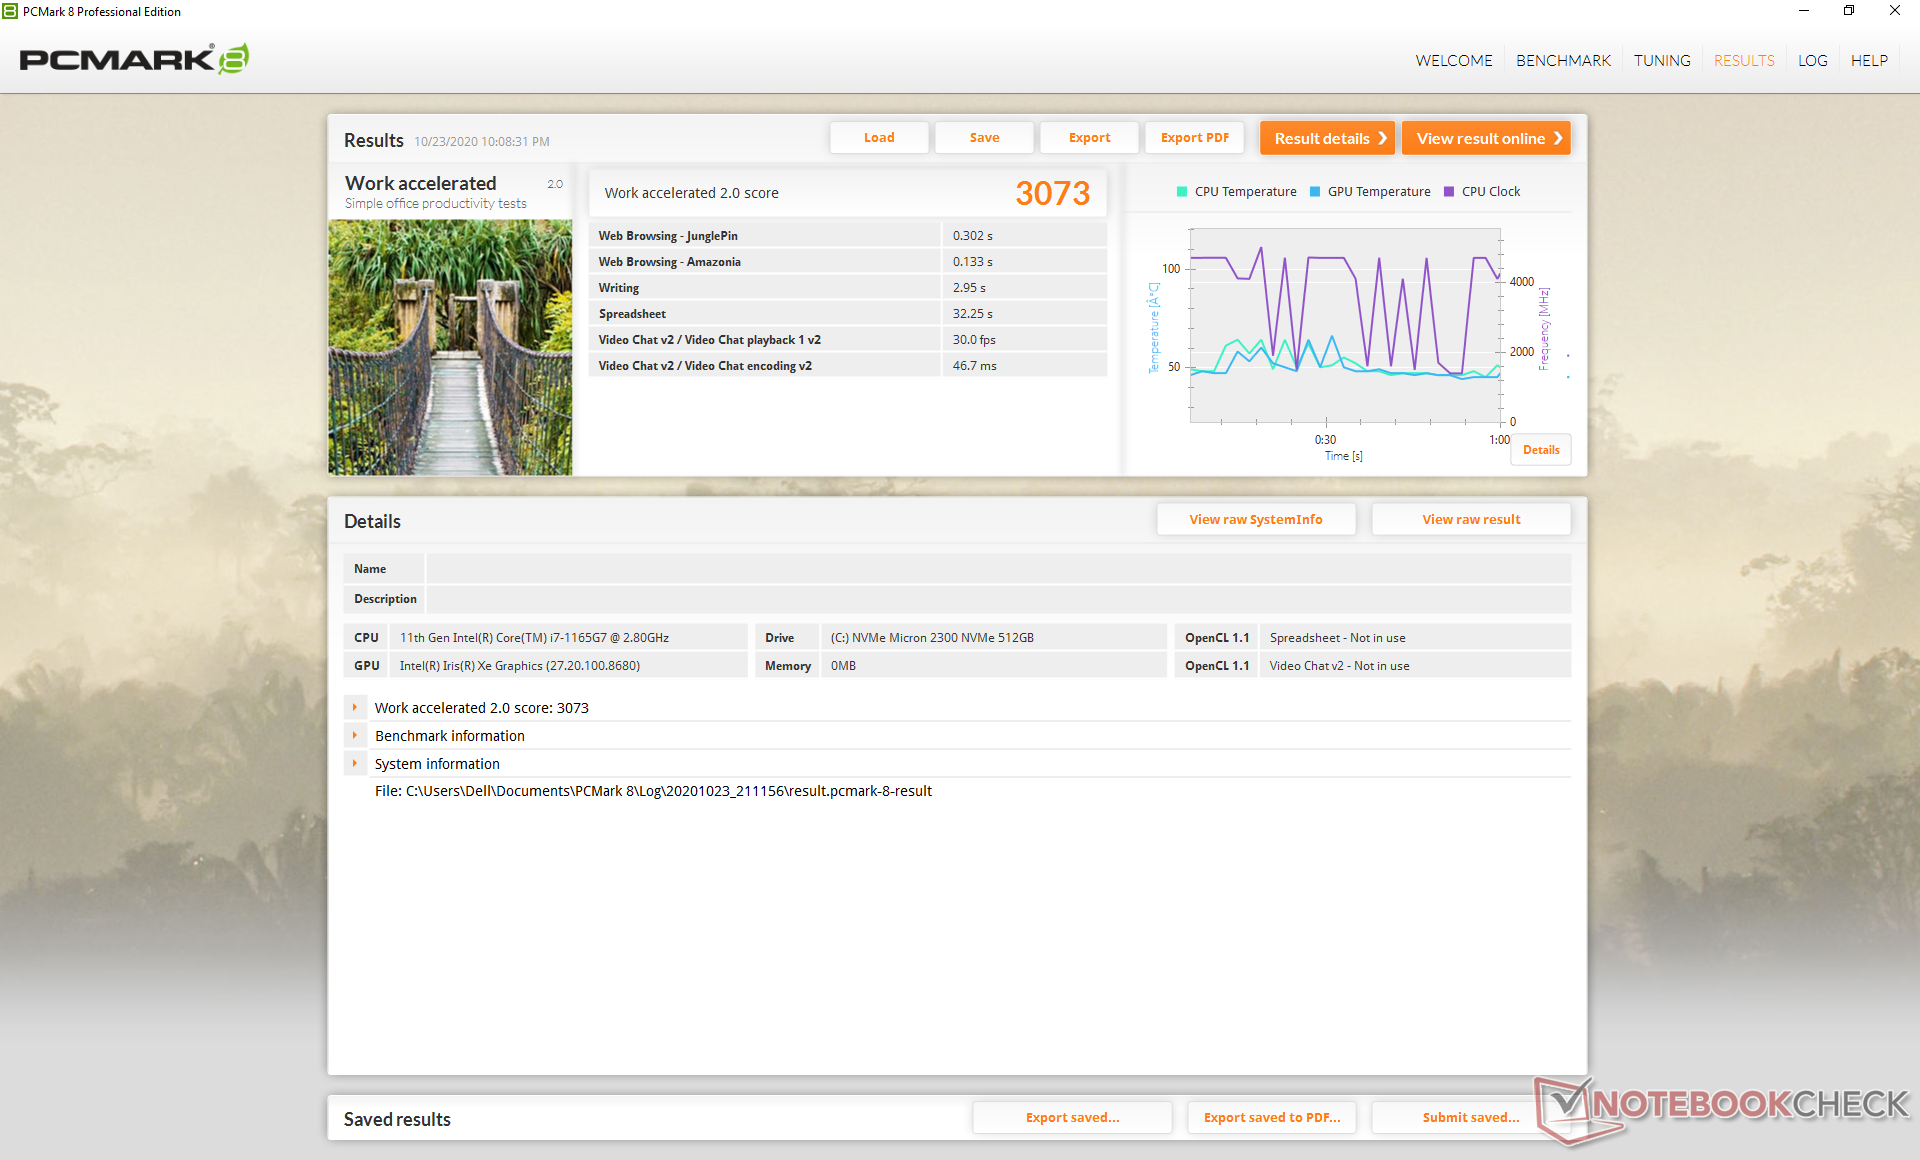
Os pontos de referência PCMark são consistentemente mais altos do que o XPS 13 9300 do ano passado, alimentado pelo Ice Lake-powered XPS 13 9300 por pelo menos dois dígitos percentuais, provavelmente devido à GPU integrada mais rápida. A Lenovo Yoga Slim 7, menos cara, no entanto, ainda sai no topo.
Durante nosso tempo com a unidade de teste, o sistema se reinicializou aleatoriamente uma noite para atualizar sua BIOS. Em seguida, ele ficaria preso na tela de bootup por quase 20 minutos antes de finalmente entrar no modo seguro do Windows. O sistema estava de volta ao normal após reiniciar a partir daí, mas todo o processo foi definitivamente uma experiência indesejável, especialmente em um novo laptop de bandeira.
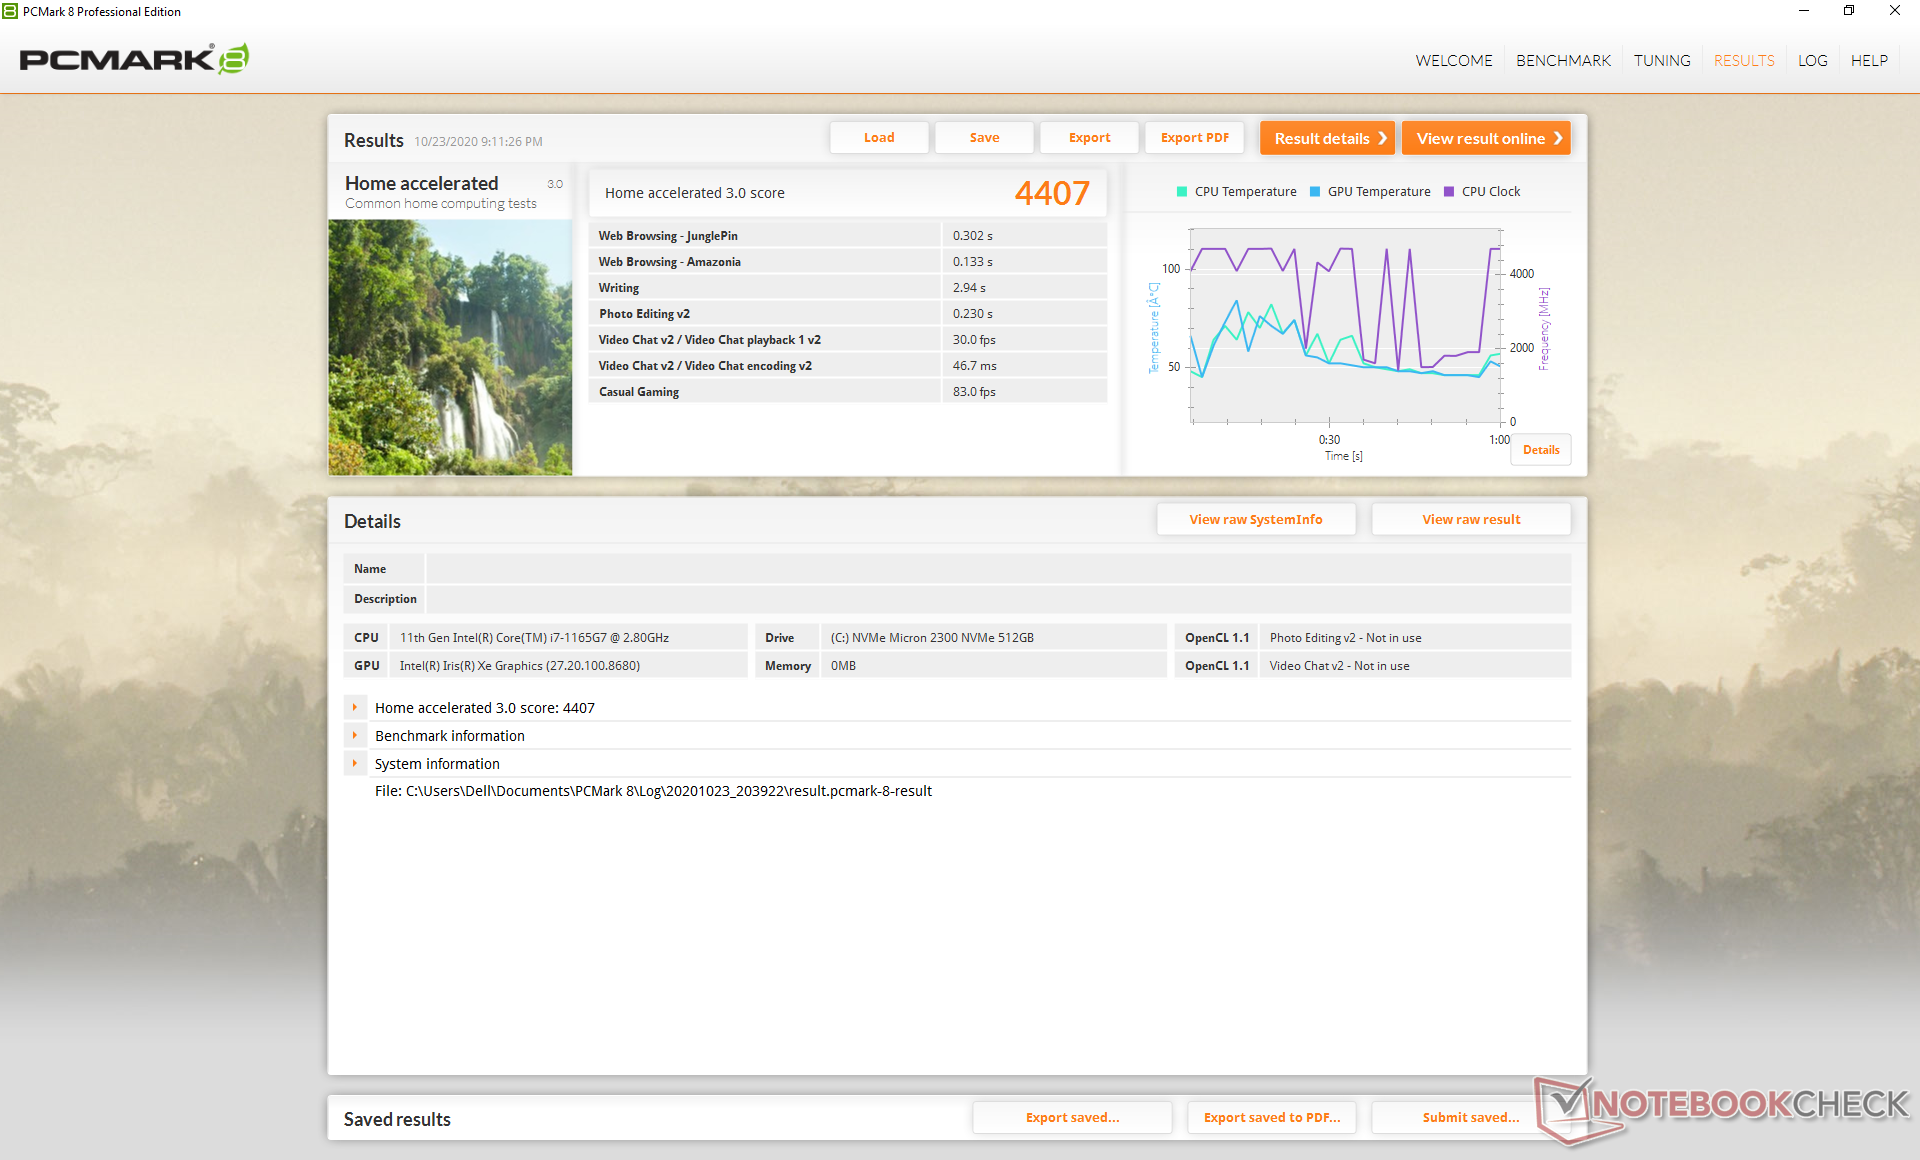
| PCMark 8 Home Score Accelerated v2 | 4407 pontos | |
| PCMark 8 Work Score Accelerated v2 | 3073 pontos | |
| PCMark 10 Score | 4914 pontos | |
Ajuda | ||
Latência do DPC
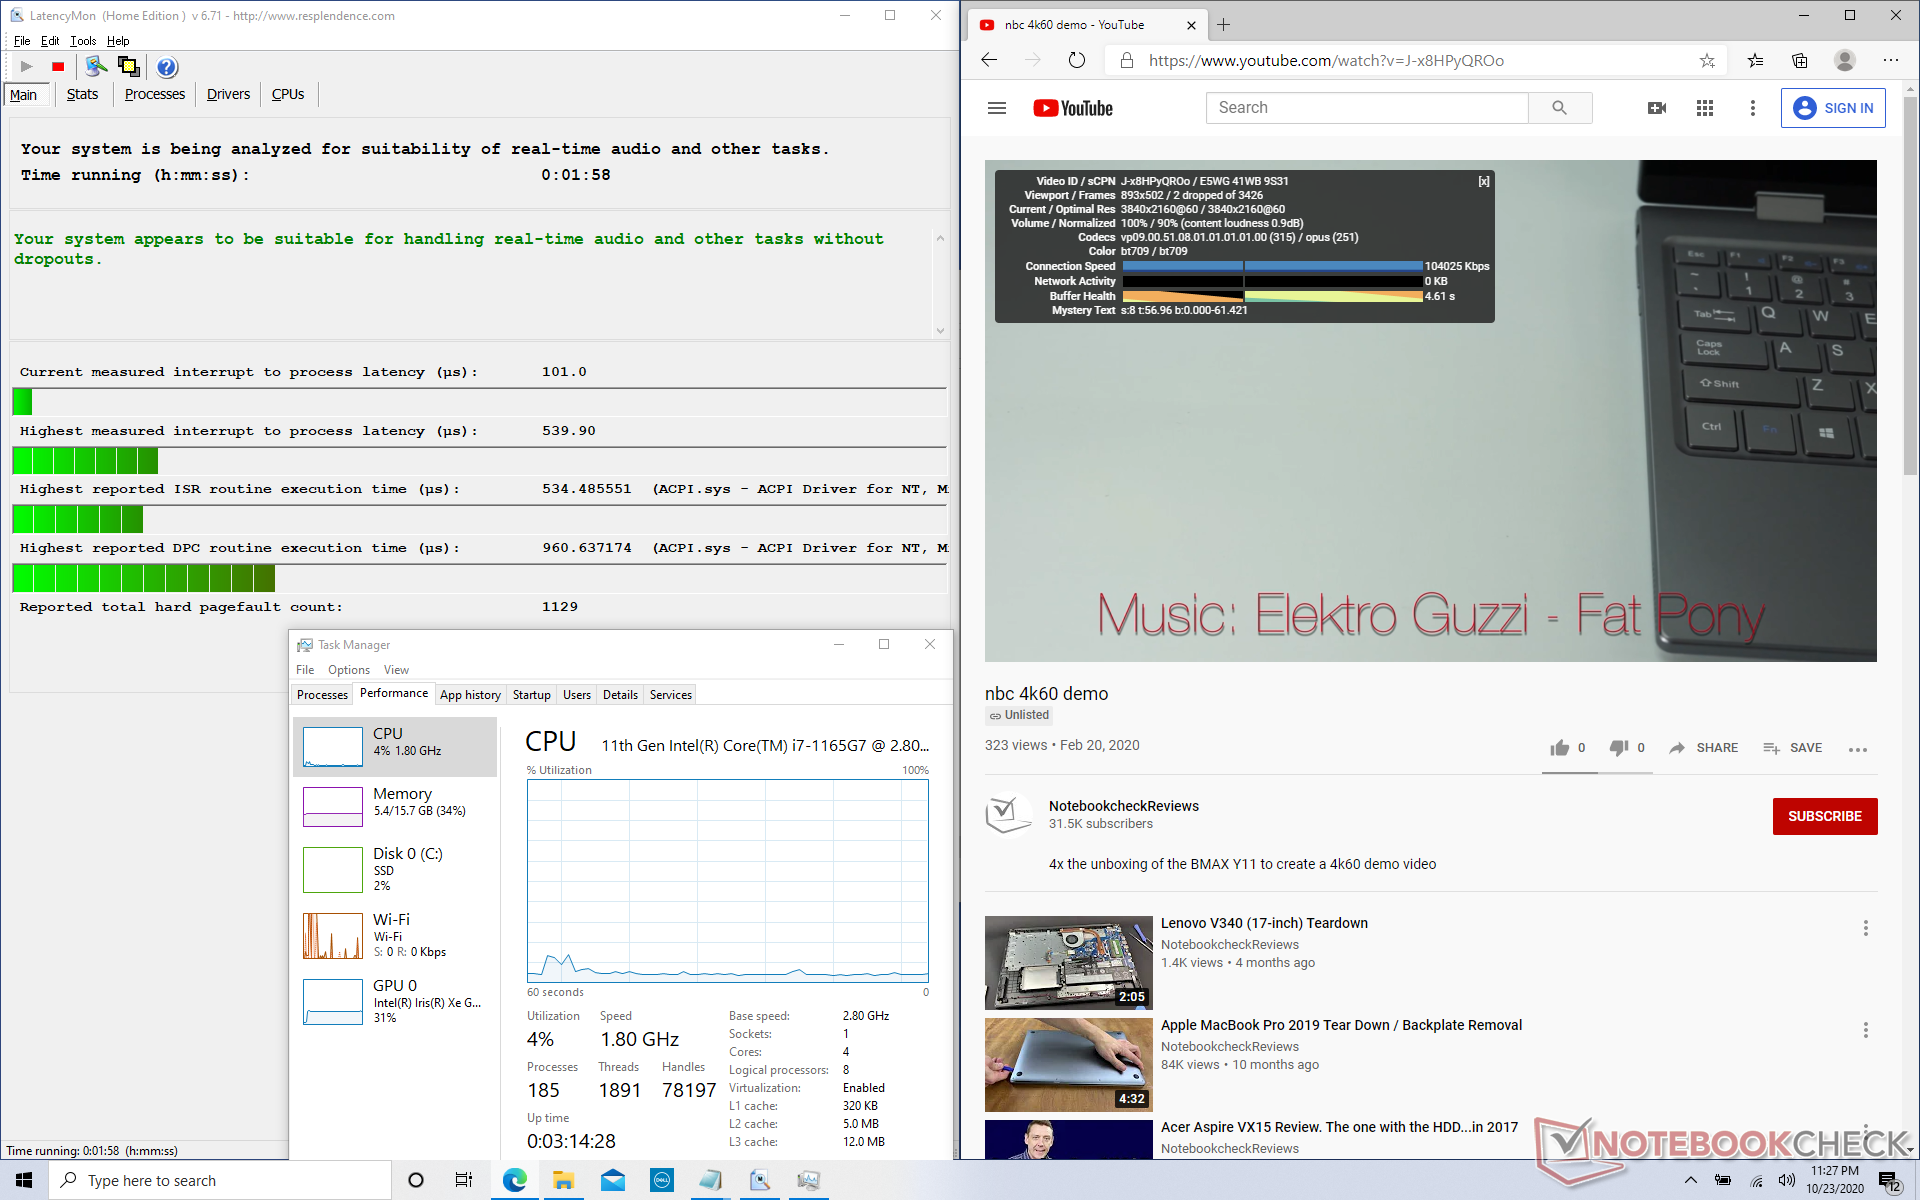
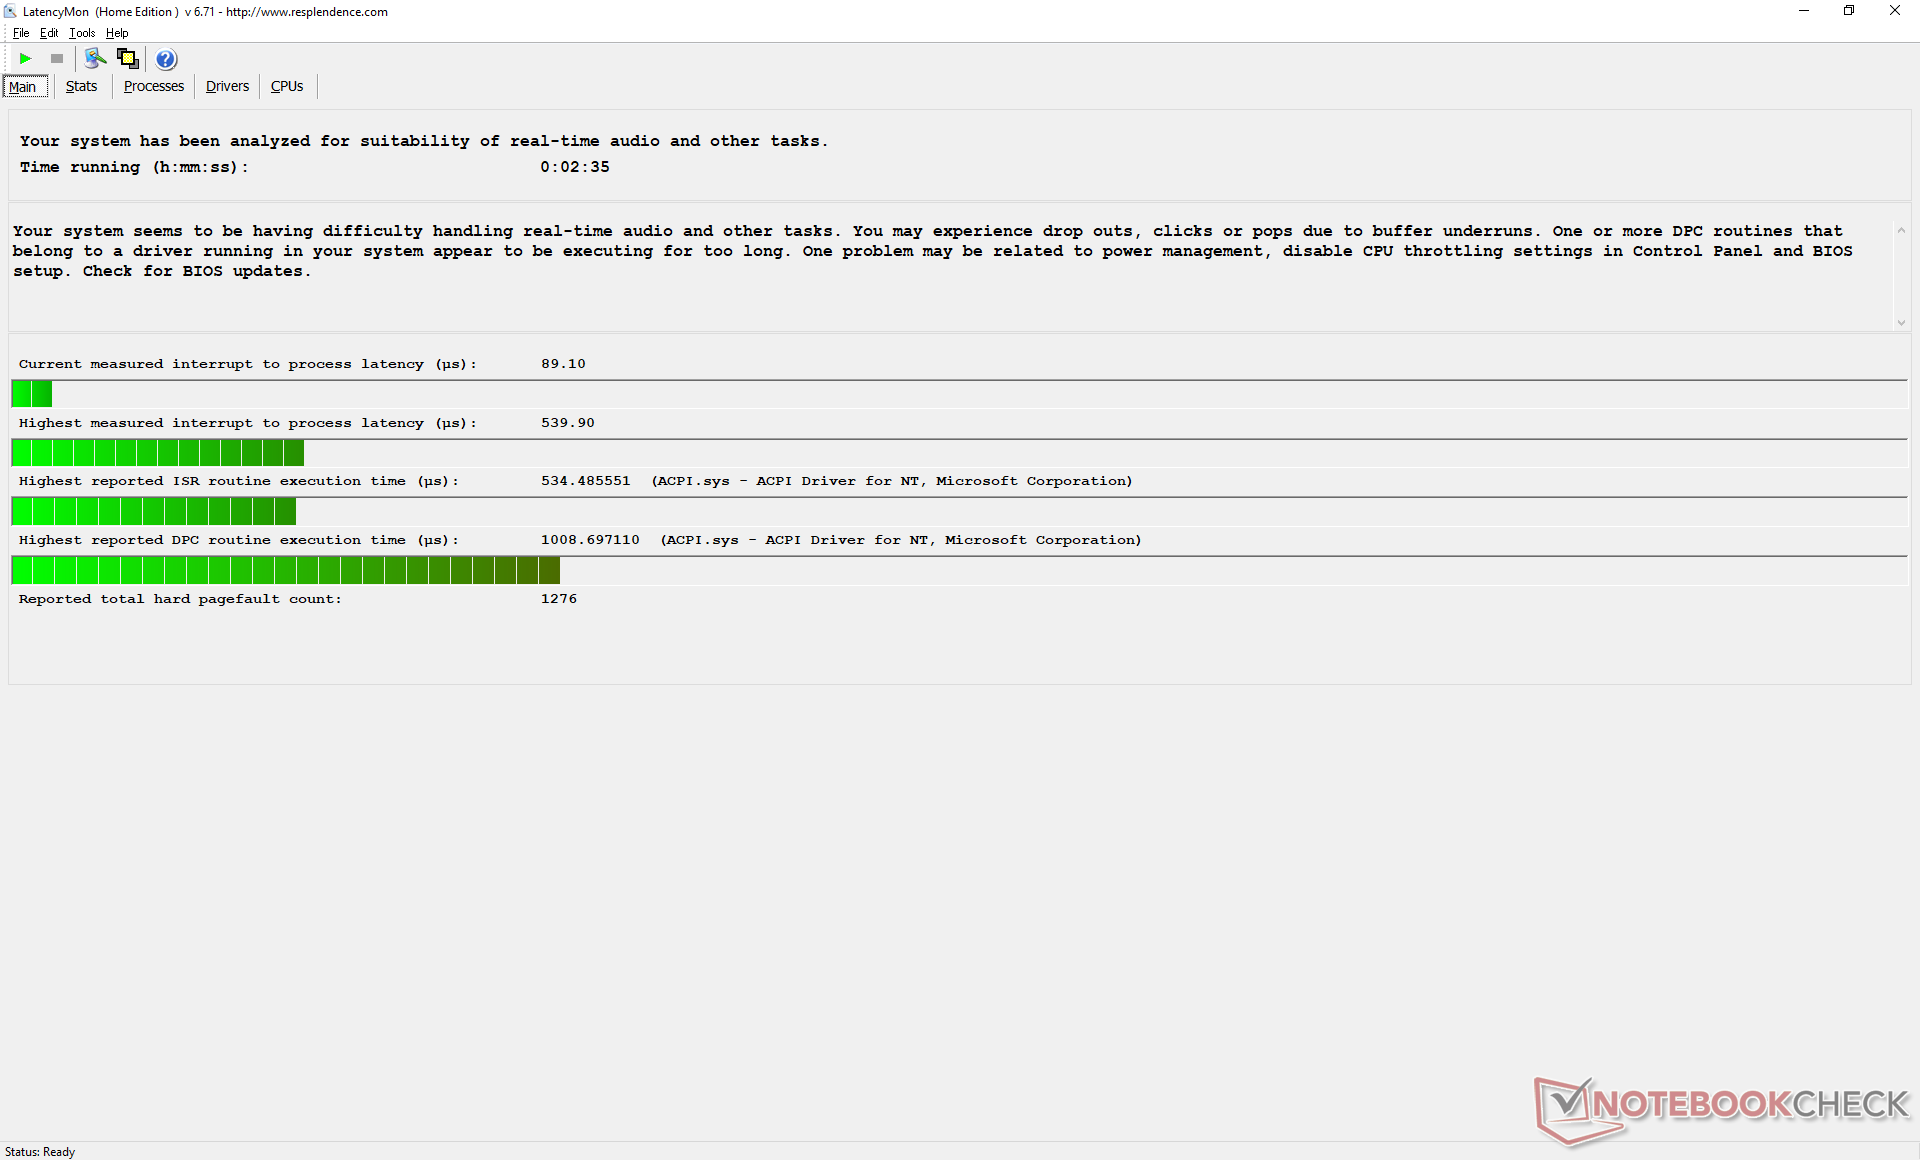
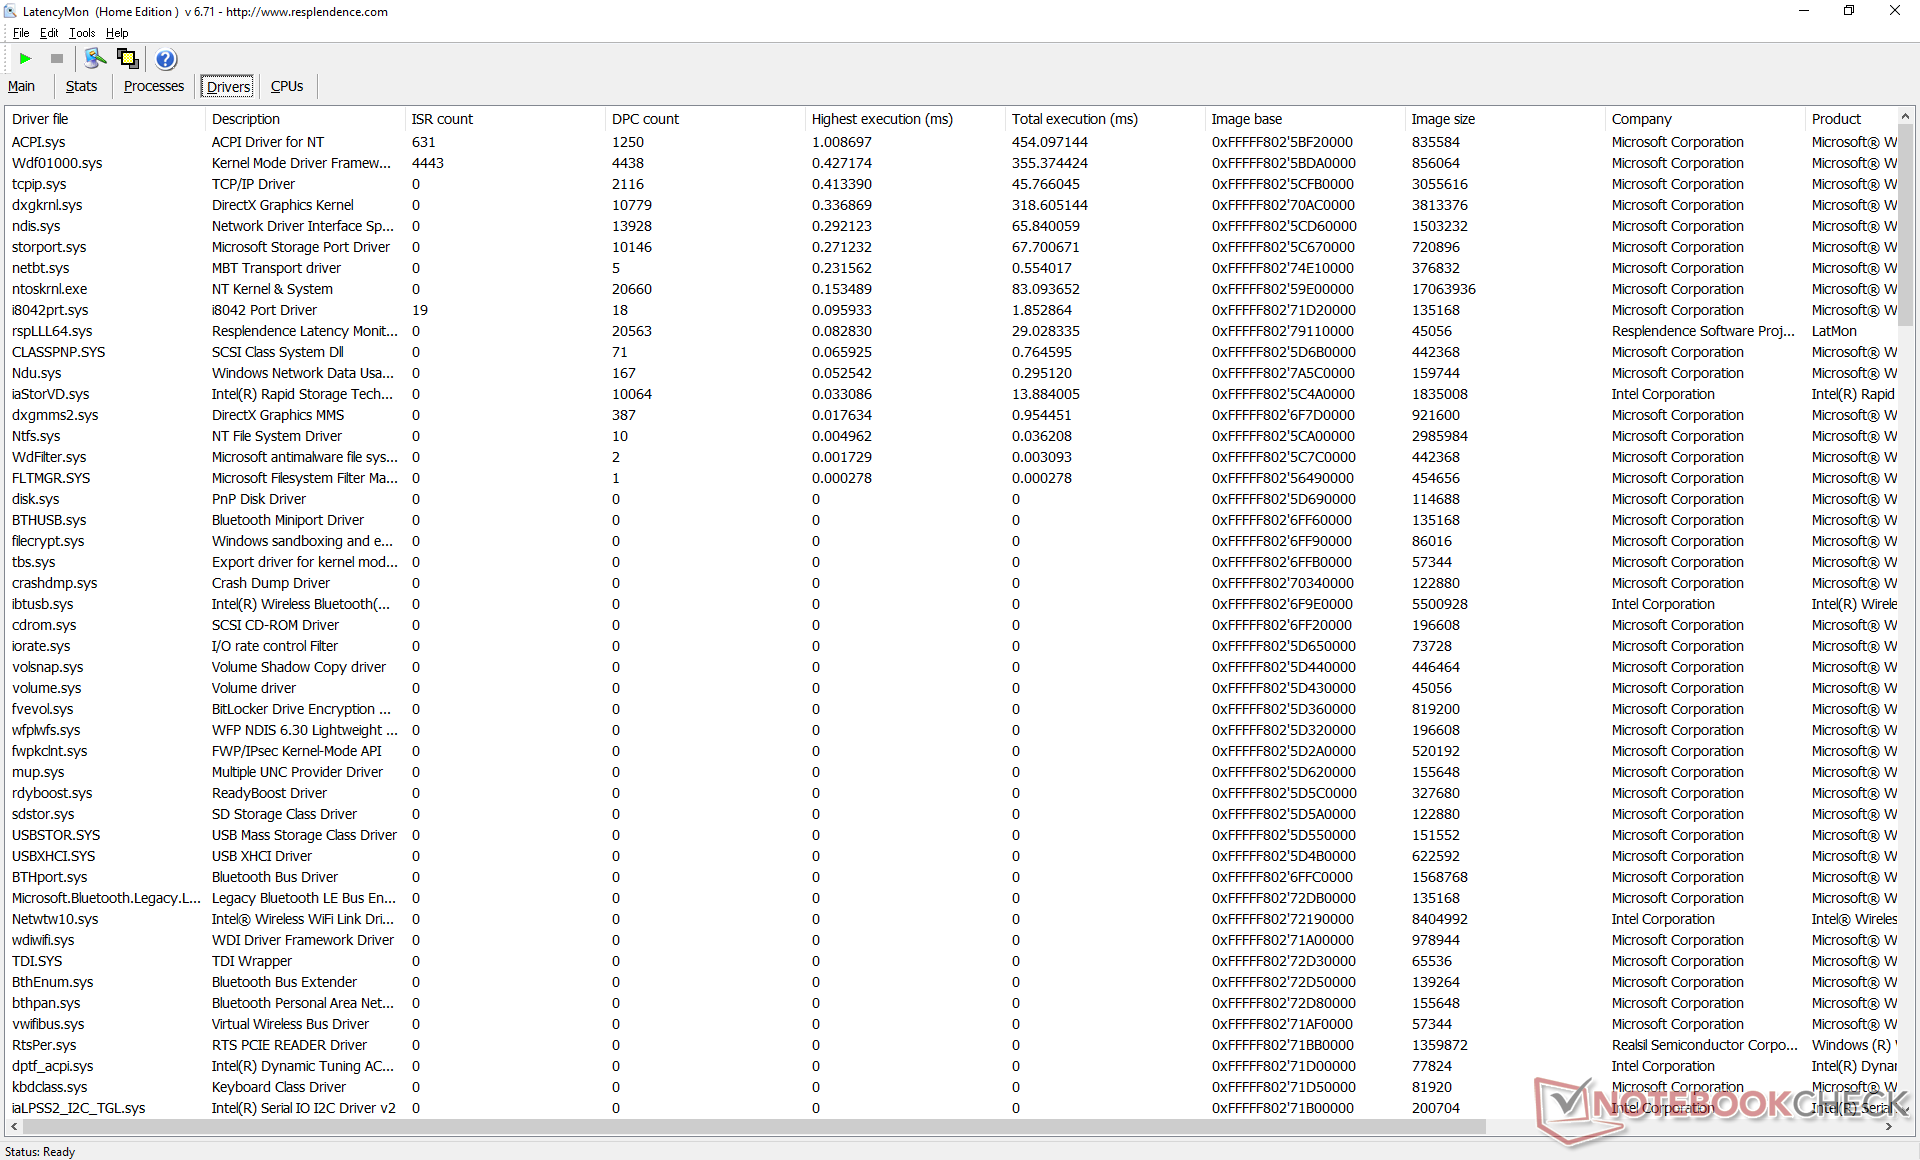
A abertura de múltiplas abas do navegador em nossa página inicial não resultaria em nenhum problema de latência do DPC de acordo com o LatencyMon. Iniciando Prime95, no entanto, causaria ligeiras latências. A reprodução de 4K60 é suave com apenas dois quadros descartados durante nosso vídeo de teste de minutos no YouTube.
| DPC Latencies / LatencyMon - interrupt to process latency (max), Web, Youtube, Prime95 | |
| Dell XPS 13 9300 Core i7-1065G7 | |
| Lenovo Yoga Slim 7-14ARE | |
| Dell XPS 13 9310 Core i7 FHD | |
* ... menor é melhor
Dispositivos de armazenamento
Enquanto os modelos anteriores XPS 13 foram fornecidos com SSDs M.2 NVMe da Samsung, SK Hynix, Intel ou Toshiba, nossa última unidade vem com um da Micron. É praticamente uma roleta para saber qual SSD você receberá ao comprar um XPS 13 a qualquer momento.
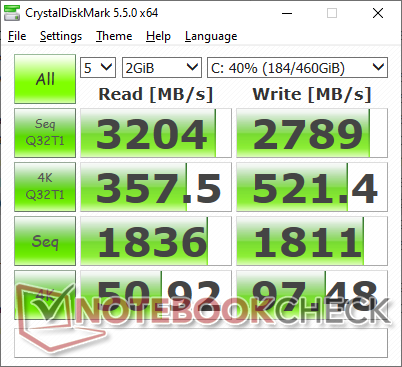
Felizmente para nós, o Micron 2200 é uma unidade NVMe de alta qualidade com taxas de leitura e escrita seqüenciais próximas de 3300 MB/s e 2700 MB/s, respectivamente, para estar perto da popular série PM981 da Samsung. Mesmo assim, não ficaríamos surpresos se os usuários recebessem unidades completamente diferentes se encomendassem SKUs de diferentes tamanhos de SSD.
Mais referências de armazenamento podem ser encontradas em nossa tabela de SSDs e HDDs aqui.
| Dell XPS 13 9310 Core i7 FHD Micron 2300 512GB MTFDHBA512TDV | Dell XPS 13 9300 Core i7-1065G7 Intel SSDPEMKF512G8 NVMe SSD | Apple MacBook Pro 13 2020 2GHz i5 10th-Gen Apple SSD SM0512F | Huawei MateBook X Pro 2020 i7 Samsung PM981a MZVLB1T0HBLR | HP Spectre x360 13-aw0013dx Intel Optane Memory H10 with Solid State Storage 32GB + 512GB HBRPEKNX0202A(L/H) | |
|---|---|---|---|---|---|
| AS SSD | -16% | -49% | 48% | -30% | |
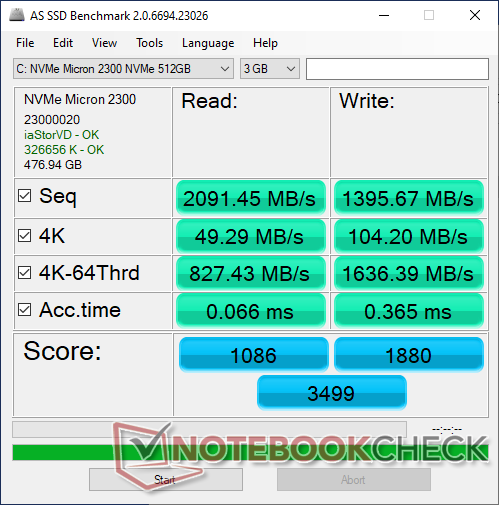
| Seq Read (MB/s) | 2091 | 1956 -6% | 1300 -38% | 2737 31% | 1039 -50% |
| Seq Write (MB/s) | 1396 | 1227 -12% | 1518 9% | 2530 81% | 310.1 -78% |
| 4K Read (MB/s) | 49.29 | 63 28% | 14.09 -71% | 54 10% | 76 54% |
| 4K Write (MB/s) | 104.2 | 156.6 50% | 24.25 -77% | 152.5 46% | 118 13% |
| 4K-64 Read (MB/s) | 827 | 475.6 -42% | 725 -12% | 2011 143% | 371.8 -55% |
| 4K-64 Write (MB/s) | 1636 | 539 -67% | 169.6 -90% | 1260 -23% | 469.5 -71% |
| Access Time Read * (ms) | 0.066 | 0.042 36% | 0.172 -161% | 0.066 -0% | 0.067 -2% |
| Access Time Write * (ms) | 0.365 | 0.105 71% | 0.155 58% | 0.024 93% | 0.138 62% |
| Score Read (Points) | 1086 | 734 -32% | 869 -20% | 2339 115% | 552 -49% |
| Score Write (Points) | 1880 | 818 -56% | 346 -82% | 1666 -11% | 618 -67% |
| Score Total (Points) | 3499 | 1915 -45% | 1667 -52% | 5191 48% | 1448 -59% |
| Copy ISO MB/s (MB/s) | 1544 | 1022 -34% | 764 -51% | ||
| Copy Program MB/s (MB/s) | 613 | 302.8 -51% | 465.8 -24% | ||
| Copy Game MB/s (MB/s) | 1451 | 491.4 -66% | 764 -47% | ||
| CrystalDiskMark 5.2 / 6 | 15% | -31% | 14% | -7% | |
| Write 4K (MB/s) | 97.5 | 186.8 92% | 28.16 -71% | 165.6 70% | 112.6 15% |
| Read 4K (MB/s) | 50.9 | 71.4 40% | 17.5 -66% | 50.2 -1% | 131 157% |
| Write Seq (MB/s) | 1811 | 1203 -34% | 1195 -34% | 1905 5% | 458.9 -75% |
| Read Seq (MB/s) | 1836 | 2600 42% | 1470 -20% | 1669 -9% | 1355 -26% |
| Write 4K Q32T1 (MB/s) | 521 | 514 -1% | 205 -61% | 474.6 -9% | 341.3 -34% |
| Read 4K Q32T1 (MB/s) | 357.5 | 570 59% | 692 94% | 508 42% | 320.6 -10% |
| Write Seq Q32T1 (MB/s) | 2879 | 786 -73% | 1475 -49% | 3007 4% | 1219 -58% |
| Read Seq Q32T1 (MB/s) | 3204 | 2947 -8% | 1920 -40% | 3556 11% | 2462 -23% |
| Média Total (Programa/Configurações) | -1% /
-5% | -40% /
-41% | 31% /
34% | -19% /
-22% |
* ... menor é melhor

Disk Throttling: DiskSpd Read Loop, Queue Depth 8
Desempenho da GPU
Os resultados do 3DMark são impressionantes para uma GPU integrada com pontuações 30 a 35% superiores até mesmo à discreta GeForce MX250 ou quase 50% superiores à Iris Plus G7 no XPS 13 9300. Entretanto, como já provamos, estes resultados sintéticos não se traduzem bem no desempenho de jogos no mundo real e, portanto, os usuários não devem esperar taxas de quadros 30 a 35 por cento mais rápidas em toda a linha do que um laptop GeForce MX250. Final Fantasy 15, Strange Brigade, e Witcher 3Por exemplo, rodar mais rápido em nosso XPS 13 9310 do que no ZenBook 14 acionado por MX250, enquanto o contrário é verdadeiro para DOTA 2 Reborn, X-Plane 11.11, e GTA V.
Observe que a sintonia dinâmica da Dell tem um efeito adverso nas taxas de quadros. Quando ocioso em Witcher 3 nas configurações mais baixas, por exemplo, as taxas de quadros flutuariam entre 61 e 80 FPS, como mostra nosso gráfico abaixo, enquanto as taxas de quadros seriam mais constantes e estáveis na maioria dos outros laptops.
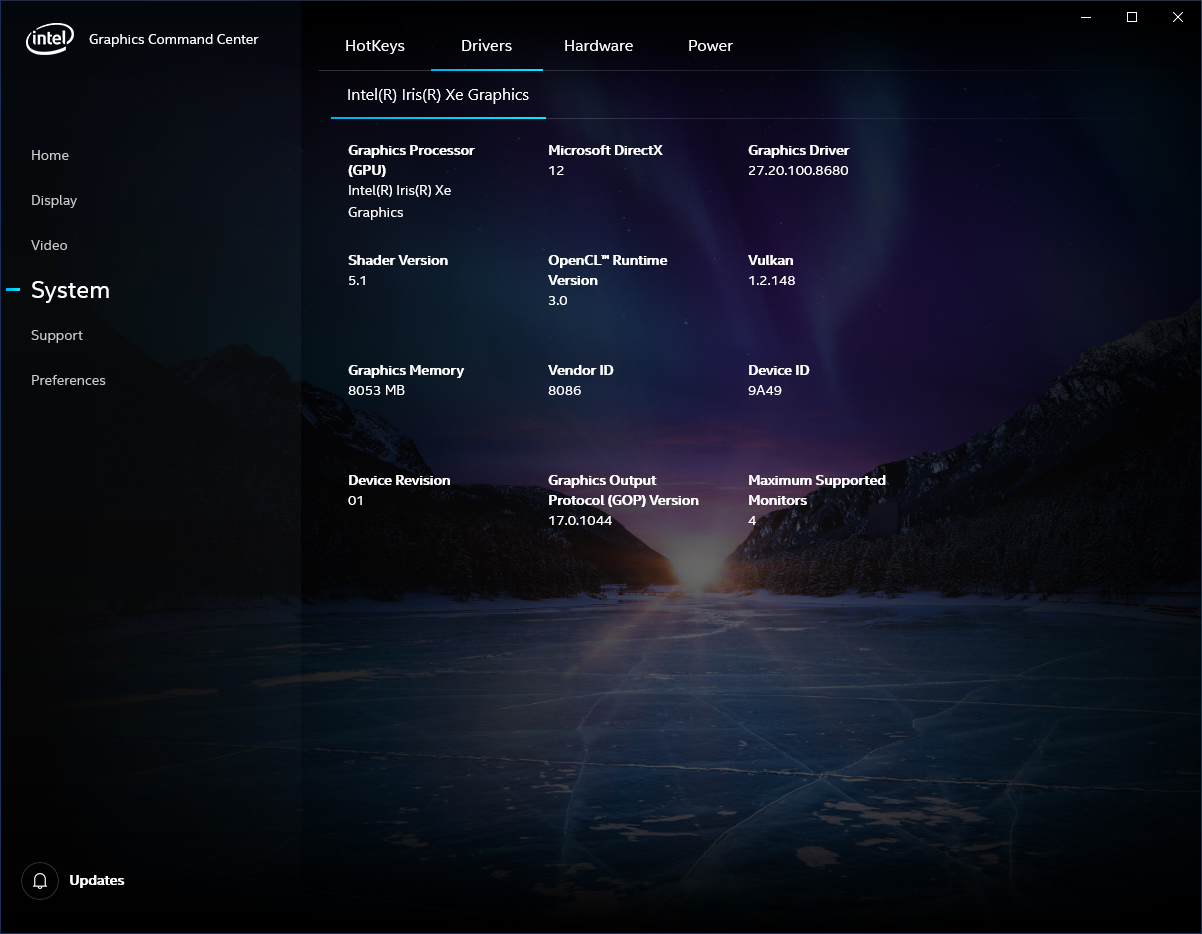
Consulte nossa página na Intel Iris Xe para obter mais informações técnicas e comparações de benchmark. Esperamos que o desempenho geral dos jogos melhore com o tempo, com atualizações dos drivers.
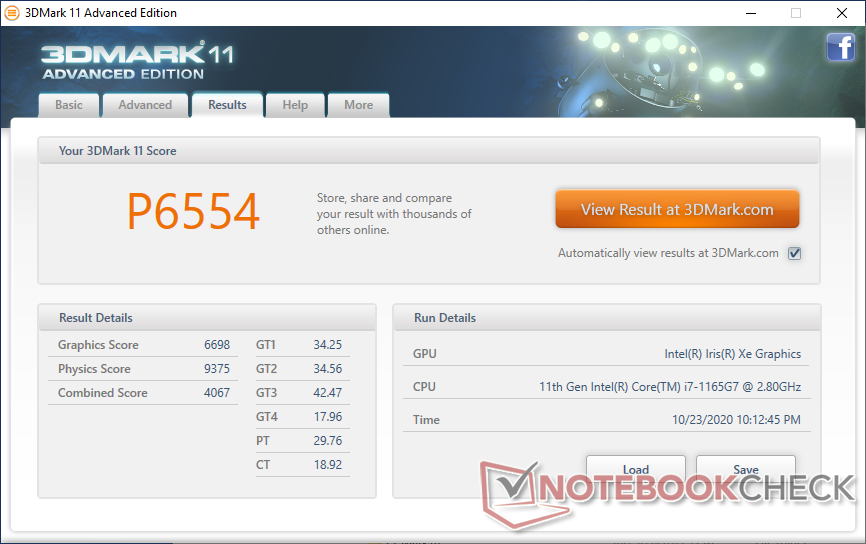
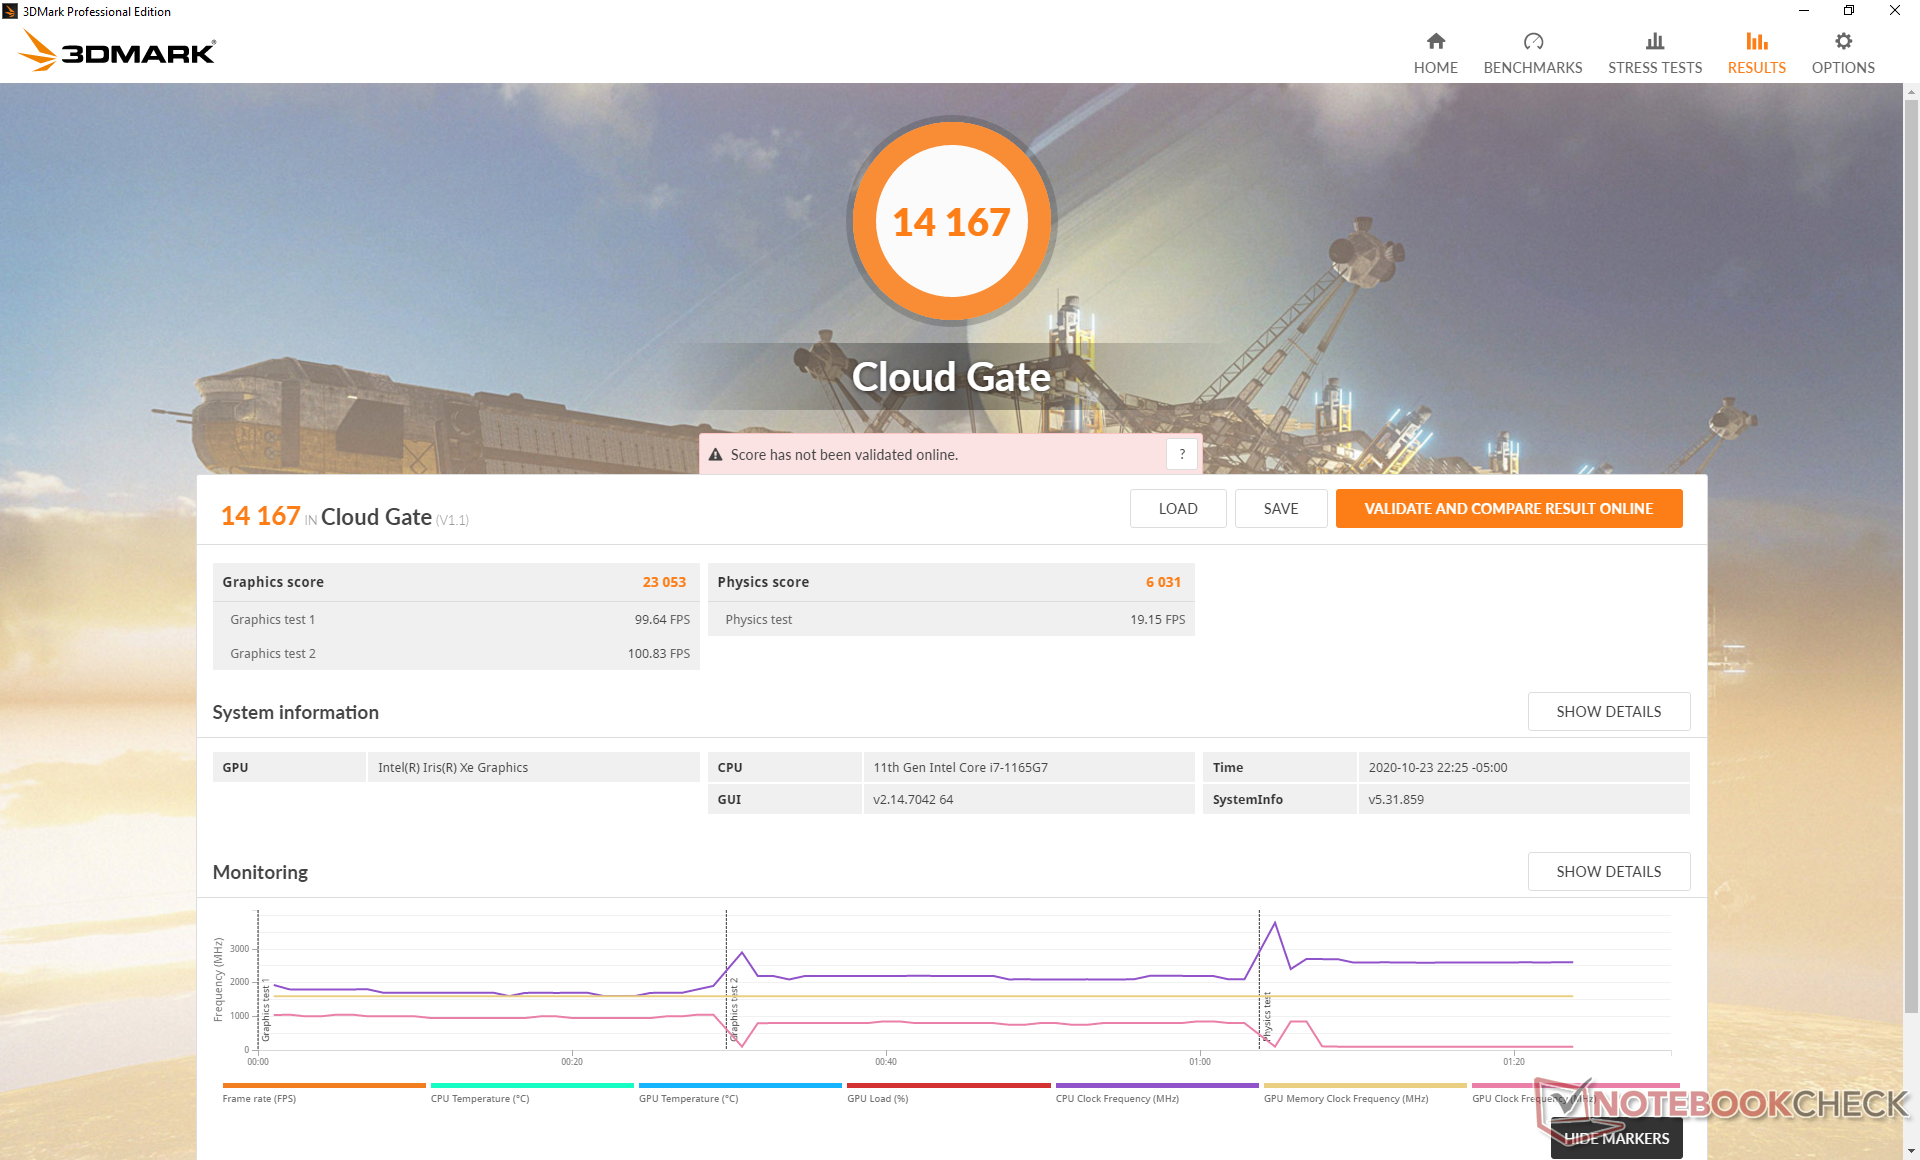
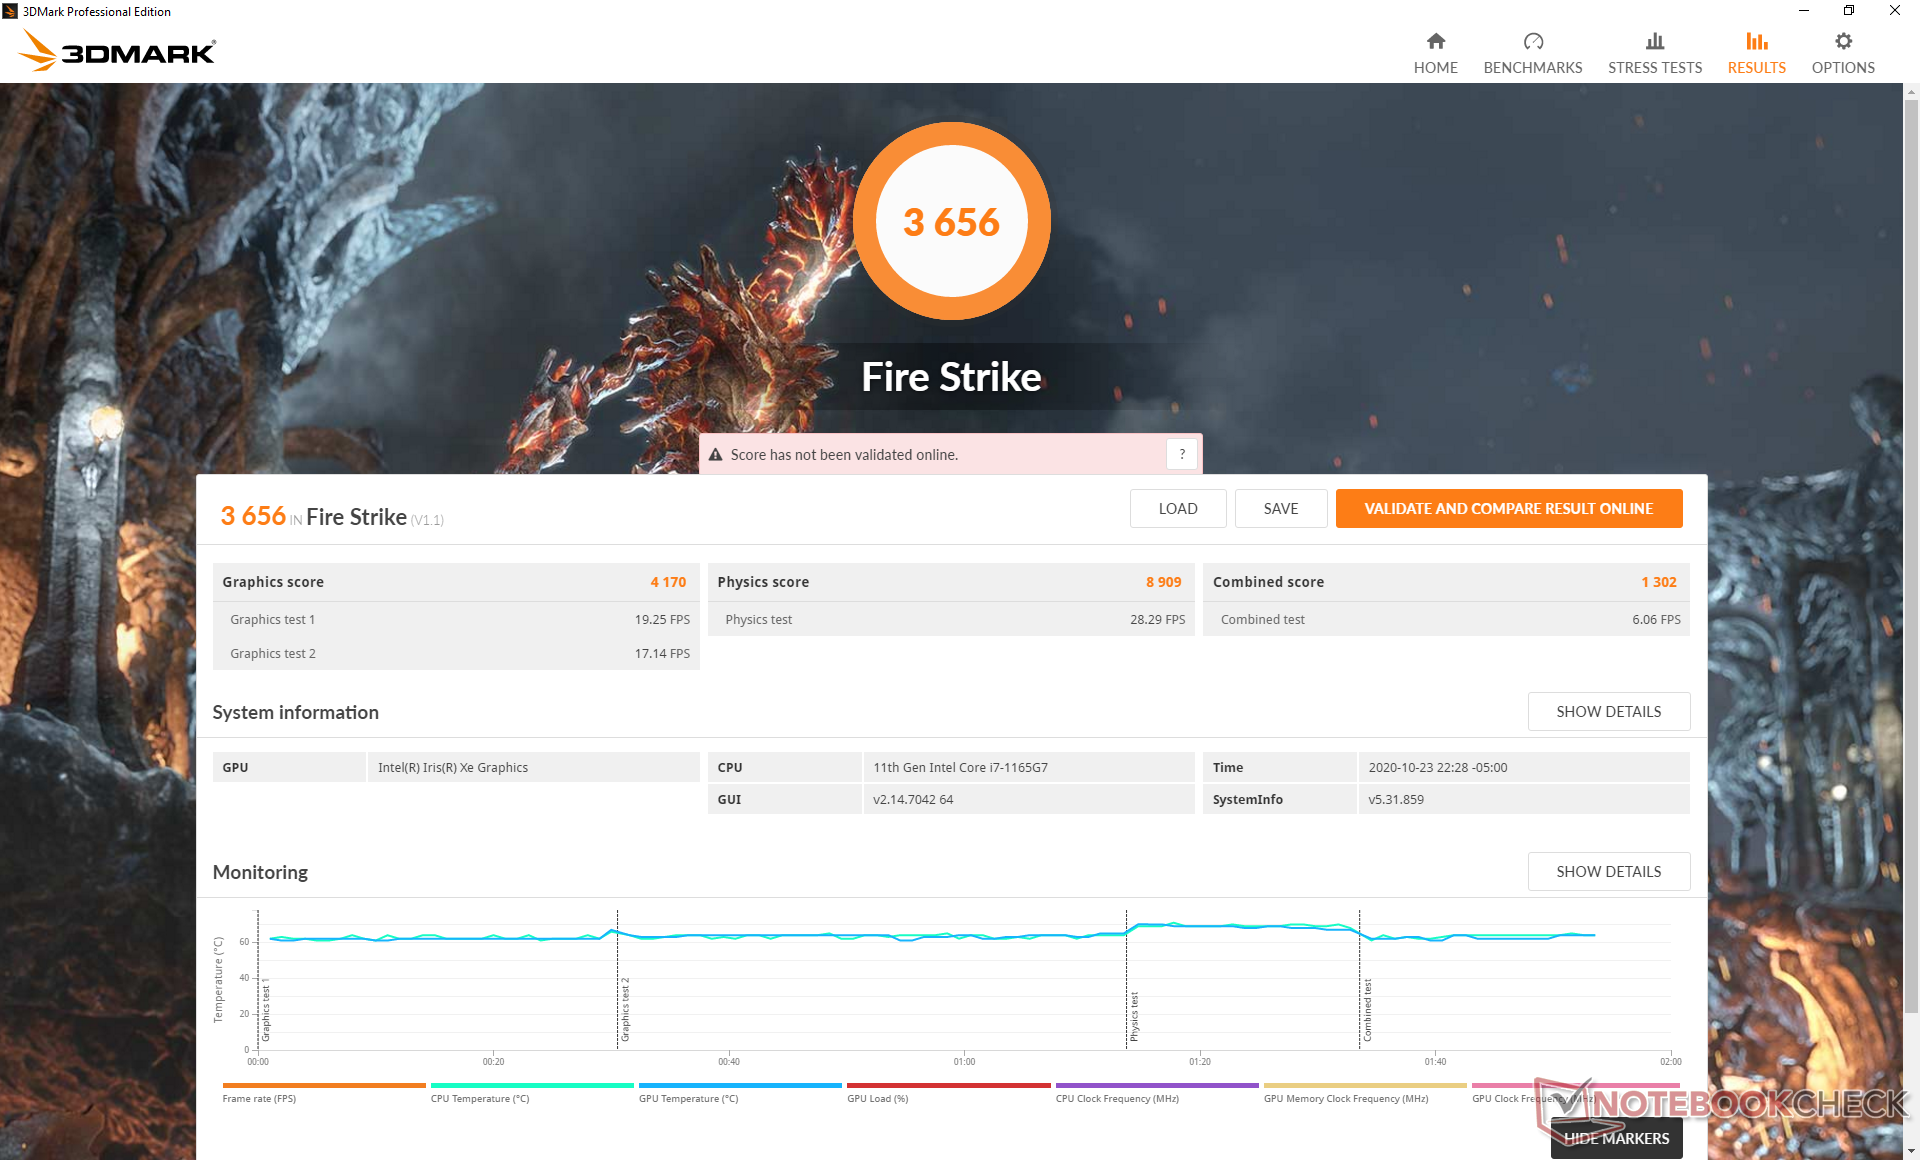
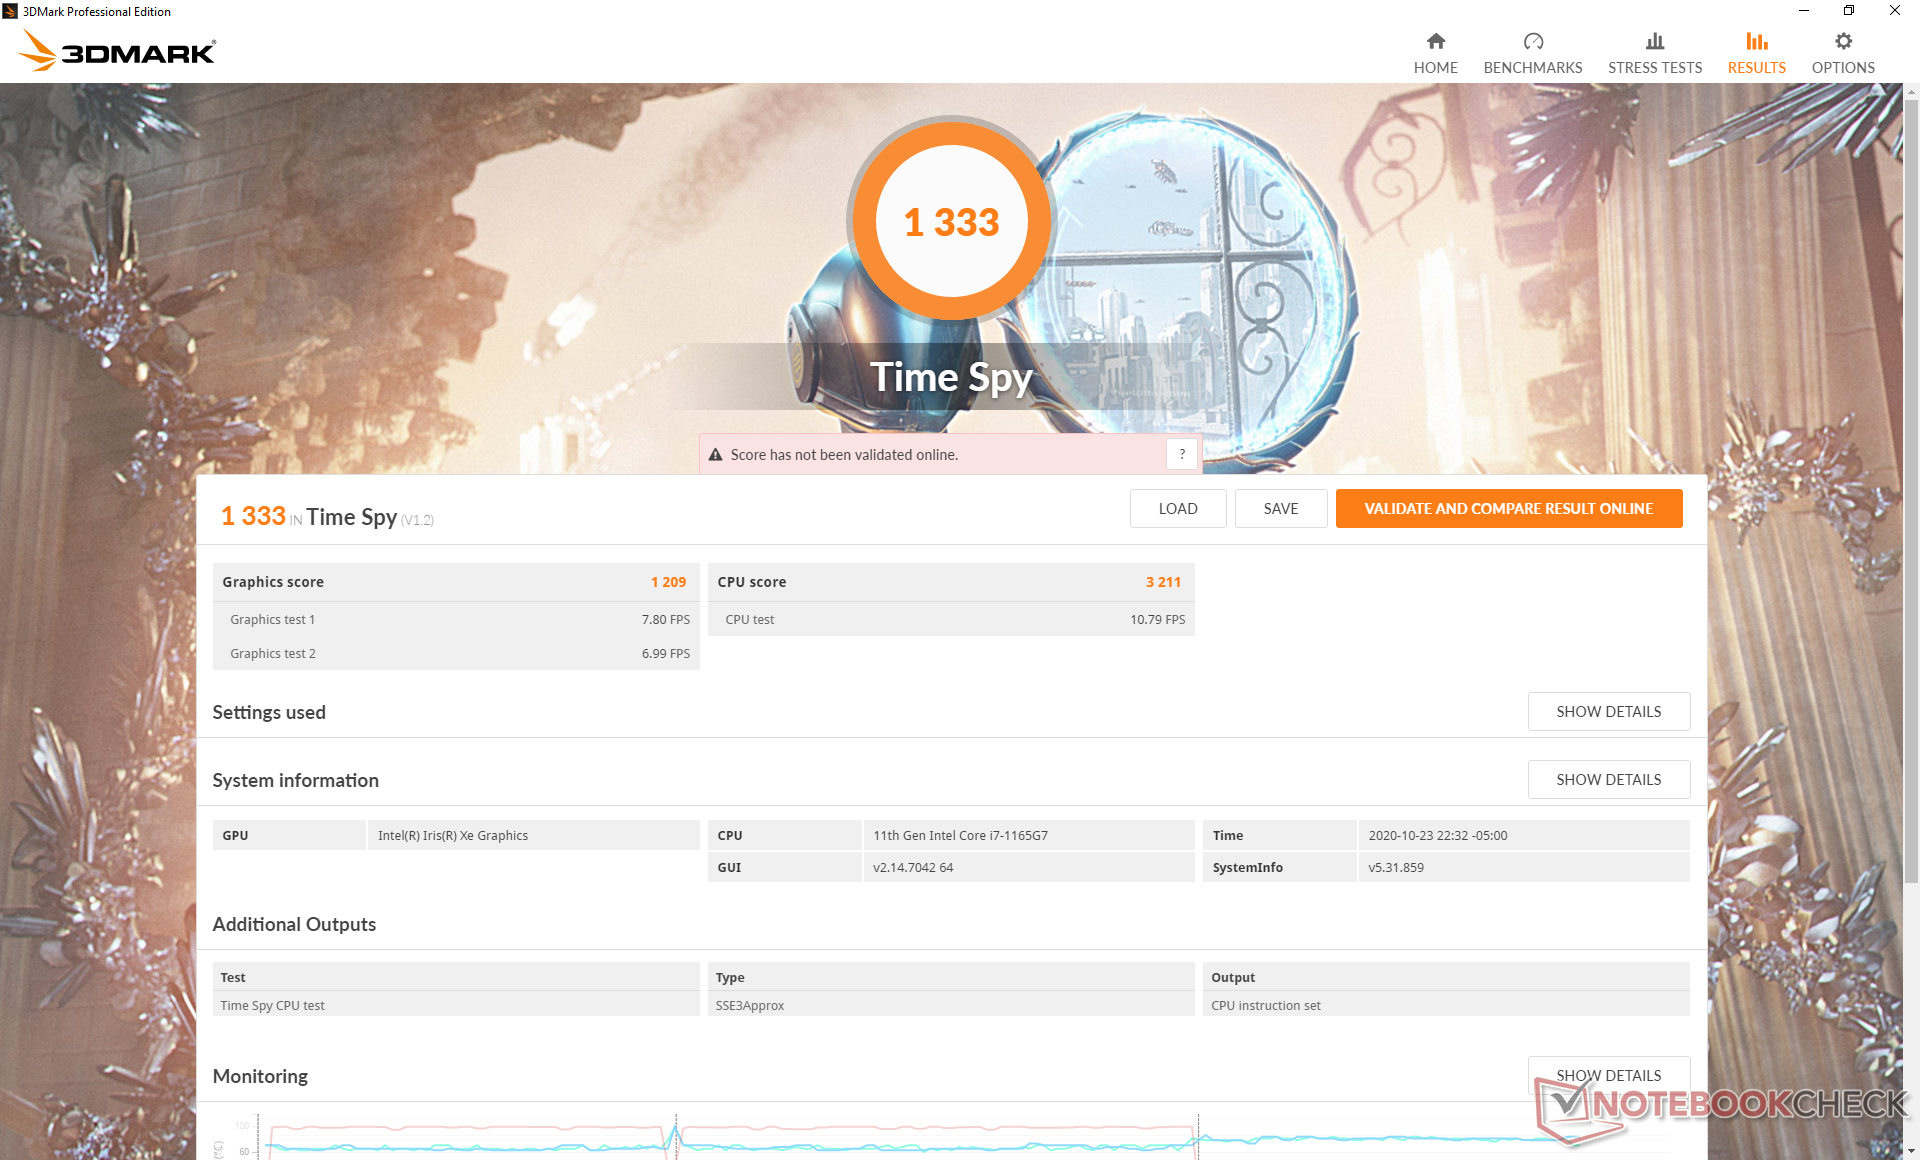
| 3DMark 11 Performance | 6554 pontos | |
| 3DMark Cloud Gate Standard Score | 14167 pontos | |
| 3DMark Fire Strike Score | 3656 pontos | |
| 3DMark Time Spy Score | 1333 pontos | |
Ajuda | ||
| baixo | média | alto | ultra | |
|---|---|---|---|---|
| GTA V (2015) | 84.3 | 76.8 | 24.7 | 10.5 |
| The Witcher 3 (2015) | 97.7 | 58.4 | 32.7 | 14.3 |
| Dota 2 Reborn (2015) | 77.5 | 54.3 | 40.5 | 42.5 |
| Final Fantasy XV Benchmark (2018) | 33.7 | 19.6 | 15.4 | |
| X-Plane 11.11 (2018) | 48 | 37.3 | 32.5 | |
| Strange Brigade (2018) | 94.4 | 38.5 | 30.4 | 24 |
Emissions
Ruído do sistema
As características de ruído dos ventiladores são basicamente as mesmas quando comparadas com o XPS 9300. Mais importante ainda, as RPMs dos ventiladores são constantes apesar das constantes mudanças nas taxas de clock da CPU quando sob altas cargas. O sistema é capaz de permanecer quase completamente silencioso mesmo durante toda a cena de referência dos primeiros 90 segundos do 3DMark 06.
| Dell XPS 13 9310 Core i7 FHD Iris Xe G7 96EUs, i7-1165G7, Micron 2300 512GB MTFDHBA512TDV | Dell XPS 13 9300 Core i7-1065G7 Iris Plus Graphics G7 (Ice Lake 64 EU), i7-1065G7, Intel SSDPEMKF512G8 NVMe SSD | Apple MacBook Pro 13 2020 2GHz i5 10th-Gen Iris Plus Graphics G7 (Ice Lake 64 EU), i5-1038NG7, Apple SSD SM0512F | Huawei MateBook X Pro 2020 i7 GeForce MX250, i7-10510U, Samsung PM981a MZVLB1T0HBLR | Lenovo Yoga Slim 7-14ARE Vega 8, R7 4800U, Samsung SSD PM981a MZVLB512HBJQ | |
|---|---|---|---|---|---|
| Noise | -11% | -15% | -16% | -4% | |
| desligado / ambiente * (dB) | 25.7 | 28.3 -10% | 29.6 -15% | 29.6 -15% | 26.3 -2% |
| Idle Minimum * (dB) | 25.7 | 28.3 -10% | 29.6 -15% | 29.6 -15% | 26.5 -3% |
| Idle Average * (dB) | 25.7 | 28.3 -10% | 29.6 -15% | 29.6 -15% | 26.5 -3% |
| Idle Maximum * (dB) | 25.9 | 28.3 -9% | 29.6 -14% | 30.3 -17% | 26.5 -2% |
| Load Average * (dB) | 26.2 | 32.5 -24% | 34.4 -31% | 38 -45% | 31.8 -21% |
| Witcher 3 ultra * (dB) | 36.5 | 39.3 -8% | 36.1 1% | 38 -4% | 35.9 2% |
| Load Maximum * (dB) | 36.6 | 39.3 -7% | 42.1 -15% | 38 -4% | 35.9 2% |
* ... menor é melhor
Barulho
| Ocioso |
| 25.7 / 25.7 / 25.9 dB |
| Carga |
| 26.2 / 36.6 dB |
 | ||
30 dB silencioso 40 dB(A) audível 50 dB(A) ruidosamente alto |
||
min: | ||
Temperatura
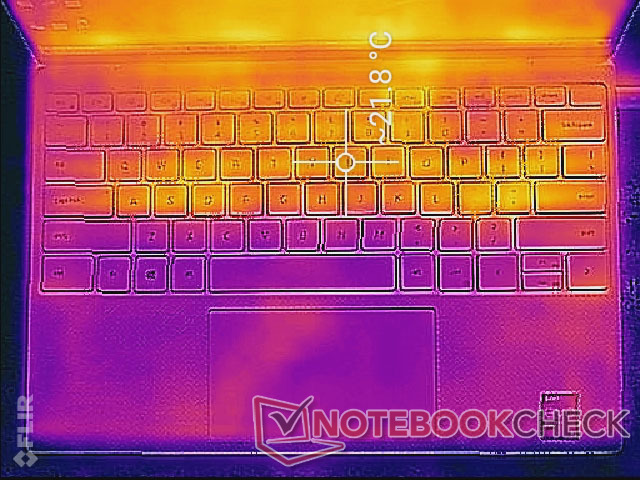
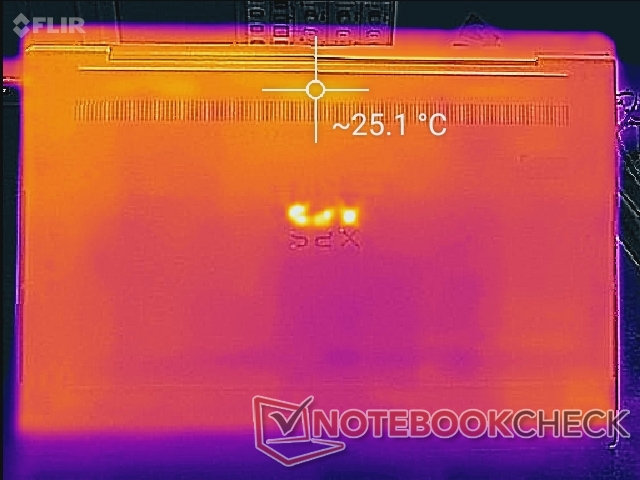
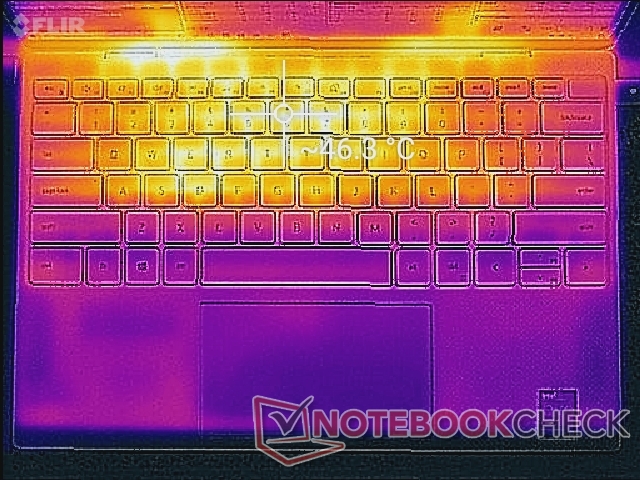
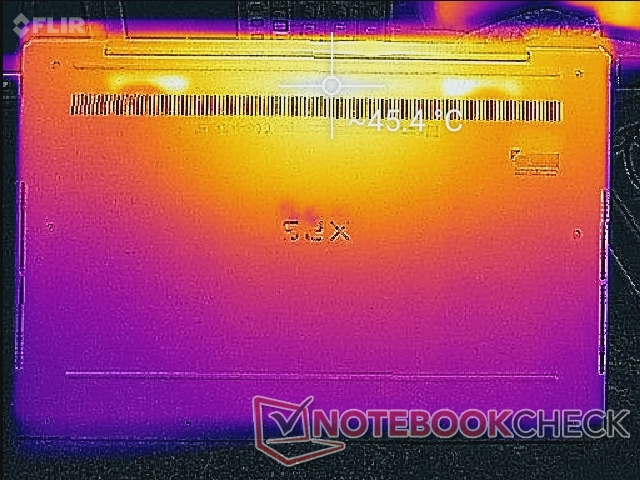
As temperaturas de superfície são quase idênticas às do XPS 13 9300 do ano passado, apesar do salto para um processador de nova geração com gráficos integrados mais rápidos. Ao contrário da maioria dos Ultrabooks mais baratos que têm apenas um ventilador interno, a Dell integra dois para um perfil de temperatura mais simétrico.

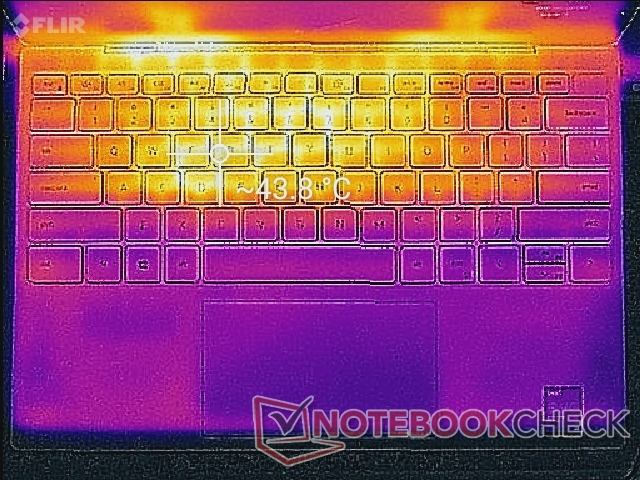
(-) A temperatura máxima no lado superior é 46.2 °C / 115 F, em comparação com a média de 35.9 °C / 97 F , variando de 21.4 a 59 °C para a classe Subnotebook.
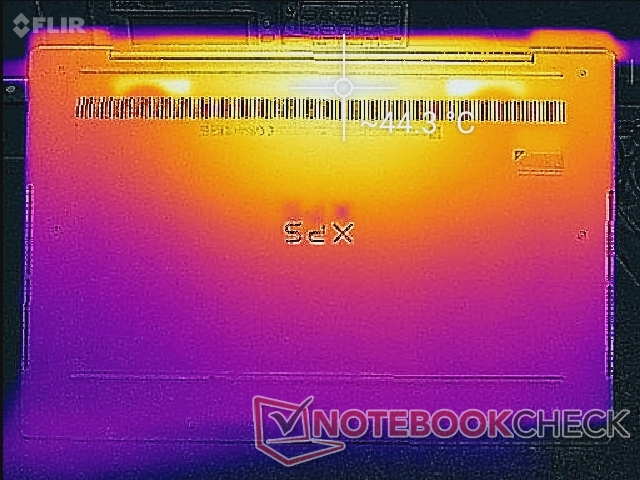
(-) A parte inferior aquece até um máximo de 46 °C / 115 F, em comparação com a média de 39.2 °C / 103 F
(+) Em uso inativo, a temperatura média para o lado superior é 20.7 °C / 69 F, em comparação com a média do dispositivo de 30.8 °C / ### class_avg_f### F.
(±) Jogando The Witcher 3, a temperatura média para o lado superior é 34.2 °C / 94 F, em comparação com a média do dispositivo de 30.8 °C / ## #class_avg_f### F.
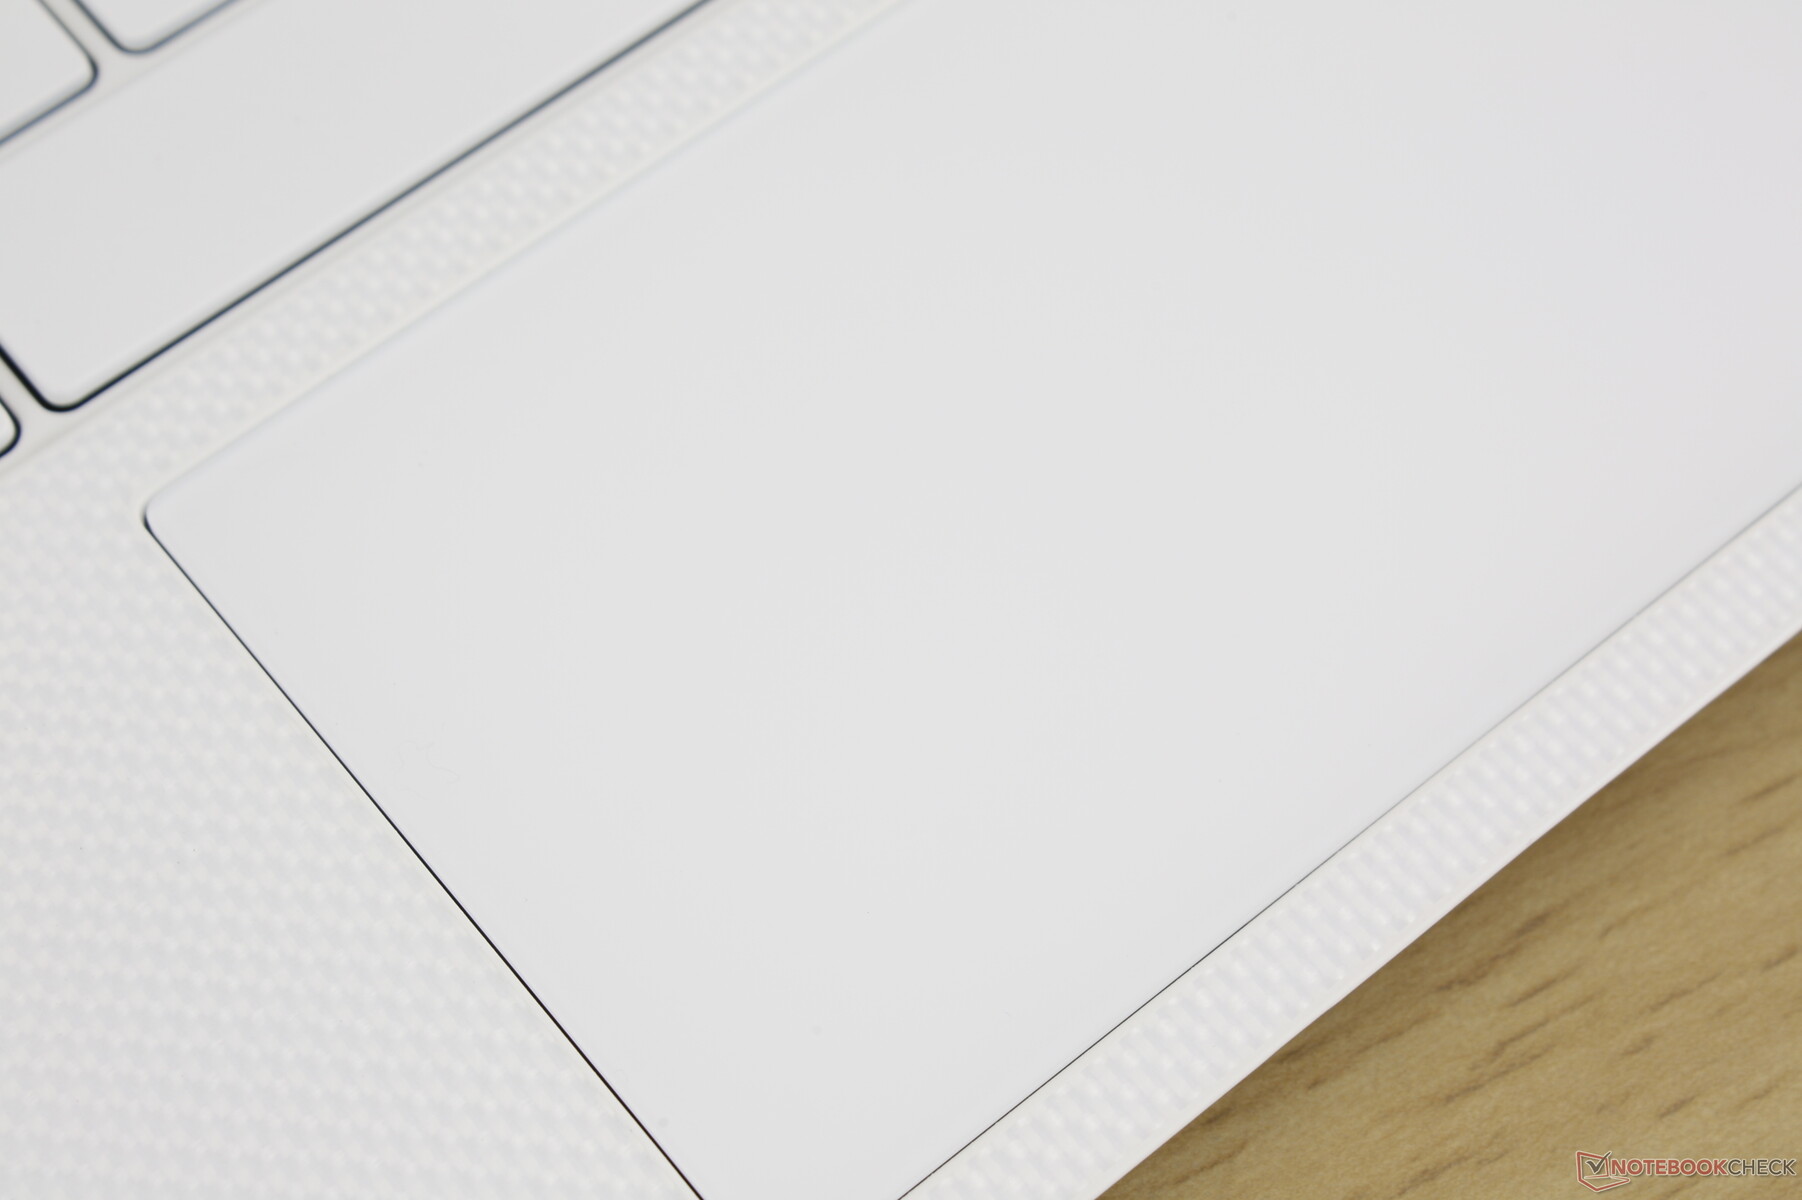
(+) Os apoios para as mãos e o touchpad estão atingindo a temperatura máxima da pele (32 °C / 89.6 F) e, portanto, não estão quentes.
(-) A temperatura média da área do apoio para as mãos de dispositivos semelhantes foi 28.2 °C / 82.8 F (-3.8 °C / -6.8 F).
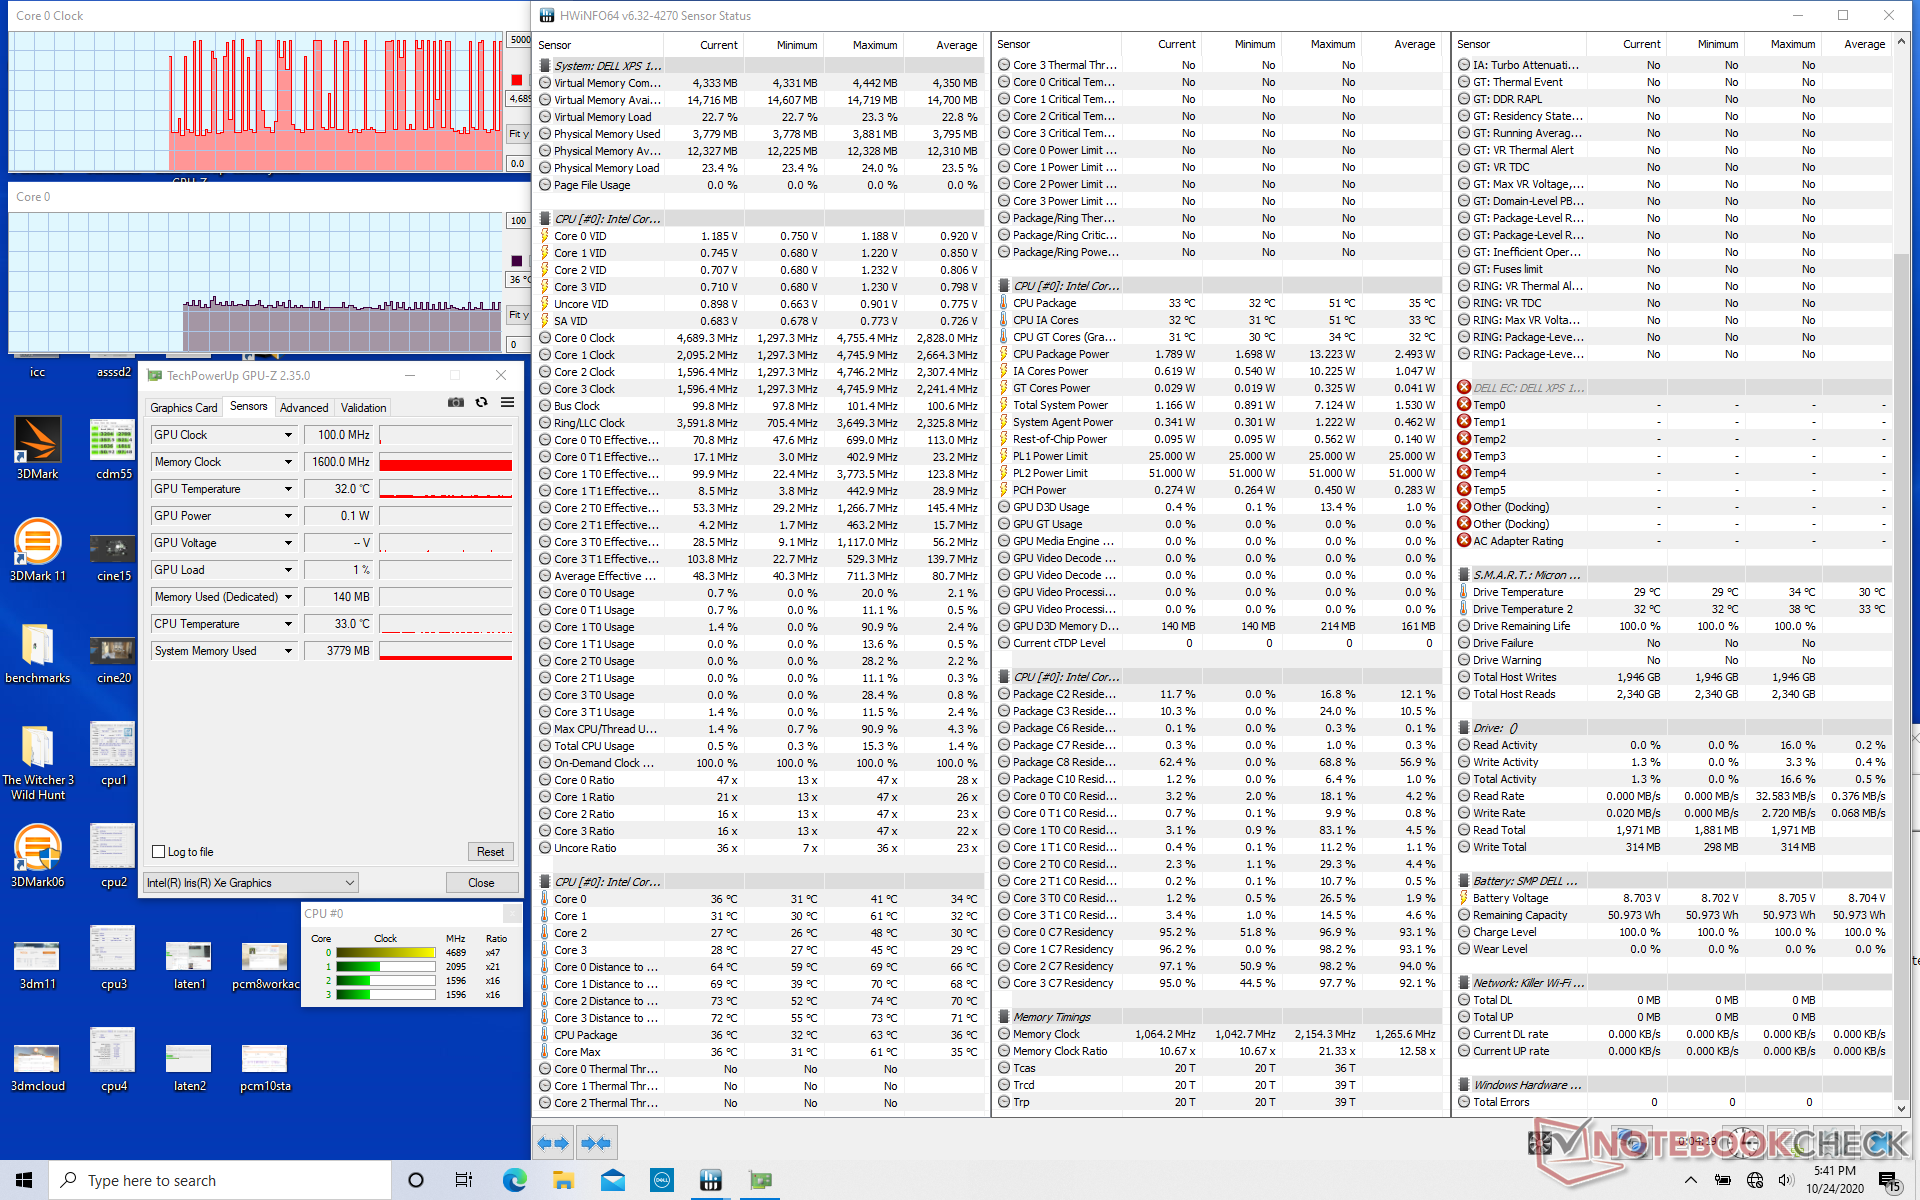
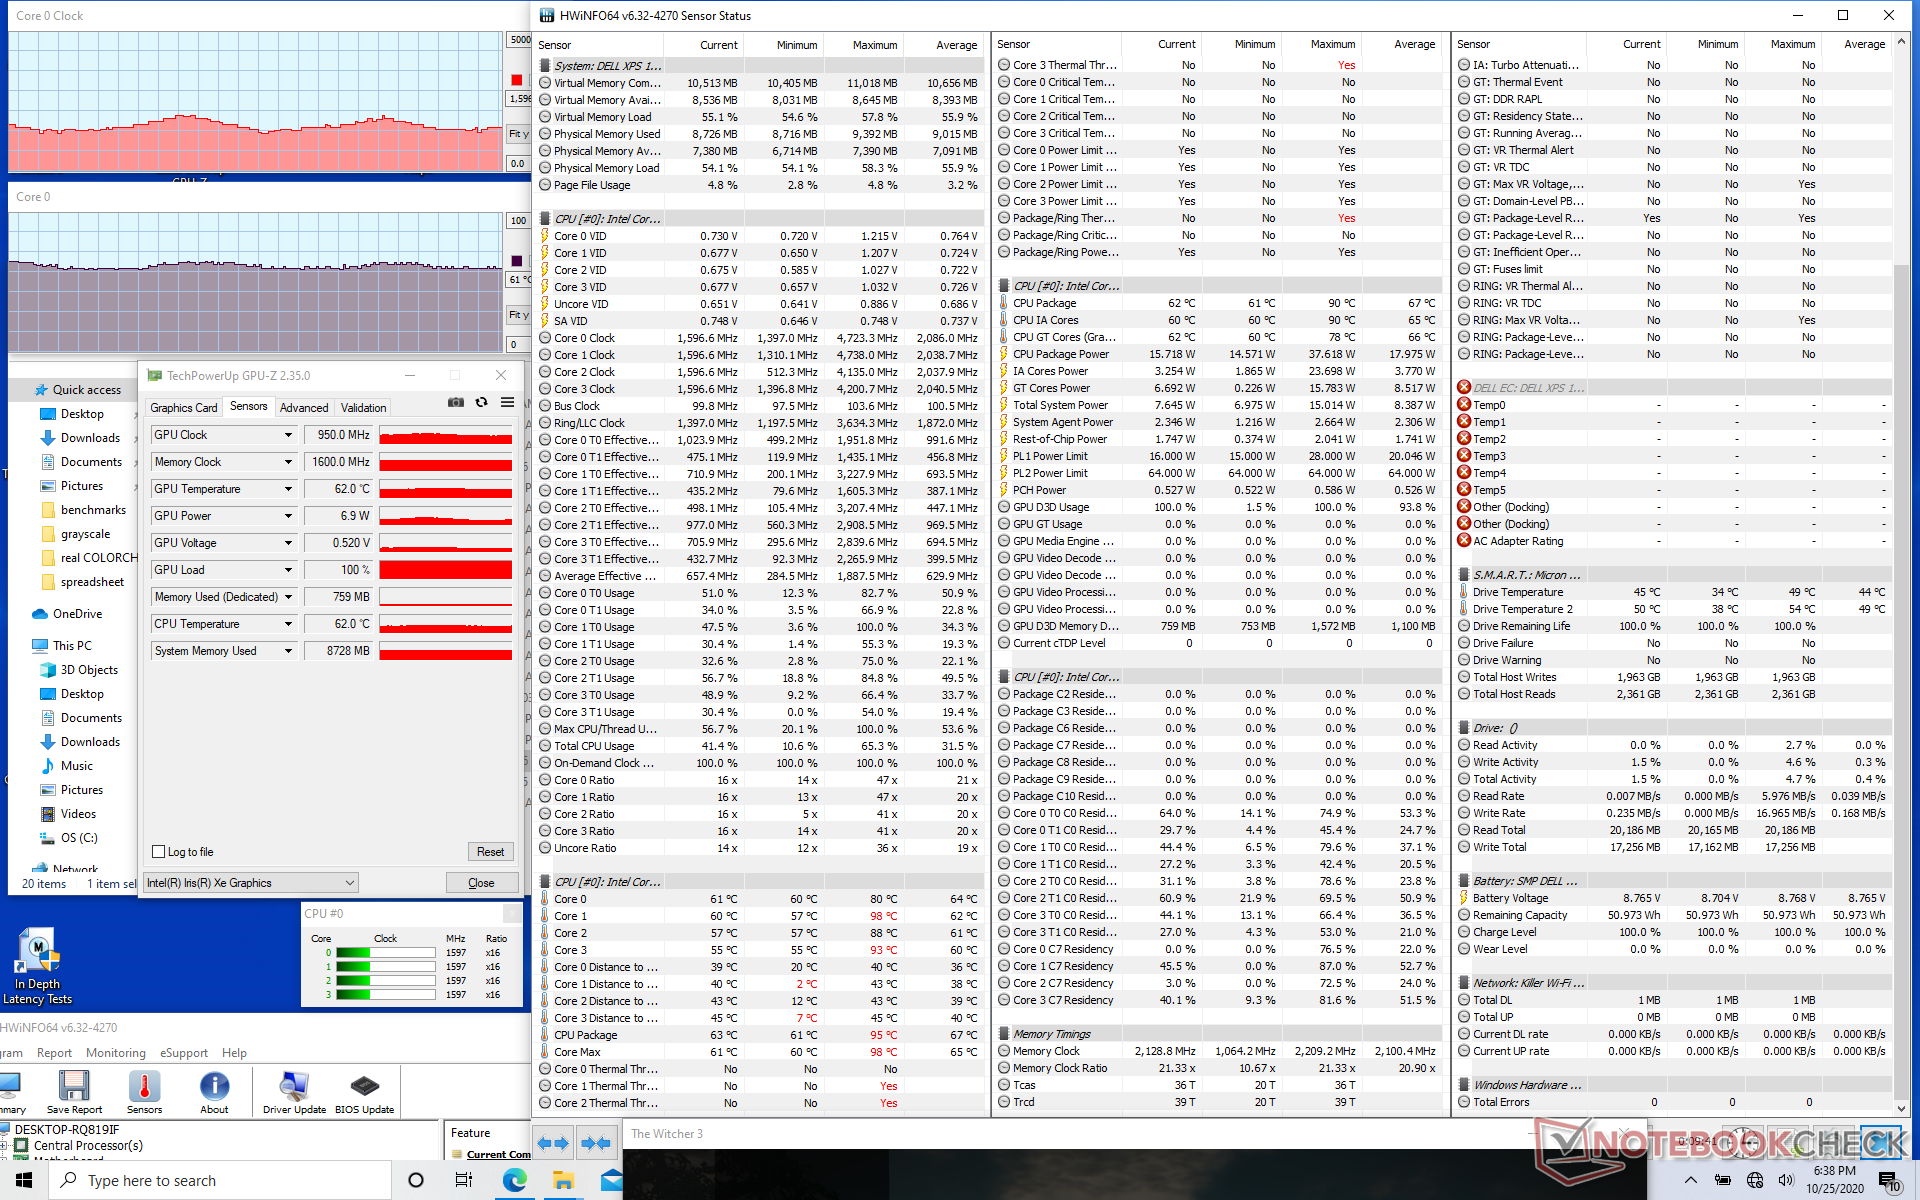
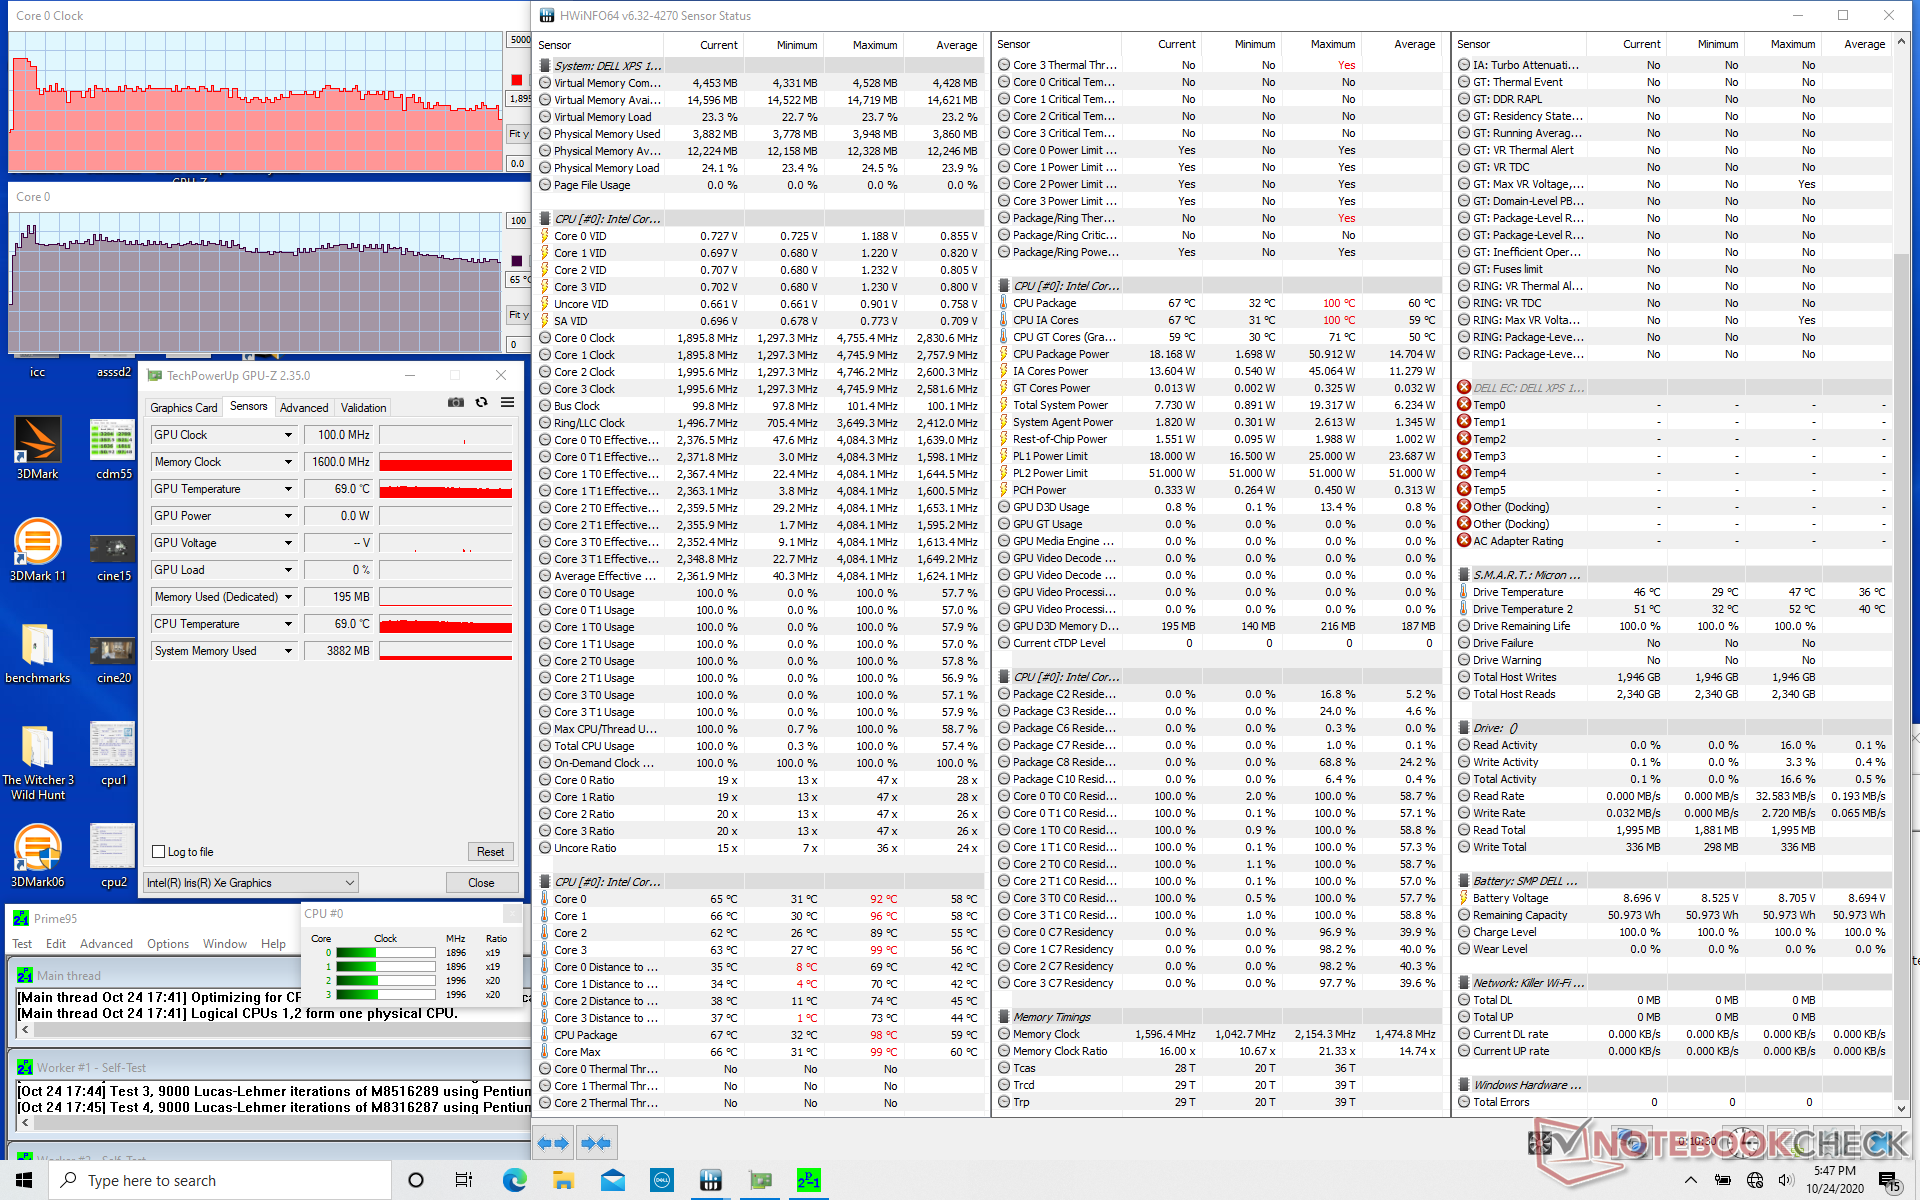
Teste de estresse
Running Prime95 revela porque nossas pontuações registradas no CineBench e as taxas de quadros acima são instáveis. As taxas do relógio primeiro aumentariam para 4,1 GHz durante os primeiros segundos de teste, mas depois começaria a pedalar entre 2,5 GHz a 3,1 GHz e 71 C a 78 C, respectivamente, em comparação com um 2,3 GHz e 68 C plano no Asus ZenBook 14 UX425 com o mesmo processador Core i7-1165G7. Em outras palavras, o Ajuste Dinâmico da Dell permite um desempenho mais rápido em média ao custo de taxas de relógio e temperaturas consistentes. Esta abordagem pode ser útil ao executar tarefas pesadas de CPU, mas pode ser um cenário de pesadelo para jogos .
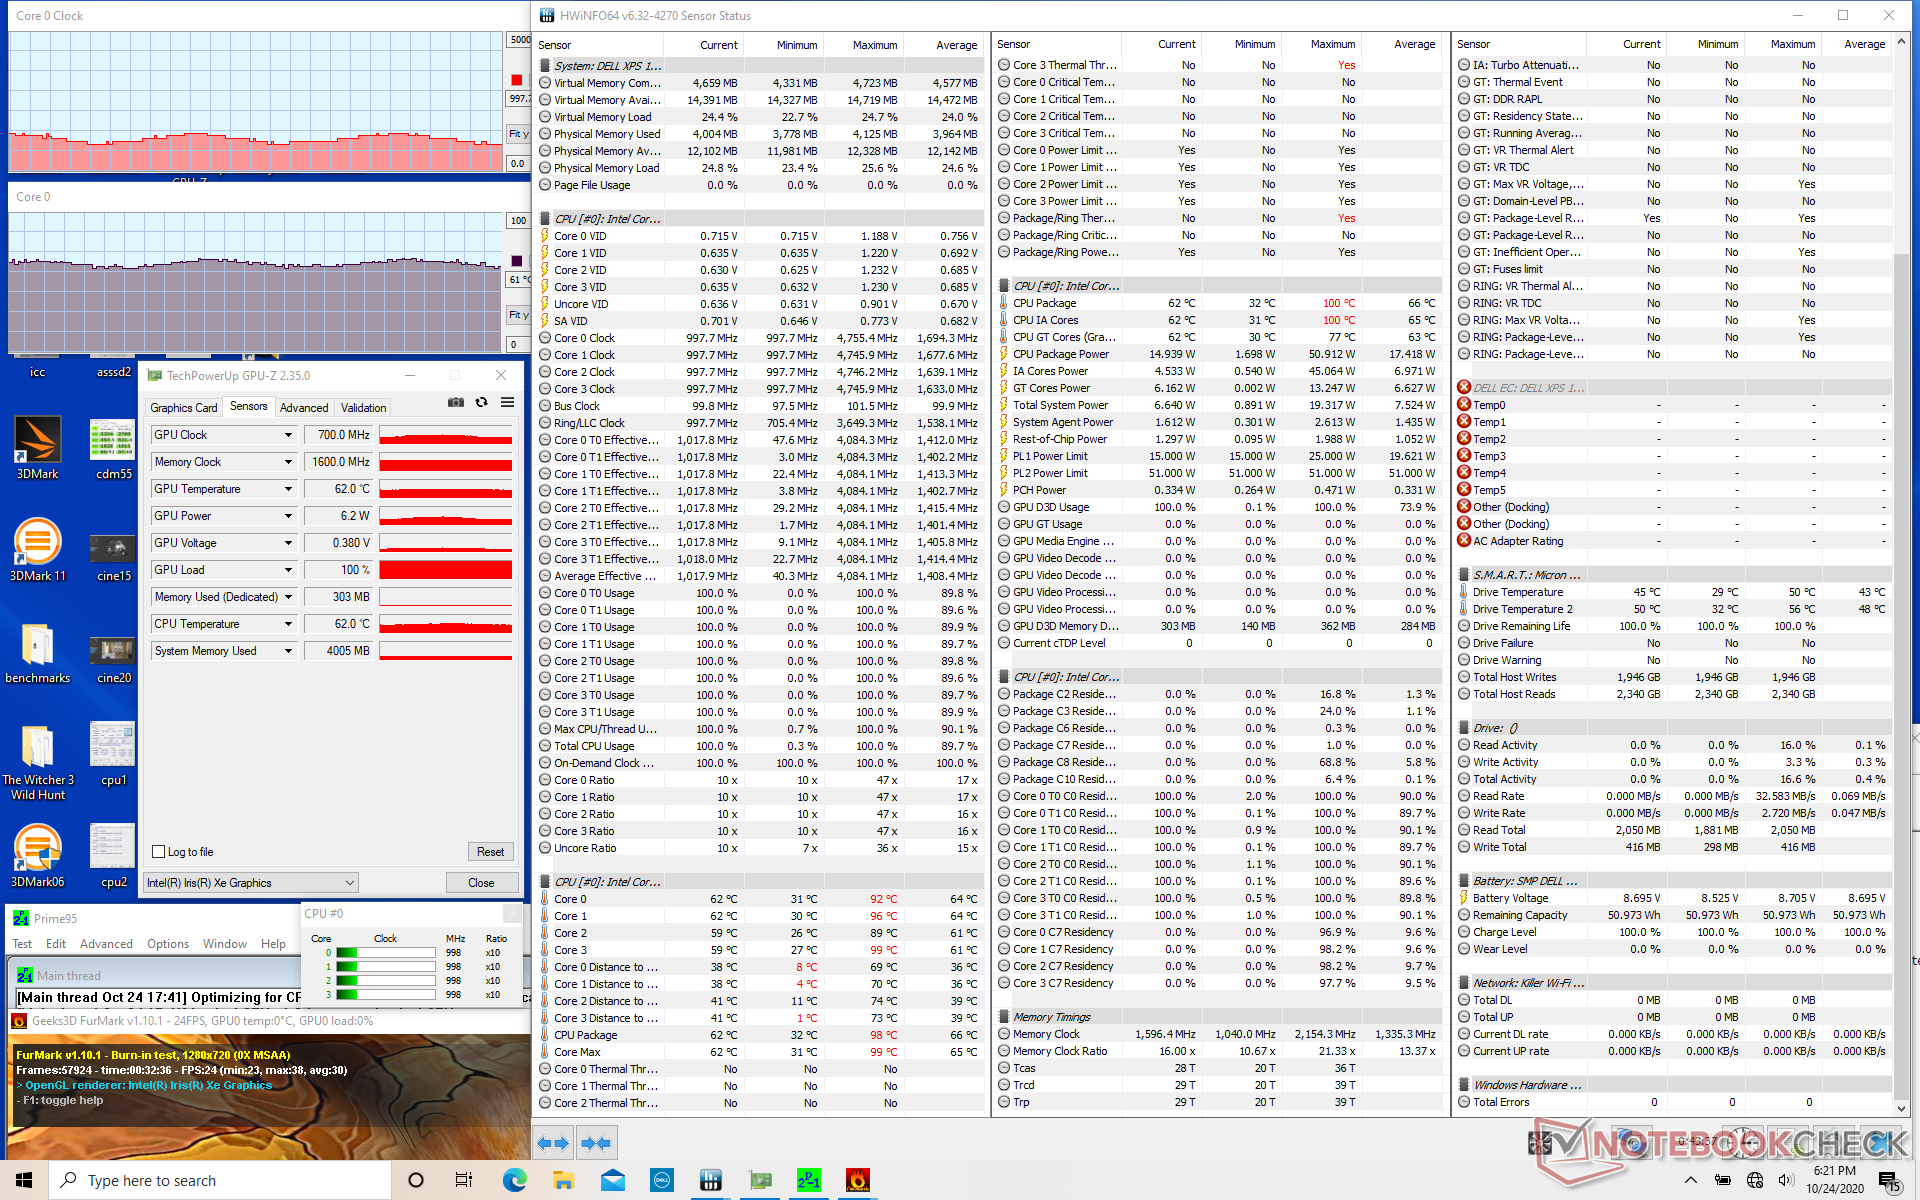
Como exemplo, rodando Witcher 3 em configurações baixas resultaria em ciclos de CPU e GPU com taxas de relógio entre 1,4 GHz a 2,0 GHz e 850 MHz a 1100 MHz, respectivamente, para taxas de quadros desiguais. A ativação do v-sync pode aliviar o ritmo de quadros desiguais, dependendo do jogo e das configurações.
O funcionamento com bateria terá um impacto maior no desempenho gráfico do que o desempenho da CPU. Um teste 3DMark 11 com baterias retornaria pontuações de Física e Gráficos de 10904 e 6093 pontos, respectivamente, em comparação com 9375 e 6698 pontos quando em rede elétrica.
| RelógioCPU (GHz) | RelógioGPU (MHz) | Temperaturamédiada CPU (°C) | |
| System Idle | -- | --36 | |
| Prime95 Stress | 2.5 - 3.1 | -71 - 78 | |
| Prime95 + FurMark Stress | 1.2 - 1.6 | 700 - 850 | 61 - 69 |
| Witcher 3 Stress | 1.4 - 2.0 | 850 - 1100 | 61 - 65 |
Oradores


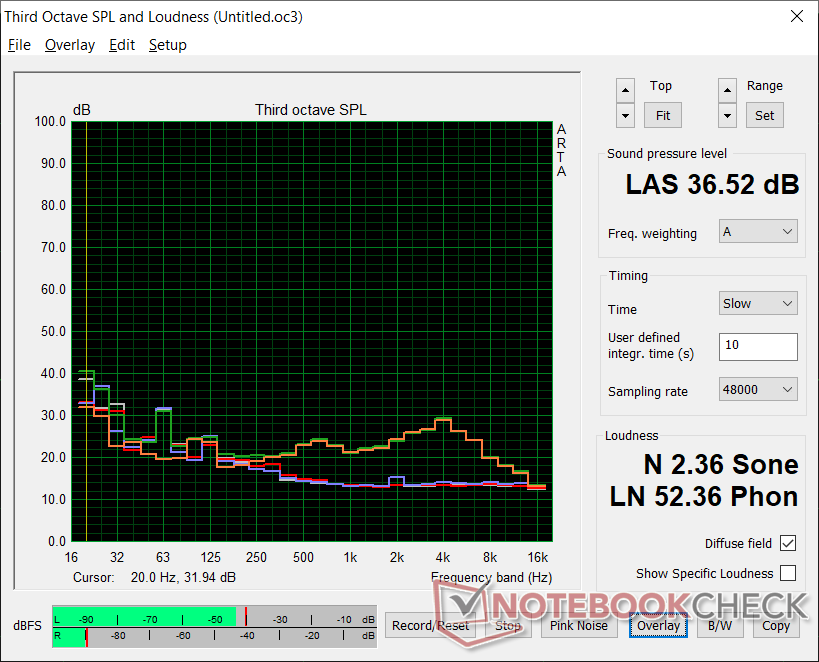
Dell XPS 13 9310 Core i7 FHD análise de áudio
(+) | os alto-falantes podem tocar relativamente alto (###valor### dB)
Graves 100 - 315Hz
(-) | quase nenhum baixo - em média 16.1% menor que a mediana
(±) | a linearidade dos graves é média (13.1% delta para a frequência anterior)
Médios 400 - 2.000 Hz
(+) | médios equilibrados - apenas 2.6% longe da mediana
(+) | médios são lineares (4.6% delta para frequência anterior)
Altos 2 - 16 kHz
(+) | agudos equilibrados - apenas 1.3% longe da mediana
(+) | os máximos são lineares (4% delta da frequência anterior)
Geral 100 - 16.000 Hz
(+) | o som geral é linear (10.7% diferença em relação à mediana)
Comparado com a mesma classe
» 9% de todos os dispositivos testados nesta classe foram melhores, 3% semelhantes, 88% piores
» O melhor teve um delta de 5%, a média foi 18%, o pior foi 53%
Comparado com todos os dispositivos testados
» 6% de todos os dispositivos testados foram melhores, 2% semelhantes, 93% piores
» O melhor teve um delta de 4%, a média foi 23%, o pior foi 134%
Apple MacBook 12 (Early 2016) 1.1 GHz análise de áudio
(+) | os alto-falantes podem tocar relativamente alto (###valor### dB)
Graves 100 - 315Hz
(±) | graves reduzidos - em média 11.3% menor que a mediana
(±) | a linearidade dos graves é média (14.2% delta para a frequência anterior)
Médios 400 - 2.000 Hz
(+) | médios equilibrados - apenas 2.4% longe da mediana
(+) | médios são lineares (5.5% delta para frequência anterior)
Altos 2 - 16 kHz
(+) | agudos equilibrados - apenas 2% longe da mediana
(+) | os máximos são lineares (4.5% delta da frequência anterior)
Geral 100 - 16.000 Hz
(+) | o som geral é linear (10.2% diferença em relação à mediana)
Comparado com a mesma classe
» 7% de todos os dispositivos testados nesta classe foram melhores, 2% semelhantes, 90% piores
» O melhor teve um delta de 5%, a média foi 18%, o pior foi 53%
Comparado com todos os dispositivos testados
» 5% de todos os dispositivos testados foram melhores, 1% semelhantes, 94% piores
» O melhor teve um delta de 4%, a média foi 23%, o pior foi 134%
Energy Management
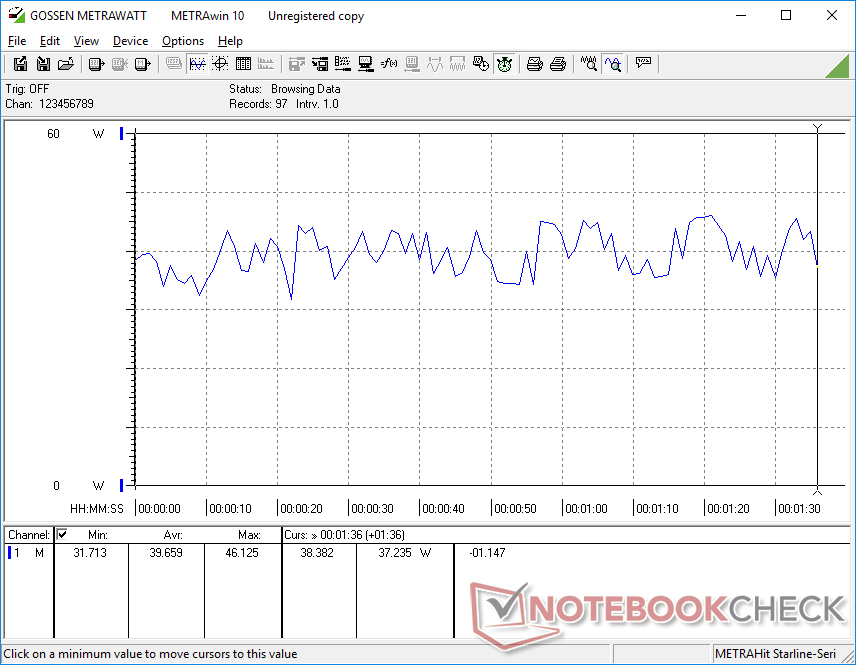
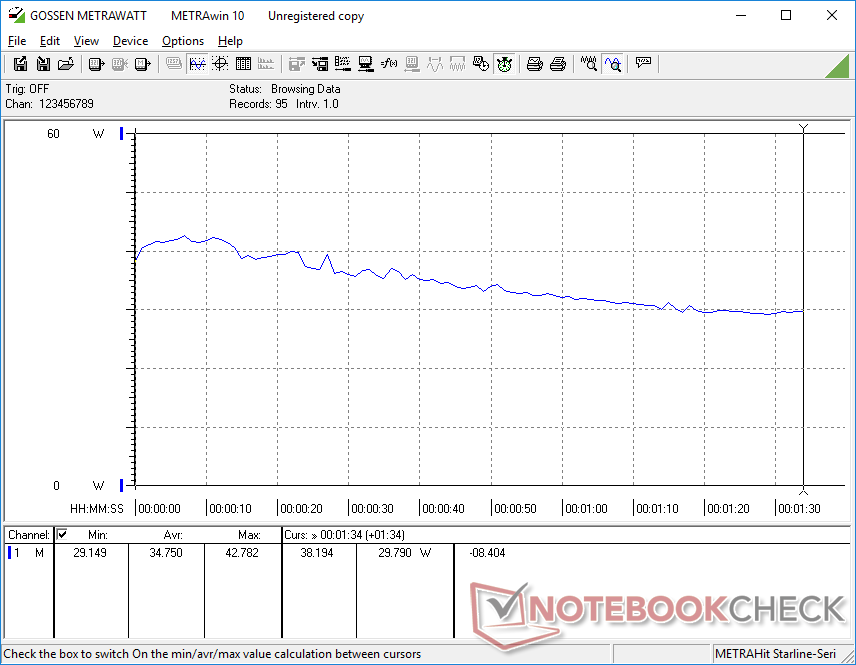
Consumo de energia
Nossa unidade Tiger Lake exige tanta potência quanto a antiga unidade Ice Lake, apesar das melhorias de gênero a gênero nos gráficos integrados. Assim, a Iris Xe G7 é capaz de fornecer desempenho gráfico adicional "grátis" sem precisar extrair mais da saída.
O desempenho por watt é excelente quando comparado aos sistemas concorrentes com a GeForce MX250 ou Radeon Vega 8 como o MateBook X Pro ou Lenovo Yoga Slim 7, respectivamente, que consomem cerca de 10 W a 15 W a mais cada um quando submetidos a cargas semelhantes e exigentes
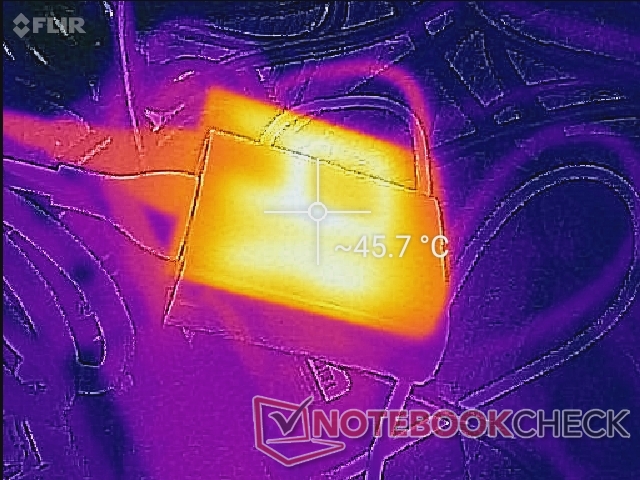
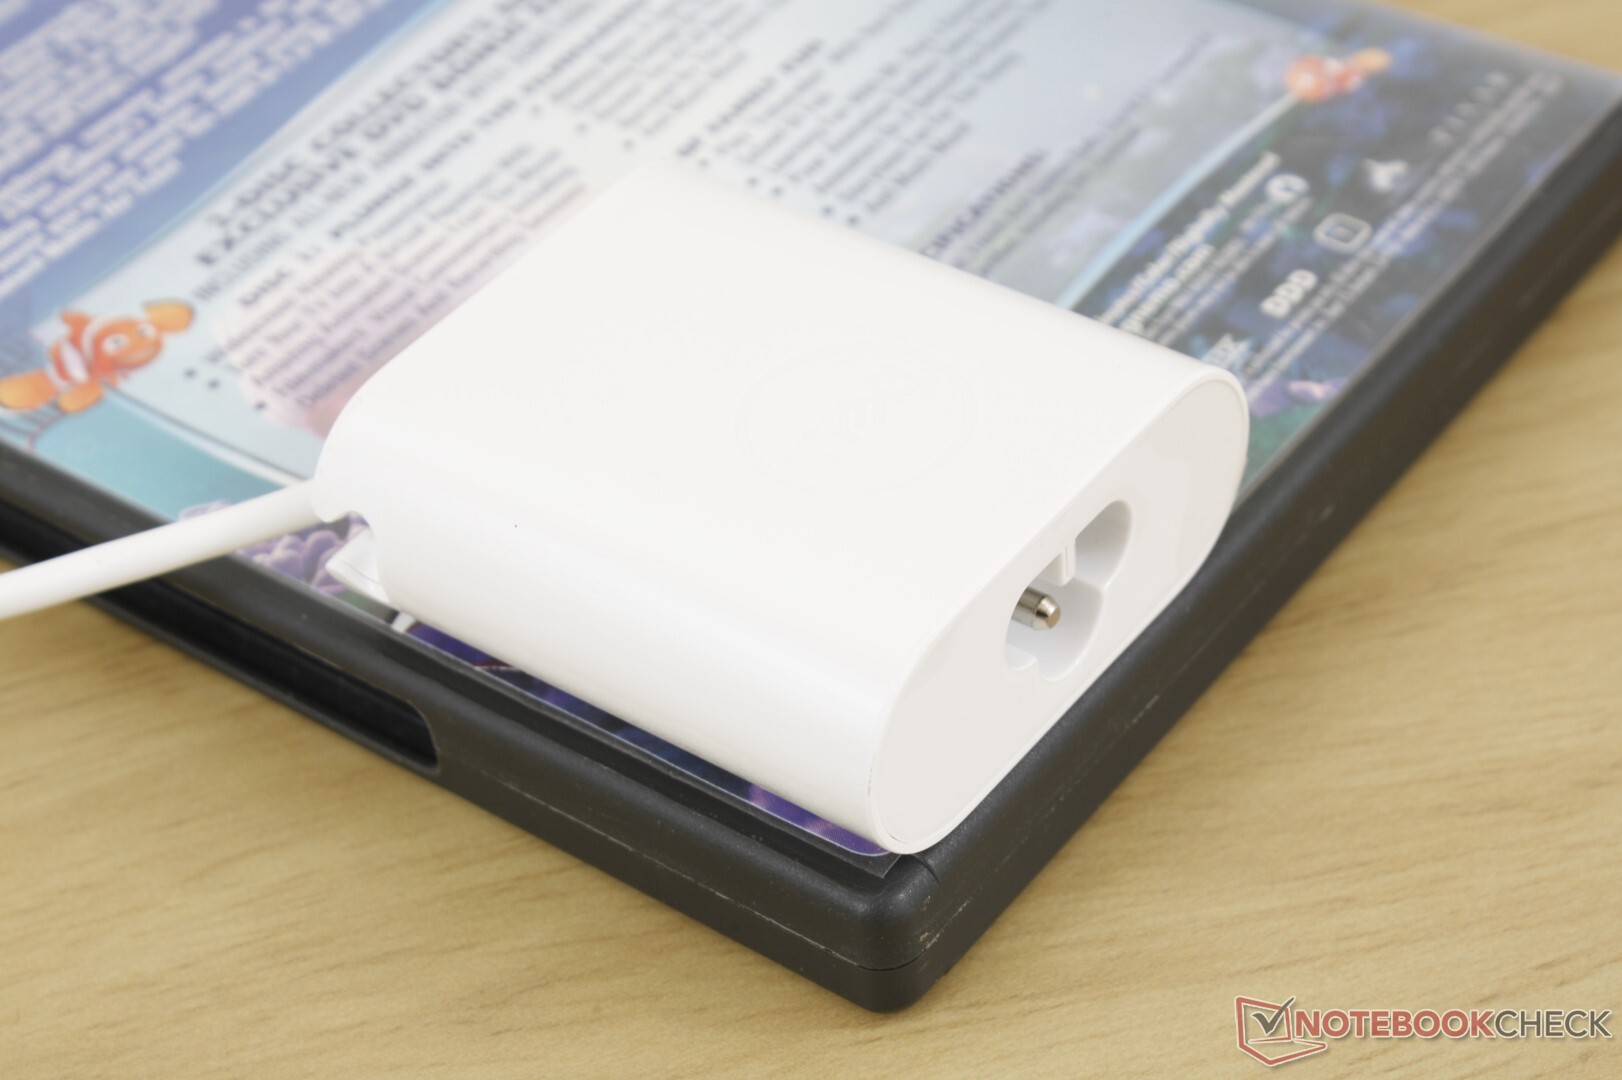
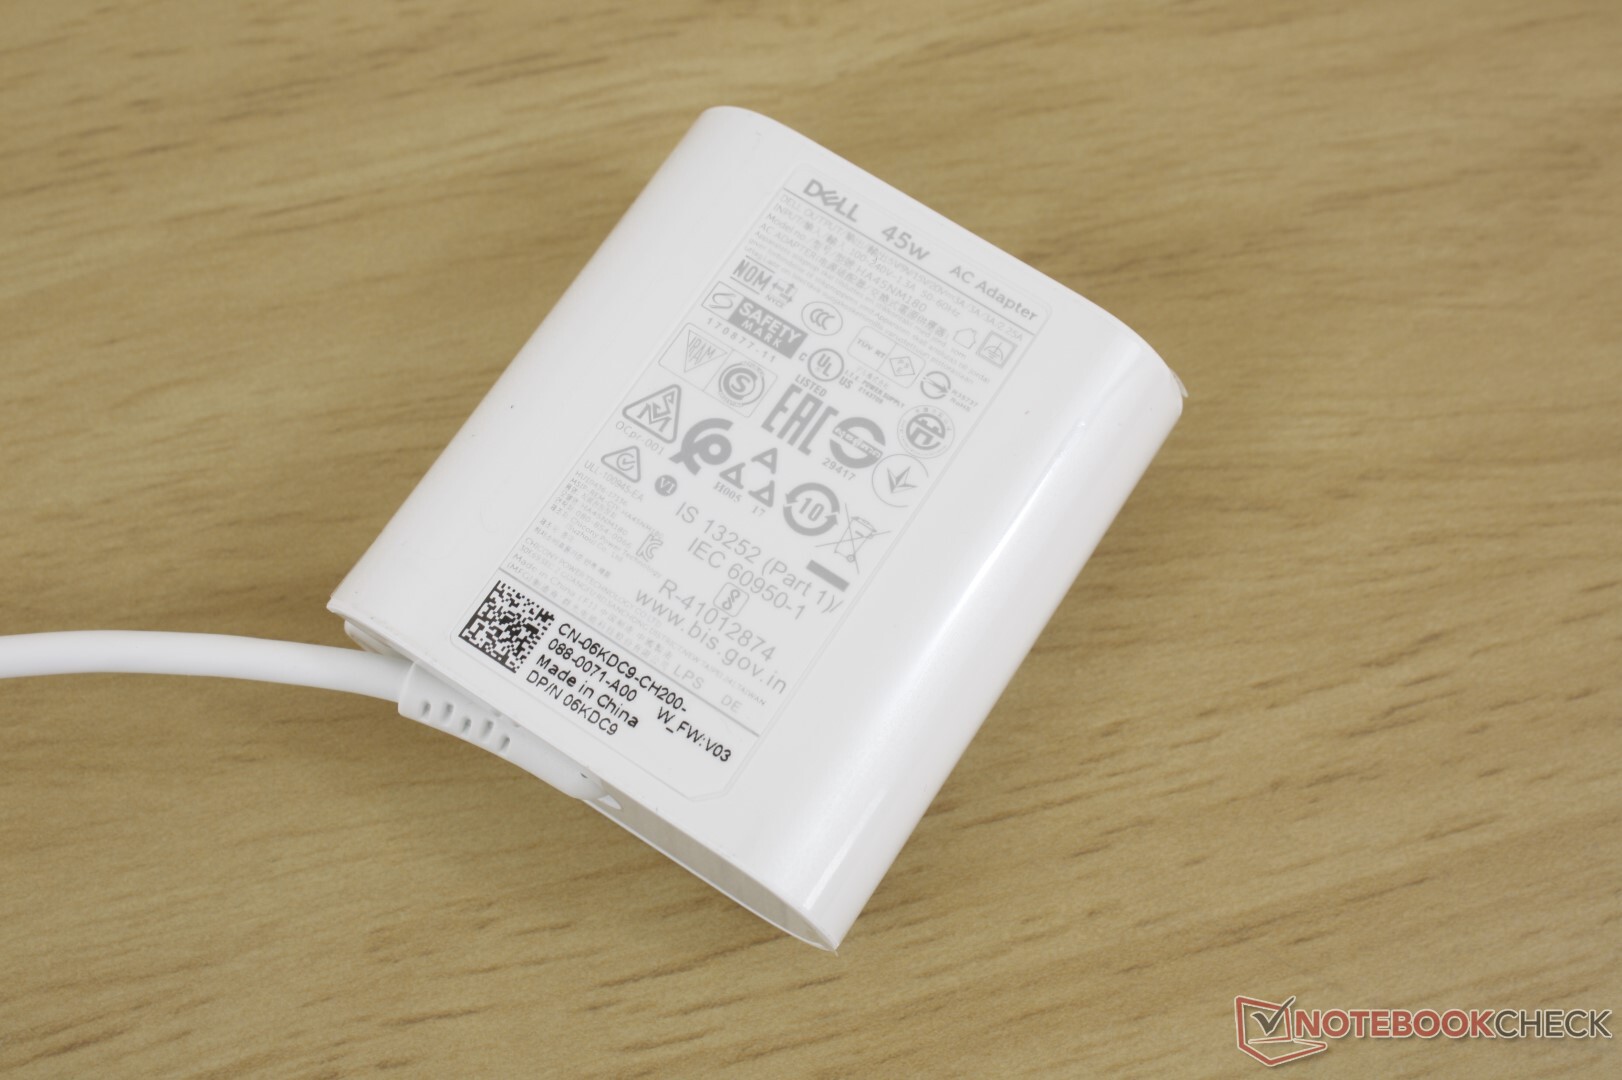
Somos capazes de medir um consumo máximo de 47,5 W do pequeno (~6,0 x 5,5 x 2,2 cm) adaptador AC de 45 W. A bateria do sistema ainda recarregará, uma vez que esta taxa máxima não é estável, como mostram nossos gráficos abaixo.
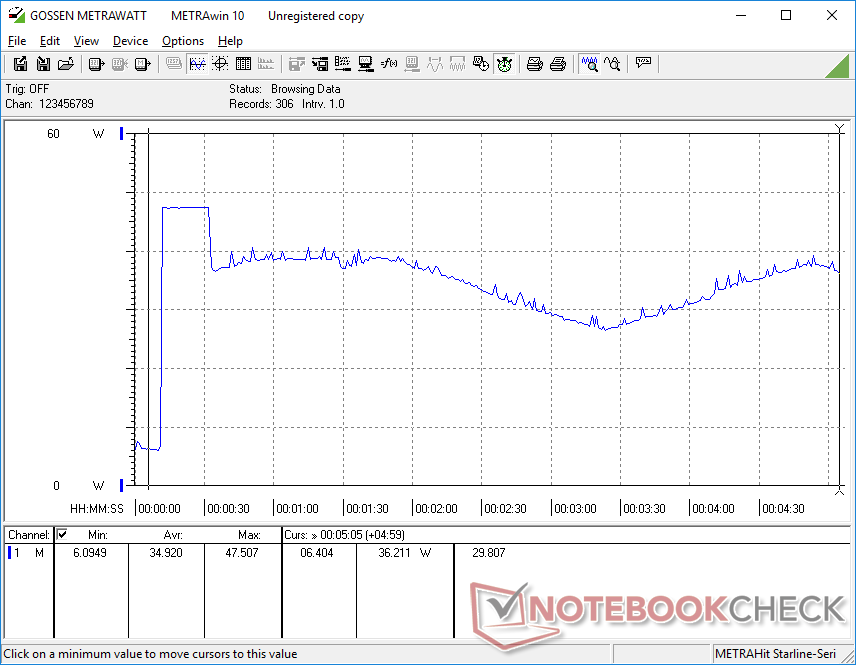
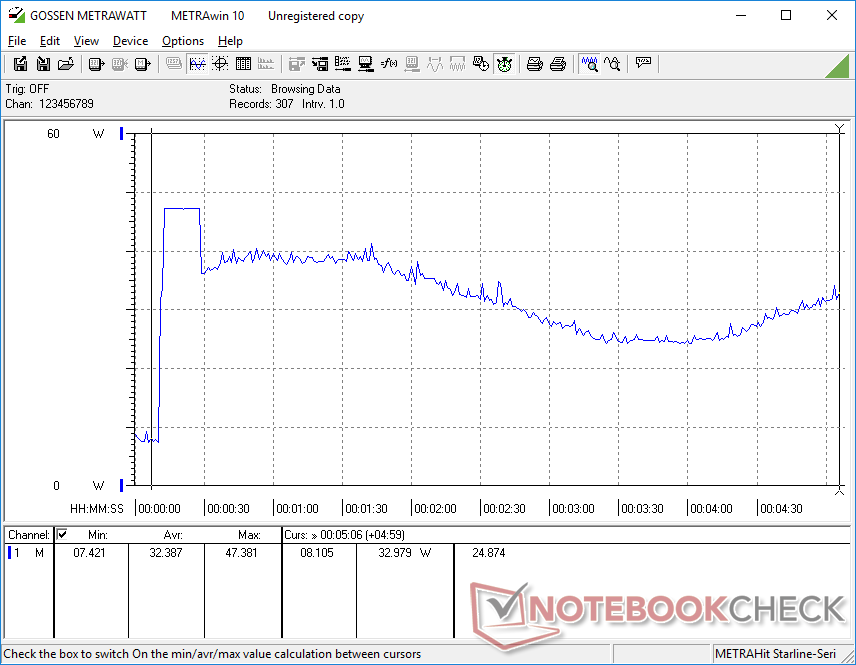
| desligado | |
| Ocioso | |
| Carga |
|
Key:
min: | |
| Dell XPS 13 9310 Core i7 FHD i7-1165G7, Iris Xe G7 96EUs, Micron 2300 512GB MTFDHBA512TDV, IPS, 1920x1200, 13.4" | Dell XPS 13 9300 Core i7-1065G7 i7-1065G7, Iris Plus Graphics G7 (Ice Lake 64 EU), Intel SSDPEMKF512G8 NVMe SSD, IPS, 1920x1200, 13.4" | Apple MacBook Pro 13 2020 2GHz i5 10th-Gen i5-1038NG7, Iris Plus Graphics G7 (Ice Lake 64 EU), Apple SSD SM0512F, IPS, 2560x1600, 13.3" | Huawei MateBook X Pro 2020 i7 i7-10510U, GeForce MX250, Samsung PM981a MZVLB1T0HBLR, LTPS, 3000x2000, 13.9" | Lenovo Yoga Slim 7-14ARE R7 4800U, Vega 8, Samsung SSD PM981a MZVLB512HBJQ, IPS, 1920x1080, 14" | HP Spectre x360 13-aw0013dx i7-1065G7, Iris Plus Graphics G7 (Ice Lake 64 EU), Intel Optane Memory H10 with Solid State Storage 32GB + 512GB HBRPEKNX0202A(L/H), IPS, 1920x1080, 13.3" | |
|---|---|---|---|---|---|---|
| Power Consumption | -6% | -36% | -41% | -19% | 1% | |
| Idle Minimum * (Watt) | 3.9 | 4.2 -8% | 3.8 3% | 4.3 -10% | 4 -3% | 3.9 -0% |
| Idle Average * (Watt) | 5.9 | 6.9 -17% | 8.6 -46% | 8.5 -44% | 6.3 -7% | 6.3 -7% |
| Idle Maximum * (Watt) | 6.3 | 7.5 -19% | 10.3 -63% | 12 -90% | 7.7 -22% | 6.8 -8% |
| Load Average * (Watt) | 39.7 | 33.3 16% | 52.1 -31% | 54.8 -38% | 48.3 -22% | 32.6 18% |
| Witcher 3 ultra * (Watt) | 34.8 | 37.1 -7% | 48.2 -39% | 47.1 -35% | 49 -41% | 25.6 26% |
| Load Maximum * (Watt) | 47.5 | 48.4 -2% | 65.2 -37% | 61.5 -29% | 57.6 -21% | 59 -24% |
* ... menor é melhor
Vida útil da bateria
Os tempos de execução não são muito diferentes dos do XPS 13 9300. Na verdade, eles podem ser um pouco mais curtos de acordo com nossos próprios testes. No entanto, 11 horas de uso da WLAN no mundo real devem ser mais do que suficientes para a maioria dos usuários.
A carga de vazio a cheio leva pouco mais de 2 horas em comparação com 1,5 horas na maioria dos outros Ultrabooks.
| Dell XPS 13 9310 Core i7 FHD i7-1165G7, Iris Xe G7 96EUs, 52 Wh | Dell XPS 13 9300 Core i7-1065G7 i7-1065G7, Iris Plus Graphics G7 (Ice Lake 64 EU), 52 Wh | Apple MacBook Pro 13 2020 2GHz i5 10th-Gen i5-1038NG7, Iris Plus Graphics G7 (Ice Lake 64 EU), 58 Wh | Huawei MateBook X Pro 2020 i7 i7-10510U, GeForce MX250, 57.4 Wh | Lenovo Yoga Slim 7-14ARE R7 4800U, Vega 8, 61 Wh | HP Spectre x360 13-aw0013dx i7-1065G7, Iris Plus Graphics G7 (Ice Lake 64 EU), 60 Wh | |
|---|---|---|---|---|---|---|
| Duração da bateria | 15% | 10% | -15% | -25% | -1% | |
| Reader / Idle (h) | 30 | 27.1 -10% | 37.1 24% | |||
| WiFi v1.3 (h) | 11 | 12.7 15% | 12.1 10% | 10.4 -5% | 10.3 -6% | 9.9 -10% |
| Load (h) | 3.2 | 2.4 -25% | 1.3 -59% | 2.7 -16% |
Pro
Contra
Veredicto
Se você já possui um laptop Ice Lake, então não há muito motivo para atualizar para o Tiger Lake. O desempenho geral do sistema não é notavelmente melhor que o XPS 13 9300 que nem sequer tem um ano de idade. A principal exceção diz respeito ao desempenho gráfico, pois o Iris Xe integrado é muito mais rápido do que o Iris Plus G7 sem exigir mais potência ou necessidade de rodar mais alto ou mais quente. Isto é particularmente atrativo para editores de vídeo ou gráficos que sabem que podem explorar a GPU para obter o máximo do XPS 13 9310 e seu novo processador.
Para todos os outros, o menos caro XPS 13 9300 será mais do que suficiente, especialmente porque a diferença de desempenho da CPU entre o Core i7 do 10º gênero e o Core i7 do 11º gênero é marginal. A vantagem mais forte do Tiger Lake, que é sua nova GPU integrada, não é muito útil para os jogadores daqui, a não ser para jogadores casuais, porque as taxas de quadros tendem a ser menos estáveis e às vezes até mais lentas do que as experimentadas e verdadeiras séries GeForce MX150/MX250. Além disso, tanto o tempo médio de resposta da tela quanto a falta de sincronização adaptativa só cimentam este fato. Seria bom ver melhorias nestas áreas específicas ou pelo menos um obturador de webcam para futuras revisões de modelos. Uma opção de software para alternar o ajuste dinâmico em favor de taxas de relógio consistentes também seria agradável.
Não se pode escolher entre o XPS 13 9300 ou 9310? Para processamento de texto, transmissão de vídeo e jogos casuais, o XPS 13 9300 se sentirá tão rápido quanto o 9310. Para editores e aplicações gráficas intensivas fora dos jogos, a potência adicional da GPU e o alto desempenho por watt do Iris Xe deve ser útil.
Dell XPS 13 9310 Core i7 FHD
- 10/28/2020 v7 (old)
Allen Ngo
Price comparison

