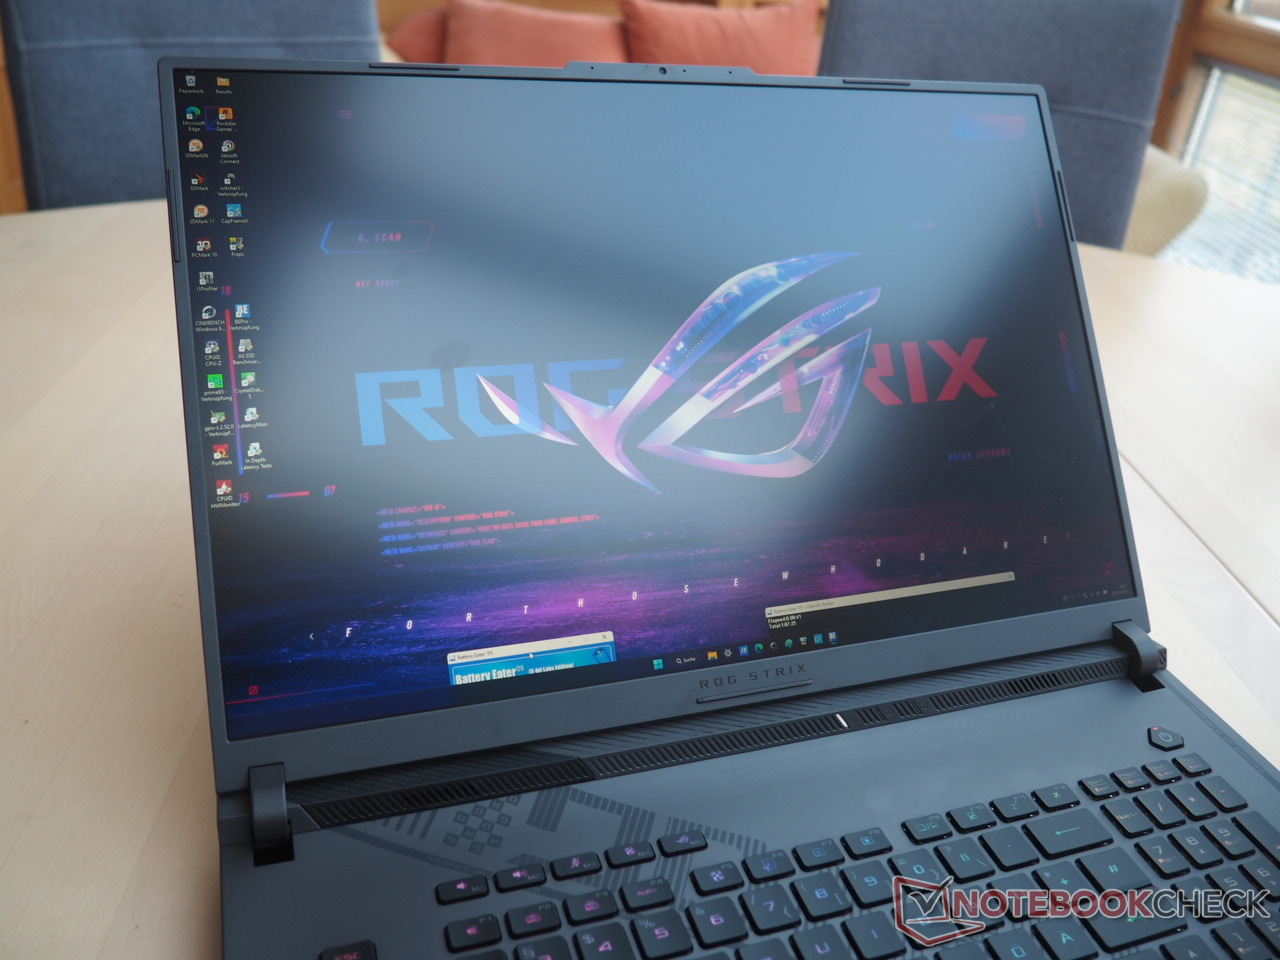
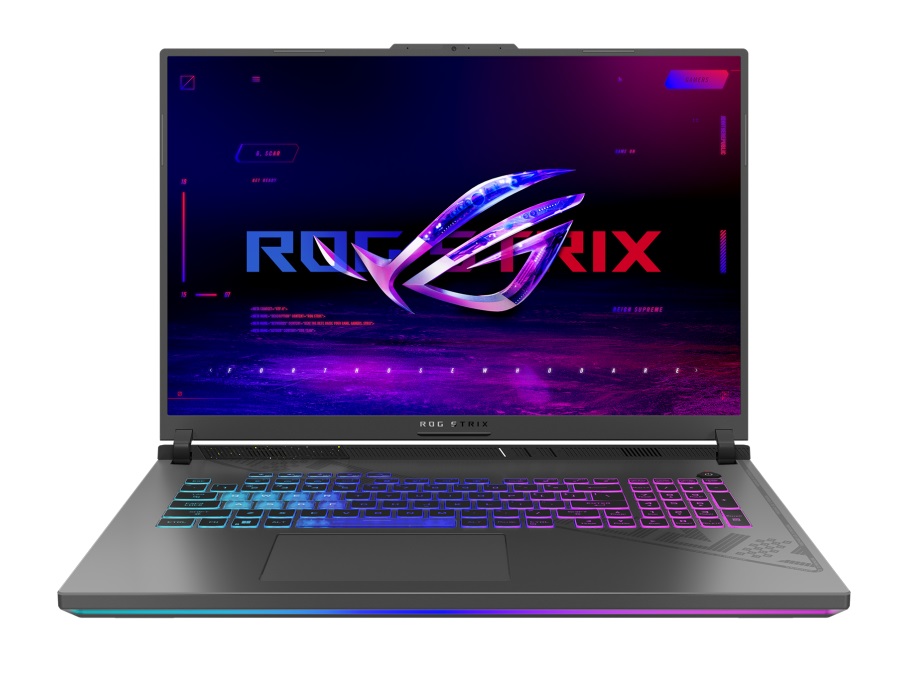
Asus ROG Strix G18 G814JI revisão de laptop: Luz e sombra com a máquina de jogo de 18 polegadas

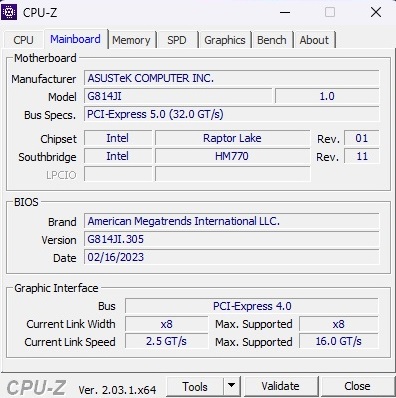
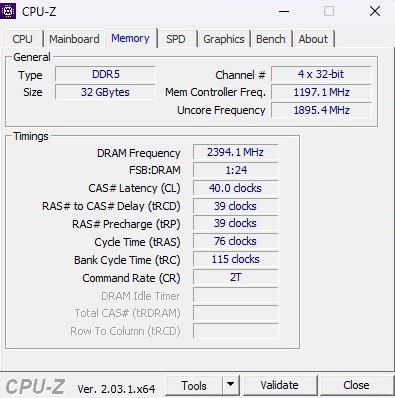
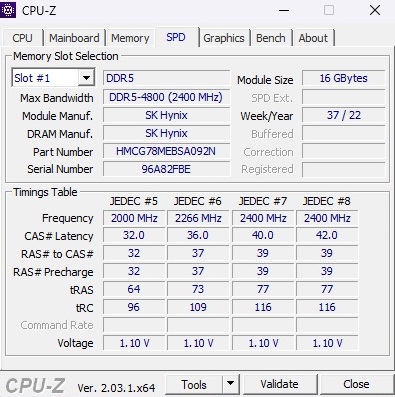
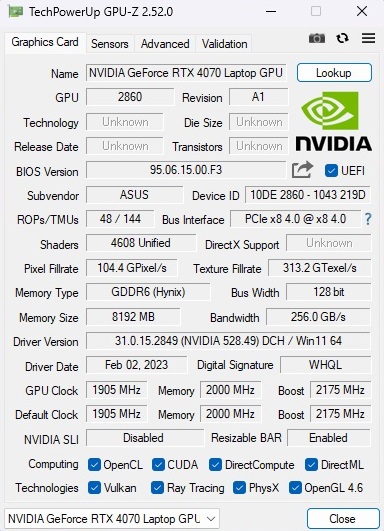
ROG Strix, ROG Strix Scar.... pode muitas vezes ser difícil acompanhar a gama de produtos da Asus. Depois de ter revisado recentemente aStrix Scar 18 G834JYcom um Núcleo i9-13980HXe GeForce RTX 4090o fabricante nos apresentou agora a Strix G18 G814JI consideravelmente mais barata, mas também menos potente, com umNúcleo i7-13650HXe GeForce RTX 4070. As características adicionais incluem 2 x 16 GB DDR5-4800 de RAM de canal duplo e um SSD de 1 TB NVMe. Com relação ao display de 2560 x 1600 pixels, WQXGA, o Asus tem características e buzzwords como 240 Hz, 500 nits, 100 % DCI-P3, 3 ms de tempo de resposta, certificação G-Sync e Pantone que, aliás, não se destina apenas aos gamers, mas também aos criadores. O dispositivo (indisponível no momento desta revisão) pode ser obtido por 2300 dólares. Uma opção mais barata é o G814JV baseado em RTX 4060. A traseira é o G814JU que tem que se contentar com umGeForce RTX 4050. Entretanto, independentemente do modelo que você esteja considerando, os laptops atuais são muito caros e é por isso que você deve pensar cuidadosamente antes de decidir qual comprar.
Os concorrentes do Strix G18 são principalmente outros laptops de 18 polegadas, como o Lâmina Razer 18a versão de revisão foi equipada com um RTX 4070. Além disso, a diferença de desempenho em comparação com placas gráficas mais antigas é particularmente interessante. Por este motivo, a tabela inclui a Gigabyte A7 X1 (RTX 3070 @140 watts), oLenovo Legion 5 Pro 16ARH7H (RTX 3070 Ti @150 watts), oAlienware x17 R1 (RTX 3080 @165 watts) e oMSI Raider GE77 HX 12UHS (RTX 3080 Ti @175 watts), todos os quais - o mesmo que o Strix G18 (175 watts) - são especificados com um TGP elevado.
Possíveis concorrentes em comparação
Avaliação | Data | Modelo | Peso | Altura | Size | Resolução | Preço |
|---|---|---|---|---|---|---|---|
| 87.4 % v7 (old) | 03/2023 | Asus ROG Strix G18 G814JI i7-13650HX, GeForce RTX 4070 Laptop GPU | 3 kg | 31 mm | 18.00" | 2560x1600 | |
| 91.4 % v7 (old) | 02/2023 | Razer Blade 18 RTX 4070 i9-13950HX, GeForce RTX 4070 Laptop GPU | 3 kg | 21.9 mm | 18.00" | 2560x1600 | |
| 83.2 % v7 (old) | 10/2021 | Gigabyte A7 X1 R9 5900HX, GeForce RTX 3070 Laptop GPU | 2.5 kg | 34 mm | 17.30" | 1920x1080 | |
| 87.7 % v7 (old) | 10/2022 | Lenovo Legion 5 Pro 16ARH7H RTX 3070 Ti R7 6800H, GeForce RTX 3070 Ti Laptop GPU | 2.6 kg | 26.6 mm | 16.00" | 2560x1600 | |
| 89 % v7 (old) | 09/2021 | Alienware x17 RTX 3080 P48E i7-11800H, GeForce RTX 3080 Laptop GPU | 3.2 kg | 21.4 mm | 17.30" | 3840x2160 | |
| 86.8 % v7 (old) | 07/2022 | MSI Raider GE77 HX 12UHS i9-12900HX, GeForce RTX 3080 Ti Laptop GPU | 3.1 kg | 25.9 mm | 17.30" | 3840x2160 |
Caso
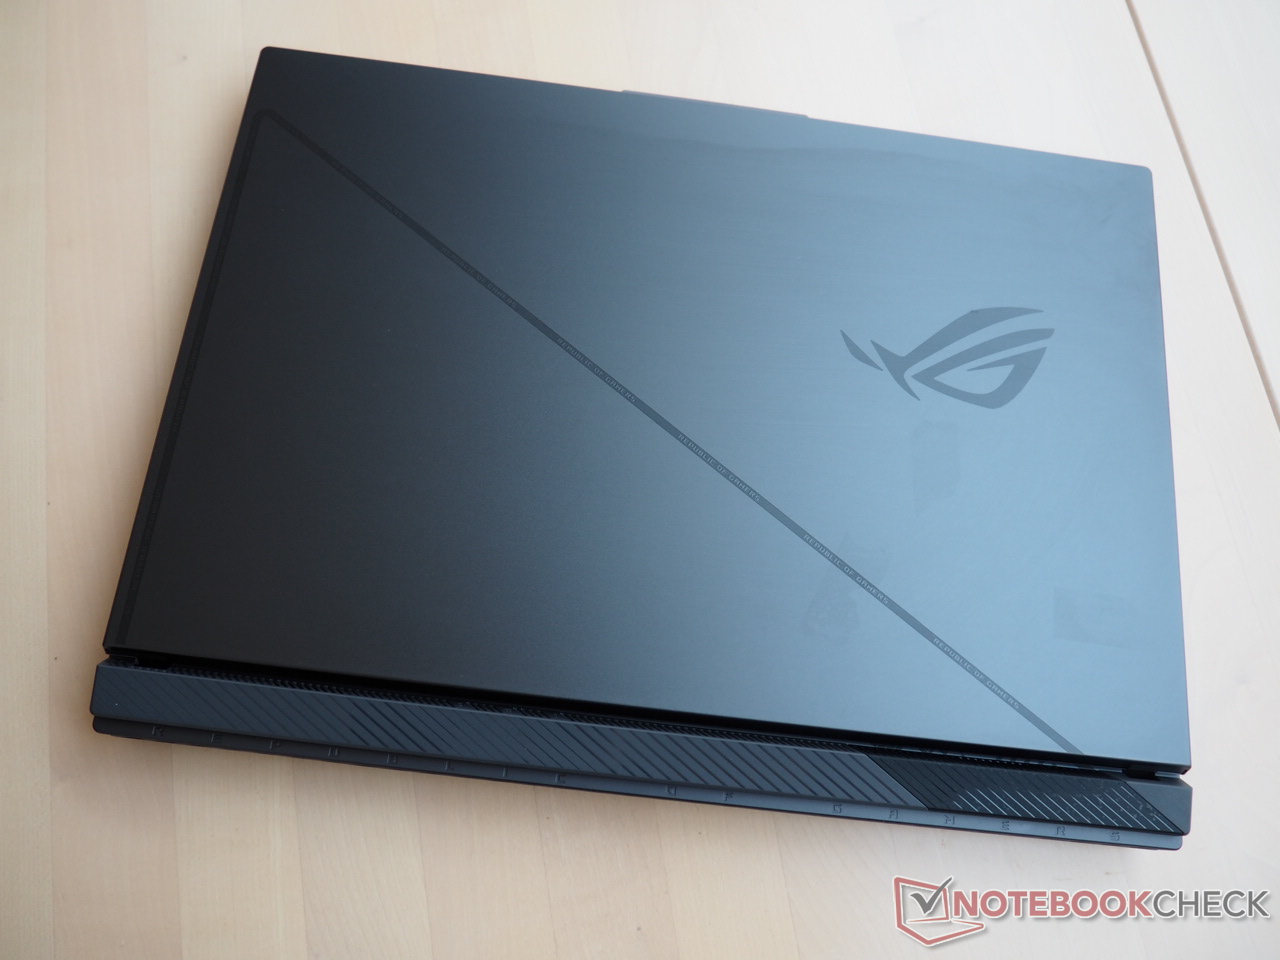
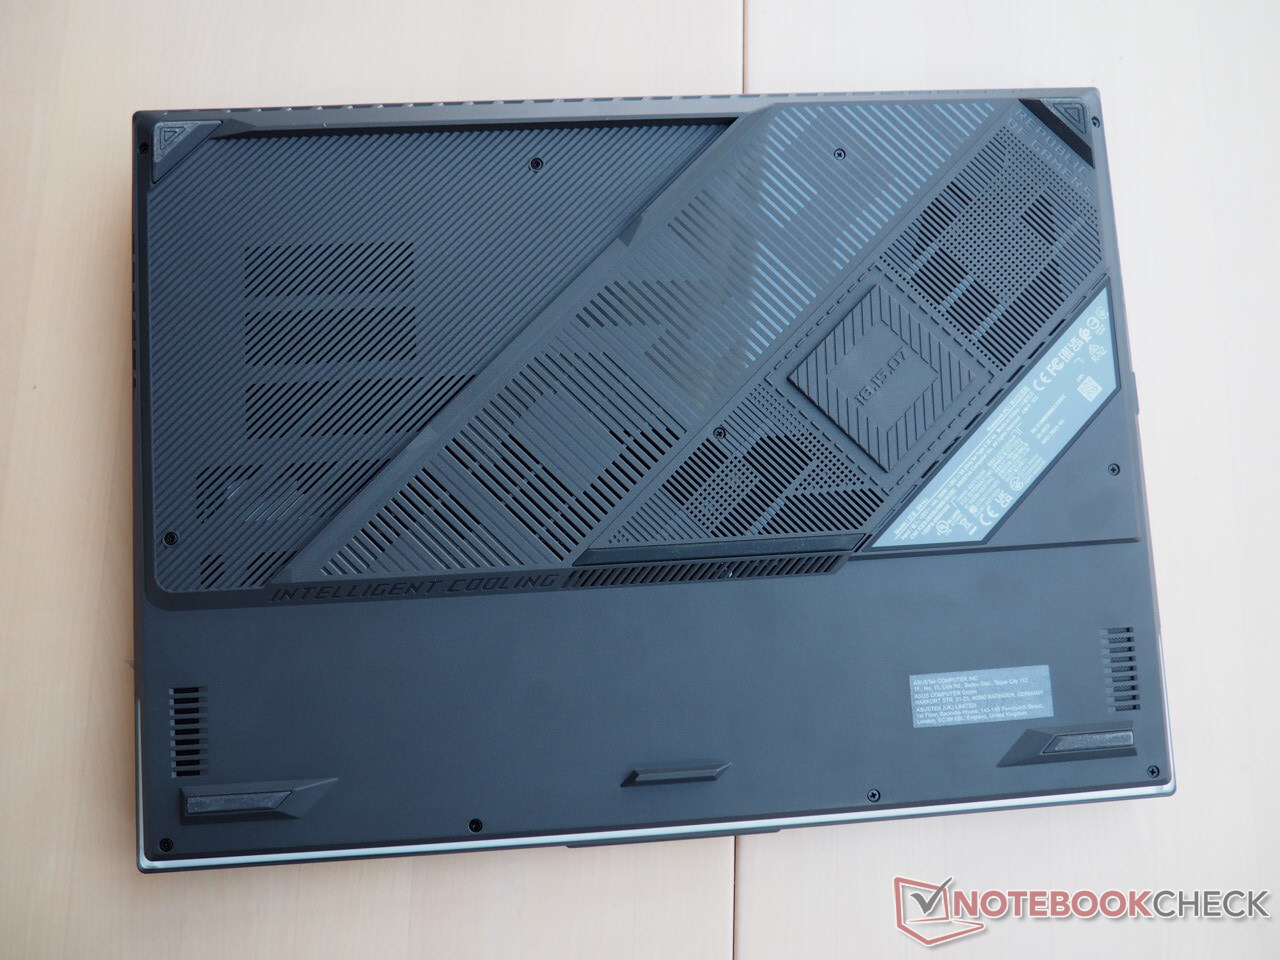
O projeto do estojo é emprestado do Strix Scar 18, pelo qual o Strix G18 "normal" tem que passar sem a superfície parcialmente transparente. A tampa robusta consiste de metal e parece muito discreta, e, com exceção do logotipo ROG e listras estreitas, muitos elementos de design podem ser encontrados na unidade de base plástica. De um ponto de vista visual, mesmo na base da caixa, que normalmente nunca vê a luz do dia, o fabricante, visualmente falando, enlouqueceu um pouco. No entanto, teria sido melhor se mais recursos fossem investidos na qualidade da construção. Em algumas partes como a área da tecla de seta, a unidade base se flexiona de forma tangível, pelo menos quando é aplicada muita pressão. Além disso, o estojo é rapidamente propenso a chocalhar, o que afeta negativamente a sensação de "premium" do dispositivo - especialmente considerando o preço.
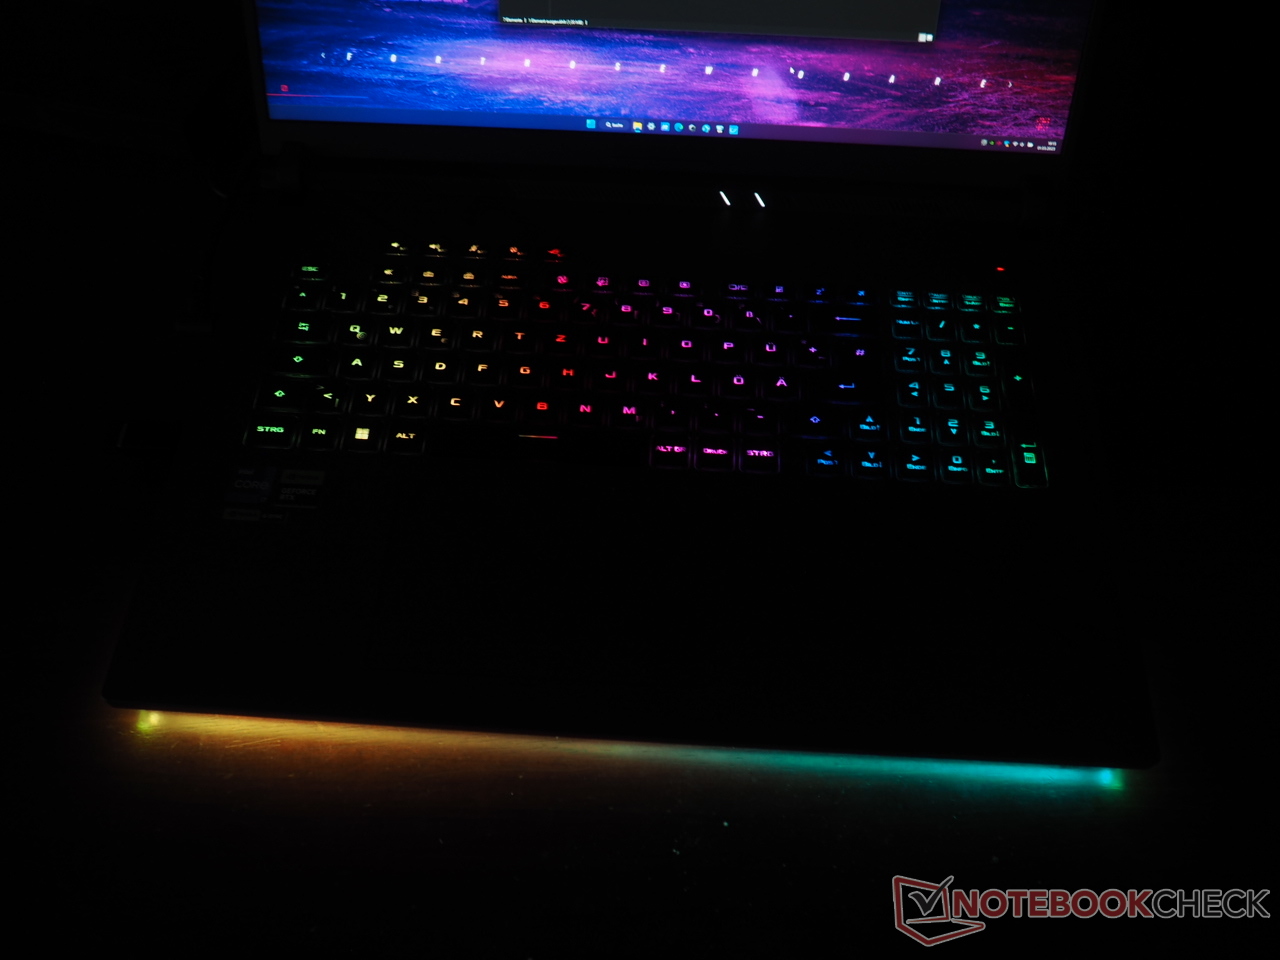
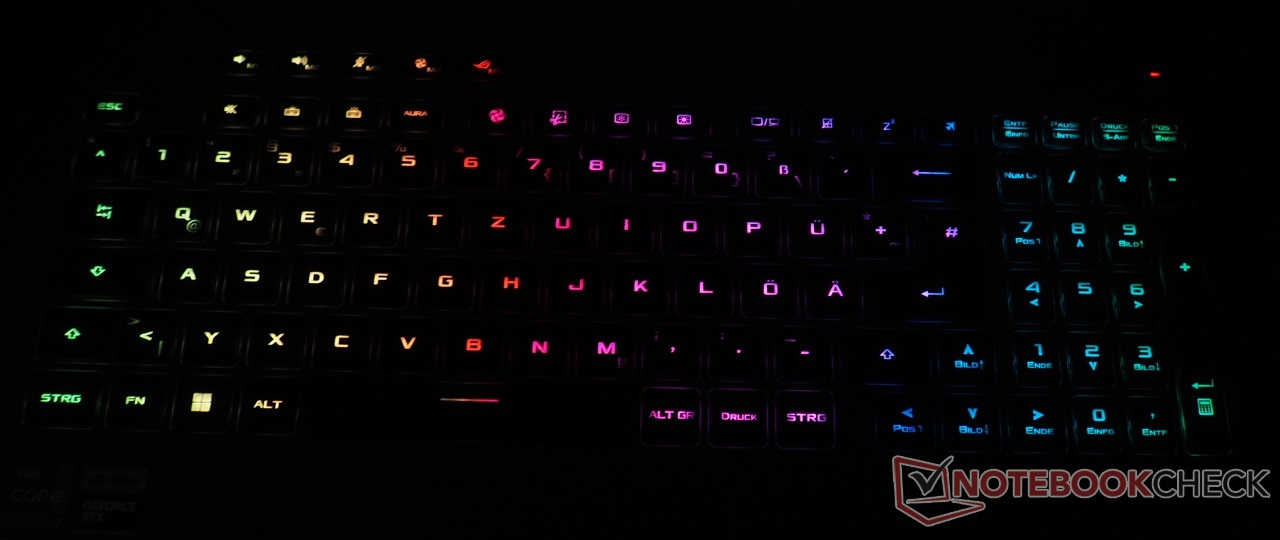
Caso contrário, nenhuma crítica pode ser feita ao chassi. O acabamento é despretensioso e as dobradiças também fazem um bom trabalho, mesmo que o ângulo máximo de abertura possa ser um pouco maior. A fim de atrair o público de jogos, o Asus não se limitou apenas a um teclado RGB, mas também tratou a frente do case com uma barra de luz LED de aparência inteligente (veja galeria de fotos).
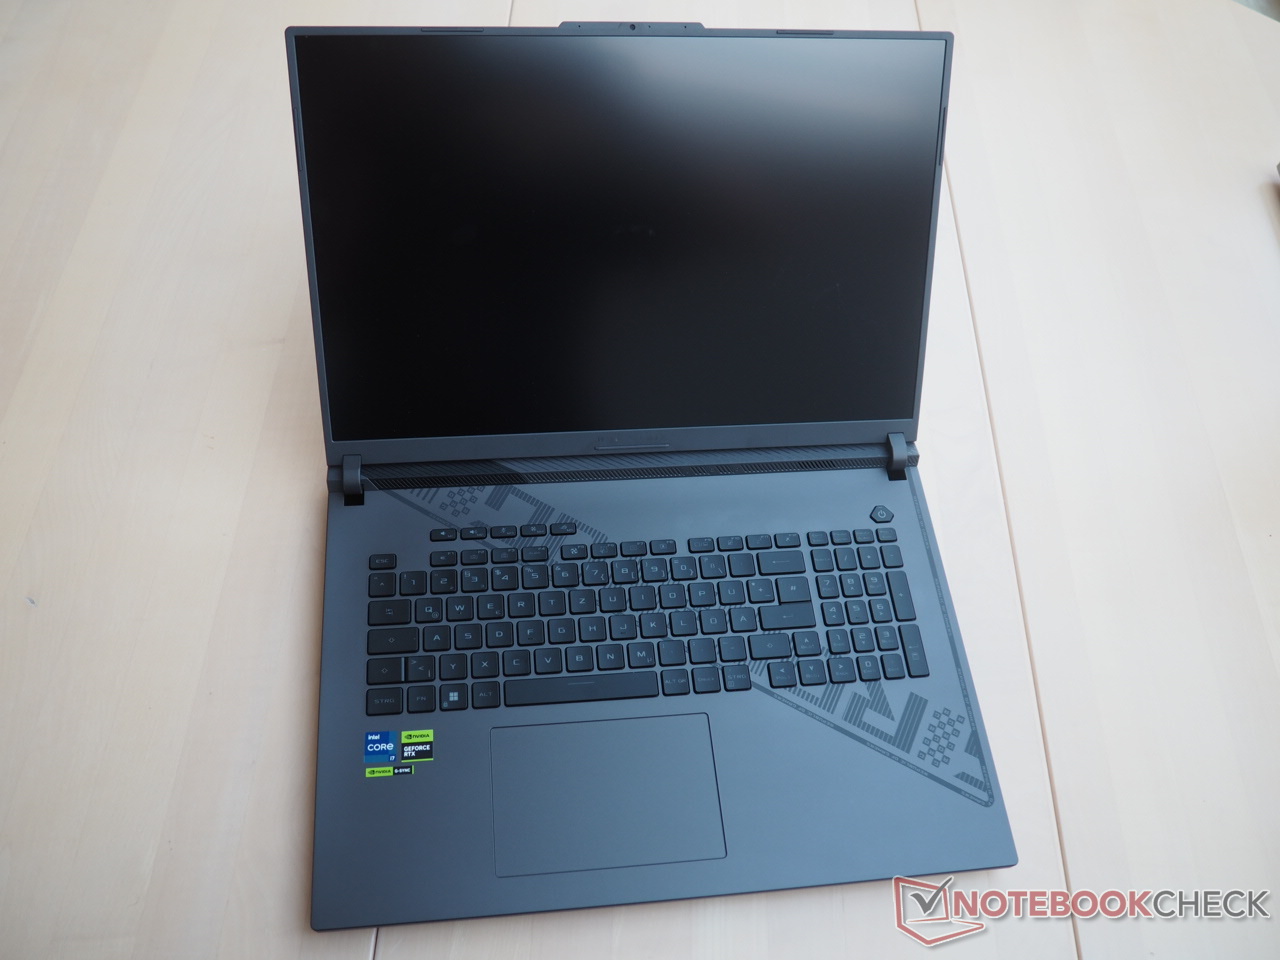
Claro que, como um laptop de 18 polegadas, o Strix G18 se apresenta como bastante volumoso, mas a moldura da tela é agradavelmente esbelta graças ao design da moldura fina e ao formato 16:10. No entanto, em comparação com a Razer Blade 18, a máquina Asus é mais profunda e, além disso, com cerca de 1 cm de espessura. Entretanto, quando se trata de peso, a concorrência não é muito melhor: 3 kg não é fácil de carregar por aí.
Características
Portos
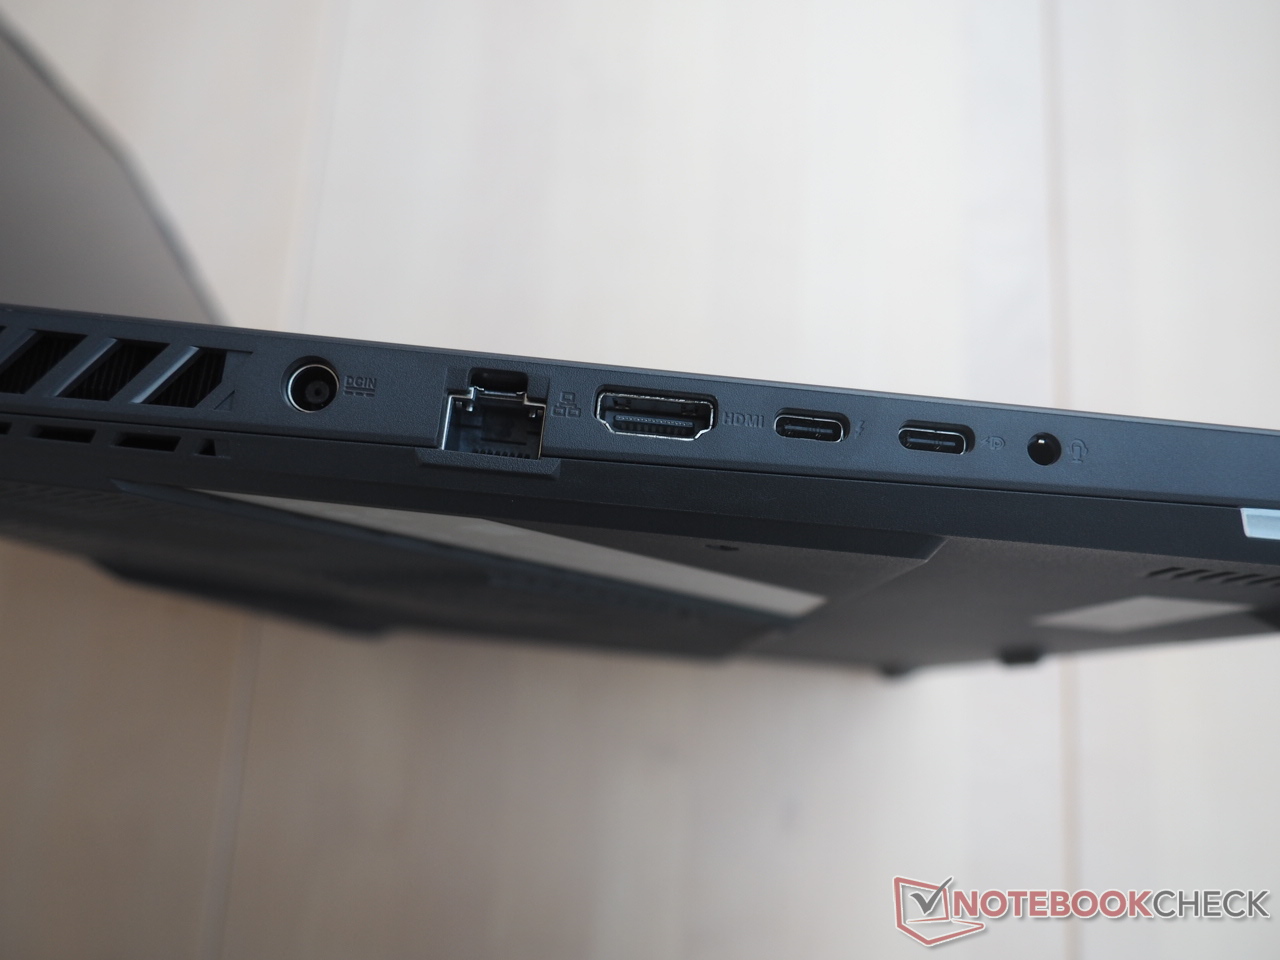
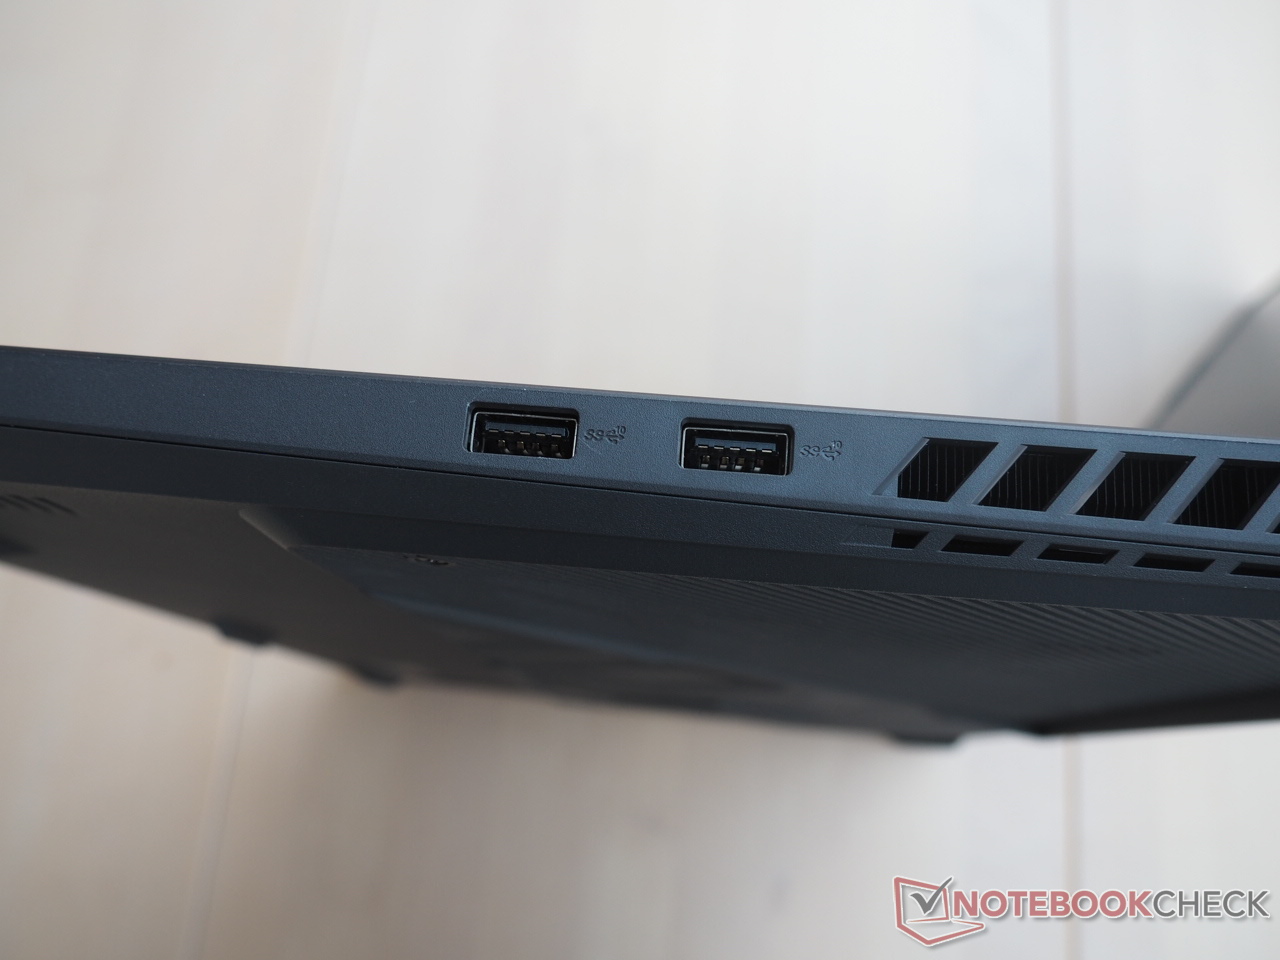
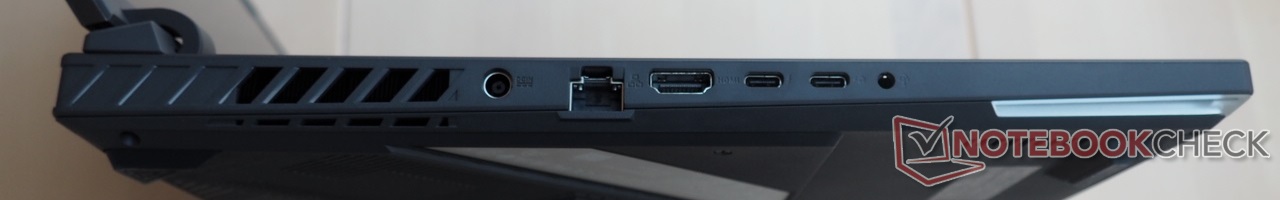
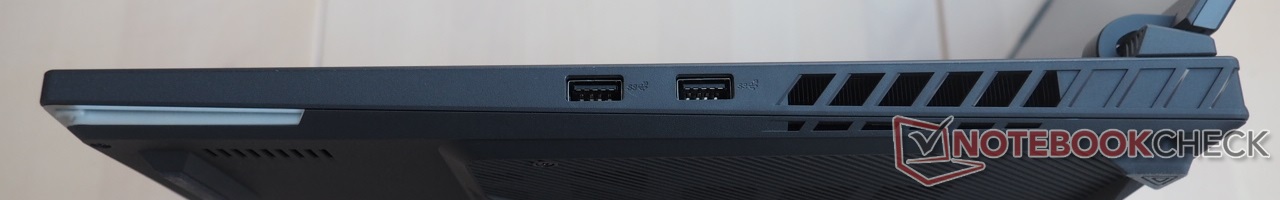
Se você desconsiderar o leitor de cartões ausente, a seleção dos portos é impressionante. Começando pelo lado esquerdo, você pode encontrar a tomada de alimentação, uma porta RJ45, uma saída HDMI 2.1, uma tomada de áudio combinada e duas portas USB-C (1x USB 3.2 Gen2, 1x USB 4), incluindo fornecimento de energia e suporte DisplayPort. No lado direito, temos duas portas clássicas tipo A que são projetadas de acordo com o padrão 3.2-Gen2. Como as portas estão localizadas na área central das superfícies laterais, isto pode levar a movimentos restritos quando conectadas a um mouse externo.
Comunicação
O desempenho do WiFi se mostra acima da média. Nosso teste WiFi padronizado foi realizado a um metro de nosso roteador de referência e o G18 atingiu cerca de 1600 Mbit/s tanto no envio como no recebimento de dados. Isto representa um bom resultado e bate o Razer Blade 18 - apesar de um módulo WiFi-Modul idêntico (Intel AX211) - em mais de 100 Mbit.
Webcam
A qualidade da webcam só é boa o suficiente para uma colocação no meio da mesa. Embora a nitidez da imagem seja um pouco melhor do que alguns concorrentes, ela realmente não consegue impressionar (o mesmo se aplica ao espaço de cores).


Acessórios
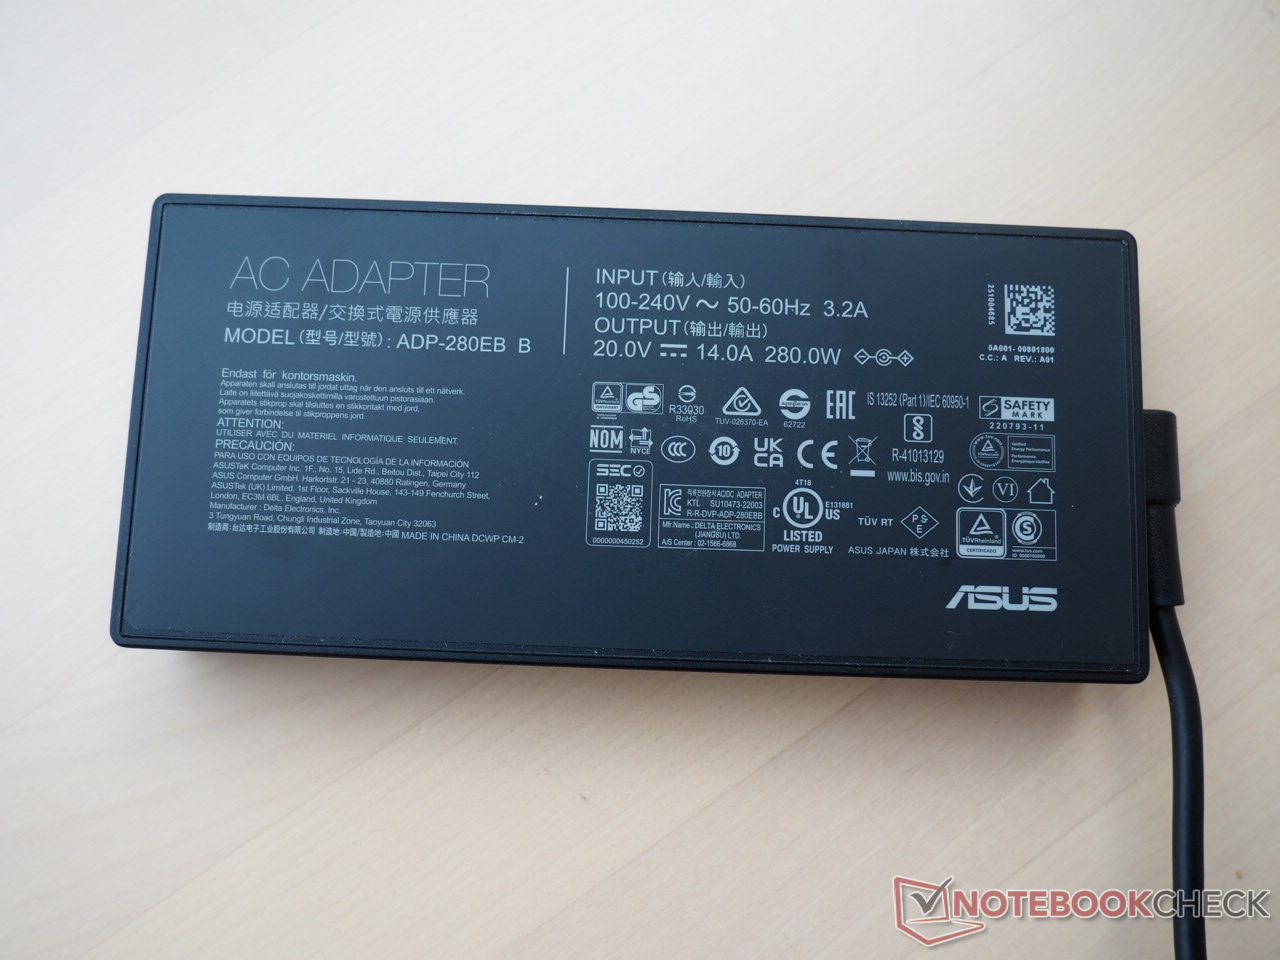
Além de alguns livretos informativos, o dispositivo vem com uma unidade de alimentação de 650 gramas e 280 watts, medindo 18 x 8 x 2,5 cm de tamanho.
Manutenção
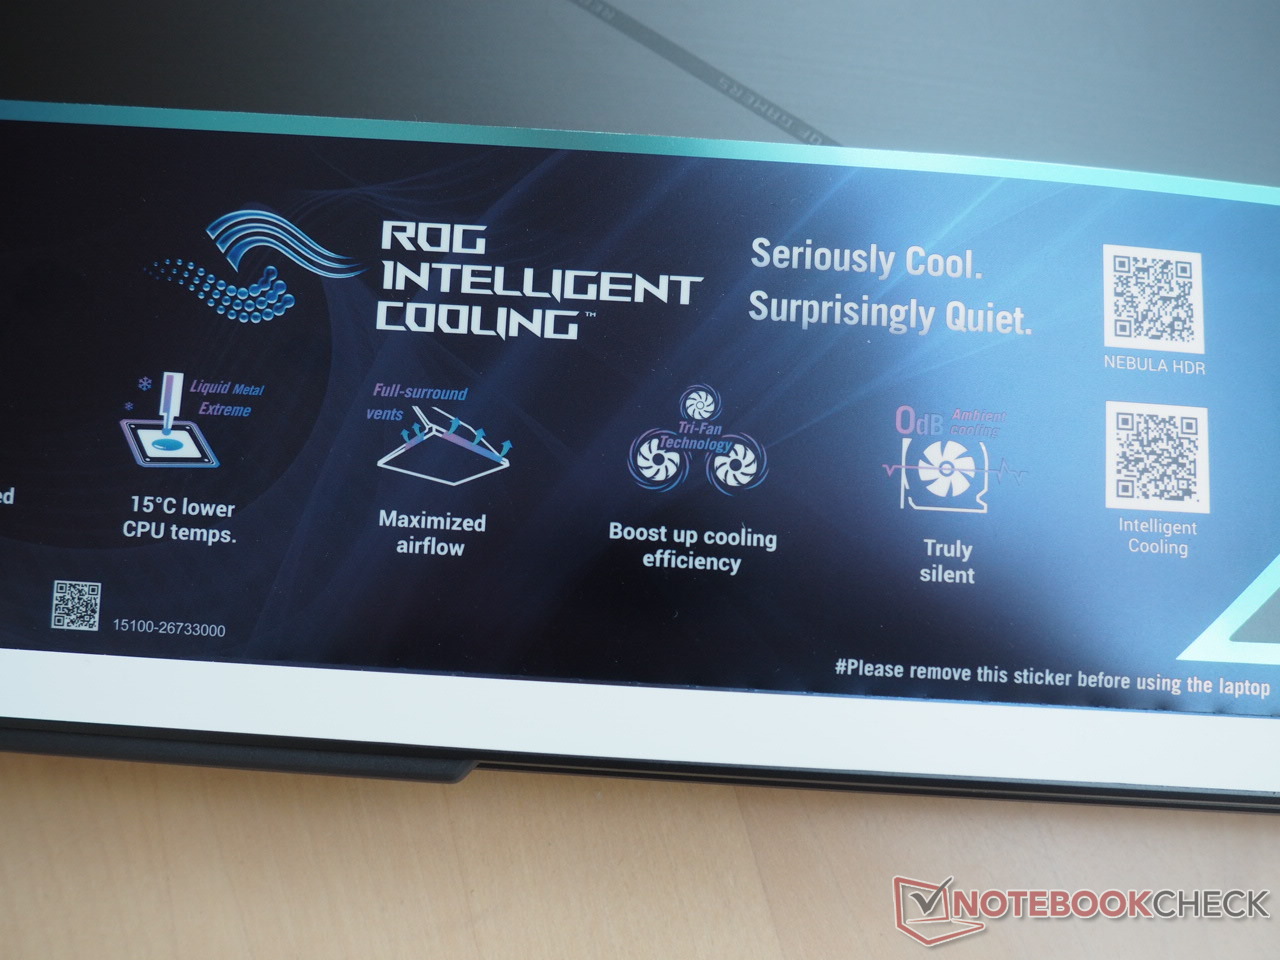
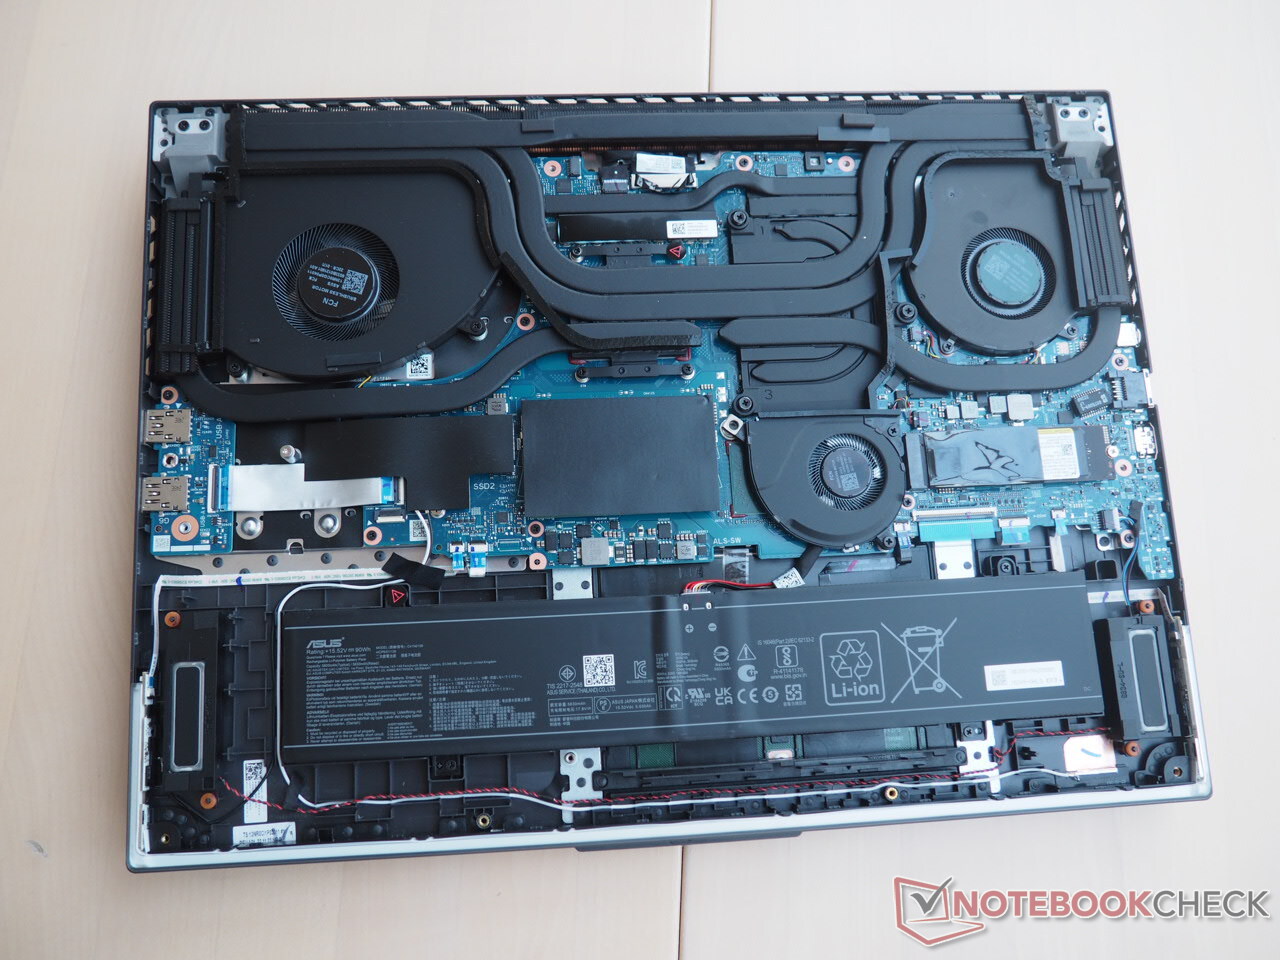
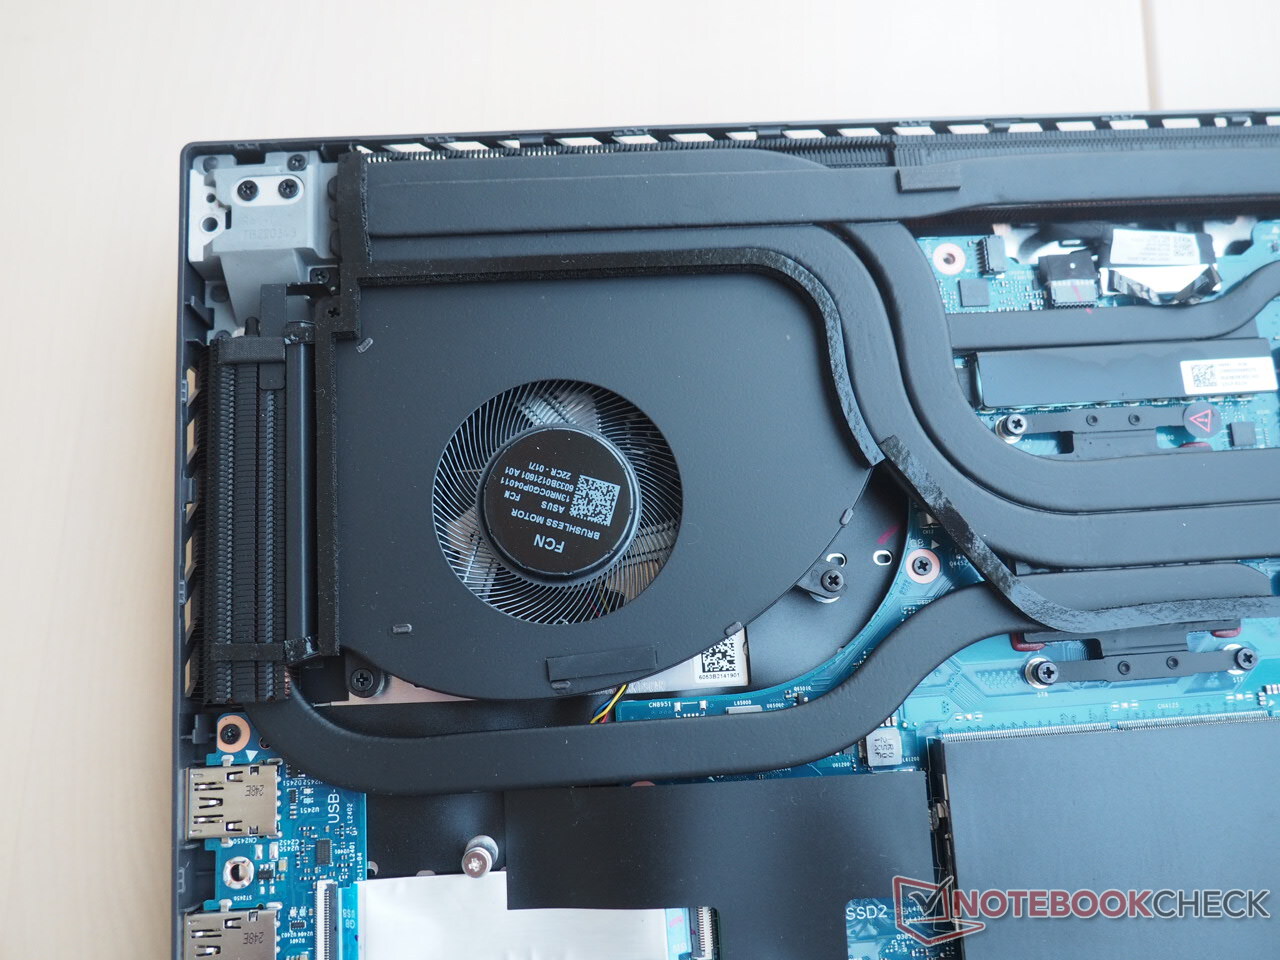
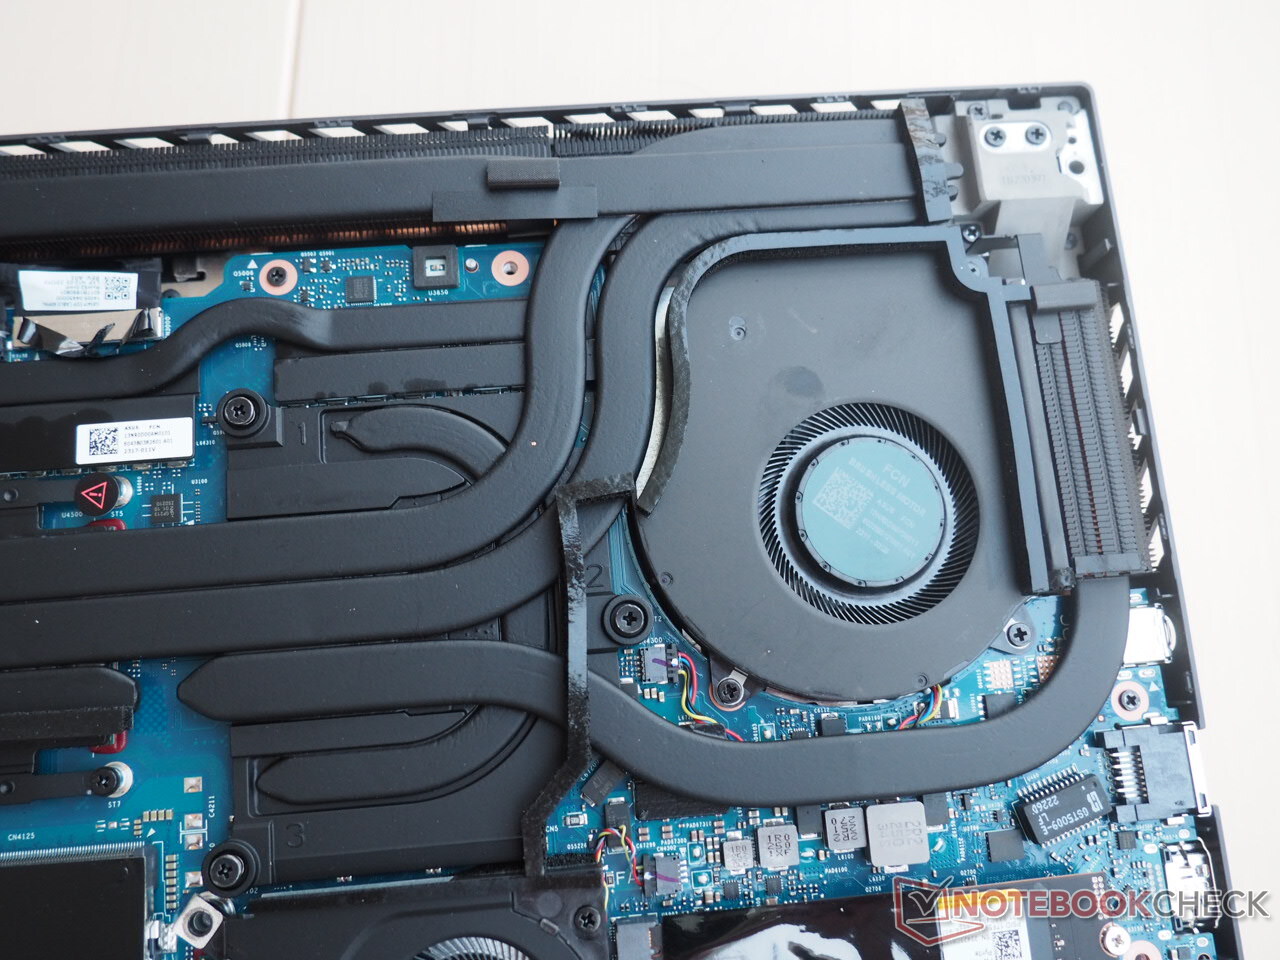
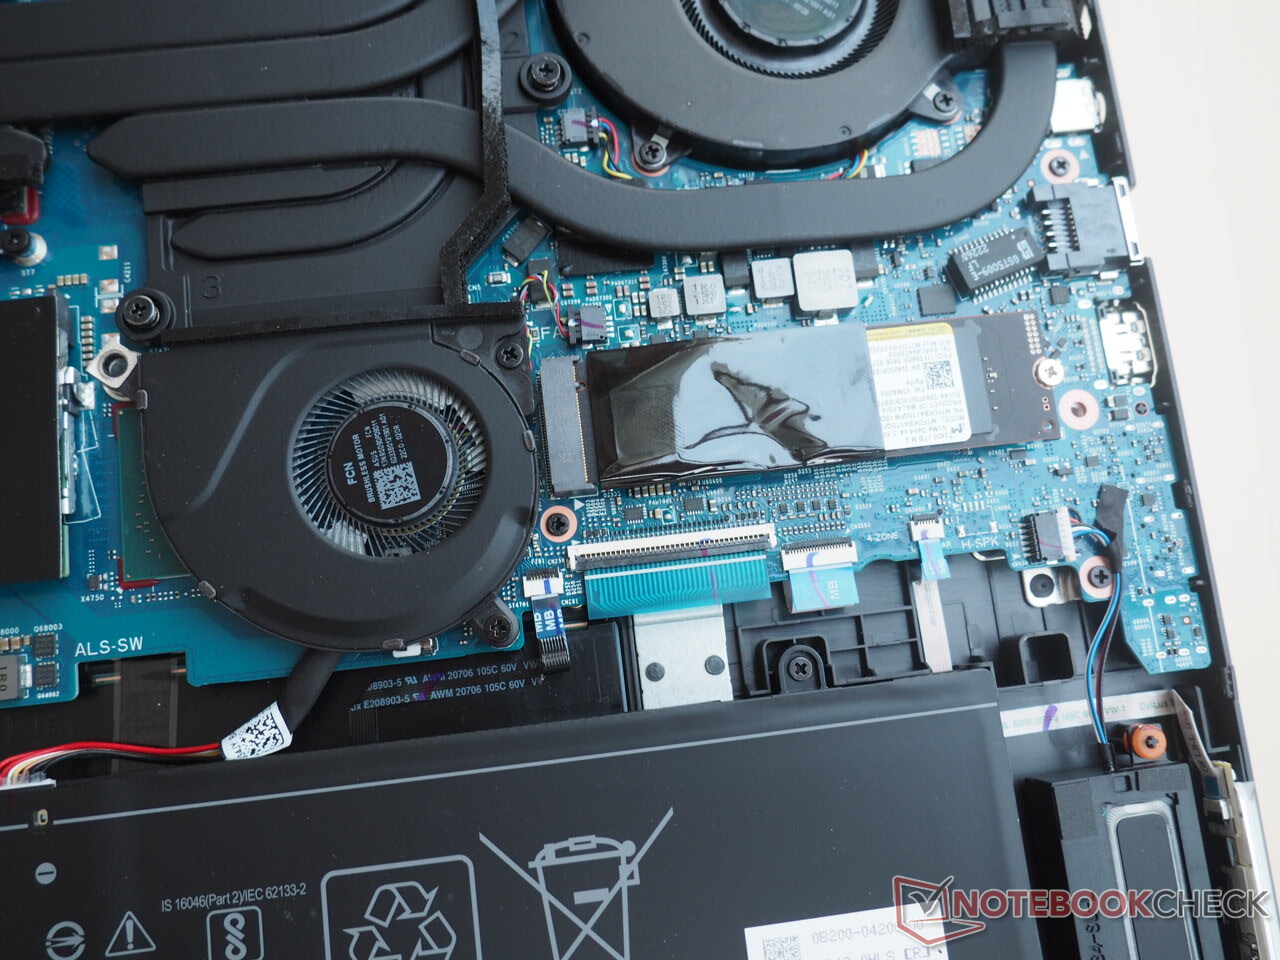
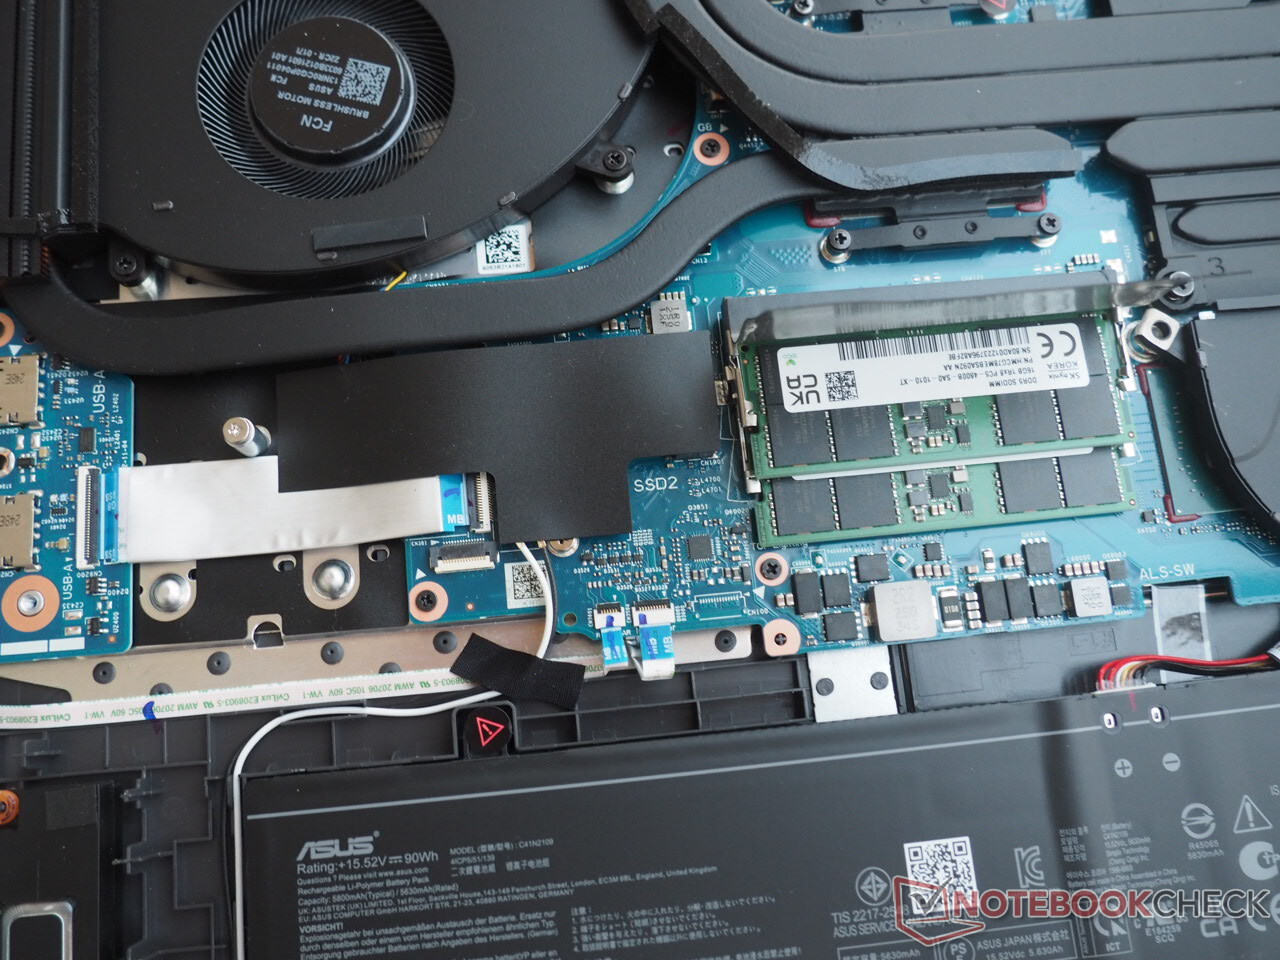
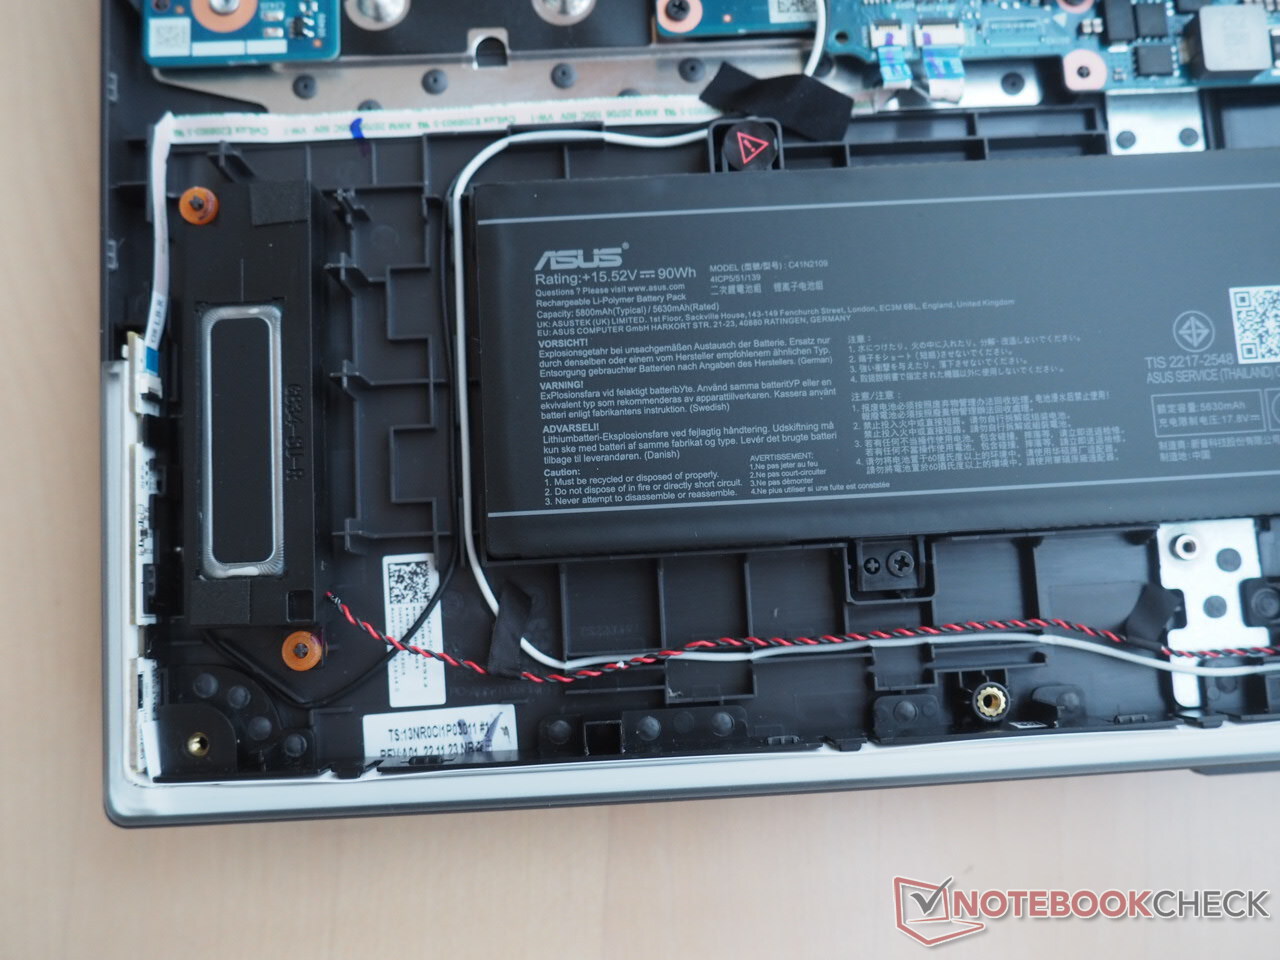
Como de costume, vários parafusos de cabeça cruzada têm que ser removidos e a placa base tem que ser alavancada para fora de posição, a fim de obter acesso ao interior do dispositivo. Este último é um pouco mais fácil do que muitos concorrentes, pois a remoção de um dos parafusos de canto levanta levemente a caixa, criando assim um bom ângulo de abertura. Um olhar sob a tampa revela um extenso sistema de refrigeração com múltiplos e complexos tubos de calor, dois grandes ventiladores e um pequeno ventilador (Asus também usa metal líquido). Além disso, há dois slots SO-DIMM para RAM (ocupado) e dois slots M.2 para SSDs (1x livre). A área de descanso da palma é ladeada por uma longa bateria.
Dispositivos de entrada
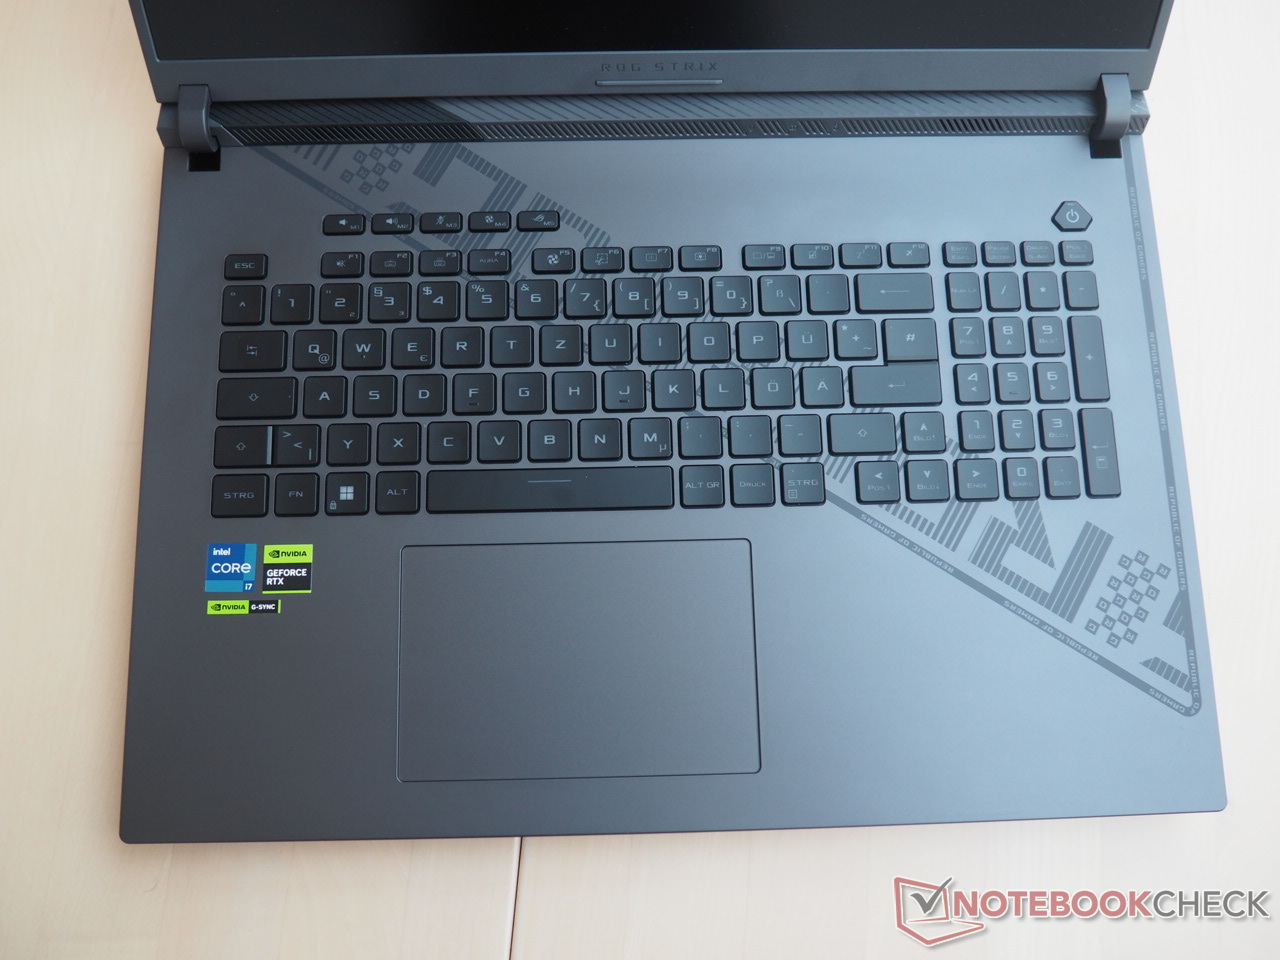
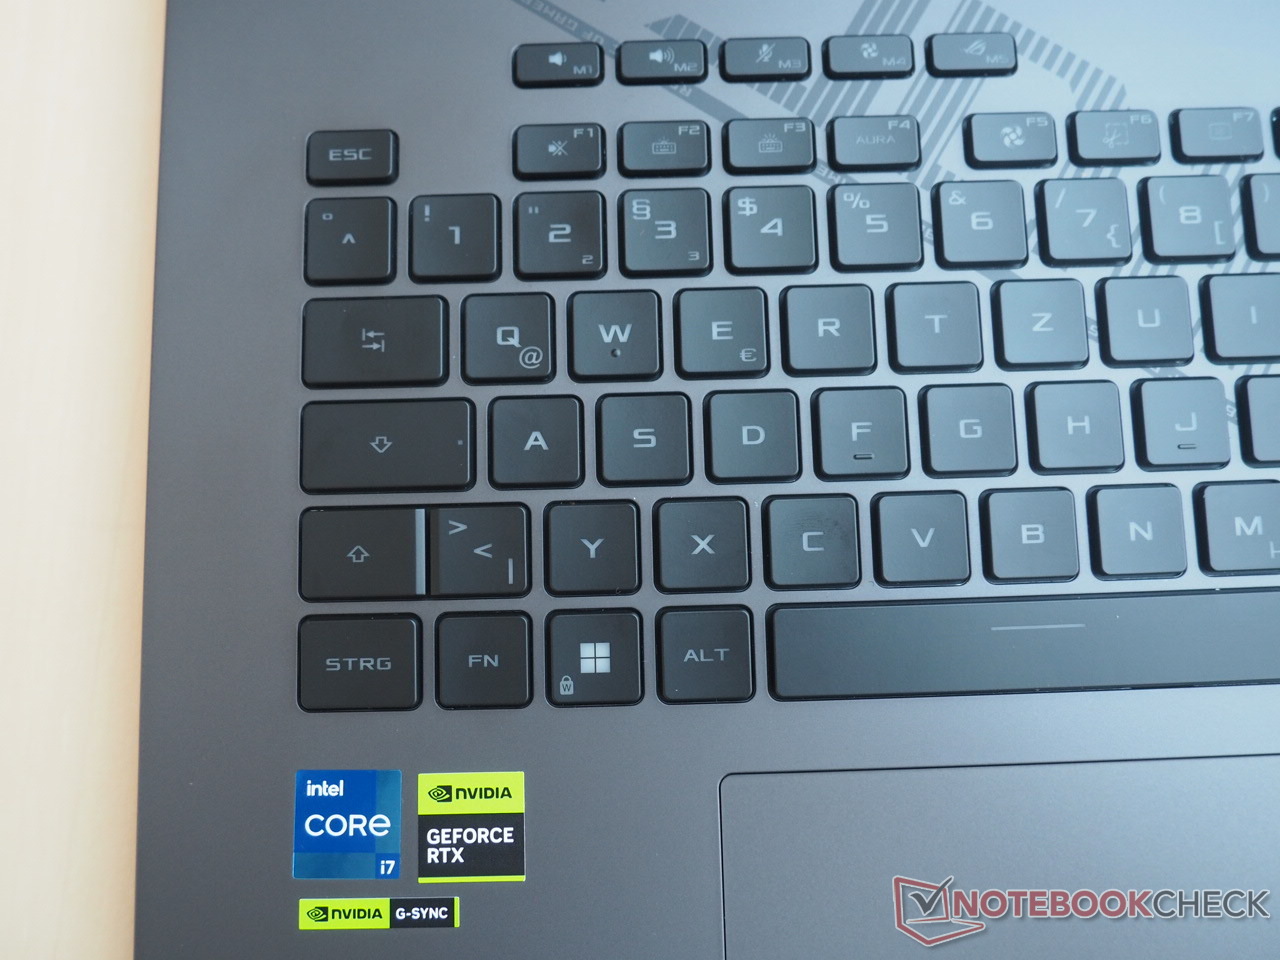
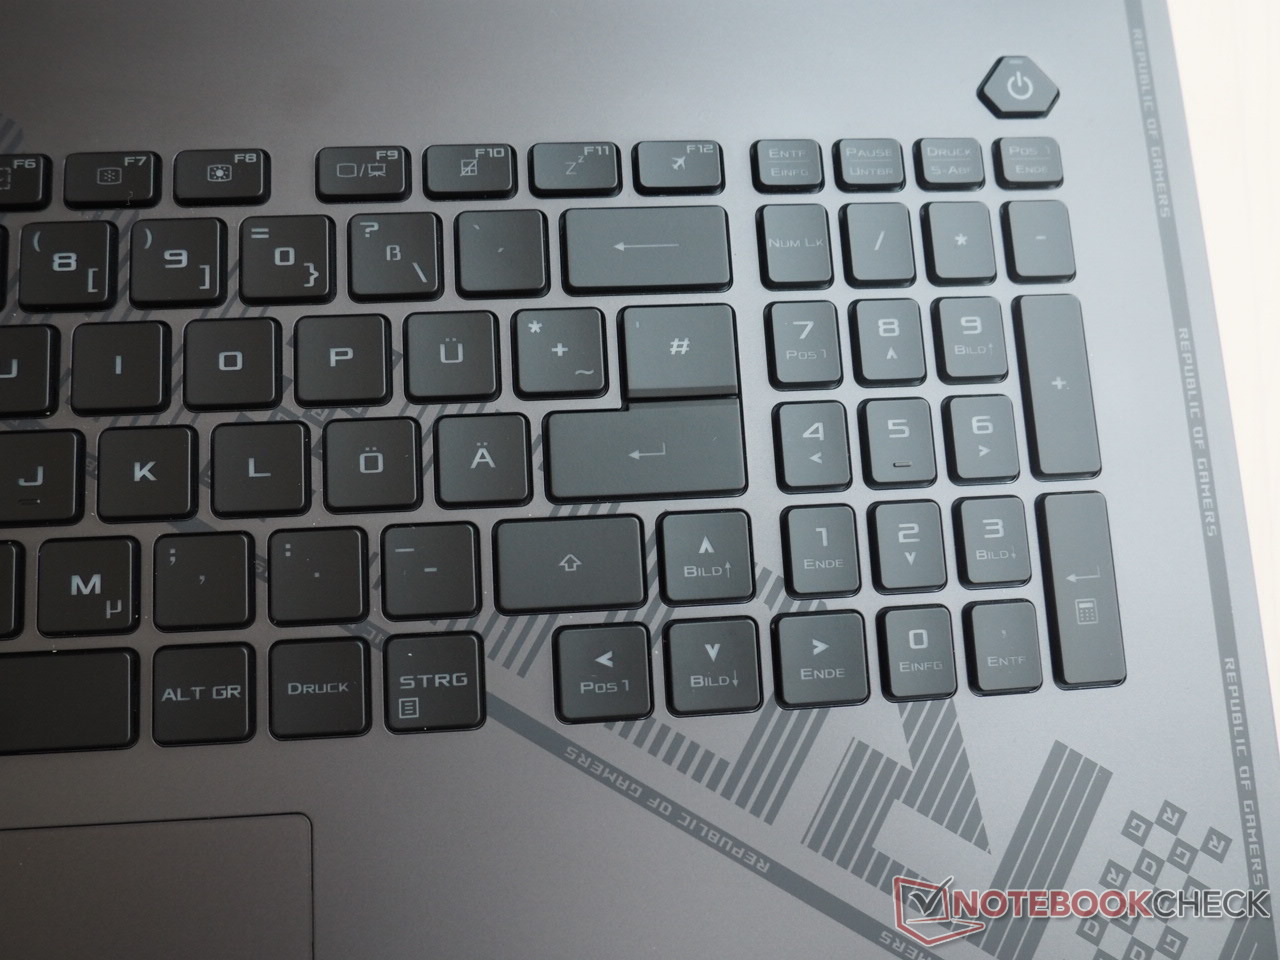
Teclado
Temos sentimentos mistos em relação ao teclado. Embora, por exemplo, as teclas de seta (ao contrário de muitos outros laptops) tenham um bom tamanho, as teclas numéricas do teclado e a linha F poderiam ser maiores considerando o formato de 18 polegadas. É pouco provável que o layout seja atraente para todos. Por exemplo, os usuários alemães têm que se contentar com uma tecla de entrada com espaçamento simples. Algumas combinações de teclas, tais como Del/Insert, também são bastante desfavoráveis.
Isso continua com a experiência da digitação. Embora isto seja aceitável em sua maioria - devido à estabilidade decente da unidade base - poderia ser um pouco mais definido (um pouco mais mole), especialmente em comparação com o tipo de teclados mecânicos encontrados em alguns laptops de jogos. Mais pontos são atribuídos às práticas teclas especiais e à boa iluminação RGB de uma tecla, que desfruta de vários modos e personalização em vários níveis.
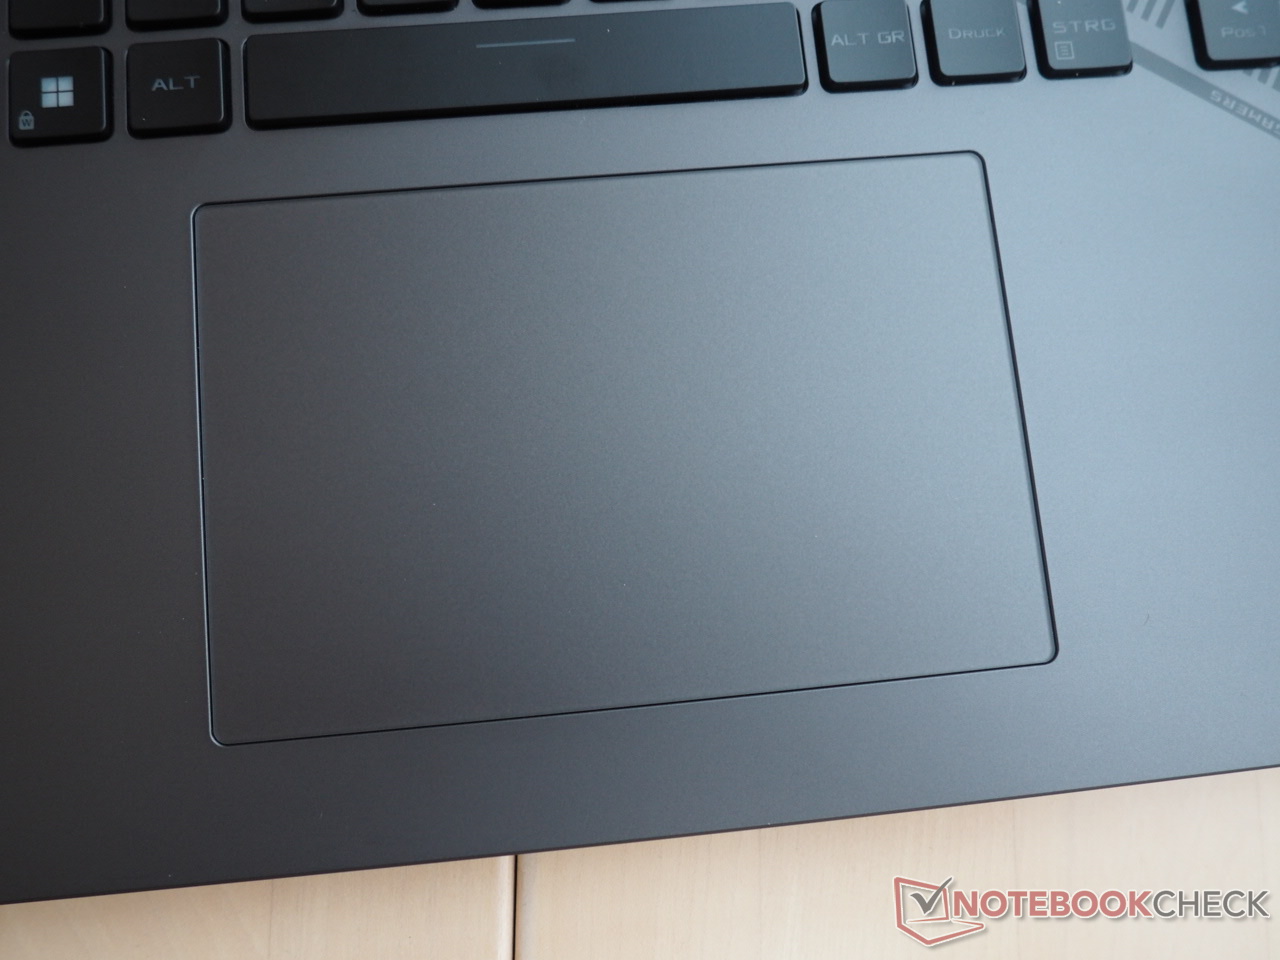
Touchpad
Até certo ponto, o touchpad também sofre de uma estabilidade de caixa subótima. Semelhante ao chassi, às vezes é bastante rangente, o que não deveria ser o caso neste ponto de preço. Além disso, o mouse de reposição causou uma impressão de primeira linha. Com sua superfície lisa e tamanho generoso (13 x 8,5 cm), entradas como a rolagem por uma longa série de imagens são fáceis de manusear, especialmente porque a precisão está no ponto.
Mostrar
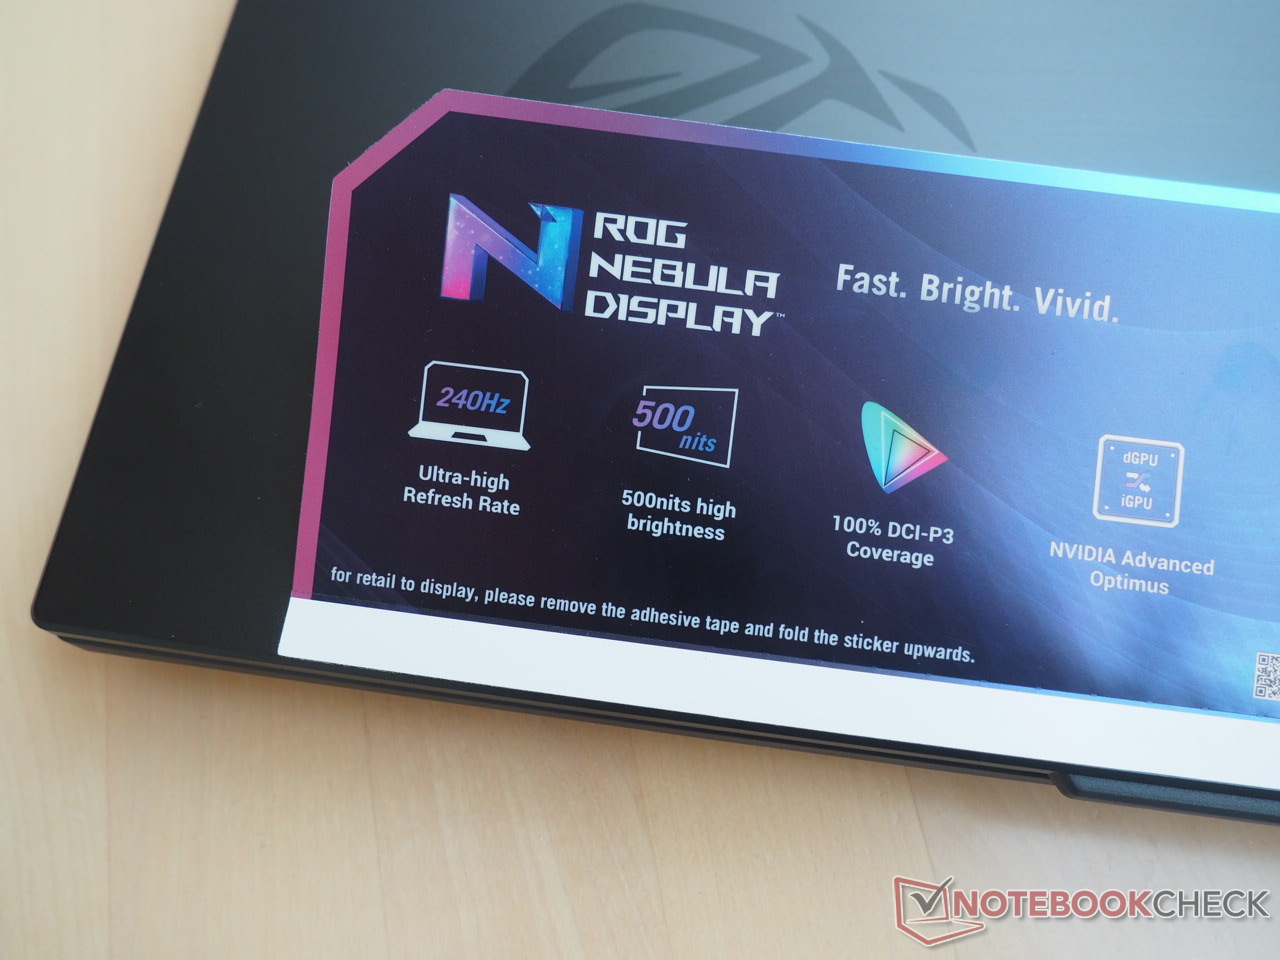
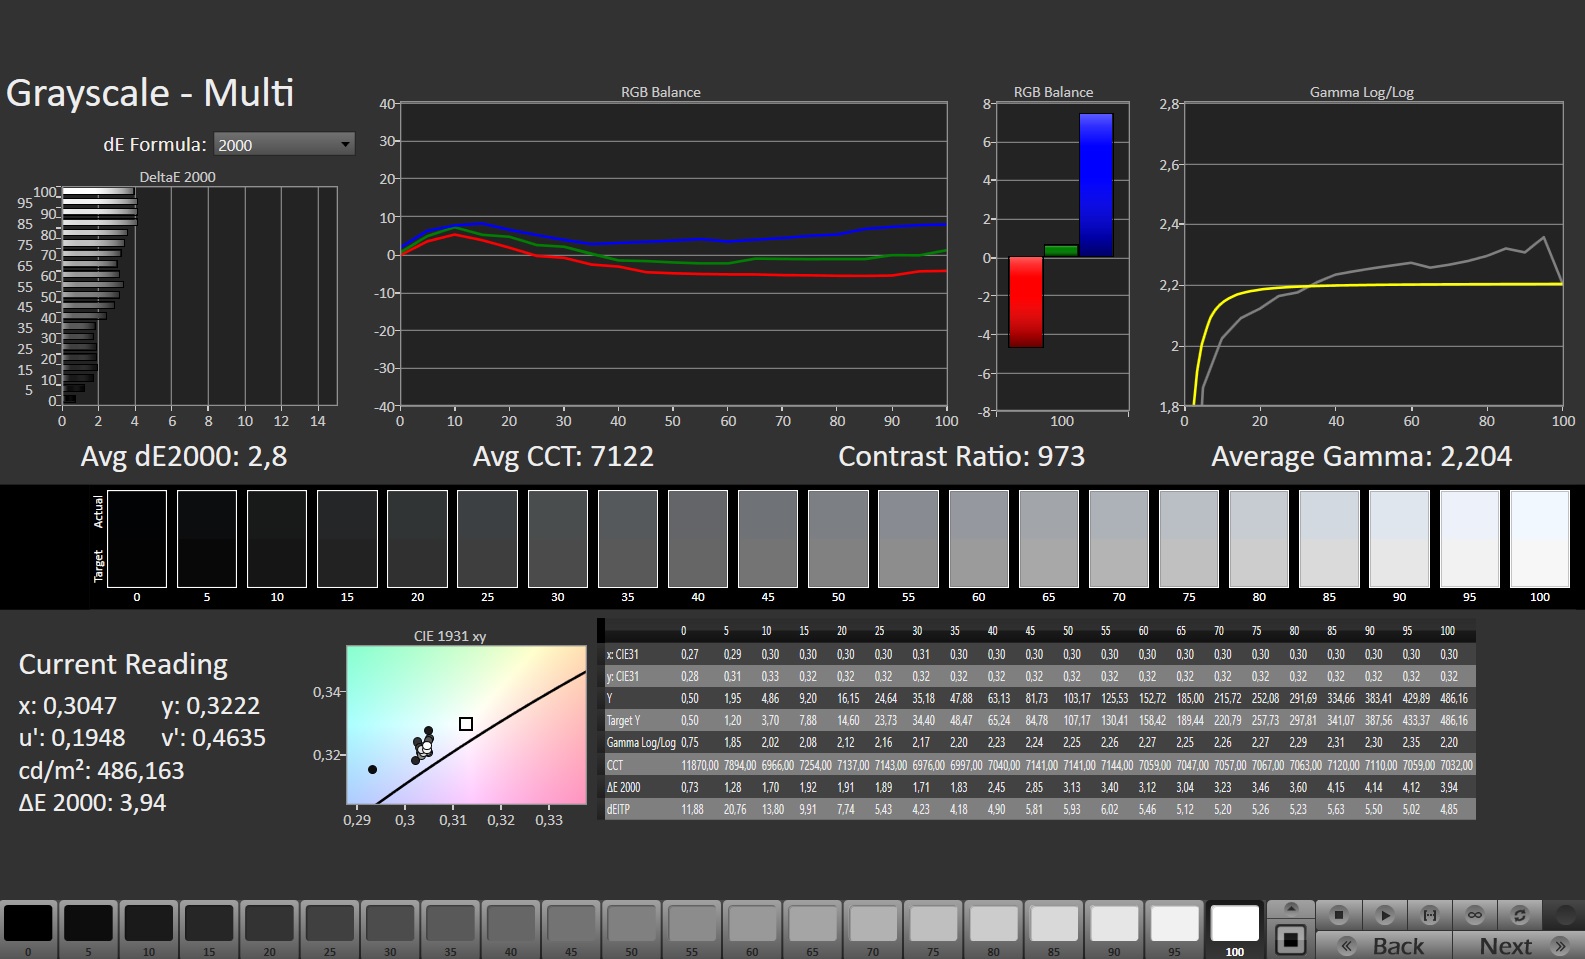
Um dos maiores destaques do G18 é a boa exibição. Embora o painel não administre bem as 500 lêndeas anunciadas pelo Asus - algo que provavelmente está ligado à pré-calibração - uma média de 420 cd/m² ainda é boa para um painel IPs e permite o uso ocasional ao ar livre.
| |||||||||||||||||||||||||
iluminação: 83 %
iluminação com acumulador: 471 cd/m²
Contraste: 1002:1 (Preto: 0.47 cd/m²)
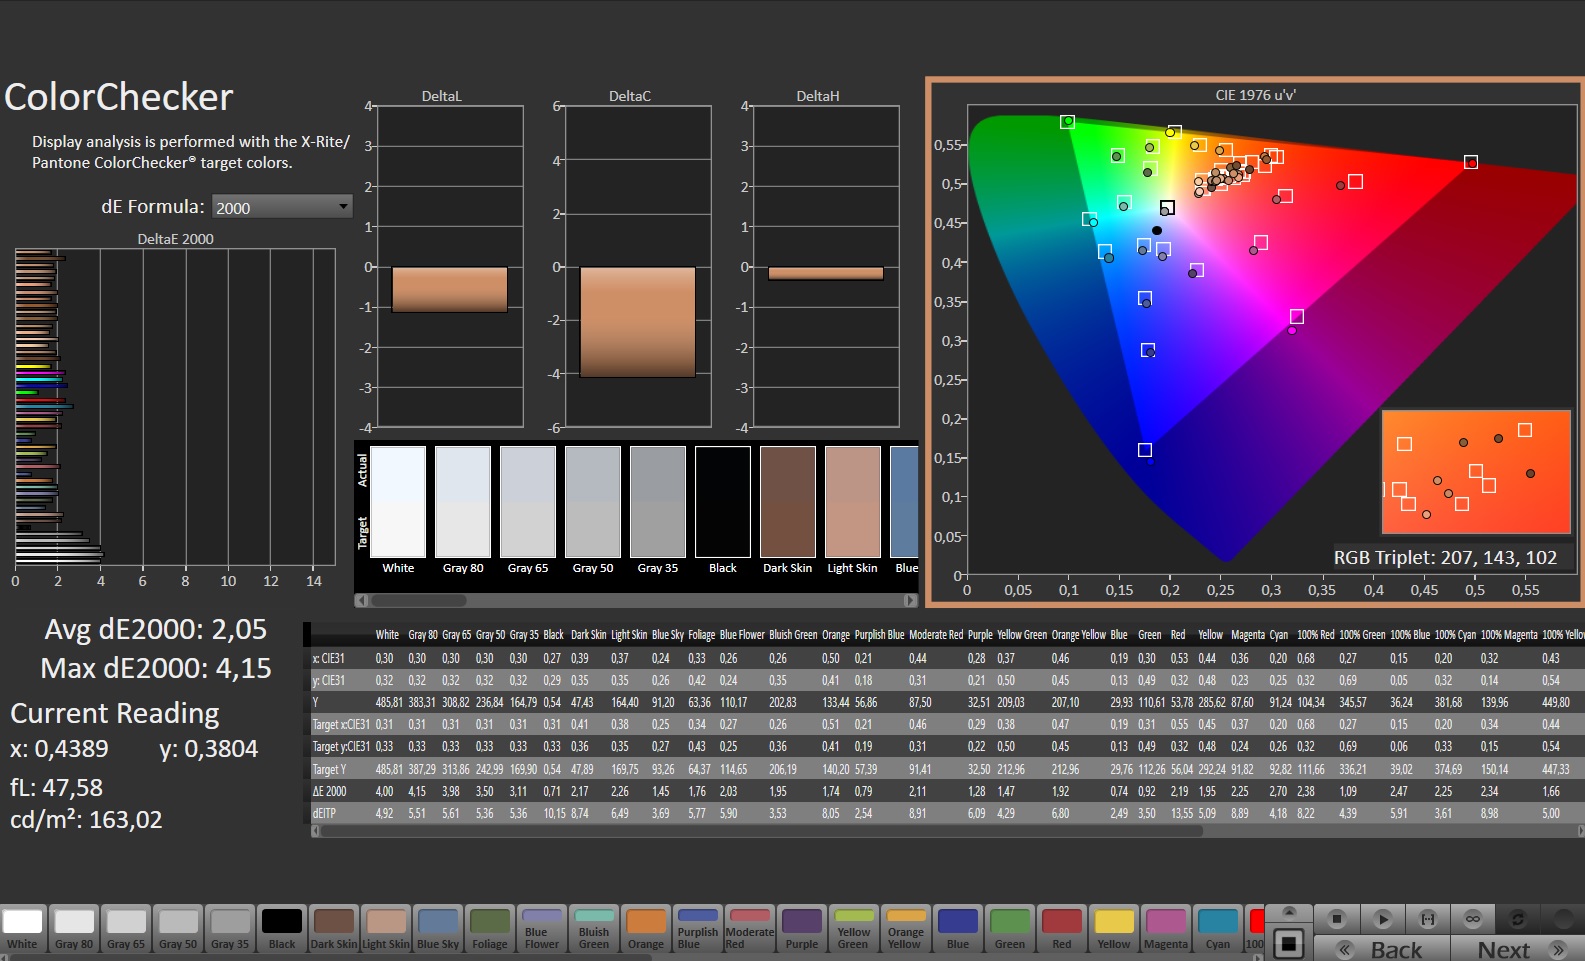
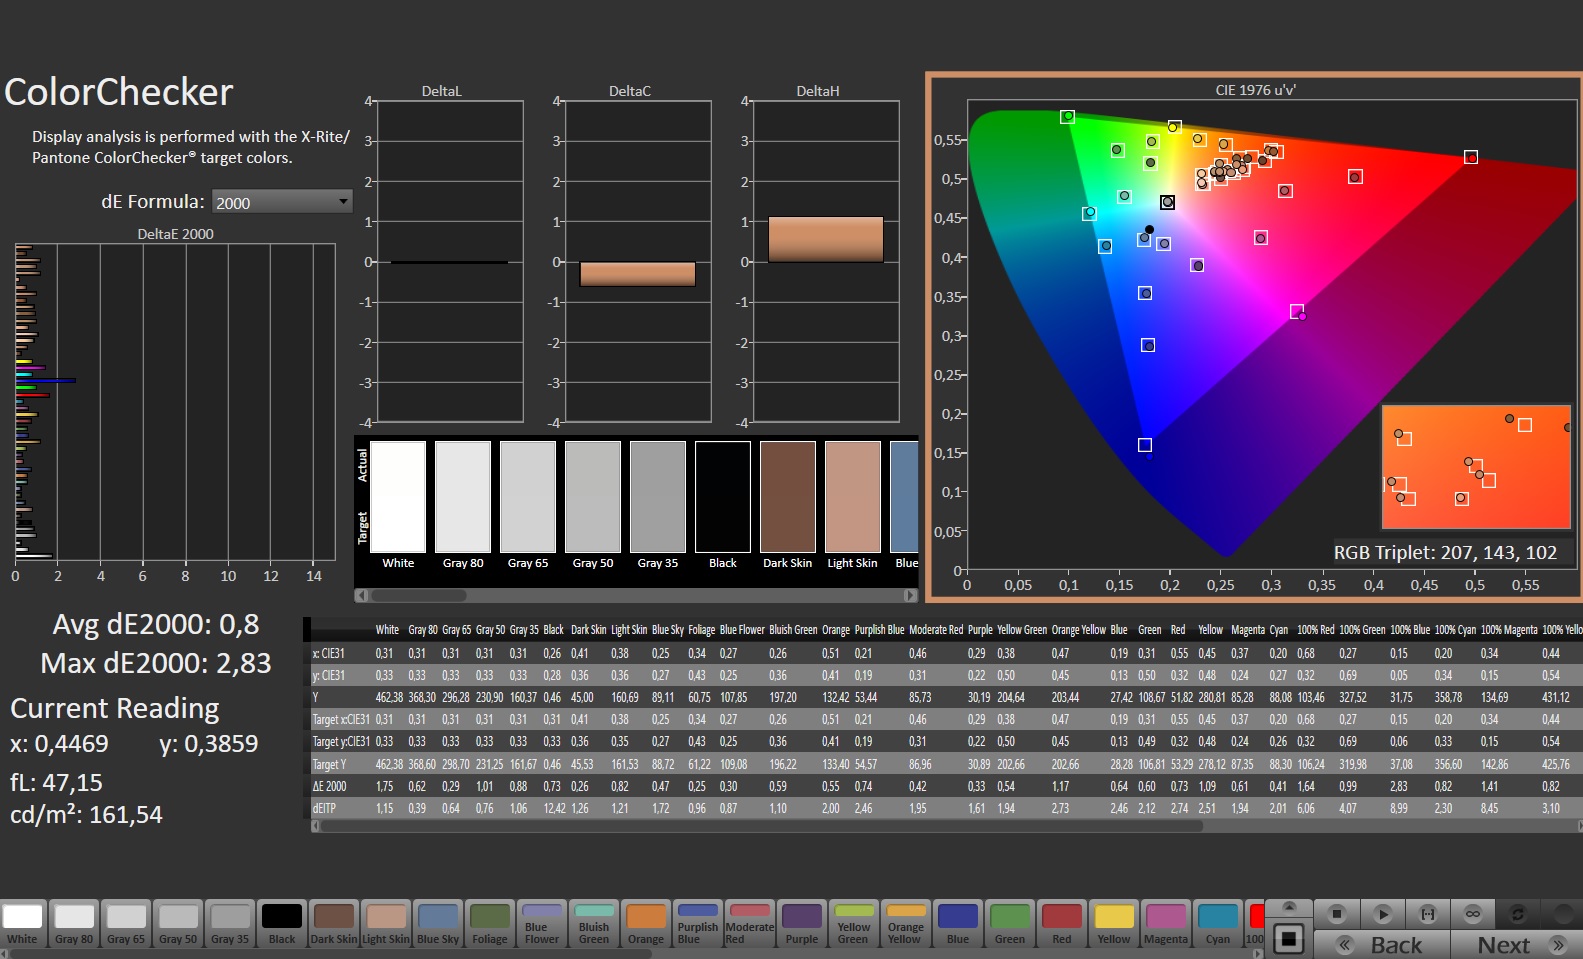
ΔE ColorChecker Calman: 2.05 | ∀{0.5-29.43 Ø4.71}
calibrated: 0.8
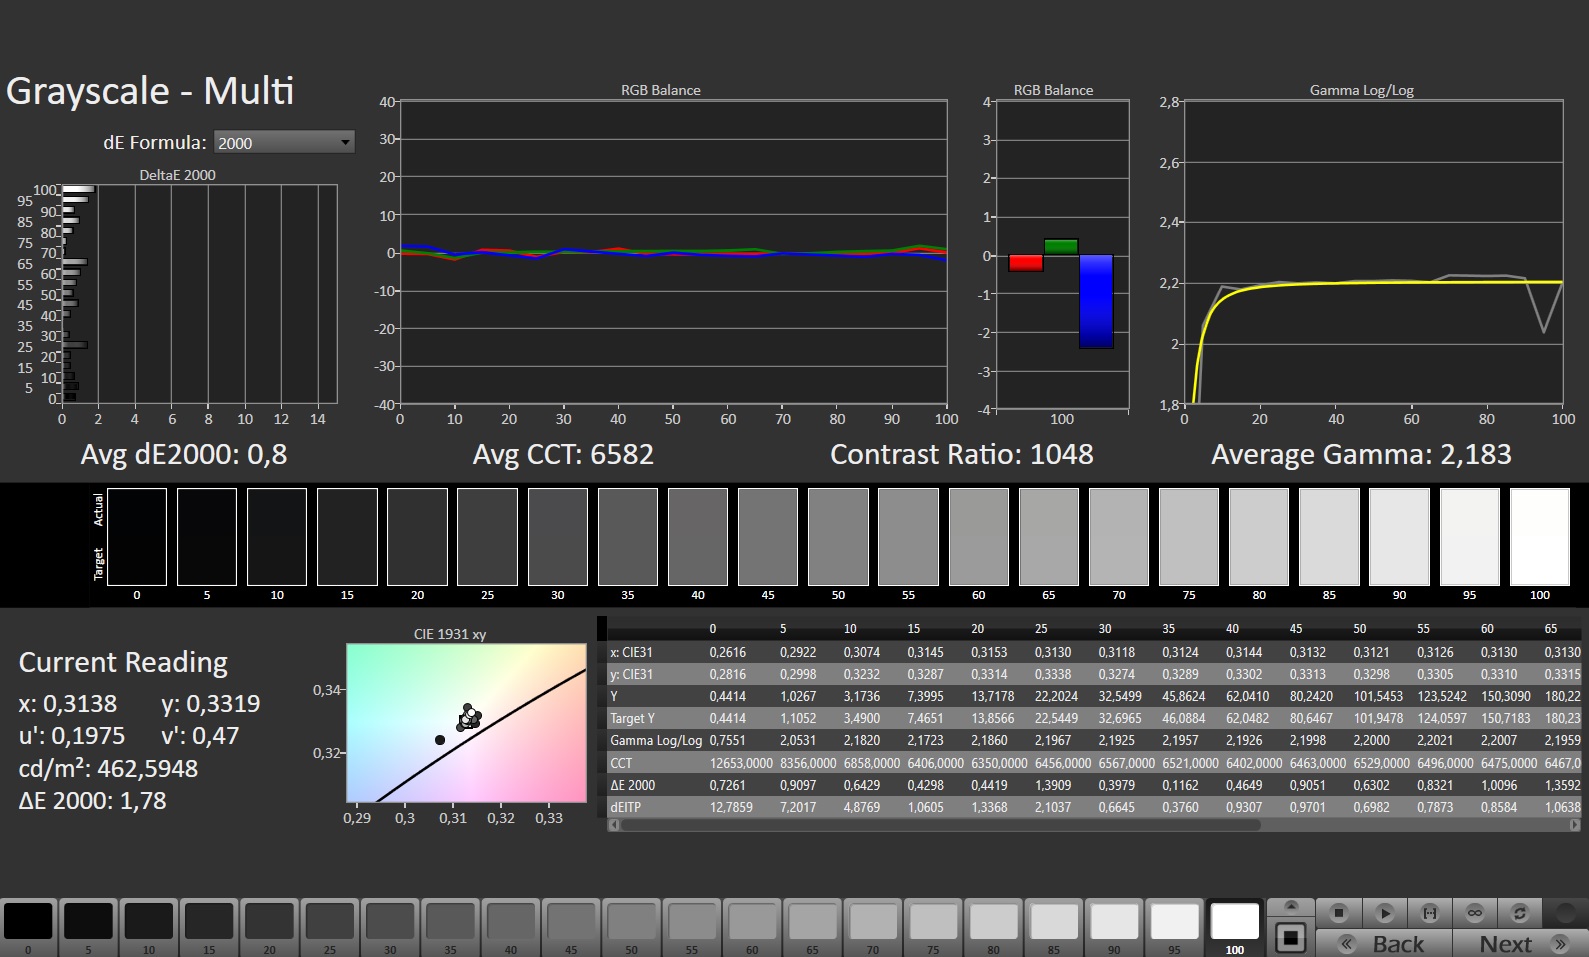
ΔE Greyscale Calman: 2.8 | ∀{0.09-98 Ø4.96}
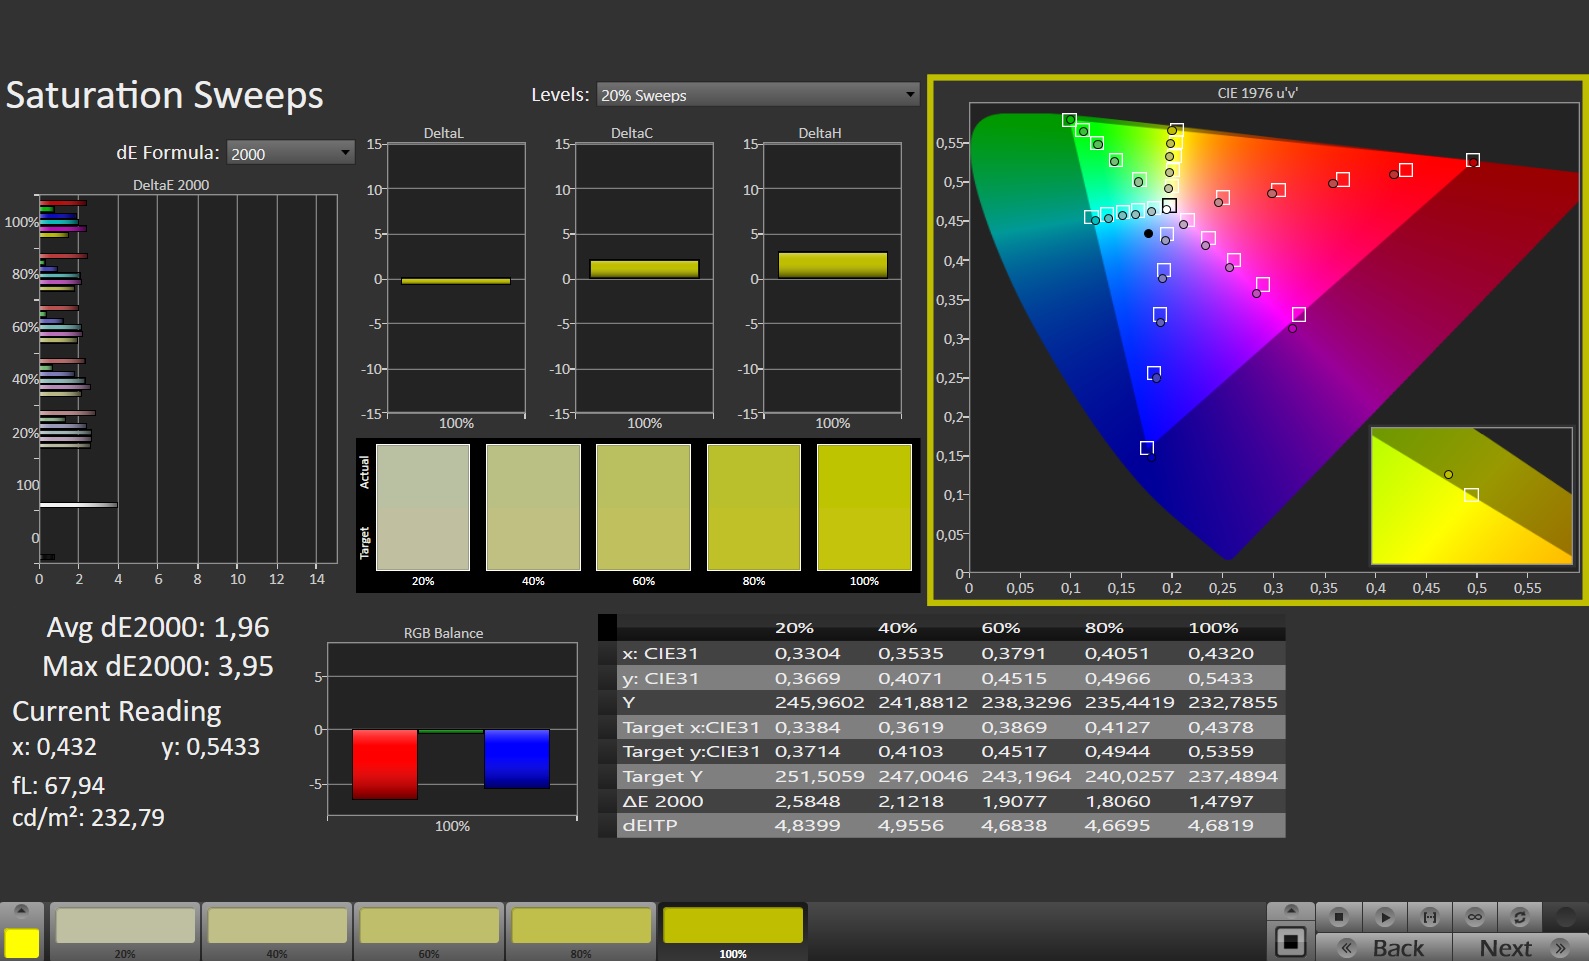
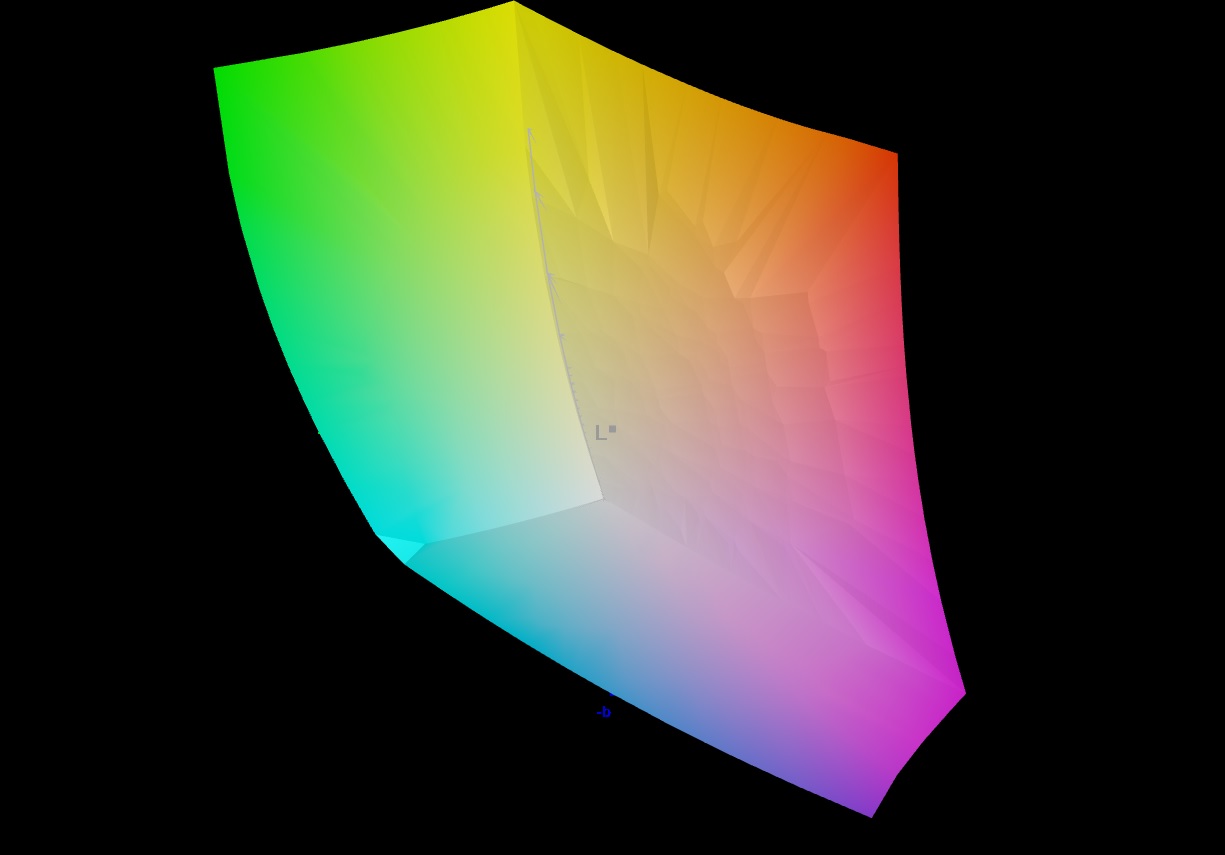
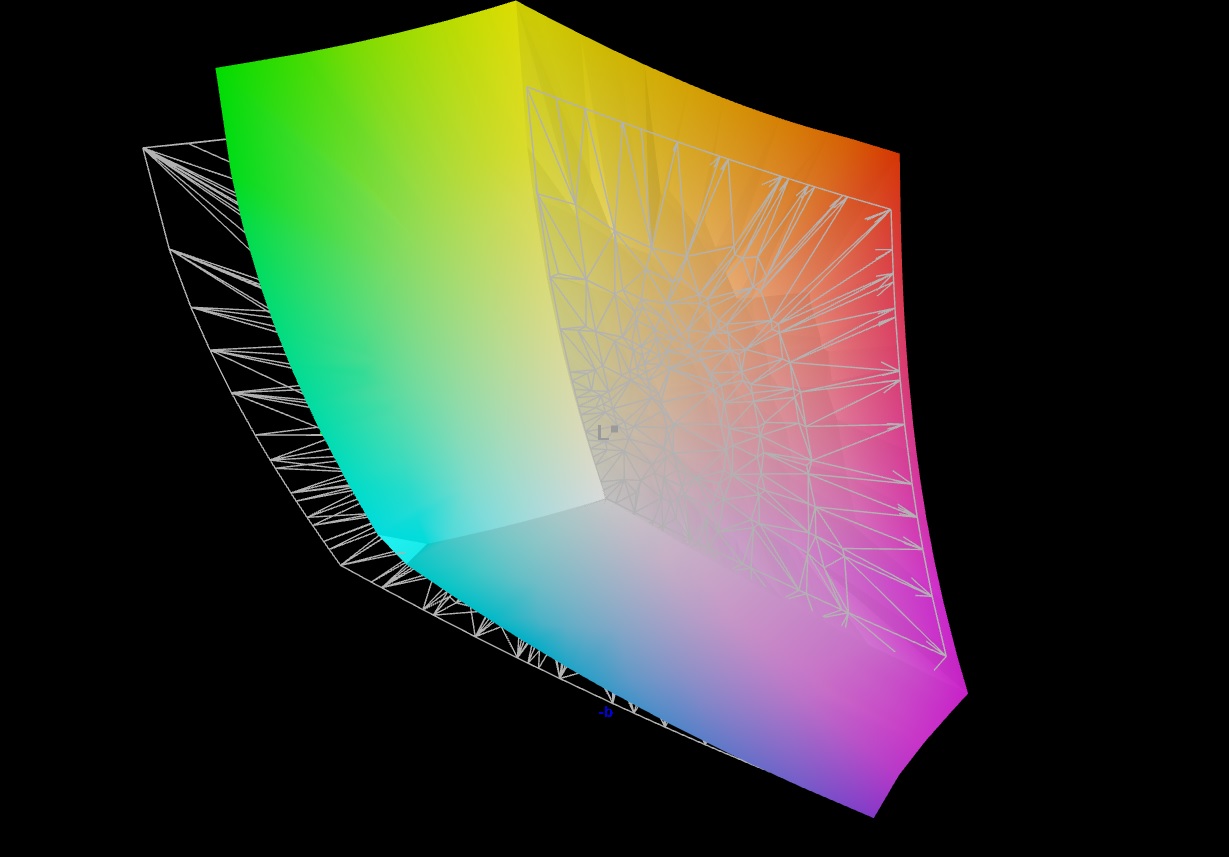
85.6% AdobeRGB 1998 (Argyll 3D)
99.9% sRGB (Argyll 3D)
98.1% Display P3 (Argyll 3D)
Gamma: 2.204
CCT: 7122 K
| Asus ROG Strix G18 G814JI NE180QDM-NZ2 (BOE0B35), IPS, 2560x1600, 18" | Razer Blade 18 RTX 4070 AU Optronics B180QAN01.0, IPS, 2560x1600, 18" | Gigabyte A7 X1 AU Optronics AUO8E8D, IPS, 1920x1080, 17.3" | Lenovo Legion 5 Pro 16ARH7H RTX 3070 Ti BOE CQ NE160QDM-NY1, IPS, 2560x1600, 16" | Alienware x17 RTX 3080 P48E AU Optronics B173ZAN, IPS, 3840x2160, 17.3" | MSI Raider GE77 HX 12UHS AU Optronics B173ZAN06.1, IPS, 3840x2160, 17.3" | |
|---|---|---|---|---|---|---|
| Display | -0% | -24% | -18% | 2% | -1% | |
| Display P3 Coverage (%) | 98.1 | 96.9 -1% | 61.5 -37% | 67.3 -31% | 88.3 -10% | 96.6 -2% |
| sRGB Coverage (%) | 99.9 | 99.8 0% | 90.9 -9% | 96.1 -4% | 100 0% | 99.8 0% |
| AdobeRGB 1998 Coverage (%) | 85.6 | 85.3 0% | 63.2 -26% | 69.5 -19% | 100 17% | 85.8 0% |
| Response Times | 18% | -103% | -91% | -87% | 17% | |
| Response Time Grey 50% / Grey 80% * (ms) | 5.6 ? | 4.2 ? 25% | 16 ? -186% | 14.4 ? -157% | 14.4 ? -157% | 5.8 ? -4% |
| Response Time Black / White * (ms) | 9 ? | 8 ? 11% | 10.8 ? -20% | 11.2 ? -24% | 10.4 ? -16% | 5.6 ? 38% |
| PWM Frequency (Hz) | ||||||
| Screen | -33% | -50% | 1% | -19% | -47% | |
| Brightness middle (cd/m²) | 471 | 549.6 17% | 325 -31% | 522.8 11% | 438.7 -7% | 381 -19% |
| Brightness (cd/m²) | 422 | 524 24% | 318 -25% | 503 19% | 435 3% | 371 -12% |
| Brightness Distribution (%) | 83 | 89 7% | 95 14% | 84 1% | 91 10% | 84 1% |
| Black Level * (cd/m²) | 0.47 | 0.53 -13% | 0.29 38% | 0.41 13% | 0.48 -2% | 0.52 -11% |
| Contrast (:1) | 1002 | 1037 3% | 1121 12% | 1275 27% | 914 -9% | 733 -27% |
| Colorchecker dE 2000 * | 2.05 | 3.32 -62% | 4.33 -111% | 2.47 -20% | 4.34 -112% | |
| Colorchecker dE 2000 max. * | 4.15 | 6.63 -60% | 8.6 -107% | 6.56 -58% | 7.3 -76% | |
| Colorchecker dE 2000 calibrated * | 0.8 | 2.7 -238% | 1.95 -144% | 0.61 24% | 0.72 10% | 2.53 -216% |
| Greyscale dE 2000 * | 2.8 | 2 29% | 5.5 -96% | 3 -7% | 2.4 14% | |
| Gamma | 2.204 100% | 2.29 96% | 2.142 103% | 2.27 97% | 2.09 105% | |
| CCT | 7122 91% | 6319 103% | 7893 82% | 6719 97% | 6413 101% | |
| Média Total (Programa/Configurações) | -5% /
-18% | -59% /
-52% | -36% /
-16% | -35% /
-24% | -10% /
-23% |
* ... menor é melhor
Os usuários profissionais ficarão felizes com o espaço de cores do laptop: De acordo com nossas medidas, o G18 gerencia 100% sRGB, 98% P3 e 86% AdobeRGB - no total, resultados impressionantes. Também não há praticamente nenhuma necessidade de críticas na área de reprodução de cores. Os valores estão em uma faixa ideal (DeltaE menos de 3), garantindo assim cores muito naturais.
No entanto, não são apenas os criadores, mas também os jogadores que recebem seu dinheiro: graças ao curto tempo de resposta (menos de 10 ms), o G18 é até mesmo adequado para jogos de ritmo mais rápido. Não detectamos nenhuma cintilação da tela (por exemplo, PWM).

Por outro lado, o dispositivo de revisão lutou com o sangramento da tela, especialmente nos cantos do painel. No entanto, isto não é algo que era perceptível em todas as situações. O contraste (cerca de 1.000:1) e o nível de preto (0,47 cd/m²) também são menos que perfeitos com a lâmina 18 pontuando de forma semelhante nesta área. Em contraste, os ângulos de visão são muito bons e típicos para um painel IPS.
Exibir tempos de resposta
| ↔ Tempo de resposta preto para branco | ||
|---|---|---|
| 9 ms ... ascensão ↗ e queda ↘ combinadas | ↗ 4 ms ascensão | 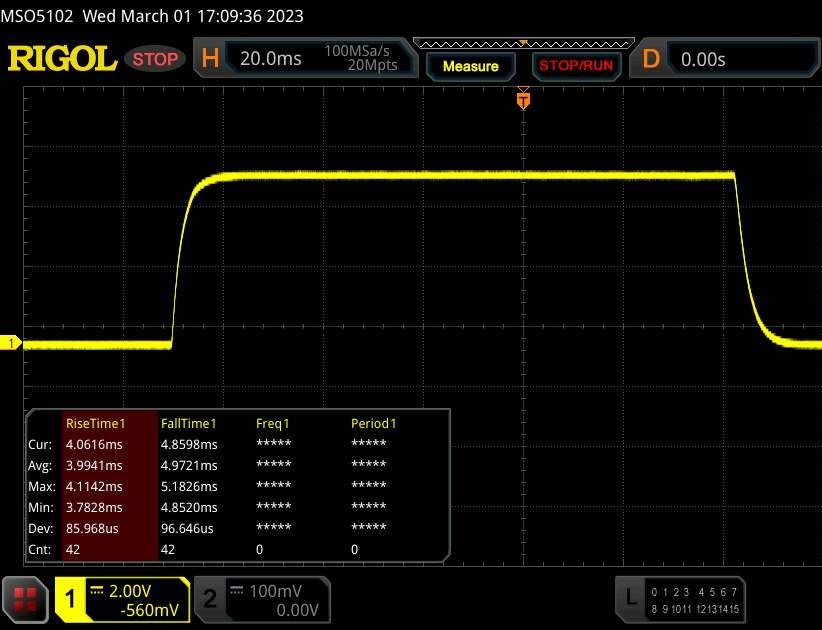 |
| ↘ 5 ms queda | ||
| A tela mostra taxas de resposta rápidas em nossos testes e deve ser adequada para jogos. Em comparação, todos os dispositivos testados variam de 0.1 (mínimo) a 240 (máximo) ms. » 25 % de todos os dispositivos são melhores. Isso significa que o tempo de resposta medido é melhor que a média de todos os dispositivos testados (19.8 ms). | ||
| ↔ Tempo de resposta 50% cinza a 80% cinza | ||
| 5.6 ms ... ascensão ↗ e queda ↘ combinadas | ↗ 2.7 ms ascensão | 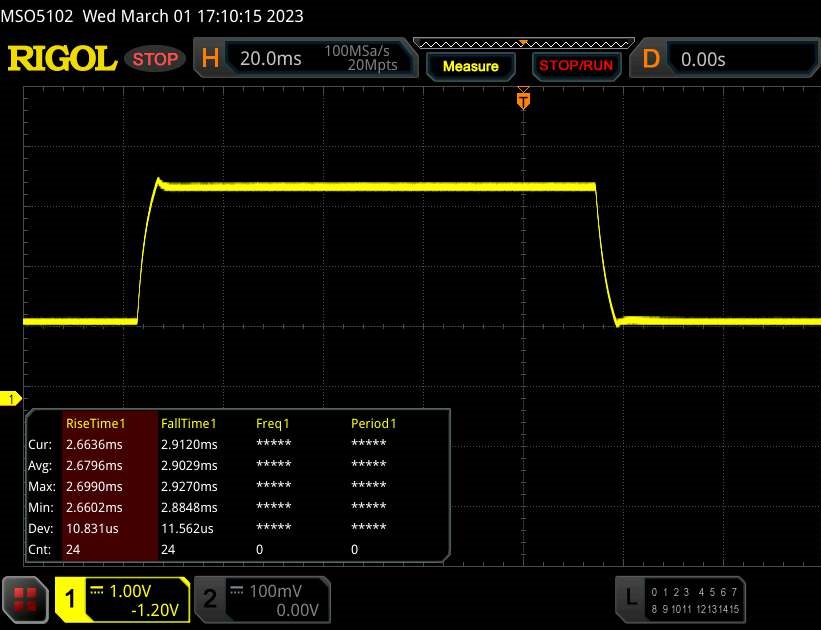 |
| ↘ 2.9 ms queda | ||
| A tela mostra taxas de resposta muito rápidas em nossos testes e deve ser muito adequada para jogos em ritmo acelerado. Em comparação, todos os dispositivos testados variam de 0.165 (mínimo) a 636 (máximo) ms. » 18 % de todos os dispositivos são melhores. Isso significa que o tempo de resposta medido é melhor que a média de todos os dispositivos testados (30.9 ms). | ||
Cintilação da tela / PWM (modulação por largura de pulso)
| Tela tremeluzindo / PWM não detectado | 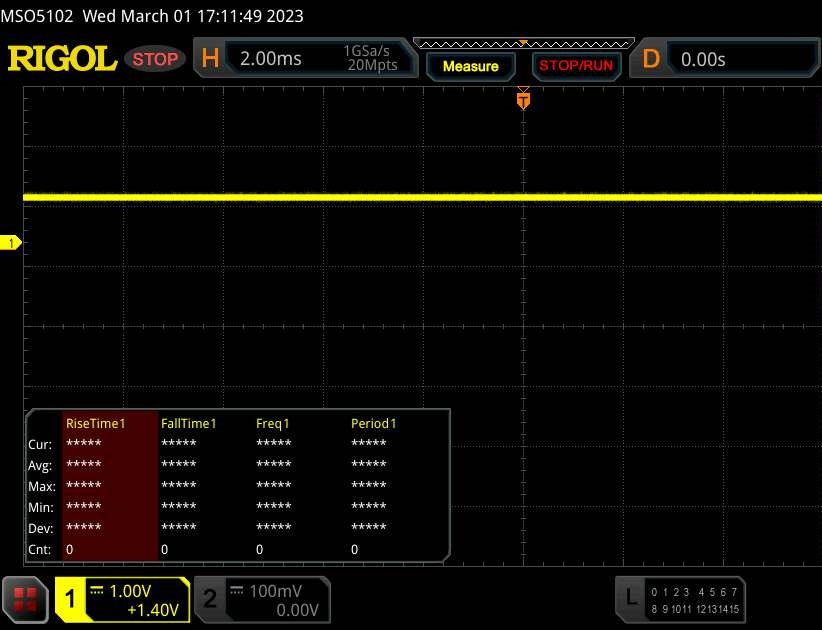 | ||
[pwm_comparison] Em comparação: 52 % de todos os dispositivos testados não usam PWM para escurecer a tela. Se PWM foi detectado, uma média de 7741 (mínimo: 5 - máximo: 343500) Hz foi medida. | |||
Desempenho
Dependendo das especificações, o Strix G18 pode ser visto como um notebook de alta qualidade com 32 GB de RAM provavelmente sendo suficiente para o próximo ano. No caso da capacidade de armazenamento do SSD ficar aquém das exigências, o dispositivo pode ser facilmente atualizado com um segundo drive M.2.
Condições de teste
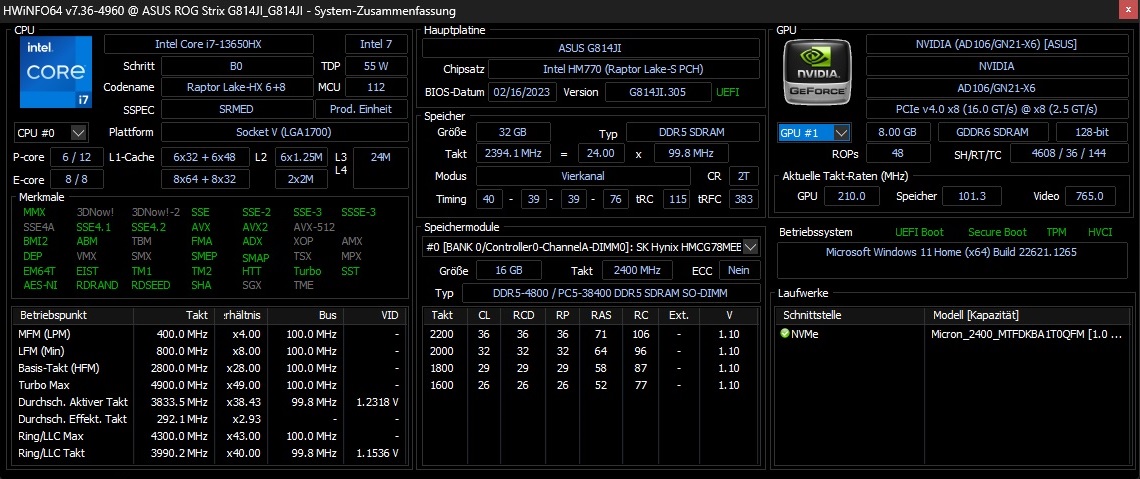
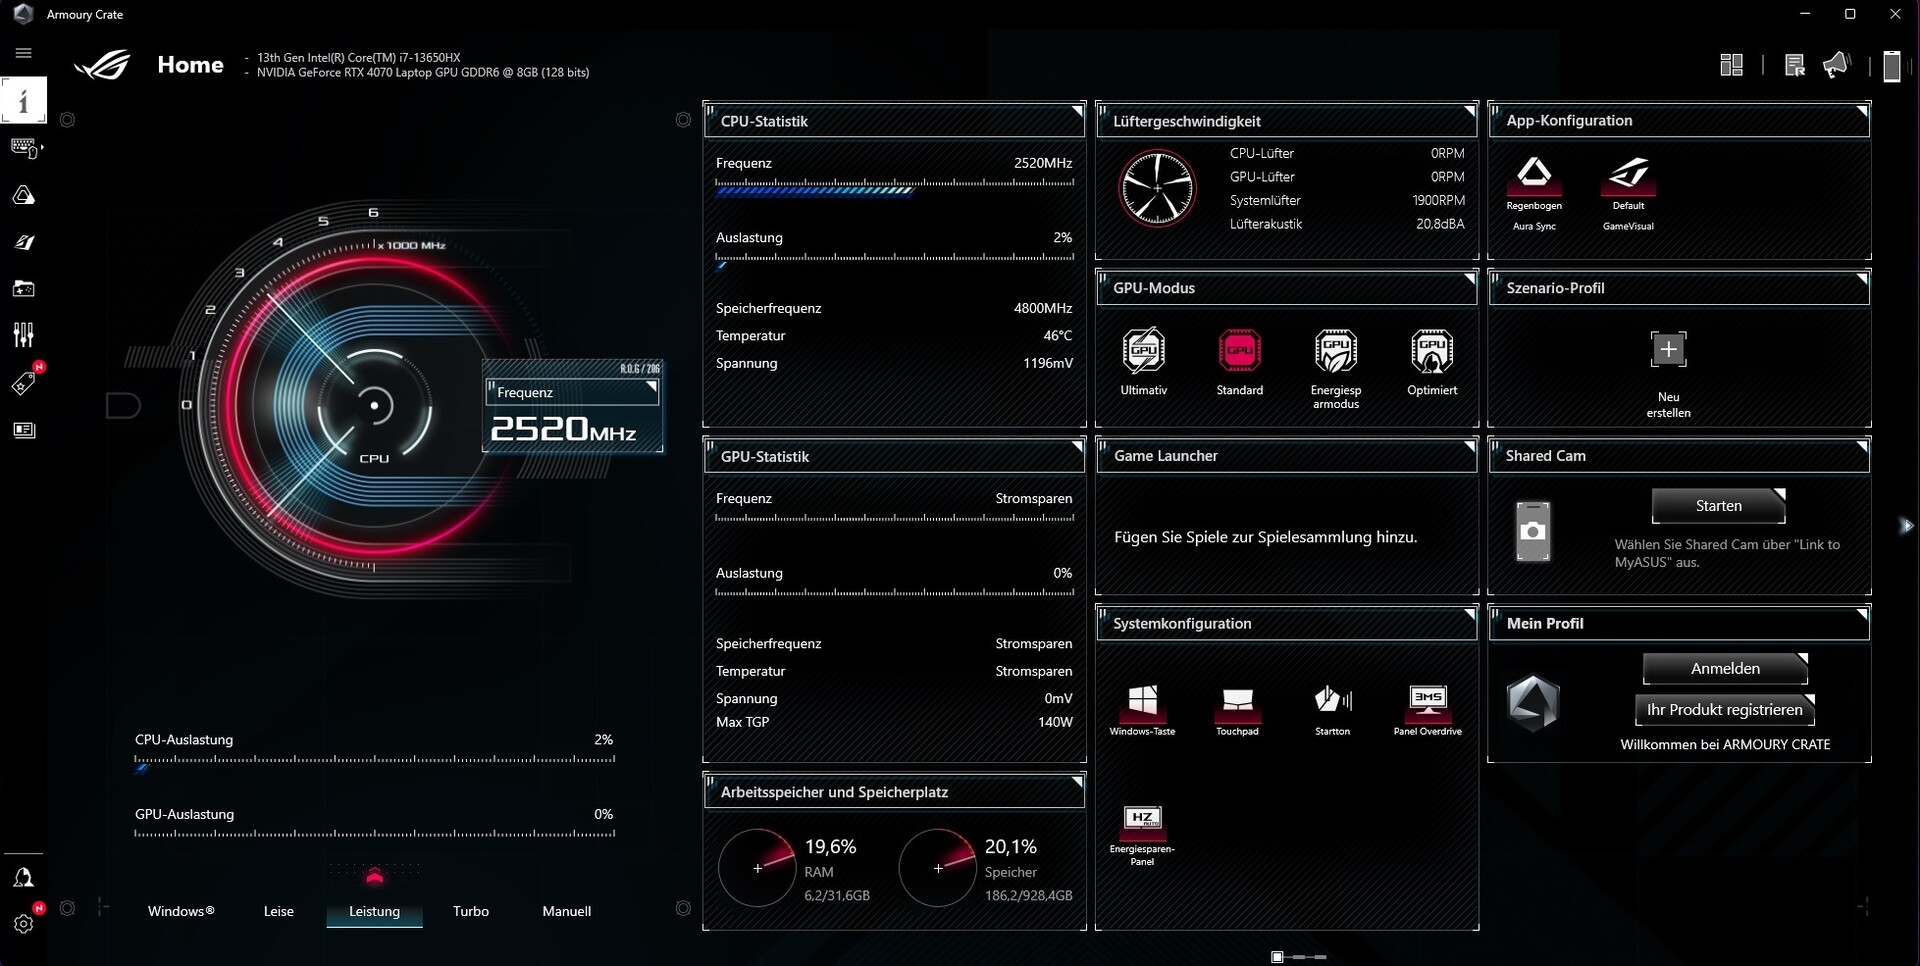
Muitos parâmetros podem ser estabelecidos no poderoso mas também bastante desordenado e confuso Armoury Crate. Nossas medições foram feitas usando os modos "Standard" (comutação gráfica ativa) e "Performance" da GPU. Estranho: Usando os modos "Quiet" ou "Turbo", o comportamento do ventilador muda, mas a performance no teste Witcher 3 permaneceu inalterada. Isto sugere que há problemas ou um erro aqui.
| Modo Silencioso | Modo Desempenho | Modo Turbo | |
| CPU PL1 (HWiNFO) | 80 W | 110 W | 170 W |
| CPU PL2 (HWiNFO) | 100 W | 120 W | 175 W |
| Ruído (Witcher 3 ) | 38 - 40 dB(A) | 42 - 44 dB(A) | 51 dB(A) |
| Desempenho (Witcher 3 ) | ~120 FPS | ~120 FPS | ~120 FPS |
Processador
O Core i7-13650HX vem da novíssima série Raptor Lake da Intel e tem uma base TDP de 55 watts. Os 14 núcleos disponíveis são divididos em 6 núcleos de desempenho, incluindo hyper-threading e 8 núcleos de eficiência sem HT, tornando possível um total de 20 roscas. Dependendo do tipo de núcleo, a velocidade do relógio pode variar muito com as variantes de desempenho, indo até 4,9 GHz.
Embora o desempenho da i7-13650HX seja cerca de 10% menos potente do que o Core i7-12900HX e cerca de 20% menor do que o Núcleo i9-13950HXno curso de teste de referência, estes suportam até 24 roscas. As CPUs, muitas vezes significativamente mais antigas, encontradas em laptops concorrentes - (Ryzen 7 6800H, Ryzen 9 5900HX & Núcleo i7-11800H) - geralmente são deixados para trás.
Cinebench R15 Multi Continuous Test
* ... menor é melhor
AIDA64: FP32 Ray-Trace | FPU Julia | CPU SHA3 | CPU Queen | FPU SinJulia | FPU Mandel | CPU AES | CPU ZLib | FP64 Ray-Trace | CPU PhotoWorxx
| Performance rating | |
| Média da turma Gaming | |
| Razer Blade 18 RTX 4070 | |
| MSI Raider GE77 HX 12UHS | |
| Asus ROG Strix G18 G814JI | |
| Lenovo Legion 5 Pro 16ARH7H RTX 3070 Ti | |
| Média Intel Core i7-13650HX | |
| Gigabyte A7 X1 | |
| Alienware x17 RTX 3080 P48E -9! | |
| AIDA64 / FP32 Ray-Trace | |
| Média da turma Gaming (10227 - 85542, n=102, últimos 2 anos) | |
| Razer Blade 18 RTX 4070 | |
| Asus ROG Strix G18 G814JI | |
| MSI Raider GE77 HX 12UHS | |
| Média Intel Core i7-13650HX (13404 - 20012, n=5) | |
| Lenovo Legion 5 Pro 16ARH7H RTX 3070 Ti | |
| Gigabyte A7 X1 | |
| AIDA64 / FPU Julia | |
| Média da turma Gaming (51376 - 372155, n=102, últimos 2 anos) | |
| Razer Blade 18 RTX 4070 | |
| MSI Raider GE77 HX 12UHS | |
| Lenovo Legion 5 Pro 16ARH7H RTX 3070 Ti | |
| Asus ROG Strix G18 G814JI | |
| Gigabyte A7 X1 | |
| Média Intel Core i7-13650HX (68241 - 97317, n=5) | |
| AIDA64 / CPU SHA3 | |
| Média da turma Gaming (2180 - 10115, n=102, últimos 2 anos) | |
| Razer Blade 18 RTX 4070 | |
| MSI Raider GE77 HX 12UHS | |
| Asus ROG Strix G18 G814JI | |
| Média Intel Core i7-13650HX (3127 - 4487, n=5) | |
| Lenovo Legion 5 Pro 16ARH7H RTX 3070 Ti | |
| Gigabyte A7 X1 | |
| AIDA64 / CPU Queen | |
| Razer Blade 18 RTX 4070 | |
| Média da turma Gaming (49785 - 173351, n=86, últimos 2 anos) | |
| Asus ROG Strix G18 G814JI | |
| Média Intel Core i7-13650HX (108627 - 110589, n=5) | |
| Lenovo Legion 5 Pro 16ARH7H RTX 3070 Ti | |
| MSI Raider GE77 HX 12UHS | |
| Gigabyte A7 X1 | |
| AIDA64 / FPU SinJulia | |
| Razer Blade 18 RTX 4070 | |
| Média da turma Gaming (4424 - 33636, n=102, últimos 2 anos) | |
| MSI Raider GE77 HX 12UHS | |
| Lenovo Legion 5 Pro 16ARH7H RTX 3070 Ti | |
| Gigabyte A7 X1 | |
| Asus ROG Strix G18 G814JI | |
| Média Intel Core i7-13650HX (9134 - 10887, n=5) | |
| AIDA64 / FPU Mandel | |
| Média da turma Gaming (25115 - 196829, n=102, últimos 2 anos) | |
| Razer Blade 18 RTX 4070 | |
| Lenovo Legion 5 Pro 16ARH7H RTX 3070 Ti | |
| MSI Raider GE77 HX 12UHS | |
| Gigabyte A7 X1 | |
| Asus ROG Strix G18 G814JI | |
| Média Intel Core i7-13650HX (33391 - 48323, n=5) | |
| AIDA64 / CPU AES | |
| MSI Raider GE77 HX 12UHS | |
| Lenovo Legion 5 Pro 16ARH7H RTX 3070 Ti | |
| Gigabyte A7 X1 | |
| Razer Blade 18 RTX 4070 | |
| Média da turma Gaming (39258 - 247074, n=102, últimos 2 anos) | |
| Asus ROG Strix G18 G814JI | |
| Média Intel Core i7-13650HX (64436 - 85343, n=5) | |
| AIDA64 / CPU ZLib | |
| Razer Blade 18 RTX 4070 | |
| Média da turma Gaming (574 - 2531, n=102, últimos 2 anos) | |
| MSI Raider GE77 HX 12UHS | |
| Asus ROG Strix G18 G814JI | |
| Média Intel Core i7-13650HX (1136 - 1285, n=5) | |
| Lenovo Legion 5 Pro 16ARH7H RTX 3070 Ti | |
| Gigabyte A7 X1 | |
| Alienware x17 RTX 3080 P48E | |
| AIDA64 / FP64 Ray-Trace | |
| Média da turma Gaming (5509 - 45446, n=102, últimos 2 anos) | |
| Razer Blade 18 RTX 4070 | |
| Asus ROG Strix G18 G814JI | |
| MSI Raider GE77 HX 12UHS | |
| Média Intel Core i7-13650HX (7270 - 10900, n=5) | |
| Lenovo Legion 5 Pro 16ARH7H RTX 3070 Ti | |
| Gigabyte A7 X1 | |
| AIDA64 / CPU PhotoWorxx | |
| Razer Blade 18 RTX 4070 | |
| MSI Raider GE77 HX 12UHS | |
| Média da turma Gaming (12271 - 89891, n=102, últimos 2 anos) | |
| Asus ROG Strix G18 G814JI | |
| Média Intel Core i7-13650HX (36170 - 43289, n=5) | |
| Lenovo Legion 5 Pro 16ARH7H RTX 3070 Ti | |
| Gigabyte A7 X1 | |
Desempenho do sistema
O Asus deve trabalhar no desempenho do sistema. Semelhante ao recentemente revisado TUF Gaming A16quando os programas são abertos, a comutação gráfica resulta em congelamentos incômodos que às vezes duram alguns segundos. Como o desempenho do SSD também não consegue acompanhar a concorrência, o benchmark PCMark 10 só poderia garantir o último lugar. O Razer Blade 18 tem seu nariz na frente em quase 20%.
CrossMark: Overall | Productivity | Creativity | Responsiveness
| PCMark 10 / Score | |
| Média da turma Gaming (5828 - 12414, n=93, últimos 2 anos) | |
| Razer Blade 18 RTX 4070 | |
| Lenovo Legion 5 Pro 16ARH7H RTX 3070 Ti | |
| Alienware x17 RTX 3080 P48E | |
| MSI Raider GE77 HX 12UHS | |
| Gigabyte A7 X1 | |
| Asus ROG Strix G18 G814JI | |
| Média Intel Core i7-13650HX, NVIDIA GeForce RTX 4070 Laptop GPU (n=1) | |
| PCMark 10 / Essentials | |
| Razer Blade 18 RTX 4070 | |
| Média da turma Gaming (8810 - 11935, n=97, últimos 2 anos) | |
| Lenovo Legion 5 Pro 16ARH7H RTX 3070 Ti | |
| Alienware x17 RTX 3080 P48E | |
| Gigabyte A7 X1 | |
| Asus ROG Strix G18 G814JI | |
| Média Intel Core i7-13650HX, NVIDIA GeForce RTX 4070 Laptop GPU (n=1) | |
| MSI Raider GE77 HX 12UHS | |
| PCMark 10 / Productivity | |
| Média da turma Gaming (6845 - 25323, n=95, últimos 2 anos) | |
| Alienware x17 RTX 3080 P48E | |
| MSI Raider GE77 HX 12UHS | |
| Razer Blade 18 RTX 4070 | |
| Lenovo Legion 5 Pro 16ARH7H RTX 3070 Ti | |
| Gigabyte A7 X1 | |
| Asus ROG Strix G18 G814JI | |
| Média Intel Core i7-13650HX, NVIDIA GeForce RTX 4070 Laptop GPU (n=1) | |
| PCMark 10 / Digital Content Creation | |
| Média da turma Gaming (7602 - 19954, n=95, últimos 2 anos) | |
| Lenovo Legion 5 Pro 16ARH7H RTX 3070 Ti | |
| Alienware x17 RTX 3080 P48E | |
| Razer Blade 18 RTX 4070 | |
| MSI Raider GE77 HX 12UHS | |
| Gigabyte A7 X1 | |
| Asus ROG Strix G18 G814JI | |
| Média Intel Core i7-13650HX, NVIDIA GeForce RTX 4070 Laptop GPU (n=1) | |
| CrossMark / Overall | |
| MSI Raider GE77 HX 12UHS | |
| Razer Blade 18 RTX 4070 | |
| Média da turma Gaming (1366 - 2409, n=94, últimos 2 anos) | |
| Lenovo Legion 5 Pro 16ARH7H RTX 3070 Ti | |
| CrossMark / Productivity | |
| MSI Raider GE77 HX 12UHS | |
| Razer Blade 18 RTX 4070 | |
| Média da turma Gaming (1386 - 2254, n=94, últimos 2 anos) | |
| Lenovo Legion 5 Pro 16ARH7H RTX 3070 Ti | |
| CrossMark / Creativity | |
| Razer Blade 18 RTX 4070 | |
| MSI Raider GE77 HX 12UHS | |
| Média da turma Gaming (1343 - 2786, n=94, últimos 2 anos) | |
| Lenovo Legion 5 Pro 16ARH7H RTX 3070 Ti | |
| CrossMark / Responsiveness | |
| MSI Raider GE77 HX 12UHS | |
| Razer Blade 18 RTX 4070 | |
| Média da turma Gaming (1226 - 2334, n=94, últimos 2 anos) | |
| Lenovo Legion 5 Pro 16ARH7H RTX 3070 Ti | |
| PCMark 10 Score | 6404 pontos | |
Ajuda | ||
| AIDA64 / Memory Copy | |
| Razer Blade 18 RTX 4070 | |
| Média da turma Gaming (21750 - 129946, n=102, últimos 2 anos) | |
| MSI Raider GE77 HX 12UHS | |
| Asus ROG Strix G18 G814JI | |
| Média Intel Core i7-13650HX (59266 - 66372, n=5) | |
| Lenovo Legion 5 Pro 16ARH7H RTX 3070 Ti | |
| Gigabyte A7 X1 | |
| AIDA64 / Memory Read | |
| Razer Blade 18 RTX 4070 | |
| Média da turma Gaming (22956 - 118858, n=102, últimos 2 anos) | |
| MSI Raider GE77 HX 12UHS | |
| Média Intel Core i7-13650HX (67305 - 71022, n=5) | |
| Asus ROG Strix G18 G814JI | |
| Lenovo Legion 5 Pro 16ARH7H RTX 3070 Ti | |
| Gigabyte A7 X1 | |
| AIDA64 / Memory Write | |
| Média da turma Gaming (22297 - 135096, n=102, últimos 2 anos) | |
| Razer Blade 18 RTX 4070 | |
| MSI Raider GE77 HX 12UHS | |
| Média Intel Core i7-13650HX (58028 - 68225, n=5) | |
| Asus ROG Strix G18 G814JI | |
| Lenovo Legion 5 Pro 16ARH7H RTX 3070 Ti | |
| Gigabyte A7 X1 | |
| AIDA64 / Memory Latency | |
| Média da turma Gaming (75.3 - 165.4, n=102, últimos 2 anos) | |
| Média Intel Core i7-13650HX (83.7 - 90.8, n=5) | |
| Lenovo Legion 5 Pro 16ARH7H RTX 3070 Ti | |
| Razer Blade 18 RTX 4070 | |
| MSI Raider GE77 HX 12UHS | |
| Asus ROG Strix G18 G814JI | |
| Gigabyte A7 X1 | |
| Alienware x17 RTX 3080 P48E | |
* ... menor é melhor
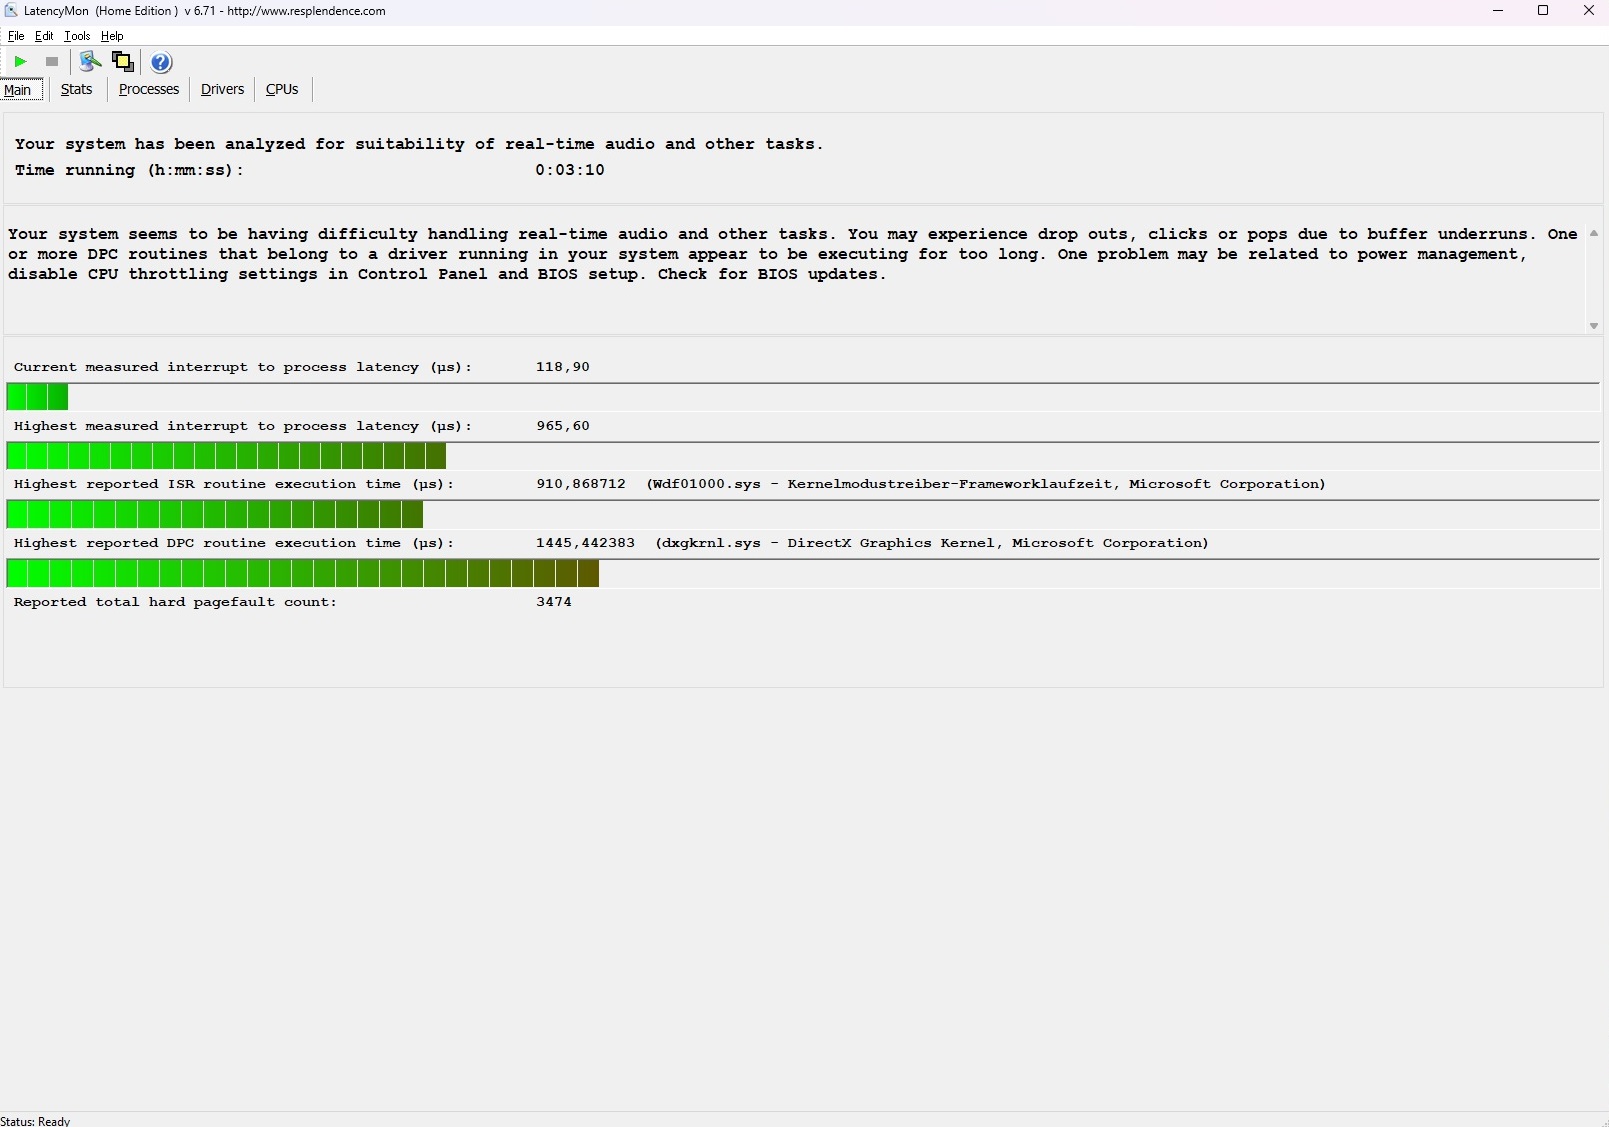
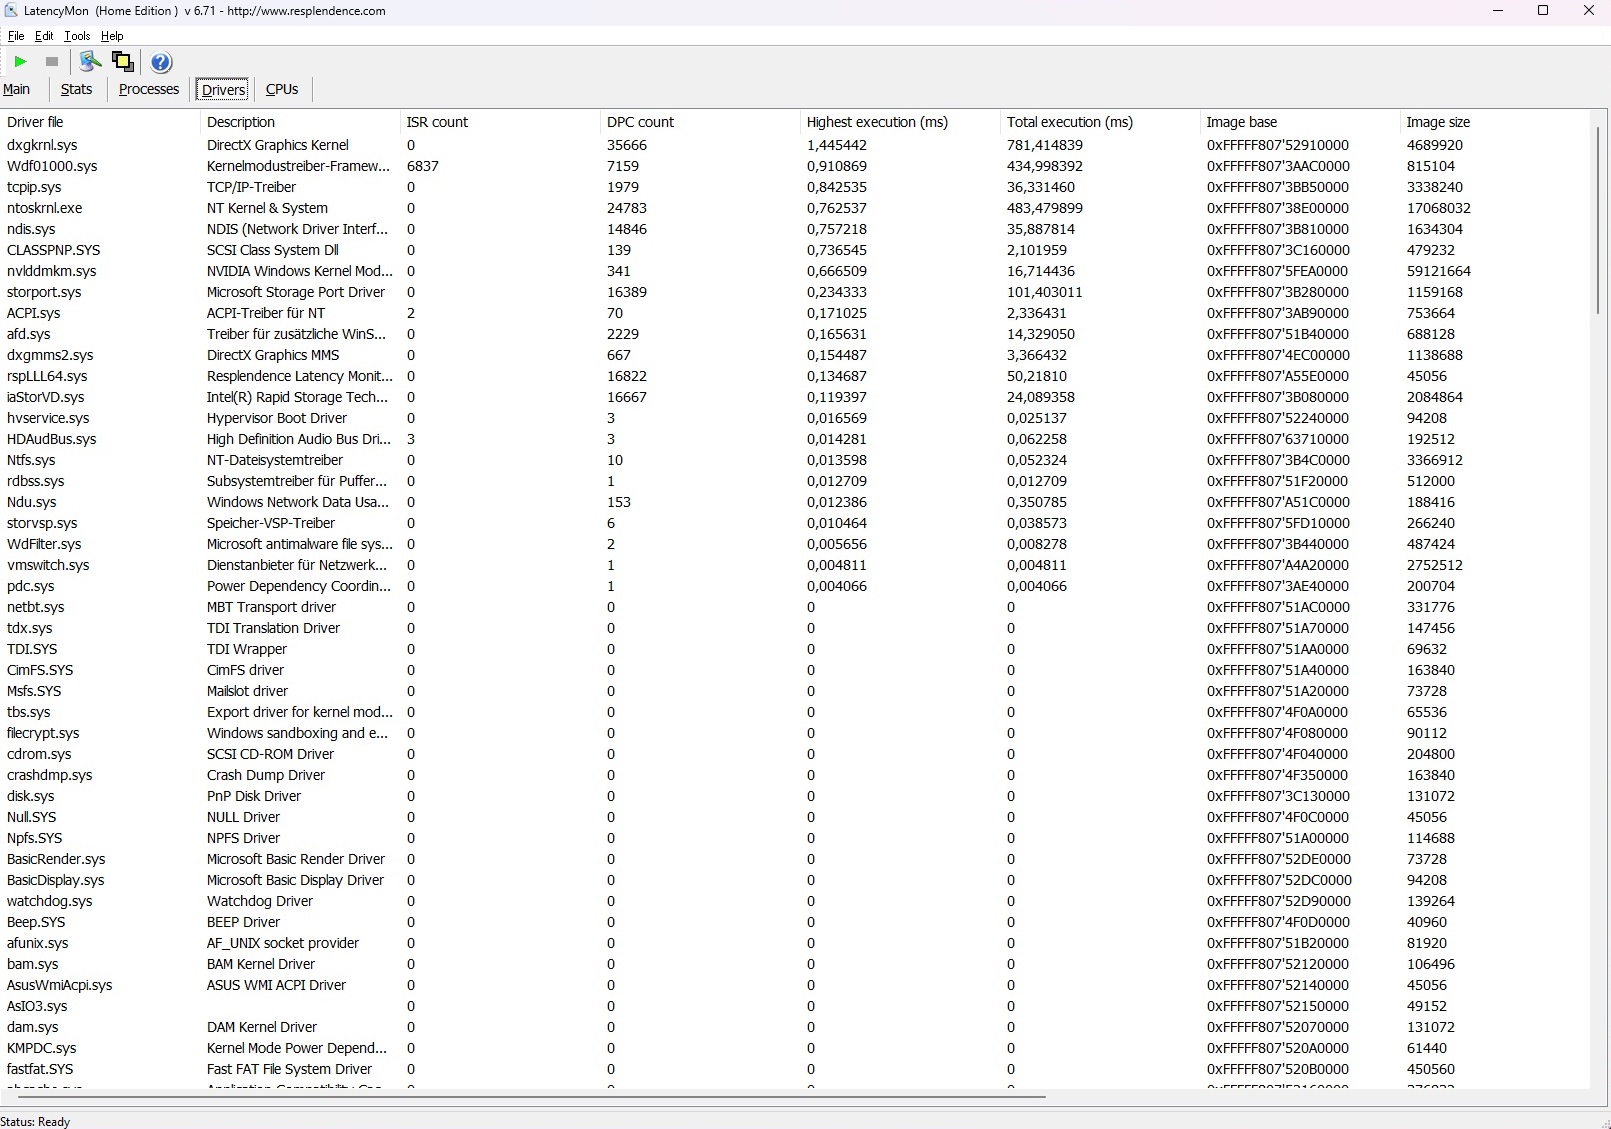
Latências DPC
Com relação às latências, o G18 administra confortavelmente um lugar no meio da mesa. Apesar do resultado sólido, a ferramenta LatencyMon indica possíveis problemas durante o processamento em tempo real de, por exemplo, conteúdo de áudio. Isto é algo que afeta muitos laptops, mas é relevante apenas para grupos específicos de usuários.
| DPC Latencies / LatencyMon - interrupt to process latency (max), Web, Youtube, Prime95 | |
| Alienware x17 RTX 3080 P48E | |
| MSI Raider GE77 HX 12UHS | |
| Razer Blade 18 RTX 4070 | |
| Asus ROG Strix G18 G814JI | |
| Gigabyte A7 X1 | |
| Lenovo Legion 5 Pro 16ARH7H RTX 3070 Ti | |
* ... menor é melhor
Armazenamento em massa
A configuração de revisão é impulsionada por um SSD Micron de 1 TB. Embora o desempenho em oferta (cerca de 3800 MB/s de velocidade de leitura & 2300 MB/s de velocidade de gravação no benchmark AS SSD) não seja, de forma alguma, pobre, os SSDs concorrentes têm, em sua maioria, a vantagem. Somente o Gigabyte A7 X1 é capaz de se diferenciar do G18 nesta disciplina.

* ... menor é melhor
Continuous Performance Read: DiskSpd Read Loop, Queue Depth 8
Placa gráfica
Depois que o GeForce RTX 4070 Ti teve que suportar muitas críticas no segmento de desktop (muito caro e com especificações questionáveis para o desempenho em oferta), o móvel GeForce RTX 4070 foi calorosamente antecipado.
Para ir direto ao assunto: Mais uma vez, a Nvidia não tomou a melhor das decisões. O nome RTX 4070 soa como sendo de alta qualidade, mas com sistemas desse tipo sendo caros, as especificações tendem a ser suficientes apenas para um dispositivo típico de médio alcance. Da mesma forma, no ano de 2023, 8 GB de VRAM é tão escasso quanto uma interface de memória de 128 bits. Além disso, 4608 unidades shader são mais parecidas com um RTX 4060 (3072) do que com oRTX 4080 (7424), que é uma lacuna considerável em comparação com modelos mais poderosos. Quando se trata de pontuações 3DMark GPU, o RTX 4070 é pouco mais rápido que um RTX 3070 e às vezes até mais lento que um RTX 3070 Ti. Tudo somado, está em um nível comparável ao RTX 3080 (também se aplica à Lâmina 18).
| 3DMark 06 Standard Score | 54916 pontos | |
| 3DMark 11 Performance | 34117 pontos | |
| 3DMark Cloud Gate Standard Score | 65577 pontos | |
| 3DMark Fire Strike Score | 25633 pontos | |
| 3DMark Time Spy Score | 12364 pontos | |
Ajuda | ||
* ... menor é melhor
Desempenho nos jogos
A situação parece melhor no jogo cotidiano. Nossa classificação de desempenho (FHD/Ultra com muitos jogos padrão) mostra uma diferença de quase 30% em relação ao RTX 3070 e uma vantagem de quase 10% em relação ao RTX 3070 Ti. Nos jogos, o RTX 4070 é colocado em algum lugar entre um RTX 3080 e um RTX 3080 Ti. Você pode ver como o dispositivo funciona em resoluções mais altas (QHD/UHD) e com traçado de raio ativado na segunda tabela, onde três exemplos de títulos mais recentes são listados. Para uma comparação mais detalhada, dê uma olhada em nosso lista de jogos.
| The Witcher 3 - 1920x1080 Ultra Graphics & Postprocessing (HBAO+) | |
| Média da turma Gaming (104.7 - 240, n=7, últimos 2 anos) | |
| MSI Raider GE77 HX 12UHS | |
| Asus ROG Strix G18 G814JI | |
| Lenovo Legion 5 Pro 16ARH7H RTX 3070 Ti | |
| Razer Blade 18 RTX 4070 | |
| Alienware x17 RTX 3080 P48E | |
| Gigabyte A7 X1 | |
| Final Fantasy XV Benchmark - 1920x1080 High Quality | |
| Média da turma Gaming (64.2 - 215, n=91, últimos 2 anos) | |
| MSI Raider GE77 HX 12UHS | |
| Lenovo Legion 5 Pro 16ARH7H RTX 3070 Ti | |
| Asus ROG Strix G18 G814JI | |
| Razer Blade 18 RTX 4070 | |
| Alienware x17 RTX 3080 P48E | |
| Strange Brigade - 1920x1080 ultra AA:ultra AF:16 | |
| Média da turma Gaming (113.6 - 458, n=83, últimos 2 anos) | |
| Lenovo Legion 5 Pro 16ARH7H RTX 3070 Ti | |
| MSI Raider GE77 HX 12UHS | |
| Asus ROG Strix G18 G814JI | |
| Razer Blade 18 RTX 4070 | |
| Alienware x17 RTX 3080 P48E | |
| Gigabyte A7 X1 | |
| Dota 2 Reborn - 1920x1080 ultra (3/3) best looking | |
| Razer Blade 18 RTX 4070 | |
| MSI Raider GE77 HX 12UHS | |
| Média da turma Gaming (84.8 - 252, n=104, últimos 2 anos) | |
| Asus ROG Strix G18 G814JI | |
| Alienware x17 RTX 3080 P48E | |
| Lenovo Legion 5 Pro 16ARH7H RTX 3070 Ti | |
| Gigabyte A7 X1 | |
| Resident Evil Village | |
| 1920x1080 Ray Tracing Preset | |
| MSI GE76 Raider | |
| Asus ROG Strix G18 G814JI | |
| Lenovo Legion 7 16ACHg6 | |
| Medion Erazer Beast X20 | |
| 2560x1440 Max Preset | |
| MSI GE76 Raider | |
| Asus ROG Strix G18 G814JI | |
| Lenovo Legion 7 16ACHg6 | |
| Medion Erazer Beast X20 | |
| 3840x2160 Max Preset | |
| MSI GE76 Raider | |
| Asus ROG Strix G18 G814JI | |
| Guardians of the Galaxy | |
| 1920x1080 Ultra Preset + Ultra Ray-Tracing | |
| MSI GE76 Raider | |
| XMG Neo 15 @165 W TGP | |
| Asus ROG Strix G18 G814JI | |
| XMG Neo 17 @140 W TGP | |
| 2560x1440 Ultra Preset | |
| MSI GE76 Raider | |
| XMG Neo 15 @165 W TGP | |
| Asus ROG Strix G18 G814JI | |
| XMG Neo 17 @140 W TGP | |
| 3840x2160 Ultra Preset | |
| MSI GE76 Raider | |
| XMG Neo 15 @165 W TGP | |
| Asus ROG Strix G18 G814JI | |
| XMG Neo 17 @140 W TGP | |
| Ghostwire Tokyo | |
| 1920x1080 Highest Settings + Maximum Ray Tracing | |
| Asus ROG Strix G18 G814JI | |
| Medion Erazer Beast X30 | |
| XMG Neo 15 @165 W TGP | |
| XMG Neo 17 @140 W TGP | |
| 2560x1440 Highest Settings | |
| Asus ROG Strix G18 G814JI | |
| Medion Erazer Beast X30 | |
| XMG Neo 15 @165 W TGP | |
| XMG Neo 17 @140 W TGP | |
| 3840x2160 Highest Settings | |
| Asus ROG Strix G18 G814JI | |
| XMG Neo 15 @165 W TGP | |
| XMG Neo 17 @140 W TGP | |
Basicamente, a GeForce RTX 4070 é uma placa gráfica muito boa para notebooks QHD. Ajustada para 2560 x 1440 pixels (o G18 também gerencia de forma excelente os 2560 x 1600 pixels nativos) a GPU Ada Lovelace geralmente atinge mais de 60fps, mesmo em configurações máximas. Somente jogos mal otimizados, tais como Um Requiem de Conto de Pestecair abaixo deste nível. Em contraste, a 4K, a RTX 4070 (sem DLSS) oferece apenas uma aptidão limitada. Em títulos mais exigentes, mais de 60 fps é a exceção e não a regra.
A fim de ver se o desempenho gráfico poderia permanecer estável mesmo durante períodos de tempo mais longos, testamos O Witcher 3 por 60 minutos. O resultado: Como visto no loop Cinebench para a CPU, o desempenho foi relativamente estável.
Witcher 3 FPS Diagram
| baixo | média | alto | ultra | QHD | 4K | |
|---|---|---|---|---|---|---|
| GTA V (2015) | 182.5 | 178.3 | 117.2 | |||
| The Witcher 3 (2015) | 379 | 237 | 119 | |||
| Dota 2 Reborn (2015) | 173.2 | 164.4 | 154.7 | |||
| Final Fantasy XV Benchmark (2018) | 162.3 | 115.5 | ||||
| X-Plane 11.11 (2018) | 145.8 | 112.6 | ||||
| Far Cry 5 (2018) | 163 | 154 | 144 | |||
| Strange Brigade (2018) | 309 | 245 | 209 | |||
| Outriders (2021) | 165.3 | 145.2 | 129.4 | 90 | 46.3 | |
| Resident Evil Village (2021) | 220 | 212 | 189.7 | 128.6 | 62.7 | |
| Days Gone (2021) | 173.2 | 154.7 | 119.2 | 83.8 | 45 | |
| Deathloop (2021) | 139.9 | 129.8 | 106.3 | 65.4 | 37.4 | |
| Back 4 Blood (2021) | 252 | 221 | 209 | 129.4 | 73.7 | |
| Guardians of the Galaxy (2021) | 148 | 147 | 144 | 108 | 60 | |
| Riders Republic (2021) | 160 | 135 | 121 | 87 | 49 | |
| Farming Simulator 22 (2021) | 203 | 148.2 | 138.9 | 137 | 94.1 | |
| Halo Infinite (2021) | 172.7 | 149.1 | 140.6 | 102.5 | 57.5 | |
| Elden Ring (2022) | 59.6 | 59.5 | 59.5 | 59.5 | 45 | |
| Elex 2 (2022) | 118.7 | 118.2 | 112.9 | 78.9 | 40 | |
| Ghostwire Tokyo (2022) | 172.7 | 171.7 | 165.9 | 108.7 | 52.3 | |
| Vampire Bloodhunt (2022) | 212 | 199.9 | 195.7 | 148.6 | 78.5 | |
| The Quarry (2022) | 146 | 122.1 | 98 | 68.2 | 28.7 | |
| A Plague Tale Requiem (2022) | 74.6 | 65.6 | 57.5 | 40.9 | 23 | |
| Need for Speed Unbound (2022) | 131.1 | 110.1 | 97.2 | 67.7 | 36.2 | |
| High On Life (2023) | 178 | 131.6 | 108.5 | 64.5 | 25.7 | |
| Hogwarts Legacy (2023) | 142.7 | 121.2 | 101.2 | 71 | 27.7 | |
| Returnal (2023) | 115 | 104 | 88 | 66 | 39 | |
| Company of Heroes 3 (2023) | 186 | 155 | 150 | 107 | 63 |
Emissões
Emissões sonoras
A emissão de ruídos depende muito do modo selecionado em Armoury Crate. Em Witcher 3, nosso dispositivo de medição registrou entre 8 e 40 dB(A) no modo "Silencioso" e 42 a 44 dB(A) no modo "Desempenho" - níveis aceitáveis para um laptop para jogos. As coisas ficam barulhentas no modo "Turbo", com os ventiladores cintando 51 dB(A) enquanto se joga. Em operação ociosa, os ventiladores estão completamente desligados ou funcionam a um nível bastante decente de quase 30 dB(A).
Irritante: A Strix G18 tem que lidar com o chorume da bobina em quase todas as faixas de carga. Muitos outros laptops também apresentam este problema, mas não a este nível de intensidade ou freqüência.
Barulho
| Ocioso |
| 26 / 28 / 29 dB |
| Carga |
| 41 / 46 dB |
 | ||
30 dB silencioso 40 dB(A) audível 50 dB(A) ruidosamente alto |
||
min: | ||
| Asus ROG Strix G18 G814JI i7-13650HX, GeForce RTX 4070 Laptop GPU | Razer Blade 18 RTX 4070 i9-13950HX, GeForce RTX 4070 Laptop GPU | Gigabyte A7 X1 R9 5900HX, GeForce RTX 3070 Laptop GPU | Lenovo Legion 5 Pro 16ARH7H RTX 3070 Ti R7 6800H, GeForce RTX 3070 Ti Laptop GPU | Alienware x17 RTX 3080 P48E i7-11800H, GeForce RTX 3080 Laptop GPU | MSI Raider GE77 HX 12UHS i9-12900HX, GeForce RTX 3080 Ti Laptop GPU | |
|---|---|---|---|---|---|---|
| Noise | 3% | -17% | -6% | 1% | -22% | |
| desligado / ambiente * (dB) | 25 | 23.5 6% | 24 4% | 23.5 6% | 24.9 -0% | 26 -4% |
| Idle Minimum * (dB) | 26 | 23.8 8% | 25 4% | 23.7 9% | 24.9 4% | 26 -0% |
| Idle Average * (dB) | 28 | 23.8 15% | 29 -4% | 31.1 -11% | 24.9 11% | 34 -21% |
| Idle Maximum * (dB) | 29 | 26.8 8% | 35 -21% | 32.2 -11% | 29.6 -2% | 46 -59% |
| Load Average * (dB) | 41 | 37.3 9% | 58 -41% | 38.4 6% | 31.1 24% | 50 -22% |
| Witcher 3 ultra * (dB) | 44 | 48 -9% | 57 -30% | 54.8 -25% | 49.7 -13% | 55 -25% |
| Load Maximum * (dB) | 46 | 53.5 -16% | 59 -28% | 54.8 -19% | 54.8 -19% | 57 -24% |
* ... menor é melhor
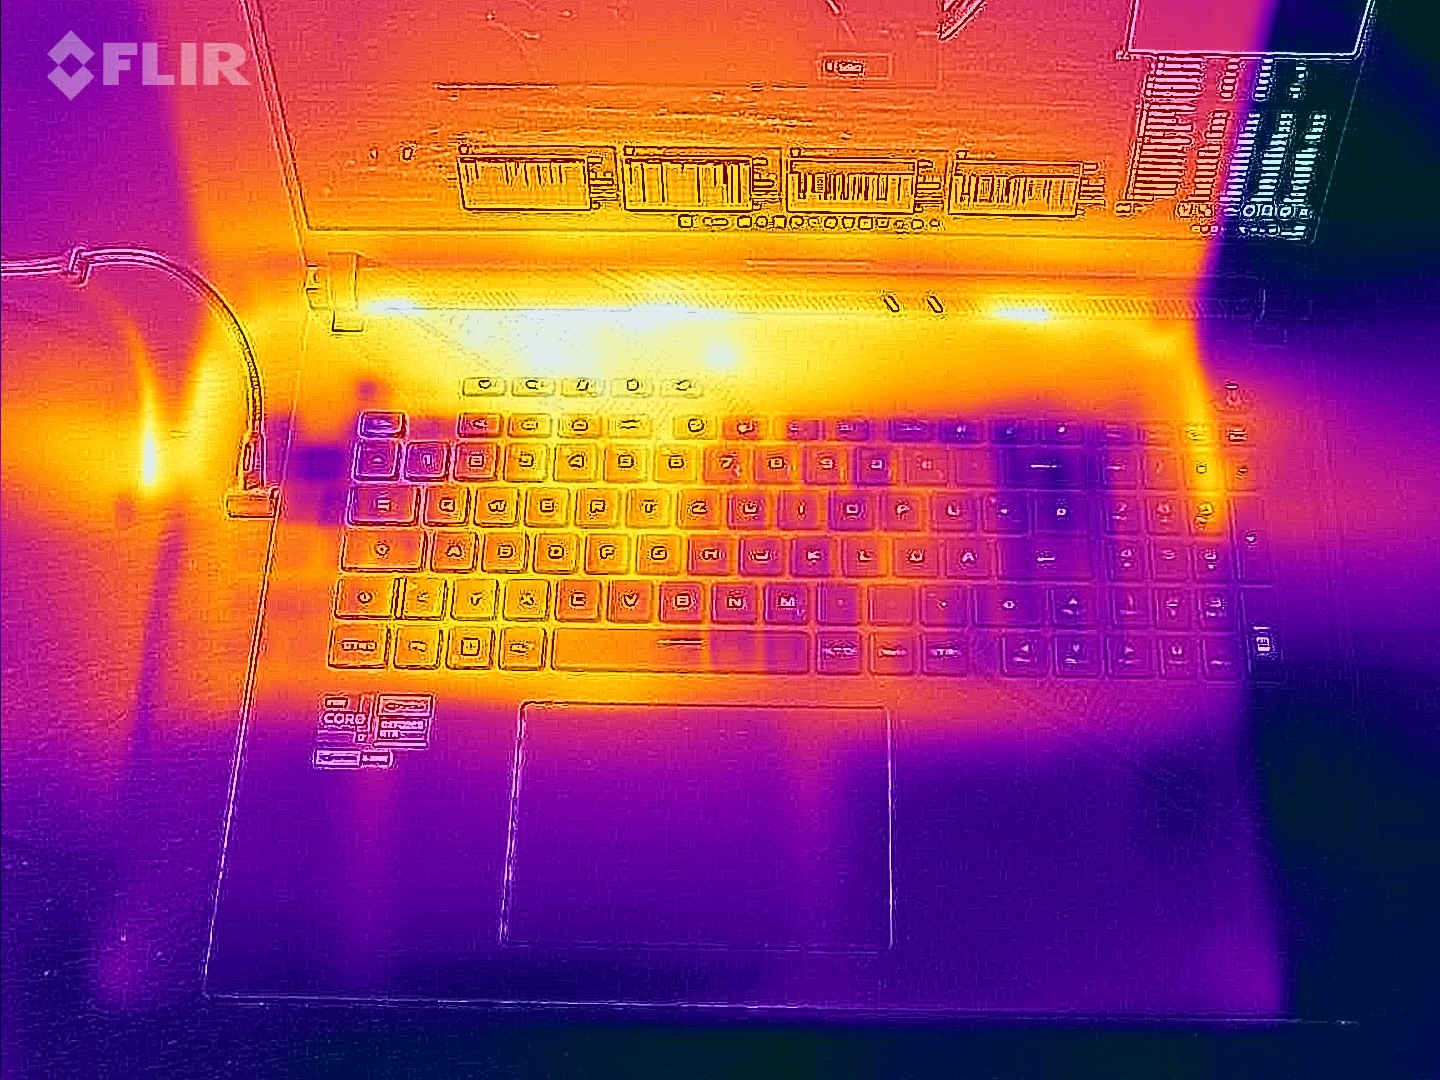
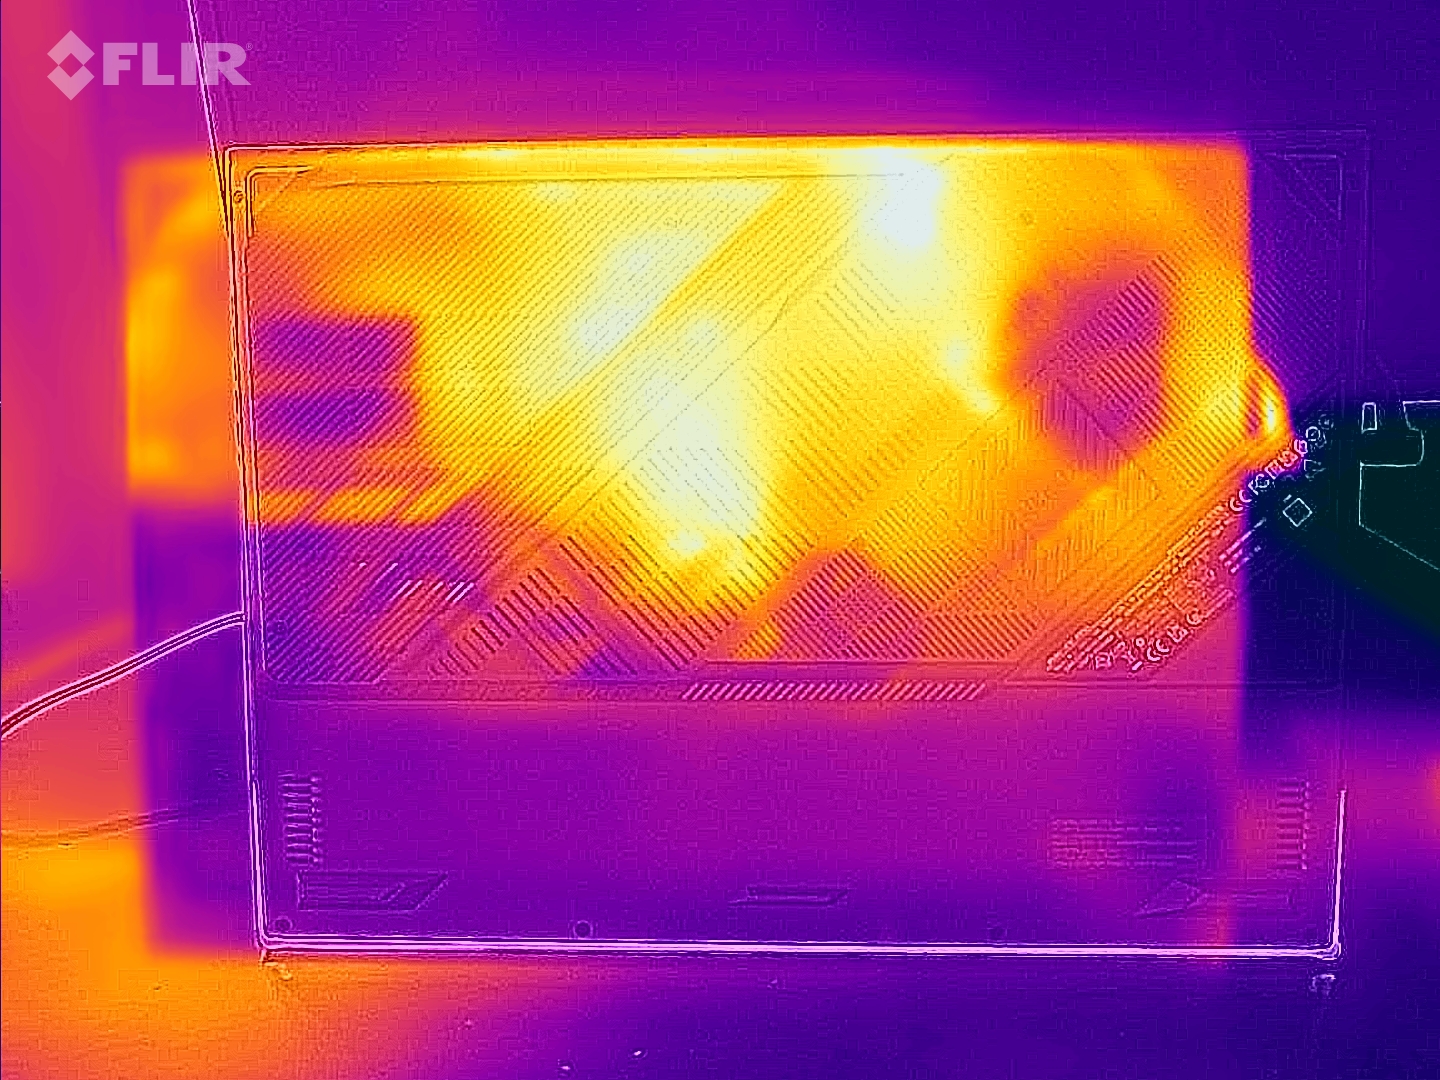
Temperatura
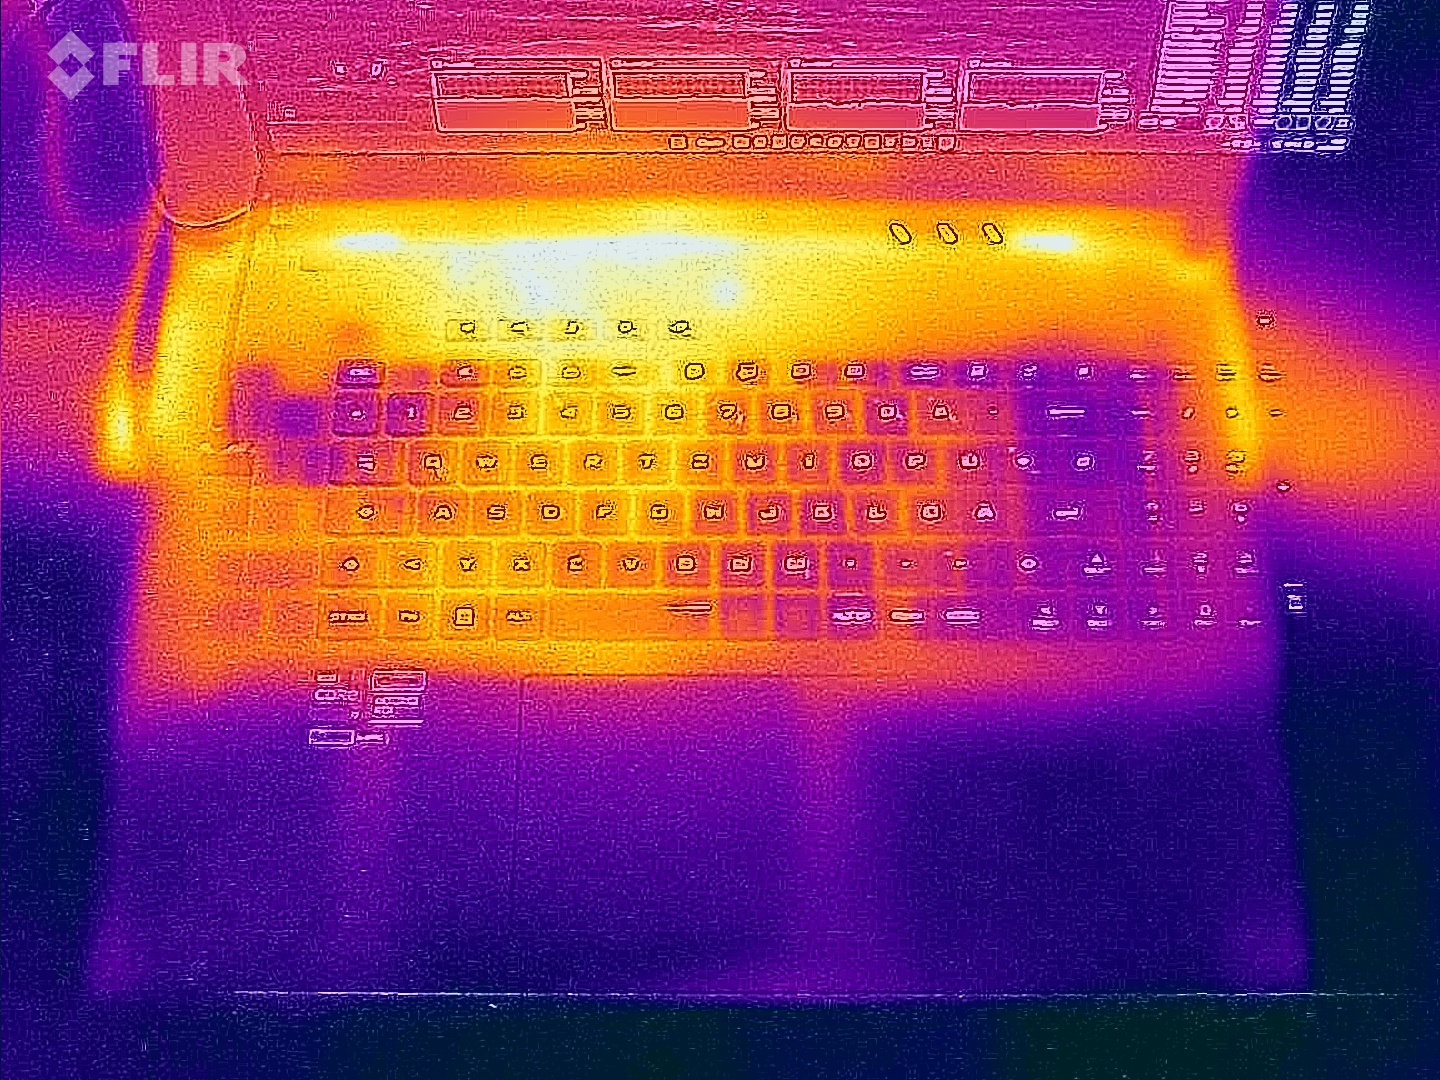
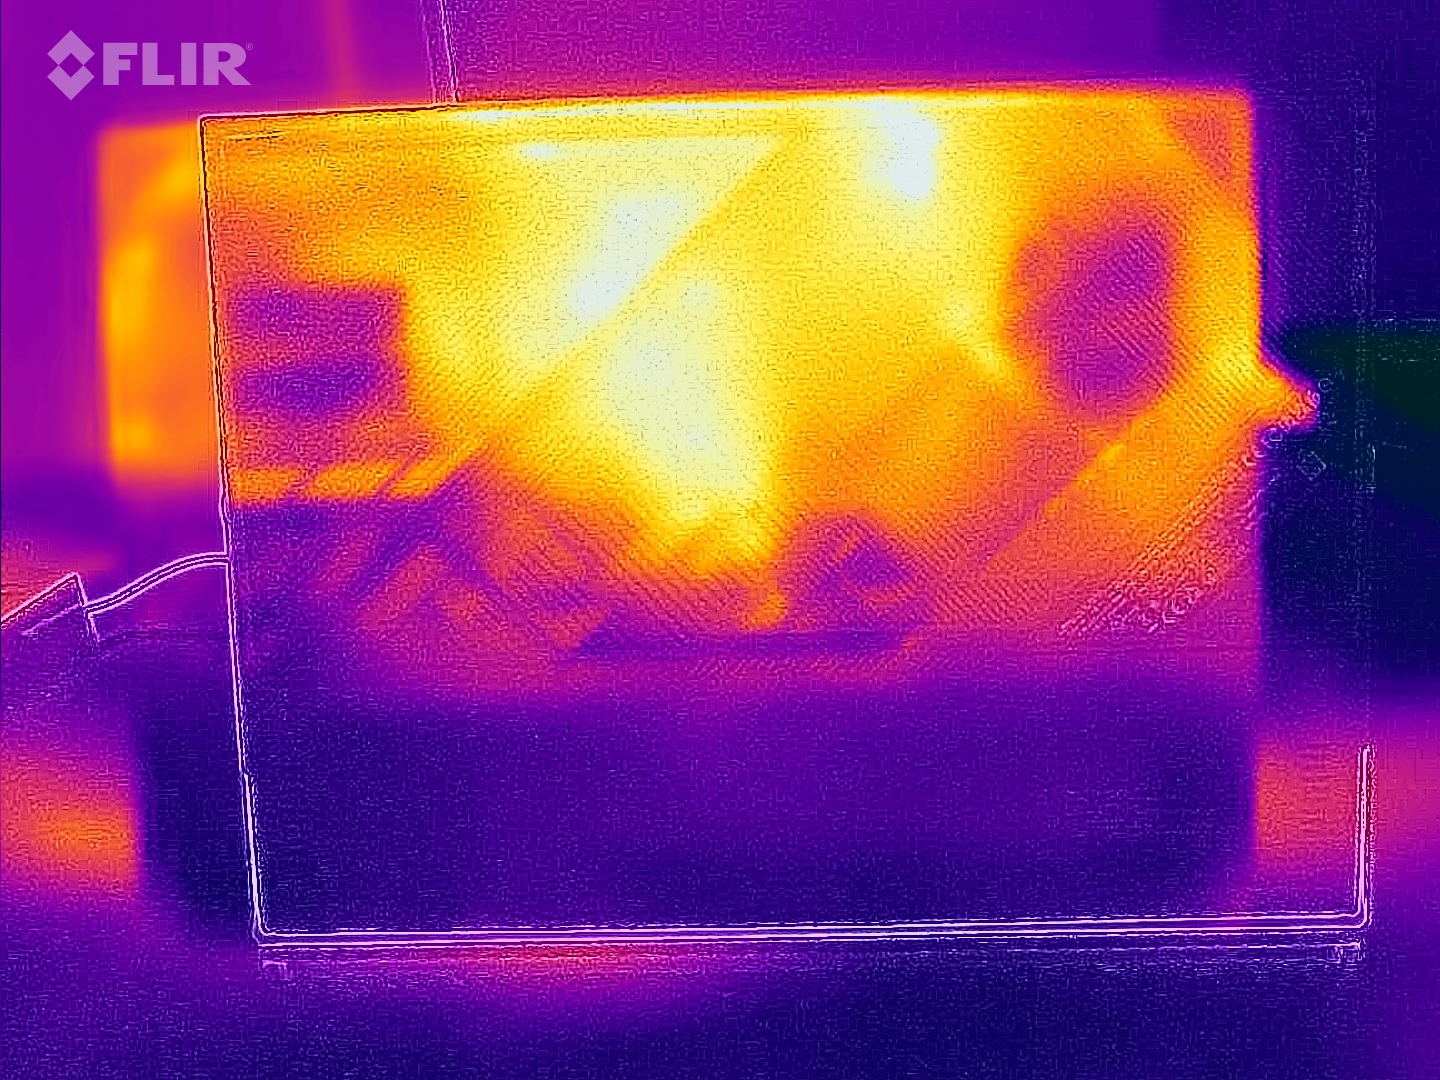
Quando se trata de temperatura, não há outliers. Enquanto o G18 é ligeiramente mais frio que o Blade 18 em uso ocioso, ele fica um pouco mais quente sob carga. Temperaturas máximas de 45 °C na parte superior da unidade e até 47 °C na base, são aceitáveis.
(±) A temperatura máxima no lado superior é 45 °C / 113 F, em comparação com a média de 40.4 °C / 105 F , variando de 21.2 a 68.8 °C para a classe Gaming.
(-) A parte inferior aquece até um máximo de 47 °C / 117 F, em comparação com a média de 43.2 °C / 110 F
(+) Em uso inativo, a temperatura média para o lado superior é 27 °C / 81 F, em comparação com a média do dispositivo de 33.9 °C / ### class_avg_f### F.
(±) Jogando The Witcher 3, a temperatura média para o lado superior é 36.8 °C / 98 F, em comparação com a média do dispositivo de 33.9 °C / ## #class_avg_f### F.
(+) Os apoios para as mãos e o touchpad estão atingindo a temperatura máxima da pele (32 °C / 89.6 F) e, portanto, não estão quentes.
(-) A temperatura média da área do apoio para as mãos de dispositivos semelhantes foi 28.8 °C / 83.8 F (-3.2 °C / -5.8 F).
| Asus ROG Strix G18 G814JI i7-13650HX, GeForce RTX 4070 Laptop GPU | Razer Blade 18 RTX 4070 i9-13950HX, GeForce RTX 4070 Laptop GPU | Gigabyte A7 X1 R9 5900HX, GeForce RTX 3070 Laptop GPU | Lenovo Legion 5 Pro 16ARH7H RTX 3070 Ti R7 6800H, GeForce RTX 3070 Ti Laptop GPU | Alienware x17 RTX 3080 P48E i7-11800H, GeForce RTX 3080 Laptop GPU | MSI Raider GE77 HX 12UHS i9-12900HX, GeForce RTX 3080 Ti Laptop GPU | |
|---|---|---|---|---|---|---|
| Heat | 4% | 1% | -5% | -17% | -29% | |
| Maximum Upper Side * (°C) | 45 | 39.2 13% | 44 2% | 43.8 3% | 58.4 -30% | 53 -18% |
| Maximum Bottom * (°C) | 47 | 35.6 24% | 49 -4% | 53 -13% | 49 -4% | 58 -23% |
| Idle Upper Side * (°C) | 28 | 31.8 -14% | 27 4% | 30 -7% | 33.6 -20% | 38 -36% |
| Idle Bottom * (°C) | 31 | 33.2 -7% | 30 3% | 31.8 -3% | 34.6 -12% | 43 -39% |
* ... menor é melhor
Teste de estresse
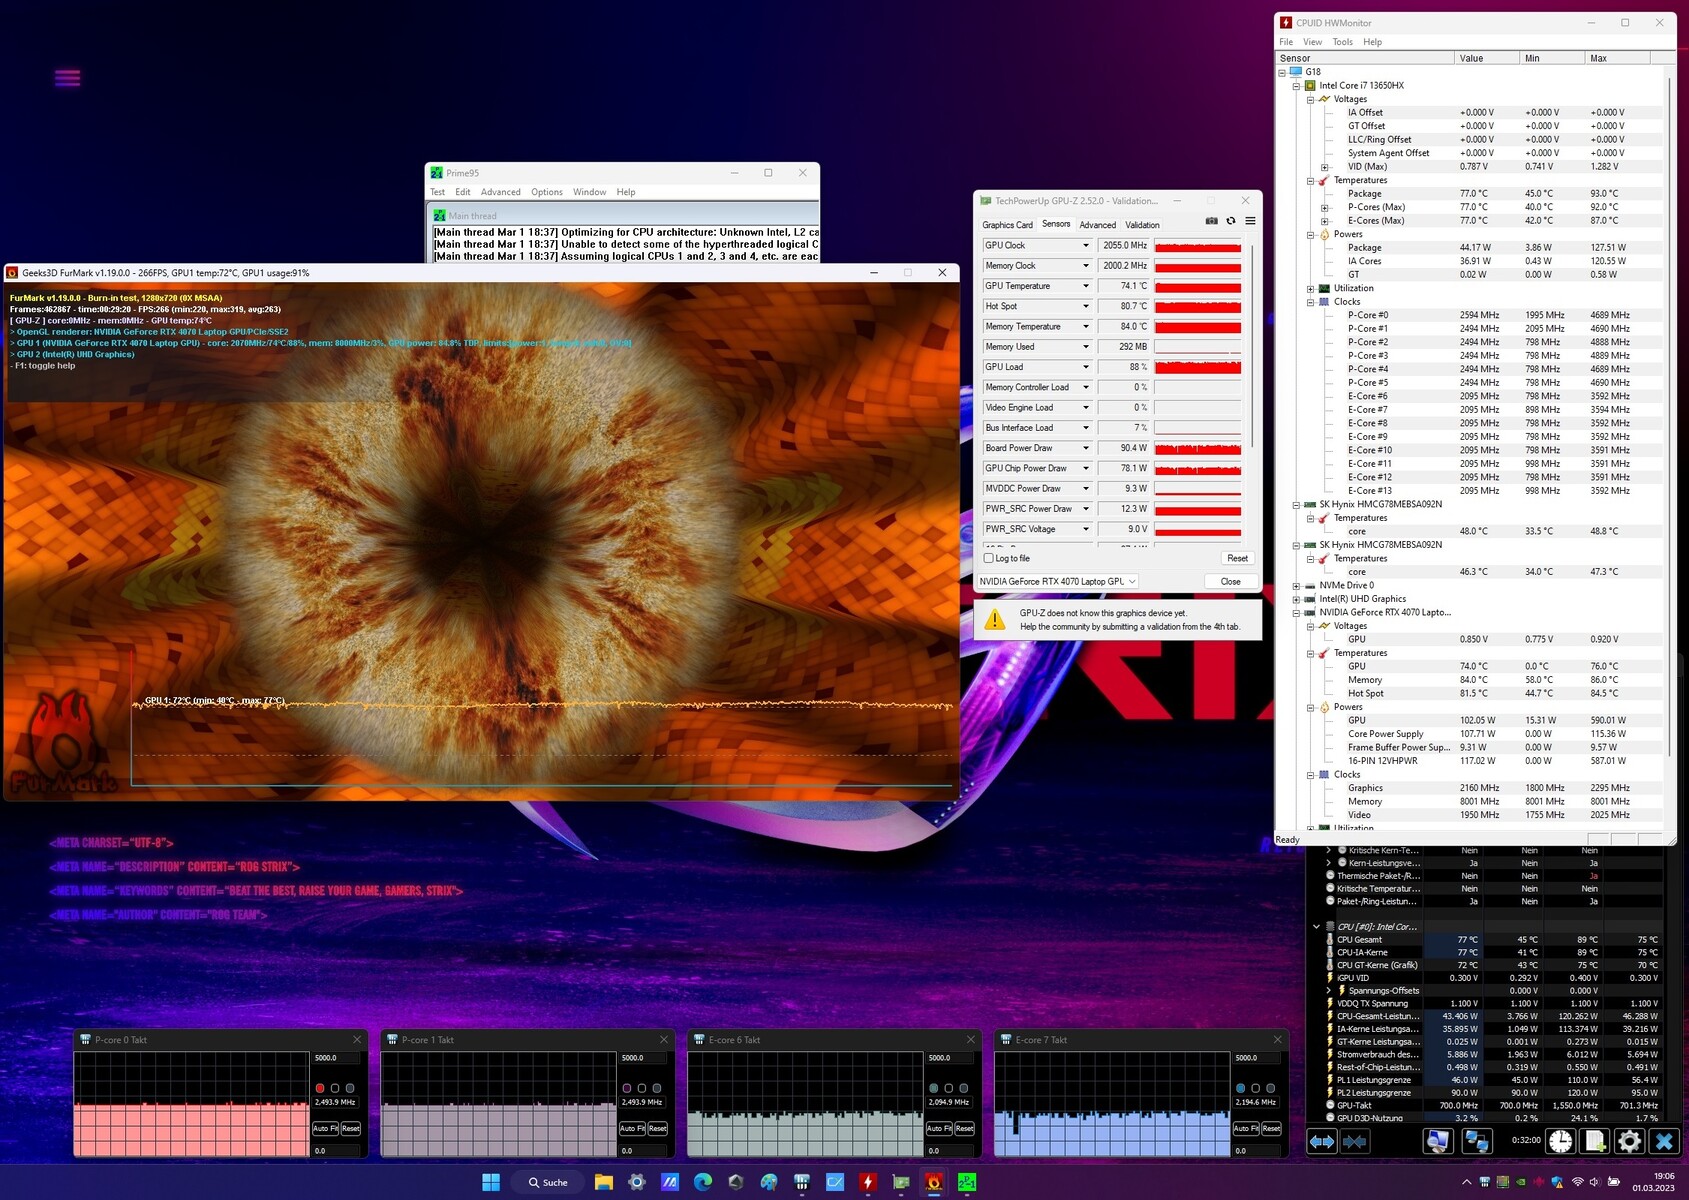
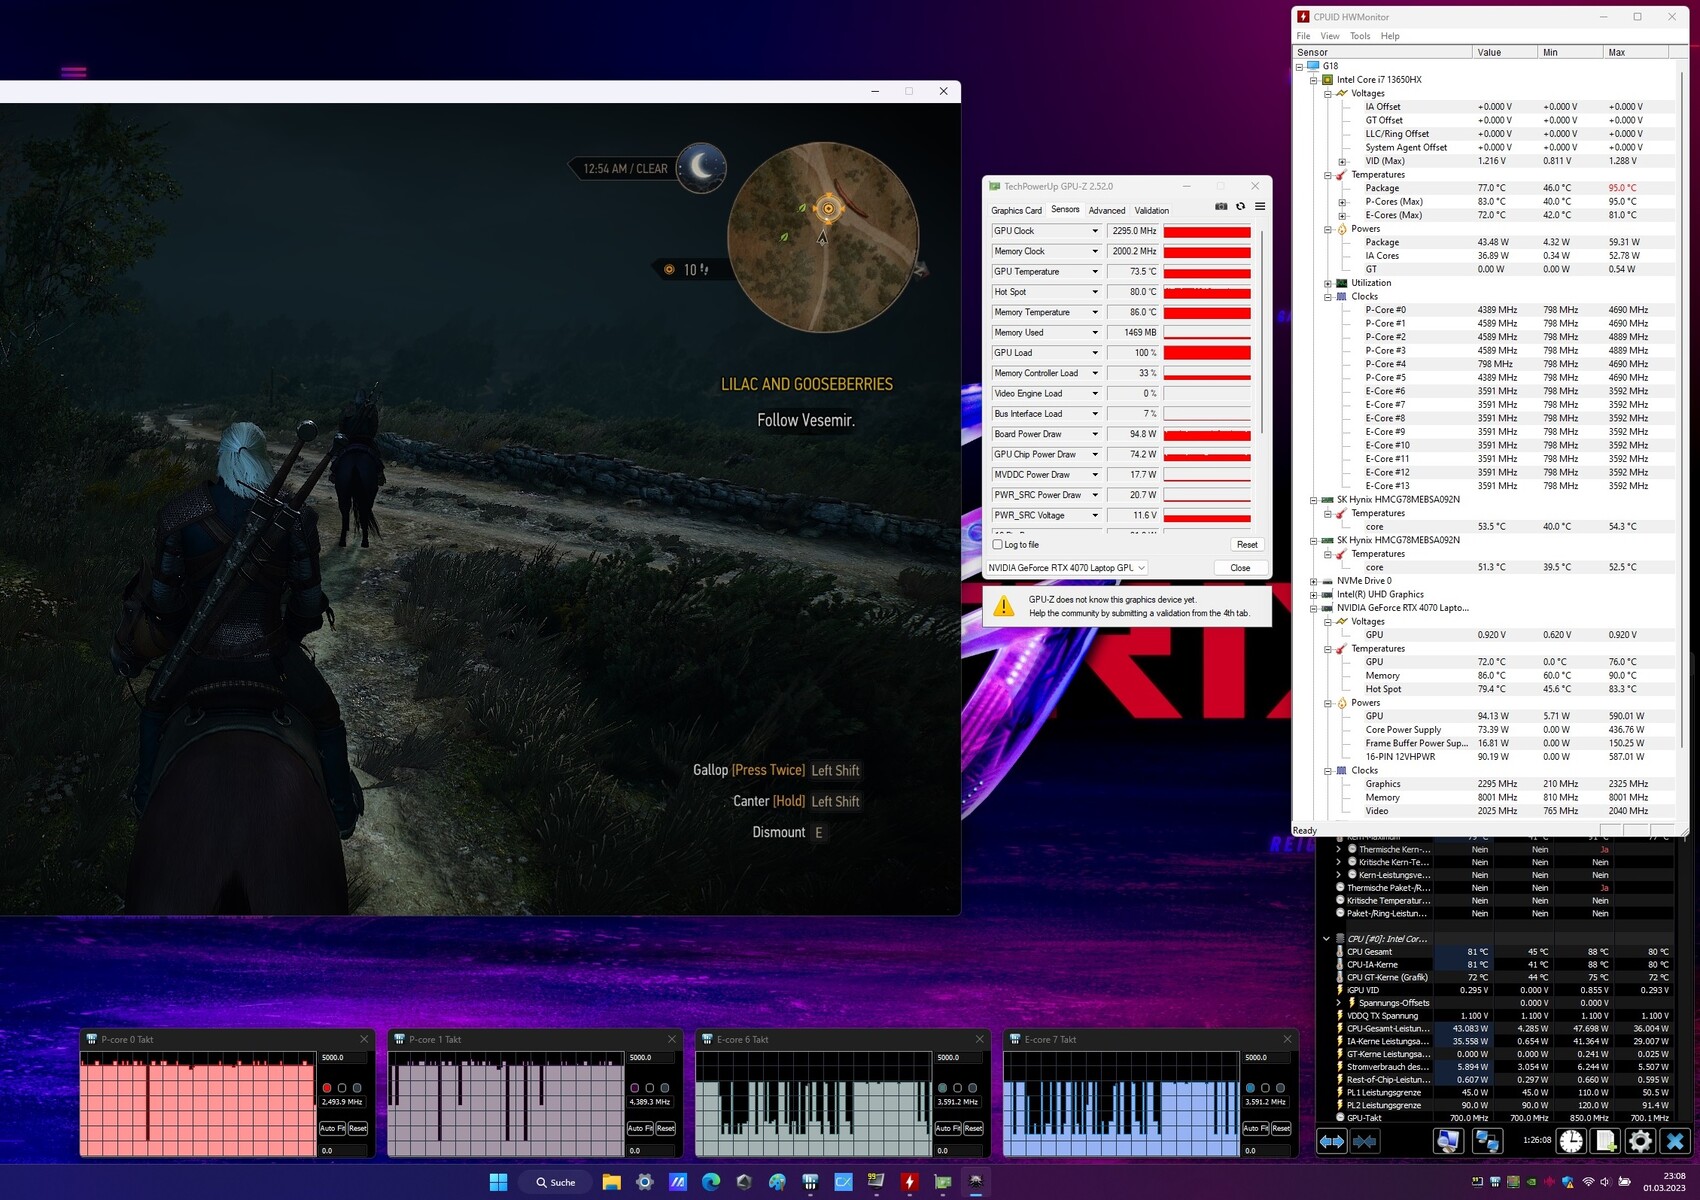
Nenhum dos componentes é excessivamente tributado quando o modo "Desempenho" é selecionado. No teste de estresse, utilizando as ferramentas Furmark e Prime95, bem como o Witcher 3, o Core i7-13650HX atingiu uma média de 77 °C - um valor moderado. O RTX 4070 atingiu cerca de 74 °C.
Oradores
A qualidade do som é bastante impressionante. O sistema 2.0 não mostrou nenhuma fraqueza gritante independentemente da faixa de freqüência, embora o Razer Blade 18 soasse ligeiramente melhor em nossa análise de áudio. Em troca, o G18 oferece um volume máximo marginalmente maior de até 88 dB(A). Desta forma, salas maiores podem ser preenchidas com som sem a necessidade de alto-falantes externos.
Asus ROG Strix G18 G814JI análise de áudio
(+) | os alto-falantes podem tocar relativamente alto (###valor### dB)
Graves 100 - 315Hz
(±) | graves reduzidos - em média 10.2% menor que a mediana
(+) | o baixo é linear (5.6% delta para a frequência anterior)
Médios 400 - 2.000 Hz
(+) | médios equilibrados - apenas 3.8% longe da mediana
(+) | médios são lineares (4% delta para frequência anterior)
Altos 2 - 16 kHz
(+) | agudos equilibrados - apenas 2.8% longe da mediana
(±) | a linearidade dos máximos é média (7% delta para frequência anterior)
Geral 100 - 16.000 Hz
(+) | o som geral é linear (11.5% diferença em relação à mediana)
Comparado com a mesma classe
» 10% de todos os dispositivos testados nesta classe foram melhores, 3% semelhantes, 87% piores
» O melhor teve um delta de 6%, a média foi 18%, o pior foi 132%
Comparado com todos os dispositivos testados
» 8% de todos os dispositivos testados foram melhores, 2% semelhantes, 90% piores
» O melhor teve um delta de 4%, a média foi 23%, o pior foi 134%
Razer Blade 18 RTX 4070 análise de áudio
(+) | os alto-falantes podem tocar relativamente alto (###valor### dB)
Graves 100 - 315Hz
(±) | graves reduzidos - em média 7.5% menor que a mediana
(±) | a linearidade dos graves é média (9.2% delta para a frequência anterior)
Médios 400 - 2.000 Hz
(+) | médios equilibrados - apenas 3.5% longe da mediana
(+) | médios são lineares (4.1% delta para frequência anterior)
Altos 2 - 16 kHz
(+) | agudos equilibrados - apenas 4.8% longe da mediana
(+) | os máximos são lineares (3.8% delta da frequência anterior)
Geral 100 - 16.000 Hz
(+) | o som geral é linear (9.2% diferença em relação à mediana)
Comparado com a mesma classe
» 3% de todos os dispositivos testados nesta classe foram melhores, 1% semelhantes, 96% piores
» O melhor teve um delta de 6%, a média foi 18%, o pior foi 132%
Comparado com todos os dispositivos testados
» 3% de todos os dispositivos testados foram melhores, 1% semelhantes, 96% piores
» O melhor teve um delta de 4%, a média foi 23%, o pior foi 134%
Gestão de energia
Consumo de energia
Em operação ociosa com a chave gráfica ativa, o laptop de 18 polegadas consome muito pouca energia. Níveis de 8 a 26 watts são completamente aceitáveis para um laptop para jogos. Sob carga, este valor de consumo sobe de 102 (nota média no 3DMark 06) para 267 watts (valor máximo do teste de estresse). A unidade de alimentação de 280 watts fornecida é também um bom tamanho. Quando se joga, pode-se contar com cerca de 180 watts que é um pouco menor do que o Blade 18, apesar do desempenho 3D comparável (com um Core i9-13950HX, a máquina Razer tem uma CPU mais potente e mais faminta).
| desligado | |
| Ocioso | |
| Carga |
|
Key:
min: | |
| Asus ROG Strix G18 G814JI i7-13650HX, GeForce RTX 4070 Laptop GPU | Razer Blade 18 RTX 4070 i9-13950HX, GeForce RTX 4070 Laptop GPU | Gigabyte A7 X1 R9 5900HX, GeForce RTX 3070 Laptop GPU | Lenovo Legion 5 Pro 16ARH7H RTX 3070 Ti R7 6800H, GeForce RTX 3070 Ti Laptop GPU | Alienware x17 RTX 3080 P48E i7-11800H, GeForce RTX 3080 Laptop GPU | MSI Raider GE77 HX 12UHS i9-12900HX, GeForce RTX 3080 Ti Laptop GPU | Média da turma Gaming | |
|---|---|---|---|---|---|---|---|
| Power Consumption | -77% | -6% | -17% | -35% | -35% | -18% | |
| Idle Minimum * (Watt) | 8 | 24.5 -206% | 12 -50% | 9.7 -21% | 10.2 -27% | 13 -63% | 13.1 ? -64% |
| Idle Average * (Watt) | 15 | 34.1 -127% | 14 7% | 14.8 1% | 21.2 -41% | 19 -27% | 19 ? -27% |
| Idle Maximum * (Watt) | 26 | 47.7 -83% | 19 27% | 45.8 -76% | 48.4 -86% | 29 -12% | 24.6 ? 5% |
| Load Average * (Watt) | 102 | 140 -37% | 118 -16% | 87.2 15% | 118.7 -16% | 143 -40% | 111.3 ? -9% |
| Witcher 3 ultra * (Watt) | 178.6 | 202 -13% | 205 -15% | 209 -17% | 249 -39% | 247 -38% | |
| Load Maximum * (Watt) | 267 | 261 2% | 229 14% | 275.3 -3% | 262 2% | 352 -32% | 260 ? 3% |
* ... menor é melhor
Power consumption Witcher 3 / stress test
Power consumption with an external monitor
Duração da bateria
Desde que você não peça ao G18 para executar aplicações 3D, a vida útil da bateria é surpreendentemente boa para um laptop de jogos. Com quase 12 horas de uso inativo com brilho mínimo e cerca de 8 horas de navegação na Internet com um brilho reduzido de 150 cd/m², o G18 deixa a concorrência para trás, apesar de oferecer principalmente baterias entre 80 e 100 Wh (o G18 possui 90 Wh).
| Asus ROG Strix G18 G814JI i7-13650HX, GeForce RTX 4070 Laptop GPU, 90 Wh | Razer Blade 18 RTX 4070 i9-13950HX, GeForce RTX 4070 Laptop GPU, 91.7 Wh | Gigabyte A7 X1 R9 5900HX, GeForce RTX 3070 Laptop GPU, 48.96 Wh | Lenovo Legion 5 Pro 16ARH7H RTX 3070 Ti R7 6800H, GeForce RTX 3070 Ti Laptop GPU, 80 Wh | Alienware x17 RTX 3080 P48E i7-11800H, GeForce RTX 3080 Laptop GPU, 87 Wh | MSI Raider GE77 HX 12UHS i9-12900HX, GeForce RTX 3080 Ti Laptop GPU, 99.99 Wh | Média da turma Gaming | |
|---|---|---|---|---|---|---|---|
| Duração da bateria | -28% | -21% | -46% | -33% | 6% | -7% | |
| Reader / Idle (h) | 11.7 | 7 -40% | 7 -40% | 9.8 -16% | 7.84 ? -33% | ||
| WiFi v1.3 (h) | 8.1 | 4 -51% | 4.7 -42% | 4.4 -46% | 5.9 -27% | 5.4 -33% | 7.08 ? -13% |
| Load (h) | 1.2 | 1.3 8% | 1.2 0% | 0.8 -33% | 2 67% | 1.496 ? 25% | |
| H.264 (h) | 6.5 | 8.27 ? |
Pro
Contra
Veredicto
Com o ROG Strix G18 G814JI, a Asus fez uma estreia quase sempre boa no ainda bastante novo segmento de laptops de 18 polegadas.
A caixa da unidade base mostra alguns sinais de fraqueza na área de estabilidade e é algo que tem um efeito na percepção da qualidade dos dispositivos de entrada (o chassi tende a chacoalhar um pouco). No entanto, graças às generosas características da porta (incl. Thunderbolt 4), um design marcante e uma iluminação extensa (teclado, fita de LED na frente), os jogadores obtêm uma plataforma de jogo adequada.
Mesmo que o Asus tenha decidido contra um visor Mini LED ou OLED, (esta última tecnologia também tem suas desvantagens), nós gostamos da qualidade da imagem. Brilho e tempos de resposta, assim como espaço de cor e precisão de cor, não têm motivo para se esconder da concorrência. Além disso, o G18 também merece elogios por sua duração relativamente longa da bateria.
O veredicto sobre o desempenho (3D) está um pouco dividido. Enquanto o Core i7-13650HX faz uma estréia bem-sucedida, a placa gráfica levanta algumas questões.
Não é inteiramente possível entender o que Nvidia estava pensando com a versão móvel doRTX 4070as especificações (VRAM de 8 GB, interface de 128 bits, ...) não estão atualizadas nem fazem jus ao preço de compra. Não apenas sua liderança sobre a geração mais velha é freqüentemente pequena, mas os custos para o usuário final aumentaram drasticamente (compare, por exemplo, com o preço de compra,Computadores portáteis RTX 3070 Ti).
Assim, os jogadores que estão à procura de um laptop devem talvez olhar para a geração anterior ou até tratar-se de um dispositivo com umRTX 4080.
Se tiver absolutamente que ser uma máquina de 18 polegadas, uma alternativa melhor seria um dispositivo referido muitas vezes na revisão, oLâmina Razer 18.
Preço e disponibilidade
A Asus ROG Strix G18 G814JI-N6051W com um display Core i7-13650HX, GeForce RTX 4070 e WQXGA, ainda não está disponível em várias lojas online.
Asus ROG Strix G18 G814JI
- 03/07/2023 v7 (old)
Florian Glaser
Transparência
A seleção dos dispositivos a serem analisados é feita pela nossa equipe editorial. A amostra de teste foi fornecida ao autor como empréstimo pelo fabricante ou varejista para fins desta revisão. O credor não teve influência nesta revisão, nem o fabricante recebeu uma cópia desta revisão antes da publicação. Não houve obrigação de publicar esta revisão. Como empresa de mídia independente, a Notebookcheck não está sujeita à autoridade de fabricantes, varejistas ou editores.
É assim que o Notebookcheck está testando
Todos os anos, o Notebookcheck analisa de forma independente centenas de laptops e smartphones usando procedimentos padronizados para garantir que todos os resultados sejam comparáveis. Desenvolvemos continuamente nossos métodos de teste há cerca de 20 anos e definimos padrões da indústria no processo. Em nossos laboratórios de teste, equipamentos de medição de alta qualidade são utilizados por técnicos e editores experientes. Esses testes envolvem um processo de validação em vários estágios. Nosso complexo sistema de classificação é baseado em centenas de medições e benchmarks bem fundamentados, o que mantém a objetividade.Price comparison

