Análise do laptop Asus ROG Strix Scar 16 (2024): Desempenho ardente e brilho de mini LEDs com um preço compatível
")
A Asus atualizou toda a sua linha de laptops na CES 2024. Entre as variantes para jogos de 2024, analisamos o ROG Zephyrus G14, ROG Zephyrus G16e o ROG Strix Scar 18 até agora. Hoje, vamos dar uma olhada no novo ROG Strix Scar 16.
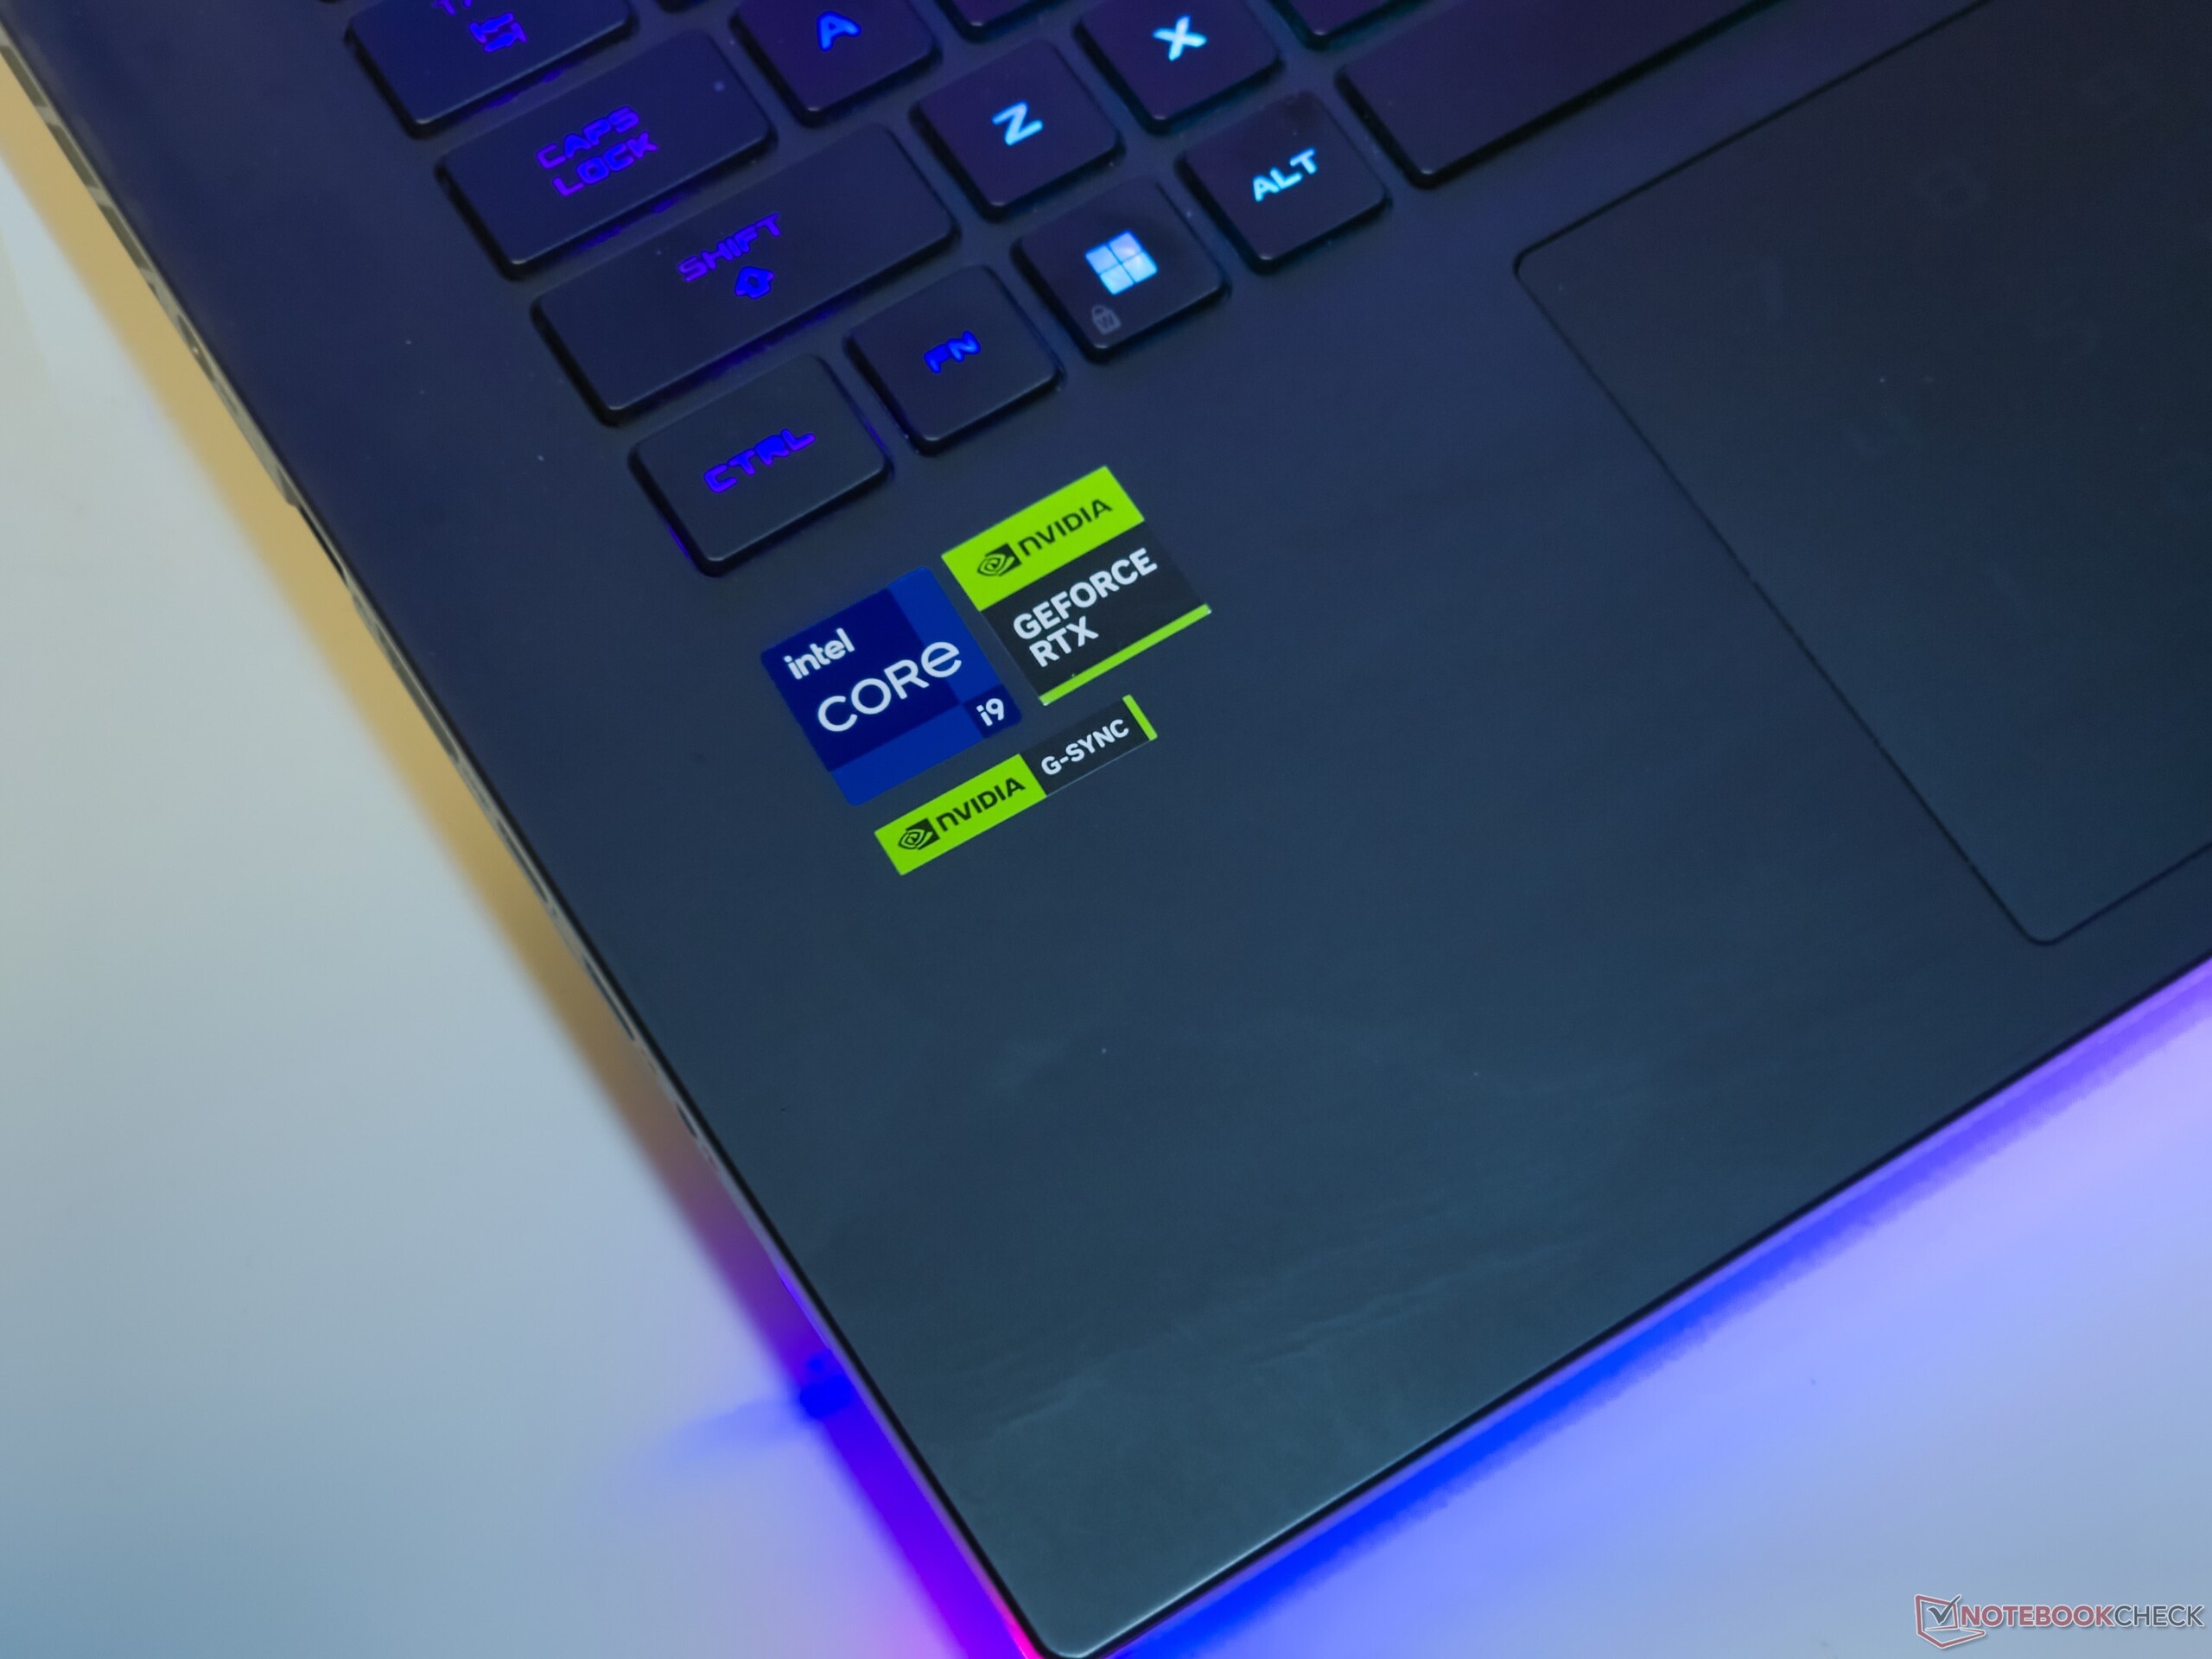
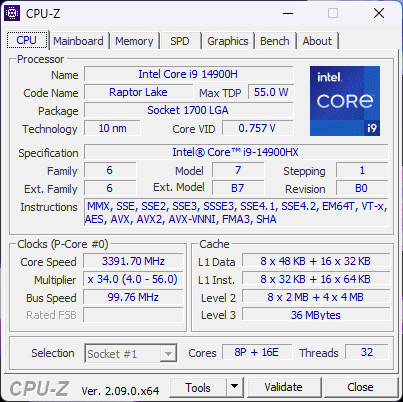
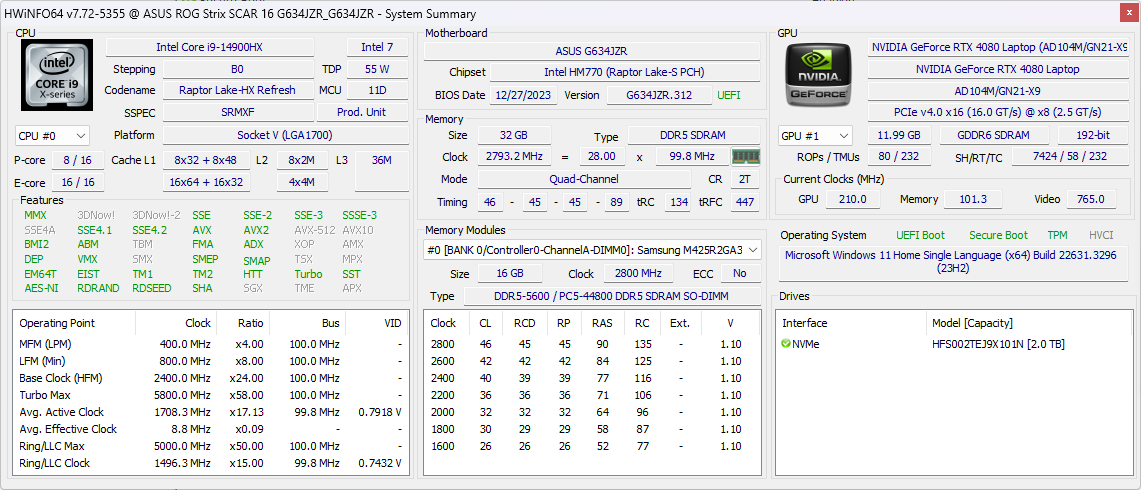
O ROG Strix Scar 16 é voltado para o público de jogos de alto escalão e tem o hardware necessário para começar. Nosso dispositivo de teste é baseado no Intel Core i9-14900HX Raptor Lake-HX, complementado por um processador de 175 W GPU para laptop Nvidia GeForce RTX 4080.
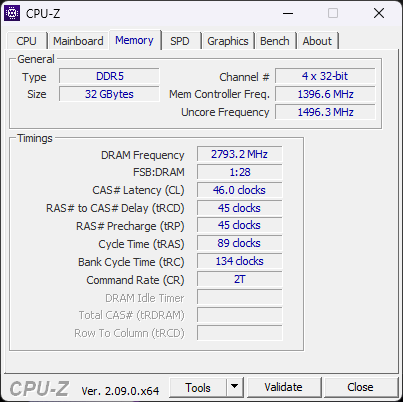
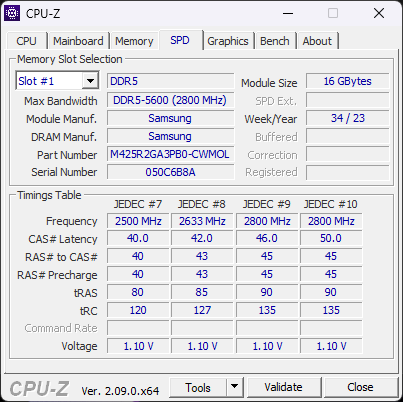
Outras especificações dignas de babar incluem 32 GB de RAM DDR5-5600, um SSD NVMe de 2 TB e uma tela mini-LED G-Sync QHD+ 240 Hz que, juntas, não hesitam em abrir um buraco de ₹2,89,990 (~US$3.473) na sua carteira.
Possíveis concorrentes em comparação
Avaliação | Data | Modelo | Peso | Altura | Size | Resolução | Preço |
|---|---|---|---|---|---|---|---|
| 87.6 % v7 (old) | 04/2024 | Asus ROG Strix Scar 16 G634JZR i9-14900HX, GeForce RTX 4080 Laptop GPU | 2.7 kg | 30.4 mm | 16.00" | 2560x1600 | |
| 87.2 % v7 (old) | 08/2023 | Asus ROG Strix Scar 17 G733PYV-LL053X R9 7945HX3D, GeForce RTX 4090 Laptop GPU | 2.9 kg | 28.3 mm | 17.30" | 2560x1440 | |
| 88.4 % v7 (old) | 03/2023 | Asus ROG Strix G16 G614JZ i9-13980HX, GeForce RTX 4080 Laptop GPU | 2.4 kg | 30.4 mm | 16.00" | 2560x1600 | |
| 89.5 % v7 (old) | 03/2024 | Lenovo Legion Pro 7 16IRX9H i9-14900HX, GeForce RTX 4080 Laptop GPU | 2.7 kg | 21.95 mm | 16.00" | 2560x1600 | |
| 86.7 % v7 (old) | 02/2024 | HP Omen 16 (2024) i9-14900HX, GeForce RTX 4080 Laptop GPU | 2.4 kg | 23.5 mm | 16.10" | 2560x1440 | |
| 88 % v7 (old) | 02/2024 | MSI Vector 16 HX A14V i9-14900HX, GeForce RTX 4080 Laptop GPU | 2.7 kg | 28.55 mm | 16.00" | 2560x1600 | |
| 90.2 % v7 (old) | 03/2024 | Alienware m16 R2 Ultra 7 155H, GeForce RTX 4070 Laptop GPU | 2.5 kg | 23.5 mm | 16.00" | 2560x1600 |
Chassi: Principalmente de plástico com um peek-a-boo translúcido
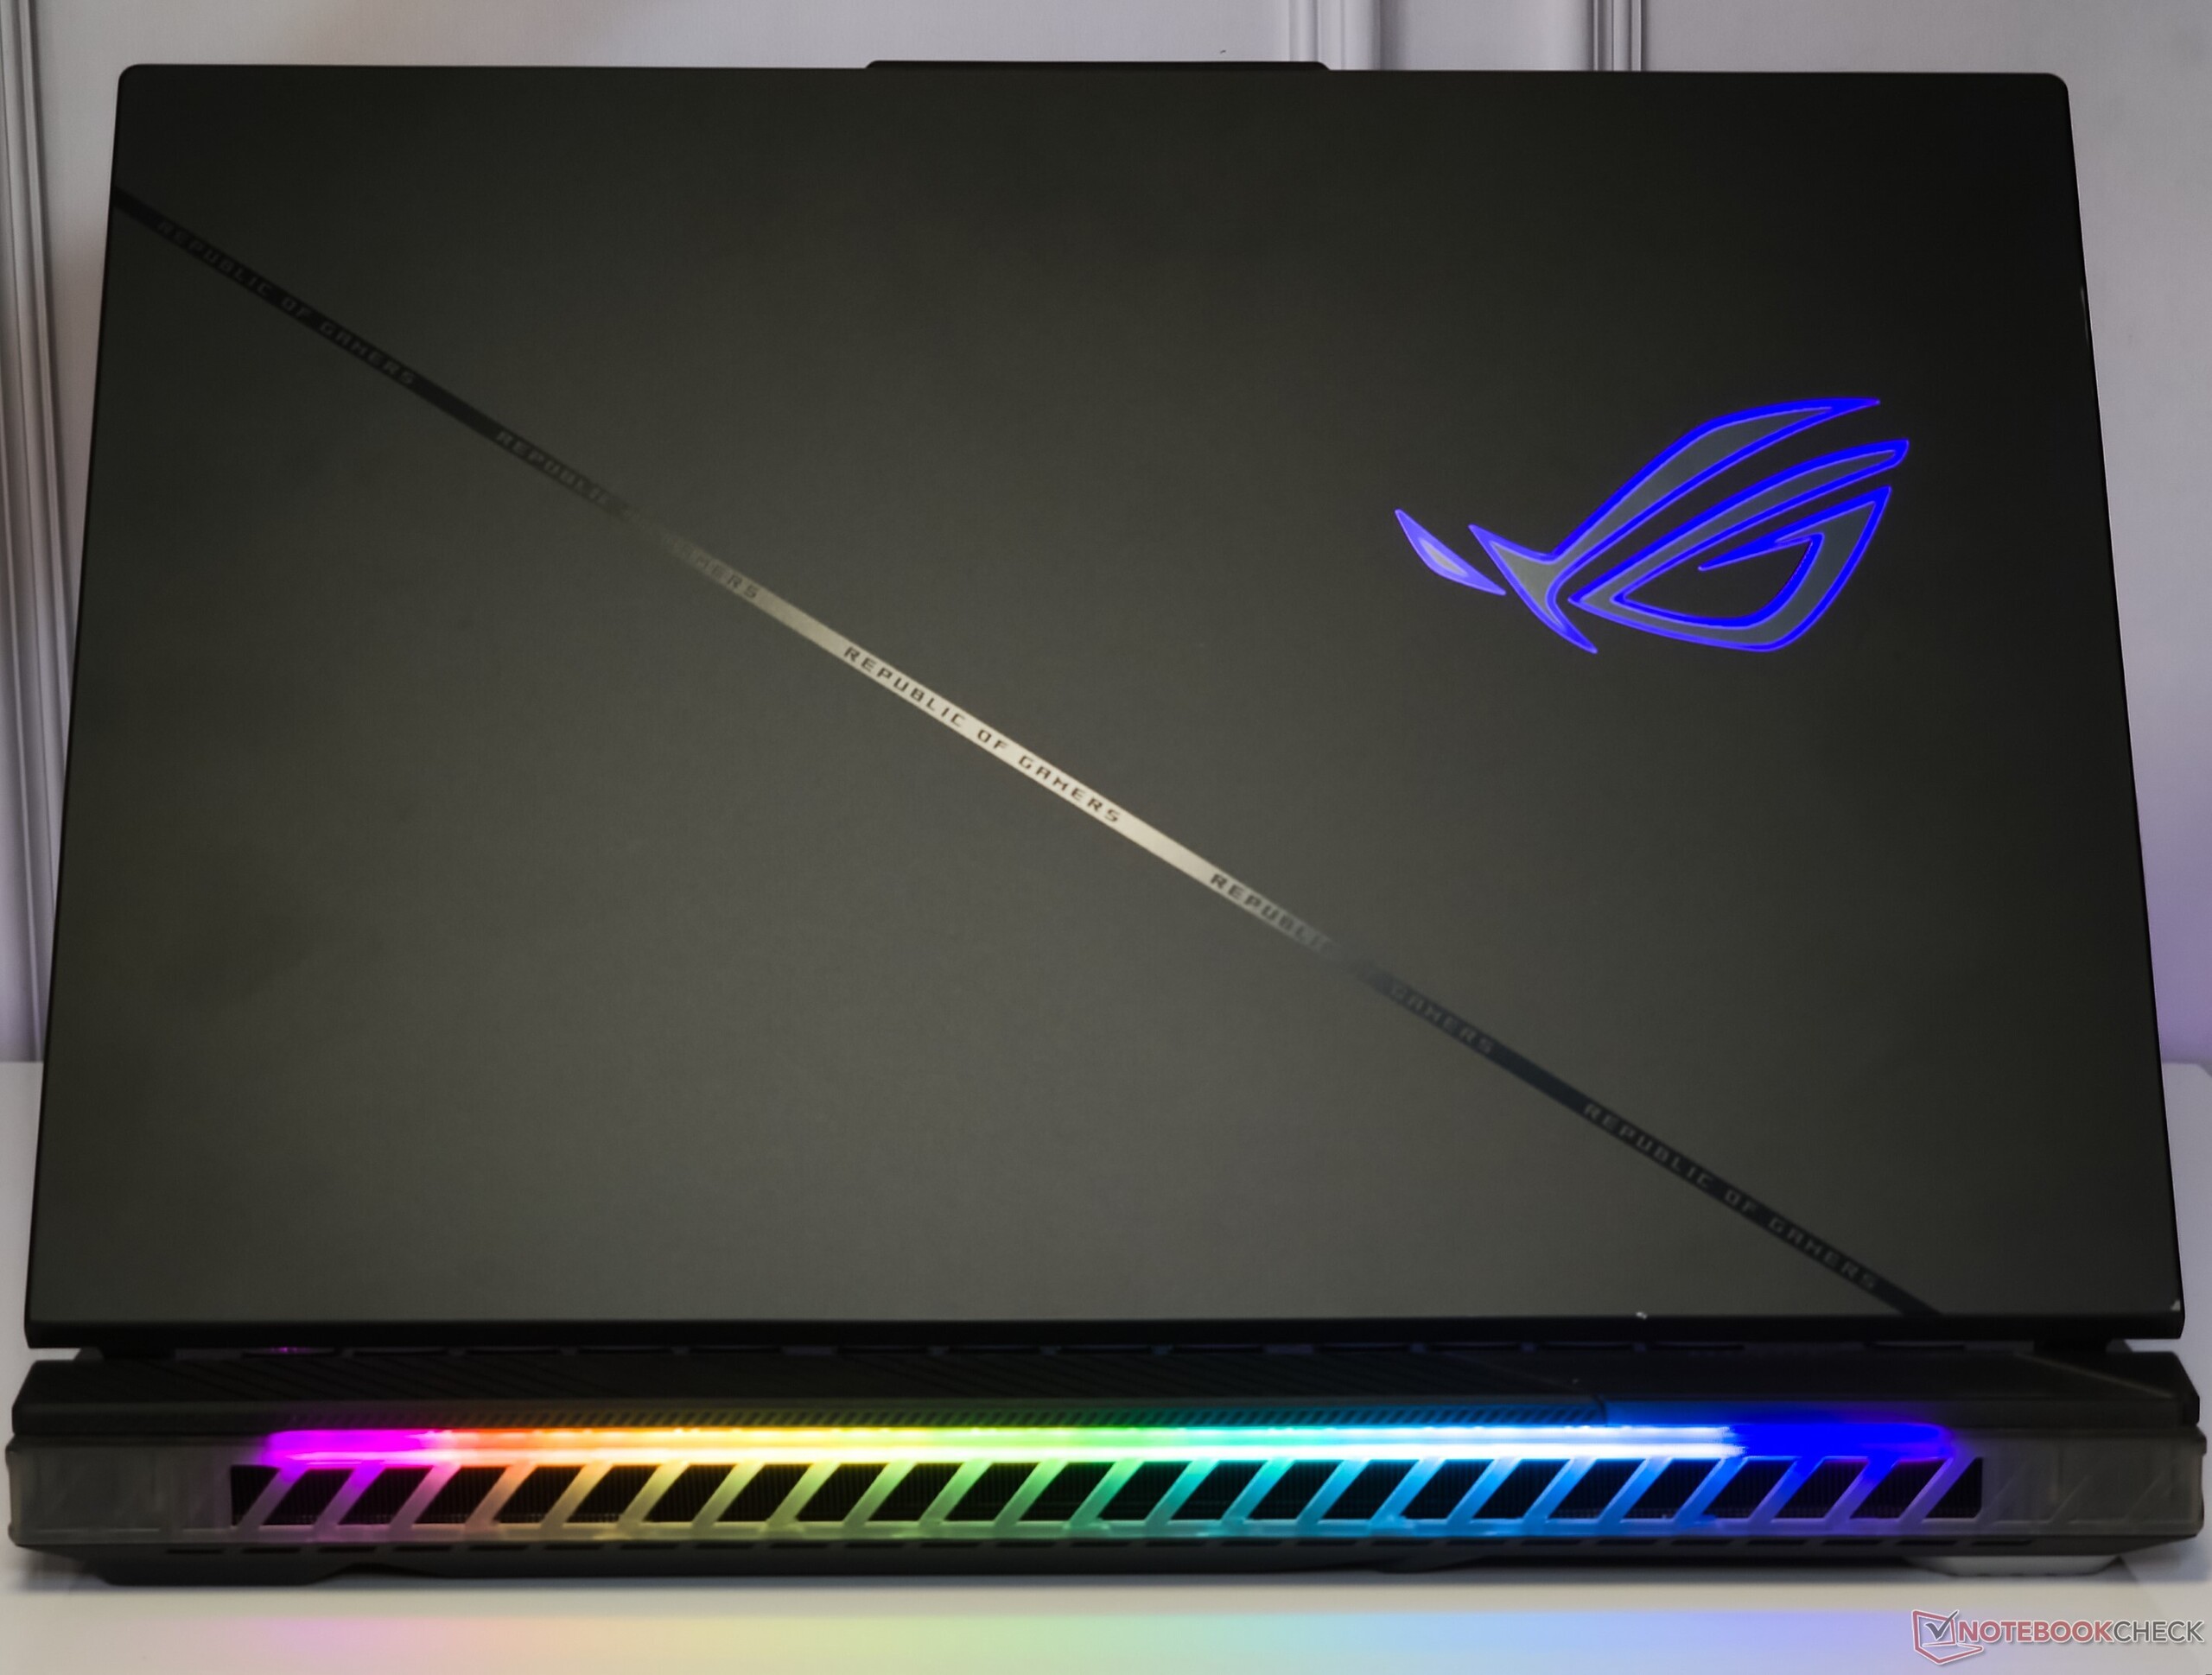
O ROG Strix Scar 16 deste ano apresenta uma linguagem de design familiar, como já vimos antes com o 2022 Scar 15 mas agora é 350 g mais pesada, pesando 2,65 kg.
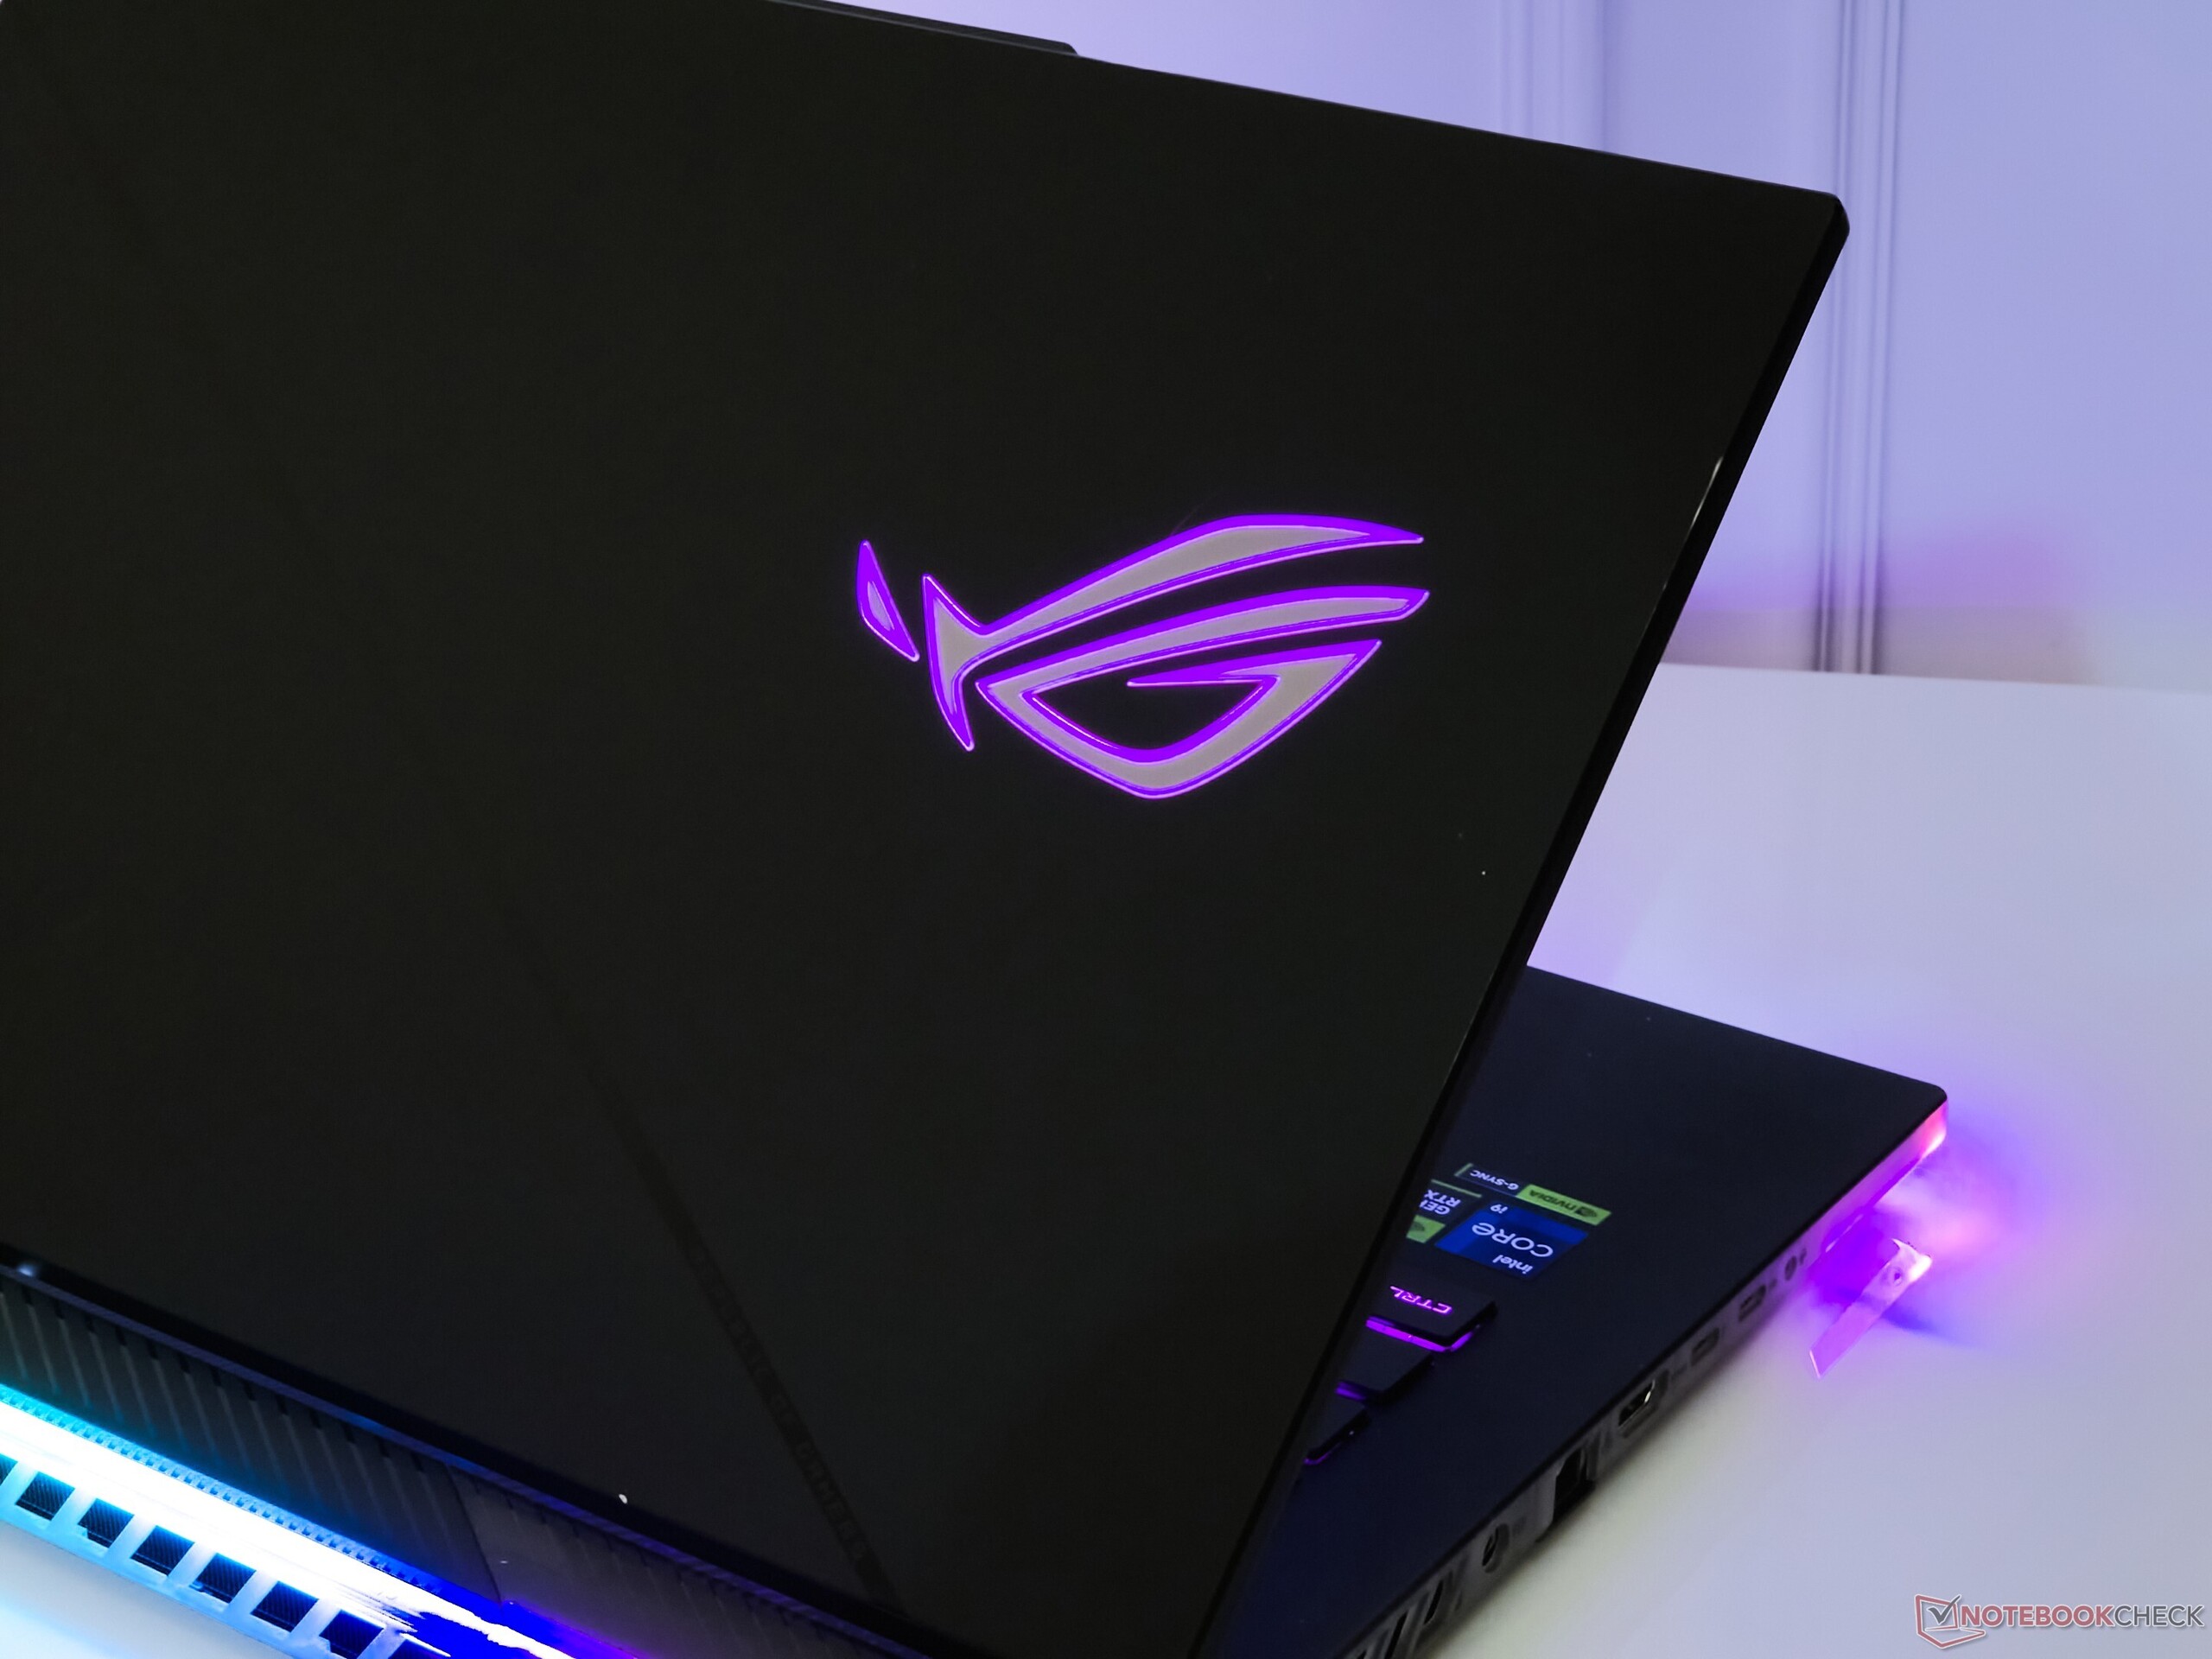
O chassi não se flexiona, apesar de ser uma construção de plástico. A tampa de alumínio com acabamento fosco também parece bastante resistente, com dobradiças estáveis.
A tampa pode ser aberta com um único dedo sem que o laptop deslize sobre a mesa, o que é evitado pela base emborrachada.
Os observadores atentos da série Scar notarão que o teclado não apresenta mais a faixa diagonal branca com o logotipo da ROG.
A parte superior da plataforma do teclado permanece translúcida como antes, oferecendo uma espiada nos componentes internos por baixo. No entanto, a Asus fez pouco para tornar a plataforma resistente a impressões digitais e gordura.
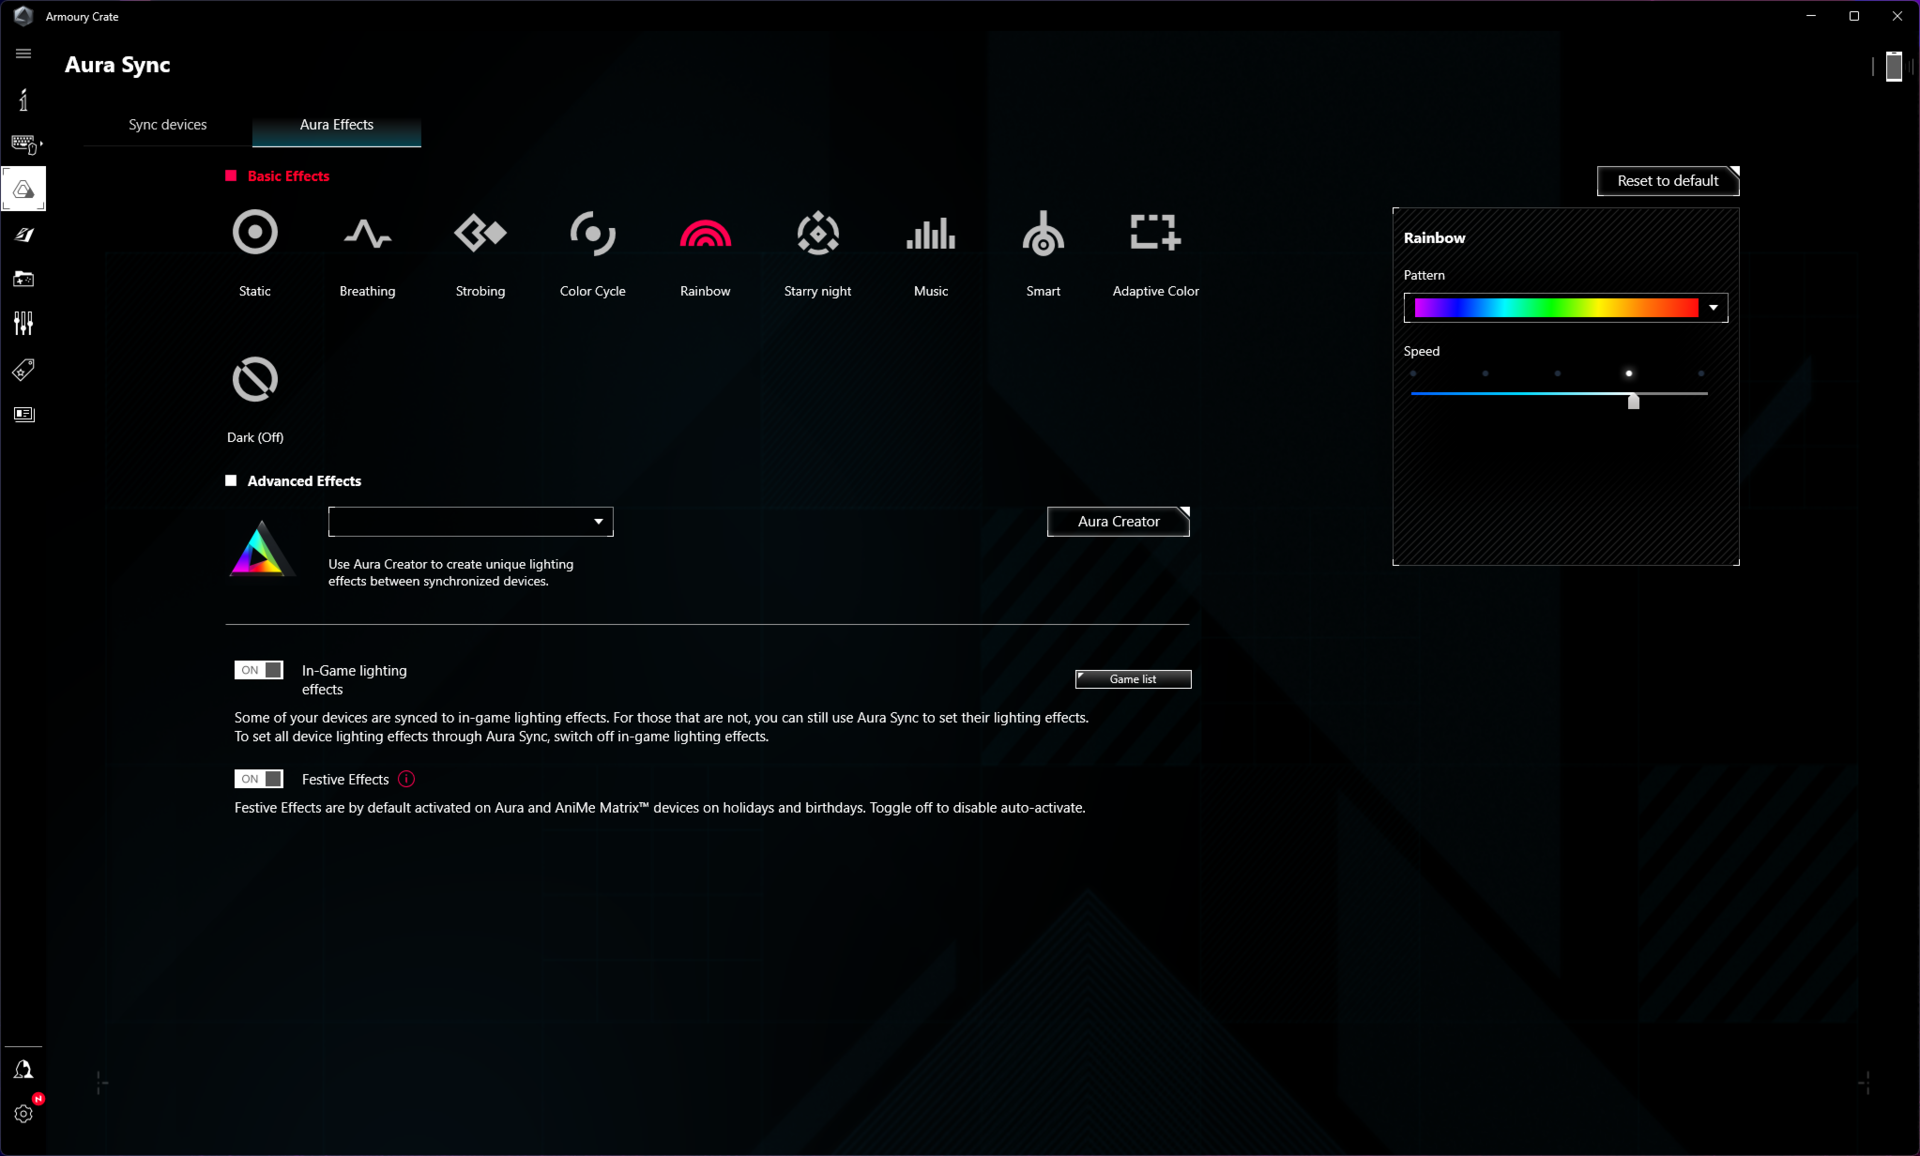
O teclado, a base, a parte traseira e o logotipo da ROG do Scar 16 são revestidos de cores RGB que podem ser controladas e personalizadas via Armory Crate. No entanto, não há nenhuma maneira aparente de iluminar individualmente essas áreas - ou é tudo RGB ou nada.
Fiel ao espírito do Scar, a Asus permite que o senhor faça um design personalizado e imprima em 3D as tampas do ROG Armor para um toque de personalização.


Conectividade: Wi-Fi 5 medíocre e potência USB de 100 W
O ROG Strix Scar 16 usa o mesmo layout de porta e funcionalidade da iteração do ano passado. A Asus não oferece mais o ROG Keystone, que há muito tempo é uma característica definidora da série Scar, apesar de sua utilidade duvidosa.
A distribuição das portas é desigual. Com exceção de duas portas USB 3.2 Gen2 Tipo A no lado direito, todas as portas adicionais estão localizadas no lado esquerdo. No entanto, as portas estão confortavelmente espaçadas e não representam obstáculos para a conexão de vários periféricos.
Há duas portas USB Tipo C, uma das quais é Thunderbolt 4. A porta Thunderbolt 4 permite a saída DisplayPort 1.4, mas sem carregamento. A porta USB 3.2 Gen2 Type-C, por outro lado, não só oferece DisplayPort-out, mas também 100 W de potência.
A parte traseira é totalmente reservada para acomodar o aparelho de resfriamento e, portanto, não tem portas.


Comunicação

Os notebooks em 2024 estão lentamente aderindo à tendência do Wi-Fi 7, embora o suporte para o padrão só esteja previsto para chegar quando o Windows 11 24H2 começar a ser lançado no final deste ano. O Scar 16, portanto, se contenta com o chip Intel Wi-Fi AX211 normal.
Testar o Scar 16 com nosso roteador de referência Asus ROG Rapture GT-AXE11000 revelou uma taxa de transferência relativamente menor na banda Wi-Fi 5 em comparação com a concorrência. No entanto, o desempenho é bastante estável, sem grandes quedas de velocidade.
O desempenho no Wi-Fi 6E foi nitidamente melhor, com velocidades de transmissão e recepção de até 1,5 Gbps e 1,74 Gbps, respectivamente, mas observamos uma limitação momentânea durante o teste de transmissão.
| Networking / iperf3 transmit AXE11000 | |
| Asus ROG Strix G16 G614JZ | |
| HP Omen 16 (2024) | |
| Lenovo Legion Pro 7 16IRX9H | |
| Média da turma Gaming (560 - 1862, n=88, últimos 2 anos) | |
| Média Intel Wi-Fi 6E AX211 (64 - 1921, n=276) | |
| Alienware m16 R2 | |
| MSI Vector 16 HX A14V | |
| Asus ROG Strix Scar 16 G634JZR | |
| Networking / iperf3 receive AXE11000 | |
| HP Omen 16 (2024) | |
| Lenovo Legion Pro 7 16IRX9H | |
| Asus ROG Strix G16 G614JZ | |
| Média da turma Gaming (680 - 1745, n=88, últimos 2 anos) | |
| Média Intel Wi-Fi 6E AX211 (582 - 1890, n=276) | |
| MSI Vector 16 HX A14V | |
| Alienware m16 R2 | |
| Asus ROG Strix Scar 16 G634JZR | |
| Networking / iperf3 transmit AXE11000 6GHz | |
| Asus ROG Strix Scar 16 G634JZR | |
| Média da turma Gaming (723 - 1868, n=36, últimos 2 anos) | |
| MSI Vector 16 HX A14V | |
| Alienware m16 R2 | |
| Média Intel Wi-Fi 6E AX211 (385 - 1851, n=226) | |
| Networking / iperf3 receive AXE11000 6GHz | |
| Asus ROG Strix Scar 16 G634JZR | |
| Média da turma Gaming (975 - 1775, n=35, últimos 2 anos) | |
| Média Intel Wi-Fi 6E AX211 (700 - 1857, n=226) | |
| Alienware m16 R2 | |
| MSI Vector 16 HX A14V | |
Webcam
Ao contrário do Scar 15 que incluía uma webcam externa ROG Eye 1080p como acessório inbox, o Scar 16 se contenta com um sensor convencional integrado de 720p.
A qualidade da imagem não é excepcional em nenhum aspecto, mas permite que o senhor faça uma ou duas chamadas de vídeo ocasionais. Observamos grandes desvios de cor em tons de azul e a nitidez geral não parece adequada.


Segurança
O Scar 16 não possui nenhuma forma de autenticação biométrica. Um módulo TPM 2.0 está presente para atender aos requisitos do Windows 11.
Acessórios e garantia
Uma capa de armadura personalizável está incluída na caixa. Não há outros acessórios além desse.
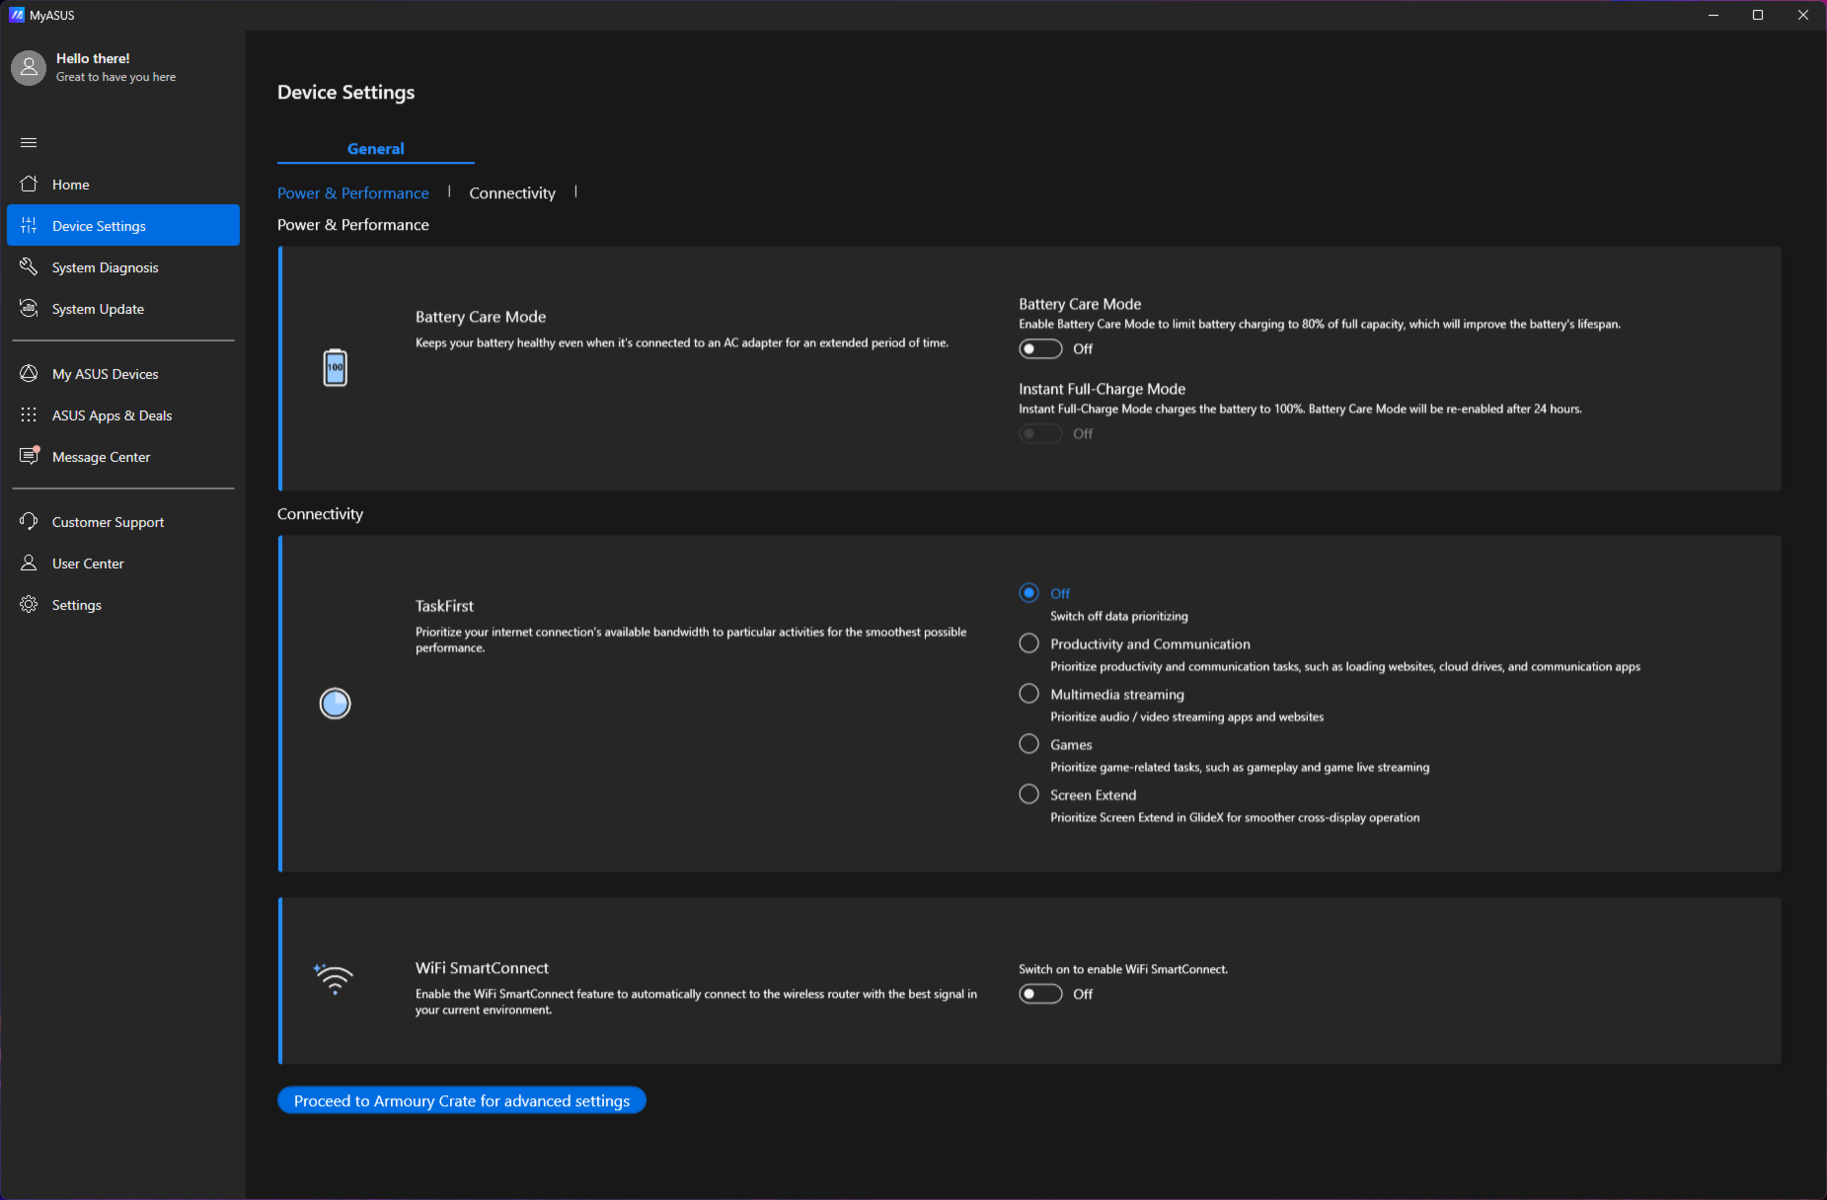
A Asus oferece uma garantia padrão de um ano para o Scar 16 na Índia. As extensões de garantia podem ser adquiridas por meio do aplicativo MyAsus pré-instalado em até 180 dias após a compra.
Os compradores também podem escolher entre várias opções de garantia https://asuspromo.in/terms que variam de ₹999 (US$ 12) para uma extensão de um ano a ₹4.999 (US$ 60) que inclui uma extensão de dois anos e três anos de proteção contra danos acidentais.
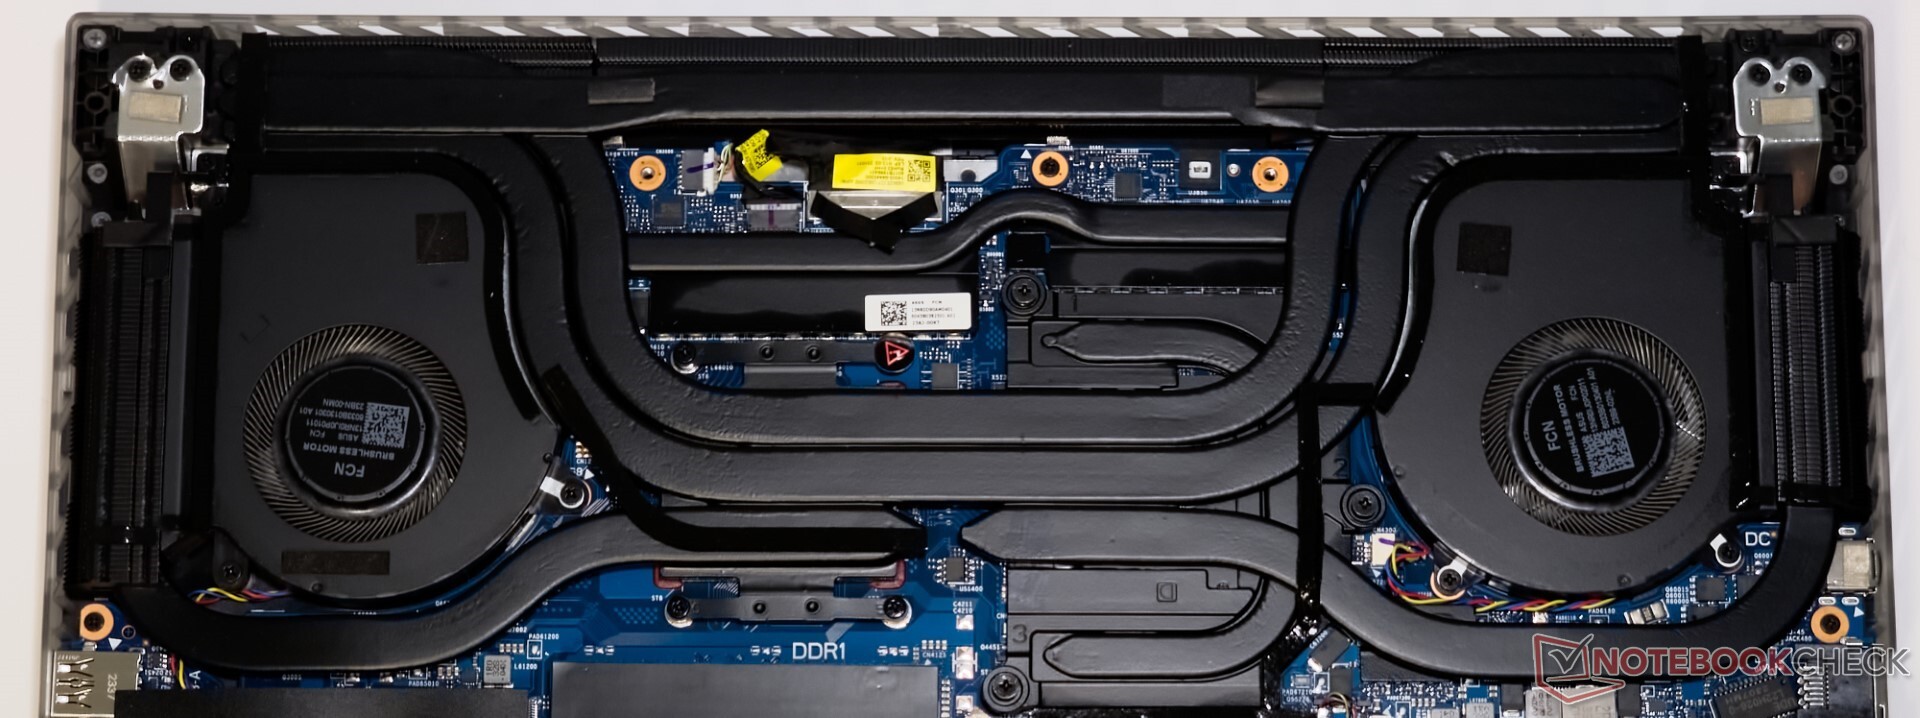
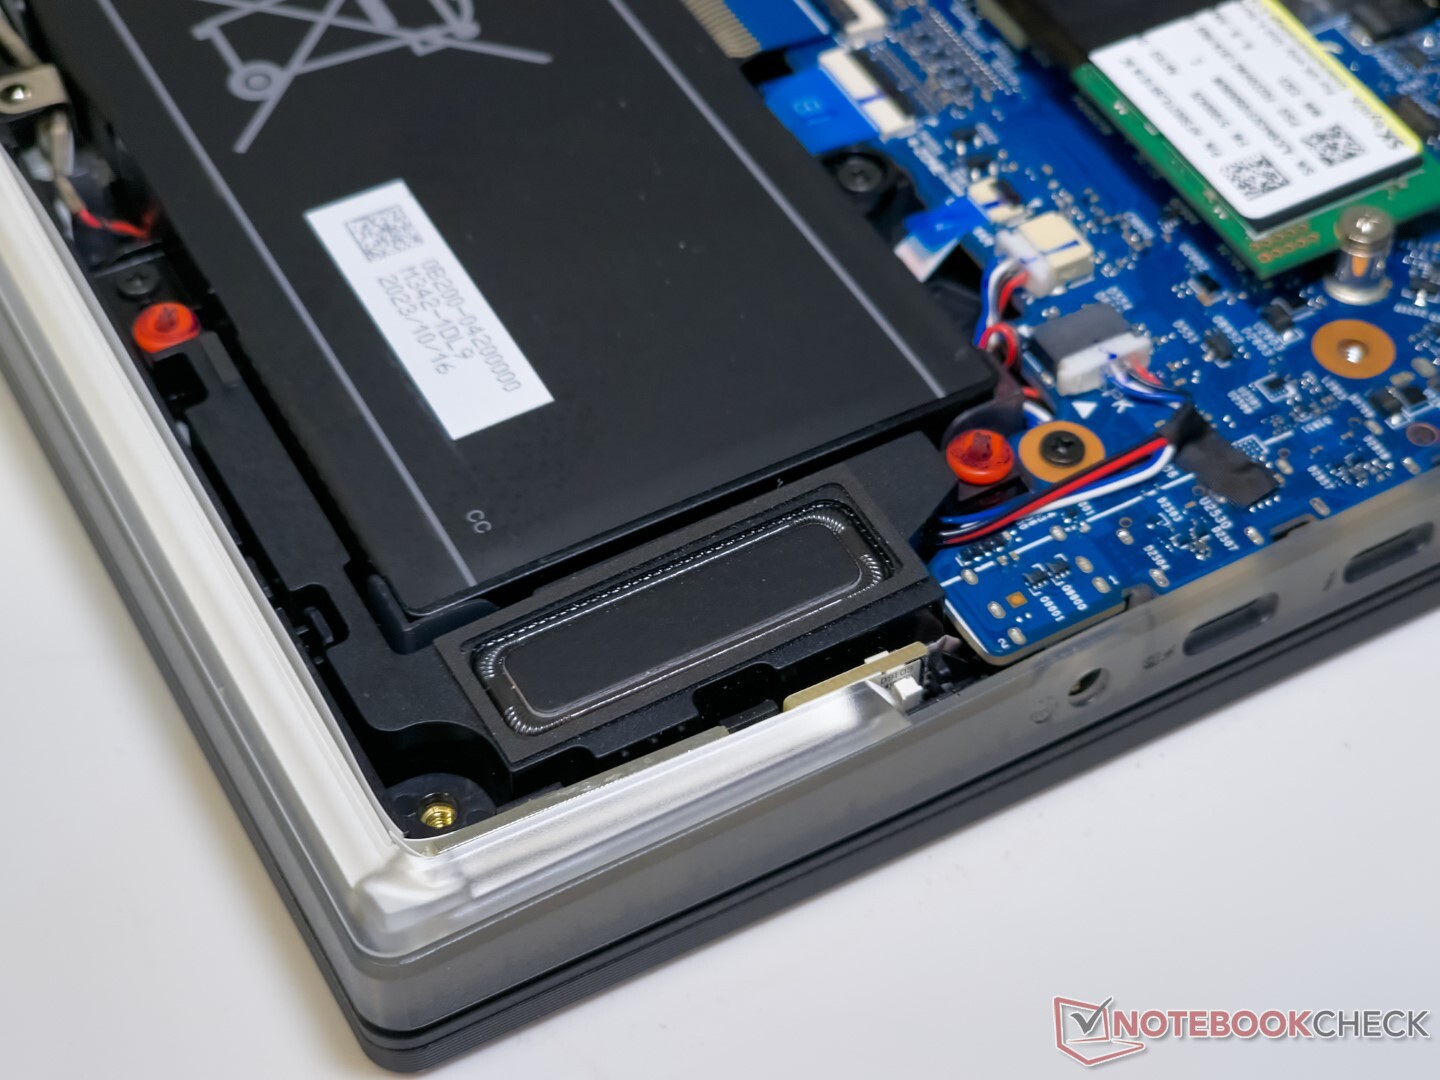
Manutenção
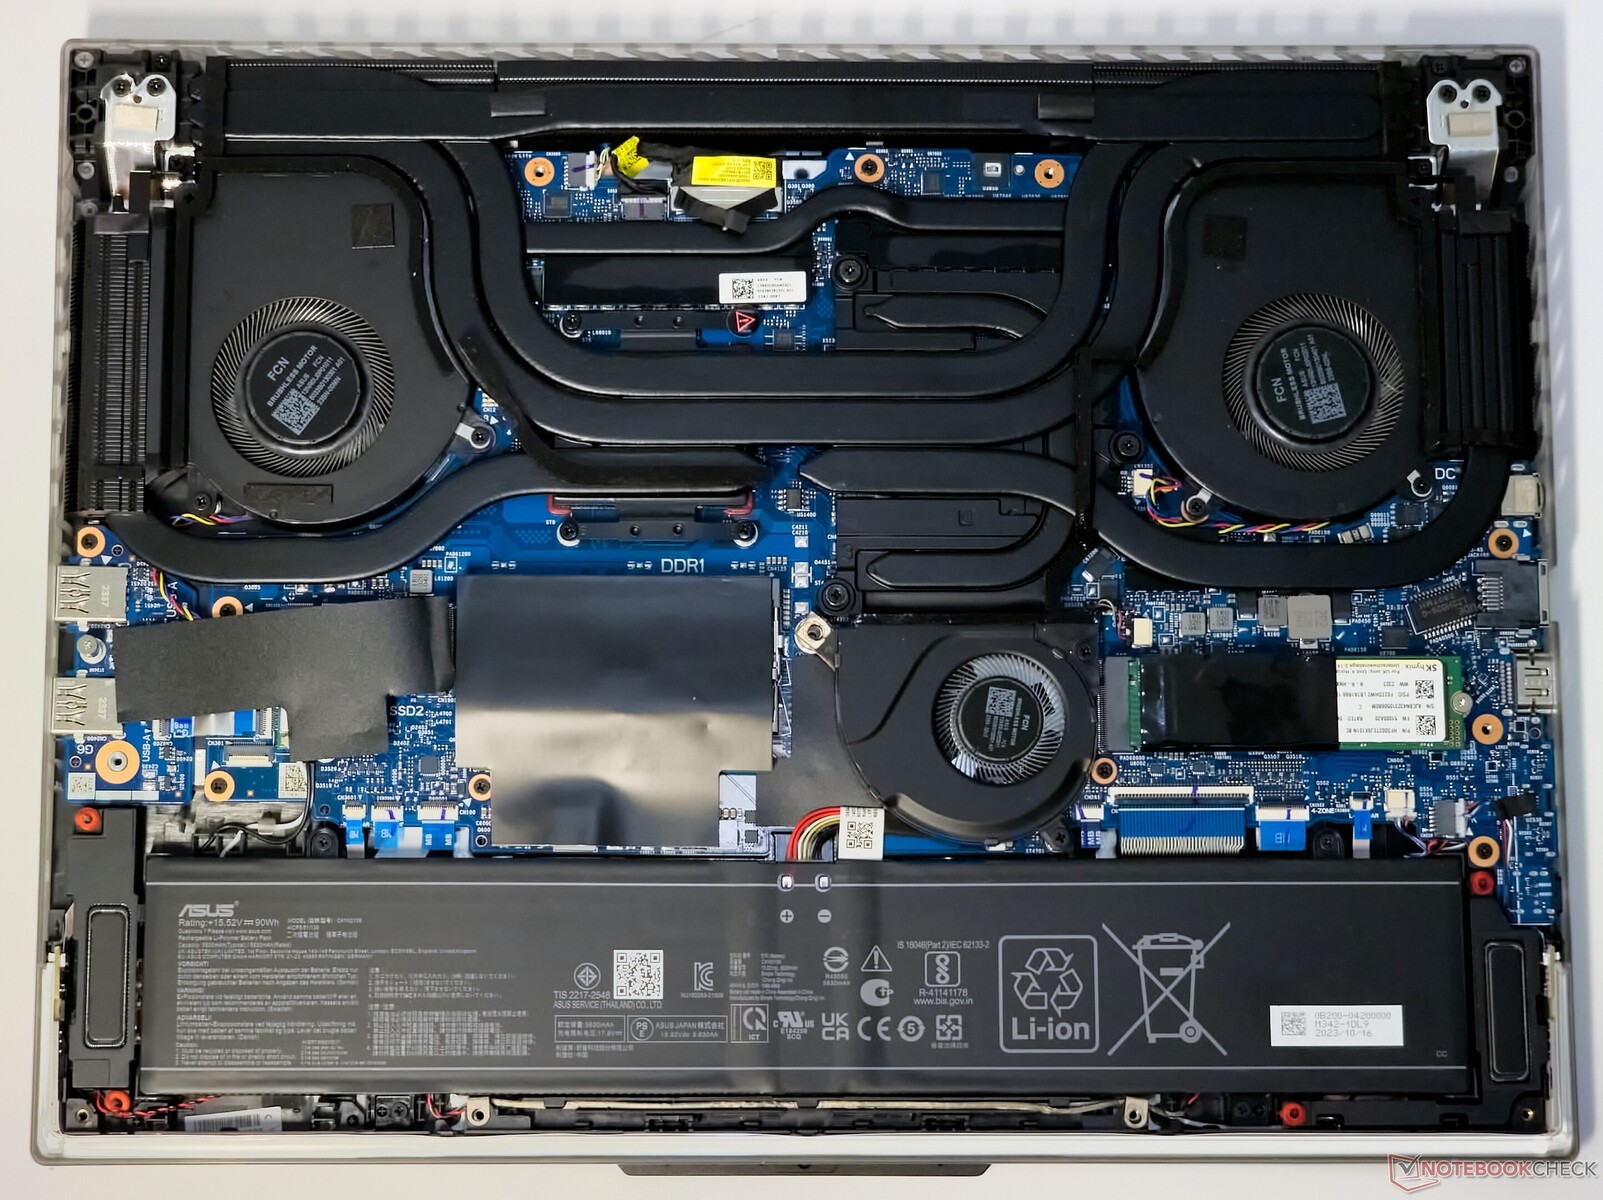
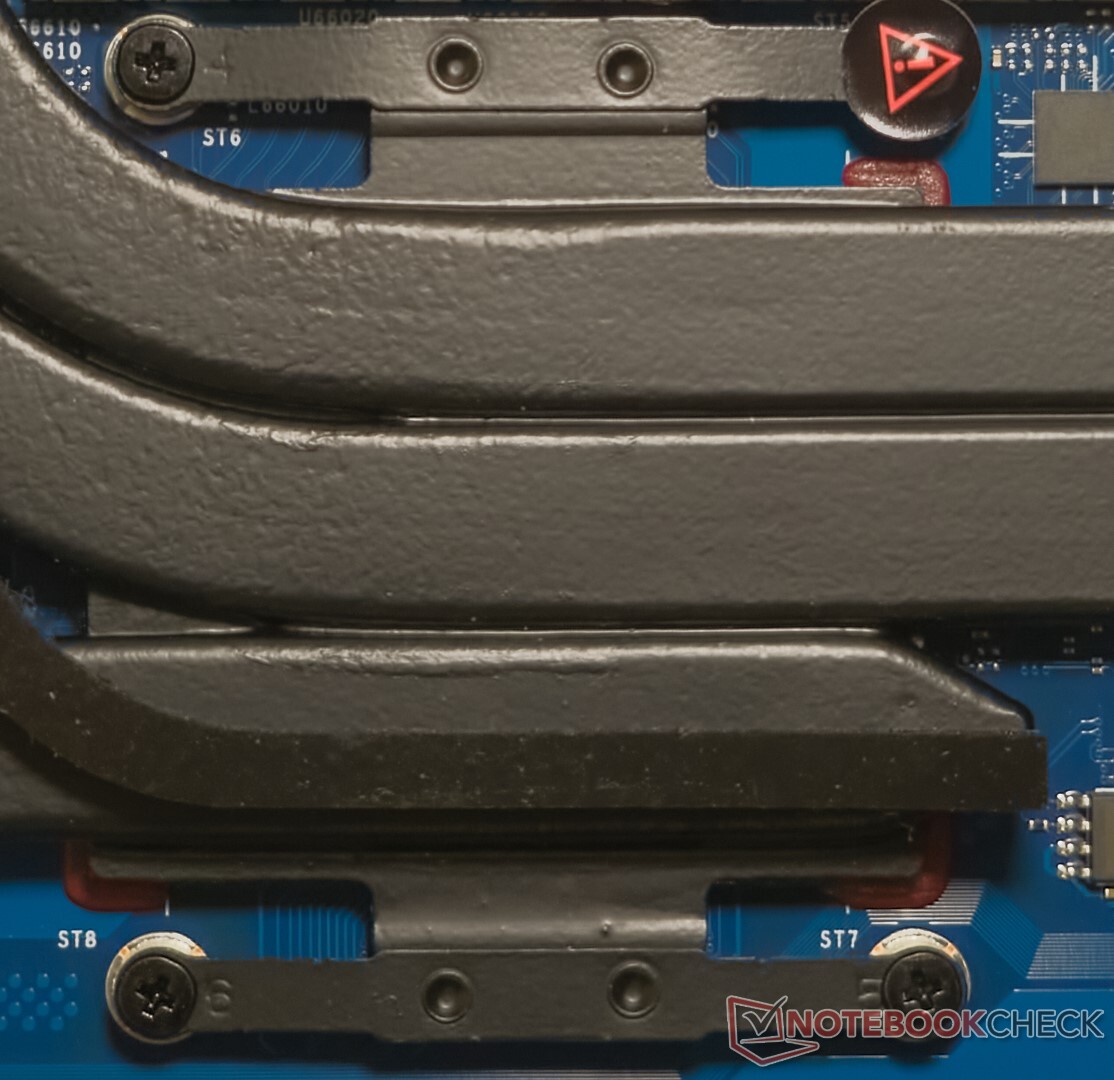
A remoção dos 11 parafusos PH0 e a abertura do painel traseiro expõe o movimentado layout interno do Scar 16. Um sensor óptico na placa-mãe funciona como um recurso de segurança, impedindo que o laptop seja ligado ou desligado se já estiver ligado quando o painel inferior for removido. Para inicializar novamente, o painel inferior precisa ser colocado de volta e o laptop deve ser conectado ao adaptador de energia.
A faixa de LED RGB não faz mais parte do painel traseiro, portanto, adeus às preocupações com cabos de fita frágeis que se quebram ao abrir a tampa.
A RAM, o SSD e a placa WLAN podem ser trocados por upgrades, se necessário. A bateria também pode ser desparafusada e substituída.
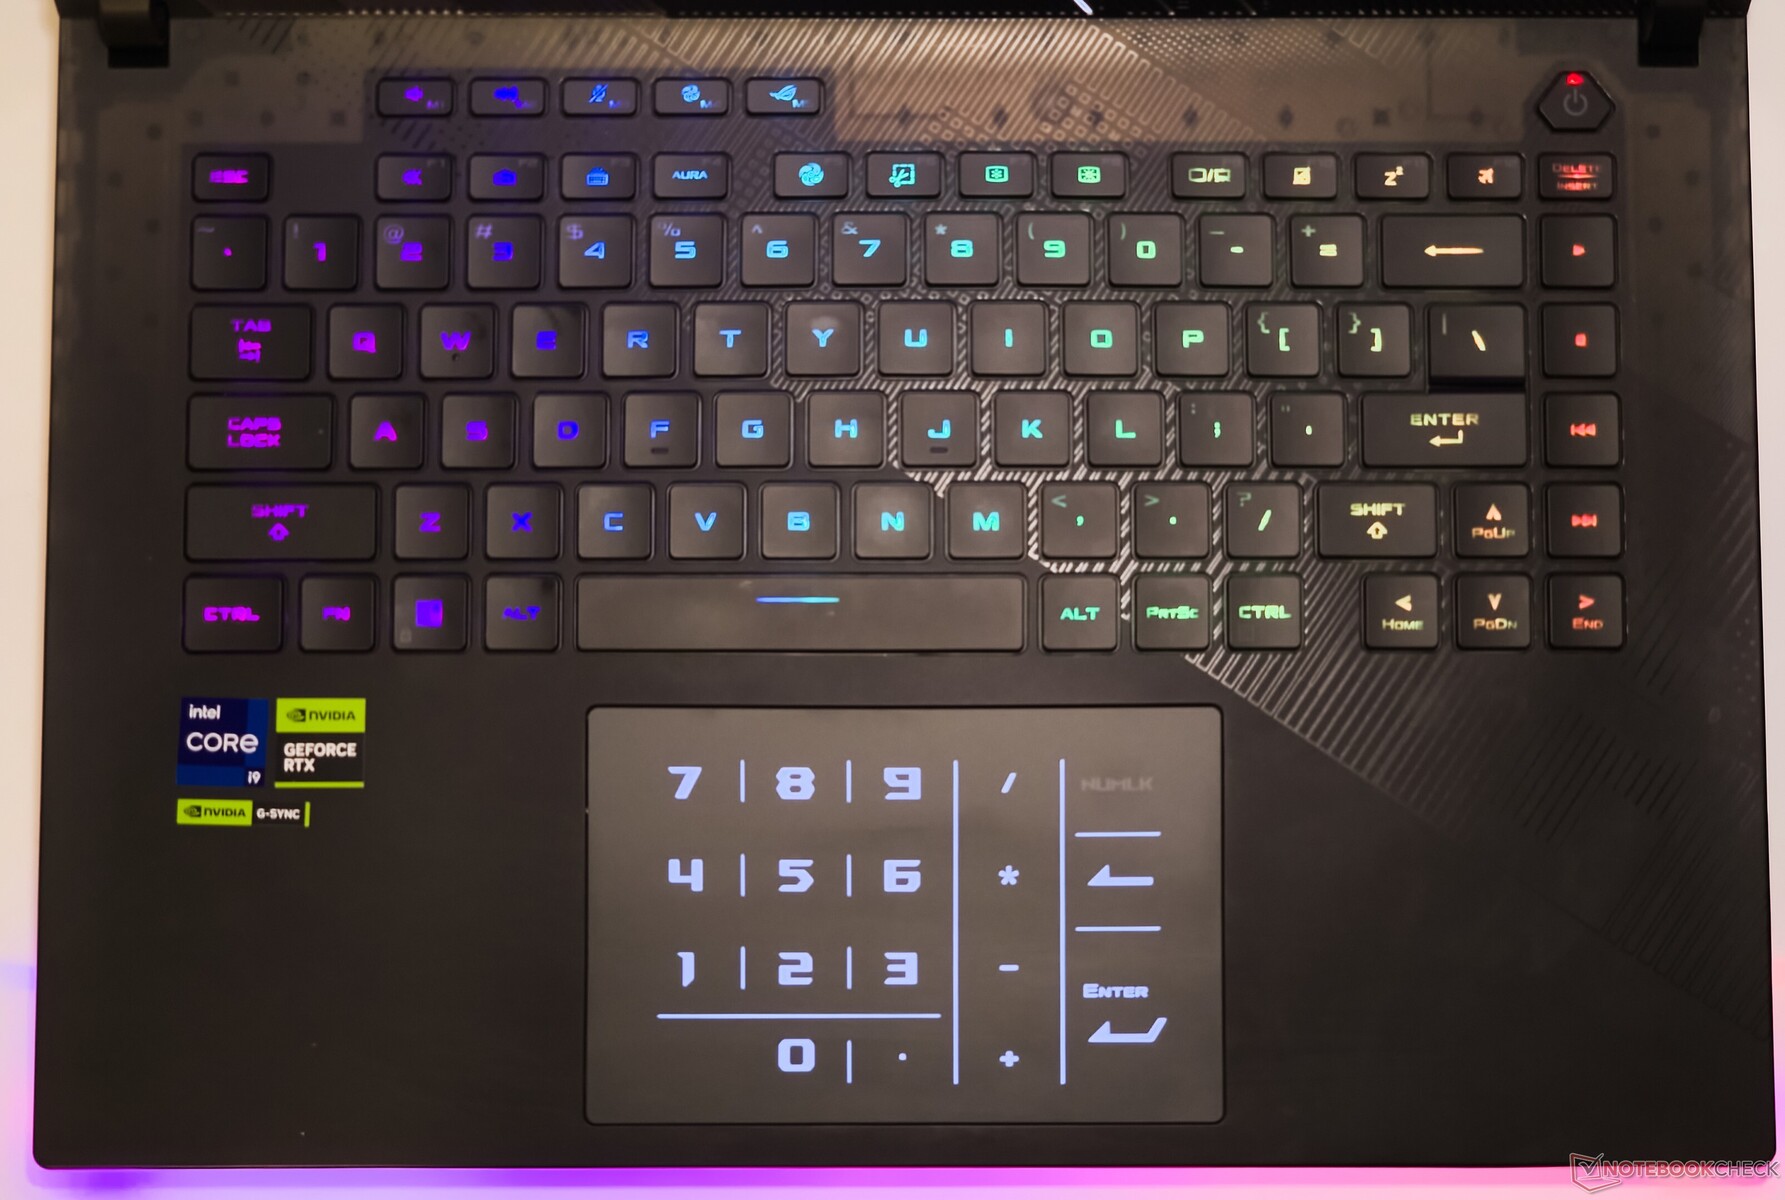
Dispositivos de entrada: Teclado numérico virtual prático, mas F1-F12 permanece apagado
Teclado
O teclado do Scar 16 oferece uma boa experiência de digitação em geral, mas o feedback poderia ter sido mais nítido. Quem vem de um notebook ROG que não é da Asus pode levar algum tempo para se adaptar à tecla Shift curta à direita e à disposição vertical das teclas de mídia à direita.
Como é padrão nos notebooks ROG, a linha superior permite a programação de funções macro via Armory Crate. É louvável que a Asus forneça teclas de seta de tamanho normal. Há teclas dedicadas para alternar entre as predefinições de iluminação RGB e os perfis de desempenho.
O RGB por tecla pode ser personalizado por meio do Armory Crate. No entanto, as letras F1-F12 continuam no escuro.
Touchpad
O touchpad de 8,5 cm x 13 cm oferece uma experiência de deslizamento suave com suporte para gestos do Windows Precision. O touchpad oferece boa sensibilidade tátil e os cliques são responsivos nos cantos.
Um botão de alternância suave do Num Lock na parte superior direita do touchpad exibe um teclado numérico virtual para as necessidades de processamento de números. Ele pode ser acionado acidentalmente ao passar o dedo, mas geralmente não atrapalha o uso normal.
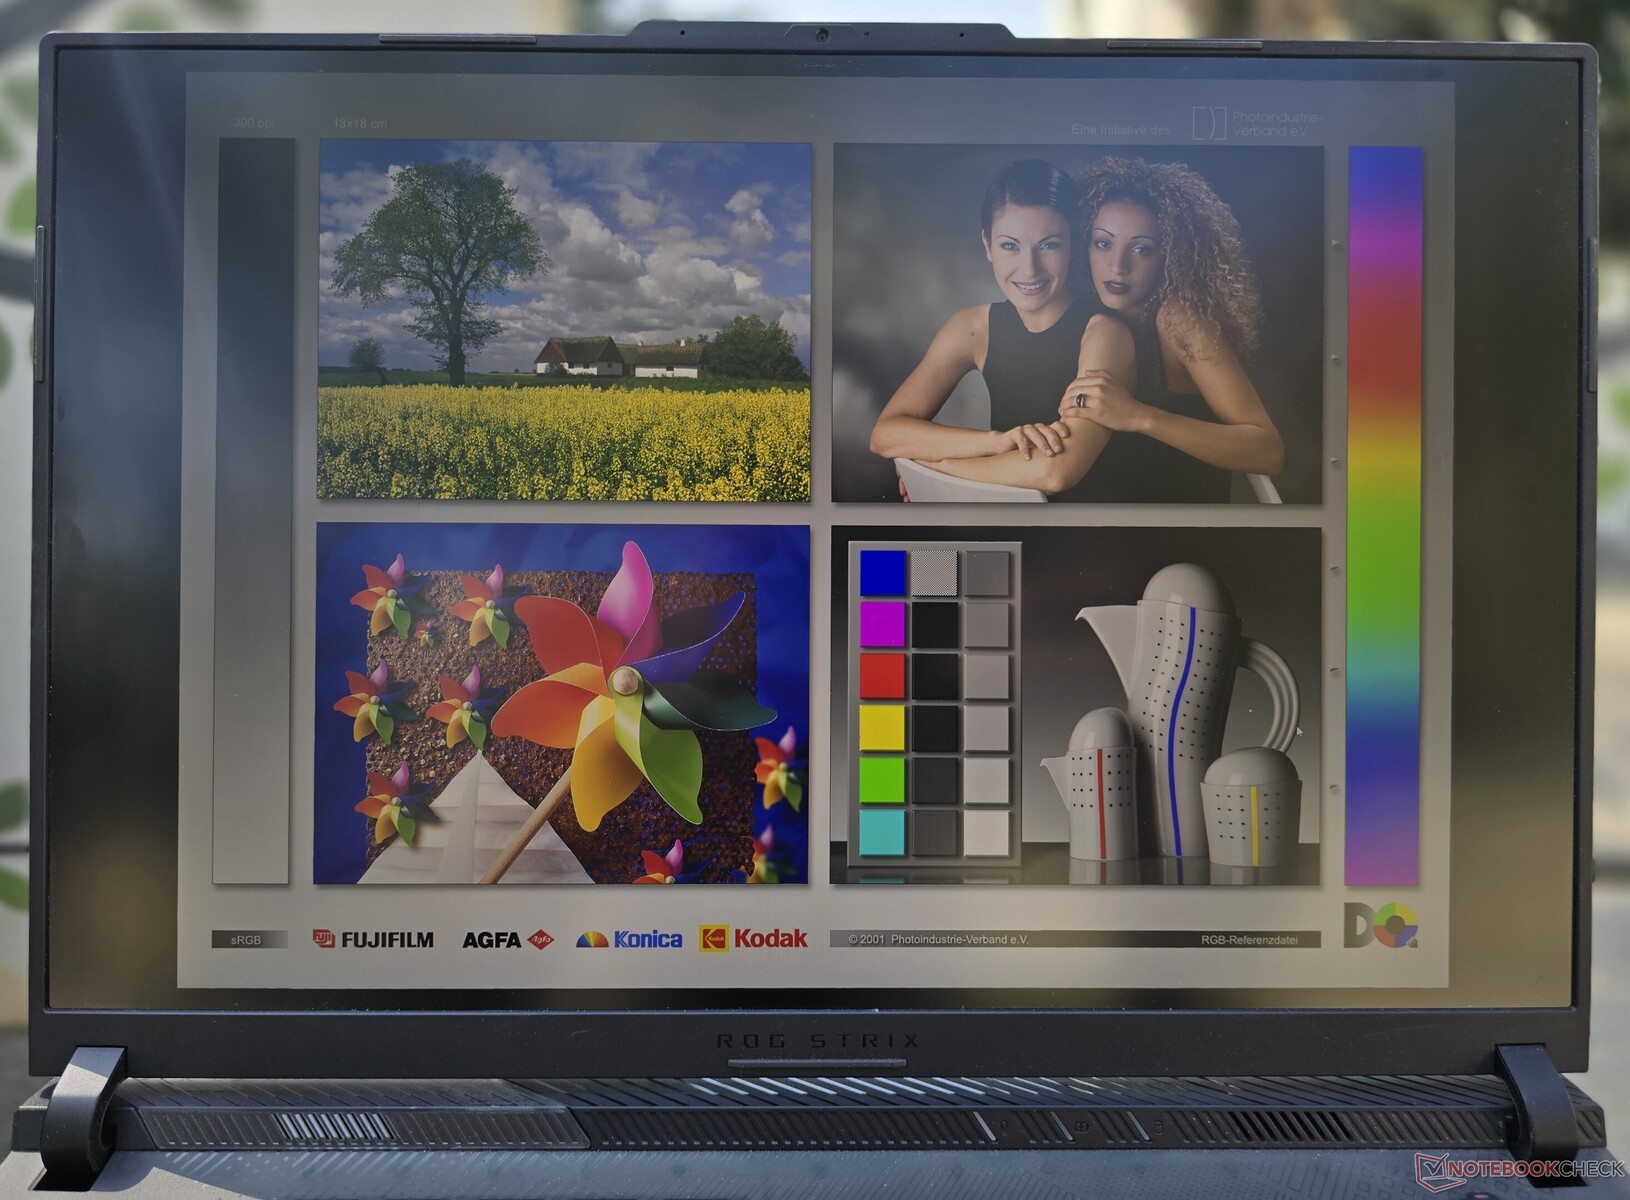
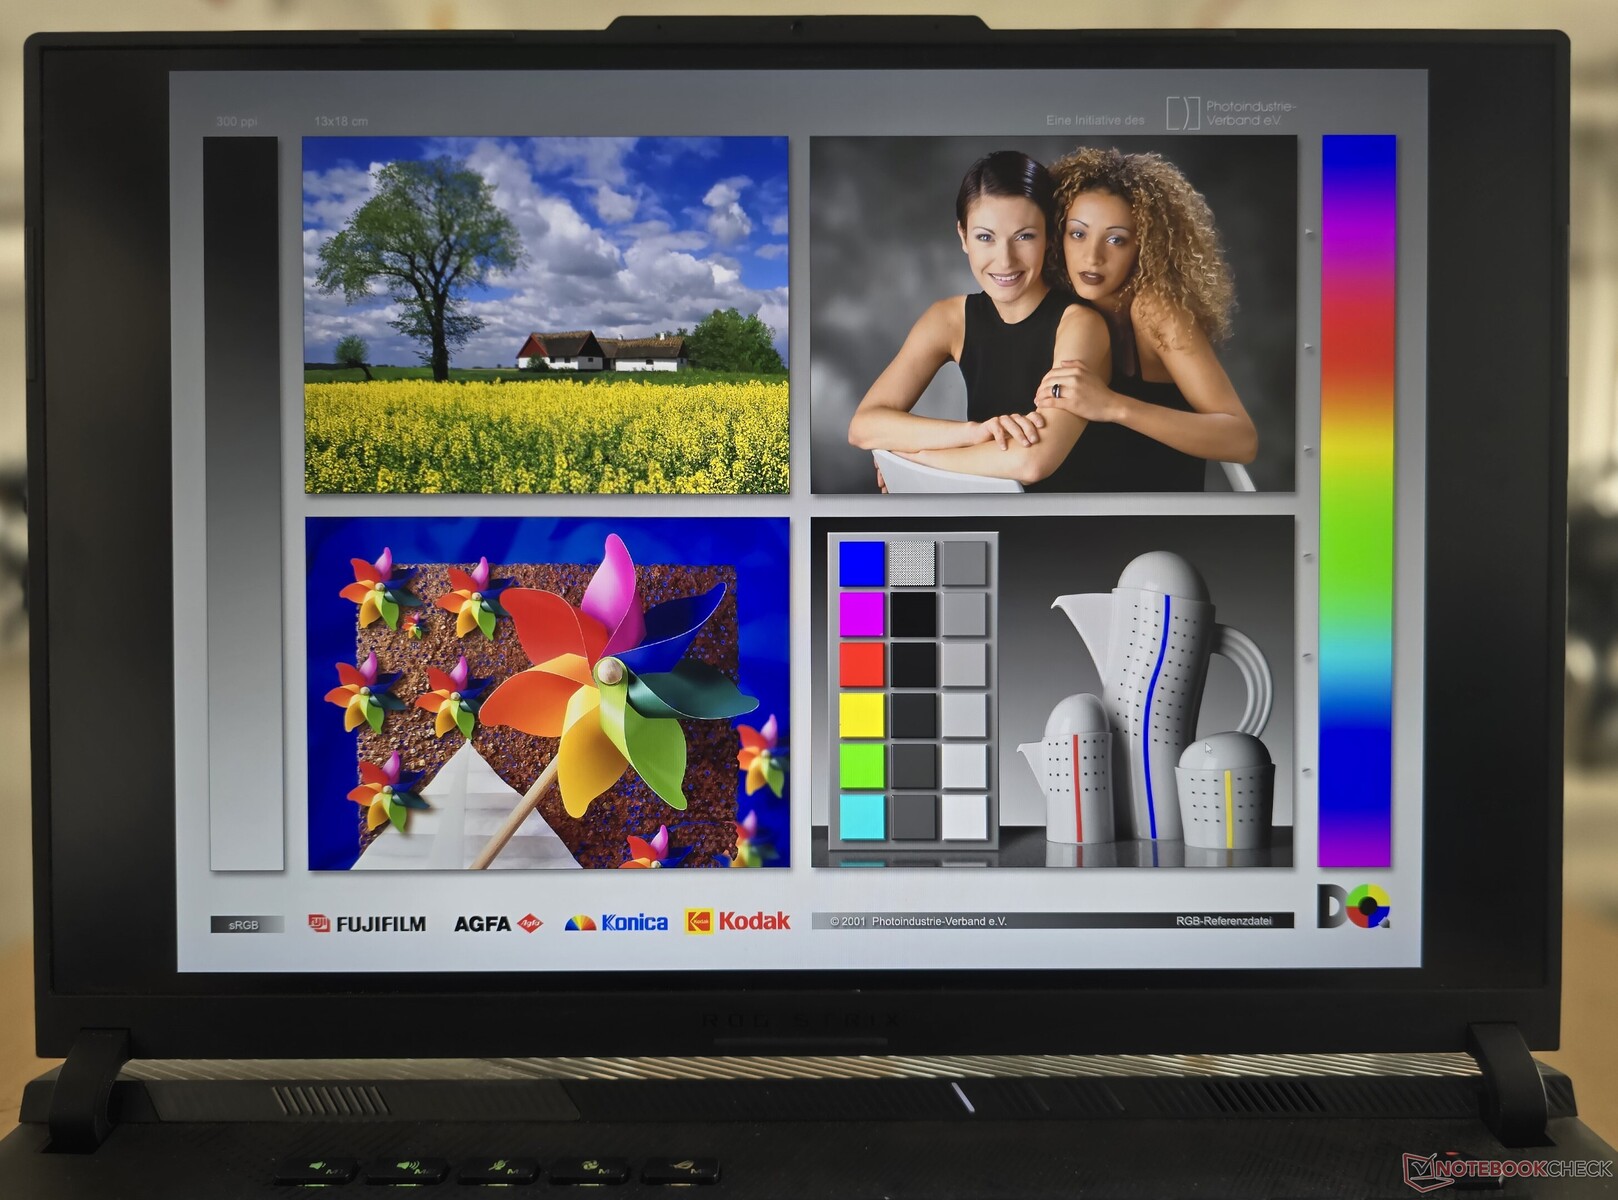
Tela: painel QHD+ G-Sync HDR de 240 Hz com PWM alto
O ROG Strix Scar 16 vem equipado com um painel mini LED "Nebula HDR" de 2560 x 1600 16:10 que a Asus especifica ter 2.048 zonas de escurecimento. A tela de 240 Hz suporta HDR10, Dolby Vision, Nvidia G-Sync e também é validada pelo Pantone.
A Armory Crate permite alternar entre iluminação de fundo de zona única e de várias zonas. O primeiro é o modo de operação padrão e permite uma iluminação mais uniforme para fluxos de trabalho com precisão de cores.
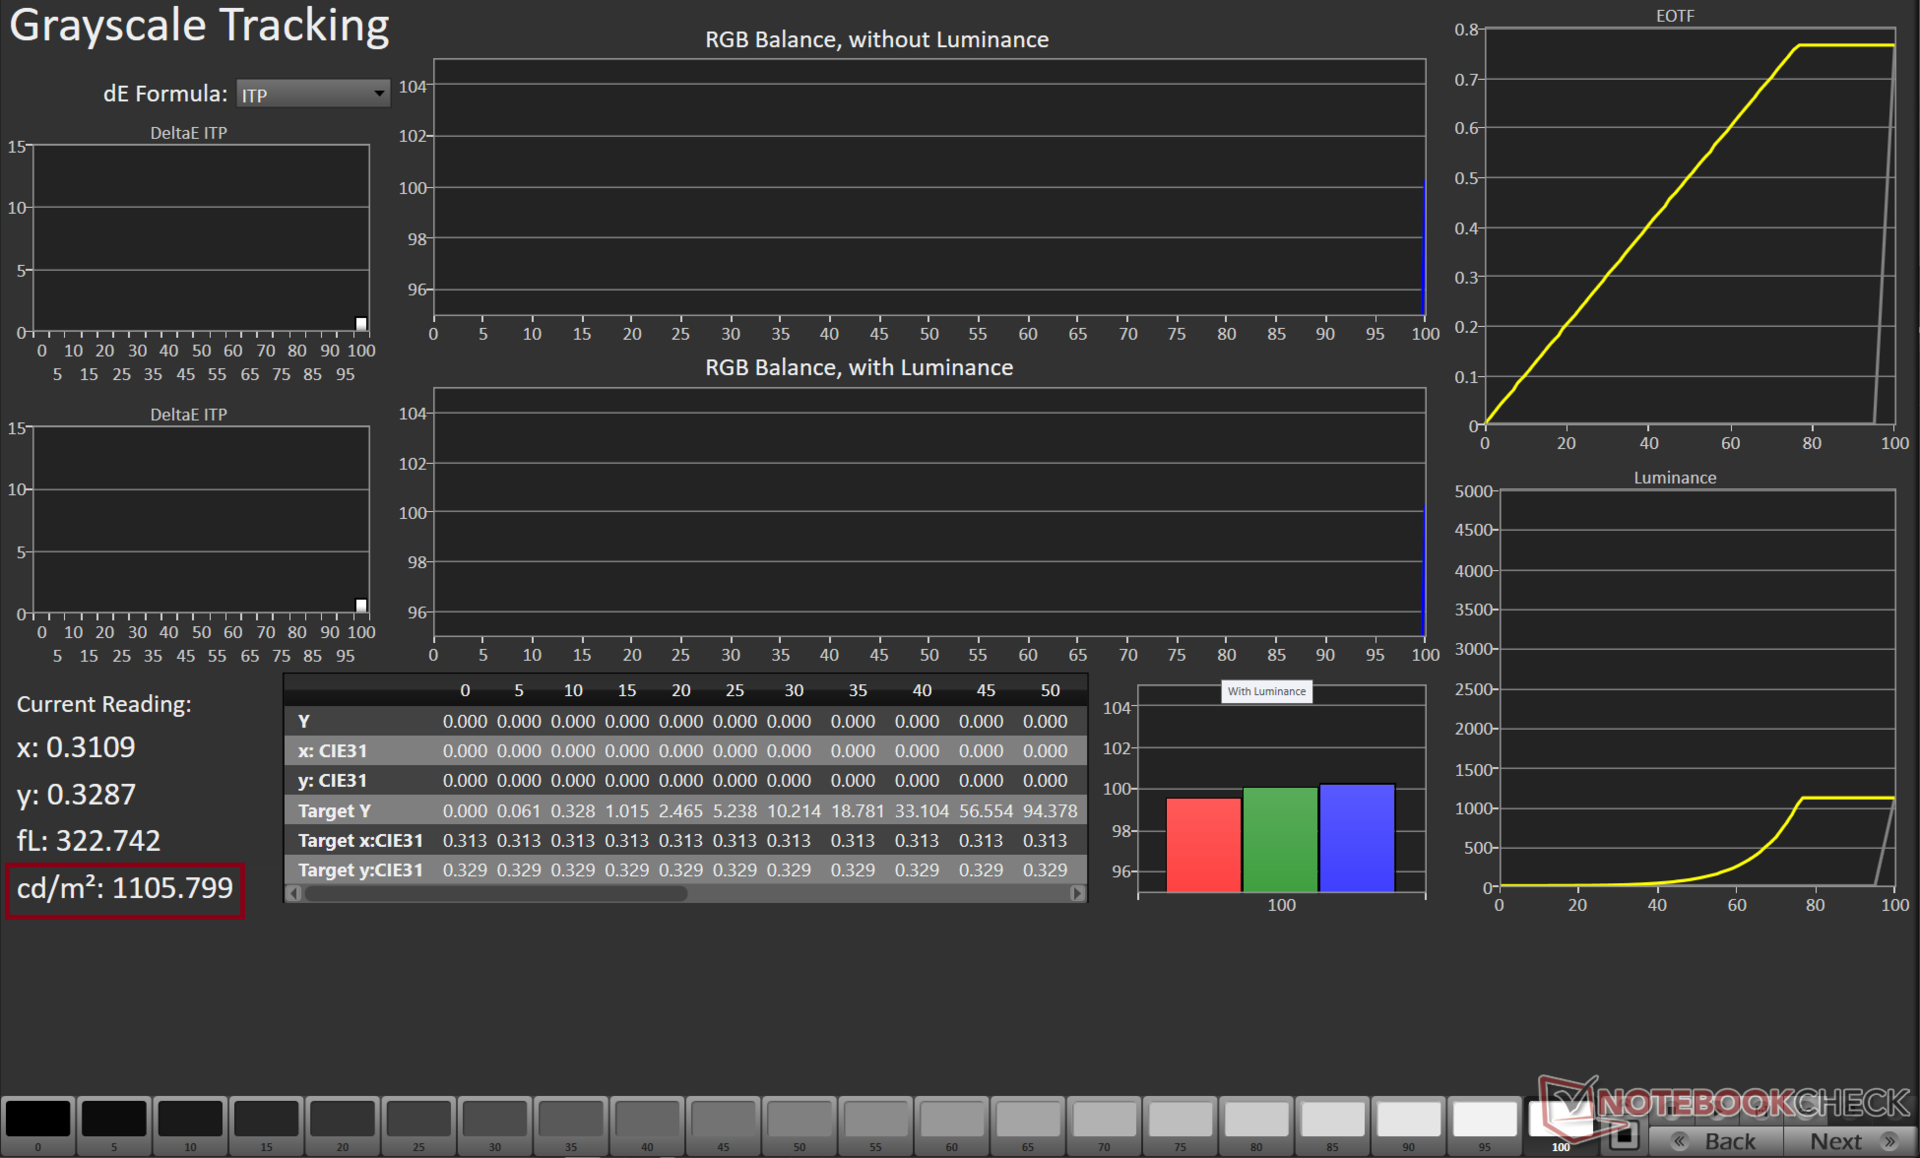
Nesse modo, a tela do Scar 16 apresentou uma boa distribuição de brilho de 94% em nossas medições de SDR, com um pico de brilho de 503 nits. Medimos uma relação de contraste de 1.225:1, o que é bom, mas o senhor poderá alternar o interruptor multizona se precisar de pretos ainda mais profundos.
Consulte nosso artigo Análise do ROG Scar 18 (2024) que possui um mini painel de LED Nebula HDR semelhante para saber o tipo de valores que podem ser esperados com a iluminação de fundo de várias zonas.
A Asus anuncia 1.100 nits de brilho de pico HDR, e descobrimos que essa afirmação é verdadeira quando medida em um tamanho de janela de 49%.
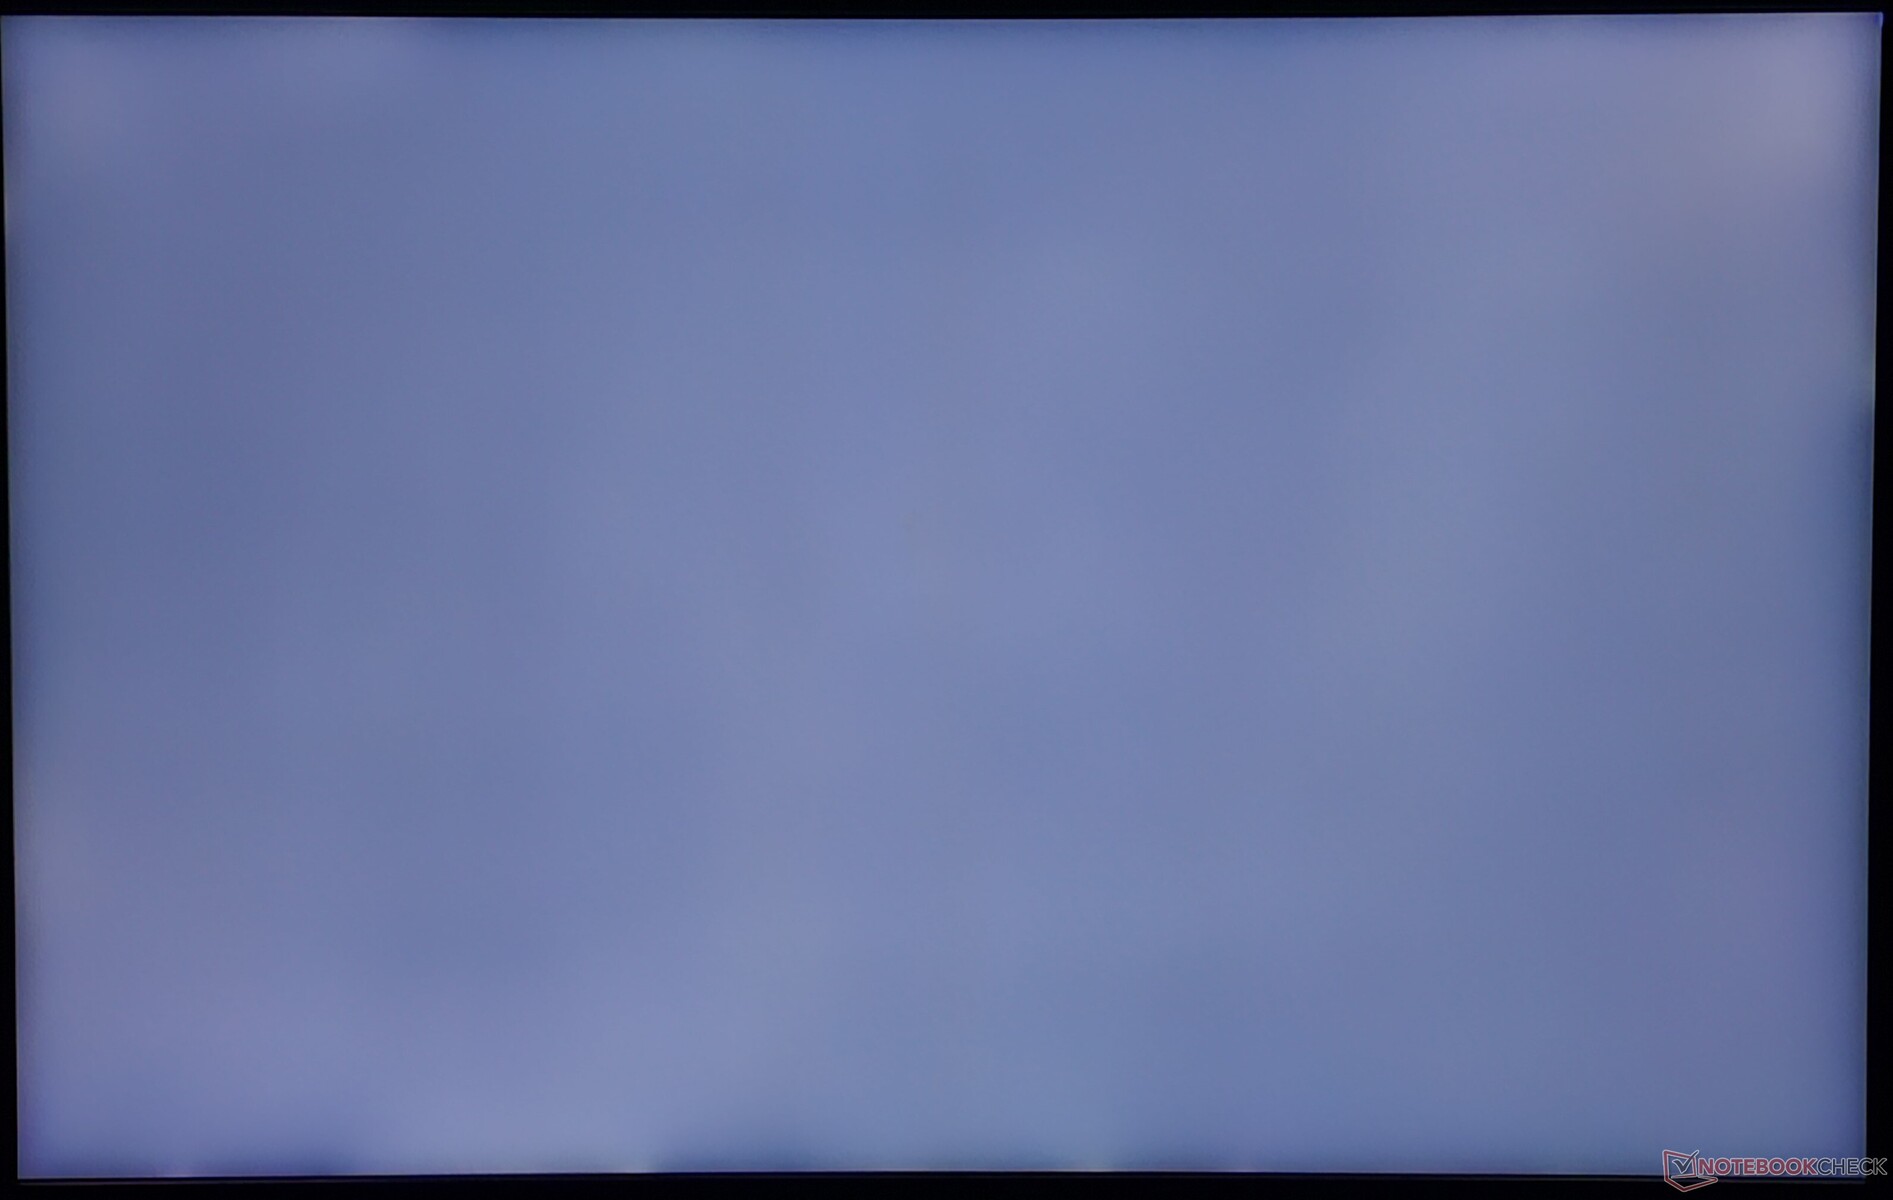
O sangramento da luz de fundo é visto apenas minimamente ao longo da moldura inferior da tela.
| |||||||||||||||||||||||||
iluminação: 94 %
iluminação com acumulador: 291 cd/m²
Contraste: 1225:1 (Preto: 0.4 cd/m²)
ΔE ColorChecker Calman: 1.08 | ∀{0.5-29.43 Ø4.71}
calibrated: 0.9
ΔE Greyscale Calman: 1.1 | ∀{0.09-98 Ø4.96}
90.8% AdobeRGB 1998 (Argyll 3D)
100% sRGB (Argyll 3D)
99.8% Display P3 (Argyll 3D)
Gamma: 2.13
CCT: 6724 K
| Asus ROG Strix Scar 16 G634JZR BOE NE160QDM-NM7, Mini LED, 2560x1600, 16" | Asus ROG Strix G16 G614JZ TL160ADMP03-0, IPS, 2560x1600, 16" | Lenovo Legion Pro 7 16IRX9H BOE CQ NE16QDM-NZB, IPS, 2560x1600, 16" | HP Omen 16 (2024) BOE BOE0B7D, IPS, 2560x1440, 16.1" | MSI Vector 16 HX A14V Chi Mei N160GME-GTB, IPS, 2560x1600, 16" | Alienware m16 R2 BOE NE16NYH, IPS, 2560x1600, 16" | |
|---|---|---|---|---|---|---|
| Display | -3% | -2% | -18% | -3% | -17% | |
| Display P3 Coverage (%) | 99.8 | 97 -3% | 98.5 -1% | 68.6 -31% | 95.4 -4% | 71 -29% |
| sRGB Coverage (%) | 100 | 99.9 0% | 99.9 0% | 98.6 -1% | 99.7 0% | 100 0% |
| AdobeRGB 1998 Coverage (%) | 90.8 | 84.9 -6% | 86.7 -5% | 70.6 -22% | 85.4 -6% | 71.4 -21% |
| Response Times | 18% | -54% | -86% | -12% | 1% | |
| Response Time Grey 50% / Grey 80% * (ms) | 5 ? | 5.1 ? -2% | 12.6 ? -152% | 14.1 ? -182% | 5.7 ? -14% | 5.7 ? -14% |
| Response Time Black / White * (ms) | 10.4 ? | 6.6 ? 37% | 5.8 ? 44% | 9.3 ? 11% | 11.4 ? -10% | 8.7 ? 16% |
| PWM Frequency (Hz) | 2040 ? | |||||
| Screen | -34% | -1% | -46% | -70% | -27% | |
| Brightness middle (cd/m²) | 490 | 470 -4% | 487 -1% | 292 -40% | 557.2 14% | 345.8 -29% |
| Brightness (cd/m²) | 487 | 459 -6% | 460 -6% | 291 -40% | 506 4% | 337 -31% |
| Brightness Distribution (%) | 94 | 93 -1% | 88 -6% | 85 -10% | 83 -12% | 87 -7% |
| Black Level * (cd/m²) | 0.4 | 0.42 -5% | 0.42 -5% | 0.24 40% | 0.41 -2% | 0.3 25% |
| Contrast (:1) | 1225 | 1119 -9% | 1160 -5% | 1217 -1% | 1359 11% | 1153 -6% |
| Colorchecker dE 2000 * | 1.08 | 1.86 -72% | 1.12 -4% | 2.36 -119% | 2.91 -169% | 1.99 -84% |
| Colorchecker dE 2000 max. * | 2.38 | 3.87 -63% | 2.26 5% | 4.08 -71% | 5.94 -150% | 3.52 -48% |
| Colorchecker dE 2000 calibrated * | 0.9 | 0.93 -3% | 0.54 40% | 0.93 -3% | 1.63 -81% | 0.62 31% |
| Greyscale dE 2000 * | 1.1 | 2.7 -145% | 1.4 -27% | 3 -173% | 3.8 -245% | 2.1 -91% |
| Gamma | 2.13 103% | 2.246 98% | 2.242 98% | 2.101 105% | 2.23 99% | 2.32 95% |
| CCT | 6724 97% | 6711 97% | 6809 95% | 5976 109% | 6408 101% | 6369 102% |
| Média Total (Programa/Configurações) | -6% /
-20% | -19% /
-9% | -50% /
-46% | -28% /
-47% | -14% /
-21% |
* ... menor é melhor
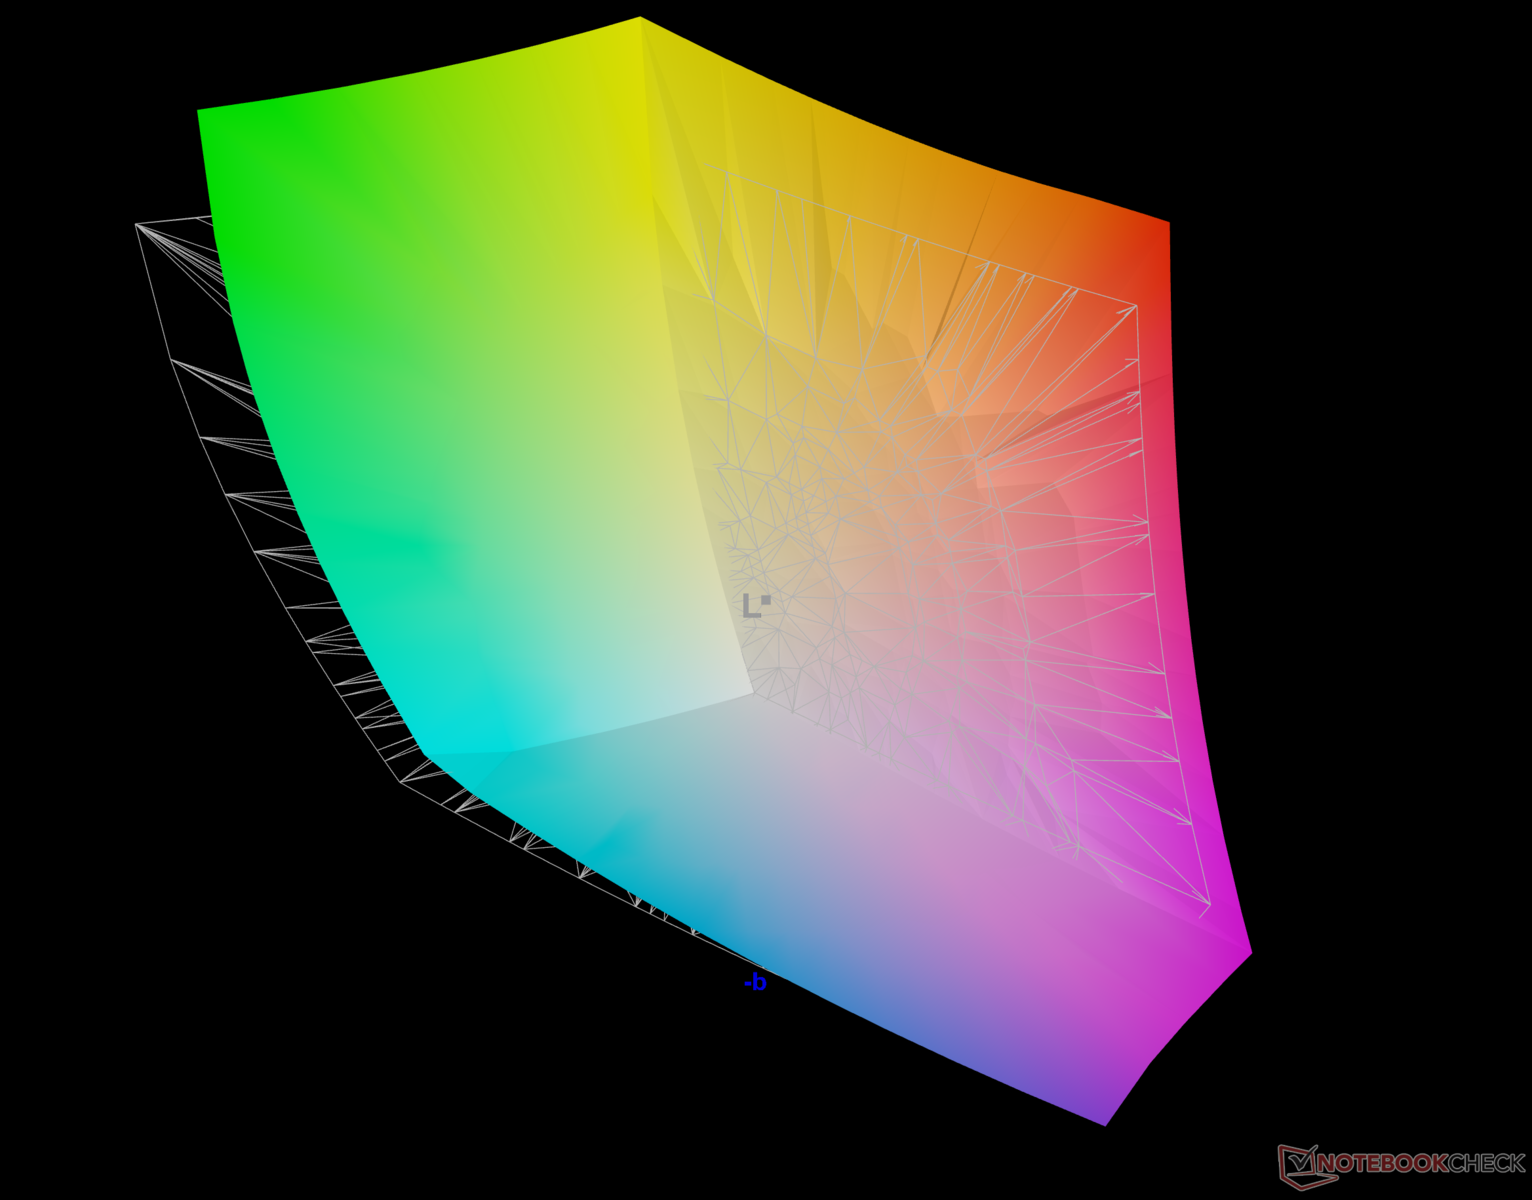
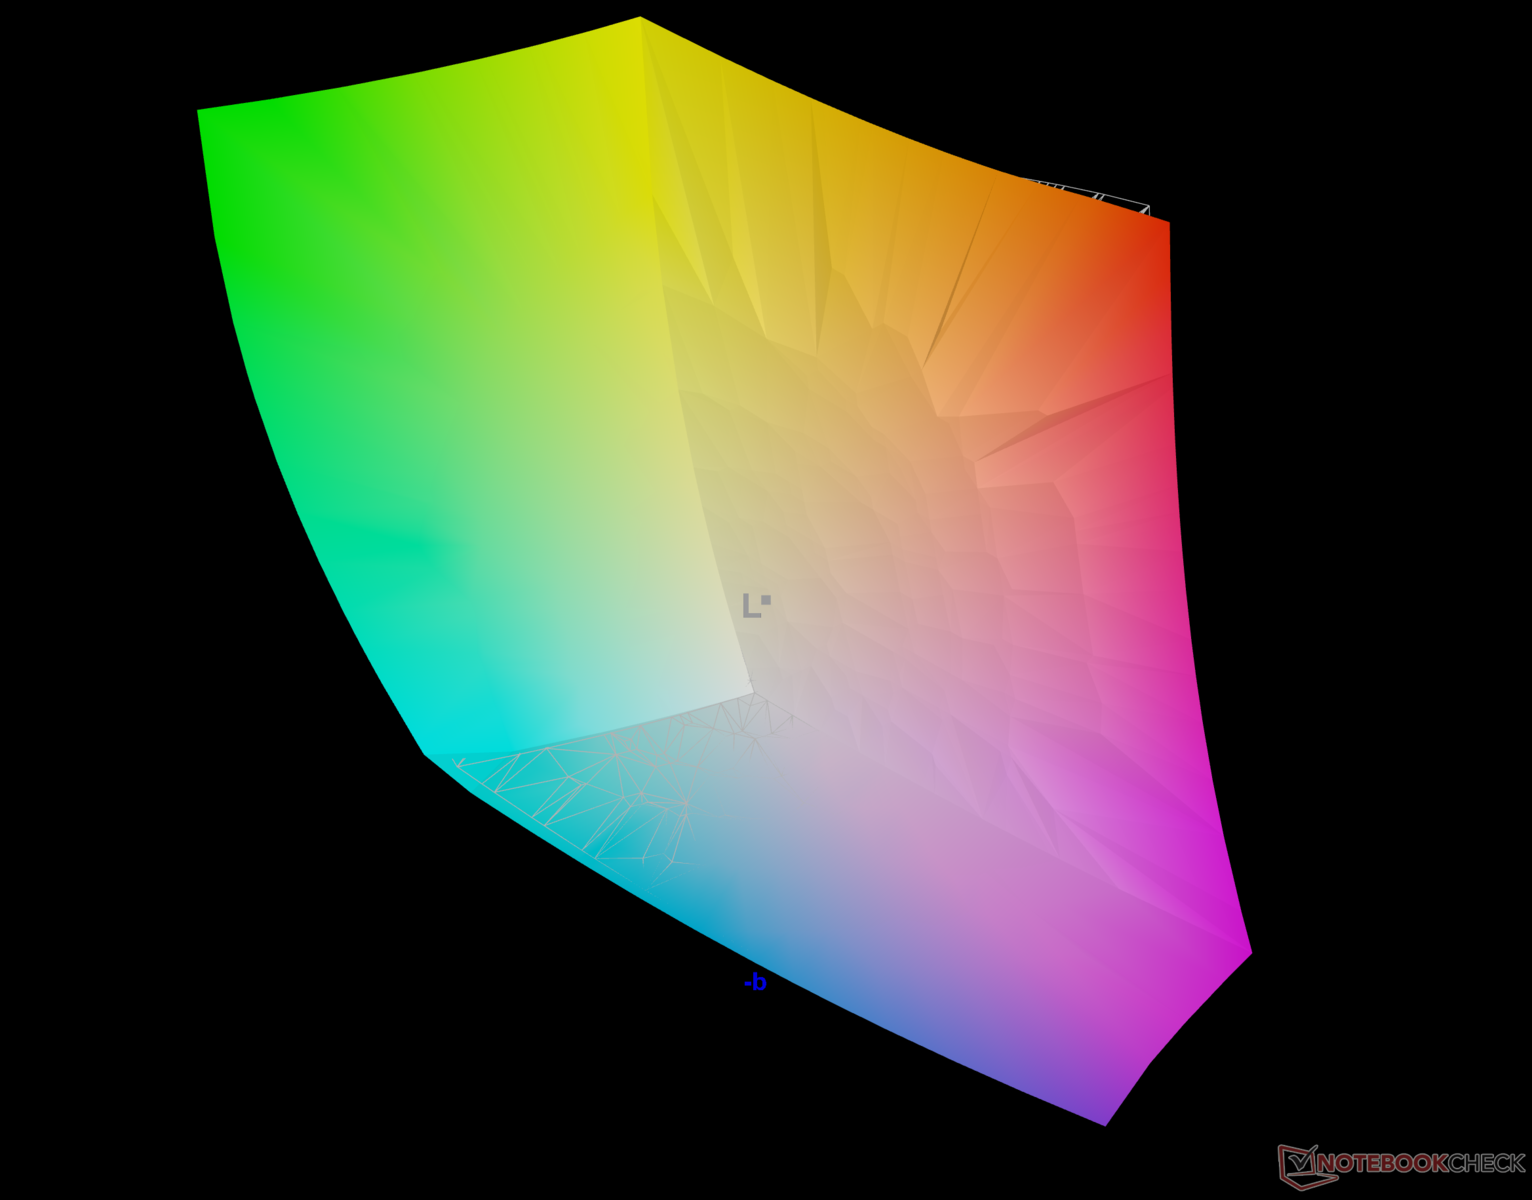
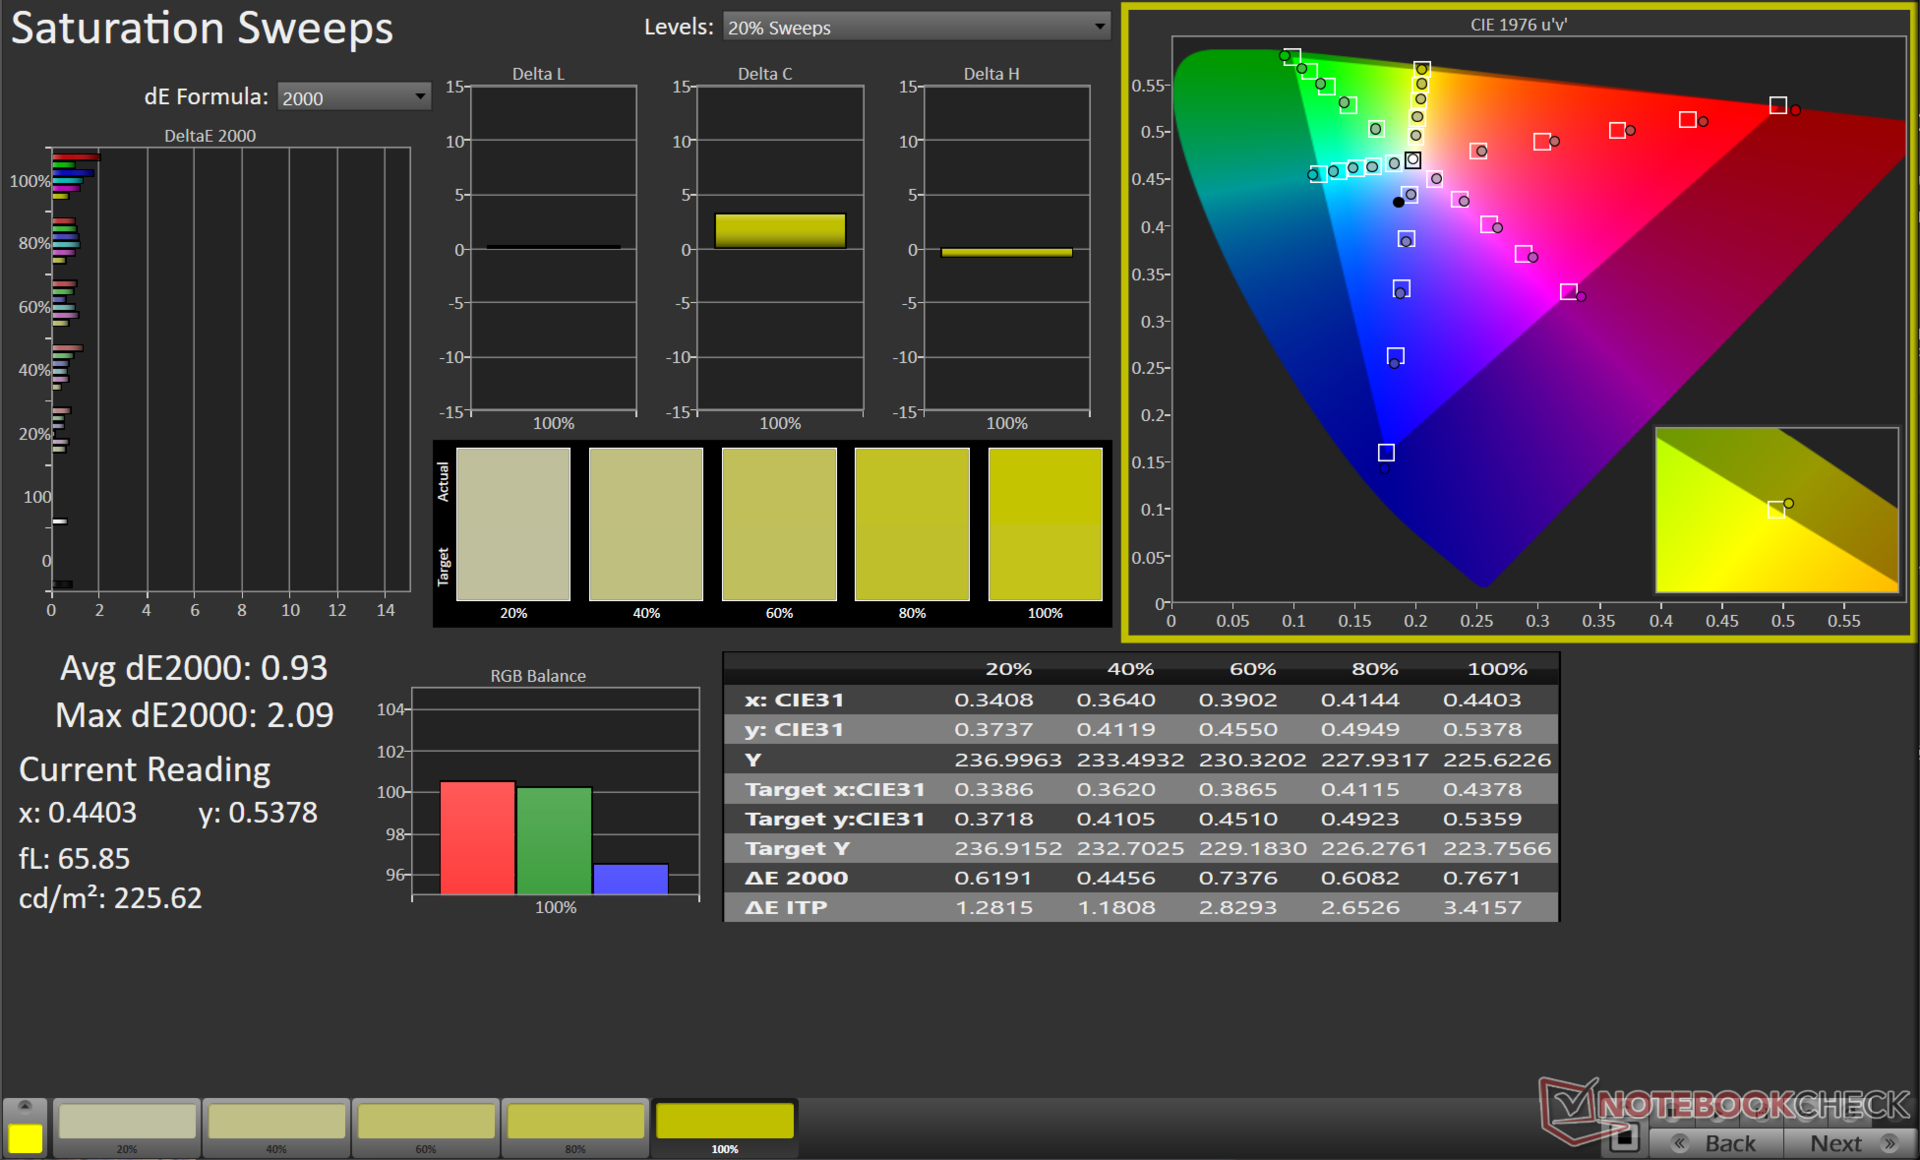
A tela do Scar 16 cobre completamente os espaços de cores sRGB e Display P3. A cobertura do Adobe RGB também é boa, com quase 91%, o que torna o Scar 16 muito adequado tanto para o consumo de mídia quanto para fluxos de trabalho de criação de conteúdo.

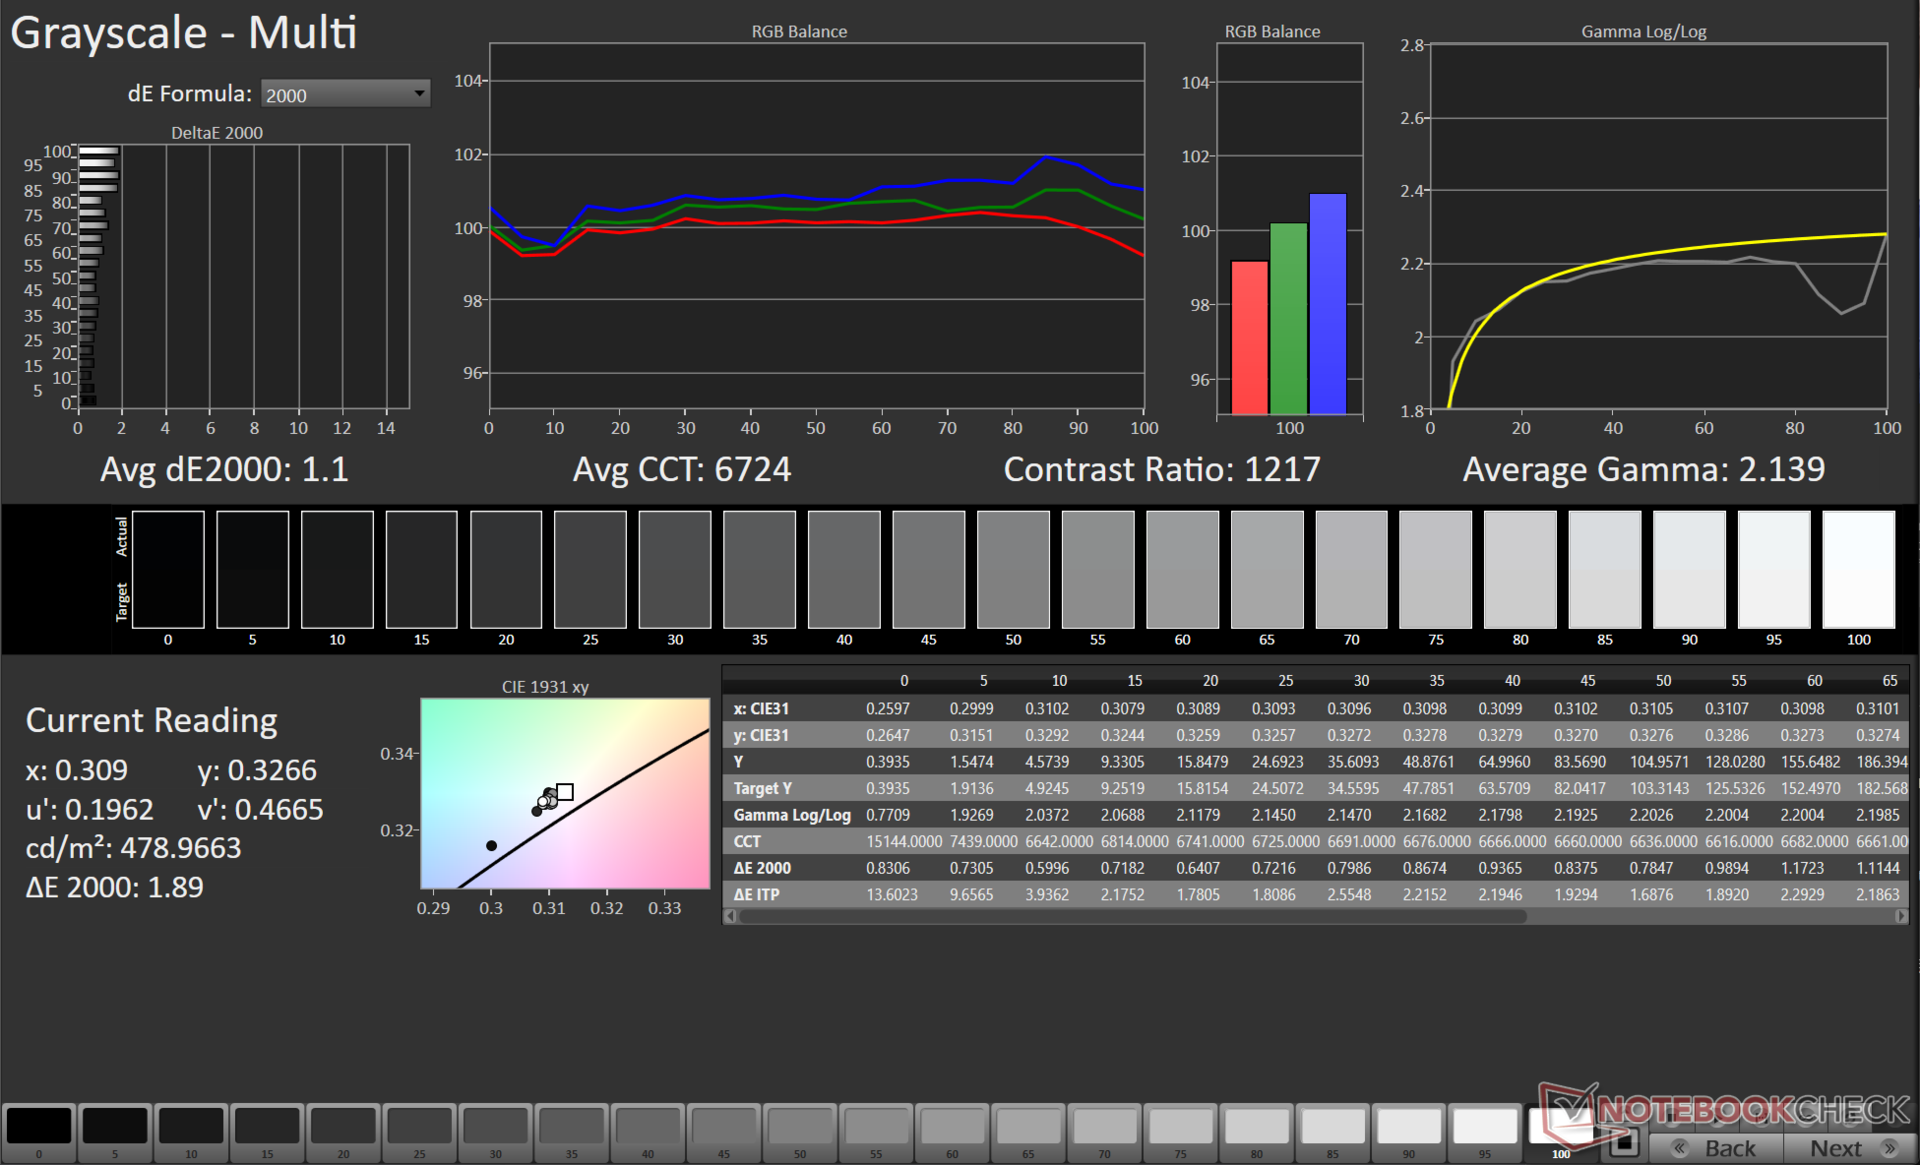
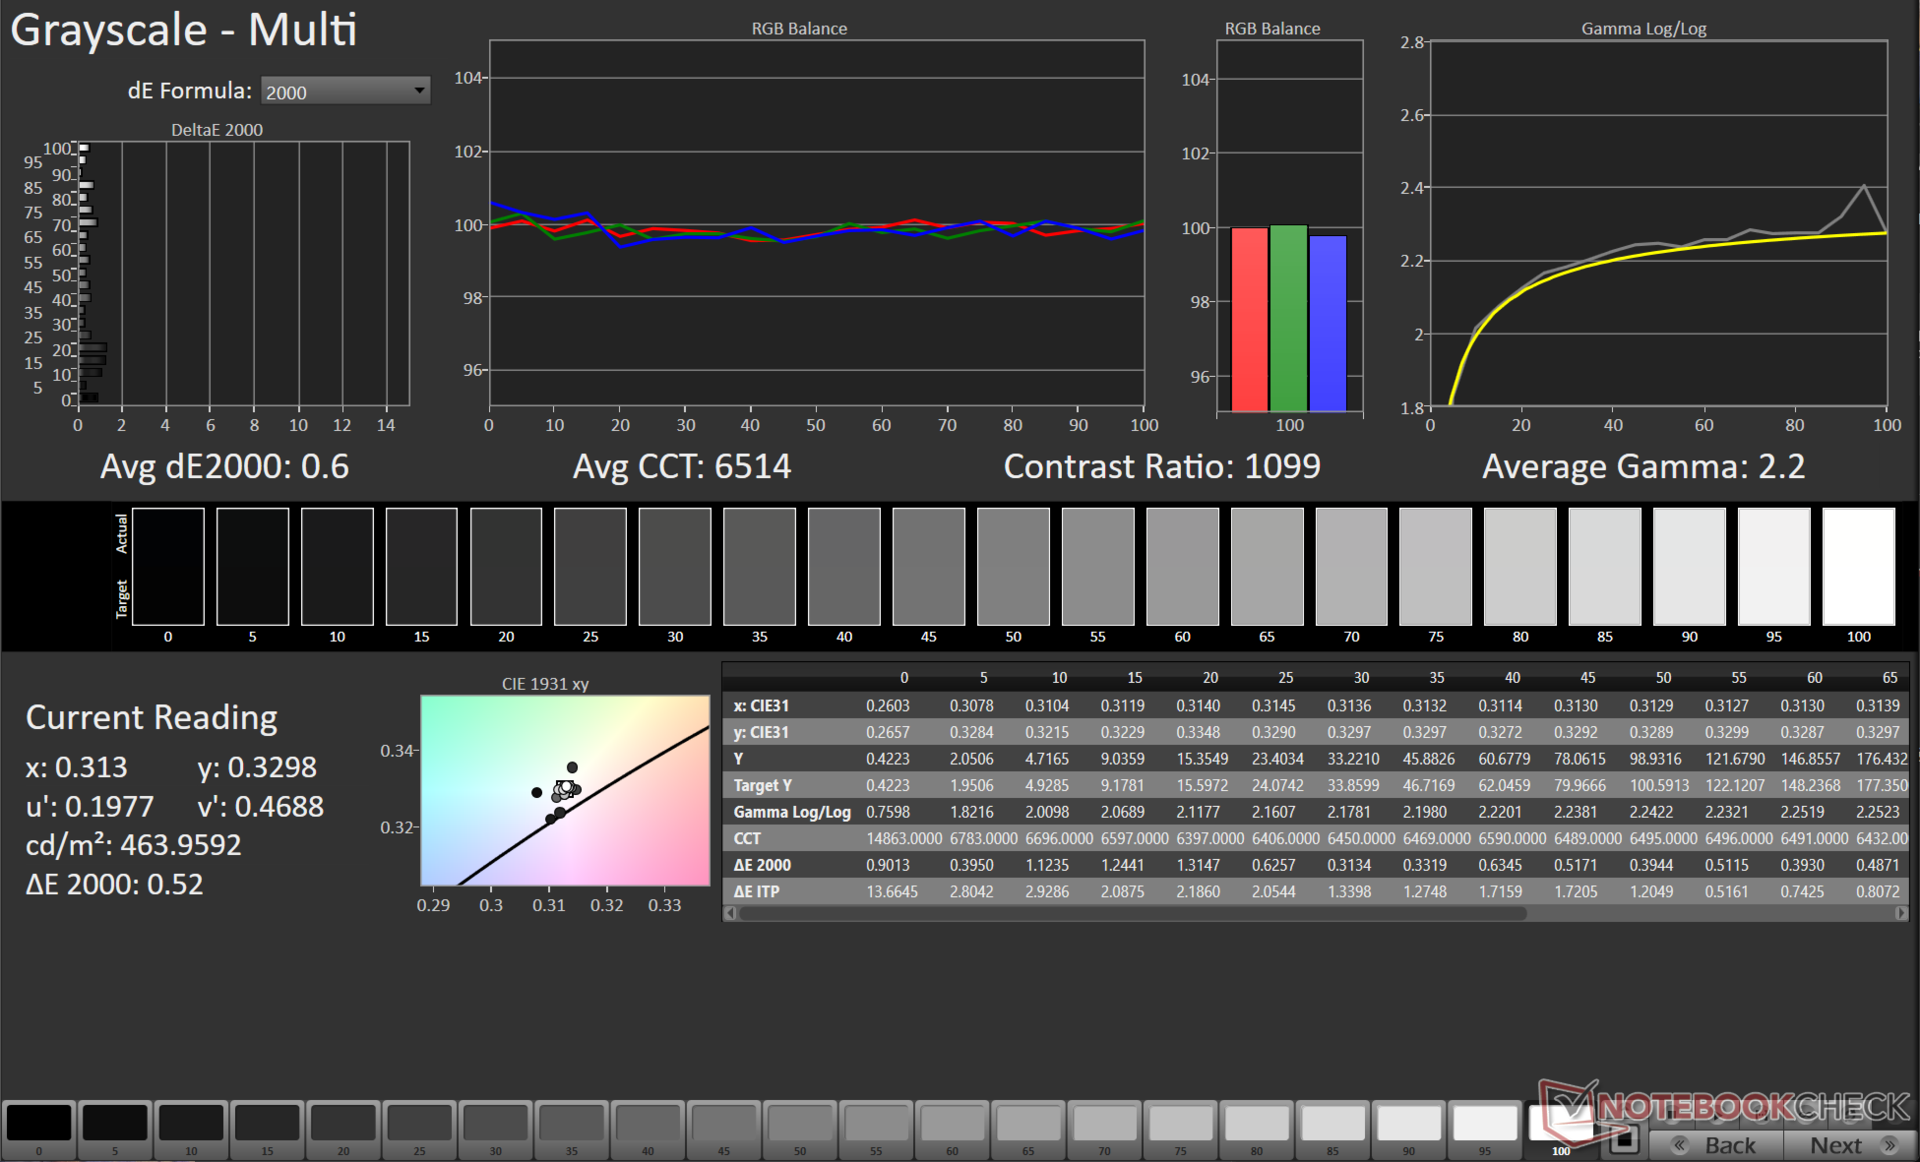
A tela da Scar 16 já vem bem calibrada, com valores médios de escala de cinza e ColorChecker Delta E 2000 de 1,1 e 1,08, respectivamente.
Nossa rotina de calibração no espaço de cores Display P3 com o espectrofotômetro X-Rite i1Basic Pro 3 e o software Calman Ultimate da Portrait Displays reduz ainda mais esses valores correspondentes para 0,6 e 0,9.


Exibir tempos de resposta
| ↔ Tempo de resposta preto para branco | ||
|---|---|---|
| 10.4 ms ... ascensão ↗ e queda ↘ combinadas | ↗ 3 ms ascensão | 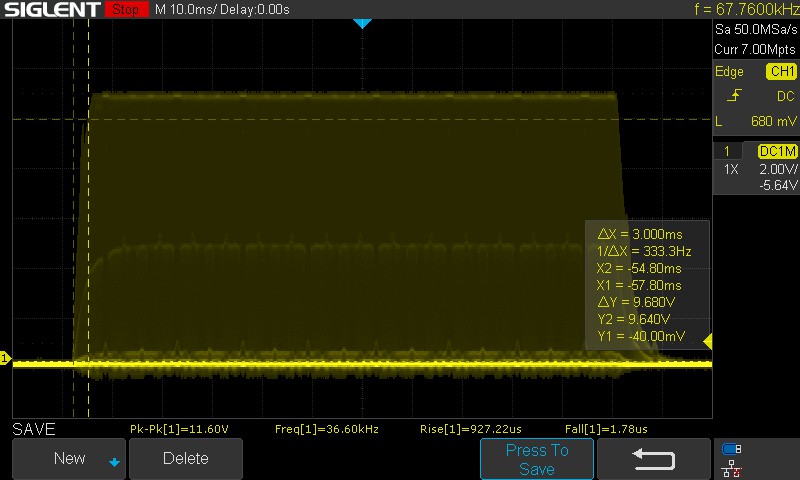  |
| ↘ 7.4 ms queda | ||
| A tela mostra boas taxas de resposta em nossos testes, mas pode ser muito lenta para jogadores competitivos. Em comparação, todos os dispositivos testados variam de 0.1 (mínimo) a 240 (máximo) ms. » 28 % de todos os dispositivos são melhores. Isso significa que o tempo de resposta medido é melhor que a média de todos os dispositivos testados (19.8 ms). | ||
| ↔ Tempo de resposta 50% cinza a 80% cinza | ||
| 5 ms ... ascensão ↗ e queda ↘ combinadas | ↗ 2 ms ascensão | 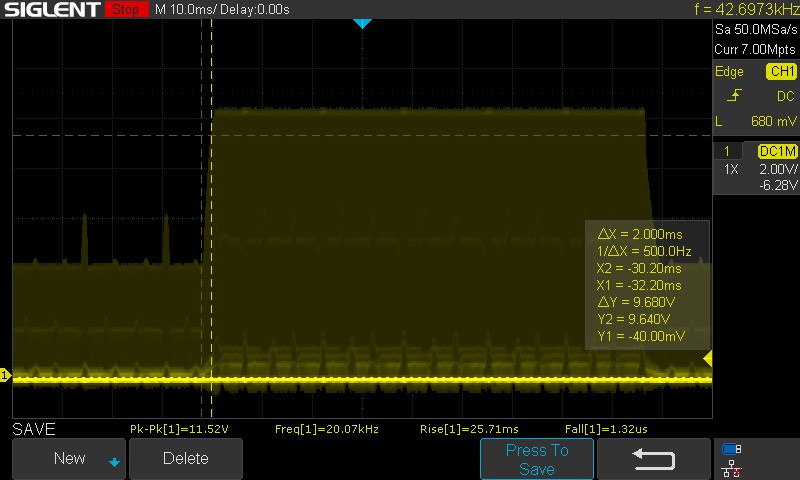 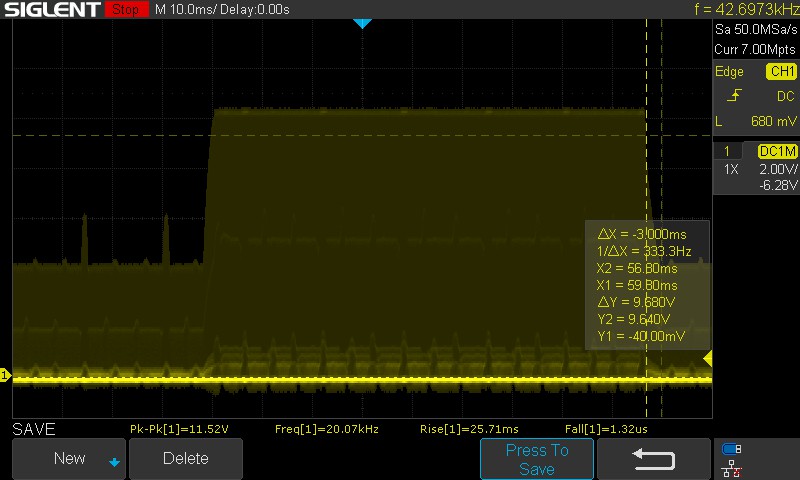 |
| ↘ 3 ms queda | ||
| A tela mostra taxas de resposta muito rápidas em nossos testes e deve ser muito adequada para jogos em ritmo acelerado. Em comparação, todos os dispositivos testados variam de 0.165 (mínimo) a 636 (máximo) ms. » 17 % de todos os dispositivos são melhores. Isso significa que o tempo de resposta medido é melhor que a média de todos os dispositivos testados (31 ms). | ||
Tivemos que estimar manualmente os tempos de resposta devido ao PWM de fundo com o mini painel de LED. Os tempos de resposta estimados parecem decentes para um notebook para jogos.
A Asus anuncia um tempo de resposta de 3 ms, mas medimos 5 ms com transições de 50% de cinza para 80% de cinza. Não é oferecida uma opção de overdrive do painel.
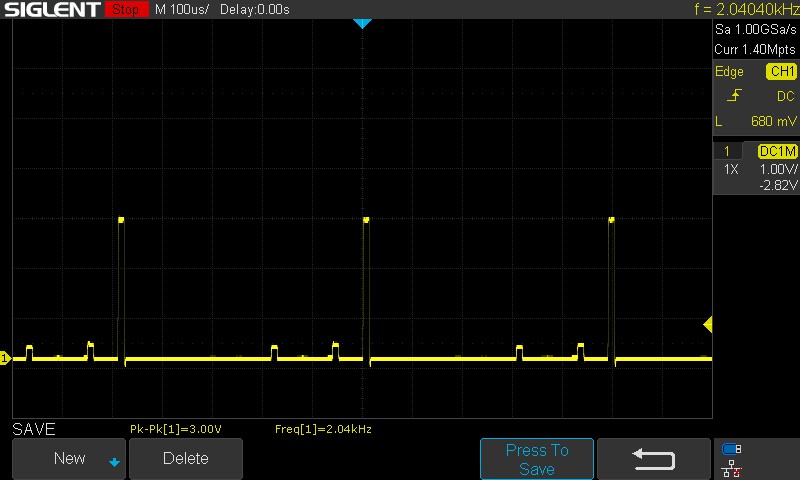
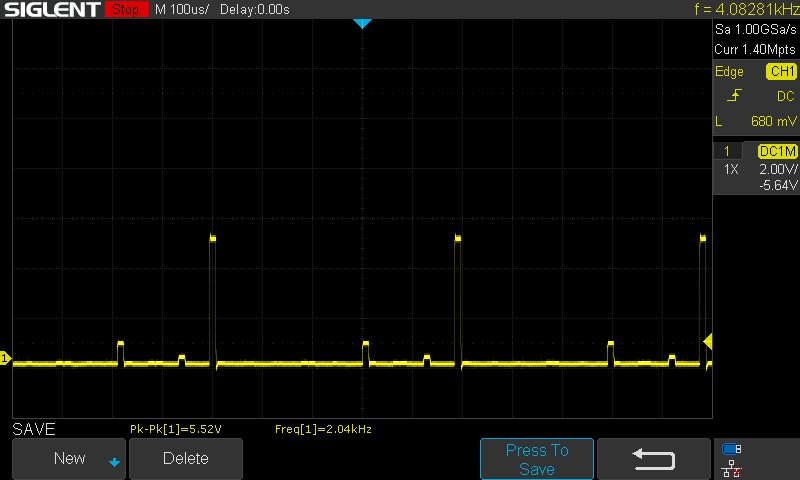
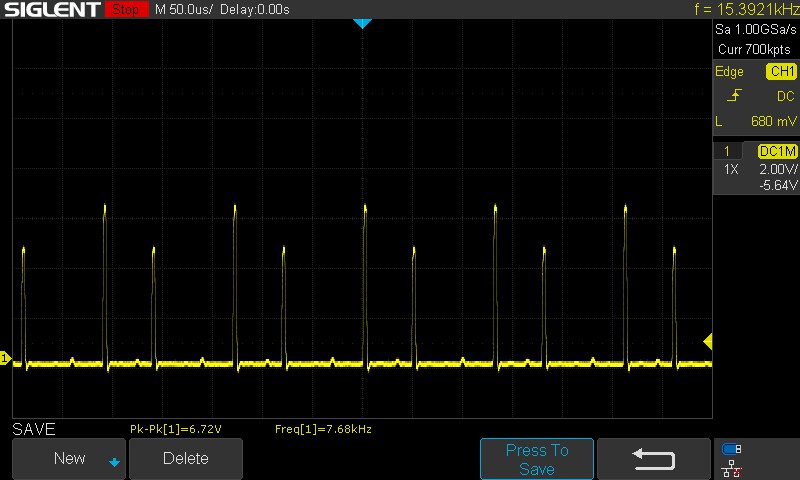
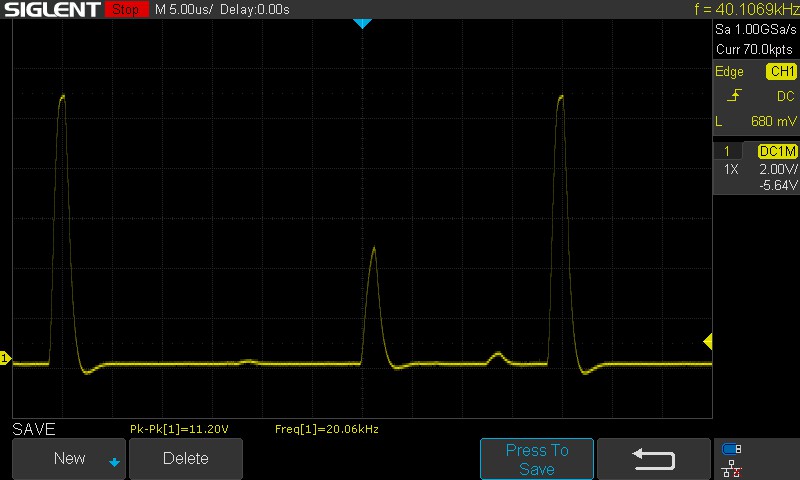
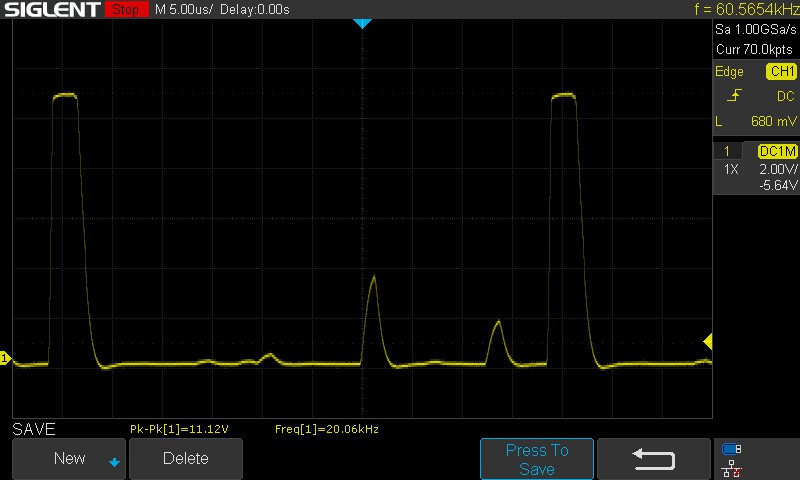
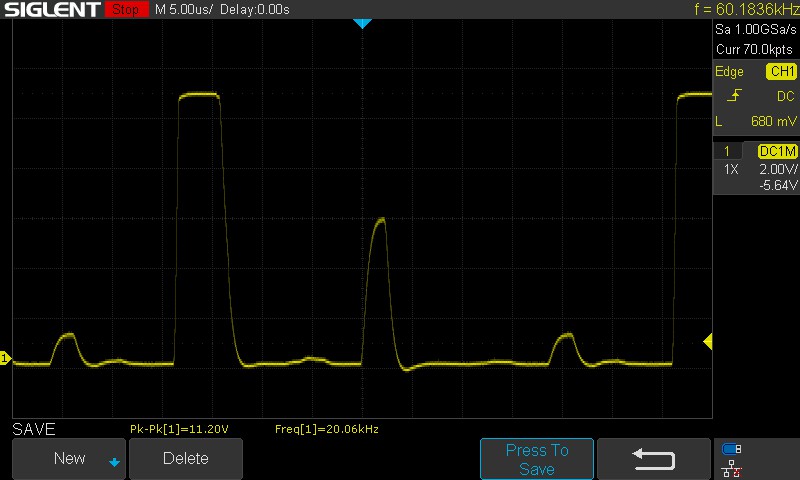
Cintilação da tela / PWM (modulação por largura de pulso)
| Tela tremeluzindo/PWM detectado | 2040 Hz | ≤ 10 % configuração de brilho |  |
A luz de fundo da tela pisca em 2040 Hz (pior caso, por exemplo, utilizando PWM) Cintilação detectada em uma configuração de brilho de 10 % e abaixo. Não deve haver cintilação ou PWM acima desta configuração de brilho. A frequência de 2040 Hz é bastante alta, então a maioria dos usuários sensíveis ao PWM não deve notar nenhuma oscilação. [pwm_comparison] Em comparação: 52 % de todos os dispositivos testados não usam PWM para escurecer a tela. Se PWM foi detectado, uma média de 7747 (mínimo: 5 - máximo: 343500) Hz foi medida. | |||
Registramos uma frequência PWM de 2,04 kHZ com o controle deslizante de brilho do Windows definido para 10%. De 50% a 100% de brilho, esse valor aumenta para 20,06 kHz. Os valores medidos são bastante altos e, portanto, não devem causar problemas de cansaço visual, mesmo em níveis de brilho mais baixos.
Consulte nosso artigo, "Por que o PWM é uma dor de cabeça" para obter mais informações. Também temos uma Página de classificação de PWM que lista as medições de frequência de todos os dispositivos analisados.
A visualização em ambientes externos geralmente é boa, mas um sol forte pode apresentar problemas com a legibilidade do conteúdo na tela. Os ângulos de visão são bastante estáveis, sem perda perceptível de brilho ou informações de cores nos extremos.

Desempenho: O Core i9-14900HX apresenta ganhos modestos em relação ao Core i9-13980HX
A Asus oferece o ROG Strix Scar 16 em duas configurações, ambas com Intel Core i9-14900HX ambos com processadores Intel Core i9-14900HX. As SKUs diferem apenas na GPU, com opções entre a Nvidia GeForce RTX 4080 e a GPU para laptop RTX 4090s.
Condições de teste
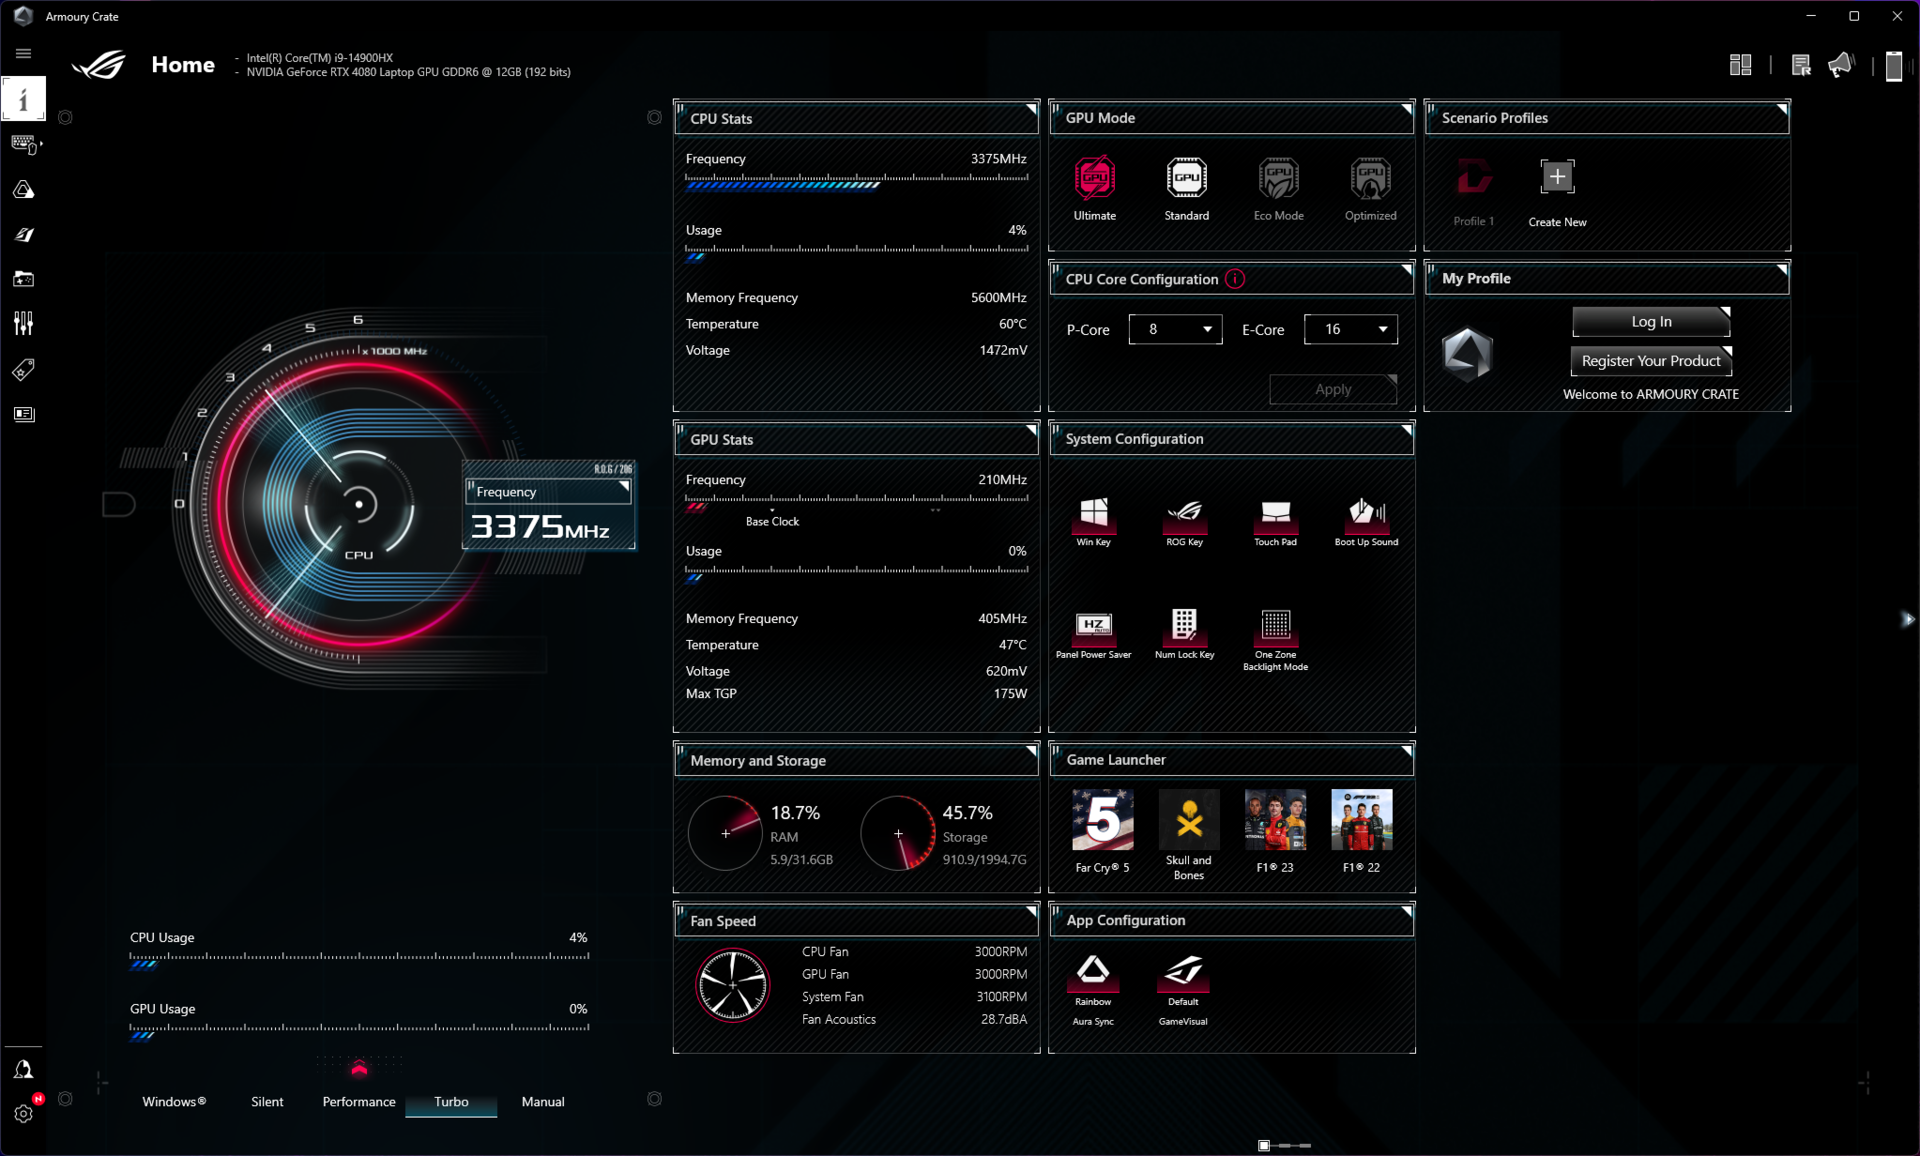
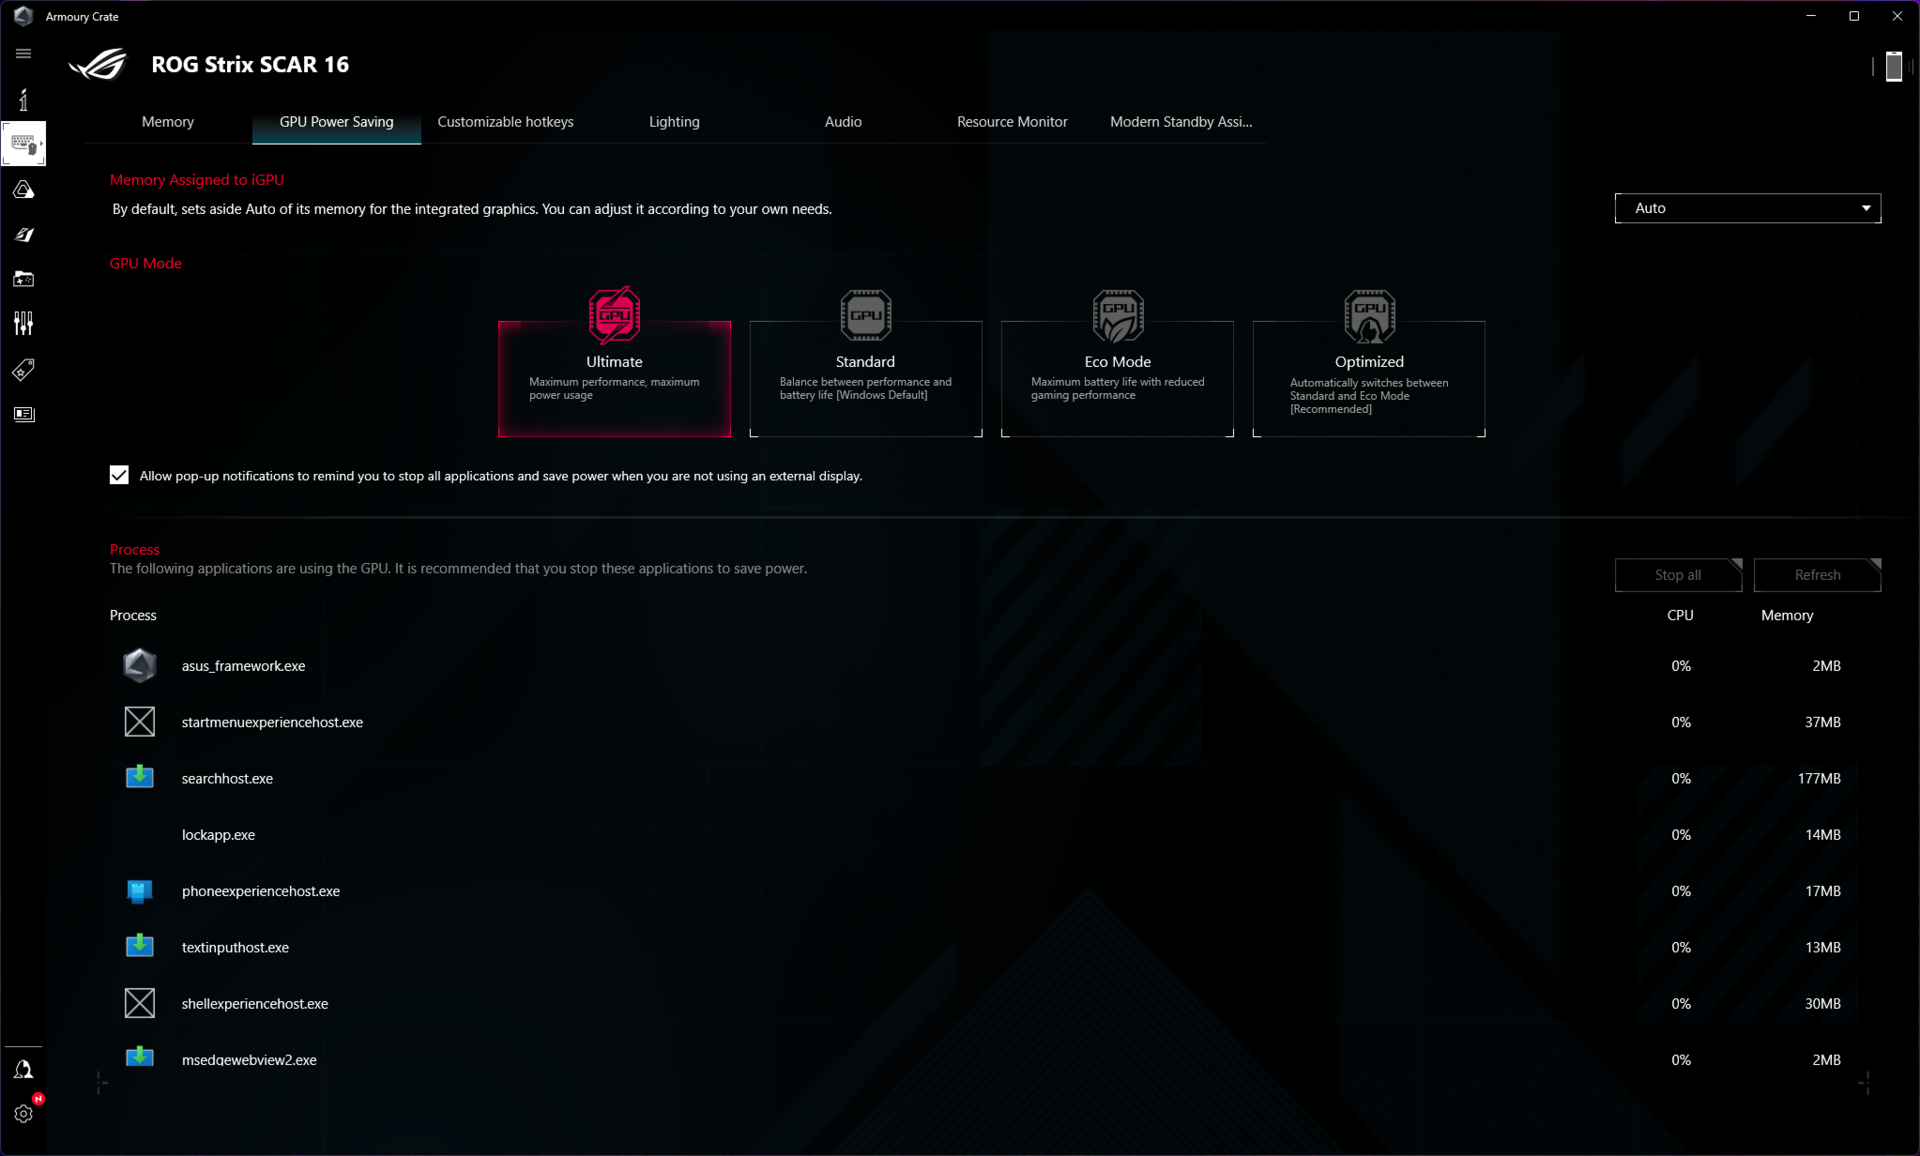
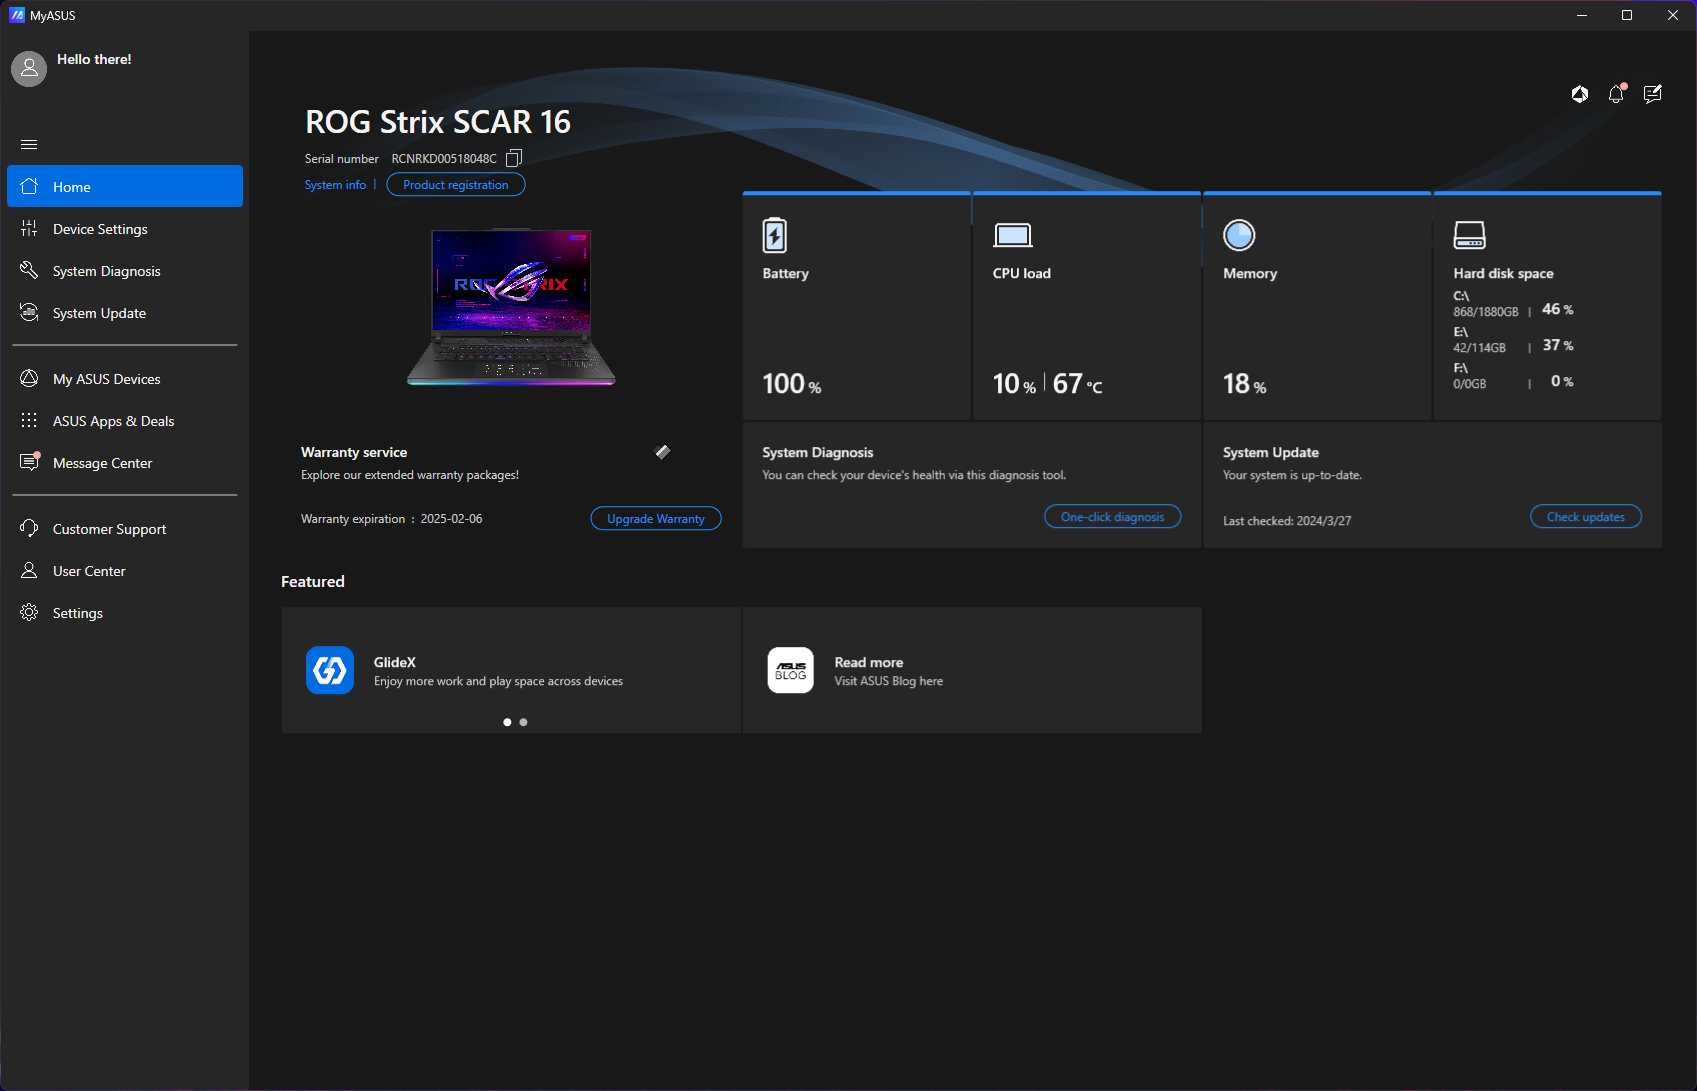
O ajuste de desempenho pode ser realizado por meio do Armory Crate. A Asus também inclui o aplicativo MyAsus que oferece funções auxiliares, como atualizações do sistema, diagnósticos, etc.
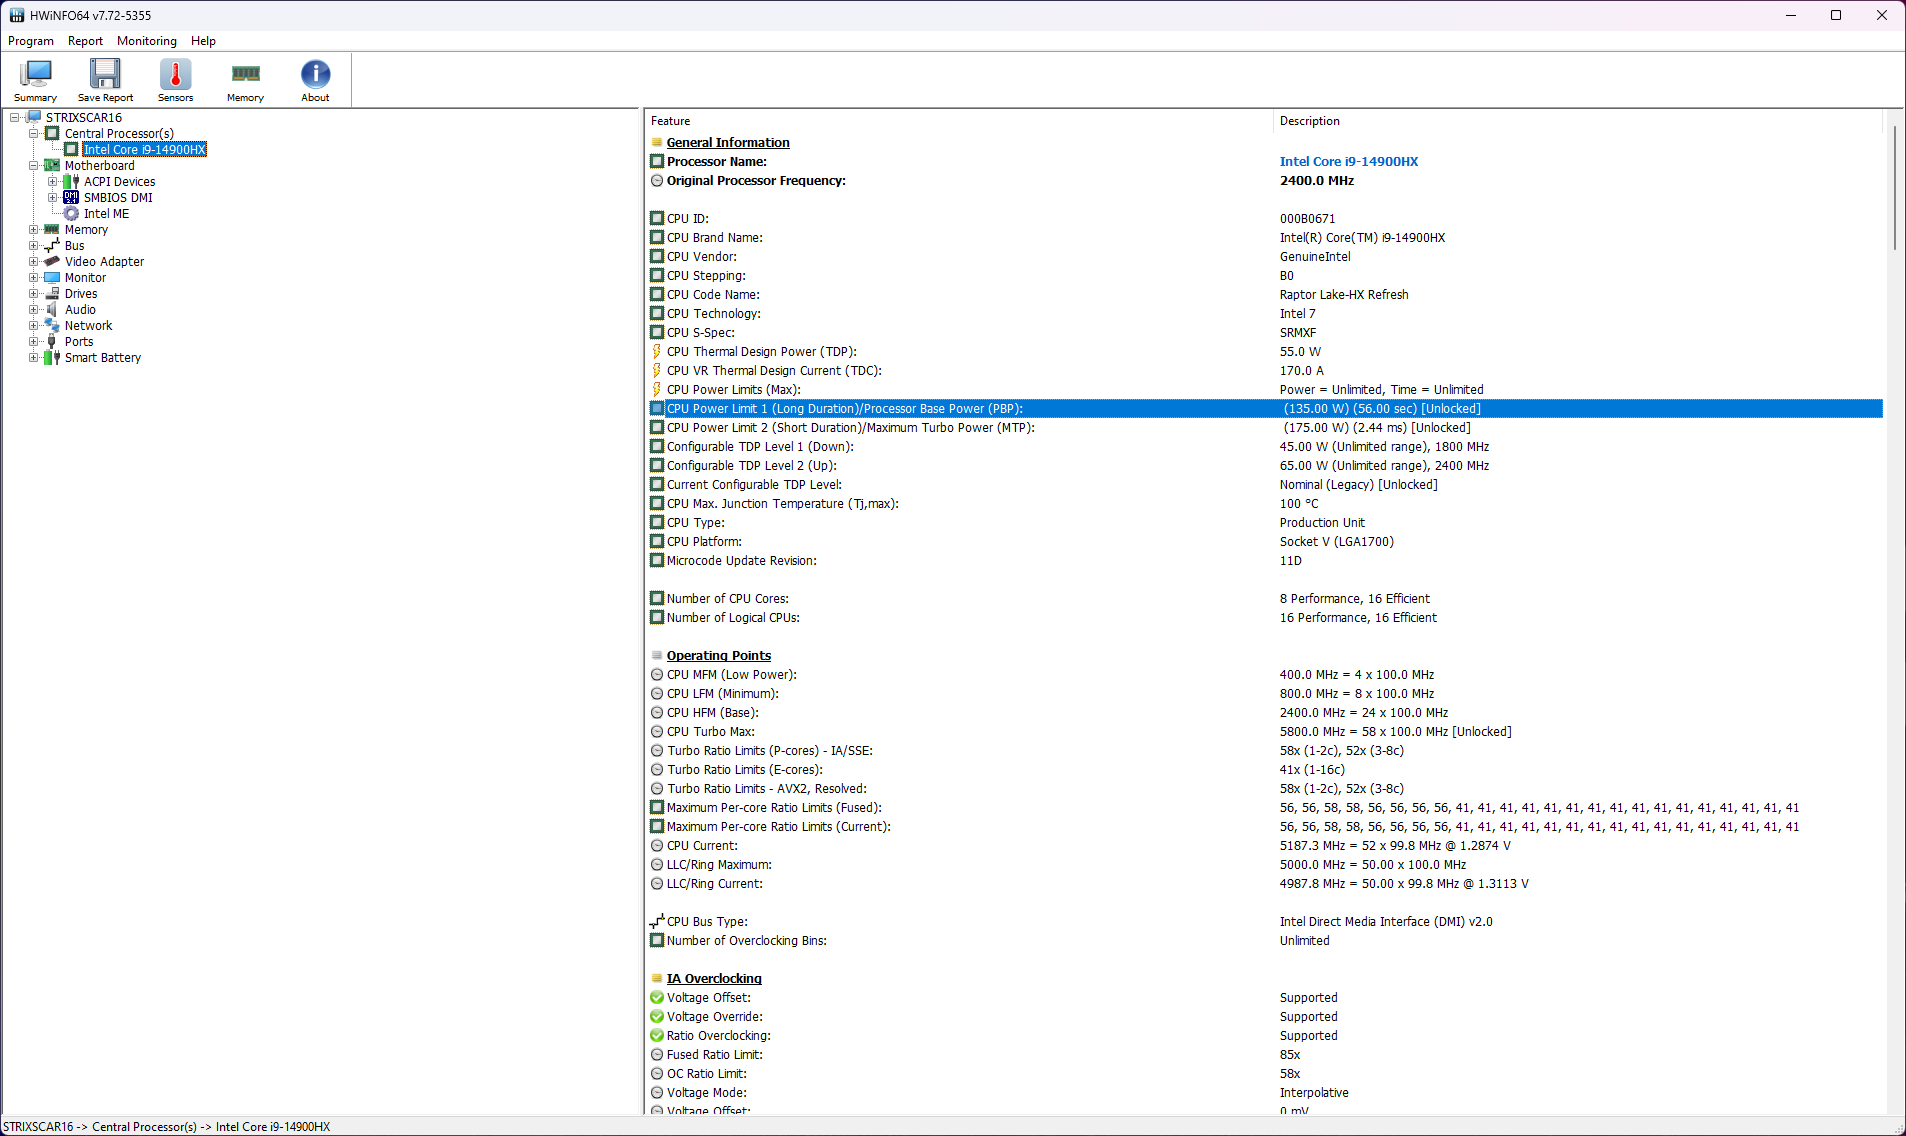
O Scar 16 oferece três perfis de energia principais para escolha: Silencioso, Desempenho e Turbo. Também é possível usar os planos de energia do Windows em vez dos disponíveis no Armory Crate. Além disso, há um modo Manual que permite configurar até um PL1 de 140 W.
| Modo de desempenho | PL1 (PBP) / Tau | PL2 (MTP) / Tau | Cinebench R15 Multi score | Cinebench R15 Multi score (30 loops) |
|---|---|---|---|---|
| Silencioso | 70 W / 56 s | 100 W / 2.44 ms | 3904 (-15.14%) | 3435 (-20.98%) |
| Desempenho | 107 W / 56 s | 120 W / 2,44 ms | 4208 (-8,54%) | 4182 (-3,79%) |
| Turbo | 135 W / 56 s | 175 W / 2,44 ms | 4601 (100%) | 4347 (100%) |
O Nvidia Advanced Optimus é compatível, mas a Asus também inclui um modo MUX de hardware. Realizamos todos os testes de benchmarking no modo Turbo com o MUX definido para a dGPU RTX 4080.
Os testes de bateria foram realizados no modo Silencioso com o MSHybrid ativado.
Processador
O Core i9-14900HX é muito parecido com o Core i9-13980HX com 24 núcleos (8P + 16E) e 32 threads, mas com um aumento de 5,8 GHz.
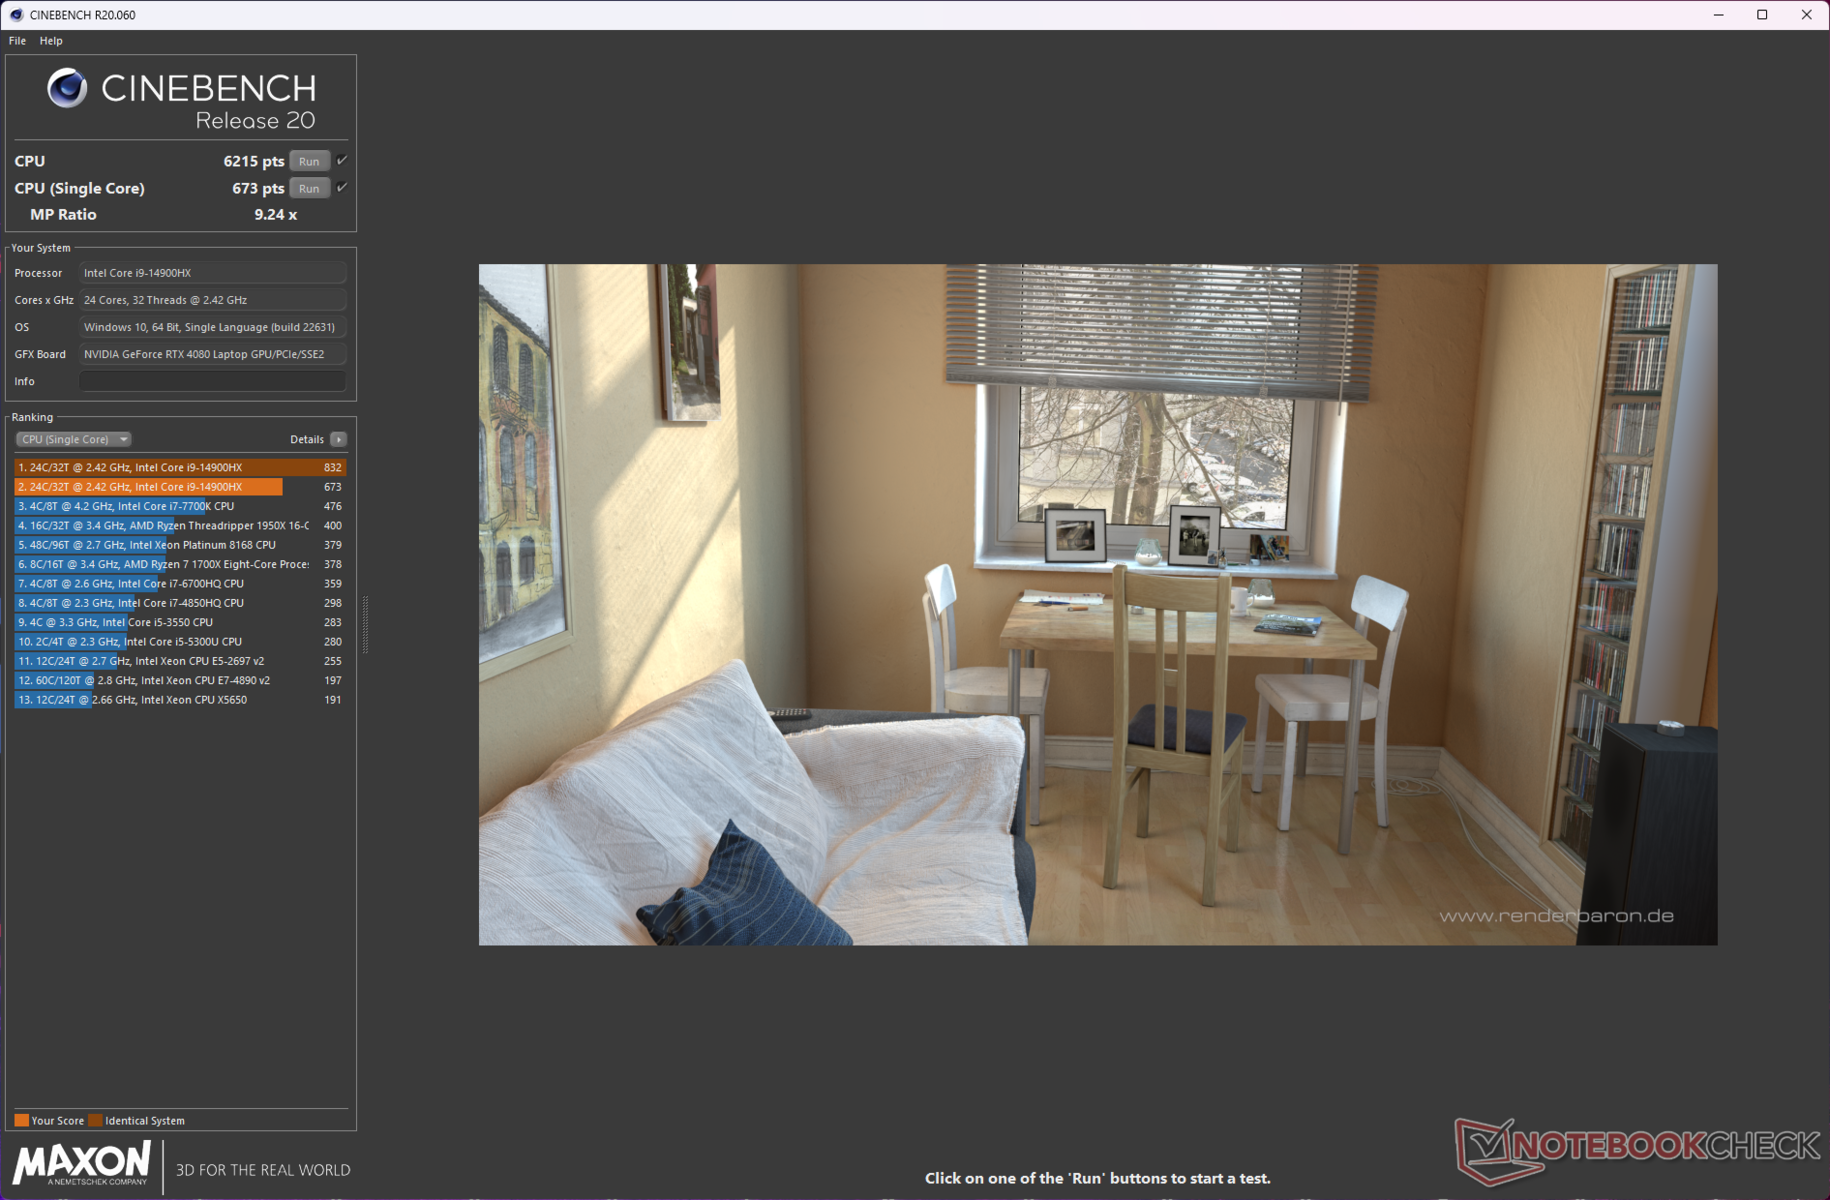
O Raptor Lake-HX de 14ª geração não é uma grande atualização e o aumento de desempenho de um Core i9-13980HX está dentro da margem de erro. O desempenho de núcleo único do Scar 16 está no mesmo nível de outros laptops Core i9-14900HX em comparação.
No entanto, o MSI Vector 16 HX com a mesma CPU tem uma vantagem perceptível em vários núcleos devido à PL2 de 184 W mais alta. Por outro lado, o HP Omen 16com um PL2 de 130 W, fica atrás do Scar 16 nesses testes.
Cinebench R15 Multi Loop
Cinebench R23: Multi Core | Single Core
Cinebench R20: CPU (Multi Core) | CPU (Single Core)
Cinebench R15: CPU Multi 64Bit | CPU Single 64Bit
Blender: v2.79 BMW27 CPU
7-Zip 18.03: 7z b 4 | 7z b 4 -mmt1
Geekbench 6.7: Multi-Core | Single-Core
Geekbench 5.5: Multi-Core | Single-Core
HWBOT x265 Benchmark v2.2: 4k Preset
LibreOffice : 20 Documents To PDF
R Benchmark 2.5: Overall mean
| CPU Performance rating | |
| Lenovo Legion Pro 7 16IRX9H | |
| Asus ROG Strix Scar 17 G733PYV-LL053X | |
| Asus ROG Strix Scar 16 G634JZR | |
| MSI Vector 16 HX A14V | |
| Média Intel Core i9-14900HX | |
| Asus ROG Strix G16 G614JZ -2! | |
| HP Omen 16 (2024) | |
| Média da turma Gaming | |
| Alienware m16 R2 -1! | |
| Cinebench R23 / Multi Core | |
| MSI Vector 16 HX A14V | |
| Asus ROG Strix Scar 17 G733PYV-LL053X | |
| Lenovo Legion Pro 7 16IRX9H | |
| Asus ROG Strix Scar 16 G634JZR | |
| Asus ROG Strix G16 G614JZ | |
| Média Intel Core i9-14900HX (17078 - 36249, n=37) | |
| HP Omen 16 (2024) | |
| Média da turma Gaming (10488 - 42661, n=107, últimos 2 anos) | |
| Alienware m16 R2 | |
| Cinebench R23 / Single Core | |
| Lenovo Legion Pro 7 16IRX9H | |
| HP Omen 16 (2024) | |
| MSI Vector 16 HX A14V | |
| Asus ROG Strix Scar 16 G634JZR | |
| Média Intel Core i9-14900HX (1720 - 2245, n=37) | |
| Asus ROG Strix G16 G614JZ | |
| Média da turma Gaming (1166 - 2415, n=107, últimos 2 anos) | |
| Asus ROG Strix Scar 17 G733PYV-LL053X | |
| Alienware m16 R2 | |
| Cinebench R20 / CPU (Multi Core) | |
| Asus ROG Strix Scar 17 G733PYV-LL053X | |
| Lenovo Legion Pro 7 16IRX9H | |
| MSI Vector 16 HX A14V | |
| Asus ROG Strix Scar 16 G634JZR | |
| Asus ROG Strix G16 G614JZ | |
| Média Intel Core i9-14900HX (6579 - 13832, n=37) | |
| Média da turma Gaming (4029 - 16433, n=106, últimos 2 anos) | |
| HP Omen 16 (2024) | |
| Alienware m16 R2 | |
| Cinebench R20 / CPU (Single Core) | |
| HP Omen 16 (2024) | |
| Asus ROG Strix Scar 16 G634JZR | |
| MSI Vector 16 HX A14V | |
| Lenovo Legion Pro 7 16IRX9H | |
| Média Intel Core i9-14900HX (657 - 859, n=37) | |
| Asus ROG Strix G16 G614JZ | |
| Média da turma Gaming (442 - 913, n=106, últimos 2 anos) | |
| Asus ROG Strix Scar 17 G733PYV-LL053X | |
| Alienware m16 R2 | |
| Cinebench R15 / CPU Multi 64Bit | |
| Asus ROG Strix Scar 17 G733PYV-LL053X | |
| Asus ROG Strix Scar 16 G634JZR | |
| Asus ROG Strix G16 G614JZ | |
| Asus ROG Strix G16 G614JZ | |
| Lenovo Legion Pro 7 16IRX9H | |
| MSI Vector 16 HX A14V | |
| Média Intel Core i9-14900HX (3263 - 5589, n=38) | |
| Média da turma Gaming (1578 - 6330, n=105, últimos 2 anos) | |
| HP Omen 16 (2024) | |
| Alienware m16 R2 | |
| Cinebench R15 / CPU Single 64Bit | |
| Asus ROG Strix Scar 16 G634JZR | |
| Lenovo Legion Pro 7 16IRX9H | |
| Asus ROG Strix Scar 17 G733PYV-LL053X | |
| HP Omen 16 (2024) | |
| MSI Vector 16 HX A14V | |
| Asus ROG Strix G16 G614JZ | |
| Asus ROG Strix G16 G614JZ | |
| Média Intel Core i9-14900HX (247 - 323, n=37) | |
| Média da turma Gaming (188.8 - 350, n=106, últimos 2 anos) | |
| Alienware m16 R2 | |
| Blender / v2.79 BMW27 CPU | |
| HP Omen 16 (2024) | |
| Média da turma Gaming (79 - 330, n=104, últimos 2 anos) | |
| Média Intel Core i9-14900HX (91 - 206, n=37) | |
| Asus ROG Strix Scar 16 G634JZR | |
| Asus ROG Strix G16 G614JZ | |
| Lenovo Legion Pro 7 16IRX9H | |
| MSI Vector 16 HX A14V | |
| Asus ROG Strix Scar 17 G733PYV-LL053X | |
| 7-Zip 18.03 / 7z b 4 | |
| Asus ROG Strix Scar 17 G733PYV-LL053X | |
| Lenovo Legion Pro 7 16IRX9H | |
| MSI Vector 16 HX A14V | |
| Asus ROG Strix Scar 16 G634JZR | |
| Asus ROG Strix G16 G614JZ | |
| Média Intel Core i9-14900HX (66769 - 136645, n=37) | |
| Média da turma Gaming (33491 - 148086, n=105, últimos 2 anos) | |
| HP Omen 16 (2024) | |
| Alienware m16 R2 | |
| 7-Zip 18.03 / 7z b 4 -mmt1 | |
| Asus ROG Strix Scar 17 G733PYV-LL053X | |
| Asus ROG Strix Scar 16 G634JZR | |
| Lenovo Legion Pro 7 16IRX9H | |
| HP Omen 16 (2024) | |
| MSI Vector 16 HX A14V | |
| Média Intel Core i9-14900HX (5452 - 7545, n=37) | |
| Asus ROG Strix G16 G614JZ | |
| Média da turma Gaming (4199 - 7436, n=105, últimos 2 anos) | |
| Alienware m16 R2 | |
| Geekbench 6.7 / Multi-Core | |
| Asus ROG Strix Scar 16 G634JZR | |
| Lenovo Legion Pro 7 16IRX9H | |
| MSI Vector 16 HX A14V | |
| Média Intel Core i9-14900HX (13158 - 19665, n=37) | |
| Asus ROG Strix Scar 17 G733PYV-LL053X | |
| HP Omen 16 (2024) | |
| Média da turma Gaming (6625 - 22850, n=106, últimos 2 anos) | |
| Alienware m16 R2 | |
| Geekbench 6.7 / Single-Core | |
| HP Omen 16 (2024) | |
| Lenovo Legion Pro 7 16IRX9H | |
| Asus ROG Strix Scar 16 G634JZR | |
| MSI Vector 16 HX A14V | |
| Média Intel Core i9-14900HX (2419 - 3129, n=37) | |
| Asus ROG Strix Scar 17 G733PYV-LL053X | |
| Média da turma Gaming (1490 - 3259, n=106, últimos 2 anos) | |
| Alienware m16 R2 | |
| Geekbench 5.5 / Multi-Core | |
| Asus ROG Strix Scar 16 G634JZR | |
| MSI Vector 16 HX A14V | |
| Lenovo Legion Pro 7 16IRX9H | |
| Asus ROG Strix Scar 17 G733PYV-LL053X | |
| Média Intel Core i9-14900HX (8618 - 23194, n=37) | |
| Asus ROG Strix G16 G614JZ | |
| HP Omen 16 (2024) | |
| Média da turma Gaming (6460 - 28263, n=105, últimos 2 anos) | |
| Alienware m16 R2 | |
| Geekbench 5.5 / Single-Core | |
| Asus ROG Strix Scar 16 G634JZR | |
| HP Omen 16 (2024) | |
| Asus ROG Strix Scar 17 G733PYV-LL053X | |
| MSI Vector 16 HX A14V | |
| Lenovo Legion Pro 7 16IRX9H | |
| Média Intel Core i9-14900HX (1669 - 2210, n=37) | |
| Média da turma Gaming (986 - 2474, n=105, últimos 2 anos) | |
| Asus ROG Strix G16 G614JZ | |
| Alienware m16 R2 | |
| HWBOT x265 Benchmark v2.2 / 4k Preset | |
| Asus ROG Strix Scar 17 G733PYV-LL053X | |
| Lenovo Legion Pro 7 16IRX9H | |
| MSI Vector 16 HX A14V | |
| Asus ROG Strix Scar 16 G634JZR | |
| Asus ROG Strix G16 G614JZ | |
| Média Intel Core i9-14900HX (16.8 - 38.9, n=37) | |
| Média da turma Gaming (11.5 - 44.4, n=105, últimos 2 anos) | |
| HP Omen 16 (2024) | |
| Alienware m16 R2 | |
| LibreOffice / 20 Documents To PDF | |
| Alienware m16 R2 | |
| Média da turma Gaming (33.2 - 88.8, n=105, últimos 2 anos) | |
| Asus ROG Strix Scar 16 G634JZR | |
| Asus ROG Strix G16 G614JZ | |
| MSI Vector 16 HX A14V | |
| HP Omen 16 (2024) | |
| Média Intel Core i9-14900HX (19 - 85.1, n=37) | |
| Asus ROG Strix Scar 17 G733PYV-LL053X | |
| Lenovo Legion Pro 7 16IRX9H | |
| R Benchmark 2.5 / Overall mean | |
| Alienware m16 R2 | |
| Média da turma Gaming (0.3439 - 0.759, n=106, últimos 2 anos) | |
| Asus ROG Strix Scar 17 G733PYV-LL053X | |
| Asus ROG Strix G16 G614JZ | |
| Lenovo Legion Pro 7 16IRX9H | |
| Média Intel Core i9-14900HX (0.3604 - 0.4859, n=37) | |
| MSI Vector 16 HX A14V | |
| HP Omen 16 (2024) | |
| Asus ROG Strix Scar 16 G634JZR | |
* ... menor é melhor
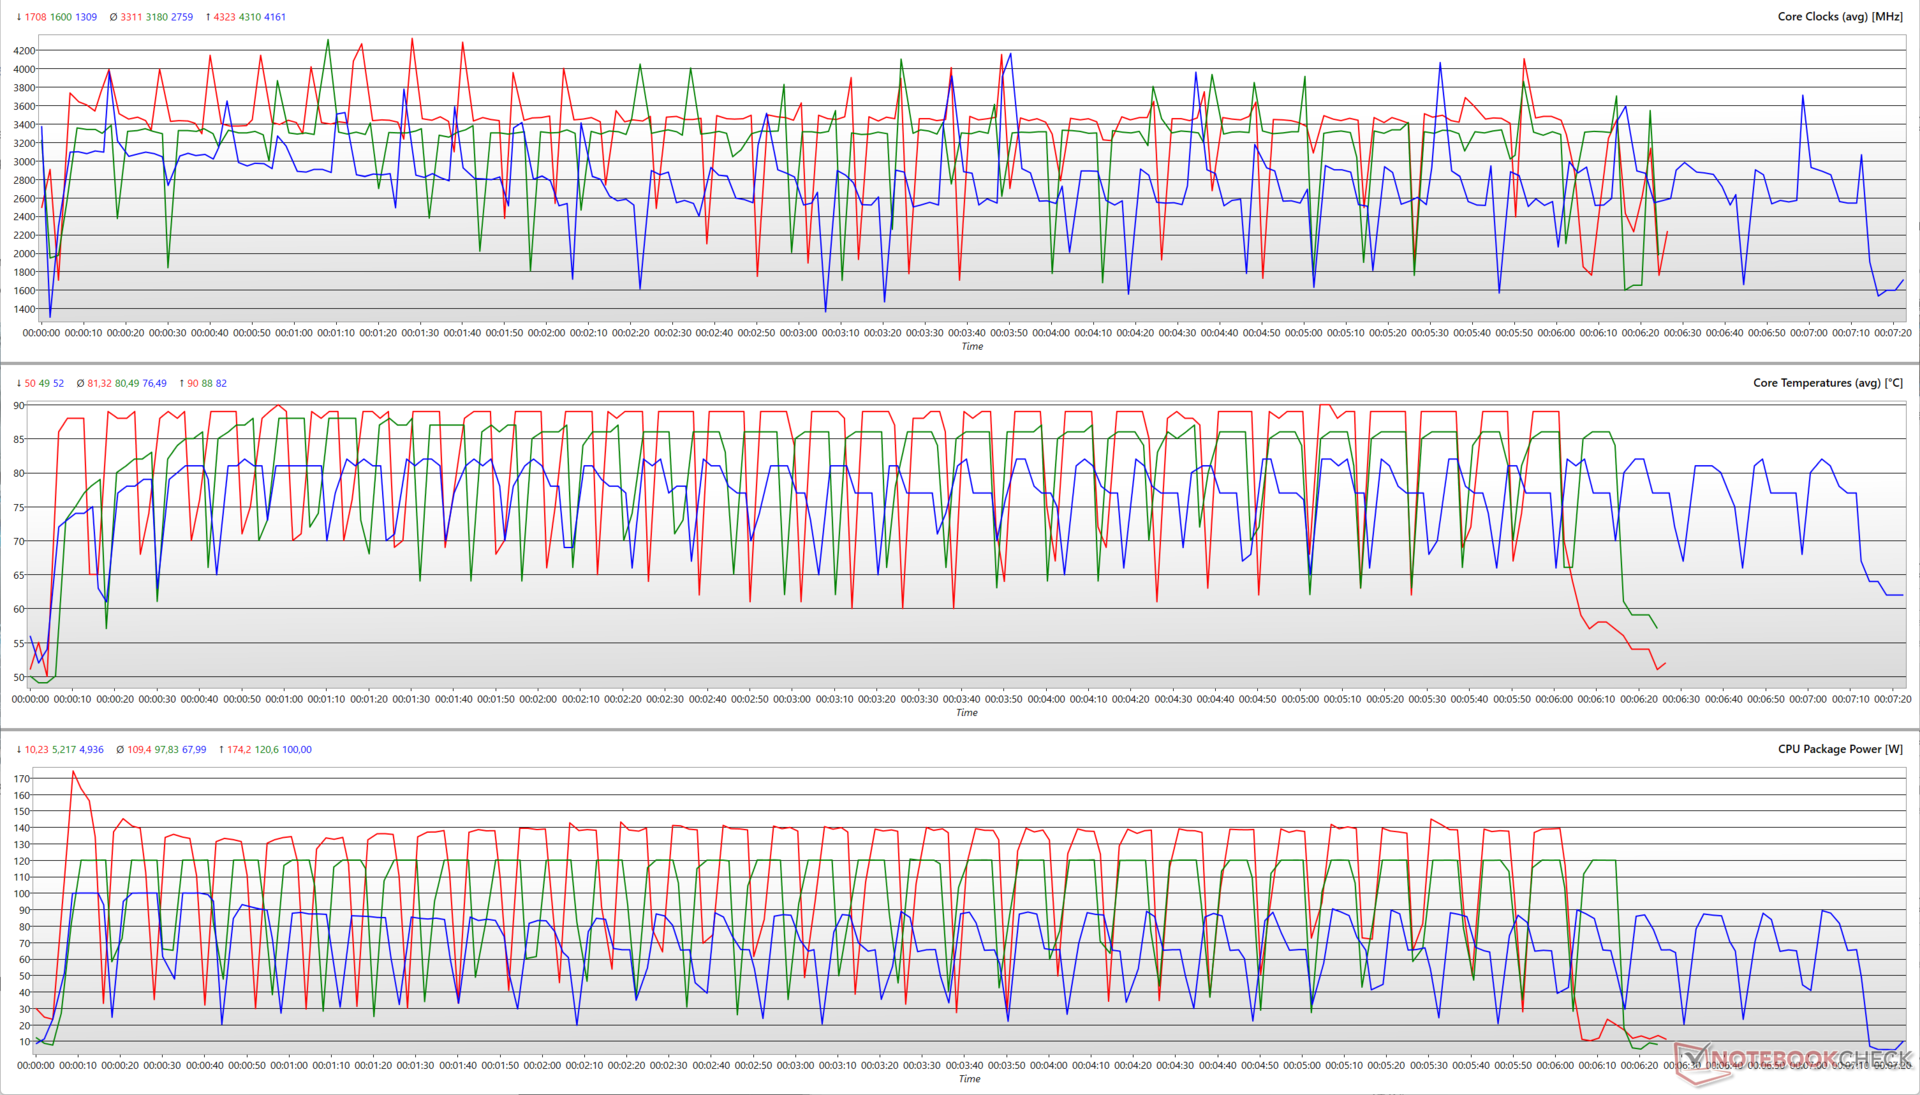
A execução do Cinebench R15 multi-core para 30 loops mostra que o Core i9-14900HX é capaz de utilizar todo o limite PL2 permitido em cada modo. No perfil Turbo, o Core i9-14900HX é capaz de atingir um aumento de 4,3 GHz a 174 W antes de se estabelecer em clocks médios de 3,3 GHz a 109 W em média.
No entanto, a CPU também consegue atingir um clock semelhante a 120 W no modo Desempenho, enquanto os clocks médios ficam em 3,18 GHz com 97,8 W de potência média do pacote.
No modo Silencioso, o consumo médio de energia do pacote é de 68 W para clocks médios de 2,76 GHz. A CPU é capaz de atingir um aumento máximo de 4,16 GHz a 100 W nesse modo.
As pontuações do Cinebench R20 em relação à energia da bateria caem 19,78% e 46,44% em núcleo único e núcleo múltiplo, respectivamente.
AIDA64: FP32 Ray-Trace | FPU Julia | CPU SHA3 | CPU Queen | FPU SinJulia | FPU Mandel | CPU AES | CPU ZLib | FP64 Ray-Trace | CPU PhotoWorxx
| Performance rating | |
| Asus ROG Strix Scar 17 G733PYV-LL053X | |
| MSI Vector 16 HX A14V | |
| Lenovo Legion Pro 7 16IRX9H | |
| Asus ROG Strix Scar 16 G634JZR | |
| Asus ROG Strix G16 G614JZ | |
| Média da turma Gaming | |
| Média Intel Core i9-14900HX | |
| HP Omen 16 (2024) | |
| Alienware m16 R2 | |
| AIDA64 / FP32 Ray-Trace | |
| Asus ROG Strix Scar 17 G733PYV-LL053X | |
| Média da turma Gaming (10227 - 85542, n=105, últimos 2 anos) | |
| MSI Vector 16 HX A14V | |
| Lenovo Legion Pro 7 16IRX9H | |
| Asus ROG Strix G16 G614JZ | |
| Asus ROG Strix Scar 16 G634JZR | |
| Média Intel Core i9-14900HX (13098 - 33474, n=36) | |
| Alienware m16 R2 | |
| HP Omen 16 (2024) | |
| AIDA64 / FPU Julia | |
| Asus ROG Strix Scar 17 G733PYV-LL053X | |
| MSI Vector 16 HX A14V | |
| Média da turma Gaming (51376 - 238426, n=105, últimos 2 anos) | |
| Lenovo Legion Pro 7 16IRX9H | |
| Asus ROG Strix G16 G614JZ | |
| Asus ROG Strix Scar 16 G634JZR | |
| Média Intel Core i9-14900HX (67573 - 166040, n=36) | |
| Alienware m16 R2 | |
| HP Omen 16 (2024) | |
| AIDA64 / CPU SHA3 | |
| Asus ROG Strix Scar 17 G733PYV-LL053X | |
| Lenovo Legion Pro 7 16IRX9H | |
| MSI Vector 16 HX A14V | |
| Asus ROG Strix Scar 16 G634JZR | |
| Asus ROG Strix G16 G614JZ | |
| Média da turma Gaming (2180 - 10115, n=105, últimos 2 anos) | |
| Média Intel Core i9-14900HX (3589 - 7979, n=36) | |
| HP Omen 16 (2024) | |
| Alienware m16 R2 | |
| AIDA64 / CPU Queen | |
| Asus ROG Strix Scar 17 G733PYV-LL053X | |
| Asus ROG Strix Scar 16 G634JZR | |
| Lenovo Legion Pro 7 16IRX9H | |
| Asus ROG Strix G16 G614JZ | |
| MSI Vector 16 HX A14V | |
| Média Intel Core i9-14900HX (118405 - 148966, n=36) | |
| HP Omen 16 (2024) | |
| Média da turma Gaming (49785 - 173351, n=90, últimos 2 anos) | |
| Alienware m16 R2 | |
| AIDA64 / FPU SinJulia | |
| Asus ROG Strix Scar 17 G733PYV-LL053X | |
| Asus ROG Strix G16 G614JZ | |
| Lenovo Legion Pro 7 16IRX9H | |
| MSI Vector 16 HX A14V | |
| Asus ROG Strix Scar 16 G634JZR | |
| Média Intel Core i9-14900HX (10475 - 18517, n=36) | |
| Média da turma Gaming (4424 - 33636, n=105, últimos 2 anos) | |
| HP Omen 16 (2024) | |
| Alienware m16 R2 | |
| AIDA64 / FPU Mandel | |
| Asus ROG Strix Scar 17 G733PYV-LL053X | |
| Média da turma Gaming (25115 - 128721, n=105, últimos 2 anos) | |
| MSI Vector 16 HX A14V | |
| Lenovo Legion Pro 7 16IRX9H | |
| Asus ROG Strix G16 G614JZ | |
| Asus ROG Strix Scar 16 G634JZR | |
| Média Intel Core i9-14900HX (32543 - 83662, n=36) | |
| Alienware m16 R2 | |
| HP Omen 16 (2024) | |
| AIDA64 / CPU AES | |
| Asus ROG Strix Scar 17 G733PYV-LL053X | |
| Asus ROG Strix Scar 16 G634JZR | |
| Média Intel Core i9-14900HX (86964 - 241777, n=36) | |
| Lenovo Legion Pro 7 16IRX9H | |
| MSI Vector 16 HX A14V | |
| Asus ROG Strix G16 G614JZ | |
| Média da turma Gaming (39258 - 247074, n=105, últimos 2 anos) | |
| HP Omen 16 (2024) | |
| Alienware m16 R2 | |
| AIDA64 / CPU ZLib | |
| Lenovo Legion Pro 7 16IRX9H | |
| MSI Vector 16 HX A14V | |
| Asus ROG Strix Scar 17 G733PYV-LL053X | |
| Asus ROG Strix G16 G614JZ | |
| Asus ROG Strix Scar 16 G634JZR | |
| Média Intel Core i9-14900HX (1054 - 2292, n=36) | |
| Média da turma Gaming (574 - 2531, n=105, últimos 2 anos) | |
| HP Omen 16 (2024) | |
| Alienware m16 R2 | |
| AIDA64 / FP64 Ray-Trace | |
| Asus ROG Strix Scar 17 G733PYV-LL053X | |
| Média da turma Gaming (5509 - 45446, n=105, últimos 2 anos) | |
| MSI Vector 16 HX A14V | |
| Lenovo Legion Pro 7 16IRX9H | |
| Asus ROG Strix G16 G614JZ | |
| Asus ROG Strix Scar 16 G634JZR | |
| Média Intel Core i9-14900HX (6809 - 18349, n=36) | |
| Alienware m16 R2 | |
| HP Omen 16 (2024) | |
| AIDA64 / CPU PhotoWorxx | |
| Asus ROG Strix Scar 16 G634JZR | |
| HP Omen 16 (2024) | |
| MSI Vector 16 HX A14V | |
| Lenovo Legion Pro 7 16IRX9H | |
| Média Intel Core i9-14900HX (23903 - 54702, n=36) | |
| Média da turma Gaming (12271 - 89891, n=105, últimos 2 anos) | |
| Alienware m16 R2 | |
| Asus ROG Strix G16 G614JZ | |
| Asus ROG Strix Scar 17 G733PYV-LL053X | |
Mais informações e comparações de desempenho podem ser encontradas em nosso Intel Core i9-14900HX dedicada.
Desempenho do sistema
O Scar 16 fica um pouco atrás do Lenovo Legion Pro 7 nos testes PCMark 10 e CrossMark. Dito isso, o laptop é bastante ágil para as tarefas diárias e não há muitas cargas de trabalho que possam prejudicar seu desempenho.
CrossMark: Overall | Productivity | Creativity | Responsiveness
AIDA64: Memory Copy | Memory Read | Memory Write | Memory Latency
WebXPRT 3: Overall
WebXPRT 4: Overall
Mozilla Kraken 1.1: Total
| PCMark 10 / Score | |
| Asus ROG Strix Scar 17 G733PYV-LL053X | |
| Lenovo Legion Pro 7 16IRX9H | |
| HP Omen 16 (2024) | |
| Média Intel Core i9-14900HX, NVIDIA GeForce RTX 4080 Laptop GPU (7703 - 9223, n=7) | |
| MSI Vector 16 HX A14V | |
| Média da turma Gaming (5828 - 12414, n=93, últimos 2 anos) | |
| Alienware m16 R2 | |
| Asus ROG Strix Scar 16 G634JZR | |
| Asus ROG Strix G16 G614JZ | |
| PCMark 10 / Essentials | |
| Asus ROG Strix G16 G614JZ | |
| Lenovo Legion Pro 7 16IRX9H | |
| Média Intel Core i9-14900HX, NVIDIA GeForce RTX 4080 Laptop GPU (11255 - 12600, n=7) | |
| Asus ROG Strix Scar 16 G634JZR | |
| Asus ROG Strix Scar 17 G733PYV-LL053X | |
| MSI Vector 16 HX A14V | |
| HP Omen 16 (2024) | |
| Média da turma Gaming (8810 - 11935, n=97, últimos 2 anos) | |
| Alienware m16 R2 | |
| PCMark 10 / Productivity | |
| HP Omen 16 (2024) | |
| Lenovo Legion Pro 7 16IRX9H | |
| Média da turma Gaming (6845 - 25323, n=95, últimos 2 anos) | |
| Asus ROG Strix Scar 17 G733PYV-LL053X | |
| Média Intel Core i9-14900HX, NVIDIA GeForce RTX 4080 Laptop GPU (6662 - 11410, n=7) | |
| MSI Vector 16 HX A14V | |
| Alienware m16 R2 | |
| Asus ROG Strix G16 G614JZ | |
| Asus ROG Strix Scar 16 G634JZR | |
| PCMark 10 / Digital Content Creation | |
| Asus ROG Strix Scar 17 G733PYV-LL053X | |
| Asus ROG Strix Scar 16 G634JZR | |
| MSI Vector 16 HX A14V | |
| Média Intel Core i9-14900HX, NVIDIA GeForce RTX 4080 Laptop GPU (14211 - 16246, n=7) | |
| HP Omen 16 (2024) | |
| Lenovo Legion Pro 7 16IRX9H | |
| Média da turma Gaming (7602 - 19954, n=95, últimos 2 anos) | |
| Alienware m16 R2 | |
| Asus ROG Strix G16 G614JZ | |
| CrossMark / Overall | |
| Lenovo Legion Pro 7 16IRX9H | |
| HP Omen 16 (2024) | |
| MSI Vector 16 HX A14V | |
| Asus ROG Strix G16 G614JZ | |
| Média Intel Core i9-14900HX, NVIDIA GeForce RTX 4080 Laptop GPU (1992 - 2334, n=7) | |
| Asus ROG Strix Scar 17 G733PYV-LL053X | |
| Asus ROG Strix Scar 16 G634JZR | |
| Média da turma Gaming (1366 - 2409, n=94, últimos 2 anos) | |
| Alienware m16 R2 | |
| CrossMark / Productivity | |
| Lenovo Legion Pro 7 16IRX9H | |
| HP Omen 16 (2024) | |
| Asus ROG Strix G16 G614JZ | |
| MSI Vector 16 HX A14V | |
| Média Intel Core i9-14900HX, NVIDIA GeForce RTX 4080 Laptop GPU (1812 - 2204, n=7) | |
| Asus ROG Strix Scar 17 G733PYV-LL053X | |
| Asus ROG Strix Scar 16 G634JZR | |
| Média da turma Gaming (1386 - 2254, n=94, últimos 2 anos) | |
| Alienware m16 R2 | |
| CrossMark / Creativity | |
| Lenovo Legion Pro 7 16IRX9H | |
| MSI Vector 16 HX A14V | |
| Asus ROG Strix Scar 17 G733PYV-LL053X | |
| Média Intel Core i9-14900HX, NVIDIA GeForce RTX 4080 Laptop GPU (2327 - 2500, n=7) | |
| Asus ROG Strix G16 G614JZ | |
| HP Omen 16 (2024) | |
| Asus ROG Strix Scar 16 G634JZR | |
| Média da turma Gaming (1343 - 2786, n=94, últimos 2 anos) | |
| Alienware m16 R2 | |
| CrossMark / Responsiveness | |
| Lenovo Legion Pro 7 16IRX9H | |
| HP Omen 16 (2024) | |
| Asus ROG Strix G16 G614JZ | |
| MSI Vector 16 HX A14V | |
| Média Intel Core i9-14900HX, NVIDIA GeForce RTX 4080 Laptop GPU (1520 - 2254, n=7) | |
| Asus ROG Strix Scar 16 G634JZR | |
| Média da turma Gaming (1226 - 2334, n=94, últimos 2 anos) | |
| Asus ROG Strix Scar 17 G733PYV-LL053X | |
| Alienware m16 R2 | |
| AIDA64 / Memory Copy | |
| HP Omen 16 (2024) | |
| Asus ROG Strix Scar 16 G634JZR | |
| Lenovo Legion Pro 7 16IRX9H | |
| MSI Vector 16 HX A14V | |
| Média Intel Core i9-14900HX, NVIDIA GeForce RTX 4080 Laptop GPU (64612 - 79244, n=8) | |
| Média da turma Gaming (21750 - 129946, n=105, últimos 2 anos) | |
| Alienware m16 R2 | |
| Asus ROG Strix G16 G614JZ | |
| Asus ROG Strix Scar 17 G733PYV-LL053X | |
| AIDA64 / Memory Read | |
| Asus ROG Strix Scar 16 G634JZR | |
| HP Omen 16 (2024) | |
| Lenovo Legion Pro 7 16IRX9H | |
| MSI Vector 16 HX A14V | |
| Média Intel Core i9-14900HX, NVIDIA GeForce RTX 4080 Laptop GPU (62535 - 87507, n=8) | |
| Alienware m16 R2 | |
| Média da turma Gaming (22956 - 118858, n=105, últimos 2 anos) | |
| Asus ROG Strix G16 G614JZ | |
| Asus ROG Strix Scar 17 G733PYV-LL053X | |
| AIDA64 / Memory Write | |
| HP Omen 16 (2024) | |
| Asus ROG Strix Scar 16 G634JZR | |
| MSI Vector 16 HX A14V | |
| Média da turma Gaming (22297 - 135096, n=105, últimos 2 anos) | |
| Média Intel Core i9-14900HX, NVIDIA GeForce RTX 4080 Laptop GPU (60645 - 77715, n=8) | |
| Lenovo Legion Pro 7 16IRX9H | |
| Alienware m16 R2 | |
| Asus ROG Strix G16 G614JZ | |
| Asus ROG Strix Scar 17 G733PYV-LL053X | |
| AIDA64 / Memory Latency | |
| Alienware m16 R2 | |
| Média da turma Gaming (75.3 - 259, n=105, últimos 2 anos) | |
| Asus ROG Strix Scar 17 G733PYV-LL053X | |
| Asus ROG Strix G16 G614JZ | |
| HP Omen 16 (2024) | |
| Média Intel Core i9-14900HX, NVIDIA GeForce RTX 4080 Laptop GPU (79.7 - 97.7, n=8) | |
| MSI Vector 16 HX A14V | |
| Asus ROG Strix Scar 16 G634JZR | |
| Lenovo Legion Pro 7 16IRX9H | |
| WebXPRT 3 / Overall | |
| Asus ROG Strix Scar 17 G733PYV-LL053X | |
| Lenovo Legion Pro 7 16IRX9H | |
| Asus ROG Strix G16 G614JZ | |
| Média Intel Core i9-14900HX, NVIDIA GeForce RTX 4080 Laptop GPU (310 - 345, n=7) | |
| HP Omen 16 (2024) | |
| MSI Vector 16 HX A14V | |
| Média da turma Gaming (220 - 532, n=98, últimos 2 anos) | |
| Asus ROG Strix Scar 16 G634JZR | |
| Alienware m16 R2 | |
| WebXPRT 4 / Overall | |
| Asus ROG Strix Scar 17 G733PYV-LL053X | |
| Lenovo Legion Pro 7 16IRX9H | |
| Média Intel Core i9-14900HX, NVIDIA GeForce RTX 4080 Laptop GPU (300 - 321, n=7) | |
| Asus ROG Strix G16 G614JZ | |
| HP Omen 16 (2024) | |
| Asus ROG Strix Scar 16 G634JZR | |
| MSI Vector 16 HX A14V | |
| Média da turma Gaming (165 - 354, n=98, últimos 2 anos) | |
| Alienware m16 R2 | |
| Mozilla Kraken 1.1 / Total | |
| Alienware m16 R2 | |
| Média da turma Gaming (391 - 590, n=100, últimos 2 anos) | |
| Asus ROG Strix G16 G614JZ | |
| MSI Vector 16 HX A14V | |
| Asus ROG Strix Scar 16 G634JZR | |
| Média Intel Core i9-14900HX, NVIDIA GeForce RTX 4080 Laptop GPU (437 - 446, n=7) | |
| Lenovo Legion Pro 7 16IRX9H | |
| HP Omen 16 (2024) | |
| Asus ROG Strix Scar 17 G733PYV-LL053X | |
* ... menor é melhor
| PCMark 8 Home Score Accelerated v2 | 5883 pontos | |
| PCMark 10 Score | 7703 pontos | |
Ajuda | ||
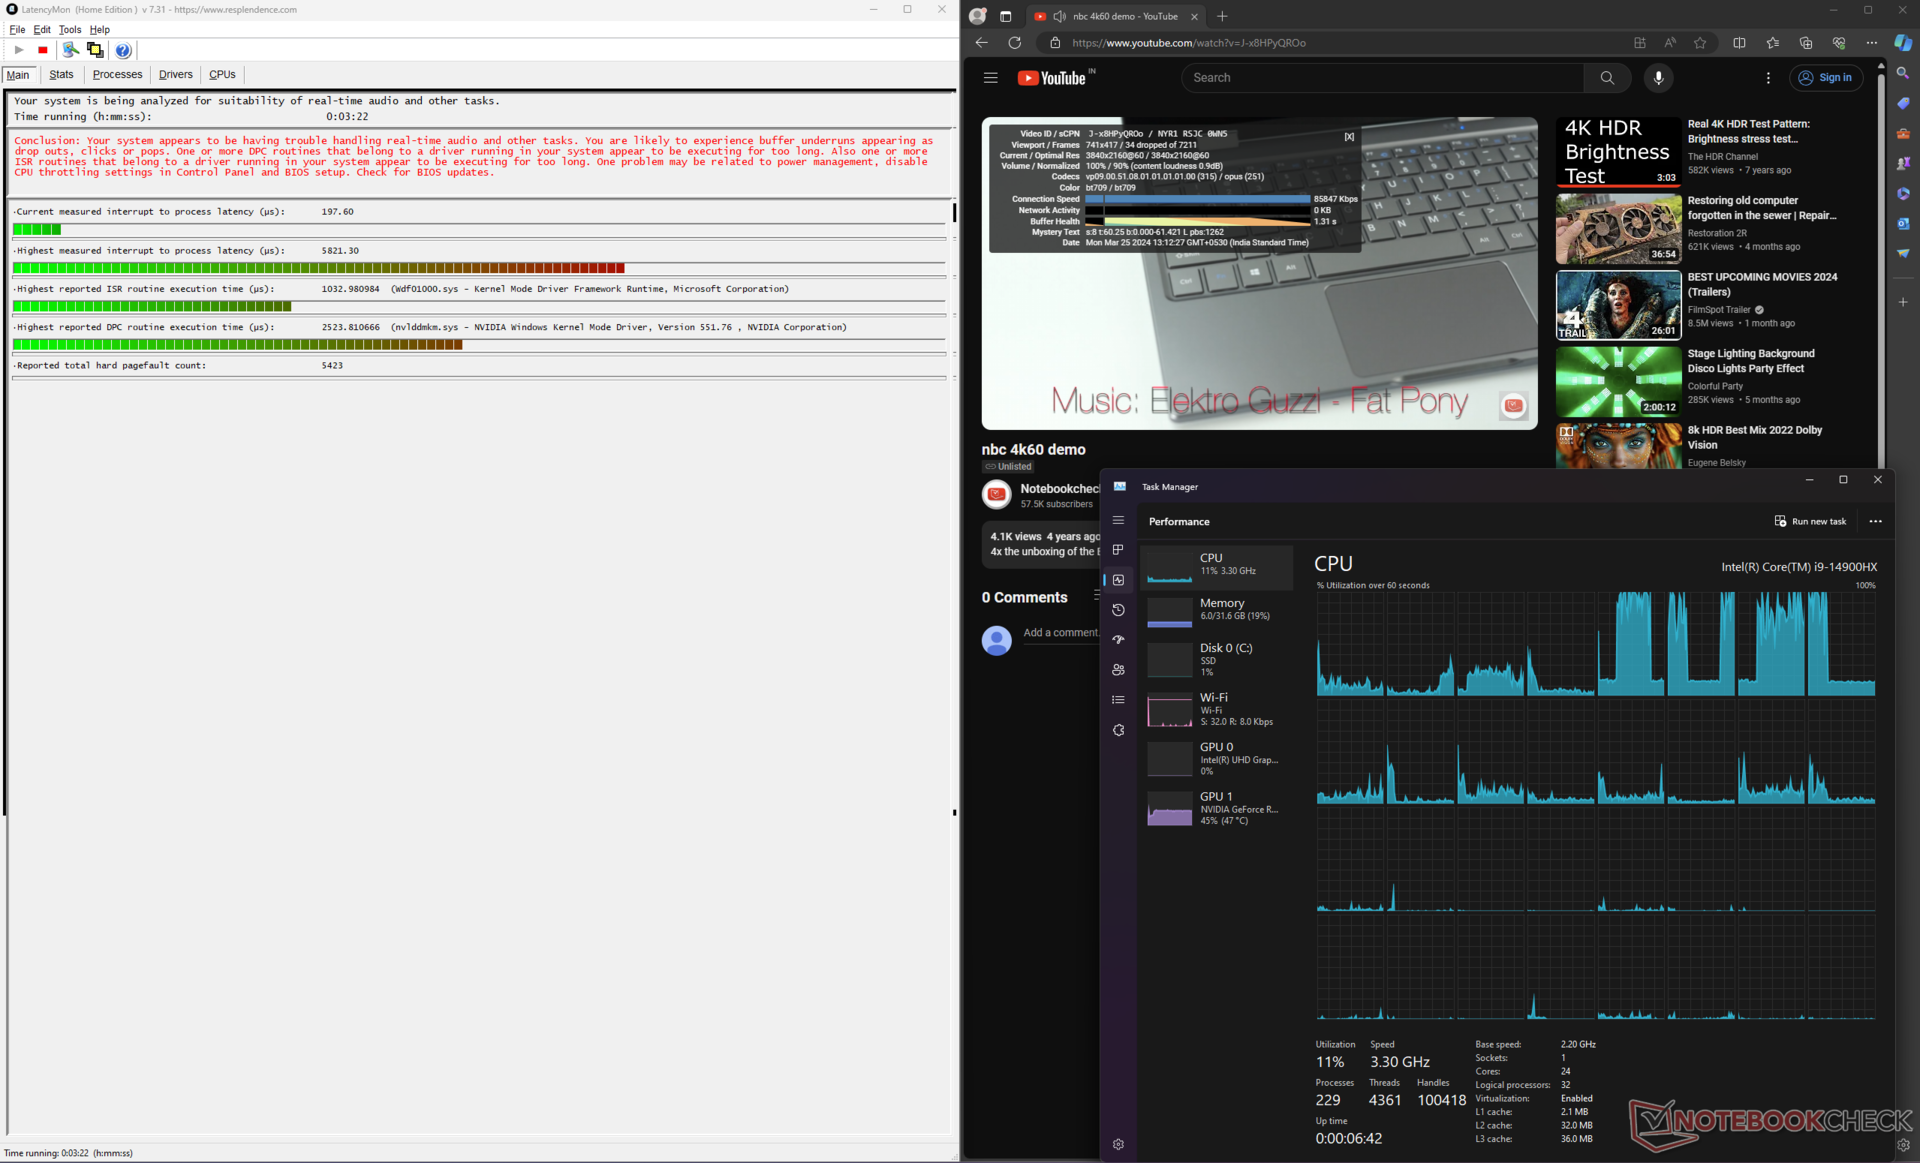
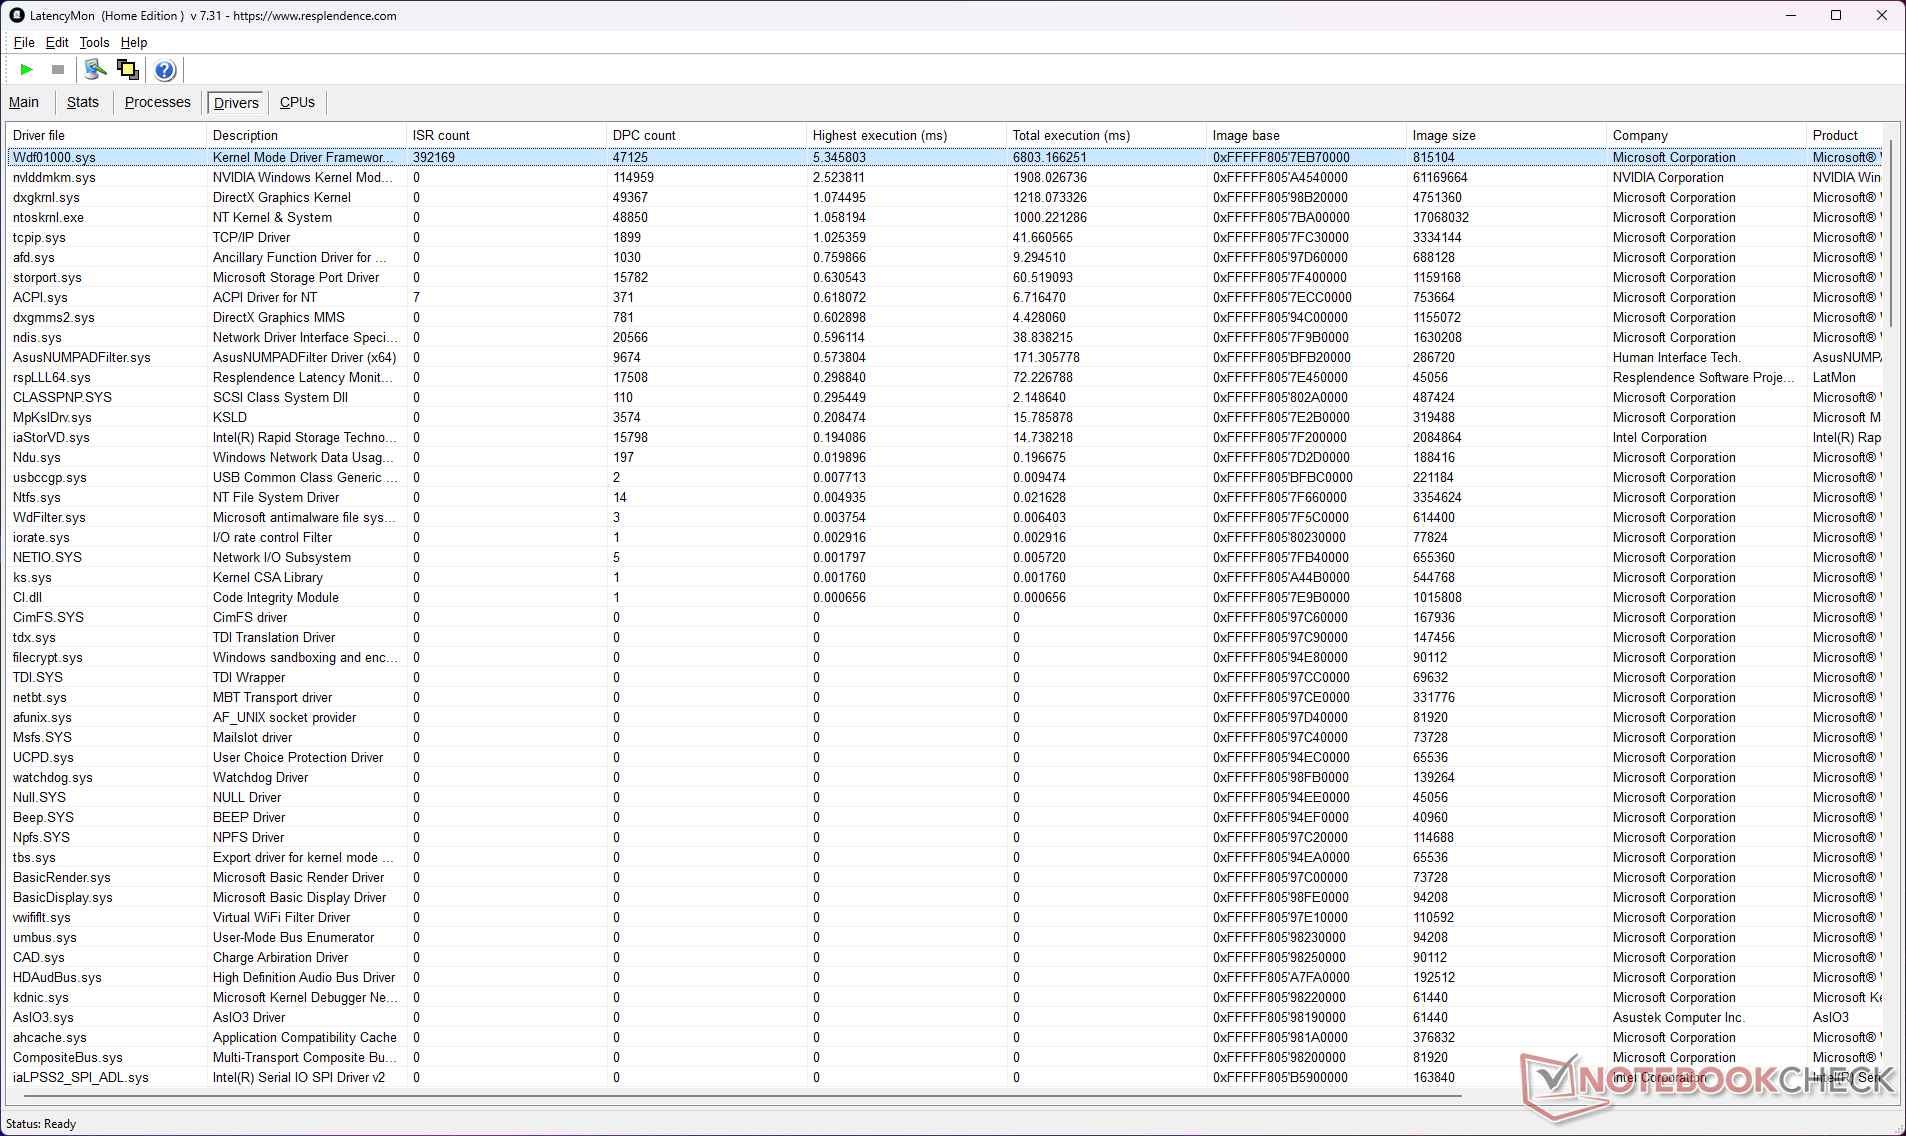
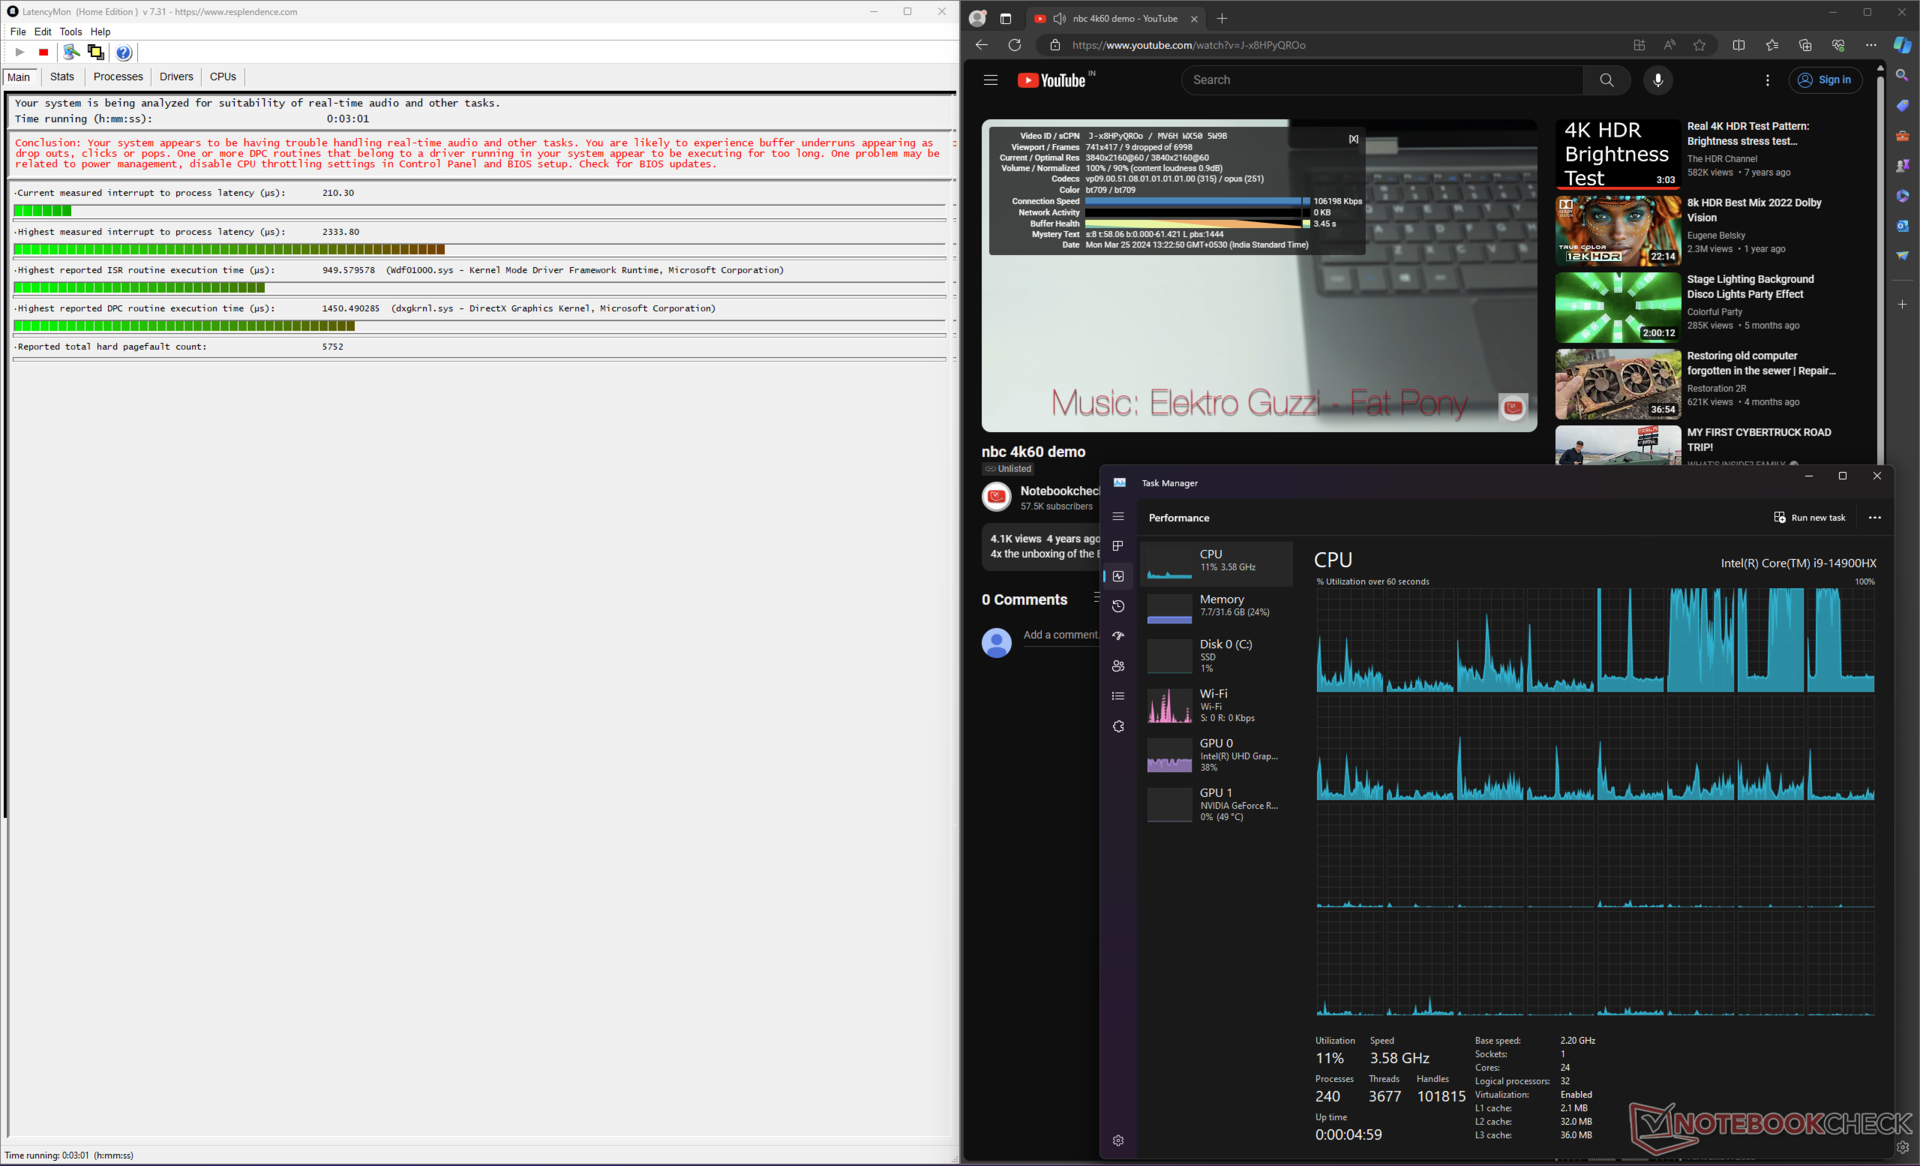
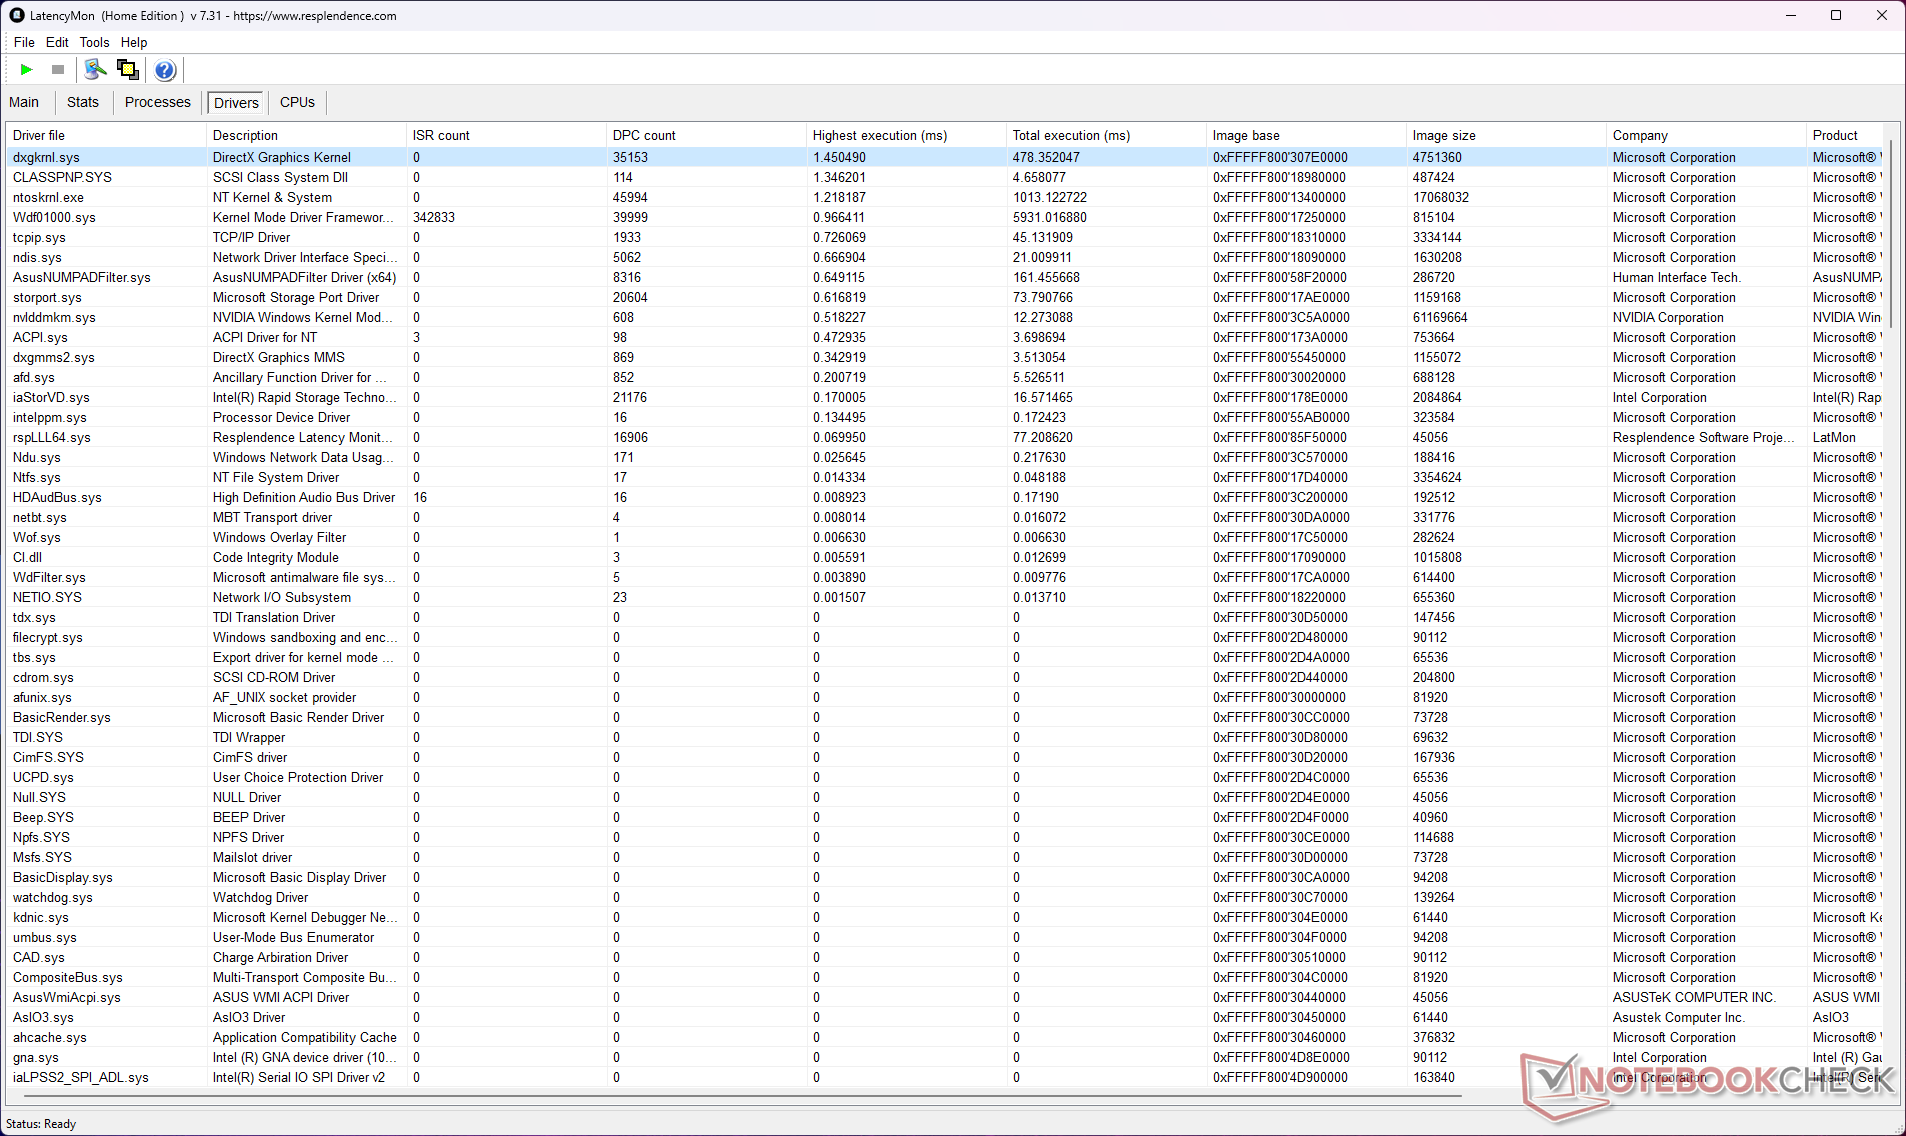
Latência DPC
A latência do DPC é mais alta com o MUX da dGPU ativado. A mudança para a iGPU reduz a latência de 5821,30 µs para 2333,80 µs, o que ainda é um valor alto. Isso pode causar problemas se o senhor estiver envolvido em fluxos de trabalho de edição de áudio ou vídeo em tempo real.
| DPC Latencies / LatencyMon - interrupt to process latency (max), Web, Youtube, Prime95 | |
| Asus ROG Strix Scar 16 G634JZR | |
| Asus ROG Strix G16 G614JZ | |
| Alienware m16 R2 | |
| MSI Vector 16 HX A14V | |
| Lenovo Legion Pro 7 16IRX9H | |
| HP Omen 16 (2024) | |
| Asus ROG Strix Scar 17 G733PYV-LL053X | |
* ... menor é melhor
Nosso Classificação de latência do DPC oferece uma visão geral das latências medidas nos dispositivos analisados.
Dispositivos de armazenamento
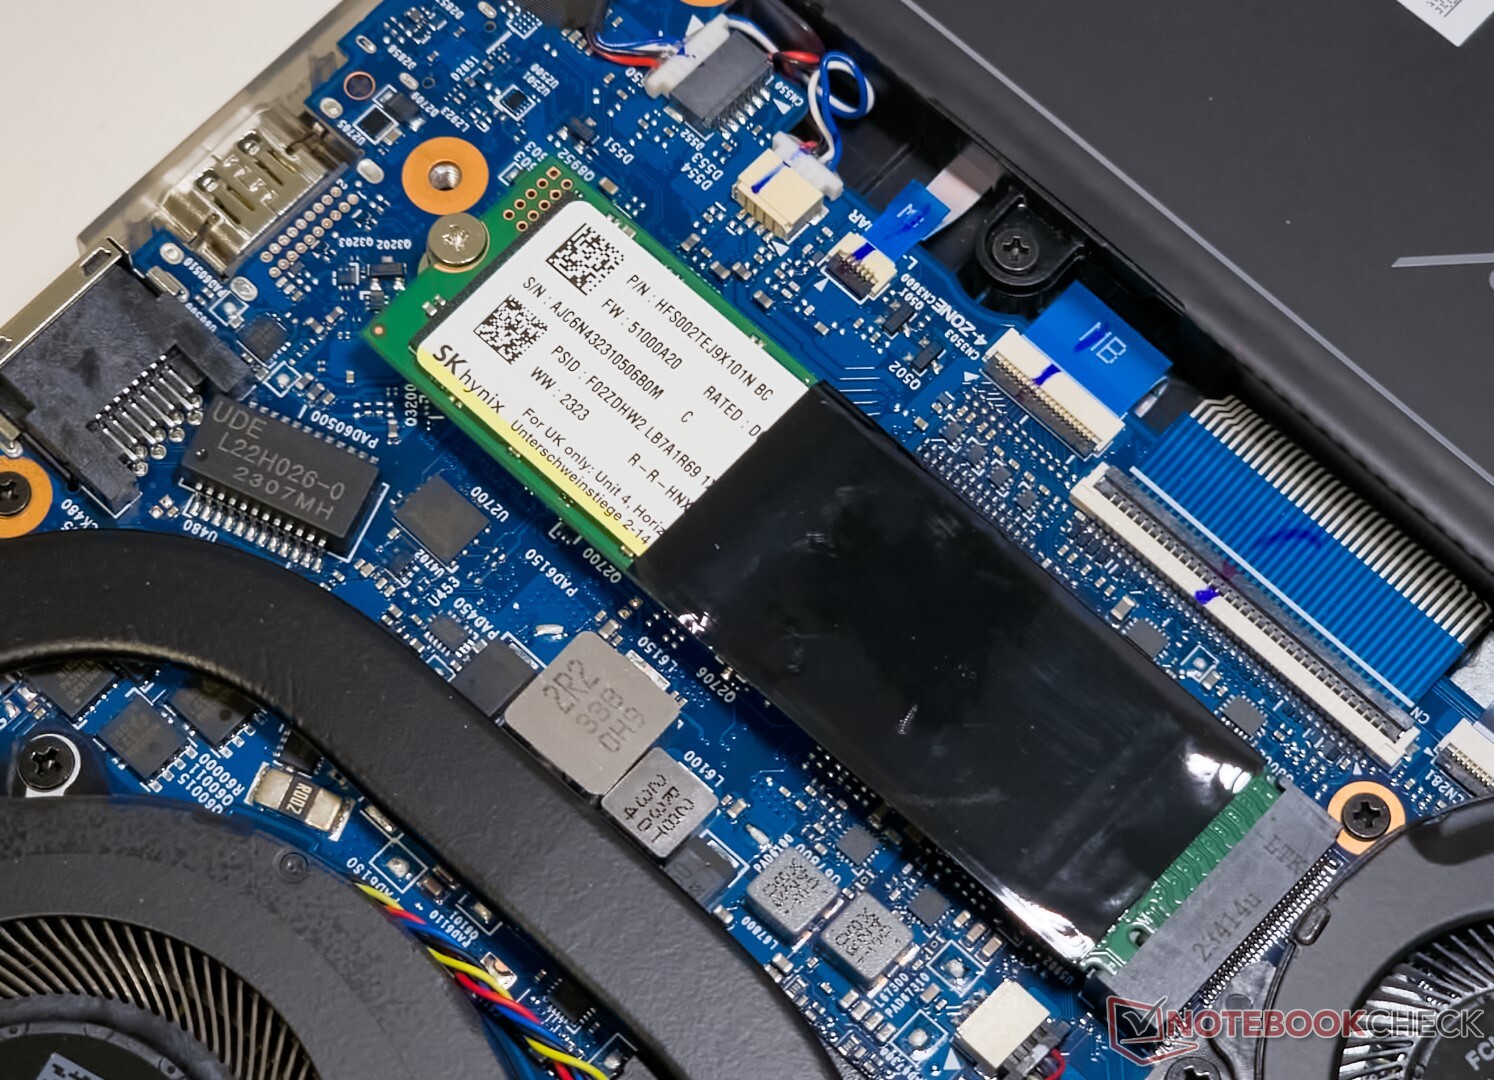
Nossa unidade Scar 16 veio equipada com um SSD Sk hynix PC801 2 TB PCIe Gen 4 NVMe.
O desempenho da SSD é prejudicado em leituras sequenciais e em vários testes 4k, mas o desempenho cumulativo está ao alcance do Alienware m16 R2da Samsung PM9A1.
O armazenamento adicional pode ser adicionado por meio de um slot de expansão para outro SSD M.2. No entanto, não há possibilidade de instalar unidades SATA de 2,5 polegadas.

* ... menor é melhor
Limitação de disco: Loop de leitura do DiskSpd, profundidade da fila 8
O desempenho da unidade cai após a 14ª execução durante um teste de loop de leitura do DiskSpd em uma profundidade de fila de 8, mas permanece estável a partir daí.
Mais comparações de desempenho de armazenamento podem ser encontradas em nossos Benchmarks de SSD e HDD página.
Desempenho da GPU

O Scar 16 está equipado com uma GPU para laptop Nvidia GeForce RTX 4080 de 175 W. O desempenho geral no 3DMark é comparável ao de outros notebooks com essa placa, mas fica atrás do Lenovo Legion Pro 7 em 6%.
O HP Omen 16 com uma GPU para laptop RTX 4080 de 140 W sofre um retrocesso maior do que o esperado de 24% em relação ao Strix Scar 16 no desempenho cumulativo do 3DMark.
A RTX 4080 do Scar 16 o coloca logo atrás do Asus ROG Strix Scar 17 com uma GPU de laptop RTX 4090 no Blender Classroom Optix, embora por uma margem de 15% - isso aumenta para 18% no Blender Classroom CUDA.
A CPU do Blender Classroom, por outro lado, mostra que o Core i9-14900HX da Scar 16 está no mesmo nível do Legion Pro 7 e do Vector 16 HX, mas a CPU da Scar 17 está no mesmo nível do AMD Ryzen 9 7945HX3D do Scar 17 é capaz de concluir a renderização 20% mais rápido.
| 3DMark 11 Performance | 42772 pontos | |
| 3DMark Ice Storm Standard Score | 284572 pontos | |
| 3DMark Cloud Gate Standard Score | 64579 pontos | |
| 3DMark Fire Strike Score | 32183 pontos | |
| 3DMark Fire Strike Extreme Score | 21288 pontos | |
| 3DMark Time Spy Score | 18822 pontos | |
Ajuda | ||
| Blender / v3.3 Classroom OPTIX/RTX | |
| Alienware m16 R2 | |
| Média da turma Gaming (9 - 32, n=106, últimos 2 anos) | |
| HP Omen 16 (2024) | |
| Média NVIDIA GeForce RTX 4080 Laptop GPU (13 - 20, n=22) | |
| Asus ROG Strix G16 G614JZ | |
| MSI Vector 16 HX A14V | |
| Lenovo Legion Pro 7 16IRX9H | |
| Asus ROG Strix Scar 16 G634JZR | |
| Asus ROG Strix Scar 17 G733PYV-LL053X | |
| Blender / v3.3 Classroom CUDA | |
| Alienware m16 R2 | |
| Média da turma Gaming (15 - 228, n=106, últimos 2 anos) | |
| HP Omen 16 (2024) | |
| Média NVIDIA GeForce RTX 4080 Laptop GPU (21 - 28, n=23) | |
| Asus ROG Strix G16 G614JZ | |
| MSI Vector 16 HX A14V | |
| Asus ROG Strix Scar 16 G634JZR | |
| Lenovo Legion Pro 7 16IRX9H | |
| Asus ROG Strix Scar 17 G733PYV-LL053X | |
| Blender / v3.3 Classroom CPU | |
| Alienware m16 R2 | |
| HP Omen 16 (2024) | |
| Média da turma Gaming (122 - 565, n=102, últimos 2 anos) | |
| Média NVIDIA GeForce RTX 4080 Laptop GPU (177 - 337, n=23) | |
| Asus ROG Strix G16 G614JZ | |
| Asus ROG Strix Scar 16 G634JZR | |
| Lenovo Legion Pro 7 16IRX9H | |
| MSI Vector 16 HX A14V | |
| Asus ROG Strix Scar 17 G733PYV-LL053X | |
* ... menor é melhor
Desempenho em jogos
A diferença de desempenho entre o Legion Pro 7 e o Strix Scar 16 desaparece no desempenho cumulativo de jogos em 1080p Ultra.
O Scar 16 pode facilmente ultrapassar a marca de 100 fps em 1440p Ultra com títulos mais antigos. O laptop pode lidar com a maioria dos jogos AAA modernos a 60 fps nessa resolução, e o senhor pode atingir taxas de quadros ainda mais altas com a ajuda de upscalers.
| The Witcher 3 - 1920x1080 Ultra Graphics & Postprocessing (HBAO+) | |
| Asus ROG Strix Scar 17 G733PYV-LL053X | |
| Média da turma Gaming (104.7 - 240, n=6, últimos 2 anos) | |
| Lenovo Legion Pro 7 16IRX9H | |
| Asus ROG Strix Scar 16 G634JZR | |
| MSI Vector 16 HX A14V | |
| Asus ROG Strix G16 G614JZ | |
| HP Omen 16 (2024) | |
| Alienware m16 R2 | |
O gráfico Witcher 3 FPS
O enorme sistema de resfriamento do Scar 16 é capaz de garantir um desempenho de jogo relativamente livre de aceleração. Não observamos nenhuma queda drástica de quadros durante o estresse com o The Witcher 3 a 1080p Ultra.
| baixo | média | alto | ultra | QHD | |
|---|---|---|---|---|---|
| GTA V (2015) | 187.3 | 187.1 | 182.6 | 139 | 130.1 |
| The Witcher 3 (2015) | 581 | 513 | 365 | 185.6 | 140.1 |
| Dota 2 Reborn (2015) | 247 | 216 | 192.7 | 177.4 | |
| Final Fantasy XV Benchmark (2018) | 228 | 207 | 178 | 138.1 | |
| X-Plane 11.11 (2018) | 211 | 184.3 | 141.3 | ||
| Far Cry 5 (2018) | 183 | 168 | 164 | 157 | 157 |
| Strange Brigade (2018) | 499 | 402 | 373 | 337 | 240 |
| F1 22 (2022) | 323 | 334 | 287 | 117.1 | 76.6 |
| F1 23 (2023) | 310 | 326 | 295 | 111.3 | 70 |
| Cyberpunk 2077 (2023) | 170.4 | 159.8 | 141.3 | 123.1 | 77.6 |
| Avatar Frontiers of Pandora (2023) | 141.4 | 131.6 | 115.2 | 88.3 | 59.3 |
| Skull & Bones (2024) | 155 | 168 | 144 | 115 | 91 |
Consulte nosso site dedicado à GPU para laptop Nvidia GeForce RTX 4080 para obter mais benchmarks de desempenho e de jogos.
Emissões: Tempos de superfície elevados e ruído apesar de 3 ventiladores e 7 heatpipes
Ruído do sistema
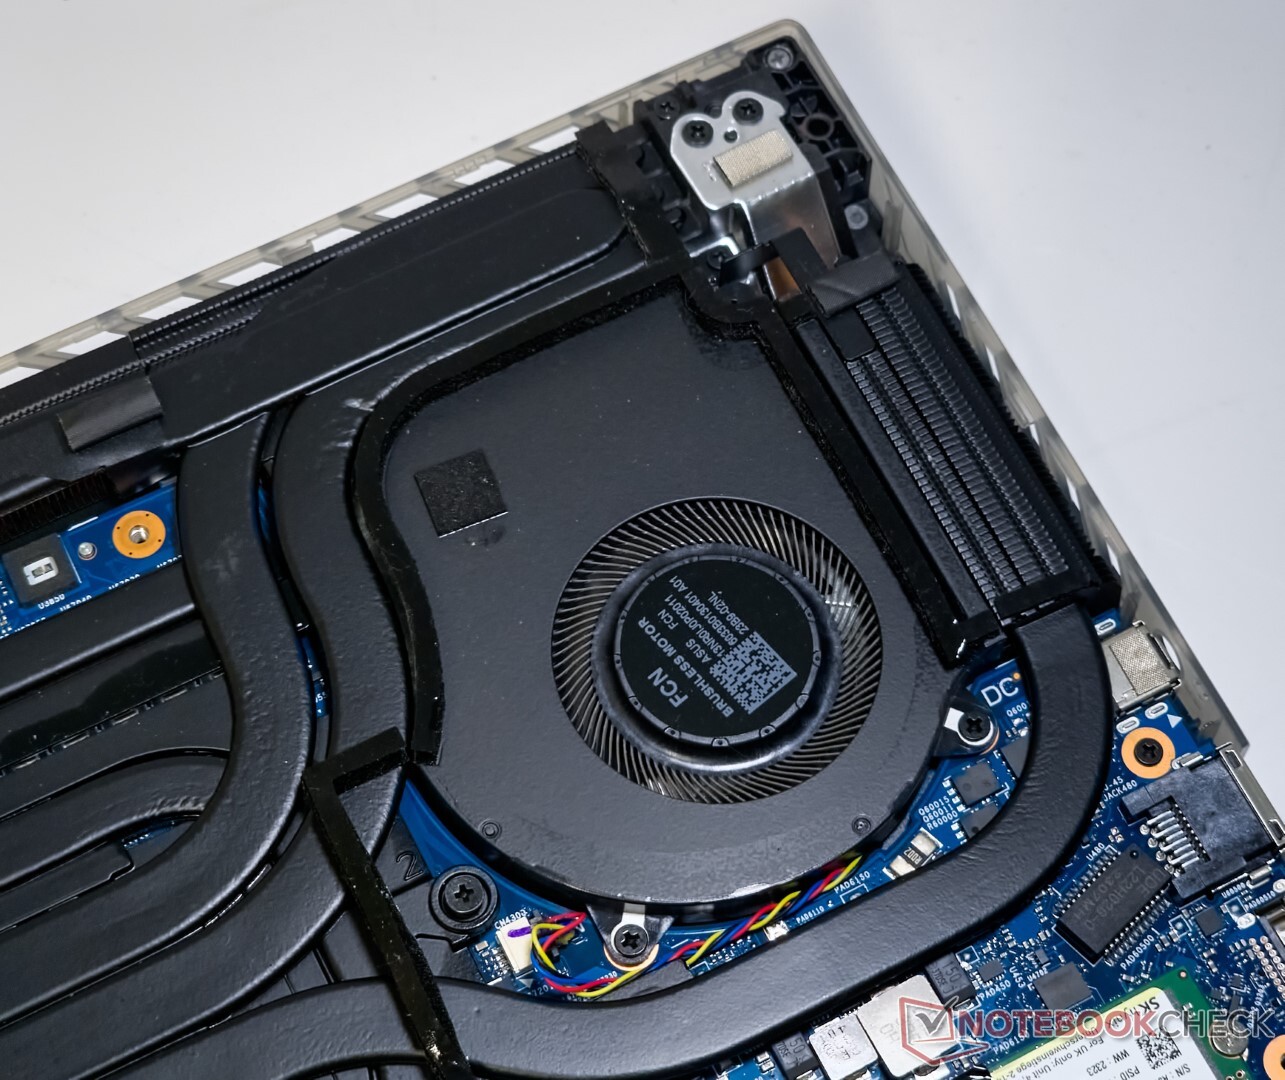
É interessante notar que a Asus inclui uma terceira ventoinha na VRAM, além das que estão conectadas à CPU e à GPU.
O Scar 16 não parece impor limites rígidos às emissões de ruído em cada perfil de energia. Como resultado, as emissões de ruído da ventoinha no modo Turbo podem chegar a 58 db(A) sob carga máxima.
O modo Performance também produz altas emissões de ruído. O modo Silencioso é comparativamente mais tolerável, mas ao custo de uma queda perceptível no desempenho dos jogos.
Dito isso, os ventiladores ficam completamente desligados no modo Silent quando ociosos e durante cargas de trabalho menos intensas, como escritório ou navegação casual na Web.
Barulho
| Ocioso |
| 29.75 / 29.75 / 29.75 dB |
| Carga |
| 54.85 / 58 dB |
 | ||
30 dB silencioso 40 dB(A) audível 50 dB(A) ruidosamente alto |
||
min: | ||
| Modo de desempenho | Idle dB(A) | Load average dB(A) | Load maximum dB(A) | The Witcher 3 1080p Ultra dB(A) |
|---|---|---|---|---|
| Silencioso | 21.07 | 37.50 | 46.56 | 46.32 / 133 fps |
| Desempenho | 21.07 | 54.03 | 54.02 | 54.08 / 174 fps |
| Turbo | 29.75 | 54.85 | 58 | 57.75 / 177 fps |
| Asus ROG Strix Scar 16 G634JZR i9-14900HX, GeForce RTX 4080 Laptop GPU | Asus ROG Strix Scar 17 G733PYV-LL053X R9 7945HX3D, GeForce RTX 4090 Laptop GPU | Asus ROG Strix G16 G614JZ i9-13980HX, GeForce RTX 4080 Laptop GPU | Lenovo Legion Pro 7 16IRX9H i9-14900HX, GeForce RTX 4080 Laptop GPU | HP Omen 16 (2024) i9-14900HX, GeForce RTX 4080 Laptop GPU | MSI Vector 16 HX A14V i9-14900HX, GeForce RTX 4080 Laptop GPU | Alienware m16 R2 Ultra 7 155H, GeForce RTX 4070 Laptop GPU | |
|---|---|---|---|---|---|---|---|
| Noise | 3% | 5% | -4% | 5% | -8% | 10% | |
| desligado / ambiente * (dB) | 21.07 | 23 -9% | 25 -19% | 24 -14% | 25 -19% | 23.2 -10% | 24.7 -17% |
| Idle Minimum * (dB) | 29.75 | 23 23% | 26 13% | 25 16% | 29 3% | 33.5 -13% | 25.3 15% |
| Idle Average * (dB) | 29.75 | 27.7 7% | 28 6% | 30 -1% | 30 -1% | 33.5 -13% | 25.3 15% |
| Idle Maximum * (dB) | 29.75 | 34.7 -17% | 30 -1% | 45 -51% | 31 -4% | 33.5 -13% | 25.3 15% |
| Load Average * (dB) | 54.85 | 53.4 3% | 48 12% | 50 9% | 46 16% | 52.1 5% | 31.7 42% |
| Witcher 3 ultra * (dB) | 57.8 | 53.4 8% | 49 15% | 54 7% | 47 19% | 62 -7% | 53.8 7% |
| Load Maximum * (dB) | 58 | 53.4 8% | 52 10% | 56 3% | 47 19% | 62 -7% | 62 -7% |
* ... menor é melhor
Temperatura
O ROG Strix Scar 16 é equipado com sete heatpipes e um sistema de resfriamento com três ventiladores. Desta vez, a Asus fez de tudo para usar o metal líquido Conductonaut Extreme tanto para a CPU quanto para a GPU.
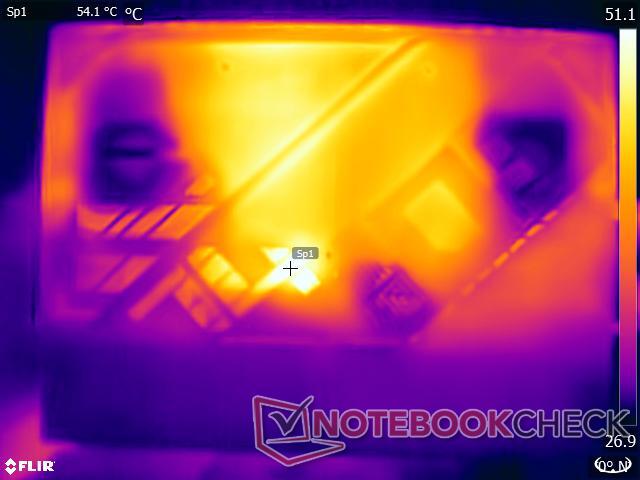
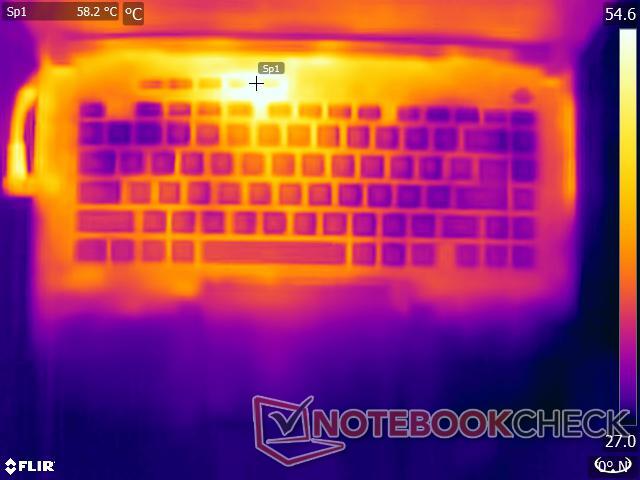
Embora o robusto aparato de resfriamento e a presença de aberturas de exaustão em três lados ajudem no resfriamento eficaz dos componentes, eles também levam a uma maior dissipação de calor, conforme evidenciado pelas leituras de alta temperatura da superfície sob carga.
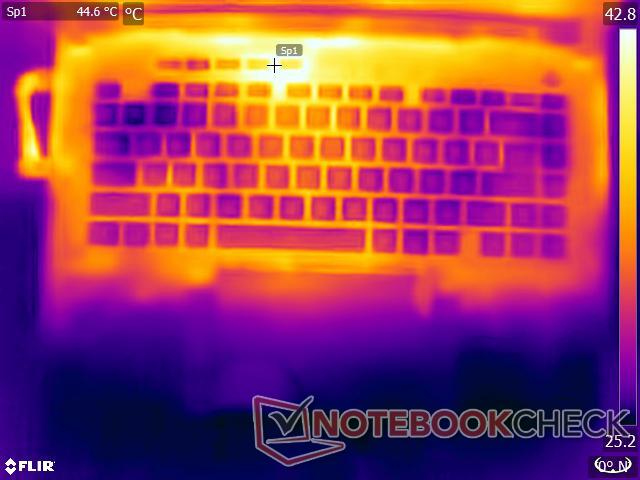
Observamos alguns pontos de aquecimento acima da marca de 55 °C na parte superior durante o teste de estresse com o The Witcher 3 a 1080p Ultra.
Em termos práticos, devido ao seu peso e às temperaturas da superfície, o Scar 16 funciona melhor como uma máquina de mesa. Dito isso, o laptop não deve causar muito desconforto ao ser usado no colo no perfil Silent, desde que não seja submetido a cargas de trabalho pesadas.
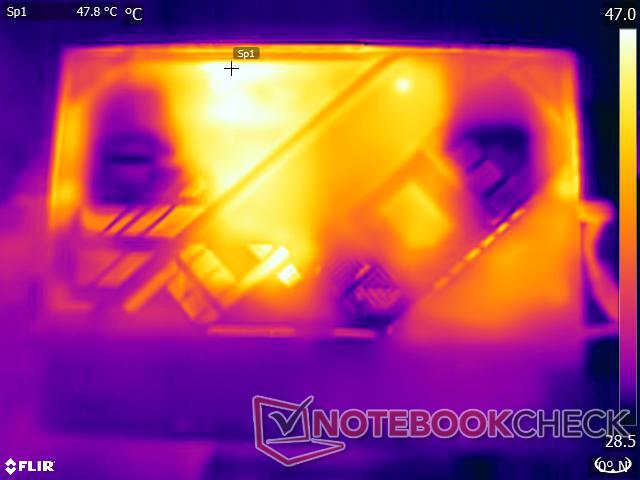
(-) A temperatura máxima no lado superior é 47.8 °C / 118 F, em comparação com a média de 40.4 °C / 105 F , variando de 21.2 a 68.8 °C para a classe Gaming.
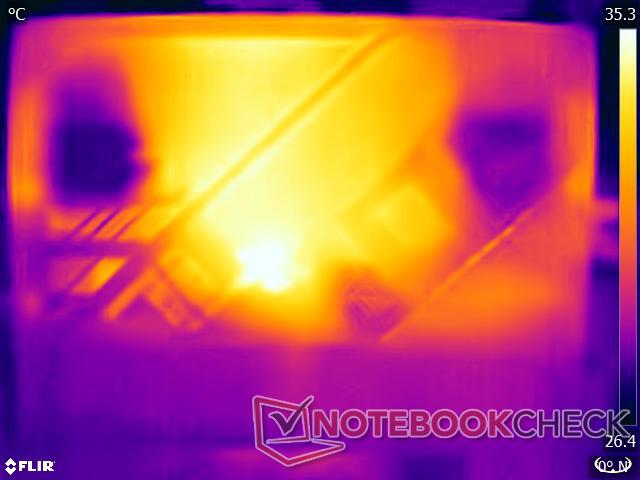
(-) A parte inferior aquece até um máximo de 52.2 °C / 126 F, em comparação com a média de 43.2 °C / 110 F
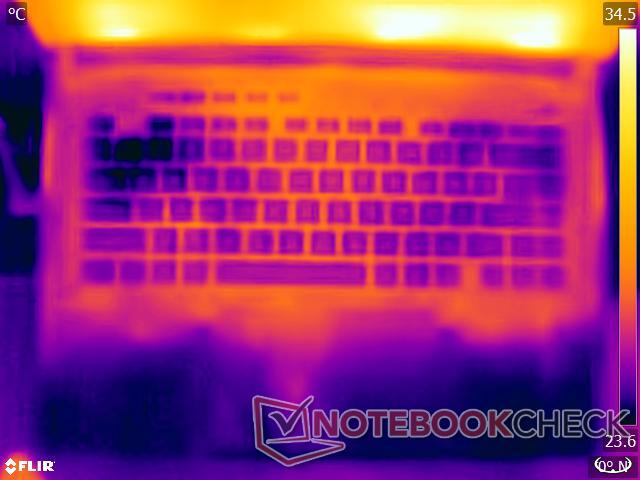
(+) Em uso inativo, a temperatura média para o lado superior é 30.9 °C / 88 F, em comparação com a média do dispositivo de 33.9 °C / ### class_avg_f### F.
(-) Jogando The Witcher 3, a temperatura média para o lado superior é 42.9 °C / 109 F, em comparação com a média do dispositivo de 33.9 °C / ## #class_avg_f### F.
(±) Os apoios para as mãos e o touchpad podem ficar muito quentes ao toque, com um máximo de 39.2 °C / 102.6 F.
(-) A temperatura média da área do apoio para as mãos de dispositivos semelhantes foi 28.8 °C / 83.8 F (-10.4 °C / -18.8 F).
| Asus ROG Strix Scar 16 G634JZR i9-14900HX, GeForce RTX 4080 Laptop GPU | Asus ROG Strix Scar 17 G733PYV-LL053X R9 7945HX3D, GeForce RTX 4090 Laptop GPU | Asus ROG Strix G16 G614JZ i9-13980HX, GeForce RTX 4080 Laptop GPU | Lenovo Legion Pro 7 16IRX9H i9-14900HX, GeForce RTX 4080 Laptop GPU | HP Omen 16 (2024) i9-14900HX, GeForce RTX 4080 Laptop GPU | MSI Vector 16 HX A14V i9-14900HX, GeForce RTX 4080 Laptop GPU | Alienware m16 R2 Ultra 7 155H, GeForce RTX 4070 Laptop GPU | |
|---|---|---|---|---|---|---|---|
| Heat | 15% | -2% | -5% | 9% | 23% | -7% | |
| Maximum Upper Side * (°C) | 47.8 | 40.1 16% | 54 -13% | 46 4% | 47 2% | 36.4 24% | 44.8 6% |
| Maximum Bottom * (°C) | 52.2 | 46.7 11% | 55 -5% | 49 6% | 57 -9% | 35.6 32% | 48 8% |
| Idle Upper Side * (°C) | 32.4 | 26.5 18% | 29 10% | 38 -17% | 25 23% | 26.6 18% | 37.2 -15% |
| Idle Bottom * (°C) | 33 | 27.7 16% | 33 -0% | 37 -12% | 26 21% | 27 18% | 42 -27% |
* ... menor é melhor
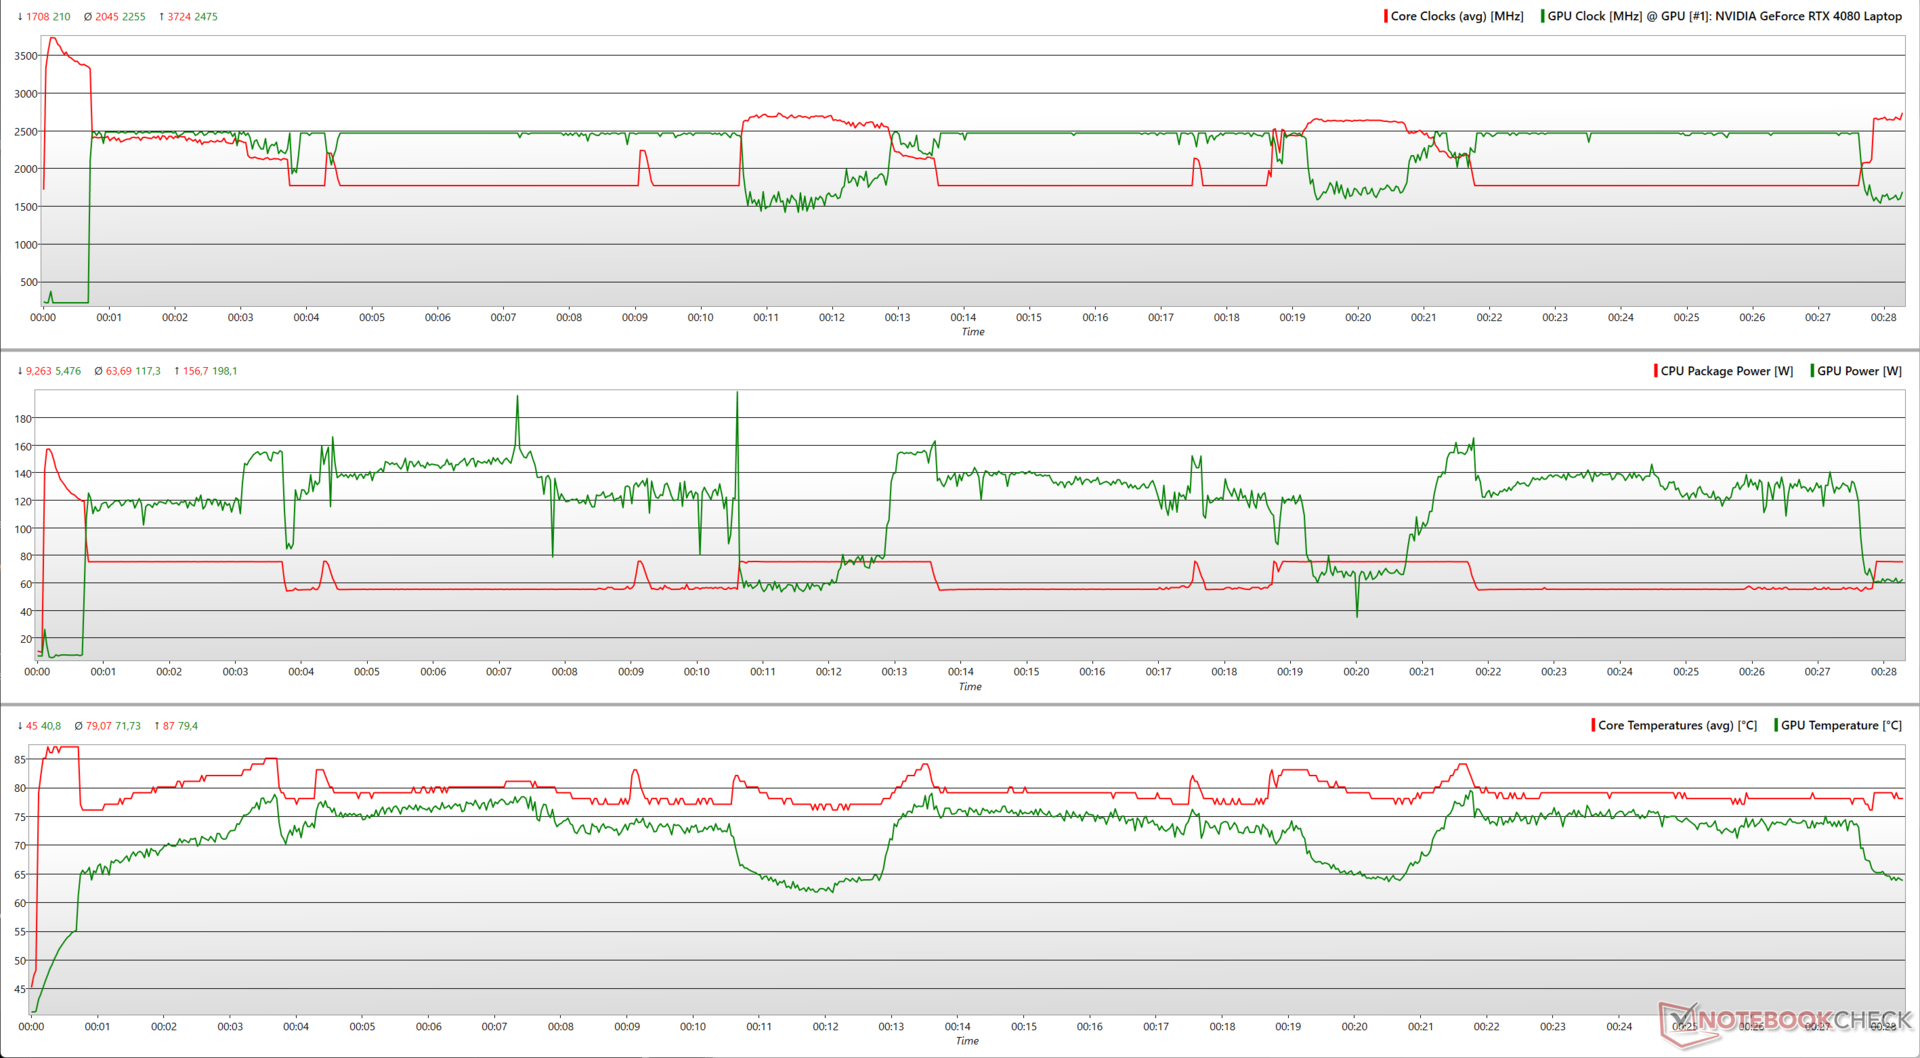
Teste de estresse
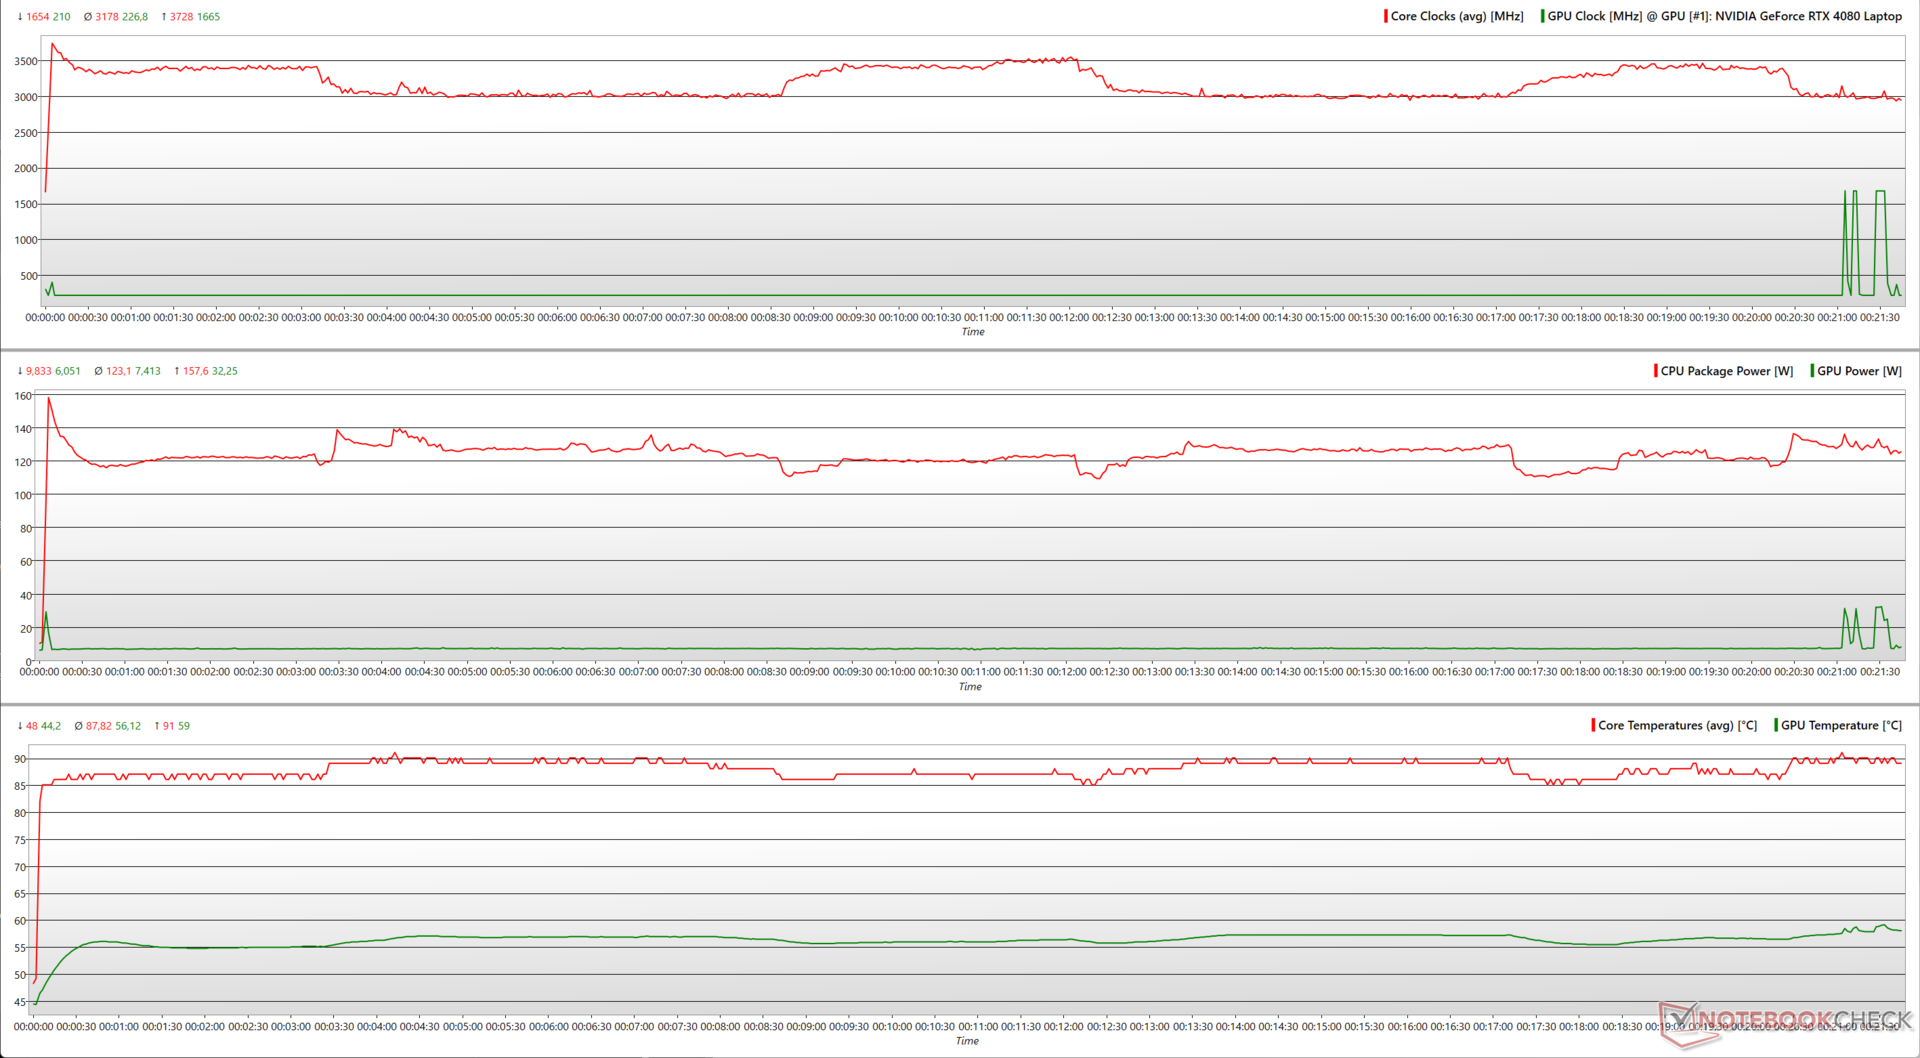
Ao sobrecarregar o Scar 16 com grandes FFTs in-place do Prime95, o Core i9-14900HX utiliza até 158 W com clocks que atingem o pico de 3,7 GHz, mas isso não pode ser mantido por muito tempo. A frequência cai para ~3 GHz quando as temperaturas do núcleo atingem a marca de 90 °C. Os núcleos ganham fôlego e são capazes de aumentar até 3,5 GHz quando as temperaturas caem para ~87 °C.
Com a adição do FurMark (1280 x 720, sem AA), a RTX 4080 do Scar 16 consome momentaneamente 198 W. O laptop pode utilizar uma potência total combinada de 181 W em média com a CPU e a GPU.
No entanto, observamos uma disputa pela energia, pois a CPU precisava diminuir o consumo para que a GPU aumentasse e vice-versa.
| Teste de estresse | Clock da CPU (GHz) | Clock da GPU (MHz) | Temperatura média da CPU (°C) | Temperatura média da GPU (°C) |
| Sistema ocioso | 1.6 | 210 | 41 | 37.5 |
| Prime95 | 3.0 | 210 | 87 | 56 |
| Prime95 + FurMark | 2.7 | 1,500 | 78 | 70.4 |
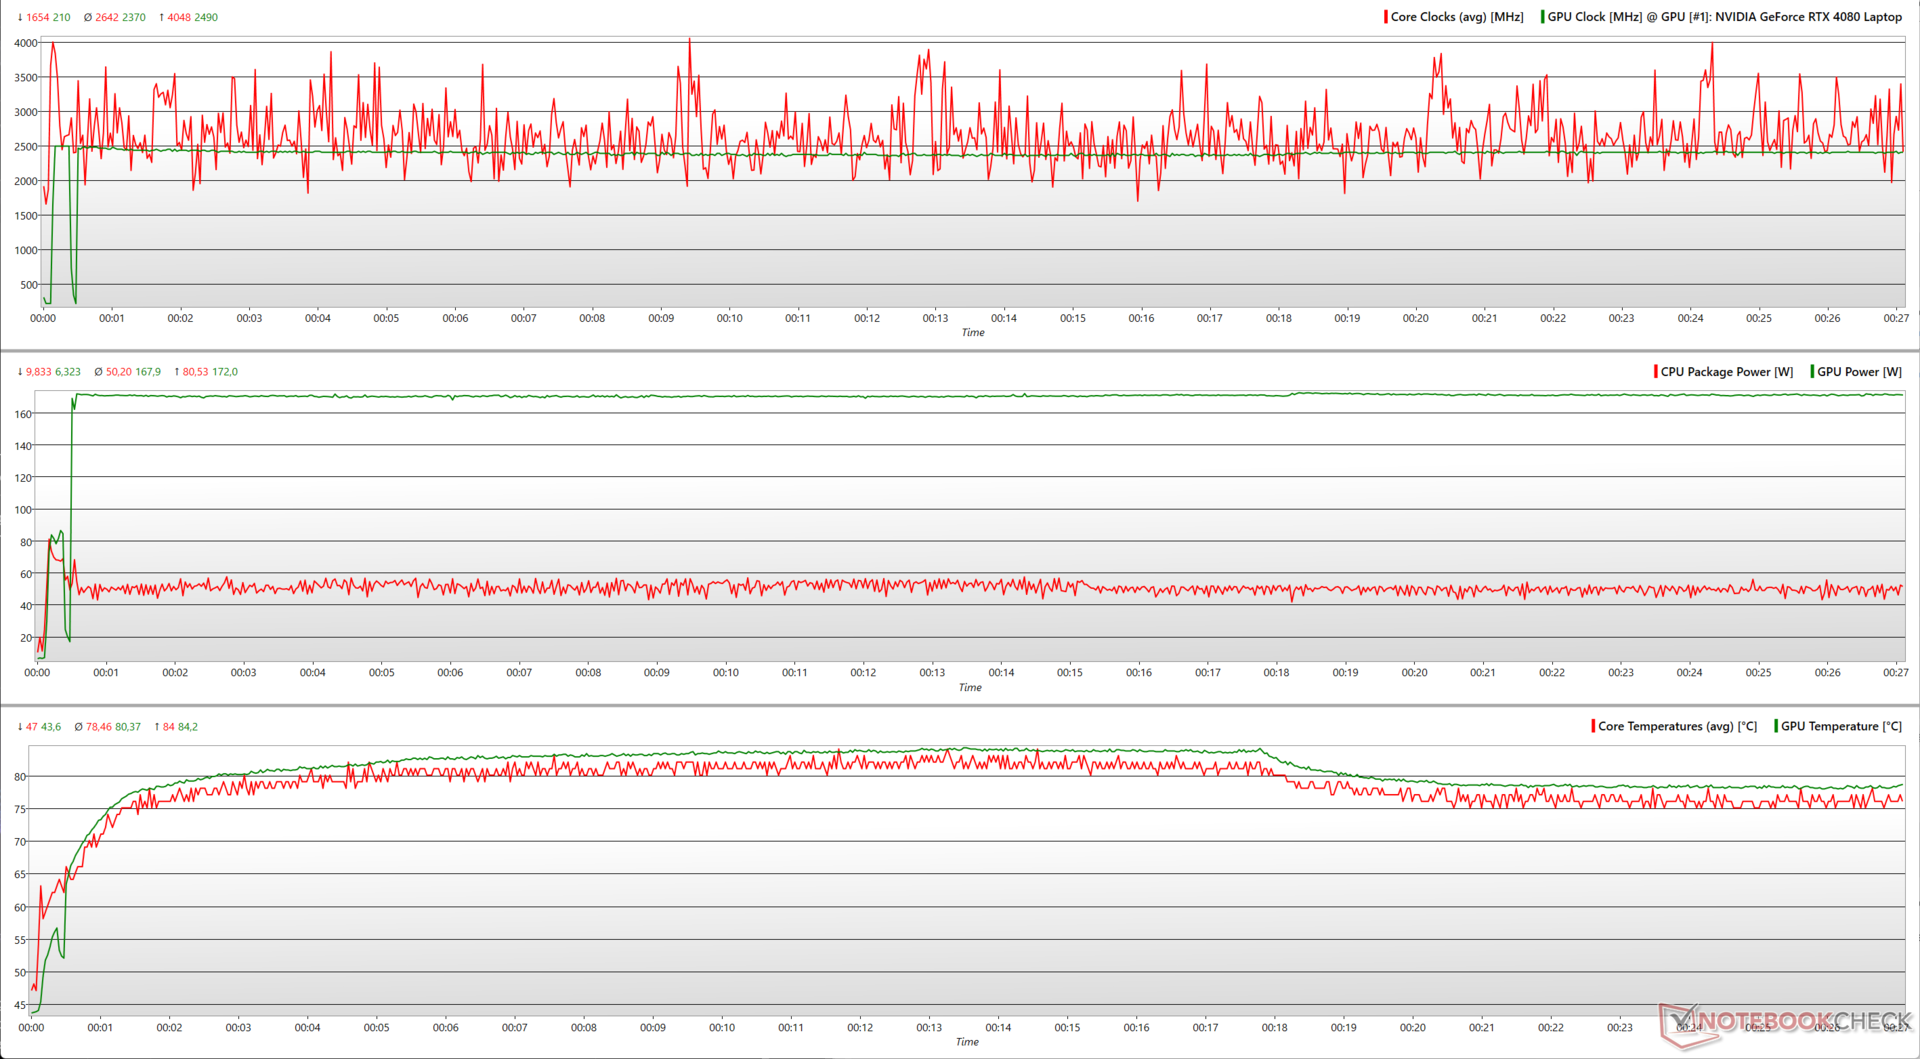
| O Witcher 3 1080p Ultra | 2.4 | 2.460 | 78 | 80.2 |
O estresse do Scar 16 com o Witcher 3 em 1080p Ultra apresenta um comportamento mais real. O Core i9-14900HX pode atingir aumentos de 4 GHz em alguns momentos, enquanto consome 81 W. A RTX 4080, por outro lado, opera a 2.500 MHz bem sustentados, enquanto utiliza ~170 W consistentes.
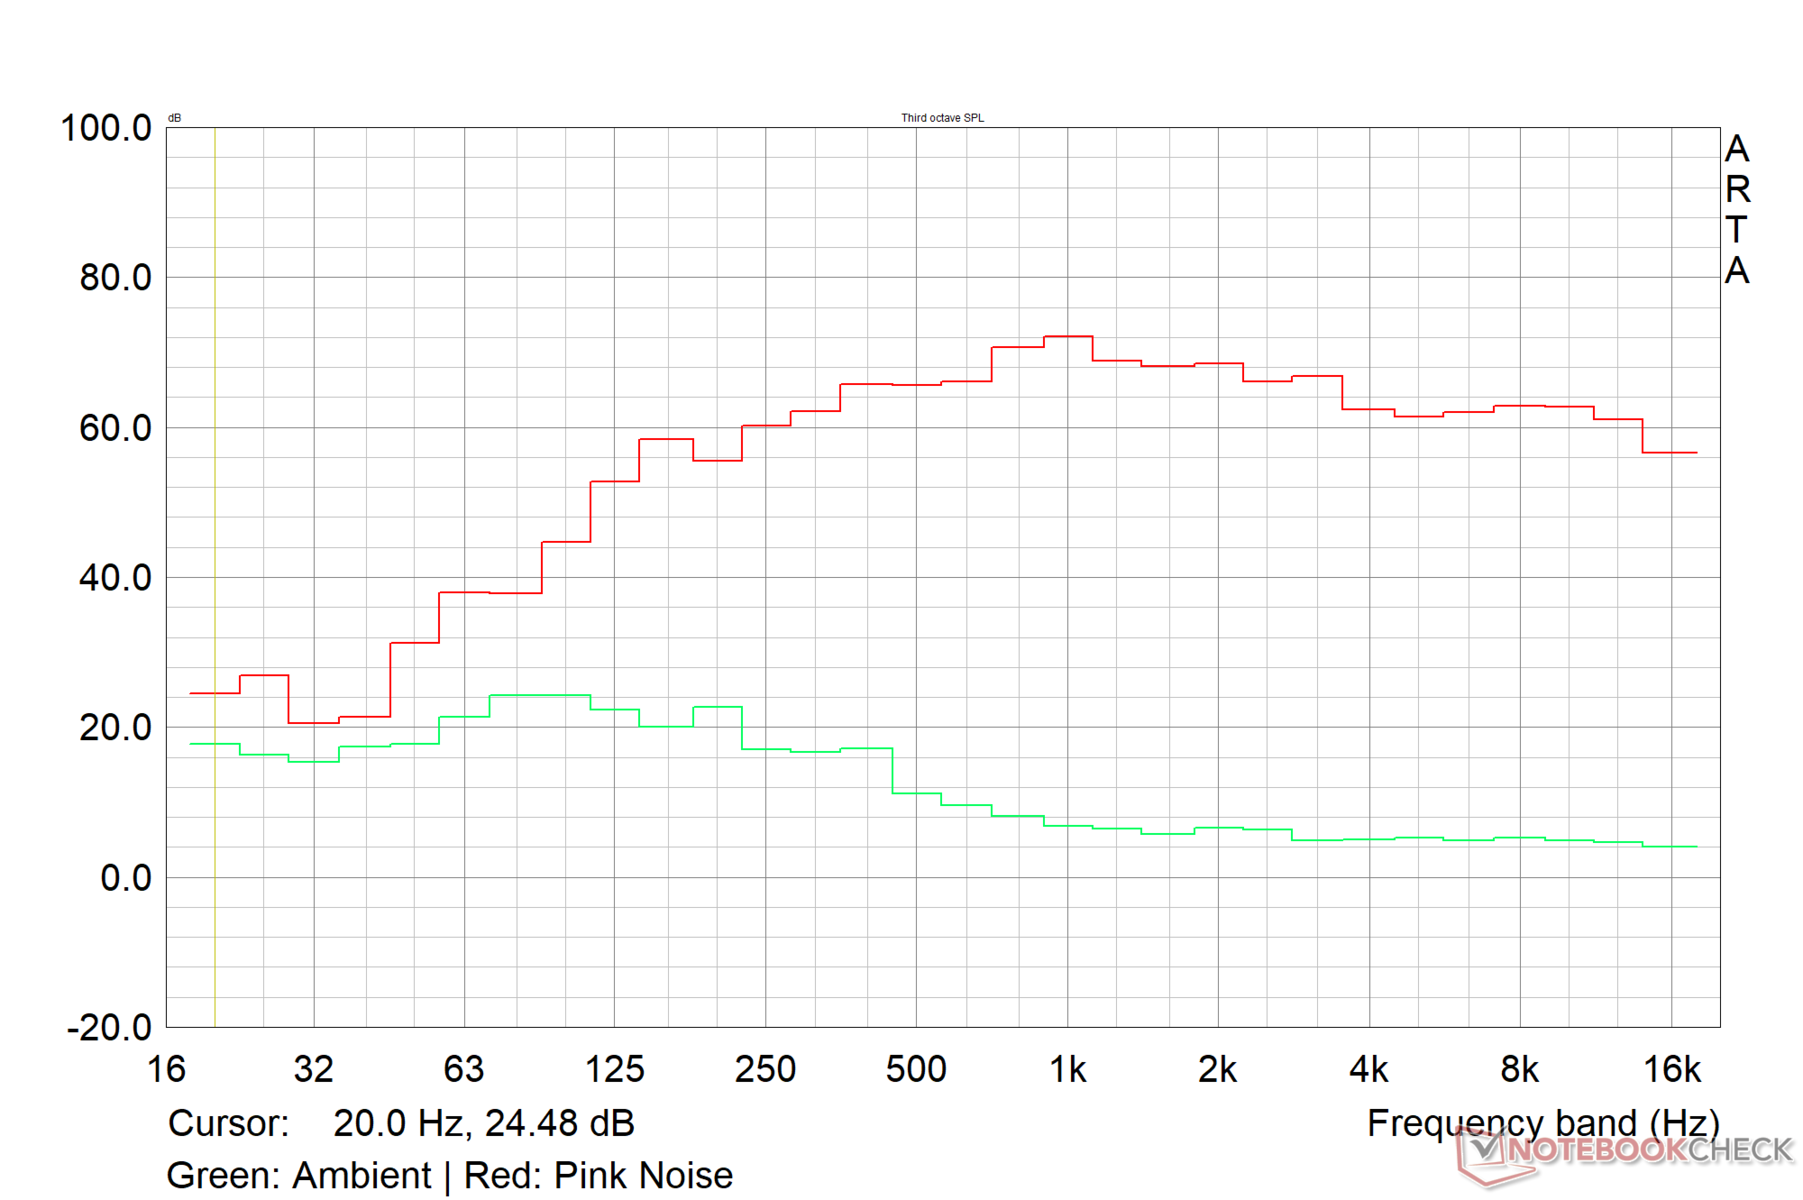
Alto-falantes
O Scar 16 usa um conjunto de quatro alto-falantes com dois tweeters perto da base da tampa e dois woofers que disparam para baixo. A Asus especifica o suporte para áudio de alta resolução e Dolby Atmos.
O volume de 79 db(A) é suficiente para uma sala de tamanho médio. A resposta dos graves é aceitável, mas poderia ter sido melhor, considerando a presença de woofers dedicados. Os médios e agudos são reproduzidos razoavelmente bem.
A presença de um conector de áudio combinado de 3,5 mm e Bluetooth 5.3 significa que os usuários podem conectar dispositivos de áudio externos muito mais capazes.
Asus ROG Strix Scar 16 G634JZR análise de áudio
(±) | o volume do alto-falante é médio, mas bom (###valor### dB)
Graves 100 - 315Hz
(±) | graves reduzidos - em média 7.1% menor que a mediana
(±) | a linearidade dos graves é média (9% delta para a frequência anterior)
Médios 400 - 2.000 Hz
(±) | médios mais altos - em média 5.5% maior que a mediana
(+) | médios são lineares (3.3% delta para frequência anterior)
Altos 2 - 16 kHz
(+) | agudos equilibrados - apenas 1.4% longe da mediana
(+) | os máximos são lineares (2.6% delta da frequência anterior)
Geral 100 - 16.000 Hz
(+) | o som geral é linear (9.8% diferença em relação à mediana)
Comparado com a mesma classe
» 5% de todos os dispositivos testados nesta classe foram melhores, 1% semelhantes, 94% piores
» O melhor teve um delta de 6%, a média foi 18%, o pior foi 132%
Comparado com todos os dispositivos testados
» 4% de todos os dispositivos testados foram melhores, 1% semelhantes, 95% piores
» O melhor teve um delta de 4%, a média foi 23%, o pior foi 134%
Apple MacBook Pro 16 2021 M1 Pro análise de áudio
(+) | os alto-falantes podem tocar relativamente alto (###valor### dB)
Graves 100 - 315Hz
(+) | bons graves - apenas 3.8% longe da mediana
(+) | o baixo é linear (5.2% delta para a frequência anterior)
Médios 400 - 2.000 Hz
(+) | médios equilibrados - apenas 1.3% longe da mediana
(+) | médios são lineares (2.1% delta para frequência anterior)
Altos 2 - 16 kHz
(+) | agudos equilibrados - apenas 1.9% longe da mediana
(+) | os máximos são lineares (2.7% delta da frequência anterior)
Geral 100 - 16.000 Hz
(+) | o som geral é linear (4.6% diferença em relação à mediana)
Comparado com a mesma classe
» 0% de todos os dispositivos testados nesta classe foram melhores, 0% semelhantes, 100% piores
» O melhor teve um delta de 5%, a média foi 17%, o pior foi 45%
Comparado com todos os dispositivos testados
» 0% de todos os dispositivos testados foram melhores, 0% semelhantes, 100% piores
» O melhor teve um delta de 4%, a média foi 23%, o pior foi 134%
Gerenciamento de energia: Nas linhas esperadas para o hardware a bordo
Consumo de energia
O Scar 16 consome um pouco mais de energia em comparação com o ROG Strix G16 com um Core i9-13980HX. O Omen 16 com uma configuração semelhante é cerca de 8% mais econômico do que o Scar 16 em geral, devido à sua CPU e GPU de menor potência.
O Vector 16 HX tem consumo de energia idêntico sob carga, embora apresente consumos de energia ociosos consideravelmente maiores.
O adaptador de energia de 330 W fornecido pode manter o laptop adequadamente alimentado sob estresse máximo.
| desligado | |
| Ocioso | |
| Carga |
|
Key:
min: | |
| Asus ROG Strix Scar 16 G634JZR i9-14900HX, GeForce RTX 4080 Laptop GPU, Mini LED, 2560x1600, 16" | Asus ROG Strix Scar 17 G733PYV-LL053X R9 7945HX3D, GeForce RTX 4090 Laptop GPU, IPS, 2560x1440, 17.3" | Asus ROG Strix G16 G614JZ i9-13980HX, GeForce RTX 4080 Laptop GPU, IPS, 2560x1600, 16" | Lenovo Legion Pro 7 16IRX9H i9-14900HX, GeForce RTX 4080 Laptop GPU, IPS, 2560x1600, 16" | HP Omen 16 (2024) i9-14900HX, GeForce RTX 4080 Laptop GPU, IPS, 2560x1440, 16.1" | MSI Vector 16 HX A14V i9-14900HX, GeForce RTX 4080 Laptop GPU, IPS, 2560x1600, 16" | Alienware m16 R2 Ultra 7 155H, GeForce RTX 4070 Laptop GPU, IPS, 2560x1600, 16" | Média NVIDIA GeForce RTX 4080 Laptop GPU | Média da turma Gaming | |
|---|---|---|---|---|---|---|---|---|---|
| Power Consumption | -8% | 3% | -20% | 8% | -16% | 16% | -21% | 1% | |
| Idle Minimum * (Watt) | 10.71 | 15.4 -44% | 10 7% | 16 -49% | 9 16% | 15.8 -48% | 8.1 24% | 16.9 ? -58% | 13 ? -21% |
| Idle Average * (Watt) | 14.75 | 21.6 -46% | 16 -8% | 21 -42% | 16 -8% | 23.3 -58% | 13 12% | 22 ? -49% | 18.7 ? -27% |
| Idle Maximum * (Watt) | 30 | 22.2 26% | 27 10% | 36 -20% | 35 -17% | 30 -0% | 40.3 -34% | 34.1 ? -14% | 24.3 ? 19% |
| Load Average * (Watt) | 135 | 116.7 14% | 129 4% | 132 2% | 129 4% | 123.9 8% | 79 41% | 117.9 ? 13% | 110.2 ? 18% |
| Witcher 3 ultra * (Watt) | 286 | 262 8% | 247 14% | 267 7% | 150.8 47% | 285 -0% | 188.1 34% | ||
| Load Maximum * (Watt) | 307 | 327.1 -7% | 342 -11% | 360 -17% | 285 7% | 306 -0% | 254.9 17% | 297 ? 3% | 258 ? 16% |
| Cyberpunk 2077 ultra external monitor * (Watt) | 272 |
* ... menor é melhor
Power Consumption: The Witcher 3 / Stress test
Power Consumption: External monitor
Duração da bateria
No perfil Silencioso com o MSHybrid ativado e uma taxa de atualização de 60 Hz, o Scar 16 dura até 7:14 horas em nosso teste padronizado de navegação na Web por Wi-Fi com 150 nits de brilho. Isso aumenta para 7,5 horas no teste de loop H.264 1080p no mesmo nível de brilho com todos os rádios desligados.
Jogar por longas horas com a bateria do Scar 16 é um sonho impossível, pois o laptop mal dura uma hora enquanto joga The Witcher 3 1080p Ultra a 150 nits.
| Asus ROG Strix Scar 16 G634JZR i9-14900HX, GeForce RTX 4080 Laptop GPU, 90 Wh | Asus ROG Strix Scar 17 G733PYV-LL053X R9 7945HX3D, GeForce RTX 4090 Laptop GPU, 90 Wh | Asus ROG Strix G16 G614JZ i9-13980HX, GeForce RTX 4080 Laptop GPU, 90 Wh | Lenovo Legion Pro 7 16IRX9H i9-14900HX, GeForce RTX 4080 Laptop GPU, 99.9 Wh | HP Omen 16 (2024) i9-14900HX, GeForce RTX 4080 Laptop GPU, 83 Wh | MSI Vector 16 HX A14V i9-14900HX, GeForce RTX 4080 Laptop GPU, 90 Wh | Alienware m16 R2 Ultra 7 155H, GeForce RTX 4070 Laptop GPU, 90 Wh | Média da turma Gaming | |
|---|---|---|---|---|---|---|---|---|
| Duração da bateria | -22% | 29% | -14% | -18% | 16% | 12% | 27% | |
| H.264 (h) | 7.5 | 5 -33% | 8.64 ? 15% | |||||
| WiFi v1.3 (h) | 7.2 | 4.8 -33% | 9.7 35% | 6.2 -14% | 5.9 -18% | 5.5 -24% | 8.1 13% | 7.11 ? -1% |
| Witcher 3 ultra (h) | 1 | |||||||
| Load (h) | 0.9 | 0.9 0% | 1.1 22% | 1.4 56% | 1 11% | 1.502 ? 67% | ||
| Reader / Idle (h) | 10.7 | 12.6 | 8.71 ? |
Pro
Contra
Veredicto: Atualização iterativa habitual para jogadores entusiastas
A Asus mantém a fórmula testada e comprovada que distingue a Scar 16 da concorrência. Nesse sentido, o Asus ROG Strix Scar 16 deste ano é apenas uma atualização evolutiva, mas não revolucionária, em relação à geração anterior.
A Asus oferece uma tela mini LED G-Sync HDR premium com a Scar 16. A tela de alta frequência PWM de 240 Hz apresenta excelentes características de cores e é perfeitamente adequada para fluxos de trabalho críticos em termos de cores, embora no modo de luz de fundo de zona única. Infelizmente, isso não está bem documentado.
O Asus ROG Strix Scar 16 preenche quase todos os requisitos esperados de um laptop para jogos de 16 polegadas para entusiastas em 2024. Seus pares, no entanto, oferecem recursos e desempenho semelhantes por um preço mais baixo.
Em termos de desempenho, o ROG Strix Scar 16 está frente a frente com outros notebooks com Core i9-14900HX e RTX 4080.
Os ajustes de resfriamento da Asus permitem que o Scar 16 use uma combinação de 180 W da CPU e da GPU sob carga. No entanto, levar o laptop tão longe resulta inevitavelmente em altas temperaturas de superfície e emissões de ruído da ventoinha.
Algumas dúvidas que gostaríamos que fossem abordadas incluem um melhor desempenho do Wi-Fi 5 e uma distribuição mais equitativa das portas em ambos os lados. Além disso, incluir uma webcam de 1080p nesse modelo não deve ser muito exigente para a Asus em 2024.
Se o senhor estiver procurando uma potência para jogos de 16 polegadas com cerca de ₹3,00,00 (~US$3.000) de sobra, o Asus ROG Strix Scar 16 se encaixa quase perfeitamente. No entanto, ele não é a pechincha ideal.
O Lenovo Legion Pro 7 tem um perfil mais fino, uma bateria maior (com menor tempo de execução) e uma webcam 1080p muito superior, além de ter um desempenho um pouco melhor em termos de CPU.
O MSI Vector 16 HX, embora não tenha alguns dos detalhes RGB e G-Sync, tem um preço um pouco mais baixo e corresponde ao desempenho do Scar 16 na maioria dos aspectos.
Preço e disponibilidade
Na Índia, o Asus ROG Strix Scar 16 (2024) com uma RTX 4080 tem preço oficial de ₹2,89,990, mas atualmente é vendido por ₹3,04,490 na Amazon Índia, enquanto a versão RTX 4090 está disponível pelo preço designado de ₹3,29,990.
O ROG Strix Scar 16 (2024) testado com um SSD de 1 TB e RTX 4080 pode ser adquirido por US$ 2.900 na Amazon US e Best Buy US, enquanto a variante RTX 4090 custará US$ 3.625.
Asus ROG Strix Scar 16 G634JZR
- 04/22/2024 v7 (old)
Vaidyanathan Subramaniam
Transparência
A seleção dos dispositivos a serem analisados é feita pela nossa equipe editorial. A amostra de teste foi fornecida ao autor como empréstimo pelo fabricante ou varejista para fins desta revisão. O credor não teve influência nesta revisão, nem o fabricante recebeu uma cópia desta revisão antes da publicação. Não houve obrigação de publicar esta revisão. Como empresa de mídia independente, a Notebookcheck não está sujeita à autoridade de fabricantes, varejistas ou editores.
É assim que o Notebookcheck está testando
Todos os anos, o Notebookcheck analisa de forma independente centenas de laptops e smartphones usando procedimentos padronizados para garantir que todos os resultados sejam comparáveis. Desenvolvemos continuamente nossos métodos de teste há cerca de 20 anos e definimos padrões da indústria no processo. Em nossos laboratórios de teste, equipamentos de medição de alta qualidade são utilizados por técnicos e editores experientes. Esses testes envolvem um processo de validação em vários estágios. Nosso complexo sistema de classificação é baseado em centenas de medições e benchmarks bem fundamentados, o que mantém a objetividade.Price comparison

