Eurocom Nightsky TXi317 revisão de laptop: 125 W GeForce RTX 3080 Ti speedster
")
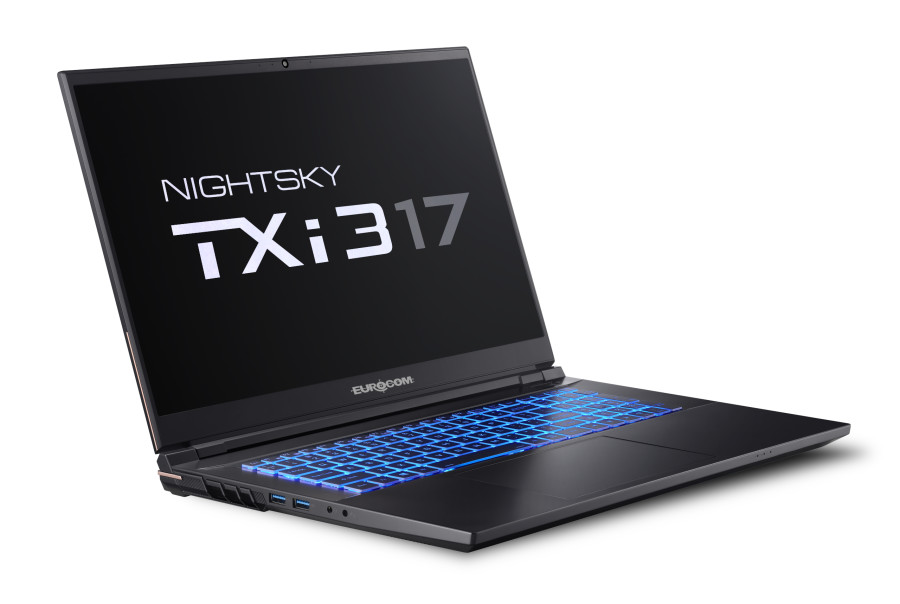
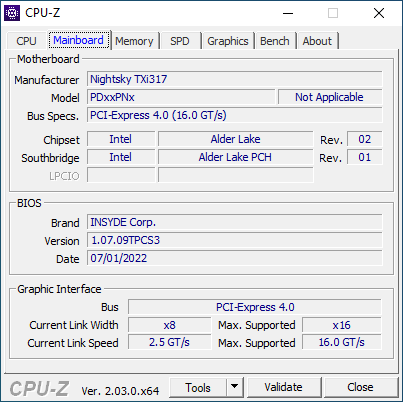
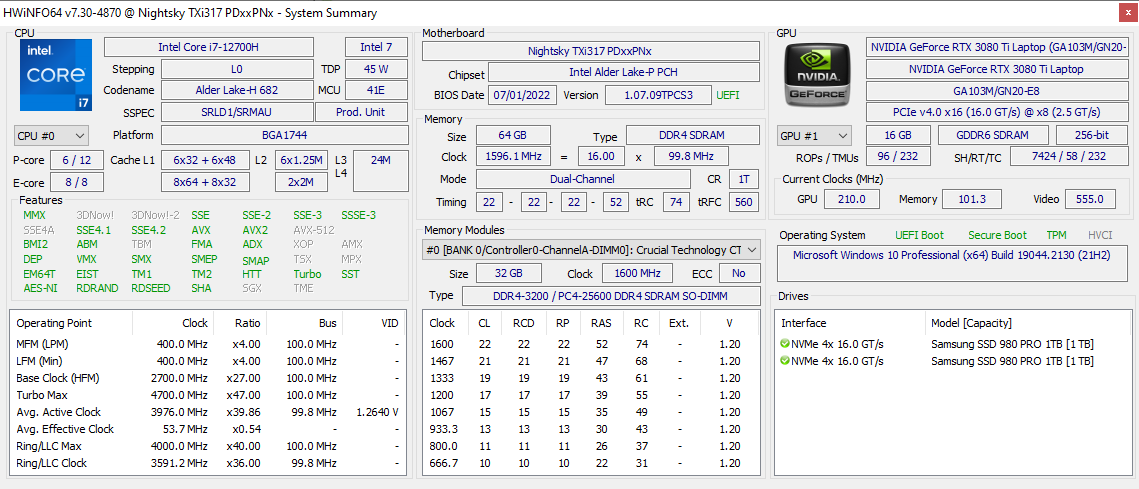
O Nightsky TXi317 é o mais recente laptop para jogos de 17,3 polegadas da Eurocom, utilizando as CPUs Alder Lake-H do 12º gênero da Intel e um TGP GeForce RTX 3080 Ti GPU de 155 W para ser um dos laptops para jogos mais rápidos atualmente disponíveis. Ela compartilha o mesmo design de chassis Tongfang que o Schenker XMG Pro 17 E22 e, portanto, recomendamos verificar nosso revisão existente aqui para mais detalhes sobre o chassi e suas características físicas.
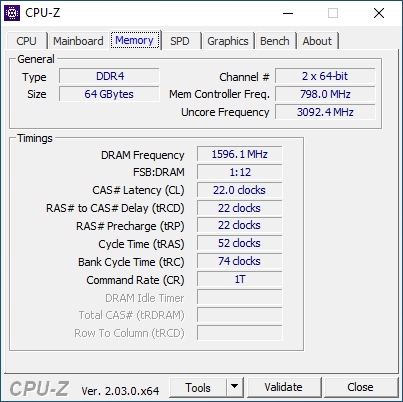
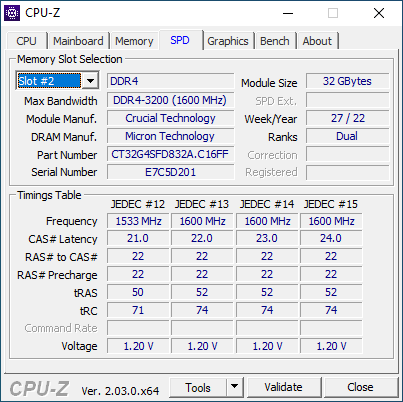
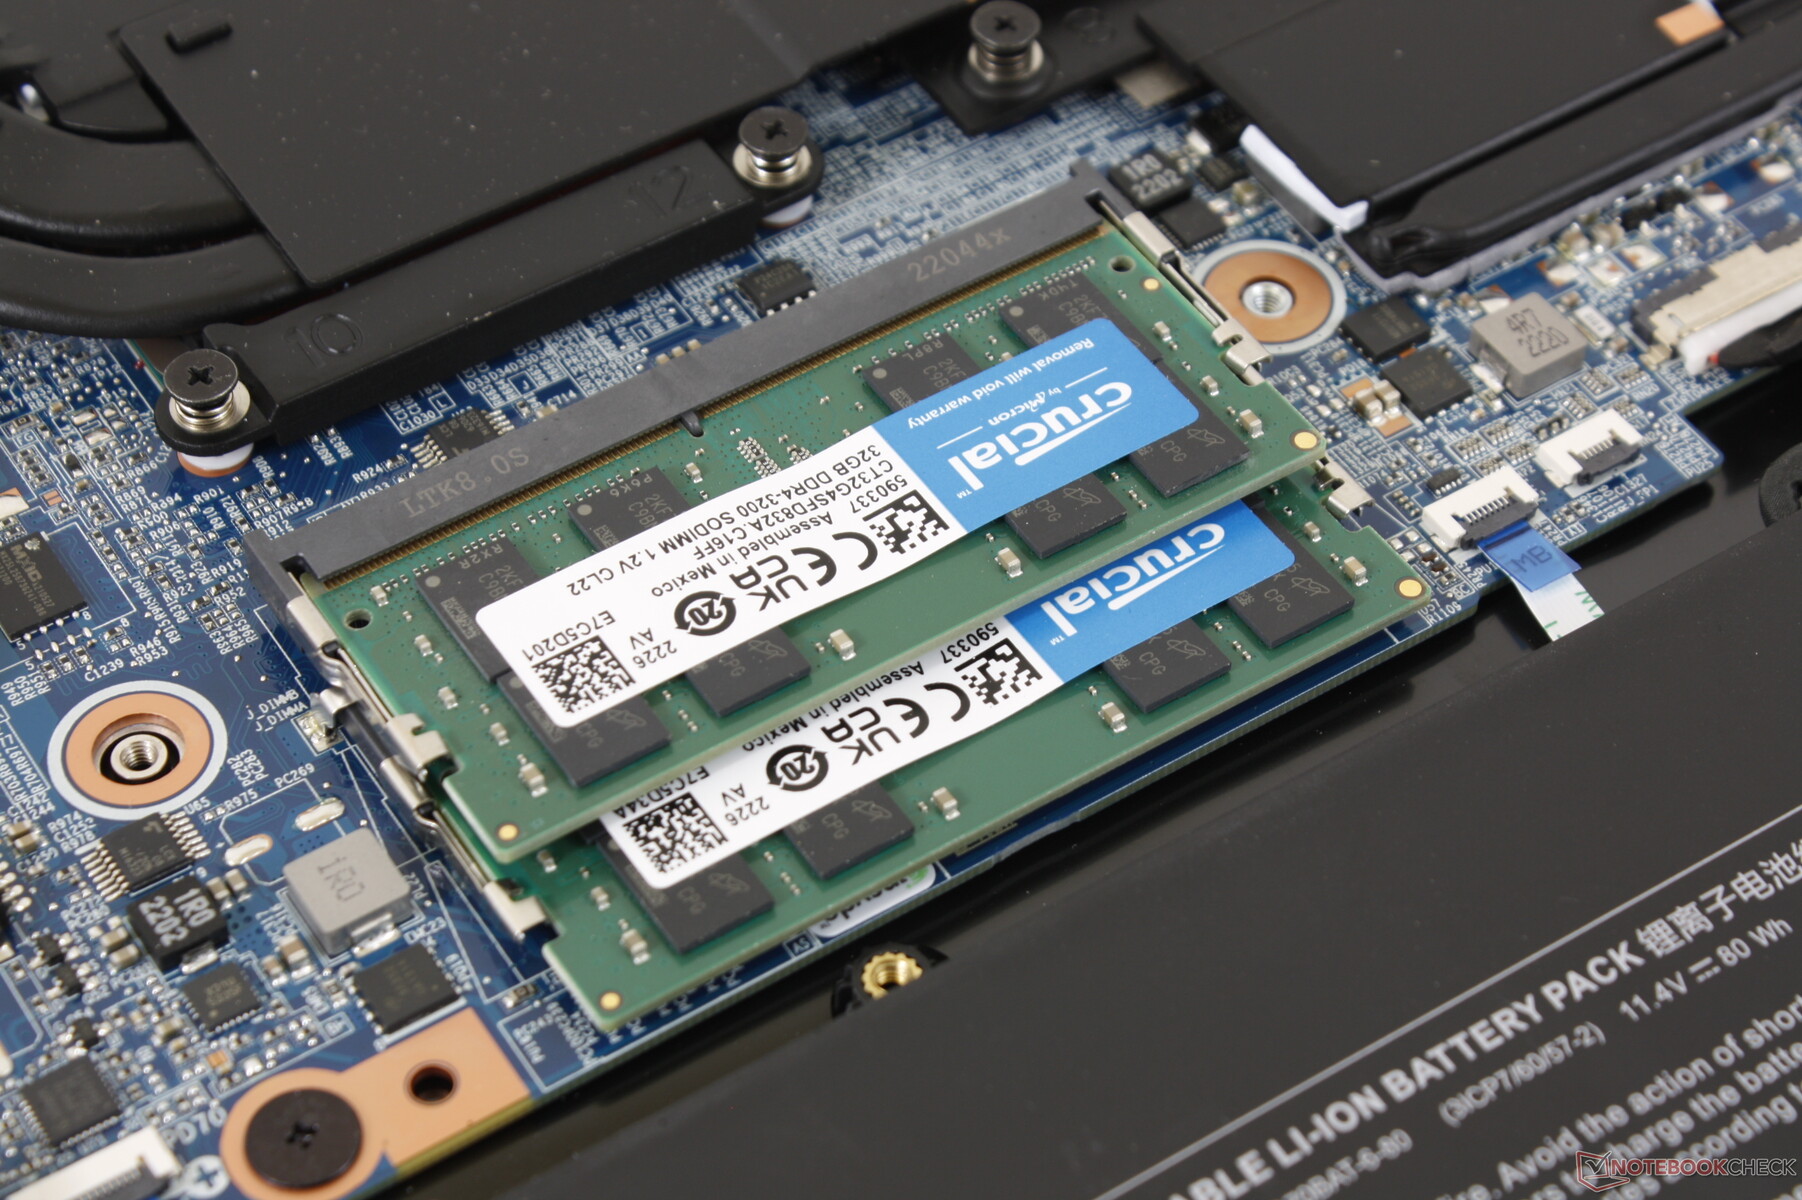
Nossa configuração de revisão vem equipada com a CPU Core i7-12700H, display IPS 144 Hz 1080p, GeForce RTX 3080 Ti GPU, e 64 GB de RAM por aproximadamente $4100 USD. A opção mais baixa de GPU é a GeForce RTX 3070 Ti que coloca o Nightsky TXi317 no mercado de laptops para jogos dos entusiastas.
Os concorrentes diretos incluem outros laptops de alto desempenho com 17 polegadas, como o Aorus 17X,MSI Raider GE77ouAlienware x17 R2.
Mais análises da Eurocom:
Possíveis concorrentes em comparação
Avaliação | Data | Modelo | Peso | Altura | Size | Resolução | Preço |
|---|---|---|---|---|---|---|---|
| 85.3 % v7 (old) | 10/2022 | Eurocom Nightsky TXi317 i7-12700H, GeForce RTX 3080 Ti Laptop GPU | 2.9 kg | 27 mm | 17.30" | 1920x1080 | |
| 85.4 % v7 (old) | 07/2022 | Schenker XMG Pro 17 E22 i9-12900H, GeForce RTX 3080 Ti Laptop GPU | 2.8 kg | 27 mm | 17.30" | 2560x1440 | |
| 83.7 % v7 (old) | 08/2022 | Aorus 17X XES i9-12900HX, GeForce RTX 3070 Ti Laptop GPU | 2.7 kg | 30 mm | 17.30" | 1920x1080 | |
| 86.8 % v7 (old) | 07/2022 | MSI Raider GE77 HX 12UHS i9-12900HX, GeForce RTX 3080 Ti Laptop GPU | 3.1 kg | 25.9 mm | 17.30" | 3840x2160 | |
| 89.9 % v7 (old) | 07/2022 | Razer Blade 17 Early 2022 i9-12900H, GeForce RTX 3080 Ti Laptop GPU | 2.8 kg | 19.9 mm | 17.30" | 3840x2160 | |
| 89.2 % v7 (old) | 05/2022 | Alienware x17 R2 P48E i9-12900HK, GeForce RTX 3080 Ti Laptop GPU | 3.1 kg | 20.9 mm | 17.30" | 1920x1080 |
Caso
Há uma diferença superficial entre o Nightsky TXi317 e o XMG Pro 17 E22: os cantos traseiros do design da Eurocom incorporam guarnições de bronze brilhante enquanto o design Schenker não. Caso contrário, seus desenhos de chassis são idênticos.
Leitor de cartões SD
| SD Card Reader | |
| average JPG Copy Test (av. of 3 runs) | |
| Alienware x17 R2 P48E (AV Pro V60) | |
| Razer Blade 17 Early 2022 (AV PRO microSD 128 GB V60) | |
| Schenker XMG Pro 17 E22 (AV PRO microSD 128 GB V60) | |
| MSI Raider GE77 HX 12UHS (AV PRO microSD 128 GB V60) | |
| Eurocom Nightsky TXi317 (AV Pro V60) | |
| maximum AS SSD Seq Read Test (1GB) | |
| Alienware x17 R2 P48E (AV Pro V60) | |
| Eurocom Nightsky TXi317 (AV Pro V60) | |
| Schenker XMG Pro 17 E22 (AV PRO microSD 128 GB V60) | |
Comunicação
O Wi-Fi 6 vem padrão sem opções Wi-Fi 6E do fabricante, apesar da alta faixa de preço do modelo. As taxas de transferência são, no entanto, estáveis e sem problemas de conectividade.
| Networking | |
| iperf3 transmit AX12 | |
| Alienware x17 R2 P48E | |
| iperf3 receive AX12 | |
| Alienware x17 R2 P48E | |
| iperf3 receive AXE11000 6GHz | |
| Aorus 17X XES | |
| MSI Raider GE77 HX 12UHS | |
| iperf3 receive AXE11000 | |
| Schenker XMG Pro 17 E22 | |
| Razer Blade 17 Early 2022 | |
| Eurocom Nightsky TXi317 | |
| iperf3 transmit AXE11000 6GHz | |
| Aorus 17X XES | |
| iperf3 transmit AXE11000 | |
| Eurocom Nightsky TXi317 | |
Webcam
A câmera tem apenas 1 MP, sem opções de 2 MP, o que é novamente decepcionante, considerando a alta faixa de preço do modelo.


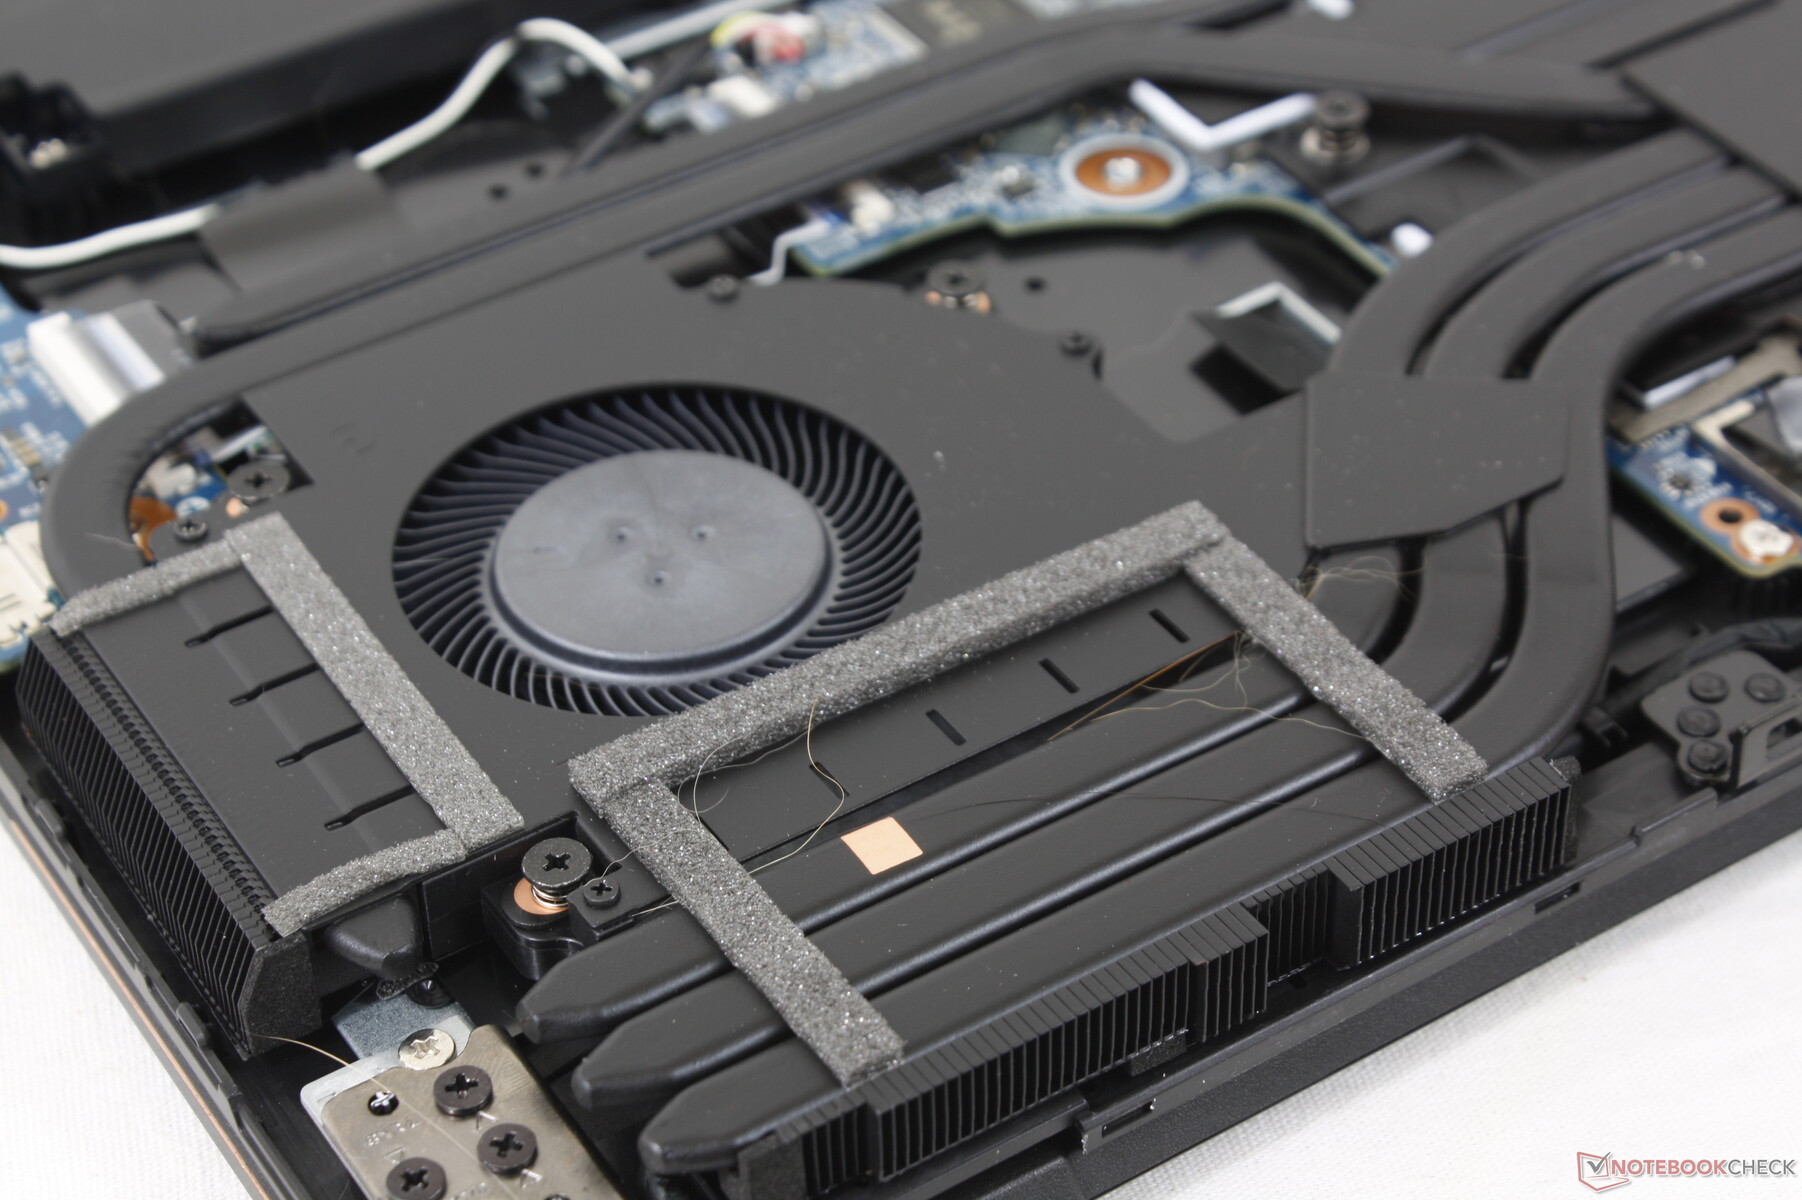
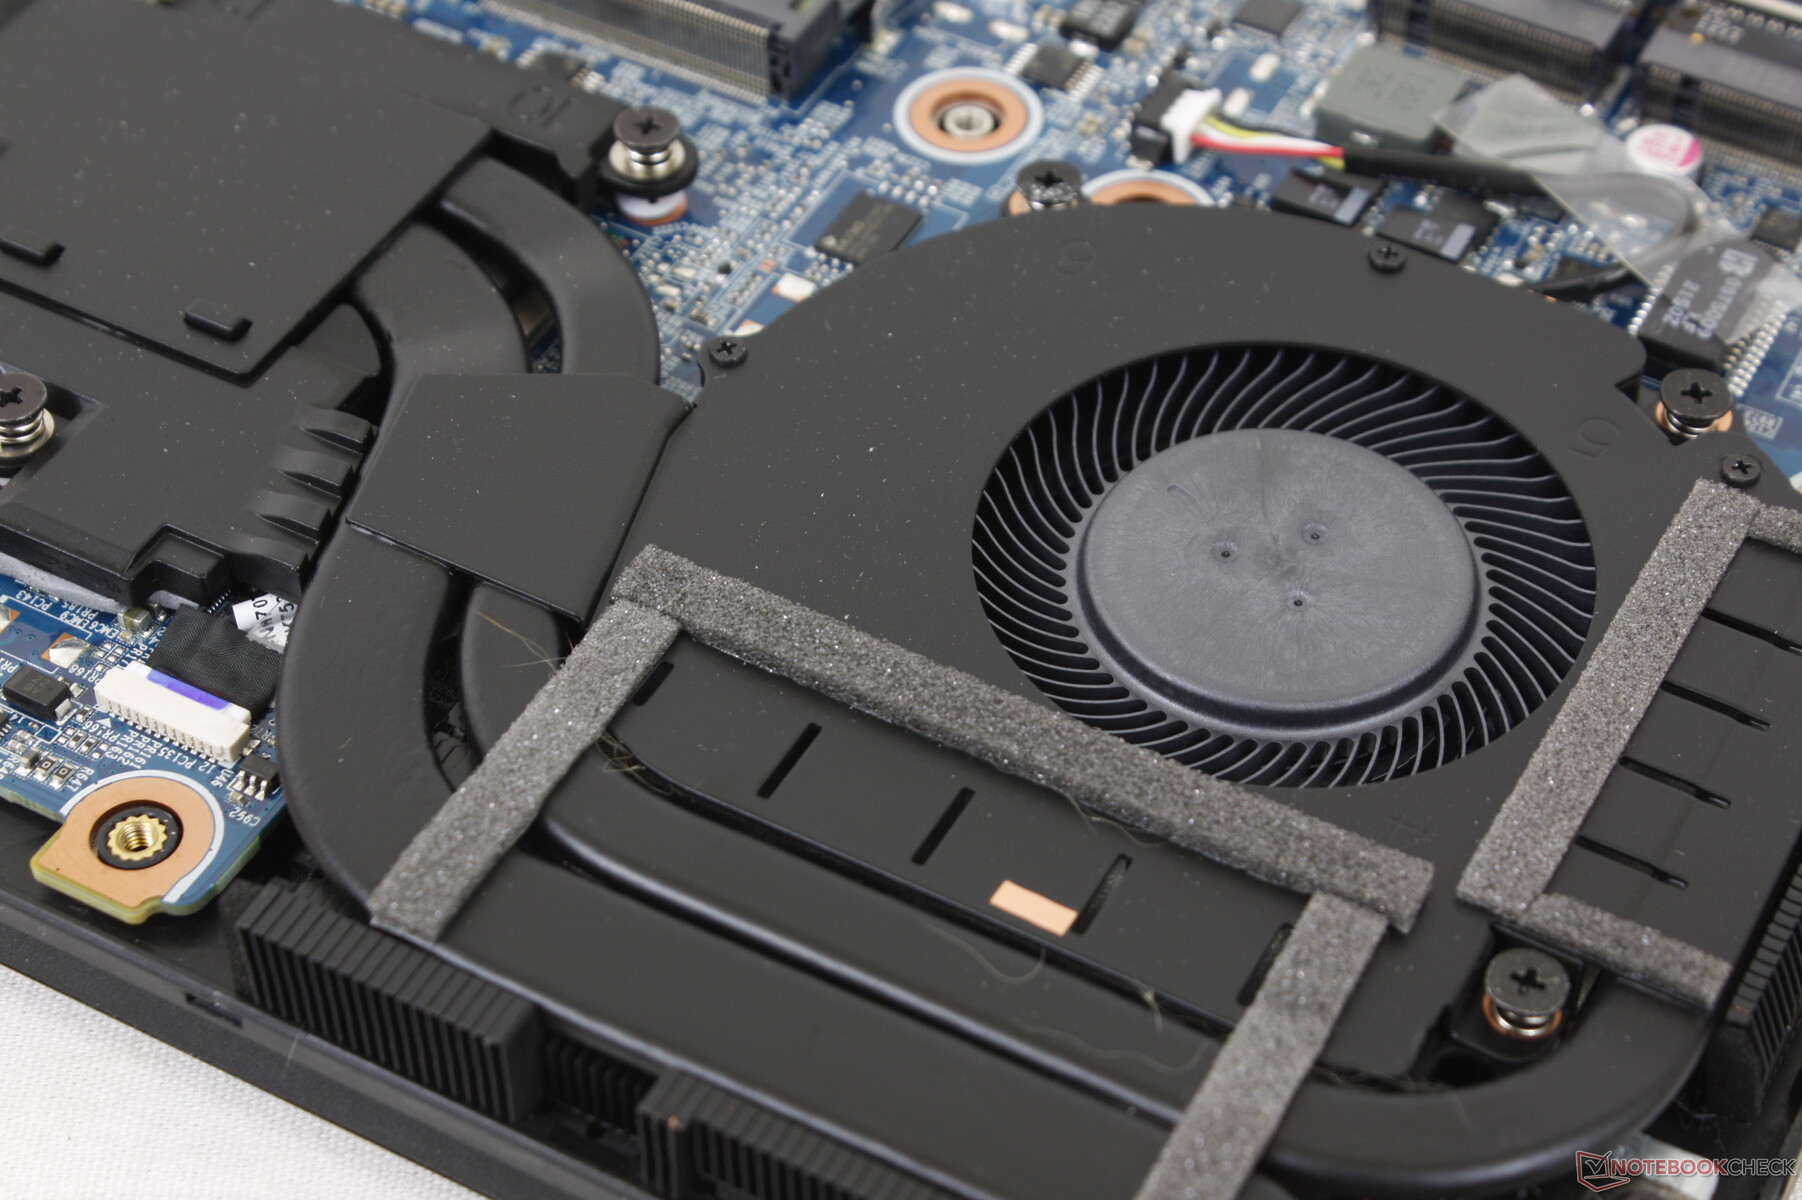
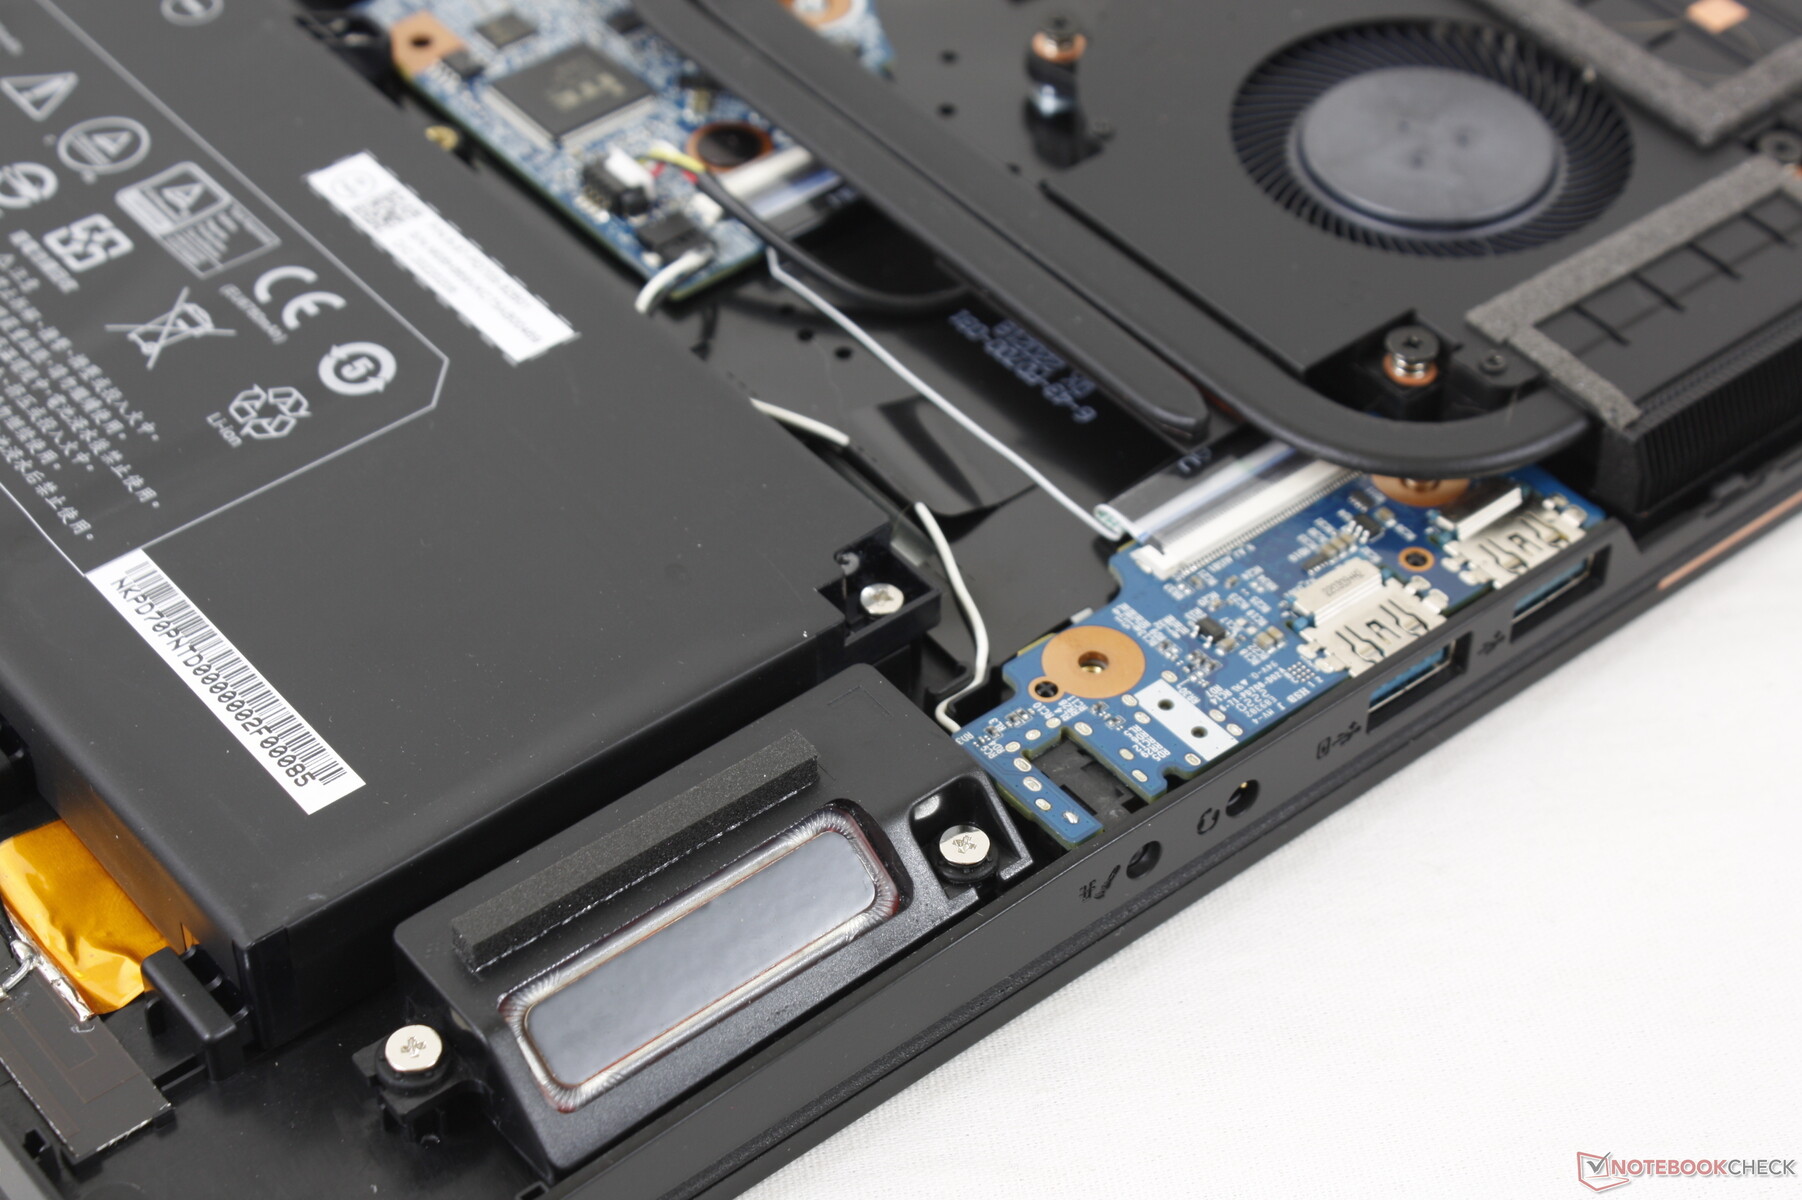
Manutenção
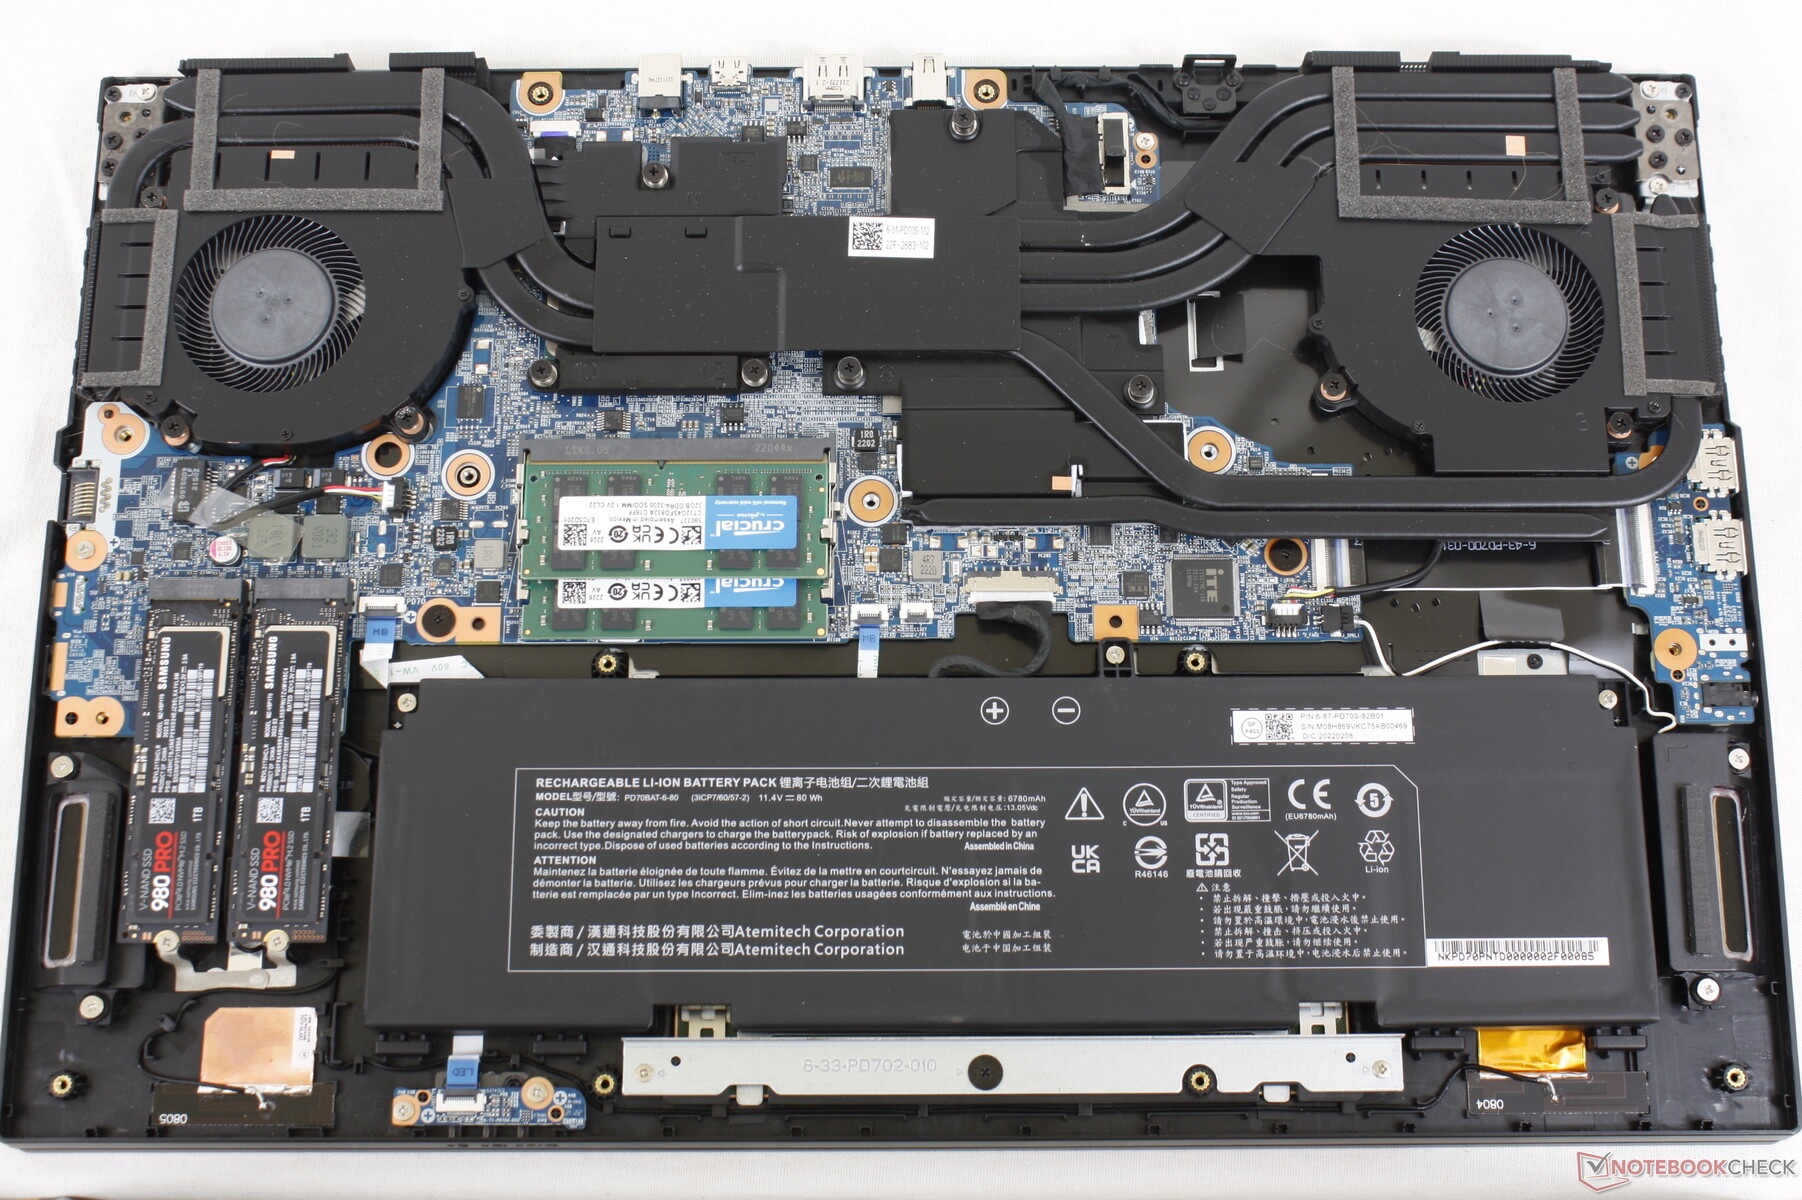
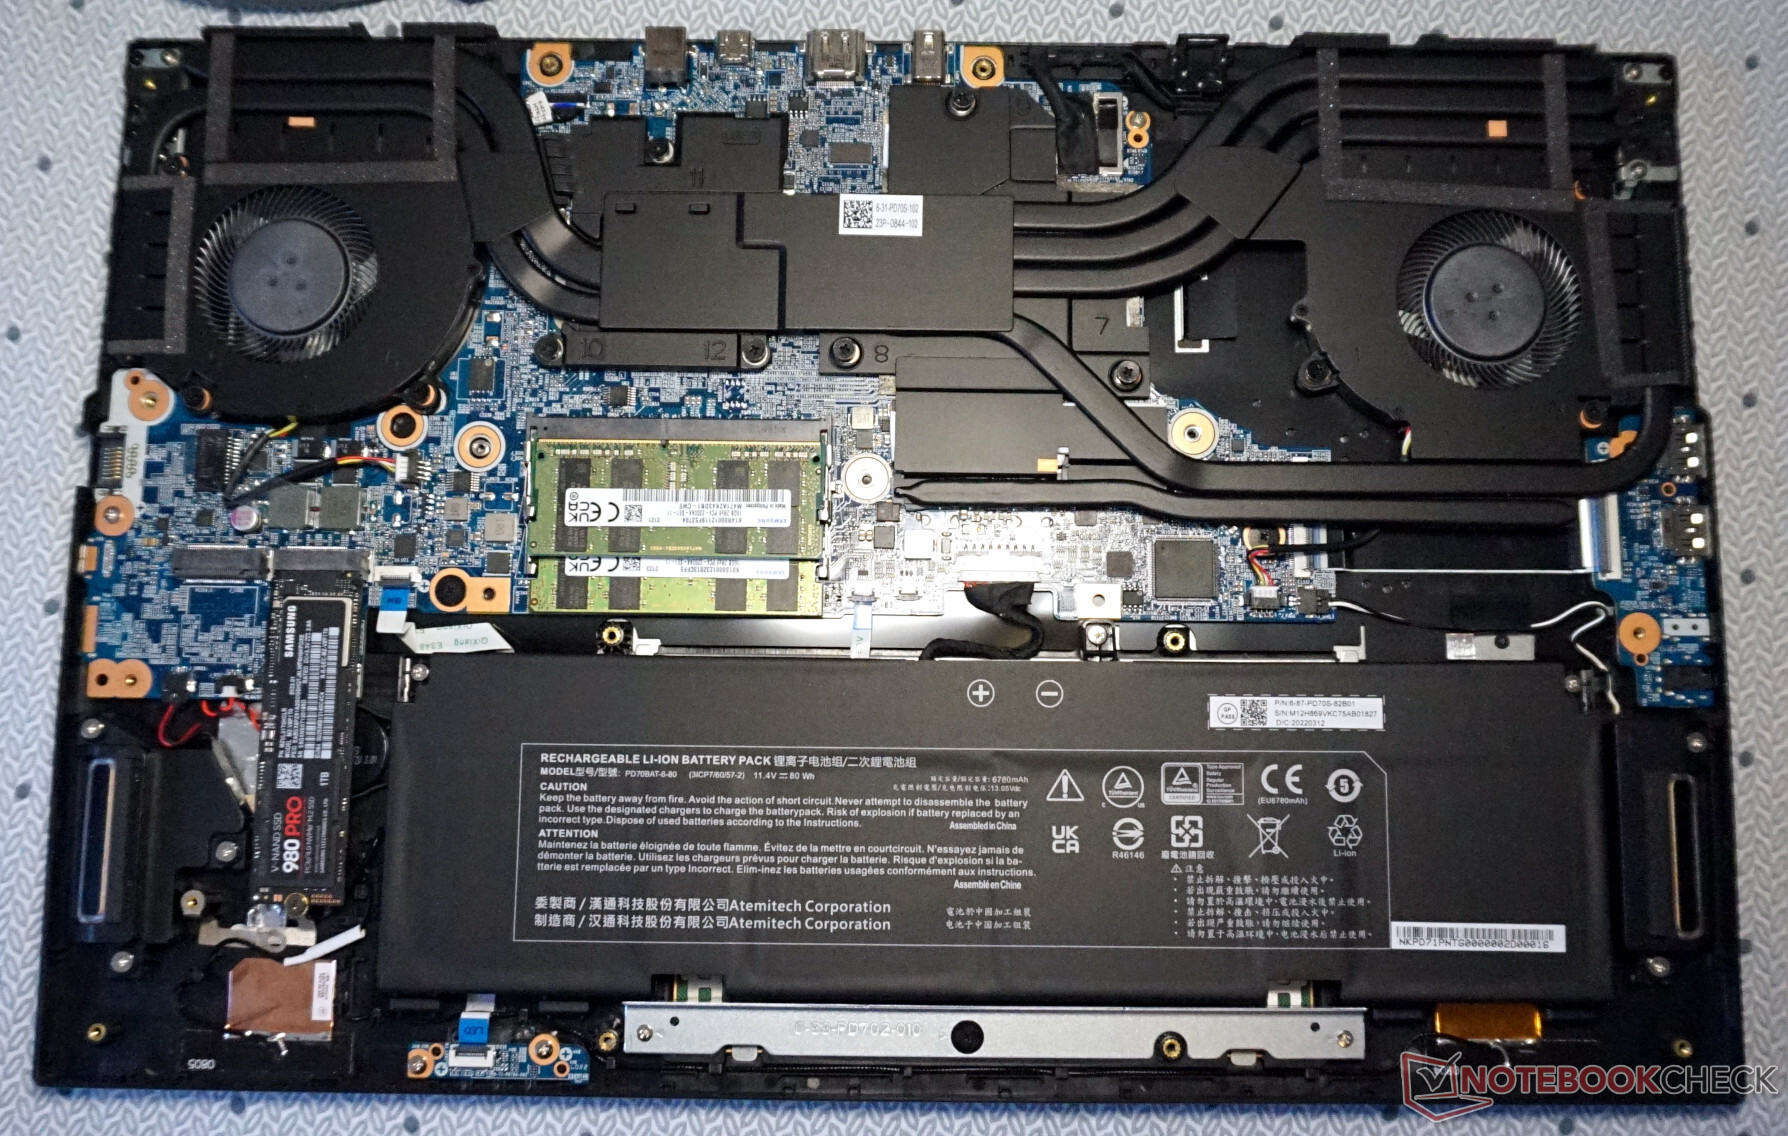
O painel inferior é fixado por 16 parafusos Philips para facilitar a manutenção. A maioria dos outros laptops para jogos tem muito menos parafusos, no entanto, e por isso é preciso um pouco mais de paciência para abrir a Eurocom.
Acessórios e Garantia
A caixa de varejo não inclui extras além do adaptador AC e da papelada. A garantia padrão limitada de um ano do fabricante se aplica se comprada nos EUA.
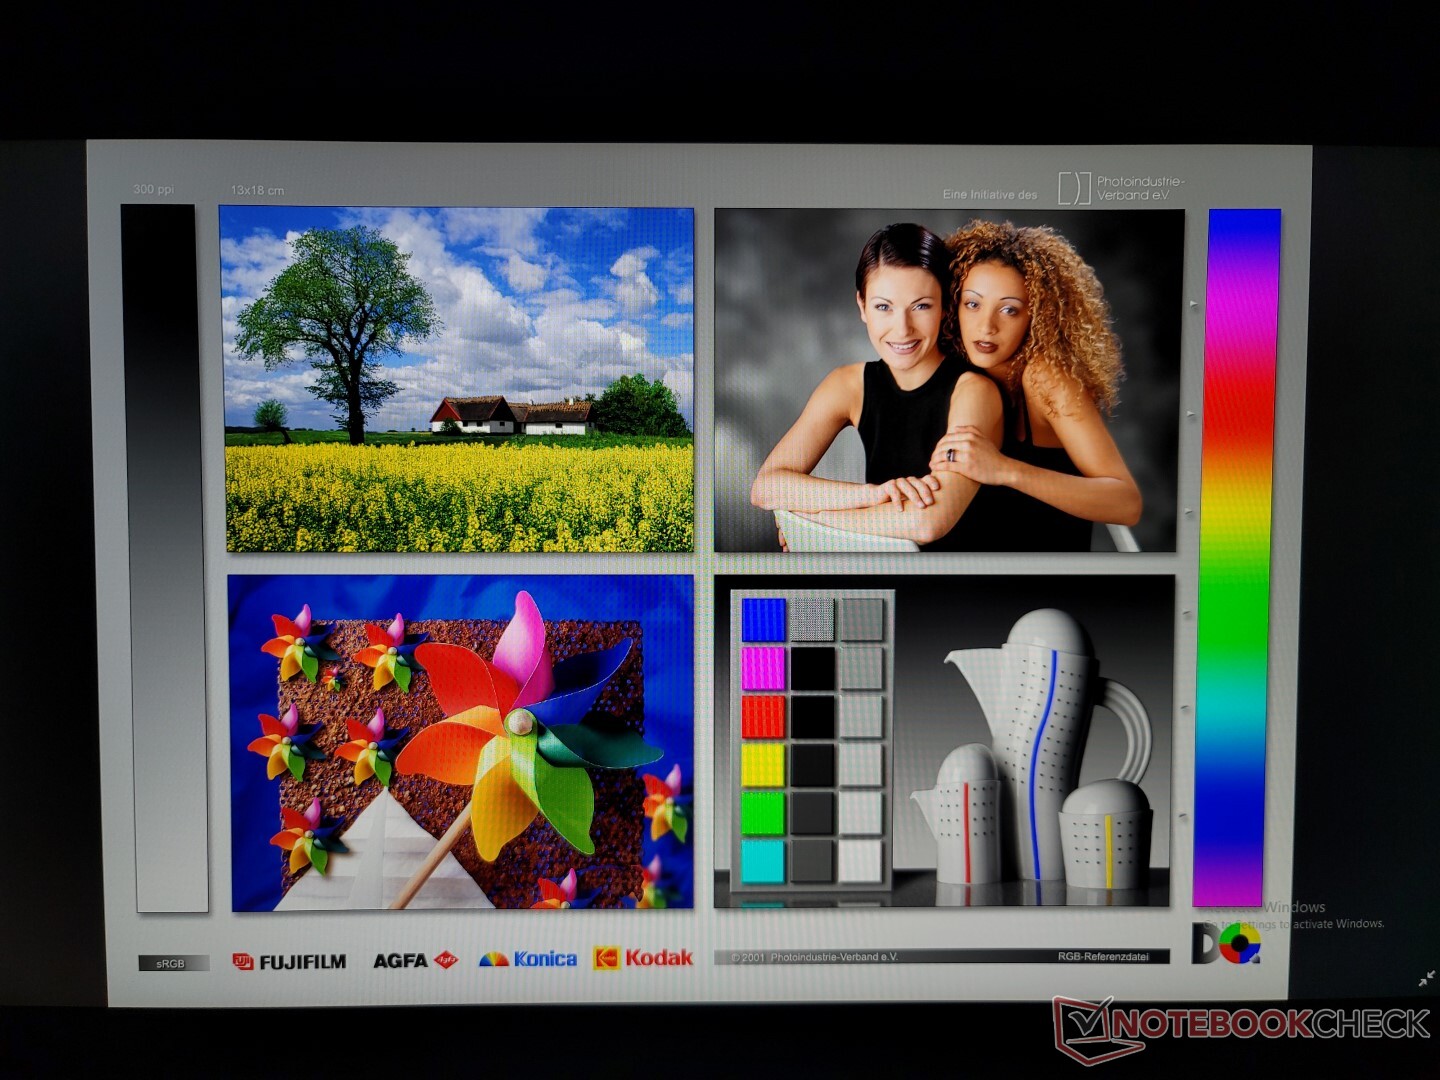
Mostrar
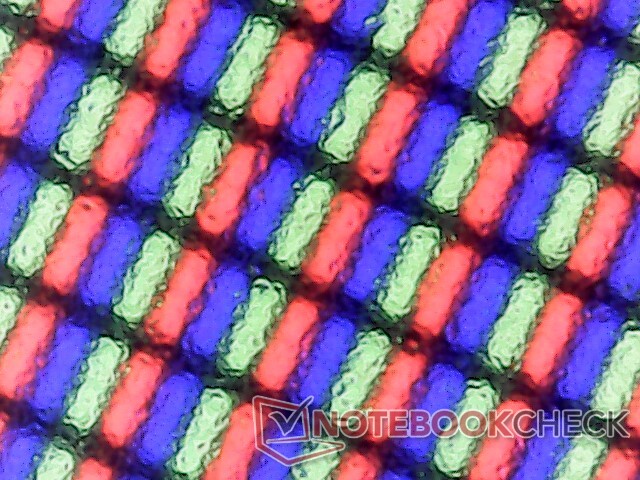
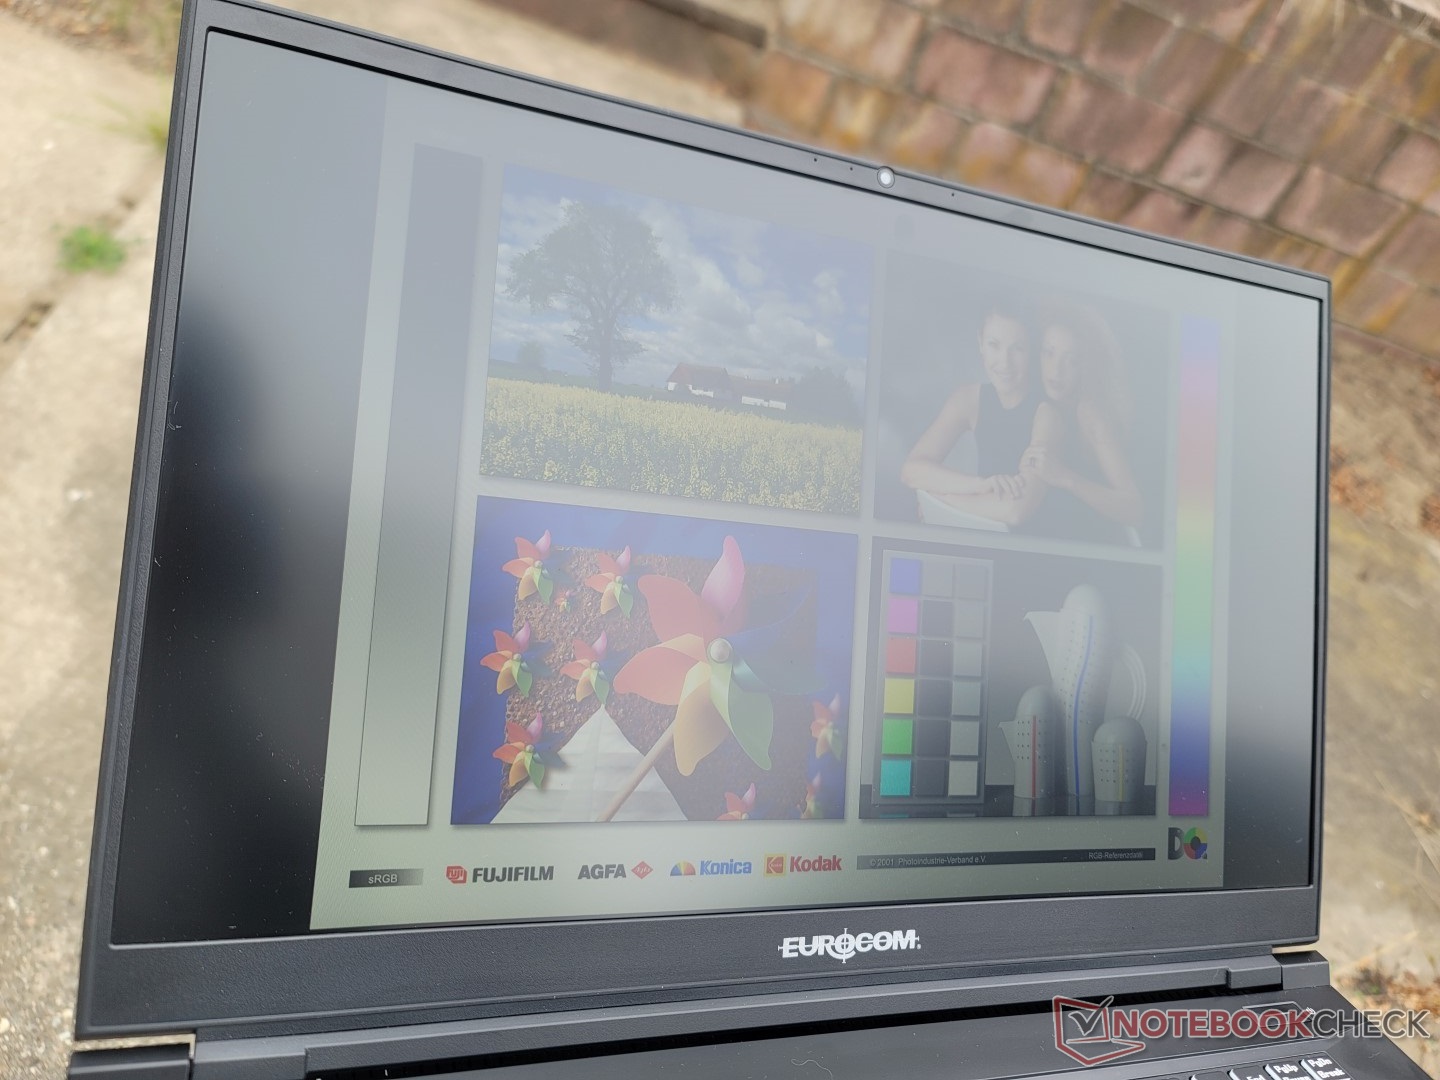
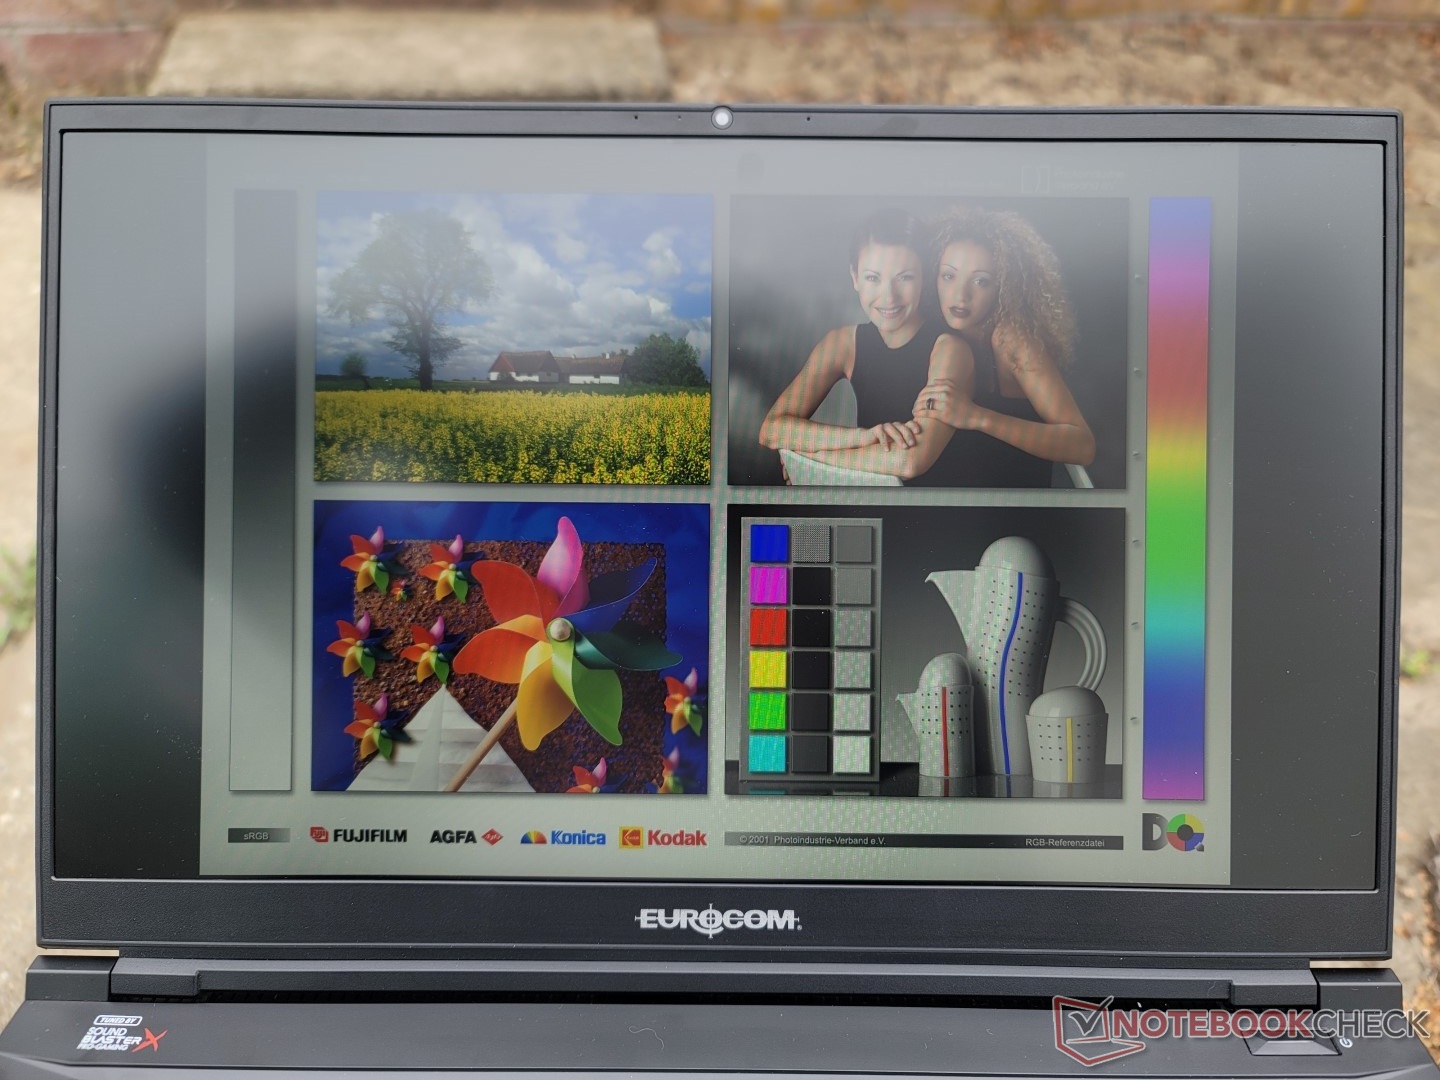
Nossa unidade de teste utiliza o mesmo painel IPS LG Philips LP173WFG-SPB3 que se encontra no Schenker XMG Foco 17. Quando comparado com o painel BOE 1440p no XMG Pro 17 E22, nosso painel Philips 1080p LG oferece cores mais estreitas, uma taxa de atualização mais lenta e tempos de resposta mais lentos em preto e branco para ser mais um display de médio alcance do que um de alta qualidade. No entanto, ainda é muito bom, mas 1440p é definitivamente um ajuste melhor do que 1080p para um laptop rodando em um GPU GeForce RTX 3080 Ti.
Por sorte, o TXi317 vem com três painéis para escolher entre 1080p e 4K. Tenha em mente que nenhum deles é OLED nem podem oferecer cobertura completa do AdobeRGB.
- 1080p, 144 Hz, 100% sRGB, IPS
- 1440p, 165 Hz, 100% sRGB, IPS
- 2160p, 60 Hz, 100% sRGB, IPS
| |||||||||||||||||||||||||
iluminação: 88 %
iluminação com acumulador: 303.9 cd/m²
Contraste: 1013:1 (Preto: 0.3 cd/m²)
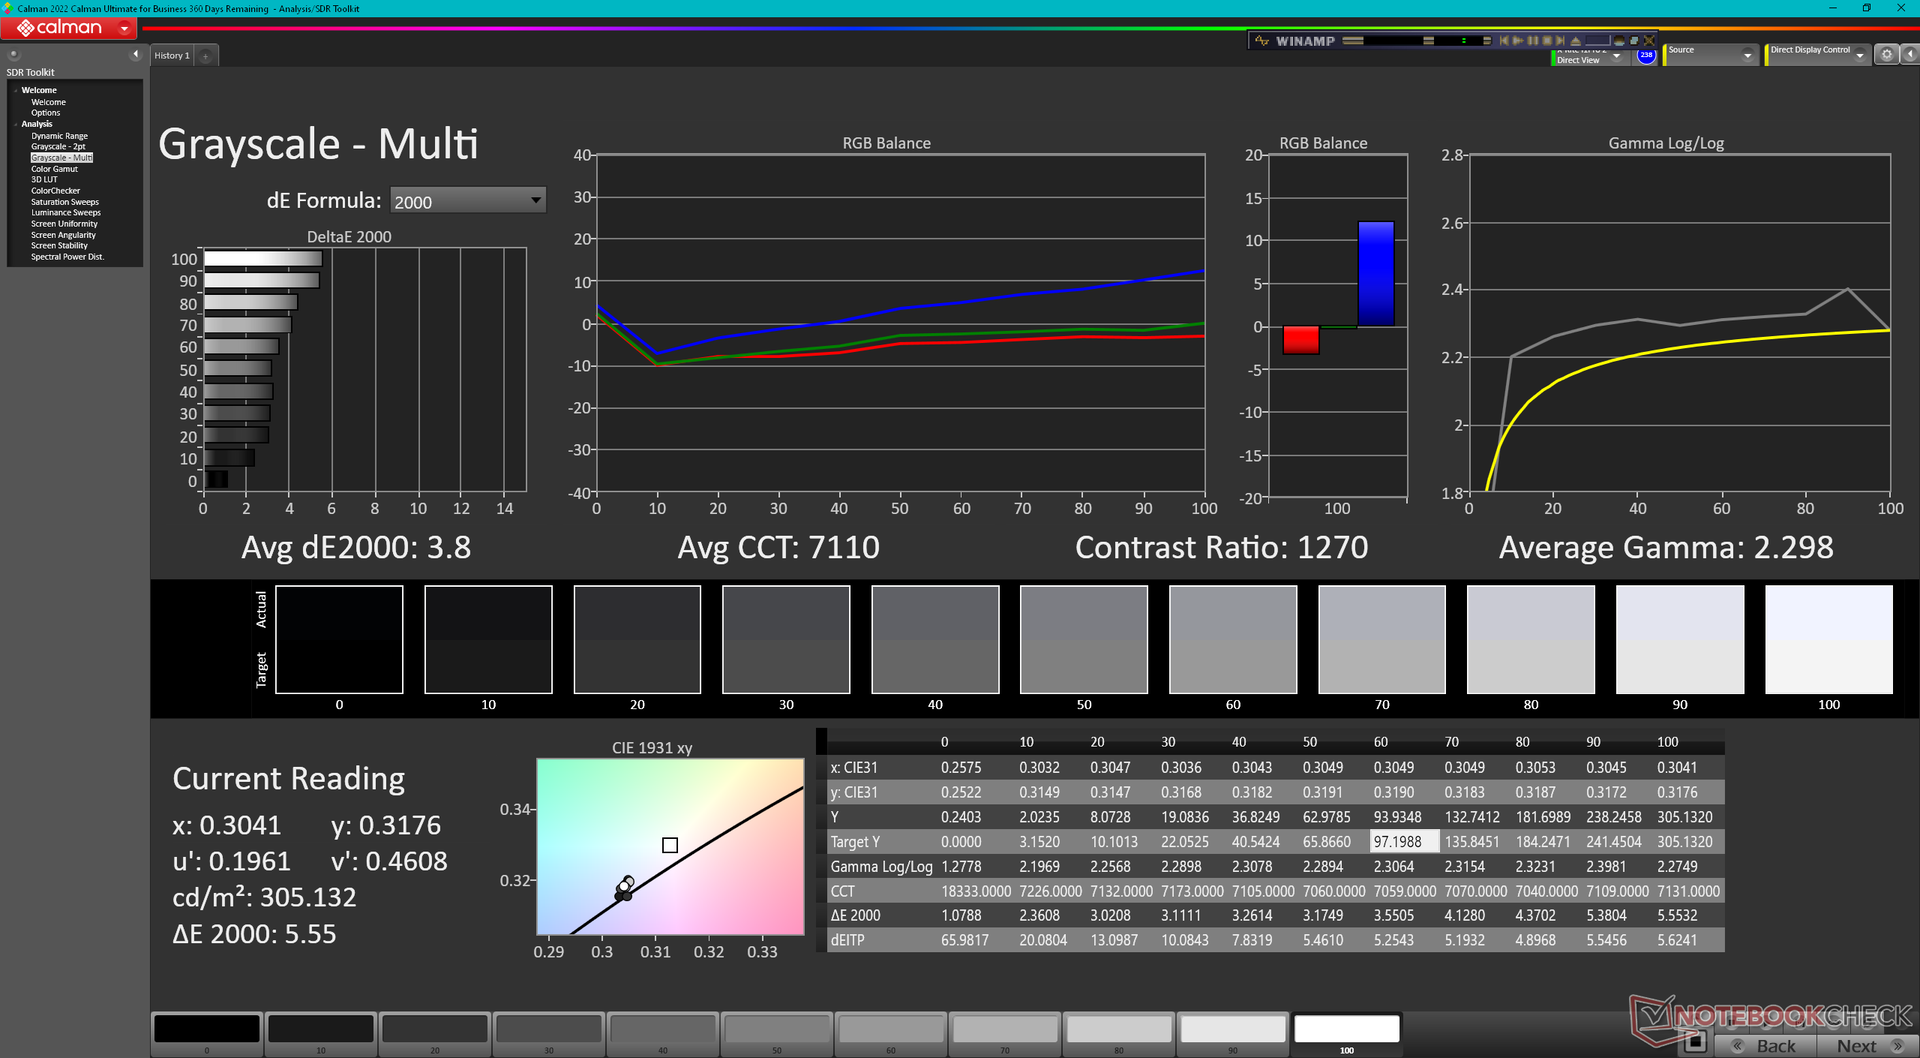
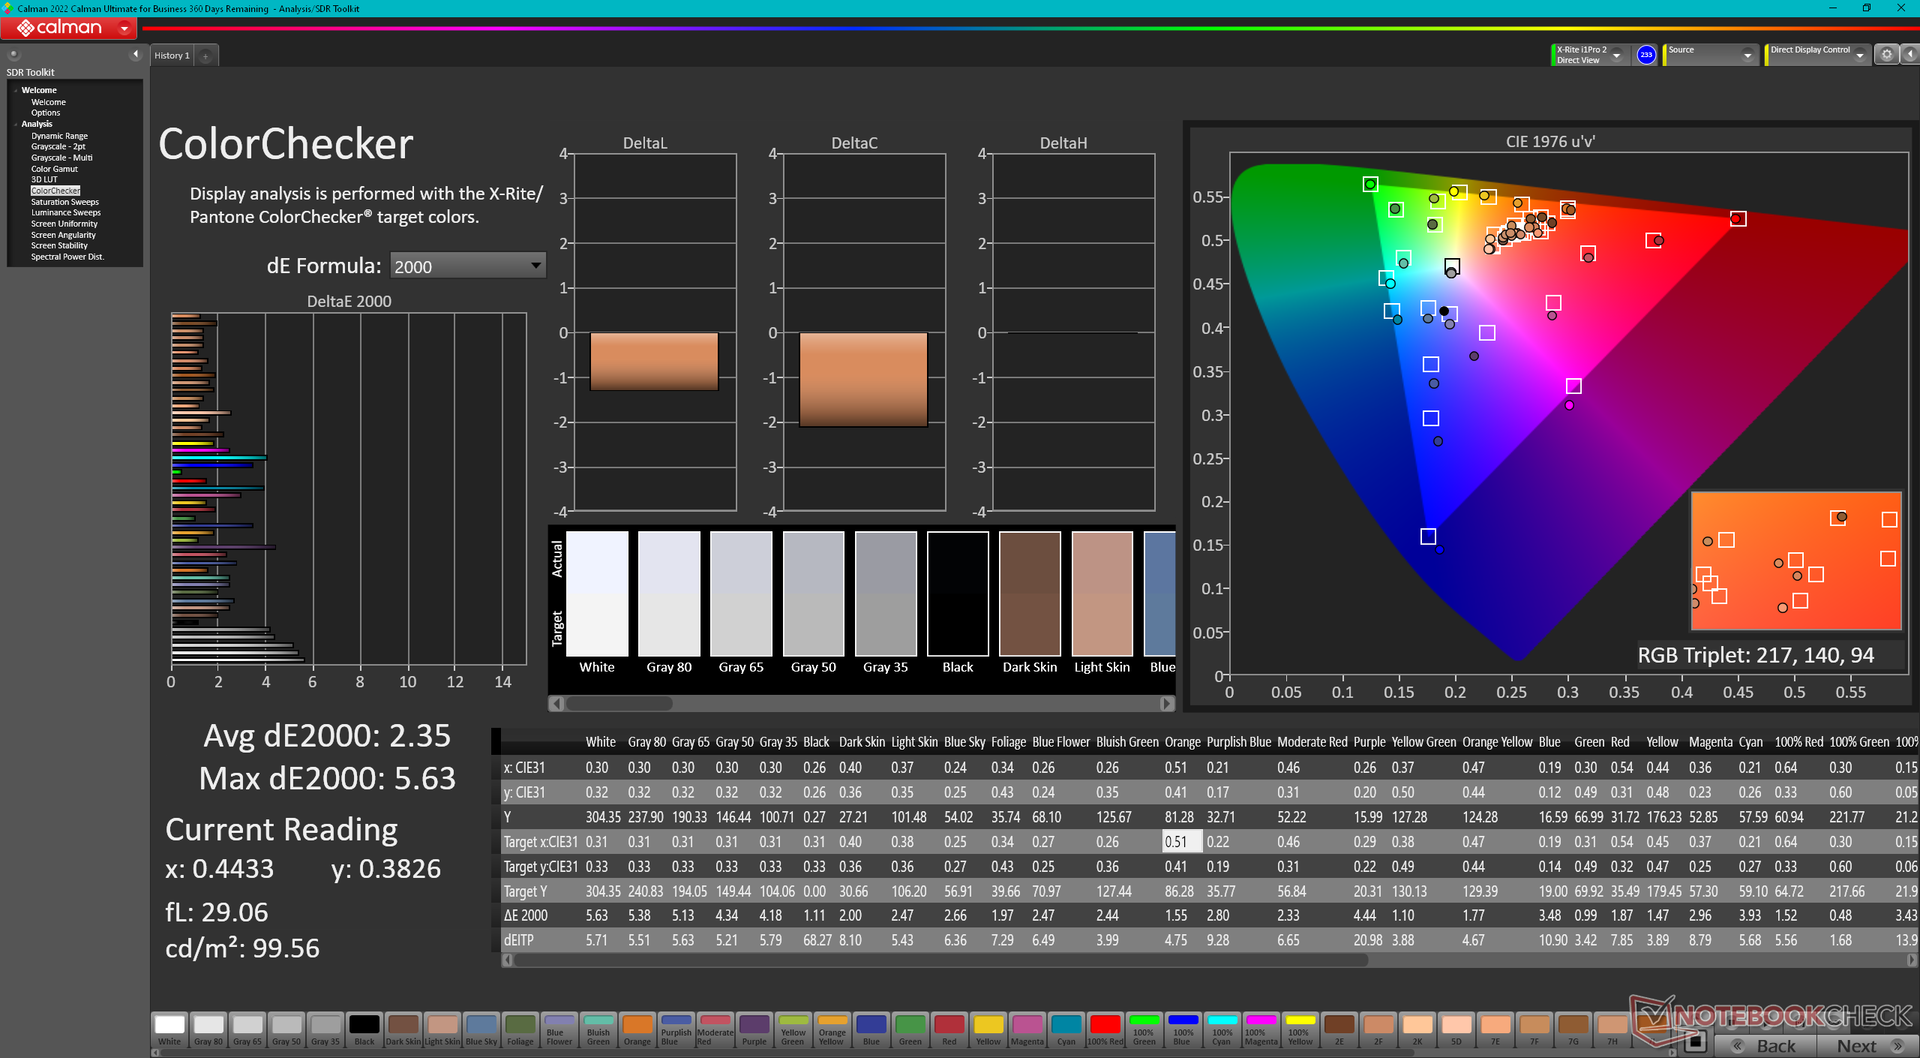
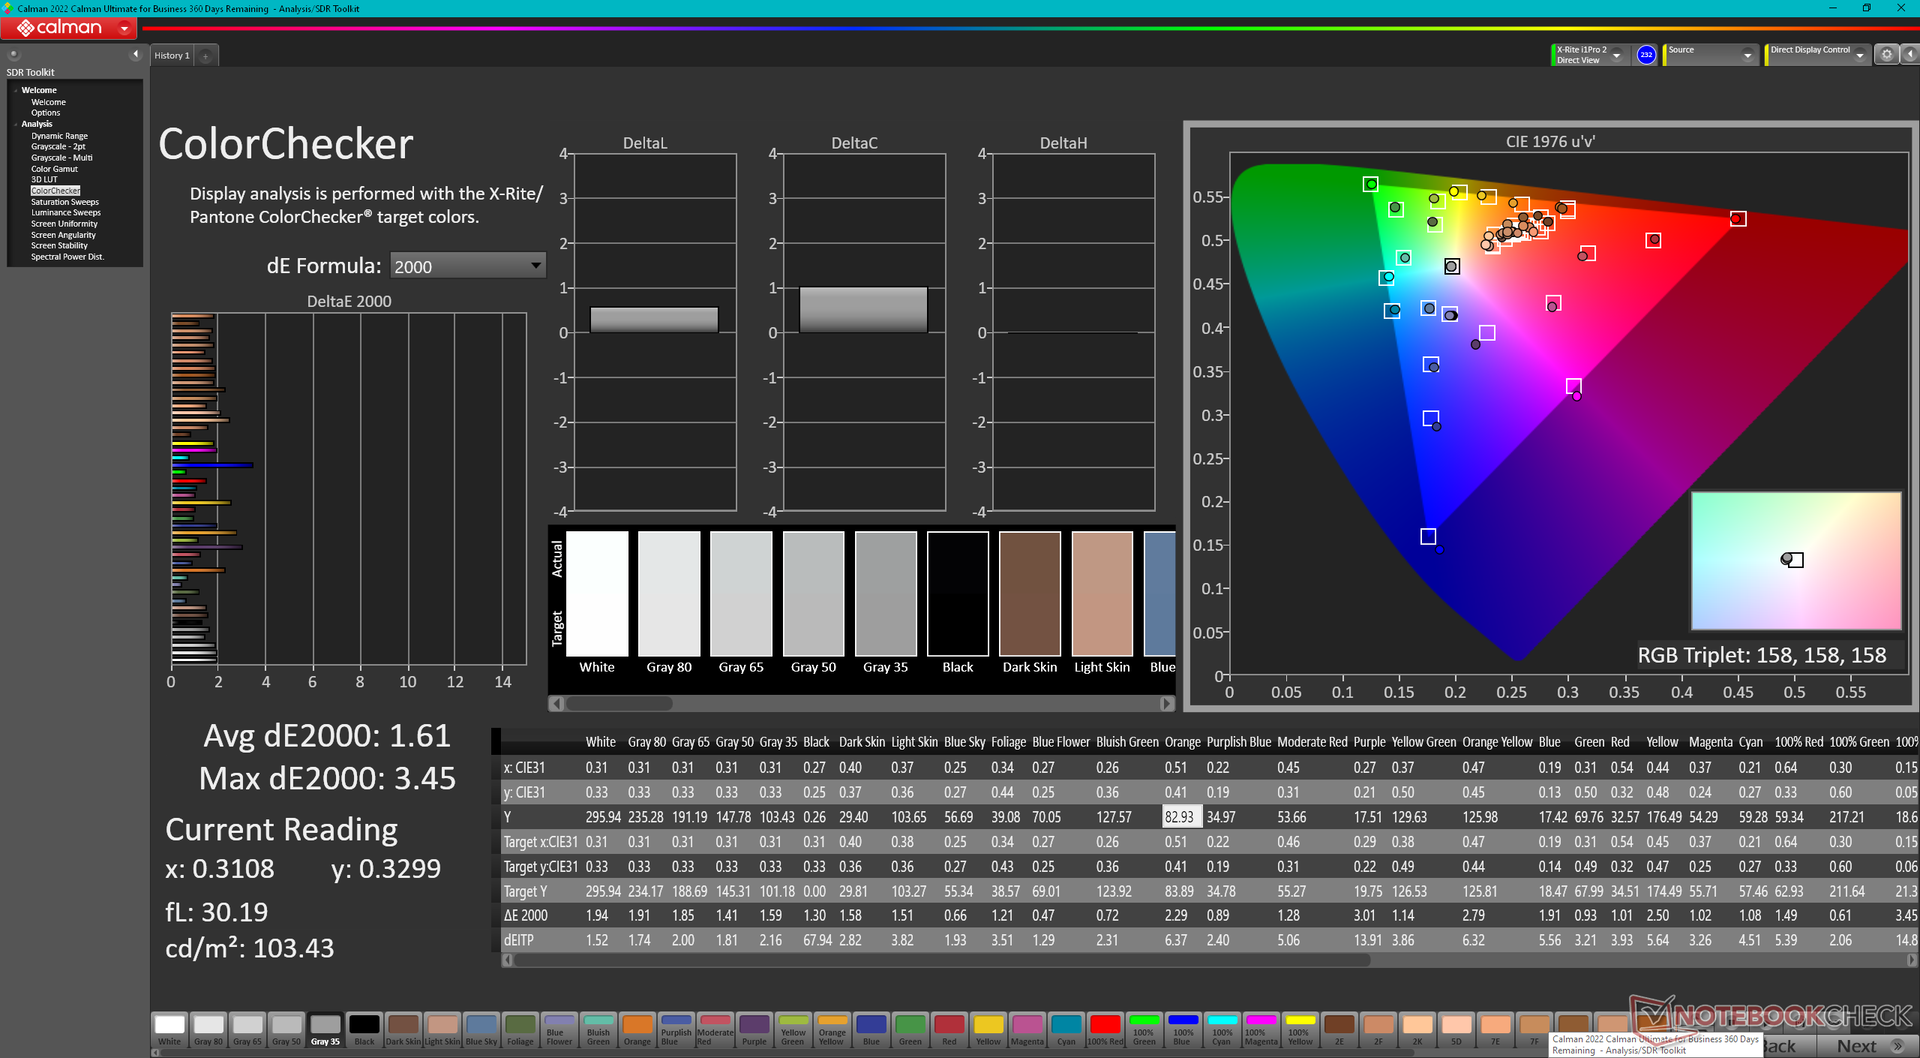
ΔE ColorChecker Calman: 2.35 | ∀{0.5-29.43 Ø4.71}
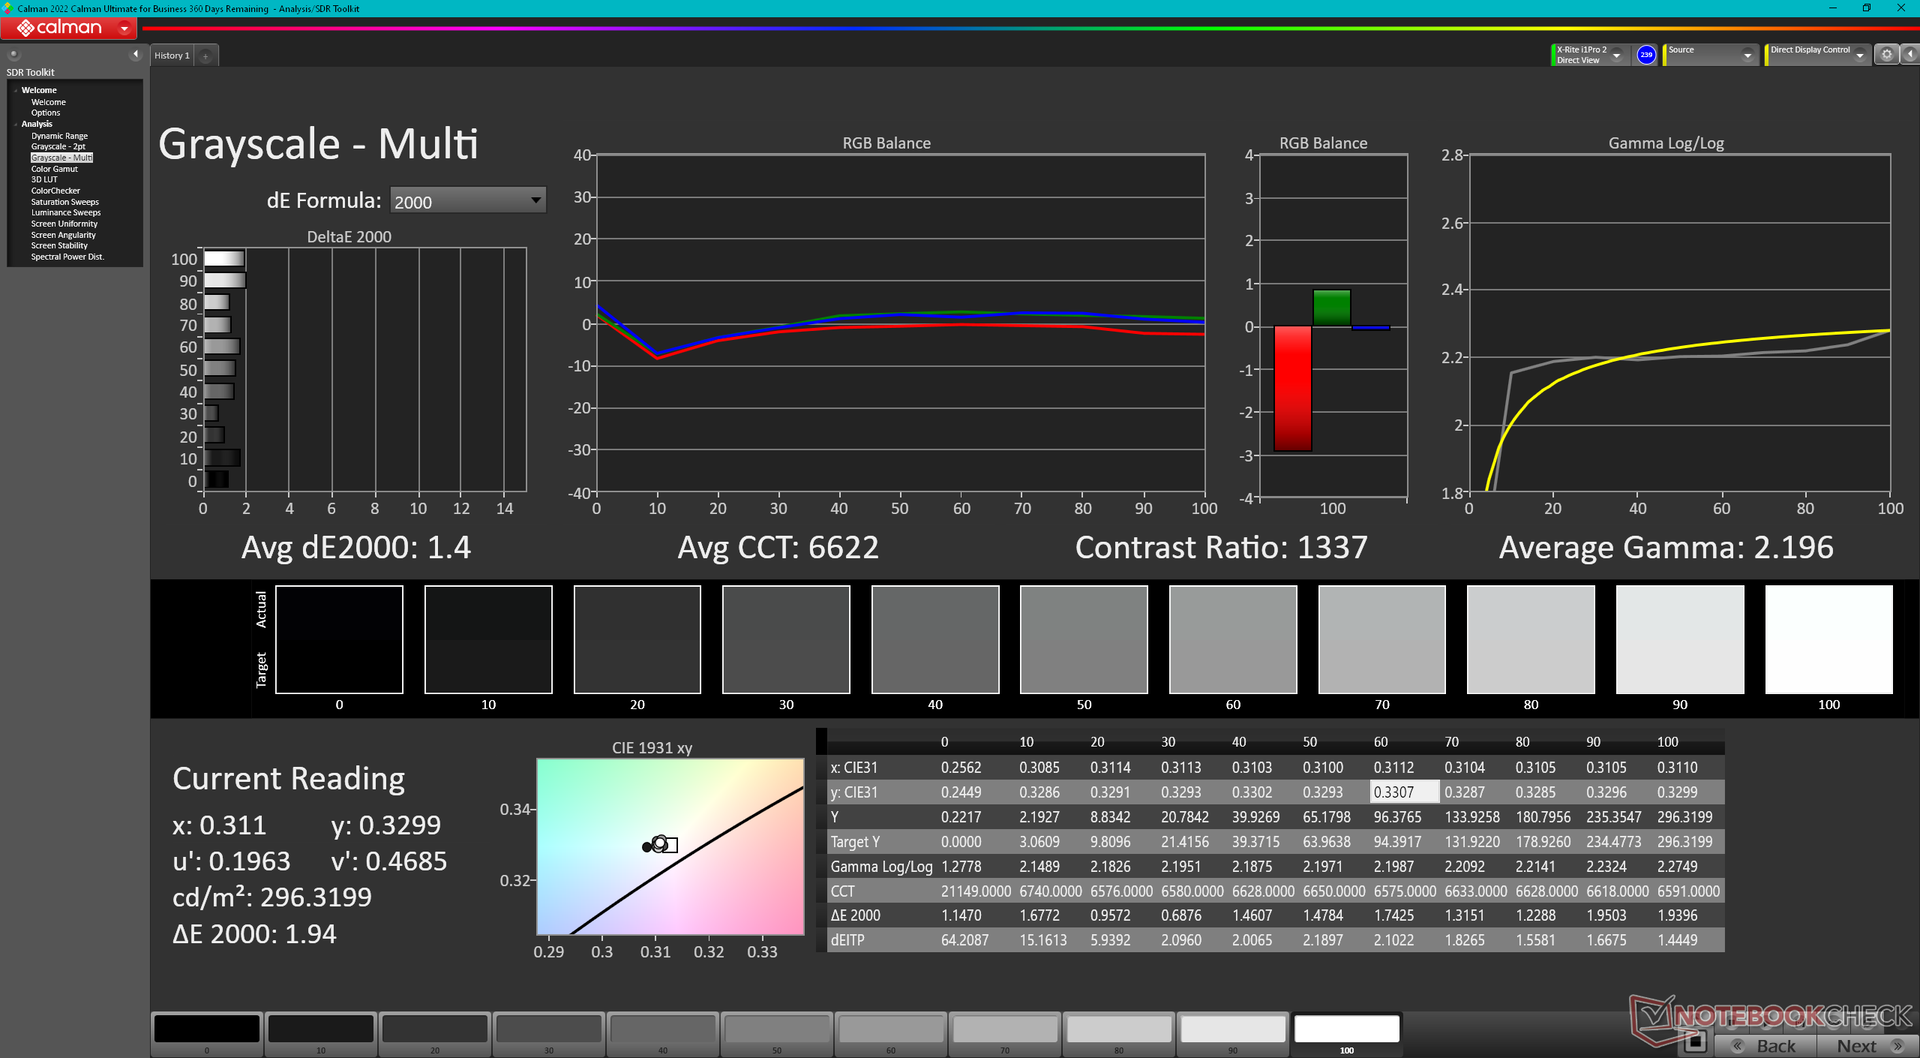
calibrated: 1.61
ΔE Greyscale Calman: 3.8 | ∀{0.09-98 Ø4.96}
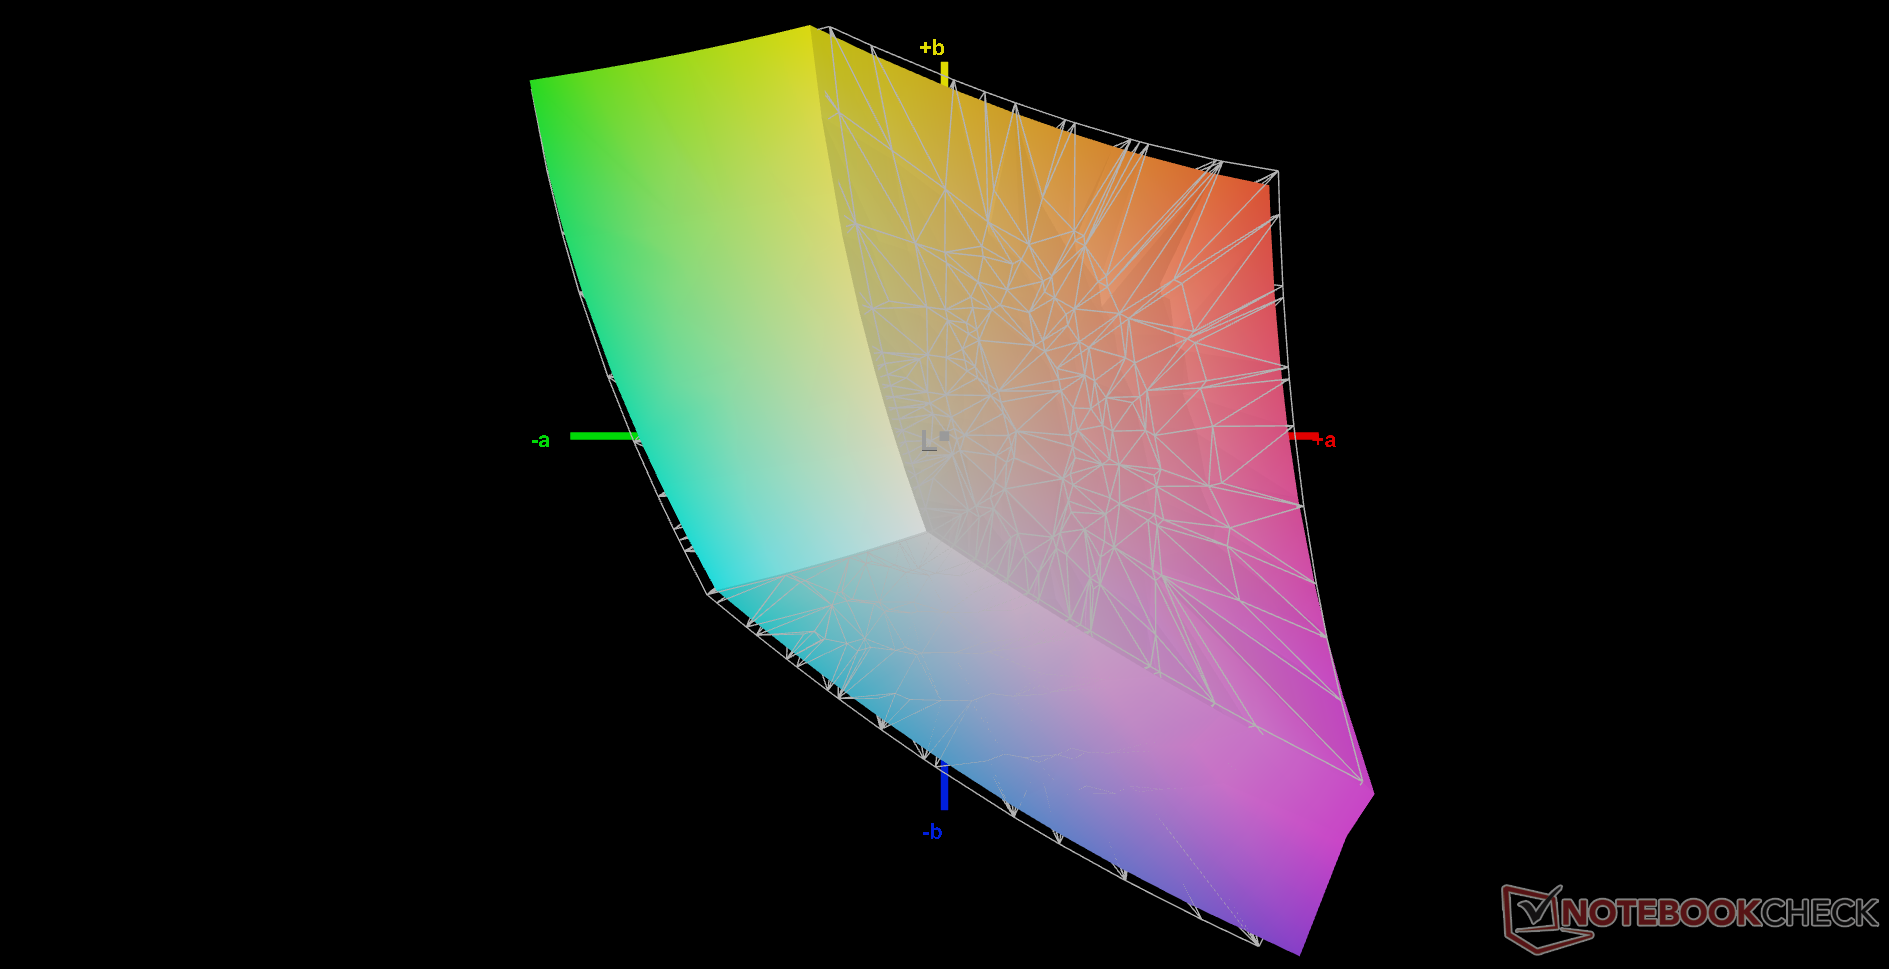
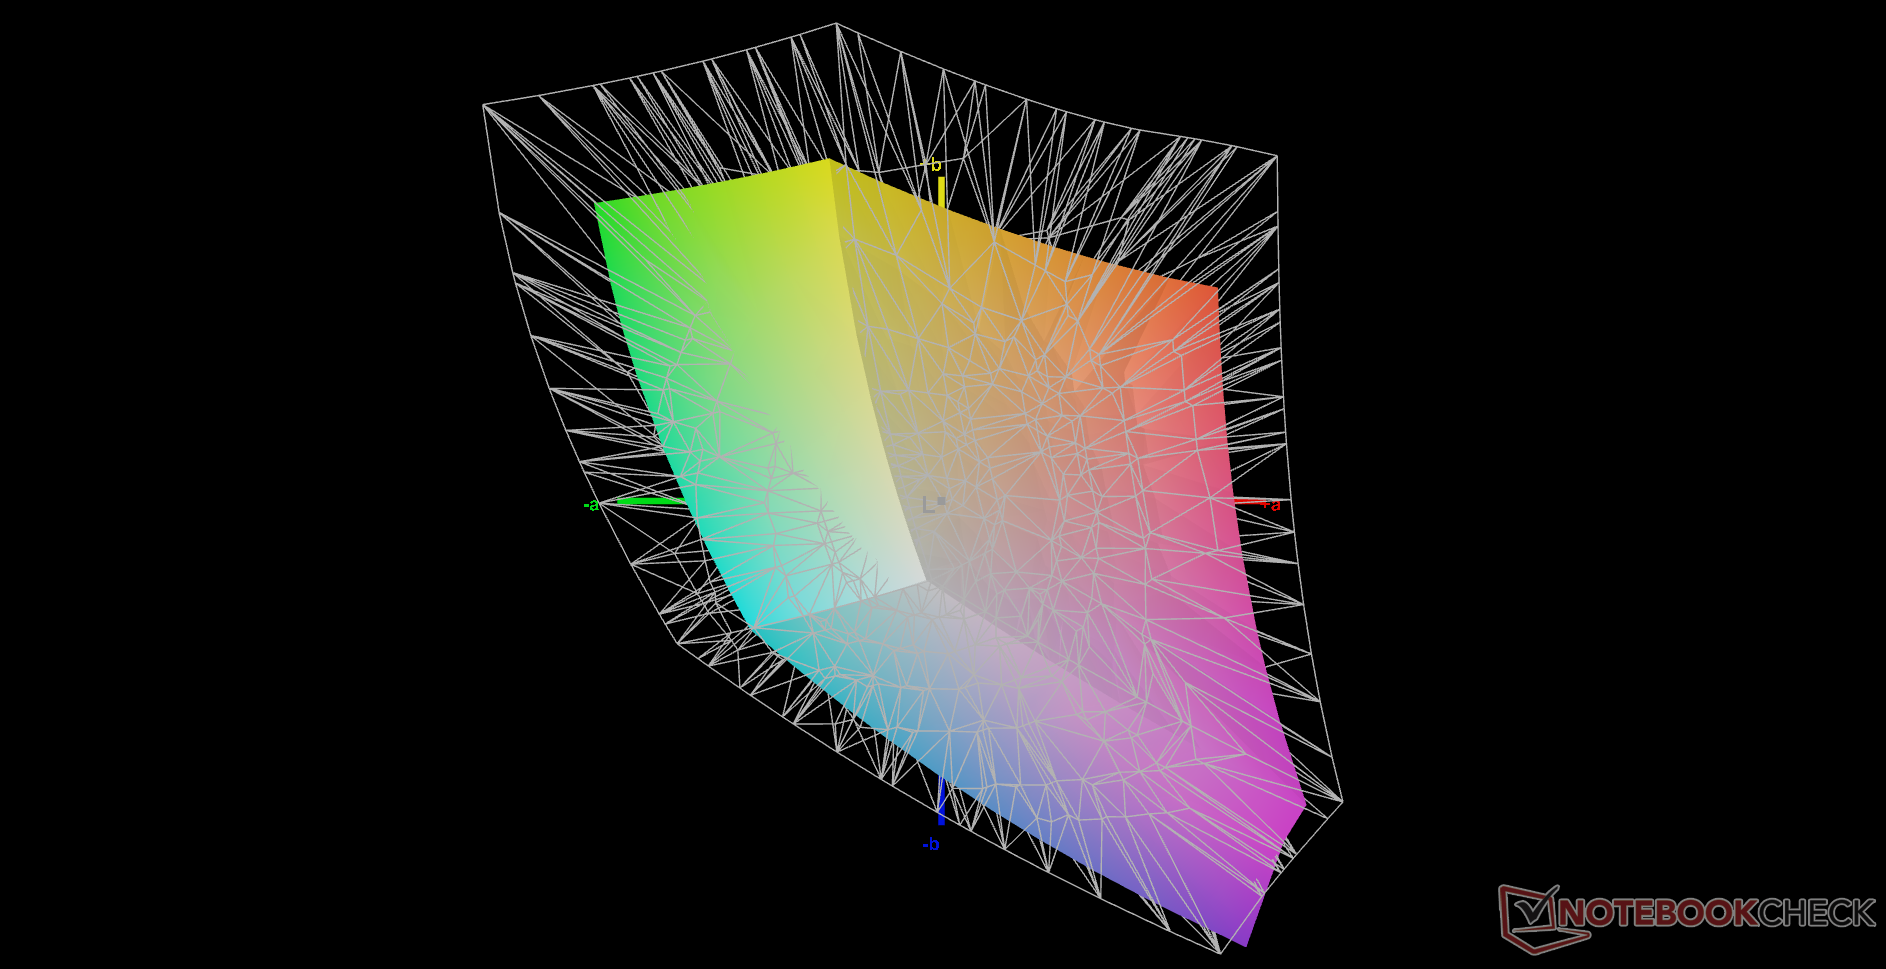
65.4% AdobeRGB 1998 (Argyll 3D)
95.2% sRGB (Argyll 3D)
64.5% Display P3 (Argyll 3D)
Gamma: 2.3
CCT: 7110 K
| Eurocom Nightsky TXi317 LG Philips LP173WFG-SPB3, IPS, 1920x1080, 17.3" | Schenker XMG Pro 17 E22 BOE099D, IPS, 2560x1440, 17.3" | Aorus 17X XES Sharp SHP1563, IPS, 1920x1080, 17.3" | MSI Raider GE77 HX 12UHS AU Optronics B173ZAN06.1, IPS, 3840x2160, 17.3" | Razer Blade 17 Early 2022 AU Optronics B173ZAN06.9, IPS, 3840x2160, 17.3" | Alienware x17 R2 P48E AU Optronics B173HAN, IPS, 1920x1080, 17.3" | |
|---|---|---|---|---|---|---|
| Display | 29% | 8% | 29% | 31% | 17% | |
| Display P3 Coverage (%) | 64.5 | 97.5 51% | 70.1 9% | 96.6 50% | 99.4 54% | 79.2 23% |
| sRGB Coverage (%) | 95.2 | 99.9 5% | 99.9 5% | 99.8 5% | 100 5% | 99.8 5% |
| AdobeRGB 1998 Coverage (%) | 65.4 | 85.2 30% | 71.9 10% | 85.8 31% | 87.3 33% | 79.6 22% |
| Response Times | 44% | 58% | 47% | 39% | -1% | |
| Response Time Grey 50% / Grey 80% * (ms) | 10.4 ? | 5.4 ? 48% | 3.4 ? 67% | 5.8 ? 44% | 7.5 ? 28% | 12.4 ? -19% |
| Response Time Black / White * (ms) | 11.2 ? | 6.8 ? 39% | 5.8 ? 48% | 5.6 ? 50% | 5.6 ? 50% | 9.2 ? 18% |
| PWM Frequency (Hz) | ||||||
| Screen | 5% | -24% | -19% | 33% | 2% | |
| Brightness middle (cd/m²) | 303.9 | 349 15% | 278 -9% | 381 25% | 503 66% | 365.4 20% |
| Brightness (cd/m²) | 292 | 319 9% | 273 -7% | 371 27% | 486 66% | 344 18% |
| Brightness Distribution (%) | 88 | 83 -6% | 79 -10% | 84 -5% | 84 -5% | 85 -3% |
| Black Level * (cd/m²) | 0.3 | 0.32 -7% | 0.26 13% | 0.52 -73% | 0.44 -47% | 0.29 3% |
| Contrast (:1) | 1013 | 1091 8% | 1069 6% | 733 -28% | 1143 13% | 1260 24% |
| Colorchecker dE 2000 * | 2.35 | 2.5 -6% | 3.96 -69% | 1.08 54% | 3.17 -35% | |
| Colorchecker dE 2000 max. * | 5.63 | 6.87 -22% | 10.78 -91% | 4.54 19% | 7.69 -37% | |
| Colorchecker dE 2000 calibrated * | 1.61 | 0.64 60% | 1.07 34% | 2.53 -57% | 0.6 63% | 0.51 68% |
| Greyscale dE 2000 * | 3.8 | 3.9 -3% | 6.8 -79% | 1.3 66% | 5.3 -39% | |
| Gamma | 2.3 96% | 2.09 105% | 2.224 99% | 2.151 102% | 2.18 101% | |
| CCT | 7110 91% | 7192 90% | 7651 85% | 6541 99% | 5879 111% | |
| Média Total (Programa/Configurações) | 26% /
16% | 14% /
-5% | 19% /
6% | 34% /
33% | 6% /
5% |
* ... menor é melhor
A Eurocom irá calibrar o display para você mediante o pagamento de uma taxa. Nossa unidade de teste não foi calibrada com valores médios de escala de cinza e deltaE de cor de 3,8 e 2,35, respectivamente, o que na verdade não é ruim. Calibrar nós mesmos o painel melhoraria ainda mais estas médias para 1,4 e 1,61. Nosso perfil calibrado está disponível para download gratuito acima.

Exibir tempos de resposta
| ↔ Tempo de resposta preto para branco | ||
|---|---|---|
| 11.2 ms ... ascensão ↗ e queda ↘ combinadas | ↗ 6 ms ascensão | 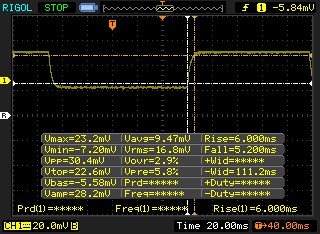 |
| ↘ 5.2 ms queda | ||
| A tela mostra boas taxas de resposta em nossos testes, mas pode ser muito lenta para jogadores competitivos. Em comparação, todos os dispositivos testados variam de 0.1 (mínimo) a 240 (máximo) ms. » 30 % de todos os dispositivos são melhores. Isso significa que o tempo de resposta medido é melhor que a média de todos os dispositivos testados (19.8 ms). | ||
| ↔ Tempo de resposta 50% cinza a 80% cinza | ||
| 10.4 ms ... ascensão ↗ e queda ↘ combinadas | ↗ 6 ms ascensão | 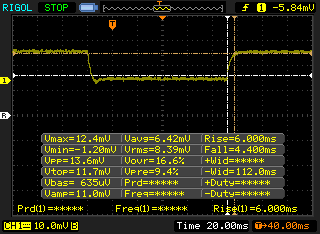 |
| ↘ 4.4 ms queda | ||
| A tela mostra boas taxas de resposta em nossos testes, mas pode ser muito lenta para jogadores competitivos. Em comparação, todos os dispositivos testados variam de 0.165 (mínimo) a 636 (máximo) ms. » 24 % de todos os dispositivos são melhores. Isso significa que o tempo de resposta medido é melhor que a média de todos os dispositivos testados (31 ms). | ||
Cintilação da tela / PWM (modulação por largura de pulso)
| Tela tremeluzindo / PWM não detectado | 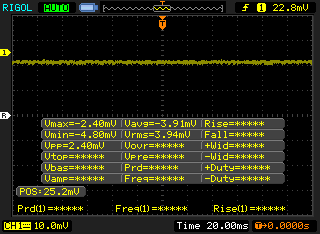 | ||
[pwm_comparison] Em comparação: 52 % de todos os dispositivos testados não usam PWM para escurecer a tela. Se PWM foi detectado, uma média de 7754 (mínimo: 5 - máximo: 343500) Hz foi medida. | |||
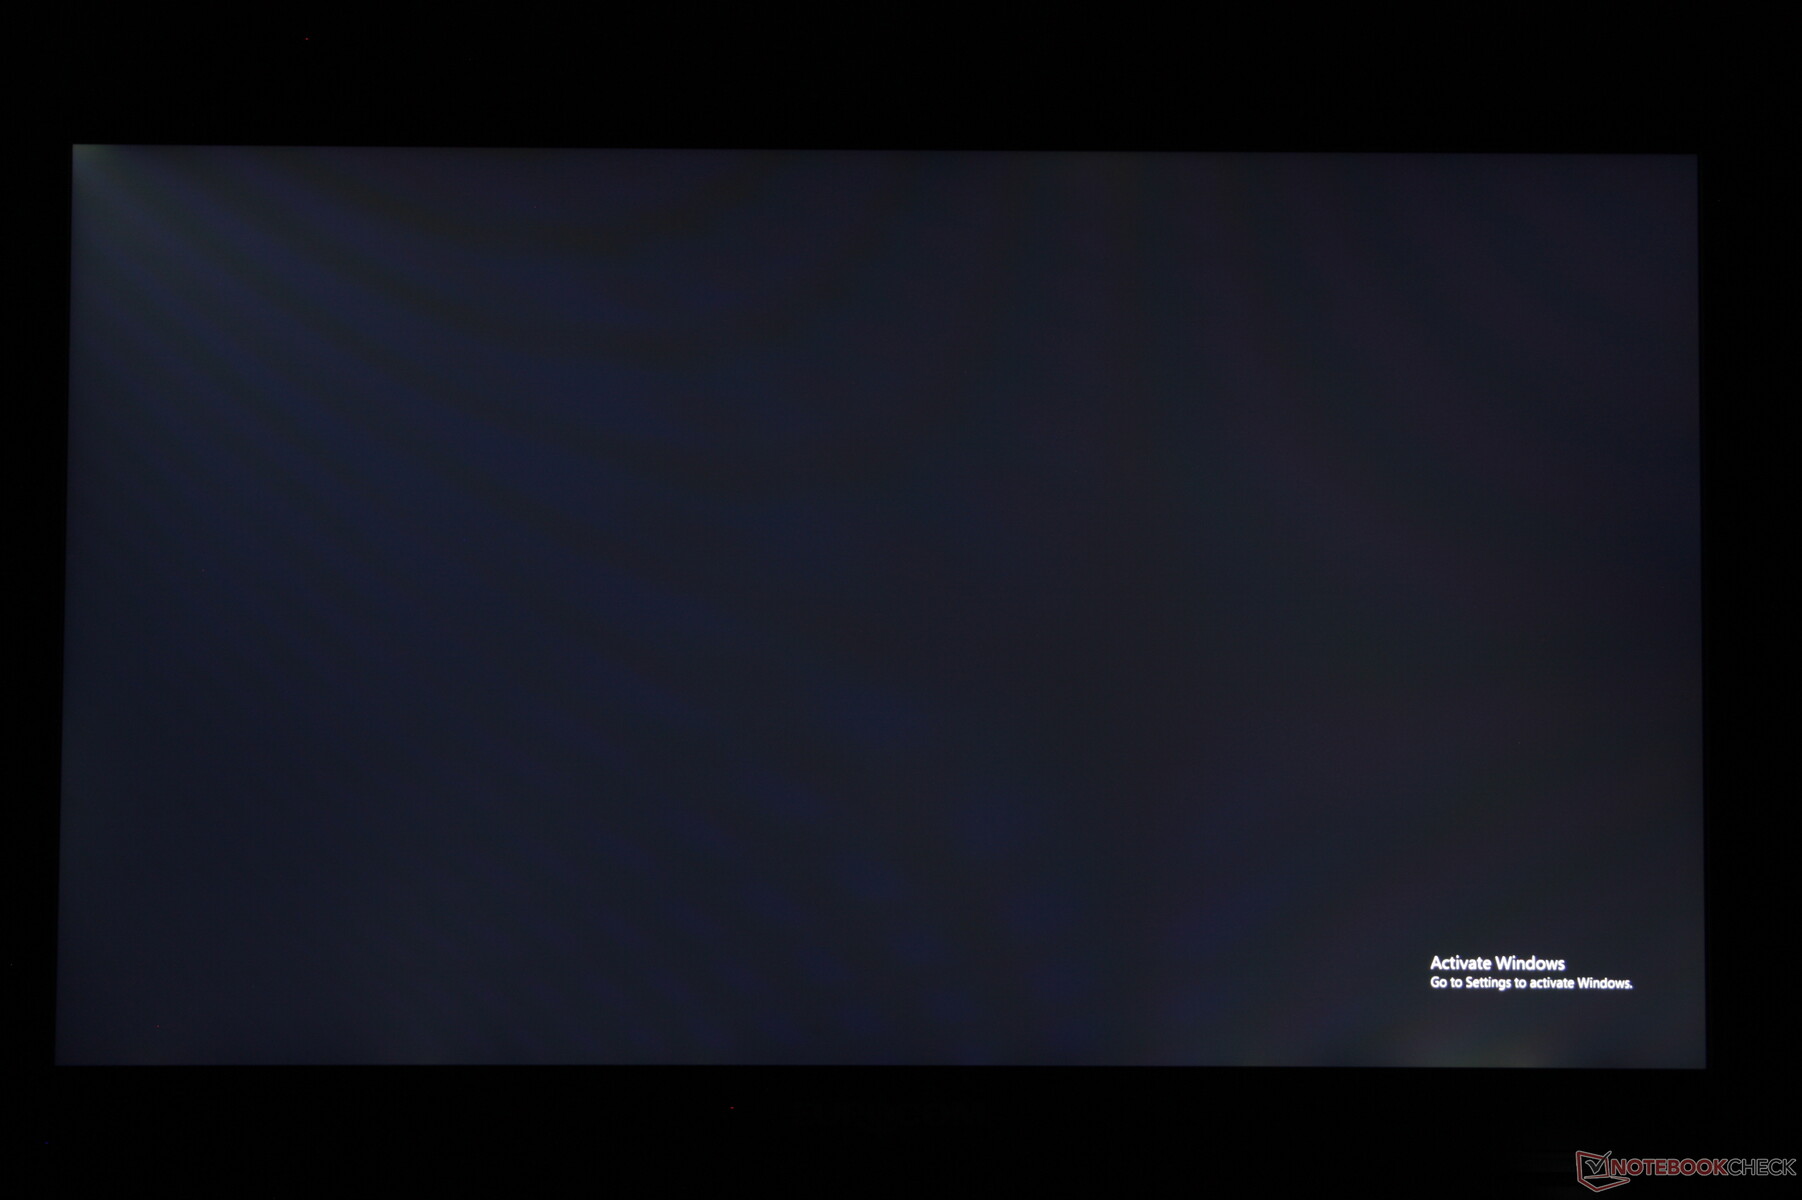
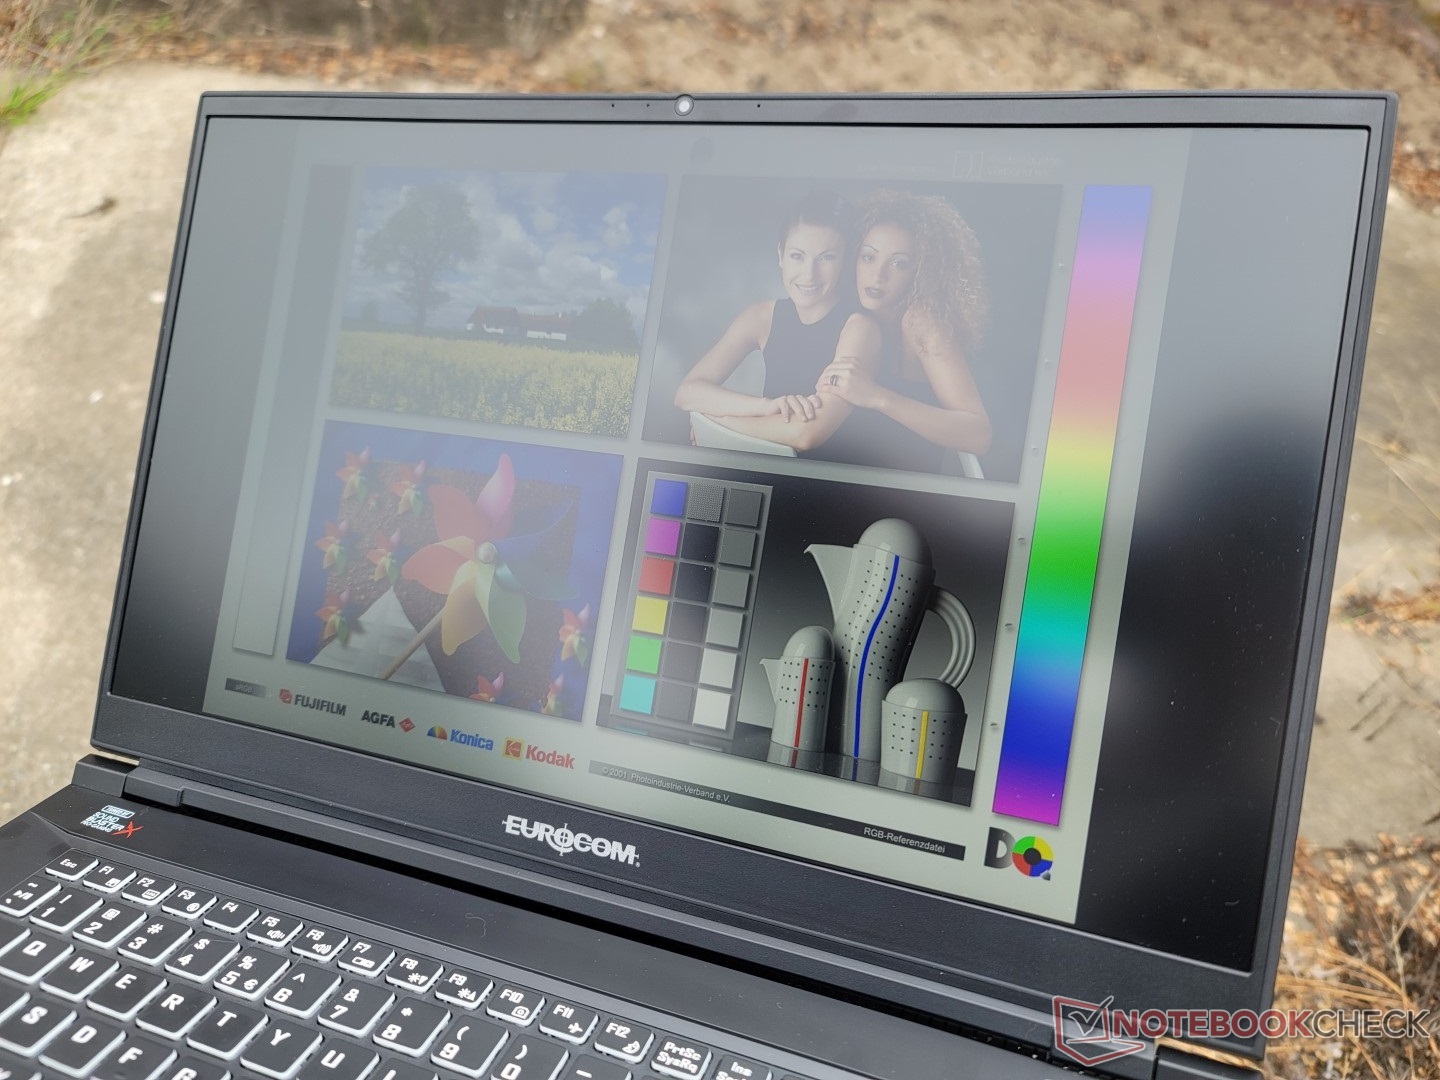
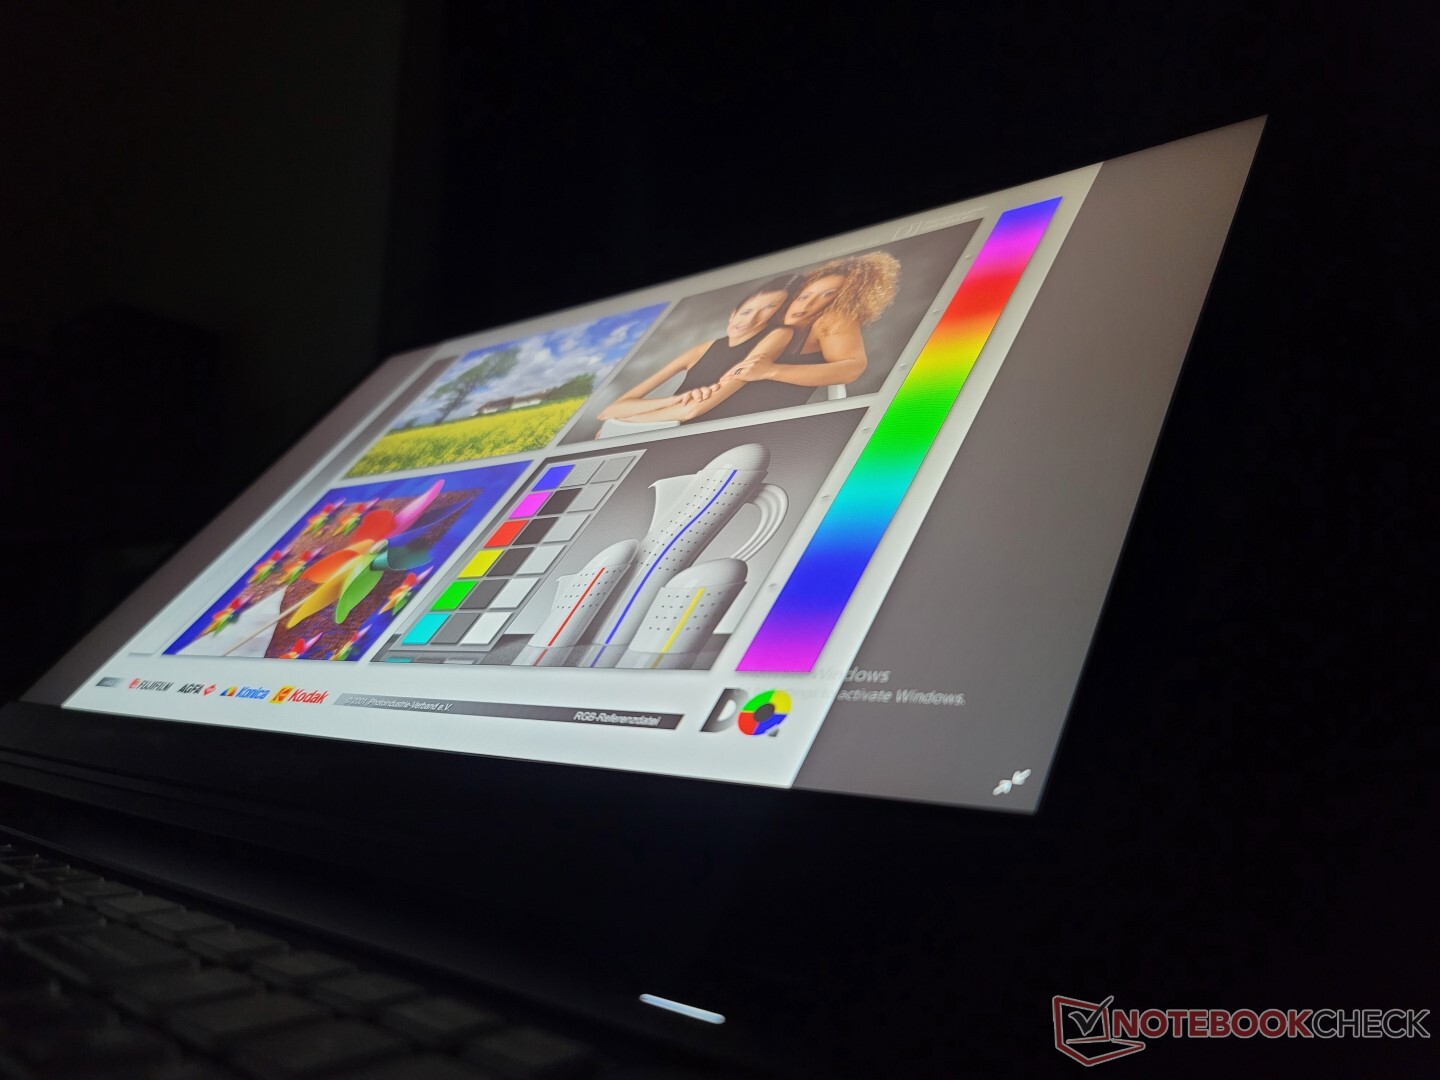
Com um máximo de 300 lêndeas, a tela tem uma média de visibilidade externa quando comparada a outros laptops de 17 polegadas para jogos. Algumas alternativas, tais como oLâmina Razer 17a tecnologia de leitura, com mais de 500 lêndeas, é muito mais brilhante para facilitar a leitura ao ar livre.
Desempenho
Condições de teste
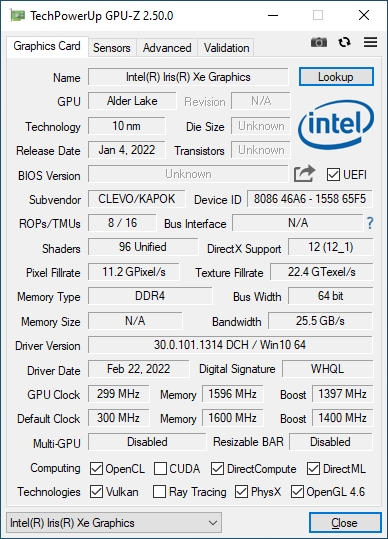
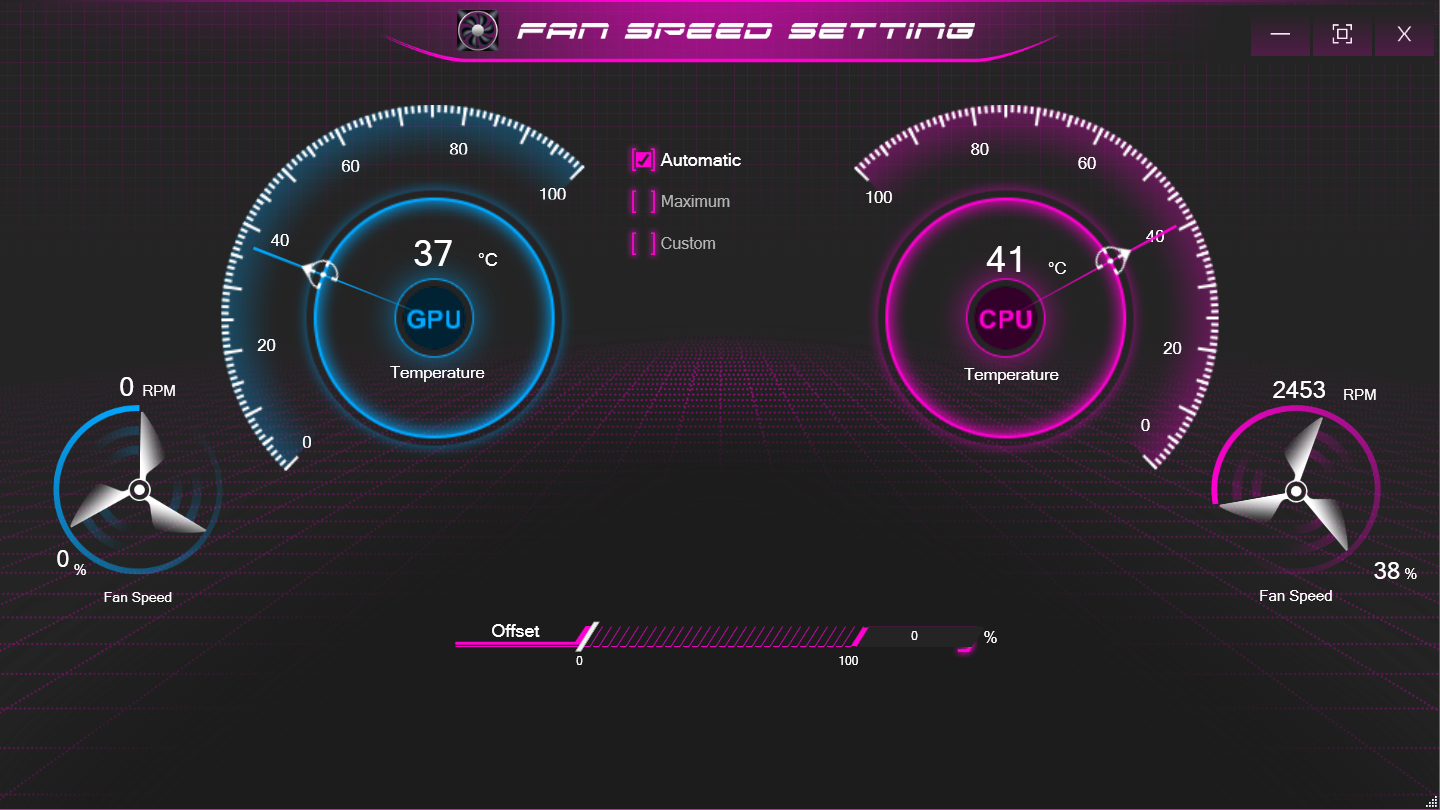
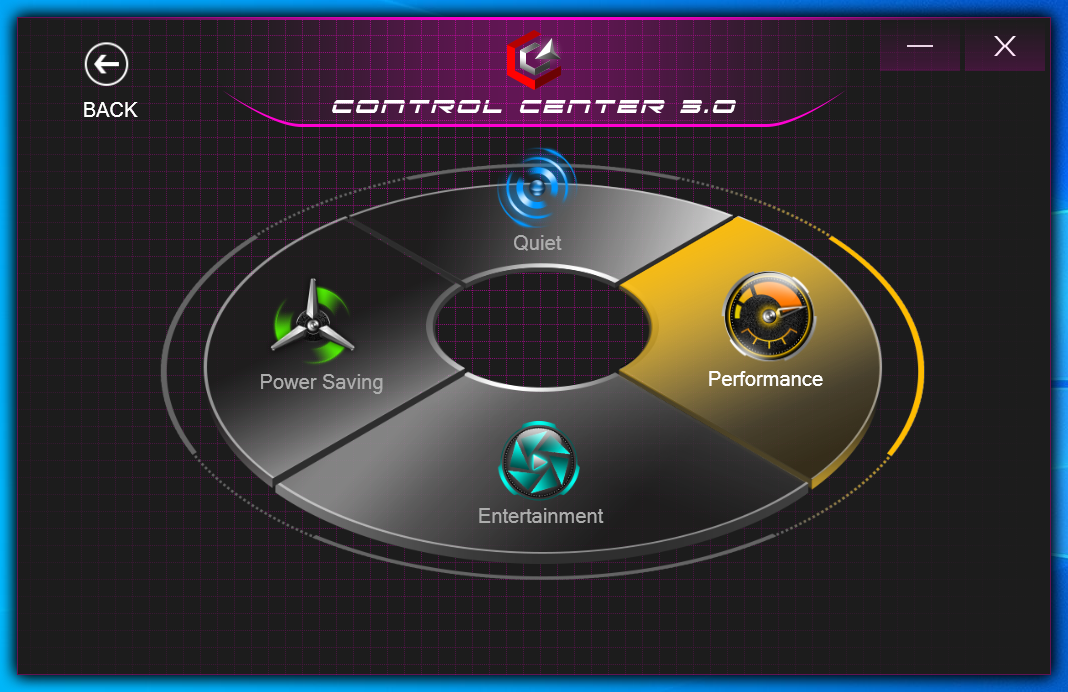
Nossa unidade foi configurada para o modo Performance através do Windows e do software do Centro de Controle 3.0 pré-instalado antes de executar quaisquer benchmarks abaixo para obter as melhores pontuações possíveis. Também nos certificamos de configurar o Nvidia Optimus para gráficos discretos; o MUX infelizmente não é suportado aqui.
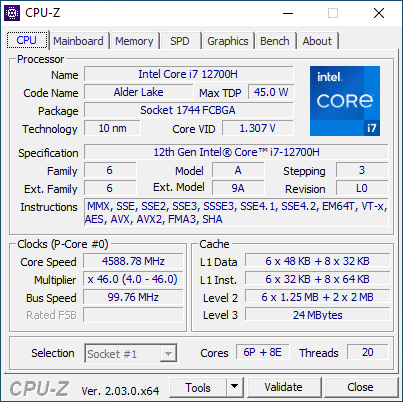
Processador
O desempenho bruto multi-linhas é cerca de 10% mais rápido do que a média dos laptops em nosso banco de dados equipados com o mesmo Núcleo i7-12700H. O processador no HP Envy 16por exemplo, é muito mais lento do que nosso Eurocom, mesmo depois de contabilizar qualquer estrangulamento de desempenho
Atualização para a Núcleo i9-12900H deverá aumentar o desempenho do processador apenas marginalmente em cerca de 5% a 10%, com base em nossa experiência com o Alienware x15 R2 e Schenker XMG Pro 17 E22
O CineBench R15 não funcionaria corretamente em nossa unidade muito como no último sistema Eurocom que revisamos no início deste ano. Fizemos contato com o fabricante e eles puderam confirmar nossas conclusões. A referência foi omitida para esta revisão.
Cinebench R23 Multi Loop
Cinebench R23: Multi Core | Single Core
Cinebench R15: CPU Multi 64Bit | CPU Single 64Bit
Blender: v2.79 BMW27 CPU
7-Zip 18.03: 7z b 4 | 7z b 4 -mmt1
Geekbench 5.5: Multi-Core | Single-Core
HWBOT x265 Benchmark v2.2: 4k Preset
LibreOffice : 20 Documents To PDF
R Benchmark 2.5: Overall mean
Cinebench R23: Multi Core | Single Core
Cinebench R15: CPU Multi 64Bit | CPU Single 64Bit
Blender: v2.79 BMW27 CPU
7-Zip 18.03: 7z b 4 | 7z b 4 -mmt1
Geekbench 5.5: Multi-Core | Single-Core
HWBOT x265 Benchmark v2.2: 4k Preset
LibreOffice : 20 Documents To PDF
R Benchmark 2.5: Overall mean
* ... menor é melhor
AIDA64: FP32 Ray-Trace | FPU Julia | CPU SHA3 | CPU Queen | FPU SinJulia | FPU Mandel | CPU AES | CPU ZLib | FP64 Ray-Trace | CPU PhotoWorxx
| Performance rating | |
| MSI Raider GE77 HX 12UHS | |
| Aorus 17X XES | |
| Eurocom Nightsky TXi317 | |
| Alienware x17 R2 P48E | |
| Média Intel Core i7-12700H | |
| Schenker XMG Pro 17 E22 | |
| Razer Blade 17 Early 2022 | |
| AIDA64 / FP32 Ray-Trace | |
| MSI Raider GE77 HX 12UHS | |
| Eurocom Nightsky TXi317 | |
| Aorus 17X XES | |
| Média Intel Core i7-12700H (2585 - 17957, n=64) | |
| Alienware x17 R2 P48E | |
| Schenker XMG Pro 17 E22 | |
| Razer Blade 17 Early 2022 | |
| AIDA64 / FPU Julia | |
| MSI Raider GE77 HX 12UHS | |
| Eurocom Nightsky TXi317 | |
| Aorus 17X XES | |
| Média Intel Core i7-12700H (12439 - 90760, n=64) | |
| Alienware x17 R2 P48E | |
| Schenker XMG Pro 17 E22 | |
| Razer Blade 17 Early 2022 | |
| AIDA64 / CPU SHA3 | |
| MSI Raider GE77 HX 12UHS | |
| Eurocom Nightsky TXi317 | |
| Aorus 17X XES | |
| Alienware x17 R2 P48E | |
| Média Intel Core i7-12700H (833 - 4242, n=64) | |
| Schenker XMG Pro 17 E22 | |
| Razer Blade 17 Early 2022 | |
| AIDA64 / CPU Queen | |
| Alienware x17 R2 P48E | |
| Schenker XMG Pro 17 E22 | |
| Aorus 17X XES | |
| Eurocom Nightsky TXi317 | |
| MSI Raider GE77 HX 12UHS | |
| Média Intel Core i7-12700H (57923 - 103202, n=63) | |
| Razer Blade 17 Early 2022 | |
| AIDA64 / FPU SinJulia | |
| MSI Raider GE77 HX 12UHS | |
| Aorus 17X XES | |
| Alienware x17 R2 P48E | |
| Eurocom Nightsky TXi317 | |
| Schenker XMG Pro 17 E22 | |
| Média Intel Core i7-12700H (3249 - 9939, n=64) | |
| Razer Blade 17 Early 2022 | |
| AIDA64 / FPU Mandel | |
| MSI Raider GE77 HX 12UHS | |
| Aorus 17X XES | |
| Eurocom Nightsky TXi317 | |
| Média Intel Core i7-12700H (7135 - 44760, n=64) | |
| Alienware x17 R2 P48E | |
| Schenker XMG Pro 17 E22 | |
| Razer Blade 17 Early 2022 | |
| AIDA64 / CPU AES | |
| MSI Raider GE77 HX 12UHS | |
| Eurocom Nightsky TXi317 | |
| Aorus 17X XES | |
| Alienware x17 R2 P48E | |
| Schenker XMG Pro 17 E22 | |
| Média Intel Core i7-12700H (31839 - 144360, n=64) | |
| Razer Blade 17 Early 2022 | |
| AIDA64 / CPU ZLib | |
| MSI Raider GE77 HX 12UHS | |
| Alienware x17 R2 P48E | |
| Eurocom Nightsky TXi317 | |
| Schenker XMG Pro 17 E22 | |
| Aorus 17X XES | |
| Média Intel Core i7-12700H (305 - 1171, n=64) | |
| Razer Blade 17 Early 2022 | |
| AIDA64 / FP64 Ray-Trace | |
| MSI Raider GE77 HX 12UHS | |
| Aorus 17X XES | |
| Eurocom Nightsky TXi317 | |
| Média Intel Core i7-12700H (1437 - 9692, n=64) | |
| Alienware x17 R2 P48E | |
| Schenker XMG Pro 17 E22 | |
| Razer Blade 17 Early 2022 | |
| AIDA64 / CPU PhotoWorxx | |
| MSI Raider GE77 HX 12UHS | |
| Aorus 17X XES | |
| Razer Blade 17 Early 2022 | |
| Alienware x17 R2 P48E | |
| Média Intel Core i7-12700H (12863 - 52207, n=64) | |
| Eurocom Nightsky TXi317 | |
| Schenker XMG Pro 17 E22 | |
Desempenho do sistema
CrossMark: Overall | Productivity | Creativity | Responsiveness
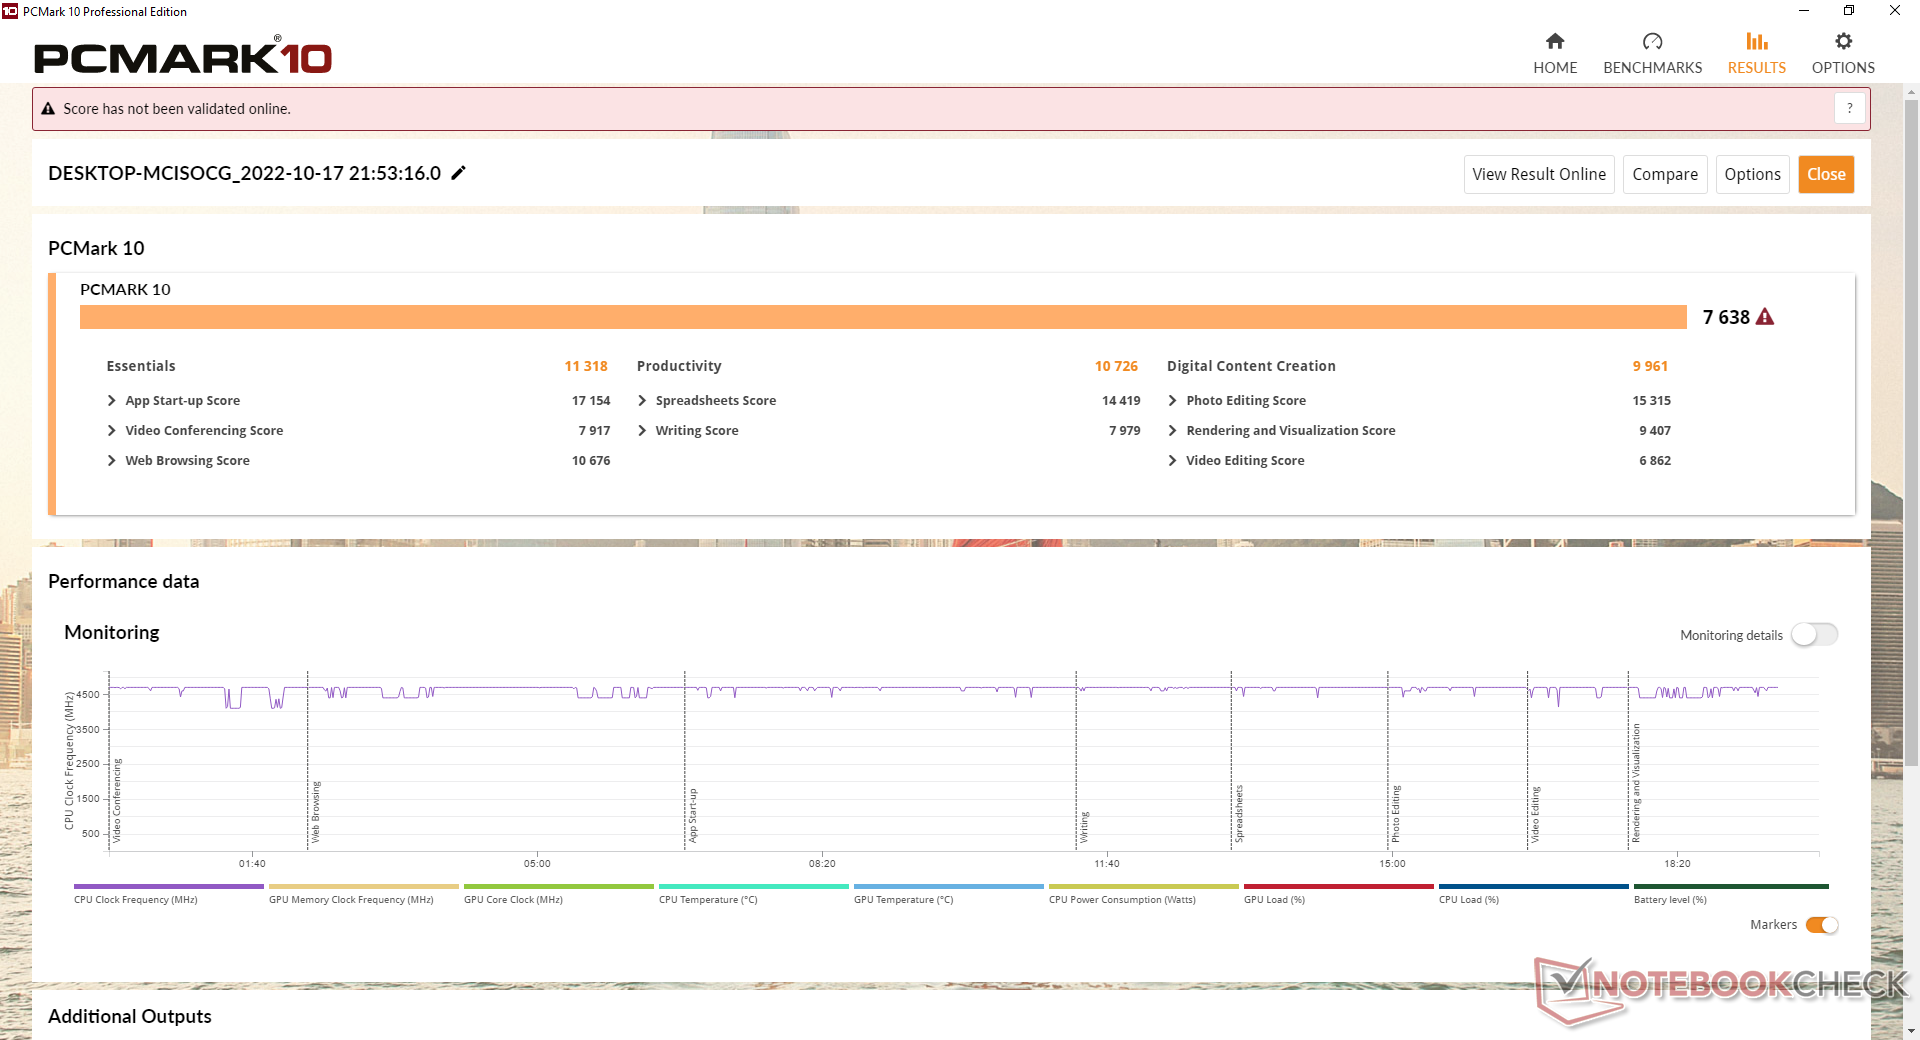
| PCMark 10 / Score | |
| Alienware x17 R2 P48E | |
| Aorus 17X XES | |
| Schenker XMG Pro 17 E22 | |
| Eurocom Nightsky TXi317 | |
| Média Intel Core i7-12700H, NVIDIA GeForce RTX 3080 Ti Laptop GPU (6868 - 7638, n=7) | |
| Razer Blade 17 Early 2022 | |
| MSI Raider GE77 HX 12UHS | |
| PCMark 10 / Essentials | |
| Eurocom Nightsky TXi317 | |
| Alienware x17 R2 P48E | |
| Schenker XMG Pro 17 E22 | |
| Aorus 17X XES | |
| Média Intel Core i7-12700H, NVIDIA GeForce RTX 3080 Ti Laptop GPU (9987 - 11318, n=7) | |
| Razer Blade 17 Early 2022 | |
| MSI Raider GE77 HX 12UHS | |
| PCMark 10 / Productivity | |
| Eurocom Nightsky TXi317 | |
| Aorus 17X XES | |
| Schenker XMG Pro 17 E22 | |
| Alienware x17 R2 P48E | |
| MSI Raider GE77 HX 12UHS | |
| Média Intel Core i7-12700H, NVIDIA GeForce RTX 3080 Ti Laptop GPU (8944 - 10726, n=7) | |
| Razer Blade 17 Early 2022 | |
| PCMark 10 / Digital Content Creation | |
| Alienware x17 R2 P48E | |
| Aorus 17X XES | |
| Schenker XMG Pro 17 E22 | |
| Média Intel Core i7-12700H, NVIDIA GeForce RTX 3080 Ti Laptop GPU (8956 - 12249, n=7) | |
| Razer Blade 17 Early 2022 | |
| Eurocom Nightsky TXi317 | |
| MSI Raider GE77 HX 12UHS | |
| CrossMark / Overall | |
| MSI Raider GE77 HX 12UHS | |
| Aorus 17X XES | |
| Alienware x17 R2 P48E | |
| Eurocom Nightsky TXi317 | |
| Média Intel Core i7-12700H, NVIDIA GeForce RTX 3080 Ti Laptop GPU (1761 - 1861, n=4) | |
| Razer Blade 17 Early 2022 | |
| CrossMark / Productivity | |
| MSI Raider GE77 HX 12UHS | |
| Aorus 17X XES | |
| Alienware x17 R2 P48E | |
| Eurocom Nightsky TXi317 | |
| Razer Blade 17 Early 2022 | |
| Média Intel Core i7-12700H, NVIDIA GeForce RTX 3080 Ti Laptop GPU (1645 - 1800, n=4) | |
| CrossMark / Creativity | |
| MSI Raider GE77 HX 12UHS | |
| Aorus 17X XES | |
| Alienware x17 R2 P48E | |
| Média Intel Core i7-12700H, NVIDIA GeForce RTX 3080 Ti Laptop GPU (1936 - 2041, n=4) | |
| Eurocom Nightsky TXi317 | |
| Razer Blade 17 Early 2022 | |
| CrossMark / Responsiveness | |
| Aorus 17X XES | |
| MSI Raider GE77 HX 12UHS | |
| Eurocom Nightsky TXi317 | |
| Alienware x17 R2 P48E | |
| Média Intel Core i7-12700H, NVIDIA GeForce RTX 3080 Ti Laptop GPU (1461 - 1868, n=4) | |
| Razer Blade 17 Early 2022 | |
| PCMark 10 Score | 7638 pontos | |
Ajuda | ||
| AIDA64 / Memory Copy | |
| MSI Raider GE77 HX 12UHS | |
| Aorus 17X XES | |
| Razer Blade 17 Early 2022 | |
| Alienware x17 R2 P48E | |
| Média Intel Core i7-12700H (25615 - 80511, n=64) | |
| Eurocom Nightsky TXi317 | |
| Schenker XMG Pro 17 E22 | |
| AIDA64 / Memory Read | |
| MSI Raider GE77 HX 12UHS | |
| Aorus 17X XES | |
| Razer Blade 17 Early 2022 | |
| Alienware x17 R2 P48E | |
| Média Intel Core i7-12700H (25586 - 79442, n=64) | |
| Eurocom Nightsky TXi317 | |
| Schenker XMG Pro 17 E22 | |
| AIDA64 / Memory Write | |
| MSI Raider GE77 HX 12UHS | |
| Aorus 17X XES | |
| Razer Blade 17 Early 2022 | |
| Média Intel Core i7-12700H (23679 - 88660, n=64) | |
| Alienware x17 R2 P48E | |
| Eurocom Nightsky TXi317 | |
| Schenker XMG Pro 17 E22 | |
| AIDA64 / Memory Latency | |
| Alienware x17 R2 P48E | |
| Schenker XMG Pro 17 E22 | |
| Eurocom Nightsky TXi317 | |
| Aorus 17X XES | |
| MSI Raider GE77 HX 12UHS | |
| Média Intel Core i7-12700H (76.2 - 133.9, n=62) | |
* ... menor é melhor
Latência do DPC
LatencyMon revela problemas de DPC ao abrir várias abas do navegador em nossa página inicial. a reprodução de vídeo de 4K a 60 FPS é perfeita, sem queda de quadros.
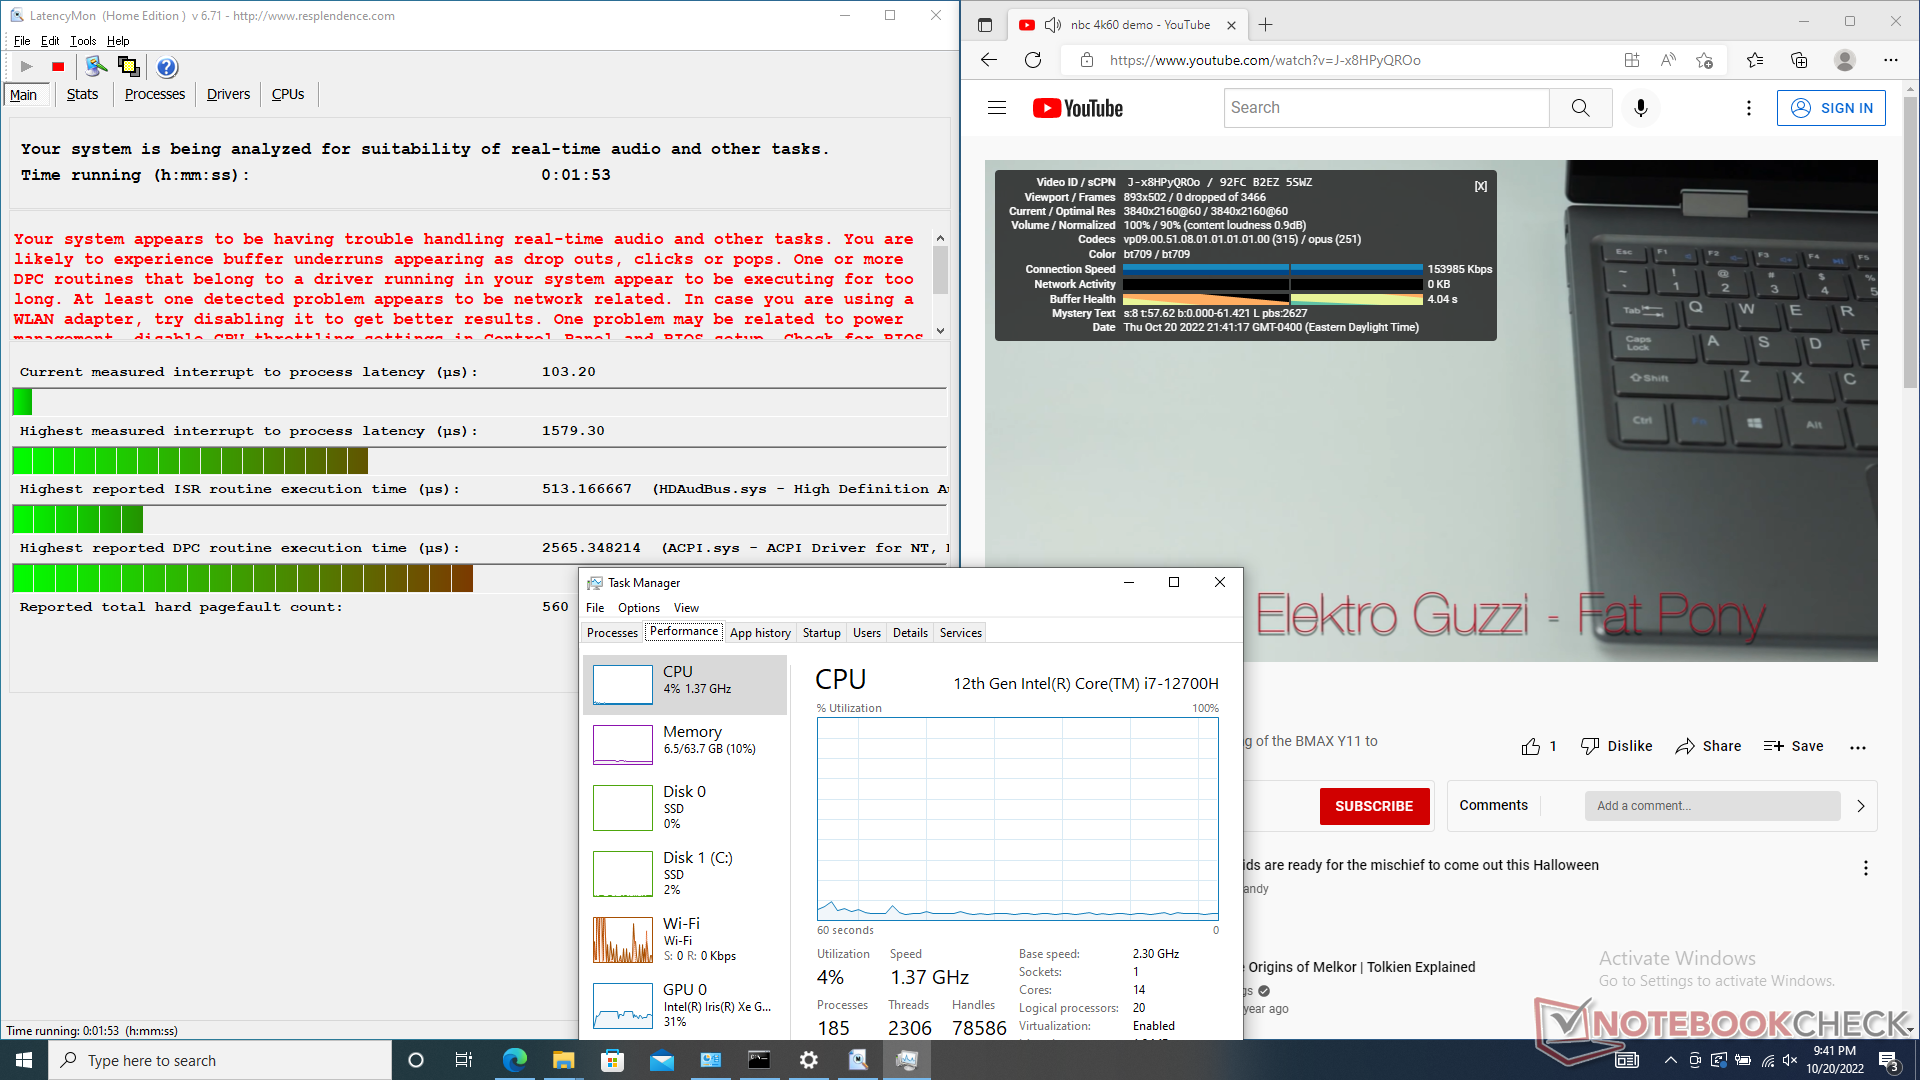
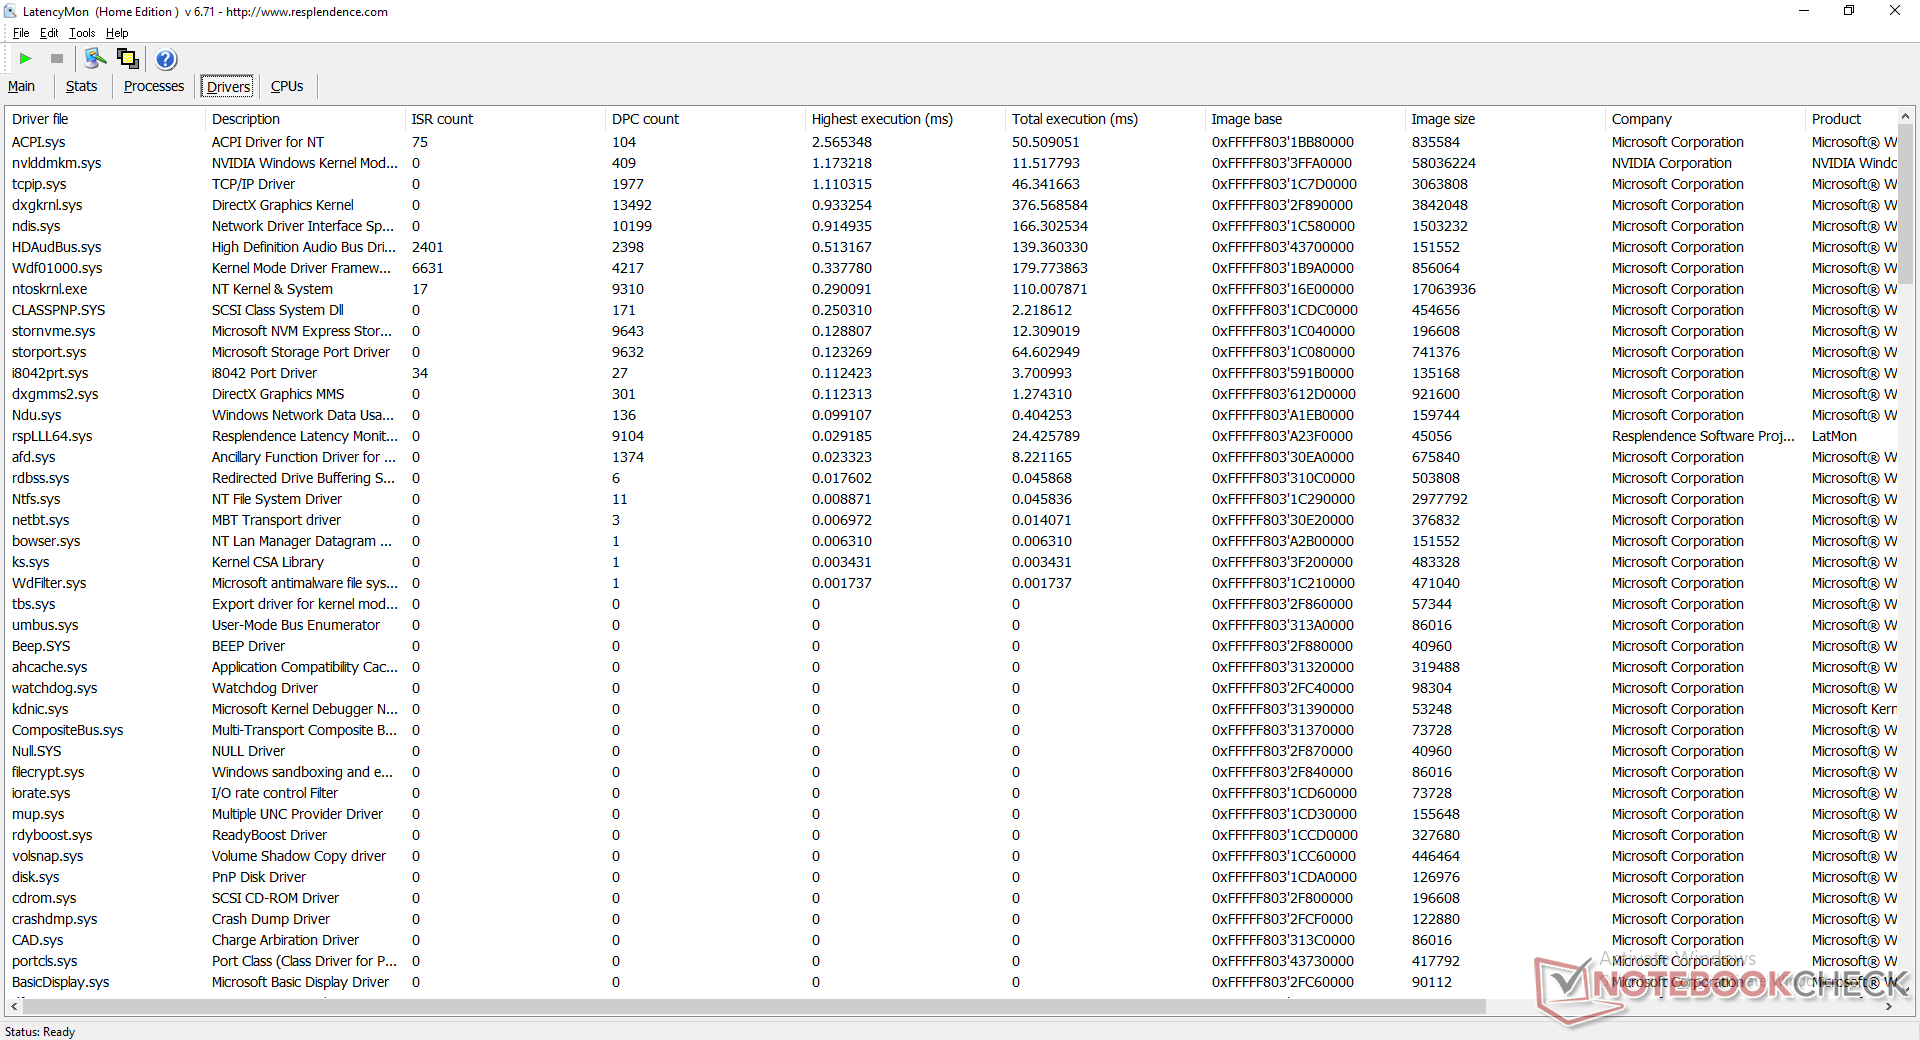
| DPC Latencies / LatencyMon - interrupt to process latency (max), Web, Youtube, Prime95 | |
| MSI Raider GE77 HX 12UHS | |
| Eurocom Nightsky TXi317 | |
| Aorus 17X XES | |
| Alienware x17 R2 P48E | |
| Schenker XMG Pro 17 E22 | |
| Razer Blade 17 Early 2022 | |
* ... menor é melhor
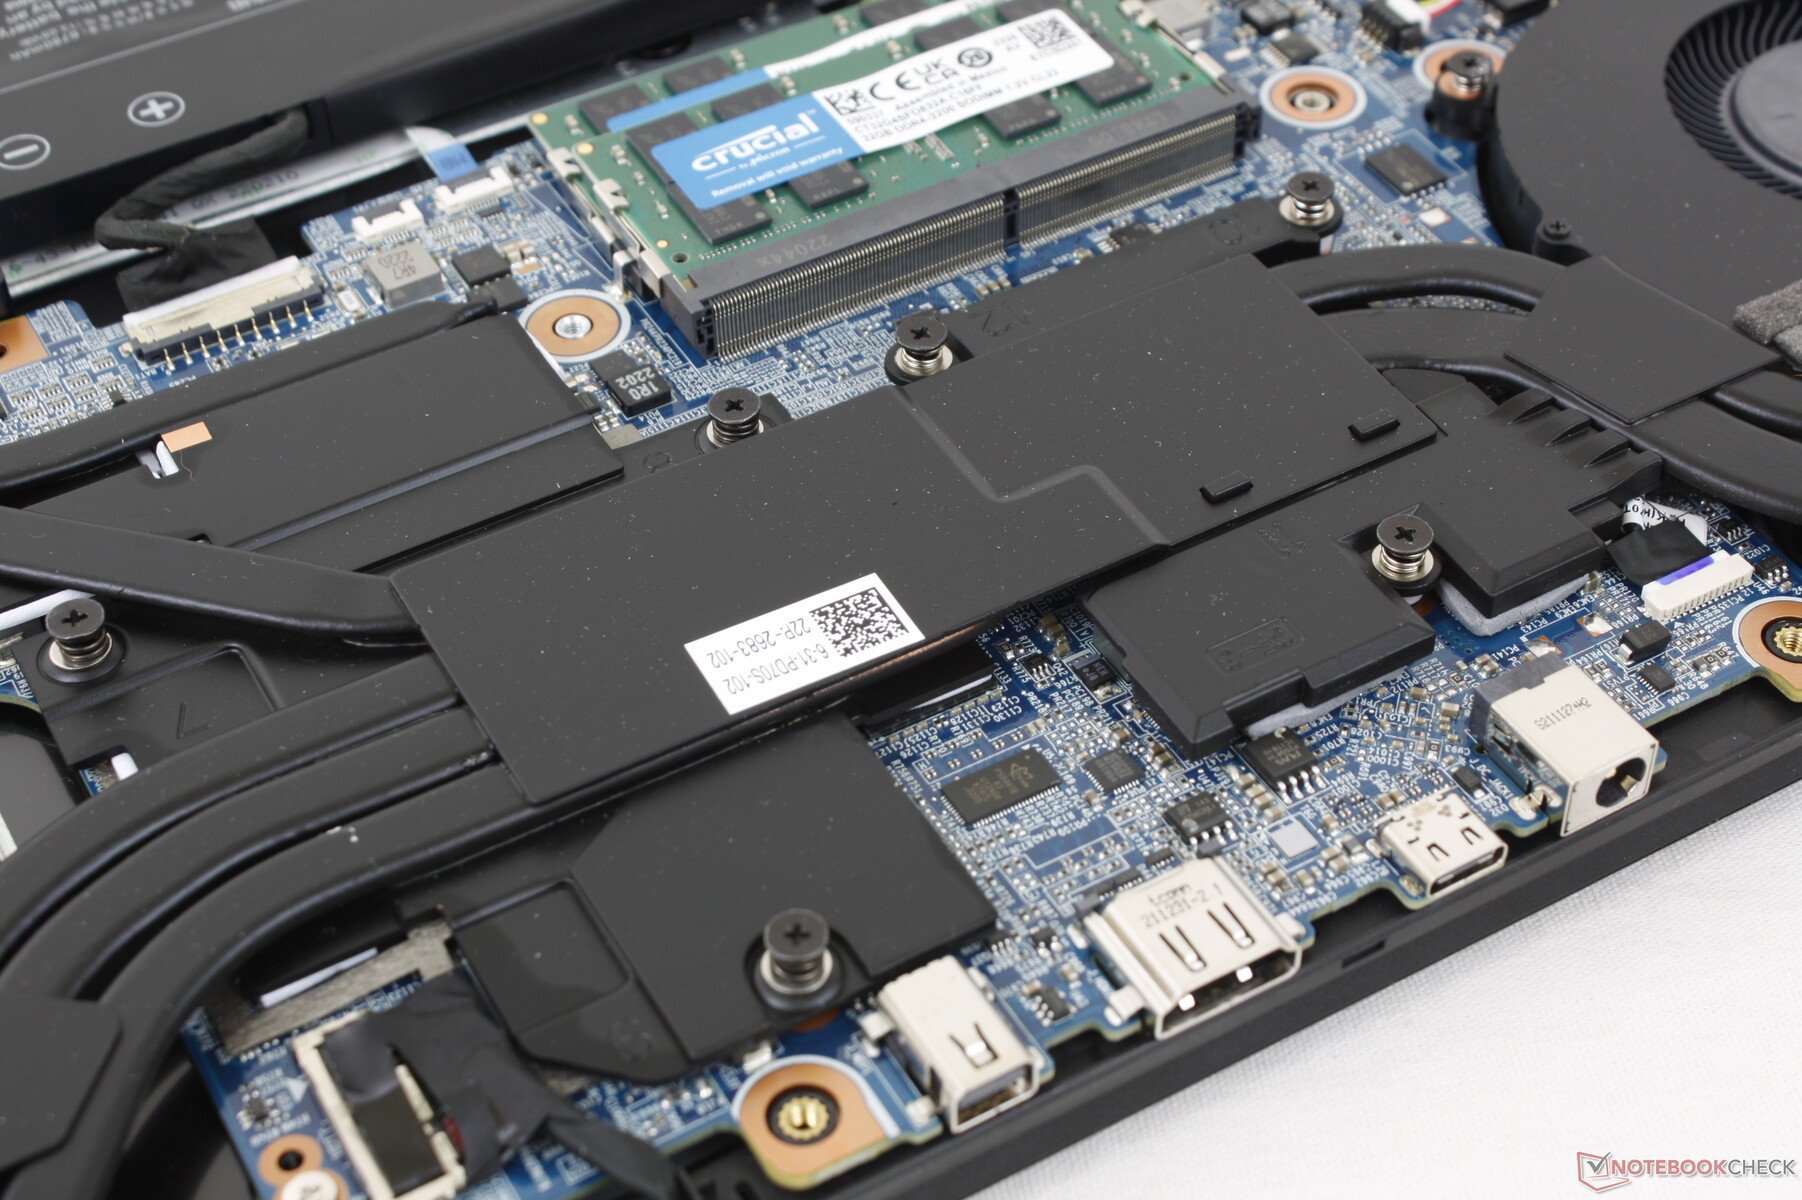
Dispositivos de armazenamento
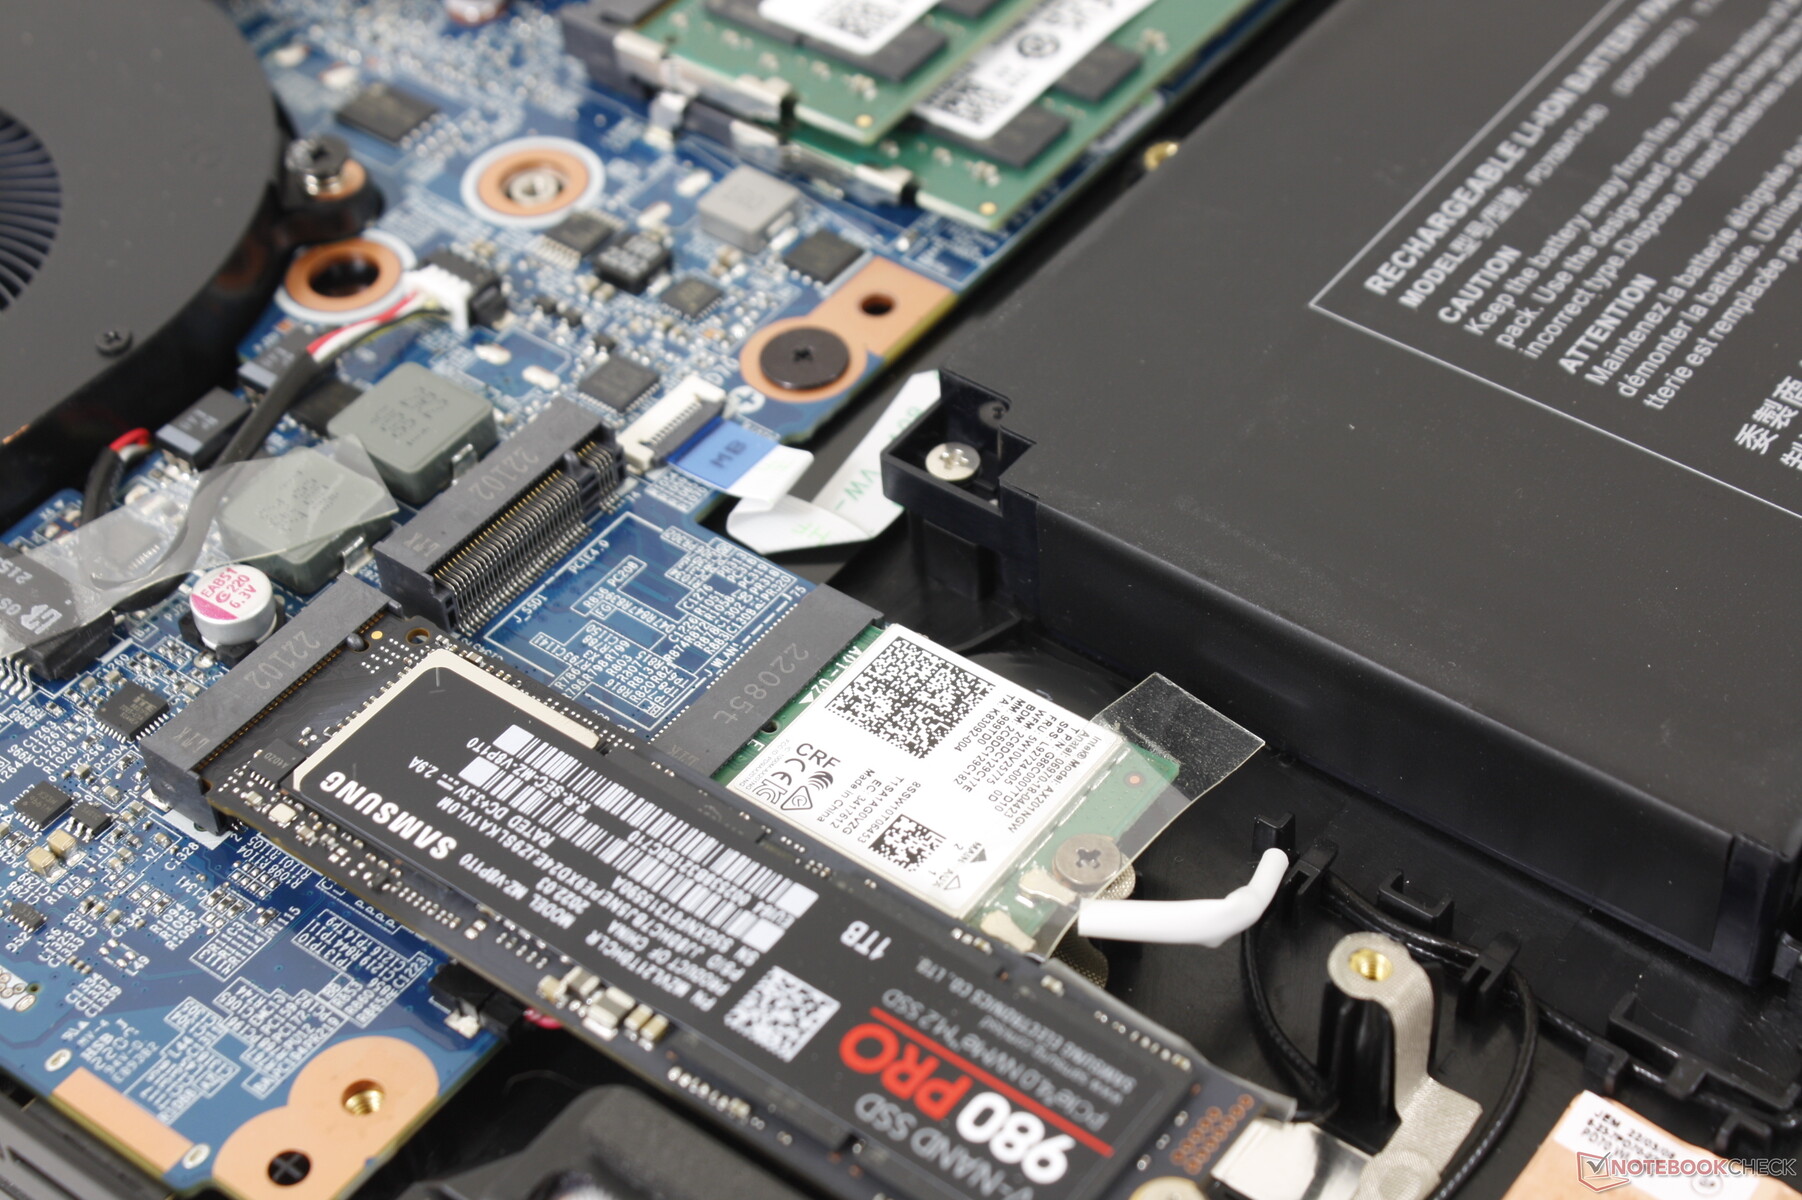
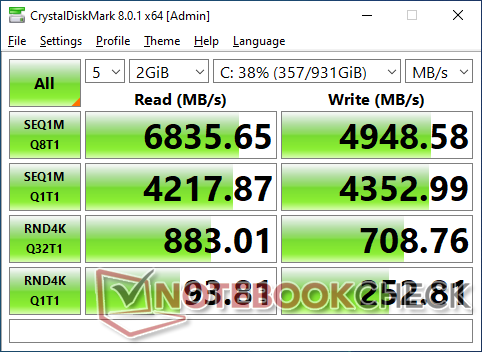
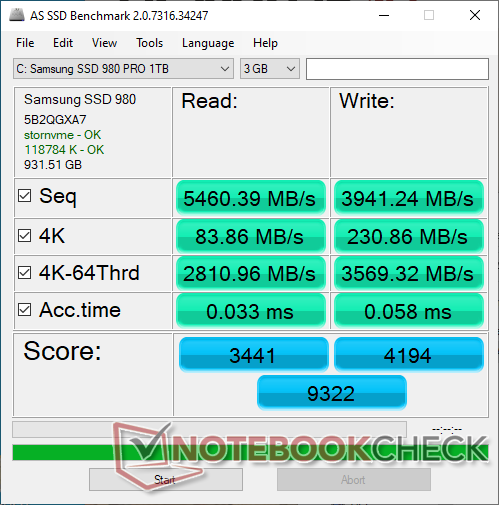
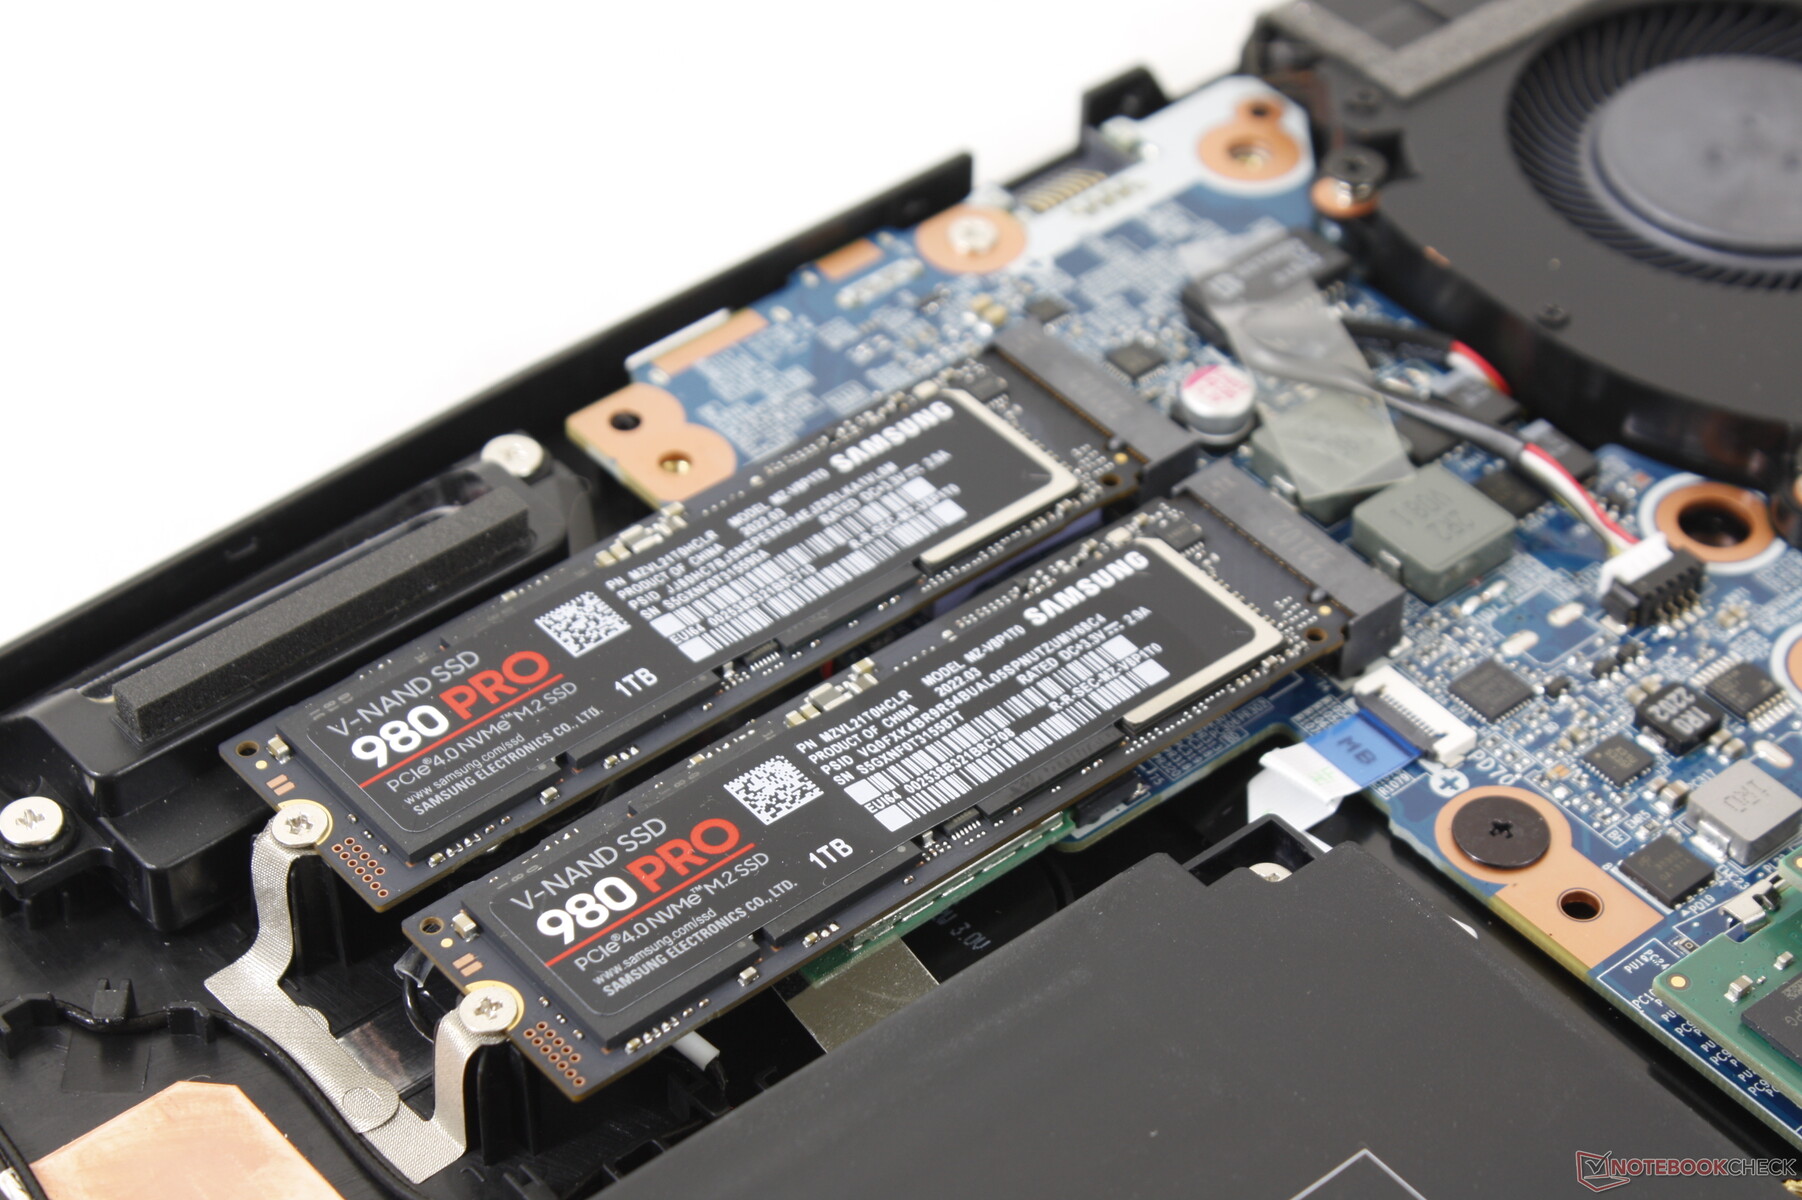
Os dois slots internos M.2 2280 podem cada um suportar PCIe4 x4 SSDs para velocidades insanas, pelo menos em teoria. Na realidade, porém, é provável que os acionamentos acelerem, uma vez que o chassi não tem um espalhador de calor incorporado para os SSDs. O 1 TB Samsung 980 Pro PCIe4 x4 NVMe SSD em nossa unidade de teste cairia para 1400 MB/s a partir de uma altura inicial de 6800 MB/s ao executar o DiskSpd em um loop, como mostra nosso gráfico abaixo. Tais resultados são geralmente aceitáveis para laptops de jogo de baixo custo, mas são decepcionantes de se ver em máquinas high-end como esta.

| Drive Performance rating - Percent | |
| MSI Raider GE77 HX 12UHS | |
| Eurocom Nightsky TXi317 | |
| Aorus 17X XES | |
| Schenker XMG Pro 17 E22 | |
| Razer Blade 17 Early 2022 | |
| Alienware x17 R2 P48E | |
* ... menor é melhor
Disk Throttling: DiskSpd Read Loop, Queue Depth 8
Desempenho da GPU
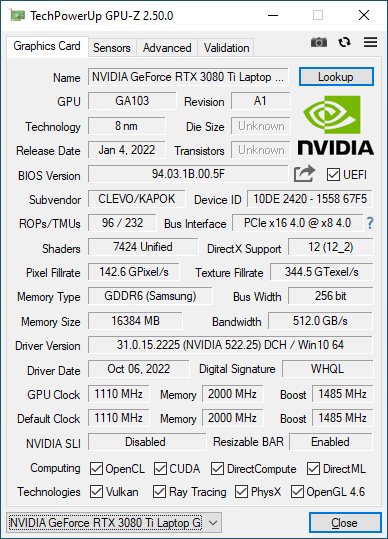
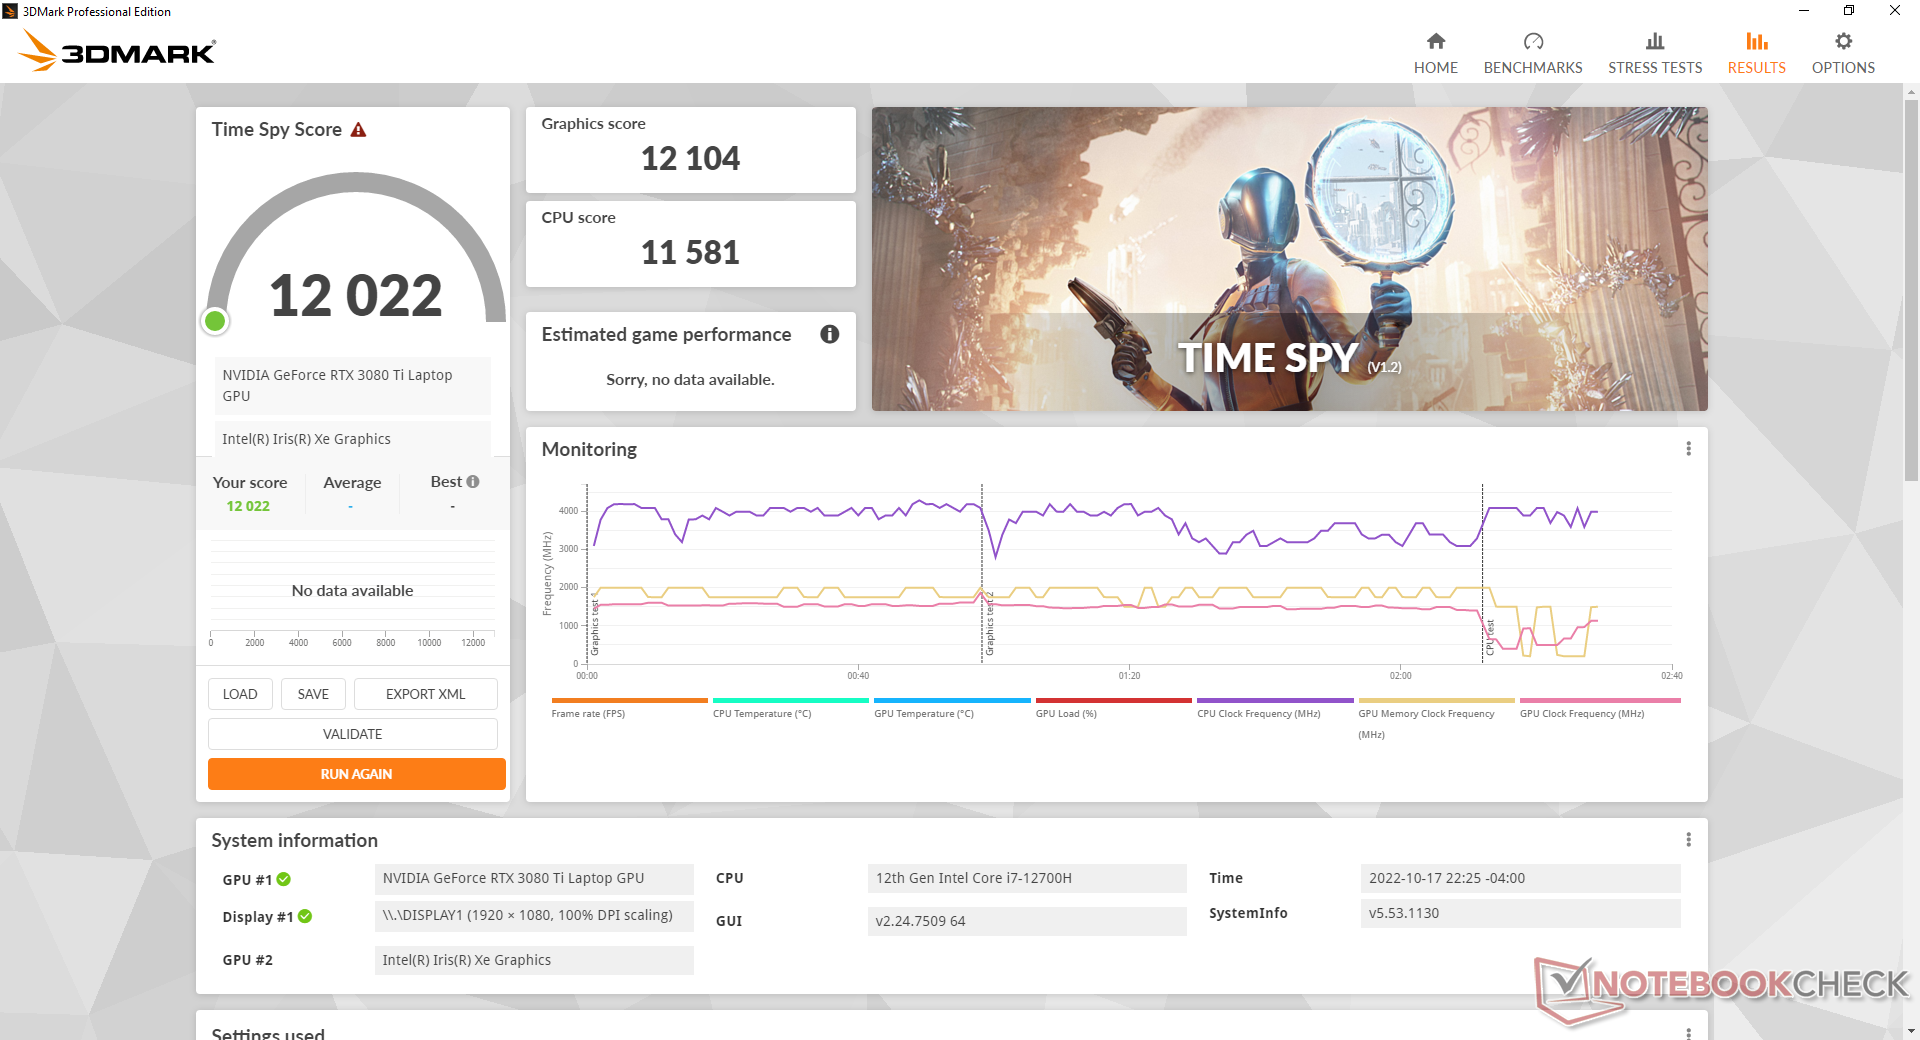
O desempenho gráfico é excelente com resultados que estão ligeiramente à frente da maioria dos outros laptops com o mesmo GeForce RTX 3080 Ti GPU. O TGP de 125 W não é o mais alto como o Alienware x17 R2 e até mesmo o Lâmina Razer 17 têm metas mais altas, mas é pelo menos maior do que em muitos computadores portáteis ultramarinos como a série MSI GS.
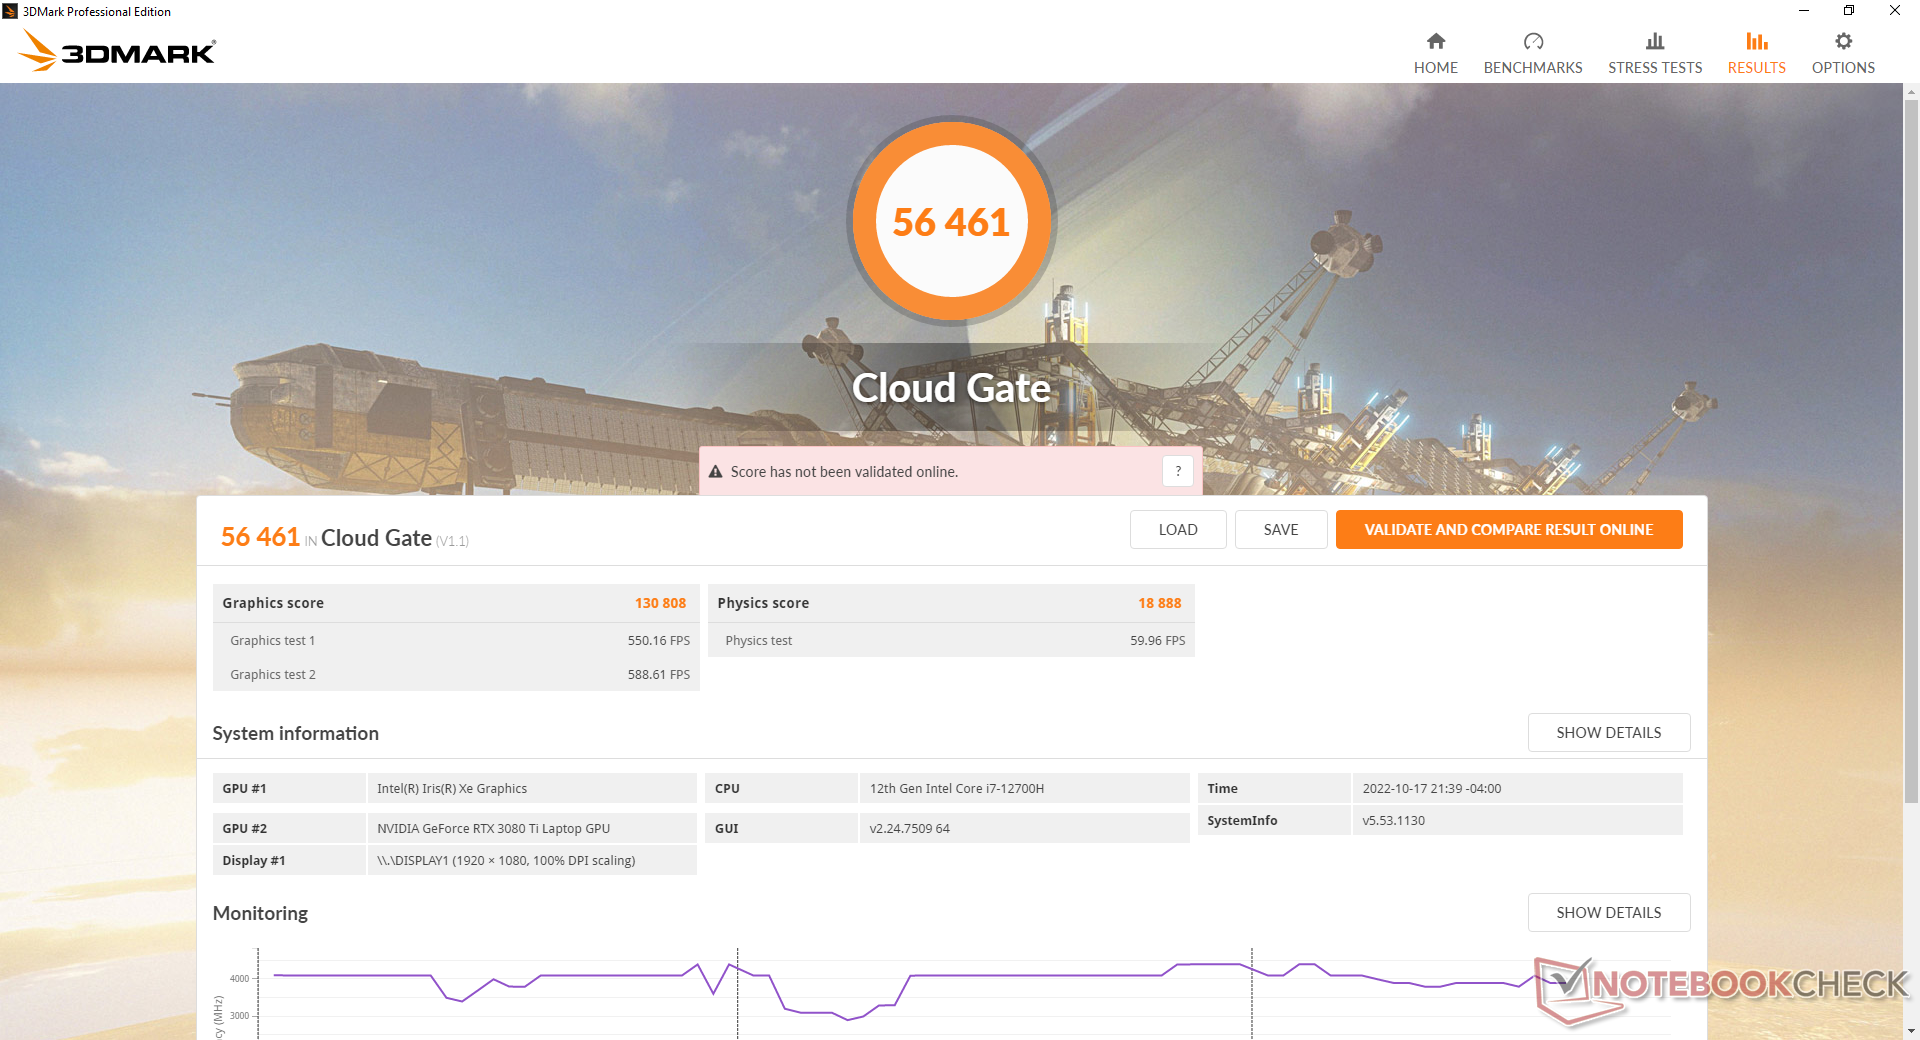
Curiosamente, o Painel de Controle de Nvidia reivindica um TGP de 155 W enquanto a Eurocom reivindica um TGP de 125 W. Este último número parece ser o alvo mais preciso como mostrará nossa seção de Teste de Estresse abaixo.
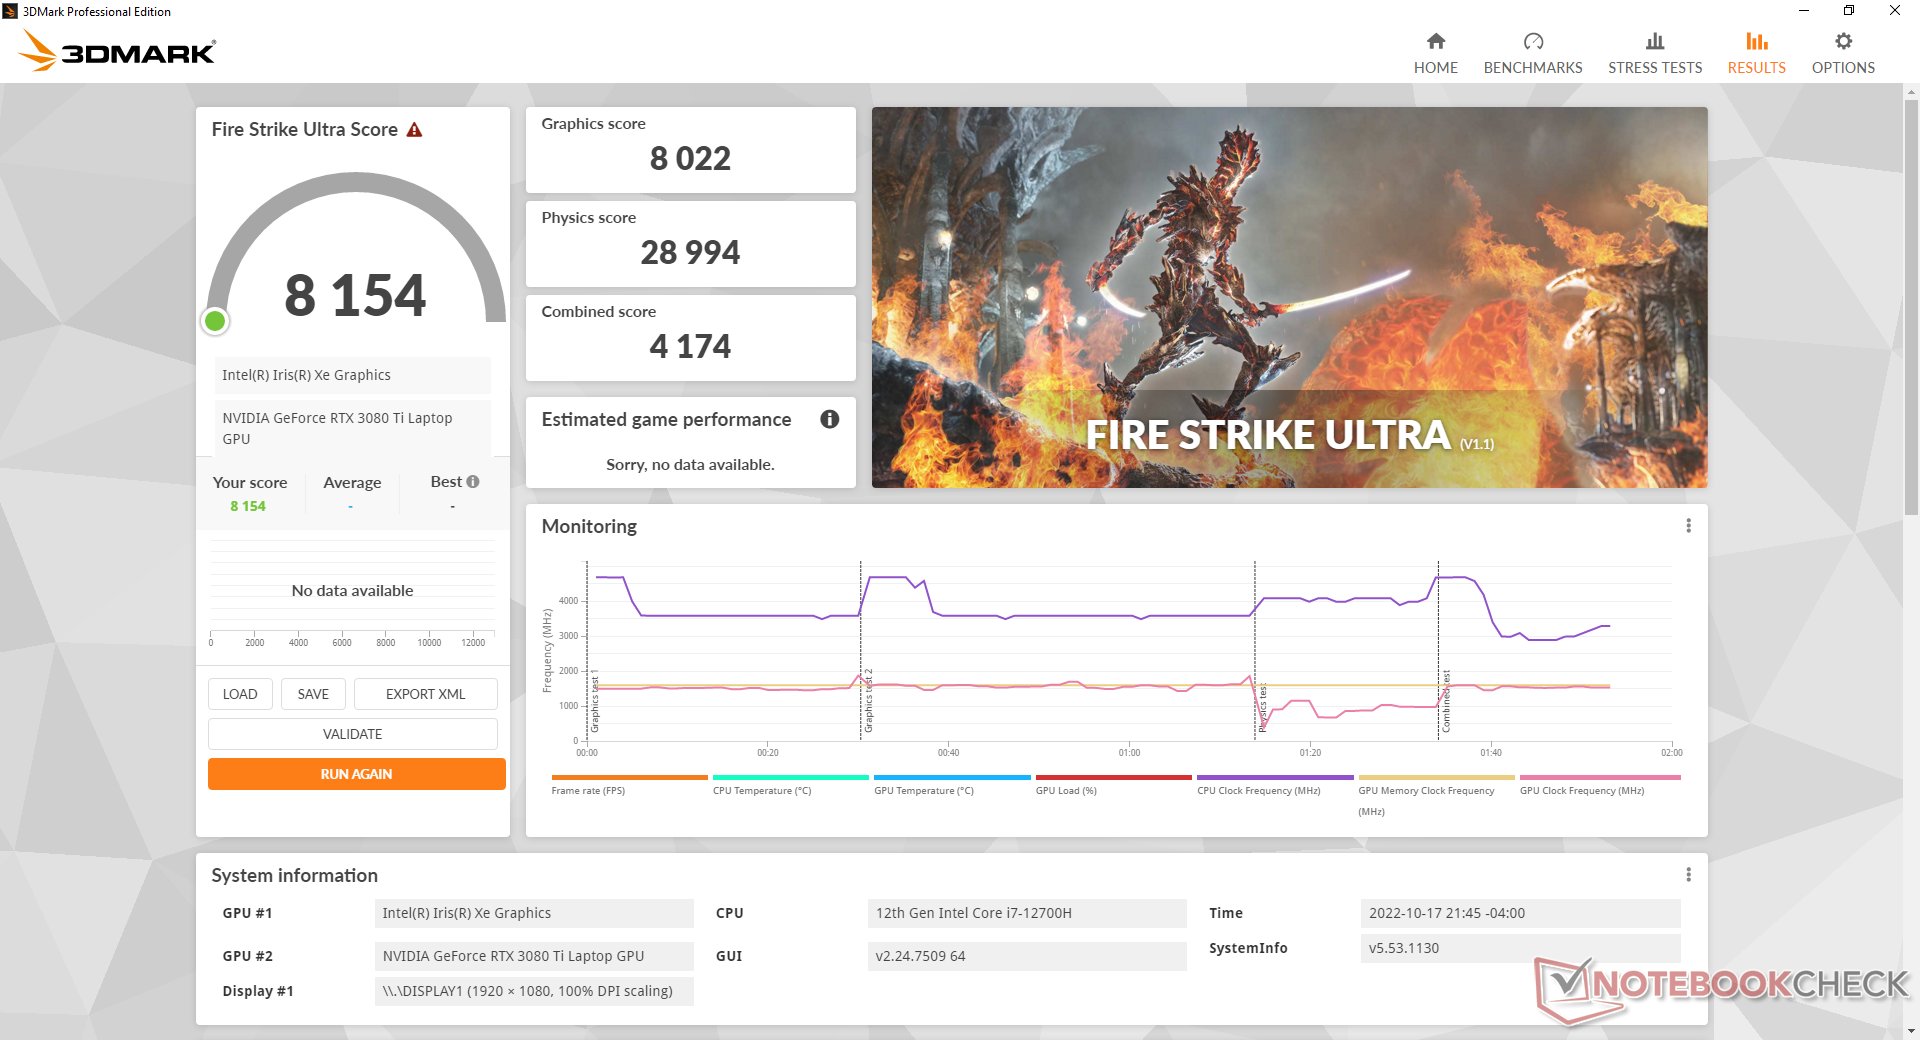
Downgrading to the GeForce RTX 3070 Ti terá um impacto no desempenho gráfico de apenas cerca de 10%. O desempenho geral é aproximadamente 20 a 30% mais lento do que nossa referência desktop GeForce RTX 3080.
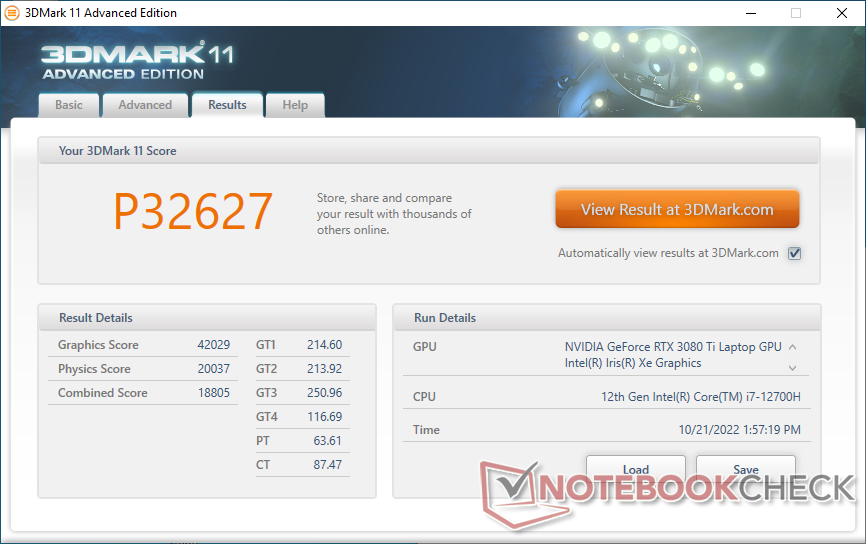
| 3DMark 11 Performance | 32627 pontos | |
| 3DMark Cloud Gate Standard Score | 56461 pontos | |
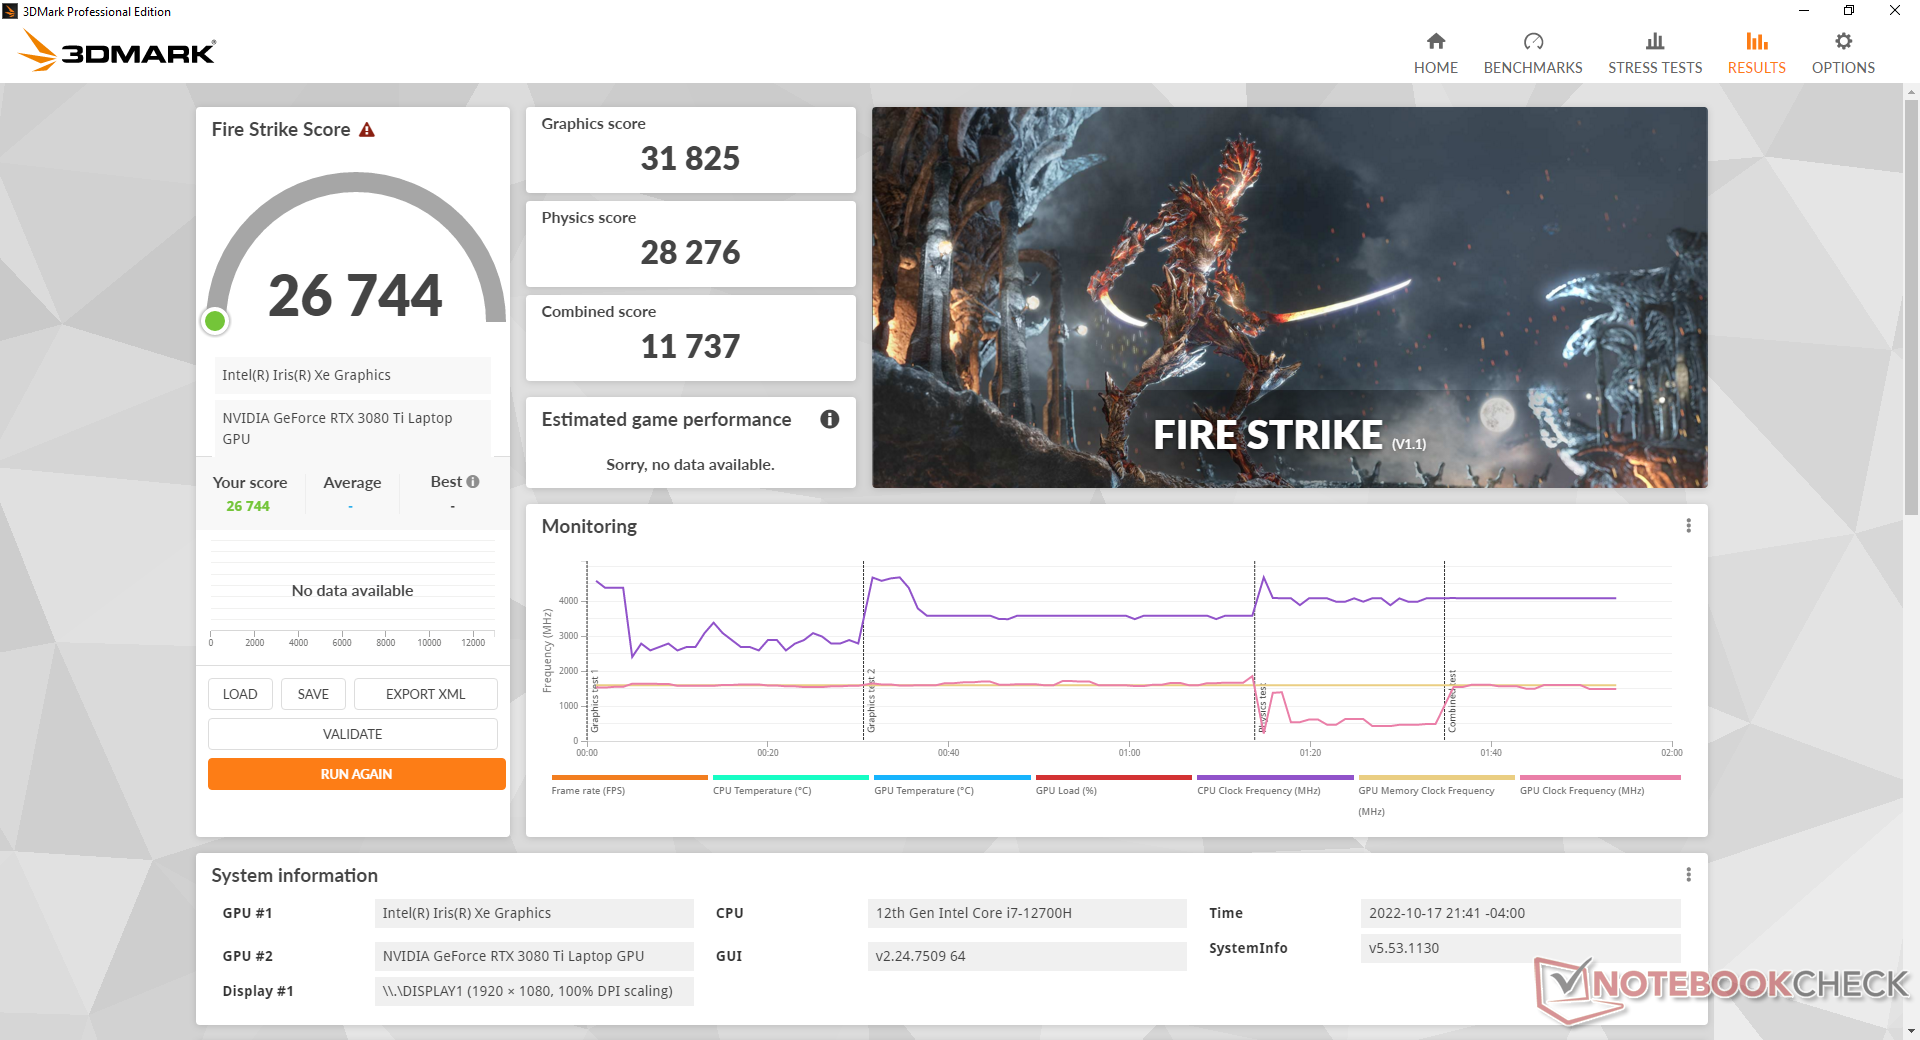
| 3DMark Fire Strike Score | 26744 pontos | |
| 3DMark Time Spy Score | 12022 pontos | |
Ajuda | ||
* ... menor é melhor
Witcher 3 FPS Chart
| baixo | média | alto | ultra | |
|---|---|---|---|---|
| GTA V (2015) | 186.2 | 181.3 | 169.5 | 107.4 |
| The Witcher 3 (2015) | 391.9 | 313.9 | 212.5 | 109.4 |
| Dota 2 Reborn (2015) | 176.1 | 157.9 | 148.6 | 140.8 |
| Final Fantasy XV Benchmark (2018) | 200 | 147.4 | 115.1 | |
| X-Plane 11.11 (2018) | 124.3 | 106.6 | 96.4 | |
| Strange Brigade (2018) | 416 | 273 | 226 | 199.8 |
| Cyberpunk 2077 1.6 (2022) | 135.4 | 123.2 | 96.2 | 80 |
Emissões
Ruído do sistema
Há quase sempre algum ruído de ventilador da máquina. Os ventiladores tendem a ficar ociosos se ociosos na área de trabalho, mas mesmo a menor carga como a navegação na web induziria um ruído do ventilador de 30 dB(A) contra um fundo silencioso de 23 dB(A). O ruído do ventilador atingiria rapidamente seu máximo de 56 dB(A) quando se executam cargas mais exigentes como 3DMark 06 ou jogos, mesmo se ajustado ao perfil de potência Balanceado. Este é um laptop para jogos que não tem medo de ser barulhento, não importa o perfil de potência definido.
A maioria dos outros laptops para jogos de 17 polegadas também atinge a faixa de 50 dB(A) ou mais alto quando em condições semelhantes e, portanto, este problema não é exclusivo da Eurocom. No entanto, a máquina Eurocom tende a ficar mais barulhenta de repente e em um ritmo mais rápido.
Barulho
| Ocioso |
| 23.3 / 30.7 / 30.7 dB |
| Carga |
| 56.2 / 55.9 dB |
 | ||
30 dB silencioso 40 dB(A) audível 50 dB(A) ruidosamente alto |
||
min: | ||
| Eurocom Nightsky TXi317 GeForce RTX 3080 Ti Laptop GPU, i7-12700H, Samsung SSD 980 Pro 1TB MZ-V8P1T0BW | Schenker XMG Pro 17 E22 GeForce RTX 3080 Ti Laptop GPU, i9-12900H, Samsung SSD 980 Pro 1TB MZ-V8P1T0BW | Aorus 17X XES GeForce RTX 3070 Ti Laptop GPU, i9-12900HX, Gigabyte AG470S1TB-SI B10 | MSI Raider GE77 HX 12UHS GeForce RTX 3080 Ti Laptop GPU, i9-12900HX, Samsung PM9A1 MZVL22T0HBLB | Razer Blade 17 Early 2022 GeForce RTX 3080 Ti Laptop GPU, i9-12900H, Samsung PM9A1 MZVL21T0HCLR | Alienware x17 R2 P48E GeForce RTX 3080 Ti Laptop GPU, i9-12900HK, 2x Samsung PM9A1 1TB (RAID 0) | |
|---|---|---|---|---|---|---|
| Noise | -12% | -7% | -11% | 2% | 16% | |
| desligado / ambiente * (dB) | 23.3 | 26 -12% | 26 -12% | 26 -12% | 26 -12% | 22.7 3% |
| Idle Minimum * (dB) | 23.3 | 26 -12% | 28 -20% | 26 -12% | 26 -12% | 23.1 1% |
| Idle Average * (dB) | 30.7 | 34 -11% | 32 -4% | 34 -11% | 27 12% | 23.1 25% |
| Idle Maximum * (dB) | 30.7 | 42 -37% | 38 -24% | 46 -50% | 32 -4% | 23.1 25% |
| Load Average * (dB) | 56.2 | 58 -3% | 53 6% | 50 11% | 50 11% | 31.9 43% |
| Witcher 3 ultra * (dB) | 56.1 | 57 -2% | 54 4% | 55 2% | 51 9% | 52.5 6% |
| Load Maximum * (dB) | 55.9 | 58 -4% | 55 2% | 57 -2% | 51 9% | 52.5 6% |
* ... menor é melhor
Temperatura
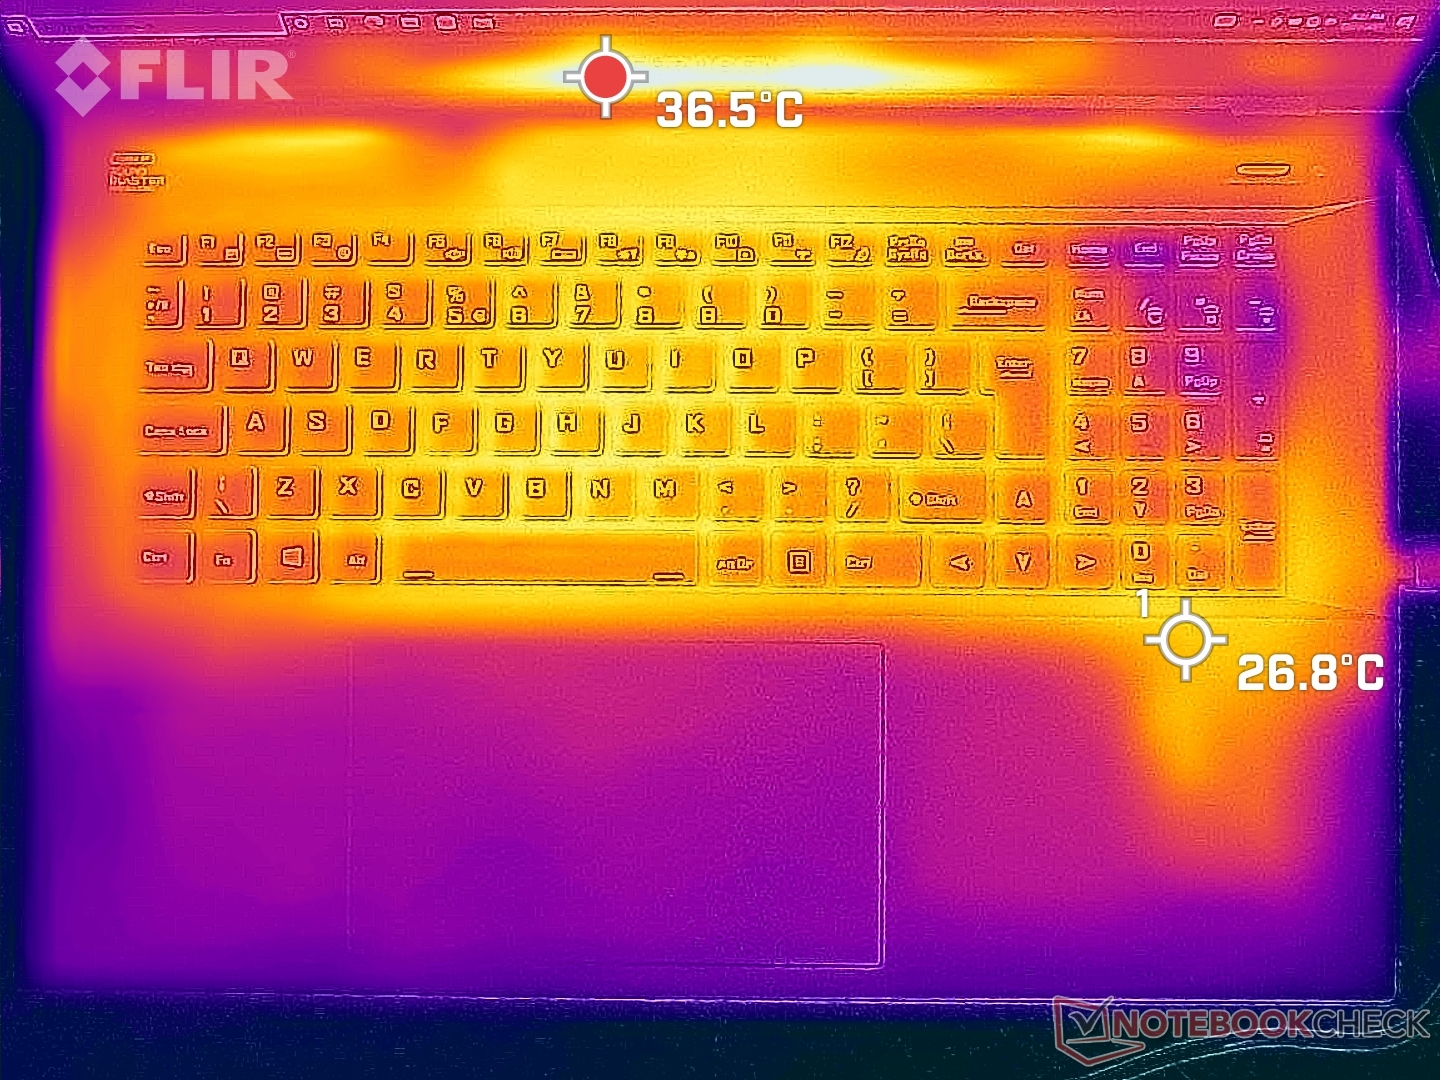
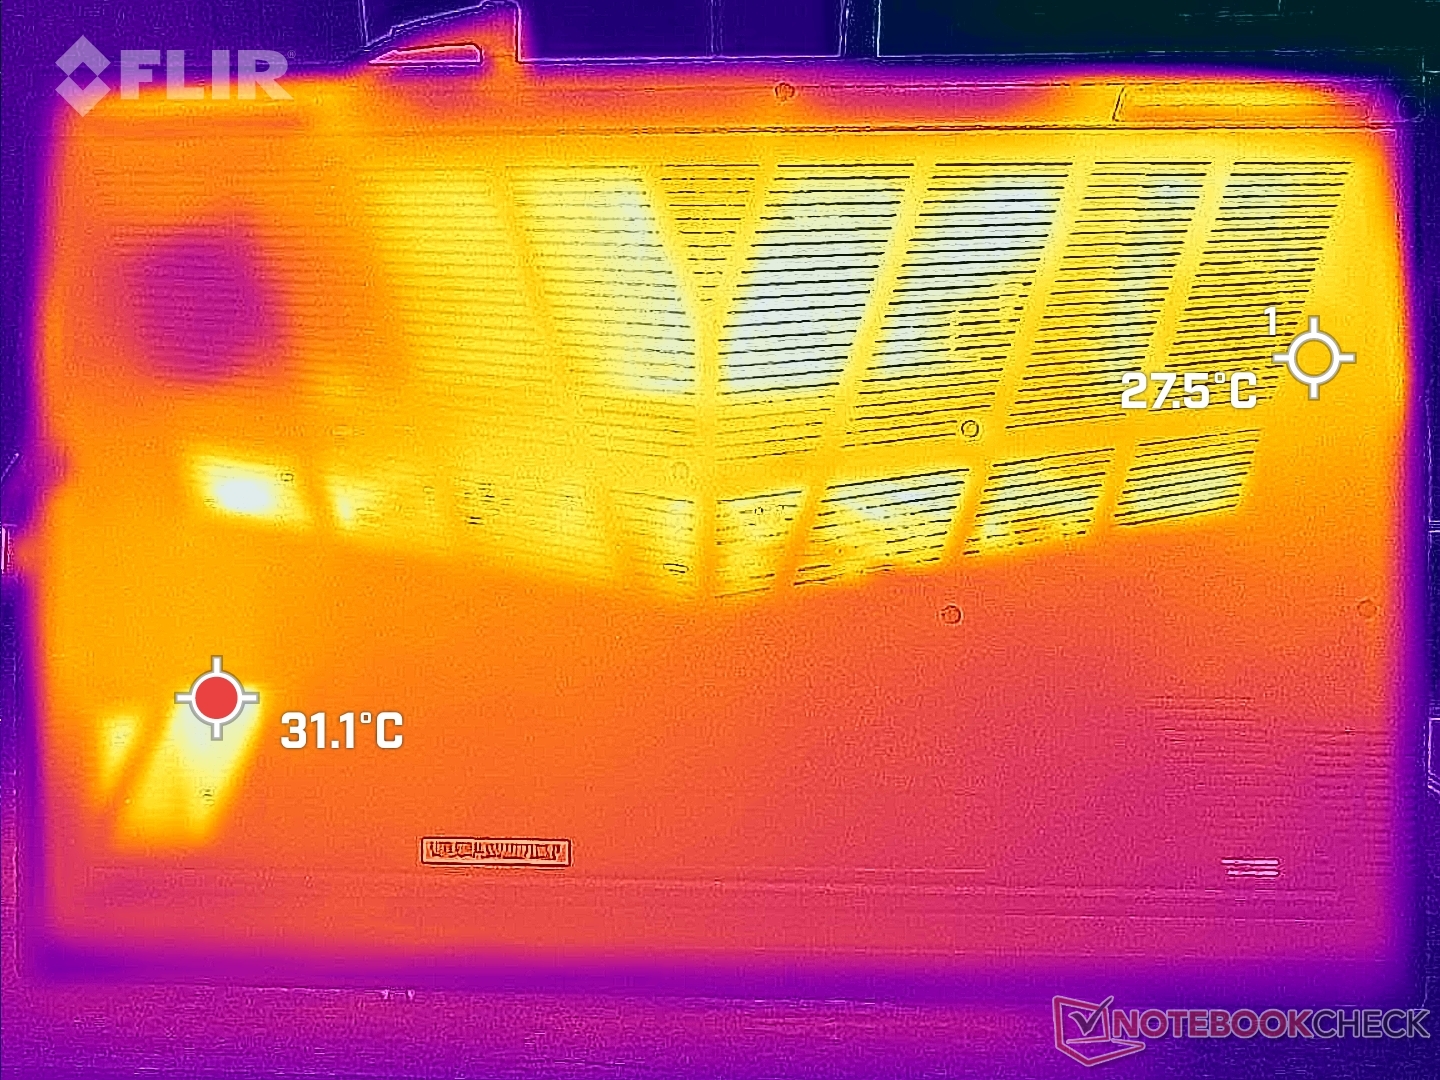
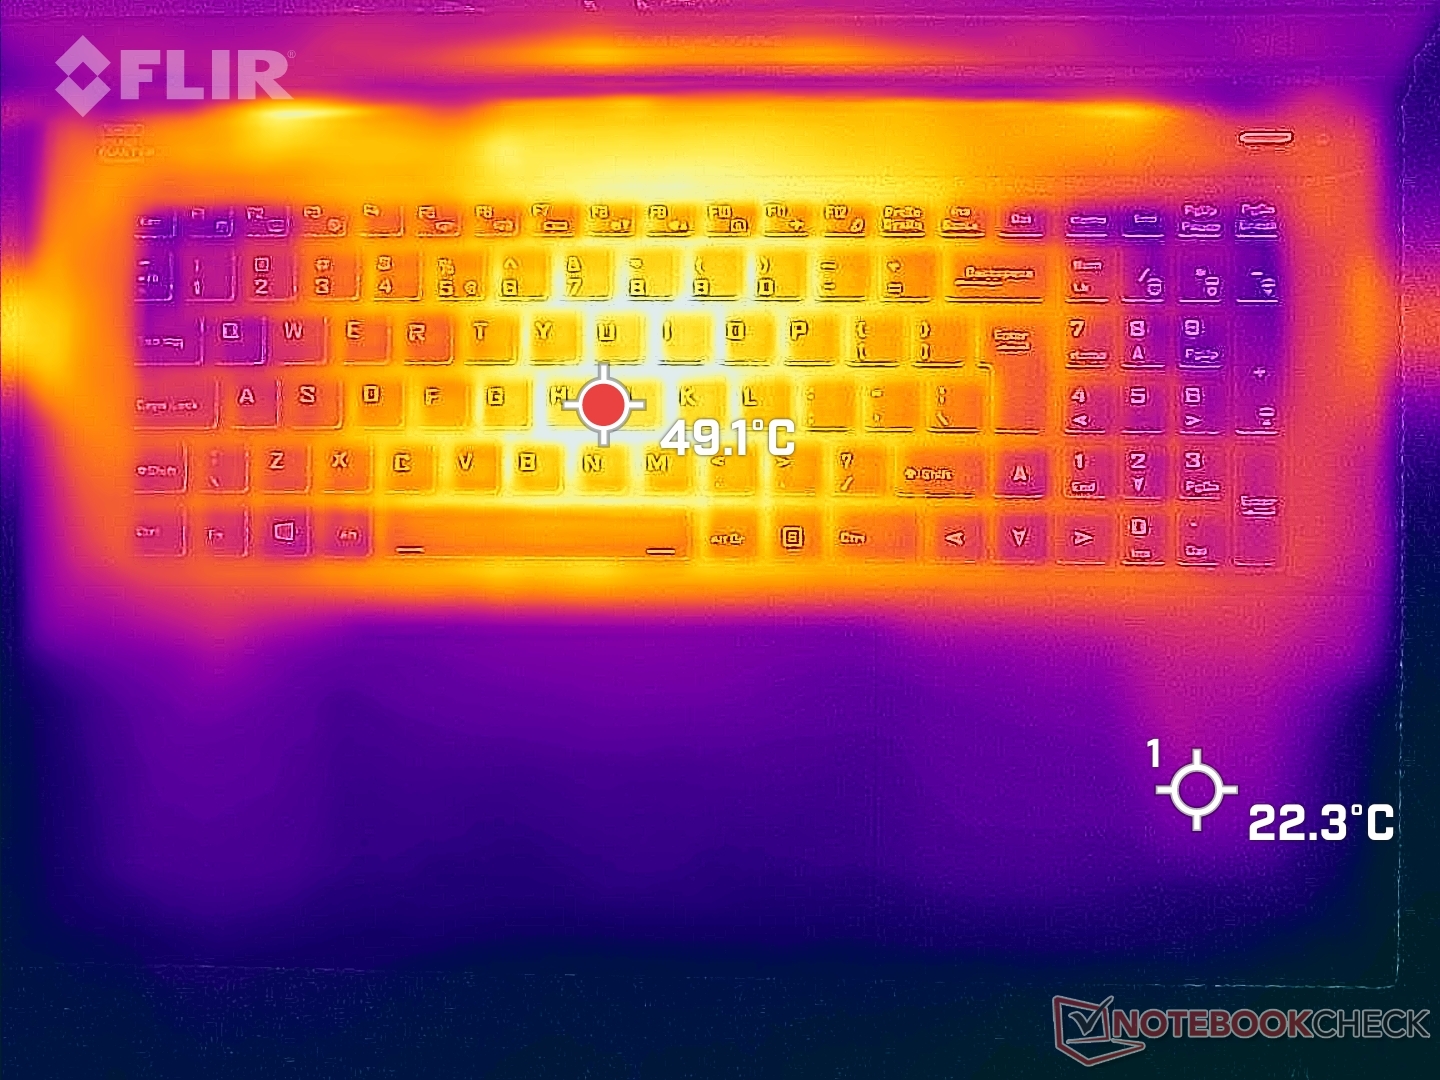
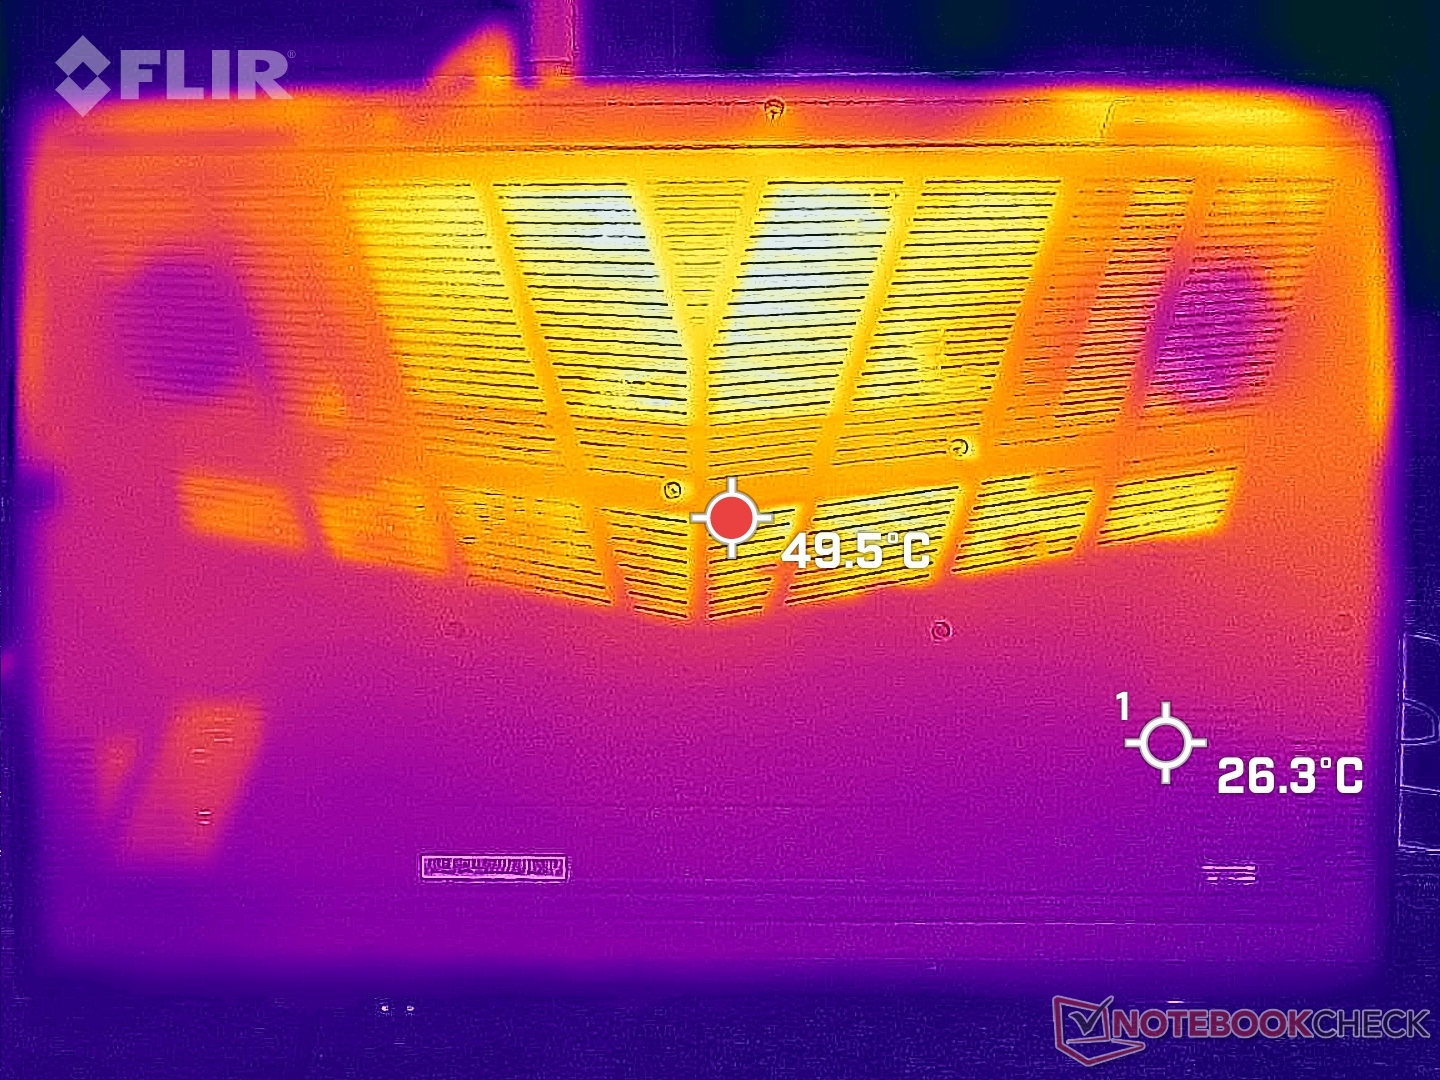
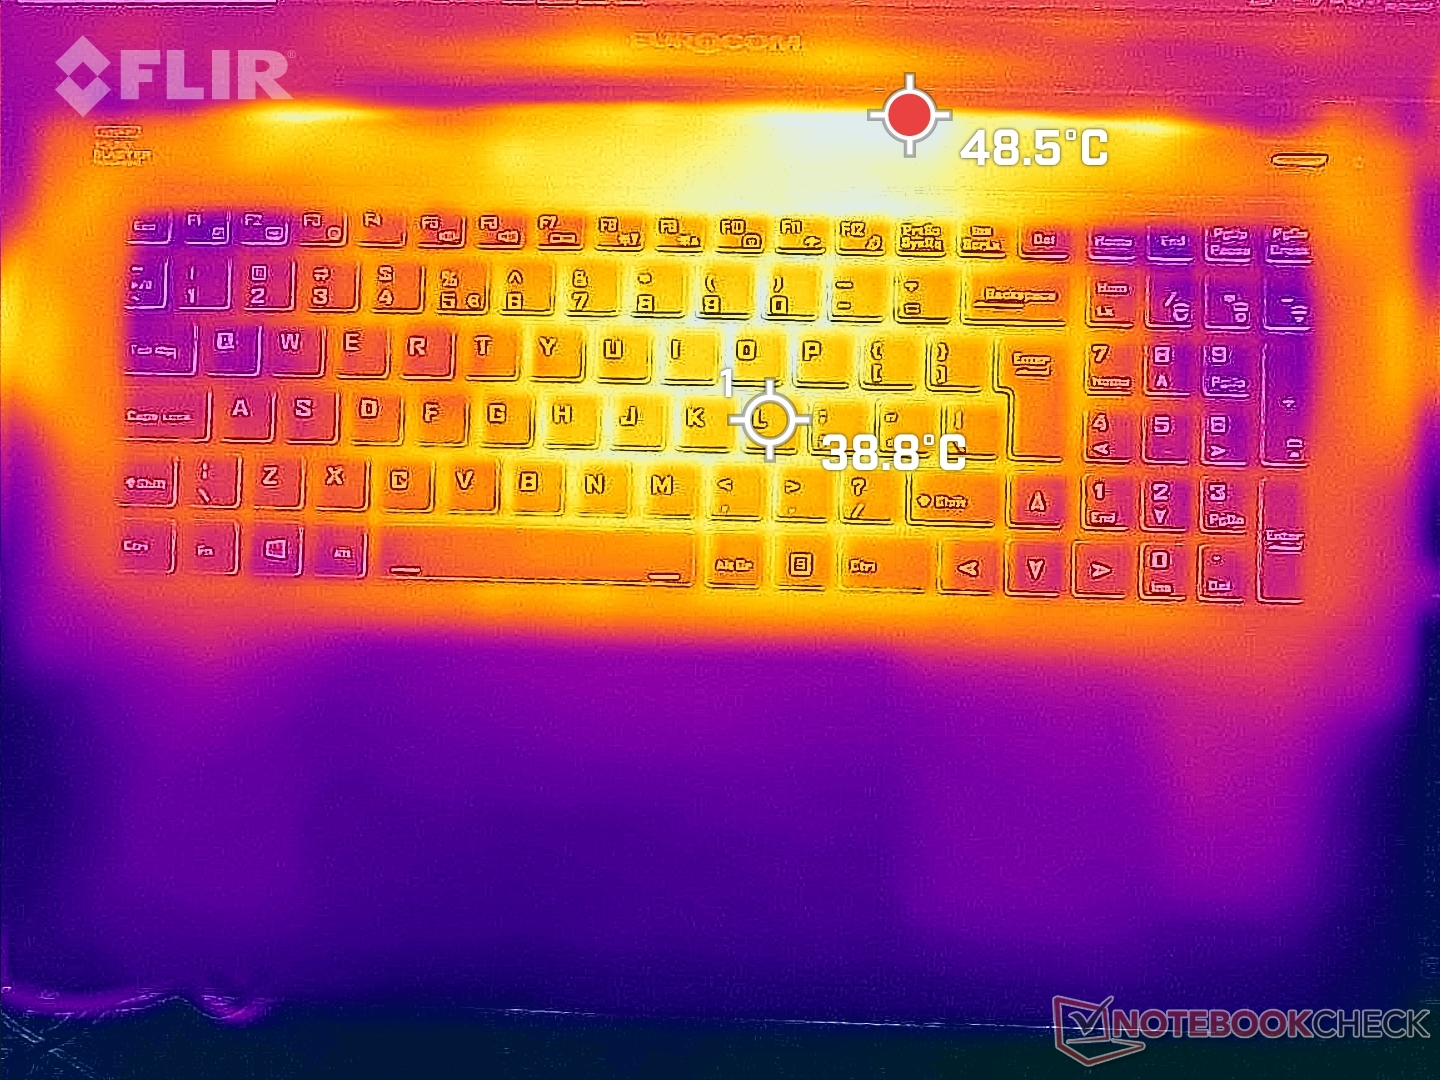
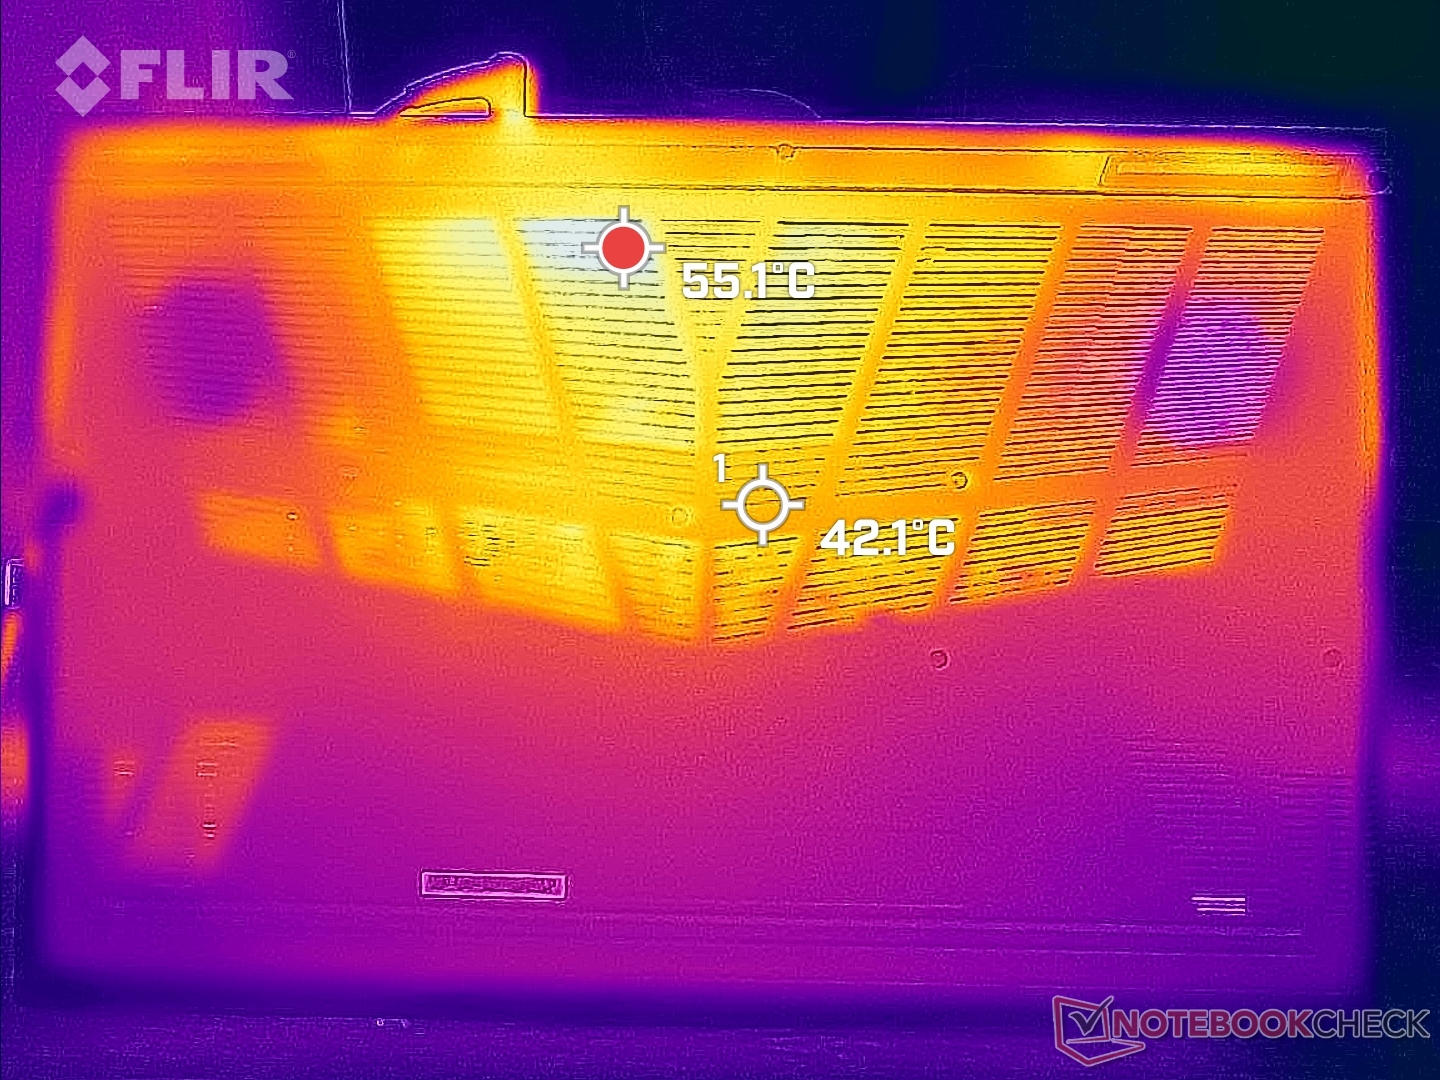
As temperaturas superficiais são mais quentes em direção ao centro do teclado enquanto os apoios das palmas são muito mais frios para jogos mais confortáveis. Os laptops mais finos como o Lâmina Razer 17 têm descansos de palma visivelmente mais quentes para serem mais desconfortáveis na mão
Note que o apoio de palma direito no Nightsky TXi317 será sempre um pouco mais quente do que o apoio de palma esquerdo, uma vez que os M.2 SSDs estão localizados sob o apoio de palma direito.
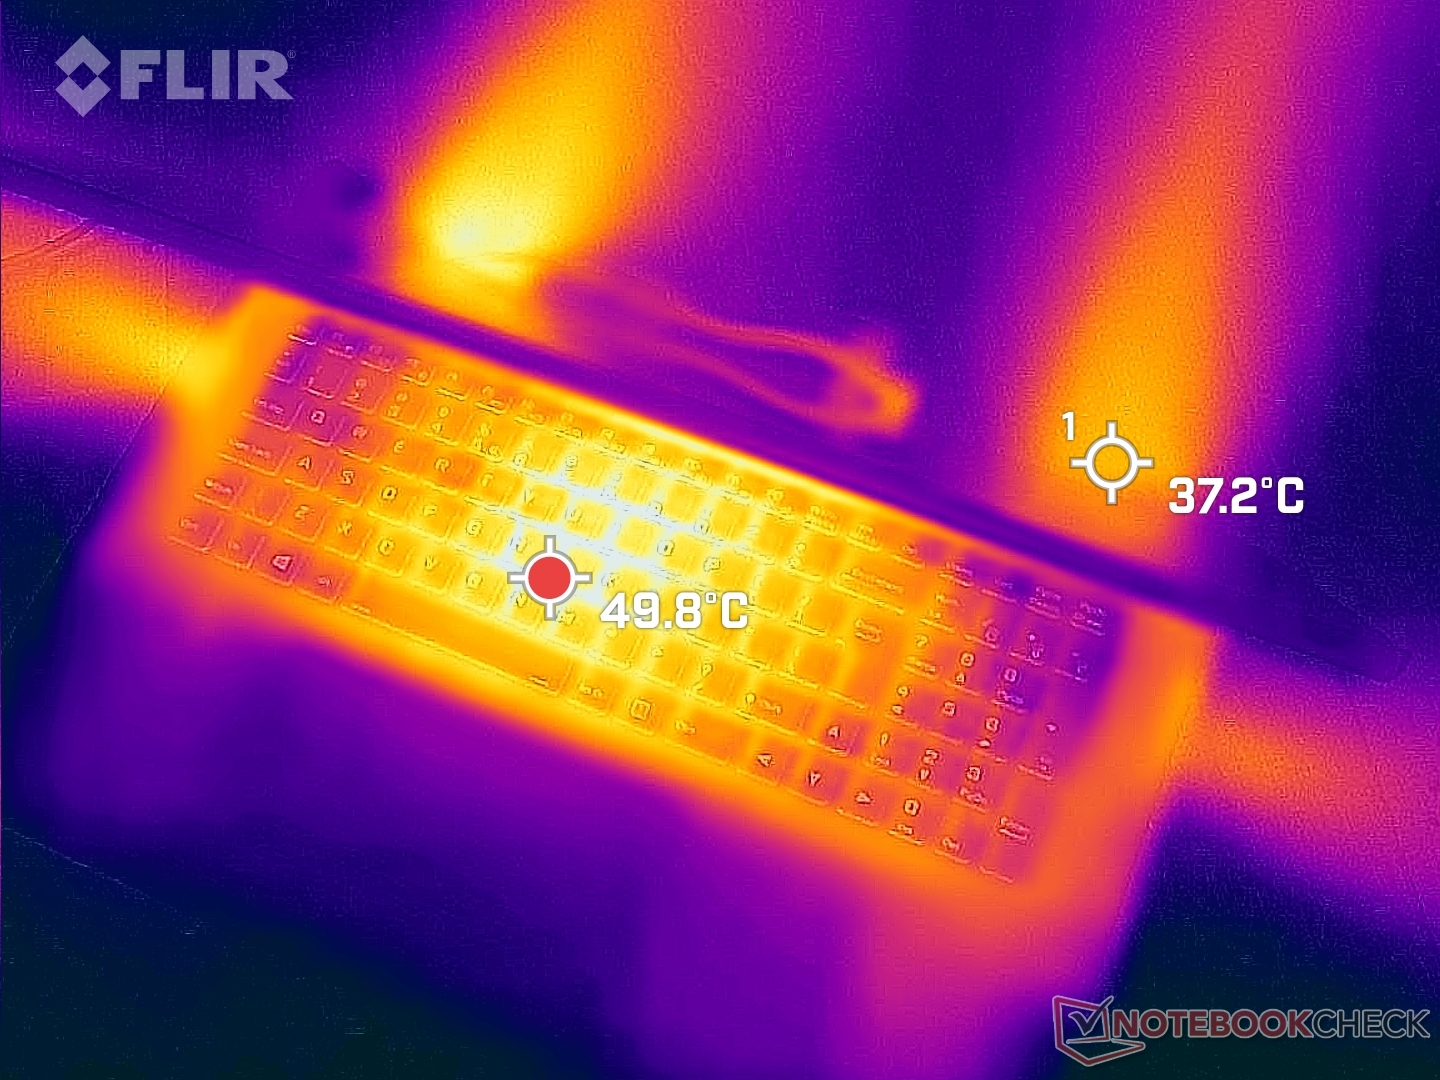
(-) A temperatura máxima no lado superior é 50.4 °C / 123 F, em comparação com a média de 40.4 °C / 105 F , variando de 21.2 a 68.8 °C para a classe Gaming.
(-) A parte inferior aquece até um máximo de 47.6 °C / 118 F, em comparação com a média de 43.2 °C / 110 F
(+) Em uso inativo, a temperatura média para o lado superior é 29.4 °C / 85 F, em comparação com a média do dispositivo de 33.9 °C / ### class_avg_f### F.
(-) Jogando The Witcher 3, a temperatura média para o lado superior é 39.2 °C / 103 F, em comparação com a média do dispositivo de 33.9 °C / ## #class_avg_f### F.
(+) Os apoios para as mãos e o touchpad são mais frios que a temperatura da pele, com um máximo de 31.2 °C / 88.2 F e, portanto, são frios ao toque.
(-) A temperatura média da área do apoio para as mãos de dispositivos semelhantes foi 28.8 °C / 83.8 F (-2.4 °C / -4.4 F).
| Eurocom Nightsky TXi317 Intel Core i7-12700H, NVIDIA GeForce RTX 3080 Ti Laptop GPU | Schenker XMG Pro 17 E22 Intel Core i9-12900H, NVIDIA GeForce RTX 3080 Ti Laptop GPU | Aorus 17X XES Intel Core i9-12900HX, NVIDIA GeForce RTX 3070 Ti Laptop GPU | MSI Raider GE77 HX 12UHS Intel Core i9-12900HX, NVIDIA GeForce RTX 3080 Ti Laptop GPU | Razer Blade 17 Early 2022 Intel Core i9-12900H, NVIDIA GeForce RTX 3080 Ti Laptop GPU | Alienware x17 R2 P48E Intel Core i9-12900HK, NVIDIA GeForce RTX 3080 Ti Laptop GPU | |
|---|---|---|---|---|---|---|
| Heat | -12% | -15% | -19% | -10% | 7% | |
| Maximum Upper Side * (°C) | 50.4 | 56 -11% | 54 -7% | 53 -5% | 50 1% | 49.6 2% |
| Maximum Bottom * (°C) | 47.6 | 60 -26% | 58 -22% | 58 -22% | 56 -18% | 42.4 11% |
| Idle Upper Side * (°C) | 32.6 | 34 -4% | 37 -13% | 38 -17% | 36 -10% | 29.2 10% |
| Idle Bottom * (°C) | 33.2 | 36 -8% | 39 -17% | 43 -30% | 38 -14% | 32 4% |
* ... menor é melhor
Teste de estresse
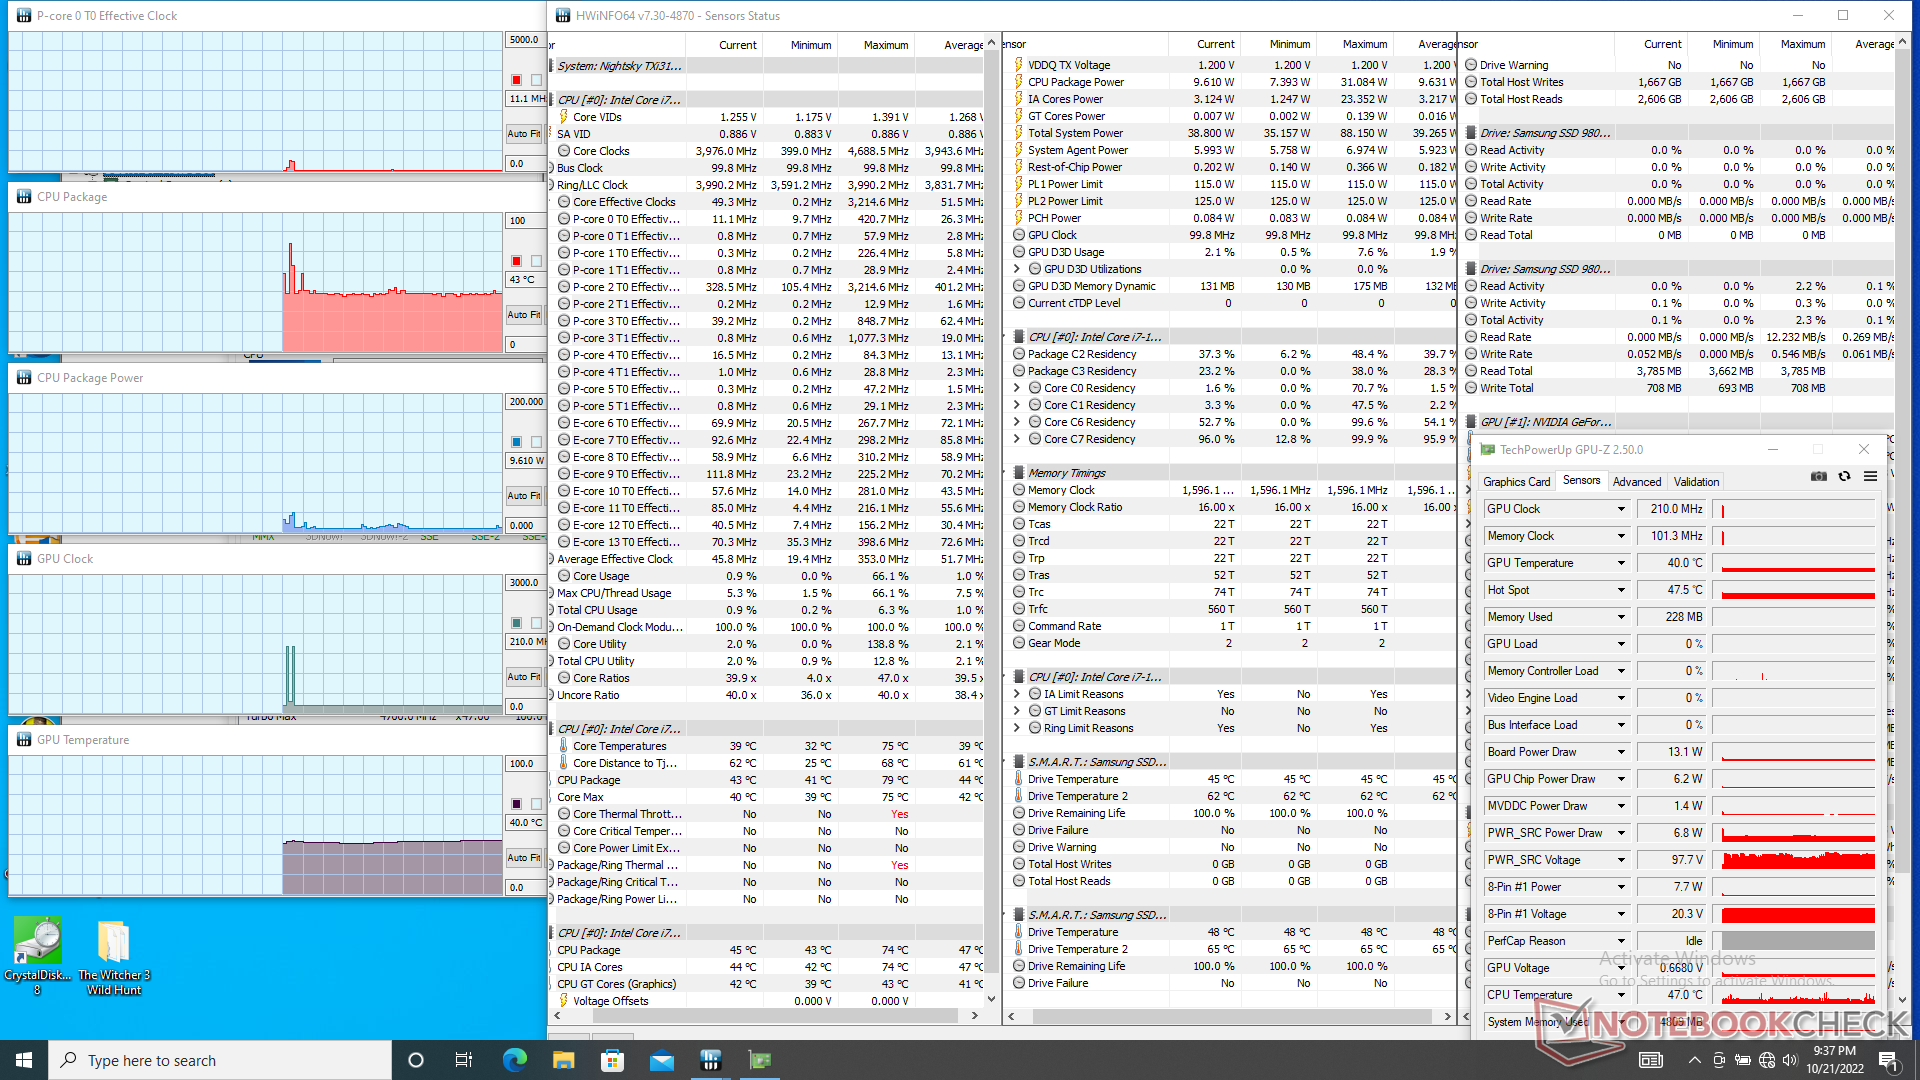
As taxas de clock da CPU, temperatura e consumo de energia da placa aumentariam para 4 GHz, 97 C e 110 W, respectivamente, ao iniciar a tensão Prime95. As taxas do relógio e o consumo de energia cairiam então constantemente antes de estabilizarem em 2,8 GHz e 76 W, respectivamente, sem mudanças na temperatura central. Repetindo este mesmo teste noDell G16 7620 com um processador idêntico resultaria em taxas de relógio estáveis ligeiramente mais rápidas de cerca de 3,3 GHz, mas temperaturas centrais similares de quase 100 C.
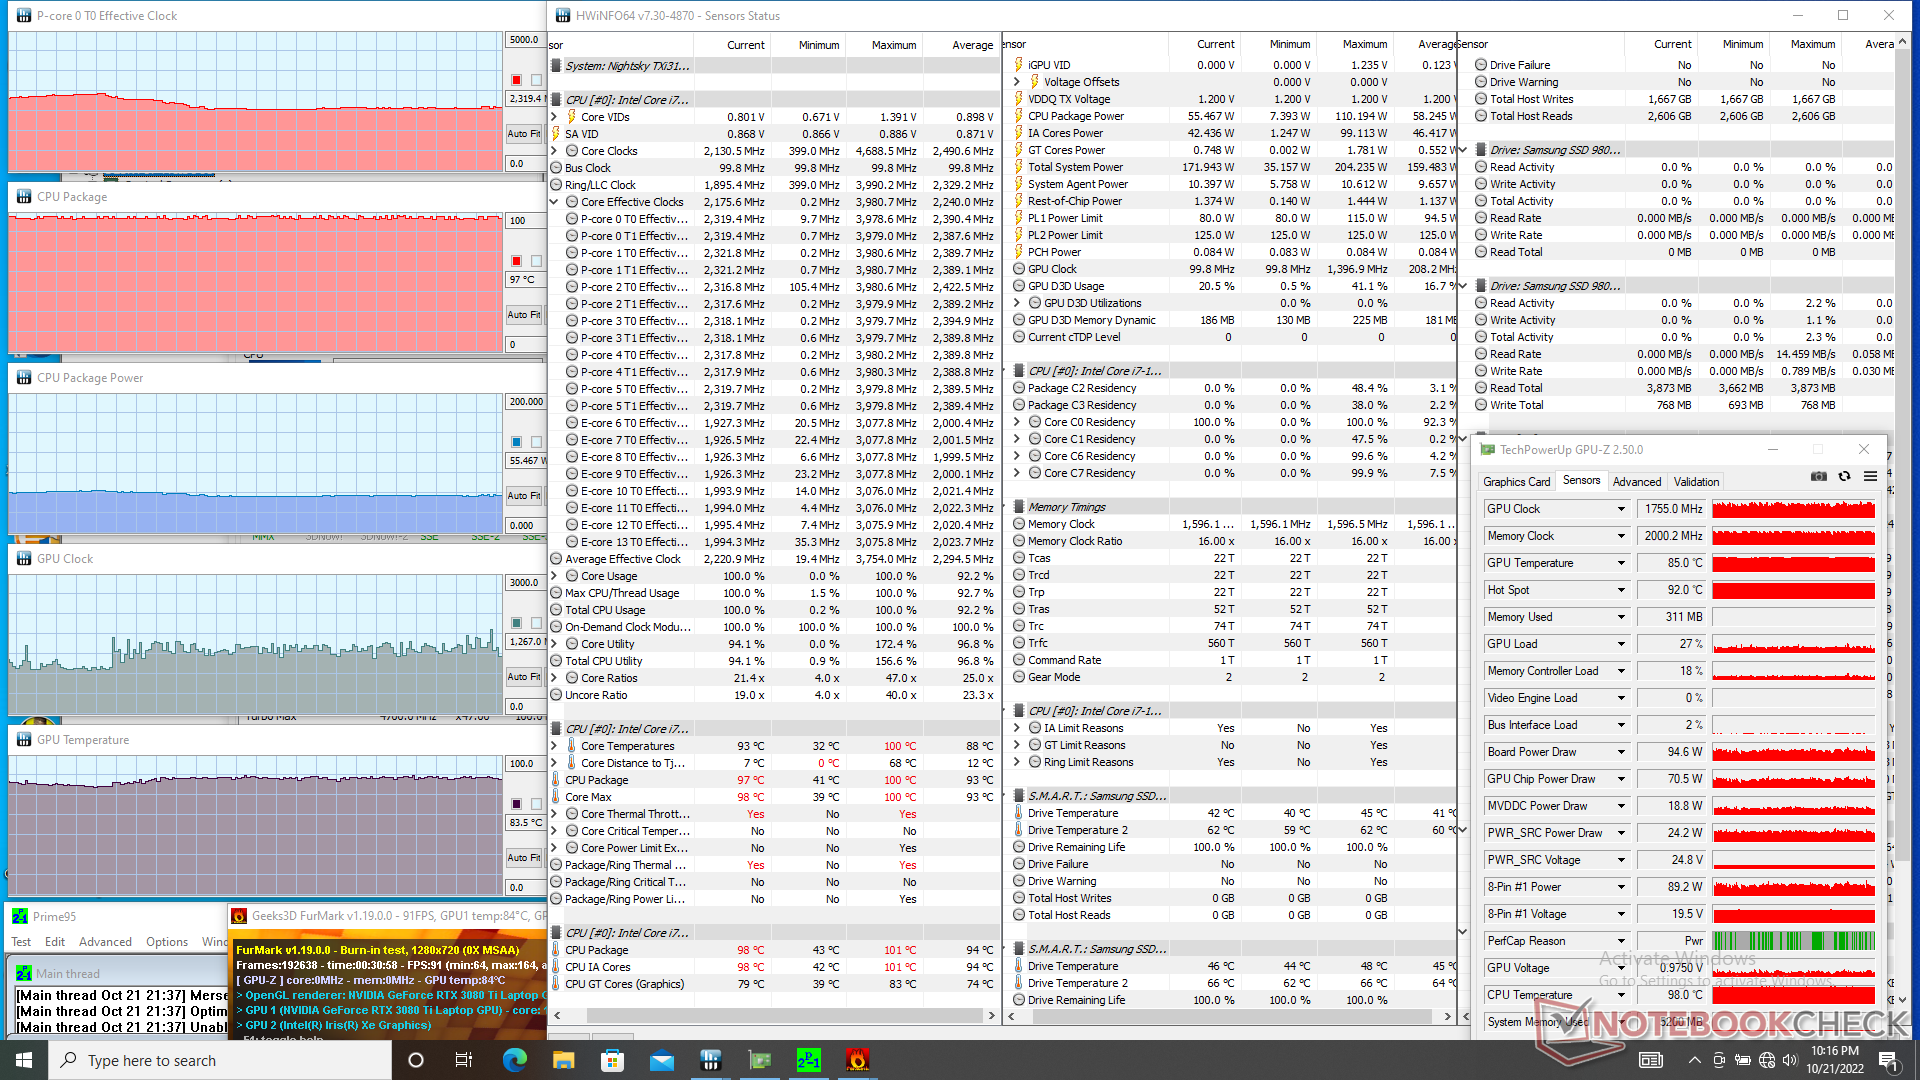
As taxas de clock GPU, temperatura e consumo de energia da placa se estabilizariam em 1432 MHz, 87 C e 121 W, respectivamente, quando em funcionamento Witcher 3. A repetição deste teste no perfil de potência "Entretenimento" resultaria em um desempenho ligeiramente reduzido da GPU: a taxa do relógio e o consumo de energia cairiam para 1327 MHz e 110 W, respectivamente, sem mudanças na temperatura. É lamentável que não possamos chegar mais perto da meta reclamada de 125 W a 155 W TGP.
Rodando Witcher 3 sobre o MSI GS77 com a mesma GPU RTX 3080 Ti resultaria em uma taxa de relógio GPU mais lenta, temperatura central mais fria e menor consumo de energia da placa de 1432 MHz, 75 C e 105 W, respectivamente, quando comparada à nossa Eurocom.
O desempenho é limitado se funcionar com baterias. Um teste Fire Strike sobre a energia da bateria retornaria pontuações de Física e Gráficos de 12300 e 5071 pontos, respectivamente, em comparação com 28276 e 31825 pontos quando em rede elétrica.
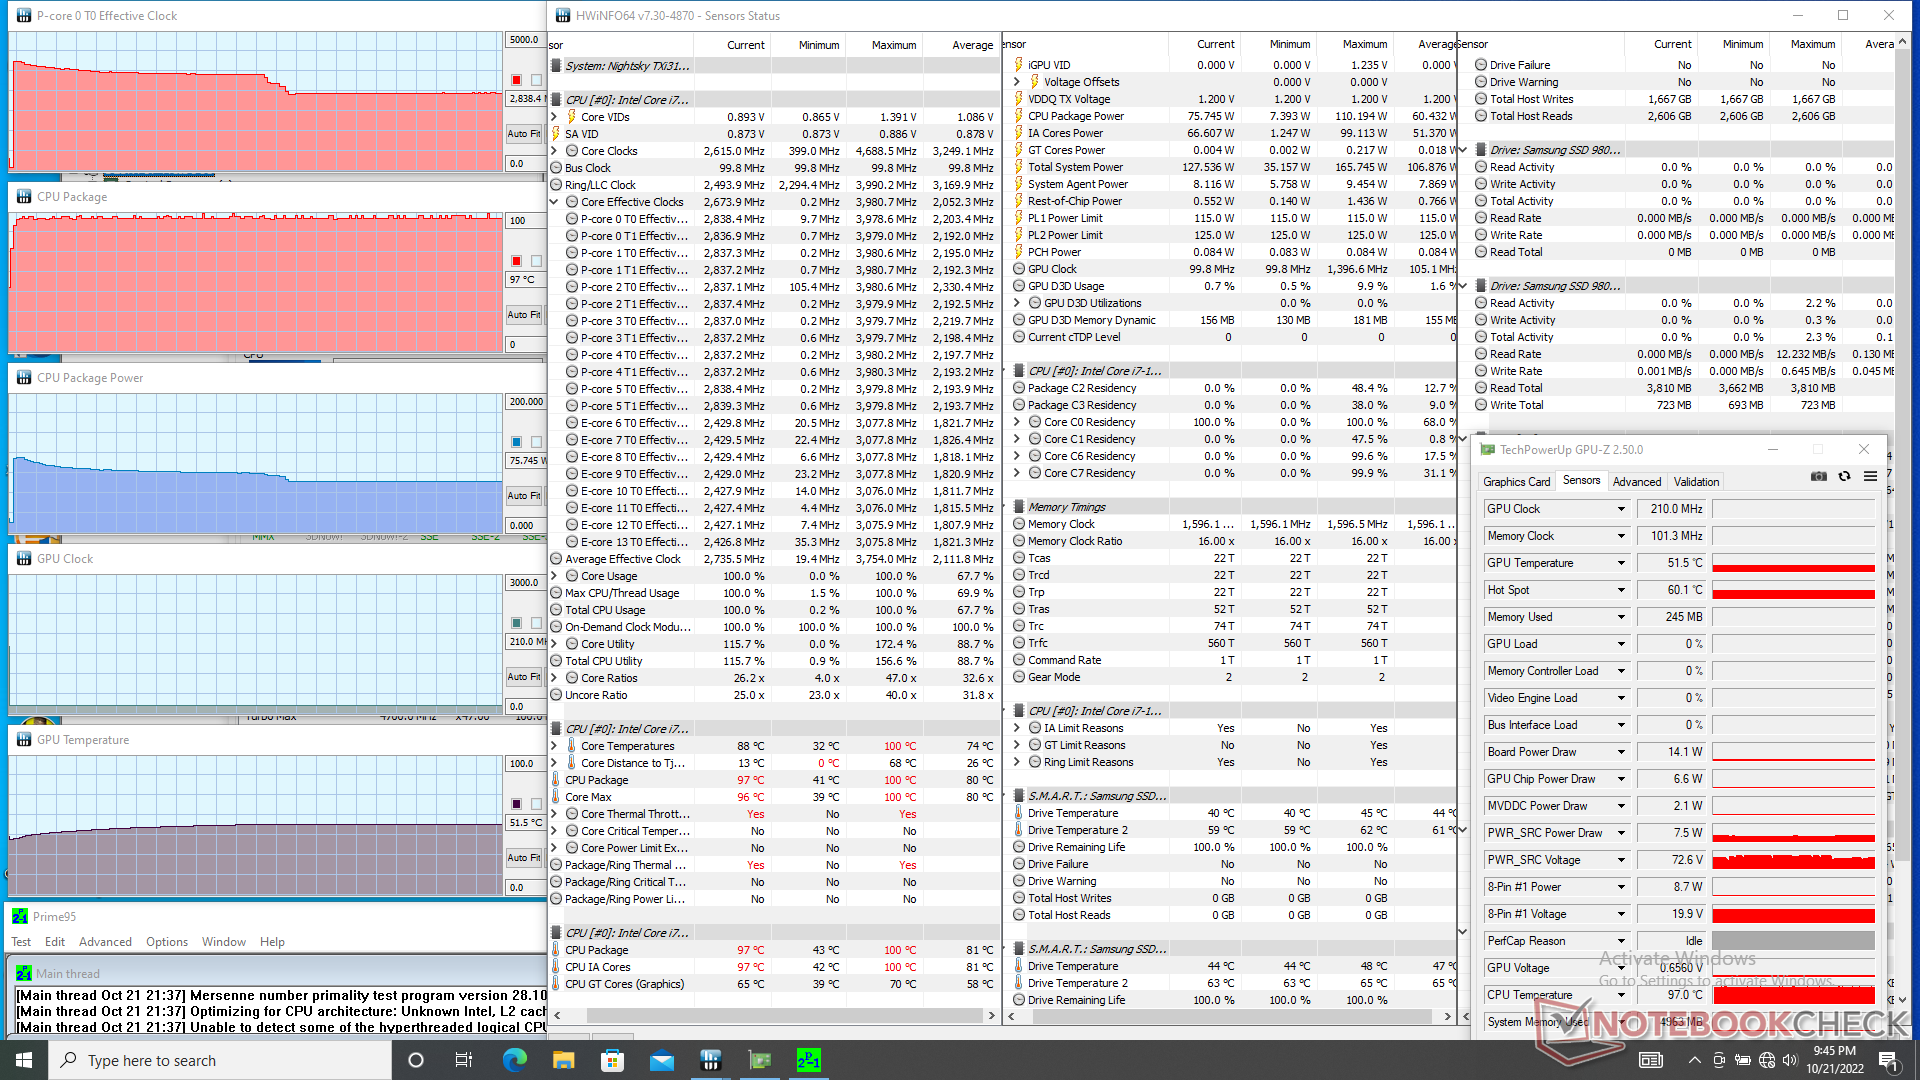
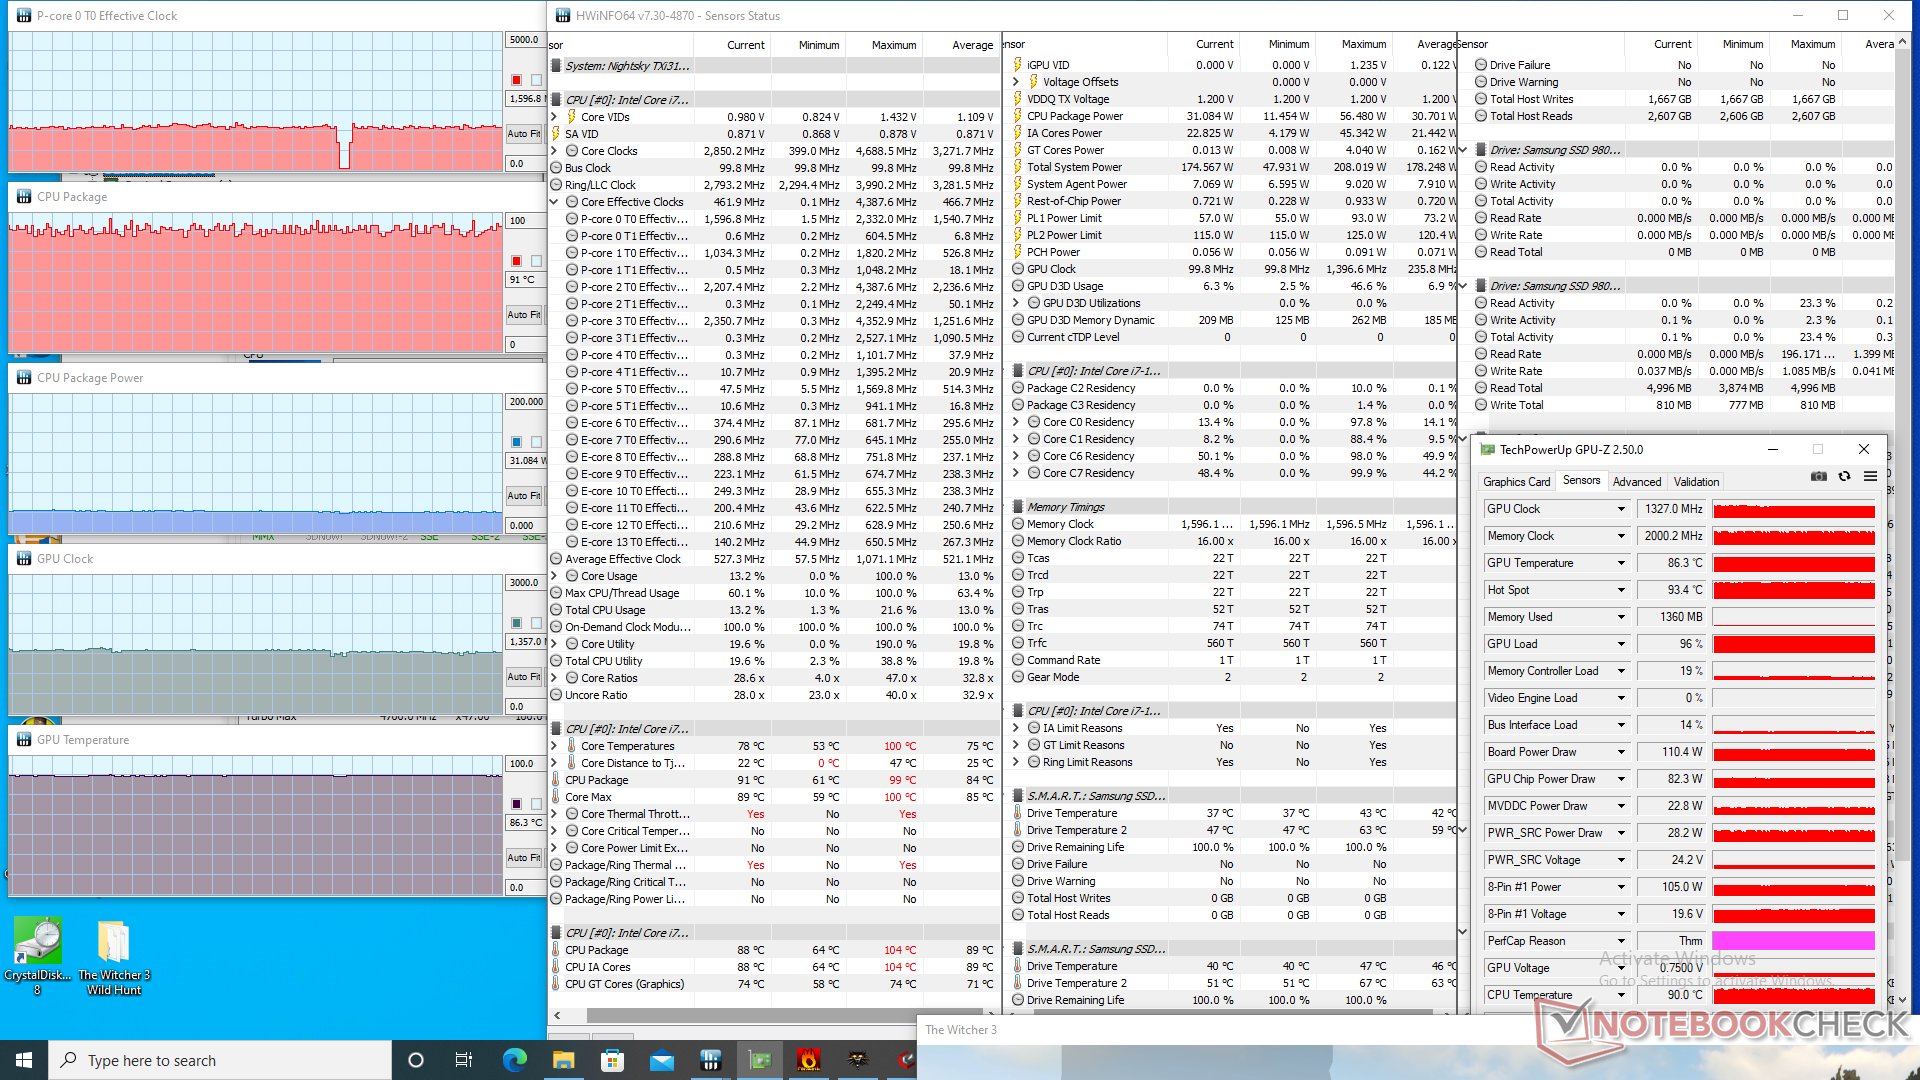
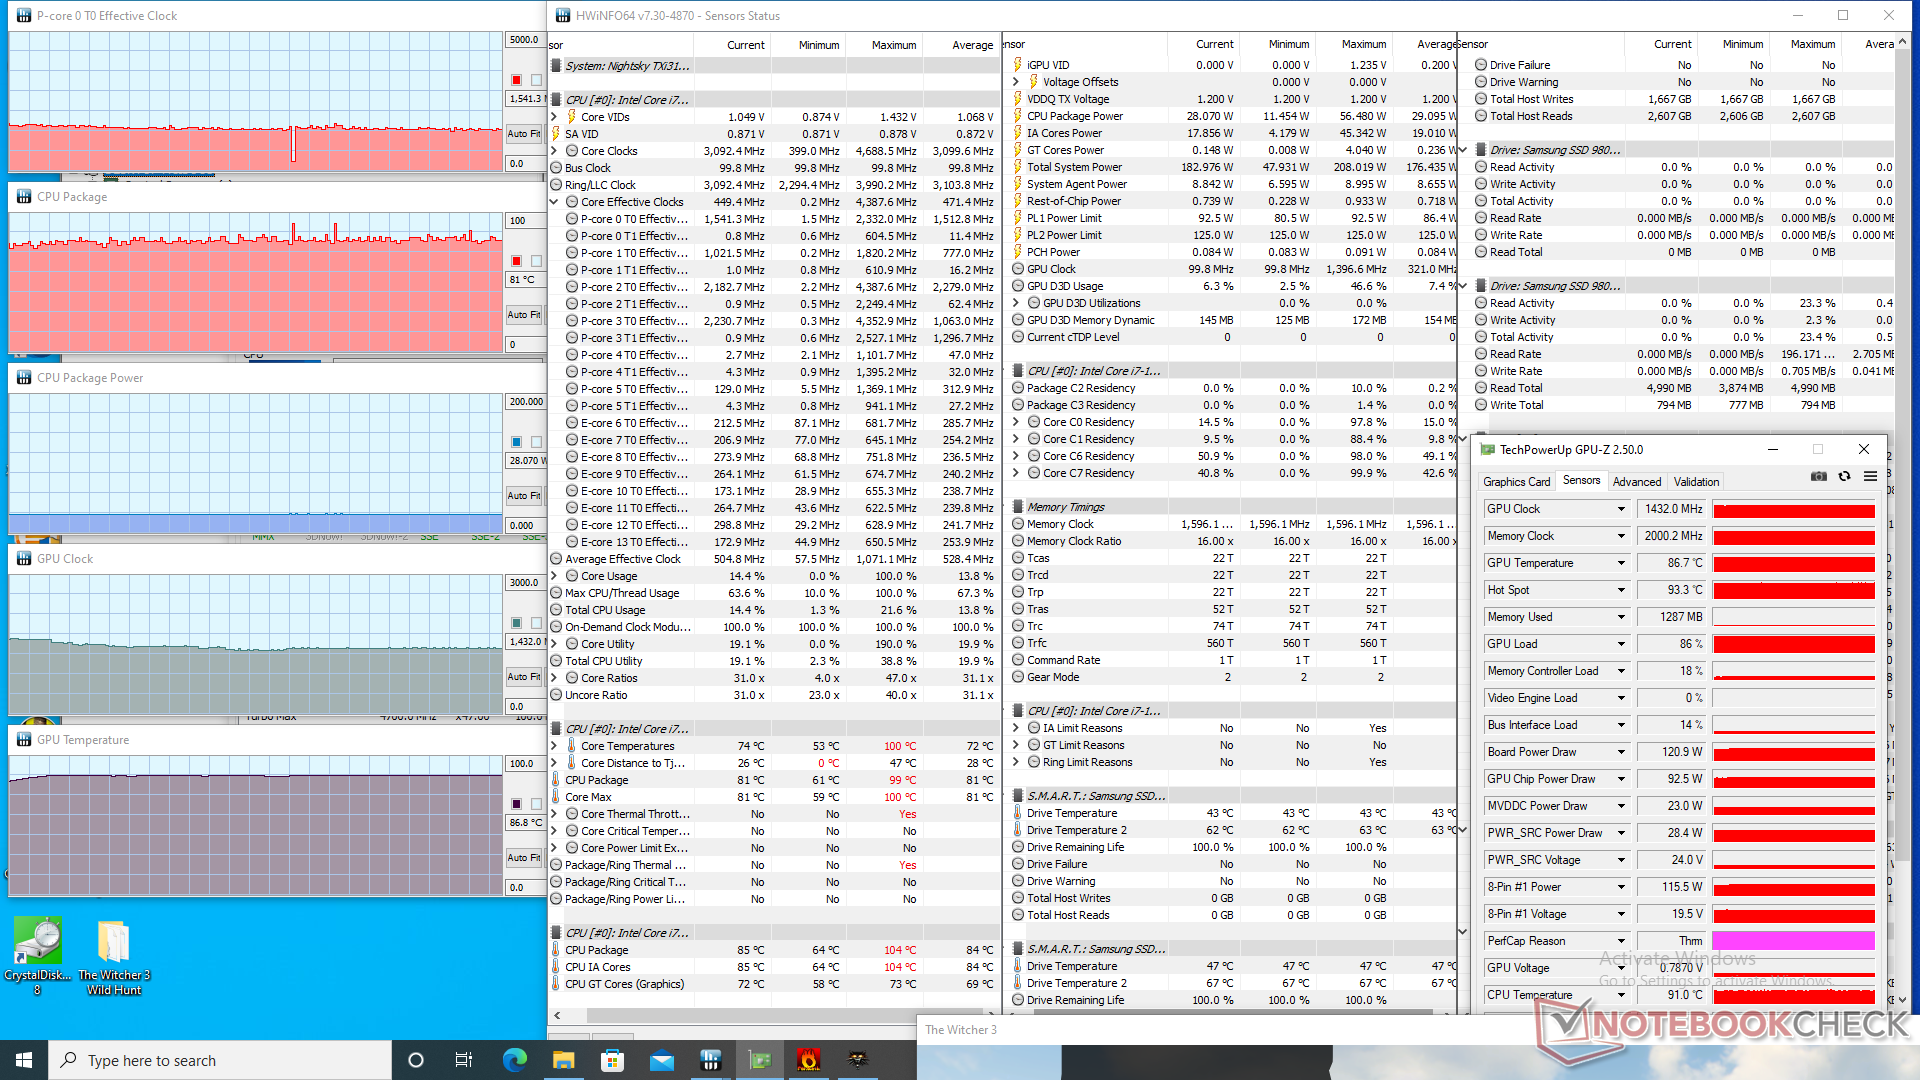
| Relógio CPU (GHz) | Relógio GPU (MHz) | Temperatura média da CPU (°C) | Temperatura média da GPU (°C) | |
| System Idle | -- | -- | 43 | 40 |
| Prime95 Stress | 2.8 | -- | 97 | 52 |
| Prime95 + FurMark Stress | 2.3 - 2.8 | 1267 - 1755 | 97 | 84 |
| Witcher 3 Stress | 1.5 | 1432 | 81 | 87 |
Oradores
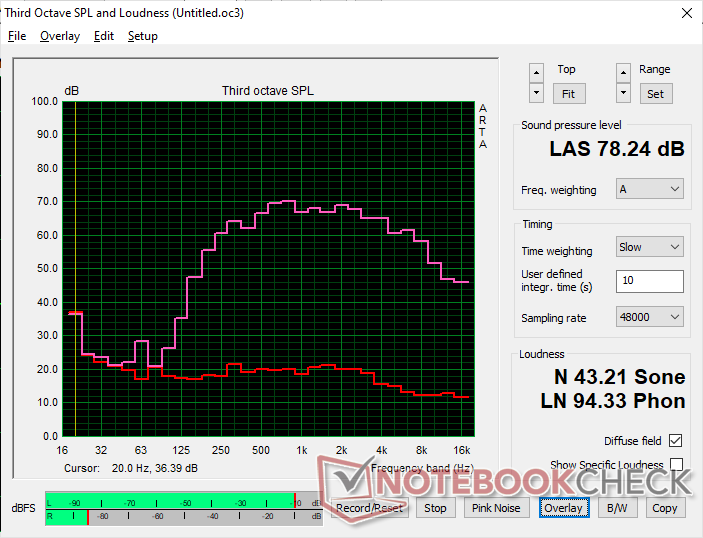
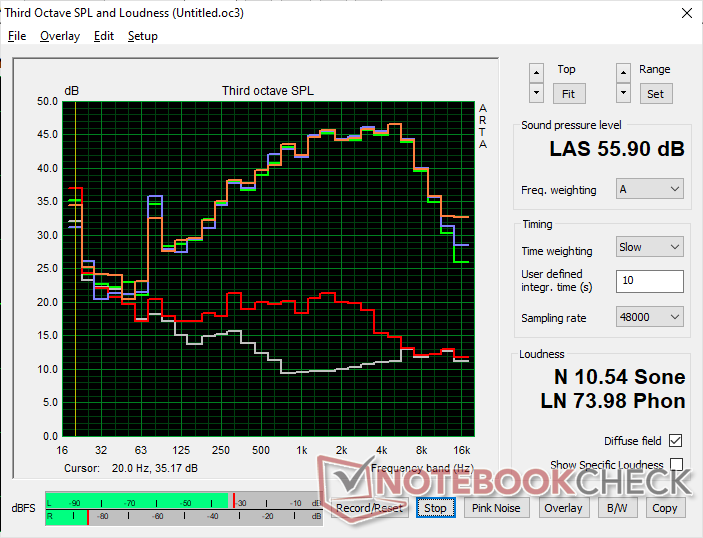
Eurocom Nightsky TXi317 análise de áudio
(±) | o volume do alto-falante é médio, mas bom (###valor### dB)
Graves 100 - 315Hz
(±) | graves reduzidos - em média 14.6% menor que a mediana
(-) | graves não são lineares (16.5% delta para frequência anterior)
Médios 400 - 2.000 Hz
(±) | médios mais altos - em média 5.1% maior que a mediana
(+) | médios são lineares (5% delta para frequência anterior)
Altos 2 - 16 kHz
(+) | agudos equilibrados - apenas 4% longe da mediana
(+) | os máximos são lineares (6.2% delta da frequência anterior)
Geral 100 - 16.000 Hz
(±) | a linearidade do som geral é média (20.4% diferença em relação à mediana)
Comparado com a mesma classe
» 72% de todos os dispositivos testados nesta classe foram melhores, 6% semelhantes, 22% piores
» O melhor teve um delta de 6%, a média foi 18%, o pior foi 132%
Comparado com todos os dispositivos testados
» 54% de todos os dispositivos testados foram melhores, 8% semelhantes, 38% piores
» O melhor teve um delta de 4%, a média foi 23%, o pior foi 134%
Apple MacBook Pro 16 2021 M1 Pro análise de áudio
(+) | os alto-falantes podem tocar relativamente alto (###valor### dB)
Graves 100 - 315Hz
(+) | bons graves - apenas 3.8% longe da mediana
(+) | o baixo é linear (5.2% delta para a frequência anterior)
Médios 400 - 2.000 Hz
(+) | médios equilibrados - apenas 1.3% longe da mediana
(+) | médios são lineares (2.1% delta para frequência anterior)
Altos 2 - 16 kHz
(+) | agudos equilibrados - apenas 1.9% longe da mediana
(+) | os máximos são lineares (2.7% delta da frequência anterior)
Geral 100 - 16.000 Hz
(+) | o som geral é linear (4.6% diferença em relação à mediana)
Comparado com a mesma classe
» 0% de todos os dispositivos testados nesta classe foram melhores, 0% semelhantes, 100% piores
» O melhor teve um delta de 5%, a média foi 17%, o pior foi 45%
Comparado com todos os dispositivos testados
» 0% de todos os dispositivos testados foram melhores, 0% semelhantes, 100% piores
» O melhor teve um delta de 4%, a média foi 23%, o pior foi 134%
Gestão de energia
Consumo de energia
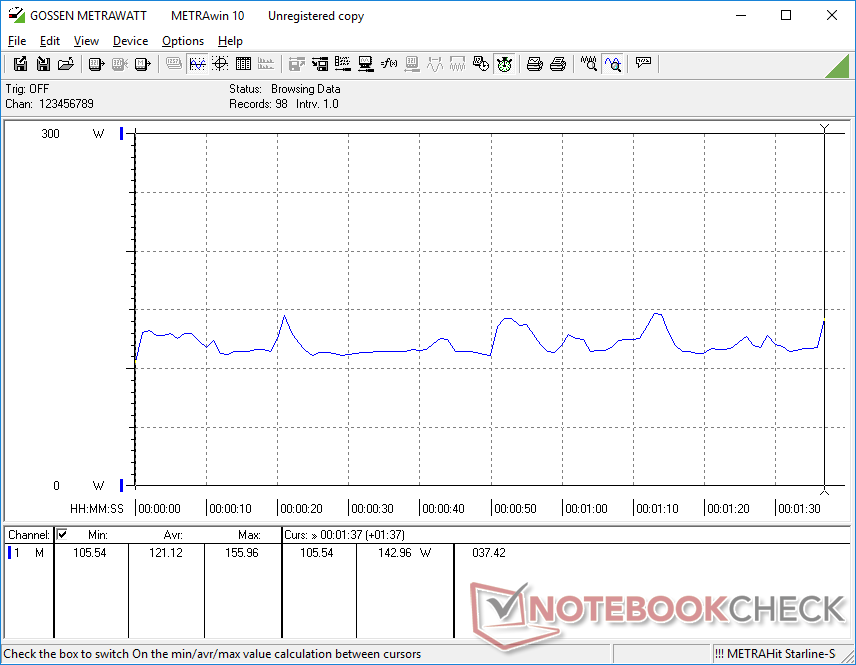
A manipulação na área de trabalho com o menor brilho e perfil de potência exigiria pouco menos de 13 W para ser comparável com o XMG Pro 17 E22. Entretanto, isto pode saltar até 40 W se na configuração de brilho máximo e no perfil de potência de desempenho com a discreta GPU Nvidia ativa. É recomendável executar em configurações de potência mais baixas se a performance extra não for necessária por causa da significativa economia de energia.
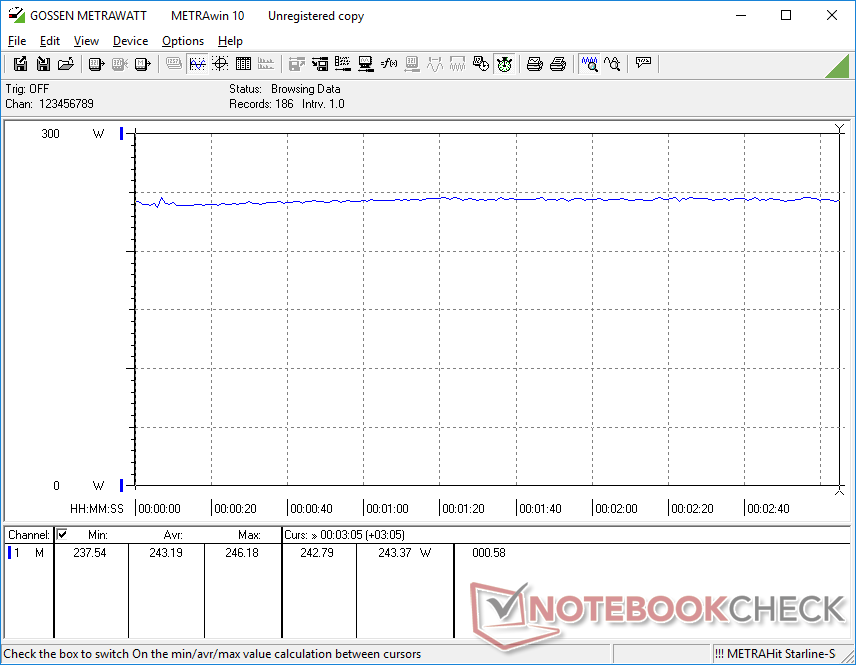
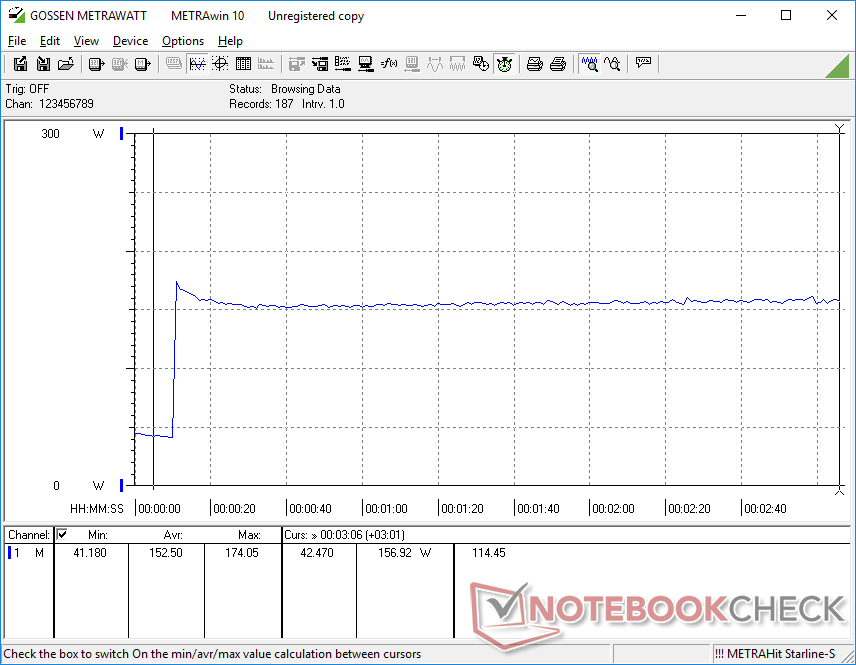
Consumo de energia durante o funcionamento Witcher 3 é quase idêntico ao que registramos noMSI Raider GE77 equipado com a mesma GPU. O sistema é muito mais exigente do que os antigos laptops para jogos rodando no GeForce RTX 2080, tais como oLenovo Legion 7 15 por mais de 80 W
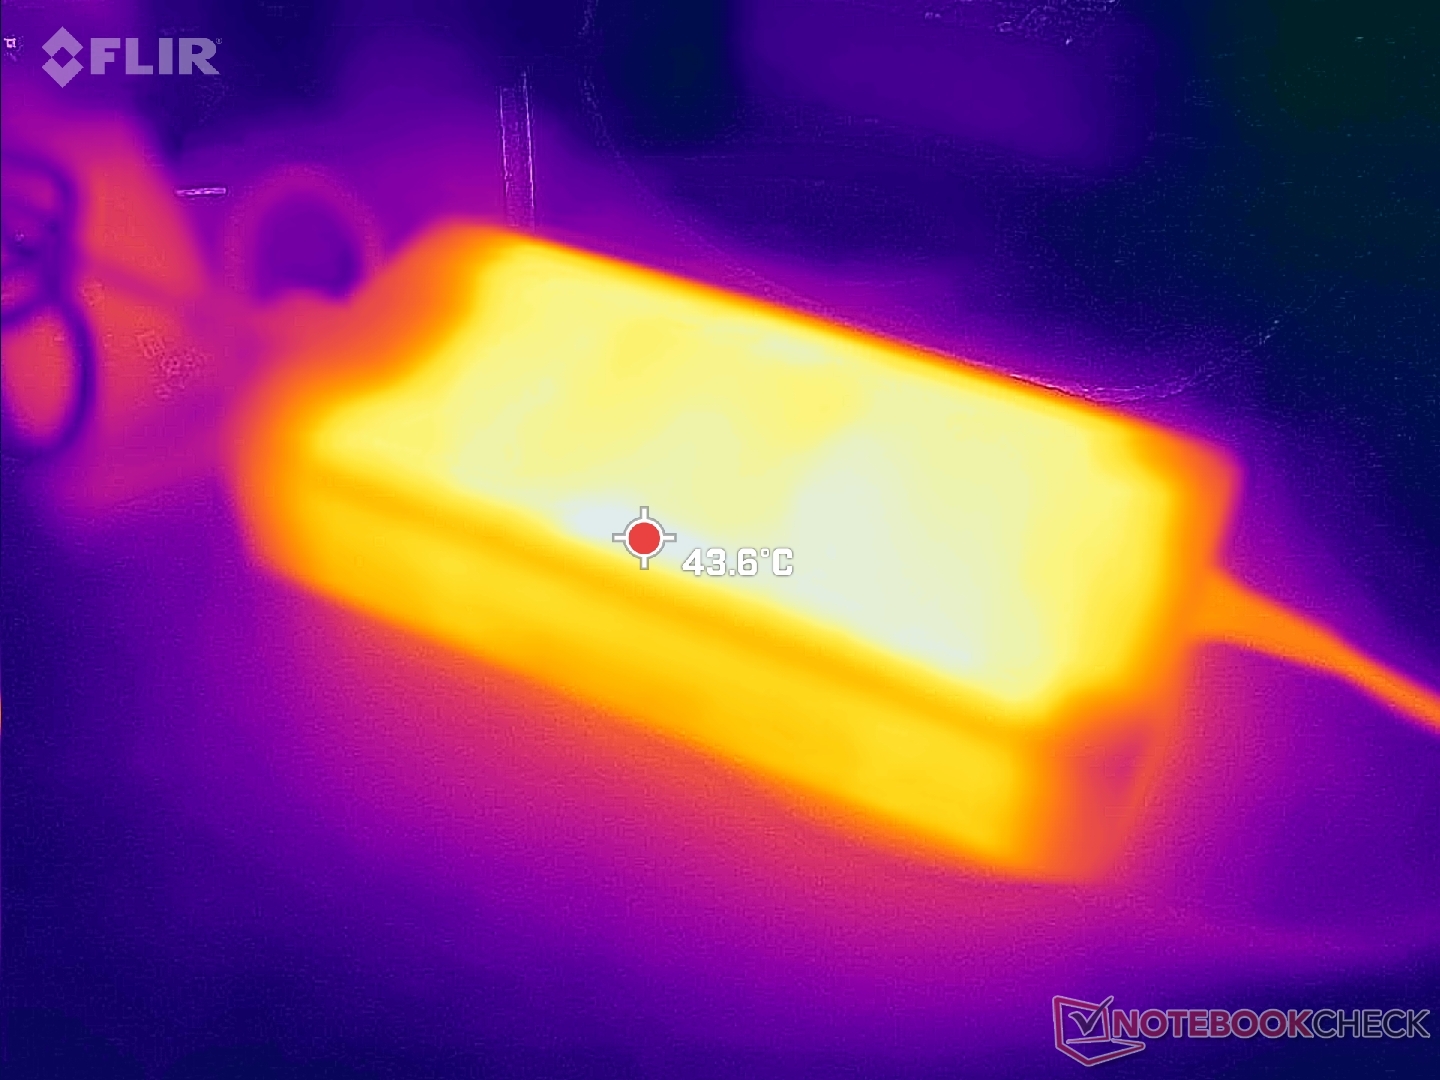
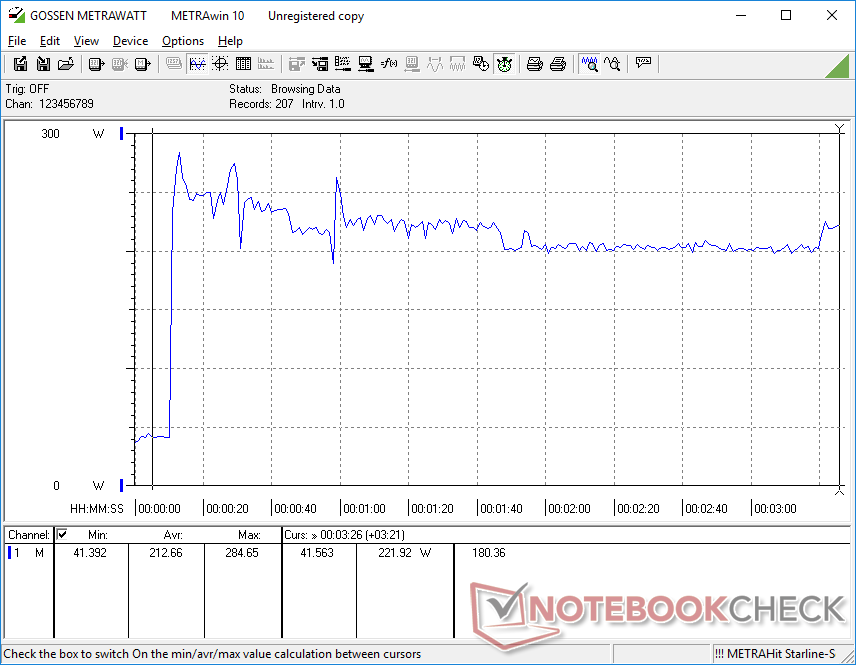
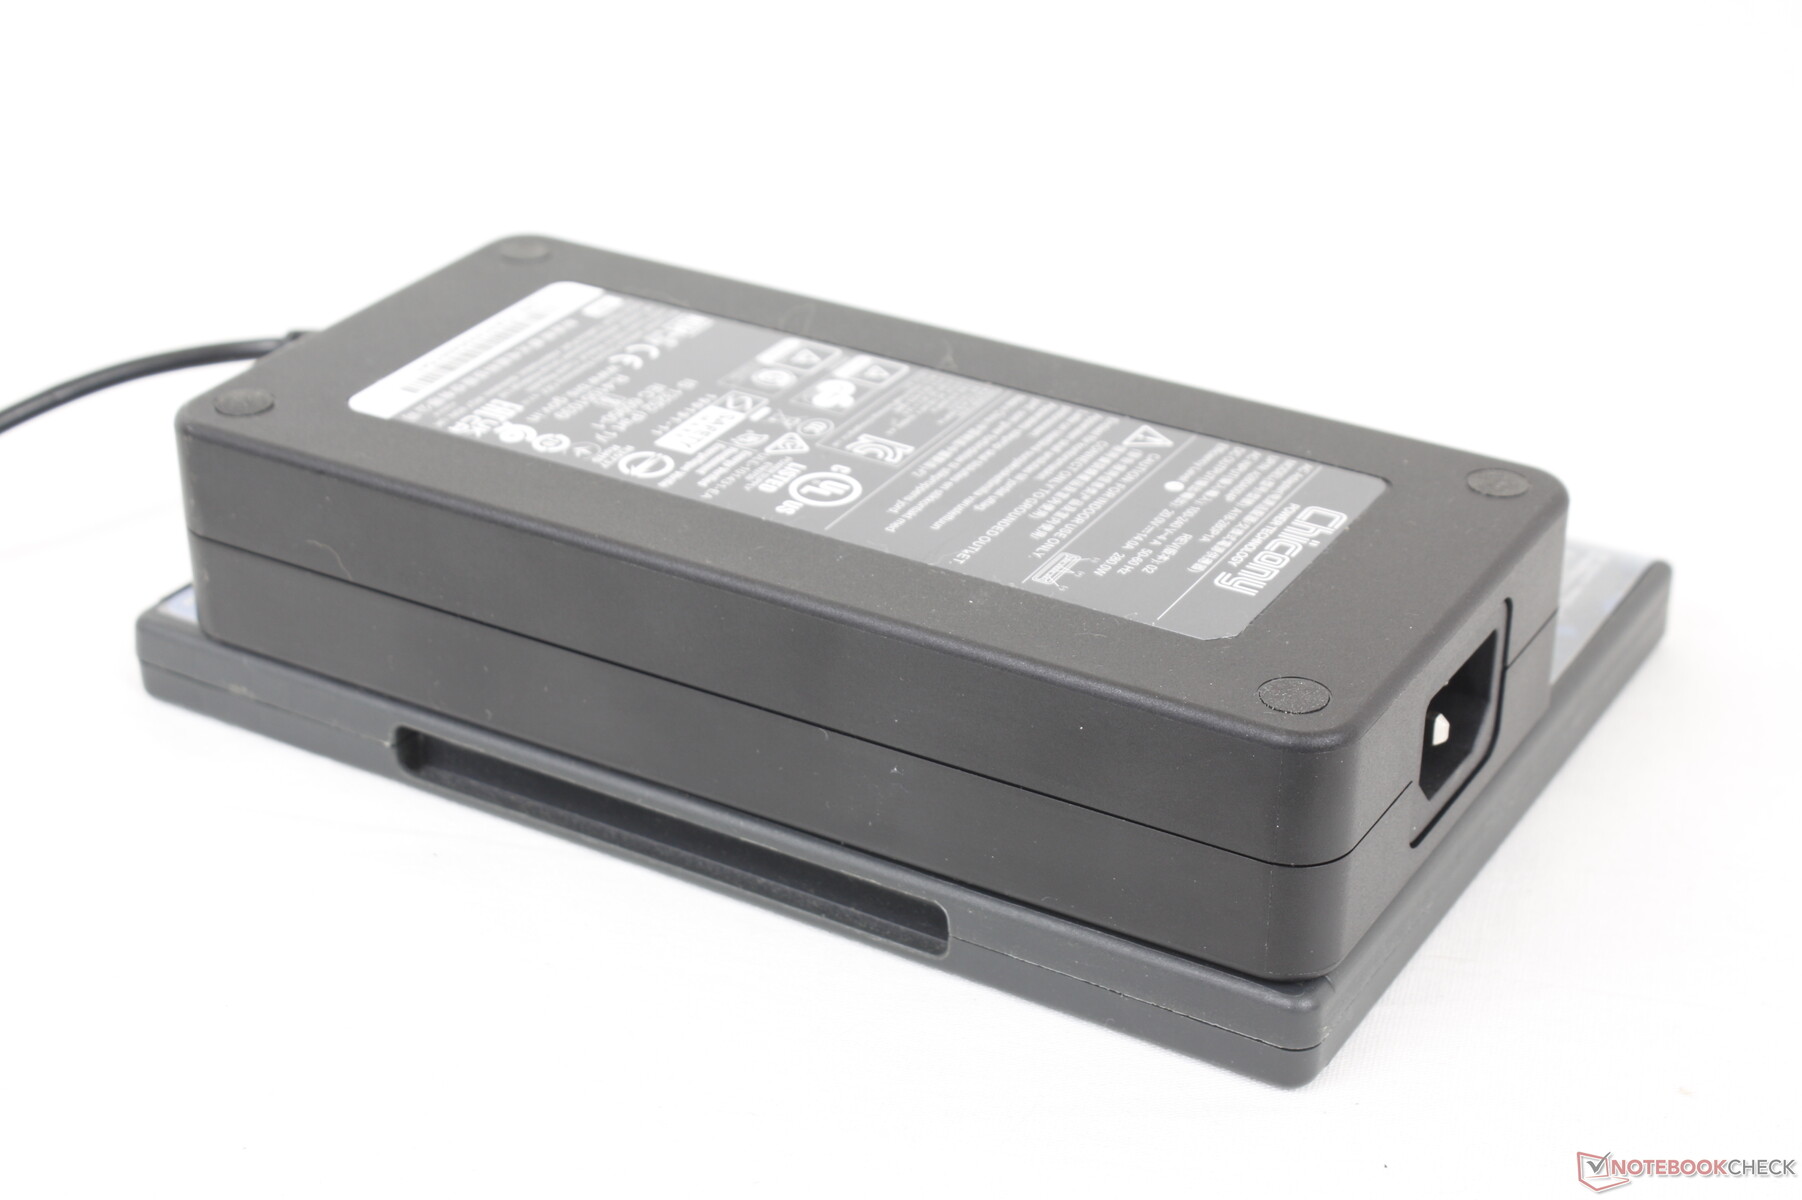
Somos capazes de registrar um consumo máximo de 285 W do grande (~18 x 8,5 x 3,5 cm) adaptador AC de 280 W quando tanto a CPU quanto a GPU estão em 100% de utilização. Esta taxa é apenas temporária, como mostra nosso gráfico abaixo, devido a limitações térmicas. O sistema ainda pode rodar jogos e recarregar a uma taxa razoável simultaneamente.
| desligado | |
| Ocioso | |
| Carga |
|
Key:
min: | |
| Eurocom Nightsky TXi317 i7-12700H, GeForce RTX 3080 Ti Laptop GPU, Samsung SSD 980 Pro 1TB MZ-V8P1T0BW, IPS, 1920x1080, 17.3" | Schenker XMG Pro 17 E22 i9-12900H, GeForce RTX 3080 Ti Laptop GPU, Samsung SSD 980 Pro 1TB MZ-V8P1T0BW, IPS, 2560x1440, 17.3" | Aorus 17X XES i9-12900HX, GeForce RTX 3070 Ti Laptop GPU, Gigabyte AG470S1TB-SI B10, IPS, 1920x1080, 17.3" | MSI Raider GE77 HX 12UHS i9-12900HX, GeForce RTX 3080 Ti Laptop GPU, Samsung PM9A1 MZVL22T0HBLB, IPS, 3840x2160, 17.3" | Razer Blade 17 Early 2022 i9-12900H, GeForce RTX 3080 Ti Laptop GPU, Samsung PM9A1 MZVL21T0HCLR, IPS, 3840x2160, 17.3" | Alienware x17 R2 P48E i9-12900HK, GeForce RTX 3080 Ti Laptop GPU, 2x Samsung PM9A1 1TB (RAID 0), IPS, 1920x1080, 17.3" | |
|---|---|---|---|---|---|---|
| Power Consumption | 17% | -6% | 4% | 6% | -25% | |
| Idle Minimum * (Watt) | 12.8 | 13 -2% | 18 -41% | 13 -2% | 17 -33% | 24.1 -88% |
| Idle Average * (Watt) | 33.9 | 17 50% | 28 17% | 19 44% | 23 32% | 28.5 16% |
| Idle Maximum * (Watt) | 39.1 | 26 34% | 36 8% | 29 26% | 34 13% | 60 -53% |
| Load Average * (Watt) | 121.1 | 120 1% | 153 -26% | 143 -18% | 120 1% | 128.7 -6% |
| Witcher 3 ultra * (Watt) | 243 | 221 9% | 221 9% | 247 -2% | 229 6% | 254 -5% |
| Load Maximum * (Watt) | 284.7 | 266 7% | 290 -2% | 352 -24% | 243 15% | 323 -13% |
* ... menor é melhor
Power Consumption Witcher 3 / Stresstest
Power Consumption external Monitor
Vida útil da bateria
O tempo de execução da WLAN é curto em pouco mais de 4 horas de navegação no mundo real antes de precisar recarregar. Nossa unidade foi ajustada para o perfil de potência balanceada com o iGPU ativo antes de executar o teste de duração da bateria. Os resultados são similares aos do Razer Blade 17 ou Aorus 17X mas ainda mais de duas horas a menos do que no Schenker XMG Pro 17 E22.
A carga desde a capacidade vazia até a plena é muito lenta em cerca de 2,5 horas. A maioria dos laptops para jogos leva apenas 1,5 a 2 horas, em comparação. O sistema não pode ser recarregado via USB-C.
| Eurocom Nightsky TXi317 i7-12700H, GeForce RTX 3080 Ti Laptop GPU, 80 Wh | Schenker XMG Pro 17 E22 i9-12900H, GeForce RTX 3080 Ti Laptop GPU, 80 Wh | Aorus 17X XES i9-12900HX, GeForce RTX 3070 Ti Laptop GPU, 99 Wh | MSI Raider GE77 HX 12UHS i9-12900HX, GeForce RTX 3080 Ti Laptop GPU, 99.99 Wh | Razer Blade 17 Early 2022 i9-12900H, GeForce RTX 3080 Ti Laptop GPU, 82 Wh | Alienware x17 R2 P48E i9-12900HK, GeForce RTX 3080 Ti Laptop GPU, 87 Wh | |
|---|---|---|---|---|---|---|
| Duração da bateria | 62% | 5% | 29% | -10% | -52% | |
| WiFi v1.3 (h) | 4.2 | 6.8 62% | 4.4 5% | 5.4 29% | 3.8 -10% | 2 -52% |
| H.264 (h) | 4.6 | 3.8 | 6.5 | 4.8 | ||
| Load (h) | 1.5 | 1.4 | 2 | 1.7 | 0.8 | |
| Reader / Idle (h) | 9.8 | 7.1 | 3.9 |
Pro
Contra
Veredicto - Precisa de uma atualização do chassi
O Eurocom Nightsky TXi317 tem o desempenho de CPU e GPU de um laptop de grande porte para jogos, mas sem muitas das características auxiliares que se espera de um projeto de médio porte. Mais notavelmente, o modelo é incapaz de executar SSDs por longos períodos sem necessidade de acelerar as taxas de transferência. O público-alvo dos usuários de desempenho é mais provável que fique desapontado por não poder explorar totalmente suas novas unidades PCIe4 x4. Alternativas como o Alienware x17ou MSI GE66 normalmente têm espalhadores de calor sobre seus SSDs internos por este exato motivo.
O Eurocom Nightsky TXi317 tem o desempenho de um laptop para jogos caro, mas falta-lhe muitas características auxiliares básicas e avançadas de um.
Outros inconvenientes menores incluem a webcam de muito baixa resolução, sem obturador de privacidade, falta de suporte a USB-C PD, sem opções avançadas de Optimus, sem Wi-Fi 6E, e as temperaturas centrais muito quentes que atingem quase 90 C quando se joga. O chassi até fica para trás quando se trata de manutenção, já que o painel inferior leva mais tempo para ser removido do que na maioria dos outros laptops para jogos de hoje em dia. Por US$ 3.000 ou mais, o Nightsky TXi317 simplesmente não oferece quase tanto quanto outros concorrentes de alto nível.
Preço e Disponibilidade
O Nightsky TXi317 pode ser adquirido diretamente da Eurocom aqui em várias configurações a partir de $3000 USD.
Eurocom Nightsky TXi317
- 10/26/2022 v7 (old)
Allen Ngo
Price comparison

