Análise do laptop Eurocom Raptor X17: A alternativa MSI e Asus ROG

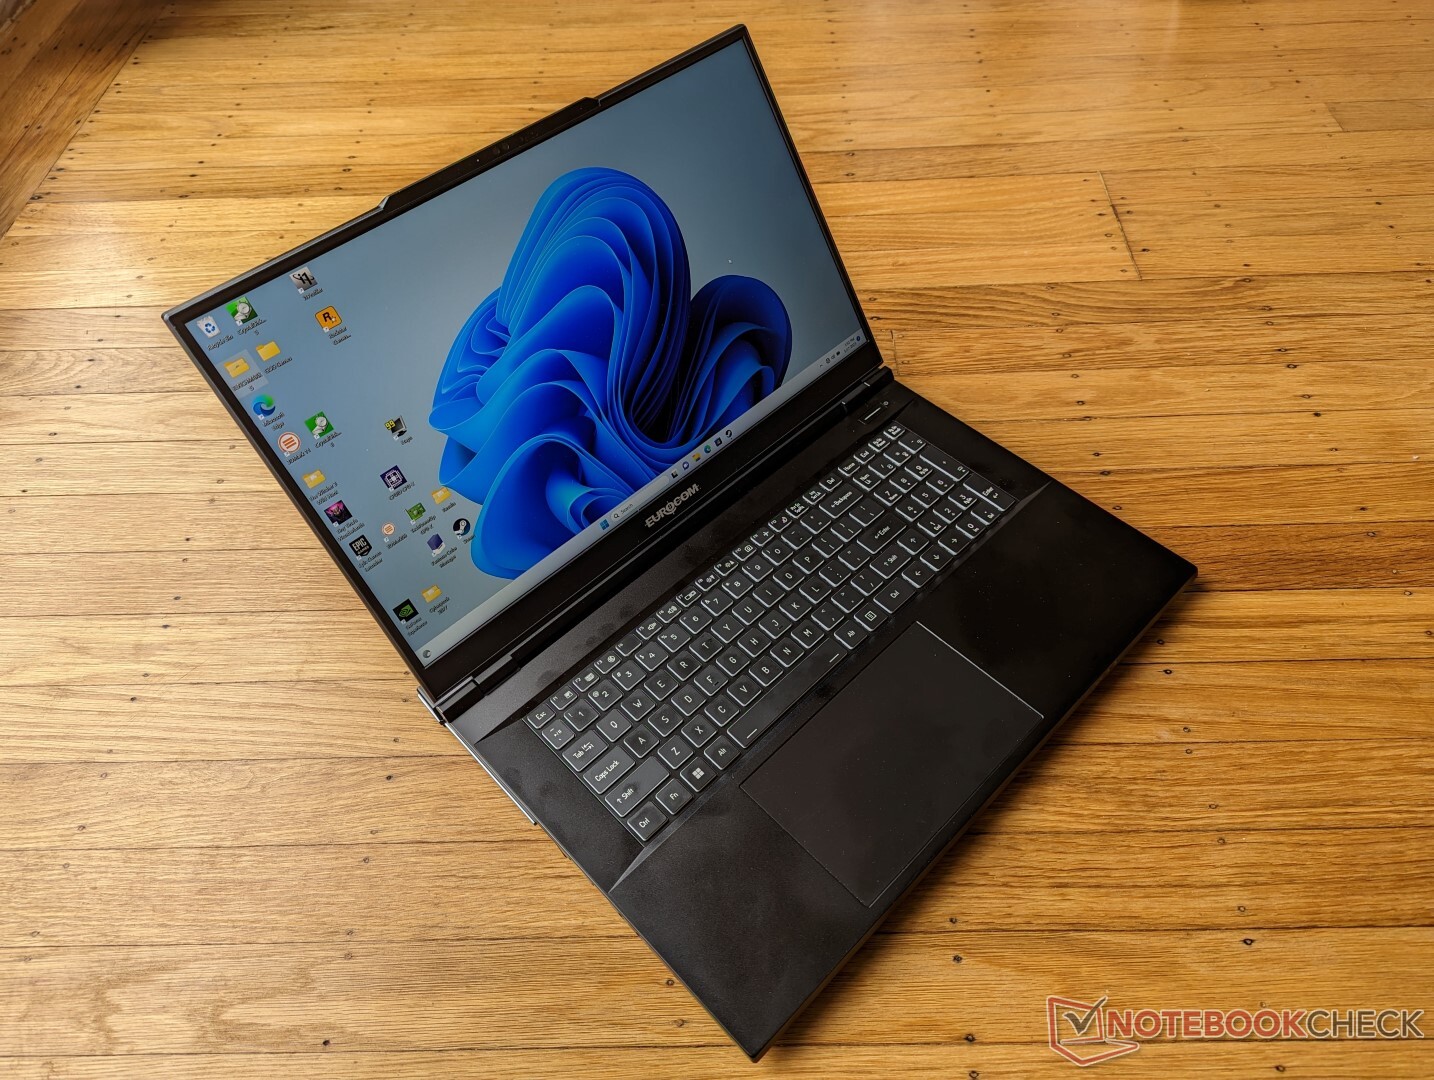
Depois de conferir recentemente o Raptor X15de 15,6 polegadas, agora estamos prontos para enfrentar seu irmão maior, o Raptor X17 de 17,3 polegadas. Seu chassi tem um novo design (X370) que ainda não tínhamos visto de outras marcas até o momento da análise. No entanto, esperamos que outros revendedores, como a Schenker, acabem oferecendo esse mesmo chassi com uma marca diferente para os mercados estrangeiros.
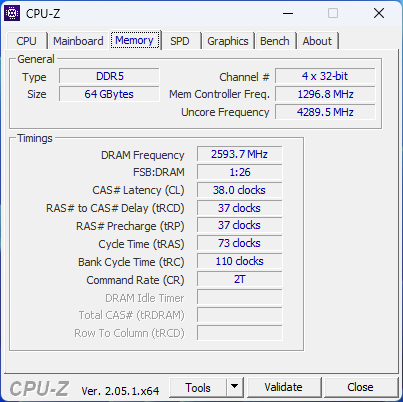
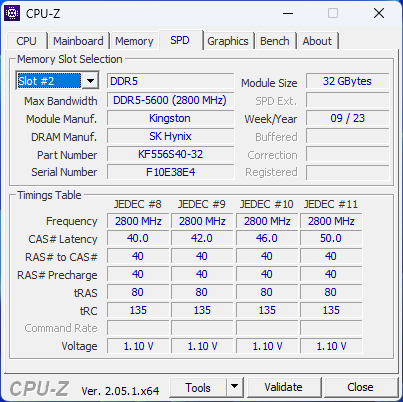
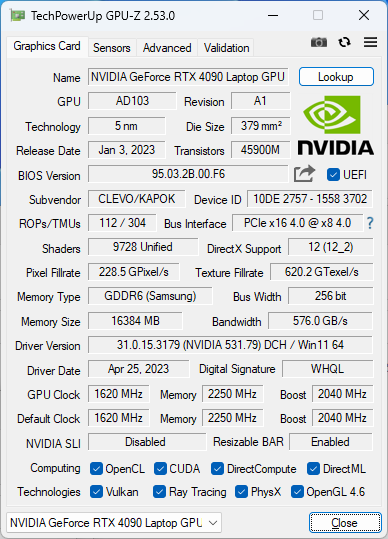
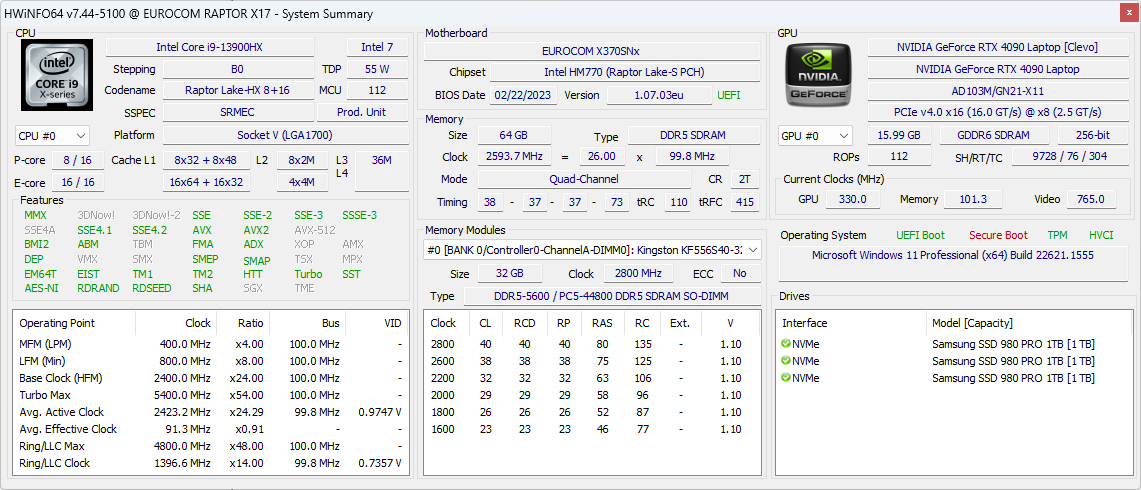
Nossa configuração em análise é uma SKU de ponta com a CPU Raptor Lake Core i9-13900HX de 13ª geração, GPU GeForce RTX 4090 de 175 W, 64 GB de RAM DDR5, 3 SSDs de 1 TB e tela de 1440p 240 Hz por aproximadamente US$ 6600. Obviamente, os usuários podem configurar com menos RAM e armazenamento e um i7-13700HX ou uma RTX 4080 por preços iniciais mais baixos.
Os concorrentes do Raptor X17 incluem outros notebooks finos e médios para jogos de 17 polegadas, como o Razer Blade 17, Asus ROG Strix Scar 17, Gigabyte Aorus 17Xou o MSI GS77.
Mais análises da Eurocom:
Possíveis concorrentes em comparação
Avaliação | Data | Modelo | Peso | Altura | Size | Resolução | Preço |
|---|---|---|---|---|---|---|---|
| 82.8 % v7 (old) | 05/2023 | Eurocom Raptor X17 i9-13900HX, GeForce RTX 4090 Laptop GPU | 3.5 kg | 24.9 mm | 17.30" | 2560x1440 | |
| 88.3 % v7 (old) | 04/2023 | Asus ROG Strix Scar 17 G733PY-XS96 R9 7945HX, GeForce RTX 4090 Laptop GPU | 2.9 kg | 28.3 mm | 17.30" | 2560x1440 | |
| 86 % v7 (old) | 04/2023 | Aorus 17X AZF i9-13900HX, GeForce RTX 4090 Laptop GPU | 2.9 kg | 21.8 mm | 17.30" | 2560x1440 | |
| 88.3 % v7 (old) | 03/2023 | MSI GE78HX 13VH-070US i9-13950HX, GeForce RTX 4080 Laptop GPU | 3 kg | 23 mm | 17.00" | 2560x1600 | |
| 89.9 % v7 (old) | 03/2023 | Eluktronics Mech-17 GP2 i9-13900HX, GeForce RTX 4090 Laptop GPU | 2.9 kg | 27 mm | 17.00" | 2560x1600 | |
| 86.1 % v7 (old) | 01/2023 | Alienware m17 R5 (R9 6900HX, RX 6850M XT) R9 6900HX, Radeon RX 6850M XT | 3.4 kg | 26.7 mm | 17.00" | 3840x2160 |
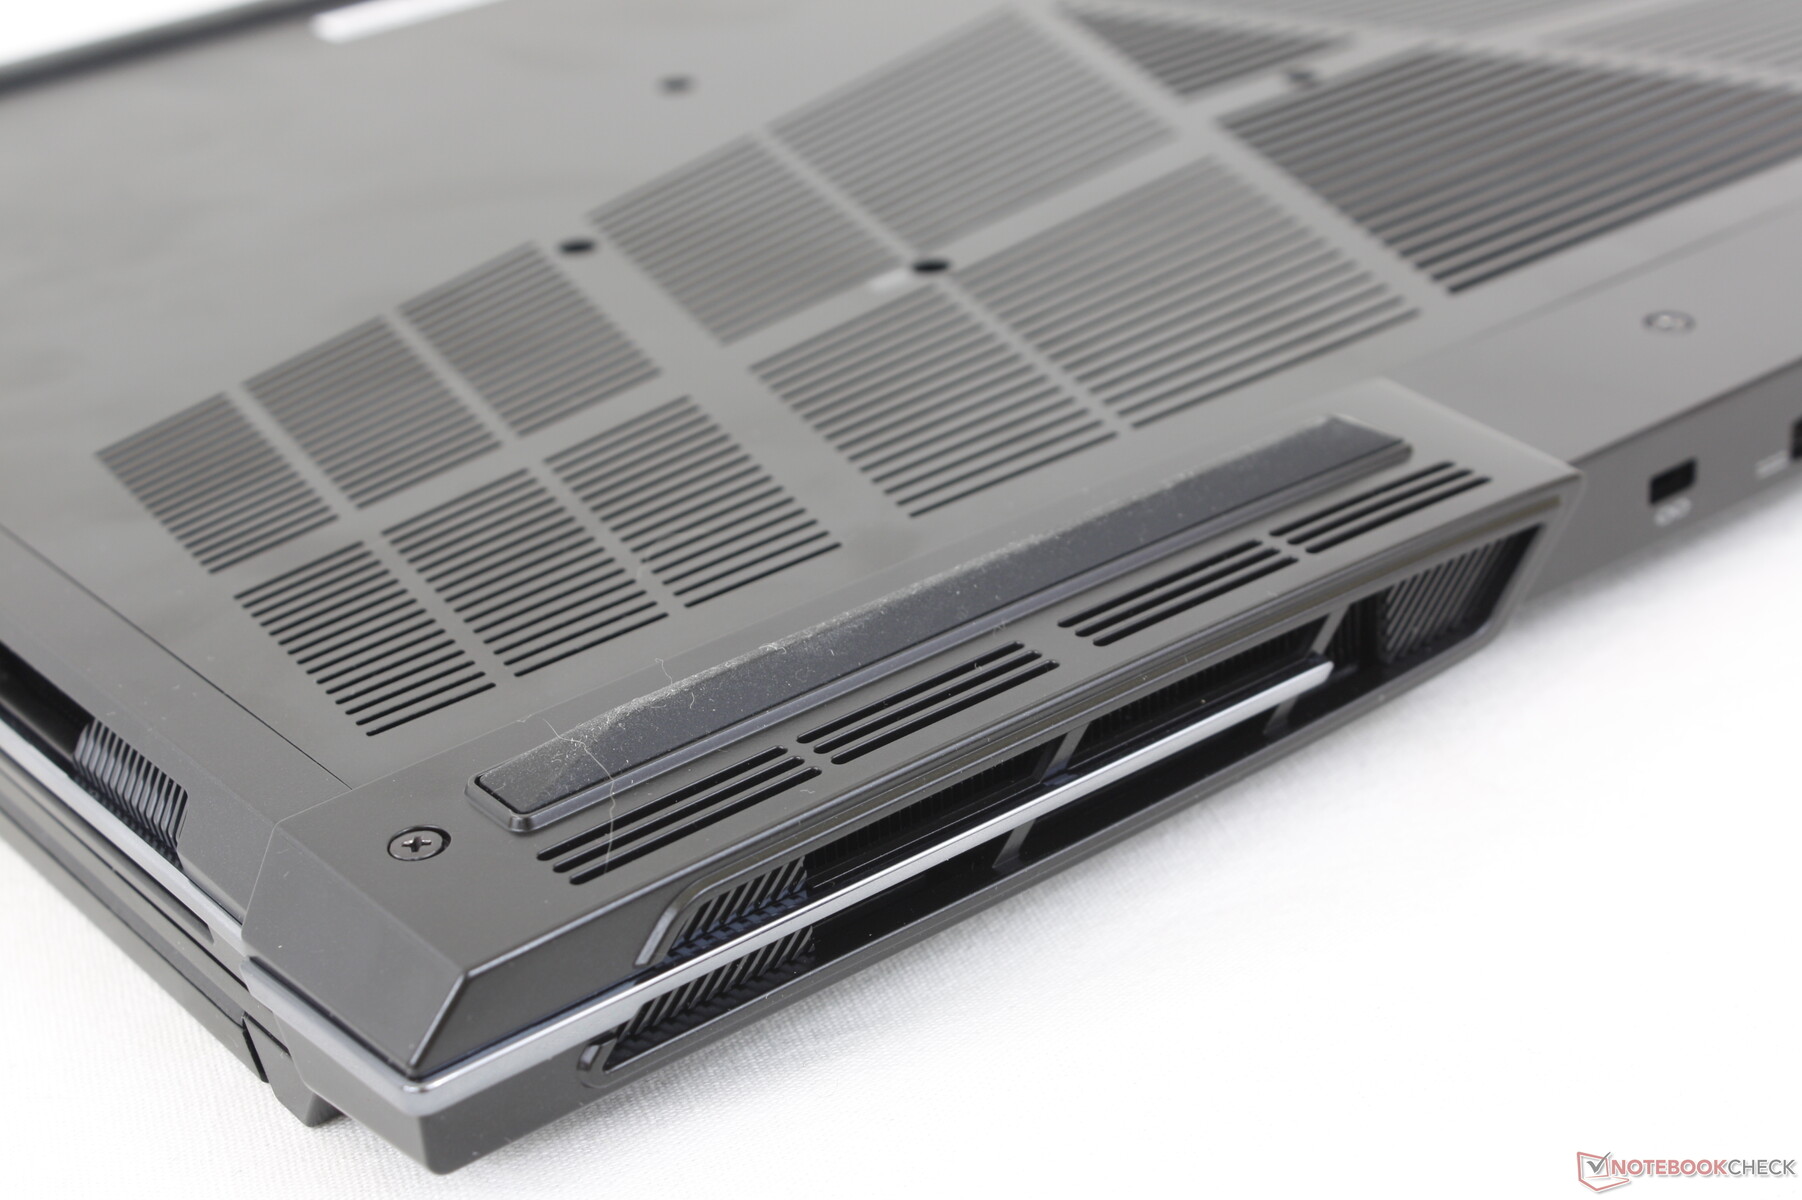
Caso - Um novo recomeço
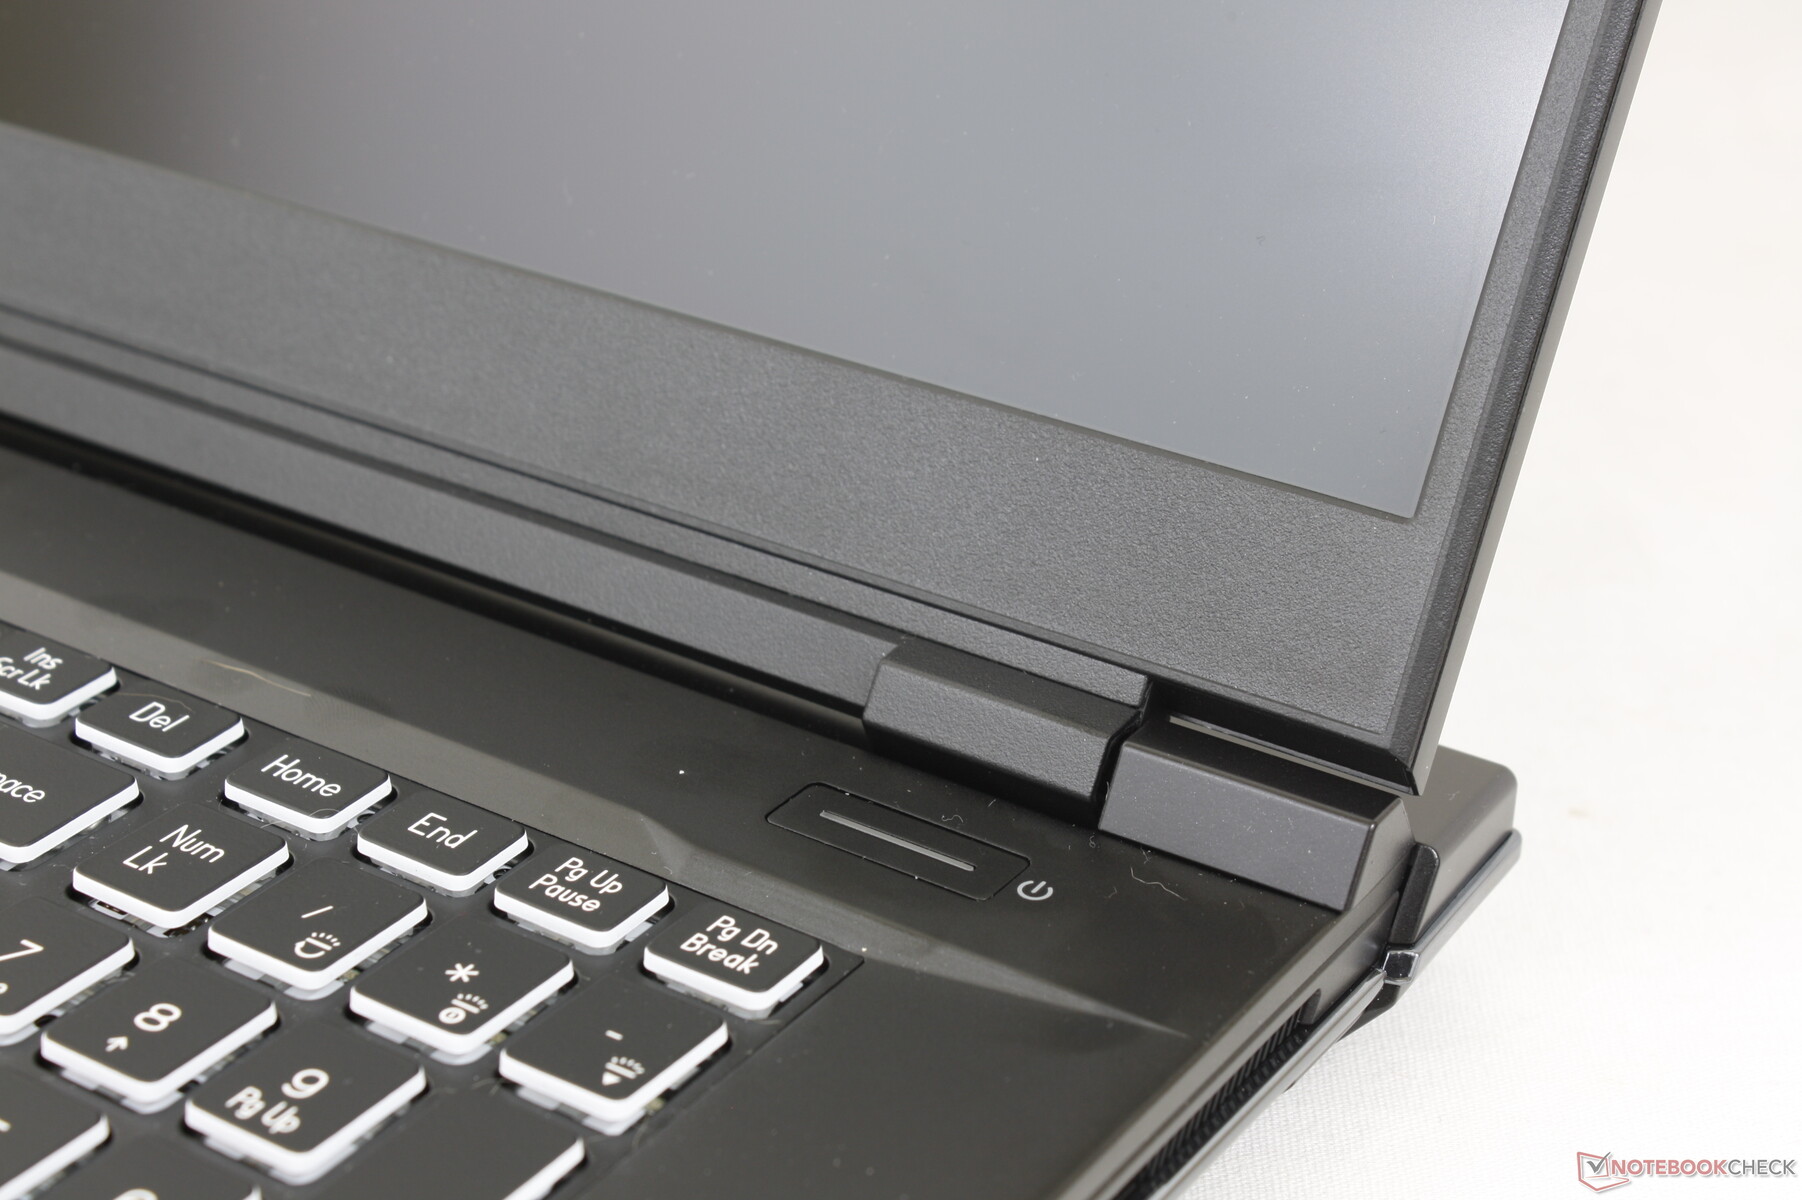
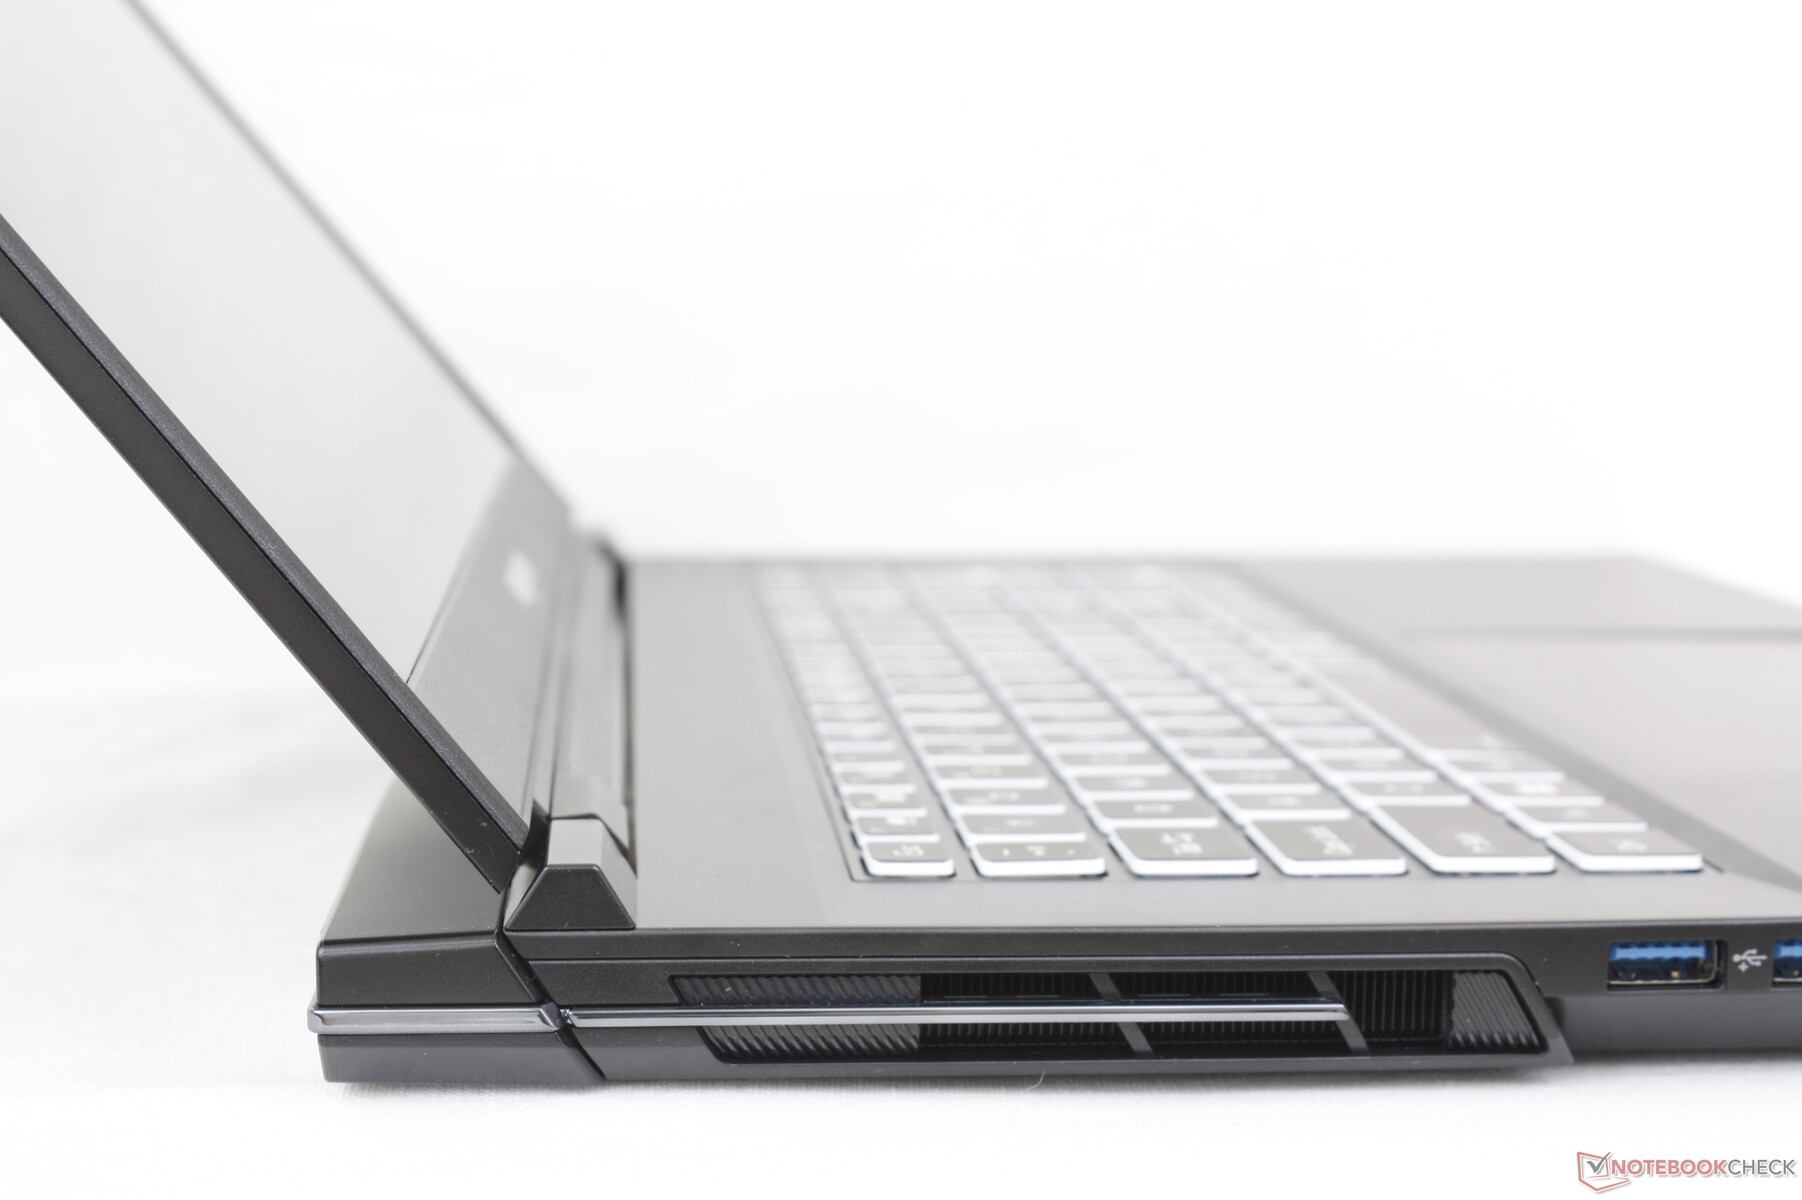
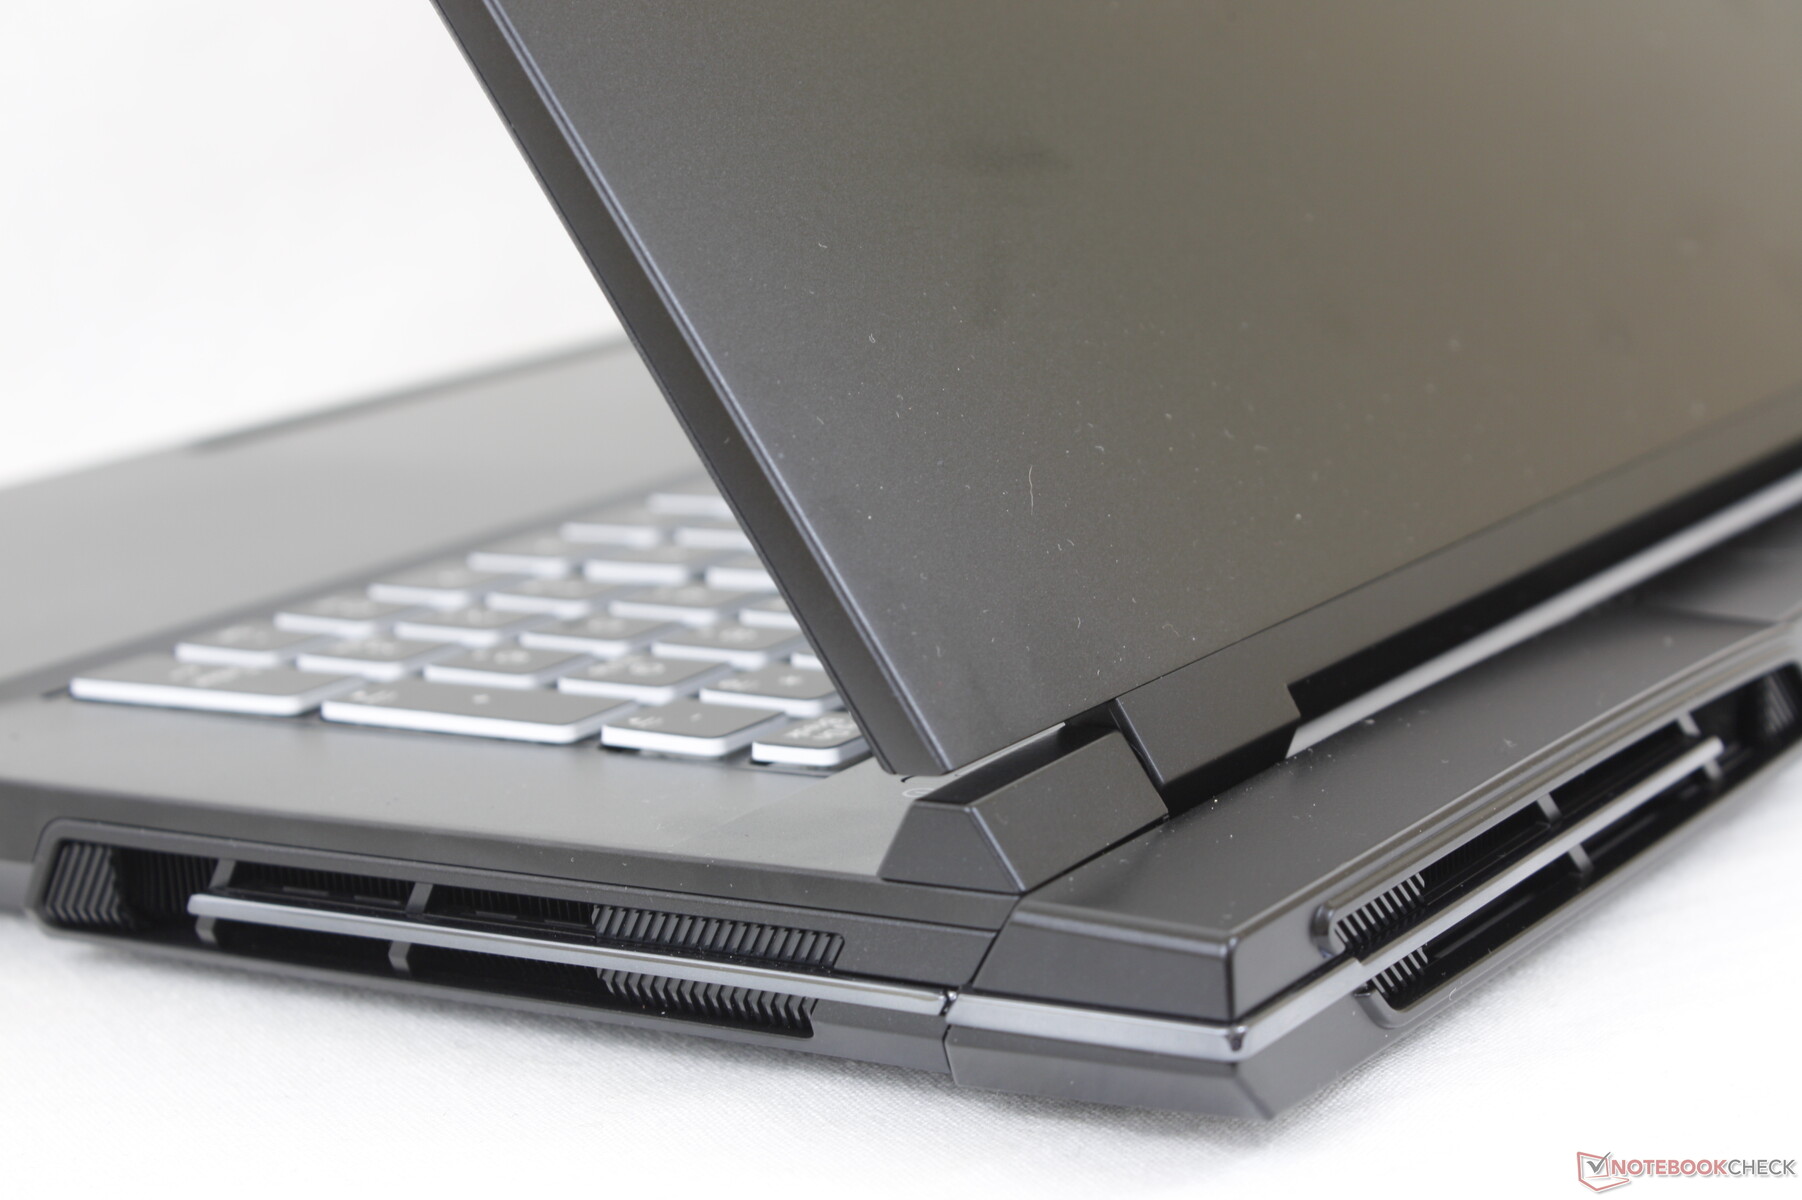
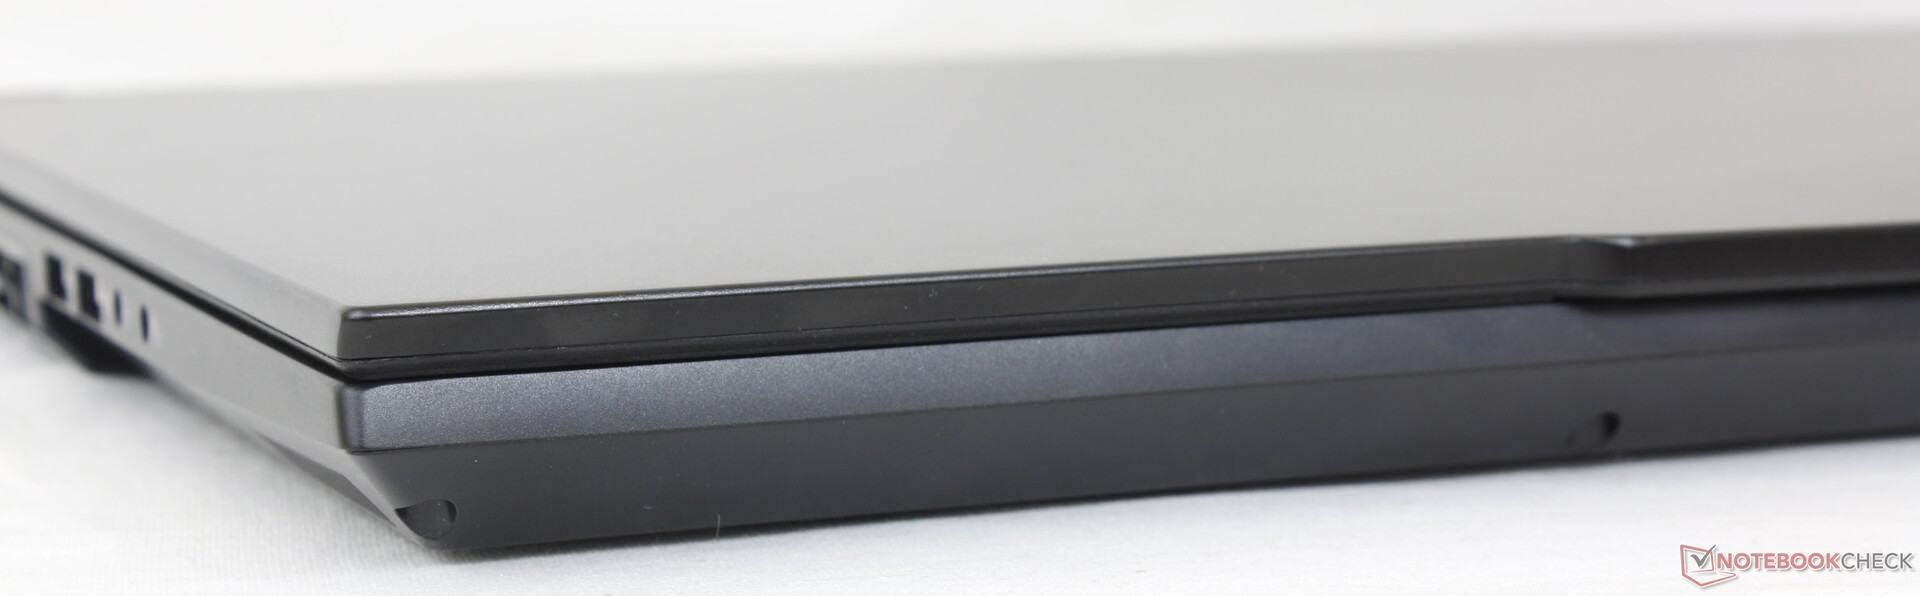
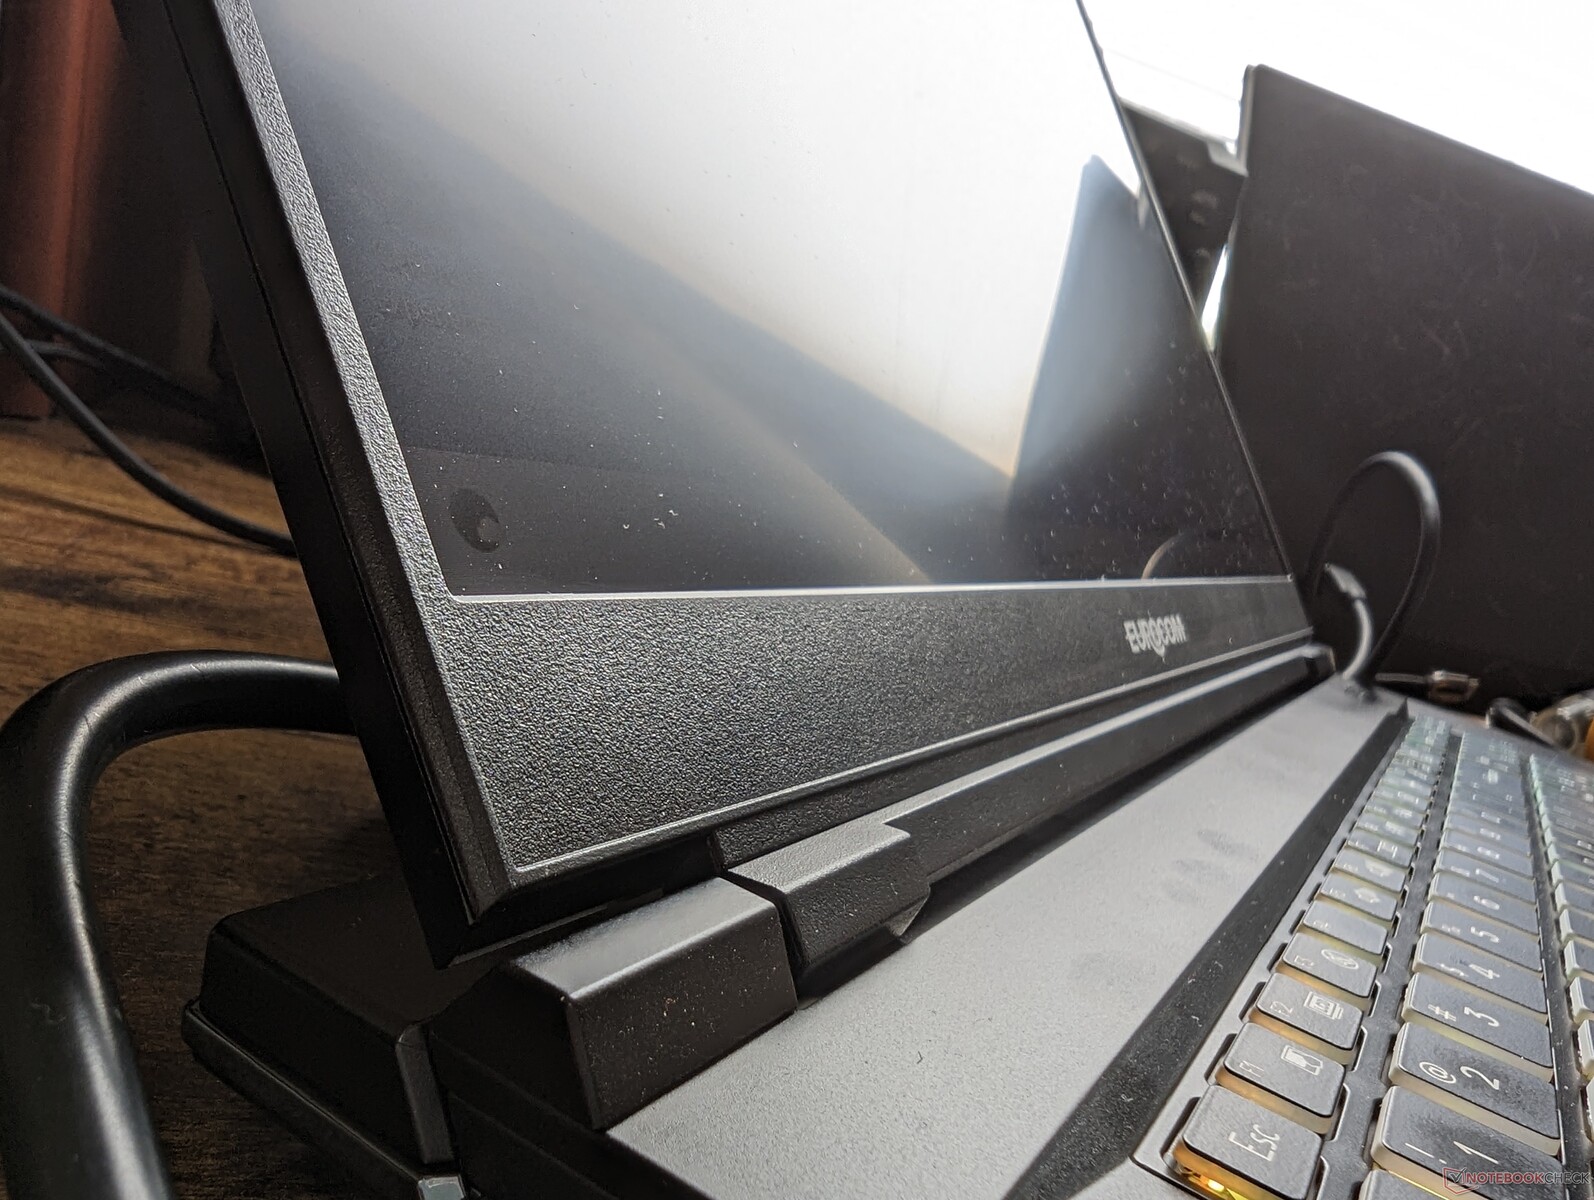
O Raptor X17 é provavelmente o laptop mais elegante que já vimos da Eurocom. O esqueleto super liso e principalmente de metal contrasta fortemente com os designs de ABS mais antigos e mais espessos da mesma empresa. A rigidez do chassi também é excelente, com flexão mínima ao longo da base e da tampa externa, o que proporciona uma primeira impressão sólida.
Talvez o aspecto mais fraco do chassi seja a dobradiça, pois a tela oscila um pouco mais agressivamente ao ajustar os ângulos em comparação com as dobradiças mais rígidas e maiores de um Laptop Asus ROG. O centro do teclado também se flexiona ligeiramente ao aplicar pressão com o dedo, o que afeta negativamente o feedback das teclas durante a digitação. Esperamos que qualquer reformulação futura possa resolver essas preocupações.
Com 3,5 kg, o Raptor X17 é um dos laptops para jogos mais pesados em sua categoria de tamanho, superando até mesmo o laptop de 3,4 kg Alienware m17 R5. Mais notavelmente, o sistema é um pouco menor do que o ROG Strix Scar 17 G733 e, ainda assim, é 20% mais pesado, proporcionando uma sensação muito densa. Para algo significativamente mais leve e menor, os usuários podem considerar o Razer Blade 17 em seu lugar.
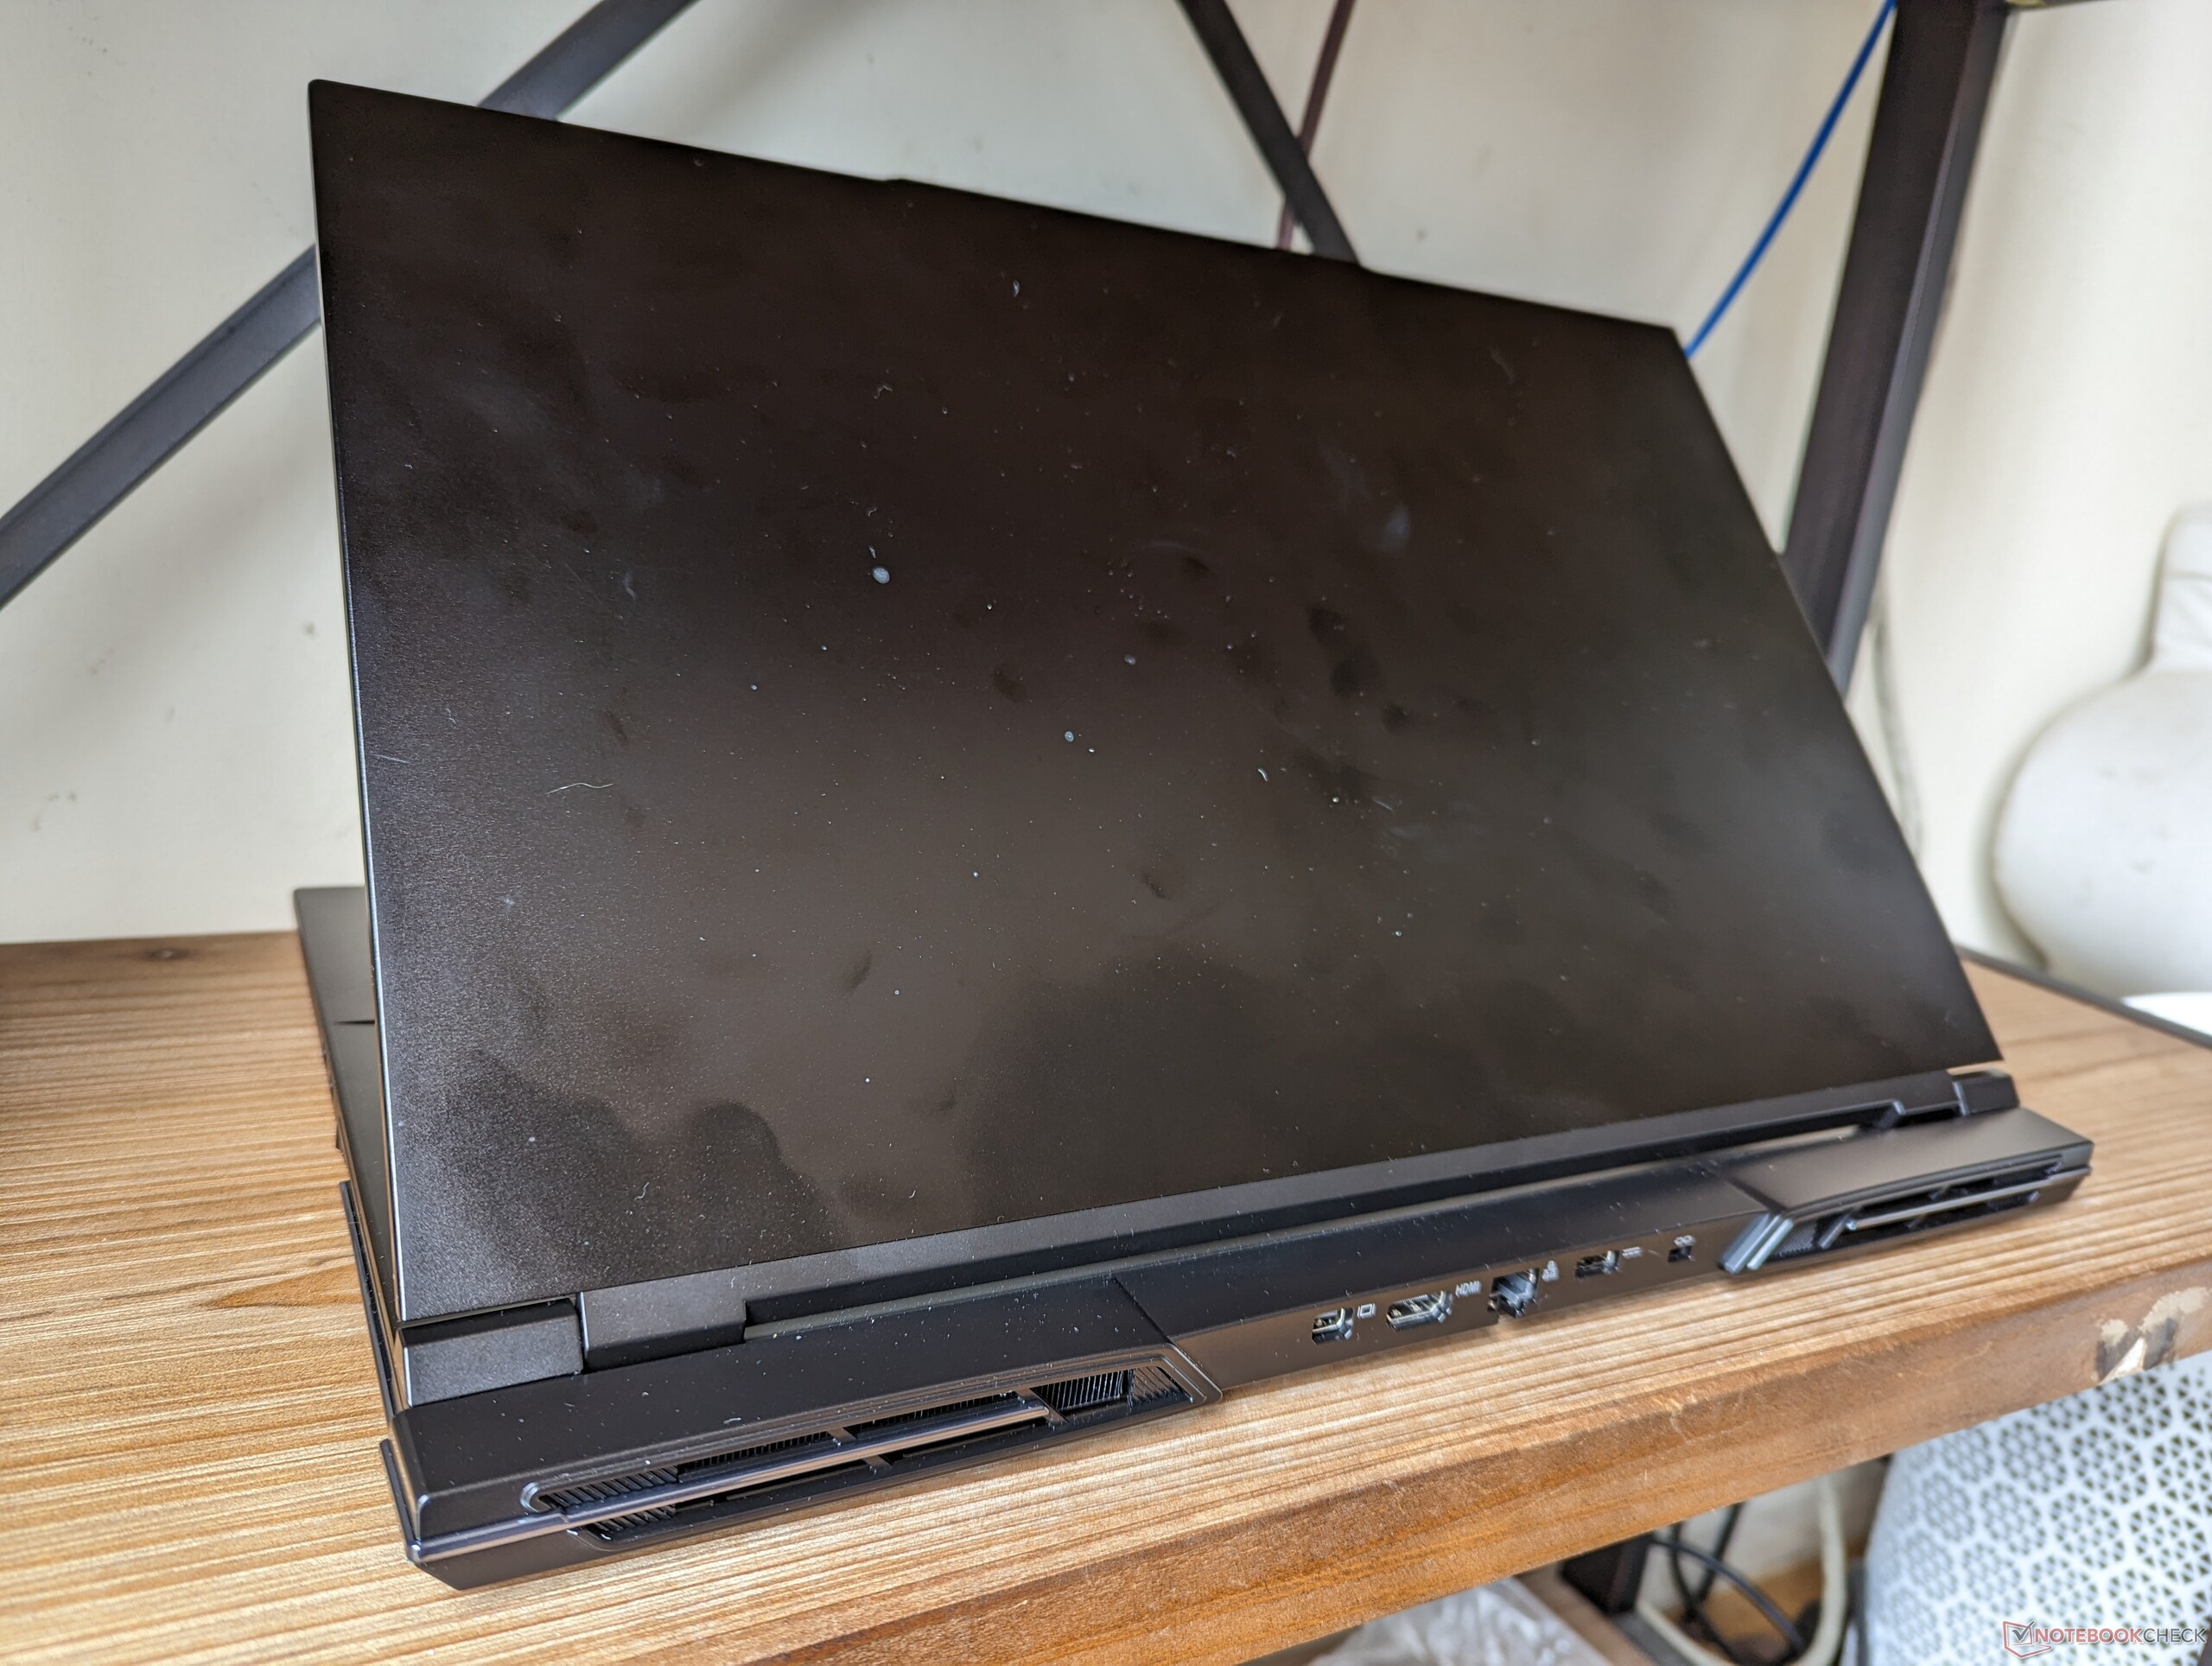
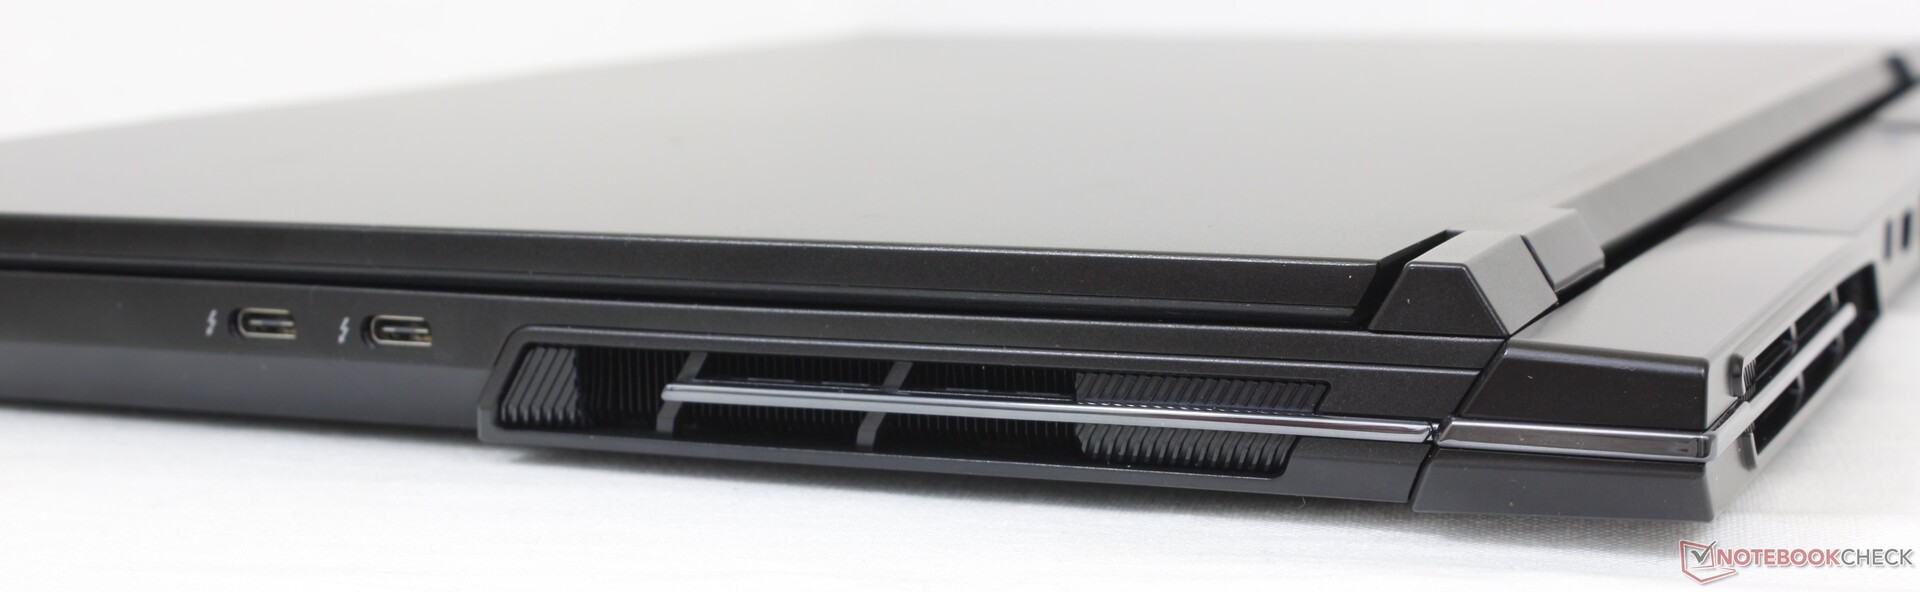
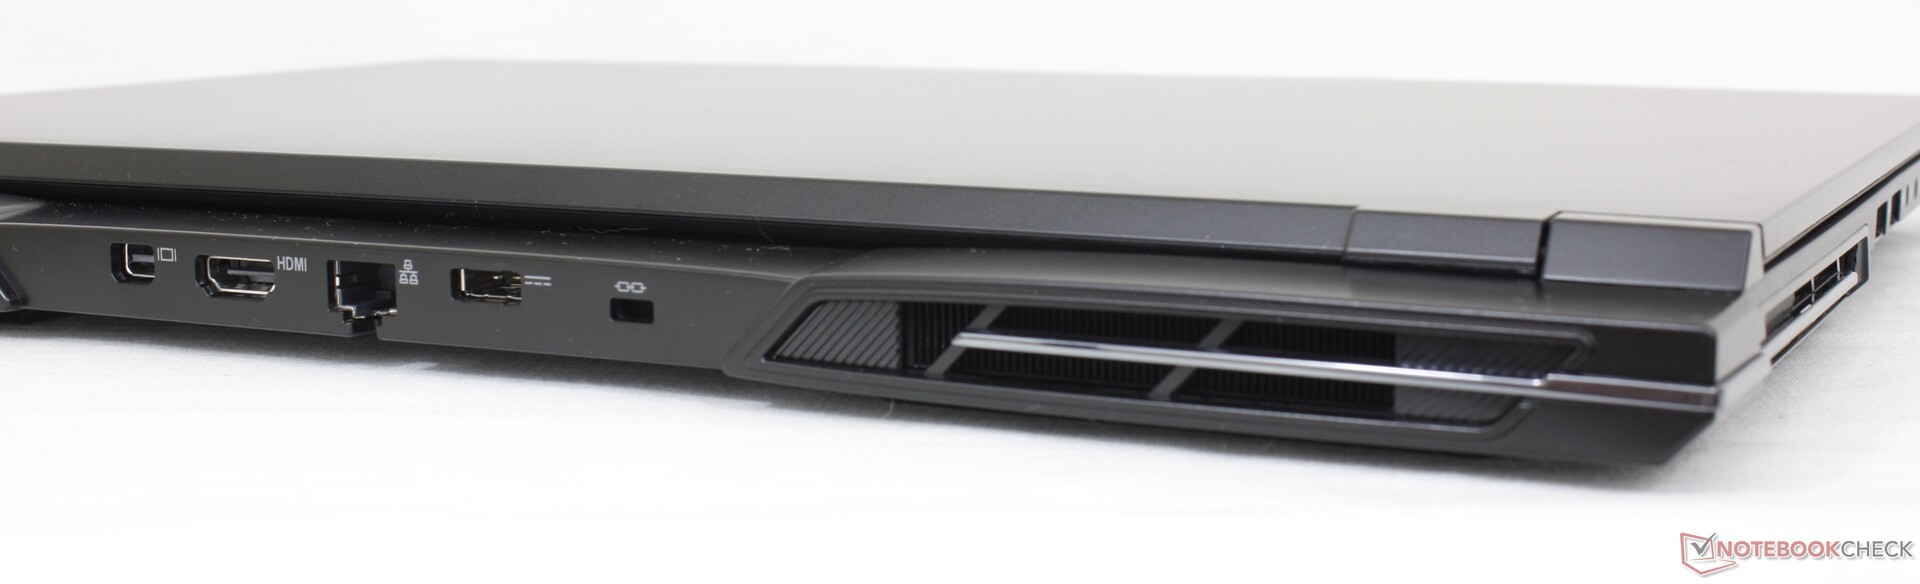
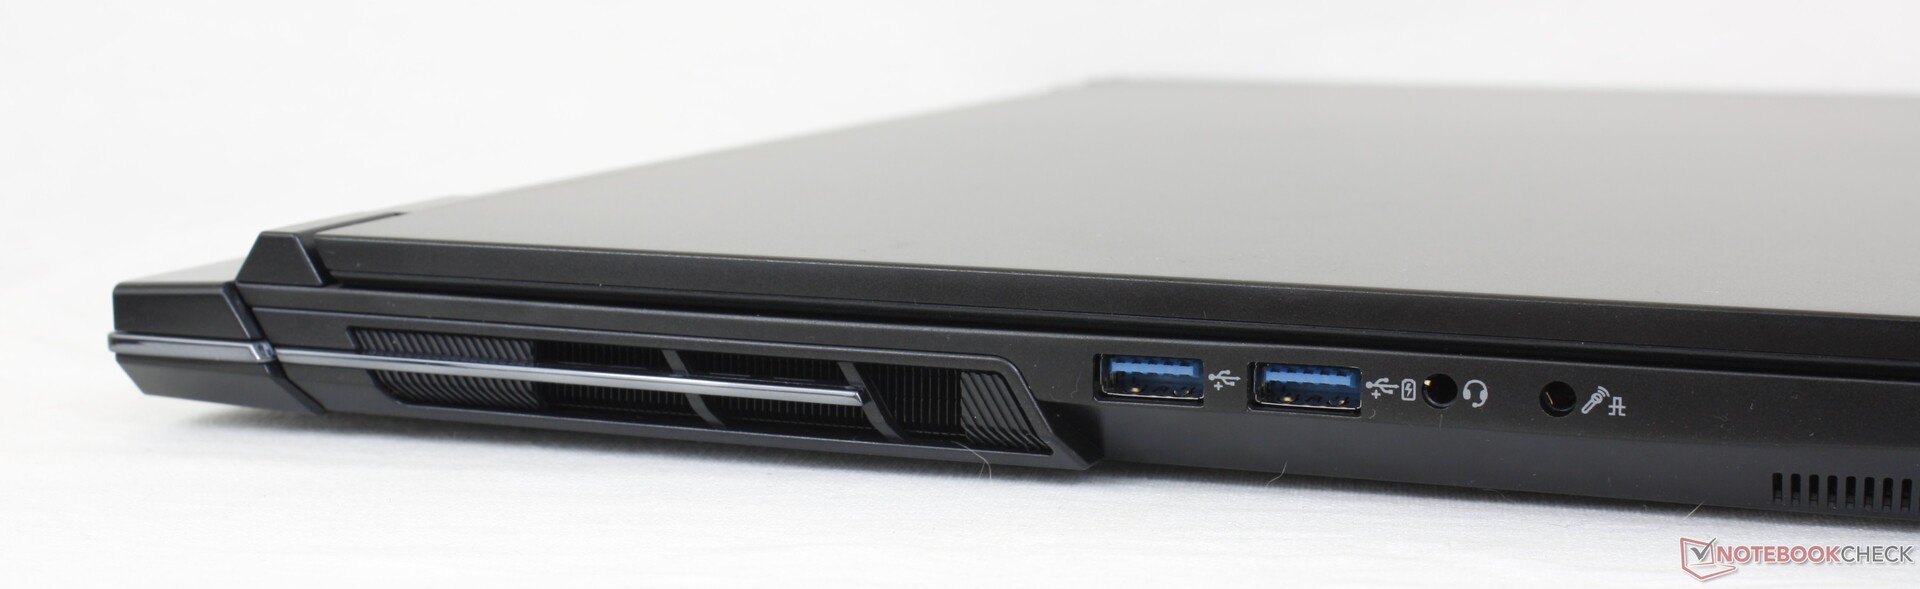
Conectividade - um pouco de tudo
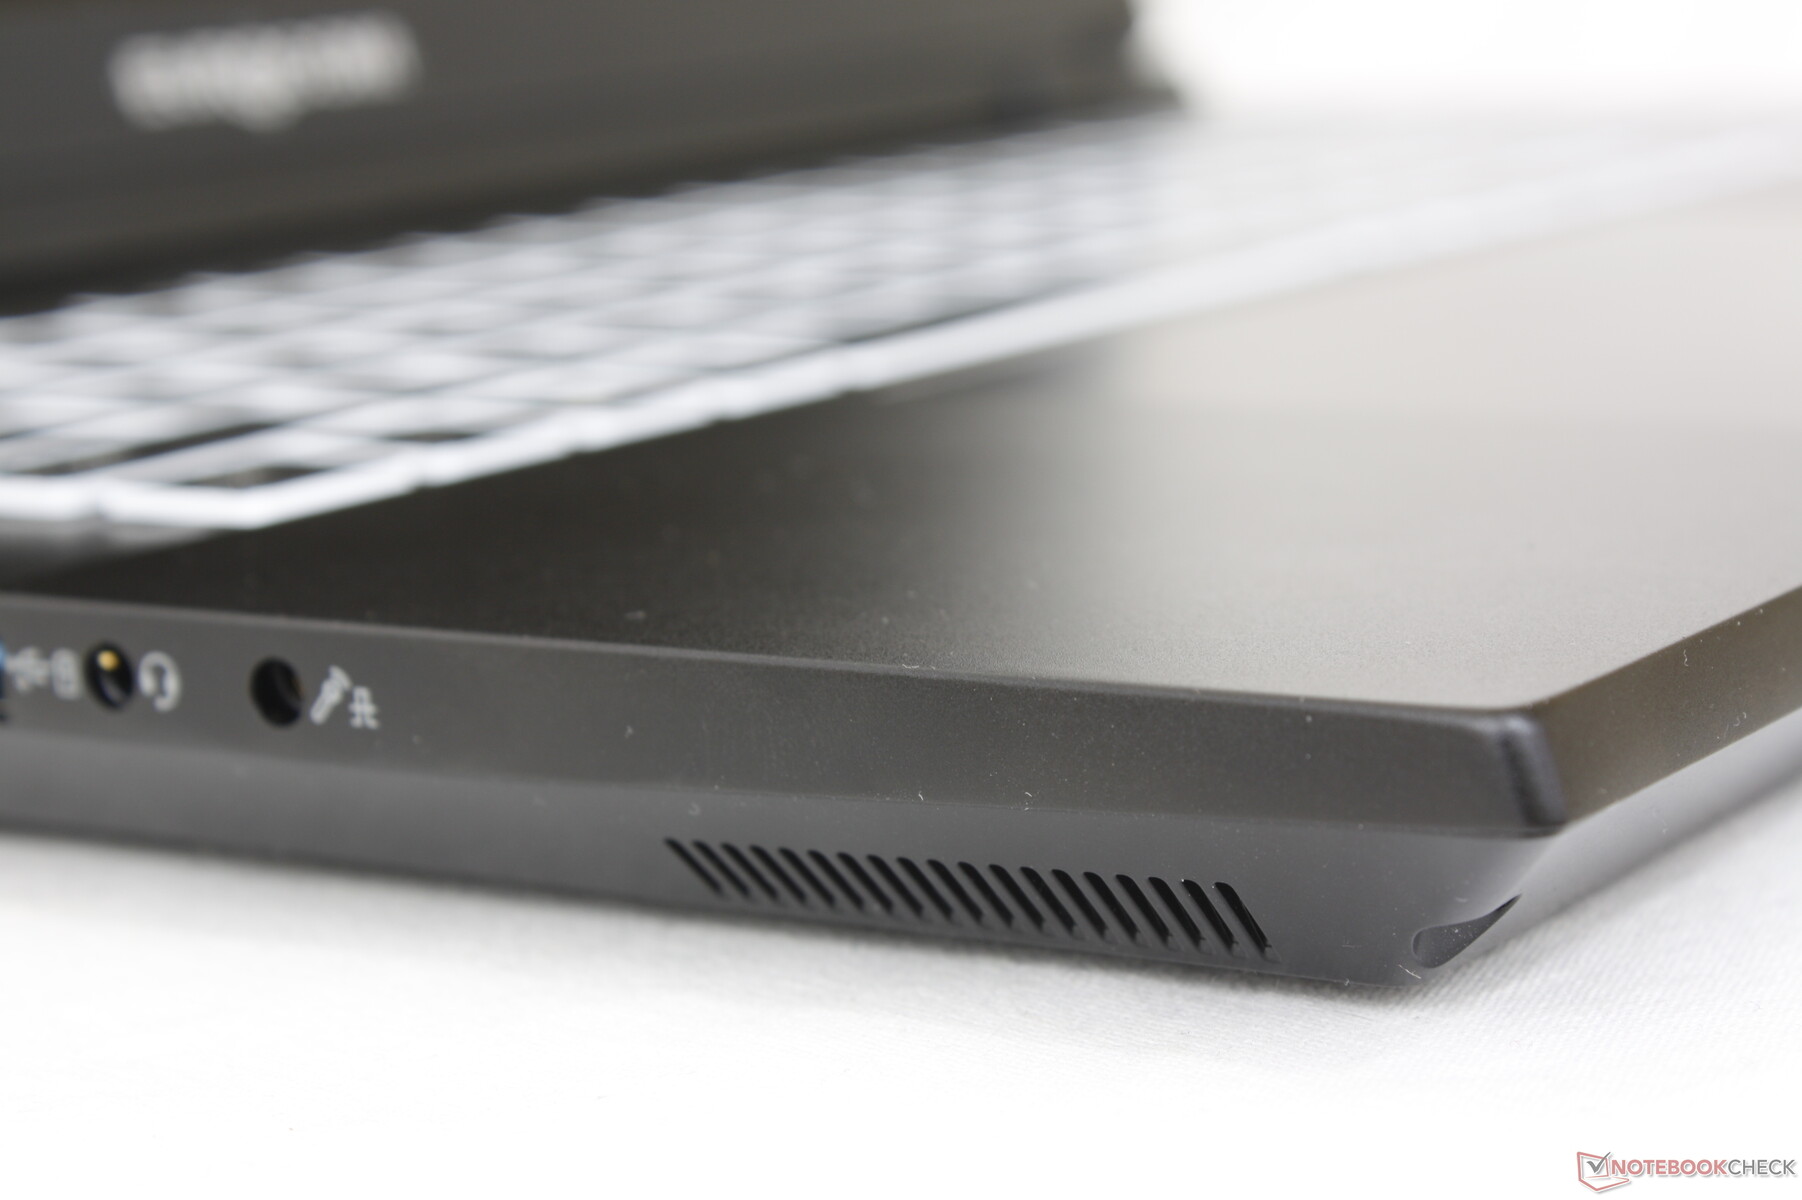
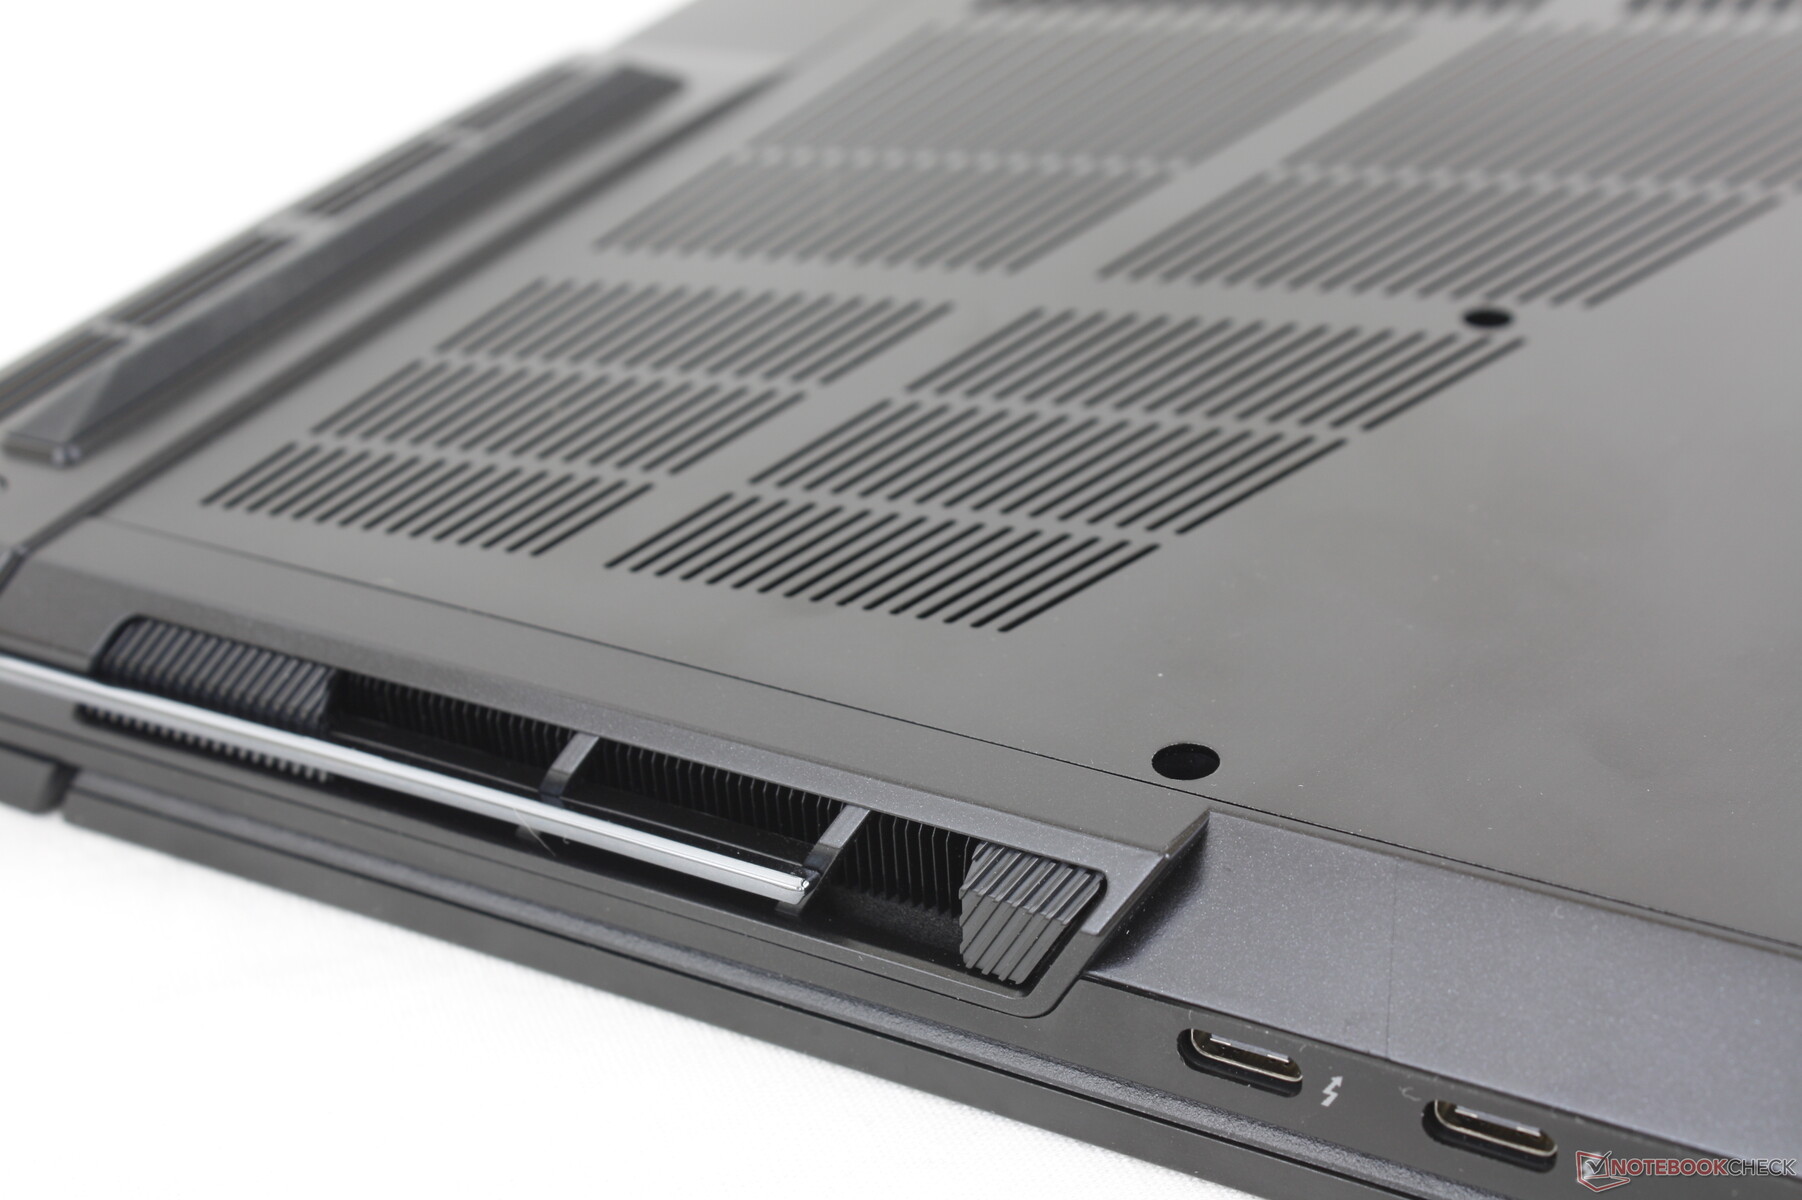
As opções de portas são mais variadas do que na maioria dos outros notebooks de 17 polegadas para jogos. Por exemplo, não é comum encontrar um modelo que integre tanto a mini DisplayPort quanto a RJ-45. Todas as portas USB estão localizadas nas laterais do chassi, enquanto a parte traseira abriga quase todo o resto.
Comunicação
| Networking | |
| iperf3 transmit AXE11000 | |
| Aorus 17X AZF | |
| Eluktronics Mech-17 GP2 | |
| MSI GE78HX 13VH-070US | |
| Eurocom Raptor X17 | |
| Alienware m17 R5 (R9 6900HX, RX 6850M XT) | |
| Asus ROG Strix Scar 17 G733PY-XS96 | |
| iperf3 receive AXE11000 | |
| Aorus 17X AZF | |
| Eluktronics Mech-17 GP2 | |
| Asus ROG Strix Scar 17 G733PY-XS96 | |
| MSI GE78HX 13VH-070US | |
| Eurocom Raptor X17 | |
| Alienware m17 R5 (R9 6900HX, RX 6850M XT) | |
| iperf3 transmit AXE11000 6GHz | |
| Asus ROG Strix Scar 17 G733PY-XS96 | |
| MSI GE78HX 13VH-070US | |
| Eurocom Raptor X17 | |
| iperf3 receive AXE11000 6GHz | |
| MSI GE78HX 13VH-070US | |
| Asus ROG Strix Scar 17 G733PY-XS96 | |
| Eurocom Raptor X17 | |
Webcam
A webcam de 2 MP é típica da maioria dos outros laptops, independentemente do preço. Pelo menos o infravermelho está integrado para suporte ao Hello e há um obturador eletrônico para privacidade. Esperamos que os modelos da próxima geração integrem webcams de 5 MP, como no mais recente Razer Blade 18.

")
")
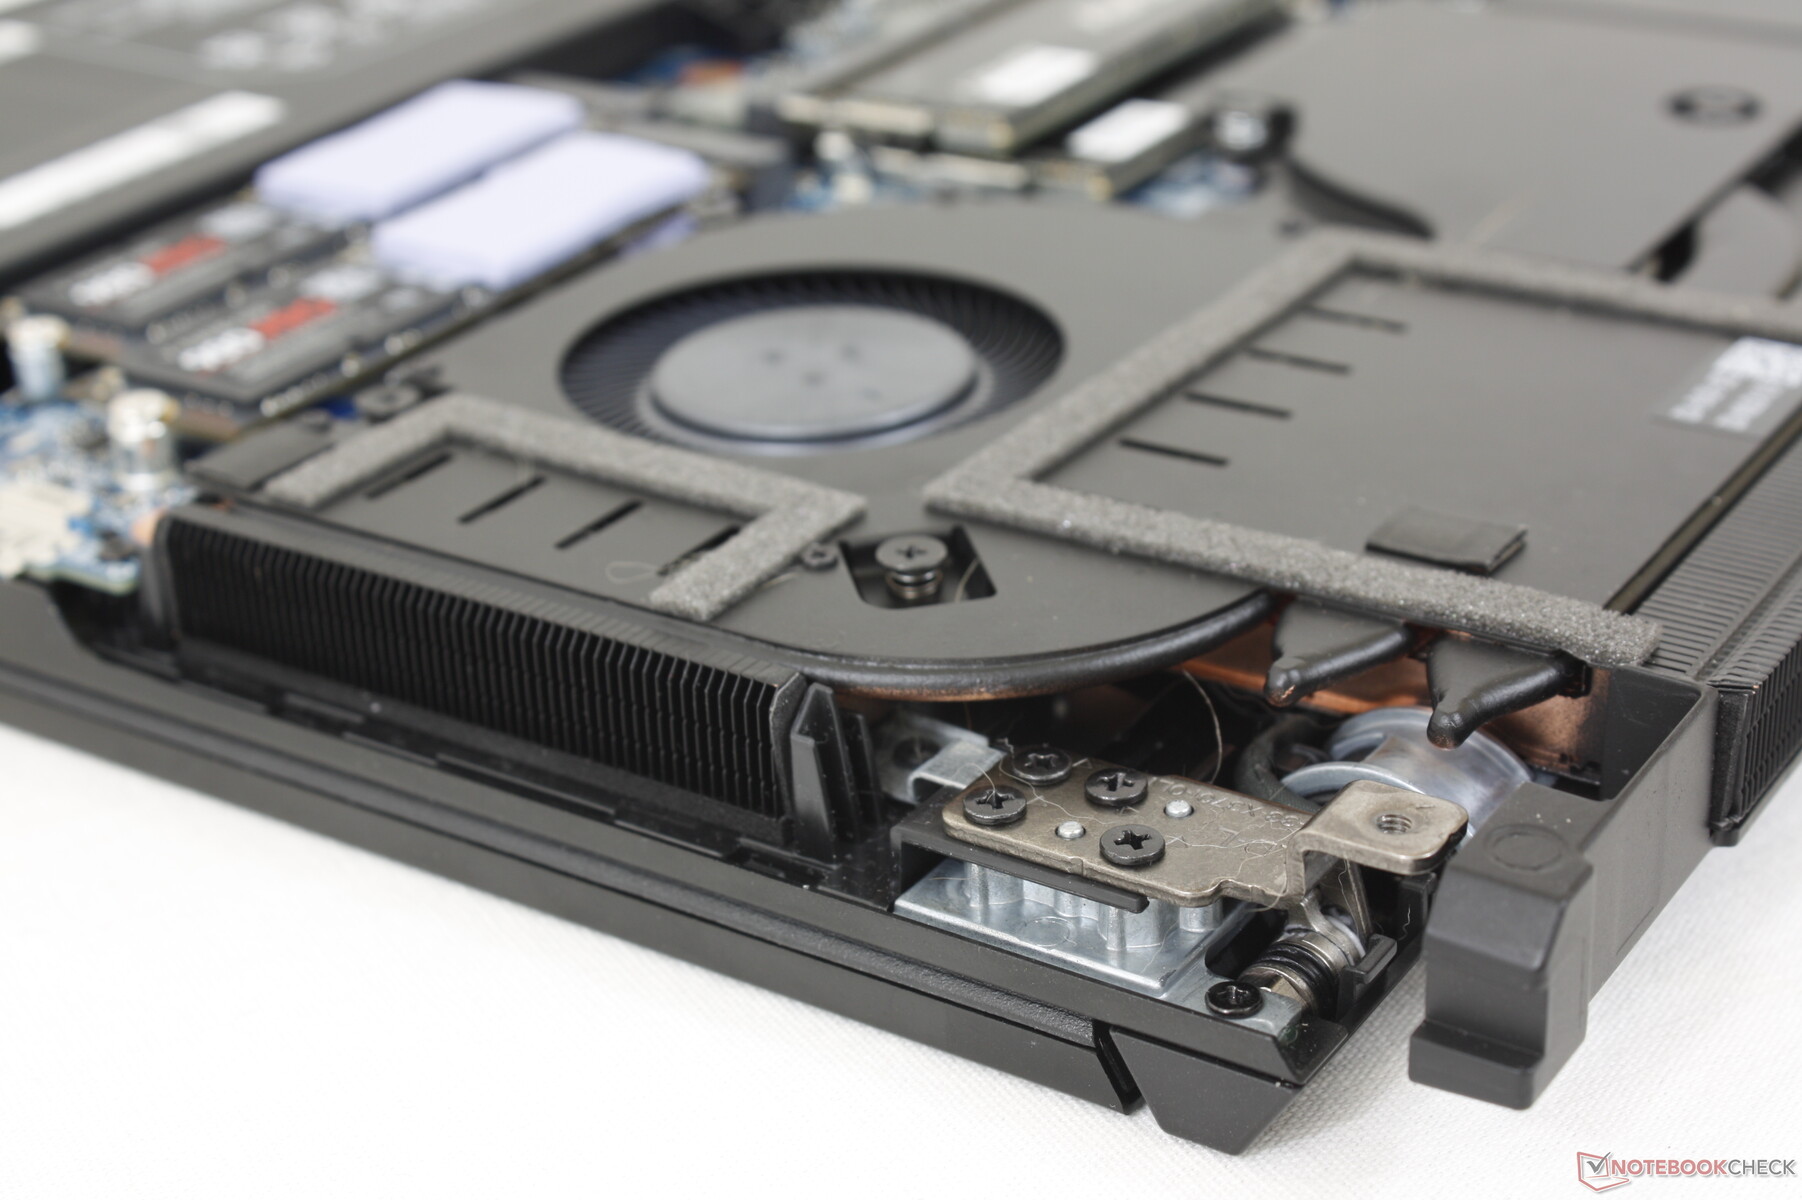
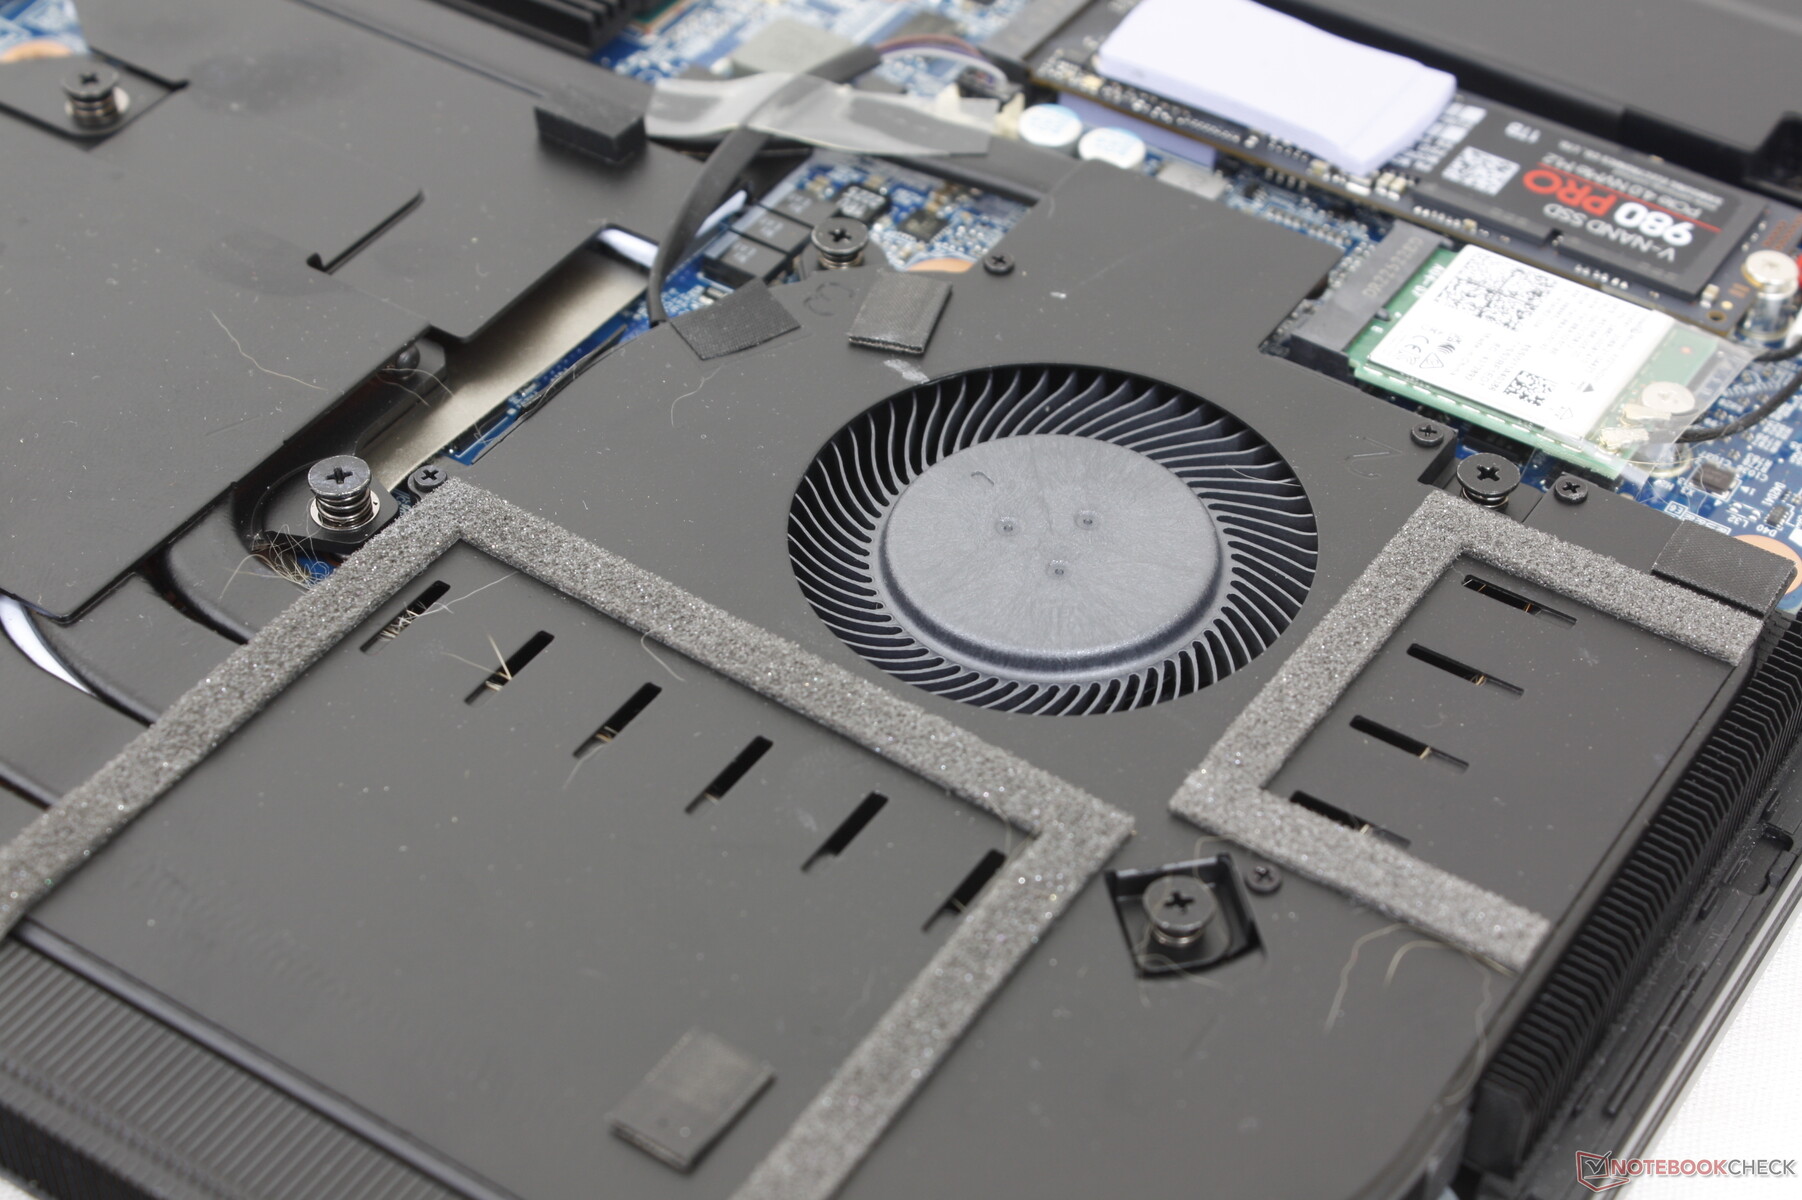
Manutenção
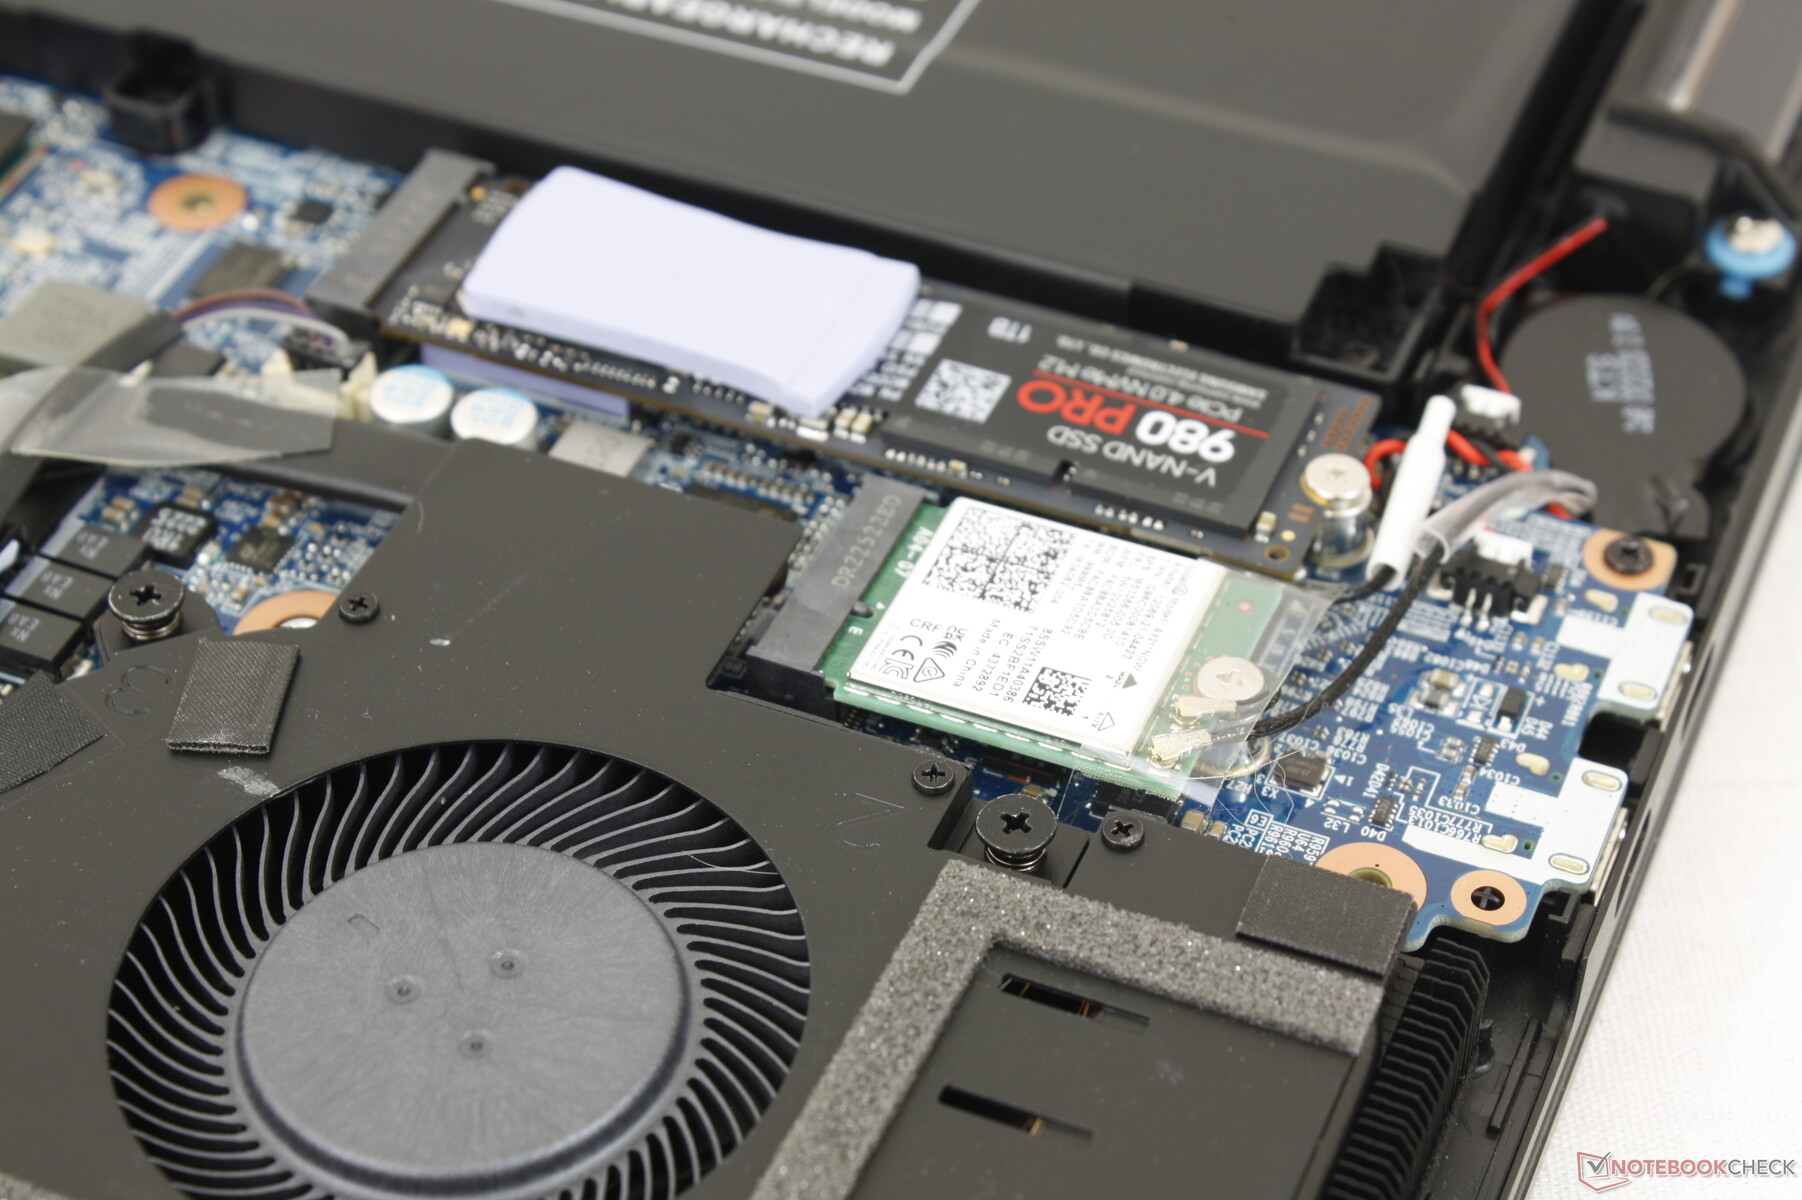
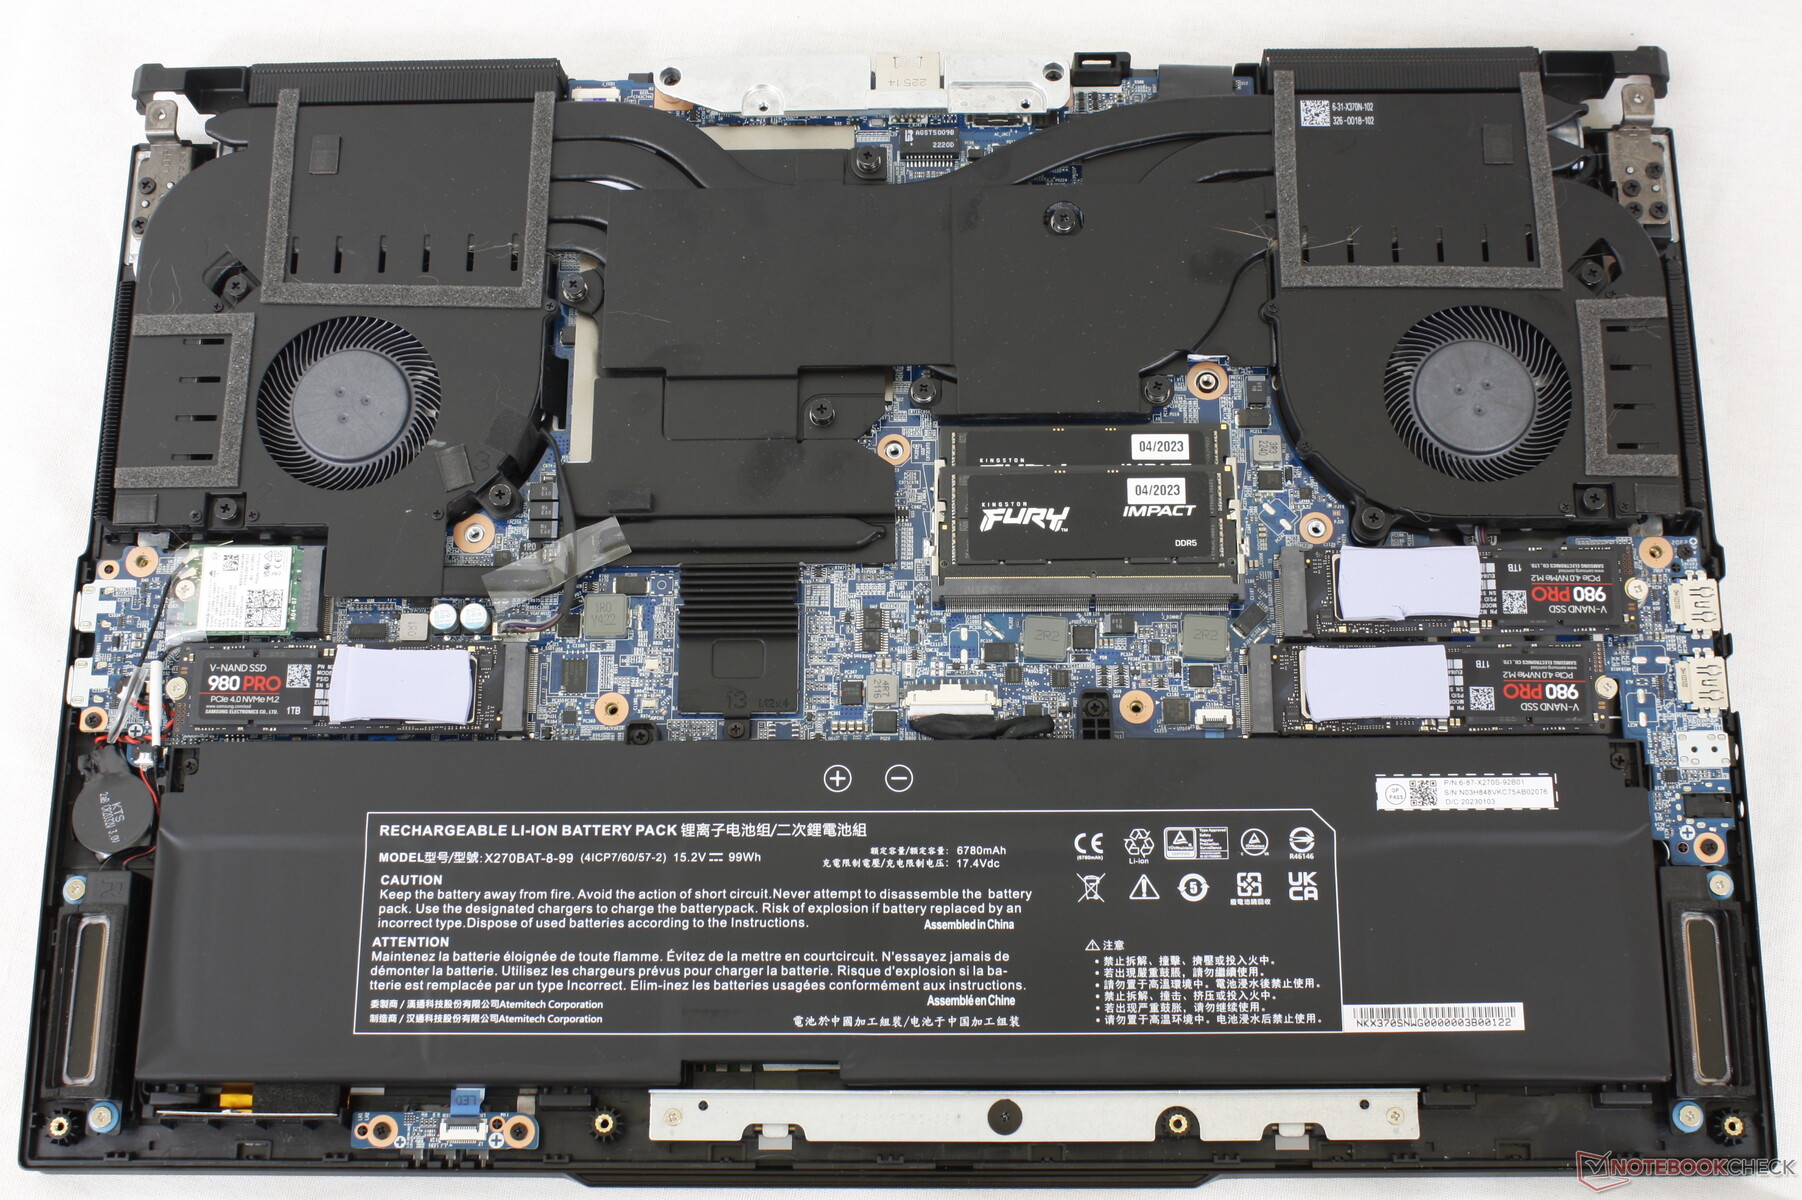
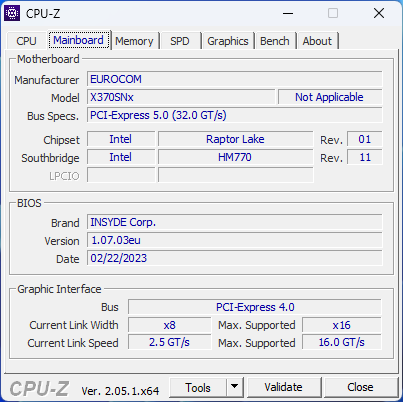
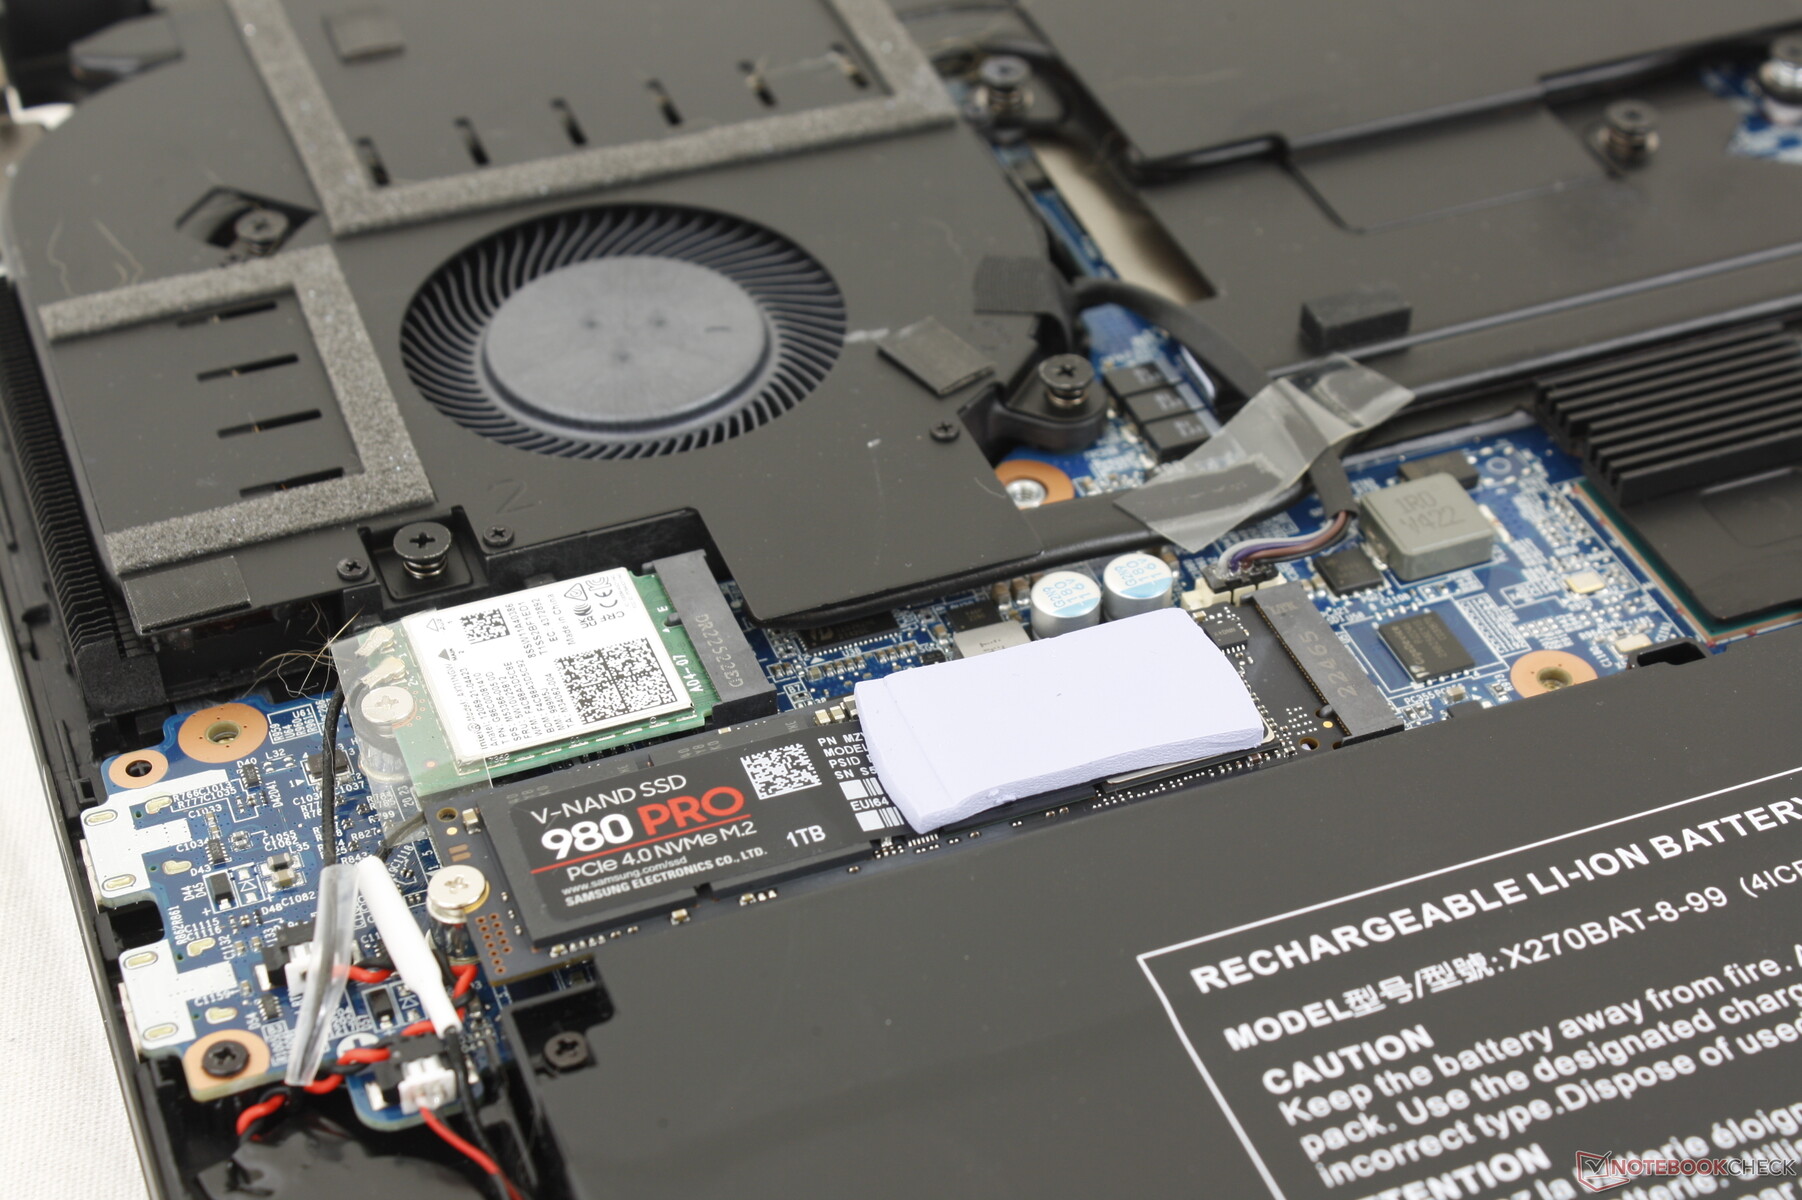
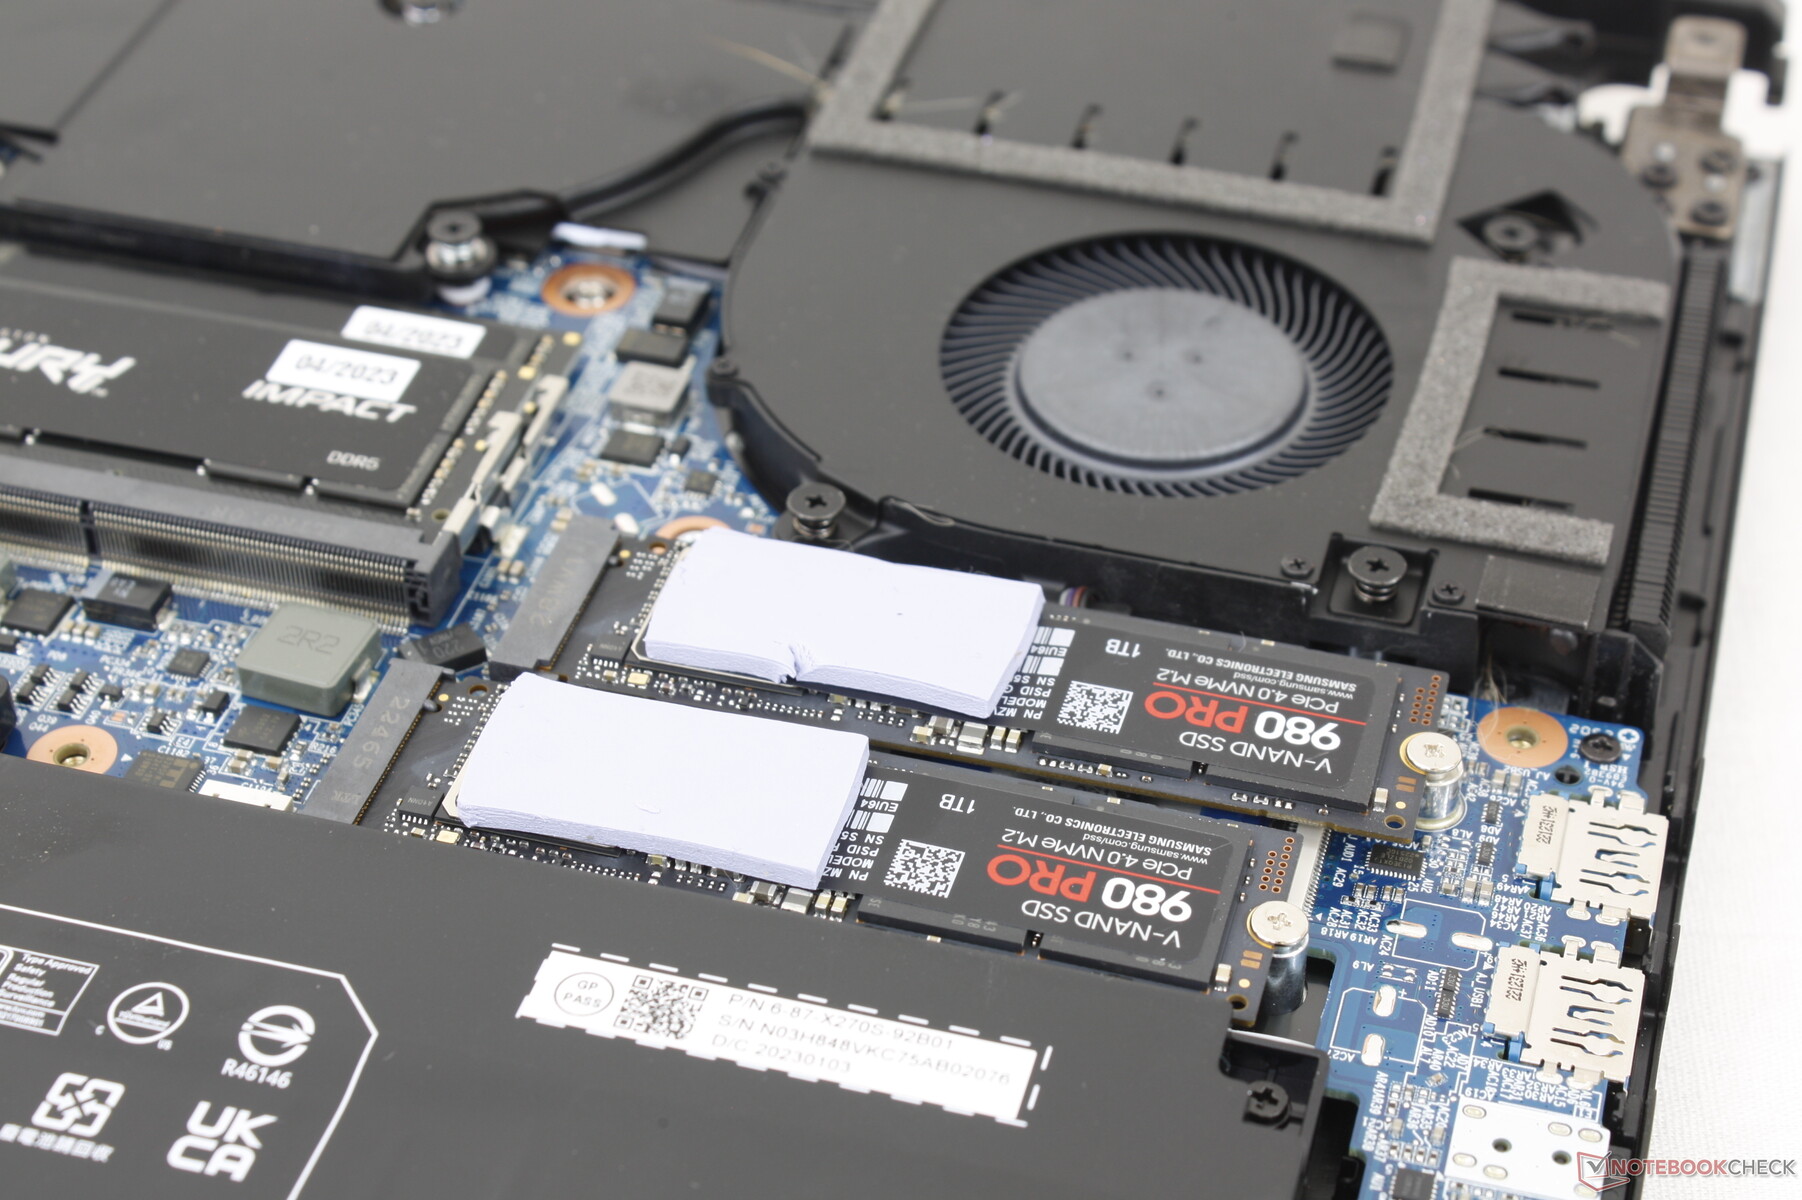
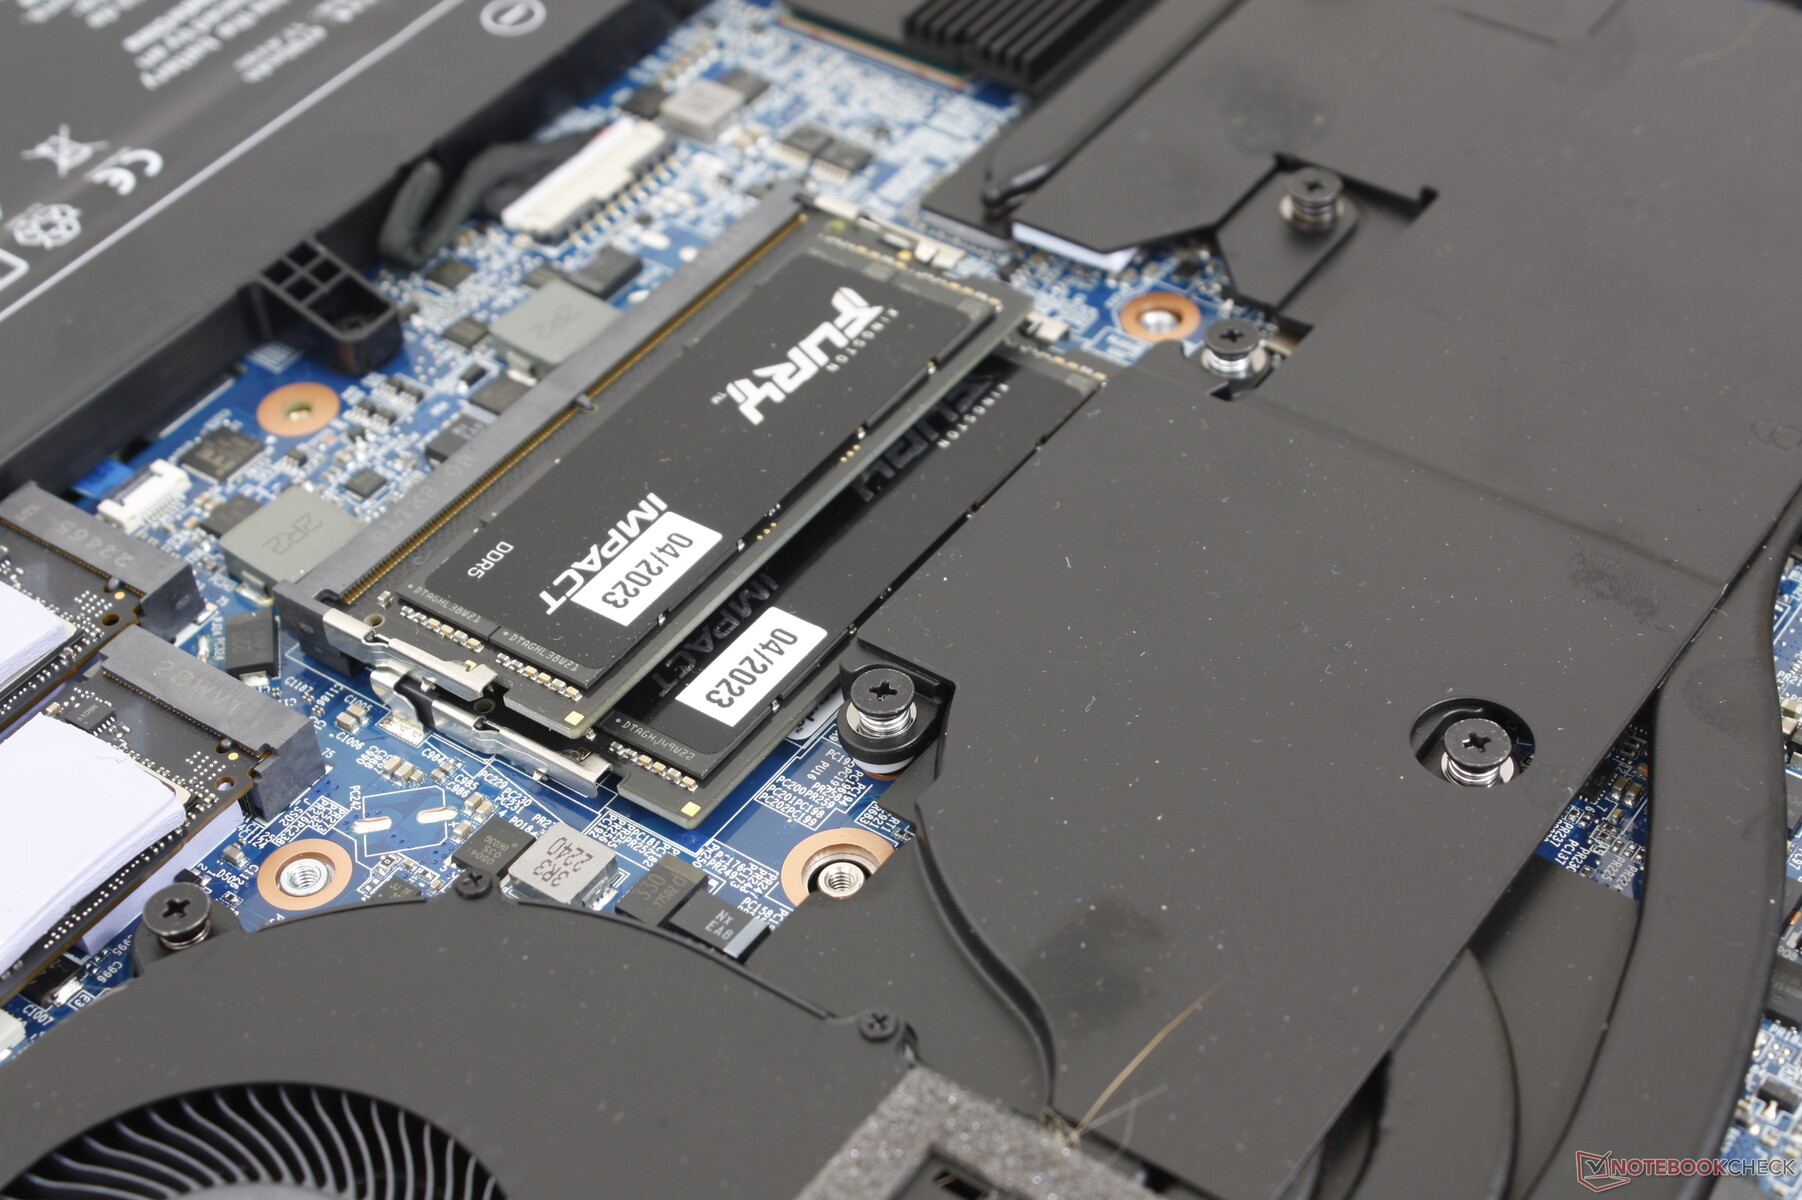
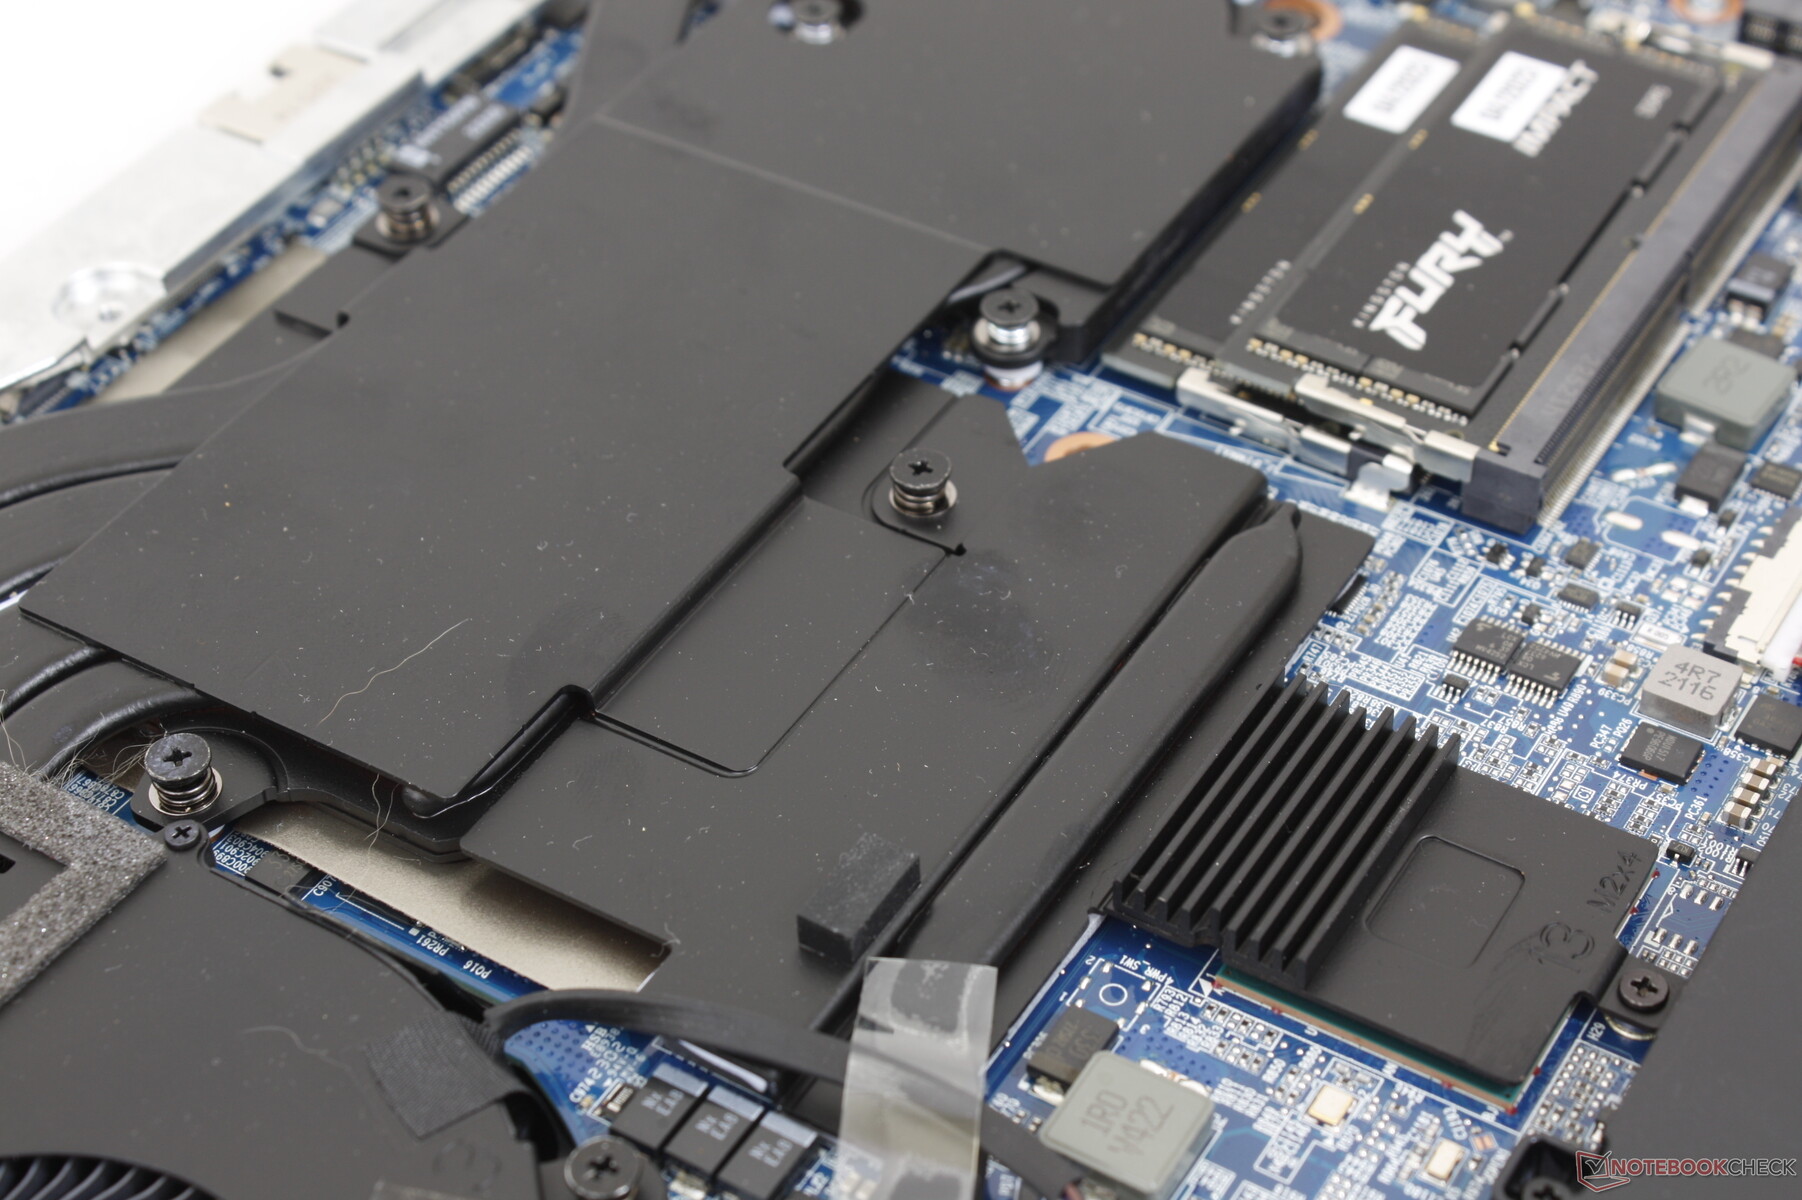
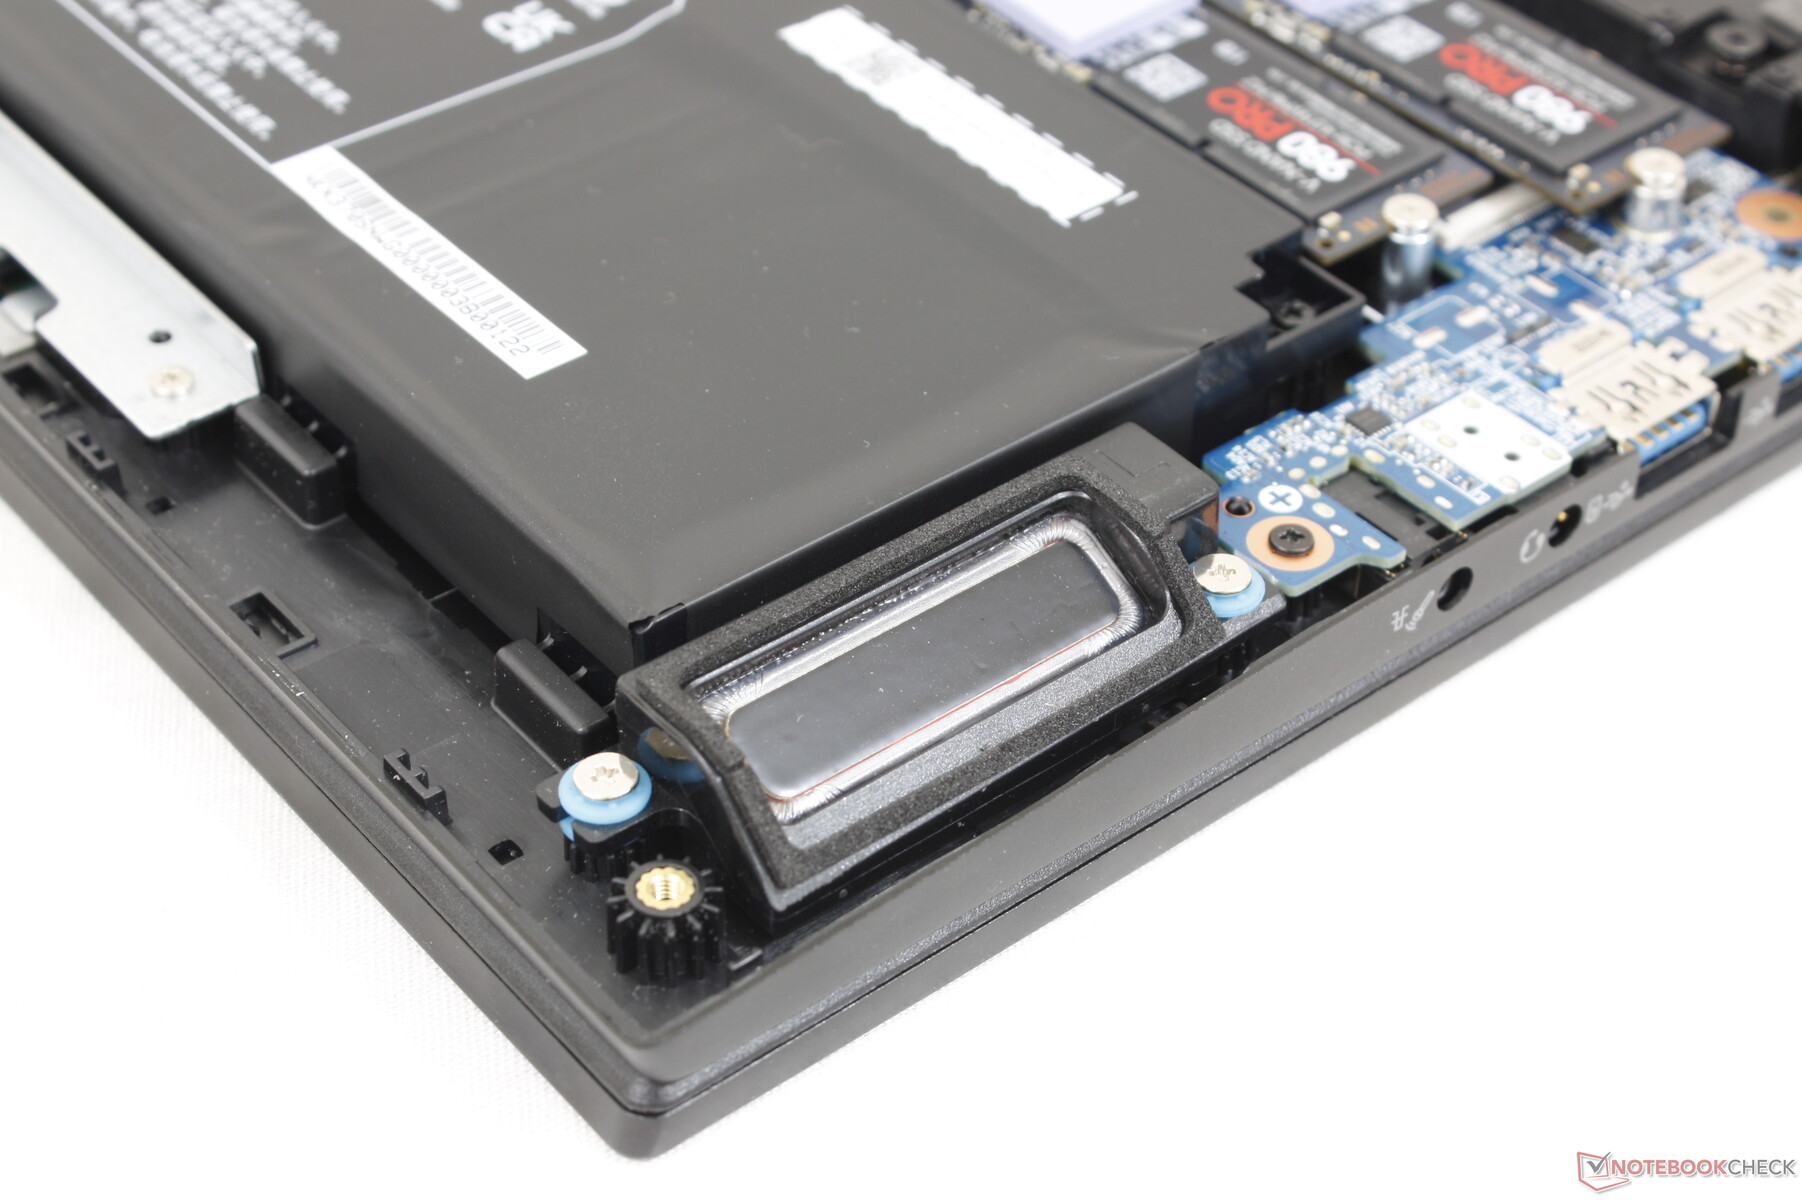
O painel inferior é fixado por 16 parafusos Philips para uma remoção relativamente fácil. Uma vez dentro, os usuários têm acesso ao módulo WLAN removível, 2 slots SODIMM e 3 slots PCIe4 x4 M.2 2280. O sistema não suporta velocidades PCIe5, ao contrário das recentes atualizações MSI GE e GT.
Acessórios e garantia
A caixa de varejo inclui um CD de drivers do dispositivo, um pendrive de drivers do Windows 11 e um lenço de veludo, além da documentação e do adaptador CA habituais. A garantia limitada padrão de um ano se aplica com opções de extensão de até três anos.
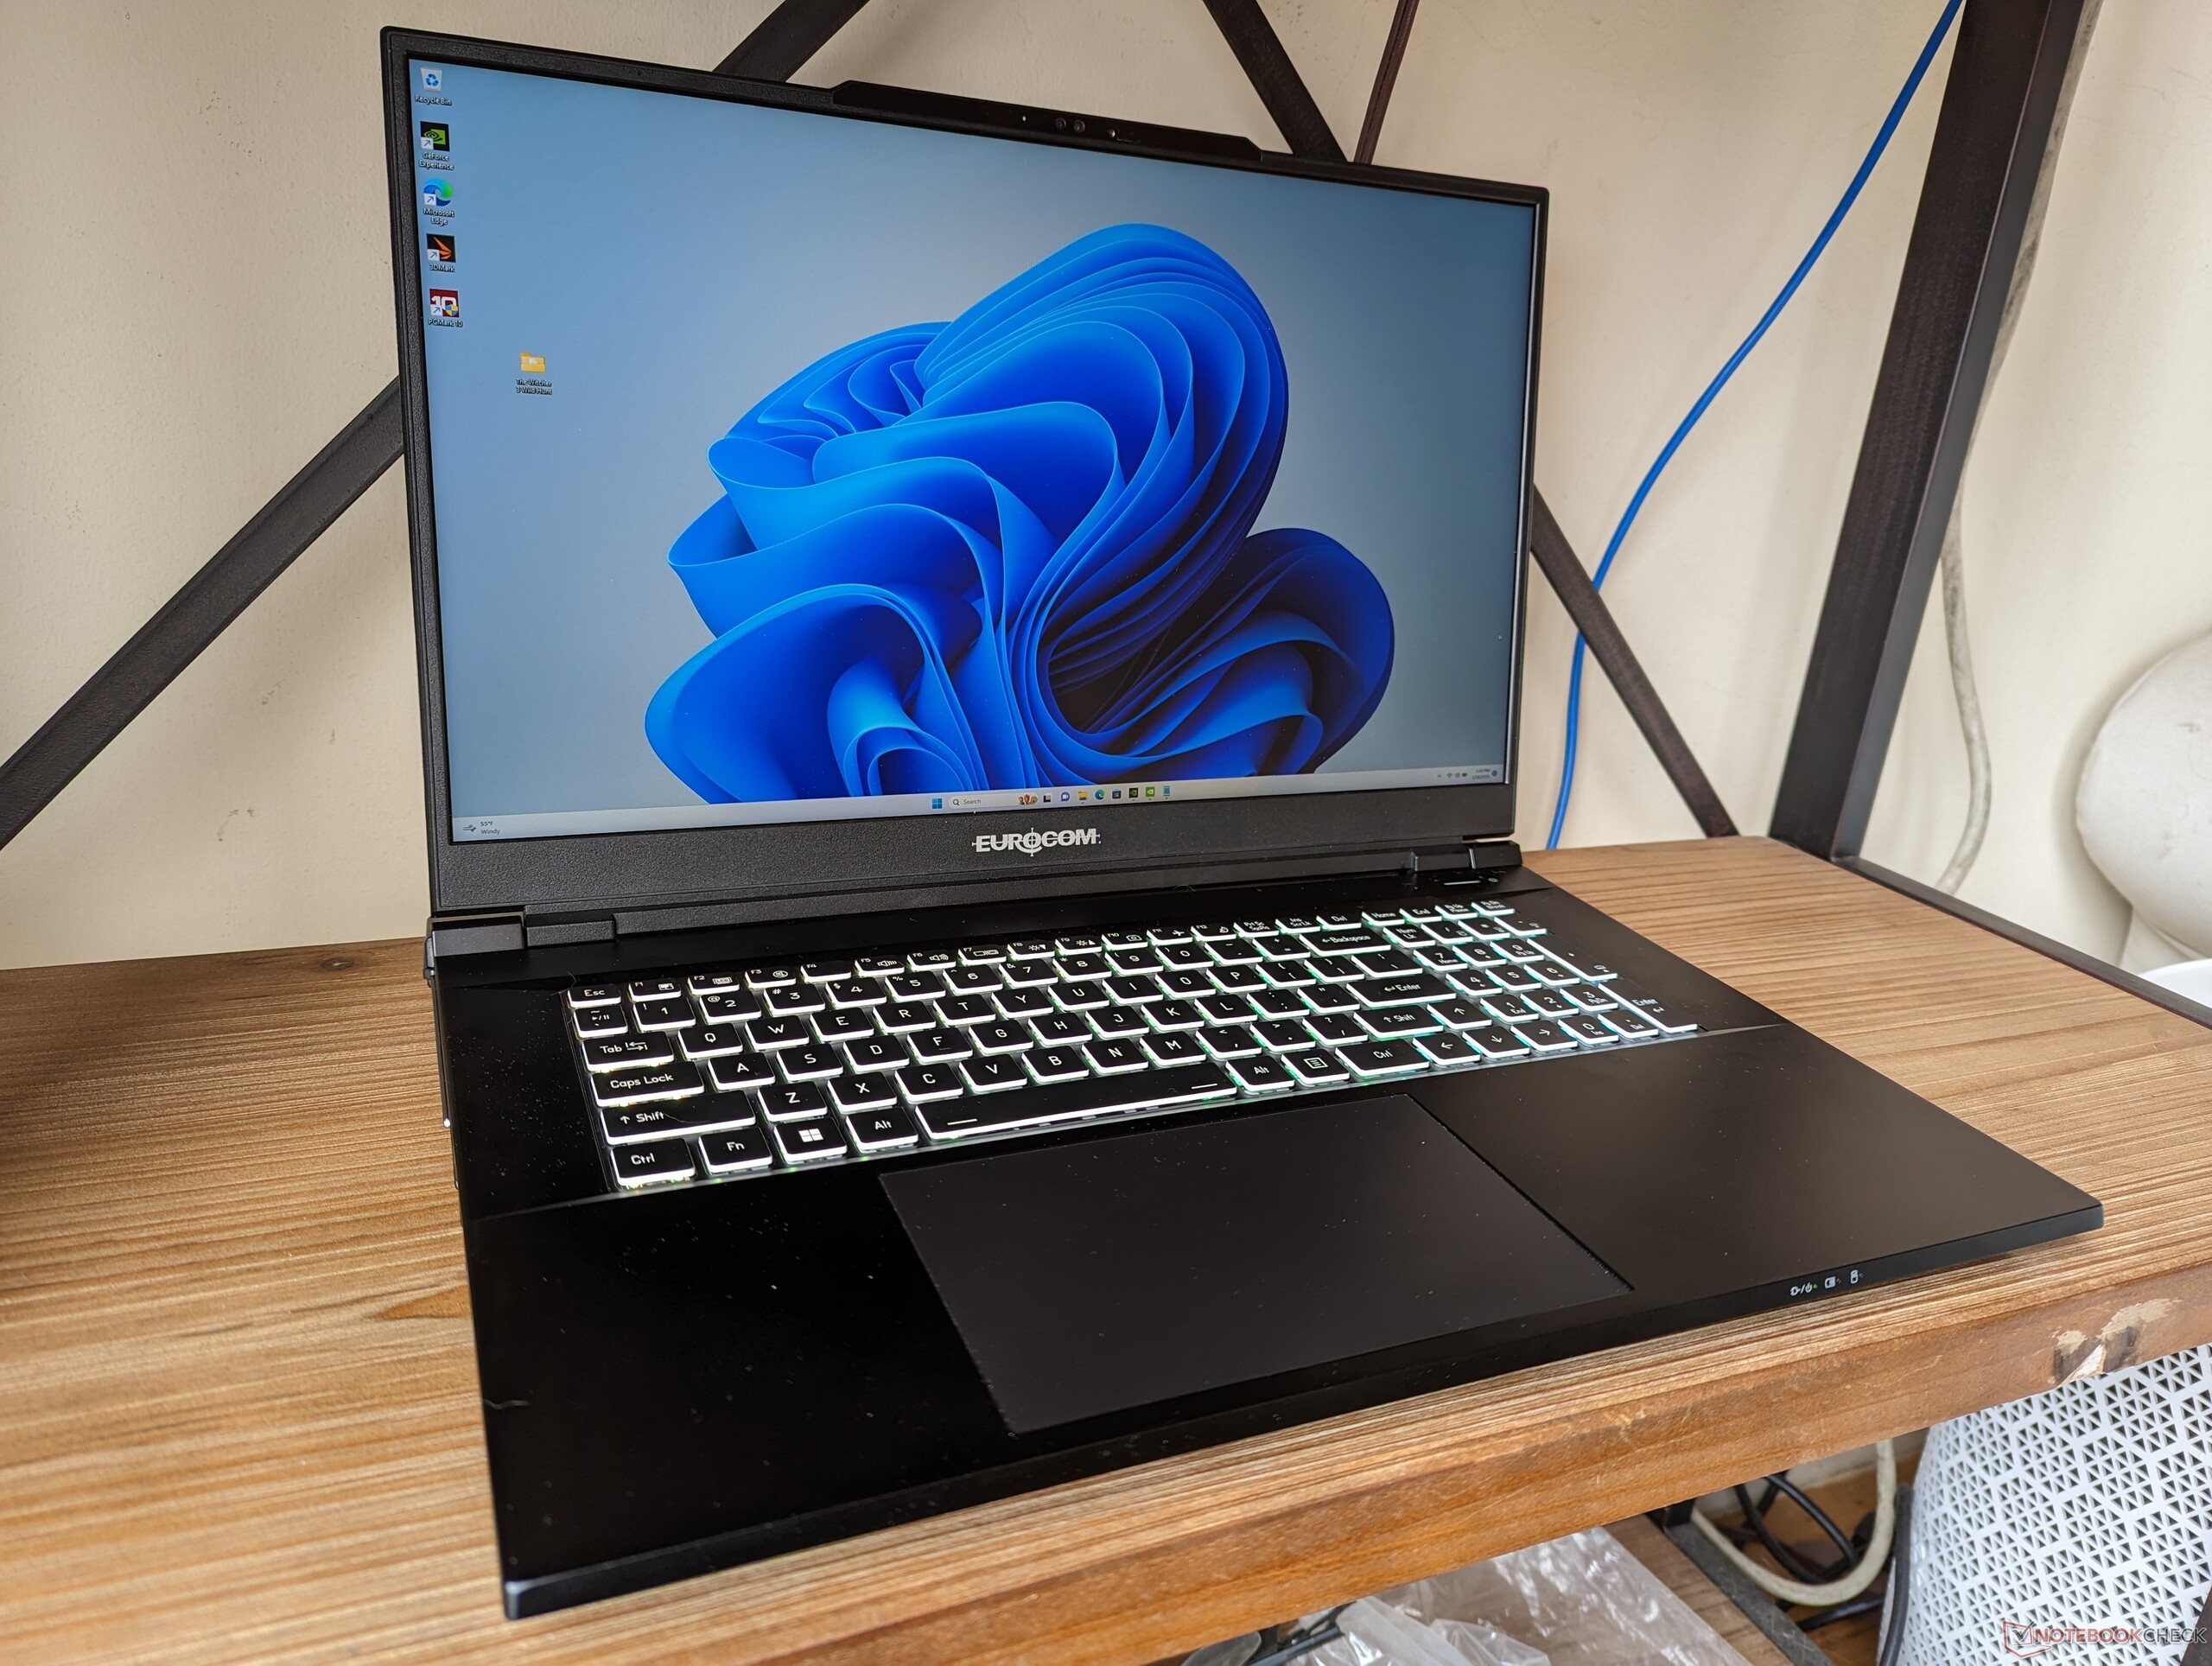
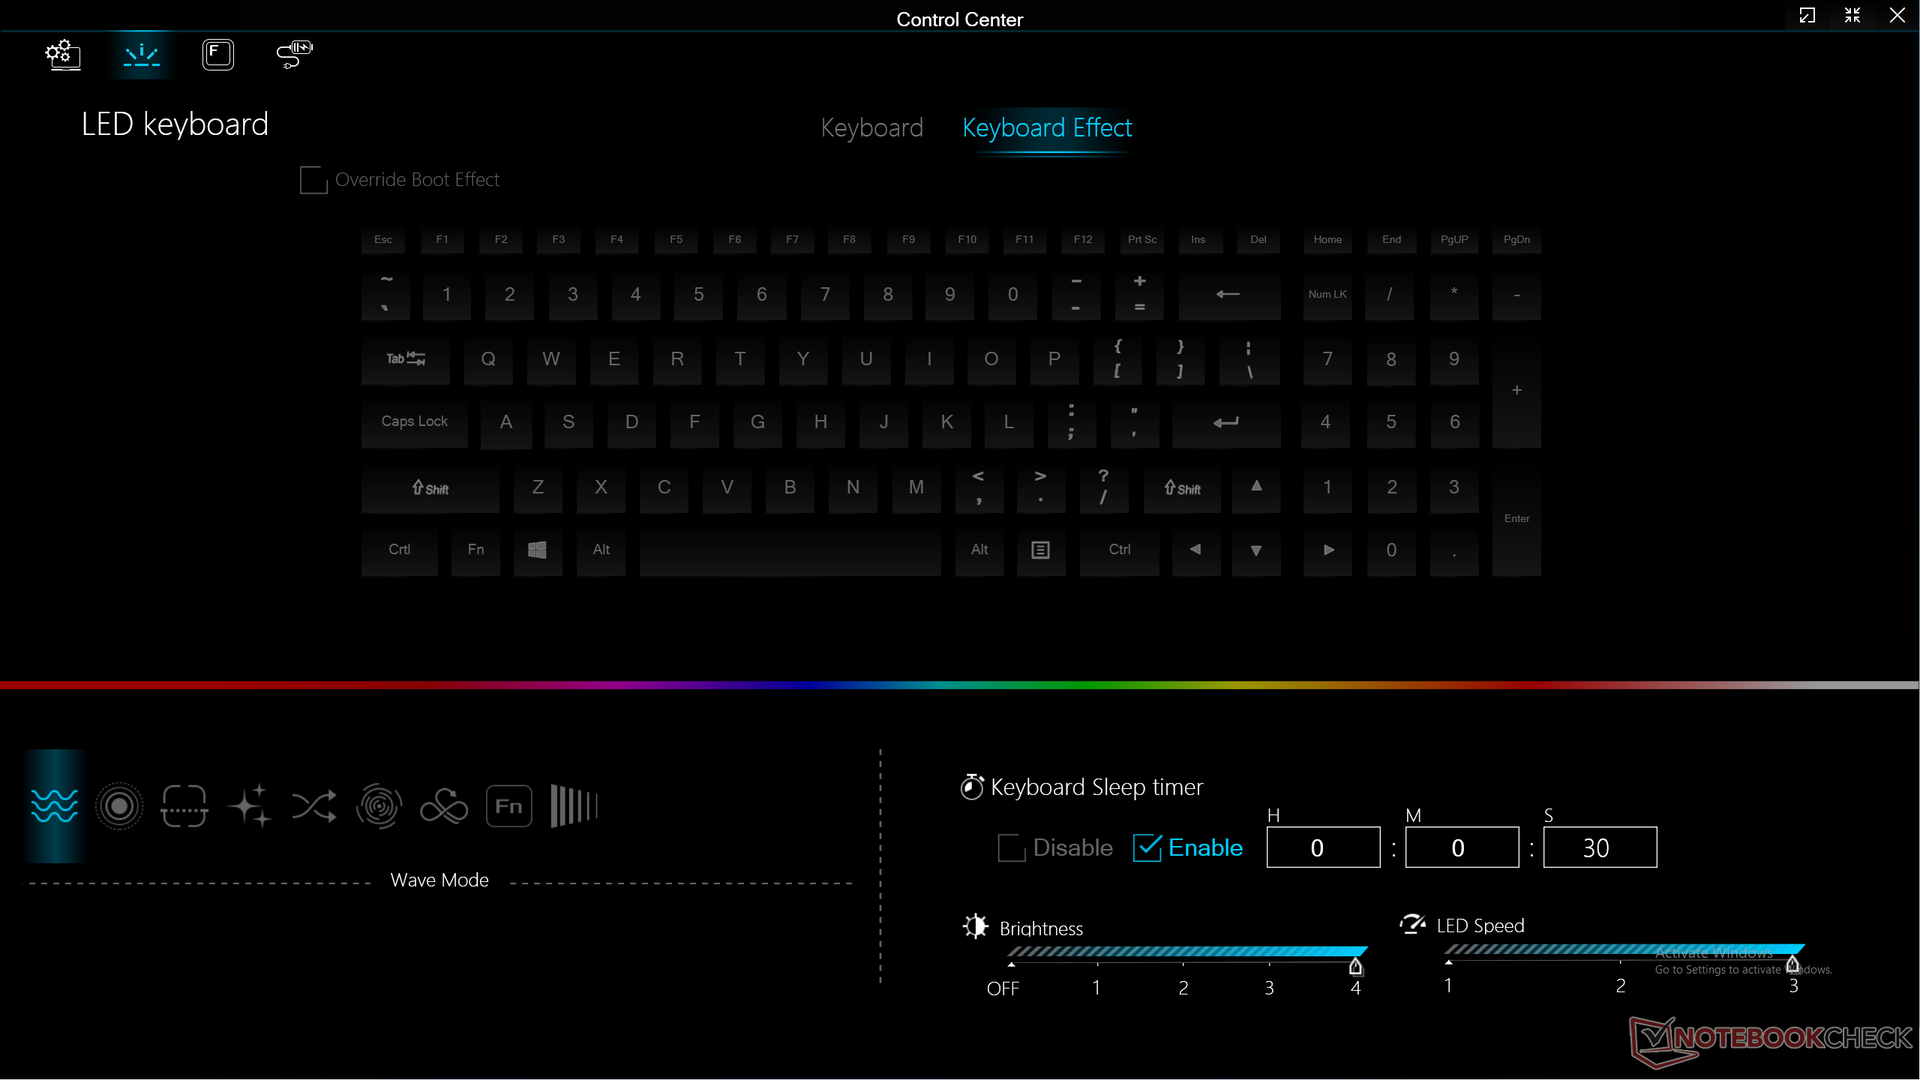
Dispositivos de entrada - Eurocom tradicional
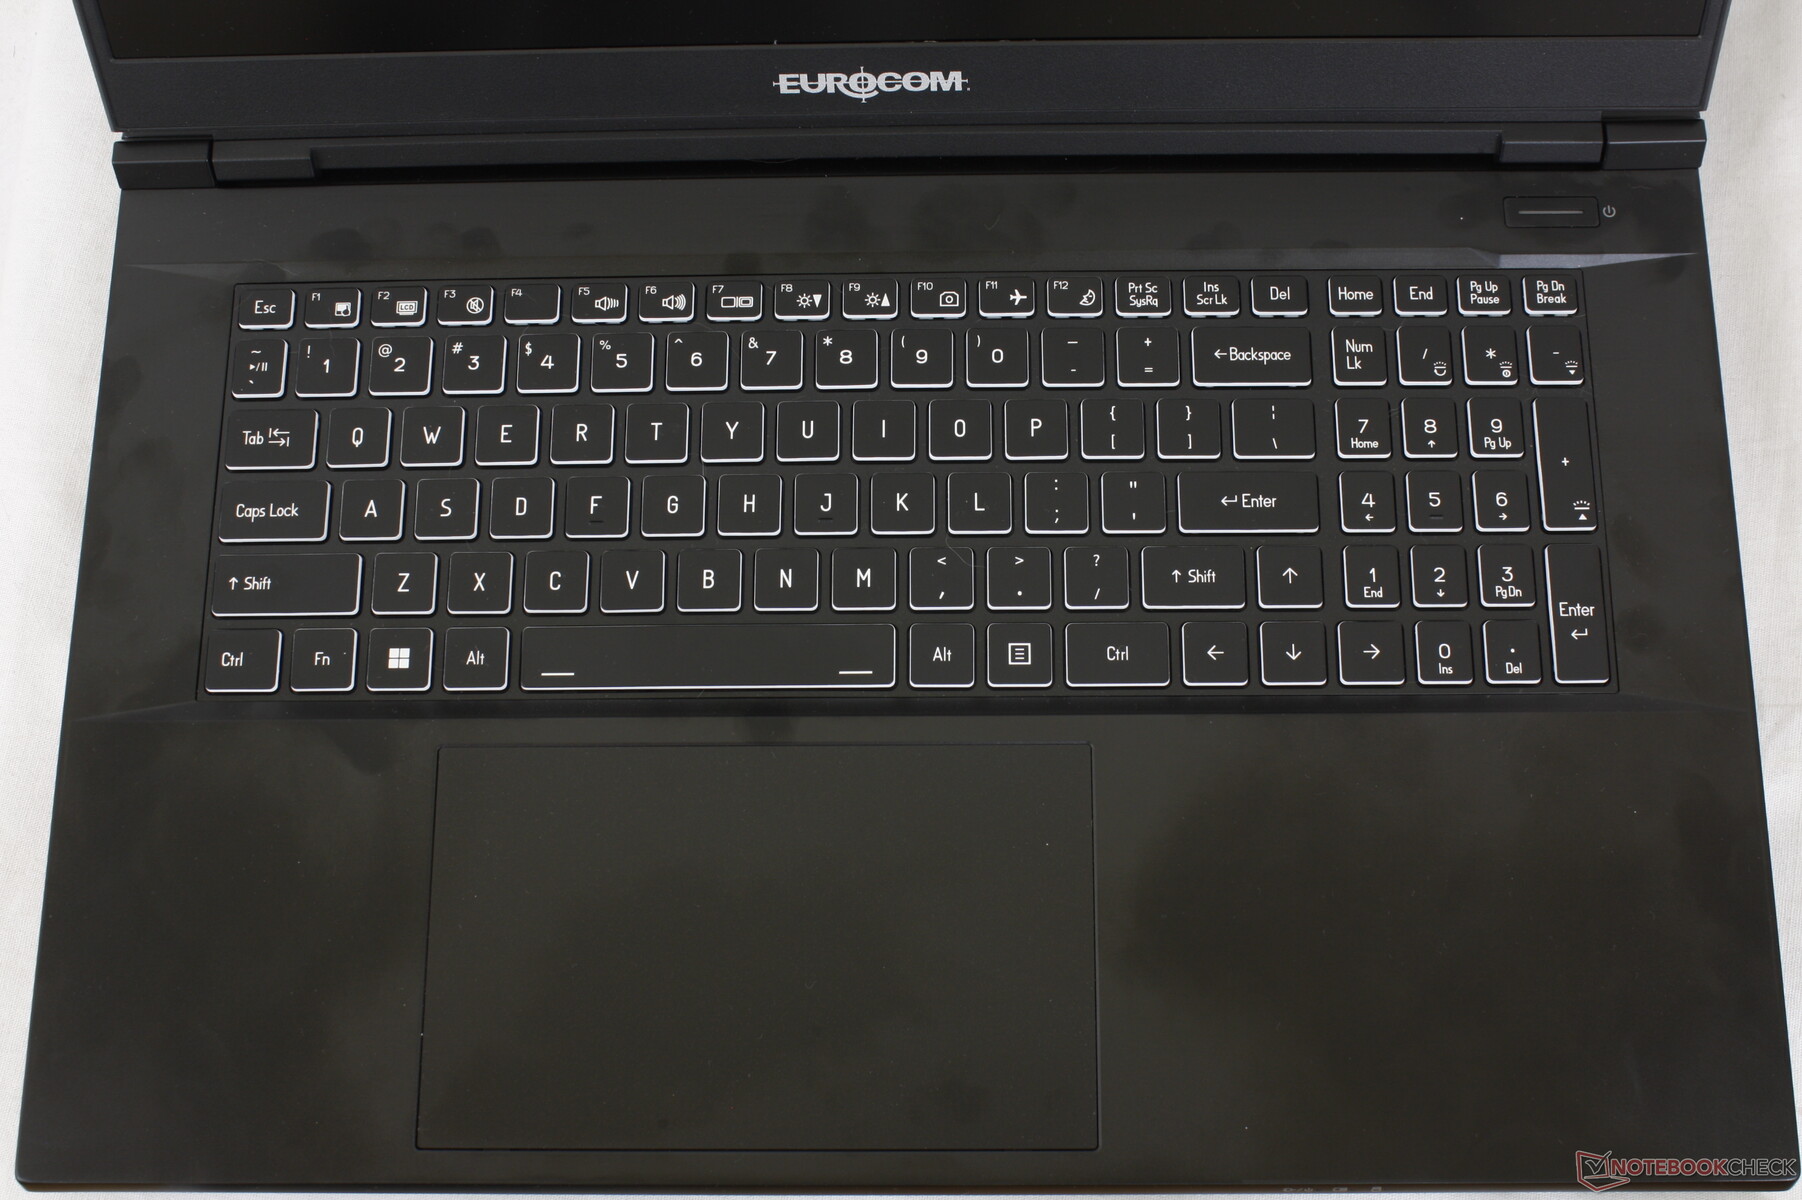
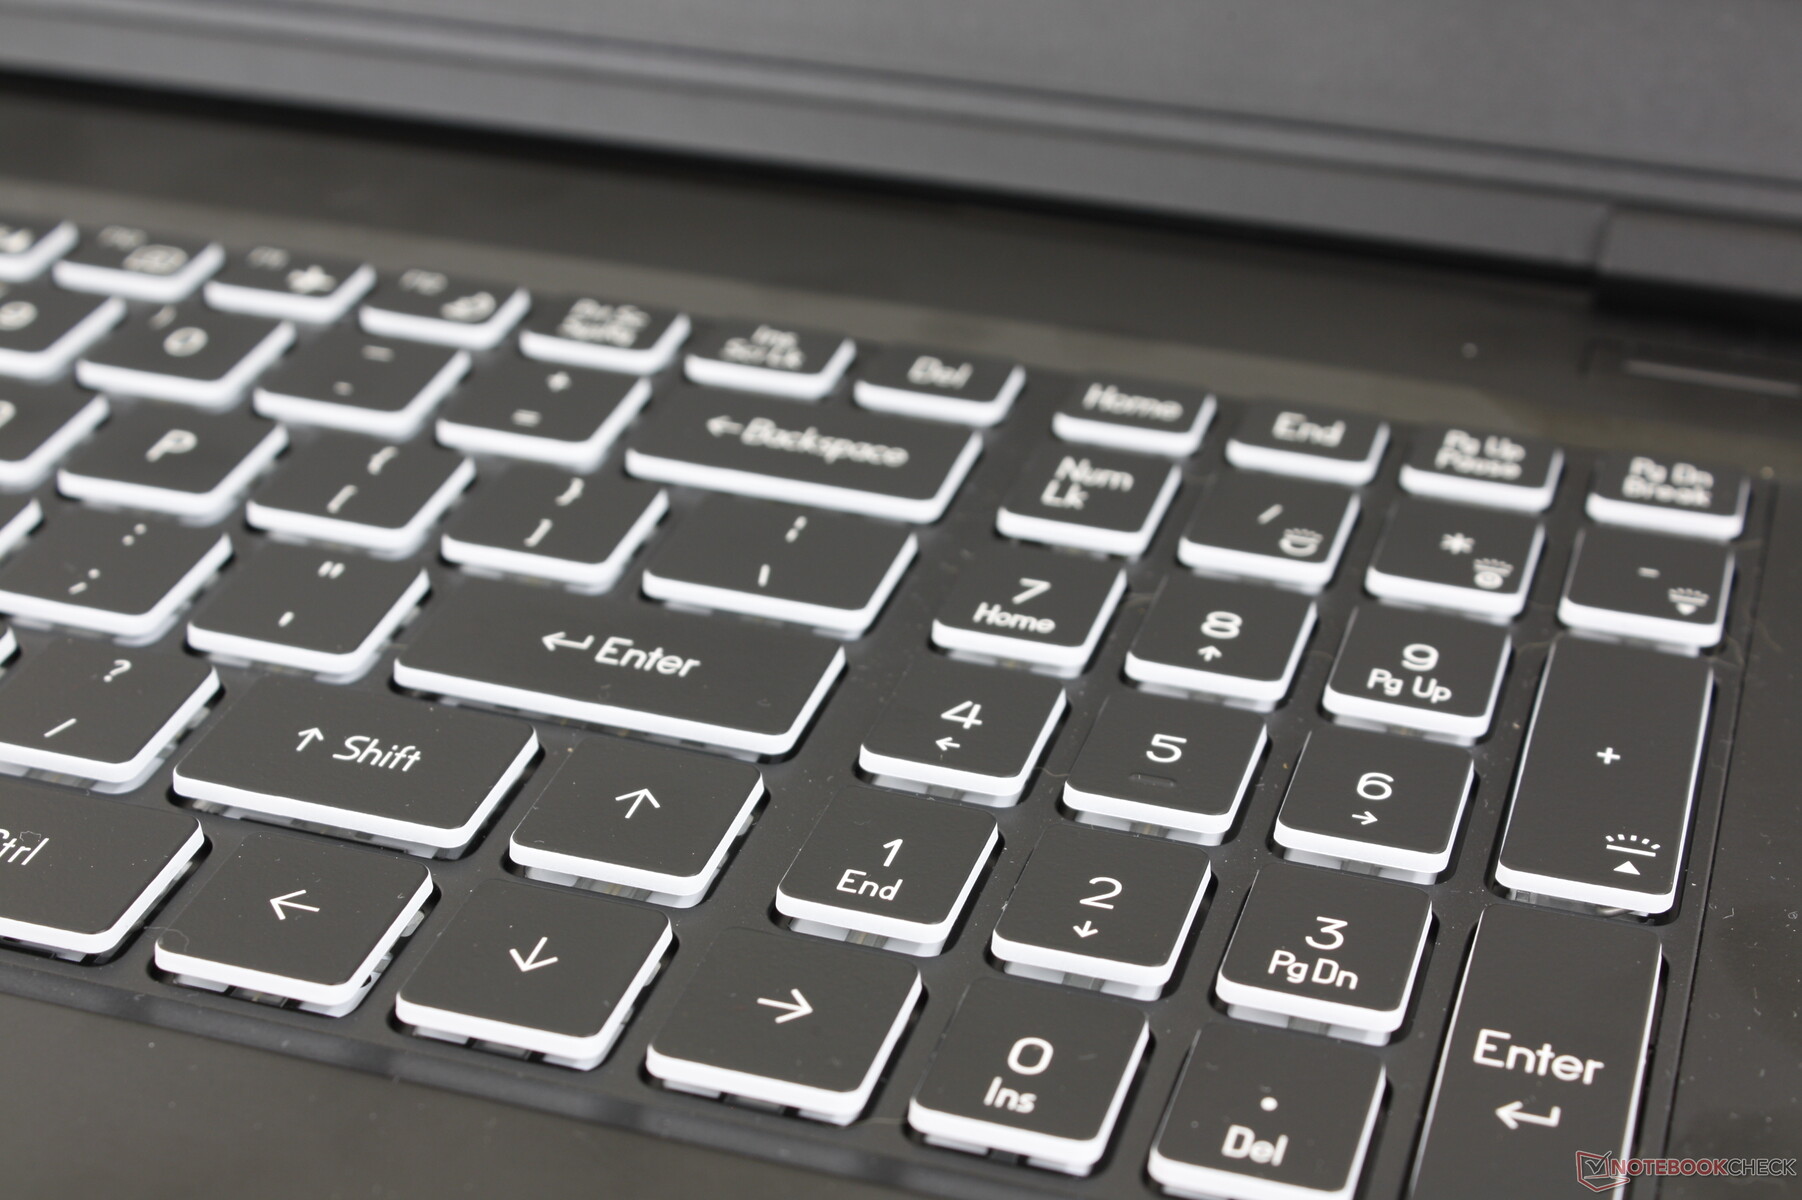
Teclado
A experiência de digitação é consistente na maioria dos modelos da Eurocom, pois o ODM subjacente permanece o mesmo. O Raptor X17 tem o mesmo teclado baseado em membrana do Raptor X15, apesar das diferenças de tamanho de tela, o que é uma pena, pois as teclas do teclado numérico continuam a ser mais estreitas e mais apertadas do que as teclas QWERTY principais.
O feedback das teclas é mais suave do que o das teclas do MSI GE78 ou do Asus ROG Strix Scar 17. Como resultado, o ruído é relativamente silencioso, o que pode ser preferido por alguns digitadores, mas os jogadores mais exigentes podem ficar desapontados com a falta de "cliques".
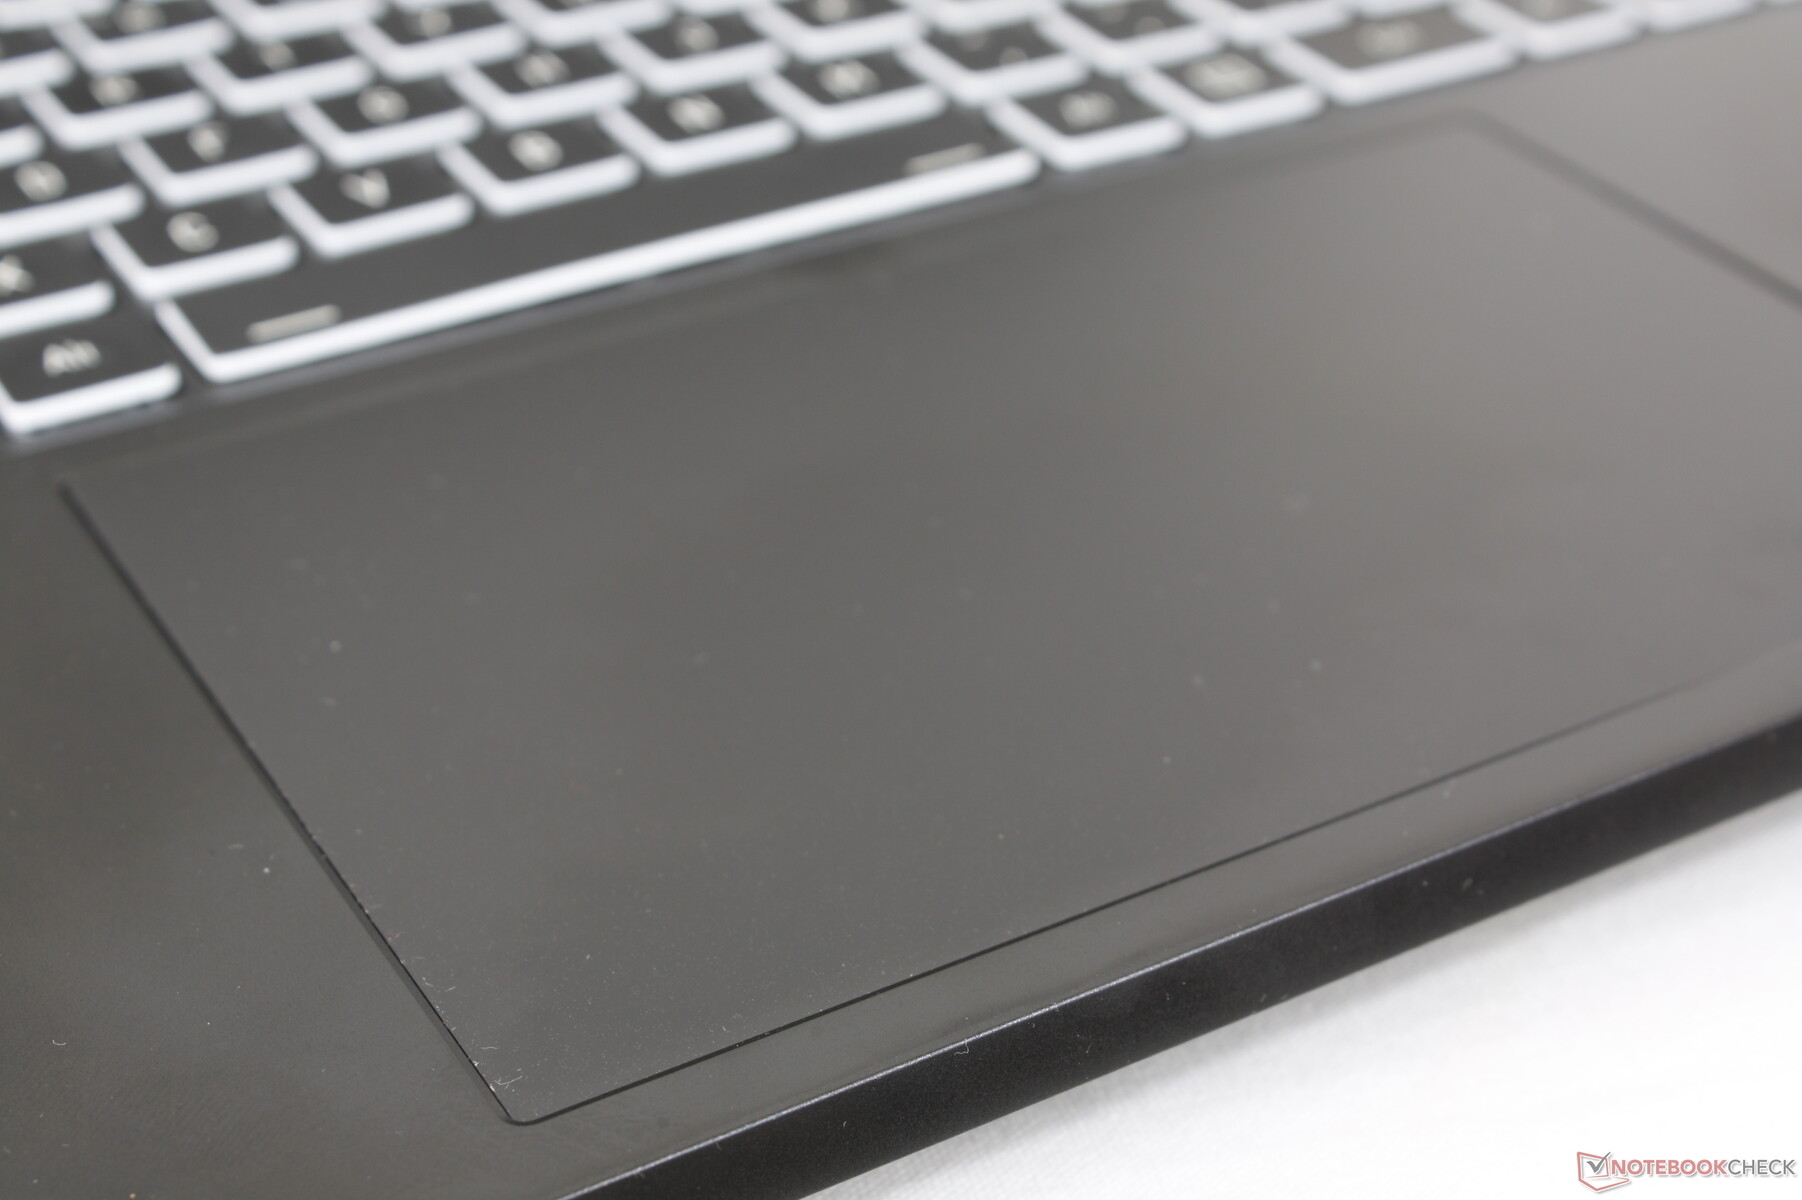
Touchpad
O clickpad é grande, com 15 x 9 cm, em comparação com o clickpad menor, de 13 x 8,2 cm, do MSI GE78 HX. O deslizamento é suave em velocidades médias e altas, enquanto há um pouco de aderência em velocidades mais lentas para ajudar na precisão.
O feedback ao clicar no clickpad é suave, com deslocamento superficial, não muito diferente do Razer Blade 17. Portanto, as ações de arrastar e soltar são um pouco complicadas de executar, apesar da grande área de superfície. Um mouse USB dedicado ainda é a melhor opção sempre que possível.

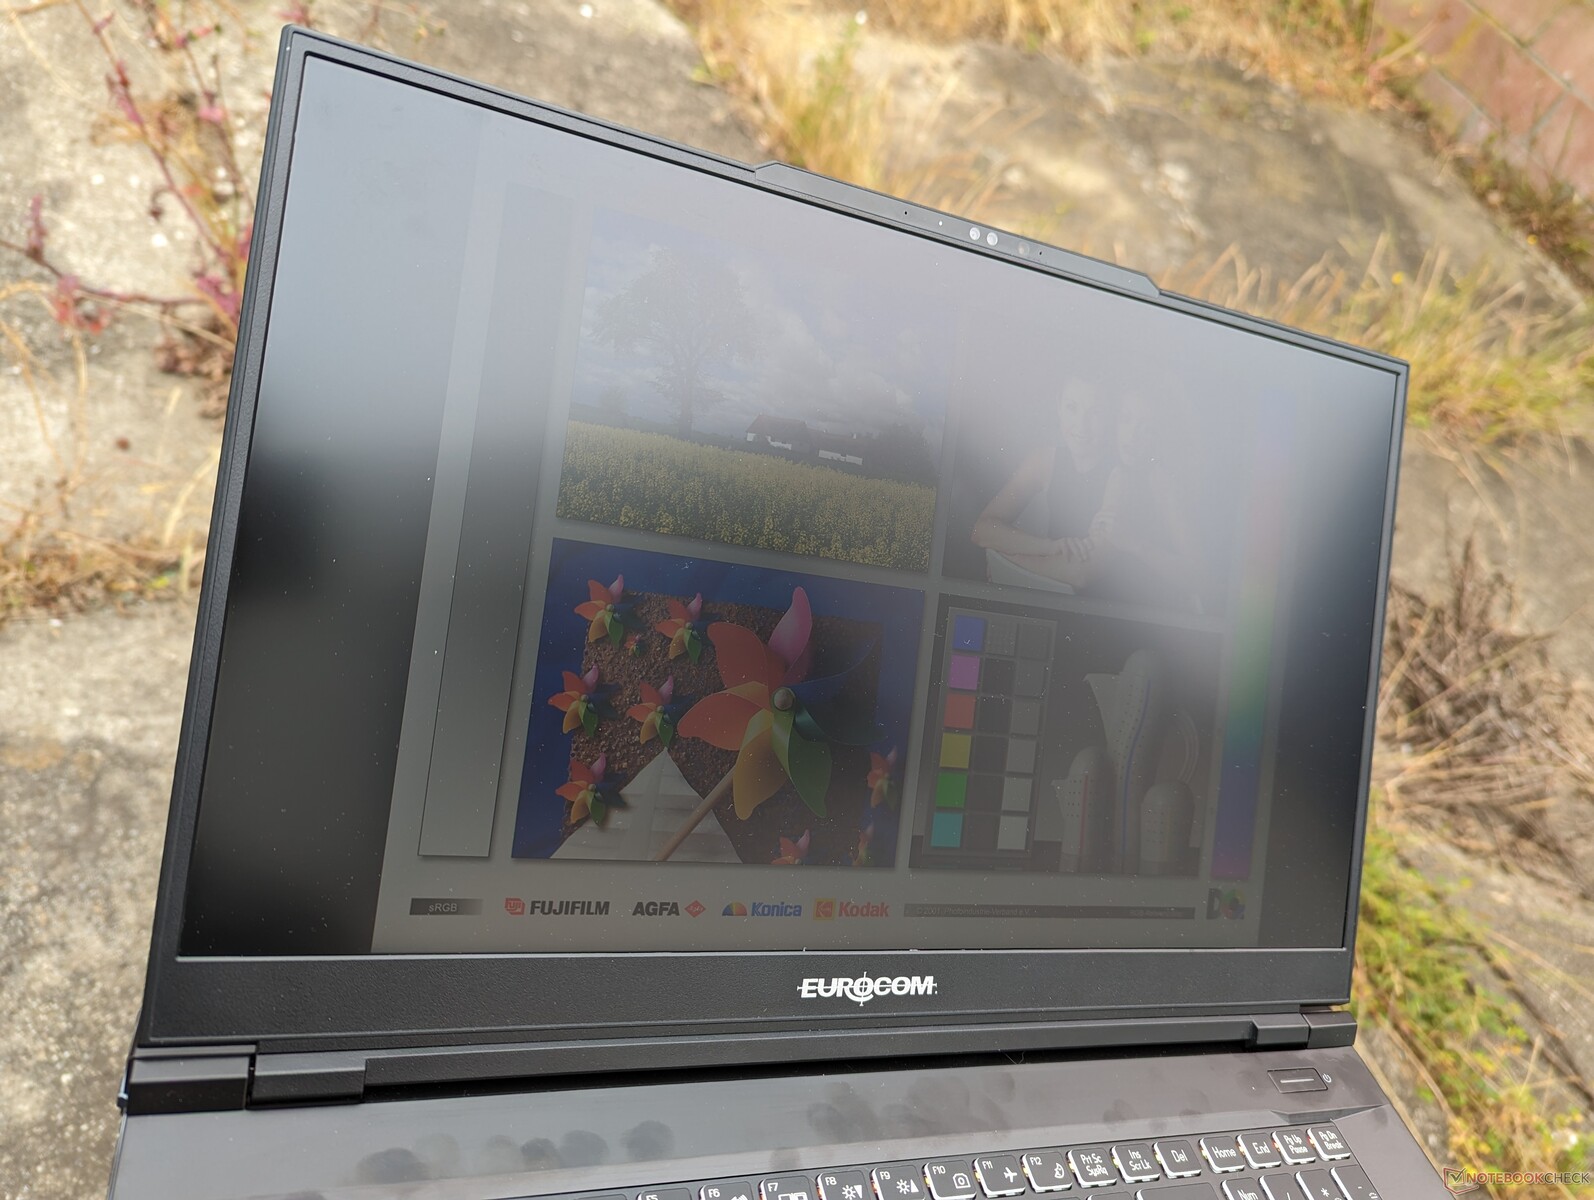
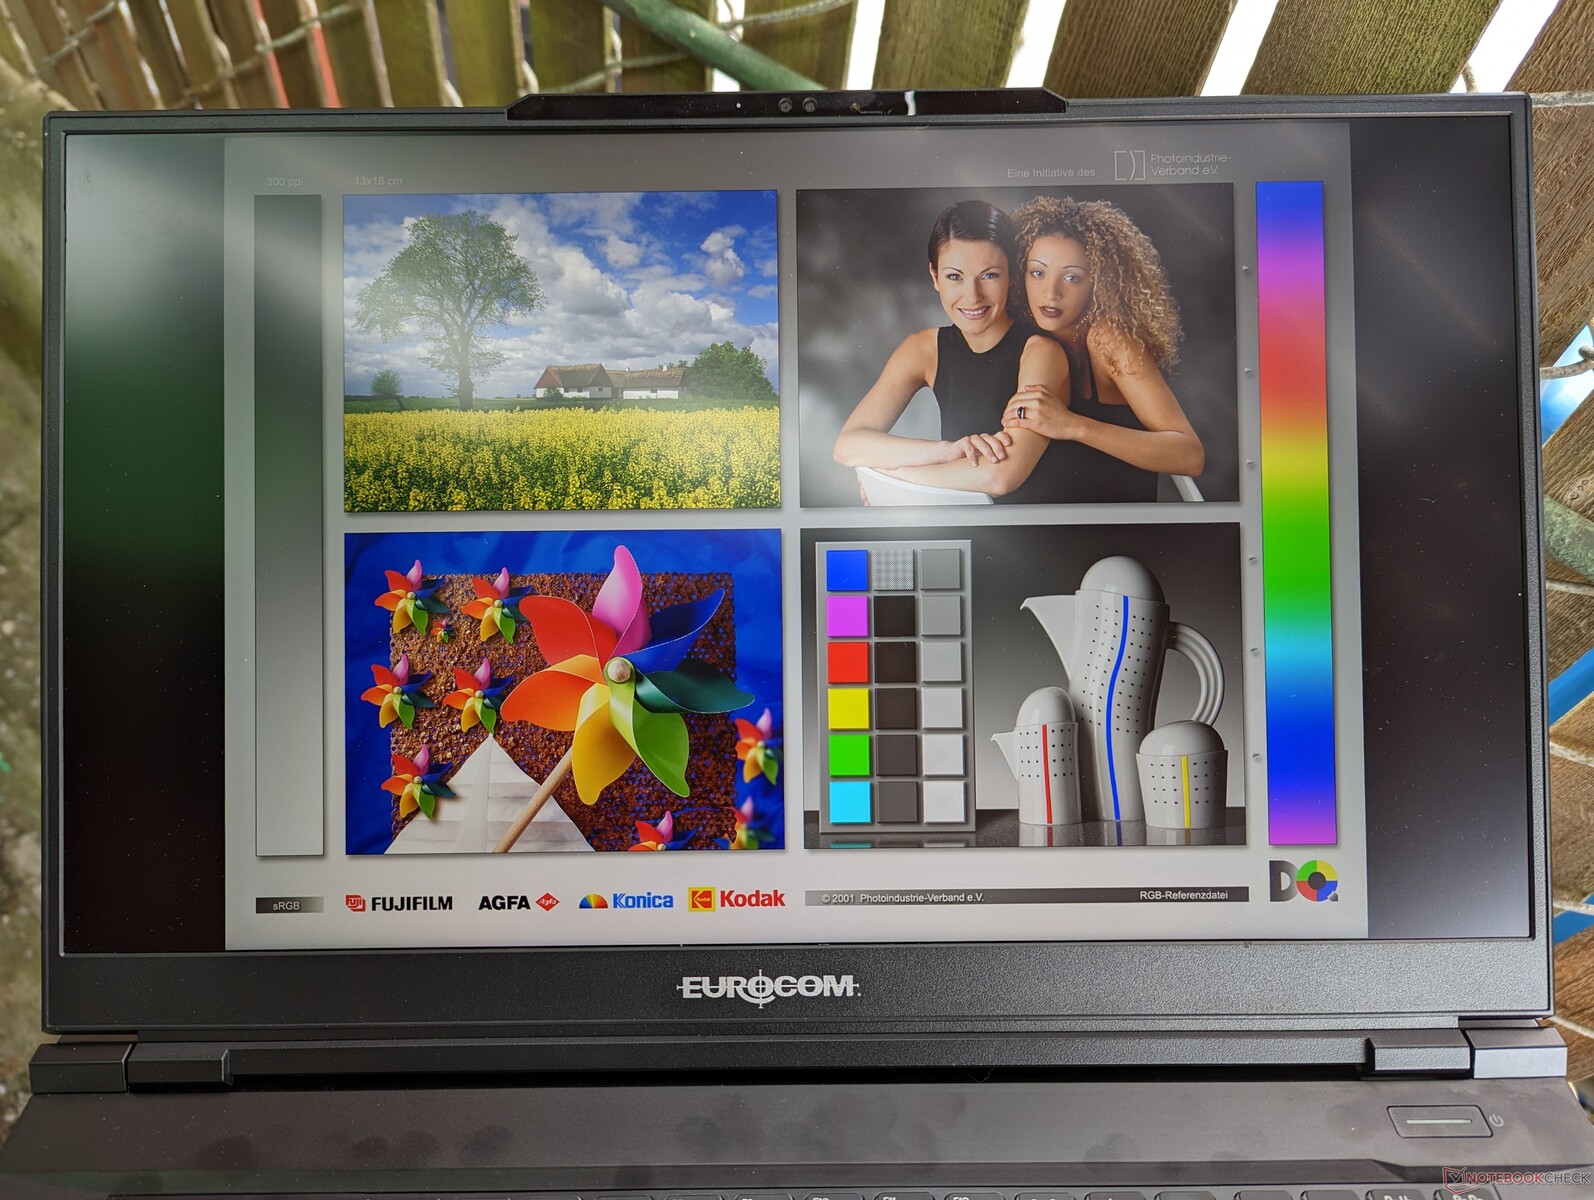
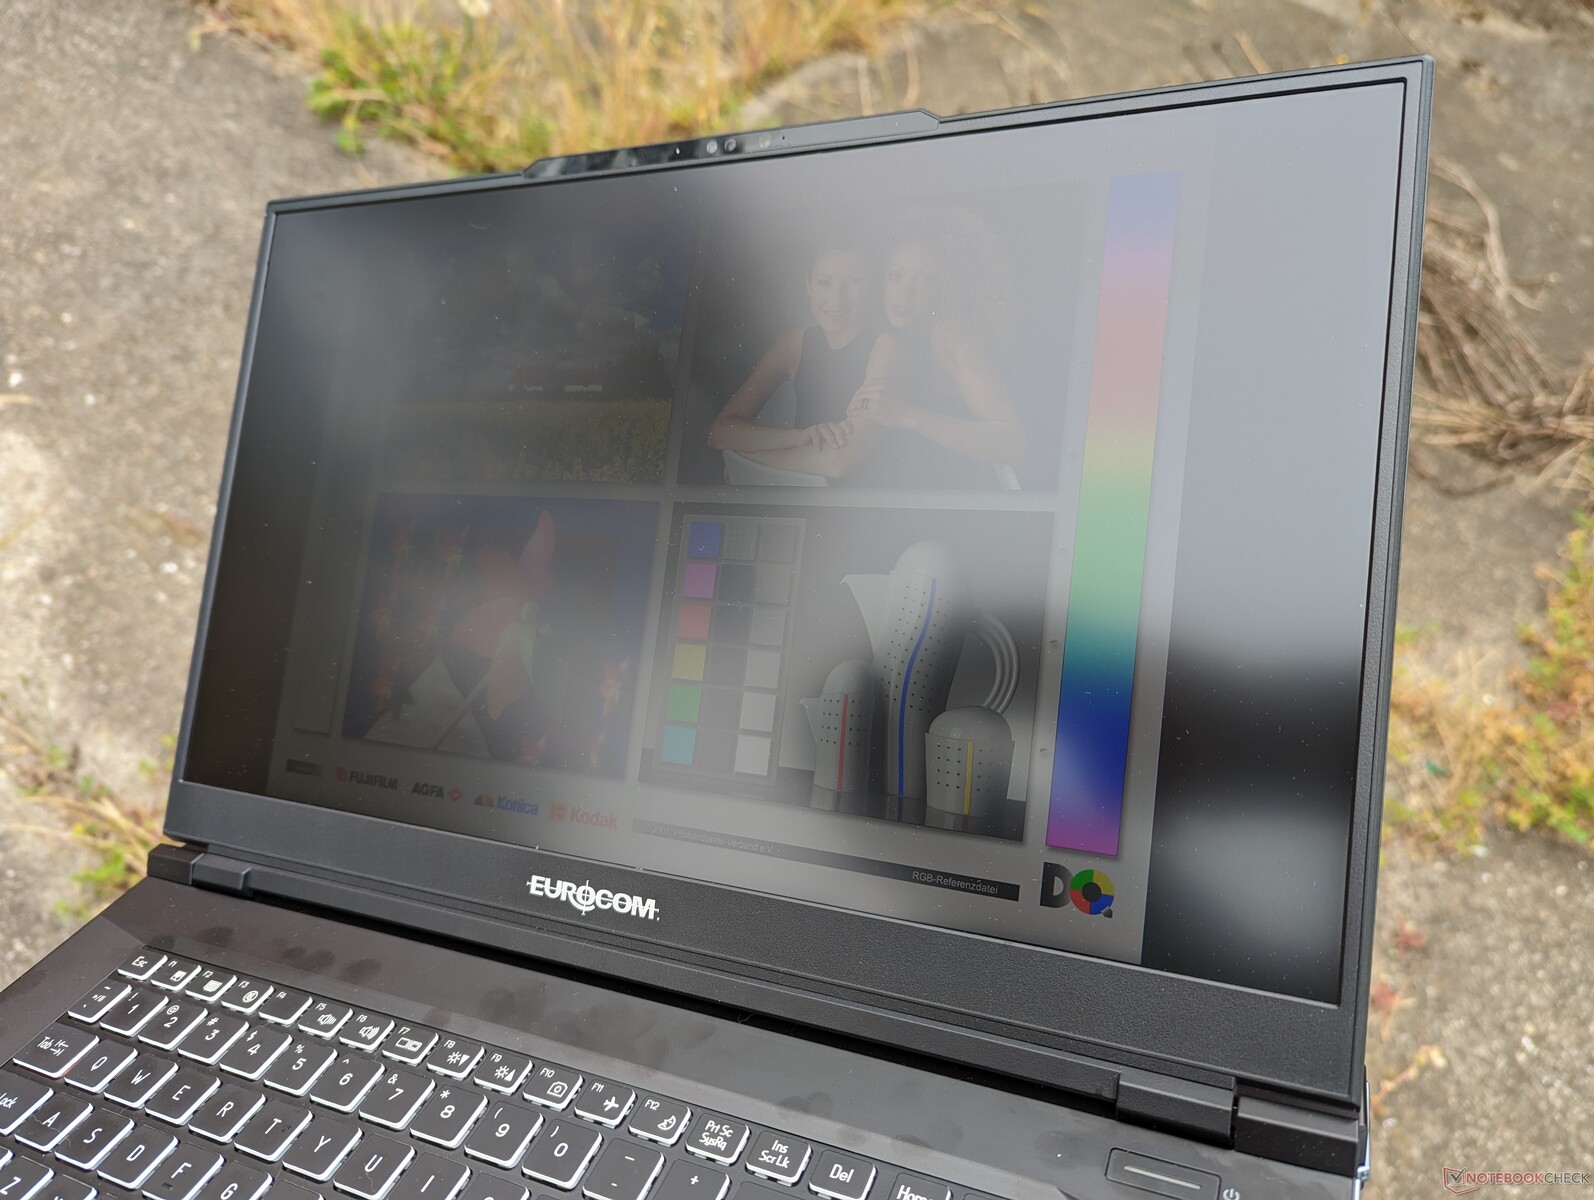
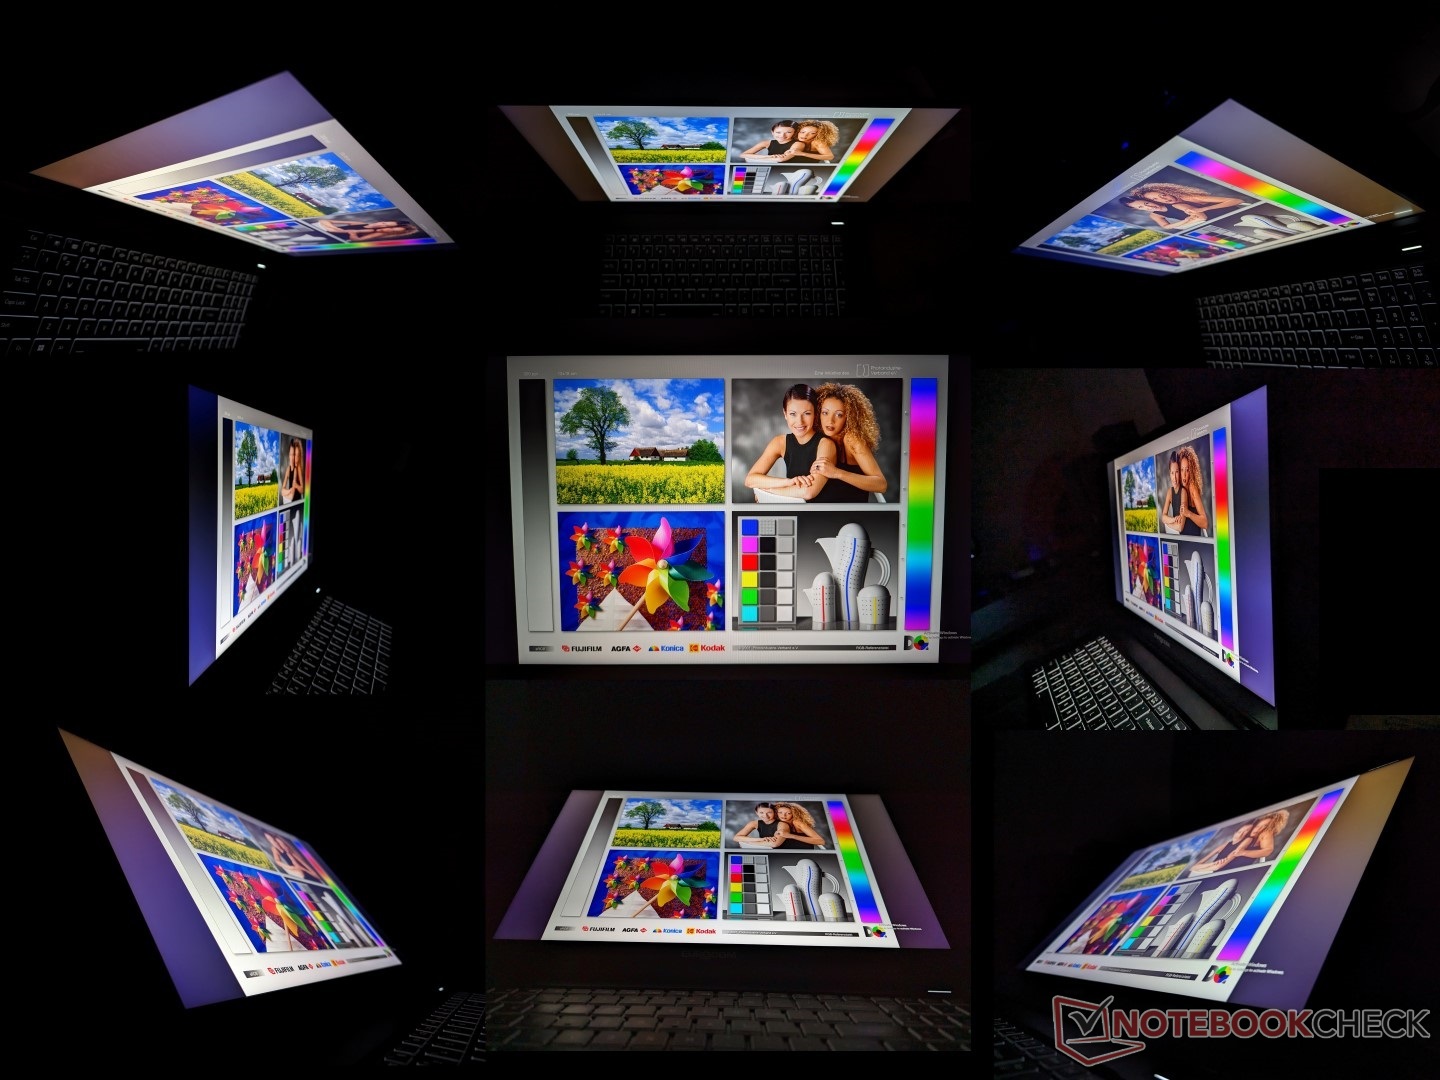
Tela - 240 Hz, QHD, G-Sync, cores DCI-P3 completas
Duas opções de tela estão disponíveis: QHD a 240 Hz ou 4K UHD a 144 Hz, cada uma com 100% de cores DCI-P3 e suporte a G-Sync. Nossa unidade de teste específica vem com a primeira opção.
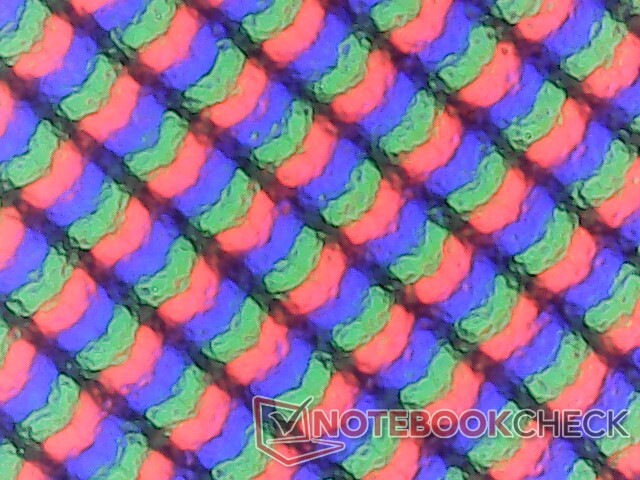
Nosso sistema emprega um painel IPS da BOE muito semelhante ao encontrado naROG Strix Scar 17 (NE173QHM-NZ1 vs. NE173QHM-NZ2). Não notamos nenhuma diferença importante entre os dois painéis, desde suas taxas de atualização rápidas, tempos de resposta rápidos, ampla cobertura de cores, metas de brilho e taxas de contraste decentes. É um painel de última geração adequado para jogos e edição de conteúdo.
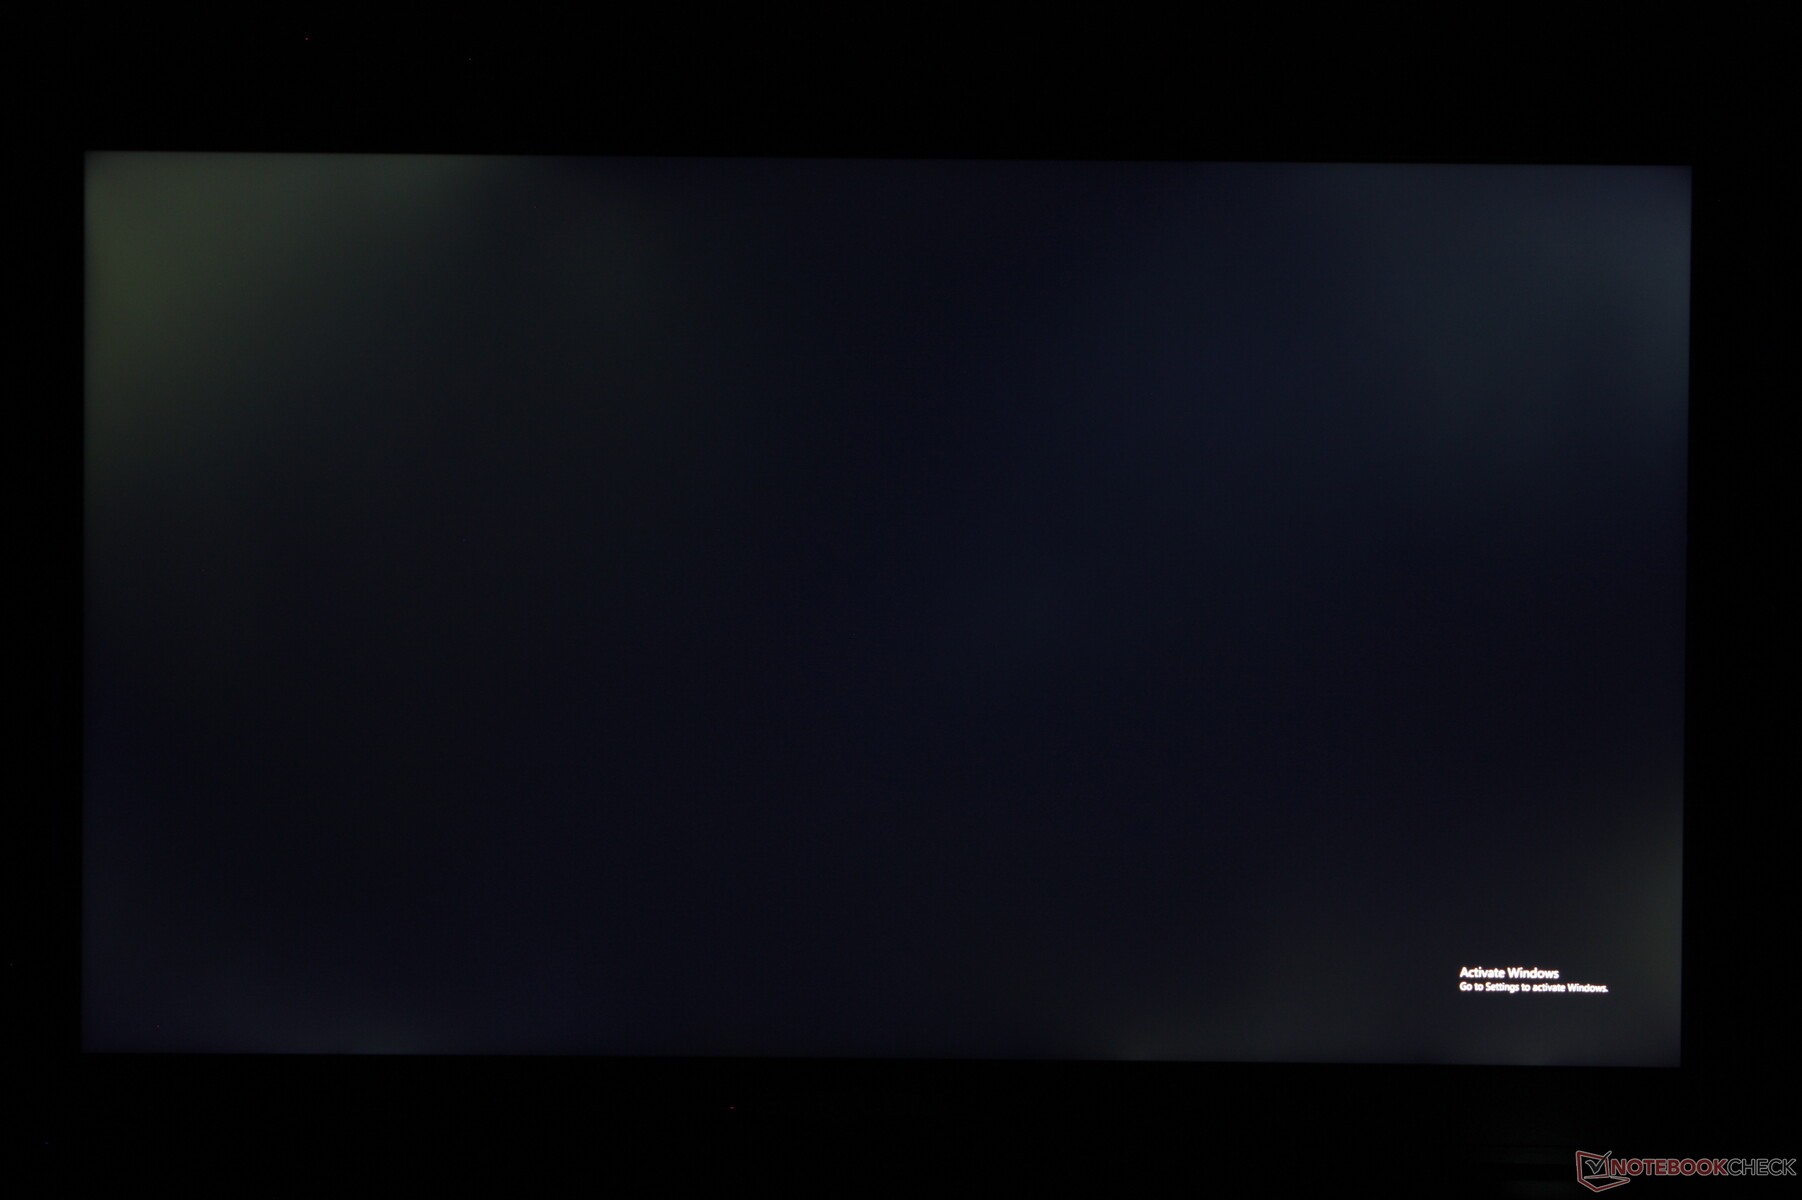
Uma reclamação que temos está relacionada ao sangramento perceptível da luz de fundo em nossa unidade de teste. Embora seja de se esperar algum sangramento na maioria dos painéis IPS, ele é mais grave aqui do que em outros laptops que testamos e que custam menos da metade do preço.
| |||||||||||||||||||||||||
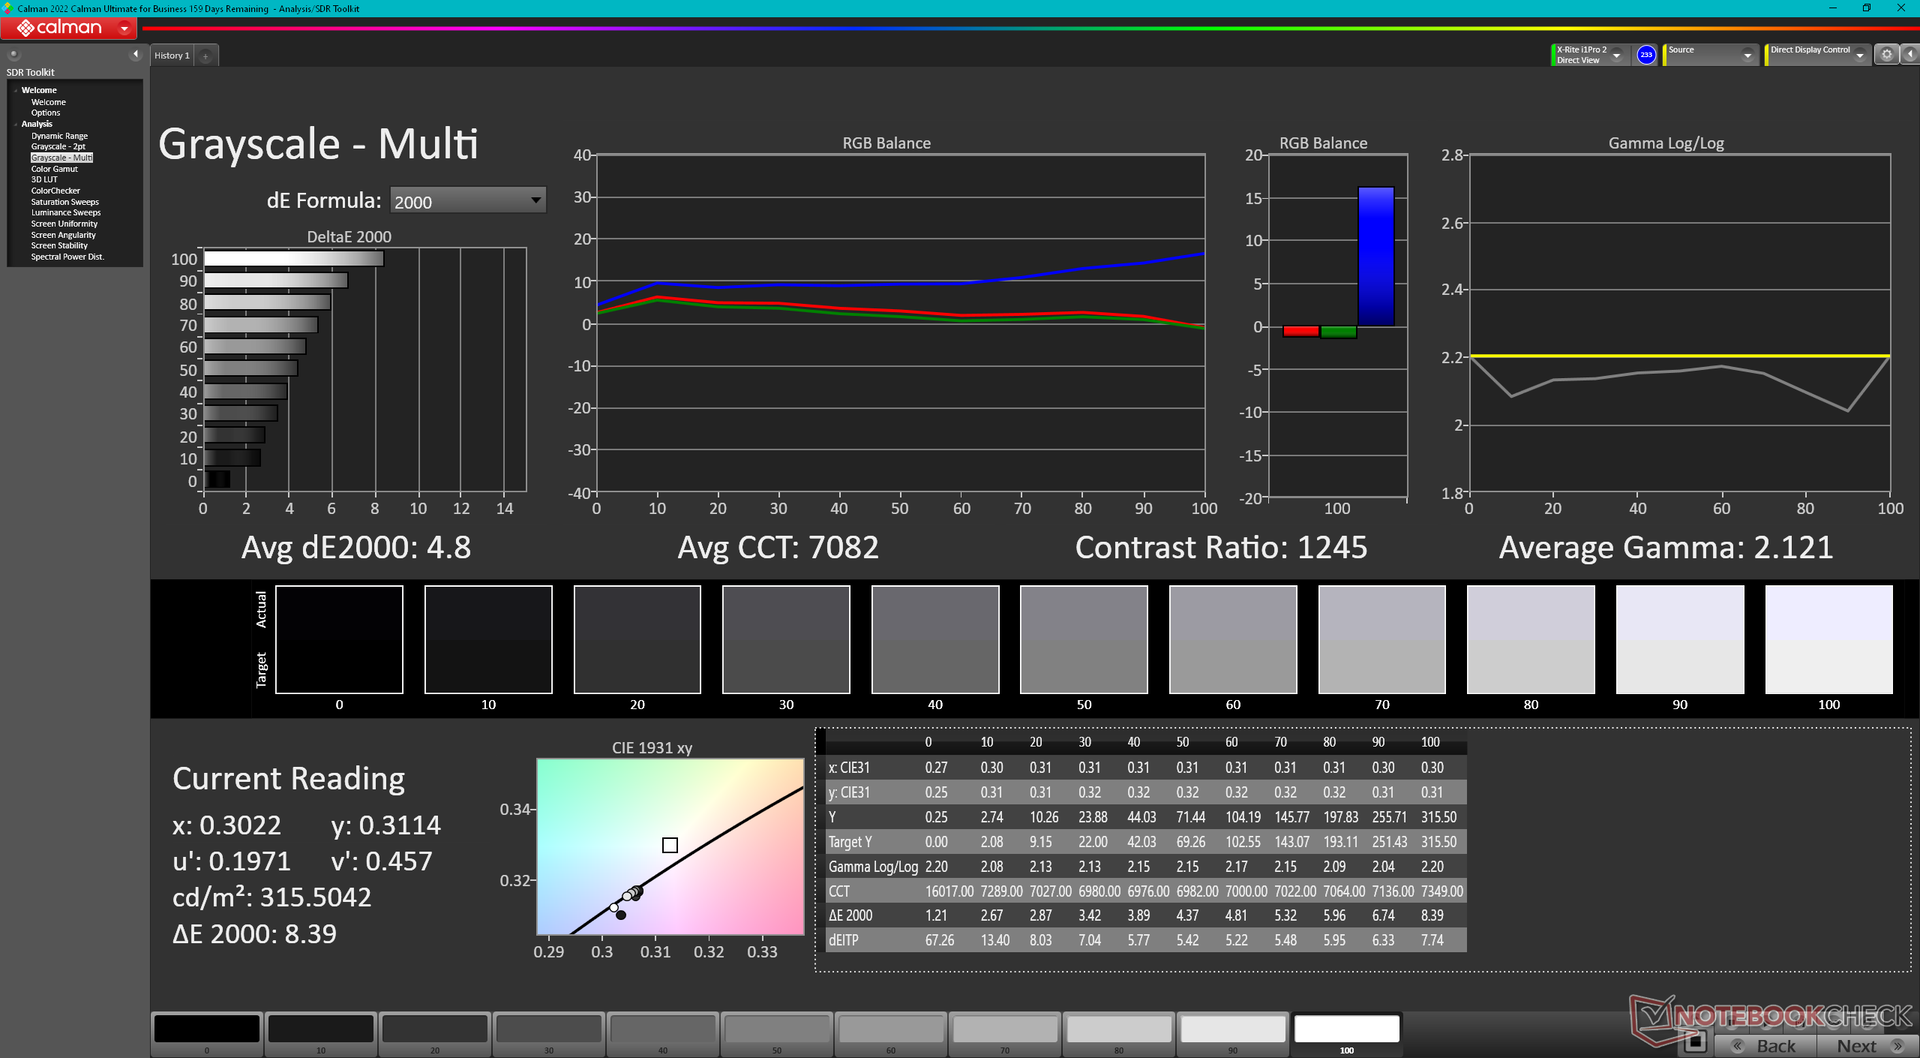
iluminação: 75 %
iluminação com acumulador: 312.6 cd/m²
Contraste: 1202:1 (Preto: 0.26 cd/m²)
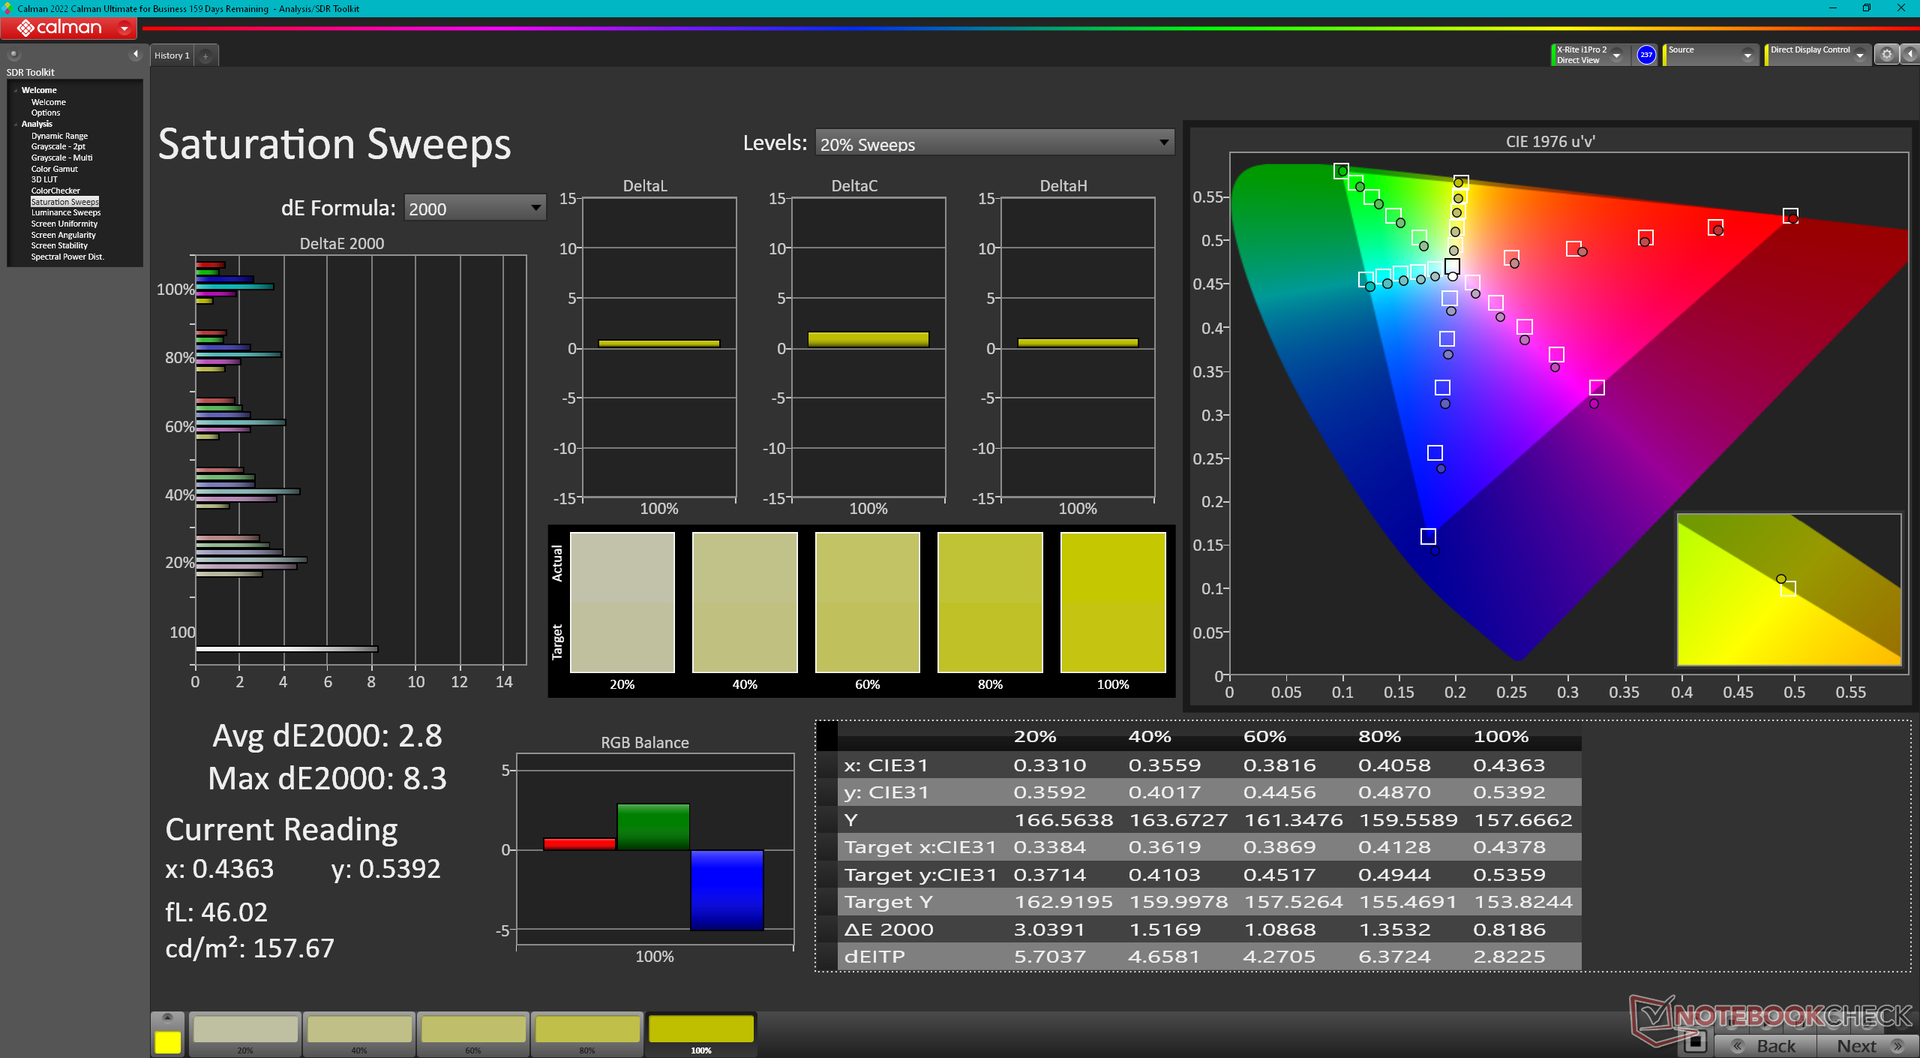
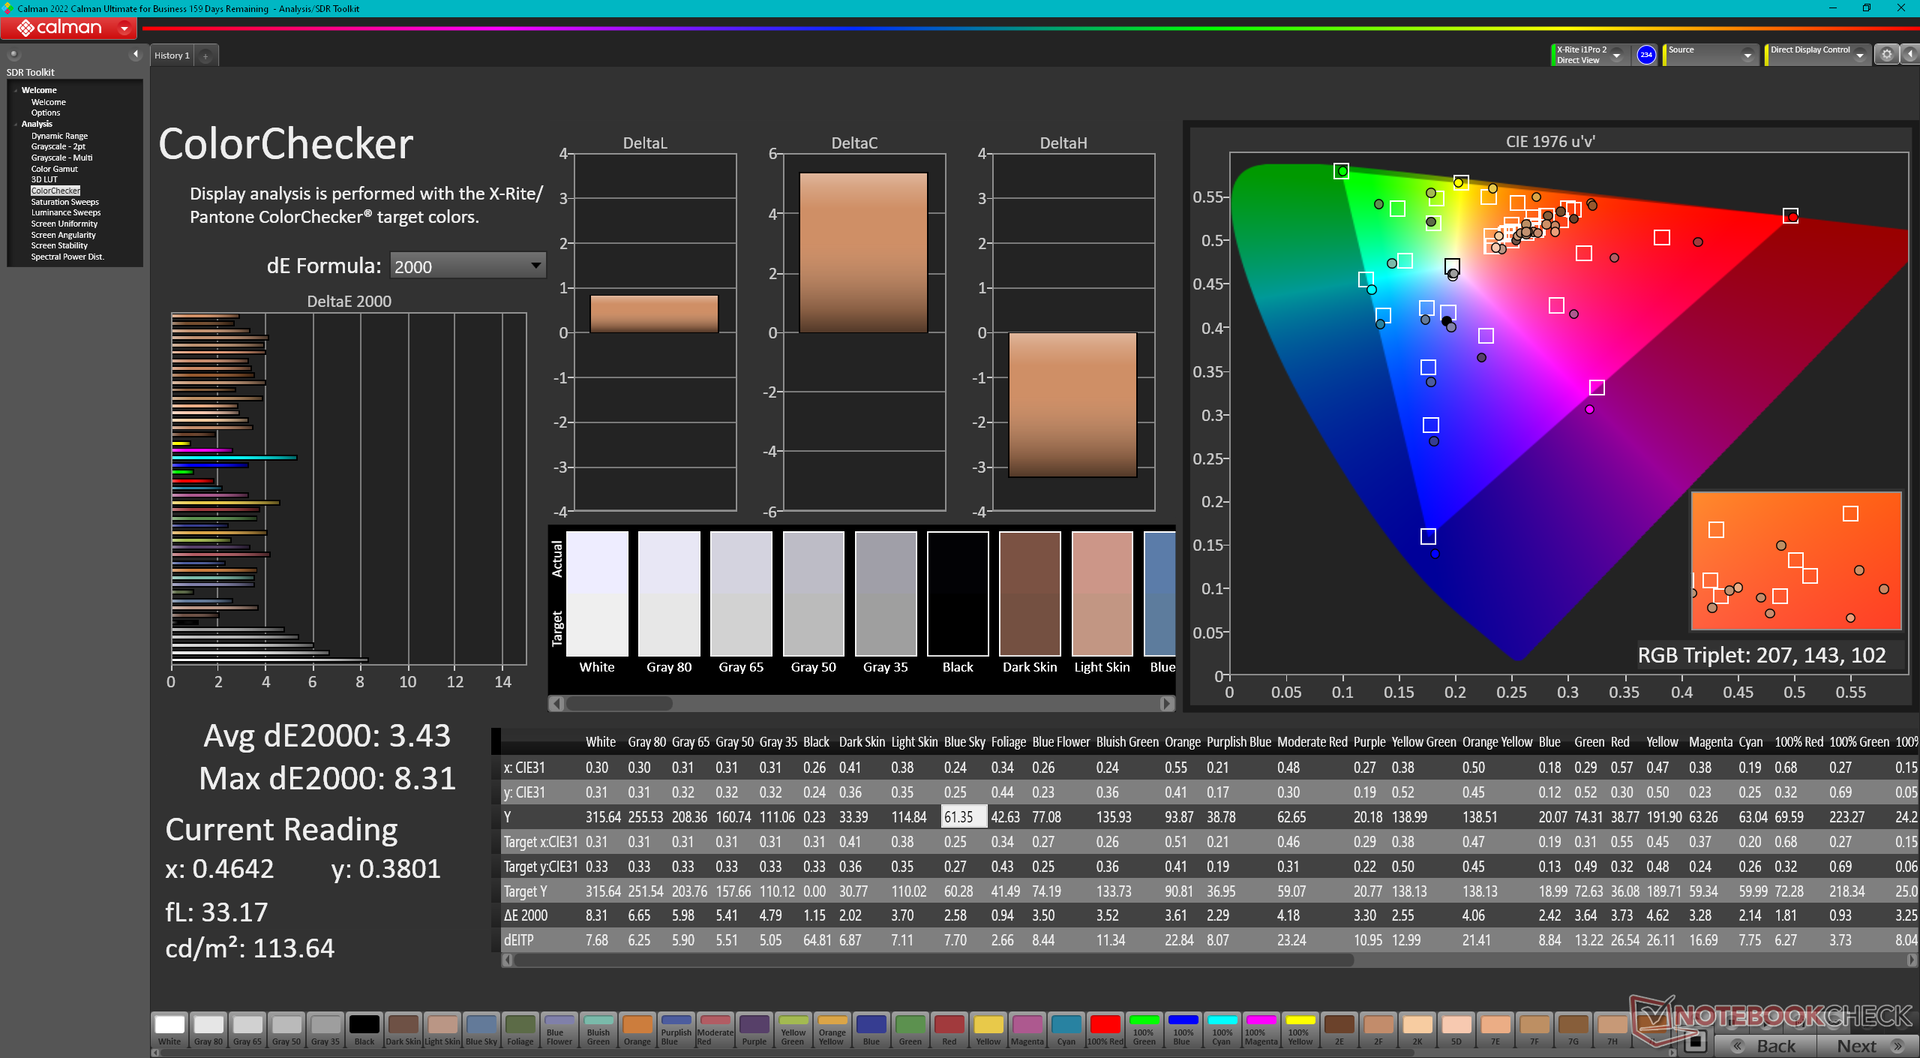
ΔE ColorChecker Calman: 3.43 | ∀{0.5-29.43 Ø4.71}
calibrated: 0.74
ΔE Greyscale Calman: 4.8 | ∀{0.09-98 Ø4.96}
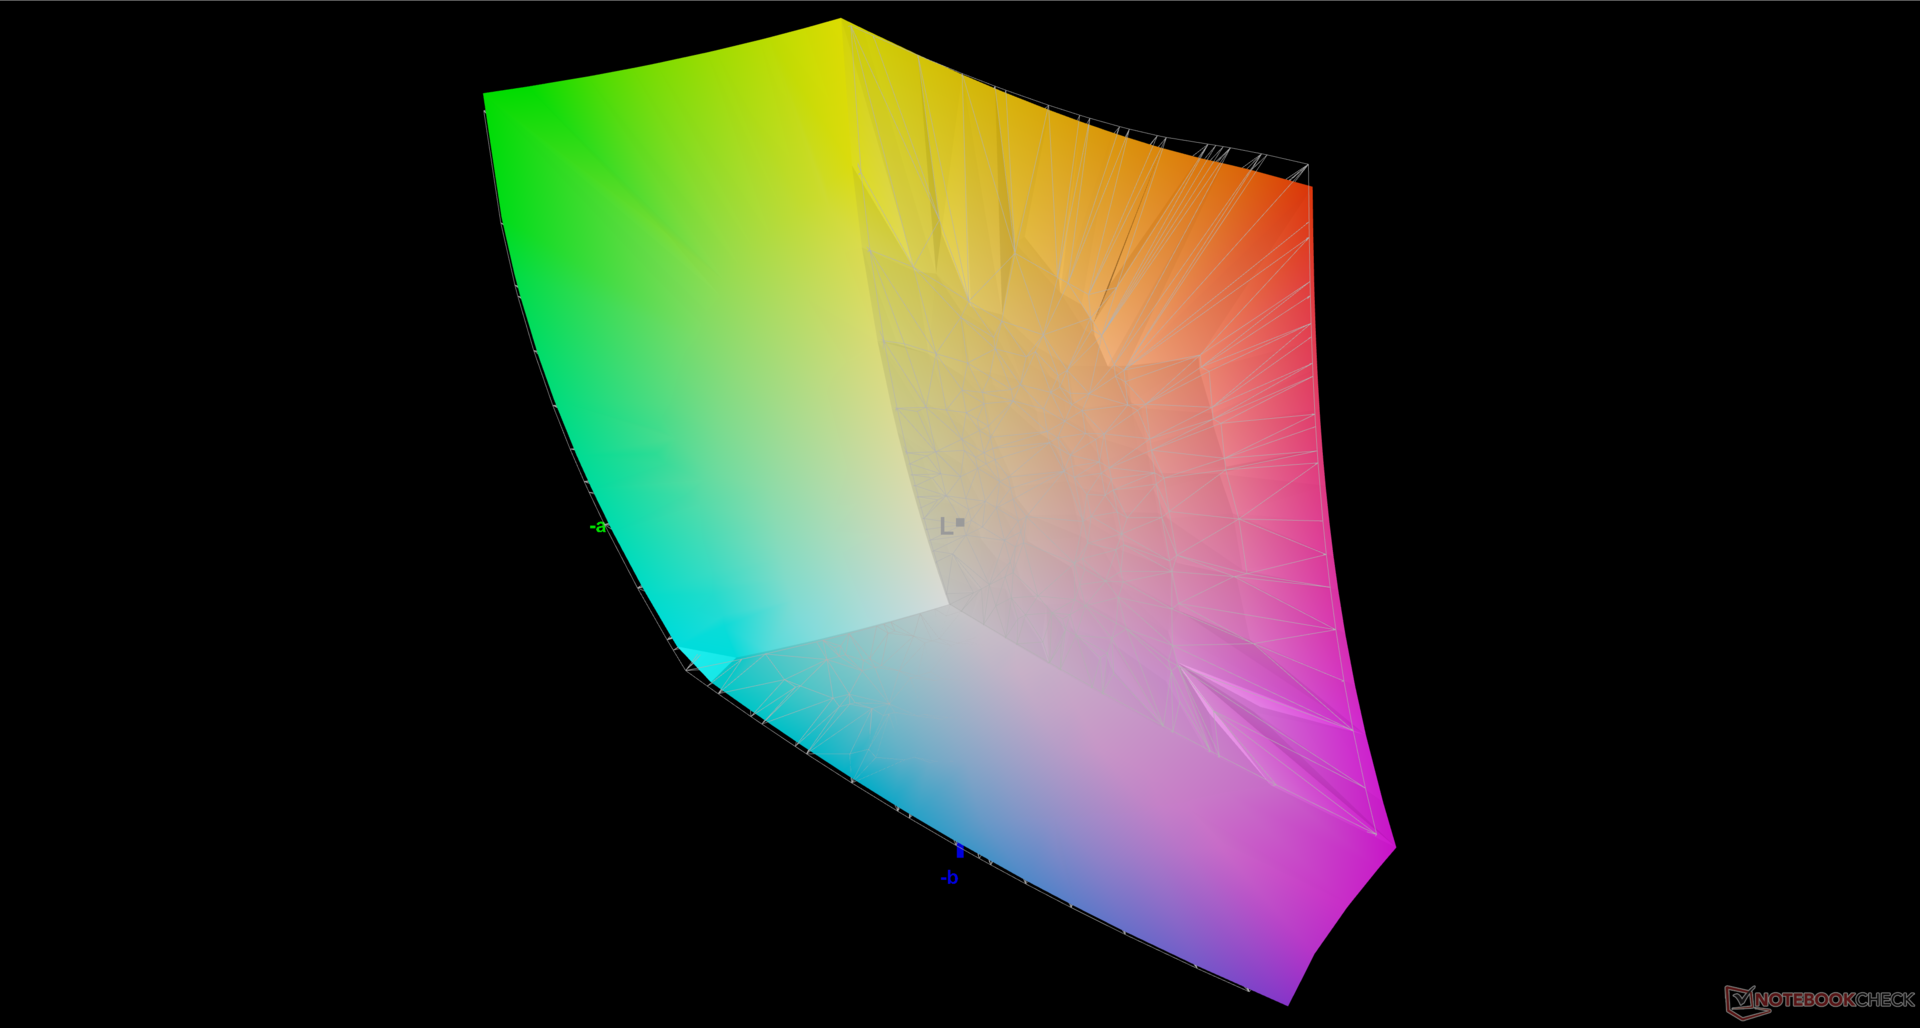
85.4% AdobeRGB 1998 (Argyll 3D)
99.9% sRGB (Argyll 3D)
97.8% Display P3 (Argyll 3D)
Gamma: 2.12
CCT: 7082 K
| Eurocom Raptor X17 BOE NE173QHM-NZ1, IPS, 2560x1440, 17.3" | Asus ROG Strix Scar 17 G733PY-XS96 NE173QHM-NZ2, IPS, 2560x1440, 17.3" | Aorus 17X AZF BOE09F9, IPS, 2560x1440, 17.3" | MSI GE78HX 13VH-070US AU Optronics B170QAN01.2, IPS, 2560x1600, 17" | Eluktronics Mech-17 GP2 BOE NE170QDM-NZ1, IPS, 2560x1600, 17" | Alienware m17 R5 (R9 6900HX, RX 6850M XT) AU Optronics AUODBA3, IPS, 3840x2160, 17" | |
|---|---|---|---|---|---|---|
| Display | 0% | -1% | 0% | -16% | 1% | |
| Display P3 Coverage (%) | 97.8 | 98 0% | 96.7 -1% | 97.6 0% | 69.1 -29% | 97.2 -1% |
| sRGB Coverage (%) | 99.9 | 100 0% | 99.9 0% | 99.9 0% | 99.7 0% | 99.6 0% |
| AdobeRGB 1998 Coverage (%) | 85.4 | 85.6 0% | 84.5 -1% | 86.5 1% | 69.8 -18% | 88.4 4% |
| Response Times | 20% | -3% | 52% | 8% | -20% | |
| Response Time Grey 50% / Grey 80% * (ms) | 13.3 ? | 6.2 ? 53% | 14 ? -5% | 4.2 ? 68% | 12 ? 10% | 16.4 ? -23% |
| Response Time Black / White * (ms) | 10 ? | 11.4 ? -14% | 10.1 ? -1% | 6.4 ? 36% | 9.4 ? 6% | 11.6 ? -16% |
| PWM Frequency (Hz) | ||||||
| Screen | 25% | 6% | -13% | 19% | -67% | |
| Brightness middle (cd/m²) | 312.6 | 322.5 3% | 294 -6% | 398.6 28% | 417.3 33% | 484 55% |
| Brightness (cd/m²) | 292 | 317 9% | 276 -5% | 384 32% | 387 33% | 449 54% |
| Brightness Distribution (%) | 75 | 86 15% | 90 20% | 89 19% | 87 16% | 87 16% |
| Black Level * (cd/m²) | 0.26 | 0.29 -12% | 0.28 -8% | 0.46 -77% | 0.42 -62% | 0.55 -112% |
| Contrast (:1) | 1202 | 1112 -7% | 1050 -13% | 867 -28% | 994 -17% | 880 -27% |
| Colorchecker dE 2000 * | 3.43 | 1.15 66% | 2.81 18% | 4.05 -18% | 2.14 38% | 4.8 -40% |
| Colorchecker dE 2000 max. * | 8.31 | 3.03 64% | 5.7 31% | 8.68 -4% | 4.09 51% | 7.48 10% |
| Colorchecker dE 2000 calibrated * | 0.74 | 0.56 24% | 0.86 -16% | 1.02 -38% | 0.42 43% | 4.74 -541% |
| Greyscale dE 2000 * | 4.8 | 1.7 65% | 3.4 29% | 6.5 -35% | 3.1 35% | 5.5 -15% |
| Gamma | 2.12 104% | 2.27 97% | 2.301 96% | 2.11 104% | 2.19 100% | 2.42 91% |
| CCT | 7082 92% | 6299 103% | 7389 88% | 7518 86% | 6040 108% | 6148 106% |
| Média Total (Programa/Configurações) | 15% /
19% | 1% /
3% | 13% /
-1% | 4% /
10% | -29% /
-45% |
* ... menor é melhor

O monitor não vem pré-calibrado da caixa. Em vez disso, a Eurocom cobra uma taxa extra pela calibração de fábrica, o que consideramos um absurdo, considerando o preço já elevado. Outros fabricantes, como MSI, Asus, Dell e outros, oferecem a pré-calibração como padrão para muitos de seus respectivos modelos.
Exibir tempos de resposta
| ↔ Tempo de resposta preto para branco | ||
|---|---|---|
| 10 ms ... ascensão ↗ e queda ↘ combinadas | ↗ 5 ms ascensão | 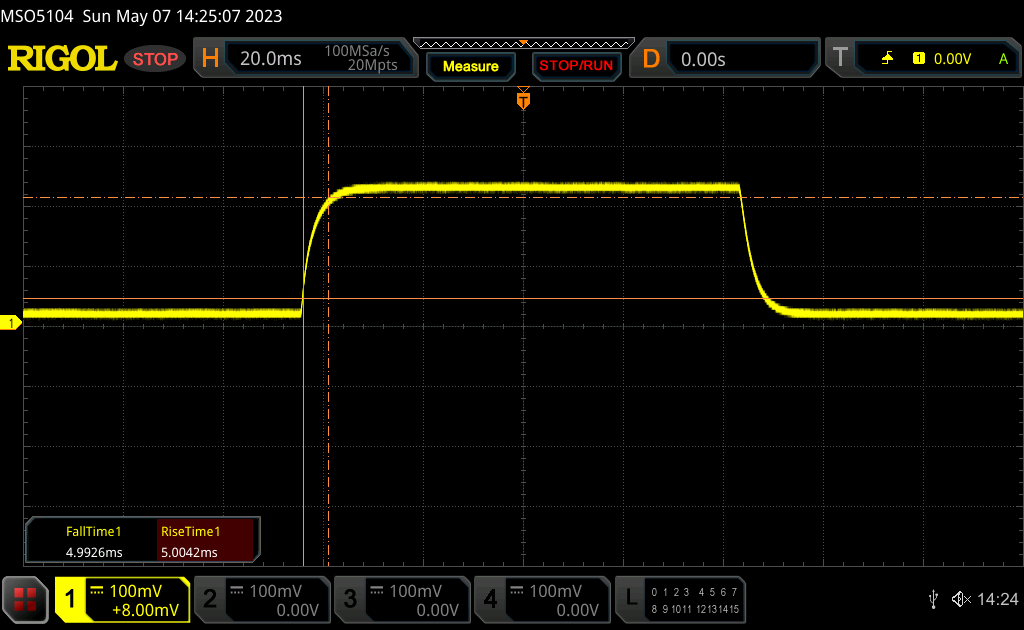 |
| ↘ 5 ms queda | ||
| A tela mostra boas taxas de resposta em nossos testes, mas pode ser muito lenta para jogadores competitivos. Em comparação, todos os dispositivos testados variam de 0.1 (mínimo) a 240 (máximo) ms. » 27 % de todos os dispositivos são melhores. Isso significa que o tempo de resposta medido é melhor que a média de todos os dispositivos testados (19.8 ms). | ||
| ↔ Tempo de resposta 50% cinza a 80% cinza | ||
| 13.3 ms ... ascensão ↗ e queda ↘ combinadas | ↗ 6 ms ascensão | 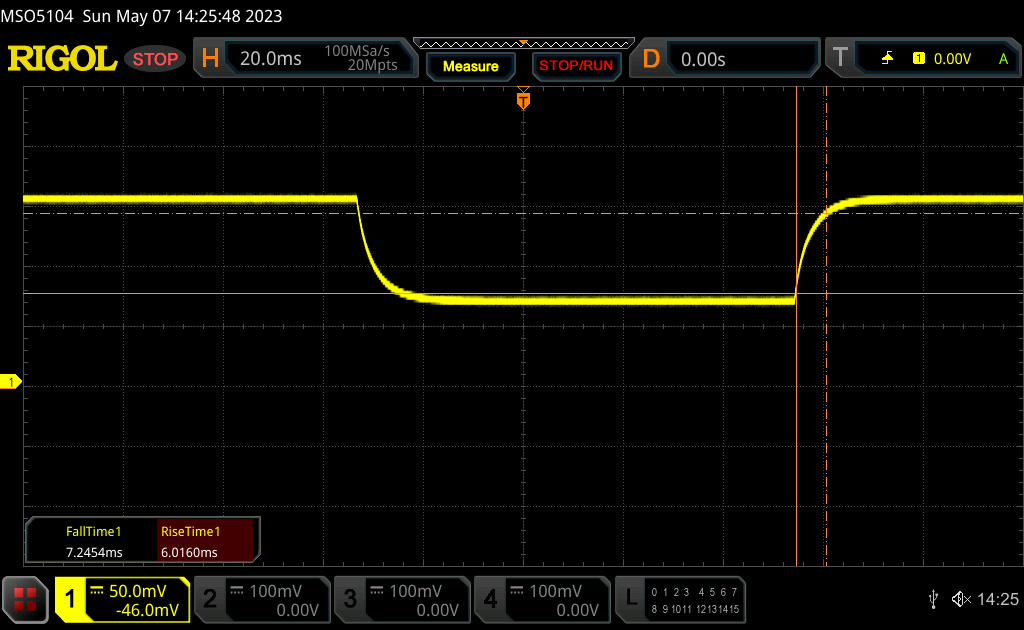 |
| ↘ 7.3 ms queda | ||
| A tela mostra boas taxas de resposta em nossos testes, mas pode ser muito lenta para jogadores competitivos. Em comparação, todos os dispositivos testados variam de 0.165 (mínimo) a 636 (máximo) ms. » 27 % de todos os dispositivos são melhores. Isso significa que o tempo de resposta medido é melhor que a média de todos os dispositivos testados (31 ms). | ||
Cintilação da tela / PWM (modulação por largura de pulso)
| Tela tremeluzindo / PWM não detectado | 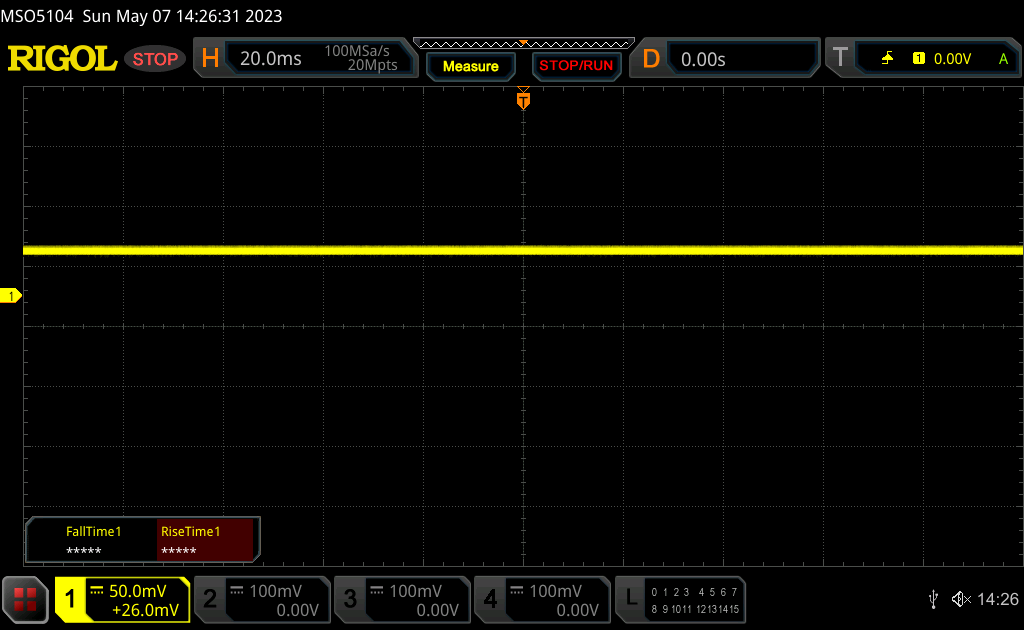 | ||
[pwm_comparison] Em comparação: 52 % de todos os dispositivos testados não usam PWM para escurecer a tela. Se PWM foi detectado, uma média de 7757 (mínimo: 5 - máximo: 343500) Hz foi medida. | |||
A visibilidade externa é típica da maioria dos laptops para jogos, pois 300 nits é a média da categoria. Os painéis de alguns modelos concorrentes podem atingir até 500 nits, como oAlienware m17 R5 ou Razer Blade 17 para facilitar a visualização em ambientes externos, mas não vemos isso como uma grande vantagem sobre o Eurocom, considerando o tamanho e o peso dos notebooks para jogos de 17 polegadas.
Desempenho - Raptor Lake para o Raptor X17
Condições de teste
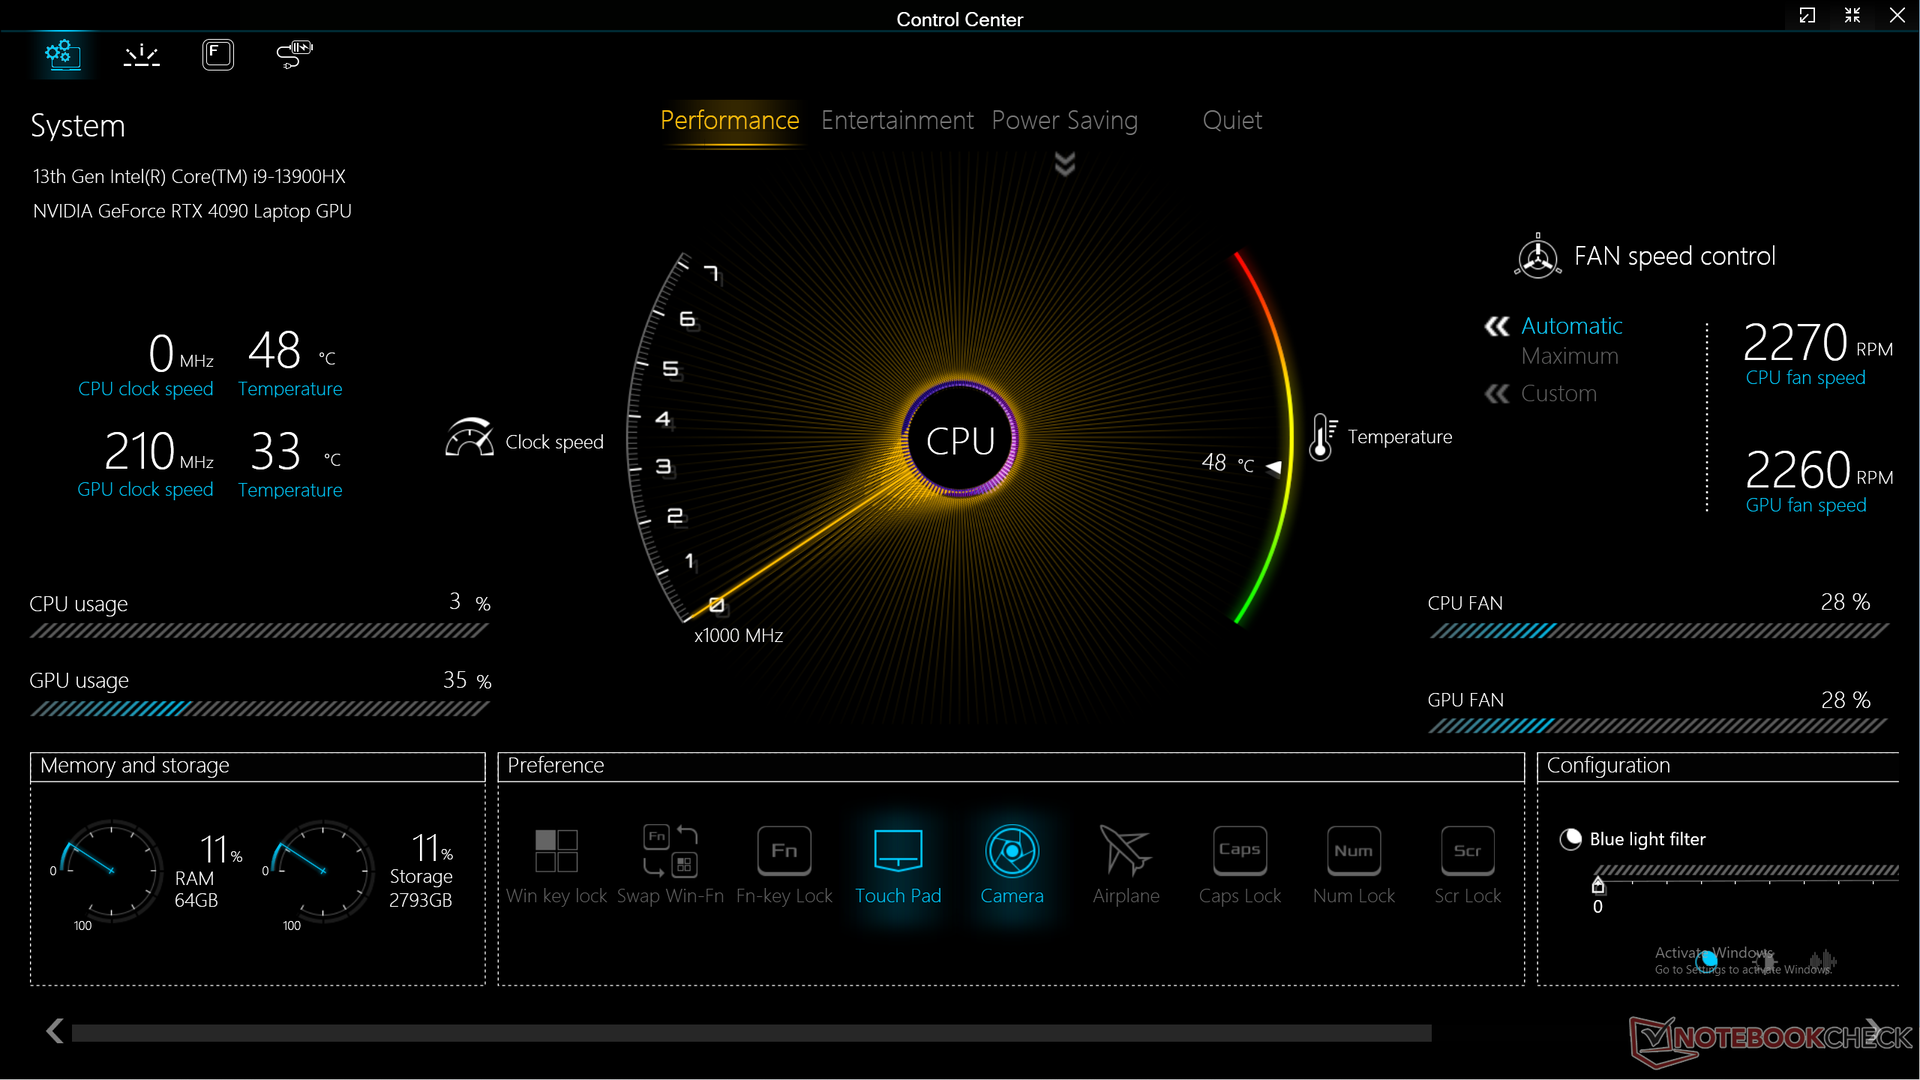
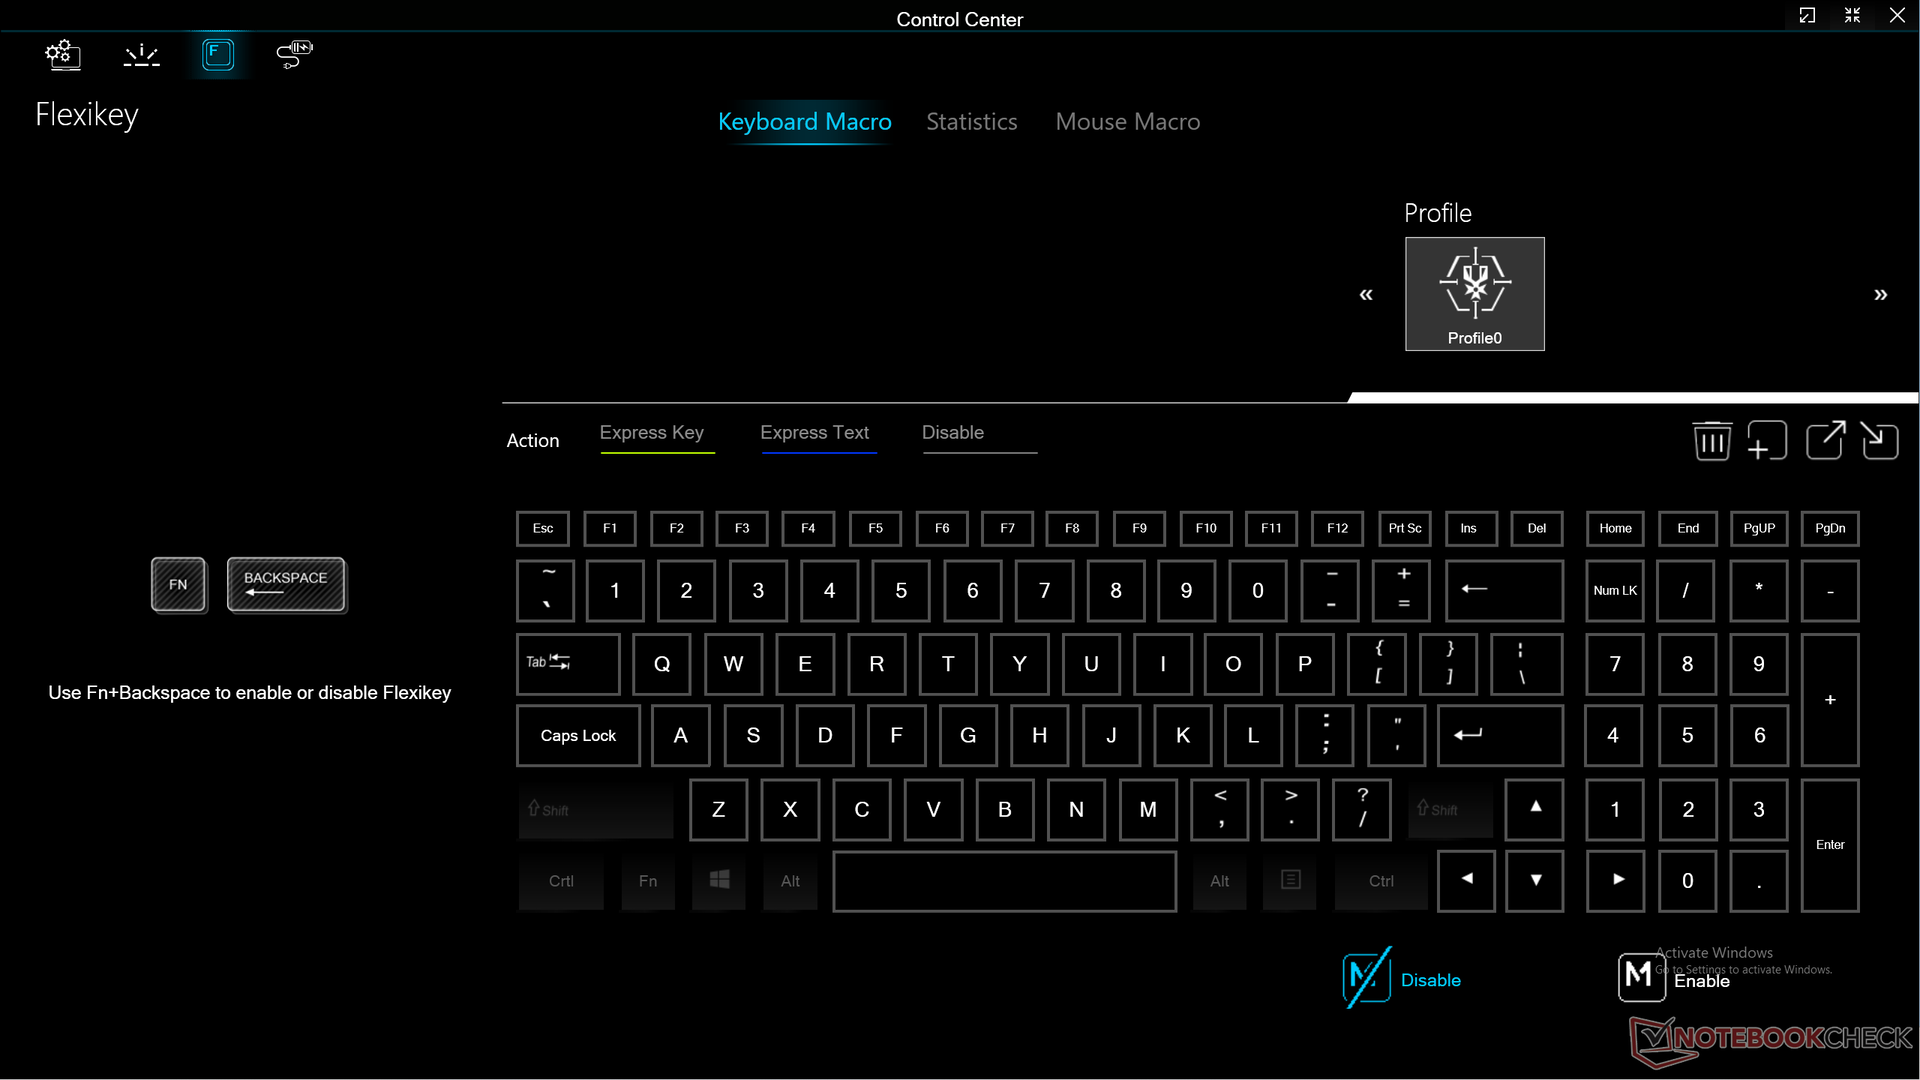
Configuramos nossa unidade para o modo Desempenho por meio do Control Center e do Windows antes de executar os benchmarks abaixo. Curiosamente, as configurações de energia da Central de controle não estão vinculadas às configurações de energia do Windows, o que significa que pode haver algum conflito se as duas configurações não forem idênticas. Por exemplo, é possível configurar o Windows no modo de economia de energia e o Control Center no modo de desempenho simultaneamente. OEMs como a Dell já resolveram esse problema em sua série Alienware.
Também configuramos nossa unidade para o modo dGPU antes do benchmarking. O Raptor X17 suporta o modo gráfico híbrido (Optimus), o modo dGPU e o modo dinâmico (também conhecido como Advanced Optimus). Embora apreciemos as opções, as configurações estão enterradas em várias camadas de submenus no BIOS. Em comparação, concorrentes como a MSI e a Asus têm configurações semelhantes em seus respectivos aplicativos do Control Center para facilitar o acesso.
Processador
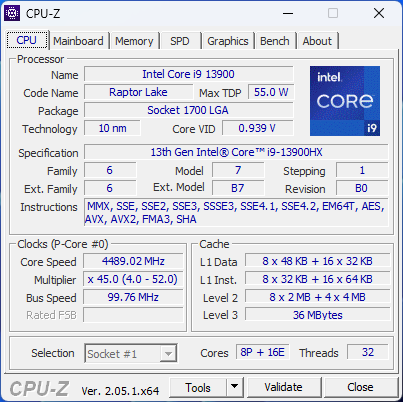
OCore i9-13900HX em nossa unidade tem um desempenho ligeiramente mais lento em relação a outros notebooks com o mesmo processador, em cerca de 5%. Independentemente disso, ele ainda é uma das CPUs da série H mais rápidas do mercado, rivalizando com o concorrente Ryzen 9 7945HX. A atualização do Core i9-12900HX do ano passado, aumentará o desempenho multi-thread em cerca de 20%.
A sustentabilidade do desempenho é excelente, especialmente quando comparada com o Aorus 17X que vem com o mesmo Core i9-13900HX. As pontuações de loop do CineBench R15 xT seriam mais estáveis em nossa unidade durante todo o teste de estresse, como mostra o gráfico de comparação abaixo.
Espera-se que o downgrade para a configuração Core i7-13700HX do nosso Core i9-13900HX reduza o desempenho multi-thread em cerca de 20 a 25%.
Cinebench R15 Multi Loop
Cinebench R23: Multi Core | Single Core
Cinebench R20: CPU (Multi Core) | CPU (Single Core)
Cinebench R15: CPU Multi 64Bit | CPU Single 64Bit
Blender: v2.79 BMW27 CPU
7-Zip 18.03: 7z b 4 | 7z b 4 -mmt1
Geekbench 5.5: Multi-Core | Single-Core
HWBOT x265 Benchmark v2.2: 4k Preset
LibreOffice : 20 Documents To PDF
R Benchmark 2.5: Overall mean
* ... menor é melhor
AIDA64: FP32 Ray-Trace | FPU Julia | CPU SHA3 | CPU Queen | FPU SinJulia | FPU Mandel | CPU AES | CPU ZLib | FP64 Ray-Trace | CPU PhotoWorxx
| Performance rating | |
| Asus ROG Strix Scar 17 G733PY-XS96 | |
| Eluktronics Mech-17 GP2 | |
| MSI GE78HX 13VH-070US | |
| Média Intel Core i9-13900HX | |
| Eurocom Raptor X17 | |
| Aorus 17X AZF | |
| Alienware m17 R5 (R9 6900HX, RX 6850M XT) | |
| AIDA64 / FP32 Ray-Trace | |
| Asus ROG Strix Scar 17 G733PY-XS96 | |
| MSI GE78HX 13VH-070US | |
| Eluktronics Mech-17 GP2 | |
| Média Intel Core i9-13900HX (17589 - 27615, n=22) | |
| Eurocom Raptor X17 | |
| Aorus 17X AZF | |
| Alienware m17 R5 (R9 6900HX, RX 6850M XT) | |
| AIDA64 / FPU Julia | |
| Asus ROG Strix Scar 17 G733PY-XS96 | |
| MSI GE78HX 13VH-070US | |
| Eluktronics Mech-17 GP2 | |
| Eurocom Raptor X17 | |
| Média Intel Core i9-13900HX (88686 - 137015, n=22) | |
| Alienware m17 R5 (R9 6900HX, RX 6850M XT) | |
| Aorus 17X AZF | |
| AIDA64 / CPU SHA3 | |
| Asus ROG Strix Scar 17 G733PY-XS96 | |
| Eluktronics Mech-17 GP2 | |
| MSI GE78HX 13VH-070US | |
| Eurocom Raptor X17 | |
| Média Intel Core i9-13900HX (4362 - 7029, n=22) | |
| Aorus 17X AZF | |
| Alienware m17 R5 (R9 6900HX, RX 6850M XT) | |
| AIDA64 / CPU Queen | |
| Asus ROG Strix Scar 17 G733PY-XS96 | |
| Eluktronics Mech-17 GP2 | |
| MSI GE78HX 13VH-070US | |
| Eurocom Raptor X17 | |
| Média Intel Core i9-13900HX (125644 - 141385, n=22) | |
| Aorus 17X AZF | |
| Alienware m17 R5 (R9 6900HX, RX 6850M XT) | |
| AIDA64 / FPU SinJulia | |
| Asus ROG Strix Scar 17 G733PY-XS96 | |
| Eluktronics Mech-17 GP2 | |
| MSI GE78HX 13VH-070US | |
| Média Intel Core i9-13900HX (12334 - 17179, n=22) | |
| Eurocom Raptor X17 | |
| Aorus 17X AZF | |
| Alienware m17 R5 (R9 6900HX, RX 6850M XT) | |
| AIDA64 / FPU Mandel | |
| Asus ROG Strix Scar 17 G733PY-XS96 | |
| MSI GE78HX 13VH-070US | |
| Eluktronics Mech-17 GP2 | |
| Média Intel Core i9-13900HX (43850 - 69202, n=22) | |
| Eurocom Raptor X17 | |
| Alienware m17 R5 (R9 6900HX, RX 6850M XT) | |
| Aorus 17X AZF | |
| AIDA64 / CPU AES | |
| Eluktronics Mech-17 GP2 | |
| Asus ROG Strix Scar 17 G733PY-XS96 | |
| Aorus 17X AZF | |
| Média Intel Core i9-13900HX (89413 - 237881, n=22) | |
| MSI GE78HX 13VH-070US | |
| Eurocom Raptor X17 | |
| Alienware m17 R5 (R9 6900HX, RX 6850M XT) | |
| AIDA64 / CPU ZLib | |
| Asus ROG Strix Scar 17 G733PY-XS96 | |
| MSI GE78HX 13VH-070US | |
| Eluktronics Mech-17 GP2 | |
| Eurocom Raptor X17 | |
| Média Intel Core i9-13900HX (1284 - 1958, n=22) | |
| Aorus 17X AZF | |
| Alienware m17 R5 (R9 6900HX, RX 6850M XT) | |
| AIDA64 / FP64 Ray-Trace | |
| Asus ROG Strix Scar 17 G733PY-XS96 | |
| MSI GE78HX 13VH-070US | |
| Eluktronics Mech-17 GP2 | |
| Média Intel Core i9-13900HX (9481 - 15279, n=22) | |
| Eurocom Raptor X17 | |
| Aorus 17X AZF | |
| Alienware m17 R5 (R9 6900HX, RX 6850M XT) | |
| AIDA64 / CPU PhotoWorxx | |
| Eurocom Raptor X17 | |
| Aorus 17X AZF | |
| MSI GE78HX 13VH-070US | |
| Média Intel Core i9-13900HX (42994 - 51994, n=22) | |
| Eluktronics Mech-17 GP2 | |
| Asus ROG Strix Scar 17 G733PY-XS96 | |
| Alienware m17 R5 (R9 6900HX, RX 6850M XT) | |
Desempenho do sistema
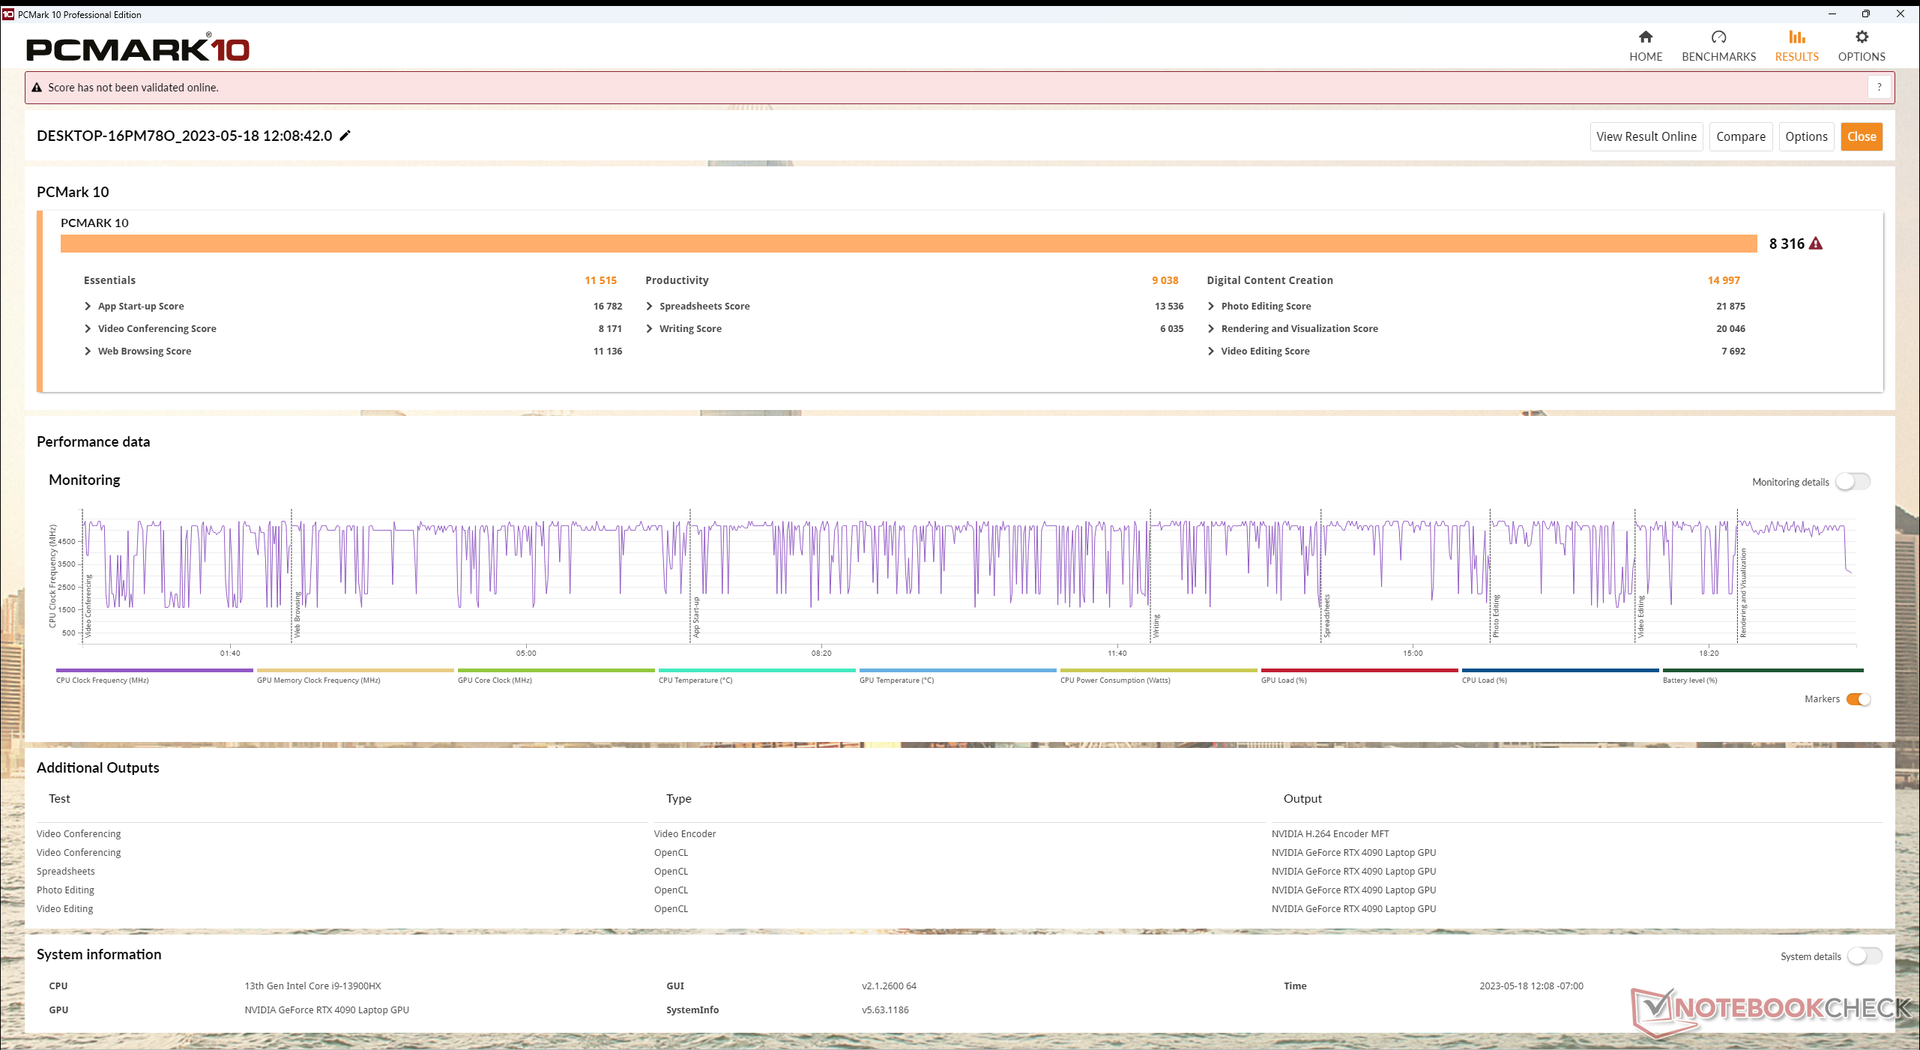
CrossMark: Overall | Productivity | Creativity | Responsiveness
| PCMark 10 / Score | |
| Eluktronics Mech-17 GP2 | |
| MSI GE78HX 13VH-070US | |
| Asus ROG Strix Scar 17 G733PY-XS96 | |
| Média Intel Core i9-13900HX, NVIDIA GeForce RTX 4090 Laptop GPU (7690 - 9331, n=8) | |
| Eurocom Raptor X17 | |
| Aorus 17X AZF | |
| Alienware m17 R5 (R9 6900HX, RX 6850M XT) | |
| PCMark 10 / Essentials | |
| Eluktronics Mech-17 GP2 | |
| Eurocom Raptor X17 | |
| MSI GE78HX 13VH-070US | |
| Média Intel Core i9-13900HX, NVIDIA GeForce RTX 4090 Laptop GPU (10972 - 11983, n=8) | |
| Aorus 17X AZF | |
| Asus ROG Strix Scar 17 G733PY-XS96 | |
| Alienware m17 R5 (R9 6900HX, RX 6850M XT) | |
| PCMark 10 / Productivity | |
| Eluktronics Mech-17 GP2 | |
| MSI GE78HX 13VH-070US | |
| Média Intel Core i9-13900HX, NVIDIA GeForce RTX 4090 Laptop GPU (9038 - 11680, n=8) | |
| Aorus 17X AZF | |
| Asus ROG Strix Scar 17 G733PY-XS96 | |
| Alienware m17 R5 (R9 6900HX, RX 6850M XT) | |
| Eurocom Raptor X17 | |
| PCMark 10 / Digital Content Creation | |
| Asus ROG Strix Scar 17 G733PY-XS96 | |
| Eluktronics Mech-17 GP2 | |
| MSI GE78HX 13VH-070US | |
| Eurocom Raptor X17 | |
| Média Intel Core i9-13900HX, NVIDIA GeForce RTX 4090 Laptop GPU (10605 - 16395, n=8) | |
| Alienware m17 R5 (R9 6900HX, RX 6850M XT) | |
| Aorus 17X AZF | |
| CrossMark / Overall | |
| Eluktronics Mech-17 GP2 | |
| Aorus 17X AZF | |
| Média Intel Core i9-13900HX, NVIDIA GeForce RTX 4090 Laptop GPU (1825 - 2295, n=8) | |
| Asus ROG Strix Scar 17 G733PY-XS96 | |
| MSI GE78HX 13VH-070US | |
| Eurocom Raptor X17 | |
| Alienware m17 R5 (R9 6900HX, RX 6850M XT) | |
| CrossMark / Productivity | |
| Aorus 17X AZF | |
| Eluktronics Mech-17 GP2 | |
| Média Intel Core i9-13900HX, NVIDIA GeForce RTX 4090 Laptop GPU (1666 - 2166, n=8) | |
| MSI GE78HX 13VH-070US | |
| Asus ROG Strix Scar 17 G733PY-XS96 | |
| Eurocom Raptor X17 | |
| Alienware m17 R5 (R9 6900HX, RX 6850M XT) | |
| CrossMark / Creativity | |
| Eluktronics Mech-17 GP2 | |
| Média Intel Core i9-13900HX, NVIDIA GeForce RTX 4090 Laptop GPU (2162 - 2514, n=8) | |
| Asus ROG Strix Scar 17 G733PY-XS96 | |
| Aorus 17X AZF | |
| Eurocom Raptor X17 | |
| MSI GE78HX 13VH-070US | |
| Alienware m17 R5 (R9 6900HX, RX 6850M XT) | |
| CrossMark / Responsiveness | |
| Aorus 17X AZF | |
| Eluktronics Mech-17 GP2 | |
| Média Intel Core i9-13900HX, NVIDIA GeForce RTX 4090 Laptop GPU (1441 - 2275, n=8) | |
| MSI GE78HX 13VH-070US | |
| Asus ROG Strix Scar 17 G733PY-XS96 | |
| Eurocom Raptor X17 | |
| Alienware m17 R5 (R9 6900HX, RX 6850M XT) | |
| PCMark 10 Score | 8316 pontos | |
Ajuda | ||
| AIDA64 / Memory Copy | |
| Aorus 17X AZF | |
| MSI GE78HX 13VH-070US | |
| Eurocom Raptor X17 | |
| Média Intel Core i9-13900HX (67716 - 79193, n=22) | |
| Eluktronics Mech-17 GP2 | |
| Alienware m17 R5 (R9 6900HX, RX 6850M XT) | |
| Asus ROG Strix Scar 17 G733PY-XS96 | |
| AIDA64 / Memory Read | |
| Aorus 17X AZF | |
| MSI GE78HX 13VH-070US | |
| Média Intel Core i9-13900HX (73998 - 88462, n=22) | |
| Eurocom Raptor X17 | |
| Eluktronics Mech-17 GP2 | |
| Asus ROG Strix Scar 17 G733PY-XS96 | |
| Alienware m17 R5 (R9 6900HX, RX 6850M XT) | |
| AIDA64 / Memory Write | |
| Aorus 17X AZF | |
| MSI GE78HX 13VH-070US | |
| Eurocom Raptor X17 | |
| Média Intel Core i9-13900HX (65472 - 77045, n=22) | |
| Eluktronics Mech-17 GP2 | |
| Asus ROG Strix Scar 17 G733PY-XS96 | |
| Alienware m17 R5 (R9 6900HX, RX 6850M XT) | |
| AIDA64 / Memory Latency | |
| Alienware m17 R5 (R9 6900HX, RX 6850M XT) | |
| Eluktronics Mech-17 GP2 | |
| Média Intel Core i9-13900HX (75.3 - 91.1, n=22) | |
| MSI GE78HX 13VH-070US | |
| Eurocom Raptor X17 | |
| Asus ROG Strix Scar 17 G733PY-XS96 | |
| Aorus 17X AZF | |
* ... menor é melhor
Latência DPC
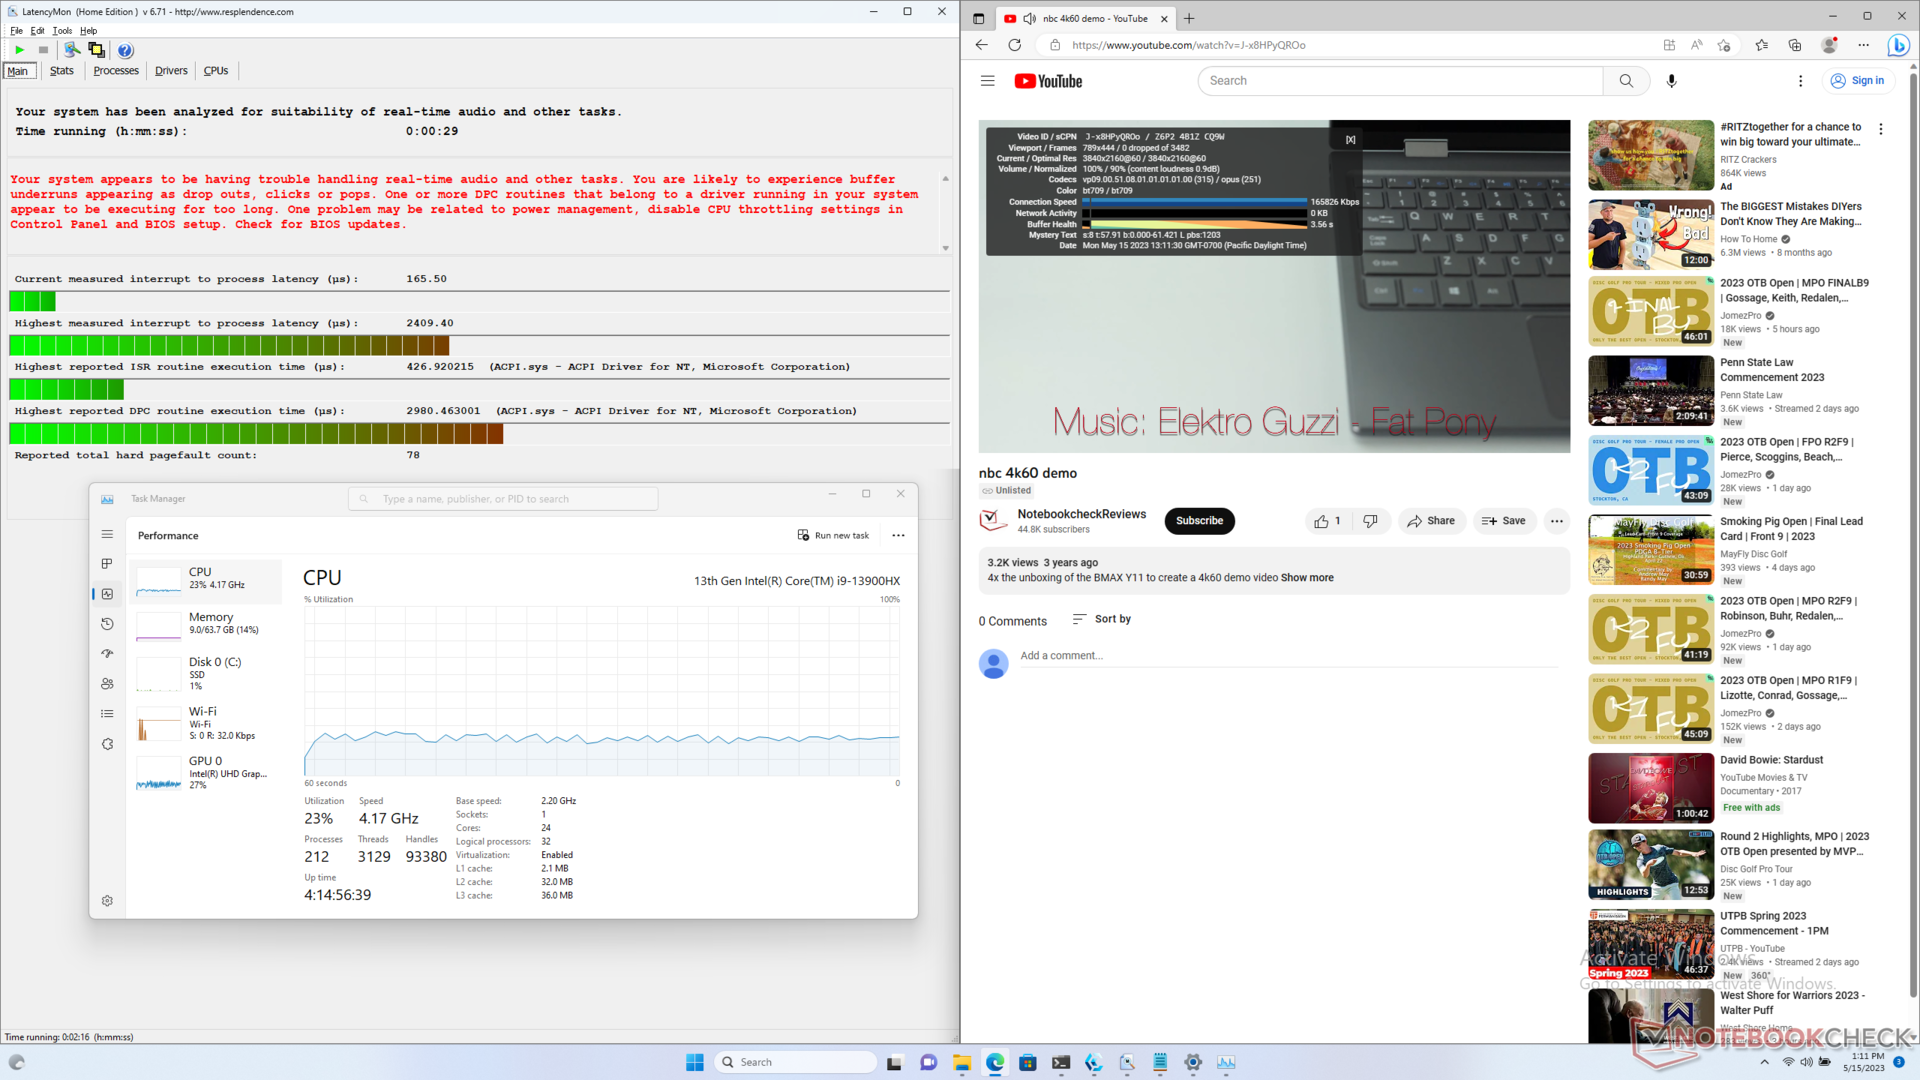
O LatencyMon revela problemas de DPC ao abrir várias guias do navegador em nossa página inicial. a reprodução de vídeo 4K a 60 FPS é perfeita, com baixa utilização da CPU e sem perda de quadros.
| DPC Latencies / LatencyMon - interrupt to process latency (max), Web, Youtube, Prime95 | |
| Aorus 17X AZF | |
| MSI GE78HX 13VH-070US | |
| Eurocom Raptor X17 | |
| Asus ROG Strix Scar 17 G733PY-XS96 | |
| Alienware m17 R5 (R9 6900HX, RX 6850M XT) | |
| Eluktronics Mech-17 GP2 | |
* ... menor é melhor
Dispositivos de armazenamento - 3x SSDs PCIe4 x4 NVMe
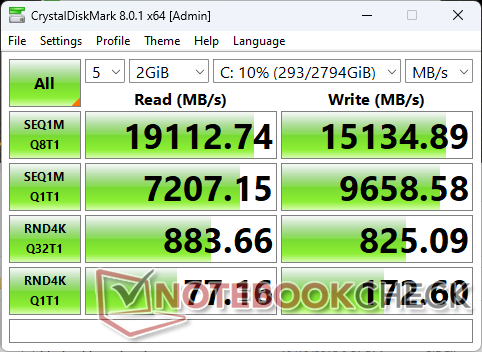
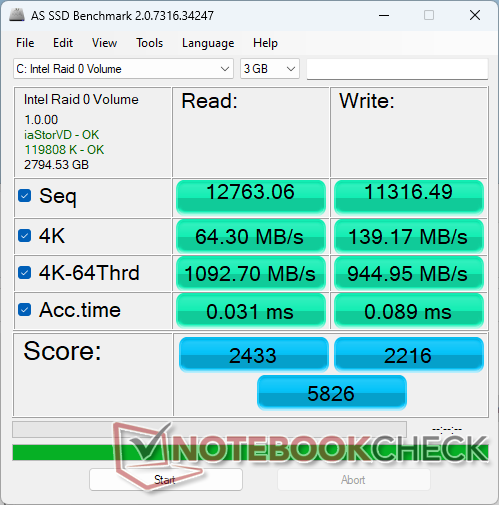
Nossa unidade vem configurada com três SSDs Samsung 980 Pro PCIe4 x4 NVMe SSDs em RAID 0 para maximizar o desempenho. Na verdade, esse é um dos poucos notebooks para jogos que suporta essa quantidade de unidades na configuração RAID. As taxas máximas de transferência chegam a cerca de 19.000 MB/s, mas espera-se que o desempenho fique entre 15.000 e 18.000 MB/s quando estiver sob estresse, o que ainda é impressionante. Não notamos nenhum problema grave de limitação nesse sentido.

| Drive Performance rating - Percent | |
| Aorus 17X AZF | |
| MSI GE78HX 13VH-070US | |
| Eurocom Raptor X17 | |
| Asus ROG Strix Scar 17 G733PY-XS96 | |
| Eluktronics Mech-17 GP2 | |
| Alienware m17 R5 (R9 6900HX, RX 6850M XT) | |
* ... menor é melhor
Disk Throttling: DiskSpd Read Loop, Queue Depth 8
Desempenho da GPU - Gráficos TGP de 175 W
O desempenho gráfico está dentro de alguns pontos percentuais do laptop médio em nosso banco de dados com a mesma GeForce RTX 4090 GPU. A execução no modo Entretenimento em vez do modo Desempenho diminuiria o desempenho gráfico em cerca de 4 a 5 por cento. Um desktop "adequado" desktop GeForce RTX 4090 ainda é significativamente mais rápido do que nossa RTX 4090 móvel, em cerca de 60 a 80%, devido às pesadas limitações térmicas das GPUs móveis.
Observe que o downgrade para a móvel GeForce RTX 4080 móvel só diminuiria o desempenho gráfico em cerca de 5 a 10%. Portanto, pode valer a pena considerar a RTX 4080 móvel, já que o desempenho é tão semelhante entre as duas GPUs.
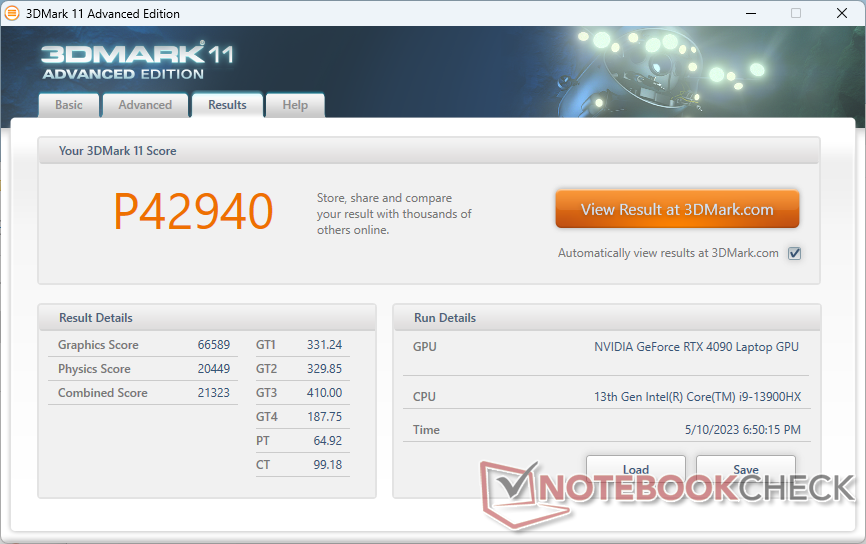
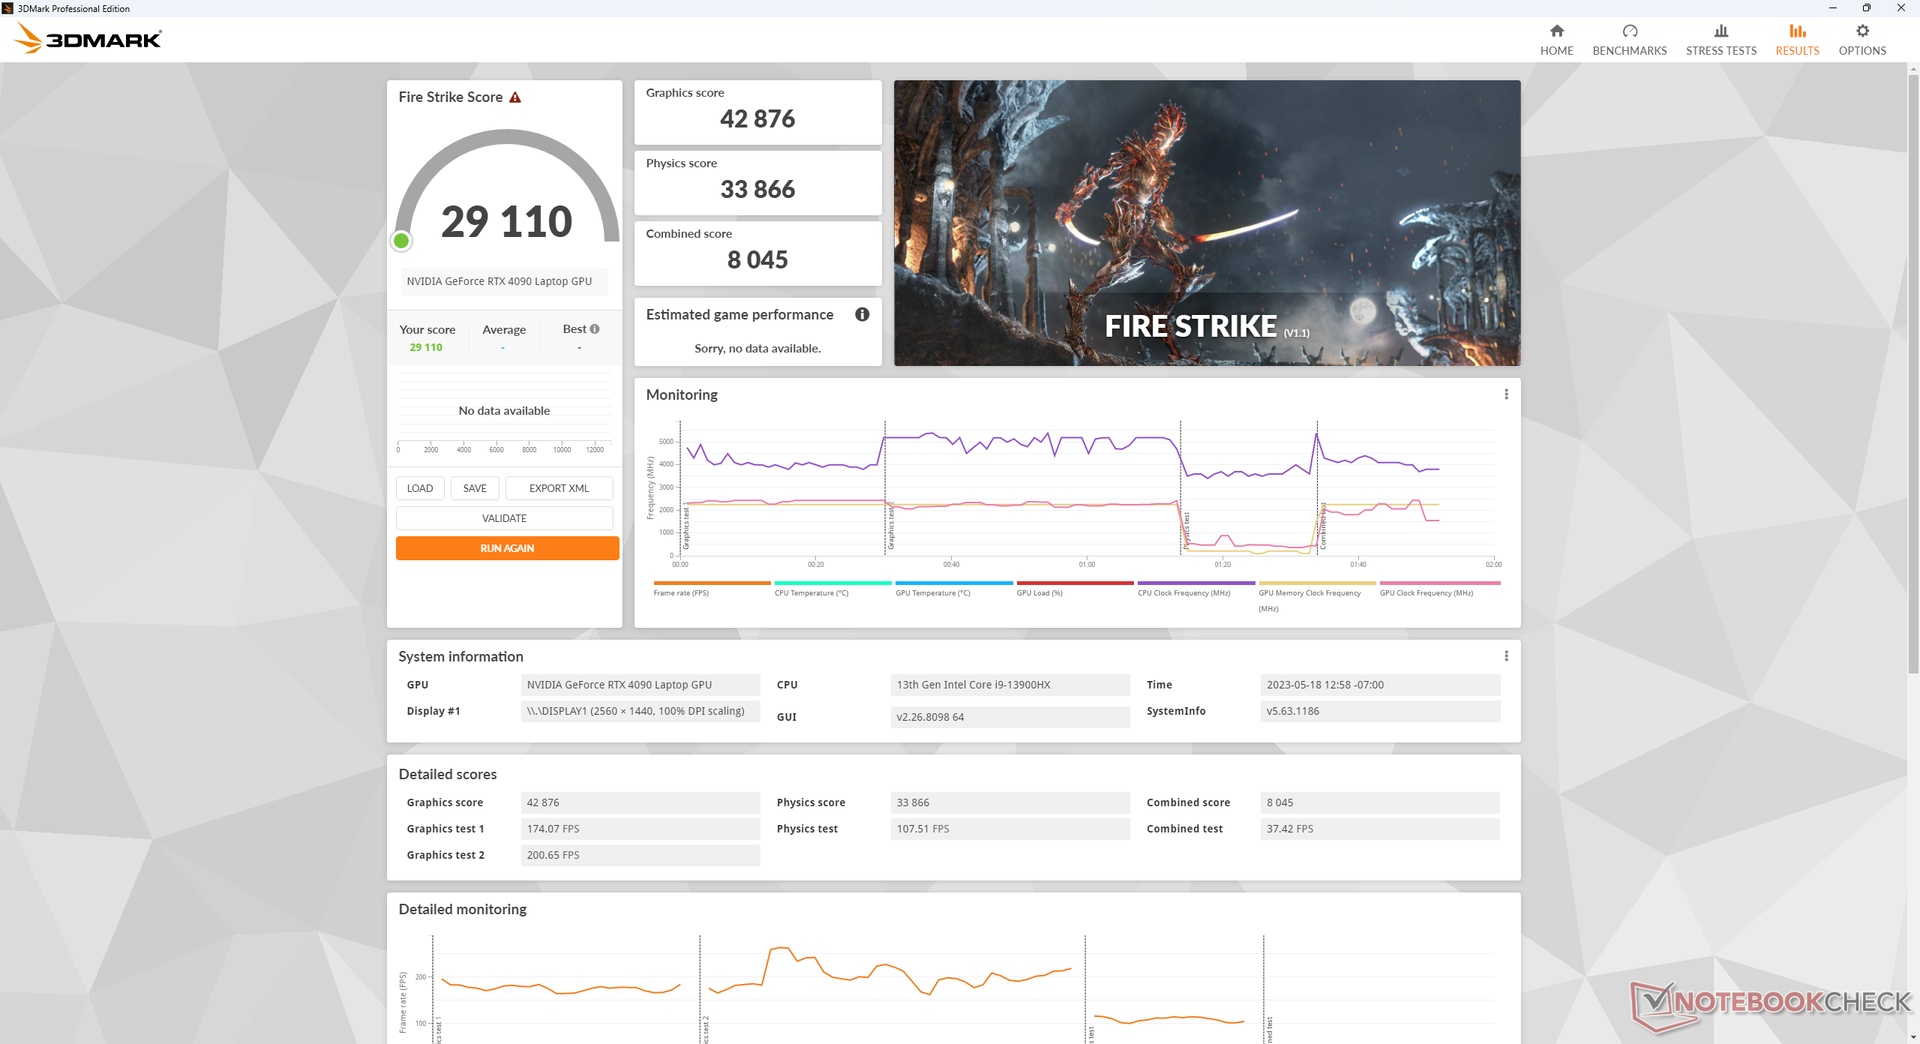
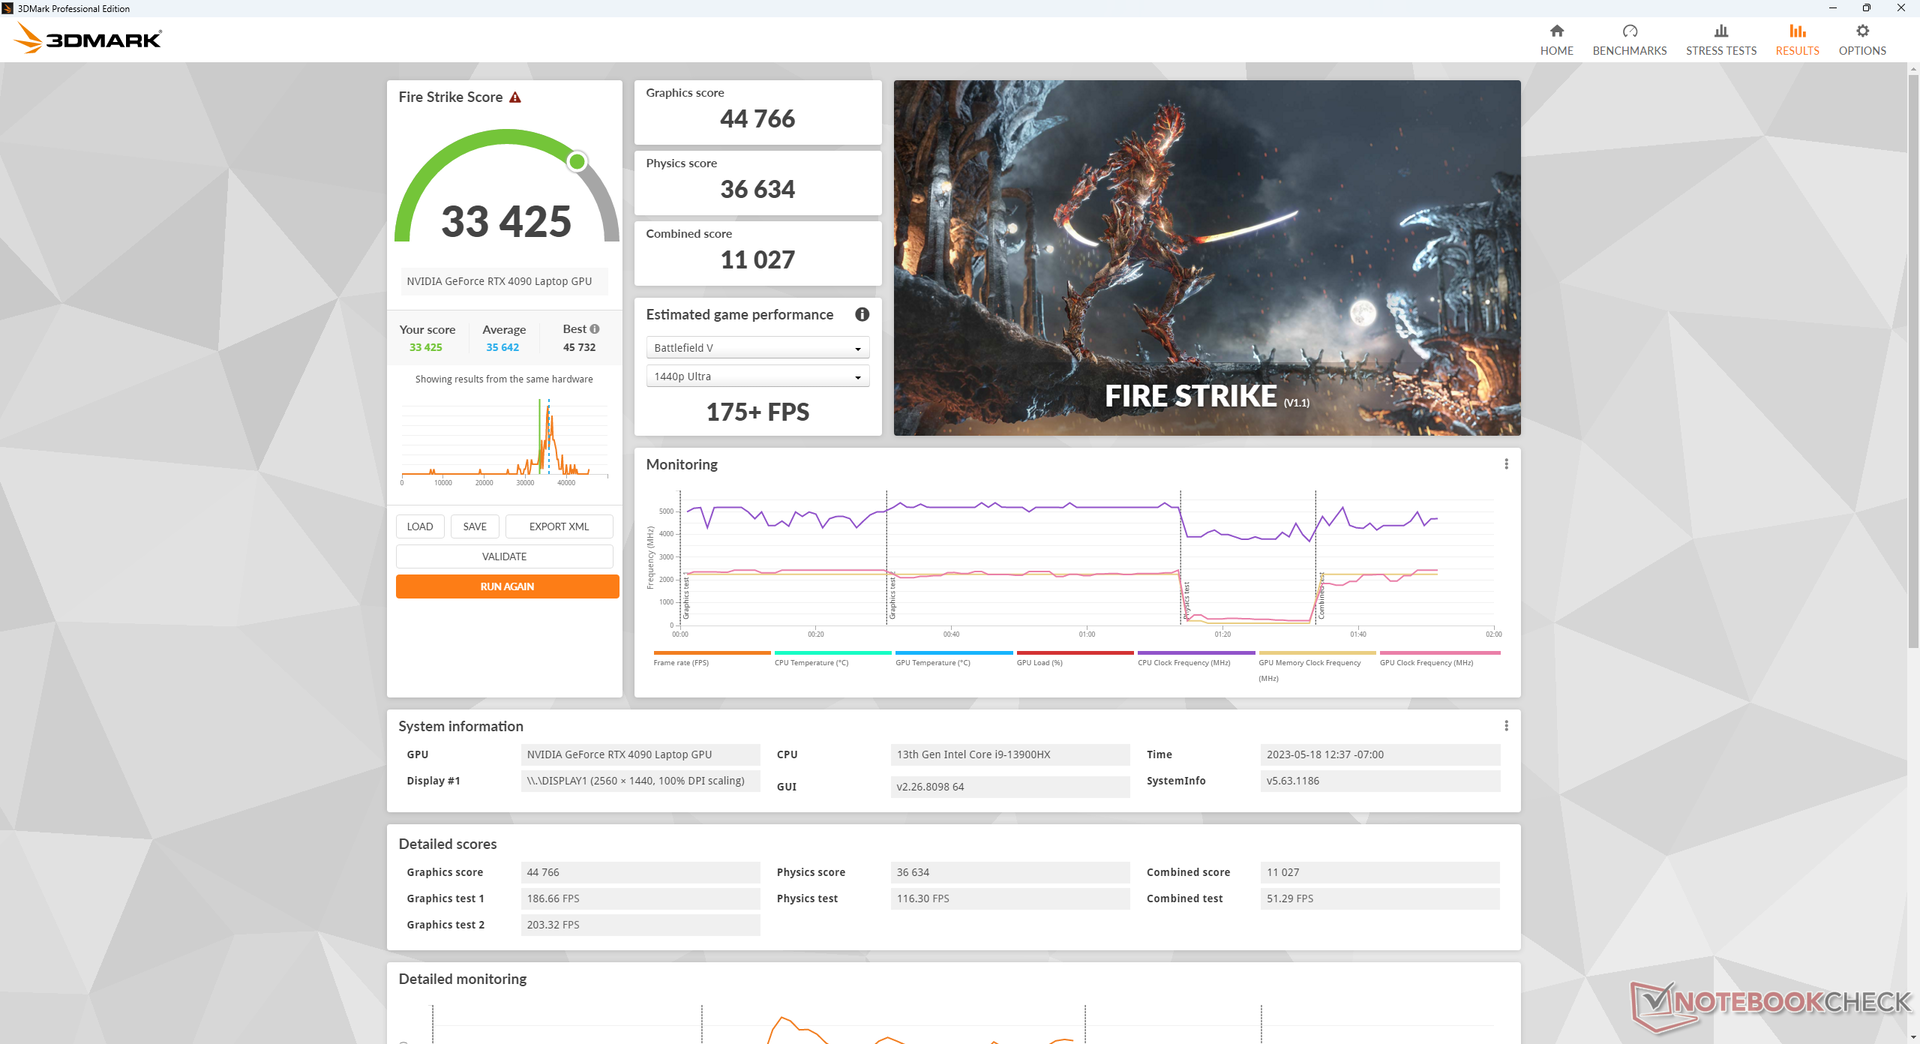
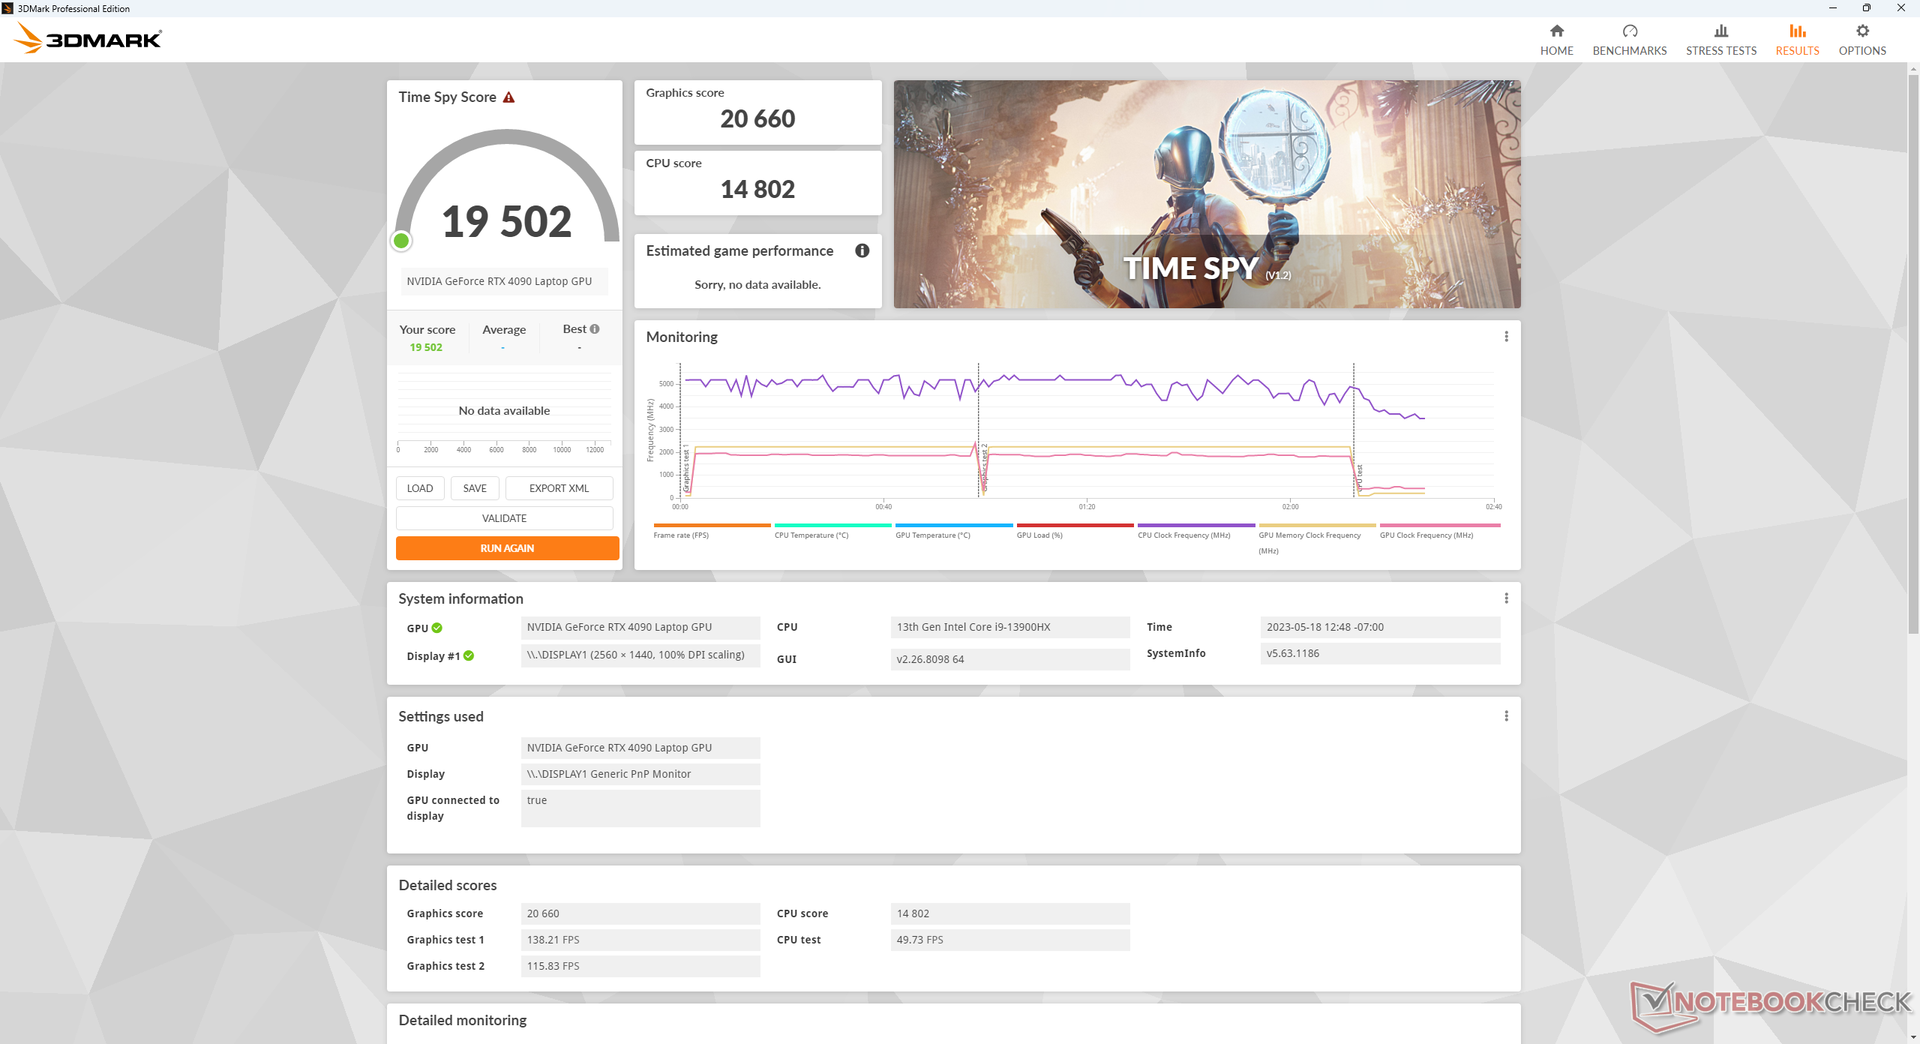
| 3DMark 11 Performance | 42940 pontos | |
| 3DMark Fire Strike Score | 33425 pontos | |
| 3DMark Time Spy Score | 19502 pontos | |
Ajuda | ||
* ... menor é melhor
Desempenho em jogos
Embora a RTX 4090 móvel não seja nem de longe tão rápida quanto a RTX 4090 para desktop, ela ainda é potente até mesmo para os títulos mais exigentes, como F1 22, Returnal ou Cyberpunk 2077. Mais especificamente, a RTX 4090 para dispositivos móveis parece ser ideal para atingir 1440p a 120 FPS ou 4K a 60 FPS em configurações de alta a ultra. Você deverá executar no modo dGPU ou no modo Advanced Optimus sempre que possível, especialmente porque o G-Sync não está disponível no modo de gráficos híbridos.
Witcher 3 FPS Chart
| baixo | média | alto | ultra | QHD | 4K | |
|---|---|---|---|---|---|---|
| GTA V (2015) | 187.2 | 186.4 | 183.7 | 139.5 | 134.3 | 173.6 |
| The Witcher 3 (2015) | 512.8 | 448.8 | 388.1 | 207.2 | 163.8 | |
| Dota 2 Reborn (2015) | 234 | 207 | 199.4 | 184.9 | 178.5 | |
| Final Fantasy XV Benchmark (2018) | 219 | 204 | 172.2 | 149 | 88.8 | |
| X-Plane 11.11 (2018) | 192.9 | 172.1 | 136.2 | 117.3 | ||
| Strange Brigade (2018) | 439 | 351 | 341 | 328 | 300 | 155.2 |
| Cyberpunk 2077 1.6 (2022) | 114 | 109.4 | 103.7 | 91 | 87.3 | 47.3 |
| Tiny Tina's Wonderlands (2022) | 271.8 | 238.8 | 203.3 | 183.1 | 130.7 | 68.7 |
| F1 22 (2022) | 210 | 209 | 199 | 120.8 | 90.2 | 44.3 |
| Returnal (2023) | 145 | 153 | 159 | 141 | 115 | 69 |
Emissões
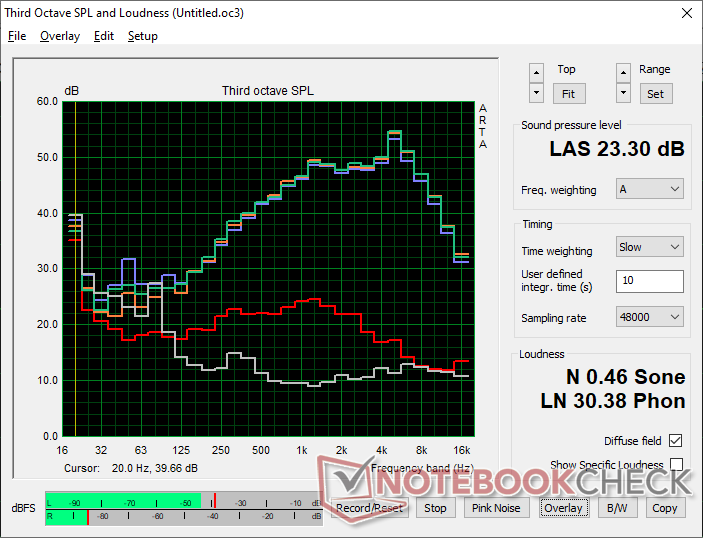
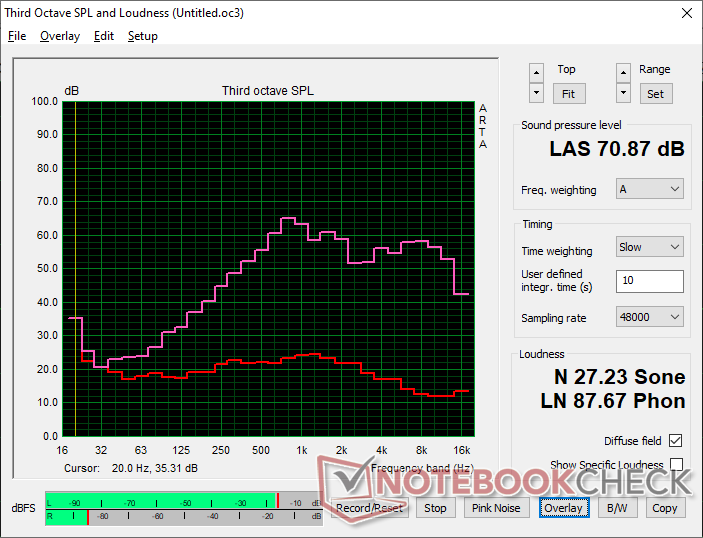
Ruído do sistema - muito alto durante os jogos
Os ventiladores estão sempre ativos, independentemente da configuração de energia ou da carga na tela. Mesmo quando configurado para o modo Silencioso, por exemplo, ainda haveria um ruído mínimo da ventoinha de 33 dB(A) contra um fundo silencioso de 23 dB(A). Esse nível é mais alto do que na maioria dos outros notebooks para jogos e é audível em ambientes de escritório. Se configurado no modo Desempenho ou no modo Entretenimento, os ventiladores pulsarão regularmente, mesmo se estiver apenas navegando ou fazendo streaming de vídeo. Definitivamente, é melhor usar uma configuração de energia mais baixa sempre que possível, quando a potência extra não for necessária.
Jogar no modo Desempenho induziria a um ruído de ventoinha de quase 61 dB(A), significativamente mais alto do que o de laptops concorrentes para jogos, como o Alienware m17 R5 ou oMSI GE78HX. A faixa de mais de 50 dB(A) é alta, mas tolerável com um bom par de fones de ouvido, mas mais de 60 dB(A) torna extremamente difícil jogar jogos sensíveis a ruídos, como Fortnite ou Overwatch , em que passos e outras filas de áudio são vitais para a jogabilidade.
Alterar a configuração de energia do modo Desempenho para o modo Entretenimento reduziria ligeiramente o ruído do ventilador de 60,7 dB(A) para 59,7 dB(A). A diferença é tão pequena que você também pode usar o modo Desempenho ao jogar e ignorar o modo Entretenimento.
Barulho
| Ocioso |
| 33.1 / 33.1 / 40.7 dB |
| Carga |
| 59.9 / 61 dB |
 | ||
30 dB silencioso 40 dB(A) audível 50 dB(A) ruidosamente alto |
||
min: | ||
| Eurocom Raptor X17 GeForce RTX 4090 Laptop GPU, i9-13900HX, 3x Samsung SSD 980 Pro 1TB (RAID 0) | Asus ROG Strix Scar 17 G733PY-XS96 GeForce RTX 4090 Laptop GPU, R9 7945HX, SK hynix PC801 HFS001TEJ9X101N | Aorus 17X AZF GeForce RTX 4090 Laptop GPU, i9-13900HX, Gigabyte AG470S1TB-SI B10 | MSI GE78HX 13VH-070US GeForce RTX 4080 Laptop GPU, i9-13950HX, Samsung PM9A1 MZVL22T0HBLB | Eluktronics Mech-17 GP2 GeForce RTX 4090 Laptop GPU, i9-13900HX, Samsung PM9A1 MZVL21T0HCLR | Alienware m17 R5 (R9 6900HX, RX 6850M XT) Radeon RX 6850M XT, R9 6900HX, SSSTC CA6-8D1024 | |
|---|---|---|---|---|---|---|
| Noise | 22% | 10% | 16% | 16% | 23% | |
| desligado / ambiente * (dB) | 23.3 | 22.7 3% | 25 -7% | 23.4 -0% | 25.2 -8% | 23 1% |
| Idle Minimum * (dB) | 33.1 | 23.5 29% | 28 15% | 24.2 27% | 28 15% | 23 31% |
| Idle Average * (dB) | 33.1 | 27.7 16% | 29 12% | 25.6 23% | 28 15% | 28.11 15% |
| Idle Maximum * (dB) | 40.7 | 27.7 32% | 34 16% | 31 24% | 30.4 25% | 28.11 31% |
| Load Average * (dB) | 59.9 | 30.5 49% | 51 15% | 43.3 28% | 41 32% | 30.62 49% |
| Witcher 3 ultra * (dB) | 60.8 | 51.4 15% | 57 6% | 56.3 7% | 50.7 17% | 49.75 18% |
| Load Maximum * (dB) | 61 | 54.1 11% | 54 11% | 59.1 3% | 52.6 14% | 50.17 18% |
* ... menor é melhor
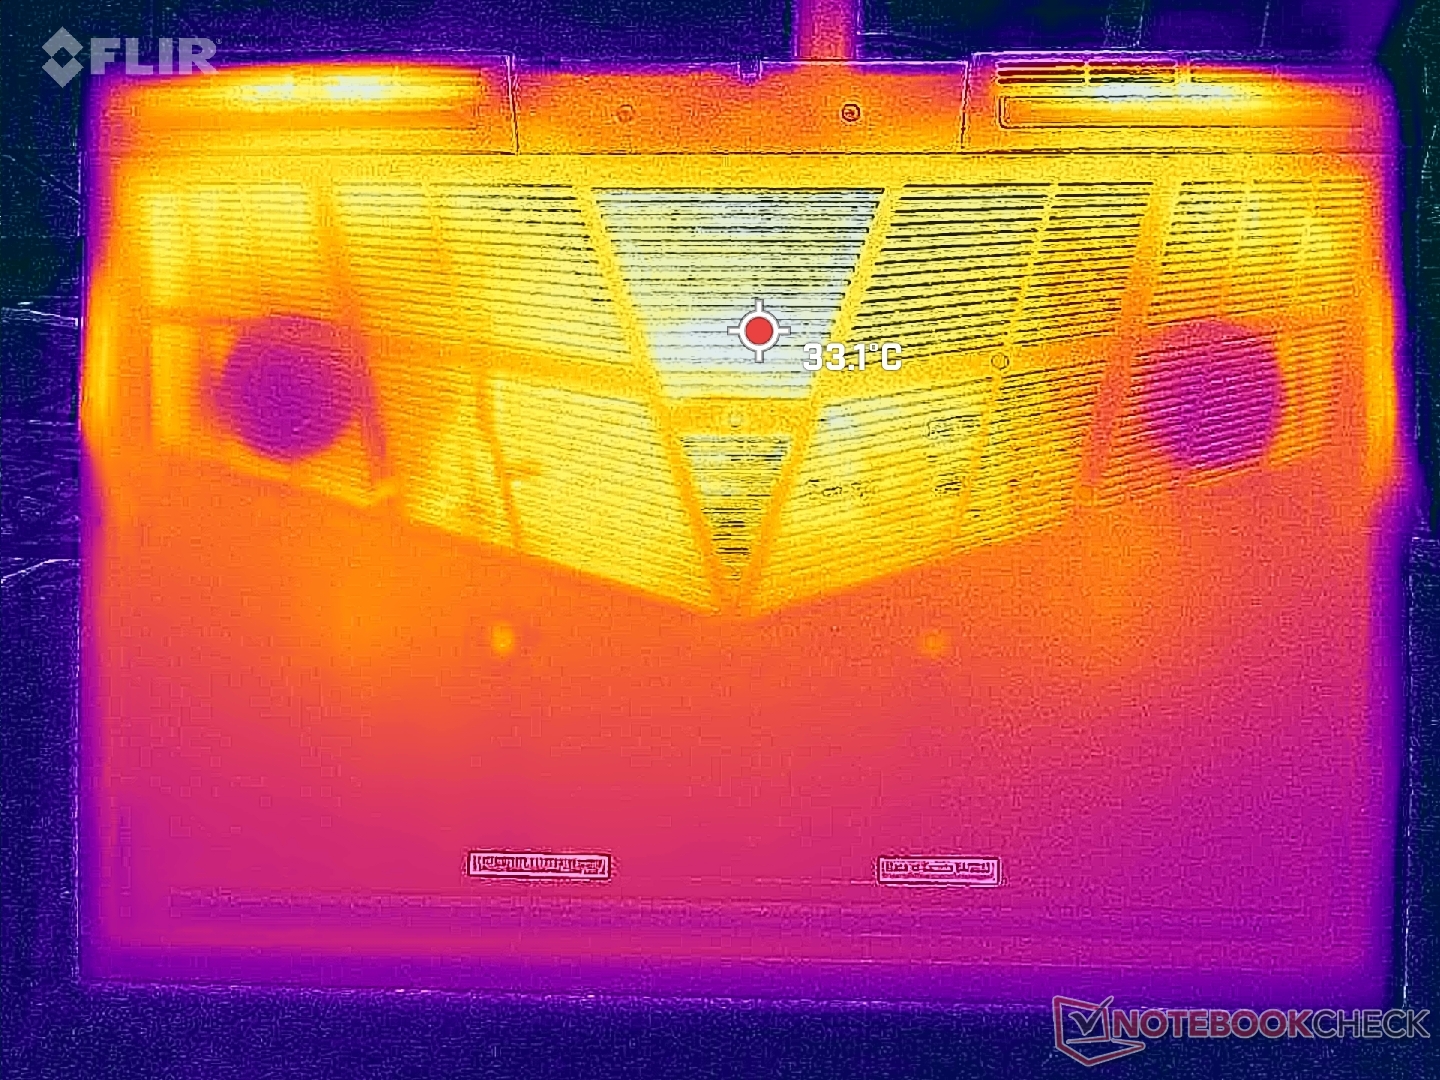
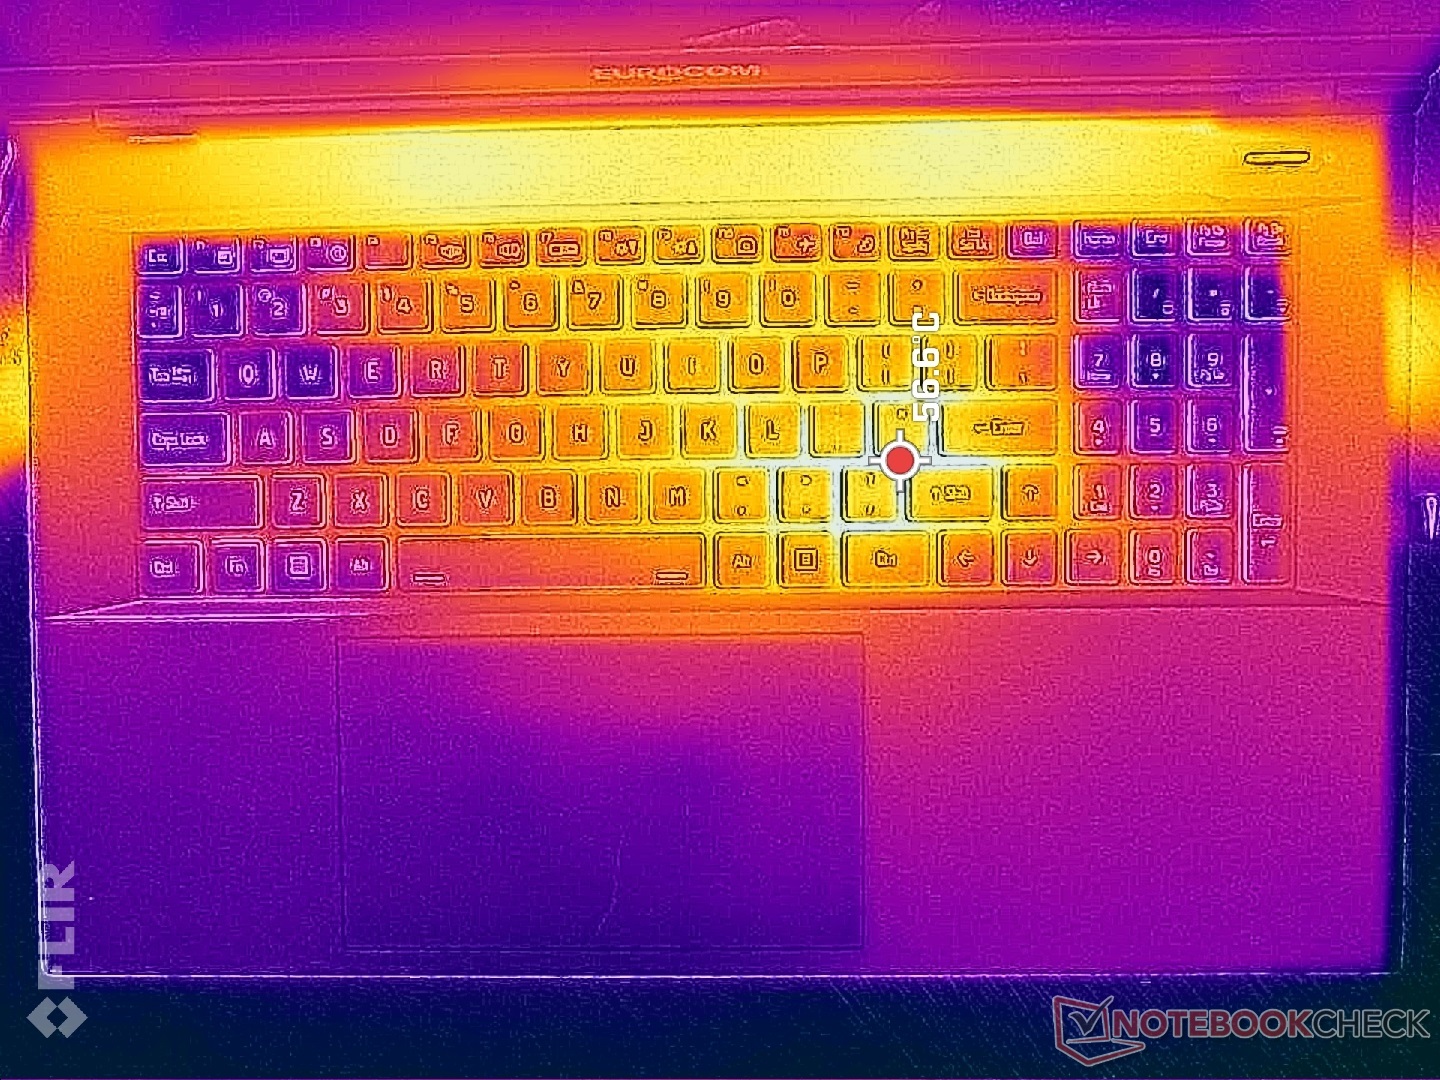
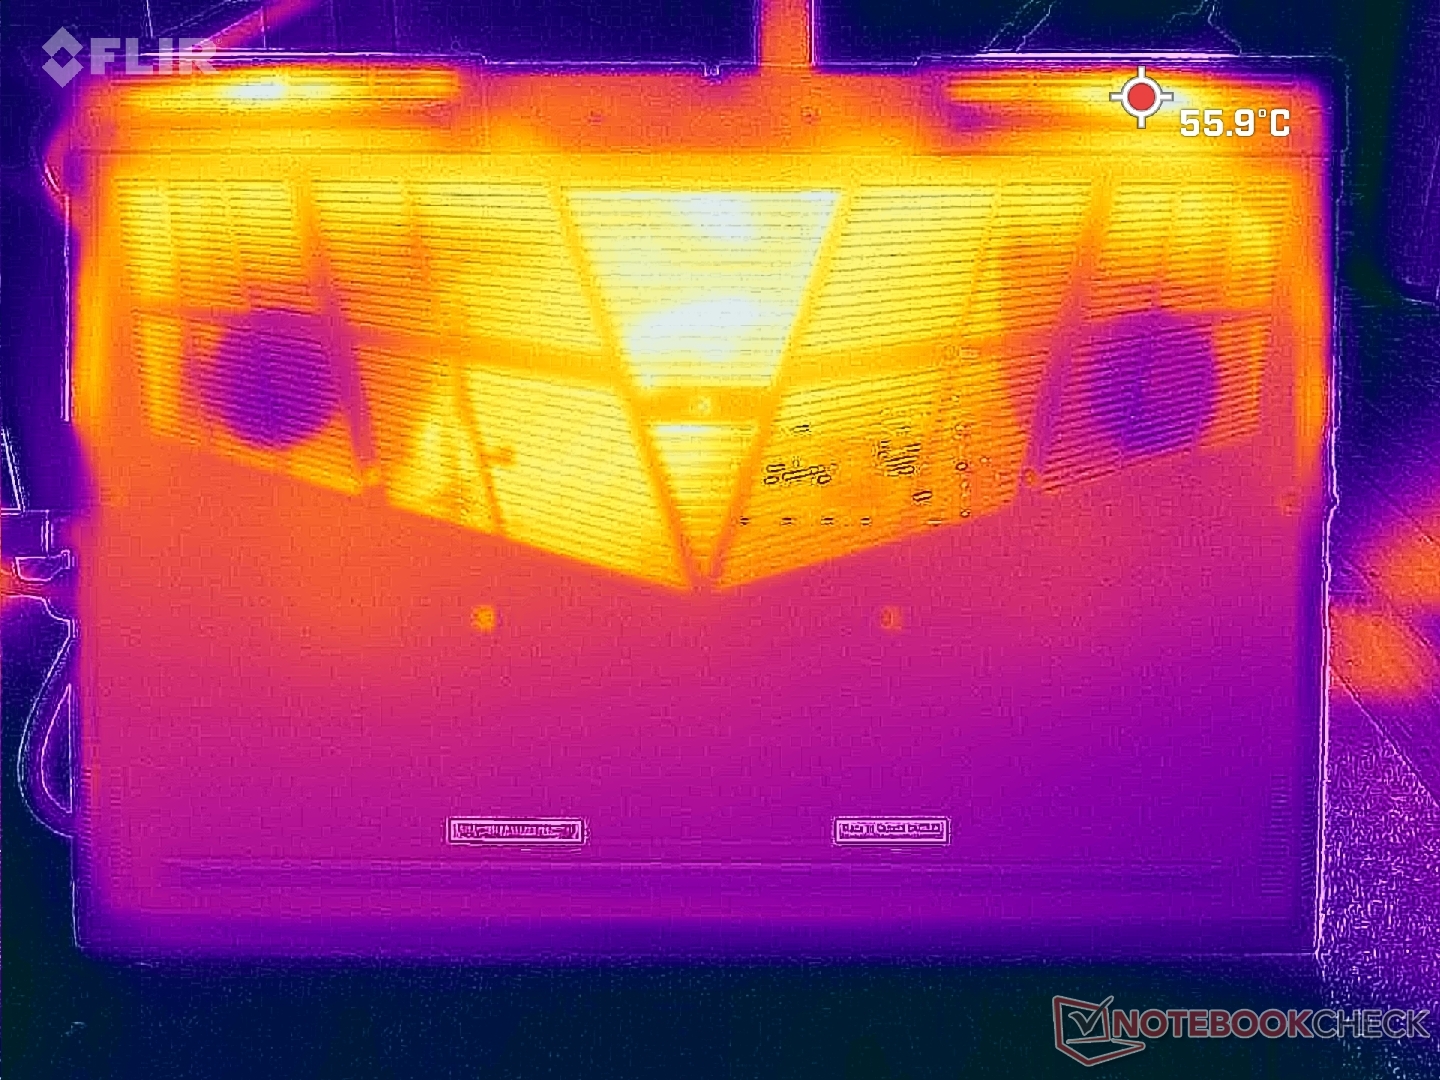
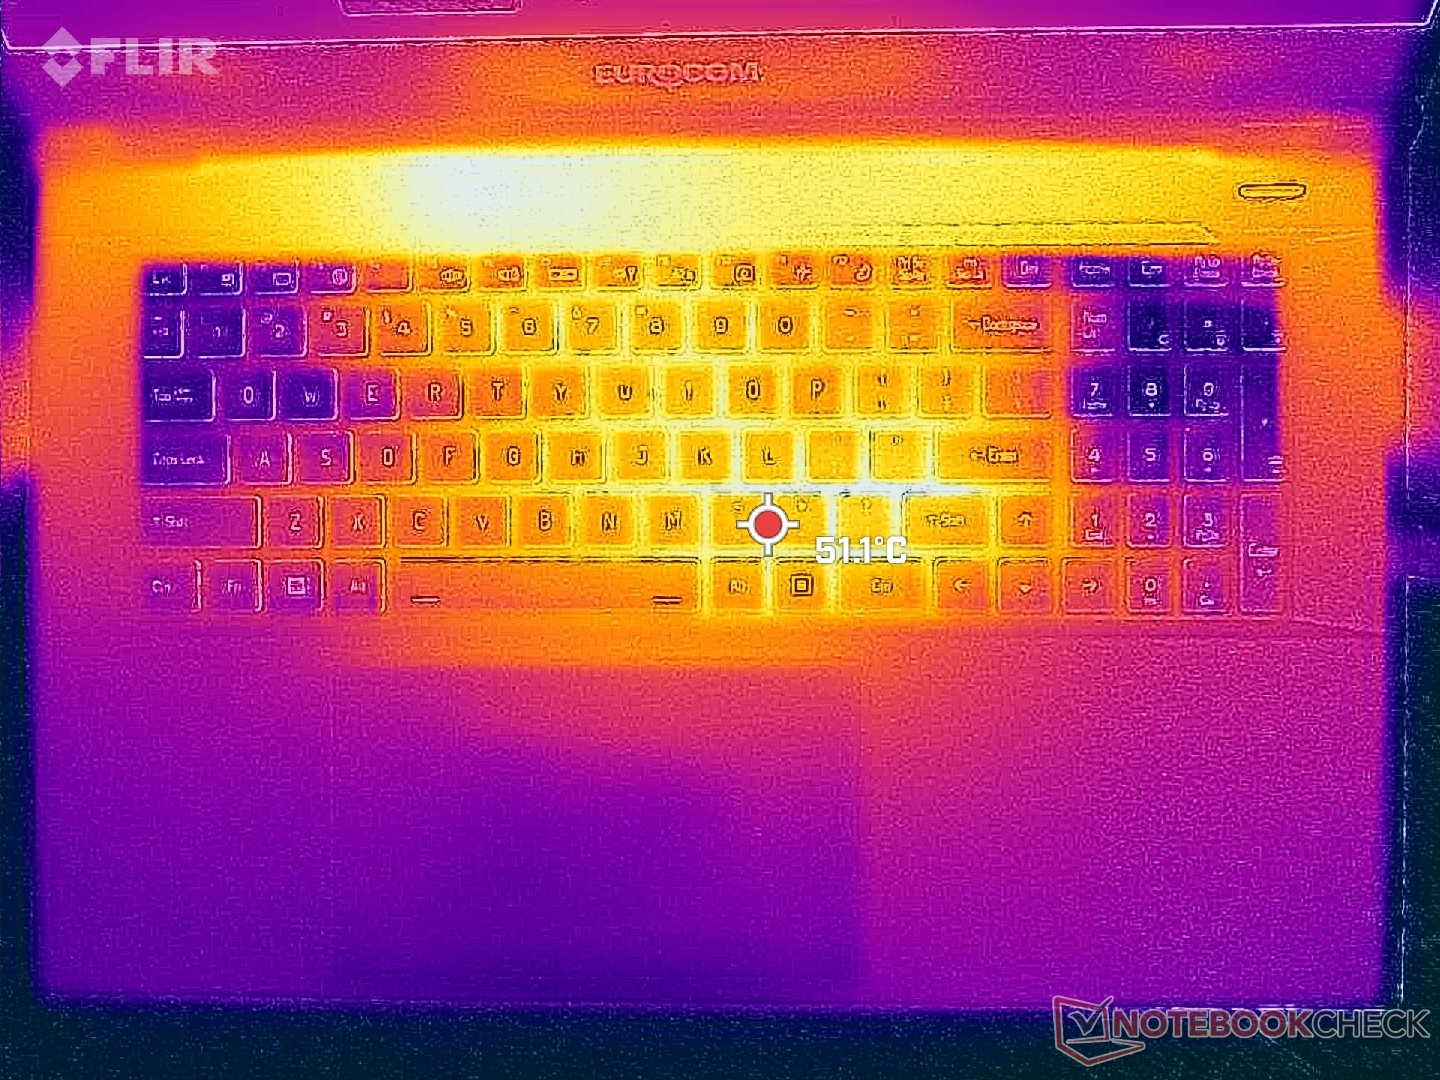
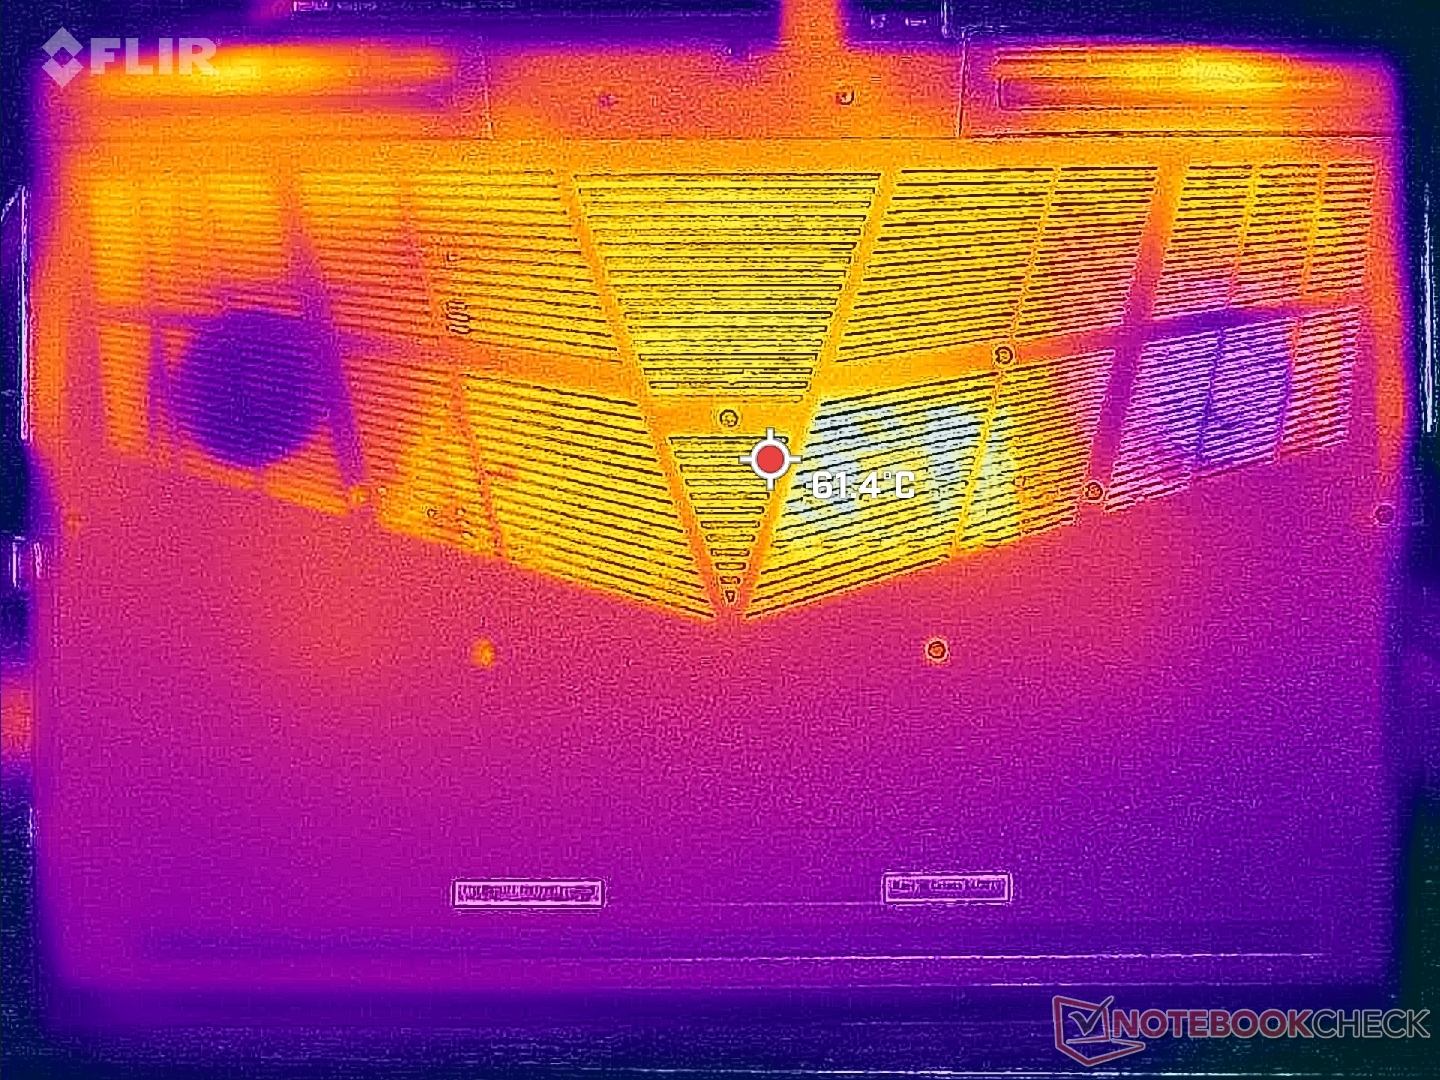
Temperatura
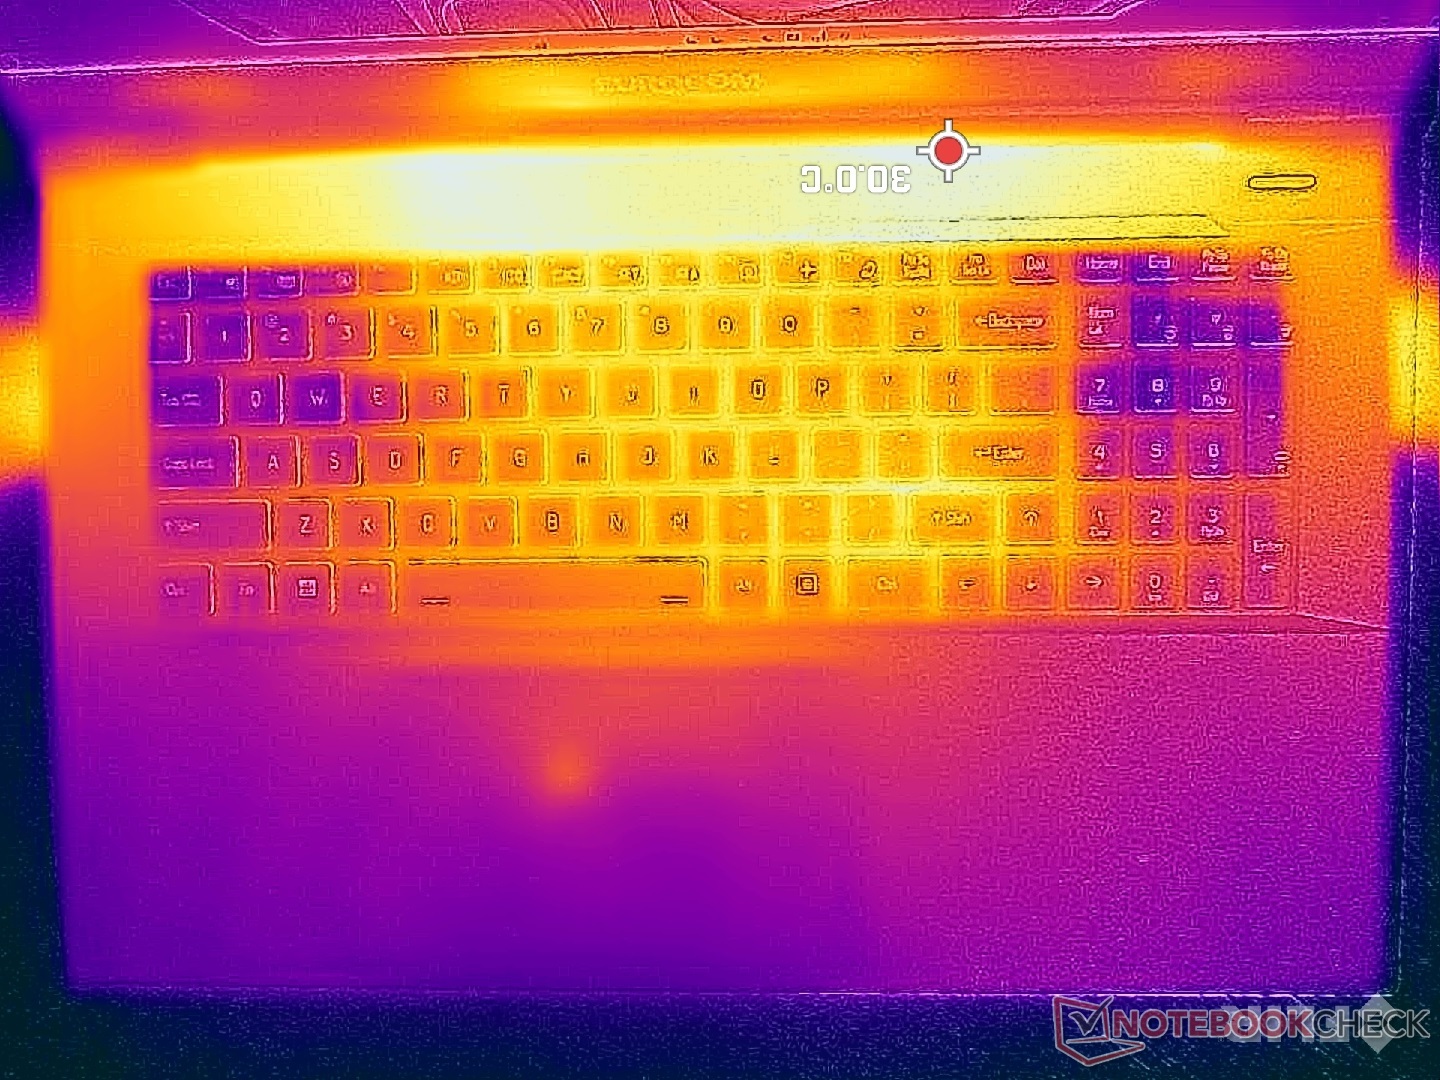
As temperaturas da superfície são mais quentes em direção ao centro do teclado, pois a CPU e a GPU estão diretamente abaixo dele. Os pontos quentes podem chegar a mais de 56 °C nessa região, em comparação com 46 °C e 35 °C noAorus 17X e MSI Raider GE78 HX, respectivamente. Felizmente, os apoios para as mãos, as teclas WASD e as áreas do teclado numérico não são tão quentes para manter as mãos confortáveis durante os jogos.
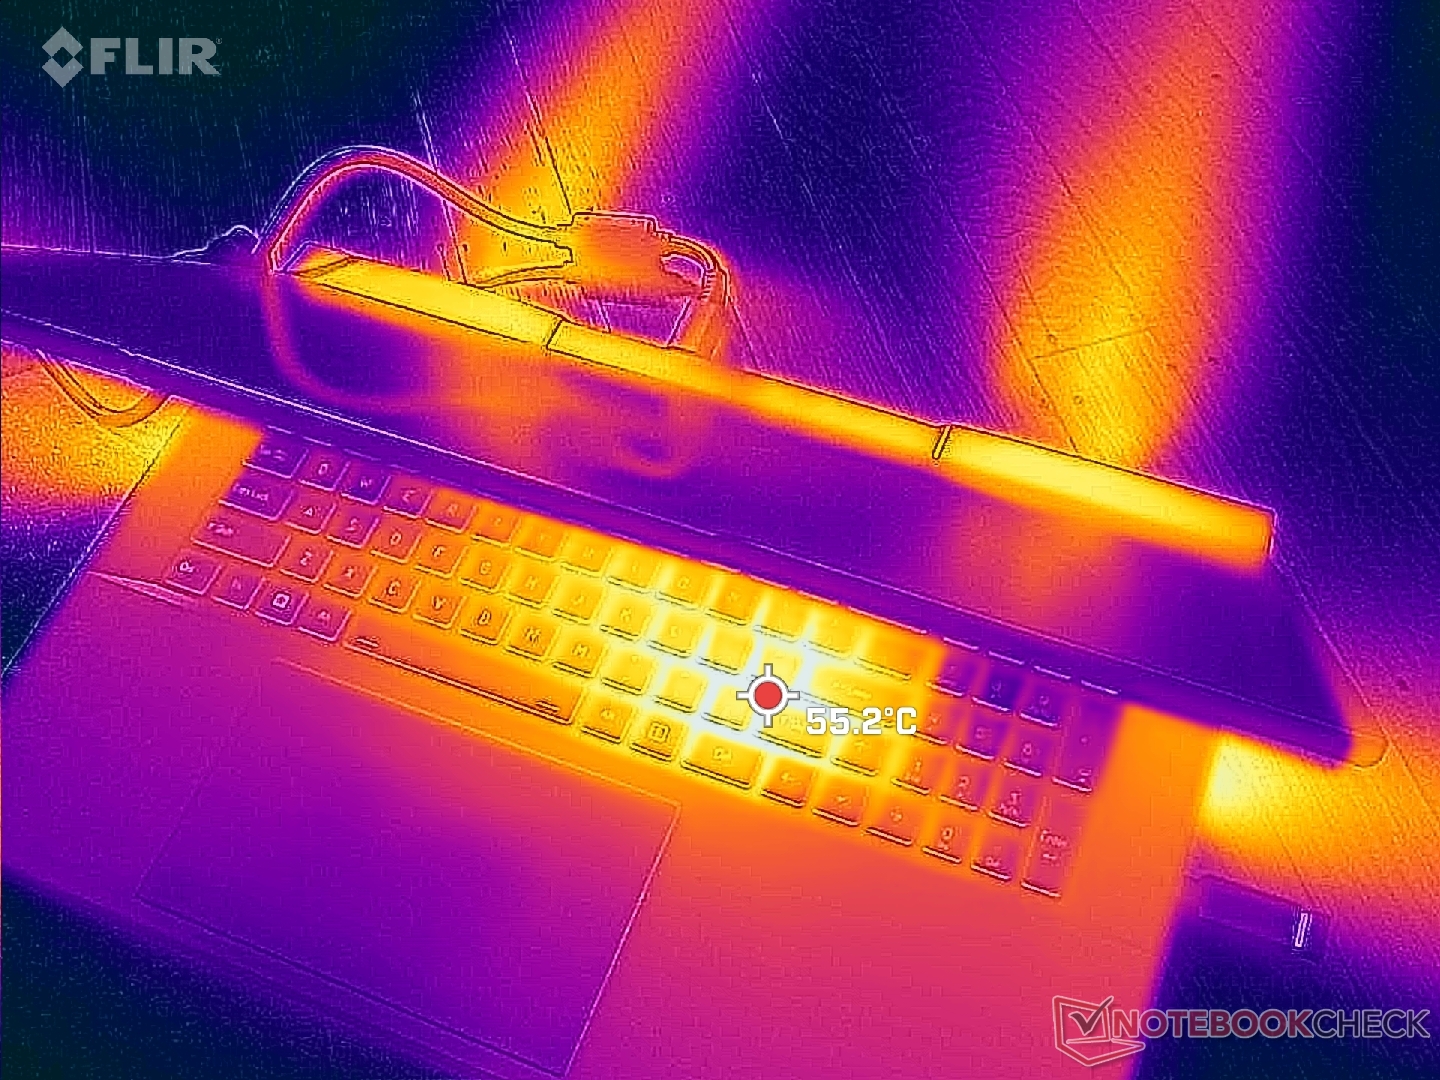
(-) A temperatura máxima no lado superior é 49.4 °C / 121 F, em comparação com a média de 40.4 °C / 105 F , variando de 21.2 a 68.8 °C para a classe Gaming.
(-) A parte inferior aquece até um máximo de 55.2 °C / 131 F, em comparação com a média de 43.2 °C / 110 F
(+) Em uso inativo, a temperatura média para o lado superior é 28.8 °C / 84 F, em comparação com a média do dispositivo de 33.9 °C / ### class_avg_f### F.
(-) Jogando The Witcher 3, a temperatura média para o lado superior é 40.4 °C / 105 F, em comparação com a média do dispositivo de 33.9 °C / ## #class_avg_f### F.
(+) Os apoios para as mãos e o touchpad são mais frios que a temperatura da pele, com um máximo de 31.2 °C / 88.2 F e, portanto, são frios ao toque.
(-) A temperatura média da área do apoio para as mãos de dispositivos semelhantes foi 28.8 °C / 83.8 F (-2.4 °C / -4.4 F).
| Eurocom Raptor X17 Intel Core i9-13900HX, NVIDIA GeForce RTX 4090 Laptop GPU | Asus ROG Strix Scar 17 G733PY-XS96 AMD Ryzen 9 7945HX, NVIDIA GeForce RTX 4090 Laptop GPU | Aorus 17X AZF Intel Core i9-13900HX, NVIDIA GeForce RTX 4090 Laptop GPU | MSI GE78HX 13VH-070US Intel Core i9-13950HX, NVIDIA GeForce RTX 4080 Laptop GPU | Eluktronics Mech-17 GP2 Intel Core i9-13900HX, NVIDIA GeForce RTX 4090 Laptop GPU | Alienware m17 R5 (R9 6900HX, RX 6850M XT) AMD Ryzen 9 6900HX, AMD Radeon RX 6850M XT | |
|---|---|---|---|---|---|---|
| Heat | 24% | 8% | 14% | 15% | 4% | |
| Maximum Upper Side * (°C) | 49.4 | 34.6 30% | 47 5% | 37.4 24% | 39 21% | 53 -7% |
| Maximum Bottom * (°C) | 55.2 | 35.6 36% | 51 8% | 45 18% | 44 20% | 56 -1% |
| Idle Upper Side * (°C) | 33.4 | 27.2 19% | 30 10% | 29.8 11% | 31 7% | 30 10% |
| Idle Bottom * (°C) | 33.4 | 30 10% | 31 7% | 32.4 3% | 29.8 11% | 29 13% |
* ... menor é melhor
Teste de estresse
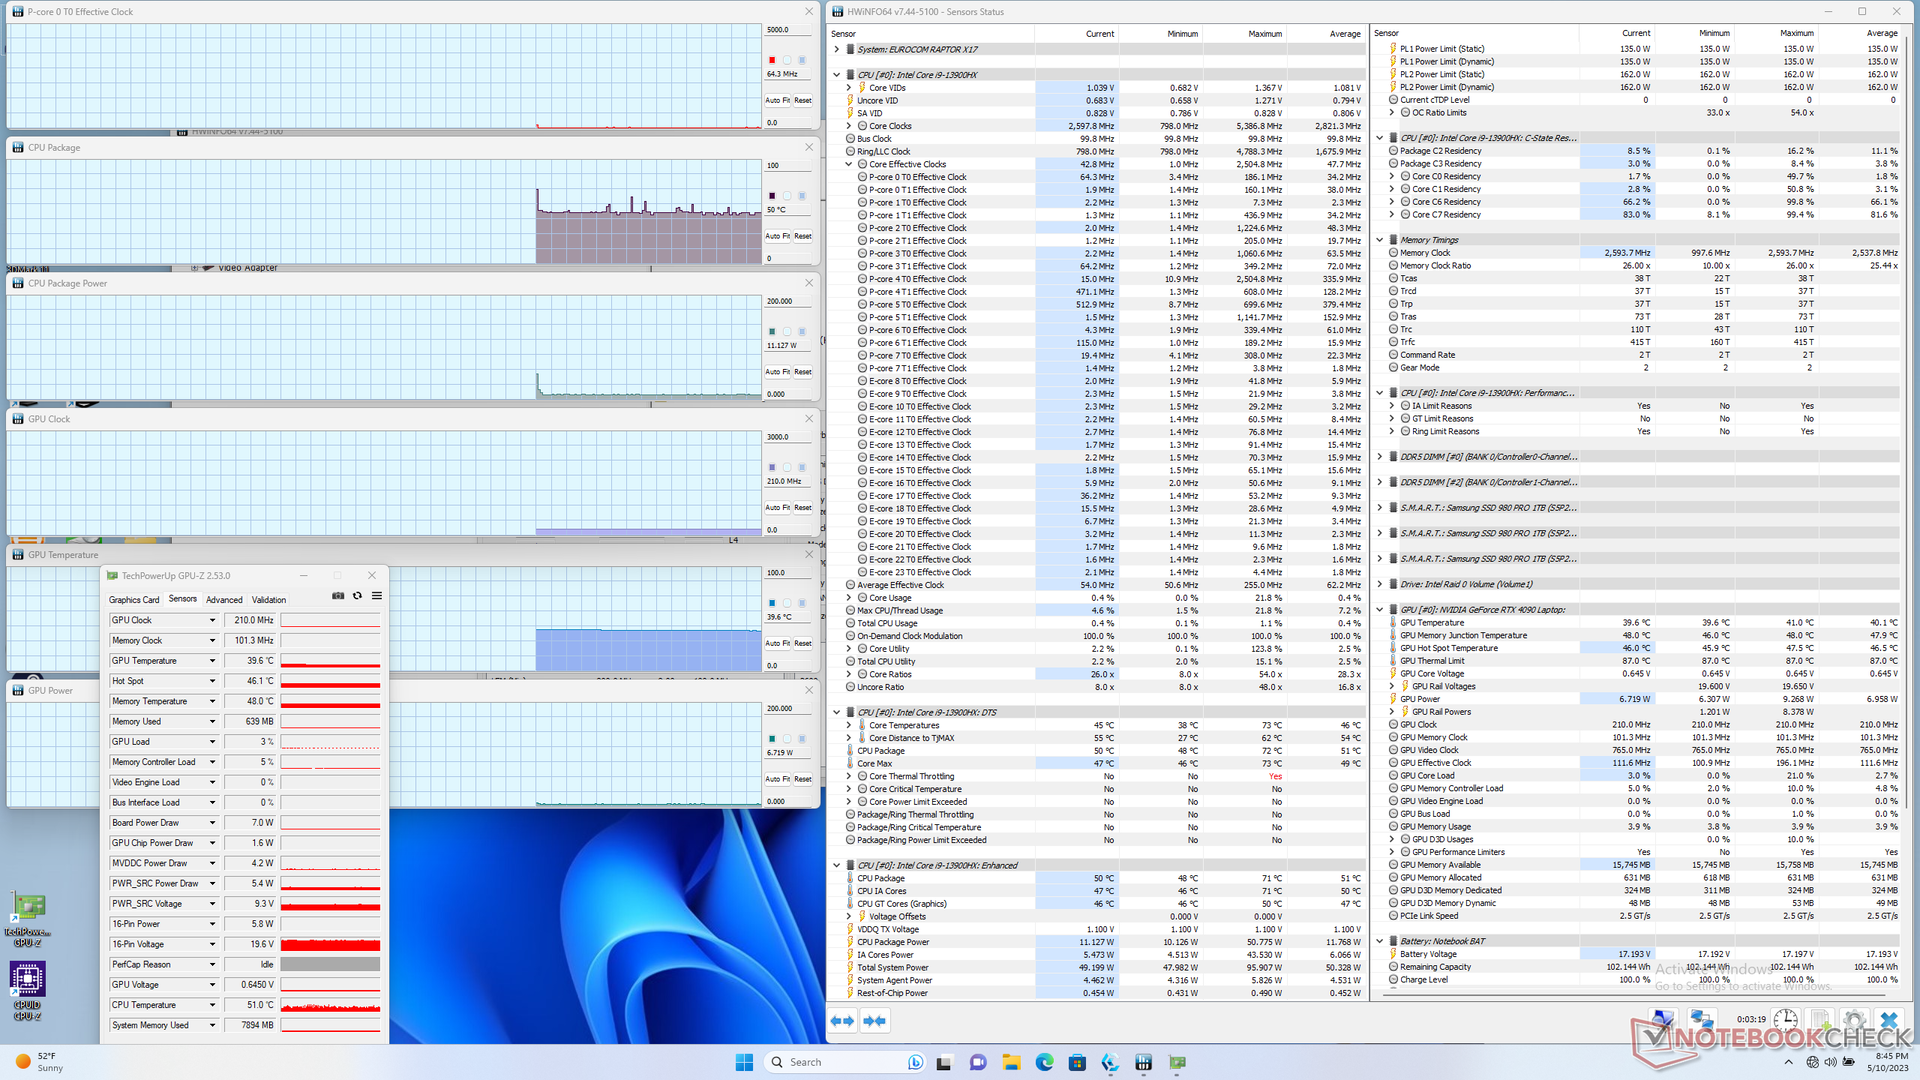
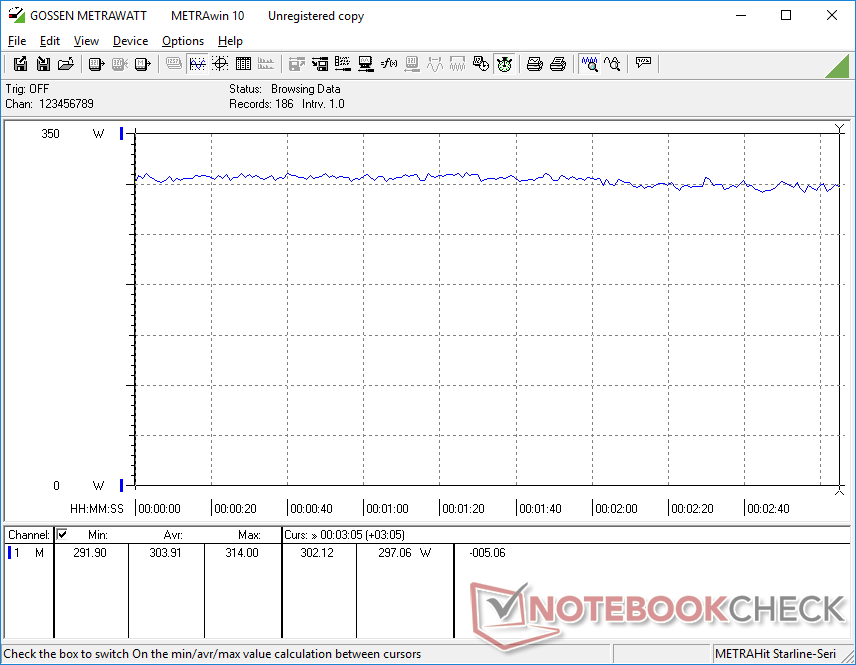
Ao executar o Prime95 para estressar a CPU, as taxas de clock e o consumo de energia da placa aumentavam para 4 GHz e 155 W, respectivamente, por apenas um momento antes de cair rapidamente para a faixa de 3,3 GHz e 110 W. A temperatura do núcleo permaneceu muito quente em 97 °C, o que provavelmente foi o motivo do Turbo Boost máximo de curta duração. Repetindo esse teste no MSI GE78HX ou no Eluktronics Mech-17 GP2 resultaria em temperaturas de núcleo semelhantes, acima de 90 °C, o que sugere que a maioria das CPUs da série H de 13ª geração é geralmente mais quente do que a média quando sob carga.
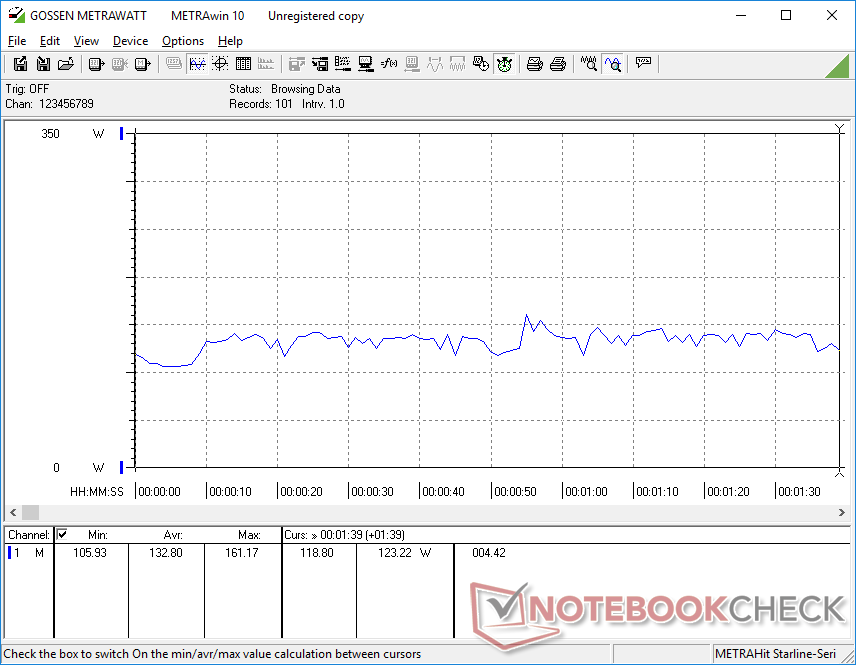
Ao executar Witcher 3 no modo Desempenho para representar cargas típicas de jogos, a GPU se estabilizaria no clock do núcleo de 2235 MHz, 81 °C e consumo de energia da placa de 170 W contra uma meta de 175 W do TGP. Ajustar o sistema para o modo Equilibrado (ou modo Entretenimento) reduziria a GPU para o clock de 2055 MHz, 76 °C e apenas 146 W. Portanto, você precisará ativar o modo Desempenho e suportar o ruído mais alto da ventoinha se quiser obter o máximo da GPU.
A execução com a energia da bateria limita o desempenho. Um teste no site Fire Strike com baterias retornaria pontuações de Física e Gráficos de 12863 e 10075 pontos, respectivamente, em comparação com 36634 e 44766 pontos quando ligado à rede elétrica.
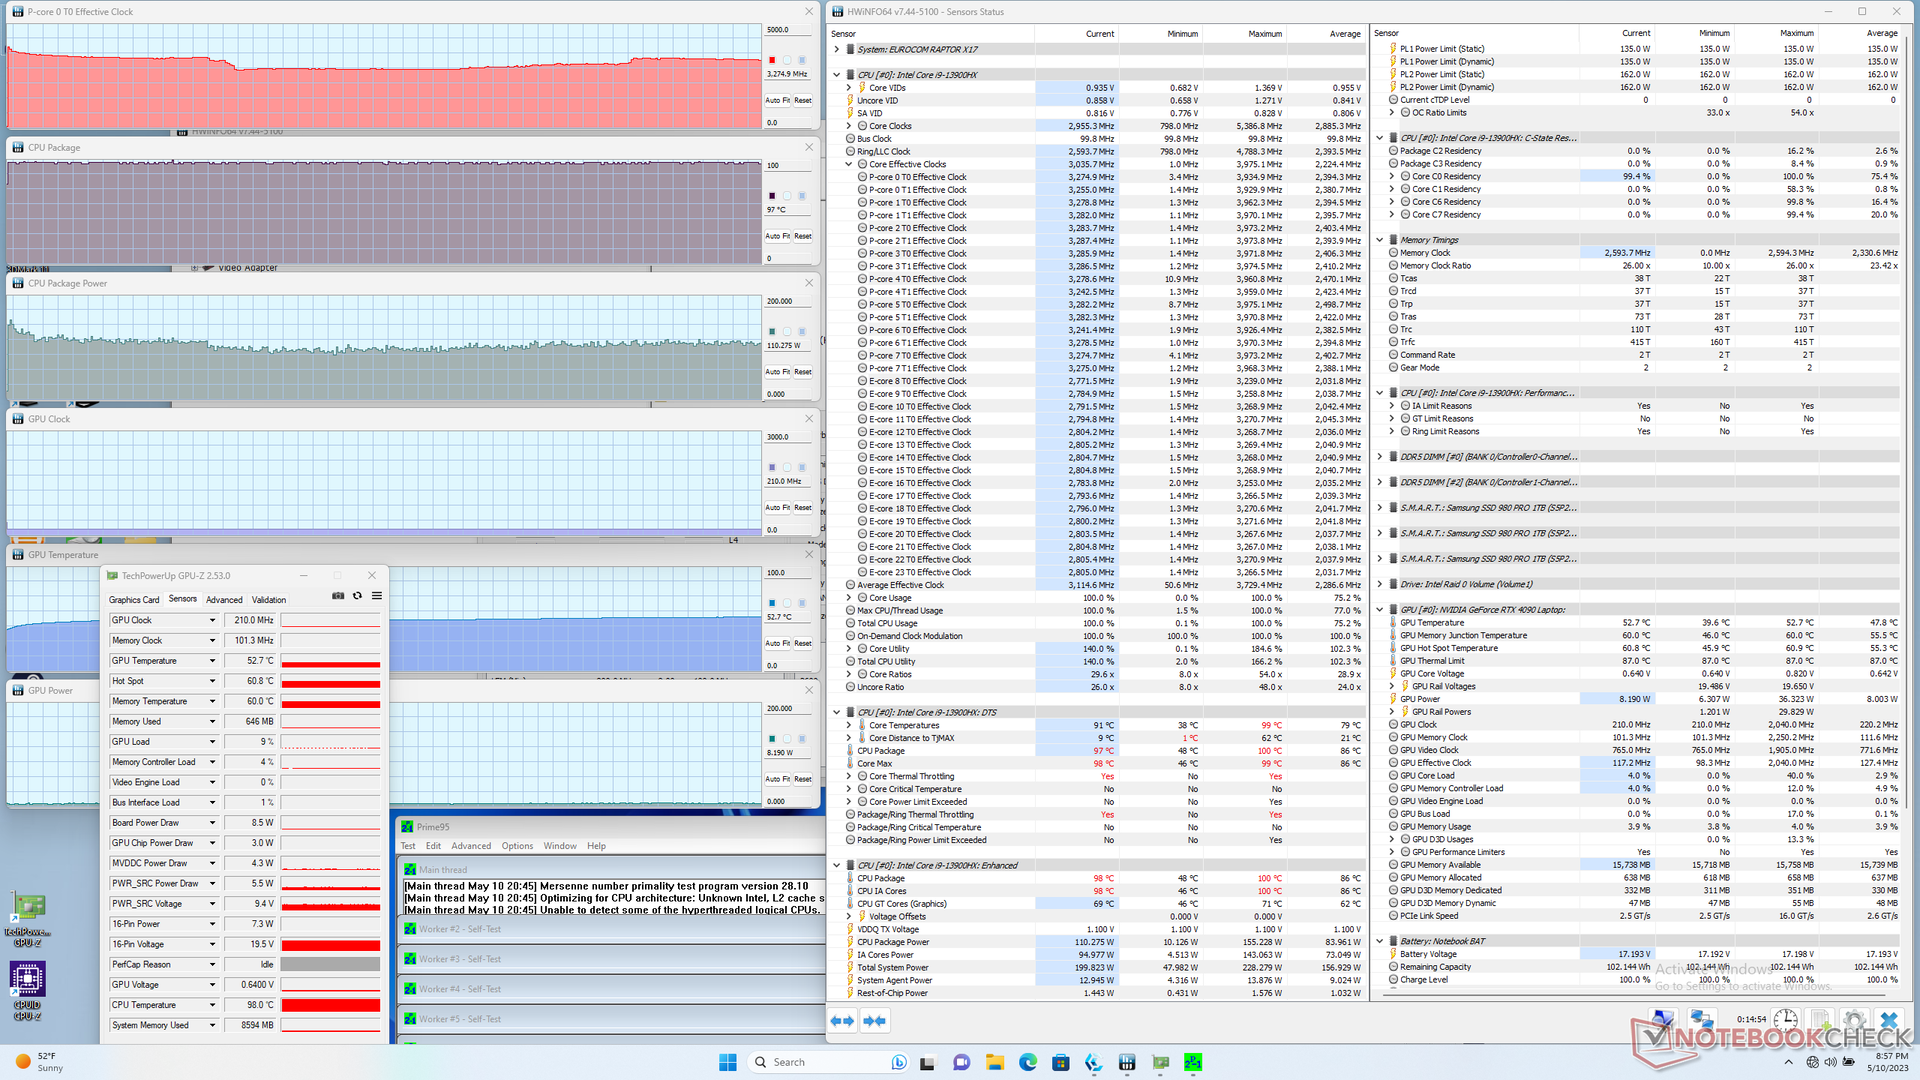
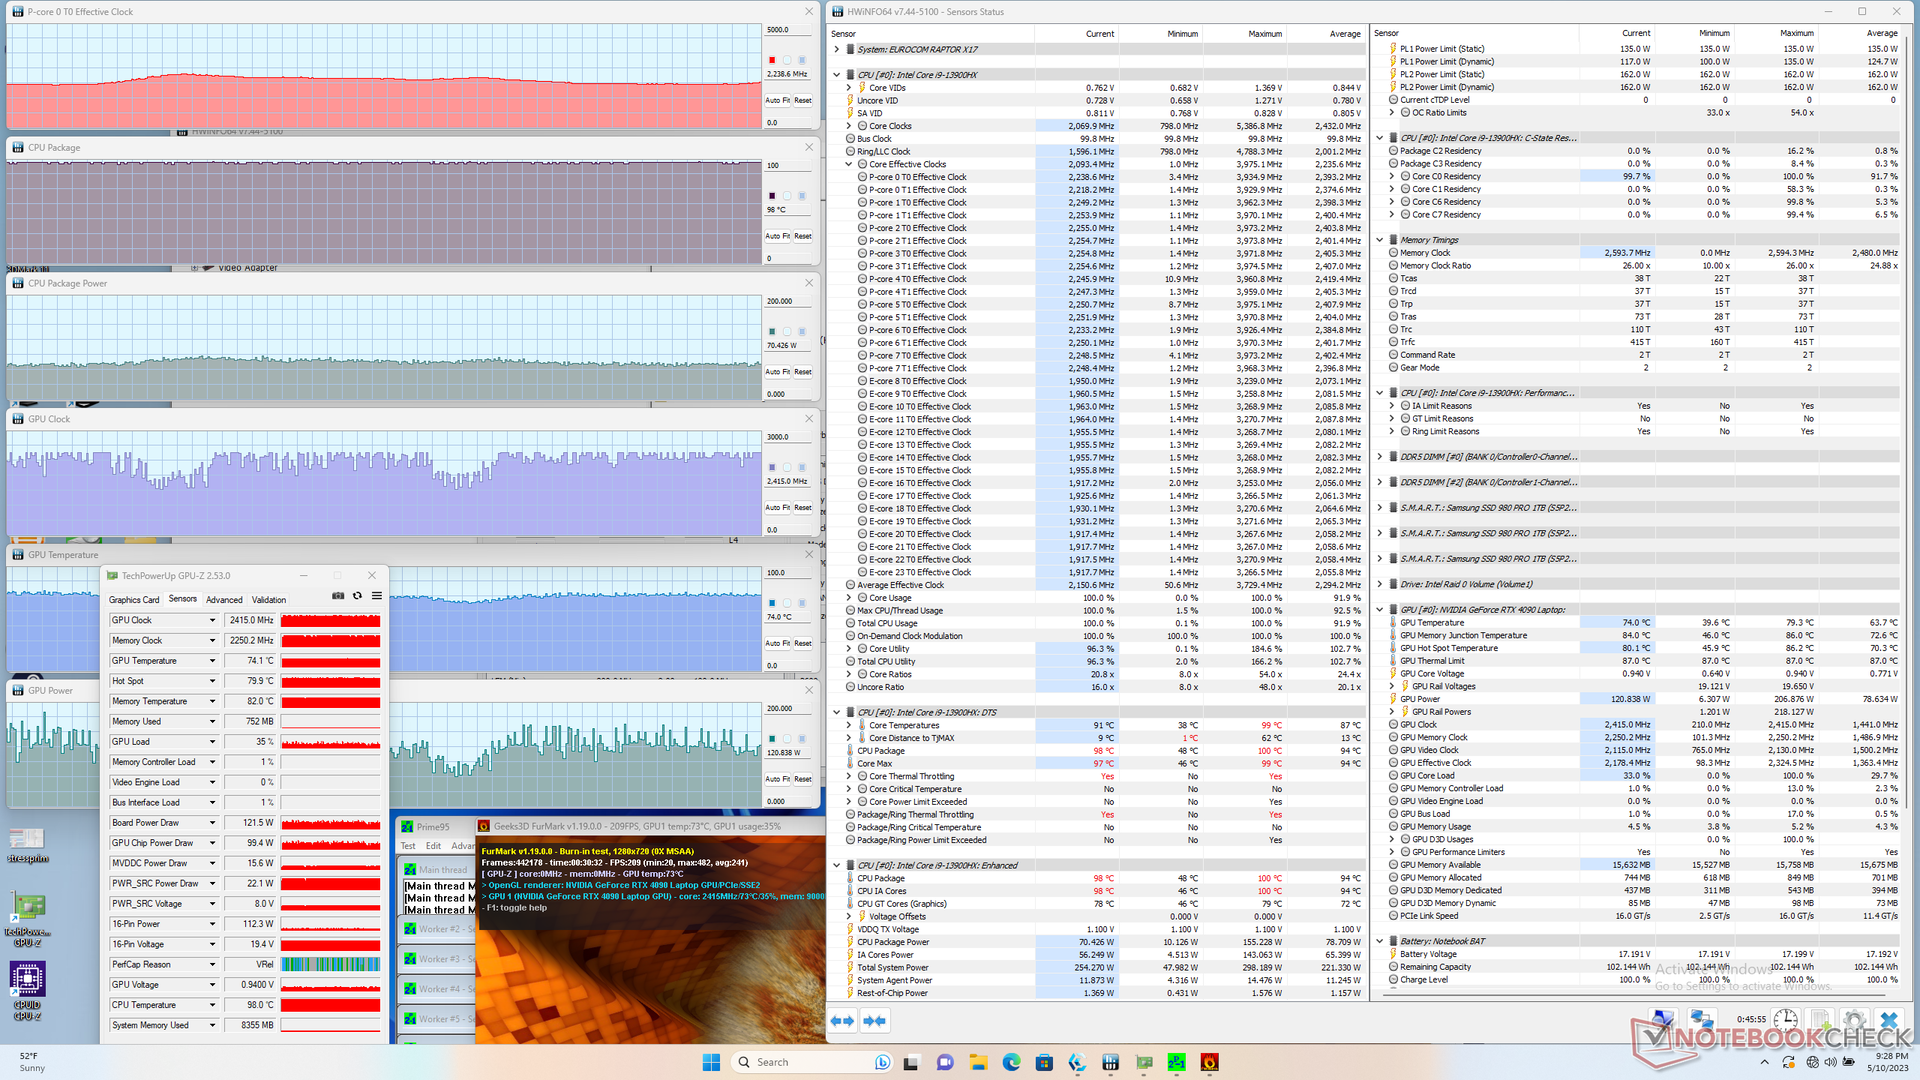
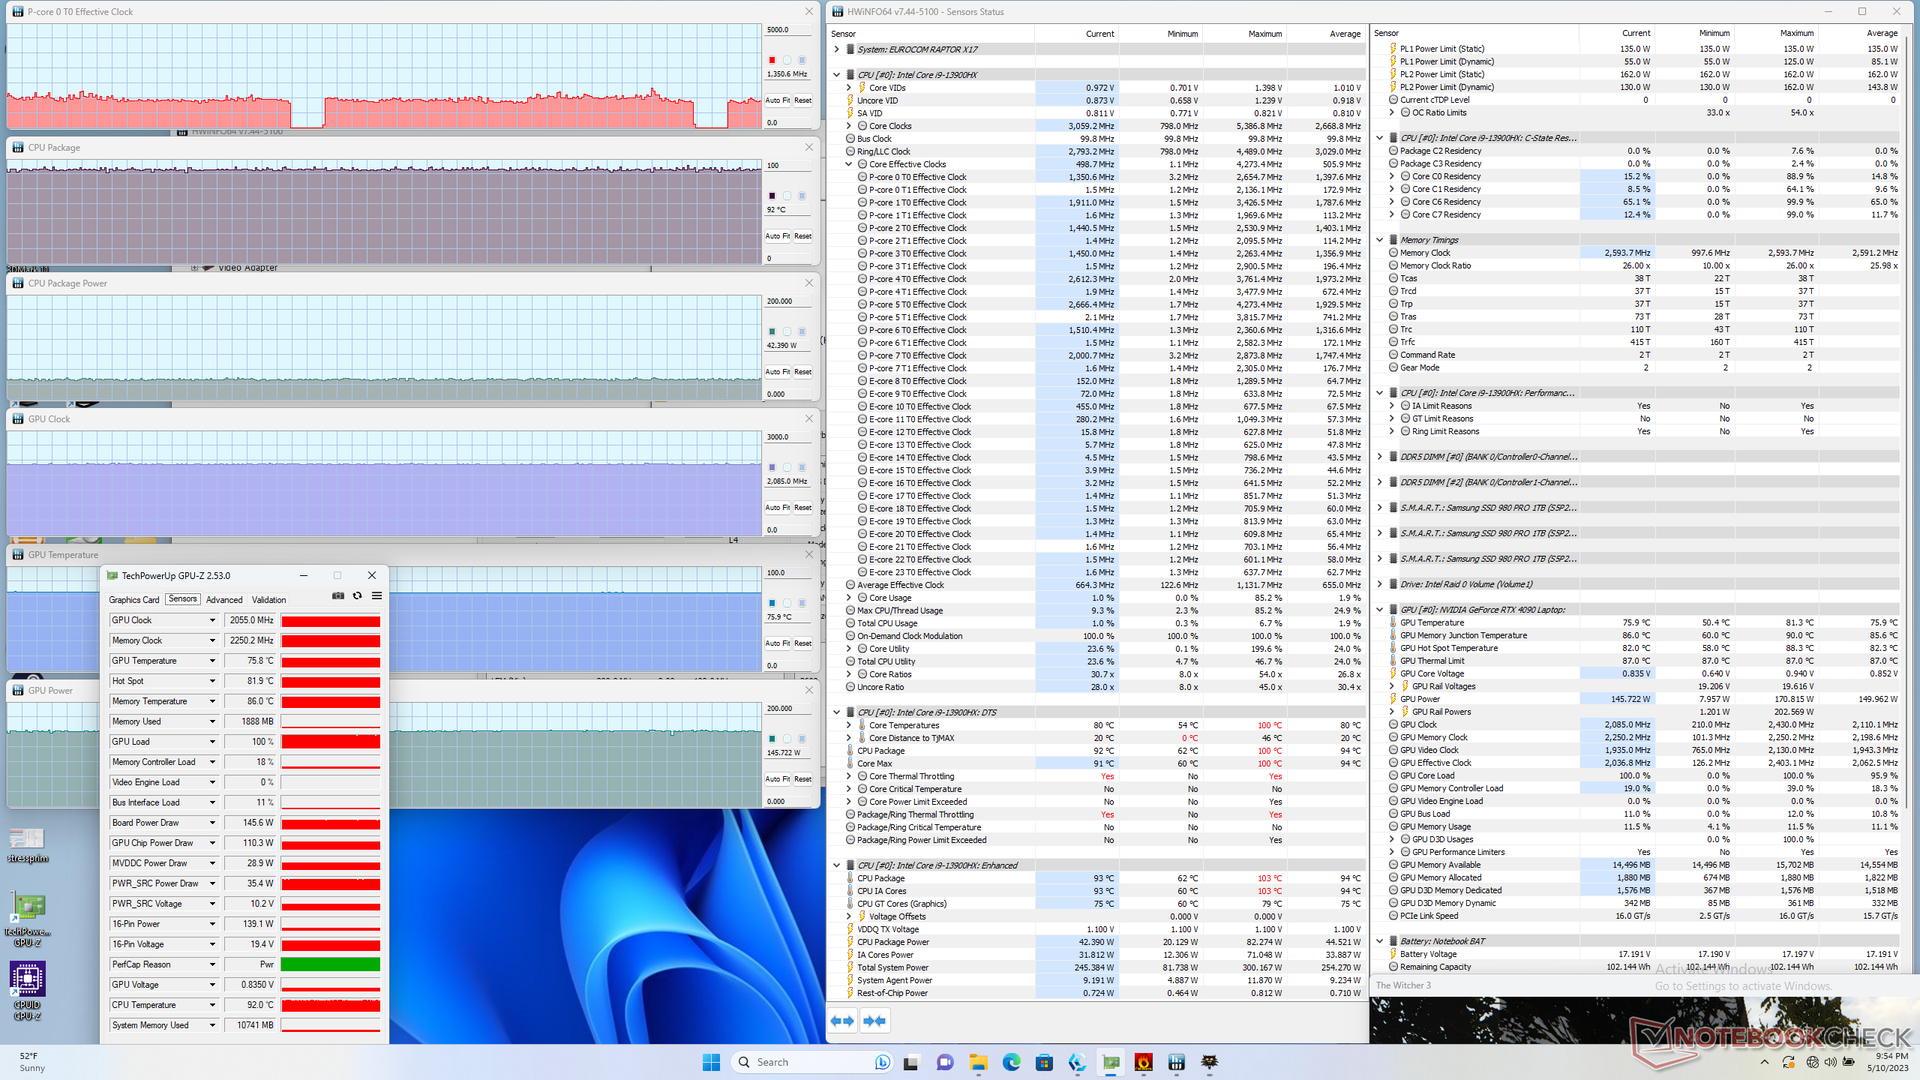
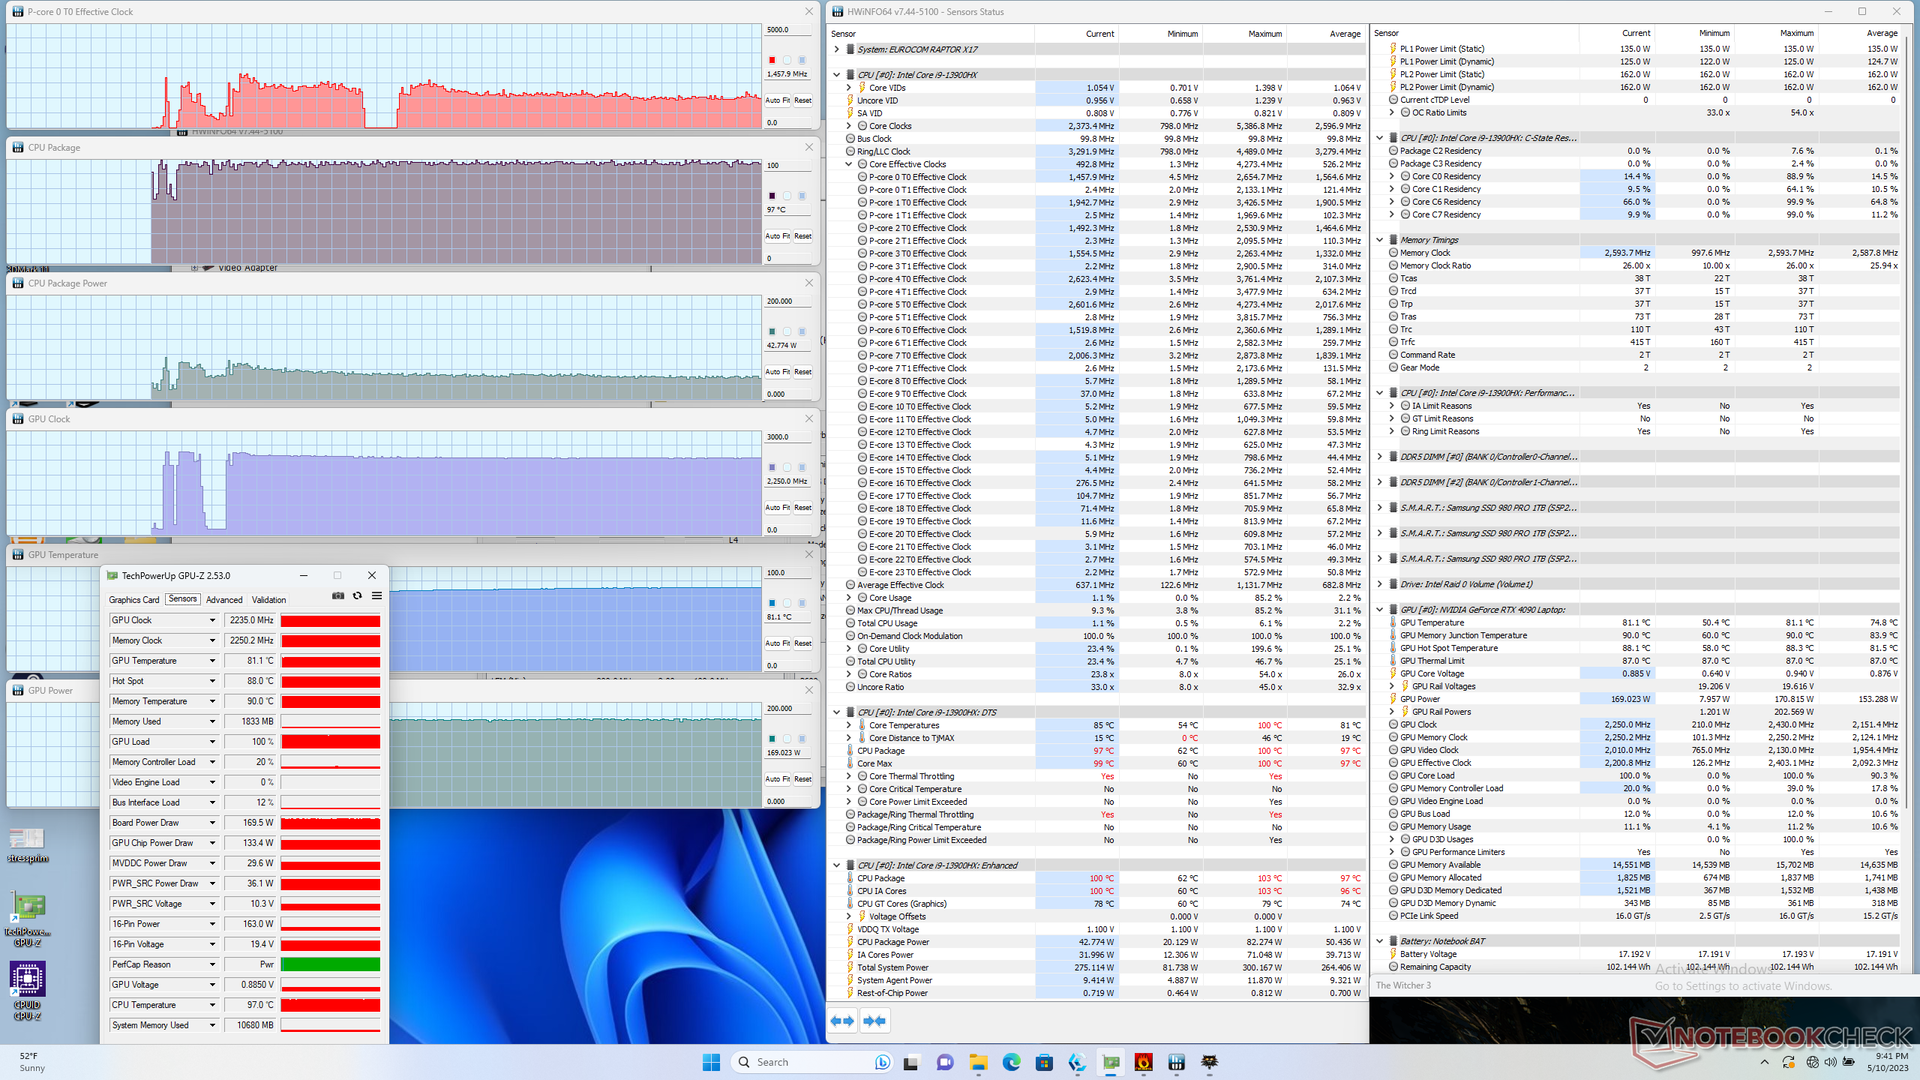
| Clock da CPU (GHz) | Clock da GPU (MHz) | Temperatura média da CPU (°C) | Temperatura média da GPU (°C) | |
| Sistema ocioso | -- | -- | 50 | 40 |
| Estresse doPrime95 | 3.3 | -- | 97 | 53 |
| Estresse doPrime95 + FurMark | 2.2 | 840 - 2400 | 98 | 74 |
| Witcher 3 Estresse(modo balanceado) | 1.4 | 2055 | 92 | 76 |
| Witcher 3 Estresse(modo de desempenho) | 1.5 | 2250 | 97 | 81 |
Alto-falantes
Os alto-falantes integrados são decepcionantes. Não apenas a reprodução de graves é ruim, mas o volume máximo de 71 dB(A) é visivelmente mais baixo do que a maioria dos outros notebooks para jogos, onde 80 dB(A) ou mais alto é comum. Isso definitivamente parece um corte para esse novo design de chassi.
Eurocom Raptor X17 análise de áudio
(-) | alto-falantes não muito altos (###valor### dB)
Graves 100 - 315Hz
(-) | quase nenhum baixo - em média 15.5% menor que a mediana
(±) | a linearidade dos graves é média (10.3% delta para a frequência anterior)
Médios 400 - 2.000 Hz
(±) | médios mais altos - em média 5.4% maior que a mediana
(±) | a linearidade dos médios é média (9.6% delta para frequência anterior)
Altos 2 - 16 kHz
(+) | agudos equilibrados - apenas 2.3% longe da mediana
(±) | a linearidade dos máximos é média (7.5% delta para frequência anterior)
Geral 100 - 16.000 Hz
(±) | a linearidade do som geral é média (23.7% diferença em relação à mediana)
Comparado com a mesma classe
» 86% de todos os dispositivos testados nesta classe foram melhores, 5% semelhantes, 10% piores
» O melhor teve um delta de 6%, a média foi 18%, o pior foi 132%
Comparado com todos os dispositivos testados
» 71% de todos os dispositivos testados foram melhores, 6% semelhantes, 23% piores
» O melhor teve um delta de 4%, a média foi 23%, o pior foi 134%
Apple MacBook Pro 16 2021 M1 Pro análise de áudio
(+) | os alto-falantes podem tocar relativamente alto (###valor### dB)
Graves 100 - 315Hz
(+) | bons graves - apenas 3.8% longe da mediana
(+) | o baixo é linear (5.2% delta para a frequência anterior)
Médios 400 - 2.000 Hz
(+) | médios equilibrados - apenas 1.3% longe da mediana
(+) | médios são lineares (2.1% delta para frequência anterior)
Altos 2 - 16 kHz
(+) | agudos equilibrados - apenas 1.9% longe da mediana
(+) | os máximos são lineares (2.7% delta da frequência anterior)
Geral 100 - 16.000 Hz
(+) | o som geral é linear (4.6% diferença em relação à mediana)
Comparado com a mesma classe
» 0% de todos os dispositivos testados nesta classe foram melhores, 0% semelhantes, 100% piores
» O melhor teve um delta de 5%, a média foi 17%, o pior foi 45%
Comparado com todos os dispositivos testados
» 0% de todos os dispositivos testados foram melhores, 0% semelhantes, 100% piores
» O melhor teve um delta de 4%, a média foi 23%, o pior foi 134%
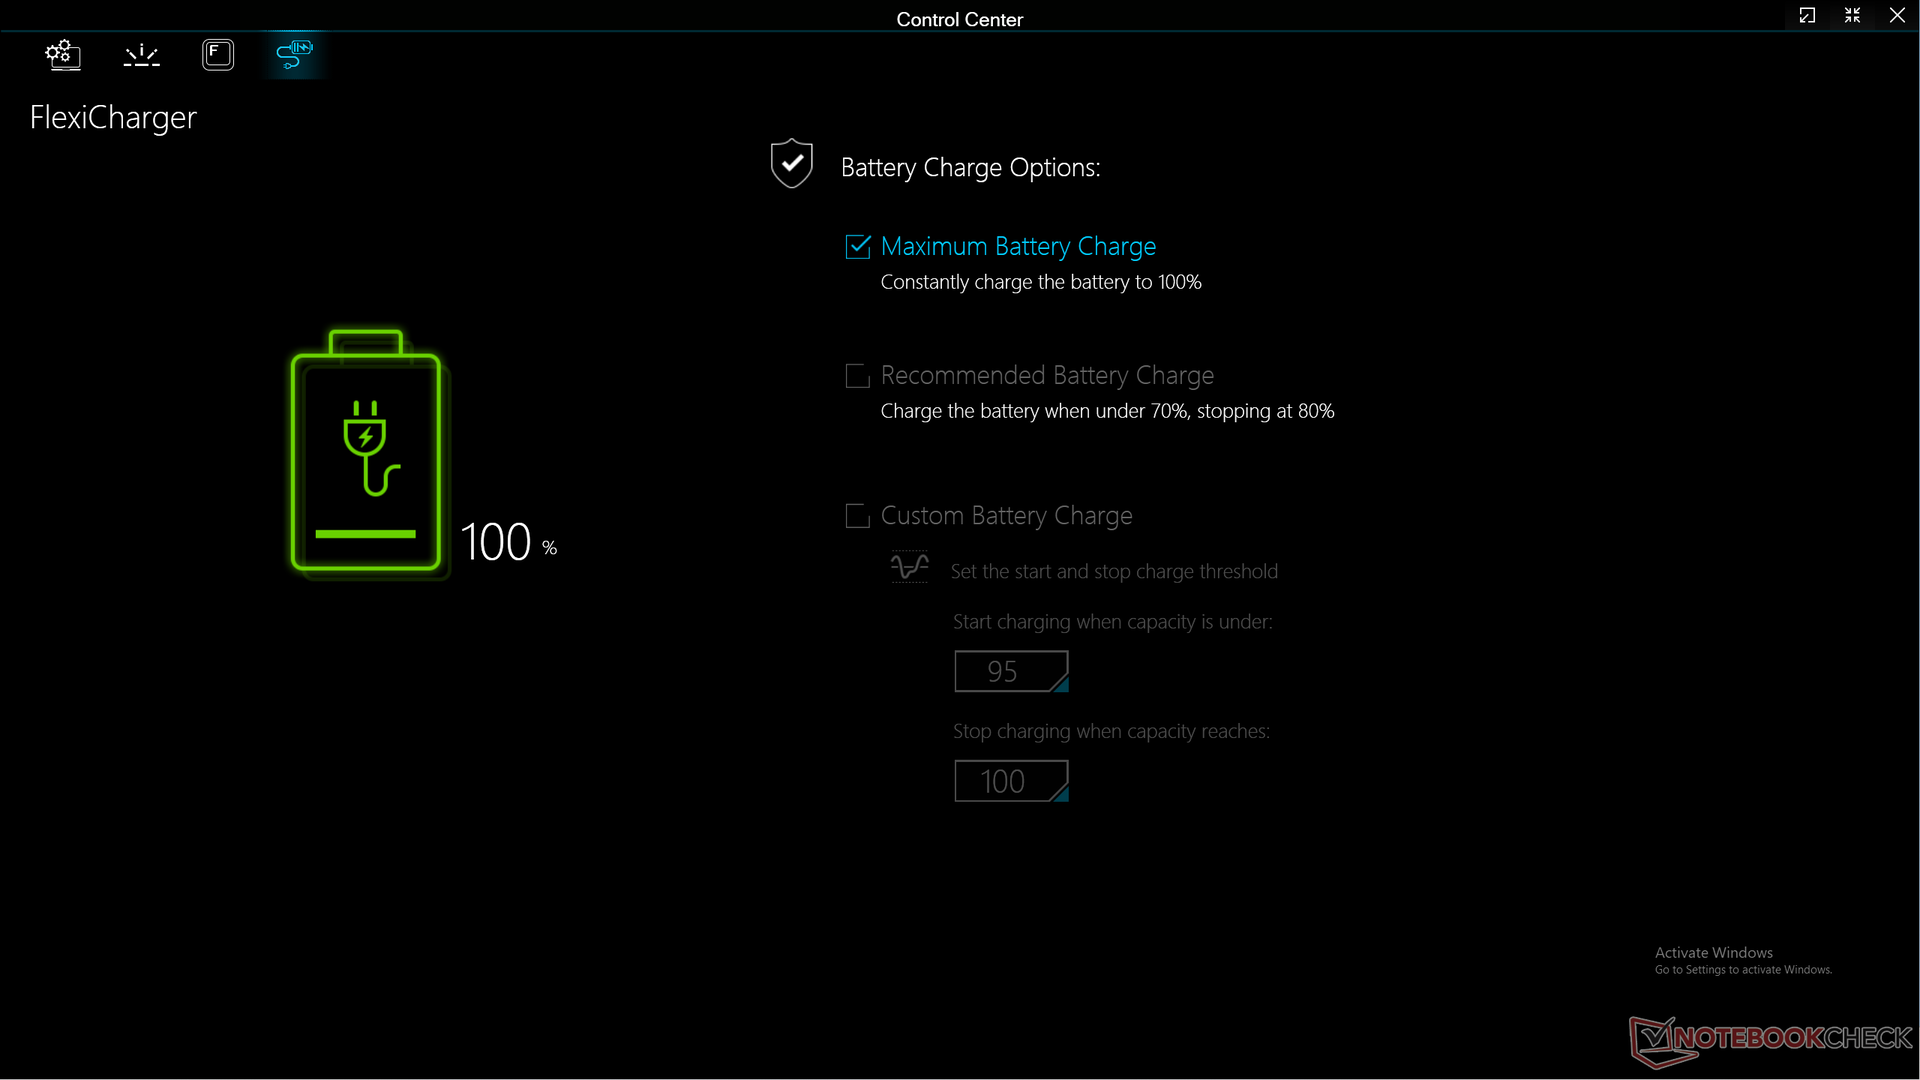
Gerenciamento de energia
Consumo de energia - Mais de 300 W em jogos
A inatividade no desktop consome entre 13 W e 43 W, dependendo do perfil de energia, da configuração da GPU e do brilho da tela. De fato, 43 W é quase o mesmo que um Ultrabook com Core U, como o Samsung Galaxy Book3 15, em carga máxima. A simples mudança do modo iGPU para o modo dGPU aumentaria o consumo de energia em cerca de 9 W no Eurocom. Portanto, o consumo de energia é muito sensível ao perfil de energia ativa.
O consumo médio de energia durante os jogos é muito alto, 304 W, em comparação com 278 W em cada um dos concorrentesAsus ROG Strix Scar 17 ou Aorus 17X com a mesma GPU GeForce RTX 4090. Os SSDs triplos, a taxa de atualização rápida de 240 Hz, a alta capacidade de RAM e o consumo de energia da GPU ligeiramente maior contribuem para o consumo mais alto do Eurocom.
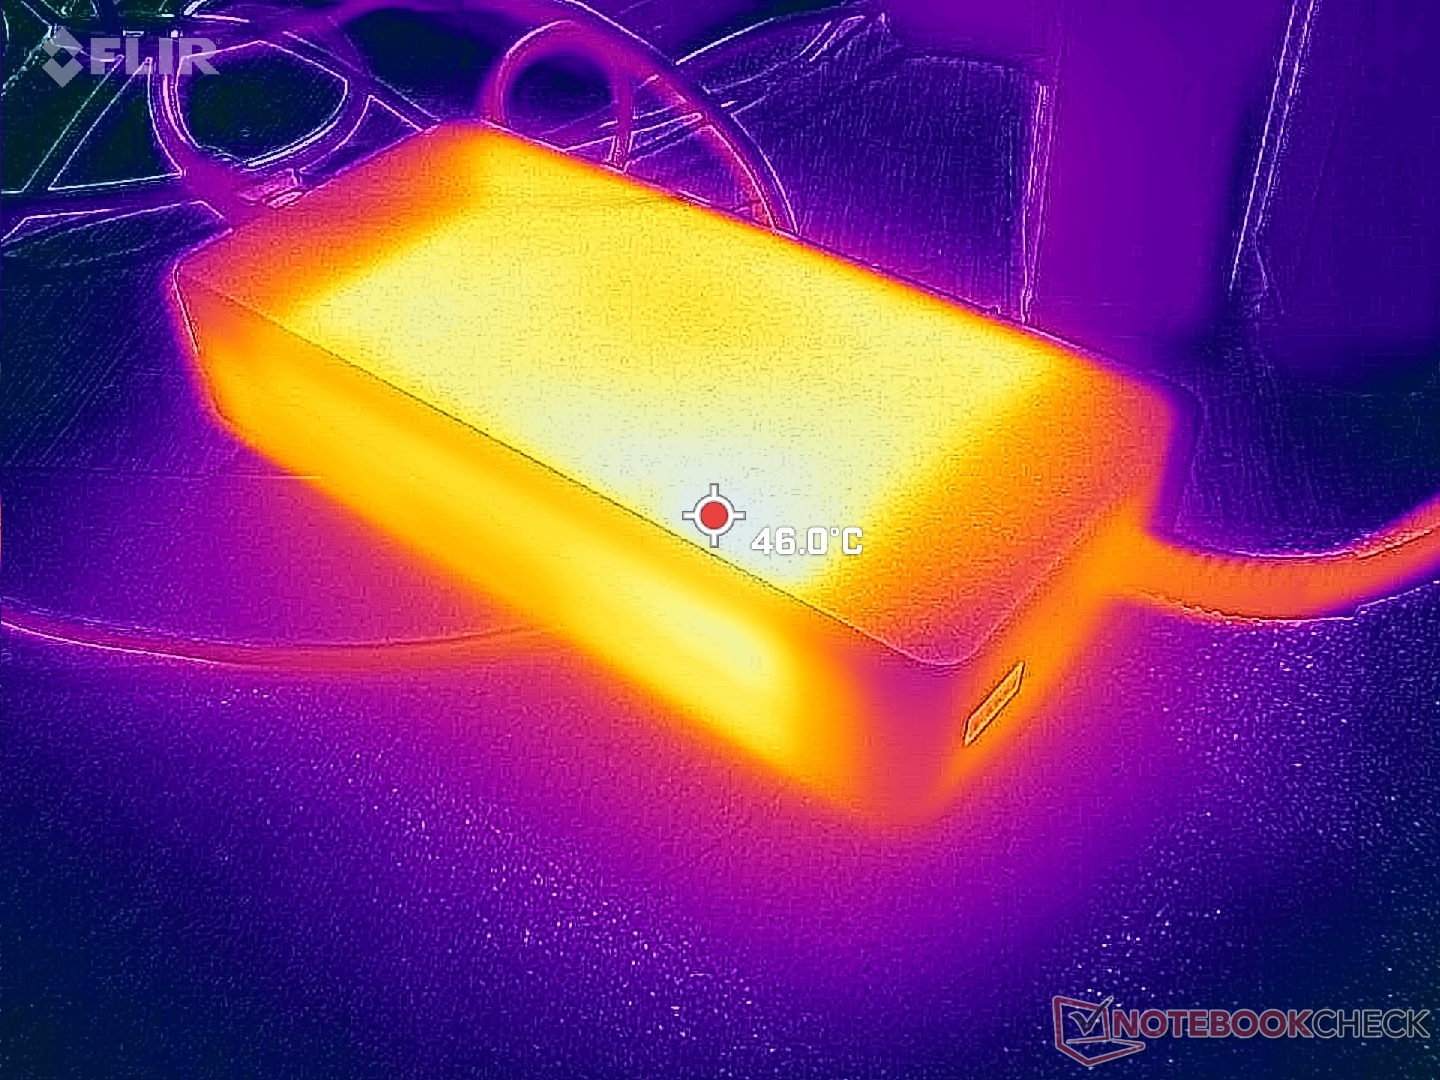
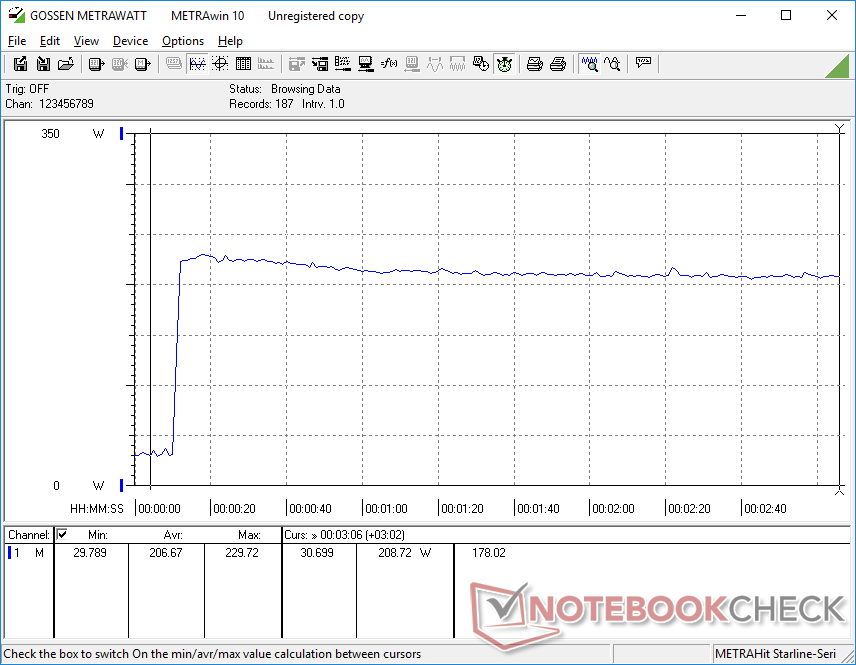
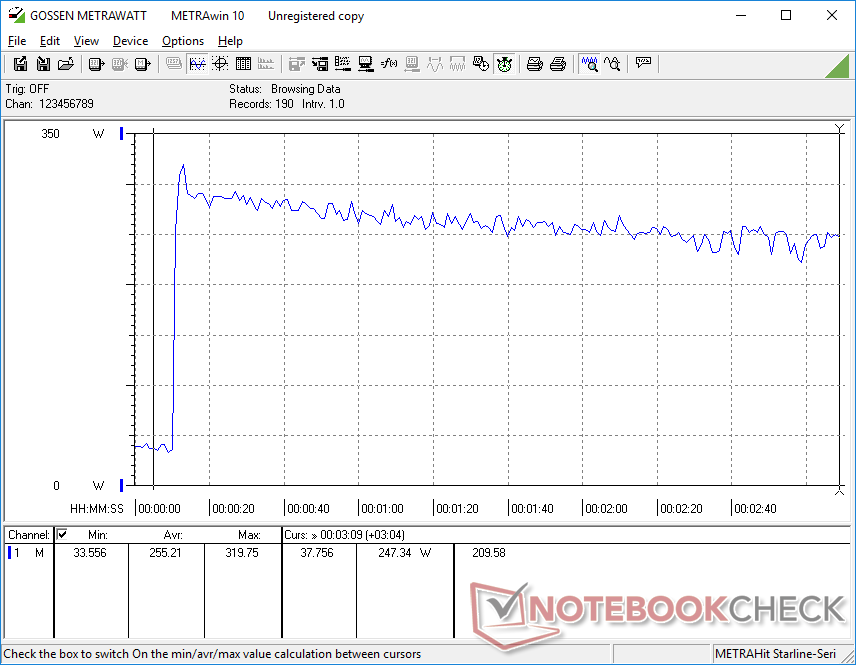
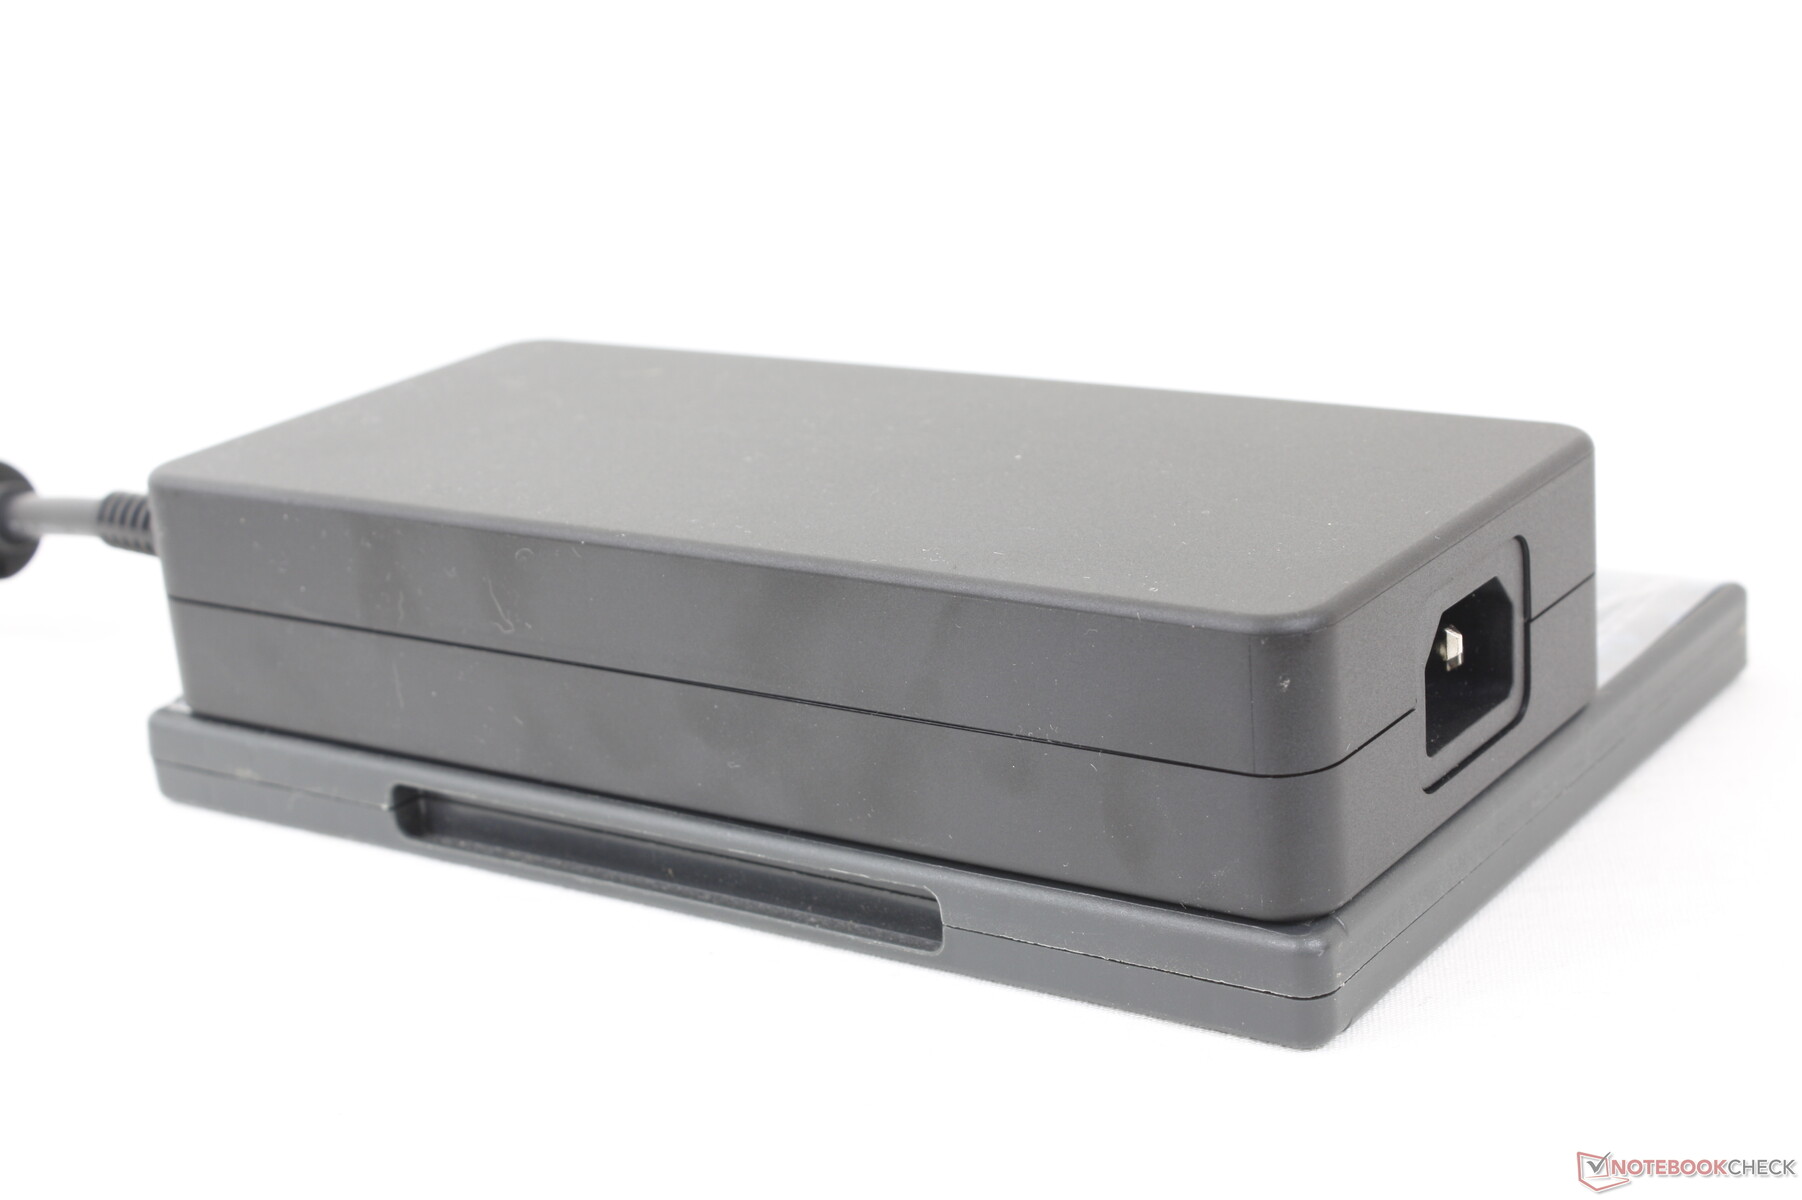
Conseguimos registrar um consumo máximo de 320 W do grande adaptador CA de 330 W (~18,5 x 8,5 x 3,5 cm) quando a CPU e a GPU estão com 100% de utilização. Essa taxa cairia com o tempo, conforme mostrado no gráfico abaixo, devido a limitações térmicas.
| desligado | |
| Ocioso | |
| Carga |
|
Key:
min: | |
| Eurocom Raptor X17 i9-13900HX, GeForce RTX 4090 Laptop GPU, 3x Samsung SSD 980 Pro 1TB (RAID 0), IPS, 2560x1440, 17.3" | Asus ROG Strix Scar 17 G733PY-XS96 R9 7945HX, GeForce RTX 4090 Laptop GPU, SK hynix PC801 HFS001TEJ9X101N, IPS, 2560x1440, 17.3" | Aorus 17X AZF i9-13900HX, GeForce RTX 4090 Laptop GPU, Gigabyte AG470S1TB-SI B10, IPS, 2560x1440, 17.3" | MSI GE78HX 13VH-070US i9-13950HX, GeForce RTX 4080 Laptop GPU, Samsung PM9A1 MZVL22T0HBLB, IPS, 2560x1600, 17" | Eluktronics Mech-17 GP2 i9-13900HX, GeForce RTX 4090 Laptop GPU, Samsung PM9A1 MZVL21T0HCLR, IPS, 2560x1600, 17" | Alienware m17 R5 (R9 6900HX, RX 6850M XT) R9 6900HX, Radeon RX 6850M XT, SSSTC CA6-8D1024, IPS, 3840x2160, 17" | |
|---|---|---|---|---|---|---|
| Power Consumption | 5% | 13% | 3% | 5% | 27% | |
| Idle Minimum * (Watt) | 13.4 | 14.5 -8% | 11 18% | 16.1 -20% | 14 -4% | 13 3% |
| Idle Average * (Watt) | 22.2 | 21.1 5% | 17 23% | 24 -8% | 19.3 13% | 16.5 26% |
| Idle Maximum * (Watt) | 42.4 | 42.8 -1% | 29 32% | 34 20% | 36.8 13% | 17 60% |
| Load Average * (Watt) | 132.8 | 116.7 12% | 134 -1% | 123.6 7% | 117.2 12% | 93 30% |
| Witcher 3 ultra * (Watt) | 304 | 278 9% | 278 9% | 286 6% | 304 -0% | 239 21% |
| Load Maximum * (Watt) | 319.8 | 279.6 13% | 334 -4% | 285.7 11% | 342.5 -7% | 251 22% |
* ... menor é melhor
Power Consumption Witcher 3 / Stresstest
Power Consumption external Monitor
Duração da bateria
Os tempos de execução são muito bons, considerando a potência dos componentes internos. Conseguimos registrar pouco menos de 5 horas de navegação em WLAN no mundo real com o perfil de energia balanceado e a iGPU ativa. Mesmo assim, os modelos concorrentes, como o Aorus 17X ou o MSI GE78HX, conseguem durar mais de uma hora a mais do que o nosso Eurocom.
O carregamento da capacidade vazia até a capacidade total com o adaptador CA de 330 W incluído é relativamente lento, com 2 a 2,5 horas. O carregamento por meio de adaptadores CA USB-C de terceiros é suportado, mas observe que ele só funciona em apenas uma das duas portas USB-C (a porta mais próxima da parte traseira).
| Eurocom Raptor X17 i9-13900HX, GeForce RTX 4090 Laptop GPU, 99 Wh | Asus ROG Strix Scar 17 G733PY-XS96 R9 7945HX, GeForce RTX 4090 Laptop GPU, 90 Wh | Aorus 17X AZF i9-13900HX, GeForce RTX 4090 Laptop GPU, 99 Wh | MSI GE78HX 13VH-070US i9-13950HX, GeForce RTX 4080 Laptop GPU, 99 Wh | Eluktronics Mech-17 GP2 i9-13900HX, GeForce RTX 4090 Laptop GPU, 99 Wh | Alienware m17 R5 (R9 6900HX, RX 6850M XT) R9 6900HX, Radeon RX 6850M XT, 97 Wh | |
|---|---|---|---|---|---|---|
| Duração da bateria | -18% | 19% | -2% | 2% | 8% | |
| Reader / Idle (h) | 10.2 | 9 -12% | 7.3 -28% | |||
| WiFi v1.3 (h) | 5 | 4.1 -18% | 6.5 30% | 6.1 22% | 5.1 2% | 4.8 -4% |
| Load (h) | 1.5 | 2.1 40% | 1.5 0% | 1.8 20% | ||
| H.264 (h) | 6.7 | 4.9 |
Pro
Contra
Veredicto - Desempenho impecável, mas poderia ter mais atenção

O melhor aspecto do Raptor X17 é seu desempenho muito rápido em relação ao perfil fino. Ele funcionará descaradamente muito quente e muito alto para extrair o máximo de desempenho possível da CPU e da GPU. Os caçadores de desempenho, em particular, provavelmente apreciarão essa abordagem, bem como o suporte para até três SSDs NVMe PCIe4 x4.
Infelizmente, há algumas desvantagens que devem ser levadas em conta. Com mais de 60 dB(A) durante os jogos, o sistema é visivelmente mais barulhento do que a maioria dos outros notebooks para jogos do mercado. Quando os modelos concorrentes, como oMSI GE78HX ou o Asus ROG Strix Scar 17 podem oferecer opções de processador semelhantes e, ao mesmo tempo, funcionam 10 dB(A) mais silenciosamente durante os jogos, torna-se mais difícil preferir o Raptor X17 a muitas alternativas no mercado. O peso muito maior também não o favorece.
O hardware e o desempenho são sólidos, mas outros aspectos, como os alto-falantes fracos, as ventoinhas muito altas e o software não refinado do Control Center, não refletem adequadamente o alto preço pedido.
Há mais alguns detalhes que, em nossa opinião, também poderiam ter sido melhores. Os perfis de energia confusos, o comportamento pulsante da ventoinha, os modos ocultos da GPU, o sangramento moderado e irregular da luz de fundo e a tela calibrada opcional são lamentáveis de se ver em um laptop de última geração que custa bem mais de US$ 3.000. A Eurocom afirma que está em processo de reformulação do menu do BIOS e do software do Control Center, o que deve solucionar algumas das nossas reclamações.
Preço e disponibilidade
A Eurocom já está enviando o Raptor X17 na América do Norte a partir de US$ 3550 para a configuração básica até mais de US$ 6000, conforme configurado com nossa unidade de teste.
Eurocom Raptor X17
- 05/18/2023 v7 (old)
Allen Ngo
Transparência
A seleção dos dispositivos a serem analisados é feita pela nossa equipe editorial. A amostra de teste foi fornecida ao autor como empréstimo pelo fabricante ou varejista para fins desta revisão. O credor não teve influência nesta revisão, nem o fabricante recebeu uma cópia desta revisão antes da publicação. Não houve obrigação de publicar esta revisão. Como empresa de mídia independente, a Notebookcheck não está sujeita à autoridade de fabricantes, varejistas ou editores.
É assim que o Notebookcheck está testando
Todos os anos, o Notebookcheck analisa de forma independente centenas de laptops e smartphones usando procedimentos padronizados para garantir que todos os resultados sejam comparáveis. Desenvolvemos continuamente nossos métodos de teste há cerca de 20 anos e definimos padrões da indústria no processo. Em nossos laboratórios de teste, equipamentos de medição de alta qualidade são utilizados por técnicos e editores experientes. Esses testes envolvem um processo de validação em vários estágios. Nosso complexo sistema de classificação é baseado em centenas de medições e benchmarks bem fundamentados, o que mantém a objetividade.Price comparison

