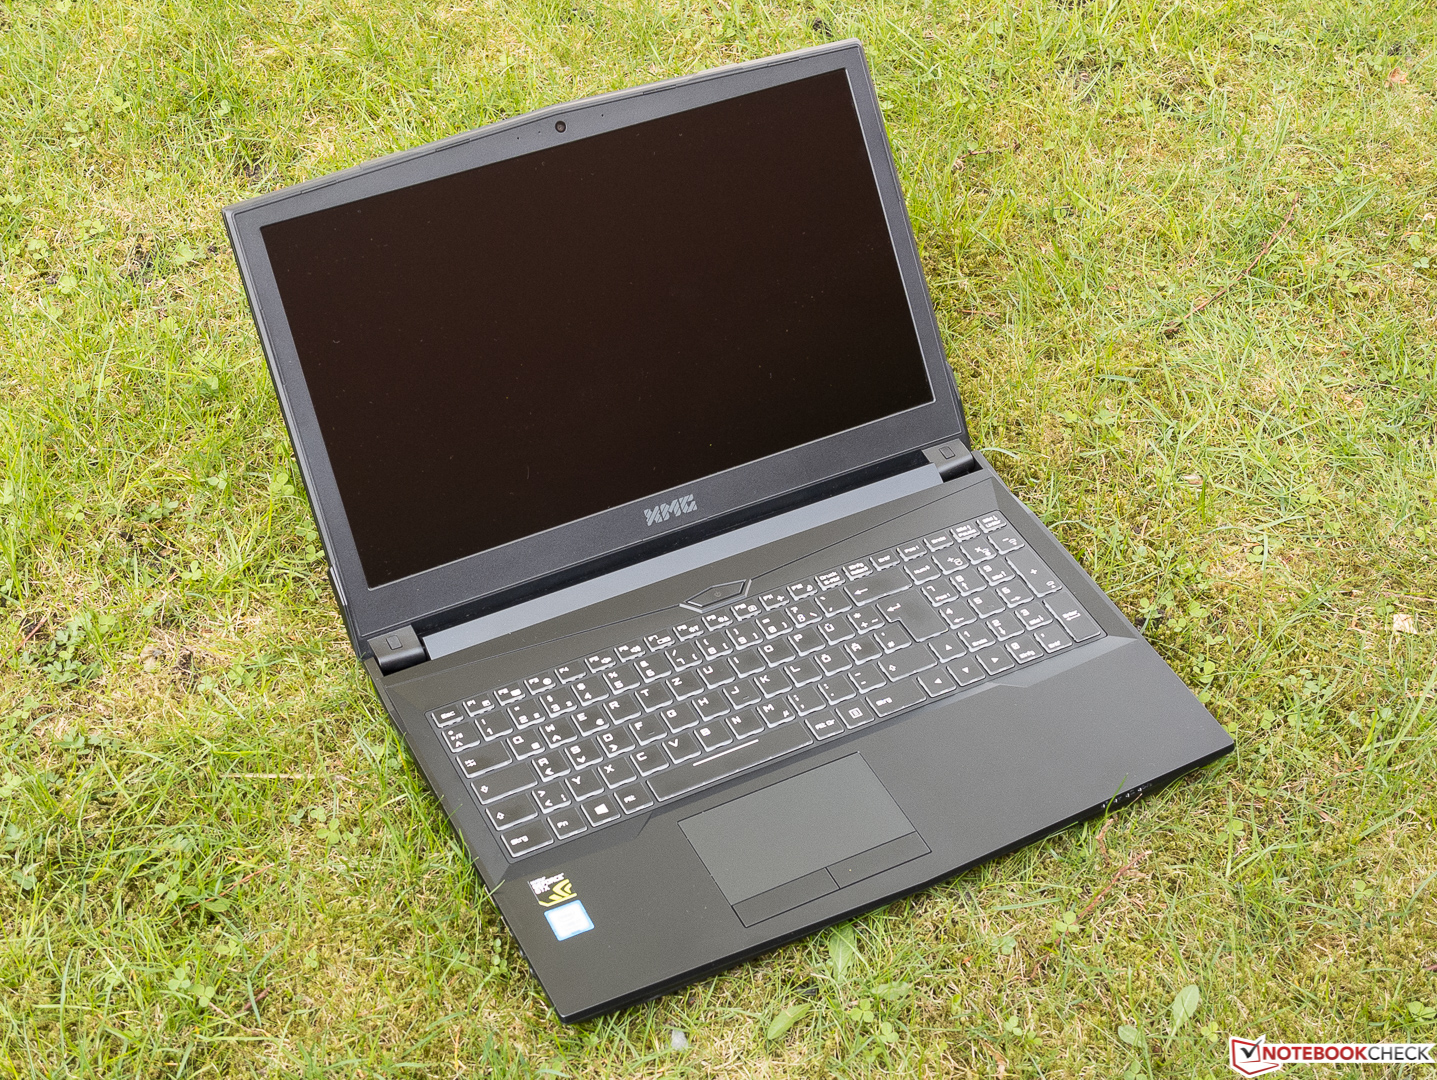
Breve Análise do Portátil Schenker XMG Apex 15 (Clevo N950TP6)

| SD Card Reader | |
| average JPG Copy Test (av. of 3 runs) | |
| MSI GE63VR 7RF Raider (Toshiba Exceria Pro SDXC 64 GB UHS-II) | |
| Média da turma Gaming (20.9 - 210, n=54, últimos 2 anos) | |
| Schenker XMG Apex 15 (Toshiba Exceria Pro SDXC 64 GB UHS-II) | |
| Schenker XMG Core 15 (Toshiba Exceria Pro SDXC 64 GB UHS-II) | |
| HP Omen 15t-ce000 (Toshiba Exceria Pro SDXC 64 GB UHS-II) | |
| maximum AS SSD Seq Read Test (1GB) | |
| MSI GE63VR 7RF Raider (Toshiba Exceria Pro SDXC 64 GB UHS-II) | |
| Média da turma Gaming (25.5 - 261, n=51, últimos 2 anos) | |
| Schenker XMG Apex 15 (Toshiba Exceria Pro SDXC 64 GB UHS-II) | |
| HP Omen 15t-ce000 (Toshiba Exceria Pro SDXC 64 GB UHS-II) | |
| Schenker XMG Core 15 (Toshiba Exceria Pro SDXC 64 GB UHS-II) | |
| Networking | |
| iperf3 transmit AX12 | |
| HP Omen 15t-ce000 | |
| MSI GE63VR 7RF Raider | |
| Schenker XMG Apex 15 | |
| Schenker XMG Core 15 | |
| iperf3 receive AX12 | |
| MSI GE63VR 7RF Raider | |
| Schenker XMG Apex 15 | |
| Schenker XMG Core 15 | |
| HP Omen 15t-ce000 | |
| |||||||||||||||||||||||||
iluminação: 91 %
iluminação com acumulador: 269 cd/m²
Contraste: 1170:1 (Preto: 0.23 cd/m²)
ΔE ColorChecker Calman: 4.25 | ∀{0.5-29.43 Ø4.71}
calibrated: 2.51
ΔE Greyscale Calman: 3.11 | ∀{0.09-98 Ø4.96}
83% sRGB (Argyll 1.6.3 3D)
54% AdobeRGB 1998 (Argyll 1.6.3 3D)
60.4% AdobeRGB 1998 (Argyll 3D)
82.7% sRGB (Argyll 3D)
62% Display P3 (Argyll 3D)
Gamma: 2.36
CCT: 6851 K
| Schenker XMG Apex 15 LG Philips LP156WF6 (LGD046F), IPS, 1920x1080 | MSI GE63VR 7RF Raider Chi Mei N156HHE-GA1 (CMN15F4), TN LED, 1920x1080 | HP Omen 15t-ce000 AU Optronics AUO23EB, IPS, 3840x2160 | Schenker XMG Core 15 LG Philips LP156WF6 (LGD046F), IPS, 1920x1080 | |
|---|---|---|---|---|
| Display | 37% | 10% | 1% | |
| Display P3 Coverage (%) | 62 | 91.3 47% | 66.1 7% | 64.3 4% |
| sRGB Coverage (%) | 82.7 | 100 21% | 91.8 11% | 83 0% |
| AdobeRGB 1998 Coverage (%) | 60.4 | 86.7 44% | 66.9 11% | 60.6 0% |
| Response Times | 77% | 17% | 5% | |
| Response Time Grey 50% / Grey 80% * (ms) | 42.4 ? | 9.6 ? 77% | 37.6 ? 11% | 40.8 ? 4% |
| Response Time Black / White * (ms) | 32 ? | 7.2 ? 77% | 24.8 ? 22% | 30.4 ? 5% |
| PWM Frequency (Hz) | 20490 ? | 26000 ? | 20490 ? | |
| Screen | 12% | -5% | -11% | |
| Brightness middle (cd/m²) | 269 | 285 6% | 358.5 33% | 297 10% |
| Brightness (cd/m²) | 274 | 273 0% | 350 28% | 276 1% |
| Brightness Distribution (%) | 91 | 84 -8% | 95 4% | 87 -4% |
| Black Level * (cd/m²) | 0.23 | 0.23 -0% | 0.39 -70% | 0.3 -30% |
| Contrast (:1) | 1170 | 1239 6% | 919 -21% | 990 -15% |
| Colorchecker dE 2000 * | 4.25 | 3.52 17% | 4.6 -8% | 5.25 -24% |
| Colorchecker dE 2000 max. * | 10.39 | 5.18 50% | 8.5 18% | 10.3 1% |
| Colorchecker dE 2000 calibrated * | 2.51 | |||
| Greyscale dE 2000 * | 3.11 | 3.41 -10% | 5.2 -67% | 4.64 -49% |
| Gamma | 2.36 93% | 2.05 107% | 2.28 96% | 2.39 92% |
| CCT | 6851 95% | 7077 92% | 6410 101% | 6600 98% |
| Color Space (Percent of AdobeRGB 1998) (%) | 54 | 77 43% | 66.9 24% | 54 0% |
| Color Space (Percent of sRGB) (%) | 83 | 100 20% | 91.8 11% | 83 0% |
| Média Total (Programa/Configurações) | 42% /
26% | 7% /
1% | -2% /
-6% |
* ... menor é melhor
Exibir tempos de resposta
| ↔ Tempo de resposta preto para branco | ||
|---|---|---|
| 32 ms ... ascensão ↗ e queda ↘ combinadas | ↗ 18 ms ascensão | 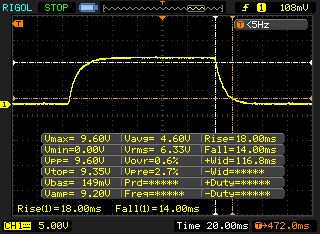 |
| ↘ 14 ms queda | ||
| A tela mostra taxas de resposta lentas em nossos testes e será insatisfatória para os jogadores. Em comparação, todos os dispositivos testados variam de 0.1 (mínimo) a 240 (máximo) ms. » 86 % de todos os dispositivos são melhores. Isso significa que o tempo de resposta medido é pior que a média de todos os dispositivos testados (19.8 ms). | ||
| ↔ Tempo de resposta 50% cinza a 80% cinza | ||
| 42.4 ms ... ascensão ↗ e queda ↘ combinadas | ↗ 20.4 ms ascensão | 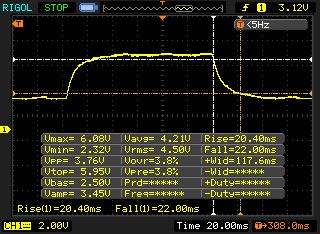 |
| ↘ 22 ms queda | ||
| A tela mostra taxas de resposta lentas em nossos testes e será insatisfatória para os jogadores. Em comparação, todos os dispositivos testados variam de 0.165 (mínimo) a 636 (máximo) ms. » 70 % de todos os dispositivos são melhores. Isso significa que o tempo de resposta medido é pior que a média de todos os dispositivos testados (31 ms). | ||
Cintilação da tela / PWM (modulação por largura de pulso)
| Tela tremeluzindo/PWM detectado | 20490 Hz | ≤ 99 % configuração de brilho | 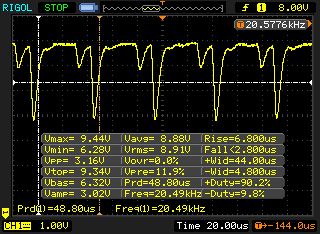 |
A luz de fundo da tela pisca em 20490 Hz (pior caso, por exemplo, utilizando PWM) Cintilação detectada em uma configuração de brilho de 99 % e abaixo. Não deve haver cintilação ou PWM acima desta configuração de brilho. A frequência de 20490 Hz é bastante alta, então a maioria dos usuários sensíveis ao PWM não deve notar nenhuma oscilação. [pwm_comparison] Em comparação: 52 % de todos os dispositivos testados não usam PWM para escurecer a tela. Se PWM foi detectado, uma média de 7757 (mínimo: 5 - máximo: 343500) Hz foi medida. | |||
| PCMark 8 Home Score Accelerated v2 | 4697 pontos | |
| PCMark 8 Work Score Accelerated v2 | 5653 pontos | |
| PCMark 10 Score | 5732 pontos | |
Ajuda | ||
| Schenker XMG Apex 15 Samsung SSD 960 Evo 250GB m.2 NVMe | MSI GE63VR 7RF Raider Toshiba HG6 THNSNJ256G8NY | HP Omen 15t-ce000 Samsung PM961 NVMe MZVLW128HEGR | Schenker XMG Core 15 Samsung SSD 960 Evo 250GB m.2 NVMe | Média Samsung SSD 960 Evo 250GB m.2 NVMe | |
|---|---|---|---|---|---|
| CrystalDiskMark 3.0 | -59% | -40% | -12% | -4% | |
| Read Seq (MB/s) | 1751 | 507 -71% | 1411 -19% | 1338 -24% | 1642 ? -6% |
| Write Seq (MB/s) | 1375 | 441.4 -68% | 749 -46% | 1188 -14% | 1408 ? 2% |
| Read 512 (MB/s) | 792 | 411.9 -48% | 503 -36% | 780 -2% | 880 ? 11% |
| Write 512 (MB/s) | 1007 | 409.9 -59% | 174 -83% | 1006 0% | 1065 ? 6% |
| Read 4k (MB/s) | 60 | 21.77 -64% | 46.09 -23% | 58.3 -3% | 54.2 ? -10% |
| Write 4k (MB/s) | 164.1 | 88.9 -46% | 130.7 -20% | 134 -18% | 141.9 ? -14% |
| Read 4k QD32 (MB/s) | 676 | 368.8 -45% | 518 -23% | 577 -15% | 617 ? -9% |
| Write 4k QD32 (MB/s) | 571 | 190.3 -67% | 173.9 -70% | 481.9 -16% | 511 ? -11% |

| 3DMark 11 Performance | 14618 pontos | |
| 3DMark Cloud Gate Standard Score | 36010 pontos | |
| 3DMark Fire Strike Score | 10794 pontos | |
Ajuda | ||
| The Witcher 3 | |
| 1920x1080 Ultra Graphics & Postprocessing (HBAO+) | |
| Média da turma Gaming (104.7 - 240, n=7, últimos 2 anos) | |
| MSI GE63VR 7RF Raider | |
| Schenker XMG Apex 15 | |
| Média NVIDIA GeForce GTX 1060 Mobile (24 - 42.3, n=60) | |
| Schenker XMG Core 15 | |
| HP Omen 15t-ce000 | |
| 1920x1080 High Graphics & Postprocessing (Nvidia HairWorks Off) | |
| Média da turma Gaming (341 - 404, n=2, últimos 2 anos) | |
| Schenker XMG Apex 15 | |
| Schenker XMG Core 15 | |
| HP Omen 15t-ce000 | |
| Média NVIDIA GeForce GTX 1060 Mobile (52.6 - 80.6, n=49) | |
| Rise of the Tomb Raider | |
| 1920x1080 Very High Preset AA:FX AF:16x | |
| MSI GE63VR 7RF Raider | |
| Schenker XMG Apex 15 | |
| Média NVIDIA GeForce GTX 1060 Mobile (51 - 68.8, n=37) | |
| Schenker XMG Core 15 | |
| HP Omen 15t-ce000 | |
| 1920x1080 High Preset AA:FX AF:4x | |
| MSI GE63VR 7RF Raider | |
| Schenker XMG Apex 15 | |
| Média NVIDIA GeForce GTX 1060 Mobile (65.3 - 82, n=24) | |
| Schenker XMG Core 15 | |
| HP Omen 15t-ce000 | |
| The Division | |
| 1920x1080 Ultra Preset AF:16x | |
| Schenker XMG Apex 15 | |
| Média NVIDIA GeForce GTX 1060 Mobile (37.8 - 57.4, n=7) | |
| 1920x1080 High Preset AF:8x | |
| Schenker XMG Apex 15 | |
| Média NVIDIA GeForce GTX 1060 Mobile (46.9 - 73.3, n=6) | |
| For Honor | |
| 1920x1080 Extreme Preset AA:T AF:16x | |
| MSI GE63VR 7RF Raider | |
| Schenker XMG Apex 15 | |
| Média NVIDIA GeForce GTX 1060 Mobile (42.4 - 78.9, n=8) | |
| 1920x1080 High Preset AA:T AF:8x | |
| MSI GE63VR 7RF Raider | |
| Schenker XMG Apex 15 | |
| Média NVIDIA GeForce GTX 1060 Mobile (56.3 - 103.2, n=7) | |
| Ghost Recon Wildlands | |
| 1920x1080 Ultra Preset AA:T AF:16x | |
| MSI GE63VR 7RF Raider | |
| Schenker XMG Apex 15 | |
| Média NVIDIA GeForce GTX 1060 Mobile (34.5 - 38.7, n=6) | |
| 1920x1080 High Preset AA:T AF:4x | |
| MSI GE63VR 7RF Raider | |
| Schenker XMG Apex 15 | |
| Média NVIDIA GeForce GTX 1060 Mobile (60.1 - 67.8, n=6) | |
| Assassin´s Creed Origins | |
| 1920x1080 Ultra High Preset | |
| Schenker XMG Apex 15 | |
| Média NVIDIA GeForce GTX 1060 Mobile (42 - 56, n=5) | |
| 1920x1080 High Preset | |
| Schenker XMG Apex 15 | |
| Média NVIDIA GeForce GTX 1060 Mobile (49 - 66, n=5) | |
| Final Fantasy XV Benchmark | |
| 1920x1080 High Quality | |
| Média da turma Gaming (41 - 215, n=95, últimos 2 anos) | |
| Schenker XMG Apex 15 | |
| Média NVIDIA GeForce GTX 1060 Mobile (37.2 - 47.3, n=5) | |
| 1920x1080 Standard Quality | |
| Média da turma Gaming (85.7 - 236, n=82, últimos 2 anos) | |
| Schenker XMG Apex 15 | |
| Média NVIDIA GeForce GTX 1060 Mobile (58.6 - 62.4, n=2) | |
| Far Cry 5 | |
| 1920x1080 Ultra Preset AA:T | |
| Média da turma Gaming (70 - 151, n=6, últimos 2 anos) | |
| Schenker XMG Apex 15 | |
| Média NVIDIA GeForce GTX 1060 Mobile (59 - 65, n=5) | |
| 1920x1080 High Preset AA:T | |
| Média da turma Gaming (82 - 163, n=6, últimos 2 anos) | |
| Schenker XMG Apex 15 | |
| Média NVIDIA GeForce GTX 1060 Mobile (62 - 69, n=5) | |
| baixo | média | alto | ultra | |
|---|---|---|---|---|
| The Witcher 3 (2015) | 77.6 | 41.9 | ||
| Rainbow Six Siege (2015) | 118 | |||
| Rise of the Tomb Raider (2016) | 76.1 | 67.9 | ||
| The Division (2016) | 72.8 | 56.7 | ||
| For Honor (2017) | 108.3 | 103.2 | 78.9 | |
| Ghost Recon Wildlands (2017) | 67.8 | 38.7 | ||
| Assassin´s Creed Origins (2017) | 74 | 66 | 56 | |
| Final Fantasy XV Benchmark (2018) | 62.4 | 47.3 | ||
| Far Cry 5 (2018) | 75 | 69 | 64 |
Barulho
| Ocioso |
| 32 / 33 / 38 dB |
| HDD |
| 33 dB |
| Carga |
| 47 / 52 dB |
 | ||
30 dB silencioso 40 dB(A) audível 50 dB(A) ruidosamente alto |
||
min: | ||
(-) A temperatura máxima no lado superior é 50 °C / 122 F, em comparação com a média de 40.4 °C / 105 F , variando de 21.2 a 68.8 °C para a classe Gaming.
(-) A parte inferior aquece até um máximo de 49 °C / 120 F, em comparação com a média de 43.2 °C / 110 F
(+) Em uso inativo, a temperatura média para o lado superior é 25.6 °C / 78 F, em comparação com a média do dispositivo de 33.9 °C / ### class_avg_f### F.
(-) Jogando The Witcher 3, a temperatura média para o lado superior é 42.7 °C / 109 F, em comparação com a média do dispositivo de 33.9 °C / ## #class_avg_f### F.
(-) Os apoios para as mãos e o touchpad podem ficar muito quentes ao toque, com um máximo de 43 °C / 109.4 F.
(-) A temperatura média da área do apoio para as mãos de dispositivos semelhantes foi 28.8 °C / 83.8 F (-14.2 °C / -25.6 F).
Schenker XMG Apex 15 análise de áudio
(±) | o volume do alto-falante é médio, mas bom (###valor### dB)
Graves 100 - 315Hz
(-) | quase nenhum baixo - em média 24.2% menor que a mediana
(±) | a linearidade dos graves é média (11.7% delta para a frequência anterior)
Médios 400 - 2.000 Hz
(±) | médios mais altos - em média 6.8% maior que a mediana
(±) | a linearidade dos médios é média (8.3% delta para frequência anterior)
Altos 2 - 16 kHz
(±) | máximos mais altos - em média 5.1% maior que a mediana
(+) | os máximos são lineares (4.1% delta da frequência anterior)
Geral 100 - 16.000 Hz
(±) | a linearidade do som geral é média (25.3% diferença em relação à mediana)
Comparado com a mesma classe
» 90% de todos os dispositivos testados nesta classe foram melhores, 2% semelhantes, 7% piores
» O melhor teve um delta de 6%, a média foi 18%, o pior foi 132%
Comparado com todos os dispositivos testados
» 78% de todos os dispositivos testados foram melhores, 5% semelhantes, 18% piores
» O melhor teve um delta de 4%, a média foi 23%, o pior foi 134%
MSI GE63VR 7RF Raider análise de áudio
(+) | os alto-falantes podem tocar relativamente alto (###valor### dB)
Graves 100 - 315Hz
(±) | graves reduzidos - em média 6.6% menor que a mediana
(±) | a linearidade dos graves é média (8.2% delta para a frequência anterior)
Médios 400 - 2.000 Hz
(+) | médios equilibrados - apenas 4.1% longe da mediana
(+) | médios são lineares (4.7% delta para frequência anterior)
Altos 2 - 16 kHz
(+) | agudos equilibrados - apenas 2.6% longe da mediana
(+) | os máximos são lineares (4.6% delta da frequência anterior)
Geral 100 - 16.000 Hz
(+) | o som geral é linear (9.9% diferença em relação à mediana)
Comparado com a mesma classe
» 5% de todos os dispositivos testados nesta classe foram melhores, 2% semelhantes, 94% piores
» O melhor teve um delta de 6%, a média foi 18%, o pior foi 132%
Comparado com todos os dispositivos testados
» 4% de todos os dispositivos testados foram melhores, 1% semelhantes, 95% piores
» O melhor teve um delta de 4%, a média foi 23%, o pior foi 134%
HP Omen 15t-ce000 análise de áudio
(-) | alto-falantes não muito altos (###valor### dB)
Graves 100 - 315Hz
(±) | graves reduzidos - em média 13.8% menor que a mediana
(-) | graves não são lineares (15.7% delta para frequência anterior)
Médios 400 - 2.000 Hz
(+) | médios equilibrados - apenas 3.3% longe da mediana
(±) | a linearidade dos médios é média (10.4% delta para frequência anterior)
Altos 2 - 16 kHz
(+) | agudos equilibrados - apenas 3.8% longe da mediana
(±) | a linearidade dos máximos é média (7.2% delta para frequência anterior)
Geral 100 - 16.000 Hz
(±) | a linearidade do som geral é média (21.7% diferença em relação à mediana)
Comparado com a mesma classe
» 78% de todos os dispositivos testados nesta classe foram melhores, 5% semelhantes, 17% piores
» O melhor teve um delta de 6%, a média foi 18%, o pior foi 132%
Comparado com todos os dispositivos testados
» 62% de todos os dispositivos testados foram melhores, 7% semelhantes, 31% piores
» O melhor teve um delta de 4%, a média foi 23%, o pior foi 134%
Schenker XMG Core 15 análise de áudio
(±) | o volume do alto-falante é médio, mas bom (###valor### dB)
Graves 100 - 315Hz
(±) | graves reduzidos - em média 8% menor que a mediana
(±) | a linearidade dos graves é média (11.7% delta para a frequência anterior)
Médios 400 - 2.000 Hz
(±) | médios mais altos - em média 10.1% maior que a mediana
(±) | a linearidade dos médios é média (13.2% delta para frequência anterior)
Altos 2 - 16 kHz
(+) | agudos equilibrados - apenas 1.9% longe da mediana
(±) | a linearidade dos máximos é média (7.5% delta para frequência anterior)
Geral 100 - 16.000 Hz
(±) | a linearidade do som geral é média (23.6% diferença em relação à mediana)
Comparado com a mesma classe
» 86% de todos os dispositivos testados nesta classe foram melhores, 4% semelhantes, 10% piores
» O melhor teve um delta de 6%, a média foi 18%, o pior foi 132%
Comparado com todos os dispositivos testados
» 71% de todos os dispositivos testados foram melhores, 6% semelhantes, 23% piores
» O melhor teve um delta de 4%, a média foi 23%, o pior foi 134%
| desligado | |
| Ocioso | |
| Carga |
|
Key:
min: | |
| Schenker XMG Apex 15 i7-8700, GeForce GTX 1060 Mobile | MSI GE63VR 7RF Raider i7-7700HQ, GeForce GTX 1070 Mobile | HP Omen 15t-ce000 i7-7700HQ, GeForce GTX 1060 Max-Q | Schenker XMG Core 15 i7-7700HQ, GeForce GTX 1060 Mobile | Média da turma Gaming | |
|---|---|---|---|---|---|
| Power Consumption | -38% | -38% | -57% | -61% | |
| Idle Minimum * (Watt) | 7 | 11 -57% | 15.4 -120% | 18 -157% | 13 ? -86% |
| Idle Average * (Watt) | 10 | 16 -60% | 22.4 -124% | 22 -120% | 19 ? -90% |
| Idle Maximum * (Watt) | 14 | 21 -50% | 22.4 -60% | 26 -86% | 24.6 ? -76% |
| Load Average * (Watt) | 114 | 92 19% | 78.1 31% | 93 18% | 110.7 ? 3% |
| Witcher 3 ultra * (Watt) | 131 | 185 -41% | 97.5 26% | 119 9% | |
| Load Maximum * (Watt) | 164 | 224 -37% | 133.52 19% | 175 -7% | 259 ? -58% |
* ... menor é melhor
| Schenker XMG Apex 15 i7-8700, GeForce GTX 1060 Mobile, 62 Wh | MSI GE63VR 7RF Raider i7-7700HQ, GeForce GTX 1070 Mobile, 51 Wh | HP Omen 15t-ce000 i7-7700HQ, GeForce GTX 1060 Max-Q, 70 Wh | Schenker XMG Core 15 i7-7700HQ, GeForce GTX 1060 Mobile, 82 Wh | Média da turma Gaming | |
|---|---|---|---|---|---|
| Duração da bateria | -48% | -36% | -29% | 15% | |
| Reader / Idle (h) | 9.6 | 5.4 -44% | 5 -48% | 5 -48% | 8.27 ? -14% |
| H.264 (h) | 5.1 | 3.9 -24% | 8.32 ? 63% | ||
| WiFi v1.3 (h) | 5.6 | 3.4 -39% | 3.5 -37% | 4.7 -16% | 7.11 ? 27% |
| Load (h) | 1.8 | 0.7 -61% | 1.4 -22% | 1.3 -28% | 1.502 ? -17% |
Pro
Contra
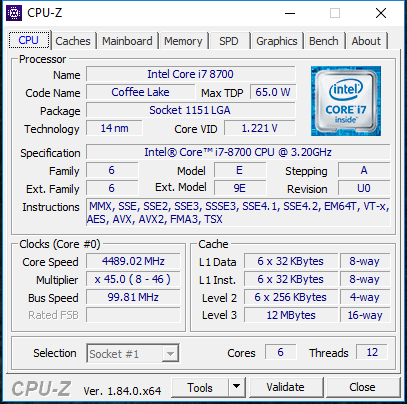
Concedido, o CPU Core i7-8700 da Schenker XMG Apex 15 é demais quando se olha exclusivamente para os requisitos de jogos. No entanto, isso não necessariamente tem que ser uma coisa ruim, dado que as desvantagens usuais, como maior consumo de energia e um ruído de sistema mais pronunciado, estavam suspeitosamente ausentes neste caso.
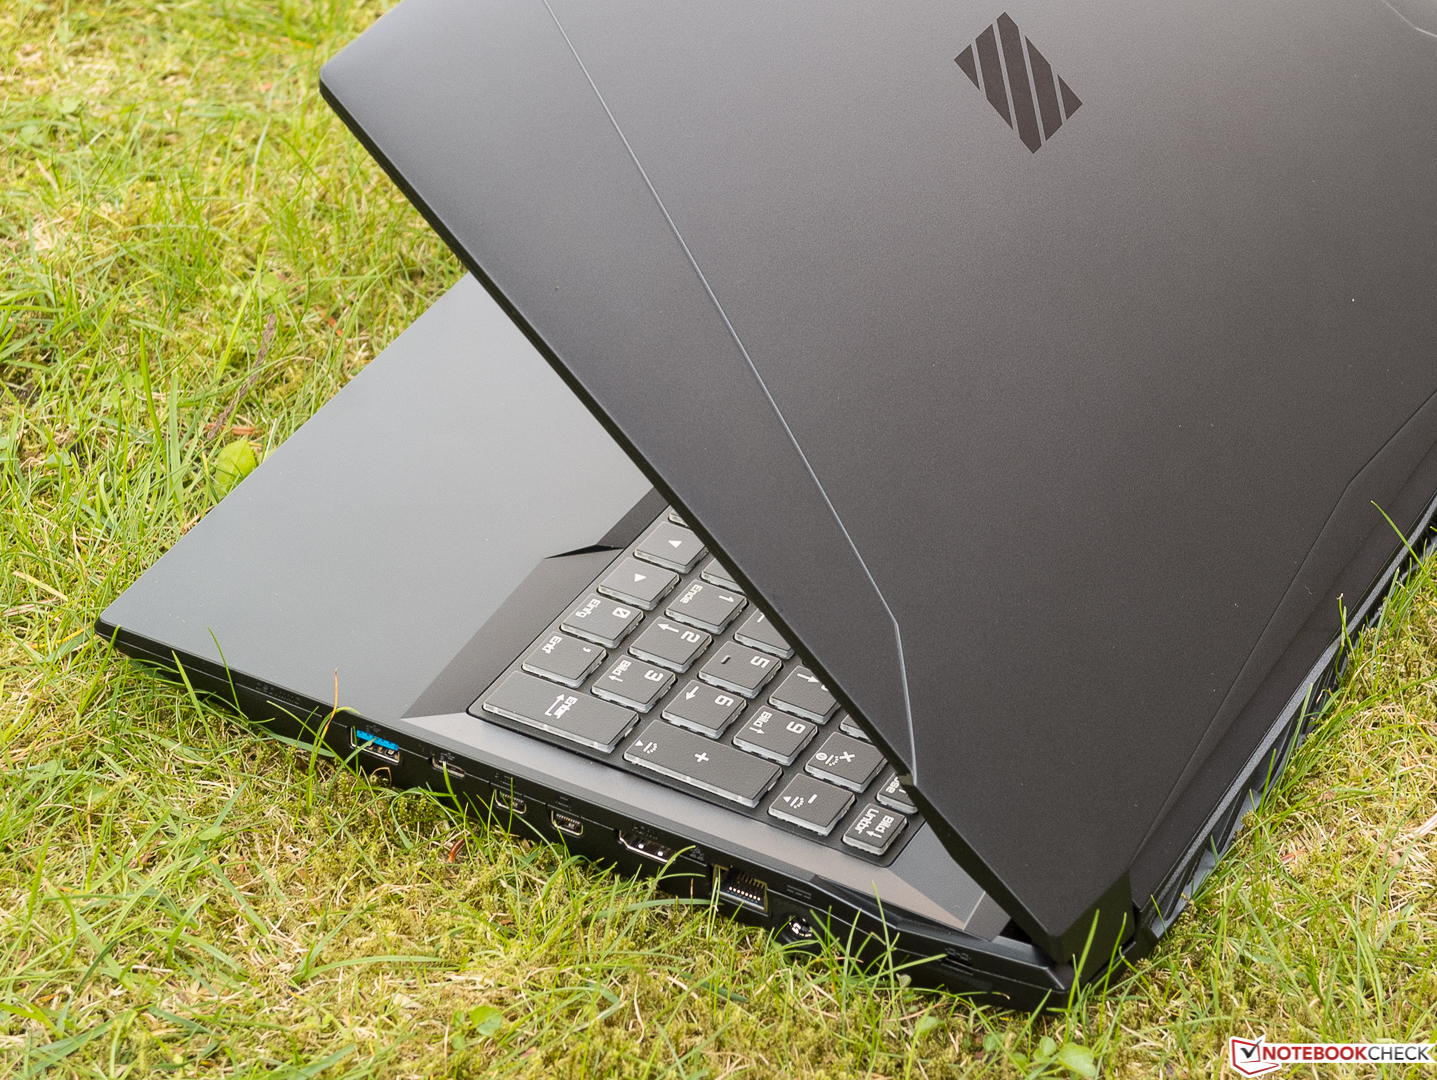
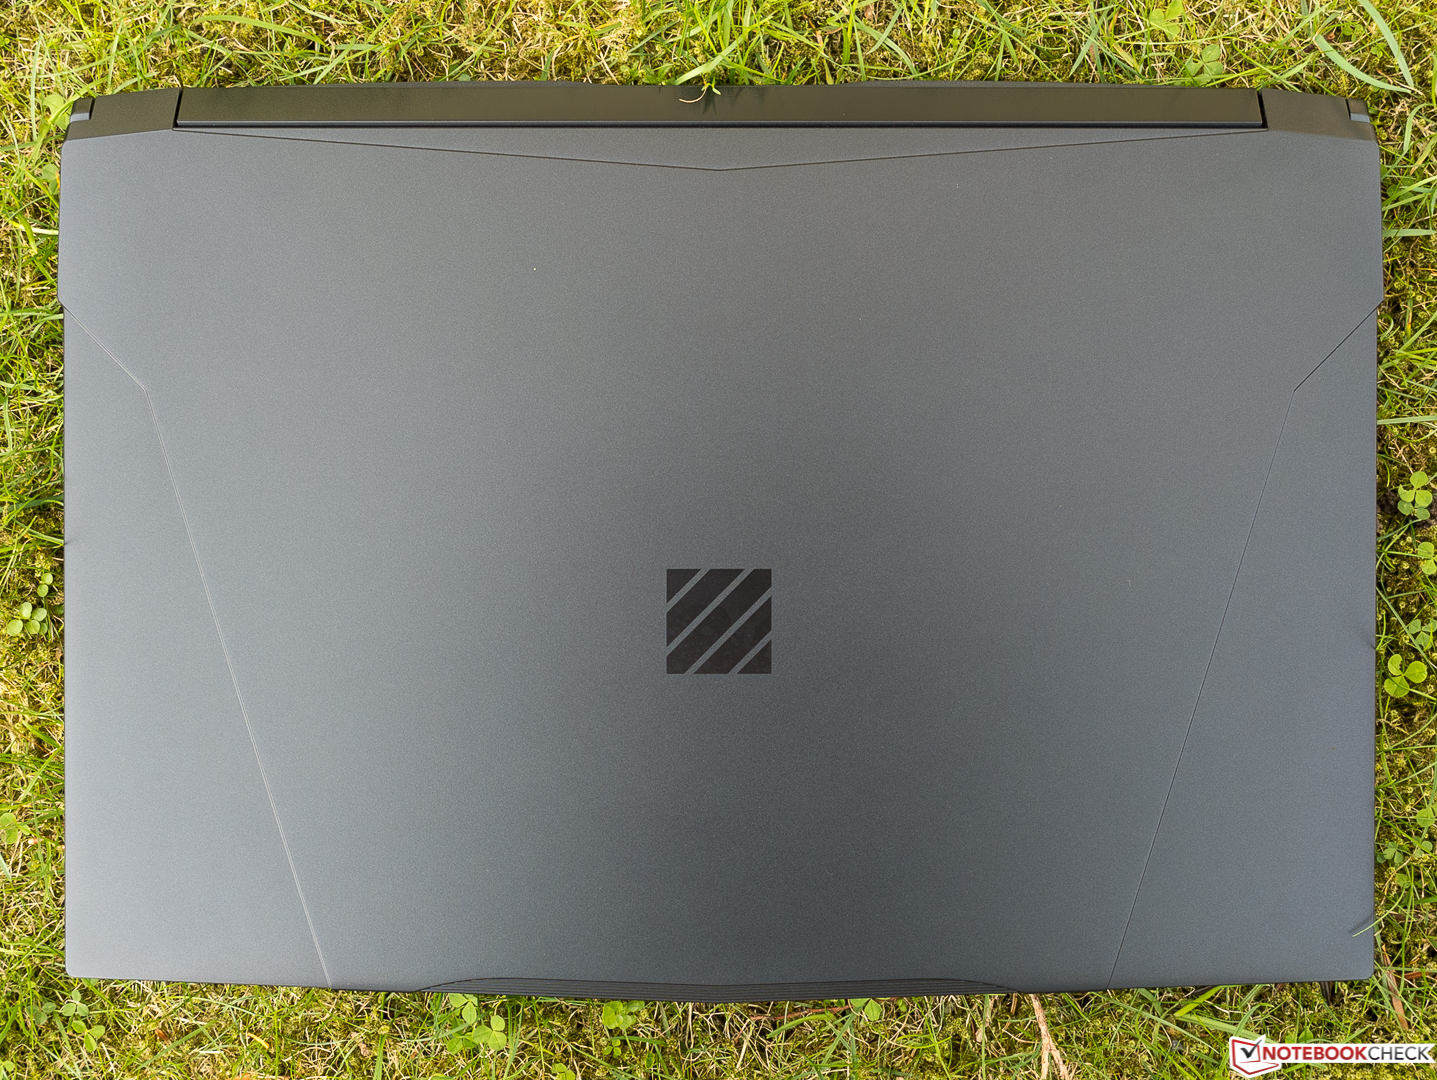
Tudo considerado o Apex 15 é um portátil divertido. Se não fosse pelo design da tampa ruim.
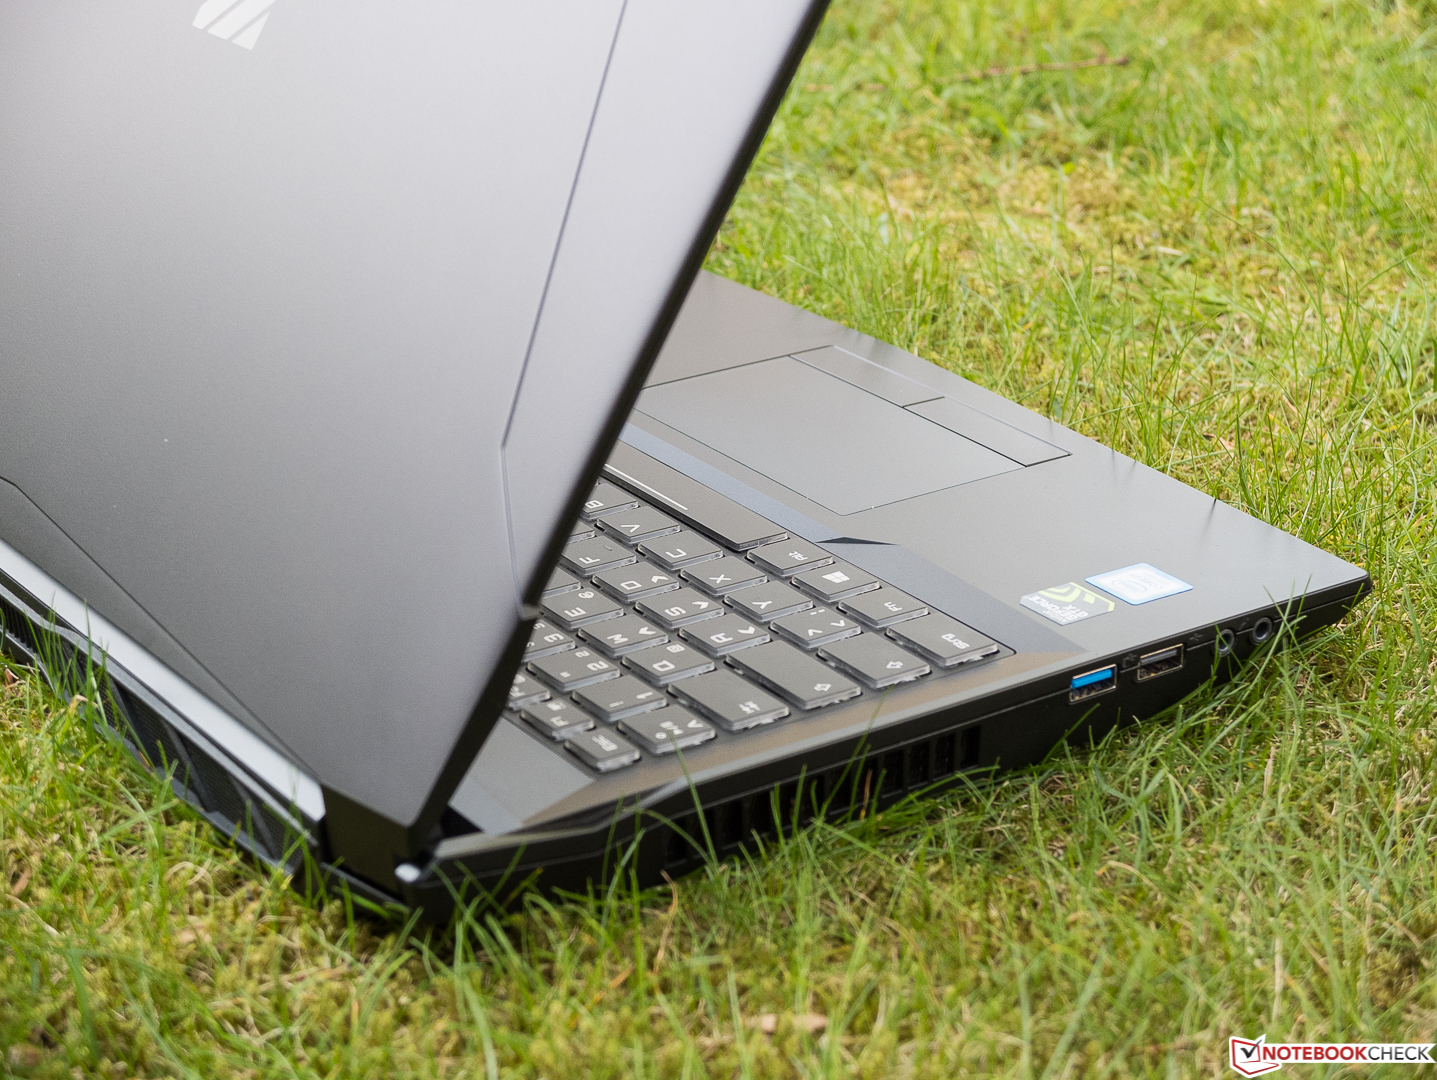
A um preço aproximado de 1.700 Euros, você obtém um sólido portátil para jogos sem extras, como G-Sync ou Thunderbolt 3. Se você não espera ir além da FHD em um futuro próximo, a GTX 1060 vai durar mais alguns anos, especialmente considerando que o Apex 15 apresenta uma das implementações mais rápidas da GTX 1060 disponíveis atualmente.
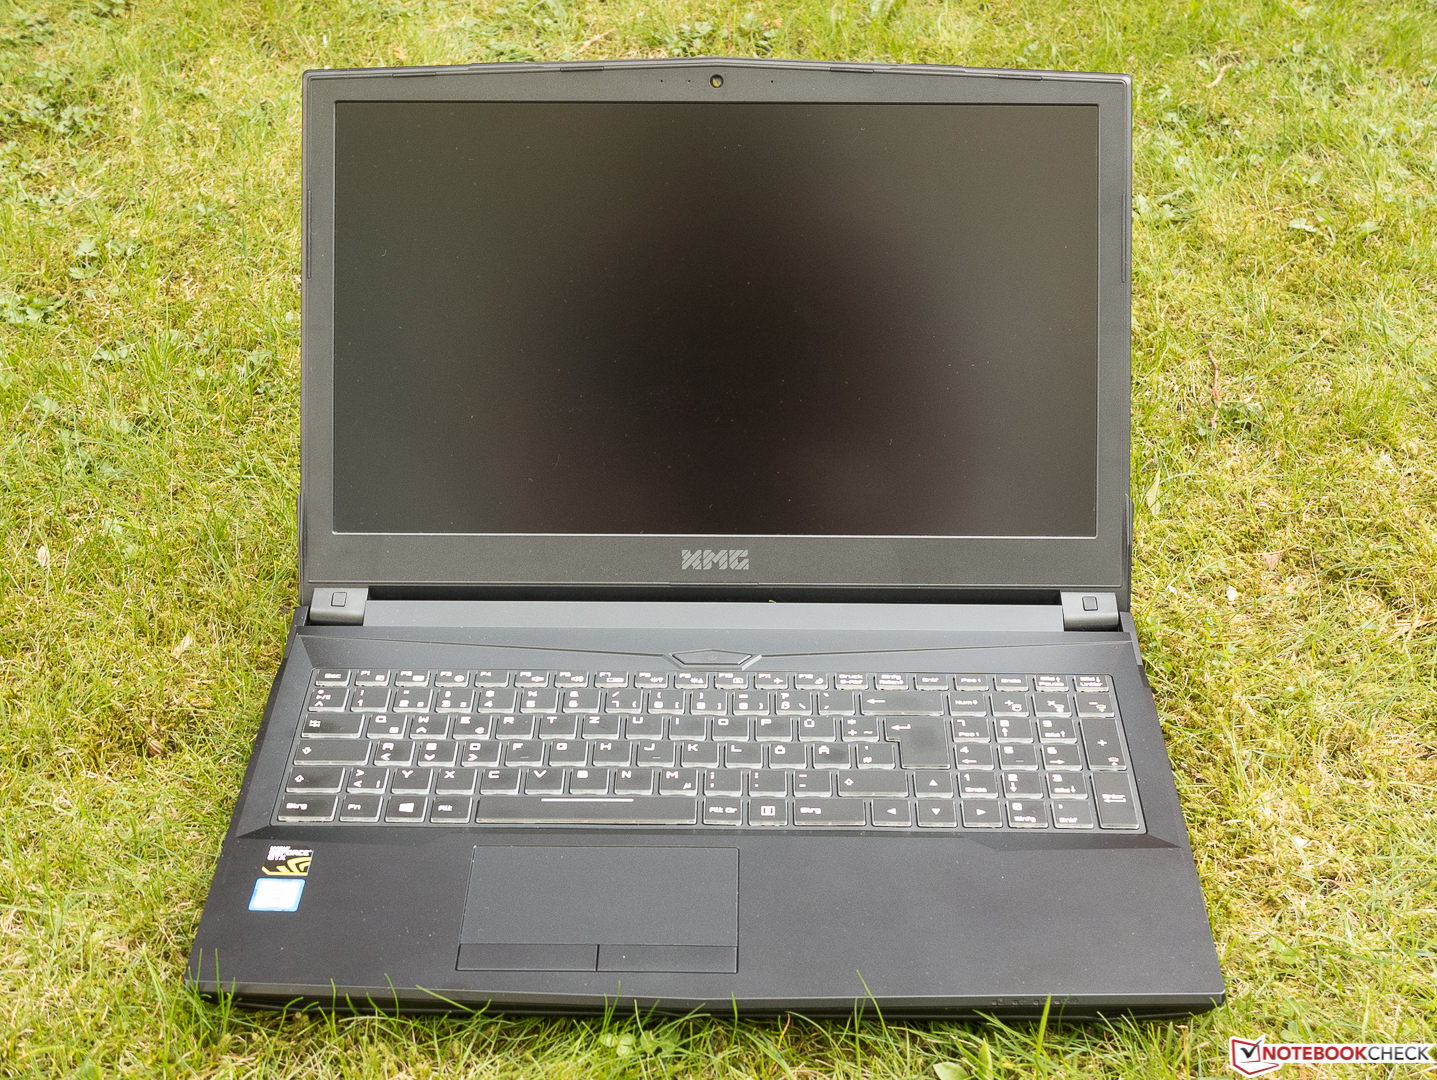
Sua conectividade diferencia o portátil de muitos de seus concorrentes e suas opções de manutenção são quase ideais. É verdade que a tela não possui recursos de jogos dedicados aos quais nos acostumamos. No entanto, faz um bom trabalho. A CPU rápida é acompanhada por um SSD muito rápido, e o baixo consumo de energia do portátil resulta em uma longa duração da bateria. A maioria das desvantagens circula ao redor da tela ou, mais especificamente, o design da tampa da tela. Enquanto nós simplesmente não podemos entender quais escolhas levaram a este projeto pobre, o dispositivo ainda merece nosso endosso total. Se você precisa de ainda mais potência 3D, vale a pena dar uma olhada no portátil MSI alimentado pela GTX 1070. No entanto, tome cuidado com o painel TN deste portátil.
Schenker XMG Apex 15
- 04/28/2018 v6 (old)
Sven Kloevekorn
Price comparison
