Revisão do laptop Alienware x17 R1 RTX 3080: Um novo começo

A série de laptops Alienware de 17,3 polegadas teve uma avalanche de mudanças nestes últimos anos. A Dell introduziu um novo chassi Alienware m17 R1 em 2019 apenas para substituí-lo por um chassi m17 R2 totalmente redesenhado apenas um ano depois, em 2020. Para 2021, o fabricante introduziu mais uma remodelação completa do chassi para substituir totalmente a série m17 chamada Alienware x17
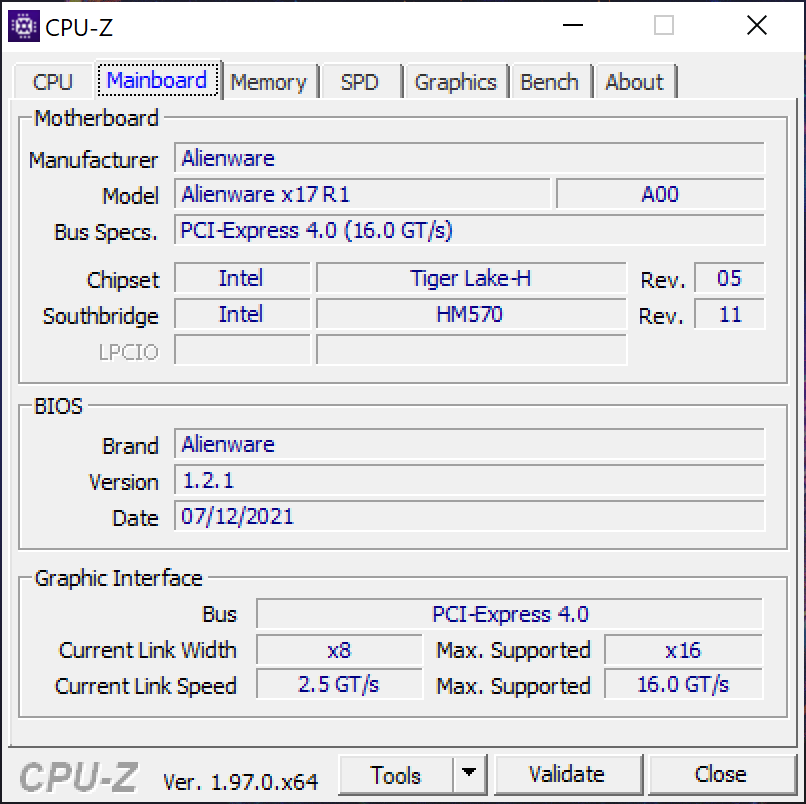
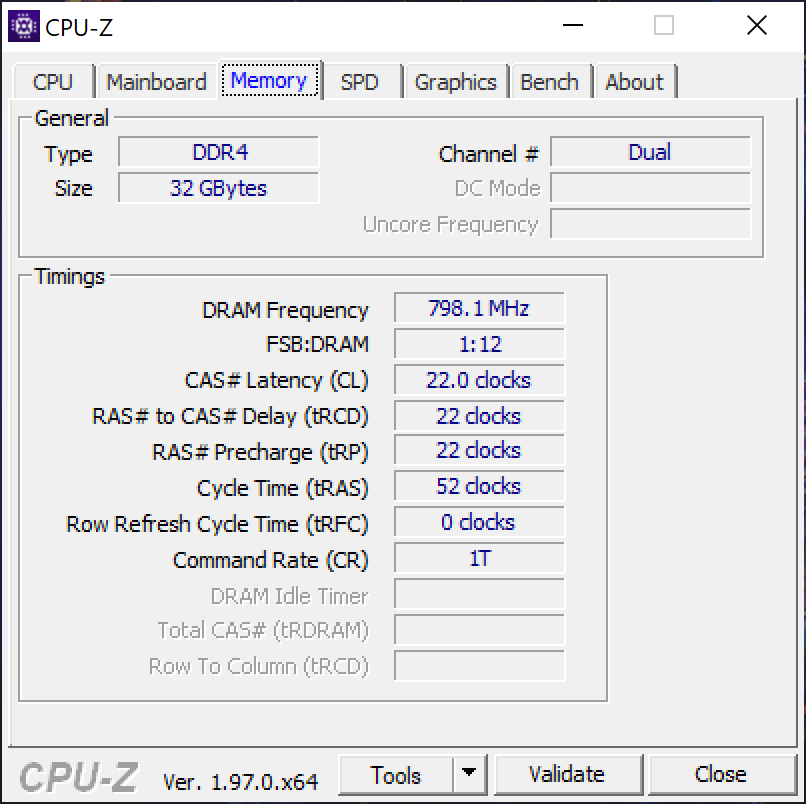
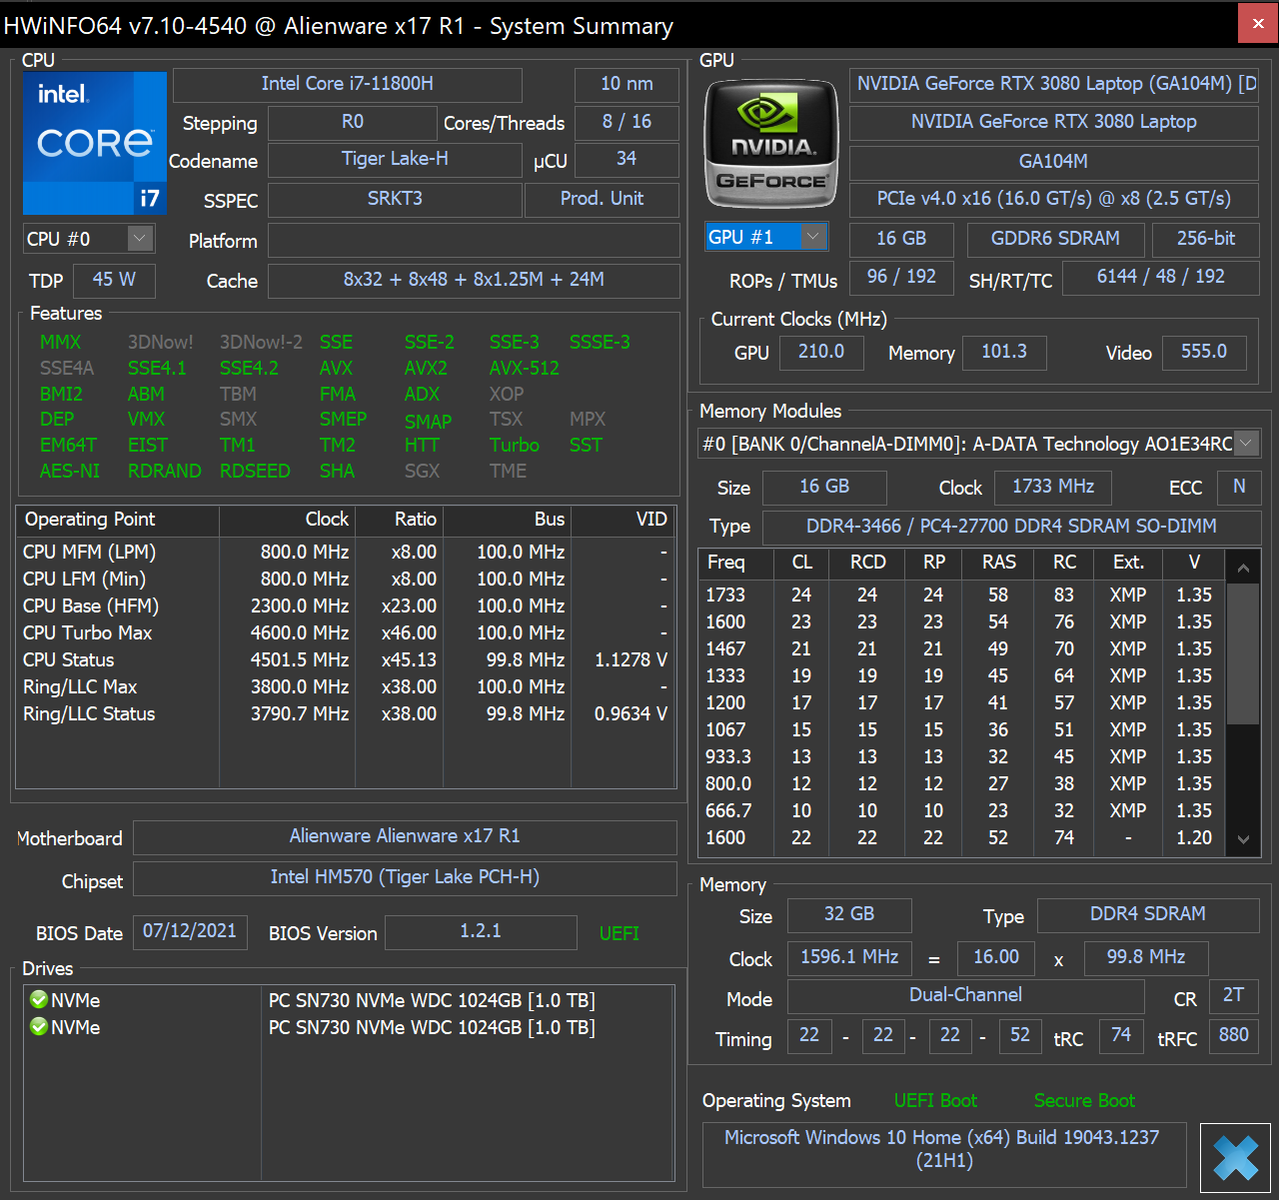
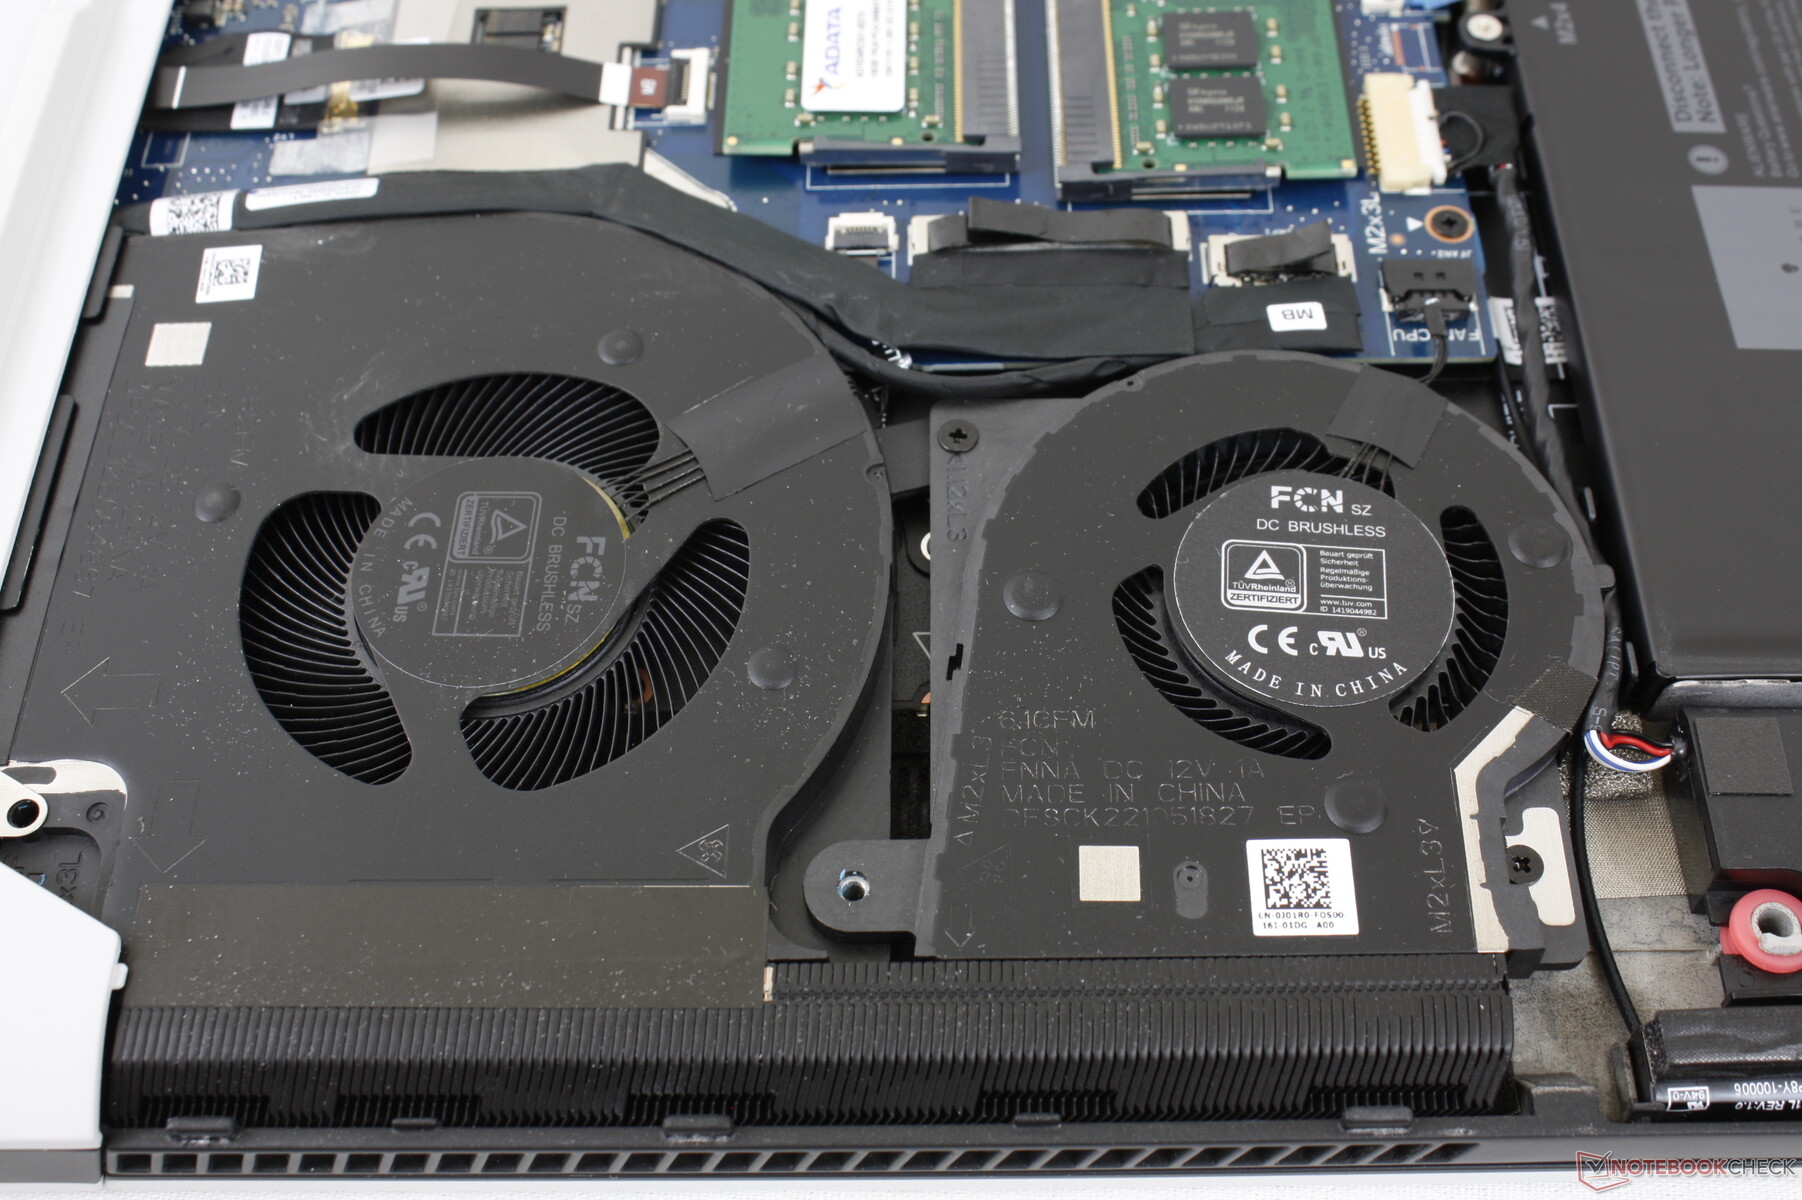
Nossa unidade de teste é uma configuração superior equipada com a CPU Core i7-11800H, GeForce RTX 3080 GPU, 120 Hz 4K UHD display, chaves mecânicas CherryMX e 32 GB de RAM por aproximadamente US$3200. Opções menores e maiores estão disponíveis com o RTX 3060 ou Núcleo i9-11980HKrespectivamente. Talvez a característica mais importante do novo chassi seja sua solução de resfriamento redesenhada que inclui mais ventiladores do que antes e uma nova pasta térmica à base de gálio-silício sobre a CPU. Uma versão de 15,6 polegadas também está disponível chamada de Alienware x15 R1
Os concorrentes ao Alienware x17 R1 incluem outros laptops ultra-finos de 17,3 polegadas como o MSI GS76, Lâmina Razer 17,Asus ROG Zephyrus S17e a base de TongfangMaingear Vector Pro.
Mais análises da Dell:
potential competitors in comparison
Avaliação | Data | Modelo | Peso | Altura | Size | Resolução | Preço |
|---|---|---|---|---|---|---|---|
| 89 % v7 (old) | 09/2021 | Alienware x17 RTX 3080 P48E i7-11800H, GeForce RTX 3080 Laptop GPU | 3.2 kg | 21.4 mm | 17.30" | 3840x2160 | |
| 85.3 % v7 (old) | 04/2021 | Alienware m17 R4 i9-10980HK, GeForce RTX 3080 Laptop GPU | 3 kg | 22 mm | 17.30" | 1920x1080 | |
| 89.4 % v7 (old) | 09/2021 | Razer Blade 17 RTX 3070 i7-11800H, GeForce RTX 3070 Laptop GPU | 2.8 kg | 19.9 mm | 17.30" | 1920x1080 | |
| 90.1 % v7 (old) | 07/2021 | Asus ROG Zephyrus S17 GX703HSD i9-11900H, GeForce RTX 3080 Laptop GPU | 2.8 kg | 19.9 mm | 17.30" | 2560x1440 | |
| 86.2 % v7 (old) | 09/2021 | MSI GS76 Stealth 11UH i9-11900H, GeForce RTX 3080 Laptop GPU | 2.4 kg | 20 mm | 17.30" | 3840x2160 | |
| 88 % v7 (old) | 05/2021 | Gigabyte Aero 17 HDR YD i9-11980HK, GeForce RTX 3080 Laptop GPU | 2.8 kg | 22 mm | 17.30" | 3840x2160 |
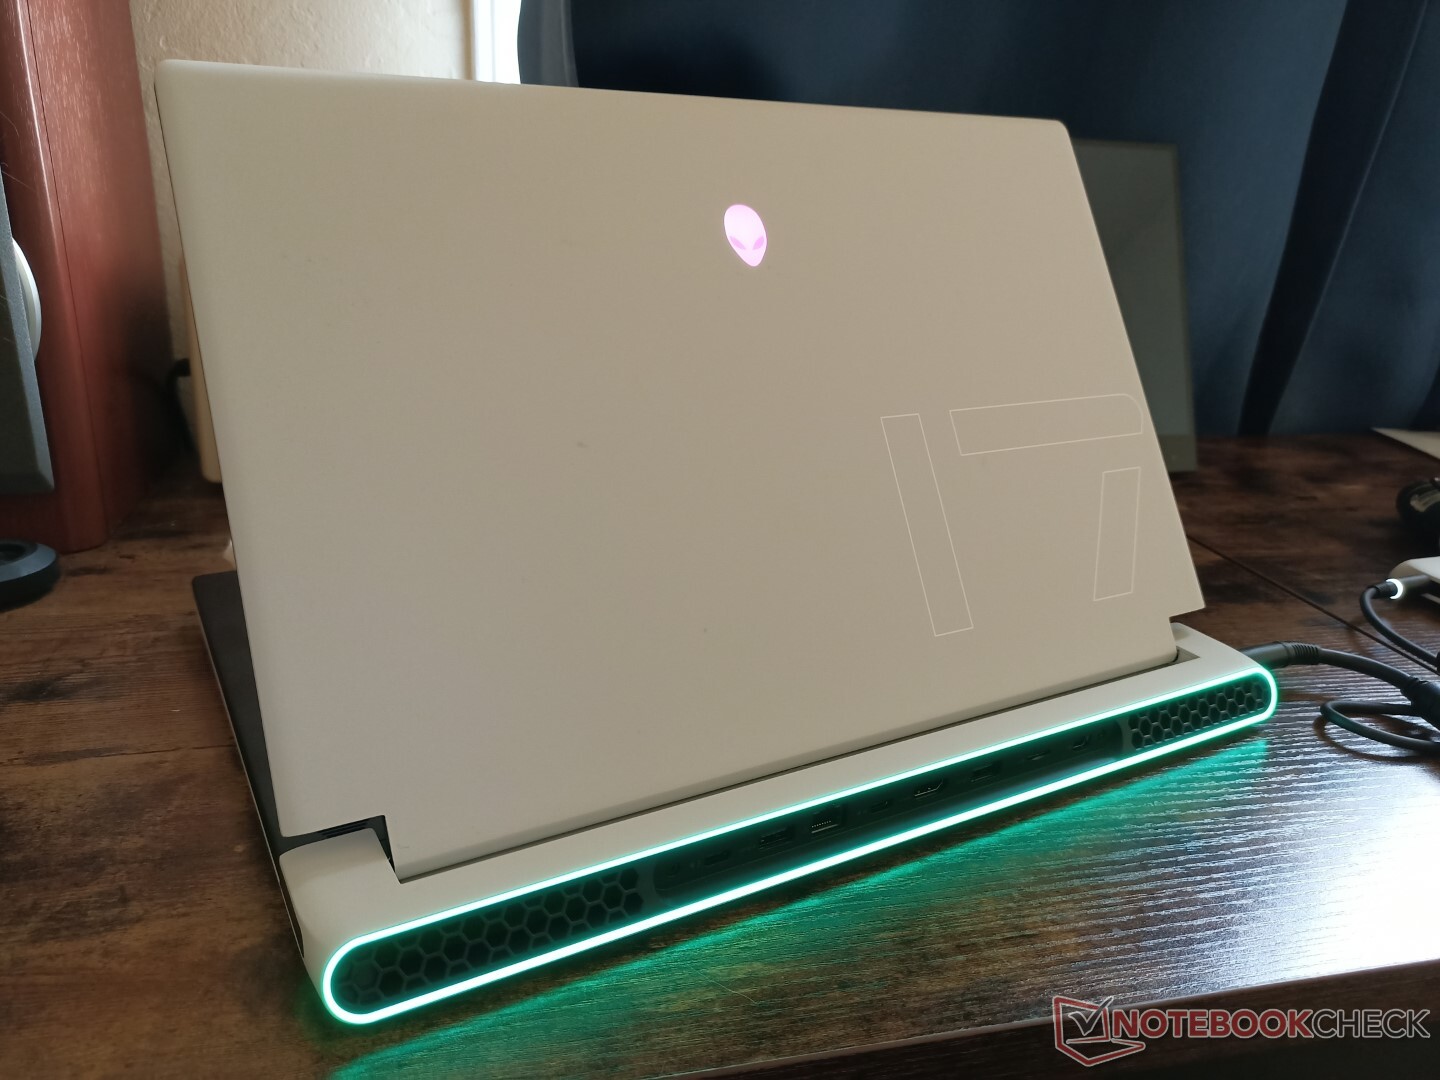
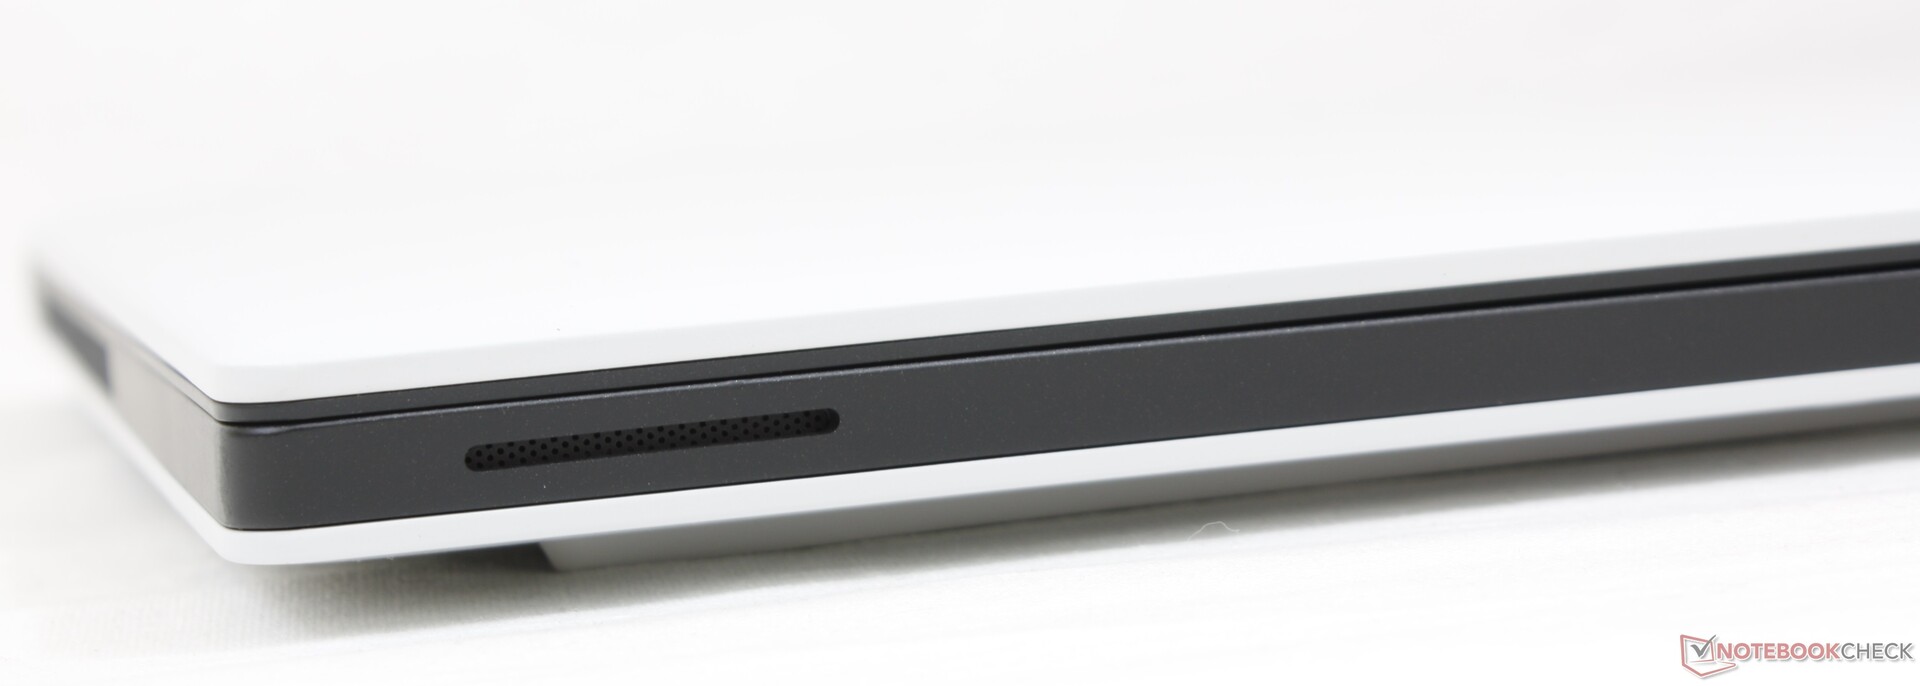
Caso - Legenda Renascer
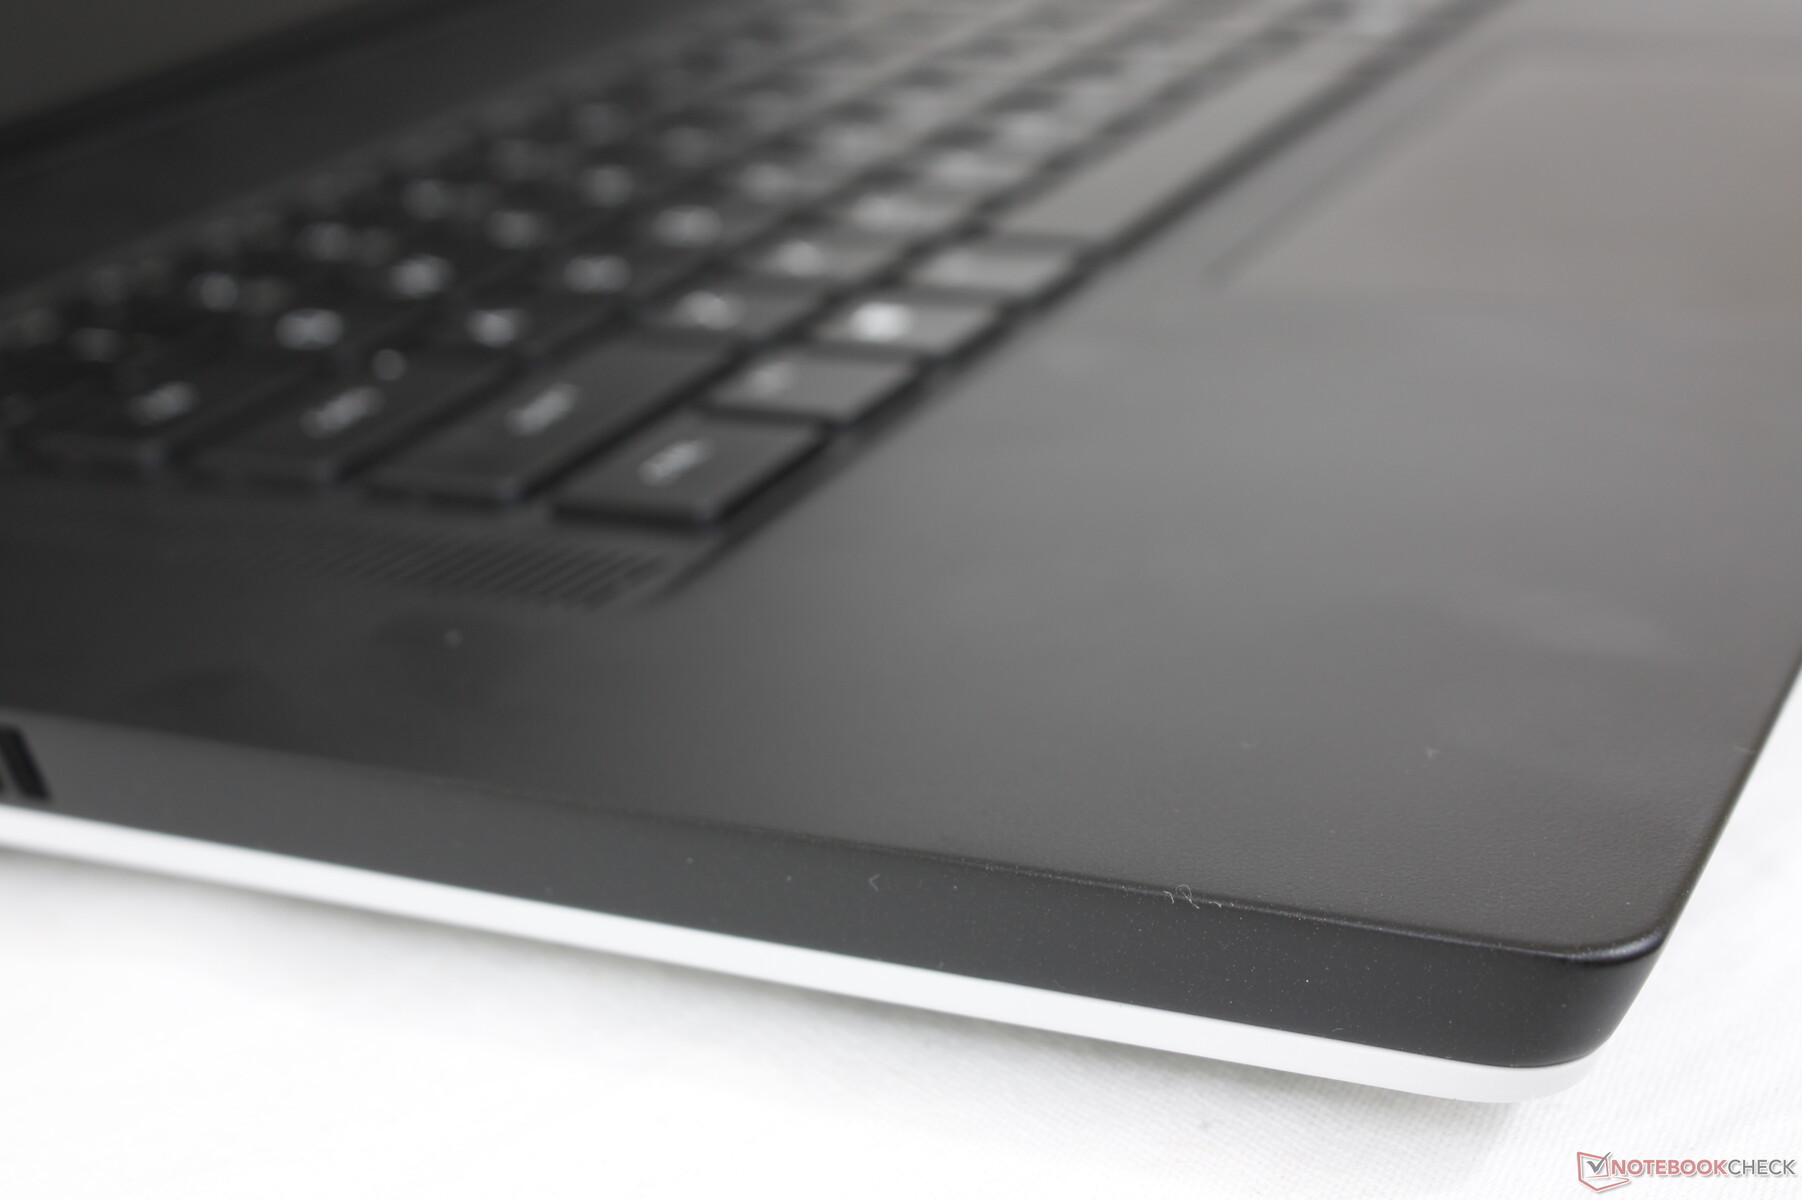
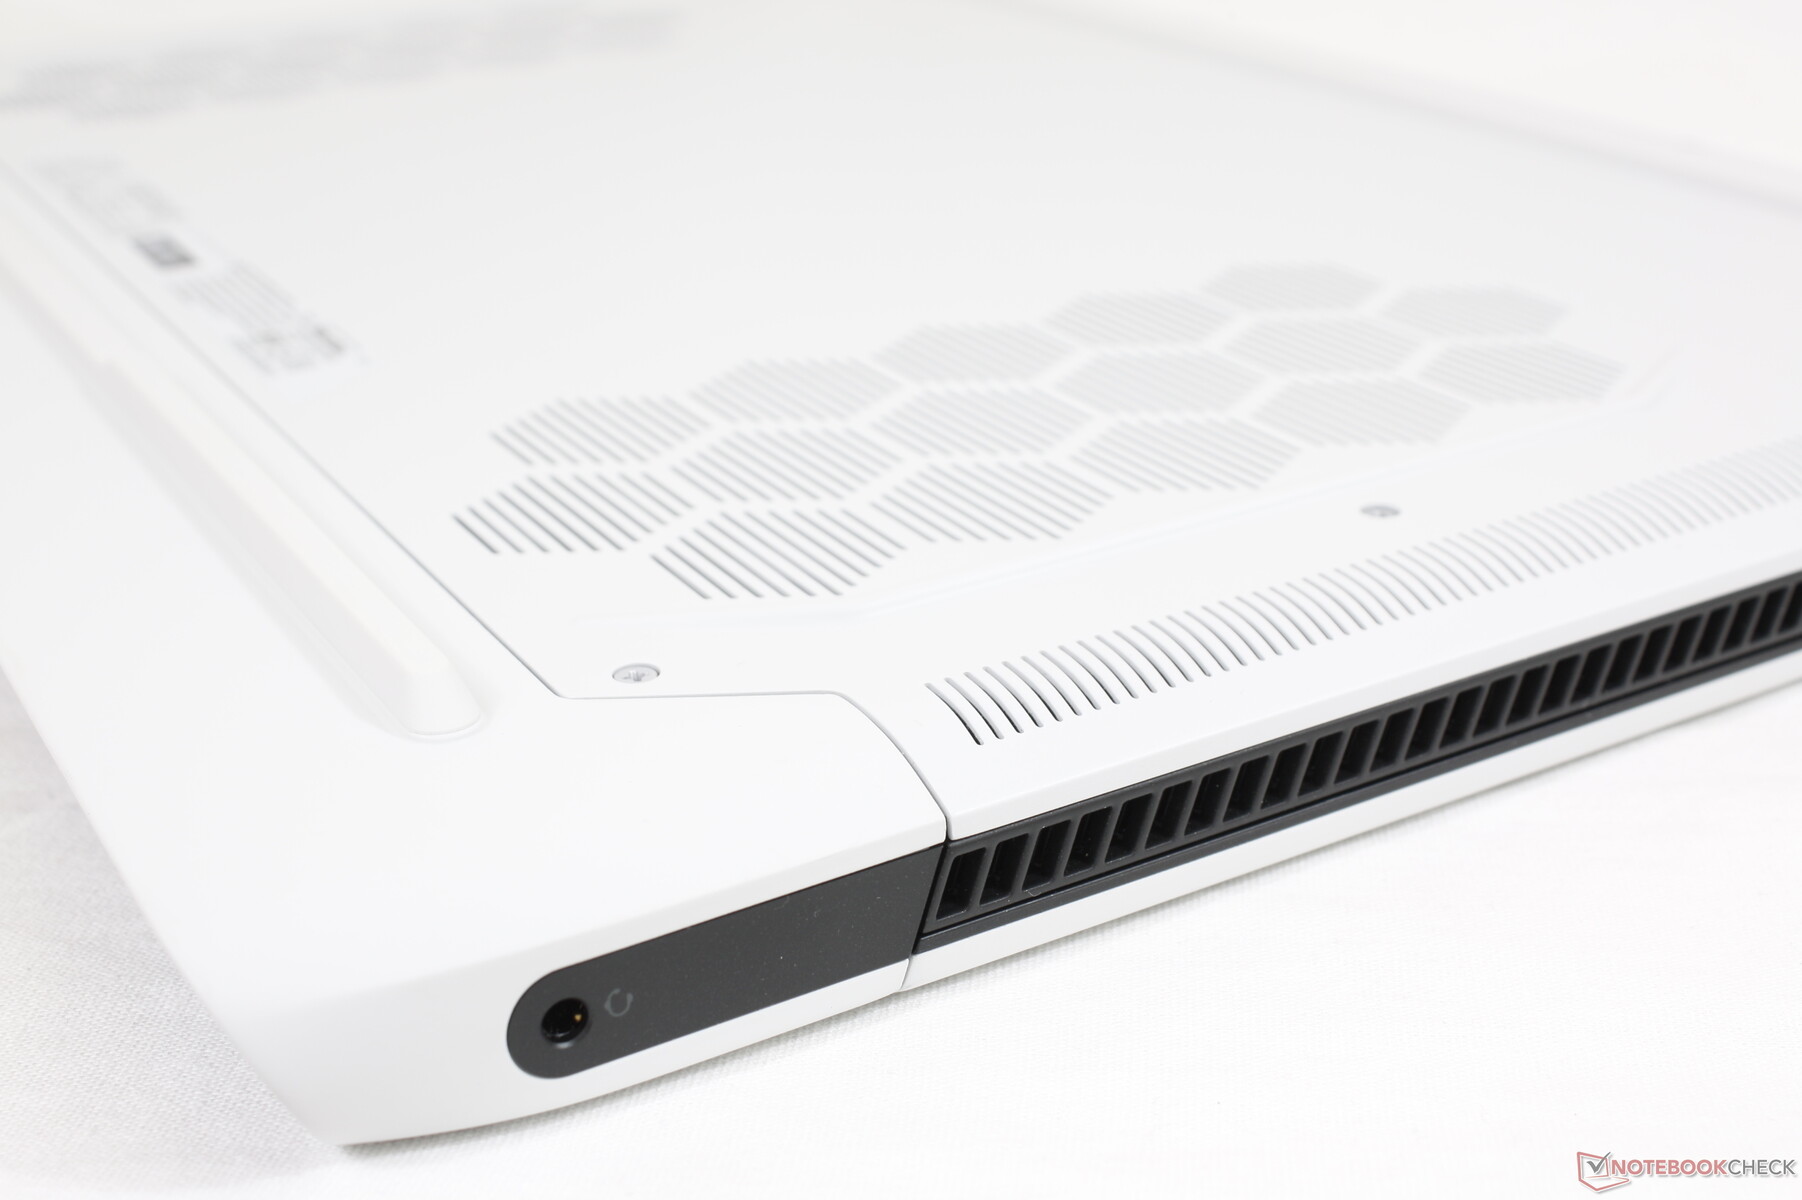
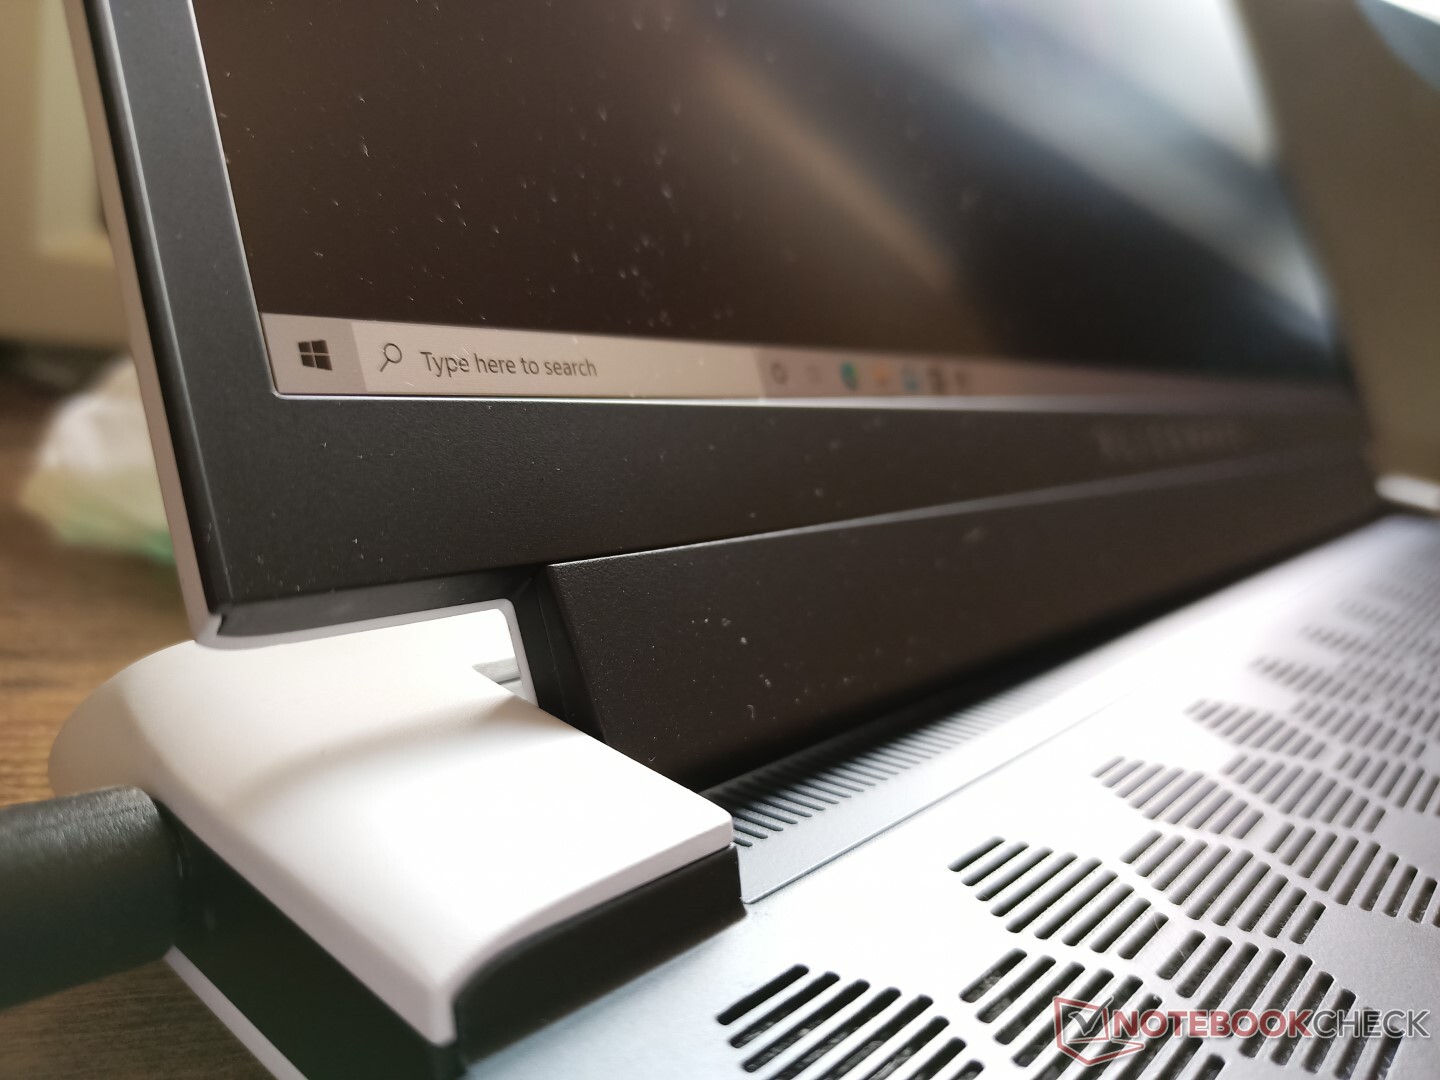
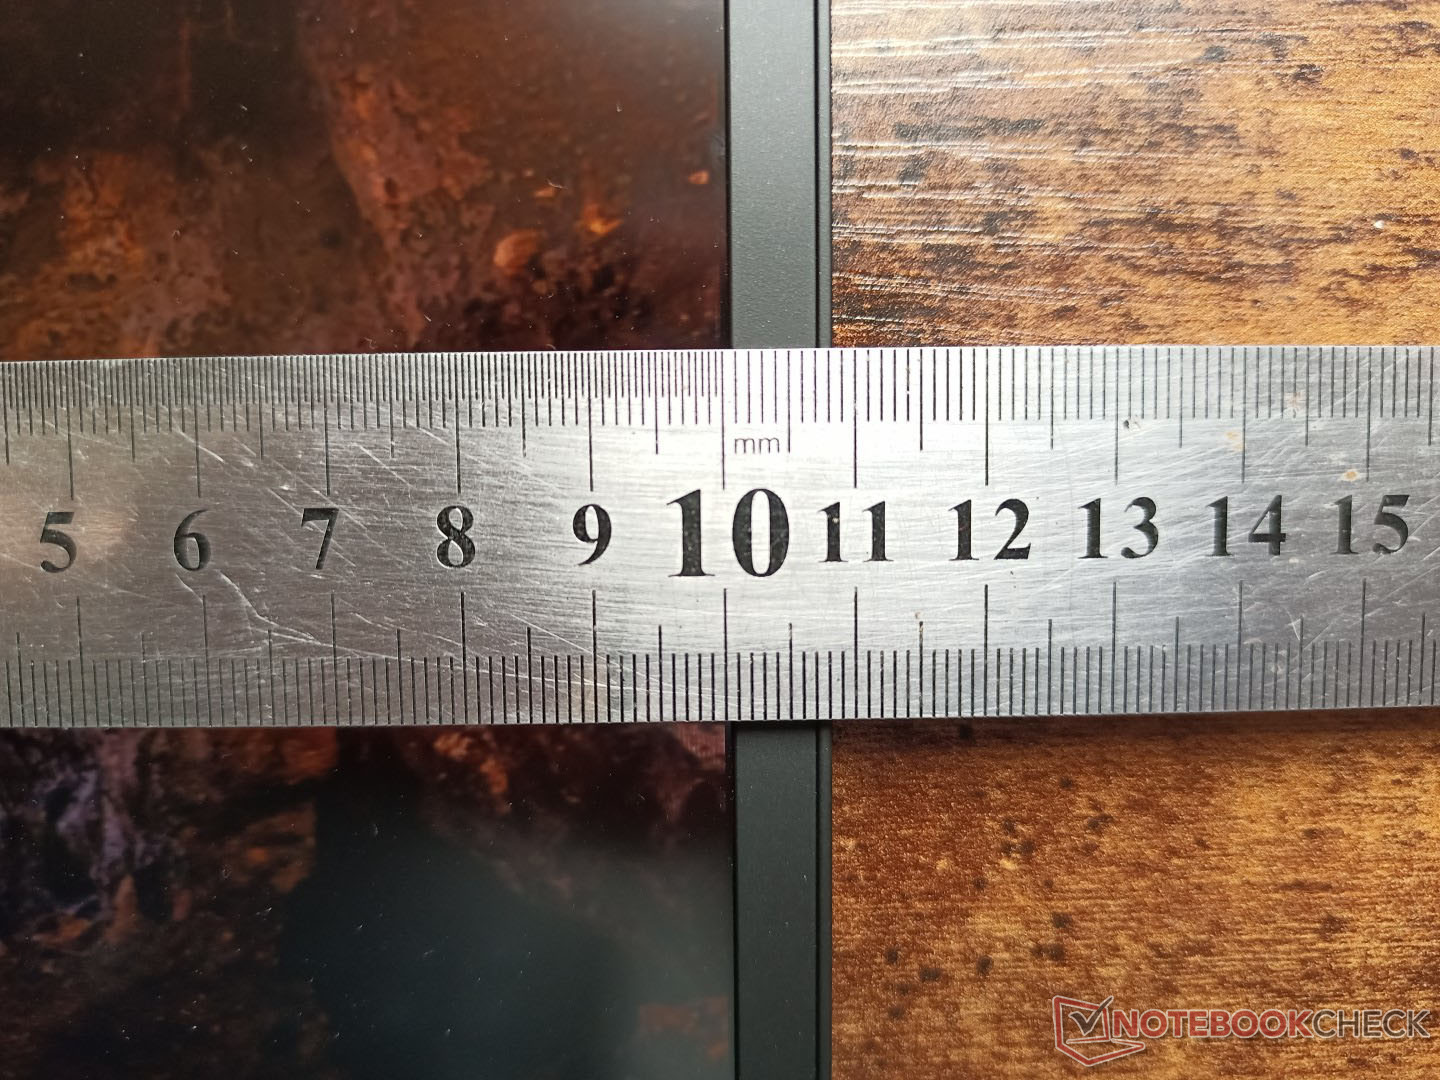
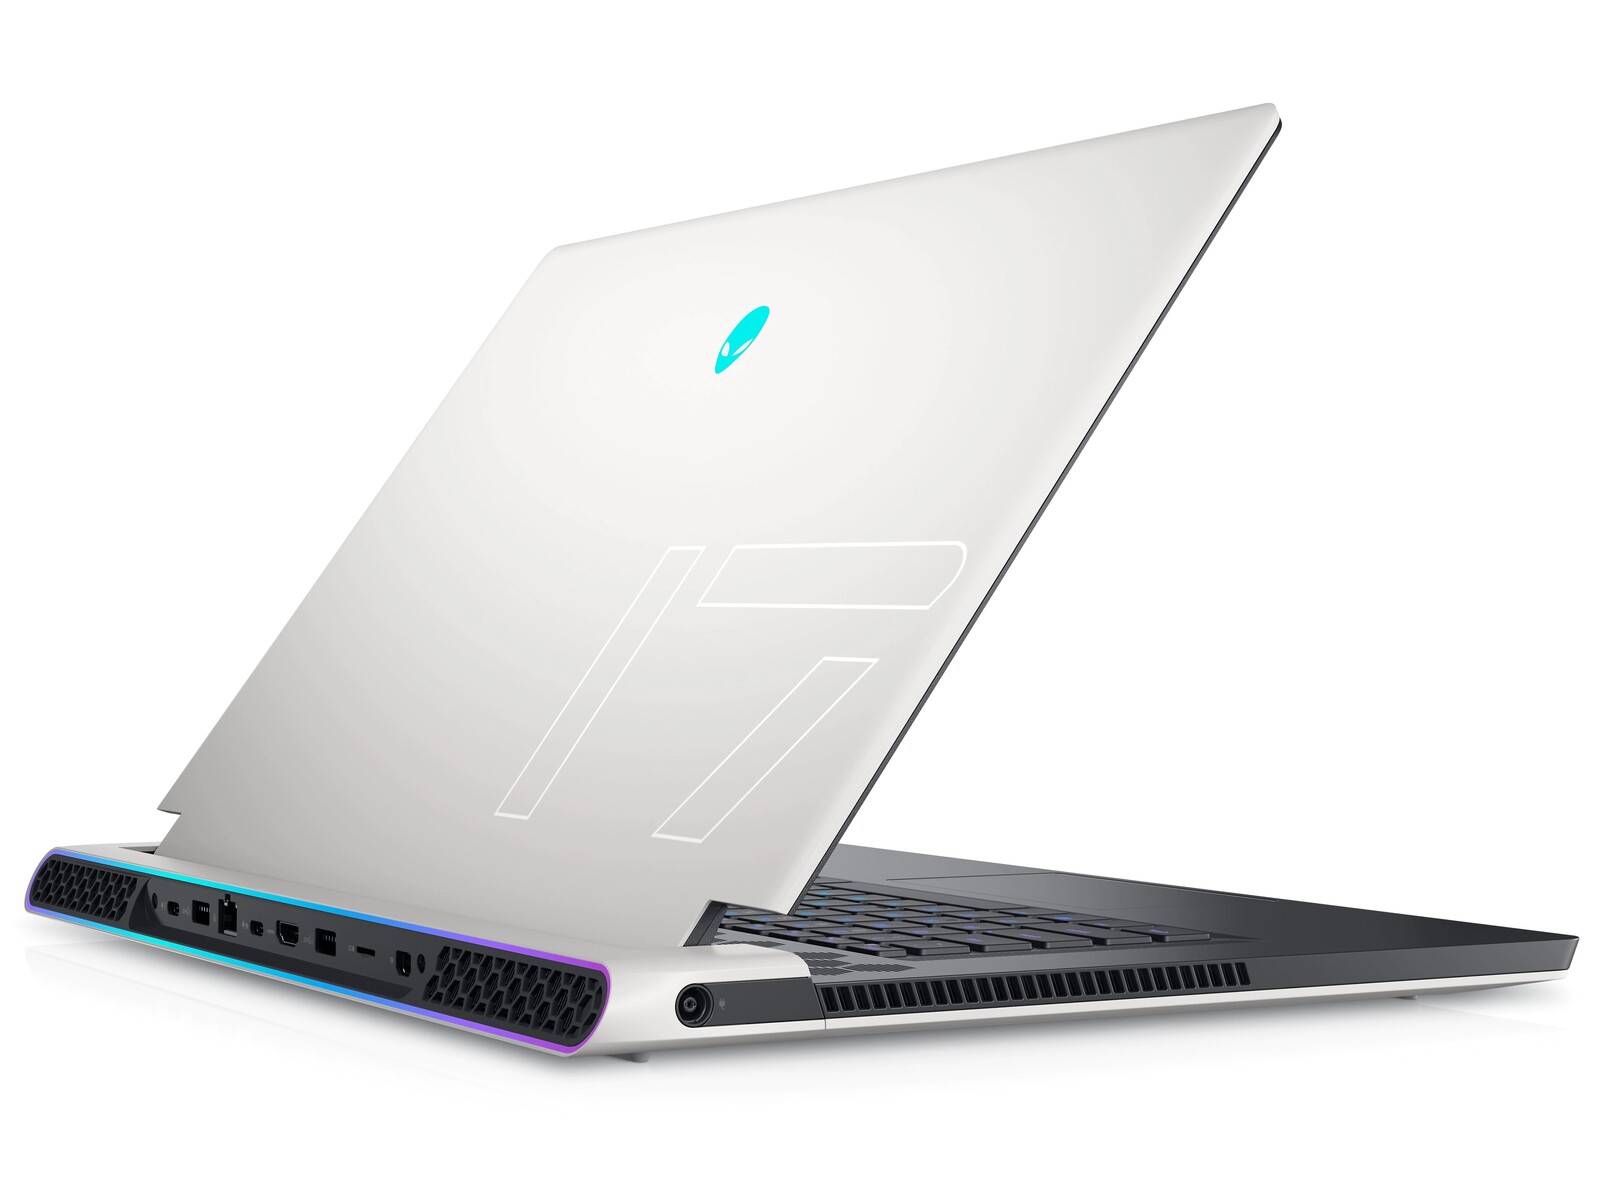
O projeto renovado do chassi "Legenda" utiliza plásticos de toque suave semelhantes aos do m17 R2, mas em proporções diferentes e geralmente mais planas para acentuar um aspecto mais fino. A tampa externa branca e as grelhas alveolares permanecem todas, por exemplo, enquanto o deck do teclado é agora preto e mais afiado ao redor das bordas. A rigidez ainda é excelente especialmente ao redor da base, com muito pouco empenos e sem rangidos para se falar.
A tampa flexiona mais do que a tampa do Lâmina 17 mas não tanto quanto no MSI GS75. Ele também tem algumas das moldura mais grossas ao longo da borda inferior de qualquer laptop para jogos de 17,3 polegadas que vimos e que são parcialmente responsáveis pela pegada extra-grande.
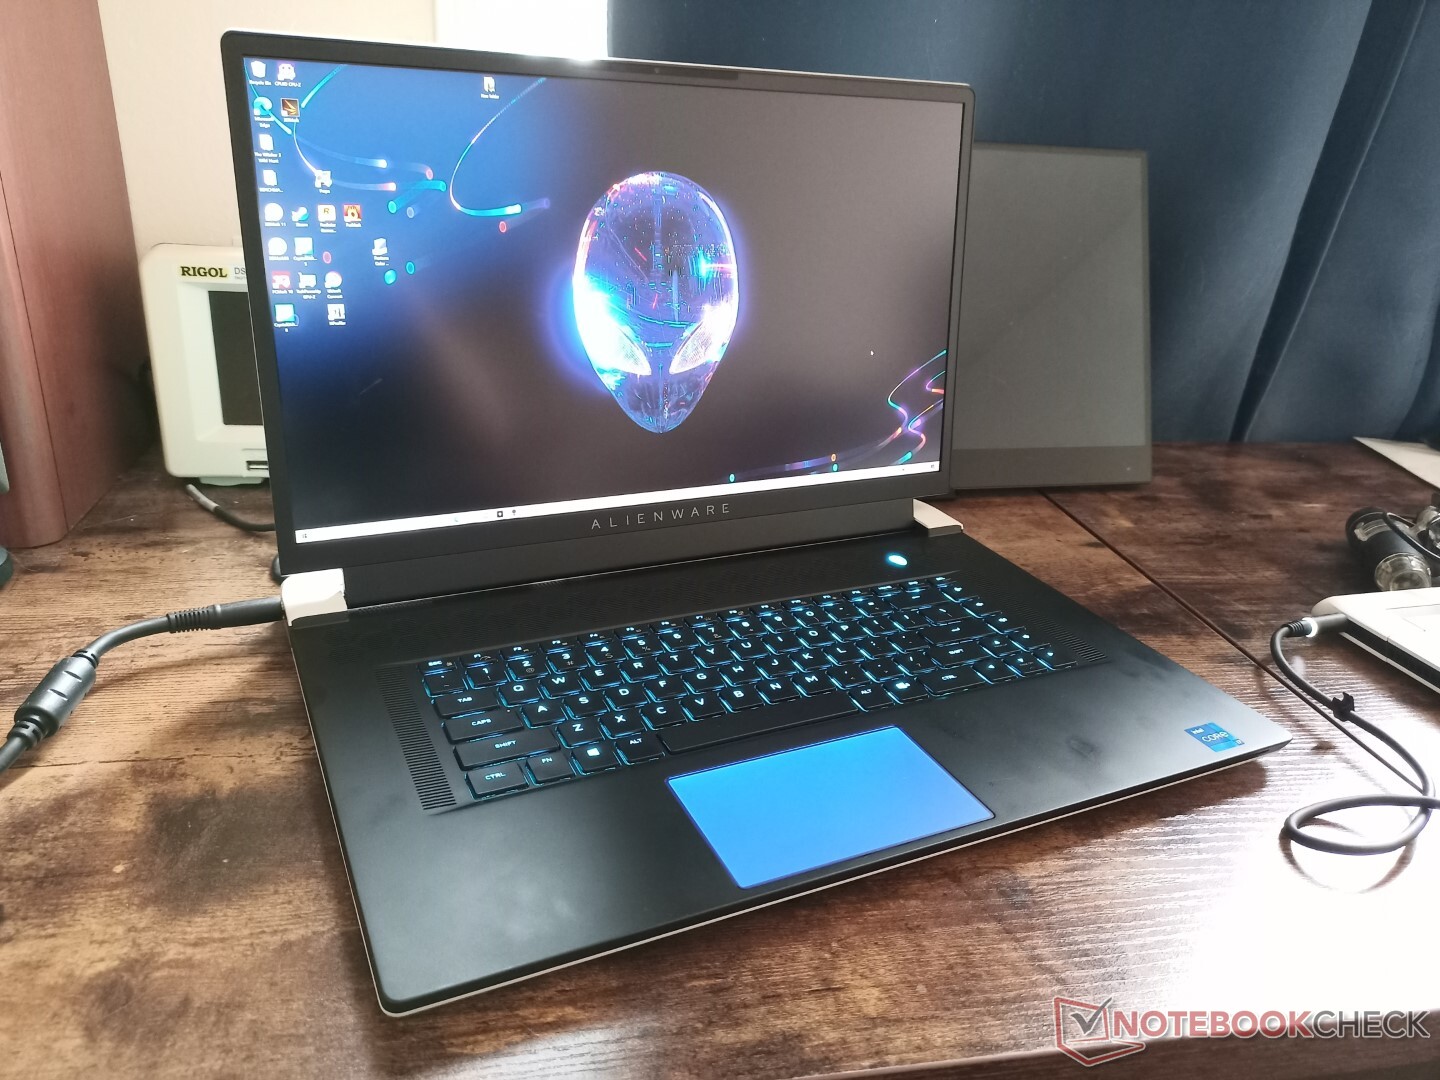
Os laptops alienígenas não têm medo de ser grandes e o x17 R1 ainda é um grande sistema, independentemente de quão "fino" a Dell gosta de comercializar o modelo. A verdade é que o sistema é visivelmente maior e mais pesado que a maioria dos modelos concorrentes como o MSI GS76, Blade 17, ou Zephyrus S17. Mesmo os mais antigos Alienware m17 R4 é mais leve que o x17 R1 em cerca de 200 gramas, apesar de seus volumes quase idênticos. No entanto, o peso adicionado contribui para uma base mais forte e mais rígida.
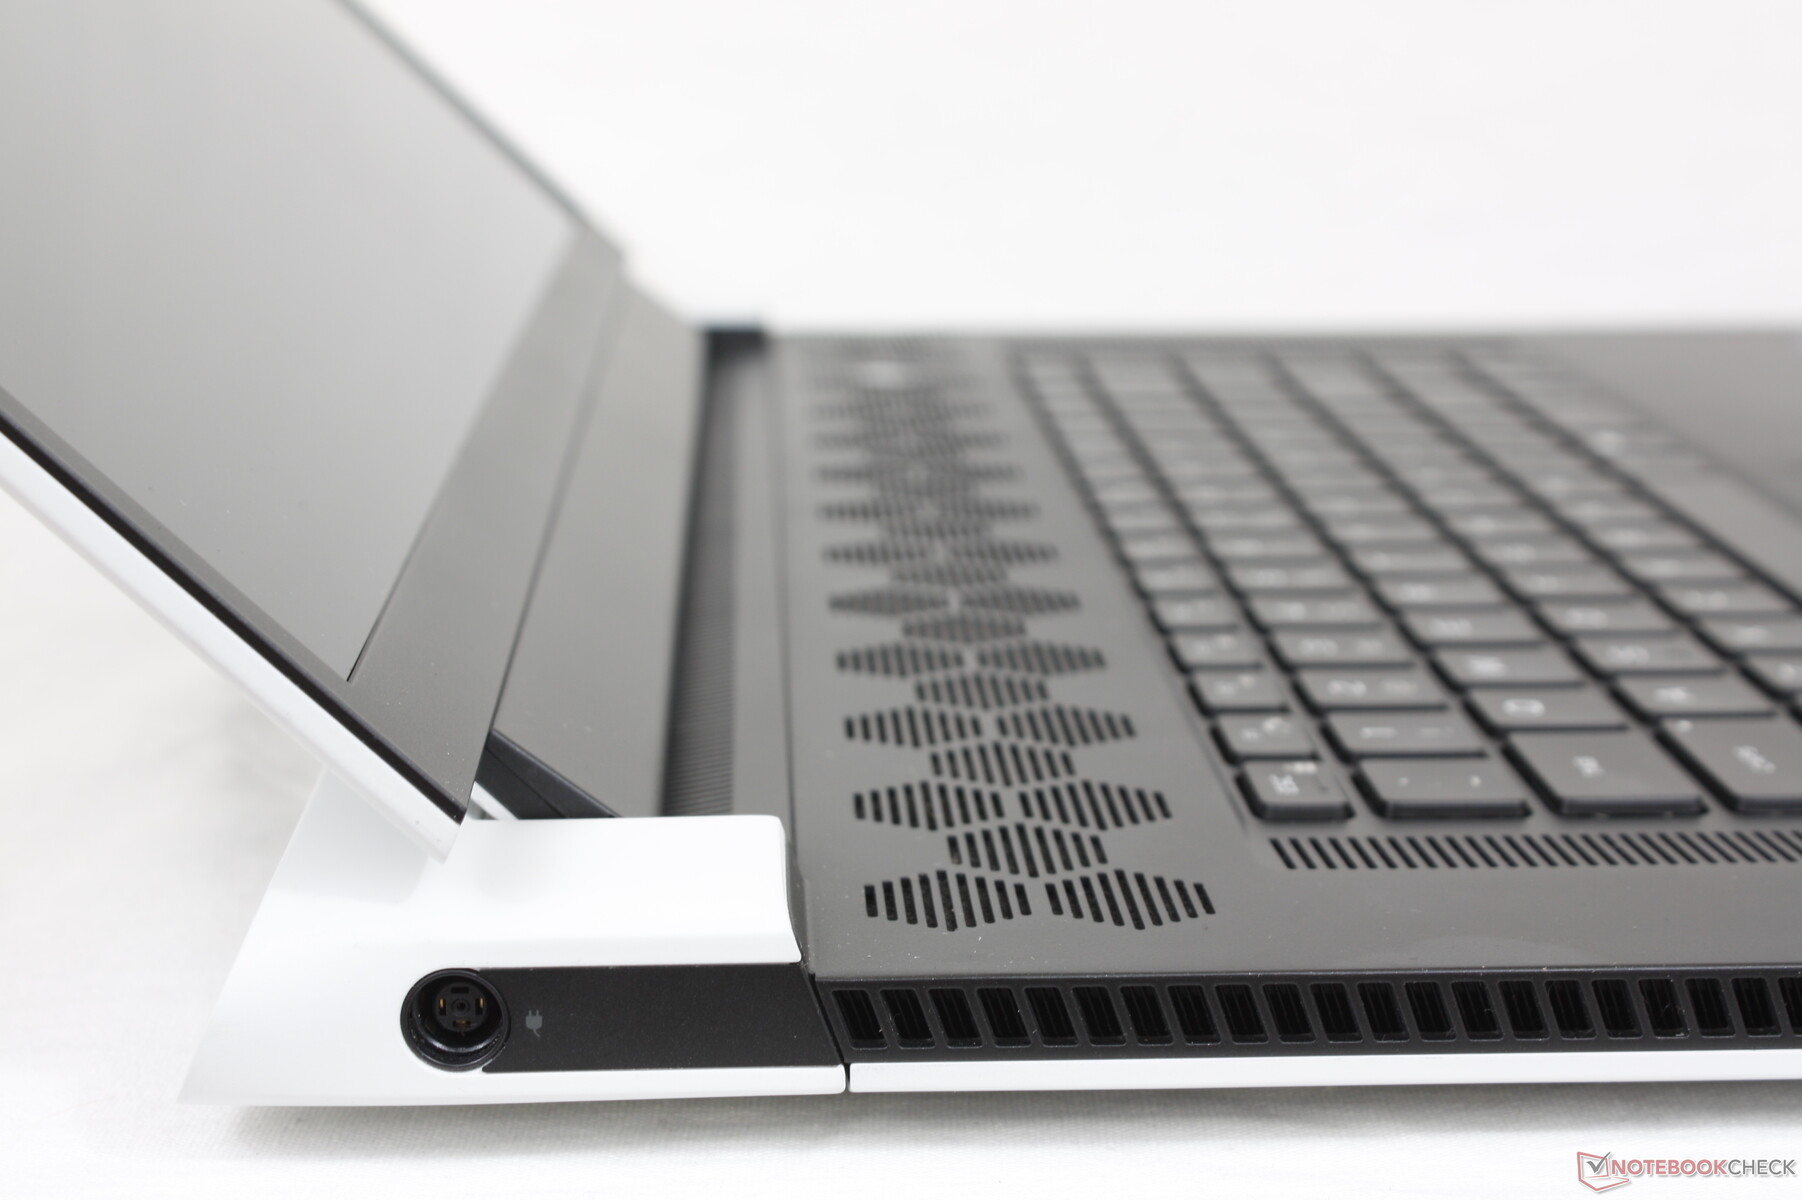
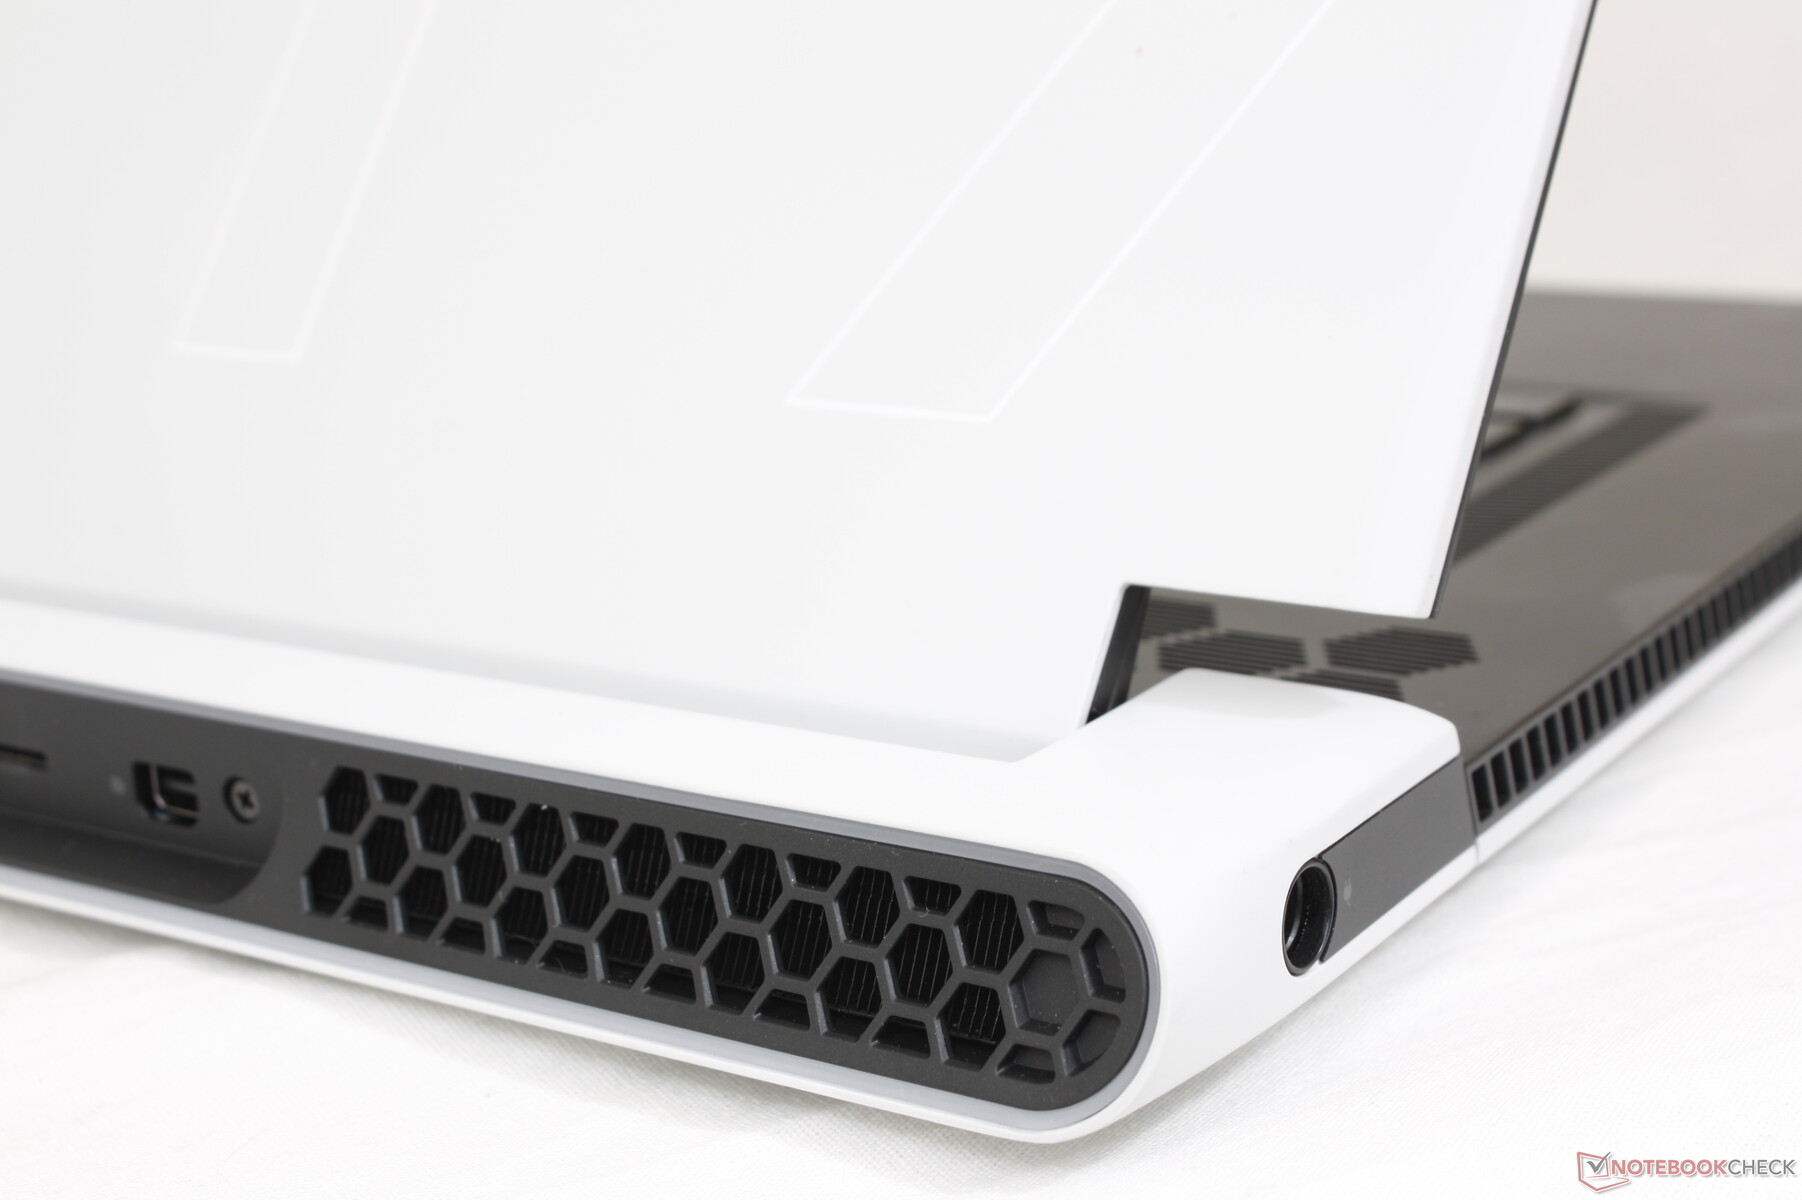
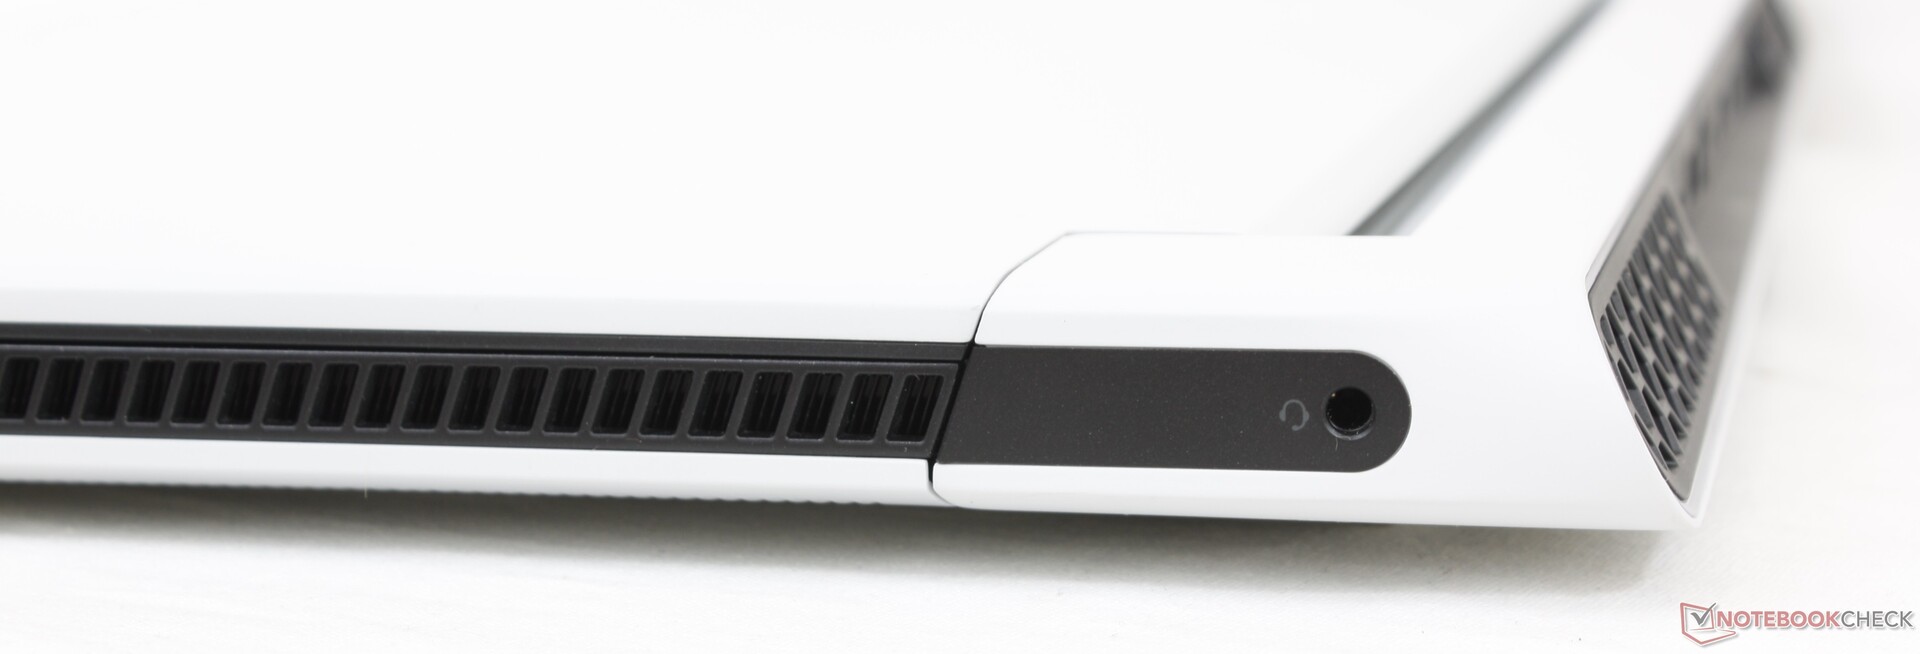
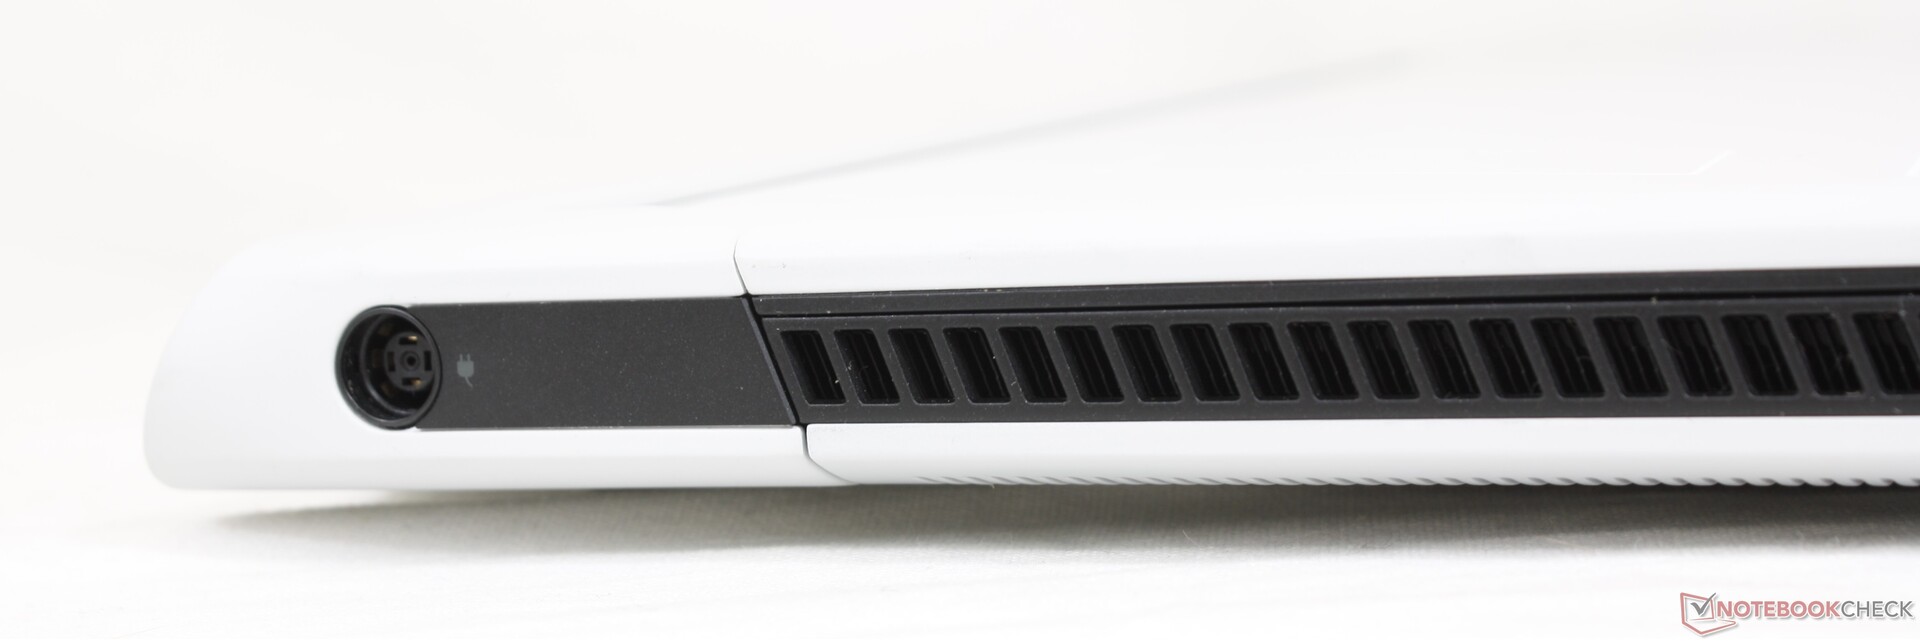
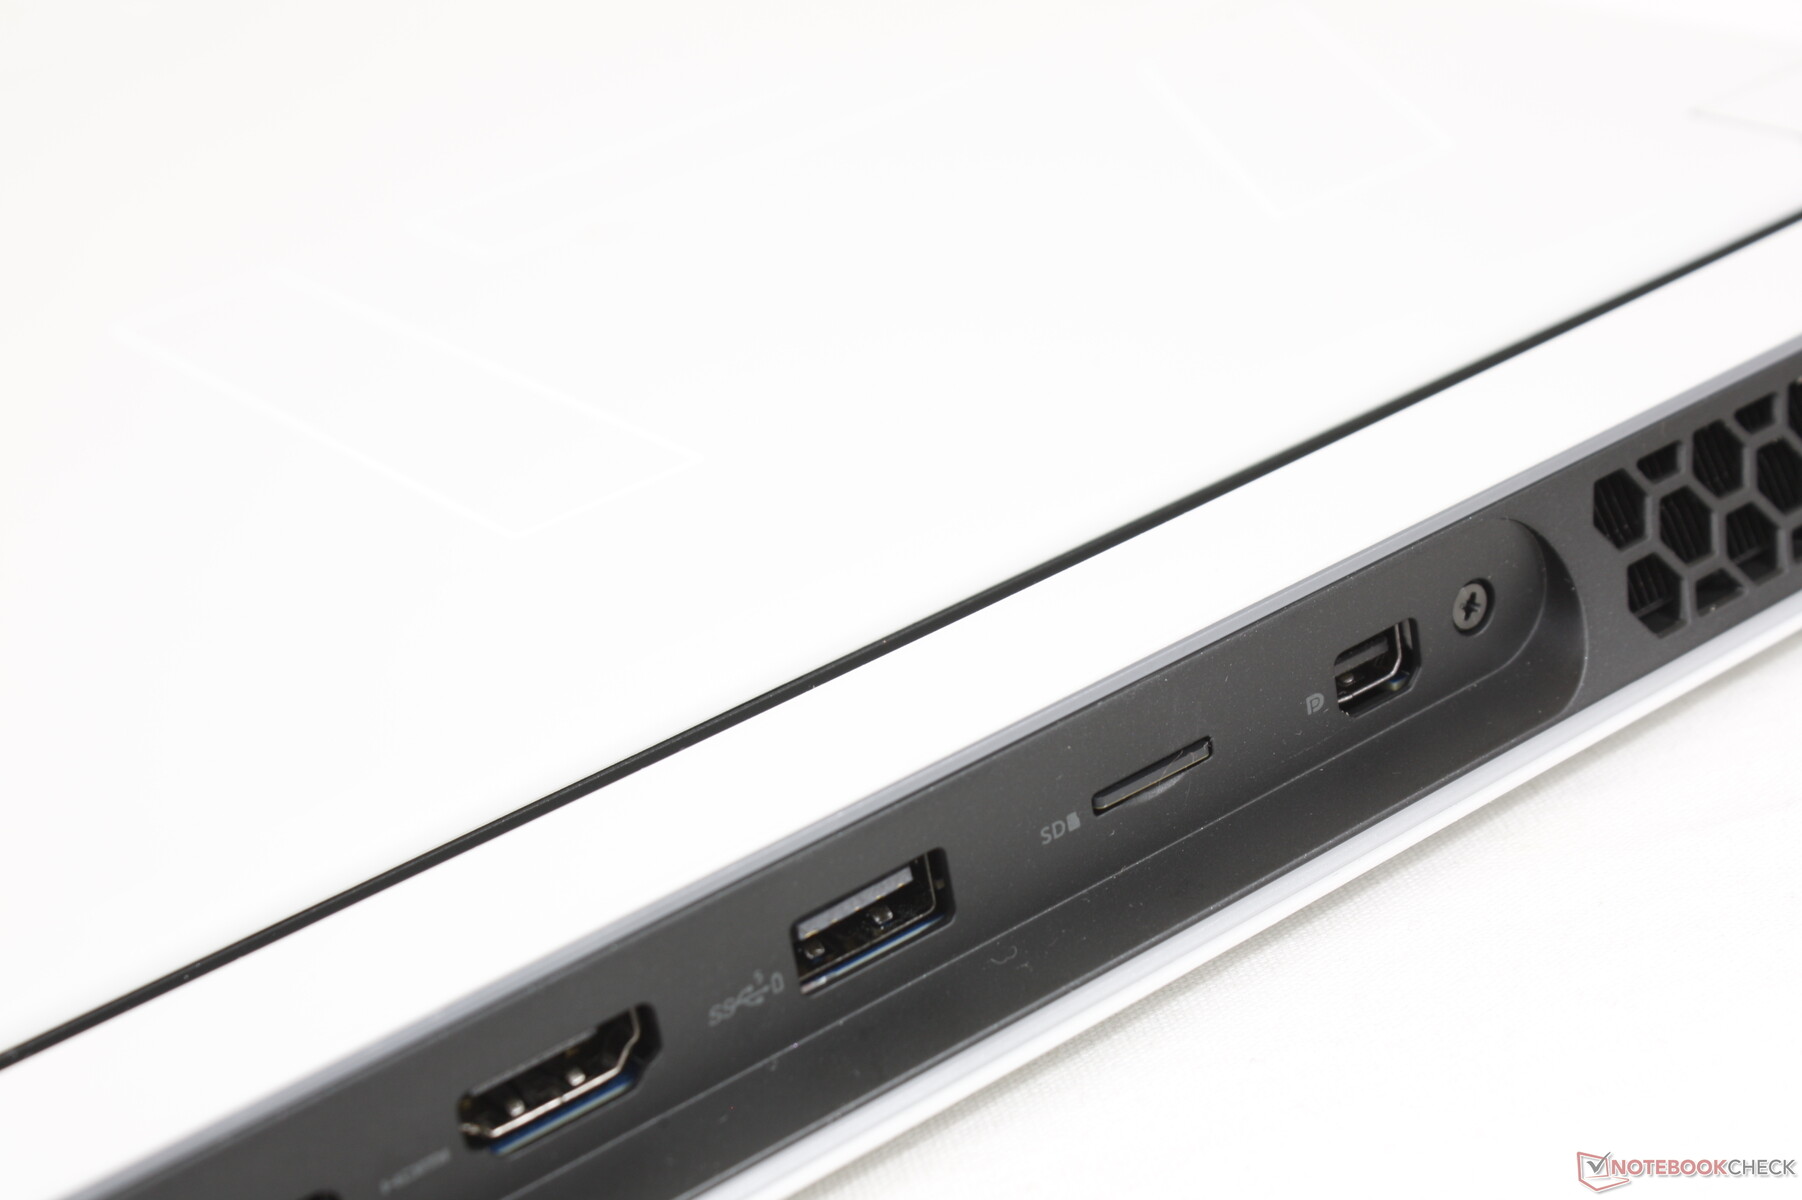
Conectividade - Tudo ao longo da parte de trás
As opções de porto são em sua maioria as mesmas do ano passado, mas com algumas mudanças importantes. A porta Amplificadores Gráficos de propriedade raramente utilizada, por exemplo, foi abandonada em favor de uma segunda porta USB-C mais prática. Há também uma porta USB-A a menos com a qual trabalhar desta vez. Caso contrário, todas as outras portas retornaram, embora reajustadas ao longo da parte traseira do chassi para serem geralmente mais difíceis de alcançar e ver do que na maioria dos outros laptops
Note que ambas as portas USB-C suportam DisplayPort e Power Delivery, mas apenas uma é realmente compatível com Thunderbolt 4.

Leitor de cartões SD
As taxas de transferência do leitor MicroSD integrado são muito rápidas a quase 250 MB/s com nossa placa de teste UHS-II. O slot é um pouco difícil de acessar já que está ao longo da traseira, mas definitivamente é melhor que não ter nenhum.
| SD Card Reader | |
| average JPG Copy Test (av. of 3 runs) | |
| Razer Blade 17 RTX 3070 (AV Pro V60) | |
| MSI GS76 Stealth 11UH (AV PRO microSD 128 GB V60) | |
| Alienware m17 R4 (AV PRO microSD 128 GB V60) | |
| Gigabyte Aero 17 HDR YD (AV PRO microSD 128 GB V60) | |
| Asus ROG Zephyrus S17 GX703HSD | |
| Alienware x17 RTX 3080 P48E (AV Pro V60) | |
| maximum AS SSD Seq Read Test (1GB) | |
| Asus ROG Zephyrus S17 GX703HSD | |
| Alienware x17 RTX 3080 P48E (AV Pro V60) | |
| Alienware m17 R4 (AV PRO microSD 128 GB V60) | |
| MSI GS76 Stealth 11UH (AV PRO microSD 128 GB V60) | |
| Razer Blade 17 RTX 3070 (AV Pro V60) | |
| Gigabyte Aero 17 HDR YD (AV PRO microSD 128 GB V60) | |
Comunicação
O módulo Killer AX1675x, equipado com Wi-Fi 6, vem soldado muito parecido com o design m17 da última geração. Curiosamente, o módulo WLAN é removível no Alienware x15, embora seja um fator de forma menor de 15,6 polegadas.
Webcam - IR, mas sem obturador
A qualidade da câmera não melhorou realmente de geração para geração, pois o sistema só vem com um sensor de 720p. Alguns outros laptops como o Lâmina Razer 17 passaram, desde então, para 1080p. Falta também um obturador de webcam.

")
")
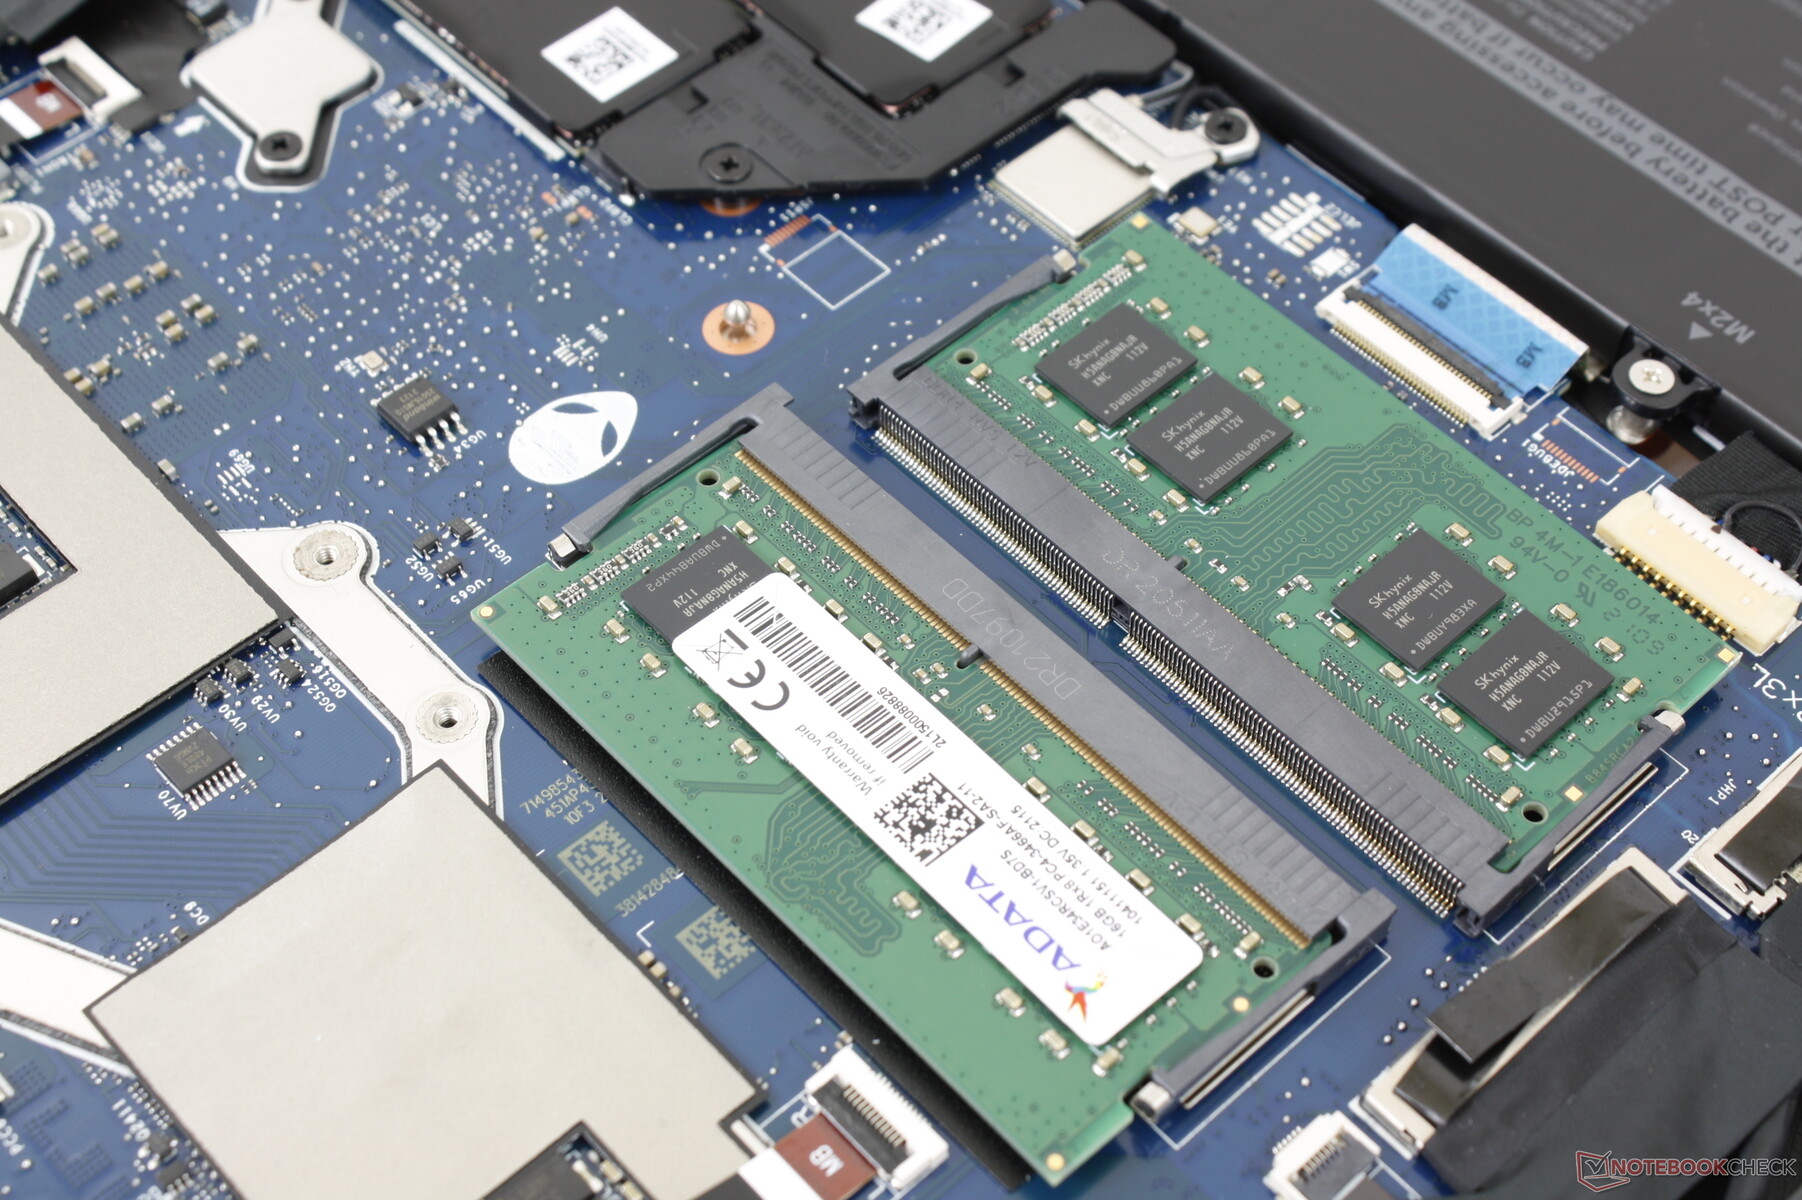
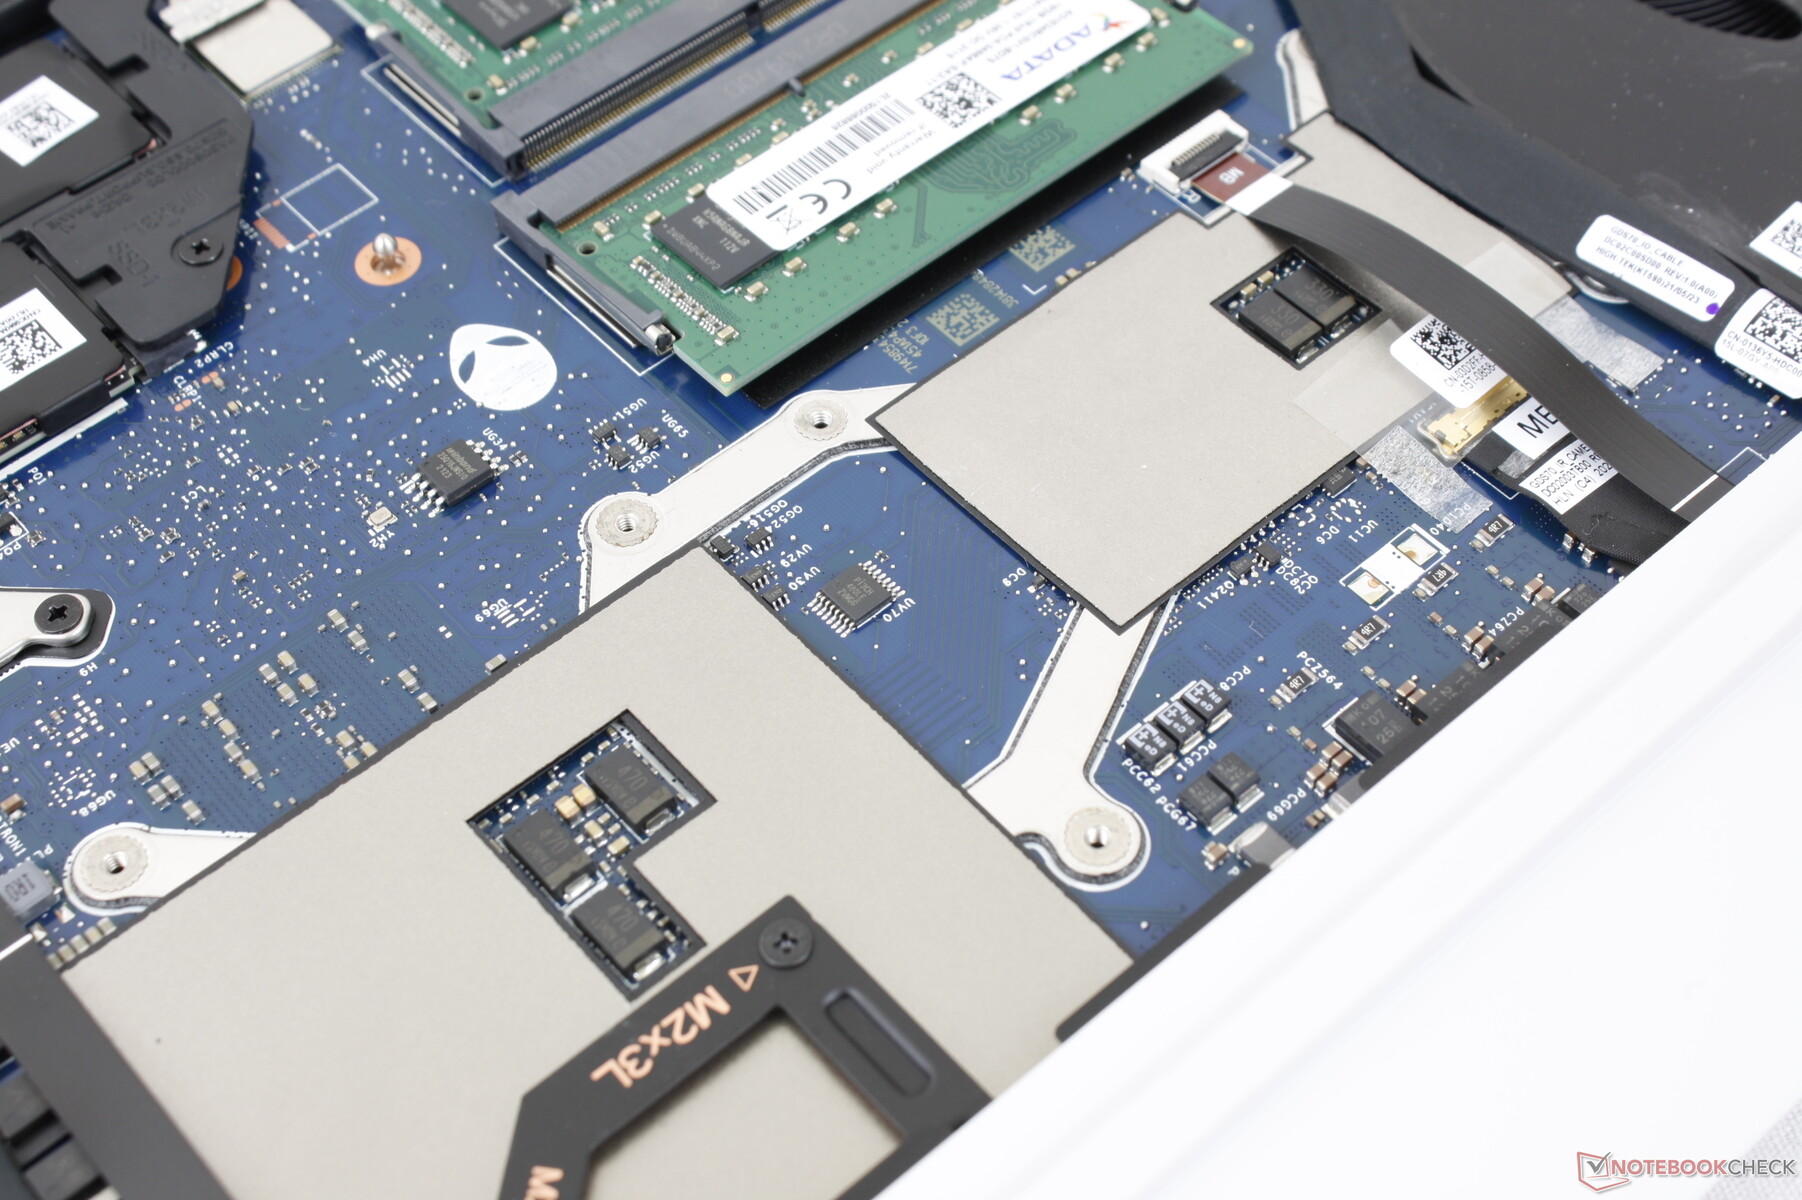
Manutenção
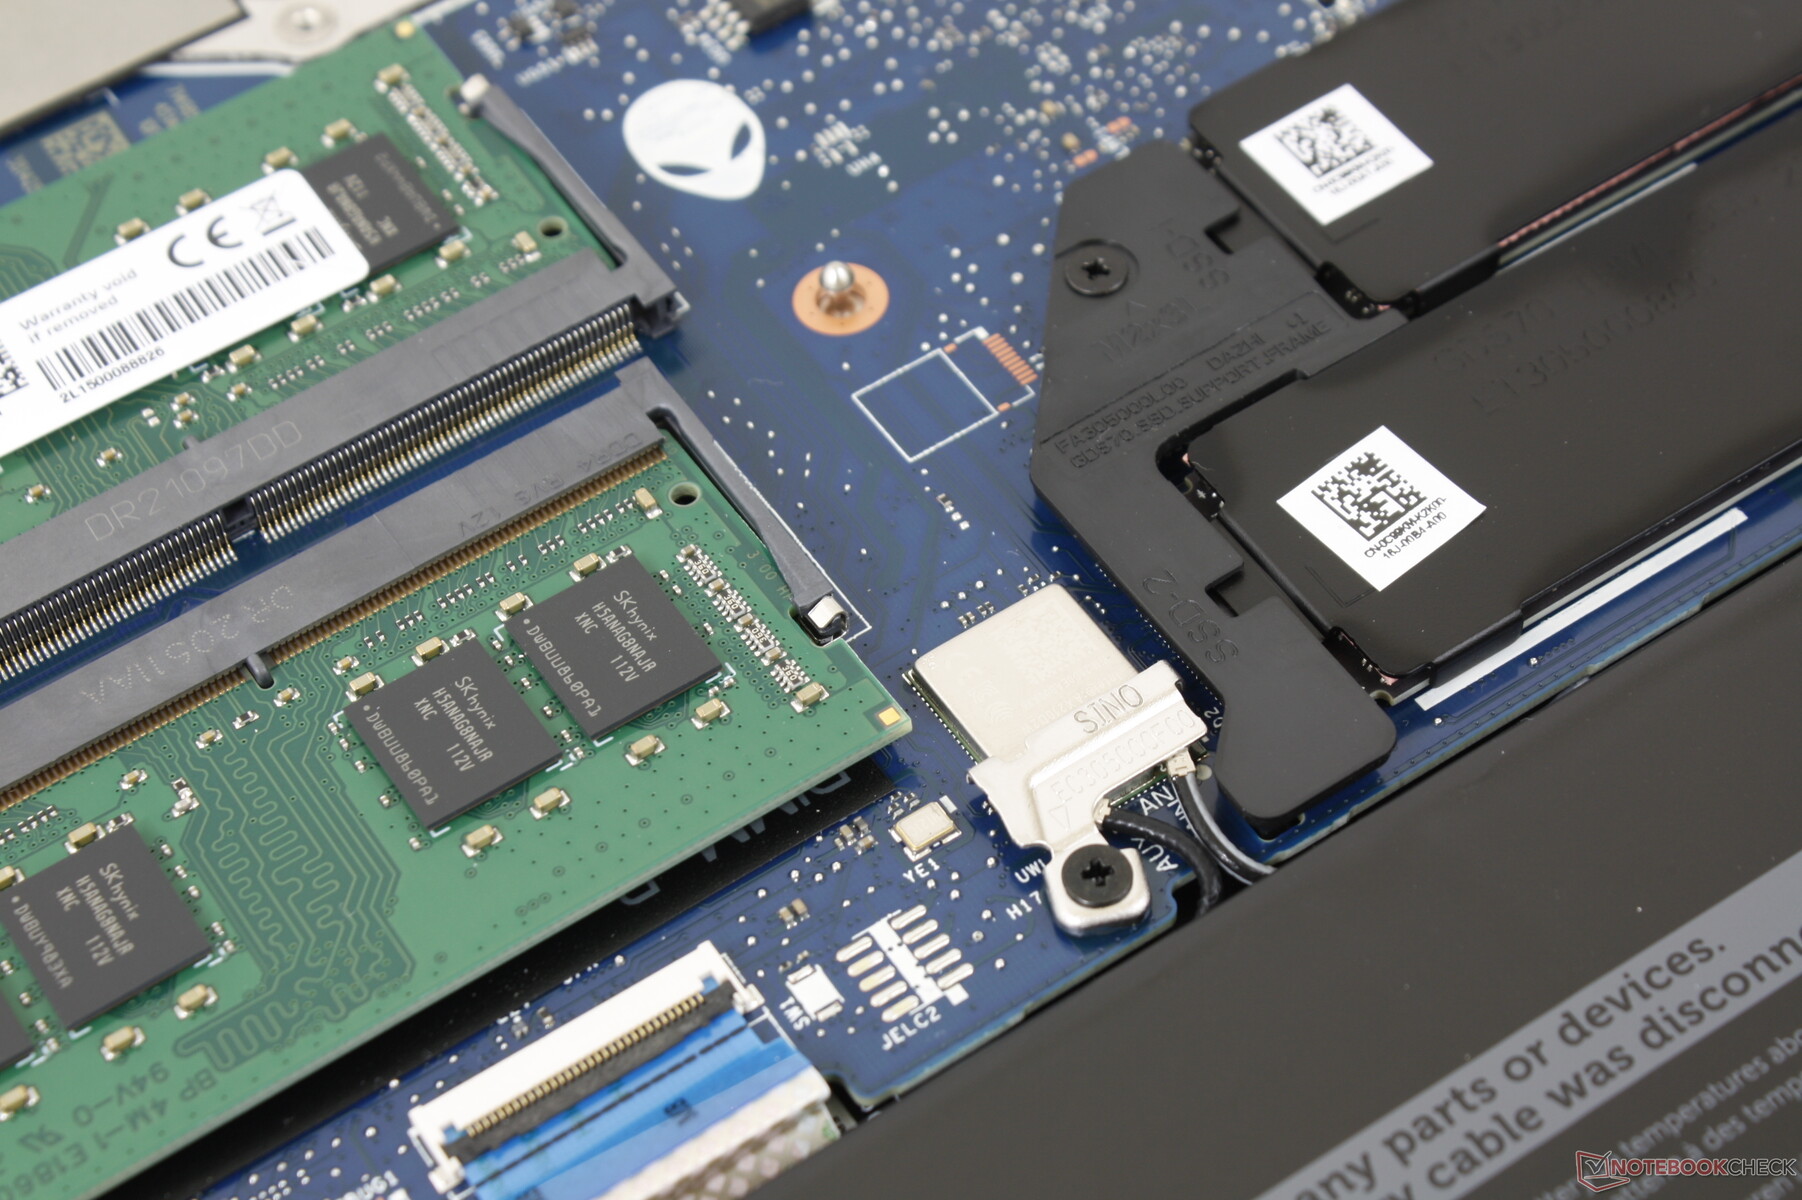
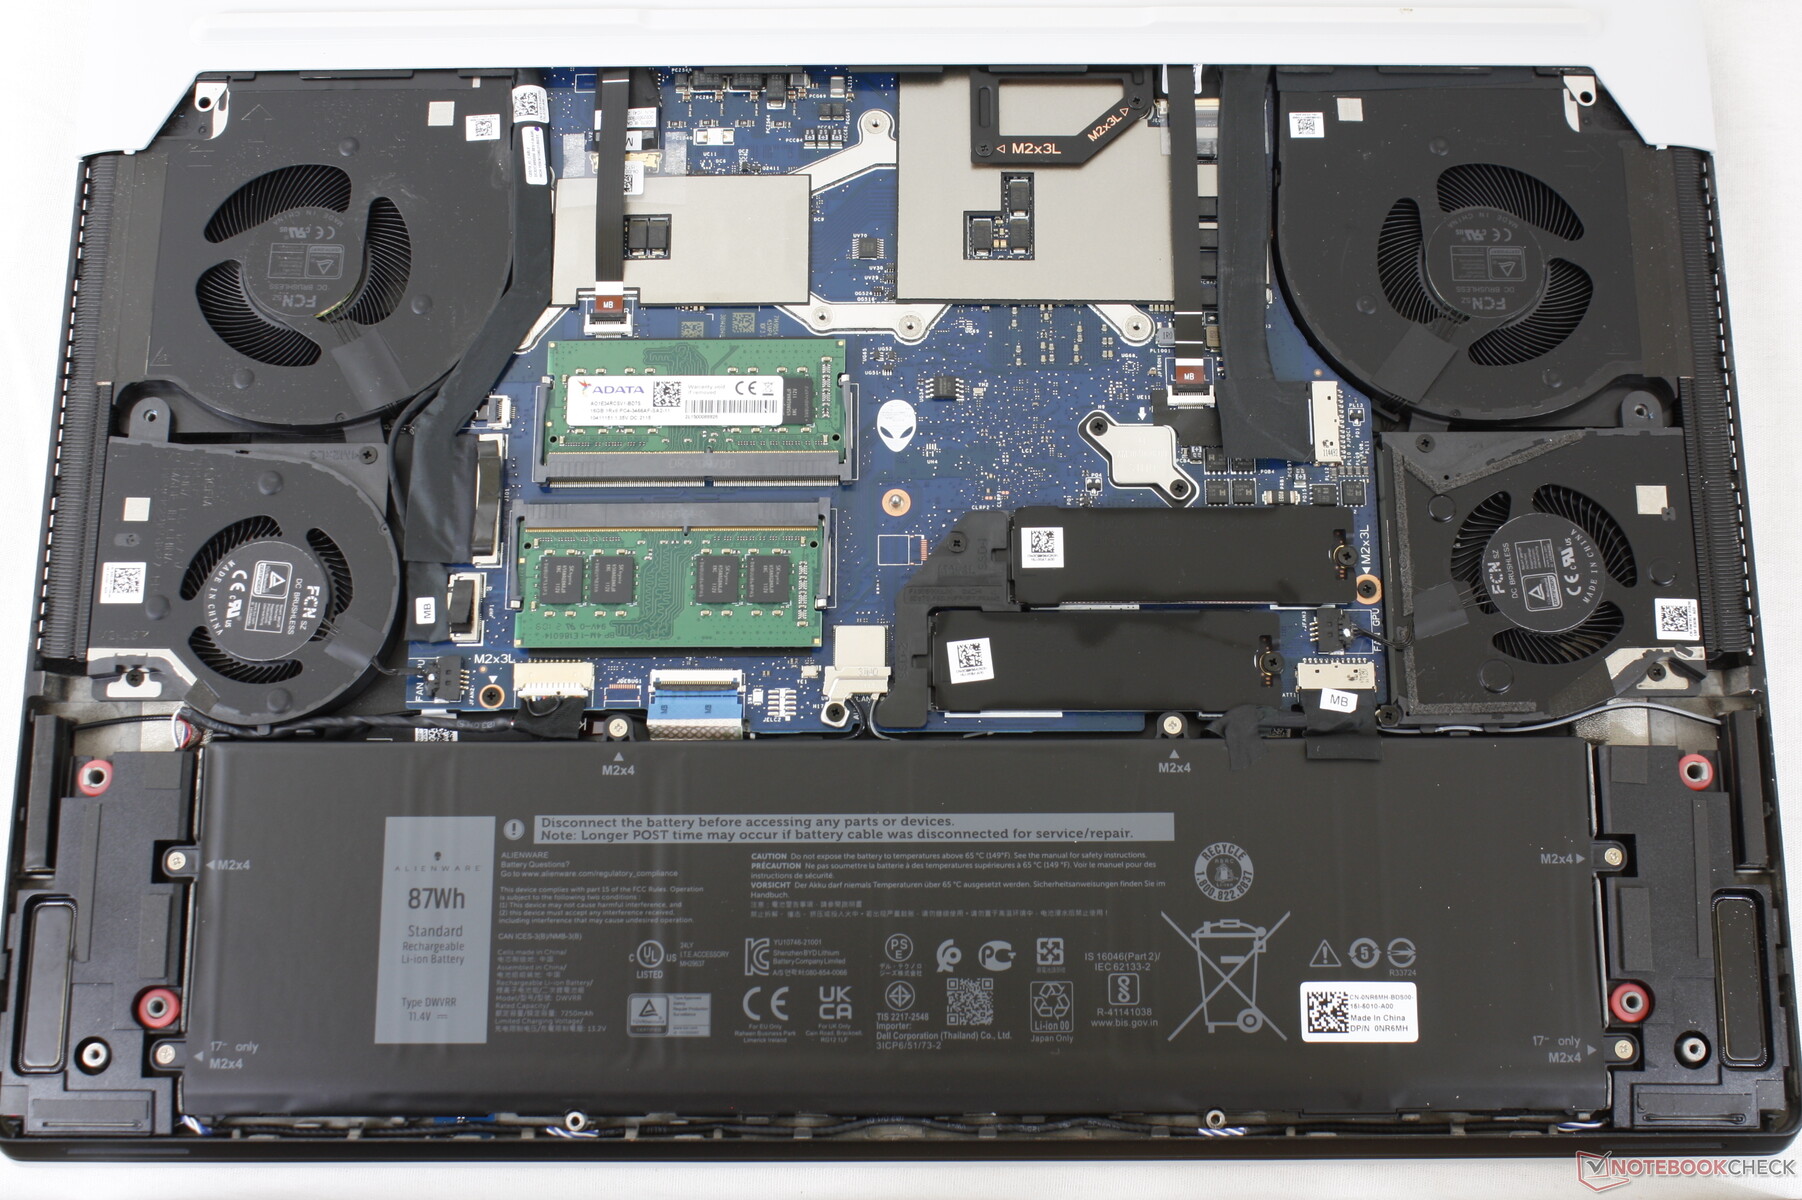
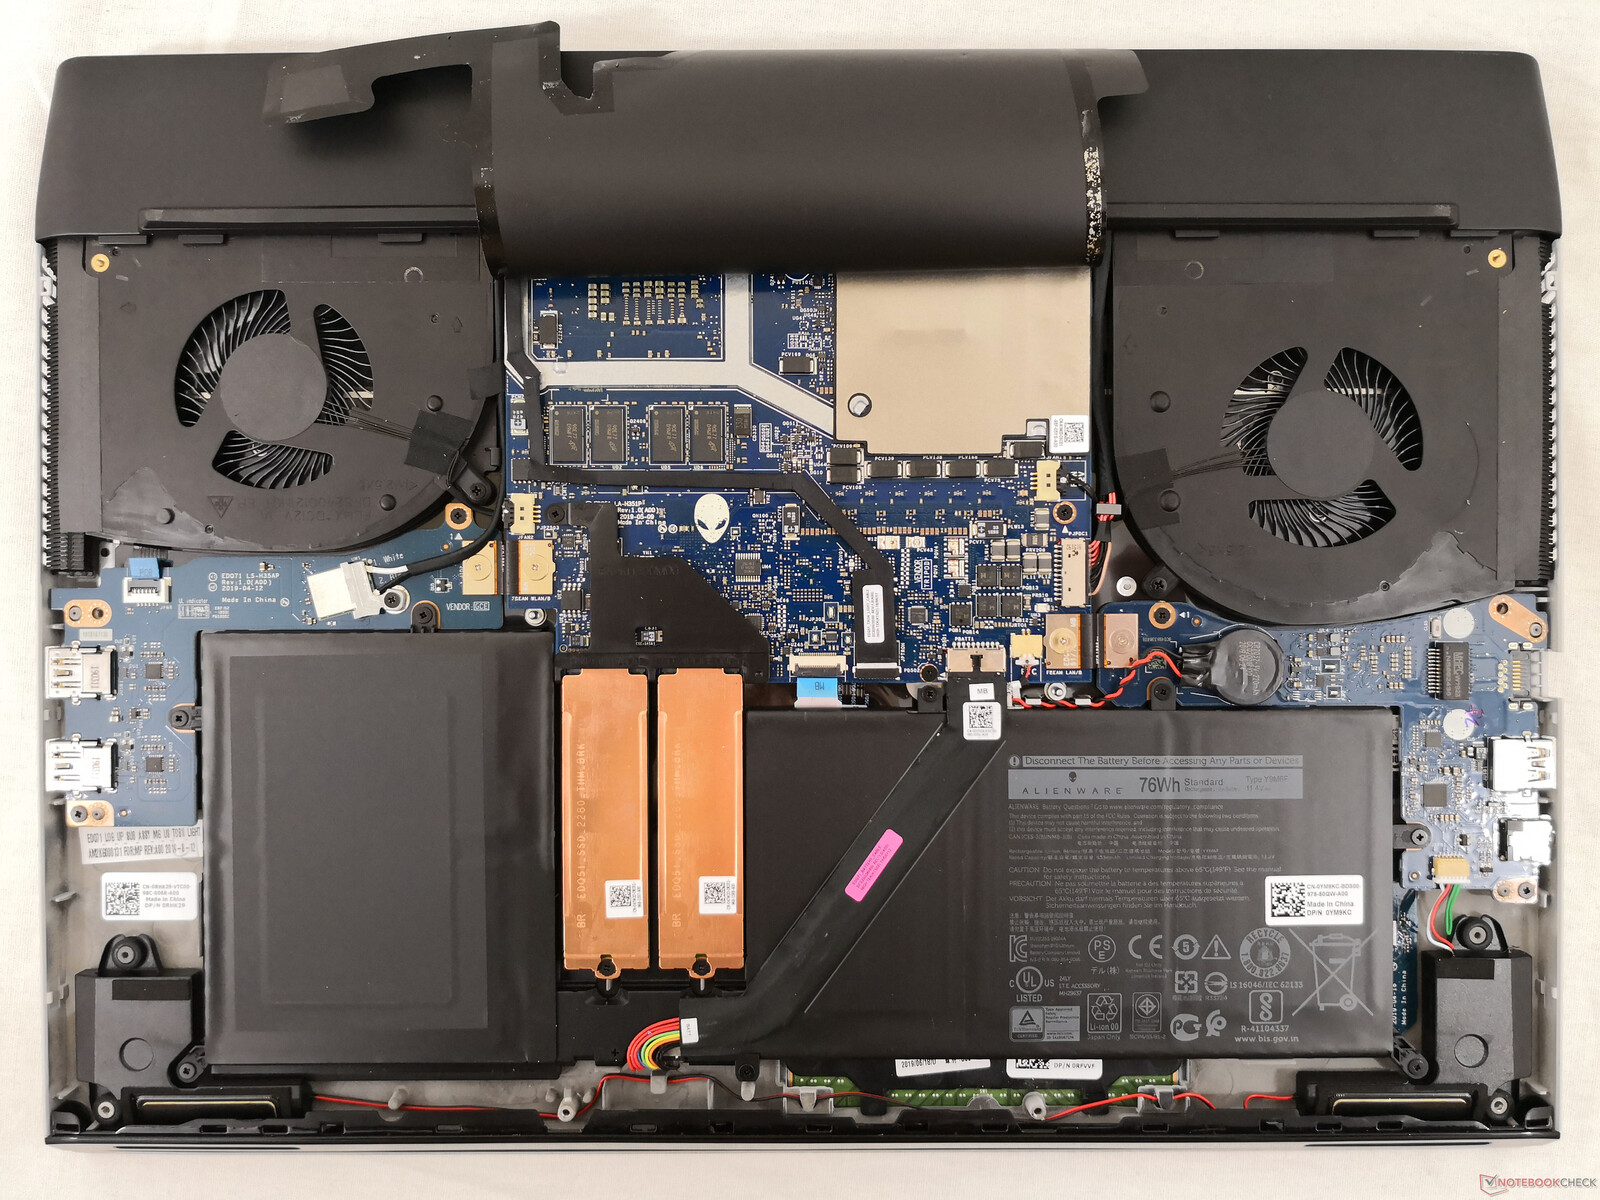
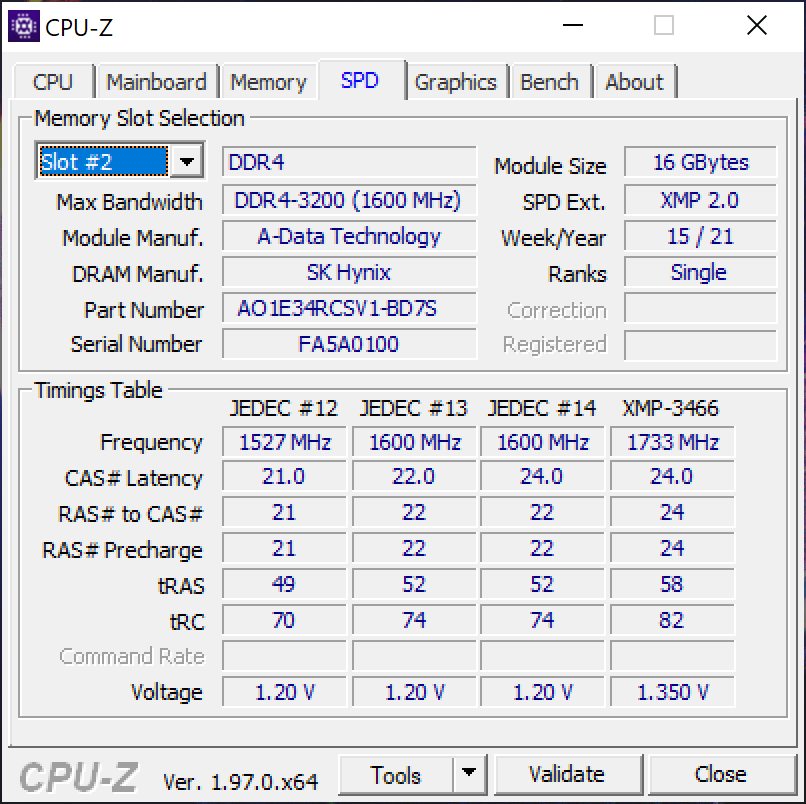
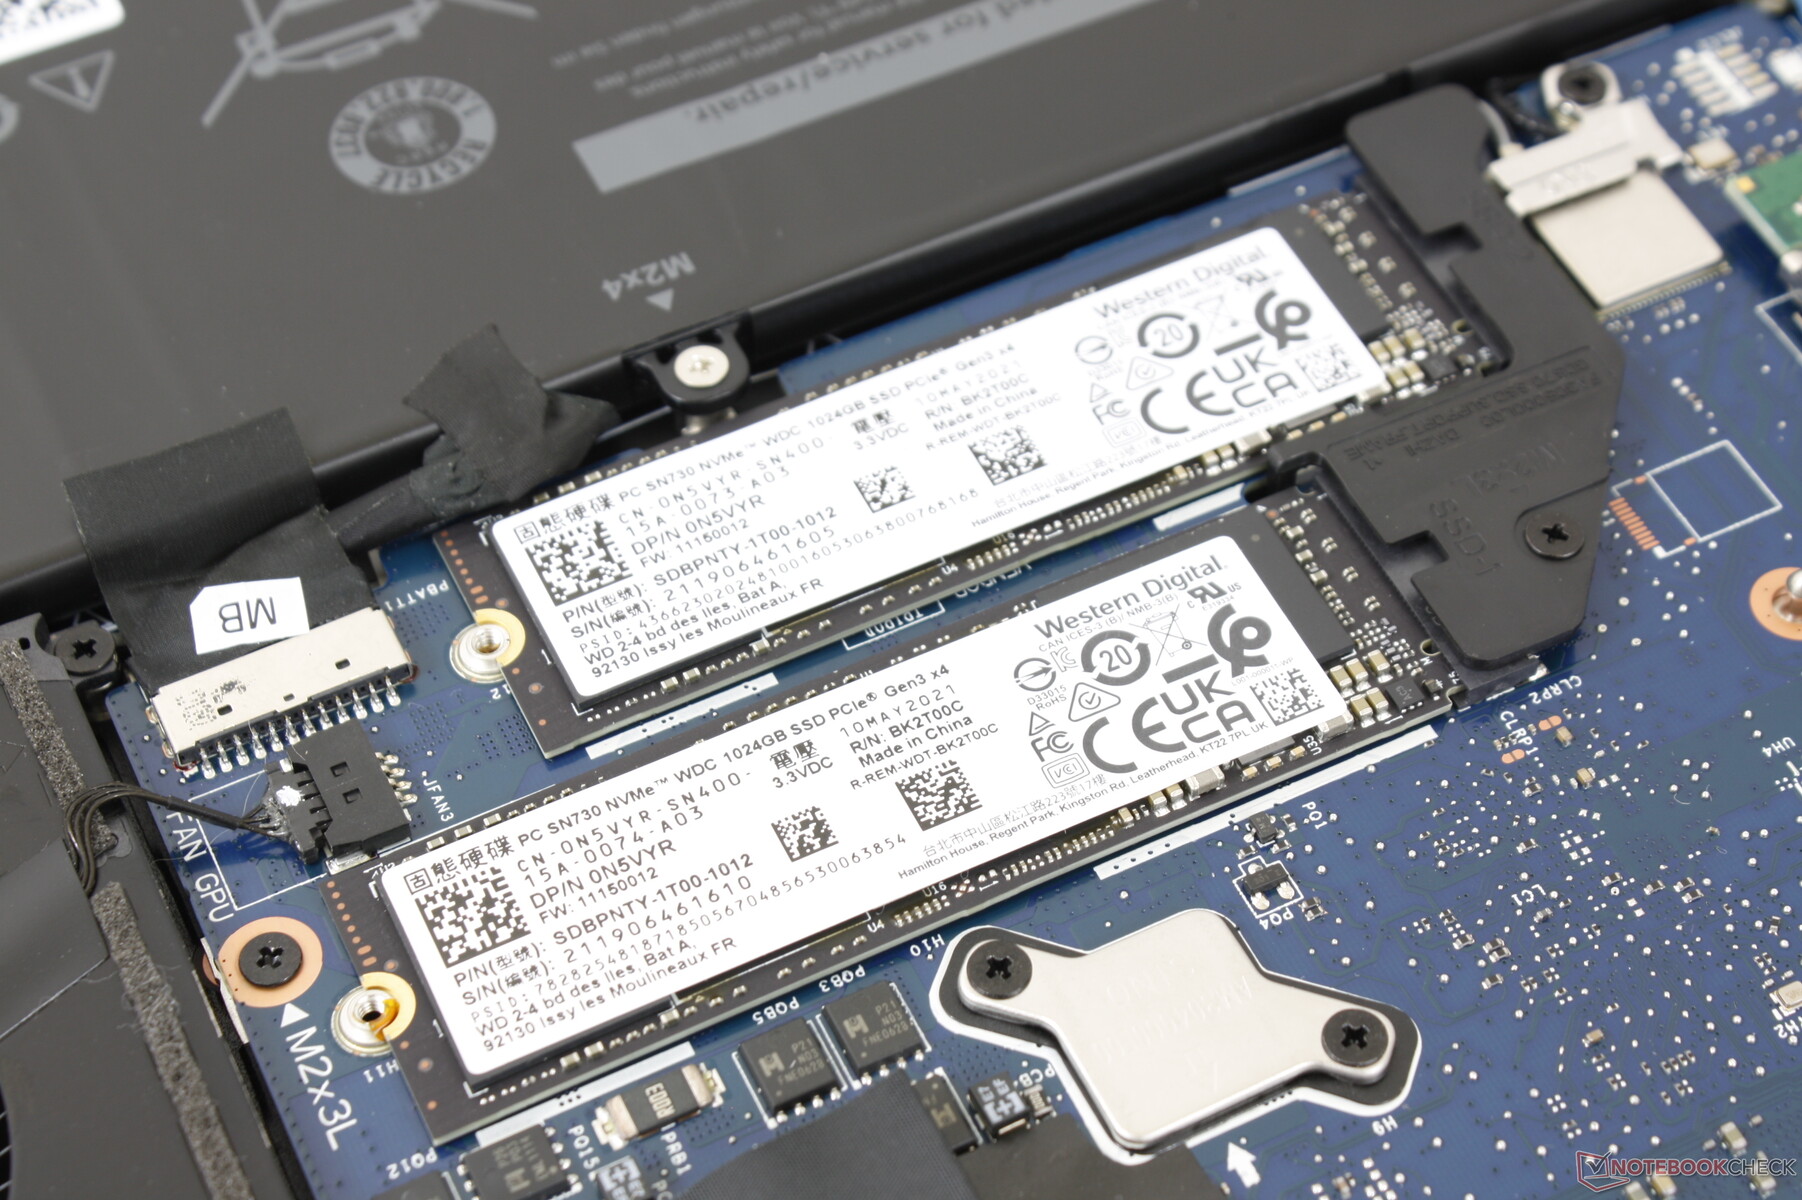
O painel inferior se solta facilmente com apenas uma chave de fenda Philips e uma aresta afiada. A RAM agora é expansível através de 2x ranhuras SODIMM, enquanto que elas são soldadas no design m17 R2 mais antigo.
Acessórios e Garantia
Não há extras na caixa fora do adaptador AC e na papelada. A garantia padrão limitada de um ano aplica-se com opções de extensão se comprada diretamente da Dell.
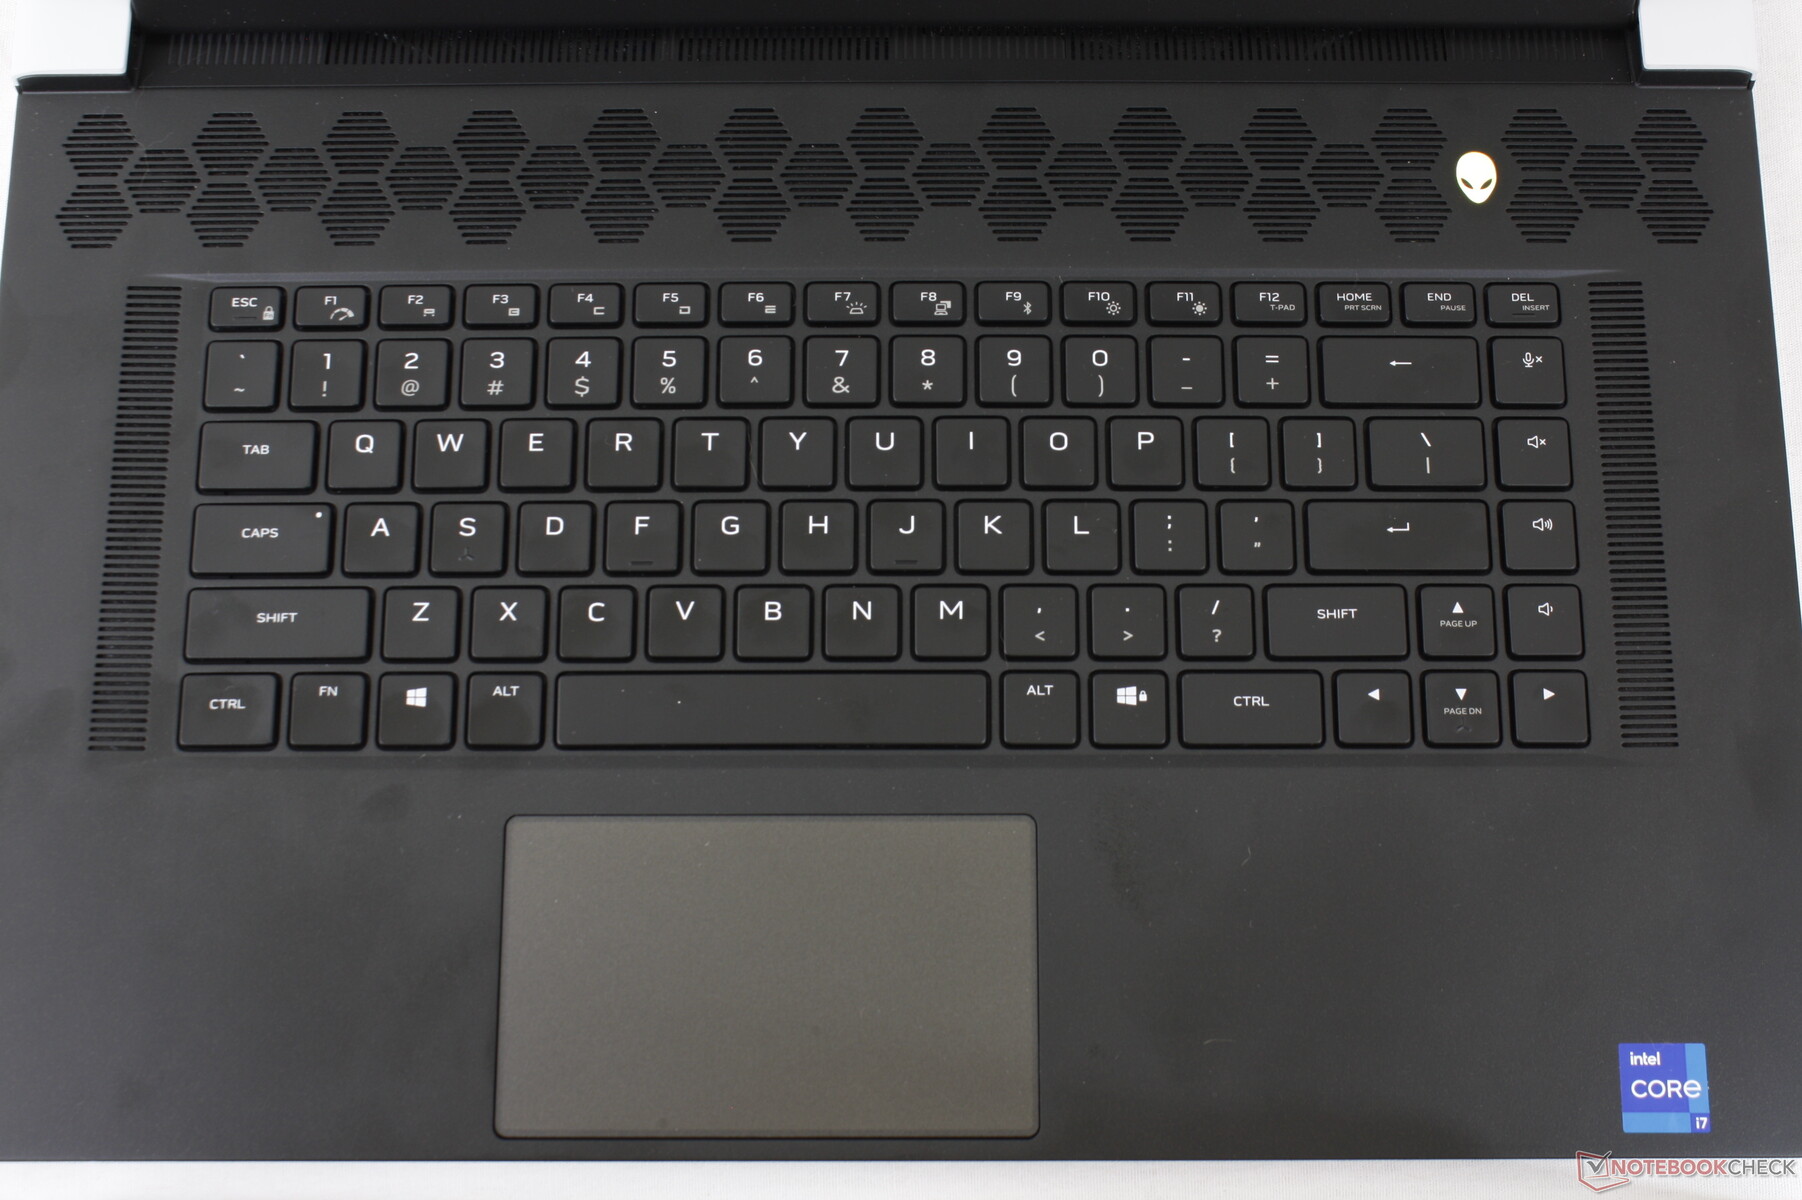
Dispositivos de entrada - CherryMX para o Resgate
Teclado
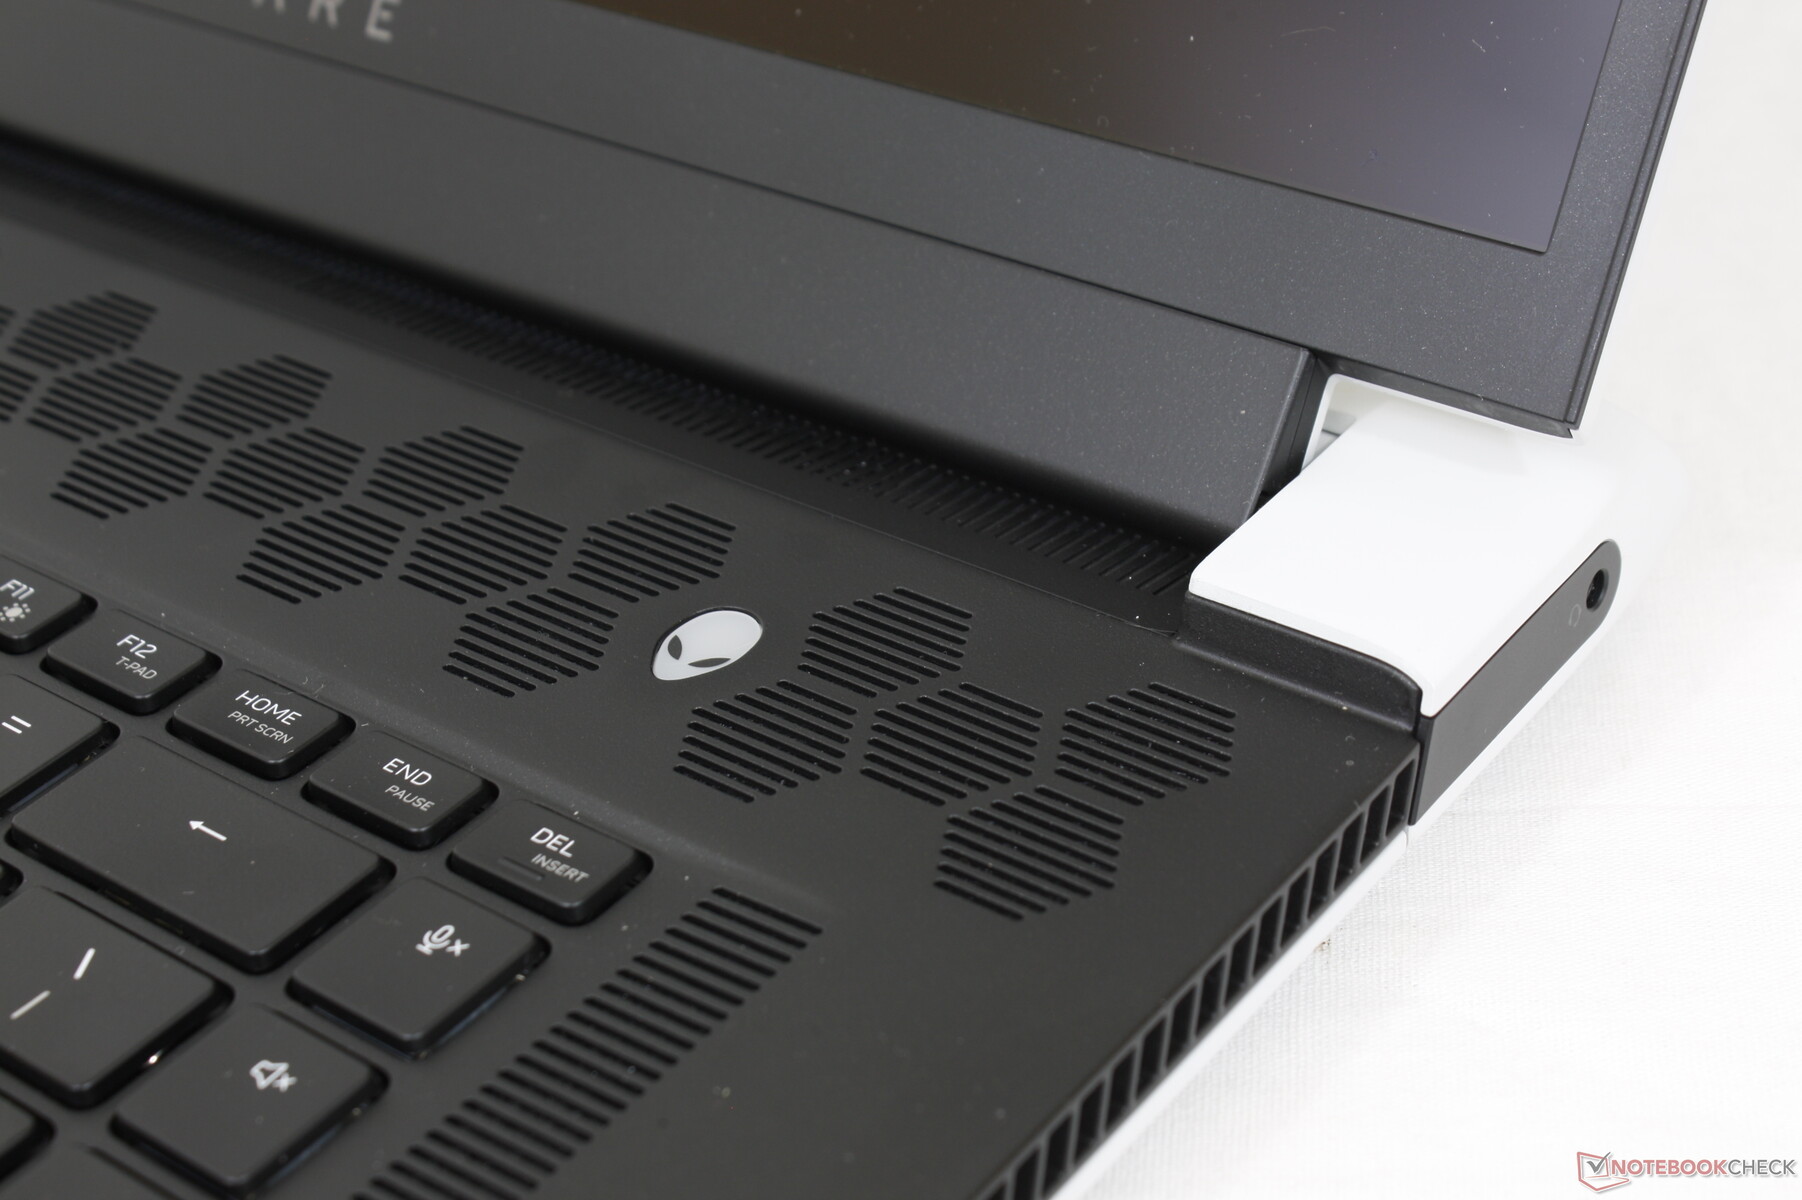
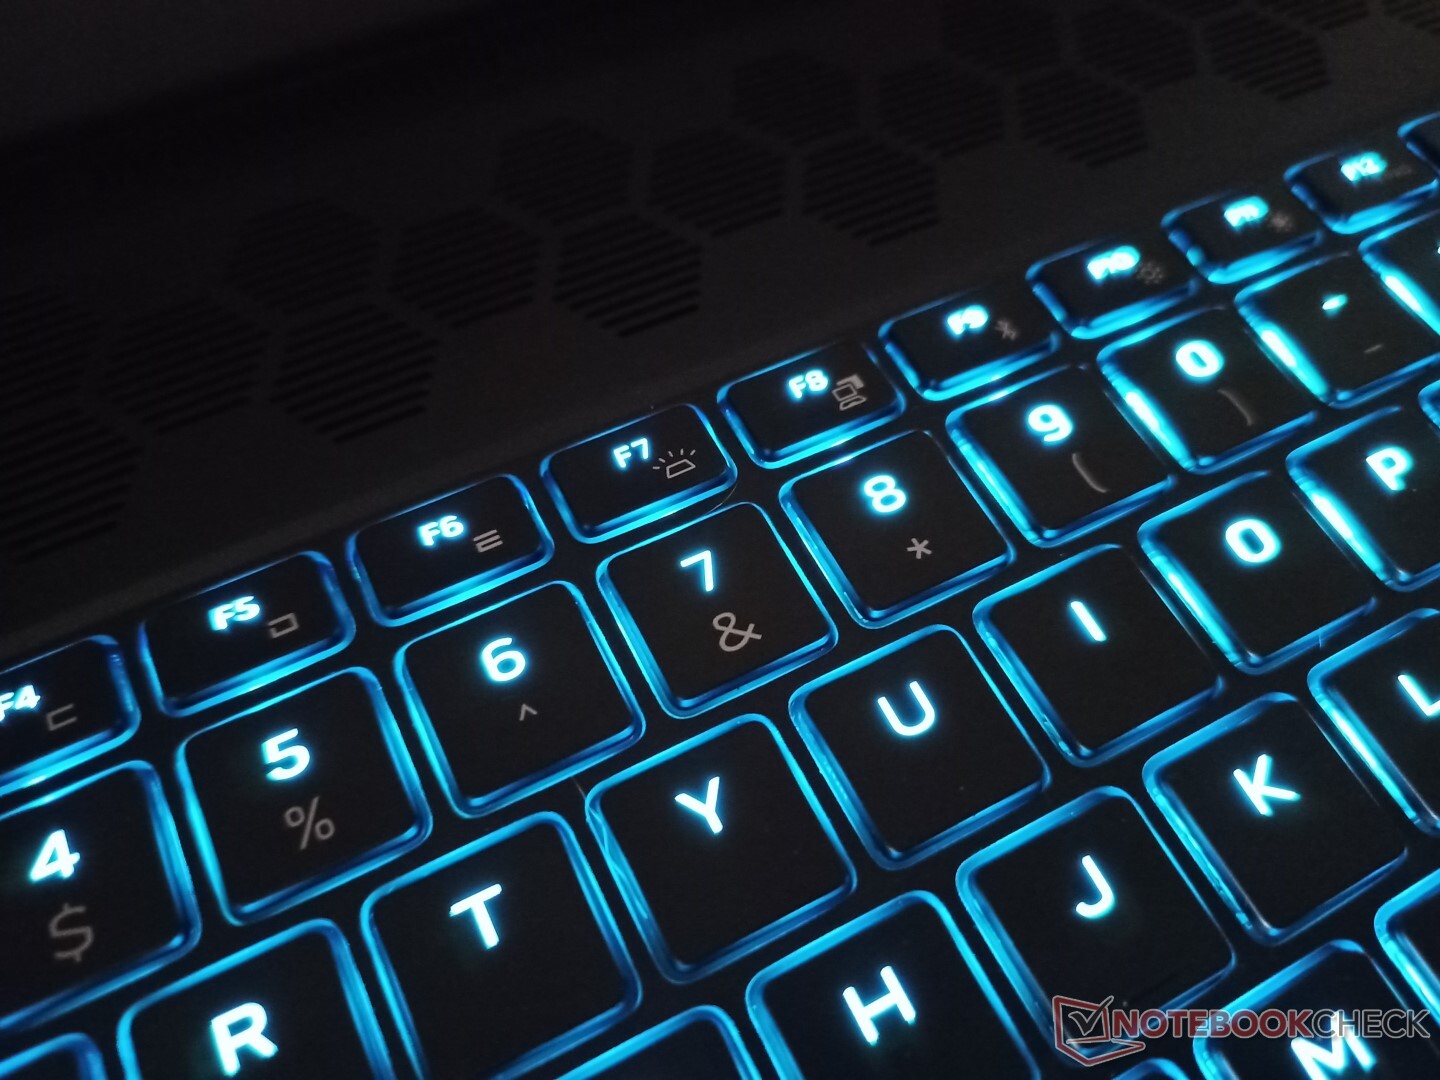
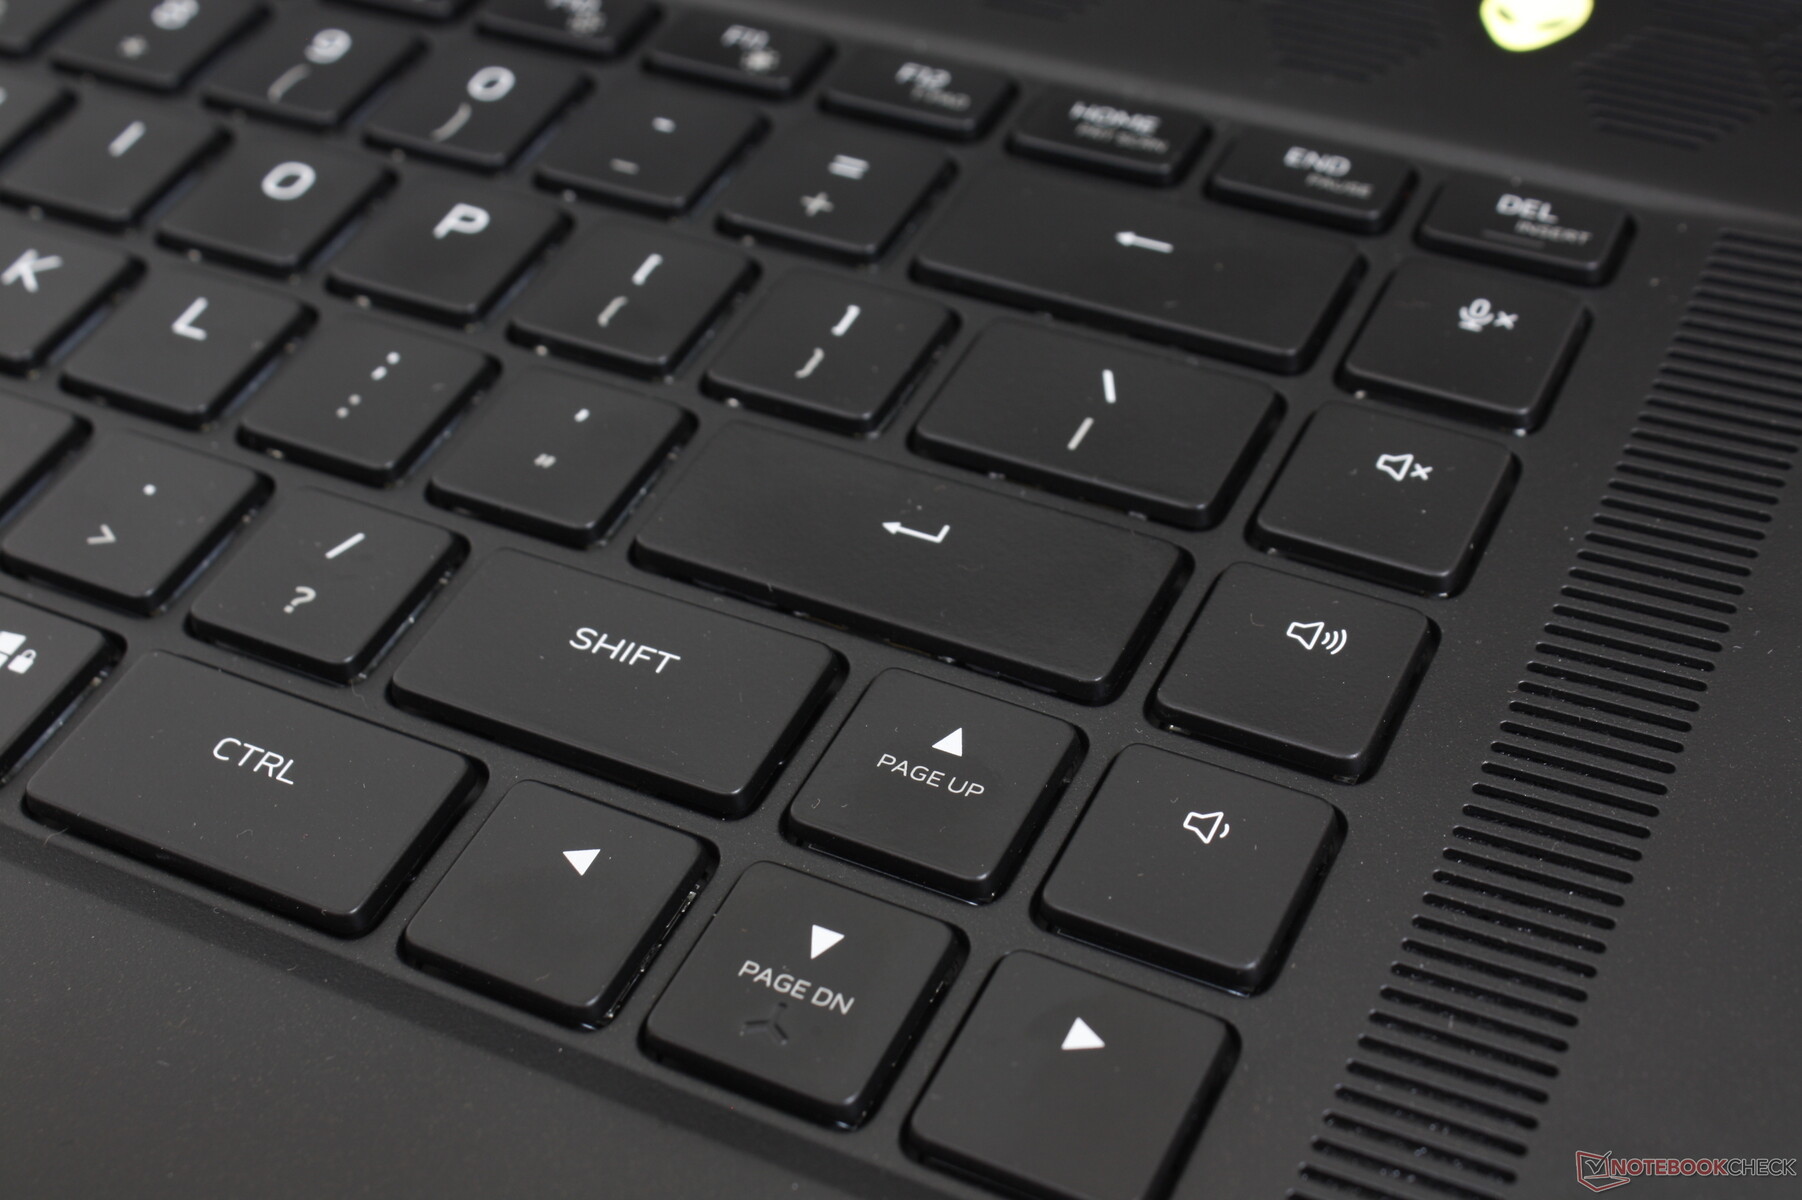
Introduzido no Alienware m17 R4 do ano passado, as chaves mecânicas CherryMX de perfil ultra-baixo voltaram no x17 R1 como uma característica opcional. Inicialmente hesitamos sobre as chaves, já que as chaves mecânicas ou ópticas têm sido, na maioria das vezes, perdidas em laptops como o MSI GT80 Titan2019 Razer Blade 15, ou Lenovo Legion Y920. Estas novas teclas CherryMX, entretanto, estão rapidamente se tornando nossas favoritas em qualquer laptop para jogos. O feedback é uniforme, mais nítido e com viagens mais profundas e um clique mais satisfatório quando comparado a laptops como o Razer Blade 17 ou o MSI GS76. As teclas por tecla RGB funcionam bem tanto para processamento de texto quanto para jogos, embora ao custo de uma grande quantidade de ruído que os colegas de quarto ou de classe podem não apreciar. Nesses cenários, recomendamos optar pelas SKUs com interruptores tradicionais baseados em membrana.
Talvez nossa maior queixa com o teclado seja que os símbolos secundários na maioria das teclas não são retroiluminados. Assim, as teclas para controle de brilho, Tela de impressão, Pausa, Inserção e mais são quase impossíveis de se ver se estão funcionando ou jogando sob pouca iluminação ambiente. Todas as teclas e símbolos estão acesas no Lâmina 17 em comparação. Note que a primeira linha de teclas de função também não são mecânicas.
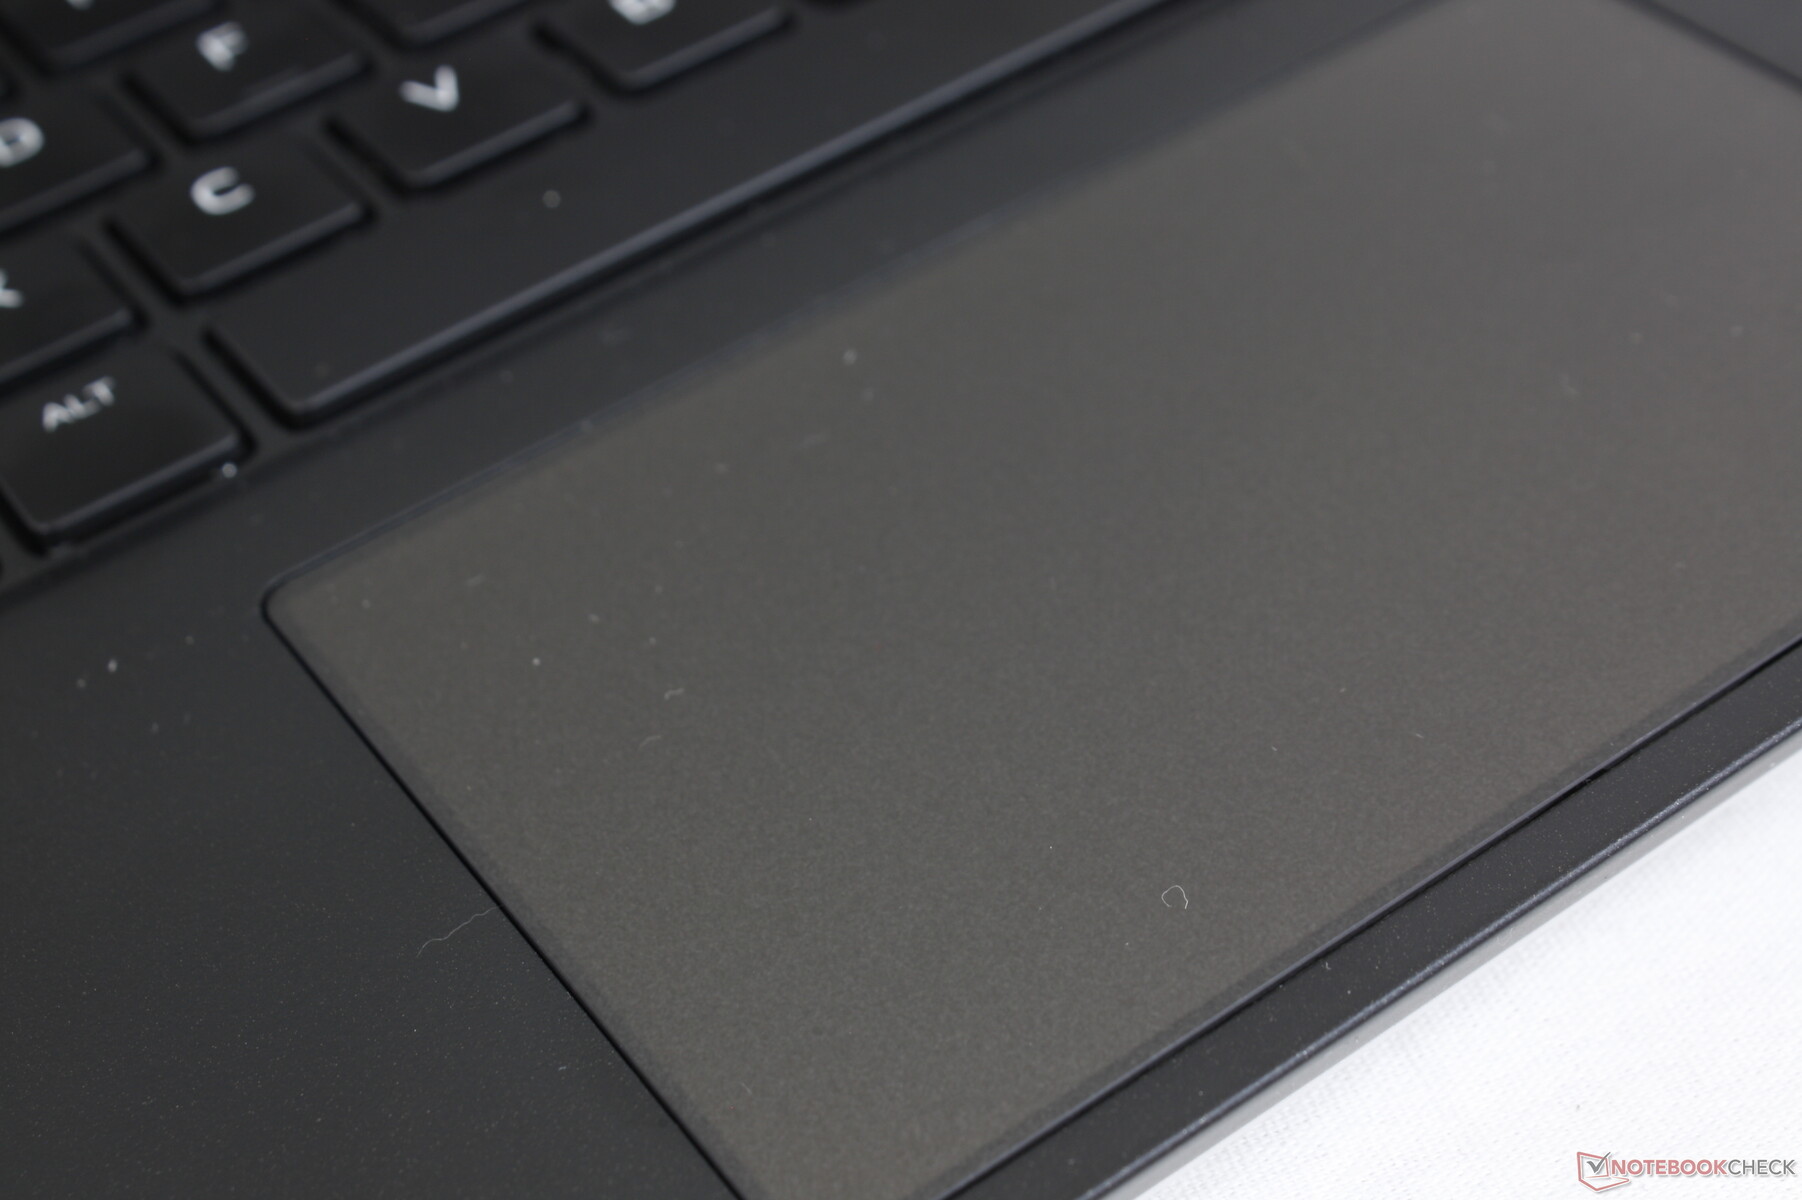
Touchpad
O clickpad Precision é relativamente pequeno em 11,3 x 6,8 cm em comparação com 14 x 6,5 cm no MSI GS75. Sua superfície é de outra forma suave ao deslizar em velocidades médias com apenas um pouco de aderência em velocidades mais lentas para cliques mais precisos. O deslocamento é muito raso e o feedback está do lado mais suave quando se pressiona para baixo. Embora uma superfície maior teria facilitado as entradas multi-toque, pelo menos o clickpad não é tão esponjoso quanto o da série Razer Blade.
A Dell oferece uma retroiluminação RGB para o clickpad em certos SKUs, que é uma opção superficial de retorno de laptops Alienware mais antigos. Este recurso não está disponível no menor Alienware de 15,6 polegadas x15 R1.

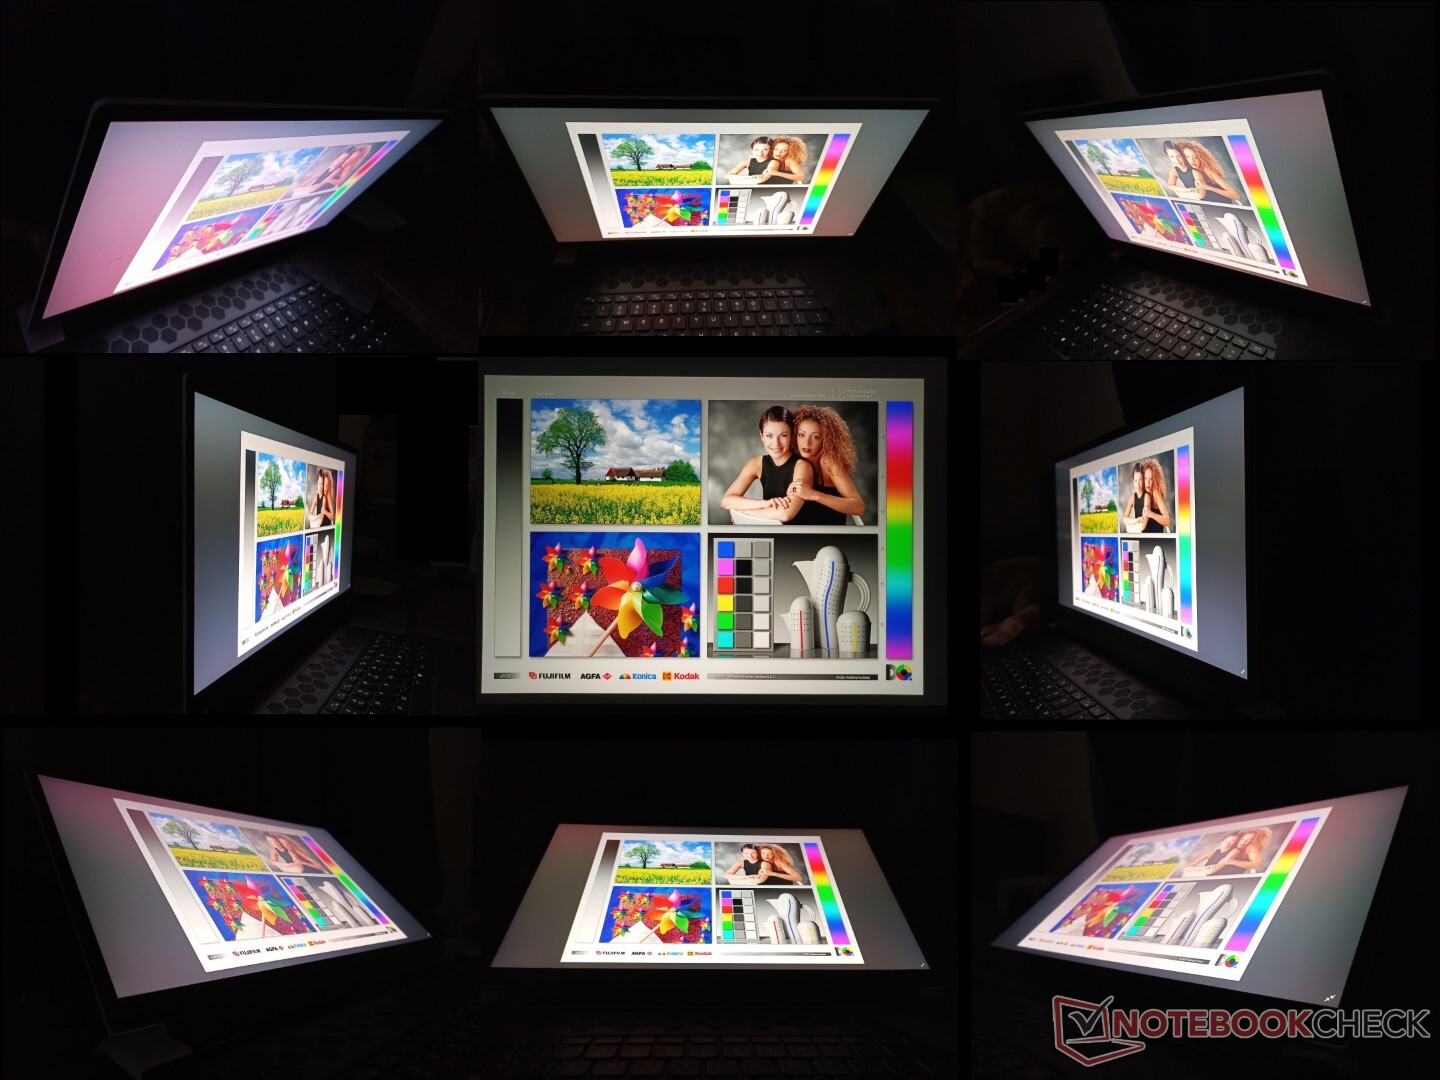
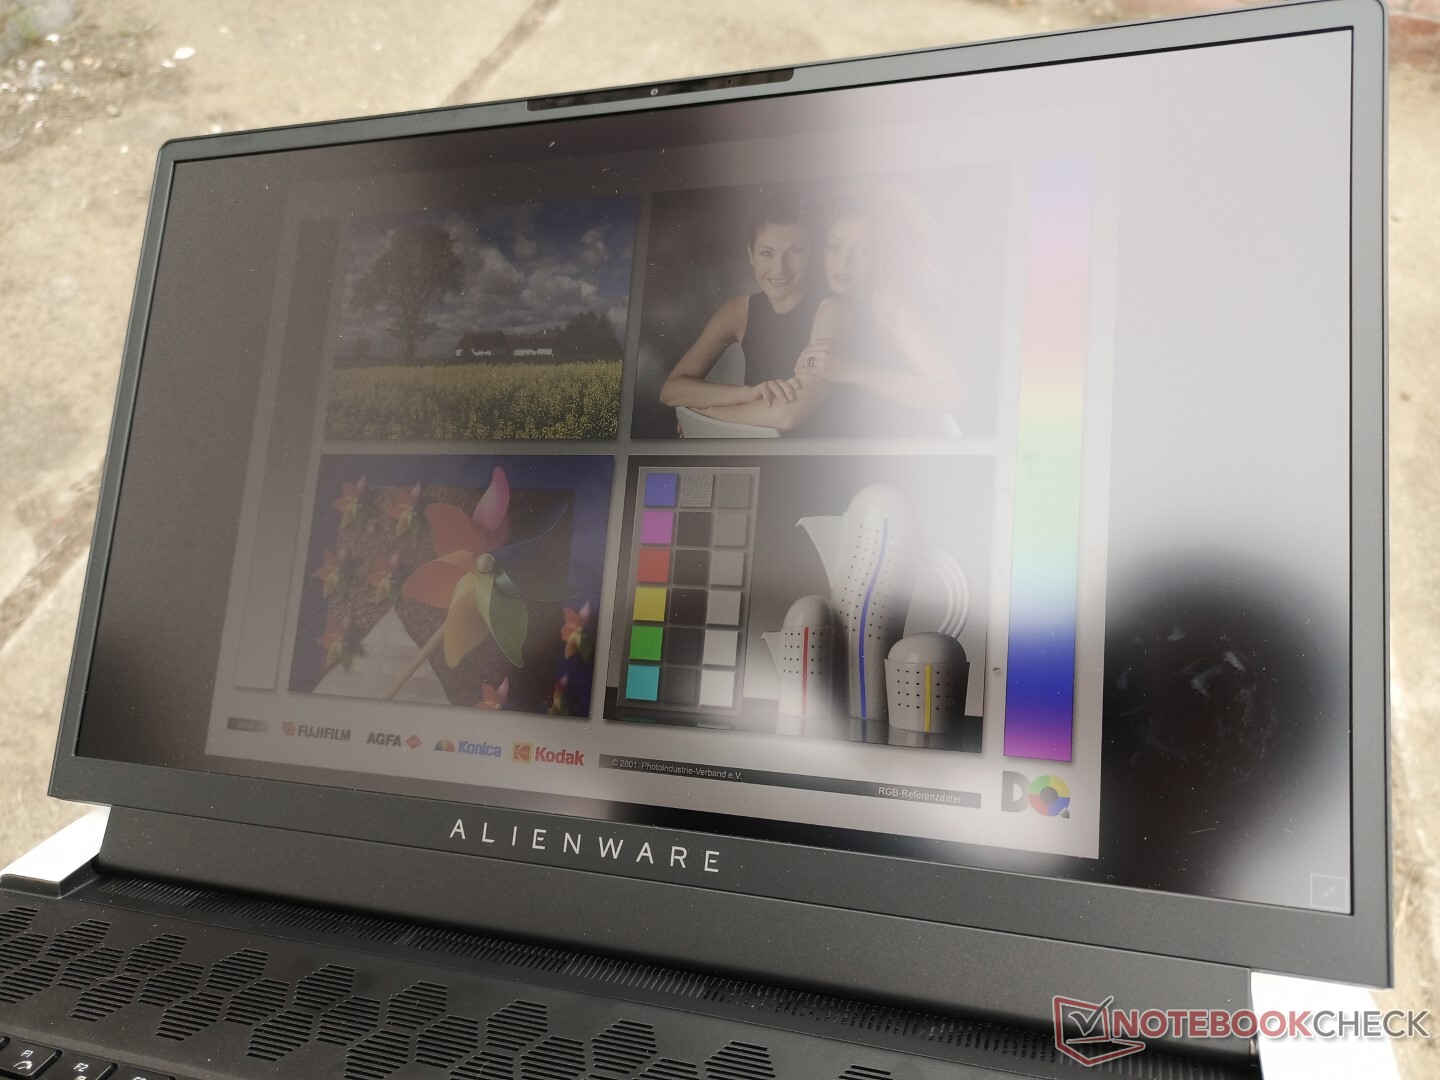
Visor - 4K, 120 Hz, 100% AdobeRGB, 5 ms
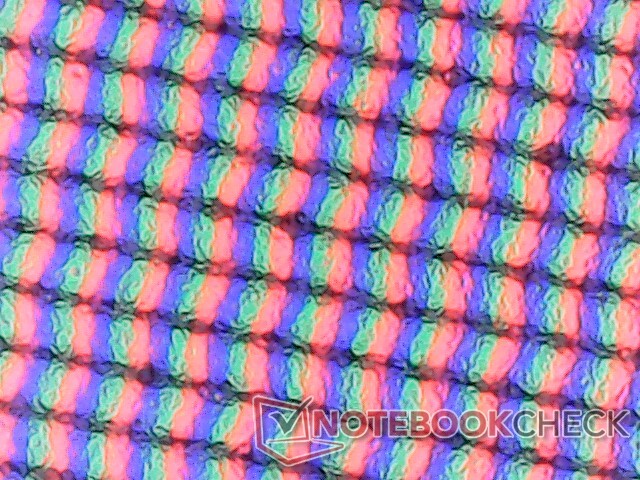
Enquanto o painel AU Optronics B173ZAN pode ser encontrado em outros laptops como oSchenker XMG Ultra 17Aquele em nosso programa alienígena tem uma taxa de atualização nativa de 120 Hz em vez de 60 Hz. Além disso, os tempos de resposta preto-branco e cinza-cinza são muito rápidos na faixa de um dígito e o brilho máximo também é visivelmente mais brilhante do que na maioria dos outros laptops de jogos. O MSI GS76 carrega um painel similar de 4K com tempos de resposta ainda mais rápidos do que nossos Alienware, embora ao custo de uma gama mais restrita. Isto faz com que o painel Alienware seja um dos poucos que vimos que aparentemente verifica todas as caixas em relação à taxa de atualização, resolução, tempos de resposta, cobertura de cores e brilho.
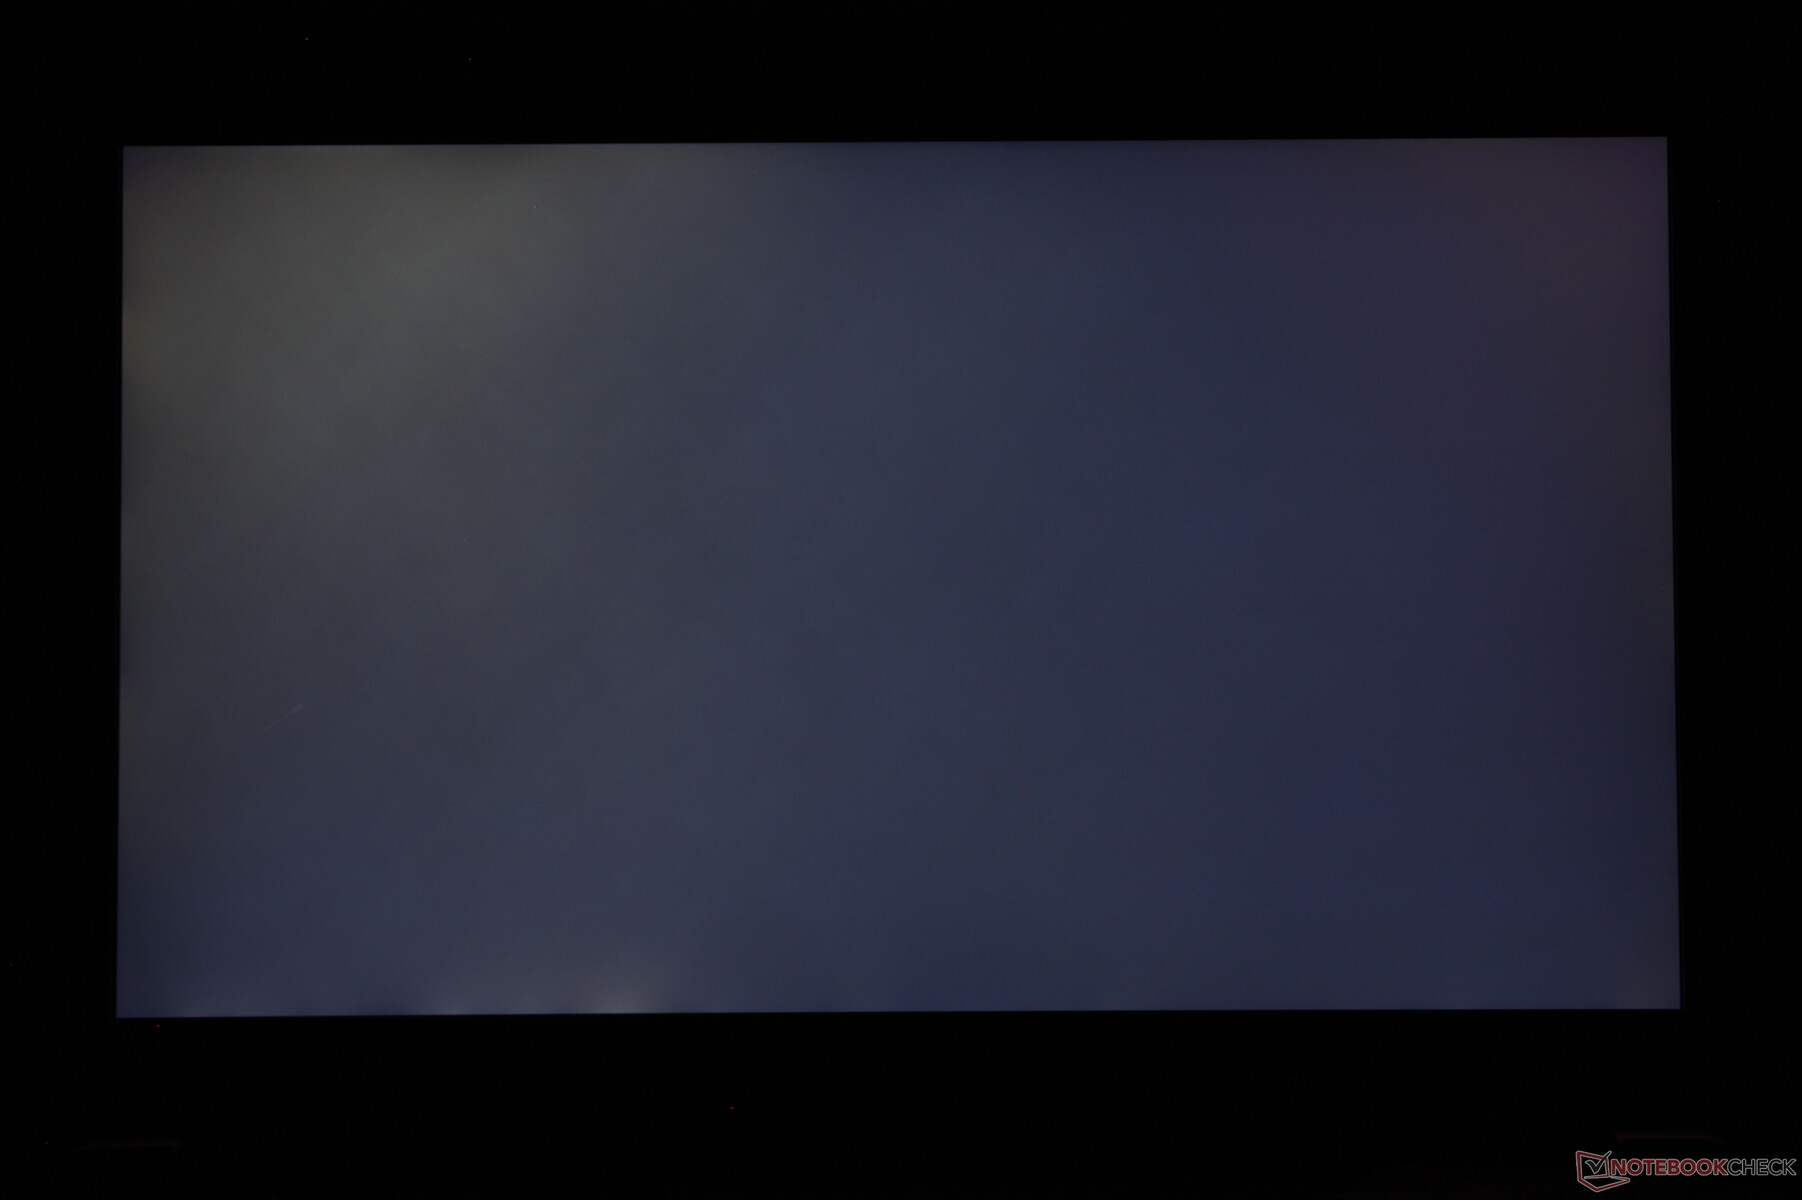
A camada fosca é ligeiramente mais granulosa do que uma alternativa brilhante e o sangramento de luz de fundo poderia ter sido melhor em nossa unidade específica. Nossas medidas abaixo refletem apenas o painel de 4K 120 Hz e não nenhuma das outras opções de visualização disponíveis para o Alienware x17, que devem ter atributos diferentes.
Note que o Advanced Optimus só está disponível em SKUs FHD 360 Hz. Outras SKUs como a nossa têm Optimus 1.0 com uma opção manual de GPU discreta na BIOS.
| |||||||||||||||||||||||||
iluminação: 91 %
iluminação com acumulador: 438.7 cd/m²
Contraste: 914:1 (Preto: 0.48 cd/m²)
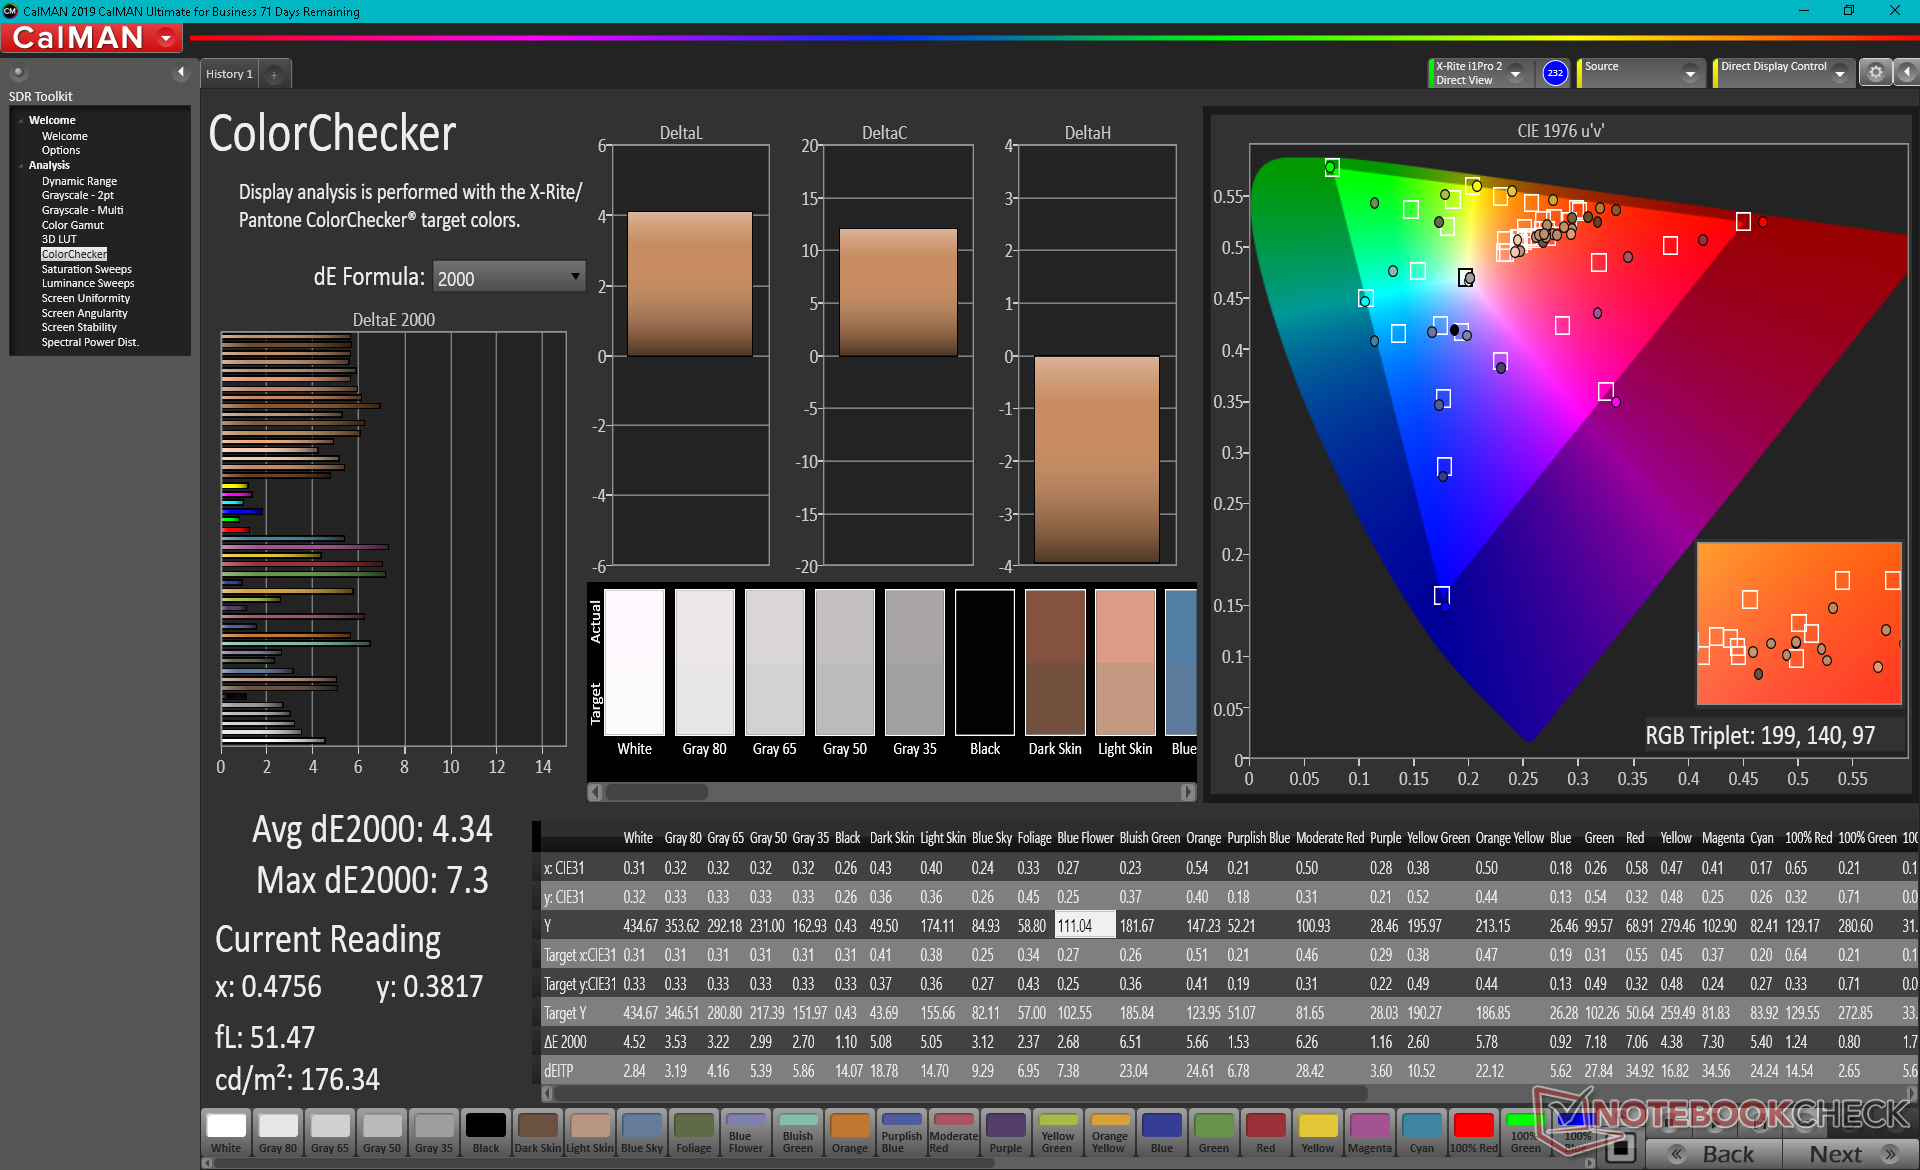
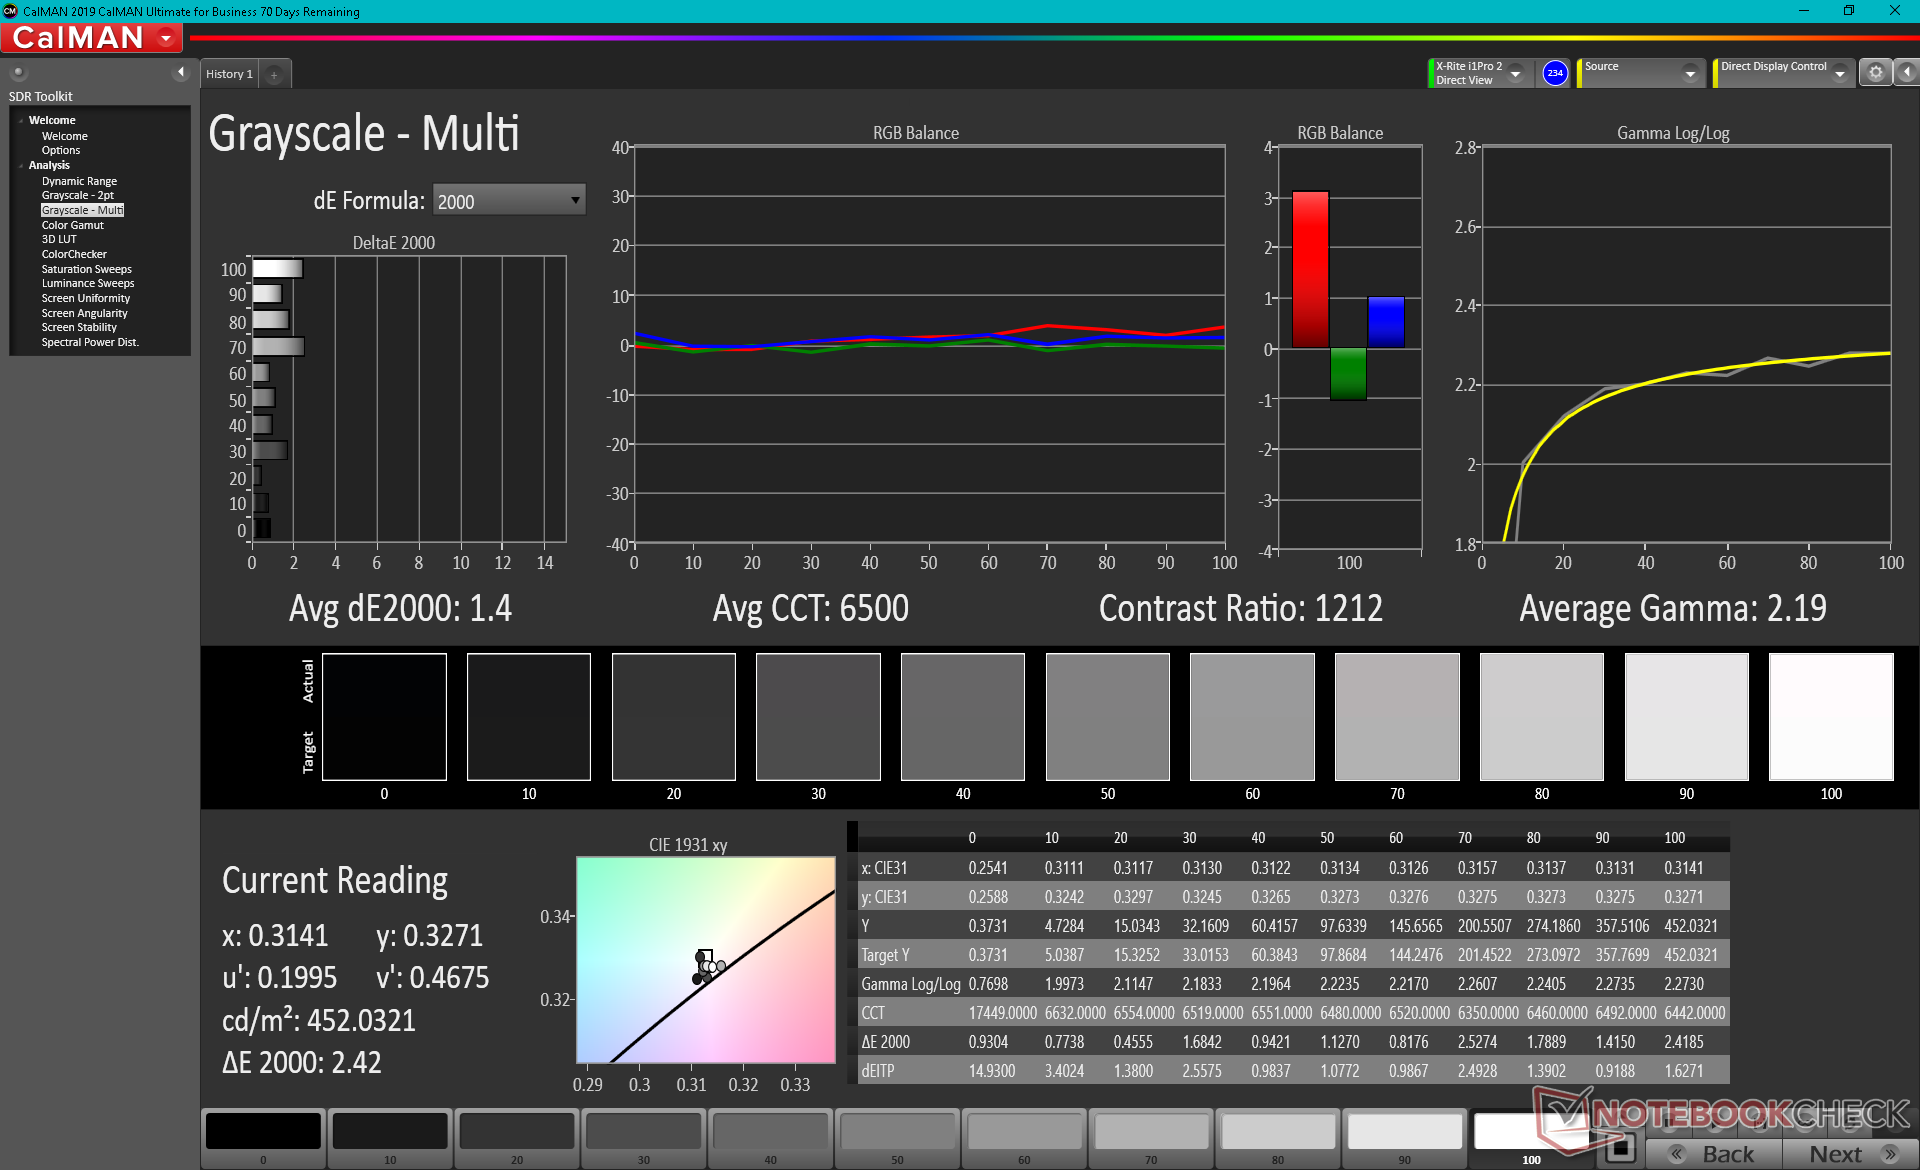
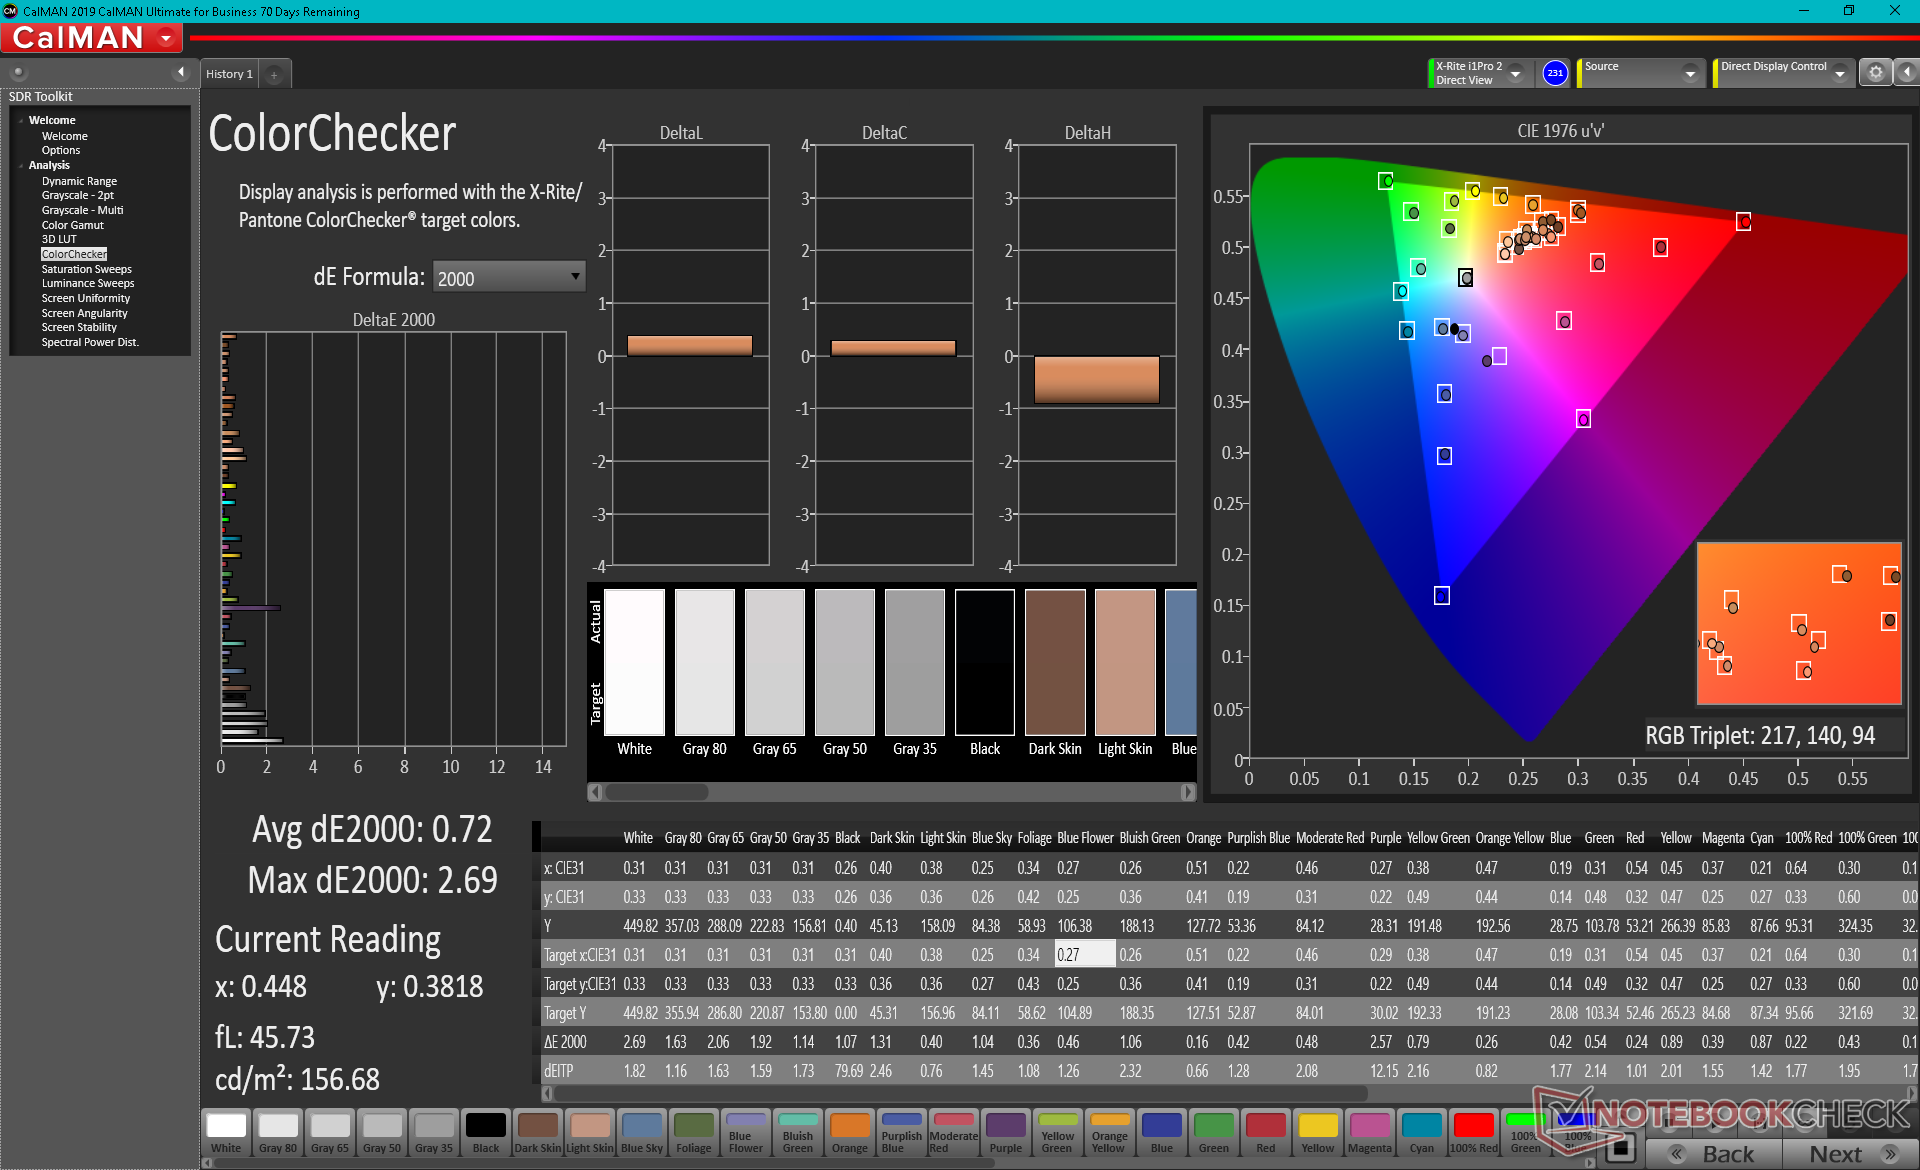
ΔE ColorChecker Calman: 4.34 | ∀{0.5-29.43 Ø4.72}
calibrated: 0.72
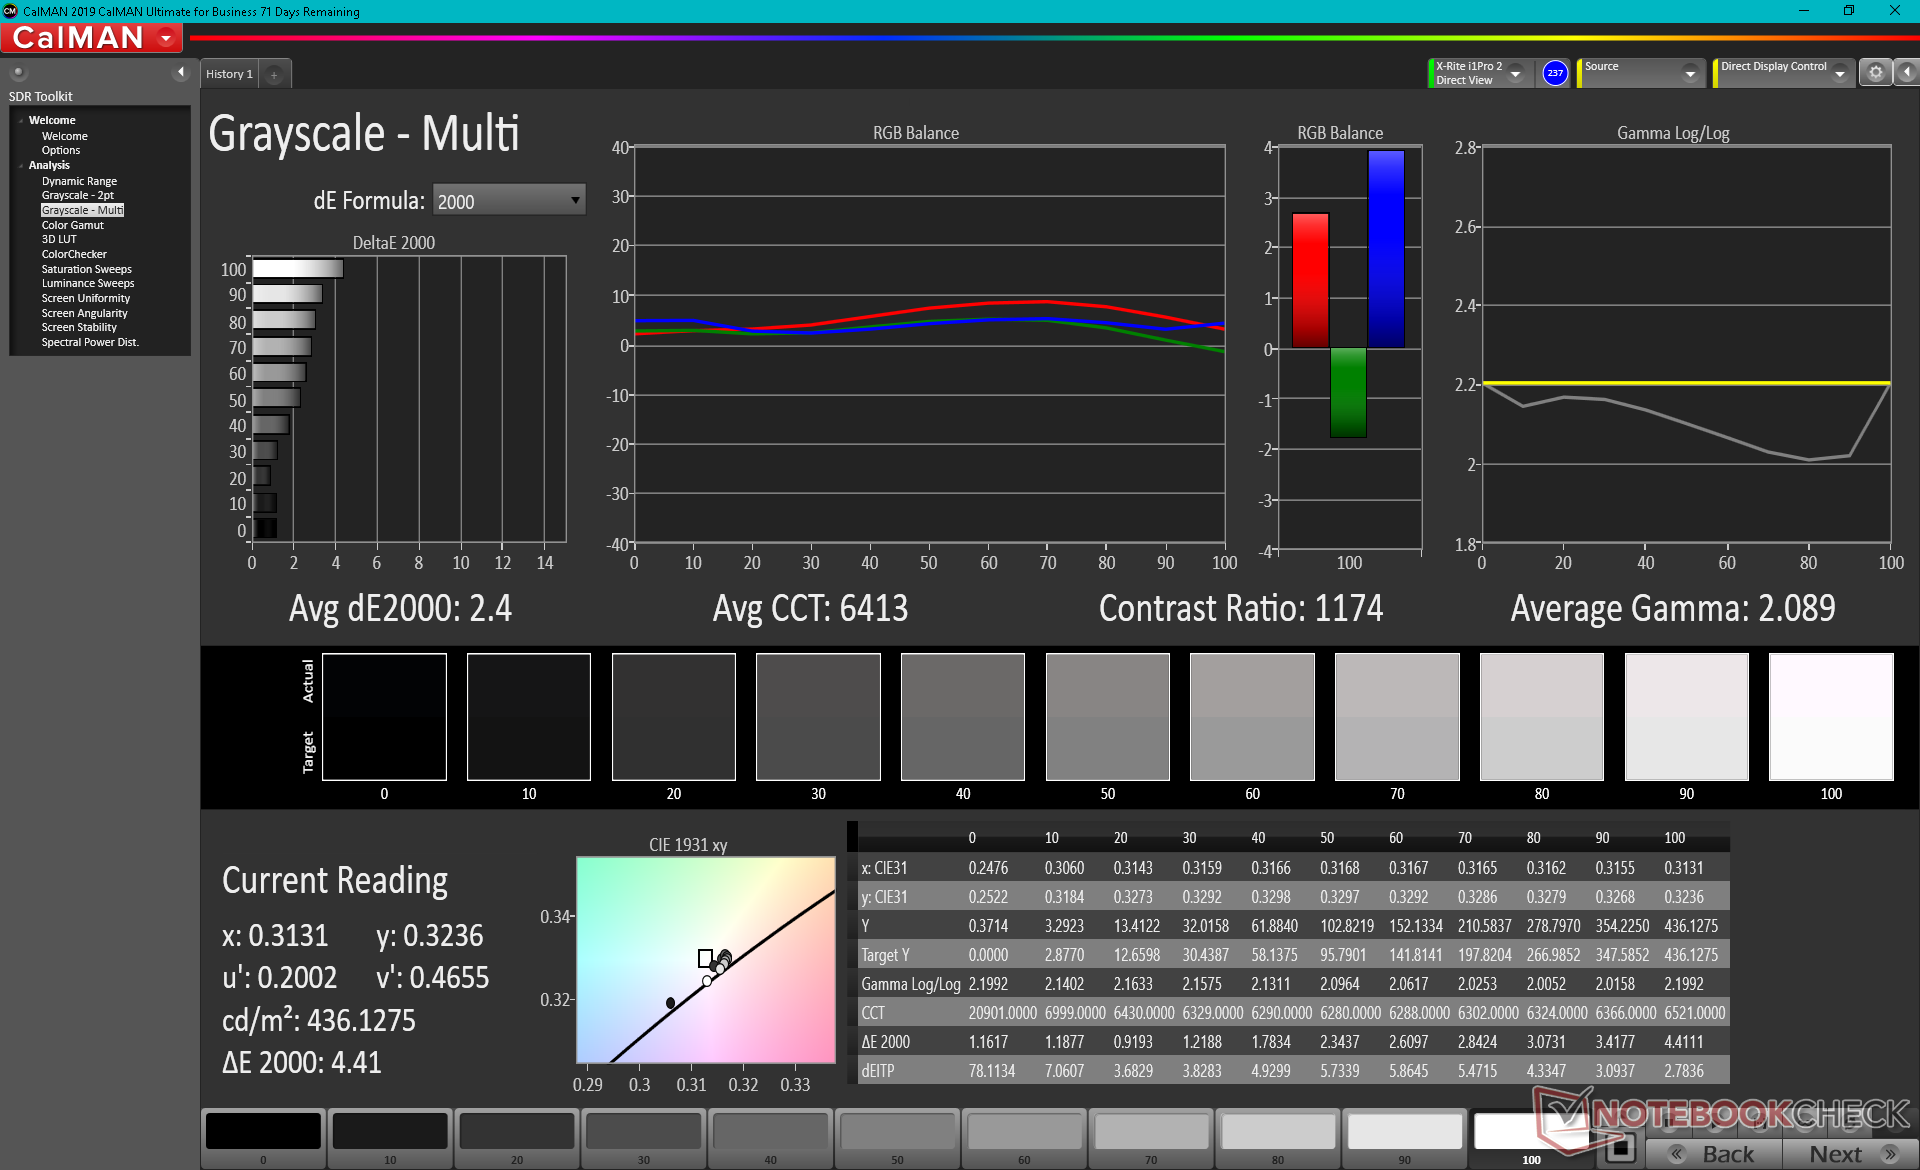
ΔE Greyscale Calman: 2.4 | ∀{0.09-98 Ø4.97}
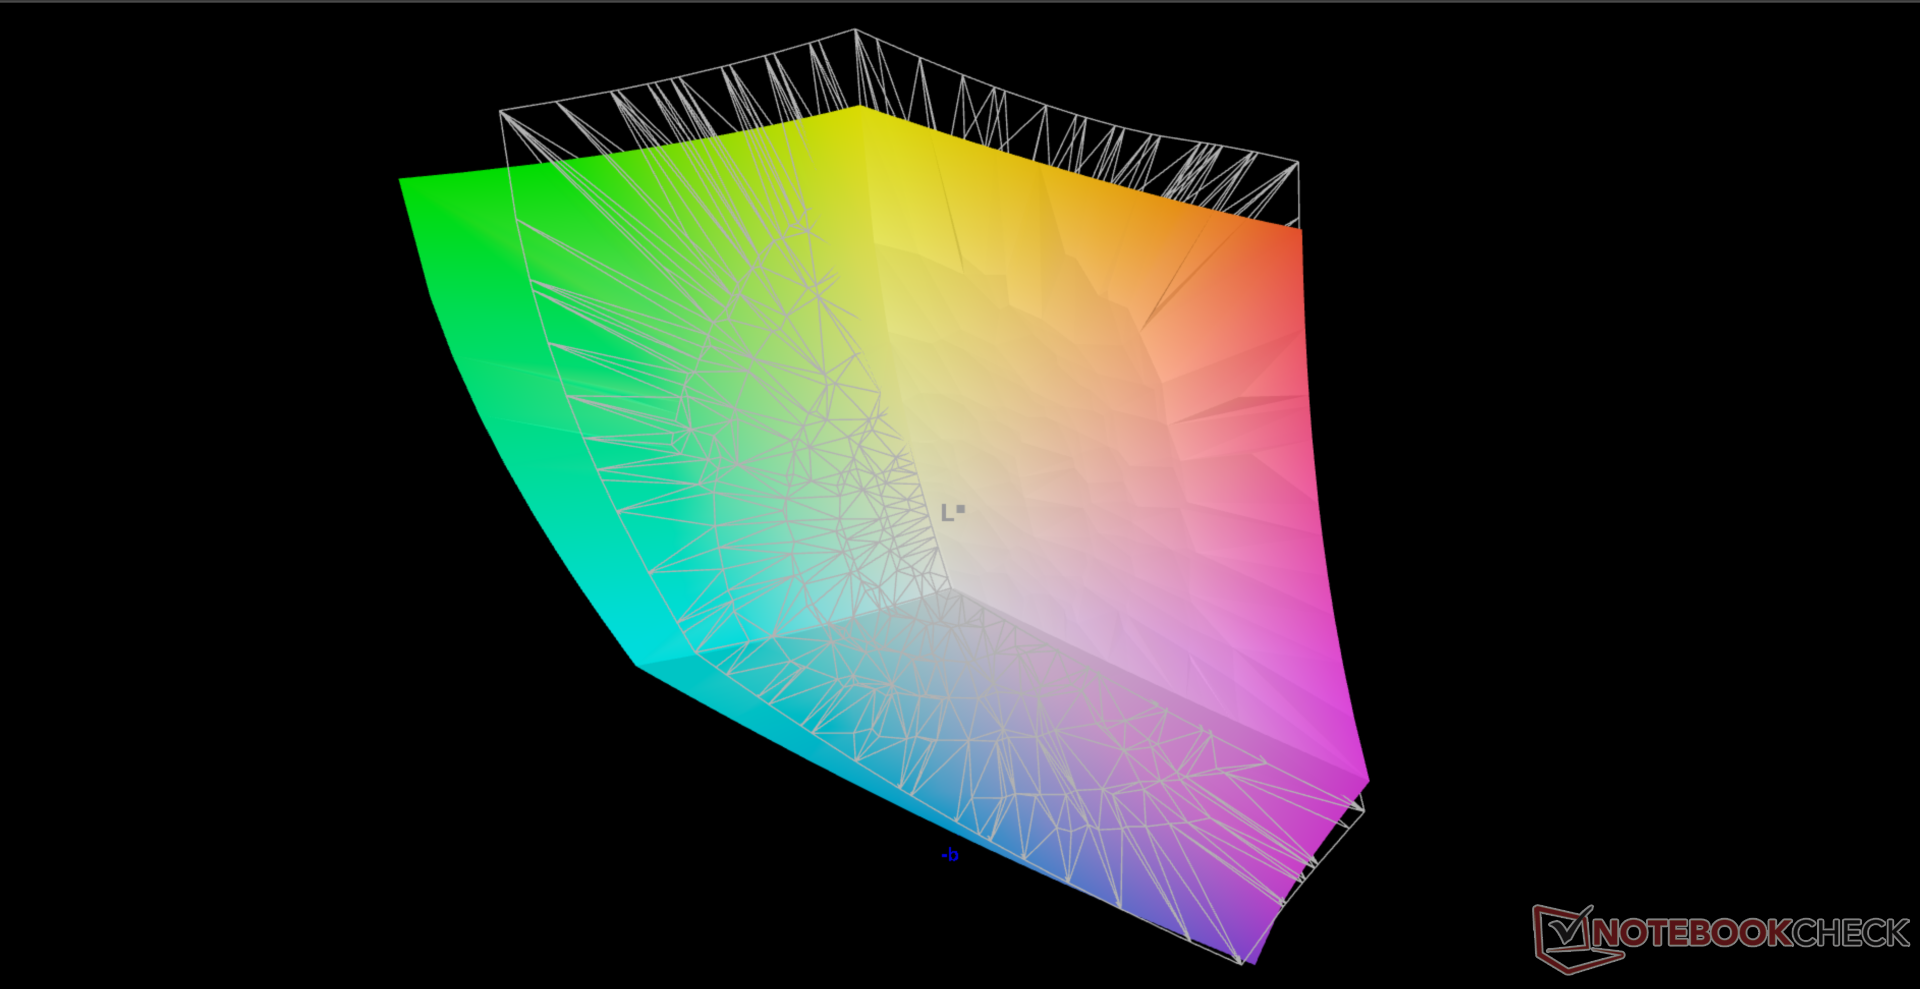
100% AdobeRGB 1998 (Argyll 3D)
100% sRGB (Argyll 3D)
88.3% Display P3 (Argyll 3D)
Gamma: 2.09
CCT: 6413 K
| Alienware x17 RTX 3080 P48E AU Optronics B173ZAN, IPS, 17.3", 3840x2160 | Alienware m17 R4 AU Optronics AUOEC91, IPS, 17.3", 1920x1080 | Razer Blade 17 RTX 3070 AU Optronics B173HAN05.4, IPS, 17.3", 1920x1080 | Asus ROG Zephyrus S17 GX703HSD BOE099D (BOE CQ NE173QHM-NY3), IPS, 17.3", 2560x1440 | MSI GS76 Stealth 11UH AUO B173ZAN06.1 (AUODE95), IPS, 17.3", 3840x2160 | Gigabyte Aero 17 HDR YD AU Optronics AUO329B, IPS, 17.3", 3840x2160 | |
|---|---|---|---|---|---|---|
| Display | -16% | -15% | -3% | -23% | -1% | |
| Display P3 Coverage (%) | 88.3 | 69.8 -21% | 71.7 -19% | 94.2 7% | 63 -29% | 86.9 -2% |
| sRGB Coverage (%) | 100 | 99.7 0% | 98.8 -1% | 98.7 -1% | 94.8 -5% | 100 0% |
| AdobeRGB 1998 Coverage (%) | 100 | 71.6 -28% | 73.6 -26% | 84.4 -16% | 65 -35% | 99.6 0% |
| Response Times | 10% | 43% | 45% | 39% | -206% | |
| Response Time Grey 50% / Grey 80% * (ms) | 14.4 ? | 13.2 ? 8% | 4.2 ? 71% | 4.8 67% | 8.8 ? 39% | 52 ? -261% |
| Response Time Black / White * (ms) | 10.4 ? | 9.2 ? 12% | 8.8 ? 15% | 8 23% | 6.4 ? 38% | 26 ? -150% |
| PWM Frequency (Hz) | ||||||
| Screen | 21% | -44% | -19% | 9% | 30% | |
| Brightness middle (cd/m²) | 438.7 | 305 -30% | 323.3 -26% | 322 -27% | 474 8% | 488 11% |
| Brightness (cd/m²) | 435 | 301 -31% | 315 -28% | 288 -34% | 454 4% | 467 7% |
| Brightness Distribution (%) | 91 | 93 2% | 91 0% | 72 -21% | 88 -3% | 86 -5% |
| Black Level * (cd/m²) | 0.48 | 0.19 60% | 0.33 31% | 0.3 37% | 0.46 4% | 0.33 31% |
| Contrast (:1) | 914 | 1605 76% | 980 7% | 1073 17% | 1030 13% | 1479 62% |
| Colorchecker dE 2000 * | 4.34 | 1.31 70% | 4.59 -6% | 3.05 30% | 1.5 65% | 1.23 72% |
| Colorchecker dE 2000 max. * | 7.3 | 2.32 68% | 10.82 -48% | 5.23 28% | 5.59 23% | 2.94 60% |
| Colorchecker dE 2000 calibrated * | 0.72 | 0.91 -26% | 1.4 -94% | 1.92 -167% | 0.86 -19% | 0.77 -7% |
| Greyscale dE 2000 * | 2.4 | 2.3 4% | 7.9 -229% | 3.11 -30% | 2.8 -17% | 1.5 37% |
| Gamma | 2.09 105% | 2.281 96% | 2.28 96% | 2.13 103% | 2.158 102% | 2.169 101% |
| CCT | 6413 101% | 6449 101% | 5941 109% | 6553 99% | 6597 99% | 6614 98% |
| Color Space (Percent of AdobeRGB 1998) (%) | 72 | 84 | 99 | |||
| Color Space (Percent of sRGB) (%) | 94 | 99 | 99 | |||
| Média Total (Programa/Configurações) | 5% /
12% | -5% /
-25% | 8% /
-6% | 8% /
6% | -59% /
-10% |
* ... menor é melhor
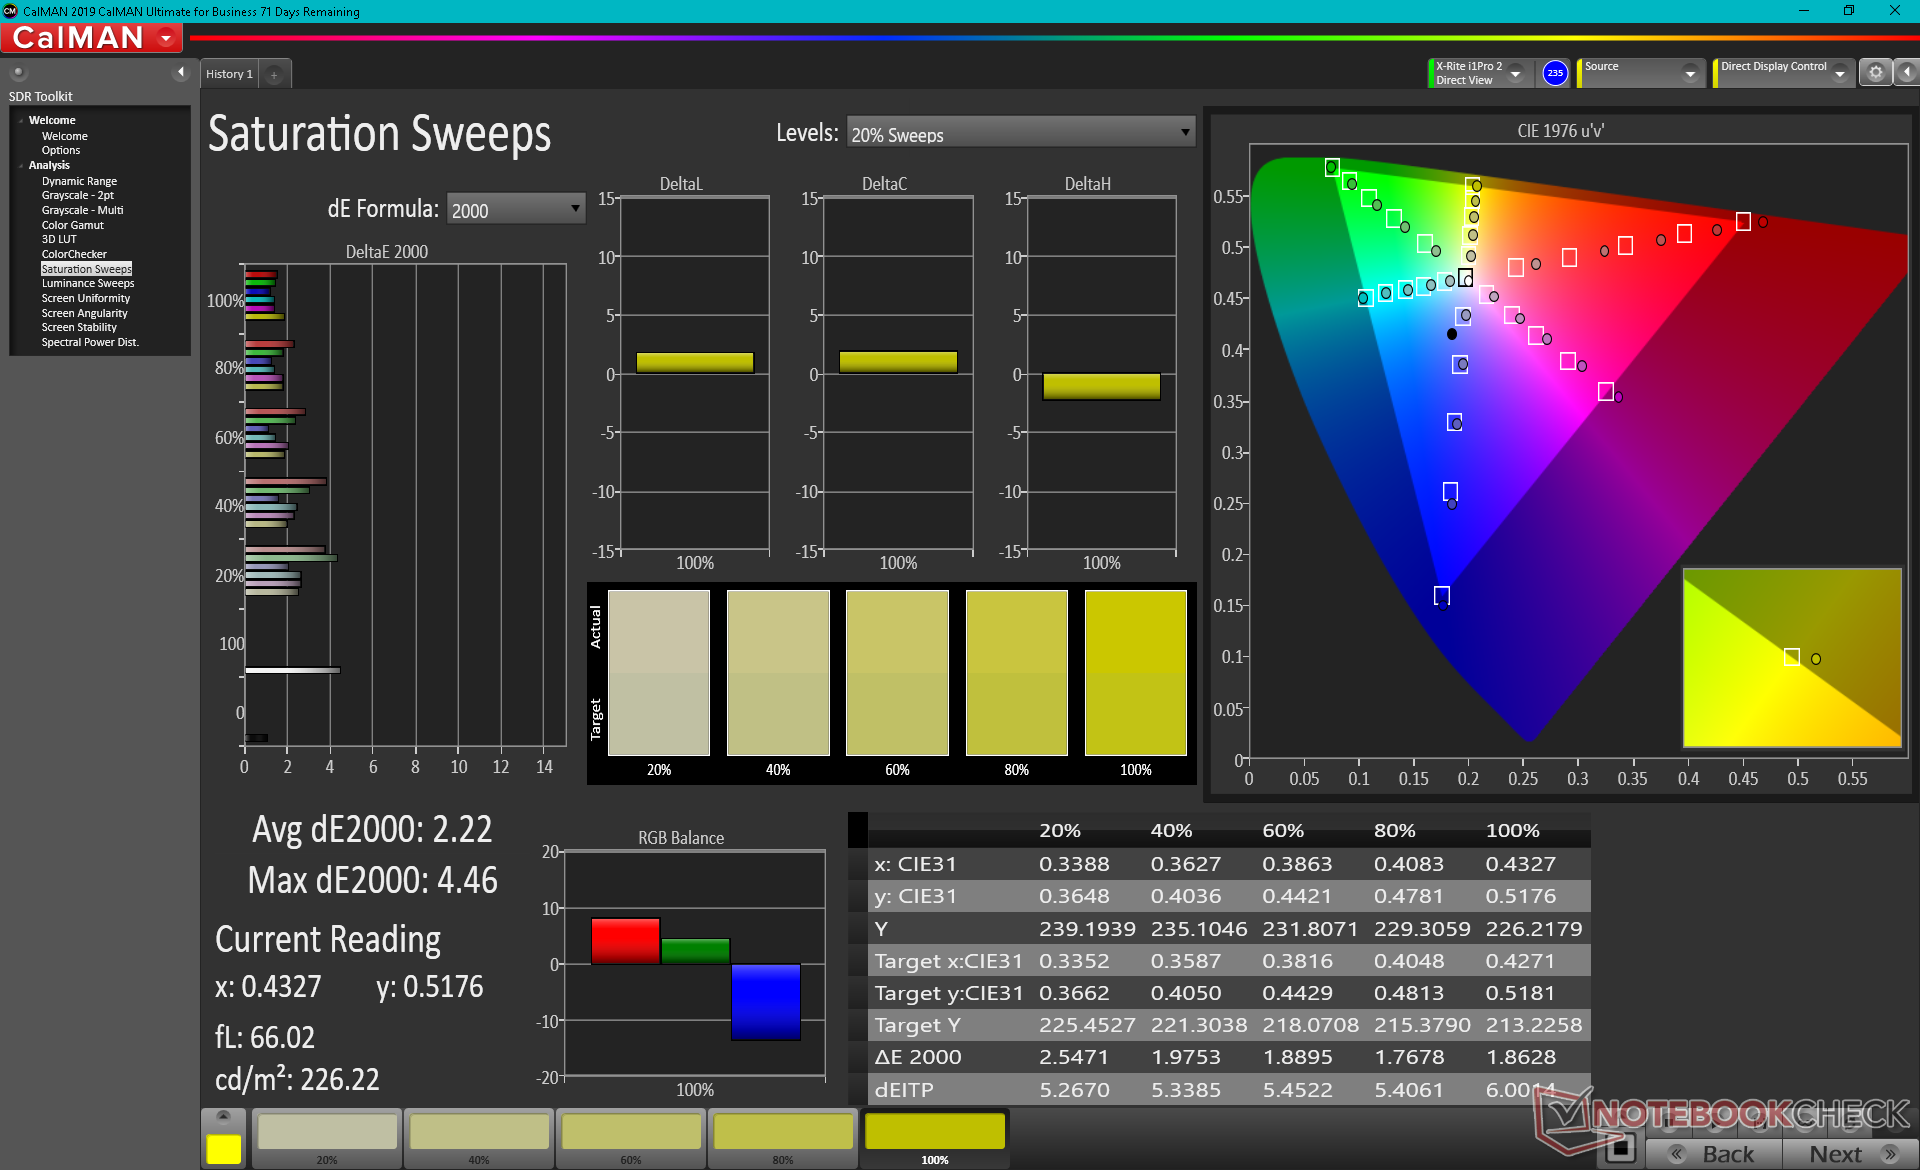
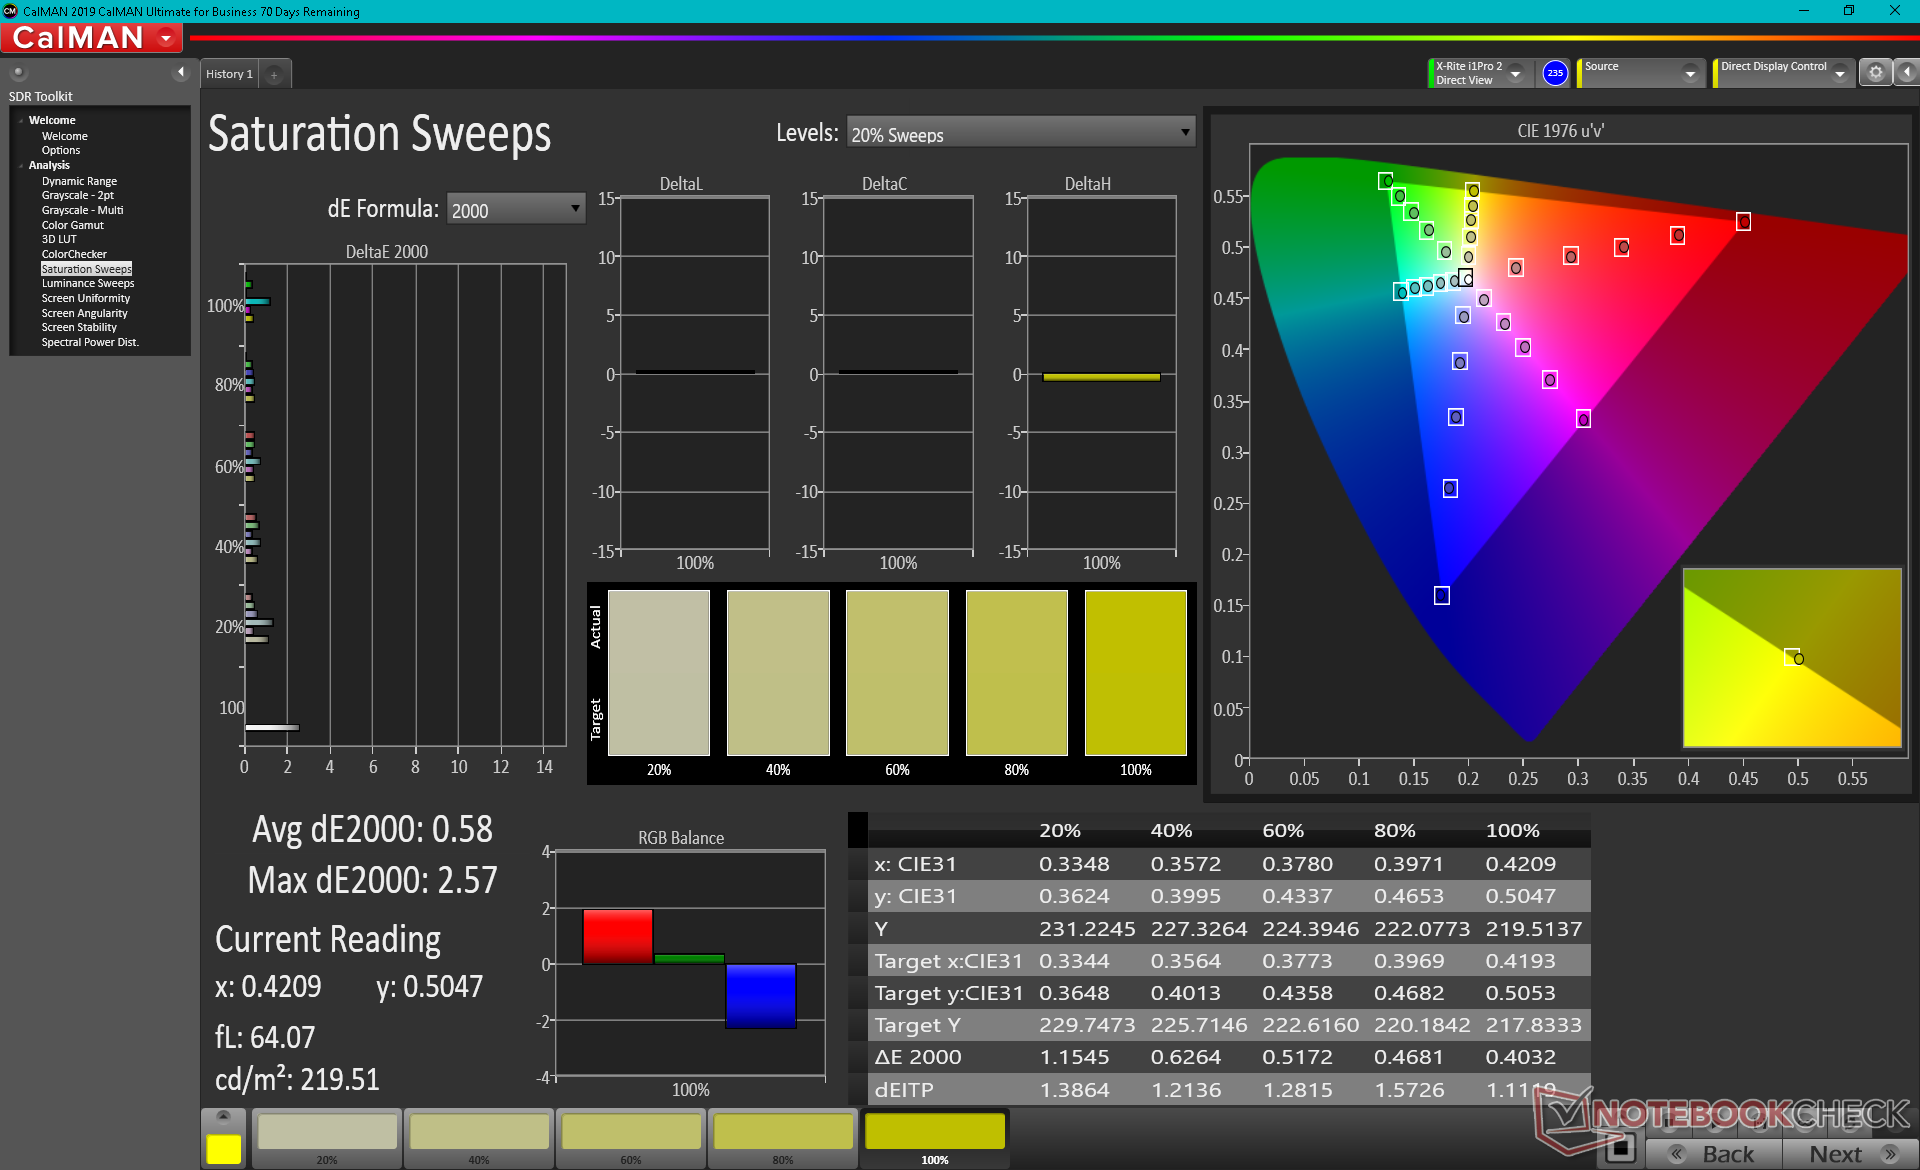
O espaço de cores abrange todo o sRGB e AdobeRGB, conforme anunciado pelo fabricante, enquanto a cobertura do DCI-P3 é de aproximadamente 88%. As cores profundas, os tempos de resposta rápidos e a taxa de atualização rápida tornam este painel de 4K adequado tanto para jogos quanto para edição gráfica.
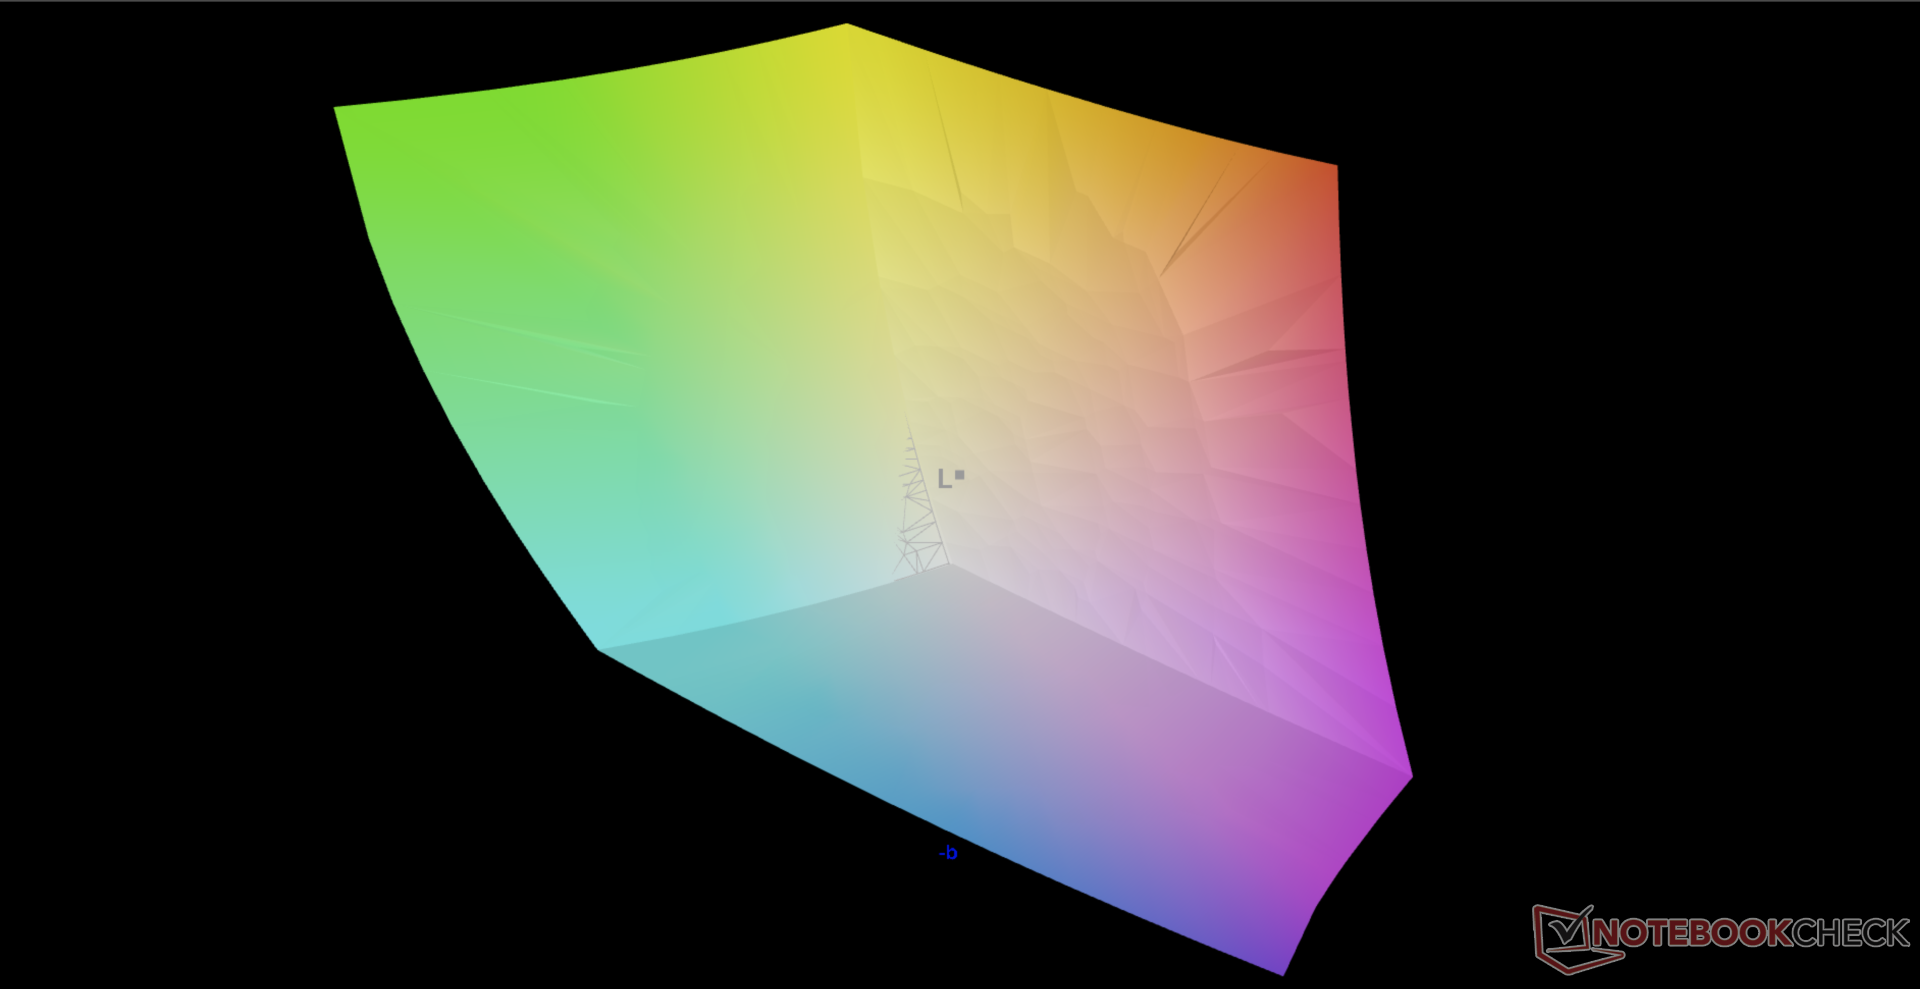
As medidas do colorímetro X-Rite mostram que o display está decentemente calibrado fora da caixa com valores médios de tons de cinza e DeltaE de apenas 2,4 e 4,34, respectivamente, quando comparado com o padrão AdobeRGB. Ajustar o display para sRGB e depois calibrar suas cores resultaria em excelentes valores DeltaE de menos de 2 em toda a linha.
Exibir tempos de resposta
| ↔ Tempo de resposta preto para branco | ||
|---|---|---|
| 10.4 ms ... ascensão ↗ e queda ↘ combinadas | ↗ 5.2 ms ascensão | 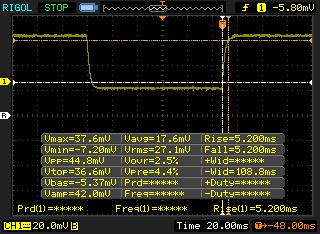 |
| ↘ 5.2 ms queda | ||
| A tela mostra boas taxas de resposta em nossos testes, mas pode ser muito lenta para jogadores competitivos. Em comparação, todos os dispositivos testados variam de 0.1 (mínimo) a 240 (máximo) ms. » 28 % de todos os dispositivos são melhores. Isso significa que o tempo de resposta medido é melhor que a média de todos os dispositivos testados (19.8 ms). | ||
| ↔ Tempo de resposta 50% cinza a 80% cinza | ||
| 14.4 ms ... ascensão ↗ e queda ↘ combinadas | ↗ 7.6 ms ascensão | 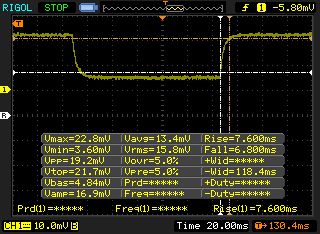 |
| ↘ 6.8 ms queda | ||
| A tela mostra boas taxas de resposta em nossos testes, mas pode ser muito lenta para jogadores competitivos. Em comparação, todos os dispositivos testados variam de 0.165 (mínimo) a 636 (máximo) ms. » 28 % de todos os dispositivos são melhores. Isso significa que o tempo de resposta medido é melhor que a média de todos os dispositivos testados (31 ms). | ||
Cintilação da tela / PWM (modulação por largura de pulso)
| Tela tremeluzindo / PWM não detectado | 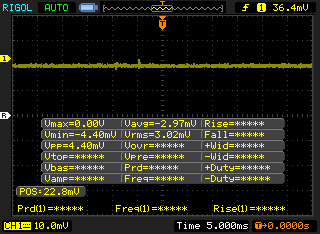 | ||
[pwm_comparison] Em comparação: 52 % de todos os dispositivos testados não usam PWM para escurecer a tela. Se PWM foi detectado, uma média de 7763 (mínimo: 5 - máximo: 343500) Hz foi medida. | |||
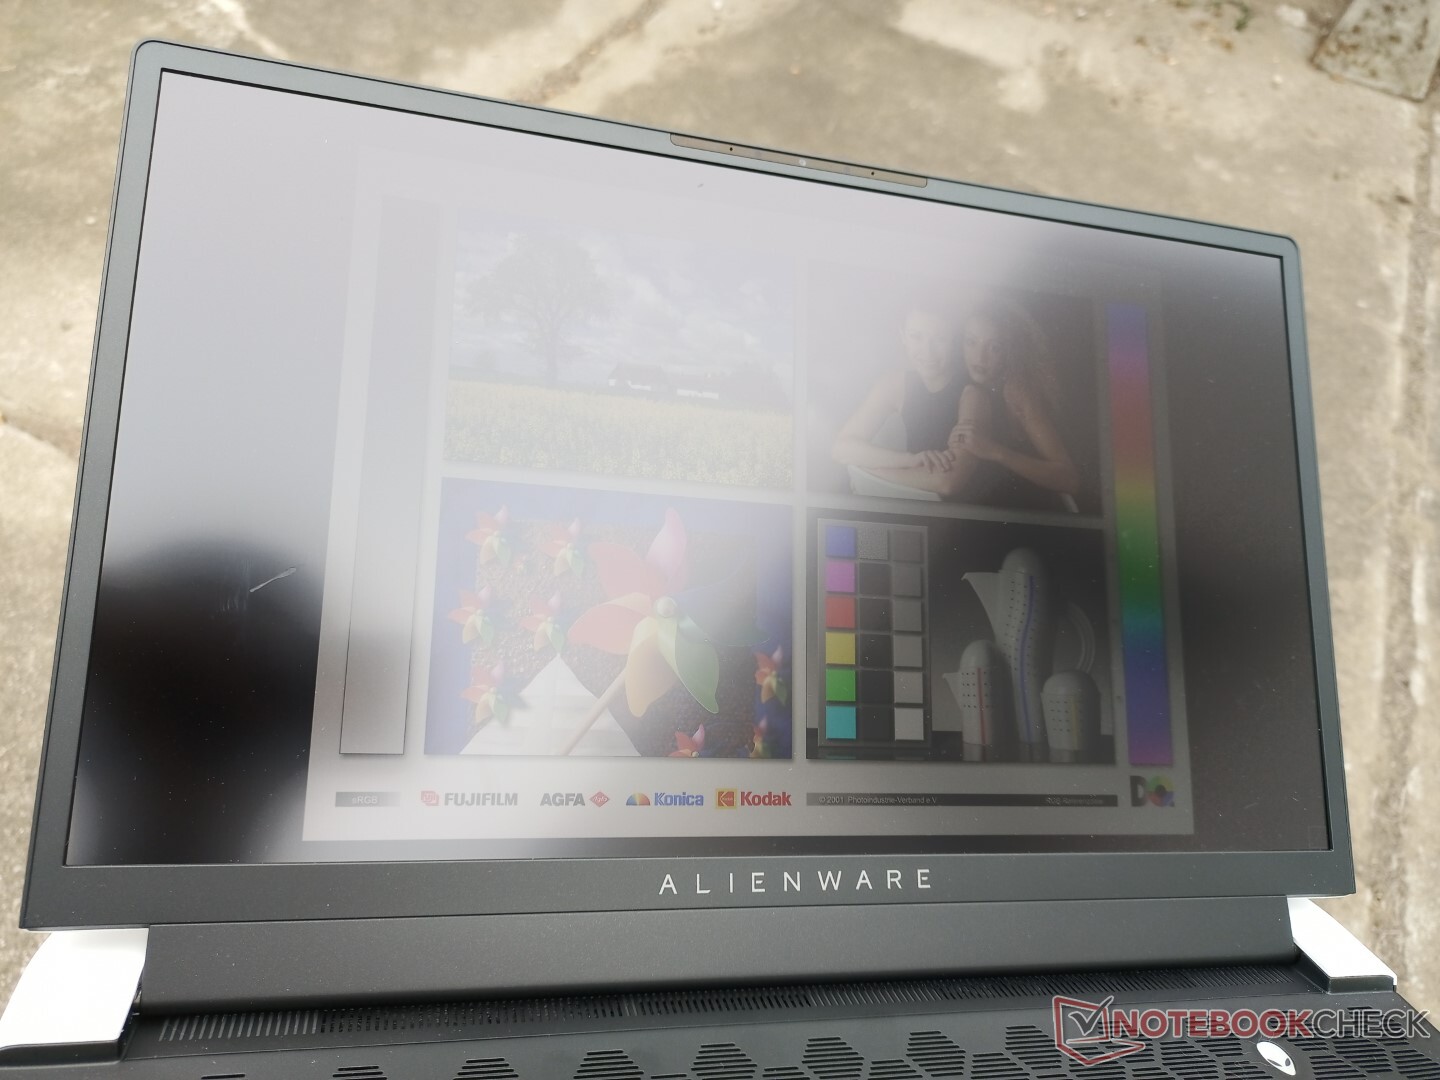
A visibilidade ao ar livre é ligeiramente melhor do que em muitos outros laptops de jogo de 17,3 polegadas, uma vez que o visor de 400-nit mate é mais brilhante do que o alvo típico de 300-nit. O peso pesado e o tamanho são difíceis de ignorar, no entanto, por isso é provável que você queira trabalhar em uma mesa plana, independentemente do ambiente.

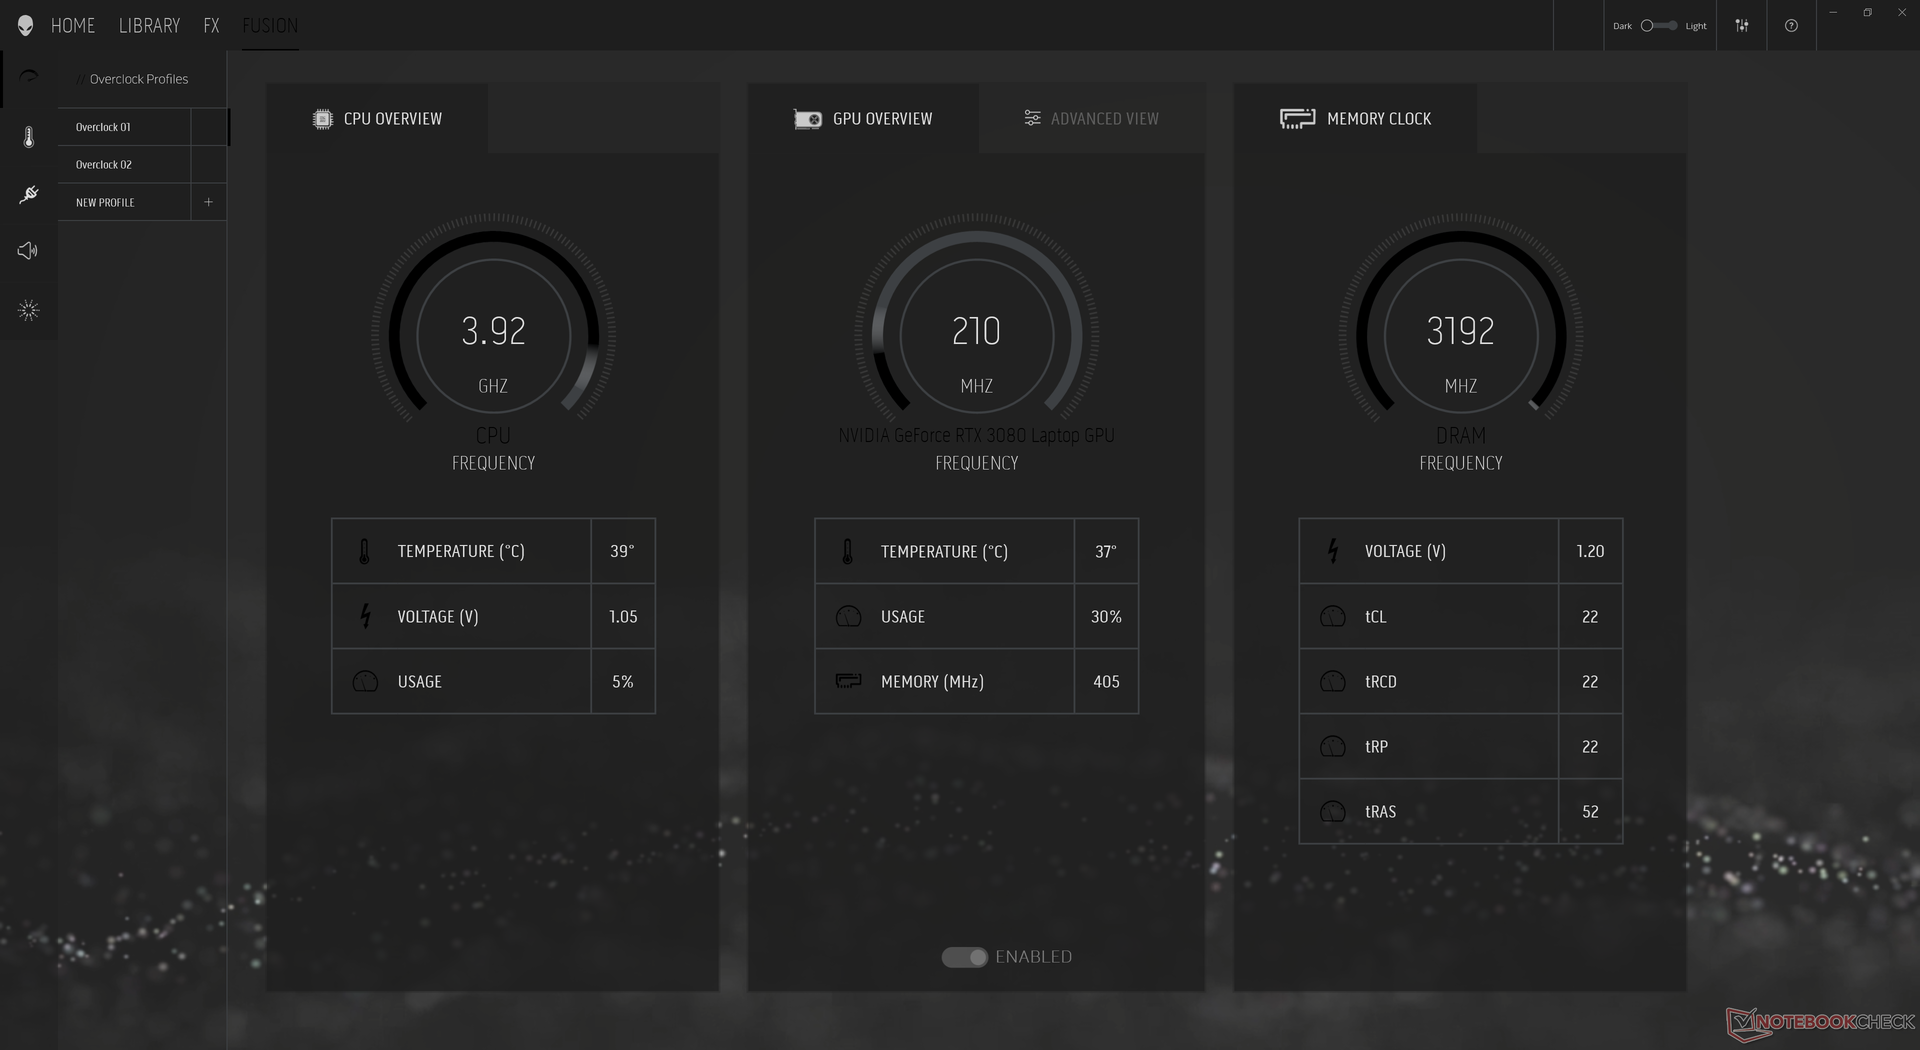
Desempenho - Taxas de Relógio de Processador Impressionantes
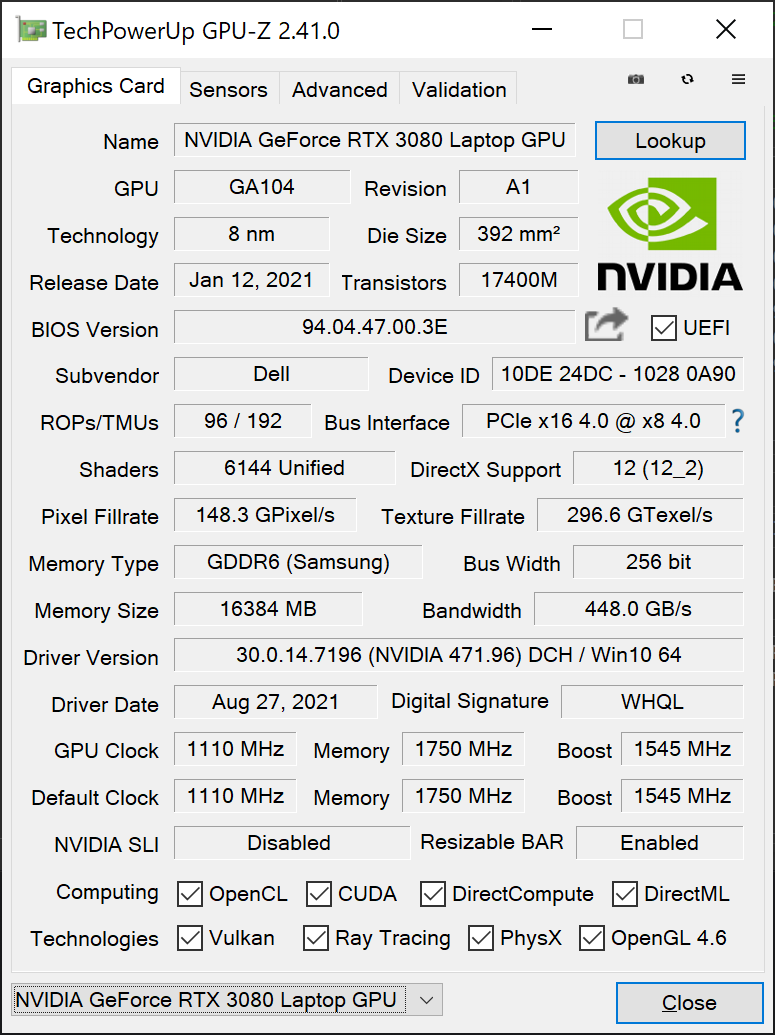
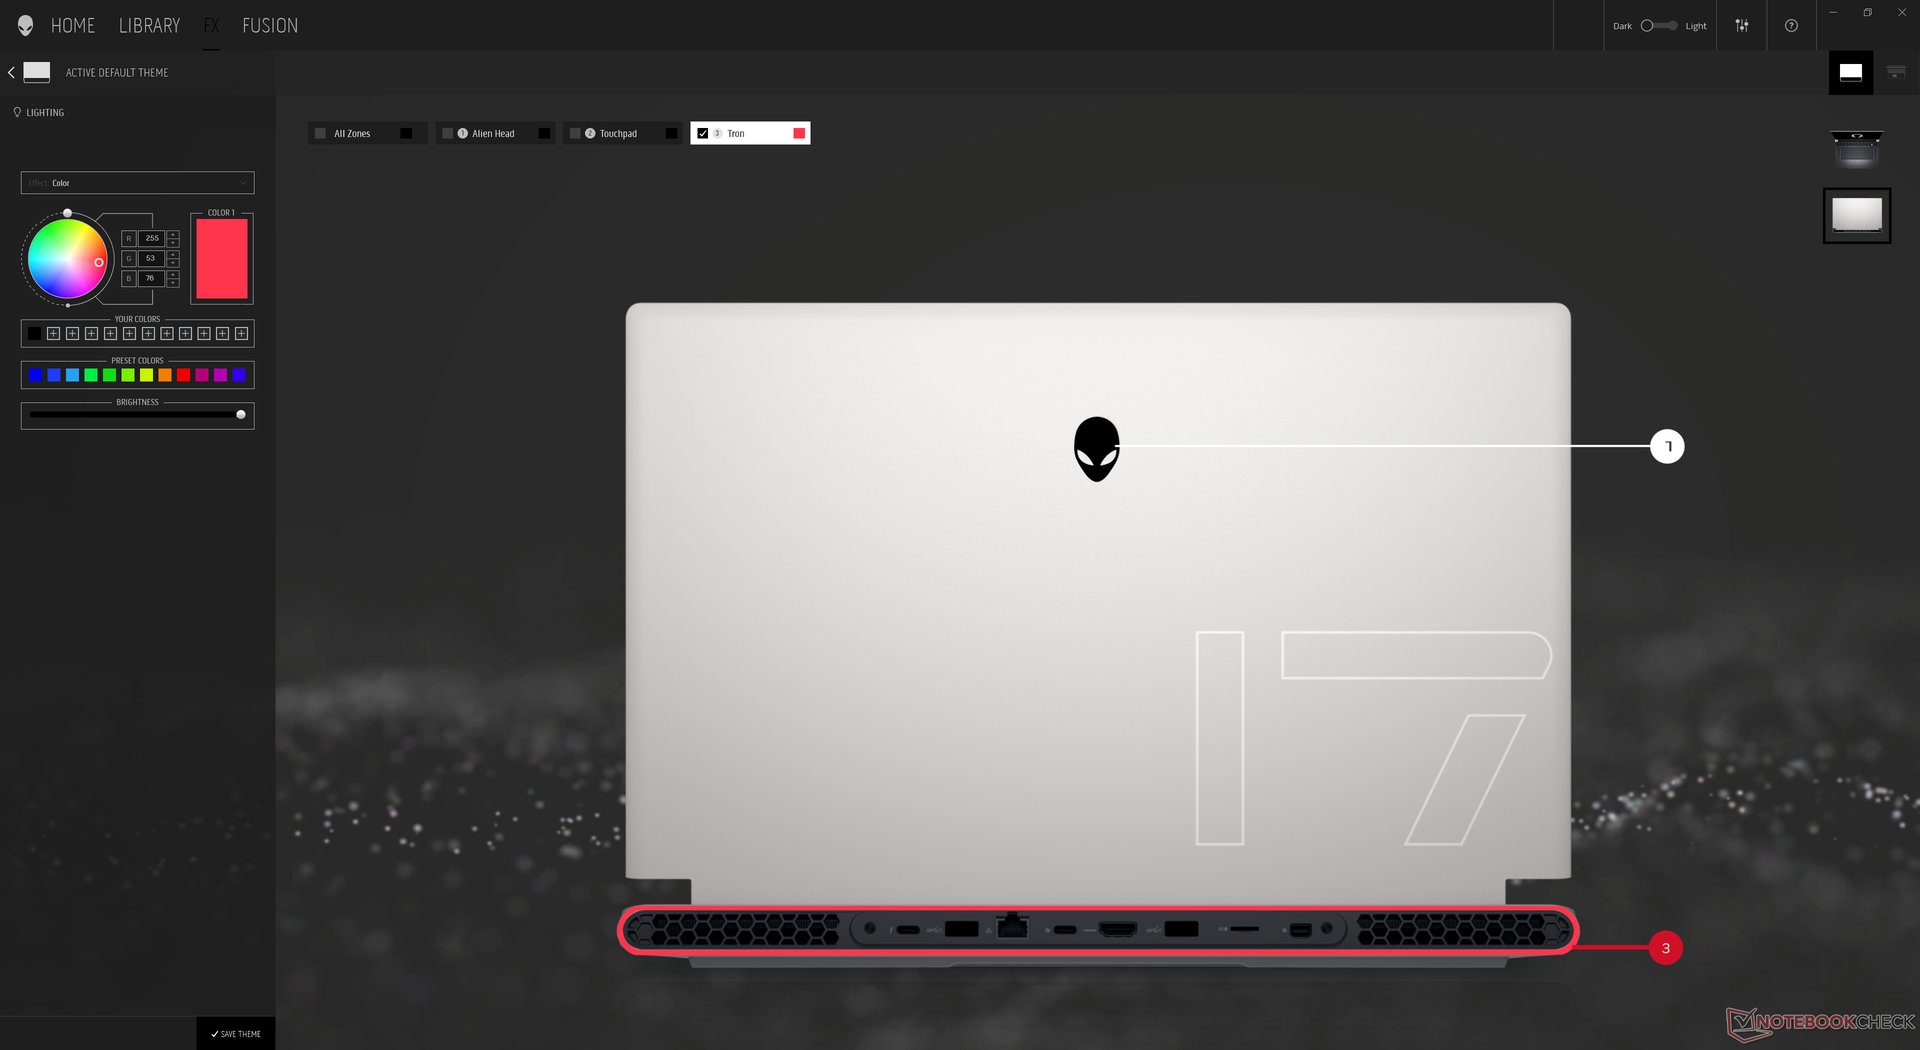
Duas opções de CPU (Core i7-11800H, Core i9-11980HK) e três opções gráficas GeForce (RTX 3060, RTX 3070RTX 3080) estão disponíveis. Não esperamos grandes diferenças entre as duas CPUs já que nossa i7-11800H já está funcionando bem acima de 90 C quando sob carga, mas as três GPUs estão cada uma rodando em alvos TGP diferentes de 130 W, 140 W, e 165 W, respectivamente. Em comparação, o RTX 3080 na Lâmina 17 da Razer visa "apenas" 130 W
Nosso sistema foi ajustado para o modo High Performance através do software Alienware Command Center antes de executar nossos benchmarks abaixo para obter as mais altas pontuações possíveis. Recomendamos aos usuários que se familiarizem com este software, pois todas as características de iluminação e desempenho são encontradas aqui. Além disso, os usuários podem configurar o sistema para o modo Optimus ou GPU discreto através do BIOS.
Advanced Optimus e, portanto, G-Sync são suportados apenas nas SKUs FHD de 360 Hz.
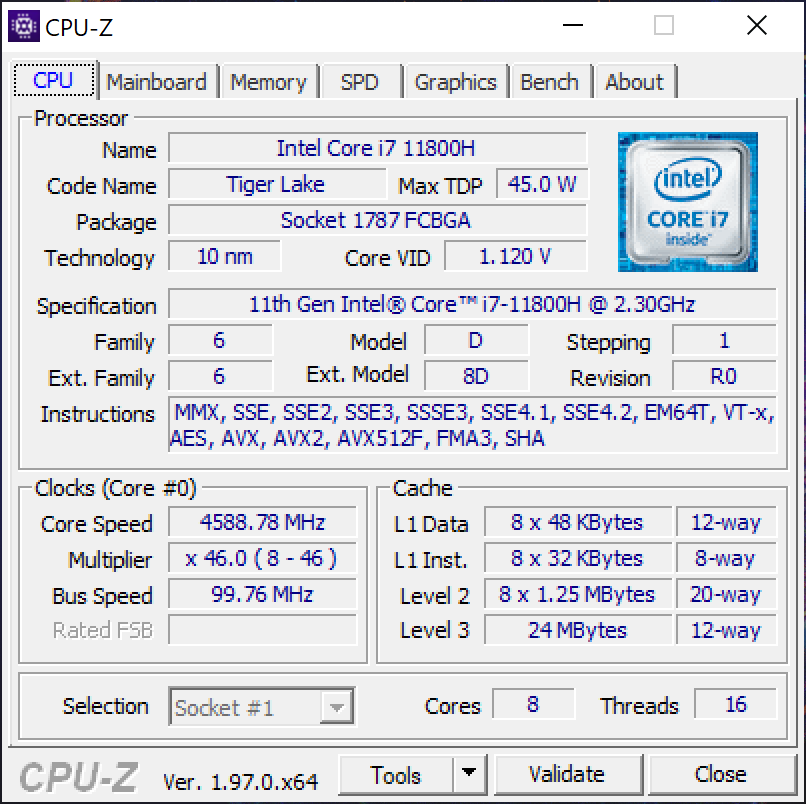

Processador
O desempenho da CPU é excelente com pontuações xT do CineBench que são até 20% mais rápidas do que a média do laptop em nosso banco de dados com o mesmo Núcleo i7-11800H CPU. Na verdade, o Alienware x17 é um dos laptops mais rápidos que você pode obter no mercado com este processador específico. O desempenho mais rápido do que o esperado de nosso sistema realmente o coloca um pouco à frente do Ryzen 9 5900HX ou Núcleo i9-11900K em cargas com múltiplas roscas, embora a i7-11800H esteja geralmente atrasada na maioria dos outros laptops
O alto desempenho da CPU do Alienware pode ser atribuído às altíssimas metas PL1 e PL2 de 165 W cada, em comparação com 65 W e 90 W, respectivamente, em outros laptops como o Razer Blade 17. O sistema também é excelente para manter altas taxas de relógio Turbo Boost durante períodos prolongados, como mostra nosso teste de loop do CineBench R15 xT abaixo. Entretanto, tais resultados de alto desempenho não são gratuitos, como mostrarão nossas seções de Teste de Estresse e Consumo de Energia abaixo.
Cinebench R15 Multi Loop
Cinebench R23: Multi Core | Single Core
Cinebench R15: CPU Multi 64Bit | CPU Single 64Bit
Blender: v2.79 BMW27 CPU
7-Zip 18.03: 7z b 4 -mmt1 | 7z b 4
Geekbench 5.5: Single-Core | Multi-Core
HWBOT x265 Benchmark v2.2: 4k Preset
LibreOffice : 20 Documents To PDF
R Benchmark 2.5: Overall mean
| Cinebench R20 / CPU (Multi Core) | |
| Alienware x17 RTX 3080 P48E | |
| Asus Strix Scar 17 G733QSA-XS99 | |
| Schenker XMG Ultra 17 Rocket Lake | |
| Asus ROG Strix G17 G713QE-RB74 | |
| MSI GS76 Stealth 11UH | |
| Eluktronics RP-17 | |
| Média Intel Core i7-11800H (2498 - 5408, n=50) | |
| Alienware m17 R4 | |
| MSI GS75 10SF-609US | |
| Medion Erazer Beast X20 | |
| Schenker XMG Pro 17 PB71RD-G | |
| Lenovo Legion 5 17IMH05 | |
| Cinebench R20 / CPU (Single Core) | |
| Schenker XMG Ultra 17 Rocket Lake | |
| MSI GS76 Stealth 11UH | |
| Alienware x17 RTX 3080 P48E | |
| Média Intel Core i7-11800H (520 - 586, n=47) | |
| Asus Strix Scar 17 G733QSA-XS99 | |
| Asus ROG Strix G17 G713QE-RB74 | |
| Alienware m17 R4 | |
| Eluktronics RP-17 | |
| MSI GS75 10SF-609US | |
| Medion Erazer Beast X20 | |
| Schenker XMG Pro 17 PB71RD-G | |
| Lenovo Legion 5 17IMH05 | |
| Cinebench R23 / Multi Core | |
| Schenker XMG Ultra 17 Rocket Lake | |
| Alienware x17 RTX 3080 P48E | |
| Asus Strix Scar 17 G733QSA-XS99 | |
| MSI GS76 Stealth 11UH | |
| Asus ROG Strix G17 G713QE-RB74 | |
| Média Intel Core i7-11800H (6508 - 14088, n=48) | |
| Alienware m17 R4 | |
| Medion Erazer Beast X20 | |
| Cinebench R23 / Single Core | |
| Schenker XMG Ultra 17 Rocket Lake | |
| MSI GS76 Stealth 11UH | |
| Alienware x17 RTX 3080 P48E | |
| Asus Strix Scar 17 G733QSA-XS99 | |
| Média Intel Core i7-11800H (1386 - 1522, n=45) | |
| Asus ROG Strix G17 G713QE-RB74 | |
| Alienware m17 R4 | |
| Medion Erazer Beast X20 | |
| Cinebench R15 / CPU Multi 64Bit | |
| Schenker XMG Ultra 17 Rocket Lake | |
| Asus Strix Scar 17 G733QSA-XS99 | |
| Alienware x17 RTX 3080 P48E | |
| MSI GS76 Stealth 11UH | |
| Asus ROG Strix G17 G713QE-RB74 | |
| Eluktronics RP-17 | |
| Média Intel Core i7-11800H (1342 - 2173, n=50) | |
| Alienware m17 R4 | |
| MSI GS75 10SF-609US | |
| Medion Erazer Beast X20 | |
| Schenker XMG Pro 17 PB71RD-G | |
| Lenovo Legion 5 17IMH05 | |
| Cinebench R15 / CPU Single 64Bit | |
| Schenker XMG Ultra 17 Rocket Lake | |
| Asus Strix Scar 17 G733QSA-XS99 | |
| MSI GS76 Stealth 11UH | |
| Asus ROG Strix G17 G713QE-RB74 | |
| Alienware x17 RTX 3080 P48E | |
| Média Intel Core i7-11800H (201 - 231, n=46) | |
| Alienware m17 R4 | |
| Medion Erazer Beast X20 | |
| MSI GS75 10SF-609US | |
| Eluktronics RP-17 | |
| Schenker XMG Pro 17 PB71RD-G | |
| Lenovo Legion 5 17IMH05 | |
| Blender / v2.79 BMW27 CPU | |
| Lenovo Legion 5 17IMH05 | |
| Schenker XMG Pro 17 PB71RD-G | |
| Medion Erazer Beast X20 | |
| MSI GS75 10SF-609US | |
| Média Intel Core i7-11800H (217 - 454, n=46) | |
| MSI GS76 Stealth 11UH | |
| Eluktronics RP-17 | |
| Alienware m17 R4 | |
| Asus ROG Strix G17 G713QE-RB74 | |
| Asus Strix Scar 17 G733QSA-XS99 | |
| Schenker XMG Ultra 17 Rocket Lake | |
| Alienware x17 RTX 3080 P48E | |
| 7-Zip 18.03 / 7z b 4 -mmt1 | |
| Schenker XMG Ultra 17 Rocket Lake | |
| Asus Strix Scar 17 G733QSA-XS99 | |
| MSI GS76 Stealth 11UH | |
| Asus ROG Strix G17 G713QE-RB74 | |
| Média Intel Core i7-11800H (5138 - 5732, n=46) | |
| Alienware m17 R4 | |
| Alienware x17 RTX 3080 P48E | |
| Medion Erazer Beast X20 | |
| MSI GS75 10SF-609US | |
| Eluktronics RP-17 | |
| Schenker XMG Pro 17 PB71RD-G | |
| Lenovo Legion 5 17IMH05 | |
| Geekbench 5.5 / Single-Core | |
| Schenker XMG Ultra 17 Rocket Lake | |
| MSI GS76 Stealth 11UH | |
| Média Intel Core i7-11800H (1429 - 1625, n=40) | |
| Asus Strix Scar 17 G733QSA-XS99 | |
| Alienware m17 R4 | |
| MSI GS75 10SF-609US | |
| Medion Erazer Beast X20 | |
| Eluktronics RP-17 | |
| Schenker XMG Pro 17 PB71RD-G | |
| Lenovo Legion 5 17IMH05 | |
| Geekbench 5.5 / Multi-Core | |
| Schenker XMG Ultra 17 Rocket Lake | |
| MSI GS76 Stealth 11UH | |
| Asus Strix Scar 17 G733QSA-XS99 | |
| Média Intel Core i7-11800H (4655 - 9851, n=40) | |
| MSI GS75 10SF-609US | |
| Alienware m17 R4 | |
| Eluktronics RP-17 | |
| Medion Erazer Beast X20 | |
| Schenker XMG Pro 17 PB71RD-G | |
| Lenovo Legion 5 17IMH05 | |
| HWBOT x265 Benchmark v2.2 / 4k Preset | |
| Alienware x17 RTX 3080 P48E | |
| Schenker XMG Ultra 17 Rocket Lake | |
| Asus Strix Scar 17 G733QSA-XS99 | |
| MSI GS76 Stealth 11UH | |
| Asus ROG Strix G17 G713QE-RB74 | |
| Alienware m17 R4 | |
| Média Intel Core i7-11800H (7.38 - 17.4, n=46) | |
| Eluktronics RP-17 | |
| MSI GS75 10SF-609US | |
| Medion Erazer Beast X20 | |
| Schenker XMG Pro 17 PB71RD-G | |
| Lenovo Legion 5 17IMH05 | |
| LibreOffice / 20 Documents To PDF | |
| Lenovo Legion 5 17IMH05 | |
| Eluktronics RP-17 | |
| Asus ROG Strix G17 G713QE-RB74 | |
| Medion Erazer Beast X20 | |
| Alienware m17 R4 | |
| MSI GS75 10SF-609US | |
| MSI GS76 Stealth 11UH | |
| Alienware x17 RTX 3080 P48E | |
| Média Intel Core i7-11800H (38.6 - 59.9, n=45) | |
| Asus Strix Scar 17 G733QSA-XS99 | |
| Schenker XMG Ultra 17 Rocket Lake | |
| R Benchmark 2.5 / Overall mean | |
| Lenovo Legion 5 17IMH05 | |
| Schenker XMG Pro 17 PB71RD-G | |
| Medion Erazer Beast X20 | |
| MSI GS75 10SF-609US | |
| Eluktronics RP-17 | |
| Alienware m17 R4 | |
| Média Intel Core i7-11800H (0.548 - 0.615, n=46) | |
| Alienware x17 RTX 3080 P48E | |
| MSI GS76 Stealth 11UH | |
| Asus ROG Strix G17 G713QE-RB74 | |
| Schenker XMG Ultra 17 Rocket Lake | |
| Asus Strix Scar 17 G733QSA-XS99 | |
* ... menor é melhor
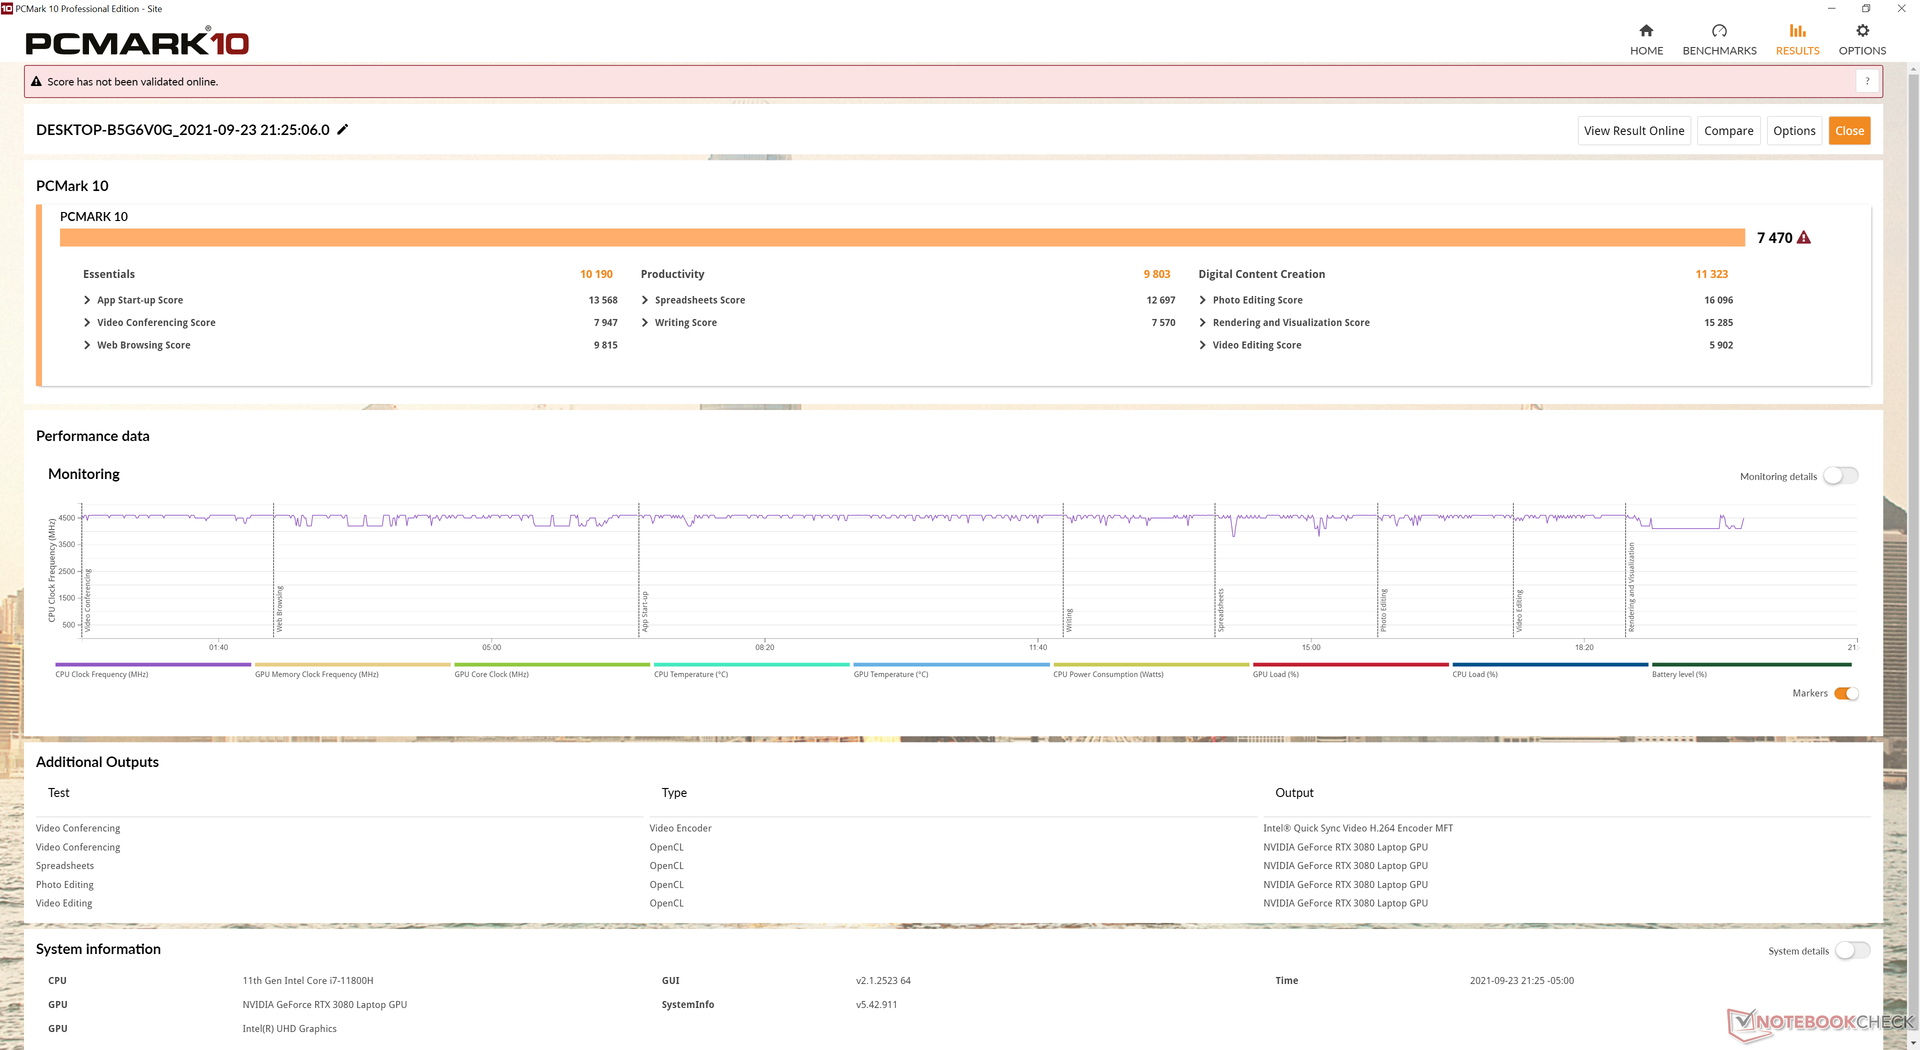
Desempenho do sistema
As pontuações PCMark estão onde esperamos que elas sejam relativas a outros laptops de alto desempenho para jogos. Em geral, os resultados gerais são apenas um pouco mais avançados que a Razer Blade 17 equipada com a mesma CPU e GPU.
| PCMark 10 / Score | |
| Alienware x17 RTX 3080 P48E | |
| Razer Blade 17 RTX 3070 | |
| Asus ROG Zephyrus S17 GX703HSD | |
| Média Intel Core i7-11800H, NVIDIA GeForce RTX 3080 Laptop GPU (6673 - 7470, n=11) | |
| Gigabyte Aero 17 HDR YD | |
| MSI GS76 Stealth 11UH | |
| Alienware m17 R4 | |
| PCMark 10 / Essentials | |
| Razer Blade 17 RTX 3070 | |
| Asus ROG Zephyrus S17 GX703HSD | |
| Média Intel Core i7-11800H, NVIDIA GeForce RTX 3080 Laptop GPU (9862 - 11064, n=11) | |
| Gigabyte Aero 17 HDR YD | |
| Alienware x17 RTX 3080 P48E | |
| MSI GS76 Stealth 11UH | |
| Alienware m17 R4 | |
| PCMark 10 / Productivity | |
| Alienware x17 RTX 3080 P48E | |
| Asus ROG Zephyrus S17 GX703HSD | |
| Razer Blade 17 RTX 3070 | |
| Média Intel Core i7-11800H, NVIDIA GeForce RTX 3080 Laptop GPU (8278 - 9803, n=11) | |
| Gigabyte Aero 17 HDR YD | |
| MSI GS76 Stealth 11UH | |
| Alienware m17 R4 | |
| PCMark 10 / Digital Content Creation | |
| Alienware x17 RTX 3080 P48E | |
| Razer Blade 17 RTX 3070 | |
| Asus ROG Zephyrus S17 GX703HSD | |
| Média Intel Core i7-11800H, NVIDIA GeForce RTX 3080 Laptop GPU (9881 - 11323, n=11) | |
| Gigabyte Aero 17 HDR YD | |
| MSI GS76 Stealth 11UH | |
| Alienware m17 R4 | |
| PCMark 10 Score | 7470 pontos | |
Ajuda | ||
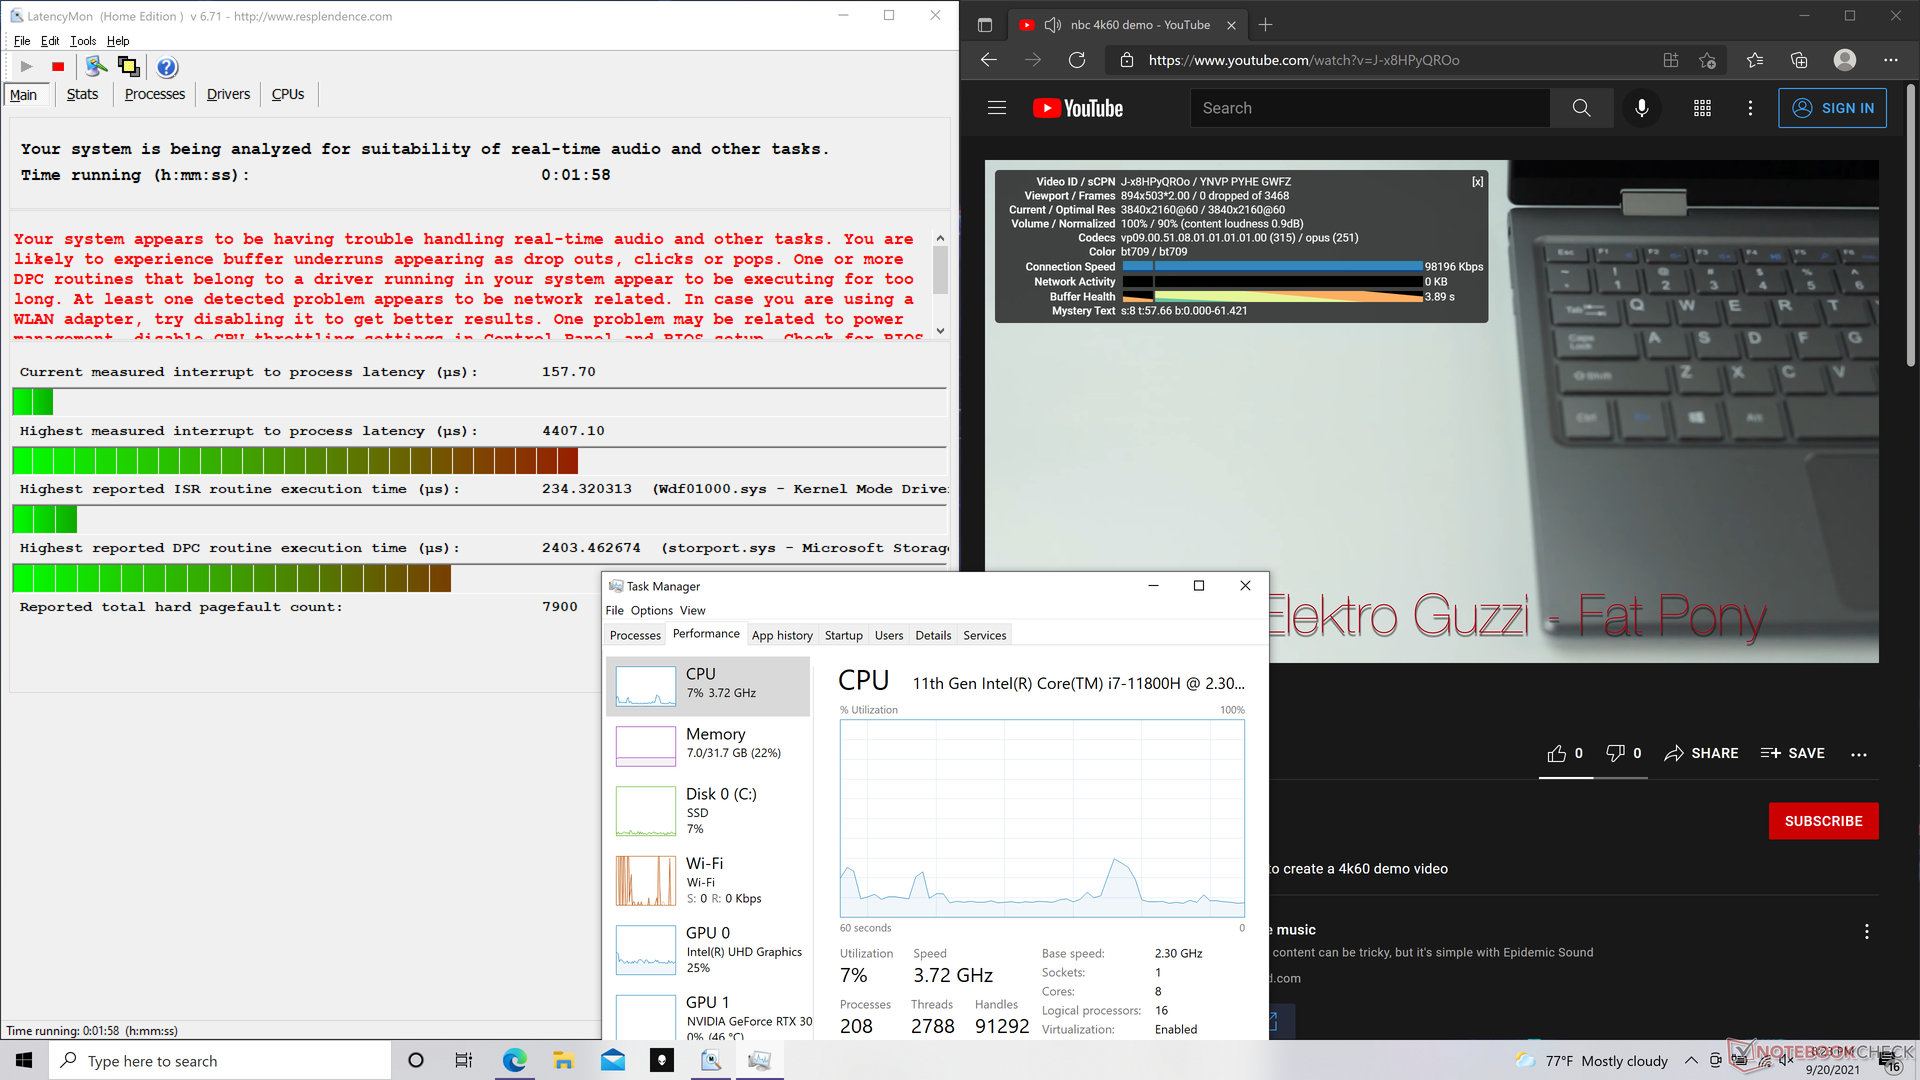
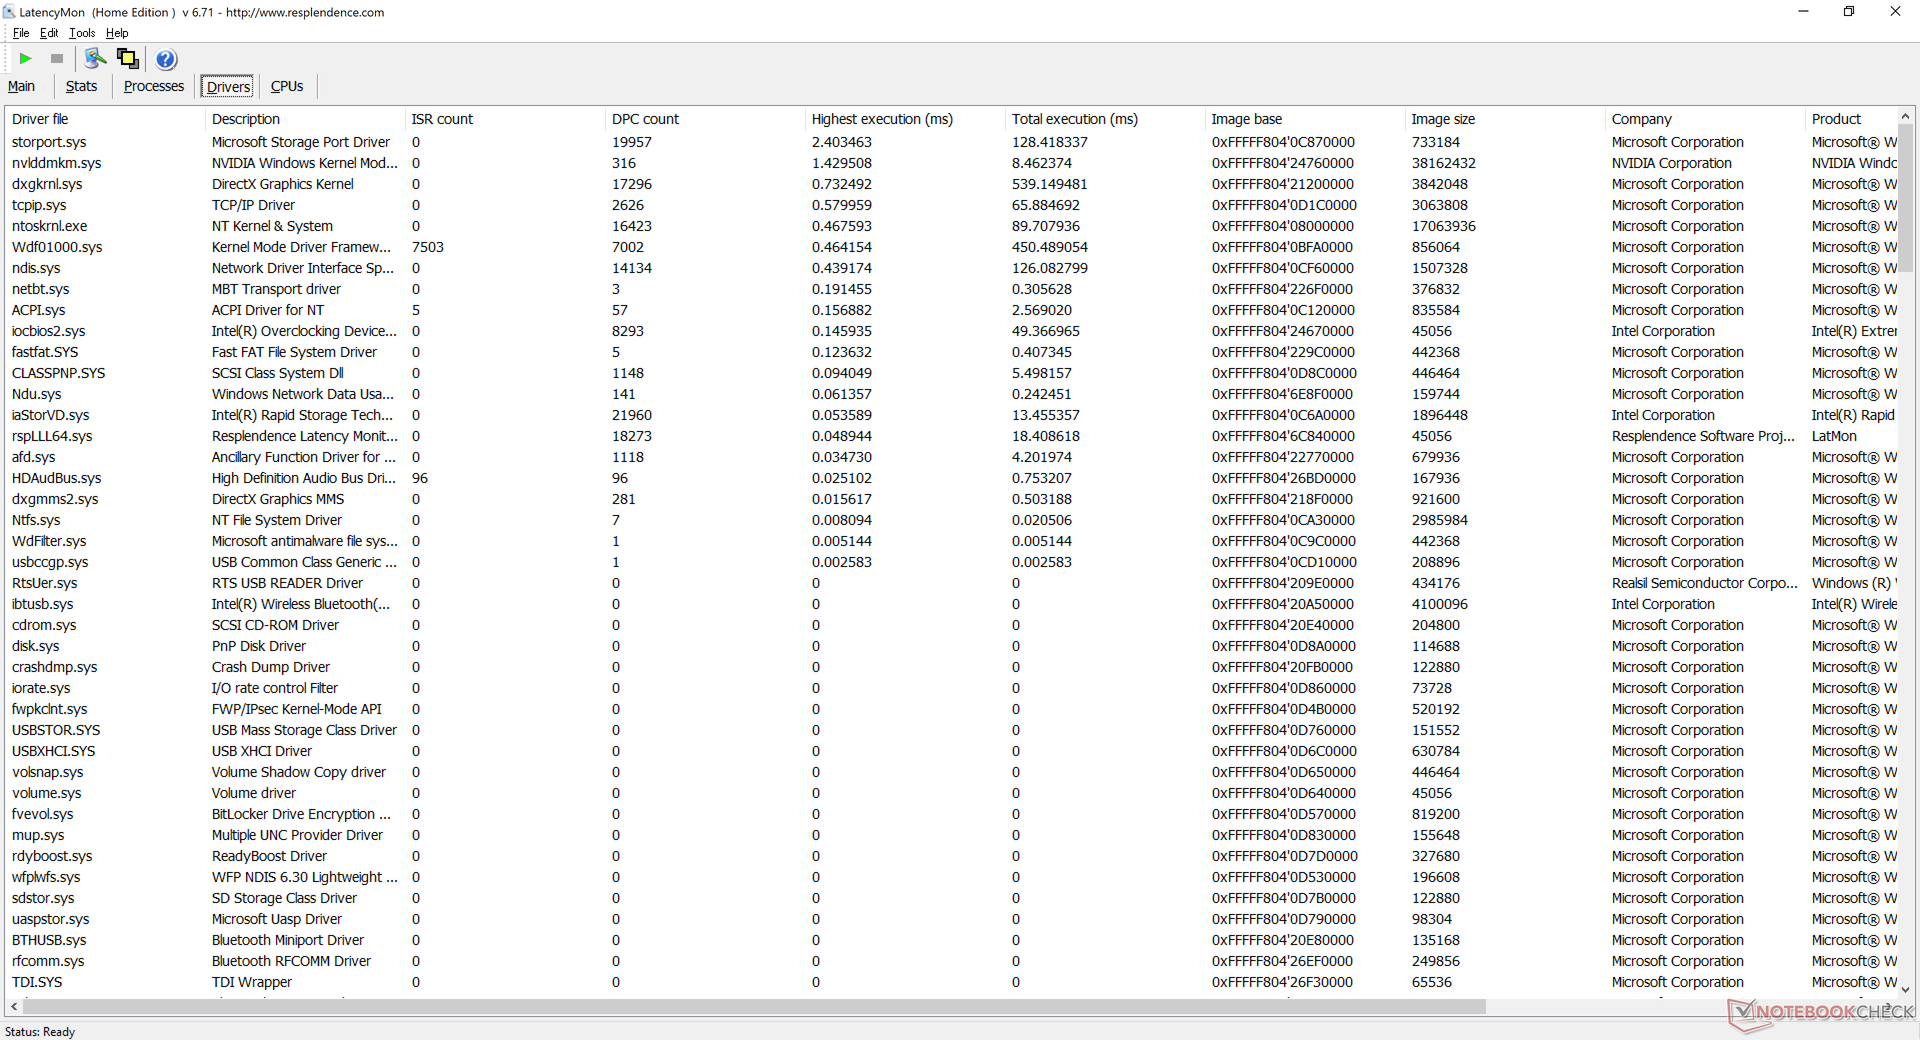
Latência do DPC
LatencyMon revela problemas de latência DPC ao abrir várias abas do navegador em nossa página inicial e ao executar Prime95 stress. A reprodução de vídeo de 4K a 60 FPS é perfeita, sem queda de quadros.
| DPC Latencies / LatencyMon - interrupt to process latency (max), Web, Youtube, Prime95 | |
| Alienware x17 RTX 3080 P48E | |
| Gigabyte Aero 17 HDR YD | |
| Asus ROG Zephyrus S17 GX703HSD | |
| MSI GS76 Stealth 11UH | |
| Alienware m17 R4 | |
| Razer Blade 17 RTX 3070 | |
* ... menor é melhor
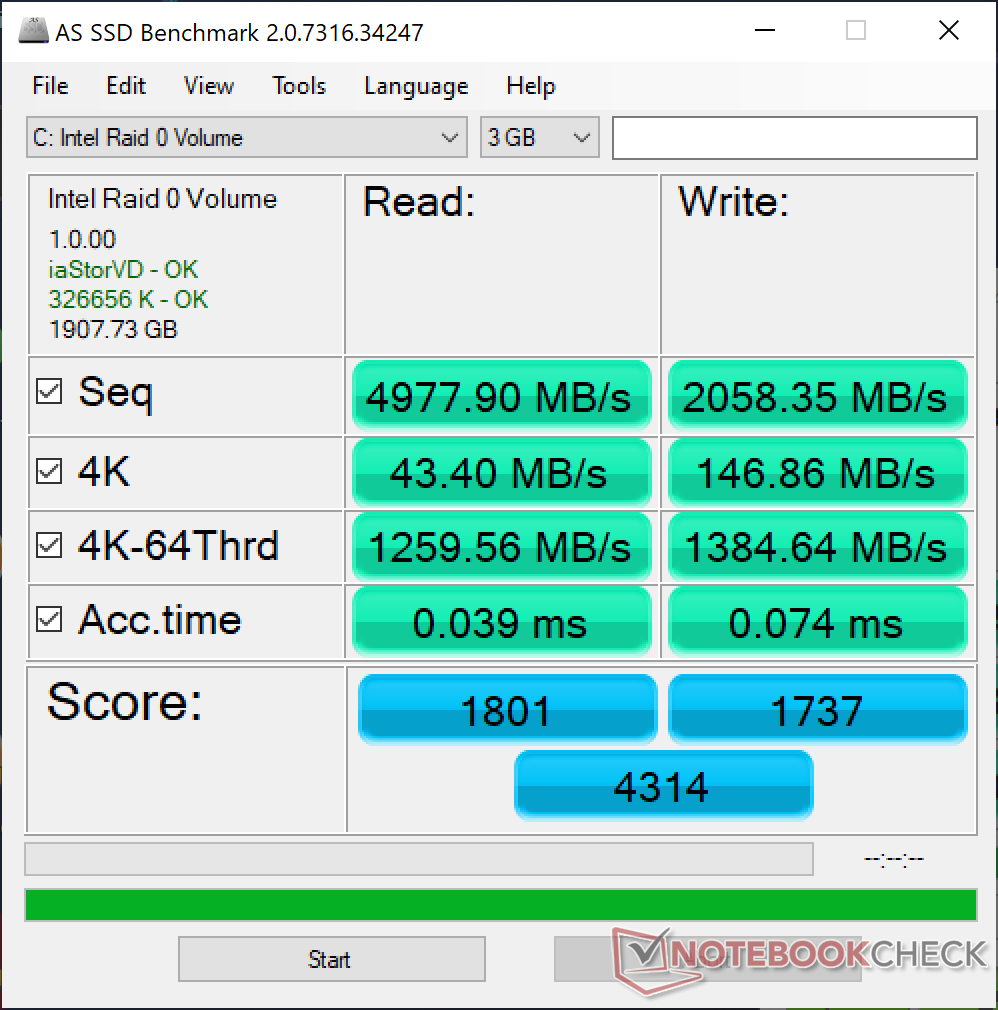
Dispositivos de armazenamento - Um PCIe4 e um PCIe3
Nossa unidade de teste vem com dois SSDs de 1 TB WD SN730 NVMe em RAID 0 para taxas sequenciais de leitura e escrita de até 6700 MB/s e 4300 MB/s, respectivamente, para ser mais rápido do que qualquer SSD PCIe3 disponível. No entanto, um únicoSamsung PM9A1 O SSD PCIe4 ainda terá um desempenho superior ao de nossa configuração PCIe3 RAID 0. A Dell diz que o sistema pode suportar até uma SSD PCIe4 se os usuários quiserem instalar uma eles mesmos.

| Alienware x17 RTX 3080 P48E 2x WDC PC SN730 SDBPNTY-1T00 (RAID 0) | Alienware m17 R4 2x Micron 2300 512 GB (RAID 0) | Razer Blade 17 RTX 3070 Samsung PM9A1 MZVL21T0HCLR | Asus ROG Zephyrus S17 GX703HSD Samsung PM9A1 MZVL22T0HBLB | MSI GS76 Stealth 11UH Samsung PM9A1 MZVL22T0HBLB | Gigabyte Aero 17 HDR YD Samsung PM9A1 MZVL2512HCJQ | |
|---|---|---|---|---|---|---|
| AS SSD | -12% | 52% | 67% | 68% | 66% | |
| Seq Read (MB/s) | 4978 | 2733 -45% | 5302 7% | 5085 2% | 5408 9% | 5438 9% |
| Seq Write (MB/s) | 2058 | 2822 37% | 3977 93% | 4434 115% | 3863 88% | 3904 90% |
| 4K Read (MB/s) | 43.4 | 45.04 4% | 55 27% | 80.3 85% | 52.7 21% | 56.2 29% |
| 4K Write (MB/s) | 146.9 | 88.4 -40% | 148.7 1% | 214.7 46% | 153.1 4% | 165.8 13% |
| 4K-64 Read (MB/s) | 1260 | 1388 10% | 2715 115% | 2573 104% | 2692 114% | 2489 98% |
| 4K-64 Write (MB/s) | 1385 | 1227 -11% | 3416 147% | 2972 115% | 3414 146% | 3480 151% |
| Access Time Read * (ms) | 0.039 | 0.079 -103% | 0.044 -13% | 0.018 54% | 0.046 -18% | 0.054 -38% |
| Access Time Write * (ms) | 0.074 | 0.095 -28% | 0.085 -15% | 0.02 73% | 0.027 64% | 0.026 65% |
| Score Read (Points) | 1801 | 1706 -5% | 3300 83% | 3161 76% | 3285 82% | 3089 72% |
| Score Write (Points) | 1737 | 1598 -8% | 3963 128% | 3631 109% | 3953 128% | 4036 132% |
| Score Total (Points) | 4314 | 4184 -3% | 8874 106% | 8380 94% | 8830 105% | 8620 100% |
| Copy ISO MB/s (MB/s) | 2009 | 2414 20% | 2710 35% | 3239 61% | ||
| Copy Program MB/s (MB/s) | 1099 | 1030 -6% | 1114 1% | 899 -18% | ||
| Copy Game MB/s (MB/s) | 1881 | 1991 6% | 2095 11% | 2171 15% | ||
| CrystalDiskMark 5.2 / 6 | -16% | 38% | 41% | 39% | 42% | |
| Write 4K (MB/s) | 159.2 | 93.1 -42% | 233.5 47% | 244.2 53% | 230.7 45% | 230.4 45% |
| Read 4K (MB/s) | 51.9 | 46.79 -10% | 90.1 74% | 89.8 73% | 87.9 69% | 91.6 76% |
| Write Seq (MB/s) | 3115 | 2853 -8% | 4263 37% | 4300 38% | 4216 35% | |
| Read Seq (MB/s) | 3298 | 2556 -22% | 4468 35% | 4392 33% | 4543 38% | |
| Write 4K Q32T1 (MB/s) | 392.6 | 475 21% | 538 37% | 607 55% | 582 48% | 667 70% |
| Read 4K Q32T1 (MB/s) | 474.7 | 529 11% | 703 48% | 658 39% | 730 54% | 728 53% |
| Write Seq Q32T1 (MB/s) | 4331 | 3331 -23% | 5097 18% | 5270 22% | 5152 19% | 5043 16% |
| Read Seq Q32T1 (MB/s) | 6746 | 3319 -51% | 7065 5% | 7091 5% | 7094 5% | 6821 1% |
| Write 4K Q8T8 (MB/s) | 2270 | |||||
| Read 4K Q8T8 (MB/s) | 2490 | |||||
| Média Total (Programa/Configurações) | -14% /
-13% | 45% /
47% | 54% /
59% | 54% /
55% | 54% /
56% |
* ... menor é melhor

Disk Throttling: DiskSpd Read Loop, Queue Depth 8
Desempenho da GPU - Um pouco mais alto que a média
Apesar dos 165 W RTX 3080 gráficos, o desempenho bruto é apenas 2% a 9% mais rápido do que o laptop RTX 3080 médio em nosso banco de dados provavelmente devido à diminuição dos retornos em metas TGP mais altas. A menor vantagem também pode ser vista ao rodar jogos, pois as taxas de quadros são novamente apenas alguns pontos percentuais mais altas em média. Entretanto, a diferença de desempenho torna-se mais pronunciada quando comparada com a RTX 3080 de 90 W no MSI GS76, onde nosso Alienware pode ser cerca de 15% a 30% mais rápido em certos títulos. A pC de mesa com gráficos RTX 3080 ainda terá um desempenho superior a qualquer laptop RTX 3080 em cerca de 40 a 45 por cento.
Manipulando em Witcher 3 por mais de uma hora mostra taxas de quadros estáveis, sem quedas aleatórias para sugerir nenhuma atividade de fundo que interrompa o jogo, ao contrário do que observamos em alguns modelos antigos Alienware m15.
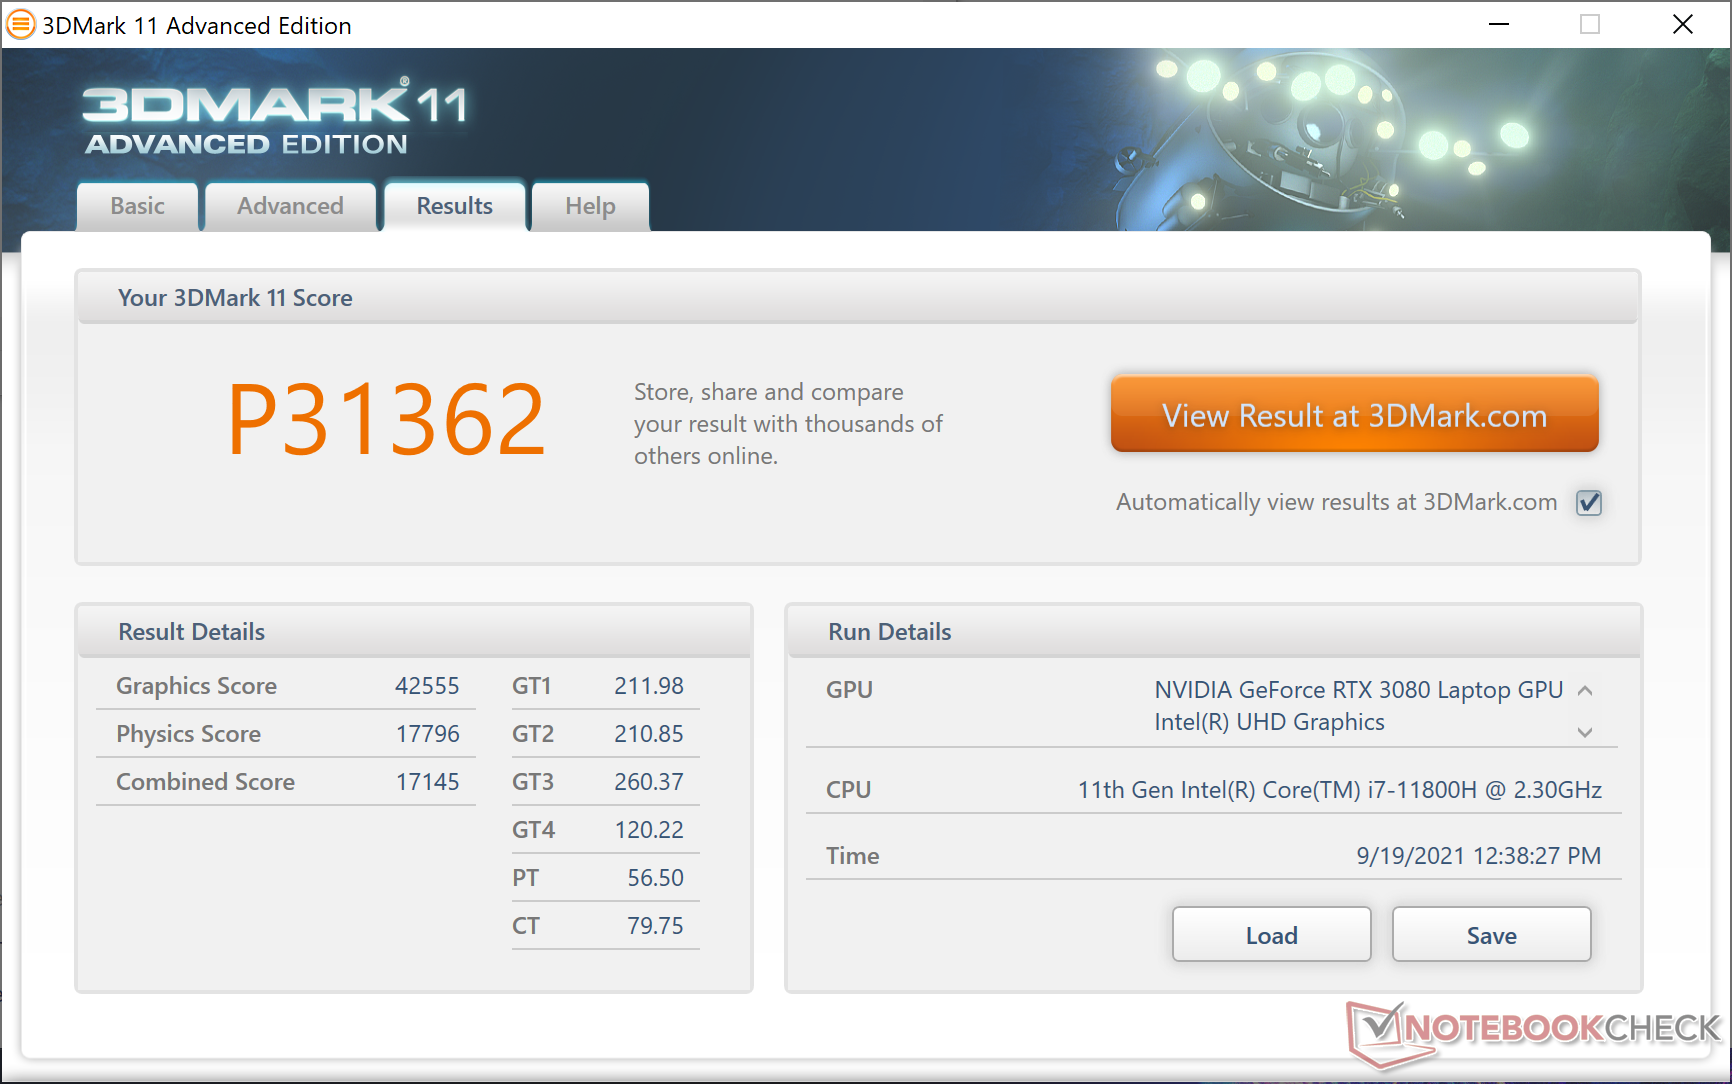
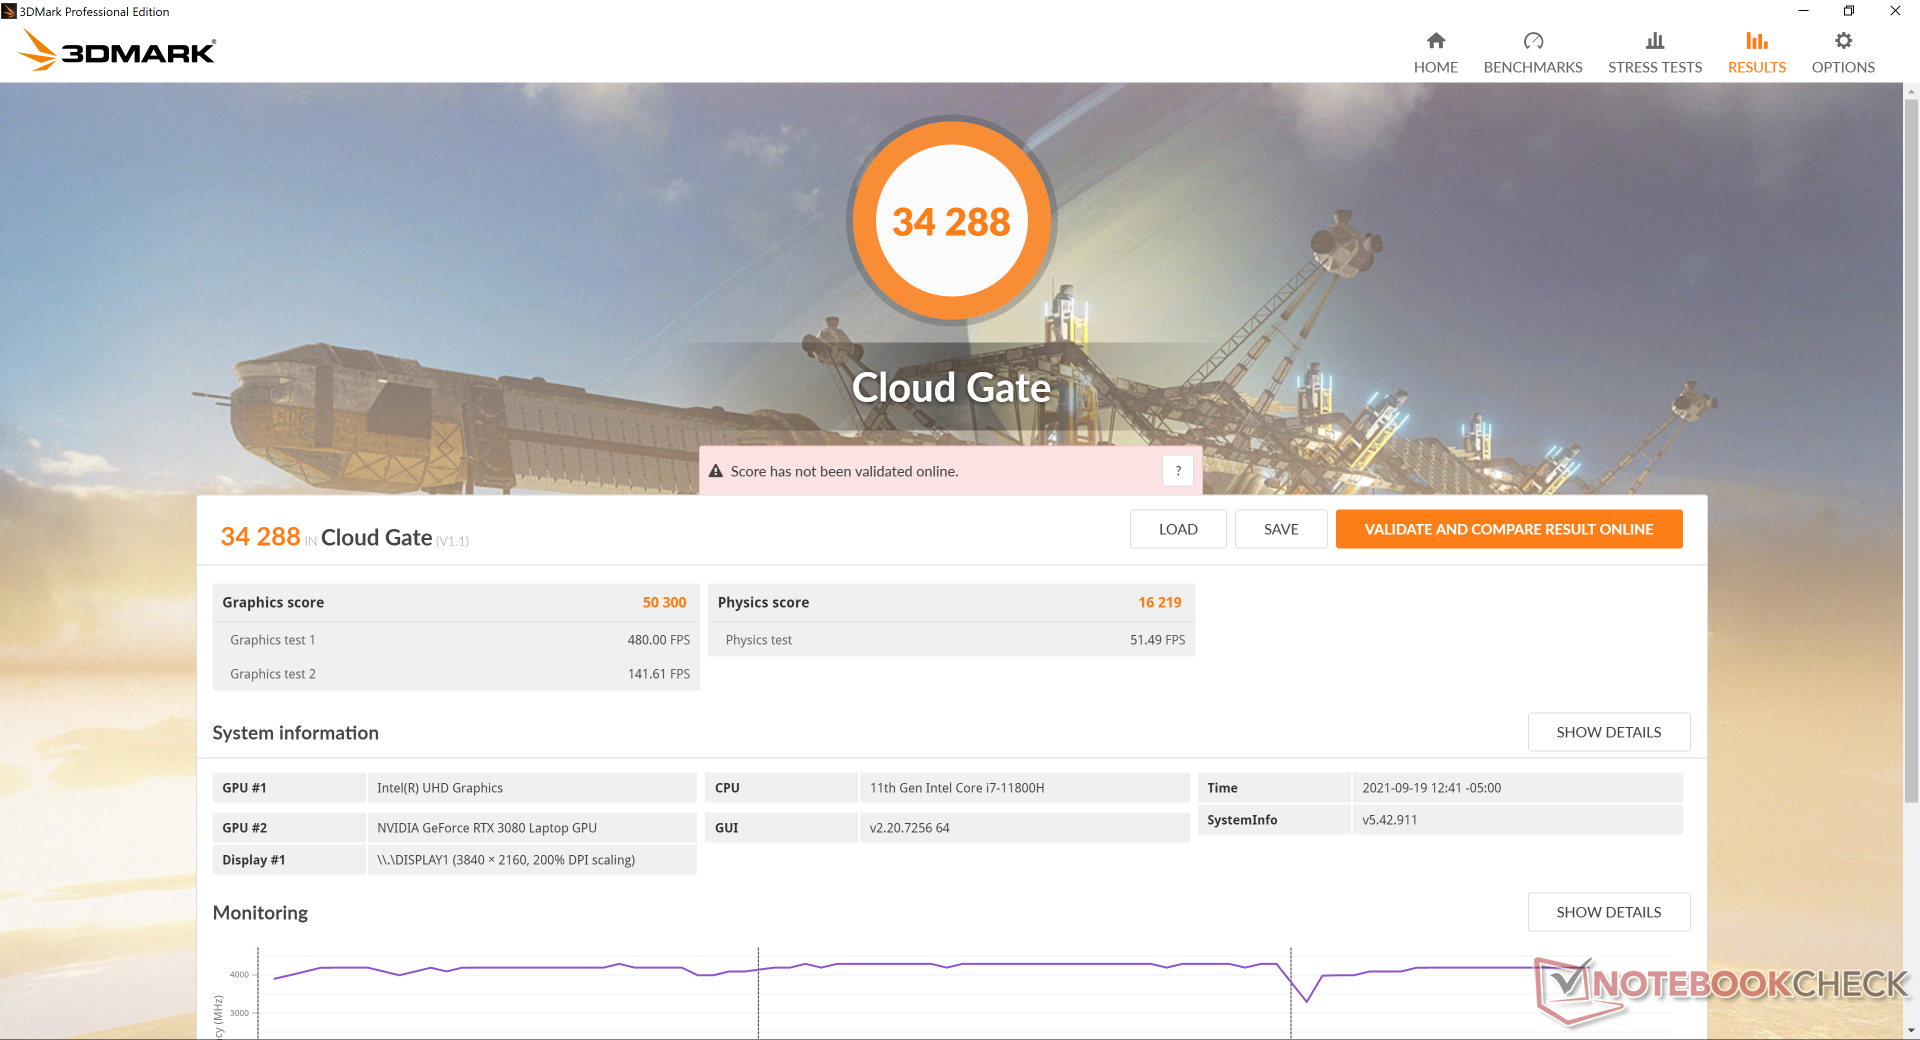
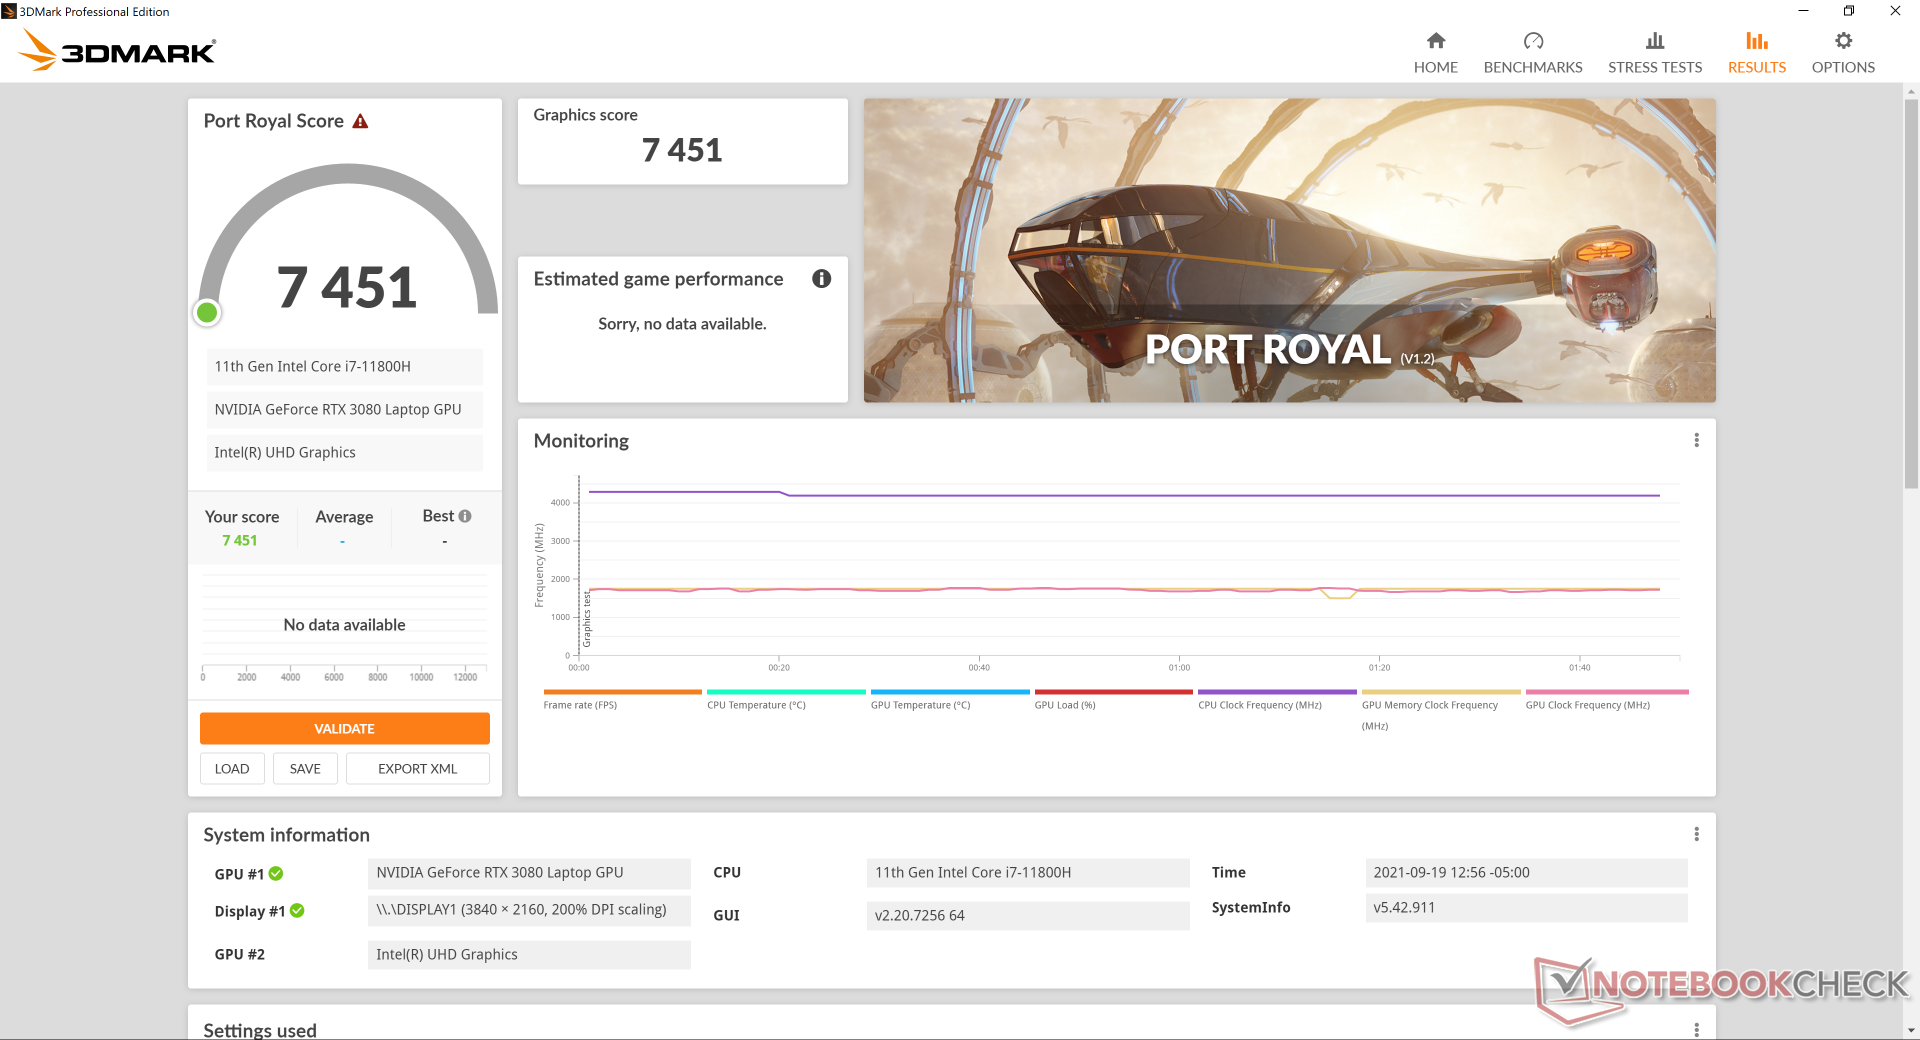
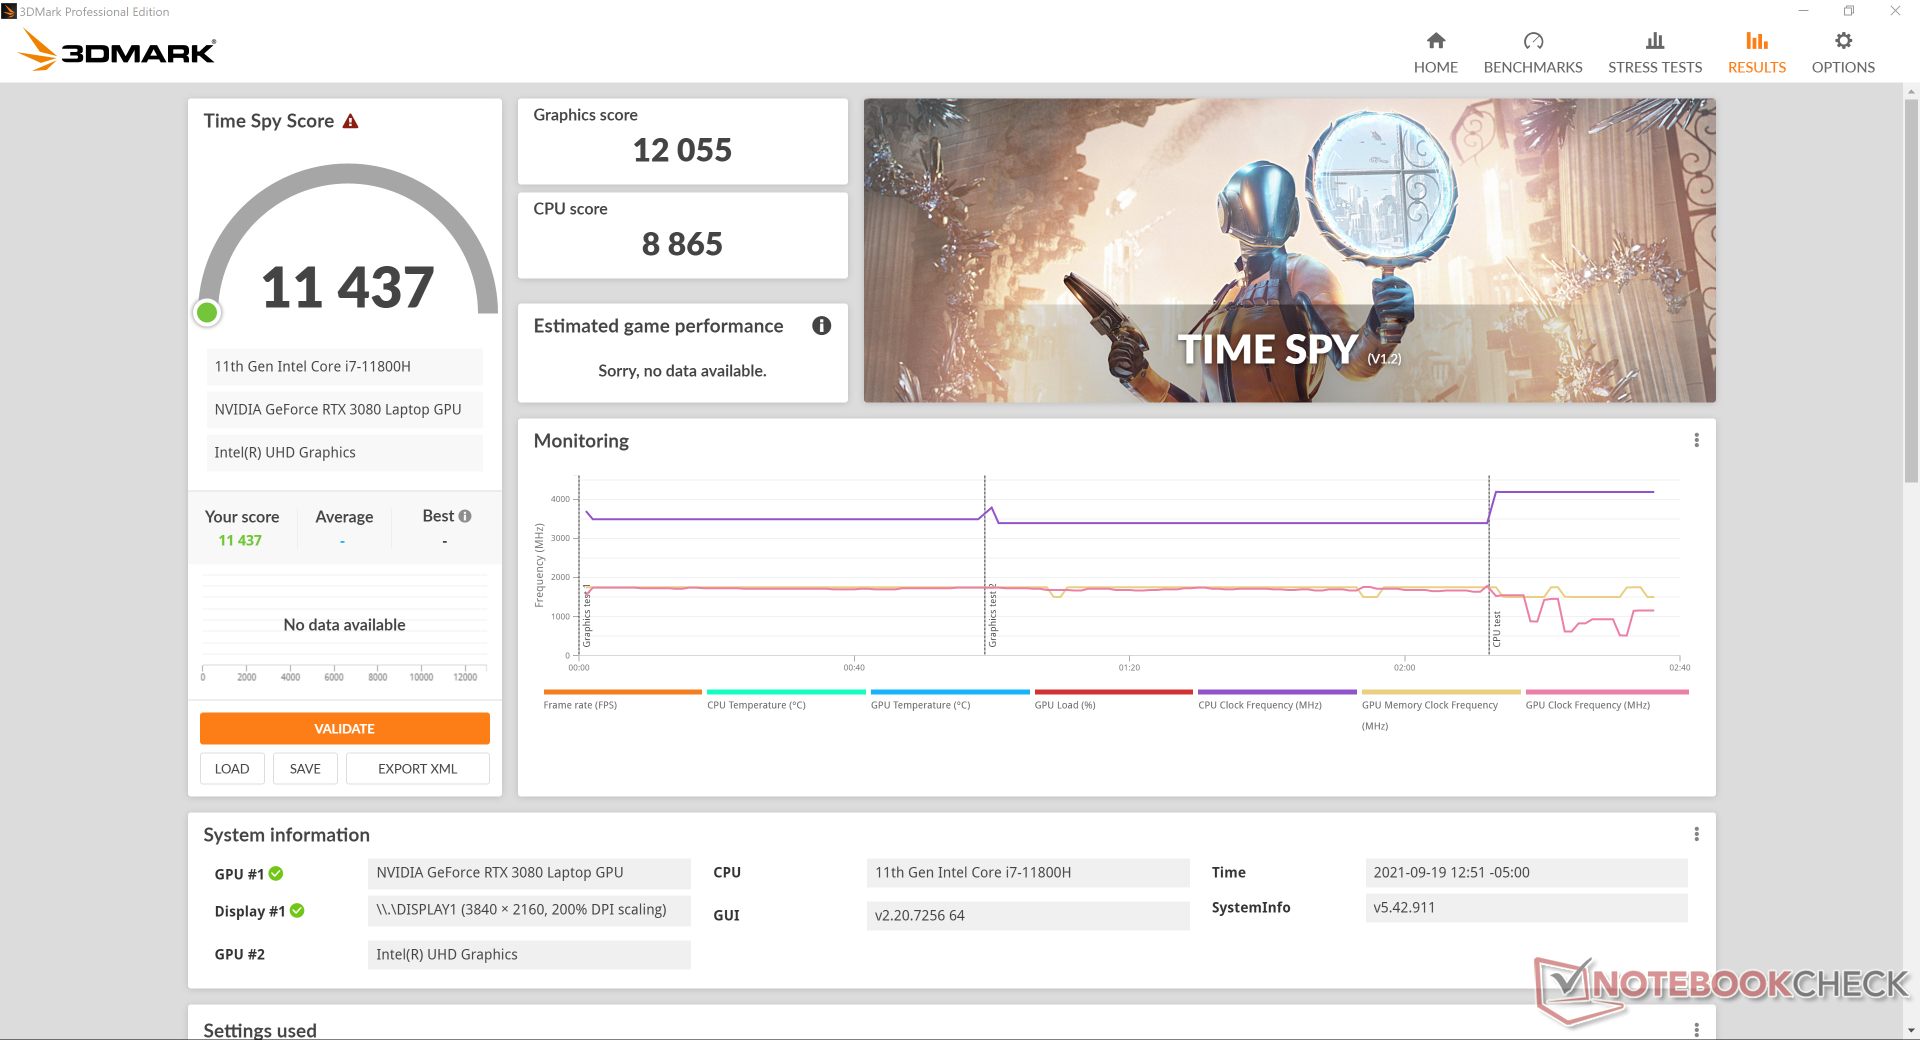
| 3DMark 11 Performance | 31362 pontos | |
| 3DMark Cloud Gate Standard Score | 34288 pontos | |
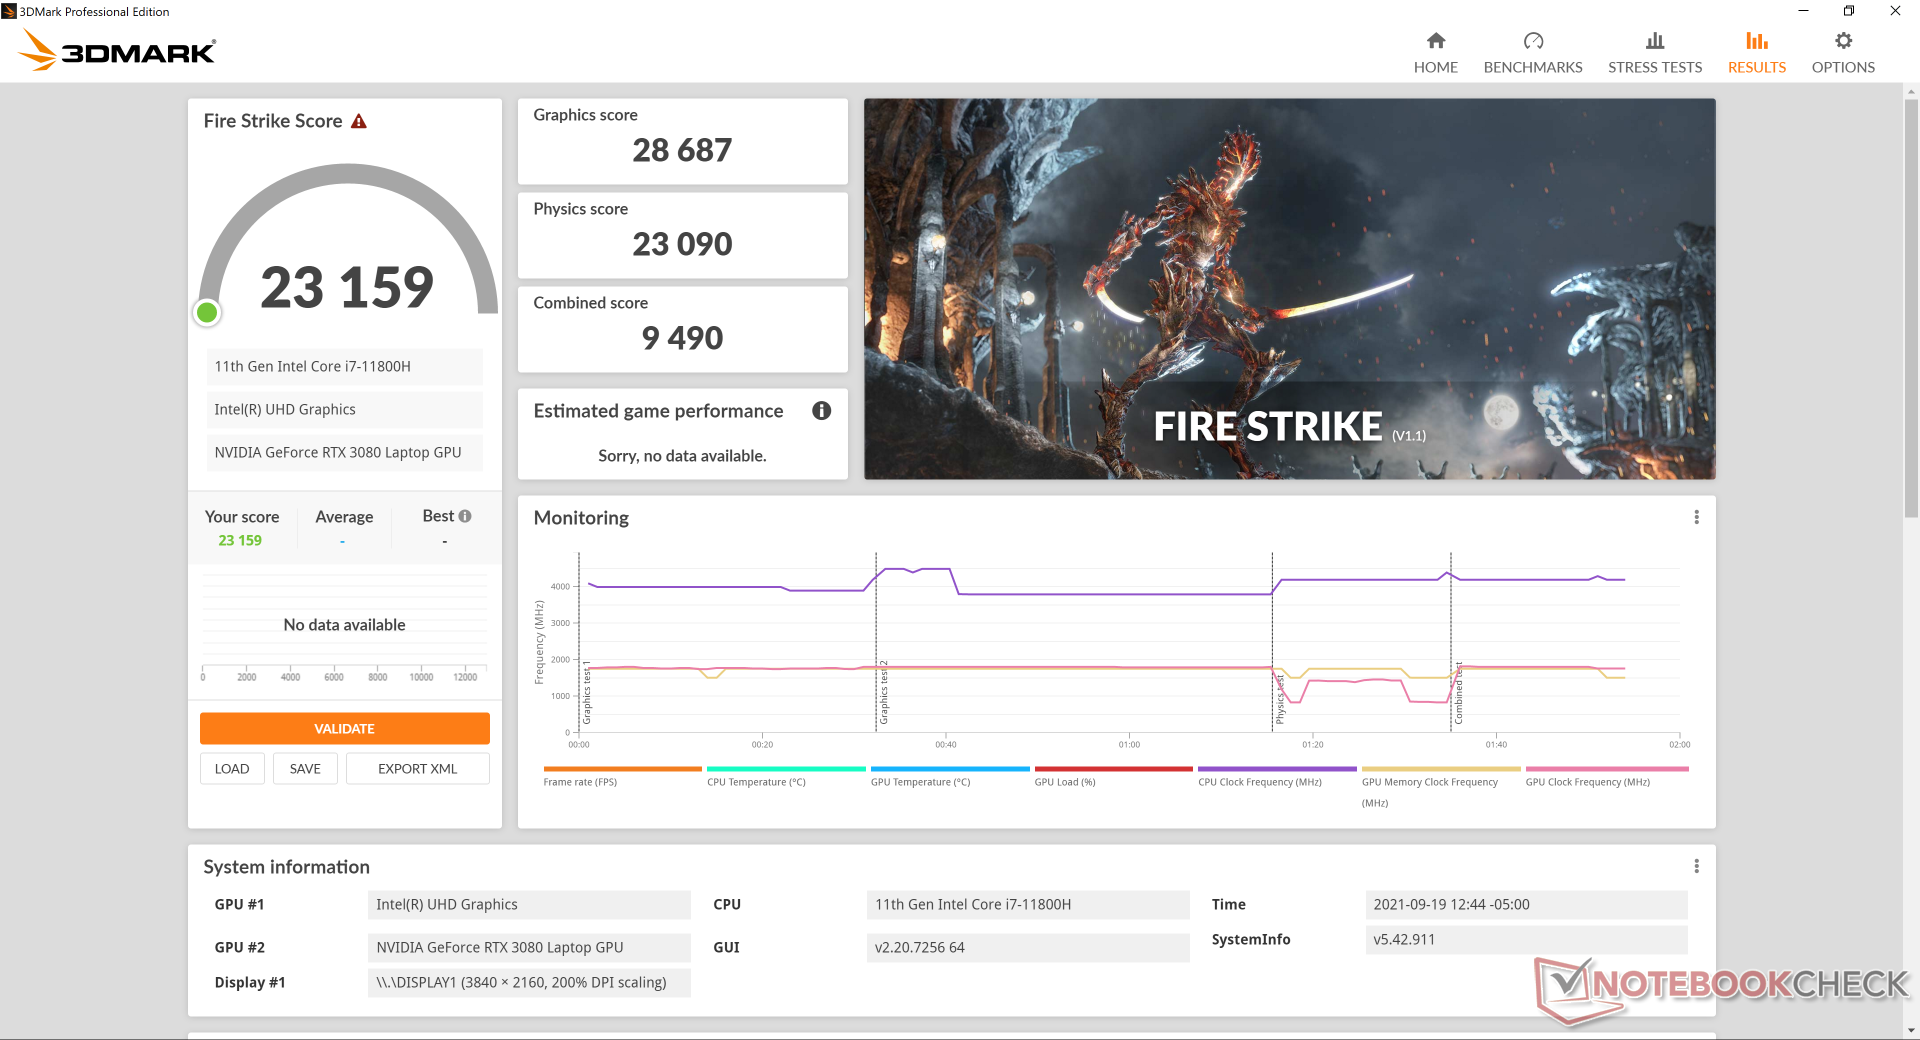
| 3DMark Fire Strike Score | 23159 pontos | |
| 3DMark Time Spy Score | 11437 pontos | |
Ajuda | ||
Witcher 3 FPS Chart
| baixo | média | alto | ultra | QHD | 4K | |
|---|---|---|---|---|---|---|
| GTA V (2015) | 183 | 176 | 163 | 98.1 | 89.2 | 98.1 |
| The Witcher 3 (2015) | 370.2 | 294 | 192 | 105.2 | 80.2 | |
| Dota 2 Reborn (2015) | 164 | 148 | 143 | 135 | 111 | |
| Final Fantasy XV Benchmark (2018) | 181 | 134 | 106 | 81.8 | 50.8 | |
| X-Plane 11.11 (2018) | 118 | 99.3 | 79.7 | 56.9 | ||
| Far Cry 5 (2018) | 144 | 125 | 120 | 112 | 98 | 63 |
| Strange Brigade (2018) | 456 | 269 | 225 | 199 | 152 | 91.6 |
Emissions
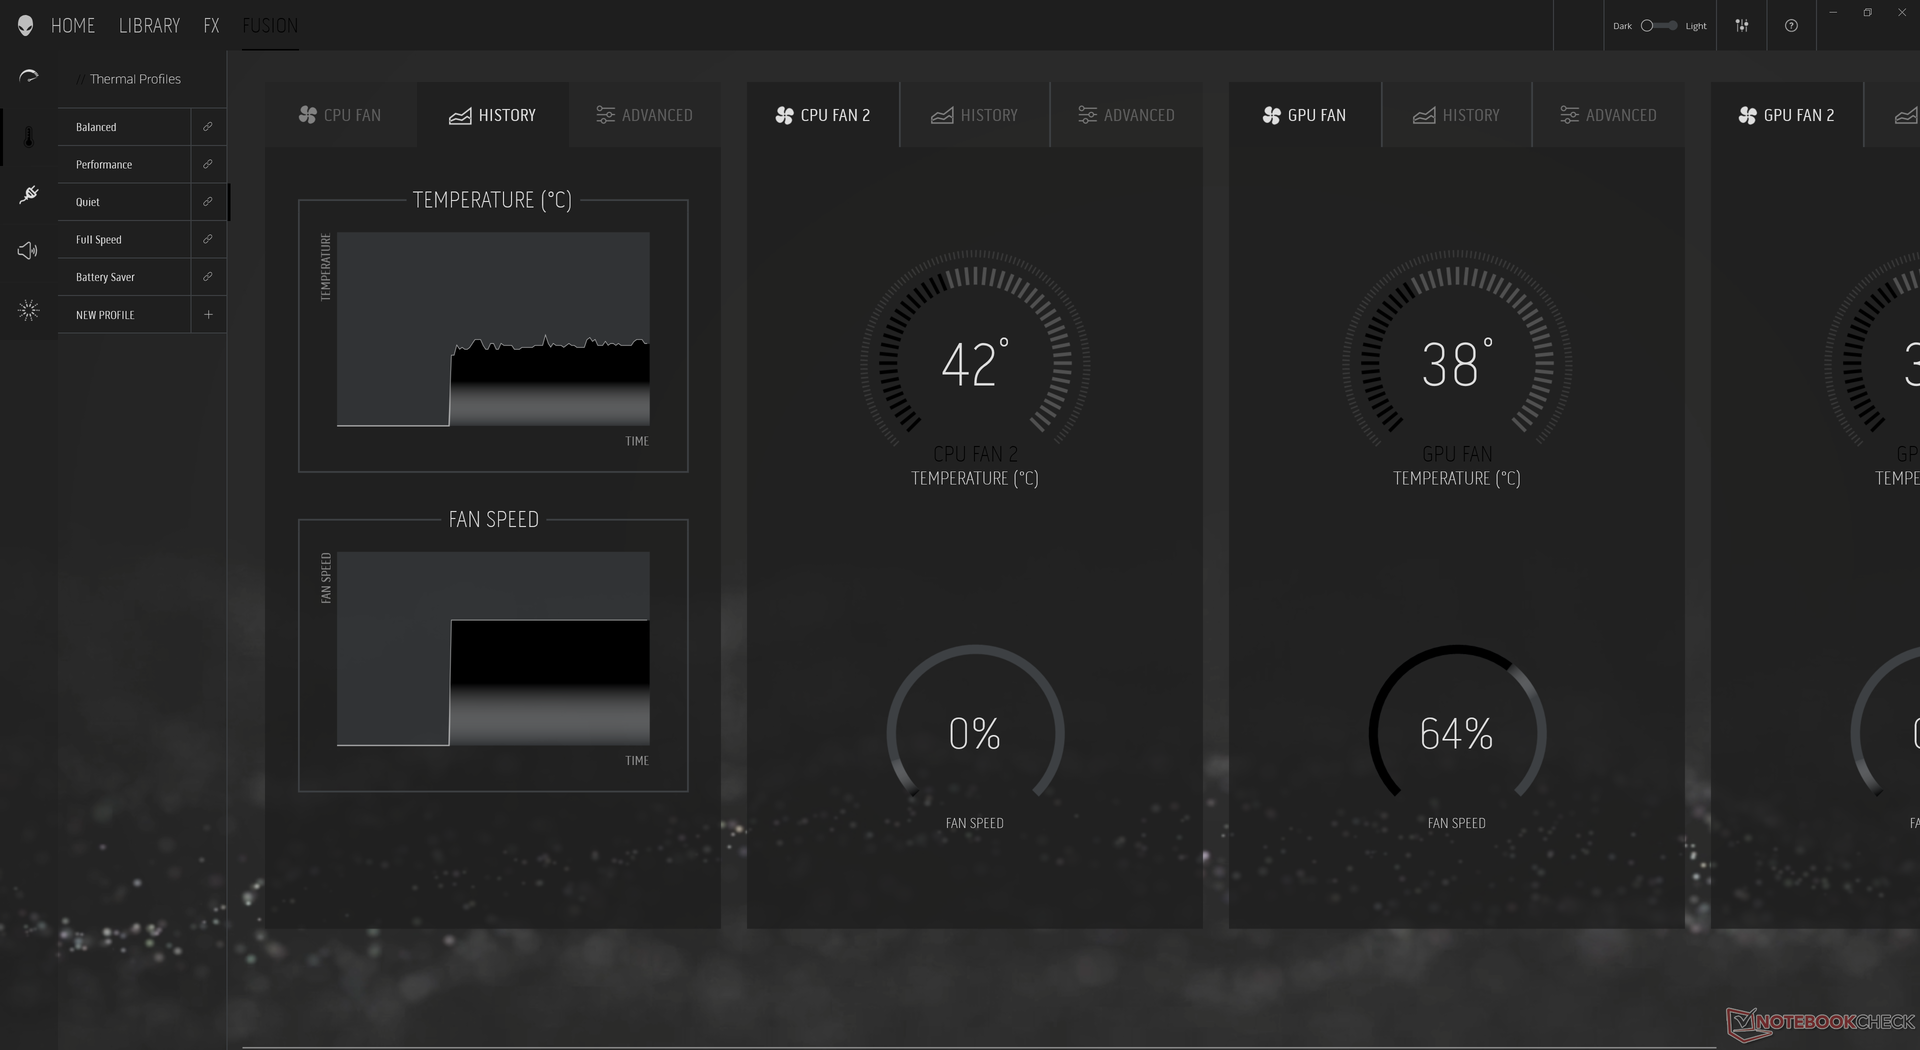
Sistema Ruído - Câmara de Vapor + Pasta Térmica de Gálio-silicone
O ruído do ventilador depende muito das configurações do Centro de Comando de Alienígenas (Silencioso, Desempenho e Velocidade Total). Apesar de ter duas vezes mais ventiladores do que na maioria dos outros laptops de jogos, o Alienware x17 é geralmente muito silencioso durante cargas baixas como navegação ou transmissão de vídeo, mesmo quando configurado para o modo Performance. Somos capazes de gravar um ruído do ventilador de apenas 31,3 dB(A) contra um fundo de 24,9 dB(A) ao rodar o 3DMark 06 por 90 segundos. No entanto, por mais tempo, e o ruído do ventilador eventualmente aumentaria para 43,8 dB(A), o que é semelhante ao que gravamos em outros laptops de jogos.
Rodar Witcher 3 no modo Performance resultaria em um ruído constante do ventilador de 49,7 dB(A). Curiosamente, este nível permaneceria o mesmo mesmo mesmo quando no modo Equilibrado e, portanto, os jogadores deveriam ajustar o sistema para o modo Performance sempre que possível. Ajustar os ventiladores para o modo Full Speed aumentará o ruído do ventilador até 55 dB(A), não importando a carga na tela. O Alienware x17 é geralmente mais silencioso que o Gigabyte Aero 17 ou o m17 R4 de última geração durante cargas baixas, mas eles quase sempre são mais ou menos os mesmos uma vez introduzidas cargas mais altas.
| Alienware x17 RTX 3080 P48E GeForce RTX 3080 Laptop GPU, i7-11800H, 2x WDC PC SN730 SDBPNTY-1T00 (RAID 0) | Alienware m17 R4 GeForce RTX 3080 Laptop GPU, i9-10980HK, 2x Micron 2300 512 GB (RAID 0) | Razer Blade 17 RTX 3070 GeForce RTX 3070 Laptop GPU, i7-11800H, Samsung PM9A1 MZVL21T0HCLR | Asus ROG Zephyrus S17 GX703HSD GeForce RTX 3080 Laptop GPU, i9-11900H, Samsung PM9A1 MZVL22T0HBLB | MSI GS76 Stealth 11UH GeForce RTX 3080 Laptop GPU, i9-11900H, Samsung PM9A1 MZVL22T0HBLB | Gigabyte Aero 17 HDR YD GeForce RTX 3080 Laptop GPU, i9-11980HK, Samsung PM9A1 MZVL2512HCJQ | |
|---|---|---|---|---|---|---|
| Noise | -6% | -3% | 4% | -10% | -20% | |
| desligado / ambiente * (dB) | 24.9 | 24 4% | 24.2 3% | 23 8% | 24 4% | 25 -0% |
| Idle Minimum * (dB) | 24.9 | 24 4% | 24.7 1% | 23 8% | 24 4% | 30 -20% |
| Idle Average * (dB) | 24.9 | 25 -0% | 24.7 1% | 23 8% | 25 -0% | 32 -29% |
| Idle Maximum * (dB) | 29.6 | 36 -22% | 24.7 17% | 23 22% | 42 -42% | 41 -39% |
| Load Average * (dB) | 31.1 | 45 -45% | 44.3 -42% | 41 -32% | 46 -48% | 43 -38% |
| Witcher 3 ultra * (dB) | 49.7 | 47 5% | 56.3 -13% | 45 9% | 48 3% | 51 -3% |
| Load Maximum * (dB) | 54.8 | 50 9% | 47.7 13% | 52 5% | 48 12% | 59 -8% |
* ... menor é melhor
Barulho
| Ocioso |
| 24.9 / 24.9 / 29.6 dB |
| Carga |
| 31.1 / 54.8 dB |
 | ||
30 dB silencioso 40 dB(A) audível 50 dB(A) ruidosamente alto |
||
min: | ||
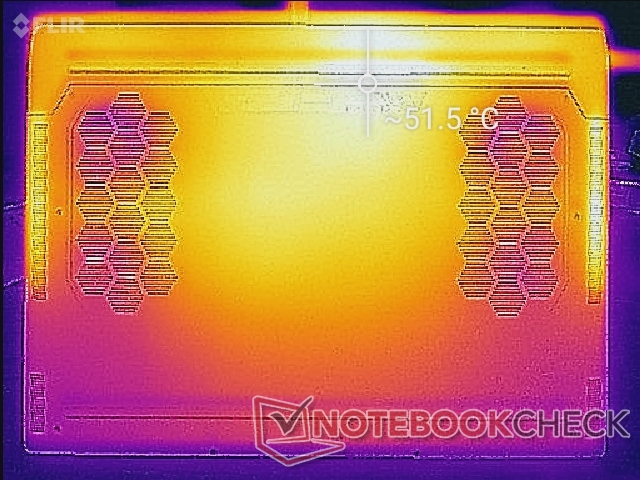
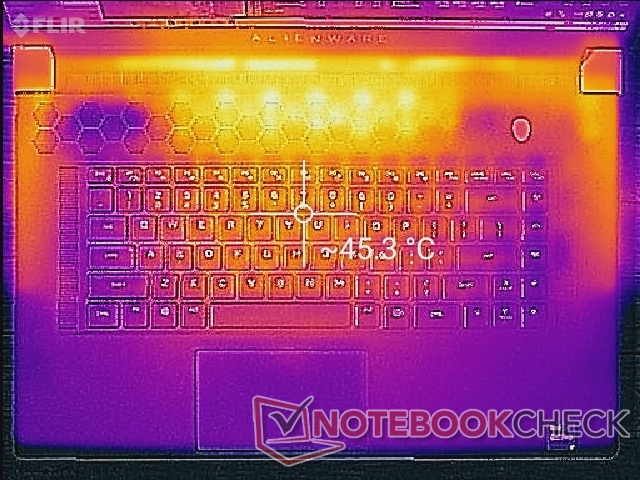
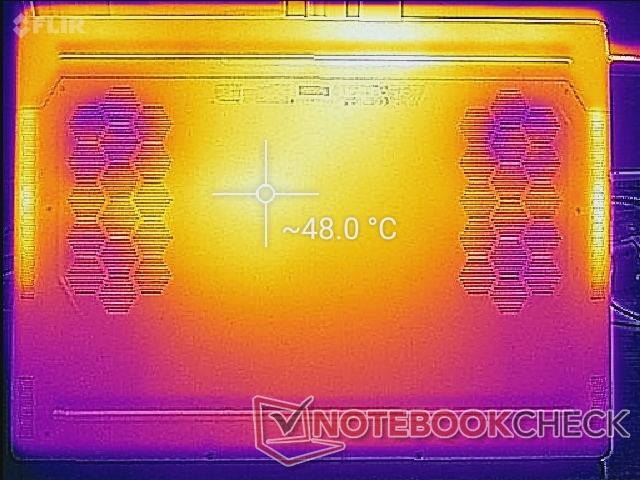
Temperatura
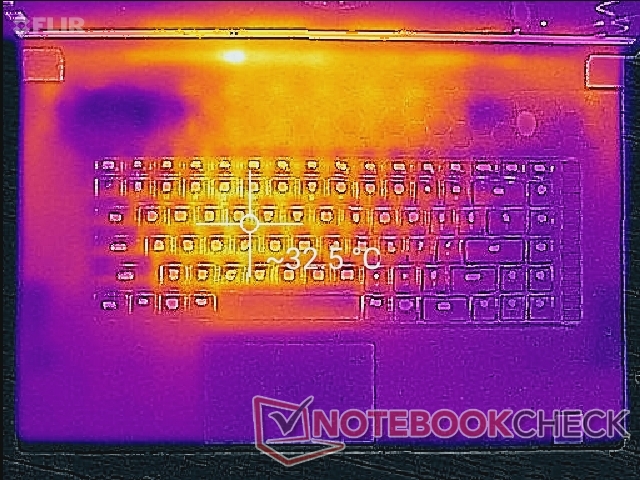
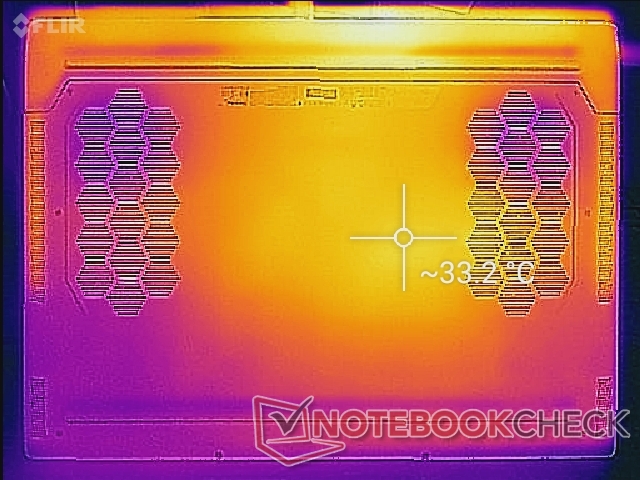
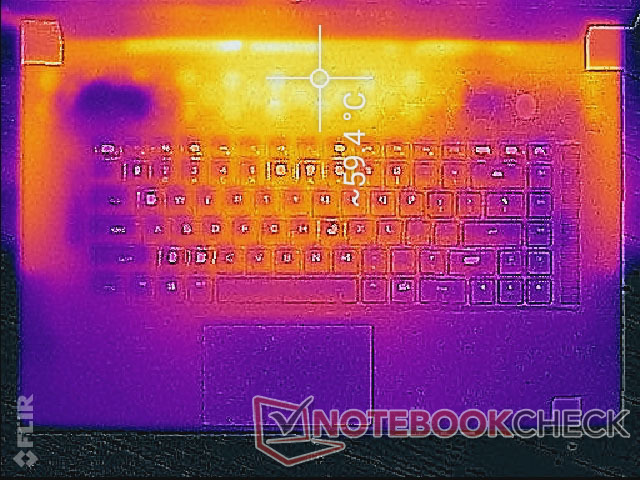
As temperaturas da superfície quando ociosas são relativamente frias no descanso da palma, enquanto o centro e o fundo do teclado podem ser visivelmente mais quentes a cerca de 33 C cada, uma vez que os ventiladores estão em baixa velocidade. Quando se joga, os pontos quentes podem se tornar tão quentes quanto 59 C e 52 C na parte superior e inferior, respectivamente, ou mesmo 39 C ao longo das bordas laterais do teclado. Estes pontos quentes estão geralmente longe das palmas das mãos e dos dedos dos usuários como para distrair menos durante o jogo, mas é definitivamente recomendado não bloquear nenhuma das várias grelhas de ventilação ao redor do sistema
Na verdade, as temperaturas gerais são mais frias do que o que observamos no Asus Zephyrus S17 provavelmente devido ao tamanho mais grosso e maior de nosso chassi de Alienware.
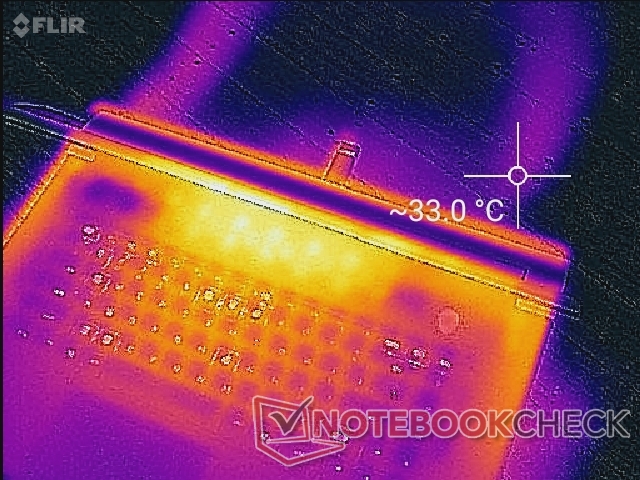
(-) A temperatura máxima no lado superior é 58.4 °C / 137 F, em comparação com a média de 40.4 °C / 105 F , variando de 21.2 a 68.8 °C para a classe Gaming.
(-) A parte inferior aquece até um máximo de 49 °C / 120 F, em comparação com a média de 43.2 °C / 110 F
(+) Em uso inativo, a temperatura média para o lado superior é 29.5 °C / 85 F, em comparação com a média do dispositivo de 33.9 °C / ### class_avg_f### F.
(-) Jogando The Witcher 3, a temperatura média para o lado superior é 41.4 °C / 107 F, em comparação com a média do dispositivo de 33.9 °C / ## #class_avg_f### F.
(+) Os apoios para as mãos e o touchpad estão atingindo a temperatura máxima da pele (32.4 °C / 90.3 F) e, portanto, não estão quentes.
(-) A temperatura média da área do apoio para as mãos de dispositivos semelhantes foi 28.8 °C / 83.8 F (-3.6 °C / -6.5 F).
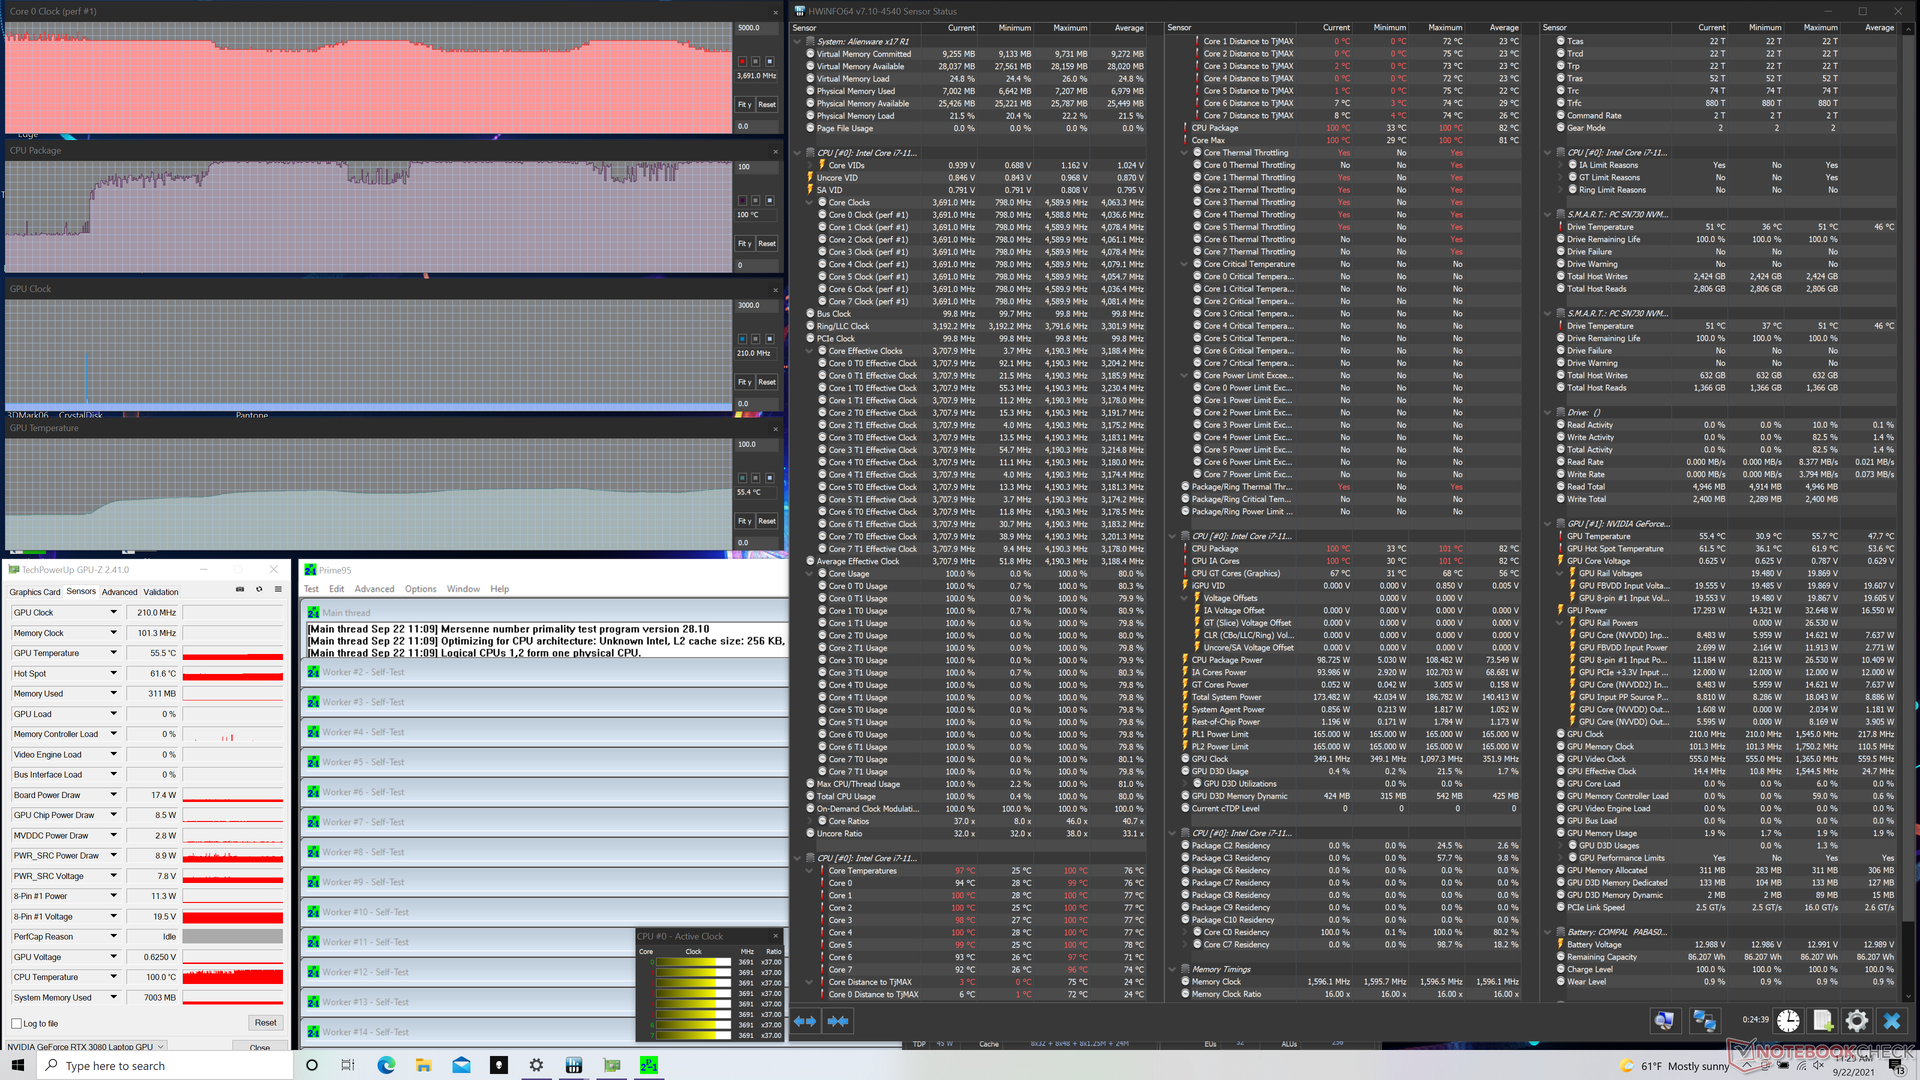
Teste de estresse
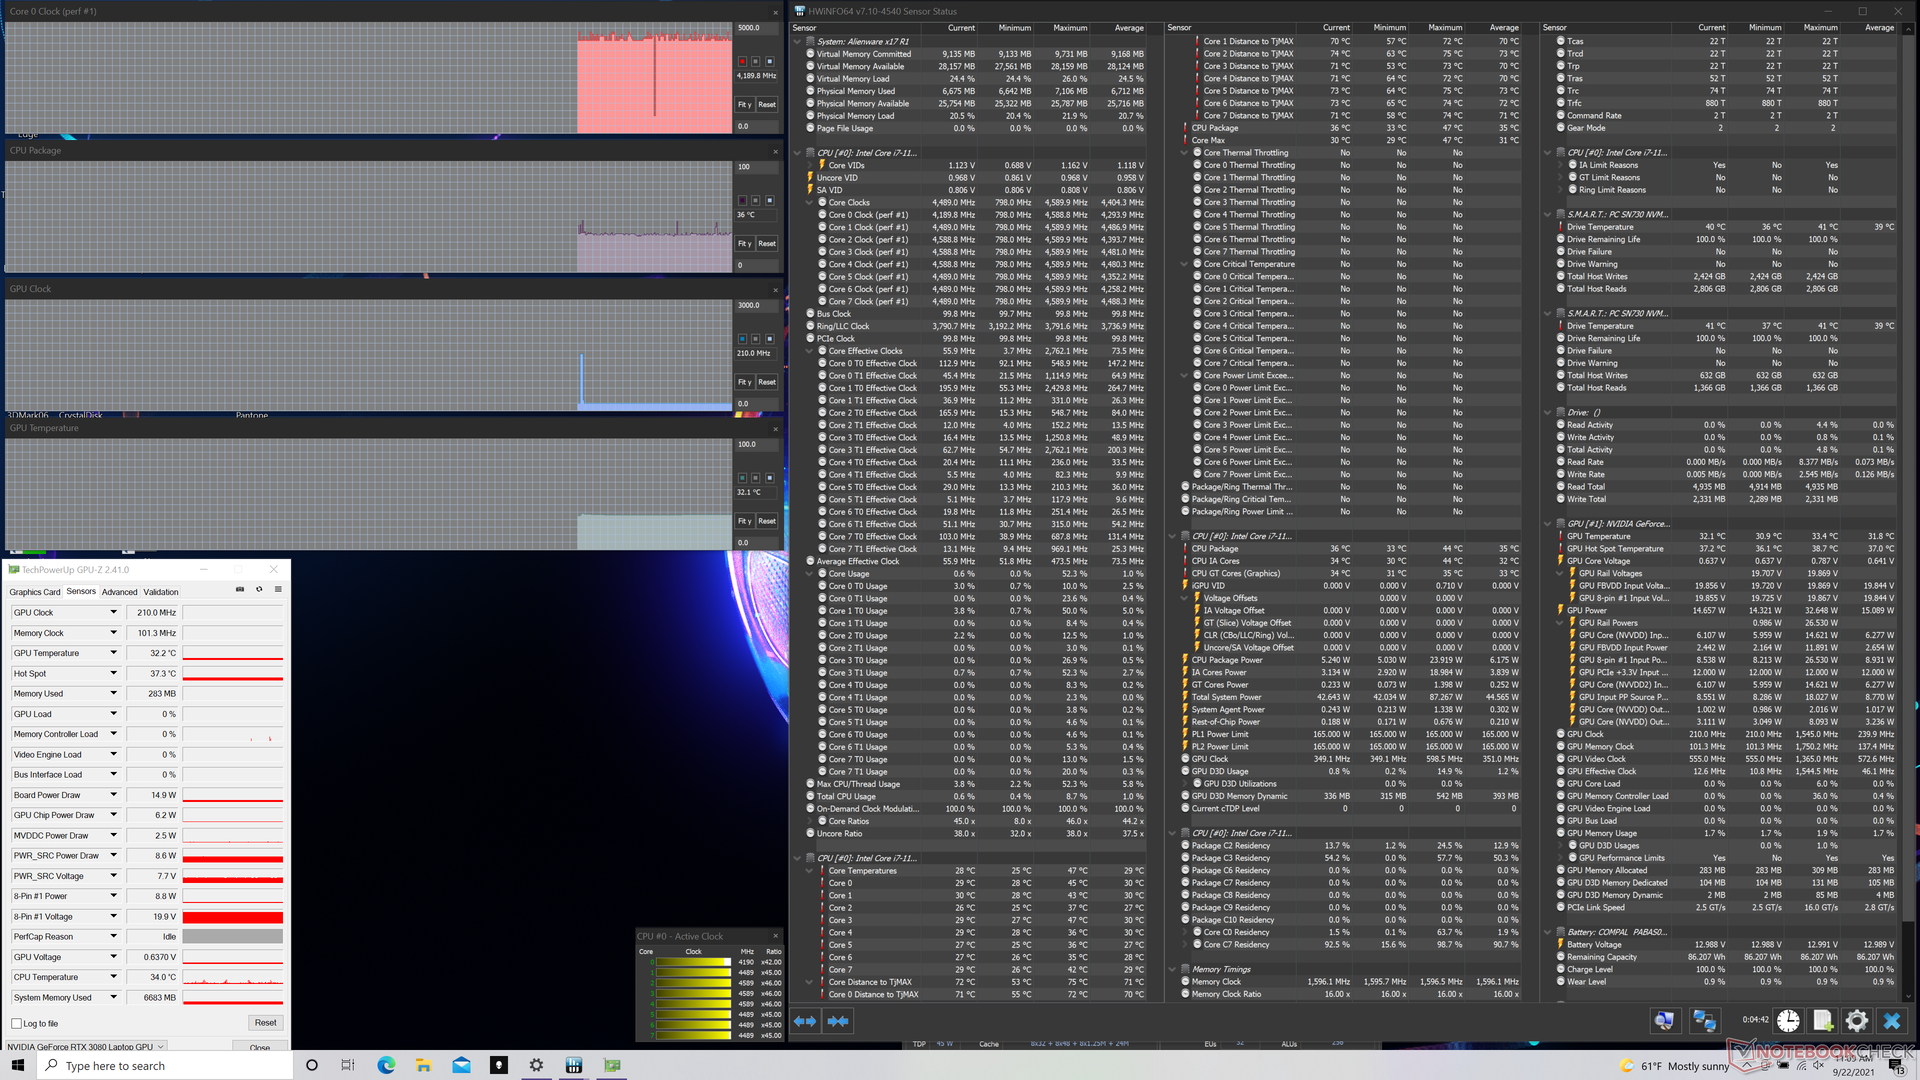
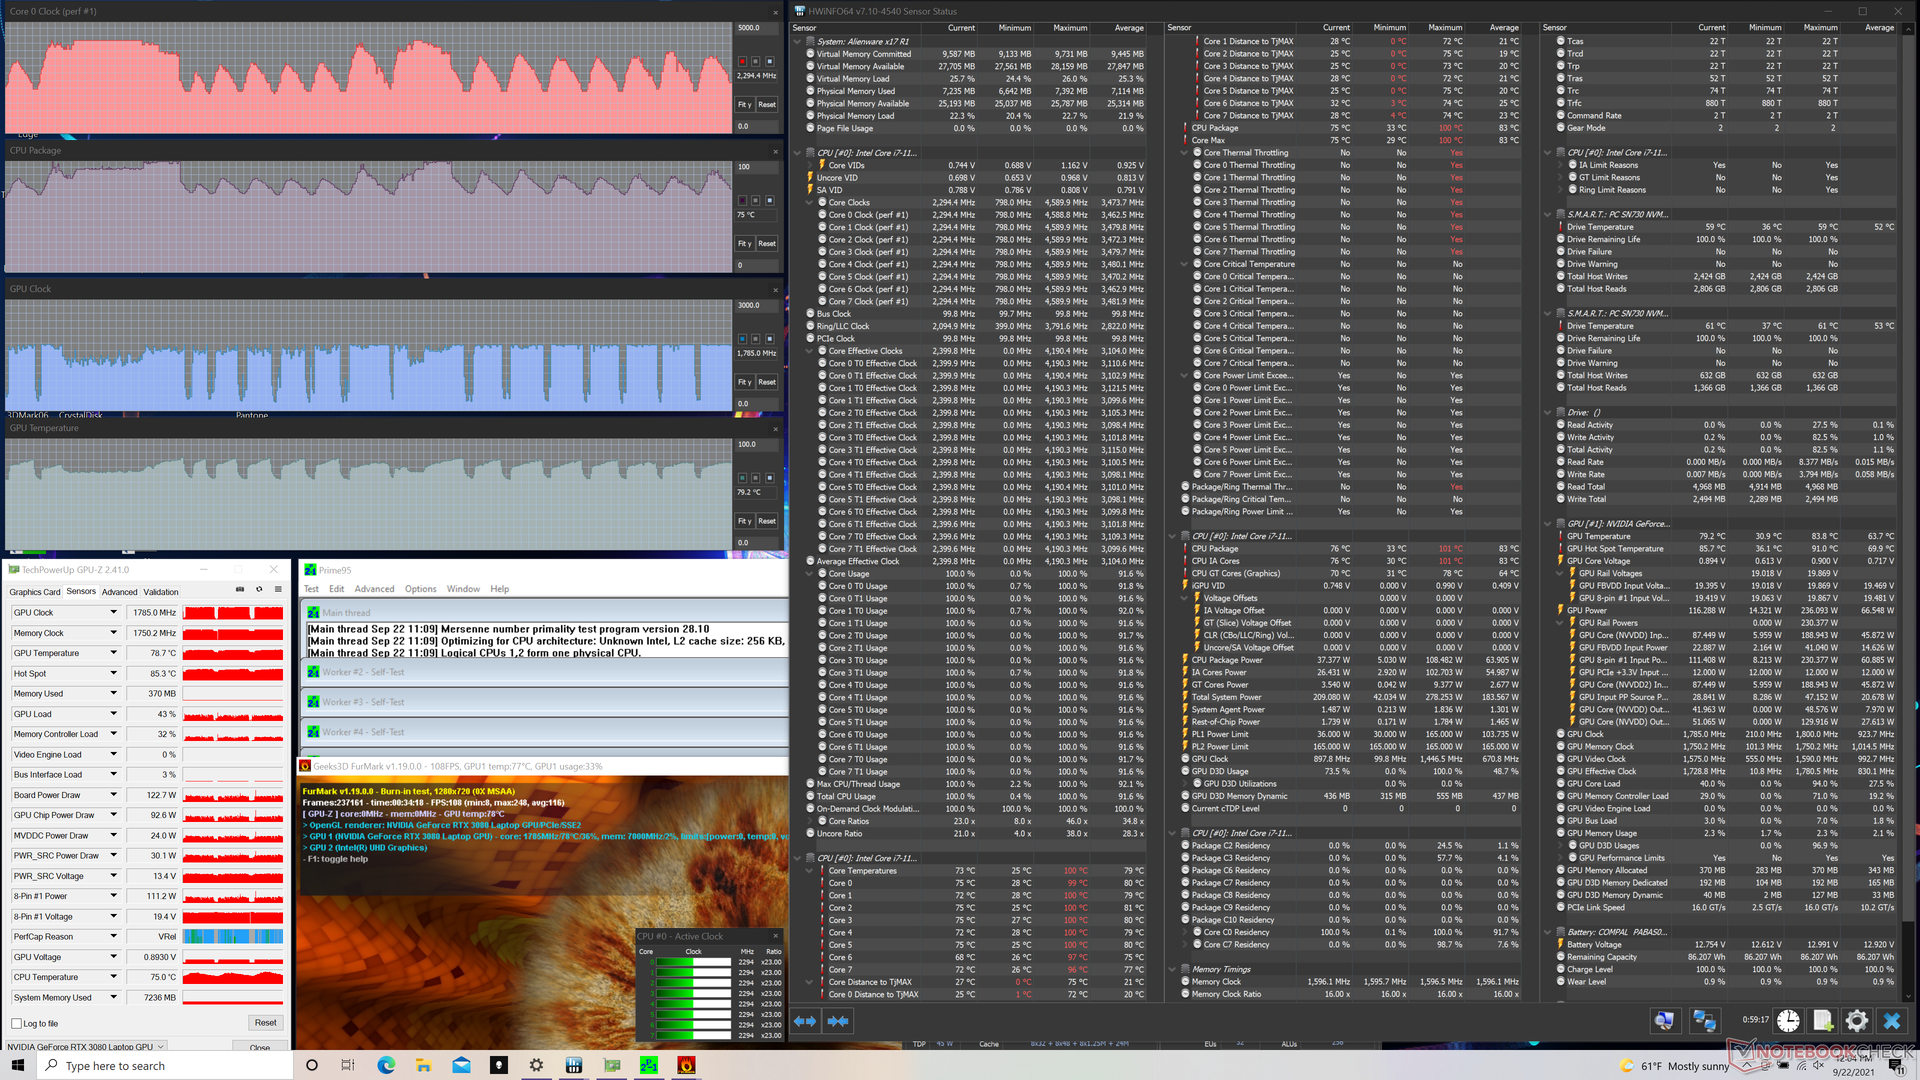
Quando estressado com Prime95, as taxas de relógio da CPU e a temperatura ciclavam entre 3,8 GHz a 4,2 GHz e 85 C a 100 C a cada par de minutos, que são valores muito altos em toda parte. Para comparação, o Razer Blade 17 vem com exatamente o mesmo processador Core i7-11800H e ainda assim estabilizaria em apenas 2,8 GHz e 78 C quando sujeito às mesmas condições. Tanto a taxa de clock da CPU quanto a da GPU serão aceleradas quando cada uma estiver a 100% de utilização via Prime95 e FurMark.
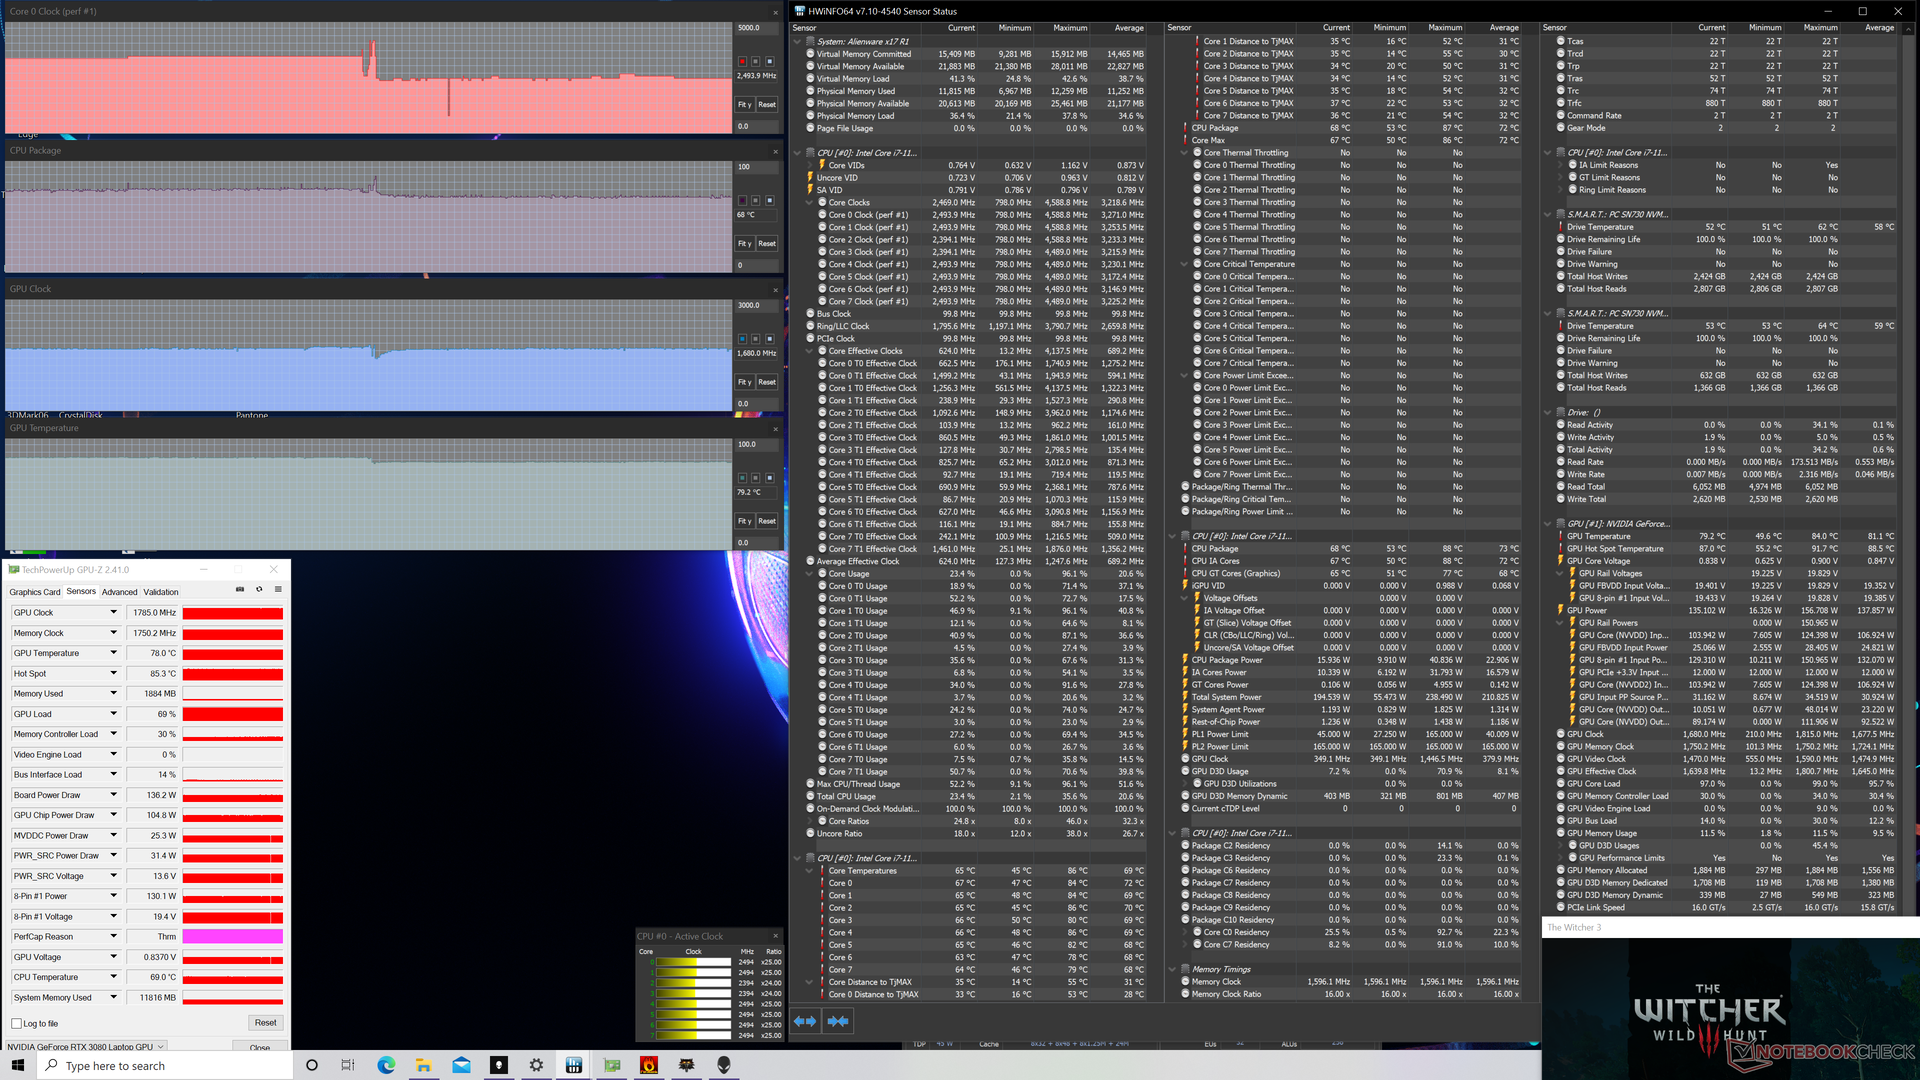
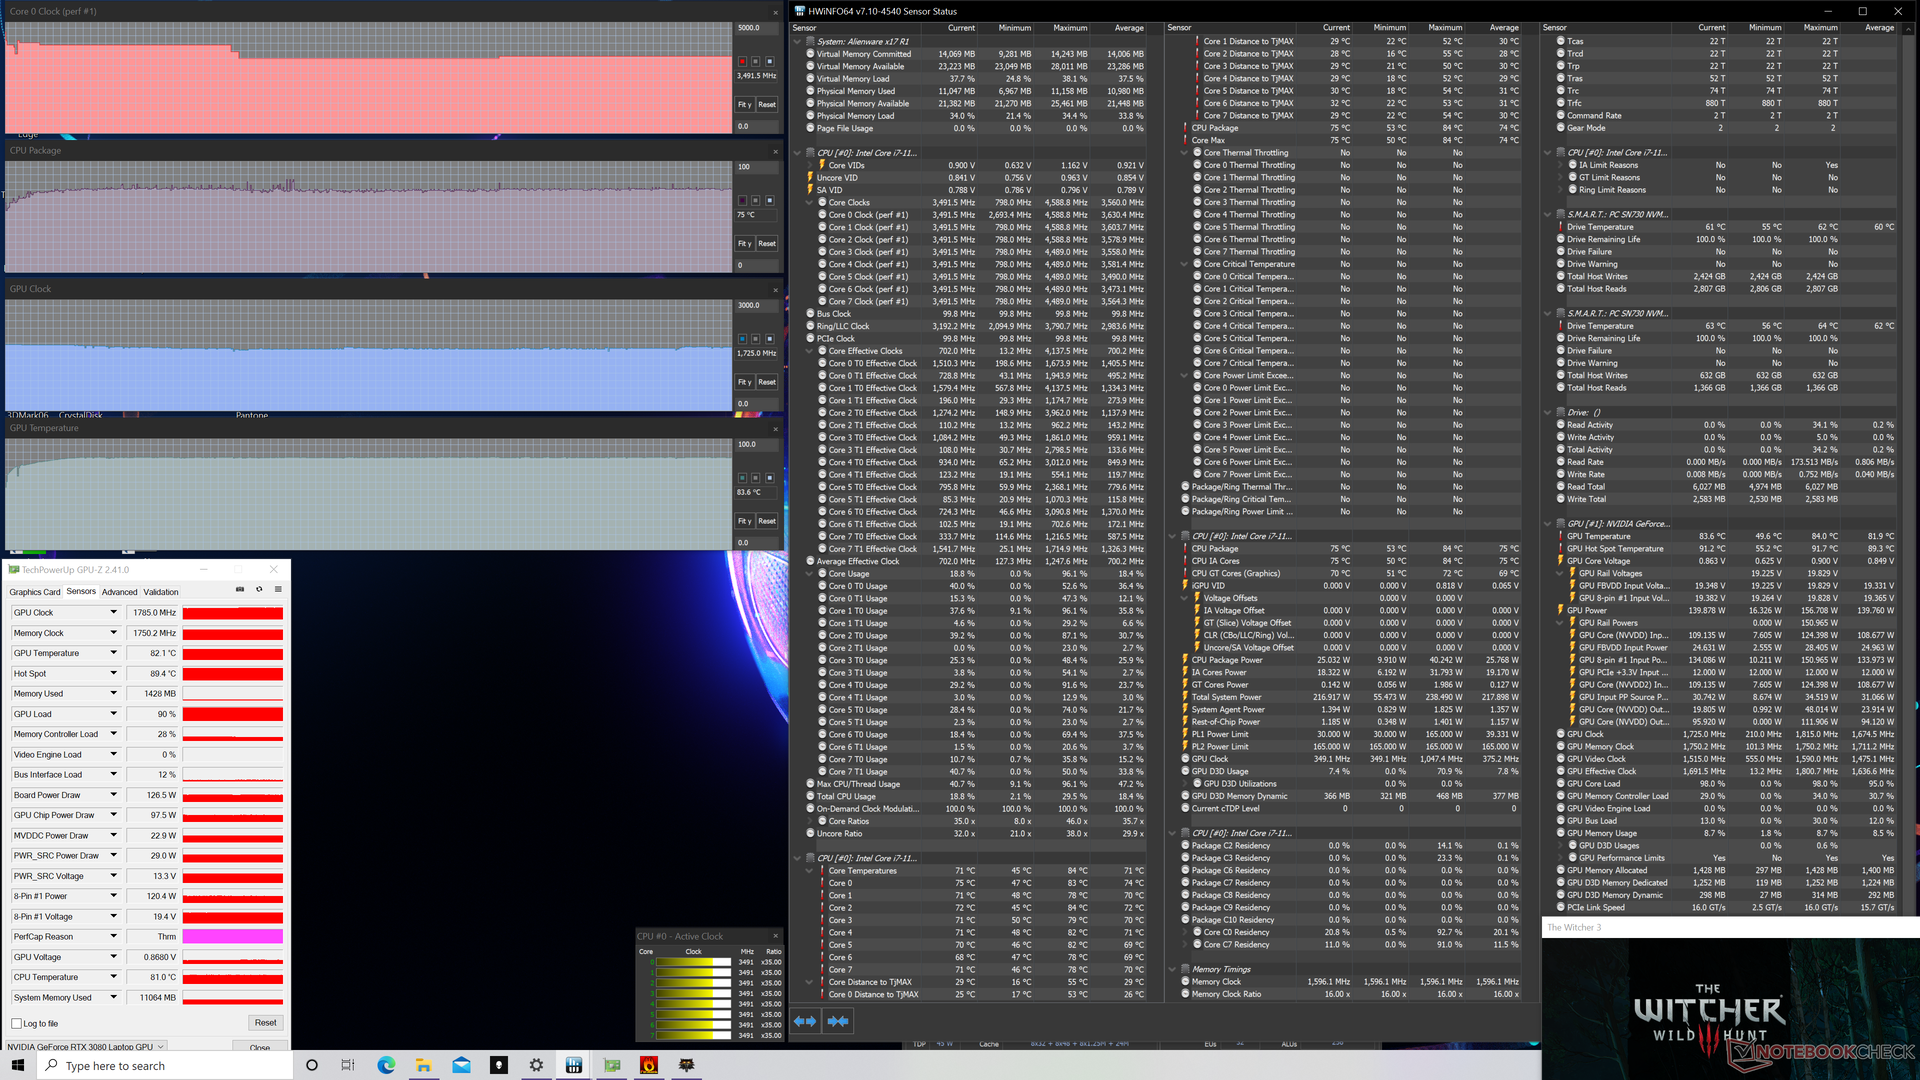
Em funcionamento Witcher 3 no modo High Performance faz com que a CPU e a GPU estabilizem em 3,5 GHz e 1785 MHz, respectivamente, com um consumo constante de energia da placa GPU de cerca de 145 W. Se no modo Balanceado, as taxas de clock da CPU cairiam para apenas 2,5 GHz enquanto as taxas de clock da GPU poderiam cair ligeiramente para 1680 MHz e um consumo de energia de ~135 W. Se você estiver jogando e quiser o máximo de seu laptop, então certifique-se de ativar o modo High Performance através do software Alienware. As taxas de relógio da GPU são mais rápidas do que o esperado em comparação com a maioria dos outros laptops com a mesma GPU, como o Maingear Vector Pro.
O funcionamento com energia de bateria limitará a performance gráfica. Um teste Fire Strike em baterias retornaria pontuações de Física e Gráficos de 24602 e 13281 pontos, respectivamente, em comparação com 22907 e 29194 pontos quando em rede elétrica.
| RelógioCPU (GHz) | RelógioGPU (MHz) | Temperaturamédiada CPU (°C) | Temperaturamédiada GPU (°C) | |
| System Idle | -- | --36 | 32 | |
| Prime95 Stress (Modo High Performance) | 3.8 - 4.2 | --85 - 100 | 55 | |
| Prime95 + FurMark Stress (Modo High Performance) | 1.9 - 3.4 | 300 - 1785 | 71 - 86 | 65 - 79 |
| Witcher 3 Stress (modo balanceado) | 2.5 | 1785 | 68 | 79 |
| Witcher 3 Stress (Modo de alto desempenho) | 3.5 | 1785 | 75 | 84 |
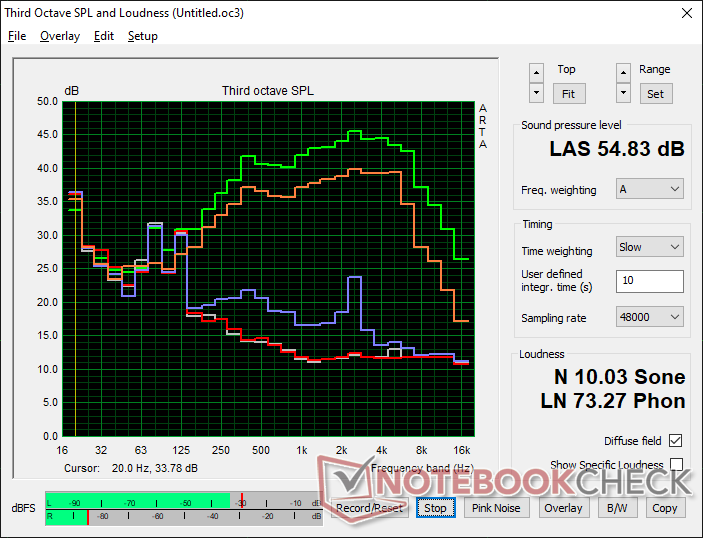
Oradores


Alienware x17 RTX 3080 P48E análise de áudio
(+) | os alto-falantes podem tocar relativamente alto (###valor### dB)
Graves 100 - 315Hz
(-) | quase nenhum baixo - em média 23% menor que a mediana
(±) | a linearidade dos graves é média (9.8% delta para a frequência anterior)
Médios 400 - 2.000 Hz
(+) | médios equilibrados - apenas 2.7% longe da mediana
(+) | médios são lineares (4% delta para frequência anterior)
Altos 2 - 16 kHz
(+) | agudos equilibrados - apenas 4.4% longe da mediana
(±) | a linearidade dos máximos é média (7% delta para frequência anterior)
Geral 100 - 16.000 Hz
(±) | a linearidade do som geral é média (17.3% diferença em relação à mediana)
Comparado com a mesma classe
» 47% de todos os dispositivos testados nesta classe foram melhores, 12% semelhantes, 41% piores
» O melhor teve um delta de 6%, a média foi 18%, o pior foi 132%
Comparado com todos os dispositivos testados
» 32% de todos os dispositivos testados foram melhores, 8% semelhantes, 59% piores
» O melhor teve um delta de 4%, a média foi 24%, o pior foi 134%
Apple MacBook 12 (Early 2016) 1.1 GHz análise de áudio
(+) | os alto-falantes podem tocar relativamente alto (###valor### dB)
Graves 100 - 315Hz
(±) | graves reduzidos - em média 11.3% menor que a mediana
(±) | a linearidade dos graves é média (14.2% delta para a frequência anterior)
Médios 400 - 2.000 Hz
(+) | médios equilibrados - apenas 2.4% longe da mediana
(+) | médios são lineares (5.5% delta para frequência anterior)
Altos 2 - 16 kHz
(+) | agudos equilibrados - apenas 2% longe da mediana
(+) | os máximos são lineares (4.5% delta da frequência anterior)
Geral 100 - 16.000 Hz
(+) | o som geral é linear (10.2% diferença em relação à mediana)
Comparado com a mesma classe
» 7% de todos os dispositivos testados nesta classe foram melhores, 2% semelhantes, 91% piores
» O melhor teve um delta de 5%, a média foi 18%, o pior foi 53%
Comparado com todos os dispositivos testados
» 5% de todos os dispositivos testados foram melhores, 1% semelhantes, 94% piores
» O melhor teve um delta de 4%, a média foi 24%, o pior foi 134%
Energy Management
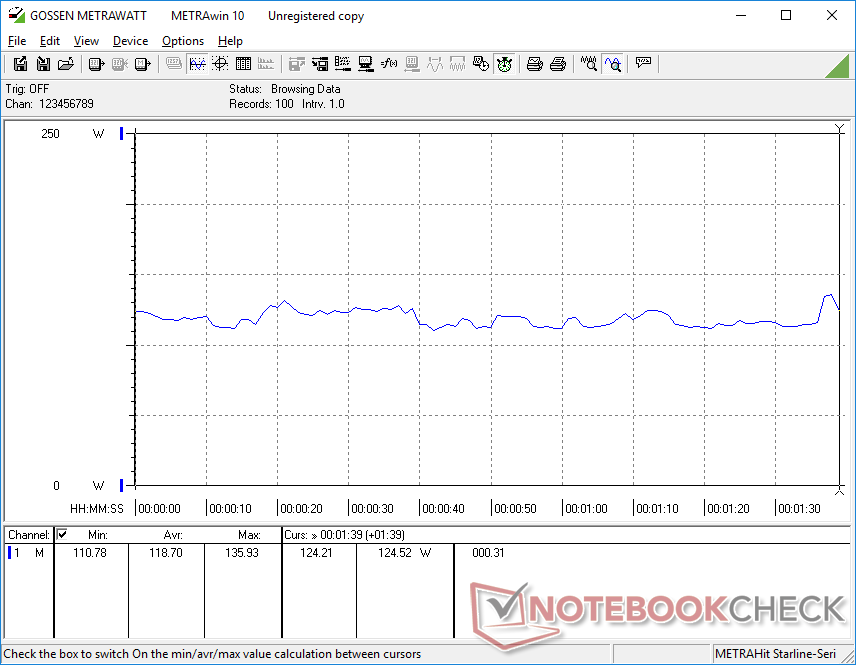
Consumo de energia - Contas de alta energia
A Dell melhorou o consumo de energia do sistema durante cargas baixas quando comparado com o m17 R4, o que pode explicar a maior duração geral da bateria em nossa próxima seção. Nosso sistema teria apenas 10 W quando ocioso na área de trabalho com o mínimo de brilho, para ser 4x mais eficiente do que o que registramos no m17 R4 do ano passado.
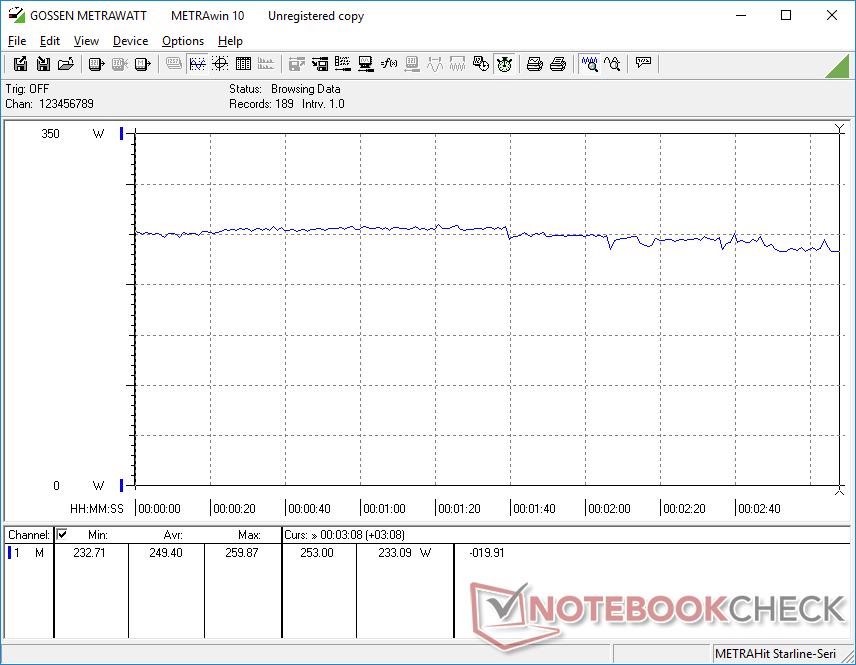
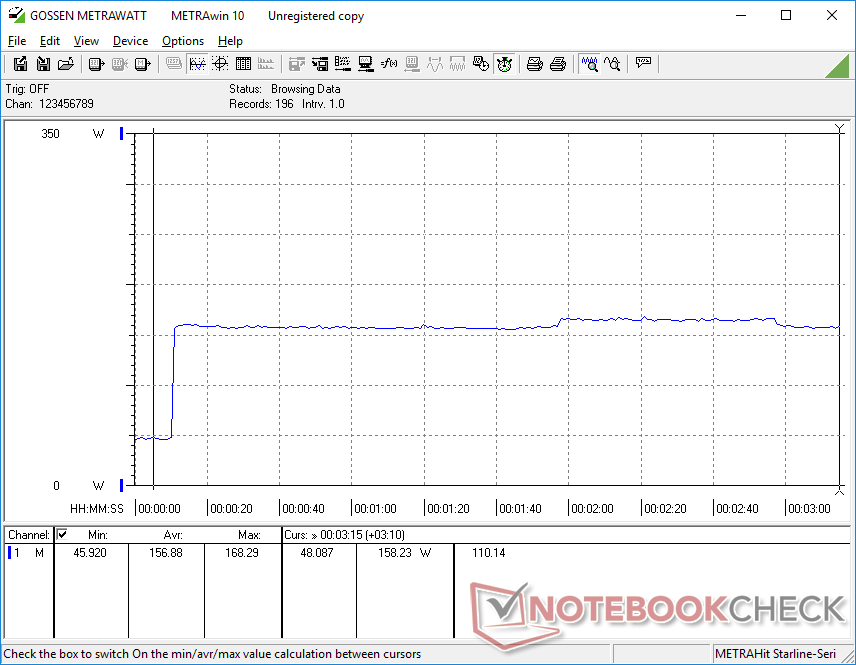
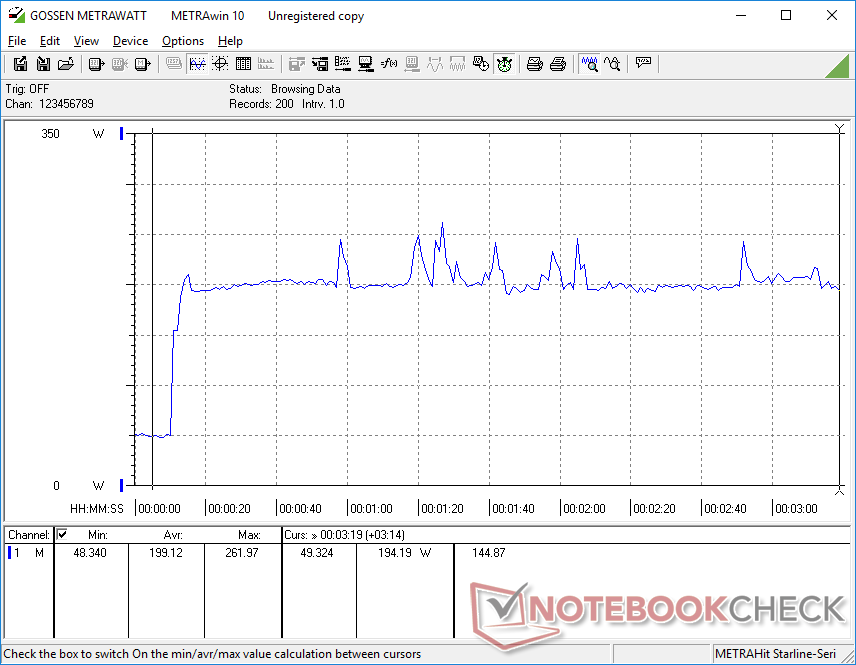
O consumo de energia quando o jogo permanece maior do que o normal, muito parecido com o que descobrimos na série m17. Rodando Witcher 3 consumiria uma média de 249 W em comparação com apenas 195 W ou 156 W no Asus ROG Zephyrus S17 ou MSI GS76, respectivamente. Os alvos mais altos de CPU TDP e GPU TGP do sistema Alienware são provavelmente responsáveis por suas maiores demandas de energia.
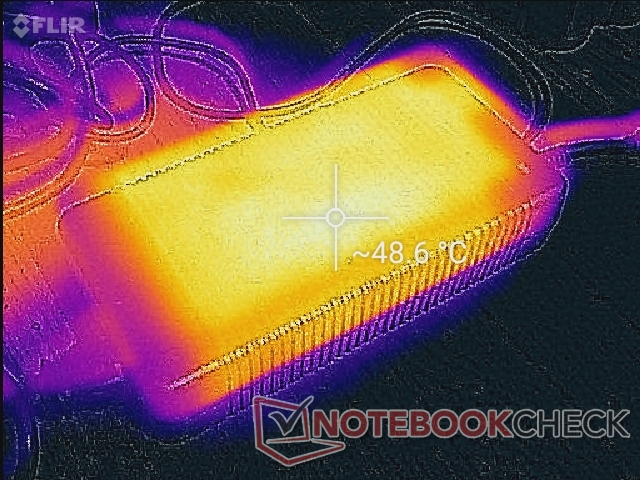
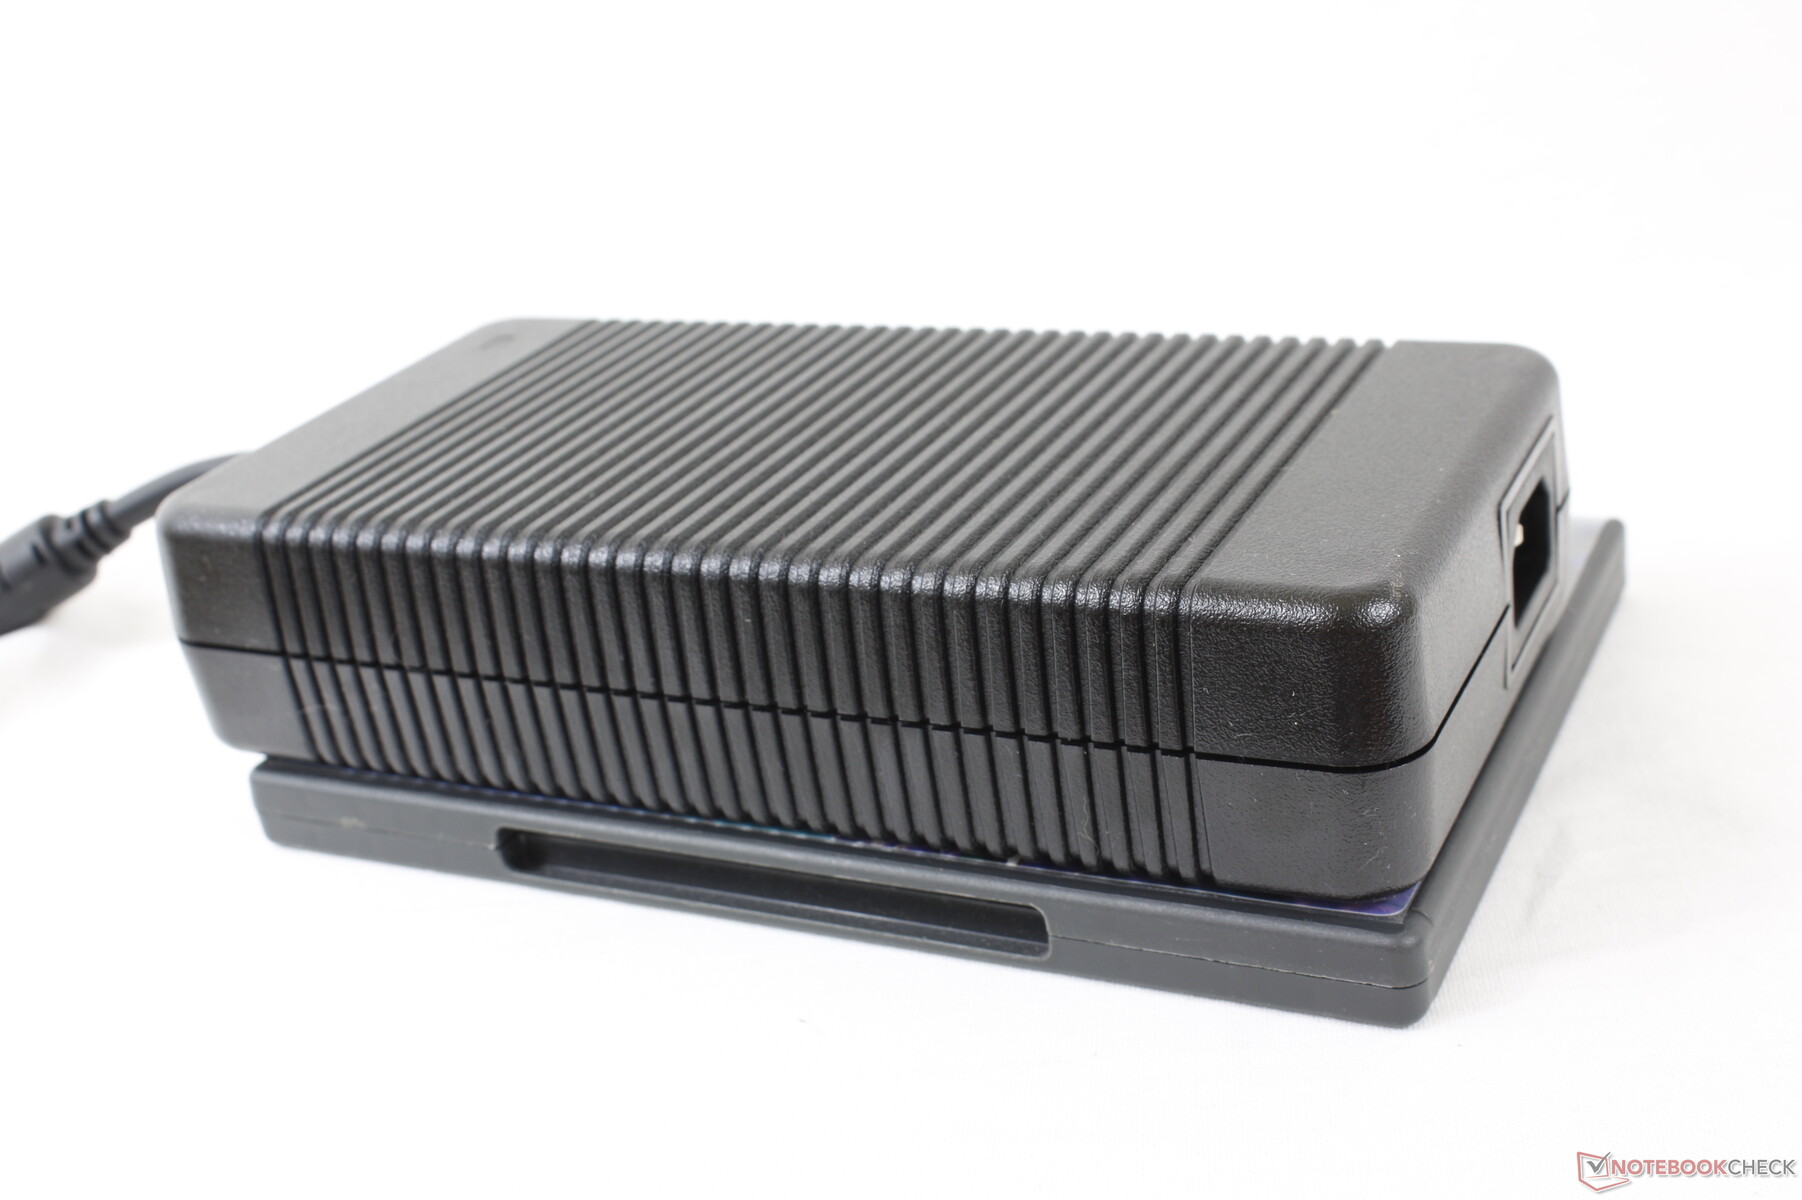
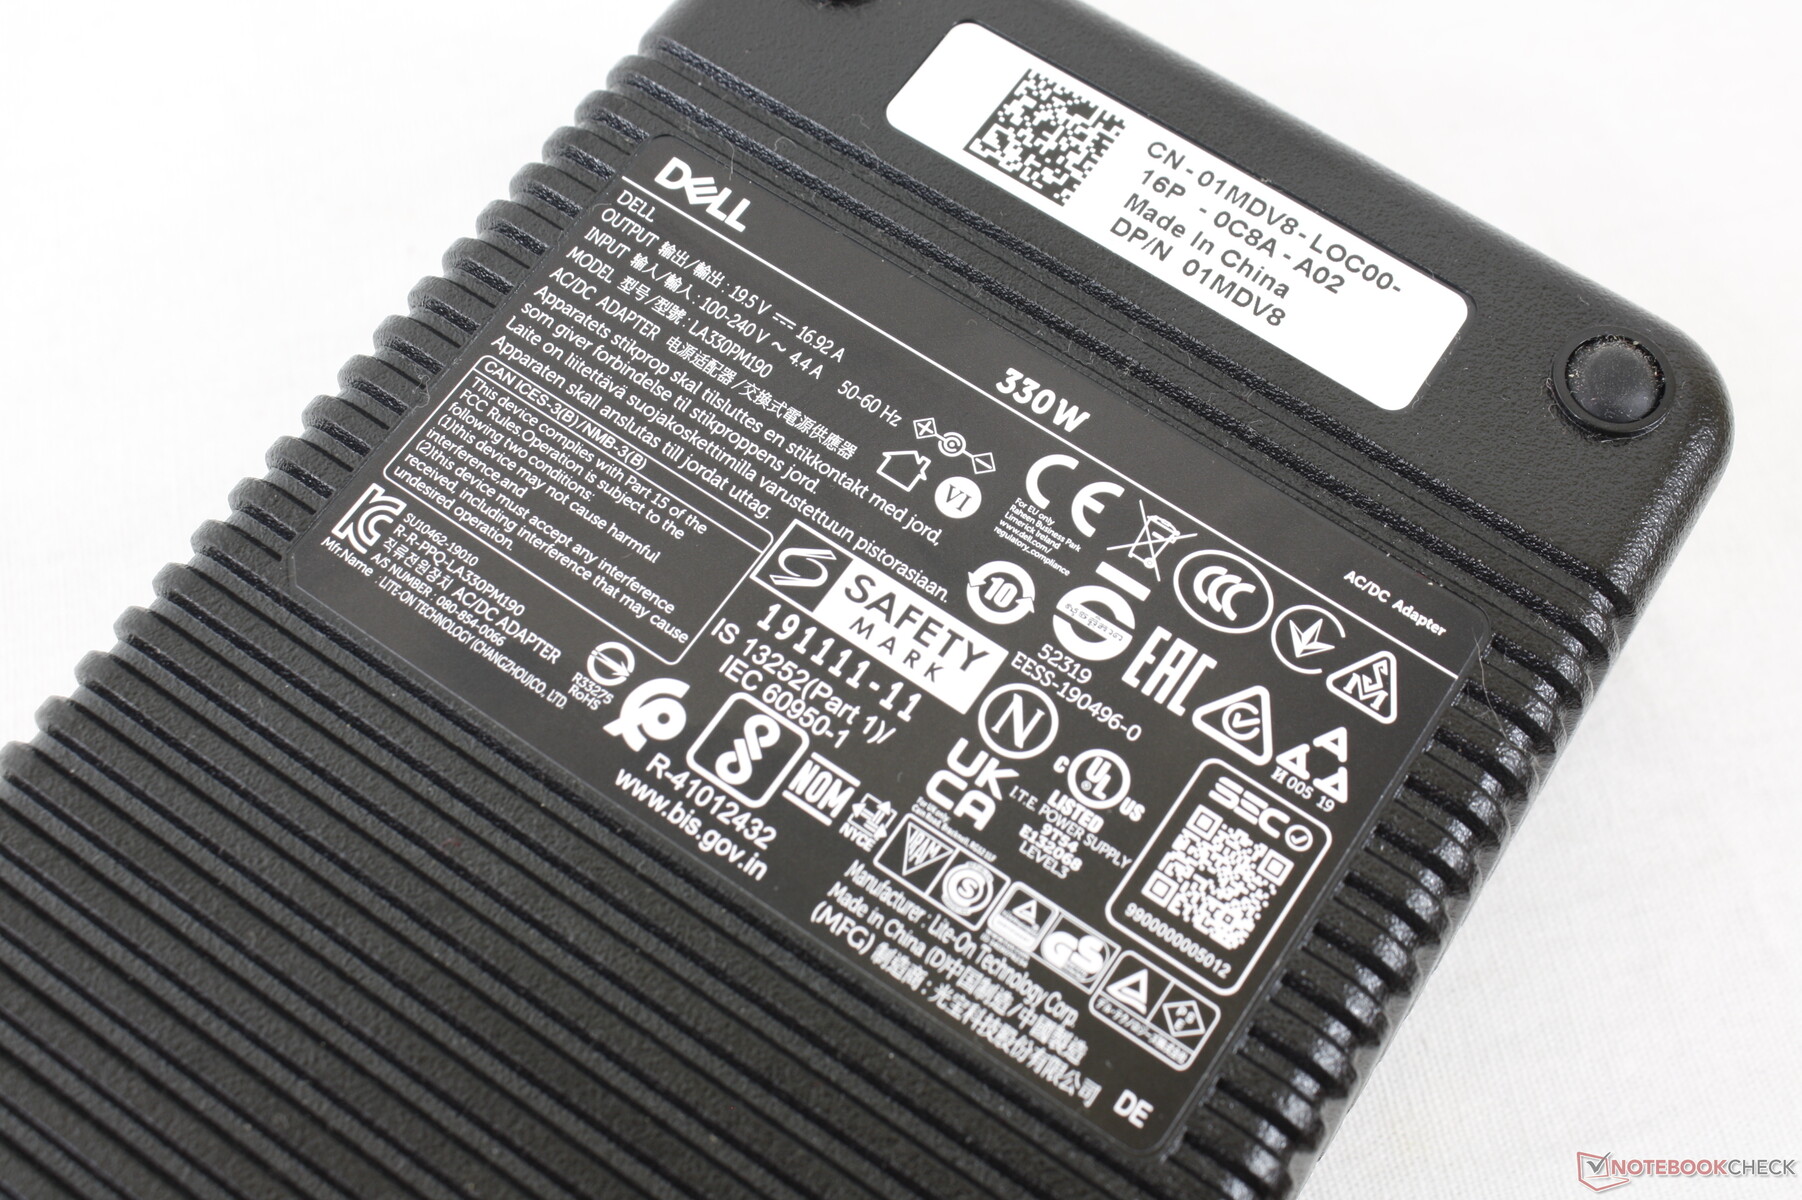
Nossa unidade de teste é fornecida com um adaptador CA de 330 W em comparação com os adaptadores CA menores de 280 W ou 230 W do ROG Zephyrus S17 ou Razer Blade 17, respectivamente. Suspeitamos que o adaptador AC superdimensionado é para suportar melhor os alvos TDP e TGP mais altos do sistema acima mencionados, bem como a taxa de carga da bateria quando se joga. A Dell oferece um adaptador AC menor de 240 W para os menores SKUs RTX 3060.
| desligado | |
| Ocioso | |
| Carga |
|
Key:
min: | |
| Alienware x17 RTX 3080 P48E i7-11800H, GeForce RTX 3080 Laptop GPU, 2x WDC PC SN730 SDBPNTY-1T00 (RAID 0), IPS, 3840x2160, 17.3" | Alienware m17 R4 i9-10980HK, GeForce RTX 3080 Laptop GPU, 2x Micron 2300 512 GB (RAID 0), IPS, 1920x1080, 17.3" | Razer Blade 17 RTX 3070 i7-11800H, GeForce RTX 3070 Laptop GPU, Samsung PM9A1 MZVL21T0HCLR, IPS, 1920x1080, 17.3" | Asus ROG Zephyrus S17 GX703HSD i9-11900H, GeForce RTX 3080 Laptop GPU, Samsung PM9A1 MZVL22T0HBLB, IPS, 2560x1440, 17.3" | MSI GS76 Stealth 11UH i9-11900H, GeForce RTX 3080 Laptop GPU, Samsung PM9A1 MZVL22T0HBLB, IPS, 3840x2160, 17.3" | Gigabyte Aero 17 HDR YD i9-11980HK, GeForce RTX 3080 Laptop GPU, Samsung PM9A1 MZVL2512HCJQ, IPS, 3840x2160, 17.3" | |
|---|---|---|---|---|---|---|
| Power Consumption | -80% | -11% | -10% | 13% | -20% | |
| Idle Minimum * (Watt) | 10.2 | 42 -312% | 20.9 -105% | 21.7 -113% | 14 -37% | 25 -145% |
| Idle Average * (Watt) | 21.2 | 48 -126% | 25.1 -18% | 27 -27% | 19 10% | 28 -32% |
| Idle Maximum * (Watt) | 48.4 | 58 -20% | 45 7% | 33 32% | 31 36% | 40 17% |
| Load Average * (Watt) | 118.7 | 124 -4% | 102 14% | 108 9% | 97 18% | 114 4% |
| Witcher 3 ultra * (Watt) | 249 | 219 12% | 189 24% | 195 22% | 156 37% | 176 29% |
| Load Maximum * (Watt) | 262 | 337 -29% | 234.8 10% | 210 20% | 231 12% | 236 10% |
* ... menor é melhor
Power Consumption Witcher 3 / Stresstest
Vida útil da bateria - Nada mal para o tamanho
Os tempos de execução foram terríveis na última geração da série m17, mesmo quando todas as configurações de desempenho foram definidas para o mínimo. Felizmente, a vida útil da bateria melhorou significativamente na série x17 sem a necessidade de aumentar a capacidade da bateria. Os usuários podem agora esperar pouco menos de 6 horas de uso da WLAN no mundo real em comparação com ~2,5 horas no m17 R4, o que é decente para um laptop de alto desempenho para jogos. Os resultados são geralmente comparáveis aos do MSI GS76 ou Gigabyte Aero 17 que vêm com baterias maiores de 99 Wh.
A carga desde a capacidade vazia até a plena é muito rápida em cerca de 75 minutos com o adaptador de barril CA incluído.
| Alienware x17 RTX 3080 P48E i7-11800H, GeForce RTX 3080 Laptop GPU, 87 Wh | Alienware m17 R4 i9-10980HK, GeForce RTX 3080 Laptop GPU, 86 Wh | Razer Blade 17 RTX 3070 i7-11800H, GeForce RTX 3070 Laptop GPU, 70 Wh | Asus ROG Zephyrus S17 GX703HSD i9-11900H, GeForce RTX 3080 Laptop GPU, 90 Wh | MSI GS76 Stealth 11UH i9-11900H, GeForce RTX 3080 Laptop GPU, 99.9 Wh | Gigabyte Aero 17 HDR YD i9-11980HK, GeForce RTX 3080 Laptop GPU, 99 Wh | |
|---|---|---|---|---|---|---|
| Duração da bateria | -5% | 24% | 133% | 37% | 23% | |
| Reader / Idle (h) | 7 | 6.7 -4% | 9.9 41% | |||
| WiFi v1.3 (h) | 5.9 | 2.4 -59% | 5.2 -12% | 7.5 27% | 6.4 8% | 5.6 -5% |
| Load (h) | 0.8 | 1.2 50% | 1.5 88% | 2.7 238% | 1.3 63% | 1.2 50% |
| Witcher 3 ultra (h) | 1 |
Pro
Contra
Veredicto - Maior e mais pesado por todas as razões certas
As características mais convincentes do Alienware x17 são seu desempenho de processador e chaves mecânicas CherryMX. A CPU Core i7-11800H funciona aqui notavelmente mais rápido do que em outros laptops equipados exatamente com o mesmo chip, enquanto as teclas mecânicas com cliques são algumas das mais confortáveis que já usamos em qualquer laptop para jogos.
O Alienware x17 da Dell não tem medo de maximizar o desempenho, mesmo que isso signifique ser ligeiramente maior e mais pesado do que os demais.
Todo esse desempenho vem ao custo da temperatura interna, consumo de energia, tamanho e peso como modelos alternativos como oLâmina Razer 17,MSI GS76 Stealthou Asus ROG Zephyrus S17 são todas menores, mais leves e mais eficientes no consumo de energia, ao mesmo tempo em que oferecem opções similares da Intel e da Nvidia. No entanto, estes sistemas tendem a funcionar um pouco mais lentamente e, portanto, caberá aos usuários equilibrar o desempenho com suas preferências pessoais de portabilidade. Se você estiver satisfeito com o desempenho de nível RTX 3060, então o Razer ou MSI mais leve pode ser a melhor opção enquanto os caçadores de desempenho RTX 3080 podem espremer muito mais do Alienware x17 e seu sistema de resfriamento comparativamente maior.
Preço e disponibilidade
Diferentes configurações do Alienware x17 R1 estão agora disponíveis em Best Buy e Newegg a partir de $2399 USD no momento em que foi escrito. Alternativamente, os usuários podem solicitar diretamente da Dell no site https://www.dell.com/en-us/member/shop/dell-laptops/alienware-x17-gaming-laptop/spd/alienware-x17-r1-laptop#configurations_section que naturalmente terá mais SKUs e opções.
Alienware x17 RTX 3080 P48E
- 09/24/2021 v7 (old)
Allen Ngo
Price comparison

