Beelink SER6 Pro Ryzen 7 7735HS revisão mini PC: Agora com DisplayPort integrado

O SER6 Pro 2023 Beelink SER6 é uma atualização do SER6 Pro 2022. Ele substitui as opções mais antigas do Ryzen 7 6800 ou Ryzen 9 6900HS no modelo do ano passado pelo mais novo Ryzen 7 7735HS. No entanto, além da atualização do processador, o chassi permanece idêntico com apenas uma mudança notável.
Nossa unidade de revisão com o Ryzen 7 7735HS, 32 GB RAM, 500 GB NVMe SSD e Windows 10 Pro pré-instalado pode ser encontrada on-line por cerca de $650 USD ou $550 se estiver à venda. O modelo concorre diretamente com outros mini PCs mais notáveis da série Intel NUC.
Mais revisões Beelink:
- SEi12
- SEi11
- SER5 Pro
- GTR6
- U59
Possíveis concorrentes em comparação
Avaliação | Data | Modelo | Peso | Altura | Size | Resolução | Preço |
|---|---|---|---|---|---|---|---|
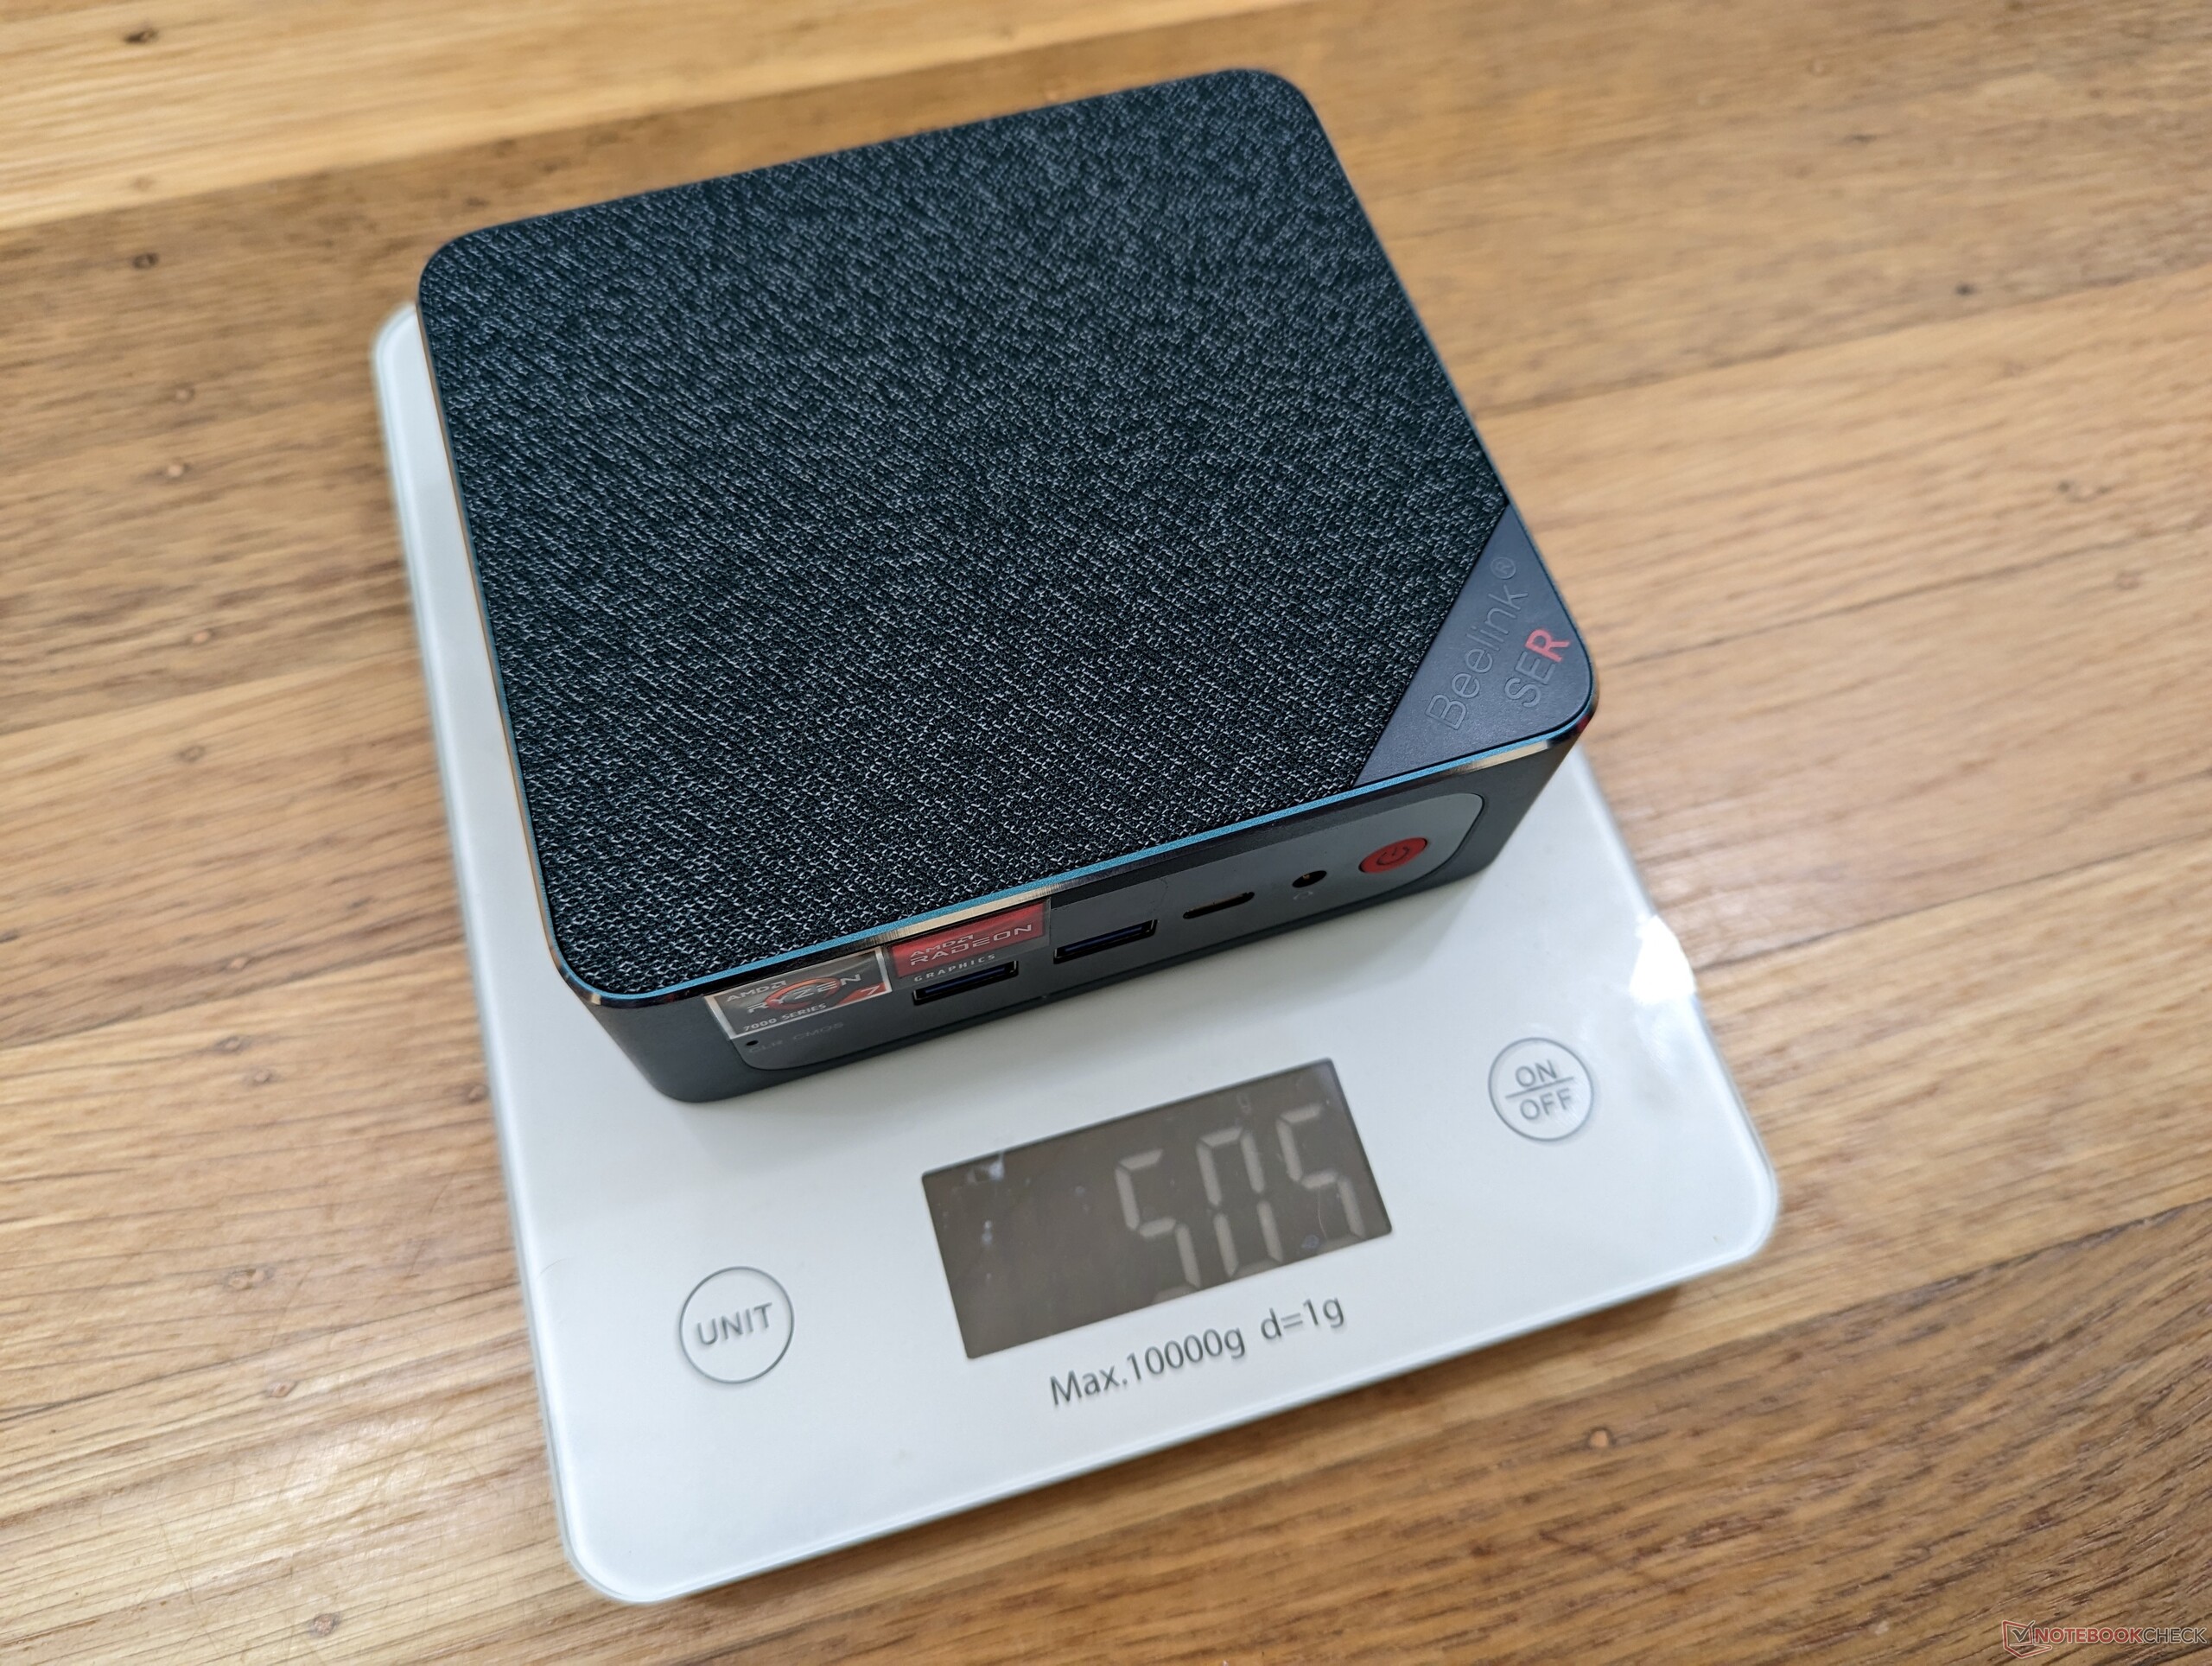
| 84.8 % v7 (old) | 04/2023 | Beelink SER6 Pro Ryzen 7 7735HS R7 7735HS, Radeon 680M | 506 g | 42 mm | x | ||
v (old) | 01/2023 | Beelink SER6 Pro R7 6800H, Radeon 680M | 511 g | 42 mm | x | ||
v (old) | 11/2022 | Beelink GTR6 R9 6900HX, Radeon 680M | 815 g | 43 mm | x | ||
| 80.8 % v7 (old) | 04/2023 | Intel NUC 13 Pro Kit NUC13ANK i7-1360P, Iris Xe G7 96EUs | 538 g | 37 mm | x | ||
v (old) | 03/2023 | Intel NUC 12 Pro Kit NUC12WSBi5 i5-1240P, Iris Xe G7 80EUs | 549 g | 45.6 mm | x | ||
| 86.1 % v7 (old) | 02/2023 | Minisforum Venus Series UM690 R9 6900HX, Radeon 680M | 621 g | 48 mm | x |
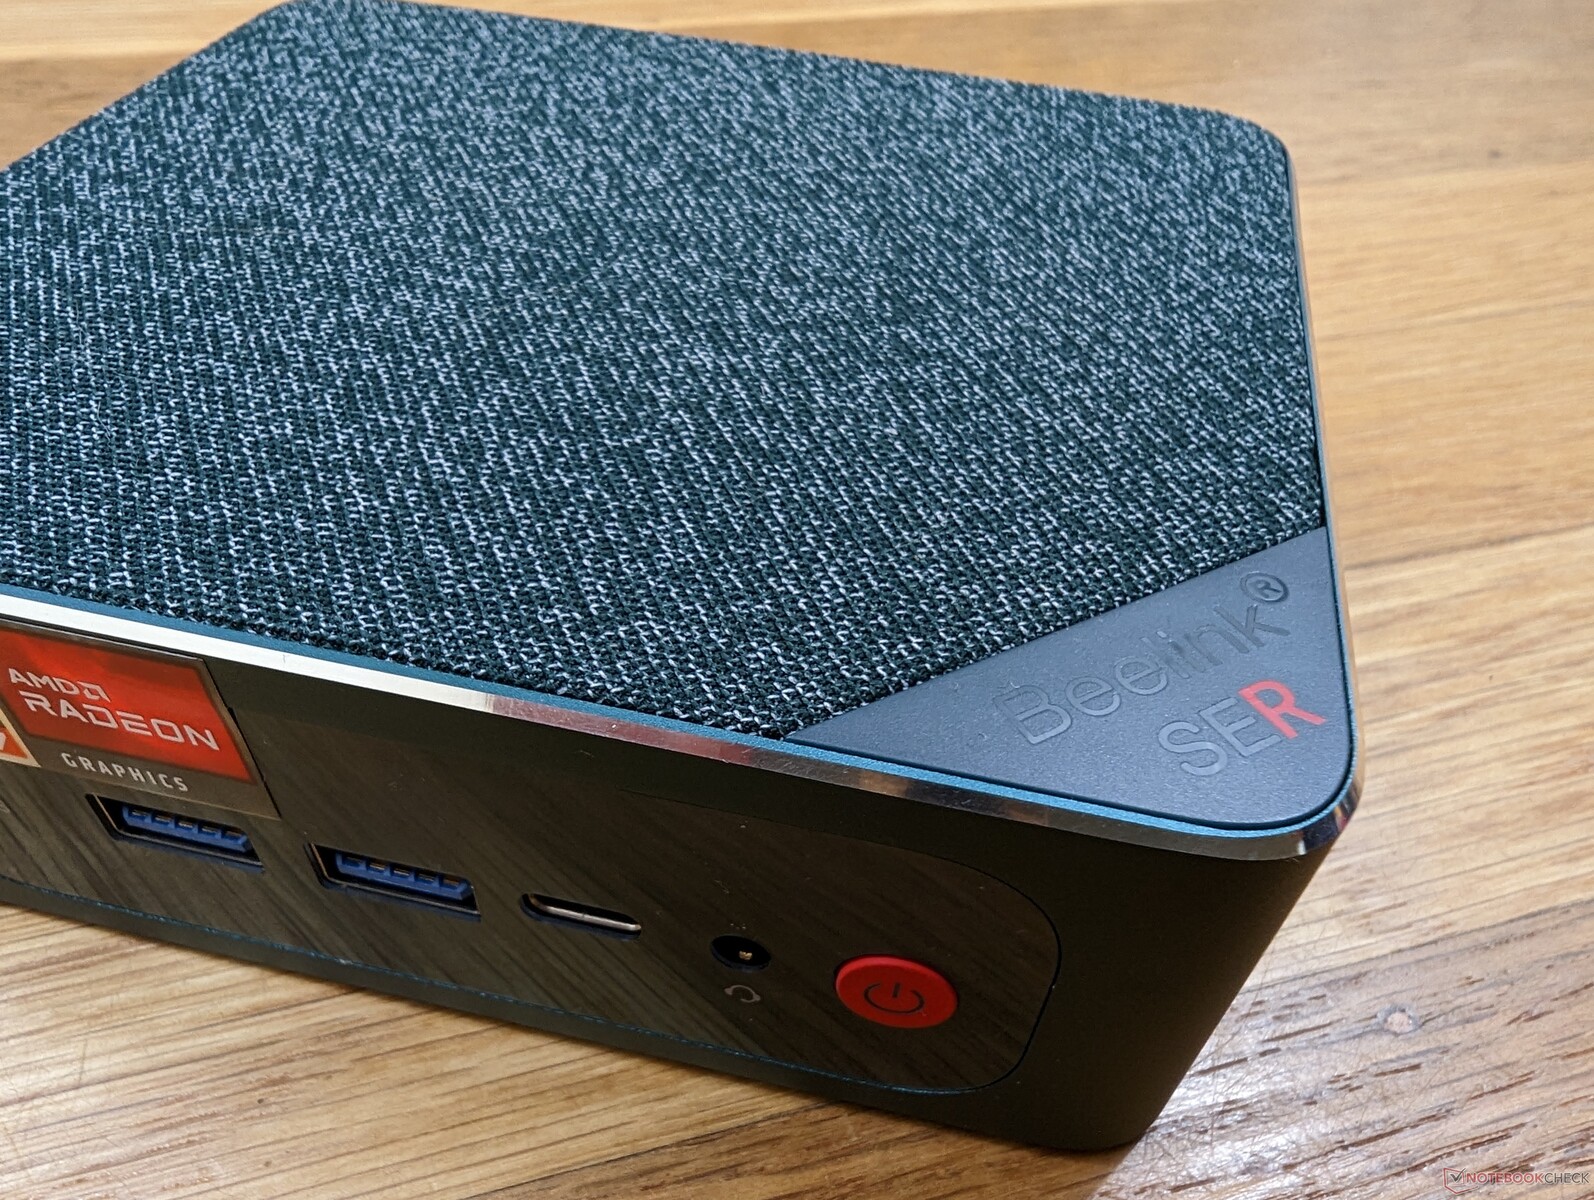
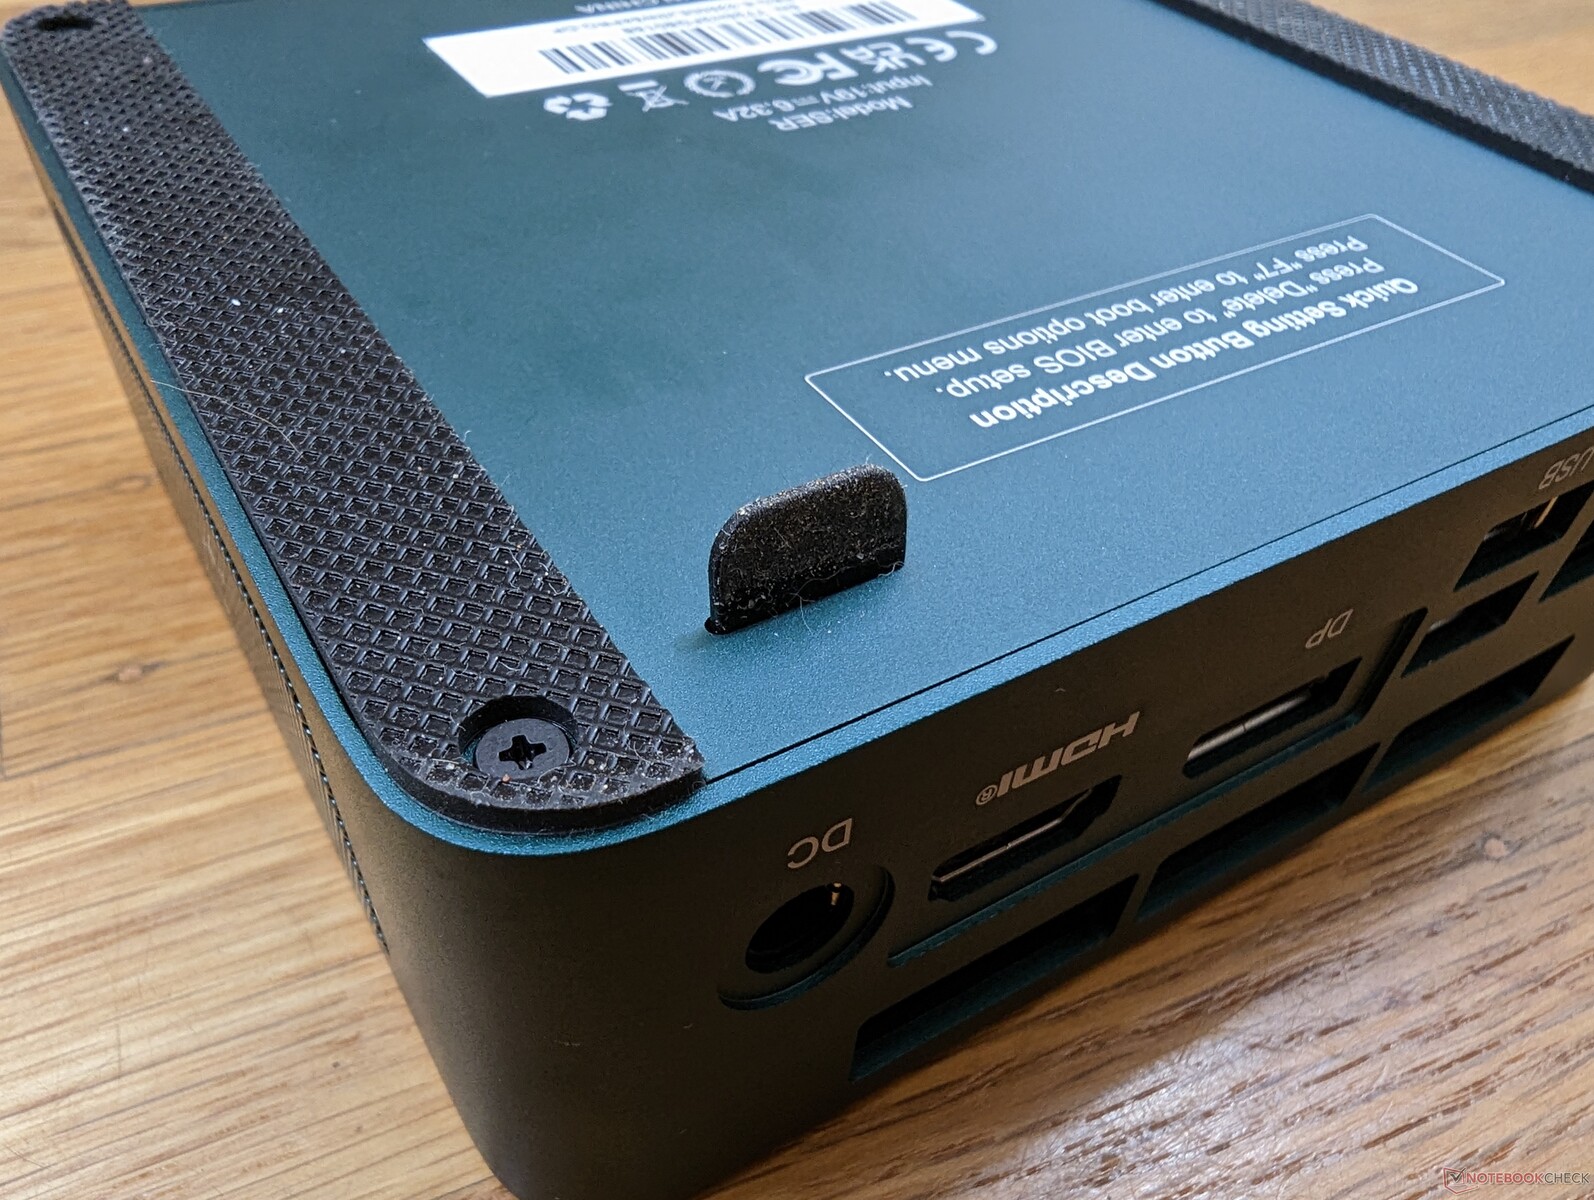
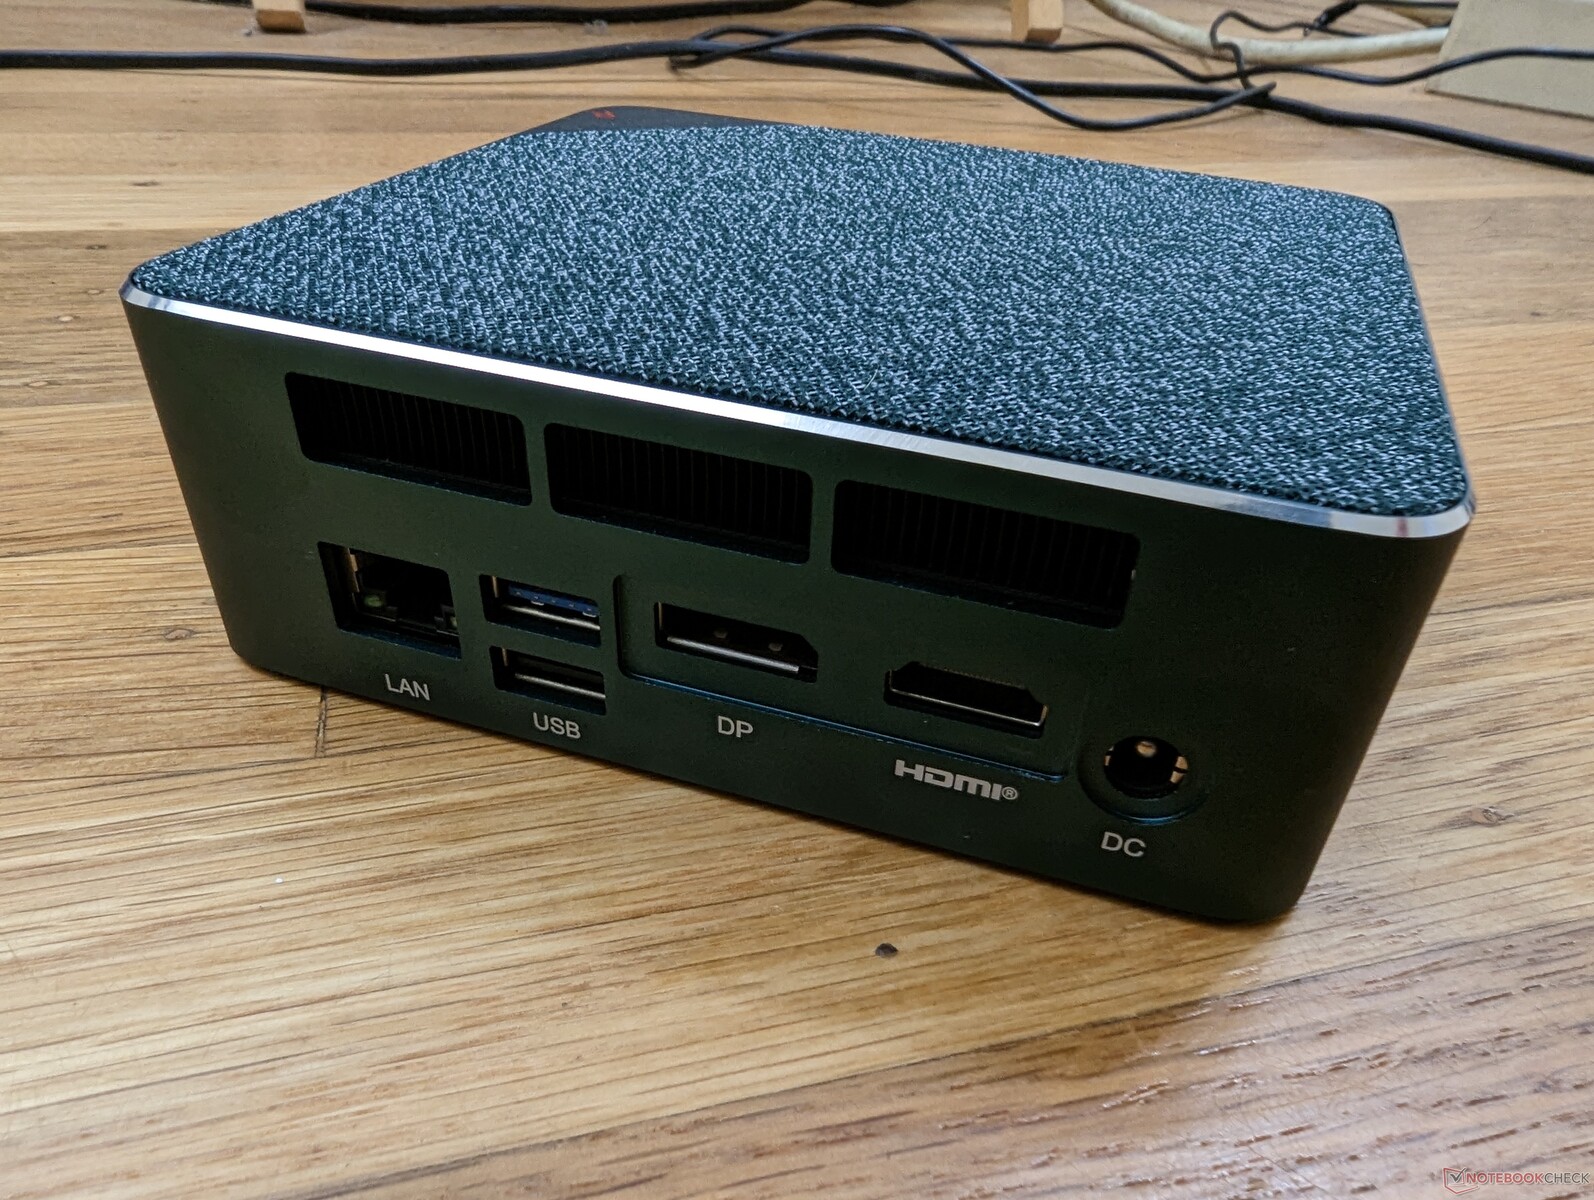
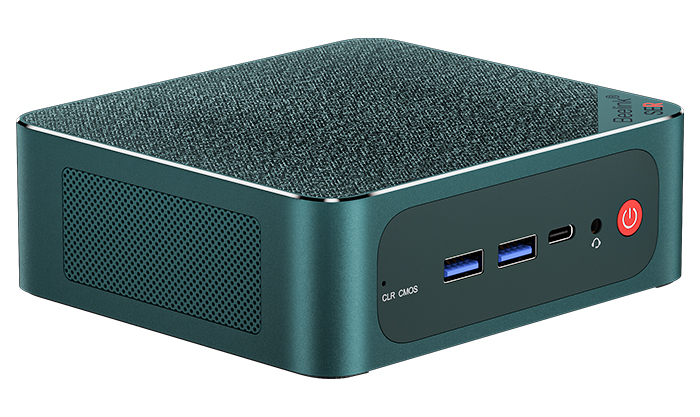
Caso
Não há grandes mudanças no design do chassi, exceto por uma exceção: a segunda porta HDMI no modelo do ano passado foi trocada por uma DisplayPort de tamanho normal. Isto é realmente preferível, pois DisplayPort tem melhor compatibilidade com taxas de atualização e monitores de sincronização adaptáveis mais altas do que HDMI.
Comunicação
Módulos embutidos de comunicação com e sem fio, comparação de dados de teste de rede com a concorrência, soluções alternativas disponíveis (5G/LTE)?, Irregularidades (recepção de rádio)?
| Networking | |
| iperf3 transmit AXE11000 | |
| Beelink SER6 Pro | |
| Beelink SER6 Pro Ryzen 7 7735HS | |
| Minisforum Venus Series UM690 | |
| Beelink GTR6 | |
| Intel NUC 13 Pro Kit NUC13ANK | |
| iperf3 receive AXE11000 | |
| Beelink SER6 Pro Ryzen 7 7735HS | |
| Beelink SER6 Pro | |
| Minisforum Venus Series UM690 | |
| Intel NUC 13 Pro Kit NUC13ANK | |
| Beelink GTR6 | |
| iperf3 transmit AXE11000 6GHz | |
| Intel NUC 13 Pro Kit NUC13ANK | |
| Beelink GTR6 | |
| Minisforum Venus Series UM690 | |
| iperf3 receive AXE11000 6GHz | |
| Intel NUC 13 Pro Kit NUC13ANK | |
| Minisforum Venus Series UM690 | |
| Beelink GTR6 | |
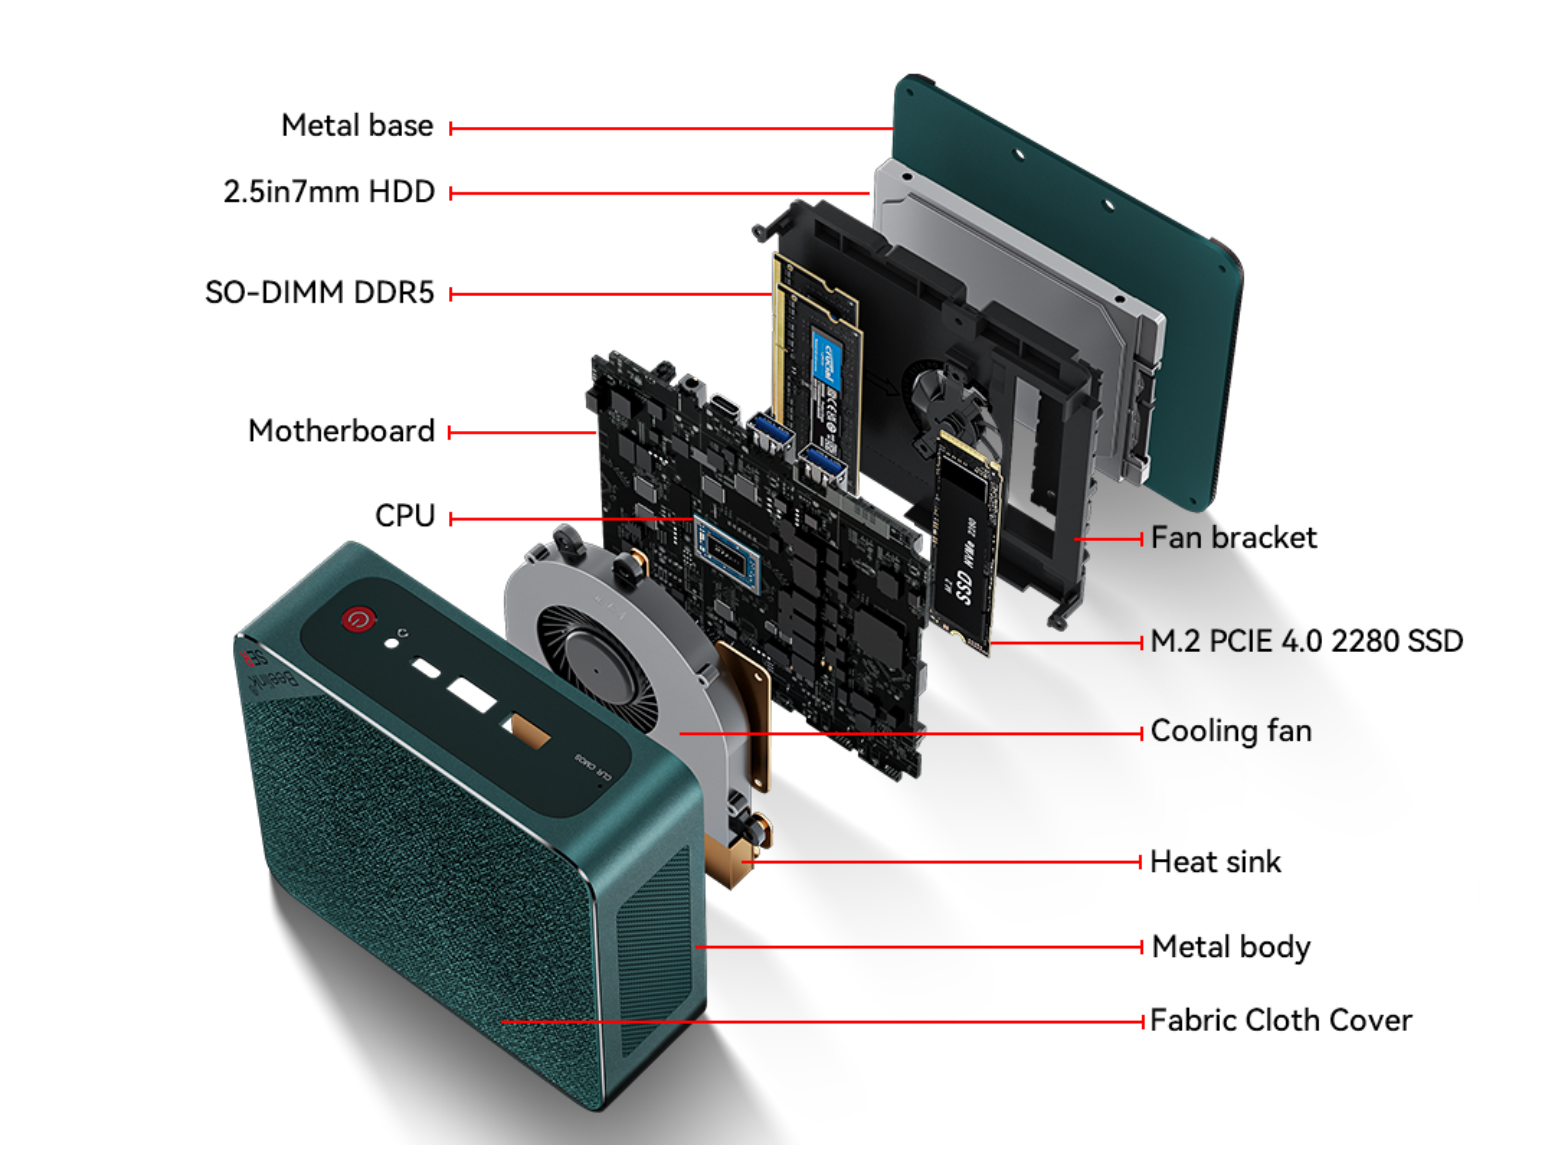
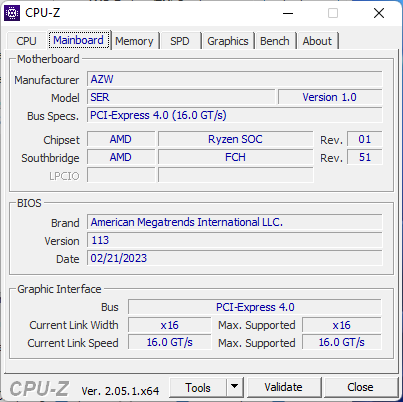
Manutenção
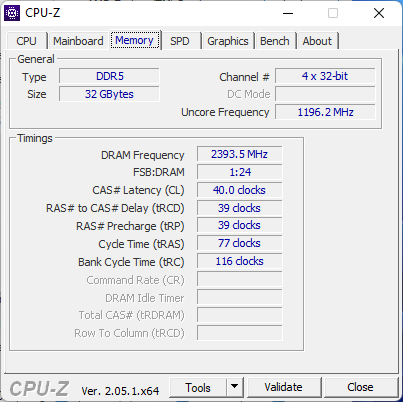
A capacidade de manutenção permanece a mesma do modelo do ano passado. Os usuários têm 2x compartimentos de armazenamento (1x PCIe4 x4 M.2 2280, 1x SATA III de 2,5 polegadas) e 2x slots DDR5 SODIMM para expansão.
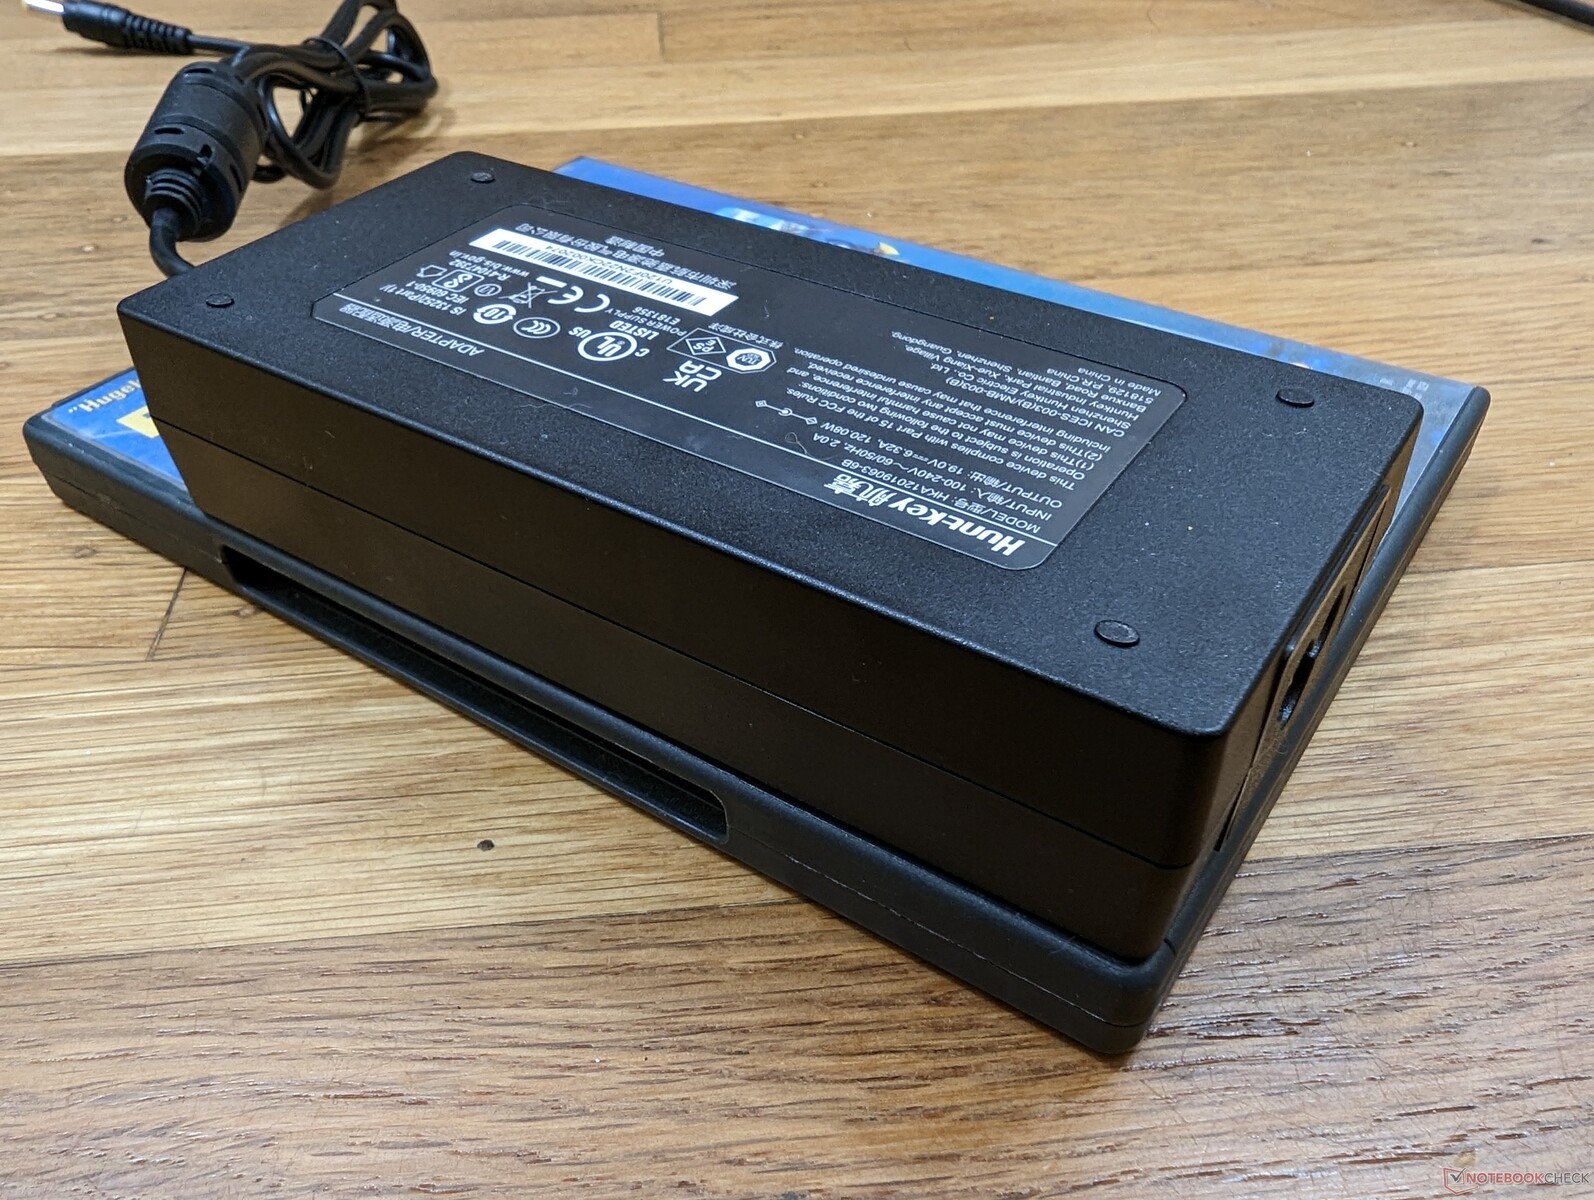
Acessórios e Garantia
A garantia padrão limitada de um ano aplica-se se comprada nos EUA. A caixa de varejo inclui um suporte VESA manual e removível montado na parede, dois cabos HDMI e o adaptador AC.
Desempenho
Condições de teste
Configuramos nossa unidade para o modo Performance via Windows antes de executar quaisquer benchmarks abaixo. Não há nenhuma aplicação do tipo "Command Center" pré-instalada, ao contrário de muitos outros laptops ou PCs de grandes marcas.
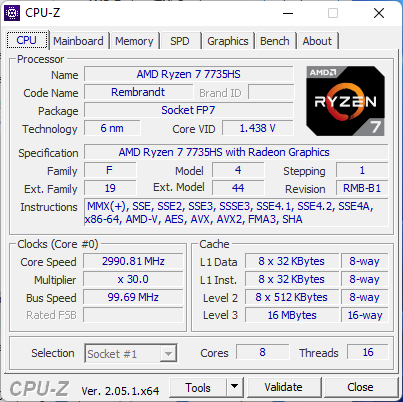
Processador
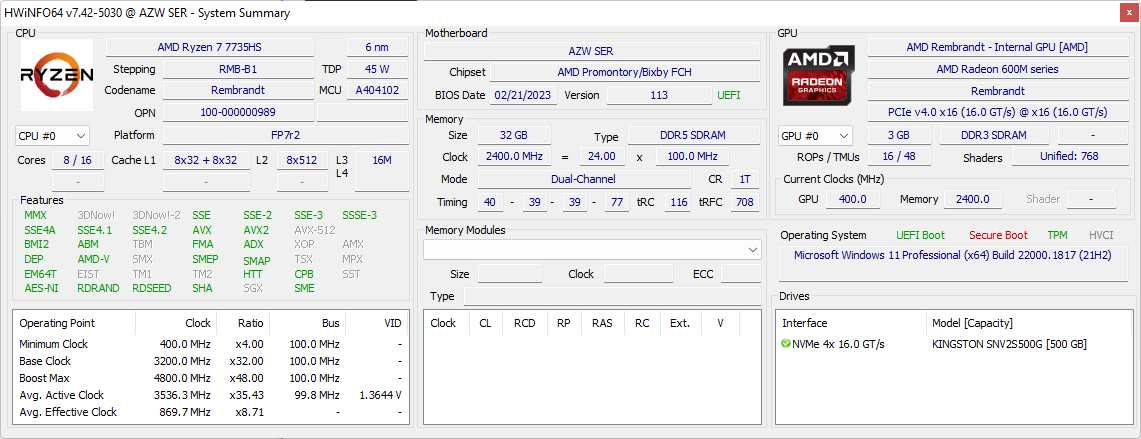
Muito parecido com o que descobrimos no Lenovo Slim 7 Pro recentemente revisto, o 2023 Ryzen 7 7735HS tem um desempenho quase idêntico ao dos Ryzen 7 6800H ou Ryzen 9 6900HS mais antigos. Isto porque o Ryzen 7 7735HS é em grande parte um rebrand da antiga série Zen 3+, apesar de seu recente lançamento no início do mês passado. Conseqüentemente, mesmo o mais antigo Core i7-12700H do 12º gênero pode superar o Ryzen 7 7735HS em praticamente tudo, exceto no desempenho gráfico integrado.
Para um processador AMD "verdadeiro" do gênero atual, você teria que obter o Zen 4 Ryzen 9 7945HX. Infelizmente, tal opção não está disponível no SER6 Pro.
Cinebench R15 Multi Loop
Cinebench R23: Multi Core | Single Core
Cinebench R20: CPU (Multi Core) | CPU (Single Core)
Cinebench R15: CPU Multi 64Bit | CPU Single 64Bit
Blender: v2.79 BMW27 CPU
7-Zip 18.03: 7z b 4 | 7z b 4 -mmt1
Geekbench 5.5: Multi-Core | Single-Core
HWBOT x265 Benchmark v2.2: 4k Preset
LibreOffice : 20 Documents To PDF
R Benchmark 2.5: Overall mean
| Cinebench R20 / CPU (Multi Core) | |
| Intel NUC13 Raptor Canyon | |
| Asus ROG Strix Scar 17 G733PY-XS96 | |
| Intel NUC 12, NUC12SNKi72_Serpent Canyon | |
| Média AMD Ryzen 7 7735HS (3968 - 5502, n=15) | |
| Intel NUC 13 Pro Kit NUC13ANK | |
| Beelink GTR6 | |
| Beelink SER6 Pro Ryzen 7 7735HS | |
| Beelink SER6 Pro | |
| Intel NUC 12 Pro Kit NUC12WSBi5 | |
| Intel NUC Pro Chassis_i7_1265U | |
| Intel NUC Pro Chassis_i5_1245U | |
| Trigkey Speed S | |
| Cinebench R20 / CPU (Single Core) | |
| Intel NUC13 Raptor Canyon | |
| Intel NUC 13 Pro Kit NUC13ANK | |
| Asus ROG Strix Scar 17 G733PY-XS96 | |
| Intel NUC 12, NUC12SNKi72_Serpent Canyon | |
| Intel NUC Pro Chassis_i7_1265U | |
| Intel NUC 12 Pro Kit NUC12WSBi5 | |
| Intel NUC Pro Chassis_i5_1245U | |
| Beelink GTR6 | |
| Beelink SER6 Pro Ryzen 7 7735HS | |
| Média AMD Ryzen 7 7735HS (502 - 613, n=15) | |
| Beelink SER6 Pro | |
| Trigkey Speed S | |
| Geekbench 5.5 / Multi-Core | |
| Intel NUC13 Raptor Canyon | |
| Asus ROG Strix Scar 17 G733PY-XS96 | |
| Intel NUC 13 Pro Kit NUC13ANK | |
| Intel NUC 12, NUC12SNKi72_Serpent Canyon | |
| Beelink SER6 Pro Ryzen 7 7735HS | |
| Beelink GTR6 | |
| Beelink SER6 Pro | |
| Média AMD Ryzen 7 7735HS (7151 - 10258, n=15) | |
| Intel NUC Pro Chassis_i5_1245U | |
| Intel NUC Pro Chassis_i7_1265U | |
| Trigkey Speed S | |
| Geekbench 5.5 / Single-Core | |
| Intel NUC13 Raptor Canyon | |
| Asus ROG Strix Scar 17 G733PY-XS96 | |
| Intel NUC 13 Pro Kit NUC13ANK | |
| Intel NUC Pro Chassis_i7_1265U | |
| Intel NUC Pro Chassis_i5_1245U | |
| Beelink GTR6 | |
| Intel NUC 12, NUC12SNKi72_Serpent Canyon | |
| Beelink SER6 Pro Ryzen 7 7735HS | |
| Beelink SER6 Pro | |
| Média AMD Ryzen 7 7735HS (1327 - 1615, n=15) | |
| Trigkey Speed S | |
| HWBOT x265 Benchmark v2.2 / 4k Preset | |
| Asus ROG Strix Scar 17 G733PY-XS96 | |
| Intel NUC13 Raptor Canyon | |
| Intel NUC 12, NUC12SNKi72_Serpent Canyon | |
| Média AMD Ryzen 7 7735HS (10.8 - 17.9, n=15) | |
| Beelink GTR6 | |
| Beelink SER6 Pro Ryzen 7 7735HS | |
| Beelink SER6 Pro | |
| Intel NUC 13 Pro Kit NUC13ANK | |
| Intel NUC 12 Pro Kit NUC12WSBi5 | |
| Intel NUC Pro Chassis_i7_1265U | |
| Intel NUC Pro Chassis_i5_1245U | |
| Trigkey Speed S | |
| LibreOffice / 20 Documents To PDF | |
| Média AMD Ryzen 7 7735HS (44.3 - 63.9, n=15) | |
| Intel NUC Pro Chassis_i5_1245U | |
| Intel NUC 12 Pro Kit NUC12WSBi5 | |
| Intel NUC Pro Chassis_i7_1265U | |
| Beelink SER6 Pro | |
| Beelink GTR6 | |
| Intel NUC 12, NUC12SNKi72_Serpent Canyon | |
| Beelink SER6 Pro Ryzen 7 7735HS | |
| Trigkey Speed S | |
| Intel NUC 13 Pro Kit NUC13ANK | |
| Intel NUC13 Raptor Canyon | |
| Asus ROG Strix Scar 17 G733PY-XS96 | |
* ... menor é melhor
* ... menor é melhor
AIDA64: FP32 Ray-Trace | FPU Julia | CPU SHA3 | CPU Queen | FPU SinJulia | FPU Mandel | CPU AES | CPU ZLib | FP64 Ray-Trace | CPU PhotoWorxx
| Performance rating | |
| Minisforum Venus Series UM690 | |
| Beelink GTR6 | |
| Beelink SER6 Pro Ryzen 7 7735HS | |
| Beelink SER6 Pro | |
| Intel NUC 13 Pro Kit NUC13ANK | |
| Intel NUC 12 Pro Kit NUC12WSBi5 | |
| AIDA64 / FP32 Ray-Trace | |
| Minisforum Venus Series UM690 | |
| Beelink GTR6 | |
| Beelink SER6 Pro Ryzen 7 7735HS | |
| Beelink SER6 Pro | |
| Intel NUC 13 Pro Kit NUC13ANK | |
| Intel NUC 12 Pro Kit NUC12WSBi5 | |
| AIDA64 / FPU Julia | |
| Minisforum Venus Series UM690 | |
| Beelink GTR6 | |
| Beelink SER6 Pro Ryzen 7 7735HS | |
| Beelink SER6 Pro | |
| Intel NUC 13 Pro Kit NUC13ANK | |
| Intel NUC 12 Pro Kit NUC12WSBi5 | |
| AIDA64 / CPU SHA3 | |
| Minisforum Venus Series UM690 | |
| Beelink GTR6 | |
| Beelink SER6 Pro | |
| Beelink SER6 Pro Ryzen 7 7735HS | |
| Intel NUC 13 Pro Kit NUC13ANK | |
| Intel NUC 12 Pro Kit NUC12WSBi5 | |
| AIDA64 / CPU Queen | |
| Minisforum Venus Series UM690 | |
| Beelink SER6 Pro Ryzen 7 7735HS | |
| Beelink GTR6 | |
| Beelink SER6 Pro | |
| Intel NUC 13 Pro Kit NUC13ANK | |
| Intel NUC 12 Pro Kit NUC12WSBi5 | |
| AIDA64 / FPU SinJulia | |
| Minisforum Venus Series UM690 | |
| Beelink GTR6 | |
| Beelink SER6 Pro Ryzen 7 7735HS | |
| Beelink SER6 Pro | |
| Intel NUC 13 Pro Kit NUC13ANK | |
| Intel NUC 12 Pro Kit NUC12WSBi5 | |
| AIDA64 / FPU Mandel | |
| Minisforum Venus Series UM690 | |
| Beelink GTR6 | |
| Beelink SER6 Pro Ryzen 7 7735HS | |
| Beelink SER6 Pro | |
| Intel NUC 13 Pro Kit NUC13ANK | |
| Intel NUC 12 Pro Kit NUC12WSBi5 | |
| AIDA64 / CPU AES | |
| Minisforum Venus Series UM690 | |
| Beelink GTR6 | |
| Beelink SER6 Pro | |
| Beelink SER6 Pro Ryzen 7 7735HS | |
| Intel NUC 13 Pro Kit NUC13ANK | |
| Intel NUC 12 Pro Kit NUC12WSBi5 | |
| AIDA64 / CPU ZLib | |
| Minisforum Venus Series UM690 | |
| Intel NUC 12 Pro Kit NUC12WSBi5 | |
| Intel NUC 13 Pro Kit NUC13ANK | |
| Beelink GTR6 | |
| Beelink SER6 Pro | |
| Beelink SER6 Pro Ryzen 7 7735HS | |
| AIDA64 / FP64 Ray-Trace | |
| Minisforum Venus Series UM690 | |
| Beelink GTR6 | |
| Beelink SER6 Pro Ryzen 7 7735HS | |
| Beelink SER6 Pro | |
| Intel NUC 13 Pro Kit NUC13ANK | |
| Intel NUC 12 Pro Kit NUC12WSBi5 | |
| AIDA64 / CPU PhotoWorxx | |
| Beelink GTR6 | |
| Beelink SER6 Pro Ryzen 7 7735HS | |
| Beelink SER6 Pro | |
| Intel NUC 13 Pro Kit NUC13ANK | |
| Intel NUC 12 Pro Kit NUC12WSBi5 | |
| Minisforum Venus Series UM690 | |
Desempenho do sistema
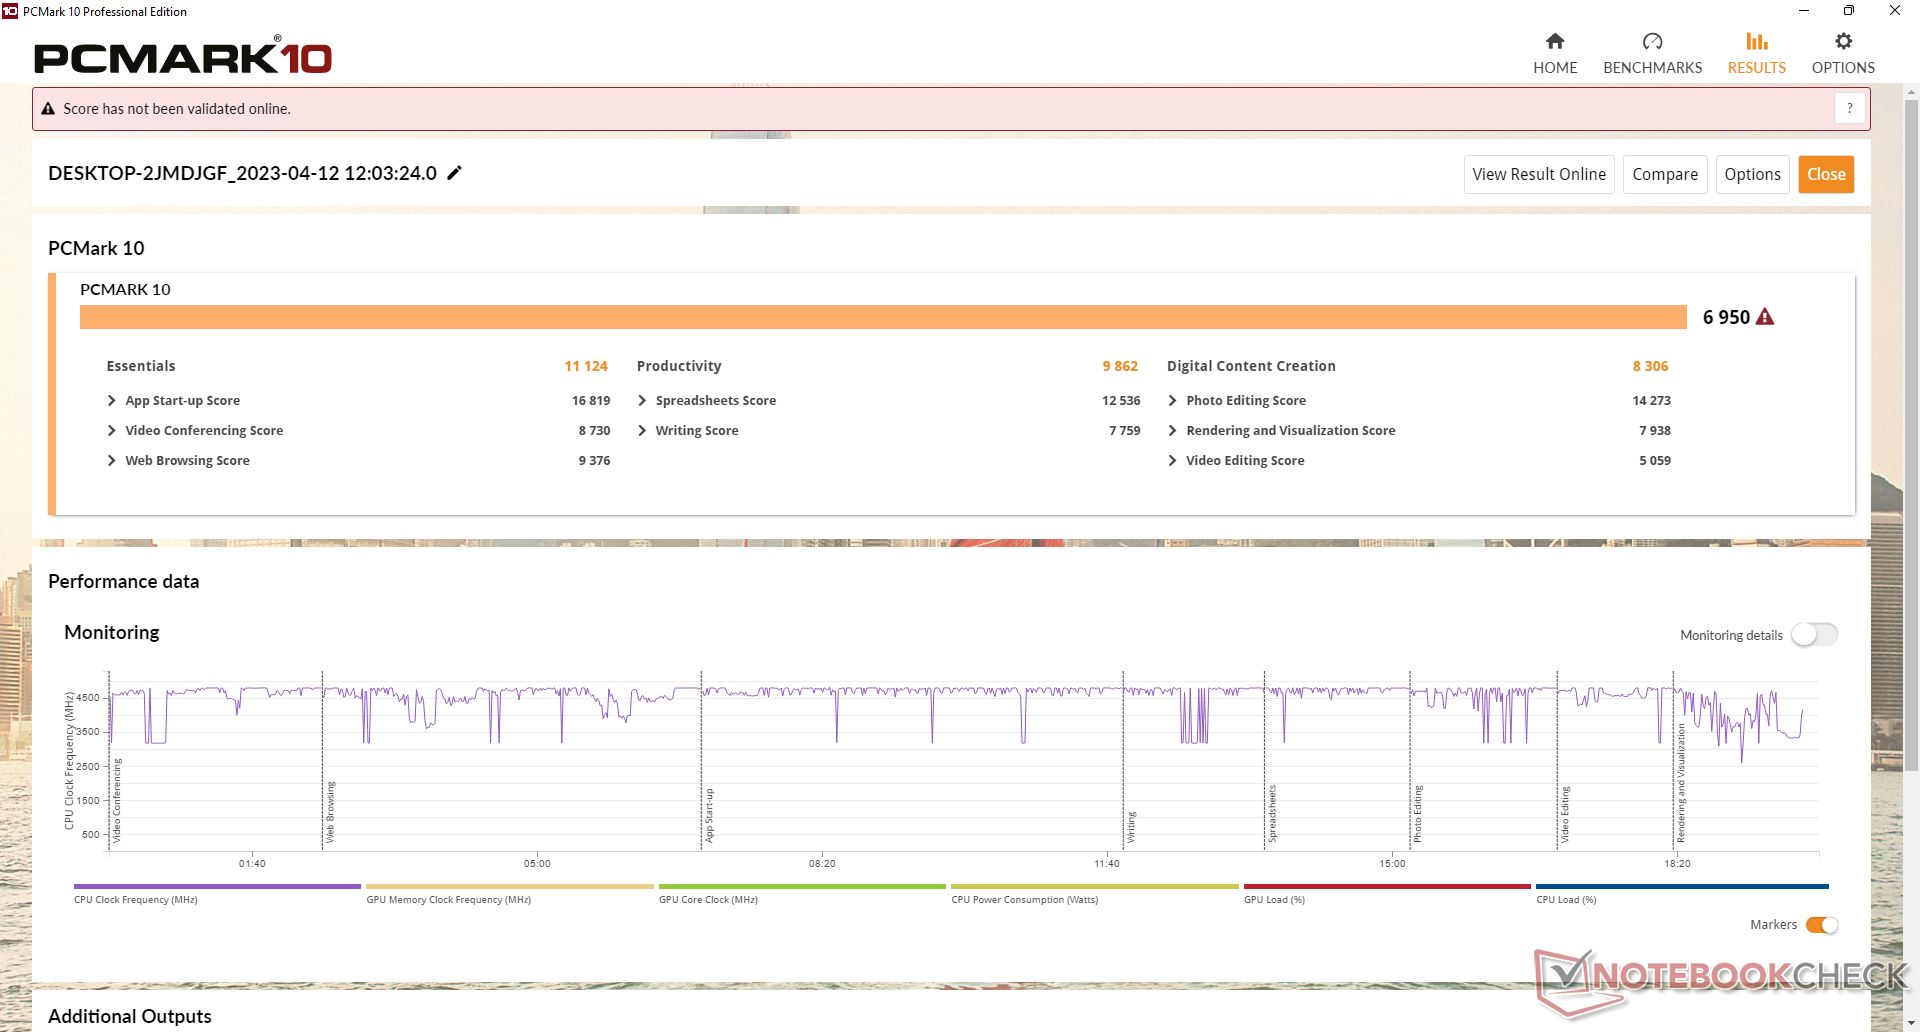
Os benchmarks PCMark são novamente essencialmente idênticos ao que registramos no SER6 Pro 2022, uma vez que seus processadores são tão similares.
CrossMark: Overall | Productivity | Creativity | Responsiveness
| PCMark 10 / Score | |
| Beelink GTR6 | |
| Minisforum Venus Series UM690 | |
| Beelink SER6 Pro Ryzen 7 7735HS | |
| Beelink SER6 Pro | |
| Média AMD Ryzen 7 7735HS, AMD Radeon 680M (5722 - 7000, n=8) | |
| Intel NUC 13 Pro Kit NUC13ANK | |
| Intel NUC 12 Pro Kit NUC12WSBi5 | |
| PCMark 10 / Essentials | |
| Intel NUC 13 Pro Kit NUC13ANK | |
| Beelink GTR6 | |
| Beelink SER6 Pro | |
| Beelink SER6 Pro Ryzen 7 7735HS | |
| Minisforum Venus Series UM690 | |
| Intel NUC 12 Pro Kit NUC12WSBi5 | |
| Média AMD Ryzen 7 7735HS, AMD Radeon 680M (8648 - 11124, n=8) | |
| PCMark 10 / Productivity | |
| Beelink GTR6 | |
| Minisforum Venus Series UM690 | |
| Beelink SER6 Pro Ryzen 7 7735HS | |
| Beelink SER6 Pro | |
| Média AMD Ryzen 7 7735HS, AMD Radeon 680M (8428 - 12153, n=8) | |
| Intel NUC 13 Pro Kit NUC13ANK | |
| Intel NUC 12 Pro Kit NUC12WSBi5 | |
| PCMark 10 / Digital Content Creation | |
| Minisforum Venus Series UM690 | |
| Beelink GTR6 | |
| Beelink SER6 Pro | |
| Beelink SER6 Pro Ryzen 7 7735HS | |
| Média AMD Ryzen 7 7735HS, AMD Radeon 680M (5798 - 8726, n=8) | |
| Intel NUC 13 Pro Kit NUC13ANK | |
| Intel NUC 12 Pro Kit NUC12WSBi5 | |
| CrossMark / Overall | |
| Intel NUC 13 Pro Kit NUC13ANK | |
| Beelink SER6 Pro Ryzen 7 7735HS | |
| Minisforum Venus Series UM690 | |
| Beelink SER6 Pro | |
| Beelink GTR6 | |
| Média AMD Ryzen 7 7735HS, AMD Radeon 680M (1280 - 1736, n=8) | |
| CrossMark / Productivity | |
| Intel NUC 13 Pro Kit NUC13ANK | |
| Minisforum Venus Series UM690 | |
| Beelink SER6 Pro Ryzen 7 7735HS | |
| Beelink GTR6 | |
| Beelink SER6 Pro | |
| Média AMD Ryzen 7 7735HS, AMD Radeon 680M (1336 - 1725, n=8) | |
| CrossMark / Creativity | |
| Intel NUC 13 Pro Kit NUC13ANK | |
| Beelink SER6 Pro Ryzen 7 7735HS | |
| Beelink SER6 Pro | |
| Minisforum Venus Series UM690 | |
| Beelink GTR6 | |
| Média AMD Ryzen 7 7735HS, AMD Radeon 680M (1273 - 1785, n=8) | |
| CrossMark / Responsiveness | |
| Minisforum Venus Series UM690 | |
| Beelink SER6 Pro Ryzen 7 7735HS | |
| Beelink GTR6 | |
| Beelink SER6 Pro | |
| Intel NUC 13 Pro Kit NUC13ANK | |
| Média AMD Ryzen 7 7735HS, AMD Radeon 680M (1144 - 1653, n=8) | |
| PCMark 10 Score | 6950 pontos | |
Ajuda | ||
| AIDA64 / Memory Copy | |
| Beelink SER6 Pro Ryzen 7 7735HS | |
| Beelink SER6 Pro | |
| Beelink GTR6 | |
| Minisforum Venus Series UM690 | |
| Média AMD Ryzen 7 7735HS (30324 - 52012, n=16) | |
| Intel NUC 13 Pro Kit NUC13ANK | |
| Intel NUC 12 Pro Kit NUC12WSBi5 | |
| AIDA64 / Memory Read | |
| Beelink GTR6 | |
| Beelink SER6 Pro Ryzen 7 7735HS | |
| Beelink SER6 Pro | |
| Minisforum Venus Series UM690 | |
| Intel NUC 12 Pro Kit NUC12WSBi5 | |
| Média AMD Ryzen 7 7735HS (33938 - 51856, n=16) | |
| Intel NUC 13 Pro Kit NUC13ANK | |
| AIDA64 / Memory Write | |
| Beelink GTR6 | |
| Beelink SER6 Pro Ryzen 7 7735HS | |
| Beelink SER6 Pro | |
| Minisforum Venus Series UM690 | |
| Média AMD Ryzen 7 7735HS (33175 - 55284, n=16) | |
| Intel NUC 12 Pro Kit NUC12WSBi5 | |
| Intel NUC 13 Pro Kit NUC13ANK | |
| AIDA64 / Memory Latency | |
| Intel NUC 13 Pro Kit NUC13ANK | |
| Média AMD Ryzen 7 7735HS (78.2 - 109.8, n=16) | |
| Intel NUC 12 Pro Kit NUC12WSBi5 | |
| Beelink SER6 Pro | |
| Minisforum Venus Series UM690 | |
| Beelink GTR6 | |
| Beelink SER6 Pro Ryzen 7 7735HS | |
* ... menor é melhor
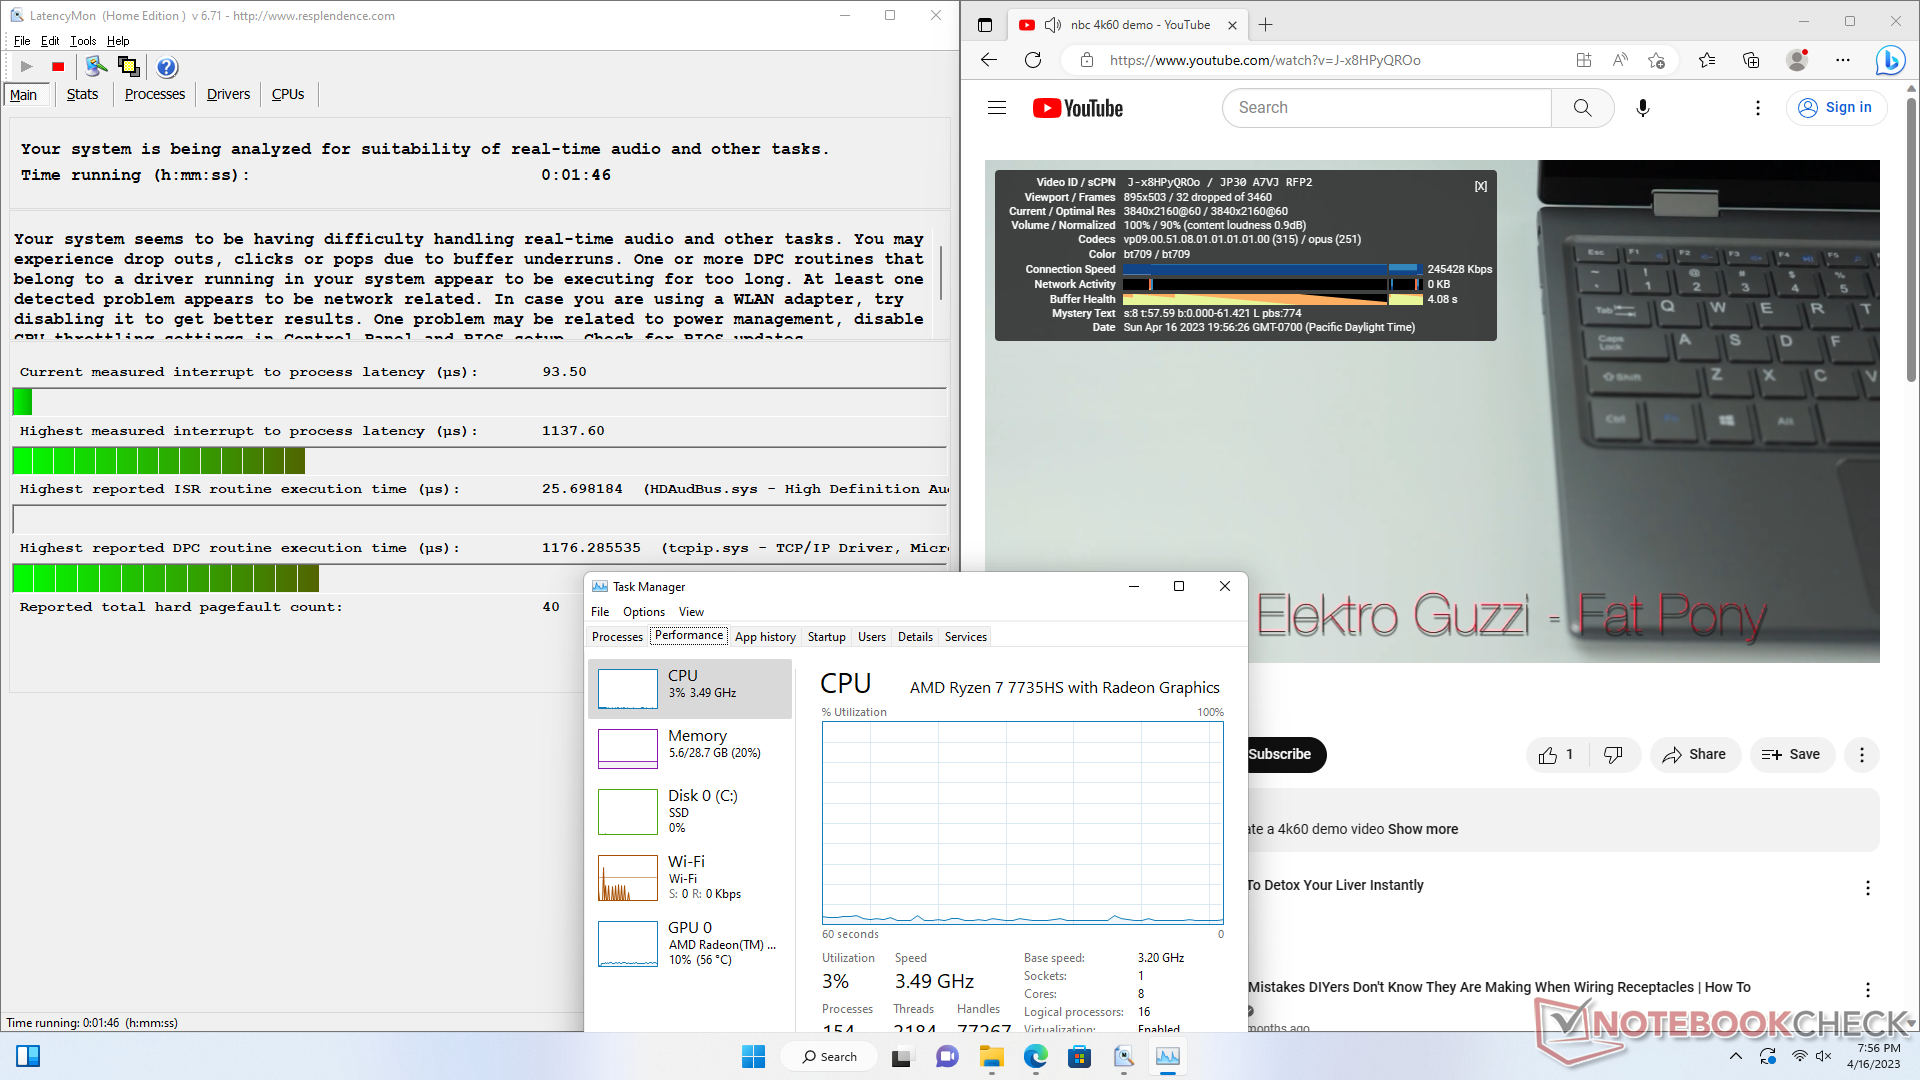
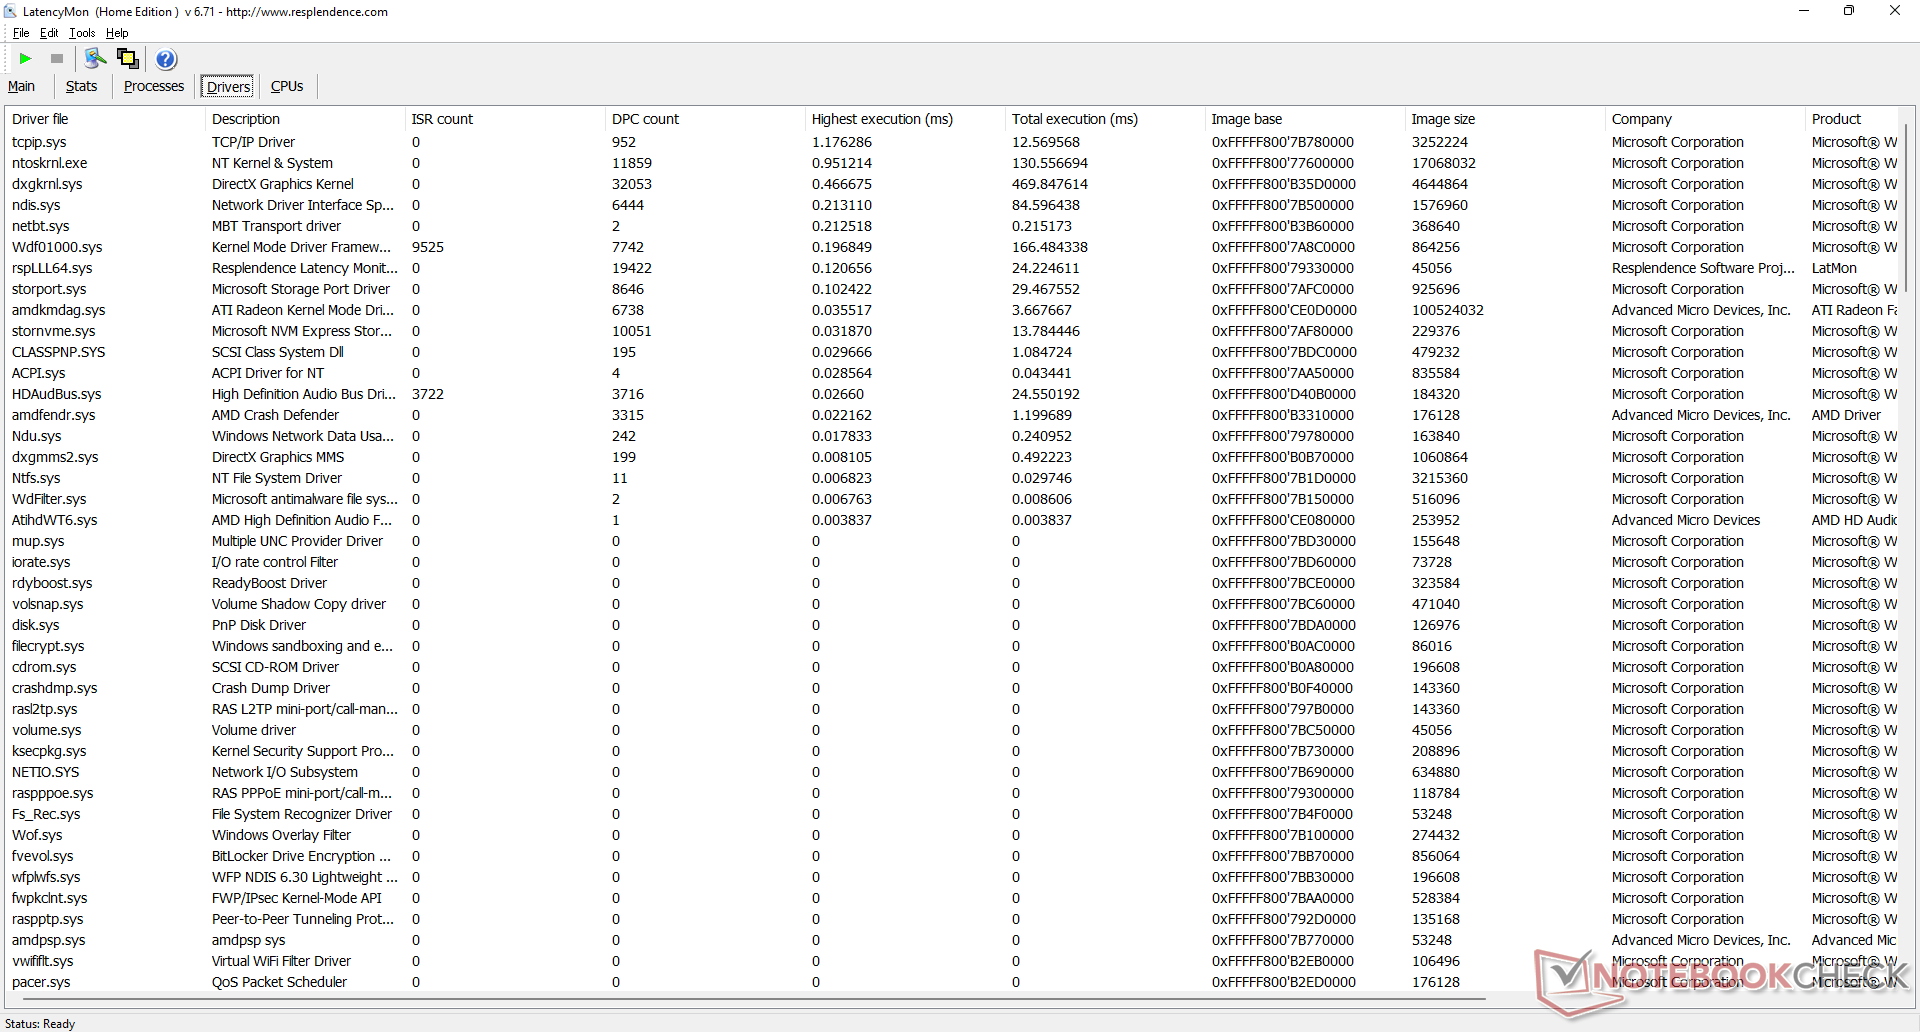
Latência do DPC
LatencyMon revela problemas de DPC ao abrir várias abas do navegador em nossa página inicial. Além disso, nossa unidade exibiria problemas de reprodução de vídeo de 4K60 com 32 quadros descartados durante nosso vídeo de teste de minutos.
| DPC Latencies / LatencyMon - interrupt to process latency (max), Web, Youtube, Prime95 | |
| Minisforum Venus Series UM690 | |
| Beelink SER6 Pro | |
| Beelink SER6 Pro Ryzen 7 7735HS | |
| Intel NUC 13 Pro Kit NUC13ANK | |
| Intel NUC 12 Pro Kit NUC12WSBi5 | |
| Beelink GTR6 | |
* ... menor é melhor
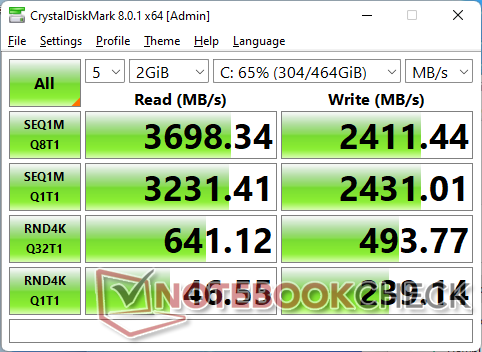
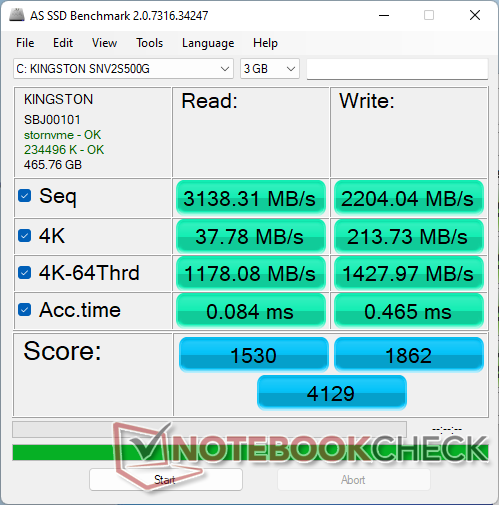
Dispositivos de armazenamento
Nossa unidade 2023 SER6 Pro é fornecida com a mesma Kingston NV2 500GB SNV2S/500G que foi encontrada no modelo do ano passado.

| Drive Performance rating - Percent | |
| Beelink GTR6 | |
| Minisforum Venus Series UM690 | |
| Intel NUC 13 Pro Kit NUC13ANK | |
| Beelink SER6 Pro | |
| Beelink SER6 Pro Ryzen 7 7735HS | |
| Intel NUC 12 Pro Kit NUC12WSBi5 | |
* ... menor é melhor
Disk Throttling: DiskSpd Read Loop, Queue Depth 8
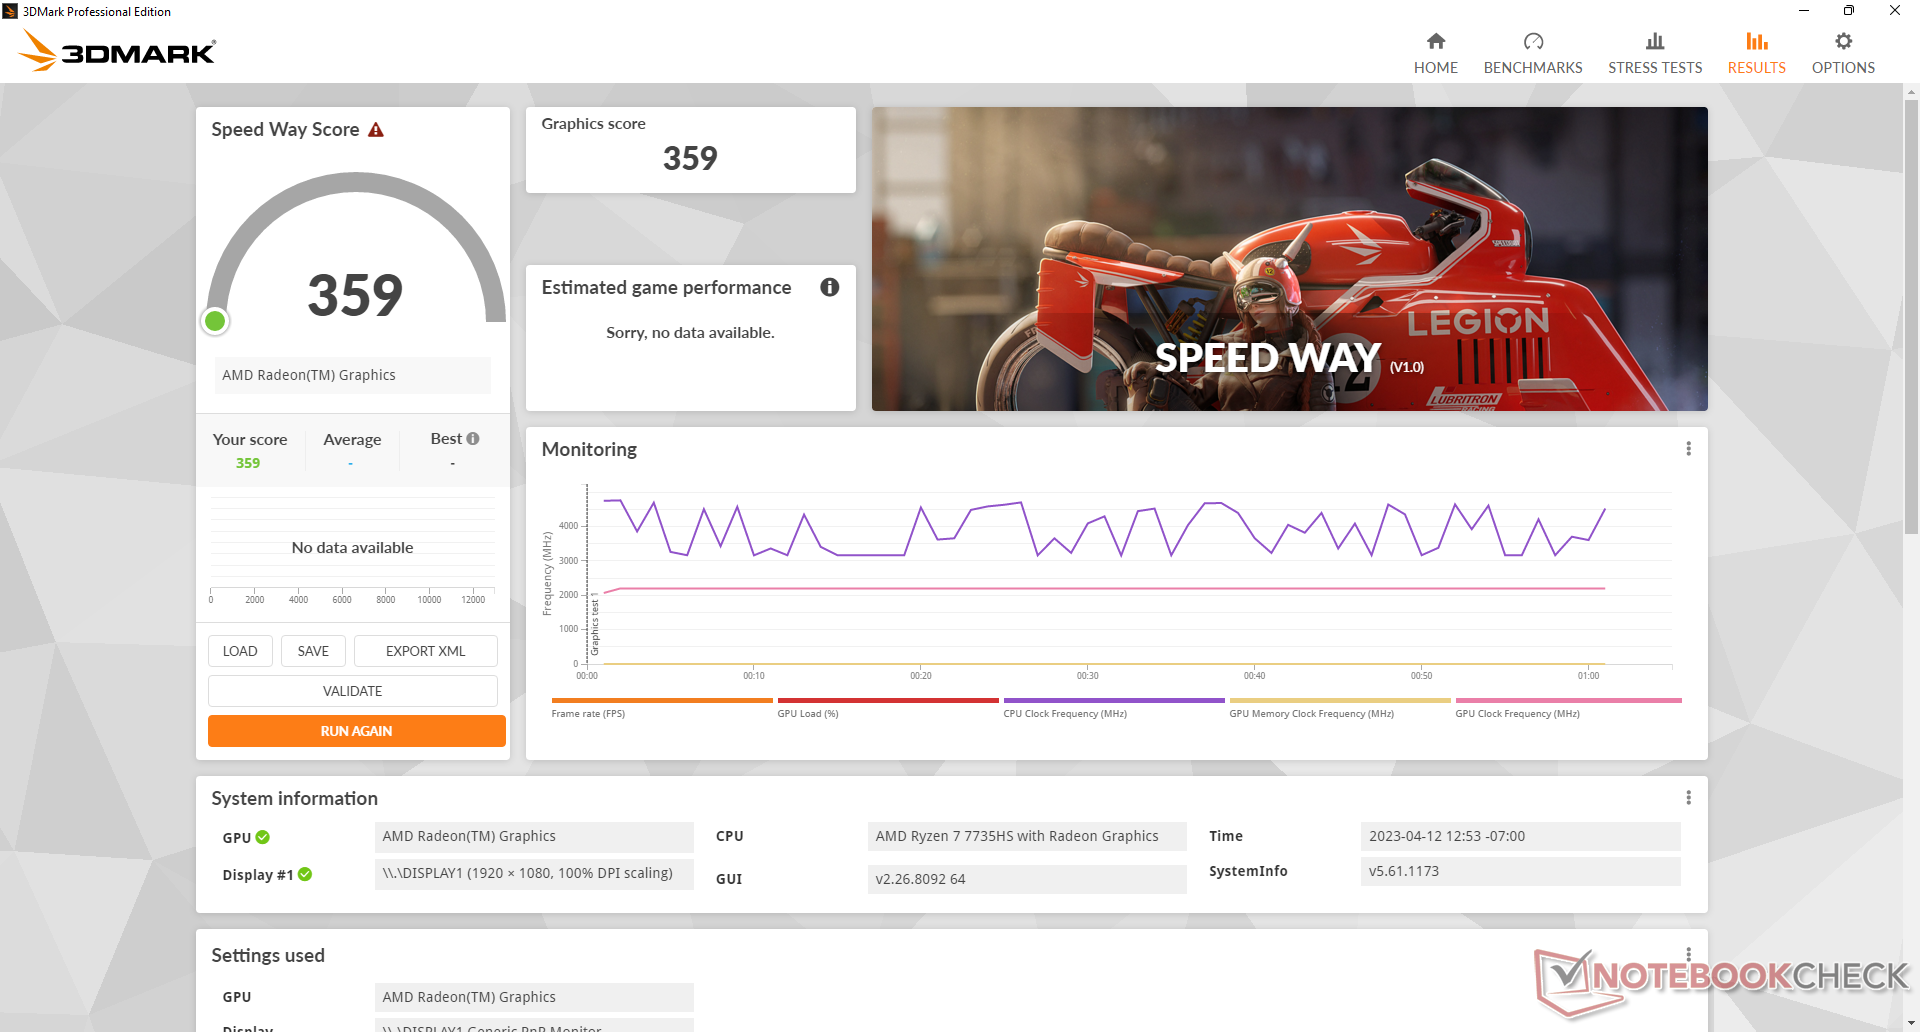
Desempenho da GPU
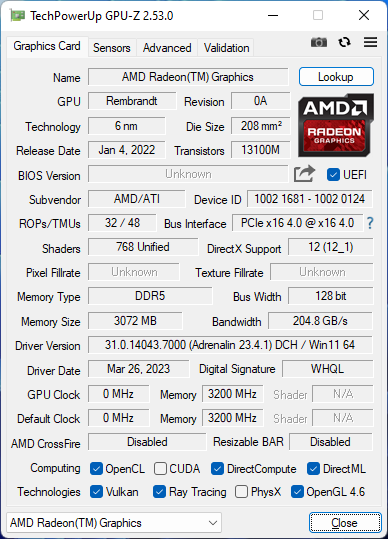
O desempenho gráfico é o mesmo do Ryzen 7 6800H ou Ryzen 9 6900HX do ano passado, já que todas essas CPUs esportem a mesma GPU integrada Radeon 680M. Isto não é necessariamente uma coisa ruim porque o Radeon 680M já está bem à frente da Intel Iris Xe 96 EU em 40 a 60%, mas os usuários que esperavam algum tipo de impulso este ano ficarão desapontados.
A análise em Witcher 3 revela problemas de estabilidade de desempenho, uma vez que as taxas de quadros freqüentemente cairiam por razões aparentemente sem razão, como mostra nosso gráfico abaixo. Este comportamento sugere uma má priorização das atividades de fundo ou problemas com o motorista com a GPU integrada. Tínhamos atualizado nossos drivers Radeon para as versões mais recentes a partir da data de publicação.
| 3DMark Performance rating - Percent | |
| Beelink SER6 Pro | |
| Beelink SER6 Pro Ryzen 7 7735HS | |
| Beelink GTR6 | |
| Média AMD Radeon 680M | |
| Intel NUC 13 Pro Kit NUC13ANK | |
| Intel NUC Pro Chassis_i7_1265U | |
| Trigkey Speed S | |
| Intel NUC 12 Pro Kit NUC12WSBi5 -2! | |
| Intel NUC Pro Chassis_i5_1245U | |
| 3DMark 11 - 1280x720 Performance GPU | |
| Beelink SER6 Pro | |
| Beelink SER6 Pro Ryzen 7 7735HS | |
| Beelink GTR6 | |
| Média AMD Radeon 680M (6858 - 11755, n=39) | |
| Intel NUC 13 Pro Kit NUC13ANK | |
| Trigkey Speed S | |
| Intel NUC Pro Chassis_i7_1265U | |
| Intel NUC 12 Pro Kit NUC12WSBi5 | |
| Intel NUC Pro Chassis_i5_1245U | |
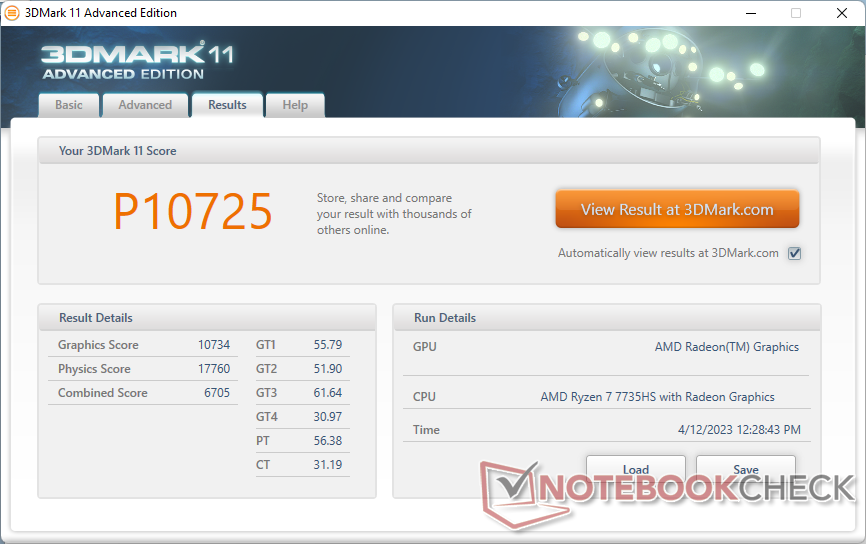
| 3DMark 11 Performance | 10725 pontos | |
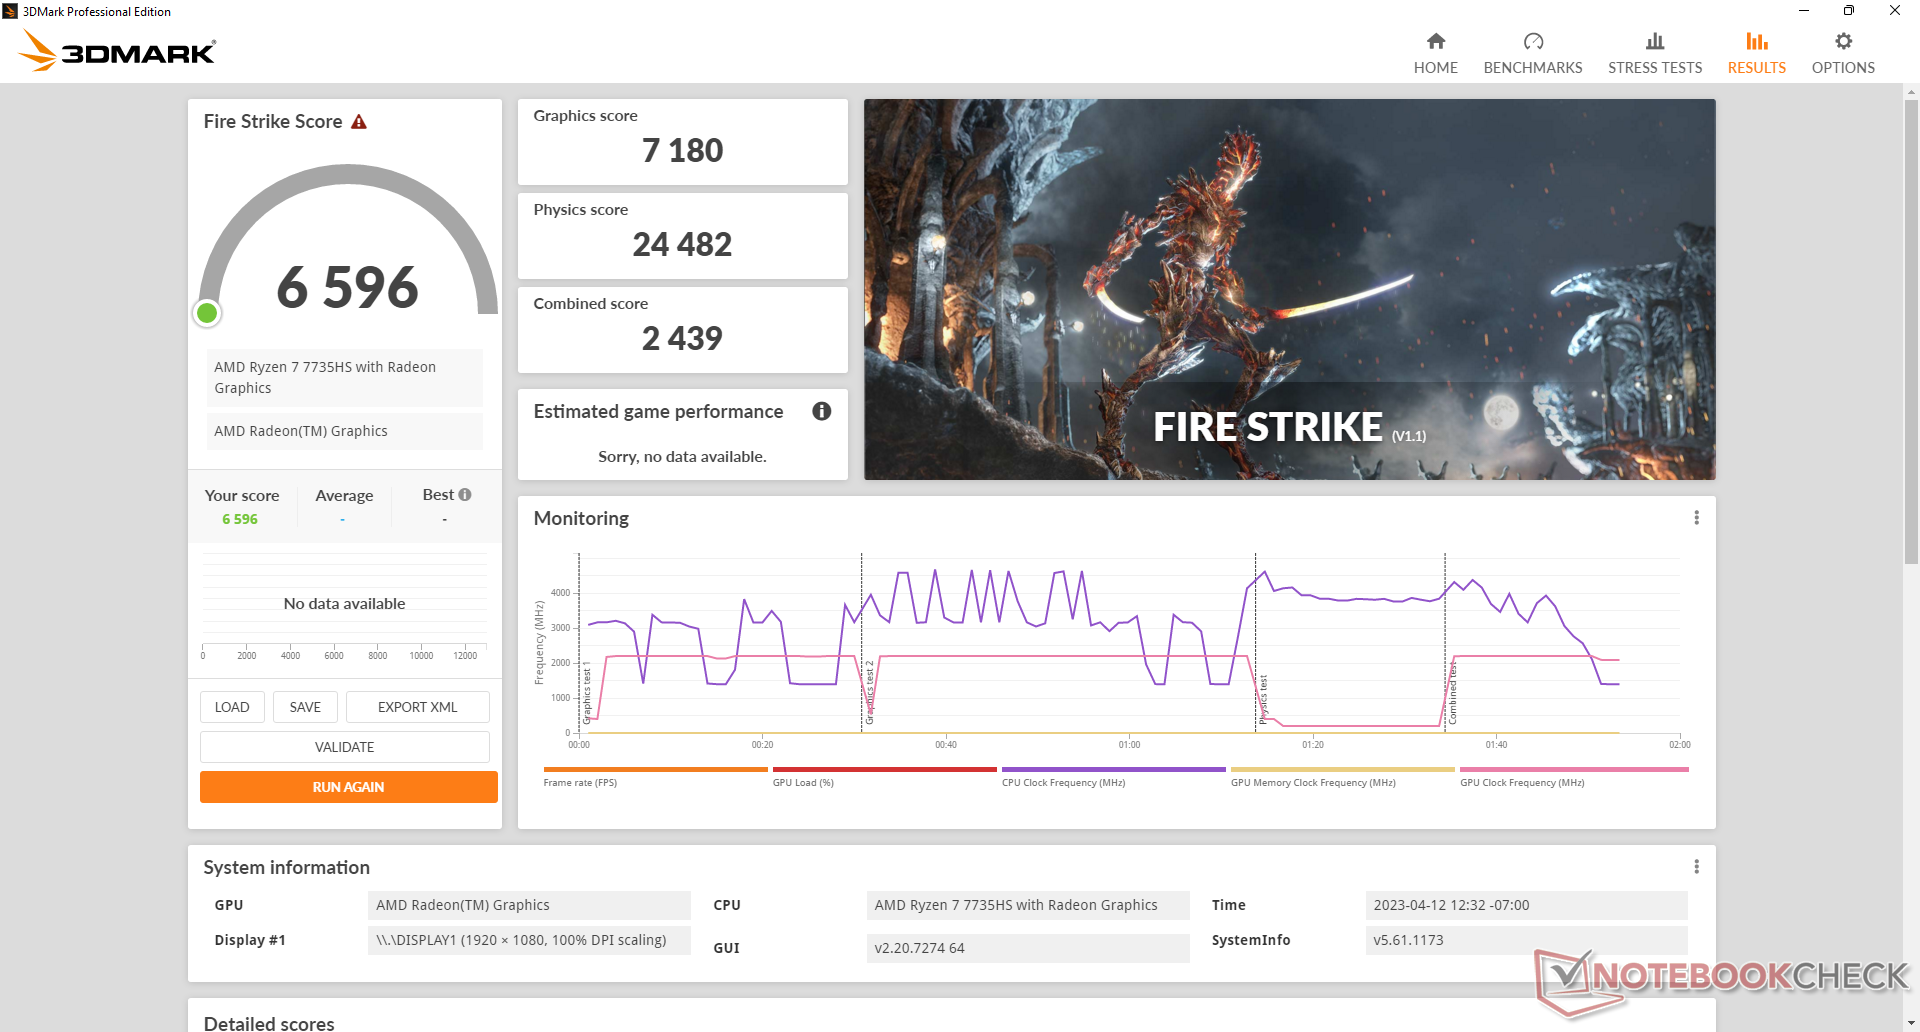
| 3DMark Fire Strike Score | 6596 pontos | |
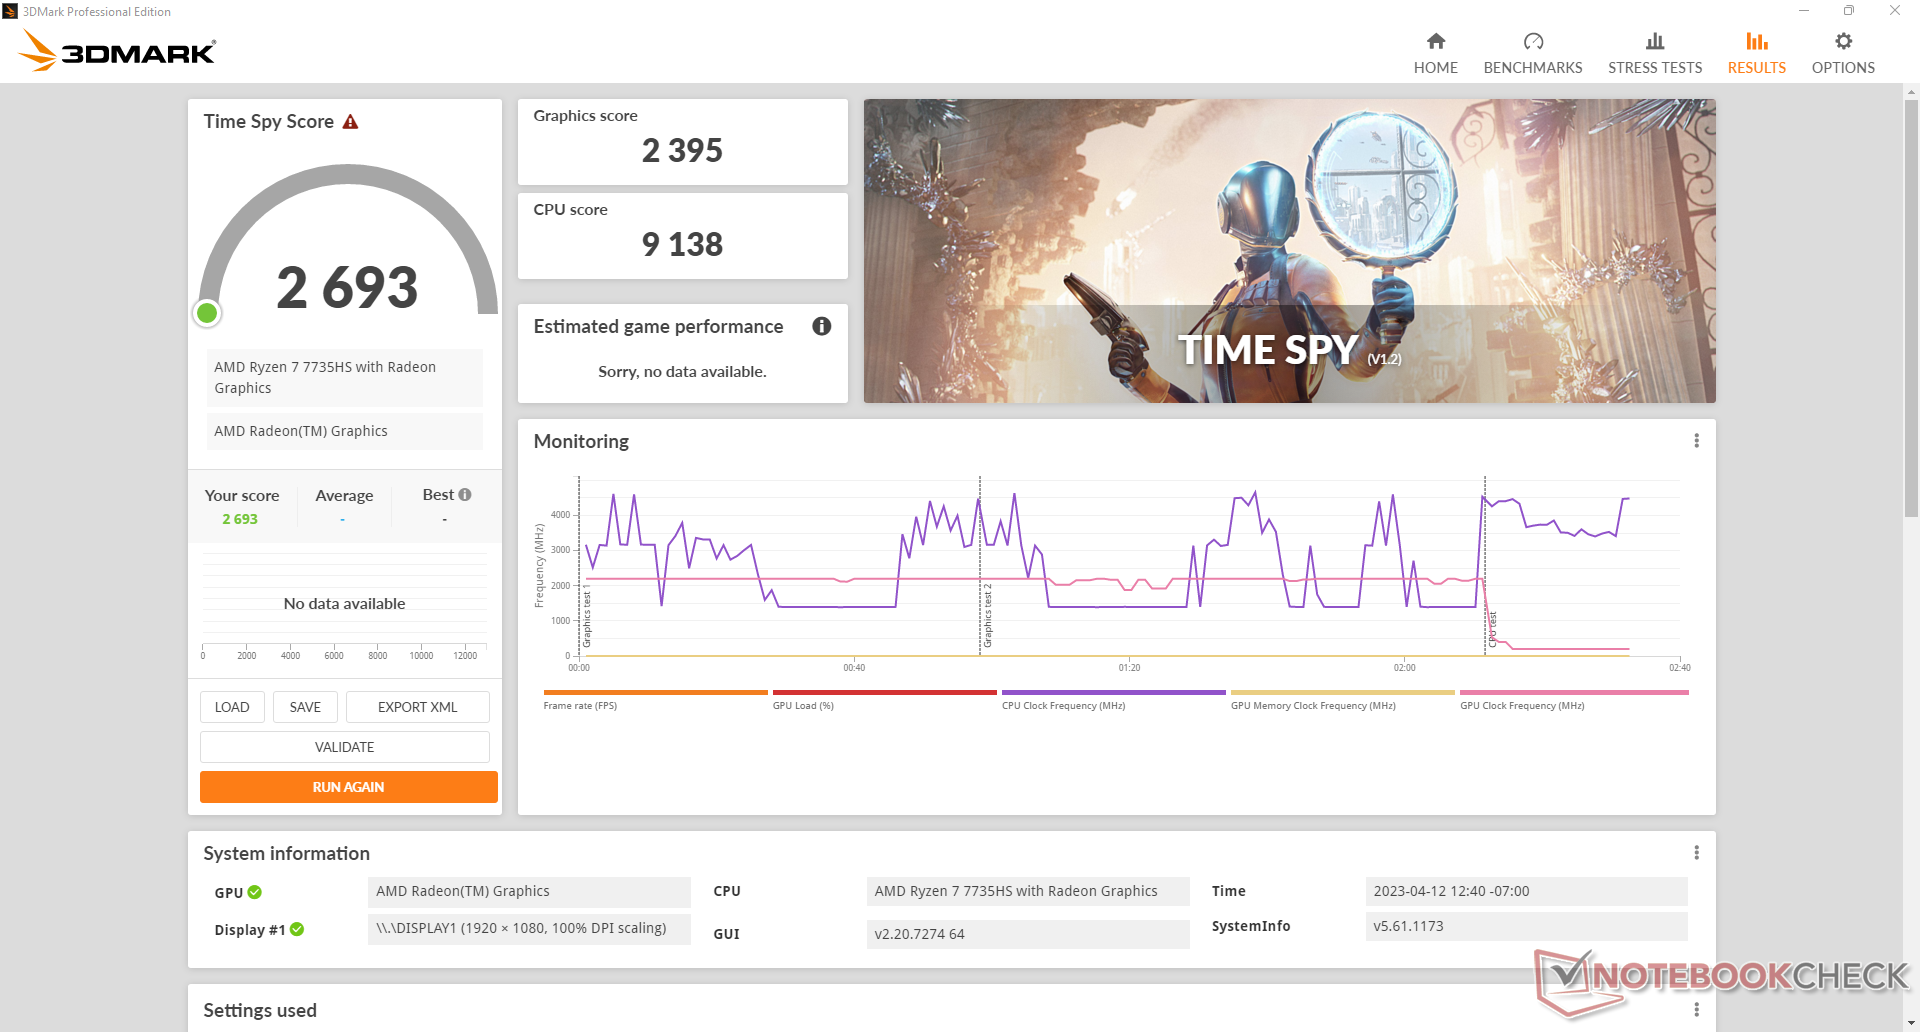
| 3DMark Time Spy Score | 2693 pontos | |
Ajuda | ||
| Performance rating - Percent | |
| Beelink SER6 Pro | |
| Beelink GTR6 | |
| Beelink SER6 Pro Ryzen 7 7735HS | |
| Intel NUC Pro Chassis_i7_1265U -1! | |
| Intel NUC 13 Pro Kit NUC13ANK -2! | |
| Trigkey Speed S | |
| Intel NUC Pro Chassis_i5_1245U -1! | |
| Intel NUC 12 Pro Kit NUC12WSBi5 -4! | |
| The Witcher 3 - 1920x1080 Ultra Graphics & Postprocessing (HBAO+) | |
| Beelink GTR6 | |
| Beelink SER6 Pro | |
| Beelink SER6 Pro Ryzen 7 7735HS | |
| Intel NUC 13 Pro Kit NUC13ANK | |
| Trigkey Speed S | |
| Final Fantasy XV Benchmark - 1920x1080 High Quality | |
| Intel NUC Pro Chassis_i7_1265U | |
| Beelink SER6 Pro Ryzen 7 7735HS | |
| Beelink SER6 Pro | |
| Beelink GTR6 | |
| Trigkey Speed S | |
| Intel NUC Pro Chassis_i5_1245U | |
| Dota 2 Reborn - 1920x1080 ultra (3/3) best looking | |
| Beelink SER6 Pro | |
| Beelink SER6 Pro Ryzen 7 7735HS | |
| Beelink GTR6 | |
| Intel NUC Pro Chassis_i7_1265U | |
| Intel NUC 13 Pro Kit NUC13ANK | |
| Trigkey Speed S | |
| Intel NUC Pro Chassis_i5_1245U | |
| Intel NUC 12 Pro Kit NUC12WSBi5 | |
| X-Plane 11.11 - 1920x1080 high (fps_test=3) | |
| Beelink SER6 Pro | |
| Beelink SER6 Pro Ryzen 7 7735HS | |
| Beelink GTR6 | |
| Trigkey Speed S | |
| Intel NUC Pro Chassis_i7_1265U | |
| Intel NUC Pro Chassis_i5_1245U | |
| Strange Brigade - 1920x1080 ultra AA:ultra AF:16 | |
| Beelink SER6 Pro | |
| Beelink GTR6 | |
| Beelink SER6 Pro Ryzen 7 7735HS | |
| Intel NUC 13 Pro Kit NUC13ANK | |
| Intel NUC Pro Chassis_i7_1265U | |
| Trigkey Speed S | |
| Intel NUC Pro Chassis_i5_1245U | |
| Final Fantasy XV Benchmark | |
| 1280x720 Lite Quality | |
| Beelink GTR6 | |
| Beelink SER6 Pro | |
| Beelink SER6 Pro Ryzen 7 7735HS | |
| Média AMD Radeon 680M (34.4 - 74.7, n=39) | |
| Intel NUC Pro Chassis_i7_1265U | |
| Intel NUC Pro Chassis_i5_1245U | |
| Trigkey Speed S | |
| Intel NUC 12 Pro Kit NUC12WSBi5 | |
| 1920x1080 Standard Quality | |
| Beelink GTR6 | |
| Beelink SER6 Pro | |
| Beelink SER6 Pro Ryzen 7 7735HS | |
| Média AMD Radeon 680M (18.3 - 36.9, n=40) | |
| Intel NUC Pro Chassis_i7_1265U | |
| Intel NUC Pro Chassis_i5_1245U | |
| Trigkey Speed S | |
| Intel NUC 12 Pro Kit NUC12WSBi5 | |
| 1920x1080 High Quality | |
| Intel NUC Pro Chassis_i7_1265U | |
| Beelink SER6 Pro Ryzen 7 7735HS | |
| Beelink SER6 Pro | |
| Beelink GTR6 | |
| Média AMD Radeon 680M (12.9 - 26.2, n=40) | |
| Trigkey Speed S | |
| Intel NUC Pro Chassis_i5_1245U | |
| X-Plane 11.11 | |
| 1280x720 low (fps_test=1) | |
| Beelink SER6 Pro | |
| Beelink SER6 Pro Ryzen 7 7735HS | |
| Beelink GTR6 | |
| Média AMD Radeon 680M (26.8 - 66.7, n=41) | |
| Trigkey Speed S | |
| Intel NUC Pro Chassis_i5_1245U | |
| Intel NUC Pro Chassis_i7_1265U | |
| 1920x1080 med (fps_test=2) | |
| Beelink SER6 Pro | |
| Beelink GTR6 | |
| Beelink SER6 Pro Ryzen 7 7735HS | |
| Trigkey Speed S | |
| Média AMD Radeon 680M (21.1 - 53.1, n=41) | |
| Intel NUC Pro Chassis_i7_1265U | |
| Intel NUC Pro Chassis_i5_1245U | |
| 1920x1080 high (fps_test=3) | |
| Beelink SER6 Pro | |
| Beelink SER6 Pro Ryzen 7 7735HS | |
| Beelink GTR6 | |
| Trigkey Speed S | |
| Média AMD Radeon 680M (16.6 - 44.5, n=41) | |
| Intel NUC Pro Chassis_i7_1265U | |
| Intel NUC Pro Chassis_i5_1245U | |
| Strange Brigade | |
| 1280x720 lowest AF:1 | |
| Beelink GTR6 | |
| Beelink SER6 Pro | |
| Beelink SER6 Pro Ryzen 7 7735HS | |
| Média AMD Radeon 680M (72.9 - 167.5, n=38) | |
| Intel NUC 13 Pro Kit NUC13ANK | |
| Intel NUC Pro Chassis_i7_1265U | |
| Trigkey Speed S | |
| Intel NUC Pro Chassis_i5_1245U | |
| 1920x1080 medium AA:medium AF:4 | |
| Beelink SER6 Pro | |
| Beelink GTR6 | |
| Beelink SER6 Pro Ryzen 7 7735HS | |
| Média AMD Radeon 680M (30 - 63, n=38) | |
| Intel NUC Pro Chassis_i7_1265U | |
| Intel NUC 13 Pro Kit NUC13ANK | |
| Trigkey Speed S | |
| Intel NUC Pro Chassis_i5_1245U | |
| 1920x1080 high AA:high AF:8 | |
| Beelink SER6 Pro | |
| Beelink GTR6 | |
| Beelink SER6 Pro Ryzen 7 7735HS | |
| Média AMD Radeon 680M (25.3 - 53.1, n=38) | |
| Intel NUC 13 Pro Kit NUC13ANK | |
| Intel NUC Pro Chassis_i7_1265U | |
| Trigkey Speed S | |
| Intel NUC Pro Chassis_i5_1245U | |
| 1920x1080 ultra AA:ultra AF:16 | |
| Beelink SER6 Pro | |
| Beelink GTR6 | |
| Beelink SER6 Pro Ryzen 7 7735HS | |
| Média AMD Radeon 680M (22 - 46, n=38) | |
| Intel NUC 13 Pro Kit NUC13ANK | |
| Intel NUC Pro Chassis_i7_1265U | |
| Trigkey Speed S | |
| Intel NUC Pro Chassis_i5_1245U | |
| Cyberpunk 2077 1.6 | |
| 1920x1080 Low Preset | |
| Beelink SER6 Pro | |
| Beelink GTR6 | |
| Beelink SER6 Pro Ryzen 7 7735HS | |
| Média AMD Radeon 680M (26 - 50.6, n=15) | |
| 1920x1080 Medium Preset | |
| Beelink SER6 Pro | |
| Beelink GTR6 | |
| Beelink SER6 Pro Ryzen 7 7735HS | |
| Média AMD Radeon 680M (20.1 - 41.8, n=15) | |
| 1280x720 Low Preset | |
| Beelink SER6 Pro | |
| Beelink GTR6 | |
| Beelink SER6 Pro Ryzen 7 7735HS | |
| Média AMD Radeon 680M (46.1 - 77.6, n=14) | |
| 1920x1080 High Preset | |
| Beelink GTR6 | |
| Beelink SER6 Pro Ryzen 7 7735HS | |
| Média AMD Radeon 680M (16.3 - 33.6, n=15) | |
| Beelink SER6 Pro | |
| 1920x1080 Ultra Preset | |
| Beelink GTR6 | |
| Beelink SER6 Pro Ryzen 7 7735HS | |
| Média AMD Radeon 680M (14 - 23.8, n=15) | |
| Beelink SER6 Pro | |
| F1 22 | |
| 1280x720 Ultra Low Preset AA:T AF:16x | |
| Beelink SER6 Pro Ryzen 7 7735HS | |
| Média AMD Radeon 680M (75.5 - 147.3, n=19) | |
| Intel NUC 13 Pro Kit NUC13ANK | |
| Intel NUC Pro Chassis_i7_1265U | |
| Intel NUC Pro Chassis_i5_1245U | |
| 1920x1080 Low Preset AA:T AF:16x | |
| Beelink SER6 Pro Ryzen 7 7735HS | |
| Média AMD Radeon 680M (44.1 - 85.4, n=25) | |
| Intel NUC 13 Pro Kit NUC13ANK | |
| Intel NUC Pro Chassis_i7_1265U | |
| Intel NUC Pro Chassis_i5_1245U | |
| 1920x1080 Medium Preset AA:T AF:16x | |
| Beelink SER6 Pro Ryzen 7 7735HS | |
| Média AMD Radeon 680M (38 - 75.1, n=25) | |
| Intel NUC 13 Pro Kit NUC13ANK | |
| Intel NUC Pro Chassis_i7_1265U | |
| Intel NUC Pro Chassis_i5_1245U | |
| 1920x1080 High Preset AA:T AF:16x | |
| Beelink SER6 Pro Ryzen 7 7735HS | |
| Média AMD Radeon 680M (30 - 56.2, n=25) | |
| Intel NUC 13 Pro Kit NUC13ANK | |
| Intel NUC Pro Chassis_i7_1265U | |
| Intel NUC Pro Chassis_i5_1245U | |
| 1920x1080 Ultra High Preset AA:T AF:16x | |
| Intel NUC 13 Pro Kit NUC13ANK | |
| Intel NUC Pro Chassis_i7_1265U | |
| Beelink SER6 Pro Ryzen 7 7735HS | |
| Média AMD Radeon 680M (7.85 - 14.7, n=22) | |
Witcher 3 FPS Chart
| baixo | média | alto | ultra | |
|---|---|---|---|---|
| The Witcher 3 (2015) | 115.6 | 79.8 | 42.4 | 25.2 |
| Dota 2 Reborn (2015) | 142.2 | 113.5 | 89.1 | 72.8 |
| Final Fantasy XV Benchmark (2018) | 62.2 | 33 | 24.7 | |
| X-Plane 11.11 (2018) | 65.2 | 52.3 | 42.2 | |
| Strange Brigade (2018) | 137.8 | 56.4 | 47.1 | 40.7 |
| Cyberpunk 2077 1.6 (2022) | 40.8 | 31.8 | 21.8 | 17.5 |
| Tiny Tina's Wonderlands (2022) | 58.6 | 44.4 | 29.9 | 23.1 |
| F1 22 (2022) | 80.1 | 69.5 | 52.9 | 13.9 |
Emissões
Ruído do sistema
Há algumas pequenas diferenças no ruído do ventilador quando comparado ao modelo do ano passado, mas ambos atingem um máximo semelhante de ~40 dB(A) quando se corre com cargas muito exigentes como jogos. Ao executar cargas mais baixas como navegadores, o modelo mais novo parece funcionar mais silencioso por períodos mais longos antes de recorrer a RPMs de ventiladores mais altos.
Barulho
| Ocioso |
| 23.3 / 23.3 / 26.2 dB |
| Carga |
| 40.2 / 40.2 dB |
 | ||
30 dB silencioso 40 dB(A) audível 50 dB(A) ruidosamente alto |
||
min: | ||
| Beelink SER6 Pro Ryzen 7 7735HS Radeon 680M, R7 7735HS, Kingston NV2 500GB SNV2S/500G | Beelink SER6 Pro Radeon 680M, R7 6800H, Kingston NV2 500GB SNV2S/500G | Beelink GTR6 Radeon 680M, R9 6900HX, Kingston KC3000 512G SKC3000S512G | Intel NUC 13 Pro Kit NUC13ANK Iris Xe G7 96EUs, i7-1360P, Samsung PM9A1 MZVL2512HCJQ | Intel NUC 12 Pro Kit NUC12WSBi5 Iris Xe G7 80EUs, i5-1240P, Lexar 512GB NM6A1 LNM6A1X512G-HNNG | Minisforum Venus Series UM690 Radeon 680M, R9 6900HX, Kingston OM8PGP4512Q-A0 | |
|---|---|---|---|---|---|---|
| Noise | -5% | -8% | -19% | -16% | ||
| desligado / ambiente * (dB) | 23.3 | 22.8 2% | 23.2 -0% | 29.8 -28% | 30.5 -31% | |
| Idle Minimum * (dB) | 23.3 | 24.1 -3% | 23.6 -1% | 30.2 -30% | 31.6 -36% | |
| Idle Average * (dB) | 23.3 | 24.1 -3% | 23.8 -2% | 31.1 -33% | 31.6 -36% | |
| Idle Maximum * (dB) | 26.2 | 33.8 -29% | 36.2 -38% | 31.9 -22% | 31.6 -21% | |
| Load Average * (dB) | 40.2 | 40.1 -0% | 39.7 1% | 40 -0% | 33.9 16% | |
| Witcher 3 ultra * (dB) | 37 | 38.7 -5% | 41 -11% | |||
| Load Maximum * (dB) | 40.2 | 40.1 -0% | 43 -7% | 40.5 -1% | 34.4 14% |
* ... menor é melhor
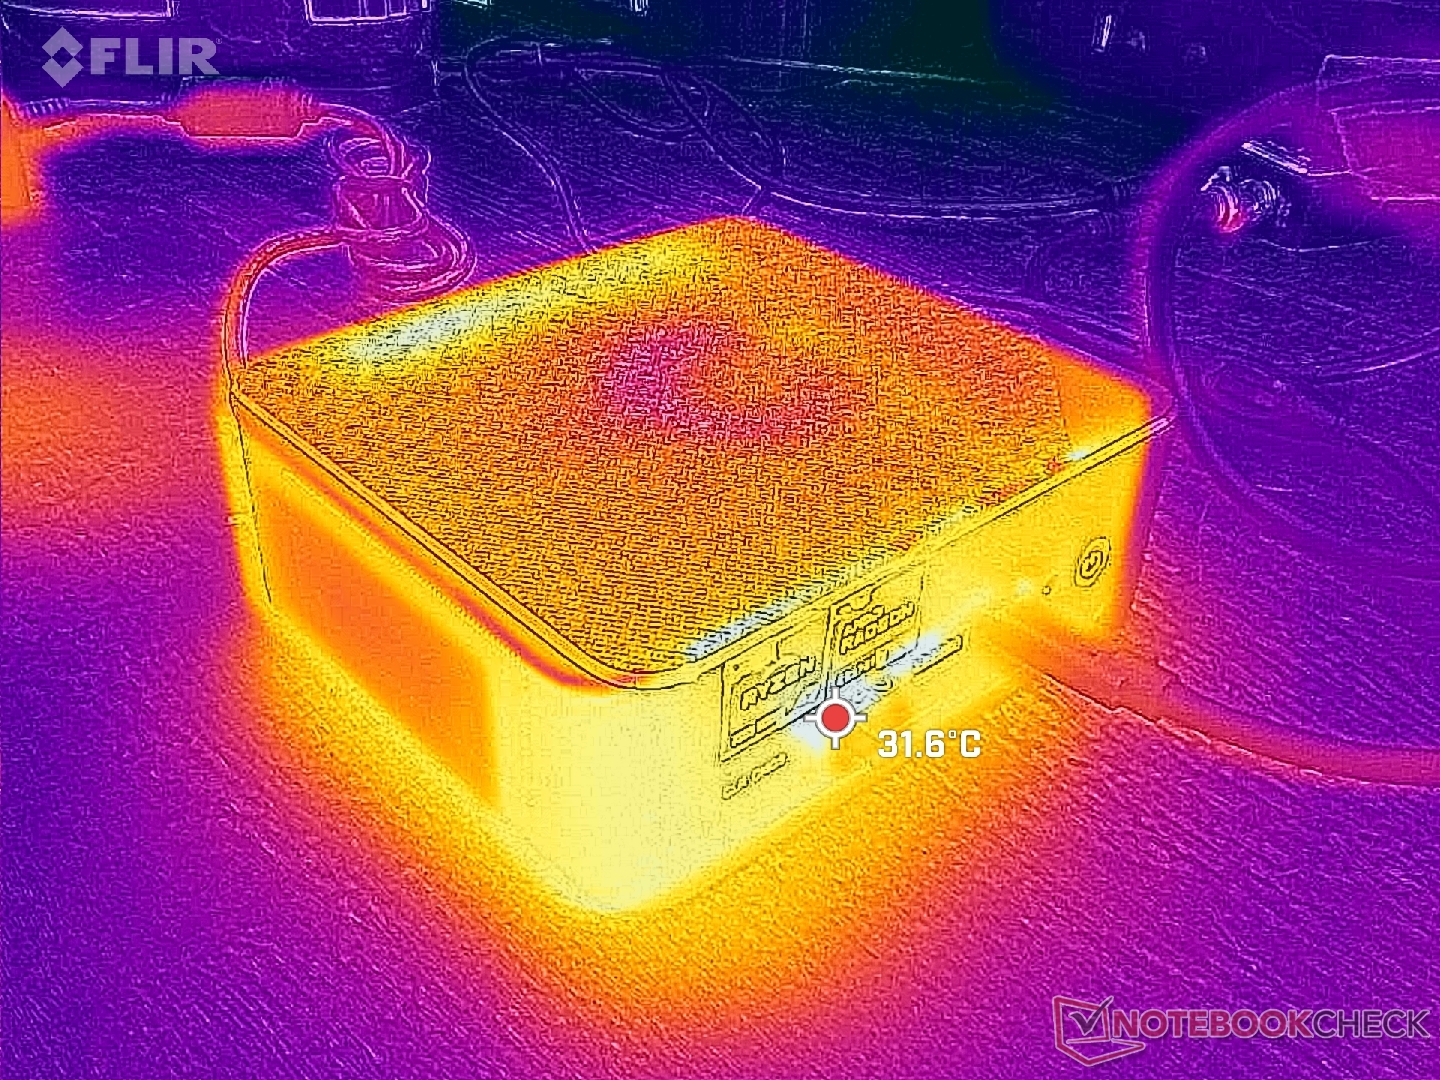
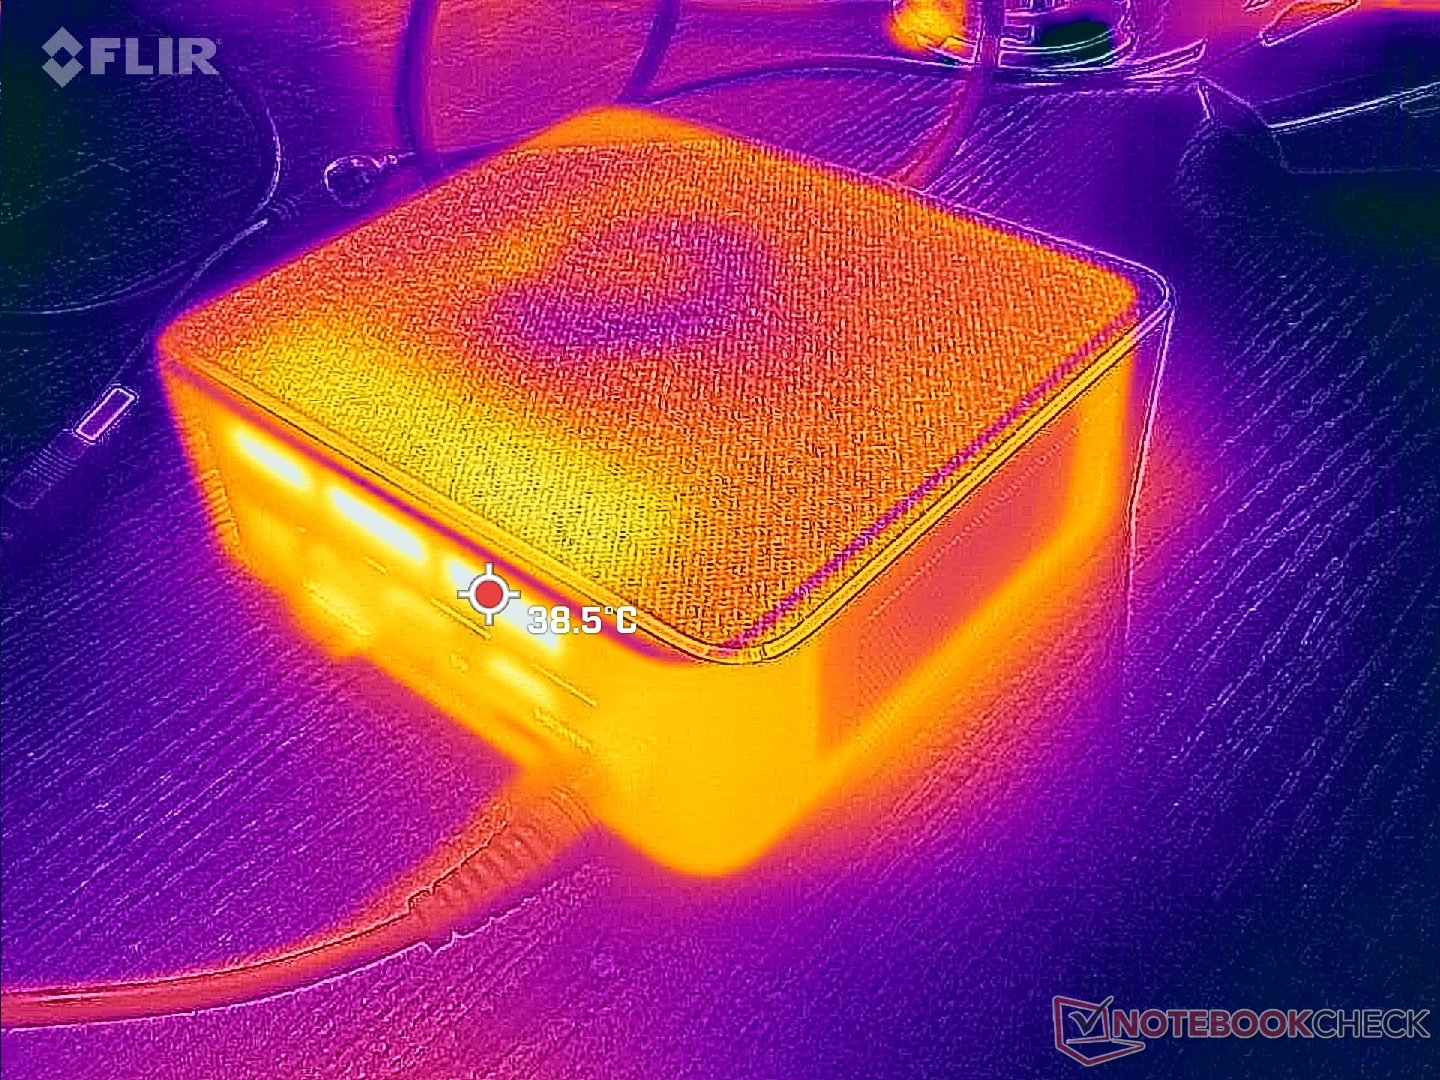
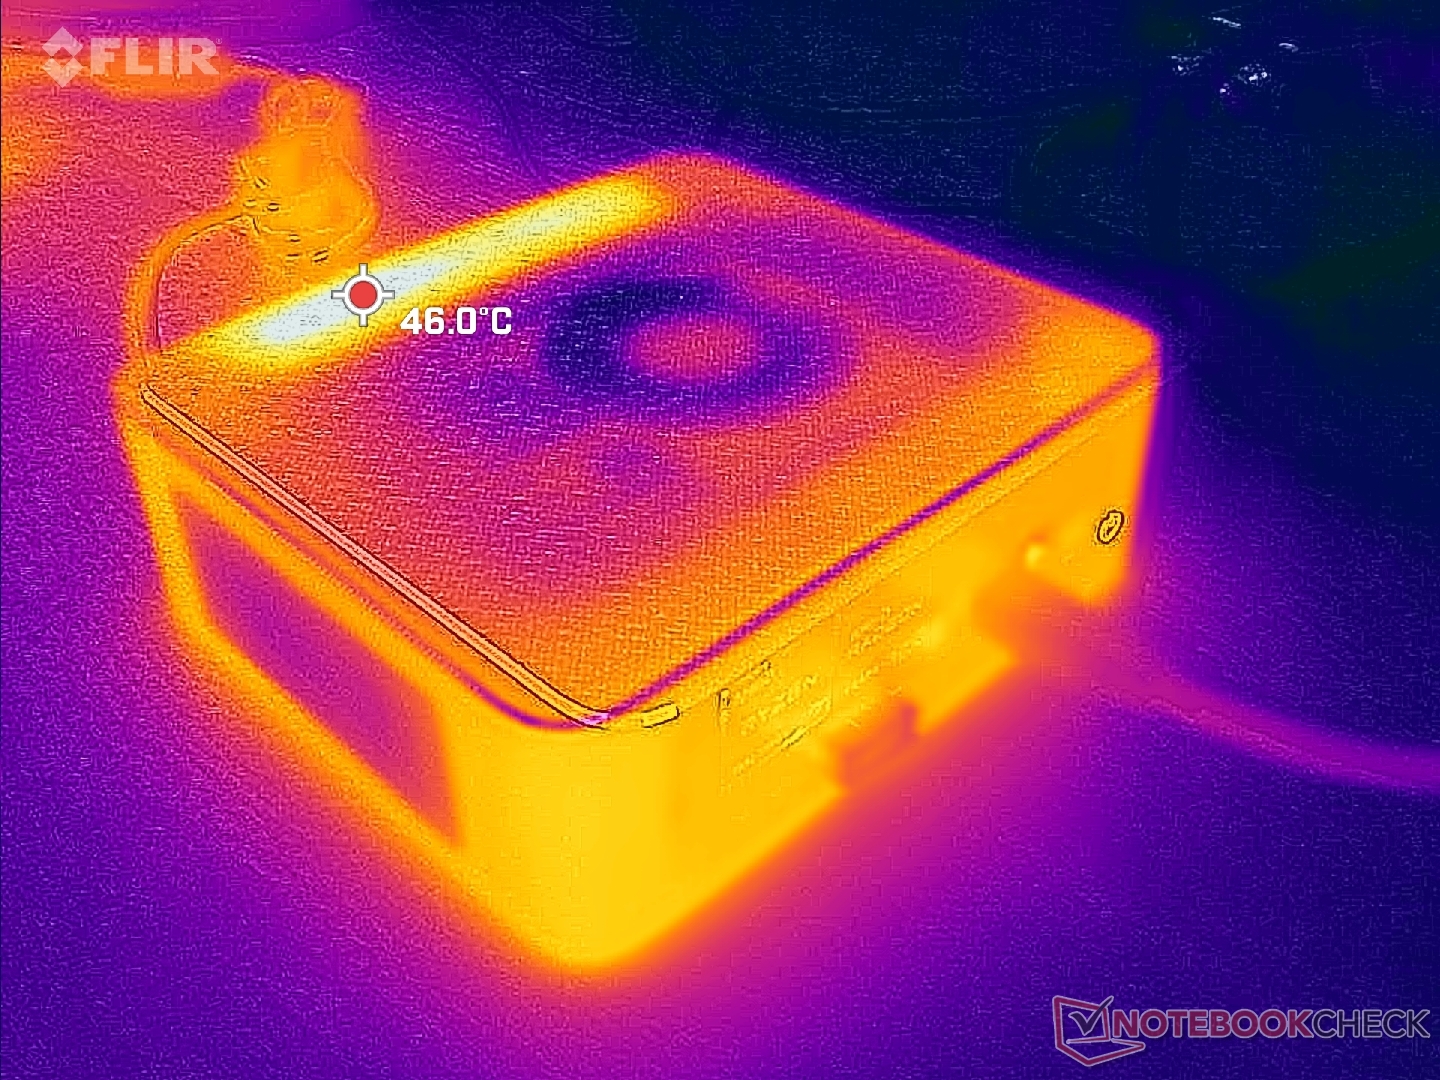
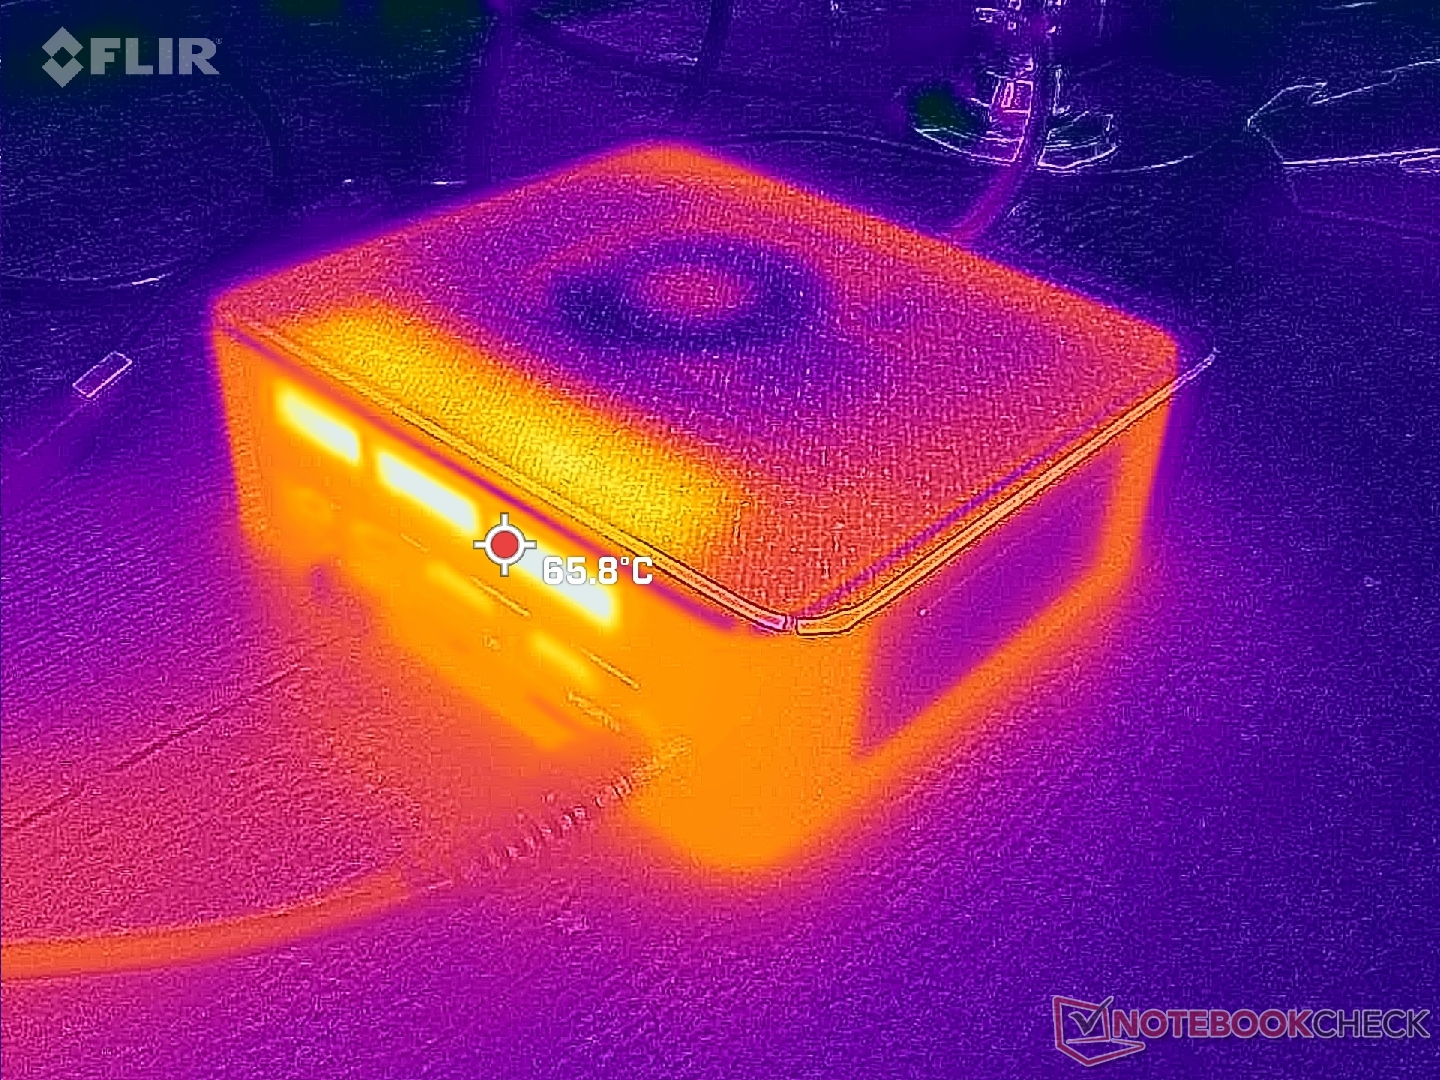
Temperatura
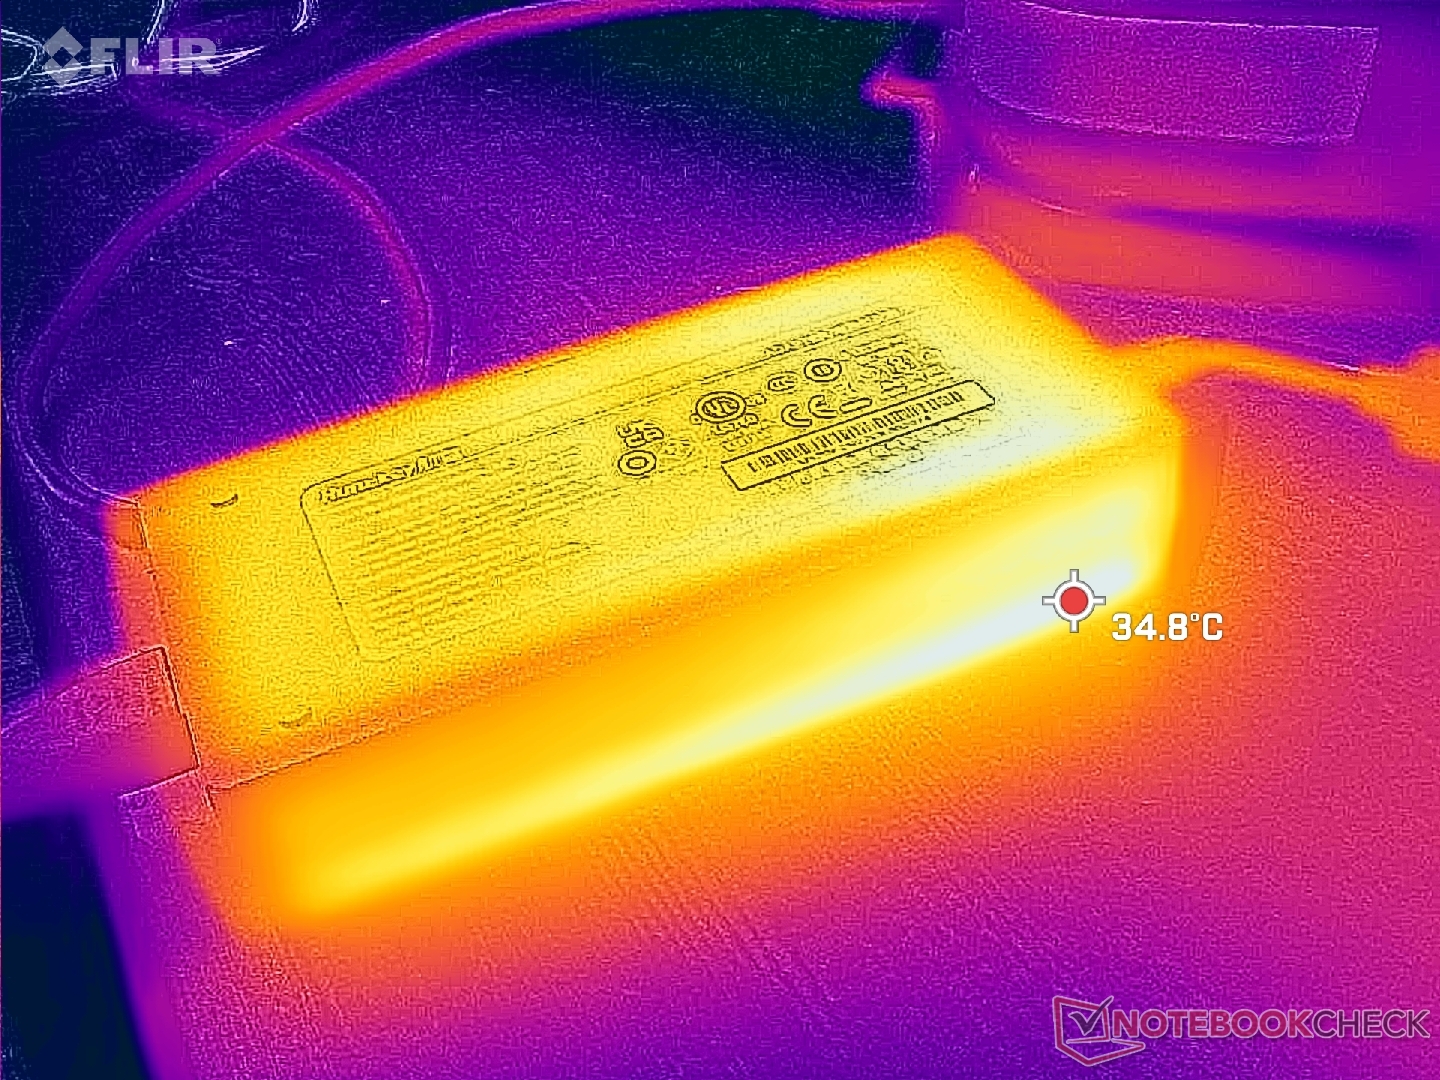
As temperaturas superficiais não são um problema no SER6 Pro. Entretanto, tenha em mente que ar fresco entra da superfície superior e, portanto, quaisquer papéis, livros ou itens não devem ser colocados em cima. Deixe algum espaço ao longo da parte traseira para que o calor residual também saia.
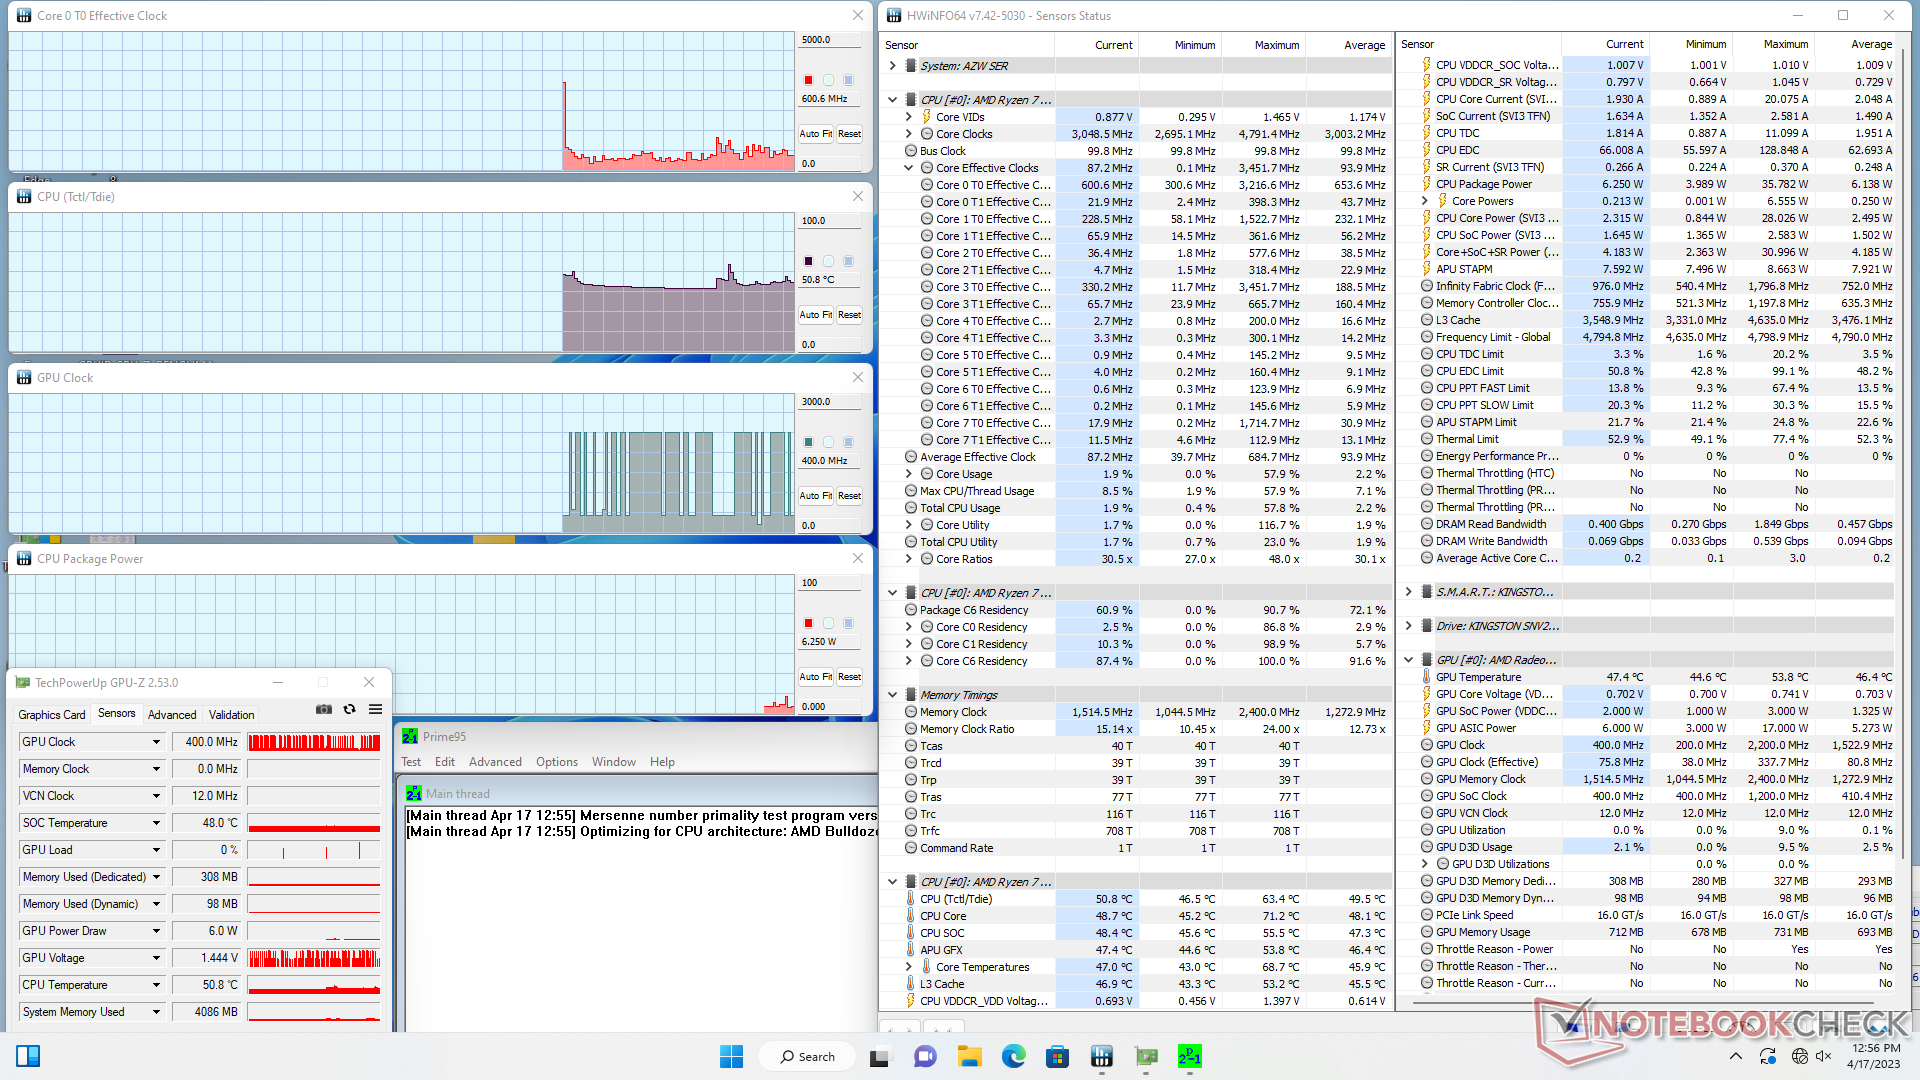
Teste de estresse
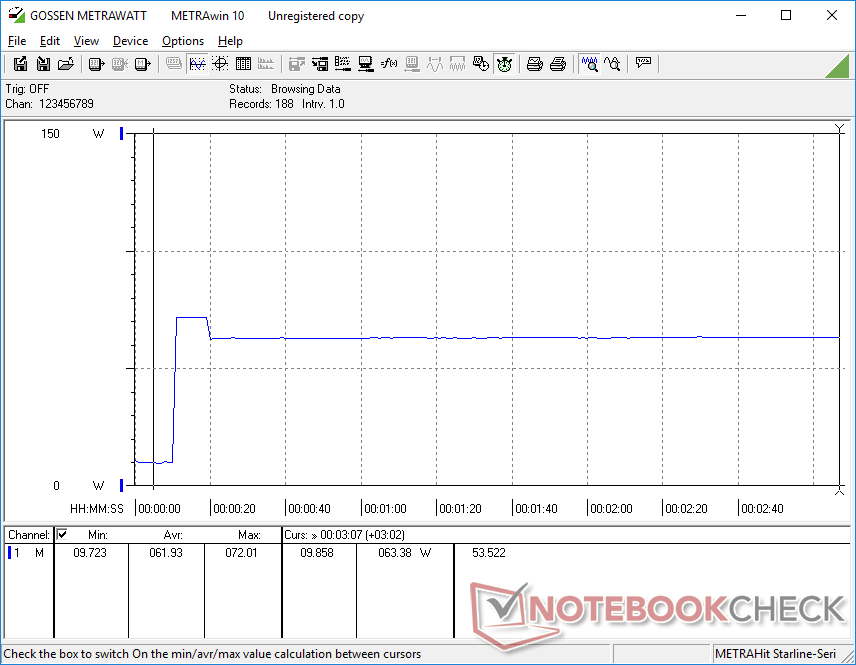
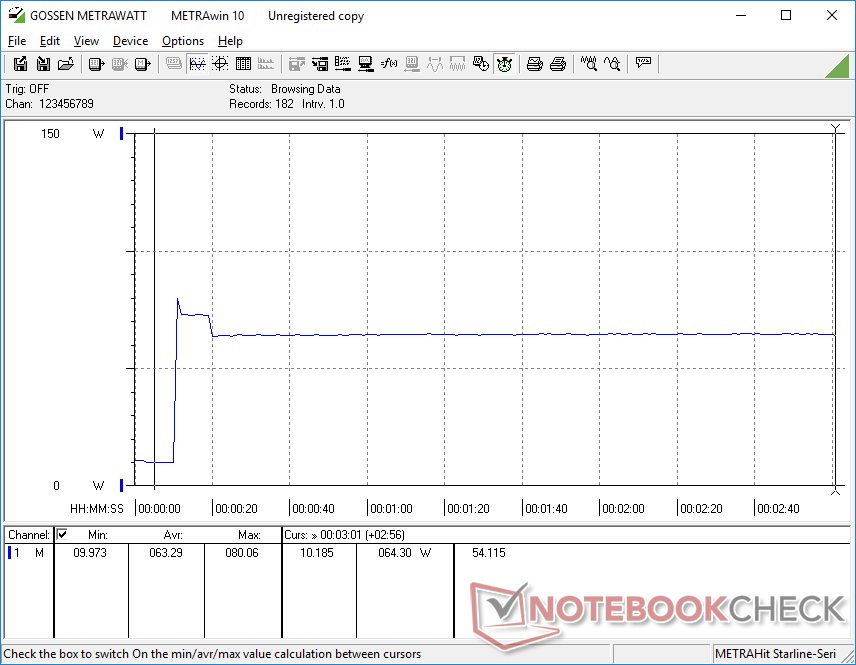
A taxa de clock da CPU e o consumo de energia da placa ao executar Prime95 aumentariam para 3,4 GHz e 45 W, respectivamente, durando apenas alguns segundos. A CPU então se estabilizaria rapidamente em 3,1 GHz, 38 W e 86 C, o que é ligeiramente mais quente e rápido do que o que registramos no SER6 Pro do ano passado.
Ao rodar Witcher 3, o relógio GPU e a temperatura se estabilizariam em 2037 MHz e 86 C, respectivamente, em comparação com 1150 MHz e apenas 68 C no mais lento SEi12 alimentado pela Intel.
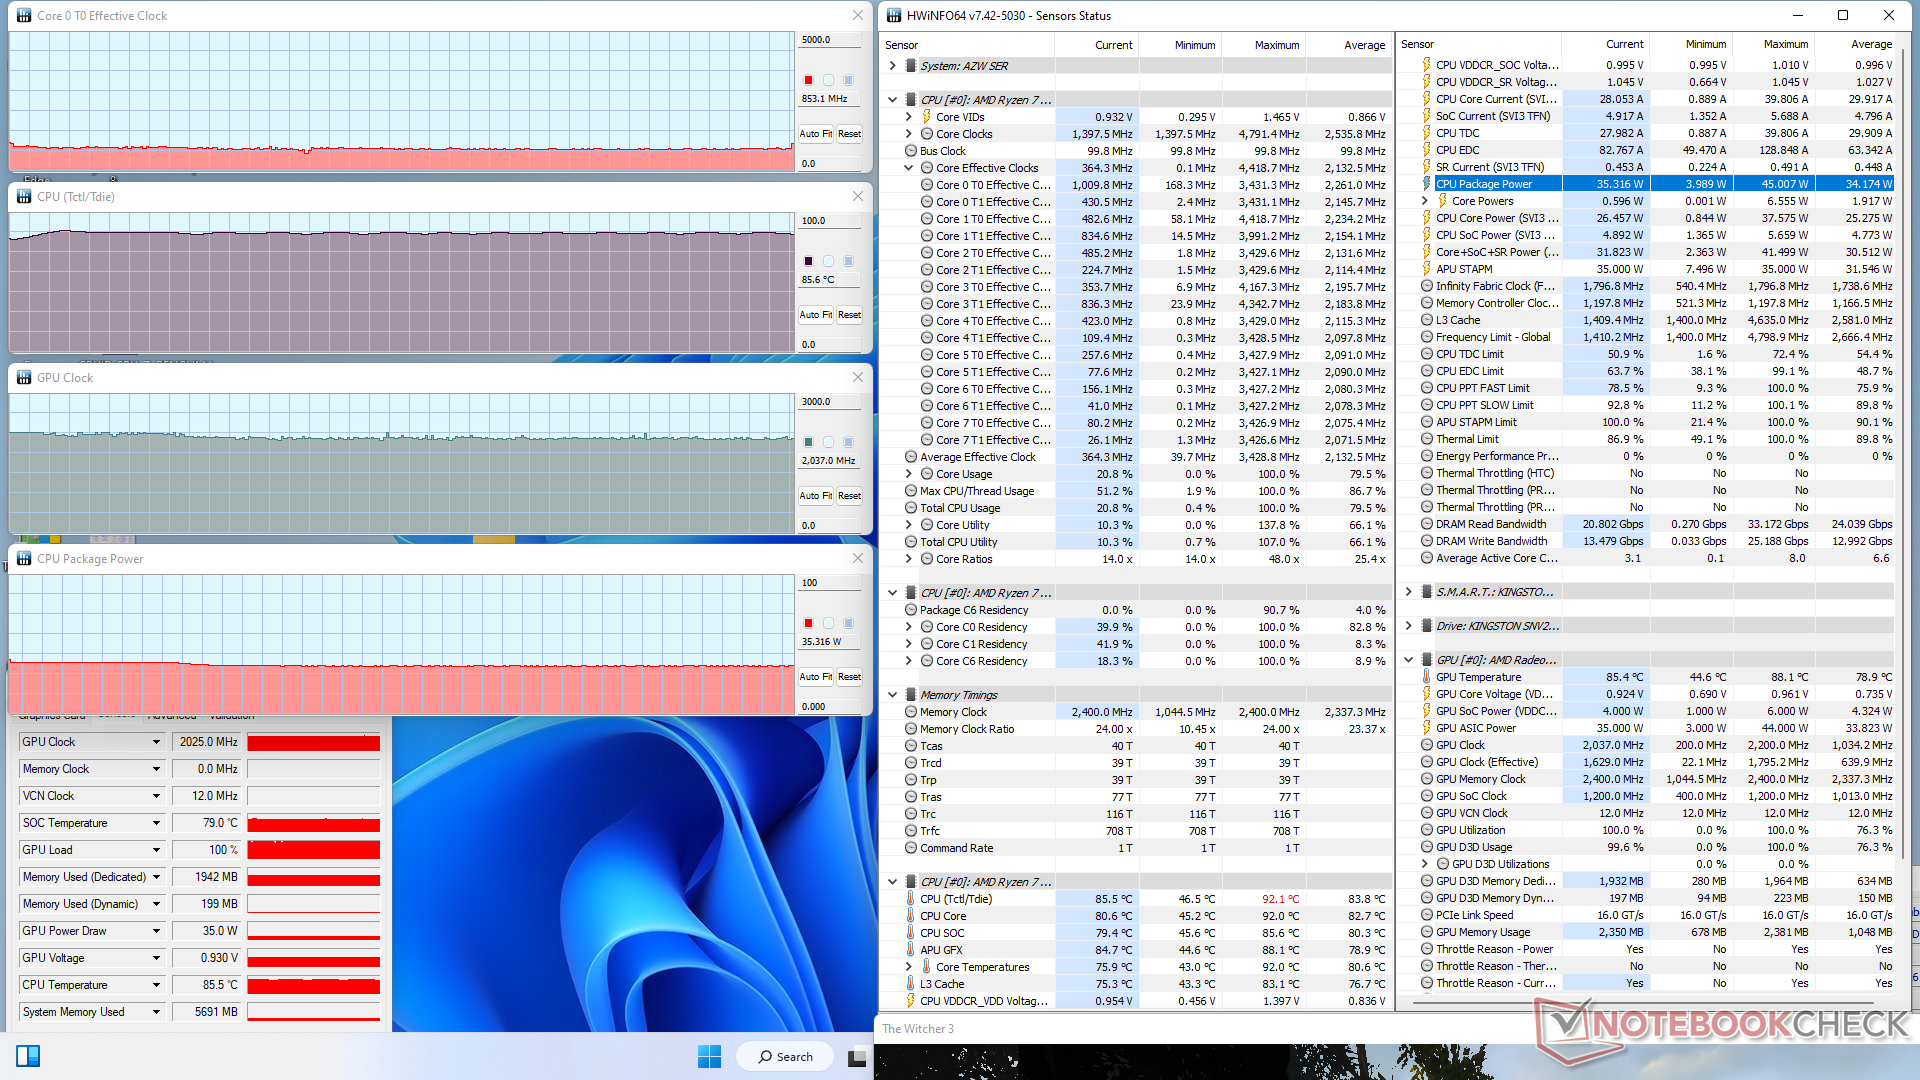
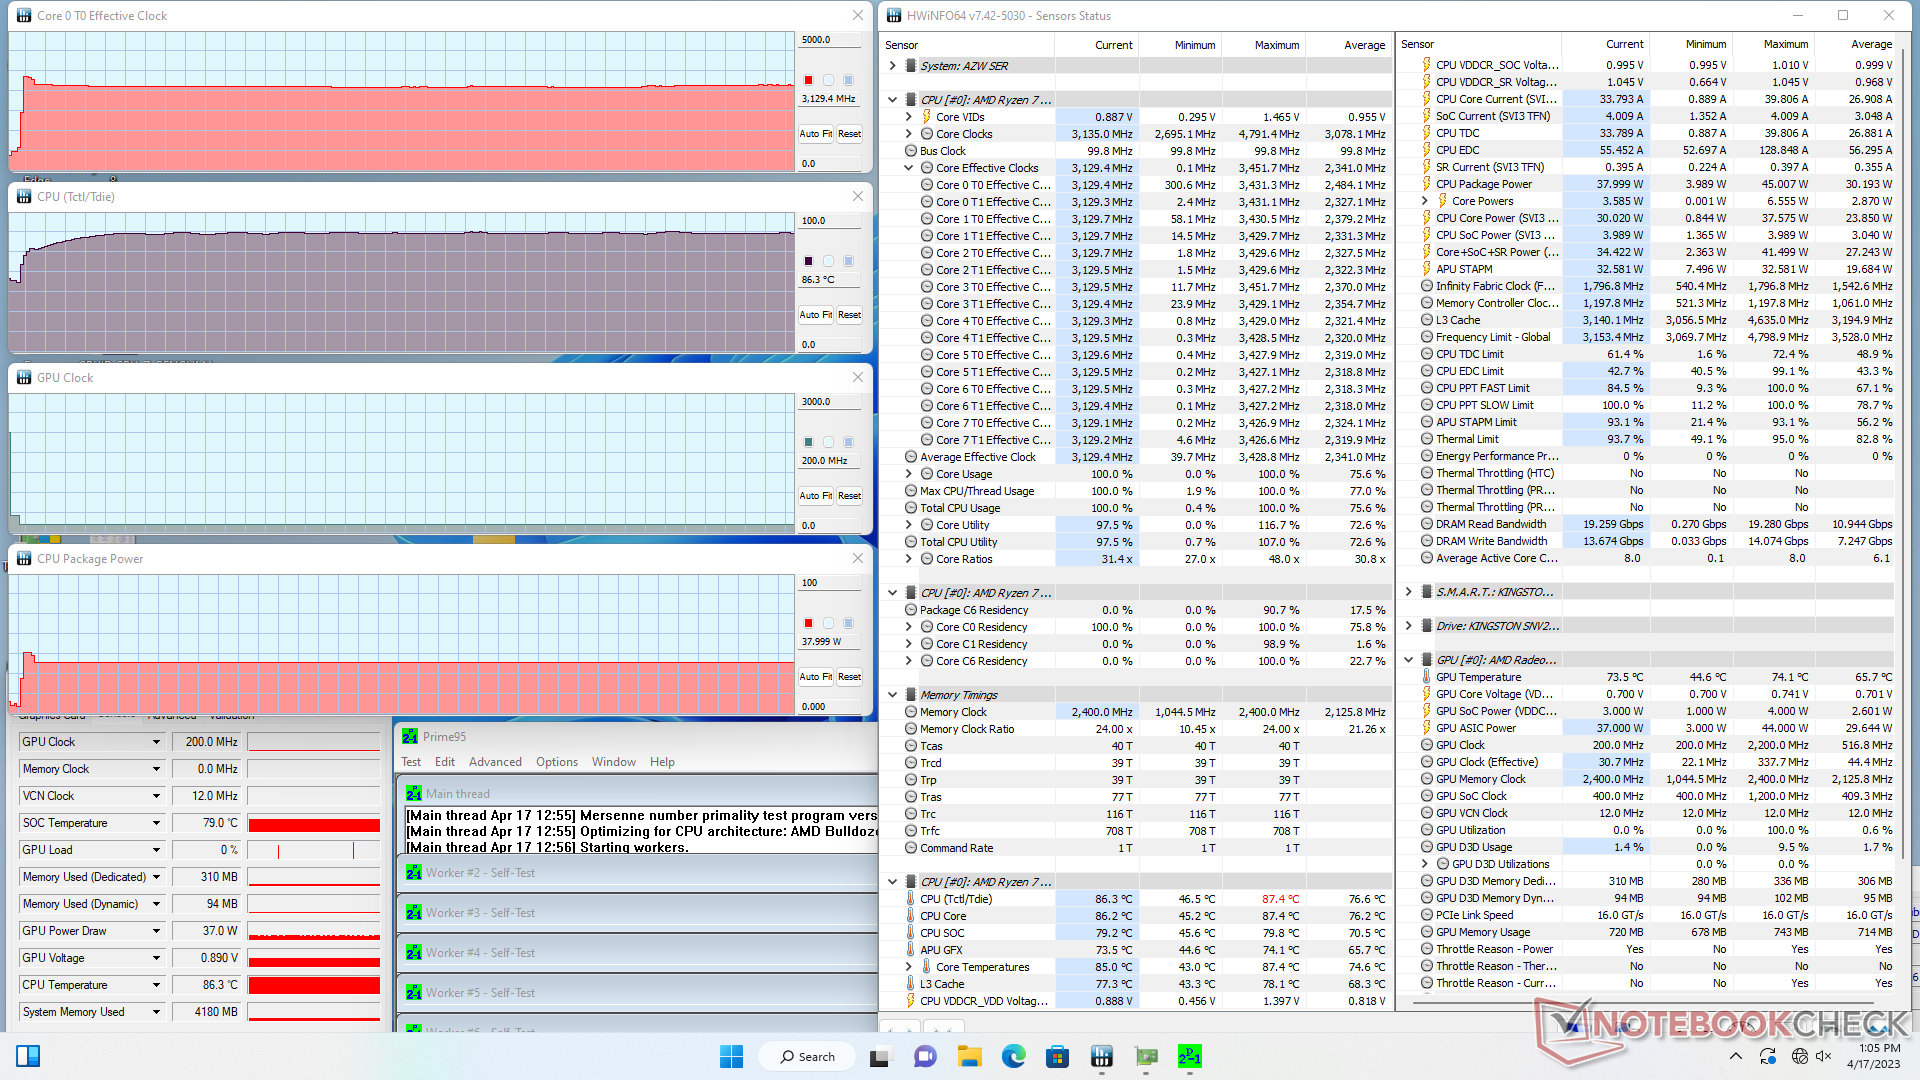
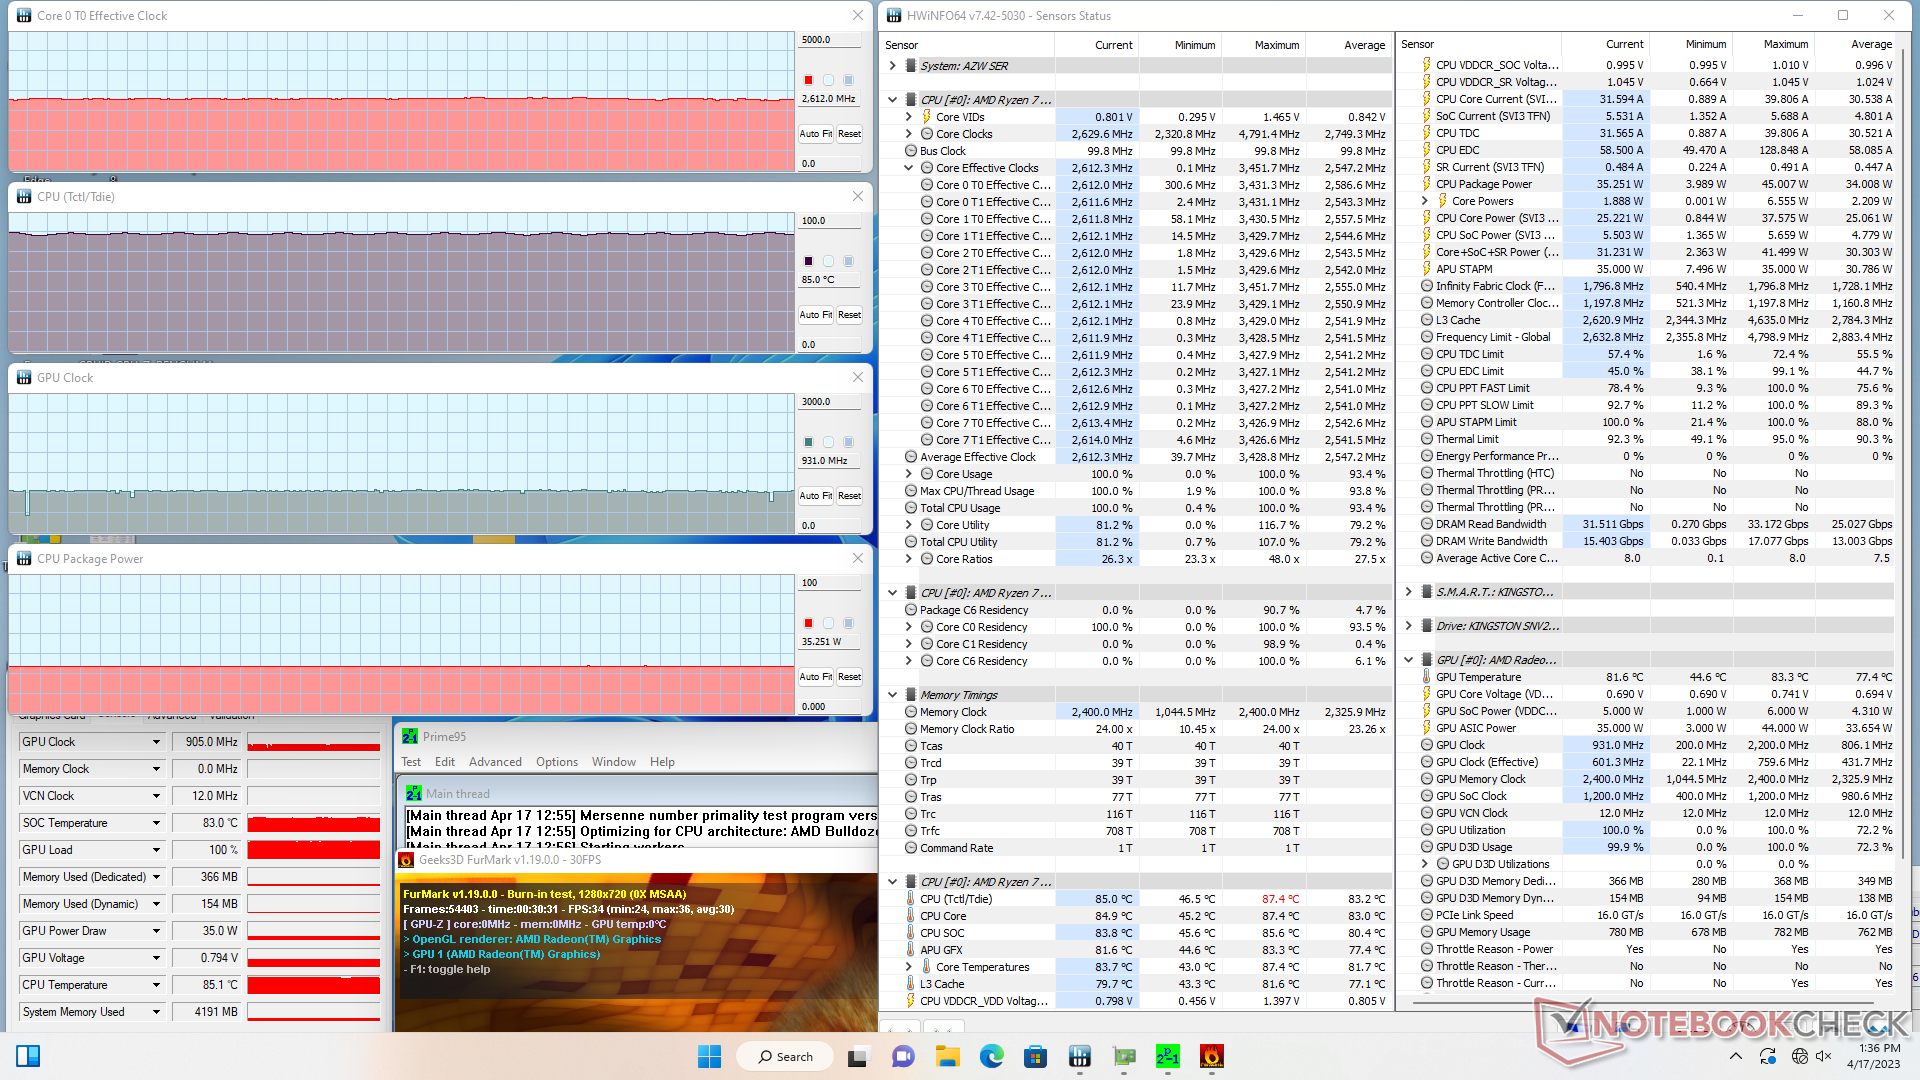
| Relógio CPU (GHz) | Relógio GPU (MHz) | Temperatura média da CPU (°C) | |
| System Idle | -- | -- | 51 |
| Prime95 Stress | 3.1 | -- | 86 |
| Prime95 + FurMark Stress | 2.6 | 931 | 85 |
| Witcher 3 Estresse | 0.8 | 2037 | 86 |
Gestão de energia
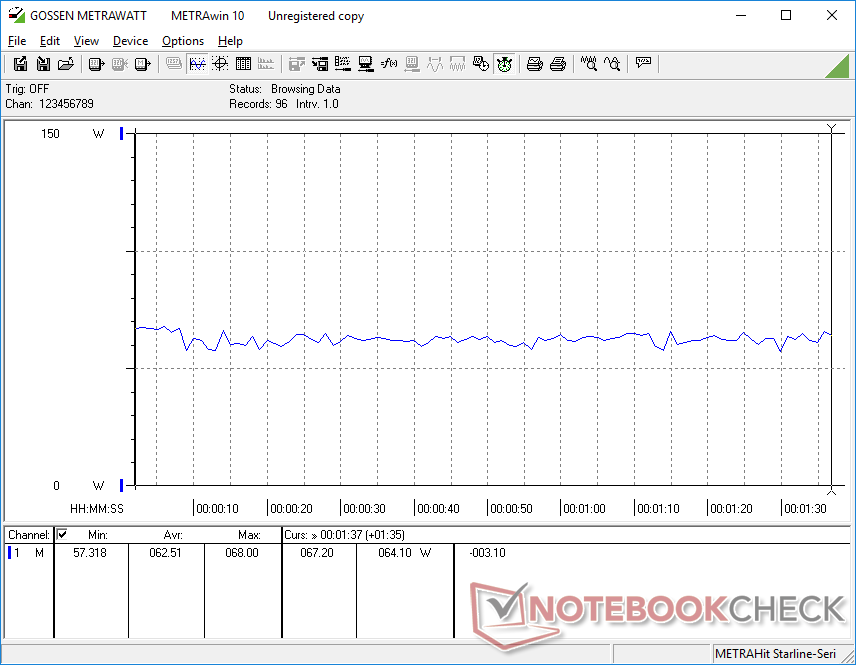
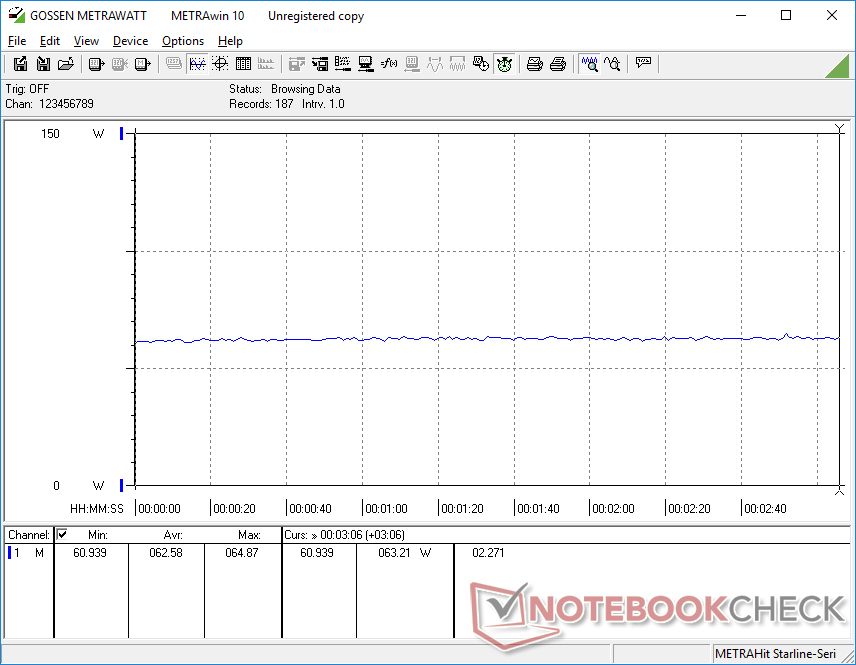
Consumo de energia
O consumo de energia é quase idêntico ao do ano passado, Ryzen 7 6800H, como mostram nossos gráficos de comparação abaixo. Assim, o desempenho por watt infelizmente não é melhor ao saltar do Ryzen 6 6800H mais antigo para o Ryzen 7 7735HS mais novo.
| desligado | |
| Ocioso | |
| Carga |
|
Key:
min: | |
| Beelink SER6 Pro Ryzen 7 7735HS R7 7735HS, Radeon 680M, Kingston NV2 500GB SNV2S/500G, , x, | Beelink SER6 Pro R7 6800H, Radeon 680M, Kingston NV2 500GB SNV2S/500G, , x, | Beelink GTR6 R9 6900HX, Radeon 680M, Kingston KC3000 512G SKC3000S512G, , x, | Intel NUC 13 Pro Kit NUC13ANK i7-1360P, Iris Xe G7 96EUs, Samsung PM9A1 MZVL2512HCJQ, , x, | Minisforum Venus Series UM690 R9 6900HX, Radeon 680M, Kingston OM8PGP4512Q-A0, , x, | Intel Hades Canyon NUC8i7HVK i7-8809G, Vega M GH, Intel Optane 120 GB SSDPEK1W120GA, , x, | |
|---|---|---|---|---|---|---|
| Power Consumption | 6% | -4% | 5% | -8% | -79% | |
| Idle Minimum * (Watt) | 8.9 | 8.3 7% | 7.6 15% | 5.1 43% | 8.7 2% | 15.5 -74% |
| Idle Average * (Watt) | 9 | 8.4 7% | 9.9 -10% | 5.8 36% | 9.6 -7% | 16.2 -80% |
| Idle Maximum * (Watt) | 9.3 | 8.7 6% | 10.6 -14% | 10.2 -10% | 10.5 -13% | 16.5 -77% |
| Load Average * (Watt) | 62.5 | 60.8 3% | 64 -2% | 68.1 -9% | 65.8 -5% | 83.4 -33% |
| Witcher 3 ultra * (Watt) | 62.6 | 61.4 2% | 69 -10% | 121.7 -94% | ||
| Load Maximum * (Watt) | 80.1 | 72 10% | 80.4 -0% | 108.3 -35% | 94.5 -18% | 173.5 -117% |
* ... menor é melhor
Power Consumption Witcher 3 / Stresstest
Power Consumption external Monitor
Pro
Contra
Veredicto - Nada mais do que uma marca Zen 3+
A melhor parte sobre o SER6 Pro Ryzen 7 7735HS é que o SER6 Pro Ryzen 7 6800H mais antigo é agora mais barato. Os dois processadores são muito parecidos em desempenho e consumo de energia, o que significa que você pode simplesmente comprar o modelo mais antigo sem medo de perder nenhuma característica importante.
O Ryzen 7 7735HS tem um desempenho idêntico ao do Ryzen 7 6800H mais antigo. O SER6 Pro 2023 é, portanto, difícil de recomendar em relação ao modelo 2022, pois não oferece quase nenhuma outra mudança.
O DisplayPort integrado é uma boa adição, mas acreditamos que Beelink poderia ter feito mais mudanças para atrair compradores. Uma segunda porta USB-C, por exemplo, um leitor de impressões digitais integrado, ou uma fechadura Kensington poderia ter ajudado a diferenciar o modelo 2023 do modelo 2022. Além disso, os problemas de latência do DPC e queda de quadros ao reproduzir vídeos 4K devem ser abordados, já que muitos usuários podem usar o SER6 Pro para fins de HTC.
Preço e Disponibilidade
A Amazon está agora enviando o Beelink SER6 Pro conforme configurado por US$550.
Beelink SER6 Pro Ryzen 7 7735HS
- 04/20/2023 v7 (old)
Allen Ngo
Transparência
A seleção dos dispositivos a serem analisados é feita pela nossa equipe editorial. A amostra de teste foi fornecida ao autor como empréstimo pelo fabricante ou varejista para fins desta revisão. O credor não teve influência nesta revisão, nem o fabricante recebeu uma cópia desta revisão antes da publicação. Não houve obrigação de publicar esta revisão. Como empresa de mídia independente, a Notebookcheck não está sujeita à autoridade de fabricantes, varejistas ou editores.
É assim que o Notebookcheck está testando
Todos os anos, o Notebookcheck analisa de forma independente centenas de laptops e smartphones usando procedimentos padronizados para garantir que todos os resultados sejam comparáveis. Desenvolvemos continuamente nossos métodos de teste há cerca de 20 anos e definimos padrões da indústria no processo. Em nossos laboratórios de teste, equipamentos de medição de alta qualidade são utilizados por técnicos e editores experientes. Esses testes envolvem um processo de validação em vários estágios. Nosso complexo sistema de classificação é baseado em centenas de medições e benchmarks bem fundamentados, o que mantém a objetividade.Price comparison

