Notebookcheck Logo

Intel NUC 13 Extreme Raptor Canyon mini PC com Core i9-13900K e GeForce RTX 3080 Ti em revisão

Compacto, rápido e versátil! A série NUC Extreme da Intel foi atualizada para a última 13ª geração. Processadores Raptor Lake. Em comparação com seu predecessor, muita coisa mudou em termos de design exterior. Nesta revisão, avaliaremos o desempenho do NUC 13 Extreme Kit com a CPU mais rápida da Intel e um GeForce RTX 3080 Ti com muitos benchmarks e detalhes técnicos.
Intel NUC 13 Extreme Raptor Canyon + Uperfect X Pro LapDock (não incluído)

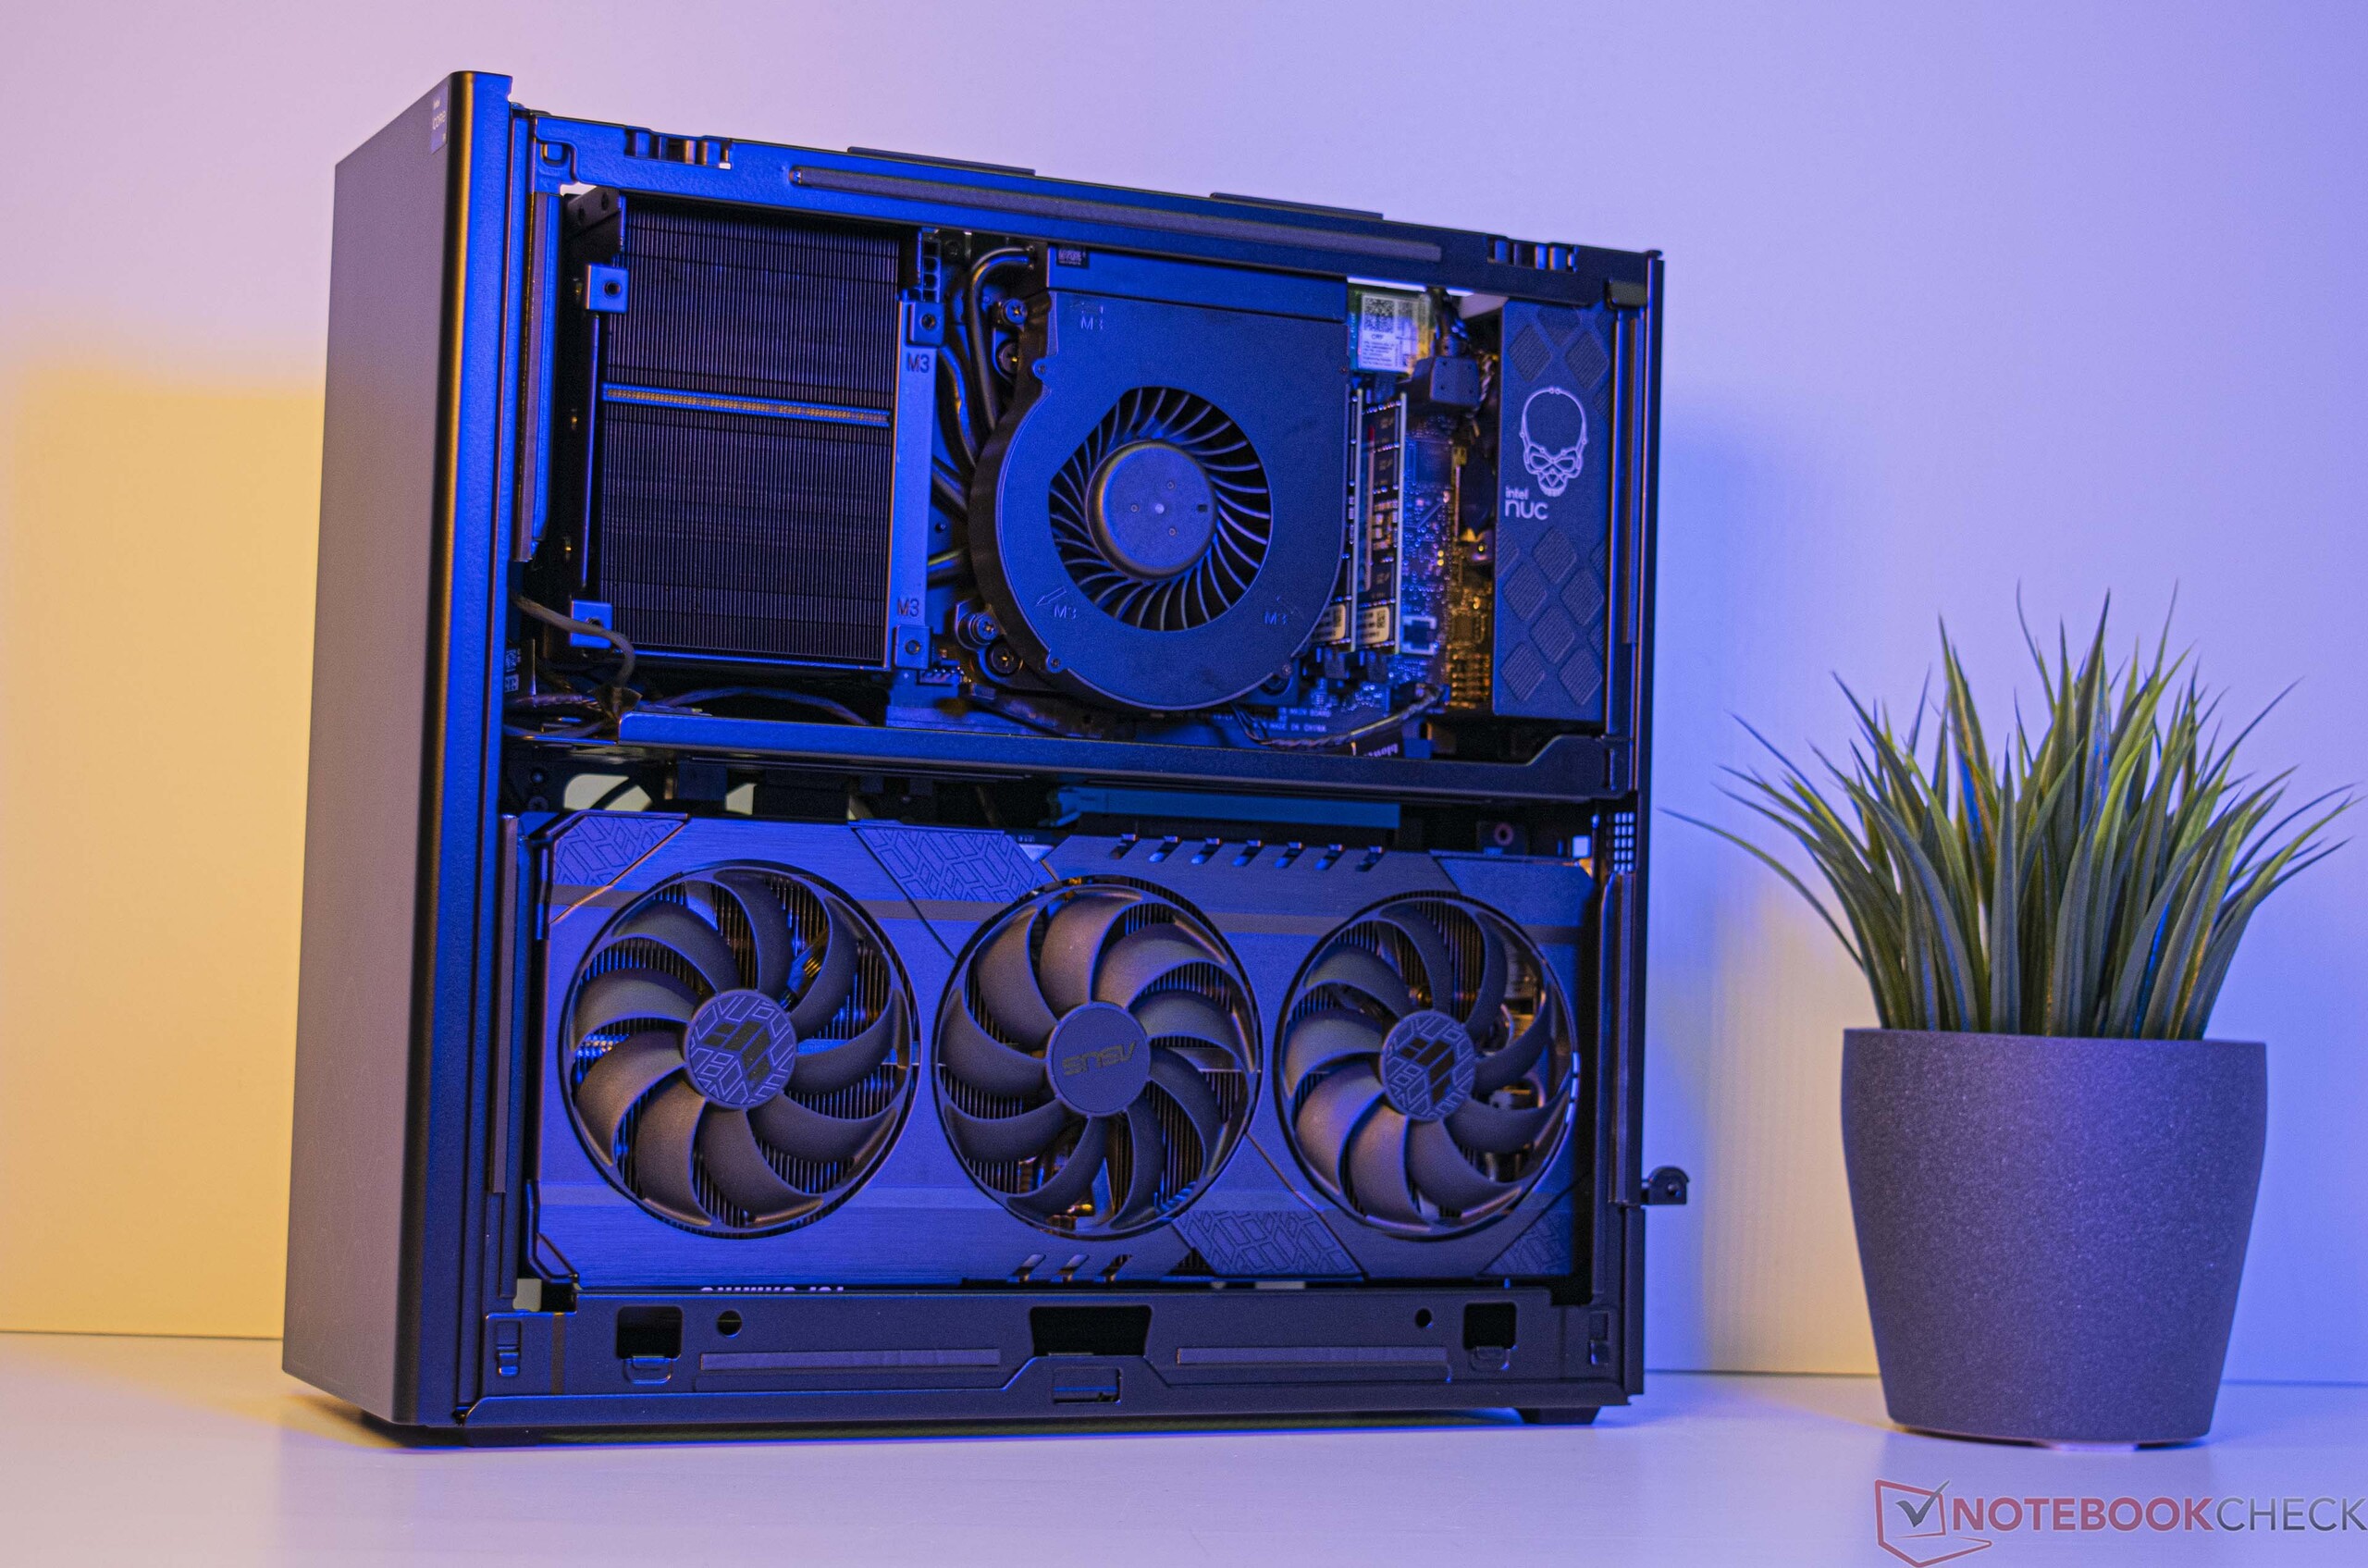
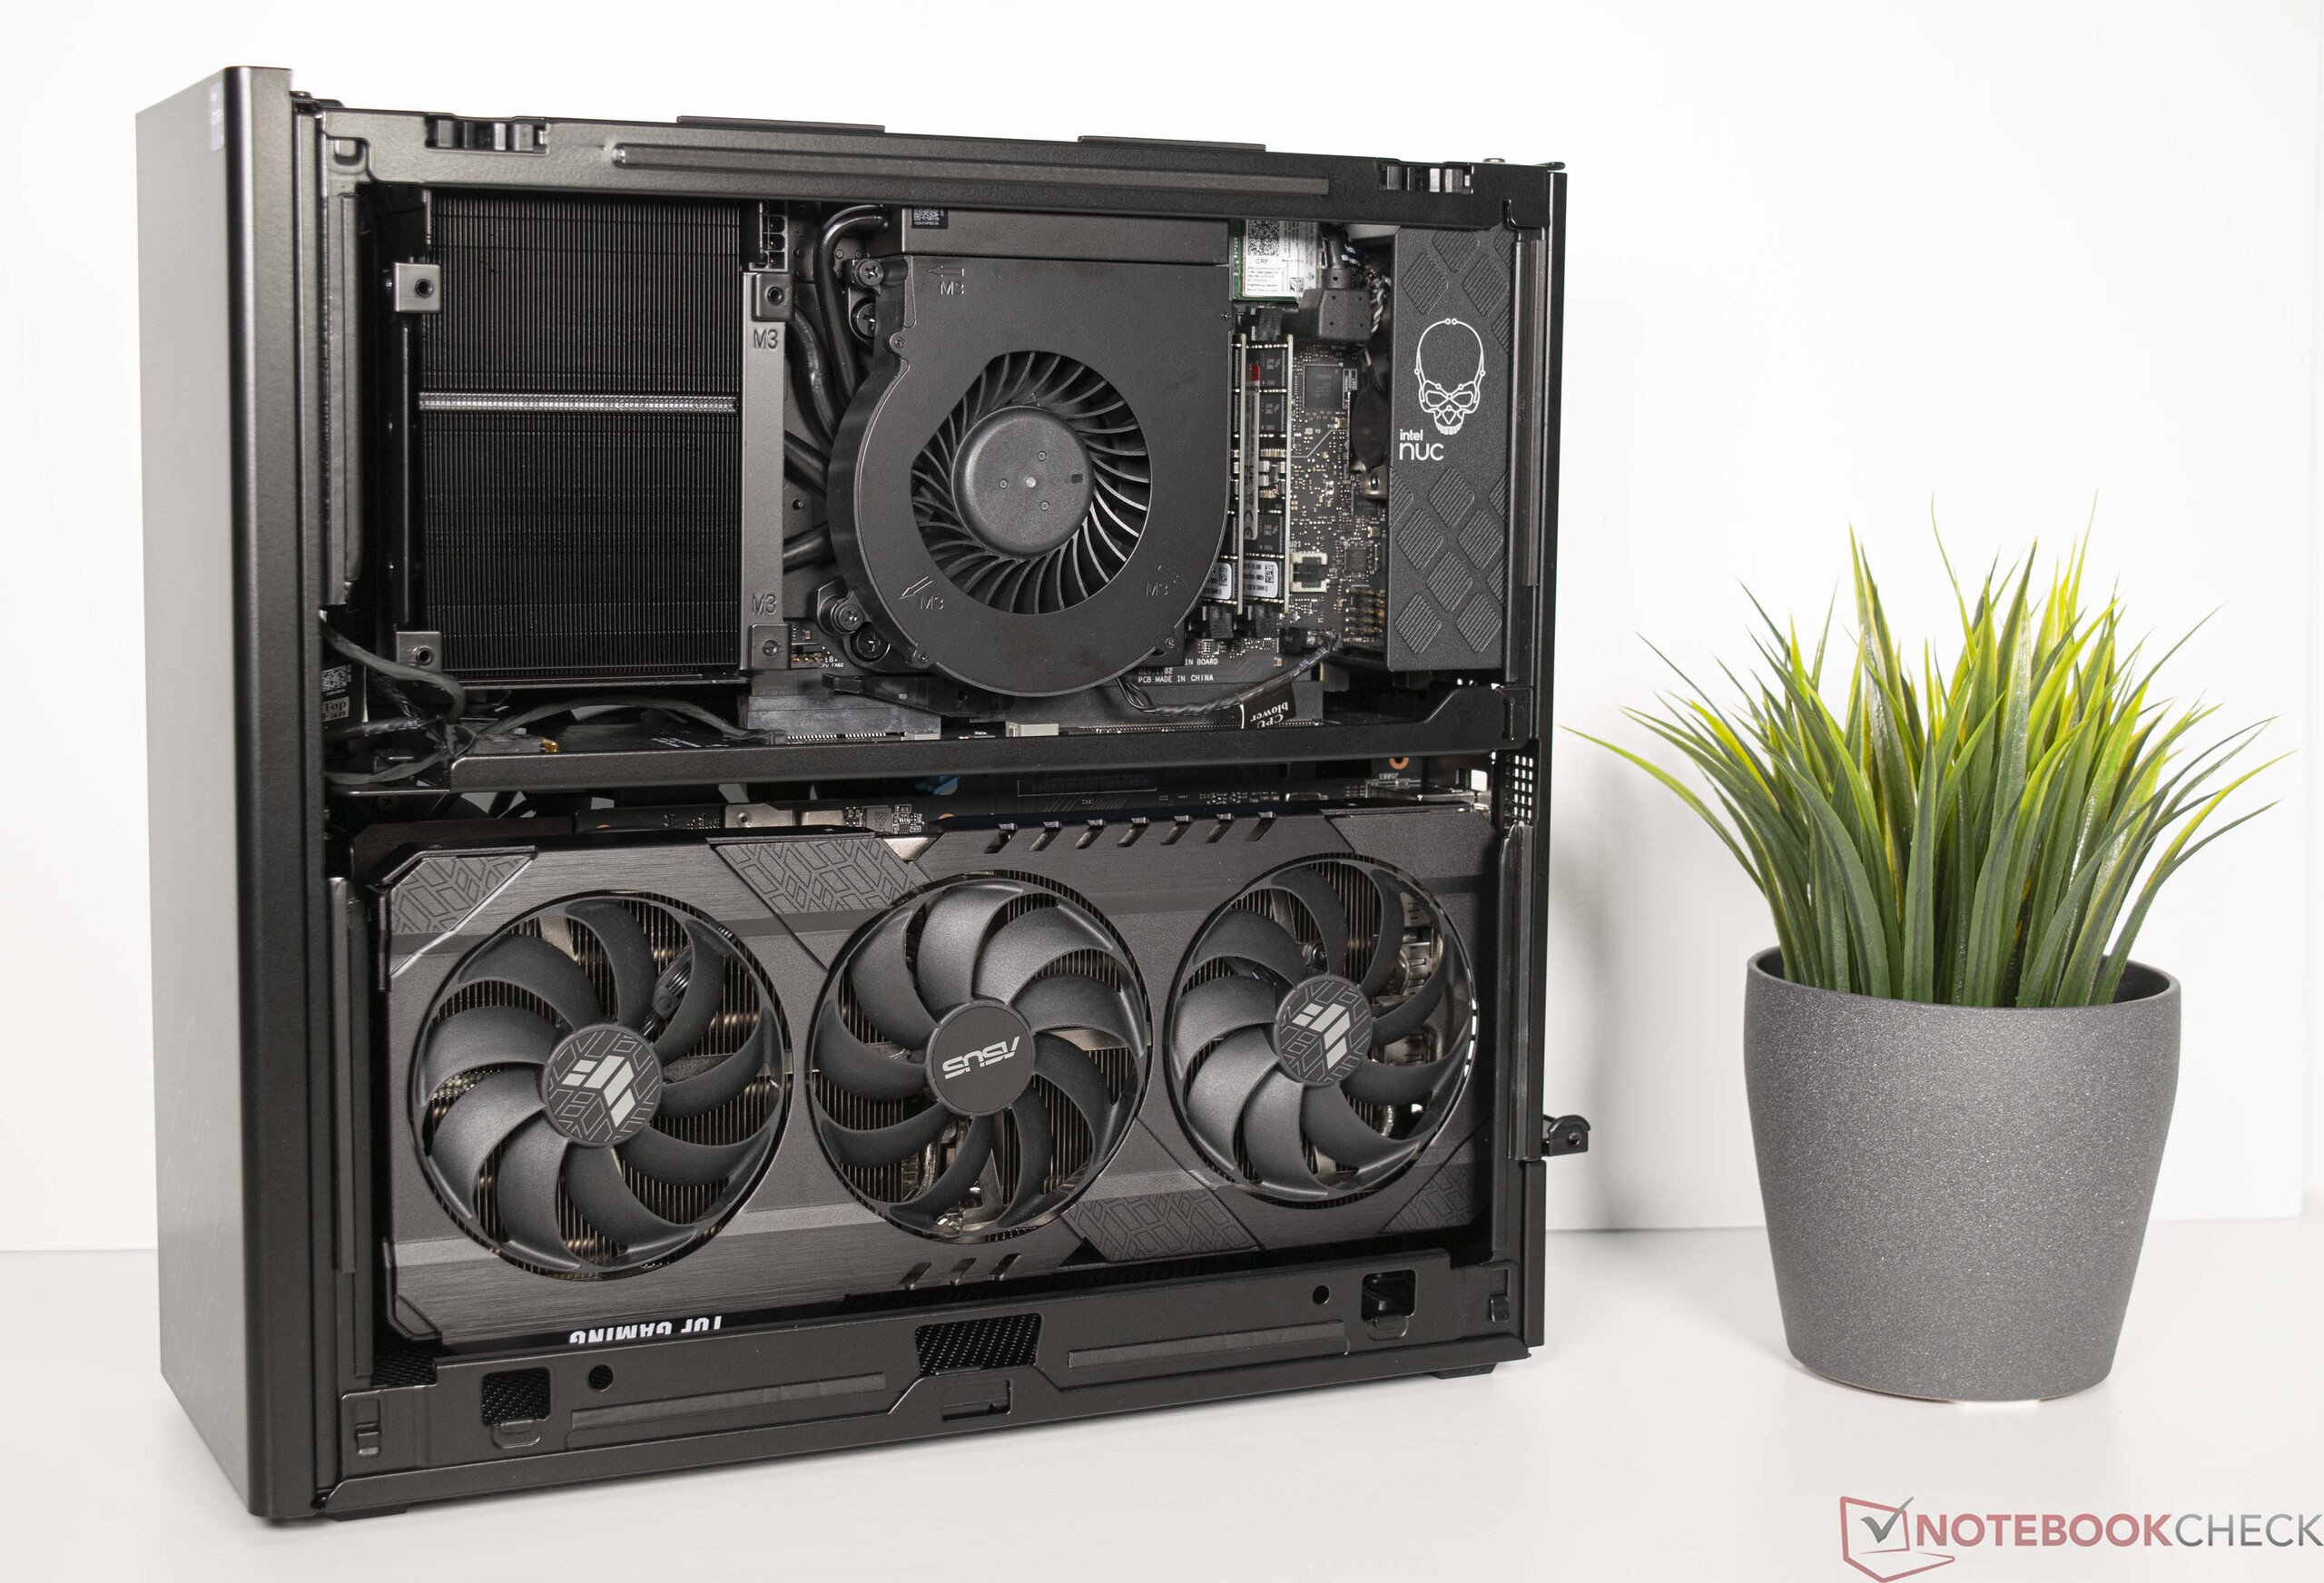
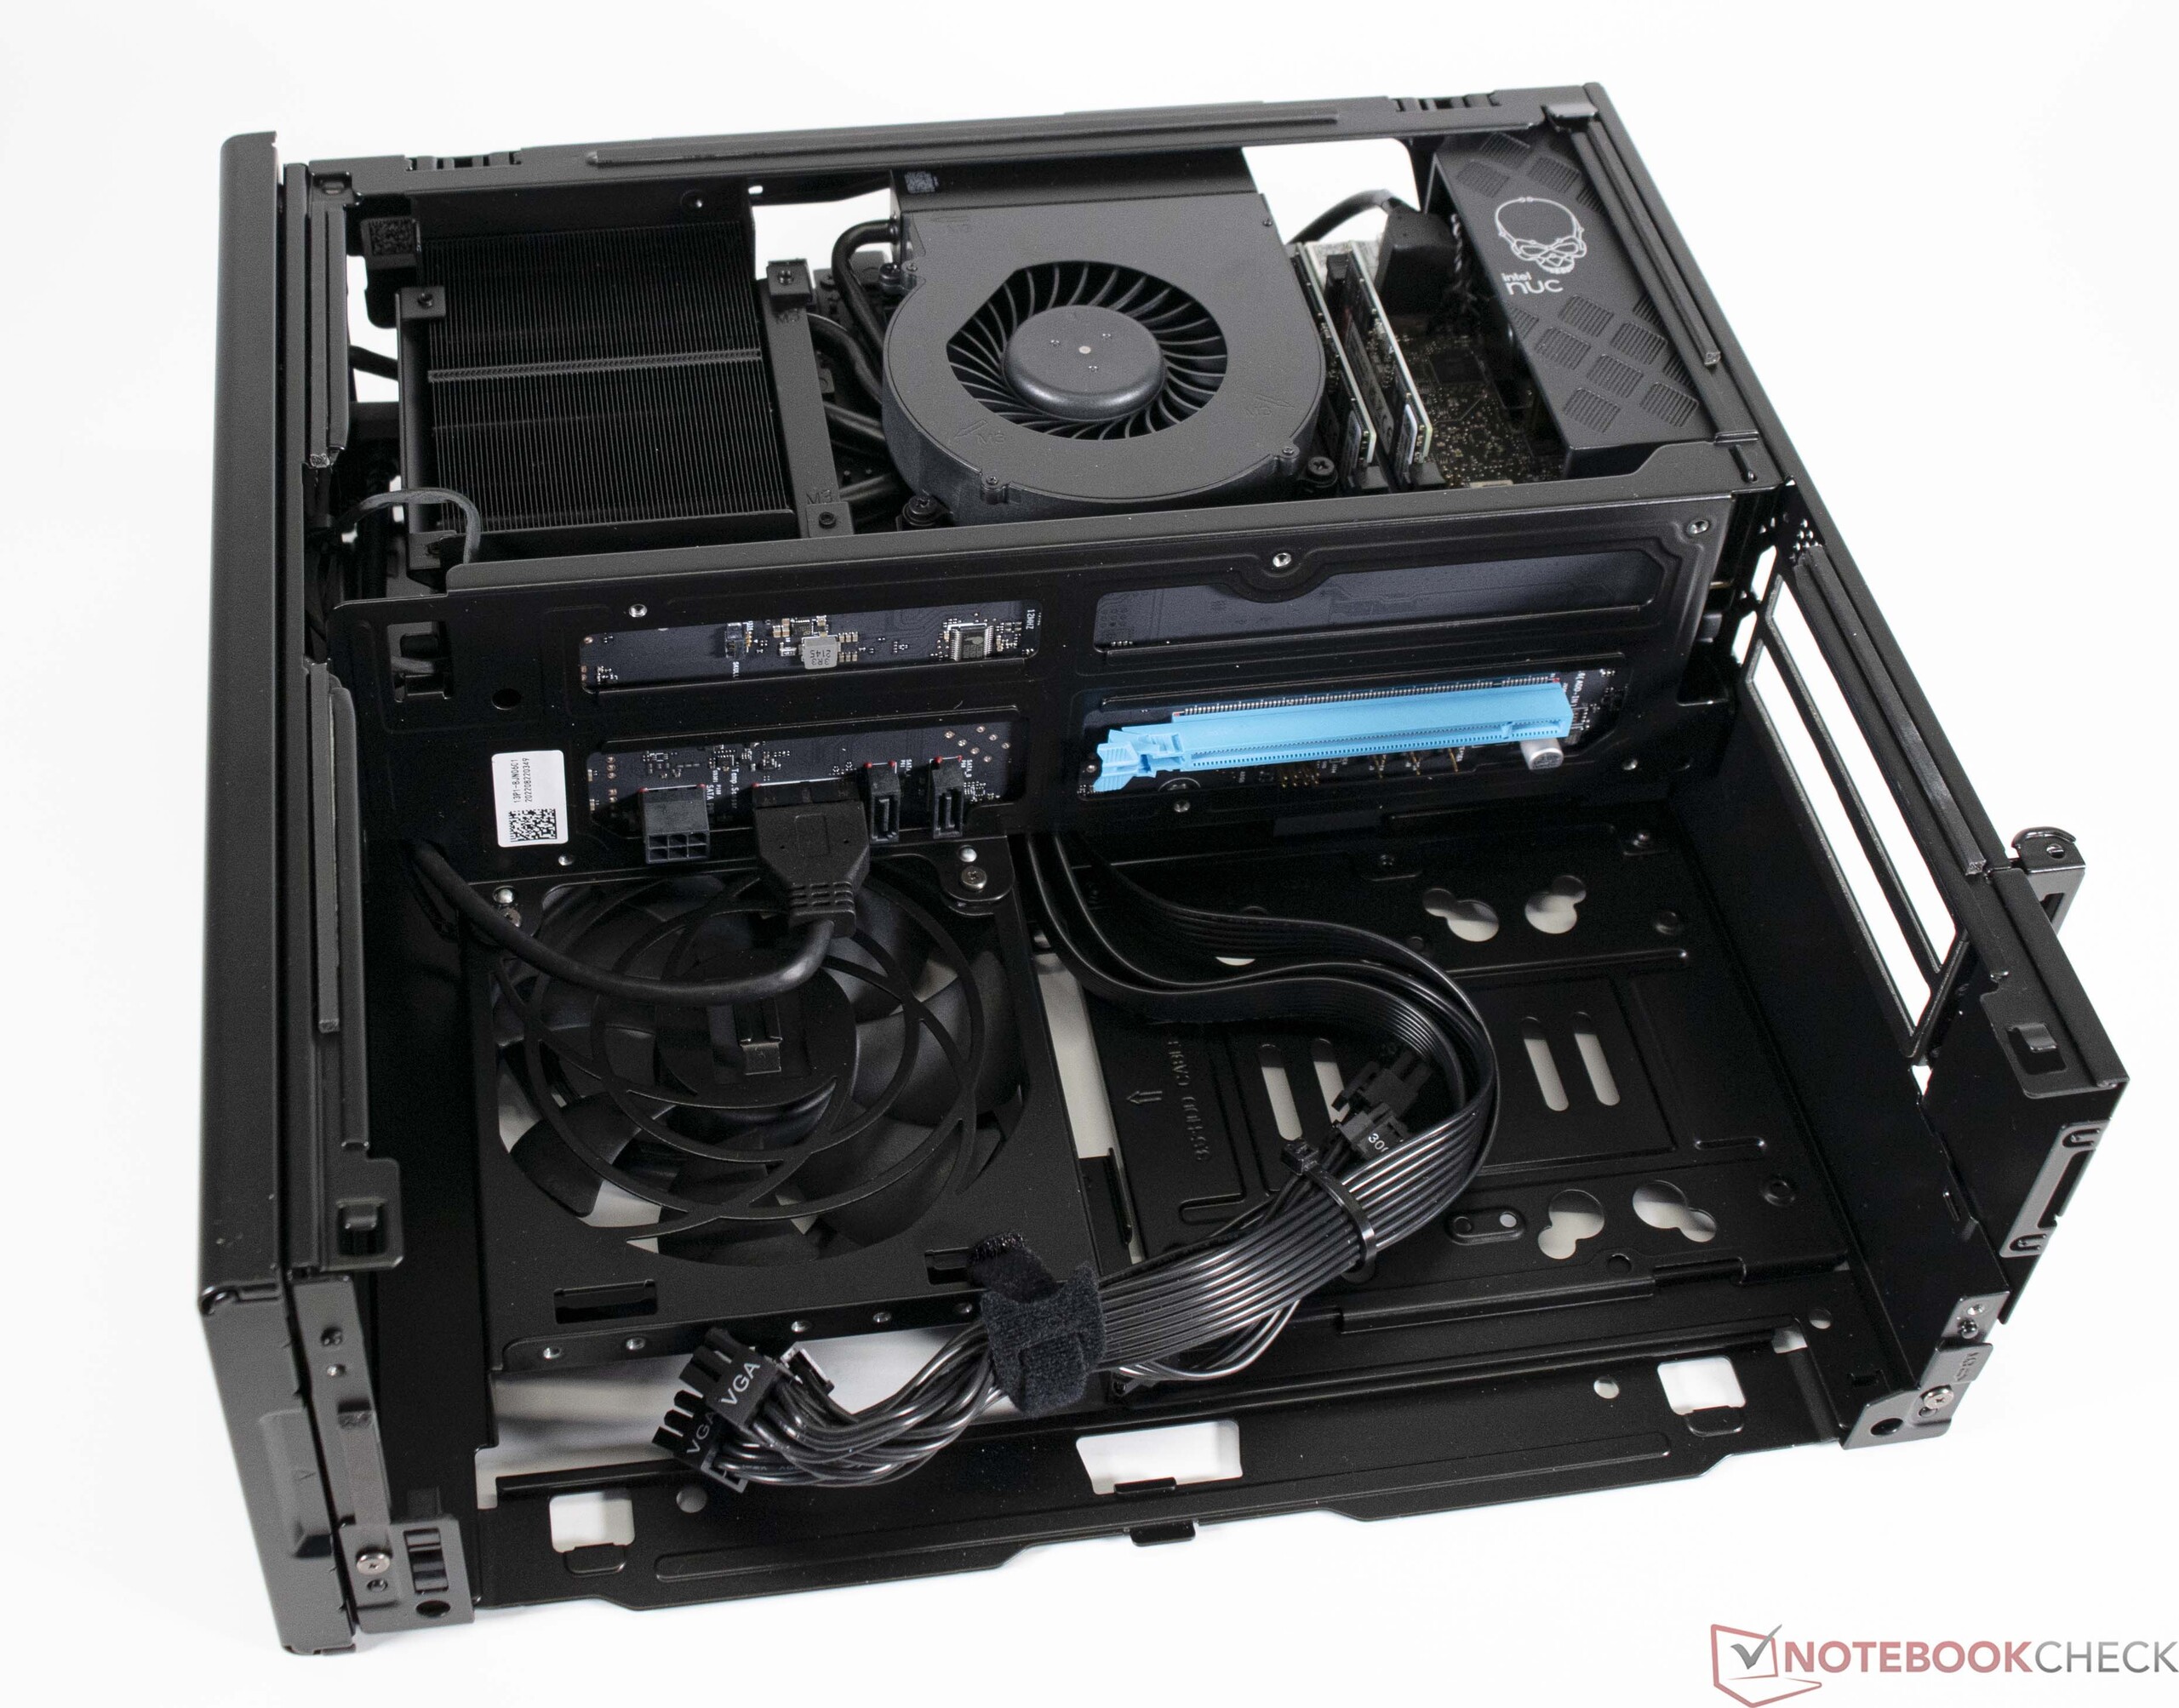
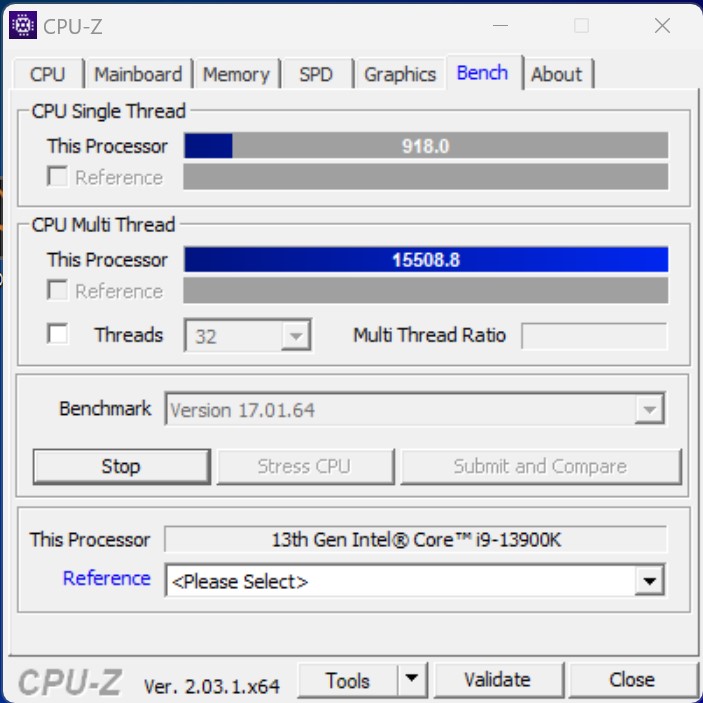
Seguindo Beast Canyon e Dragon Canyon, o último Raptor Canyon NUC Extreme Kit da Intel se desvia significativamente do projeto de seus antecessores. No entanto, a Intel ainda visa um PC muito compacto que não deixa praticamente nada a desejar. Além disso, uma placa gráfica em tamanho real pode ser instalada. Para a CPU, estão disponíveis modelos da linha atual do Raptor Lake da Intel. Os usuários também podem, naturalmente, escolher sua própria CPU, já que o processador não é soldado. Nesta revisão, nosso NUC 13 Extreme Raptor Canyon utiliza um Intel Core i9-13900K. Além disso, o Nvidia GeForce RTX 3080 Ti oferece desempenho 3D suficiente mesmo para jogadores exigentes.

Deve-se notar que o Intel NUC 13 Extreme Kit é um sistema de barebone que vem sem um SSD, RAM ou placa gráfica. O preço depende da CPU incluída. O modelo básico com oIntel Core i5-13600K custa 1179 USD, enquanto a configuração de ponta mais alta está disponível por 1549 USD.

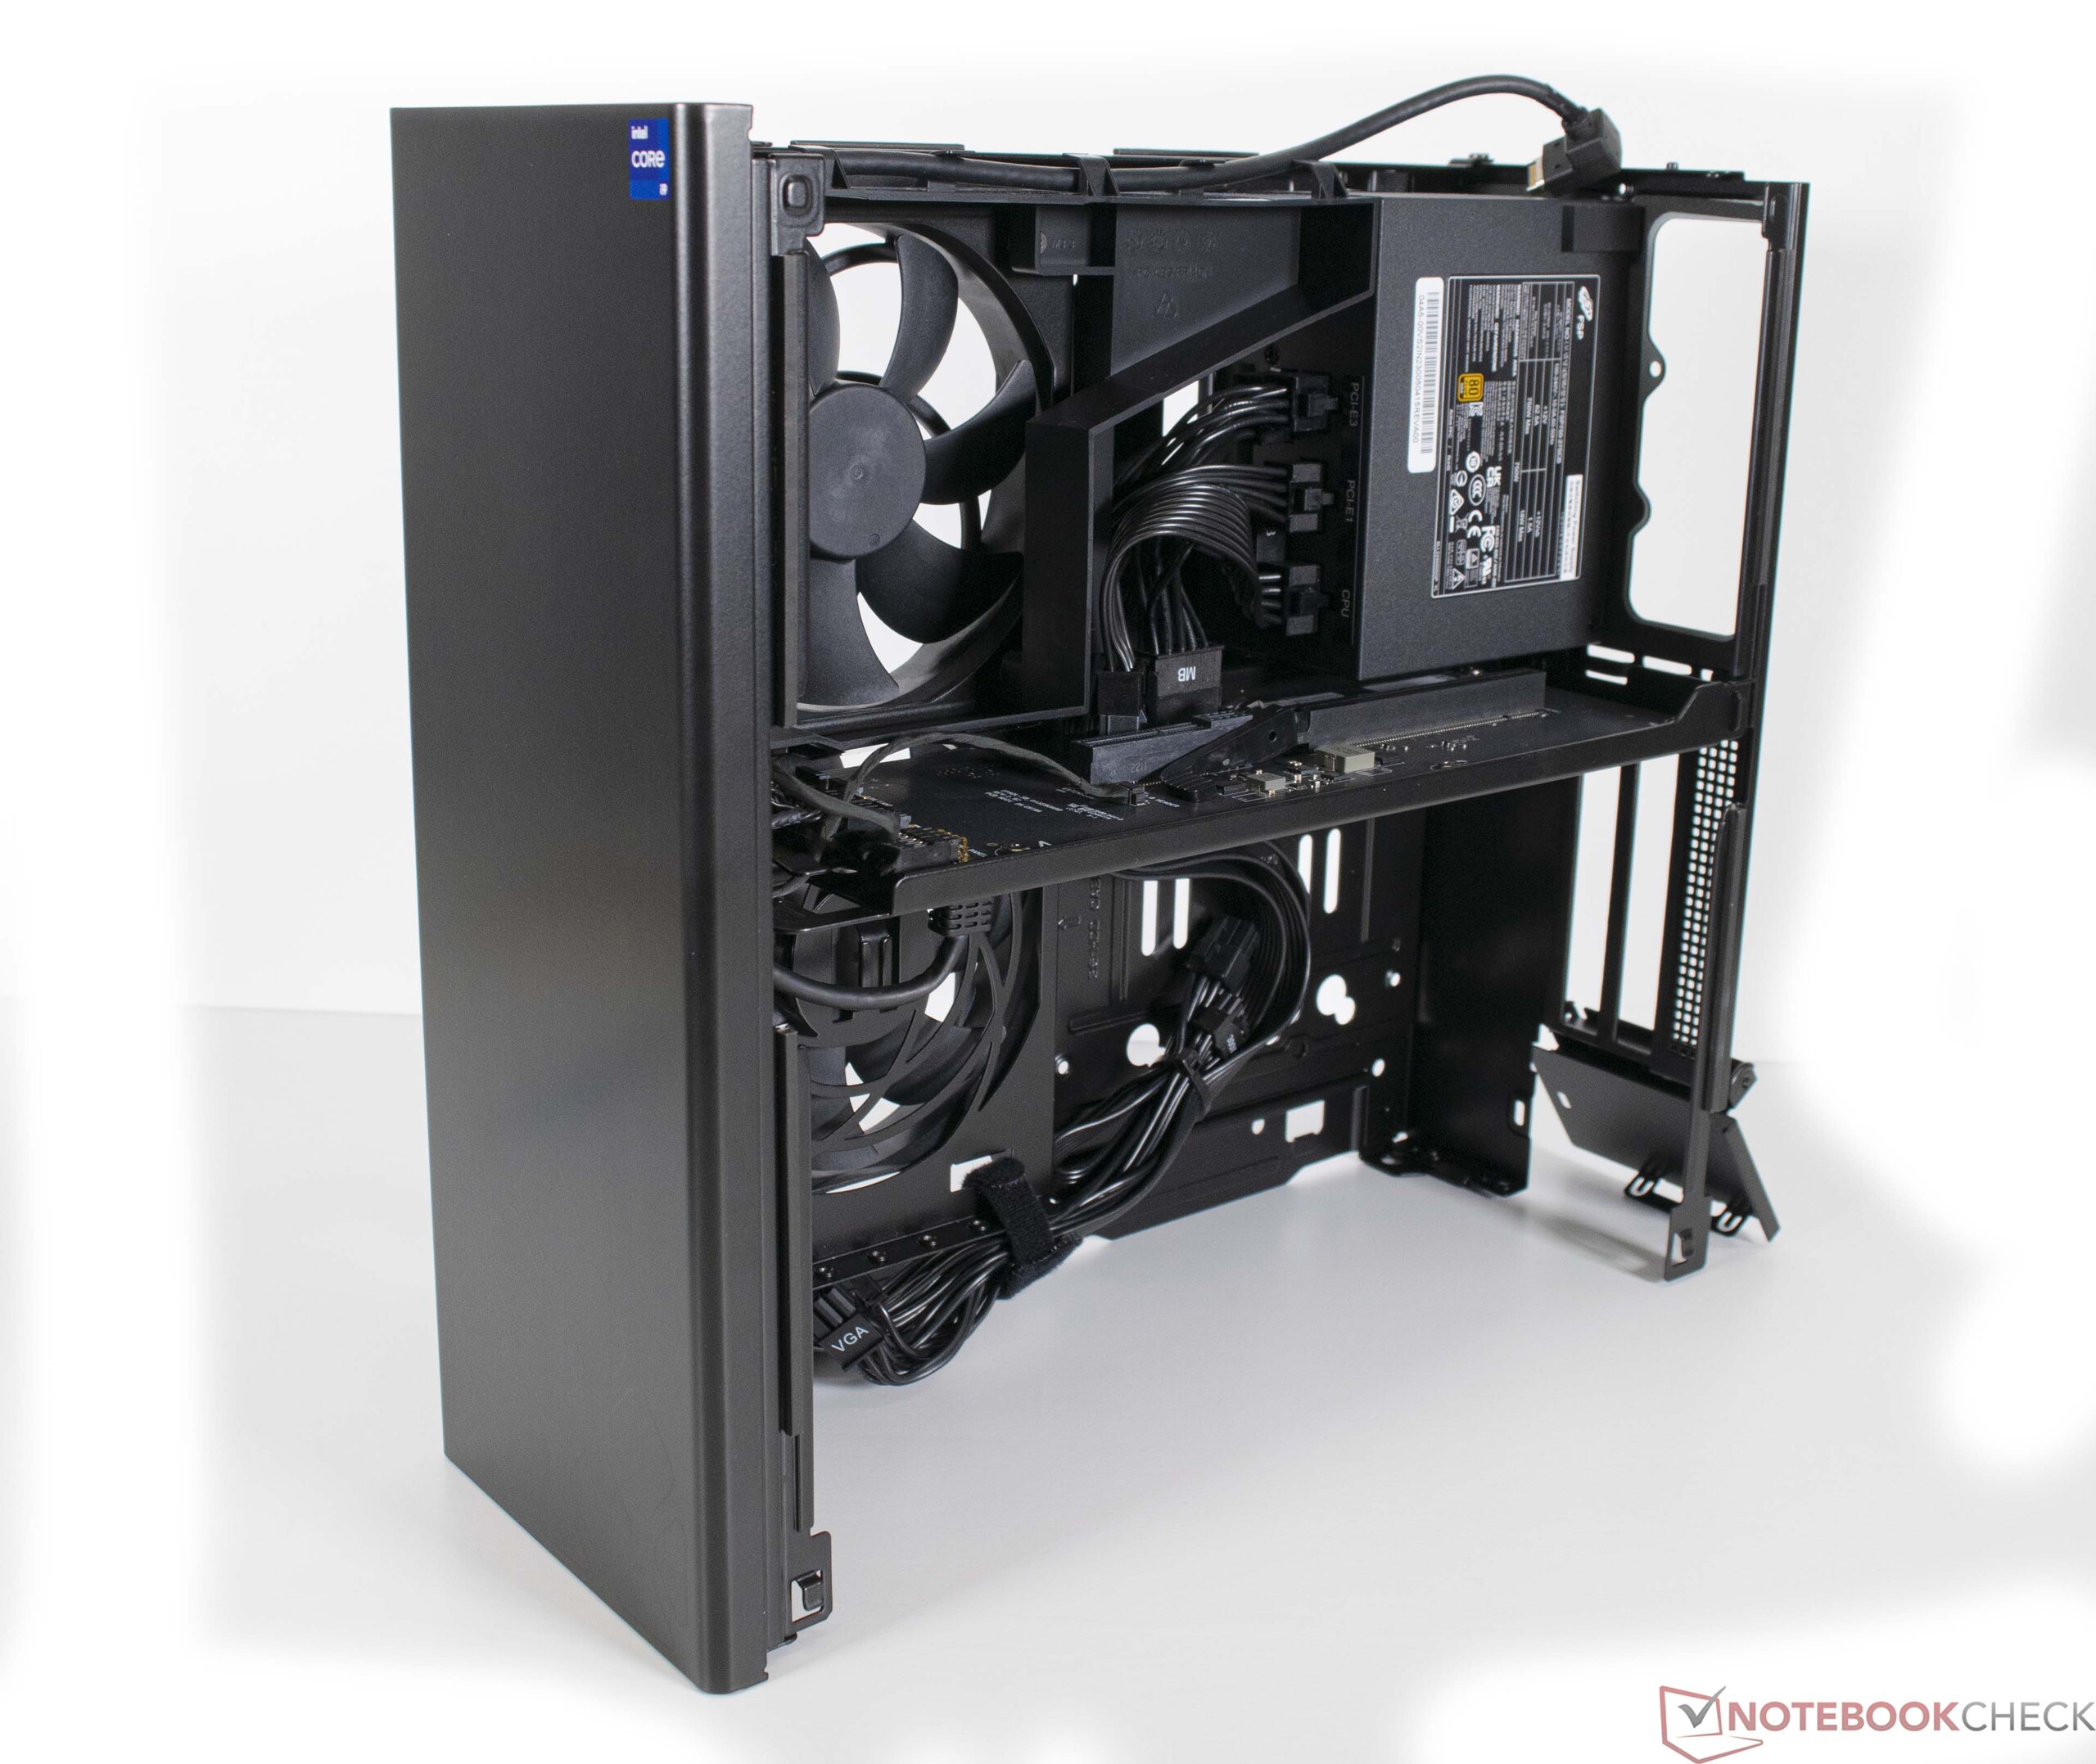
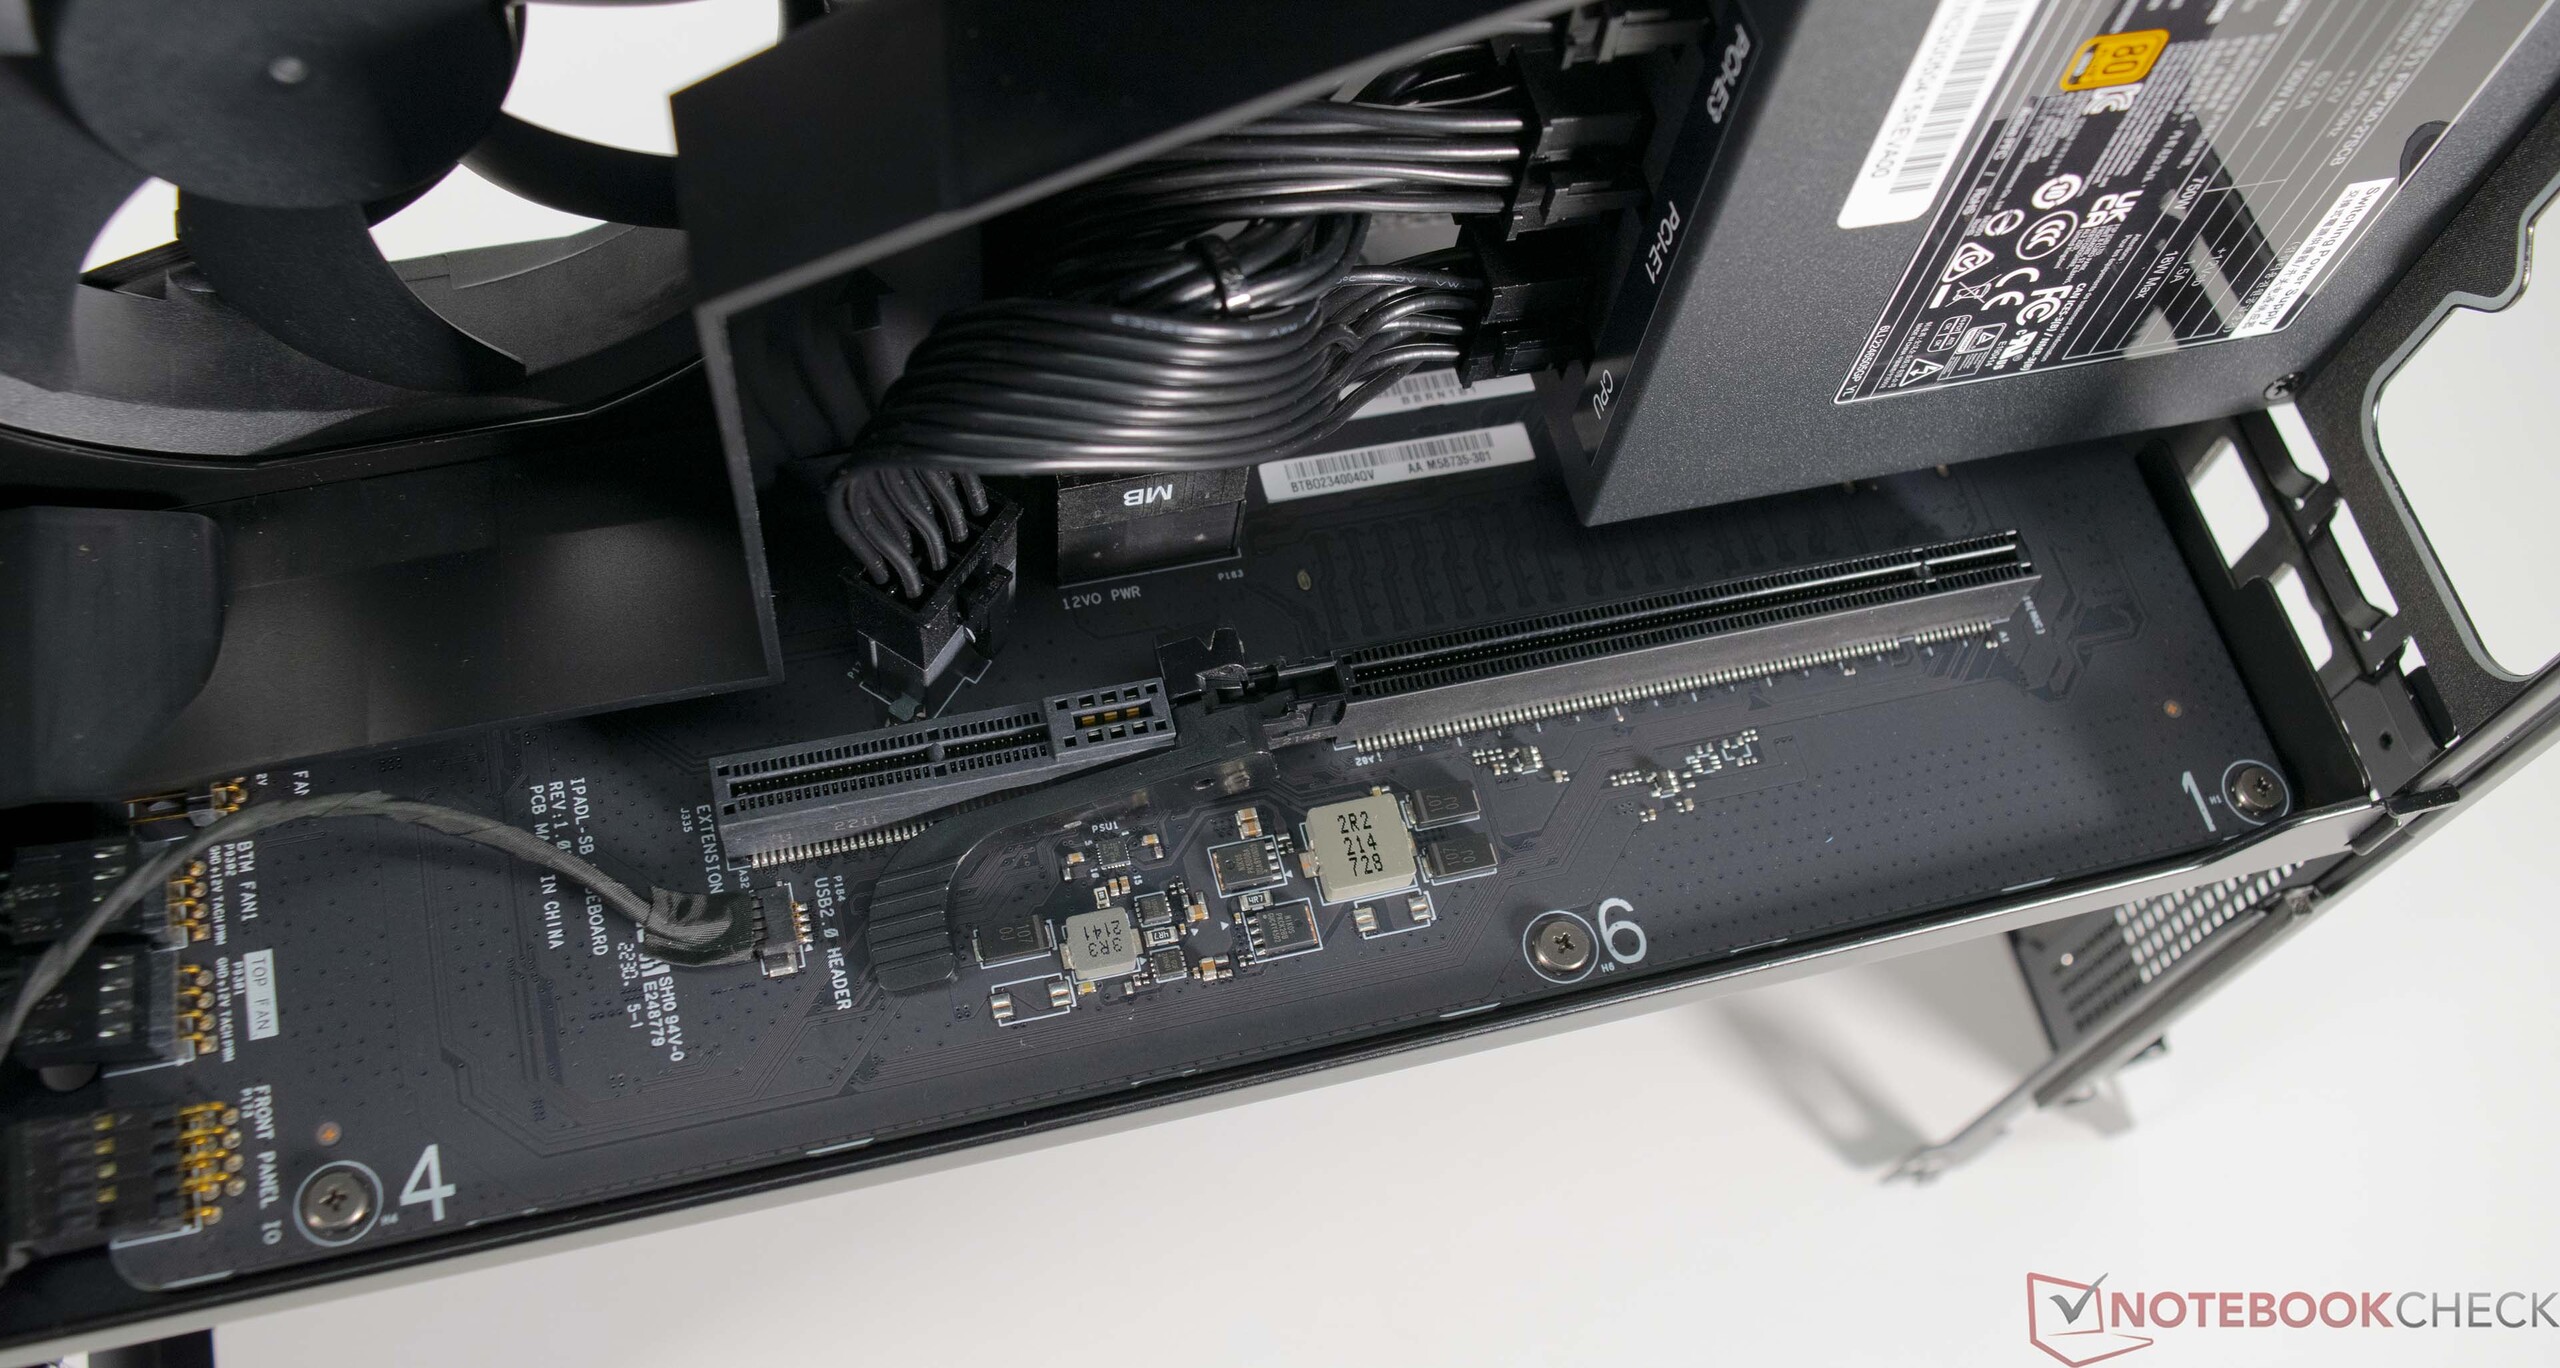
São suportadas soluções gráficas dedicadas com um comprimento máximo de 31 cm (~12 pol.). Graças à fonte de alimentação SFX de 750 watts incluída, mesmo os modelos atuais de GPU high-end podem ser usados. Teoricamente, é possível caber até mesmo um Nvidia GeForce RTX 4090 FE. O problema é o cabo de 12VHPWR, que só pode fornecer até 300 watts. Como a fonte de alimentação só vem com três cabos 6+2 para a GPU, o orçamento de energia é limitado a 450 watts de qualquer forma.

Intel NUC13 Raptor Canyon
Processador
Intel Core i9-13900K 24 x 3 - 5.8 GHz, 250 W PL2 / Short Burst, 150 W PL1 / Sustained, Raptor Lake
Placa gráfica
NVIDIA GeForce RTX 3080 Ti - 12 GB VRAM, Análises do: 1665 MHz, Memoría: 1188 MHz, 350 W TDP, Nvidia 526.98
Memória
32 GB 
, DDR5-5600, SO-DIMM, 2 of 2 occupied, up to 64 GB
placa mãe
Intel Z690 (Alder Lake-S PCH)
Disco rígido
Kingston Fury Renegade SFYRS1000G, 1024 GB 
, M.2-2280 NVMe
Placa de Som
Intel Alder Lake-S PCH - cAVS (Audio, Voice, Speech)
Conexões
2 USB 3.0, 7 USB 3.1 Gen2, 2 USB 3.2 Gen 2x2 20Gbps, 2 Thunderbolt, 1 HDMI
Funcionamento em rede
Aquantia AQtion 10Gbit Network Adapter (10/100/1000/2500/5000/10000MBit/s), Killer Wi-Fi 6E AX1690i 160MHz (a/b/g/h/n = Wi-Fi 4/ac = Wi-Fi 5/ax = Wi-Fi 6/ Wi-Fi 6E 6 GHz), Bluetooth 5.2
Tamanho
altura x largura x profundidade (em mm): 318 x 129 x 337
Sistema Operativo
Microsoft Windows 11 Pro
Características adicionais
36 Meses Garantia
Note: The manufacturer may use components from different suppliers including display panels, drives or memory sticks with similar specifications.


Intel NUC 13 Elemento de Cálculo Extremo em Detalhes

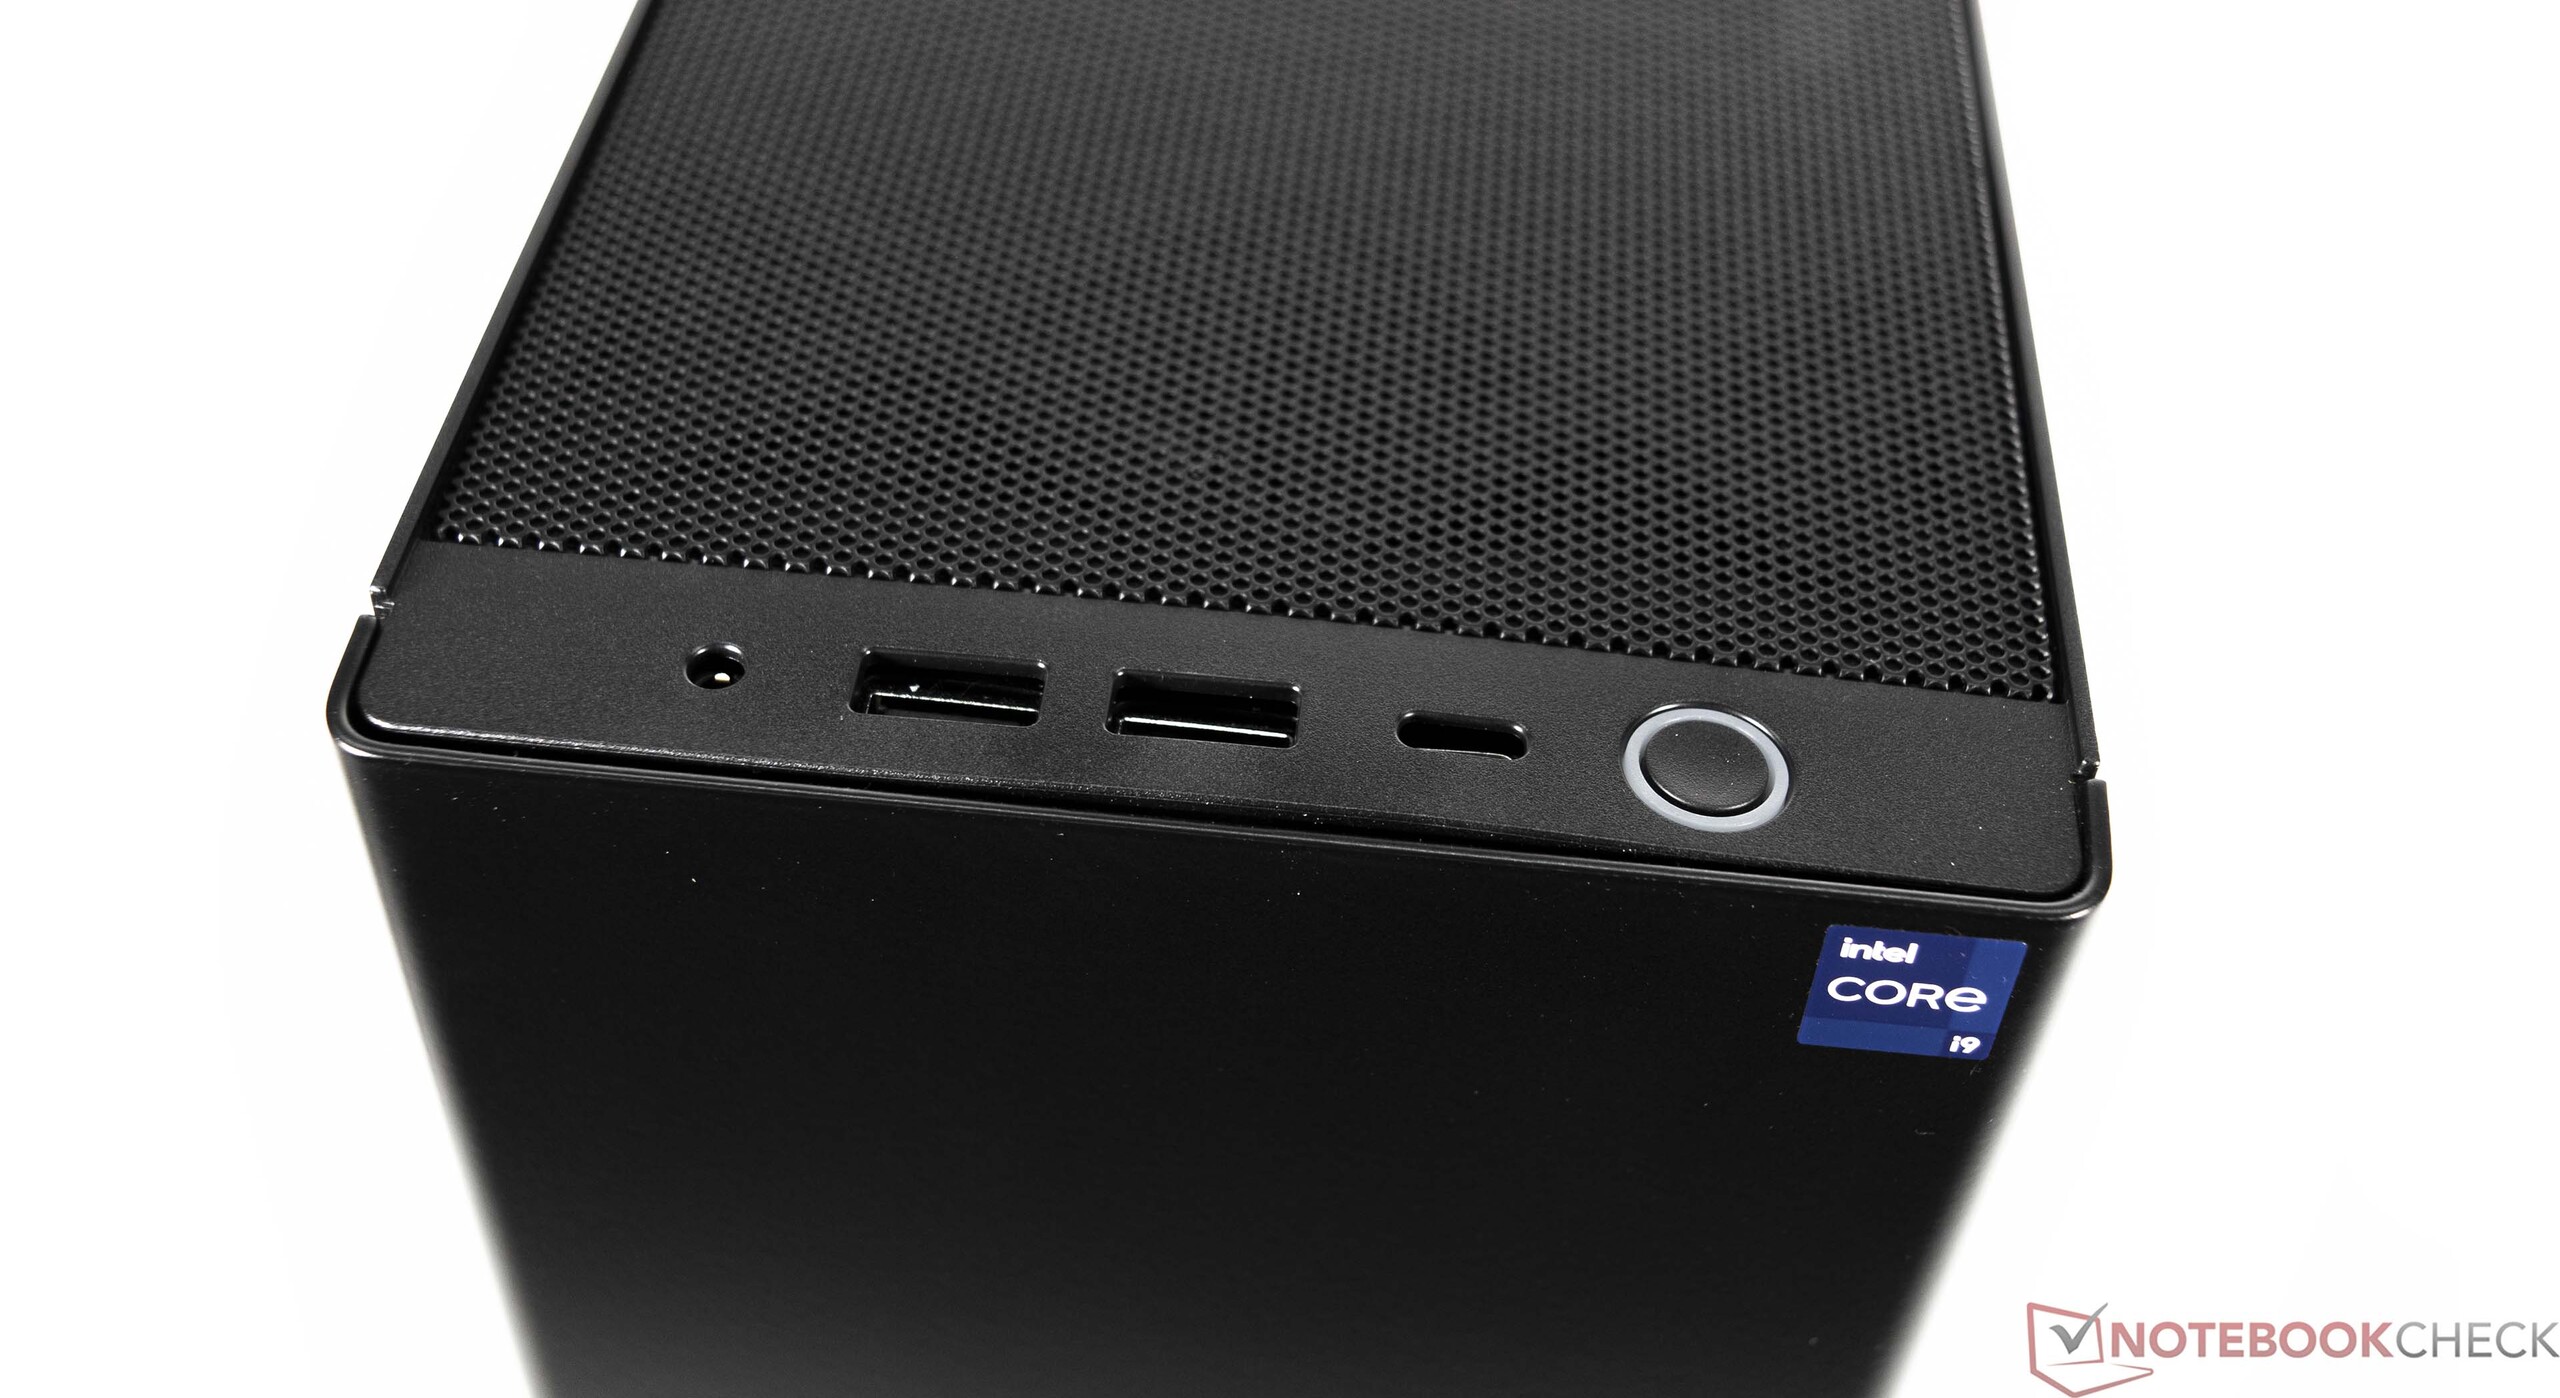
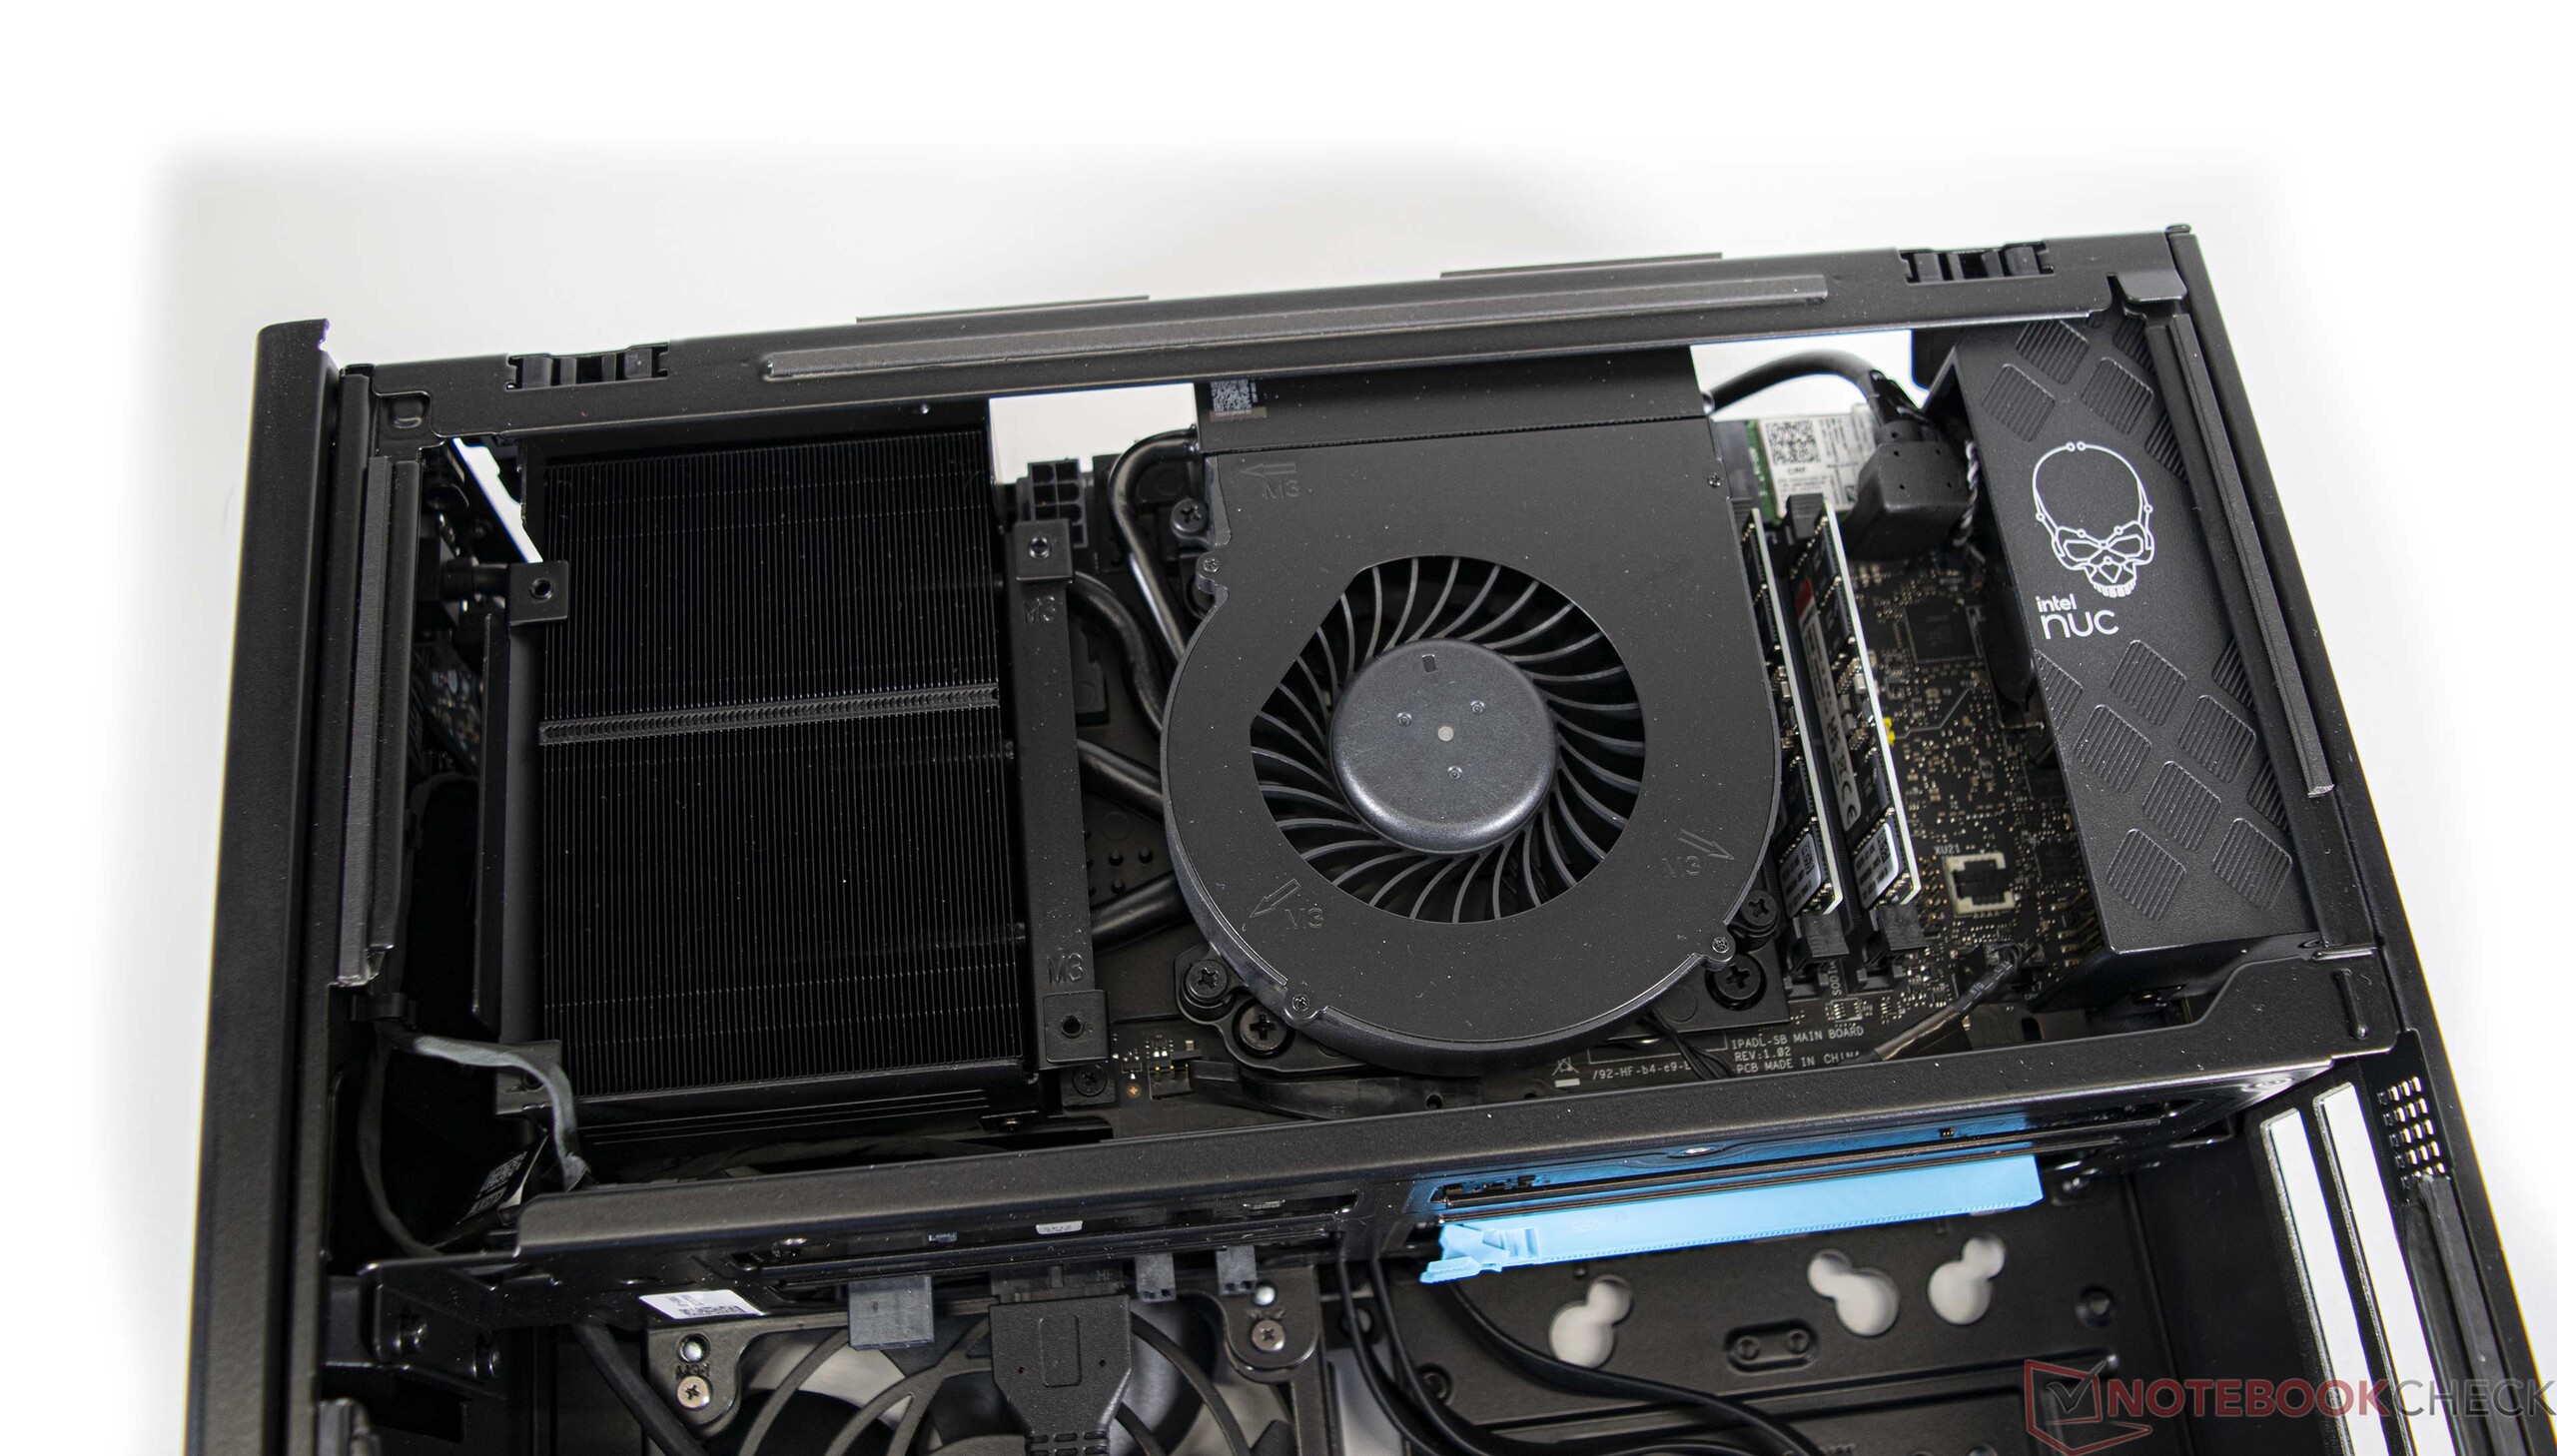
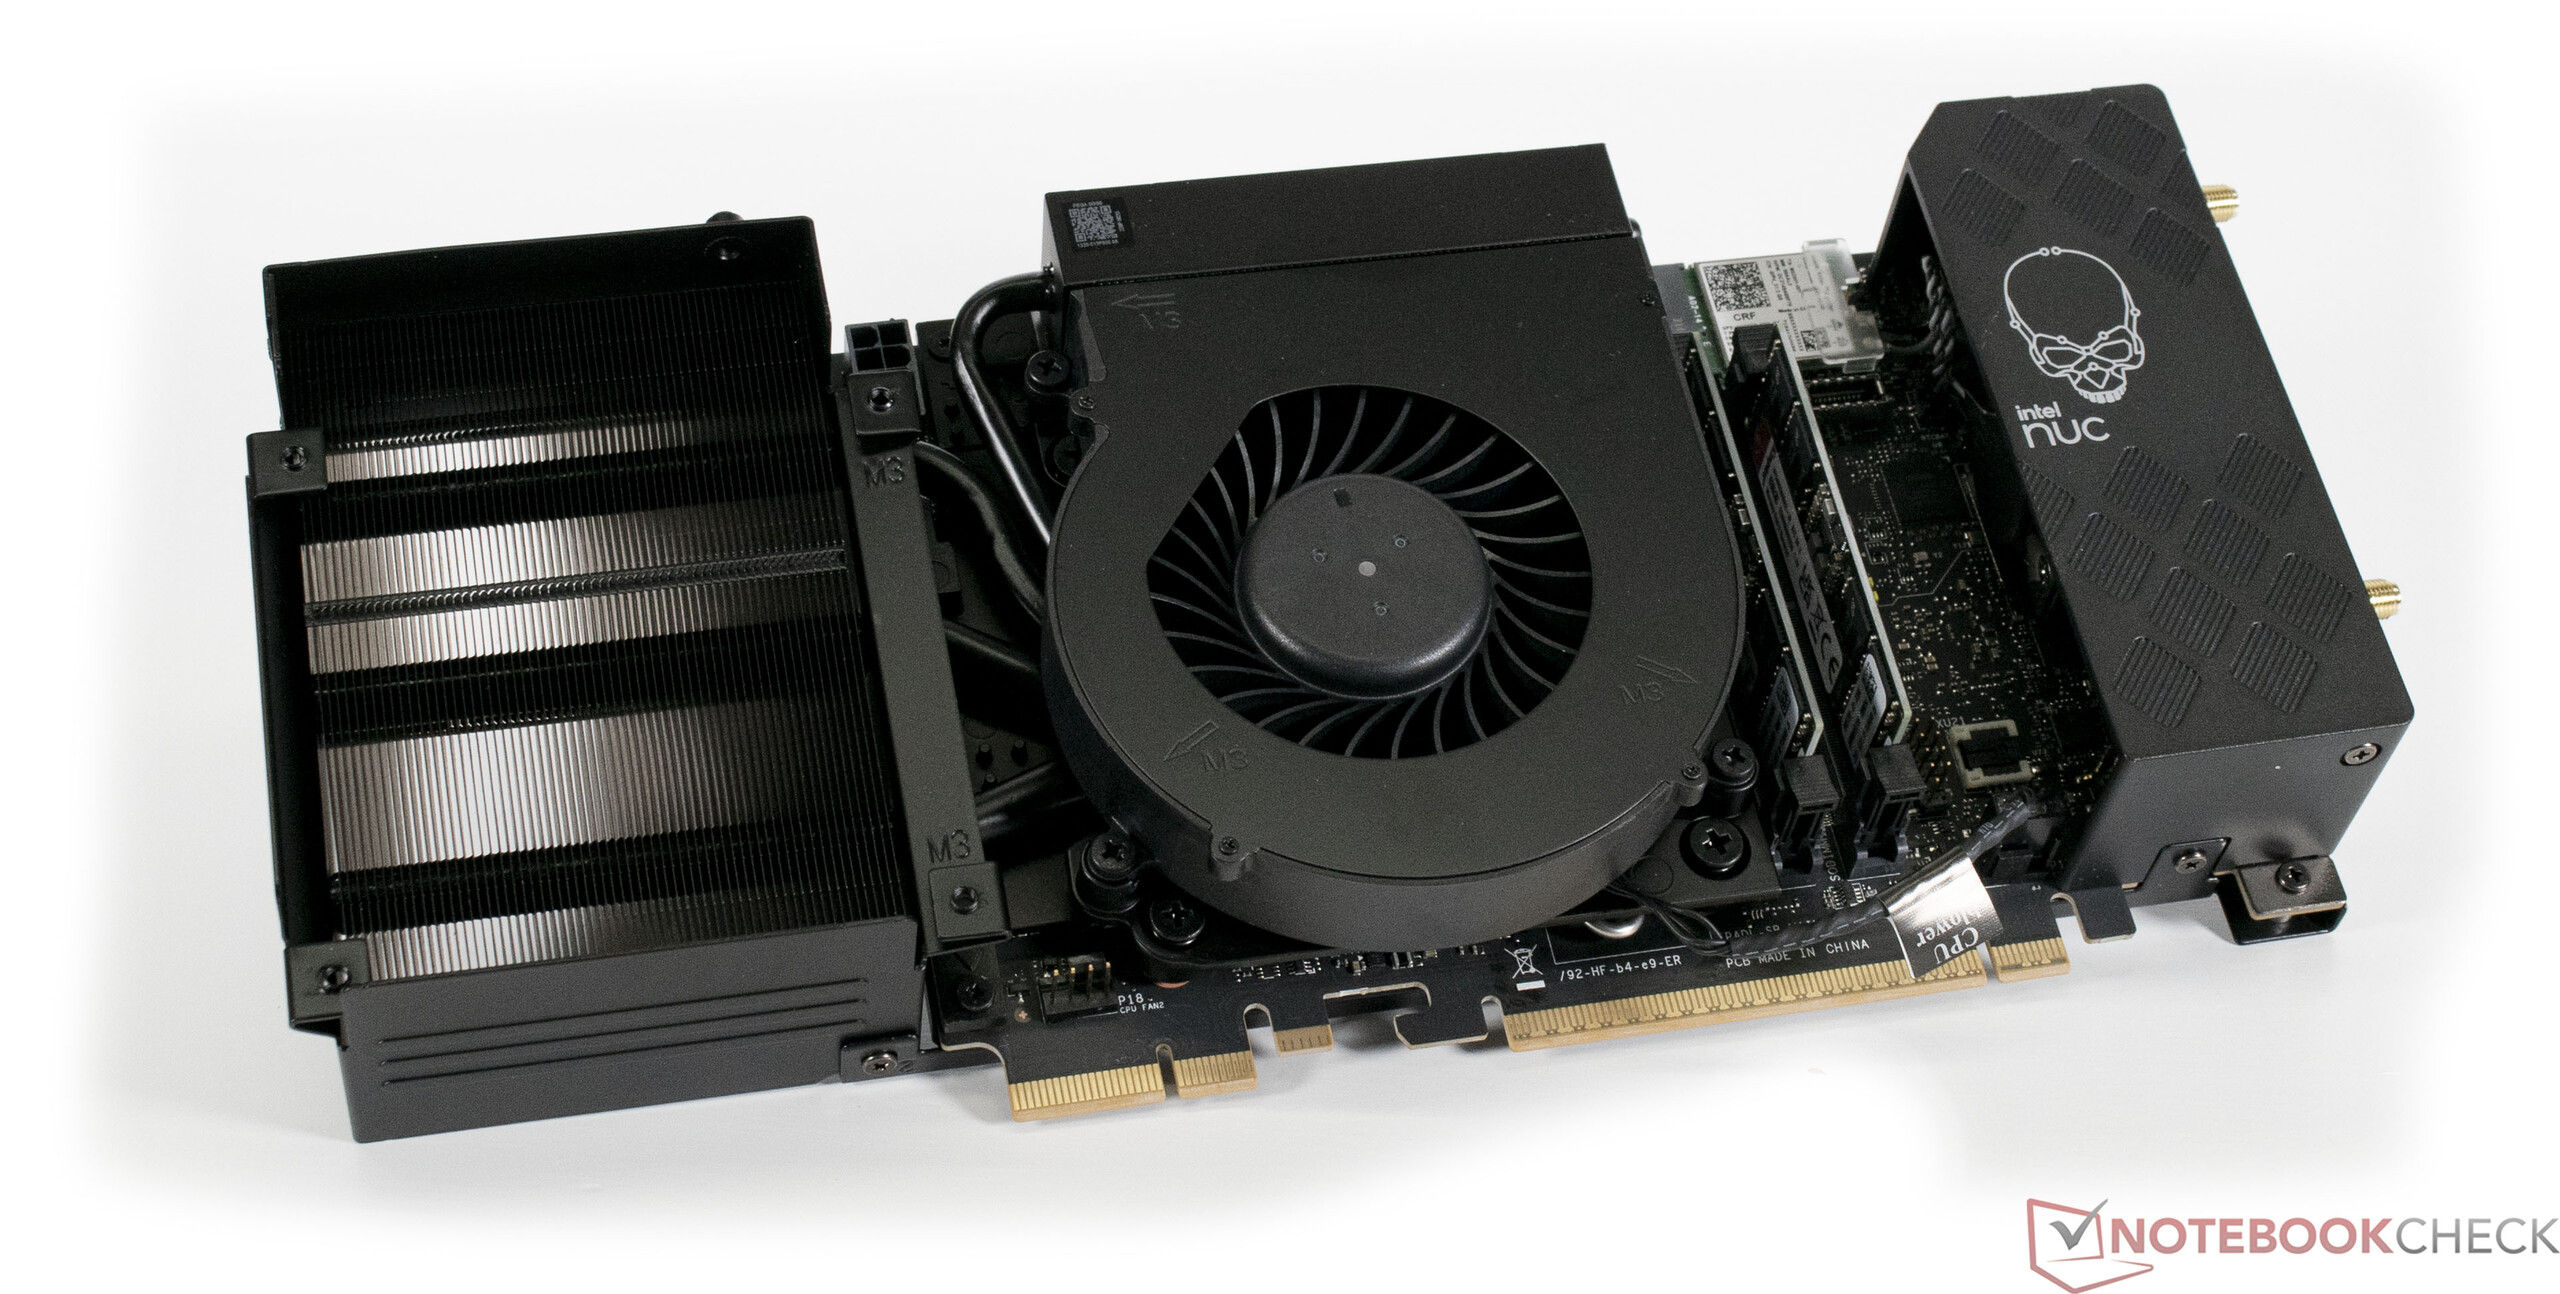
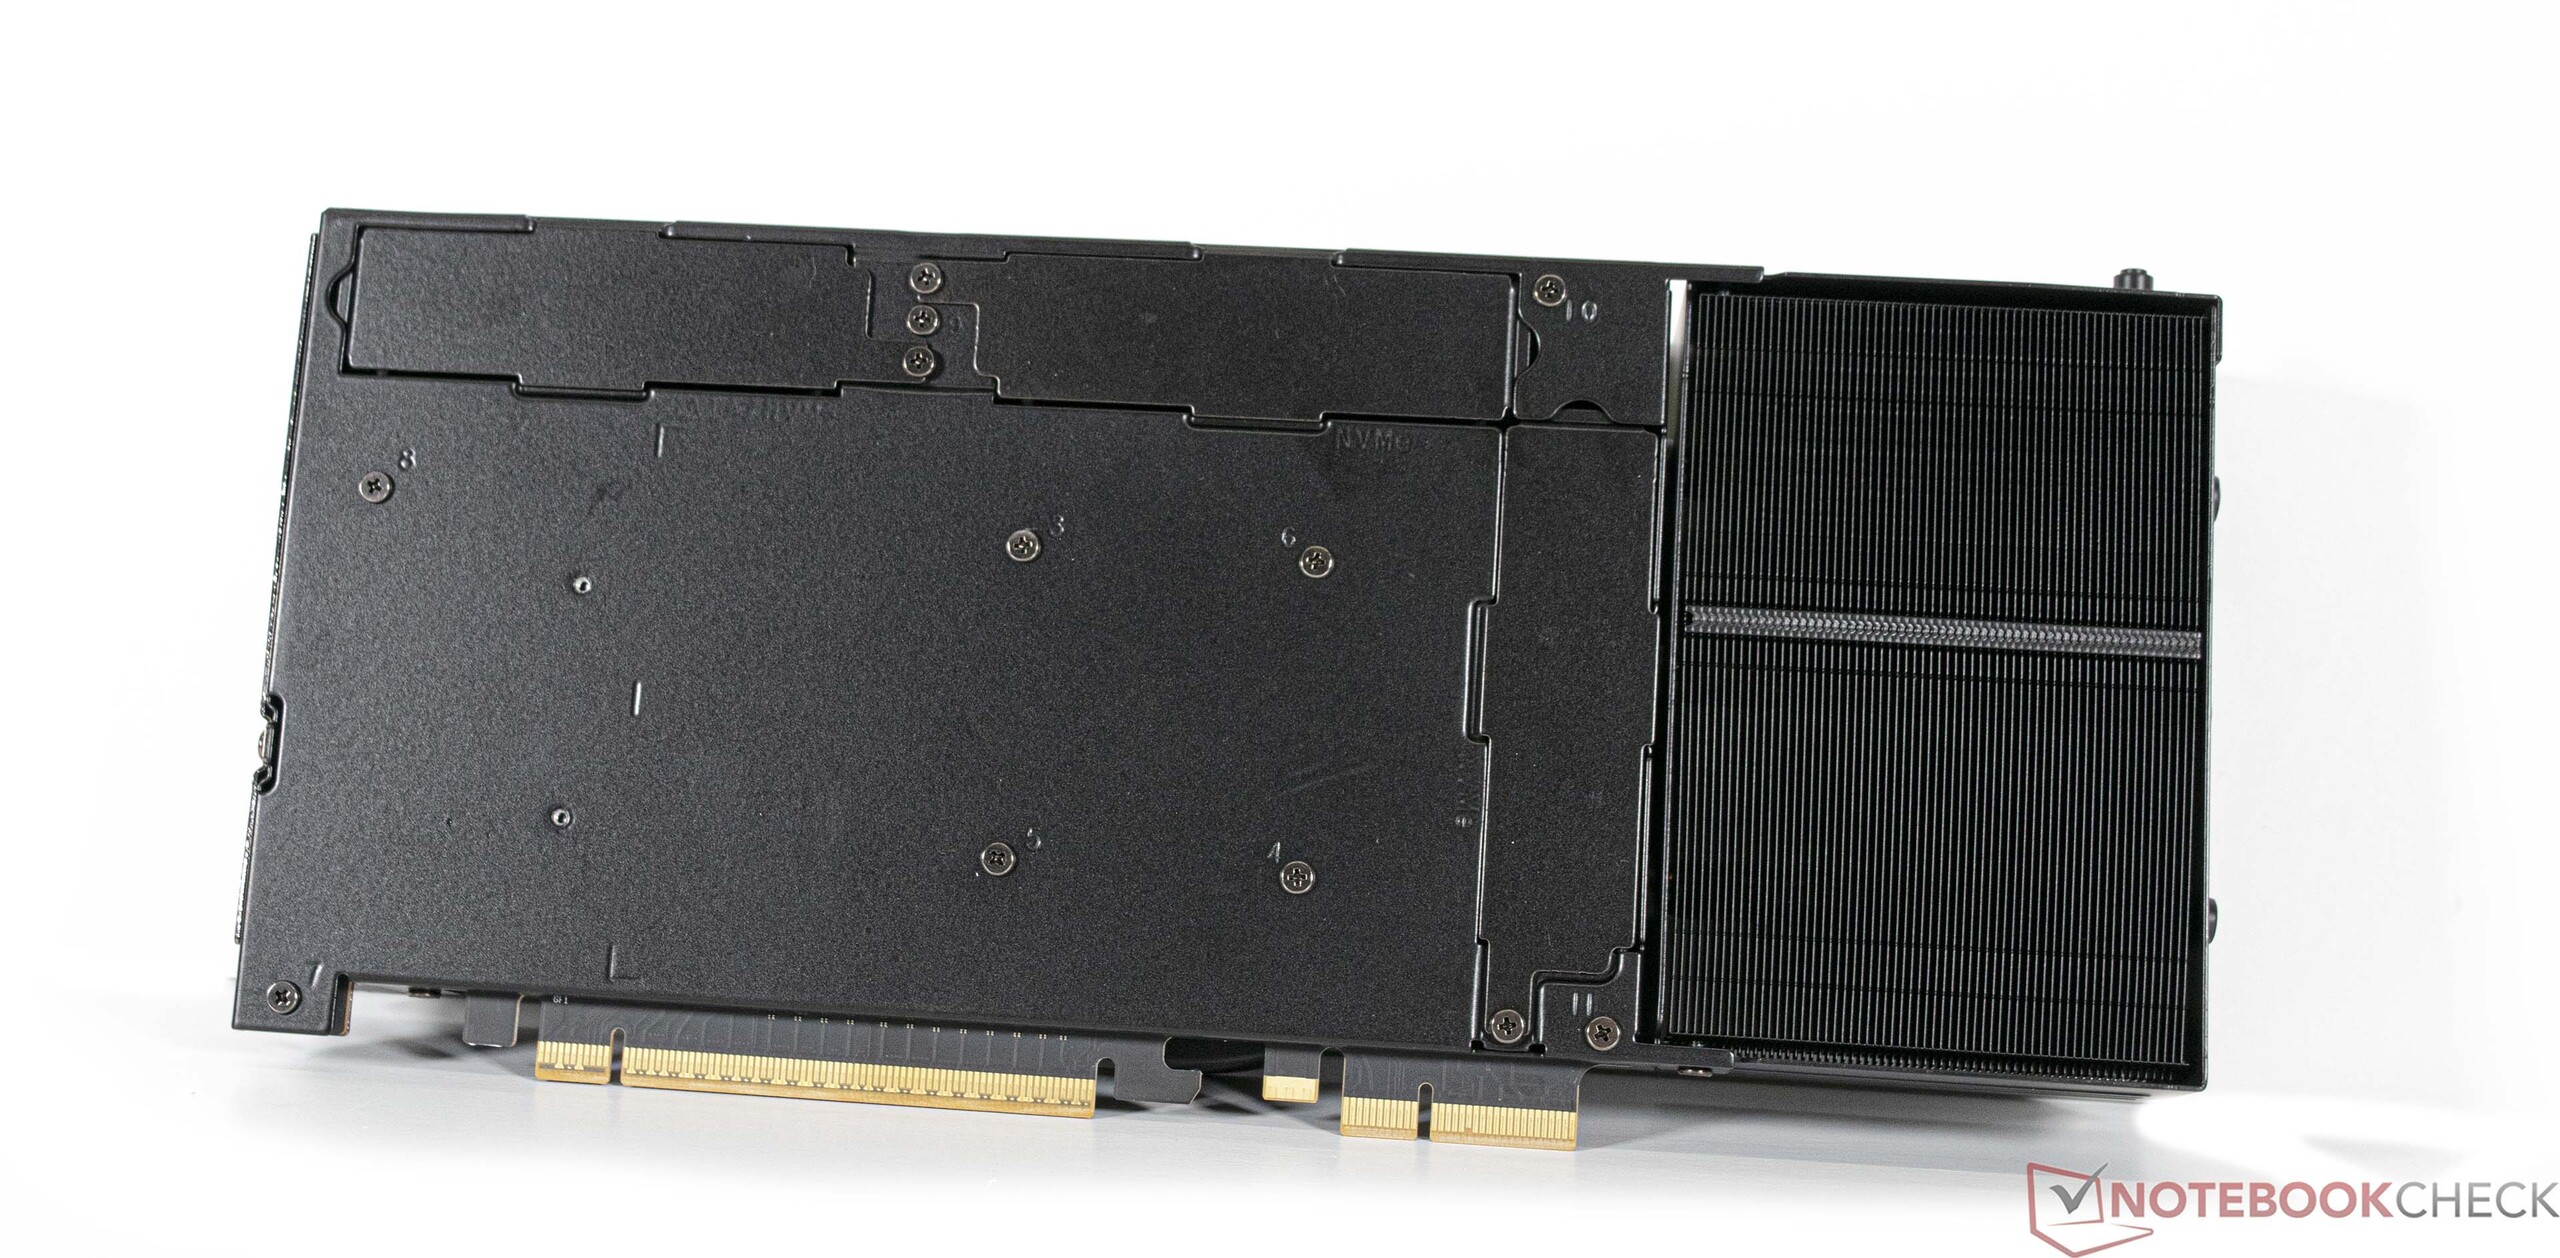
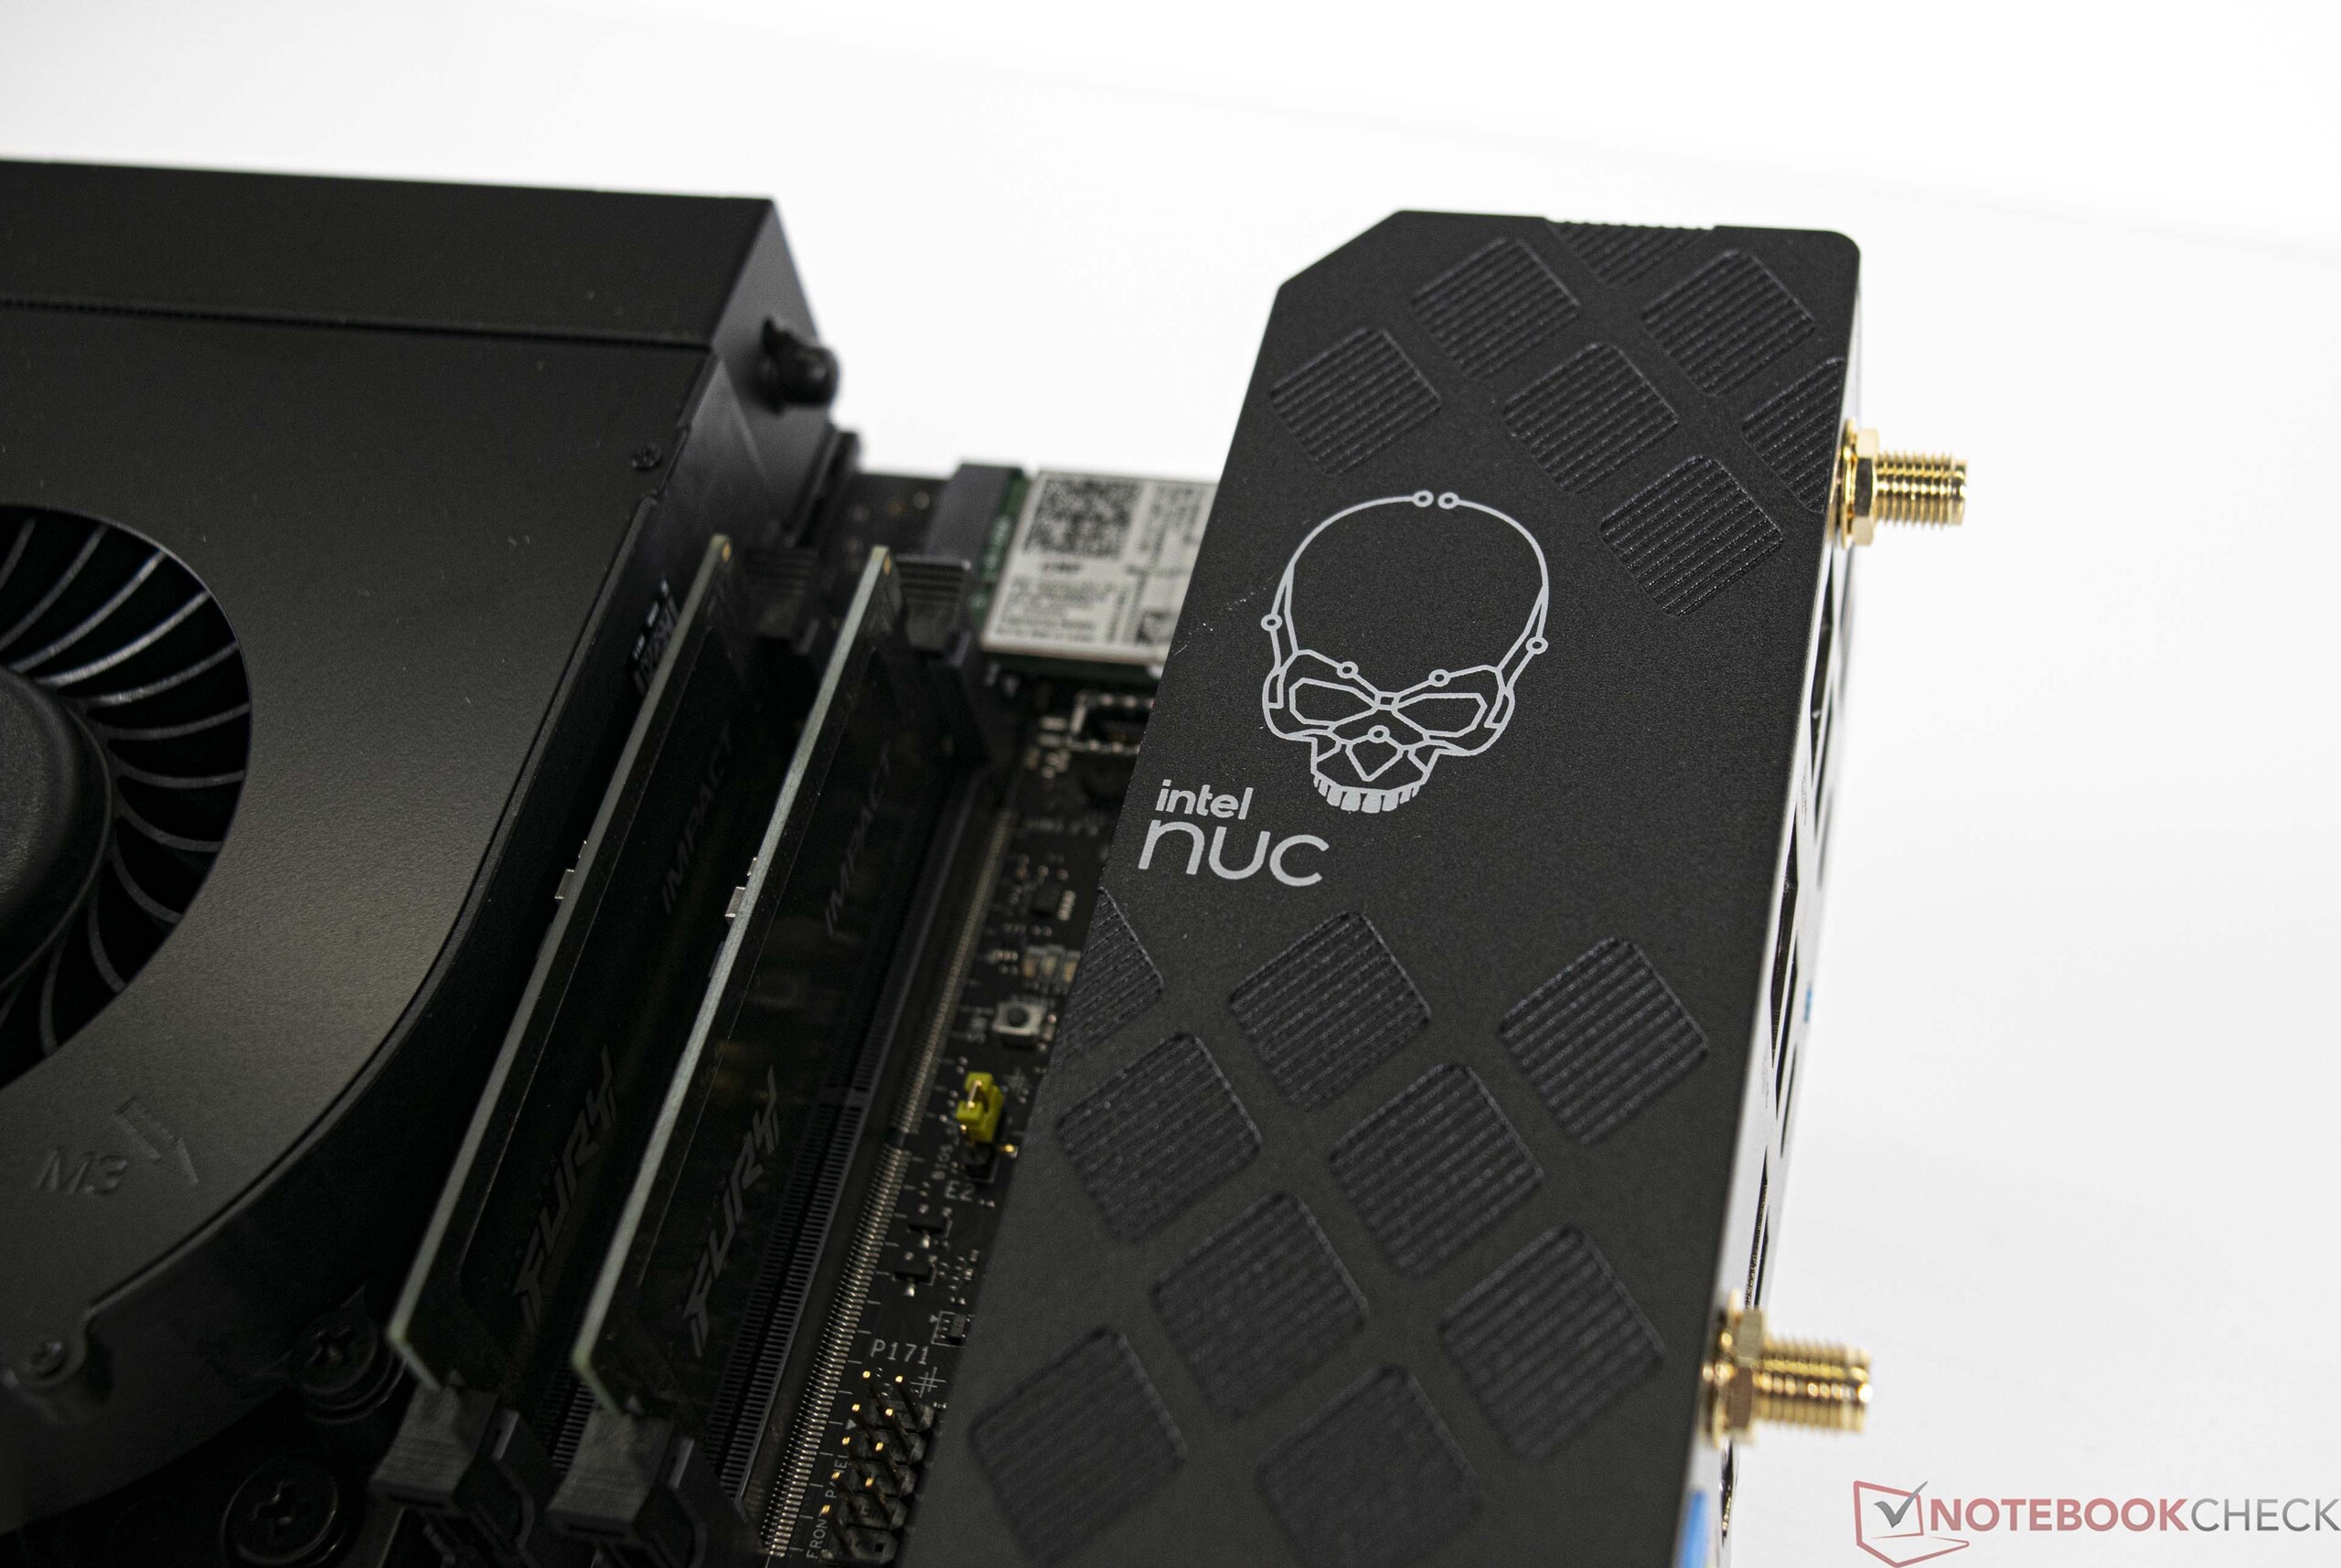
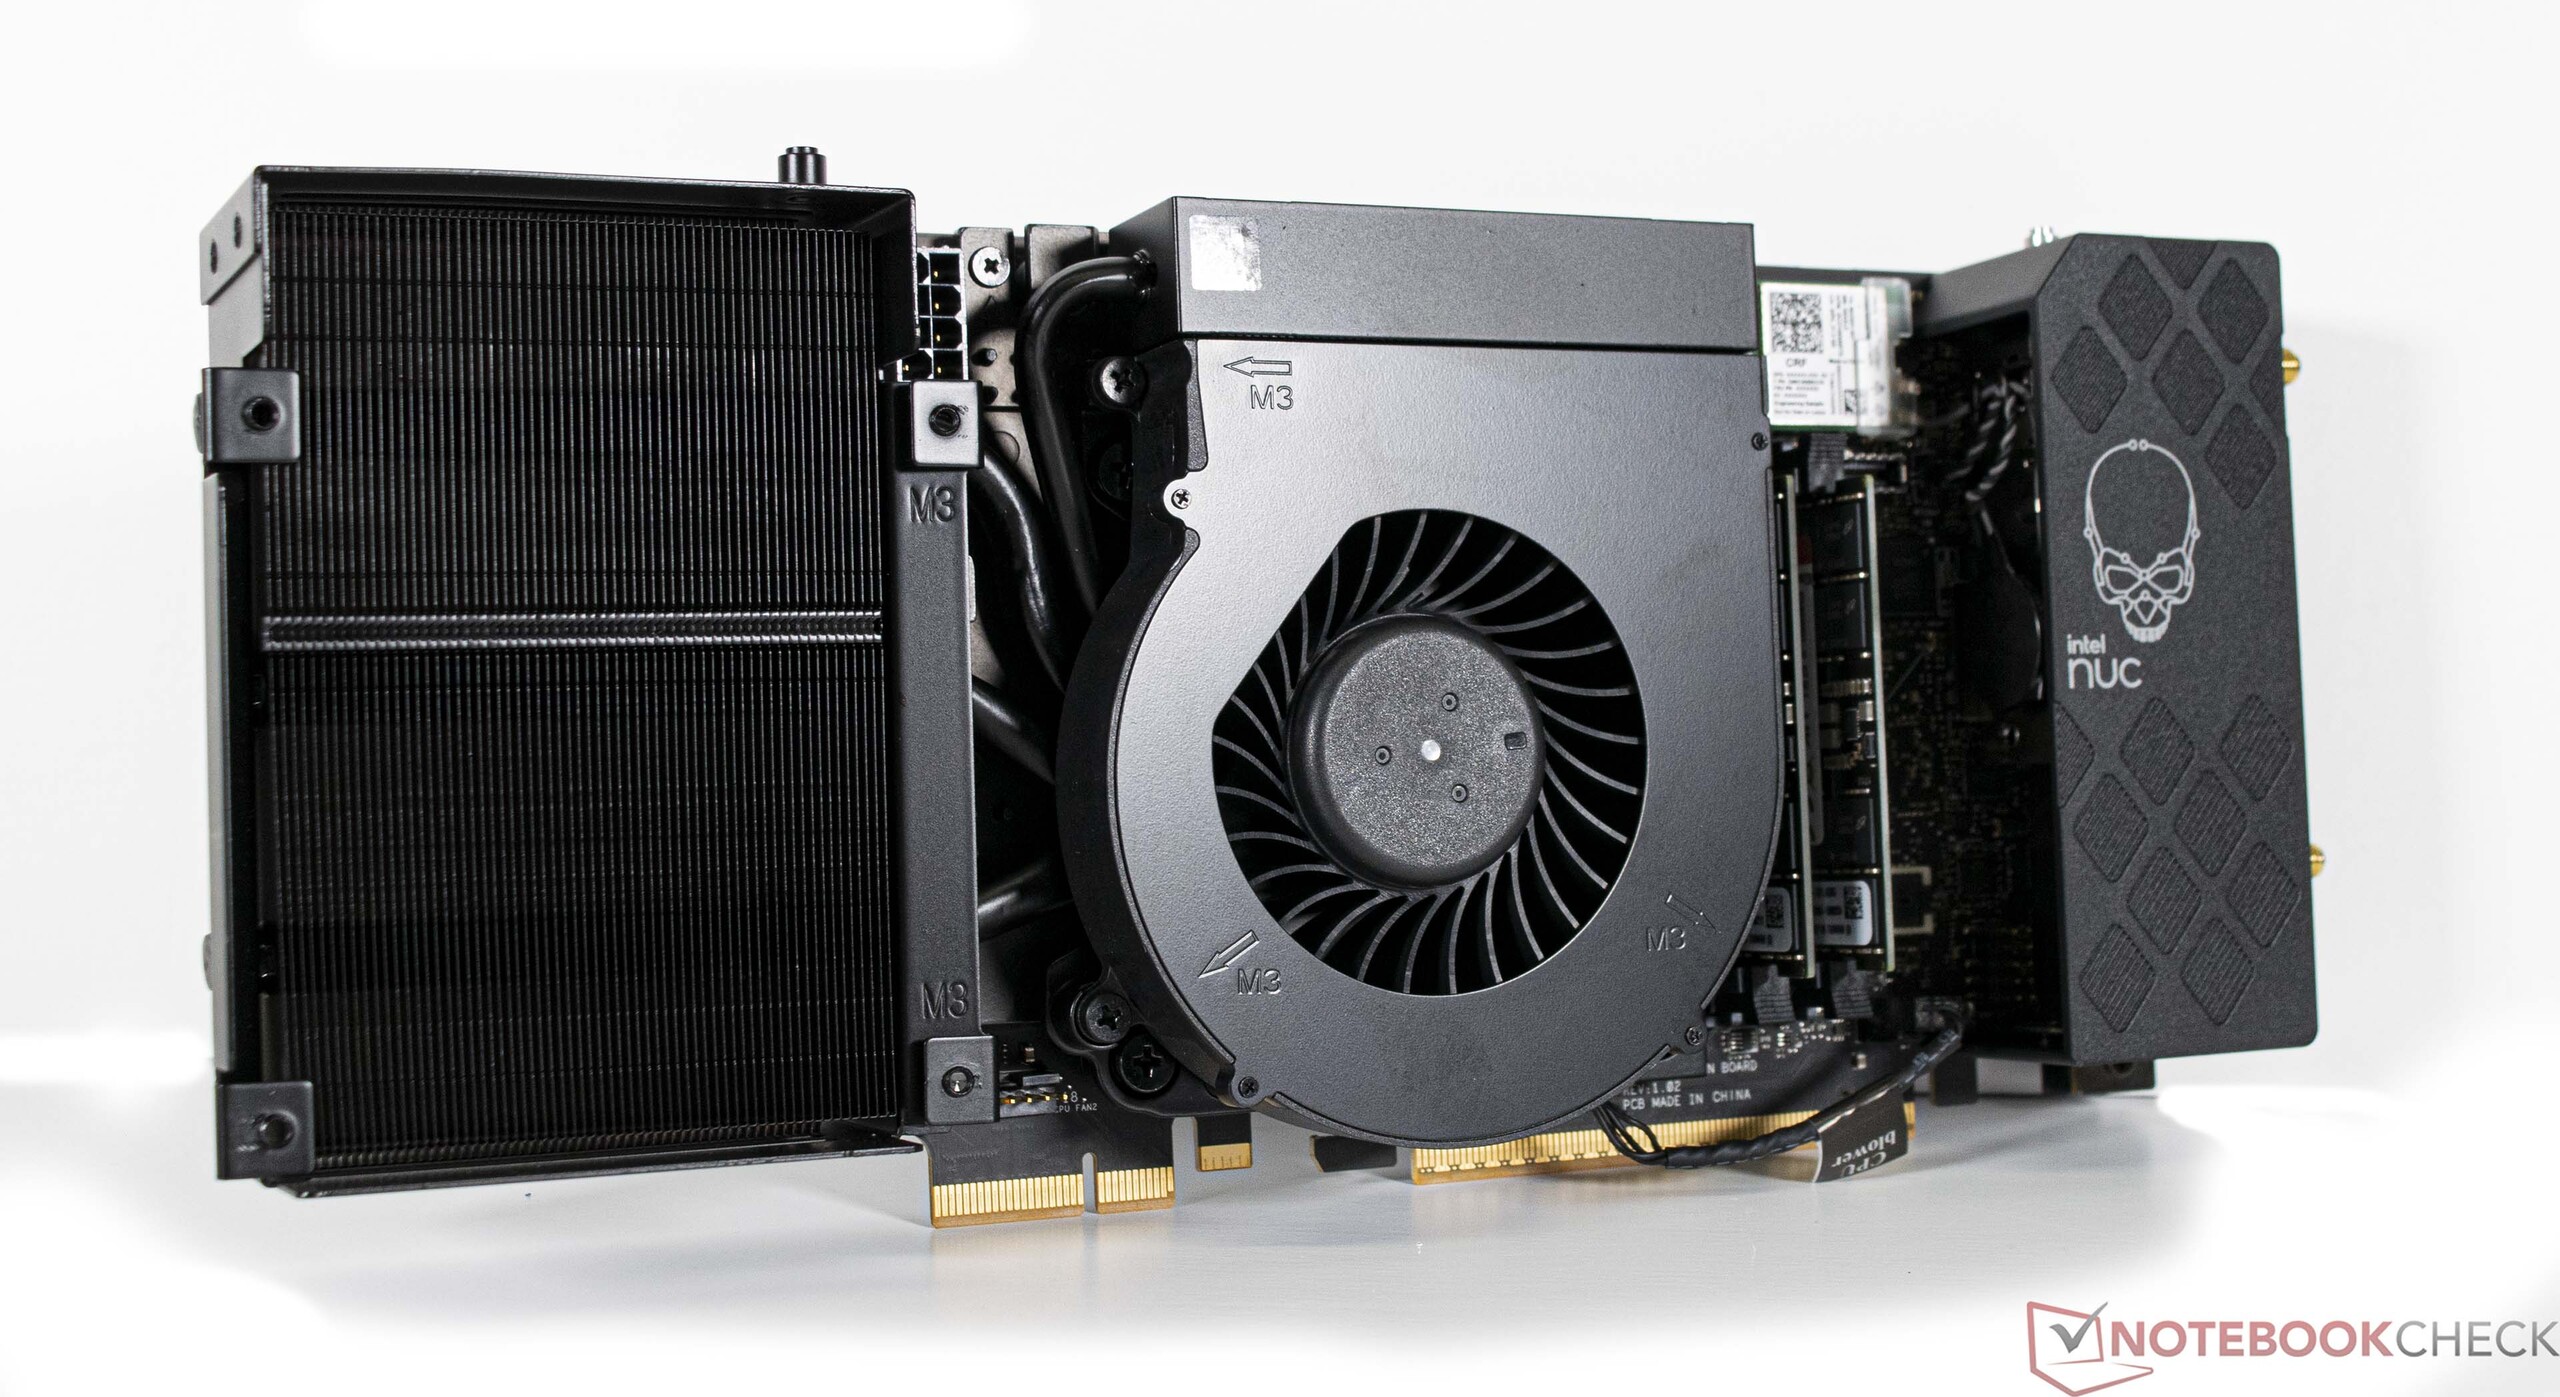
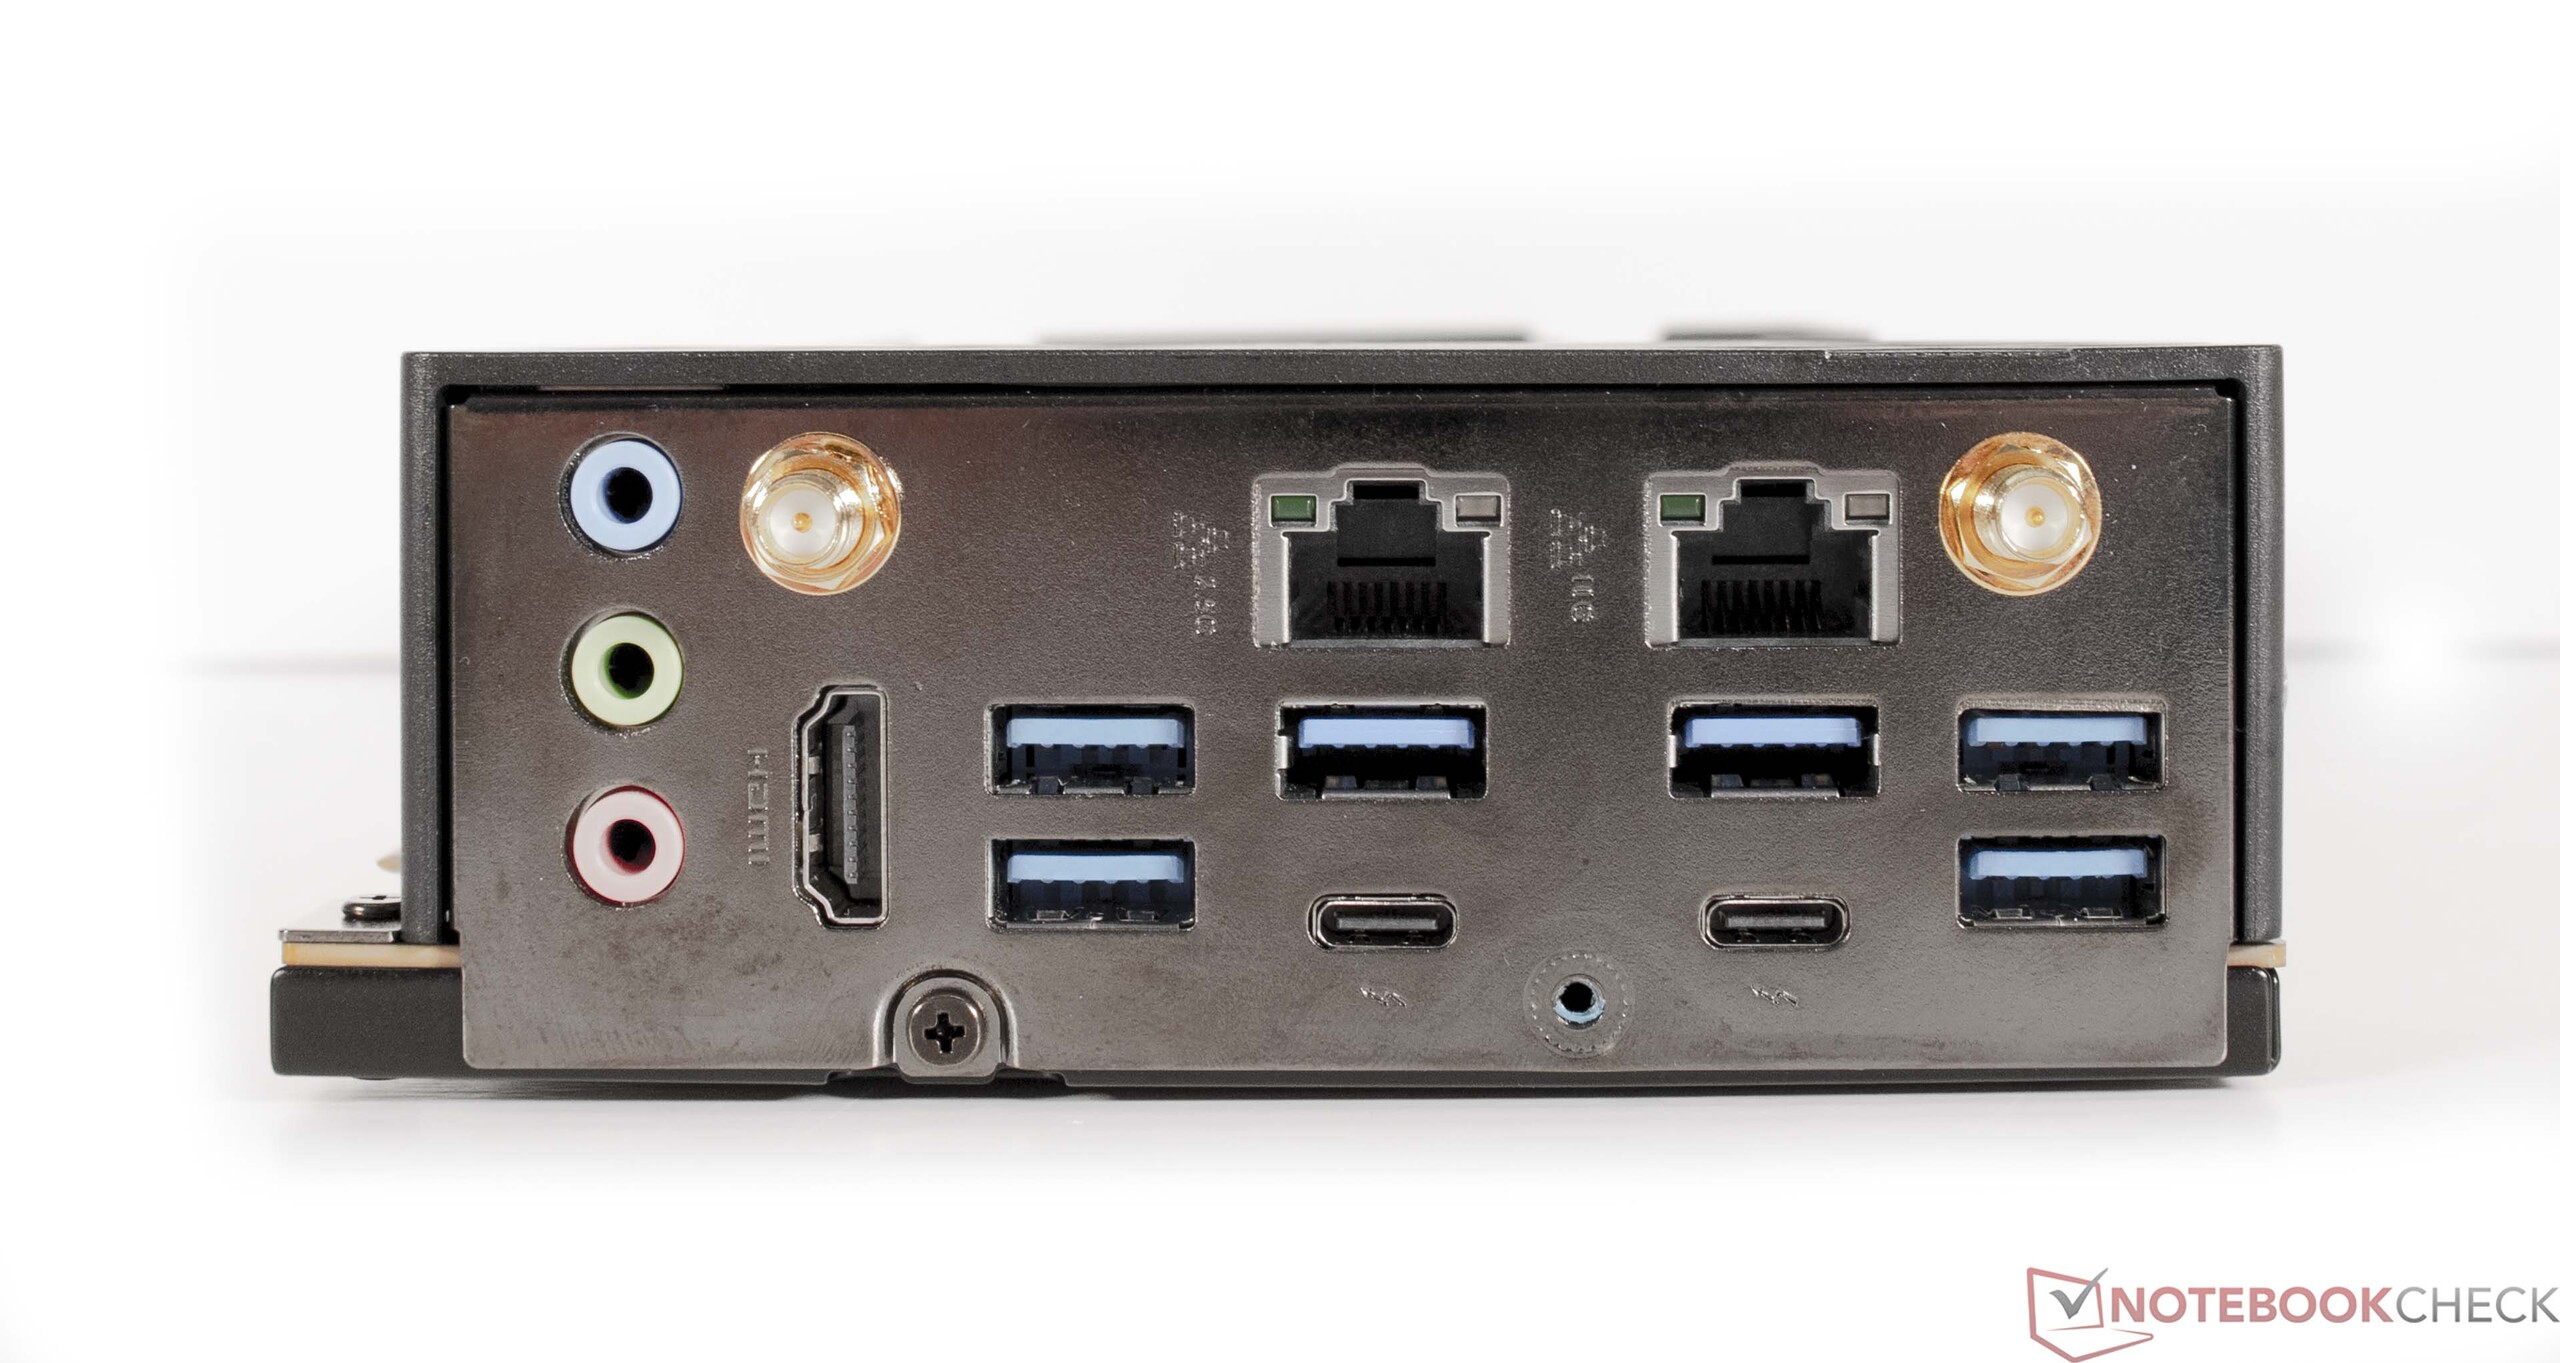
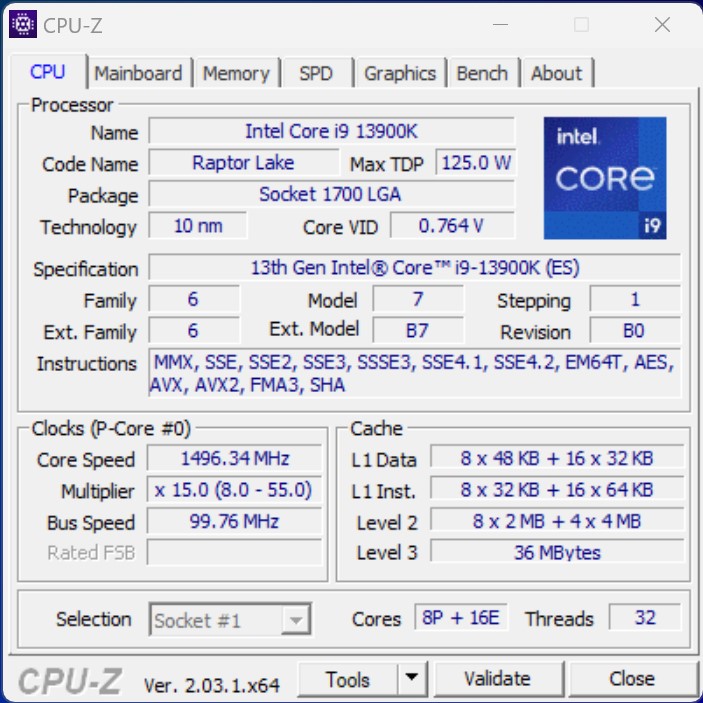
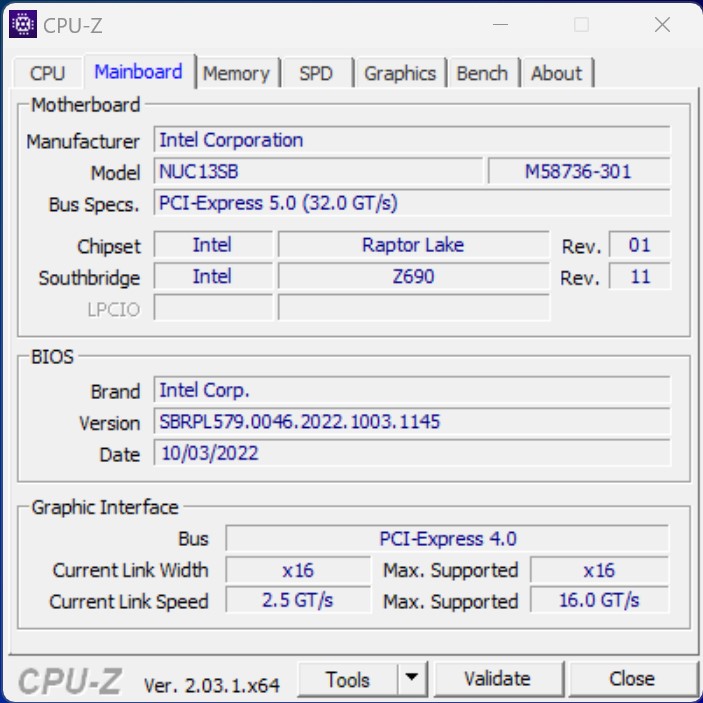
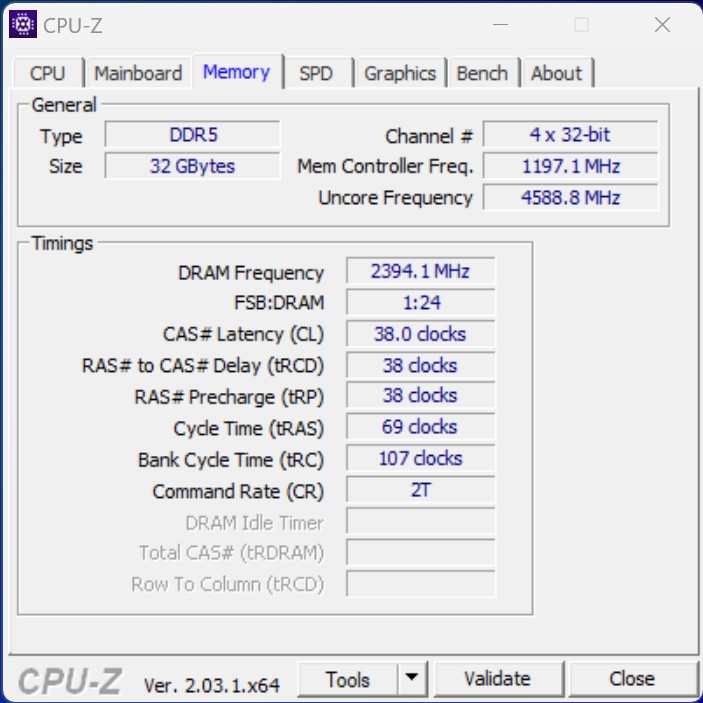
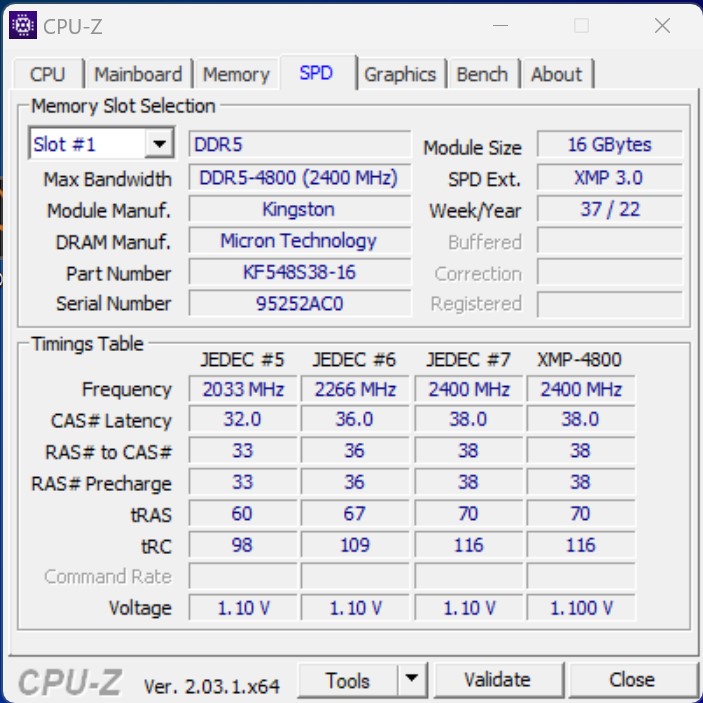
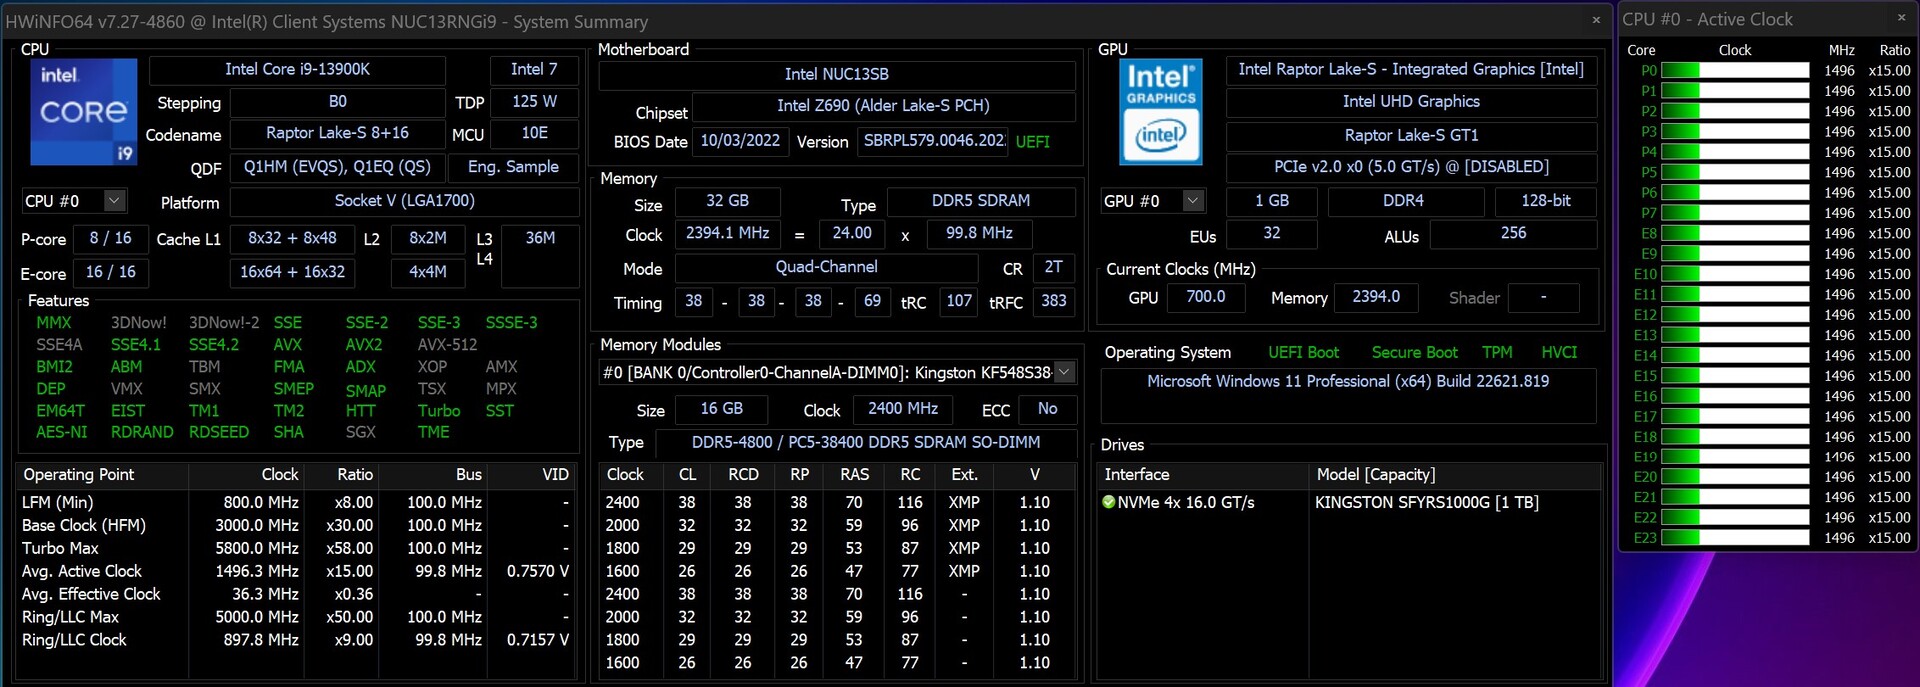
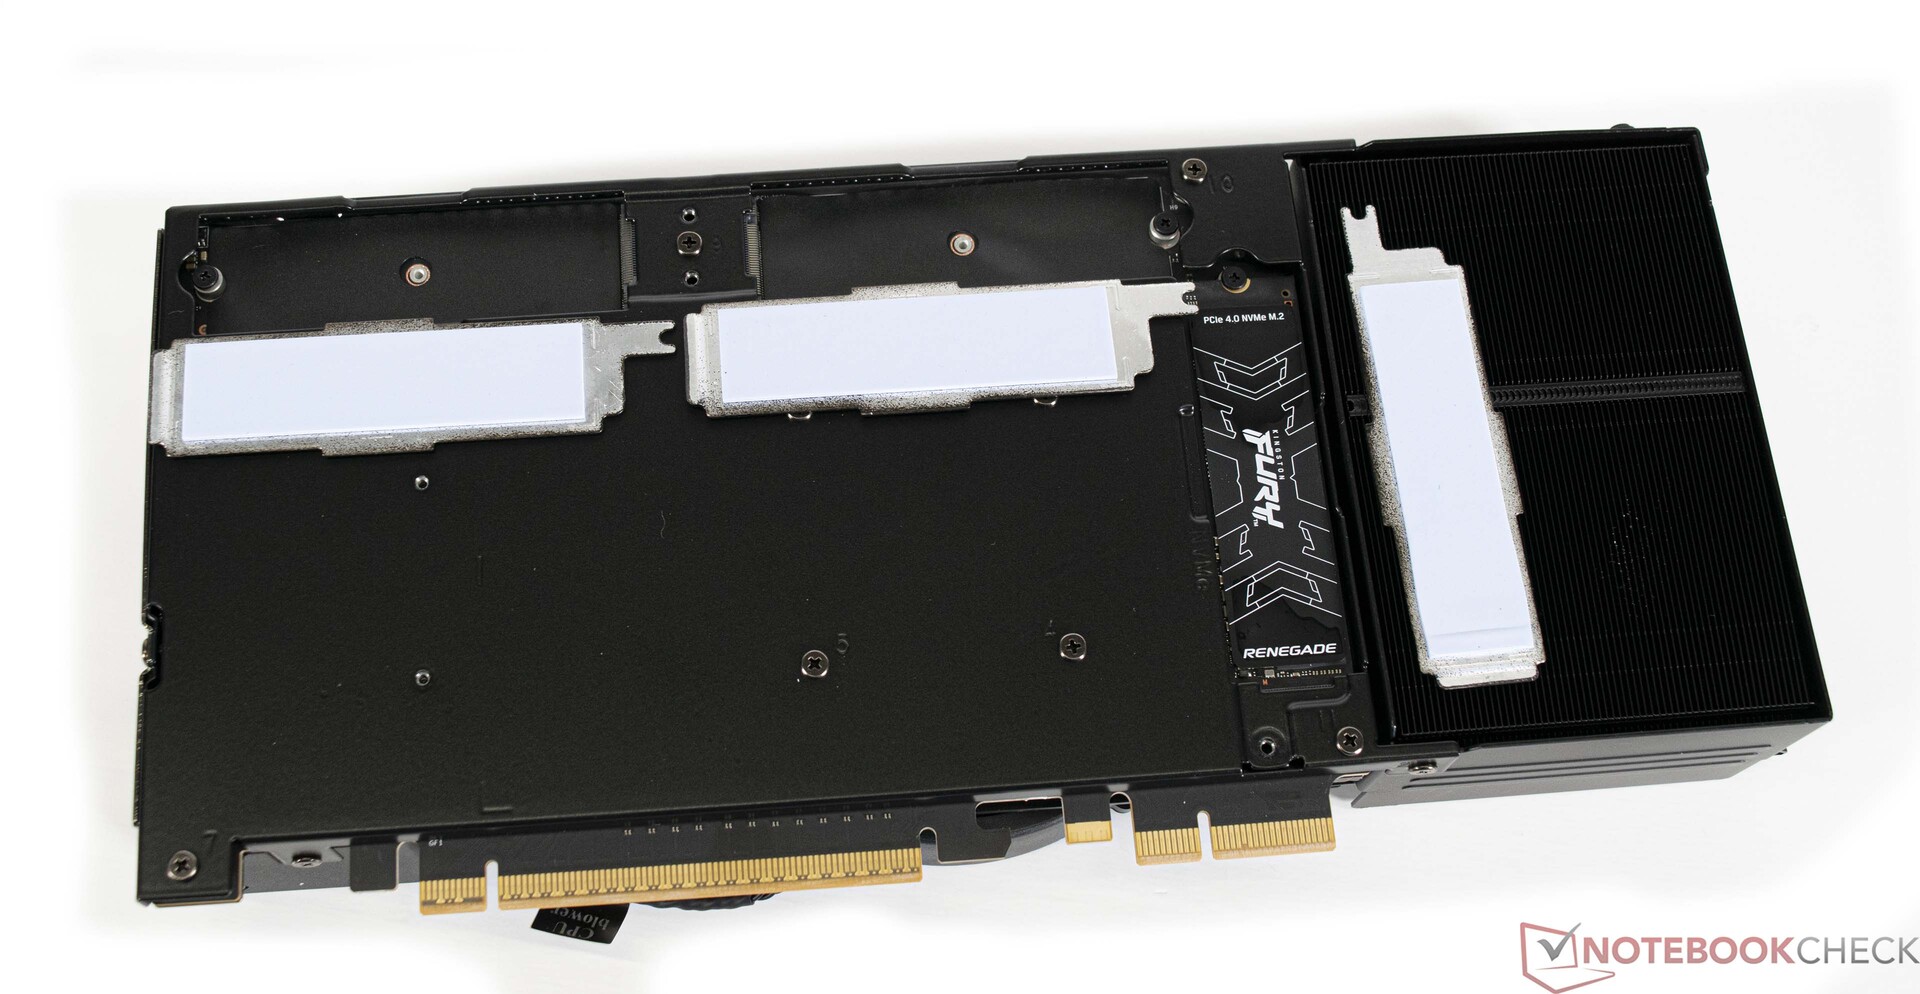
Com o Intel Core i9-13900Ka nossa configuração da Intel NUC 13 Extreme vem com a CPU de jogos mais rápida disponível no momento. Ela tem um total de 24 núcleos e 32 fios. É de conhecimento comum que as CPUs da geração Raptor Lake utilizam um design híbrido com núcleos E e P. Como na Intel NUC 12 Extreme, sua antecessora também inclui um processador padrão para desktop. Além disso, o Elemento de Computação vem com todas as portas necessárias. Há três slots NVMe SSD na parte inferior da placa de circuito impresso e todas as interfaces externas na lateral.

Desempenho Wi-Fi

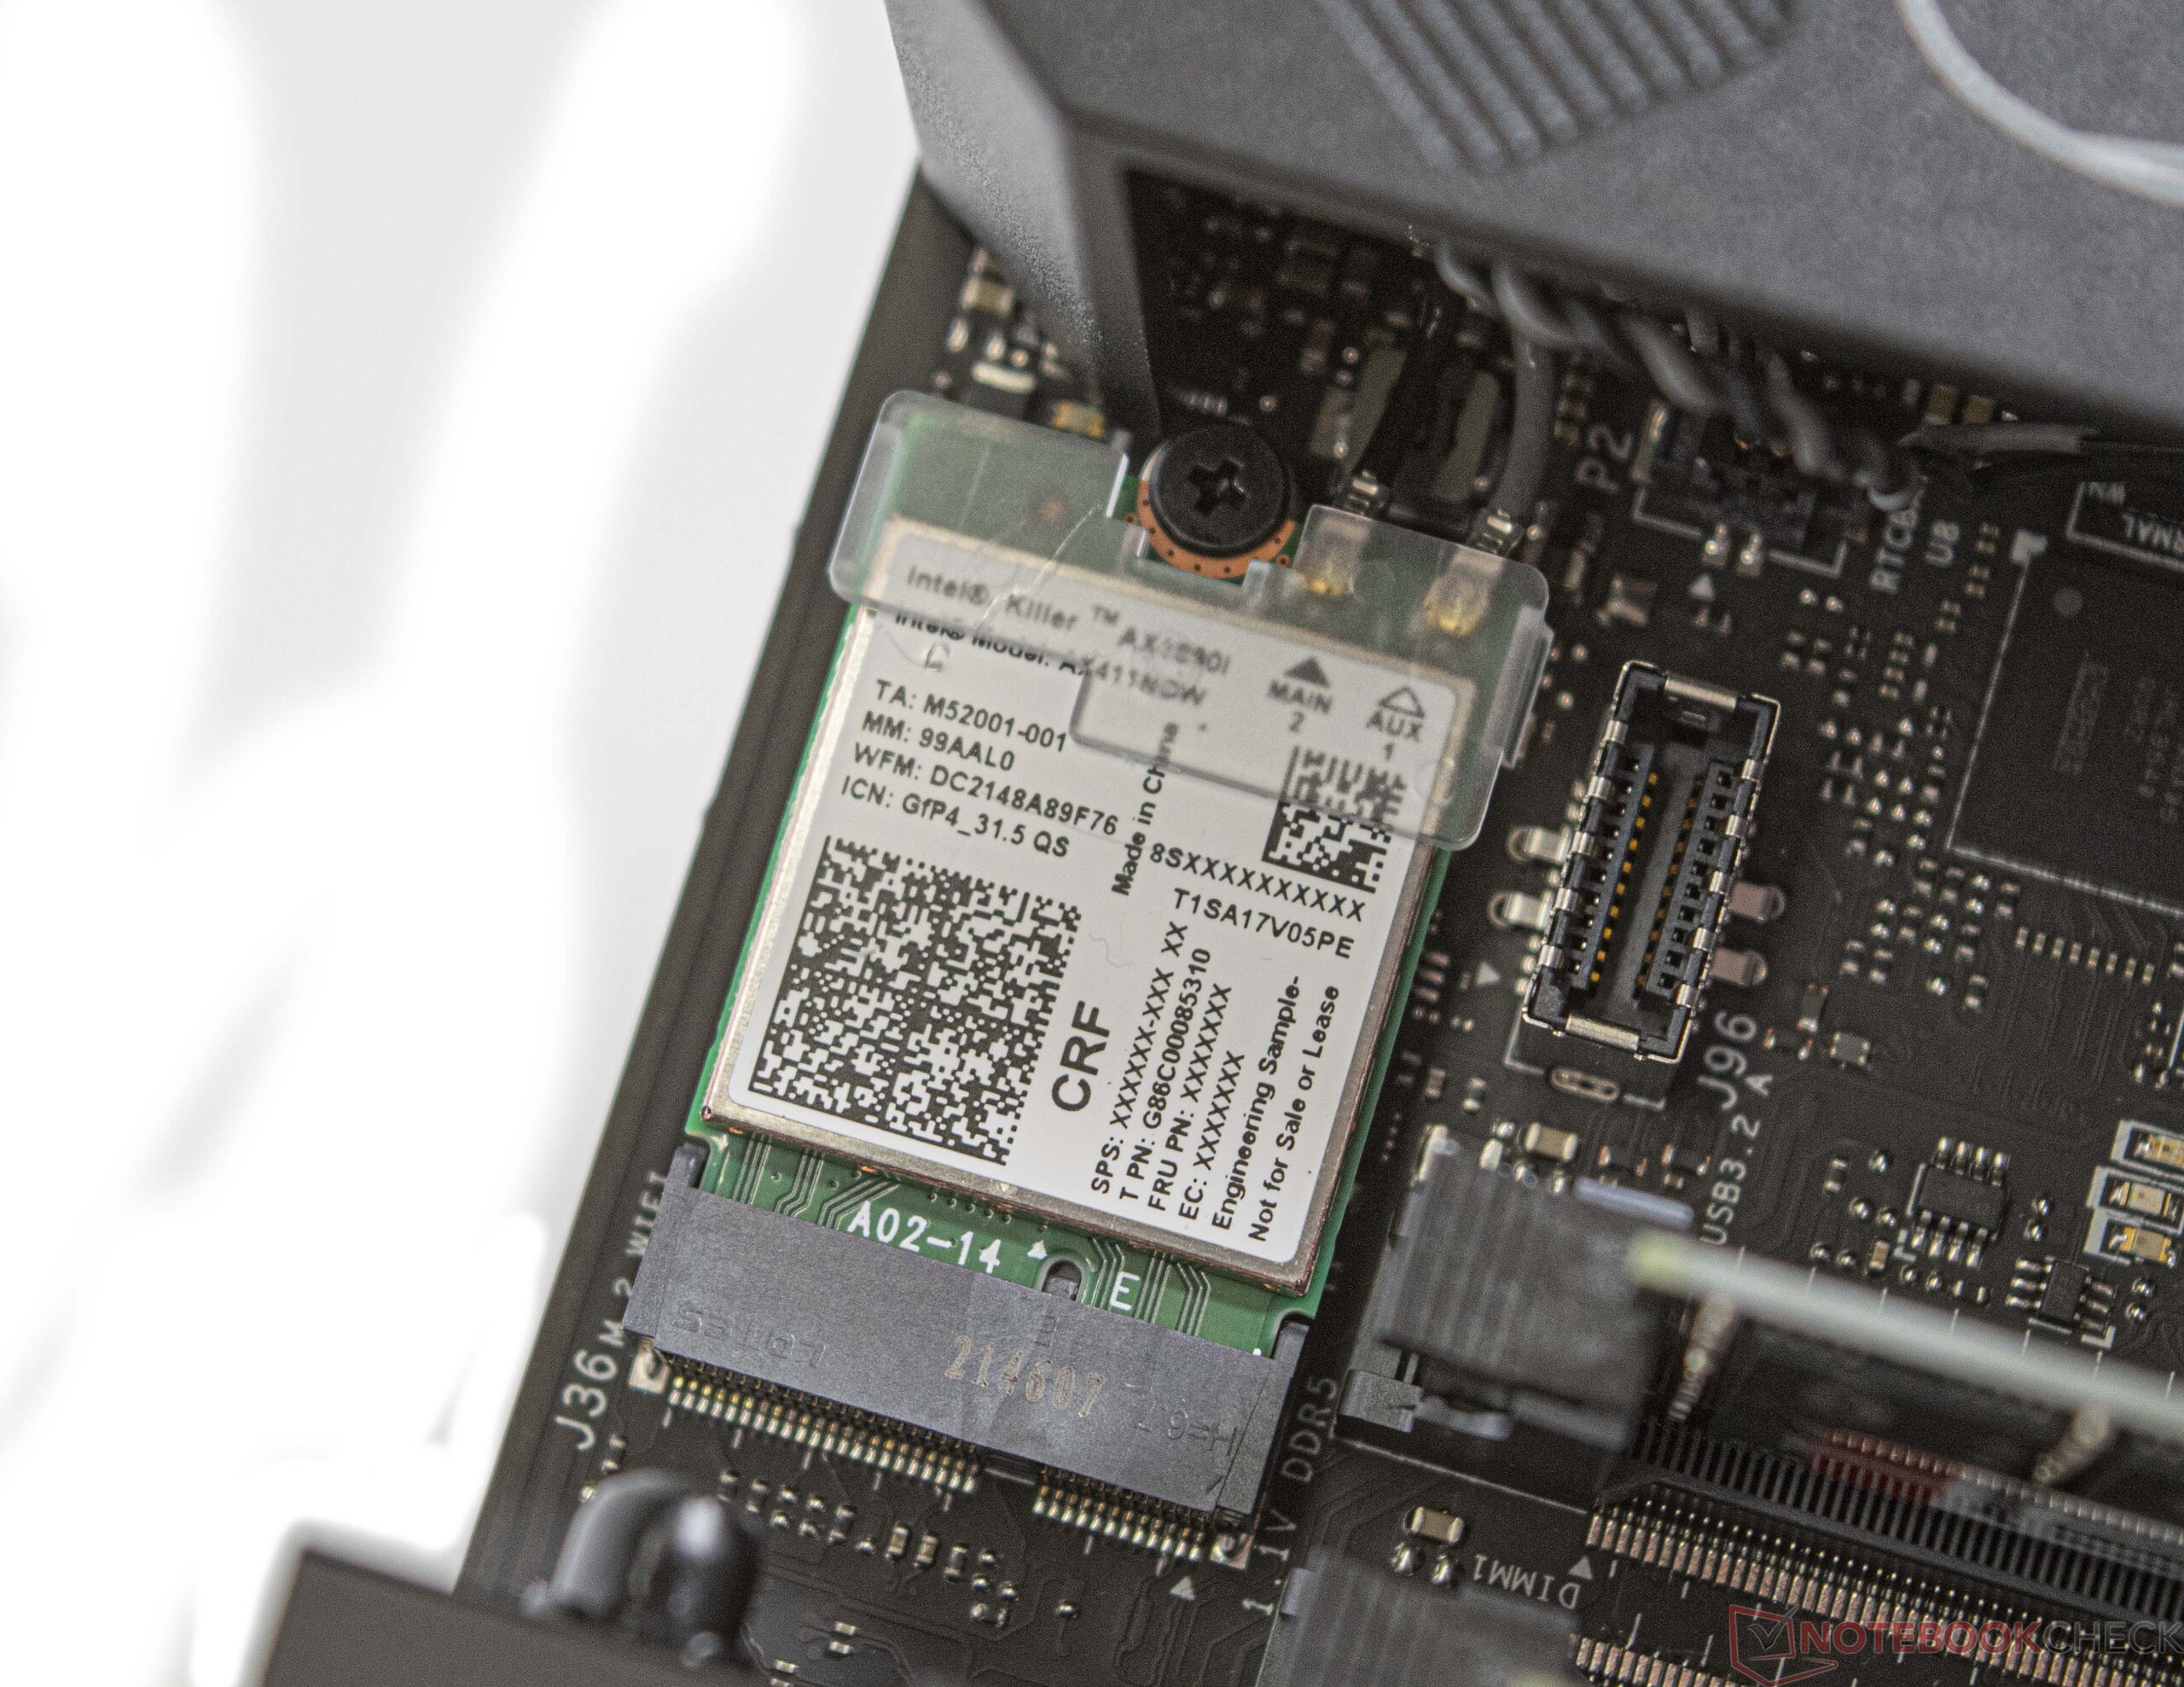
O Intel NUC 13 Extreme Raptor Canyon integra o módulo Killer Wi-Fi 6E AX1690i Wi-Fi. Em conjunto com nosso roteador de referência Asus ROG Rapture GT-AXE11000, medimos boas velocidades de upload e download. A unidade Wi-Fi é um módulo no Elemento de Computação e, portanto, substituível pelo usuário. Para comunicação com fio, tanto uma interface de 10Gb/s como uma de 2,5Gb/s está disponível.

Observação

Não foi possível obter uma conexão Wi-Fi 6G estável com nosso dispositivo de teste. A atualização dos componentes com os últimos drivers e atualizações de firmware para o Intel NUC 13 Extreme Raptor Canyon, bem como nosso roteador de teste, não melhorou as coisas. Revisaremos esta parte da revisão se a situação mudar nos próximos dois dias antes de termos que devolver o dispositivo.

Networking
iperf3 receive AXE11000
Intel NUC Pro Chassis_i7_1185G7
Intel Wi-Fi 6 AX201
1685 (841min - 1722max) MBit/s +84%
Average Killer Wi-Fi 6E AX1690i 160MHz
  (917 - 1727, n=8)
1477 MBit/s +61%
Intel NUC13 Raptor Canyon
Killer Wi-Fi 6E AX1690i 160MHz
917 (844min - 932max) MBit/s
Corsair Voyager a1600
Qualcomm WCN685x
852 (425min - 931max) MBit/s -7%
Average of class Desktop
  (322 - 1478, n=10, last 2 years)
803 MBit/s -12%
iperf3 transmit AXE11000
Corsair Voyager a1600
Qualcomm WCN685x
1780 (896min - 1840max) MBit/s +10%
Intel NUC13 Raptor Canyon
Killer Wi-Fi 6E AX1690i 160MHz
1618 (1563min - 1670max) MBit/s
Average Killer Wi-Fi 6E AX1690i 160MHz
  (1145 - 1650, n=7)
1470 MBit/s -9%
Intel NUC Pro Chassis_i7_1185G7
Intel Wi-Fi 6 AX201
1011 (529min - 1068max) MBit/s -38%
Average of class Desktop
  (188.4 - 1618, n=9, last 2 years)
734 MBit/s -55%
05010015020025030035040045050055060065070075080085090095010001050110011501200125013001350140014501500155016001650Tooltip
Intel NUC13 Raptor Canyon; iperf3 receive AXE11000; iperf 3.1.3: Ø916 (844-932)
Intel NUC13 Raptor Canyon; iperf3 transmit AXE11000; iperf 3.1.3: Ø1618 (1563-1670)

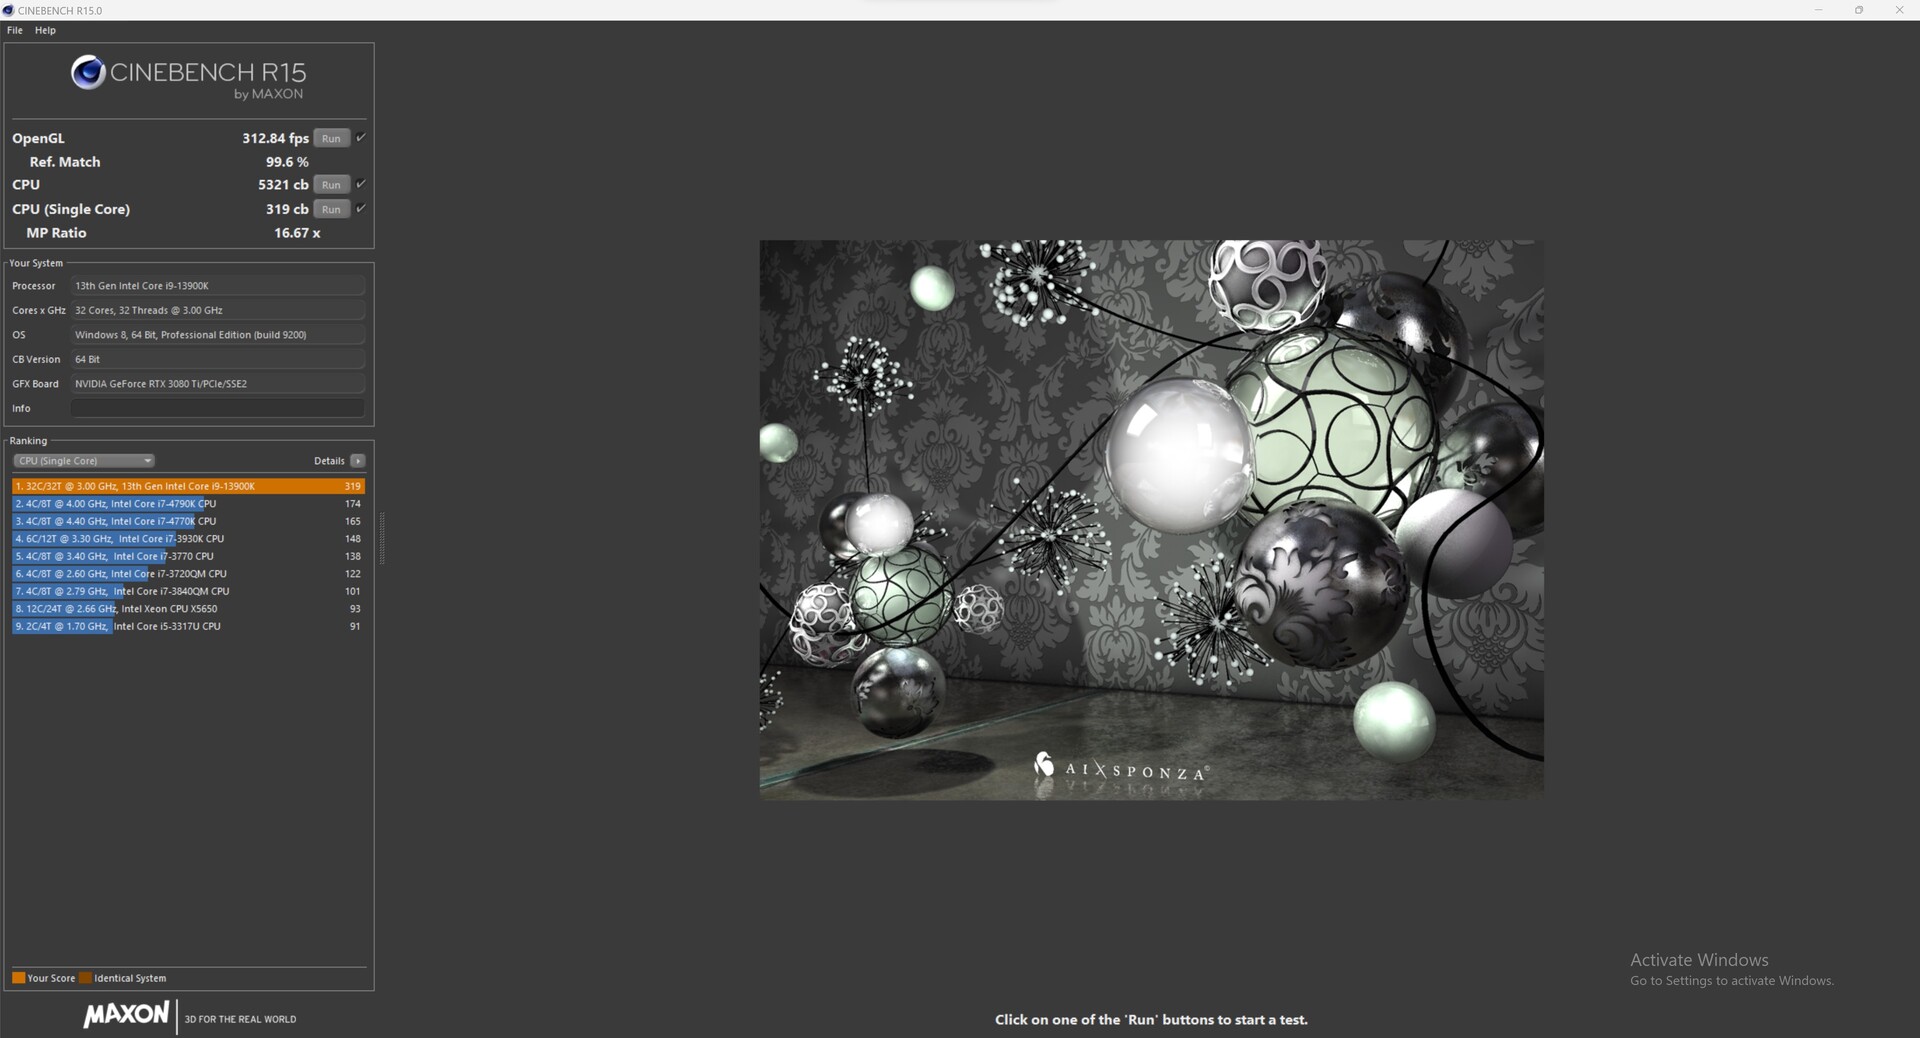
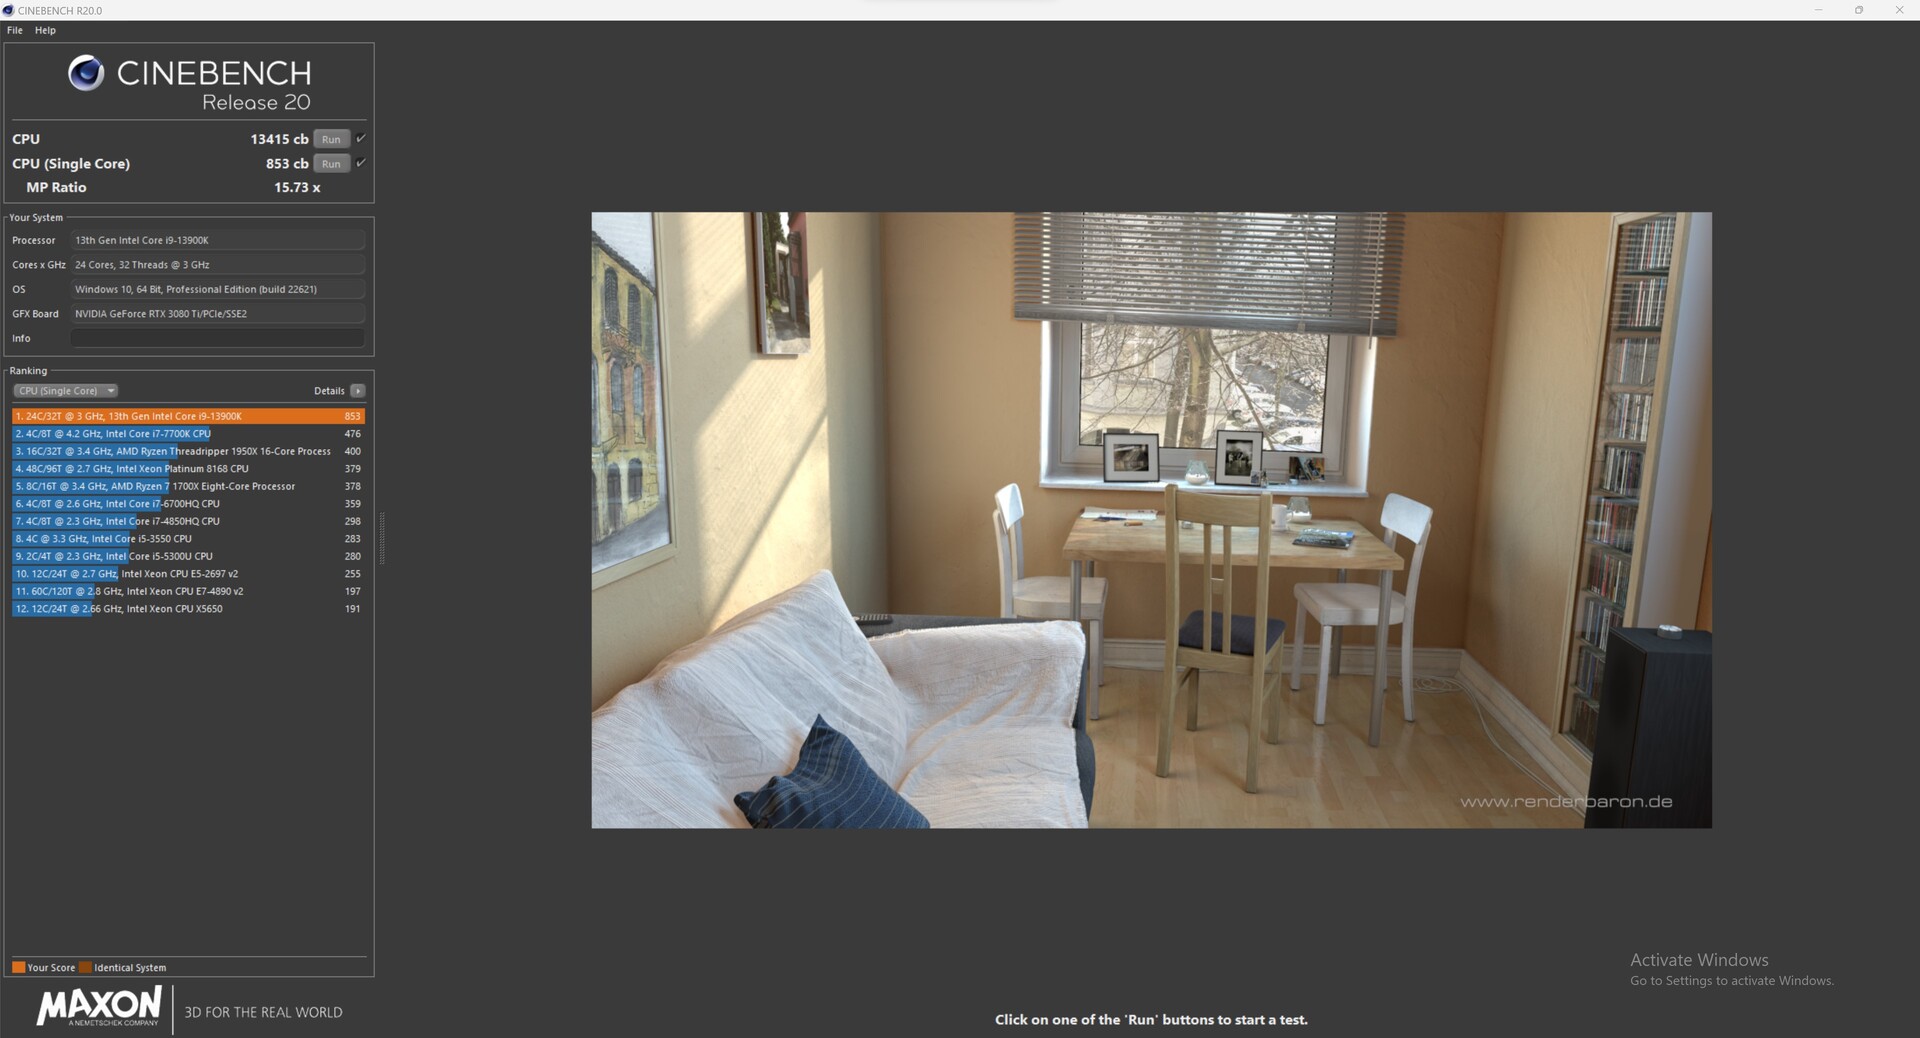
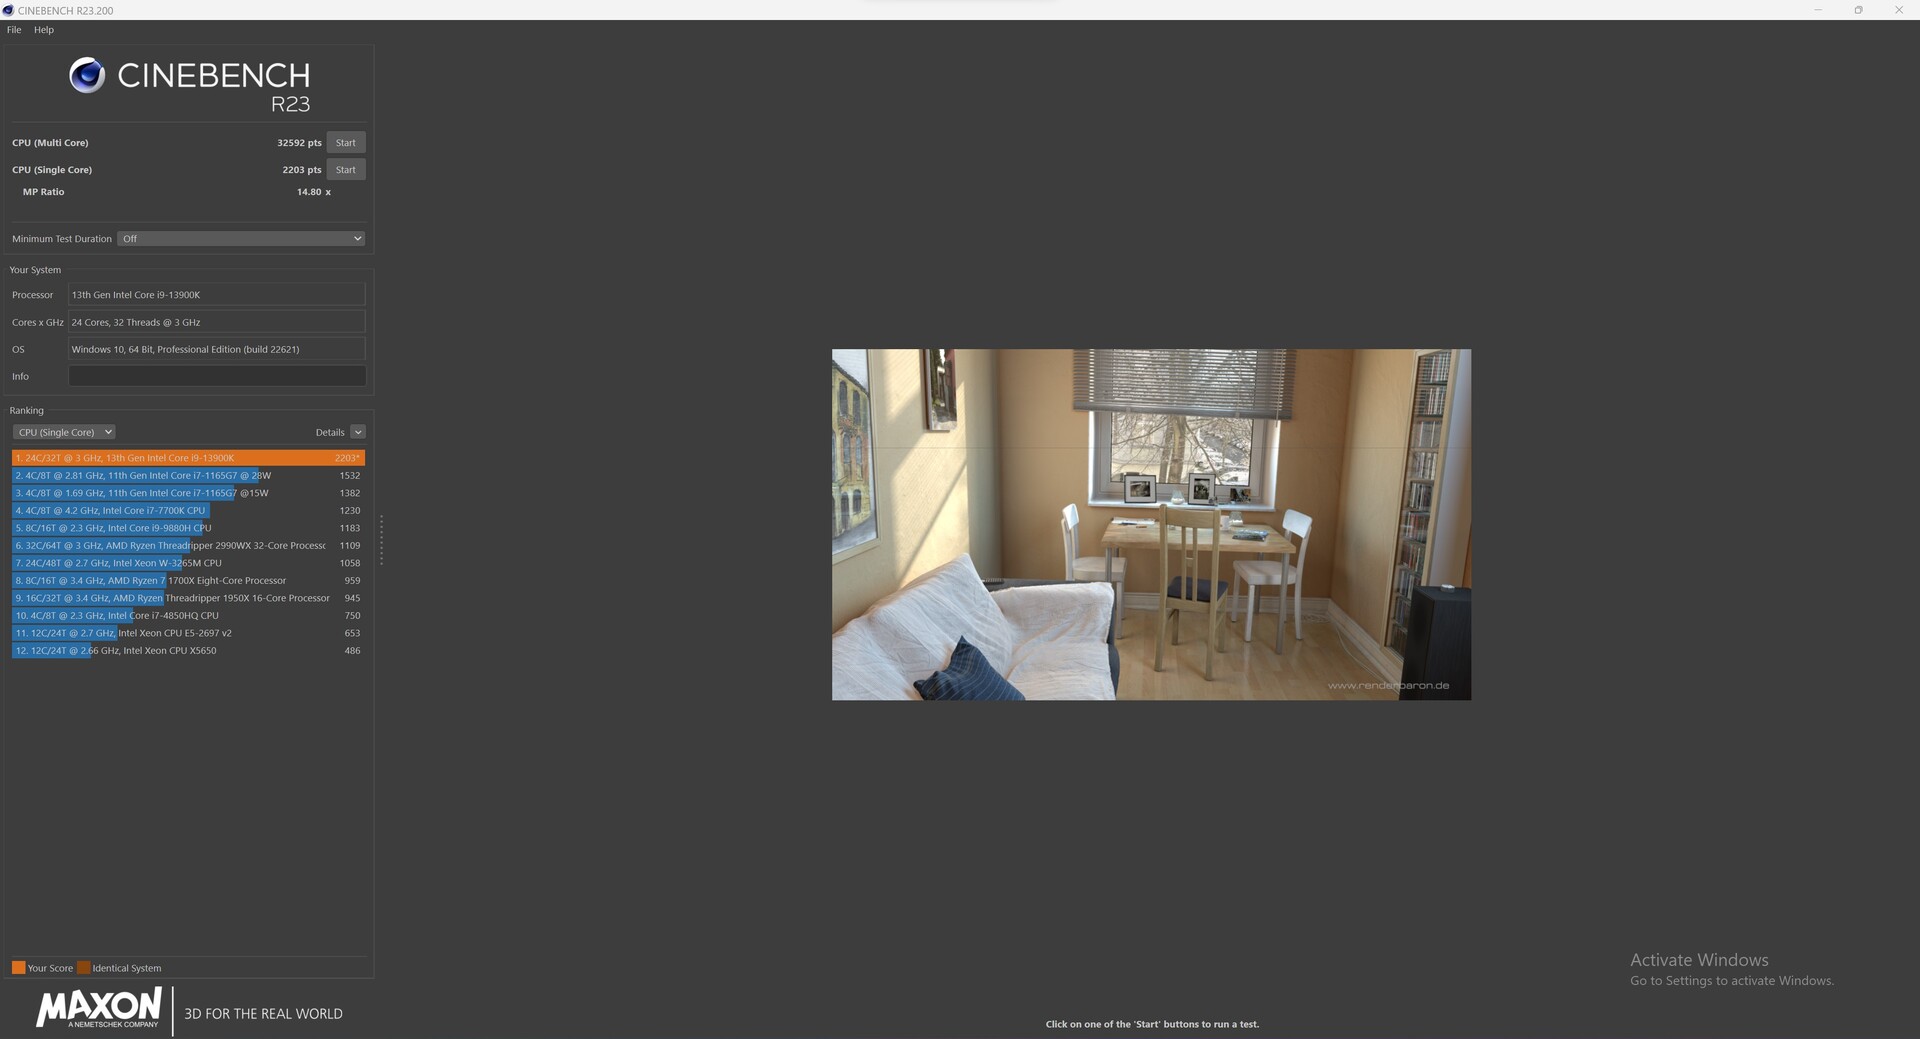
Benchmarks de Processador

Com o Intel Core i9-13900Ka Intel NUC 13 Extreme Raptor Canyon usa a CPU de jogos mais rápida da Intel. Como tal, os bons resultados de benchmark correspondem às nossas expectativas. Apesar da solução de refrigeração relativamente pequena, medimos um déficit de desempenho de apenas 7% em comparação com um sistema de desktop diferente com um refrigerador líquido potente.

Em termos de limites de potência há algumas pequenas limitações e o limite de 150 watts explica a pequena diferença. A maioria das aplicações não fará uso dos 250 watts completos. Ao combinar o Intel NUC 13 Extreme Raptor Canyon com o Intel Core i5-13600K menos potente, o nível de desempenho deve corresponder aos resultados em nossa tabela comparativa. O PL2 mais baixo (181 watts) provavelmente compensará parte do déficit sob carga total.

Mais benchmarks de processador podem ser encontrados aqui.

CPU-Z
CPU-Z
CPU-Z
CPU-Z
CPU-Z
CPU-Z
HWiNFO
Cinebench R15
Cinebench R15
Cinebench R20
Cinebench R20
Cinebench R23
Cinebench R23
Performance Rating - Percent
Intel Core i9-13900K
i9-13900K, 3000 MHz
74.1 pt
AMD Ryzen 9 7950X
R9 7950X, 4500 MHz
72.7 pt
Intel Core i9-13900K
i9-13900K, 3000 MHz
69.4 pt
AMD Ryzen 9 7900X
R9 7900X, 4700 MHz
67.7 pt
Intel Core i9-12900K
i9-12900K, 3200 MHz
62.9 pt
Intel Core i5-13600K
i5-13600K, 3500 MHz
61.8 pt
AMD Ryzen 5 7600X
R5 7600X, 4700 MHz
57.5 pt
Intel Core i5-12600K
i5-12600K, 2800 MHz
54.8 pt
Cinebench R15
CPU Single 64Bit
AMD Ryzen 9 7950X
R9 7950X, 4500 MHz
328 Points +3%
Intel Core i9-13900K
i9-13900K, 3000 MHz
327 Points +3%
AMD Ryzen 9 7900X
R9 7900X, 4700 MHz
324 Points +2%
Intel Core i9-13900K
i9-13900K, 3000 MHz
319 Points
AMD Ryzen 5 7600X
R5 7600X, 4700 MHz
315 Points -1%
Intel Core i5-13600K
i5-13600K, 3500 MHz
289 Points -9%
Intel Core i9-12900K
i9-12900K, 3200 MHz
286 Points -10%
Intel Core i5-12600K
i5-12600K, 2800 MHz
275 Points -14%
CPU Multi 64Bit
AMD Ryzen 9 7950X
R9 7950X, 4500 MHz
6209 Points +17%
Intel Core i9-13900K
i9-13900K, 3000 MHz
6191 Points +16%
Intel Core i9-13900K
i9-13900K, 3000 MHz
5321 Points
AMD Ryzen 9 7900X
R9 7900X, 4700 MHz
4856 Points -9%
Intel Core i9-12900K
i9-12900K, 3200 MHz
4057 Points -24%
Intel Core i5-13600K
i5-13600K, 3500 MHz
3643 Points -32%
Intel Core i5-12600K
i5-12600K, 2800 MHz
2555 Points -52%
AMD Ryzen 5 7600X
R5 7600X, 4700 MHz
2507 Points -53%
Cinebench R20
CPU (Single Core)
Intel Core i9-13900K
i9-13900K, 3000 MHz
853 Points
Intel Core i9-13900K
i9-13900K, 3000 MHz
828 Points -3%
AMD Ryzen 9 7950X
R9 7950X, 4500 MHz
795 Points -7%
AMD Ryzen 9 7900X
R9 7900X, 4700 MHz
786 Points -8%
Intel Core i5-13600K
i5-13600K, 3500 MHz
775 Points -9%
Intel Core i9-12900K
i9-12900K, 3200 MHz
766 Points -10%
AMD Ryzen 5 7600X
R5 7600X, 4700 MHz
761 Points -11%
Intel Core i5-12600K
i5-12600K, 2800 MHz
734 Points -14%
CPU (Multi Core)
Intel Core i9-13900K
i9-13900K, 3000 MHz
15181 Points +13%
AMD Ryzen 9 7950X
R9 7950X, 4500 MHz
14786 Points +10%
Intel Core i9-13900K
i9-13900K, 3000 MHz
13415 Points
AMD Ryzen 9 7900X
R9 7900X, 4700 MHz
11563 Points -14%
Intel Core i9-12900K
i9-12900K, 3200 MHz
10240 Points -24%
Intel Core i5-13600K
i5-13600K, 3500 MHz
9265 Points -31%
Intel Core i5-12600K
i5-12600K, 2800 MHz
6692 Points -50%
AMD Ryzen 5 7600X
R5 7600X, 4700 MHz
5985 Points -55%
Cinebench R23
Single Core
Intel Core i9-13900K
i9-13900K, 3000 MHz
2267 Points +3%
Intel Core i9-13900K
i9-13900K, 3000 MHz
2203 Points
AMD Ryzen 9 7950X
R9 7950X, 4500 MHz
2045 Points -7%
AMD Ryzen 9 7900X
R9 7900X, 4700 MHz
2039 Points -7%
Intel Core i5-13600K
i5-13600K, 3500 MHz
2010 Points -9%
Intel Core i9-12900K
i9-12900K, 3200 MHz
1998 Points -9%
AMD Ryzen 5 7600X
R5 7600X, 4700 MHz
1967 Points -11%
Intel Core i5-12600K
i5-12600K, 2800 MHz
1907 Points -13%
Multi Core
Intel Core i9-13900K
i9-13900K, 3000 MHz
40103 Points +23%
AMD Ryzen 9 7950X
R9 7950X, 4500 MHz
37792 Points +16%
Intel Core i9-13900K
i9-13900K, 3000 MHz
32592 Points
AMD Ryzen 9 7900X
R9 7900X, 4700 MHz
29480 Points -10%
Intel Core i9-12900K
i9-12900K, 3200 MHz
27005 Points -17%
Intel Core i5-13600K
i5-13600K, 3500 MHz
24268 Points -26%
Intel Core i5-12600K
i5-12600K, 2800 MHz
17491 Points -46%
AMD Ryzen 5 7600X
R5 7600X, 4700 MHz
15322 Points -53%
Cinebench R11.5
CPU Single 64Bit
Intel Core i9-13900K
i9-13900K, 3000 MHz
3.92 Points +3%
AMD Ryzen 9 7950X
R9 7950X, 4500 MHz
3.86 Points +2%
AMD Ryzen 9 7900X
R9 7900X, 4700 MHz
3.83 Points +1%
Intel Core i9-13900K
i9-13900K, 3000 MHz
3.8 Points
AMD Ryzen 5 7600X
R5 7600X, 4700 MHz
3.72 Points -2%
Intel Core i9-12900K
i9-12900K, 3200 MHz
3.49 Points -8%
Intel Core i5-13600K
i5-13600K, 3500 MHz
3.48 Points -8%
Intel Core i5-12600K
i5-12600K, 2800 MHz
3.31 Points -13%
CPU Multi 64Bit
Intel Core i9-13900K
i9-13900K, 3000 MHz
70.78 Points +14%
AMD Ryzen 9 7950X
R9 7950X, 4500 MHz
68.61 Points +10%
Intel Core i9-13900K
i9-13900K, 3000 MHz
62.2 Points
AMD Ryzen 9 7900X
R9 7900X, 4700 MHz
54.51 Points -12%
Intel Core i9-12900K
i9-12900K, 3200 MHz
47.06 Points -24%
Intel Core i5-13600K
i5-13600K, 3500 MHz
42.38 Points -32%
Intel Core i5-12600K
i5-12600K, 2800 MHz
30.01 Points -52%
AMD Ryzen 5 7600X
R5 7600X, 4700 MHz
28.41 Points -54%
Cinebench R10
Rendering Single CPUs 64Bit
Intel Core i9-13900K
i9-13900K, 3000 MHz
18236 Points +3%
Intel Core i9-13900K
i9-13900K, 3000 MHz
17761 Points
AMD Ryzen 9 7900X
R9 7900X, 4700 MHz
16338 Points -8%
AMD Ryzen 9 7950X
R9 7950X, 4500 MHz
16260 Points -8%
Intel Core i5-13600K
i5-13600K, 3500 MHz
16235 Points -9%
Intel Core i9-12900K
i9-12900K, 3200 MHz
16144 Points -9%
AMD Ryzen 5 7600X
R5 7600X, 4700 MHz
16010 Points -10%
Intel Core i5-12600K
i5-12600K, 2800 MHz
15180 Points -15%
Rendering Multiple CPUs 64Bit
Intel Core i9-13900K
i9-13900K, 3000 MHz
138969 Points
Intel Core i9-13900K
i9-13900K, 3000 MHz
132000 Points -5%
AMD Ryzen 9 7950X
R9 7950X, 4500 MHz
130289 Points -6%
AMD Ryzen 9 7900X
R9 7900X, 4700 MHz
121250 Points -13%
Intel Core i9-12900K
i9-12900K, 3200 MHz
112749 Points -19%
Intel Core i5-13600K
i5-13600K, 3500 MHz
110412 Points -21%
AMD Ryzen 5 7600X
R5 7600X, 4700 MHz
89641 Points -35%
Intel Core i5-12600K
i5-12600K, 2800 MHz
89478 Points -36%
Blender - v2.79 BMW27 CPU
AMD Ryzen 5 7600X
R5 7600X, 4700 MHz
203 Seconds * -101%
Intel Core i5-12600K
i5-12600K, 2800 MHz
189.5 Seconds * -88%
Intel Core i5-13600K
i5-13600K, 3500 MHz
135 Seconds * -34%
Intel Core i9-12900K
i9-12900K, 3200 MHz
121.1 Seconds * -20%
AMD Ryzen 9 7900X
R9 7900X, 4700 MHz
106 Seconds * -5%
Intel Core i9-13900K
i9-13900K, 3000 MHz
101 Seconds *
AMD Ryzen 9 7950X
R9 7950X, 4500 MHz
85 Seconds * +16%
Intel Core i9-13900K
i9-13900K, 3000 MHz
80 Seconds * +21%
wPrime 2.10
32m
Intel Core i9-12900K
i9-12900K, 3200 MHz
4.924 s * -150%
Intel Core i5-12600K
i5-12600K, 2800 MHz
4.725 s * -140%
AMD Ryzen 5 7600X
R5 7600X, 4700 MHz
2.78 s * -41%
Intel Core i5-13600K
i5-13600K, 3500 MHz
2.527 s * -28%
Intel Core i9-13900K
i9-13900K, 3000 MHz
1.97 s *
Intel Core i9-13900K
i9-13900K, 3000 MHz
1.818 s * +8%
AMD Ryzen 9 7900X
R9 7900X, 4700 MHz
1.781 s * +10%
AMD Ryzen 9 7950X
R9 7950X, 4500 MHz
1.669 s * +15%
1024m
Intel Core i5-12600K
i5-12600K, 2800 MHz
202.7 s * -125%
Intel Core i9-12900K
i9-12900K, 3200 MHz
190.6 s * -111%
Intel Core i5-13600K
i5-13600K, 3500 MHz
177.592 s * -97%
Intel Core i9-13900K
i9-13900K, 3000 MHz
90.13 s *
Intel Core i9-13900K
i9-13900K, 3000 MHz
79.738 s * +12%
AMD Ryzen 5 7600X
R5 7600X, 4700 MHz
74.491 s * +17%
AMD Ryzen 9 7900X
R9 7900X, 4700 MHz
39.954 s * +56%
AMD Ryzen 9 7950X
R9 7950X, 4500 MHz
30.811 s * +66%
X264 HD Benchmark 4.0
Pass 1
Intel Core i9-13900K
i9-13900K, 3000 MHz
416.5 (414min - 417max) fps
Intel Core i9-13900K
i9-13900K, 3000 MHz
412 (410min - 417max) fps -1%
Intel Core i5-13600K
i5-13600K, 3500 MHz
388 (386min - 388max) fps -7%
AMD Ryzen 9 7950X
R9 7950X, 4500 MHz
379.5 (378min - 385max) fps -9%
AMD Ryzen 9 7900X
R9 7900X, 4700 MHz
376 (369min - 378max) fps -10%
Intel Core i9-12900K
i9-12900K, 3200 MHz
368.5 (366min - 369max) fps -12%
AMD Ryzen 5 7600X
R5 7600X, 4700 MHz
367 (363min - 371max) fps -12%
Intel Core i5-12600K
i5-12600K, 2800 MHz
333.5 (332min - 336max) fps -20%
Pass 2
Intel Core i9-13900K
i9-13900K, 3000 MHz
267 (266min - 271max) fps +8%
AMD Ryzen 9 7950X
R9 7950X, 4500 MHz
266.5 (263min - 267max) fps +8%
Intel Core i9-13900K
i9-13900K, 3000 MHz
247.5 (238min - 251max) fps
AMD Ryzen 9 7900X
R9 7900X, 4700 MHz
241 (240min - 242max) fps -3%
Intel Core i9-12900K
i9-12900K, 3200 MHz
206 (206min - 206max) fps -17%
Intel Core i5-13600K
i5-13600K, 3500 MHz
199 (198.5min - 199.4max) fps -20%
Intel Core i5-12600K
i5-12600K, 2800 MHz
148 (147min - 148max) fps -40%
AMD Ryzen 5 7600X
R5 7600X, 4700 MHz
147.8 (147.7min - 147.9max) fps -40%
WinRAR - Result
AMD Ryzen 9 7900X
R9 7900X, 4700 MHz
17225 KB/s +30%
AMD Ryzen 9 7950X
R9 7950X, 4500 MHz
16351 KB/s +24%
AMD Ryzen 5 7600X
R5 7600X, 4700 MHz
16178 KB/s +22%
Intel Core i9-13900K
i9-13900K, 3000 MHz
14836 KB/s +12%
Intel Core i9-13900K
i9-13900K, 3000 MHz
13210 KB/s
Intel Core i5-13600K
i5-13600K, 3500 MHz
10937 KB/s -17%
Intel Core i9-12900K
i9-12900K, 3200 MHz
10792 KB/s -18%
Intel Core i5-12600K
i5-12600K, 2800 MHz
6239 KB/s -53%
TrueCrypt
AES Mean 100MB
AMD Ryzen 9 7950X
R9 7950X, 4500 MHz
30.7 GB/s +50%
Intel Core i9-13900K
i9-13900K, 3000 MHz
27 GB/s +32%
Intel Core i9-13900K
i9-13900K, 3000 MHz
20.5 GB/s
Intel Core i5-13600K
i5-13600K, 3500 MHz
18.8 GB/s -8%
Intel Core i9-12900K
i9-12900K, 3200 MHz
18.5 GB/s -10%
AMD Ryzen 9 7900X
R9 7900X, 4700 MHz
14.8 GB/s -28%
AMD Ryzen 5 7600X
R5 7600X, 4700 MHz
13.2 GB/s -36%
Intel Core i5-12600K
i5-12600K, 2800 MHz
12.8 GB/s -38%
Twofish Mean 100MB
Intel Core i9-13900K
i9-13900K, 3000 MHz
5.4 GB/s +4%
Intel Core i9-13900K
i9-13900K, 3000 MHz
5.2 GB/s
AMD Ryzen 9 7950X
R9 7950X, 4500 MHz
4.5 GB/s -13%
Intel Core i9-12900K
i9-12900K, 3200 MHz
3.7 GB/s -29%
Intel Core i5-13600K
i5-13600K, 3500 MHz
3.1 GB/s -40%
AMD Ryzen 9 7900X
R9 7900X, 4700 MHz
2.8 GB/s -46%
Intel Core i5-12600K
i5-12600K, 2800 MHz
2.2 GB/s -58%
AMD Ryzen 5 7600X
R5 7600X, 4700 MHz
1.8 GB/s -65%
Serpent Mean 100MB
Intel Core i9-13900K
i9-13900K, 3000 MHz
3 GB/s +15%
AMD Ryzen 9 7950X
R9 7950X, 4500 MHz
2.8 GB/s +8%
Intel Core i9-13900K
i9-13900K, 3000 MHz
2.6 GB/s
Intel Core i9-12900K
i9-12900K, 3200 MHz
1.9 GB/s -27%
Intel Core i5-13600K
i5-13600K, 3500 MHz
1.7 GB/s -35%
AMD Ryzen 9 7900X
R9 7900X, 4700 MHz
1.5 GB/s -42%
Intel Core i5-12600K
i5-12600K, 2800 MHz
1.3 GB/s -50%
AMD Ryzen 5 7600X
R5 7600X, 4700 MHz
1.1 GB/s -58%
Geekbench 5.5
Multi-Core
AMD Ryzen 9 7950X
R9 7950X, 4500 MHz
24625 Points +10%
Intel Core i9-13900K
i9-13900K, 3000 MHz
24157 Points +8%
Intel Core i9-13900K
i9-13900K, 3000 MHz
22448 Points
AMD Ryzen 9 7900X
R9 7900X, 4700 MHz
19987 Points -11%
Intel Core i9-12900K
i9-12900K, 3200 MHz
17854 Points -20%
Intel Core i5-13600K
i5-13600K, 3500 MHz
16651 Points -26%
Intel Core i5-12600K
i5-12600K, 2800 MHz
12797 Points -43%
AMD Ryzen 5 7600X
R5 7600X, 4700 MHz
11917 Points -47%
Single-Core
AMD Ryzen 9 7950X
R9 7950X, 4500 MHz
2311 Points +10%
Intel Core i9-13900K
i9-13900K, 3000 MHz
2290 Points +9%
AMD Ryzen 9 7900X
R9 7900X, 4700 MHz
2274 Points +8%
AMD Ryzen 5 7600X
R5 7600X, 4700 MHz
2205 Points +5%
Intel Core i9-13900K
i9-13900K, 3000 MHz
2106 Points
Intel Core i9-12900K
i9-12900K, 3200 MHz
2042 Points -3%
Intel Core i5-13600K
i5-13600K, 3500 MHz
1967 Points -7%
Intel Core i5-12600K
i5-12600K, 2800 MHz
1904 Points -10%
Geekbench 5.0
5.0 Multi-Core
AMD Ryzen 9 7950X
R9 7950X, 4500 MHz
24479 Points +11%
Intel Core i9-13900K
i9-13900K, 3000 MHz
24021 Points +9%
Intel Core i9-13900K
i9-13900K, 3000 MHz
22024 Points
AMD Ryzen 9 7900X
R9 7900X, 4700 MHz
19975 Points -9%
Intel Core i9-12900K
i9-12900K, 3200 MHz
17959 Points -18%
Intel Core i5-13600K
i5-13600K, 3500 MHz
16635 Points -24%
Intel Core i5-12600K
i5-12600K, 2800 MHz
12746 Points -42%
AMD Ryzen 5 7600X
R5 7600X, 4700 MHz
11880 Points -46%
5.0 Single-Core
AMD Ryzen 9 7950X
R9 7950X, 4500 MHz
2222 Points +3%
Intel Core i9-13900K
i9-13900K, 3000 MHz
2214 Points +3%
AMD Ryzen 9 7900X
R9 7900X, 4700 MHz
2194 Points +2%
Intel Core i9-13900K
i9-13900K, 3000 MHz
2148 Points
AMD Ryzen 5 7600X
R5 7600X, 4700 MHz
2126 Points -1%
Intel Core i9-12900K
i9-12900K, 3200 MHz
1968 Points -8%
Intel Core i5-13600K
i5-13600K, 3500 MHz
1931 Points -10%
Intel Core i5-12600K
i5-12600K, 2800 MHz
1821 Points -15%
Geekbench 4.4
64 Bit Single-Core Score
Intel Core i9-13900K
i9-13900K, 3000 MHz
9598 Points +4%
AMD Ryzen 9 7950X
R9 7950X, 4500 MHz
9322 Points +1%
Intel Core i9-13900K
i9-13900K, 3000 MHz
9218 Points
AMD Ryzen 9 7900X
R9 7900X, 4700 MHz
9193 Points 0%
AMD Ryzen 5 7600X
R5 7600X, 4700 MHz
8926 Points -3%
Intel Core i9-12900K
i9-12900K, 3200 MHz
8665 Points -6%
Intel Core i5-13600K
i5-13600K, 3500 MHz
8618 Points -7%
Intel Core i5-12600K
i5-12600K, 2800 MHz
8223 Points -11%
64 Bit Multi-Core Score
AMD Ryzen 9 7950X
R9 7950X, 4500 MHz
89678 Points +16%
Intel Core i9-13900K
i9-13900K, 3000 MHz
86695 Points +12%
Intel Core i9-13900K
i9-13900K, 3000 MHz
77347 Points
AMD Ryzen 9 7900X
R9 7900X, 4700 MHz
74731 Points -3%
Intel Core i9-12900K
i9-12900K, 3200 MHz
63583 Points -18%
Intel Core i5-13600K
i5-13600K, 3500 MHz
60407 Points -22%
AMD Ryzen 5 7600X
R5 7600X, 4700 MHz
47407 Points -39%
Intel Core i5-12600K
i5-12600K, 2800 MHz
46557 Points -40%
3DMark 11 - 1280x720 Performance Physics
Intel Core i9-13900K
i9-13900K, 3000 MHz
32273 Points +11%
Intel Core i5-13600K
i5-13600K, 3500 MHz
30480 Points +5%
Intel Core i9-13900K
i9-13900K, 3000 MHz
29023 Points
AMD Ryzen 9 7900X
R9 7900X, 4700 MHz
28618 Points -1%
AMD Ryzen 9 7950X
R9 7950X, 4500 MHz
28618 Points -1%
Intel Core i9-12900K
i9-12900K, 3200 MHz
28211 Points -3%
AMD Ryzen 5 7600X
R5 7600X, 4700 MHz
25396 Points -12%
Intel Core i5-12600K
i5-12600K, 2800 MHz
25017 Points -14%
7-Zip 18.03
7z b 4
AMD Ryzen 9 7950X
R9 7950X, 4500 MHz
161724 MIPS +27%
Intel Core i9-13900K
i9-13900K, 3000 MHz
147068 MIPS +16%
Intel Core i9-13900K
i9-13900K, 3000 MHz
127201 MIPS
AMD Ryzen 9 7900X
R9 7900X, 4700 MHz
124975 MIPS -2%
Intel Core i9-12900K
i9-12900K, 3200 MHz
97671 MIPS -23%
Intel Core i5-13600K
i5-13600K, 3500 MHz
89647 MIPS -30%
AMD Ryzen 5 7600X
R5 7600X, 4700 MHz
69291 MIPS -46%
Intel Core i5-12600K
i5-12600K, 2800 MHz
64260 MIPS -49%
7z b 4 -mmt1
AMD Ryzen 9 7950X
R9 7950X, 4500 MHz
8365 MIPS +15%
AMD Ryzen 9 7900X
R9 7900X, 4700 MHz
8282 MIPS +14%
AMD Ryzen 5 7600X
R5 7600X, 4700 MHz
8063 MIPS +11%
Intel Core i9-13900K
i9-13900K, 3000 MHz
7272 MIPS 0%
Intel Core i9-13900K
i9-13900K, 3000 MHz
7255 MIPS
Intel Core i9-12900K
i9-12900K, 3200 MHz
6571 MIPS -9%
Intel Core i5-13600K
i5-13600K, 3500 MHz
6502 MIPS -10%
Intel Core i5-12600K
i5-12600K, 2800 MHz
5944 MIPS -18%
HWBOT x265 Benchmark v2.2 - 4k Preset
AMD Ryzen 9 7950X
R9 7950X, 4500 MHz
44.4 fps +29%
Intel Core i9-13900K
i9-13900K, 3000 MHz
42.6 fps +23%
AMD Ryzen 9 7900X
R9 7900X, 4700 MHz
36.2 fps +5%
Intel Core i9-13900K
i9-13900K, 3000 MHz
34.5 fps
Intel Core i5-12600K
i5-12600K, 2800 MHz
30.1 fps -13%
Intel Core i9-12900K
i9-12900K, 3200 MHz
30 fps -13%
Intel Core i5-13600K
i5-13600K, 3500 MHz
27.6 fps -20%
AMD Ryzen 5 7600X
R5 7600X, 4700 MHz
21.1 fps -39%
R Benchmark 2.5 - Overall mean
Intel Core i5-12600K
i5-12600K, 2800 MHz
0.4456 sec * -14%
Intel Core i9-12900K
i9-12900K, 3200 MHz
0.4216 sec * -8%
Intel Core i5-13600K
i5-13600K, 3500 MHz
0.405 sec * -4%
Intel Core i9-13900K
i9-13900K, 3000 MHz
0.3911 sec *
AMD Ryzen 5 7600X
R5 7600X, 4700 MHz
0.3749 sec * +4%
AMD Ryzen 9 7900X
R9 7900X, 4700 MHz
0.3736 sec * +4%
AMD Ryzen 9 7950X
R9 7950X, 4500 MHz
0.3682 sec * +6%
Intel Core i9-13900K
i9-13900K, 3000 MHz
0.3539 sec * +10%
LibreOffice - 20 Documents To PDF
Intel Core i5-12600K
i5-12600K, 2800 MHz
71.8 s * -73%
Intel Core i9-13900K
i9-13900K, 3000 MHz
41.6 s *
Intel Core i9-12900K
i9-12900K, 3200 MHz
40.6 s * +2%
AMD Ryzen 5 7600X
R5 7600X, 4700 MHz
36.8 s * +12%
Intel Core i9-13900K
i9-13900K, 3000 MHz
36.6 s * +12%
AMD Ryzen 9 7950X
R9 7950X, 4500 MHz
35.5 s * +15%
Intel Core i5-13600K
i5-13600K, 3500 MHz
35 s * +16%
AMD Ryzen 9 7900X
R9 7900X, 4700 MHz
34.9 s * +16%
WebXPRT 3 - Overall
AMD Ryzen 9 7900X
R9 7900X, 4700 MHz
371 Points +10%
AMD Ryzen 9 7950X
R9 7950X, 4500 MHz
366 Points +8%
AMD Ryzen 5 7600X
R5 7600X, 4700 MHz
362 Points +7%
Intel Core i9-13900K
i9-13900K, 3000 MHz
361 Points +7%
Intel Core i9-13900K
i9-13900K, 3000 MHz
338 Points
Intel Core i5-13600K
i5-13600K, 3500 MHz
333 Points -1%
Intel Core i9-12900K
i9-12900K, 3200 MHz
320 Points -5%
Intel Core i5-12600K
i5-12600K, 2800 MHz
293 Points -13%
Mozilla Kraken 1.1 - Total
Intel Core i5-12600K
i5-12600K, 2800 MHz
511 ms * -17%
Intel Core i9-12900K
i9-12900K, 3200 MHz
481 ms * -10%
Intel Core i5-13600K
i5-13600K, 3500 MHz
469 ms * -7%
AMD Ryzen 5 7600X
R5 7600X, 4700 MHz
441 ms * -1%
Intel Core i9-13900K
i9-13900K, 3000 MHz
438 ms *
AMD Ryzen 9 7950X
R9 7950X, 4500 MHz
433 ms * +1%
Intel Core i9-13900K
i9-13900K, 3000 MHz
432 ms * +1%
AMD Ryzen 9 7900X
R9 7900X, 4700 MHz
431 ms * +2%
3DMark
3840x2160 Fire Strike Ultra Physics
Intel Core i9-13900K
i9-13900K, 3000 MHz
54036 Points +17%
Intel Core i9-13900K
i9-13900K, 3000 MHz
46030 Points
AMD Ryzen 9 7900X
R9 7900X, 4700 MHz
42399 Points -8%
AMD Ryzen 9 7950X
R9 7950X, 4500 MHz
42399 Points -8%
Intel Core i9-12900K
i9-12900K, 3200 MHz
39462 Points -14%
Intel Core i5-13600K
i5-13600K, 3500 MHz
36774 Points -20%
AMD Ryzen 5 7600X
R5 7600X, 4700 MHz
30780 Points -33%
Intel Core i5-12600K
i5-12600K, 2800 MHz
29443 Points -36%
1920x1080 Fire Strike Physics
Intel Core i9-13900K
i9-13900K, 3000 MHz
53853 Points +17%
Intel Core i9-13900K
i9-13900K, 3000 MHz
46013 Points
AMD Ryzen 9 7900X
R9 7900X, 4700 MHz
42682 Points -7%
AMD Ryzen 9 7950X
R9 7950X, 4500 MHz
42682 Points -7%
Intel Core i9-12900K
i9-12900K, 3200 MHz
39112 Points -15%
Intel Core i5-13600K
i5-13600K, 3500 MHz
35386 Points -23%
AMD Ryzen 5 7600X
R5 7600X, 4700 MHz
30691 Points -33%
Intel Core i5-12600K
i5-12600K, 2800 MHz
29671 Points -36%
2560x1440 Time Spy CPU
Intel Core i9-13900K
i9-13900K, 3000 MHz
19392 Points +19%
Intel Core i9-12900K
i9-12900K, 3200 MHz
18431 Points +14%
Intel Core i5-13600K
i5-13600K, 3500 MHz
17124 Points +5%
AMD Ryzen 9 7900X
R9 7900X, 4700 MHz
16616 Points +2%
AMD Ryzen 9 7950X
R9 7950X, 4500 MHz
16616 Points +2%
Intel Core i9-13900K
i9-13900K, 3000 MHz
16236 Points
Intel Core i5-12600K
i5-12600K, 2800 MHz
13869 Points -15%
AMD Ryzen 5 7600X
R5 7600X, 4700 MHz
10458 Points -36%

* ... smaller is better

Performance Rating
AMD Ryzen 9 7950X
NVIDIA GeForce RTX 3090 Founders Edition
98.8 pt
Intel Core i9-13900K
78.7 pt
AMD Ryzen 9 7900X
AMD Ryzen 9 7900X
75 pt
Intel Core i9-13900K
Intel NUC13 Raptor Canyon
61.7 pt
Intel Core i5-13600K
52.5 pt
Intel Core i9-12900K
44 pt
AMD Ryzen 5 7600X
AMD Ryzen 5 7600X
41.8 pt
AMD Ryzen 9 5900HX
Minisforum Neptune Series HX90G
37.4 pt
Average of class Desktop
 
36.6 pt
Intel Core i5-12600K
32.5 pt
Intel Core i7-11800H
Minisforum NUCX i7
31.6 pt
AIDA64 / FP32 Ray-Trace
AMD Ryzen 9 7950X
NVIDIA GeForce RTX 3090 Founders Edition
61180 KRay/s +117%
Intel Core i9-13900K
36939 KRay/s +31%
AMD Ryzen 9 7900X
AMD Ryzen 9 7900X
33676 KRay/s +19%
Intel Core i9-13900K
Intel NUC13 Raptor Canyon
28226 KRay/s
Intel Core i5-13600K
23446 KRay/s -17%
AMD Ryzen 5 7600X
AMD Ryzen 5 7600X
17633 KRay/s -38%
Average of class Desktop
  (490 - 62786, n=25, last 2 years)
17460 KRay/s -38%
AMD Ryzen 9 5900HX
Minisforum Neptune Series HX90G
15334 KRay/s -46%
Intel Core i9-12900K
13266 KRay/s -53%
Intel Core i7-11800H
Minisforum NUCX i7
12788 KRay/s -55%
Intel Core i5-12600K
8243 KRay/s -71%
AIDA64 / FPU Julia
AMD Ryzen 9 7950X
NVIDIA GeForce RTX 3090 Founders Edition
234844 Points +66%
AMD Ryzen 9 7900X
AMD Ryzen 9 7900X
201995 Points +43%
Intel Core i9-13900K
183390 Points +30%
Intel Core i9-13900K
Intel NUC13 Raptor Canyon
141111 Points
Intel Core i5-13600K
111374 Points -21%
AMD Ryzen 5 7600X
AMD Ryzen 5 7600X
103526 Points -27%
AMD Ryzen 9 5900HX
Minisforum Neptune Series HX90G
99427 Points -30%
Average of class Desktop
  (2932 - 264044, n=25, last 2 years)
81505 Points -42%
Intel Core i9-12900K
59419 Points -58%
Intel Core i7-11800H
Minisforum NUCX i7
54342 Points -61%
Intel Core i5-12600K
37321 Points -74%
AIDA64 / CPU SHA3
AMD Ryzen 9 7950X
NVIDIA GeForce RTX 3090 Founders Edition
10076 MB/s +48%
Intel Core i9-13900K
9180 MB/s +35%
AMD Ryzen 9 7900X
AMD Ryzen 9 7900X
7018 MB/s +3%
Intel Core i9-13900K
Intel NUC13 Raptor Canyon
6810 MB/s
Intel Core i5-13600K
5253 MB/s -23%
Intel Core i9-12900K
4952 MB/s -27%
Average of class Desktop
  (202 - 10362, n=25, last 2 years)
3734 MB/s -45%
Intel Core i7-11800H
Minisforum NUCX i7
3655 MB/s -46%
AMD Ryzen 5 7600X
AMD Ryzen 5 7600X
3601 MB/s -47%
AMD Ryzen 9 5900HX
Minisforum Neptune Series HX90G
3401 MB/s -50%
Intel Core i5-12600K
3250 MB/s -52%
AIDA64 / CPU Queen
AMD Ryzen 9 7950X
NVIDIA GeForce RTX 3090 Founders Edition
203324 Points +30%
AMD Ryzen 9 7900X
AMD Ryzen 9 7900X
172637 Points +11%
Intel Core i9-13900K
159676 Points +2%
Intel Core i9-13900K
Intel NUC13 Raptor Canyon
155930 Points
Intel Core i5-13600K
120485 Points -23%
Intel Core i9-12900K
112694 Points -28%
AMD Ryzen 5 7600X
AMD Ryzen 5 7600X
107954 Points -31%
AMD Ryzen 9 5900HX
Minisforum Neptune Series HX90G
104437 Points -33%
Average of class Desktop
  (8820 - 205588, n=25, last 2 years)
94006 Points -40%
Intel Core i7-11800H
Minisforum NUCX i7
89290 Points -43%
Intel Core i5-12600K
88337 Points -43%
AIDA64 / FPU SinJulia
AMD Ryzen 9 7950X
NVIDIA GeForce RTX 3090 Founders Edition
32823 Points +89%
AMD Ryzen 9 7900X
AMD Ryzen 9 7900X
24881 Points +43%
Intel Core i9-13900K
19920 Points +14%
Intel Core i9-13900K
Intel NUC13 Raptor Canyon
17400 Points
Intel Core i9-12900K
14664 Points -16%
AMD Ryzen 5 7600X
AMD Ryzen 5 7600X
12774 Points -27%
AMD Ryzen 9 5900HX
Minisforum Neptune Series HX90G
12662 Points -27%
Intel Core i5-13600K
12201 Points -30%
Average of class Desktop
  (396 - 32855, n=25, last 2 years)
10987 Points -37%
Intel Core i7-11800H
Minisforum NUCX i7
9734 Points -44%
Intel Core i5-12600K
9510 Points -45%
AIDA64 / FPU Mandel
AMD Ryzen 9 7950X
NVIDIA GeForce RTX 3090 Founders Edition
118564 Points +68%
AMD Ryzen 9 7900X
AMD Ryzen 9 7900X
106620 Points +51%
Intel Core i9-13900K
91721 Points +30%
Intel Core i9-13900K
Intel NUC13 Raptor Canyon
70668 Points
Intel Core i5-13600K
57797 Points -18%
AMD Ryzen 9 5900HX
Minisforum Neptune Series HX90G
54893 Points -22%
AMD Ryzen 5 7600X
AMD Ryzen 5 7600X
54555 Points -23%
Average of class Desktop
  (1558 - 138291, n=25, last 2 years)
43317 Points -39%
Intel Core i9-12900K
38042 Points -46%
Intel Core i7-11800H
Minisforum NUCX i7
32372 Points -54%
Intel Core i5-12600K
24230 Points -66%
AIDA64 / CPU AES
AMD Ryzen 9 7950X
NVIDIA GeForce RTX 3090 Founders Edition
377952 MB/s +183%
Intel Core i9-13900K
297727 MB/s +123%
AMD Ryzen 9 7900X
AMD Ryzen 9 7900X
279956 MB/s +110%
Intel Core i5-13600K
175556 MB/s +31%
AMD Ryzen 5 7600X
AMD Ryzen 5 7600X
144365 MB/s +8%
AMD Ryzen 9 5900HX
Minisforum Neptune Series HX90G
134031 MB/s 0%
Intel Core i9-13900K
Intel NUC13 Raptor Canyon
133509 MB/s
Intel Core i7-11800H
Minisforum NUCX i7
128262 MB/s -4%
Average of class Desktop
  (3778 - 379659, n=25, last 2 years)
108385 MB/s -19%
Intel Core i9-12900K
94062 MB/s -30%
Intel Core i5-12600K
58635 MB/s -56%
AIDA64 / CPU ZLib
Intel Core i9-13900K
2490 MB/s +27%
AMD Ryzen 9 7950X
NVIDIA GeForce RTX 3090 Founders Edition
2427 MB/s +24%
Intel Core i9-13900K
Intel NUC13 Raptor Canyon
1965 MB/s
AMD Ryzen 9 7900X
AMD Ryzen 9 7900X
1848 MB/s -6%
Intel Core i9-12900K
1560 MB/s -21%
Intel Core i5-13600K
1426 MB/s -27%
Intel Core i5-12600K
988 MB/s -50%
AMD Ryzen 5 7600X
AMD Ryzen 5 7600X
945 MB/s -52%
Average of class Desktop
  (75.2 - 2441, n=25, last 2 years)
936 MB/s -52%
AMD Ryzen 9 5900HX
Minisforum Neptune Series HX90G
859 MB/s -56%
Intel Core i7-11800H
Minisforum NUCX i7
756 MB/s -62%
AIDA64 / FP64 Ray-Trace
AMD Ryzen 9 7950X
NVIDIA GeForce RTX 3090 Founders Edition
32883 KRay/s +114%
Intel Core i9-13900K
20298 KRay/s +32%
AMD Ryzen 9 7900X
AMD Ryzen 9 7900X
18490 KRay/s +20%
Intel Core i9-13900K
Intel NUC13 Raptor Canyon
15363 KRay/s
Intel Core i5-13600K
12806 KRay/s -17%
AMD Ryzen 5 7600X
AMD Ryzen 5 7600X
9488 KRay/s -38%
Average of class Desktop
  (273 - 33821, n=25, last 2 years)
9478 KRay/s -38%
Intel Core i9-12900K
8078 KRay/s -47%
AMD Ryzen 9 5900HX
Minisforum Neptune Series HX90G
8000 KRay/s -48%
Intel Core i7-11800H
Minisforum NUCX i7
7109 KRay/s -54%
Intel Core i5-12600K
5149 KRay/s -66%
AIDA64 / CPU PhotoWorxx
Intel Core i9-13900K
48674 MPixel/s +8%
Intel Core i5-12600K
48577 MPixel/s +8%
Intel Core i5-13600K
48434 MPixel/s +8%
Intel Core i9-12900K
48307 MPixel/s +7%
Intel Core i9-13900K
Intel NUC13 Raptor Canyon
45051 MPixel/s
AMD Ryzen 9 7950X
NVIDIA GeForce RTX 3090 Founders Edition
43947 MPixel/s -2%
AMD Ryzen 9 7900X
AMD Ryzen 9 7900X
40893 MPixel/s -9%
AMD Ryzen 5 7600X
AMD Ryzen 5 7600X
32202 MPixel/s -29%
Average of class Desktop
  (5125 - 54037, n=25, last 2 years)
26592 MPixel/s -41%
Intel Core i7-11800H
Minisforum NUCX i7
23758 MPixel/s -47%
AMD Ryzen 9 5900HX
Minisforum Neptune Series HX90G
20422 MPixel/s -55%

Kit Extremo Intel NUC 13: Cinebench R15 Multi Loop

Nosso Cinebench R15 Multi loop mostra um declínio significativo de desempenho após o primeiro loop. Devido à solução de refrigeração compacta e aos limites de potência, observamos um nível de desempenho inferior em comparação com um Intel Core i9-13900K em um sistema alternativo com o Intel Core i9-13900K sob estresse contínuo da CPU. Dito isto, o resultado de 4779 pontos ainda é substancialmente maior do que o da Intel Dragon Canyon NUC.

03156309451260157518902205252028353150346537804095441047255040535556705985Tooltip
Intel NUC13 Raptor Canyon Intel Core i9-13900K, Intel Core i9-13900K: Ø4779 (4708.1-5265.93)
Intel Ghost Canyon NUC (RTX 2070) Intel Core i9-9980HK, Intel Core i9-9980HK: Ø1463 (1410.79-1593.44)
Intel Beast Canyon NUC Intel Core i9-11900KB, Intel Core i9-11900KB: Ø1800 (1776.75-1859.25)
Intel Dragon Canyon NUC - RTX 3060 Intel Core i9-12900, Intel Core i9-12900: Ø2592 (2433.39-3346.44)
Intel Core i9-13900K Intel Core i9-13900K, Intel Core i9-13900K: Ø6182 (6045.95-6213.11)
Intel Core i9-12900K Intel Core i9-12900K, Intel Core i9-12900K: Ø3987 (3920.42-4037.55)

Desempenho do sistema

Quando se trata de benchmarks sintéticos, o Intel NUC 13 Extreme Raptor Canyon brilha com um desempenho de sistema muito rápido. Aqui, oIntel Core i9-13900K com melhor resfriamento ainda tem uma pequena vantagem. Os concorrentes do Minisforum e os antecessores diretos da série NUC não têm nenhuma chance, no entanto. Subjetivamente, nosso sistema de teste é muito rápido e responsivo e não há atrasos perceptíveis.

Performance Rating - Percent
AMD Ryzen 9 7900X, AMD Ryzen 9 7900X
NVIDIA GeForce RTX 3090,
97.4 pt
NVIDIA GeForce RTX 3090 Founders Edition, AMD Ryzen 9 7950X
NVIDIA GeForce RTX 3090, Corsair MP600
97.4 pt
AMD Ryzen 5 7600X, AMD Ryzen 5 7600X
NVIDIA GeForce RTX 3090,
96.9 pt
Intel Core i9-13900K, Intel Core i9-13900K
NVIDIA GeForce RTX 3090, Corsair MP600
96.3 pt
Intel Core i5-13600K, Intel Core i5-13600K
NVIDIA GeForce RTX 3090, Corsair MP600
94.1 pt
Intel NUC13 Raptor Canyon, Intel Core i9-13900K
NVIDIA GeForce RTX 3080 Ti, Kingston Fury Renegade SFYRS1000G
89.8 pt
Intel Core i9-12900K, Intel Core i9-12900K
NVIDIA Titan RTX, Intel Optane 905P 480GB 2.5
85.9 pt
Intel Core i5-12600K, Intel Core i5-12600K
NVIDIA Titan RTX, Intel Optane 905P 480GB 2.5
84.4 pt
Intel Dragon Canyon NUC - RTX 3060, Intel Core i9-12900
NVIDIA GeForce RTX 3060, Transcend M.2 SSD 2200S TS512GMTE220S
83.1 pt
Intel Beast Canyon NUC, Intel Core i9-11900KB
NVIDIA GeForce RTX 3060, Sabrent Rocket 4.0 500GB
76.8 pt
Minisforum Neptune Series HX90G, AMD Ryzen 9 5900HX
AMD Radeon RX 6600M, ESO512GYLCT
76.6 pt
Minisforum NUCX i7, Intel Core i7-11800H
NVIDIA GeForce RTX 3070 Laptop GPU,
71.3 pt
PCMark 10
Score
AMD Ryzen 9 7900X, AMD Ryzen 9 7900X
NVIDIA GeForce RTX 3090,
9911 Points +9%
NVIDIA GeForce RTX 3090 Founders Edition, AMD Ryzen 9 7950X
NVIDIA GeForce RTX 3090, Corsair MP600
9911 Points +9%
Intel Core i9-13900K, Intel Core i9-13900K
NVIDIA GeForce RTX 3090, Corsair MP600
9788 Points +7%
AMD Ryzen 5 7600X, AMD Ryzen 5 7600X
NVIDIA GeForce RTX 3090,
9470 Points +4%
Intel Core i5-13600K, Intel Core i5-13600K
NVIDIA GeForce RTX 3090, Corsair MP600
9362 Points +3%
Intel NUC13 Raptor Canyon, Intel Core i9-13900K
NVIDIA GeForce RTX 3080 Ti, Kingston Fury Renegade SFYRS1000G
9118 Points
Intel Core i9-12900K, Intel Core i9-12900K
NVIDIA Titan RTX, Intel Optane 905P 480GB 2.5
8604 Points -6%
Intel Core i5-12600K, Intel Core i5-12600K
NVIDIA Titan RTX, Intel Optane 905P 480GB 2.5
8259 Points -9%
Intel Dragon Canyon NUC - RTX 3060, Intel Core i9-12900
NVIDIA GeForce RTX 3060, Transcend M.2 SSD 2200S TS512GMTE220S
8083 Points -11%
Minisforum Neptune Series HX90G, AMD Ryzen 9 5900HX
AMD Radeon RX 6600M, ESO512GYLCT
7341 Points -19%
Intel Beast Canyon NUC, Intel Core i9-11900KB
NVIDIA GeForce RTX 3060, Sabrent Rocket 4.0 500GB
7281 Points -20%
Minisforum NUCX i7, Intel Core i7-11800H
NVIDIA GeForce RTX 3070 Laptop GPU,
6863 Points -25%
Essentials
Intel Core i9-13900K, Intel Core i9-13900K
NVIDIA GeForce RTX 3090, Corsair MP600
12868 Points +11%
AMD Ryzen 9 7900X, AMD Ryzen 9 7900X
NVIDIA GeForce RTX 3090,
12651 Points +9%
NVIDIA GeForce RTX 3090 Founders Edition, AMD Ryzen 9 7950X
NVIDIA GeForce RTX 3090, Corsair MP600
12651 Points +9%
Intel Core i5-13600K, Intel Core i5-13600K
NVIDIA GeForce RTX 3090, Corsair MP600
12306 Points +6%
AMD Ryzen 5 7600X, AMD Ryzen 5 7600X
NVIDIA GeForce RTX 3090,
12259 Points +6%
Intel NUC13 Raptor Canyon, Intel Core i9-13900K
NVIDIA GeForce RTX 3080 Ti, Kingston Fury Renegade SFYRS1000G
11598 Points
Intel Dragon Canyon NUC - RTX 3060, Intel Core i9-12900
NVIDIA GeForce RTX 3060, Transcend M.2 SSD 2200S TS512GMTE220S
11171 Points -4%
Intel Core i9-12900K, Intel Core i9-12900K
NVIDIA Titan RTX, Intel Optane 905P 480GB 2.5
11086 Points -4%
Intel Core i5-12600K, Intel Core i5-12600K
NVIDIA Titan RTX, Intel Optane 905P 480GB 2.5
10650 Points -8%
Minisforum Neptune Series HX90G, AMD Ryzen 9 5900HX
AMD Radeon RX 6600M, ESO512GYLCT
10552 Points -9%
Intel Beast Canyon NUC, Intel Core i9-11900KB
NVIDIA GeForce RTX 3060, Sabrent Rocket 4.0 500GB
10422 Points -10%
Minisforum NUCX i7, Intel Core i7-11800H
NVIDIA GeForce RTX 3070 Laptop GPU,
9865 Points -15%
Productivity
AMD Ryzen 5 7600X, AMD Ryzen 5 7600X
NVIDIA GeForce RTX 3090,
12608 Points +15%
AMD Ryzen 9 7900X, AMD Ryzen 9 7900X
NVIDIA GeForce RTX 3090,
11853 Points +8%
NVIDIA GeForce RTX 3090 Founders Edition, AMD Ryzen 9 7950X
NVIDIA GeForce RTX 3090, Corsair MP600
11853 Points +8%
Intel Core i5-13600K, Intel Core i5-13600K
NVIDIA GeForce RTX 3090, Corsair MP600
11630 Points +6%
Intel Core i9-13900K, Intel Core i9-13900K
NVIDIA GeForce RTX 3090, Corsair MP600
11370 Points +3%
Intel Core i5-12600K, Intel Core i5-12600K
NVIDIA Titan RTX, Intel Optane 905P 480GB 2.5
11001 Points 0%
Intel NUC13 Raptor Canyon, Intel Core i9-13900K
NVIDIA GeForce RTX 3080 Ti, Kingston Fury Renegade SFYRS1000G
10988 Points
Intel Core i9-12900K, Intel Core i9-12900K
NVIDIA Titan RTX, Intel Optane 905P 480GB 2.5
10699 Points -3%
Intel Dragon Canyon NUC - RTX 3060, Intel Core i9-12900
NVIDIA GeForce RTX 3060, Transcend M.2 SSD 2200S TS512GMTE220S
10205 Points -7%
Intel Beast Canyon NUC, Intel Core i9-11900KB
NVIDIA GeForce RTX 3060, Sabrent Rocket 4.0 500GB
9582 Points -13%
Minisforum Neptune Series HX90G, AMD Ryzen 9 5900HX
AMD Radeon RX 6600M, ESO512GYLCT
9288 Points -15%
Minisforum NUCX i7, Intel Core i7-11800H
NVIDIA GeForce RTX 3070 Laptop GPU,
8579 Points -22%

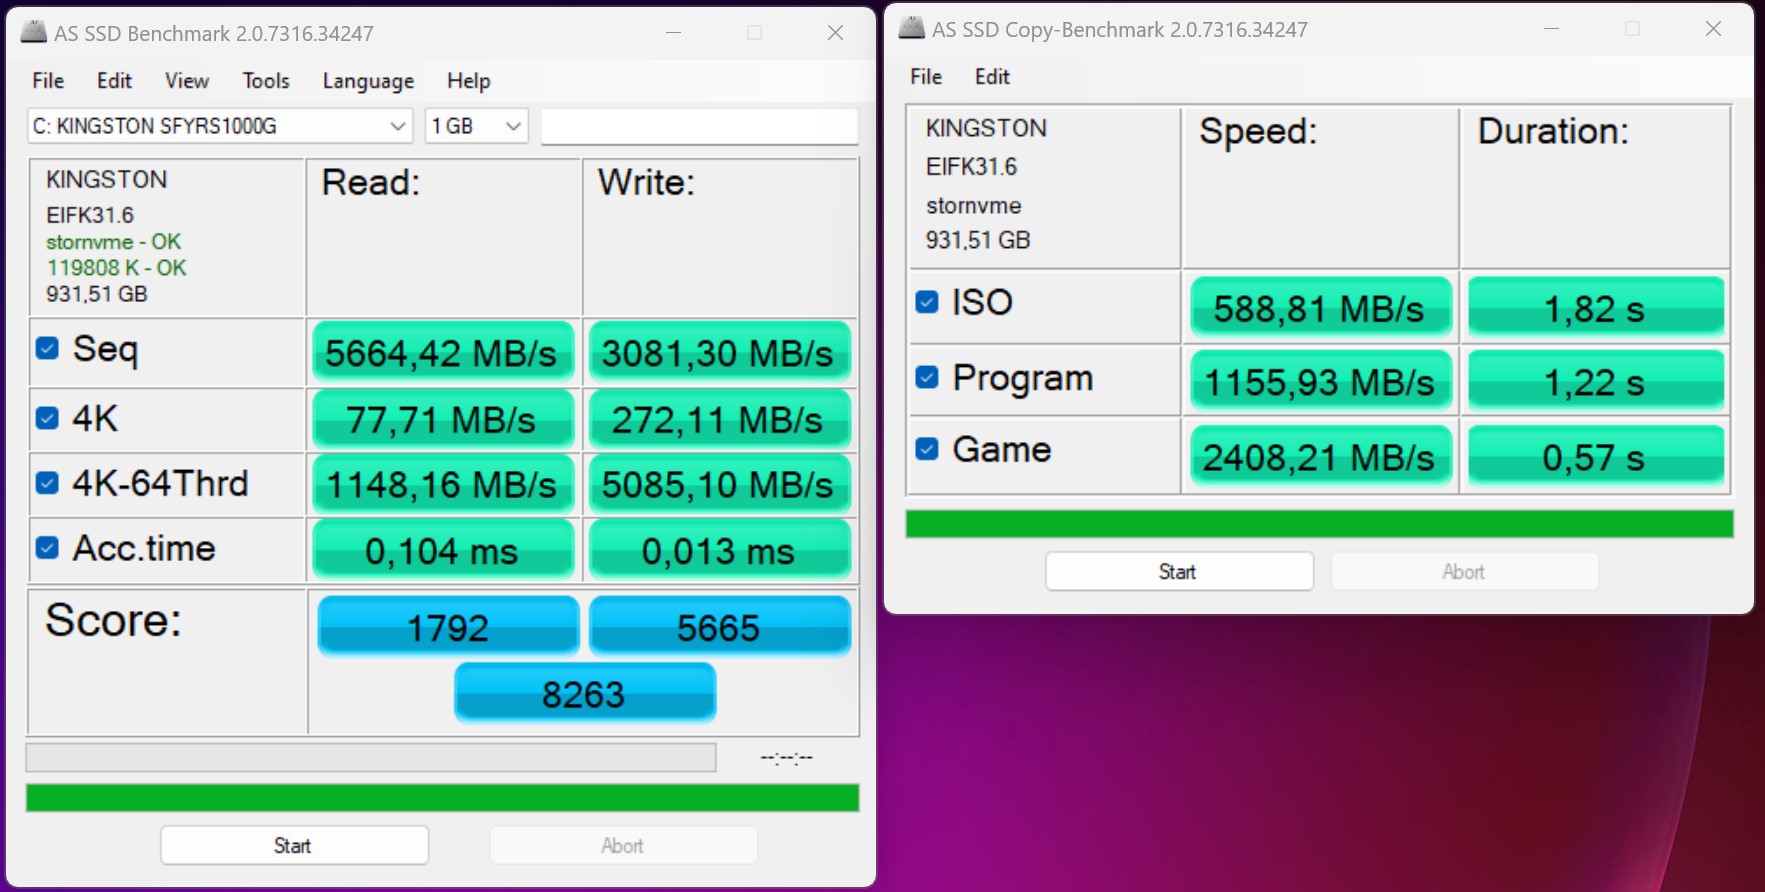
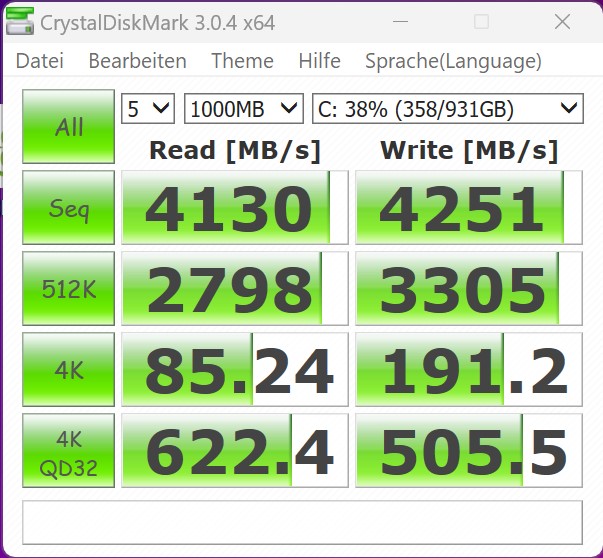
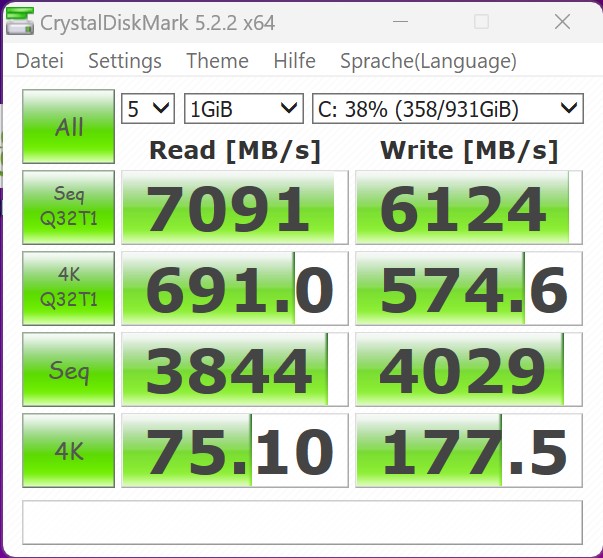
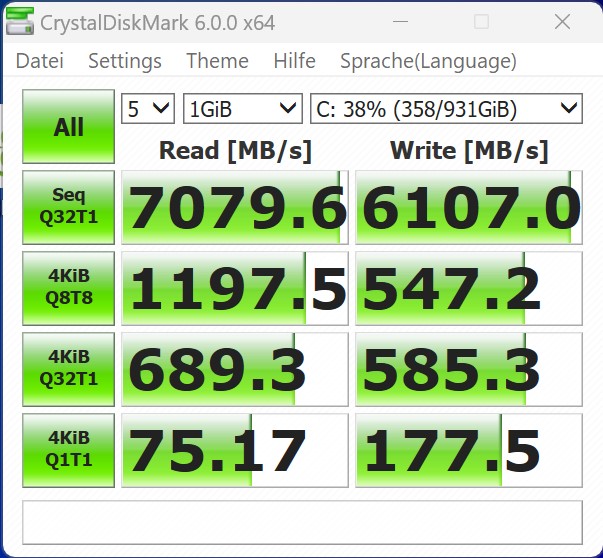
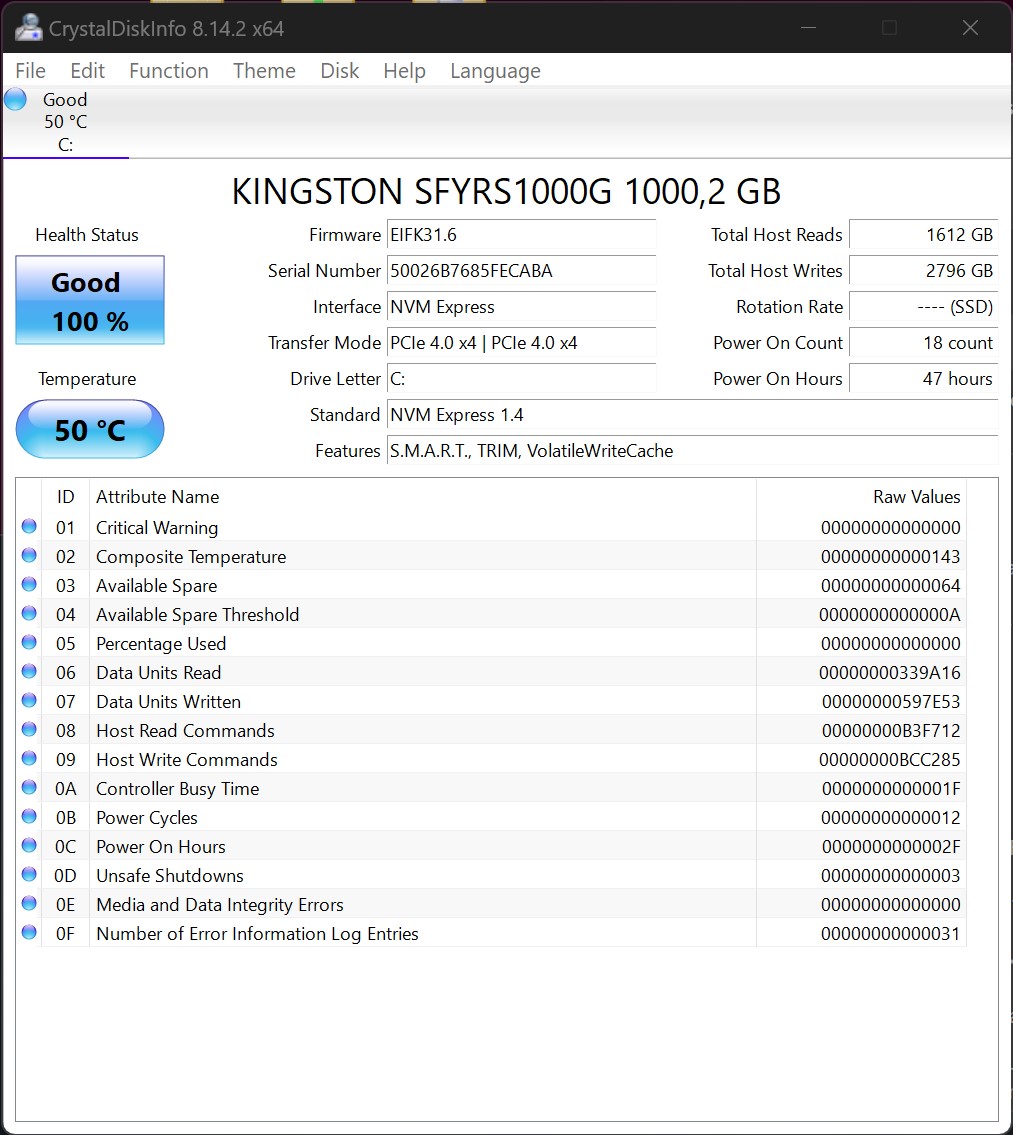
Solução de armazenamento

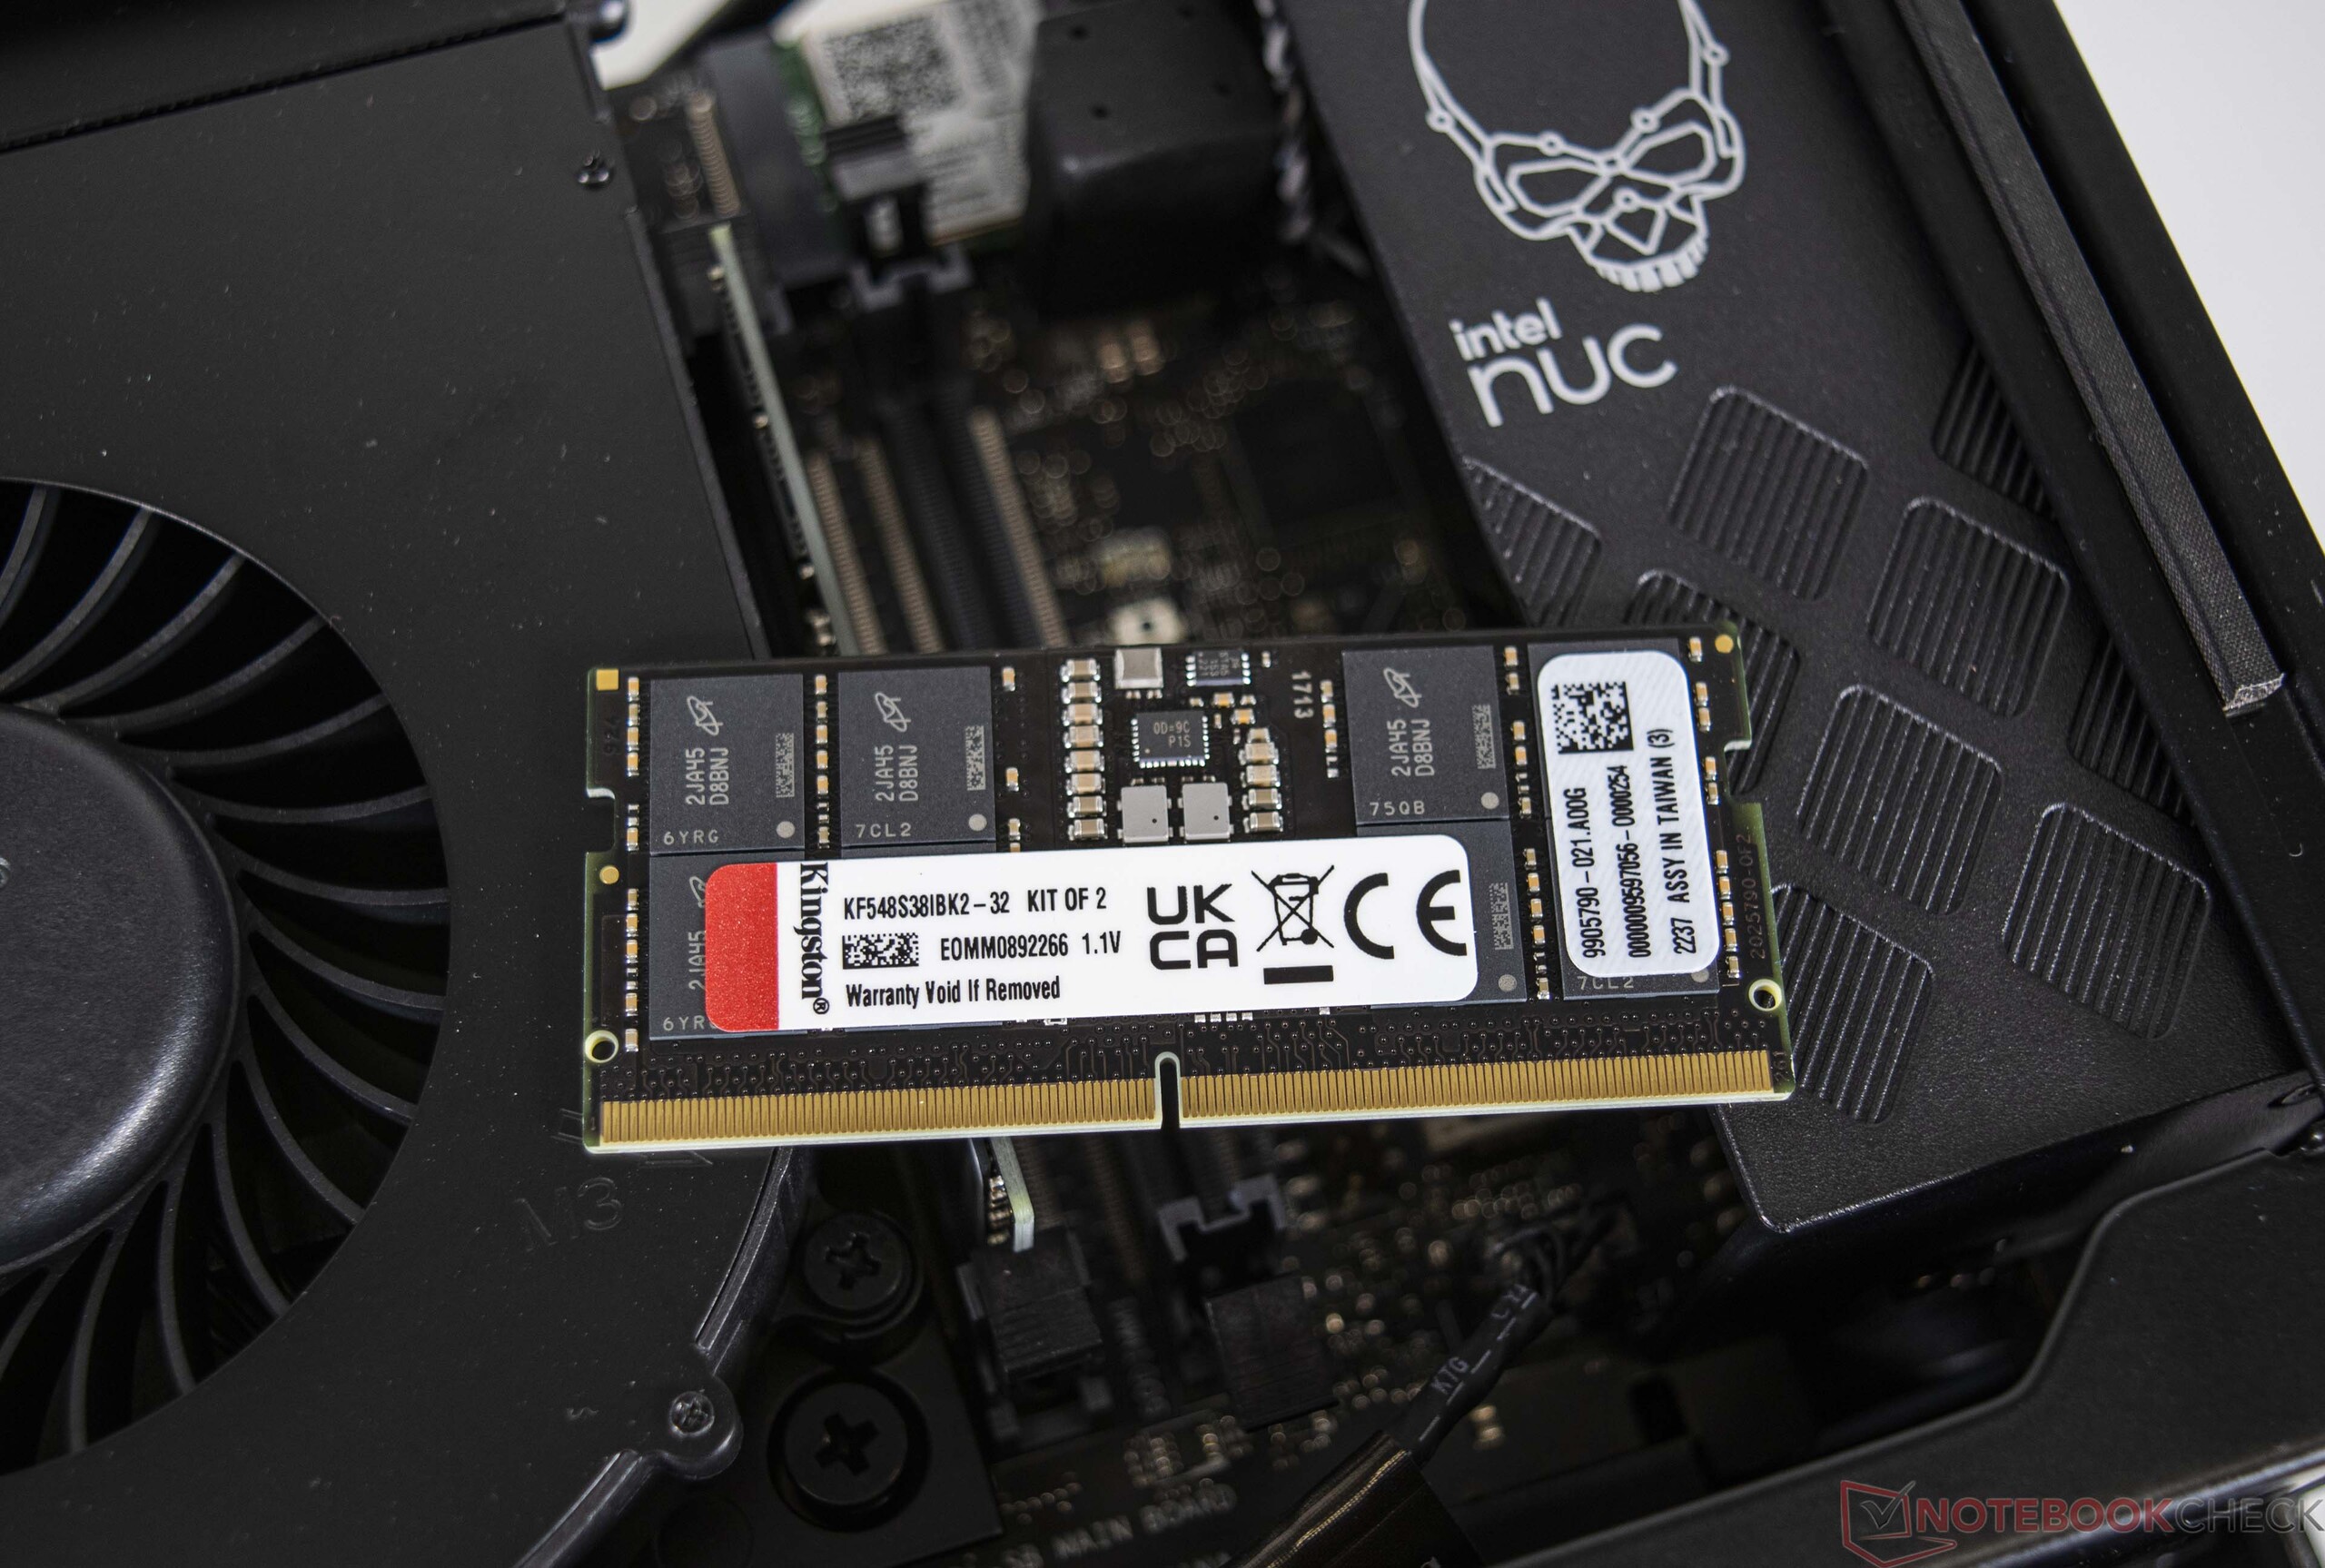
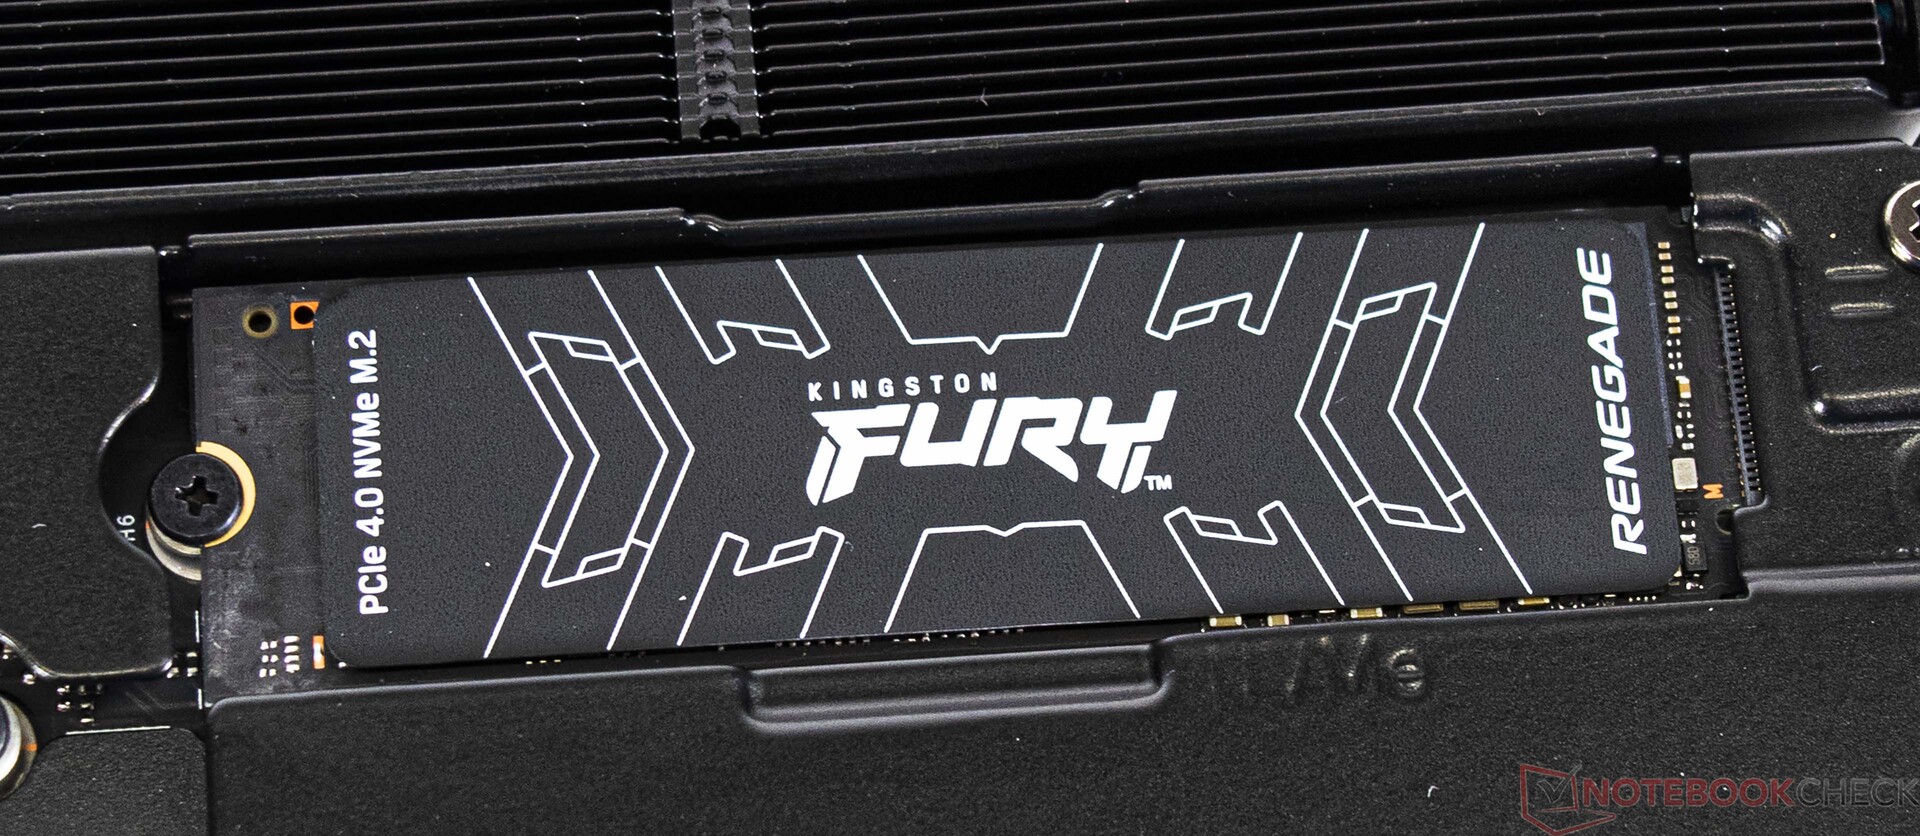
Nossa amostra de teste usa um SSD Kingston NVMe muito rápido como a unidade do sistema. O modelo funciona muito bem, atingindo velocidades de transferência muito rápidas tanto em AS SSD quanto em DiskSpd. Como o Intel NUC 13 Extreme Raptor Canyon é um sistema de barebone, os usuários podem escolher qual unidade SSD querem instalar. O Compute Element suporta até três SSDs M.2 no total. Instalar os SSDs é um pouco complicado, já que o Elemento de Computação primeiro precisa ser completamente removido do NUC 13.

Mais comparações e referências podem ser encontradas em nosso tabela comparativa.

1-TB Kingston SSD
1-TB Kingston SSD
A Elemento de Cálculo abriga até três M.2-2280 SSDs.
AS SSD
AS SSD
MDL 3
MDL 3
MDL 5
MDL 5
MDL 6
MDL 6
CDI
CDI
Kingston Fury Renegade SFYRS1000G
Sequential Read: 4130 MB/s
Sequential Write: 4251 MB/s
512K Read: 2798 MB/s
512K Write: 3305 MB/s
4K Read: 85.24 MB/s
4K Write: 191.2 MB/s
4K QD32 Read: 622.4 MB/s
4K QD32 Write: 505.5 MB/s
Drive Performance Rating - Percent
Intel NUC13 Raptor Canyon
Kingston Fury Renegade SFYRS1000G
84.9 pt
Average Kingston Fury Renegade SFYRS1000G
 
84.9 pt
Intel Beast Canyon NUC
Sabrent Rocket 4.0 500GB
72.1 pt
Intel Dragon Canyon NUC - RTX 3060 -11!
Transcend M.2 SSD 2200S TS512GMTE220S
63.8 pt
Minisforum Neptune Series HX90G
ESO512GYLCT
45.7 pt
Average of class Desktop
 
45.4 pt
Minisforum NUCX i7
 
40.7 pt
DiskSpd
seq read
Intel NUC13 Raptor Canyon
Kingston Fury Renegade SFYRS1000G
3912 (3515.15min - 3912.09max) MB/s
Average Kingston Fury Renegade SFYRS1000G
  ()
3912 MB/s 0%
Intel Beast Canyon NUC
Sabrent Rocket 4.0 500GB
1936 (1755.26min - 1936.41max) MB/s -51%
Intel Dragon Canyon NUC - RTX 3060
Transcend M.2 SSD 2200S TS512GMTE220S
1936 (1755.26min - 1936.41max) MB/s -51%
Average of class Desktop
  (229 - 4276, n=20, last 2 years)
1935 MB/s -51%
Minisforum NUCX i7
 
1620 (1579.16min - 1620.17max) MB/s -59%
Minisforum Neptune Series HX90G
ESO512GYLCT
1614 (1595.77min - 1613.55max) MB/s -59%
seq write
Intel NUC13 Raptor Canyon
Kingston Fury Renegade SFYRS1000G
4256 (3822.69min - 4255.75max) MB/s
Average Kingston Fury Renegade SFYRS1000G
  ()
4256 MB/s 0%
Average of class Desktop
  (105.7 - 6288, n=20, last 2 years)
2108 MB/s -50%
Intel Beast Canyon NUC
Sabrent Rocket 4.0 500GB
1744 (525.75min - 1743.78max) MB/s -59%
Intel Dragon Canyon NUC - RTX 3060
Transcend M.2 SSD 2200S TS512GMTE220S
1744 (525.75min - 1743.78max) MB/s -59%
Minisforum NUCX i7
 
1707 (1684.21min - 1706.66max) MB/s -60%
Minisforum Neptune Series HX90G
ESO512GYLCT
1681 (1674.37min - 1681.28max) MB/s -61%
seq q8 t1 read
Intel NUC13 Raptor Canyon
Kingston Fury Renegade SFYRS1000G
7116 (6584.47min - 7116.06max) MB/s
Average Kingston Fury Renegade SFYRS1000G
  ()
7116 MB/s 0%
Intel Beast Canyon NUC
Sabrent Rocket 4.0 500GB
4996 (4330.97min - 4996.25max) MB/s -30%
Intel Dragon Canyon NUC - RTX 3060
Transcend M.2 SSD 2200S TS512GMTE220S
4996 (4330.97min - 4996.25max) MB/s -30%
Average of class Desktop
  (254 - 7219, n=20, last 2 years)
3190 MB/s -55%
Minisforum Neptune Series HX90G
ESO512GYLCT
2344 (2130.71min - 2343.78max) MB/s -67%
Minisforum NUCX i7
 
2308 (2036.12min - 2307.5max) MB/s -68%
seq q8 t1 write
Intel NUC13 Raptor Canyon
Kingston Fury Renegade SFYRS1000G
6135 (6096.84min - 6134.8max) MB/s
Average Kingston Fury Renegade SFYRS1000G
  ()
6135 MB/s 0%
Average of class Desktop
  (100.9 - 6920, n=20, last 2 years)
2620 MB/s -57%
Intel Beast Canyon NUC
Sabrent Rocket 4.0 500GB
2524 (535.17min - 2524.36max) MB/s -59%
Intel Dragon Canyon NUC - RTX 3060
Transcend M.2 SSD 2200S TS512GMTE220S
2524 (535.17min - 2524.36max) MB/s -59%
Minisforum Neptune Series HX90G
ESO512GYLCT
1849 (1833.02min - 1849.14max) MB/s -70%
Minisforum NUCX i7
 
1843 (1731.1min - 1843.4max) MB/s -70%
4k q1 t1 read
Intel NUC13 Raptor Canyon
Kingston Fury Renegade SFYRS1000G
86.5 (82.21min - 86.46max) MB/s
Average Kingston Fury Renegade SFYRS1000G
  ()
86.5 MB/s 0%
Average of class Desktop
  (13.7 - 91.9, n=20, last 2 years)
51.9 MB/s -40%
Intel Beast Canyon NUC
Sabrent Rocket 4.0 500GB
45.7 (45.38min - 45.71max) MB/s -47%
Intel Dragon Canyon NUC - RTX 3060
Transcend M.2 SSD 2200S TS512GMTE220S
45.7 (45.38min - 45.71max) MB/s -47%
Minisforum NUCX i7
 
38.9 (38.65min - 38.87max) MB/s -55%
Minisforum Neptune Series HX90G
ESO512GYLCT
37.9 (37.34min - 37.87max) MB/s -56%
4k q1 t1 write
Intel Beast Canyon NUC
Sabrent Rocket 4.0 500GB
320 (298.75min - 319.53max) MB/s +67%
Intel Dragon Canyon NUC - RTX 3060
Transcend M.2 SSD 2200S TS512GMTE220S
320 (298.75min - 319.53max) MB/s +67%
Intel NUC13 Raptor Canyon
Kingston Fury Renegade SFYRS1000G
192 (183.56min - 191.99max) MB/s
Average Kingston Fury Renegade SFYRS1000G
  ()
192 MB/s 0%
Minisforum NUCX i7
 
187.4 (170.03min - 187.4max) MB/s -2%
Average of class Desktop
  (13.8 - 364, n=20, last 2 years)
181 MB/s -6%
Minisforum Neptune Series HX90G
ESO512GYLCT
161.3 (150.7min - 161.34max) MB/s -16%
4k q32 t16 read
Average of class Desktop
  (26 - 4319, n=20, last 2 years)
1201 MB/s +2%
Intel NUC13 Raptor Canyon
Kingston Fury Renegade SFYRS1000G
1176 (1157.2min - 1176.4max) MB/s
Average Kingston Fury Renegade SFYRS1000G
  ()
1176 MB/s 0%
Intel Beast Canyon NUC
Sabrent Rocket 4.0 500GB
970 (966.45min - 970.29max) MB/s -18%
Intel Dragon Canyon NUC - RTX 3060
Transcend M.2 SSD 2200S TS512GMTE220S
970 (966.45min - 970.29max) MB/s -18%
Minisforum Neptune Series HX90G
ESO512GYLCT
822 (773.05min - 821.5max) MB/s -30%
Minisforum NUCX i7
 
786 (734.36min - 786.34max) MB/s -33%
4k q32 t16 write
Minisforum Neptune Series HX90G
ESO512GYLCT
1492 (333.99min - 1492.35max) MB/s +177%
Average of class Desktop
  (13.1 - 5015, n=20, last 2 years)
1241 MB/s +131%
Intel Beast Canyon NUC
Sabrent Rocket 4.0 500GB
1119 (483.18min - 1119.3max) MB/s +108%
Intel Dragon Canyon NUC - RTX 3060
Transcend M.2 SSD 2200S TS512GMTE220S
1119 (483.18min - 1119.3max) MB/s +108%
Minisforum NUCX i7
 
1032 (266.97min - 1032.05max) MB/s +92%
Intel NUC13 Raptor Canyon
Kingston Fury Renegade SFYRS1000G
538 (527.91min - 538.21max) MB/s
Average Kingston Fury Renegade SFYRS1000G
  ()
538 MB/s 0%
AS SSD
Score Total
Intel NUC13 Raptor Canyon
Kingston Fury Renegade SFYRS1000G
8263 Points
Average Kingston Fury Renegade SFYRS1000G
  ()
8263 Points 0%
Intel Beast Canyon NUC
Sabrent Rocket 4.0 500GB
6467 Points -22%
Average of class Desktop
  (136 - 8347, n=16, last 2 years)
3122 Points -62%
Minisforum Neptune Series HX90G
ESO512GYLCT
2988 Points -64%
Minisforum NUCX i7
 
1054.23 Points -87%
Score Read
Intel Beast Canyon NUC
Sabrent Rocket 4.0 500GB
2462 Points +37%
Intel NUC13 Raptor Canyon
Kingston Fury Renegade SFYRS1000G
1792 Points
Average Kingston Fury Renegade SFYRS1000G
  ()
1792 Points 0%
Average of class Desktop
  (65 - 3253, n=16, last 2 years)
1112 Points -38%
Minisforum Neptune Series HX90G
ESO512GYLCT
1001 Points -44%
Minisforum NUCX i7
 
895 Points -50%
Score Write
Intel NUC13 Raptor Canyon
Kingston Fury Renegade SFYRS1000G
5665 Points
Average Kingston Fury Renegade SFYRS1000G
  ()
5665 Points 0%
Intel Beast Canyon NUC
Sabrent Rocket 4.0 500GB
2827 Points -50%
Average of class Desktop
  (39 - 5665, n=16, last 2 years)
1582 Points -72%
Minisforum NUCX i7
 
1556 Points -73%
Minisforum Neptune Series HX90G
ESO512GYLCT
1482 Points -74%
Seq Read
Intel NUC13 Raptor Canyon
Kingston Fury Renegade SFYRS1000G
5664 MB/s
Average Kingston Fury Renegade SFYRS1000G
  ()
5664 MB/s 0%
Intel Beast Canyon NUC
Sabrent Rocket 4.0 500GB
4274 MB/s -25%
Average of class Desktop
  (265 - 6331, n=16, last 2 years)
2332 MB/s -59%
Minisforum Neptune Series HX90G
ESO512GYLCT
2215 MB/s -61%
Minisforum NUCX i7
 
1613 MB/s -72%
Seq Write
Intel NUC13 Raptor Canyon
Kingston Fury Renegade SFYRS1000G
3081 MB/s
Average Kingston Fury Renegade SFYRS1000G
  ()
3081 MB/s 0%
Intel Beast Canyon NUC
Sabrent Rocket 4.0 500GB
2382 MB/s -23%
Minisforum Neptune Series HX90G
ESO512GYLCT
1780 MB/s -42%
Average of class Desktop
  (117 - 5326, n=16, last 2 years)
1630 MB/s -47%
Minisforum NUCX i7
 
1468 MB/s -52%
4K Read
Intel Beast Canyon NUC
Sabrent Rocket 4.0 500GB
83.9 MB/s +8%
Intel NUC13 Raptor Canyon
Kingston Fury Renegade SFYRS1000G
77.71 MB/s
Average Kingston Fury Renegade SFYRS1000G
  ()
77.7 MB/s 0%
Minisforum NUCX i7
 
54.25 MB/s -30%
Minisforum Neptune Series HX90G
ESO512GYLCT
53.18 MB/s -32%
Average of class Desktop
  (13.2 - 83.7, n=16, last 2 years)
48.2 MB/s -38%
4K Write
Intel Beast Canyon NUC
Sabrent Rocket 4.0 500GB
308.4 MB/s +13%
Intel NUC13 Raptor Canyon
Kingston Fury Renegade SFYRS1000G
272.11 MB/s
Average Kingston Fury Renegade SFYRS1000G
  ()
272 MB/s 0%
Minisforum Neptune Series HX90G
ESO512GYLCT
157.2 MB/s -42%
Average of class Desktop
  (13.5 - 272, n=16, last 2 years)
141.9 MB/s -48%
Minisforum NUCX i7
 
129.81 MB/s -52%
4K-64 Read
Intel Beast Canyon NUC
Sabrent Rocket 4.0 500GB
1950 MB/s +70%
Intel NUC13 Raptor Canyon
Kingston Fury Renegade SFYRS1000G
1148.16 MB/s
Average Kingston Fury Renegade SFYRS1000G
  ()
1148 MB/s 0%
Average of class Desktop
  (25.7 - 2536, n=16, last 2 years)
830 MB/s -28%
Minisforum Neptune Series HX90G
ESO512GYLCT
725.98 MB/s -37%
Minisforum NUCX i7
 
679.23 MB/s -41%
4K-64 Write
Intel NUC13 Raptor Canyon
Kingston Fury Renegade SFYRS1000G
5085.1 MB/s
Average Kingston Fury Renegade SFYRS1000G
  ()
5085 MB/s 0%
Intel Beast Canyon NUC
Sabrent Rocket 4.0 500GB
2281 MB/s -55%
Minisforum NUCX i7
 
1279.71 MB/s -75%
Average of class Desktop
  (13.7 - 5085, n=16, last 2 years)
1277 MB/s -75%
Minisforum Neptune Series HX90G
ESO512GYLCT
1146.83 MB/s -77%
Access Time Read
Average of class Desktop
  (0.031 - 0.311, n=16, last 2 years)
0.123 ms * -18%
Minisforum Neptune Series HX90G
ESO512GYLCT
0.117 ms * -13%
Intel NUC13 Raptor Canyon
Kingston Fury Renegade SFYRS1000G
0.104 ms *
Average Kingston Fury Renegade SFYRS1000G
  ()
0.104 ms * -0%
Minisforum NUCX i7
 
0.092 ms * +12%
Intel Beast Canyon NUC
Sabrent Rocket 4.0 500GB
0.071 ms * +32%
Access Time Write
Average of class Desktop
  (0.013 - 0.942, n=16, last 2 years)
0.1468 ms * -1029%
Minisforum NUCX i7
 
0.079 ms * -508%
Minisforum Neptune Series HX90G
ESO512GYLCT
0.024 ms * -85%
Intel NUC13 Raptor Canyon
Kingston Fury Renegade SFYRS1000G
0.013 ms *
Average Kingston Fury Renegade SFYRS1000G
  ()
0.013 ms * -0%
Intel Beast Canyon NUC
Sabrent Rocket 4.0 500GB
0.012 ms * +8%

* ... smaller is better

Disk Throttling: DiskSpd Read Loop, Queue Depth 8
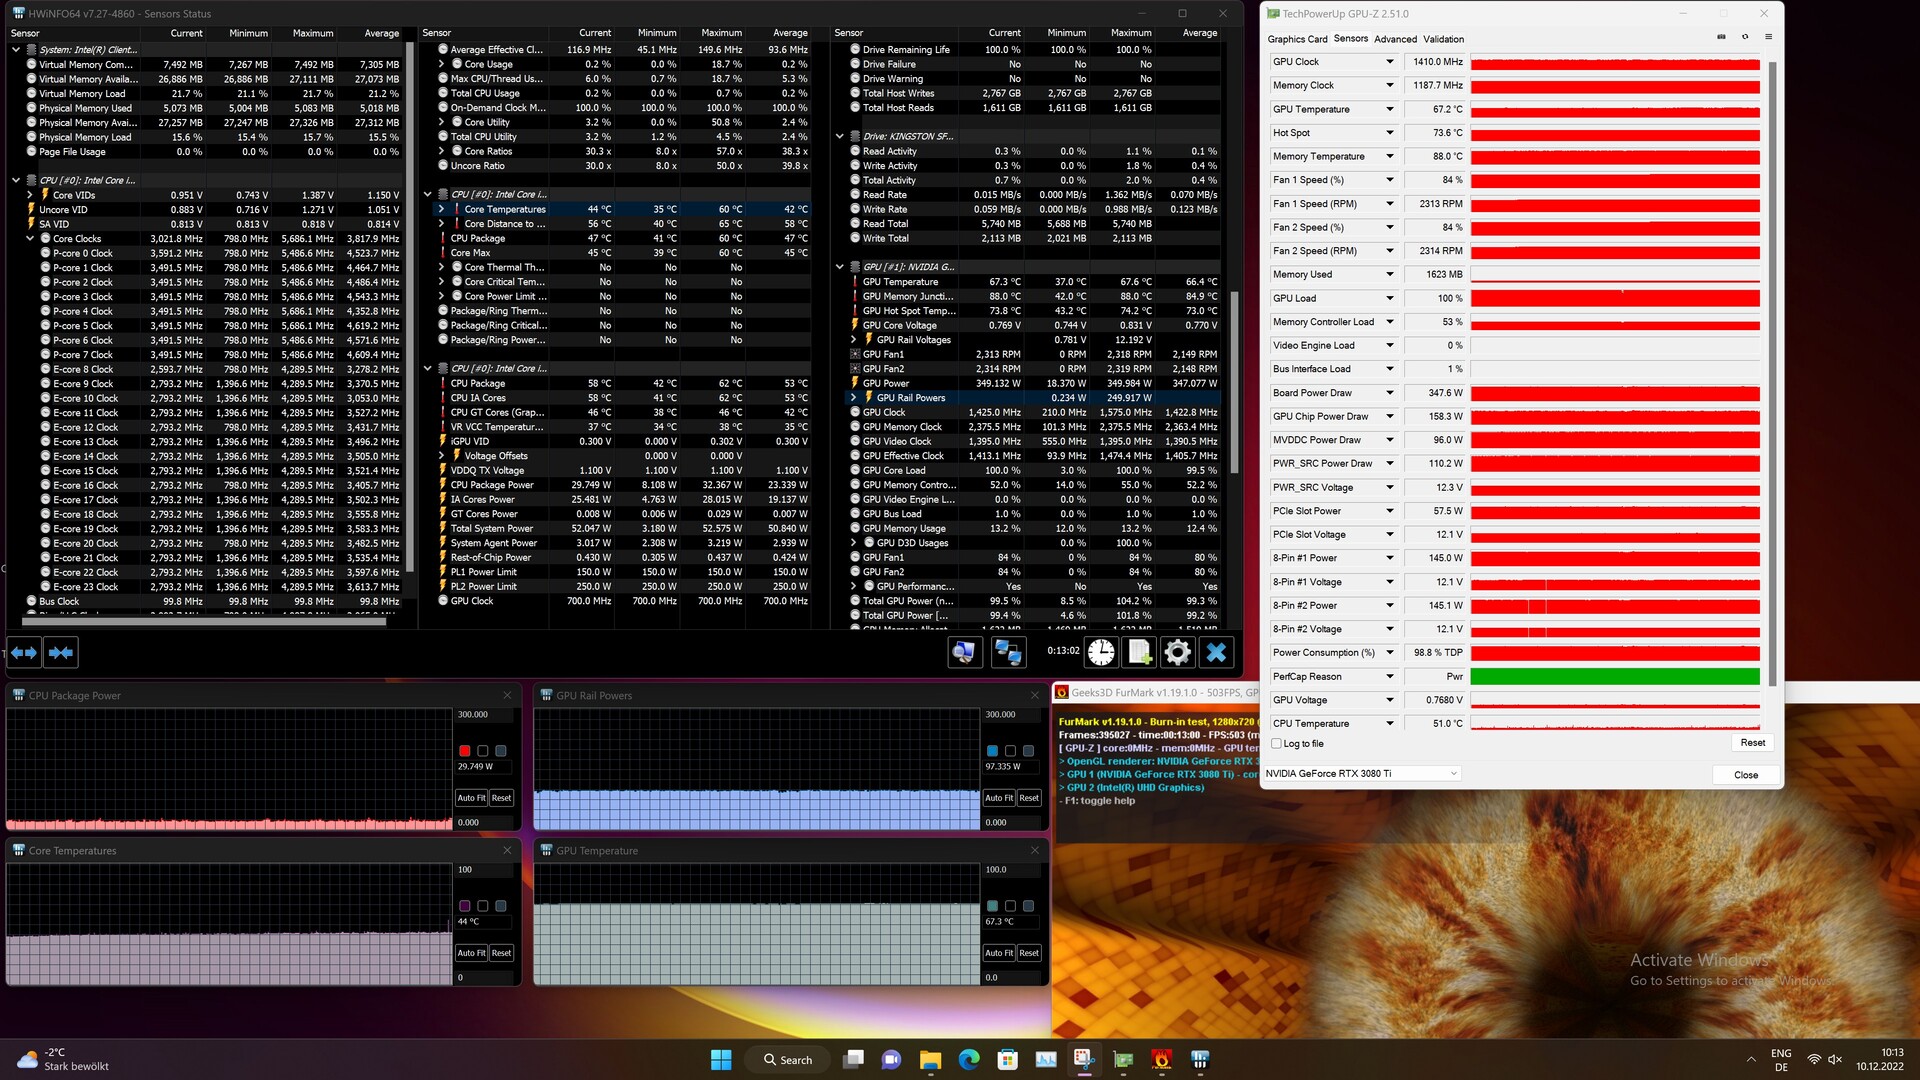
035571010651420177521302485284031953550390542604615497053255680603563906745Tooltip
Intel NUC13 Raptor Canyon Kingston Fury Renegade SFYRS1000G: Ø6568 (2645.61-7096.48)
Intel Beast Canyon NUC Sabrent Rocket 4.0 500GB: Ø3896 (225.06-5002.7)
Zotac ZBOX Magnus EN173070C Transcend M.2 SSD 2200S TS512GMTE220S: Ø2440 (1786.98-2501.9)
Intel Dragon Canyon NUC - RTX 3060 Transcend M.2 SSD 2200S TS512GMTE220S: Ø3896 (225.06-5002.7)
Minisforum NUCX i7  : Ø2309 (2137.76-2318.4)
Minisforum Neptune Series HX90G ESO512GYLCT: Ø1859 (996.67-1961.26)

Desempenho da GPU

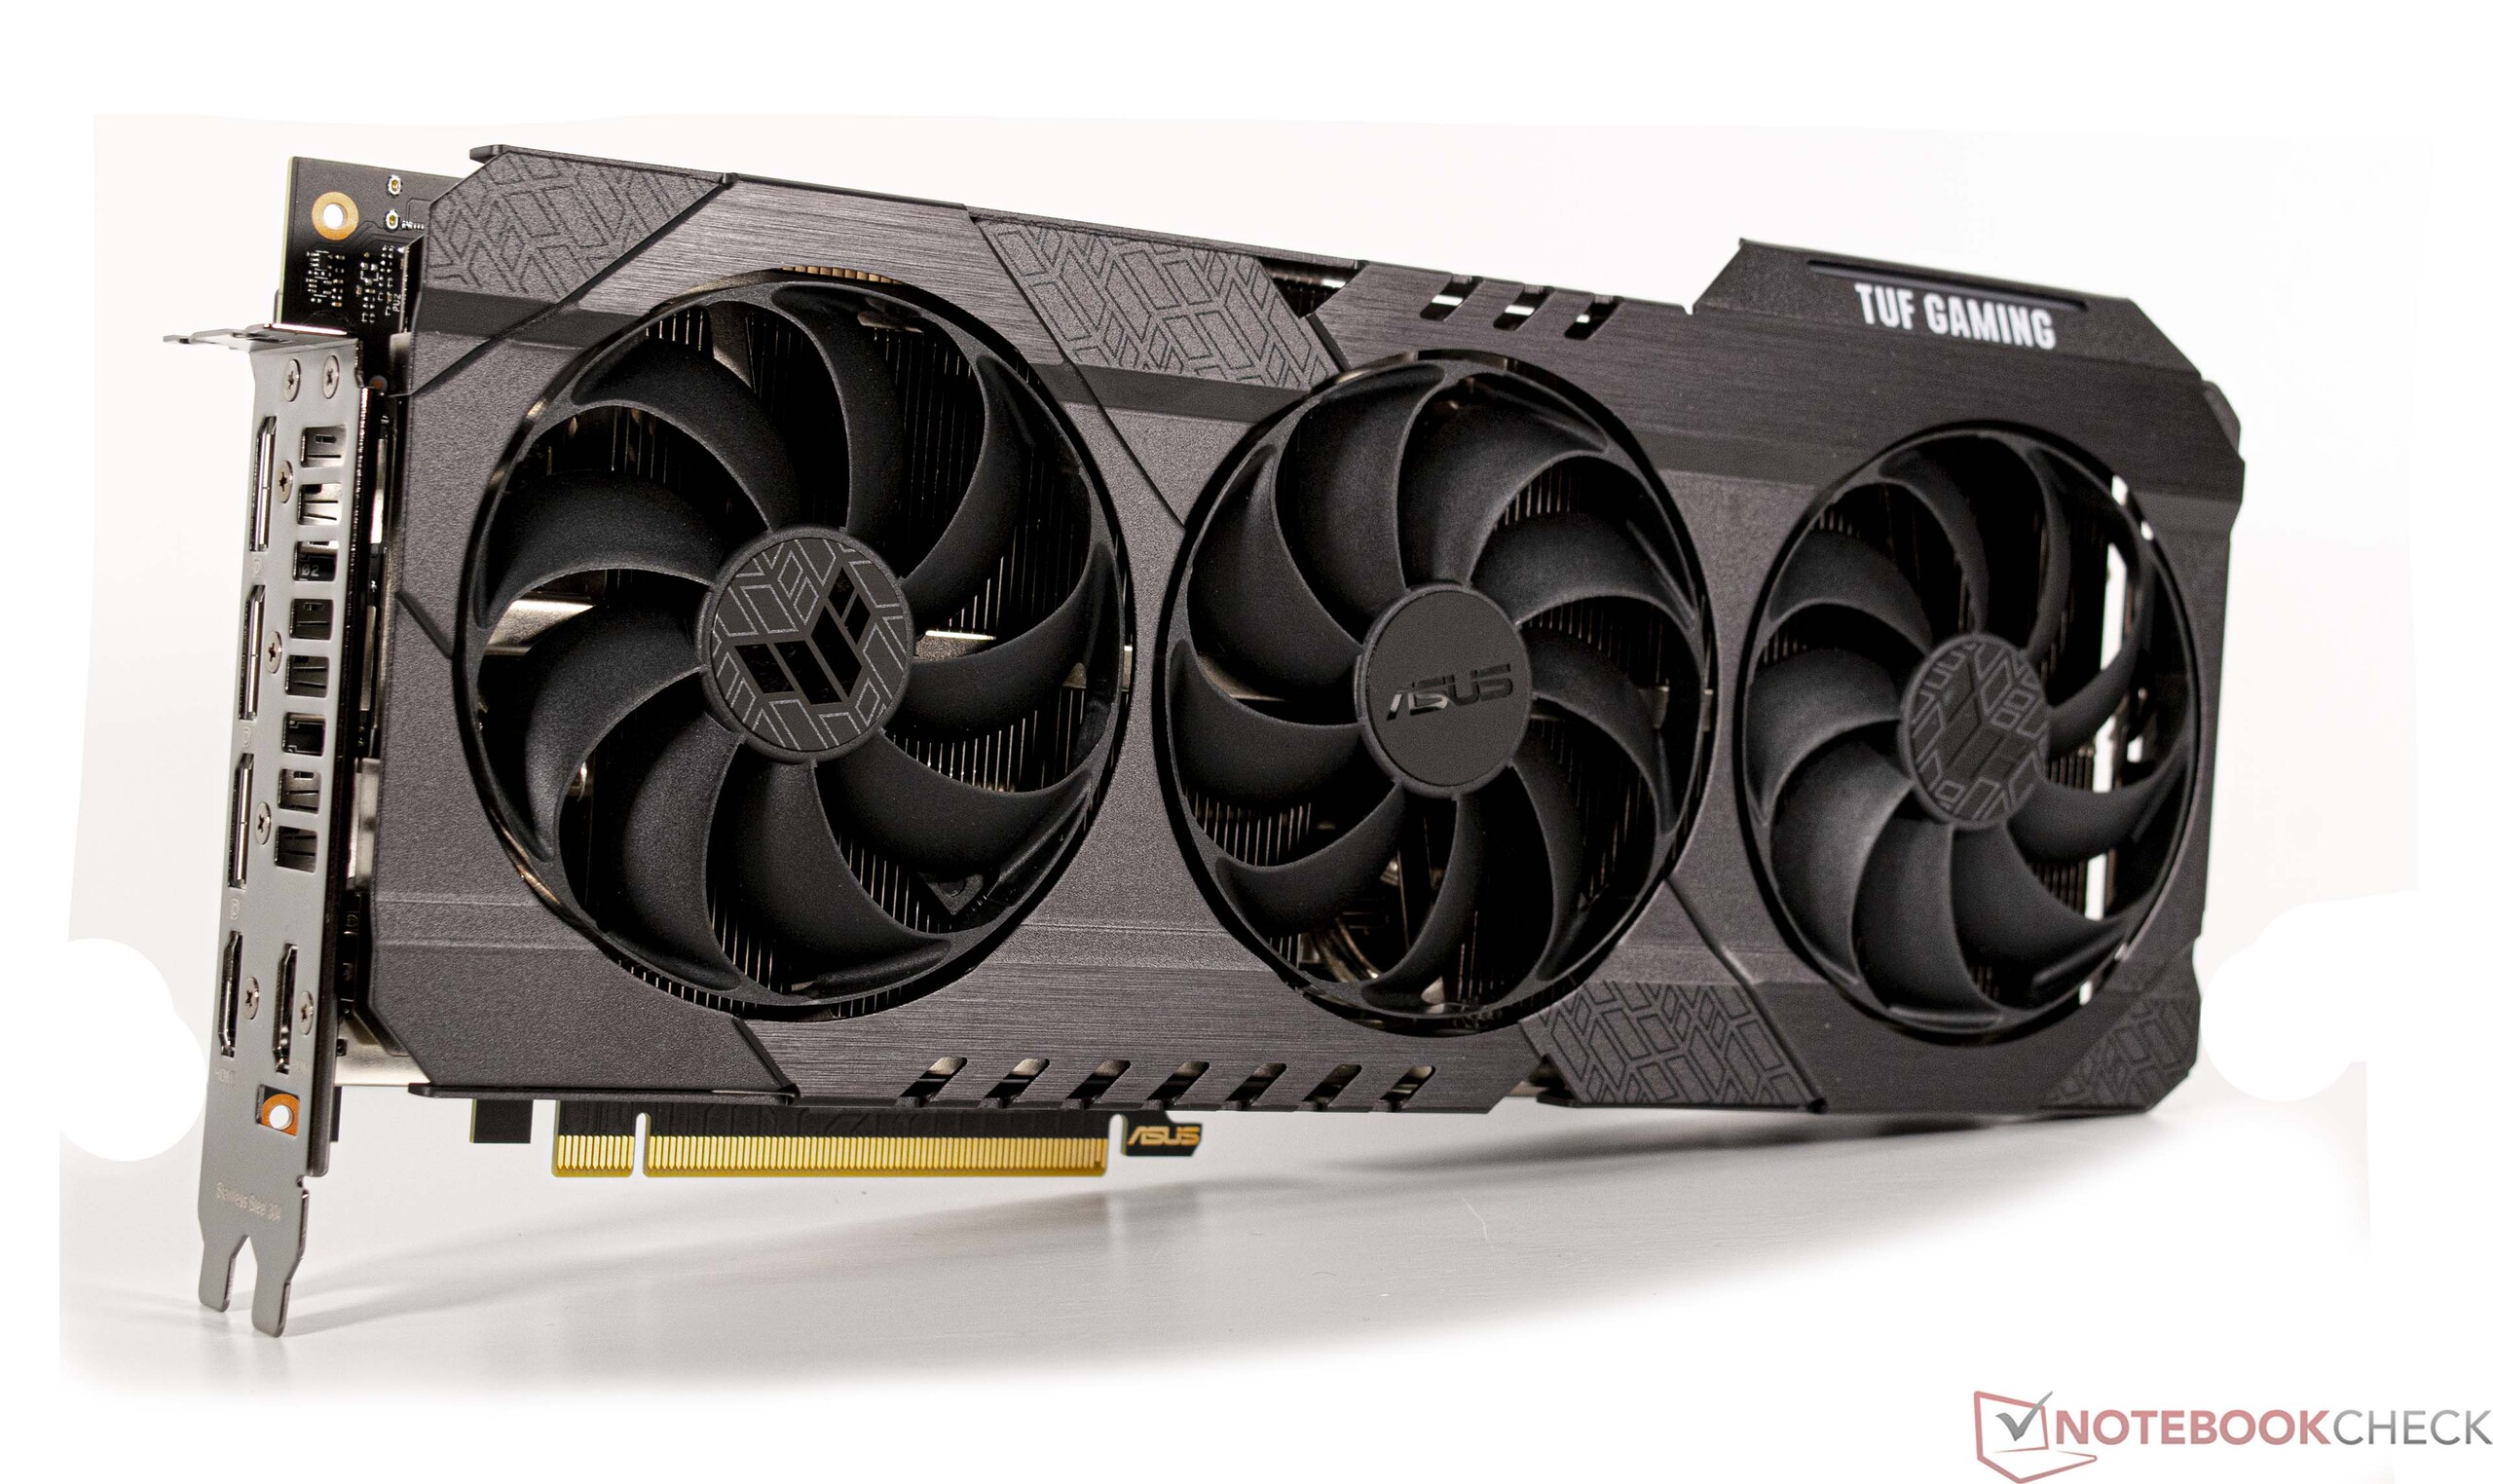
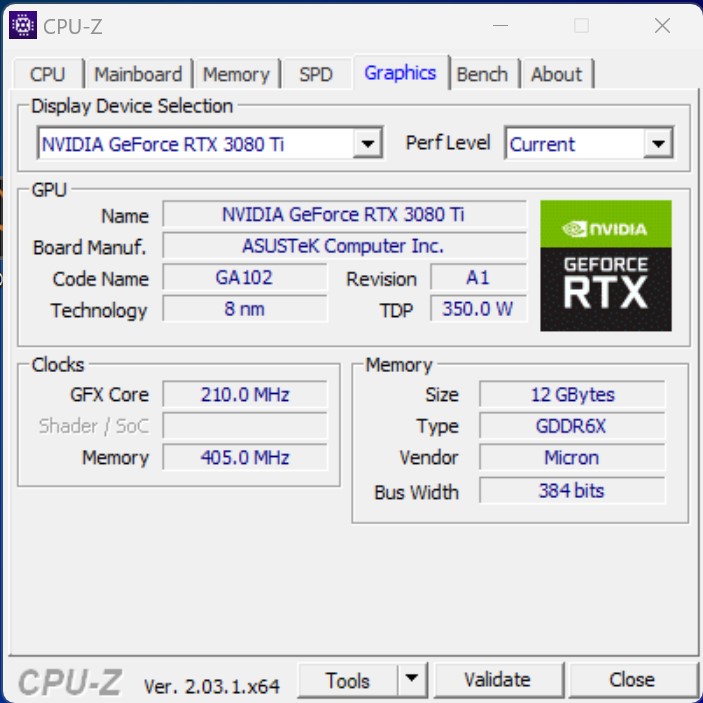
A Intel equipa nossa amostra de teste com um Nvidia GeForce RTX 3080 Ti. A GPU oferece ótimo desempenho e quase combina com o Nvidia GeForce RTX 3090. Embora a 12 GB de VRAM, ela vem com metade da VRAM do RTX 3090, isto ainda é suficiente na maioria dos casos. Com 350 watts, o modelo instalado está funcionando no limite do que consideramos razoável e não recomendamos o uso de GPUs ainda maiores no sistema compacto. Isto se aplica apenas ao consumo de energia, uma vez que o sistema suporta fisicamente até mesmo o Nvidia GeForce RTX 4090. Os usuários que insistem em um cartão da série GeForce-RTX-4000 podem ficar melhor com um Nvidia GeForce RTX 4080. Com um TGP de até 320 watts, é mais econômico e substancialmente mais rápido do que nosso GeForce RTX 3080 Ti da Asus.

Mais comparações e referências podem ser encontradas em nosso Página da GPU.

3DMark Performance Rating - Percent
ASUS TUF Gaming GeForce RTX 3080 Ti OC
NVIDIA GeForce RTX 3080 Ti, AMD Ryzen 9 7950X
100 pt
Corsair One i300
NVIDIA GeForce RTX 3080 Ti, Intel Core i9-12900K
98 pt
Intel Core i9-13900K
NVIDIA GeForce RTX 3090, Intel Core i9-13900K
97.6 pt
Intel NUC13 Raptor Canyon
NVIDIA GeForce RTX 3080 Ti, Intel Core i9-13900K
97 pt
Minisforum NUCX i7
NVIDIA GeForce RTX 3070 Laptop GPU, Intel Core i7-11800H
50.6 pt
Minisforum Neptune Series HX90G
AMD Radeon RX 6600M, AMD Ryzen 9 5900HX
45.3 pt
Intel Dragon Canyon NUC - RTX 3060
NVIDIA GeForce RTX 3060, Intel Core i9-12900
44.6 pt
Intel Beast Canyon NUC
NVIDIA GeForce RTX 3060, Intel Core i9-11900KB
44.1 pt
3DMark 11 - 1280x720 Performance GPU
ASUS TUF Gaming GeForce RTX 3080 Ti OC
NVIDIA GeForce RTX 3080 Ti, AMD Ryzen 9 7950X
62189 Points +4%
Corsair One i300
NVIDIA GeForce RTX 3080 Ti, Intel Core i9-12900K
60716 Points +2%
Intel Core i9-13900K
NVIDIA GeForce RTX 3090, Intel Core i9-13900K
59972 Points 0%
Intel NUC13 Raptor Canyon
NVIDIA GeForce RTX 3080 Ti, Intel Core i9-13900K
59799 Points
Minisforum NUCX i7
NVIDIA GeForce RTX 3070 Laptop GPU, Intel Core i7-11800H
34986 Points -41%
Minisforum Neptune Series HX90G
AMD Radeon RX 6600M, AMD Ryzen 9 5900HX
31877 Points -47%
Intel Dragon Canyon NUC - RTX 3060
NVIDIA GeForce RTX 3060, Intel Core i9-12900
29172 Points -51%
Intel Beast Canyon NUC
NVIDIA GeForce RTX 3060, Intel Core i9-11900KB
28939 Points -52%
3DMark
1920x1080 Fire Strike Graphics
ASUS TUF Gaming GeForce RTX 3080 Ti OC
NVIDIA GeForce RTX 3080 Ti, AMD Ryzen 9 7950X
48709 Points +5%
Corsair One i300
NVIDIA GeForce RTX 3080 Ti, Intel Core i9-12900K
47757 Points +3%
Intel Core i9-13900K
NVIDIA GeForce RTX 3090, Intel Core i9-13900K
47241 Points +2%
Intel NUC13 Raptor Canyon
NVIDIA GeForce RTX 3080 Ti, Intel Core i9-13900K
46469 Points
Minisforum NUCX i7
NVIDIA GeForce RTX 3070 Laptop GPU, Intel Core i7-11800H
24451 Points -47%
Minisforum Neptune Series HX90G
AMD Radeon RX 6600M, AMD Ryzen 9 5900HX
22884 Points -51%
Intel Dragon Canyon NUC - RTX 3060
NVIDIA GeForce RTX 3060, Intel Core i9-12900
21984 Points -53%
Intel Beast Canyon NUC
NVIDIA GeForce RTX 3060, Intel Core i9-11900KB
21379 Points -54%
2560x1440 Time Spy Graphics
ASUS TUF Gaming GeForce RTX 3080 Ti OC
NVIDIA GeForce RTX 3080 Ti, AMD Ryzen 9 7950X
19460 Points 0%
Intel NUC13 Raptor Canyon
NVIDIA GeForce RTX 3080 Ti, Intel Core i9-13900K
19367 Points
Intel Core i9-13900K
NVIDIA GeForce RTX 3090, Intel Core i9-13900K
19198 Points -1%
Corsair One i300
NVIDIA GeForce RTX 3080 Ti, Intel Core i9-12900K
19041 Points -2%
Minisforum NUCX i7
NVIDIA GeForce RTX 3070 Laptop GPU, Intel Core i7-11800H
9205 Points -52%
Intel Dragon Canyon NUC - RTX 3060
NVIDIA GeForce RTX 3060, Intel Core i9-12900
8578 Points -56%
Intel Beast Canyon NUC
NVIDIA GeForce RTX 3060, Intel Core i9-11900KB
8525 Points -56%
Minisforum Neptune Series HX90G
AMD Radeon RX 6600M, AMD Ryzen 9 5900HX
7685 Points -60%
Fire Strike Extreme Graphics
ASUS TUF Gaming GeForce RTX 3080 Ti OC
NVIDIA GeForce RTX 3080 Ti, AMD Ryzen 9 7950X
24250 Points +3%
Intel Core i9-13900K
NVIDIA GeForce RTX 3090, Intel Core i9-13900K
23839 Points +2%
Corsair One i300
NVIDIA GeForce RTX 3080 Ti, Intel Core i9-12900K
23835 Points +2%
Intel NUC13 Raptor Canyon
NVIDIA GeForce RTX 3080 Ti, Intel Core i9-13900K
23460 Points
Minisforum NUCX i7
NVIDIA GeForce RTX 3070 Laptop GPU, Intel Core i7-11800H
11757 Points -50%
Minisforum Neptune Series HX90G
AMD Radeon RX 6600M, AMD Ryzen 9 5900HX
10545 Points -55%
Intel Dragon Canyon NUC - RTX 3060
NVIDIA GeForce RTX 3060, Intel Core i9-12900
10244 Points -56%
Intel Beast Canyon NUC
NVIDIA GeForce RTX 3060, Intel Core i9-11900KB
10181 Points -57%
Performance Rating - Percent
ASUS TUF Gaming GeForce RTX 3080 Ti OC
NVIDIA GeForce RTX 3080 Ti, R9 7950X, Corsair MP600
99.4 pt
Intel Core i9-13900K
NVIDIA GeForce RTX 3090, i9-13900K, Corsair MP600
99.2 pt
Intel NUC13 Raptor Canyon
NVIDIA GeForce RTX 3080 Ti, i9-13900K, Kingston Fury Renegade SFYRS1000G
98.3 pt
Corsair One i300
NVIDIA GeForce RTX 3080 Ti, i9-12900K, Samsung PM9A1 MZVL22T0HBLB
96.7 pt
Minisforum NUCX i7
GeForce RTX 3070 Laptop GPU, i7-11800H
48.6 pt
Intel Dragon Canyon NUC - RTX 3060
NVIDIA GeForce RTX 3060, i9-12900, Transcend M.2 SSD 2200S TS512GMTE220S
42.8 pt
Intel Beast Canyon NUC
NVIDIA GeForce RTX 3060, i9-11900KB, Sabrent Rocket 4.0 500GB
42.2 pt
Minisforum Neptune Series HX90G
Radeon RX 6600M, R9 5900HX, ESO512GYLCT
38.7 pt
Unigine Heaven 4.0
Extreme Preset OpenGL
ASUS TUF Gaming GeForce RTX 3080 Ti OC
NVIDIA GeForce RTX 3080 Ti, R9 7950X, Corsair MP600
282.1 fps +1%
Intel NUC13 Raptor Canyon
NVIDIA GeForce RTX 3080 Ti, i9-13900K, Kingston Fury Renegade SFYRS1000G
279.3 fps
Intel Core i9-13900K
NVIDIA GeForce RTX 3090, i9-13900K, Corsair MP600
277.9 fps -1%
Corsair One i300
NVIDIA GeForce RTX 3080 Ti, i9-12900K, Samsung PM9A1 MZVL22T0HBLB
271.9 fps -3%
Minisforum NUCX i7
GeForce RTX 3070 Laptop GPU, i7-11800H
139.4 fps -50%
Minisforum Neptune Series HX90G
Radeon RX 6600M, R9 5900HX, ESO512GYLCT
135.1 fps -52%
Intel Dragon Canyon NUC - RTX 3060
NVIDIA GeForce RTX 3060, i9-12900, Transcend M.2 SSD 2200S TS512GMTE220S
124.9 fps -55%
Intel Beast Canyon NUC
NVIDIA GeForce RTX 3060, i9-11900KB, Sabrent Rocket 4.0 500GB
121 fps -57%
Extreme Preset DX11
ASUS TUF Gaming GeForce RTX 3080 Ti OC
NVIDIA GeForce RTX 3080 Ti, R9 7950X, Corsair MP600
311.6 fps +3%
Intel Core i9-13900K
NVIDIA GeForce RTX 3090, i9-13900K, Corsair MP600
309.2 fps +2%
Intel NUC13 Raptor Canyon
NVIDIA GeForce RTX 3080 Ti, i9-13900K, Kingston Fury Renegade SFYRS1000G
302.6 fps
Corsair One i300
NVIDIA GeForce RTX 3080 Ti, i9-12900K, Samsung PM9A1 MZVL22T0HBLB
296.6 fps -2%
Minisforum NUCX i7
GeForce RTX 3070 Laptop GPU, i7-11800H
152.9 fps -49%
Intel Dragon Canyon NUC - RTX 3060
NVIDIA GeForce RTX 3060, i9-12900, Transcend M.2 SSD 2200S TS512GMTE220S
134.8 fps -55%
Intel Beast Canyon NUC
NVIDIA GeForce RTX 3060, i9-11900KB, Sabrent Rocket 4.0 500GB
130.8 fps -57%
Minisforum Neptune Series HX90G
Radeon RX 6600M, R9 5900HX, ESO512GYLCT
127.7 fps -58%
Unigine Valley 1.0
1920x1080 Extreme HD DirectX AA:x8
Intel Core i9-13900K
NVIDIA GeForce RTX 3090, i9-13900K, Corsair MP600
245 fps +2%
Intel NUC13 Raptor Canyon
NVIDIA GeForce RTX 3080 Ti, i9-13900K, Kingston Fury Renegade SFYRS1000G
240.4 fps
ASUS TUF Gaming GeForce RTX 3080 Ti OC
NVIDIA GeForce RTX 3080 Ti, R9 7950X, Corsair MP600
237.3 fps -1%
Corsair One i300
NVIDIA GeForce RTX 3080 Ti, i9-12900K, Samsung PM9A1 MZVL22T0HBLB
229.3 fps -5%
Minisforum NUCX i7
GeForce RTX 3070 Laptop GPU, i7-11800H
120.9 fps -50%
Intel Dragon Canyon NUC - RTX 3060
NVIDIA GeForce RTX 3060, i9-12900, Transcend M.2 SSD 2200S TS512GMTE220S
108.3 fps -55%
Intel Beast Canyon NUC
NVIDIA GeForce RTX 3060, i9-11900KB, Sabrent Rocket 4.0 500GB
106.7 fps -56%
Minisforum Neptune Series HX90G
Radeon RX 6600M, R9 5900HX, ESO512GYLCT
93.3 fps -61%
1920x1080 Extreme HD Preset OpenGL AA:x8
Intel Core i9-13900K
NVIDIA GeForce RTX 3090, i9-13900K, Corsair MP600
210.8 fps 0%
Intel NUC13 Raptor Canyon
NVIDIA GeForce RTX 3080 Ti, i9-13900K, Kingston Fury Renegade SFYRS1000G
209.8 fps
ASUS TUF Gaming GeForce RTX 3080 Ti OC
NVIDIA GeForce RTX 3080 Ti, R9 7950X, Corsair MP600
208.8 fps 0%
Corsair One i300
NVIDIA GeForce RTX 3080 Ti, i9-12900K, Samsung PM9A1 MZVL22T0HBLB
202.9 fps -3%
Minisforum NUCX i7
GeForce RTX 3070 Laptop GPU, i7-11800H
104.8 fps -50%
Intel Dragon Canyon NUC - RTX 3060
NVIDIA GeForce RTX 3060, i9-12900, Transcend M.2 SSD 2200S TS512GMTE220S
96.1 fps -54%
Intel Beast Canyon NUC
NVIDIA GeForce RTX 3060, i9-11900KB, Sabrent Rocket 4.0 500GB
93.9 fps -55%
Minisforum Neptune Series HX90G
Radeon RX 6600M, R9 5900HX, ESO512GYLCT
91.6 fps -56%
Unigine Superposition
1920x1080 1080p High
ASUS TUF Gaming GeForce RTX 3080 Ti OC
NVIDIA GeForce RTX 3080 Ti, R9 7950X, Corsair MP600
26711 Points +2%
Intel Core i9-13900K
NVIDIA GeForce RTX 3090, i9-13900K, Corsair MP600
26393 Points +1%
Corsair One i300
NVIDIA GeForce RTX 3080 Ti, i9-12900K, Samsung PM9A1 MZVL22T0HBLB
26193 Points 0%
Intel NUC13 Raptor Canyon
NVIDIA GeForce RTX 3080 Ti, i9-13900K, Kingston Fury Renegade SFYRS1000G
26131 Points
Minisforum NUCX i7
GeForce RTX 3070 Laptop GPU, i7-11800H
12667 Points -52%
Intel Beast Canyon NUC
NVIDIA GeForce RTX 3060, i9-11900KB, Sabrent Rocket 4.0 500GB
11177 Points -57%
Intel Dragon Canyon NUC - RTX 3060
NVIDIA GeForce RTX 3060, i9-12900, Transcend M.2 SSD 2200S TS512GMTE220S
11130 Points -57%
Minisforum Neptune Series HX90G
Radeon RX 6600M, R9 5900HX, ESO512GYLCT
10187 Points -61%
1920x1080 1080p Extreme
ASUS TUF Gaming GeForce RTX 3080 Ti OC
NVIDIA GeForce RTX 3080 Ti, R9 7950X, Corsair MP600
12347 Points +2%
Corsair One i300
NVIDIA GeForce RTX 3080 Ti, i9-12900K, Samsung PM9A1 MZVL22T0HBLB
12100 Points 0%
Intel NUC13 Raptor Canyon
NVIDIA GeForce RTX 3080 Ti, i9-13900K, Kingston Fury Renegade SFYRS1000G
12071 Points
Intel Core i9-13900K
NVIDIA GeForce RTX 3090, i9-13900K, Corsair MP600
12069 Points 0%
Minisforum NUCX i7
GeForce RTX 3070 Laptop GPU, i7-11800H
5847 Points -52%
Intel Dragon Canyon NUC - RTX 3060
NVIDIA GeForce RTX 3060, i9-12900, Transcend M.2 SSD 2200S TS512GMTE220S
5008 Points -59%
Intel Beast Canyon NUC
NVIDIA GeForce RTX 3060, i9-11900KB, Sabrent Rocket 4.0 500GB
5006 Points -59%
Minisforum Neptune Series HX90G
Radeon RX 6600M, R9 5900HX, ESO512GYLCT
4274 Points -65%
3840x2160 4k Optimized
ASUS TUF Gaming GeForce RTX 3080 Ti OC
NVIDIA GeForce RTX 3080 Ti, R9 7950X, Corsair MP600
16412 Points +2%
Intel Core i9-13900K
NVIDIA GeForce RTX 3090, i9-13900K, Corsair MP600
16322 Points +1%
Corsair One i300
NVIDIA GeForce RTX 3080 Ti, i9-12900K, Samsung PM9A1 MZVL22T0HBLB
16124 Points 0%
Intel NUC13 Raptor Canyon
NVIDIA GeForce RTX 3080 Ti, i9-13900K, Kingston Fury Renegade SFYRS1000G
16108 Points
Minisforum NUCX i7
GeForce RTX 3070 Laptop GPU, i7-11800H
7574 Points -53%
Intel Beast Canyon NUC
NVIDIA GeForce RTX 3060, i9-11900KB, Sabrent Rocket 4.0 500GB
6733 Points -58%
Intel Dragon Canyon NUC - RTX 3060
NVIDIA GeForce RTX 3060, i9-12900, Transcend M.2 SSD 2200S TS512GMTE220S
6694 Points -58%
Minisforum Neptune Series HX90G
Radeon RX 6600M, R9 5900HX, ESO512GYLCT
5478 Points -66%
ComputeMark v2.1 - 1024x600 Normal, Score
Intel Core i9-13900K
NVIDIA GeForce RTX 3090, i9-13900K, Corsair MP600
49118 Points +1%
ASUS TUF Gaming GeForce RTX 3080 Ti OC
NVIDIA GeForce RTX 3080 Ti, R9 7950X, Corsair MP600
48892 Points 0%
Intel NUC13 Raptor Canyon
NVIDIA GeForce RTX 3080 Ti, i9-13900K, Kingston Fury Renegade SFYRS1000G
48749 Points
Corsair One i300
NVIDIA GeForce RTX 3080 Ti, i9-12900K, Samsung PM9A1 MZVL22T0HBLB
48047 Points -1%
Minisforum NUCX i7
GeForce RTX 3070 Laptop GPU, i7-11800H
24877 Points -49%
Intel Dragon Canyon NUC - RTX 3060
NVIDIA GeForce RTX 3060, i9-12900, Transcend M.2 SSD 2200S TS512GMTE220S
20805 Points -57%
Intel Beast Canyon NUC
NVIDIA GeForce RTX 3060, i9-11900KB, Sabrent Rocket 4.0 500GB
20322 Points -58%
Minisforum Neptune Series HX90G
Radeon RX 6600M, R9 5900HX, ESO512GYLCT
16123 Points -67%
3DMark 05 Standard
82816 pontos
3DMark 06 Standard Score
71555 pontos
3DMark Vantage P Result
118753 pontos
3DMark 11 Performance
46806 pontos
3DMark Ice Storm Standard Score
288716 pontos
3DMark Cloud Gate Standard Score
76027 pontos
3DMark Fire Strike Score
37178 pontos
3DMark Fire Strike Extreme Score
23232 pontos
3DMark Time Spy Score
18822 pontos
Ajuda

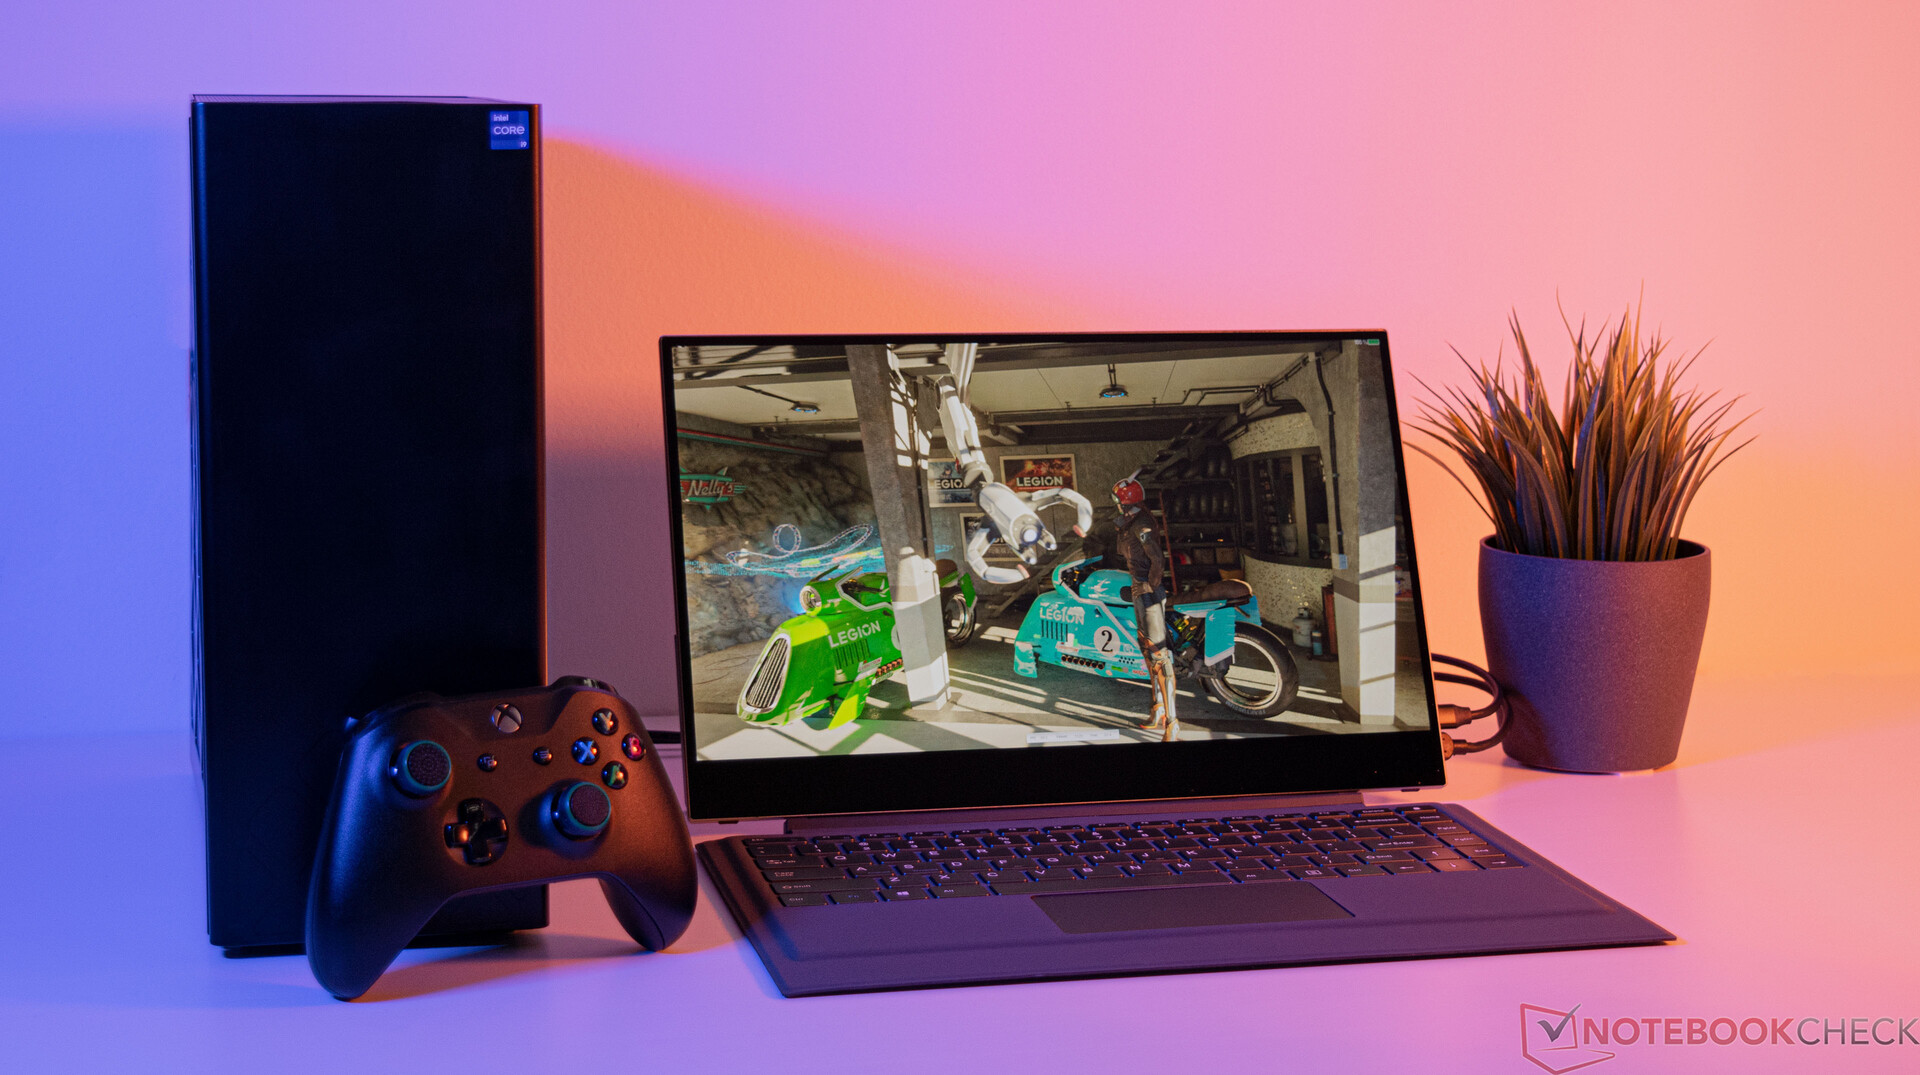
Desempenho nos jogos

Embora o Nvidia GeForce RTX 3080 Ti não é mais uma das últimas placas gráficas, o modelo certamente não é uma má escolha. Uma combinação do Intel Core i9-13900K e o GeForce RTX 3080 Ti ainda faz muito sentido, uma vez que é capaz de exibir até mesmo jogos recentes suavemente em configurações máximas. O déficit de desempenho em comparação com os jogos mais rápidos Nvidia GeForce RTX 3090 é marginal. Em um sistema baseado noAMD Ryzen 9 7950Xque construímos para fins de comparação, o mesmo Nvidia GeForce RTX 3080 Ti não consegue um grande salto de desempenho, uma vez que o desempenho do processador se torna menos importante quando a GPU está perto da carga total.

Quando se trata de escolher uma placa gráfica, recomendamos aos usuários que verifiquem a compabilidade de seu modelo favorito, uma vez que o comprimento máximo suportado é limitado. As soluções gráficas não podem exceder o comprimento máximo de 31,3 cm (~12,32 pol.). Em termos de espessura, o estojo permite até três ranhuras.

GTA V
1920x1080 Highest Settings possible AA:4xMSAA + FX AF:16x
Intel Core i9-13900K
NVIDIA GeForce RTX 3090, i9-13900K, Corsair MP600
165.6 (9.1min, 125P1 - 349max) fps +3%
ASUS TUF Gaming GeForce RTX 3080 Ti OC
NVIDIA GeForce RTX 3080 Ti, R9 7950X, Corsair MP600
163.6 (8.63min, 111.1P1 - 329max) fps +1%
Intel NUC13 Raptor Canyon
NVIDIA GeForce RTX 3080 Ti, i9-13900K, Kingston Fury Renegade SFYRS1000G
161.5 (2.84min, 125P1 - 280max) fps
Corsair One i300
NVIDIA GeForce RTX 3080 Ti, i9-12900K, Samsung PM9A1 MZVL22T0HBLB
149 (8.57min, 100P1 - 295max) fps -8%
Minisforum NUCX i7
GeForce RTX 3070 Laptop GPU, i7-11800H
106 (6.46min, 76.9P1 - 212max) fps -34%
Intel Beast Canyon NUC
NVIDIA GeForce RTX 3060, i9-11900KB, Sabrent Rocket 4.0 500GB
104 (4.33min, 71.4P1 - 206max) fps -36%
Intel Dragon Canyon NUC - RTX 3060
NVIDIA GeForce RTX 3060, i9-12900, Transcend M.2 SSD 2200S TS512GMTE220S
104 (4.33min, 71.4P1 - 206max) fps -36%
Minisforum Neptune Series HX90G
Radeon RX 6600M, R9 5900HX, ESO512GYLCT
86.6 (3.43min, 58.8P1 - 176max) fps -46%
3840x2160 High/On (Advanced Graphics Off) AA:FX AF:8x
ASUS TUF Gaming GeForce RTX 3080 Ti OC
NVIDIA GeForce RTX 3080 Ti, R9 7950X, Corsair MP600
182.6 (2.49min, 125P1 - 569max) fps 0%
Intel Core i9-13900K
NVIDIA GeForce RTX 3090, i9-13900K, Corsair MP600
182.5 (1.708min, 142.9P1 - 583max) fps 0%
Intel NUC13 Raptor Canyon
NVIDIA GeForce RTX 3080 Ti, i9-13900K, Kingston Fury Renegade SFYRS1000G
182 (1.762min, 125P1 - 491max) fps
Corsair One i300
NVIDIA GeForce RTX 3080 Ti, i9-12900K, Samsung PM9A1 MZVL22T0HBLB
180 (2.49min, 143P1 - 329max) fps -1%
Minisforum NUCX i7
GeForce RTX 3070 Laptop GPU, i7-11800H
85.6 fps -53%
Intel Beast Canyon NUC
NVIDIA GeForce RTX 3060, i9-11900KB, Sabrent Rocket 4.0 500GB
82.3 (7.1min, 58.8P1 - 158max) fps -55%
Intel Dragon Canyon NUC - RTX 3060
NVIDIA GeForce RTX 3060, i9-12900, Transcend M.2 SSD 2200S TS512GMTE220S
82.3 (7.1min, 58.8P1 - 158max) fps -55%
Minisforum Neptune Series HX90G
Radeon RX 6600M, R9 5900HX, ESO512GYLCT
57.9 (7.18min, 41.7P1 - 231max) fps -68%
The Witcher 3
1920x1080 Ultra Graphics & Postprocessing (HBAO+)
ASUS TUF Gaming GeForce RTX 3080 Ti OC
NVIDIA GeForce RTX 3080 Ti, R9 7950X, Corsair MP600
184.6 (67.2min, 103.2P0.1, 158P1 - 493max) fps +3%
Corsair One i300
NVIDIA GeForce RTX 3080 Ti, i9-12900K, Samsung PM9A1 MZVL22T0HBLB
183 (62.1min, 107P0.1, 149P1 - 431max) fps +2%
Intel Core i9-13900K
NVIDIA GeForce RTX 3090, i9-13900K, Corsair MP600
179.8 (98.3min, 120.2P0.1, 148.7P1 - 458max) fps 0%
Intel NUC13 Raptor Canyon
NVIDIA GeForce RTX 3080 Ti, i9-13900K, Kingston Fury Renegade SFYRS1000G
179.1 (88.3min, 112.8P0.1, 149.4P1 - 475max) fps
Minisforum NUCX i7
GeForce RTX 3070 Laptop GPU, i7-11800H
104.1 (24.9min, 51.1P0.1, 81.2P1 - 254max) fps -42%
Intel Dragon Canyon NUC - RTX 3060
NVIDIA GeForce RTX 3060, i9-12900, Transcend M.2 SSD 2200S TS512GMTE220S
91.3 (52.3min, 64.5P0.1, 77.1P1 - 310max) fps -49%
Minisforum Neptune Series HX90G
Radeon RX 6600M, R9 5900HX, ESO512GYLCT
88 (41.9min, 48.7P0.1, 72.5P1 - 232max) fps -51%
3840x2160 High Graphics & Postprocessing (Nvidia HairWorks Off)
Intel NUC13 Raptor Canyon
NVIDIA GeForce RTX 3080 Ti, i9-13900K, Kingston Fury Renegade SFYRS1000G
156.8 (29.3min, 110.6P0.1, 134.2P1 - 617max) fps
ASUS TUF Gaming GeForce RTX 3080 Ti OC
NVIDIA GeForce RTX 3080 Ti, R9 7950X, Corsair MP600
154.9 (54.5min, 91.3P0.1, 134.4P1 - 636max) fps -1%
Intel Core i9-13900K
NVIDIA GeForce RTX 3090, i9-13900K, Corsair MP600
151.6 (24.7min, 114.1P0.1, 131.8P1 - 659max) fps -3%
Corsair One i300
NVIDIA GeForce RTX 3080 Ti, i9-12900K, Samsung PM9A1 MZVL22T0HBLB
149 (41.5min, 102P0.1, 127P1 - 584max) fps -5%
Minisforum NUCX i7
GeForce RTX 3070 Laptop GPU, i7-11800H
71.6 (27.6min, 44.2P0.1, 60.8P1 - 323max) fps -54%
Intel Dragon Canyon NUC - RTX 3060
NVIDIA GeForce RTX 3060, i9-12900, Transcend M.2 SSD 2200S TS512GMTE220S
62.5 (22min, 41.4P0.1, 54.9P1 - 339max) fps -60%
Minisforum Neptune Series HX90G
Radeon RX 6600M, R9 5900HX, ESO512GYLCT
43.9 (32.8min, 33P0.1, 34.2P1 - 66.8max) fps -72%
Final Fantasy XV Benchmark
3840x2160 High Quality
Intel Core i9-13900K
NVIDIA GeForce RTX 3090, i9-13900K, Corsair MP600
88.5 fps +5%
ASUS TUF Gaming GeForce RTX 3080 Ti OC
NVIDIA GeForce RTX 3080 Ti, R9 7950X, Corsair MP600
86.4 fps +3%
Intel NUC13 Raptor Canyon
NVIDIA GeForce RTX 3080 Ti, i9-13900K, Kingston Fury Renegade SFYRS1000G
84.2 fps
Corsair One i300
NVIDIA GeForce RTX 3080 Ti, i9-12900K, Samsung PM9A1 MZVL22T0HBLB
84 fps 0%
Minisforum NUCX i7
GeForce RTX 3070 Laptop GPU, i7-11800H
45.6 fps -46%
Intel Beast Canyon NUC
NVIDIA GeForce RTX 3060, i9-11900KB, Sabrent Rocket 4.0 500GB
38 fps -55%
Intel Dragon Canyon NUC - RTX 3060
NVIDIA GeForce RTX 3060, i9-12900, Transcend M.2 SSD 2200S TS512GMTE220S
38 fps -55%
Minisforum Neptune Series HX90G
Radeon RX 6600M, R9 5900HX, ESO512GYLCT
30.6 fps -64%
1920x1080 High Quality
Intel Core i9-13900K
NVIDIA GeForce RTX 3090, i9-13900K, Corsair MP600
188.9 fps +5%
ASUS TUF Gaming GeForce RTX 3080 Ti OC
NVIDIA GeForce RTX 3080 Ti, R9 7950X, Corsair MP600
186.4 fps +3%
Intel NUC13 Raptor Canyon
NVIDIA GeForce RTX 3080 Ti, i9-13900K, Kingston Fury Renegade SFYRS1000G
180.6 fps
Corsair One i300
NVIDIA GeForce RTX 3080 Ti, i9-12900K, Samsung PM9A1 MZVL22T0HBLB
175 fps -3%
Minisforum NUCX i7
GeForce RTX 3070 Laptop GPU, i7-11800H
103.3 fps -43%
Intel Beast Canyon NUC
NVIDIA GeForce RTX 3060, i9-11900KB, Sabrent Rocket 4.0 500GB
88.6 fps -51%
Intel Dragon Canyon NUC - RTX 3060
NVIDIA GeForce RTX 3060, i9-12900, Transcend M.2 SSD 2200S TS512GMTE220S
88.6 fps -51%
Minisforum Neptune Series HX90G
Radeon RX 6600M, R9 5900HX, ESO512GYLCT
81.4 fps -55%
X-Plane 11.11
3840x2160 high (fps_test=3)
Intel Core i9-13900K
NVIDIA GeForce RTX 3090, i9-13900K, Corsair MP600
128.4 fps +1%
Intel NUC13 Raptor Canyon
NVIDIA GeForce RTX 3080 Ti, i9-13900K, Kingston Fury Renegade SFYRS1000G
127.3 fps
Corsair One i300
NVIDIA GeForce RTX 3080 Ti, i9-12900K, Samsung PM9A1 MZVL22T0HBLB
118 fps -7%
ASUS TUF Gaming GeForce RTX 3080 Ti OC
NVIDIA GeForce RTX 3080 Ti, R9 7950X, Corsair MP600
118 fps -7%
Intel Beast Canyon NUC
NVIDIA GeForce RTX 3060, i9-11900KB, Sabrent Rocket 4.0 500GB
88.5 fps -30%
Intel Dragon Canyon NUC - RTX 3060
NVIDIA GeForce RTX 3060, i9-12900, Transcend M.2 SSD 2200S TS512GMTE220S
88.5 fps -30%
Minisforum NUCX i7
GeForce RTX 3070 Laptop GPU, i7-11800H
81.5 fps -36%
Minisforum Neptune Series HX90G
Radeon RX 6600M, R9 5900HX, ESO512GYLCT
29 fps -77%
1920x1080 high (fps_test=3)
Intel NUC13 Raptor Canyon
NVIDIA GeForce RTX 3080 Ti, i9-13900K, Kingston Fury Renegade SFYRS1000G
148.8 fps
Intel Core i9-13900K
NVIDIA GeForce RTX 3090, i9-13900K, Corsair MP600
148.4 fps 0%
ASUS TUF Gaming GeForce RTX 3080 Ti OC
NVIDIA GeForce RTX 3080 Ti, R9 7950X, Corsair MP600
140.1 fps -6%
Corsair One i300
NVIDIA GeForce RTX 3080 Ti, i9-12900K, Samsung PM9A1 MZVL22T0HBLB
135 fps -9%
Intel Beast Canyon NUC
NVIDIA GeForce RTX 3060, i9-11900KB, Sabrent Rocket 4.0 500GB
105 fps -29%
Intel Dragon Canyon NUC - RTX 3060
NVIDIA GeForce RTX 3060, i9-12900, Transcend M.2 SSD 2200S TS512GMTE220S
105 fps -29%
Minisforum NUCX i7
GeForce RTX 3070 Laptop GPU, i7-11800H
94.8 fps -36%
Minisforum Neptune Series HX90G
Radeon RX 6600M, R9 5900HX, ESO512GYLCT
47.1 fps -68%
Far Cry 5
1920x1080 Ultra Preset AA:T
Intel Core i9-13900K
NVIDIA GeForce RTX 3090, i9-13900K, Corsair MP600
205 (155min - 278max) fps +10%
ASUS TUF Gaming GeForce RTX 3080 Ti OC
NVIDIA GeForce RTX 3080 Ti, R9 7950X, Corsair MP600
188 (137min - 271max) fps +1%
Intel NUC13 Raptor Canyon
NVIDIA GeForce RTX 3080 Ti, i9-13900K, Kingston Fury Renegade SFYRS1000G
186 (141min - 254max) fps
Corsair One i300
NVIDIA GeForce RTX 3080 Ti, i9-12900K, Samsung PM9A1 MZVL22T0HBLB
175 (134min - 238max) fps -6%
Intel Dragon Canyon NUC - RTX 3060
NVIDIA GeForce RTX 3060, i9-12900, Transcend M.2 SSD 2200S TS512GMTE220S
132 (114min - 150max) fps -29%
Intel Beast Canyon NUC
NVIDIA GeForce RTX 3060, i9-11900KB, Sabrent Rocket 4.0 500GB
122 (93min - 151max) fps -34%
Minisforum NUCX i7
GeForce RTX 3070 Laptop GPU, i7-11800H
119 (90min - 152max) fps -36%
Minisforum Neptune Series HX90G
Radeon RX 6600M, R9 5900HX, ESO512GYLCT
110 (87min - 142max) fps -41%
3840x2160 Ultra Preset AA:T
Intel Core i9-13900K
NVIDIA GeForce RTX 3090, i9-13900K, Corsair MP600
110 (99min - 129max) fps +1%
ASUS TUF Gaming GeForce RTX 3080 Ti OC
NVIDIA GeForce RTX 3080 Ti, R9 7950X, Corsair MP600
109 (98min - 128max) fps 0%
Intel NUC13 Raptor Canyon
NVIDIA GeForce RTX 3080 Ti, i9-13900K, Kingston Fury Renegade SFYRS1000G
109 (98min - 129max) fps
Corsair One i300
NVIDIA GeForce RTX 3080 Ti, i9-12900K, Samsung PM9A1 MZVL22T0HBLB
108 (97min - 128max) fps -1%
Minisforum NUCX i7
GeForce RTX 3070 Laptop GPU, i7-11800H
55 (48min - 67max) fps -50%
Intel Beast Canyon NUC
NVIDIA GeForce RTX 3060, i9-11900KB, Sabrent Rocket 4.0 500GB
49 (44min - 60max) fps -55%
Intel Dragon Canyon NUC - RTX 3060
NVIDIA GeForce RTX 3060, i9-12900, Transcend M.2 SSD 2200S TS512GMTE220S
48 (43min - 59max) fps -56%
Minisforum Neptune Series HX90G
Radeon RX 6600M, R9 5900HX, ESO512GYLCT
43 (36min - 57max) fps -61%
Far Cry New Dawn
1920x1080 Ultra Preset
Intel Core i9-13900K
NVIDIA GeForce RTX 3090, i9-13900K, Corsair MP600
166 (118min - 265max) fps +11%
ASUS TUF Gaming GeForce RTX 3080 Ti OC
NVIDIA GeForce RTX 3080 Ti, R9 7950X, Corsair MP600
153 (104min - 256max) fps +2%
Intel NUC13 Raptor Canyon
NVIDIA GeForce RTX 3080 Ti, i9-13900K, Kingston Fury Renegade SFYRS1000G
150 (106min - 242max) fps
Corsair One i300
NVIDIA GeForce RTX 3080 Ti, i9-12900K, Samsung PM9A1 MZVL22T0HBLB
141 (98min - 229max) fps -6%
Intel Dragon Canyon NUC - RTX 3060
NVIDIA GeForce RTX 3060, i9-12900, Transcend M.2 SSD 2200S TS512GMTE220S
113 (86min - 148max) fps -25%
Intel Beast Canyon NUC
NVIDIA GeForce RTX 3060, i9-11900KB, Sabrent Rocket 4.0 500GB
102 (72min - 145max) fps -32%
Minisforum NUCX i7
GeForce RTX 3070 Laptop GPU, i7-11800H
100 (71min - 156max) fps -33%
Minisforum Neptune Series HX90G
Radeon RX 6600M, R9 5900HX, ESO512GYLCT
90 (63min - 144max) fps -40%
3840x2160 Ultra Preset
Intel Core i9-13900K
NVIDIA GeForce RTX 3090, i9-13900K, Corsair MP600
111 (94min - 132max) fps +2%
ASUS TUF Gaming GeForce RTX 3080 Ti OC
NVIDIA GeForce RTX 3080 Ti, R9 7950X, Corsair MP600
110 (85min - 131max) fps +1%
Intel NUC13 Raptor Canyon
NVIDIA GeForce RTX 3080 Ti, i9-13900K, Kingston Fury Renegade SFYRS1000G
109 (93min - 130max) fps
Corsair One i300
NVIDIA GeForce RTX 3080 Ti, i9-12900K, Samsung PM9A1 MZVL22T0HBLB
107 (85min - 127max) fps -2%
Minisforum NUCX i7
GeForce RTX 3070 Laptop GPU, i7-11800H
58 (50min - 71max) fps -47%
Intel Dragon Canyon NUC - RTX 3060
NVIDIA GeForce RTX 3060, i9-12900, Transcend M.2 SSD 2200S TS512GMTE220S
51 (42min - 61max) fps -53%
Intel Beast Canyon NUC
NVIDIA GeForce RTX 3060, i9-11900KB, Sabrent Rocket 4.0 500GB
50 (42min - 60max) fps -54%
Minisforum Neptune Series HX90G
Radeon RX 6600M, R9 5900HX, ESO512GYLCT
48 (38min - 62max) fps -56%
Far Cry 6
1920x1080 Ultra Graphics Quality + HD Textures AA:T
ASUS TUF Gaming GeForce RTX 3080 Ti OC
NVIDIA GeForce RTX 3080 Ti, R9 7950X, Corsair MP600
159.6 (123min - 198max) fps +32%
Intel Core i9-13900K
NVIDIA GeForce RTX 3090, i9-13900K, Corsair MP600
159.1 (137min - 188max) fps +32%
Corsair One i300
NVIDIA GeForce RTX 3080 Ti, i9-12900K, Samsung PM9A1 MZVL22T0HBLB
149 (125min - 185max) fps +23%
Intel NUC13 Raptor Canyon
NVIDIA GeForce RTX 3080 Ti, i9-13900K, Kingston Fury Renegade SFYRS1000G
120.7 (100min - 164max) fps
Intel Dragon Canyon NUC - RTX 3060
NVIDIA GeForce RTX 3060, i9-12900, Transcend M.2 SSD 2200S TS512GMTE220S
96 (83min - 107max) fps -20%
Intel Beast Canyon NUC
NVIDIA GeForce RTX 3060, i9-11900KB, Sabrent Rocket 4.0 500GB
90.8 (78min - 103max) fps -25%
Minisforum Neptune Series HX90G
Radeon RX 6600M, R9 5900HX, ESO512GYLCT
71.5 (51min - 93max) fps -41%
3840x2160 Ultra Graphics Quality + HD Textures AA:T
ASUS TUF Gaming GeForce RTX 3080 Ti OC
NVIDIA GeForce RTX 3080 Ti, R9 7950X, Corsair MP600
86.2 (79min - 93max) fps 0%
Intel NUC13 Raptor Canyon
NVIDIA GeForce RTX 3080 Ti, i9-13900K, Kingston Fury Renegade SFYRS1000G
86 (77min - 93max) fps
Intel Core i9-13900K
NVIDIA GeForce RTX 3090, i9-13900K, Corsair MP600
84.5 (76min - 92max) fps -2%
Corsair One i300
NVIDIA GeForce RTX 3080 Ti, i9-12900K, Samsung PM9A1 MZVL22T0HBLB
81.6 (74min - 88max) fps -5%
Intel Dragon Canyon NUC - RTX 3060
NVIDIA GeForce RTX 3060, i9-12900, Transcend M.2 SSD 2200S TS512GMTE220S
39.3 (34min - 43max) fps -54%
Intel Beast Canyon NUC
NVIDIA GeForce RTX 3060, i9-11900KB, Sabrent Rocket 4.0 500GB
38.8 (34min - 42max) fps -55%
Minisforum Neptune Series HX90G
Radeon RX 6600M, R9 5900HX, ESO512GYLCT
2.85 (2min - 3max) fps -97%
Metro Exodus
1920x1080 Ultra Quality AF:16x
ASUS TUF Gaming GeForce RTX 3080 Ti OC
NVIDIA GeForce RTX 3080 Ti, R9 7950X, Corsair MP600
144.2 (71.71min - 266.45max) fps +8%
Intel Core i9-13900K
NVIDIA GeForce RTX 3090, i9-13900K, Corsair MP600
141.3 (72.08min - 276.09max) fps +5%
Corsair One i300
NVIDIA GeForce RTX 3080 Ti, i9-12900K, Samsung PM9A1 MZVL22T0HBLB
137 (66.86min - 244.08max) fps +2%
Intel NUC13 Raptor Canyon
NVIDIA GeForce RTX 3080 Ti, i9-13900K, Kingston Fury Renegade SFYRS1000G
134 (62.23min - 264.55max) fps
Minisforum NUCX i7
GeForce RTX 3070 Laptop GPU, i7-11800H
74.6 (38.07min - 133.07max) fps -44%
Intel Dragon Canyon NUC - RTX 3060
NVIDIA GeForce RTX 3060, i9-12900, Transcend M.2 SSD 2200S TS512GMTE220S
65.3 (34.71min - 117.86max) fps -51%
Intel Beast Canyon NUC
NVIDIA GeForce RTX 3060, i9-11900KB, Sabrent Rocket 4.0 500GB
59.8 (30.99min - 119.9max) fps -55%
Minisforum Neptune Series HX90G
Radeon RX 6600M, R9 5900HX, ESO512GYLCT
59.2 (34.14min - 86.99max) fps -56%
3840x2160 Ultra Quality AF:16x
ASUS TUF Gaming GeForce RTX 3080 Ti OC
NVIDIA GeForce RTX 3080 Ti, R9 7950X, Corsair MP600
77.1 (48.66min - 128.68max) fps +1%
Intel NUC13 Raptor Canyon
NVIDIA GeForce RTX 3080 Ti, i9-13900K, Kingston Fury Renegade SFYRS1000G
76.5 (48.81min - 120.82max) fps
Intel Core i9-13900K
NVIDIA GeForce RTX 3090, i9-13900K, Corsair MP600
76.2 (48.9min - 128.44max) fps 0%
Corsair One i300
NVIDIA GeForce RTX 3080 Ti, i9-12900K, Samsung PM9A1 MZVL22T0HBLB
75 (46.62min - 125.88max) fps -2%
Minisforum NUCX i7
GeForce RTX 3070 Laptop GPU, i7-11800H
37.6 (22.55min - 69.77max) fps -51%
Intel Dragon Canyon NUC - RTX 3060
NVIDIA GeForce RTX 3060, i9-12900, Transcend M.2 SSD 2200S TS512GMTE220S
32.2 (20.64min - 49.49max) fps -58%
Intel Beast Canyon NUC
NVIDIA GeForce RTX 3060, i9-11900KB, Sabrent Rocket 4.0 500GB
31.3 (19.73min - 51.77max) fps -59%
Minisforum Neptune Series HX90G
Radeon RX 6600M, R9 5900HX, ESO512GYLCT
27.3 (18.02min - 35.61max) fps -64%
Borderlands 3
3840x2160 Badass Overall Quality (DX11)
Intel NUC13 Raptor Canyon
NVIDIA GeForce RTX 3080 Ti, i9-13900K, Kingston Fury Renegade SFYRS1000G
74 fps
ASUS TUF Gaming GeForce RTX 3080 Ti OC
NVIDIA GeForce RTX 3080 Ti, R9 7950X, Corsair MP600
73.8 fps 0%
Intel Core i9-13900K
NVIDIA GeForce RTX 3090, i9-13900K, Corsair MP600
73.1 fps -1%
Corsair One i300
NVIDIA GeForce RTX 3080 Ti, i9-12900K, Samsung PM9A1 MZVL22T0HBLB
72 fps -3%
Intel Beast Canyon NUC
NVIDIA GeForce RTX 3060, i9-11900KB, Sabrent Rocket 4.0 500GB
36.8 fps -50%
Minisforum NUCX i7
GeForce RTX 3070 Laptop GPU, i7-11800H
34.8 fps -53%
Intel Dragon Canyon NUC - RTX 3060
NVIDIA GeForce RTX 3060, i9-12900, Transcend M.2 SSD 2200S TS512GMTE220S
33.3 fps -55%
Minisforum Neptune Series HX90G
Radeon RX 6600M, R9 5900HX, ESO512GYLCT
23.7 fps -68%
1920x1080 Badass Overall Quality (DX11)
ASUS TUF Gaming GeForce RTX 3080 Ti OC
NVIDIA GeForce RTX 3080 Ti, R9 7950X, Corsair MP600
164.9 fps +3%
Intel Core i9-13900K
NVIDIA GeForce RTX 3090, i9-13900K, Corsair MP600
163 fps +2%
Intel NUC13 Raptor Canyon
NVIDIA GeForce RTX 3080 Ti, i9-13900K, Kingston Fury Renegade SFYRS1000G
160 fps
Corsair One i300
NVIDIA GeForce RTX 3080 Ti, i9-12900K, Samsung PM9A1 MZVL22T0HBLB
152 fps -5%
Intel Beast Canyon NUC
NVIDIA GeForce RTX 3060, i9-11900KB, Sabrent Rocket 4.0 500GB
100 fps -37%
Intel Dragon Canyon NUC - RTX 3060
NVIDIA GeForce RTX 3060, i9-12900, Transcend M.2 SSD 2200S TS512GMTE220S
84.7 fps -47%
Minisforum NUCX i7
GeForce RTX 3070 Laptop GPU, i7-11800H
84.7 fps -47%
Minisforum Neptune Series HX90G
Radeon RX 6600M, R9 5900HX, ESO512GYLCT
66.2 fps -59%
F1 2020
1920x1080 Ultra High Preset AA:T AF:16x
ASUS TUF Gaming GeForce RTX 3080 Ti OC
NVIDIA GeForce RTX 3080 Ti, R9 7950X, Corsair MP600
313 (254min - 380max) fps +1%
Intel NUC13 Raptor Canyon
NVIDIA GeForce RTX 3080 Ti, i9-13900K, Kingston Fury Renegade SFYRS1000G
310 (246min - 379max) fps
Corsair One i300
NVIDIA GeForce RTX 3080 Ti, i9-12900K, Samsung PM9A1 MZVL22T0HBLB
298 (238min - 364max) fps -4%
Intel Core i9-13900K
NVIDIA GeForce RTX 3090, i9-13900K, Corsair MP600
297 (238min - 361max) fps -4%
Minisforum NUCX i7
GeForce RTX 3070 Laptop GPU, i7-11800H
166.2 (136min - 198max) fps -46%
Intel Beast Canyon NUC
NVIDIA GeForce RTX 3060, i9-11900KB, Sabrent Rocket 4.0 500GB
142 (114min - 171max) fps -54%
Intel Dragon Canyon NUC - RTX 3060
NVIDIA GeForce RTX 3060, i9-12900, Transcend M.2 SSD 2200S TS512GMTE220S
142 (114min - 171max) fps -54%
Minisforum Neptune Series HX90G
Radeon RX 6600M, R9 5900HX, ESO512GYLCT
132.4 (98min - 165max) fps -57%
3840x2160 Ultra High Preset AA:T AF:16x
ASUS TUF Gaming GeForce RTX 3080 Ti OC
NVIDIA GeForce RTX 3080 Ti, R9 7950X, Corsair MP600
145.9 (124min - 173max) fps 0%
Intel NUC13 Raptor Canyon
NVIDIA GeForce RTX 3080 Ti, i9-13900K, Kingston Fury Renegade SFYRS1000G
145.2 (122min - 172max) fps
Corsair One i300
NVIDIA GeForce RTX 3080 Ti, i9-12900K, Samsung PM9A1 MZVL22T0HBLB
143 (122min - 169max) fps -2%
Intel Core i9-13900K
NVIDIA GeForce RTX 3090, i9-13900K, Corsair MP600
142.4 (118min - 168max) fps -2%
Minisforum NUCX i7
GeForce RTX 3070 Laptop GPU, i7-11800H
69.7 (59min - 82max) fps -52%
Intel Beast Canyon NUC
NVIDIA GeForce RTX 3060, i9-11900KB, Sabrent Rocket 4.0 500GB
60.2 (51min - 71max) fps -59%
Intel Dragon Canyon NUC - RTX 3060
NVIDIA GeForce RTX 3060, i9-12900, Transcend M.2 SSD 2200S TS512GMTE220S
60.2 (51min - 71max) fps -59%
Minisforum Neptune Series HX90G
Radeon RX 6600M, R9 5900HX, ESO512GYLCT
52.6 (42min - 63max) fps -64%
F1 2021
1920x1080 Ultra High Preset + Raytracing AA:T AF:16x
ASUS TUF Gaming GeForce RTX 3080 Ti OC
NVIDIA GeForce RTX 3080 Ti, R9 7950X, Corsair MP600
234 (196min, 186P1 - 256max) fps +4%
Intel NUC13 Raptor Canyon
NVIDIA GeForce RTX 3080 Ti, i9-13900K, Kingston Fury Renegade SFYRS1000G
225 (181min, 182P1 - 249max) fps
Intel Core i9-13900K
NVIDIA GeForce RTX 3090, i9-13900K, Corsair MP600
224 (191min, 182P1 - 252max) fps 0%
Corsair One i300
NVIDIA GeForce RTX 3080 Ti, i9-12900K, Samsung PM9A1 MZVL22T0HBLB
219 fps -3%
Minisforum NUCX i7
GeForce RTX 3070 Laptop GPU, i7-11800H
123.1 (104min, 93P1 - 137max) fps -45%
Intel Beast Canyon NUC
NVIDIA GeForce RTX 3060, i9-11900KB, Sabrent Rocket 4.0 500GB
96.9 (83min, 83P1 - 107max) fps -57%
Intel Dragon Canyon NUC - RTX 3060
NVIDIA GeForce RTX 3060, i9-12900, Transcend M.2 SSD 2200S TS512GMTE220S
96.9 (83min, 83P1 - 107max) fps -57%
Minisforum Neptune Series HX90G
Radeon RX 6600M, R9 5900HX, ESO512GYLCT
95.8 (80min, 80P1 - 110max) fps -57%
3840x2160 Ultra High Preset + Raytracing AA:T AF:16x
ASUS TUF Gaming GeForce RTX 3080 Ti OC
NVIDIA GeForce RTX 3080 Ti, R9 7950X, Corsair MP600
105.6 (91min, 91P1 - 117max) fps +2%
Intel Core i9-13900K
NVIDIA GeForce RTX 3090, i9-13900K, Corsair MP600
103.4 (90min, 89P1 - 116max) fps 0%
Intel NUC13 Raptor Canyon
NVIDIA GeForce RTX 3080 Ti, i9-13900K, Kingston Fury Renegade SFYRS1000G
103.2 (89min, 89P1 - 115max) fps
Corsair One i300
NVIDIA GeForce RTX 3080 Ti, i9-12900K, Samsung PM9A1 MZVL22T0HBLB
101 (88min, 87P1 - 114max) fps -2%
Minisforum NUCX i7
GeForce RTX 3070 Laptop GPU, i7-11800H
51.1 (44min, 43P1 - 58max) fps -50%
Intel Beast Canyon NUC
NVIDIA GeForce RTX 3060, i9-11900KB, Sabrent Rocket 4.0 500GB
40.9 (35min, 35P1 - 46max) fps -60%
Intel Dragon Canyon NUC - RTX 3060
NVIDIA GeForce RTX 3060, i9-12900, Transcend M.2 SSD 2200S TS512GMTE220S
40.9 (35min, 35P1 - 46max) fps -60%
Minisforum Neptune Series HX90G
Radeon RX 6600M, R9 5900HX, ESO512GYLCT
31.6 (27min, 26P1 - 38max) fps -69%
Forza Horizon 5
1920x1080 Extreme Preset
ASUS TUF Gaming GeForce RTX 3080 Ti OC
NVIDIA GeForce RTX 3080 Ti, R9 7950X, Corsair MP600
141 fps +9%
Intel NUC13 Raptor Canyon
NVIDIA GeForce RTX 3080 Ti, i9-13900K, Kingston Fury Renegade SFYRS1000G
129 fps
Intel Core i9-13900K
NVIDIA GeForce RTX 3090, i9-13900K, Corsair MP600
127 fps -2%
Corsair One i300
NVIDIA GeForce RTX 3080 Ti, i9-12900K, Samsung PM9A1 MZVL22T0HBLB
126 fps -2%
Minisforum NUCX i7
GeForce RTX 3070 Laptop GPU, i7-11800H
81 fps -37%
Minisforum Neptune Series HX90G
Radeon RX 6600M, R9 5900HX, ESO512GYLCT
62 fps -52%
3840x2160 Extreme Preset
ASUS TUF Gaming GeForce RTX 3080 Ti OC
NVIDIA GeForce RTX 3080 Ti, R9 7950X, Corsair MP600
90 fps +3%
Intel NUC13 Raptor Canyon
NVIDIA GeForce RTX 3080 Ti, i9-13900K, Kingston Fury Renegade SFYRS1000G
87 fps
Intel Core i9-13900K
NVIDIA GeForce RTX 3090, i9-13900K, Corsair MP600
85 fps -2%
Corsair One i300
NVIDIA GeForce RTX 3080 Ti, i9-12900K, Samsung PM9A1 MZVL22T0HBLB
84 fps -3%
Minisforum NUCX i7
GeForce RTX 3070 Laptop GPU, i7-11800H
50 fps -43%
Minisforum Neptune Series HX90G
Radeon RX 6600M, R9 5900HX, ESO512GYLCT
30 fps -66%
baixo média alto ultraQHD4K
GTA V (2015) 187.6 187.4 187 161.5 152.8 182
The Witcher 3 (2015) 702 564 374 179.1 156.8
Dota 2 Reborn (2015) 278.9 242.4 234.1 216.6 211.1
Final Fantasy XV Benchmark (2018) 234 229 180.6 141 84.2
X-Plane 11.11 (2018) 232 202 148.8 127.3
Far Cry 5 (2018) 239 208 198 186 176 109
Strange Brigade (2018) 613 489 407 359 269 161
Far Cry New Dawn (2019) 200 174 167 150 144 109
Metro Exodus (2019) 241 200 165.8 134 115 76.5
Borderlands 3 (2019) 229 195.3 179.7 160 128.7 74
F1 2020 (2020) 520 448 419 310 240 145.2
F1 2021 (2021) 615 525 428 225 174.3 103.2
Far Cry 6 (2021) 211 180.4 160.6 120.7 136 86
Forza Horizon 5 (2021) 256 191 182 129 117 87
God of War (2022) 229 200 166.6 119.6 105.8 77.5
Tiny Tina's Wonderlands (2022) 355 291 211 168.5 123.1 70
F1 22 (2022) 367 342 321 128.8 85.6 43

Emissões

Temperaturas e Ruído do Sistema

Intel NUC 13 Extreme Raptor Canyon durante nosso teste de estresse

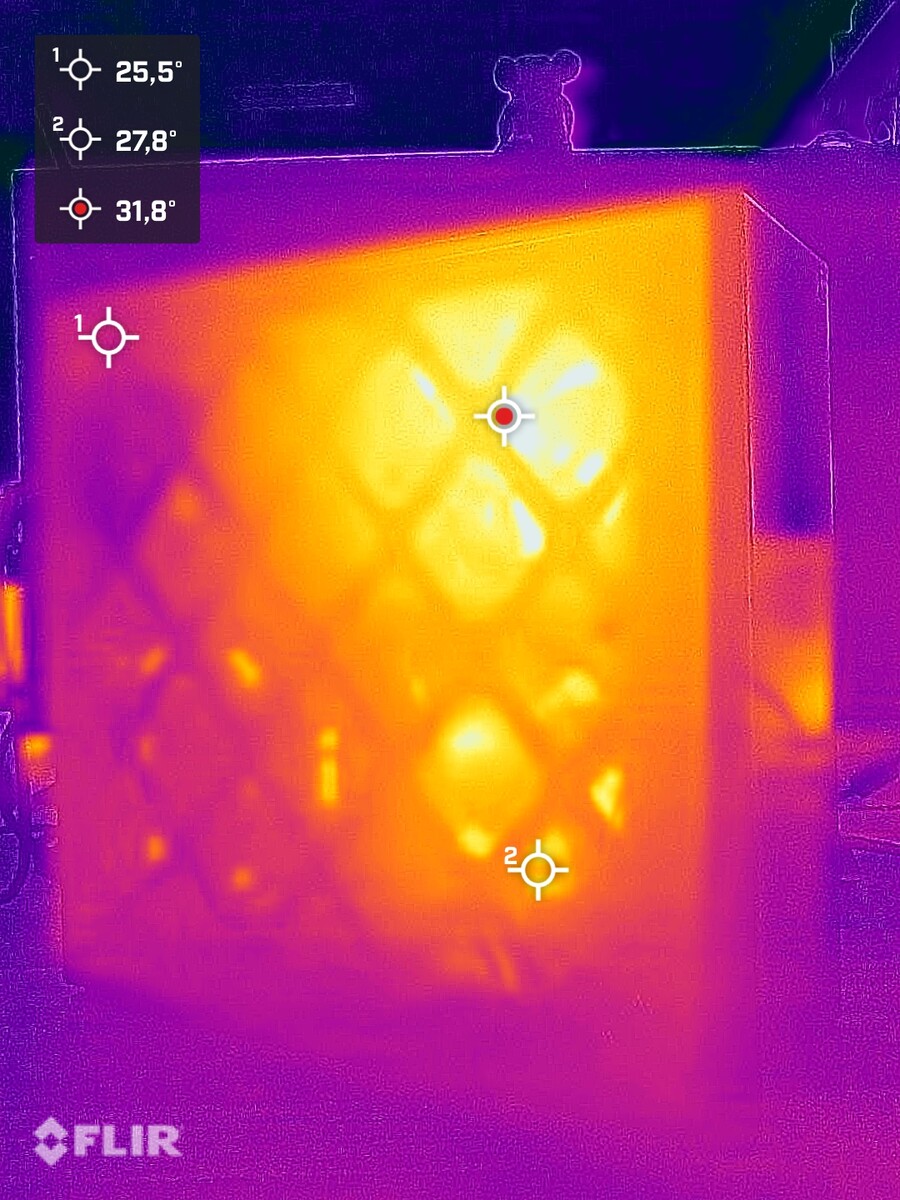
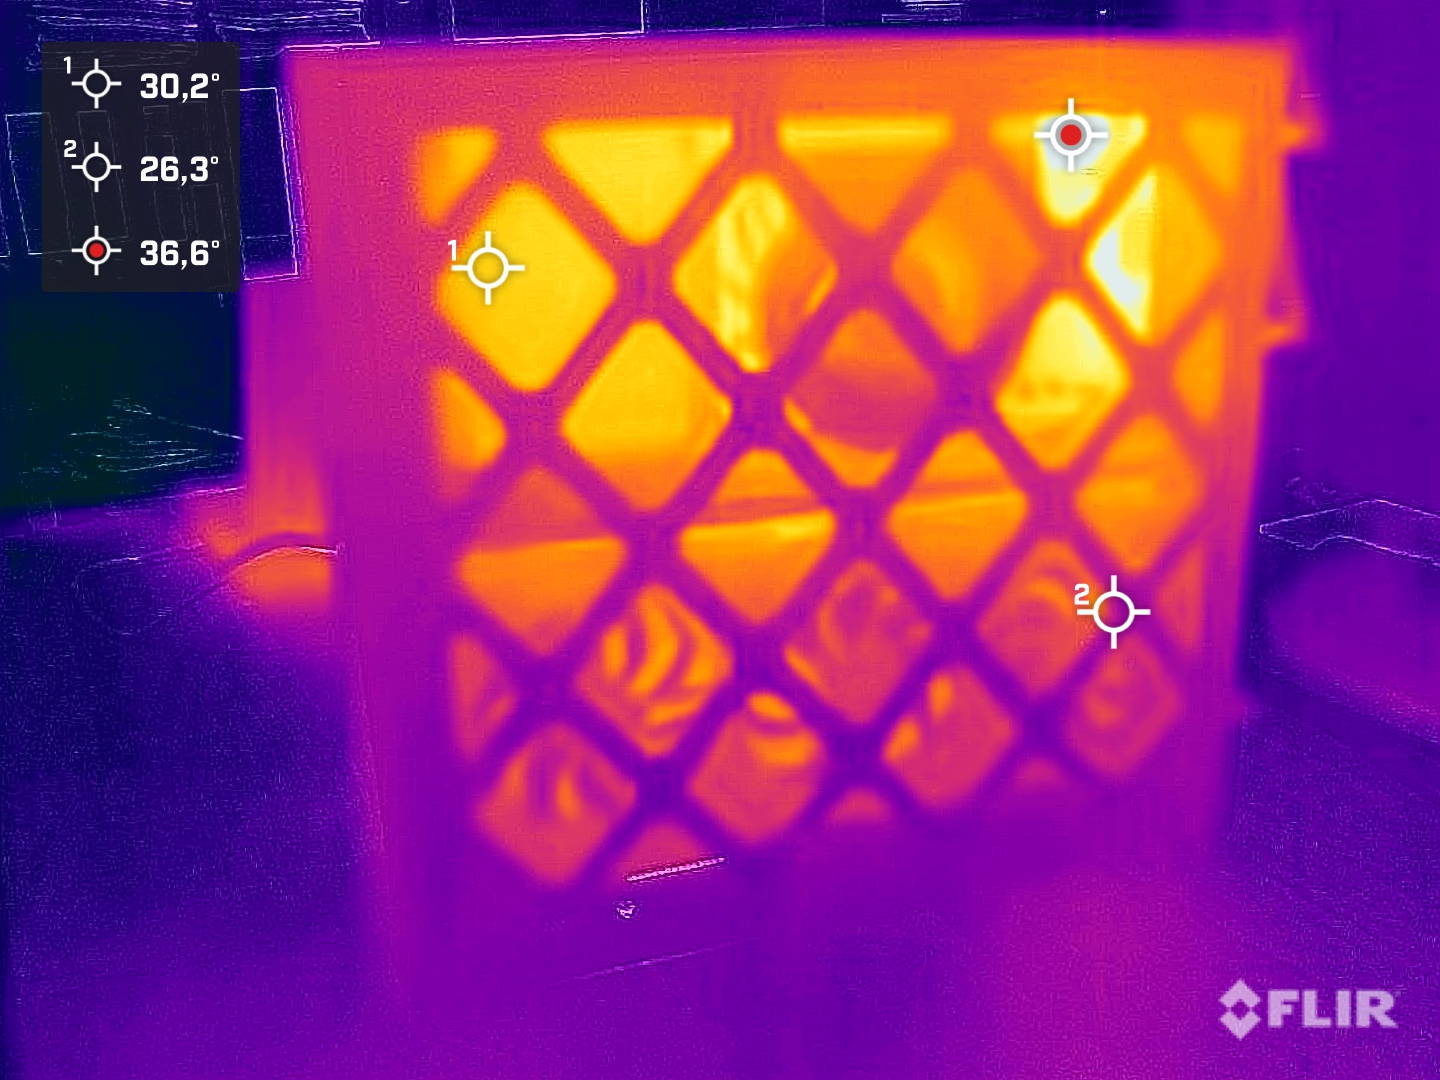
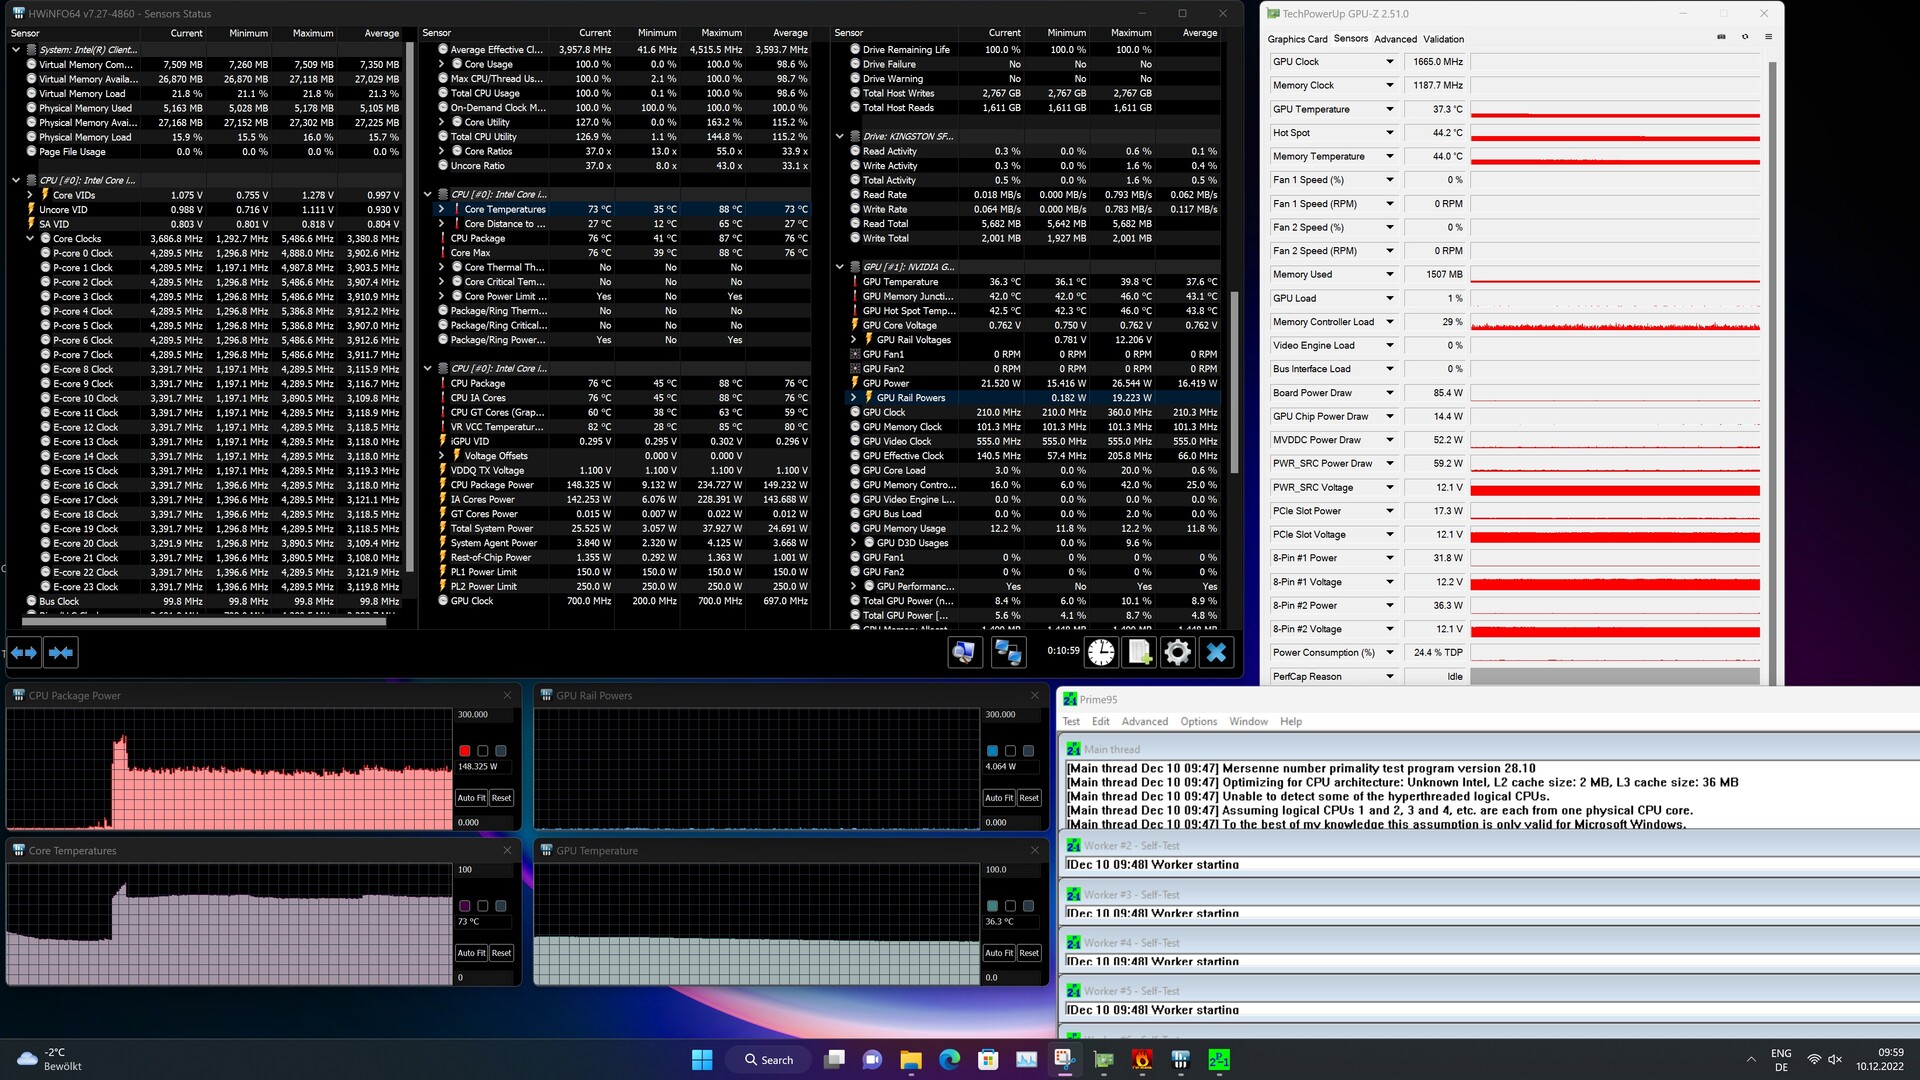
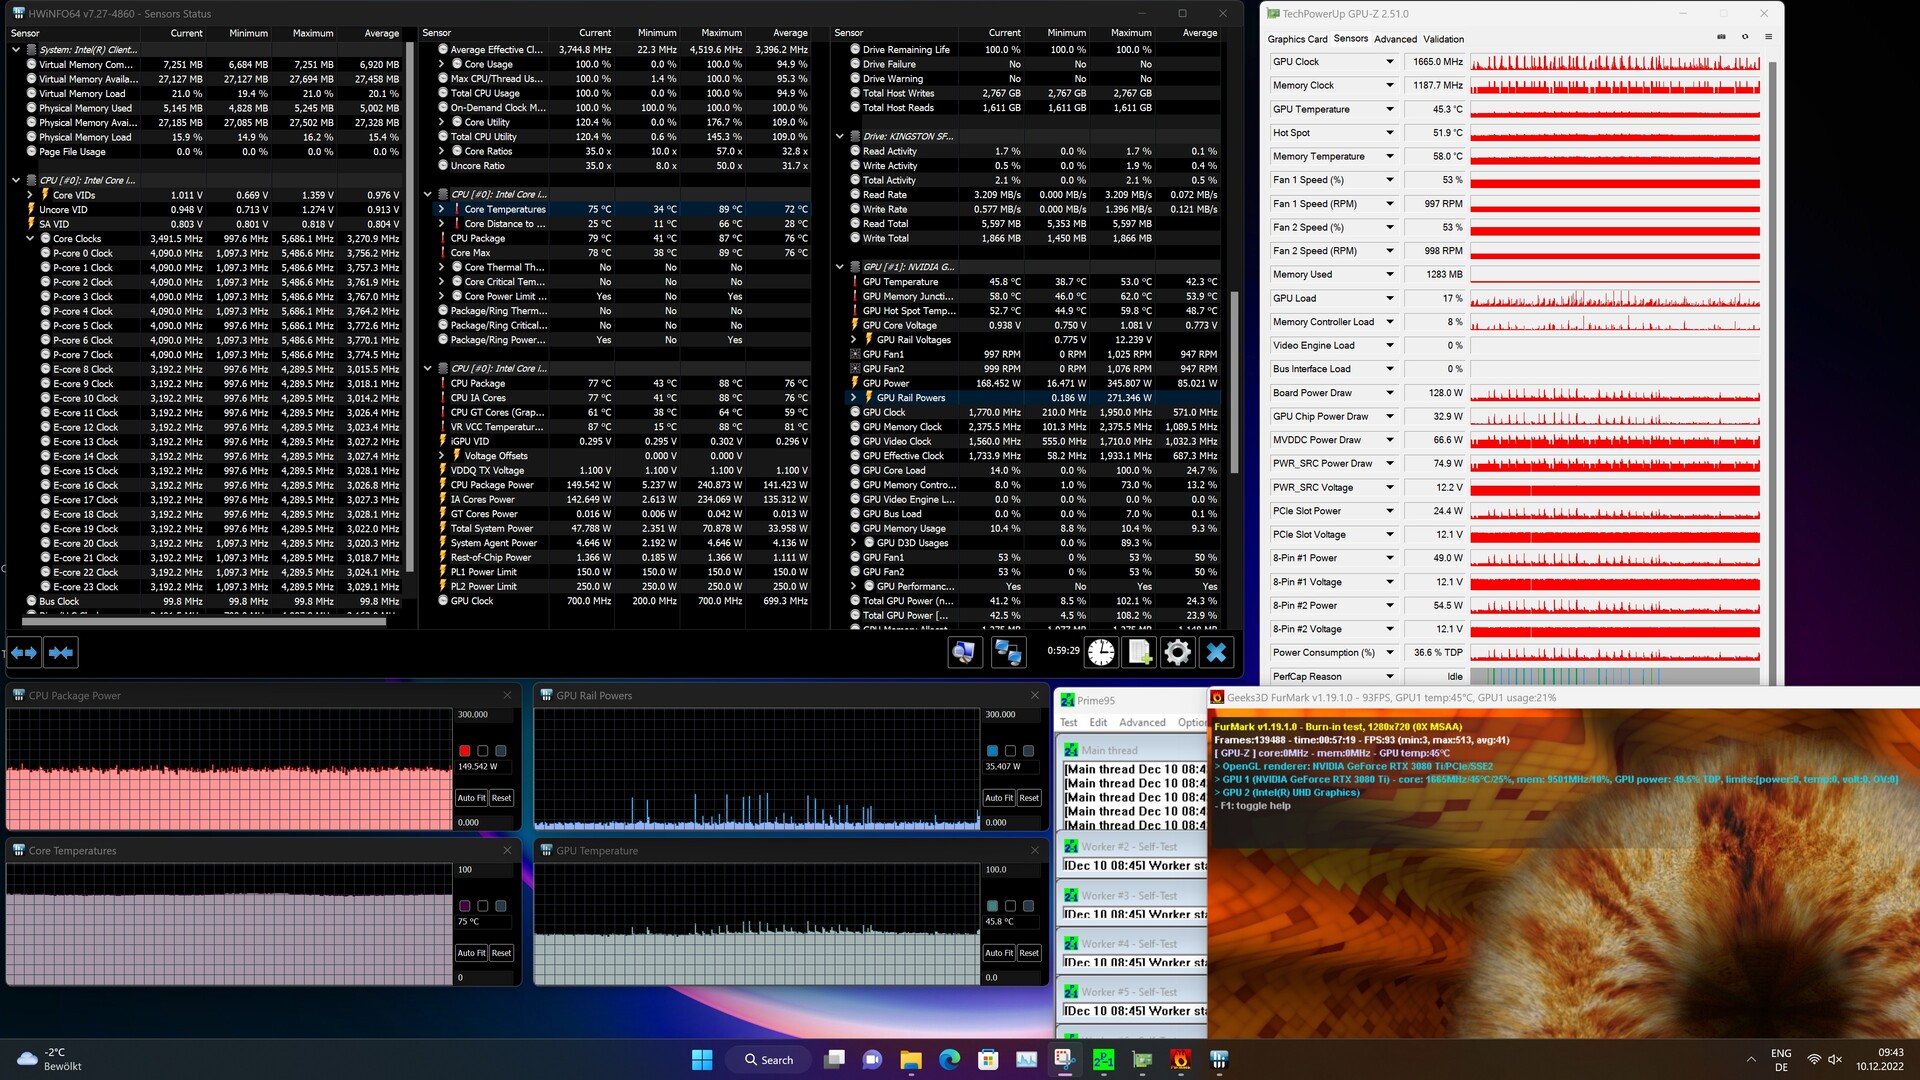
O caso do Intel NUC 13 Extreme Raptor Canyon é dividido em duas câmaras. A parte superior abriga o Elemento de Cálculo, que inclui a CPU, RAM e SSD, bem como a fonte de alimentação, enquanto a parte inferior é reservada inteiramente para uma placa gráfica dedicada. Embora este conceito funcione bem na prática, o PL2 do Intel Core i9-13900K só pode ser mantido por um curto período de tempo. A CPU atinge inevitavelmente 100 °C sob carga. Dito isto, porém, a CPU só raramente atinge esta temperatura por períodos muito curtos. Em média, a temperatura da CPU se estabiliza entre 60 e 90 °C, dependendo do cenário.

Quando se trata de emissões sonoras, nossa configuração do sistema permanece relativamente silenciosa. Embora a 39 dB(A), o ruído do sistema é perceptível sob carga total, ele ainda está longe de ser um incômodo. Medimos um valor semelhante de pouco mais de 38 dB(A) enquanto jogamos. Assim, a placa gráfica instalada é a principal fonte de ruído sob carga. É possível criar um sistema muito silencioso com um modelo mais silencioso.

Barulho

Ocioso
32.1 / 32.1 / 32.1 dB
Carga
33.4 / 39 dB
  red to green bar
 
 
30 dB
silencioso
40 dB(A)
audível
50 dB(A)
ruidosamente alto
 
min: dark, med: mid, max: light   Earthworks M23R, Arta (15 cm de distância)   environment noise: 30.4 dB(A)
dB(A) 0102030405060708090Deep BassMiddle BassHigh BassLower RangeMidsHigher MidsLower HighsMid HighsUpper HighsSuper Highs2034.435.23434.234.42531.534.434.631.531.53132.634.134.330.532.64030.13131.92930.15030.231.831.831.130.26329.1303126.529.18030.53029.727.530.510033.430302733.412530.227.929.525.330.216030.826.728.124.730.8200282625.723.12825028.424.622.422.428.431528.523.72321.428.54003124.824.420.23150030.123.521.820.530.163031.323.522.319.431.380029.723.52118.729.7100030.924.121.718.330.9125029.822.520.41829.8160027.420.919.117.827.4200027.321.11917.627.3250026.120.518.417.426.1315022.218.618.317.222.2400020.718.618.217.520.7500020.518.918.317.620.5630019.518.618.417.919.5800018.618.418.41818.61000018.718.518.618.318.71250018.918.918.918.718.91600019.319.319.419.119.3SPL3933.432.130.439N3.121.81.43.1median 28median 22.5median 20.4median 18.7median 28Delta4.93.12.62.24.9hearing rangehide median Fan NoiseIntel NUC13 Raptor Canyon
Teste de estresse FurMark solo
Teste de estresse Prime95 solo
Teste de estresse Prime95+FurMark

Consumo de energia

fonte de alimentação de 750 watts SFX

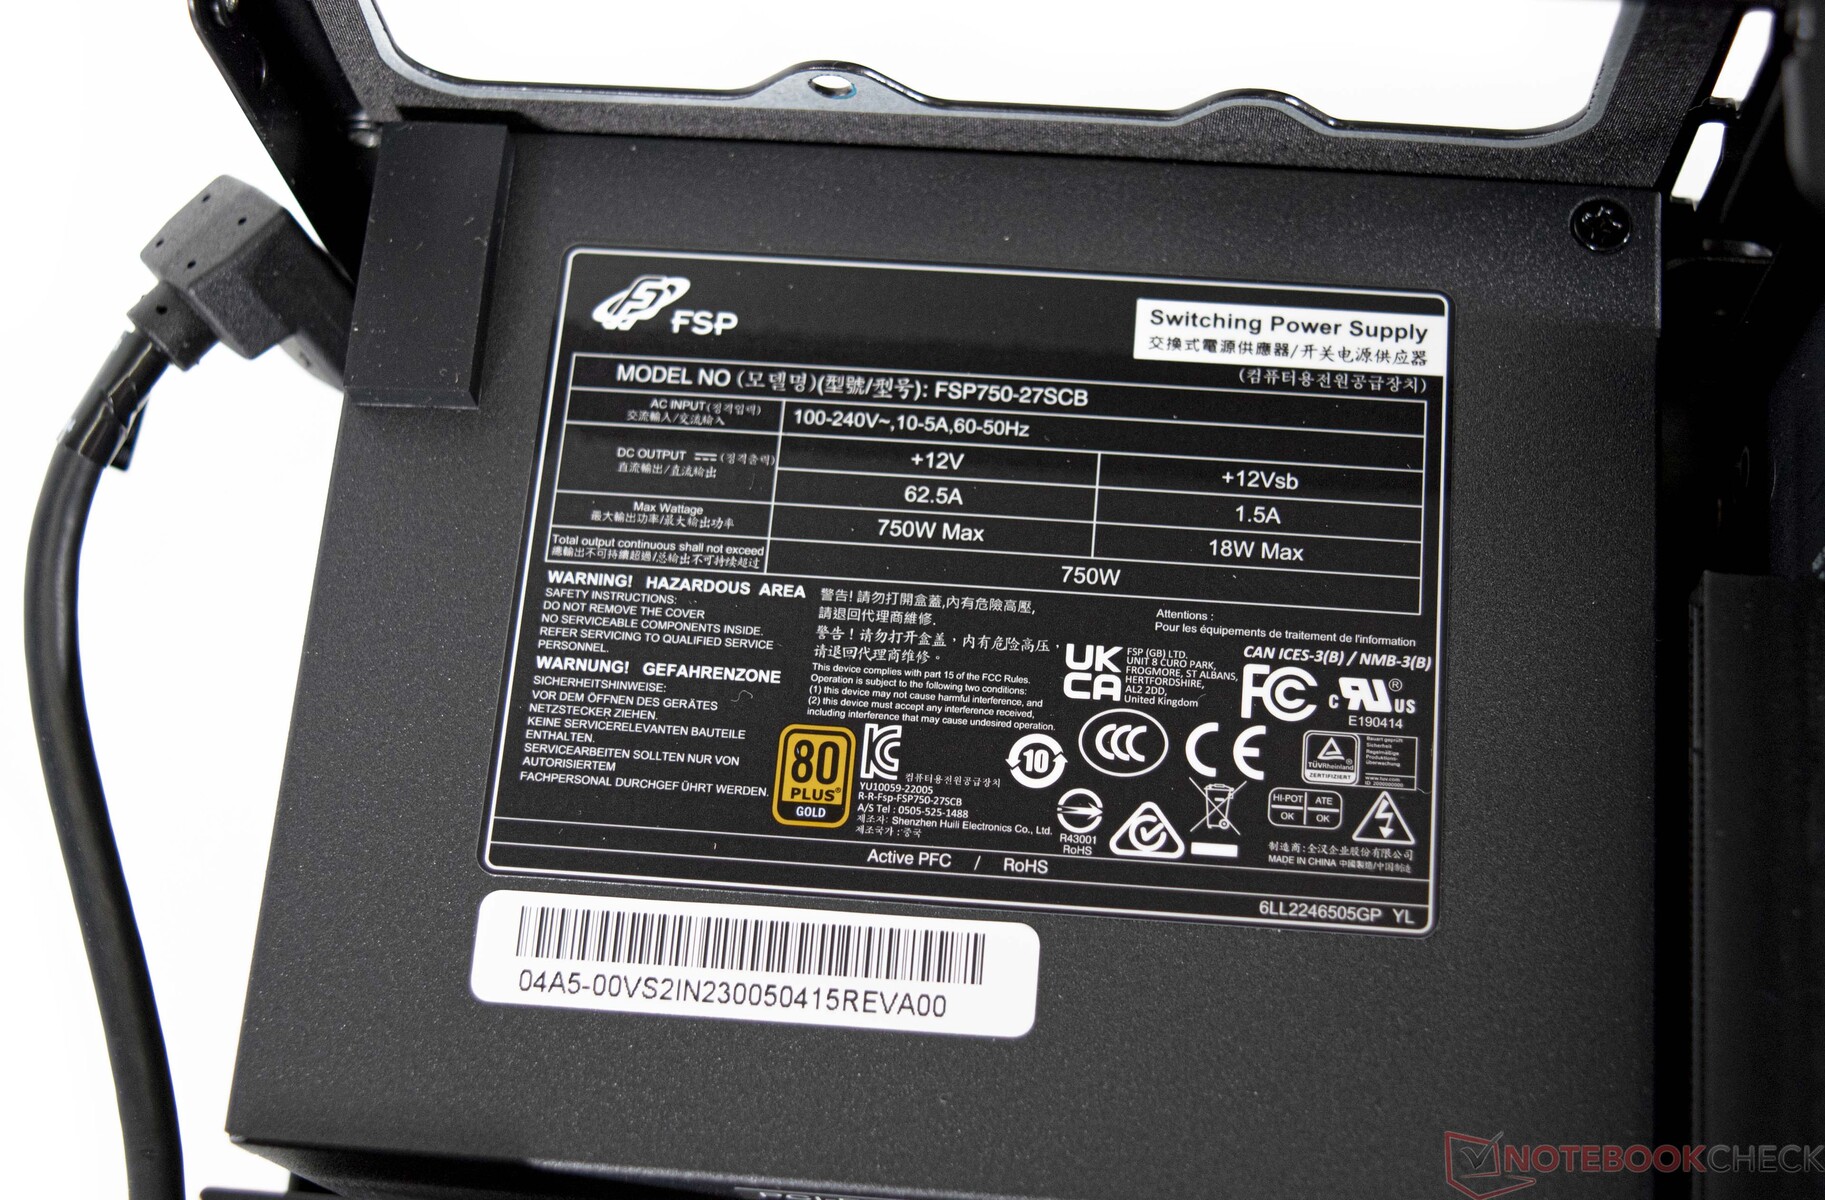
Uma fonte de alimentação de 750 watts em SFX trata da conversão CA. Como medimos uma potência máxima de 499 watts enquanto jogávamos, os usuários não terão que se preocupar mesmo quando o sistema estiver sob carga máxima. Também observamos picos de 544 watts em nossos testes, o que não nos levou a nenhum problema. Com 350 watts, a placa gráfica consome a maior parte da potência enquanto joga. Recomendamos não usar GPUs com um TGP ainda maior. O novo cabo de 21VHPWR só pode fornecer até 300 watts de qualquer forma - pelo menos de acordo com a lenda no plugue. No total, há três cabos 6+2-PCIe.

Intel NUC13 Raptor Canyon
i9-13900K, NVIDIA GeForce RTX 3080 Ti
Minisforum Neptune Series HX90G
R9 5900HX, Radeon RX 6600M
Minisforum NUCX i7
i7-11800H, GeForce RTX 3070 Laptop GPU
Average NVIDIA GeForce RTX 3080 Ti
 
Average of class Desktop
 
Power Consumption
51%
36%
0%
49%
Idle Minimum *
39
17.8
54%
28.2
28%
39 ?()
-0%
Idle Average *
42
17.9
57%
29.9
29%
42 ?()
-0%
Idle Maximum *
52
18.1
65%
36.2
30%
52 ?()
-0%
Load Average *
228
82.1
64%
83.2
64%
228 ?()
-0%
Load Maximum *
308
262
15%
215.7
30%
308 ?()
-0%
Witcher 3 ultra *
167

* ... smaller is better

Consumo de energia
desligadodarklight 2.5 / 25 Watt
Ociosodarkmidlight 39 / 42 / 52 Watt
Carga midlight 228 / 308 Watt
 color bar
Key: min: dark, med: mid, max: light        Metrahit Energy
Currently we use the Metrahit Energy, a professional single phase power quality and energy measurement digital multimeter, for our measurements. Find out more about it here. All of our test methods can be found here.

Consumption External Monitor

0306090120150180210240270300330360390420450480510540Tooltip
Intel NUC13 Raptor Canyon; Prime95 V2810 Stress (external Monitor): Ø228 (209-335)
Intel NUC13 Raptor Canyon; Cinebench R15 Multi (external Monitor): Ø349 (264-406)
Intel NUC13 Raptor Canyon; 1280x720 FurMark 1.19 GPU Stress Test (external Monitor): Ø427 (410-454)
Intel NUC13 Raptor Canyon; 1920x1080 The Witcher 3 ultra (external Monitor): Ø499 (487-544)
Intel NUC13 Raptor Canyon; Idle 1min (external Monitor): Ø41.8 (39.3-51.5)

Pro

+ estojo robusto e de alta qualidade
+ Núcleo i9 com 24 núcleos e 32 fios
+ processador socketed (CPU de mesa cheia de recursos)
+ desempenho rápido do sistema
+ SFX PSU com 750W e 12VHPWR
+ muita conectividade moderna
+ 2x Thunderbolt 4
+ Wi-Fi 6E
+ 2.5Gb/s e 10Gb/s LAN

Contra

- manutenção difícil do SSD
- sem leitor de cartões SD
- limitações de compatibilidade limitadas

Veredicto - Muitas melhorias e um desempenho significativamente maior

Intel NUC 13 Extreme Raptor Canyon em revisão, cortesia da Intel Alemanha.

A Intel NUC 13 Extreme Raptor Canyon se sai bem em muitos aspectos. Com os atuais modelos Raptor Lake, o fabricante não apenas atualiza o hardware, mas também revisa o caso. Agora ele é significativamente maior do que antes. Como resultado, nós não consideramos mais este sistema como um mini PC, mesmo que a Intel possa discordar. Com um volume de 14 litros, o Intel NUC 13 Extreme Raptor Canyon compete contra o Corsair-One-i300 seriesque é um pouco mais compacto a 12 litros.

Nossa configuração do sistema vem com desempenho suficiente para todos os títulos recentes a 2160p. Devido à natureza de barebone do Raptor Canyon NUC 13, o dispositivo pode ser personalizado de acordo com as exigências e preferências do usuário. O Intel Core i9-13900K tem um desempenho excepcionalmente bom, algo que não esperávamos. Além disso, o dispositivo permanece relativamente silencioso, mesmo sob carga.

O Intel NUC 13 Extreme Kit é baseado no Intel Core i9-13900K e oferece um desempenho muito rápido. Emparelhado com uma GPU apropriada, ele pode ser um ótimo sistema de jogos ou uma estação de trabalho de alta qualidade.

O sistema, que inclui a CPU, custa atualmente 1550 USD. A adição de RAM, um SSD e uma GPU pode rapidamente impulsionar o preço para alturas assombrosas. Dito isto, concorrentes como o já mencionado Corsair One i300 também têm um preço de até cerca de 5000 USD.

O novo estojo parece elegante e robusto graças aos materiais premium. Além disso, apresenta um design funcional, o que beneficia as capacidades de refrigeração. Independentemente disso, há inconvenientes como os SSDs de difícil acesso e a falta de um leitor de cartões. O modelo dos últimos anos ainda incluía este último, oferecendo rápidas velocidades UHS-II.

Preço e Disponibilidade

Na China, a Intel NUC 13 Extreme Raptor Canyon será lançada no quarto trimestre de 2022. Um lançamento global se seguirá no 1º trimestre de 2023. Dependendo da configuração, o NUC 13 Extreme custa entre 1179 USD e 1549 USD sem GPU, RAM, ou SSD - isto é normal para NUCs. O Elemento de Cálculo também está disponível separadamente sem a caixa do PC por 760 a 1100 USD.

A Intel nos forneceu a Intel NUC 13 Extreme Raptor Canyon para a duração desta revisão.

Please share our article, every link counts!
> Análises e revisões de portáteis e celulares > Análises > Análises > Intel NUC 13 Extreme Raptor Canyon mini PC com Core i9-13900K e GeForce RTX 3080 Ti em revisão
Sebastian Bade, 2022-12-15 (Update: 2022-12-15)