Revisão do SER4 mini PC Beelink: AMD Zen 2 ainda está dando à Intel NUC uma corrida por seu dinheiro
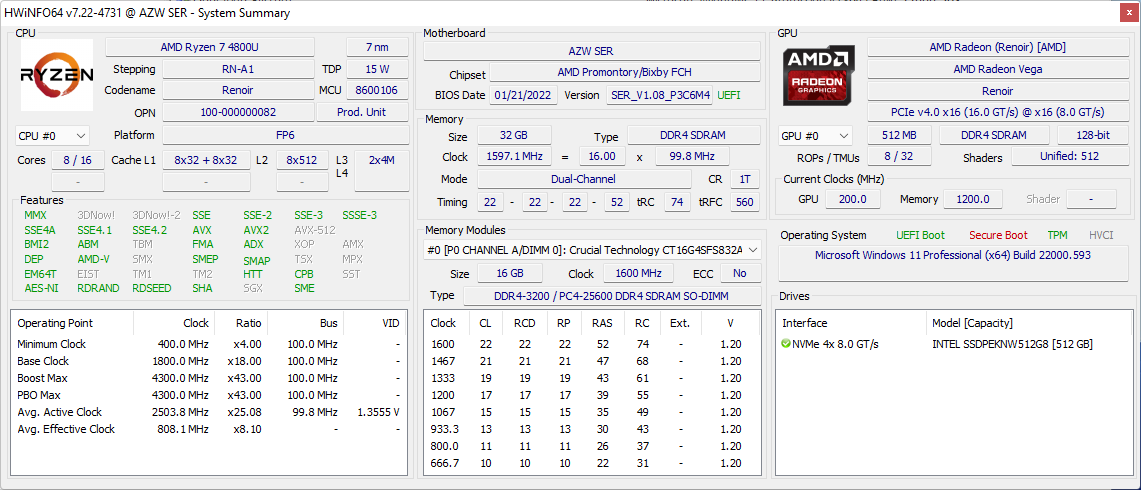
O SER4 sucede diretamente o SER3 do ano passado, trocando a CPU Zen+ mais antiga por uma Zen 2 mais nova. Em particular, o SER4 utiliza o Ryzen 7 4800U muito rápido e relativamente incomum que, infelizmente, está em muito poucos outros produtos.
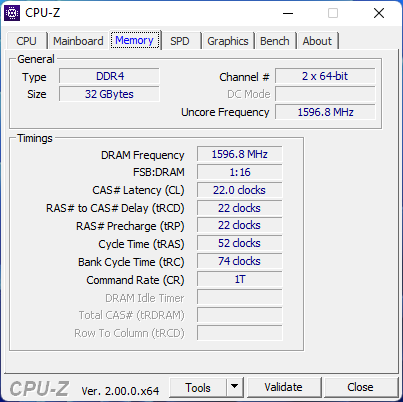
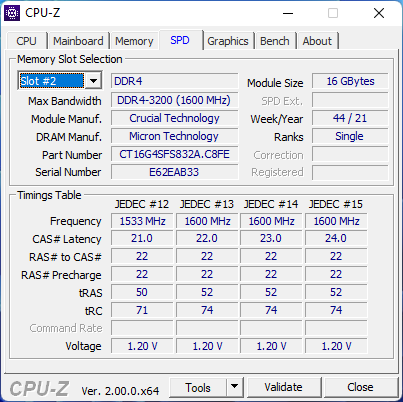
Nossa configuração conforme revisada vem com a CPU Ryzen 7 4800U, 32 GB de RAM DDR4-3200 e um SSD NVMe de 512 GB por US$650. Uma SKU menor com metade da RAM está disponível por US$50 a menos. Os usuários interessados em uma versão Intel devem, ao invés disso, olhar para a série Beelink SEI. O SER4 compete diretamente com a série Intel NUC, bem como com outros mini PCs alimentados por CPUs da série U
Mais análises do Beelink
Possíveis concorrentes em comparação
Avaliação | Data | Modelo | Peso | Altura | Size | Resolução | Preço |
|---|---|---|---|---|---|---|---|
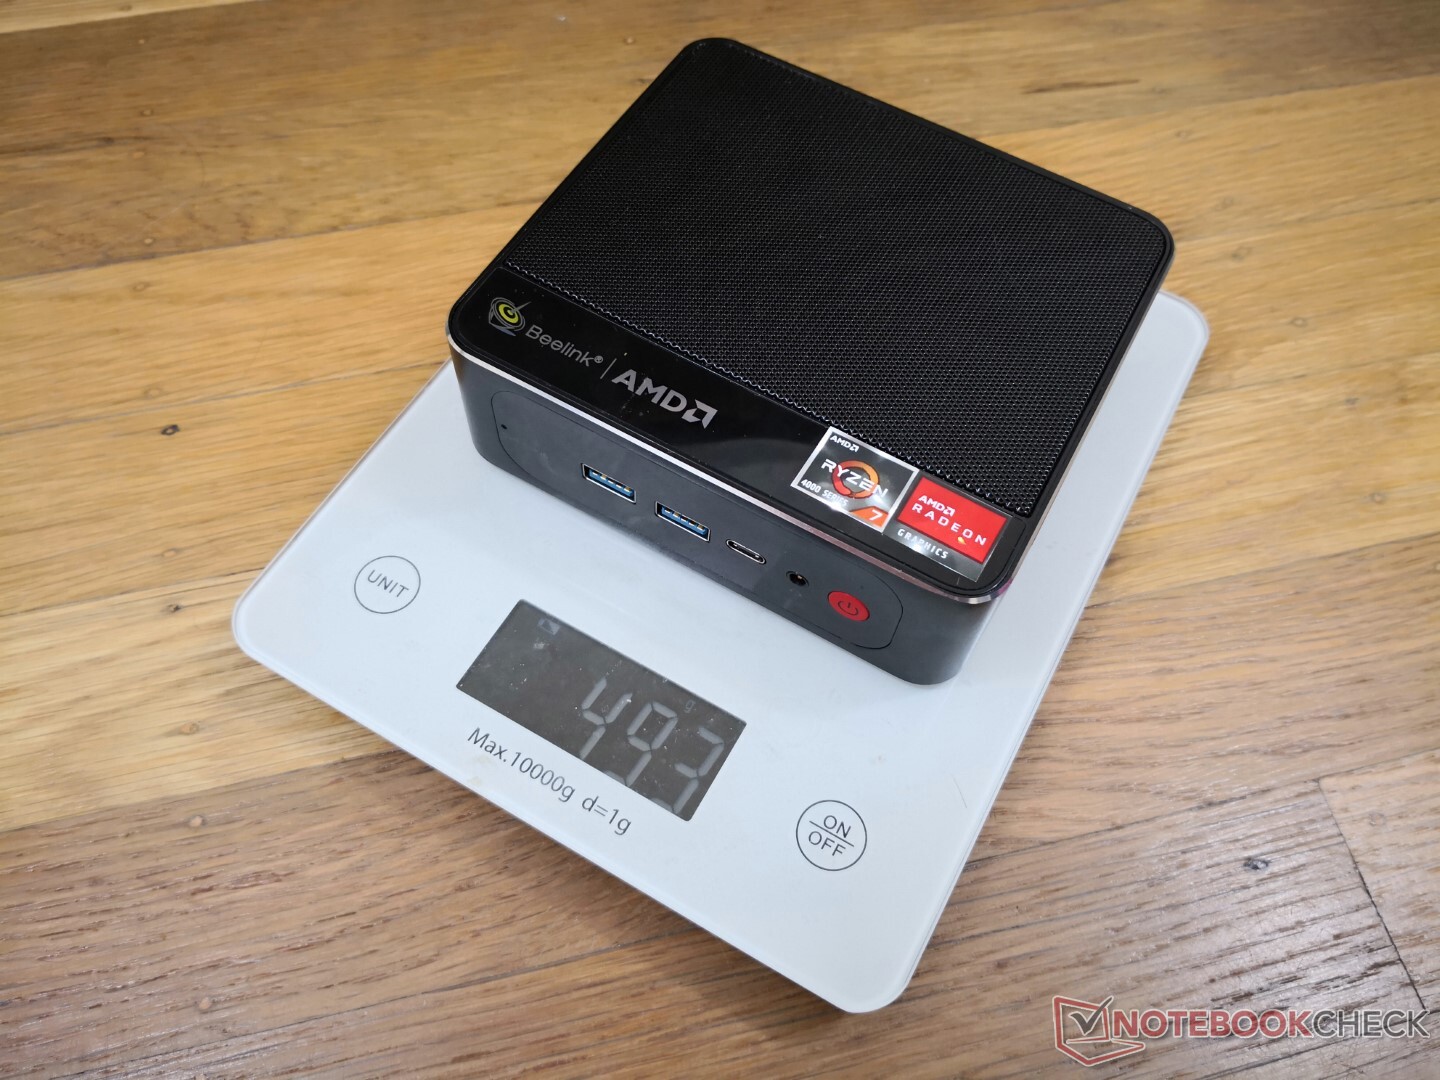
v (old) | 04/2022 | Beelink SER4 R7 4800U, Vega 8 | 494 g | 40 mm | x | ||
v (old) | 02/2022 | GMK NucBox 3 Celeron J4125, UHD Graphics 600 | 410 g | 32.5 mm | x | ||
v (old) | 01/2022 | Beelink GTR5 R9 5900HX, Vega 8 | 686 g | 39 mm | x | ||
v (old) | 02/2021 | Intel NUC11PAQi7 i7-1165G7, Iris Xe G7 96EUs | 647 g | 56 mm | x | ||
v (old) | 11/2021 | Beelink SER3 R7 3750H, Vega 10 | 492 g | 40 mm | x | ||
v (old) | Intel NUC10i5FNK i5-10210U, UHD Graphics 620 | 493 g | 36 mm | 0.00" | 0x0 |
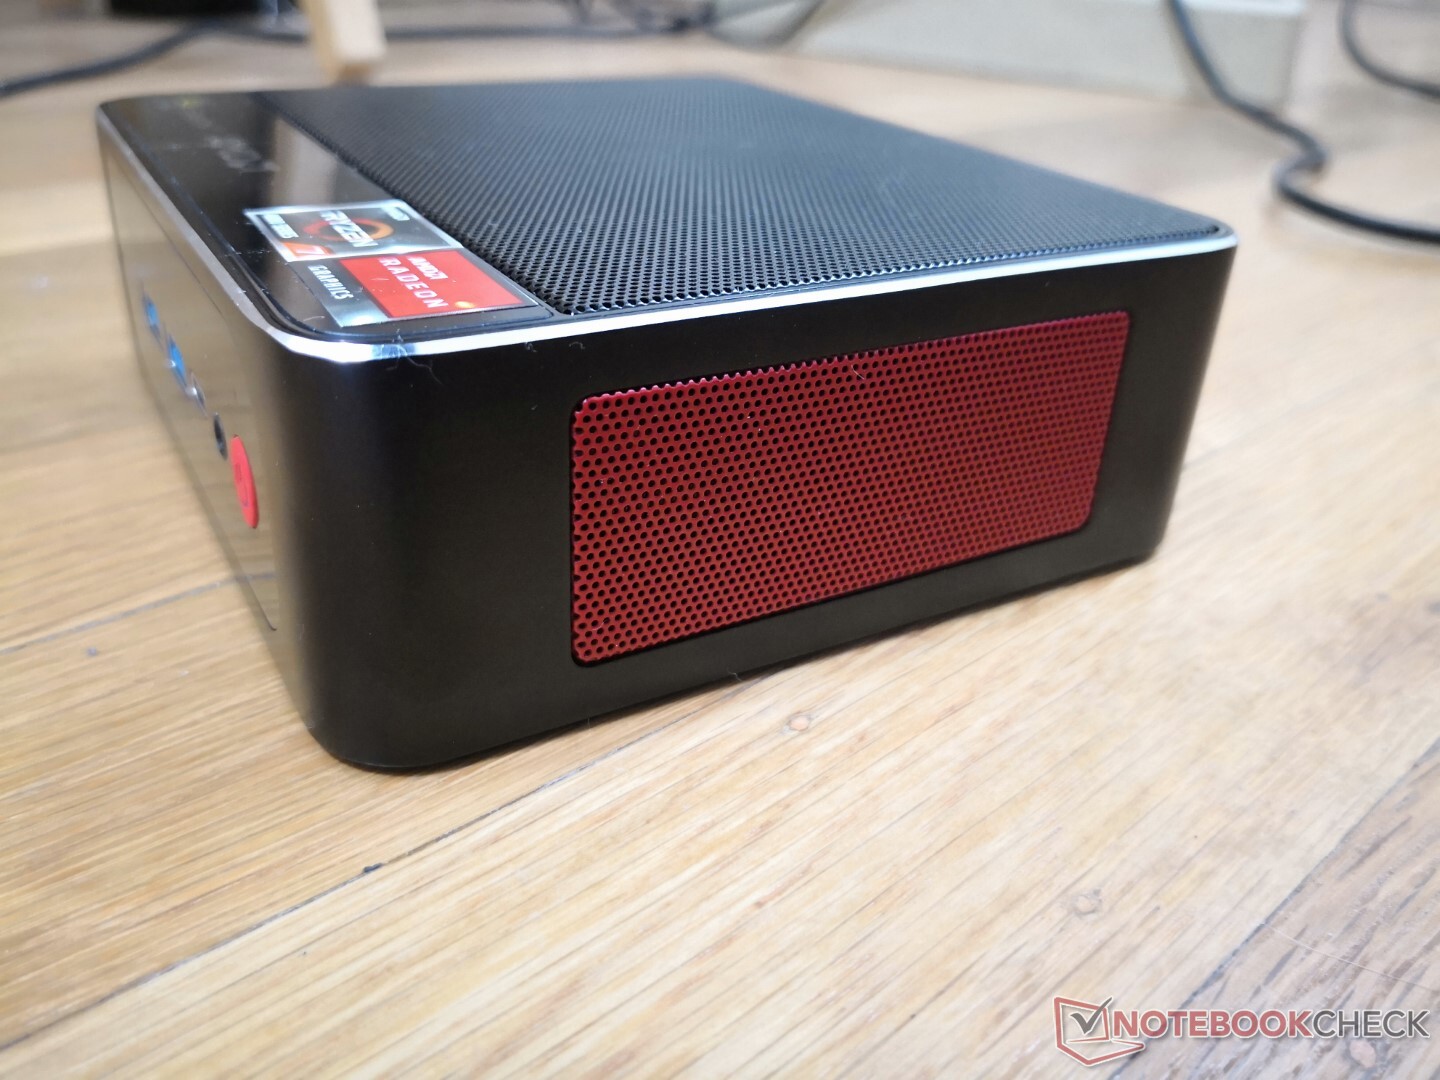
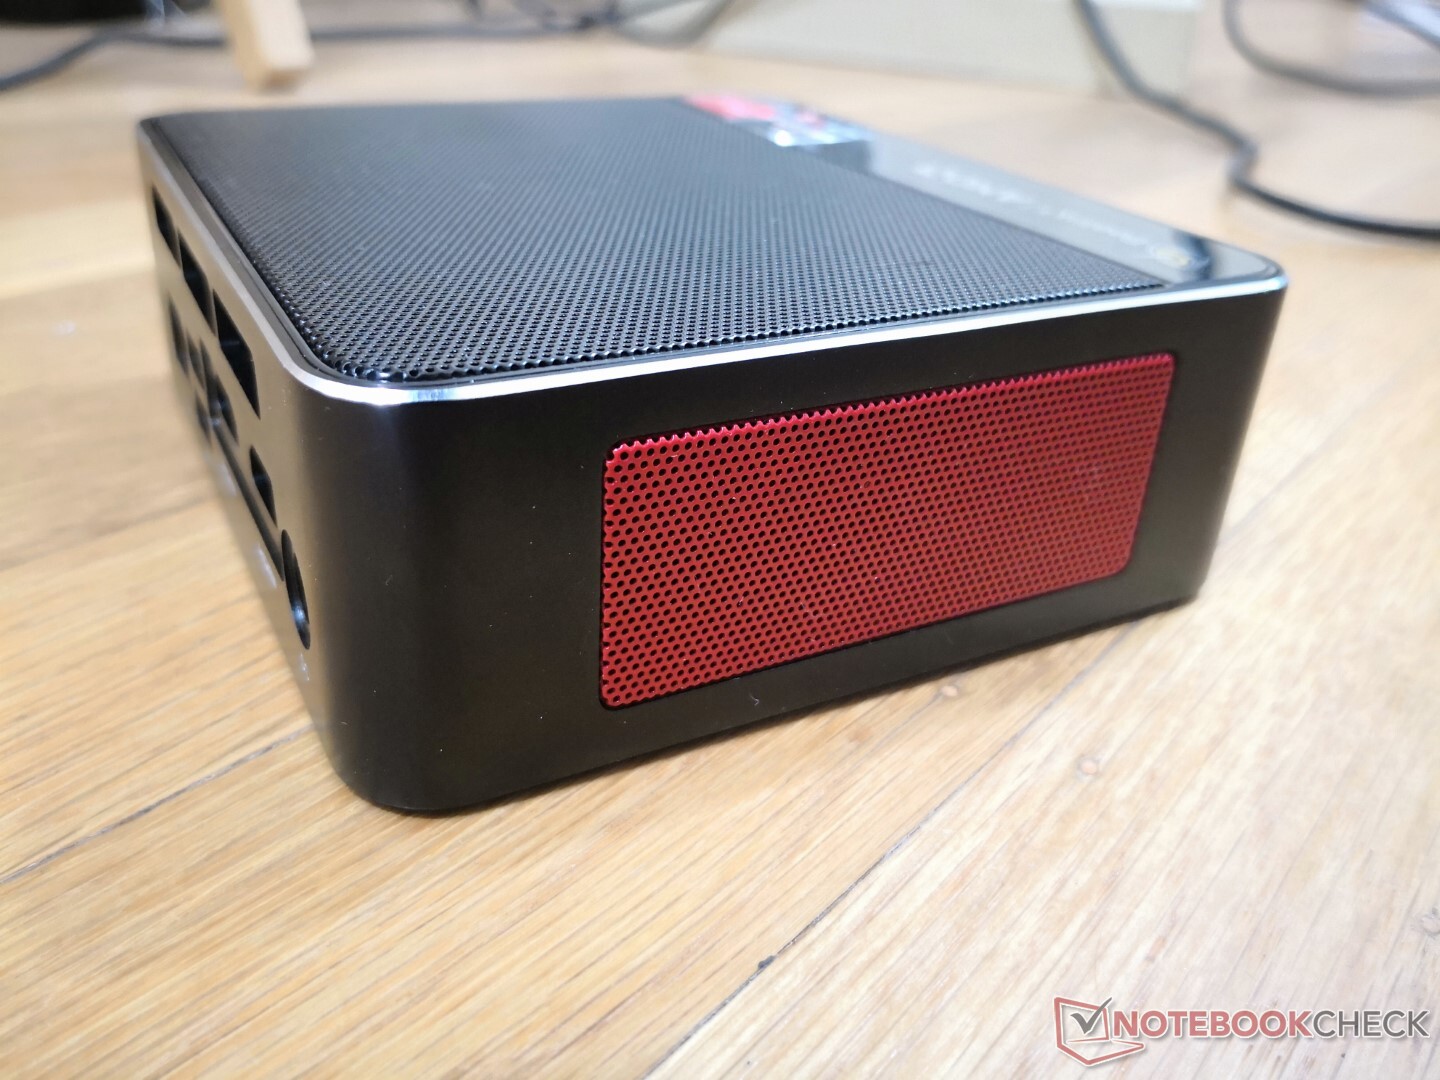
Estojo - Muitas Grelhas de Ventilação
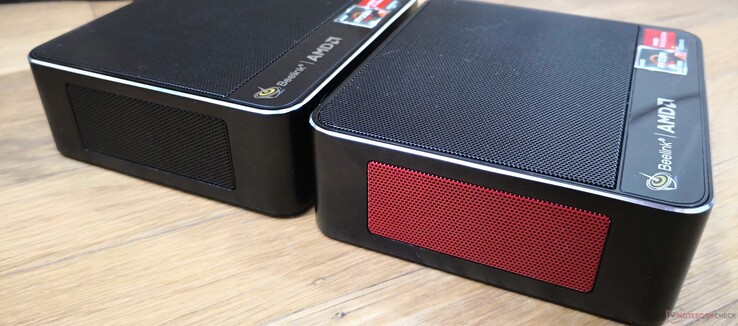
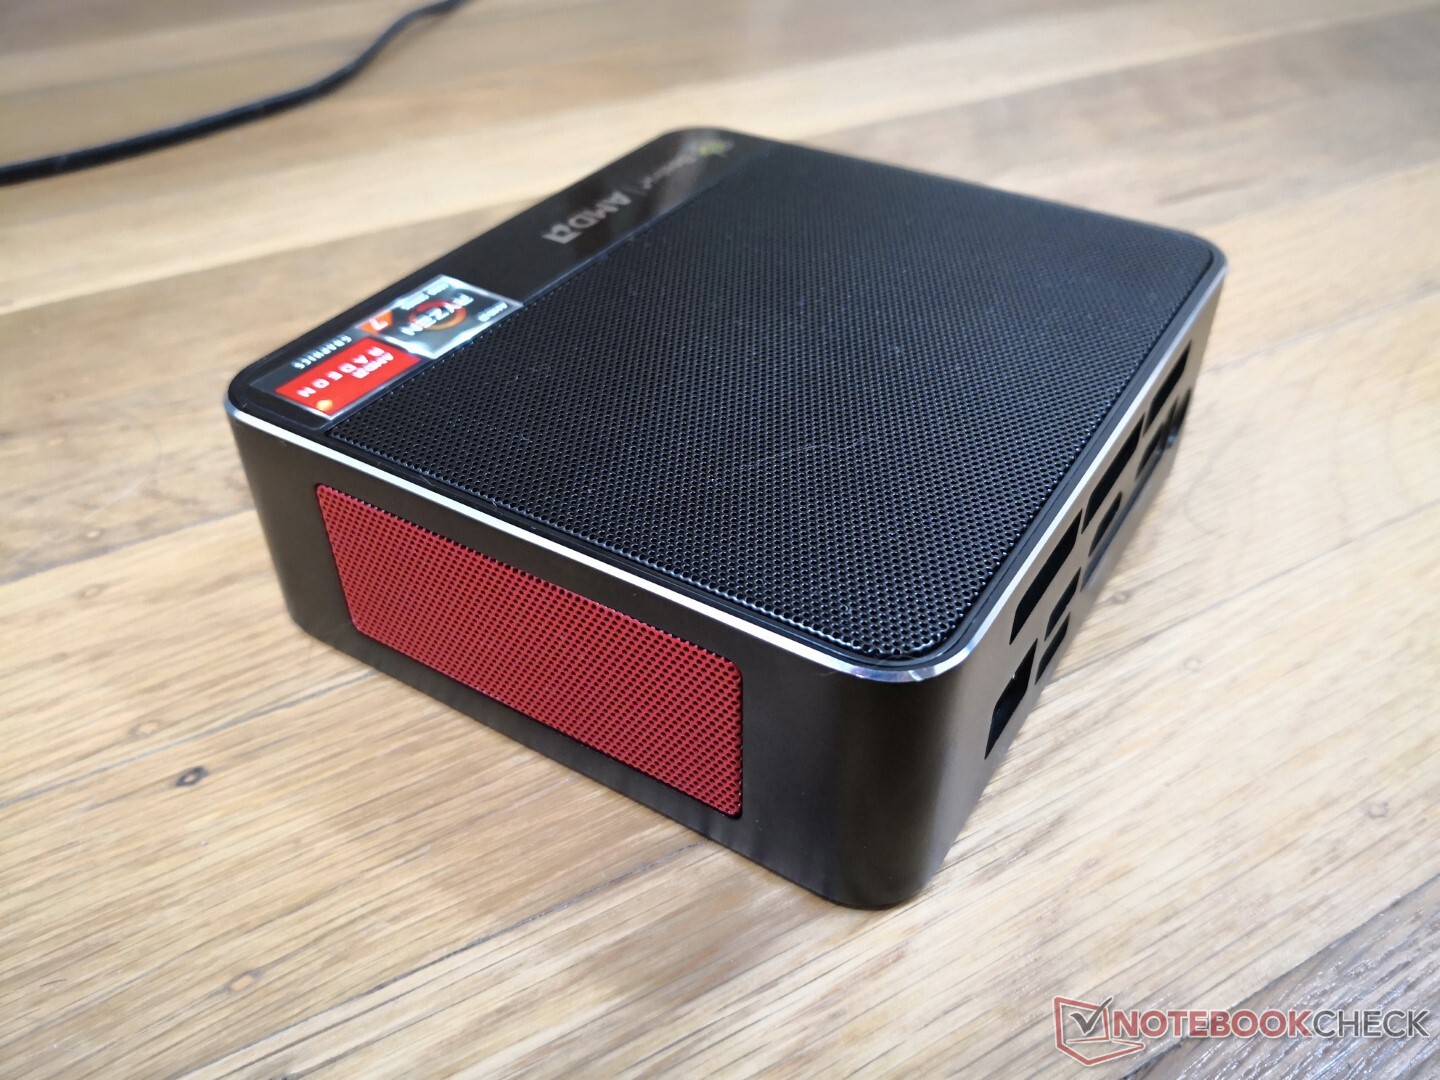
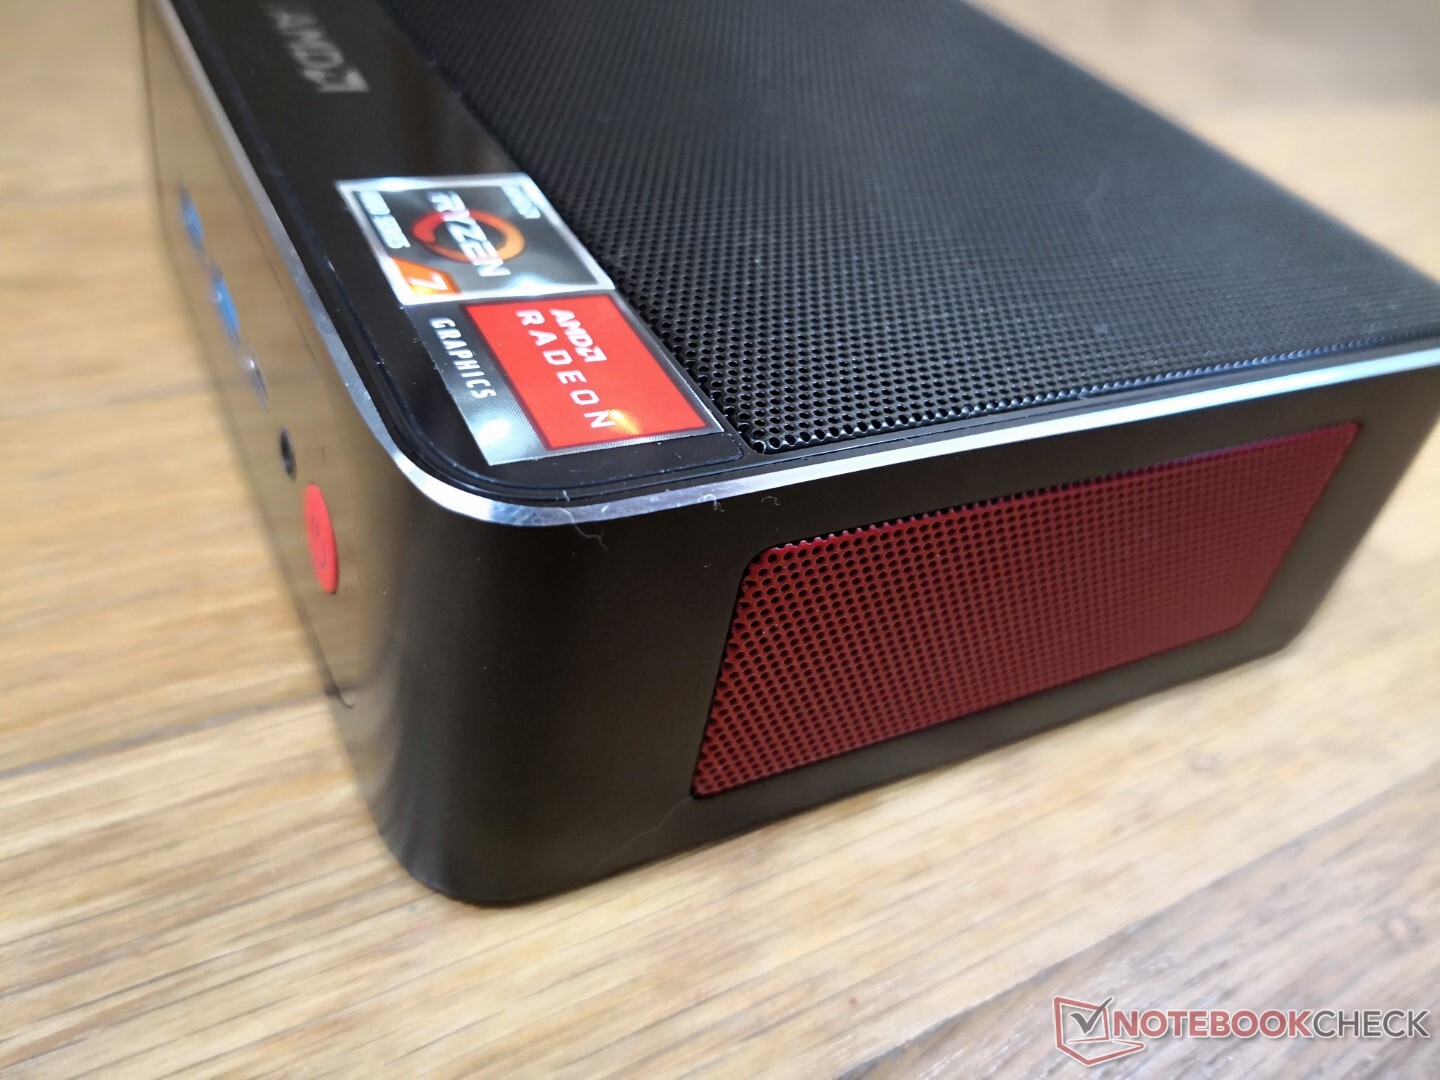
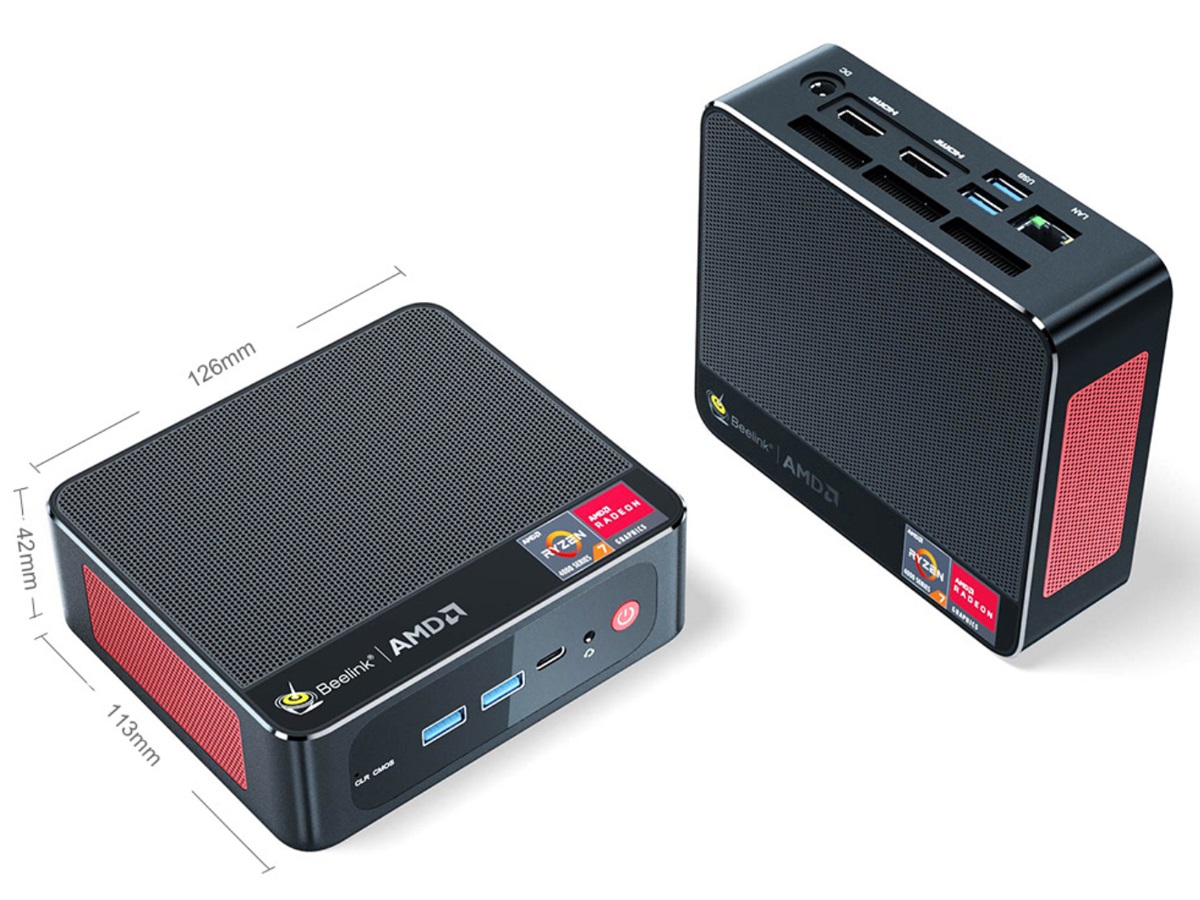
O SER4 utiliza o mesmo chassi que o SER3, mas com uma mudança superficial. Mais especificamente, as grelhas ao longo das laterais da unidade agora são vermelhas em vez de pretas como uma homenagem à CPU AMD no interior.
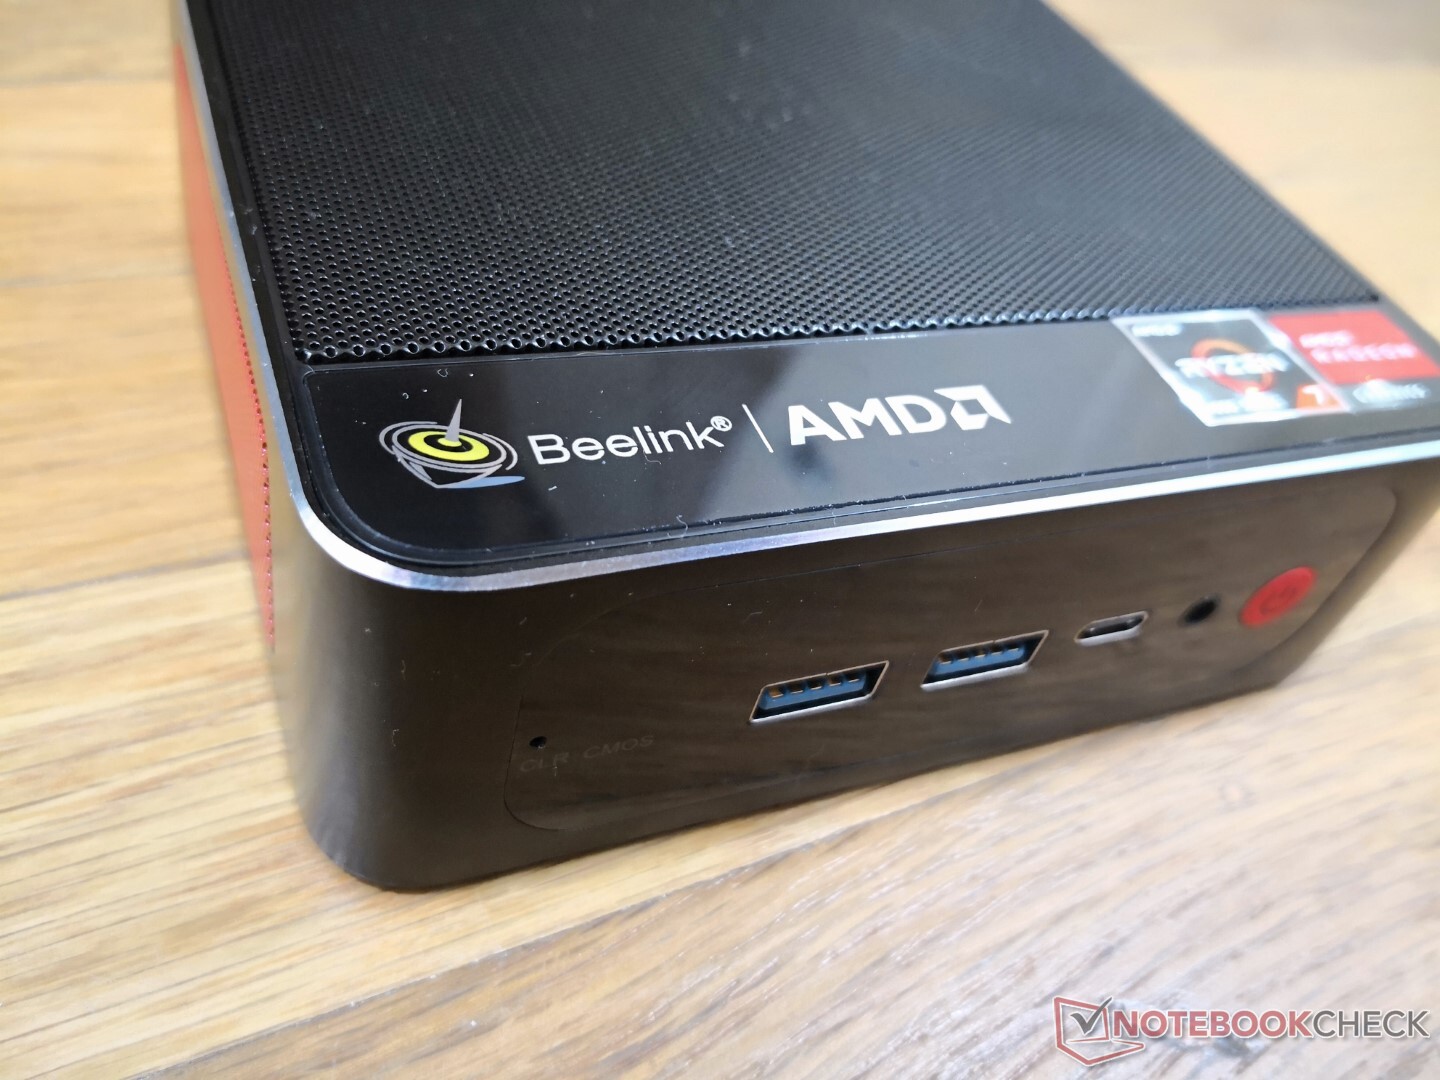
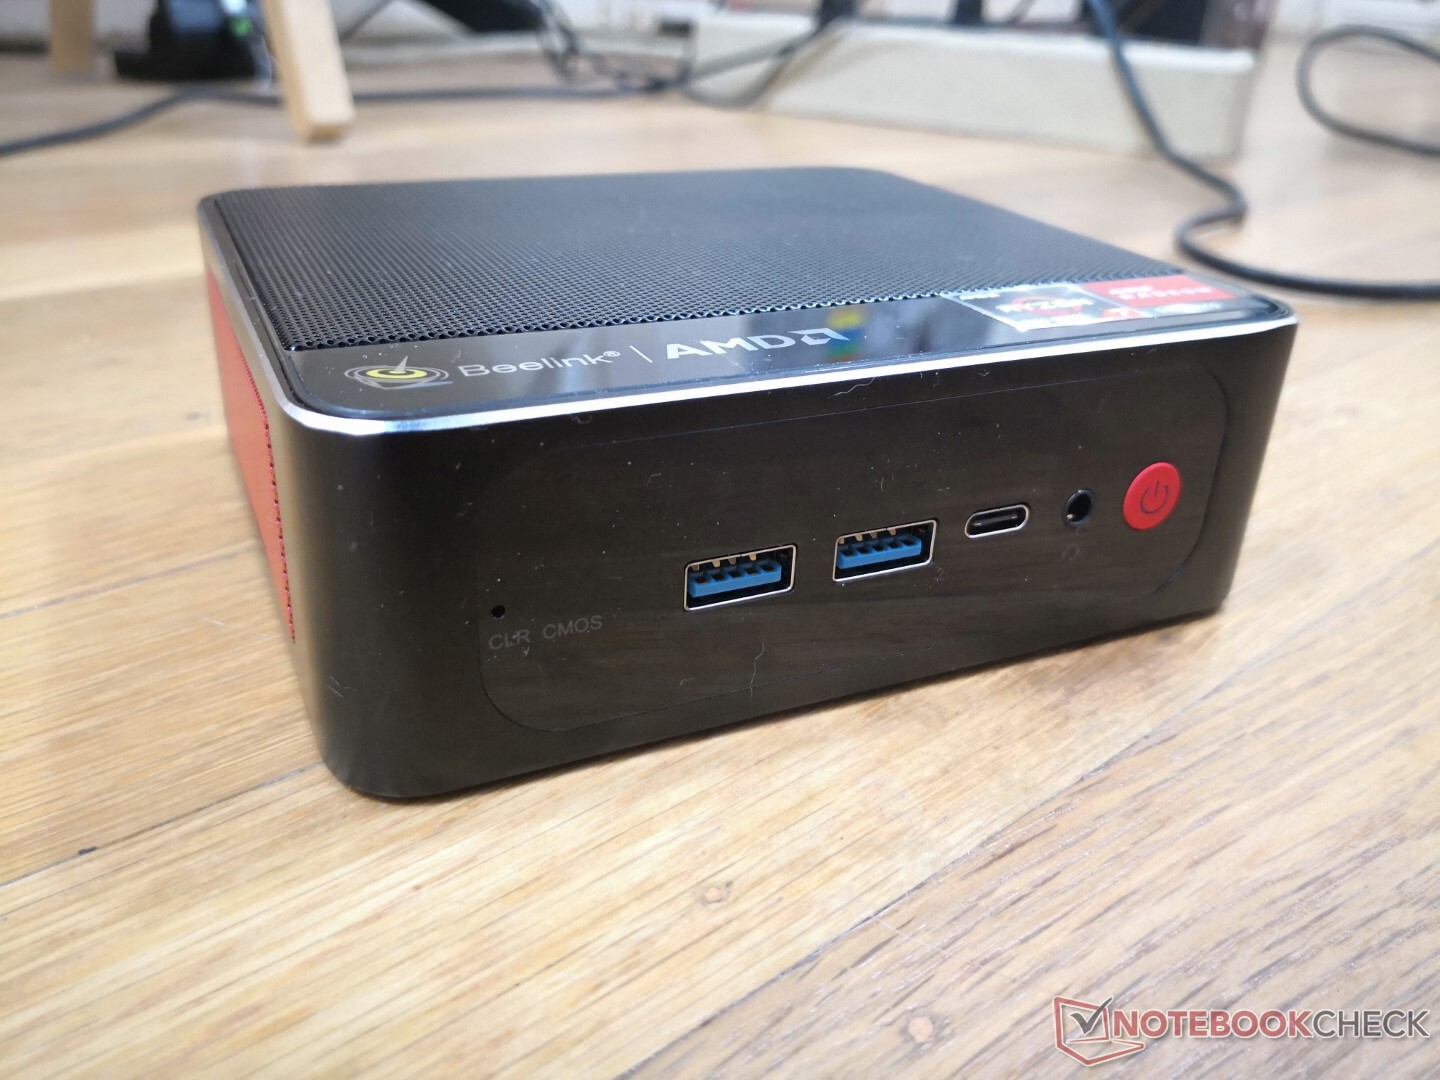
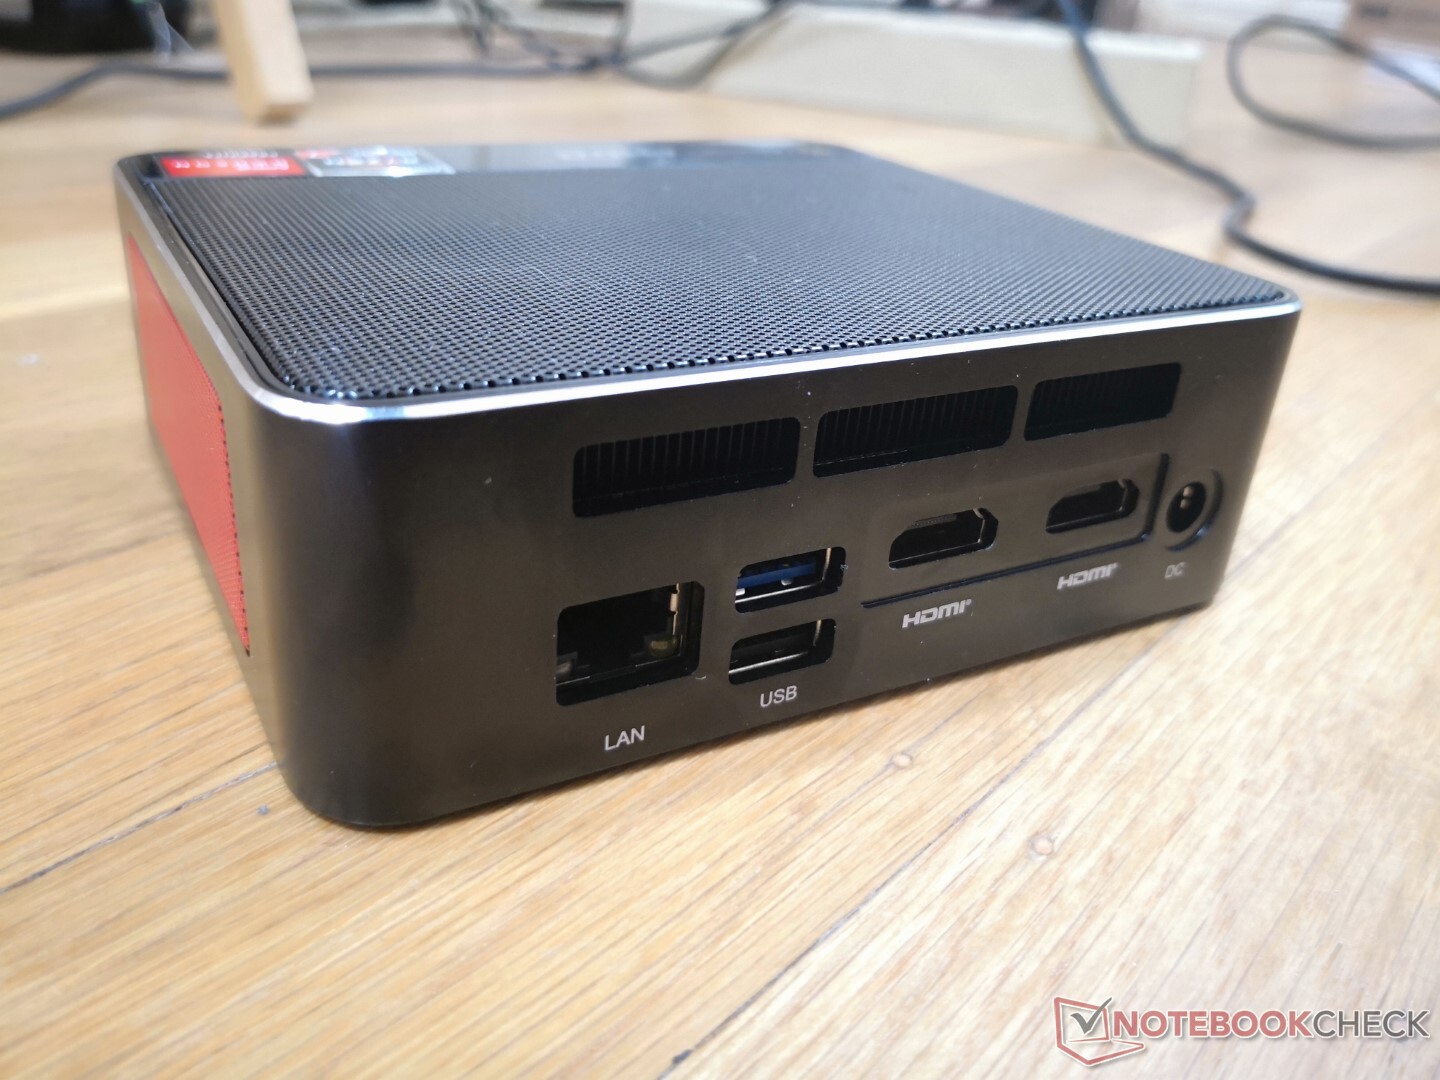
Conectividade - Sem suporte de relâmpagos
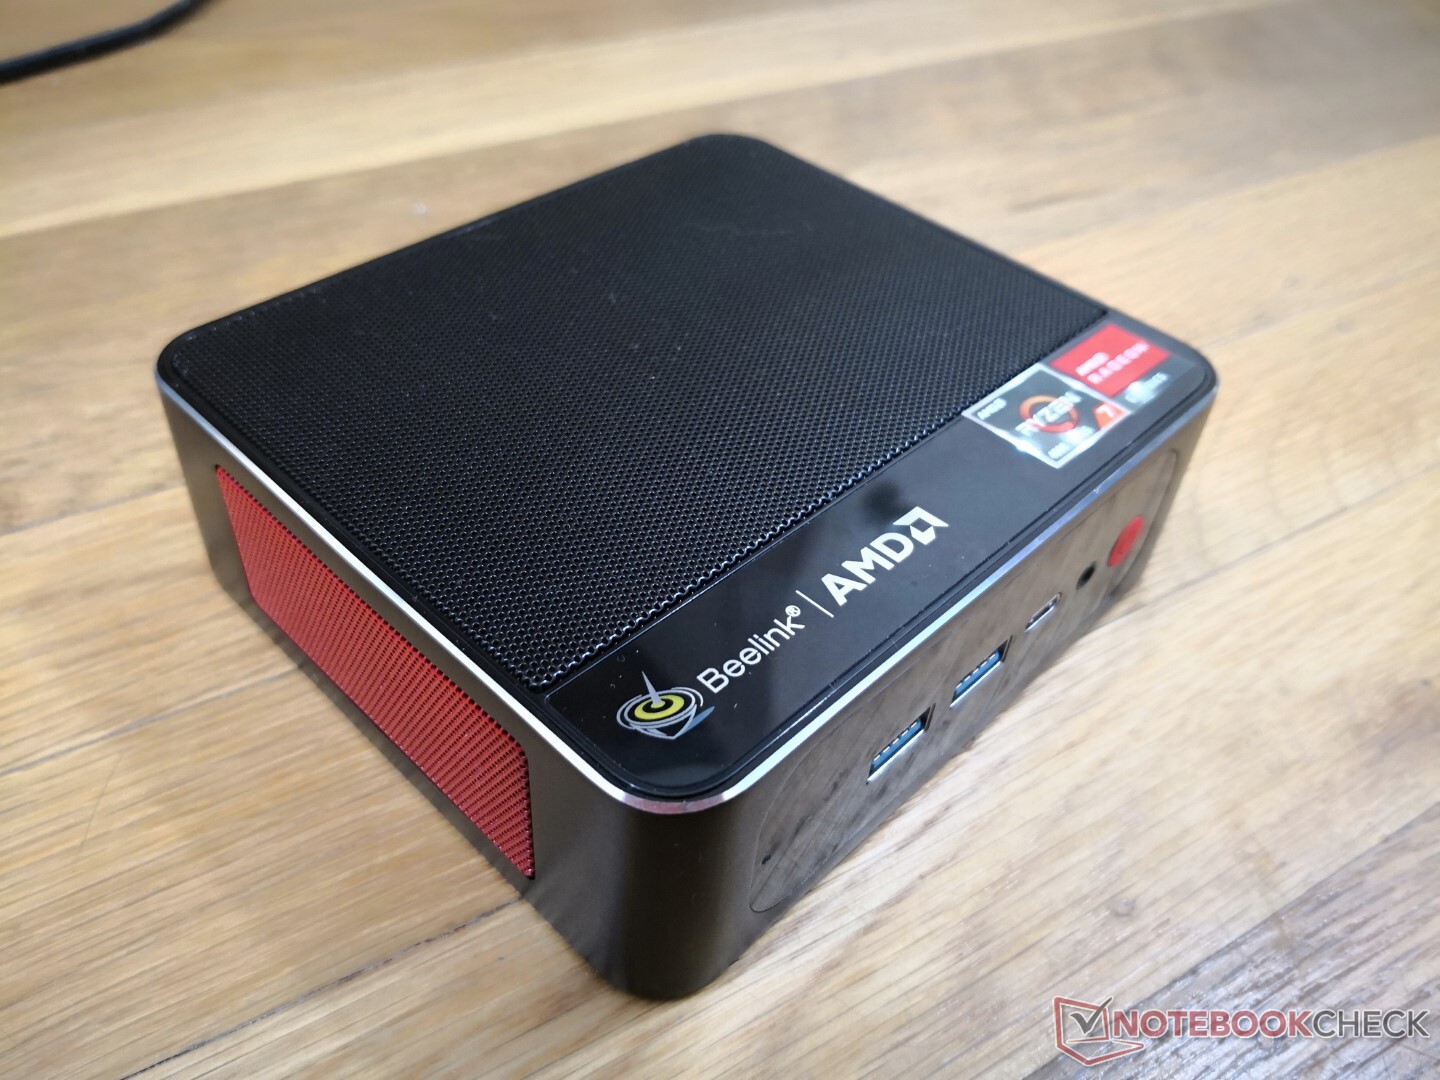
As opções de porto são idênticas ao que foi oferecido no SER3. Note que é possível ligar o SER4 com certos adaptadores USB-C AC caso os proprietários percam o cabo adaptador AC de barril proprietário que vem na caixa.
Comunicação
| Networking | |
| iperf3 transmit AX12 | |
| Beelink SER4 | |
| Beelink GTR5 | |
| Intel NUC11PAQi7 | |
| Beelink SER3 | |
| GMK NucBox 3 | |
| iperf3 receive AX12 | |
| Beelink SER4 | |
| Intel NUC11PAQi7 | |
| Beelink GTR5 | |
| GMK NucBox 3 | |
| Beelink SER3 | |
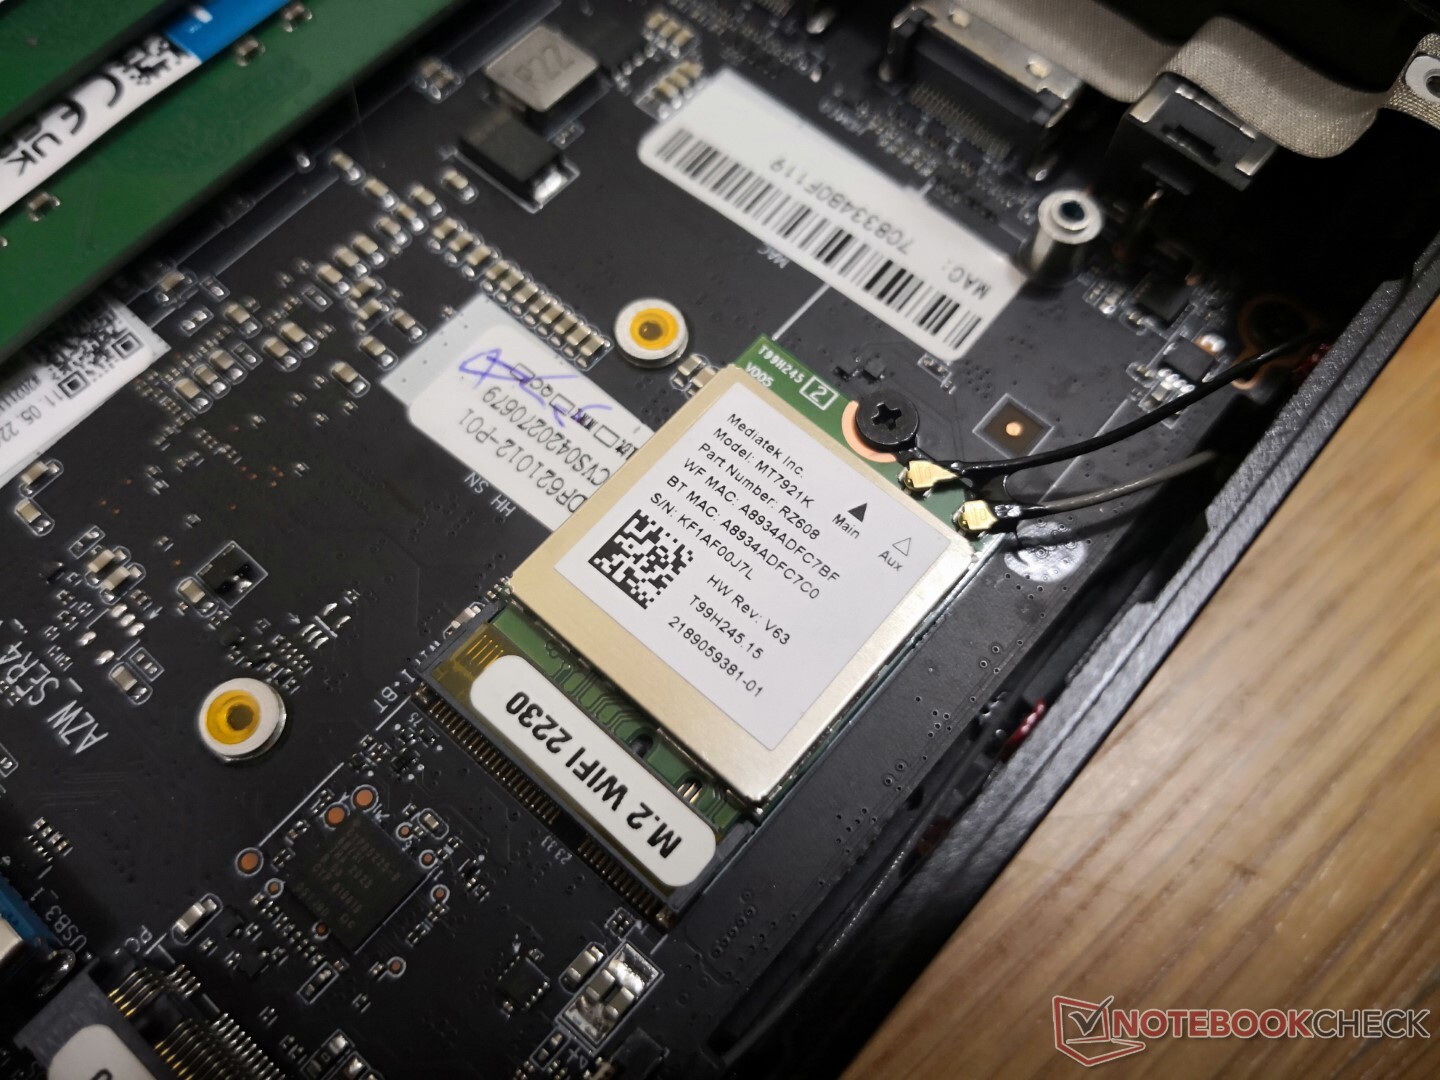
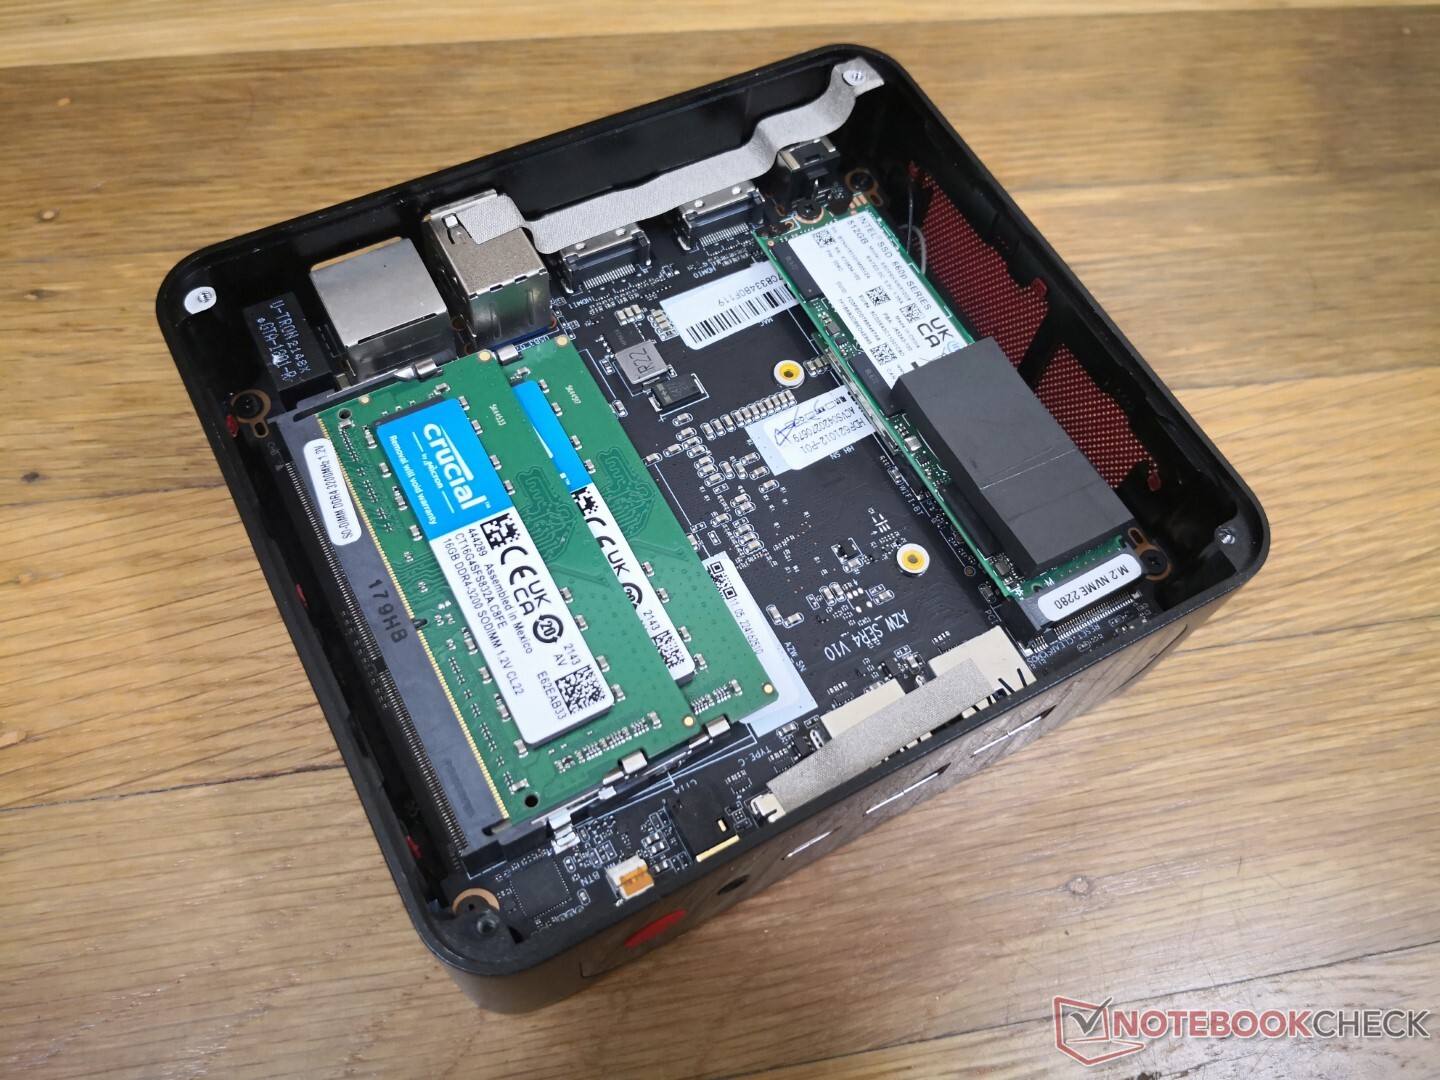
Manutenção
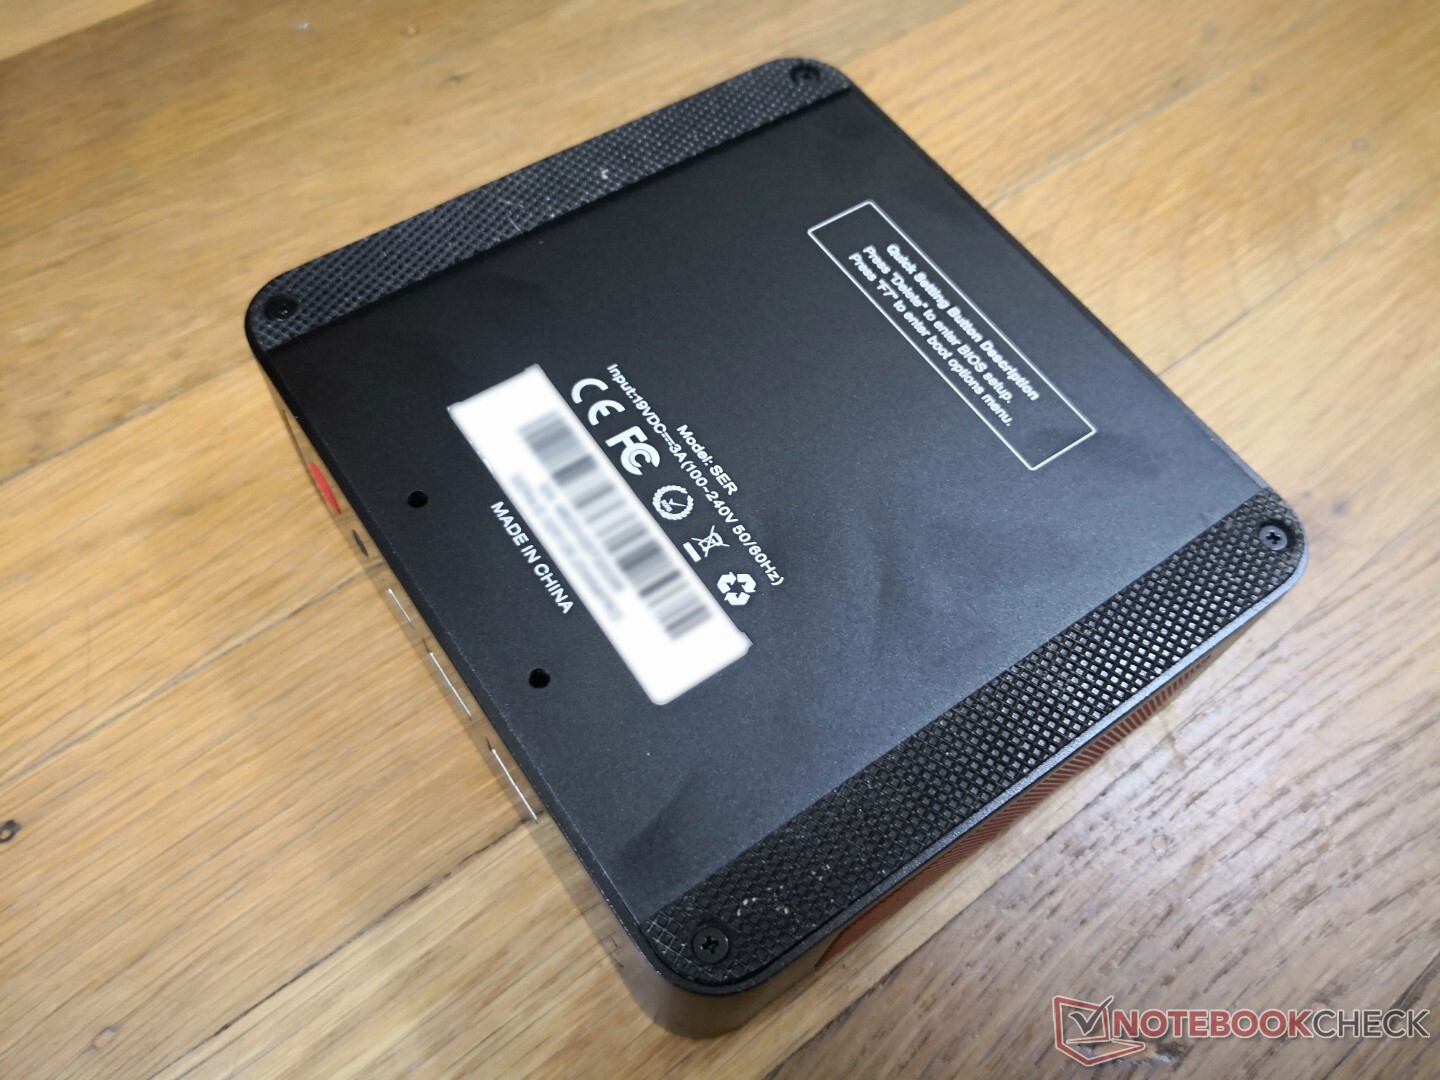
O painel inferior é fixado por quatro parafusos Philips muito parecidos com o SER3. Entretanto, o painel em nossa unidade SER4 estava preso e era difícil de remover mesmo depois de desatarraxar todos os parafusos. Recomendamos fixar a placa de montagem como âncora para agarrar e puxar mais facilmente a placa inferior.
Curiosamente, falta a bateria da BIOS no SER4 enquanto estava presente em nosso SER3. É possível que o fabricante tenha deslocado a bateria para o outro lado da placa-mãe para esta geração.
Acessórios e Garantia
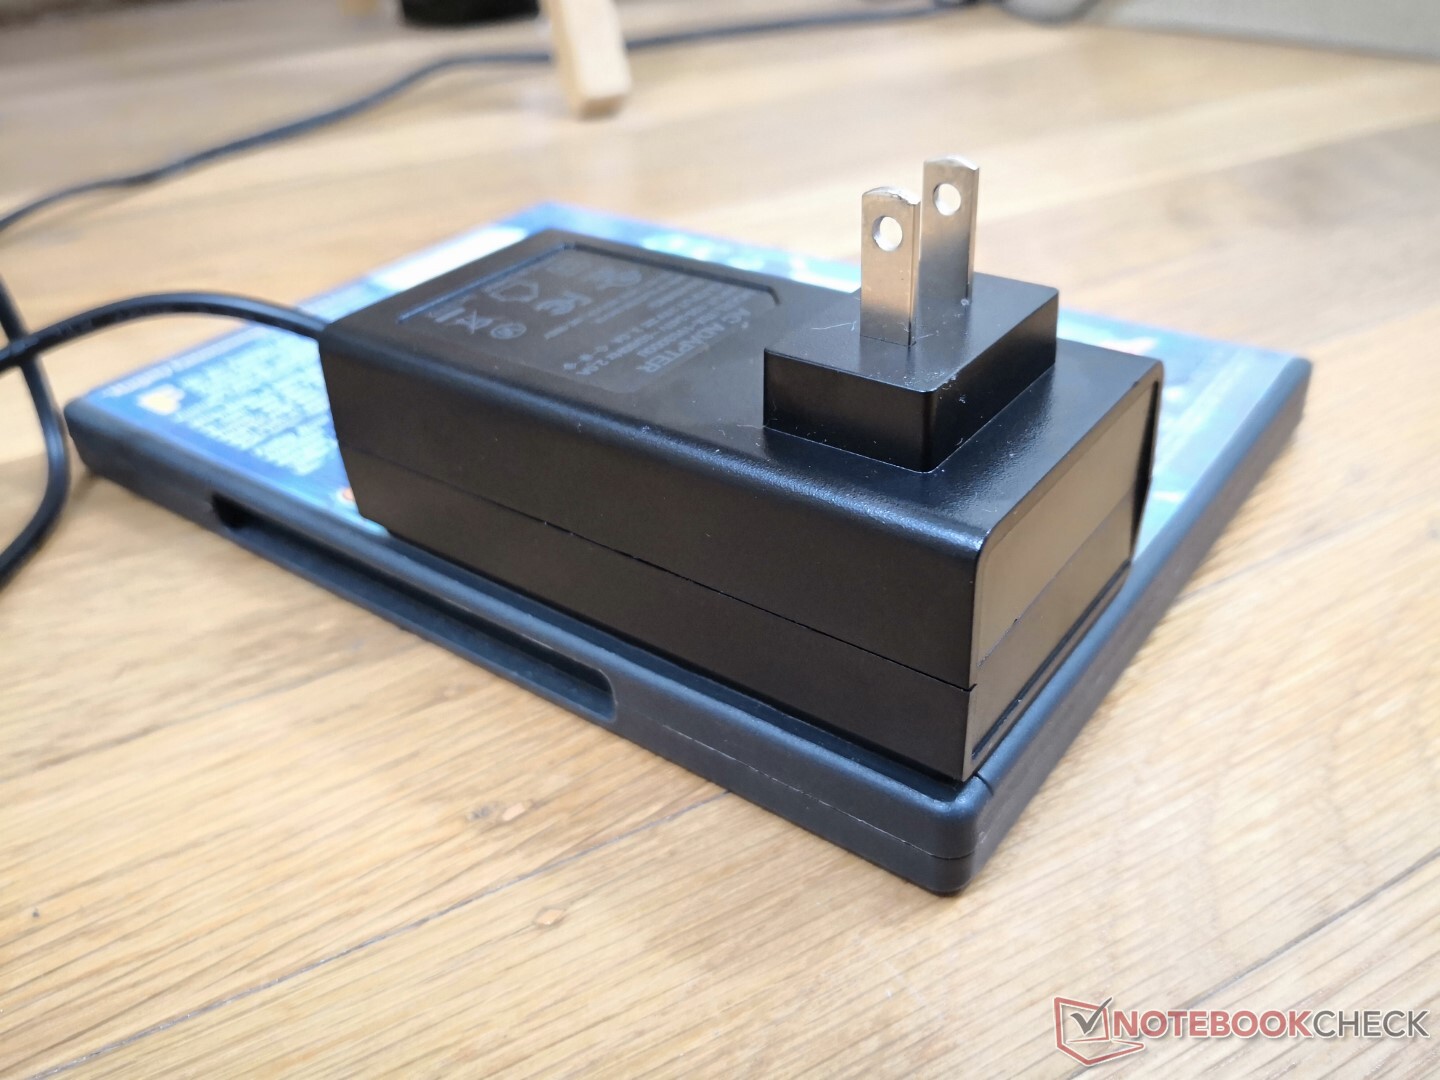
A caixa de varejo inclui um suporte VESA removível montado na parede, adaptador AC, dois cabos HDMI curtos, e um manual. A garantia padrão limitada de um ano do fabricante se aplica em comparação a três anos na maioria dos sistemas Intel NUC.
Desempenho - Mais rápido que a maioria dos Mini PCs da Série U
Condições de teste
Nossa unidade foi configurada para o modo Performance via Windows antes de executar quaisquer benchmarks de performance abaixo.
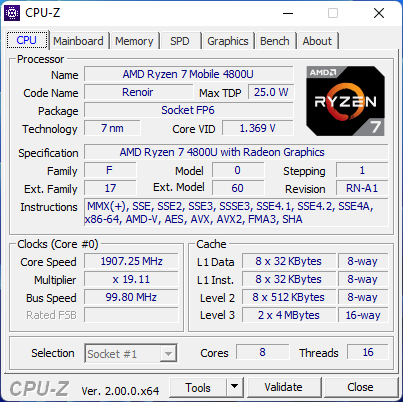
Processador - CPU série U de 8 núcleos com 16 fios
O desempenho da CPU é um dos mais rápidos de qualquer mini PC alimentado por uma CPU da série U e uma grande atualização em relação aos PCs mais antigos Ryzen 7-3750H no SER3. O sistema não apresenta um comportamento de estrangulamento importante, assim como exemplificado por nossos resultados de teste de loop do CineBench R15 xT abaixo. Isto realmente permite que o Ryzen 7 4800U em nosso Beelink para superar o desempenho do mais novo Ryzen 7 5800U no ThinkPad 13s.
O desempenho de uma única linha é medíocre, mas ainda assim muito bom em geral, com resultados próximos aos Núcleo i5-1135G7.
Cinebench R15 Multi Loop
Cinebench R23: Multi Core | Single Core
Cinebench R15: CPU Multi 64Bit | CPU Single 64Bit
Blender: v2.79 BMW27 CPU
7-Zip 18.03: 7z b 4 | 7z b 4 -mmt1
Geekbench 5.5: Multi-Core | Single-Core
HWBOT x265 Benchmark v2.2: 4k Preset
LibreOffice : 20 Documents To PDF
R Benchmark 2.5: Overall mean
| Cinebench R20 / CPU (Multi Core) | |
| Beelink GTR5 | |
| Beelink SER4 | |
| Média AMD Ryzen 7 4800U (2943 - 3306, n=4) | |
| Lenovo ThinkBook 13s G3 20YA0005GE | |
| Intel NUC11PAQi7 | |
| Intel NUC11TNKi5 | |
| Intel NUC10i5FNK | |
| Beelink SER3 | |
| Infinix INBook X2 | |
| GMK NucBox 3 | |
| Cinebench R20 / CPU (Single Core) | |
| Intel NUC11PAQi7 | |
| Beelink GTR5 | |
| Lenovo ThinkBook 13s G3 20YA0005GE | |
| Intel NUC11TNKi5 | |
| Beelink SER4 | |
| Média AMD Ryzen 7 4800U (474 - 488, n=4) | |
| Intel NUC10i5FNK | |
| Infinix INBook X2 | |
| Beelink SER3 | |
| GMK NucBox 3 | |
| Cinebench R23 / Multi Core | |
| Beelink GTR5 | |
| Média AMD Ryzen 7 4800U (7558 - 9762, n=3) | |
| Beelink SER4 | |
| Lenovo ThinkBook 13s G3 20YA0005GE | |
| Intel NUC11PAQi7 | |
| Intel NUC11TNKi5 | |
| Beelink SER3 | |
| Infinix INBook X2 | |
| GMK NucBox 3 | |
| Cinebench R23 / Single Core | |
| Beelink GTR5 | |
| Lenovo ThinkBook 13s G3 20YA0005GE | |
| Intel NUC11TNKi5 | |
| Beelink SER4 | |
| Média AMD Ryzen 7 4800U (1231 - 1240, n=3) | |
| Infinix INBook X2 | |
| Beelink SER3 | |
| GMK NucBox 3 | |
| Cinebench R15 / CPU Multi 64Bit | |
| Beelink GTR5 | |
| Lenovo ThinkBook 13s G3 20YA0005GE | |
| Lenovo ThinkBook 13s G3 20YA0005GE | |
| Média AMD Ryzen 7 4800U (1281 - 1639, n=3) | |
| Beelink SER4 | |
| Intel NUC11PAQi7 | |
| Intel NUC11TNKi5 | |
| Intel NUC10i5FNK | |
| Beelink SER3 | |
| Infinix INBook X2 | |
| GMK NucBox 3 | |
| Cinebench R15 / CPU Single 64Bit | |
| Beelink GTR5 | |
| Intel NUC11PAQi7 | |
| Lenovo ThinkBook 13s G3 20YA0005GE | |
| Intel NUC11TNKi5 | |
| Beelink SER4 | |
| Média AMD Ryzen 7 4800U (182 - 187, n=3) | |
| Intel NUC10i5FNK | |
| Infinix INBook X2 | |
| Beelink SER3 | |
| GMK NucBox 3 | |
| Blender / v2.79 BMW27 CPU | |
| GMK NucBox 3 | |
| Infinix INBook X2 | |
| Beelink SER3 | |
| Intel NUC11TNKi5 | |
| Intel NUC10i5FNK | |
| Intel NUC11PAQi7 | |
| Lenovo ThinkBook 13s G3 20YA0005GE | |
| Média AMD Ryzen 7 4800U (322 - 374, n=3) | |
| Beelink SER4 | |
| Beelink GTR5 | |
| 7-Zip 18.03 / 7z b 4 | |
| Beelink GTR5 | |
| Média AMD Ryzen 7 4800U (38654 - 44804, n=3) | |
| Beelink SER4 | |
| Lenovo ThinkBook 13s G3 20YA0005GE | |
| Intel NUC11PAQi7 | |
| Intel NUC11TNKi5 | |
| Intel NUC10i5FNK | |
| Beelink SER3 | |
| Infinix INBook X2 | |
| GMK NucBox 3 | |
| 7-Zip 18.03 / 7z b 4 -mmt1 | |
| Beelink GTR5 | |
| Intel NUC11PAQi7 | |
| Lenovo ThinkBook 13s G3 20YA0005GE | |
| Intel NUC11TNKi5 | |
| Beelink SER4 | |
| Média AMD Ryzen 7 4800U (4420 - 4603, n=3) | |
| Intel NUC10i5FNK | |
| Beelink SER3 | |
| Infinix INBook X2 | |
| GMK NucBox 3 | |
| Geekbench 5.5 / Multi-Core | |
| Beelink GTR5 | |
| Lenovo ThinkBook 13s G3 20YA0005GE | |
| Beelink SER4 | |
| Média AMD Ryzen 7 4800U (5798 - 6950, n=4) | |
| Intel NUC11PAQi7 | |
| Intel NUC11TNKi5 | |
| Intel NUC10i5FNK | |
| Infinix INBook X2 | |
| GMK NucBox 3 | |
| Geekbench 5.5 / Single-Core | |
| Beelink GTR5 | |
| Intel NUC11PAQi7 | |
| Lenovo ThinkBook 13s G3 20YA0005GE | |
| Intel NUC11TNKi5 | |
| Beelink SER4 | |
| Infinix INBook X2 | |
| Média AMD Ryzen 7 4800U (1150 - 1192, n=4) | |
| Intel NUC10i5FNK | |
| GMK NucBox 3 | |
| HWBOT x265 Benchmark v2.2 / 4k Preset | |
| Beelink GTR5 | |
| Beelink SER4 | |
| Média AMD Ryzen 7 4800U (9.48 - 10.8, n=3) | |
| Lenovo ThinkBook 13s G3 20YA0005GE | |
| Intel NUC11PAQi7 | |
| Intel NUC11TNKi5 | |
| Intel NUC10i5FNK | |
| Infinix INBook X2 | |
| Beelink SER3 | |
| GMK NucBox 3 | |
| LibreOffice / 20 Documents To PDF | |
| GMK NucBox 3 | |
| Beelink SER3 | |
| Infinix INBook X2 | |
| Beelink SER4 | |
| Média AMD Ryzen 7 4800U (57.8 - 62.6, n=3) | |
| Intel NUC11TNKi5 | |
| Lenovo ThinkBook 13s G3 20YA0005GE | |
| Beelink GTR5 | |
| Intel NUC11PAQi7 | |
| R Benchmark 2.5 / Overall mean | |
| GMK NucBox 3 | |
| Infinix INBook X2 | |
| Beelink SER3 | |
| Intel NUC10i5FNK | |
| Intel NUC11TNKi5 | |
| Média AMD Ryzen 7 4800U (0.576 - 0.613, n=3) | |
| Beelink SER4 | |
| Intel NUC11PAQi7 | |
| Lenovo ThinkBook 13s G3 20YA0005GE | |
| Beelink GTR5 | |
* ... menor é melhor
AIDA64: FP32 Ray-Trace | FPU Julia | CPU SHA3 | CPU Queen | FPU SinJulia | FPU Mandel | CPU AES | CPU ZLib | FP64 Ray-Trace | CPU PhotoWorxx
| Performance rating | |
| Beelink GTR5 | |
| Beelink SER4 | |
| Média AMD Ryzen 7 4800U | |
| Beelink SER3 | |
| GMK NucBox 3 | |
| AIDA64 / FP32 Ray-Trace | |
| Beelink GTR5 | |
| Beelink SER4 | |
| Média AMD Ryzen 7 4800U (9268 - 10046, n=2) | |
| Beelink SER3 | |
| GMK NucBox 3 | |
| AIDA64 / FPU Julia | |
| Beelink GTR5 | |
| Beelink SER4 | |
| Média AMD Ryzen 7 4800U (53257 - 56388, n=2) | |
| Beelink SER3 | |
| GMK NucBox 3 | |
| AIDA64 / CPU SHA3 | |
| Beelink GTR5 | |
| Beelink SER4 | |
| Média AMD Ryzen 7 4800U (1732 - 1840, n=2) | |
| Beelink SER3 | |
| GMK NucBox 3 | |
| AIDA64 / CPU Queen | |
| Beelink GTR5 | |
| Beelink SER4 | |
| Média AMD Ryzen 7 4800U (77333 - 78511, n=2) | |
| Beelink SER3 | |
| GMK NucBox 3 | |
| AIDA64 / FPU SinJulia | |
| Beelink GTR5 | |
| Beelink SER4 | |
| Média AMD Ryzen 7 4800U (11293 - 11799, n=2) | |
| Beelink SER3 | |
| GMK NucBox 3 | |
| AIDA64 / FPU Mandel | |
| Beelink GTR5 | |
| Beelink SER4 | |
| Média AMD Ryzen 7 4800U (27938 - 28667, n=2) | |
| Beelink SER3 | |
| GMK NucBox 3 | |
| AIDA64 / CPU AES | |
| Beelink GTR5 | |
| Beelink SER4 | |
| Média AMD Ryzen 7 4800U (52147 - 54686, n=2) | |
| Beelink SER3 | |
| GMK NucBox 3 | |
| AIDA64 / CPU ZLib | |
| Beelink GTR5 | |
| Beelink SER4 | |
| Média AMD Ryzen 7 4800U (580 - 593, n=2) | |
| Beelink SER3 | |
| GMK NucBox 3 | |
| AIDA64 / FP64 Ray-Trace | |
| Beelink GTR5 | |
| Beelink SER4 | |
| Média AMD Ryzen 7 4800U (4877 - 5555, n=2) | |
| Beelink SER3 | |
| GMK NucBox 3 | |
| AIDA64 / CPU PhotoWorxx | |
| Beelink SER4 | |
| Média AMD Ryzen 7 4800U (22818 - 24254, n=2) | |
| Beelink GTR5 | |
| Beelink SER3 | |
| GMK NucBox 3 | |
Desempenho do sistema
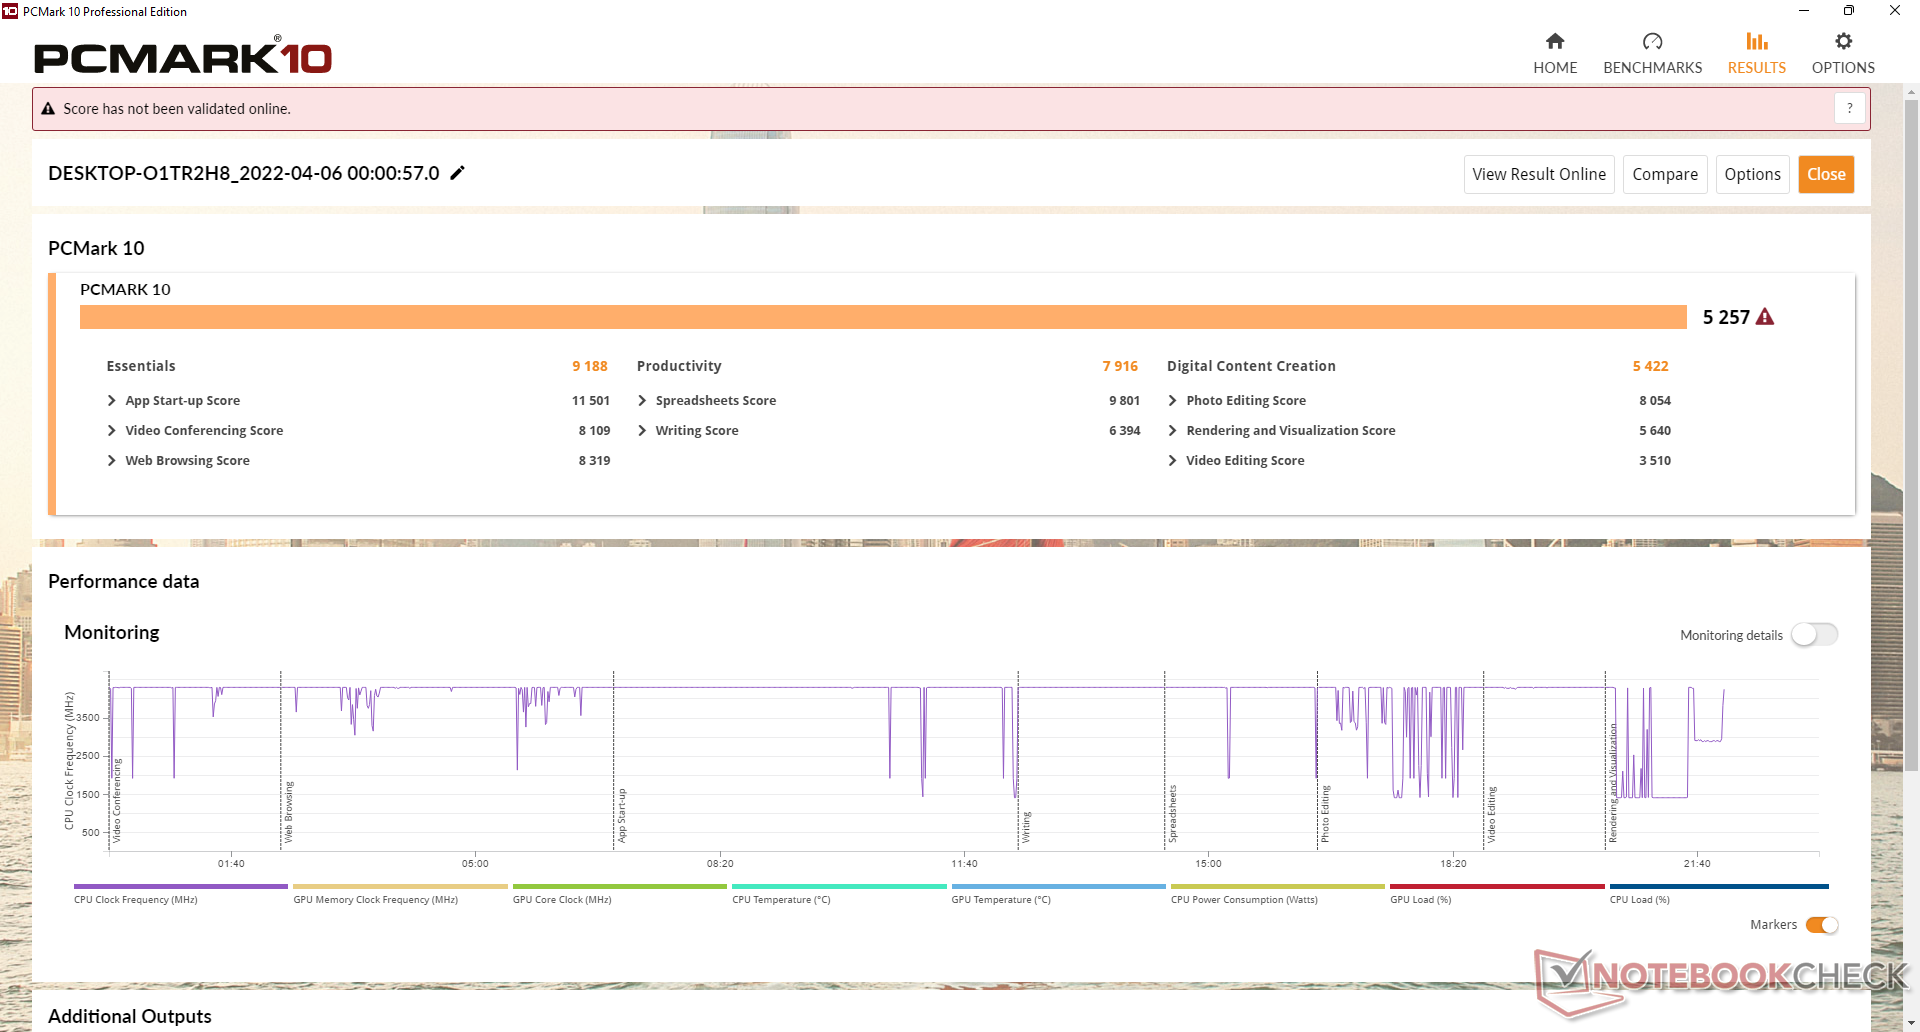
Os resultados do PCMark 10 estão ao mesmo nível, se não um pouco mais altos do que o Intel NUC 11, rodando em um Core i7-1165G7 do 11º gênero. Suspeitamos que o modelo Intel poderia ter tido uma pontuação ainda maior, no entanto, se nossa unidade de teste Intel não tivesse sido limitada à memória de um único canal.
CrossMark: Overall | Productivity | Creativity | Responsiveness
| PCMark 10 / Score | |
| Beelink GTR5 | |
| Média AMD Ryzen 7 4800U, AMD Radeon RX Vega 8 (Ryzen 4000/5000) (5233 - 5383, n=3) | |
| Beelink SER4 | |
| Intel NUC11PAQi7 | |
| Intel NUC10i5FNK | |
| Beelink SER3 | |
| GMK NucBox 3 | |
| PCMark 10 / Essentials | |
| Beelink GTR5 | |
| Intel NUC11PAQi7 | |
| Média AMD Ryzen 7 4800U, AMD Radeon RX Vega 8 (Ryzen 4000/5000) (9188 - 9637, n=3) | |
| Beelink SER4 | |
| Intel NUC10i5FNK | |
| Beelink SER3 | |
| GMK NucBox 3 | |
| PCMark 10 / Productivity | |
| Beelink GTR5 | |
| Beelink SER4 | |
| Média AMD Ryzen 7 4800U, AMD Radeon RX Vega 8 (Ryzen 4000/5000) (7631 - 8091, n=3) | |
| Intel NUC11PAQi7 | |
| Intel NUC10i5FNK | |
| Beelink SER3 | |
| GMK NucBox 3 | |
| PCMark 10 / Digital Content Creation | |
| Beelink GTR5 | |
| Média AMD Ryzen 7 4800U, AMD Radeon RX Vega 8 (Ryzen 4000/5000) (5123 - 5758, n=3) | |
| Beelink SER4 | |
| Intel NUC11PAQi7 | |
| Beelink SER3 | |
| Intel NUC10i5FNK | |
| GMK NucBox 3 | |
| CrossMark / Overall | |
| Beelink GTR5 | |
| CrossMark / Productivity | |
| Beelink GTR5 | |
| CrossMark / Creativity | |
| Beelink GTR5 | |
| CrossMark / Responsiveness | |
| Beelink GTR5 | |
| PCMark 10 Score | 5257 pontos | |
Ajuda | ||
| AIDA64 / Memory Copy | |
| Beelink GTR5 | |
| Média AMD Ryzen 7 4800U (37086 - 40961, n=2) | |
| Beelink SER4 | |
| Beelink SER3 | |
| GMK NucBox 3 | |
| AIDA64 / Memory Read | |
| Beelink GTR5 | |
| Média AMD Ryzen 7 4800U (44706 - 46406, n=2) | |
| Beelink SER4 | |
| Beelink SER3 | |
| GMK NucBox 3 | |
| AIDA64 / Memory Write | |
| Beelink SER4 | |
| Média AMD Ryzen 7 4800U (42240 - 43768, n=2) | |
| Beelink GTR5 | |
| Beelink SER3 | |
| GMK NucBox 3 | |
| AIDA64 / Memory Latency | |
| Média AMD Ryzen 7 4800U (94.7 - 115, n=2) | |
| Beelink SER3 | |
| Beelink SER4 | |
| GMK NucBox 3 | |
| Beelink GTR5 | |
* ... menor é melhor
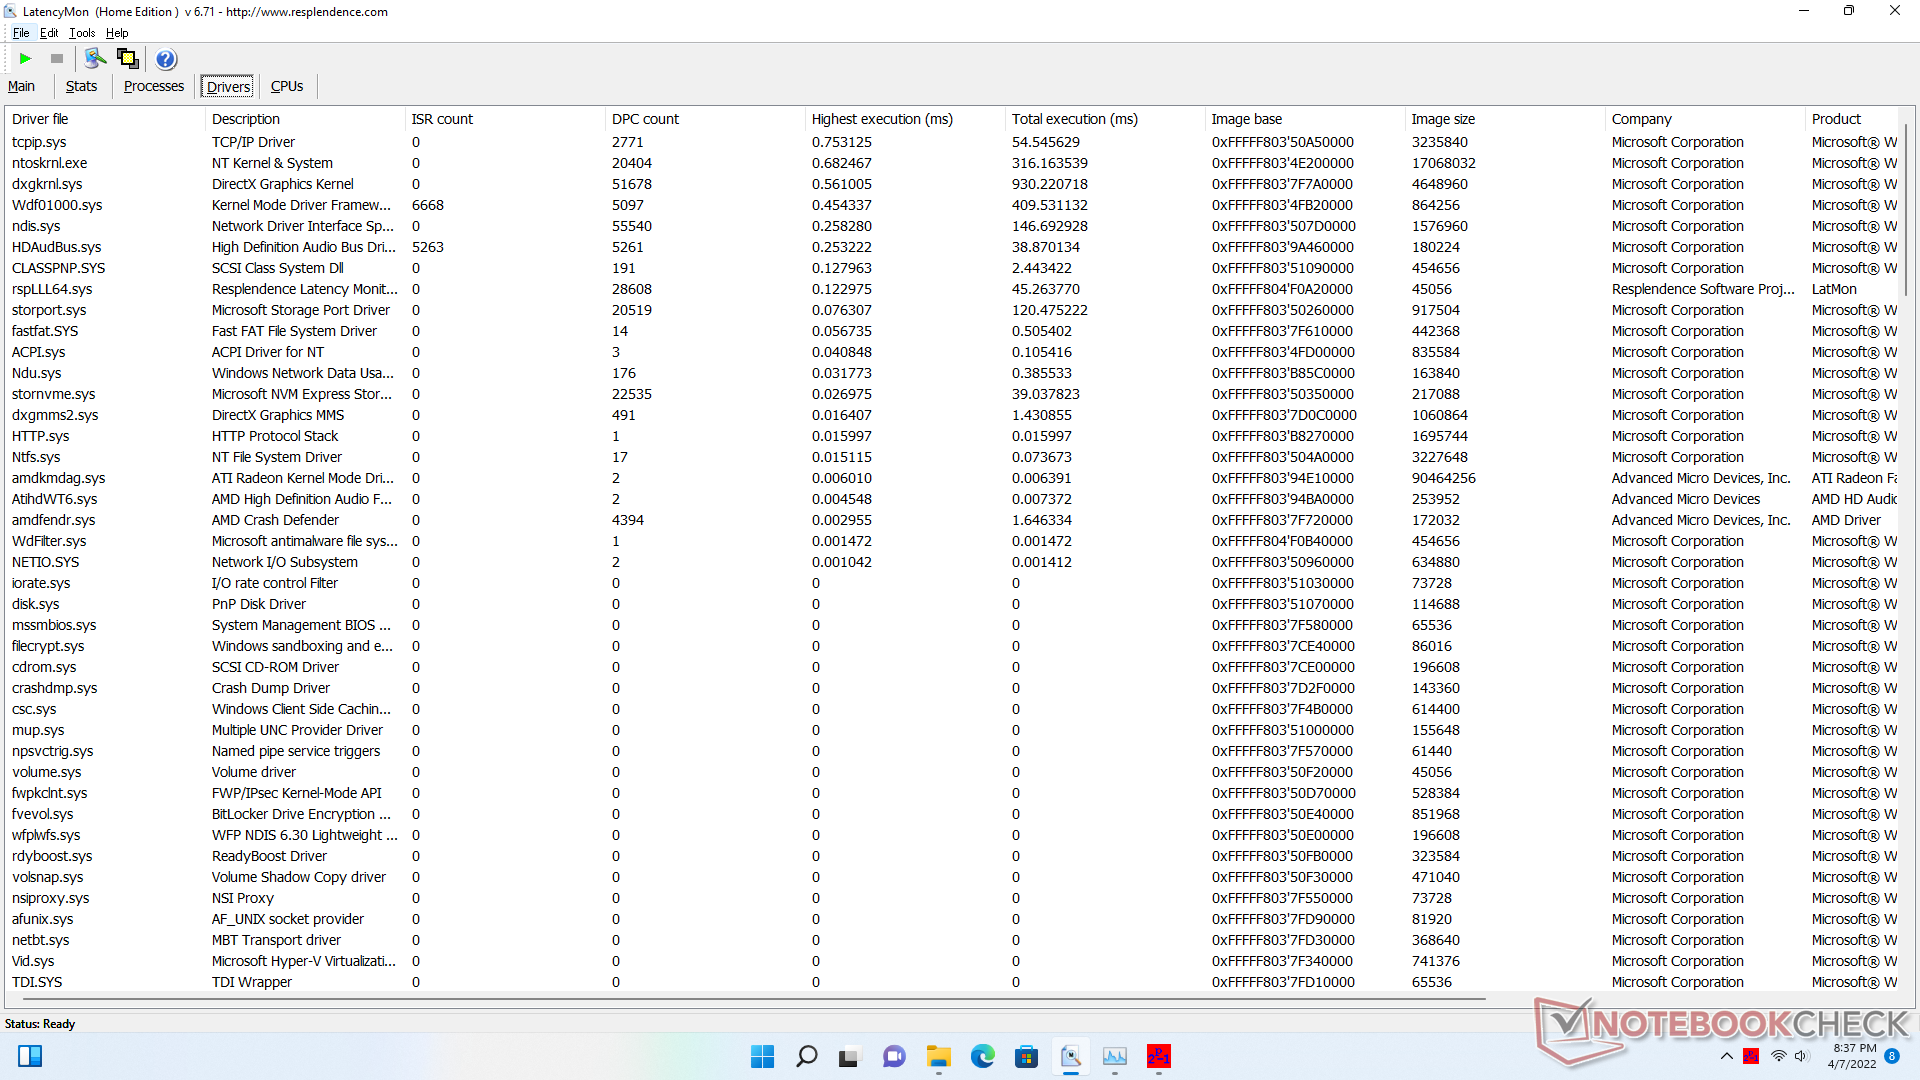
Latência do DPC
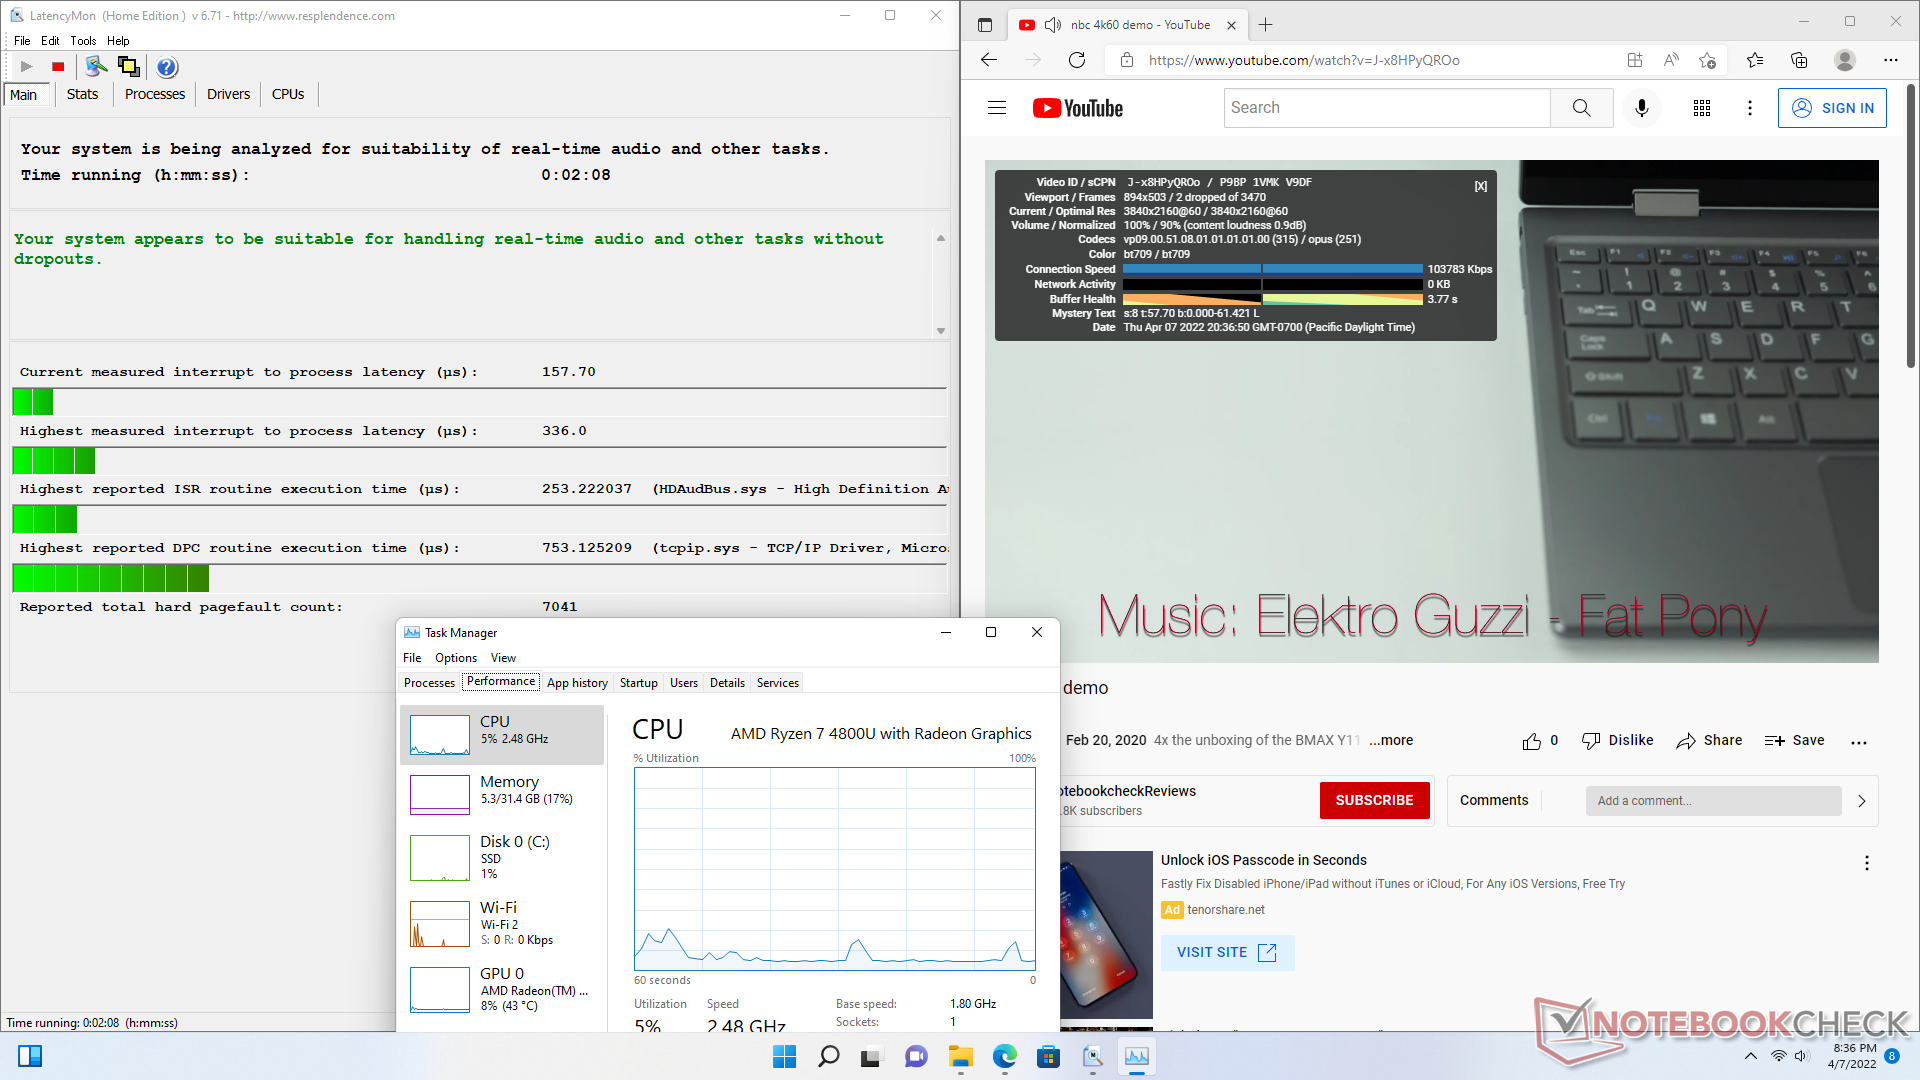
LatencyMon não revela nenhum problema de DPC ao abrir várias abas do navegador em nossa página inicial. a reprodução do vídeo de 4K a 60 FPS é quase perfeita, com apenas 2 quadros descartados durante nosso vídeo de minutos de duração.
| DPC Latencies / LatencyMon - interrupt to process latency (max), Web, Youtube, Prime95 | |
| GMK NucBox 3 | |
| Beelink SER3 | |
| Intel NUC11PAQi7 | |
| Beelink SER4 | |
| Beelink GTR5 | |
* ... menor é melhor
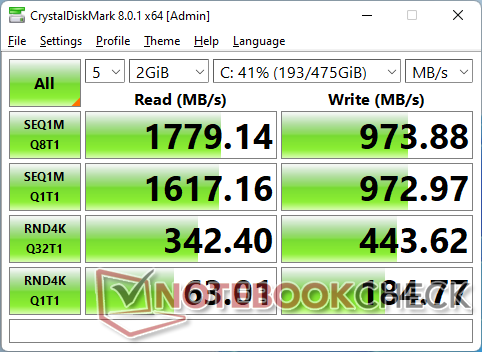
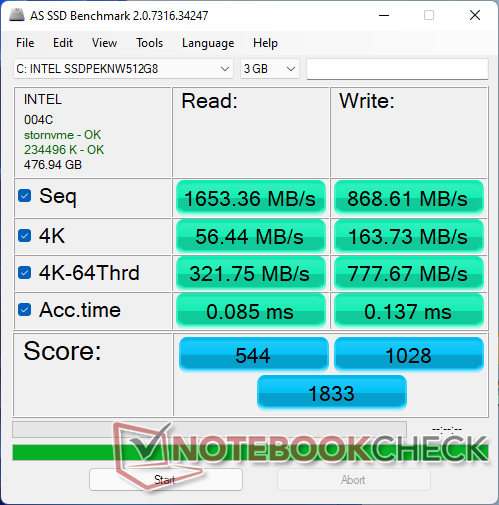
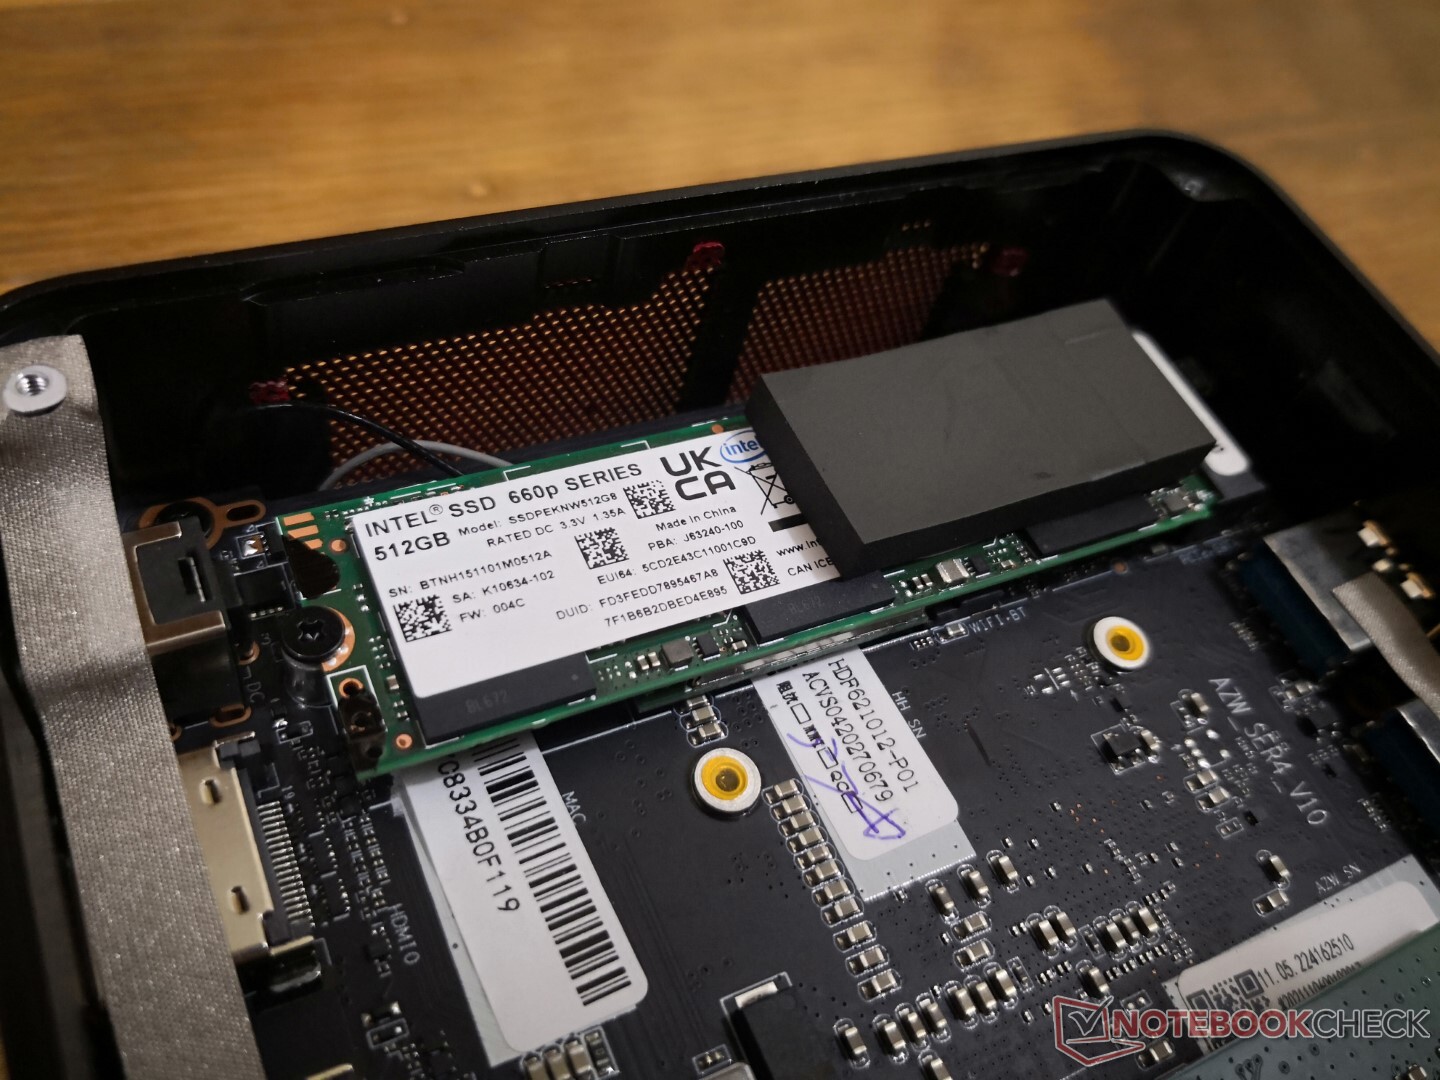
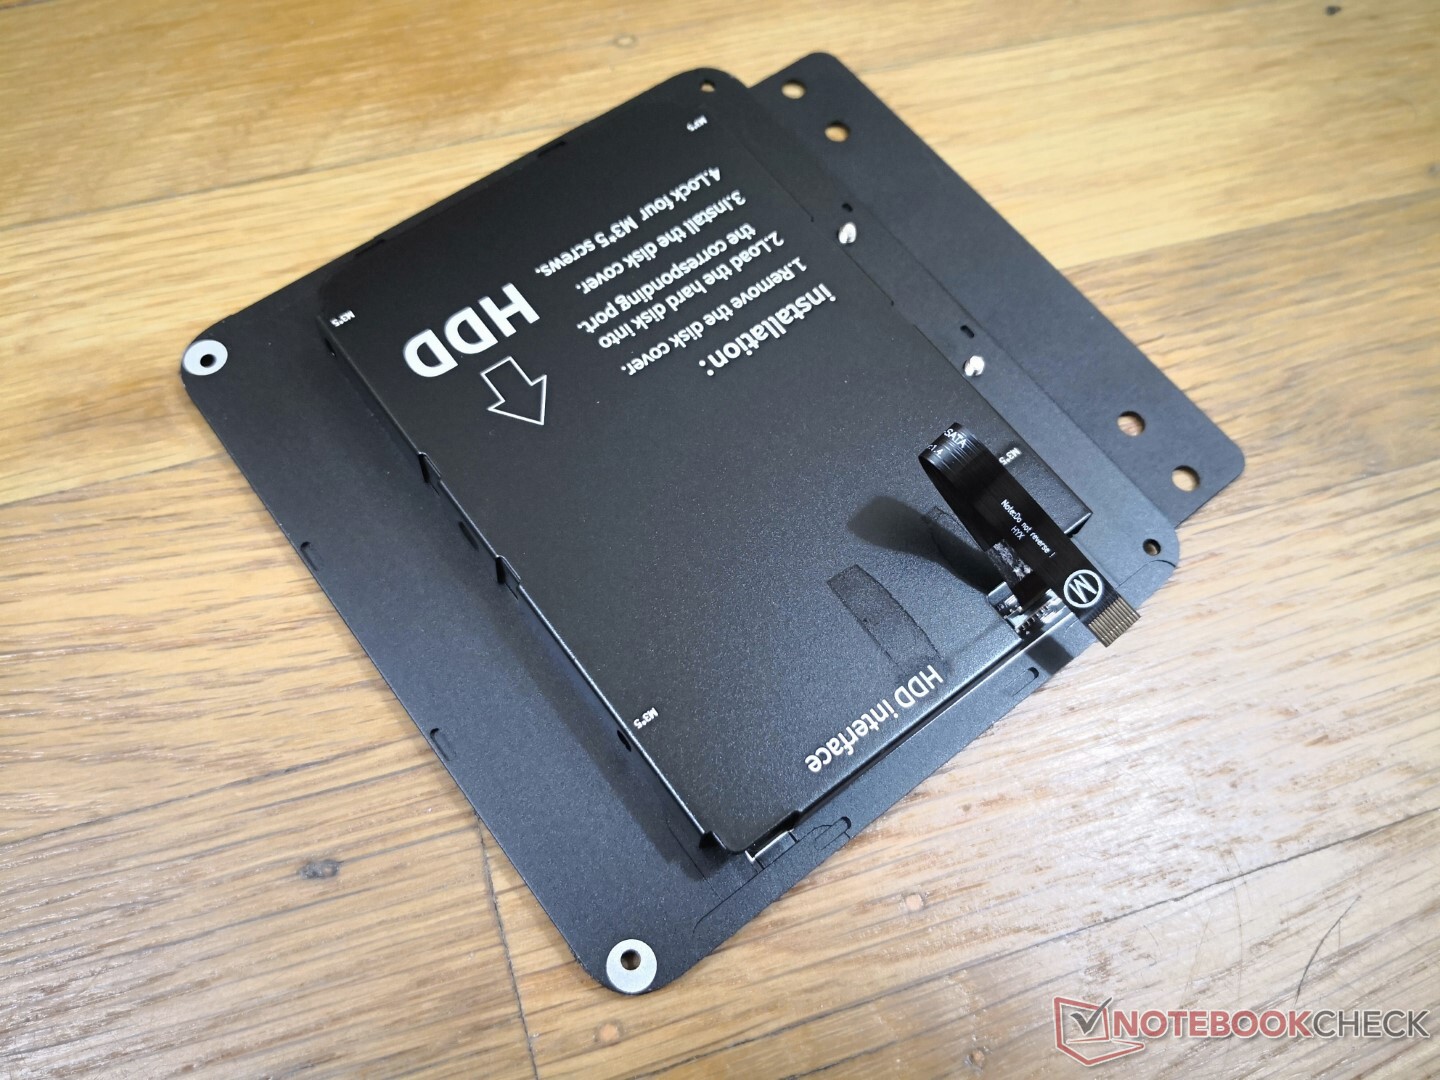
Dispositivos de armazenamento - PCIe3 x4 + SATA III de 2,5 polegadas
Nossa unidade de teste inclui uma unidade de 512 GB Intel SSD 660p que é um orçamento PCIe3 x4 NVMe SSD. As taxas de leitura seqüencial são de apenas cerca de 1400 MB/s em comparação com >3000 MB/s ou >7000 MB/s em unidades PCIe3 ou PCIe4 de alto nível, respectivamente. Para o público alvo, entretanto, a Intel 660p será suficiente.

| Drive Performance rating - Percent | |
| Intel NUC11PAQi7 | |
| Beelink GTR5 | |
| Beelink SER4 | |
| Beelink SER3 | |
| Intel NUC10i5FNK | |
| GMK NucBox 3 | |
| DiskSpd | |
| seq read | |
| Intel NUC11PAQi7 | |
| Beelink GTR5 | |
| Beelink SER4 | |
| Beelink SER3 | |
| Intel NUC10i5FNK | |
| GMK NucBox 3 | |
| seq write | |
| Intel NUC11PAQi7 | |
| Beelink GTR5 | |
| Beelink SER3 | |
| Beelink SER4 | |
| Intel NUC10i5FNK | |
| GMK NucBox 3 | |
| seq q8 t1 read | |
| Intel NUC11PAQi7 | |
| Beelink GTR5 | |
| Beelink SER3 | |
| Beelink SER4 | |
| Intel NUC10i5FNK | |
| GMK NucBox 3 | |
| seq q8 t1 write | |
| Intel NUC11PAQi7 | |
| Beelink GTR5 | |
| Beelink SER3 | |
| Beelink SER4 | |
| Intel NUC10i5FNK | |
| GMK NucBox 3 | |
| 4k q1 t1 read | |
| Beelink SER4 | |
| Intel NUC11PAQi7 | |
| Beelink GTR5 | |
| Beelink SER3 | |
| Intel NUC10i5FNK | |
| GMK NucBox 3 | |
| 4k q1 t1 write | |
| Beelink GTR5 | |
| Beelink SER4 | |
| Beelink SER3 | |
| Intel NUC11PAQi7 | |
| GMK NucBox 3 | |
| Intel NUC10i5FNK | |
| 4k q32 t16 read | |
| Intel NUC11PAQi7 | |
| Beelink SER3 | |
| Beelink GTR5 | |
| Beelink SER4 | |
| Intel NUC10i5FNK | |
| GMK NucBox 3 | |
| 4k q32 t16 write | |
| Intel NUC11PAQi7 | |
| Beelink SER4 | |
| Beelink GTR5 | |
| Beelink SER3 | |
| Intel NUC10i5FNK | |
| GMK NucBox 3 | |
* ... menor é melhor
Disk Throttling: DiskSpd Read Loop, Queue Depth 8
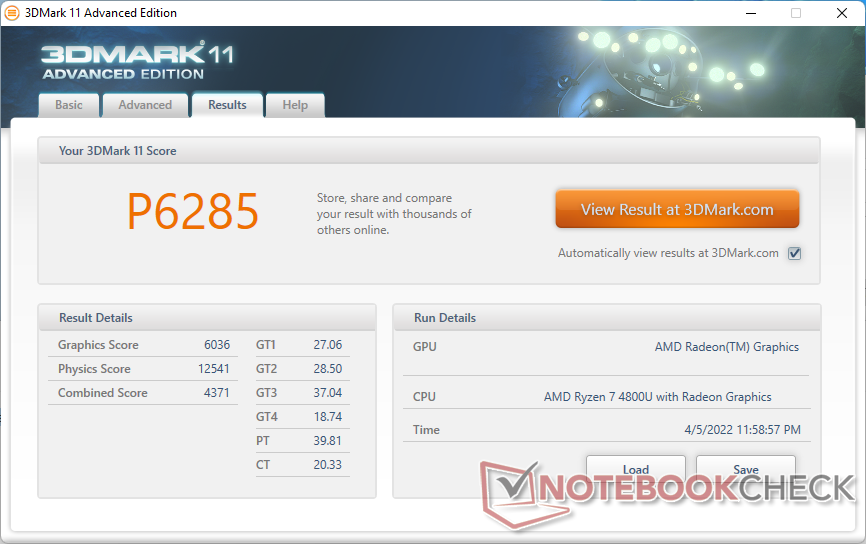
GPU Performance - Pescoço a Pescoço com a Iris Xe 80 EU
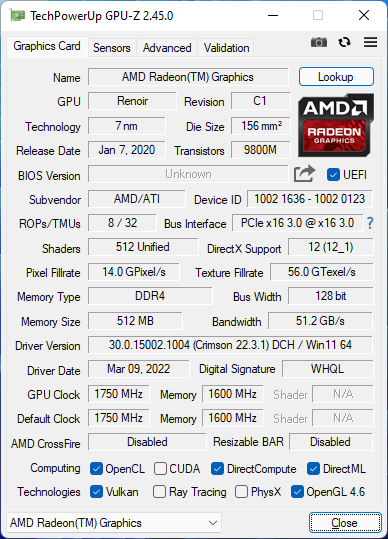
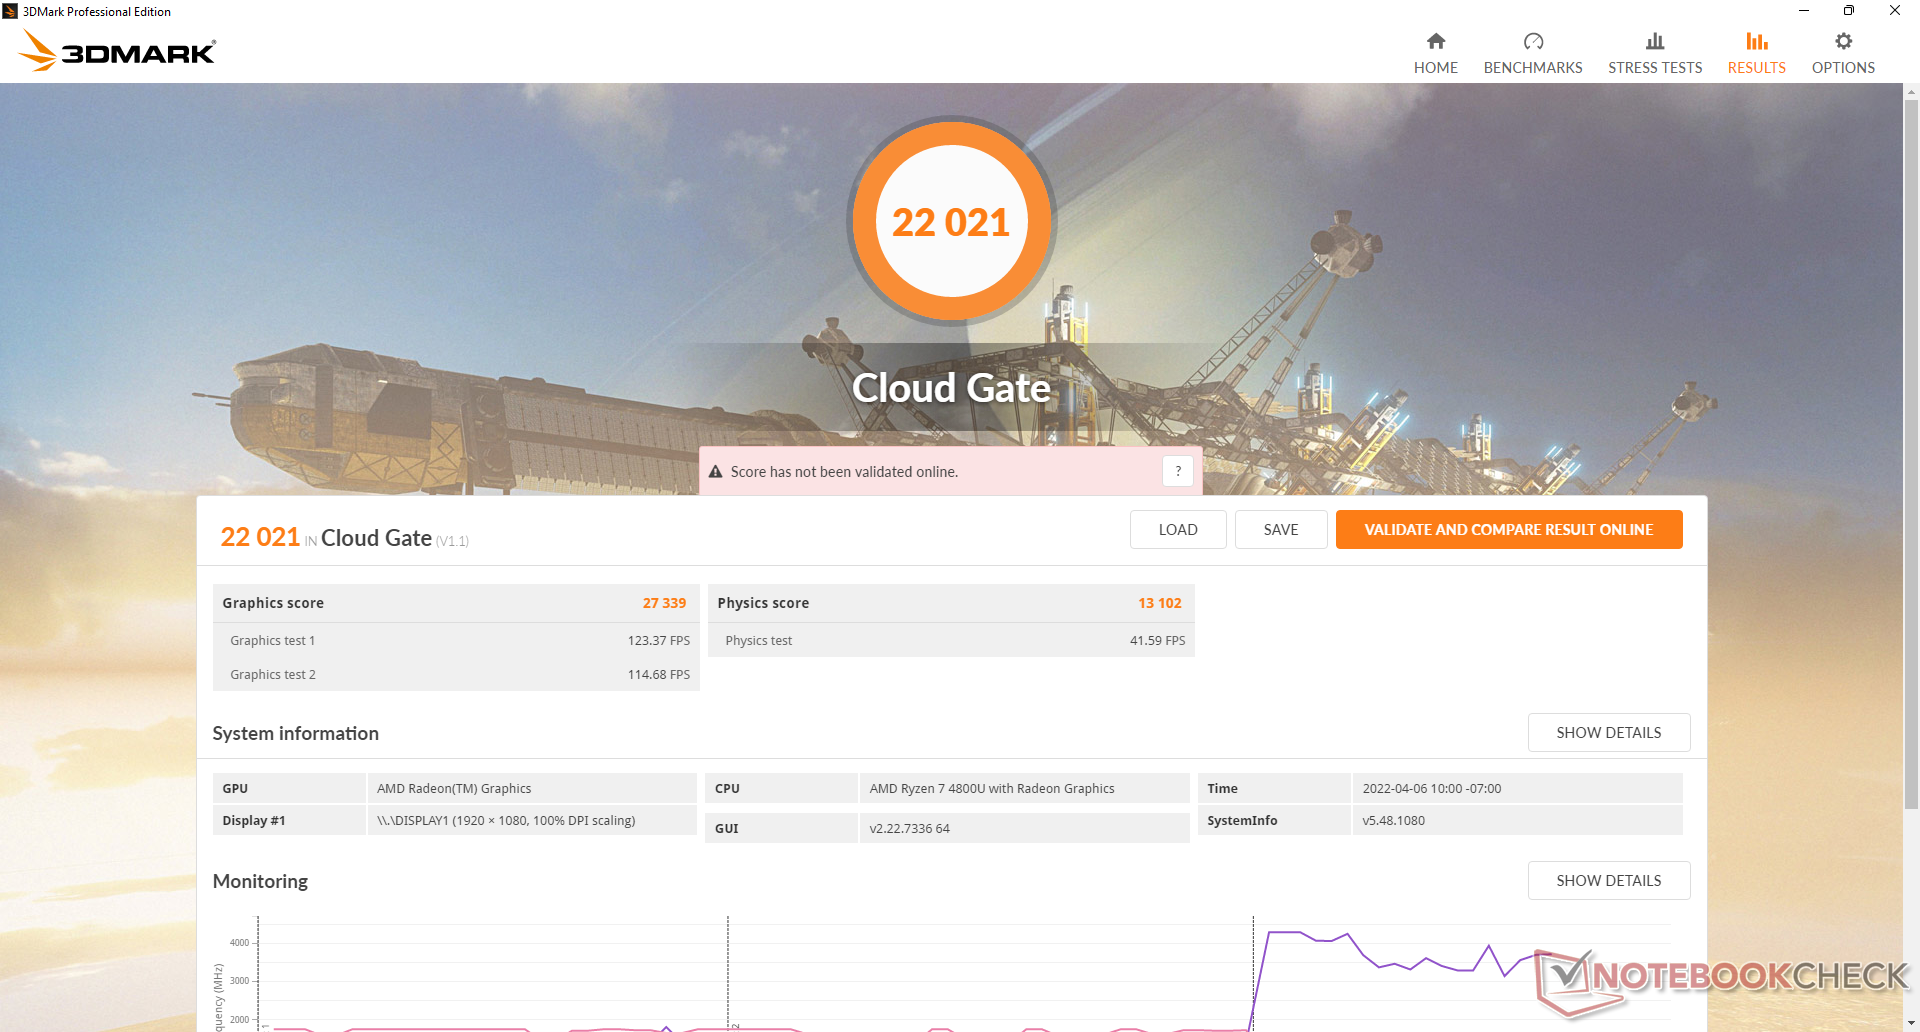
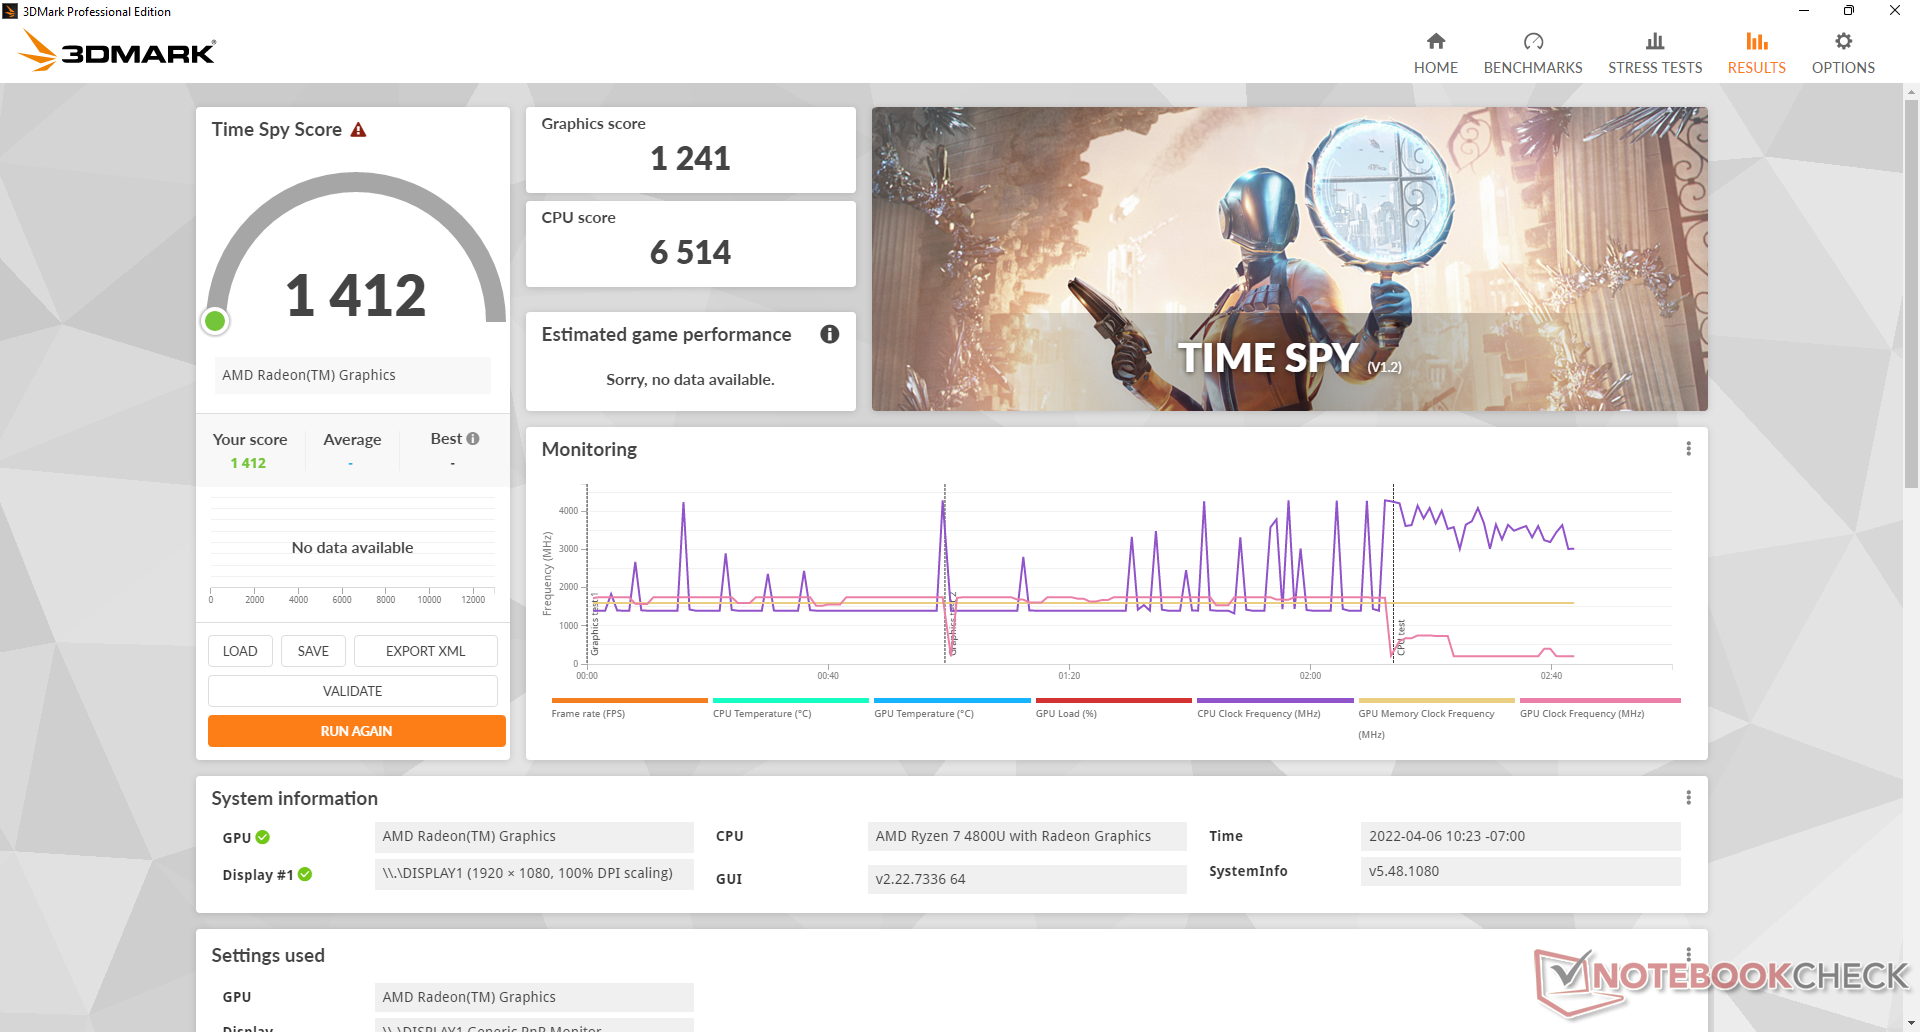
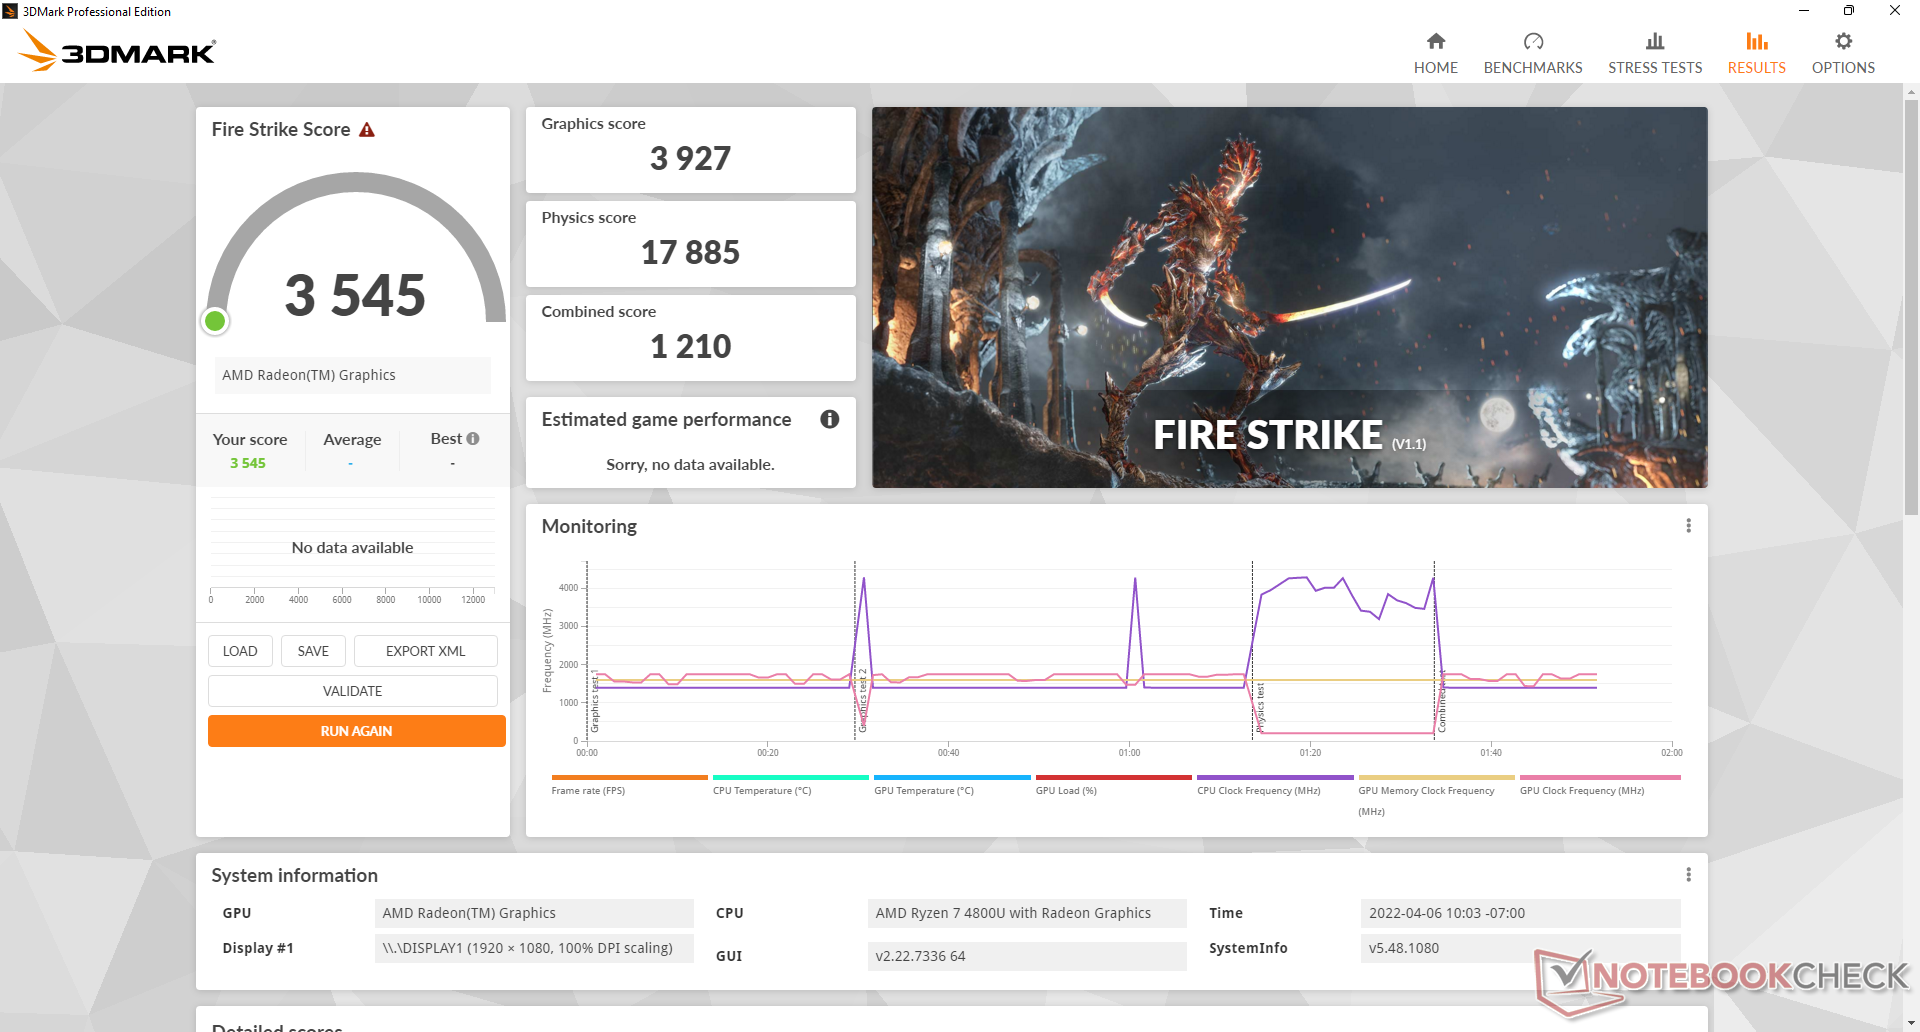
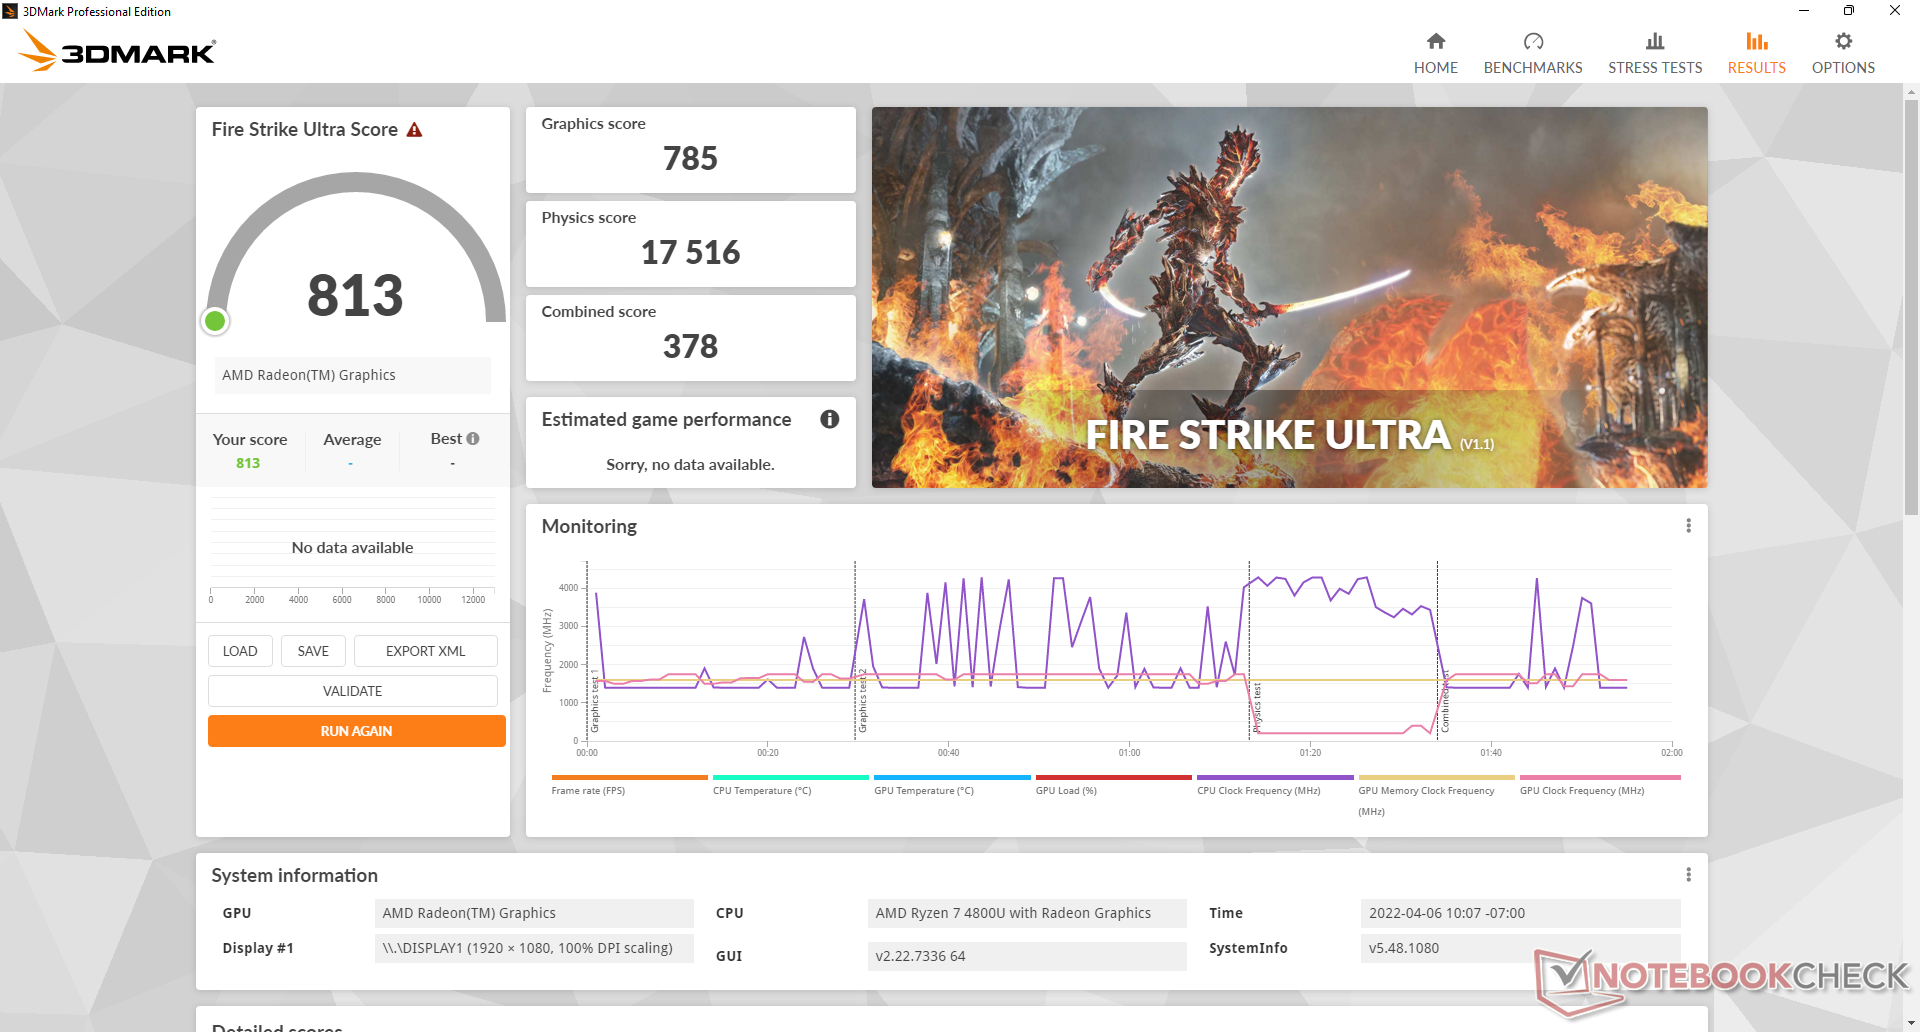
A integração Radeon Vega 8 A GPU ainda é muito boa apesar de ter uma ou duas gerações de idade. os resultados da 3DMark são cerca de 20 a 30% mais lentos do que os da concorrência Iris Xe 96 EUs rodando em RAM de canal duplo ou cerca de 5 a 20 por cento mais rápido se a GPU Intel estivesse rodando em RAM de canal único. Esperar mais de 30 FPS em configurações baixas de 1080p ou 720p não é irrazoável, dependendo do título.
| 3DMark | |
| 1280x720 Cloud Gate Standard Graphics | |
| Beelink GTR5 | |
| Samsung Galaxy Book Pro 15 NP950XDB-KC5US | |
| Beelink SER4 | |
| Média AMD Radeon RX Vega 8 (Ryzen 4000/5000) (13941 - 36134, n=49) | |
| Intel NUC11PAQi7 | |
| Beelink SER3 | |
| Intel NUC10i5FNK | |
| GMK NucBox 3 | |
| 1920x1080 Fire Strike Graphics | |
| Samsung Galaxy Book Pro 15 NP950XDB-KC5US | |
| Beelink GTR5 | |
| Beelink SER4 | |
| Intel NUC11PAQi7 | |
| Média AMD Radeon RX Vega 8 (Ryzen 4000/5000) (1694 - 5041, n=57) | |
| Beelink SER3 | |
| Intel NUC10i5FNK | |
| GMK NucBox 3 | |
| 2560x1440 Time Spy Graphics | |
| Samsung Galaxy Book Pro 15 NP950XDB-KC5US | |
| Beelink GTR5 | |
| Beelink SER4 | |
| Intel NUC11PAQi7 | |
| Média AMD Radeon RX Vega 8 (Ryzen 4000/5000) (540 - 1557, n=57) | |
| Beelink SER3 | |
| Intel NUC10i5FNK | |
| GMK NucBox 3 | |
| 2560x1440 Time Spy Score | |
| Samsung Galaxy Book Pro 15 NP950XDB-KC5US | |
| Beelink GTR5 | |
| Beelink SER4 | |
| Intel NUC11PAQi7 | |
| Média AMD Radeon RX Vega 8 (Ryzen 4000/5000) (620 - 1781, n=58) | |
| Beelink SER3 | |
| Intel NUC10i5FNK | |
| GMK NucBox 3 | |
| 3DMark 11 - 1280x720 Performance GPU | |
| Beelink GTR5 | |
| Samsung Galaxy Book Pro 15 NP950XDB-KC5US | |
| Beelink SER4 | |
| Intel NUC11PAQi7 | |
| Média AMD Radeon RX Vega 8 (Ryzen 4000/5000) (3459 - 7591, n=57) | |
| Beelink SER3 | |
| Intel NUC10i5FNK | |
| GMK NucBox 3 | |
| 3DMark 11 Performance | 6285 pontos | |
| 3DMark Cloud Gate Standard Score | 22021 pontos | |
| 3DMark Fire Strike Score | 3545 pontos | |
| 3DMark Time Spy Score | 1412 pontos | |
Ajuda | ||
| The Witcher 3 | |
| 1024x768 Low Graphics & Postprocessing | |
| Samsung Galaxy Book Pro 15 NP950XDB-KC5US | |
| Beelink GTR5 | |
| Intel NUC11PAQi7 | |
| Média AMD Radeon RX Vega 8 (Ryzen 4000/5000) (27.2 - 89, n=47) | |
| Beelink SER4 | |
| Beelink SER3 | |
| 1366x768 Medium Graphics & Postprocessing | |
| Samsung Galaxy Book Pro 15 NP950XDB-KC5US | |
| Beelink GTR5 | |
| Beelink SER4 | |
| Intel NUC11PAQi7 | |
| Média AMD Radeon RX Vega 8 (Ryzen 4000/5000) (19.6 - 55.2, n=35) | |
| Beelink SER3 | |
| 1920x1080 High Graphics & Postprocessing (Nvidia HairWorks Off) | |
| Samsung Galaxy Book Pro 15 NP950XDB-KC5US | |
| Beelink GTR5 | |
| Beelink SER4 | |
| Intel NUC11PAQi7 | |
| Média AMD Radeon RX Vega 8 (Ryzen 4000/5000) (8.7 - 26.8, n=46) | |
| Beelink SER3 | |
| 1920x1080 Ultra Graphics & Postprocessing (HBAO+) | |
| Beelink GTR5 | |
| Samsung Galaxy Book Pro 15 NP950XDB-KC5US | |
| Beelink SER4 | |
| Média AMD Radeon RX Vega 8 (Ryzen 4000/5000) (7.07 - 17.6, n=49) | |
| Intel NUC11PAQi7 | |
| Beelink SER3 | |
| X-Plane 11.11 | |
| 1280x720 low (fps_test=1) | |
| Beelink GTR5 | |
| Média AMD Radeon RX Vega 8 (Ryzen 4000/5000) (25.3 - 64.9, n=59) | |
| Intel NUC11PAQi7 | |
| Beelink SER4 | |
| Samsung Galaxy Book Pro 15 NP950XDB-KC5US | |
| Beelink SER3 | |
| Intel NUC10i5FNK | |
| GMK NucBox 3 | |
| 1920x1080 med (fps_test=2) | |
| Beelink GTR5 | |
| Samsung Galaxy Book Pro 15 NP950XDB-KC5US | |
| Média AMD Radeon RX Vega 8 (Ryzen 4000/5000) (18.7 - 49.6, n=59) | |
| Beelink SER4 | |
| Intel NUC11PAQi7 | |
| Beelink SER3 | |
| Intel NUC10i5FNK | |
| GMK NucBox 3 | |
| 1920x1080 high (fps_test=3) | |
| Beelink GTR5 | |
| Samsung Galaxy Book Pro 15 NP950XDB-KC5US | |
| Média AMD Radeon RX Vega 8 (Ryzen 4000/5000) (16.9 - 43.1, n=59) | |
| Beelink SER4 | |
| Intel NUC11PAQi7 | |
| Beelink SER3 | |
| Intel NUC10i5FNK | |
| GMK NucBox 3 | |
Witcher 3 FPS Chart
| baixo | média | alto | ultra | |
|---|---|---|---|---|
| GTA V (2015) | 110 | 98.3 | 29.6 | 13.4 |
| The Witcher 3 (2015) | 64.2 | 45.2 | 22.6 | 14.3 |
| Dota 2 Reborn (2015) | 103 | 83.3 | 53.1 | 51.1 |
| Final Fantasy XV Benchmark (2018) | 37.3 | 19.2 | 13.8 | |
| X-Plane 11.11 (2018) | 41.1 | 33.2 | 29.5 | |
| Far Cry 5 (2018) | 46 | 22 | 20 | 19 |
| Strange Brigade (2018) | 82.3 | 33.3 | 28.1 | 24 |
Emissões
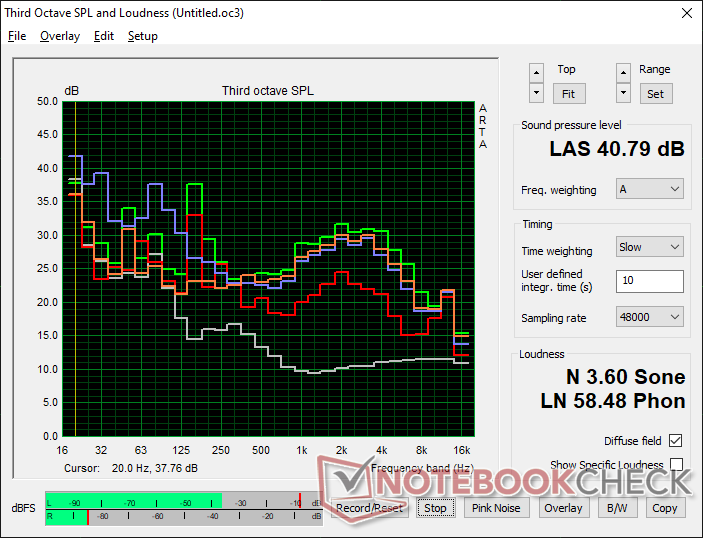
Ruído do sistema - Comportamento de pulsação irritante
O ruído dos ventiladores é talvez o pior aspecto do SER4. Embora não tão alto quanto o ruído dos Ryzen 9 H GTR5o SER4 ainda é muito barulhento para um mini PC da série U. A manipulação na mesa de trabalho, por exemplo, é suficiente para causar um ruído do ventilador de 33,2 dB(A) contra um fundo silencioso de 23,4 dB(A). Cargas baixas de processamento como navegação na web ou streaming de vídeo podem irritantemente causar flutuações no ventilador entre 33 e 39 dB(A). Em contraste, o Intel NUC 11 é capaz de permanecer mais silencioso ou mesmo próximo ao silêncio por períodos mais longos.
O ruído dos ventiladores pode ser tão alto quanto 40 dB(A) quando se corre com cargas de jogo, comparado a apenas 34 dB(A) no NUC 11.
Barulho
| Ocioso |
| 33.2 / 33.2 / 33.2 dB |
| Carga |
| 38.6 / 40.8 dB |
 | ||
30 dB silencioso 40 dB(A) audível 50 dB(A) ruidosamente alto |
||
min: | ||
| Beelink SER4 Vega 8, R7 4800U, Intel SSD 660p SSDPEKNW512G8 | Beelink GTR5 Vega 8, R9 5900HX, Kingston NV1 SNVS/500GCN | Intel NUC11PAQi7 Iris Xe G7 96EUs, i7-1165G7, Samsung SSD 980 Pro 500GB MZ-V8P500BW | Beelink SER3 Vega 10, R7 3750H, GSemi AZW GSDFN512TS3F1OGCX | |
|---|---|---|---|---|
| Noise | -6% | 8% | 11% | |
| desligado / ambiente * (dB) | 23.4 | 23.1 1% | 25.6 -9% | 23.4 -0% |
| Idle Minimum * (dB) | 33.2 | 34.2 -3% | 25.6 23% | 23.4 30% |
| Idle Average * (dB) | 33.2 | 34.2 -3% | 25.6 23% | 23.4 30% |
| Idle Maximum * (dB) | 33.2 | 34.2 -3% | 25.6 23% | 29.4 11% |
| Load Average * (dB) | 38.6 | 44.6 -16% | 33.6 13% | 35.2 9% |
| Witcher 3 ultra * (dB) | 39.2 | 41.4 -6% | 33.6 14% | 37.2 5% |
| Load Maximum * (dB) | 40.8 | 45.1 -11% | 54.5 -34% | 43.3 -6% |
* ... menor é melhor
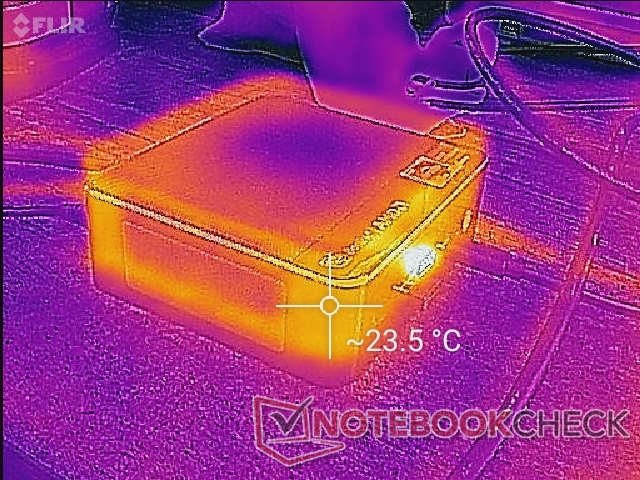
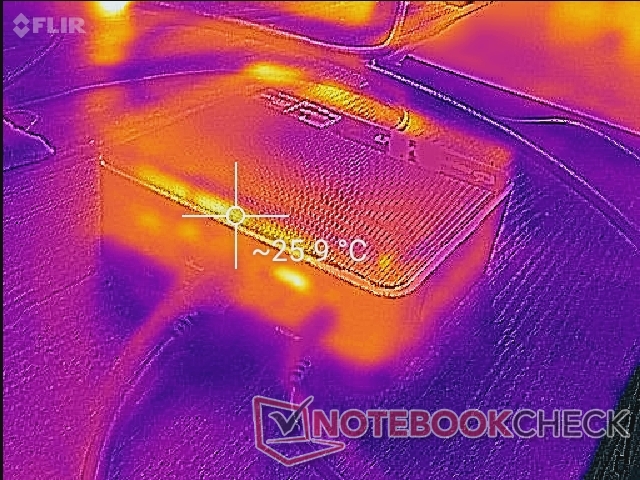
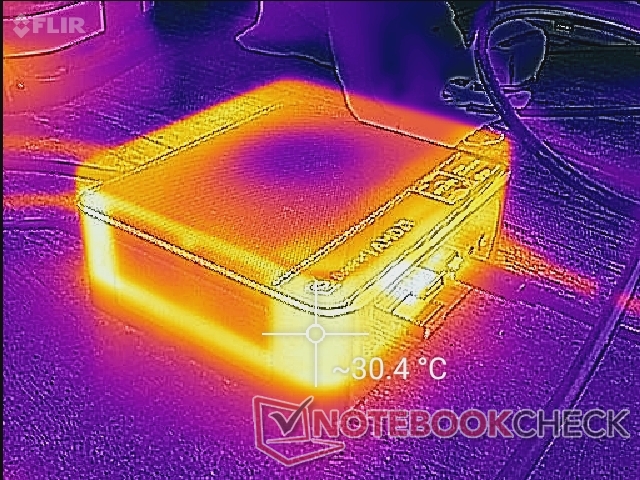
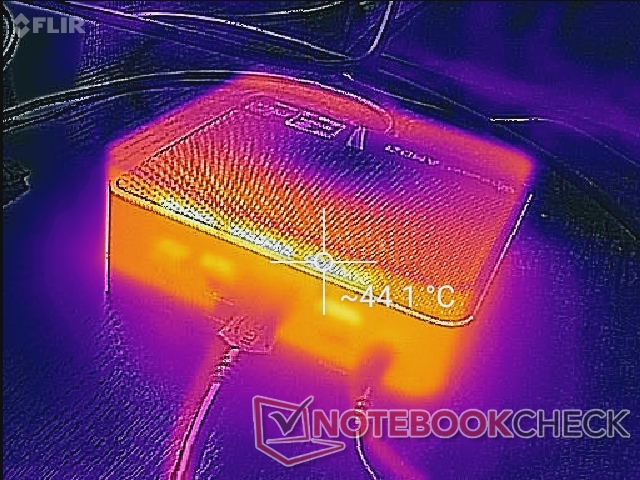
Temperatura - Mantenha essa parte superior livre
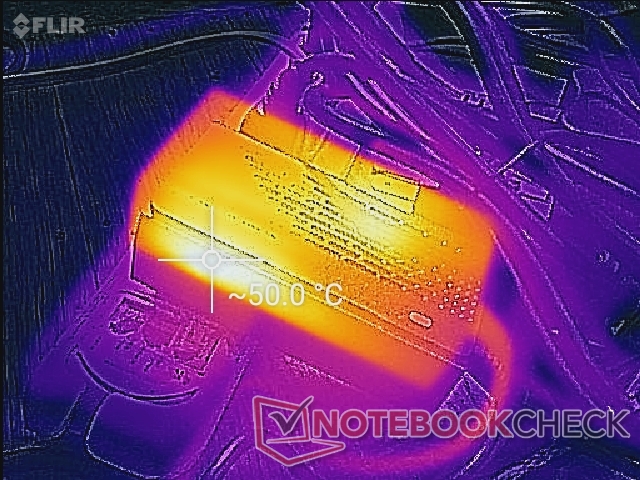
As temperaturas superficiais não são um problema. A unidade tem grelhas de ventilação em quatro de seus seis lados para o fluxo de ar. O ar frio entra pela superfície superior e, portanto, não é recomendado colocar papéis ou livros em cima da unidade.
Teste de estresse
Quando estressada sob Prime95, a CPU aumentaria para 2,8 GHz indefinidamente e a uma temperatura SoC estável de 64 C. A execução deste mesmo teste na Intel NUC11PAQi7 resultaria em uma temperatura central mais quente de até 79 C. As taxas de relógio permaneceriam estáveis e sem comportamento de ciclismo também nos jogos.
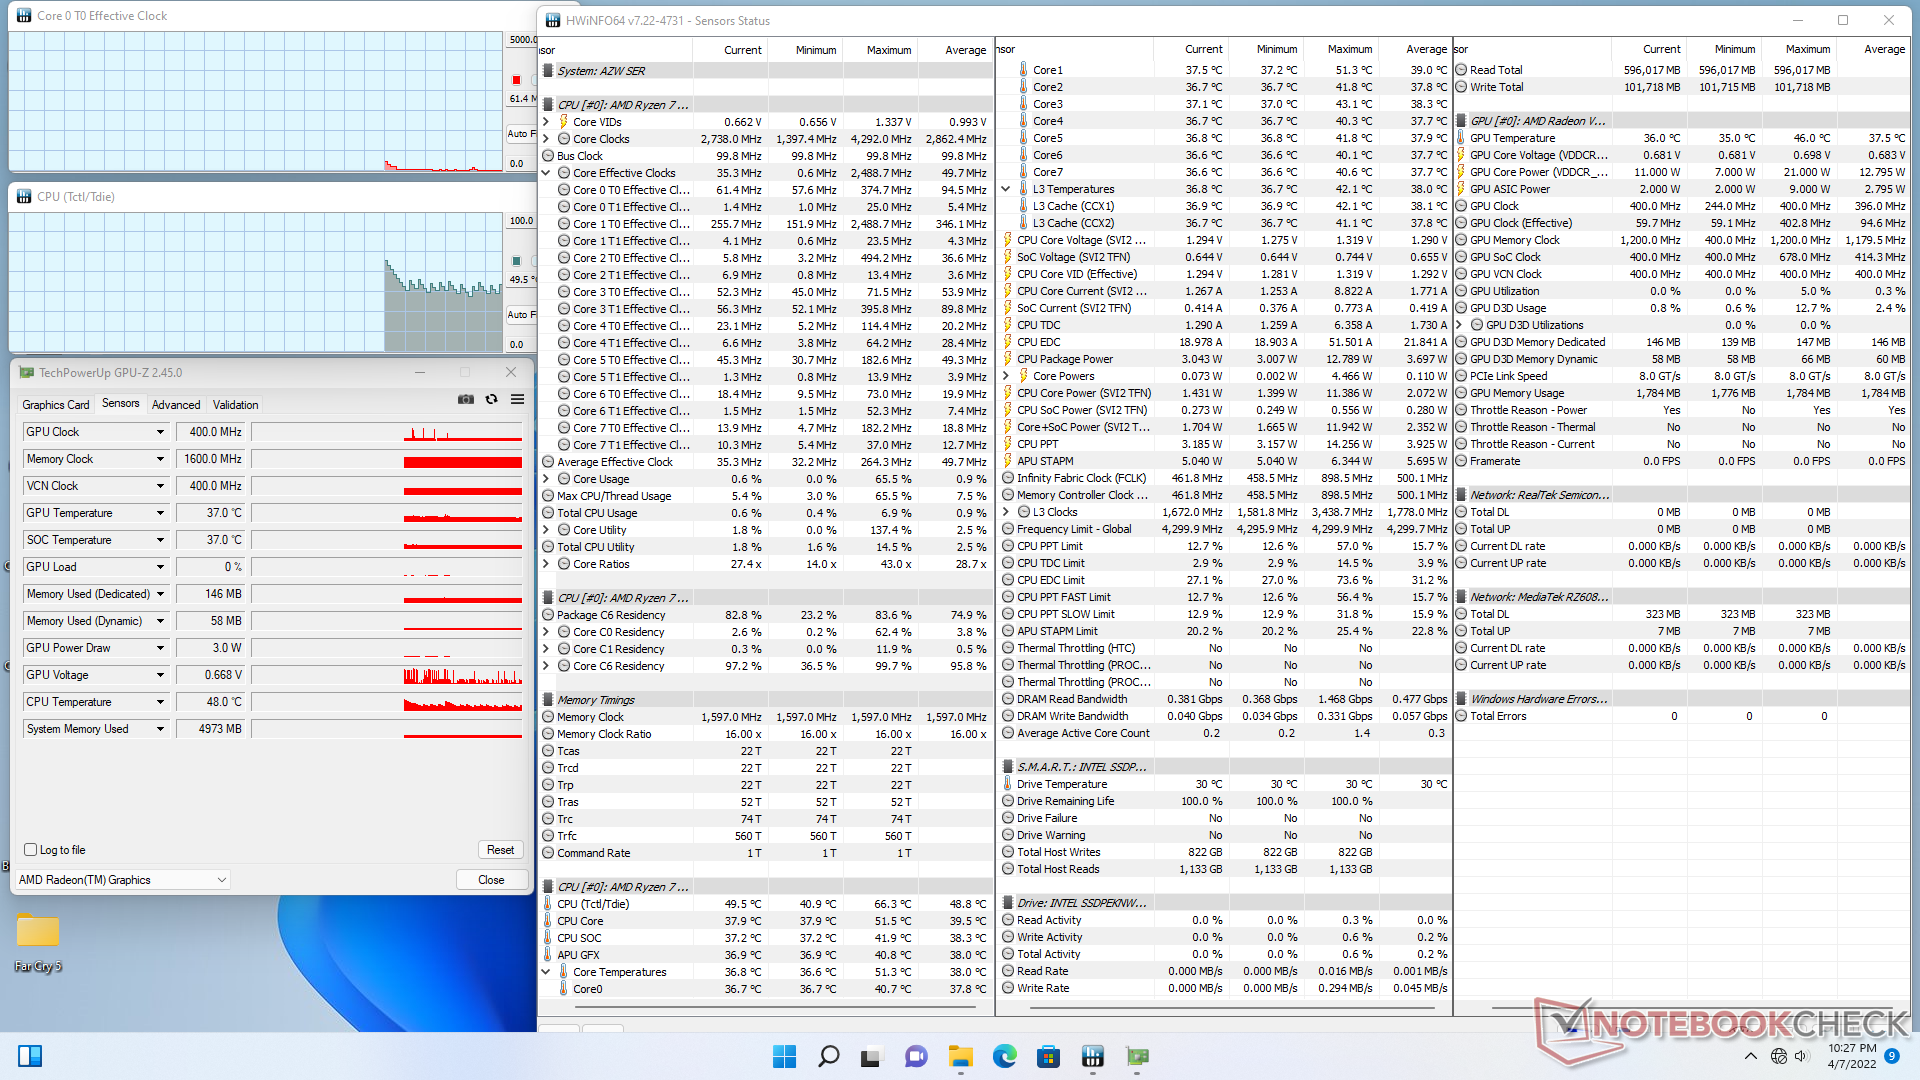
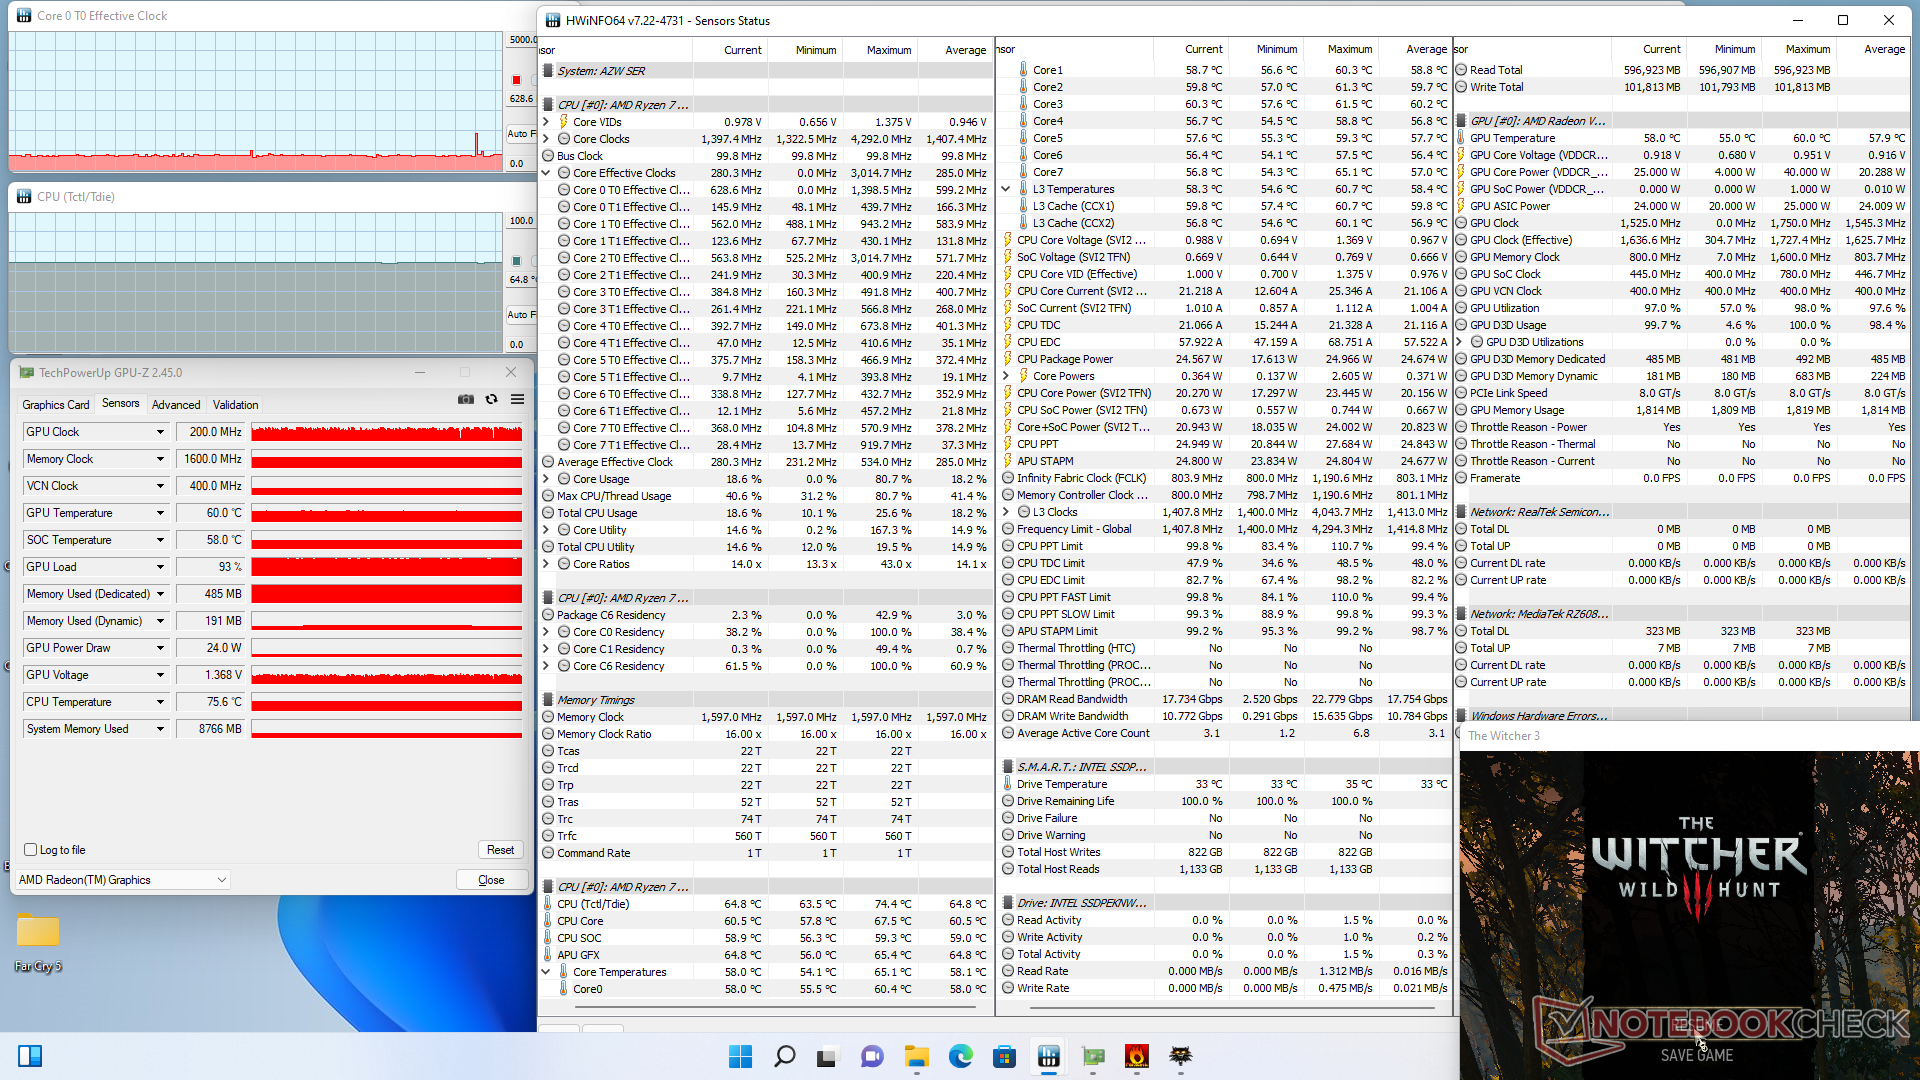
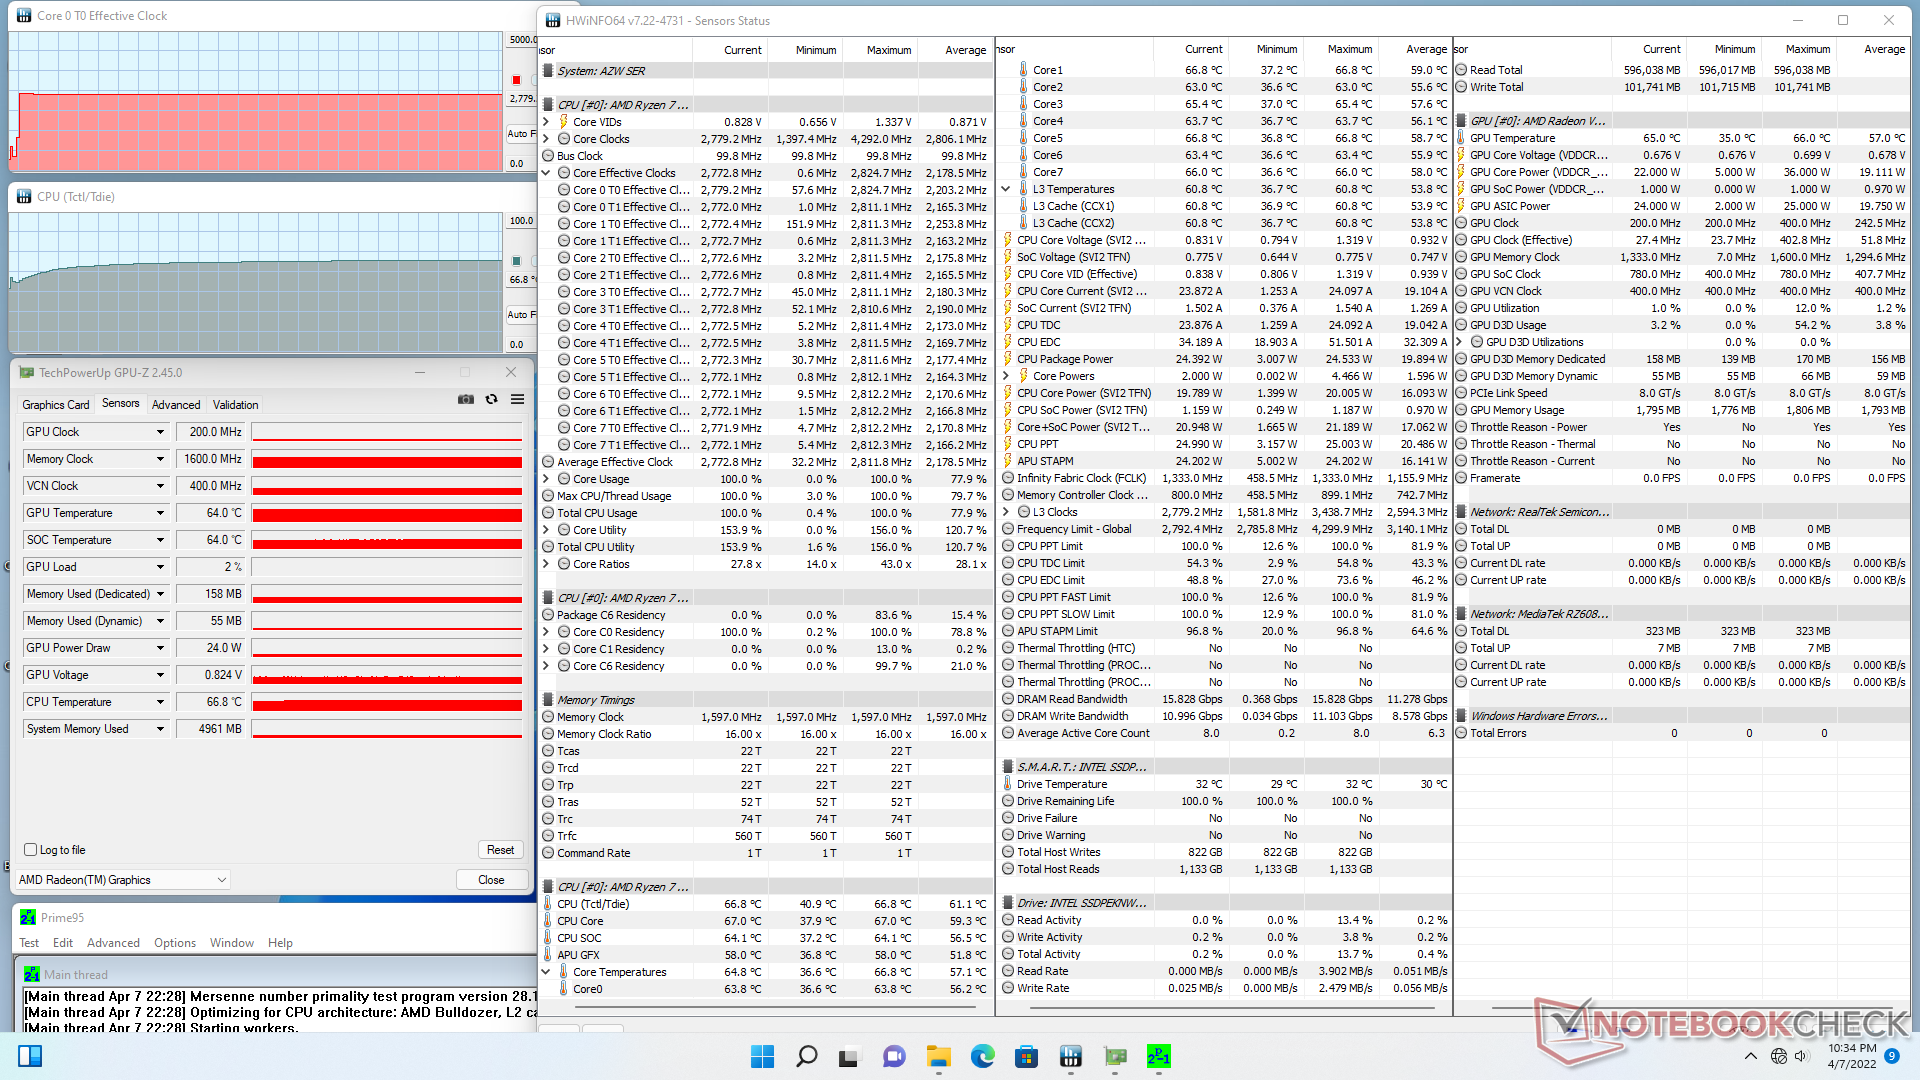
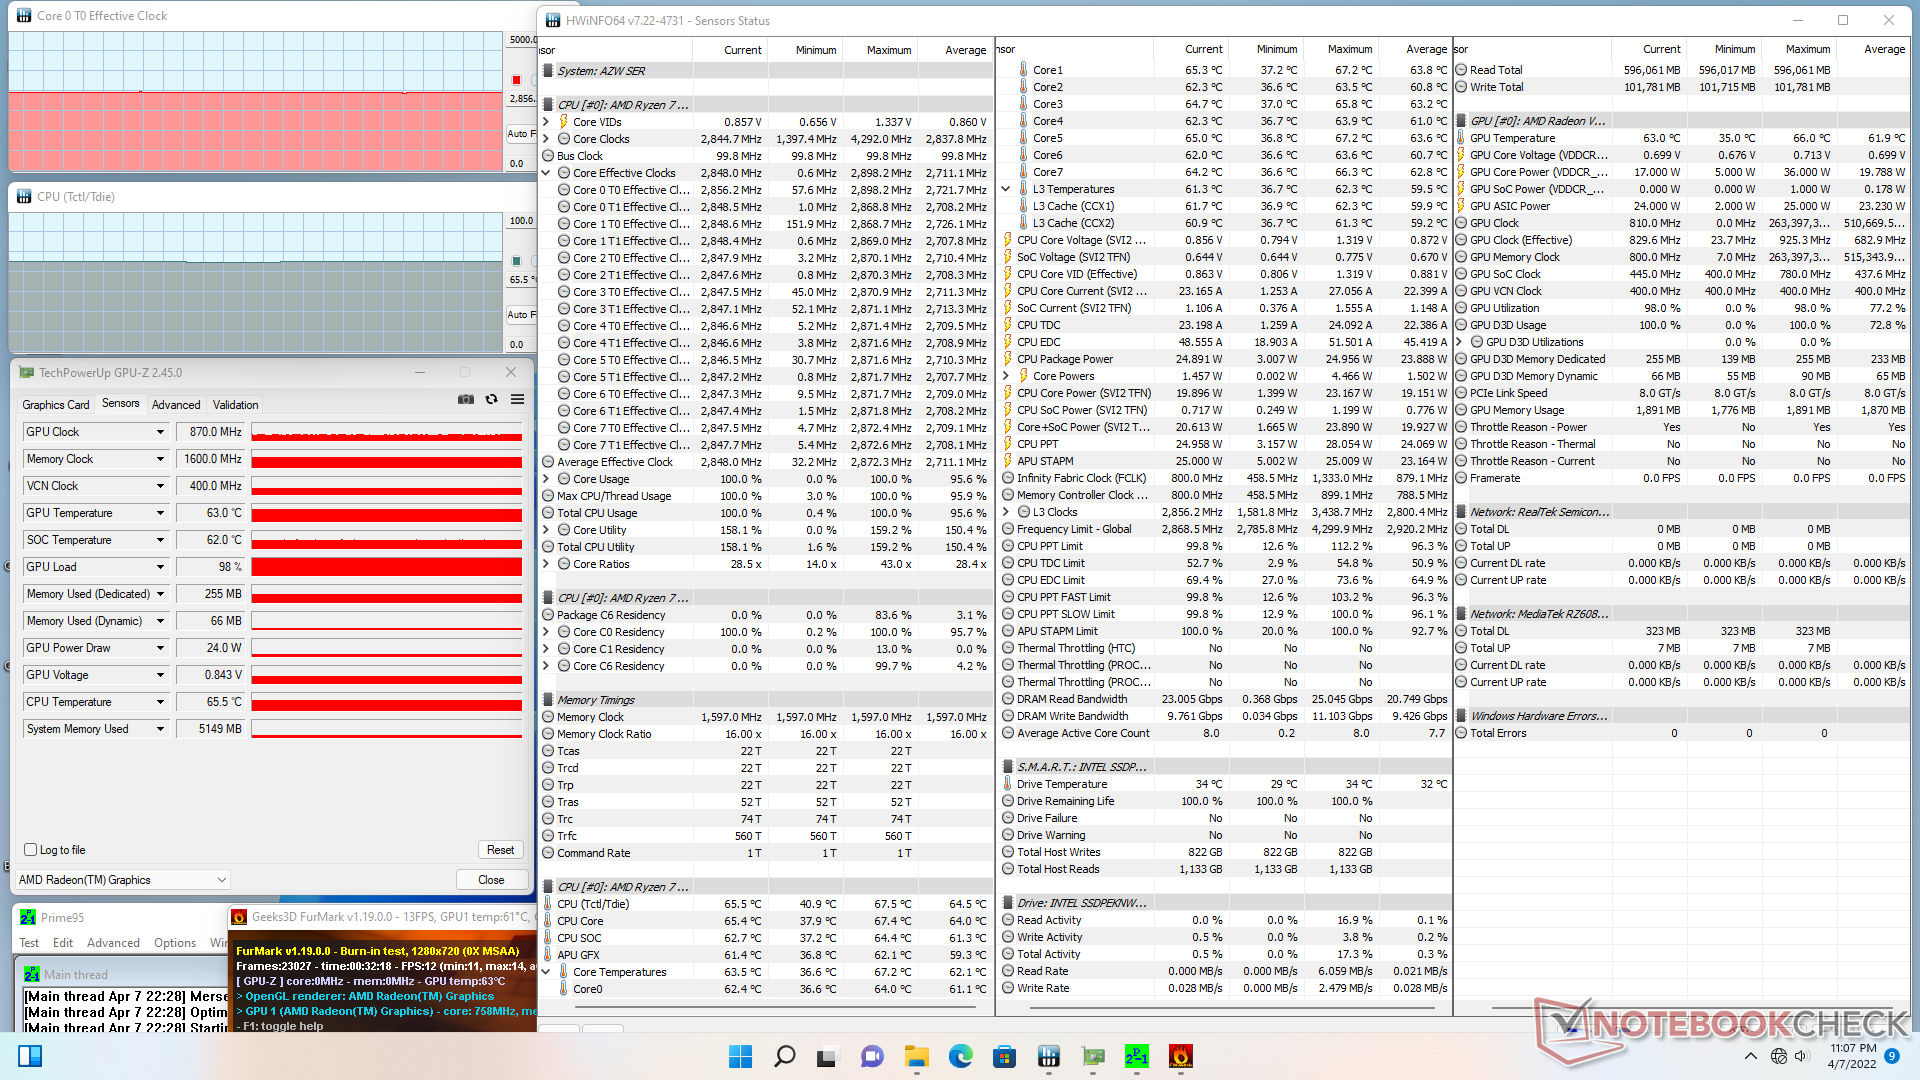
| Relógio CPU (GHz) | Relógio GPU (MHz) | Temperatura média da CPU SoC (°C) | |
| System Idle | -- | -- | 37 |
| Prime95 Stress | 2.8 | -- | 64 |
| Prime95 + FurMark Stress | 2.9 | 870 | 62 |
| Witcher 3 Estresse | 0.6 | 1525 | 58 |
Gestão de energia
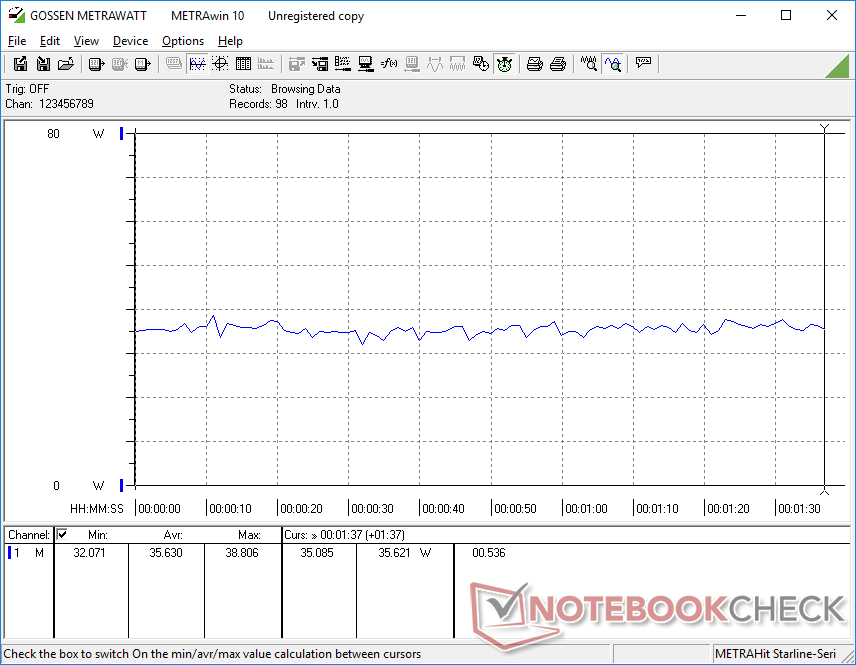
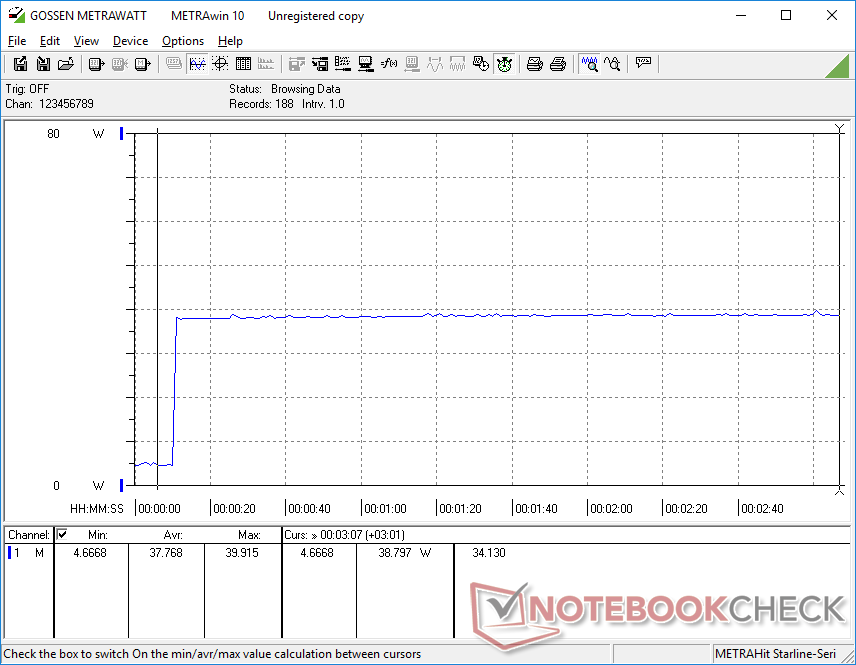
Consumo de energia
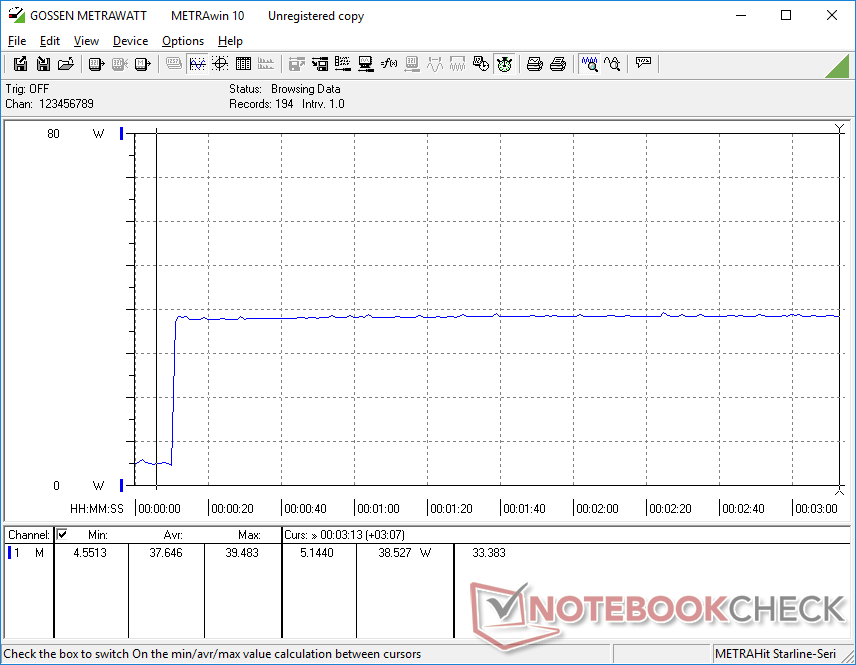
O SER4 exige tanto poder quanto a Intel NUC11PAQi7 apesar de todas as suas diferenças de desempenho. Em outras palavras, o sistema Beelink oferece maior desempenho da CPU por watt, mas menor desempenho da GPU por watt quando comparado ao Core i7-1165G7 NUC.
Somos capazes de gravar um desenho máximo de 49 W do pequeno ())(() adaptador AC de verruga de parede de 57 W ao executar o Prime95 e o FurMark simultaneamente. Isto pode ser ainda maior se conectarmos dispositivos USB adicionais, como monitores ou smartphones.

| desligado | |
| Ocioso | |
| Carga |
|
Key:
min: | |
| Beelink SER4 R7 4800U, Vega 8, Intel SSD 660p SSDPEKNW512G8, , x, | GMK NucBox 3 Celeron J4125, UHD Graphics 600, Netac S535N8/256GYN, , x, | Beelink GTR5 R9 5900HX, Vega 8, Kingston NV1 SNVS/500GCN, , x, | Intel NUC11PAQi7 i7-1165G7, Iris Xe G7 96EUs, Samsung SSD 980 Pro 500GB MZ-V8P500BW, , x, | Beelink SER3 R7 3750H, Vega 10, GSemi AZW GSDFN512TS3F1OGCX, , x, | Intel NUC10i5FNK i5-10210U, UHD Graphics 620, Kingston RBUSNS8154P3256GJ1, , 0x0, 0" | |
|---|---|---|---|---|---|---|
| Power Consumption | 36% | -89% | -34% | -50% | -165% | |
| Idle Minimum * (Watt) | 4.1 | 3 27% | 6.2 -51% | 5.6 -37% | 7 -71% | |
| Idle Average * (Watt) | 4.1 | 3.1 24% | 8.9 -117% | 5.6 -37% | 9.1 -122% | 15.7 -283% |
| Idle Maximum * (Watt) | 4.6 | 3.6 22% | 9 -96% | 6 -30% | 9.7 -111% | |
| Load Average * (Watt) | 35.6 | 11.1 69% | 66.8 -88% | 31.4 12% | 29.5 17% | |
| Witcher 3 ultra * (Watt) | 35.6 | 62.6 -76% | 39 -10% | 32.5 9% | ||
| Load Maximum * (Watt) | 39.9 | 25.4 36% | 81.6 -105% | 80.5 -102% | 48.7 -22% | 58.6 -47% |
* ... menor é melhor
Power Consumption Witcher 3 / Stresstest
{
Pro
Contra
Veredicto - Alto Desempenho-Por-Dólar
Por US$ 600 na Amazon, os usuários estão obtendo a CPU Ryzen 7 4800U com 16 GB de RAM, uma licença Windows 11 Pro, e um SSD de 512 GB. Em contraste, um barebone Intel NUC 11 com o Core i7-1165G7 é varejo por pouco mais de $700 USD sem SO, RAM, ou armazenamento. O SER4 oferece um desempenho mais rápido da CPU multi-thread a um preço significativamente menor do que a opção Intel, que é sua característica mais notável.
O SER4 tornou o SER3 obsoleto. Seu processador Ryzen 7 4800U não é frouxo, com velocidades que rivalizam com qualquer opção do Core U da Intel NUC 11.
A desvantagem mais notável do SER4 é seu ruído mais alto do ventilador do que o do Intel NUC. Nós também experimentamos isto em muitos outros mini PCs Beelink e o SER4 continua esta tendência. As desvantagens menores incluem o desempenho gráfico ligeiramente mais lento em comparação com os Iris Xe 96 EUs, garantia base de um ano em vez de três, suporte PCIe3 SSD em vez de PCIe4, nenhum suporte Thunderbolt, e uma BIOS UI menos desenvolvida do que uma Intel NUC. Se estes inconvenientes não são grandes preocupações, então o SER4 é uma forte recomendação como uma alternativa do Intel NUC.
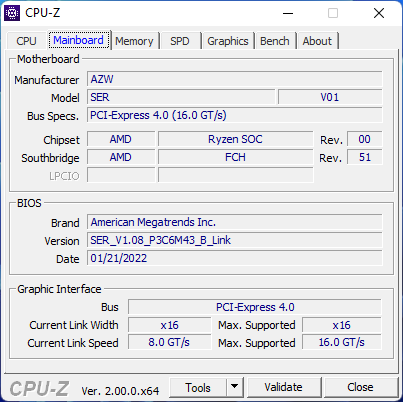
Preço e Disponibilidade
Price comparison

