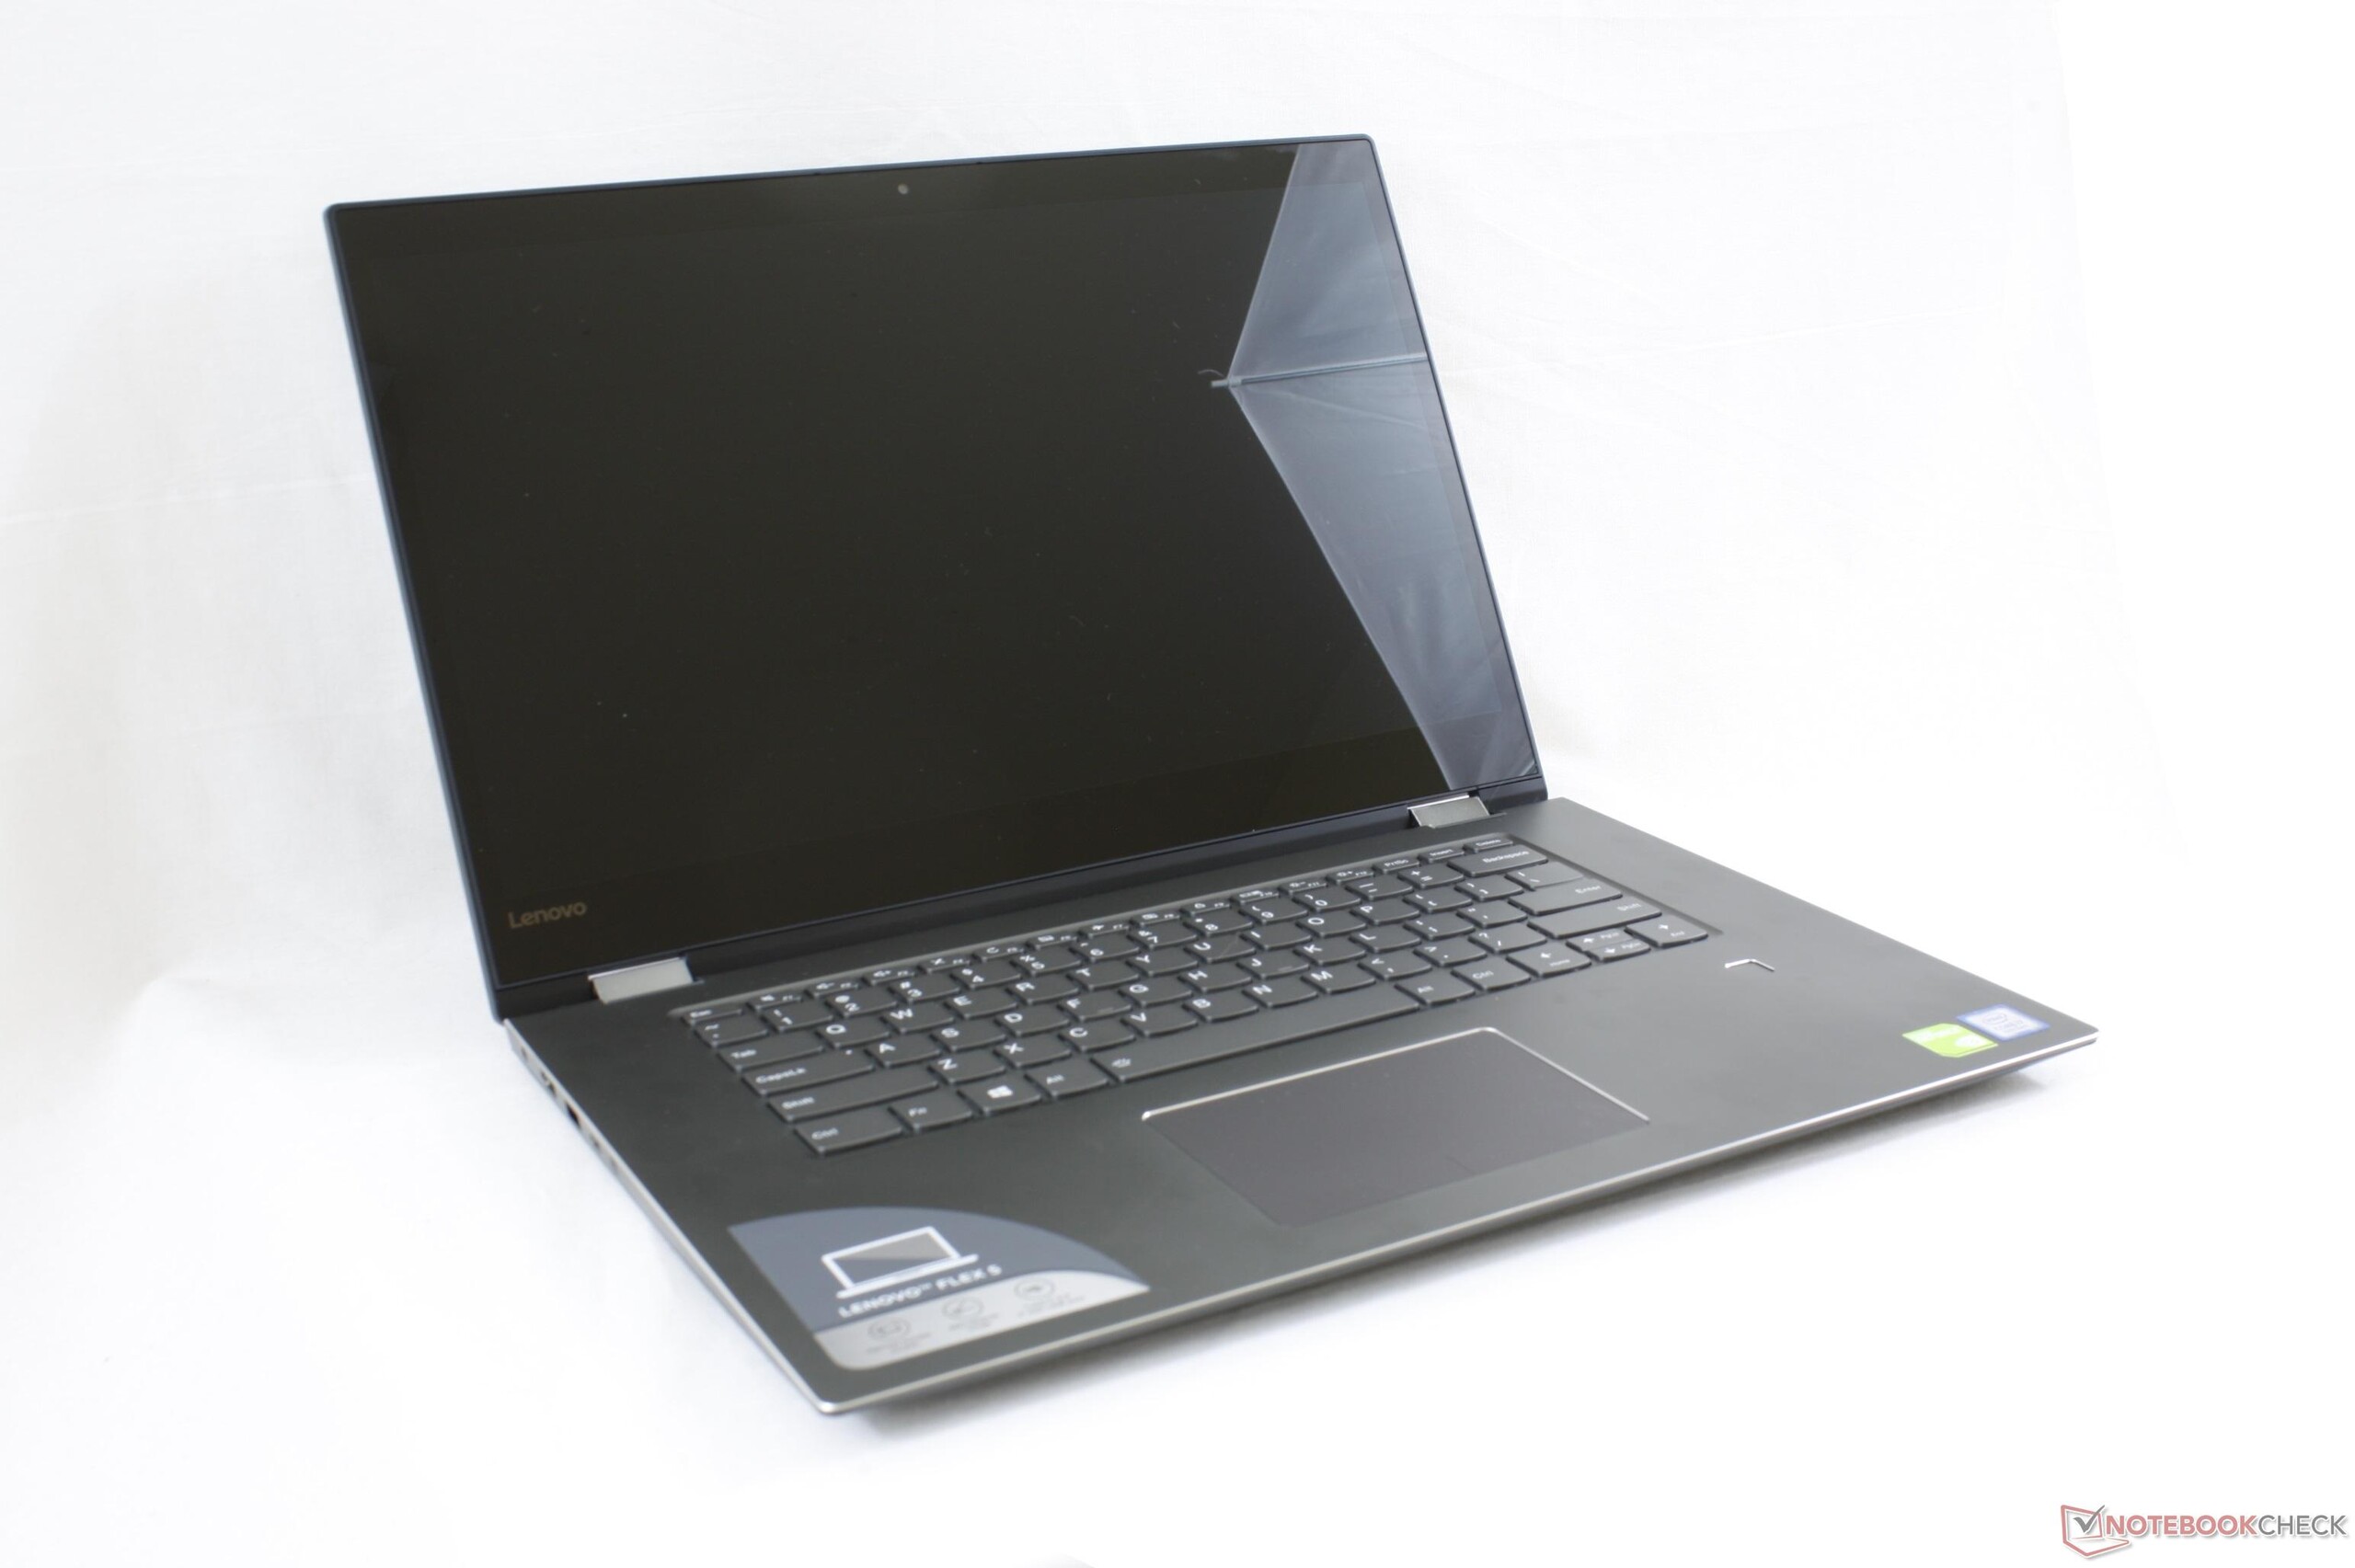
Breve Análise do Conversível Lenovo Flex 5 15 (i7-8550U, GeForce MX130)
| SD Card Reader | |
| average JPG Copy Test (av. of 3 runs) | |
| Dell XPS 15 9575 i7-8705G (Toshiba Exceria Pro M501 UHS-II) | |
| Lenovo IdeaPad Flex-1570 81CA000RUS (Toshiba Exceria Pro SDXC 64 GB UHS-II) | |
| HP Pavilion 15-cs0053cl (Toshiba Exceria Pro SDXC 64 GB UHS-II) | |
| Lenovo Ideapad 530S-15IKB (Toshiba Exceria Pro SDXC 64 GB UHS-II) | |
| maximum AS SSD Seq Read Test (1GB) | |
| Dell XPS 15 9575 i7-8705G (Toshiba Exceria Pro M501 UHS-II) | |
| Lenovo IdeaPad Flex-1570 81CA000RUS (Toshiba Exceria Pro SDXC 64 GB UHS-II) | |
| HP Pavilion 15-cs0053cl (Toshiba Exceria Pro SDXC 64 GB UHS-II) | |
| Lenovo Ideapad 530S-15IKB (Toshiba Exceria Pro SDXC 64 GB UHS-II) | |
| |||||||||||||||||||||||||
iluminação: 82 %
iluminação com acumulador: 196.3 cd/m²
Contraste: 755:1 (Preto: 0.26 cd/m²)
ΔE ColorChecker Calman: 6.97 | ∀{0.5-29.43 Ø4.73}
calibrated: 4.85
ΔE Greyscale Calman: 6.1 | ∀{0.09-98 Ø4.97}
57.7% sRGB (Argyll 1.6.3 3D)
37.4% AdobeRGB 1998 (Argyll 1.6.3 3D)
41.77% AdobeRGB 1998 (Argyll 3D)
58.2% sRGB (Argyll 3D)
40.43% Display P3 (Argyll 3D)
Gamma: 2.2
CCT: 5800 K
| Lenovo IdeaPad Flex-1570 81CA000RUS NV156FHM-N48, IPS, 15.6", 1920x1080 | Dell XPS 15 9575 i7-8705G Sharp SHP148D, IPS, 15.6", 3840x2160 | Lenovo Ideapad 530S-15IKB N156HCA-EAB, IPS, 15.6", 1920x1080 | Huawei MateBook D 15-53010BAJ AU Optronics B156HW02, IPS, 15.6", 1920x1080 | Asus ZenBook Flip 15 UX561UD B156ZAN03.1, IPS, 15.6", 3840x2160 | Acer Swift 3 SF315-41G-R6BR BOE CQ NV156FHM-N48, IPS, 15.6", 1920x1080 | |
|---|---|---|---|---|---|---|
| Display | 84% | 5% | 2% | 108% | -0% | |
| Display P3 Coverage (%) | 40.43 | 78.7 95% | 41.84 3% | 40.96 1% | 86.6 114% | 40.1 -1% |
| sRGB Coverage (%) | 58.2 | 97.9 68% | 62.4 7% | 60.9 5% | 100 72% | 59 1% |
| AdobeRGB 1998 Coverage (%) | 41.77 | 79.2 90% | 43.32 4% | 42.24 1% | 99.5 138% | 41.43 -1% |
| Response Times | -24% | -5% | 5% | -19% | -9% | |
| Response Time Grey 50% / Grey 80% * (ms) | 37.6 ? | 48.4 ? -29% | 37.2 ? 1% | 36.4 ? 3% | 52 ? -38% | 43 ? -14% |
| Response Time Black / White * (ms) | 29.2 ? | 34.8 ? -19% | 32.4 ? -11% | 27.2 ? 7% | 29 ? 1% | 30 ? -3% |
| PWM Frequency (Hz) | 21190 ? | 1000 ? | 25770 ? | 1471 ? | ||
| Screen | 72% | 23% | 16% | 63% | 29% | |
| Brightness middle (cd/m²) | 196.3 | 488 149% | 285.1 45% | 265.7 35% | 380 94% | 284 45% |
| Brightness (cd/m²) | 185 | 440 138% | 271 46% | 258 39% | 371 101% | 254 37% |
| Brightness Distribution (%) | 82 | 81 -1% | 88 7% | 91 11% | 87 6% | 80 -2% |
| Black Level * (cd/m²) | 0.26 | 0.3 -15% | 0.28 -8% | 0.31 -19% | 0.28 -8% | 0.29 -12% |
| Contrast (:1) | 755 | 1627 115% | 1018 35% | 857 14% | 1357 80% | 979 30% |
| Colorchecker dE 2000 * | 6.97 | 3.16 55% | 4.38 37% | 6.01 14% | 4.38 37% | 4.22 39% |
| Colorchecker dE 2000 max. * | 25.53 | 8.8 66% | 24.07 6% | 18.87 26% | 7.59 70% | 9.29 64% |
| Colorchecker dE 2000 calibrated * | 4.85 | 3.95 19% | 3.94 19% | |||
| Greyscale dE 2000 * | 6.1 | 3.3 46% | 3.1 49% | 5 18% | 3.6 41% | 1.17 81% |
| Gamma | 2.2 100% | 2.178 101% | 2.24 98% | 2.7 81% | 2.32 95% | 2.39 92% |
| CCT | 5800 112% | 6811 95% | 6705 97% | 6569 99% | 6860 95% | 6360 102% |
| Color Space (Percent of AdobeRGB 1998) (%) | 37.4 | 71.7 92% | 40 7% | 42.24 13% | 88 135% | 38 2% |
| Color Space (Percent of sRGB) (%) | 57.7 | 97.9 70% | 62 7% | 60.92 6% | 100 73% | 59 2% |
| Média Total (Programa/Configurações) | 44% /
61% | 8% /
16% | 8% /
12% | 51% /
61% | 7% /
18% |
* ... menor é melhor
Exibir tempos de resposta
| ↔ Tempo de resposta preto para branco | ||
|---|---|---|
| 29.2 ms ... ascensão ↗ e queda ↘ combinadas | ↗ 17.6 ms ascensão | 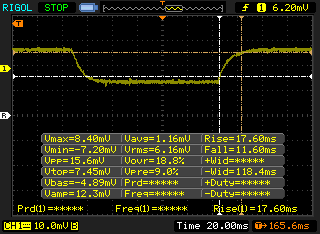 |
| ↘ 11.6 ms queda | ||
| A tela mostra taxas de resposta relativamente lentas em nossos testes e pode ser muito lenta para os jogadores. Em comparação, todos os dispositivos testados variam de 0.1 (mínimo) a 240 (máximo) ms. » 78 % de todos os dispositivos são melhores. Isso significa que o tempo de resposta medido é pior que a média de todos os dispositivos testados (19.9 ms). | ||
| ↔ Tempo de resposta 50% cinza a 80% cinza | ||
| 37.6 ms ... ascensão ↗ e queda ↘ combinadas | ↗ 19.2 ms ascensão |  |
| ↘ 18.4 ms queda | ||
| A tela mostra taxas de resposta lentas em nossos testes e será insatisfatória para os jogadores. Em comparação, todos os dispositivos testados variam de 0.165 (mínimo) a 636 (máximo) ms. » 54 % de todos os dispositivos são melhores. Isso significa que o tempo de resposta medido é pior que a média de todos os dispositivos testados (31.1 ms). | ||
Cintilação da tela / PWM (modulação por largura de pulso)
| Tela tremeluzindo/PWM detectado | 21190 Hz | ≤ 99 % configuração de brilho | 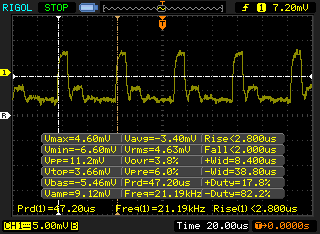 |
A luz de fundo da tela pisca em 21190 Hz (pior caso, por exemplo, utilizando PWM) Cintilação detectada em uma configuração de brilho de 99 % e abaixo. Não deve haver cintilação ou PWM acima desta configuração de brilho. A frequência de 21190 Hz é bastante alta, então a maioria dos usuários sensíveis ao PWM não deve notar nenhuma oscilação. [pwm_comparison] Em comparação: 52 % de todos os dispositivos testados não usam PWM para escurecer a tela. Se PWM foi detectado, uma média de 7784 (mínimo: 5 - máximo: 343500) Hz foi medida. | |||
| Cinebench R15 | |
| CPU Single 64Bit | |
| Lenovo ThinkPad P52 20MAS03N00 | |
| Média Intel Core i7-8550U (108 - 172, n=76) | |
| Lenovo Legion Y520-15IKBA-80WY001VGE | |
| Lenovo ThinkPad 13 20J1005TPB | |
| Lenovo Ideapad 530S-15IKB | |
| Lenovo Ideapad 720S-13ARR | |
| Lenovo Ideapad 720S-13ARR | |
| Lenovo IdeaPad Flex-1570 81CA000RUS | |
| Lenovo IdeaPad Miix 320-10ICR Pro LTE | |
| CPU Multi 64Bit | |
| Lenovo ThinkPad P52 20MAS03N00 | |
| Média Intel Core i7-8550U (301 - 761, n=78) | |
| Lenovo Ideapad 720S-13ARR | |
| Lenovo Ideapad 720S-13ARR | |
| Lenovo IdeaPad Flex-1570 81CA000RUS | |
| Lenovo Ideapad 530S-15IKB | |
| Lenovo Legion Y520-15IKBA-80WY001VGE | |
| Lenovo ThinkPad 13 20J1005TPB | |
| Lenovo IdeaPad Miix 320-10ICR Pro LTE | |
| Cinebench R11.5 | |
| CPU Single 64Bit | |
| Lenovo ThinkPad P52 20MAS03N00 | |
| Média Intel Core i7-8550U (1.43 - 1.95, n=32) | |
| CPU Multi 64Bit | |
| Lenovo ThinkPad P52 20MAS03N00 | |
| Média Intel Core i7-8550U (4.38 - 8.56, n=32) | |
| Cinebench R10 | |
| Rendering Multiple CPUs 32Bit | |
| Lenovo ThinkPad P52 20MAS03N00 | |
| Média Intel Core i7-8550U (11694 - 24180, n=31) | |
| Lenovo Ideapad 720S-13ARR | |
| Rendering Single 32Bit | |
| Lenovo ThinkPad P52 20MAS03N00 | |
| Média Intel Core i7-8550U (4202 - 8211, n=31) | |
| Lenovo Ideapad 720S-13ARR | |
| wPrime 2.10 - 1024m | |
| Lenovo ThinkPad 13 20J1005TPB | |
| Média Intel Core i7-8550U (258 - 435, n=11) | |
* ... menor é melhor
| PCMark 8 | |
| Home Score Accelerated v2 | |
| Média da turma Multimedia (n=1últimos 2 anos) | |
| Lenovo Legion Y520-15IKBA-80WY001VGE | |
| Dell XPS 15 9575 i7-8705G | |
| Huawei MateBook D 15-53010BAJ | |
| HP Pavilion 15-cs0053cl | |
| Asus ZenBook Flip 15 UX561UD | |
| Lenovo Ideapad 530S-15IKB | |
| Média Intel Core i7-8550U, NVIDIA GeForce MX130 (3381 - 3704, n=4) | |
| Lenovo IdeaPad Flex-1570 81CA000RUS | |
| Work Score Accelerated v2 | |
| Huawei MateBook D 15-53010BAJ | |
| Lenovo Ideapad 530S-15IKB | |
| Média Intel Core i7-8550U, NVIDIA GeForce MX130 (4327 - 5030, n=3) | |
| Lenovo Legion Y520-15IKBA-80WY001VGE | |
| HP Pavilion 15-cs0053cl | |
| Dell XPS 15 9575 i7-8705G | |
| Asus ZenBook Flip 15 UX561UD | |
| Lenovo IdeaPad Flex-1570 81CA000RUS | |
| PCMark 8 Home Score Accelerated v2 | 3381 pontos | |
| PCMark 8 Work Score Accelerated v2 | 4327 pontos | |
| PCMark 10 Score | 2837 pontos | |
Ajuda | ||
| Lenovo IdeaPad Flex-1570 81CA000RUS SK Hynix PC401 512GB M.2 (HFS512GD9TNG) | Dell XPS 15 9575 i7-8705G SK hynix PC401 NVMe 500 GB | Huawei MateBook D 15-53010BAJ Samsung SSD PM981 MZVLB512HAJQ | Asus ZenBook Flip 15 UX561UD Micron 1100 MTFDDAV256TBN | Lenovo Ideapad 530S-15IKB SK hynix PC401 HFS256GD9TNG | |
|---|---|---|---|---|---|
| AS SSD | 7% | 34% | -58% | -28% | |
| Copy Game MB/s (MB/s) | 684 | 944 38% | 1047 53% | 282.3 -59% | 301.1 -56% |
| Copy Program MB/s (MB/s) | 495.6 | 487.9 -2% | 438.1 -12% | 196.8 -60% | 233.5 -53% |
| Copy ISO MB/s (MB/s) | 1013 | 1523 50% | 1287 27% | 291 -71% | 868 -14% |
| Score Total (Points) | 2123 | 2132 0% | 4225 99% | 844 -60% | 1387 -35% |
| Score Write (Points) | 832 | 807 -3% | 1709 105% | 371 -55% | 415 -50% |
| Score Read (Points) | 860 | 921 7% | 1665 94% | 310 -64% | 690 -20% |
| Access Time Write * (ms) | 0.051 | 0.051 -0% | 0.143 -180% | 0.056 -10% | 0.051 -0% |
| Access Time Read * (ms) | 0.045 | 0.044 2% | 0.043 4% | 0.097 -116% | 0.06 -33% |
| 4K-64 Write (MB/s) | 612 | 637 4% | 1486 143% | 248.5 -59% | 271.6 -56% |
| 4K-64 Read (MB/s) | 660 | 649 -2% | 1455 120% | 235.5 -64% | 431.3 -35% |
| 4K Write (MB/s) | 99.5 | 94.3 -5% | 81.9 -18% | 84.8 -15% | 88.4 -11% |
| 4K Read (MB/s) | 40.59 | 41.38 2% | 53 31% | 25.79 -36% | 38.69 -5% |
| Seq Write (MB/s) | 1209 | 752 -38% | 1411 17% | 379.3 -69% | 550 -55% |
| Seq Read (MB/s) | 1596 | 2302 44% | 1567 -2% | 488 -69% | 2205 38% |
* ... menor é melhor

| 3DMark 11 | |
| 1280x720 Performance GPU | |
| Lenovo Yoga 730-15IKB | |
| Lenovo ThinkPad T580-20LAS01H00 | |
| Média NVIDIA GeForce MX130 (2476 - 3203, n=14) | |
| Lenovo ThinkPad 25 | |
| Lenovo Ideapad 720S-13ARR | |
| Lenovo IdeaPad Flex-1570 81CA000RUS | |
| Lenovo IdeaPad 510S-14ISK | |
| Lenovo Ideapad 720S-13ARR | |
| 1280x720 Performance Combined | |
| Lenovo Yoga 730-15IKB | |
| Lenovo ThinkPad T580-20LAS01H00 | |
| Lenovo ThinkPad 25 | |
| Lenovo IdeaPad Flex-1570 81CA000RUS | |
| Média NVIDIA GeForce MX130 (2169 - 3031, n=13) | |
| Lenovo IdeaPad 510S-14ISK | |
| Lenovo Ideapad 720S-13ARR | |
| Lenovo Ideapad 720S-13ARR | |
| 3DMark | |
| 1280x720 Cloud Gate Standard Graphics | |
| Lenovo Yoga 730-15IKB | |
| Lenovo ThinkPad T580-20LAS01H00 | |
| Média NVIDIA GeForce MX130 (12166 - 14880, n=13) | |
| Lenovo ThinkPad 25 | |
| Lenovo IdeaPad Flex-1570 81CA000RUS | |
| Lenovo Ideapad 720S-13ARR | |
| Lenovo IdeaPad 510S-14ISK | |
| Lenovo Ideapad 720S-13ARR | |
| 1920x1080 Fire Strike Graphics | |
| Lenovo Yoga 730-15IKB | |
| Lenovo ThinkPad T580-20LAS01H00 | |
| Média NVIDIA GeForce MX130 (2149 - 2495, n=13) | |
| Lenovo ThinkPad 25 | |
| Lenovo IdeaPad Flex-1570 81CA000RUS | |
| Lenovo Ideapad 720S-13ARR | |
| Lenovo Ideapad 720S-13ARR | |
| Lenovo IdeaPad 510S-14ISK | |
| 3DMark 11 Performance | 28 pontos | |
| 3DMark Cloud Gate Standard Score | 8662 pontos | |
| 3DMark Fire Strike Score | 1991 pontos | |
Ajuda | ||
| baixo | média | alto | ultra | |
|---|---|---|---|---|
| BioShock Infinite (2013) | 126.9 | 74.2 | 64.4 | 23.1 |
| The Witcher 3 (2015) | 42.7 | 25 | 13.6 | 7.2 |
| Rise of the Tomb Raider (2016) | 51.2 | 28.6 | 15.6 | 12.5 |
Barulho
| Ocioso |
| 29.6 / 29.6 / 29.6 dB |
| Carga |
| 39.2 / 41.6 dB |
 | ||
30 dB silencioso 40 dB(A) audível 50 dB(A) ruidosamente alto |
||
min: | ||
| Lenovo IdeaPad Flex-1570 81CA000RUS GeForce MX130, i5-8550U, SK Hynix PC401 512GB M.2 (HFS512GD9TNG) | Dell XPS 15 9575 i7-8705G Vega M GL / 870, i7-8705G, SK hynix PC401 NVMe 500 GB | Lenovo Ideapad 530S-15IKB UHD Graphics 620, i5-8250U, SK hynix PC401 HFS256GD9TNG | Asus ZenBook Flip 15 UX561UD GeForce GTX 1050 Mobile, i5-8550U, Micron 1100 MTFDDAV256TBN | HP Envy x360 15-bq102ng Vega 8, R5 2500U, Samsung PM961 MZVLW256HEHP | |
|---|---|---|---|---|---|
| Noise | 2% | 9% | -1% | -1% | |
| desligado / ambiente * (dB) | 28.2 | 28.2 -0% | 28 1% | 30.4 -8% | 30.13 -7% |
| Idle Minimum * (dB) | 29.6 | 28.2 5% | 28 5% | 31.3 -6% | 30.13 -2% |
| Idle Average * (dB) | 29.6 | 28.2 5% | 28 5% | 31.3 -6% | 30.13 -2% |
| Idle Maximum * (dB) | 29.6 | 28.2 5% | 30.1 -2% | 31.3 -6% | 30.13 -2% |
| Load Average * (dB) | 39.2 | 29 26% | 30.2 23% | 36.4 7% | 38.8 1% |
| Witcher 3 ultra * (dB) | 39.2 | 44.7 -14% | |||
| Load Maximum * (dB) | 41.6 | 47.4 -14% | 33.2 20% | 37.1 11% | 38.8 7% |
* ... menor é melhor
(-) A temperatura máxima no lado superior é 49 °C / 120 F, em comparação com a média de 36.8 °C / 98 F , variando de 21 a 71 °C para a classe Multimedia.
(-) A parte inferior aquece até um máximo de 55.2 °C / 131 F, em comparação com a média de 39.1 °C / 102 F
(+) Em uso inativo, a temperatura média para o lado superior é 24.6 °C / 76 F, em comparação com a média do dispositivo de 31.3 °C / ### class_avg_f### F.
(±) Jogando The Witcher 3, a temperatura média para o lado superior é 32.6 °C / 91 F, em comparação com a média do dispositivo de 31.3 °C / ## #class_avg_f### F.
(+) Os apoios para as mãos e o touchpad são mais frios que a temperatura da pele, com um máximo de 31.2 °C / 88.2 F e, portanto, são frios ao toque.
(-) A temperatura média da área do apoio para as mãos de dispositivos semelhantes foi 28.7 °C / 83.7 F (-2.5 °C / -4.5 F).
Lenovo IdeaPad Flex-1570 81CA000RUS análise de áudio
(±) | o volume do alto-falante é médio, mas bom (###valor### dB)
Graves 100 - 315Hz
(±) | graves reduzidos - em média 14.4% menor que a mediana
(-) | graves não são lineares (15.7% delta para frequência anterior)
Médios 400 - 2.000 Hz
(+) | médios equilibrados - apenas 4.6% longe da mediana
(±) | a linearidade dos médios é média (14.5% delta para frequência anterior)
Altos 2 - 16 kHz
(+) | agudos equilibrados - apenas 3% longe da mediana
(±) | a linearidade dos máximos é média (11.7% delta para frequência anterior)
Geral 100 - 16.000 Hz
(±) | a linearidade do som geral é média (22.4% diferença em relação à mediana)
Comparado com a mesma classe
» 80% de todos os dispositivos testados nesta classe foram melhores, 4% semelhantes, 16% piores
» O melhor teve um delta de 5%, a média foi 17%, o pior foi 45%
Comparado com todos os dispositivos testados
» 65% de todos os dispositivos testados foram melhores, 6% semelhantes, 29% piores
» O melhor teve um delta de 4%, a média foi 24%, o pior foi 134%
Apple MacBook 12 (Early 2016) 1.1 GHz análise de áudio
(+) | os alto-falantes podem tocar relativamente alto (###valor### dB)
Graves 100 - 315Hz
(±) | graves reduzidos - em média 11.3% menor que a mediana
(±) | a linearidade dos graves é média (14.2% delta para a frequência anterior)
Médios 400 - 2.000 Hz
(+) | médios equilibrados - apenas 2.4% longe da mediana
(+) | médios são lineares (5.5% delta para frequência anterior)
Altos 2 - 16 kHz
(+) | agudos equilibrados - apenas 2% longe da mediana
(+) | os máximos são lineares (4.5% delta da frequência anterior)
Geral 100 - 16.000 Hz
(+) | o som geral é linear (10.2% diferença em relação à mediana)
Comparado com a mesma classe
» 7% de todos os dispositivos testados nesta classe foram melhores, 2% semelhantes, 91% piores
» O melhor teve um delta de 5%, a média foi 18%, o pior foi 53%
Comparado com todos os dispositivos testados
» 5% de todos os dispositivos testados foram melhores, 1% semelhantes, 94% piores
» O melhor teve um delta de 4%, a média foi 24%, o pior foi 134%
| desligado | |
| Ocioso | |
| Carga |
|
Key:
min: | |
| Lenovo IdeaPad Flex-1570 81CA000RUS i5-8550U, GeForce MX130, SK Hynix PC401 512GB M.2 (HFS512GD9TNG), IPS, 1920x1080, 15.6" | Dell XPS 15 9575 i7-8705G i7-8705G, Vega M GL / 870, SK hynix PC401 NVMe 500 GB, IPS, 3840x2160, 15.6" | Huawei MateBook D 15-53010BAJ i5-8250U, GeForce MX150, Samsung SSD PM981 MZVLB512HAJQ, IPS, 1920x1080, 15.6" | HP Pavilion 15-cs0053cl i5-8250U, UHD Graphics 620, Toshiba MQ04ABF100, TN LED, 1366x768, 15.6" | Lenovo Ideapad 530S-15IKB i5-8250U, UHD Graphics 620, SK hynix PC401 HFS256GD9TNG, IPS, 1920x1080, 15.6" | Asus ZenBook Flip 15 UX561UD i5-8550U, GeForce GTX 1050 Mobile, Micron 1100 MTFDDAV256TBN, IPS, 3840x2160, 15.6" | |
|---|---|---|---|---|---|---|
| Power Consumption | -79% | -20% | 7% | 15% | -77% | |
| Idle Minimum * (Watt) | 4.1 | 6.2 -51% | 4.2 -2% | 5.6 -37% | 3.5 15% | 5.4 -32% |
| Idle Average * (Watt) | 7.6 | 12.9 -70% | 7.2 5% | 7.1 7% | 5.6 26% | 10.8 -42% |
| Idle Maximum * (Watt) | 7.9 | 13.6 -72% | 12.1 -53% | 7.9 -0% | 10.3 -30% | 13.9 -76% |
| Load Average * (Watt) | 42.5 | 76.1 -79% | 51.1 -20% | 32.8 23% | 30.5 28% | 94 -121% |
| Witcher 3 ultra * (Watt) | 38.6 | 84.3 -118% | 52.7 -37% | |||
| Load Maximum * (Watt) | 54 | 99.4 -84% | 59.9 -11% | 30.5 44% | 33.8 37% | 116.6 -116% |
* ... menor é melhor
| Lenovo IdeaPad Flex-1570 81CA000RUS i5-8550U, GeForce MX130, 52.5 Wh | Dell XPS 15 9575 i7-8705G i7-8705G, Vega M GL / 870, 75 Wh | Huawei MateBook D 15-53010BAJ i5-8250U, GeForce MX150, 43.3 Wh | HP Pavilion 15-cs0053cl i5-8250U, UHD Graphics 620, 41 Wh | Lenovo Ideapad 530S-15IKB i5-8250U, UHD Graphics 620, 45 Wh | Asus ZenBook Flip 15 UX561UD i5-8550U, GeForce GTX 1050 Mobile, 52 Wh | |
|---|---|---|---|---|---|---|
| Duração da bateria | -36% | -25% | -22% | -13% | -44% | |
| Reader / Idle (h) | 18.9 | 11.2 -41% | 15.2 -20% | 12 -37% | 9.3 -51% | |
| WiFi v1.3 (h) | 7.5 | 7 -7% | 7.7 3% | 7 -7% | 6.5 -13% | 5.2 -31% |
| Load (h) | 2.8 | 1.1 -61% | 1.2 -57% | 2.2 -21% | 1.4 -50% |
Pro
Contra
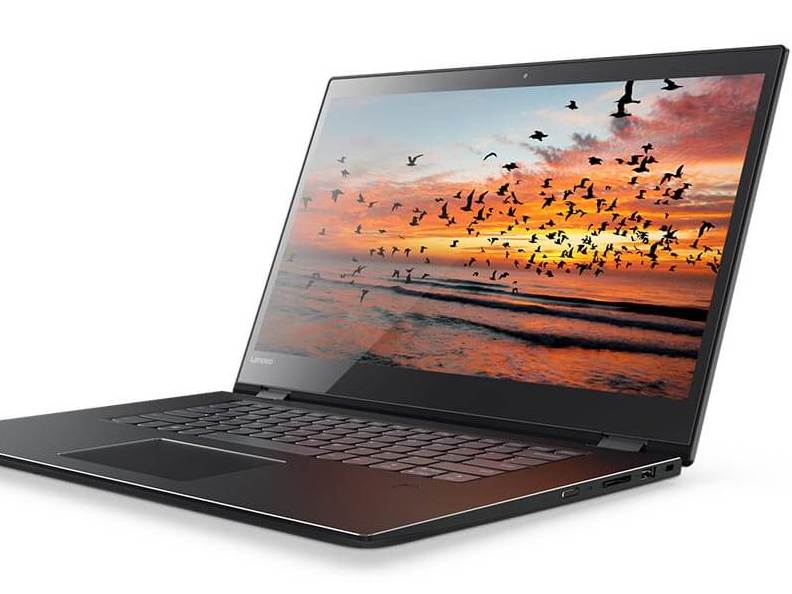
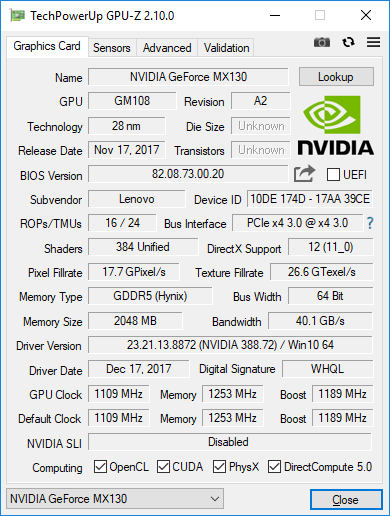
O Flex 5 não é para entusiastas ou usuários de desempenho e a Lenovo sabe disso. Em vez disso, o sistema é para o usuário ou estudante de multimídia doméstico que pode simplesmente querer um portátil de 15 polegadas do Windows com recursos de tablet para reprodução de filmes, processamento de texto e jogos casuais ocasionais. Não oferece vatagens significantes sobre o Pavilion 2-em-1, Vivobook 2-em-1, Envy 2-em-1, ou o mais pesado Inspiron 15 2-em-1 mais que uma opção para a lenta GPU GeForce MX130. Como um conversível familiar, o Flex 5 apenas se encaixa ao preço.
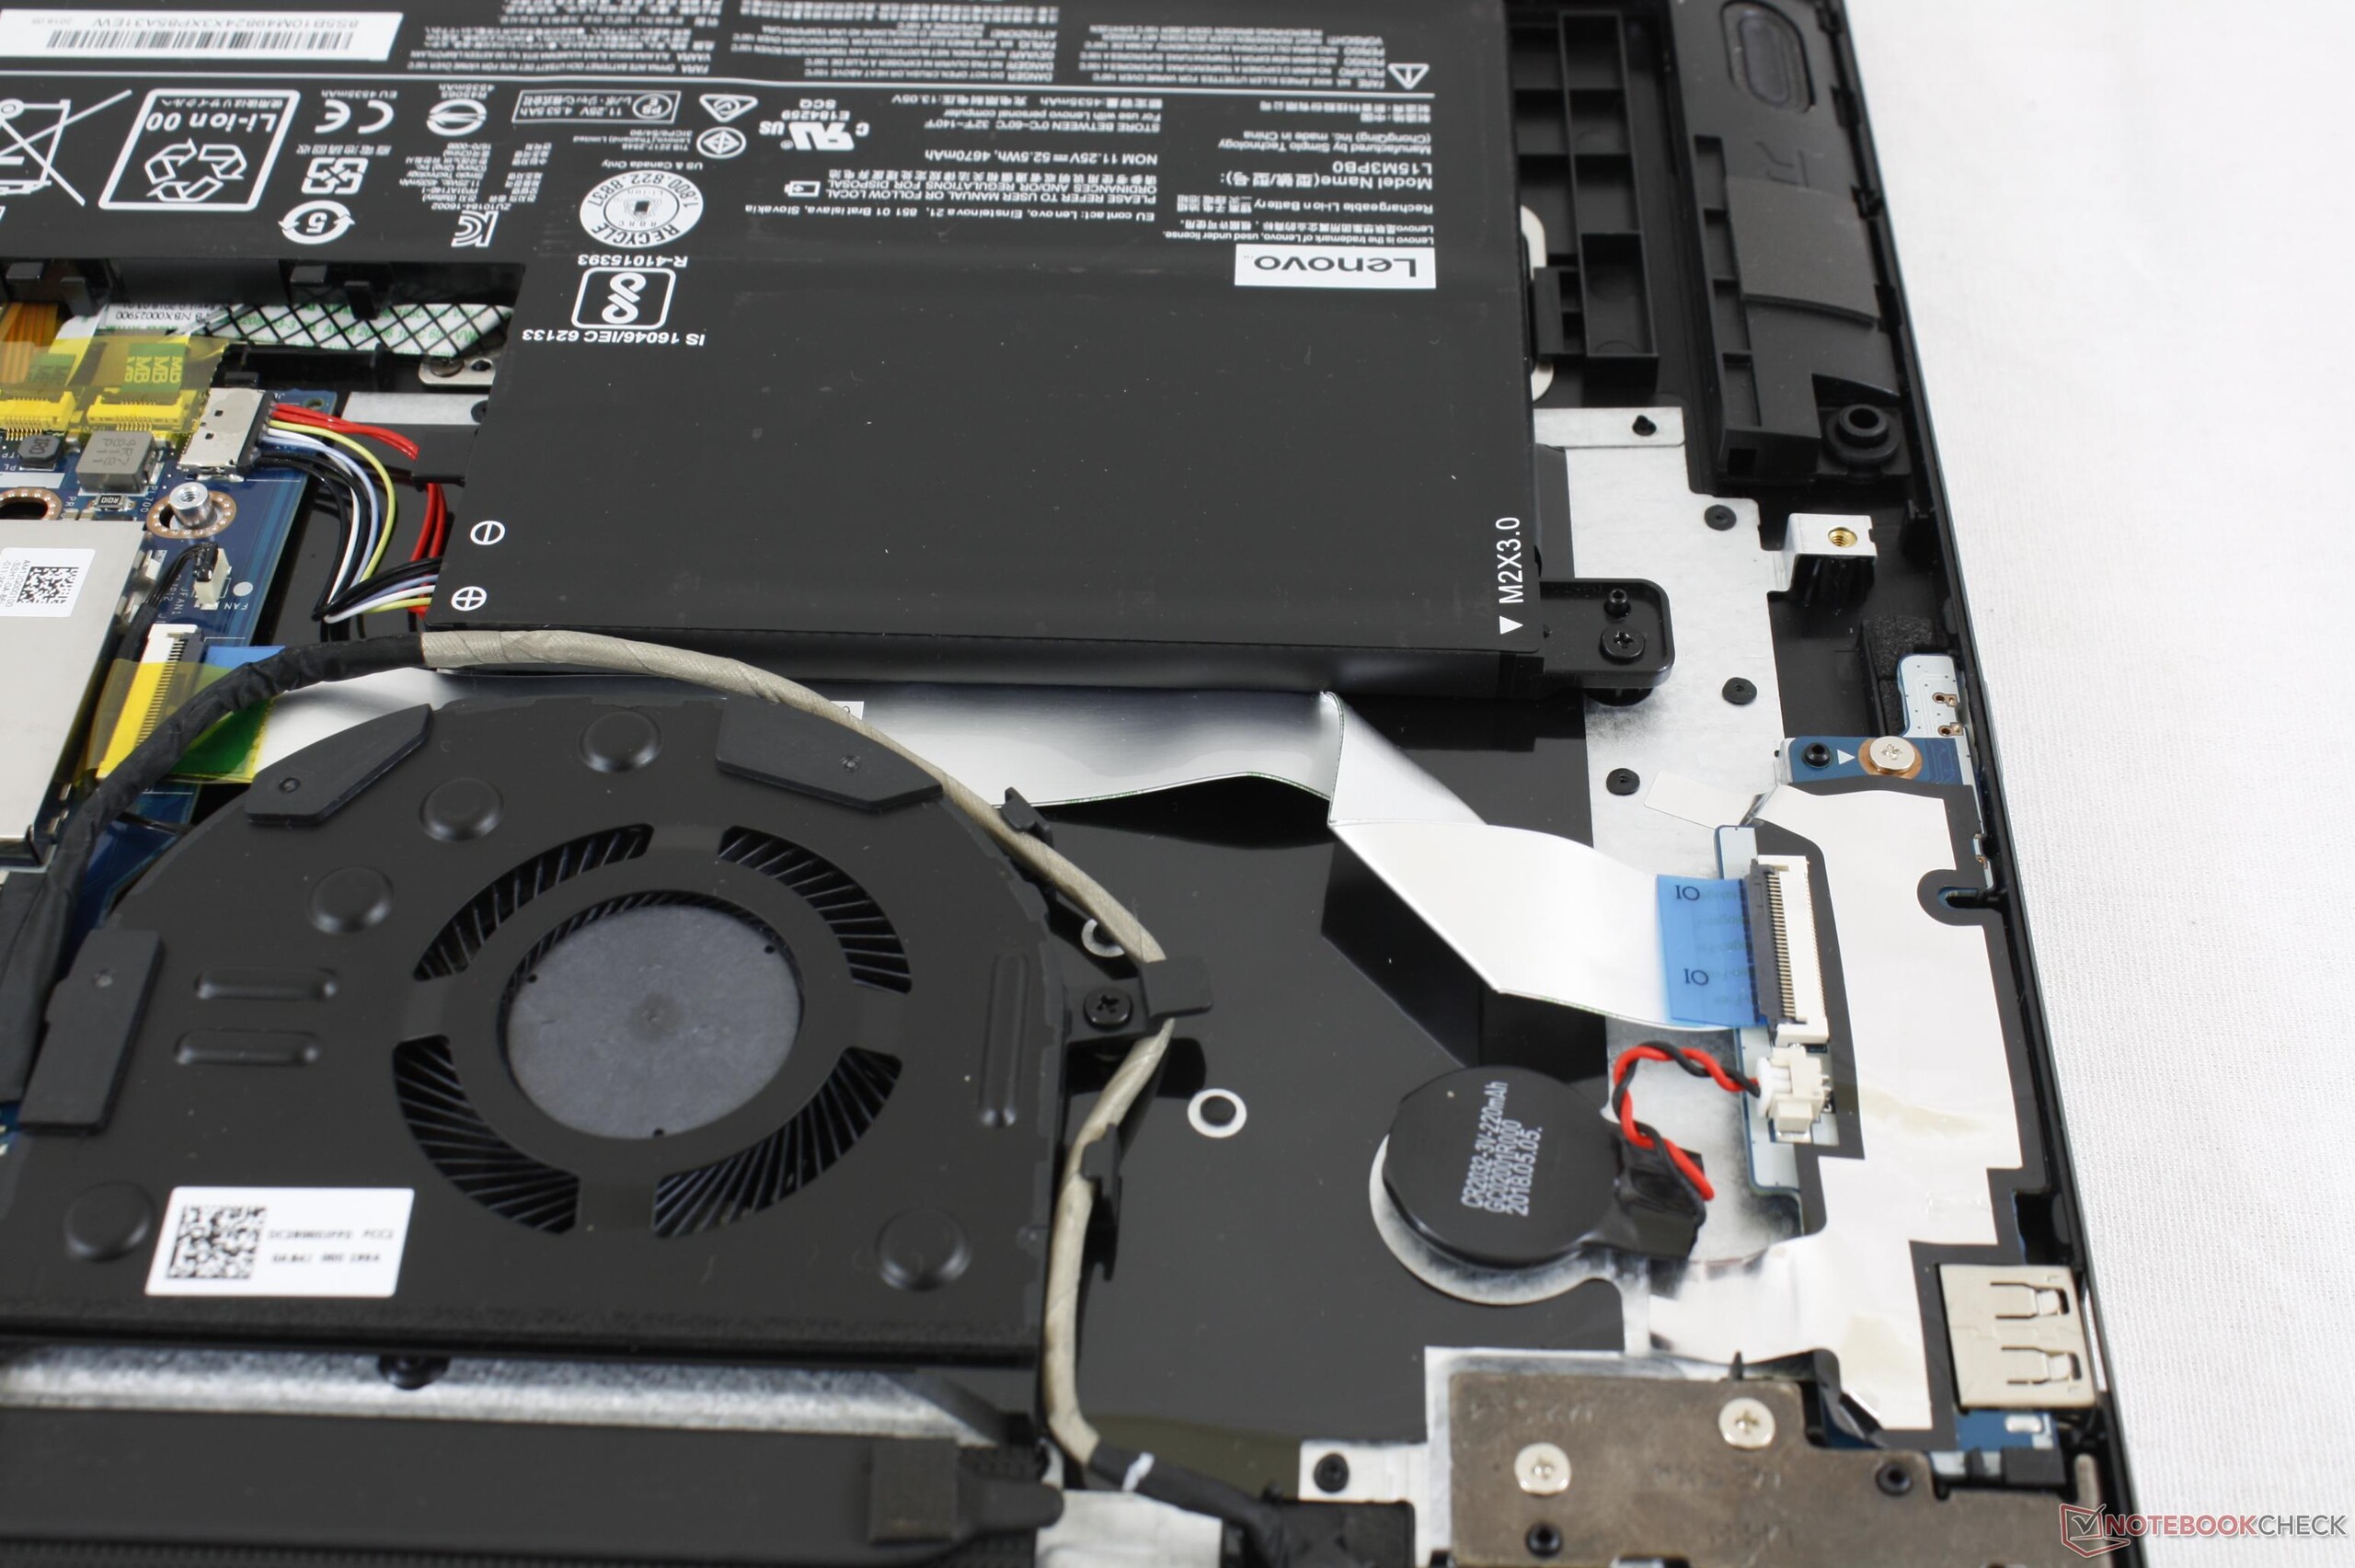
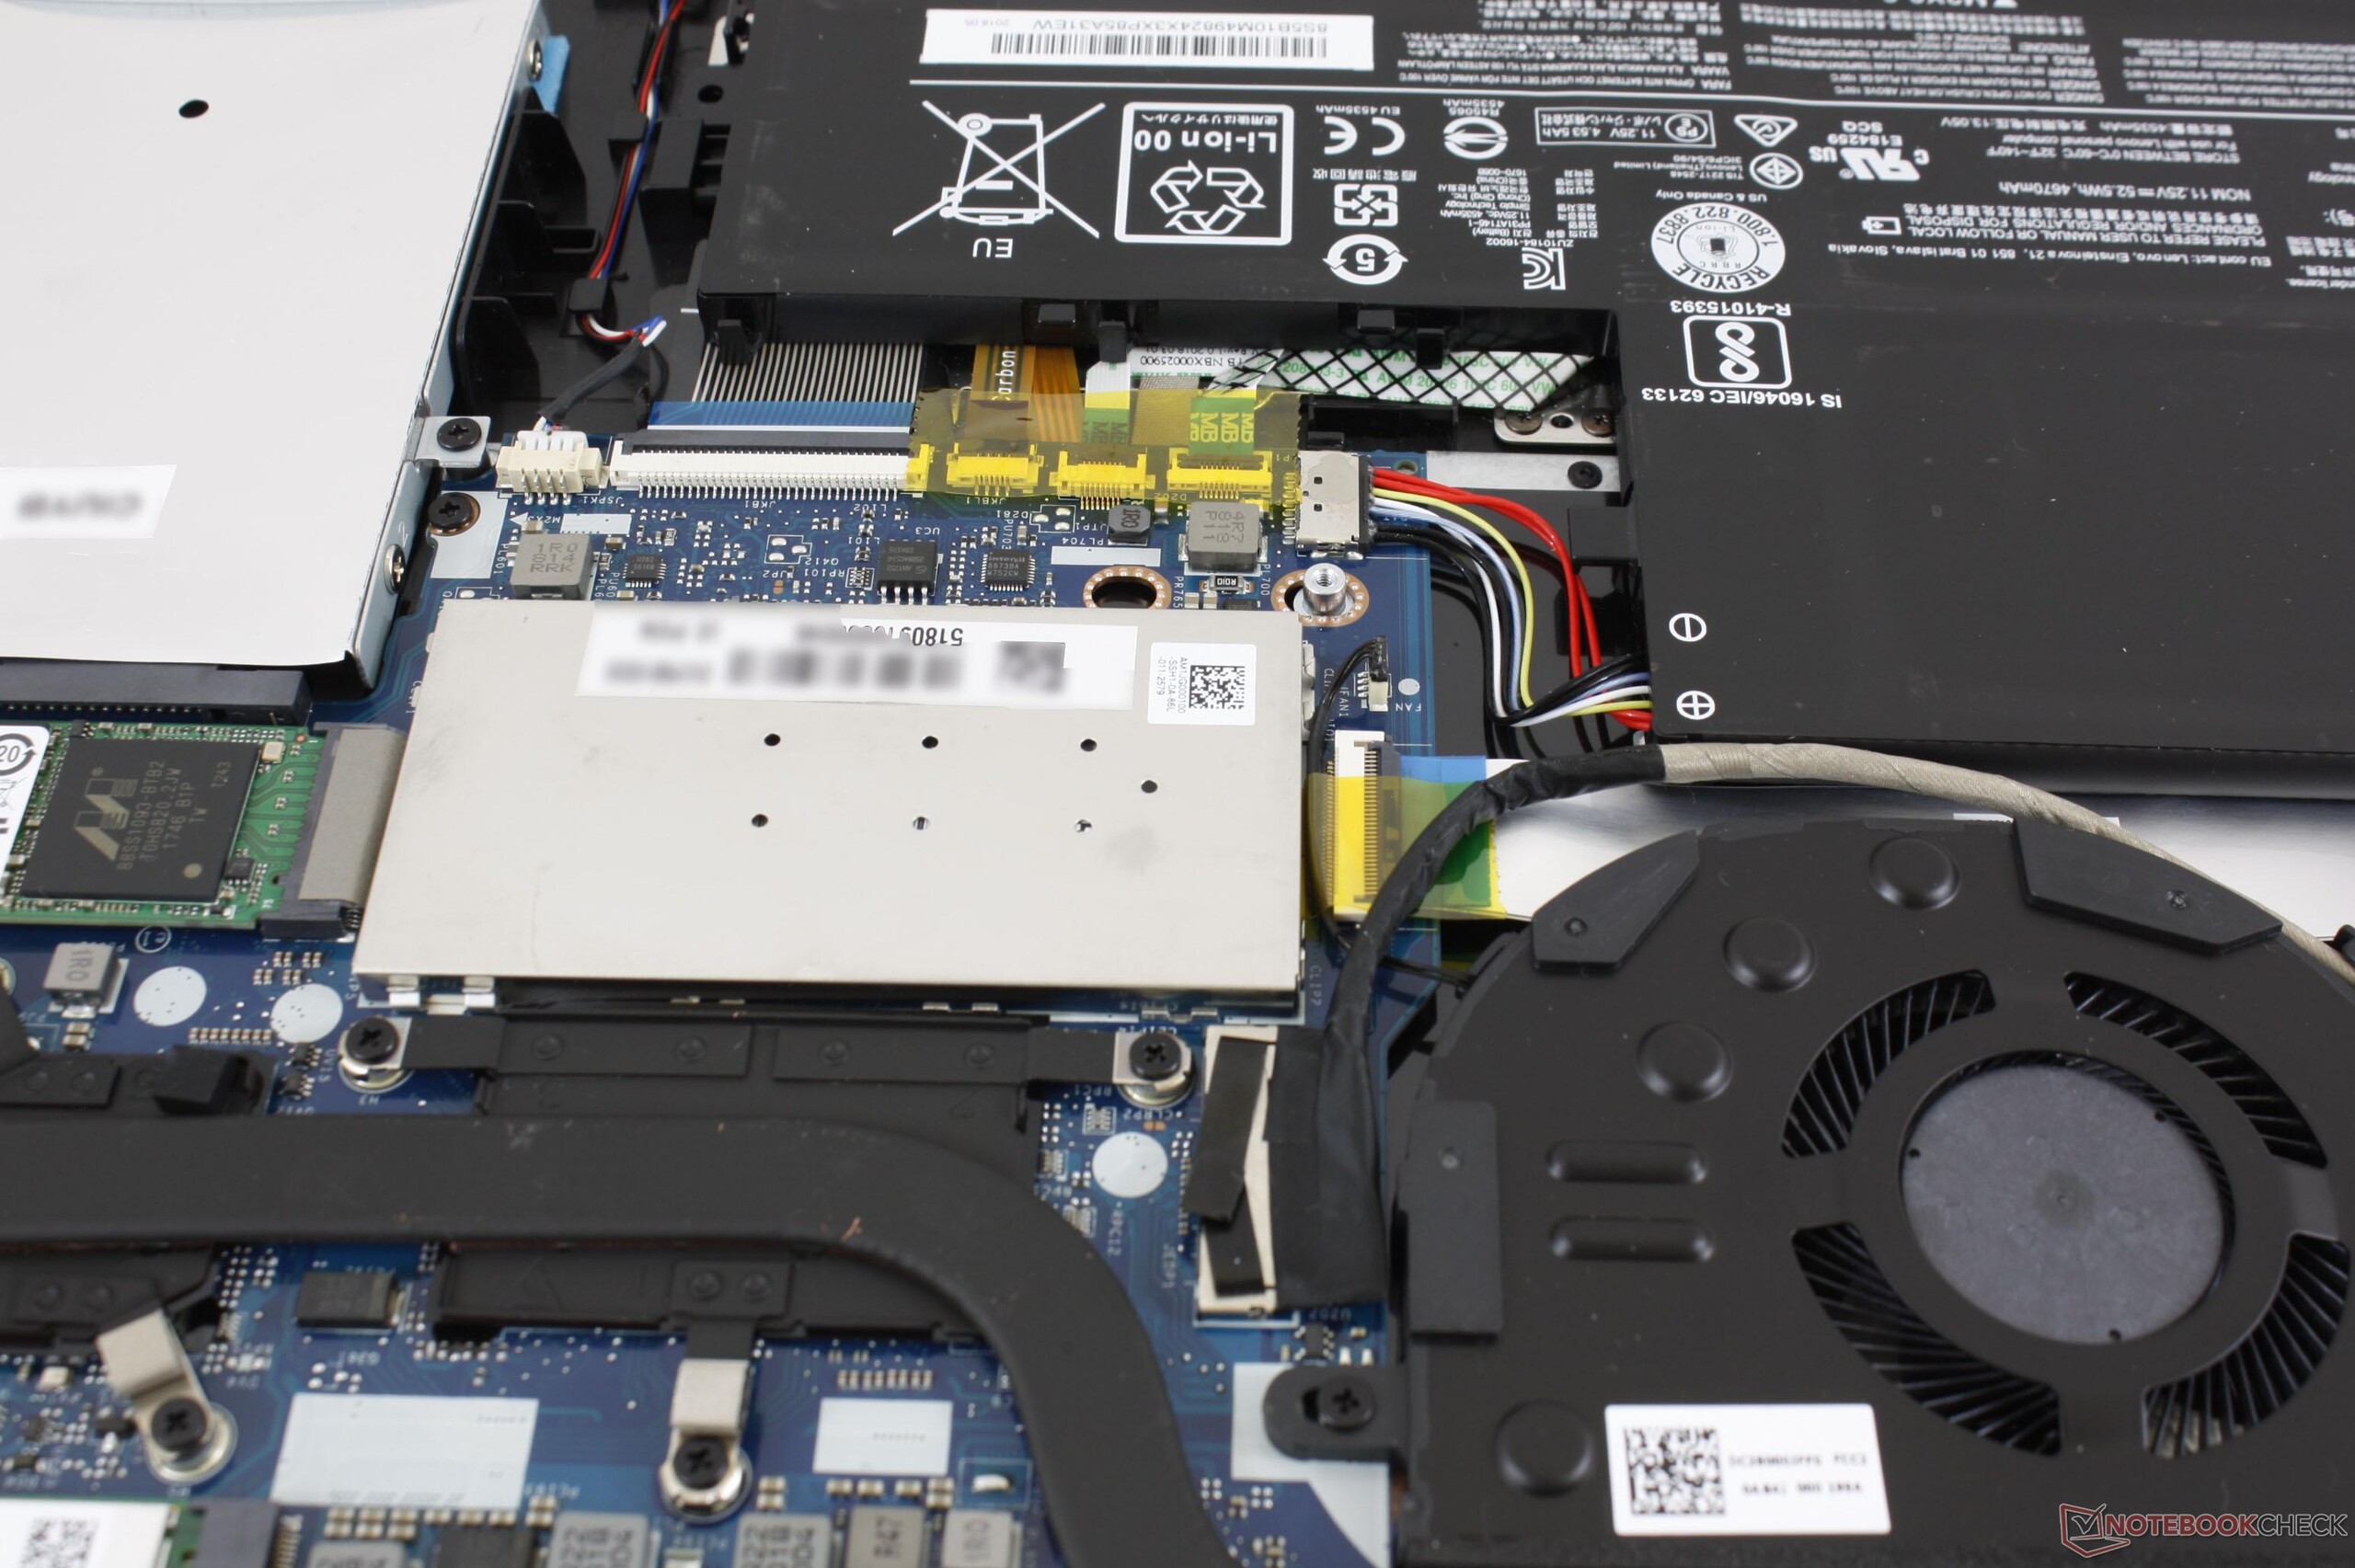
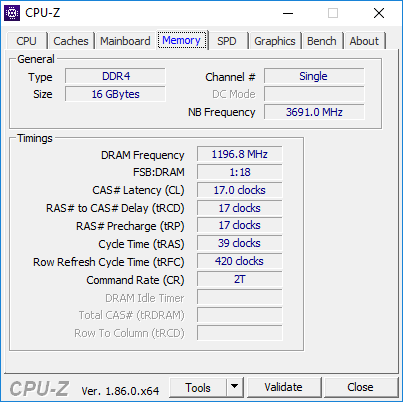
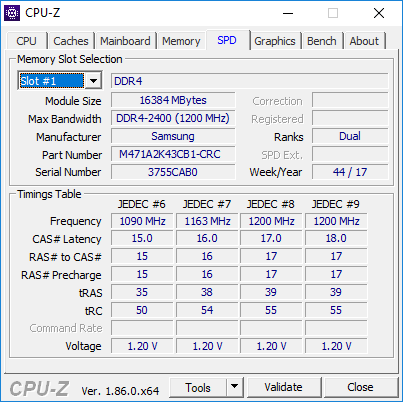
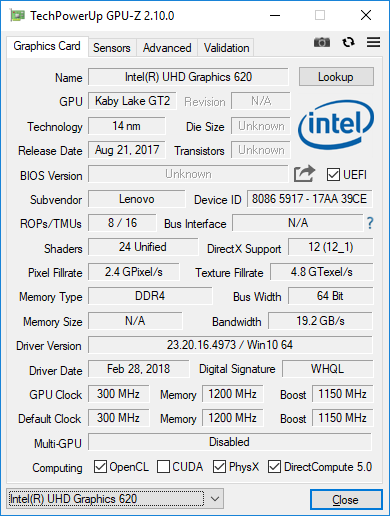
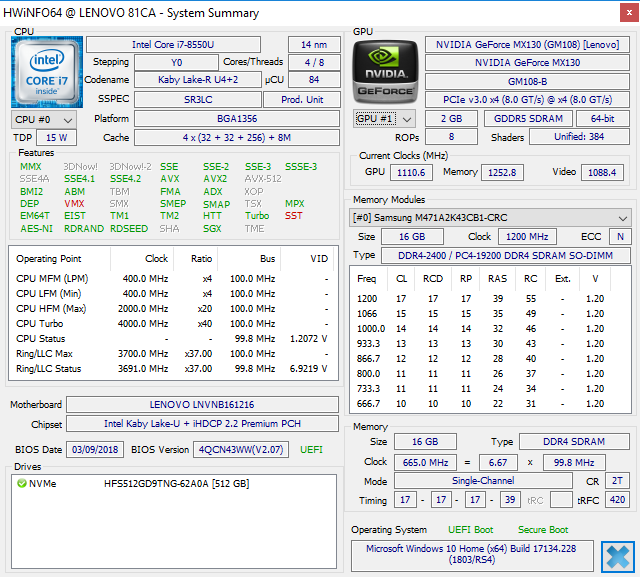
Lamentavelmente, há uma longa lista de cortes de desempenho. A tela muito fraca significa que este é um conversível feito principalmente para uso em interiores e o extremamente limitado Turbo Boost significa que há muitos poucos motivos para comprar o SKU Core i7-8550U quando o mais barato i5-8250U SKU pode se desempenhar quase igual Sua RAM de canal único dificulta ainda mais o desempenho e a solução de resfriamento é embaraçosamente pequena, considerando-se o espaçoso formato de 15 polegadas. Há um amplo espaço vazio ao redor do ventilador, que poderia ter sido utilizado para uma solução de resfriamento maior para reduzir o ruído do ventilador.
O preço inicial de $700 é justo para um sistema sem brilho e honestamente esquecível, enquanto SKUs de ponta podem alcançar mais de $1.000. Recomendamos evitar as opções mais caras, pois seria melhor usar um portátil tradicional bem feito, como o XPS 15 ou gastar um pouco mais no Spectre x360 15. O extremamente fraco Turbo Boost e tela fraca tornam isso uma tarefa difícil.
Lenovo IdeaPad Flex-1570 81CA000RUS
- 09/03/2018 v6 (old)
Allen Ngo
Price comparison
