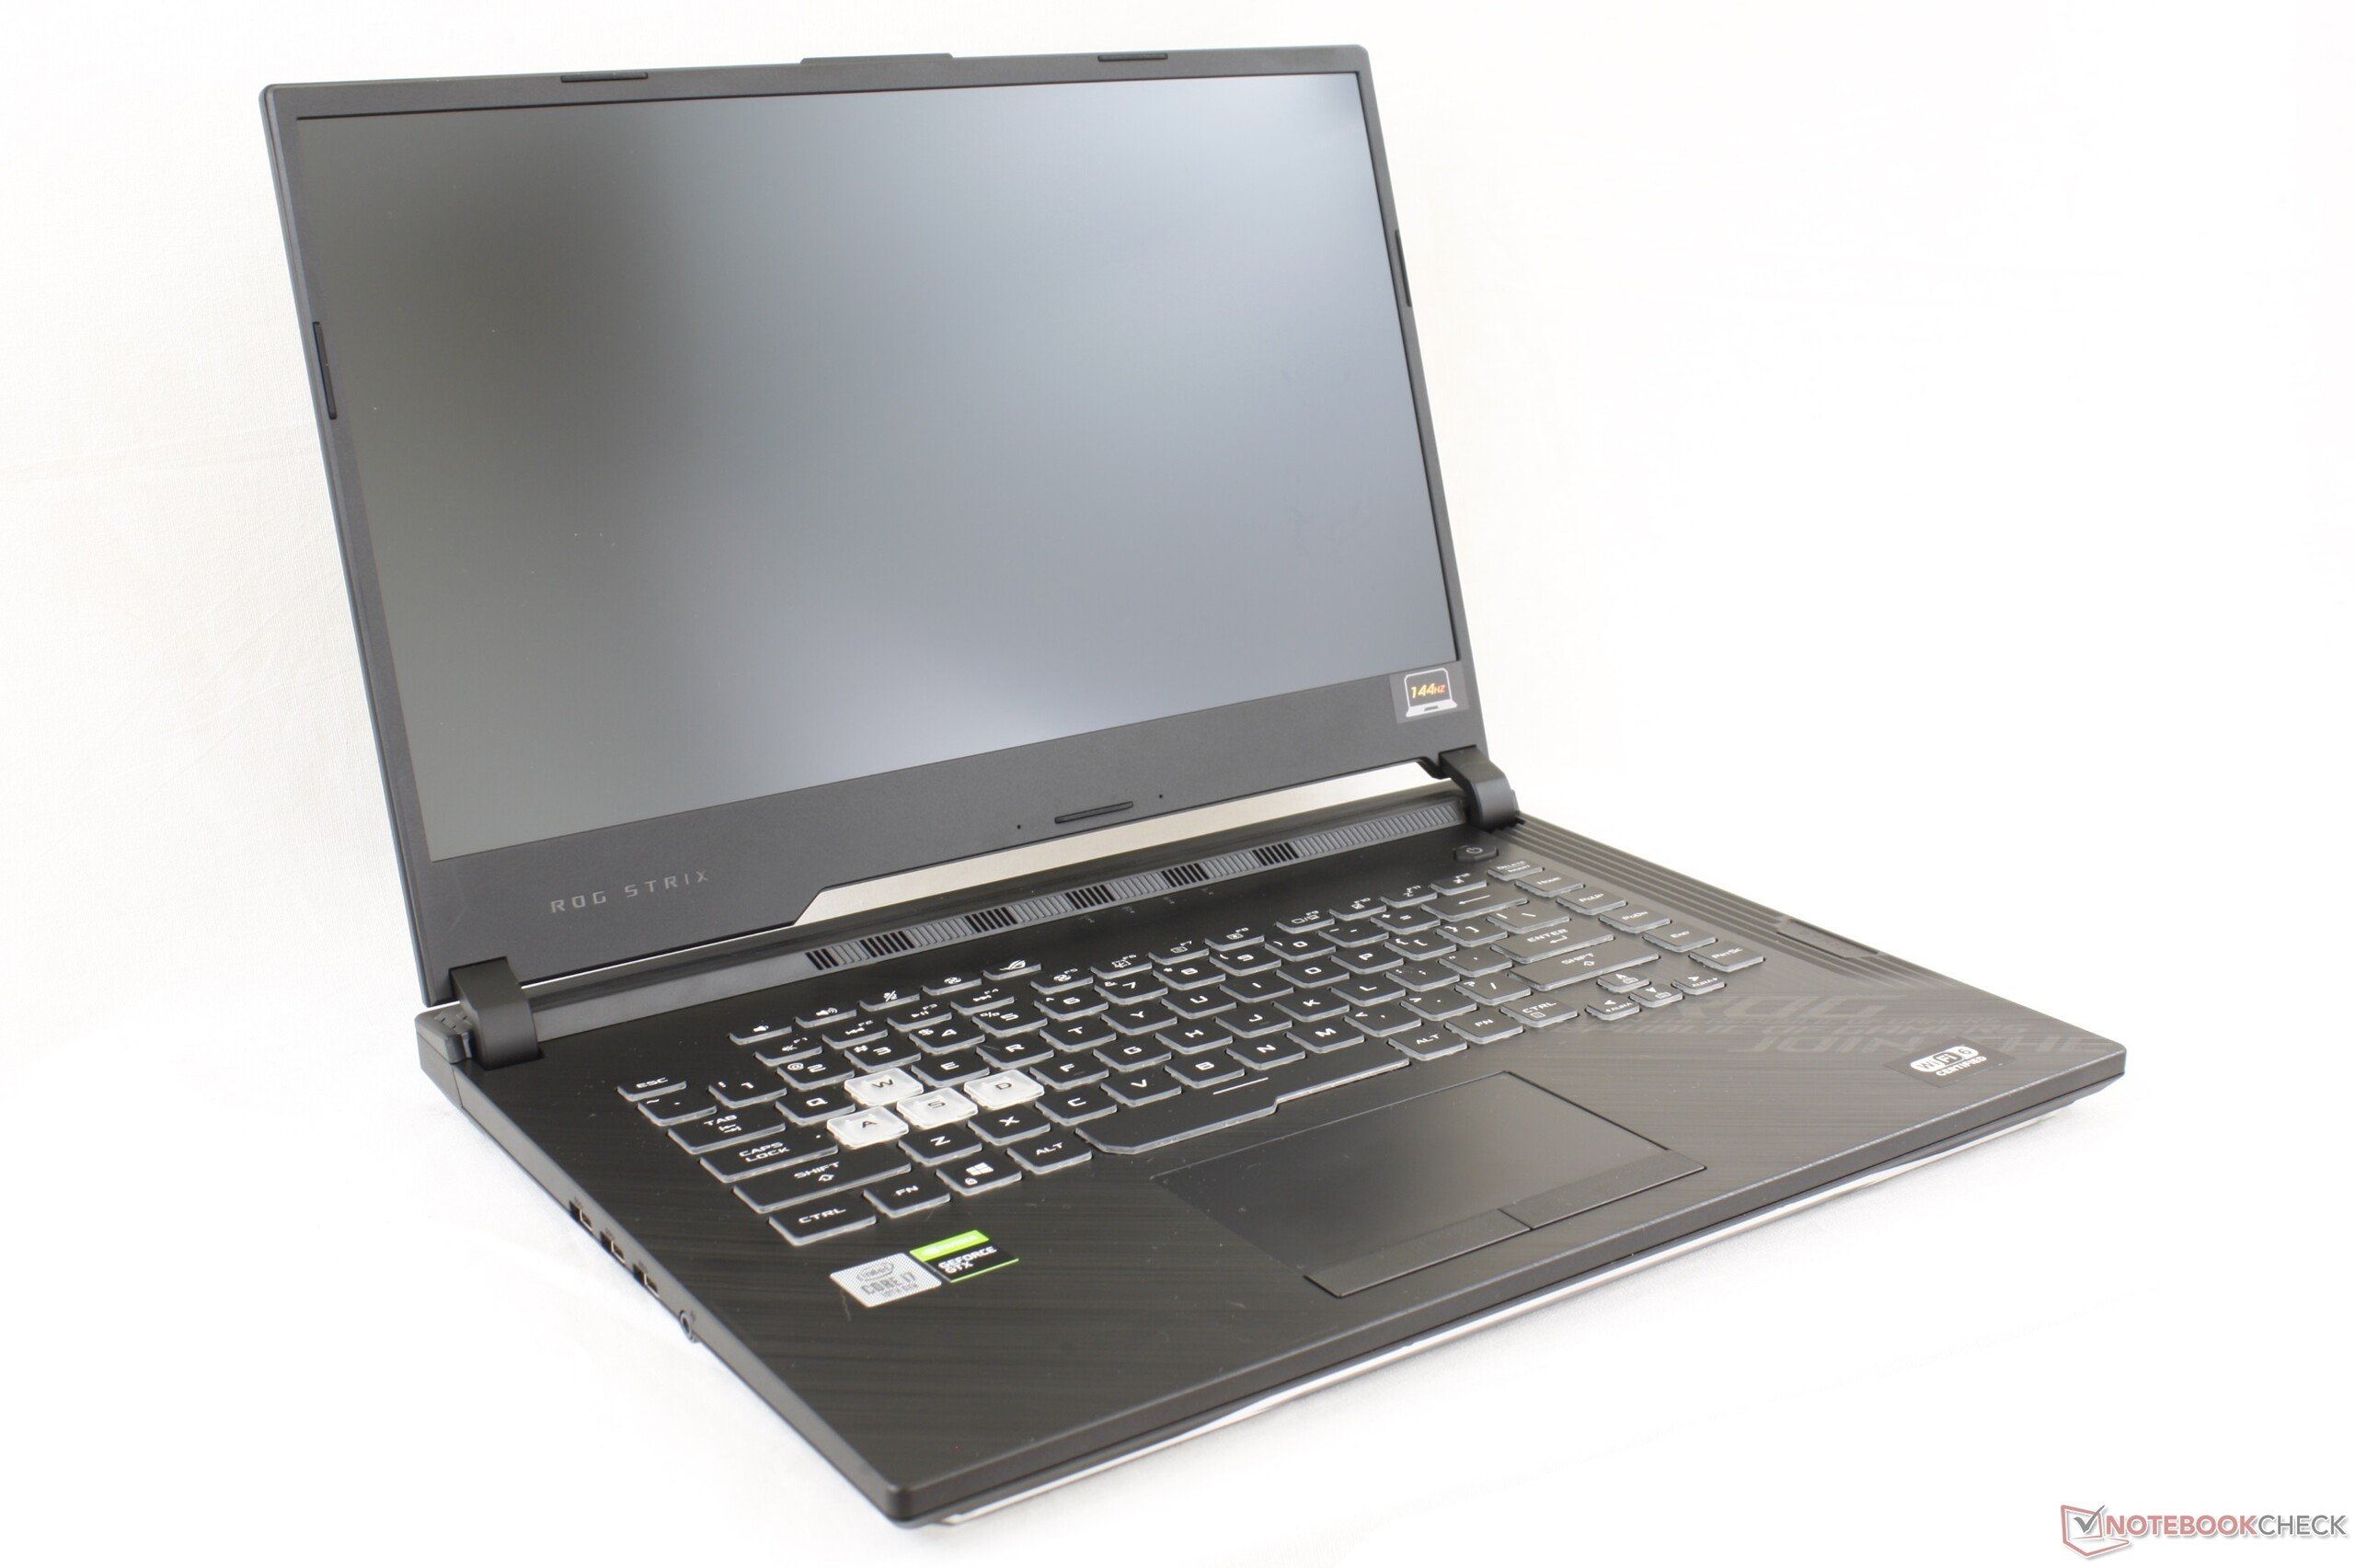
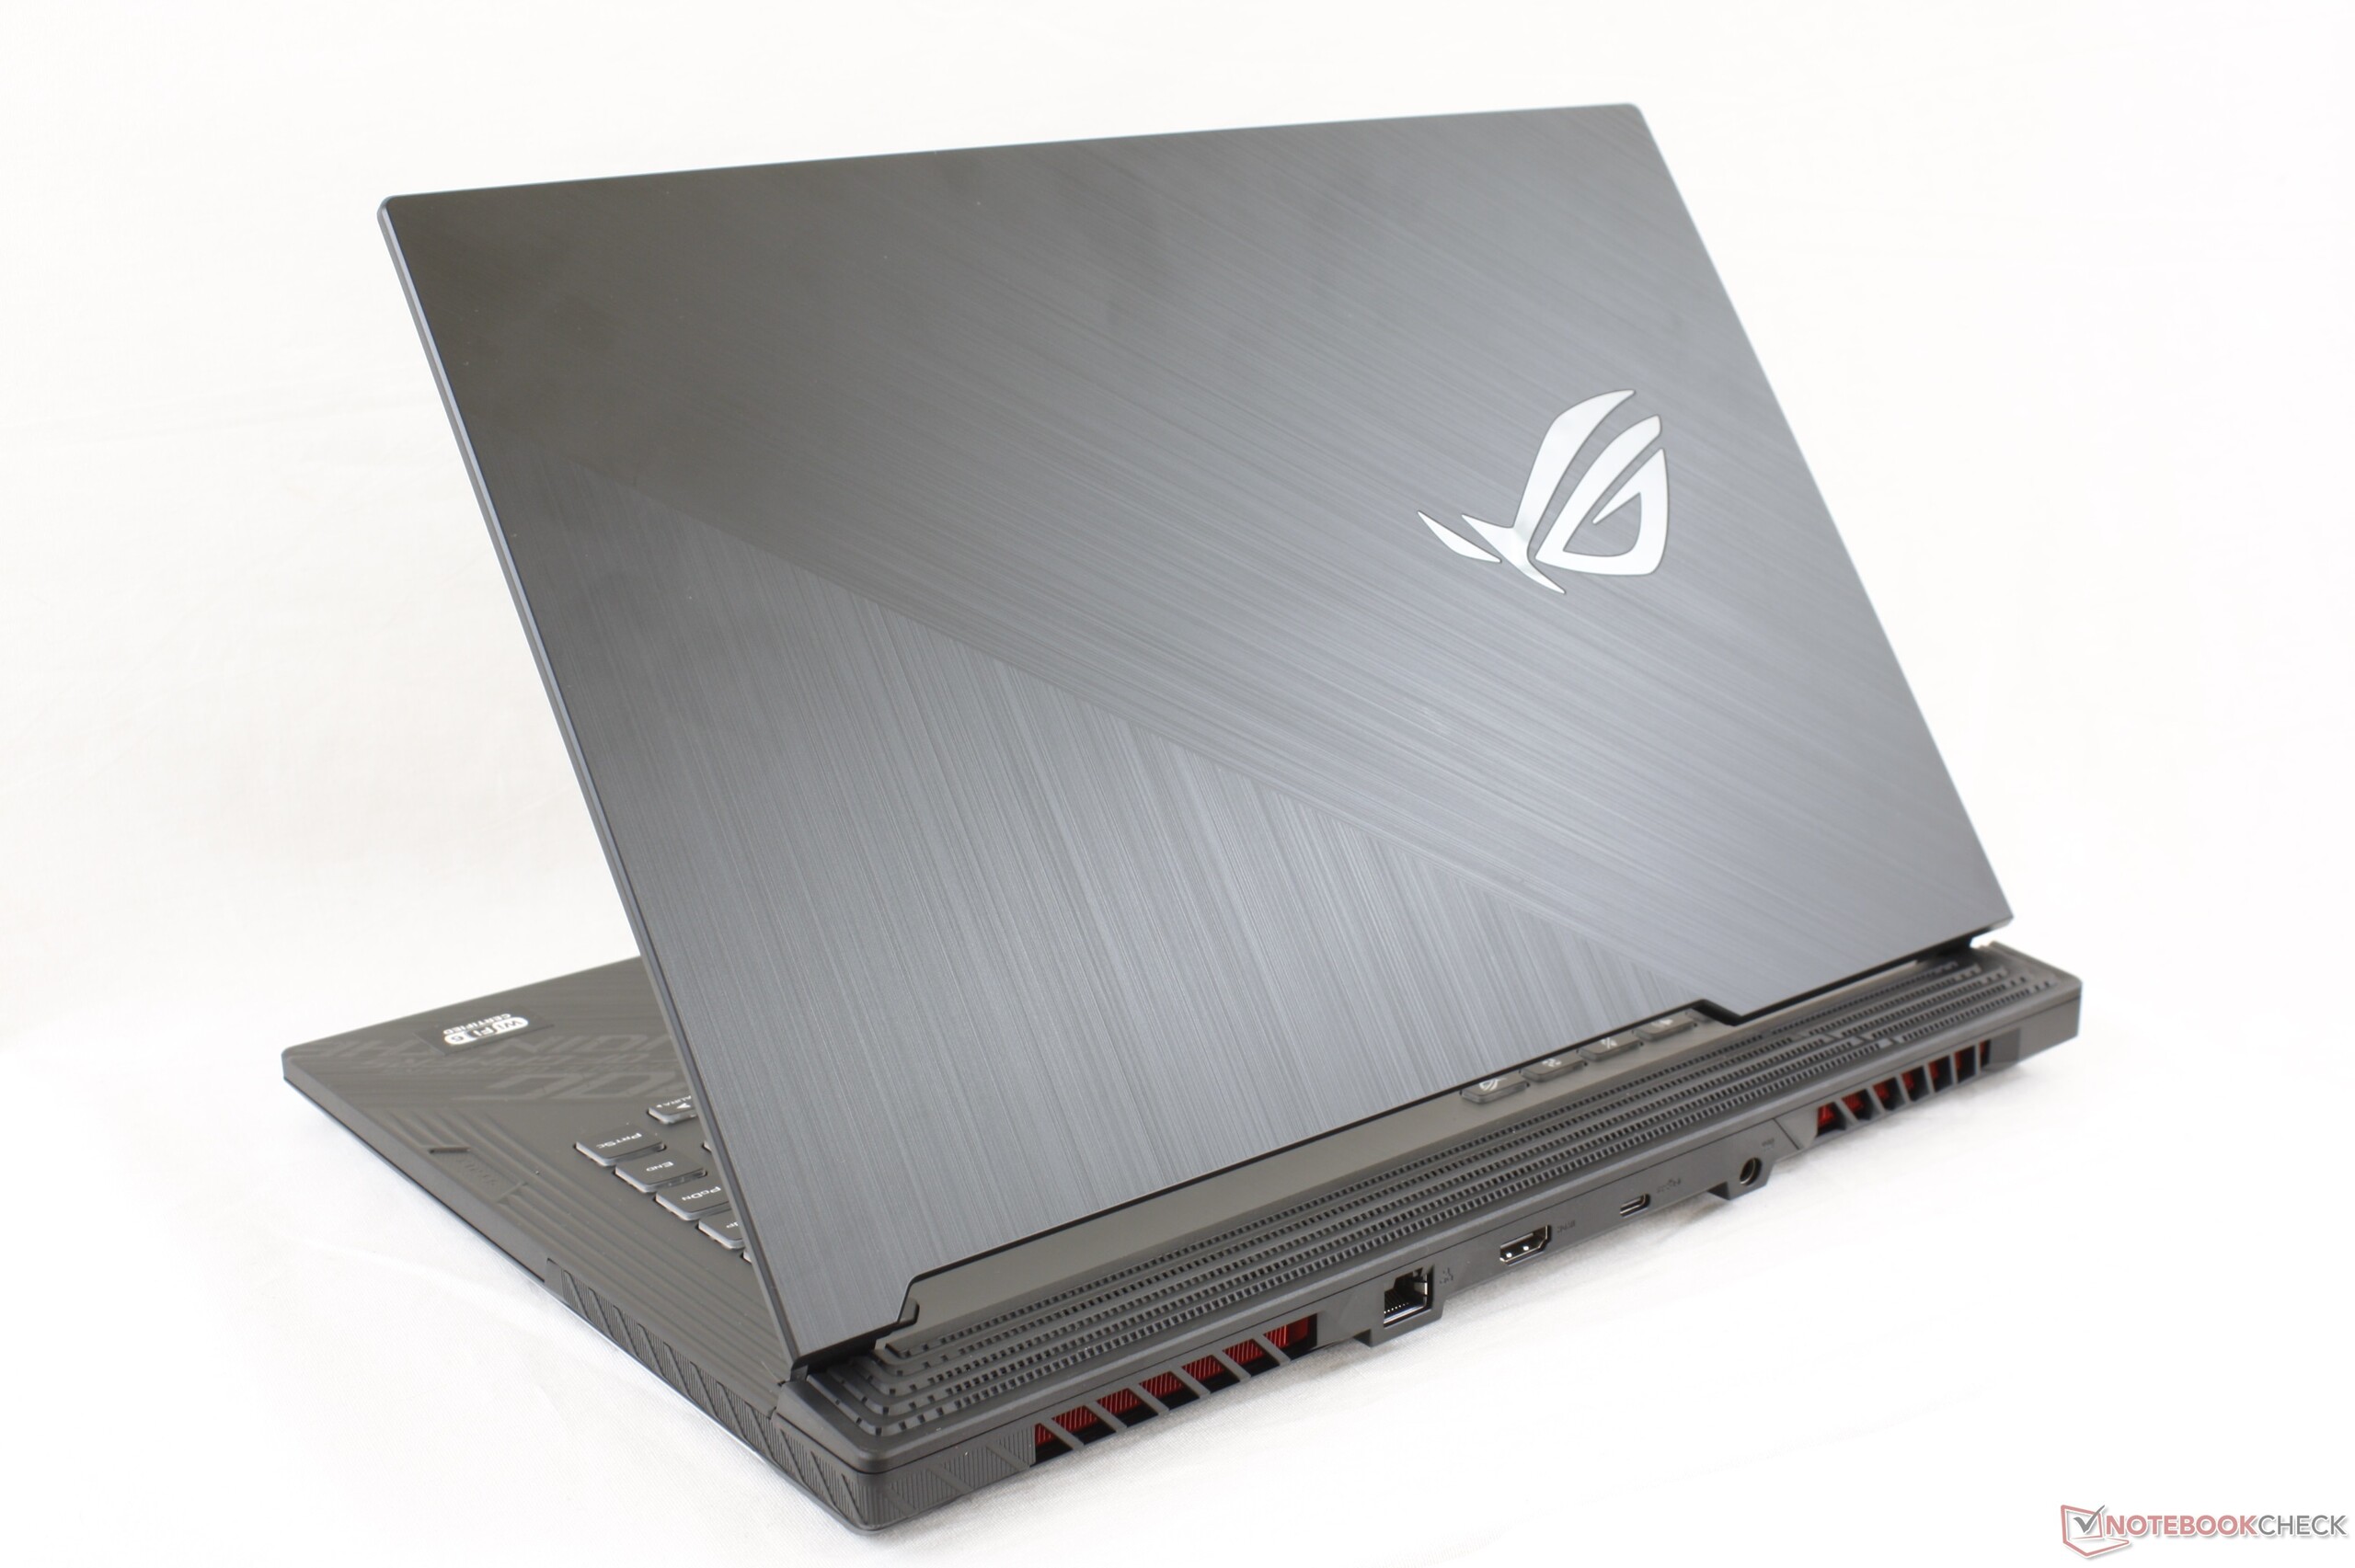
Breve Análise do Portátil Asus ROG Strix G15 G512LI: US$1000 pela GeForce GTX 1650 Ti Graphics é demais
Avaliação | Data | Modelo | Peso | Altura | Size | Resolução | Preço |
|---|---|---|---|---|---|---|---|
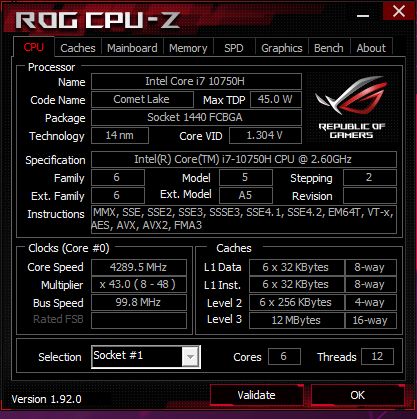
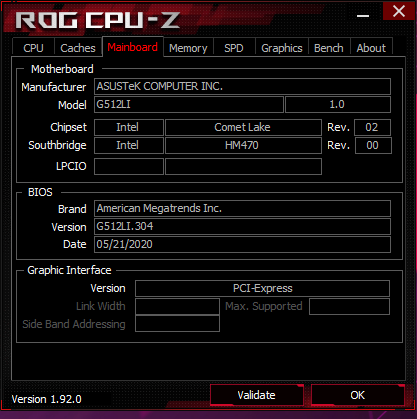
| 80.8 % v7 (old) | 07/2020 | Asus ROG Strix G15 G512LI i7-10750H, GeForce GTX 1650 Ti Mobile | 2.3 kg | 25.8 mm | 15.60" | 1920x1080 | |
| 82.7 % v7 (old) | 06/2020 | Asus TUF Gaming A15 FA506IV-HN172 R7 4800H, GeForce RTX 2060 Mobile | 2.2 kg | 24.9 mm | 15.60" | 1920x1080 | |
| 82.1 % v7 (old) | Asus Strix Scar III G531GW-AZ062T i7-9750H, GeForce RTX 2070 Mobile | 2.4 kg | 25 mm | 15.60" | 1920x1080 | ||
| 83.2 % v7 (old) | 05/2020 | MSI GP65 10SFK-047US i7-10750H, GeForce RTX 2070 Mobile | 2.3 kg | 27.5 mm | 15.60" | 1920x1080 | |
| 83.7 % v7 (old) | 06/2020 | Dell G5 15 SE 5505 P89F R7 4800H, Radeon RX 5600M | 2.4 kg | 21.6 mm | 15.60" | 1920x1080 | |
| 81.5 % v7 (old) | 07/2019 | HP Omen 15-dc1020ng i5-9300H, GeForce GTX 1650 Mobile | 2.3 kg | 25 mm | 15.60" | 1920x1080 |
| Networking | |
| iperf3 transmit AX12 | |
| Asus ROG Strix G15 G512LI | |
| MSI GP65 10SFK-047US | |
| Dell G5 15 SE 5505 P89F | |
| Asus TUF Gaming A15 FA506IV-HN172 | |
| iperf3 receive AX12 | |
| Dell G5 15 SE 5505 P89F | |
| MSI GP65 10SFK-047US | |
| Asus ROG Strix G15 G512LI | |
| Asus TUF Gaming A15 FA506IV-HN172 | |
| |||||||||||||||||||||||||
iluminação: 79 %
iluminação com acumulador: 271.2 cd/m²
Contraste: 512:1 (Preto: 0.53 cd/m²)
ΔE ColorChecker Calman: 5.04 | ∀{0.5-29.43 Ø4.72}
calibrated: 4.26
ΔE Greyscale Calman: 3.4 | ∀{0.09-98 Ø4.97}
59.5% sRGB (Argyll 1.6.3 3D)
37.8% AdobeRGB 1998 (Argyll 1.6.3 3D)
41.06% AdobeRGB 1998 (Argyll 3D)
59.8% sRGB (Argyll 3D)
39.73% Display P3 (Argyll 3D)
Gamma: 2.09
CCT: 7079 K
| Asus ROG Strix G15 G512LI Panda LM156LF-2F01, IPS, 15.6", 1920x1080 | Asus TUF Gaming A15 FA506IV-HN172 LM156LF-2F01, IPS, 15.6", 1920x1080 | Asus Strix Scar III G531GW-AZ062T Sharp LQ156M1JW09 (SHP14D3), IPS, 15.6", 1920x1080 | MSI GP65 10SFK-047US LG Philips LP156WFG-SPB3, IPS, 15.6", 1920x1080 | Dell G5 15 SE 5505 P89F BOE NV156FH, WVA, 15.6", 1920x1080 | HP Omen 15-dc1020ng LGD05CE, IPS, 15.6", 1920x1080 | |
|---|---|---|---|---|---|---|
| Display | -2% | 65% | 59% | 55% | -3% | |
| Display P3 Coverage (%) | 39.73 | 38.92 -2% | 66.2 67% | 63.5 60% | 63 59% | 38.37 -3% |
| sRGB Coverage (%) | 59.8 | 58.5 -2% | 97.1 62% | 94.4 58% | 90.1 51% | 57.6 -4% |
| AdobeRGB 1998 Coverage (%) | 41.06 | 40.22 -2% | 67.6 65% | 65.1 59% | 64.1 56% | 39.69 -3% |
| Response Times | 6% | 61% | 63% | 50% | -13% | |
| Response Time Grey 50% / Grey 80% * (ms) | 33.6 ? | 34 ? -1% | 15 ? 55% | 10.4 ? 69% | 20.4 ? 39% | 40 ? -19% |
| Response Time Black / White * (ms) | 27.6 ? | 24 ? 13% | 9 ? 67% | 12 ? 57% | 10.8 ? 61% | 29.6 ? -7% |
| PWM Frequency (Hz) | 250 ? | 198.4 ? | ||||
| Screen | 25% | 29% | 36% | 36% | 14% | |
| Brightness middle (cd/m²) | 271.2 | 280 3% | 309 14% | 384.9 42% | 292 8% | 251 -7% |
| Brightness (cd/m²) | 252 | 254 1% | 284 13% | 358 42% | 290 15% | 232 -8% |
| Brightness Distribution (%) | 79 | 88 11% | 88 11% | 87 10% | 77 -3% | 76 -4% |
| Black Level * (cd/m²) | 0.53 | 0.15 72% | 0.42 21% | 0.67 -26% | 0.27 49% | 0.17 68% |
| Contrast (:1) | 512 | 1867 265% | 736 44% | 574 12% | 1081 111% | 1476 188% |
| Colorchecker dE 2000 * | 5.04 | 5.89 -17% | 3.99 21% | 2.43 52% | 3.99 21% | 6.2 -23% |
| Colorchecker dE 2000 max. * | 16.07 | 19 -18% | 8.3 48% | 4.58 71% | 6.11 62% | 18.6 -16% |
| Colorchecker dE 2000 calibrated * | 4.26 | 4.79 -12% | 1.12 74% | 2.03 52% | 3.02 29% | 4.8 -13% |
| Greyscale dE 2000 * | 3.4 | 4.08 -20% | 5.43 -60% | 2.6 24% | 3.3 3% | 4.2 -24% |
| Gamma | 2.09 105% | 2.33 94% | 2.57 86% | 2.2 100% | 2.25 98% | 2.32 95% |
| CCT | 7079 92% | 7303 89% | 7767 84% | 6981 93% | 7047 92% | 7454 87% |
| Color Space (Percent of AdobeRGB 1998) (%) | 37.8 | 37 -2% | 63 67% | 59.7 58% | 58.1 54% | 36.5 -3% |
| Color Space (Percent of sRGB) (%) | 59.5 | 58 -3% | 97 63% | 93.9 58% | 89.7 51% | 57.4 -4% |
| Média Total (Programa/Configurações) | 10% /
18% | 52% /
40% | 53% /
44% | 47% /
42% | -1% /
7% |
* ... menor é melhor
Exibir tempos de resposta
| ↔ Tempo de resposta preto para branco | ||
|---|---|---|
| 27.6 ms ... ascensão ↗ e queda ↘ combinadas | ↗ 15.6 ms ascensão | 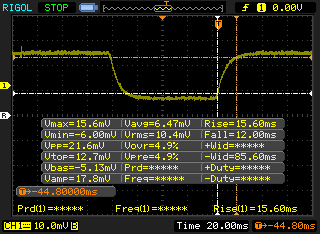 |
| ↘ 12 ms queda | ||
| A tela mostra taxas de resposta relativamente lentas em nossos testes e pode ser muito lenta para os jogadores. Em comparação, todos os dispositivos testados variam de 0.1 (mínimo) a 240 (máximo) ms. » 70 % de todos os dispositivos são melhores. Isso significa que o tempo de resposta medido é pior que a média de todos os dispositivos testados (19.8 ms). | ||
| ↔ Tempo de resposta 50% cinza a 80% cinza | ||
| 33.6 ms ... ascensão ↗ e queda ↘ combinadas | ↗ 18.4 ms ascensão | 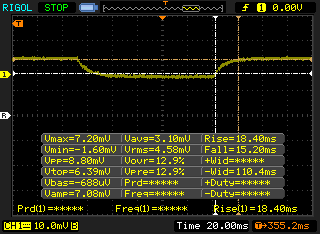 |
| ↘ 15.2 ms queda | ||
| A tela mostra taxas de resposta lentas em nossos testes e será insatisfatória para os jogadores. Em comparação, todos os dispositivos testados variam de 0.165 (mínimo) a 636 (máximo) ms. » 46 % de todos os dispositivos são melhores. Isso significa que o tempo de resposta medido é semelhante à média de todos os dispositivos testados (31 ms). | ||
Cintilação da tela / PWM (modulação por largura de pulso)
| Tela tremeluzindo / PWM não detectado |  | ||
[pwm_comparison] Em comparação: 52 % de todos os dispositivos testados não usam PWM para escurecer a tela. Se PWM foi detectado, uma média de 7781 (mínimo: 5 - máximo: 343500) Hz foi medida. | |||
Cinebench R15: CPU Multi 64Bit | CPU Single 64Bit
Blender: v2.79 BMW27 CPU
7-Zip 18.03: 7z b 4 -mmt1 | 7z b 4
Geekbench 5.5: Single-Core | Multi-Core
HWBOT x265 Benchmark v2.2: 4k Preset
LibreOffice : 20 Documents To PDF
R Benchmark 2.5: Overall mean
| Geekbench 5.5 / Single-Core | |
| MSI GE66 Raider 10SFS | |
| Gigabyte Aero 15 OLED XB-8DE51B0SP | |
| Média Intel Core i7-10750H (1114 - 1333, n=43) | |
| Lenovo Legion 5 15IMH05H | |
| Asus Zephyrus G14 GA401IV | |
| Dell G5 15 SE 5505 P89F | |
| Schenker XMG Pro 15 | |
| Asus ROG Strix G15 G512LI | |
| Acer Nitro 5 AN515-44-R5FT | |
| Geekbench 5.5 / Multi-Core | |
| MSI GE66 Raider 10SFS | |
| Gigabyte Aero 15 OLED XB-8DE51B0SP | |
| Dell G5 15 SE 5505 P89F | |
| Asus Zephyrus G14 GA401IV | |
| Asus ROG Strix G15 G512LI | |
| Média Intel Core i7-10750H (4443 - 6674, n=43) | |
| Schenker XMG Pro 15 | |
| Acer Nitro 5 AN515-44-R5FT | |
| Lenovo Legion 5 15IMH05H | |
| HWBOT x265 Benchmark v2.2 / 4k Preset | |
| Gigabyte Aero 15 OLED XB-8DE51B0SP | |
| MSI GE66 Raider 10SFS | |
| Dell G5 15 SE 5505 P89F | |
| Asus Zephyrus G14 GA401IV | |
| Asus ROG Strix G15 G512LI | |
| Média Intel Core i7-10750H (5.54 - 11.6, n=43) | |
| Acer Nitro 5 AN515-44-R5FT | |
| Schenker XMG Pro 15 | |
| Lenovo Legion 5 15IMH05H | |
| Asus ROG Zephyrus G15 GA502DU | |
| LibreOffice / 20 Documents To PDF | |
| Dell G5 15 SE 5505 P89F | |
| Acer Nitro 5 AN515-44-R5FT | |
| MSI GE66 Raider 10SFS | |
| Média Intel Core i7-10750H (43.1 - 99.2, n=43) | |
| Lenovo Legion 5 15IMH05H | |
| Gigabyte Aero 15 OLED XB-8DE51B0SP | |
| Asus ROG Strix G15 G512LI | |
| R Benchmark 2.5 / Overall mean | |
| Schenker XMG Pro 15 | |
| Lenovo Legion 5 15IMH05H | |
| Acer Nitro 5 AN515-44-R5FT | |
| Asus ROG Strix G15 G512LI | |
| Média Intel Core i7-10750H (0.578 - 0.708, n=42) | |
| Dell G5 15 SE 5505 P89F | |
| MSI GE66 Raider 10SFS | |
| Gigabyte Aero 15 OLED XB-8DE51B0SP | |
* ... menor é melhor
| PCMark 10 | |
| Score | |
| MSI GP65 10SFK-047US | |
| Dell G5 15 SE 5505 P89F | |
| Asus Strix Scar III G531GW-AZ062T | |
| Asus ROG Strix G15 G512LI | |
| Asus TUF Gaming A15 FA506IV-HN172 | |
| HP Omen 15-dc1020ng | |
| Essentials | |
| MSI GP65 10SFK-047US | |
| Dell G5 15 SE 5505 P89F | |
| Asus ROG Strix G15 G512LI | |
| Asus Strix Scar III G531GW-AZ062T | |
| Asus TUF Gaming A15 FA506IV-HN172 | |
| HP Omen 15-dc1020ng | |
| Productivity | |
| MSI GP65 10SFK-047US | |
| Asus ROG Strix G15 G512LI | |
| Asus Strix Scar III G531GW-AZ062T | |
| Dell G5 15 SE 5505 P89F | |
| HP Omen 15-dc1020ng | |
| Asus TUF Gaming A15 FA506IV-HN172 | |
| Digital Content Creation | |
| Dell G5 15 SE 5505 P89F | |
| MSI GP65 10SFK-047US | |
| Asus Strix Scar III G531GW-AZ062T | |
| Asus ROG Strix G15 G512LI | |
| Asus TUF Gaming A15 FA506IV-HN172 | |
| HP Omen 15-dc1020ng | |
| PCMark 8 | |
| Home Score Accelerated v2 | |
| Dell G5 15 SE 5505 P89F | |
| Asus Strix Scar III G531GW-AZ062T | |
| Asus TUF Gaming A15 FA506IV-HN172 | |
| MSI GP65 10SFK-047US | |
| Asus ROG Strix G15 G512LI | |
| HP Omen 15-dc1020ng | |
| Work Score Accelerated v2 | |
| MSI GP65 10SFK-047US | |
| Asus TUF Gaming A15 FA506IV-HN172 | |
| Asus Strix Scar III G531GW-AZ062T | |
| Asus ROG Strix G15 G512LI | |
| Dell G5 15 SE 5505 P89F | |
| HP Omen 15-dc1020ng | |
| PCMark 8 Home Score Accelerated v2 | 4420 pontos | |
| PCMark 8 Work Score Accelerated v2 | 5587 pontos | |
| PCMark 10 Score | 5466 pontos | |
Ajuda | ||
| DPC Latencies / LatencyMon - interrupt to process latency (max), Web, Youtube, Prime95 | |
| Dell G5 15 SE 5505 P89F | |
| Gigabyte Aero 15 OLED XB-8DE51B0SP | |
| MSI Bravo 15 A4DCR | |
| Asus ROG Strix G15 G512LI | |
| Acer Nitro 5 AN515-44-R5FT | |
| MSI GE66 Raider 10SFS | |
| Razer Blade 15 RZ09-0328 | |
| Asus TUF Gaming A15 FA506IV-HN172 | |
| Lenovo Legion 5 15IMH05H | |
| Eluktronics RP-15 | |
* ... menor é melhor
| Asus ROG Strix G15 G512LI Intel SSD 660p SSDPEKNW512G8 | Asus TUF Gaming A15 FA506IV-HN172 Kingston OM8PCP3512F-AB | Asus Strix Scar III G531GW-AZ062T Intel SSD 660p SSDPEKNW512G8 | MSI GP65 10SFK-047US Samsung SSD PM981 MZVLB1T0HALR | Dell G5 15 SE 5505 P89F Samsung PM991 MZ9LQ512HALU | HP Omen 15-dc1020ng WDC PC SN720 SDAQNTW-512G | |
|---|---|---|---|---|---|---|
| AS SSD | 17% | -18% | 150% | 32% | 99% | |
| Seq Read (MB/s) | 1157 | 1682 45% | 1163 1% | 2066 79% | 1386 20% | 2955 155% |
| Seq Write (MB/s) | 675 | 904 34% | 919 36% | 2418 258% | 1234 83% | 2440 261% |
| 4K Read (MB/s) | 49.99 | 60.2 20% | 48.88 -2% | 54.2 8% | 41.32 -17% | 40.56 -19% |
| 4K Write (MB/s) | 114 | 164.8 45% | 90.1 -21% | 129 13% | 128 12% | 118.6 4% |
| 4K-64 Read (MB/s) | 322.2 | 472.5 47% | 323.8 0% | 1865 479% | 854 165% | 1283 298% |
| 4K-64 Write (MB/s) | 759 | 845 11% | 403.8 -47% | 1878 147% | 721 -5% | 1538 103% |
| Access Time Read * (ms) | 0.07 | 0.087 -24% | 0.24 -243% | 0.042 40% | 0.098 -40% | 0.084 -20% |
| Access Time Write * (ms) | 0.137 | 0.02 85% | 0.046 66% | 0.091 34% | 0.095 31% | 0.032 77% |
| Score Read (Points) | 488 | 701 44% | 489 0% | 2126 336% | 1034 112% | 1619 232% |
| Score Write (Points) | 940 | 1101 17% | 586 -38% | 2249 139% | 973 4% | 1901 102% |
| Score Total (Points) | 1673 | 2143 28% | 1332 -20% | 5482 228% | 2536 52% | 4323 158% |
| Copy ISO MB/s (MB/s) | 939 | 675 -28% | 1269 35% | 2927 212% | 1284 37% | 1418 51% |
| Copy Program MB/s (MB/s) | 489.9 | 248.4 -49% | 452.8 -8% | 728 49% | 401.9 -18% | 392.5 -20% |
| Copy Game MB/s (MB/s) | 895 | 535 -40% | 755 -16% | 1614 80% | 1013 13% | 907 1% |
| CrystalDiskMark 5.2 / 6 | 19% | -2% | 69% | 22% | 51% | |
| Write 4K (MB/s) | 125.4 | 219.8 75% | 133.3 6% | 145 16% | 142.1 13% | 112.1 -11% |
| Read 4K (MB/s) | 52.7 | 50.2 -5% | 55.3 5% | 46.84 -11% | 46.43 -12% | 42.01 -20% |
| Write Seq (MB/s) | 943 | 979 4% | 980 4% | 2377 152% | 1108 17% | 1964 108% |
| Read Seq (MB/s) | 1383 | 1990 44% | 1406 2% | 2185 58% | 1622 17% | 2065 49% |
| Write 4K Q32T1 (MB/s) | 437.9 | 516 18% | 286.3 -35% | 463.5 6% | 467 7% | 318.2 -27% |
| Read 4K Q32T1 (MB/s) | 334.9 | 298.3 -11% | 331.5 -1% | 527 57% | 525 57% | 406.7 21% |
| Write Seq Q32T1 (MB/s) | 960 | 982 2% | 976 2% | 2395 149% | 1203 25% | 2534 164% |
| Read Seq Q32T1 (MB/s) | 1530 | 1907 25% | 1520 -1% | 3470 127% | 2288 50% | 3438 125% |
| Write 4K Q8T8 (MB/s) | 981 | 748 | ||||
| Read 4K Q8T8 (MB/s) | 300.9 | 344.6 | ||||
| Média Total (Programa/Configurações) | 18% /
18% | -10% /
-13% | 110% /
121% | 27% /
28% | 75% /
81% |
* ... menor é melhor

Disk Throttling: DiskSpd Read Loop, Queue Depth 8
| 3DMark | |
| 1920x1080 Fire Strike Graphics | |
| MSI GE66 Raider 10SFS | |
| MSI RTX 2060 Gaming Z 6G | |
| Dell G5 15 SE 5505 P89F | |
| Razer Blade 15 RZ09-0328 | |
| Eluktronics RP-15 | |
| Maingear Vector 15 | |
| MSI GS63VR 7RG-005 | |
| Asus Zephyrus S GX531GM | |
| Asus ROG Strix G15 G512LI | |
| MSI Bravo 15 A4DCR | |
| Média NVIDIA GeForce GTX 1650 Ti Mobile (9691 - 10733, n=9) | |
| HP Pavilion Gaming 15-cx0003ng | |
| 2560x1440 Time Spy Graphics | |
| MSI GE66 Raider 10SFS | |
| MSI RTX 2060 Gaming Z 6G | |
| Razer Blade 15 RZ09-0328 | |
| Dell G5 15 SE 5505 P89F | |
| Eluktronics RP-15 | |
| Maingear Vector 15 | |
| MSI GS63VR 7RG-005 | |
| Asus ROG Strix G15 G512LI | |
| Média NVIDIA GeForce GTX 1650 Ti Mobile (3554 - 3904, n=9) | |
| Asus Zephyrus S GX531GM | |
| MSI Bravo 15 A4DCR | |
| HP Pavilion Gaming 15-cx0003ng | |
| 2560x1440 Time Spy Score | |
| MSI GE66 Raider 10SFS | |
| MSI RTX 2060 Gaming Z 6G | |
| Dell G5 15 SE 5505 P89F | |
| Eluktronics RP-15 | |
| Razer Blade 15 RZ09-0328 | |
| Maingear Vector 15 | |
| MSI GS63VR 7RG-005 | |
| Asus ROG Strix G15 G512LI | |
| Média NVIDIA GeForce GTX 1650 Ti Mobile (3738 - 4201, n=9) | |
| MSI Bravo 15 A4DCR | |
| Asus Zephyrus S GX531GM | |
| HP Pavilion Gaming 15-cx0003ng | |
| 3DMark 11 | |
| 1280x720 Performance GPU | |
| MSI GE66 Raider 10SFS | |
| MSI RTX 2060 Gaming Z 6G | |
| Dell G5 15 SE 5505 P89F | |
| Razer Blade 15 RZ09-0328 | |
| Eluktronics RP-15 | |
| Maingear Vector 15 | |
| MSI GS63VR 7RG-005 | |
| MSI Bravo 15 A4DCR | |
| Asus ROG Strix G15 G512LI | |
| Média NVIDIA GeForce GTX 1650 Ti Mobile (12865 - 14415, n=8) | |
| Asus Zephyrus S GX531GM | |
| HP Pavilion Gaming 15-cx0003ng | |
| 1280x720 Performance Combined | |
| MSI GE66 Raider 10SFS | |
| Eluktronics RP-15 | |
| MSI RTX 2060 Gaming Z 6G | |
| Dell G5 15 SE 5505 P89F | |
| Asus ROG Strix G15 G512LI | |
| Maingear Vector 15 | |
| Razer Blade 15 RZ09-0328 | |
| MSI Bravo 15 A4DCR | |
| Média NVIDIA GeForce GTX 1650 Ti Mobile (9749 - 13027, n=8) | |
| HP Pavilion Gaming 15-cx0003ng | |
| MSI GS63VR 7RG-005 | |
| Asus Zephyrus S GX531GM | |
| 3DMark 11 Performance | 14000 pontos | |
| 3DMark Cloud Gate Standard Score | 33407 pontos | |
| 3DMark Fire Strike Score | 9710 pontos | |
| 3DMark Time Spy Score | 4131 pontos | |
Ajuda | ||
| The Witcher 3 - 1920x1080 Ultra Graphics & Postprocessing (HBAO+) | |
| Gigabyte Aero 15 OLED XB-8DE51B0SP | |
| MSI GE65 Raider 9SF-049US | |
| MSI RTX 2060 Gaming Z 6G | |
| Asus Strix Scar III G531GW-AZ062T | |
| Lenovo Legion 5 15IMH05H | |
| Dell G5 15 SE 5505 P89F | |
| Eluktronics RP-15 | |
| Razer Blade 15 RZ09-0328 | |
| Maingear Vector 15 | |
| Asus TUF Gaming A15 FA506IV-HN172 | |
| Asus Zephyrus G14 GA401IV | |
| MSI GS63VR 7RG-005 | |
| Asus ROG Zephyrus G15 GA502DU | |
| Asus ROG Strix G15 G512LI | |
| Asus Zephyrus S GX531GM | |
| Média NVIDIA GeForce GTX 1650 Ti Mobile (34.7 - 42.3, n=8) | |
| Acer Nitro 5 AN515-44-R5FT | |
| MSI Bravo 15 A4DCR | |
| HP Omen 15-dc1020ng | |
| MSI GF63 Thin 9SC | |
| HP Pavilion Gaming 15-cx0003ng | |
| baixo | média | alto | ultra | |
|---|---|---|---|---|
| The Witcher 3 (2015) | 223.5 | 135.5 | 76.1 | 40.1 |
| Dota 2 Reborn (2015) | 148 | 132 | 122 | 115 |
| X-Plane 11.11 (2018) | 98.9 | 82.7 | 71.8 |
| Asus ROG Strix G15 G512LI GeForce GTX 1650 Ti Mobile, i7-10750H, Intel SSD 660p SSDPEKNW512G8 | Asus TUF Gaming A15 FA506IV-HN172 GeForce RTX 2060 Mobile, R7 4800H, Kingston OM8PCP3512F-AB | Asus Strix Scar III G531GW-AZ062T GeForce RTX 2070 Mobile, i7-9750H, Intel SSD 660p SSDPEKNW512G8 | MSI GP65 10SFK-047US GeForce RTX 2070 Mobile, i7-10750H, Samsung SSD PM981 MZVLB1T0HALR | Dell G5 15 SE 5505 P89F Radeon RX 5600M, R7 4800H, Samsung PM991 MZ9LQ512HALU | HP Omen 15-dc1020ng GeForce GTX 1650 Mobile, i5-9300H, WDC PC SN720 SDAQNTW-512G | |
|---|---|---|---|---|---|---|
| Noise | 6% | 4% | -2% | 13% | 16% | |
| desligado / ambiente * (dB) | 27.7 | 30.2 -9% | 30 -8% | 29.3 -6% | 28 -1% | 28.8 -4% |
| Idle Minimum * (dB) | 34.2 | 30.2 12% | 30.6 11% | 31.9 7% | 28 18% | 28.8 16% |
| Idle Average * (dB) | 36 | 30.2 16% | 30.6 15% | 31.9 11% | 28 22% | 29.5 18% |
| Idle Maximum * (dB) | 36.6 | 30.2 17% | 37.7 -3% | 33.5 8% | 28 23% | 31.1 15% |
| Load Average * (dB) | 44.3 | 40 10% | 36.5 18% | 47 -6% | 28 37% | 35.2 21% |
| Witcher 3 ultra * (dB) | 47.9 | 49 -2% | 52.1 -9% | 53.8 -12% | 50.6 -6% | 35.2 27% |
| Load Maximum * (dB) | 49.3 | 49 1% | 48.1 2% | 56.7 -15% | 50.6 -3% | 41 17% |
* ... menor é melhor
Barulho
| Ocioso |
| 34.2 / 36 / 36.6 dB |
| Carga |
| 44.3 / 49.3 dB |
 | ||
30 dB silencioso 40 dB(A) audível 50 dB(A) ruidosamente alto |
||
min: | ||
(-) A temperatura máxima no lado superior é 46.2 °C / 115 F, em comparação com a média de 40.4 °C / 105 F , variando de 21.2 a 68.8 °C para a classe Gaming.
(-) A parte inferior aquece até um máximo de 53.6 °C / 128 F, em comparação com a média de 43.2 °C / 110 F
(+) Em uso inativo, a temperatura média para o lado superior é 26 °C / 79 F, em comparação com a média do dispositivo de 33.9 °C / ### class_avg_f### F.
(+) Jogando The Witcher 3, a temperatura média para o lado superior é 31.8 °C / 89 F, em comparação com a média do dispositivo de 33.9 °C / ## #class_avg_f### F.
(+) Os apoios para as mãos e o touchpad são mais frios que a temperatura da pele, com um máximo de 25.8 °C / 78.4 F e, portanto, são frios ao toque.
(+) A temperatura média da área do apoio para as mãos de dispositivos semelhantes foi 28.8 °C / 83.8 F (+3 °C / 5.4 F).
Asus ROG Strix G15 G512LI análise de áudio
(+) | os alto-falantes podem tocar relativamente alto (###valor### dB)
Graves 100 - 315Hz
(±) | graves reduzidos - em média 14.3% menor que a mediana
(±) | a linearidade dos graves é média (12.3% delta para a frequência anterior)
Médios 400 - 2.000 Hz
(±) | médios mais altos - em média 8.2% maior que a mediana
(+) | médios são lineares (5.1% delta para frequência anterior)
Altos 2 - 16 kHz
(+) | agudos equilibrados - apenas 3.4% longe da mediana
(±) | a linearidade dos máximos é média (9.5% delta para frequência anterior)
Geral 100 - 16.000 Hz
(±) | a linearidade do som geral é média (18.9% diferença em relação à mediana)
Comparado com a mesma classe
» 63% de todos os dispositivos testados nesta classe foram melhores, 8% semelhantes, 29% piores
» O melhor teve um delta de 6%, a média foi 18%, o pior foi 132%
Comparado com todos os dispositivos testados
» 44% de todos os dispositivos testados foram melhores, 8% semelhantes, 48% piores
» O melhor teve um delta de 4%, a média foi 24%, o pior foi 134%
Apple MacBook 12 (Early 2016) 1.1 GHz análise de áudio
(+) | os alto-falantes podem tocar relativamente alto (###valor### dB)
Graves 100 - 315Hz
(±) | graves reduzidos - em média 11.3% menor que a mediana
(±) | a linearidade dos graves é média (14.2% delta para a frequência anterior)
Médios 400 - 2.000 Hz
(+) | médios equilibrados - apenas 2.4% longe da mediana
(+) | médios são lineares (5.5% delta para frequência anterior)
Altos 2 - 16 kHz
(+) | agudos equilibrados - apenas 2% longe da mediana
(+) | os máximos são lineares (4.5% delta da frequência anterior)
Geral 100 - 16.000 Hz
(+) | o som geral é linear (10.2% diferença em relação à mediana)
Comparado com a mesma classe
» 7% de todos os dispositivos testados nesta classe foram melhores, 2% semelhantes, 91% piores
» O melhor teve um delta de 5%, a média foi 18%, o pior foi 53%
Comparado com todos os dispositivos testados
» 5% de todos os dispositivos testados foram melhores, 1% semelhantes, 94% piores
» O melhor teve um delta de 4%, a média foi 24%, o pior foi 134%
| desligado | |
| Ocioso | |
| Carga |
|
Key:
min: | |
| Asus ROG Strix G15 G512LI i7-10750H, GeForce GTX 1650 Ti Mobile, Intel SSD 660p SSDPEKNW512G8, IPS, 1920x1080, 15.6" | Asus TUF Gaming A15 FA506IV-HN172 R7 4800H, GeForce RTX 2060 Mobile, Kingston OM8PCP3512F-AB, IPS, 1920x1080, 15.6" | MSI GP65 10SFK-047US i7-10750H, GeForce RTX 2070 Mobile, Samsung SSD PM981 MZVLB1T0HALR, IPS, 1920x1080, 15.6" | Dell G5 15 SE 5505 P89F R7 4800H, Radeon RX 5600M, Samsung PM991 MZ9LQ512HALU, WVA, 1920x1080, 15.6" | HP Omen 15-dc1020ng i5-9300H, GeForce GTX 1650 Mobile, WDC PC SN720 SDAQNTW-512G, IPS, 1920x1080, 15.6" | HP Pavilion Gaming 15-cx0003ng i7-8750H, GeForce GTX 1050 Ti Mobile, Intel Optane 16 GB MEMPEK1J016GAH + HGST HTS721010A9E630 1 TB HDD, IPS, 1920x1080, 15.6" | |
|---|---|---|---|---|---|---|
| Power Consumption | -4% | -66% | -6% | 22% | 14% | |
| Idle Minimum * (Watt) | 5.7 | 5.4 5% | 14.2 -149% | 6.5 -14% | 4.04 29% | 5.5 4% |
| Idle Average * (Watt) | 9.3 | 10 -8% | 18.8 -102% | 10.6 -14% | 7.2 23% | 8.5 9% |
| Idle Maximum * (Watt) | 20.9 | 10.5 50% | 23.9 -14% | 11 47% | 11.4 45% | 11.9 43% |
| Load Average * (Watt) | 105.1 | 135 -28% | 96.9 8% | 84.1 20% | 80.8 23% | 94 11% |
| Witcher 3 ultra * (Watt) | 94.5 | 144 -52% | 185 -96% | 152.9 -62% | 93.6 1% | 86 9% |
| Load Maximum * (Watt) | 160.8 | 147 9% | 233.4 -45% | 180.4 -12% | 144.5 10% | 144 10% |
* ... menor é melhor
| Asus ROG Strix G15 G512LI i7-10750H, GeForce GTX 1650 Ti Mobile, 48 Wh | Asus TUF Gaming A15 FA506IV-HN172 R7 4800H, GeForce RTX 2060 Mobile, 48 Wh | Asus Strix Scar III G531GW-AZ062T i7-9750H, GeForce RTX 2070 Mobile, 66 Wh | MSI GP65 10SFK-047US i7-10750H, GeForce RTX 2070 Mobile, 51 Wh | Dell G5 15 SE 5505 P89F R7 4800H, Radeon RX 5600M, 51 Wh | HP Omen 15-dc1020ng i5-9300H, GeForce GTX 1650 Mobile, 52.5 Wh | |
|---|---|---|---|---|---|---|
| Duração da bateria | 16% | 24% | -18% | 10% | 16% | |
| Reader / Idle (h) | 13.3 | 9.8 -26% | 11.2 -16% | 15.9 20% | ||
| WiFi v1.3 (h) | 4.5 | 6.2 38% | 5.6 24% | 3.7 -18% | 6.2 38% | 6.4 42% |
| Load (h) | 1.4 | 1.9 36% | 1.5 7% | 1.2 -14% | ||
| Witcher 3 ultra (h) | 1 |
Pro
Contra
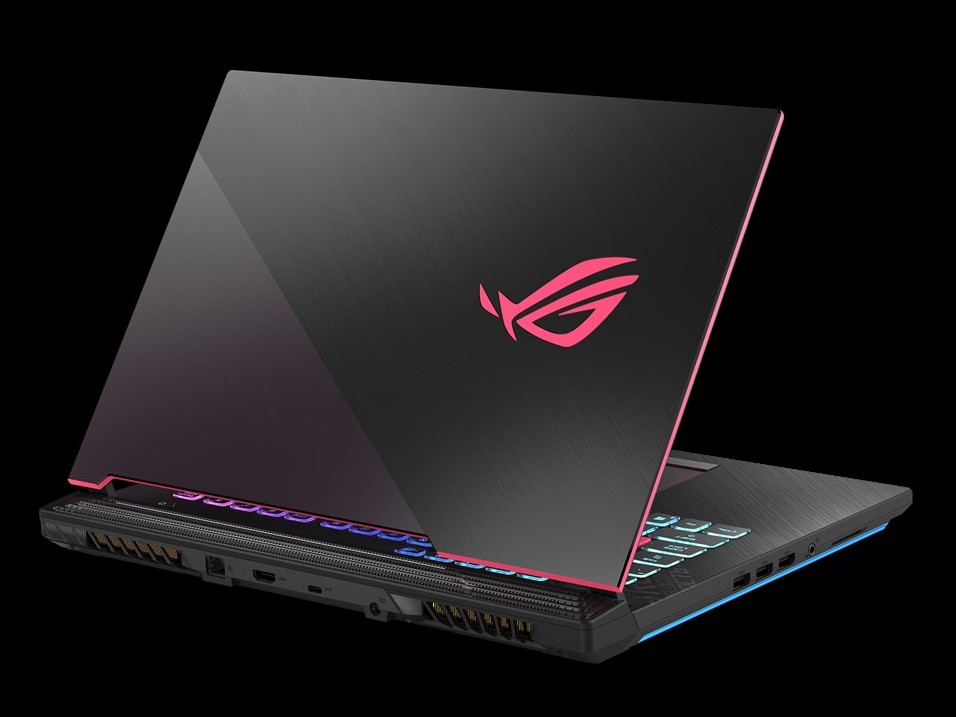
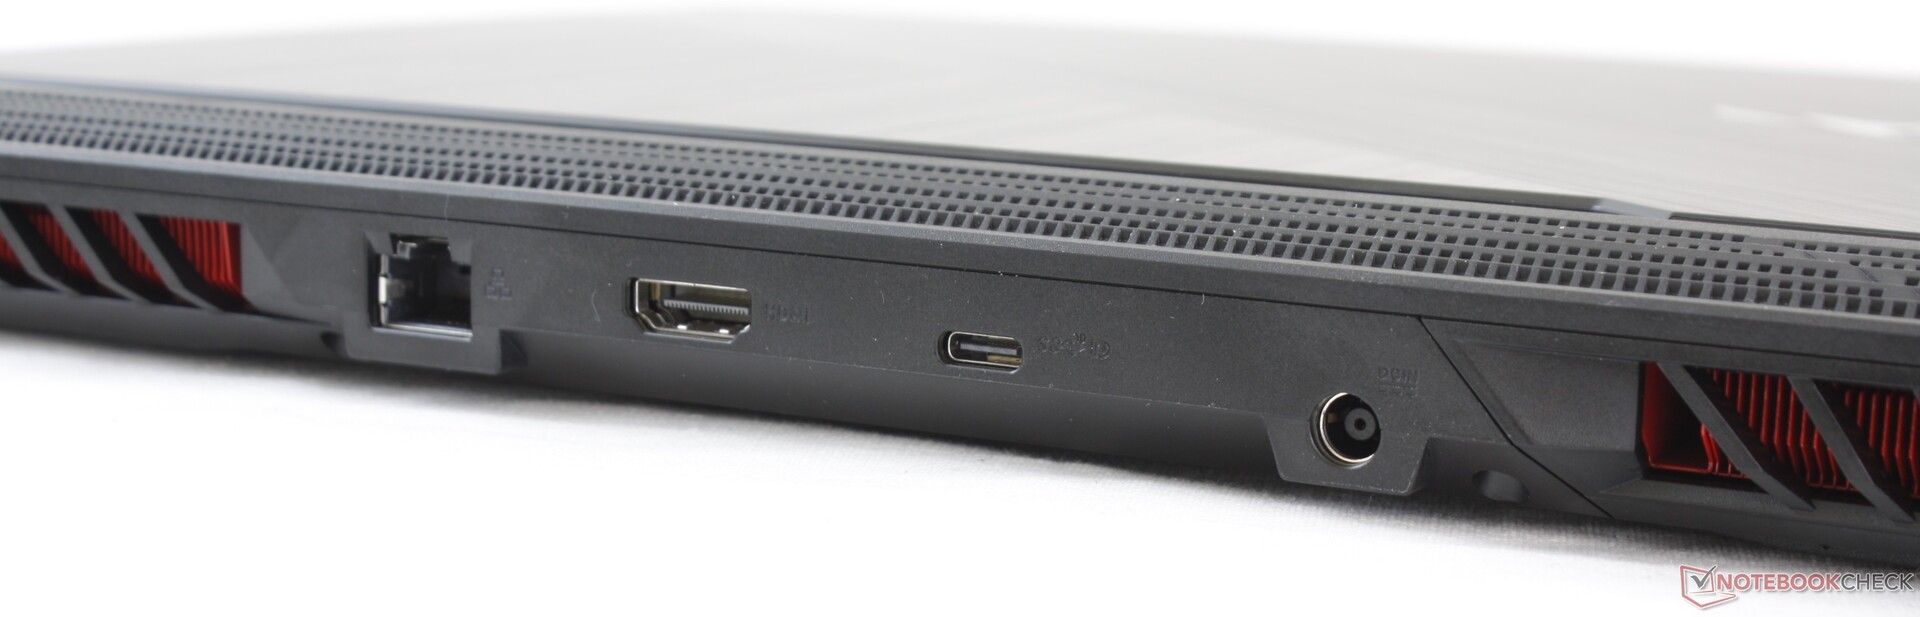
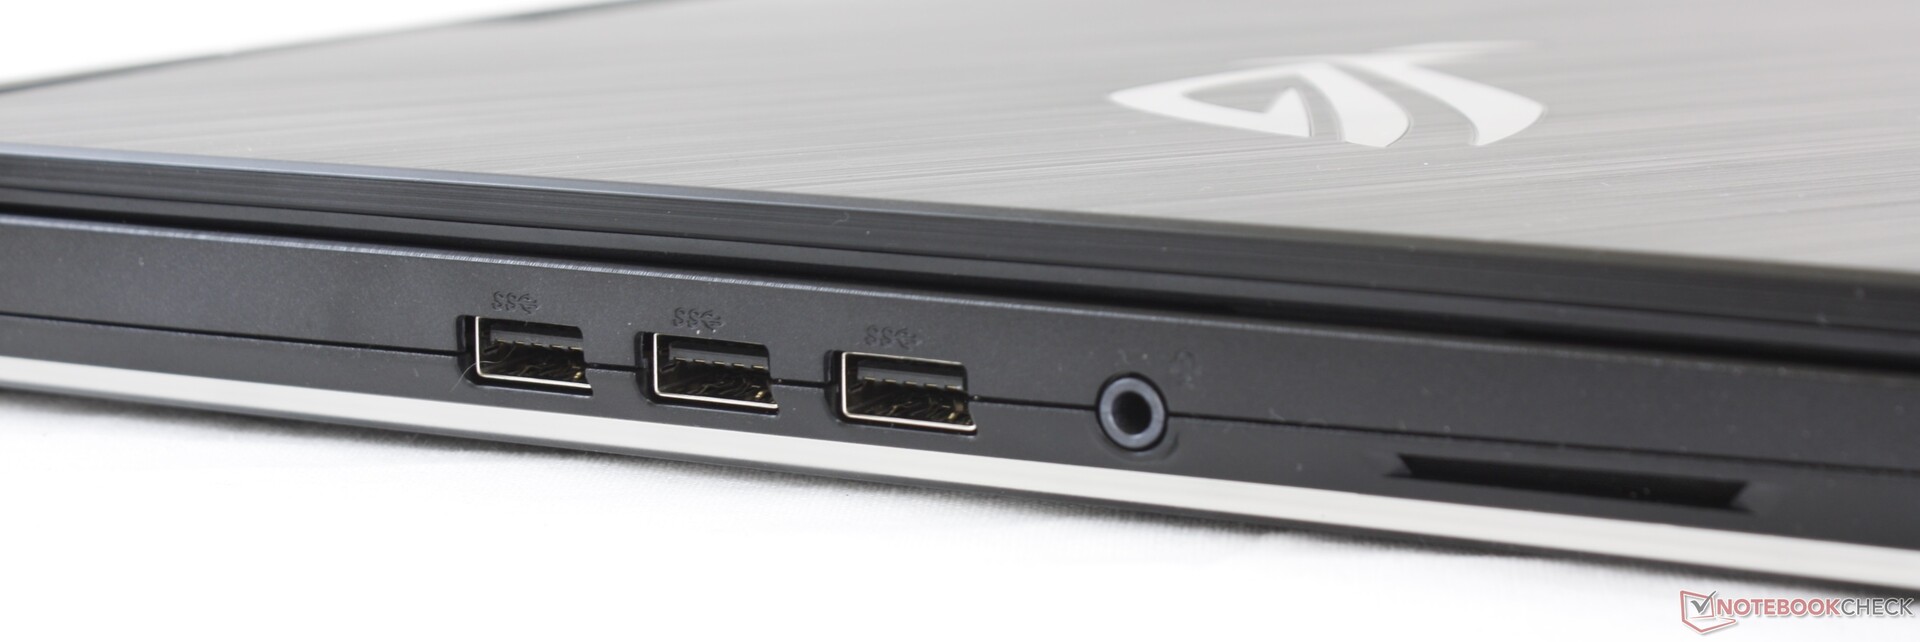
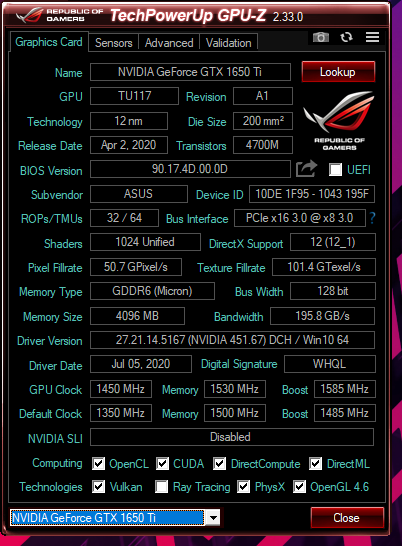
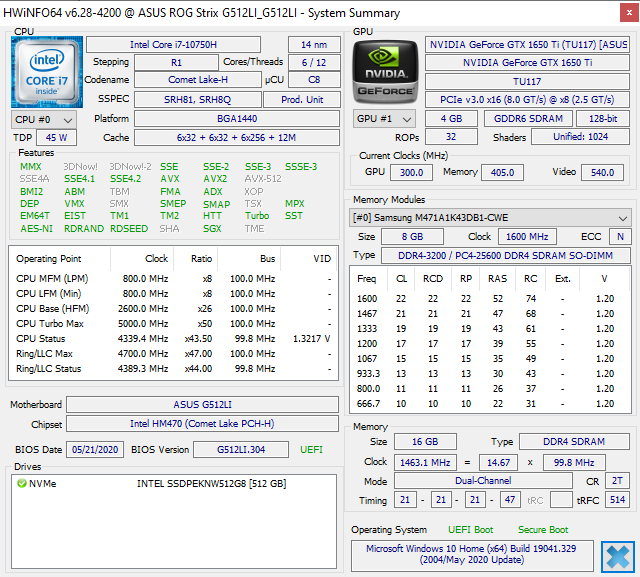
Os recursos que mais se destacam são o suporte para 3 SSDs M.2 2280, a opção de tela de 144 Hz na linha de base e a barra de LEDs nas bordas inferiores do chassi para dar um toque visual. A maioria dos outros portáteis dessa classe de tamanho pode acomodar apenas duas unidades de armazenamento. Caso contrário, o desempenho é um pouco decepcionante para uma máquina de jogos de US$ 1.000, porque os usuários podem obter praticamente o mesmo desempenho gráfico de um portátil GTX 1060 mais antigo e mais barato ou até um desempenho quase 50% mais rápido de sistemas rodando no GTX 1660 Ti, gastando apenas US$ 100 para US$ 200 a mais.
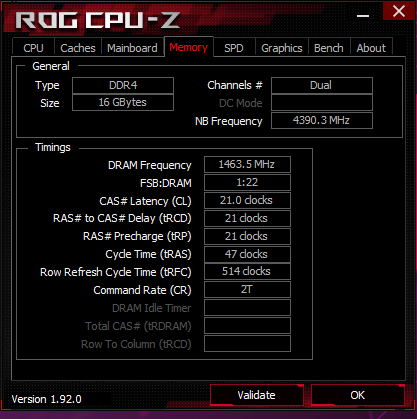
Além disso, a tela de 144 Hz aqui soa bem no papel, mas esse painel Panda em particular tem grandes vantagens, incluindo seu espaço de cores mais limitado, ghosting mais perceptível e baixa relação de contraste. Portanto, a experiência de jogos não é tão fluente ou colorida quanto poderia ter sido, a menos que os usuários estejam dispostos a gastar mais com a opção de 144 Hz.
Por US$ 1.000, o Asus ROG Strix G15 G512LI não oferece uma GPU atraente o suficiente para valer a pena, especialmente agora que os portáteis para jogos com AMD Ryzen estão decolando. Os usuários ficarão mais felizes com o desempenho de um modelo Asus TUF ou alternativa GTX 1660 Ti por esse mesmo preço.
Asus ROG Strix G15 G512LI
- 11/04/2020 v7 (old)
Allen Ngo
Price comparison
