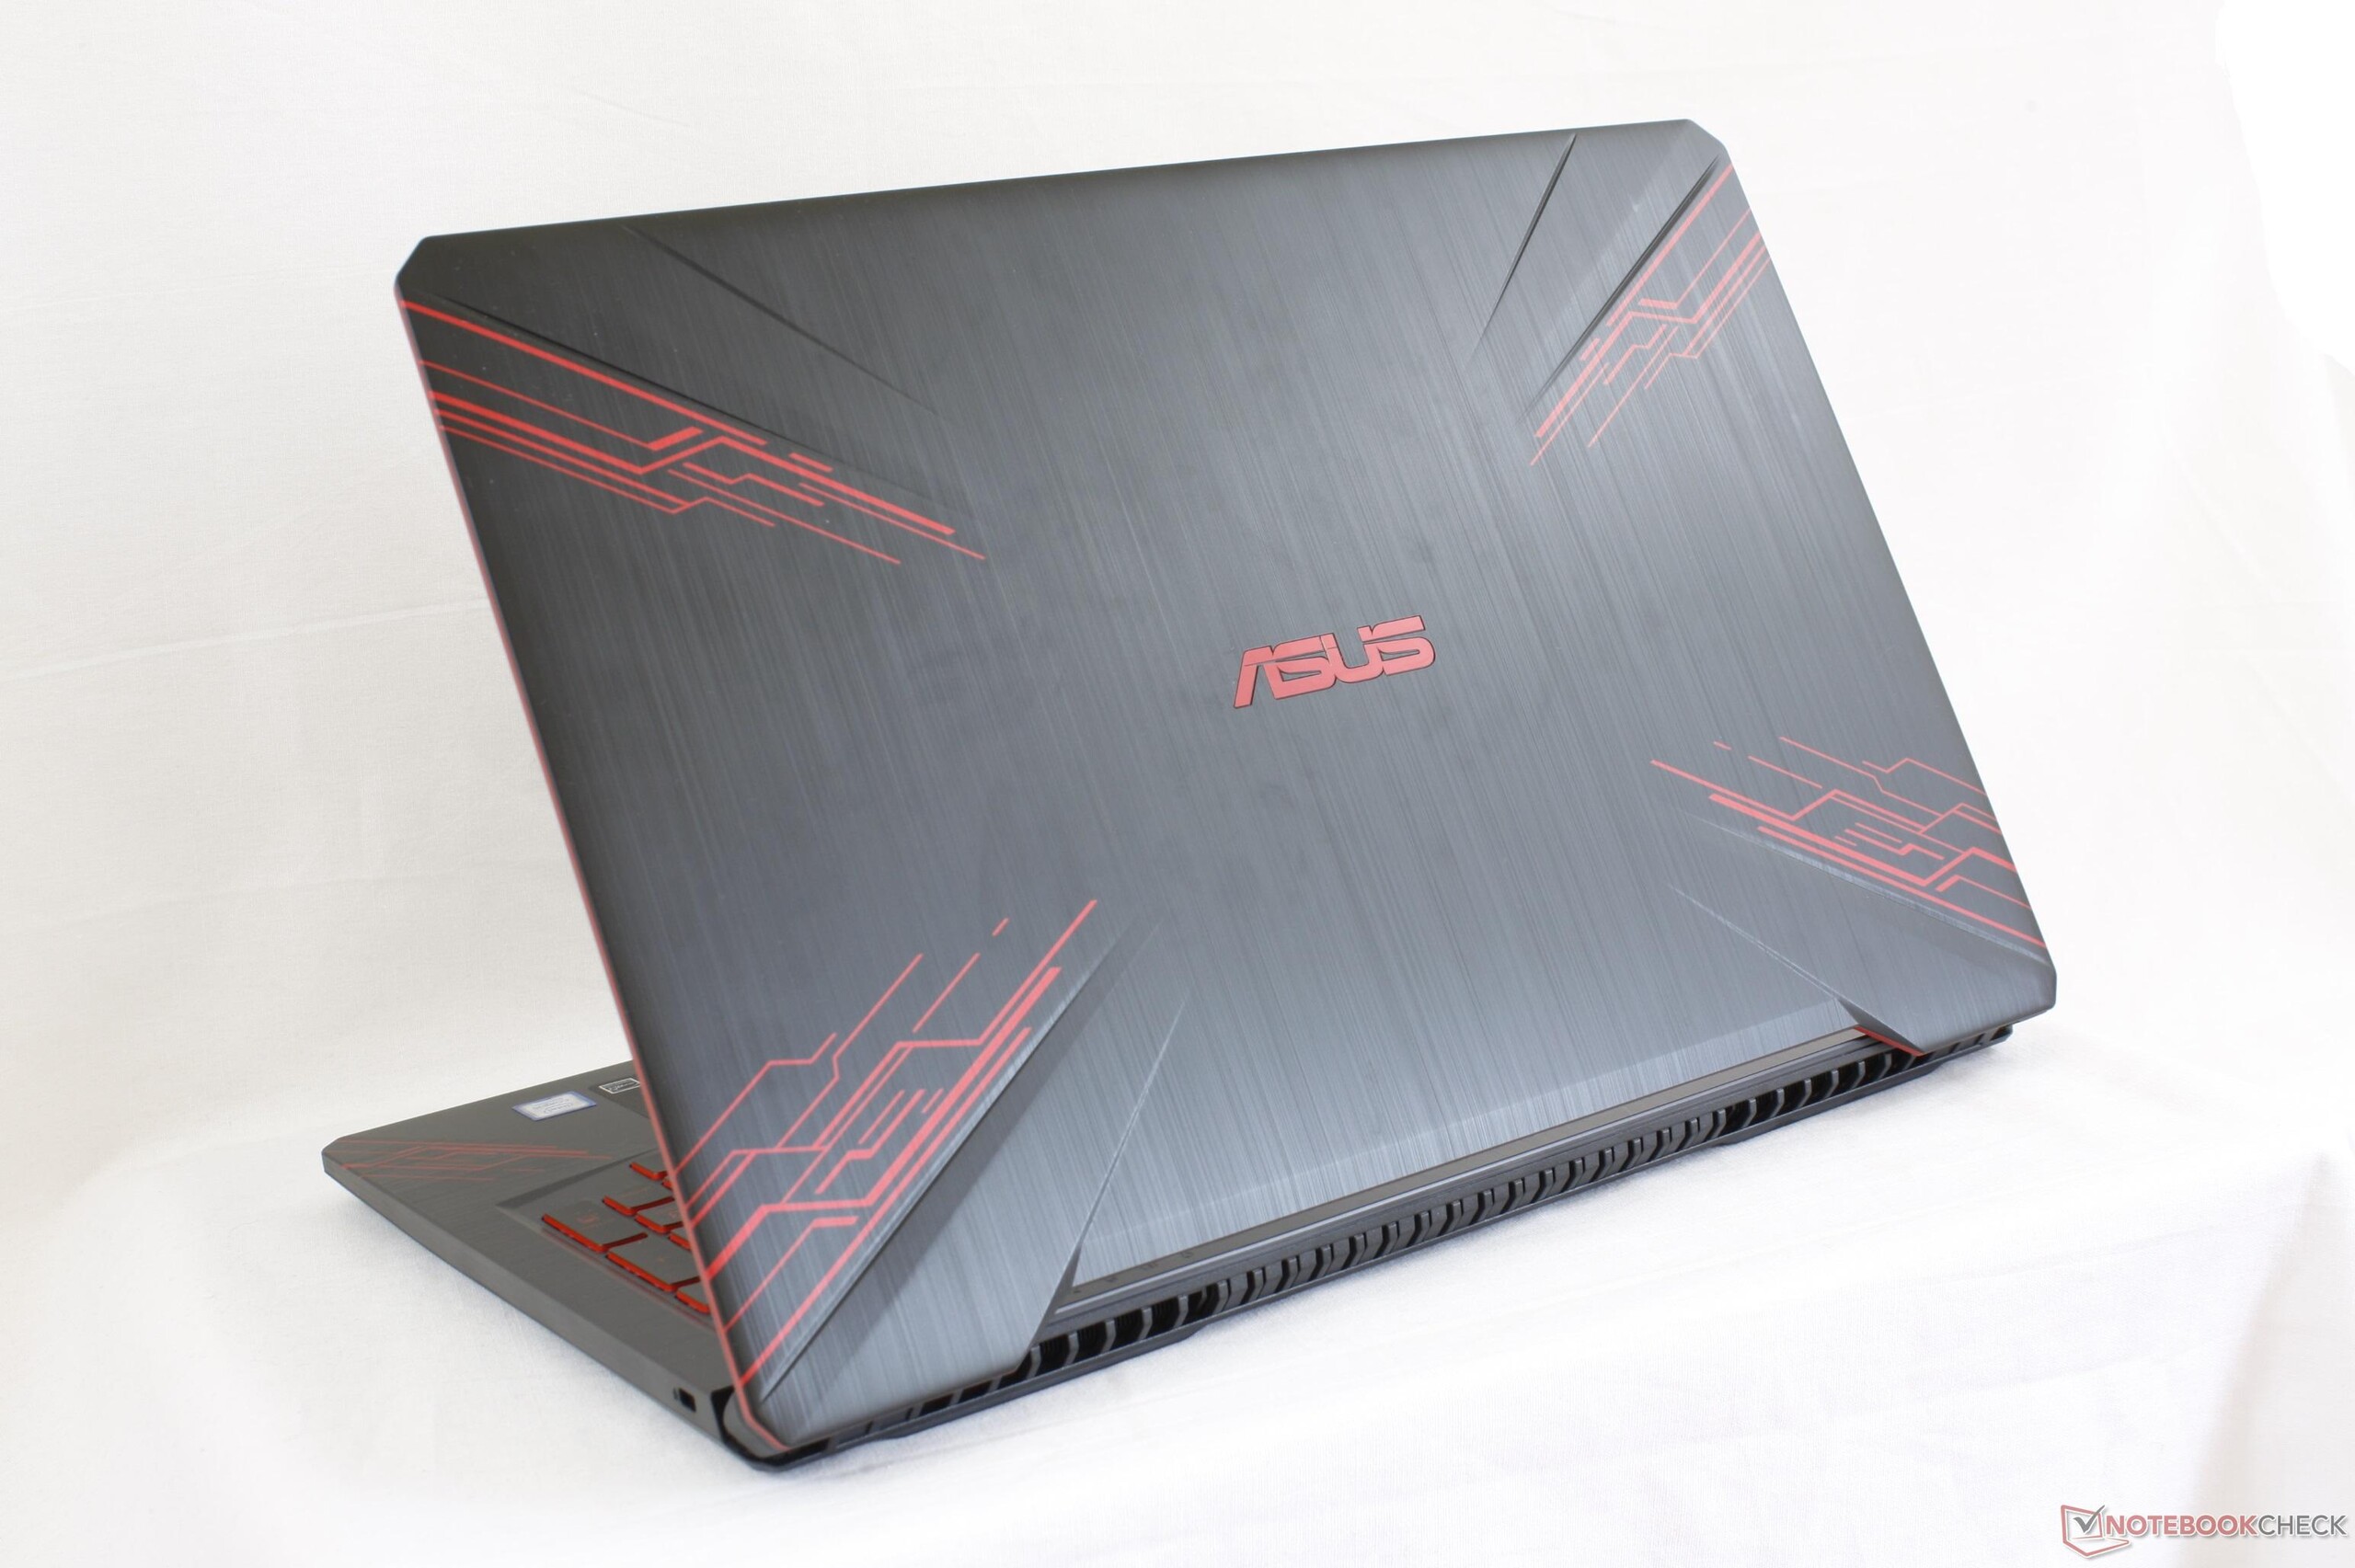
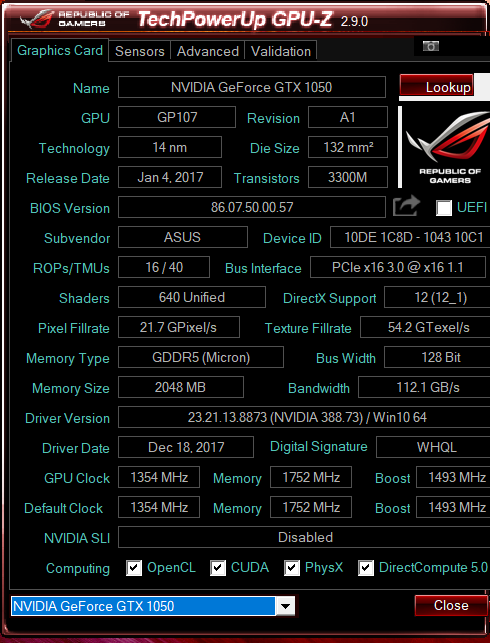
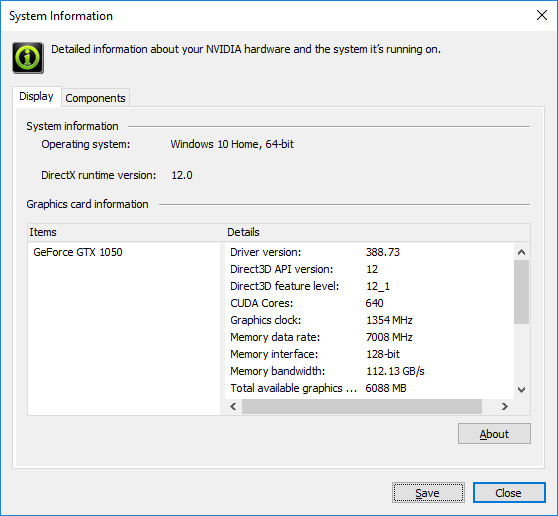
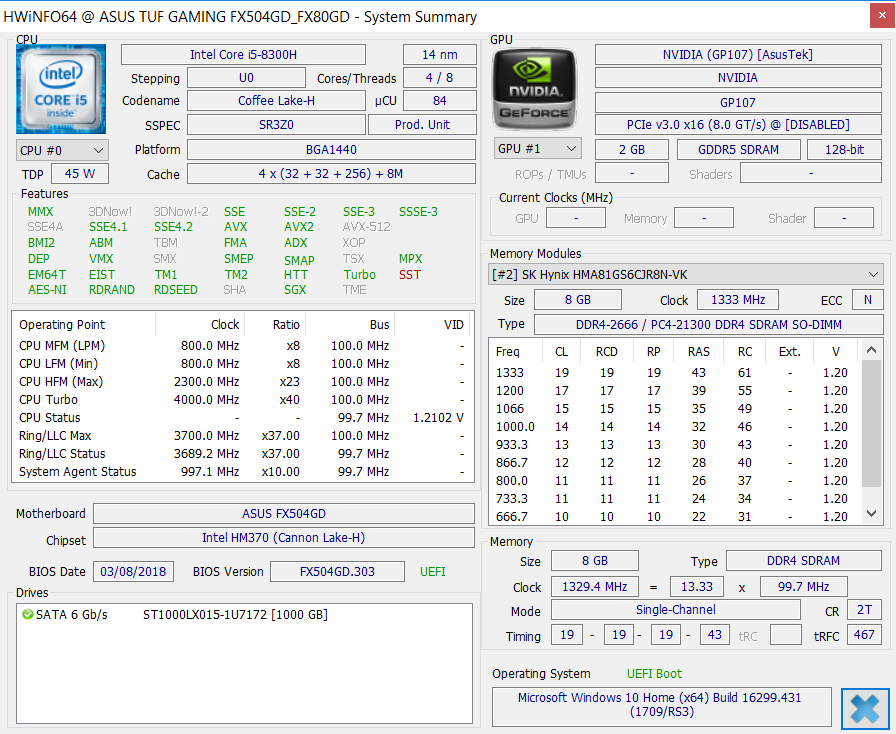
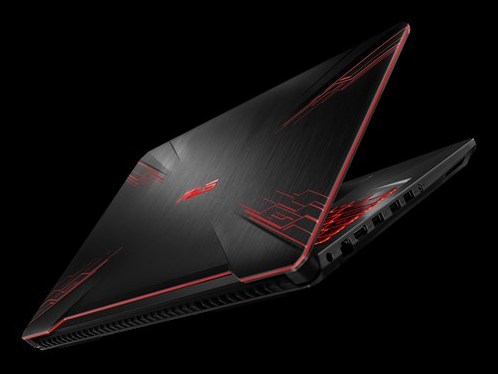
Breve Análise do Portátil Asus TUF FX504GD (Core i5-8300H, GTX 1050)
| Networking | |
| iperf3 transmit AX12 | |
| Asus FX504GD | |
| Asus FX503VM-EH73 | |
| MSI GP62 7REX-1045US | |
| iperf3 receive AX12 | |
| Asus FX504GD | |
| Asus FX503VM-EH73 | |
| MSI GP62 7REX-1045US | |
| |||||||||||||||||||||||||
iluminação: 85 %
iluminação com acumulador: 260 cd/m²
Contraste: 473:1 (Preto: 0.55 cd/m²)
ΔE ColorChecker Calman: 7 | ∀{0.5-29.43 Ø4.71}
calibrated: 5.27
ΔE Greyscale Calman: 6.1 | ∀{0.09-98 Ø4.96}
61% sRGB (Argyll 1.6.3 3D)
35.5% AdobeRGB 1998 (Argyll 1.6.3 3D)
38.34% AdobeRGB 1998 (Argyll 3D)
55.8% sRGB (Argyll 3D)
37.09% Display P3 (Argyll 3D)
Gamma: 1.97
CCT: 7894 K
| Asus FX504GD AU Optronics B156HTN03.8, TN LED, 15.6", 1920x1080 | Lenovo Legion Y520-15IKBN 80WK0042GE LG Philips LP156WF6-SPK3, IPS, 15.6", 1920x1080 | Asus FX503VM-EH73 AU Optronics B156HAN06.1, IPS, 15.6", 1920x1080 | Dell Inspiron 15 7000 7577 ID: LG Philips LGD053F, Name: 156WF6, Dell P/N: 4XK13, IPS, 15.6", 1920x1080 | MSI GP62 7REX-1045US CMN N156HGE-EAL, TN LED, 15.6", 1920x1080 | Gigabyte Aero 15X v8 LGD05C0, IPS, 15.6", 1920x1080 | |
|---|---|---|---|---|---|---|
| Display | 5% | 1% | 9% | 110% | 69% | |
| Display P3 Coverage (%) | 37.09 | 39.01 5% | 37.48 1% | 40.4 9% | 85.8 131% | 63.6 71% |
| sRGB Coverage (%) | 55.8 | 58.4 5% | 56.3 1% | 60.5 8% | 100 79% | 93.8 68% |
| AdobeRGB 1998 Coverage (%) | 38.34 | 40.34 5% | 38.72 1% | 41.77 9% | 84.2 120% | 64.9 69% |
| Response Times | -43% | -48% | -42% | -27% | 43% | |
| Response Time Grey 50% / Grey 80% * (ms) | 41.6 ? | 39 ? 6% | 36.8 ? 12% | 41 ? 1% | 34.4 ? 17% | 16.8 ? 60% |
| Response Time Black / White * (ms) | 15.2 ? | 29 ? -91% | 31.6 ? -108% | 28 ? -84% | 26 ? -71% | 11.2 ? 26% |
| PWM Frequency (Hz) | 21000 ? | 200 ? | ||||
| Screen | 19% | 21% | 39% | 3% | 56% | |
| Brightness middle (cd/m²) | 260 | 283 9% | 235.9 -9% | 257 -1% | 265.7 2% | 313 20% |
| Brightness (cd/m²) | 241 | 281 17% | 235 -2% | 229 -5% | 243 1% | 300 24% |
| Brightness Distribution (%) | 85 | 91 7% | 91 7% | 84 -1% | 87 2% | 78 -8% |
| Black Level * (cd/m²) | 0.55 | 0.39 29% | 0.27 51% | 0.17 69% | 0.63 -15% | 0.33 40% |
| Contrast (:1) | 473 | 726 53% | 874 85% | 1512 220% | 422 -11% | 948 100% |
| Colorchecker dE 2000 * | 7 | 6.1 13% | 4.81 31% | 5.34 24% | 9.6 -37% | 1.29 82% |
| Colorchecker dE 2000 max. * | 22.52 | 11.08 51% | 21.55 4% | 9.99 56% | 18.5 18% | 2.04 91% |
| Colorchecker dE 2000 calibrated * | 5.27 | |||||
| Greyscale dE 2000 * | 6.1 | 5.69 7% | 3.1 49% | 4.82 21% | 12.7 -108% | 0.69 89% |
| Gamma | 1.97 112% | 2.44 90% | 2.31 95% | 2.46 89% | 2.01 109% | 2.43 91% |
| CCT | 7894 82% | 6702 97% | 6984 93% | 6587 99% | 13654 48% | 6550 99% |
| Color Space (Percent of AdobeRGB 1998) (%) | 35.5 | 37 4% | 36 1% | 38 7% | 76 114% | 60 69% |
| Color Space (Percent of sRGB) (%) | 61 | 58 -5% | 56 -8% | 60 -2% | 100 64% | 94 54% |
| Média Total (Programa/Configurações) | -6% /
8% | -9% /
8% | 2% /
22% | 29% /
20% | 56% /
57% |
* ... menor é melhor
Exibir tempos de resposta
| ↔ Tempo de resposta preto para branco | ||
|---|---|---|
| 15.2 ms ... ascensão ↗ e queda ↘ combinadas | ↗ 10 ms ascensão | 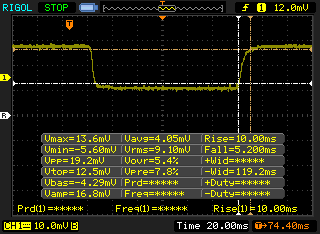 |
| ↘ 5.2 ms queda | ||
| A tela mostra boas taxas de resposta em nossos testes, mas pode ser muito lenta para jogadores competitivos. Em comparação, todos os dispositivos testados variam de 0.1 (mínimo) a 240 (máximo) ms. » 37 % de todos os dispositivos são melhores. Isso significa que o tempo de resposta medido é melhor que a média de todos os dispositivos testados (19.8 ms). | ||
| ↔ Tempo de resposta 50% cinza a 80% cinza | ||
| 41.6 ms ... ascensão ↗ e queda ↘ combinadas | ↗ 19.6 ms ascensão | 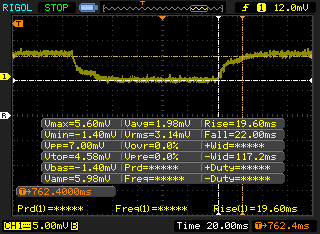 |
| ↘ 22 ms queda | ||
| A tela mostra taxas de resposta lentas em nossos testes e será insatisfatória para os jogadores. Em comparação, todos os dispositivos testados variam de 0.165 (mínimo) a 636 (máximo) ms. » 67 % de todos os dispositivos são melhores. Isso significa que o tempo de resposta medido é pior que a média de todos os dispositivos testados (31 ms). | ||
Cintilação da tela / PWM (modulação por largura de pulso)
| Tela tremeluzindo / PWM não detectado | 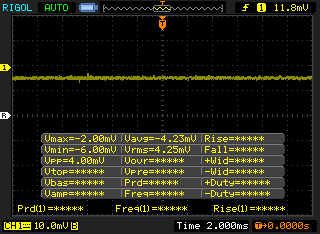 | ||
[pwm_comparison] Em comparação: 52 % de todos os dispositivos testados não usam PWM para escurecer a tela. Se PWM foi detectado, uma média de 7754 (mínimo: 5 - máximo: 343500) Hz foi medida. | |||
| PCMark 10 - Score | |
| Gigabyte Aero 15X v8 | |
| Asus FX503VM-EH73 | |
| MSI GP62 7REX-1045US | |
| Lenovo Legion Y520-15IKBN 80WK0042GE | |
| Asus FX504GD | |
| Dell Inspiron 15 7000 7577 | |
| PCMark 8 Home Score Accelerated v2 | 3909 pontos | |
| PCMark 8 Creative Score Accelerated v2 | 4646 pontos | |
| PCMark 8 Work Score Accelerated v2 | 5018 pontos | |
| PCMark 10 Score | 3808 pontos | |
Ajuda | ||
| Asus FX504GD Seagate Mobile HDD 1TB ST1000LX015-1U7172 | Asus FX503VM-EH73 SanDisk SD8SN8U128G1002 | Dell Inspiron 15 7000 7577 Seagate Mobile HDD 1TB ST1000LX015-1U7172 | MSI GP62 7REX-1045US Toshiba NVMe THNSN5128GP | Gigabyte Aero 15X v8 Toshiba NVMe THNSN5512GPU7 | Média Seagate Mobile HDD 1TB ST1000LX015-1U7172 | |
|---|---|---|---|---|---|---|
| CrystalDiskMark 5.2 / 6 | 17375% | -10% | 38865% | 24087% | 25% | |
| Write 4K (MB/s) | 0.27 | 51.2 18863% | 0.42 56% | 158.4 58567% | 94.4 34863% | 0.4682 ? 73% |
| Read 4K (MB/s) | 0.586 | 24.82 4135% | 0.41 -30% | 45.04 7586% | 37.65 6325% | 0.533 ? -9% |
| Write Seq (MB/s) | 86.8 | 313.1 261% | 55.6 -36% | 622 617% | 1335 1438% | 75.6 ? -13% |
| Read Seq (MB/s) | 113.2 | 458.3 305% | 114.3 1% | 1592 1306% | 1404 1140% | 116.1 ? 3% |
| Write 4K Q32T1 (MB/s) | 0.242 | 208.1 85892% | 0.238 -2% | 434.2 179321% | 268.6 110892% | 0.643 ? 166% |
| Read 4K Q32T1 (MB/s) | 0.963 | 279.3 28903% | 0.942 -2% | 590 61167% | 332.8 34459% | 1.067 ? 11% |
| Write Seq Q32T1 (MB/s) | 98.4 | 337.9 243% | 68.2 -31% | 630 540% | 1375 1297% | 81.9 ? -17% |
| Read Seq Q32T1 (MB/s) | 110.2 | 545 395% | 69.6 -37% | 2108 1813% | 2627 2284% | 97 ? -12% |

| 3DMark 11 Performance | 6971 pontos | |
| 3DMark Ice Storm Standard Score | 128216 pontos | |
| 3DMark Cloud Gate Standard Score | 18404 pontos | |
| 3DMark Fire Strike Score | 5656 pontos | |
| 3DMark Fire Strike Extreme Score | 2702 pontos | |
| 3DMark Time Spy Score | 1729 pontos | |
Ajuda | ||
| BioShock Infinite - 1920x1080 Ultra Preset, DX11 (DDOF) | |
| Alienware 13 R3 (i5-7300HQ, GTX 1050 Ti) | |
| Asus Strix GL502VT-DS74 | |
| Asus GL503VD-DB74 | |
| Dell Inspiron 15 7000 7577 | |
| Asus FX504GD | |
| Asus ZenBook Flip 15 UX561UD | |
| Huawei Matebook X Pro i5 | |
| baixo | média | alto | ultra | |
|---|---|---|---|---|
| BioShock Infinite (2013) | 192.7 | 167.8 | 151.5 | 63 |
| The Witcher 3 (2015) | 119.9 | 72.2 | 40.9 | 22.2 |
| Rise of the Tomb Raider (2016) | 85.9 | 71.8 | 38.2 | 31.9 |
Barulho
| Ocioso |
| 29 / 29.2 / 29.7 dB |
| Carga |
| 44.3 / 47.7 dB |
 | ||
30 dB silencioso 40 dB(A) audível 50 dB(A) ruidosamente alto |
||
min: | ||
| Asus FX504GD GeForce GTX 1050 Mobile, i5-8300H, Seagate Mobile HDD 1TB ST1000LX015-1U7172 | Lenovo Legion Y520-15IKBN 80WK0042GE GeForce GTX 1050 Ti Mobile, i5-7300HQ, Samsung PM961 NVMe MZVLW128HEGR | Asus FX503VM-EH73 GeForce GTX 1060 Mobile, i7-7700HQ, SanDisk SD8SN8U128G1002 | Dell Inspiron 15 7000 7577 GeForce GTX 1050 Mobile, i5-7300HQ, Seagate Mobile HDD 1TB ST1000LX015-1U7172 | MSI GP62 7REX-1045US GeForce GTX 1050 Ti Mobile, i7-7700HQ, Toshiba NVMe THNSN5128GP | Gigabyte Aero 15X v8 GeForce GTX 1070 Max-Q, i7-8750H, Toshiba NVMe THNSN5512GPU7 | |
|---|---|---|---|---|---|---|
| Noise | 0% | -3% | -3% | -5% | -11% | |
| desligado / ambiente * (dB) | 28.1 | 30.6 -9% | 27.8 1% | 31 -10% | 28 -0% | 29 -3% |
| Idle Minimum * (dB) | 29 | 31.9 -10% | 29.6 -2% | 32.7 -13% | 32.2 -11% | 30 -3% |
| Idle Average * (dB) | 29.2 | 31.9 -9% | 29.6 -1% | 32.7 -12% | 32.2 -10% | 31 -6% |
| Idle Maximum * (dB) | 29.7 | 31.9 -7% | 29.6 -0% | 32.7 -10% | 32.2 -8% | 35 -18% |
| Load Average * (dB) | 44.3 | 34.6 22% | 37.3 16% | 38.7 13% | 40.9 8% | 49 -11% |
| Witcher 3 ultra * (dB) | 40.7 | 39.3 3% | 49.8 -22% | 39 4% | 45.4 -12% | 51 -25% |
| Load Maximum * (dB) | 47.7 | 41.7 13% | 53.7 -13% | 44.6 6% | 48.6 -2% | 54 -13% |
* ... menor é melhor
(-) A temperatura máxima no lado superior é 55.8 °C / 132 F, em comparação com a média de 40.4 °C / 105 F , variando de 21.2 a 68.8 °C para a classe Gaming.
(-) A parte inferior aquece até um máximo de 51.4 °C / 125 F, em comparação com a média de 43.2 °C / 110 F
(+) Em uso inativo, a temperatura média para o lado superior é 25.3 °C / 78 F, em comparação com a média do dispositivo de 33.9 °C / ### class_avg_f### F.
(±) Jogando The Witcher 3, a temperatura média para o lado superior é 37.3 °C / 99 F, em comparação com a média do dispositivo de 33.9 °C / ## #class_avg_f### F.
(+) Os apoios para as mãos e o touchpad estão atingindo a temperatura máxima da pele (32.4 °C / 90.3 F) e, portanto, não estão quentes.
(-) A temperatura média da área do apoio para as mãos de dispositivos semelhantes foi 28.8 °C / 83.8 F (-3.6 °C / -6.5 F).
Asus FX504GD análise de áudio
(-) | alto-falantes não muito altos (###valor### dB)
Graves 100 - 315Hz
(-) | quase nenhum baixo - em média 17.6% menor que a mediana
(±) | a linearidade dos graves é média (10.9% delta para a frequência anterior)
Médios 400 - 2.000 Hz
(+) | médios equilibrados - apenas 3.9% longe da mediana
(±) | a linearidade dos médios é média (7.7% delta para frequência anterior)
Altos 2 - 16 kHz
(±) | máximos mais altos - em média 5.3% maior que a mediana
(±) | a linearidade dos máximos é média (9.8% delta para frequência anterior)
Geral 100 - 16.000 Hz
(±) | a linearidade do som geral é média (25% diferença em relação à mediana)
Comparado com a mesma classe
» 90% de todos os dispositivos testados nesta classe foram melhores, 3% semelhantes, 7% piores
» O melhor teve um delta de 6%, a média foi 18%, o pior foi 132%
Comparado com todos os dispositivos testados
» 76% de todos os dispositivos testados foram melhores, 5% semelhantes, 19% piores
» O melhor teve um delta de 4%, a média foi 23%, o pior foi 134%
Apple MacBook 12 (Early 2016) 1.1 GHz análise de áudio
(+) | os alto-falantes podem tocar relativamente alto (###valor### dB)
Graves 100 - 315Hz
(±) | graves reduzidos - em média 11.3% menor que a mediana
(±) | a linearidade dos graves é média (14.2% delta para a frequência anterior)
Médios 400 - 2.000 Hz
(+) | médios equilibrados - apenas 2.4% longe da mediana
(+) | médios são lineares (5.5% delta para frequência anterior)
Altos 2 - 16 kHz
(+) | agudos equilibrados - apenas 2% longe da mediana
(+) | os máximos são lineares (4.5% delta da frequência anterior)
Geral 100 - 16.000 Hz
(+) | o som geral é linear (10.2% diferença em relação à mediana)
Comparado com a mesma classe
» 7% de todos os dispositivos testados nesta classe foram melhores, 2% semelhantes, 90% piores
» O melhor teve um delta de 5%, a média foi 18%, o pior foi 53%
Comparado com todos os dispositivos testados
» 5% de todos os dispositivos testados foram melhores, 1% semelhantes, 94% piores
» O melhor teve um delta de 4%, a média foi 23%, o pior foi 134%
| desligado | |
| Ocioso | |
| Carga |
|
Key:
min: | |
| Asus FX504GD i5-8300H, GeForce GTX 1050 Mobile, Seagate Mobile HDD 1TB ST1000LX015-1U7172, TN LED, 1920x1080, 15.6" | Lenovo Legion Y520-15IKBN 80WK0042GE i5-7300HQ, GeForce GTX 1050 Ti Mobile, Samsung PM961 NVMe MZVLW128HEGR, IPS, 1920x1080, 15.6" | Asus FX503VM-EH73 i7-7700HQ, GeForce GTX 1060 Mobile, SanDisk SD8SN8U128G1002, IPS, 1920x1080, 15.6" | MSI GP62 7REX-1045US i7-7700HQ, GeForce GTX 1050 Ti Mobile, Toshiba NVMe THNSN5128GP, TN LED, 1920x1080, 15.6" | Gigabyte Aero 15X v8 i7-8750H, GeForce GTX 1070 Max-Q, Toshiba NVMe THNSN5512GPU7, IPS, 1920x1080, 15.6" | Dell Inspiron 15 7000 7577 4K i7-7700HQ, GeForce GTX 1060 Max-Q, SK hynix SC311 M.2, IPS, 3840x2160, 15.6" | |
|---|---|---|---|---|---|---|
| Power Consumption | 15% | -35% | -44% | -65% | 3% | |
| Idle Minimum * (Watt) | 7.2 | 5.2 28% | 12.8 -78% | 14.6 -103% | 14 -94% | 5.5 24% |
| Idle Average * (Watt) | 10.2 | 8.3 19% | 15.4 -51% | 17.2 -69% | 18 -76% | 10.5 -3% |
| Idle Maximum * (Watt) | 10.9 | 10.1 7% | 15.9 -46% | 17.3 -59% | 22 -102% | 10.9 -0% |
| Load Average * (Watt) | 93.3 | 62.7 33% | 78 16% | 82.7 11% | 91 2% | 72 23% |
| Witcher 3 ultra * (Watt) | 95.8 | 94 2% | 107.3 -12% | 107 -12% | 142 -48% | 97.4 -2% |
| Load Maximum * (Watt) | 102.5 | 100 2% | 143.4 -40% | 136.7 -33% | 173 -69% | 130.4 -27% |
* ... menor é melhor
| Asus FX504GD i5-8300H, GeForce GTX 1050 Mobile, 48 Wh | Lenovo Legion Y520-15IKBN 80WK0042GE i5-7300HQ, GeForce GTX 1050 Ti Mobile, 45 Wh | Asus FX503VM-EH73 i7-7700HQ, GeForce GTX 1060 Mobile, 64 Wh | Dell Inspiron 15 7000 7577 i5-7300HQ, GeForce GTX 1050 Mobile, 56 Wh | MSI GP62 7REX-1045US i7-7700HQ, GeForce GTX 1050 Ti Mobile, 41 Wh | Gigabyte Aero 15X v8 i7-8750H, GeForce GTX 1070 Max-Q, 94.24 Wh | |
|---|---|---|---|---|---|---|
| Duração da bateria | 46% | 7% | 77% | -29% | 130% | |
| Reader / Idle (h) | 7.5 | 10.6 41% | 5.7 -24% | 11.1 48% | 4.3 -43% | 12.7 69% |
| WiFi v1.3 (h) | 3.7 | 5.2 41% | 4.6 24% | 6.8 84% | 2.9 -22% | 8.6 132% |
| Load (h) | 0.9 | 1.4 56% | 1.1 22% | 1.8 100% | 0.7 -22% | 2.6 189% |
Pro
Contra
Recebemos gratamente portáteis de jogos mais baratos e acessíveis, desde que preservem os recursos principais e ofereçam uma experiência equilibrada. Muitos recortes podem fazer com que as desvantagens se tornem uma distração. Por $700 USD, o FX504 sacrifica qualidade da tela e não inclui SSD para uma experiência geral mais pobre. É melhor os usuários investirem de $100 a $200 a mais em um pequeno SSD primário e em uma tela IPS de qualidade.
Os portáteis de jogos existentes com sistemas i5-7300HQ ou i7-7700HQ não precisam se atualizar para o i5-8300H se os jogos forem uma prioridade. Em vez disso, investir em um sistema com o antigo i7-7700HQ e GTX 1060 seria tremendamente mais frutífero do que um sistema com o mais recente i5-8300H e GTX 1050 ou 1050 Ti.
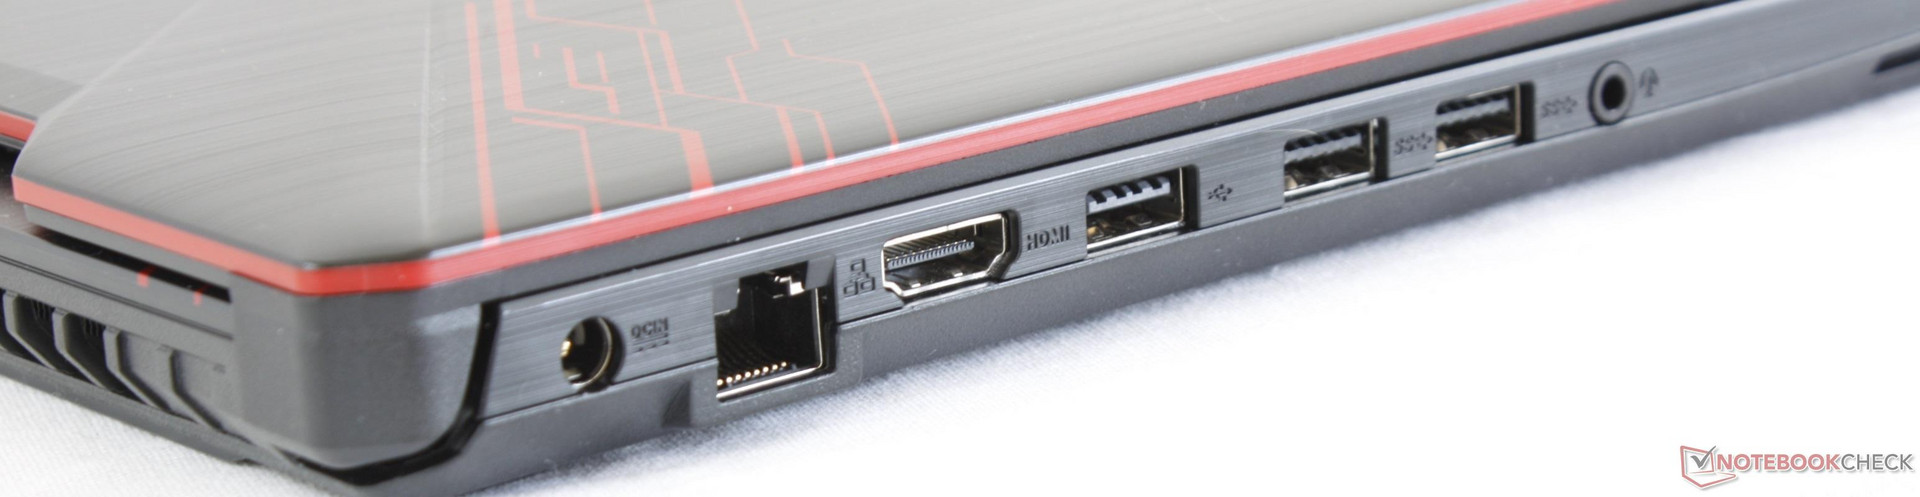
O FX504 falha quando comparado a outros sistemas de jogos econômicos. Alternativas como o Legion Y520, Sabre 15, e Inspiron 7577 têm maior duração de bateria e mais recursos de portas, incluindo USB tipo C e leitores de cartões SD. Os jogadores em um orçamento podem querer considerar o FX503 em vez do FX504, já que o primeiro é essencialmente o mesmo sistema, mas com maior facilidade de manutenção, duração mais longa da bateria e opções de CPU e GPU mais balanceadas.
O FX504GD é um dos portáteis de jogos mais baratos disponíveis com a GTX 1050. No entanto, recomendamos que você gaste um pouco mais nos SKUs mais avançados com opções IPS e SSD ou até mesmo com o velho FX503 com processador Intel GTX 1060 por aproximadamente o mesmo preço.
Asus FX504GD
- 05/24/2018 v6 (old)
Allen Ngo
Price comparison
