Breve Análise do Portátil HP 15-bw075ax (A12-9720P, Radeon R7)
| SD Card Reader | |
| average JPG Copy Test (av. of 3 runs) | |
| Lenovo Yoga 510-14AST | |
| HP Pavilion 15-aw004ng W8Y60EA | |
| Lenovo B50-10 80QR0013GE | |
| HP 15-bw075ax | |
| HP 15-bw077ax | |
| Asus X555DA-BB11 | |
| maximum AS SSD Seq Read Test (1GB) | |
| Lenovo B50-10 80QR0013GE | |
| Lenovo Yoga 510-14AST | |
| HP Pavilion 15-aw004ng W8Y60EA | |
| HP 15-bw077ax | |
| HP 15-bw075ax | |
| Asus X555DA-BB11 | |
| Networking | |
| iperf3 transmit AX12 | |
| HP 15-bw075ax | |
| HP 15-bw077ax | |
| Lenovo Yoga 510-14AST | |
| Asus X555DA-BB11 | |
| iperf3 receive AX12 | |
| HP 15-bw075ax | |
| HP 15-bw077ax | |
| Asus X555DA-BB11 | |
| Lenovo Yoga 510-14AST | |
| |||||||||||||||||||||||||
iluminação: 81 %
iluminação com acumulador: 212.9 cd/m²
Contraste: 760:1 (Preto: 0.28 cd/m²)
ΔE ColorChecker Calman: 10.1 | ∀{0.5-29.43 Ø4.72}
ΔE Greyscale Calman: 12 | ∀{0.09-98 Ø4.97}
58% sRGB (Argyll 1.6.3 3D)
37% AdobeRGB 1998 (Argyll 1.6.3 3D)
39.34% AdobeRGB 1998 (Argyll 3D)
57.3% sRGB (Argyll 3D)
38.07% Display P3 (Argyll 3D)
Gamma: 2.16
CCT: 12551 K
| HP 15-bw075ax BOE06A4, TN LED, 15.6", 1366x768 | HP 15-bw077ax BOE BOE06A4, TN LED, 15.6", 1366x768 | Asus X555DA-BB11 TN LED, 15.6", 1920x1080 | Lenovo B50-10 80QR0013GE Chi Mei N156BGE-EA2, TN LED, 15.6", 1366x768 | Lenovo Yoga 510-14AST AU Optronics B140XTN02.E, TN LED, 14", 1366x768 | HP Pavilion 15-aw004ng W8Y60EA Chi Mei, TN LED, 15.6", 1920x1080 | |
|---|---|---|---|---|---|---|
| Display | -8% | 6% | -10% | 6% | ||
| Display P3 Coverage (%) | 38.07 | 35.12 -8% | 40.21 6% | 34.15 -10% | 40.35 6% | |
| sRGB Coverage (%) | 57.3 | 52.7 -8% | 60.1 5% | 51.4 -10% | 60.3 5% | |
| AdobeRGB 1998 Coverage (%) | 39.34 | 36.29 -8% | 41.56 6% | 35.28 -10% | 41.71 6% | |
| Response Times | 9% | 9% | 30% | -37% | 9% | |
| Response Time Grey 50% / Grey 80% * (ms) | 42 ? | 42.4 ? -1% | 42 ? -0% | 28 ? 33% | 70 ? -67% | 41 ? 2% |
| Response Time Black / White * (ms) | 27.2 ? | 22.4 ? 18% | 22.4 ? 18% | 20 ? 26% | 29 ? -7% | 23 ? 15% |
| PWM Frequency (Hz) | 198.4 ? | 198.4 ? | 200 ? | |||
| Screen | -3% | 3% | 2% | -19% | -6% | |
| Brightness middle (cd/m²) | 212.9 | 194.1 -9% | 242.7 14% | 245 15% | 242 14% | 240 13% |
| Brightness (cd/m²) | 206 | 192 -7% | 232 13% | 230 12% | 224 9% | 228 11% |
| Brightness Distribution (%) | 81 | 73 -10% | 88 9% | 84 4% | 88 9% | 89 10% |
| Black Level * (cd/m²) | 0.28 | 0.27 4% | 0.52 -86% | 0.46 -64% | 0.62 -121% | 0.49 -75% |
| Contrast (:1) | 760 | 719 -5% | 467 -39% | 533 -30% | 390 -49% | 490 -36% |
| Colorchecker dE 2000 * | 10.1 | 9.9 2% | 4.9 51% | 8.34 17% | 13.03 -29% | 10.96 -9% |
| Colorchecker dE 2000 max. * | 22.3 | 23.4 -5% | 20.3 9% | 12.31 45% | 18.79 16% | 18.36 18% |
| Greyscale dE 2000 * | 12 | 11.6 3% | 2.7 77% | 9.48 21% | 14.6 -22% | 11.34 5% |
| Gamma | 2.16 102% | 2.16 102% | 2.34 94% | 2.38 92% | 2.22 99% | 2.27 97% |
| CCT | 12551 52% | 11981 54% | 6876 95% | 10624 61% | 18869 34% | 12292 53% |
| Color Space (Percent of AdobeRGB 1998) (%) | 37 | 37 0% | 33.5 -9% | 38 3% | 33 -11% | 39 5% |
| Color Space (Percent of sRGB) (%) | 58 | 58 0% | 52.5 -9% | 57 -2% | 52 -10% | 60 3% |
| Média Total (Programa/Configurações) | 3% /
-1% | 1% /
2% | 13% /
6% | -22% /
-20% | 3% /
-1% |
* ... menor é melhor
Exibir tempos de resposta
| ↔ Tempo de resposta preto para branco | ||
|---|---|---|
| 27.2 ms ... ascensão ↗ e queda ↘ combinadas | ↗ 22 ms ascensão | 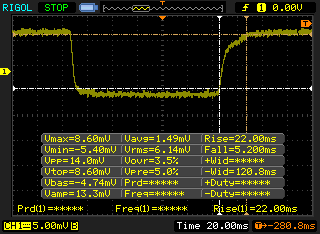 |
| ↘ 5.2 ms queda | ||
| A tela mostra taxas de resposta relativamente lentas em nossos testes e pode ser muito lenta para os jogadores. Em comparação, todos os dispositivos testados variam de 0.1 (mínimo) a 240 (máximo) ms. » 69 % de todos os dispositivos são melhores. Isso significa que o tempo de resposta medido é pior que a média de todos os dispositivos testados (19.8 ms). | ||
| ↔ Tempo de resposta 50% cinza a 80% cinza | ||
| 42 ms ... ascensão ↗ e queda ↘ combinadas | ↗ 20.8 ms ascensão | 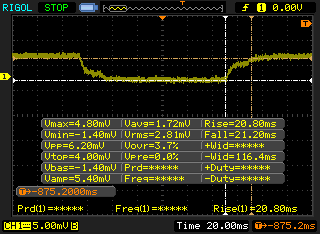 |
| ↘ 21.2 ms queda | ||
| A tela mostra taxas de resposta lentas em nossos testes e será insatisfatória para os jogadores. Em comparação, todos os dispositivos testados variam de 0.165 (mínimo) a 636 (máximo) ms. » 67 % de todos os dispositivos são melhores. Isso significa que o tempo de resposta medido é pior que a média de todos os dispositivos testados (31 ms). | ||
Cintilação da tela / PWM (modulação por largura de pulso)
| Tela tremeluzindo/PWM detectado | 198.4 Hz | ≤ 99 % configuração de brilho | 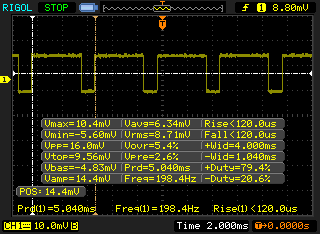 |
A luz de fundo da tela pisca em 198.4 Hz (pior caso, por exemplo, utilizando PWM) Cintilação detectada em uma configuração de brilho de 99 % e abaixo. Não deve haver cintilação ou PWM acima desta configuração de brilho. A frequência de 198.4 Hz é relativamente baixa, portanto, usuários sensíveis provavelmente notarão cintilação e sentirão fadiga ocular na configuração de brilho indicada e abaixo. [pwm_comparison] Em comparação: 52 % de todos os dispositivos testados não usam PWM para escurecer a tela. Se PWM foi detectado, uma média de 7781 (mínimo: 5 - máximo: 343500) Hz foi medida. | |||

| Cinebench R15 | |
| CPU Single 64Bit | |
| Dell Latitude 5580 | |
| Lenovo ThinkPad L570 20J80020PB | |
| Acer TravelMate P249-M-5452 | |
| Acer Spin 5 SP513-51 | |
| Lenovo Thinkpad 13-20J1001BUS | |
| HP 15-bw075ax | |
| HP Pavilion 15-aw004ng W8Y60EA | |
| HP 15-bw077ax | |
| Asus X555DA-BB11 | |
| Lenovo Yoga 510-14AST | |
| Lenovo B50-10 80QR0013GE | |
| CPU Multi 64Bit | |
| Dell Latitude 5580 | |
| Lenovo ThinkPad L570 20J80020PB | |
| Acer TravelMate P249-M-5452 | |
| Lenovo Thinkpad 13-20J1001BUS | |
| Acer Spin 5 SP513-51 | |
| HP 15-bw075ax | |
| HP Pavilion 15-aw004ng W8Y60EA | |
| Asus X555DA-BB11 | |
| Lenovo B50-10 80QR0013GE | |
| Lenovo Yoga 510-14AST | |
| HP 15-bw077ax | |
| wPrime 2.10 - 1024m | |
| Lenovo Yoga 510-14AST | |
| HP 15-bw077ax | |
| Lenovo Thinkpad 13-20J1001BUS | |
| Lenovo ThinkPad L570 20J80020PB | |
| Asus X555DA-BB11 | |
* ... menor é melhor
| PCMark 8 | |
| Home Score Accelerated v2 | |
| HP Pavilion 15-aw004ng W8Y60EA | |
| HP 15-bw075ax | |
| Lenovo Yoga 510-14AST | |
| Asus X555DA-BB11 | |
| HP 15-bw077ax | |
| Lenovo B50-10 80QR0013GE | |
| Work Score Accelerated v2 | |
| HP Pavilion 15-aw004ng W8Y60EA | |
| Lenovo Yoga 510-14AST | |
| Asus X555DA-BB11 | |
| HP 15-bw077ax | |
| HP 15-bw075ax | |
| Lenovo B50-10 80QR0013GE | |
| Creative Score Accelerated v2 | |
| HP Pavilion 15-aw004ng W8Y60EA | |
| HP 15-bw075ax | |
| Lenovo Yoga 510-14AST | |
| Asus X555DA-BB11 | |
| HP 15-bw077ax | |
| Lenovo B50-10 80QR0013GE | |
| PCMark 8 Home Score Accelerated v2 | 2722 pontos | |
| PCMark 8 Creative Score Accelerated v2 | 3111 pontos | |
| PCMark 8 Work Score Accelerated v2 | 2891 pontos | |
Ajuda | ||
| HP 15-bw075ax WDC Scorpio Blue WD10JPVX-60JC3T1 | HP 15-bw077ax WDC Scorpio Blue WD10JPVX-60JC3T1 | Asus X555DA-BB11 Seagate Momentus SpinPoint M8 ST1000LM024 HN-M101MBB | Lenovo B50-10 80QR0013GE Seagate Momentus Thin ST500LT012-1DG142 | Lenovo Yoga 510-14AST | HP Pavilion 15-aw004ng W8Y60EA | |
|---|---|---|---|---|---|---|
| CrystalDiskMark 3.0 | 27% | 22% | 24% | 8206% | 6190% | |
| Read Seq (MB/s) | 63.3 | 91.3 44% | 106.9 69% | 103.5 64% | 434.6 587% | 503 695% |
| Write Seq (MB/s) | 62.2 | 90.2 45% | 97.5 57% | 91.1 46% | 207.7 234% | 316.6 409% |
| Read 512 (MB/s) | 22.96 | 29.02 26% | 32.28 41% | 33.74 47% | 356.3 1452% | 261.9 1041% |
| Write 512 (MB/s) | 32.08 | 39.51 23% | 35.39 10% | 38.77 21% | 195.6 510% | 281.2 777% |
| Read 4k (MB/s) | 0.29 | 0.34 17% | 0.373 29% | 0.374 29% | 26.71 9110% | 17.04 5776% |
| Write 4k (MB/s) | 0.79 | 0.94 19% | 0.636 -19% | 0.649 -18% | 56.8 7090% | 46.55 5792% |
| Read 4k QD32 (MB/s) | 0.68 | 0.83 22% | 0.694 2% | 0.818 20% | 176.3 25826% | 125 18282% |
| Write 4k QD32 (MB/s) | 0.78 | 0.96 23% | 0.682 -13% | 0.648 -17% | 163.3 20836% | 131.4 16746% |

| 3DMark | |
| 1280x720 Cloud Gate Standard Graphics | |
| HP Pavilion 15-aw004ng W8Y60EA | |
| Lenovo Yoga 510-14AST | |
| Asus X555DA-BB11 | |
| HP 15-bw077ax | |
| HP 15-bw075ax | |
| Lenovo B50-10 80QR0013GE | |
| 1920x1080 Fire Strike Graphics | |
| HP Pavilion 15-aw004ng W8Y60EA | |
| Lenovo Yoga 510-14AST | |
| Asus X555DA-BB11 | |
| HP 15-bw075ax | |
| HP 15-bw077ax | |
| 1920x1080 Ice Storm Extreme Graphics | |
| HP Pavilion 15-aw004ng W8Y60EA | |
| Lenovo Yoga 510-14AST | |
| Asus X555DA-BB11 | |
| 3DMark Cloud Gate Standard Score | 3162 pontos | |
| 3DMark Fire Strike Score | 667 pontos | |
Ajuda | ||
| BioShock Infinite | |
| 1280x720 Very Low Preset (classificar por valor) | |
| HP 15-bw075ax | |
| HP 15-bw077ax | |
| Asus X555DA-BB11 | |
| Lenovo B50-10 80QR0013GE | |
| Lenovo Yoga 510-14AST | |
| HP Pavilion 15-aw004ng W8Y60EA | |
| Lenovo ThinkPad L570 20J80020PB | |
| Dell Latitude 5580 | |
| Lenovo Thinkpad 13-20J1001BUS | |
| Acer Spin 5 SP513-51 | |
| Acer TravelMate P249-M-5452 | |
| 1366x768 Medium Preset (classificar por valor) | |
| HP 15-bw075ax | |
| HP 15-bw077ax | |
| Lenovo B50-10 80QR0013GE | |
| Lenovo Yoga 510-14AST | |
| HP Pavilion 15-aw004ng W8Y60EA | |
| Lenovo ThinkPad L570 20J80020PB | |
| Dell Latitude 5580 | |
| Lenovo Thinkpad 13-20J1001BUS | |
| Acer Spin 5 SP513-51 | |
| Acer TravelMate P249-M-5452 | |
| Alien: Isolation | |
| 1024x768 (Very) Low, Off, Shadow Map 512 AF:1x (classificar por valor) | |
| HP 15-bw075ax | |
| HP 15-bw077ax | |
| HP Pavilion 15-aw004ng W8Y60EA | |
| 1366x768 Medium, On (AA & SSAO Off), Shadow Map 1024 AF:4x (classificar por valor) | |
| HP 15-bw075ax | |
| HP 15-bw077ax | |
| HP Pavilion 15-aw004ng W8Y60EA | |
| Metro: Last Light | |
| 1024x768 Low (DX10) AF:4x (classificar por valor) | |
| HP 15-bw075ax | |
| HP 15-bw077ax | |
| 1366x768 Medium (DX10) AF:4x (classificar por valor) | |
| HP 15-bw075ax | |
| HP 15-bw077ax | |
| Deus Ex Mankind Divided | |
| 1280x720 Low Preset AF:1x (classificar por valor) | |
| HP 15-bw075ax | |
| HP Pavilion 15-aw004ng W8Y60EA | |
| 1366x768 Medium Preset AF:2x (classificar por valor) | |
| HP 15-bw075ax | |
| HP Pavilion 15-aw004ng W8Y60EA | |
| Rise of the Tomb Raider | |
| 1024x768 Lowest Preset (classificar por valor) | |
| HP 15-bw075ax | |
| HP 15-bw077ax | |
| Asus X555DA-BB11 | |
| Lenovo Yoga 510-14AST | |
| HP Pavilion 15-aw004ng W8Y60EA | |
| Acer Spin 5 SP513-51 | |
| 1366x768 Medium Preset AF:2x (classificar por valor) | |
| HP 15-bw075ax | |
| HP 15-bw077ax | |
| Lenovo Yoga 510-14AST | |
| HP Pavilion 15-aw004ng W8Y60EA | |
| baixo | média | alto | ultra | |
|---|---|---|---|---|
| Batman: Arkham City (2011) | 36 | 29 | 15 | |
| The Elder Scrolls V: Skyrim (2011) | 28 | 19 | 13 | |
| BioShock Infinite (2013) | 43 | 26 | ||
| Metro: Last Light (2013) | 16 | 12 | ||
| Company of Heroes 2 (2013) | 11 | 11 | 6 | |
| Batman: Arkham Origins (2013) | 48 | 29 | 15 | |
| Thief (2014) | 13 | 10 | 8 | |
| Alien: Isolation (2014) | 32 | 20 | ||
| Call of Duty: Advanced Warfare (2014) | 16 | |||
| Batman: Arkham Knight (2015) | 9 | 3 | ||
| Rise of the Tomb Raider (2016) | 18 | 11 | ||
| Ashes of the Singularity (2016) | 8 | |||
| Deus Ex Mankind Divided (2016) | 10 | 7 |
Barulho
| Ocioso |
| 30.9 / 31.2 / 32 dB |
| Carga |
| 35 / 36.4 dB |
 | ||
30 dB silencioso 40 dB(A) audível 50 dB(A) ruidosamente alto |
||
min: | ||
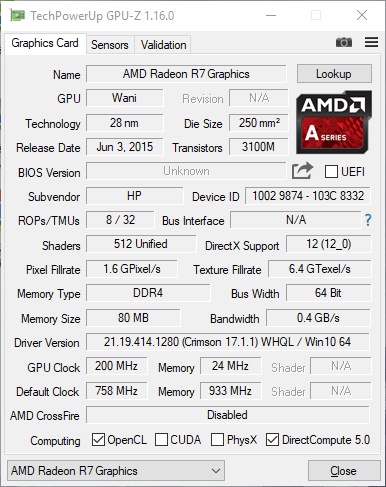
| HP 15-bw075ax Radeon R7 (Bristol Ridge), A12-9720P, WDC Scorpio Blue WD10JPVX-60JC3T1 | HP 15-bw077ax Radeon R5 (Stoney Ridge), A9-9420, WDC Scorpio Blue WD10JPVX-60JC3T1 | Asus X555DA-BB11 Radeon R6 (Carrizo), A10-8700P, Seagate Momentus SpinPoint M8 ST1000LM024 HN-M101MBB | Lenovo B50-10 80QR0013GE HD Graphics (Bay Trail), N3540, Seagate Momentus Thin ST500LT012-1DG142 | Lenovo Yoga 510-14AST Radeon R5 (Stoney Ridge), A9-9410 | HP Pavilion 15-aw004ng W8Y60EA Radeon R8 M445DX, A10-9600P | |
|---|---|---|---|---|---|---|
| Noise | -2% | -1% | -3% | 4% | -9% | |
| desligado / ambiente * (dB) | 27.8 | 27.8 -0% | 28.9 -4% | 31.2 -12% | 30.4 -9% | 31.2 -12% |
| Idle Minimum * (dB) | 30.9 | 31.8 -3% | 31.6 -2% | 33.5 -8% | 30.4 2% | 31.7 -3% |
| Idle Average * (dB) | 31.2 | 33.2 -6% | 32 -3% | 33.5 -7% | 30.4 3% | 31.9 -2% |
| Idle Maximum * (dB) | 32 | 34 -6% | 32.4 -1% | 33.5 -5% | 30.4 5% | 31.9 -0% |
| Load Average * (dB) | 35 | 33.3 5% | 33.3 5% | 33.5 4% | 31.3 11% | 41 -17% |
| Load Maximum * (dB) | 36.4 | 36.4 -0% | 35.5 2% | 33.5 8% | 33.3 9% | 42.7 -17% |
* ... menor é melhor
(±) A temperatura máxima no lado superior é 40.8 °C / 105 F, em comparação com a média de 36.8 °C / 98 F , variando de 21 a 71 °C para a classe Multimedia.
(±) A parte inferior aquece até um máximo de 44.4 °C / 112 F, em comparação com a média de 39.1 °C / 102 F
(+) Em uso inativo, a temperatura média para o lado superior é 29.6 °C / 85 F, em comparação com a média do dispositivo de 31.3 °C / ### class_avg_f### F.
(±) Os apoios para as mãos e o touchpad podem ficar muito quentes ao toque, com um máximo de 36.8 °C / 98.2 F.
(-) A temperatura média da área do apoio para as mãos de dispositivos semelhantes foi 28.7 °C / 83.7 F (-8.1 °C / -14.5 F).
HP 15-bw075ax análise de áudio
(±) | o volume do alto-falante é médio, mas bom (###valor### dB)
Graves 100 - 315Hz
(±) | graves reduzidos - em média 8.2% menor que a mediana
(±) | a linearidade dos graves é média (9.4% delta para a frequência anterior)
Médios 400 - 2.000 Hz
(+) | médios equilibrados - apenas 2.5% longe da mediana
(±) | a linearidade dos médios é média (8.1% delta para frequência anterior)
Altos 2 - 16 kHz
(+) | agudos equilibrados - apenas 2.7% longe da mediana
(±) | a linearidade dos máximos é média (7.5% delta para frequência anterior)
Geral 100 - 16.000 Hz
(+) | o som geral é linear (14.8% diferença em relação à mediana)
Comparado com a mesma classe
» 35% de todos os dispositivos testados nesta classe foram melhores, 4% semelhantes, 61% piores
» O melhor teve um delta de 5%, a média foi 17%, o pior foi 45%
Comparado com todos os dispositivos testados
» 20% de todos os dispositivos testados foram melhores, 4% semelhantes, 76% piores
» O melhor teve um delta de 4%, a média foi 24%, o pior foi 134%
Asus X555DA-BB11 análise de áudio
(±) | o volume do alto-falante é médio, mas bom (###valor### dB)
Graves 100 - 315Hz
(-) | quase nenhum baixo - em média 21.4% menor que a mediana
(±) | a linearidade dos graves é média (13.5% delta para a frequência anterior)
Médios 400 - 2.000 Hz
(±) | médios reduzidos - em média 5.1% menor que a mediana
(±) | a linearidade dos médios é média (14.6% delta para frequência anterior)
Altos 2 - 16 kHz
(±) | máximos mais altos - em média 7.2% maior que a mediana
(±) | a linearidade dos máximos é média (14.6% delta para frequência anterior)
Geral 100 - 16.000 Hz
(±) | a linearidade do som geral é média (29% diferença em relação à mediana)
Comparado com a mesma classe
» 95% de todos os dispositivos testados nesta classe foram melhores, 1% semelhantes, 4% piores
» O melhor teve um delta de 5%, a média foi 17%, o pior foi 45%
Comparado com todos os dispositivos testados
» 87% de todos os dispositivos testados foram melhores, 2% semelhantes, 11% piores
» O melhor teve um delta de 4%, a média foi 24%, o pior foi 134%
| desligado | |
| Ocioso | |
| Carga |
|
Key:
min: | |
| HP 15-bw075ax A12-9720P, Radeon R7 (Bristol Ridge), WDC Scorpio Blue WD10JPVX-60JC3T1, TN LED, 1366x768, 15.6" | HP 15-bw077ax A9-9420, Radeon R5 (Stoney Ridge), WDC Scorpio Blue WD10JPVX-60JC3T1, TN LED, 1366x768, 15.6" | Asus X555DA-BB11 A10-8700P, Radeon R6 (Carrizo), Seagate Momentus SpinPoint M8 ST1000LM024 HN-M101MBB, TN LED, 1920x1080, 15.6" | Lenovo B50-10 80QR0013GE N3540, HD Graphics (Bay Trail), Seagate Momentus Thin ST500LT012-1DG142, TN LED, 1366x768, 15.6" | Lenovo Yoga 510-14AST A9-9410, Radeon R5 (Stoney Ridge), , TN LED, 1366x768, 14" | HP Pavilion 15-aw004ng W8Y60EA A10-9600P, Radeon R8 M445DX, , TN LED, 1920x1080, 15.6" | |
|---|---|---|---|---|---|---|
| Power Consumption | -19% | -36% | 17% | 15% | -32% | |
| Idle Minimum * (Watt) | 4.2 | 8 -90% | 8.3 -98% | 4.8 -14% | 3.9 7% | 5.5 -31% |
| Idle Average * (Watt) | 6.6 | 9.4 -42% | 8.6 -30% | 7.5 -14% | 7.4 -12% | 8.2 -24% |
| Idle Maximum * (Watt) | 10.4 | 13.9 -34% | 13.1 -26% | 9.2 12% | 9.4 10% | 9.5 9% |
| Load Average * (Watt) | 28.2 | 18.5 34% | 31.2 -11% | 16 43% | 19.2 32% | 44.5 -58% |
| Load Maximum * (Watt) | 37.6 | 23 39% | 43.9 -17% | 15.4 59% | 22.5 40% | 58 -54% |
* ... menor é melhor
| HP 15-bw075ax A12-9720P, Radeon R7 (Bristol Ridge), 31 Wh | HP 15-bw077ax A9-9420, Radeon R5 (Stoney Ridge), 31 Wh | Asus X555DA-BB11 A10-8700P, Radeon R6 (Carrizo), 37 Wh | Lenovo B50-10 80QR0013GE N3540, HD Graphics (Bay Trail), 24 Wh | Lenovo Yoga 510-14AST A9-9410, Radeon R5 (Stoney Ridge), 35 Wh | HP Pavilion 15-aw004ng W8Y60EA A10-9600P, Radeon R8 M445DX, 41 Wh | |
|---|---|---|---|---|---|---|
| Duração da bateria | 6% | -3% | -5% | 72% | 32% | |
| Reader / Idle (h) | 7.8 | 9 15% | 7.3 -6% | 14.1 81% | 9.3 19% | |
| WiFi v1.3 (h) | 3.7 | 3.4 -8% | 2.9 -22% | 3.5 -5% | 5.4 46% | 4.3 16% |
| Load (h) | 1 | 1.1 10% | 1.2 20% | 1.9 90% | 1.6 60% |
Pro
Contra


Enquanto o HP 15 (A9) que analisamos recentemente, foi um exercício de paciência devido aos seus componentes e operação lenta, o HP 15 (A12) é um teste devido à sua instabilidade. O processador é muito mais rápido do que o dual-core A9 em nossa unidade anterior, mas devido ao suporte pobre dos controladores, à má otimização de software ou a algum outro fator não visto, o sistema é quase inutilizável devido às probabilidades insondáveis de uma falha no sistema. Por enquanto, não podemos recomendar o HP 15 (A12) até que a estabilidade do sistema melhore.
Isso é uma pena, dado que o HP 15 (A12) é uma melhoria em relação à variante A9 em cada um dos testes de desempenho. Enquanto ainda encontramos reclamações com a tela pobre e o teclado esponjoso, os componentes internos foram muito melhorados (quando eles realmente conseguirem funcionar). No entanto, observamos um afogamento intenso sob estresse, apesar do amplo espaço livre para que a APU estique os músculos.
Mesmo sem levar em consideração as falhas do sistema, o HP 15 (A12) ainda é um portátil econômico comum, que não traz nada atraente para as prateleiras das lojas. Como mencionamos com o HP 15 (A9), existem opções muito melhores nessa faixa de preços.
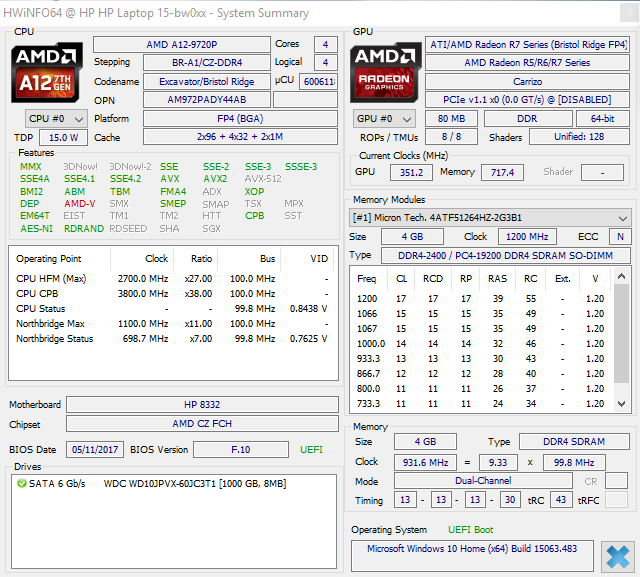
HP 15-bw075ax
- 07/15/2017 v6 (old)
Sam Medley
Price comparison
