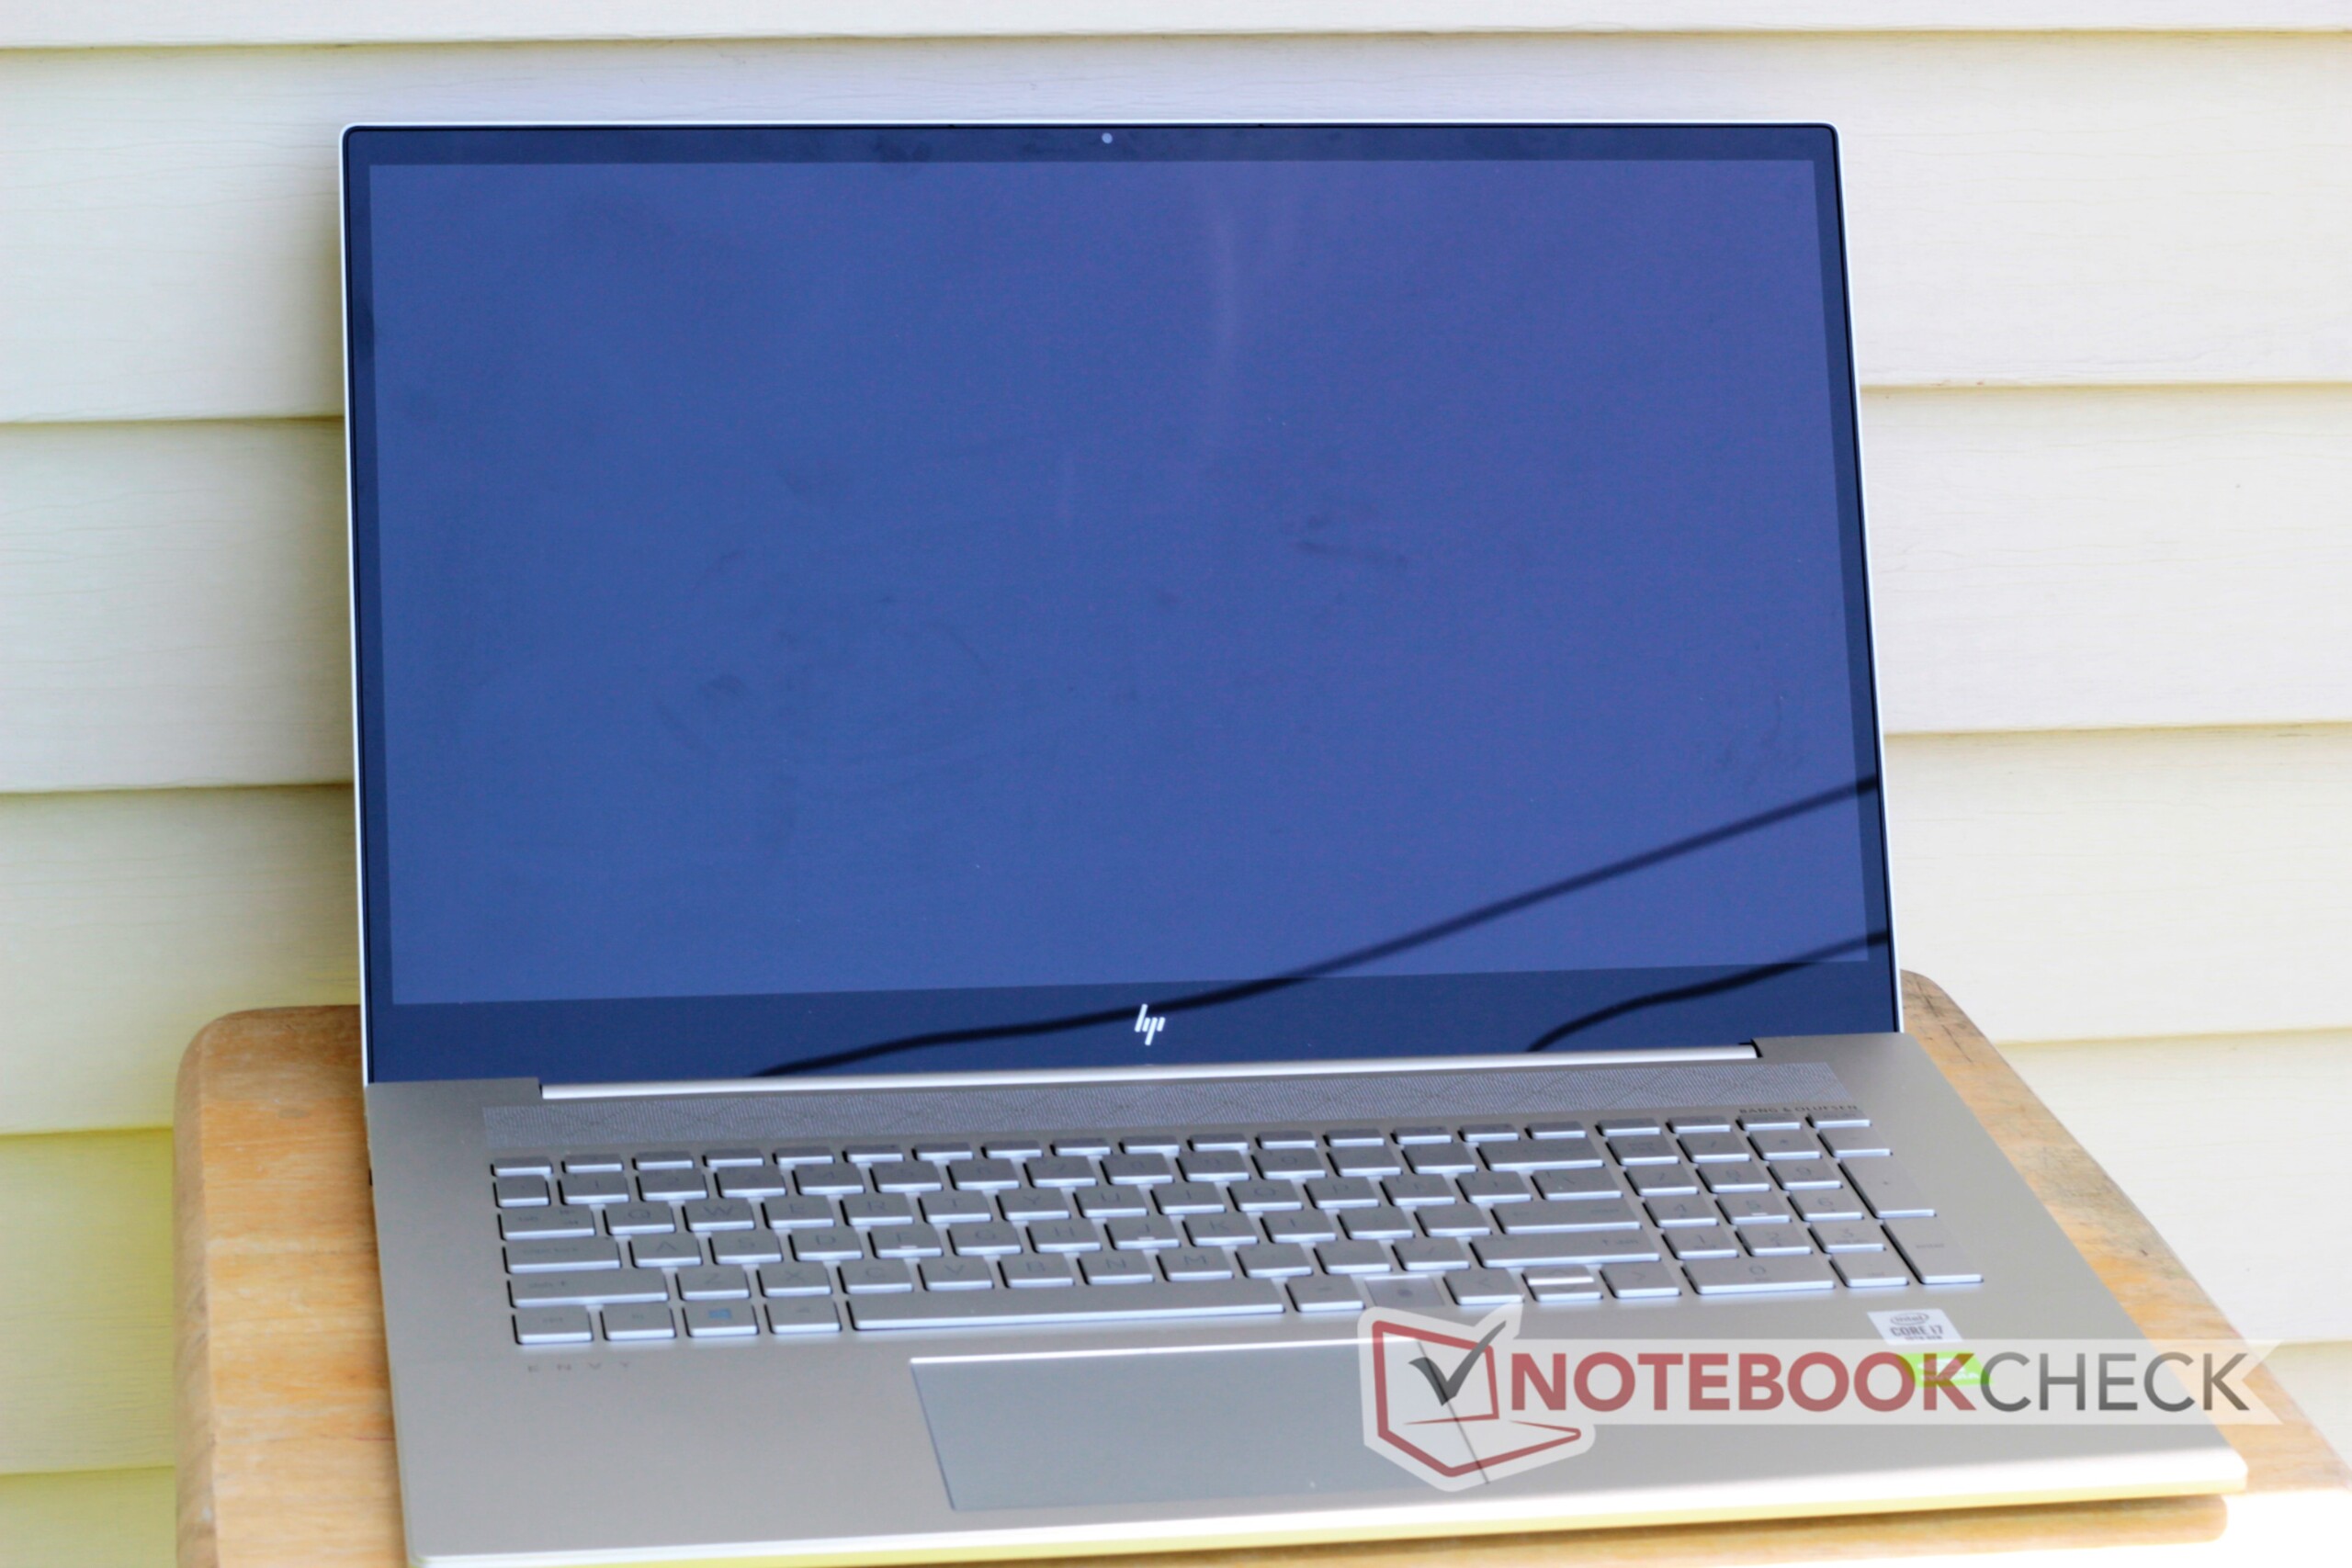
Breve Análise do Portátil HP Envy 17t (Core i7-1065G7, Nvidia MX330, 4K)
Avaliação | Data | Modelo | Peso | Altura | Size | Resolução | Preço |
|---|---|---|---|---|---|---|---|
| 80.9 % v7 (old) | 06/2020 | HP Envy 17t-cg000 i7-1065G7, GeForce MX330 | 2.7 kg | 19.3 mm | 17.30" | 3840x2160 | |
| 79.3 % v7 (old) | Medion Akoya P17605 i7-10510U, GeForce MX250 | 2.3 kg | 18.45 mm | 17.30" | 1920x1080 | ||
| 75.6 % v7 (old) | 05/2020 | Asus VivoBook 17 M712DA-AU017T R5 3500U, Vega 8 | 2.3 kg | 21 mm | 17.30" | 1920x1080 | |
| 78.5 % v7 (old) | 11/2019 | HP Envy 17-ce1004ng i7-10510U, GeForce MX250 | 2.8 kg | 23 mm | 17.30" | 1920x1080 | |
| 78.9 % v6 (old) | 05/2019 | Dell Inspiron 17 3780 i7-8565U, Radeon 520 | 2.8 kg | 25 mm | 17.30" | 1920x1080 | |
| 83.5 % v6 (old) | 04/2019 | LG Gram 17Z990-R.AAS7U1 i7-8565U, UHD Graphics 620 | 1.3 kg | 17.8 mm | 17.00" | 2560x1600 |

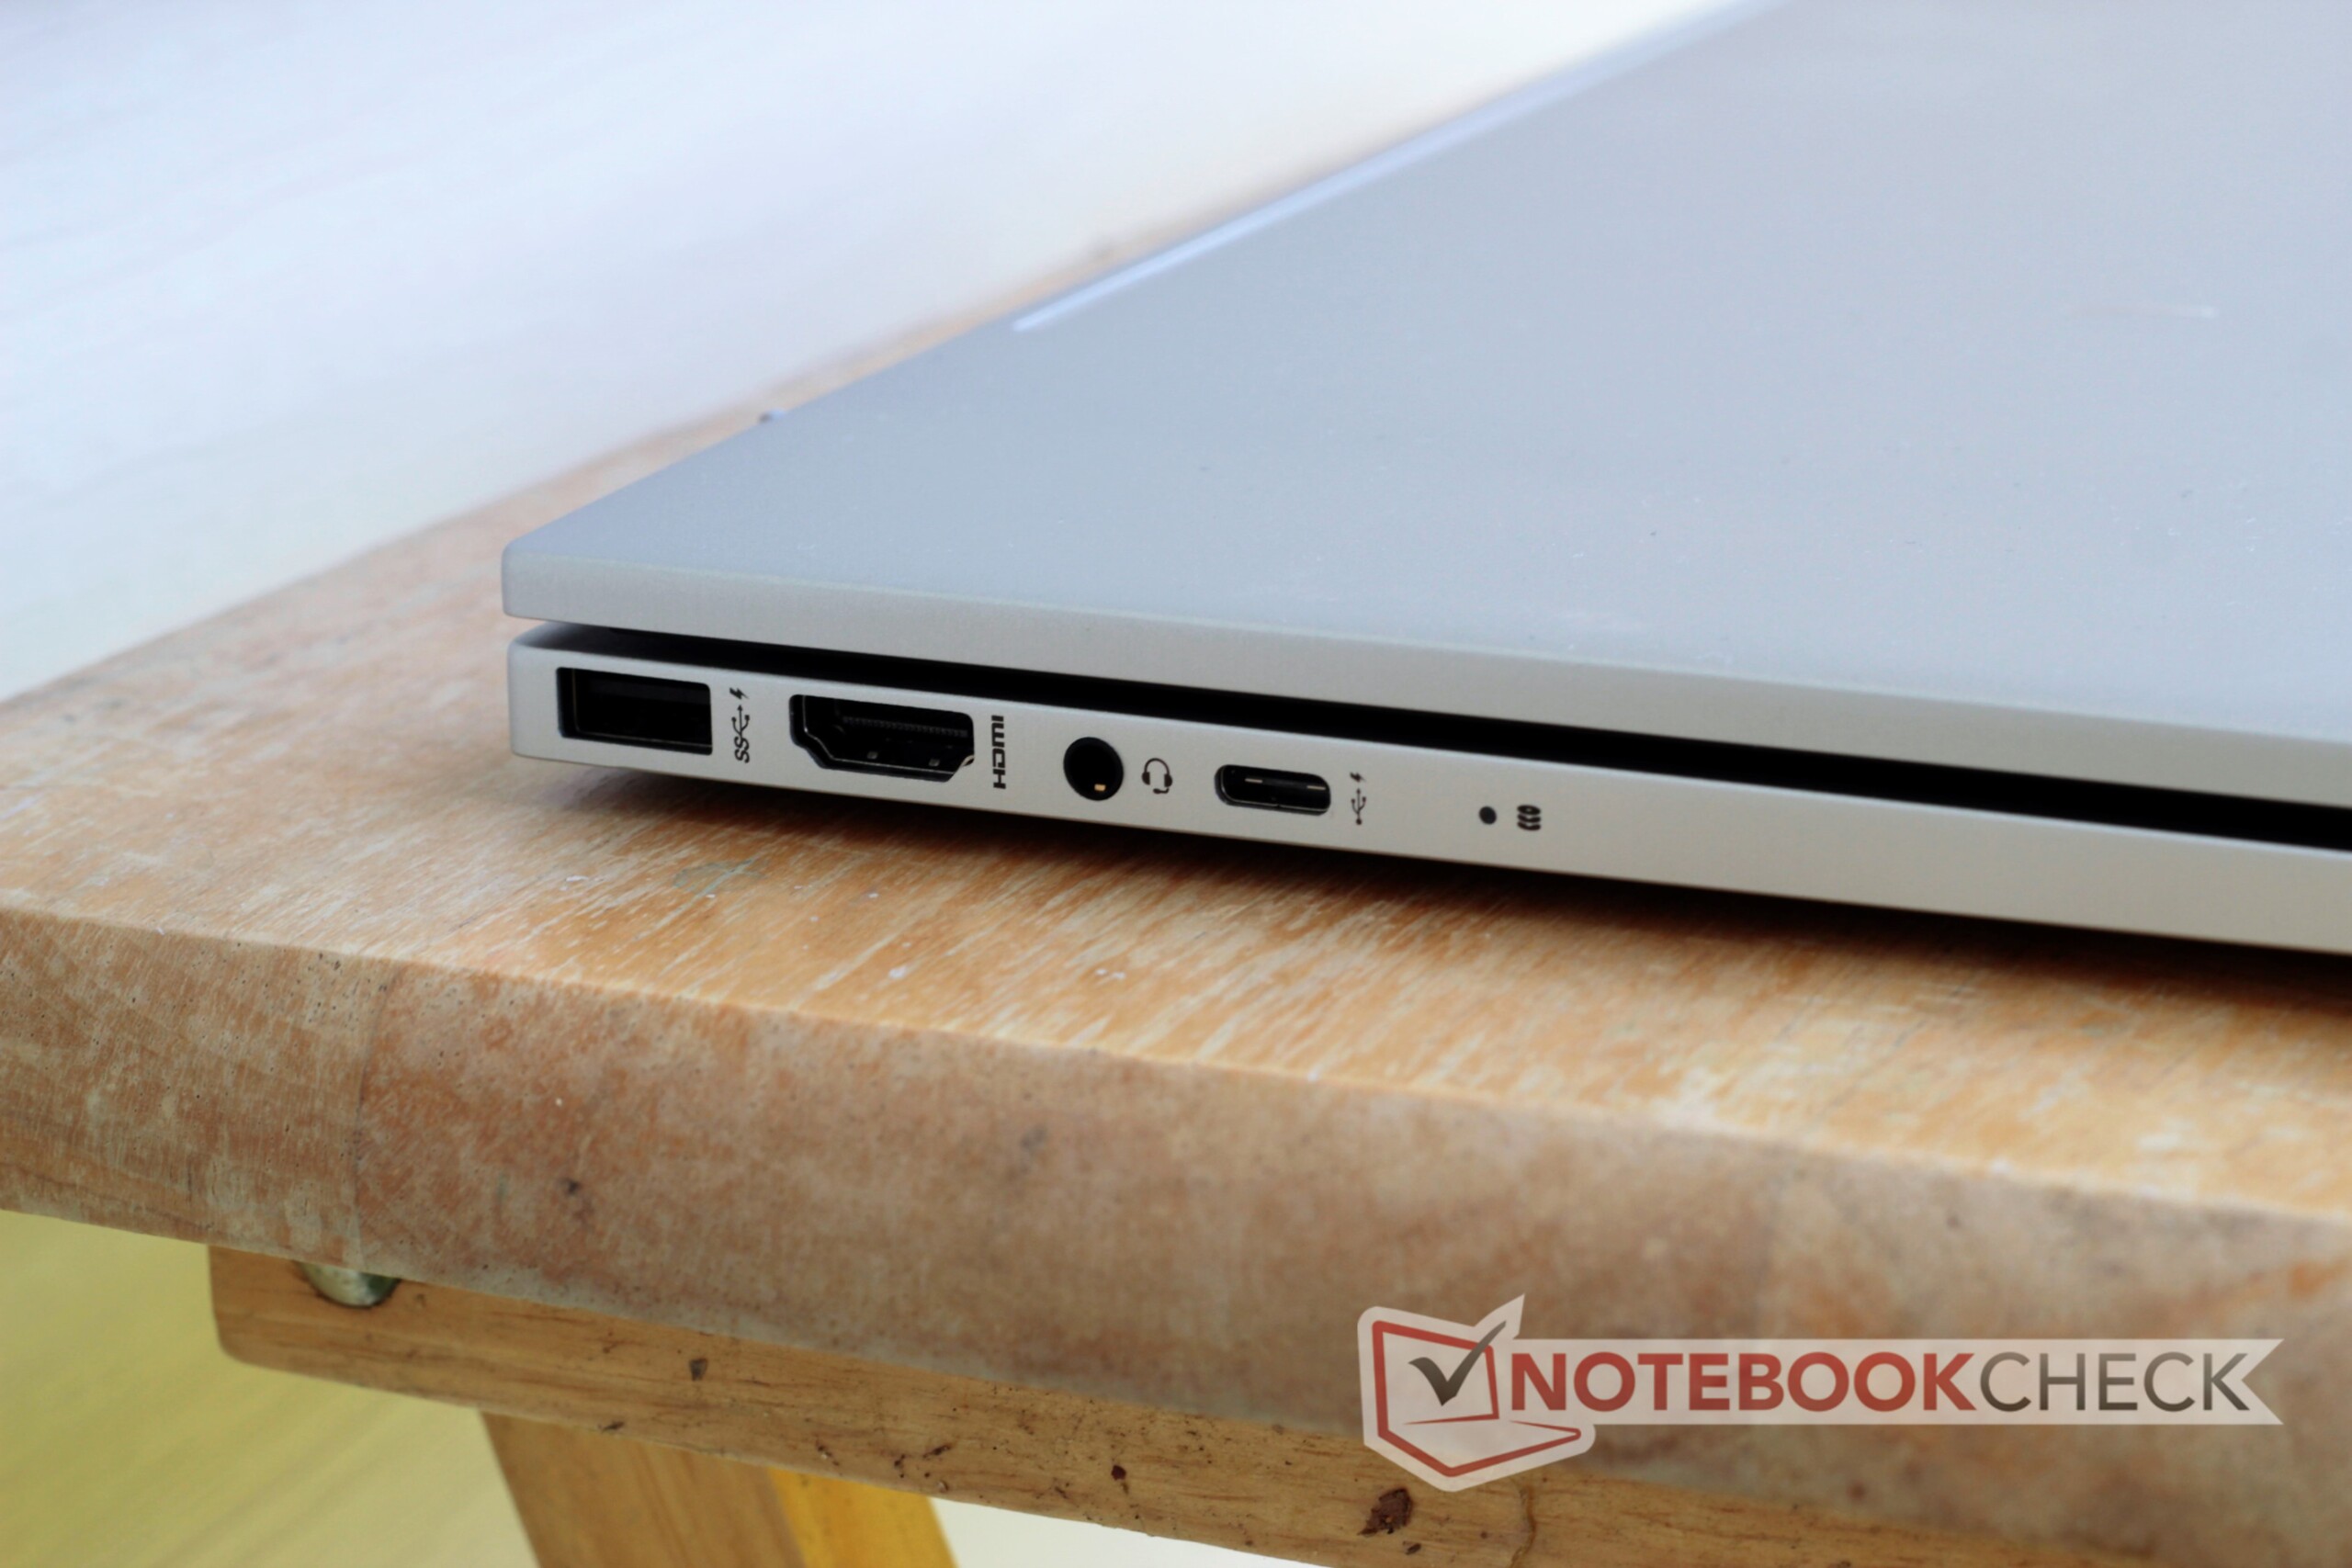
| SD Card Reader | |
| average JPG Copy Test (av. of 3 runs) | |
| Dell XPS 15 9500 Core i7 4K UHD (Toshiba Exceria Pro SDXC 64 GB UHS-II) | |
| HP Envy 17t-cg000 (Toshiba Exceria Pro SDXC 64 GB UHS-II) | |
| LG Gram 17Z990-R.AAS7U1 (Toshiba Exceria Pro M501 64 GB UHS-II) | |
| HP Envy 17-ce1004ng (Toshiba Exceria Pro SDXC 64 GB UHS-II) | |
| Asus VivoBook 17 M712DA-AU017T (Toshiba Exceria Pro M501 microSDXC 64GB) | |
| Dell Inspiron 17 3780 (Toshiba Exceria Pro SDXC 64 GB UHS-II) | |
| Medion Akoya P17605 (Toshiba Exceria Pro SDXC 64 GB UHS-II) | |
| maximum AS SSD Seq Read Test (1GB) | |
| Dell XPS 15 9500 Core i7 4K UHD (Toshiba Exceria Pro SDXC 64 GB UHS-II) | |
| LG Gram 17Z990-R.AAS7U1 (Toshiba Exceria Pro M501 64 GB UHS-II) | |
| HP Envy 17t-cg000 (Toshiba Exceria Pro SDXC 64 GB UHS-II) | |
| HP Envy 17-ce1004ng (Toshiba Exceria Pro SDXC 64 GB UHS-II) | |
| Asus VivoBook 17 M712DA-AU017T (Toshiba Exceria Pro M501 microSDXC 64GB) | |
| Dell Inspiron 17 3780 (Toshiba Exceria Pro SDXC 64 GB UHS-II) | |
| Medion Akoya P17605 (Toshiba Exceria Pro SDXC 64 GB UHS-II) | |
| Networking | |
| iperf3 transmit AX12 | |
| Medion Akoya P17605 | |
| HP Envy 17t-cg000 | |
| LG Gram 17Z990-R.AAS7U1 | |
| HP Envy 17-ce1004ng | |
| Asus VivoBook 17 M712DA-AU017T | |
| Dell Inspiron 17 3780 | |
| iperf3 receive AX12 | |
| HP Envy 17t-cg000 | |
| Medion Akoya P17605 | |
| HP Envy 17-ce1004ng | |
| LG Gram 17Z990-R.AAS7U1 | |
| Asus VivoBook 17 M712DA-AU017T | |
| Dell Inspiron 17 3780 | |


| |||||||||||||||||||||||||
iluminação: 86 %
iluminação com acumulador: 383.4 cd/m²
Contraste: 1128:1 (Preto: 0.34 cd/m²)
ΔE ColorChecker Calman: 6.24 | ∀{0.5-29.43 Ø4.72}
calibrated: 3.7
ΔE Greyscale Calman: 6.6 | ∀{0.09-98 Ø4.97}
100% sRGB (Argyll 1.6.3 3D)
88% AdobeRGB 1998 (Argyll 1.6.3 3D)
99.8% AdobeRGB 1998 (Argyll 3D)
100% sRGB (Argyll 3D)
86.2% Display P3 (Argyll 3D)
Gamma: 2.272
CCT: 5973 K
| HP Envy 17t-cg000 AU Optronics AUO168E, IPS, 17.3", 3840x2160 | Medion Akoya P17605 AU Optronics AUO429D, IPS, 17.3", 1920x1080 | Asus VivoBook 17 M712DA-AU017T BOE084E, IPS, 17.3", 1920x1080 | HP Envy 17-ce1004ng BOE0825, IPS, 17.3", 1920x1080 | Dell Inspiron 17 3780 AU Optronics B173HAN01.3, IPS, 17.3", 1920x1080 | LG Gram 17Z990-R.AAS7U1 LG Philips LP170WQ1-SPA1, IPS, 17", 2560x1600 | Dell XPS 15 9500 Core i7 4K UHD Sharp LQ156R1, IPS, 15.6", 3840x2400 | |
|---|---|---|---|---|---|---|---|
| Display | -25% | -50% | -23% | -24% | -21% | 1% | |
| Display P3 Coverage (%) | 86.2 | 62.3 -28% | 40.76 -53% | 63.3 -27% | 63.7 -26% | 64.2 -26% | 89.7 4% |
| sRGB Coverage (%) | 100 | 88.6 -11% | 59.7 -40% | 91.5 -8% | 88.9 -11% | 96.3 -4% | 100 0% |
| AdobeRGB 1998 Coverage (%) | 99.8 | 63.7 -36% | 42.11 -58% | 64.6 -35% | 64.6 -35% | 66.3 -34% | 99.8 0% |
| Response Times | -3% | 43% | 37% | -11% | 1% | -16% | |
| Response Time Grey 50% / Grey 80% * (ms) | 45.2 ? | 45 ? -0% | 24 ? 47% | 30 ? 34% | 46 ? -2% | 42 ? 7% | 54 ? -19% |
| Response Time Black / White * (ms) | 29.6 ? | 31 ? -5% | 18 ? 39% | 18 ? 39% | 35.2 ? -19% | 31.2 ? -5% | 33.2 ? -12% |
| PWM Frequency (Hz) | |||||||
| Screen | 14% | -14% | -5% | 5% | 17% | 19% | |
| Brightness middle (cd/m²) | 383.4 | 298 -22% | 262 -32% | 293 -24% | 322.9 -16% | 370.6 -3% | 557.9 46% |
| Brightness (cd/m²) | 382 | 294 -23% | 234 -39% | 280 -27% | 322 -16% | 356 -7% | 541 42% |
| Brightness Distribution (%) | 86 | 88 2% | 84 -2% | 83 -3% | 84 -2% | 89 3% | 91 6% |
| Black Level * (cd/m²) | 0.34 | 0.255 25% | 0.265 22% | 0.335 1% | 0.26 24% | 0.28 18% | 0.39 -15% |
| Contrast (:1) | 1128 | 1169 4% | 989 -12% | 875 -22% | 1242 10% | 1324 17% | 1431 27% |
| Colorchecker dE 2000 * | 6.24 | 3.01 52% | 5.13 18% | 4.79 23% | 4.19 33% | 3.28 47% | 4.54 27% |
| Colorchecker dE 2000 max. * | 10.18 | 4.59 55% | 19.16 -88% | 11.42 -12% | 7.04 31% | 5.85 43% | 7.92 22% |
| Colorchecker dE 2000 calibrated * | 3.7 | 2.1 43% | 3.96 -7% | 1.76 52% | 3.55 4% | 1.03 72% | 3.82 -3% |
| Greyscale dE 2000 * | 6.6 | 2.29 65% | 1.22 82% | 6.32 4% | 4.5 32% | 4.9 26% | 3.2 52% |
| Gamma | 2.272 97% | 2.62 84% | 2.42 91% | 2.49 88% | 1.97 112% | 2.19 100% | 1.99 111% |
| CCT | 5973 109% | 6655 98% | 6584 99% | 8002 81% | 7041 92% | 6376 102% | 6451 101% |
| Color Space (Percent of AdobeRGB 1998) (%) | 88 | 58 -34% | 38 -57% | 59 -33% | 57.6 -35% | 60.8 -31% | 89.5 2% |
| Color Space (Percent of sRGB) (%) | 100 | 89 -11% | 59 -41% | 91 -9% | 88.4 -12% | 96.6 -3% | 100 0% |
| Média Total (Programa/Configurações) | -5% /
5% | -7% /
-14% | 3% /
-3% | -10% /
-3% | -1% /
8% | 1% /
11% |
* ... menor é melhor
Exibir tempos de resposta
| ↔ Tempo de resposta preto para branco | ||
|---|---|---|
| 29.6 ms ... ascensão ↗ e queda ↘ combinadas | ↗ 16.4 ms ascensão | 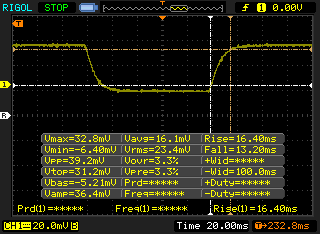 |
| ↘ 13.2 ms queda | ||
| A tela mostra taxas de resposta relativamente lentas em nossos testes e pode ser muito lenta para os jogadores. Em comparação, todos os dispositivos testados variam de 0.1 (mínimo) a 240 (máximo) ms. » 79 % de todos os dispositivos são melhores. Isso significa que o tempo de resposta medido é pior que a média de todos os dispositivos testados (19.8 ms). | ||
| ↔ Tempo de resposta 50% cinza a 80% cinza | ||
| 45.2 ms ... ascensão ↗ e queda ↘ combinadas | ↗ 24 ms ascensão | 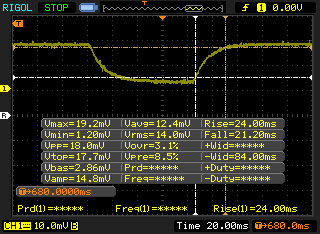 |
| ↘ 21 ms queda | ||
| A tela mostra taxas de resposta lentas em nossos testes e será insatisfatória para os jogadores. Em comparação, todos os dispositivos testados variam de 0.165 (mínimo) a 636 (máximo) ms. » 78 % de todos os dispositivos são melhores. Isso significa que o tempo de resposta medido é pior que a média de todos os dispositivos testados (31 ms). | ||
Cintilação da tela / PWM (modulação por largura de pulso)
| Tela tremeluzindo / PWM não detectado | 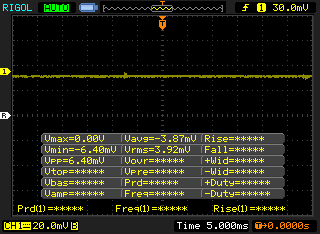 | ||
[pwm_comparison] Em comparação: 52 % de todos os dispositivos testados não usam PWM para escurecer a tela. Se PWM foi detectado, uma média de 7769 (mínimo: 5 - máximo: 343500) Hz foi medida. | |||
Cinebench R15: CPU Single 64Bit | CPU Multi 64Bit
Blender: v2.79 BMW27 CPU
7-Zip 18.03: 7z b 4 -mmt1 | 7z b 4
Geekbench 5.5: Single-Core | Multi-Core
HWBOT x265 Benchmark v2.2: 4k Preset
LibreOffice : 20 Documents To PDF
R Benchmark 2.5: Overall mean
| Cinebench R20 / CPU (Single Core) | |
| Média da turma Multimedia (425 - 853, n=64, últimos 2 anos) | |
| HP Envy 17t-cg000 | |
| Acer Swift 3 SF314-42-R4XJ | |
| HP ProBook 445 G7 175W4EA | |
| Dell XPS 15 9500 Core i5 | |
| Média Intel Core i7-1065G7 (358 - 474, n=31) | |
| Cinebench R20 / CPU (Multi Core) | |
| Média da turma Multimedia (1887 - 12912, n=64, últimos 2 anos) | |
| Acer Swift 3 SF314-42-R4XJ | |
| HP ProBook 445 G7 175W4EA | |
| Dell XPS 15 9500 Core i5 | |
| HP Envy 17t-cg000 | |
| Média Intel Core i7-1065G7 (1081 - 2024, n=31) | |
| Cinebench R15 / CPU Single 64Bit | |
| Média da turma Multimedia (184.8 - 326, n=66, últimos 2 anos) | |
| HP Envy 17-ce1004ng | |
| HP Envy 17t-cg000 | |
| Dell XPS 15 9500 Core i5 | |
| Acer Swift 3 SF314-42-R4XJ | |
| HP ProBook 445 G7 175W4EA | |
| Média Intel Core i7-1065G7 (141 - 190, n=35) | |
| LG Gram 17Z990-R.AAS7U1 | |
| Dell Inspiron 17 3780 | |
| Asus VivoBook 17 M712DA-AU017T | |
| Cinebench R15 / CPU Multi 64Bit | |
| Média da turma Multimedia (856 - 5224, n=68, últimos 2 anos) | |
| Acer Swift 3 SF314-42-R4XJ | |
| HP ProBook 445 G7 175W4EA | |
| Dell XPS 15 9500 Core i5 | |
| HP Envy 17t-cg000 | |
| Média Intel Core i7-1065G7 (288 - 836, n=36) | |
| Asus VivoBook 17 M712DA-AU017T | |
| Dell Inspiron 17 3780 | |
| HP Envy 17-ce1004ng | |
| LG Gram 17Z990-R.AAS7U1 | |
| Blender / v2.79 BMW27 CPU | |
| Média Intel Core i7-1065G7 (675 - 1650, n=23) | |
| HP Envy 17t-cg000 | |
| HP ProBook 445 G7 175W4EA | |
| Acer Swift 3 SF314-42-R4XJ | |
| Dell XPS 15 9500 Core i5 | |
| Média da turma Multimedia (100 - 557, n=65, últimos 2 anos) | |
| 7-Zip 18.03 / 7z b 4 -mmt1 | |
| Média da turma Multimedia (3666 - 7545, n=63, últimos 2 anos) | |
| Dell XPS 15 9500 Core i5 | |
| HP Envy 17t-cg000 | |
| HP ProBook 445 G7 175W4EA | |
| Acer Swift 3 SF314-42-R4XJ | |
| Média Intel Core i7-1065G7 (3289 - 4589, n=24) | |
| 7-Zip 18.03 / 7z b 4 | |
| Média da turma Multimedia (26062 - 130368, n=62, últimos 2 anos) | |
| Acer Swift 3 SF314-42-R4XJ | |
| Dell XPS 15 9500 Core i5 | |
| HP ProBook 445 G7 175W4EA | |
| Média Intel Core i7-1065G7 (10406 - 22898, n=24) | |
| HP Envy 17t-cg000 | |
| Geekbench 5.5 / Single-Core | |
| Média da turma Multimedia (805 - 2974, n=62, últimos 2 anos) | |
| HP Envy 17t-cg000 | |
| Média Intel Core i7-1065G7 (948 - 1348, n=18) | |
| Dell XPS 15 9500 Core i5 | |
| Acer Swift 3 SF314-42-R4XJ | |
| HP ProBook 445 G7 175W4EA | |
| Geekbench 5.5 / Multi-Core | |
| Média da turma Multimedia (4652 - 20422, n=62, últimos 2 anos) | |
| Acer Swift 3 SF314-42-R4XJ | |
| HP ProBook 445 G7 175W4EA | |
| Dell XPS 15 9500 Core i5 | |
| Média Intel Core i7-1065G7 (2464 - 4855, n=18) | |
| HP Envy 17t-cg000 | |
| HWBOT x265 Benchmark v2.2 / 4k Preset | |
| Média da turma Multimedia (5.26 - 36.1, n=63, últimos 2 anos) | |
| Acer Swift 3 SF314-42-R4XJ | |
| Dell XPS 15 9500 Core i5 | |
| HP Envy 17t-cg000 | |
| Média Intel Core i7-1065G7 (2.2 - 6.38, n=22) | |
| LibreOffice / 20 Documents To PDF | |
| HP ProBook 445 G7 175W4EA | |
| Dell XPS 15 9500 Core i5 | |
| Média Intel Core i7-1065G7 (46.9 - 85.3, n=19) | |
| Acer Swift 3 SF314-42-R4XJ | |
| HP Envy 17t-cg000 | |
| Média da turma Multimedia (23.9 - 146.7, n=64, últimos 2 anos) | |
| R Benchmark 2.5 / Overall mean | |
| Média Intel Core i7-1065G7 (0.661 - 0.798, n=18) | |
| HP Envy 17t-cg000 | |
| Dell XPS 15 9500 Core i5 | |
| Acer Swift 3 SF314-42-R4XJ | |
| Média da turma Multimedia (0.3604 - 0.947, n=63, últimos 2 anos) | |
* ... menor é melhor
| PCMark 8 Home Score Accelerated v2 | 3762 pontos | |
| PCMark 8 Work Score Accelerated v2 | 5267 pontos | |
| PCMark 10 Score | 4102 pontos | |
Ajuda | ||
| DPC Latencies / LatencyMon - interrupt to process latency (max), Web, Youtube, Prime95 | |
| Dell XPS 15 9500 Core i7 4K UHD | |
| Razer Blade Stealth Core i7 GTX 1650 Ti Max-Q 4K | |
| HP Envy 17t-cg000 | |
* ... menor é melhor
| HP Envy 17t-cg000 WDC PC SN520 SDAPNUW-512G | Medion Akoya P17605 Phison E12-256G-Phison-SSD-B16-BB1 | Asus VivoBook 17 M712DA-AU017T Intel SSD 660p SSDPEKNW512G8 | HP Envy 17-ce1004ng Intel SSD 660p SSDPEKNW512G8 | Dell Inspiron 17 3780 SK Hynix BC501 NVMe 256 GB | LG Gram 17Z990-R.AAS7U1 Samsung SSD PM871b MZNLN256HAJQ | |
|---|---|---|---|---|---|---|
| AS SSD | 38% | -20% | -24% | -33% | -52% | |
| Seq Read (MB/s) | 1161 | 2482 114% | 1592 37% | 1620 40% | 1061 -9% | 454.5 -61% |
| Seq Write (MB/s) | 809 | 1079 33% | 900 11% | 373.7 -54% | 491.4 -39% | 461 -43% |
| 4K Read (MB/s) | 40.63 | 59.3 46% | 45.24 11% | 53.8 32% | 39.13 -4% | 30.18 -26% |
| 4K Write (MB/s) | 138.6 | 194.6 40% | 104.3 -25% | 170.3 23% | 104 -25% | 71 -49% |
| 4K-64 Read (MB/s) | 857 | 1180 38% | 324 -62% | 321.5 -62% | 505 -41% | 369.6 -57% |
| 4K-64 Write (MB/s) | 1041 | 1058 2% | 835 -20% | 715 -31% | 314.8 -70% | 305.5 -71% |
| Access Time Read * (ms) | 0.067 | 0.047 30% | 0.058 13% | 0.081 -21% | 0.063 6% | 0.084 -25% |
| Access Time Write * (ms) | 0.026 | 0.019 27% | 0.047 -81% | 0.046 -77% | 0.034 -31% | 0.05 -92% |
| Score Read (Points) | 1013 | 1488 47% | 528 -48% | 537 -47% | 650 -36% | 445 -56% |
| Score Write (Points) | 1260 | 1361 8% | 1030 -18% | 923 -27% | 468 -63% | 423 -66% |
| Score Total (Points) | 2783 | 3552 28% | 1810 -35% | 1693 -39% | 1434 -48% | 1106 -60% |
| Copy ISO MB/s (MB/s) | 1350 | 876 -35% | 816 -40% | |||
| Copy Program MB/s (MB/s) | 766 | 653 -15% | 614 -20% | |||
| Copy Game MB/s (MB/s) | 1190 | 512 -57% | 414.9 -65% | |||
| CrystalDiskMark 5.2 / 6 | 44% | -12% | -5% | -7% | -36% | |
| Write 4K (MB/s) | 124.2 | 213.2 72% | 132 6% | 134.8 9% | 120.3 -3% | 89.7 -28% |
| Read 4K (MB/s) | 46.11 | 59.2 28% | 52 13% | 54.7 19% | 41.81 -9% | 36.59 -21% |
| Write Seq (MB/s) | 1124 | 973 | 872 | 619 | 422.4 | |
| Read Seq (MB/s) | 1156 | 1606 | 1447 | 1119 | 454.9 | |
| Write 4K Q32T1 (MB/s) | 447 | 588 32% | 210.4 -53% | 392.2 -12% | 492.2 10% | 321.1 -28% |
| Read 4K Q32T1 (MB/s) | 350.1 | 612 75% | 312.2 -11% | 331.6 -5% | 398.8 14% | 340.1 -3% |
| Write Seq Q32T1 (MB/s) | 1463 | 1112 -24% | 982 -33% | 920 -37% | 812 -44% | 509 -65% |
| Read Seq Q32T1 (MB/s) | 1751 | 3121 78% | 1847 5% | 1723 -2% | 1616 -8% | 545 -69% |
| Write 4K Q8T8 (MB/s) | 445.5 | |||||
| Read 4K Q8T8 (MB/s) | 926 | |||||
| Média Total (Programa/Configurações) | 41% /
40% | -16% /
-17% | -15% /
-17% | -20% /
-25% | -44% /
-47% |
* ... menor é melhor

Disk Throttling: DiskSpd Read Loop, Queue Depth 8
| 3DMark 11 Performance | 5180 pontos | |
| 3DMark Ice Storm Standard Score | 22597 pontos | |
| 3DMark Cloud Gate Standard Score | 15382 pontos | |
| 3DMark Fire Strike Score | 3470 pontos | |
| 3DMark Fire Strike Extreme Score | 1773 pontos | |
| 3DMark Time Spy Score | 1293 pontos | |
Ajuda | ||
| BioShock Infinite | |
| 1920x1080 Ultra Preset, DX11 (DDOF) | |
| MSI Prestige 15 A10SC | |
| HP Envy 17t-cg000 | |
| Média NVIDIA GeForce MX330 (n=1) | |
| HP Envy 17-ce1004ng | |
| Microsoft Surface Laptop 3 15 i7-1065G7 | |
| 1366x768 High Preset | |
| MSI Prestige 15 A10SC | |
| HP Envy 17-ce1004ng | |
| HP Envy 17t-cg000 | |
| Média NVIDIA GeForce MX330 (n=1) | |
| Microsoft Surface Laptop 3 15 i7-1065G7 | |
| 1366x768 Medium Preset | |
| MSI Prestige 15 A10SC | |
| HP Envy 17-ce1004ng | |
| HP Envy 17t-cg000 | |
| Média NVIDIA GeForce MX330 (n=1) | |
| Microsoft Surface Laptop 3 15 i7-1065G7 | |
| 1280x720 Very Low Preset | |
| MSI Prestige 15 A10SC | |
| HP Envy 17t-cg000 | |
| Média NVIDIA GeForce MX330 (n=1) | |
| HP Envy 17-ce1004ng | |
| Microsoft Surface Laptop 3 15 i7-1065G7 | |
| baixo | média | alto | ultra | 4K | |
|---|---|---|---|---|---|
| BioShock Infinite (2013) | 173.9 | 113.8 | 96 | 37.9 | |
| The Witcher 3 (2015) | 17 | ||||
| Dota 2 Reborn (2015) | 110 | 104 | 73.2 | 65.3 | 25.4 |
| X-Plane 11.11 (2018) | 71 | 56.5 | 51.3 | 23.9 | |
| Shadow of the Tomb Raider (2018) | 42 | 17 | 10 | 8 | |
| F1 2019 (2019) | 73 | 31 | 24 | 19 |
| HP Envy 17t-cg000 GeForce MX330, i7-1065G7, WDC PC SN520 SDAPNUW-512G | Medion Akoya P17605 GeForce MX250, i7-10510U, Phison E12-256G-Phison-SSD-B16-BB1 | Asus VivoBook 17 M712DA-AU017T Vega 8, R5 3500U, Intel SSD 660p SSDPEKNW512G8 | HP Envy 17-ce1004ng GeForce MX250, i7-10510U, Intel SSD 660p SSDPEKNW512G8 | Dell Inspiron 17 3780 Radeon 520, i7-8565U, SK Hynix BC501 NVMe 256 GB | LG Gram 17Z990-R.AAS7U1 UHD Graphics 620, i7-8565U, Samsung SSD PM871b MZNLN256HAJQ | |
|---|---|---|---|---|---|---|
| Noise | -2% | 4% | 2% | -5% | 7% | |
| desligado / ambiente * (dB) | 28.2 | 30.3 -7% | 30.3 -7% | 30 -6% | 28.1 -0% | 28.1 -0% |
| Idle Minimum * (dB) | 28.2 | 32.4 -15% | 30.3 -7% | 30 -6% | 31.7 -12% | 28.1 -0% |
| Idle Average * (dB) | 28.2 | 32.4 -15% | 30.3 -7% | 30 -6% | 31.8 -13% | 28.1 -0% |
| Idle Maximum * (dB) | 29.5 | 32.7 -11% | 30.3 -3% | 30 -2% | 31.8 -8% | 28.1 5% |
| Load Average * (dB) | 43.9 | 36.4 17% | 31.6 28% | 36.4 17% | 38.7 12% | 35 20% |
| Witcher 3 ultra * (dB) | 43.9 | |||||
| Load Maximum * (dB) | 43.9 | 36 18% | 35.7 19% | 36.5 17% | 48.5 -10% | 37.4 15% |
* ... menor é melhor
Barulho
| Ocioso |
| 28.2 / 28.2 / 29.5 dB |
| Carga |
| 43.9 / 43.9 dB |
 | ||
30 dB silencioso 40 dB(A) audível 50 dB(A) ruidosamente alto |
||
min: | ||
(±) A temperatura máxima no lado superior é 42 °C / 108 F, em comparação com a média de 36.8 °C / 98 F , variando de 21 a 71 °C para a classe Multimedia.
(±) A parte inferior aquece até um máximo de 44.2 °C / 112 F, em comparação com a média de 39.1 °C / 102 F
(+) Em uso inativo, a temperatura média para o lado superior é 29.3 °C / 85 F, em comparação com a média do dispositivo de 31.3 °C / ### class_avg_f### F.
(±) Jogando The Witcher 3, a temperatura média para o lado superior é 32.2 °C / 90 F, em comparação com a média do dispositivo de 31.3 °C / ## #class_avg_f### F.
(+) Os apoios para as mãos e o touchpad são mais frios que a temperatura da pele, com um máximo de 28 °C / 82.4 F e, portanto, são frios ao toque.
(±) A temperatura média da área do apoio para as mãos de dispositivos semelhantes foi 28.7 °C / 83.7 F (+0.7 °C / 1.3 F).
| desligado | |
| Ocioso | |
| Carga |
|
Key:
min: | |
| HP Envy 17t-cg000 i7-1065G7, GeForce MX330, WDC PC SN520 SDAPNUW-512G, IPS, 3840x2160, 17.3" | Medion Akoya P17605 i7-10510U, GeForce MX250, Phison E12-256G-Phison-SSD-B16-BB1, IPS, 1920x1080, 17.3" | Asus VivoBook 17 M712DA-AU017T R5 3500U, Vega 8, Intel SSD 660p SSDPEKNW512G8, IPS, 1920x1080, 17.3" | HP Envy 17-ce1004ng i7-10510U, GeForce MX250, Intel SSD 660p SSDPEKNW512G8, IPS, 1920x1080, 17.3" | Dell Inspiron 17 3780 i7-8565U, Radeon 520, SK Hynix BC501 NVMe 256 GB, IPS, 1920x1080, 17.3" | LG Gram 17Z990-R.AAS7U1 i7-8565U, UHD Graphics 620, Samsung SSD PM871b MZNLN256HAJQ, IPS, 2560x1600, 17" | |
|---|---|---|---|---|---|---|
| Power Consumption | 24% | 43% | 33% | 22% | 47% | |
| Idle Minimum * (Watt) | 6.1 | 4.2 31% | 4.2 31% | 3.6 41% | 5 18% | 2.7 56% |
| Idle Average * (Watt) | 13 | 9.9 24% | 7.9 39% | 8.5 35% | 10.9 16% | 8.1 38% |
| Idle Maximum * (Watt) | 13.5 | 11.6 14% | 8.4 38% | 10.4 23% | 12 11% | 10.2 24% |
| Load Average * (Watt) | 72.7 | 60 17% | 34 53% | 52.6 28% | 49.6 32% | 32.7 55% |
| Witcher 3 ultra * (Watt) | 62.2 | |||||
| Load Maximum * (Watt) | 97.1 | 64.1 34% | 43.7 55% | 61 37% | 66.9 31% | 34.8 64% |
* ... menor é melhor
| HP Envy 17t-cg000 i7-1065G7, GeForce MX330, 55 Wh | Medion Akoya P17605 i7-10510U, GeForce MX250, 42.2 Wh | Asus VivoBook 17 M712DA-AU017T R5 3500U, Vega 8, 37 Wh | HP Envy 17-ce1004ng i7-10510U, GeForce MX250, 52 Wh | Dell Inspiron 17 3780 i7-8565U, Radeon 520, 42 Wh | LG Gram 17Z990-R.AAS7U1 i7-8565U, UHD Graphics 620, 72 Wh | |
|---|---|---|---|---|---|---|
| Duração da bateria | 2% | -28% | 11% | -23% | 107% | |
| Reader / Idle (h) | 15.4 | 17 10% | 9.6 -38% | 34.8 126% | ||
| WiFi v1.3 (h) | 4.6 | 4.7 2% | 3.3 -28% | 4 -13% | 4.2 -9% | 11.9 159% |
| Load (h) | 1.4 | 1.9 36% | 1.1 -21% | 1.9 36% |
Pro
Contra
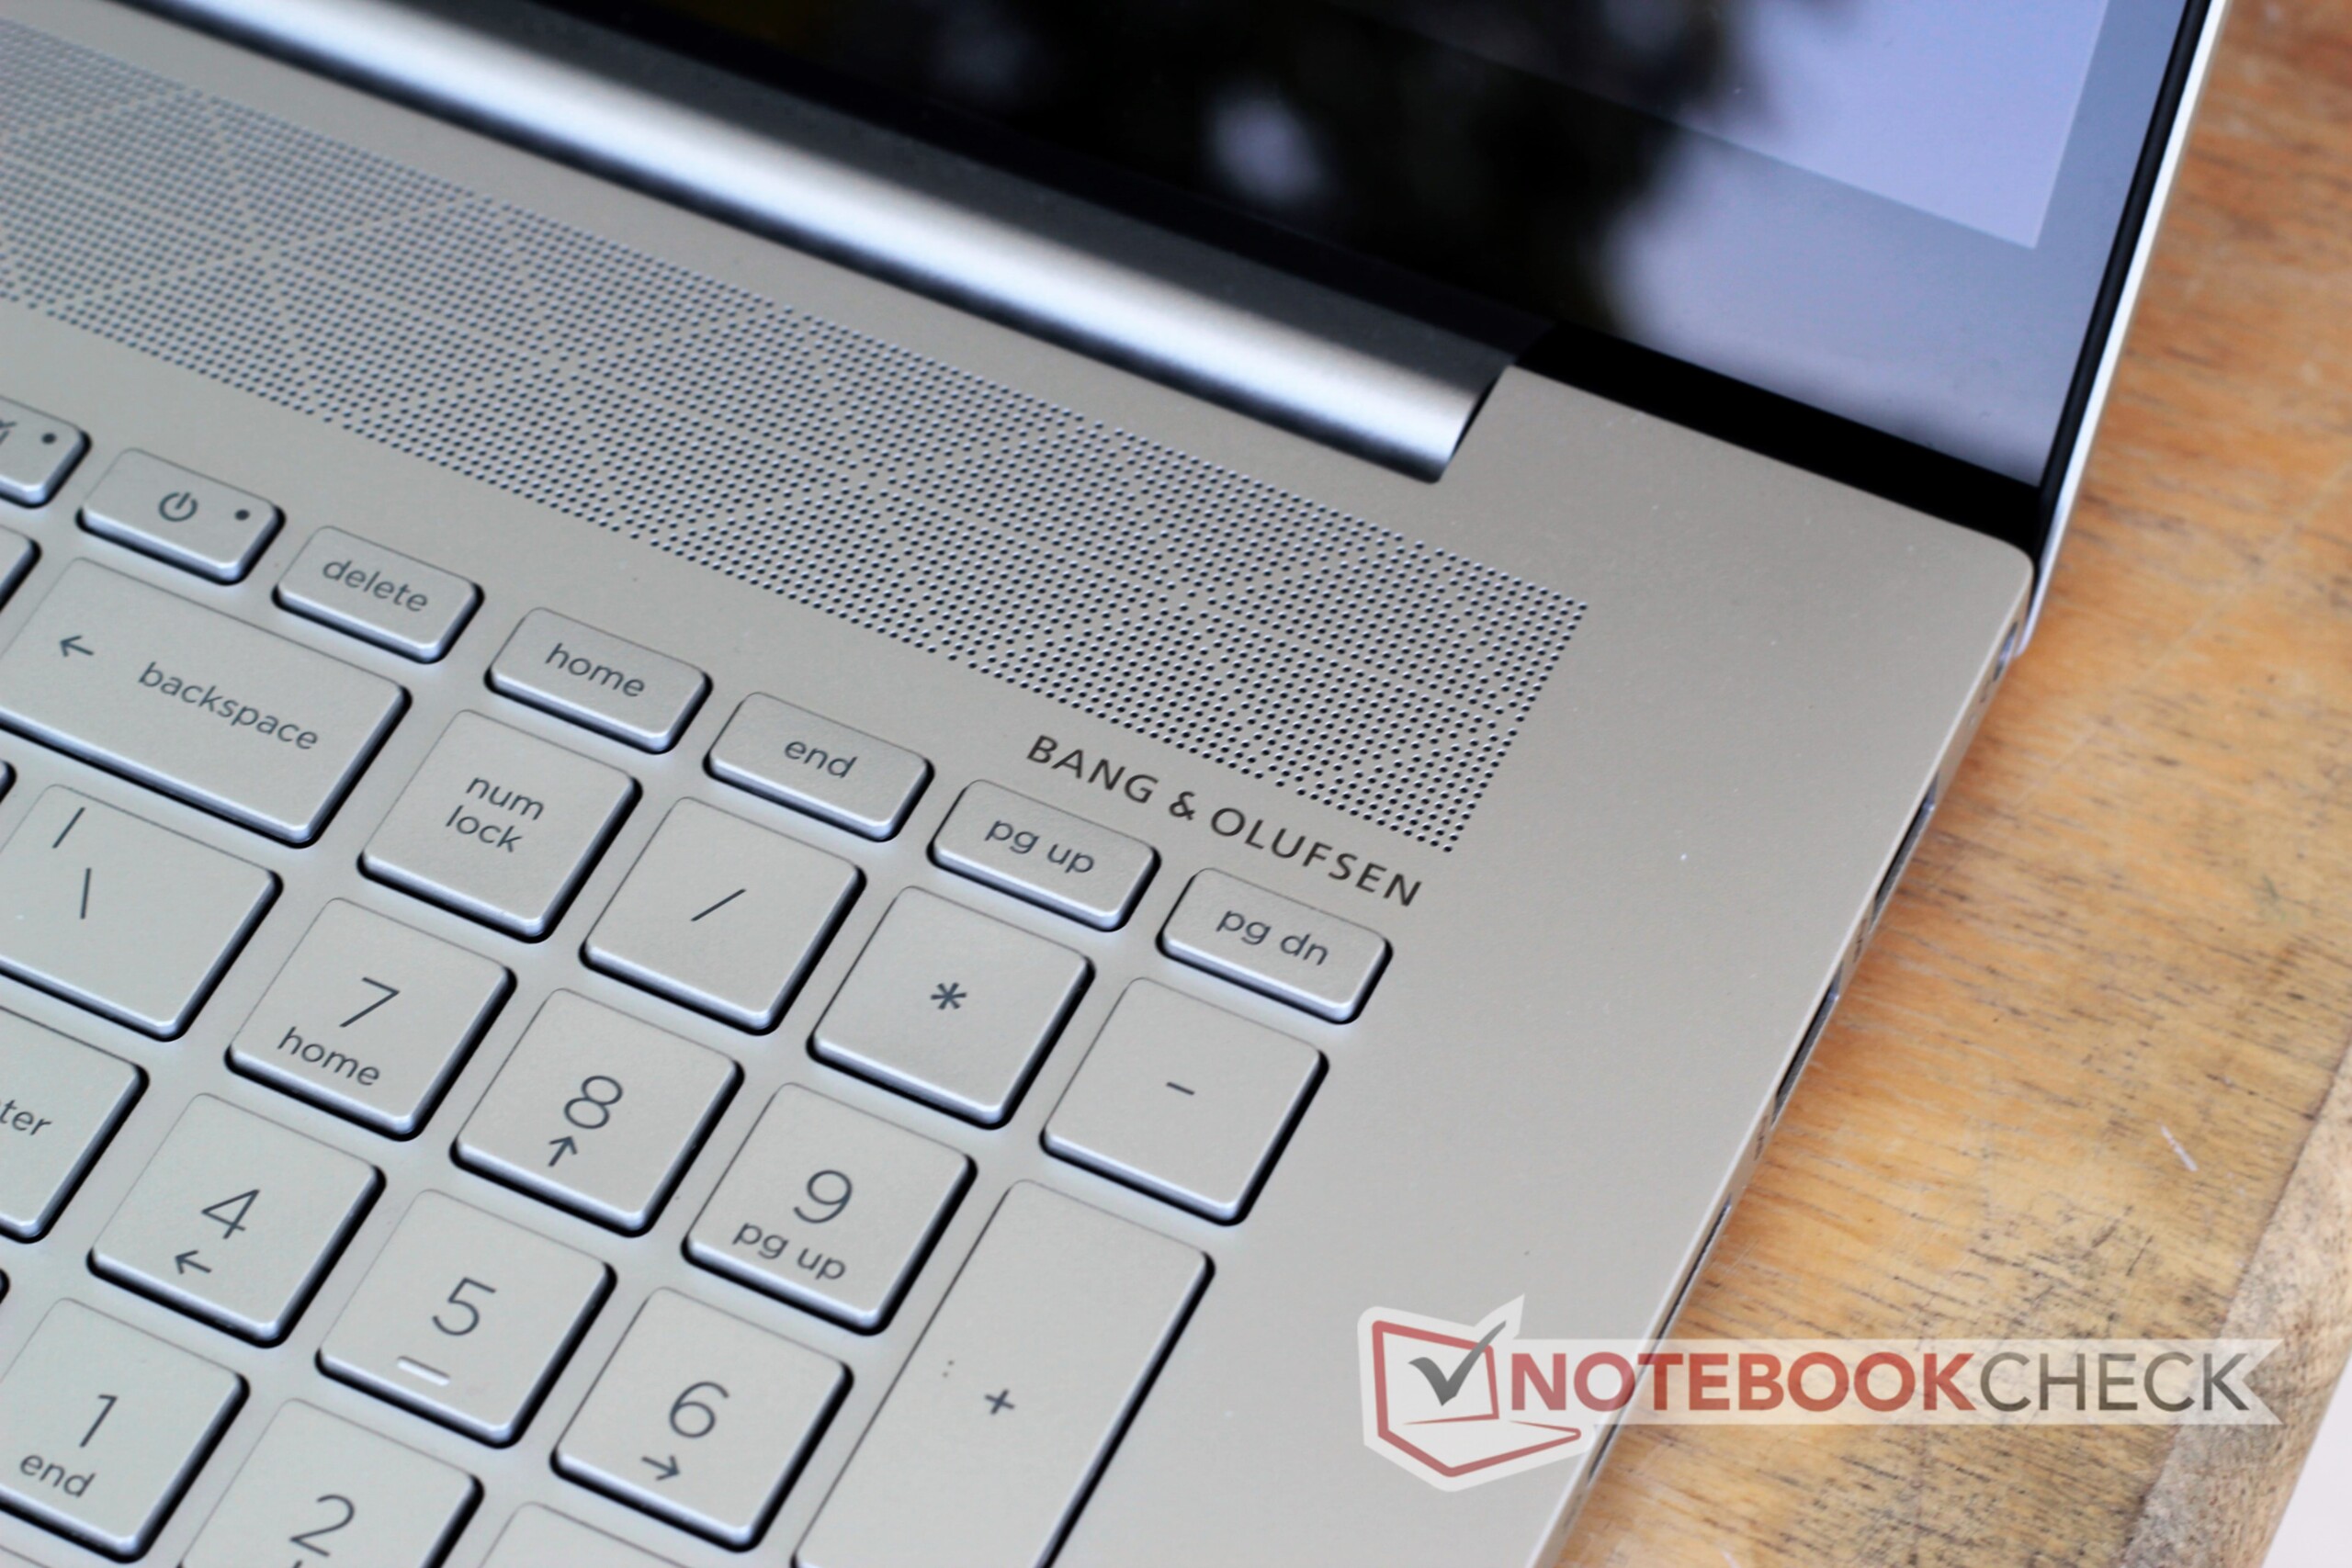
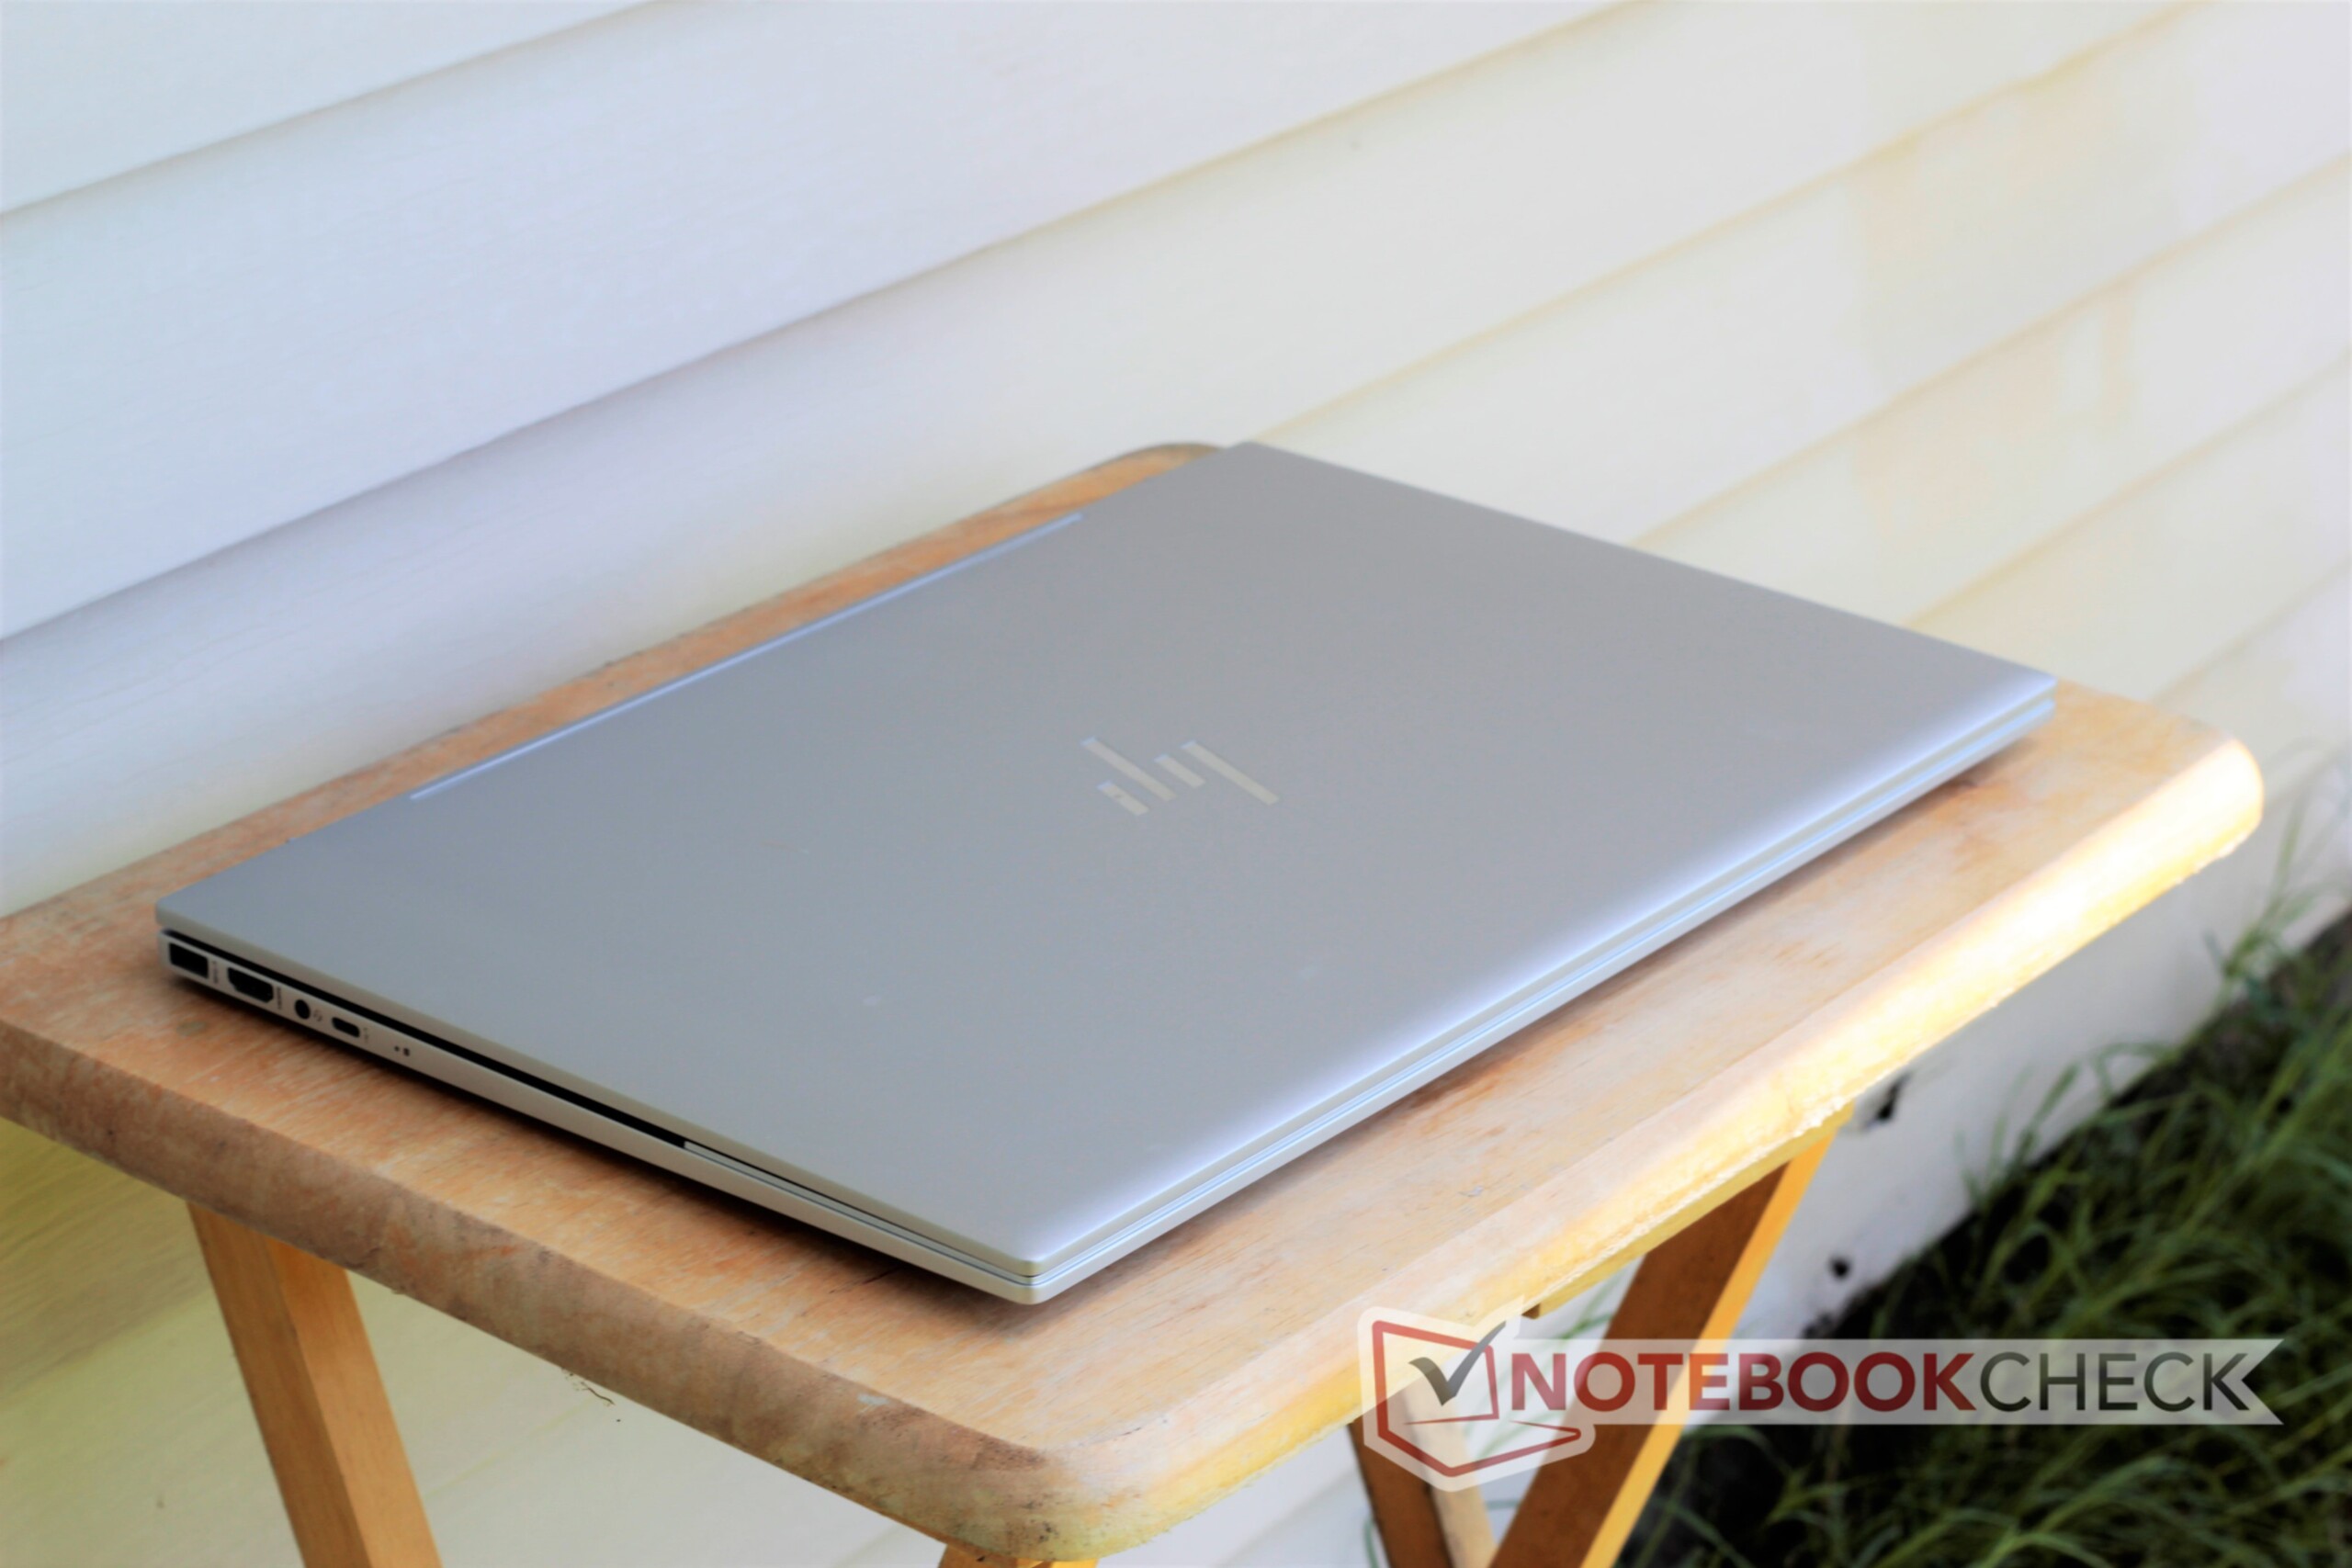
A HP atingiu várias notas altas com o Envy 17t. Seu chassi de alumínio é bem construído e tem ótima aparência. O acabamento anodizado deve manter sua boa aparência por um bom tempo. A tela 4K brilhante é linda e de cores precisas. A CPU Ice Lake Core i7 e a GPU Nvidia Geforce MX330 oferecem uma transmissão fluente de mídia e pode lidar com alguns jogos. O teclado e o touchpad são bons, os alto-falantes são potentes, e a experiência geral é agradável... na maior parte do tempo.
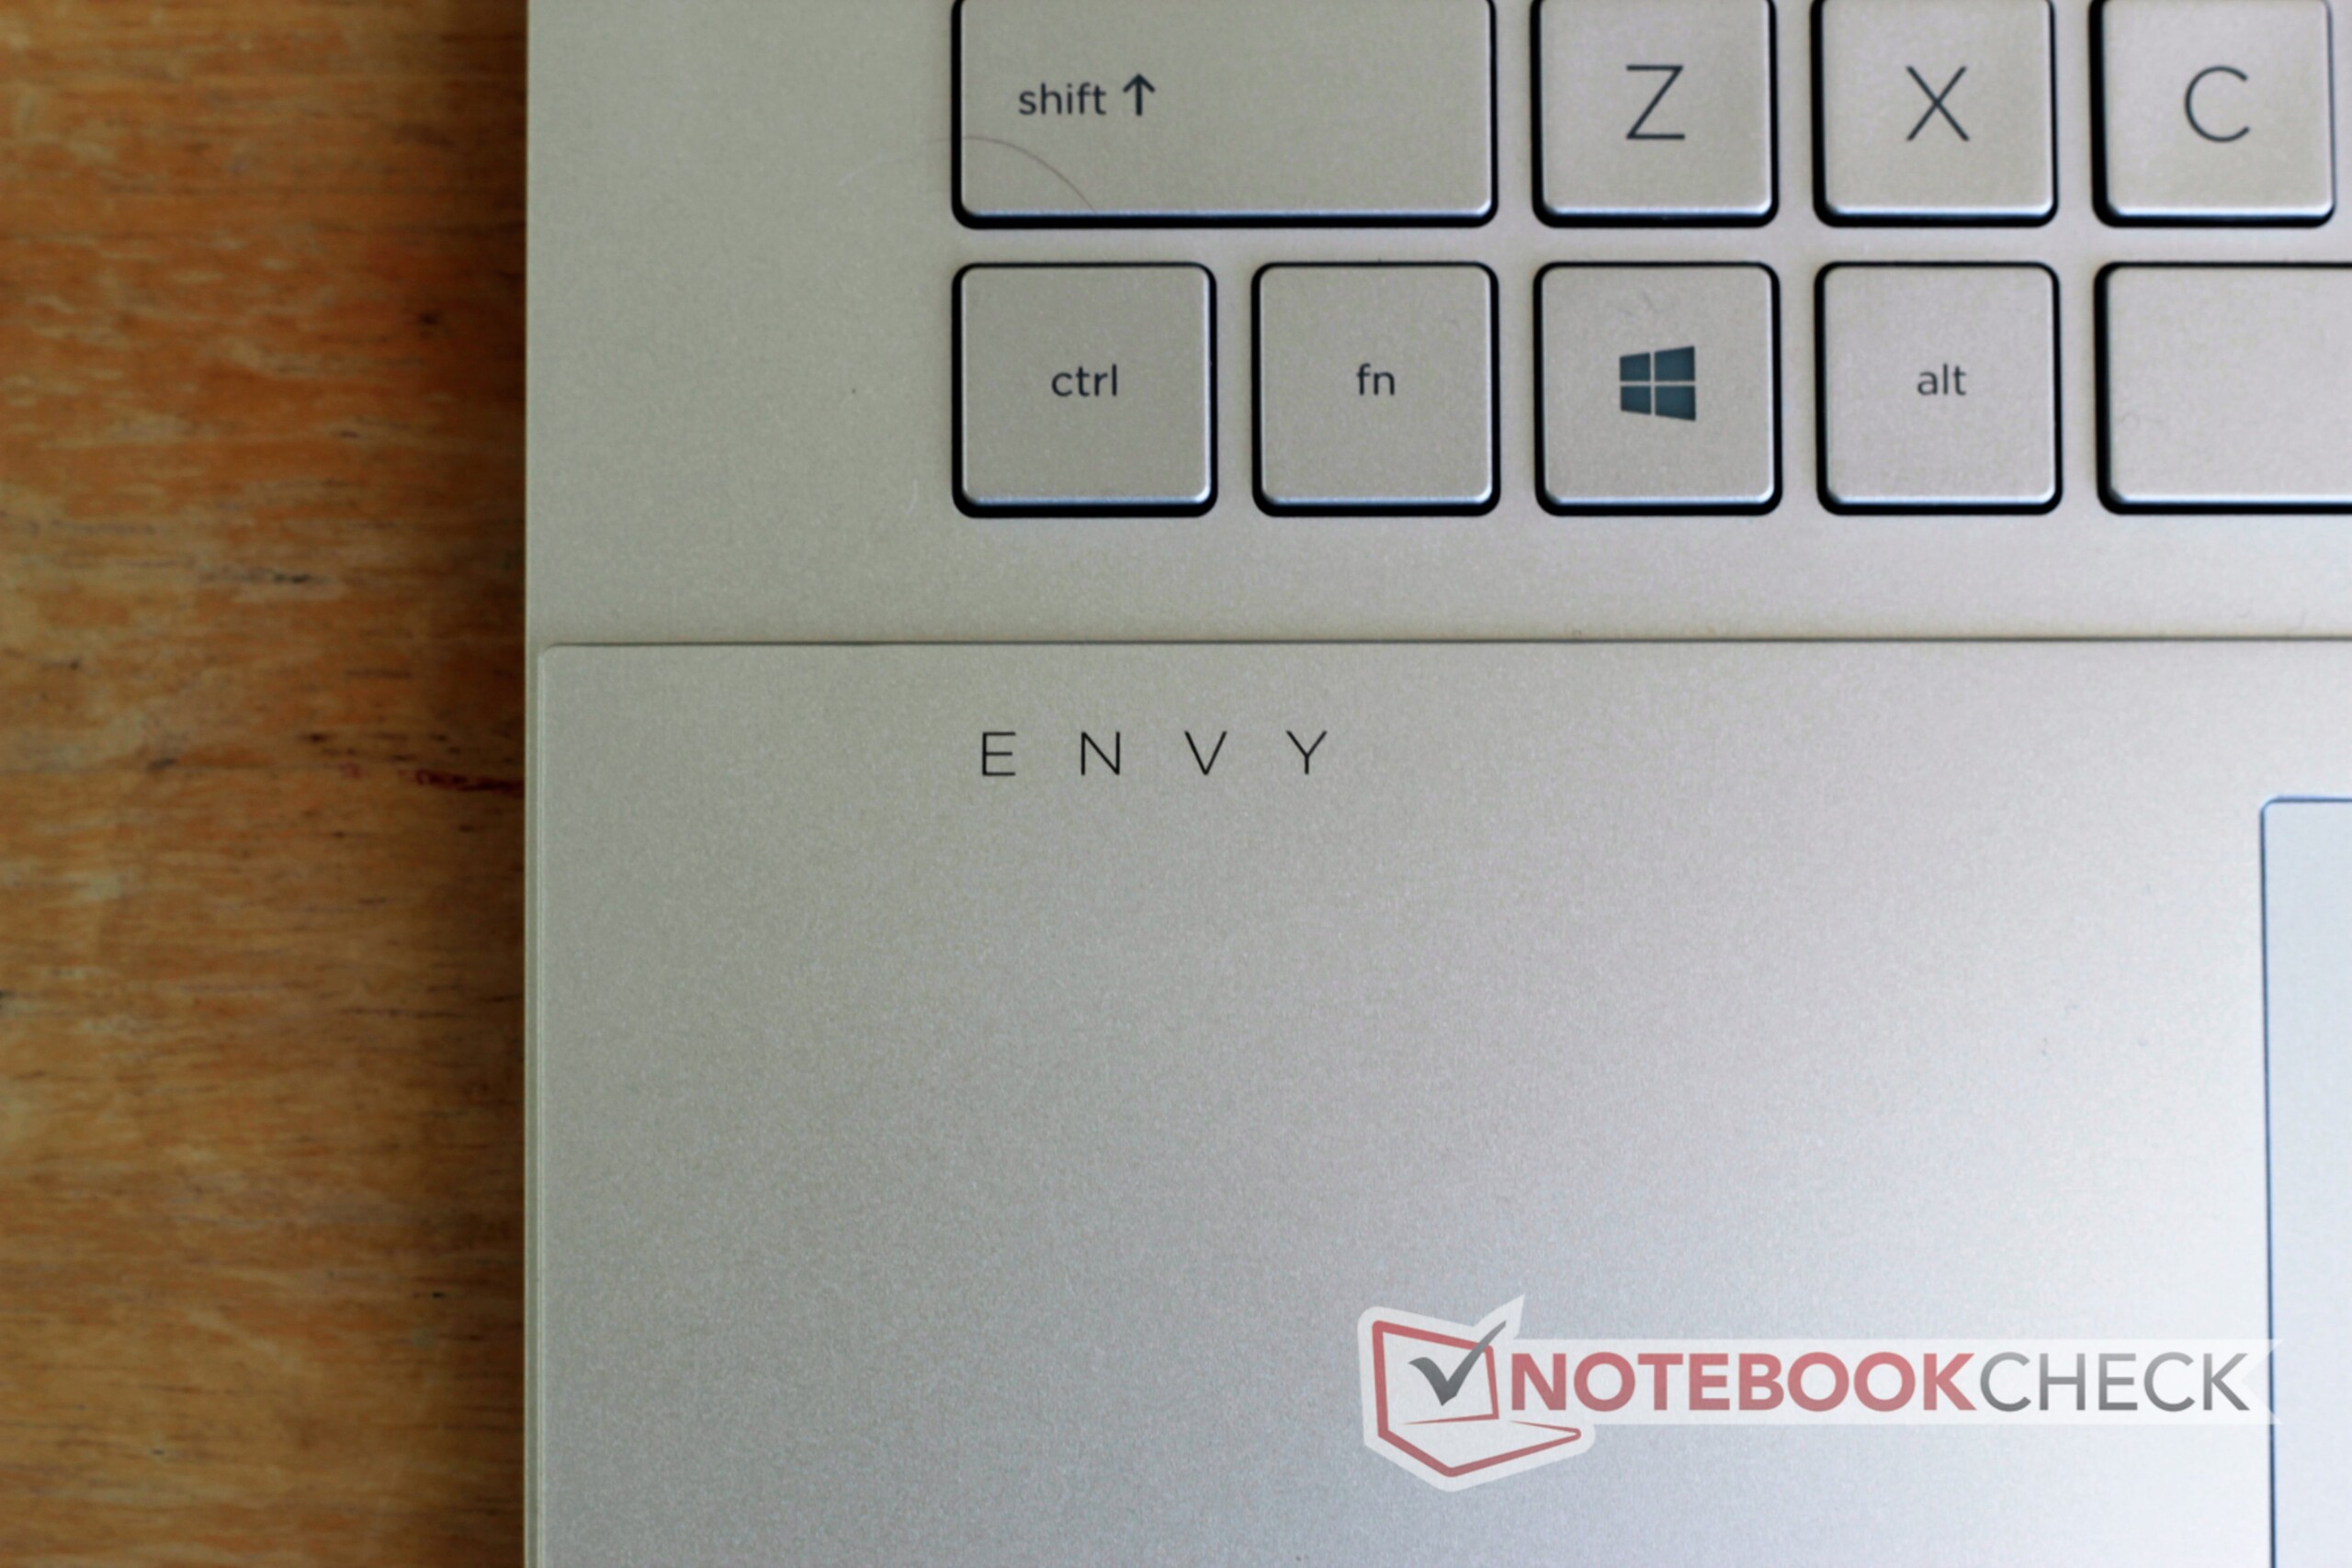
Vários pequenos aborrecimentos que distraem dos pontos altos. Por exemplo, a substituição do botão Ctrl direito por um leitor de digitais é desconcertante. Considerando quão dependentes são muitas combinações de teclas são, é lúgubre como a HP achou que essa configuração era uma boa ideia. O ventilador, embora silencioso sob carga leve, fica gradeado durante o funcionamento. Finalmente, a duração da bateria da máquina é decepcionante.
O Envy 17t é bastante bom para o que é, mas com um preço de rua recomendado de US$ 1.600, os aborrecimentos que notamos são mais do que pequenas reclamações. Apesar dessas falhas, o Envy 17t é um dos melhores portáteis multimídia de 17,3 polegadas disponíveis atualmente. Ainda assim, a esse preço, existem algumas opções melhores. O conversível Inspiron 17-7786 da Dell oferece hardware semelhante por um preço um pouco mais baixo. O HP Pavilion Gaming 17 carece da qualidade de construção do Envy 17t, mas oferece uma GPU muito mais poderosa e um processador mais rápido por cerca de US$ 300 a menos.
O HP Envy 17t é um portátil multimídia sólido, marcado por algumas falhas que acabam prejudicando a experiência geral.
HP Envy 17t-cg000
- 06/10/2020 v7 (old)
Sam Medley
Price comparison
