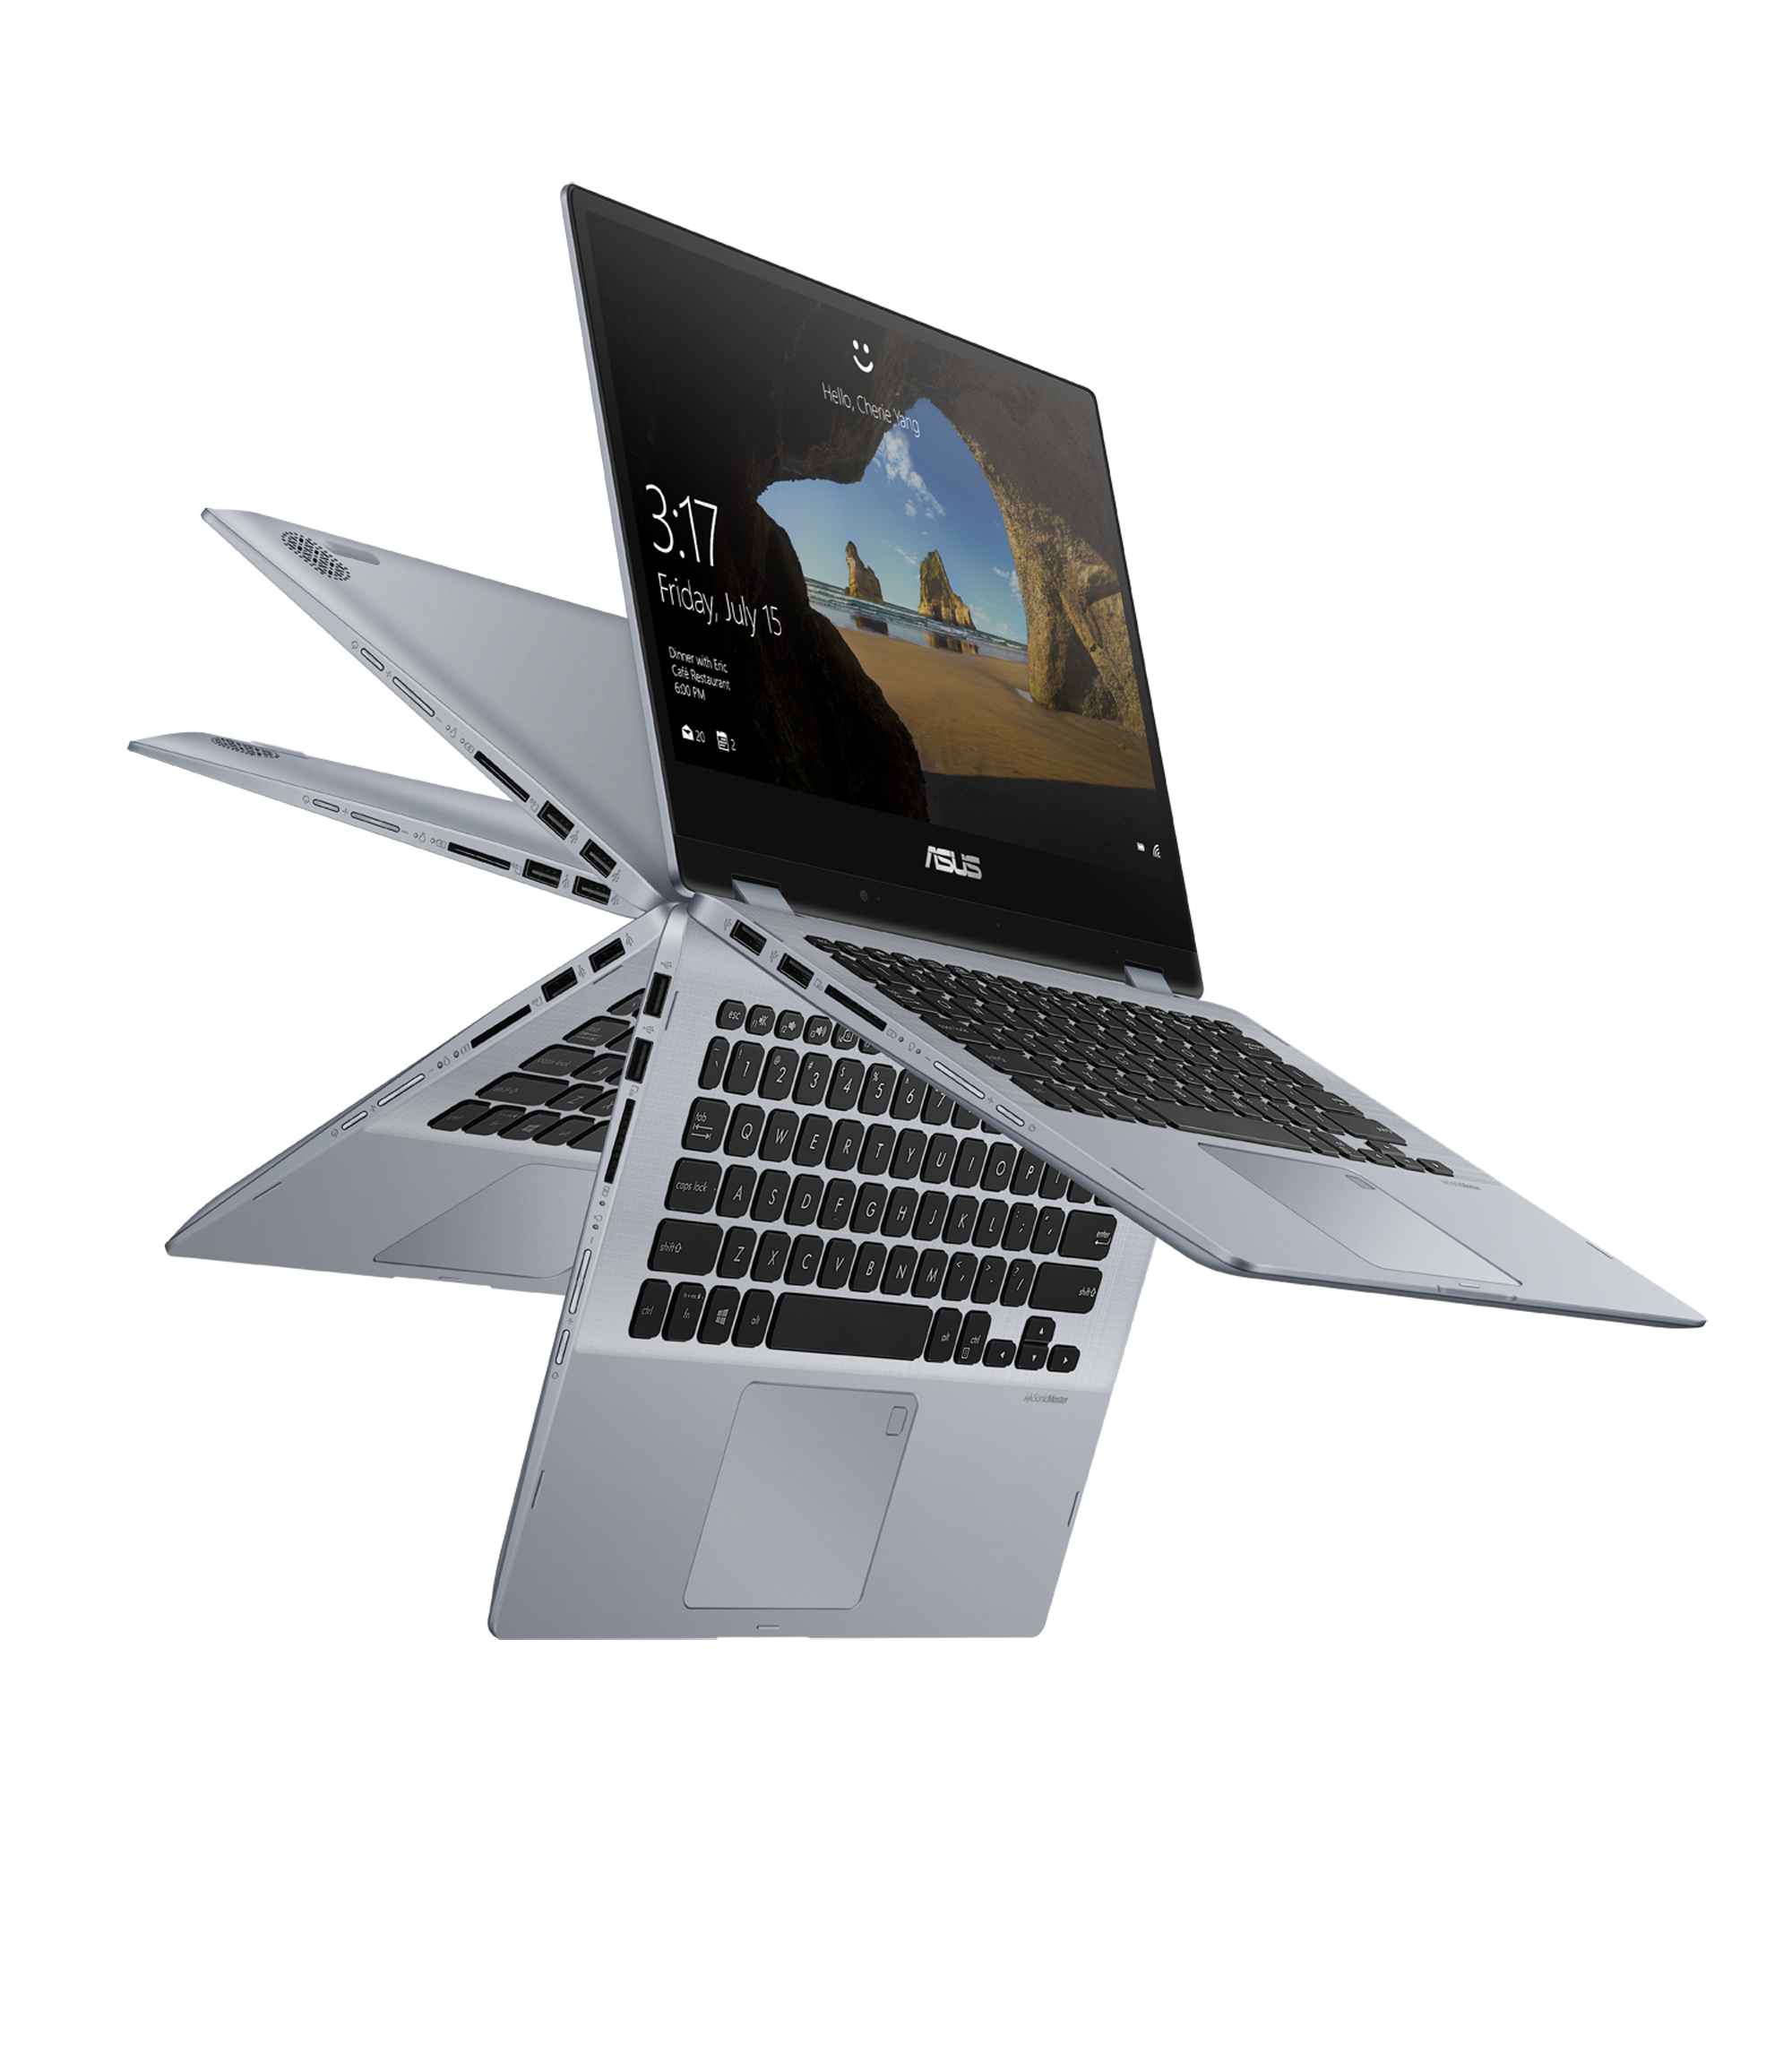
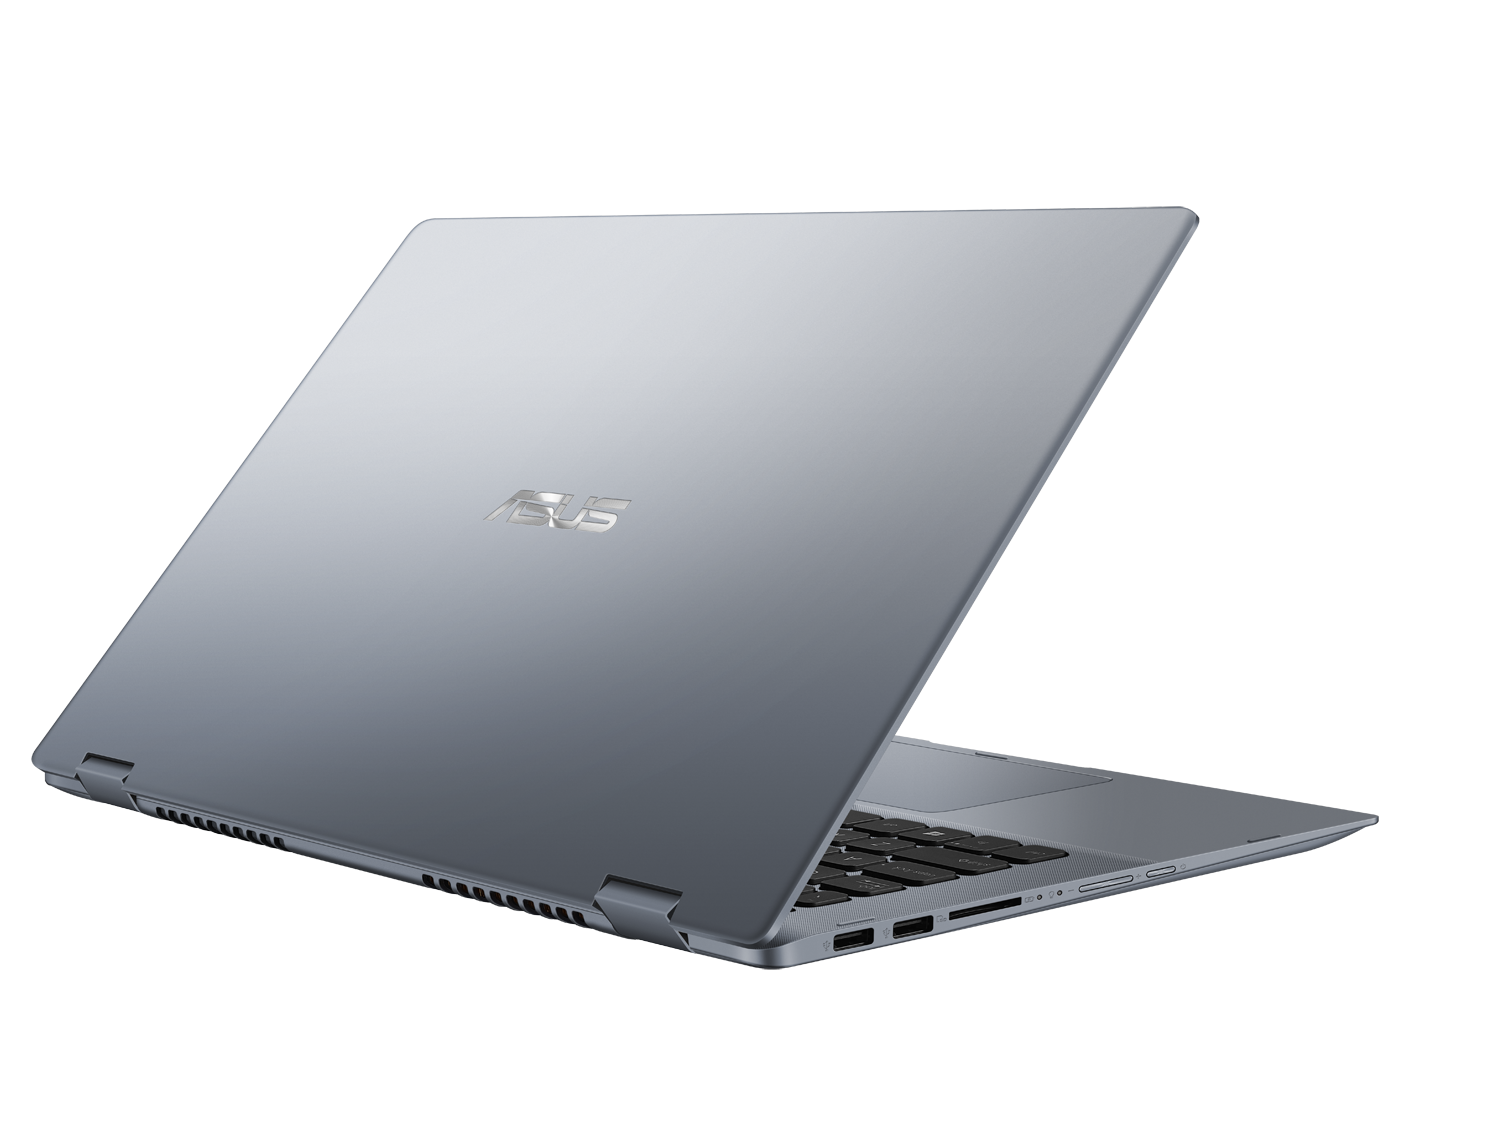
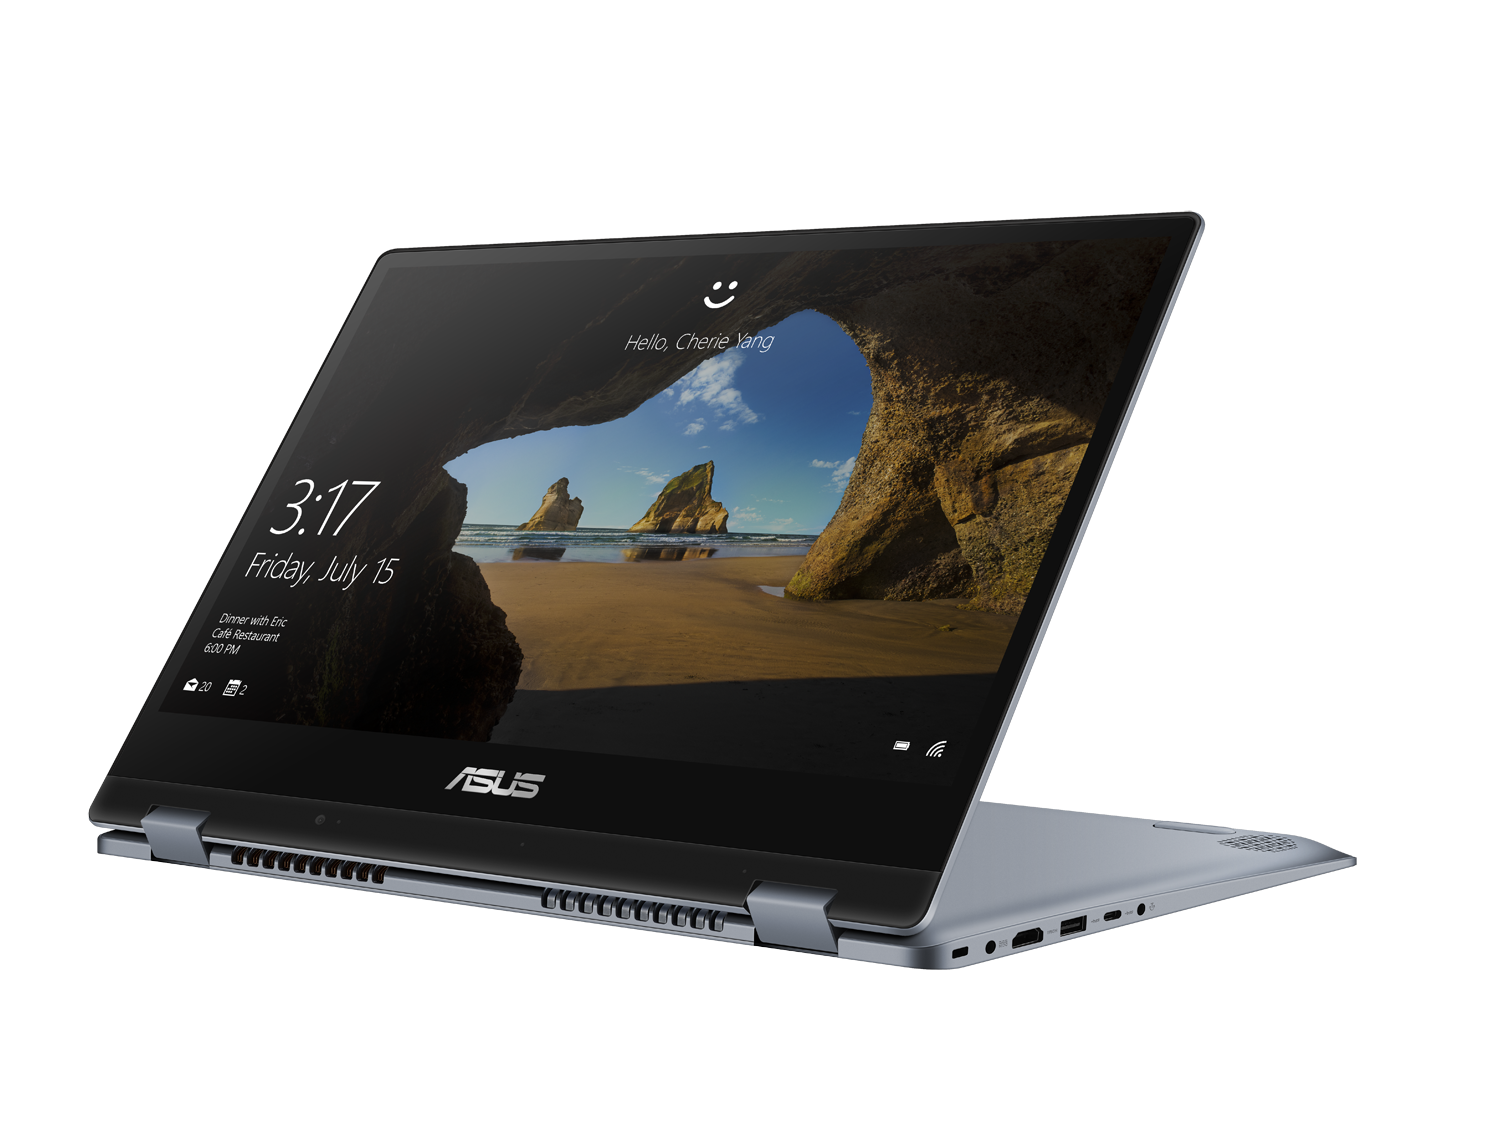
Breve Análise do Conversível Asus VivoBook Flip 14 TP412UA (i5-8250U)
| SD Card Reader | |
| average JPG Copy Test (av. of 3 runs) | |
| HP Spectre x360 15-ch000 (Toshiba Exceria Pro SDXC 64 GB UHS-II) | |
| Dell XPS 15 9570 i7 UHD (Toshiba Exceria Pro SDXC 64 GB UHS-II) | |
| Asus VivoBook Flip 14 TP412UA-DB51T (Toshiba Exceria Pro SDXC 64 GB UHS-II) | |
| Asus VivoBook Flip 14 TP410UA-EC242T (Toshiba Exceria Pro SDXC 64 GB UHS-II) | |
| maximum AS SSD Seq Read Test (1GB) | |
| HP Spectre x360 15-ch000 (Toshiba Exceria Pro SDXC 64 GB UHS-II) | |
| Dell XPS 15 9570 i7 UHD (Toshiba Exceria Pro SDXC 64 GB UHS-II) | |
| Asus VivoBook Flip 14 TP412UA-DB51T (Toshiba Exceria Pro SDXC 64 GB UHS-II) | |
| Asus VivoBook Flip 14 TP410UA-EC242T (Toshiba Exceria Pro SDXC 64 GB UHS-II) | |
| Networking | |
| iperf3 transmit AX12 | |
| Asus VivoBook Flip 14 TP410UA-EC242T | |
| Dell XPS 15 9570 i7 UHD | |
| Asus VivoBook Flip 14 TP412UA-DB51T | |
| Lenovo IdeaPad 330-15IGM | |
| iperf3 receive AX12 | |
| Asus VivoBook Flip 14 TP412UA-DB51T | |
| Asus VivoBook Flip 14 TP410UA-EC242T | |
| Dell XPS 15 9570 i7 UHD | |
| Lenovo IdeaPad 330-15IGM | |
| |||||||||||||||||||||||||
iluminação: 87 %
iluminação com acumulador: 252.5 cd/m²
Contraste: 881:1 (Preto: 0.29 cd/m²)
ΔE ColorChecker Calman: 4.18 | ∀{0.5-29.43 Ø4.72}
calibrated: 3.8
ΔE Greyscale Calman: 2.2 | ∀{0.09-98 Ø4.97}
59.1% sRGB (Argyll 1.6.3 3D)
37.5% AdobeRGB 1998 (Argyll 1.6.3 3D)
40.73% AdobeRGB 1998 (Argyll 3D)
59.2% sRGB (Argyll 3D)
39.42% Display P3 (Argyll 3D)
Gamma: 2.05
CCT: 6599 K
| Asus VivoBook Flip 14 TP412UA-DB51T AUO B140HAN04.0, IPS, 14", 1920x1080 | Lenovo Yoga 920-13IKB-80Y7 AU Optronics B139HAN03.0, IPS, 13.9", 1920x1080 | Asus VivoBook Flip 14 TP410UA-EC242T Chi Mei N140HCE-EN1, IPS, 14", 1920x1080 | Lenovo Yoga 530-14IKB-81EK00CWGE InfoVision M140NWF5 R2, IPS, 14", 1920x1080 | Dell XPS 15 9570 i7 UHD LQ156D1, IPS, 15.6", 3840x2160 | HP Spectre x360 15-ch000 BOE0730, IPS, 15.6", 3840x2160 | |
|---|---|---|---|---|---|---|
| Display | 57% | 67% | 5% | 87% | 58% | |
| Display P3 Coverage (%) | 39.42 | 62.5 59% | 66.7 69% | 41.52 5% | 79.1 101% | 66.7 69% |
| sRGB Coverage (%) | 59.2 | 91.7 55% | 96.6 63% | 62.1 5% | 98.8 67% | 87.4 48% |
| AdobeRGB 1998 Coverage (%) | 40.73 | 64.1 57% | 68.9 69% | 42.92 5% | 79.2 94% | 63.8 57% |
| Response Times | -12% | 9% | -8% | -13% | 14% | |
| Response Time Grey 50% / Grey 80% * (ms) | 38 ? | 46 ? -21% | 34 ? 11% | 45 ? -18% | 46.4 ? -22% | 36 ? 5% |
| Response Time Black / White * (ms) | 30.8 ? | 31.6 ? -3% | 29 ? 6% | 30 ? 3% | 32 ? -4% | 23.6 ? 23% |
| PWM Frequency (Hz) | 24750 ? | 520 ? | 980 ? | 943 ? | ||
| Screen | -11% | 29% | 18% | 35% | 15% | |
| Brightness middle (cd/m²) | 255.5 | 297.9 17% | 327 28% | 240 -6% | 494 93% | 349.5 37% |
| Brightness (cd/m²) | 242 | 278 15% | 308 27% | 234 -3% | 457 89% | 330 36% |
| Brightness Distribution (%) | 87 | 81 -7% | 90 3% | 93 7% | 88 1% | 90 3% |
| Black Level * (cd/m²) | 0.29 | 0.44 -52% | 0.23 21% | 0.11 62% | 0.34 -17% | 0.29 -0% |
| Contrast (:1) | 881 | 677 -23% | 1422 61% | 2182 148% | 1453 65% | 1205 37% |
| Colorchecker dE 2000 * | 4.18 | 5.1 -22% | 2.63 37% | 4.98 -19% | 5.2 -24% | 4.06 3% |
| Colorchecker dE 2000 max. * | 19.15 | 11 43% | 6.58 66% | 10.75 44% | 17.5 9% | 7.68 60% |
| Colorchecker dE 2000 calibrated * | 3.8 | 3.33 12% | 4.22 -11% | |||
| Greyscale dE 2000 * | 2.2 | 6.7 -205% | 4.11 -87% | 3.51 -60% | 2.7 -23% | 4.4 -100% |
| Gamma | 2.05 107% | 2.9 76% | 2.45 90% | 2.2 100% | 2.1 105% | 2.11 104% |
| CCT | 6599 98% | 6839 95% | 7352 88% | 6606 98% | 7038 92% | 7422 88% |
| Color Space (Percent of AdobeRGB 1998) (%) | 37.5 | 64.1 71% | 63 68% | 40 7% | 71.2 90% | 56.5 51% |
| Color Space (Percent of sRGB) (%) | 59.1 | 91.7 55% | 97 64% | 62 5% | 98.8 67% | 86.9 47% |
| Média Total (Programa/Configurações) | 11% /
3% | 35% /
34% | 5% /
12% | 36% /
39% | 29% /
23% |
* ... menor é melhor
Exibir tempos de resposta
| ↔ Tempo de resposta preto para branco | ||
|---|---|---|
| 30.8 ms ... ascensão ↗ e queda ↘ combinadas | ↗ 17.2 ms ascensão | 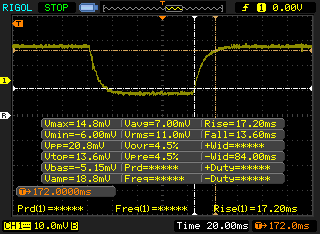 |
| ↘ 13.6 ms queda | ||
| A tela mostra taxas de resposta lentas em nossos testes e será insatisfatória para os jogadores. Em comparação, todos os dispositivos testados variam de 0.1 (mínimo) a 240 (máximo) ms. » 83 % de todos os dispositivos são melhores. Isso significa que o tempo de resposta medido é pior que a média de todos os dispositivos testados (19.8 ms). | ||
| ↔ Tempo de resposta 50% cinza a 80% cinza | ||
| 38 ms ... ascensão ↗ e queda ↘ combinadas | ↗ 19.6 ms ascensão | 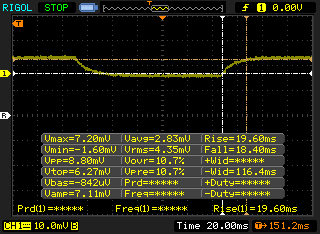 |
| ↘ 18.4 ms queda | ||
| A tela mostra taxas de resposta lentas em nossos testes e será insatisfatória para os jogadores. Em comparação, todos os dispositivos testados variam de 0.165 (mínimo) a 636 (máximo) ms. » 55 % de todos os dispositivos são melhores. Isso significa que o tempo de resposta medido é pior que a média de todos os dispositivos testados (31 ms). | ||
Cintilação da tela / PWM (modulação por largura de pulso)
| Tela tremeluzindo / PWM não detectado | 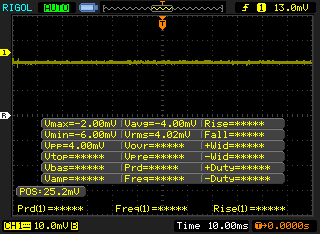 | ||
[pwm_comparison] Em comparação: 52 % de todos os dispositivos testados não usam PWM para escurecer a tela. Se PWM foi detectado, uma média de 7772 (mínimo: 5 - máximo: 343500) Hz foi medida. | |||
| PCMark 10 - Score | |
| Dell XPS 15 9570 i7 UHD | |
| HP Spectre x360 15-ch000 | |
| Lenovo Yoga 920-13IKB-80Y7 | |
| Asus VivoBook Flip 14 TP412UA-DB51T | |
| Lenovo Yoga 530-14IKB-81EK00CWGE | |
| Média Intel Core i5-8250U, Intel UHD Graphics 620 (3358 - 4081, n=67) | |
| Asus VivoBook Flip 14 TP410UA-EC242T | |
| PCMark 8 - Home Score Accelerated v2 | |
| Lenovo Yoga 920-13IKB-80Y7 | |
| HP Spectre x360 15-ch000 | |
| Dell XPS 15 9570 i7 UHD | |
| Média Intel Core i5-8250U, Intel UHD Graphics 620 (2986 - 4458, n=69) | |
| Asus VivoBook Flip 14 TP410UA-EC242T | |
| Asus VivoBook Flip 14 TP412UA-DB51T | |
| PCMark 8 Home Score Accelerated v2 | 2986 pontos | |
| PCMark 10 Score | 3564 pontos | |
Ajuda | ||
| Asus VivoBook Flip 14 TP412UA-DB51T Micron 1100 MTFDDAV256TBN | Lenovo Yoga 920-13IKB-80Y7 Samsung PM961 MZVLW256HEHP | Asus VivoBook Flip 14 TP410UA-EC242T SK Hynix HFS256G39TND-N210A | HP Spectre x360 15-ch000 Toshiba XG5-P KXG50PNV2T04 | Lenovo Yoga 520-14IKB 80X80097GE Intel SSD 600p SSDPEKKW256G7 | |
|---|---|---|---|---|---|
| AS SSD | 150% | -29% | 162% | 51% | |
| Copy Game MB/s (MB/s) | 354 | 319.2 -10% | 183.5 -48% | 698 97% | 425.7 20% |
| Copy Program MB/s (MB/s) | 364.3 | 463.3 27% | 120.9 -67% | 463.7 27% | 227.4 -38% |
| Copy ISO MB/s (MB/s) | 414.4 | 1341 224% | 241.6 -42% | 1674 304% | 579 40% |
| Score Total (Points) | 839 | 2536 202% | 1005 20% | 2720 224% | 1312 56% |
| Score Write (Points) | 379 | 608 60% | 323 -15% | 1145 202% | 662 75% |
| Score Read (Points) | 301 | 1316 337% | 453 50% | 1087 261% | 449 49% |
| Access Time Write * (ms) | 0.056 | 0.028 50% | 0.226 -304% | 0.065 -16% | 0.033 41% |
| Access Time Read * (ms) | 0.079 | 0.044 44% | 0.118 -49% | 0.047 41% | 0.092 -16% |
| 4K-64 Write (MB/s) | 279.4 | 391.3 40% | 230.2 -18% | 950 240% | 495.4 77% |
| 4K-64 Read (MB/s) | 234.3 | 1039 343% | 375.3 60% | 840 259% | 279.3 19% |
| 4K Write (MB/s) | 64.7 | 128.1 98% | 68.3 6% | 96.9 50% | 110.2 70% |
| 4K Read (MB/s) | 23.31 | 48.46 108% | 28.07 20% | 20.21 -13% | 33.13 42% |
| Seq Write (MB/s) | 350.3 | 885 153% | 248.8 -29% | 980 180% | 561 60% |
| Seq Read (MB/s) | 437.9 | 2282 421% | 499.7 14% | 2269 418% | 1367 212% |
* ... menor é melhor

| 3DMark 11 | |
| 1280x720 Performance GPU | |
| HP Spectre x360 15-ch000 | |
| MSI Prestige PS42 8RB-059 | |
| Acer Swift 3 SF315-41-R6J9 | |
| HP ProBook 645 G4 3UP62EA | |
| Asus VivoBook S410UQ-NH74 | |
| Média Intel UHD Graphics 620 (1144 - 3432, n=244) | |
| Asus VivoBook Flip 14 TP412UA-DB51T | |
| Lenovo Yoga 920-13IKB-80Y7 | |
| Asus VivoBook Flip 14 TP410UA-EC242T | |
| Microsoft Surface Go MHN-00003 | |
| Chuwi GBox CWI560 | |
| 1280x720 Performance Combined | |
| HP Spectre x360 15-ch000 | |
| MSI Prestige PS42 8RB-059 | |
| Acer Swift 3 SF315-41-R6J9 | |
| Asus VivoBook S410UQ-NH74 | |
| HP ProBook 645 G4 3UP62EA | |
| Lenovo Yoga 920-13IKB-80Y7 | |
| Média Intel UHD Graphics 620 (927 - 2505, n=244) | |
| Asus VivoBook Flip 14 TP412UA-DB51T | |
| Asus VivoBook Flip 14 TP410UA-EC242T | |
| Microsoft Surface Go MHN-00003 | |
| Chuwi GBox CWI560 | |
| 3DMark | |
| 1280x720 Cloud Gate Standard Graphics | |
| HP Spectre x360 15-ch000 | |
| MSI Prestige PS42 8RB-059 | |
| Acer Swift 3 SF315-41-R6J9 | |
| Asus VivoBook S410UQ-NH74 | |
| HP ProBook 645 G4 3UP62EA | |
| Lenovo Yoga 920-13IKB-80Y7 | |
| Média Intel UHD Graphics 620 (6205 - 16400, n=225) | |
| Asus VivoBook Flip 14 TP410UA-EC242T | |
| Microsoft Surface Go MHN-00003 | |
| 1920x1080 Fire Strike Graphics | |
| HP Spectre x360 15-ch000 | |
| MSI Prestige PS42 8RB-059 | |
| Acer Swift 3 SF315-41-R6J9 | |
| Asus VivoBook S410UQ-NH74 | |
| HP ProBook 645 G4 3UP62EA | |
| Média Intel UHD Graphics 620 (557 - 2608, n=213) | |
| Lenovo Yoga 920-13IKB-80Y7 | |
| Microsoft Surface Go MHN-00003 | |
| Asus VivoBook Flip 14 TP410UA-EC242T | |
| 1920x1080 Ice Storm Extreme Graphics | |
| HP ProBook 645 G4 3UP62EA | |
| Lenovo Yoga 920-13IKB-80Y7 | |
| Média Intel UHD Graphics 620 (26409 - 59483, n=71) | |
| Microsoft Surface Go MHN-00003 | |
| 3DMark 11 Performance | 1929 pontos | |
Ajuda | ||
| baixo | média | alto | ultra | |
|---|---|---|---|---|
| BioShock Infinite (2013) | 63.8 | 34.3 | 29.1 | 9.7 |
Barulho
| Ocioso |
| 28.4 / 28.4 / 28.4 dB |
| Carga |
| 35.7 / 39 dB |
 | ||
30 dB silencioso 40 dB(A) audível 50 dB(A) ruidosamente alto |
||
min: | ||
| Asus VivoBook Flip 14 TP412UA-DB51T UHD Graphics 620, i5-8250U, Micron 1100 MTFDDAV256TBN | Lenovo Yoga 920-13IKB-80Y7 UHD Graphics 620, i5-8550U, Samsung PM961 MZVLW256HEHP | Dell XPS 15 9570 i7 UHD GeForce GTX 1050 Ti Max-Q, i7-8750H, Toshiba XG5 KXG50ZNV512G | Asus VivoBook Flip 14 TP410UA-EC242T HD Graphics 620, i5-7200U, SK Hynix HFS256G39TND-N210A | HP Spectre x360 15-ch000 Vega M GL / 870, i7-8705G, Toshiba XG5-P KXG50PNV2T04 | Lenovo Yoga 530-14IKB-81EK00CWGE UHD Graphics 620, i5-8250U, SK hynix PC401 HFS256GD9TNG | |
|---|---|---|---|---|---|---|
| Noise | 2% | -5% | -6% | -5% | -3% | |
| desligado / ambiente * (dB) | 28.4 | 28 1% | 29.9 -5% | 30.3 -7% | 28.1 1% | 30.3 -7% |
| Idle Minimum * (dB) | 28.4 | 28 1% | 29.9 -5% | 31.2 -10% | 30.8 -8% | 30.3 -7% |
| Idle Average * (dB) | 28.4 | 28.8 -1% | 29.9 -5% | 31.2 -10% | 30.9 -9% | 30.3 -7% |
| Idle Maximum * (dB) | 28.4 | 30.3 -7% | 30.3 -7% | 31.2 -10% | 30.9 -9% | 30.3 -7% |
| Load Average * (dB) | 35.7 | 34.5 3% | 36.5 -2% | 36.2 -1% | 31.8 11% | 36.1 -1% |
| Load Maximum * (dB) | 39 | 34.3 12% | 40.4 -4% | 38.3 2% | 44.2 -13% | 33.9 13% |
| Witcher 3 ultra * (dB) | 40.4 | 48.1 |
* ... menor é melhor
(+) A temperatura máxima no lado superior é 36.6 °C / 98 F, em comparação com a média de 35.4 °C / 96 F , variando de 19.6 a 60 °C para a classe Convertible.
(-) A parte inferior aquece até um máximo de 49.4 °C / 121 F, em comparação com a média de 36.9 °C / 98 F
(+) Em uso inativo, a temperatura média para o lado superior é 24 °C / 75 F, em comparação com a média do dispositivo de 30.3 °C / ### class_avg_f### F.
(+) Os apoios para as mãos e o touchpad são mais frios que a temperatura da pele, com um máximo de 22.2 °C / 72 F e, portanto, são frios ao toque.
(+) A temperatura média da área do apoio para as mãos de dispositivos semelhantes foi 28 °C / 82.4 F (+5.8 °C / 10.4 F).
Asus VivoBook Flip 14 TP412UA-DB51T análise de áudio
(±) | o volume do alto-falante é médio, mas bom (###valor### dB)
Graves 100 - 315Hz
(-) | quase nenhum baixo - em média 18.2% menor que a mediana
(±) | a linearidade dos graves é média (12.3% delta para a frequência anterior)
Médios 400 - 2.000 Hz
(+) | médios equilibrados - apenas 3.2% longe da mediana
(+) | médios são lineares (6.4% delta para frequência anterior)
Altos 2 - 16 kHz
(+) | agudos equilibrados - apenas 4.6% longe da mediana
(+) | os máximos são lineares (5.6% delta da frequência anterior)
Geral 100 - 16.000 Hz
(±) | a linearidade do som geral é média (18.4% diferença em relação à mediana)
Comparado com a mesma classe
» 41% de todos os dispositivos testados nesta classe foram melhores, 7% semelhantes, 52% piores
» O melhor teve um delta de 6%, a média foi 20%, o pior foi 57%
Comparado com todos os dispositivos testados
» 41% de todos os dispositivos testados foram melhores, 8% semelhantes, 52% piores
» O melhor teve um delta de 4%, a média foi 24%, o pior foi 134%
Apple MacBook 12 (Early 2016) 1.1 GHz análise de áudio
(+) | os alto-falantes podem tocar relativamente alto (###valor### dB)
Graves 100 - 315Hz
(±) | graves reduzidos - em média 11.3% menor que a mediana
(±) | a linearidade dos graves é média (14.2% delta para a frequência anterior)
Médios 400 - 2.000 Hz
(+) | médios equilibrados - apenas 2.4% longe da mediana
(+) | médios são lineares (5.5% delta para frequência anterior)
Altos 2 - 16 kHz
(+) | agudos equilibrados - apenas 2% longe da mediana
(+) | os máximos são lineares (4.5% delta da frequência anterior)
Geral 100 - 16.000 Hz
(+) | o som geral é linear (10.2% diferença em relação à mediana)
Comparado com a mesma classe
» 7% de todos os dispositivos testados nesta classe foram melhores, 2% semelhantes, 91% piores
» O melhor teve um delta de 5%, a média foi 18%, o pior foi 53%
Comparado com todos os dispositivos testados
» 5% de todos os dispositivos testados foram melhores, 1% semelhantes, 94% piores
» O melhor teve um delta de 4%, a média foi 24%, o pior foi 134%
| desligado | |
| Ocioso | |
| Carga |
|
Key:
min: | |
| Asus VivoBook Flip 14 TP412UA-DB51T i5-8250U, UHD Graphics 620, Micron 1100 MTFDDAV256TBN, IPS, 1920x1080, 14" | Lenovo Yoga 920-13IKB-80Y7 i5-8550U, UHD Graphics 620, Samsung PM961 MZVLW256HEHP, IPS, 1920x1080, 13.9" | Dell XPS 15 9570 i7 UHD i7-8750H, GeForce GTX 1050 Ti Max-Q, Toshiba XG5 KXG50ZNV512G, IPS, 3840x2160, 15.6" | Asus VivoBook Flip 14 TP410UA-EC242T i5-7200U, HD Graphics 620, SK Hynix HFS256G39TND-N210A, IPS, 1920x1080, 14" | HP Spectre x360 15-ch000 i7-8705G, Vega M GL / 870, Toshiba XG5-P KXG50PNV2T04, IPS, 3840x2160, 15.6" | Lenovo Yoga 530-14IKB-81EK00CWGE i5-8250U, UHD Graphics 620, SK hynix PC401 HFS256GD9TNG, IPS, 1920x1080, 14" | |
|---|---|---|---|---|---|---|
| Power Consumption | -10% | -211% | -24% | -207% | -6% | |
| Idle Minimum * (Watt) | 3.3 | 3.1 6% | 9.48 -187% | 3.9 -18% | 11.7 -255% | 3.3 -0% |
| Idle Average * (Watt) | 5.2 | 6.6 -27% | 16.1 -210% | 7 -35% | 16.8 -223% | 5.8 -12% |
| Idle Maximum * (Watt) | 5.6 | 7 -25% | 16.9 -202% | 9.3 -66% | 18.9 -238% | 8 -43% |
| Load Average * (Watt) | 32.9 | 35.2 -7% | 90.8 -176% | 35 -6% | 82.3 -150% | 29.2 11% |
| Load Maximum * (Watt) | 35.2 | 34.6 2% | 134.4 -282% | 33 6% | 94.9 -170% | 31.1 12% |
| Witcher 3 ultra * (Watt) | 87.2 |
* ... menor é melhor
| Asus VivoBook Flip 14 TP412UA-DB51T i5-8250U, UHD Graphics 620, 42 Wh | Lenovo Yoga 920-13IKB-80Y7 i5-8550U, UHD Graphics 620, 70 Wh | Dell XPS 15 9570 i7 UHD i7-8750H, GeForce GTX 1050 Ti Max-Q, 97 Wh | Asus VivoBook Flip 14 TP410UA-EC242T i5-7200U, HD Graphics 620, 42 Wh | HP Spectre x360 15-ch000 i7-8705G, Vega M GL / 870, 84 Wh | Lenovo Yoga 530-14IKB-81EK00CWGE i5-8250U, UHD Graphics 620, 45 Wh | |
|---|---|---|---|---|---|---|
| Duração da bateria | 19% | 0% | -29% | -41% | -27% | |
| WiFi v1.3 (h) | 9.6 | 11.4 19% | 9.6 0% | 6.8 -29% | 5.7 -41% | 7 -27% |
| Reader / Idle (h) | 27.6 | 9 | 15.3 | |||
| Load (h) | 2.3 | 1.3 | 1.1 | 1.8 | ||
| Witcher 3 ultra (h) | 1 |
Pro
Contra
O 2018 VivoBook Flip TP412 está alguns passos à frente e a alguns passos atrás em comparação com o seu antecessor imediato. Sua atualização Kaby Lake-R é indubitavelmente mais rápida, sendo mais fina, mais leve e mais resistente para um pacote mais atraente em geral. Infelizmente, sua tela é mais escura, sua gama é mais estreita e está faltando o compartimento SATA secundário de 2,5 polegadas que estava presente no TP410.
Por um preço de varejo de $700 a $800, o TP412 é um atrativo conversível de 14 polegadas sem qualquer um dos recursos sofisticados dos modelos mais caros. Sua versatilidade faz com que seja bom para uso em interiores e em sala de aula, enquanto sua tela fraca o torna mais pobre para o uso em exteriores.
Justo para o preço. O VivoBook Flip TP412 não oferece nada acima de sua faixa de preço para torná-lo uma barganha para os usuários convencionais. Esperamos que as futuras iterações irão iluminar a tela refletiva para melhorar a visibilidade em exteriores.
Asus VivoBook Flip 14 TP412UA-DB51T
- 09/29/2018 v6 (old)
Allen Ngo
Price comparison
