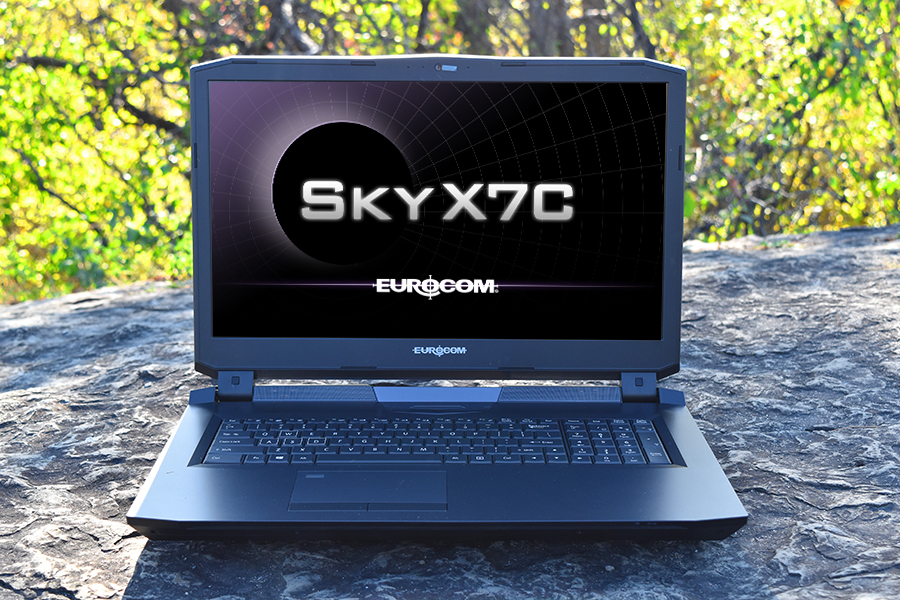
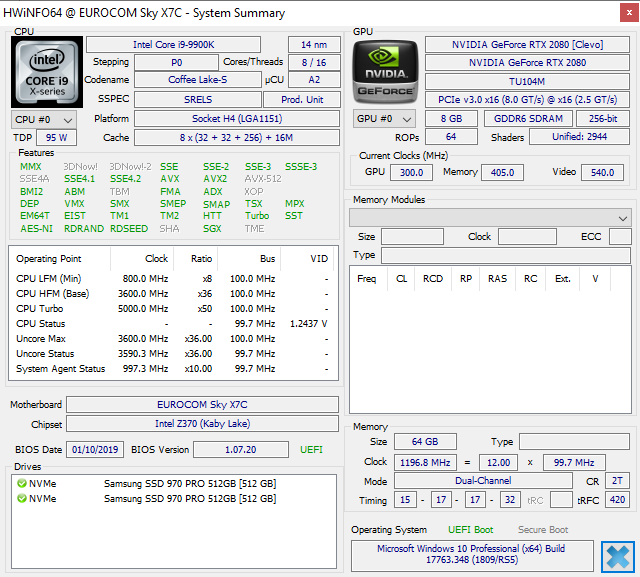
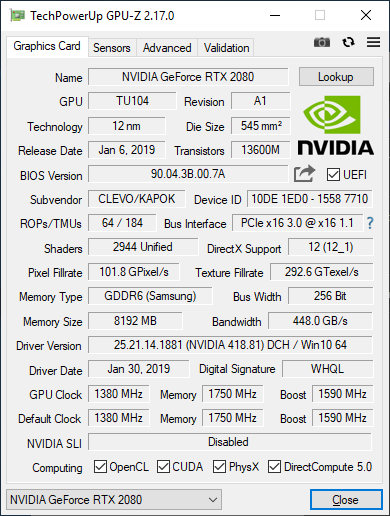
Breve Análise do Portátil Eurocom Sky X7C (i9-9900K, RTX 2080, FHD 144 Hz) Clevo P775TM1-G
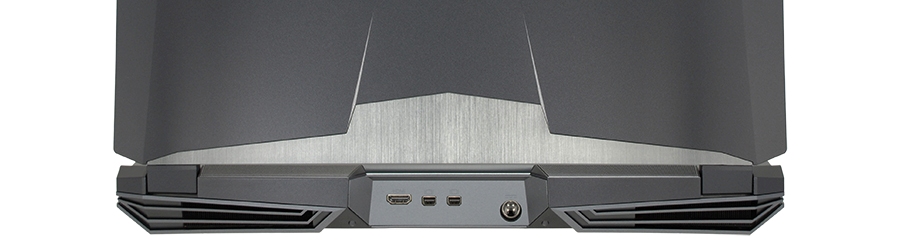
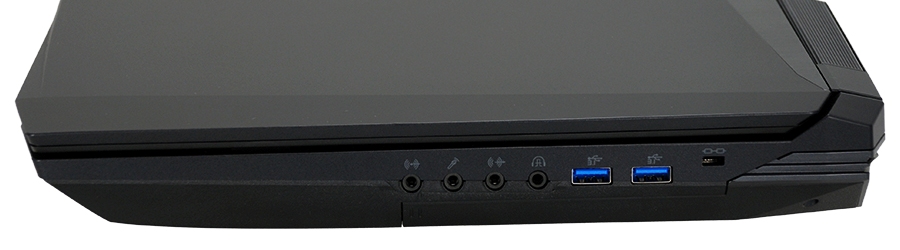
Connectivity
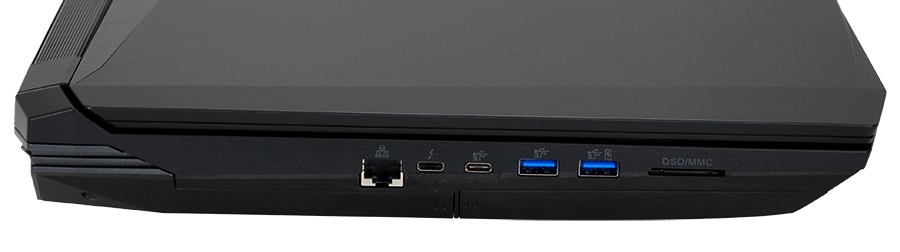
SD Card Reader
| SD Card Reader | |
| average JPG Copy Test (av. of 3 runs) | |
| Eurocom Sky X7C i9-9900K (Toshiba Exceria Pro SDXC 64 GB UHS-II) | |
| Asus ROG G703GX (Toshiba Exceria Pro SDXC 64 GB UHS-II) | |
| MSI GT75 8RG-090 Titan (Toshiba Exceria Pro SDXC 64 GB UHS-II) | |
| Acer Predator 17 G9-793-70PJ (Toshiba Exceria Pro SDXC 64 GB UHS-II) | |
| maximum AS SSD Seq Read Test (1GB) | |
| Asus ROG G703GX (Toshiba Exceria Pro SDXC 64 GB UHS-II) | |
| Eurocom Sky X7C i9-9900K (Toshiba Exceria Pro SDXC 64 GB UHS-II) | |
| Acer Predator 17 G9-793-70PJ (Toshiba Exceria Pro SDXC 64 GB UHS-II) | |
| MSI GT75 8RG-090 Titan (Toshiba Exceria Pro SDXC 64 GB UHS-II) | |
| Networking | |
| iperf3 transmit AX12 | |
| Asus ROG G703GX | |
| MSI GT75 8RG-090 Titan | |
| Eurocom Sky X7C i9-9900K | |
| Alienware 17 R5 | |
| iperf3 receive AX12 | |
| MSI GT75 8RG-090 Titan | |
| Asus ROG G703GX | |
| Alienware 17 R5 | |
| Eurocom Sky X7C i9-9900K | |
| |||||||||||||||||||||||||
iluminação: 85 %
iluminação com acumulador: 276.1 cd/m²
Contraste: 767:1 (Preto: 0.36 cd/m²)
ΔE ColorChecker Calman: 3.51 | ∀{0.5-29.43 Ø4.71}
calibrated: 3.56
ΔE Greyscale Calman: 2.7 | ∀{0.09-98 Ø4.96}
88.8% sRGB (Argyll 1.6.3 3D)
57.8% AdobeRGB 1998 (Argyll 1.6.3 3D)
65.2% AdobeRGB 1998 (Argyll 3D)
89.1% sRGB (Argyll 3D)
64.7% Display P3 (Argyll 3D)
Gamma: 2.28
CCT: 6947 K
| Eurocom Sky X7C i9-9900K AU Optronics B173HAN03.1, IPS, 17.3", 1920x1080 | Eurocom Sky X7C AU Optronics B173ZAN01.0, IPS, 17.3", 3840x2160 | Alienware 17 R5 JYWWF_B173QTN (AUO1496), TN, 17.3", 2560x1440 | Asus ROG G703GX AU Optronics B173HAN03.2 (AUO329D), IPS, 17.3", 1920x1080 | MSI GT75 8RG-090 Titan CMN N173HHE-G32 (CMN1747), TN, 17.3", 1920x1080 | Lenovo Legion Y740-17ICH AU Optronics B173HAN03.2, IPS, 17.3", 1920x1080 | |
|---|---|---|---|---|---|---|
| Display | 32% | -3% | 2% | 28% | -0% | |
| Display P3 Coverage (%) | 64.7 | 86 33% | 63.4 -2% | 64.1 -1% | 90.9 40% | 64 -1% |
| sRGB Coverage (%) | 89.1 | 99.9 12% | 86.1 -3% | 93.3 5% | 100 12% | 90.4 1% |
| AdobeRGB 1998 Coverage (%) | 65.2 | 98.9 52% | 62.9 -4% | 65.6 1% | 86.2 32% | 64.8 -1% |
| Response Times | -131% | 14% | 36% | 52% | -3% | |
| Response Time Grey 50% / Grey 80% * (ms) | 18 ? | 38.4 ? -113% | 20.8 ? -16% | 7.2 ? 60% | 8 ? 56% | 15.6 ? 13% |
| Response Time Black / White * (ms) | 10.8 ? | 26.8 ? -148% | 6 ? 44% | 9.6 ? 11% | 5.6 ? 48% | 12.8 ? -19% |
| PWM Frequency (Hz) | 26000 ? | |||||
| Screen | -8% | -13% | -2% | 24% | -15% | |
| Brightness middle (cd/m²) | 276.1 | 333 21% | 398 44% | 296 7% | 240 -13% | 299.1 8% |
| Brightness (cd/m²) | 260 | 330 27% | 367 41% | 279 7% | 248 -5% | 273 5% |
| Brightness Distribution (%) | 85 | 88 4% | 86 1% | 85 0% | 83 -2% | 81 -5% |
| Black Level * (cd/m²) | 0.36 | 0.4 -11% | 0.51 -42% | 0.25 31% | 0.22 39% | 0.27 25% |
| Contrast (:1) | 767 | 833 9% | 780 2% | 1184 54% | 1091 42% | 1108 44% |
| Colorchecker dE 2000 * | 3.51 | 5.87 -67% | 5.45 -55% | 4.77 -36% | 2.14 39% | 5.07 -44% |
| Colorchecker dE 2000 max. * | 6.84 | 9.74 -42% | 10.36 -51% | 9.08 -33% | 5.04 26% | 10.55 -54% |
| Colorchecker dE 2000 calibrated * | 3.56 | 4.59 -29% | 2.56 28% | 1.46 59% | 1.54 57% | 3.31 7% |
| Greyscale dE 2000 * | 2.7 | 4.5 -67% | 5.4 -100% | 5.83 -116% | 1.62 40% | 6.8 -152% |
| Gamma | 2.28 96% | 2.34 94% | 2.4 92% | 2.47 89% | 2.28 96% | 2.46 89% |
| CCT | 6947 94% | 6384 102% | 7453 87% | 8076 80% | 6846 95% | 7805 83% |
| Color Space (Percent of AdobeRGB 1998) (%) | 57.8 | 88 52% | 56 -3% | 60 4% | 77 33% | 58.5 1% |
| Color Space (Percent of sRGB) (%) | 88.8 | 100 13% | 86 -3% | 93 5% | 100 13% | 89.9 1% |
| Média Total (Programa/Configurações) | -36% /
-16% | -1% /
-7% | 12% /
4% | 35% /
29% | -6% /
-11% |
* ... menor é melhor
Exibir tempos de resposta
| ↔ Tempo de resposta preto para branco | ||
|---|---|---|
| 10.8 ms ... ascensão ↗ e queda ↘ combinadas | ↗ 5.6 ms ascensão | 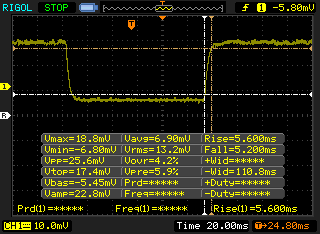 |
| ↘ 5.2 ms queda | ||
| A tela mostra boas taxas de resposta em nossos testes, mas pode ser muito lenta para jogadores competitivos. Em comparação, todos os dispositivos testados variam de 0.1 (mínimo) a 240 (máximo) ms. » 29 % de todos os dispositivos são melhores. Isso significa que o tempo de resposta medido é melhor que a média de todos os dispositivos testados (19.8 ms). | ||
| ↔ Tempo de resposta 50% cinza a 80% cinza | ||
| 18 ms ... ascensão ↗ e queda ↘ combinadas | ↗ 10 ms ascensão | 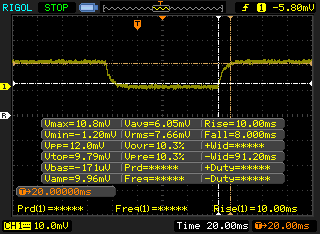 |
| ↘ 8 ms queda | ||
| A tela mostra boas taxas de resposta em nossos testes, mas pode ser muito lenta para jogadores competitivos. Em comparação, todos os dispositivos testados variam de 0.165 (mínimo) a 636 (máximo) ms. » 32 % de todos os dispositivos são melhores. Isso significa que o tempo de resposta medido é melhor que a média de todos os dispositivos testados (31 ms). | ||
Cintilação da tela / PWM (modulação por largura de pulso)
| Tela tremeluzindo / PWM não detectado | 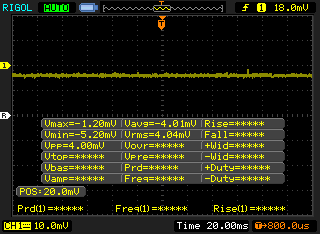 | ||
[pwm_comparison] Em comparação: 52 % de todos os dispositivos testados não usam PWM para escurecer a tela. Se PWM foi detectado, uma média de 7754 (mínimo: 5 - máximo: 343500) Hz foi medida. | |||
| Cinebench R15 | |
| CPU Single 64Bit | |
| Intel Core i9-9900K, AMD Radeon RX Vega 64 | |
| Eurocom Sky X7C i9-9900K | |
| Média Intel Core i9-9900K (203 - 218, n=9) | |
| Eurocom Sky X7C | |
| MSI GT75 8RG-090 Titan | |
| Schenker XMG Ultra 15 Turing | |
| Eurocom Sky X9C | |
| AMD Radeon RX Vega 64 | |
| AMD Threadripper 2970WX, AMD Radeon RX Vega 64 | |
| Asus ROG G703GX | |
| Lenovo Legion Y730-15ICH i5-8300H | |
| Acer Predator 17 G9-793-70PJ | |
| Asus GL702ZC-GC104T | |
| CPU Multi 64Bit | |
| AMD Threadripper 2970WX, AMD Radeon RX Vega 64 | |
| Intel Core i9-9900K, AMD Radeon RX Vega 64 | |
| Eurocom Sky X7C i9-9900K | |
| Média Intel Core i9-9900K (1623 - 2040, n=9) | |
| AMD Radeon RX Vega 64 | |
| Schenker XMG Ultra 15 Turing | |
| Asus GL702ZC-GC104T | |
| Eurocom Sky X7C | |
| MSI GT75 8RG-090 Titan | |
| Eurocom Sky X9C | |
| Asus ROG G703GX | |
| Lenovo Legion Y730-15ICH i5-8300H | |
| Acer Predator 17 G9-793-70PJ | |
| PCMark 8 Home Score Accelerated v2 | 5610 pontos | |
| PCMark 8 Work Score Accelerated v2 | 6352 pontos | |
| PCMark 10 Score | 7171 pontos | |
Ajuda | ||
| Eurocom Sky X7C i9-9900K 2x Samsung SSD 970 Pro 512GB (RAID 0) | Alienware 17 R5 SK hynix PC401 HFS256GD9TNG | Asus ROG G703GX Samsung SSD PM981 MZVLB512HAJQ | MSI GT75 8RG-090 Titan 2x Samsung PM961 MZVLW256HEHP (RAID 0) | Acer Predator 17 G9-793-70PJ Toshiba NVMe THNSN5512GPU7 | Lenovo Legion Y740-17ICH Samsung SSD PM981 MZVLB256HAHQ | |
|---|---|---|---|---|---|---|
| AS SSD | -69% | -19% | -15% | -33% | -36% | |
| Seq Read (MB/s) | 2323 | 2203 -5% | 1632 -30% | 3058 32% | 2237 -4% | 1153 -50% |
| Seq Write (MB/s) | 2887 | 559 -81% | 1767 -39% | 2196 -24% | 1230 -57% | 1328 -54% |
| 4K Read (MB/s) | 30.51 | 38.74 27% | 50.4 65% | 38.37 26% | 37.51 23% | 35.05 15% |
| 4K Write (MB/s) | 131.8 | 92.7 -30% | 101.9 -23% | 97.7 -26% | 120.8 -8% | 96 -27% |
| 4K-64 Read (MB/s) | 1507 | 447.2 -70% | 1196 -21% | 1347 -11% | 851 -44% | 727 -52% |
| 4K-64 Write (MB/s) | 1483 | 279.1 -81% | 1631 10% | 1236 -17% | 646 -56% | 1212 -18% |
| Access Time Read * (ms) | 0.032 | 0.091 -184% | 0.061 -91% | 0.056 -75% | 0.052 -63% | 0.063 -97% |
| Access Time Write * (ms) | 0.028 | 0.065 -132% | 0.037 -32% | 0.038 -36% | 0.033 -18% | 0.04 -43% |
| Score Read (Points) | 1770 | 706 -60% | 1410 -20% | 1691 -4% | 1112 -37% | 878 -50% |
| Score Write (Points) | 1904 | 428 -78% | 1910 0% | 1553 -18% | 890 -53% | 1441 -24% |
| Score Total (Points) | 4602 | 1424 -69% | 4057 -12% | 4066 -12% | 2547 -45% | 2784 -40% |
| Copy ISO MB/s (MB/s) | 3044 | 2048 -33% | 1487 -51% | |||
| Copy Program MB/s (MB/s) | 574 | 428.5 -25% | 608 6% | |||
| Copy Game MB/s (MB/s) | 1489 | 1173 -21% | 1162 -22% |
* ... menor é melhor

| 3DMark 11 Performance | 28229 pontos | |
| 3DMark Cloud Gate Standard Score | 58727 pontos | |
| 3DMark Fire Strike Score | 22398 pontos | |
| 3DMark Time Spy Score | 9890 pontos | |
Ajuda | ||
| The Witcher 3 - 1920x1080 Ultra Graphics & Postprocessing (HBAO+) | |
| Eurocom Sky X9C | |
| Asus ROG Strix RTX 2080 OC | |
| Eurocom Sky X7C i9-9900K | |
| Asus Zephyrus S GX701GX | |
| Intel Core i9-9900K, AMD Radeon RX Vega 64 | |
| MSI GT75 8RG-090 Titan | |
| Schenker XMG Ultra 15 Turing | |
| Razer Blade 15 RTX 2070 Max-Q | |
| Alienware 17 R5 | |
| MSI GL73 8SE-010US | |
| Asus Zephyrus S GX531GM | |
| Asus GL702ZC-GC104T | |
| Lenovo Legion Y730-15ICH i5-8300H | |
| baixo | média | alto | ultra | |
|---|---|---|---|---|
| BioShock Infinite (2013) | 452.2 | 368.6 | 344.1 | 201.1 |
| The Witcher 3 (2015) | 387.2 | 272.8 | 174.2 | 90.3 |
| Rise of the Tomb Raider (2016) | 318.2 | 225 | 175.7 | 140.5 |
| Eurocom Sky X7C i9-9900K GeForce RTX 2080 Mobile, i9-9900K, 2x Samsung SSD 970 Pro 512GB (RAID 0) | Asus ROG G703GX GeForce RTX 2080 Mobile, i7-8750H, Samsung SSD PM981 MZVLB512HAJQ | MSI GT75 8RG-090 Titan GeForce GTX 1080 Mobile, i9-8950HK, 2x Samsung PM961 MZVLW256HEHP (RAID 0) | Lenovo Legion Y740-17ICH GeForce RTX 2080 Max-Q, i7-8750H, Samsung SSD PM981 MZVLB256HAHQ | MSI GE75 8SF GeForce RTX 2070 Mobile, i7-8750H, Kingston RBUSNS8154P3256GJ1 | Asus Zephyrus S GX701GX GeForce RTX 2080 Max-Q, i7-8750H, Samsung SSD PM981 MZVLB1T0HALR | |
|---|---|---|---|---|---|---|
| Noise | -11% | -13% | 4% | -7% | -5% | |
| desligado / ambiente * (dB) | 28.9 | 30 -4% | 30 -4% | 28.3 2% | 28.3 2% | 29 -0% |
| Idle Minimum * (dB) | 29.7 | 30 -1% | 32 -8% | 31.5 -6% | 33.5 -13% | 29 2% |
| Idle Average * (dB) | 29.7 | 35 -18% | 34 -14% | 31.6 -6% | 33.6 -13% | 32 -8% |
| Idle Maximum * (dB) | 30 | 41 -37% | 37 -23% | 31.6 -5% | 35 -17% | 33 -10% |
| Load Average * (dB) | 36.5 | 44 -21% | 43 -18% | 32.3 12% | 38 -4% | 47 -29% |
| Witcher 3 ultra * (dB) | 49 | 51 -4% | 57 -16% | 43 12% | 50 -2% | 49 -0% |
| Load Maximum * (dB) | 57 | 52 9% | 62 -9% | 45.5 20% | 56.9 -0% | 51 11% |
* ... menor é melhor
Barulho
| Ocioso |
| 29.7 / 29.7 / 30 dB |
| Carga |
| 36.5 / 57 dB |
 | ||
30 dB silencioso 40 dB(A) audível 50 dB(A) ruidosamente alto |
||
min: | ||
(+) A temperatura máxima no lado superior é 39 °C / 102 F, em comparação com a média de 40.4 °C / 105 F , variando de 21.2 a 68.8 °C para a classe Gaming.
(+) A parte inferior aquece até um máximo de 33.8 °C / 93 F, em comparação com a média de 43.2 °C / 110 F
(+) Em uso inativo, a temperatura média para o lado superior é 27.7 °C / 82 F, em comparação com a média do dispositivo de 33.9 °C / ### class_avg_f### F.
(+) Jogando The Witcher 3, a temperatura média para o lado superior é 31.5 °C / 89 F, em comparação com a média do dispositivo de 33.9 °C / ## #class_avg_f### F.
(+) Os apoios para as mãos e o touchpad são mais frios que a temperatura da pele, com um máximo de 25.4 °C / 77.7 F e, portanto, são frios ao toque.
(+) A temperatura média da área do apoio para as mãos de dispositivos semelhantes foi 28.8 °C / 83.8 F (+3.4 °C / 6.1 F).
Eurocom Sky X7C i9-9900K análise de áudio
(±) | o volume do alto-falante é médio, mas bom (###valor### dB)
Graves 100 - 315Hz
(±) | graves reduzidos - em média 11.4% menor que a mediana
(-) | graves não são lineares (15.1% delta para frequência anterior)
Médios 400 - 2.000 Hz
(±) | médios mais altos - em média 7.9% maior que a mediana
(+) | médios são lineares (6.5% delta para frequência anterior)
Altos 2 - 16 kHz
(±) | máximos reduzidos - em média 5.8% menor que a mediana
(±) | a linearidade dos máximos é média (9.9% delta para frequência anterior)
Geral 100 - 16.000 Hz
(-) | o som geral não é linear (30.6% diferença em relação à mediana)
Comparado com a mesma classe
» 96% de todos os dispositivos testados nesta classe foram melhores, 2% semelhantes, 2% piores
» O melhor teve um delta de 6%, a média foi 18%, o pior foi 132%
Comparado com todos os dispositivos testados
» 89% de todos os dispositivos testados foram melhores, 3% semelhantes, 8% piores
» O melhor teve um delta de 4%, a média foi 23%, o pior foi 134%
Apple MacBook 12 (Early 2016) 1.1 GHz análise de áudio
(+) | os alto-falantes podem tocar relativamente alto (###valor### dB)
Graves 100 - 315Hz
(±) | graves reduzidos - em média 11.3% menor que a mediana
(±) | a linearidade dos graves é média (14.2% delta para a frequência anterior)
Médios 400 - 2.000 Hz
(+) | médios equilibrados - apenas 2.4% longe da mediana
(+) | médios são lineares (5.5% delta para frequência anterior)
Altos 2 - 16 kHz
(+) | agudos equilibrados - apenas 2% longe da mediana
(+) | os máximos são lineares (4.5% delta da frequência anterior)
Geral 100 - 16.000 Hz
(+) | o som geral é linear (10.2% diferença em relação à mediana)
Comparado com a mesma classe
» 7% de todos os dispositivos testados nesta classe foram melhores, 2% semelhantes, 90% piores
» O melhor teve um delta de 5%, a média foi 18%, o pior foi 53%
Comparado com todos os dispositivos testados
» 5% de todos os dispositivos testados foram melhores, 1% semelhantes, 94% piores
» O melhor teve um delta de 4%, a média foi 23%, o pior foi 134%
| desligado | |
| Ocioso | |
| Carga |
|
Key:
min: | |
| Eurocom Sky X7C i9-9900K i9-9900K, GeForce RTX 2080 Mobile, 2x Samsung SSD 970 Pro 512GB (RAID 0), IPS, 1920x1080, 17.3" | Asus ROG G703GX i7-8750H, GeForce RTX 2080 Mobile, Samsung SSD PM981 MZVLB512HAJQ, IPS, 1920x1080, 17.3" | MSI GT75 8RG-090 Titan i9-8950HK, GeForce GTX 1080 Mobile, 2x Samsung PM961 MZVLW256HEHP (RAID 0), TN, 1920x1080, 17.3" | Acer Predator 17 G9-793-70PJ i7-7700HQ, GeForce GTX 1070 Mobile, Toshiba NVMe THNSN5512GPU7, IPS, 3840x2160, 17.3" | MSI GE75 8SF i7-8750H, GeForce RTX 2070 Mobile, Kingston RBUSNS8154P3256GJ1, IPS, 1920x1080, 17.3" | Asus Zephyrus S GX701GX i7-8750H, GeForce RTX 2080 Max-Q, Samsung SSD PM981 MZVLB1T0HALR, IPS, 1920x1080, 17.3" | |
|---|---|---|---|---|---|---|
| Power Consumption | 23% | 3% | 27% | 38% | 37% | |
| Idle Minimum * (Watt) | 41.3 | 5 88% | 31 25% | 23 44% | 16.4 60% | 19 54% |
| Idle Average * (Watt) | 41.8 | 24 43% | 35 16% | 33 21% | 21.9 48% | 22 47% |
| Idle Maximum * (Watt) | 46.1 | 42 9% | 45 2% | 40 13% | 25.4 45% | 30 35% |
| Load Average * (Watt) | 116.6 | 112 4% | 130 -11% | 94 19% | 90.7 22% | 104 11% |
| Witcher 3 ultra * (Watt) | 245.9 | 284 -15% | 268 -9% | 177 28% | 203.3 17% | 167 32% |
| Load Maximum * (Watt) | 352.6 | 320 9% | 374 -6% | 228 35% | 222.9 37% | 203 42% |
* ... menor é melhor
| Eurocom Sky X7C i9-9900K i9-9900K, GeForce RTX 2080 Mobile, 82 Wh | Alienware 17 R5 i7-8750H, GeForce GTX 1070 Mobile, 99 Wh | Asus ROG G703GX i7-8750H, GeForce RTX 2080 Mobile, 96 Wh | MSI GT75 8RG-090 Titan i9-8950HK, GeForce GTX 1080 Mobile, 75 Wh | Lenovo Legion Y740-17ICH i7-8750H, GeForce RTX 2080 Max-Q, 76 Wh | Eurocom Sky X7C i7-8086K, GeForce GTX 1080 Mobile, 82 Wh | |
|---|---|---|---|---|---|---|
| Duração da bateria | 80% | 100% | 60% | 20% | ||
| WiFi v1.3 (h) | 2 | 3.6 80% | 4 100% | 3.2 60% | 2.4 20% | |
| Reader / Idle (h) | 4.5 | 5 | 3.8 | |||
| Load (h) | 1.1 | 1.3 | 1.1 |
Pro
Contra
A lacuna de desempenho entre um GeForce GTX 2080 e GeForce GTX 2080 Max-Q parece ser mais estreita nesta geração, quando comparado à última. Optar pelo RTX 2080 da Eurocom Sky X7C trará apenas um aumento de 15% a 20% no desempenho da GPU com uma alternativa RTX 2080 Max-Q muito mais fina, mais leve, mais barata, mais durável e mais eficiente em termos de consumo de energia.
As maiores razões para possuir um Sky X7C não são pelo desempenho gráfico ou tela, mas pelo desempenho e capacidade de atualização da CPU. O Core i9-9900K é mais rápido que o Core i7-8750H em 60 por cento para ser uma melhor justificativa para o aumento significativo no tamanho do chassi, no ruído do ventilador e no consumo de energia. Se você depende de tarefas intensivas de CPU em vez dos habituais jogos ligados a GPU, então o Sky X7C deve ser o indicado.
Os usuários que sabem que vão aproveitar ao máximo a CPU Core i9 para desktop tirarão o máximo proveito do Eurocom Sky X7C. Caso contrário, o aumento mínimo no desempenho gráfico em uma RTX 2080 ou RTX 2080 Max-Q soldadas, é muito pequeno para justificar o chassi muito grande, o alto consumo de energia e o volumoso adaptador de CA.
Eurocom Sky X7C i9-9900K
- 03/11/2019 v6 (old)
Allen Ngo
Price comparison
