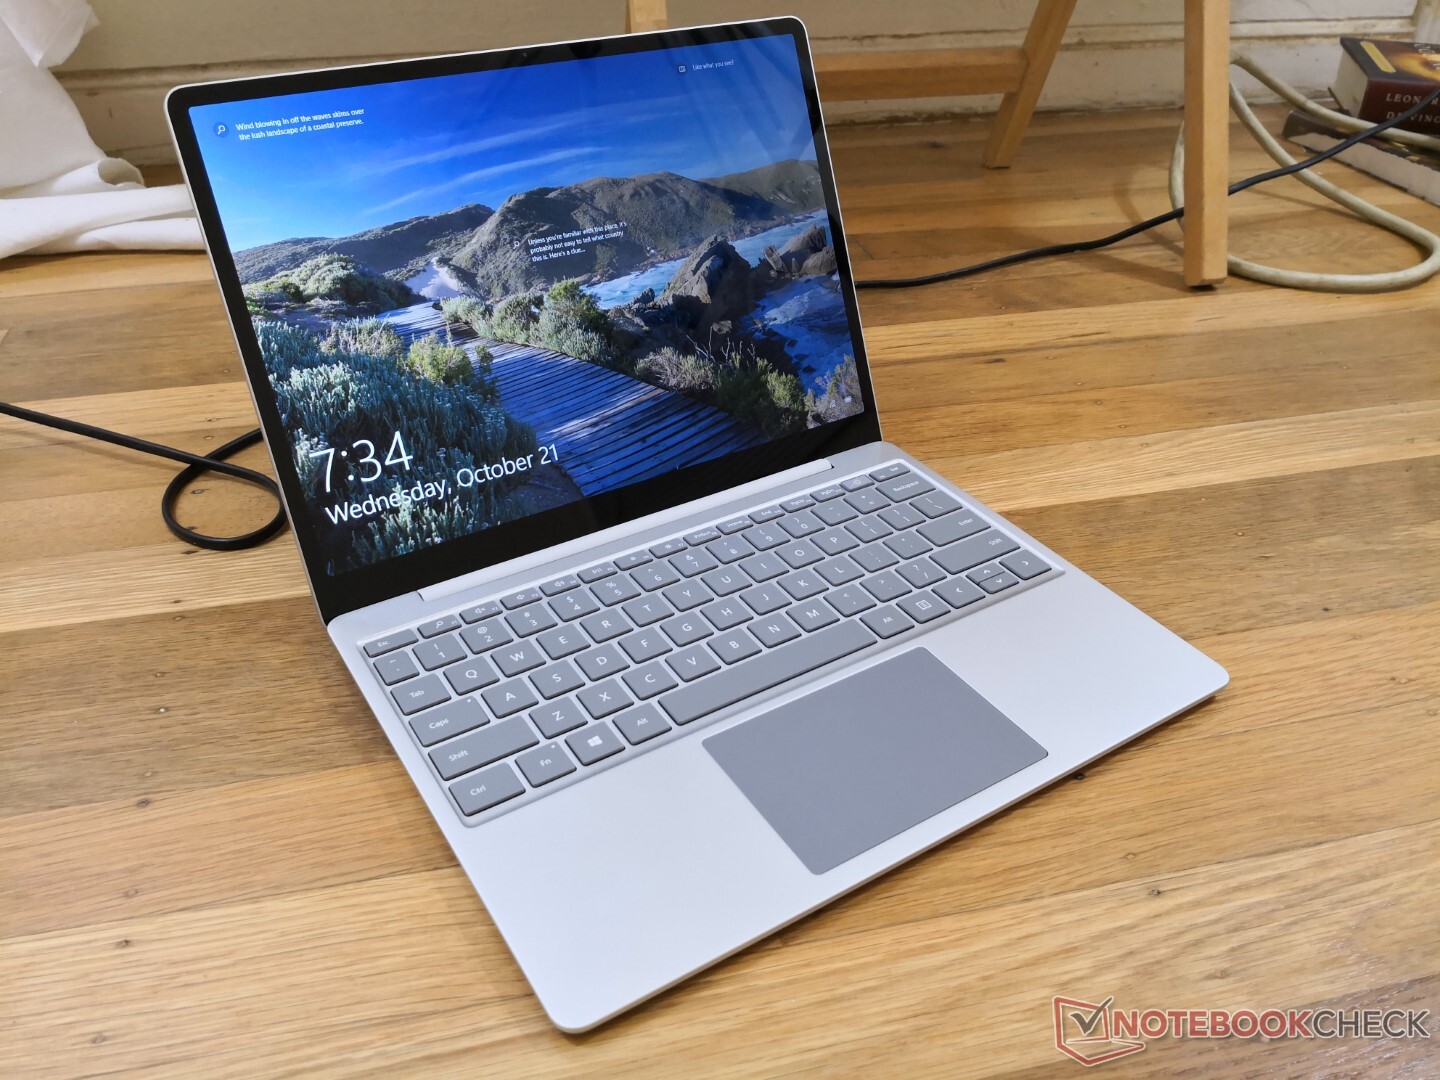
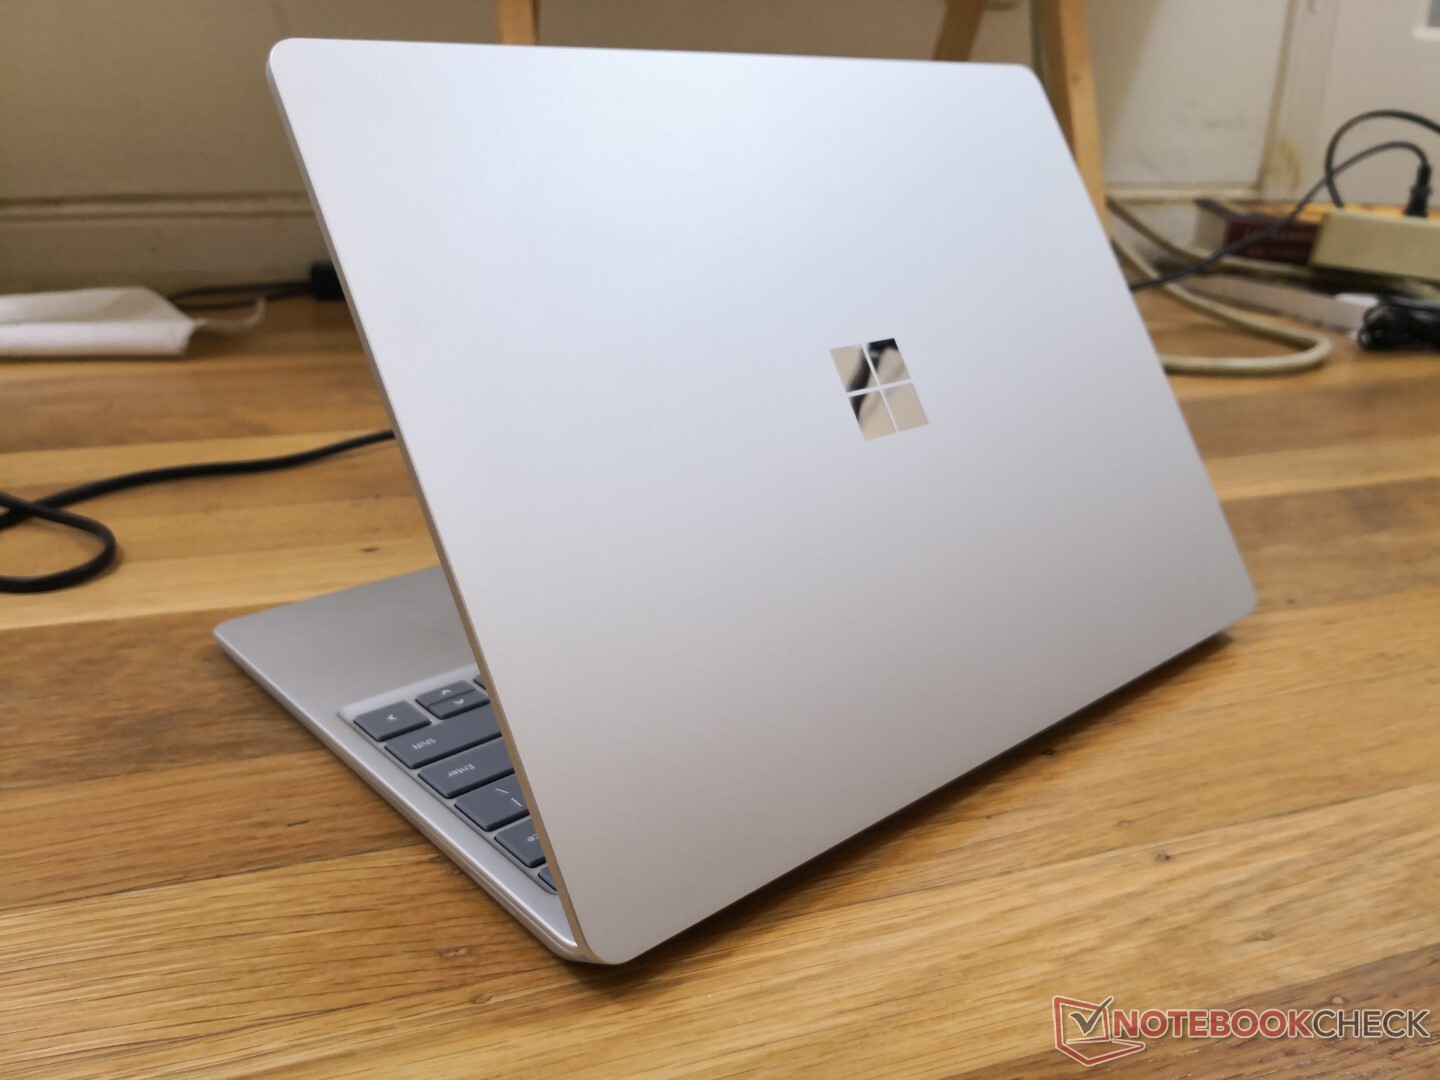
Breve Análise do Microsoft Surface Laptop Go: Um netbook superfaturado
Avaliação | Data | Modelo | Peso | Altura | Size | Resolução | Preço |
|---|---|---|---|---|---|---|---|
| 84.6 % v7 (old) | 10/2020 | Microsoft Surface Laptop Go Core i5 i5-1035G1, UHD Graphics G1 (Ice Lake 32 EU) | 1.1 kg | 15.69 mm | 12.40" | 1536x1024 | |
| 85.1 % v7 (old) | 10/2020 | Asus Zenbook S UX393JA i7-1065G7, Iris Plus Graphics G7 (Ice Lake 64 EU) | 1.4 kg | 15.7 mm | 13.90" | 3300x2200 | |
| 88.7 % v7 (old) | 09/2020 | HP EliteBook 830 G7 i7-10810U, UHD Graphics 620 | 1.3 kg | 18.1 mm | 13.30" | 1920x1080 | |
| 84 % v7 (old) | 03/2020 | Microsoft Surface Laptop 3 13 Core i5-1035G7 i5-1035G7, Iris Plus Graphics G7 (Ice Lake 64 EU) | 1.3 kg | 14.5 mm | 13.50" | 2256x1504 | |
| 87.4 % v7 (old) | 06/2020 | Huawei MateBook X Pro 2020 i7 i7-10510U, GeForce MX250 | 1.3 kg | 14.6 mm | 13.90" | 3000x2000 | |
| 92.1 % v7 (old) | 06/2020 | Apple MacBook Pro 13 2020 2GHz i5 10th-Gen i5-1038NG7, Iris Plus Graphics G7 (Ice Lake 64 EU) | 1.4 kg | 15.6 mm | 13.30" | 2560x1600 |

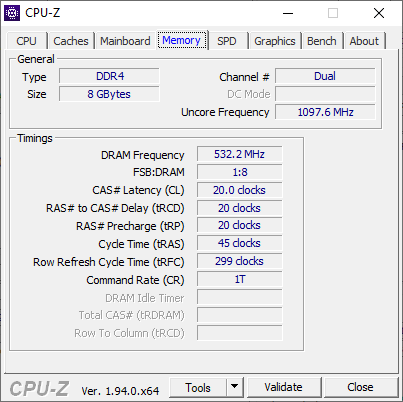
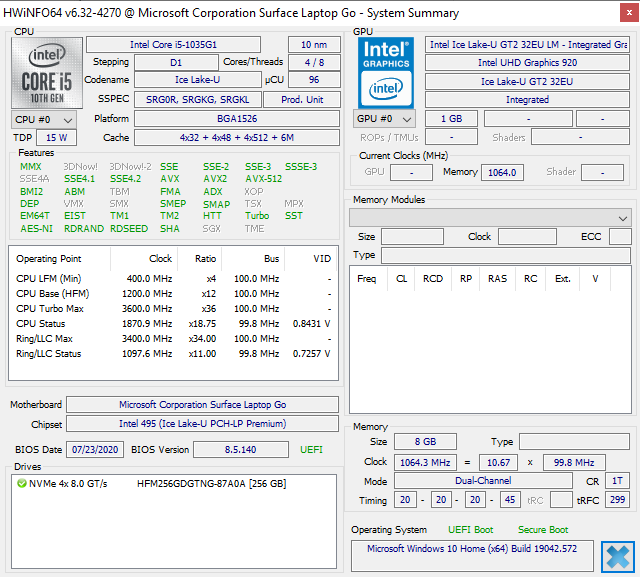
, i5-1035G1, SK hynix BC501 HFM256GDGTNG")
, i5-1035G1, SK hynix BC501 HFM256GDGTNG")
| |||||||||||||||||||||||||
iluminação: 95 %
iluminação com acumulador: 354.3 cd/m²
Contraste: 1222:1 (Preto: 0.29 cd/m²)
ΔE ColorChecker Calman: 1.41 | ∀{0.5-29.43 Ø4.72}
calibrated: 1.44
ΔE Greyscale Calman: 1.2 | ∀{0.09-98 Ø4.97}
94.4% sRGB (Argyll 1.6.3 3D)
60.2% AdobeRGB 1998 (Argyll 1.6.3 3D)
65.7% AdobeRGB 1998 (Argyll 3D)
94.6% sRGB (Argyll 3D)
64.4% Display P3 (Argyll 3D)
Gamma: 2.26
CCT: 6600 K
| Microsoft Surface Laptop Go Core i5 LG Philips LP125WX112403, IPS, 12.4", 1536x1024 | Asus Zenbook S UX393JA AU Optronics B139KAN01.0, IPS, 13.9", 3300x2200 | HP EliteBook 830 G7 Chi Mei CMN13A9, IPS, 13.3", 1920x1080 | Microsoft Surface Laptop 3 13 Core i5-1035G7 Sharp LQ135P1JX51, IPS, 13.5", 2256x1504 | Huawei MateBook X Pro 2020 i7 JDI LPM139M422A, LTPS, 13.9", 3000x2000 | Apple MacBook Pro 13 2020 2GHz i5 10th-Gen APPA03D, IPS, 13.3", 2560x1600 | |
|---|---|---|---|---|---|---|
| Display | 30% | 3% | 3% | 4% | 30% | |
| Display P3 Coverage (%) | 64.4 | 97.7 52% | 65.7 2% | 65.7 2% | 66.6 3% | 98.8 53% |
| sRGB Coverage (%) | 94.6 | 99.8 5% | 97.4 3% | 98.6 4% | 99.4 5% | 99.9 6% |
| AdobeRGB 1998 Coverage (%) | 65.7 | 87.9 34% | 67.4 3% | 67.8 3% | 68.6 4% | 86.4 32% |
| Response Times | -48% | -22% | -56% | -24% | -22% | |
| Response Time Grey 50% / Grey 80% * (ms) | 34.8 ? | 56.4 ? -62% | 46.8 ? -34% | 59.2 ? -70% | 49.6 ? -43% | 46 ? -32% |
| Response Time Black / White * (ms) | 29.2 ? | 38.8 ? -33% | 32 ? -10% | 41.6 ? -42% | 30.8 ? -5% | 32.4 ? -11% |
| PWM Frequency (Hz) | 21930 ? | 26600 ? | 21740 ? | 29070 ? | 113600 ? | |
| Screen | -42% | -26% | 9% | 12% | 7% | |
| Brightness middle (cd/m²) | 354.3 | 444.1 25% | 454.5 28% | 403.4 14% | 557 57% | 512 45% |
| Brightness (cd/m²) | 353 | 423 20% | 435 23% | 397 12% | 532 51% | 491 39% |
| Brightness Distribution (%) | 95 | 89 -6% | 91 -4% | 89 -6% | 87 -8% | 91 -4% |
| Black Level * (cd/m²) | 0.29 | 0.37 -28% | 0.27 7% | 0.34 -17% | 0.33 -14% | 0.32 -10% |
| Contrast (:1) | 1222 | 1200 -2% | 1683 38% | 1186 -3% | 1688 38% | 1600 31% |
| Colorchecker dE 2000 * | 1.41 | 2.94 -109% | 3.12 -121% | 0.94 33% | 1.4 1% | 1.7 -21% |
| Colorchecker dE 2000 max. * | 2.96 | 7.37 -149% | 4.85 -64% | 2.92 1% | 2.5 16% | 3.4 -15% |
| Colorchecker dE 2000 calibrated * | 1.44 | 3.05 -112% | 1.97 -37% | 0.99 31% | 0.7 51% | 1 31% |
| Greyscale dE 2000 * | 1.2 | 2.9 -142% | 3.1 -158% | 0.9 25% | 2 -67% | 1.9 -58% |
| Gamma | 2.26 97% | 2.1 105% | 2.01 109% | 2.13 103% | 2.14 103% | 2.19 100% |
| CCT | 6600 98% | 6766 96% | 6902 94% | 6620 98% | 6689 97% | 6817 95% |
| Color Space (Percent of AdobeRGB 1998) (%) | 60.2 | 78.2 30% | 61.5 2% | 62.3 3% | 62.5 4% | 77.4 29% |
| Color Space (Percent of sRGB) (%) | 94.4 | 99.8 6% | 97 3% | 98.7 5% | 99.5 5% | 99.9 6% |
| Média Total (Programa/Configurações) | -20% /
-29% | -15% /
-20% | -15% /
-0% | -3% /
6% | 5% /
8% |
* ... menor é melhor
Exibir tempos de resposta
| ↔ Tempo de resposta preto para branco | ||
|---|---|---|
| 29.2 ms ... ascensão ↗ e queda ↘ combinadas | ↗ 17.2 ms ascensão | 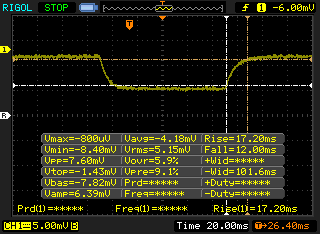 |
| ↘ 12 ms queda | ||
| A tela mostra taxas de resposta relativamente lentas em nossos testes e pode ser muito lenta para os jogadores. Em comparação, todos os dispositivos testados variam de 0.1 (mínimo) a 240 (máximo) ms. » 78 % de todos os dispositivos são melhores. Isso significa que o tempo de resposta medido é pior que a média de todos os dispositivos testados (19.8 ms). | ||
| ↔ Tempo de resposta 50% cinza a 80% cinza | ||
| 34.8 ms ... ascensão ↗ e queda ↘ combinadas | ↗ 19.6 ms ascensão | 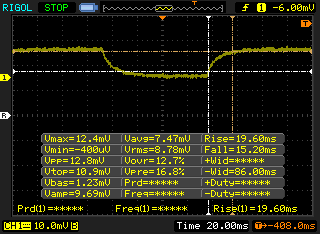 |
| ↘ 15.2 ms queda | ||
| A tela mostra taxas de resposta lentas em nossos testes e será insatisfatória para os jogadores. Em comparação, todos os dispositivos testados variam de 0.165 (mínimo) a 636 (máximo) ms. » 48 % de todos os dispositivos são melhores. Isso significa que o tempo de resposta medido é pior que a média de todos os dispositivos testados (31 ms). | ||
Cintilação da tela / PWM (modulação por largura de pulso)
| Tela tremeluzindo/PWM detectado | 21930 Hz | ≤ 51 % configuração de brilho | 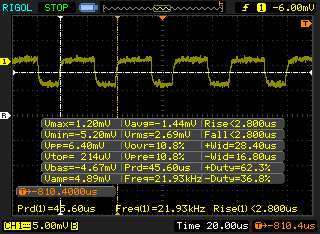 |
A luz de fundo da tela pisca em 21930 Hz (pior caso, por exemplo, utilizando PWM) Cintilação detectada em uma configuração de brilho de 51 % e abaixo. Não deve haver cintilação ou PWM acima desta configuração de brilho. A frequência de 21930 Hz é bastante alta, então a maioria dos usuários sensíveis ao PWM não deve notar nenhuma oscilação. [pwm_comparison] Em comparação: 52 % de todos os dispositivos testados não usam PWM para escurecer a tela. Se PWM foi detectado, uma média de 7781 (mínimo: 5 - máximo: 343500) Hz foi medida. | |||
Cinebench R15: CPU Multi 64Bit | CPU Single 64Bit
Blender: v2.79 BMW27 CPU
7-Zip 18.03: 7z b 4 -mmt1 | 7z b 4
Geekbench 5.5: Single-Core | Multi-Core
HWBOT x265 Benchmark v2.2: 4k Preset
LibreOffice : 20 Documents To PDF
R Benchmark 2.5: Overall mean
Cinebench R15: CPU Multi 64Bit | CPU Single 64Bit
Blender: v2.79 BMW27 CPU
7-Zip 18.03: 7z b 4 -mmt1 | 7z b 4
Geekbench 5.5: Single-Core | Multi-Core
HWBOT x265 Benchmark v2.2: 4k Preset
LibreOffice : 20 Documents To PDF
R Benchmark 2.5: Overall mean
* ... menor é melhor
| PCMark 8 Home Score Accelerated v2 | 3469 pontos | |
| PCMark 8 Work Score Accelerated v2 | 2647 pontos | |
| PCMark 10 Score | 3474 pontos | |
Ajuda | ||
| DPC Latencies / LatencyMon - interrupt to process latency (max), Web, Youtube, Prime95 | |
| Asus Zenbook S UX393JA | |
| HP EliteBook 830 G7 | |
| Microsoft Surface Laptop Go Core i5 | |
* ... menor é melhor
| Microsoft Surface Laptop Go Core i5 SK hynix BC501 HFM256GDGTNG | Asus Zenbook S UX393JA Intel SSD 660p 1TB SSDPEKNW010T8 | Microsoft Surface Laptop 3 13 Core i5-1035G7 SK hynix BC501 HFM256GDGTNG | Huawei MateBook X Pro 2020 i7 Samsung PM981a MZVLB1T0HBLR | Apple MacBook Pro 13 2020 2GHz i5 10th-Gen Apple SSD SM0512F | |
|---|---|---|---|---|---|
| AS SSD | 73% | 4% | 182% | -15% | |
| Seq Read (MB/s) | 1347 | 1405 4% | 1387 3% | 2737 103% | 1300 -3% |
| Seq Write (MB/s) | 491 | 1062 116% | 504 3% | 2530 415% | 1518 209% |
| 4K Read (MB/s) | 38.08 | 50.8 33% | 42.35 11% | 54 42% | 14.09 -63% |
| 4K Write (MB/s) | 98.2 | 124.9 27% | 120 22% | 152.5 55% | 24.25 -75% |
| 4K-64 Read (MB/s) | 483.1 | 590 22% | 497.4 3% | 2011 316% | 725 50% |
| 4K-64 Write (MB/s) | 350.9 | 840 139% | 354.9 1% | 1260 259% | 169.6 -52% |
| Access Time Read * (ms) | 0.057 | 0.041 28% | 0.055 4% | 0.066 -16% | 0.172 -202% |
| Access Time Write * (ms) | 0.105 | 0.118 -12% | 0.093 11% | 0.024 77% | 0.155 -48% |
| Score Read (Points) | 656 | 781 19% | 678 3% | 2339 257% | 869 32% |
| Score Write (Points) | 498 | 1071 115% | 525 5% | 1666 235% | 346 -31% |
| Score Total (Points) | 1458 | 2251 54% | 1520 4% | 5191 256% | 1667 14% |
| Copy ISO MB/s (MB/s) | 765 | 1459 91% | 764 0% | ||
| Copy Program MB/s (MB/s) | 299.6 | 600 100% | 256.1 -15% | ||
| Copy Game MB/s (MB/s) | 371.5 | 1411 280% | 368.4 -1% | ||
| CrystalDiskMark 5.2 / 6 | 53% | 14% | 113% | 29% | |
| Write 4K (MB/s) | 87.6 | 129.5 48% | 112.3 28% | 165.6 89% | 28.16 -68% |
| Read 4K (MB/s) | 40.41 | 54 34% | 42.13 4% | 50.2 24% | 17.5 -57% |
| Write Seq (MB/s) | 601 | 1265 110% | 630 5% | 1905 217% | 1195 99% |
| Read Seq (MB/s) | 1033 | 1410 36% | 1023 -1% | 1669 62% | 1470 42% |
| Write 4K Q32T1 (MB/s) | 269.1 | 420.3 56% | 336.6 25% | 474.6 76% | 205 -24% |
| Read 4K Q32T1 (MB/s) | 261.4 | 357.7 37% | 399.6 53% | 508 94% | 692 165% |
| Write Seq Q32T1 (MB/s) | 818 | 1799 120% | 821 0% | 3007 268% | 1475 80% |
| Read Seq Q32T1 (MB/s) | 2025 | 1616 -20% | 2030 0% | 3556 76% | 1920 -5% |
| Média Total (Programa/Configurações) | 63% /
65% | 9% /
8% | 148% /
153% | 7% /
3% |
* ... menor é melhor

Disk Throttling: DiskSpd Read Loop, Queue Depth 8
| 3DMark 11 Performance | 2458 pontos | |
| 3DMark Cloud Gate Standard Score | 10013 pontos | |
| 3DMark Fire Strike Score | 1635 pontos | |
| 3DMark Time Spy Score | 505 pontos | |
Ajuda | ||
| baixo | média | alto | ultra | |
|---|---|---|---|---|
| Dota 2 Reborn (2015) | 78.1 | 40.1 | 23.5 | 21.4 |
| Final Fantasy XV Benchmark (2018) | 15.1 | 7.49 | 5.21 | |
| X-Plane 11.11 (2018) | 17.3 | 10.4 | 10.8 |
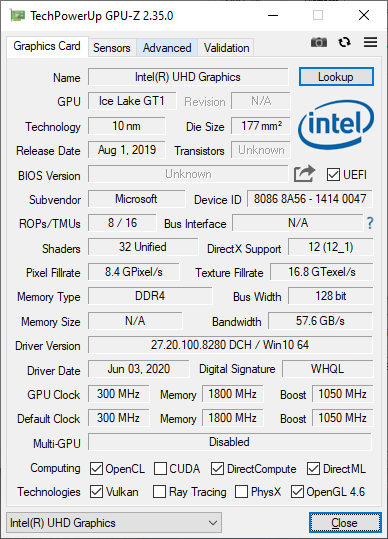
| Microsoft Surface Laptop Go Core i5 UHD Graphics G1 (Ice Lake 32 EU), i5-1035G1, SK hynix BC501 HFM256GDGTNG | Asus Zenbook S UX393JA Iris Plus Graphics G7 (Ice Lake 64 EU), i7-1065G7, Intel SSD 660p 1TB SSDPEKNW010T8 | Microsoft Surface Laptop 3 13 Core i5-1035G7 Iris Plus Graphics G7 (Ice Lake 64 EU), i5-1035G7, SK hynix BC501 HFM256GDGTNG | Huawei MateBook X Pro 2020 i7 GeForce MX250, i7-10510U, Samsung PM981a MZVLB1T0HBLR | Apple MacBook Pro 13 2020 2GHz i5 10th-Gen Iris Plus Graphics G7 (Ice Lake 64 EU), i5-1038NG7, Apple SSD SM0512F | |
|---|---|---|---|---|---|
| Noise | -3% | 0% | -7% | -6% | |
| desligado / ambiente * (dB) | 26.4 | 26.9 -2% | 28.5 -8% | 29.6 -12% | 29.6 -12% |
| Idle Minimum * (dB) | 26.4 | 26.9 -2% | 28.5 -8% | 29.6 -12% | 29.6 -12% |
| Idle Average * (dB) | 26.4 | 29 -10% | 28.5 -8% | 29.6 -12% | 29.6 -12% |
| Idle Maximum * (dB) | 26.4 | 31.1 -18% | 28.5 -8% | 30.3 -15% | 29.6 -12% |
| Load Average * (dB) | 36.9 | 37.7 -2% | 28.5 23% | 38 -3% | 34.4 7% |
| Load Maximum * (dB) | 44.2 | 38.1 14% | 40.4 9% | 38 14% | 42.1 5% |
| Witcher 3 ultra * (dB) | 40.2 | 40.4 | 38 | 36.1 |
* ... menor é melhor
Barulho
| Ocioso |
| 26.4 / 26.4 / 26.4 dB |
| Carga |
| 36.9 / 44.2 dB |
 | ||
30 dB silencioso 40 dB(A) audível 50 dB(A) ruidosamente alto |
||
min: | ||
(±) A temperatura máxima no lado superior é 42 °C / 108 F, em comparação com a média de 35.9 °C / 97 F , variando de 21.4 a 59 °C para a classe Subnotebook.
(-) A parte inferior aquece até um máximo de 51 °C / 124 F, em comparação com a média de 39.2 °C / 103 F
(+) Em uso inativo, a temperatura média para o lado superior é 27.3 °C / 81 F, em comparação com a média do dispositivo de 30.8 °C / ### class_avg_f### F.
(+) Os apoios para as mãos e o touchpad estão atingindo a temperatura máxima da pele (32 °C / 89.6 F) e, portanto, não estão quentes.
(-) A temperatura média da área do apoio para as mãos de dispositivos semelhantes foi 28.2 °C / 82.8 F (-3.8 °C / -6.8 F).
Microsoft Surface Laptop Go Core i5 análise de áudio
(±) | o volume do alto-falante é médio, mas bom (###valor### dB)
Graves 100 - 315Hz
(±) | graves reduzidos - em média 14.6% menor que a mediana
(±) | a linearidade dos graves é média (8.1% delta para a frequência anterior)
Médios 400 - 2.000 Hz
(+) | médios equilibrados - apenas 4.4% longe da mediana
(+) | médios são lineares (4.1% delta para frequência anterior)
Altos 2 - 16 kHz
(+) | agudos equilibrados - apenas 2.8% longe da mediana
(+) | os máximos são lineares (6.7% delta da frequência anterior)
Geral 100 - 16.000 Hz
(+) | o som geral é linear (13.6% diferença em relação à mediana)
Comparado com a mesma classe
» 23% de todos os dispositivos testados nesta classe foram melhores, 5% semelhantes, 71% piores
» O melhor teve um delta de 5%, a média foi 18%, o pior foi 53%
Comparado com todos os dispositivos testados
» 15% de todos os dispositivos testados foram melhores, 4% semelhantes, 82% piores
» O melhor teve um delta de 4%, a média foi 24%, o pior foi 134%
Apple MacBook 12 (Early 2016) 1.1 GHz análise de áudio
(+) | os alto-falantes podem tocar relativamente alto (###valor### dB)
Graves 100 - 315Hz
(±) | graves reduzidos - em média 11.3% menor que a mediana
(±) | a linearidade dos graves é média (14.2% delta para a frequência anterior)
Médios 400 - 2.000 Hz
(+) | médios equilibrados - apenas 2.4% longe da mediana
(+) | médios são lineares (5.5% delta para frequência anterior)
Altos 2 - 16 kHz
(+) | agudos equilibrados - apenas 2% longe da mediana
(+) | os máximos são lineares (4.5% delta da frequência anterior)
Geral 100 - 16.000 Hz
(+) | o som geral é linear (10.2% diferença em relação à mediana)
Comparado com a mesma classe
» 7% de todos os dispositivos testados nesta classe foram melhores, 2% semelhantes, 91% piores
» O melhor teve um delta de 5%, a média foi 18%, o pior foi 53%
Comparado com todos os dispositivos testados
» 5% de todos os dispositivos testados foram melhores, 1% semelhantes, 94% piores
» O melhor teve um delta de 4%, a média foi 24%, o pior foi 134%
| desligado | |
| Ocioso | |
| Carga |
|
Key:
min: | |
| Microsoft Surface Laptop Go Core i5 i5-1035G1, UHD Graphics G1 (Ice Lake 32 EU), SK hynix BC501 HFM256GDGTNG, IPS, 1536x1024, 12.4" | Asus Zenbook S UX393JA i7-1065G7, Iris Plus Graphics G7 (Ice Lake 64 EU), Intel SSD 660p 1TB SSDPEKNW010T8, IPS, 3300x2200, 13.9" | HP EliteBook 830 G7 i7-10810U, UHD Graphics 620, Samsung SSD PM981a MZVLB512HBJQ, IPS, 1920x1080, 13.3" | Microsoft Surface Laptop 3 13 Core i5-1035G7 i5-1035G7, Iris Plus Graphics G7 (Ice Lake 64 EU), SK hynix BC501 HFM256GDGTNG, IPS, 2256x1504, 13.5" | Huawei MateBook X Pro 2020 i7 i7-10510U, GeForce MX250, Samsung PM981a MZVLB1T0HBLR, LTPS, 3000x2000, 13.9" | Apple MacBook Pro 13 2020 2GHz i5 10th-Gen i5-1038NG7, Iris Plus Graphics G7 (Ice Lake 64 EU), Apple SSD SM0512F, IPS, 2560x1600, 13.3" | |
|---|---|---|---|---|---|---|
| Power Consumption | -16% | 2% | -20% | -39% | -31% | |
| Idle Minimum * (Watt) | 2.8 | 4.1 -46% | 3.6 -29% | 4.4 -57% | 4.3 -54% | 3.8 -36% |
| Idle Average * (Watt) | 6.8 | 7.5 -10% | 4.7 31% | 7.5 -10% | 8.5 -25% | 8.6 -26% |
| Idle Maximum * (Watt) | 8 | 8.5 -6% | 5.1 36% | 7.8 2% | 12 -50% | 10.3 -29% |
| Load Average * (Watt) | 37.2 | 36.8 1% | 33.3 10% | 41.9 -13% | 54.8 -47% | 52.1 -40% |
| Load Maximum * (Watt) | 51.6 | 61.6 -19% | 70 -36% | 63.9 -24% | 61.5 -19% | 65.2 -26% |
| Witcher 3 ultra * (Watt) | 39.2 | 40.8 | 47.1 | 48.2 |
* ... menor é melhor
| Microsoft Surface Laptop Go Core i5 i5-1035G1, UHD Graphics G1 (Ice Lake 32 EU), 39 Wh | Asus Zenbook S UX393JA i7-1065G7, Iris Plus Graphics G7 (Ice Lake 64 EU), 67 Wh | HP EliteBook 830 G7 i7-10810U, UHD Graphics 620, 53 Wh | Microsoft Surface Laptop 3 13 Core i5-1035G7 i5-1035G7, Iris Plus Graphics G7 (Ice Lake 64 EU), 45 Wh | Huawei MateBook X Pro 2020 i7 i7-10510U, GeForce MX250, 57.4 Wh | Apple MacBook Pro 13 2020 2GHz i5 10th-Gen i5-1038NG7, Iris Plus Graphics G7 (Ice Lake 64 EU), 58 Wh | |
|---|---|---|---|---|---|---|
| Duração da bateria | 16% | 43% | -1% | 25% | 51% | |
| Reader / Idle (h) | 35 | 38.4 10% | 34.6 -1% | 34.4 -2% | ||
| WiFi v1.3 (h) | 8 | 8.3 4% | 11.5 44% | 8.3 4% | 10.4 30% | 12.1 51% |
| Load (h) | 2 | 2.7 35% | 3.7 85% | 1.9 -5% | 2.4 20% |
Pro
Contra
O Surface Laptop Go é uma máquina desequilibrada. Por um lado, é um dos melhores portáteis de US$ 550 que você pode encontrar porque sua CPU Core i5 de 10ª geração, tela táctil 3:2 e design de metal são melhores do que qualquer outro nesta faixa de preço. Por outro lado, os 4 GB de RAM soldados, SSD de 64 GB, difícil manutenção, gráficos lentos e falta de opções de portas, são péssimos para os padrões de hoje. A Microsoft está cobrando um braço e uma perna por SKUs de ponta apenas para ter 8 GB de RAM decentes. Os recursos básicos e as especificações ridículas parecem um netbook Acer barato de meia década atrás.
Se você não se importa em ficar preso com apenas 4 GB de RAM, podemos ver o apelo dos SKUs de baixo custo porque você ainda obteria uma ótima tela e chassi. Caso contrário, vale a pena olhar outros Ultrabooks como o XPS 13, Spectre 13, ZenBook 13, ou o Lenovo IdeaPad Slim 7 todos com SKUs abaixo de $ 1000 semelhantes a um Surface Laptop Go totalmente equipado, mas com recursos mais úteis e pernas mais longas.
Microsoft Surface Laptop Go Core i5
- 10/24/2020 v7 (old)
Allen Ngo
Price comparison
