Breve Análise do Smartphone Apple iPhone XS
| Networking | |
| iperf3 transmit AX12 | |
| Sony Xperia XZ2 Premium | |
| OnePlus 6 | |
| Apple iPhone XS | |
| Samsung Galaxy S9 | |
| Huawei P20 Pro | |
| iperf3 receive AX12 | |
| Sony Xperia XZ2 Premium | |
| Samsung Galaxy S9 | |
| Apple iPhone XS | |
| Huawei P20 Pro | |
| OnePlus 6 | |


| |||||||||||||||||||||||||
iluminação: 94 %
iluminação com acumulador: 639 cd/m²
Contraste: ∞:1 (Preto: 0 cd/m²)
ΔE ColorChecker Calman: 1 | ∀{0.5-29.43 Ø4.71}
ΔE Greyscale Calman: 2.2 | ∀{0.09-98 Ø4.96}
98.8% sRGB (Calman 2D)
Gamma: 1.9
CCT: 6364 K
| Apple iPhone XS OLED, 2436x1125, 5.8" | Apple iPhone X Super AMOLED, 2436x1125, 5.8" | Samsung Galaxy S9 Super AMOLED, 2960x1440, 5.8" | Huawei P20 Pro OLED, 2240x1080, 6.1" | Sony Xperia XZ2 Premium LCD-IPS, 3840x2160, 5.8" | OnePlus 6 Optic AMOLED, 2280x1080, 6.3" | LG G7 ThinQ IPS, 3120x1440, 6.1" | HTC U12 Plus Super LCD 6, 2880x1440, 6" | |
|---|---|---|---|---|---|---|---|---|
| Screen | -7% | -21% | -3% | -70% | -53% | -159% | -24% | |
| Brightness middle (cd/m²) | 639 | 600 -6% | 529 -17% | 569 -11% | 477 -25% | 430 -33% | 974 52% | 395 -38% |
| Brightness (cd/m²) | 637 | 606 -5% | 527 -17% | 578 -9% | 453 -29% | 437 -31% | 975 53% | 402 -37% |
| Brightness Distribution (%) | 94 | 94 0% | 96 2% | 95 1% | 86 -9% | 87 -7% | 96 2% | 90 -4% |
| Black Level * (cd/m²) | 0.33 | 0.49 | 0.37 | |||||
| Colorchecker dE 2000 * | 1 | 1.2 -20% | 1.4 -40% | 1.3 -30% | 2.1 -110% | 2.3 -130% | 5.4 -440% | 1.6 -60% |
| Colorchecker dE 2000 max. * | 2.2 | 3 -36% | 4 -82% | 2.1 5% | 8.2 -273% | 4.6 -109% | 13.1 -495% | 3.4 -55% |
| Greyscale dE 2000 * | 2.2 | 1.6 27% | 1.6 27% | 1.6 27% | 1.6 27% | 2.4 -9% | 5 -127% | 1.1 50% |
| Gamma | 1.9 116% | 2.23 99% | 2.16 102% | 2.31 95% | 2.28 96% | 2.28 96% | 2.31 95% | 2.14 103% |
| CCT | 6364 102% | 6707 97% | 6358 102% | 6401 102% | 6425 101% | 6160 106% | 7480 87% | 6536 99% |
| Contrast (:1) | 1445 | 1988 | 1068 |
* ... menor é melhor
Cintilação da tela / PWM (modulação por largura de pulso)
| Tela tremeluzindo/PWM detectado | 240.4 Hz | ≤ 99 % configuração de brilho | 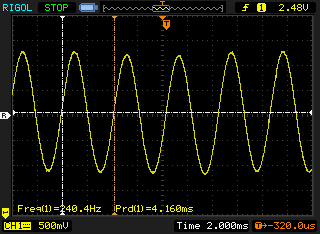 |
A luz de fundo da tela pisca em 240.4 Hz (pior caso, por exemplo, utilizando PWM) Cintilação detectada em uma configuração de brilho de 99 % e abaixo. Não deve haver cintilação ou PWM acima desta configuração de brilho. A frequência de 240.4 Hz é relativamente baixa, portanto, usuários sensíveis provavelmente notarão cintilação e sentirão fadiga ocular na configuração de brilho indicada e abaixo. [pwm_comparison] Em comparação: 52 % de todos os dispositivos testados não usam PWM para escurecer a tela. Se PWM foi detectado, uma média de 7757 (mínimo: 5 - máximo: 343500) Hz foi medida. | |||
Exibir tempos de resposta
| ↔ Tempo de resposta preto para branco | ||
|---|---|---|
| 4 ms ... ascensão ↗ e queda ↘ combinadas | ↗ 2 ms ascensão | 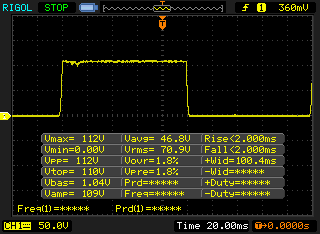 |
| ↘ 2 ms queda | ||
| A tela mostra taxas de resposta muito rápidas em nossos testes e deve ser muito adequada para jogos em ritmo acelerado. Em comparação, todos os dispositivos testados variam de 0.1 (mínimo) a 240 (máximo) ms. » 16 % de todos os dispositivos são melhores. Isso significa que o tempo de resposta medido é melhor que a média de todos os dispositivos testados (19.8 ms). | ||
| ↔ Tempo de resposta 50% cinza a 80% cinza | ||
| 4.8 ms ... ascensão ↗ e queda ↘ combinadas | ↗ 2 ms ascensão | 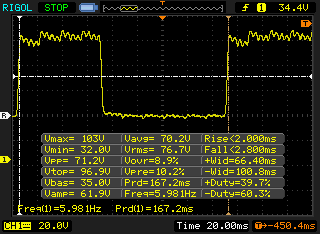 |
| ↘ 2.8 ms queda | ||
| A tela mostra taxas de resposta muito rápidas em nossos testes e deve ser muito adequada para jogos em ritmo acelerado. Em comparação, todos os dispositivos testados variam de 0.165 (mínimo) a 636 (máximo) ms. » 17 % de todos os dispositivos são melhores. Isso significa que o tempo de resposta medido é melhor que a média de todos os dispositivos testados (31 ms). | ||
| Basemark ES 3.1 / Metal - offscreen Overall Score (classificar por valor) | |
| Apple iPhone XS | |
| Apple iPhone X | |
| Samsung Galaxy S9 | |
| LG G7 ThinQ | |
| Huawei P20 Pro | |
| OnePlus 6 | |
| Média Apple A12 Bionic (2407 - 2873, n=6) | |
| Média da turma Smartphone (544 - 7731, n=21, últimos 2 anos) | |
* ... menor é melhor
(+) A temperatura máxima no lado superior é 39.9 °C / 104 F, em comparação com a média de 35.3 °C / 96 F , variando de 21.9 a 247 °C para a classe Smartphone.
(±) A parte inferior aquece até um máximo de 43.4 °C / 110 F, em comparação com a média de 34 °C / 93 F
(+) Em uso inativo, a temperatura média para o lado superior é 29.2 °C / 85 F, em comparação com a média do dispositivo de 33 °C / ### class_avg_f### F.
Apple iPhone XS análise de áudio
(+) | os alto-falantes podem tocar relativamente alto (###valor### dB)
Graves 100 - 315Hz
(-) | quase nenhum baixo - em média 17.9% menor que a mediana
(±) | a linearidade dos graves é média (10.3% delta para a frequência anterior)
Médios 400 - 2.000 Hz
(±) | médios mais altos - em média 5.6% maior que a mediana
(+) | médios são lineares (5.5% delta para frequência anterior)
Altos 2 - 16 kHz
(±) | máximos mais altos - em média 8.7% maior que a mediana
(+) | os máximos são lineares (3.7% delta da frequência anterior)
Geral 100 - 16.000 Hz
(±) | a linearidade do som geral é média (19.7% diferença em relação à mediana)
Comparado com a mesma classe
» 31% de todos os dispositivos testados nesta classe foram melhores, 8% semelhantes, 61% piores
» O melhor teve um delta de 11%, a média foi 34%, o pior foi 134%
Comparado com todos os dispositivos testados
» 50% de todos os dispositivos testados foram melhores, 7% semelhantes, 43% piores
» O melhor teve um delta de 4%, a média foi 23%, o pior foi 134%
Samsung Galaxy S9 análise de áudio
(+) | os alto-falantes podem tocar relativamente alto (###valor### dB)
Graves 100 - 315Hz
(-) | quase nenhum baixo - em média 23.1% menor que a mediana
(±) | a linearidade dos graves é média (11.5% delta para a frequência anterior)
Médios 400 - 2.000 Hz
(+) | médios equilibrados - apenas 3.1% longe da mediana
(+) | médios são lineares (3.8% delta para frequência anterior)
Altos 2 - 16 kHz
(+) | agudos equilibrados - apenas 4.8% longe da mediana
(+) | os máximos são lineares (4.3% delta da frequência anterior)
Geral 100 - 16.000 Hz
(±) | a linearidade do som geral é média (17.2% diferença em relação à mediana)
Comparado com a mesma classe
» 11% de todos os dispositivos testados nesta classe foram melhores, 8% semelhantes, 81% piores
» O melhor teve um delta de 11%, a média foi 34%, o pior foi 134%
Comparado com todos os dispositivos testados
» 32% de todos os dispositivos testados foram melhores, 8% semelhantes, 60% piores
» O melhor teve um delta de 4%, a média foi 23%, o pior foi 134%
Sony Xperia XZ2 Premium análise de áudio
(+) | os alto-falantes podem tocar relativamente alto (###valor### dB)
Graves 100 - 315Hz
(-) | quase nenhum baixo - em média 34.5% menor que a mediana
(±) | a linearidade dos graves é média (9.2% delta para a frequência anterior)
Médios 400 - 2.000 Hz
(+) | médios equilibrados - apenas 4% longe da mediana
(+) | médios são lineares (6.3% delta para frequência anterior)
Altos 2 - 16 kHz
(+) | agudos equilibrados - apenas 3.5% longe da mediana
(+) | os máximos são lineares (3.5% delta da frequência anterior)
Geral 100 - 16.000 Hz
(±) | a linearidade do som geral é média (23.9% diferença em relação à mediana)
Comparado com a mesma classe
» 55% de todos os dispositivos testados nesta classe foram melhores, 8% semelhantes, 36% piores
» O melhor teve um delta de 11%, a média foi 34%, o pior foi 134%
Comparado com todos os dispositivos testados
» 72% de todos os dispositivos testados foram melhores, 6% semelhantes, 22% piores
» O melhor teve um delta de 4%, a média foi 23%, o pior foi 134%
| desligado | |
| Ocioso | |
| Carga |
|
Key:
min: | |
| Apple iPhone XS 2658 mAh | Apple iPhone X 2716 mAh | Samsung Galaxy S9 3000 mAh | Huawei P20 Pro 4000 mAh | Sony Xperia XZ2 Premium 3540 mAh | OnePlus 6 3300 mAh | Média Apple A12 Bionic | Média da turma Smartphone | |
|---|---|---|---|---|---|---|---|---|
| Power Consumption | -33% | 18% | 16% | -34% | -4% | -100% | -41% | |
| Idle Minimum * (Watt) | 0.95 | 1.03 -8% | 0.65 32% | 0.84 12% | 0.67 29% | 0.6 37% | 1.36 ? -43% | 0.888 ? 7% |
| Idle Average * (Watt) | 1.34 | 2.4 -79% | 0.81 40% | 1.54 -15% | 2.5 -87% | 1 25% | 3.41 ? -154% | 1.481 ? -11% |
| Idle Maximum * (Watt) | 1.48 | 2.6 -76% | 0.92 38% | 1.57 -6% | 2.51 -70% | 1.6 -8% | 4.05 ? -174% | 1.669 ? -13% |
| Load Average * (Watt) | 4 | 2.96 26% | 4.76 -19% | 2.47 38% | 4.3 -8% | 4.3 -8% | 6.4 ? -60% | 6.73 ? -68% |
| Load Maximum * (Watt) | 5.13 | 6.6 -29% | 5.16 -1% | 2.49 51% | 6.87 -34% | 8.6 -68% | 8.75 ? -71% | 11.2 ? -118% |
* ... menor é melhor
| Apple iPhone XS 2658 mAh | Apple iPhone X 2716 mAh | Apple iPhone Xs Max 3174 mAh | Samsung Galaxy S9 3000 mAh | Huawei P20 Pro 4000 mAh | Sony Xperia XZ2 Premium 3540 mAh | OnePlus 6 3300 mAh | |
|---|---|---|---|---|---|---|---|
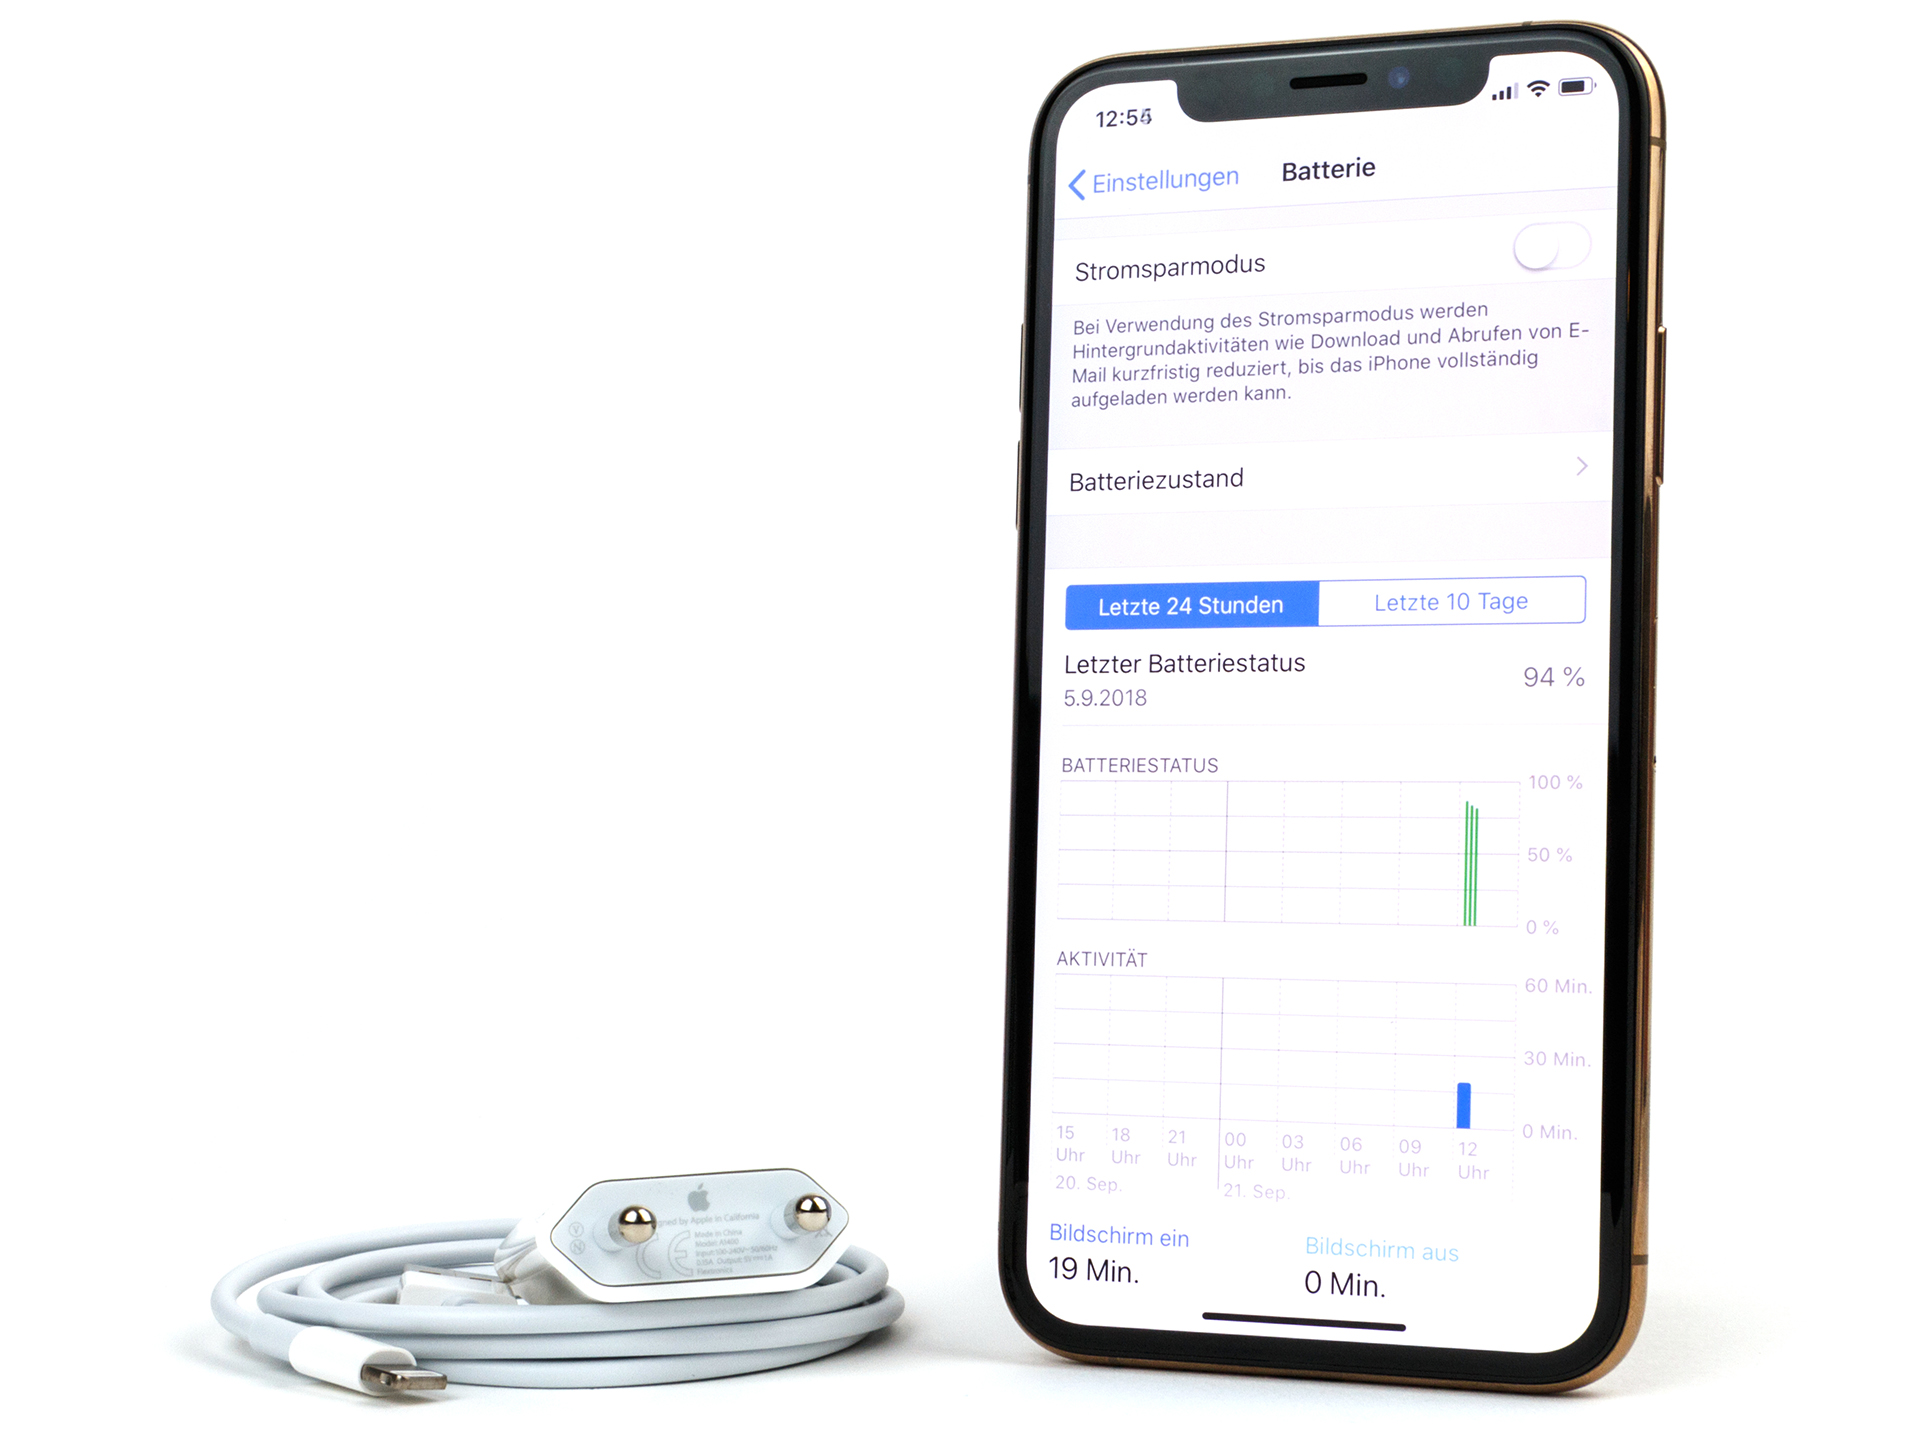
| Duração da bateria | -13% | 5% | -22% | 25% | -11% | 16% | |
| Reader / Idle (h) | 24 | 21.5 -10% | 21.8 -9% | 19.7 -18% | 28.8 20% | 22.5 -6% | 30.1 25% |
| H.264 (h) | 12.4 | 10.6 -15% | 13.4 8% | 10.2 -18% | 13.1 6% | 8.7 -30% | 13.2 6% |
| WiFi v1.3 (h) | 9.5 | 9.4 -1% | 12.4 31% | 7.9 -17% | 12.4 31% | 9.1 -4% | 12.7 34% |
| Load (h) | 4.1 | 3 -27% | 3.7 -10% | 2.7 -34% | 5.8 41% | 3.9 -5% | 4.1 0% |
Pro
Contra
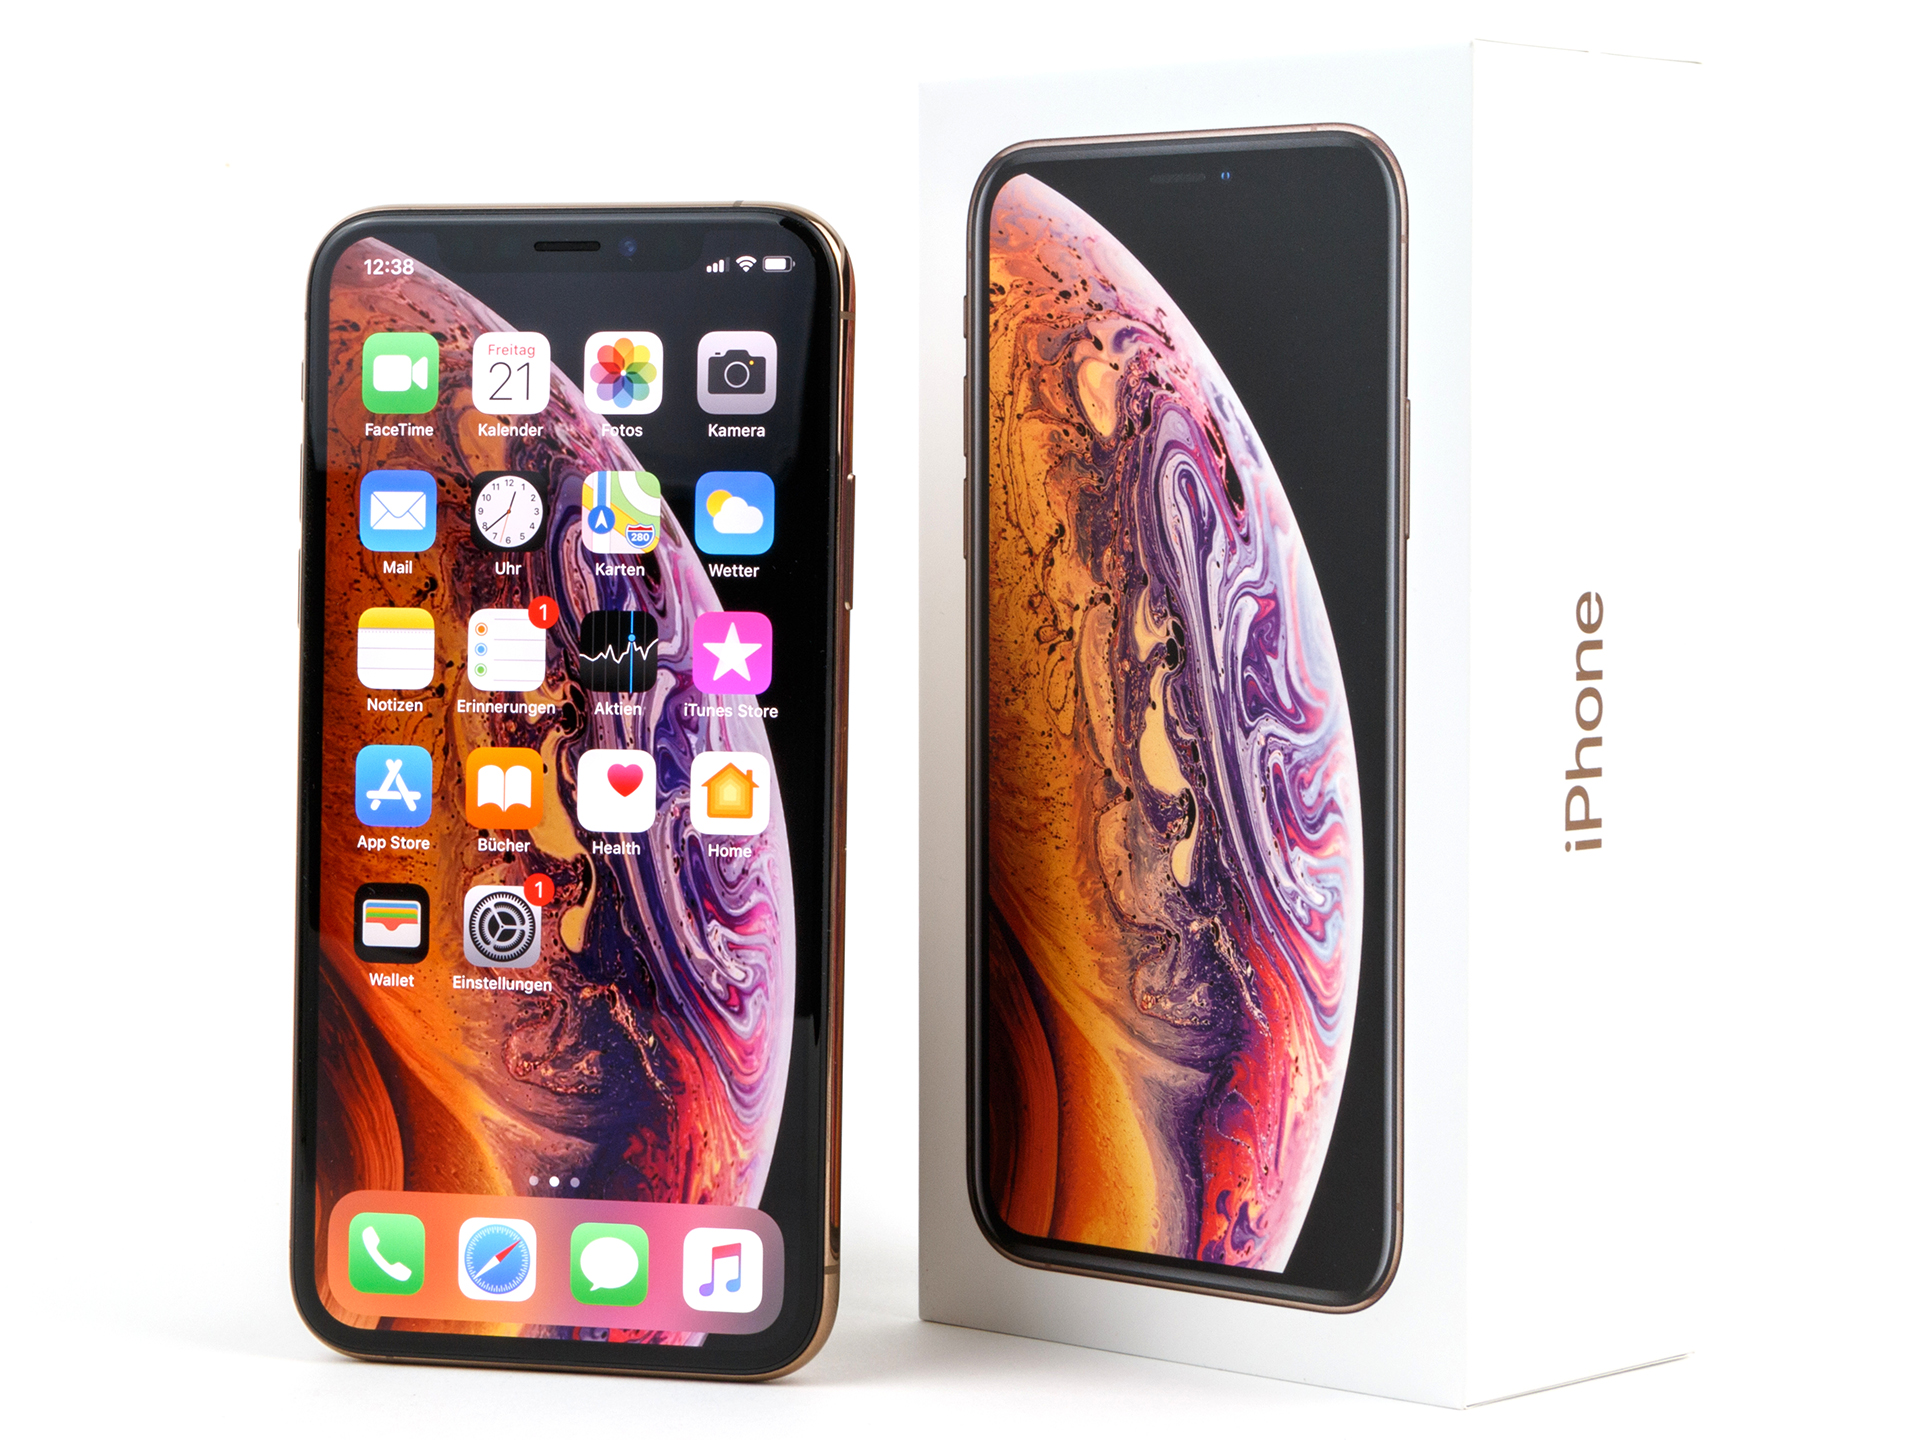
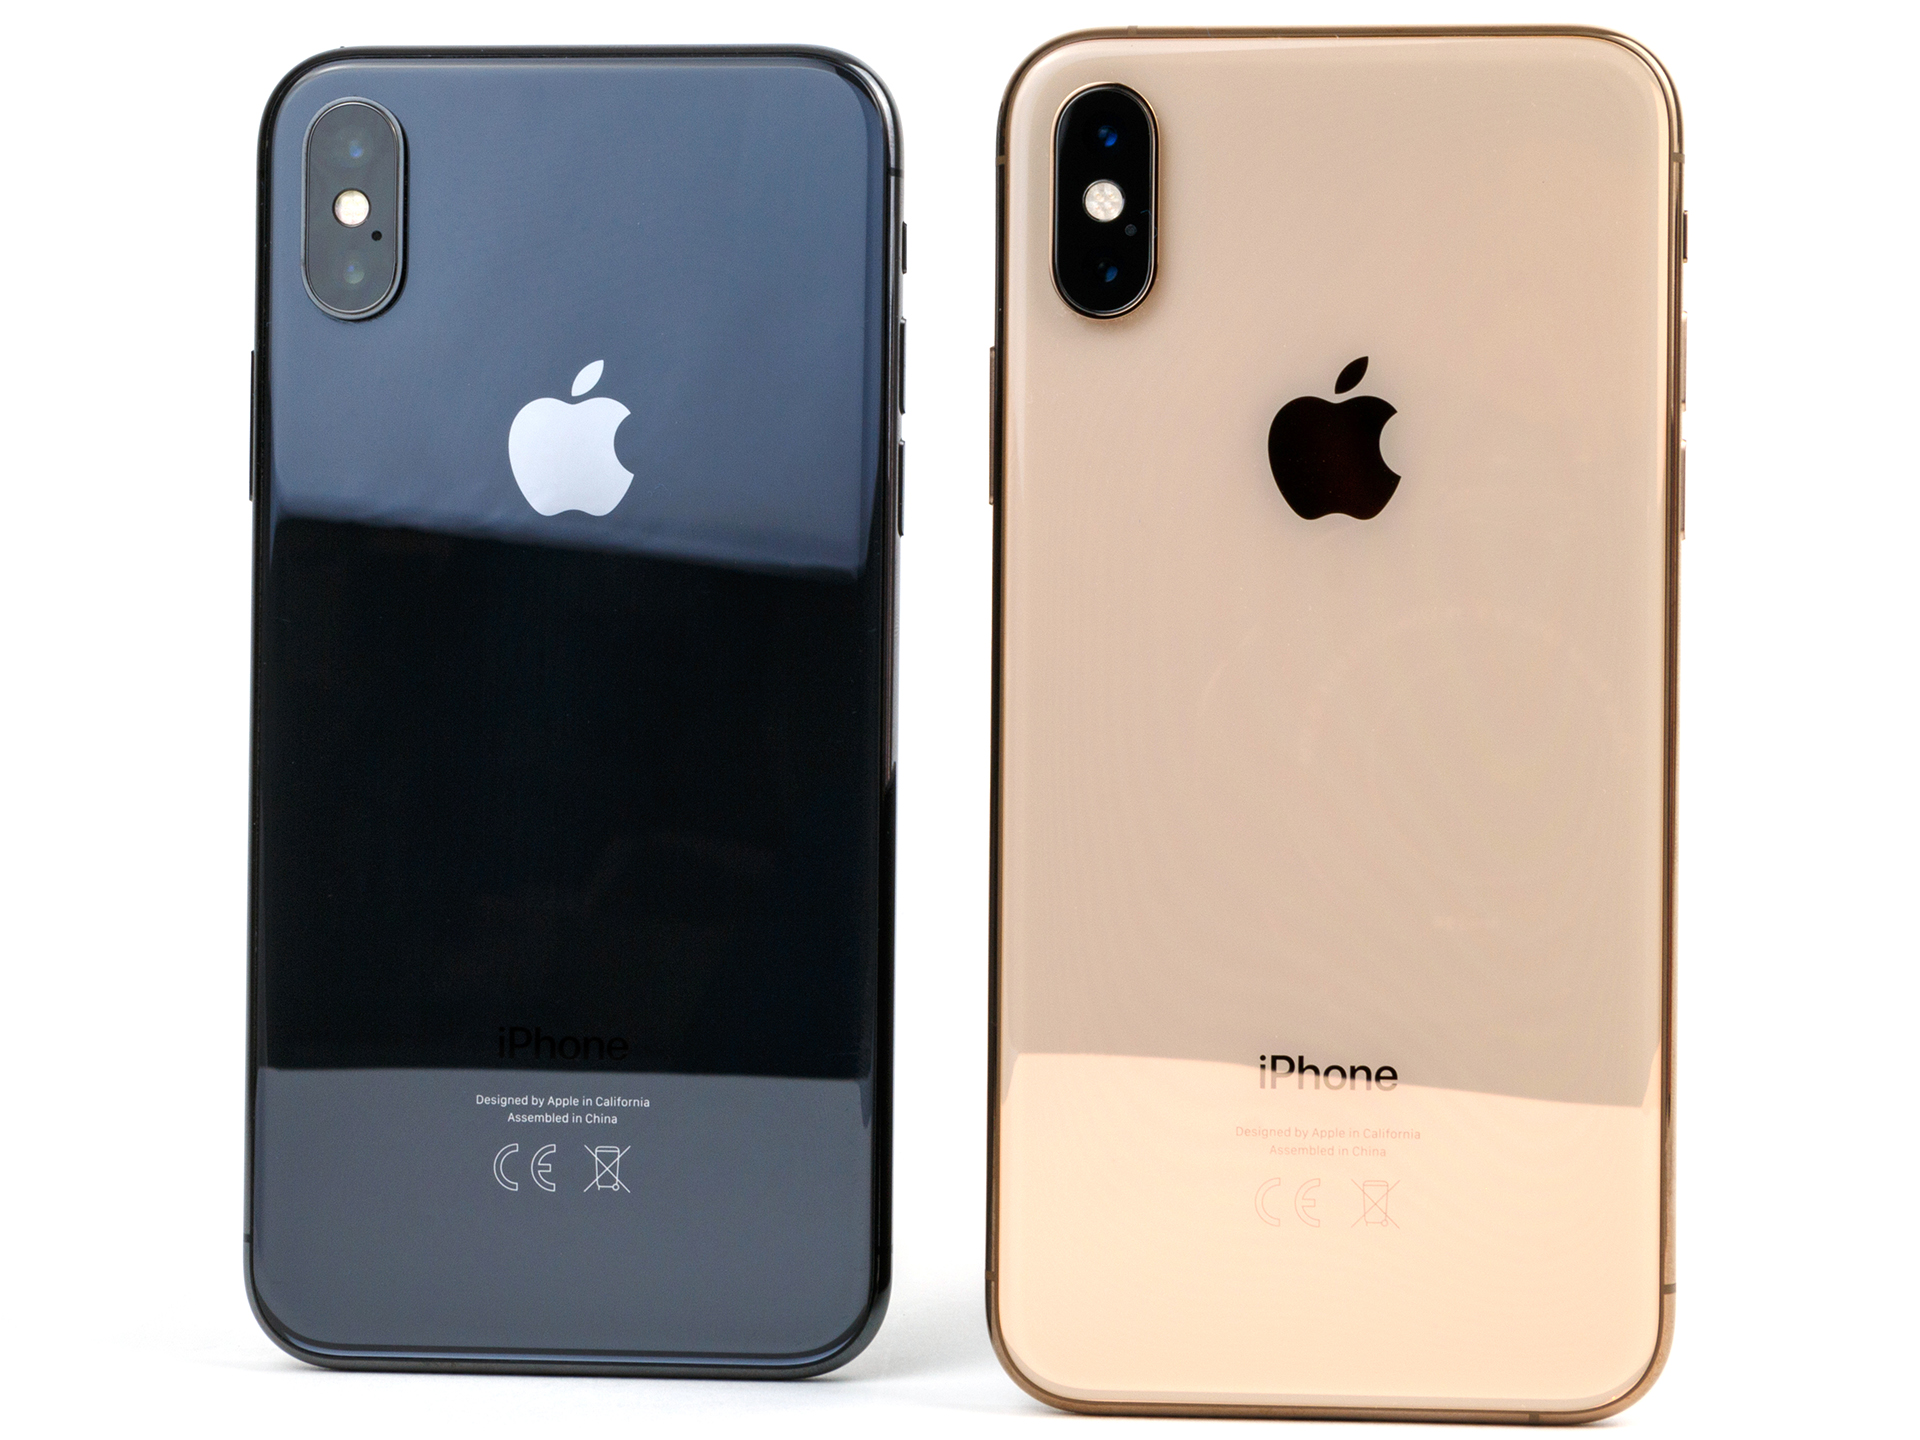
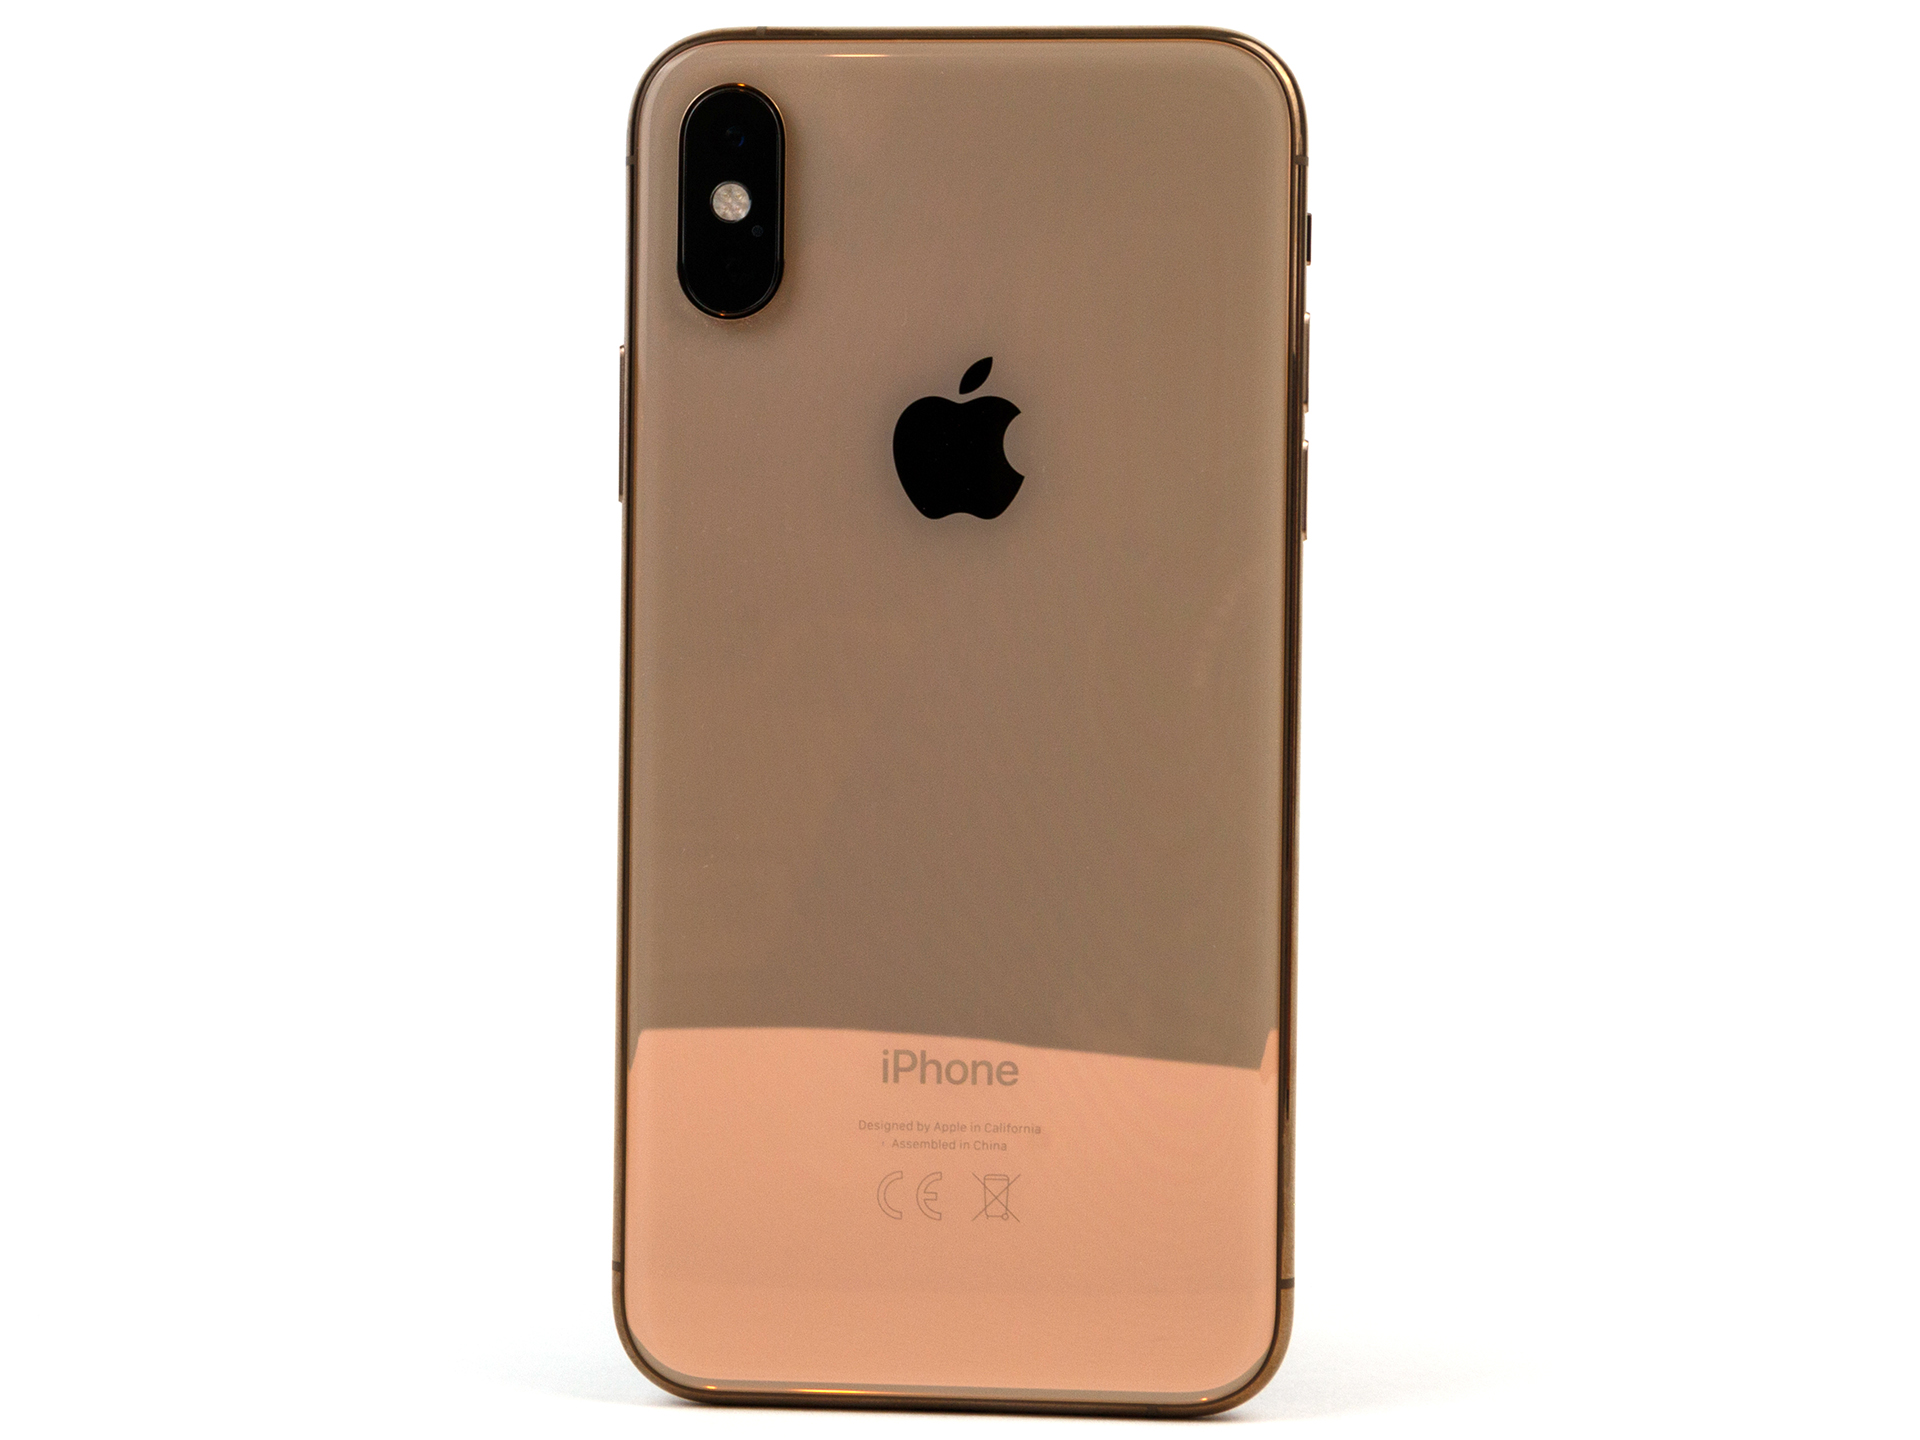
O Apple iPhone XS é um exercício de ajuste fino. O dispositivo tem não apenas um SoC mais rápido e econômico do que seu antecessor, mas também possui uma câmera mais dinâmica, opções de armazenamento maiores, uma classificação IP aprimorada e melhorias no SO associadas ao salto para o iOS 12. Acima de tudo, a função de tempo na tela pode ser útil para os pais que desejam restringir o tempo gasto pelos filhos em jogos. O design do dispositivo permanece o mesmo, mas esperamos que com dispositivos “S”. A única mudança estética é que a Apple também vende o XS em uma nova cor dourada, da qual gostamos particularmente.
O Apple iPhone XS oferece muita tecnologia pelo preço de um pequeno MacBook Pro ou um iMac.
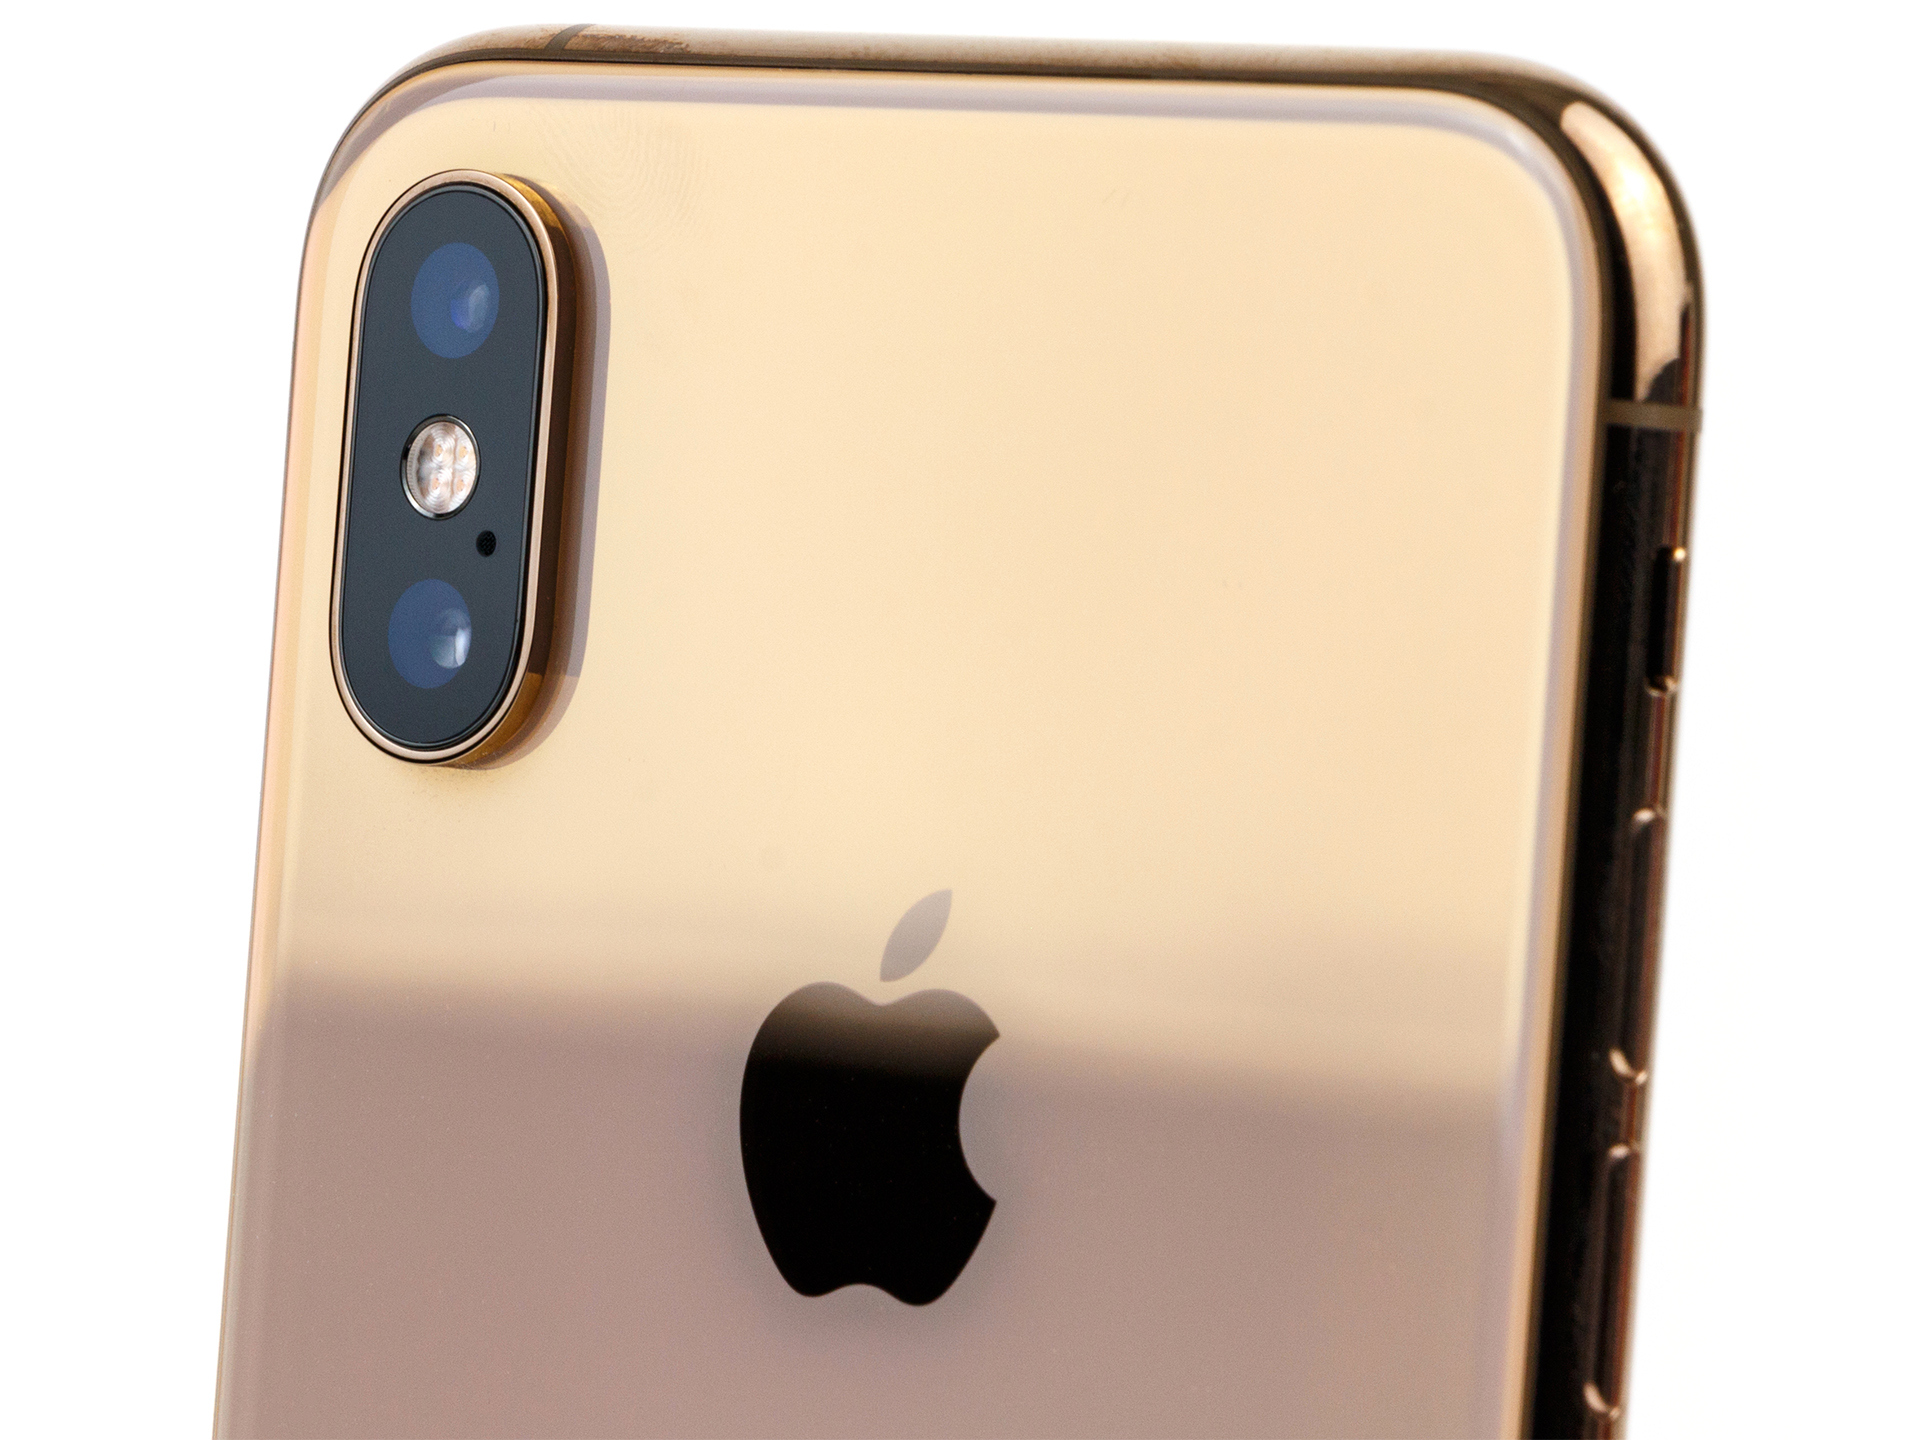
O XS tem algumas desvantagens, mas sem falhas reais. A duração da bateria é boa e melhor do que a do iPhone X. A nova série iPhone XS também enterrou o Touch ID, e todos os novos iPhones dependem apenas da identificação facial para segurança biométrica. Além disso, enquanto a Apple melhorou o desempenho da câmera com pouca luz, a lente telefoto é perceptivelmente inferior ao sensor principal da câmera. Gostaríamos que a Apple tivesse usado um melhor sensor de telefoto, já que também criticamos o iPhone X pelo mesmo motivo.
Nossa maior crítica ao iPhone XS é seu preço. O modelo de 64 GB está a partir de 1.149 Euros (~$1.347) com a versão de 512 GB custando ridículos 1.549 Euros (~$1.817). Você precisará ir fundo para comprar o iPhone mais recente, e o XS não traz novos recursos suficientes para justificar a atualização do iPhone X. Por fim, a última palavra sobre o assunto é a de sua carteira.
Price comparison
