Breve Análise do Smartphone Huawei Mate 10 Lite

| Networking | |
| iperf3 transmit AX12 | |
| ZTE Axon 7 | |
| HTC U Ultra | |
| Samsung Galaxy A5 2017 | |
| BQ Aquaris X Pro | |
| Honor 9 | |
| Huawei Mate 10 Lite | |
| iperf3 receive AX12 | |
| ZTE Axon 7 | |
| Honor 9 | |
| HTC U Ultra | |
| BQ Aquaris X Pro | |
| Samsung Galaxy A5 2017 | |
| Huawei Mate 10 Lite | |


| |||||||||||||||||||||||||
iluminação: 89 %
iluminação com acumulador: 467 cd/m²
Contraste: 1557:1 (Preto: 0.3 cd/m²)
ΔE ColorChecker Calman: 5 | ∀{0.5-29.43 Ø4.71}
ΔE Greyscale Calman: 6.1 | ∀{0.09-98 Ø4.96}
Gamma: 2.15
CCT: 7961 K
| Huawei Mate 10 Lite IPS, 2160x1080, 5.9" | Samsung Galaxy A5 2017 Super AMOLED, 1920x1080, 5.2" | HTC U Ultra SLCD 5, 2560x1440, 5.7" | BQ Aquaris X Pro IPS, 1920x1080, 5.2" | ZTE Axon 7 AMOLED, 2560x1440, 5.5" | Honor 9 IPS/LTPS, 1920x1080, 5.2" | |
|---|---|---|---|---|---|---|
| Screen | 42% | -2% | -38% | -13% | 13% | |
| Brightness middle (cd/m²) | 467 | 539 15% | 470 1% | 458 -2% | 328 -30% | 550 18% |
| Brightness (cd/m²) | 457 | 542 19% | 445 -3% | 473 4% | 334 -27% | 535 17% |
| Brightness Distribution (%) | 89 | 93 4% | 88 -1% | 88 -1% | 88 -1% | 92 3% |
| Black Level * (cd/m²) | 0.3 | 0.22 27% | 0.51 -70% | 0.42 -40% | ||
| Contrast (:1) | 1557 | 2136 37% | 898 -42% | 1310 -16% | ||
| Colorchecker dE 2000 * | 5 | 1.6 68% | 5.5 -10% | 7.1 -42% | 4.6 8% | 3.3 34% |
| Colorchecker dE 2000 max. * | 8.2 | 2.6 68% | 11.9 -45% | 14.5 -77% | 14.7 -79% | 4.5 45% |
| Greyscale dE 2000 * | 6.1 | 1.5 75% | 7.6 -25% | 10.5 -72% | 2.8 54% | 3.6 41% |
| Gamma | 2.15 102% | 2.28 96% | 2.2 100% | 2.28 96% | 2.29 96% | 2.38 92% |
| CCT | 7961 82% | 6422 101% | 7454 87% | 8951 73% | 6612 98% | 7226 90% |
* ... menor é melhor
Cintilação da tela / PWM (modulação por largura de pulso)
| Tela tremeluzindo / PWM não detectado | 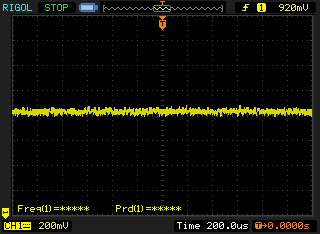 | ||
[pwm_comparison] Em comparação: 52 % de todos os dispositivos testados não usam PWM para escurecer a tela. Se PWM foi detectado, uma média de 7757 (mínimo: 5 - máximo: 343500) Hz foi medida. | |||
Exibir tempos de resposta
| ↔ Tempo de resposta preto para branco | ||
|---|---|---|
| 28 ms ... ascensão ↗ e queda ↘ combinadas | ↗ 12.4 ms ascensão | 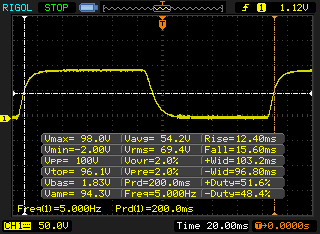 |
| ↘ 15.6 ms queda | ||
| A tela mostra taxas de resposta relativamente lentas em nossos testes e pode ser muito lenta para os jogadores. Em comparação, todos os dispositivos testados variam de 0.1 (mínimo) a 240 (máximo) ms. » 71 % de todos os dispositivos são melhores. Isso significa que o tempo de resposta medido é pior que a média de todos os dispositivos testados (19.8 ms). | ||
| ↔ Tempo de resposta 50% cinza a 80% cinza | ||
| 43.2 ms ... ascensão ↗ e queda ↘ combinadas | ↗ 19.6 ms ascensão |  |
| ↘ 23.6 ms queda | ||
| A tela mostra taxas de resposta lentas em nossos testes e será insatisfatória para os jogadores. Em comparação, todos os dispositivos testados variam de 0.165 (mínimo) a 636 (máximo) ms. » 72 % de todos os dispositivos são melhores. Isso significa que o tempo de resposta medido é pior que a média de todos os dispositivos testados (31 ms). | ||
| AnTuTu v6 - Total Score (classificar por valor) | |
| Huawei Mate 10 Lite | |
| Huawei Nova 2 | |
| HTC U Ultra | |
| BQ Aquaris X Pro | |
| Honor 9 | |
| ZTE Axon 7 | |
| Samsung Galaxy A5 2017 | |
| PCMark for Android | |
| Work performance score (classificar por valor) | |
| Huawei Mate 10 Lite | |
| Huawei Nova 2 | |
| HTC U Ultra | |
| BQ Aquaris X Pro | |
| Honor 9 | |
| ZTE Axon 7 | |
| Samsung Galaxy A5 2017 | |
| Work 2.0 performance score (classificar por valor) | |
| Huawei Mate 10 Lite | |
| Huawei Nova 2 | |
| HTC U Ultra | |
| BQ Aquaris X Pro | |
| Honor 9 | |
| Samsung Galaxy A5 2017 | |
| Geekbench 4.4 | |
| 64 Bit Single-Core Score (classificar por valor) | |
| Huawei Mate 10 Lite | |
| Huawei Nova 2 | |
| BQ Aquaris X Pro | |
| Honor 9 | |
| Samsung Galaxy A5 2017 | |
| 64 Bit Multi-Core Score (classificar por valor) | |
| Huawei Mate 10 Lite | |
| Huawei Nova 2 | |
| BQ Aquaris X Pro | |
| Honor 9 | |
| Samsung Galaxy A5 2017 | |
| Geekbench 4.0 | |
| 64 Bit Single-Core Score (classificar por valor) | |
| Huawei Mate 10 Lite | |
| Huawei Nova 2 | |
| HTC U Ultra | |
| BQ Aquaris X Pro | |
| ZTE Axon 7 | |
| Samsung Galaxy A5 2017 | |
| 64 Bit Multi-Core Score (classificar por valor) | |
| Huawei Mate 10 Lite | |
| Huawei Nova 2 | |
| HTC U Ultra | |
| BQ Aquaris X Pro | |
| ZTE Axon 7 | |
| Samsung Galaxy A5 2017 | |
| GFXBench (DX / GLBenchmark) 2.7 | |
| T-Rex Onscreen (classificar por valor) | |
| Huawei Mate 10 Lite | |
| Huawei Nova 2 | |
| HTC U Ultra | |
| BQ Aquaris X Pro | |
| Honor 9 | |
| ZTE Axon 7 | |
| Samsung Galaxy A5 2017 | |
| 1920x1080 T-Rex Offscreen (classificar por valor) | |
| Huawei Mate 10 Lite | |
| Huawei Nova 2 | |
| HTC U Ultra | |
| BQ Aquaris X Pro | |
| Honor 9 | |
| ZTE Axon 7 | |
| Samsung Galaxy A5 2017 | |
| GFXBench 3.0 | |
| on screen Manhattan Onscreen OGL (classificar por valor) | |
| Huawei Mate 10 Lite | |
| Huawei Nova 2 | |
| HTC U Ultra | |
| BQ Aquaris X Pro | |
| Honor 9 | |
| ZTE Axon 7 | |
| Samsung Galaxy A5 2017 | |
| 1920x1080 1080p Manhattan Offscreen (classificar por valor) | |
| Huawei Mate 10 Lite | |
| Huawei Nova 2 | |
| HTC U Ultra | |
| BQ Aquaris X Pro | |
| Honor 9 | |
| ZTE Axon 7 | |
| Samsung Galaxy A5 2017 | |
| GFXBench 3.1 | |
| on screen Manhattan ES 3.1 Onscreen (classificar por valor) | |
| Huawei Mate 10 Lite | |
| Huawei Nova 2 | |
| HTC U Ultra | |
| BQ Aquaris X Pro | |
| Honor 9 | |
| ZTE Axon 7 | |
| Samsung Galaxy A5 2017 | |
| 1920x1080 Manhattan ES 3.1 Offscreen (classificar por valor) | |
| Huawei Mate 10 Lite | |
| Huawei Nova 2 | |
| HTC U Ultra | |
| BQ Aquaris X Pro | |
| Honor 9 | |
| ZTE Axon 7 | |
| Samsung Galaxy A5 2017 | |
| GFXBench | |
| on screen Car Chase Onscreen (classificar por valor) | |
| Huawei Mate 10 Lite | |
| Huawei Nova 2 | |
| HTC U Ultra | |
| BQ Aquaris X Pro | |
| Honor 9 | |
| ZTE Axon 7 | |
| Samsung Galaxy A5 2017 | |
| 1920x1080 Car Chase Offscreen (classificar por valor) | |
| Huawei Mate 10 Lite | |
| Huawei Nova 2 | |
| HTC U Ultra | |
| BQ Aquaris X Pro | |
| Honor 9 | |
| ZTE Axon 7 | |
| Samsung Galaxy A5 2017 | |
| Lightmark - 1920x1080 1080p (classificar por valor) | |
| Huawei Nova 2 | |
| Basemark X 1.1 | |
| Medium Quality (classificar por valor) | |
| Huawei Nova 2 | |
| High Quality (classificar por valor) | |
| Huawei Nova 2 | |
| Basemark ES 3.1 / Metal - offscreen Overall Score (classificar por valor) | |
| Huawei Nova 2 | |
| Samsung Galaxy A5 2017 | |
| Epic Citadel - Ultra High Quality (classificar por valor) | |
| Huawei Nova 2 | |
| JetStream 1.1 - 1.1 Total | |
| Honor 9 (Chrome 59) | |
| HTC U Ultra (Chrome 56) | |
| ZTE Axon 7 (Chrome 53.0.2785.124) | |
| Samsung Galaxy A5 2017 (Samsung Browser (Chrome 44)) | |
| Huawei Mate 10 Lite (Chrome 62) | |
| Huawei Nova 2 (Chrome 60.0.3112.116) | |
| BQ Aquaris X Pro (Chrome 59.0.3071.125) | |
| Octane V2 - Total Score | |
| Honor 9 (Chrome 59) | |
| ZTE Axon 7 (Chrome 53.0.2785.124) | |
| HTC U Ultra (Chrome 56) | |
| Samsung Galaxy A5 2017 (Samsung Browser (Chrome 44)) | |
| Huawei Mate 10 Lite (Chrome 62) | |
| Huawei Nova 2 (Chrome 60.0.3112.116) | |
| BQ Aquaris X Pro (Chrome 59.0.3071.125) | |
| Mozilla Kraken 1.1 - Total | |
| Huawei Nova 2 (Chrome 60.0.3112.116) | |
| BQ Aquaris X Pro (Chrome 59.0.3071.125) | |
| Huawei Mate 10 Lite (Chrome 62) | |
| Samsung Galaxy A5 2017 (Samsung Browser (Chrome 44)) | |
| HTC U Ultra (Chrome 56) | |
| Honor 9 (Chrome 59) | |
| ZTE Axon 7 (Chrome 53.0.2785.124) | |
| WebXPRT 2015 - Overall | |
| ZTE Axon 7 (Chrome 53.0.2785.124) | |
| Honor 9 (Chrome 59) | |
| Huawei Mate 10 Lite (Chrome 62) | |
| Huawei Nova 2 (Chrome 60.0.3112.116) | |
| Samsung Galaxy A5 2017 (Samsung Browser (Chrome 44)) | |
| BQ Aquaris X Pro (Chrome 59.0.3071.125) | |
* ... menor é melhor
| Huawei Mate 10 Lite | Samsung Galaxy A5 2017 | HTC U Ultra | BQ Aquaris X Pro | ZTE Axon 7 | Honor 9 | |
|---|---|---|---|---|---|---|
| AndroBench 3-5 | -8% | 64% | 15% | 74% | 49% | |
| Sequential Read 256KB (MB/s) | 286.8 | 182 -37% | 423.9 48% | 270.5 -6% | 406.5 42% | 293 2% |
| Sequential Write 256KB (MB/s) | 99.8 | 77.1 -23% | 164.7 65% | 139.6 40% | 150.9 51% | 204 104% |
| Random Read 4KB (MB/s) | 31.5 | 22.41 -29% | 84.2 167% | 37.97 21% | 121.1 284% | 55.7 77% |
| Random Write 4KB (MB/s) | 15.26 | 12.13 -21% | 13.7 -10% | 12.07 -21% | 16.22 6% | 32.7 114% |
| Sequential Read 256KB SDCard (MB/s) | 69.1 ? | 73.7 ? 7% | 82.8 ? 20% | 78.7 ? 14% | 78.4 ? 13% | 68 ? -2% |
| Sequential Write 256KB SDCard (MB/s) | 35.35 ? | 56 ? 58% | 67.6 ? 91% | 49.77 ? 41% | 51.3 ? 45% | 34.64 ? -2% |
| Real Racing 3 | |||
| Configurações | Valor | ||
| high | 26 fps | ||
| Asphalt 8: Airborne | |||
| Configurações | Valor | ||
| high | 22 fps | ||
| very low | 30 fps | ||
| Dead Trigger 2 | |||
| Configurações | Valor | ||
| high | 30 fps | ||
(+) A temperatura máxima no lado superior é 35.5 °C / 96 F, em comparação com a média de 35.3 °C / 96 F , variando de 21.9 a 247 °C para a classe Smartphone.
(+) A parte inferior aquece até um máximo de 31.3 °C / 88 F, em comparação com a média de 34 °C / 93 F
(+) Em uso inativo, a temperatura média para o lado superior é 28.8 °C / 84 F, em comparação com a média do dispositivo de 33 °C / ### class_avg_f### F.
Huawei Mate 10 Lite análise de áudio
(+) | os alto-falantes podem tocar relativamente alto (###valor### dB)
Graves 100 - 315Hz
(-) | quase nenhum baixo - em média 28% menor que a mediana
(±) | a linearidade dos graves é média (7.3% delta para a frequência anterior)
Médios 400 - 2.000 Hz
(±) | médios reduzidos - em média 5% menor que a mediana
(+) | médios são lineares (5.7% delta para frequência anterior)
Altos 2 - 16 kHz
(±) | máximos mais altos - em média 10.5% maior que a mediana
(+) | os máximos são lineares (4.2% delta da frequência anterior)
Geral 100 - 16.000 Hz
(±) | a linearidade do som geral é média (25.5% diferença em relação à mediana)
Comparado com a mesma classe
» 64% de todos os dispositivos testados nesta classe foram melhores, 6% semelhantes, 30% piores
» O melhor teve um delta de 11%, a média foi 34%, o pior foi 134%
Comparado com todos os dispositivos testados
» 78% de todos os dispositivos testados foram melhores, 4% semelhantes, 17% piores
» O melhor teve um delta de 4%, a média foi 23%, o pior foi 134%
HTC U Ultra análise de áudio
(+) | os alto-falantes podem tocar relativamente alto (###valor### dB)
Graves 100 - 315Hz
(-) | quase nenhum baixo - em média 27.3% menor que a mediana
(±) | a linearidade dos graves é média (10.1% delta para a frequência anterior)
Médios 400 - 2.000 Hz
(+) | médios equilibrados - apenas 4.4% longe da mediana
(+) | médios são lineares (6.6% delta para frequência anterior)
Altos 2 - 16 kHz
(±) | máximos mais altos - em média 12.1% maior que a mediana
(+) | os máximos são lineares (6.3% delta da frequência anterior)
Geral 100 - 16.000 Hz
(±) | a linearidade do som geral é média (29% diferença em relação à mediana)
Comparado com a mesma classe
» 76% de todos os dispositivos testados nesta classe foram melhores, 3% semelhantes, 20% piores
» O melhor teve um delta de 11%, a média foi 34%, o pior foi 134%
Comparado com todos os dispositivos testados
» 87% de todos os dispositivos testados foram melhores, 2% semelhantes, 11% piores
» O melhor teve um delta de 4%, a média foi 23%, o pior foi 134%
Samsung Galaxy A5 2017 análise de áudio
(+) | os alto-falantes podem tocar relativamente alto (###valor### dB)
Graves 100 - 315Hz
(-) | quase nenhum baixo - em média 15.5% menor que a mediana
(±) | a linearidade dos graves é média (9.1% delta para a frequência anterior)
Médios 400 - 2.000 Hz
(±) | médios mais altos - em média 9.4% maior que a mediana
(±) | a linearidade dos médios é média (7.6% delta para frequência anterior)
Altos 2 - 16 kHz
(±) | máximos mais altos - em média 5% maior que a mediana
(±) | a linearidade dos máximos é média (7.6% delta para frequência anterior)
Geral 100 - 16.000 Hz
(±) | a linearidade do som geral é média (23.6% diferença em relação à mediana)
Comparado com a mesma classe
» 54% de todos os dispositivos testados nesta classe foram melhores, 8% semelhantes, 38% piores
» O melhor teve um delta de 11%, a média foi 34%, o pior foi 134%
Comparado com todos os dispositivos testados
» 71% de todos os dispositivos testados foram melhores, 6% semelhantes, 23% piores
» O melhor teve um delta de 4%, a média foi 23%, o pior foi 134%
| desligado | |
| Ocioso | |
| Carga |
|
Key:
min: | |
| Huawei Mate 10 Lite 3340 mAh | Samsung Galaxy S8 3000 mAh | HTC U Ultra 3000 mAh | BQ Aquaris X Pro 3100 mAh | Honor 9 3200 mAh | ZTE Axon 7 3250 mAh | Samsung Galaxy A5 2017 3000 mAh | |
|---|---|---|---|---|---|---|---|
| Power Consumption | 20% | -38% | 6% | -24% | -1% | 33% | |
| Idle Minimum * (Watt) | 0.87 | 0.78 10% | 1 -15% | 0.67 23% | 1.13 -30% | 0.64 26% | 0.64 26% |
| Idle Average * (Watt) | 2.14 | 1.1 49% | 2.41 -13% | 1.7 21% | 2.25 -5% | 0.84 61% | 1.36 36% |
| Idle Maximum * (Watt) | 2.16 | 1.16 46% | 2.46 -14% | 1.78 18% | 2.3 -6% | 0.87 60% | 1.4 35% |
| Load Average * (Watt) | 3.7 | 4.15 -12% | 6.8 -84% | 4.42 -19% | 4.89 -32% | 6.02 -63% | 2.53 32% |
| Load Maximum * (Watt) | 5.48 | 5.12 7% | 8.9 -62% | 6.3 -15% | 7.99 -46% | 10.45 -91% | 3.63 34% |
* ... menor é melhor
| Huawei Mate 10 Lite 3340 mAh | Samsung Galaxy A5 2017 3000 mAh | HTC U Ultra 3000 mAh | BQ Aquaris X Pro 3100 mAh | ZTE Axon 7 3250 mAh | Honor 9 3200 mAh | |
|---|---|---|---|---|---|---|
| Duração da bateria | 95% | 15% | 35% | 20% | 14% | |
| Reader / Idle (h) | 19.2 | 40.3 110% | 26.1 36% | 30.7 60% | 28.9 51% | 23.3 21% |
| H.264 (h) | 8.4 | 16.4 95% | 10.1 20% | 10.7 27% | 11.7 39% | 9.4 12% |
| WiFi v1.3 (h) | 8.7 | 14.1 62% | 9.1 5% | 12.2 40% | 6.9 -21% | 8.6 -1% |
| Load (h) | 3.7 | 7.8 111% | 3.6 -3% | 4.2 14% | 4.1 11% | 4.6 24% |
Pro
Contra
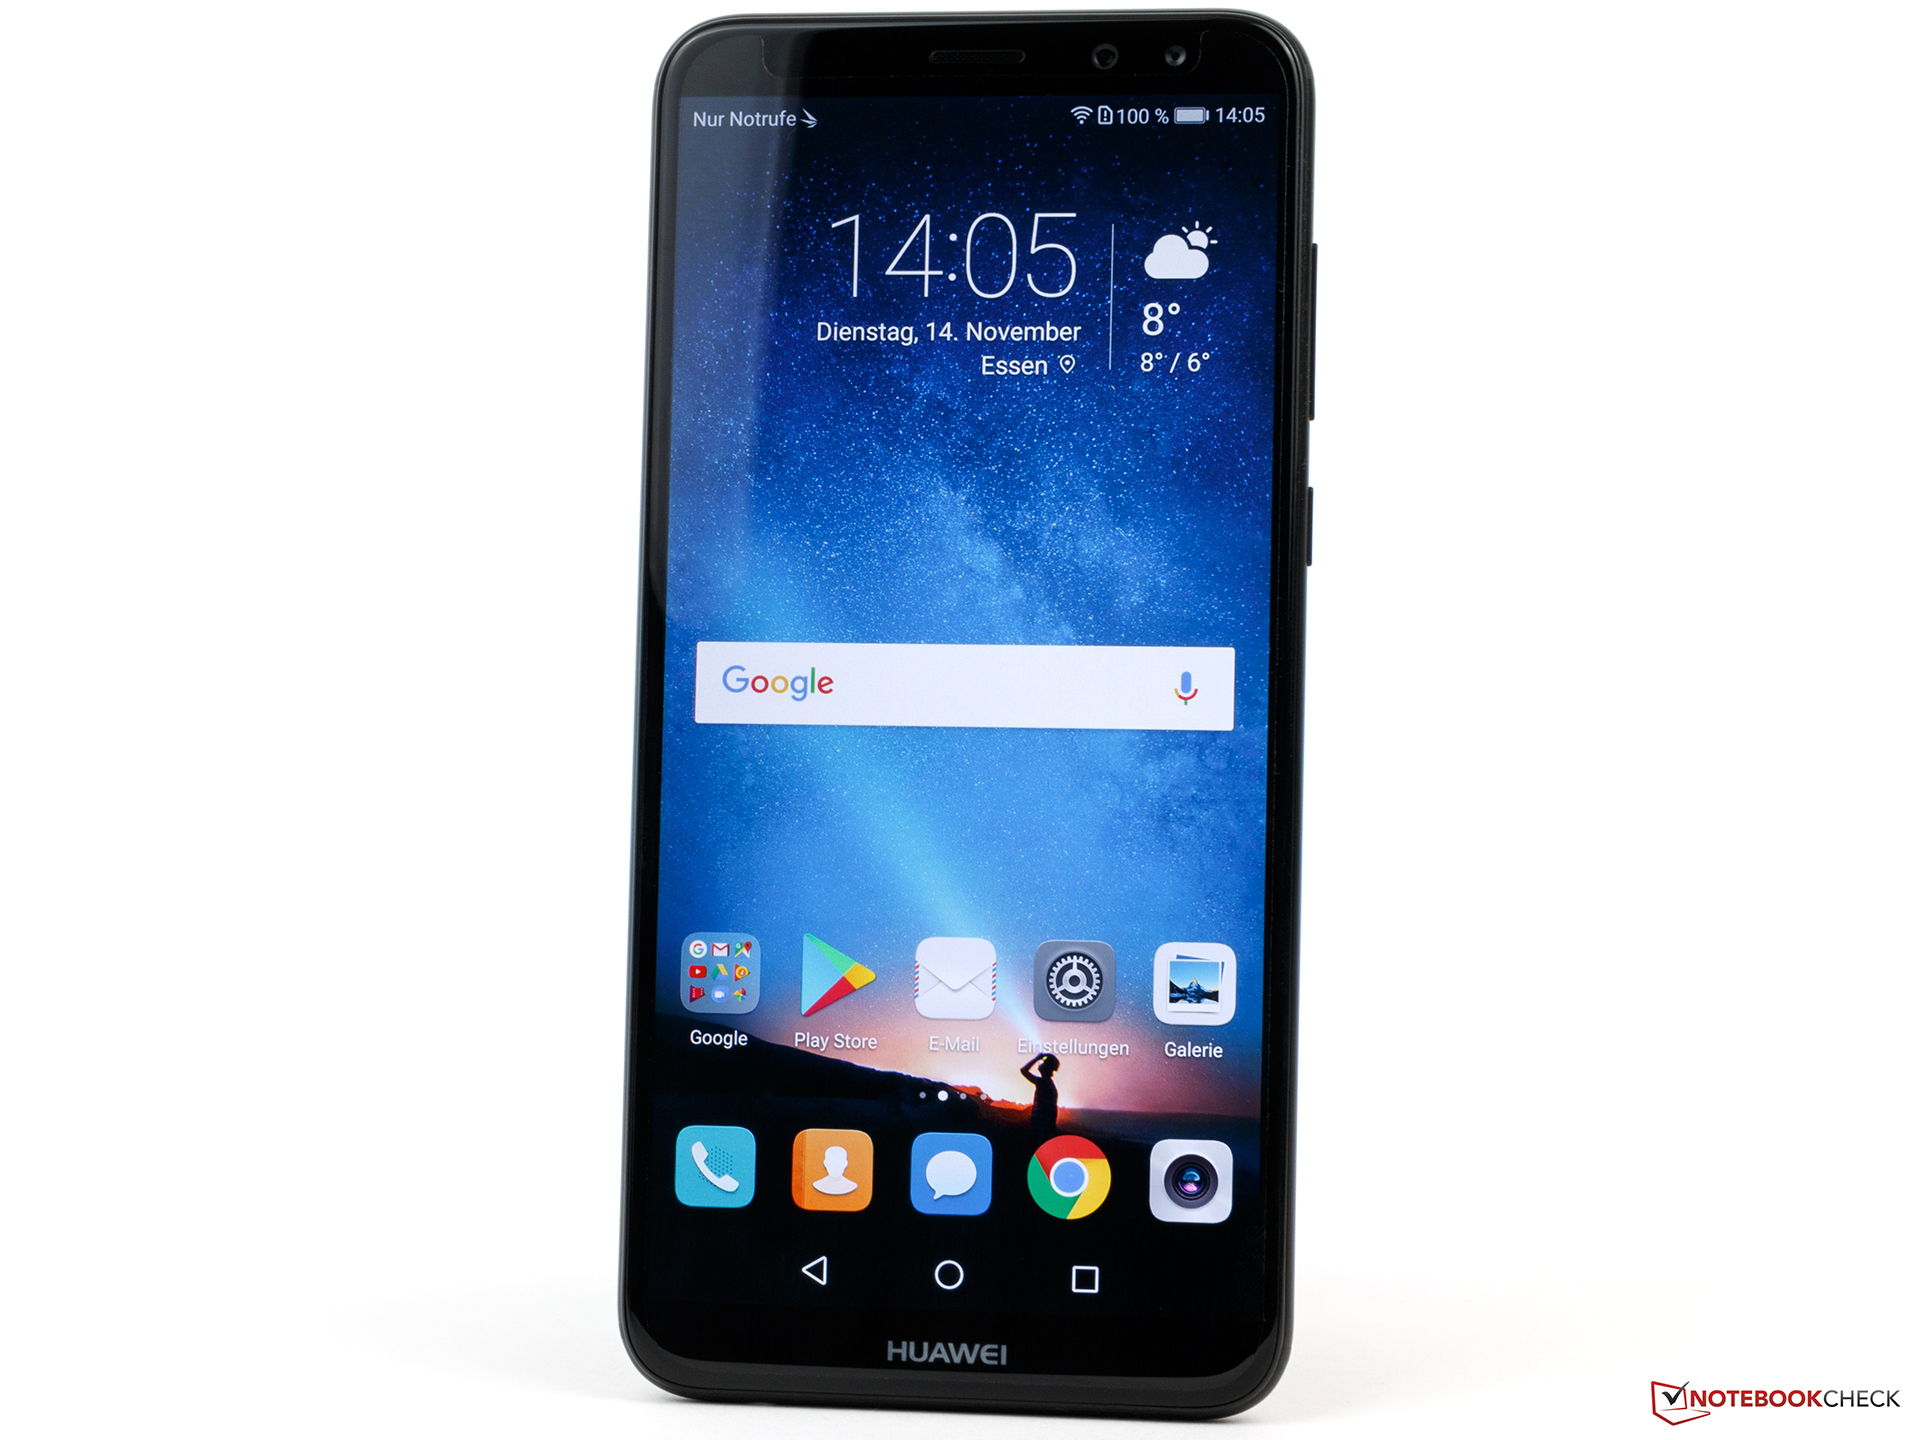
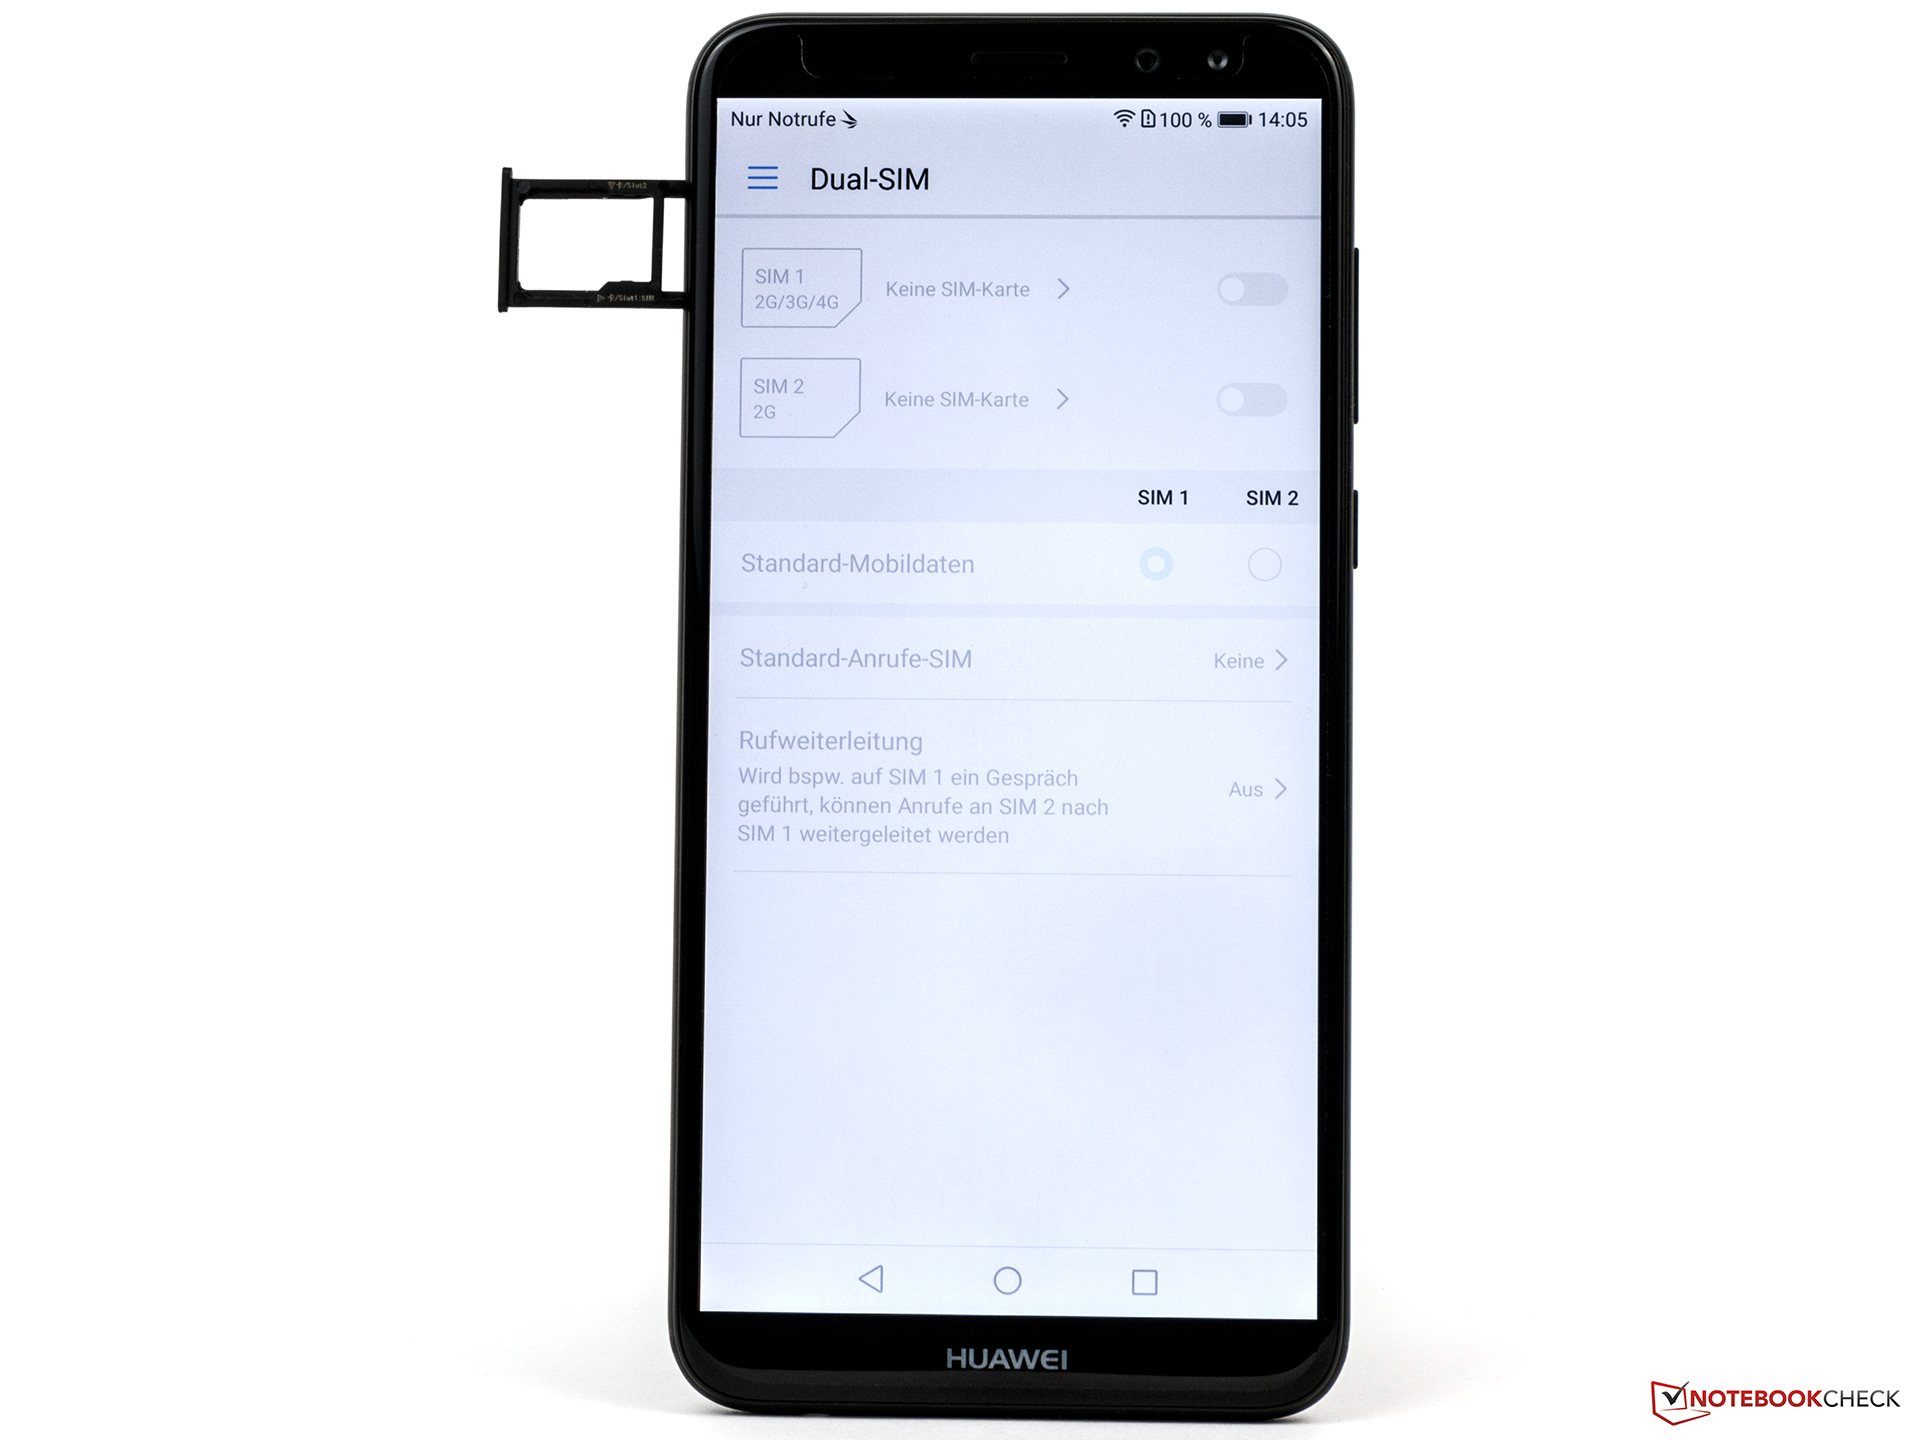
O membro menor e acessível da família Mate 10 revelou-se muito interessante. Infelizmente, a concorrência no seu campo escolhido é imensa, e a única característica do Mate 10 Lite realmente única é a sua tela de 5,9 polegadas 18:9 polegadas com uma excelente relação tela corpo. Outros recursos incluem o SIM híbrido, 4 GB de RAM, 64 GB de armazenamento interno que é expansível via microSD e câmeras duplas em ambos os lados do telefone. No geral, o pacote se sente como uma versão maior do Nova 2, e gostamos mais da câmera frontal do Mate 10 Lite que a besta de megapixels massiva do anterior.
Além de seu nome, o Mate 10 Lite tem pouco em comum com a série Mate em geral. No entanto, é um smartphone bastante decente.
O tamanho da tela ao lado do Huawei Mate 10 Lite tem pouco em comum com os outros dois membros da família Mate. Não tem NFC, a bateria é menor, o SoC é muito mais lento, a configuração da câmera dupla Leica está longe de ser notável, o aptX para áudio Bluetooth de alta resolução não é suportado e, em vez de Super Charge, ele só suporta QuickCharge.
Apesar de tudo, ele acabou por ser um smartphone bastante decente, particularmente para aqueles que preferem que suas telas de smartphone sejam grandes e maciças. Nós teríamos desejado menos compromissos quando comparados com seus dois irmãos maiores, e a duração da bateria poderia ter sido um pouco melhor para começar.
Huawei Mate 10 Lite
- 11/27/2017 v6 (old)
Daniel Schmidt
Price comparison
