Breve Análise do Smartphone Samsung Galaxy J7 (2016)

| Networking | |
| iperf3 transmit AX12 | |
| Samsung Galaxy J7 2016 | |
| iperf3 receive AX12 | |
| Samsung Galaxy J7 2016 | |


| |||||||||||||||||||||||||
iluminação: 91 %
iluminação com acumulador: 287 cd/m²
Contraste: ∞:1 (Preto: 0 cd/m²)
ΔE ColorChecker Calman: 2.9 | ∀{0.5-29.43 Ø4.71}
ΔE Greyscale Calman: 2.1 | ∀{0.09-98 Ø4.96}
Gamma: 2.05
CCT: 6228 K
| Samsung Galaxy J7 2016 Super AMOLED, 1280x720, 5.5" | Honor 5X IPS, 1920x1080, 5.5" | Huawei P9 Lite IPS, 1920x1080, 5.2" | Sony Xperia XA IPS, 1280x720, 5" | Samsung Galaxy J5 2016 AMOLED, 1280x720, 5.2" | |
|---|---|---|---|---|---|
| Screen | -7% | 1% | -41% | -12% | |
| Brightness middle (cd/m²) | 287 | 535 86% | 505 76% | 518 80% | 289 1% |
| Brightness (cd/m²) | 289 | 521 80% | 468 62% | 475 64% | 291 1% |
| Brightness Distribution (%) | 91 | 85 -7% | 88 -3% | 81 -11% | 96 5% |
| Black Level * (cd/m²) | 0.43 | 0.74 | 0.61 | ||
| Colorchecker dE 2000 * | 2.9 | 4.88 -68% | 4.1 -41% | 6.8 -134% | 4.7 -62% |
| Colorchecker dE 2000 max. * | 10.1 | 8.66 14% | 5.8 43% | 11.4 -13% | 7.3 28% |
| Greyscale dE 2000 * | 2.1 | 5.2 -148% | 4.9 -133% | 7 -233% | 3 -43% |
| Gamma | 2.05 107% | 2.26 97% | 2.5 88% | 2.35 94% | 2.03 108% |
| CCT | 6228 104% | 7766 84% | 7116 91% | 8151 80% | 6291 103% |
| Contrast (:1) | 1244 | 682 | 849 |
* ... menor é melhor
Cintilação da tela / PWM (modulação por largura de pulso)
| Tela tremeluzindo/PWM detectado | 238.1 Hz | 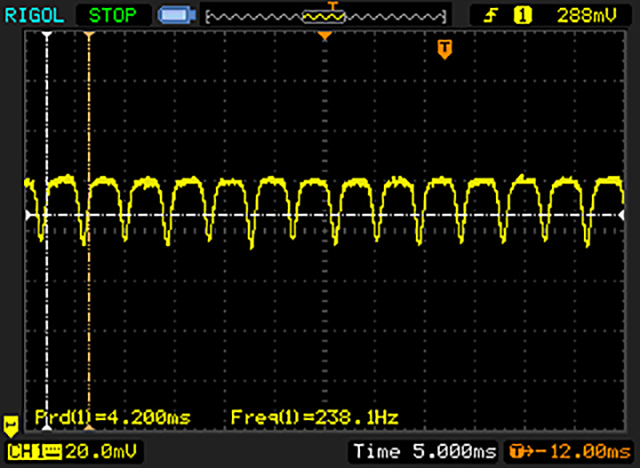 | |
A luz de fundo da tela pisca em 238.1 Hz (pior caso, por exemplo, utilizando PWM) . A frequência de 238.1 Hz é relativamente baixa, portanto, usuários sensíveis provavelmente notarão cintilação e sentirão fadiga ocular na configuração de brilho indicada e abaixo. [pwm_comparison] Em comparação: 52 % de todos os dispositivos testados não usam PWM para escurecer a tela. Se PWM foi detectado, uma média de 7757 (mínimo: 5 - máximo: 343500) Hz foi medida. | |||
Exibir tempos de resposta
| ↔ Tempo de resposta preto para branco | ||
|---|---|---|
| 6 ms ... ascensão ↗ e queda ↘ combinadas | ↗ 3 ms ascensão | 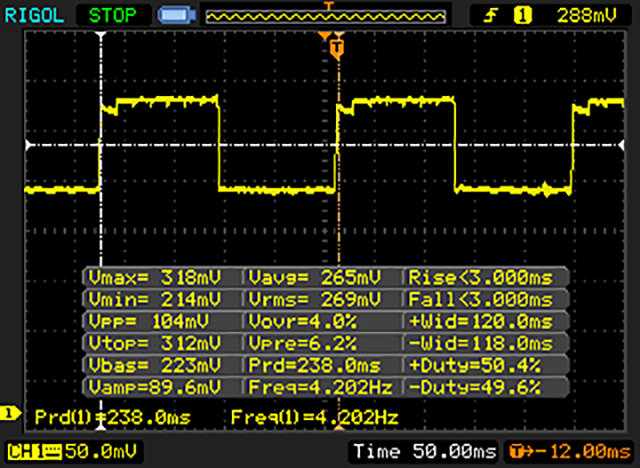 |
| ↘ 3 ms queda | ||
| A tela mostra taxas de resposta muito rápidas em nossos testes e deve ser muito adequada para jogos em ritmo acelerado. Em comparação, todos os dispositivos testados variam de 0.1 (mínimo) a 240 (máximo) ms. » 19 % de todos os dispositivos são melhores. Isso significa que o tempo de resposta medido é melhor que a média de todos os dispositivos testados (19.8 ms). | ||
| ↔ Tempo de resposta 50% cinza a 80% cinza | ||
| 40 ms ... ascensão ↗ e queda ↘ combinadas | ↗ 21 ms ascensão | 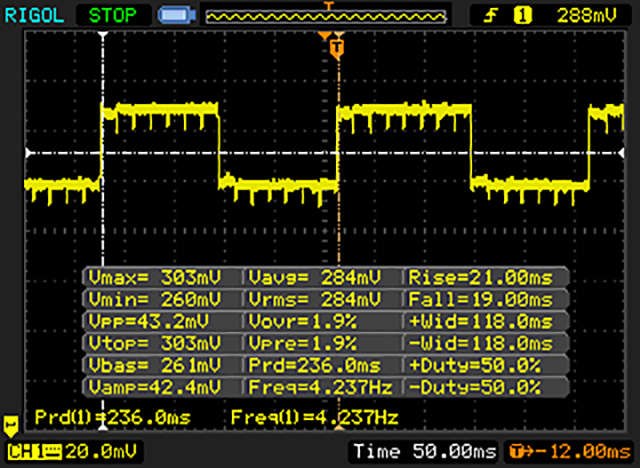 |
| ↘ 19 ms queda | ||
| A tela mostra taxas de resposta lentas em nossos testes e será insatisfatória para os jogadores. Em comparação, todos os dispositivos testados variam de 0.165 (mínimo) a 636 (máximo) ms. » 61 % de todos os dispositivos são melhores. Isso significa que o tempo de resposta medido é pior que a média de todos os dispositivos testados (31 ms). | ||
| AnTuTu v6 - Total Score (classificar por valor) | |
| Samsung Galaxy J7 2016 | |
| Honor 5X | |
| Huawei P9 Lite | |
| Sony Xperia XA | |
| Samsung Galaxy J5 2016 | |
| Geekbench 4.0 | |
| 64 Bit Single-Core Score (classificar por valor) | |
| Samsung Galaxy J7 2016 | |
| 64 Bit Multi-Core Score (classificar por valor) | |
| Samsung Galaxy J7 2016 | |
| GFXBench (DX / GLBenchmark) 2.7 | |
| T-Rex Onscreen (classificar por valor) | |
| Samsung Galaxy J7 2016 | |
| Honor 5X | |
| Huawei P9 Lite | |
| Sony Xperia XA | |
| Samsung Galaxy J5 2016 | |
| 1920x1080 T-Rex Offscreen (classificar por valor) | |
| Samsung Galaxy J7 2016 | |
| Honor 5X | |
| Huawei P9 Lite | |
| Sony Xperia XA | |
| Samsung Galaxy J5 2016 | |
| GFXBench 3.0 | |
| on screen Manhattan Onscreen OGL (classificar por valor) | |
| Samsung Galaxy J7 2016 | |
| Honor 5X | |
| Huawei P9 Lite | |
| Sony Xperia XA | |
| Samsung Galaxy J5 2016 | |
| 1920x1080 1080p Manhattan Offscreen (classificar por valor) | |
| Samsung Galaxy J7 2016 | |
| Honor 5X | |
| Huawei P9 Lite | |
| Sony Xperia XA | |
| Samsung Galaxy J5 2016 | |
| GFXBench 3.1 | |
| on screen Manhattan ES 3.1 Onscreen (classificar por valor) | |
| Samsung Galaxy J7 2016 | |
| Huawei P9 Lite | |
| Sony Xperia XA | |
| Samsung Galaxy J5 2016 | |
| 1920x1080 Manhattan ES 3.1 Offscreen (classificar por valor) | |
| Samsung Galaxy J7 2016 | |
| Huawei P9 Lite | |
| Sony Xperia XA | |
| Samsung Galaxy J5 2016 | |
| PCMark for Android - Work performance score (classificar por valor) | |
| Samsung Galaxy J7 2016 | |
| Honor 5X | |
| Huawei P9 Lite | |
| Sony Xperia XA | |
| Samsung Galaxy J5 2016 | |
| Octane V2 - Total Score (classificar por valor) | |
| Samsung Galaxy J7 2016 | |
| Honor 5X | |
| Huawei P9 Lite | |
| Sony Xperia XA | |
| Samsung Galaxy J5 2016 | |
| Mozilla Kraken 1.1 - Total (classificar por valor) | |
| Samsung Galaxy J7 2016 | |
| Honor 5X | |
| Huawei P9 Lite | |
| Sony Xperia XA | |
| Samsung Galaxy J5 2016 | |
| WebXPRT 2015 - Overall (classificar por valor) | |
| Samsung Galaxy J7 2016 | |
| Honor 5X | |
| Huawei P9 Lite | |
| Sony Xperia XA | |
| Samsung Galaxy J5 2016 | |
| JetStream 1.1 - 1.1 Total (classificar por valor) | |
| Samsung Galaxy J7 2016 | |
| Honor 5X | |
| Huawei P9 Lite | |
| Sony Xperia XA | |
| Samsung Galaxy J5 2016 | |
* ... menor é melhor
| Samsung Galaxy J7 2016 | Honor 5X | Huawei P9 Lite | Sony Xperia XA | Samsung Galaxy J5 2016 | |
|---|---|---|---|---|---|
| AndroBench 3-5 | 5% | 16% | 11% | 5% | |
| Sequential Read 256KB (MB/s) | 189.4 | 144 -24% | 283.5 50% | 240.4 27% | 147 -22% |
| Sequential Write 256KB (MB/s) | 46.24 | 78 69% | 46.24 0% | 68.6 48% | 72 56% |
| Random Read 4KB (MB/s) | 22.33 | 17 -24% | 38.22 71% | 22.05 -1% | 21 -6% |
| Random Write 4KB (MB/s) | 10.11 | 10 -1% | 15.35 52% | 10.6 5% | 11.6 15% |
| Sequential Read 256KB SDCard (MB/s) | 75.5 | 60.8 -19% | 72.9 -3% | 79.8 6% | |
| Sequential Write 256KB SDCard (MB/s) | 58.2 | 25.1 -57% | 50.7 -13% | 46.61 -20% |
| Asphalt 8: Airborne | |||
| Configurações | Valor | ||
| high | 30 fps | ||
| very low | 30 fps | ||
| Dead Trigger 2 | |||
| Configurações | Valor | ||
| high | 30 fps | ||
(+) A temperatura máxima no lado superior é 30.1 °C / 86 F, em comparação com a média de 35.3 °C / 96 F , variando de 21.9 a 247 °C para a classe Smartphone.
(+) A parte inferior aquece até um máximo de 31 °C / 88 F, em comparação com a média de 34 °C / 93 F
(+) Em uso inativo, a temperatura média para o lado superior é 29 °C / 84 F, em comparação com a média do dispositivo de 33 °C / ### class_avg_f### F.
Samsung Galaxy J7 2016 análise de áudio
(+) | os alto-falantes podem tocar relativamente alto (###valor### dB)
Graves 100 - 315Hz
(-) | quase nenhum baixo - em média 32.7% menor que a mediana
(±) | a linearidade dos graves é média (10.2% delta para a frequência anterior)
Médios 400 - 2.000 Hz
(±) | médios reduzidos - em média 5.8% menor que a mediana
(+) | médios são lineares (6.1% delta para frequência anterior)
Altos 2 - 16 kHz
(±) | máximos mais altos - em média 7% maior que a mediana
(+) | os máximos são lineares (5.5% delta da frequência anterior)
Geral 100 - 16.000 Hz
(±) | a linearidade do som geral é média (25.5% diferença em relação à mediana)
Comparado com a mesma classe
» 64% de todos os dispositivos testados nesta classe foram melhores, 6% semelhantes, 30% piores
» O melhor teve um delta de 11%, a média foi 34%, o pior foi 134%
Comparado com todos os dispositivos testados
» 78% de todos os dispositivos testados foram melhores, 4% semelhantes, 17% piores
» O melhor teve um delta de 4%, a média foi 23%, o pior foi 134%
Samsung Galaxy J5 2016 análise de áudio
(+) | os alto-falantes podem tocar relativamente alto (###valor### dB)
Graves 100 - 315Hz
(-) | quase nenhum baixo - em média 32.6% menor que a mediana
(±) | a linearidade dos graves é média (7.1% delta para a frequência anterior)
Médios 400 - 2.000 Hz
(±) | médios mais altos - em média 7.6% maior que a mediana
(±) | a linearidade dos médios é média (10.9% delta para frequência anterior)
Altos 2 - 16 kHz
(±) | máximos mais altos - em média 6.1% maior que a mediana
(+) | os máximos são lineares (6.5% delta da frequência anterior)
Geral 100 - 16.000 Hz
(-) | o som geral não é linear (30.2% diferença em relação à mediana)
Comparado com a mesma classe
» 79% de todos os dispositivos testados nesta classe foram melhores, 4% semelhantes, 17% piores
» O melhor teve um delta de 11%, a média foi 34%, o pior foi 134%
Comparado com todos os dispositivos testados
» 88% de todos os dispositivos testados foram melhores, 3% semelhantes, 9% piores
» O melhor teve um delta de 4%, a média foi 23%, o pior foi 134%
Huawei P9 Lite análise de áudio
(+) | os alto-falantes podem tocar relativamente alto (###valor### dB)
Graves 100 - 315Hz
(-) | quase nenhum baixo - em média 31% menor que a mediana
(±) | a linearidade dos graves é média (9.2% delta para a frequência anterior)
Médios 400 - 2.000 Hz
(+) | médios equilibrados - apenas 4.4% longe da mediana
(+) | médios são lineares (4.2% delta para frequência anterior)
Altos 2 - 16 kHz
(±) | máximos mais altos - em média 5.2% maior que a mediana
(+) | os máximos são lineares (2.2% delta da frequência anterior)
Geral 100 - 16.000 Hz
(±) | a linearidade do som geral é média (21% diferença em relação à mediana)
Comparado com a mesma classe
» 39% de todos os dispositivos testados nesta classe foram melhores, 8% semelhantes, 53% piores
» O melhor teve um delta de 11%, a média foi 34%, o pior foi 134%
Comparado com todos os dispositivos testados
» 58% de todos os dispositivos testados foram melhores, 7% semelhantes, 35% piores
» O melhor teve um delta de 4%, a média foi 23%, o pior foi 134%
| desligado | |
| Ocioso | |
| Carga |
|
Key:
min: | |
| Samsung Galaxy J7 2016 3300 mAh | Honor 5X 3000 mAh | Huawei P9 Lite 3000 mAh | Sony Xperia XA 2300 mAh | Samsung Galaxy J5 2016 3100 mAh | |
|---|---|---|---|---|---|
| Power Consumption | -57% | -35% | -22% | 8% | |
| Idle Minimum * (Watt) | 0.67 | 0.87 -30% | 0.73 -9% | 0.72 -7% | 0.61 9% |
| Idle Average * (Watt) | 1.71 | 2.08 -22% | 2.09 -22% | 1.5 12% | 1.41 18% |
| Idle Maximum * (Watt) | 1.83 | 2.22 -21% | 2.11 -15% | 1.57 14% | 1.51 17% |
| Load Average * (Watt) | 2.37 | 5.26 -122% | 4.15 -75% | 3.48 -47% | 2.56 -8% |
| Load Maximum * (Watt) | 3.31 | 6.34 -92% | 5.05 -53% | 6.04 -82% | 3.1 6% |
* ... menor é melhor
| Samsung Galaxy J7 2016 3300 mAh | Honor 5X 3000 mAh | Huawei P9 Lite 3000 mAh | Sony Xperia XA 2300 mAh | Samsung Galaxy J5 2016 3100 mAh | |
|---|---|---|---|---|---|
| Duração da bateria | -54% | -47% | -66% | -36% | |
| Reader / Idle (h) | 33.8 | 17.6 -48% | 23.4 -31% | 12.9 -62% | 26.7 -21% |
| H.264 (h) | 20.3 | 10 -51% | 9.5 -53% | 7.7 -62% | 11 -46% |
| WiFi v1.3 (h) | 17.1 | 10.7 -37% | 10.1 -41% | 5.9 -65% | 10.7 -37% |
| Load (h) | 11.4 | 2.4 -79% | 4.5 -61% | 2.8 -75% | 6.7 -41% |
Pro
Contra
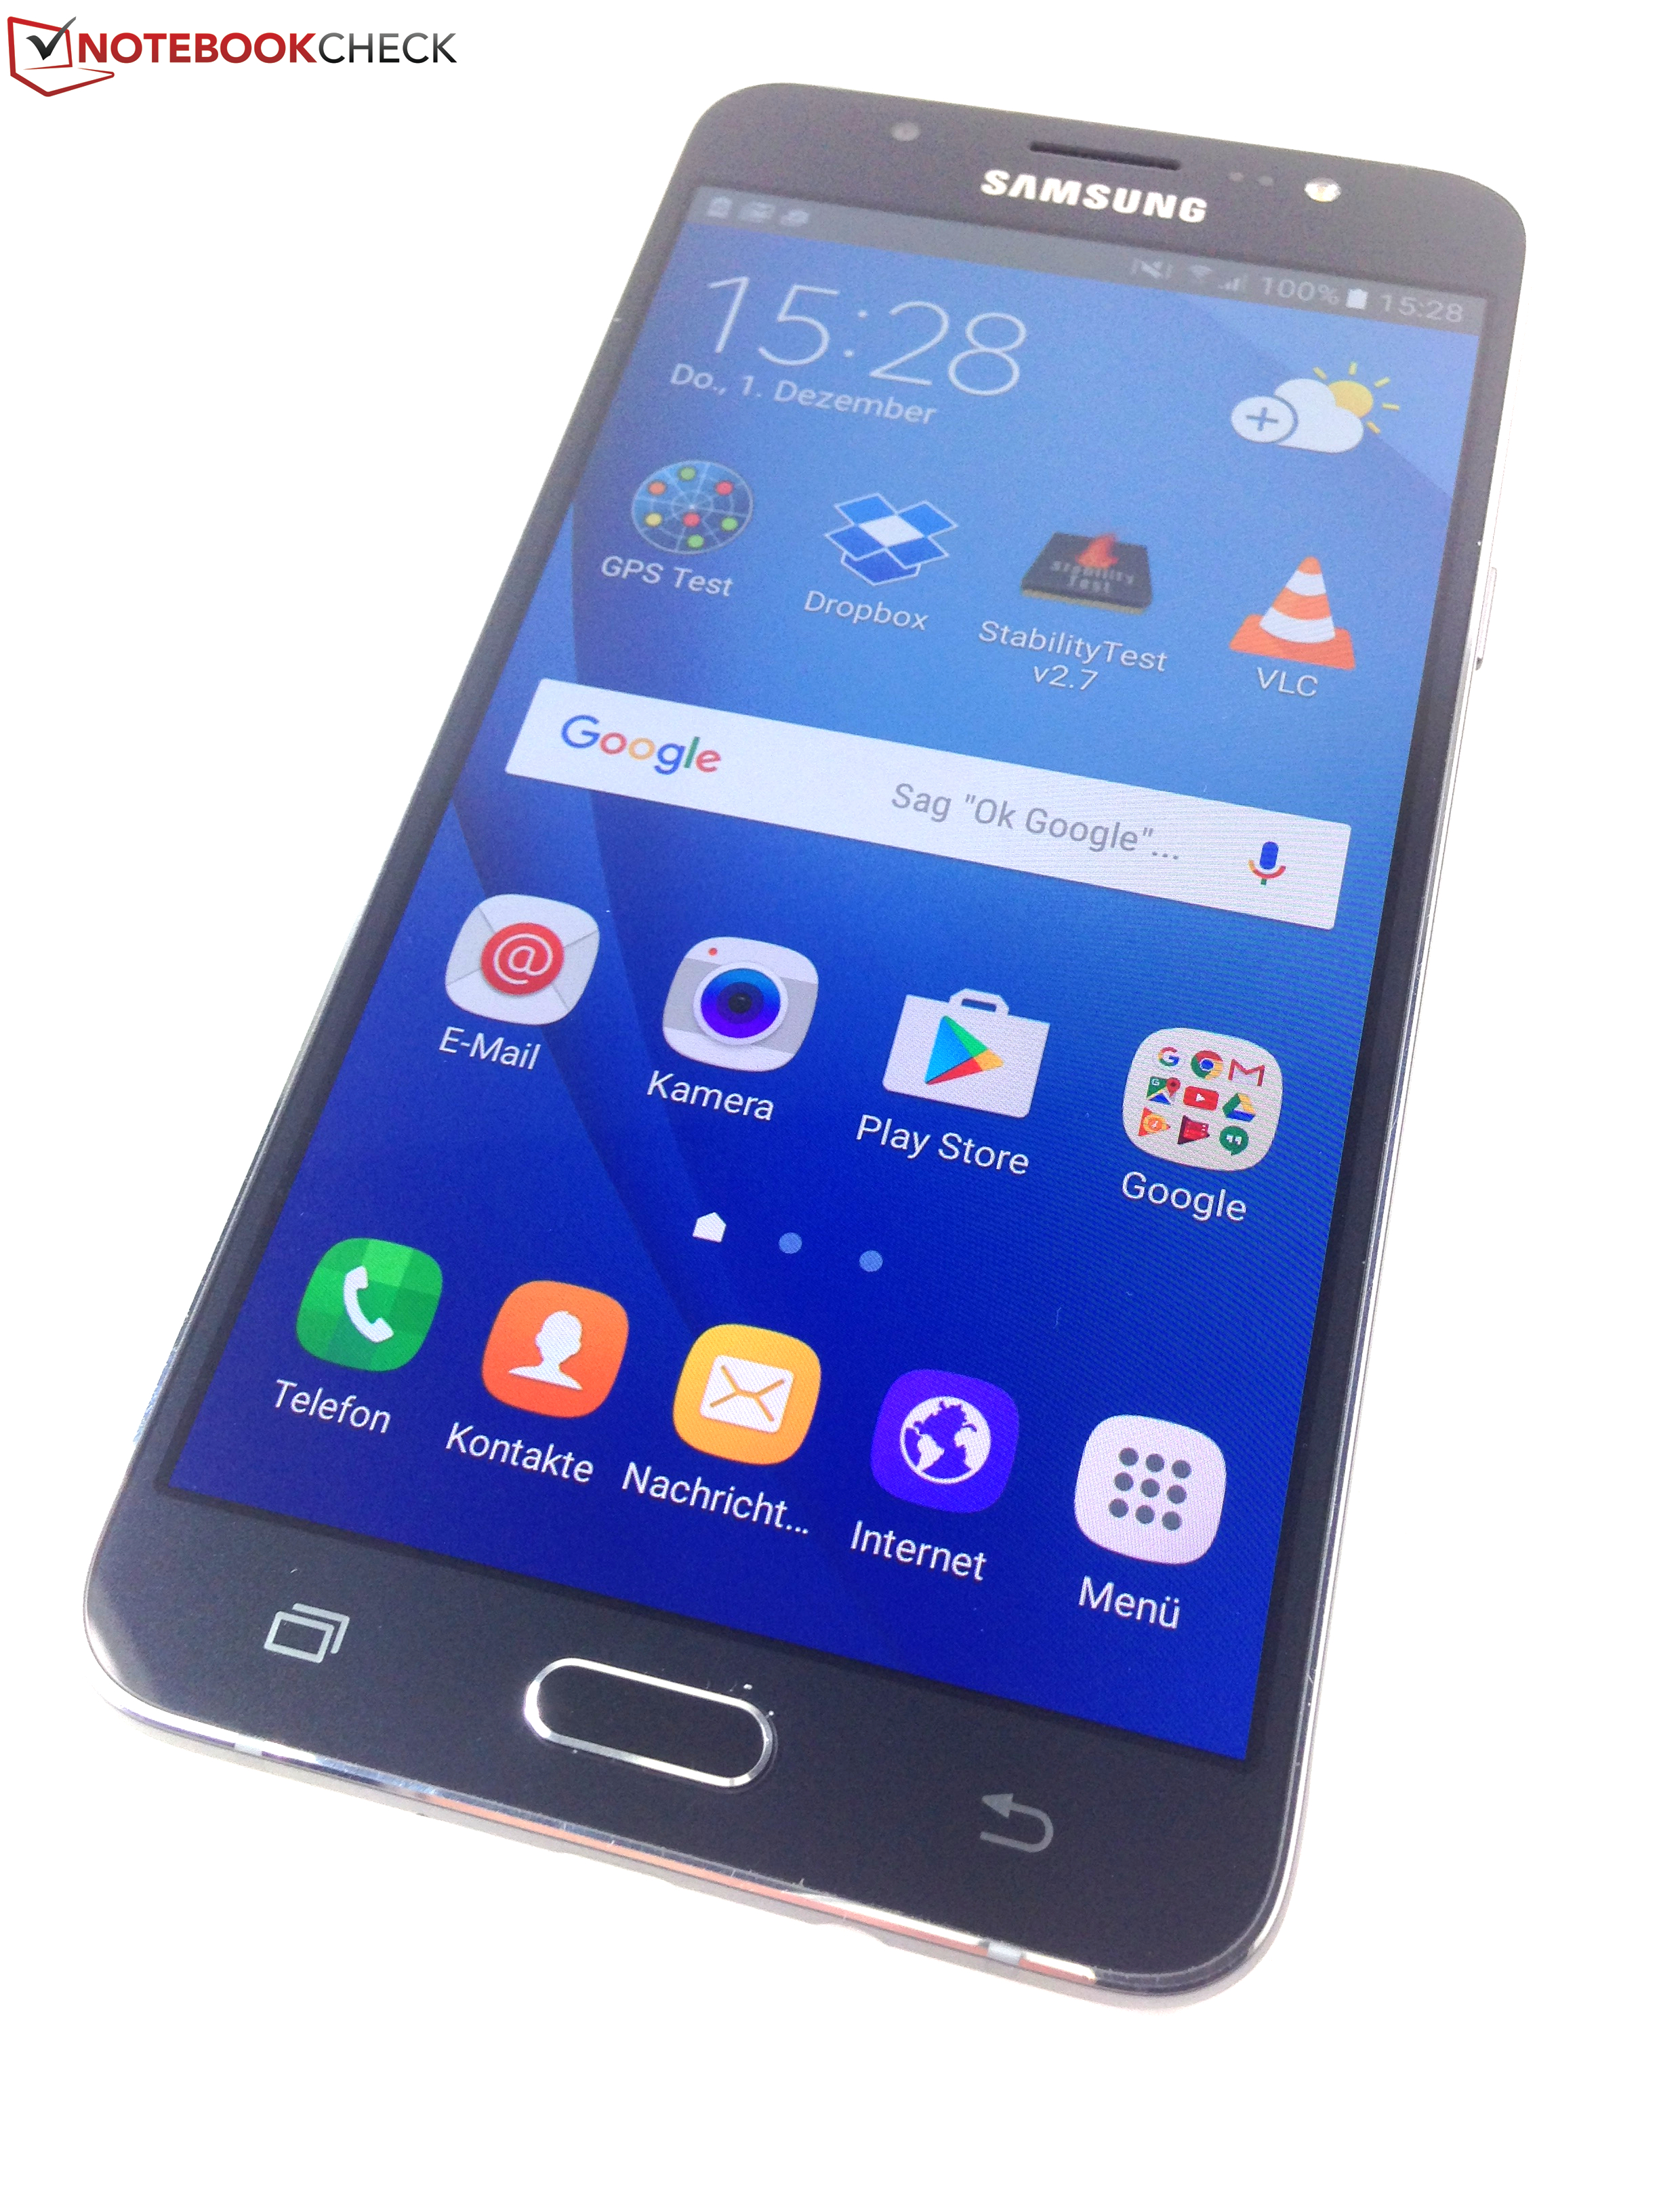
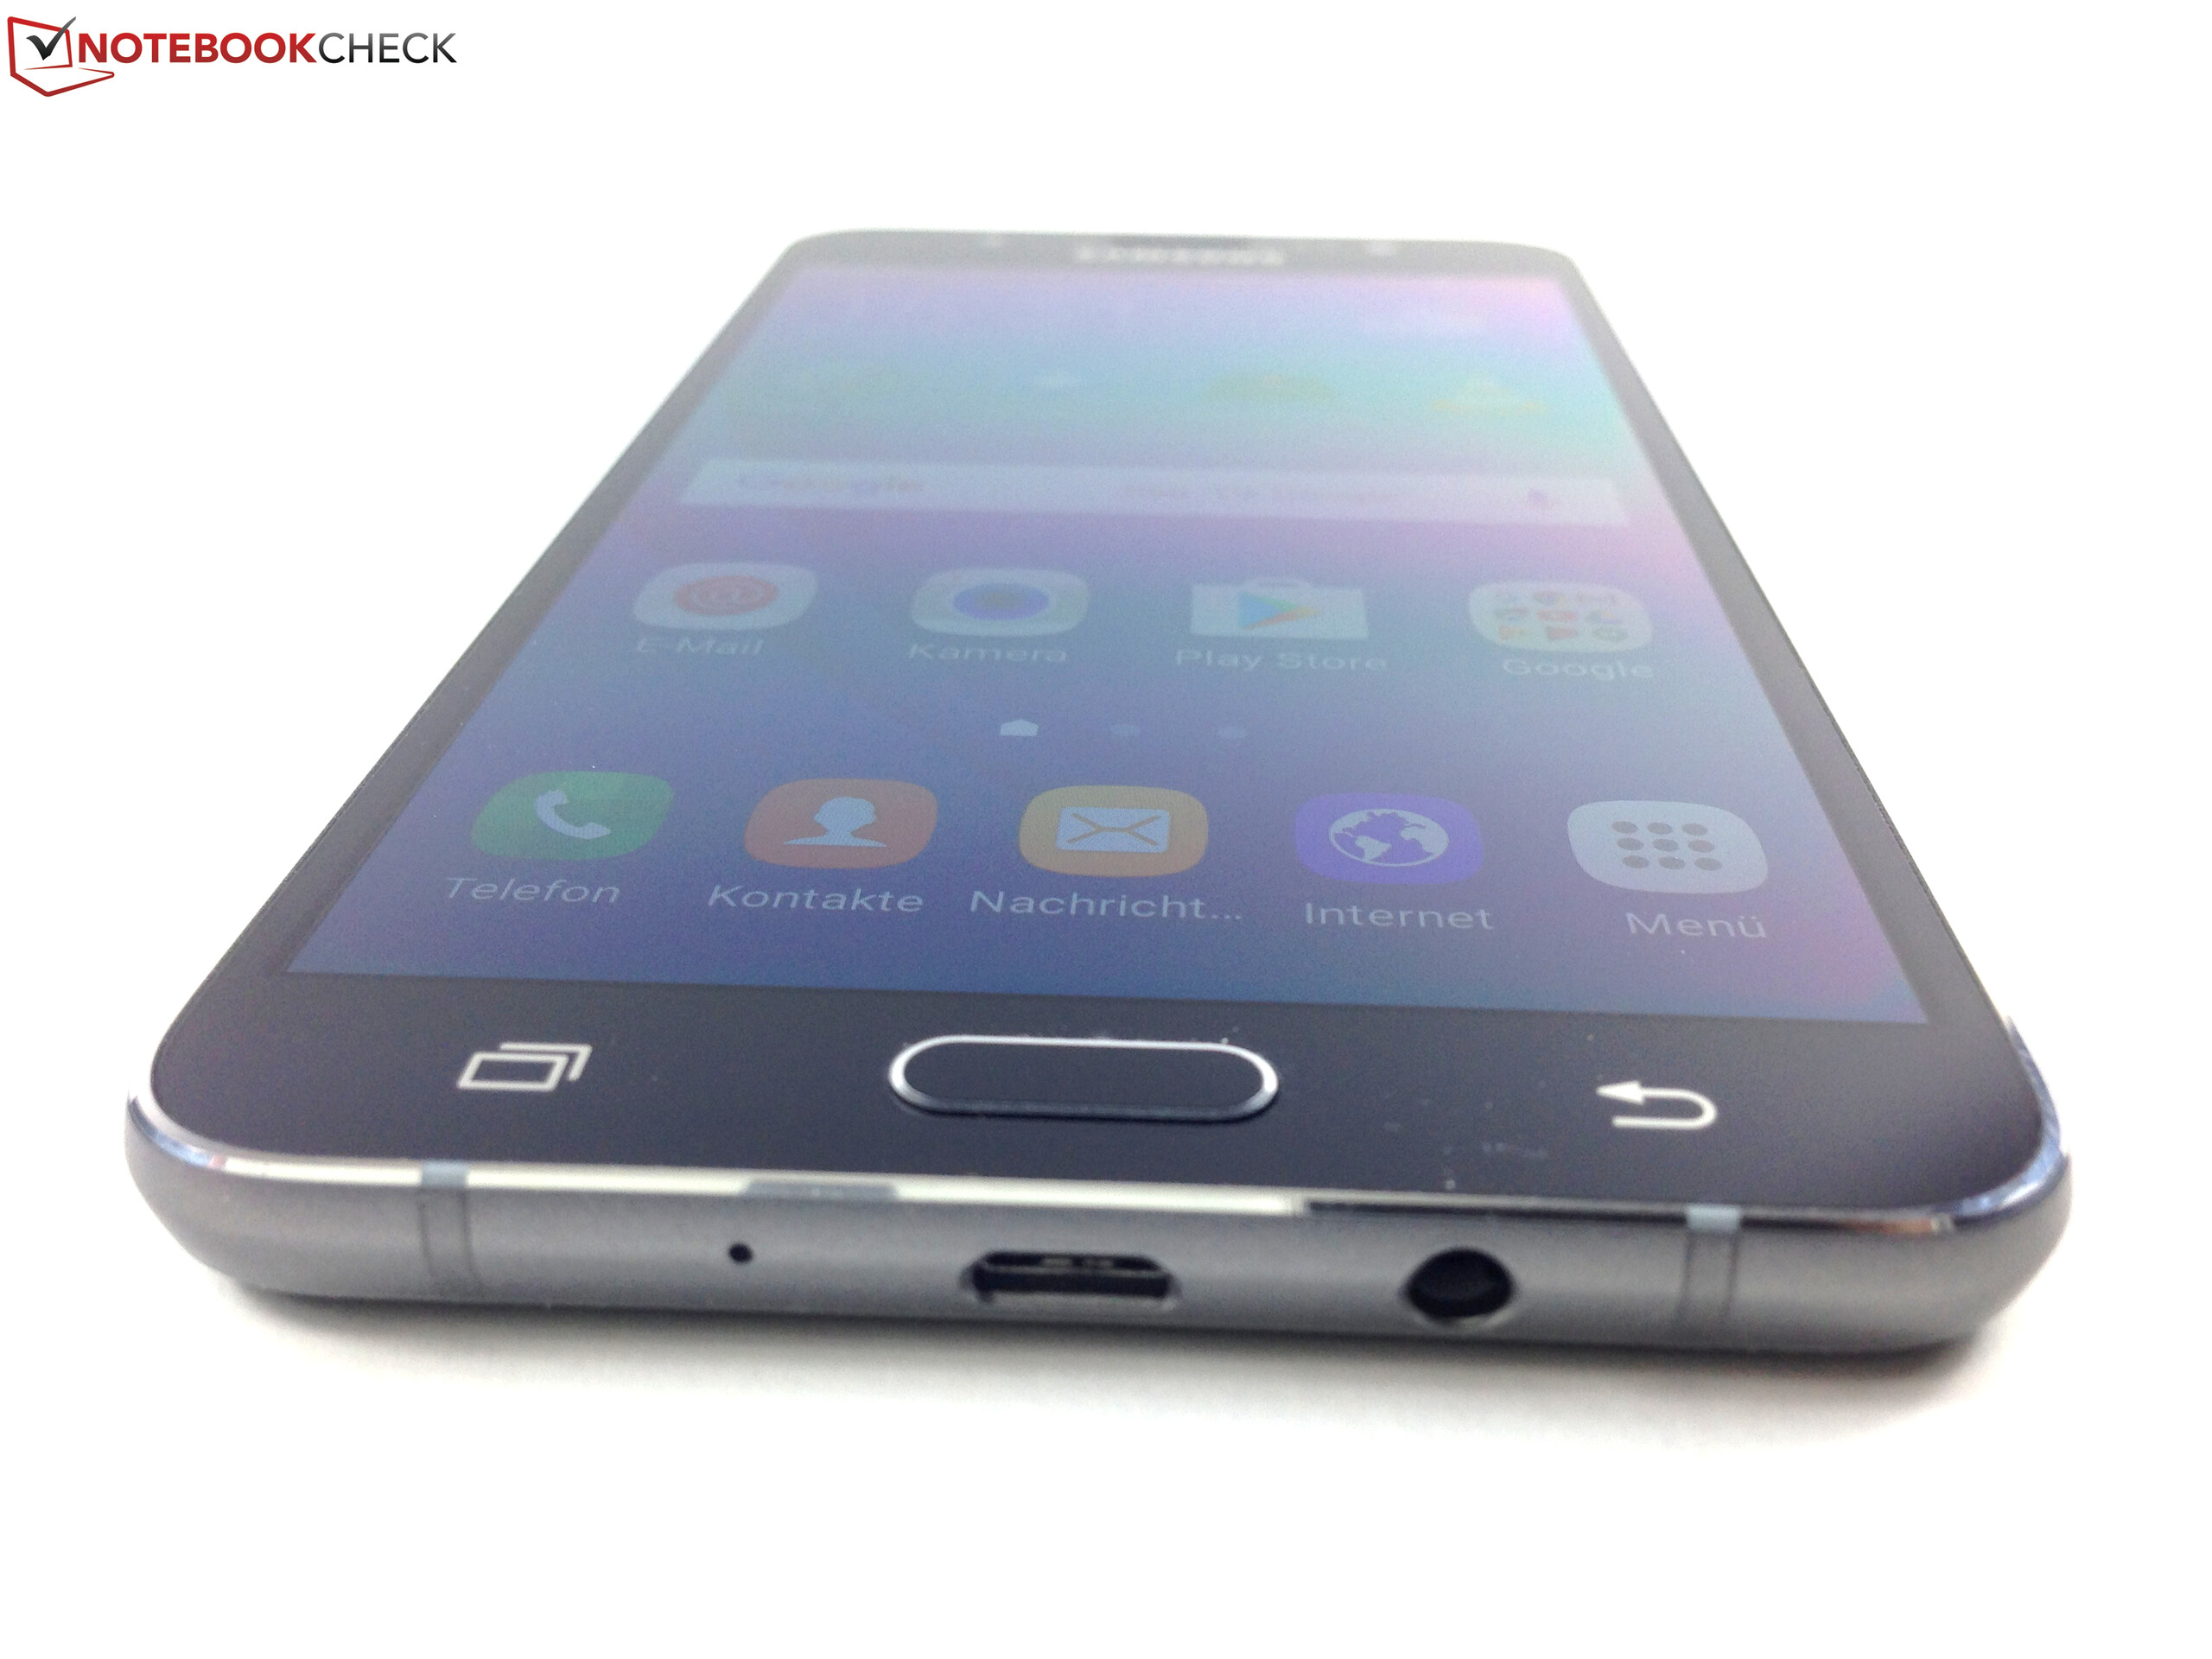
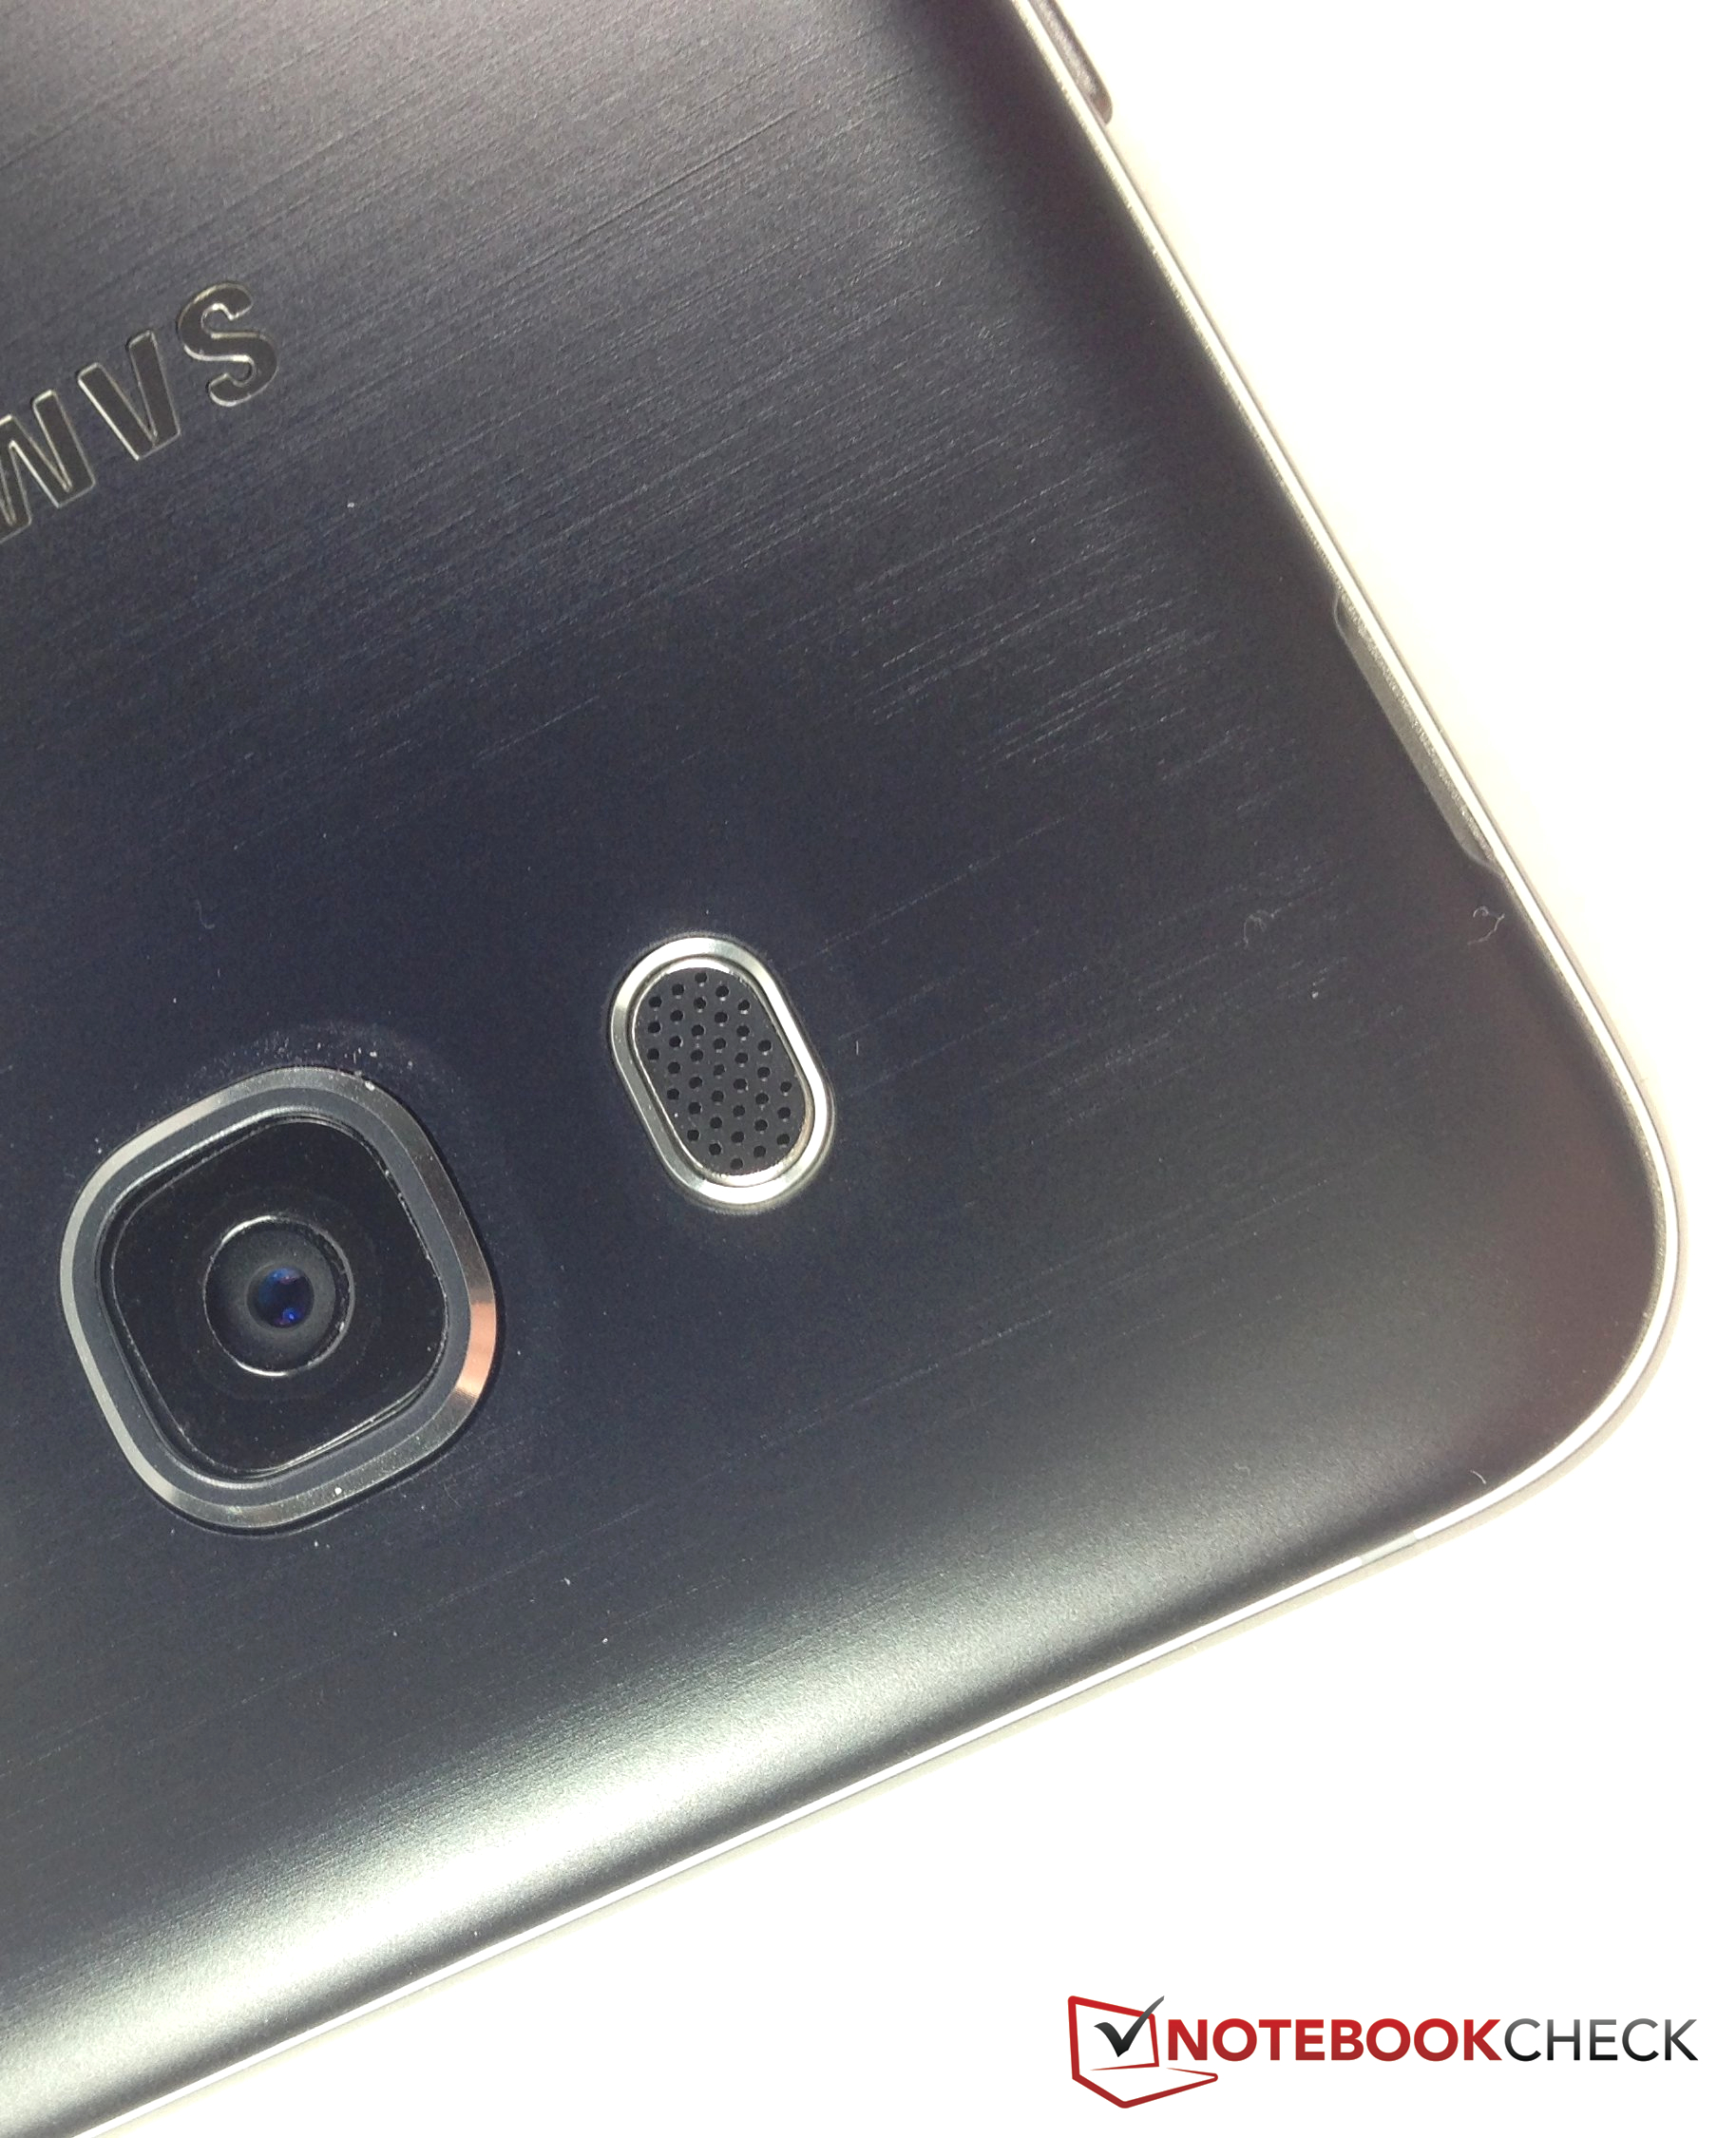
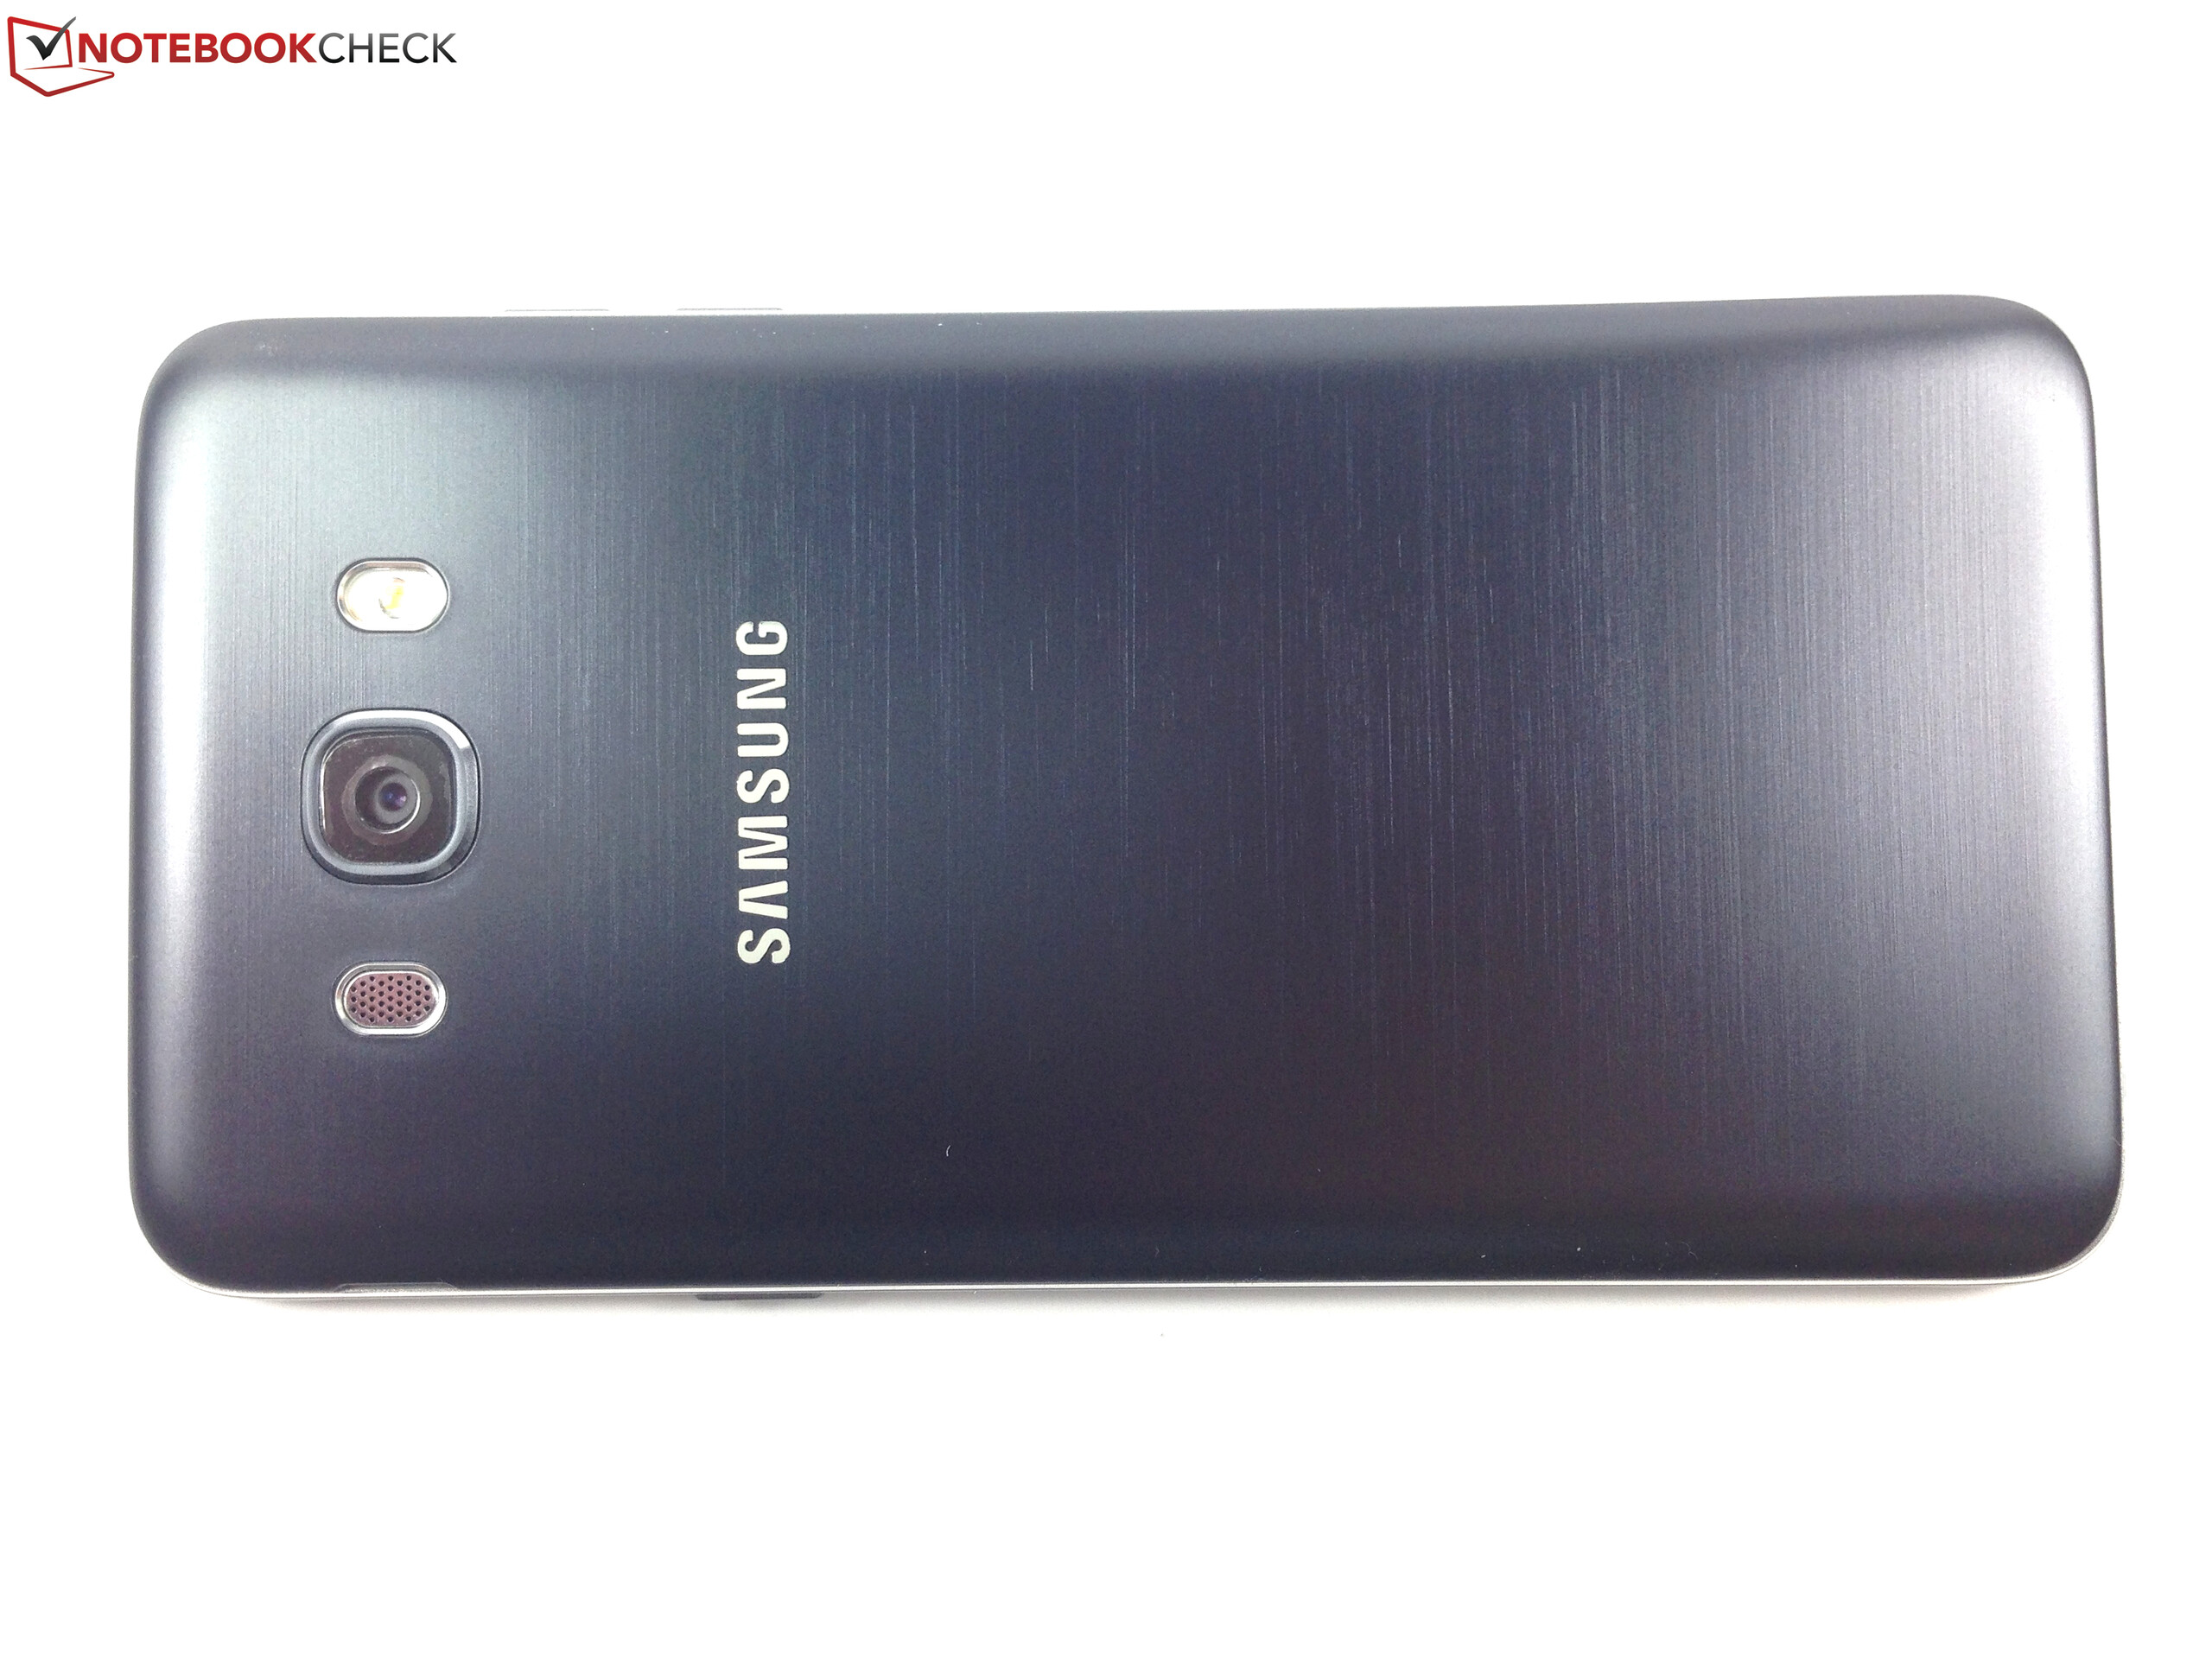
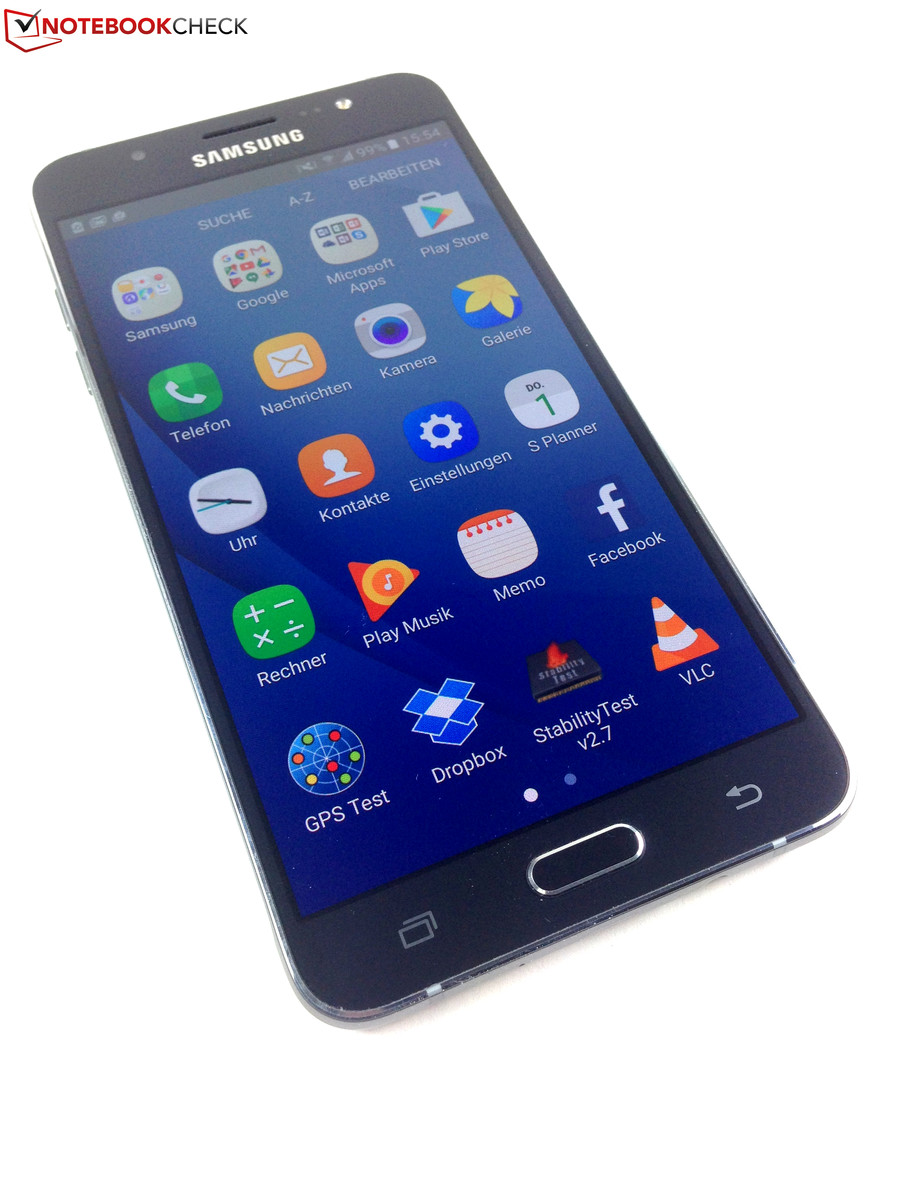
Com o Galaxy J7 (2016), a Samsung aprimorou o seu smartphone de gama média de 5,5 polegadas de forma sutil e efetiva. Um destaque da edição 2016 é a carcaça de metal, que adiciona ao smartphone uma sensação táctil de maior qualidade e mais rigidez quando comparado com seu predecessor. O desempenho também foi melhorado com a modificação do SoC Snapdragon 615 octa-core para o Samsung Exynos 7870 Octa e a atualização da RAM de 1,5 para 2 GB. Outros pontos positivos: A nova edição vem com o SO Android 6.0.1 Marshmallow mais atual, em vez do Android 5.1.
A atualização valeu a pena: Se estiver procurando um bom smartphone de gama média acessível, o Galaxy J7 (2016) poderia ser o candidato correto.
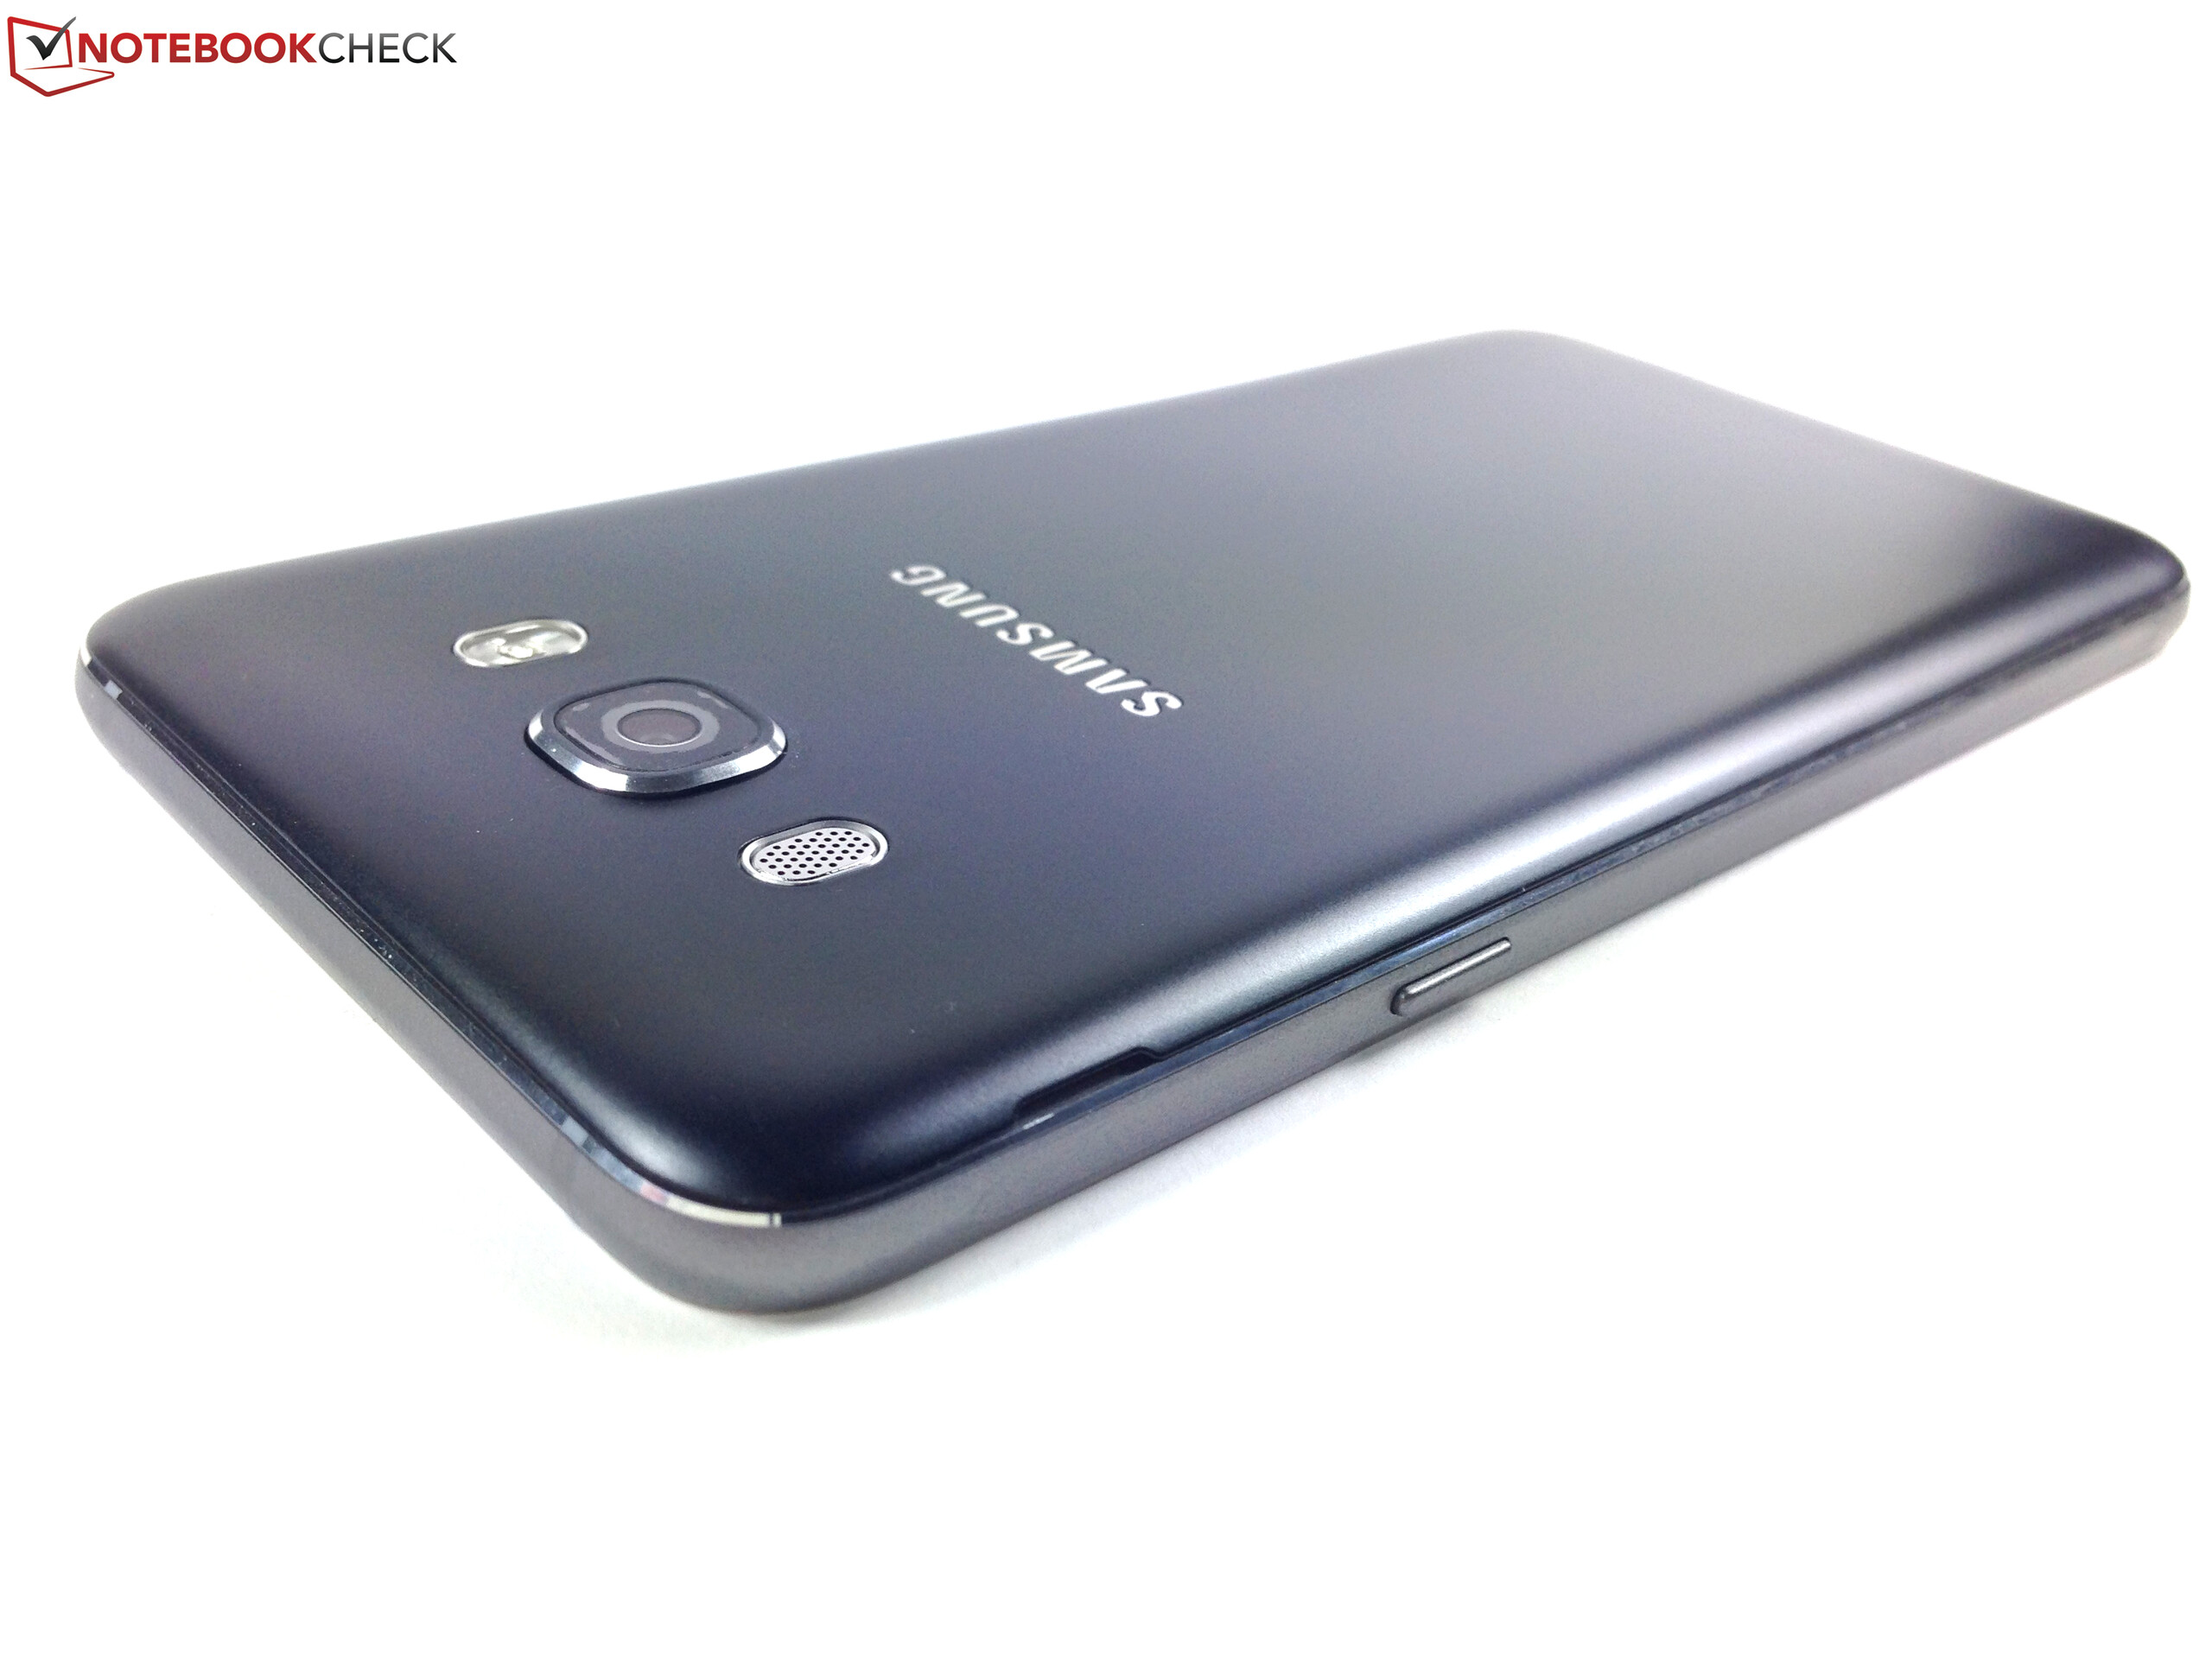
As virtudes do predecessor, como uma tela Super AMOLED, a câmera traseira de 13 MP, a câmera frontal de 5 MP, e uma bateria removível, foram preservadas. No entanto, esta última tem inclusive mais capacidade no Galaxy J7 (2016) e fornece ao smartphone uma excelente duração da bateria.
Infelizmente, o Galaxy J7 (2016) também tem alguns pontos fracos. As lentas velocidades de Wi-Fi, a falta de um sensor de brilho, a medíocre qualidade de voz, e uma câmera principal apenas média precisa ser mencionada. Um leitor de digitais também poderia ter sido incluído nesta faixa de preços. Usuários mais sensíveis também poderiam perceber um pouco do perturbante flickering da tela em certas configurações do brilho. Basicamente, estes são mais ou menos os mesmos pontos que já criticamos no Galaxy J5 (2016). Portanto, se você deseja economizar 50 Euros (~$52) e pode viver com uma tela um pouco menor (5,2 em vez de 5,5-polegadas) bem como com um SoC mais lento, então o Galaxy J5 (2016) também poderia ser interessante.
With the Galaxy J7 (2016), Samsung has overhauled its mid-range 5.5-inch smartphone in a subtle, but effective way. One highlight of the 2016 edition is the metal case, which provides the smartphone with higher-quality haptics and more sturdiness when compared to its predecessor. The performance has also been taken up a notch by switching from the octa-core Snapdragon 615 SoC to the Samsung Exynos 7870 Octa and upgrading the RAM from 1.5 to 2 GB. Another plus point: The new edition comes with the more current Android 6.0.1 Marshmallow OS instead of Android 5.1.
The overhaul has been worth it: If you are looking for a good, affordable mid-range smartphone, the Galaxy J7 (2016) could be the right candidate.
The virtues of the predecessor, such as a Super AMOLED display, the 13 MP rear camera, the 5 MP front camera, and a removable battery, have been preserved. However, the latter has even more capacity on the Galaxy J7 (2016) and gives the smartphone excellent battery life.
Unfortunately, the Galaxy J7 (2016) also has a few weak points. The slow Wi-Fi speeds, a missing brightness sensor, the mediocre voice quality, and a qualitatively only average main camera need to be mentioned here. A fingerprint sensor could have also been included in this price range. More sensitive user could also perceive some disturbing screen flickering at certain brightness settings. Basically, these are more or less the same points we have already criticised with the Galaxy J5 (2016). So, if you want to save 50 Euros (~$52) and can live with a slightly smaller display (5.2 instead of 5.5-inch) as well as a slower SoC, then the Galaxy J5 (2016) could also be interesting.
Samsung Galaxy J7 2016
- 12/06/2016 v6 (old)
Manuel Masiero