Breve Análise do Smartphone Samsung Galaxy A6 Plus (2018)


| |||||||||||||||||||||||||
iluminação: 93 %
iluminação com acumulador: 519 cd/m²
Contraste: ∞:1 (Preto: 0 cd/m²)
ΔE ColorChecker Calman: 1.8 | ∀{0.5-29.43 Ø4.71}
ΔE Greyscale Calman: 1.5 | ∀{0.09-98 Ø4.96}
95% sRGB (Calman 2D)
Gamma: 2.06
CCT: 6462 K
| Samsung Galaxy A6 Plus 2018 Super AMOLED, 2220x1080, 6" | Huawei P20 Lite IPS, 2280x1080, 5.8" | HTC U11 Life SLCD, 1920x1080, 5.2" | Sony Xperia XA2 IPS, 1920x1080, 5.2" | Samsung Galaxy A5 2017 Super AMOLED, 1920x1080, 5.2" | BQ Aquaris X Pro IPS, 1920x1080, 5.2" | Nokia 7 Plus IPS, 2160x1080, 6" | |
|---|---|---|---|---|---|---|---|
| Screen | -106% | -94% | -136% | 8% | -204% | -77% | |
| Brightness middle (cd/m²) | 519 | 528 2% | 545 5% | 513 -1% | 539 4% | 458 -12% | 458 -12% |
| Brightness (cd/m²) | 513 | 525 2% | 526 3% | 506 -1% | 542 6% | 473 -8% | 463 -10% |
| Brightness Distribution (%) | 93 | 89 -4% | 87 -6% | 93 0% | 93 0% | 88 -5% | 92 -1% |
| Black Level * (cd/m²) | 0.51 | 0.42 | 0.42 | 0.51 | 0.22 | ||
| Colorchecker dE 2000 * | 1.8 | 4.7 -161% | 4.9 -172% | 5 -178% | 1.6 11% | 7.1 -294% | 4 -122% |
| Colorchecker dE 2000 max. * | 3.6 | 8.9 -147% | 8.5 -136% | 11.4 -217% | 2.6 28% | 14.5 -303% | 7.4 -106% |
| Greyscale dE 2000 * | 1.5 | 6.4 -327% | 5.4 -260% | 7.8 -420% | 1.5 -0% | 10.5 -600% | 4.7 -213% |
| Gamma | 2.06 107% | 2.22 99% | 2.31 95% | 2.2 100% | 2.28 96% | 2.28 96% | 2.19 100% |
| CCT | 6462 101% | 7987 81% | 7610 85% | 7964 82% | 6422 101% | 8951 73% | 7425 88% |
| Contrast (:1) | 1035 | 1298 | 1221 | 898 | 2082 |
* ... menor é melhor
Cintilação da tela / PWM (modulação por largura de pulso)
| Tela tremeluzindo/PWM detectado | 240 Hz | 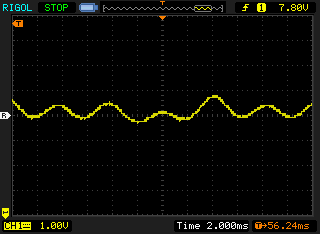 | |
A luz de fundo da tela pisca em 240 Hz (pior caso, por exemplo, utilizando PWM) . A frequência de 240 Hz é relativamente baixa, portanto, usuários sensíveis provavelmente notarão cintilação e sentirão fadiga ocular na configuração de brilho indicada e abaixo. [pwm_comparison] Em comparação: 52 % de todos os dispositivos testados não usam PWM para escurecer a tela. Se PWM foi detectado, uma média de 7757 (mínimo: 5 - máximo: 343500) Hz foi medida. | |||
Exibir tempos de resposta
| ↔ Tempo de resposta preto para branco | ||
|---|---|---|
| 4 ms ... ascensão ↗ e queda ↘ combinadas | ↗ 2 ms ascensão | 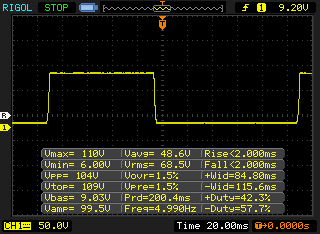 |
| ↘ 2 ms queda | ||
| A tela mostra taxas de resposta muito rápidas em nossos testes e deve ser muito adequada para jogos em ritmo acelerado. Em comparação, todos os dispositivos testados variam de 0.1 (mínimo) a 240 (máximo) ms. » 16 % de todos os dispositivos são melhores. Isso significa que o tempo de resposta medido é melhor que a média de todos os dispositivos testados (19.8 ms). | ||
| ↔ Tempo de resposta 50% cinza a 80% cinza | ||
| 4.4 ms ... ascensão ↗ e queda ↘ combinadas | ↗ 2.4 ms ascensão | 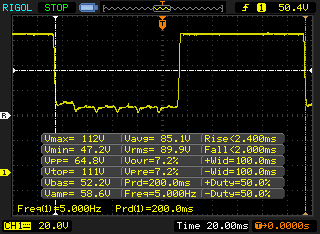 |
| ↘ 2 ms queda | ||
| A tela mostra taxas de resposta muito rápidas em nossos testes e deve ser muito adequada para jogos em ritmo acelerado. Em comparação, todos os dispositivos testados variam de 0.165 (mínimo) a 636 (máximo) ms. » 16 % de todos os dispositivos são melhores. Isso significa que o tempo de resposta medido é melhor que a média de todos os dispositivos testados (31 ms). | ||
| AnTuTu v7 - Total Score (classificar por valor) | |
| Samsung Galaxy A6 Plus 2018 | |
| Huawei P20 Lite | |
| Sony Xperia XA2 | |
| BQ Aquaris X Pro | |
| Nokia 7 Plus | |
| Média Qualcomm Snapdragon 450 (56497 - 73468, n=11) | |
| Lightmark - 1920x1080 1080p (classificar por valor) | |
| Nokia 7 Plus | |
| Média Qualcomm Snapdragon 450 (5.38 - 5.41, n=2) | |
| Basemark ES 3.1 / Metal - offscreen Overall Score (classificar por valor) | |
| Samsung Galaxy A5 2017 | |
| Nokia 7 Plus | |
| Média Qualcomm Snapdragon 450 (129 - 129, n=2) | |
| Média da turma Smartphone (544 - 7731, n=18, últimos 2 anos) | |
| JetStream 1.1 - 1.1 Total | |
| Nokia 7 Plus (Chrome 60) | |
| Samsung Galaxy A5 2017 (Samsung Browser (Chrome 44)) | |
| HTC U11 Life (Chrome 63) | |
| Sony Xperia XA2 (Chrome 65.0.3325.109) | |
| BQ Aquaris X Pro (Chrome 59.0.3071.125) | |
| Huawei P20 Lite (Chrome 63) | |
| Média Qualcomm Snapdragon 450 (22 - 22.7, n=13) | |
| Samsung Galaxy A6 Plus 2018 (Chrome 67) | |
| Octane V2 - Total Score | |
| Média da turma Smartphone (2800 - 126661, n=142, últimos 2 anos) | |
| Nokia 7 Plus (Chrome 60) | |
| Samsung Galaxy A5 2017 (Samsung Browser (Chrome 44)) | |
| HTC U11 Life (Chrome 63) | |
| Sony Xperia XA2 (Chrome 65.0.3325.109) | |
| BQ Aquaris X Pro (Chrome 59.0.3071.125) | |
| Huawei P20 Lite | |
| Samsung Galaxy A6 Plus 2018 (Chrome 67) | |
| Média Qualcomm Snapdragon 450 (3470 - 4115, n=14) | |
| Mozilla Kraken 1.1 - Total | |
| Média Qualcomm Snapdragon 450 (11012 - 11863, n=14) | |
| Samsung Galaxy A6 Plus 2018 (Chrome 67) | |
| Huawei P20 Lite (Chrome 63) | |
| Sony Xperia XA2 (Chrome 65.0.3325.109) | |
| HTC U11 Life (Chrome 63) | |
| BQ Aquaris X Pro (Chrome 59.0.3071.125) | |
| Samsung Galaxy A5 2017 (Samsung Browser (Chrome 44)) | |
| Nokia 7 Plus (Chrome 60) | |
| Média da turma Smartphone (257 - 28190, n=121, últimos 2 anos) | |
| WebXPRT 2015 - Overall | |
| Nokia 7 Plus (Chrome 60) | |
| Sony Xperia XA2 (Chrome 65.0.3325.109) | |
| HTC U11 Life (Chrome 63) | |
| Média Qualcomm Snapdragon 450 (90 - 103, n=7) | |
| Samsung Galaxy A6 Plus 2018 (Chrome 67) | |
| Samsung Galaxy A5 2017 (Samsung Browser (Chrome 44)) | |
| BQ Aquaris X Pro (Chrome 59.0.3071.125) | |
| Huawei P20 Lite (Chrome 63) | |
* ... menor é melhor
| Samsung Galaxy A6 Plus 2018 | Huawei P20 Lite | HTC U11 Life | Sony Xperia XA2 | Samsung Galaxy A5 2017 | BQ Aquaris X Pro | Nokia 7 Plus | Média 32 GB eMMC Flash | Média da turma Smartphone | |
|---|---|---|---|---|---|---|---|---|---|
| AndroBench 3-5 | 72% | 30% | -4% | -29% | -10% | 20% | -7% | 1287% | |
| Sequential Read 256KB (MB/s) | 298.8 | 293.9 -2% | 268 -10% | 271.5 -9% | 182 -39% | 270.5 -9% | 283.1 -5% | 242 ? -19% | 2225 ? 645% |
| Sequential Write 256KB (MB/s) | 88.5 | 198.3 124% | 120 36% | 127.4 44% | 77.1 -13% | 139.6 58% | 211.6 139% | 100.5 ? 14% | 1903 ? 2050% |
| Random Read 4KB (MB/s) | 72.9 | 48.19 -34% | 39.3 -46% | 43.07 -41% | 22.41 -69% | 37.97 -48% | 54.7 -25% | 43.1 ? -41% | 311 ? 327% |
| Random Write 4KB (MB/s) | 16.1 | 71.1 342% | 50.2 212% | 13.82 -14% | 12.13 -25% | 12.07 -25% | 19.62 22% | 22.3 ? 39% | 358 ? 2124% |
| Sequential Read 256KB SDCard (MB/s) | 83.4 ? | 83.5 ? 0% | 82.8 ? -1% | 86 ? 3% | 73.7 ? -12% | 78.7 ? -6% | 82.2 -1% | 71.8 ? -14% | |
| Sequential Write 256KB SDCard (MB/s) | 67.8 ? | 69 ? 2% | 59.8 ? -12% | 64.8 ? -4% | 56 ? -17% | 49.77 ? -27% | 62.3 -8% | 52.9 ? -22% |
| Dead Trigger 2 | |||
| Configurações | Valor | ||
| high | 30 fps | ||
| Temple Run 2 | |||
| Configurações | Valor | ||
| default | 60 fps | ||
(+) A temperatura máxima no lado superior é 26.9 °C / 80 F, em comparação com a média de 35.3 °C / 96 F , variando de 21.9 a 247 °C para a classe Smartphone.
(+) A parte inferior aquece até um máximo de 26.1 °C / 79 F, em comparação com a média de 34 °C / 93 F
(+) Em uso inativo, a temperatura média para o lado superior é 25.1 °C / 77 F, em comparação com a média do dispositivo de 33 °C / ### class_avg_f### F.
Samsung Galaxy A6 Plus 2018 análise de áudio
(+) | os alto-falantes podem tocar relativamente alto (###valor### dB)
Graves 100 - 315Hz
(-) | quase nenhum baixo - em média 24.3% menor que a mediana
(±) | a linearidade dos graves é média (7.4% delta para a frequência anterior)
Médios 400 - 2.000 Hz
(+) | médios equilibrados - apenas 4.9% longe da mediana
(+) | médios são lineares (6.8% delta para frequência anterior)
Altos 2 - 16 kHz
(±) | máximos mais altos - em média 8.6% maior que a mediana
(+) | os máximos são lineares (6.7% delta da frequência anterior)
Geral 100 - 16.000 Hz
(±) | a linearidade do som geral é média (21.7% diferença em relação à mediana)
Comparado com a mesma classe
» 44% de todos os dispositivos testados nesta classe foram melhores, 8% semelhantes, 48% piores
» O melhor teve um delta de 11%, a média foi 34%, o pior foi 134%
Comparado com todos os dispositivos testados
» 62% de todos os dispositivos testados foram melhores, 7% semelhantes, 31% piores
» O melhor teve um delta de 4%, a média foi 23%, o pior foi 134%
Huawei P20 Lite análise de áudio
(+) | os alto-falantes podem tocar relativamente alto (###valor### dB)
Graves 100 - 315Hz
(-) | quase nenhum baixo - em média 25% menor que a mediana
(±) | a linearidade dos graves é média (9.4% delta para a frequência anterior)
Médios 400 - 2.000 Hz
(+) | médios equilibrados - apenas 4.4% longe da mediana
(±) | a linearidade dos médios é média (8.7% delta para frequência anterior)
Altos 2 - 16 kHz
(±) | máximos mais altos - em média 10.5% maior que a mediana
(+) | os máximos são lineares (3.4% delta da frequência anterior)
Geral 100 - 16.000 Hz
(±) | a linearidade do som geral é média (25.5% diferença em relação à mediana)
Comparado com a mesma classe
» 64% de todos os dispositivos testados nesta classe foram melhores, 6% semelhantes, 30% piores
» O melhor teve um delta de 11%, a média foi 34%, o pior foi 134%
Comparado com todos os dispositivos testados
» 78% de todos os dispositivos testados foram melhores, 4% semelhantes, 17% piores
» O melhor teve um delta de 4%, a média foi 23%, o pior foi 134%
| desligado | |
| Ocioso | |
| Carga |
|
Key:
min: | |
| Samsung Galaxy A6 Plus 2018 3500 mAh | Huawei P20 Lite 3000 mAh | HTC U11 Life 2600 mAh | Sony Xperia XA2 3300 mAh | Samsung Galaxy A5 2017 3000 mAh | BQ Aquaris X Pro 3100 mAh | Nokia 7 Plus 3800 mAh | Média Qualcomm Snapdragon 450 | Média da turma Smartphone | |
|---|---|---|---|---|---|---|---|---|---|
| Power Consumption | -95% | -76% | -45% | -28% | -82% | -102% | -101% | -140% | |
| Idle Minimum * (Watt) | 0.62 | 0.98 -58% | 0.63 -2% | 0.39 37% | 0.64 -3% | 0.67 -8% | 0.65 -5% | 0.794 ? -28% | 0.887 ? -43% |
| Idle Average * (Watt) | 0.96 | 2 -108% | 2.1 -119% | 1.61 -68% | 1.36 -42% | 1.7 -77% | 1.76 -83% | 2.27 ? -136% | 1.485 ? -55% |
| Idle Maximum * (Watt) | 0.99 | 2.11 -113% | 2.15 -117% | 1.62 -64% | 1.4 -41% | 1.78 -80% | 1.78 -80% | 2.48 ? -151% | 1.672 ? -69% |
| Load Average * (Watt) | 1.85 | 3.9 -111% | 3.34 -81% | 3.12 -69% | 2.53 -37% | 4.42 -139% | 4.47 -142% | 3.95 ? -114% | 6.76 ? -265% |
| Load Maximum * (Watt) | 3.04 | 5.62 -85% | 4.83 -59% | 4.92 -62% | 3.63 -19% | 6.3 -107% | 9.13 -200% | 5.38 ? -77% | 11.2 ? -268% |
* ... menor é melhor
| Samsung Galaxy A6 Plus 2018 3500 mAh | Huawei P20 Lite 3000 mAh | HTC U11 Life 2600 mAh | Sony Xperia XA2 3300 mAh | Samsung Galaxy A5 2017 3000 mAh | BQ Aquaris X Pro 3100 mAh | Nokia 7 Plus 3800 mAh | |
|---|---|---|---|---|---|---|---|
| Duração da bateria | -42% | -9% | 4% | 20% | -17% | -26% | |
| Reader / Idle (h) | 30.3 | 12.5 -59% | 30.3 0% | 41.7 38% | 40.3 33% | 30.7 1% | 28.4 -6% |
| H.264 (h) | 15.3 | 7.8 -49% | 13.3 -13% | 12.8 -16% | 16.4 7% | 10.7 -30% | 11.8 -23% |
| WiFi v1.3 (h) | 14.1 | 9.7 -31% | 12.1 -14% | 14.8 5% | 14.1 0% | 12.2 -13% | 11.2 -21% |
| Load (h) | 5.6 | 4.1 -27% | 5.1 -9% | 5 -11% | 7.8 39% | 4.2 -25% | 2.6 -54% |
Pro
Contra
Samsung Galaxy A6 Plus 2018
- 06/26/2018 v6 (old)
Mike Wobker