Breve Análise do Smartphone Samsung Galaxy A9 (2018)


| |||||||||||||||||||||||||
iluminação: 96 %
iluminação com acumulador: 553 cd/m²
Contraste: ∞:1 (Preto: 0 cd/m²)
ΔE ColorChecker Calman: 2.2 | ∀{0.5-29.43 Ø4.73}
ΔE Greyscale Calman: 1.7 | ∀{0.09-98 Ø4.97}
97% sRGB (Calman 2D)
Gamma: 2.06
CCT: 6434 K
| Samsung Galaxy A9 2018 OLED, 2220x1080, 6.3" | Xiaomi Poco F1 IPS, 2246x1080, 6.2" | OnePlus 6T Optic AMOLED, 2340x1080, 6.4" | Samsung Galaxy S9 Super AMOLED, 2960x1440, 5.8" | Huawei P20 LTPS, 2240x1080, 5.8" | LG G7 ThinQ IPS, 3120x1440, 6.1" | BQ Aquaris X2 Pro LTPS, 2160x1080, 5.7" | Nokia 7 Plus IPS, 2160x1080, 6" | |
|---|---|---|---|---|---|---|---|---|
| Screen | -50% | -8% | 9% | 28% | -57% | -84% | -57% | |
| Brightness middle (cd/m²) | 553 | 489 -12% | 437 -21% | 529 -4% | 753 36% | 974 76% | 675 22% | 458 -17% |
| Brightness (cd/m²) | 553 | 486 -12% | 442 -20% | 527 -5% | 748 35% | 975 76% | 650 18% | 463 -16% |
| Brightness Distribution (%) | 96 | 93 -3% | 95 -1% | 96 0% | 96 0% | 96 0% | 92 -4% | 92 -4% |
| Black Level * (cd/m²) | 0.34 | 0.37 | 0.49 | 0.46 | 0.22 | |||
| Colorchecker dE 2000 * | 2.2 | 3.8 -73% | 2.21 -0% | 1.4 36% | 1.3 41% | 5.4 -145% | 5.9 -168% | 4 -82% |
| Colorchecker dE 2000 max. * | 5.1 | 7.1 -39% | 4.27 16% | 4 22% | 2.3 55% | 13.1 -157% | 9.5 -86% | 7.4 -45% |
| Greyscale dE 2000 * | 1.7 | 4.4 -159% | 2.1 -24% | 1.6 6% | 1.7 -0% | 5 -194% | 6.6 -288% | 4.7 -176% |
| Gamma | 2.06 107% | 2.22 99% | 2.307 95% | 2.16 102% | 2.18 101% | 2.31 95% | 2.36 93% | 2.19 100% |
| CCT | 6434 101% | 7213 90% | 6353 102% | 6358 102% | 66.76 9736% | 7480 87% | 7846 83% | 7425 88% |
| Contrast (:1) | 1438 | 2035 | 1988 | 1467 | 2082 |
* ... menor é melhor
Cintilação da tela / PWM (modulação por largura de pulso)
| Tela tremeluzindo/PWM detectado | 250 Hz | ≤ 99 % configuração de brilho | 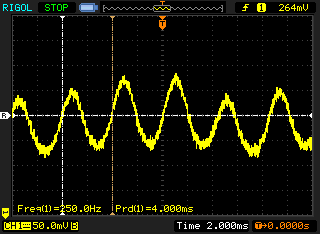 |
A luz de fundo da tela pisca em 250 Hz (pior caso, por exemplo, utilizando PWM) Cintilação detectada em uma configuração de brilho de 99 % e abaixo. Não deve haver cintilação ou PWM acima desta configuração de brilho. A frequência de 250 Hz é relativamente baixa, portanto, usuários sensíveis provavelmente notarão cintilação e sentirão fadiga ocular na configuração de brilho indicada e abaixo. [pwm_comparison] Em comparação: 52 % de todos os dispositivos testados não usam PWM para escurecer a tela. Se PWM foi detectado, uma média de 7784 (mínimo: 5 - máximo: 343500) Hz foi medida. | |||
Exibir tempos de resposta
| ↔ Tempo de resposta preto para branco | ||
|---|---|---|
| 4 ms ... ascensão ↗ e queda ↘ combinadas | ↗ 2 ms ascensão | 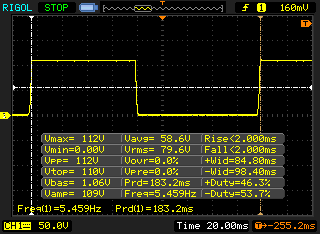 |
| ↘ 2 ms queda | ||
| A tela mostra taxas de resposta muito rápidas em nossos testes e deve ser muito adequada para jogos em ritmo acelerado. Em comparação, todos os dispositivos testados variam de 0.1 (mínimo) a 240 (máximo) ms. » 16 % de todos os dispositivos são melhores. Isso significa que o tempo de resposta medido é melhor que a média de todos os dispositivos testados (19.9 ms). | ||
| ↔ Tempo de resposta 50% cinza a 80% cinza | ||
| 4.8 ms ... ascensão ↗ e queda ↘ combinadas | ↗ 2.4 ms ascensão | 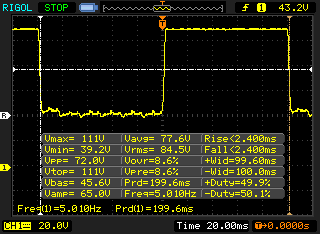 |
| ↘ 2.4 ms queda | ||
| A tela mostra taxas de resposta muito rápidas em nossos testes e deve ser muito adequada para jogos em ritmo acelerado. Em comparação, todos os dispositivos testados variam de 0.165 (mínimo) a 636 (máximo) ms. » 16 % de todos os dispositivos são melhores. Isso significa que o tempo de resposta medido é melhor que a média de todos os dispositivos testados (31.1 ms). | ||
| JetStream 1.1 - 1.1 Total | |
| LG G7 ThinQ (Chrome 66) | |
| OnePlus 6T (Chrome 70) | |
| Xiaomi Poco F1 (Chrome 68) | |
| Samsung Galaxy S9 (Samsung Browser 7.0) | |
| Huawei P20 (Chrome 66.0.3359.126) | |
| Nokia 7 Plus (Chrome 60) | |
| Média Qualcomm Snapdragon 660 (45.3 - 55.5, n=12) | |
| Samsung Galaxy A9 2018 (Chrome 70) | |
| BQ Aquaris X2 Pro (Chrome 67) | |
| Octane V2 - Total Score | |
| Média da turma Smartphone (2800 - 126661, n=156, últimos 2 anos) | |
| OnePlus 6T (Chrome 70) | |
| LG G7 ThinQ (Chrome 66) | |
| Samsung Galaxy S9 (Samsung Browser 7.0) | |
| Xiaomi Poco F1 (Chrome 68) | |
| Huawei P20 (Chrome 66.0.3359.126) | |
| Nokia 7 Plus (Chrome 60) | |
| Samsung Galaxy A9 2018 (Chrome 70) | |
| Média Qualcomm Snapdragon 660 (8463 - 10945, n=14) | |
| BQ Aquaris X2 Pro (Chrome 67) | |
| Mozilla Kraken 1.1 - Total | |
| Média Qualcomm Snapdragon 660 (3796 - 4769, n=13) | |
| BQ Aquaris X2 Pro (Chrome 67) | |
| Huawei P20 (Chrome 66.0.3359.126) | |
| Nokia 7 Plus (Chrome 60) | |
| Samsung Galaxy A9 2018 (Chrome 70) | |
| Xiaomi Poco F1 (Chrome 68) | |
| LG G7 ThinQ (Chrome 66) | |
| OnePlus 6T (Chrome 70) | |
| Samsung Galaxy S9 (Samsung Browser 7.0) | |
| Média da turma Smartphone (257 - 28190, n=134, últimos 2 anos) | |
| WebXPRT 3 - Overall | |
| Média da turma Smartphone (104 - 380, n=12, últimos 2 anos) | |
| LG G7 ThinQ (Chrome 66) | |
| Huawei P20 | |
| Samsung Galaxy S9 | |
| Nokia 7 Plus (Chrome 60) | |
| Samsung Galaxy A9 2018 (Chrome 70) | |
| BQ Aquaris X2 Pro (Chrome 67) | |
| Média Qualcomm Snapdragon 660 (47 - 63, n=9) | |
| WebXPRT 2015 - Overall | |
| OnePlus 6T (Chrome 70) | |
| LG G7 ThinQ (Chrome 66) | |
| Xiaomi Poco F1 (Chrome 68) | |
| Huawei P20 (Chrome 66.0.3359.126) | |
| Média Qualcomm Snapdragon 660 (159 - 182, n=8) | |
| Nokia 7 Plus (Chrome 60) | |
| Samsung Galaxy A9 2018 (Chrome 70) | |
| Samsung Galaxy S9 (Samsung Browser 7.0) | |
| BQ Aquaris X2 Pro (Chrome 67) | |
* ... menor é melhor
| Samsung Galaxy A9 2018 | Xiaomi Poco F1 | OnePlus 6T | Samsung Galaxy S9 | Huawei P20 | LG G7 ThinQ | BQ Aquaris X2 Pro | Nokia 7 Plus | Média 128 GB UFS 2.1 Flash | Média da turma Smartphone | |
|---|---|---|---|---|---|---|---|---|---|---|
| AndroBench 3-5 | 8% | 27% | 24% | 209% | 15% | -15% | -11% | 122% | 801% | |
| Sequential Read 256KB (MB/s) | 426.6 | 705 65% | 735 72% | 815 91% | 827 94% | 695 63% | 280.8 -34% | 283.1 -34% | 762 ? 79% | 2242 ? 426% |
| Sequential Write 256KB (MB/s) | 194.6 | 155.6 -20% | 204.4 5% | 206.9 6% | 193.6 -1% | 176.4 -9% | 204.8 5% | 211.6 9% | 300 ? 54% | 1924 ? 889% |
| Random Read 4KB (MB/s) | 116.8 | 101 -14% | 138.5 19% | 131 12% | 147 26% | 110.5 -5% | 51.3 -56% | 54.7 -53% | 154.7 ? 32% | 309 ? 165% |
| Random Write 4KB (MB/s) | 19.79 | 17.81 -10% | 22 11% | 23.07 17% | 161.5 716% | 23.26 18% | 15.43 -22% | 19.62 -1% | 131.1 ? 562% | 361 ? 1724% |
| Sequential Read 256KB SDCard (MB/s) | 73.7 ? | 85.3 ? 16% | 79.2 ? 7% | 84.7 ? 15% | 83.3 ? 13% | 82.2 12% | 76 ? 3% | |||
| Sequential Write 256KB SDCard (MB/s) | 59.7 ? | 65.6 ? 10% | 67.2 ? 13% | 62.7 ? 5% | 61.1 ? 2% | 62.3 4% | 59.6 ? 0% |
PUBG Molbile
Asphalt 9 Legends
(+) A temperatura máxima no lado superior é 33.8 °C / 93 F, em comparação com a média de 35.3 °C / 96 F , variando de 21.9 a 247 °C para a classe Smartphone.
(+) A parte inferior aquece até um máximo de 33.4 °C / 92 F, em comparação com a média de 34 °C / 93 F
(+) Em uso inativo, a temperatura média para o lado superior é 26.2 °C / 79 F, em comparação com a média do dispositivo de 32.9 °C / ### class_avg_f### F.
Samsung Galaxy A9 2018 análise de áudio
(+) | os alto-falantes podem tocar relativamente alto (###valor### dB)
Graves 100 - 315Hz
(-) | quase nenhum baixo - em média 25.9% menor que a mediana
(±) | a linearidade dos graves é média (11.4% delta para a frequência anterior)
Médios 400 - 2.000 Hz
(+) | médios equilibrados - apenas 3.8% longe da mediana
(+) | médios são lineares (4.8% delta para frequência anterior)
Altos 2 - 16 kHz
(±) | máximos mais altos - em média 7.7% maior que a mediana
(+) | os máximos são lineares (5.2% delta da frequência anterior)
Geral 100 - 16.000 Hz
(±) | a linearidade do som geral é média (21.1% diferença em relação à mediana)
Comparado com a mesma classe
» 40% de todos os dispositivos testados nesta classe foram melhores, 8% semelhantes, 52% piores
» O melhor teve um delta de 11%, a média foi 34%, o pior foi 134%
Comparado com todos os dispositivos testados
» 58% de todos os dispositivos testados foram melhores, 7% semelhantes, 35% piores
» O melhor teve um delta de 4%, a média foi 24%, o pior foi 134%
Xiaomi Poco F1 análise de áudio
(+) | os alto-falantes podem tocar relativamente alto (###valor### dB)
Graves 100 - 315Hz
(-) | quase nenhum baixo - em média 24.4% menor que a mediana
(±) | a linearidade dos graves é média (10.6% delta para a frequência anterior)
Médios 400 - 2.000 Hz
(±) | médios mais altos - em média 6.2% maior que a mediana
(±) | a linearidade dos médios é média (10.2% delta para frequência anterior)
Altos 2 - 16 kHz
(±) | máximos mais altos - em média 5.3% maior que a mediana
(+) | os máximos são lineares (5.8% delta da frequência anterior)
Geral 100 - 16.000 Hz
(±) | a linearidade do som geral é média (23.9% diferença em relação à mediana)
Comparado com a mesma classe
» 55% de todos os dispositivos testados nesta classe foram melhores, 8% semelhantes, 37% piores
» O melhor teve um delta de 11%, a média foi 34%, o pior foi 134%
Comparado com todos os dispositivos testados
» 72% de todos os dispositivos testados foram melhores, 6% semelhantes, 22% piores
» O melhor teve um delta de 4%, a média foi 24%, o pior foi 134%
| desligado | |
| Ocioso | |
| Carga |
|
Key:
min: | |
| Samsung Galaxy A9 2018 3800 mAh | Xiaomi Poco F1 4000 mAh | OnePlus 6T 3700 mAh | Samsung Galaxy S9 3000 mAh | Huawei P20 3400 mAh | LG G7 ThinQ 3000 mAh | BQ Aquaris X2 Pro 3100 mAh | Nokia 7 Plus 3800 mAh | Média Qualcomm Snapdragon 660 | Média da turma Smartphone | |
|---|---|---|---|---|---|---|---|---|---|---|
| Power Consumption | -1% | 8% | 30% | -11% | -11% | -2% | 2% | -29% | -17% | |
| Idle Minimum * (Watt) | 1.06 | 0.65 39% | 0.7 34% | 0.65 39% | 0.67 37% | 1.16 -9% | 0.63 41% | 0.65 39% | 1.052 ? 1% | 0.87 ? 18% |
| Idle Average * (Watt) | 1.94 | 1.97 -2% | 1.1 43% | 0.81 58% | 2.05 -6% | 1.98 -2% | 2.16 -11% | 1.76 9% | 2.62 ? -35% | 1.467 ? 24% |
| Idle Maximum * (Watt) | 1.98 | 2.01 -2% | 2.1 -6% | 0.92 54% | 2.11 -7% | 2.07 -5% | 2.18 -10% | 1.78 10% | 2.88 ? -45% | 1.656 ? 16% |
| Load Average * (Watt) | 3.56 | 4.29 -21% | 4.2 -18% | 4.76 -34% | 6.15 -73% | 4.51 -27% | 4.48 -26% | 4.47 -26% | 5.1 ? -43% | 6.81 ? -91% |
| Load Maximum * (Watt) | 7.49 | 9.05 -21% | 8.3 -11% | 5.16 31% | 8.09 -8% | 8.3 -11% | 7.87 -5% | 9.13 -22% | 9.08 ? -21% | 11.3 ? -51% |
* ... menor é melhor
| Samsung Galaxy A9 2018 3800 mAh | Xiaomi Poco F1 4000 mAh | OnePlus 6T 3700 mAh | Samsung Galaxy S9 3000 mAh | Huawei P20 3400 mAh | LG G7 ThinQ 3000 mAh | BQ Aquaris X2 Pro 3100 mAh | Nokia 7 Plus 3800 mAh | |
|---|---|---|---|---|---|---|---|---|
| Duração da bateria | 9% | 13% | -31% | 12% | -1% | -25% | -15% | |
| Reader / Idle (h) | 29.7 | 34.8 17% | 32.3 9% | 19.7 -34% | 31.5 6% | 27.7 -7% | 22.9 -23% | 28.4 -4% |
| H.264 (h) | 16.8 | 15.6 -7% | 15.1 -10% | 10.2 -39% | 13.5 -20% | 15.1 -10% | 11 -35% | 11.8 -30% |
| WiFi v1.3 (h) | 11.5 | 13.5 17% | 14.4 25% | 7.9 -31% | 13.6 18% | 9.9 -14% | 10.1 -12% | 11.2 -3% |
| Load (h) | 3.4 | 3.7 9% | 4.4 29% | 2.7 -21% | 4.9 44% | 4.3 26% | 2.4 -29% | 2.6 -24% |
Pro
Contra
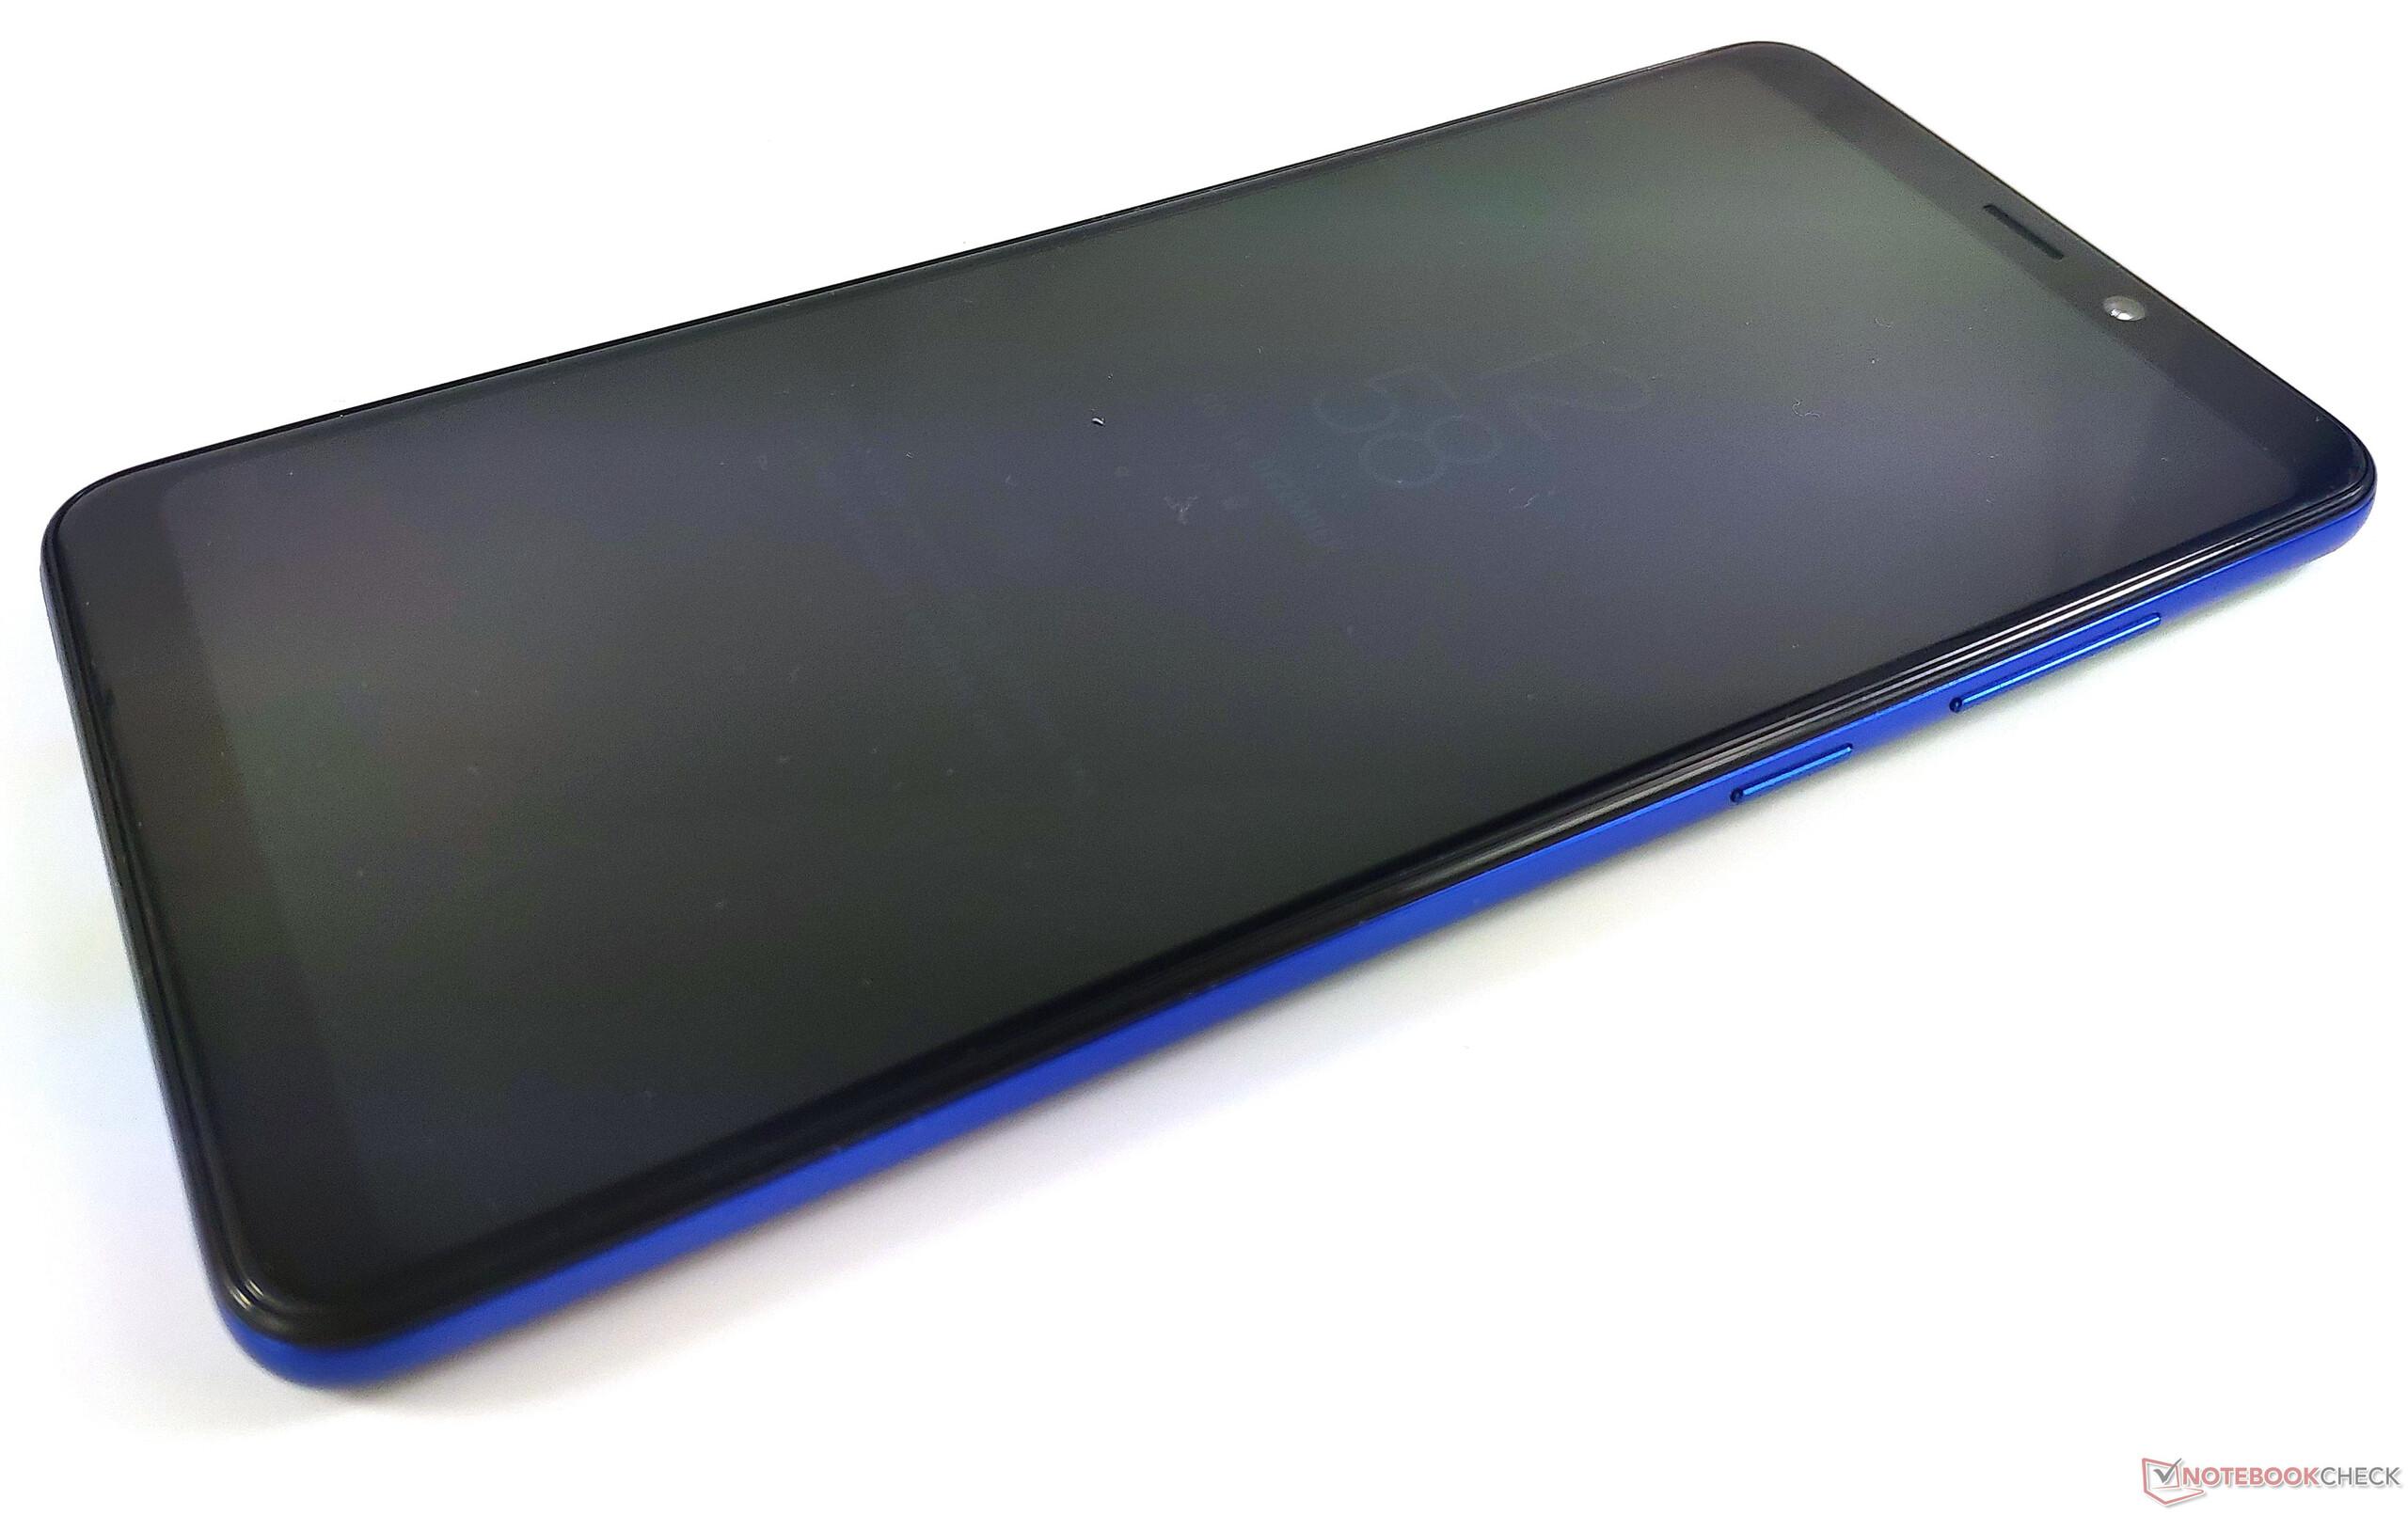
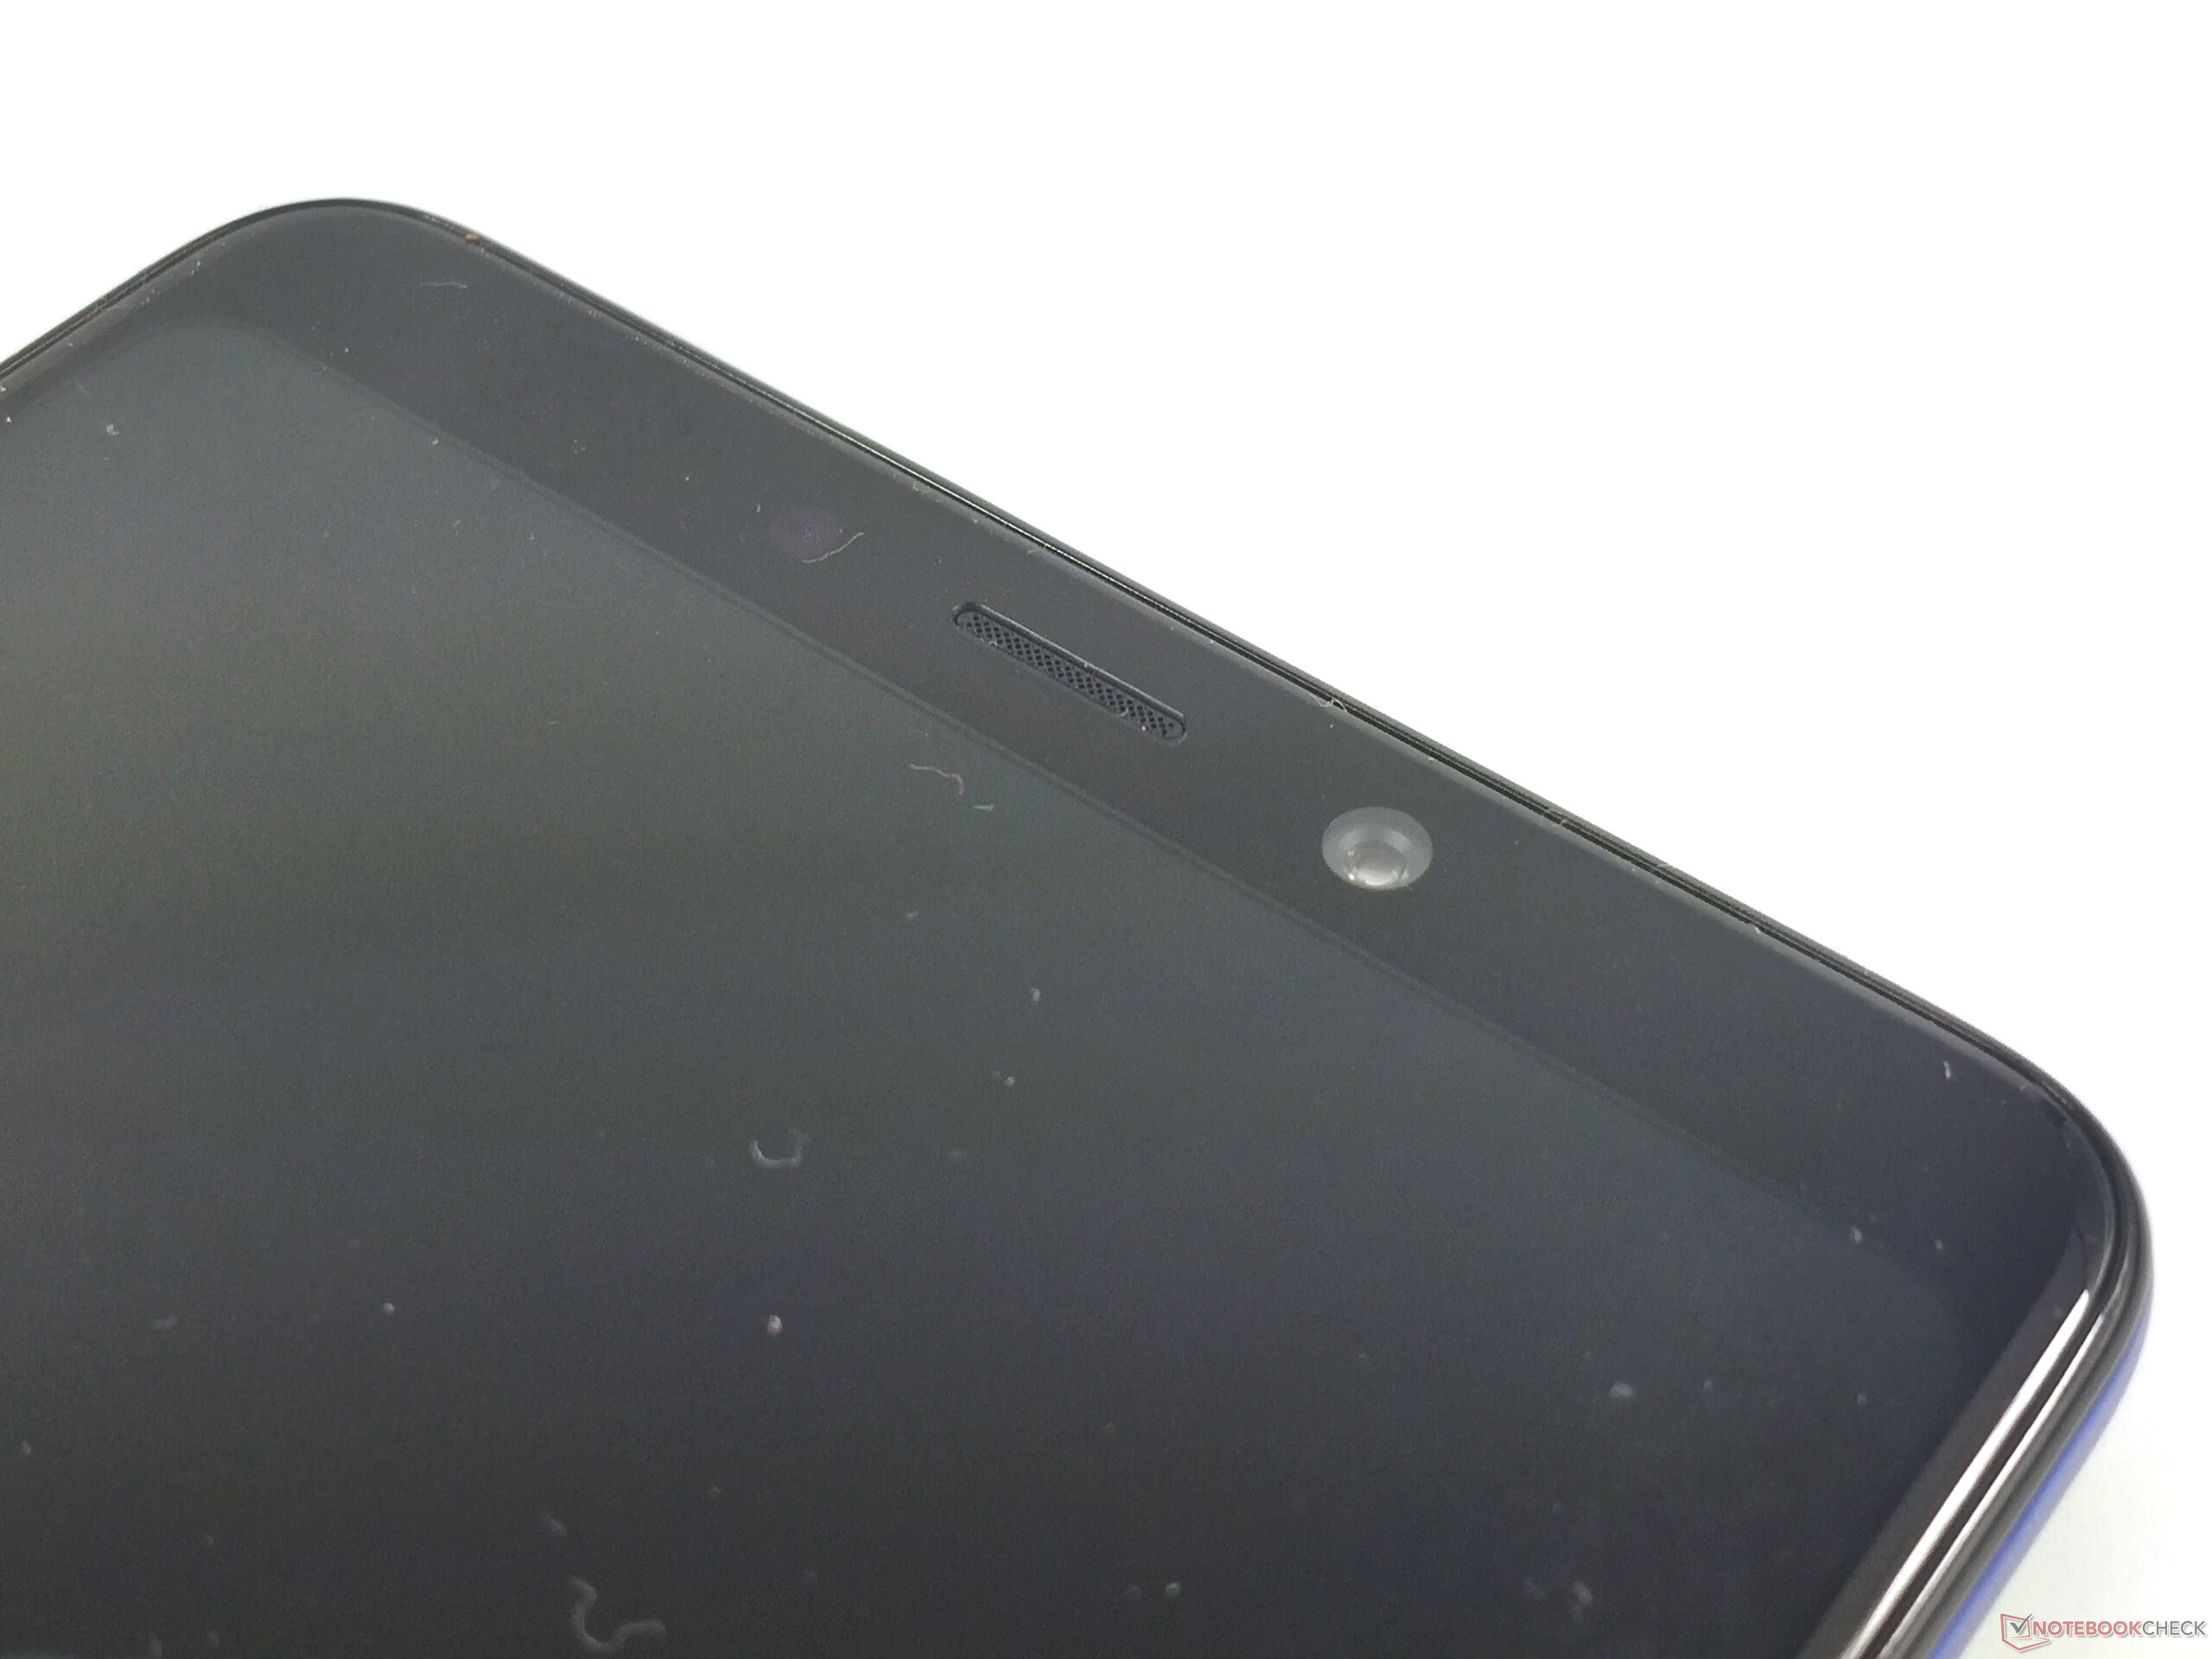
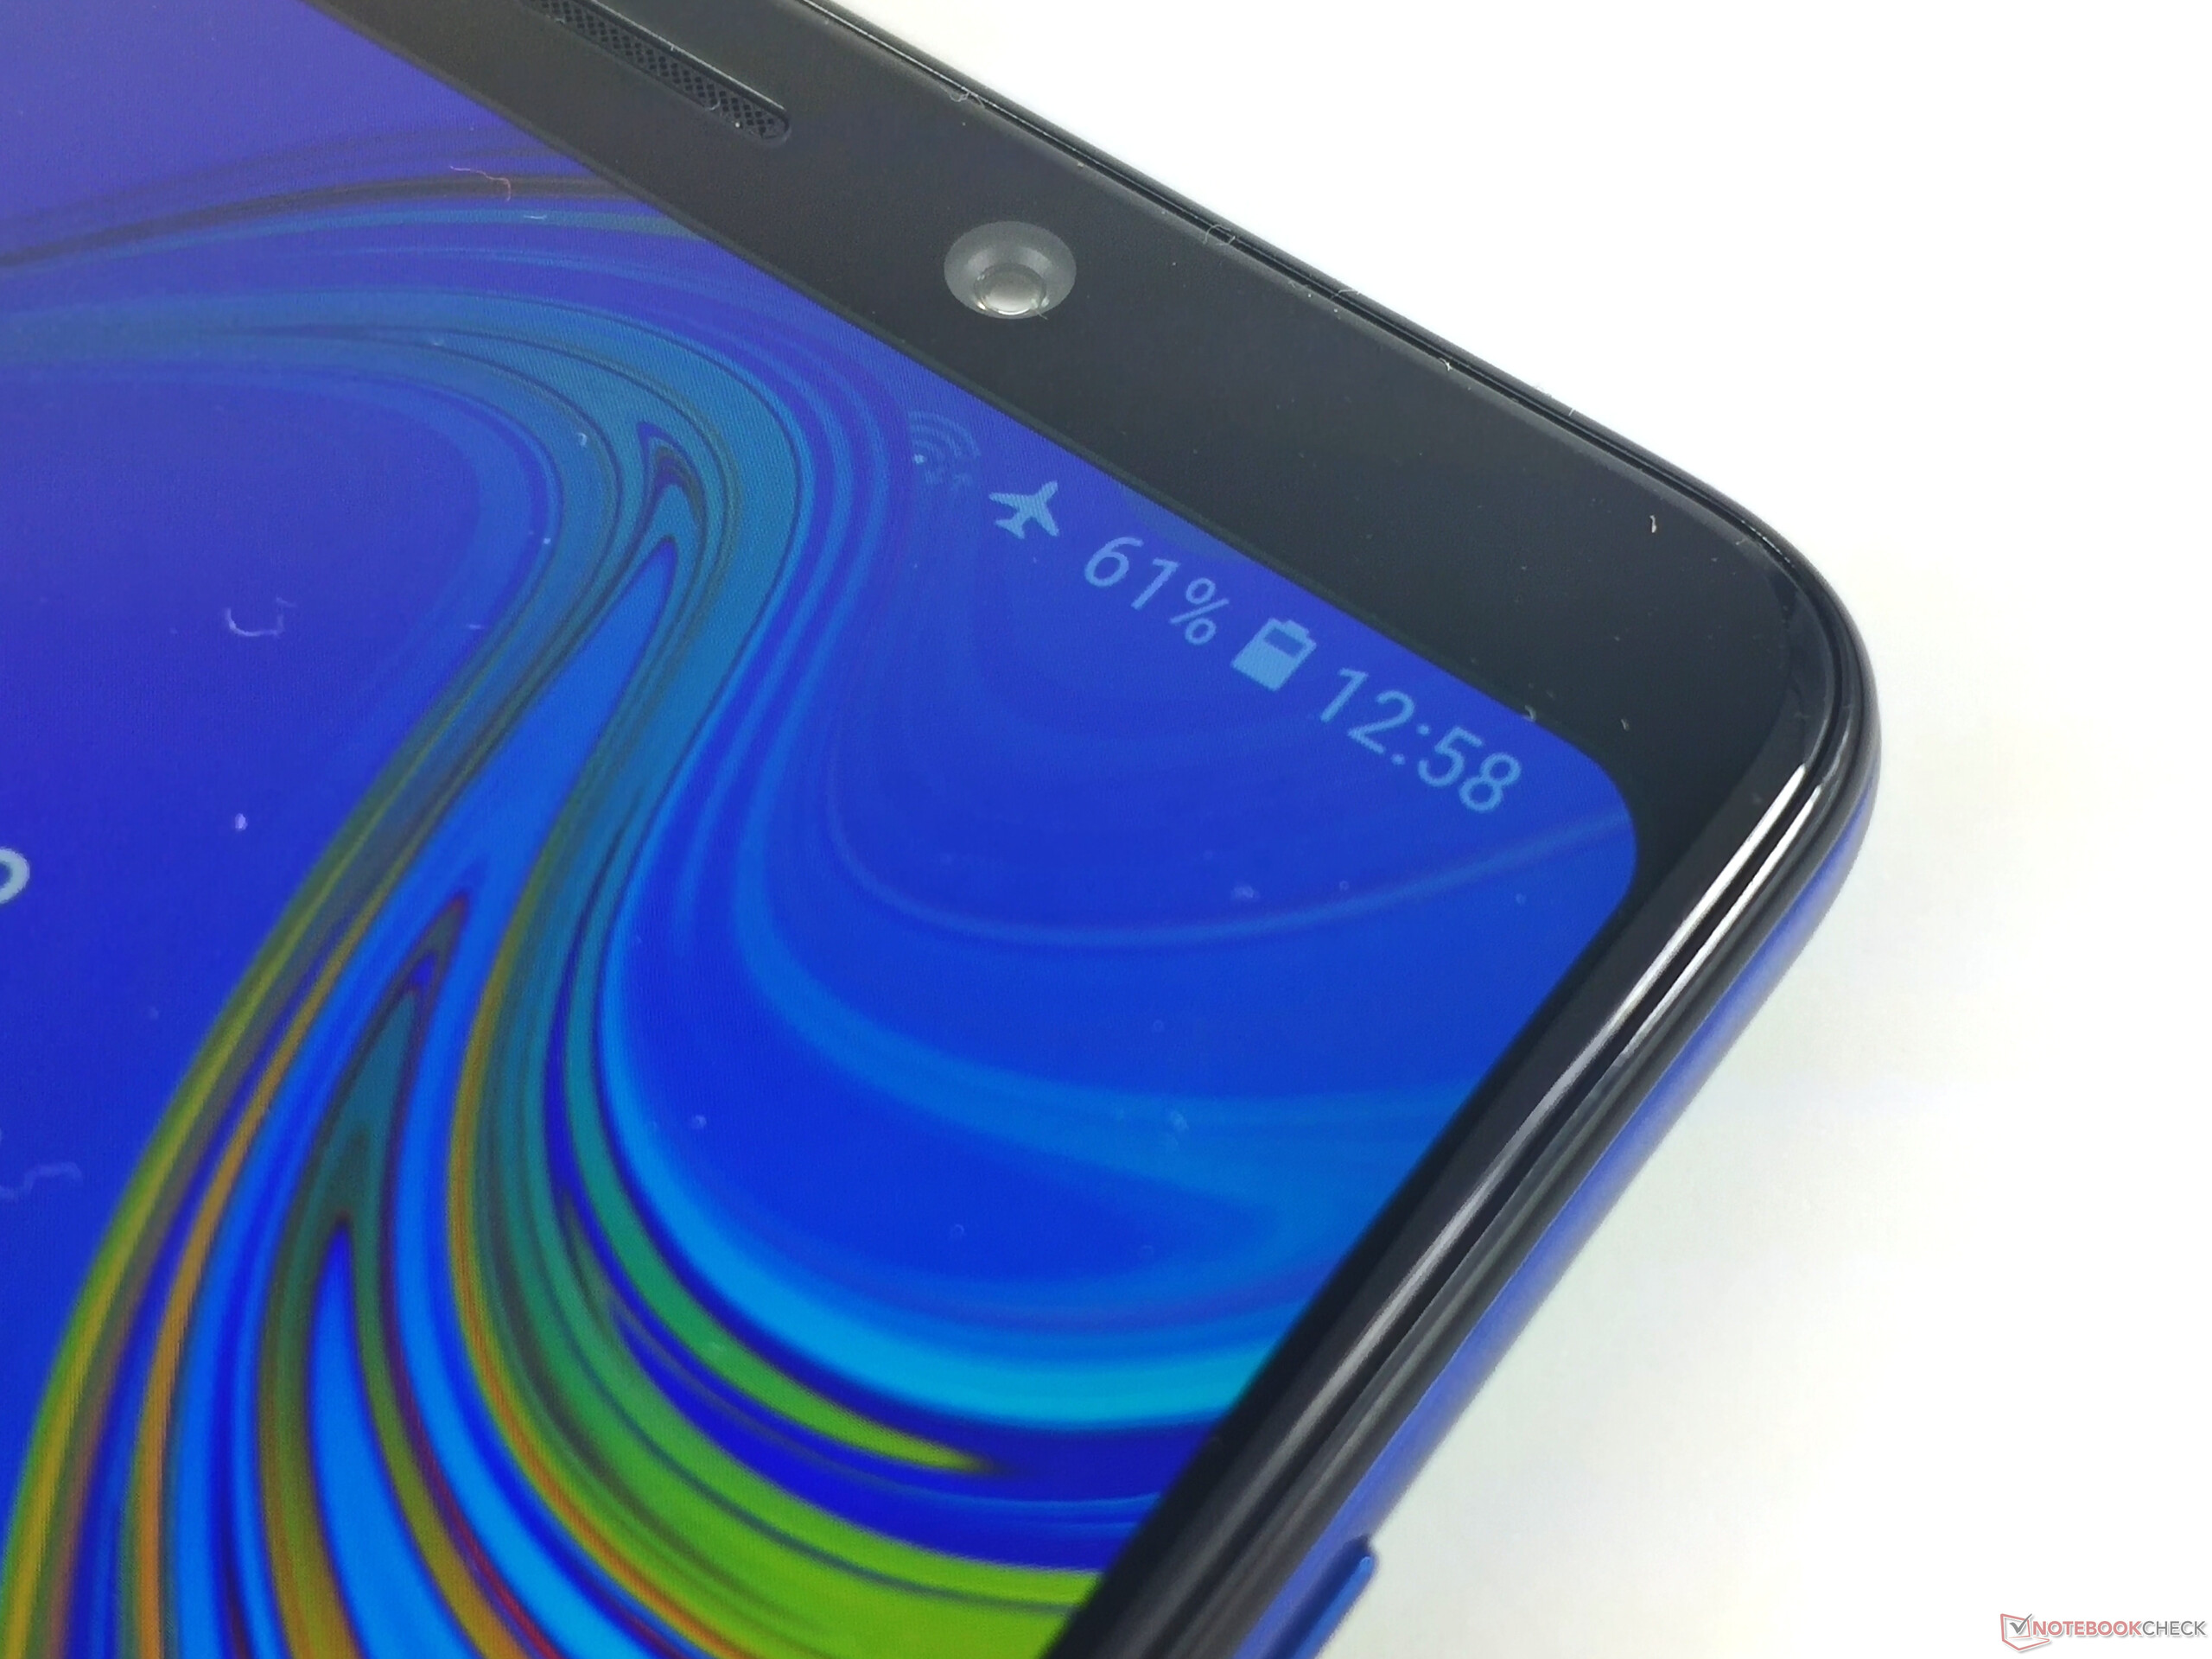
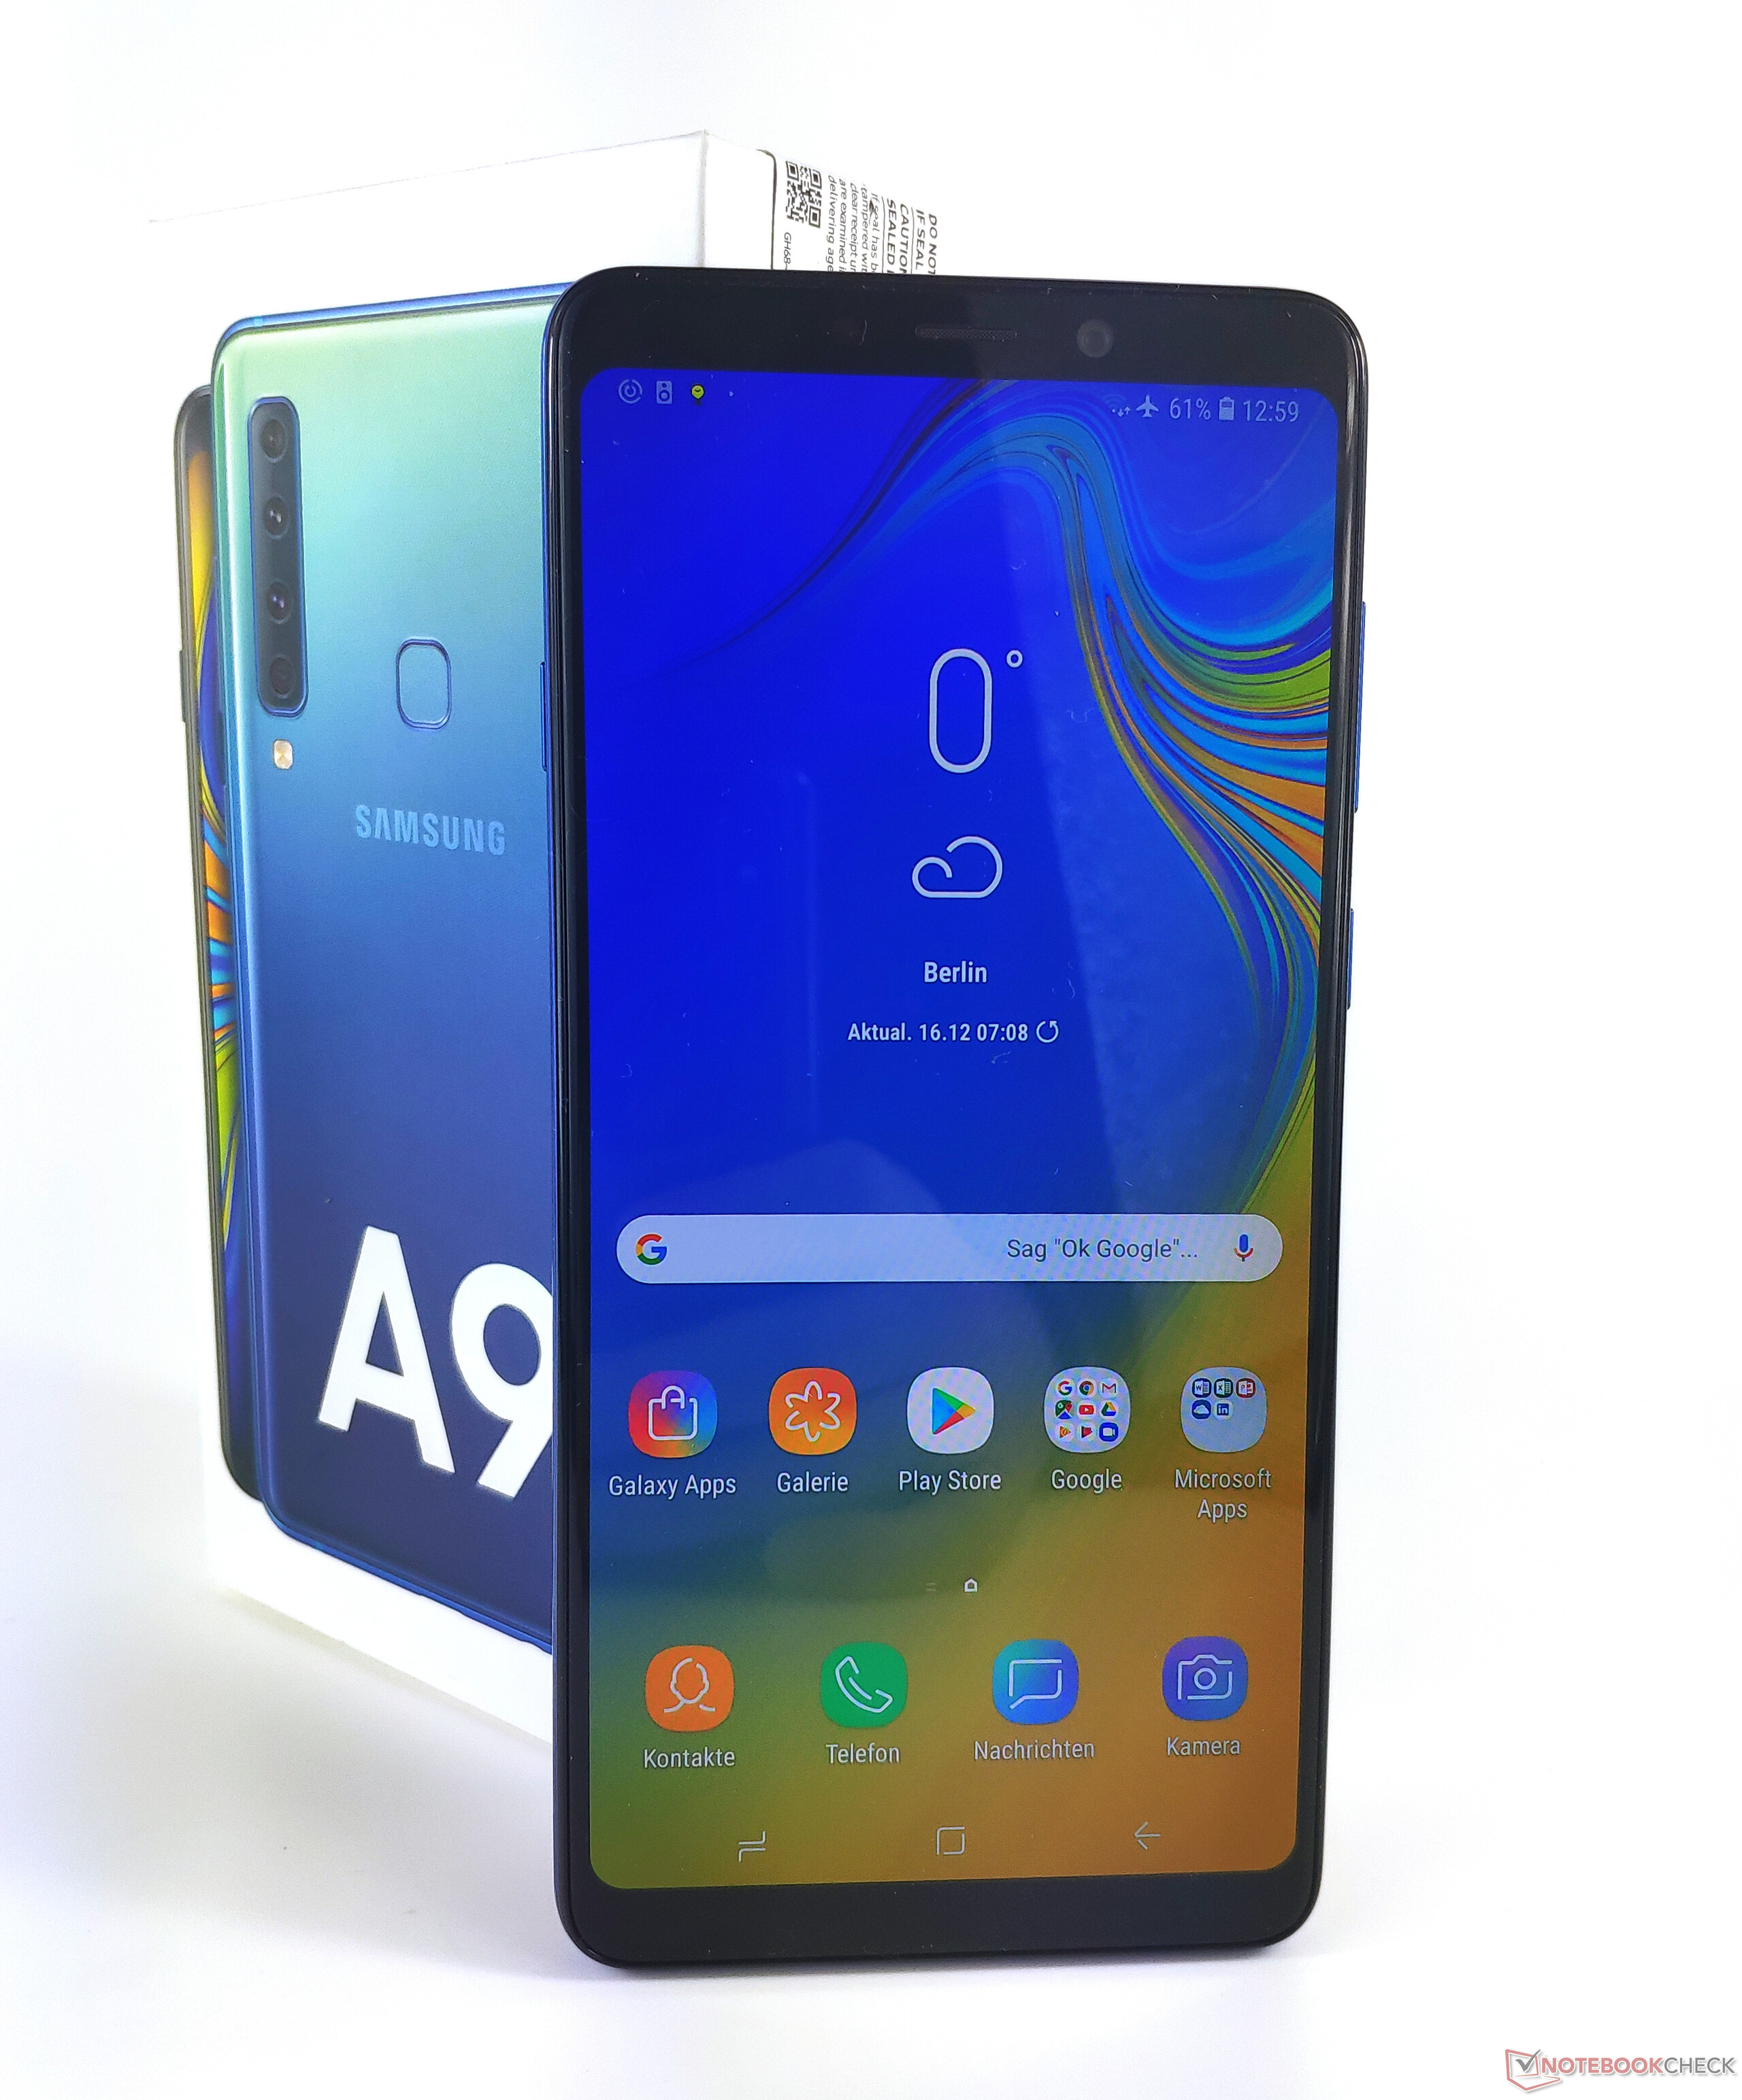
Com o seu impressionante vidro traseiro, a aparência externa do Samsung Galaxy A9 (2018) é um verdadeiro destaque. Sua qualidade de fabricação também é muito boa, embora nosso dispositivo de teste, em particular, tenha algumas pequenas falhas. Como o fabricante coreano parece estar fazendo mais frequentemente, a Samsung escolheu equipar seu mais novo membro da família na série Galaxy A com um painel OLED muito bom. Em termos de reprodução de cores e brilho, o Galaxy A9 (2018) compete no topo da sua liga. No entanto, o mesmo não pode ser dito do desempenho do sistema no padrão de fábrica. Devido às suas animações pré-instaladas, o smartphone de gama média se sente um pouco lento, o único remédio aqui é se livrar deles no menu de opções do desenvolvedor.
Devido às suas animações pré-instaladas, o smartphone de gama média se sente um pouco lento, o único remédio aqui é para se livrar deles no menu de opções do desenvolvedor. Claro, nem todos os smartphones de gama alta precisam ser comparados com o Xiaomi Pocophone F1, mas o fabricante chinês conseguiu equipar seu dispositivo de gama média com o atual chip de gama alta da Qualcomm. Como resultado, com um preço de varejo recomendado de 600 Euros (~$680), a Samsung poderia ter pelo menos equipado o Galaxy A9 (2018) com o chip de maior desempenho do ano passado - considerando que a empresa optou um SoC de 2017 em primeiro lugar.
O Samsung Galaxy A9 (2018) é um bom e muito atraente smartphone de gama média - mas ao preço atual de cerca de 480 Euros (~$550; versão internacional ~$525), existem alternativas melhores no mercado.
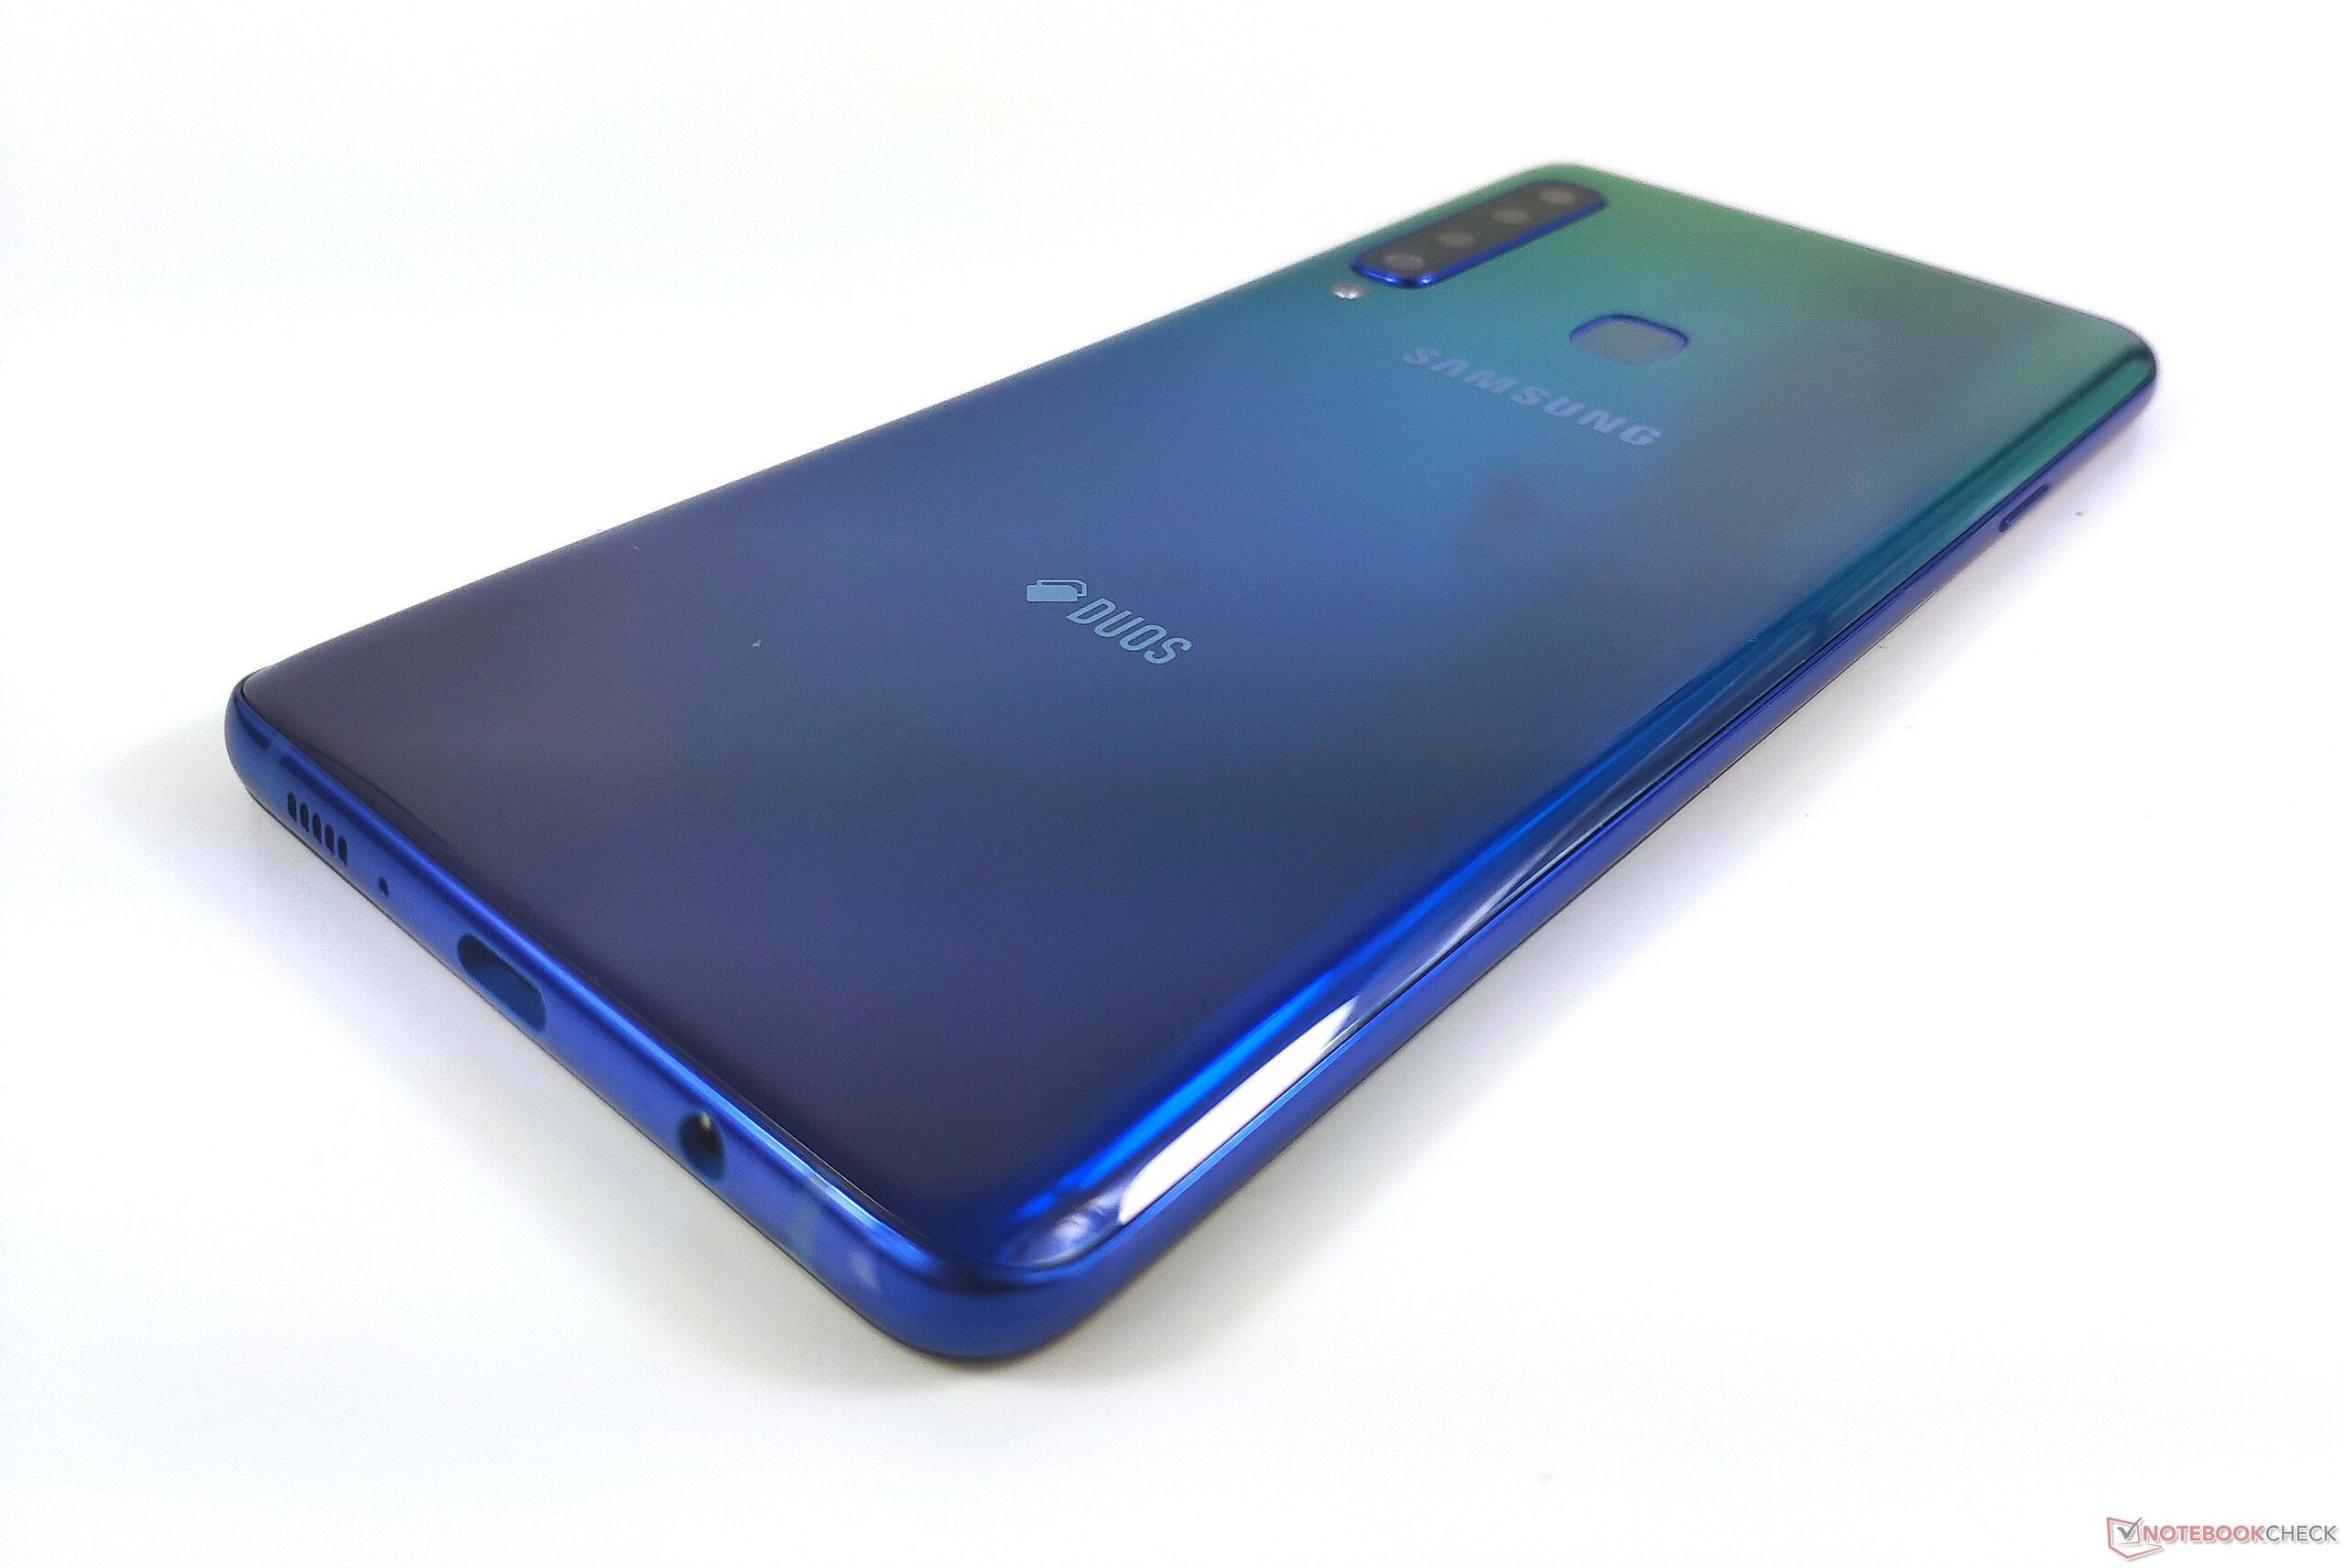
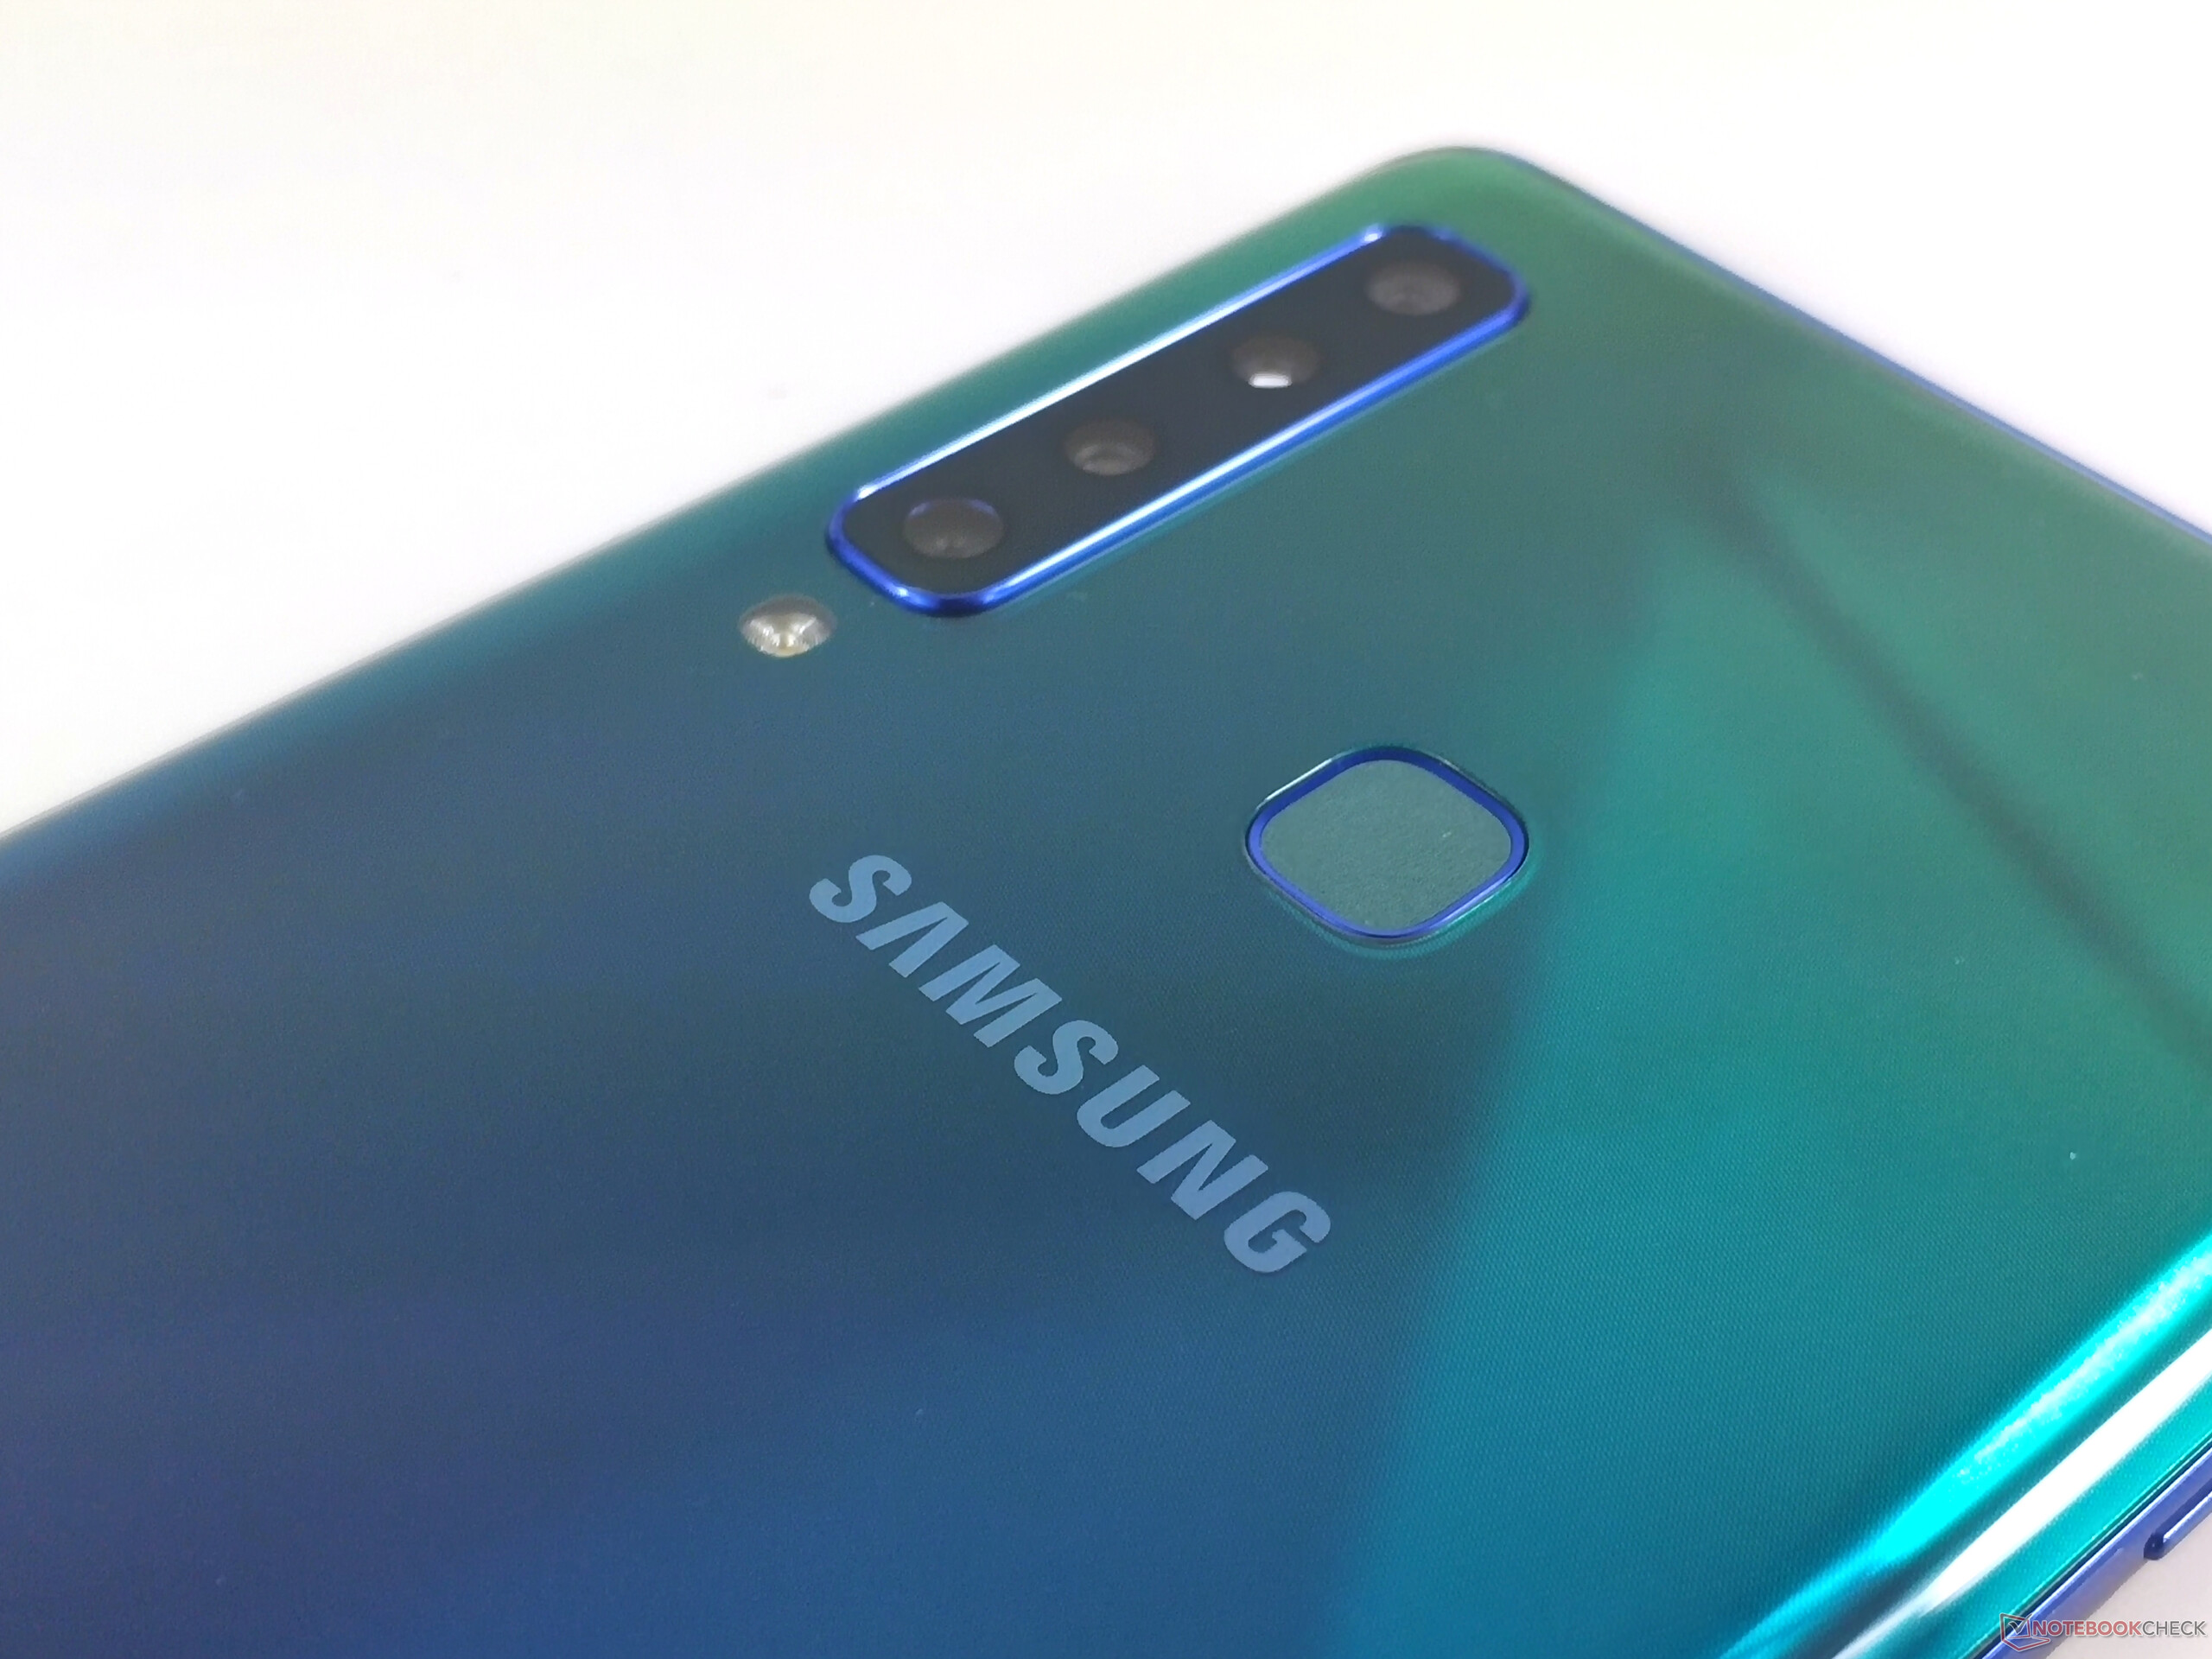
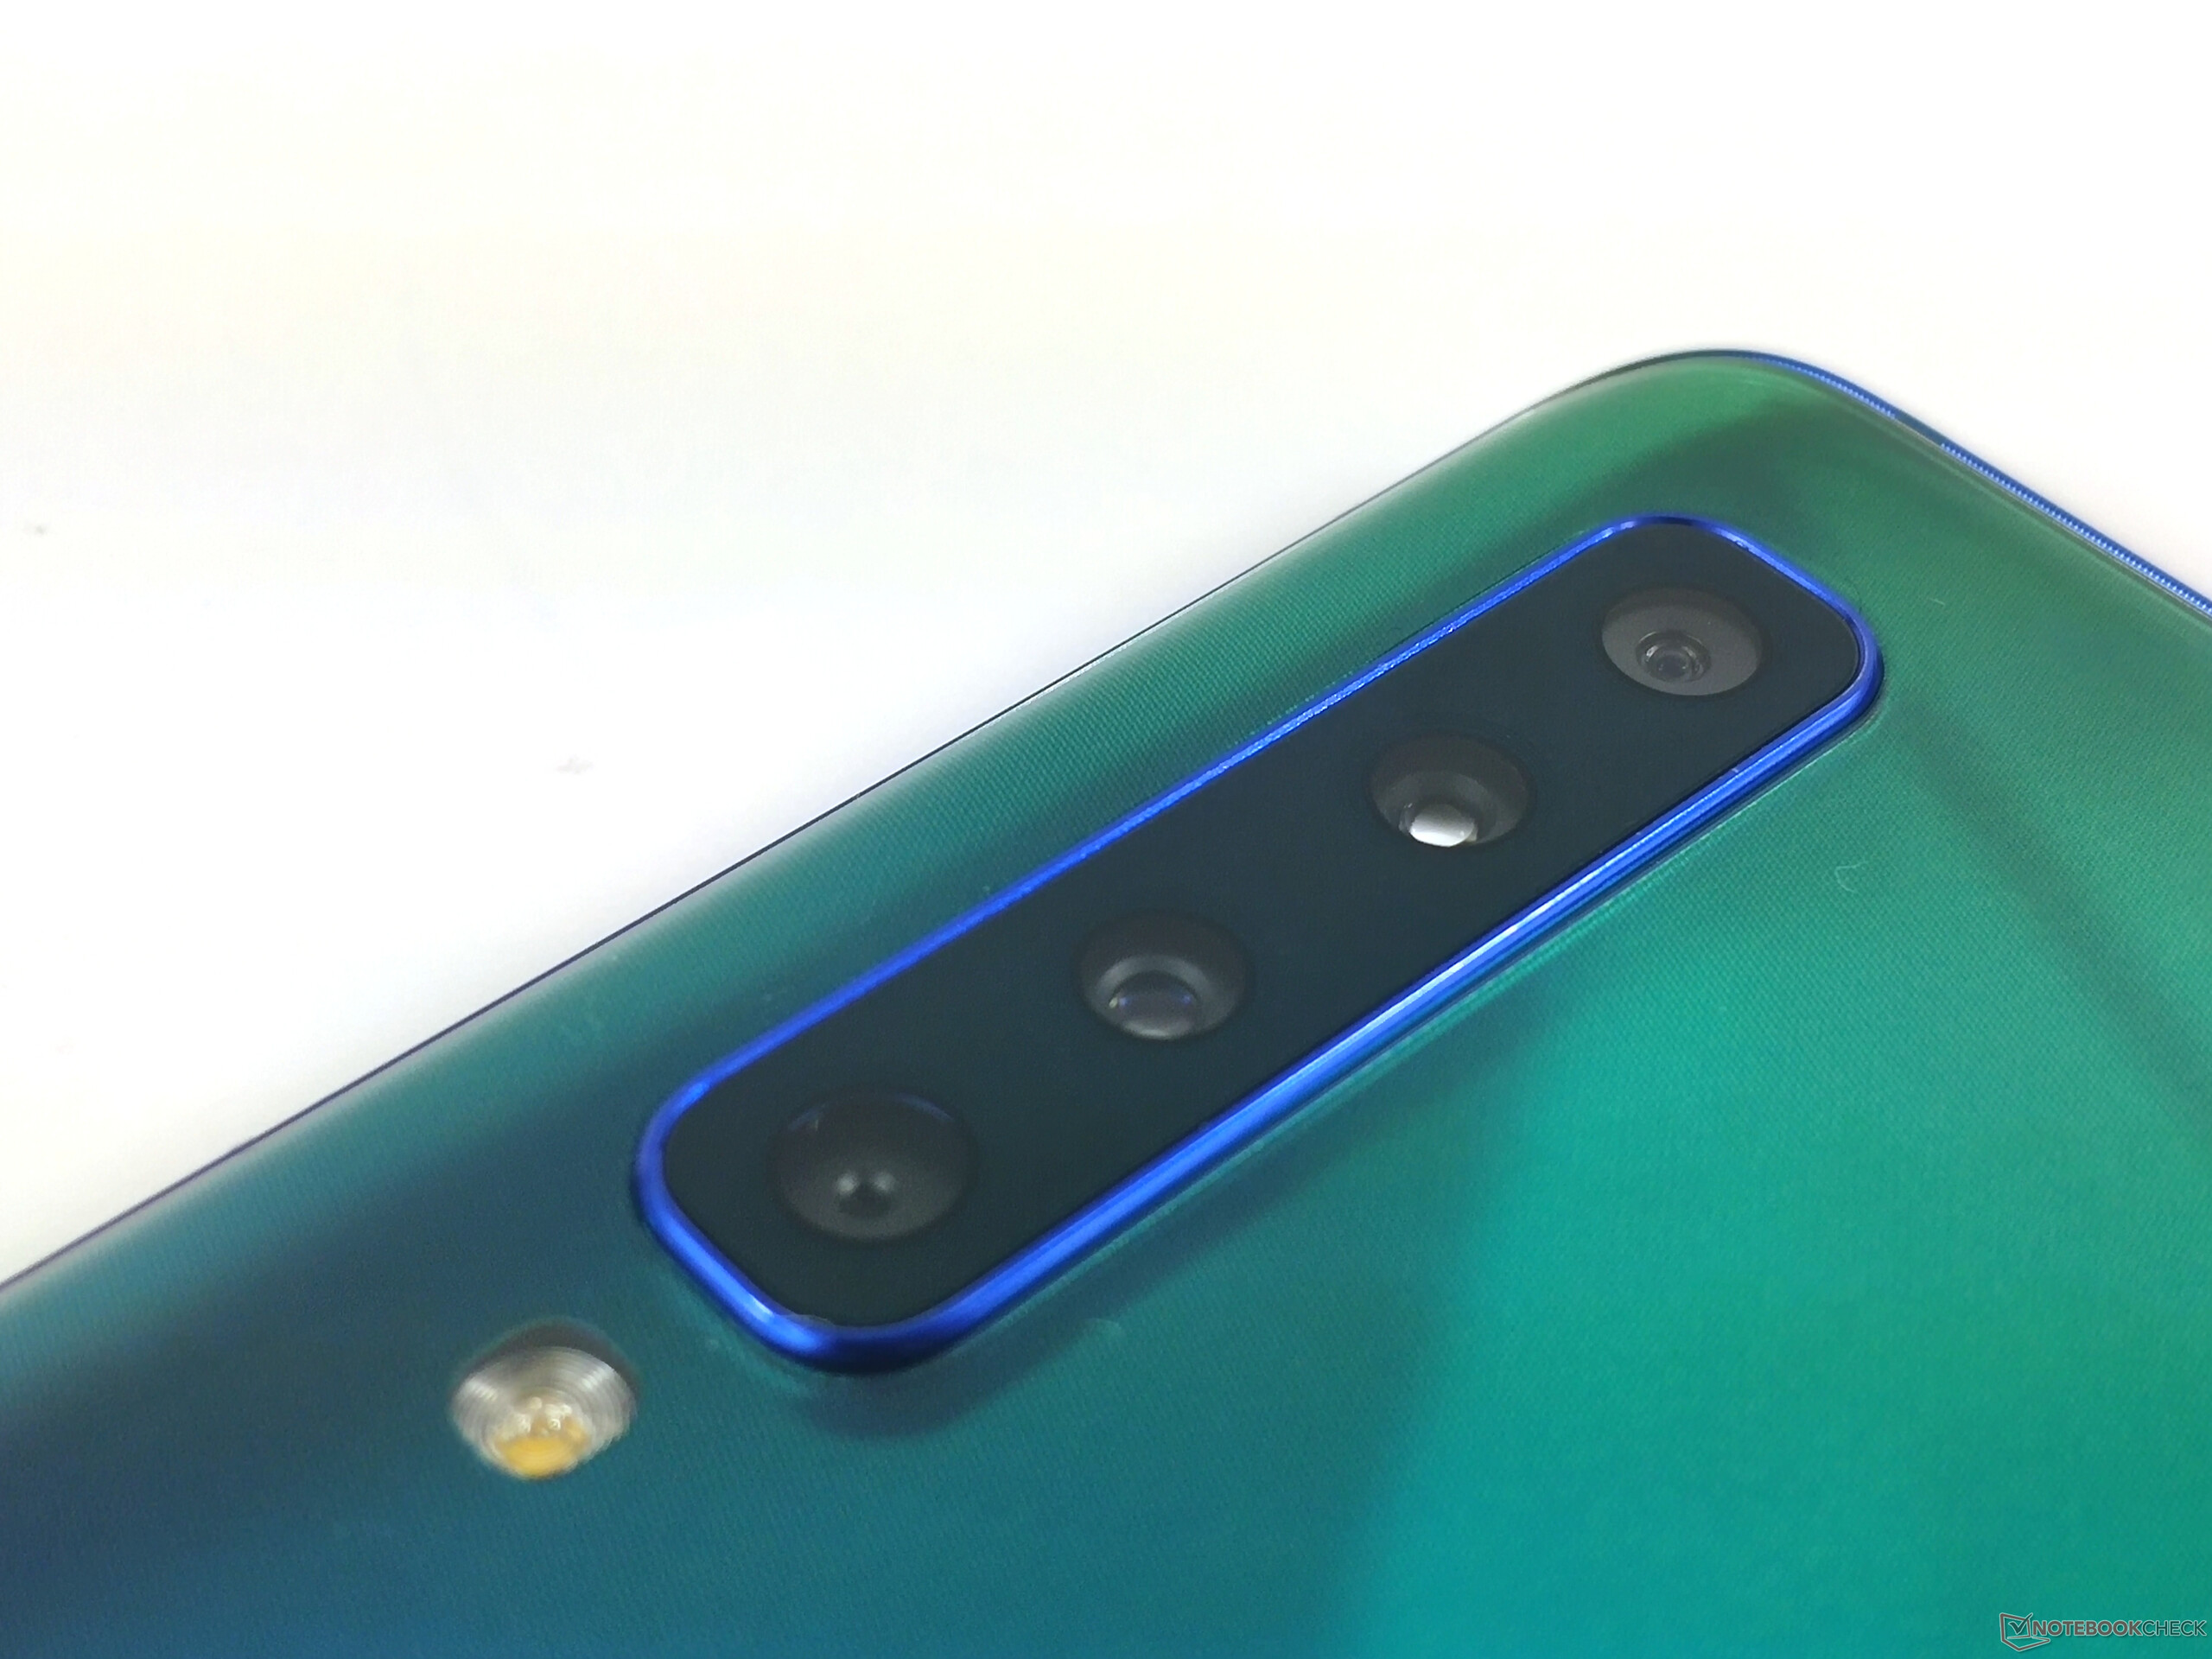
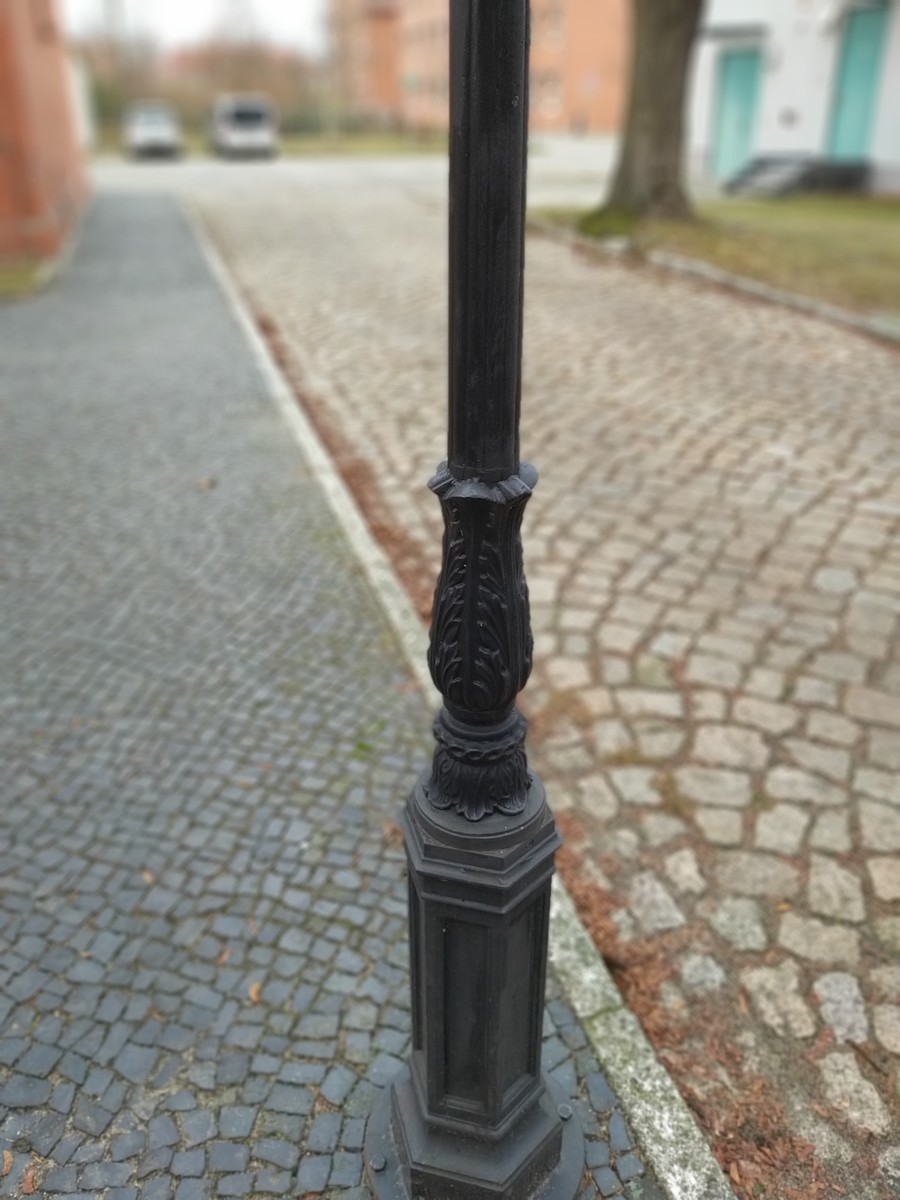
O ponto de venda exclusivo do Samsung Galaxy A9 (2018) - a câmera quádrupla na parte de trás - pode ser usada para uma ampla gama de aplicações, graças às suas quatro lentes diferentes. Combina todas as vantagens habituais das multi-câmaras (efeito bokeh, ultra grande angular, zoom ótico) num único dispositivo. No entanto, nenhuma conclusão deve ser tirada com base no preço de varejo recomendado quando se trata da qualidade da câmera principal. A câmera é muito rápida, mas em termos de qualidade de imagem, ela não tem desempenho melhor do que a média de um smartphone de gama média.
Samsung Galaxy A9 2018
- 12/22/2018 v6 (old)
Marcus Herbrich