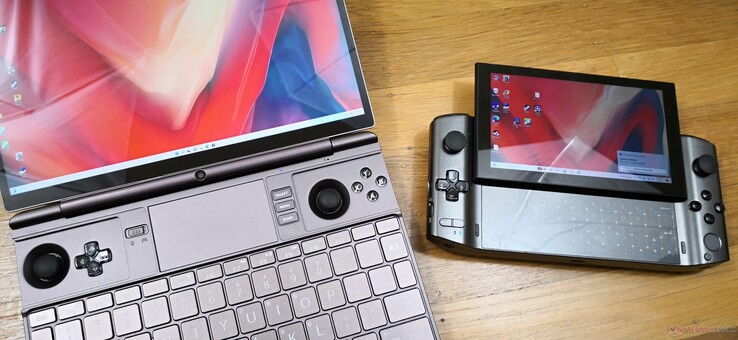
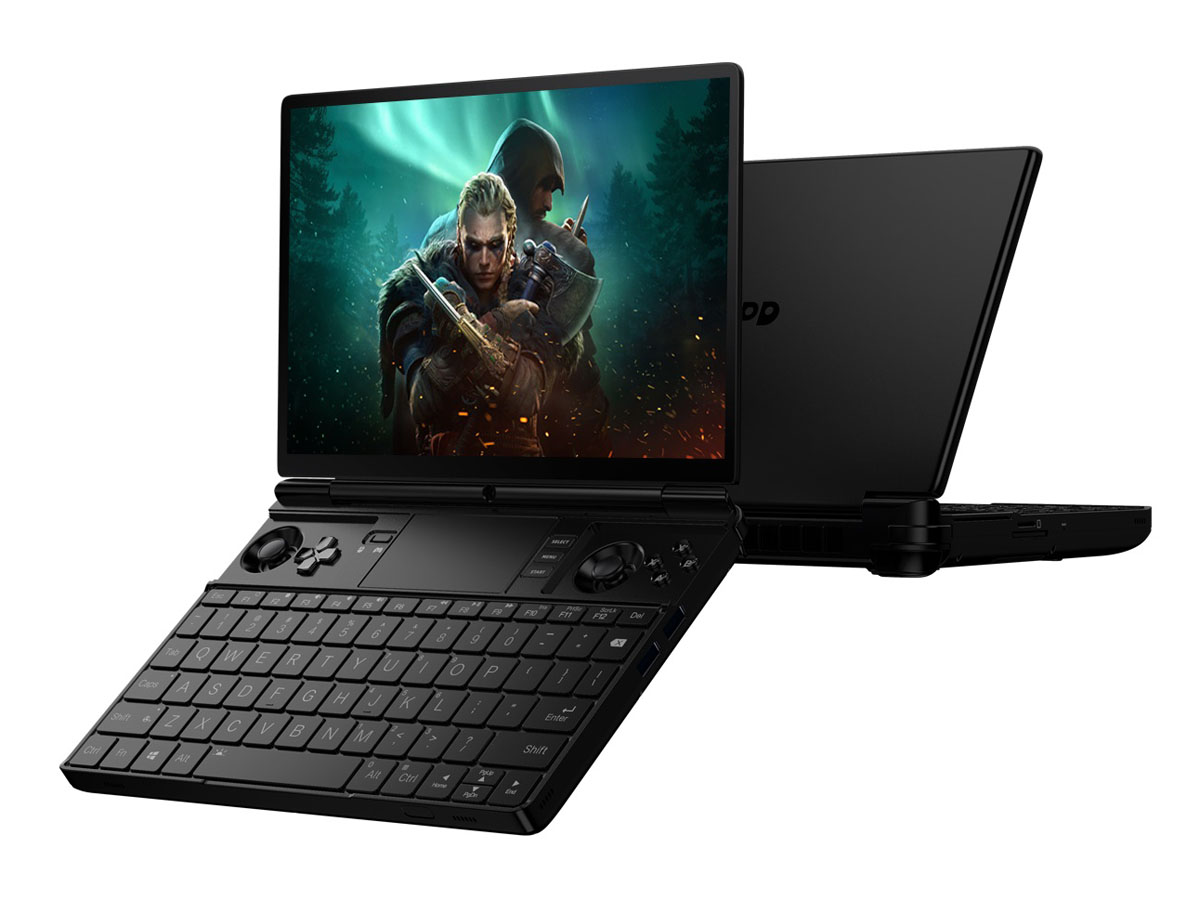
GPD Win Max 2 revisão PC de jogos portáteis: Intel Core i7-1260P ou AMD Ryzen 7 6800U?
A GPD tem feito manchetes com sua crescente linha de PCs portáteis equipados com hardware suficientemente rápido para fins de jogos. Somente no ano passado, foram lançados três desses modelos: o Win 3, Win Max e o Pocket 3, cada um com seus próprios desenhos exclusivos e torções sobre como pode ser o jogo em movimento.
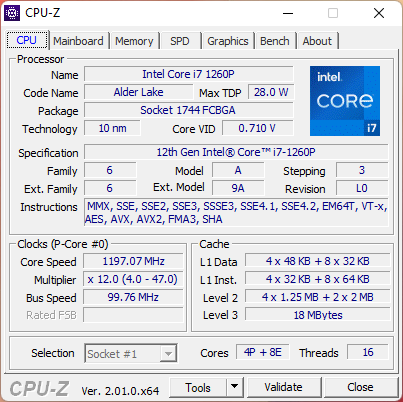
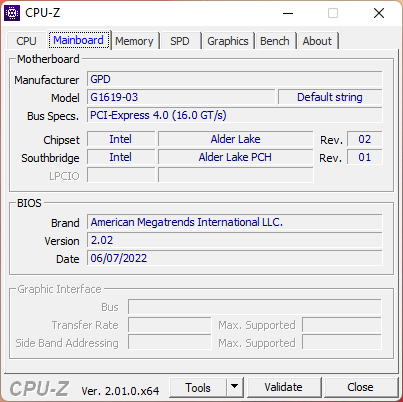
Para 2022, o GPD introduziu o Win Max 2 para substituir diretamente a primeira geração 2021 Win Max. Este último modelo é um redesenho completo do primeiro modelo com características ainda mais auxiliares e hardware mais rápido. Os usuários podem escolher entre o Intel 12th gen Núcleo i7-1260P ou AMD Ryzen 7 6800U com gráficos integrados Iris Xe ou Radeon 680M, respectivamente. Espera-se que cada versão seja vendida no varejo por US$ 1.000
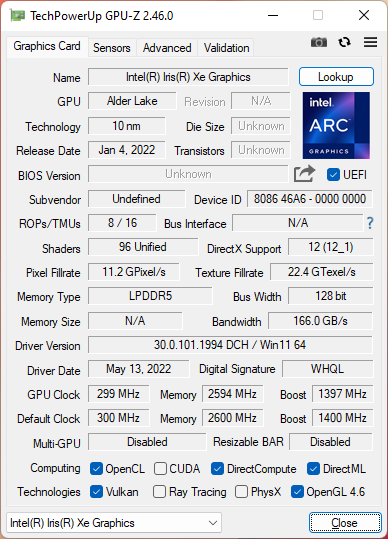
O Win Max 2 é único em seu espaço, pois é um dos únicos laptops de 10,1 polegadas com um CPU Intel Alder Lake-P para um nível muito alto de desempenho em relação à sua categoria de tamanho. Mais informações e especificações podem ser encontradas em sua página oficial de produtos aqui. Esta revisão se concentra na versão Intel do modelo.
Mais revisões do GPD:
Possíveis concorrentes em comparação
Avaliação | Data | Modelo | Peso | Altura | Size | Resolução | Preço |
|---|---|---|---|---|---|---|---|
| 84.5 % v7 (old) | 07/2022 | GPD Win Max 2 i7-1260P, Iris Xe G7 96EUs | 1 kg | 23 mm | 10.10" | 2560x1600 | |
| 86.3 % v7 (old) | 11/2021 | GPD Pocket 3 i7-1195G7, Iris Xe G7 96EUs | 730 g | 20 mm | 8.00" | 1920x1200 | |
| 79.3 % v7 (old) | 08/2021 | GPD Win Max 2021 R7 4800U, Vega 8 | 850 g | 26 mm | 8.00" | 1280x800 | |
v (old) | 01/2021 | GPD Win 3 i5-1135G7, Iris Xe G7 80EUs | 553 g | 27 mm | 5.50" | 1280x720 | |
| 85.3 % v7 (old) | 10/2021 | Microsoft Surface Go 3 Core i3 i3-10100Y, UHD Graphics 615 | 783 g | 8.3 mm | 10.50" | 1920x1280 | |
| 78.1 % v7 (old) | 02/2021 | Lenovo IdeaPad Flex 3 11IGL05 Celeron N4020, UHD Graphics 600 | 1.1 kg | 17.5 mm | 11.60" | 1366x768 |
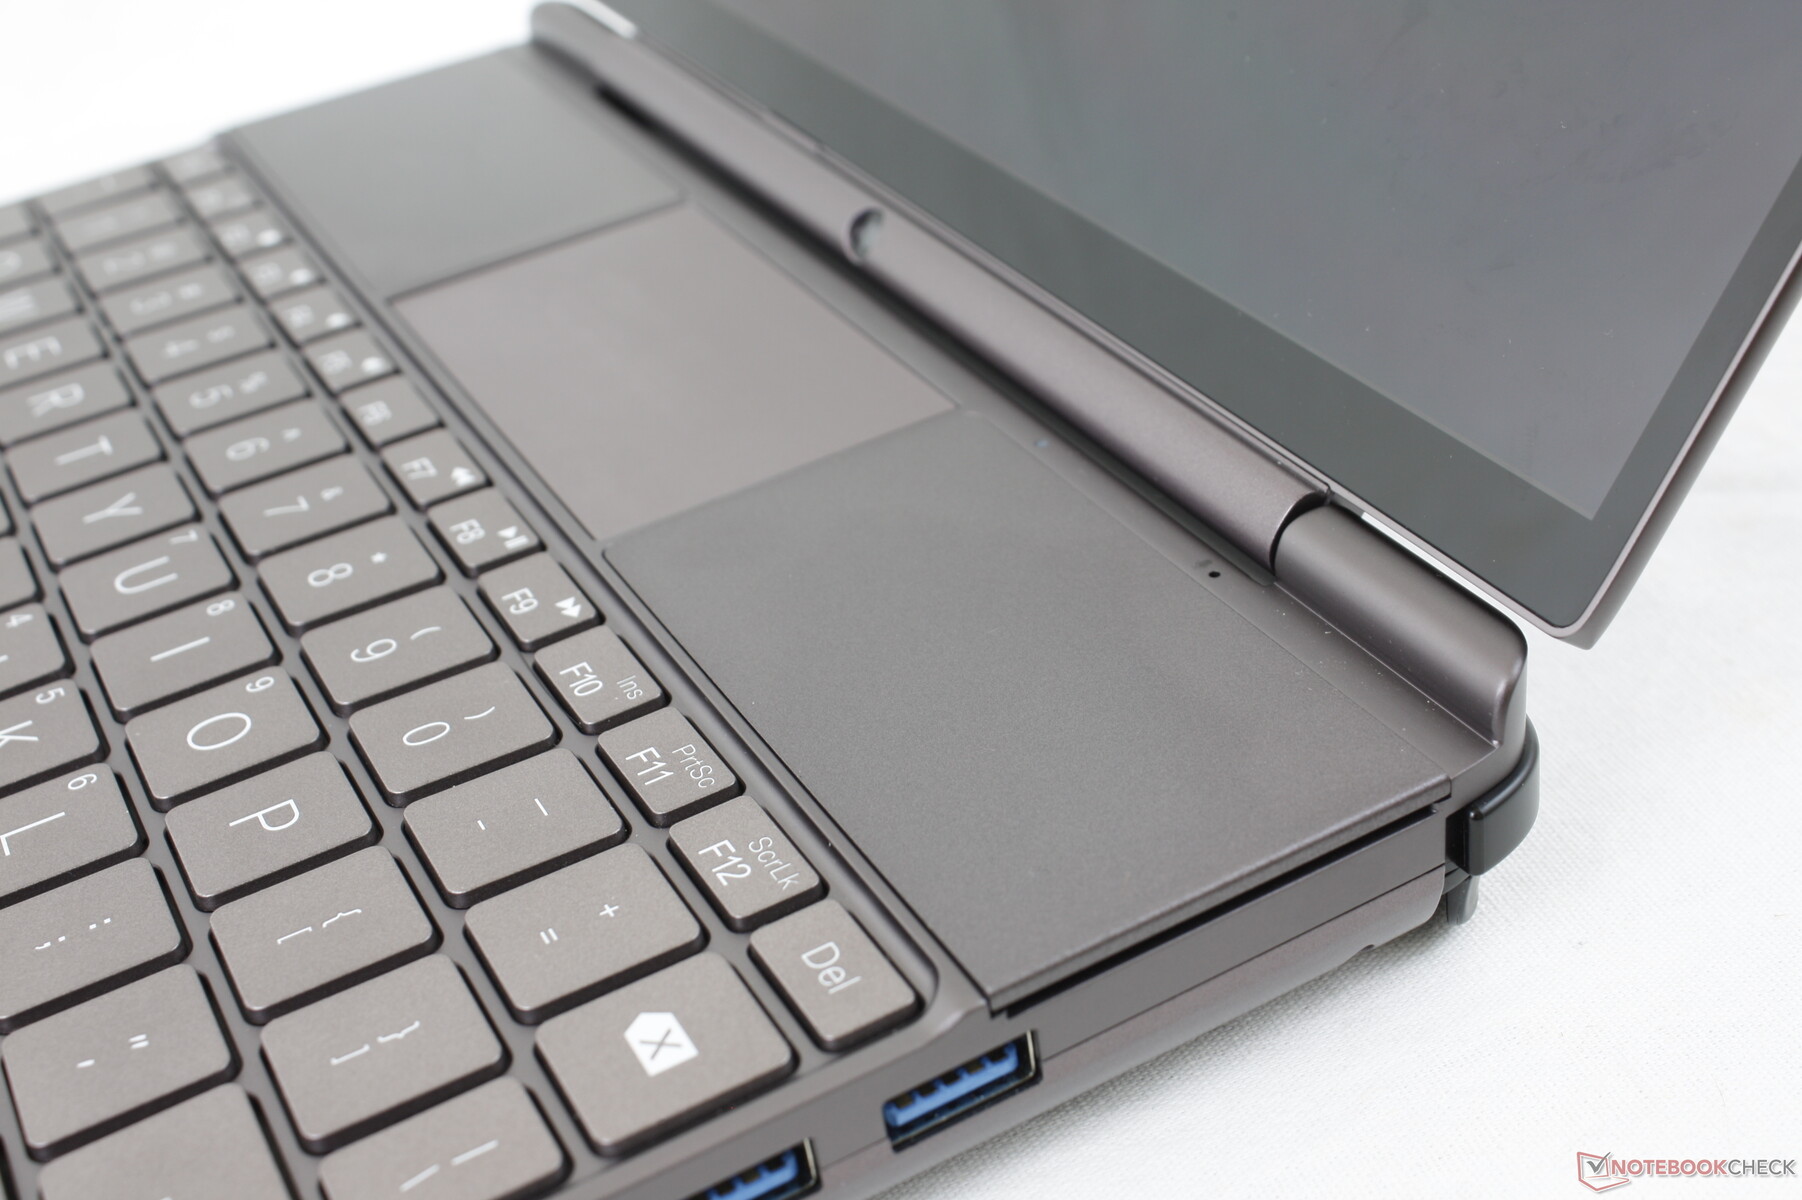
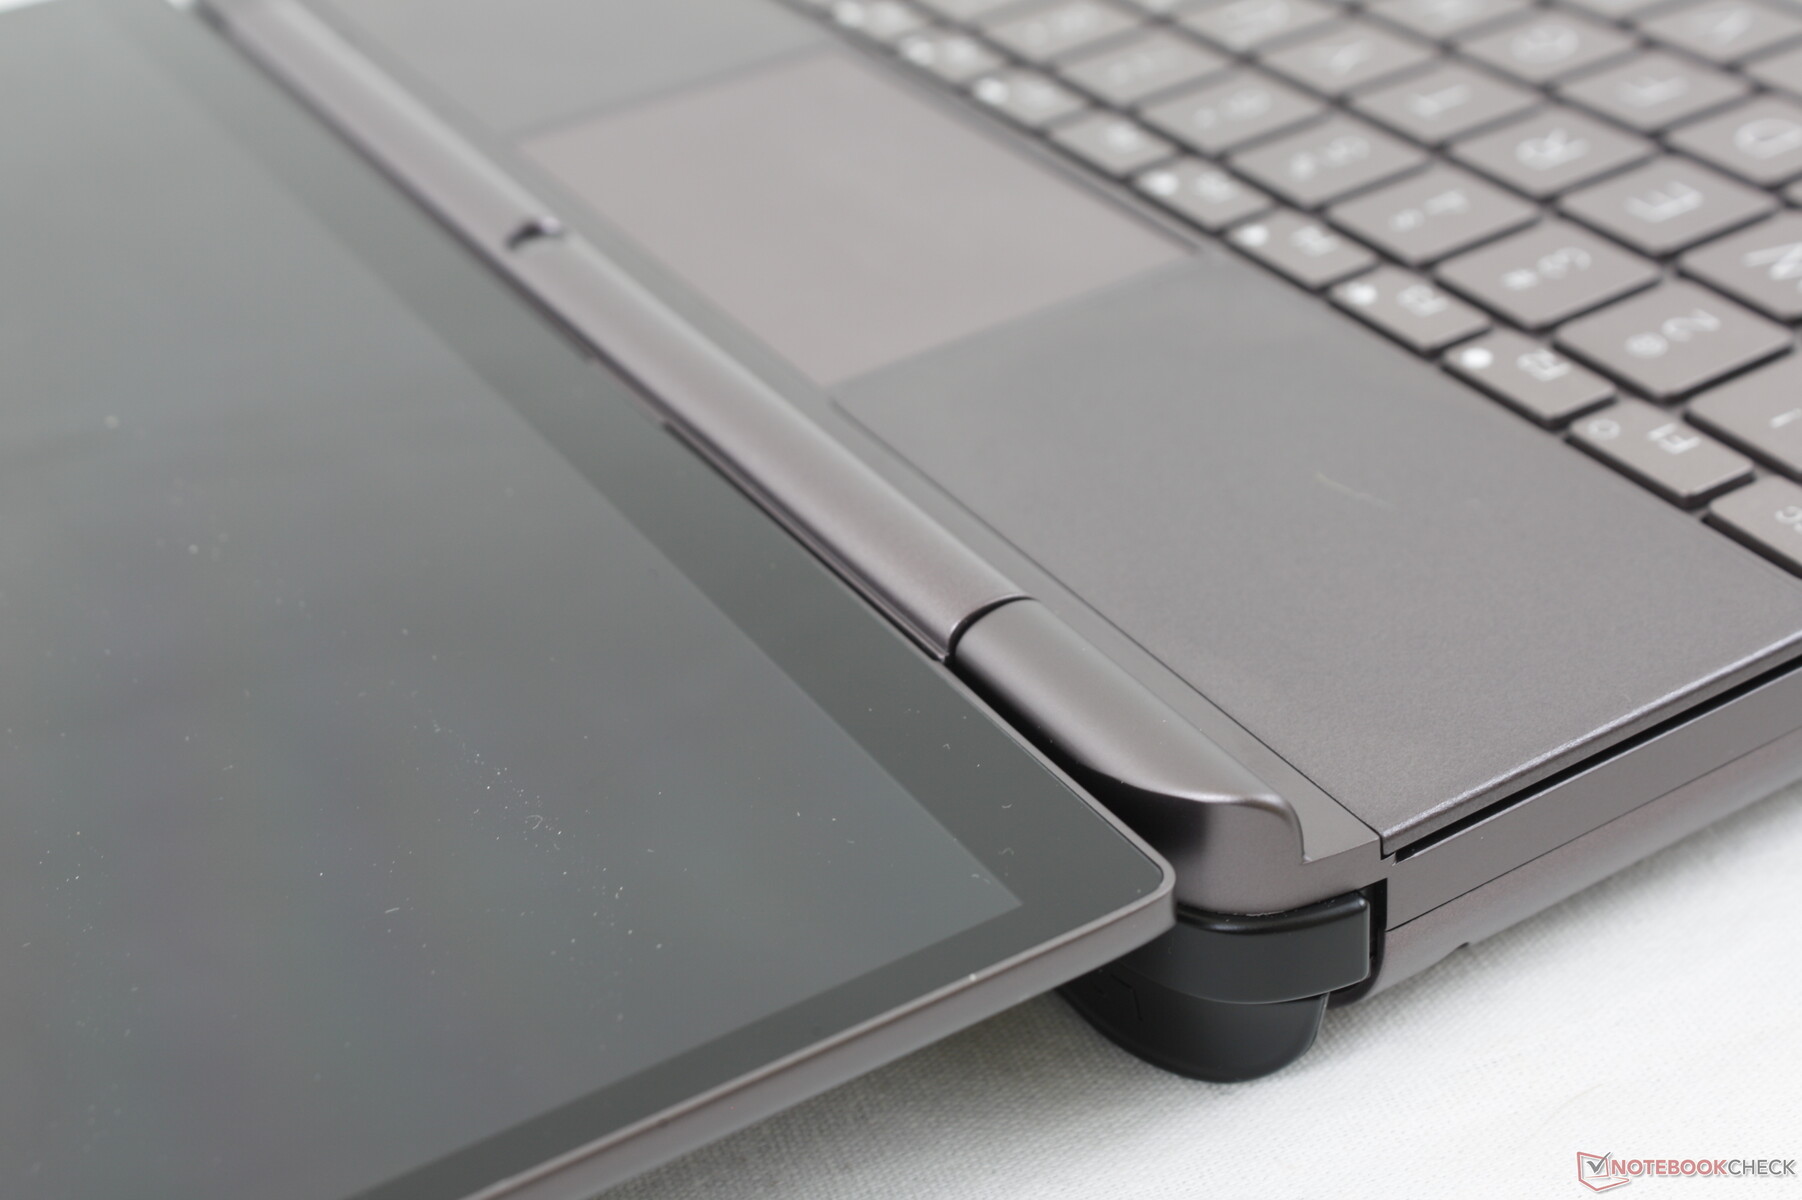
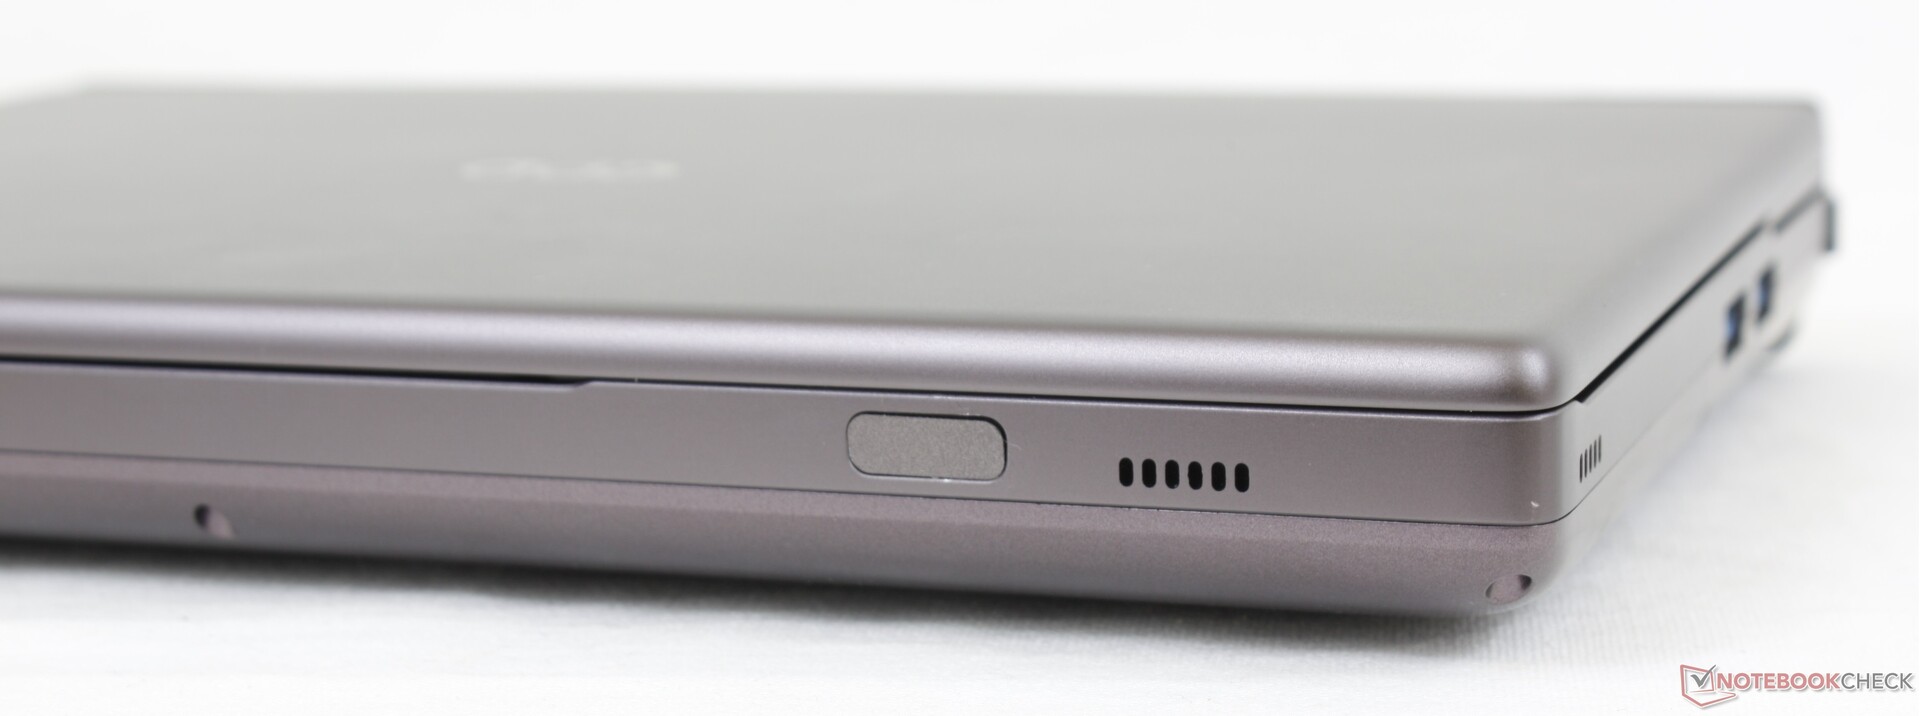
Caso - Sentimento Familiar
A GPD utiliza materiais metálicos similares em seus produtos e assim todos eles compartilham a mesma textura, sensação e aparência. Mesmo assim, a qualidade de construção é melhor do que no Win Max original, pois tanto a base quanto a tampa apresentam apenas uma flexão mínima e quase nenhum rangido. É também uma melhoria em relação ao Win 3, que consideramos um pouco frágil em relação ao seu mecanismo de deslizamento
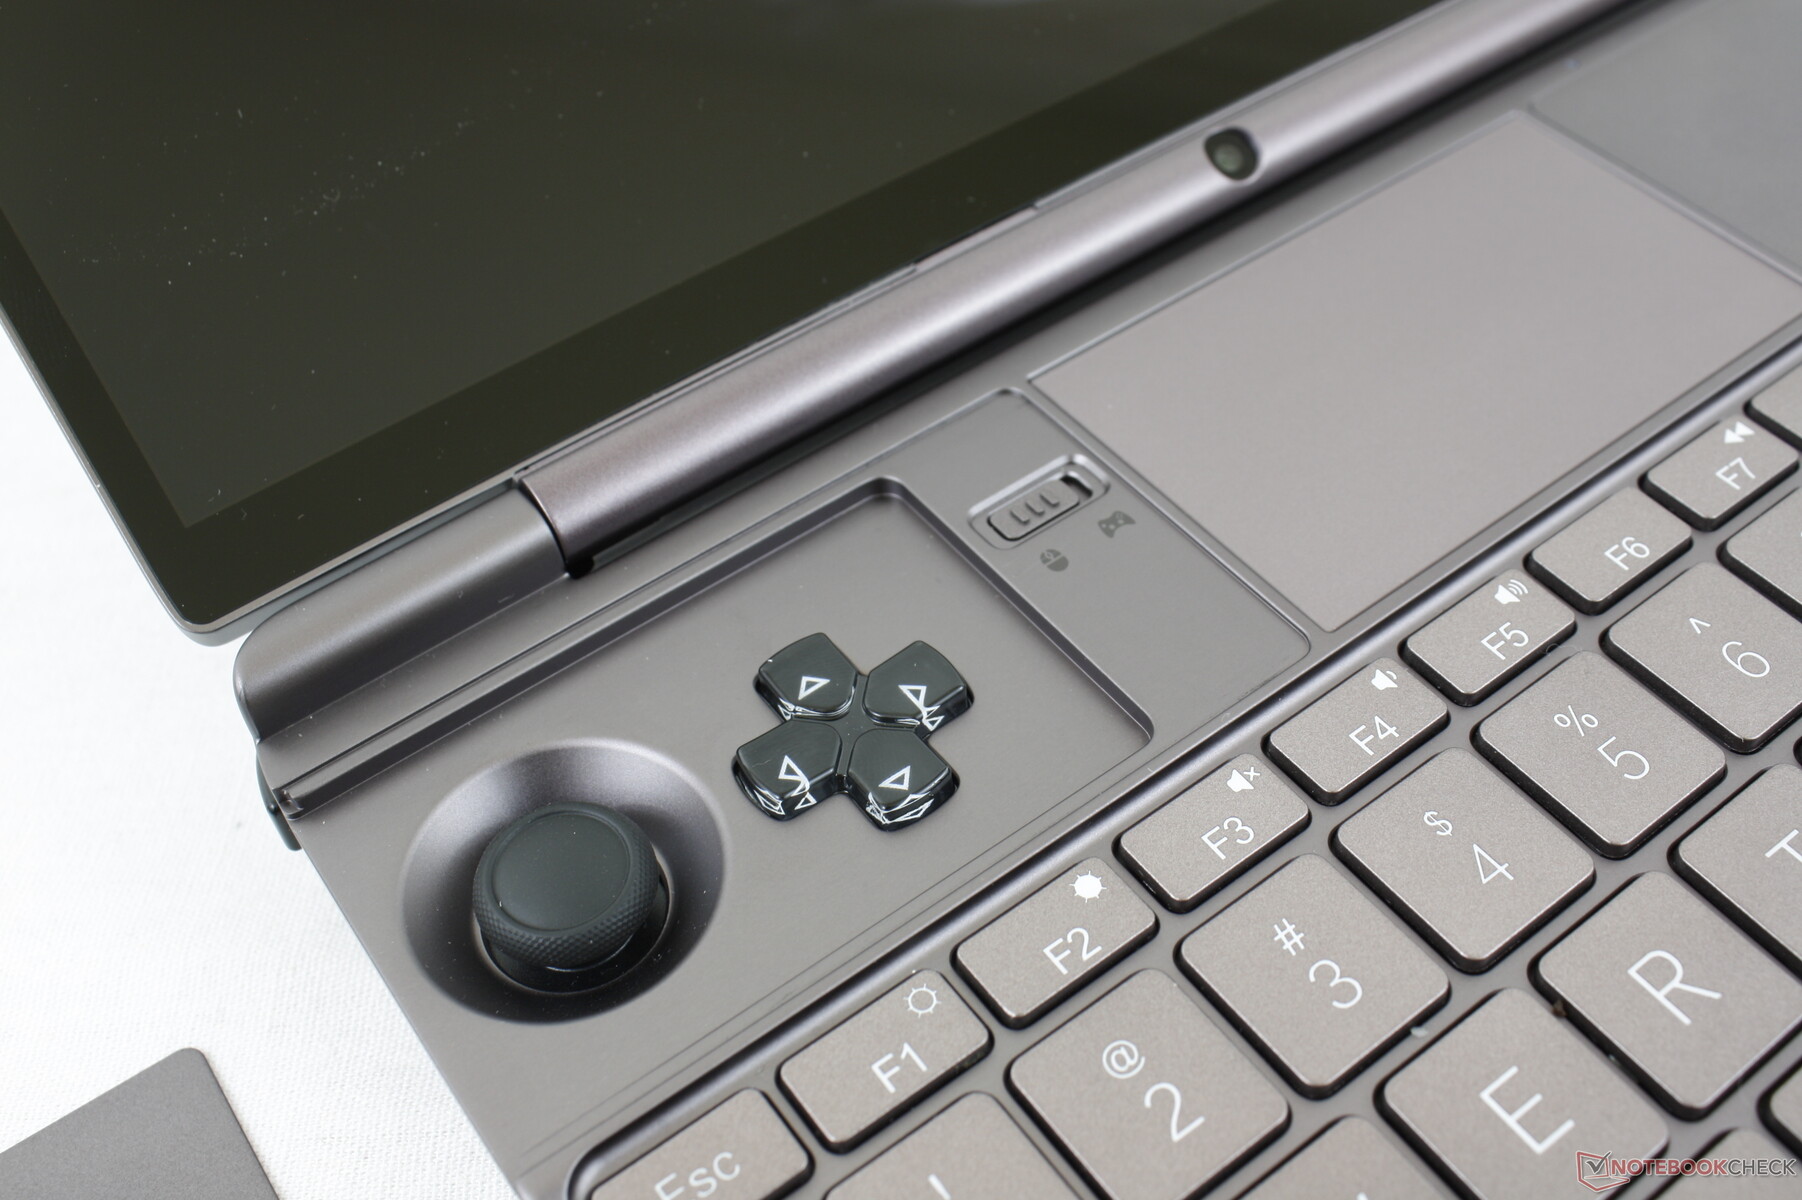
Novidade na série são as duas tampas magnéticas removíveis para os joysticks. Sua utilidade é principalmente superficial para os usuários que querem cobrir os botões do controlador durante as salas de aula ou reuniões.
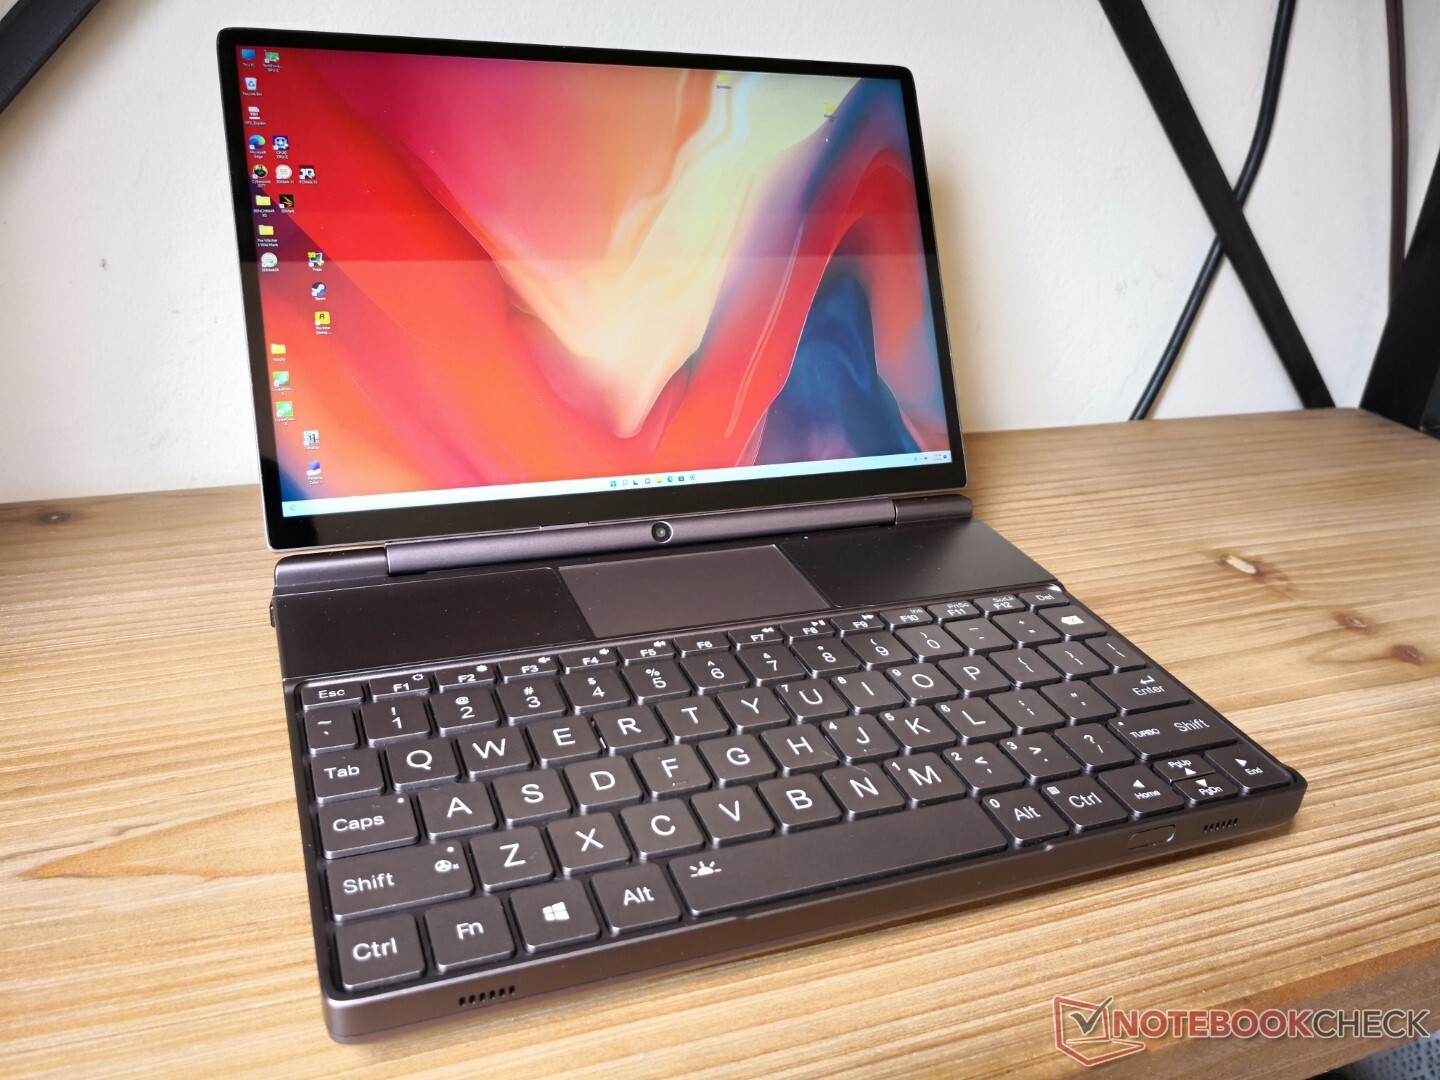
O tamanho muito maior da tela do Win Max 2 sobre o Win Max original significa que o modelo mais novo é tanto mais pesado quanto maior do que seu antecessor, mesmo depois de contabilizar as luneiras de exibição mais estreitas. No entanto, ainda é mais leve que a maioria dos laptops com pouco mais de 1 kg e sua portabilidade não pode ser subestimada.
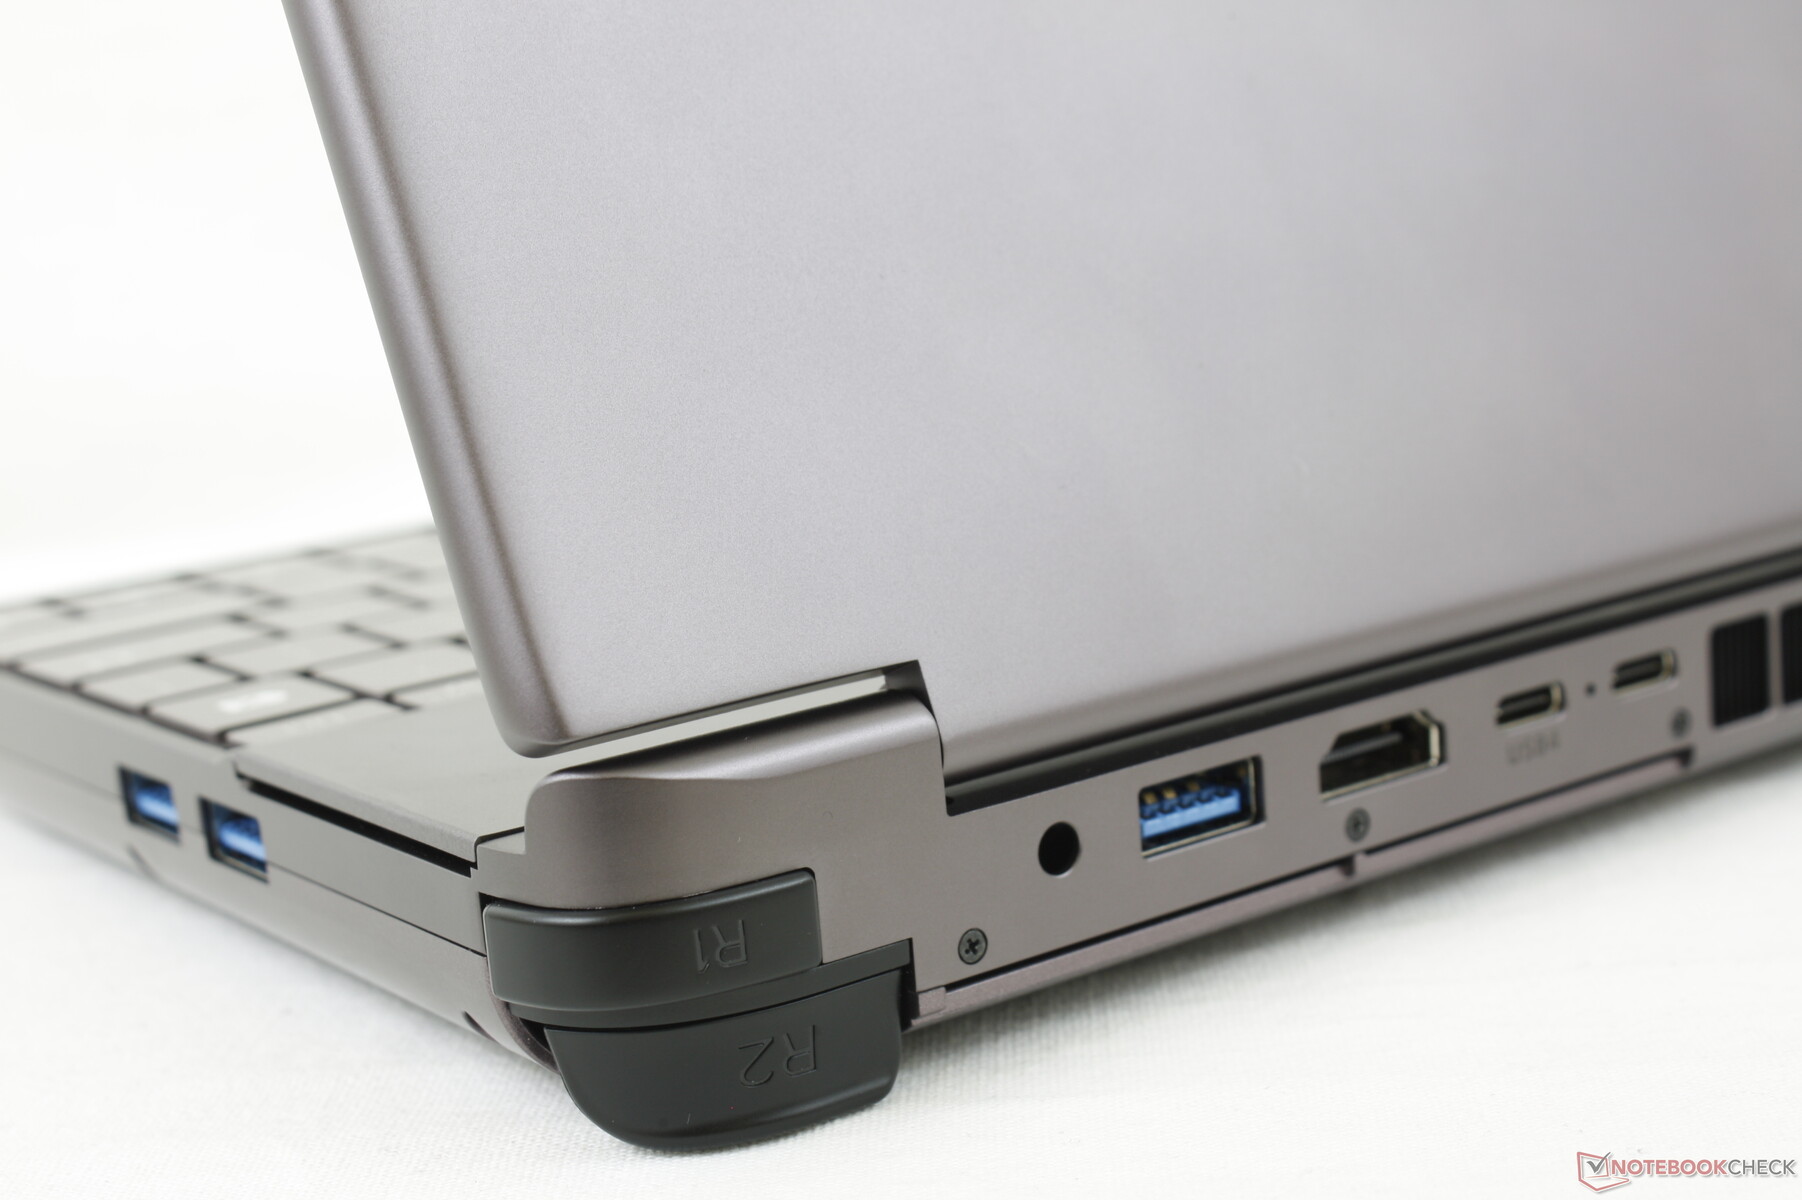
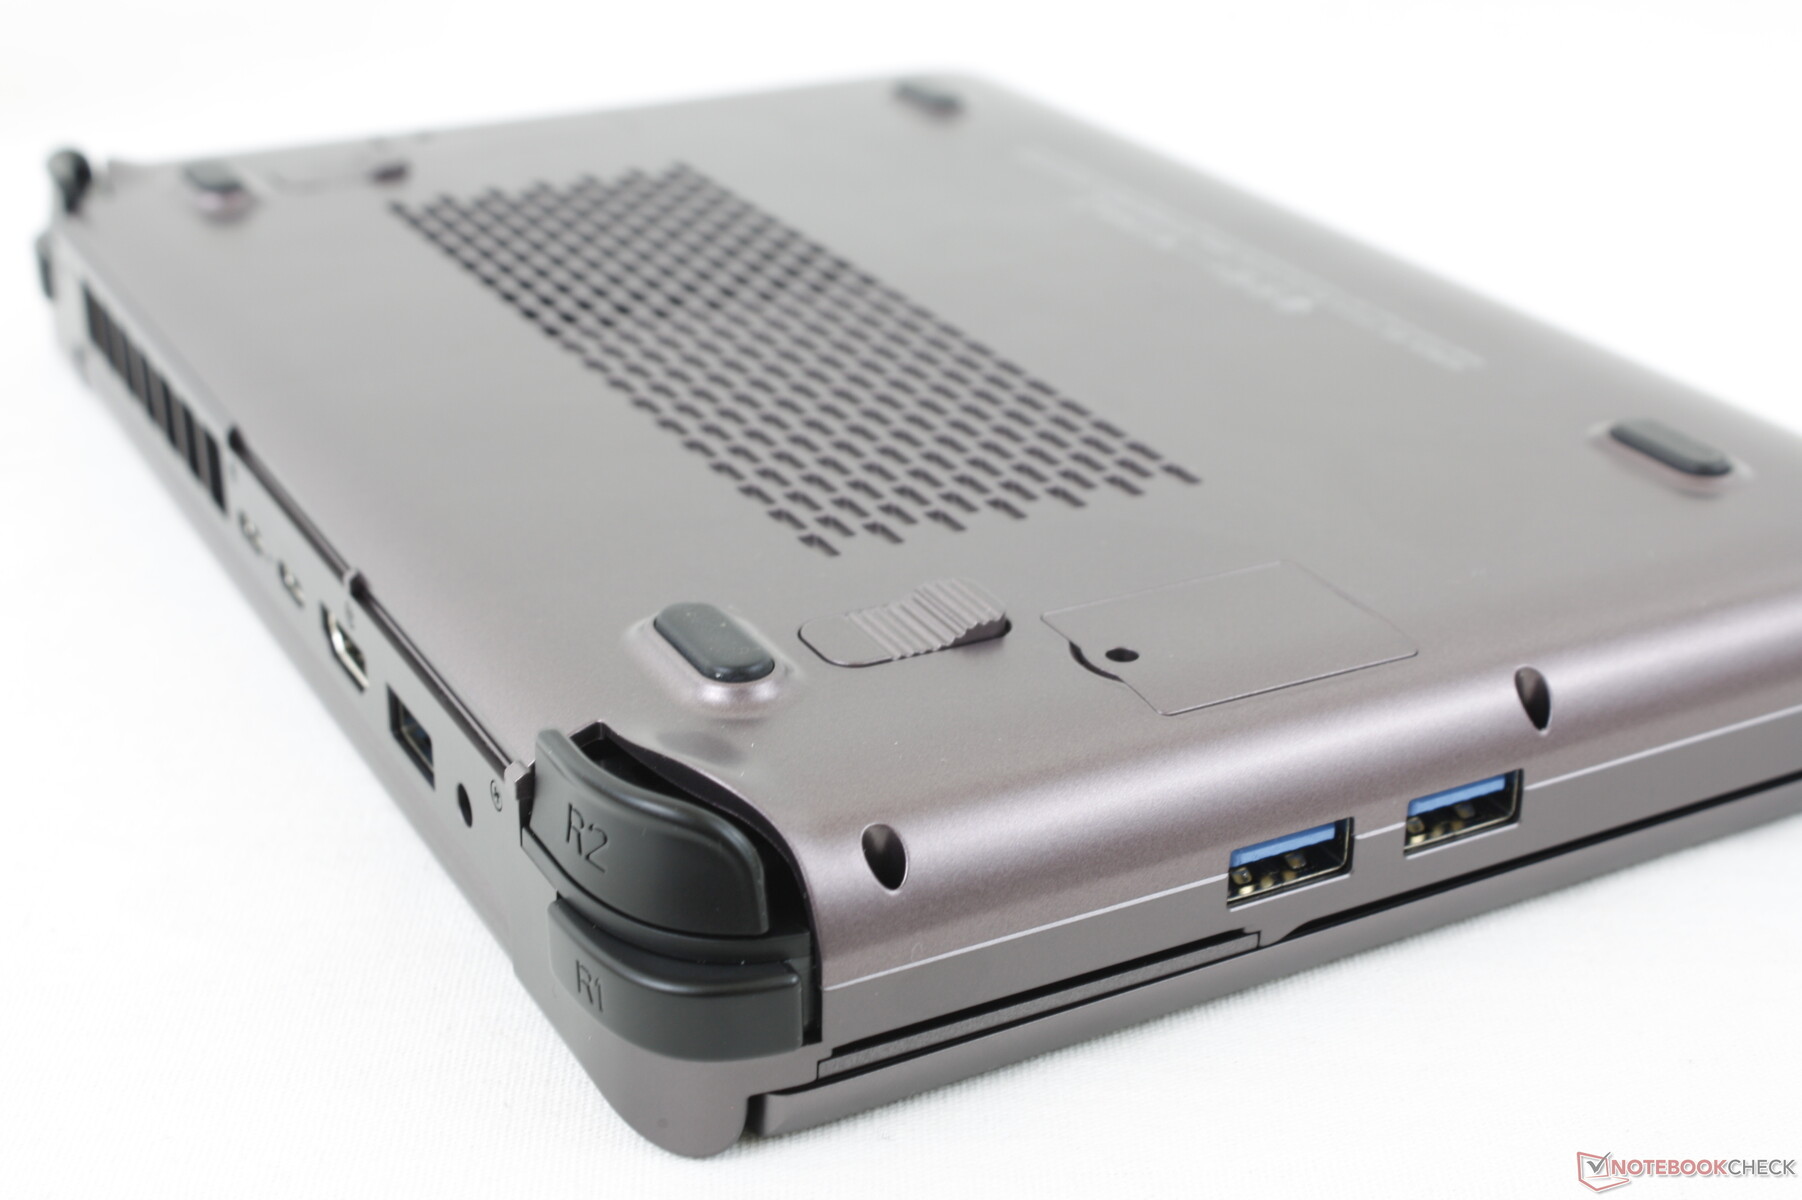
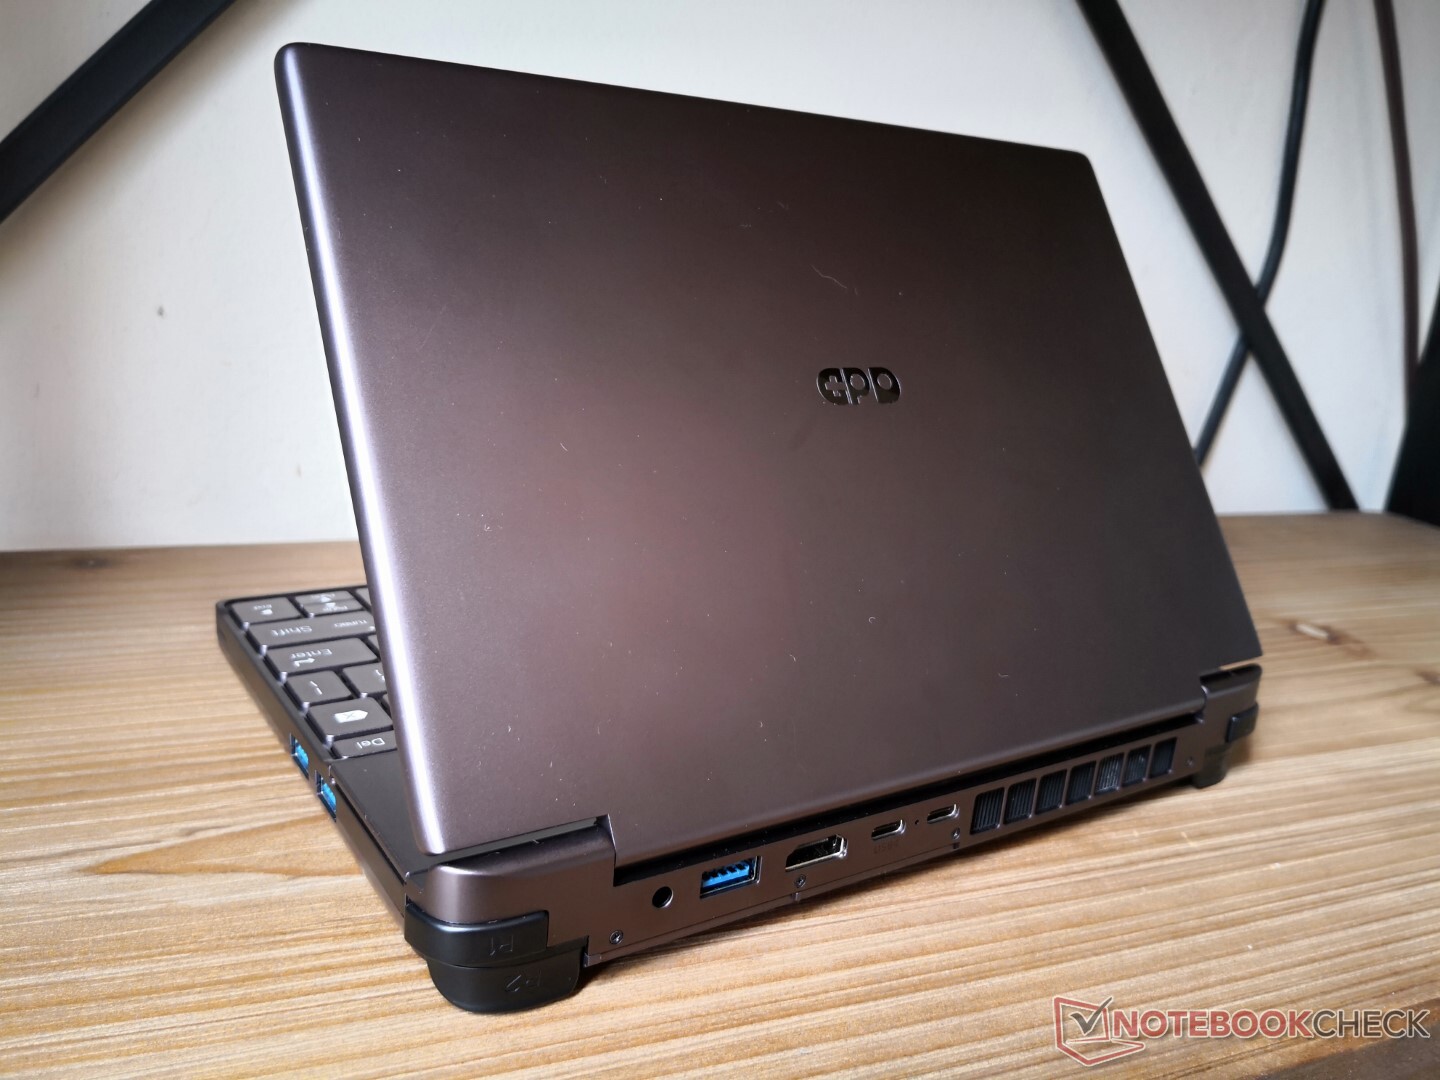
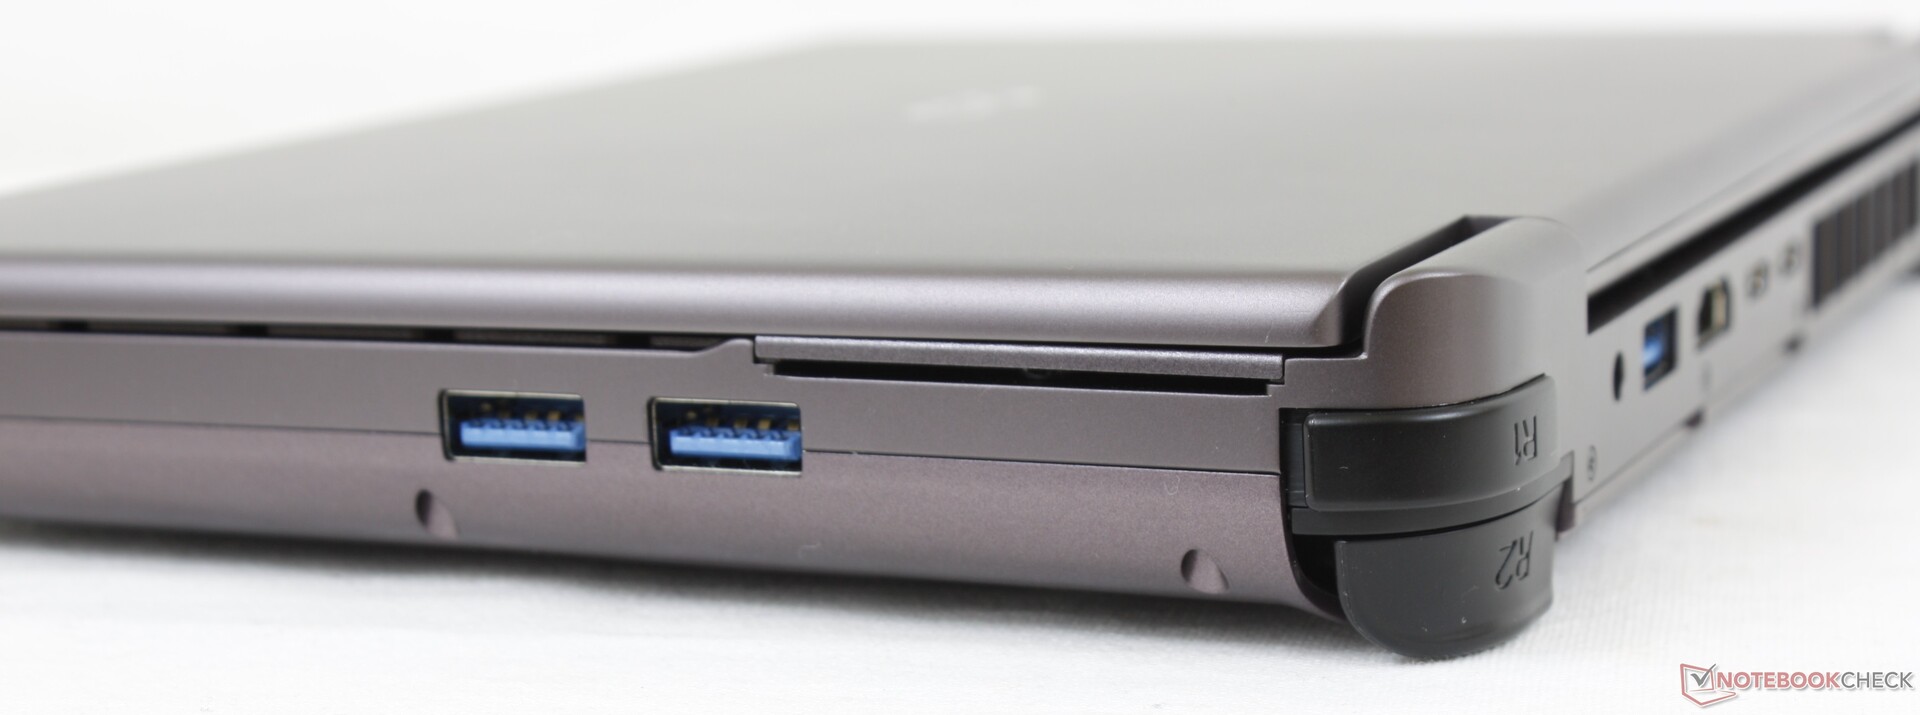
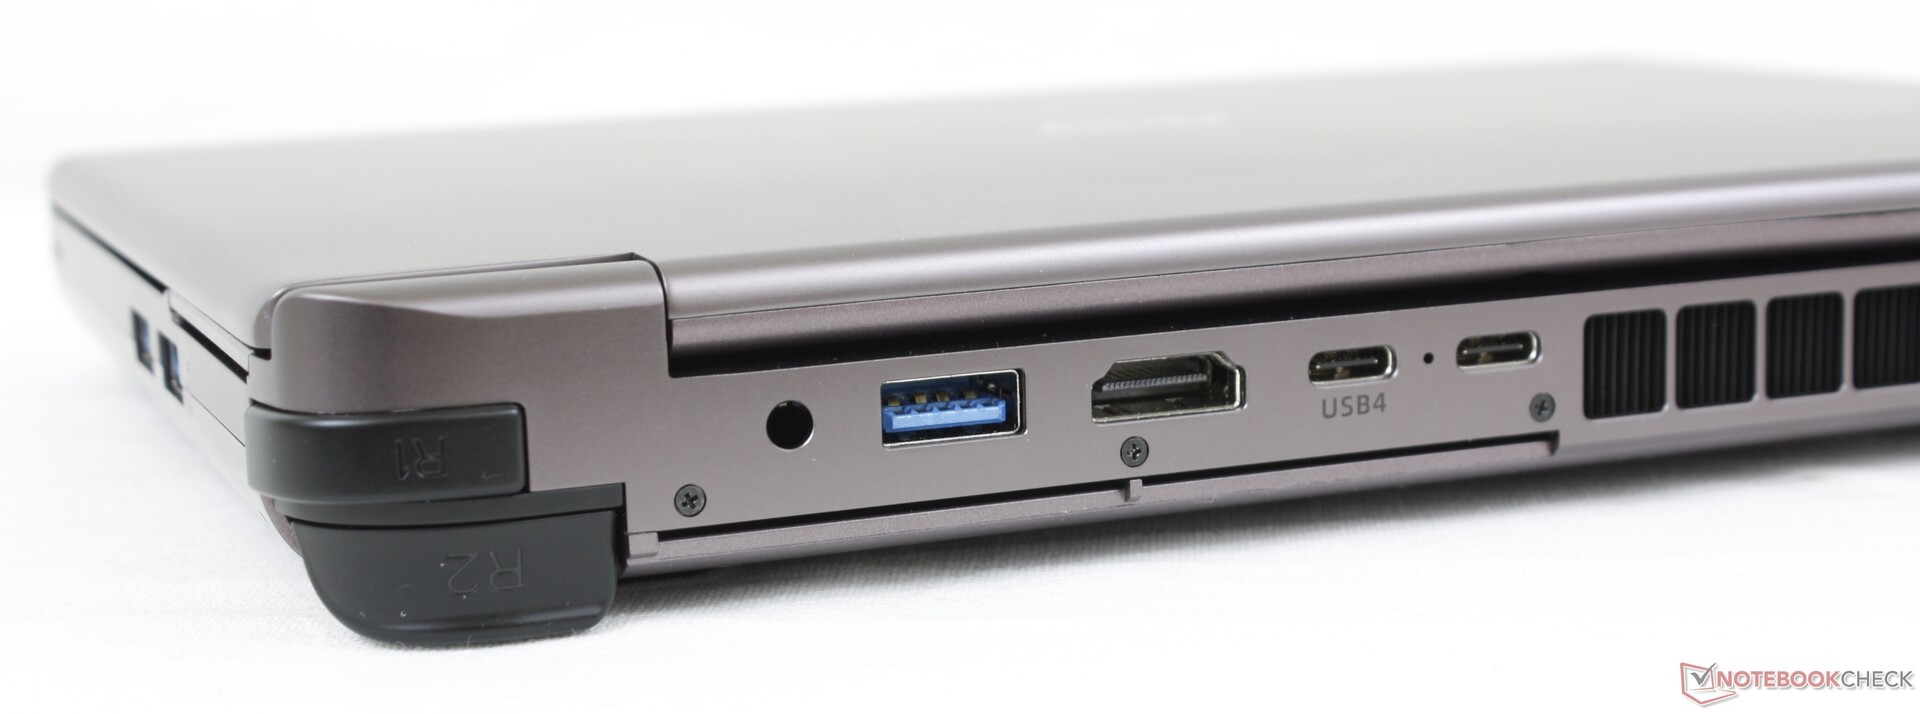
Conectividade - Sem Thunderbolt para a versão AMD
O Win Max 2 deixou cair a porta RJ-45 como encontrada no Win Max original para uma porta USB-A extra e um leitor de cartões SD de tamanho normal. O Thunderbolt 4 é suportado somente para o Intel SKU.
Note que as portas HDMI e USB-A estão de cabeça para baixo, o que pode ser um pouco irritante, pois quase sempre estão do lado direito para cima nos laptops.
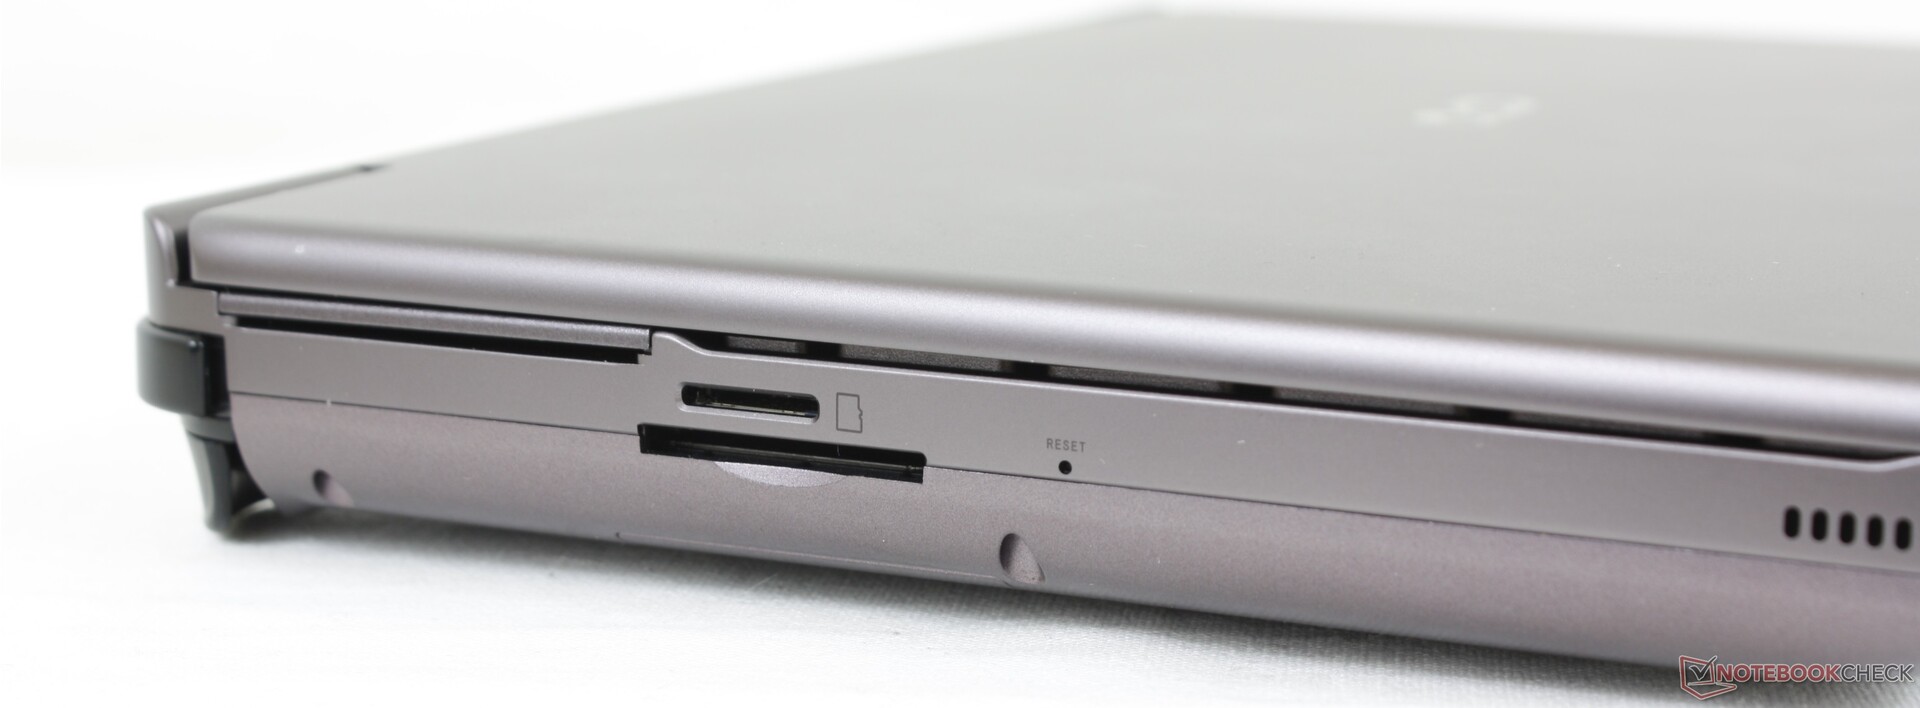
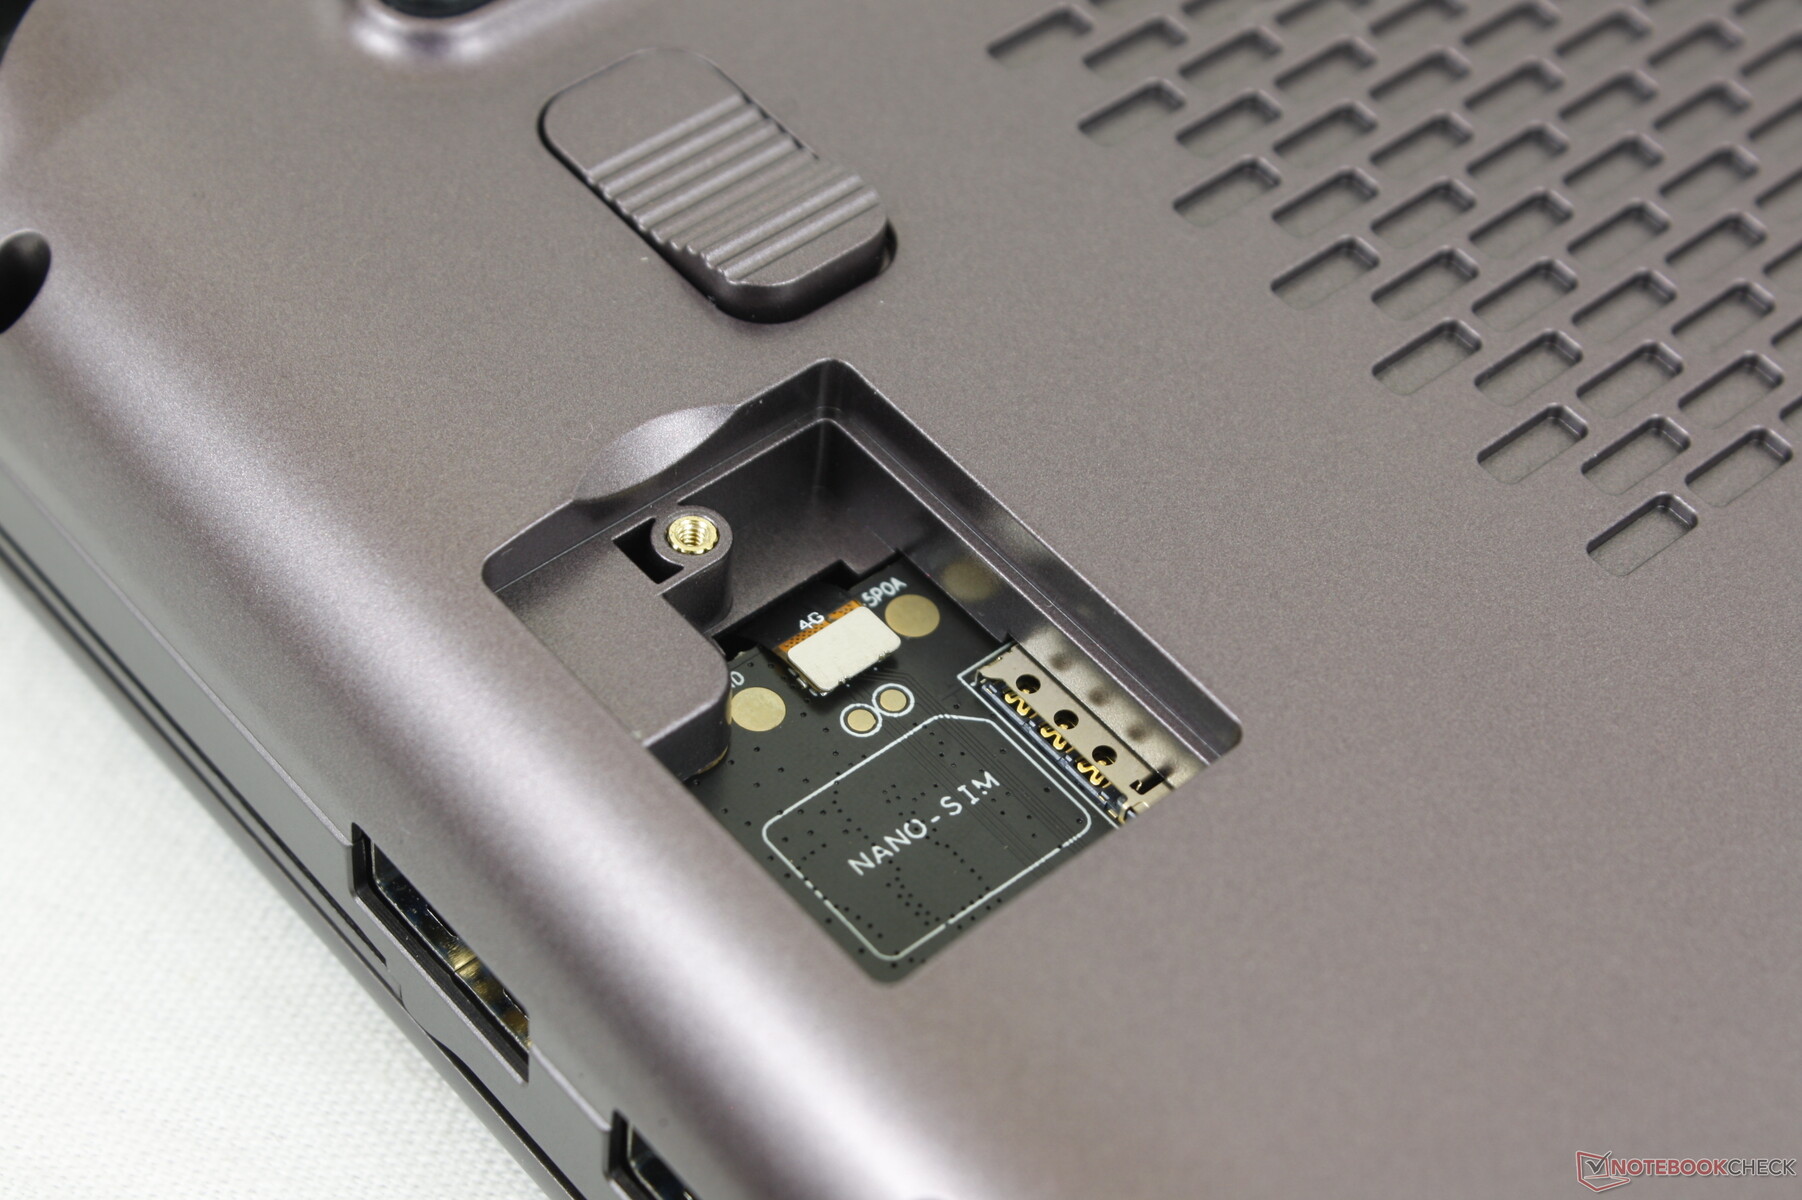
Leitor de cartões SD - Dois para escolher
O Win Max 2 é um dos poucos dispositivos com leitores MicroSD e SD de tamanho padrão. Não apenas isso, mas também suas taxas de transferência diferem umas das outras. Nosso cartão de teste UHS-II no leitor de tamanho completo mostraria taxas de transferência de 239 MB/s em comparação a apenas 91 MB/s no leitor MicroSD. Assim, você vai querer ficar com o slot SD de tamanho completo ao transferir arquivos grandes.
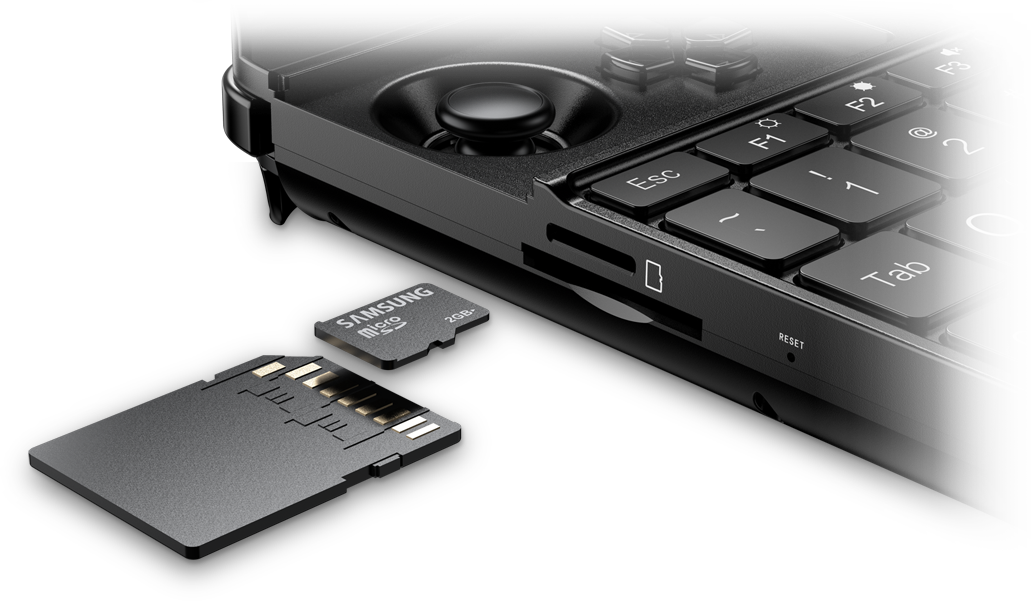
Tenha em mente que o cartão SD de tamanho normal deve ser inserido de cabeça para baixo enquanto o cartão MicroSD deve ser inserido do lado direito para cima, como mostra a imagem oficial do GPD.
| SD Card Reader | |
| average JPG Copy Test (av. of 3 runs) | |
| GPD Win Max 2 (Toshiba Exceria Pro SDXC 64 GB UHS-II) | |
| GPD Win 3 (Toshiba Exceria Pro M501 32 GB UHS-II) | |
| Microsoft Surface Go 3 Core i3 (AV Pro V60) | |
| Lenovo IdeaPad Flex 3 11IGL05 (Toshiba Exceria Pro SDXC 64 GB UHS-II) | |
| maximum AS SSD Seq Read Test (1GB) | |
| GPD Win Max 2 (Toshiba Exceria Pro SDXC 64 GB UHS-II) | |
| GPD Win 3 (Toshiba Exceria Pro M501 32 GB UHS-II) | |
| Lenovo IdeaPad Flex 3 11IGL05 (Toshiba Exceria Pro SDXC 64 GB UHS-II) | |
| Microsoft Surface Go 3 Core i3 (AV Pro V60) | |
Comunicação - Padrão Wi-Fi 6E
Não tivemos nenhum problema de desempenho quando conectados à nossa rede de 6 GHz. O AX210 é uma enorme atualização sobre o Intel 7265 no Win Max do ano passado que foi limitado a apenas velocidades Wi-Fi 5.
| Networking | |
| iperf3 transmit AX12 | |
| Microsoft Surface Go 3 Core i3 | |
| GPD Win 3 | |
| GPD Pocket 3 | |
| Lenovo IdeaPad Flex 3 11IGL05 | |
| GPD Win Max 2021 | |
| iperf3 receive AX12 | |
| GPD Win 3 | |
| Microsoft Surface Go 3 Core i3 | |
| GPD Pocket 3 | |
| Lenovo IdeaPad Flex 3 11IGL05 | |
| GPD Win Max 2021 | |
| iperf3 receive AXE11000 6GHz | |
| GPD Win Max 2 | |
| iperf3 transmit AXE11000 6GHz | |
| GPD Win Max 2 | |
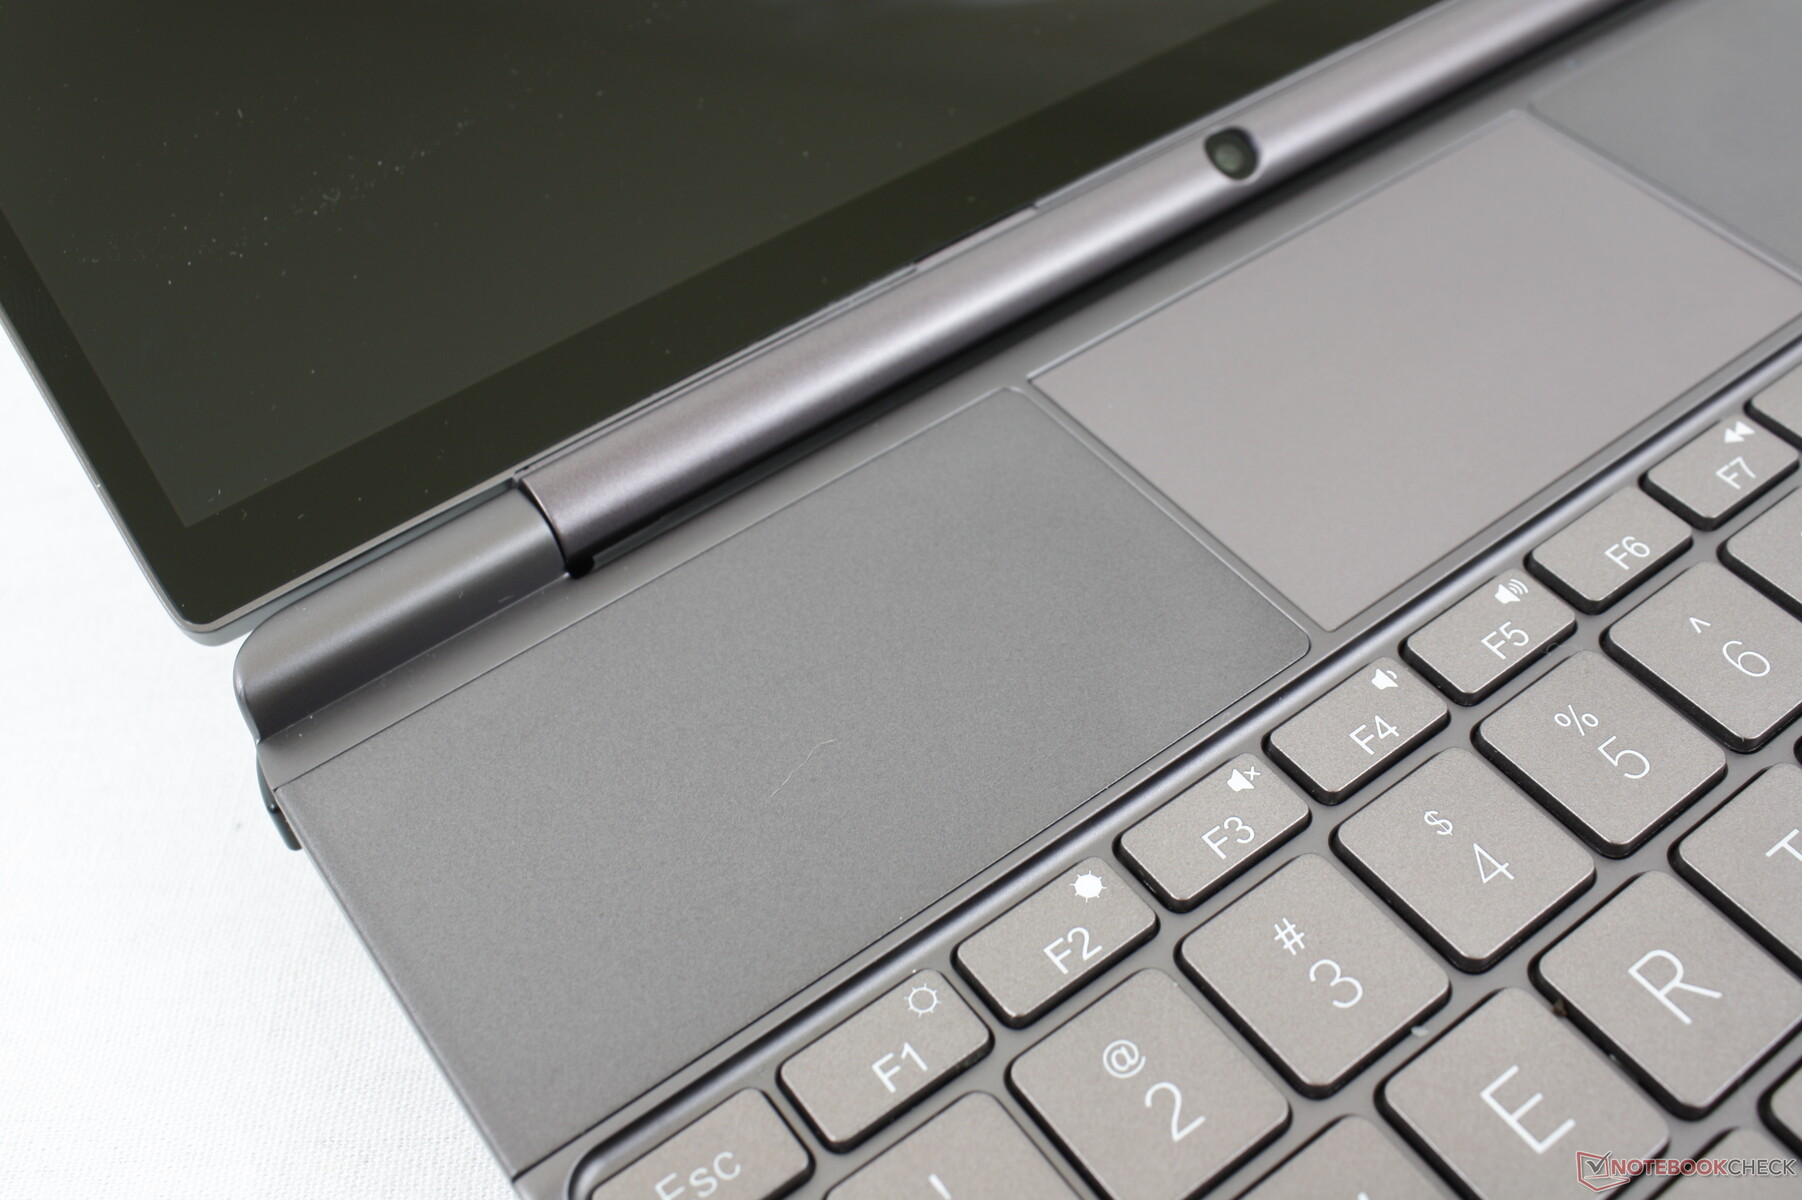
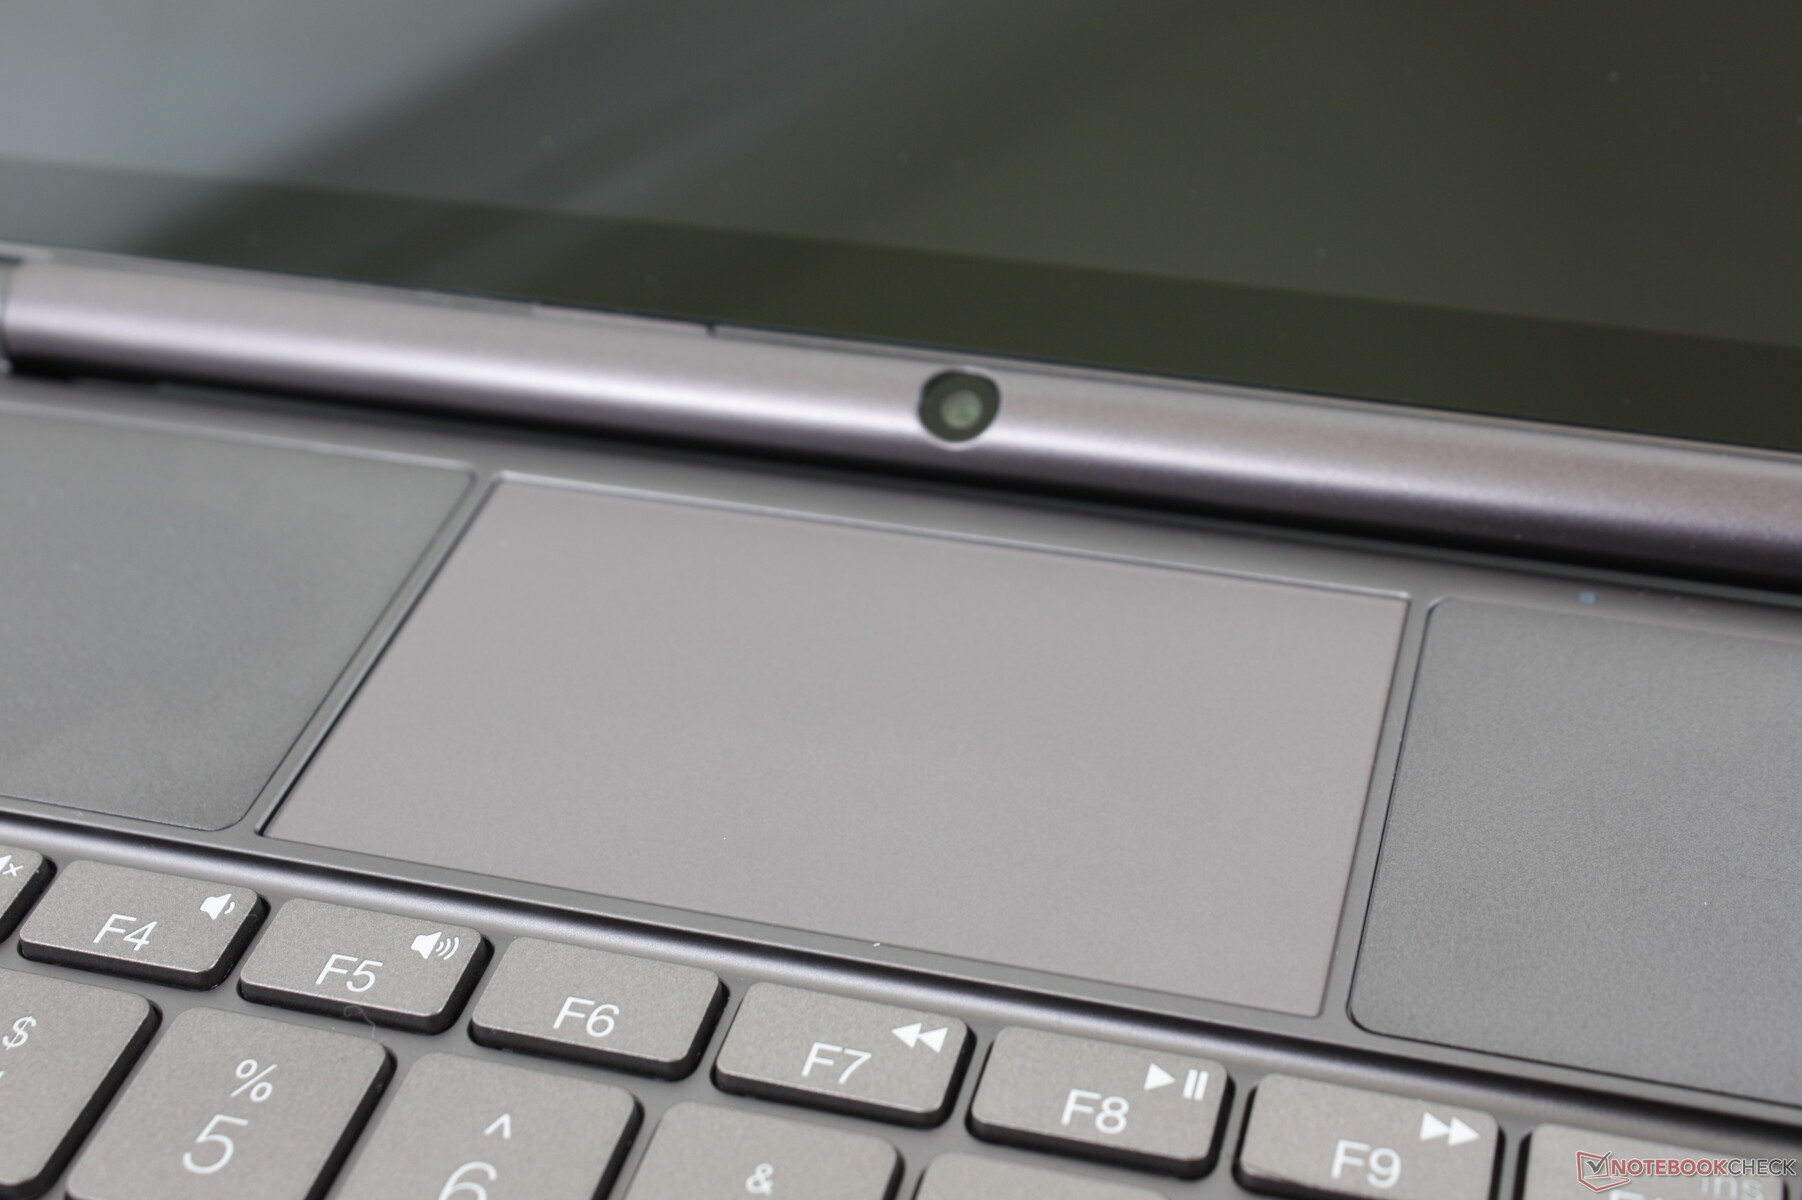
Webcam
A câmera de 2 MP é decepcionante devido à sua qualidade de imagem lamacenta e ao posicionamento subótimo ao longo da borda inferior da tela, em vez de cima. É essencialmente a "câmera do nariz" novamente. Além disso, não há obturador de privacidade ou suporte a Windows Hello IR.


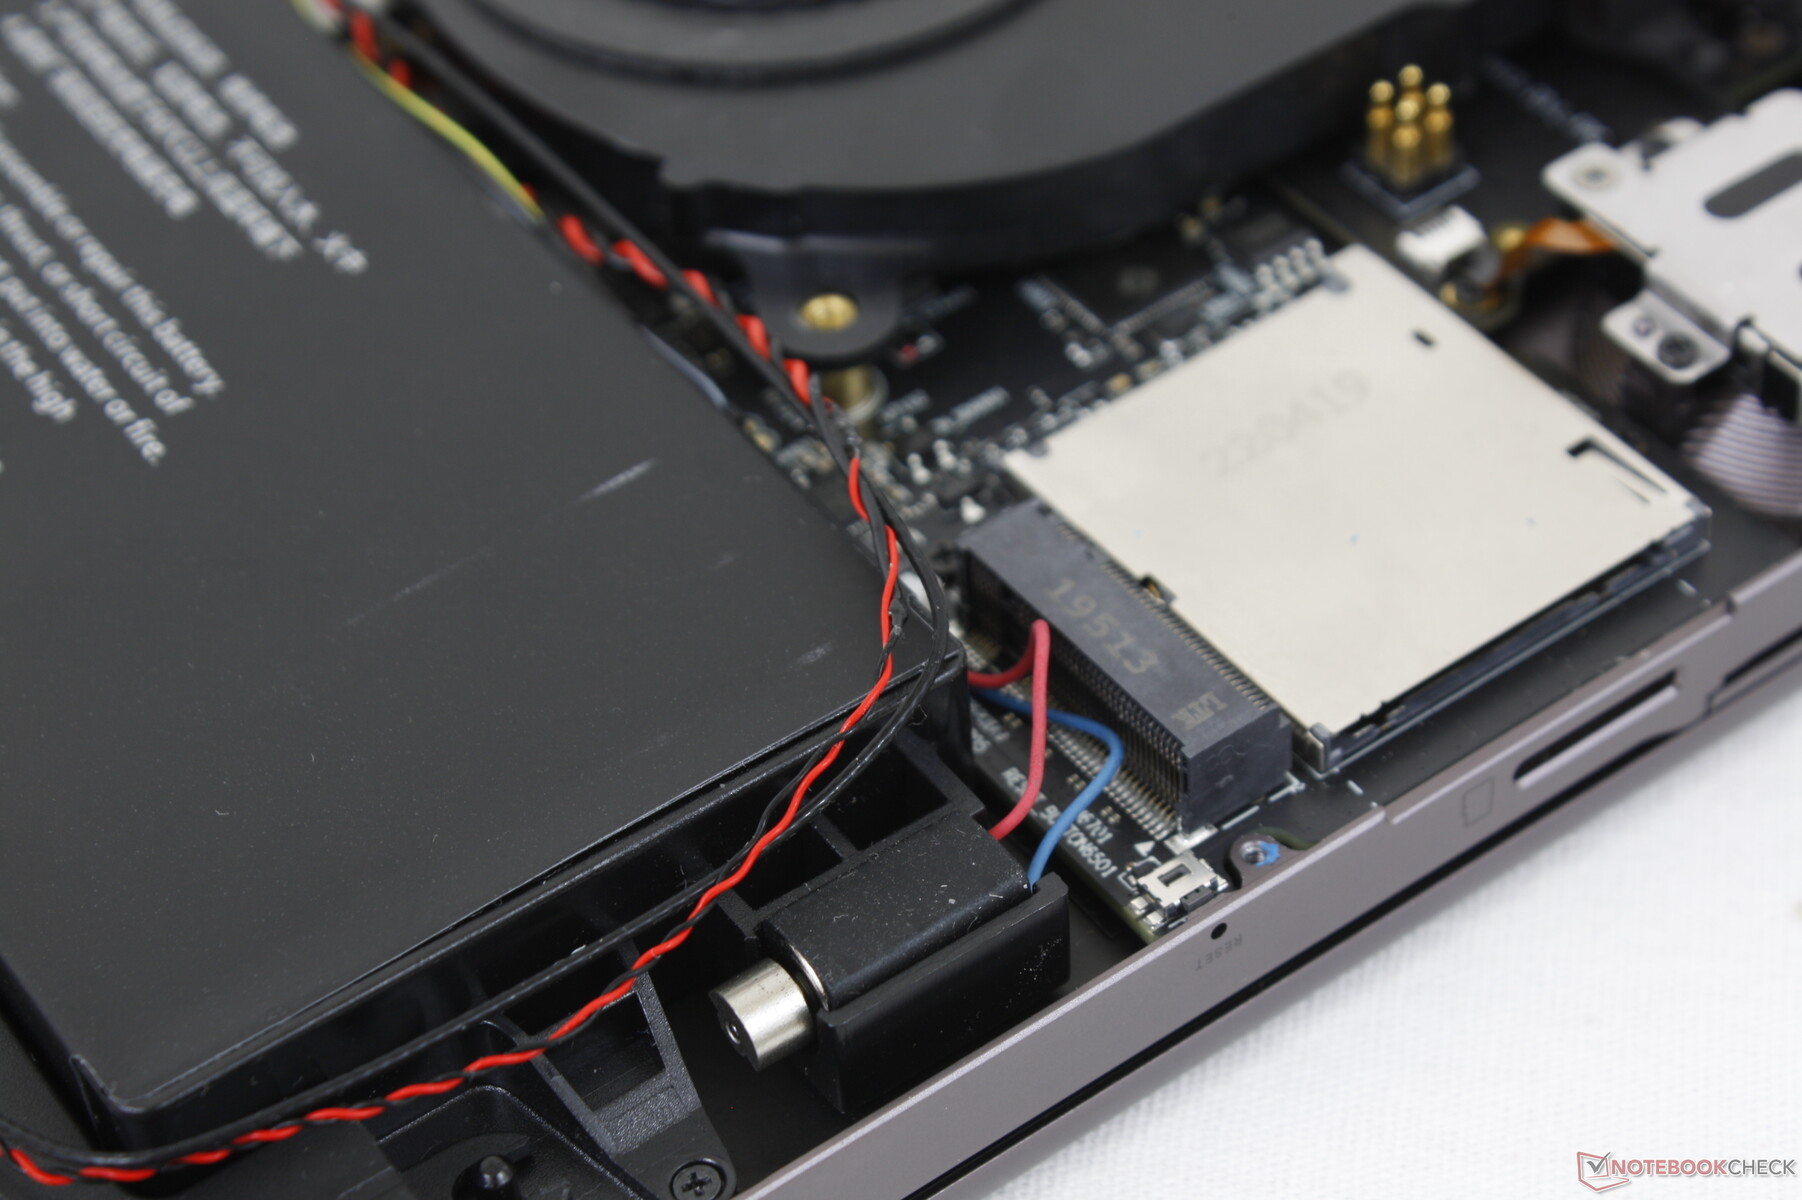
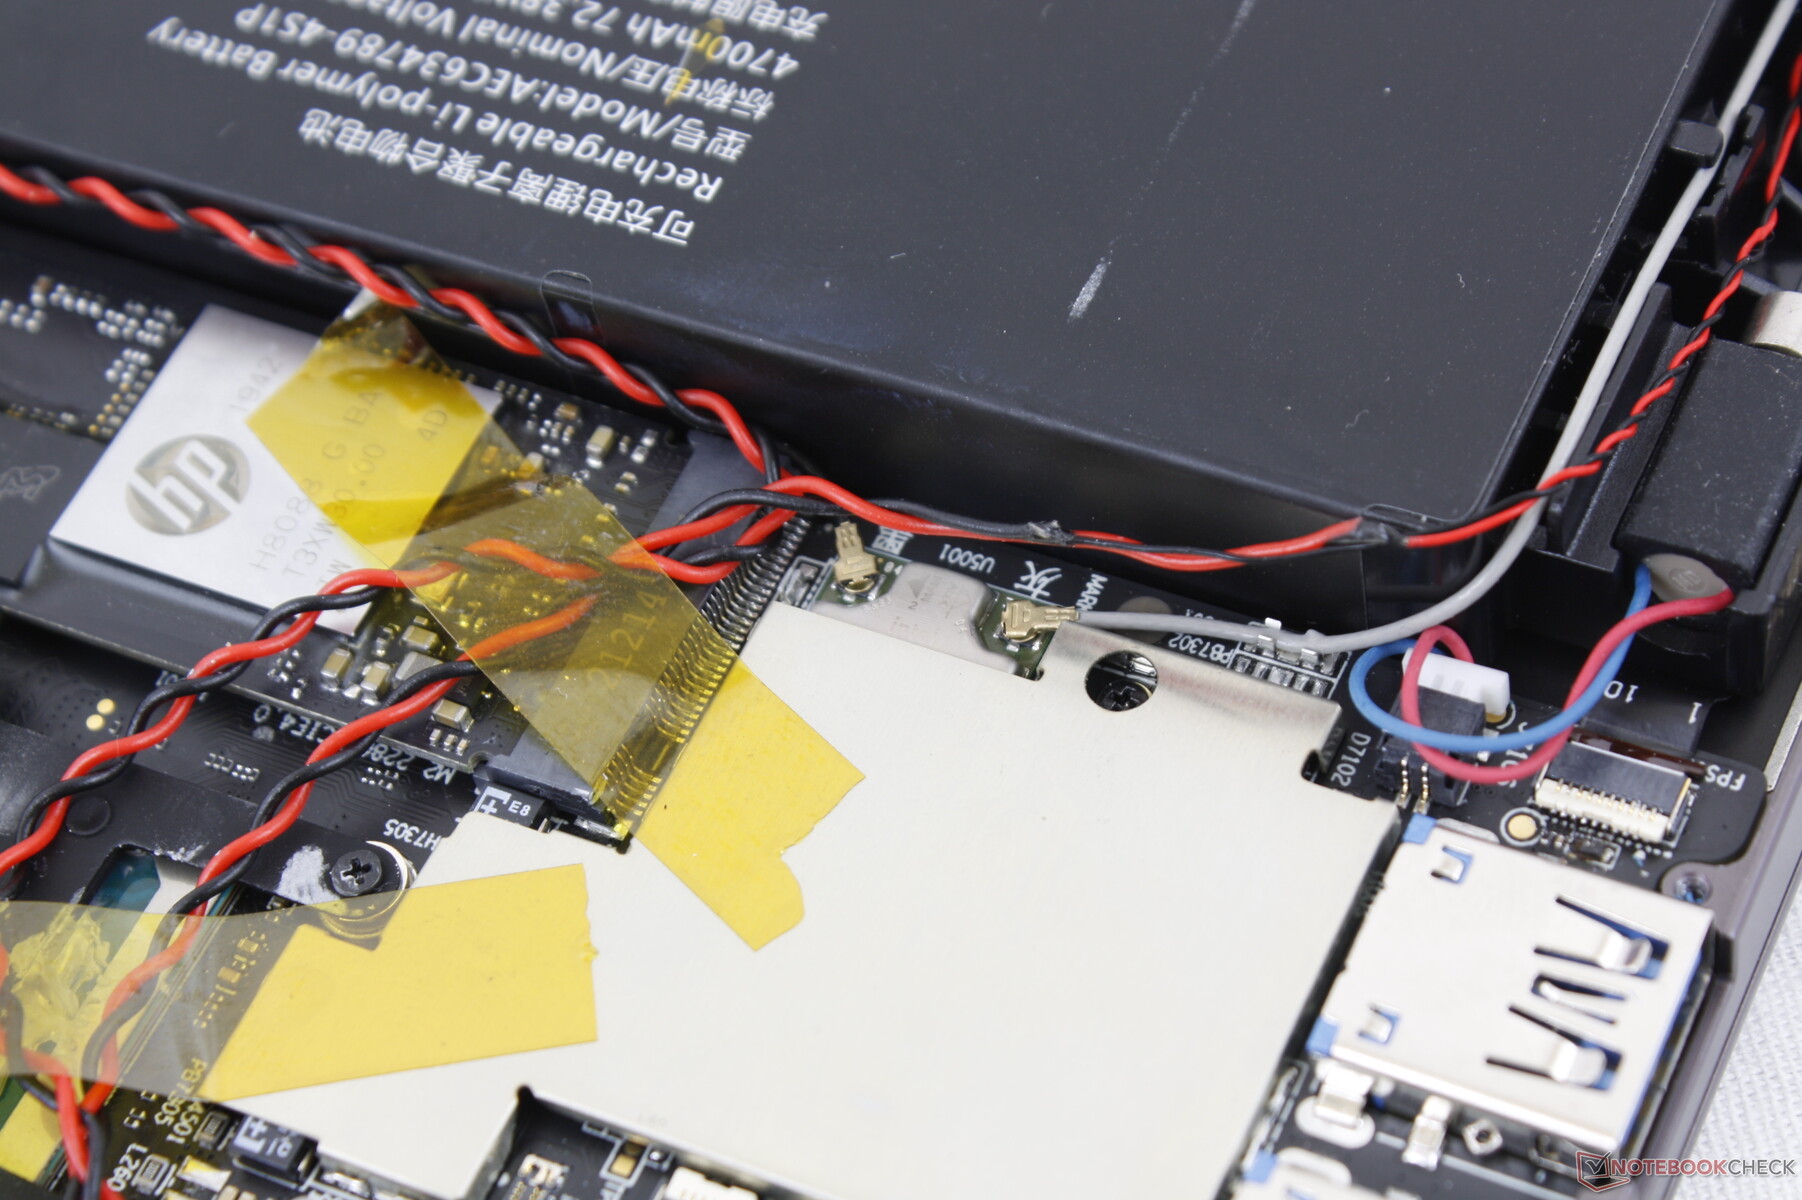
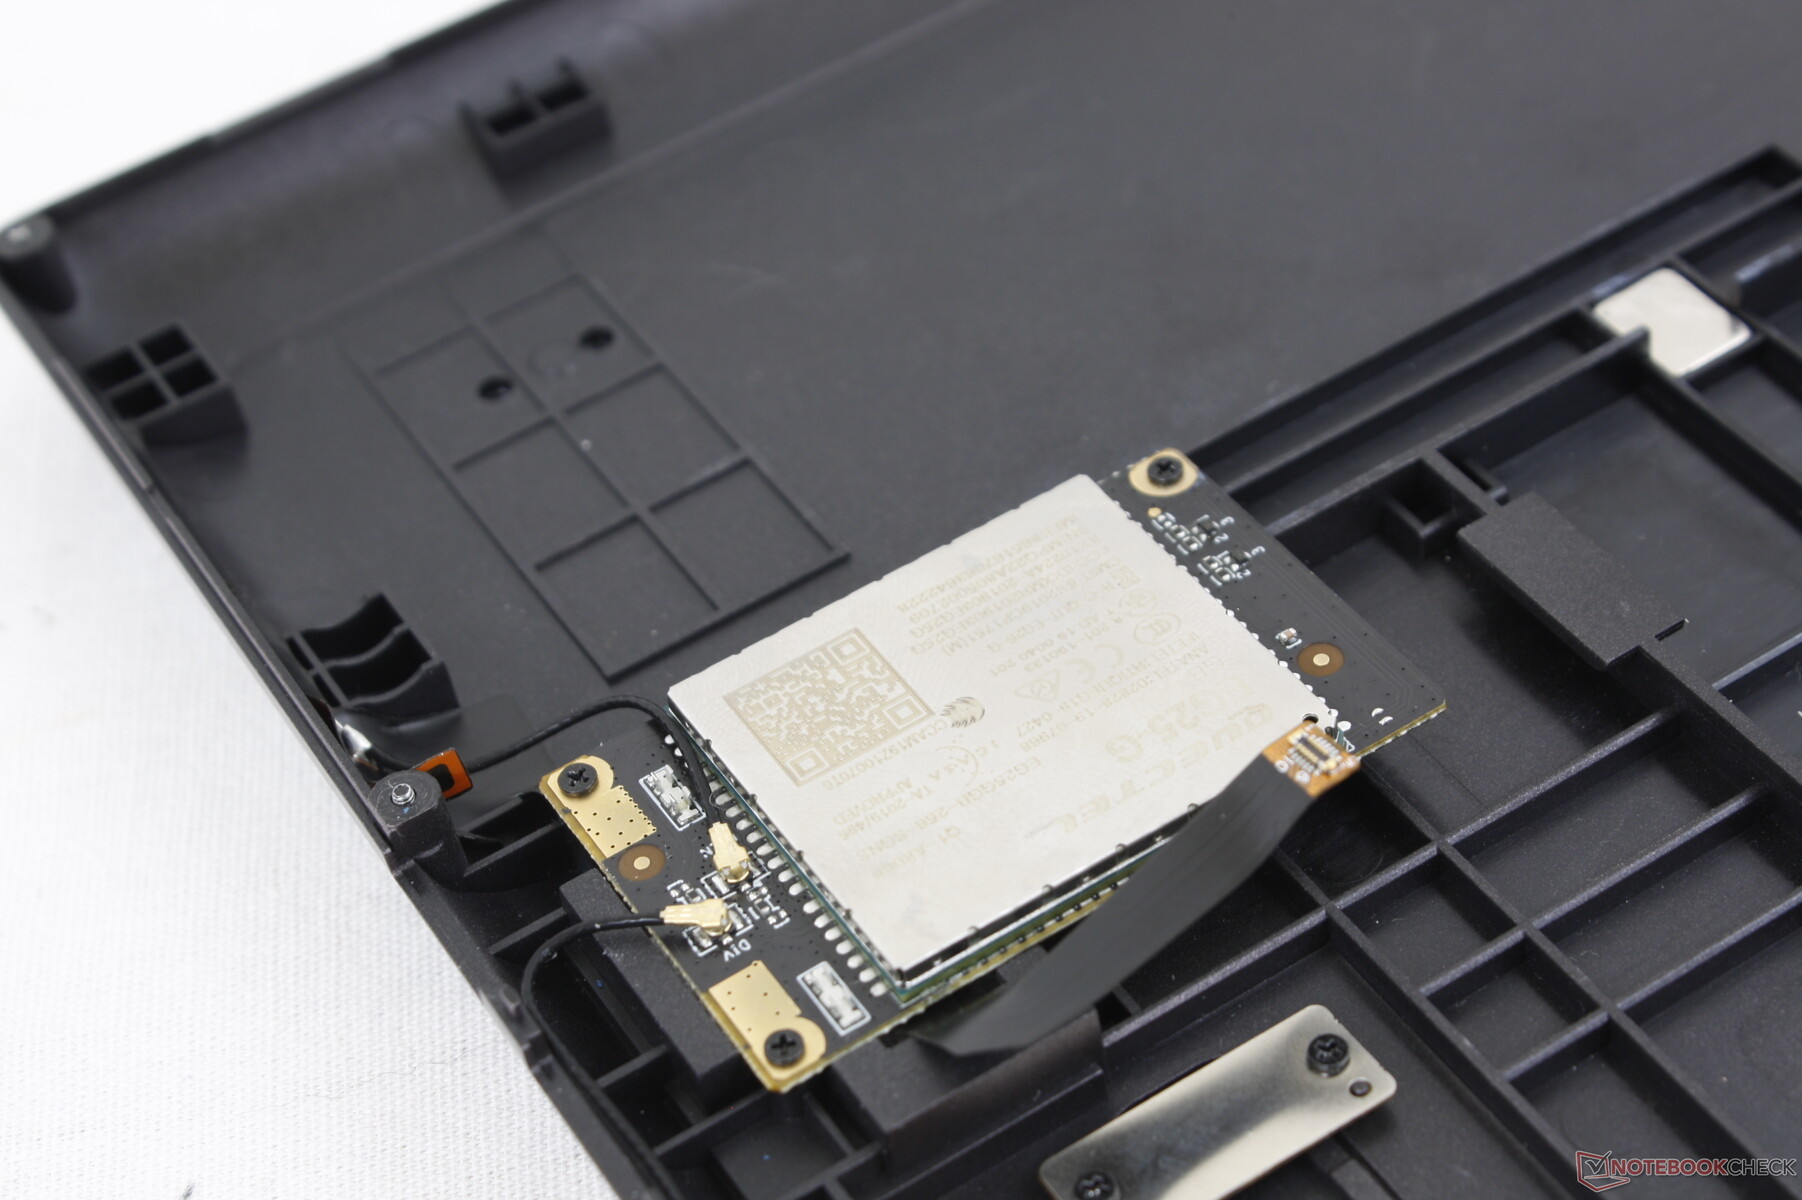
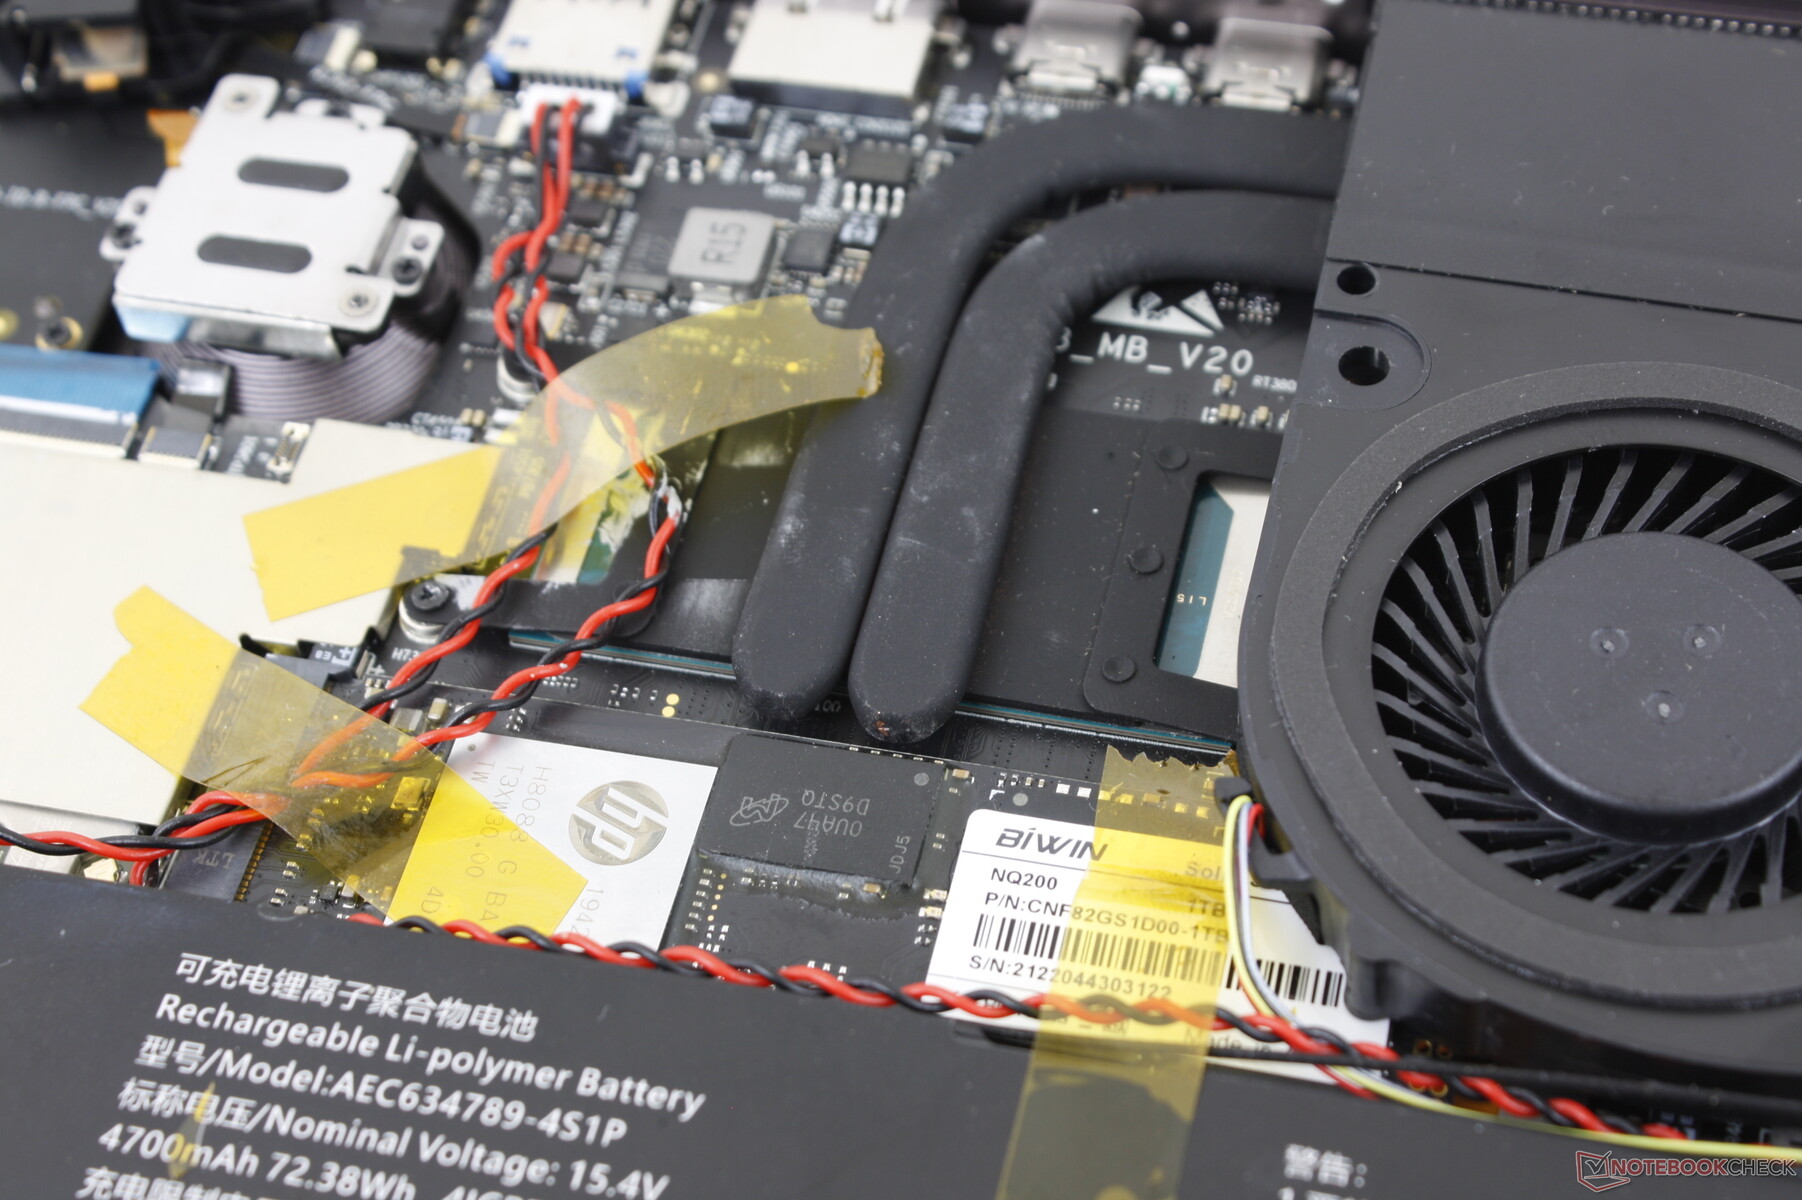
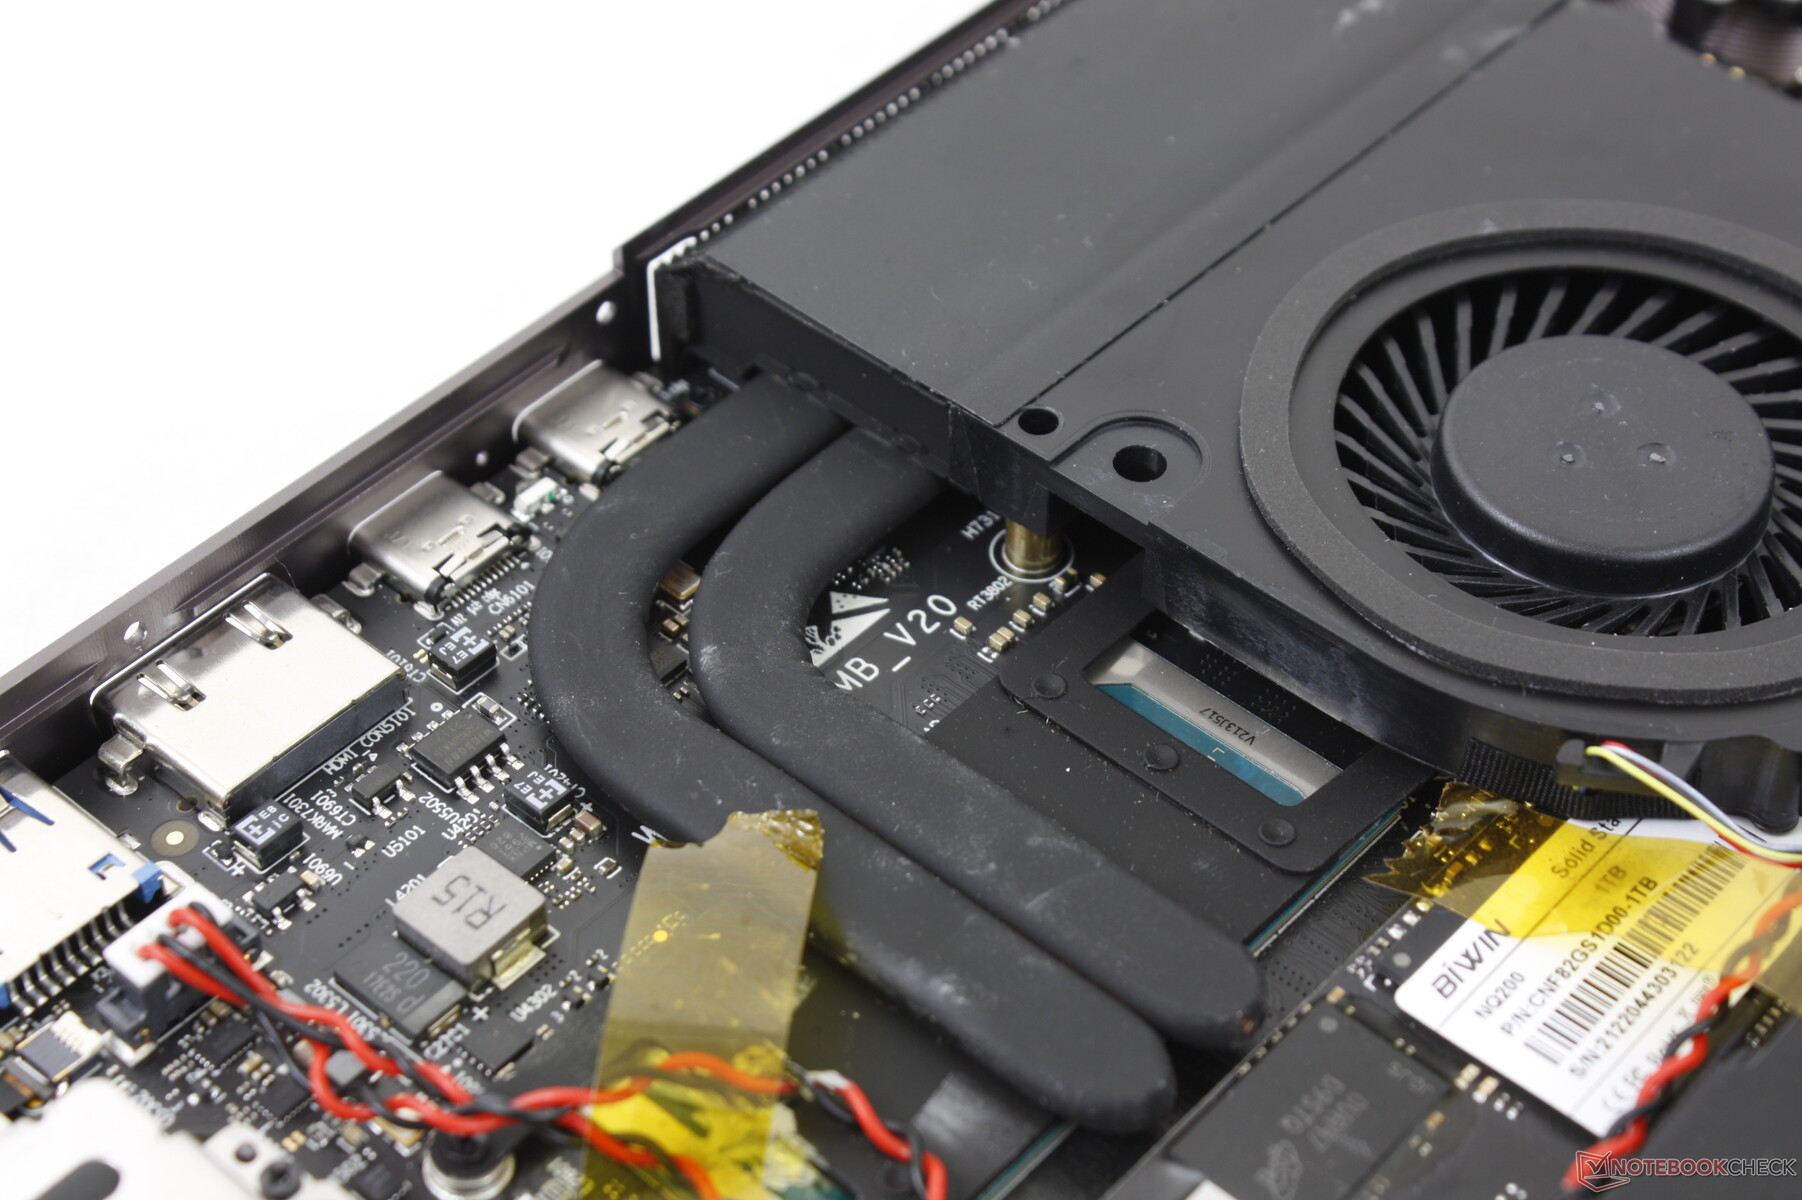
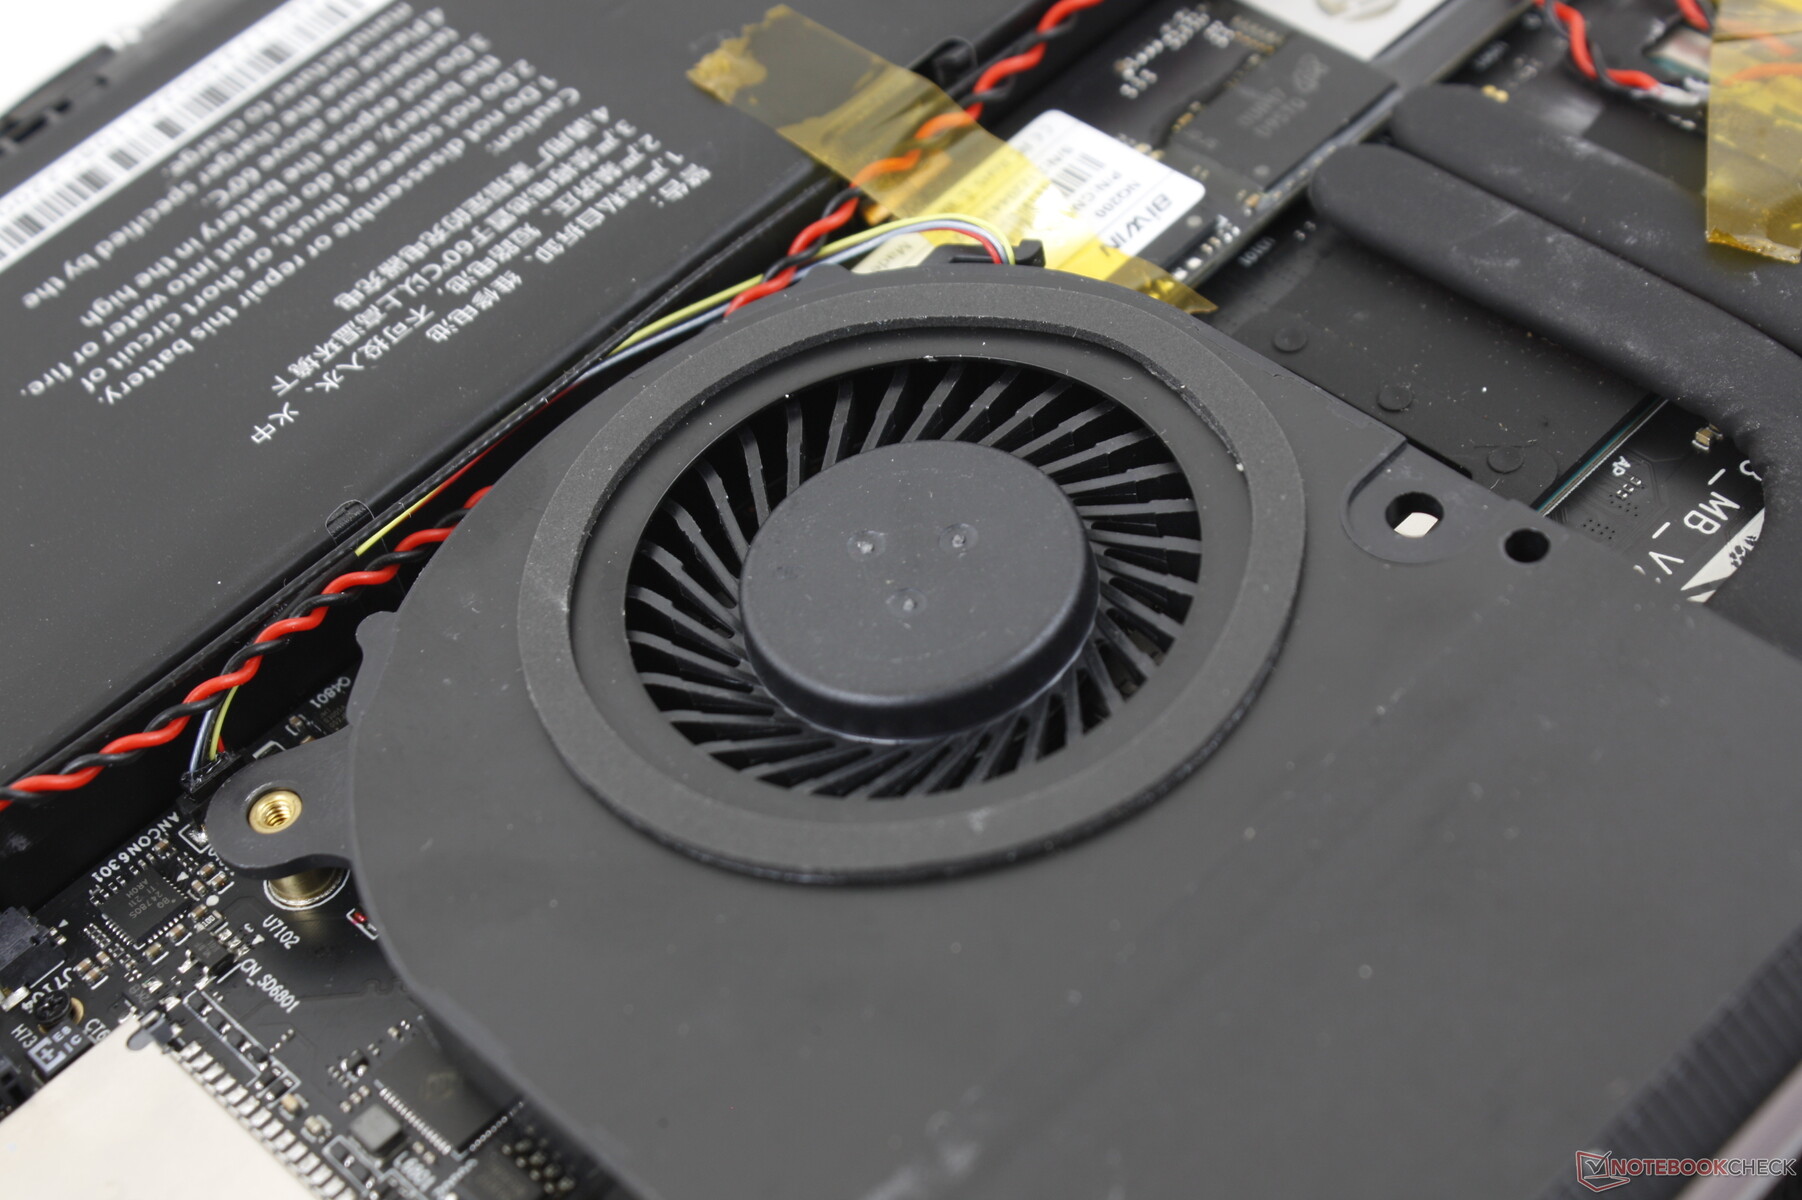
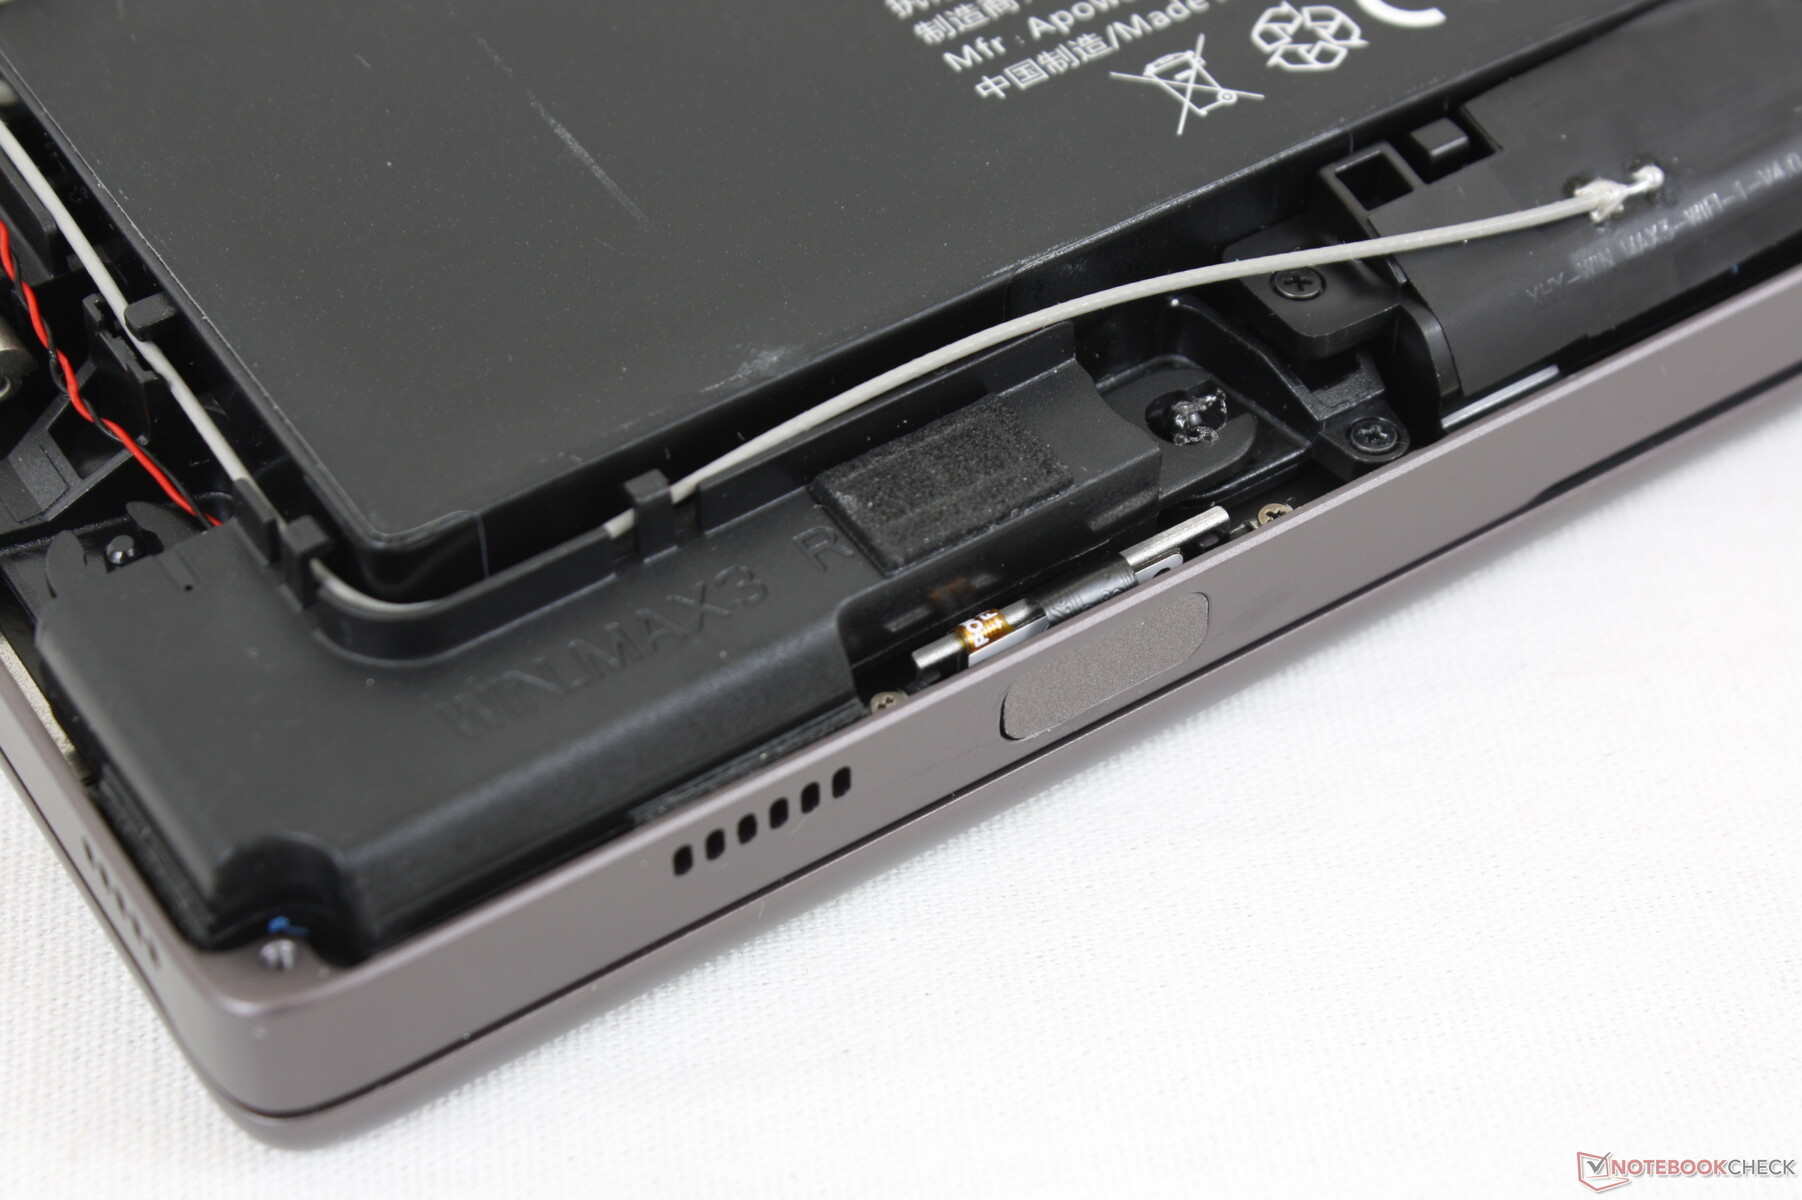
Manutenção
O painel inferior é fixado por 13 parafusos muito pequenos da Philips que são relativamente fáceis de remover. A questão principal, no entanto, é que o módulo WAN repousa no painel inferior em vez de na placa-mãe. O cabo de fita que liga o módulo WAN à placa mãe deve, portanto, ser removido sempre que o painel inferior for removido. A recolocação deste cabo na placa-mãe durante a remontagem é extremamente difícil devido à sua curta duração.
Acessórios e Garantia
Não há extras na caixa além do adaptador AC e da papelada. Aplica-se uma garantia limitada de um ano se comprada nos EUA, mas o GPD diz que qualquer custo de envio de retorno não será coberto.
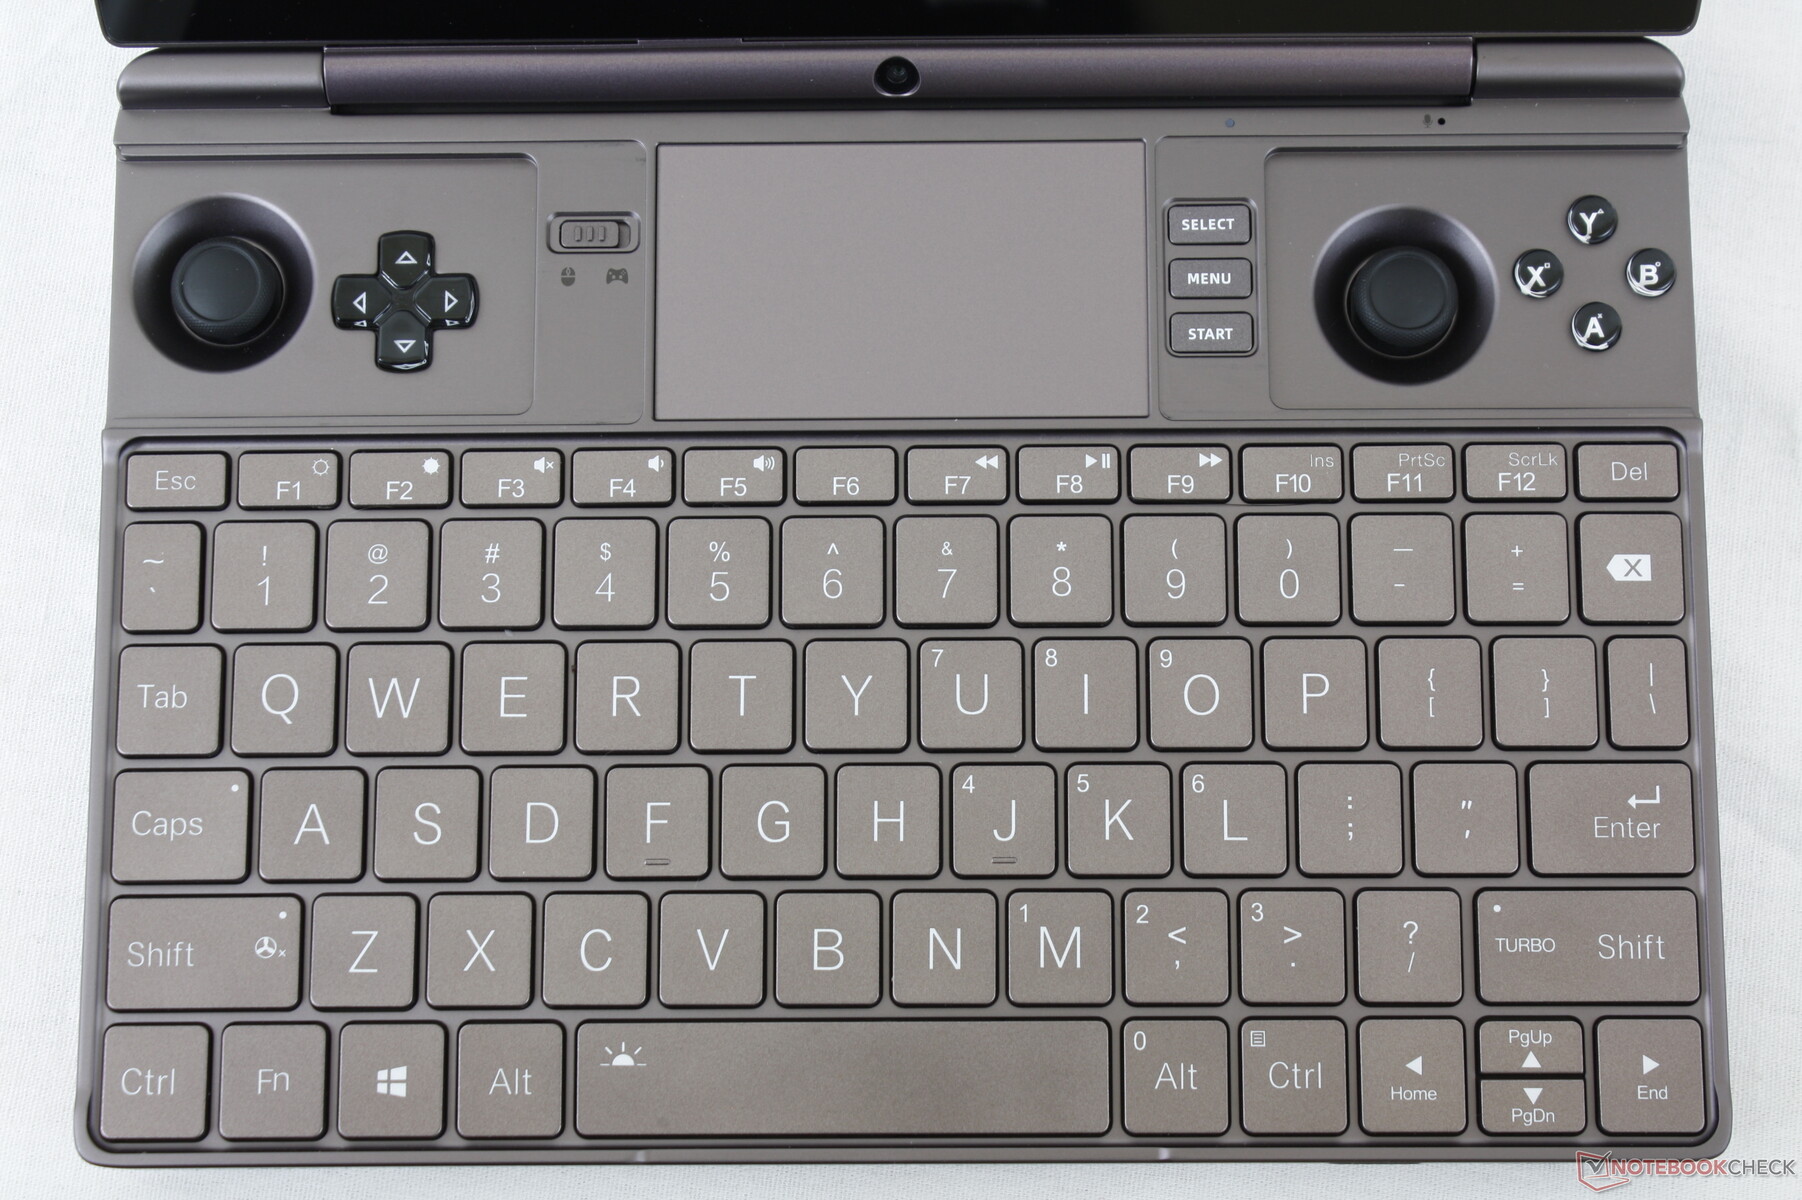
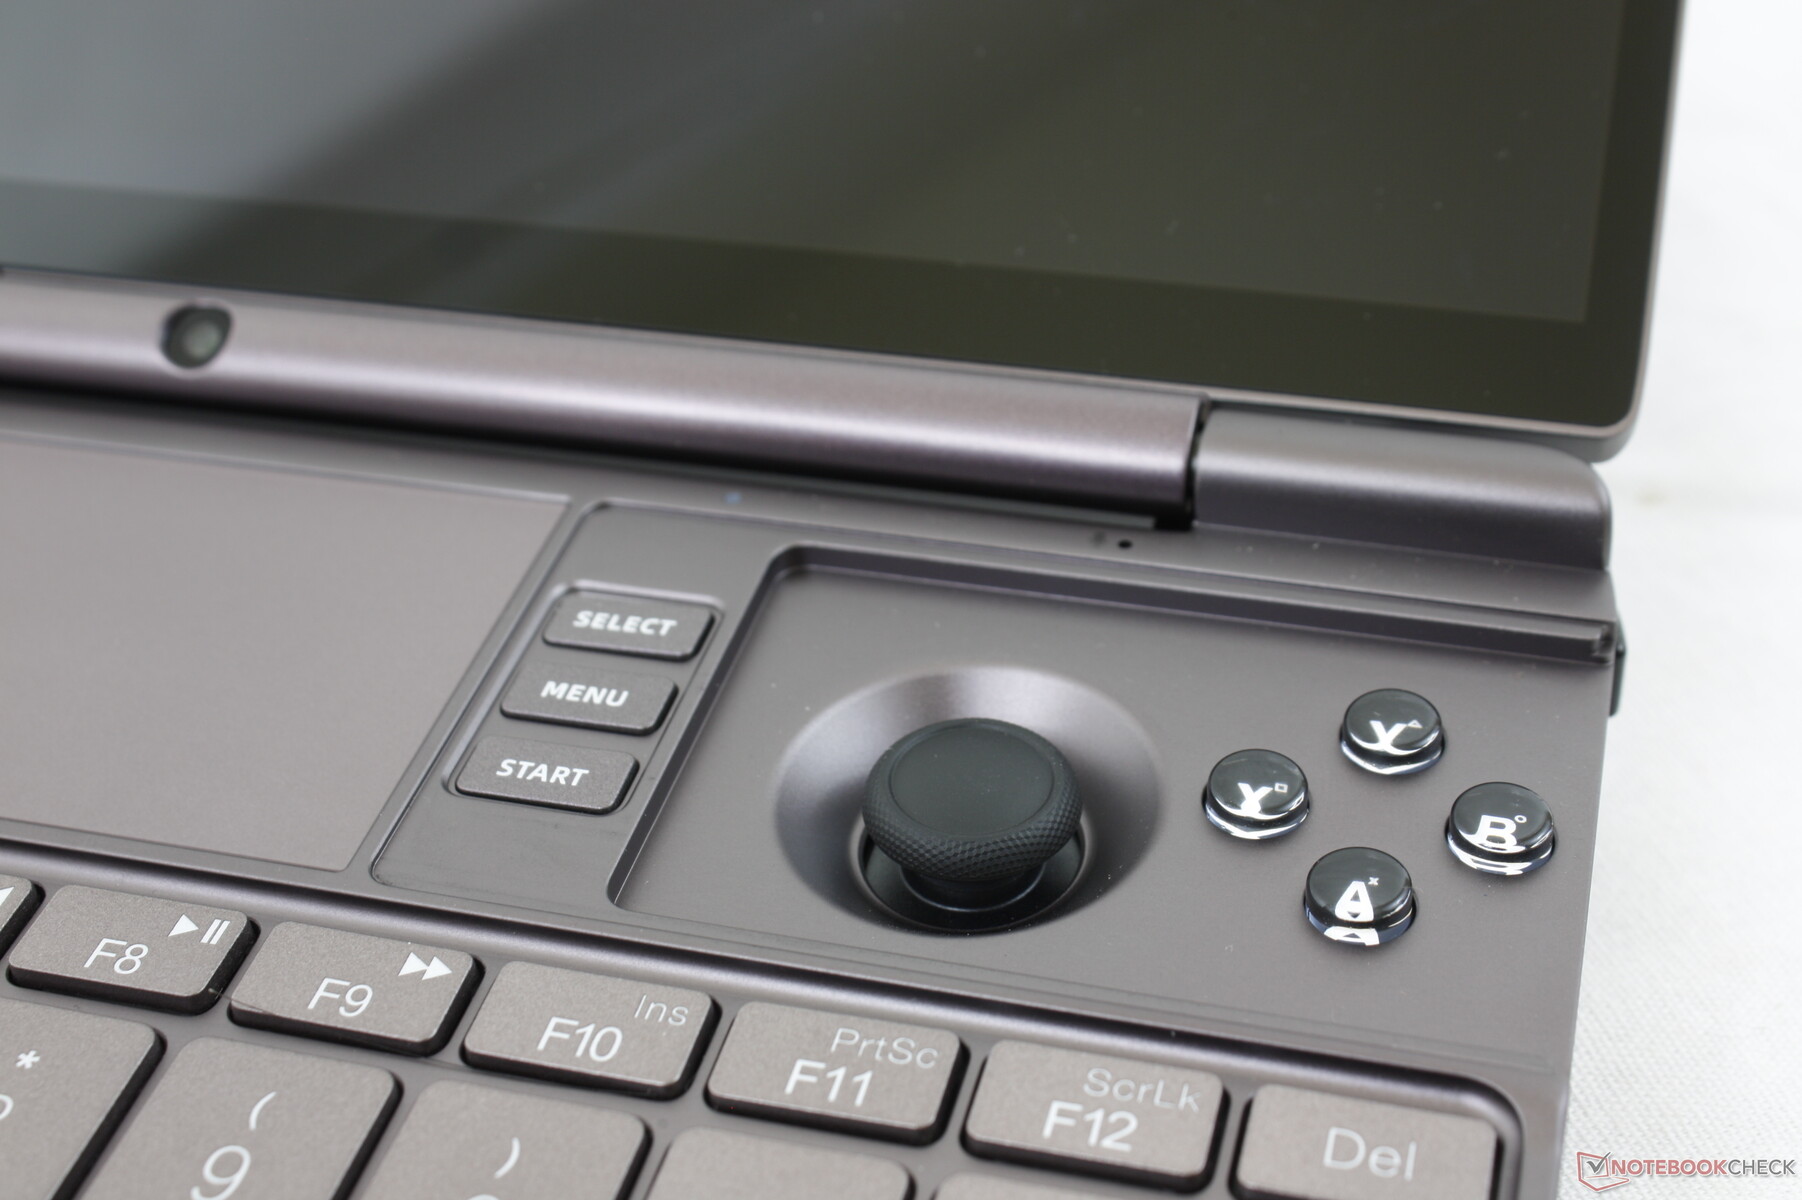
Dispositivos de entrada - Cansaço de segurar por longos períodos
Controlador
O controlador pode alternar entre dois modos através de um interruptor: Padrão e de Jogo. Quando no modo Padrão, os botões são ajustados para o seguinte por padrão:
- Joystick esquerdo: W, A, S, D
- Joystick direito: Controle de cursor
- Almofada direcional esquerda: Início
- Almofada direcional direita: Fim
- Almofada direcional para cima e botões em Y: Para cima
- Almofada direcional para baixo e botões A: Para baixo
- X botão: Esquerda
- Botão B: Direita
Os botões de ombro também têm suas próprias funções, incluindo Ctrl+Alt+Del para o gatilho certo. O problema aqui é que é fácil pressionar acidentalmente um botão de ombro e inserir algo não intencional. Não há um software especial pré-instalado para refazer ou desativar facilmente os botões. Um terceiro modo para desabilitar completamente o controlador teria sido útil
Quando no modo de jogo, as teclas serão reconhecidas pelo Windows como um controlador XBox genérico e, portanto, serão tratadas e mapeadas como tal. Os botões e joysticks aqui estão mais próximos da sensação, tamanho e feedback dos Nintendo Joy-cons do que dos controladores PS ou XBox mais confortáveis.
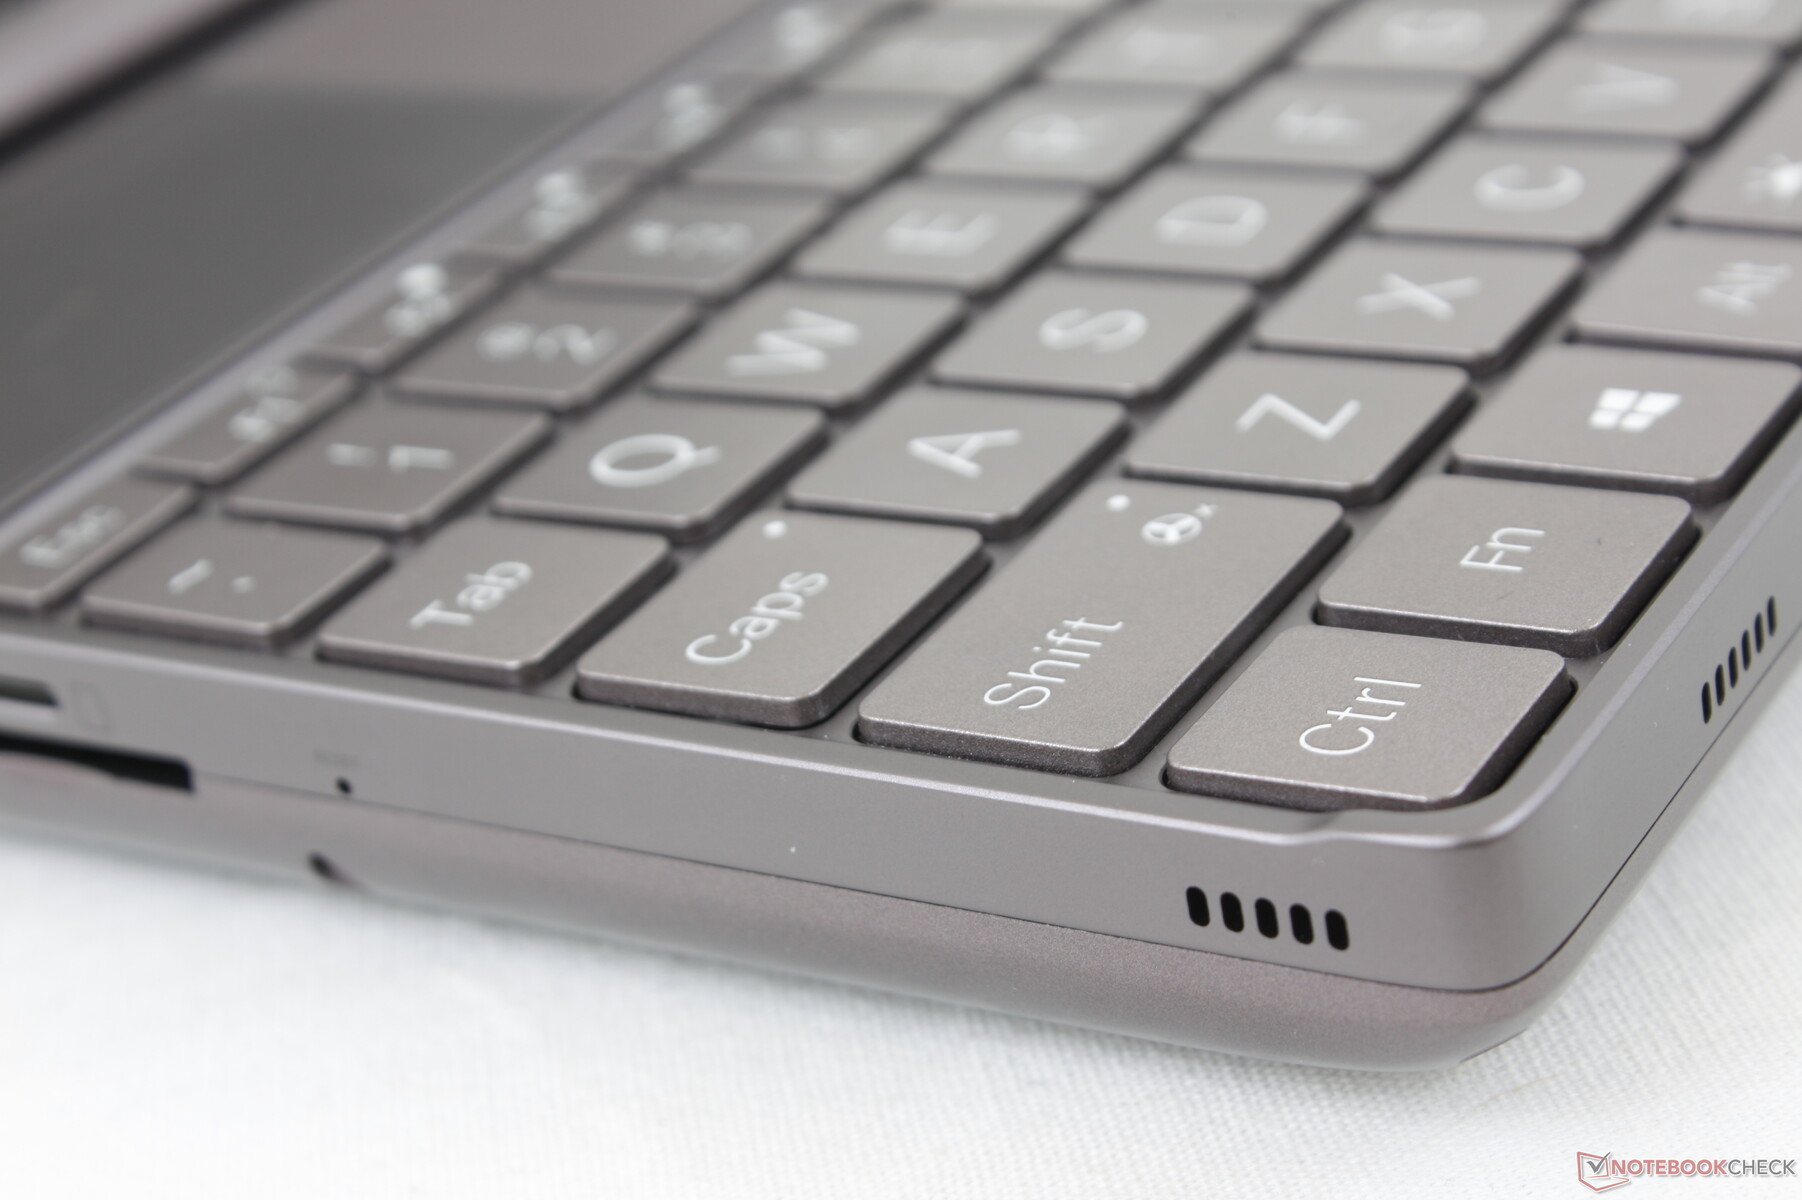
Teclado
O teclado é uma melhoria em relação ao original Ganhe Max em termos de tamanho e layout. As chaves numéricas, Caps Lock, e Shift key, por exemplo, são agora maiores e mais próximas do que os usuários esperam de um layout QWERTY. O feedback é semelhante à maioria dos Ultrabooks maiores, embora mais apertado, é claro
O teclado parece ter problemas ao reconhecer mais de 2 teclas ao mesmo tempo. O Fn+Alt+PrtSc, por exemplo, não se registraria em nossa unidade.
Touchpad
Espera-se que o clickpad seja pequeno em apenas 7,0 x 4,1 cm, mas ainda é maior que o clickpad de 5,8 x 3,3 cm do Win Max 2021. A tração é suave ao deslizar em velocidades médias ou altas enquanto há um pouco de aderência em velocidades mais lentas para cliques mais precisos. Clicar no clickpad é surpreendentemente firme e com um forte feedback também, mas é barulhento como resultado.

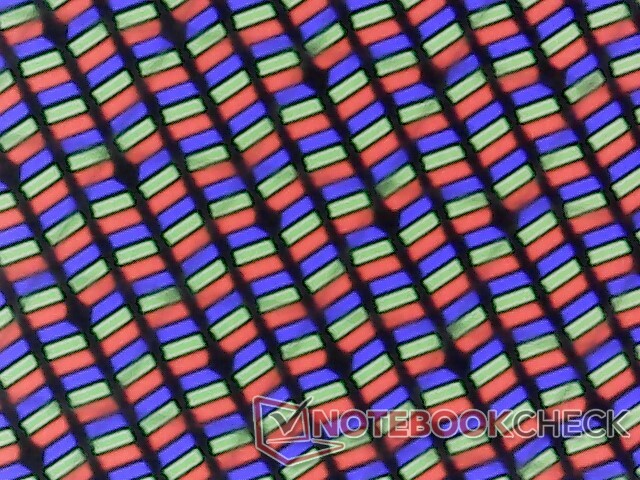
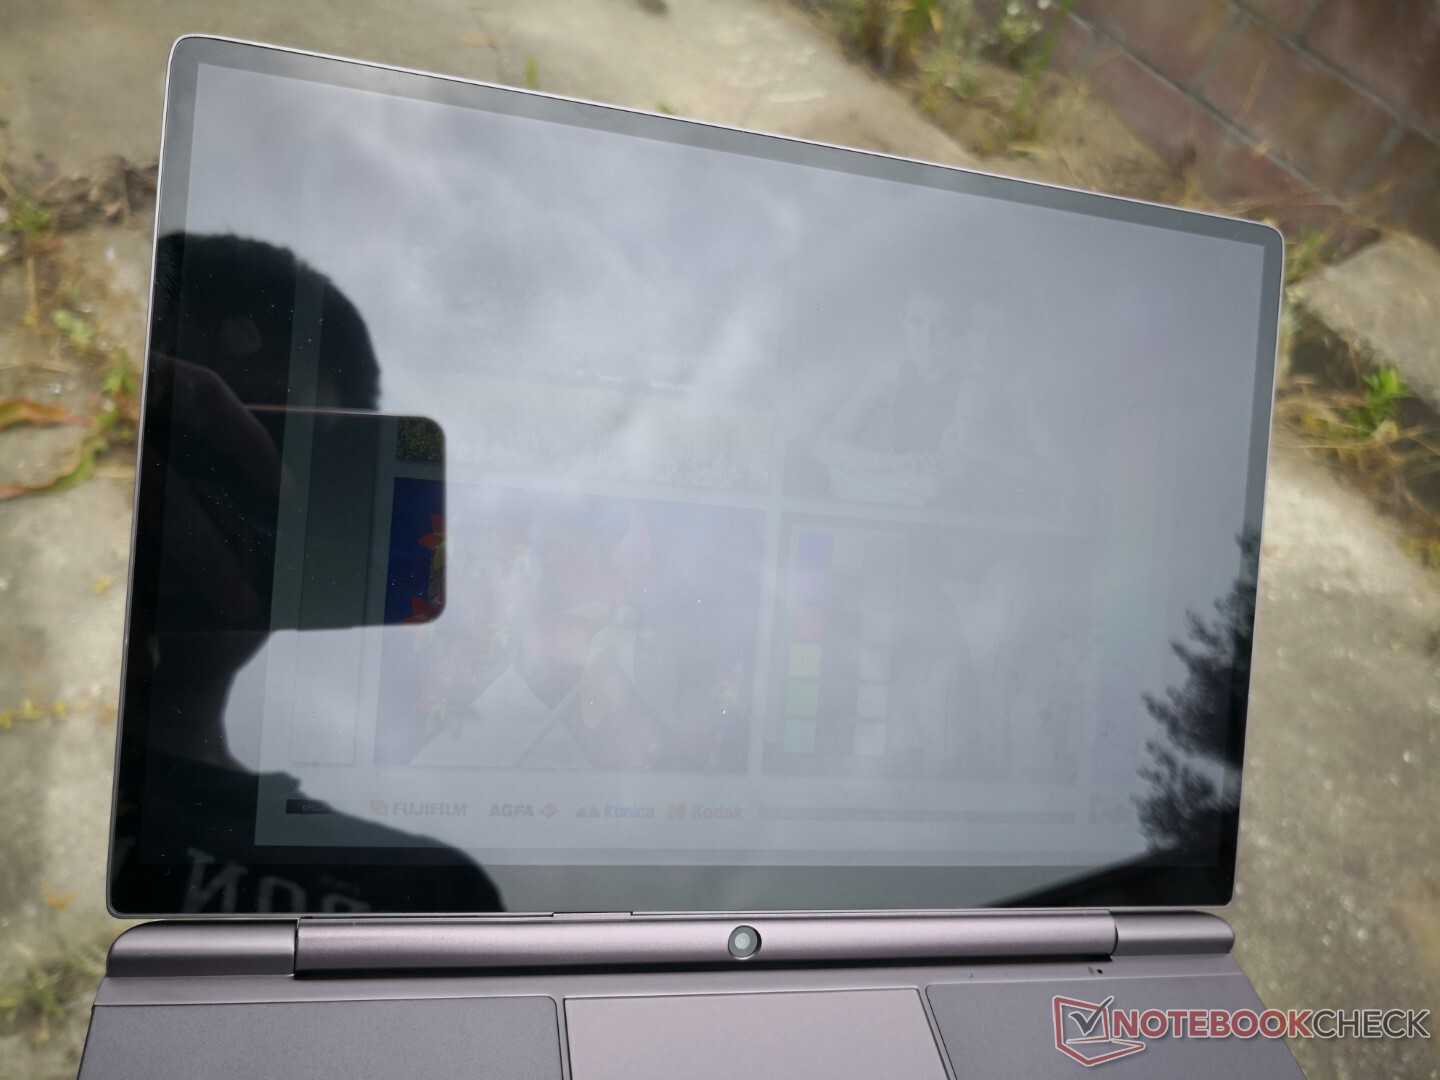
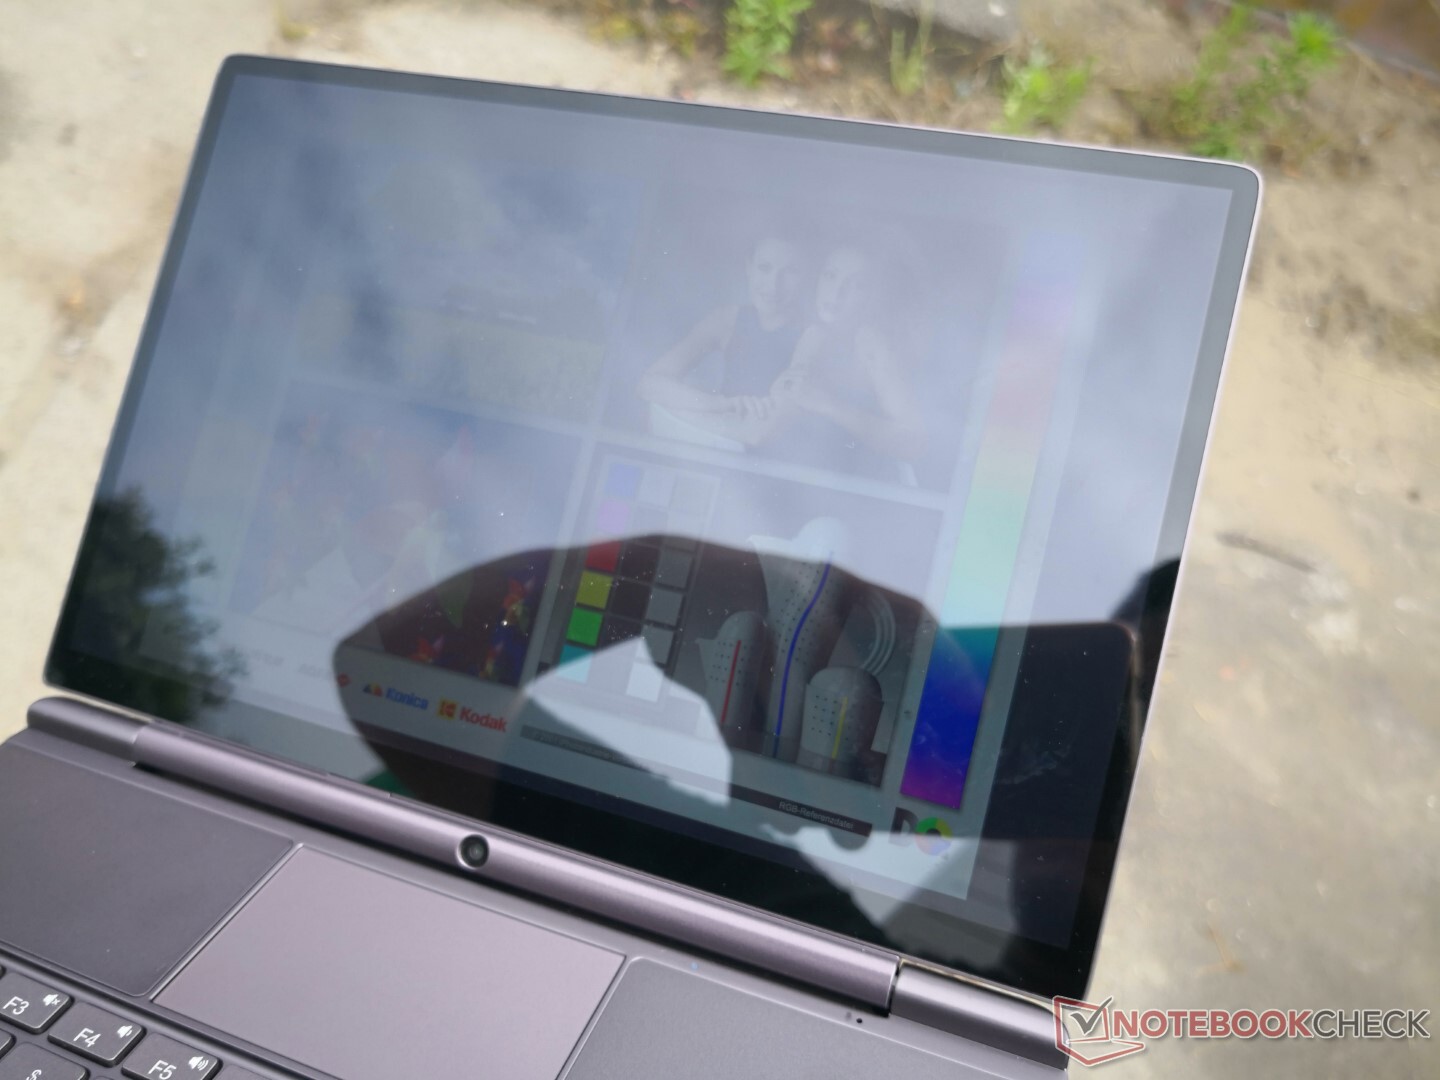
Visor - Alta resolução com cores sRGB
A tela sensível ao toque de 10,1 polegadas é outra grande melhoria em relação à tela de 8 polegadas do Win Max de 2021. Não só as moldura são mais estreitas, mas o painel oferece cores melhores e tempos de resposta mais rápidos em preto e branco para uma experiência de visualização de maior qualidade. No entanto, a taxa de contraste e atualização não mudou. Seria ótimo ver opções de 90 Hz ou 120 Hz ao lado de suporte de sincronização adaptativa em modelos futuros
Embora a tela seja muito nítida em sua resolução nativa de 2560 x 1600, tenha em mente que a GPU integrada não é suficientemente potente para rodar a maioria dos títulos em resoluções tão altas.


| |||||||||||||||||||||||||
iluminação: 89 %
iluminação com acumulador: 396.7 cd/m²
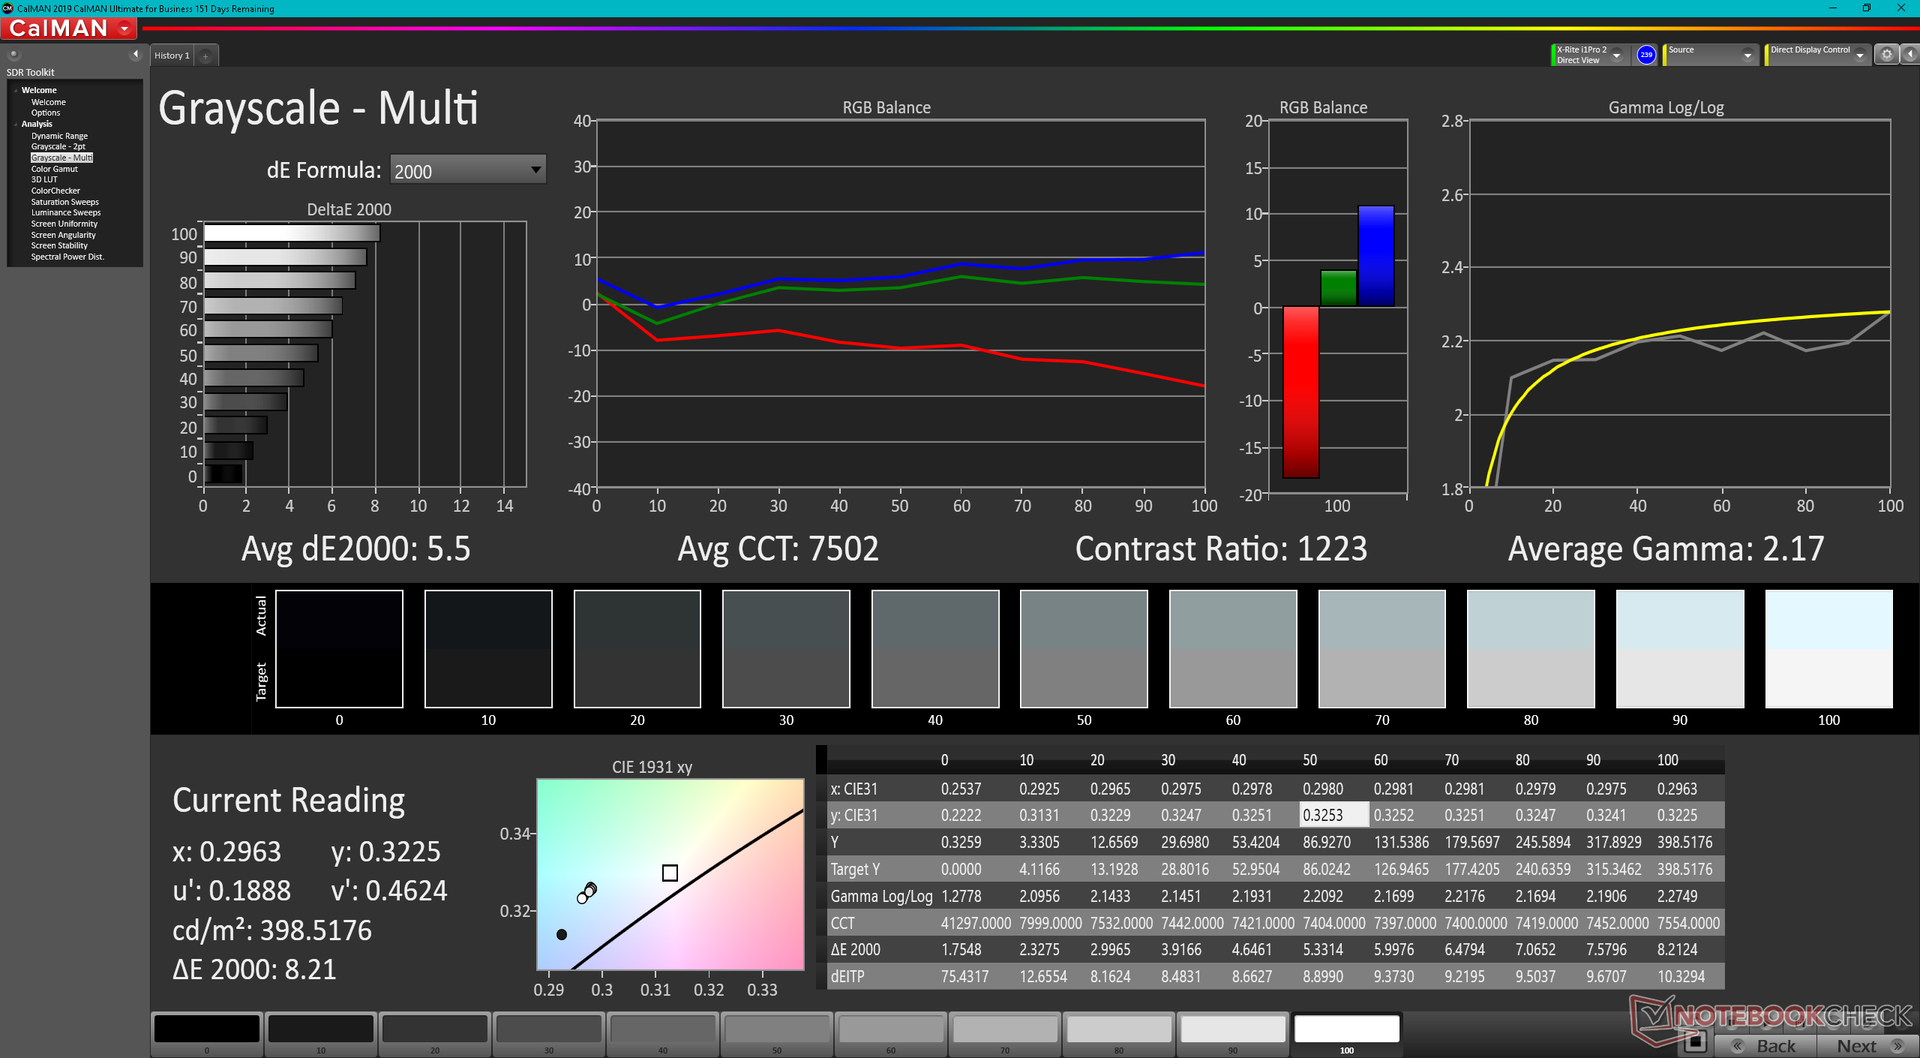
Contraste: 1102:1 (Preto: 0.36 cd/m²)
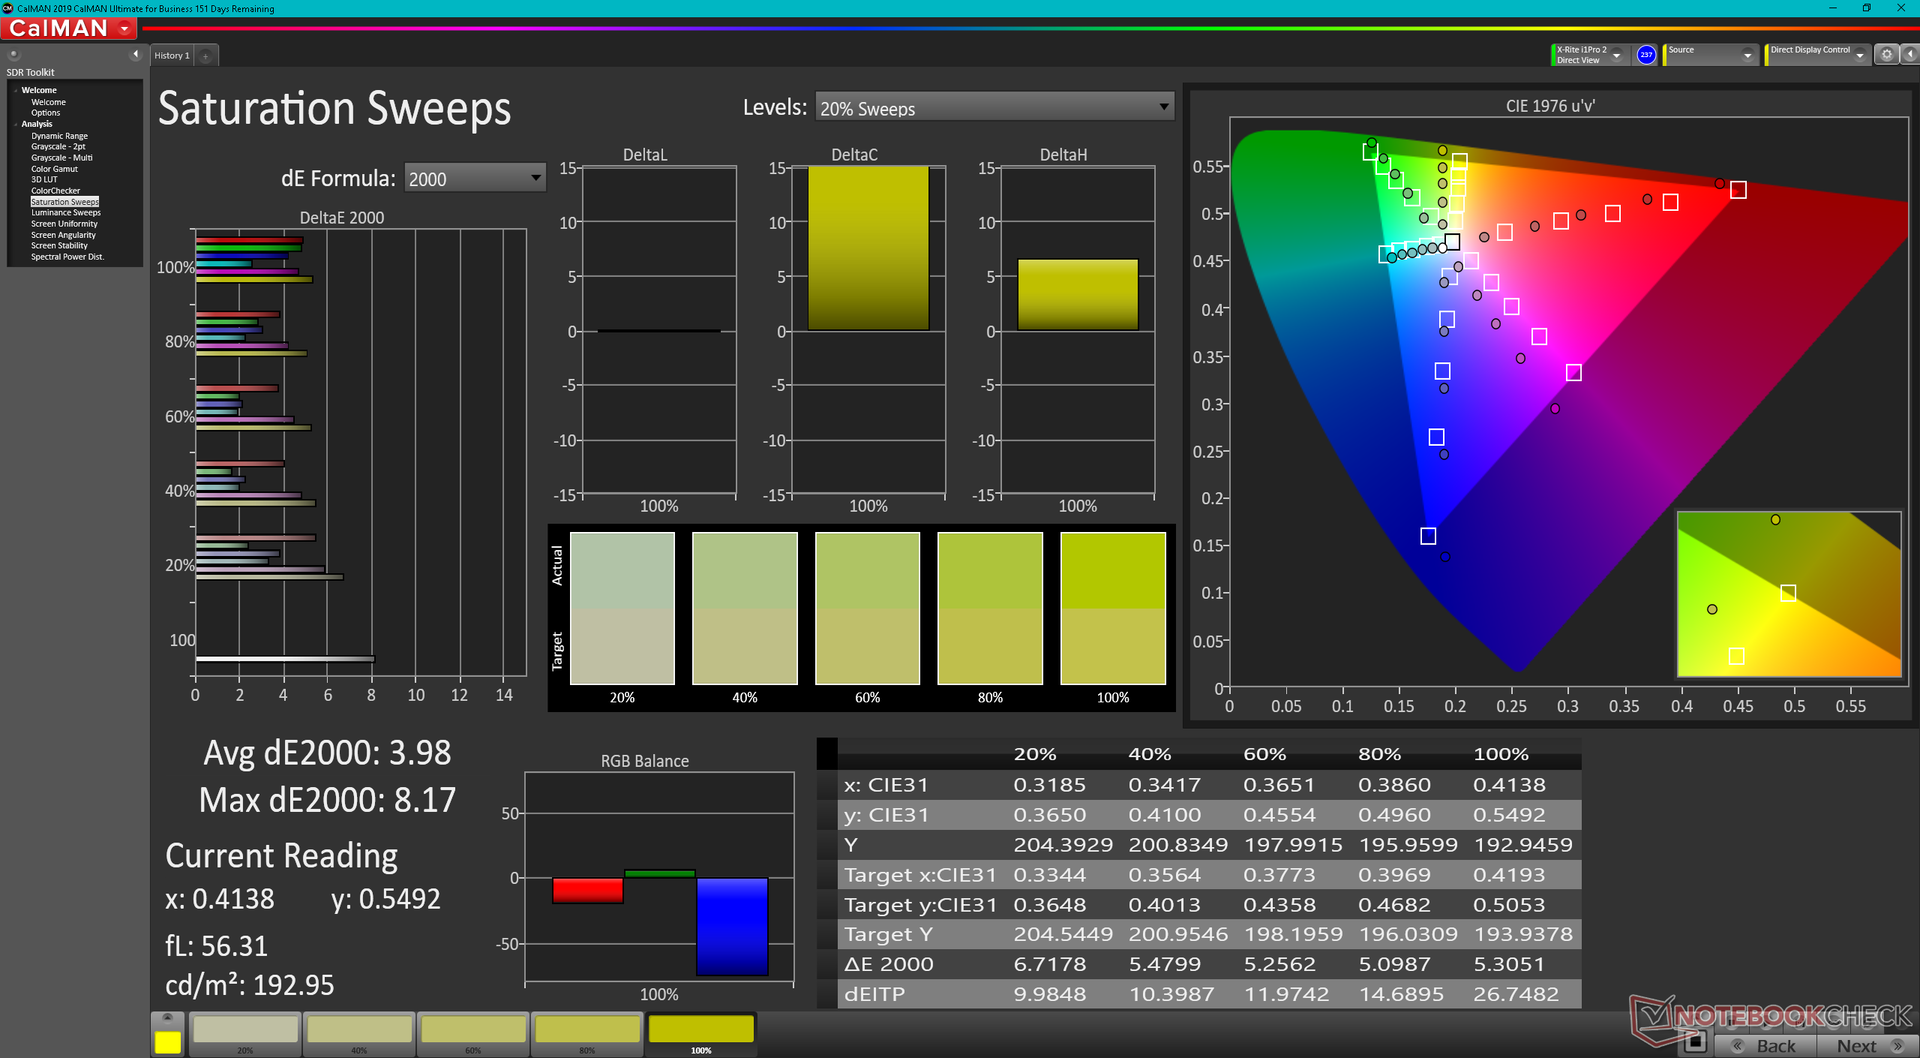
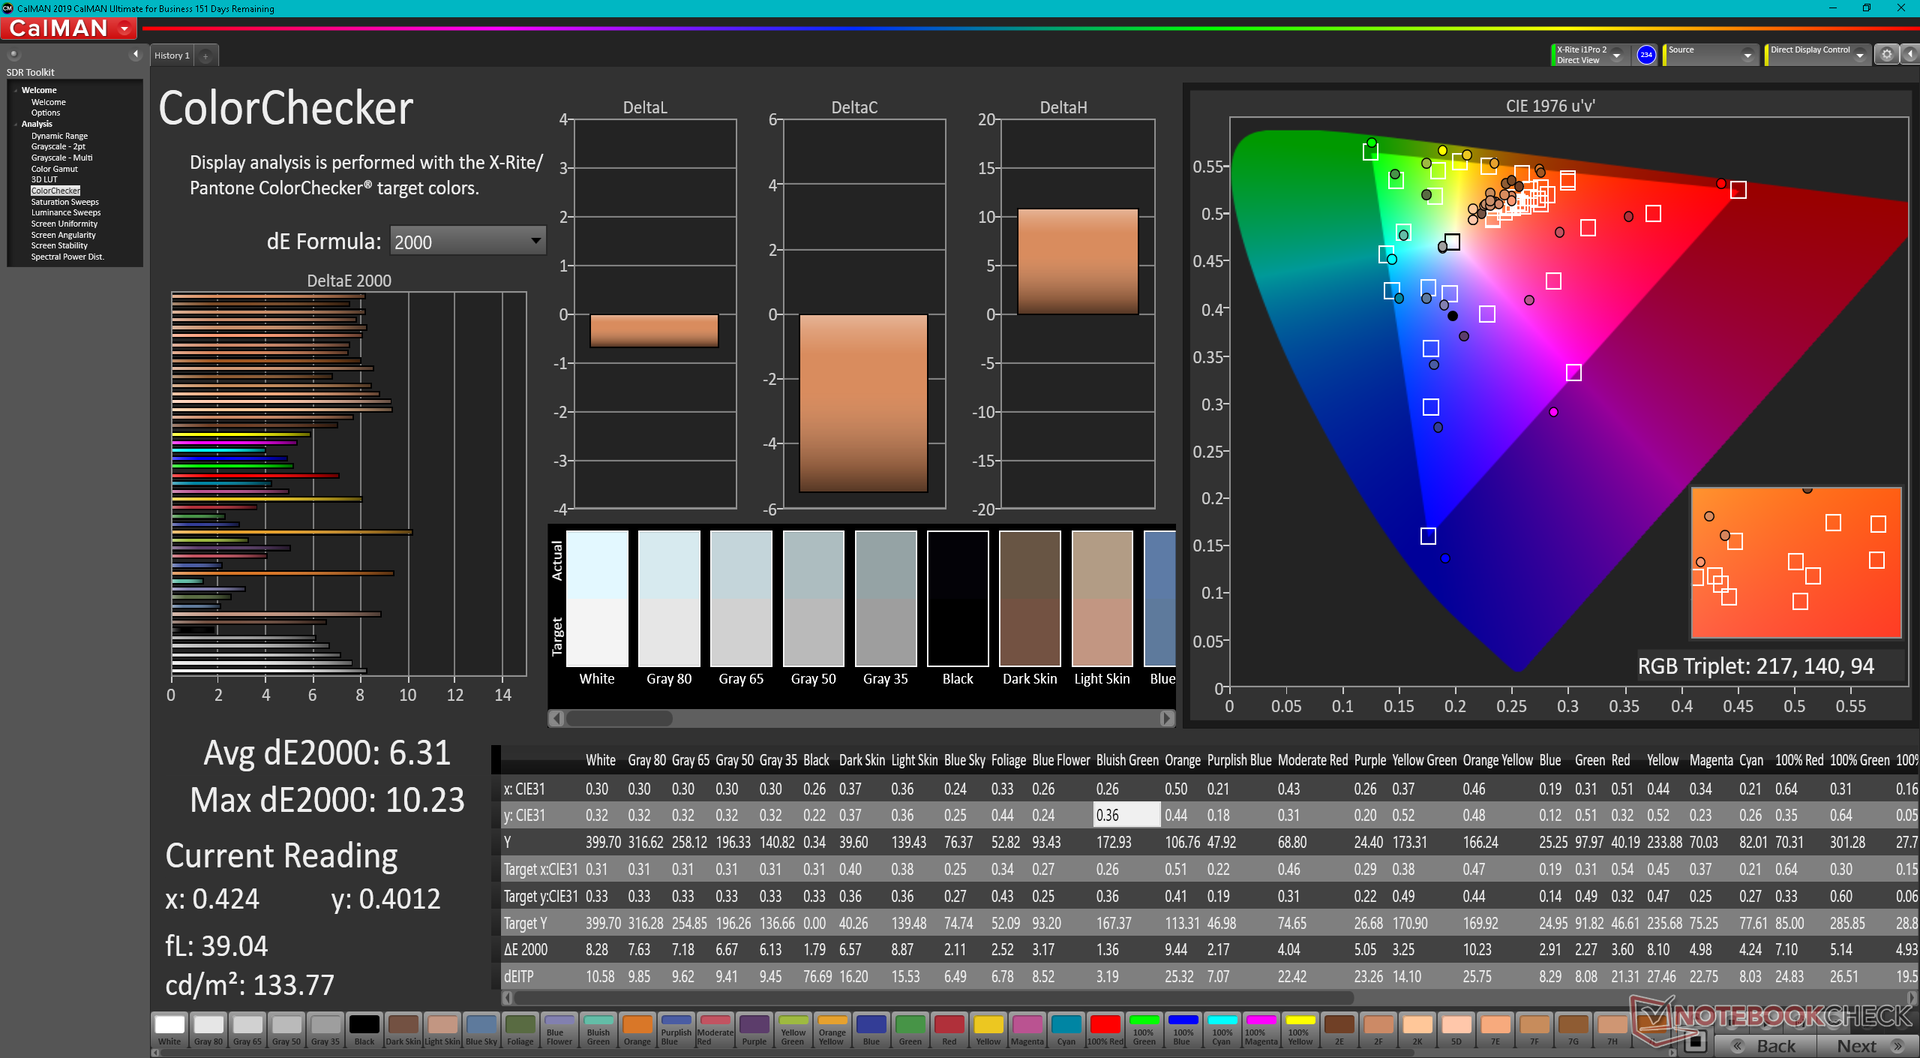
ΔE ColorChecker Calman: 6.31 | ∀{0.5-29.43 Ø4.71}
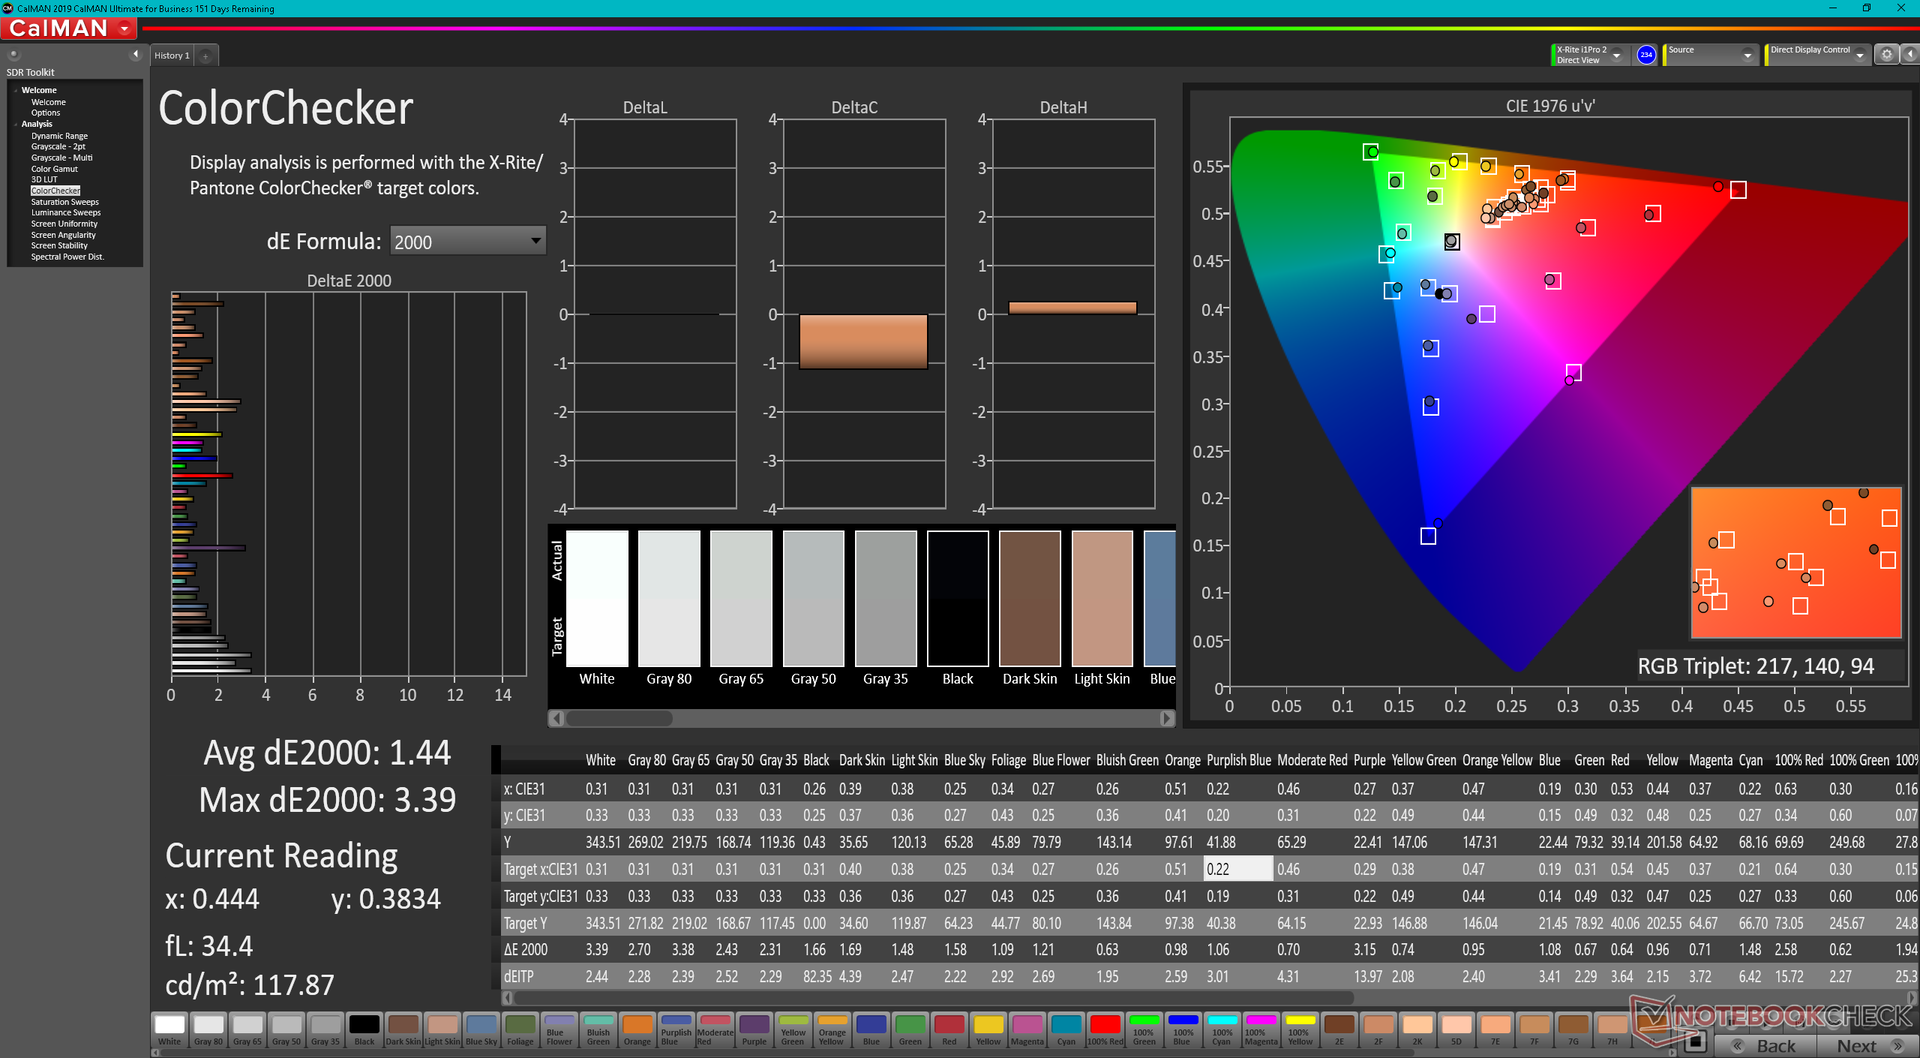
calibrated: 1.44
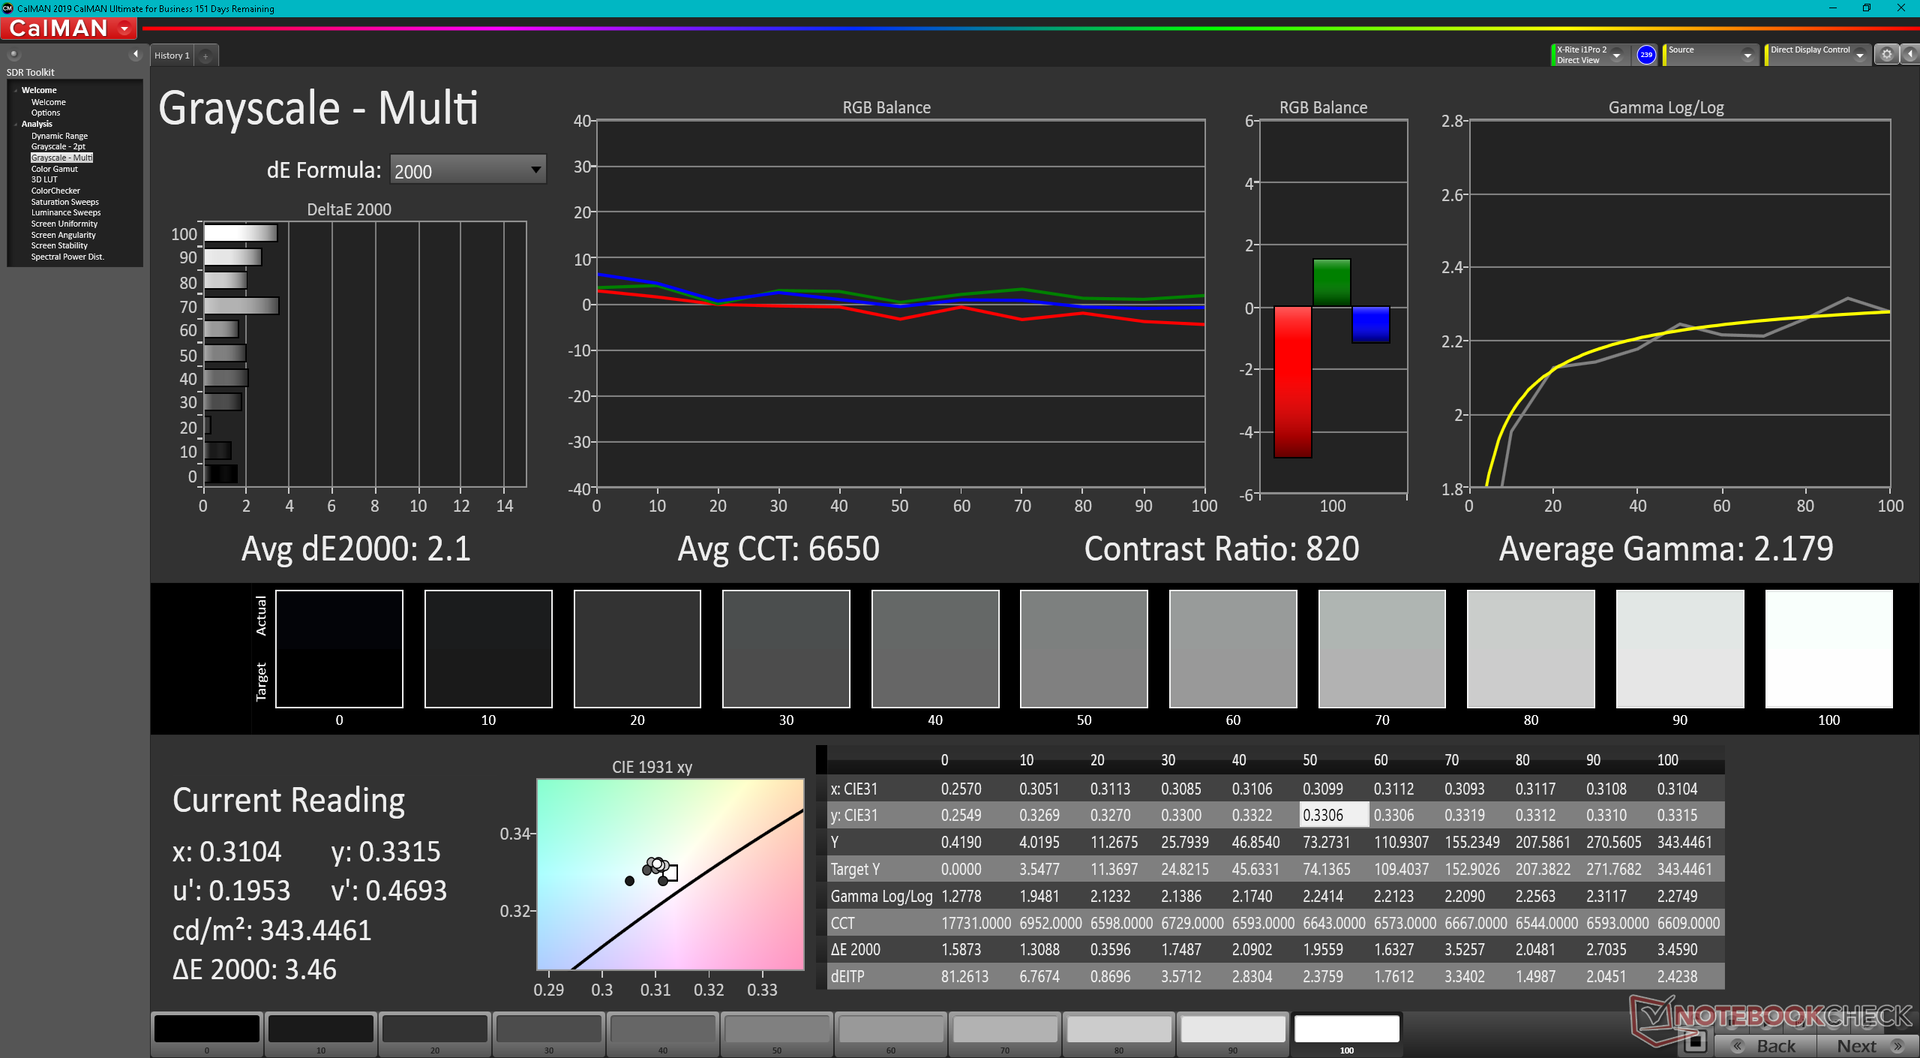
ΔE Greyscale Calman: 5.5 | ∀{0.09-98 Ø4.96}
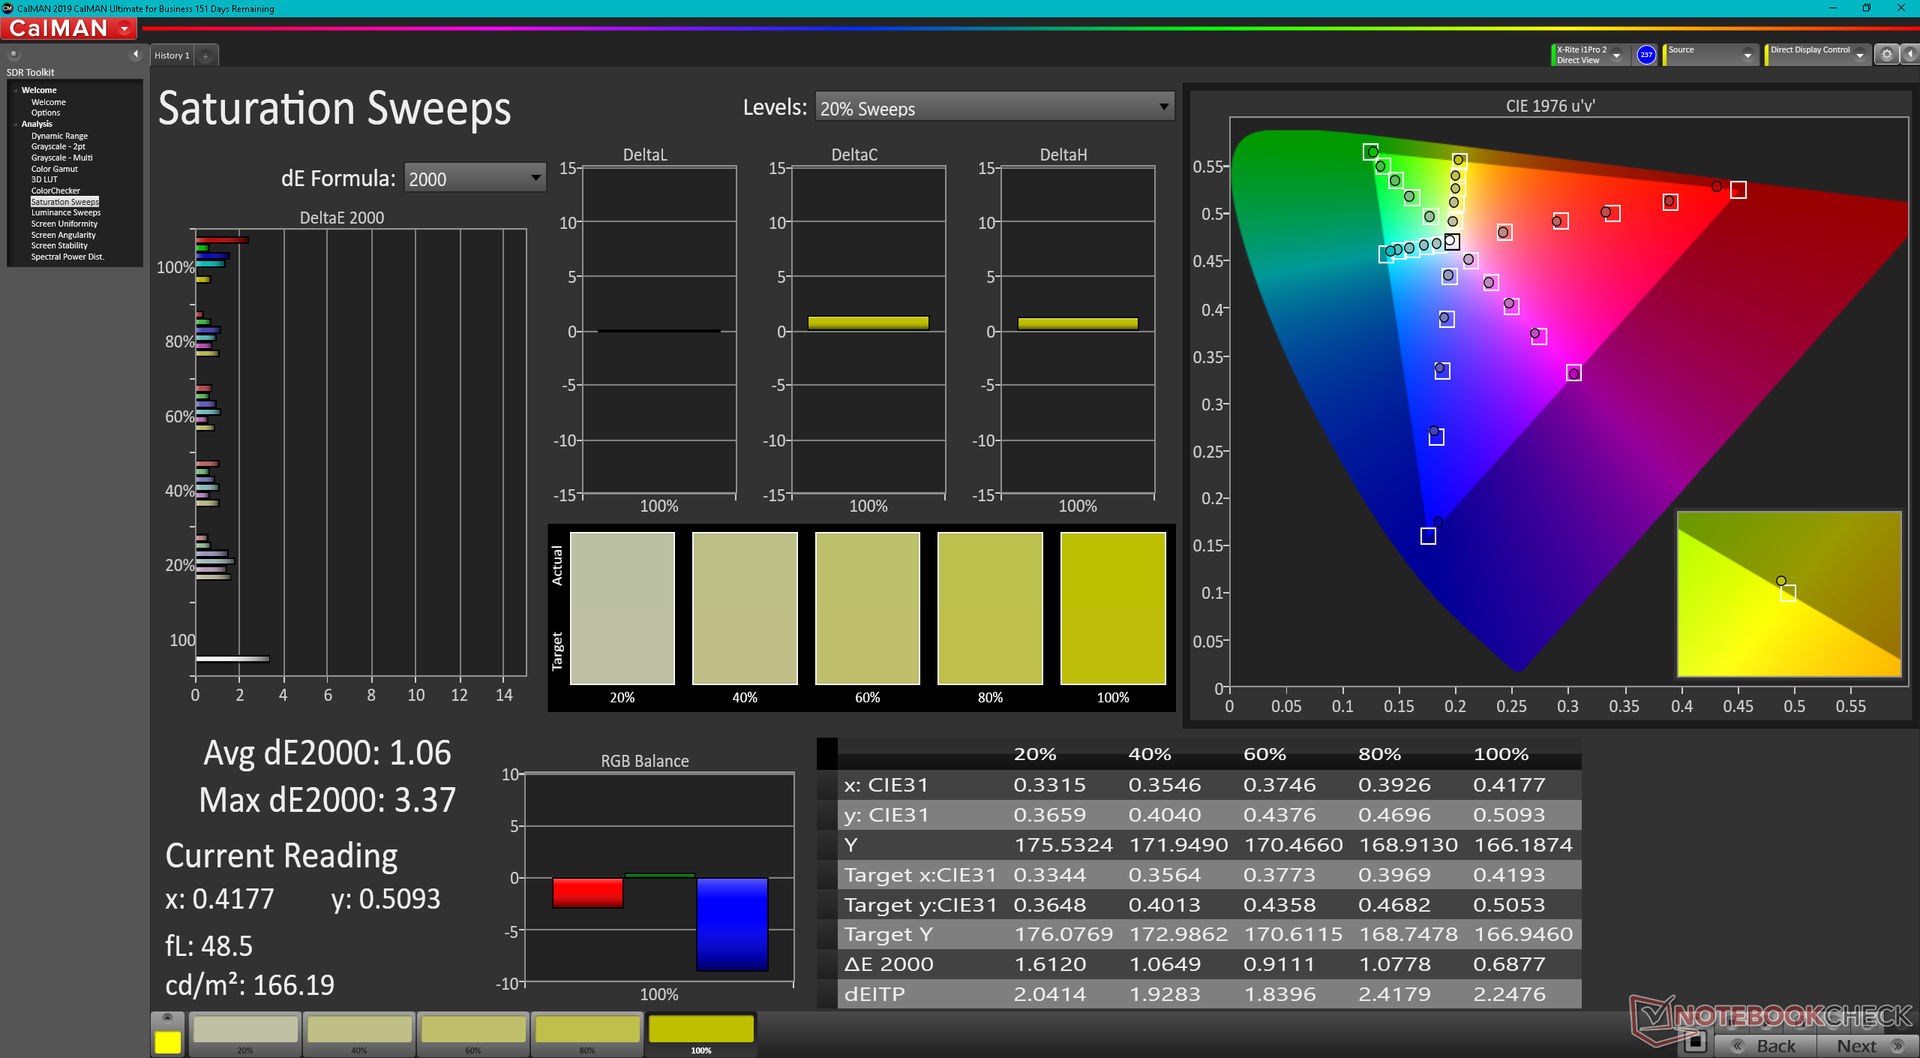
66.6% AdobeRGB 1998 (Argyll 3D)
91% sRGB (Argyll 3D)
69.8% Display P3 (Argyll 3D)
Gamma: 2.17
CCT: 7502 K
| GPD Win Max 2 Toshiba HX_10.1_LCD, IPS, 2560x1600, 10.1" | GPD Pocket 3 Digital Flat Panel, IPS, 1920x1200, 8" | GPD Win Max 2021 LT7911D, IPS, 1280x800, 8" | GPD Win 3 IPS, 1280x720, 5.5" | Microsoft Surface Go 3 Core i3 NV105WAM-N31, IPS , 1920x1280, 10.5" | Lenovo IdeaPad Flex 3 11IGL05 N116BCA-EA1, IPS LED, 1366x768, 11.6" | |
|---|---|---|---|---|---|---|
| Display | -22% | -30% | -8% | 4% | -30% | |
| Display P3 Coverage (%) | 69.8 | 51.1 -27% | 47.2 -32% | 59.5 -15% | 69 -1% | 45.35 -35% |
| sRGB Coverage (%) | 91 | 74.7 -18% | 65.2 -28% | 89.6 -2% | 99.1 9% | 67.7 -26% |
| AdobeRGB 1998 Coverage (%) | 66.6 | 52.8 -21% | 47.6 -29% | 61.4 -8% | 69.8 5% | 46.93 -30% |
| Response Times | -71% | -135% | -63% | -49% | -57% | |
| Response Time Grey 50% / Grey 80% * (ms) | 21.2 ? | 37.2 ? -75% | 56.8 ? -168% | 40 ? -89% | 37.2 ? -75% | 38 ? -79% |
| Response Time Black / White * (ms) | 18.7 ? | 31.2 ? -67% | 37.6 ? -101% | 25.6 ? -37% | 22.8 ? -22% | 25 ? -34% |
| PWM Frequency (Hz) | 201.6 ? | 962 ? | 250 ? | |||
| Screen | -13% | -34% | -24% | 36% | -9% | |
| Brightness middle (cd/m²) | 396.7 | 438.4 11% | 374.6 -6% | 468.8 18% | 418 5% | 270 -32% |
| Brightness (cd/m²) | 381 | 421 10% | 361 -5% | 460 21% | 415 9% | 259 -32% |
| Brightness Distribution (%) | 89 | 92 3% | 92 3% | 93 4% | 90 1% | 76 -15% |
| Black Level * (cd/m²) | 0.36 | 0.4 -11% | 0.45 -25% | 0.45 -25% | 0.28 22% | 0.195 46% |
| Contrast (:1) | 1102 | 1096 -1% | 832 -25% | 1042 -5% | 1493 35% | 1385 26% |
| Colorchecker dE 2000 * | 6.31 | 5.02 20% | 6.21 2% | 9 -43% | 1.2 81% | 3.98 37% |
| Colorchecker dE 2000 max. * | 10.23 | 9.59 6% | 9.89 3% | 15.5 -52% | 2.6 75% | 8.46 17% |
| Colorchecker dE 2000 calibrated * | 1.44 | 4.05 -181% | 5.4 -275% | 1.91 -33% | 1 31% | 4 -178% |
| Greyscale dE 2000 * | 5.5 | 4 27% | 4.5 18% | 10.9 -98% | 1.8 67% | 2.57 53% |
| Gamma | 2.17 101% | 2.29 96% | 2.49 88% | 2.13 103% | 2.21 100% | 2.3 96% |
| CCT | 7502 87% | 7087 92% | 6726 97% | 10972 59% | 6225 104% | 6332 103% |
| Color Space (Percent of AdobeRGB 1998) (%) | 56.6 | 43 | ||||
| Color Space (Percent of sRGB) (%) | 89.2 | 67 | ||||
| Média Total (Programa/Configurações) | -35% /
-23% | -66% /
-48% | -32% /
-26% | -3% /
17% | -32% /
-20% |
* ... menor é melhor
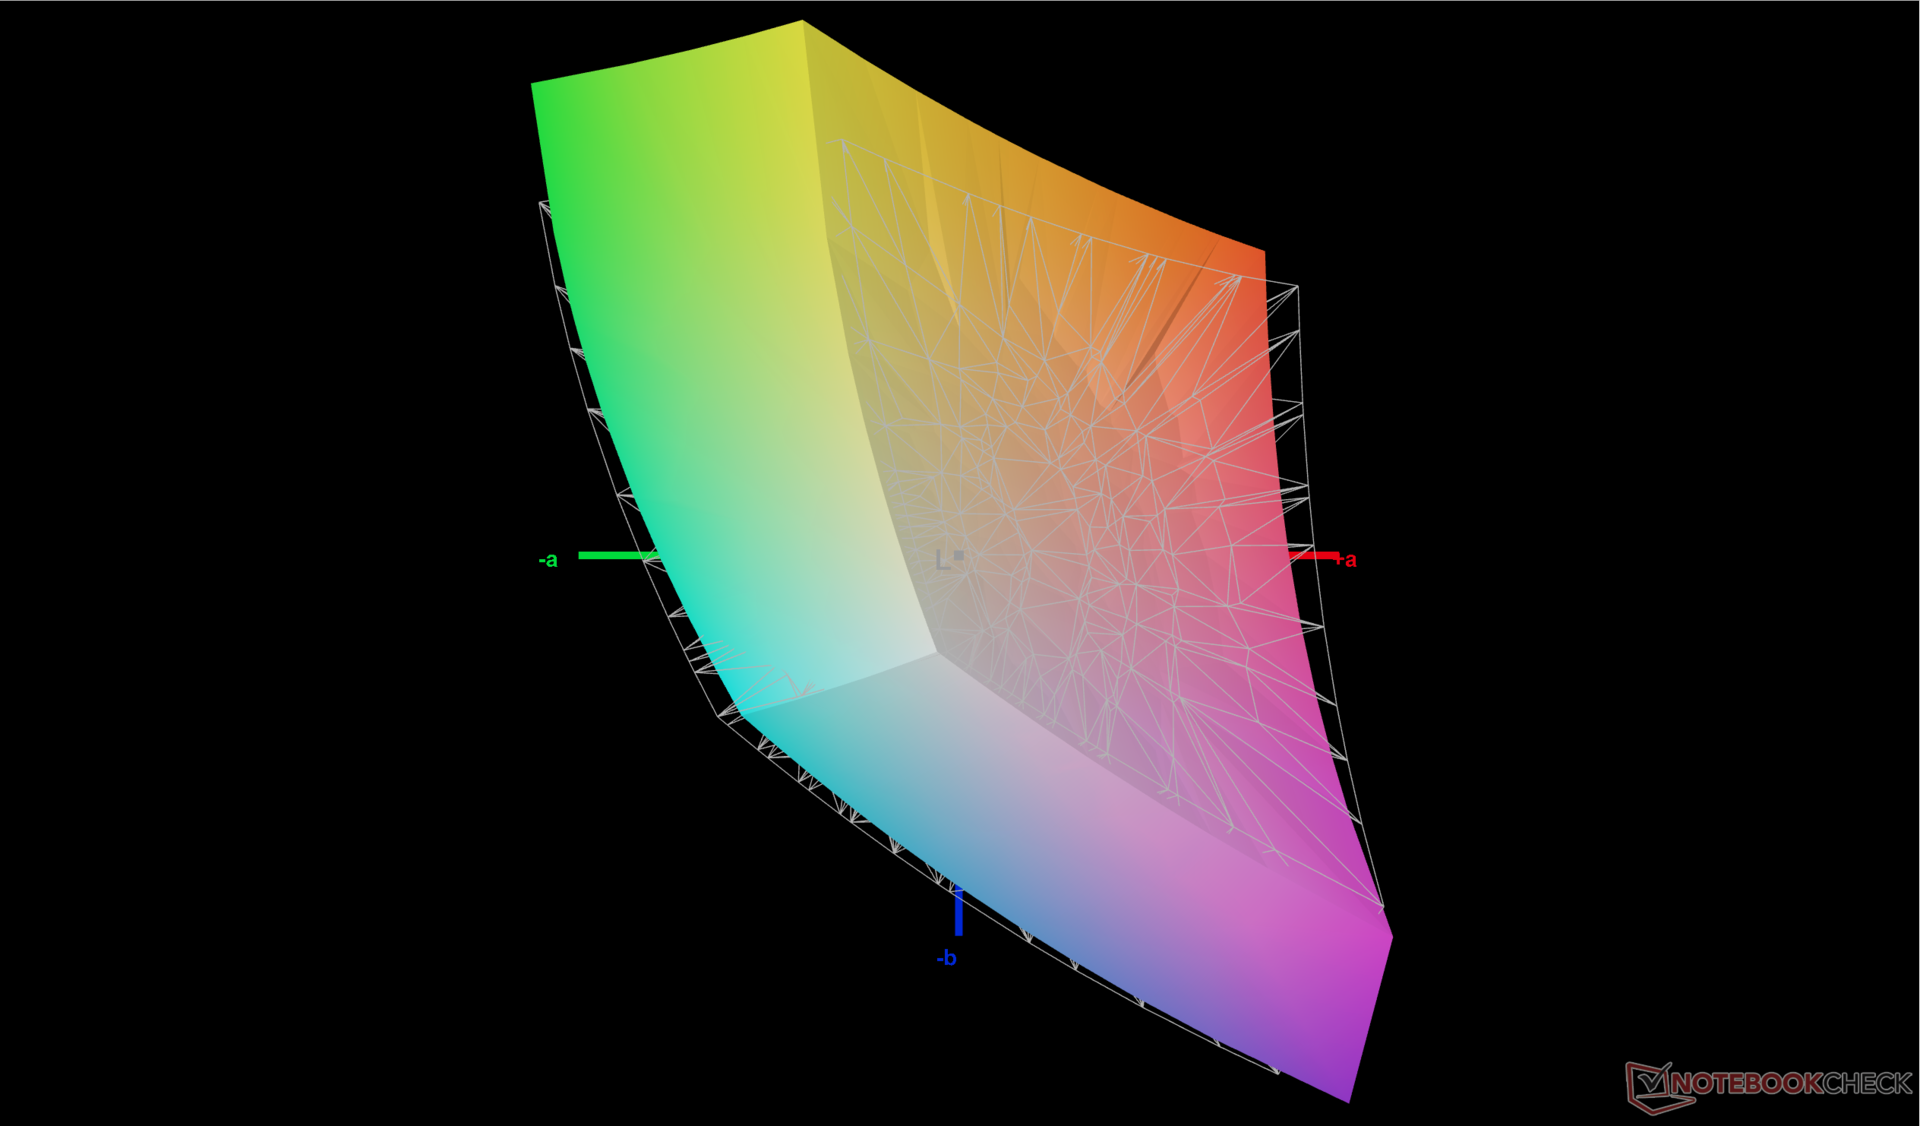
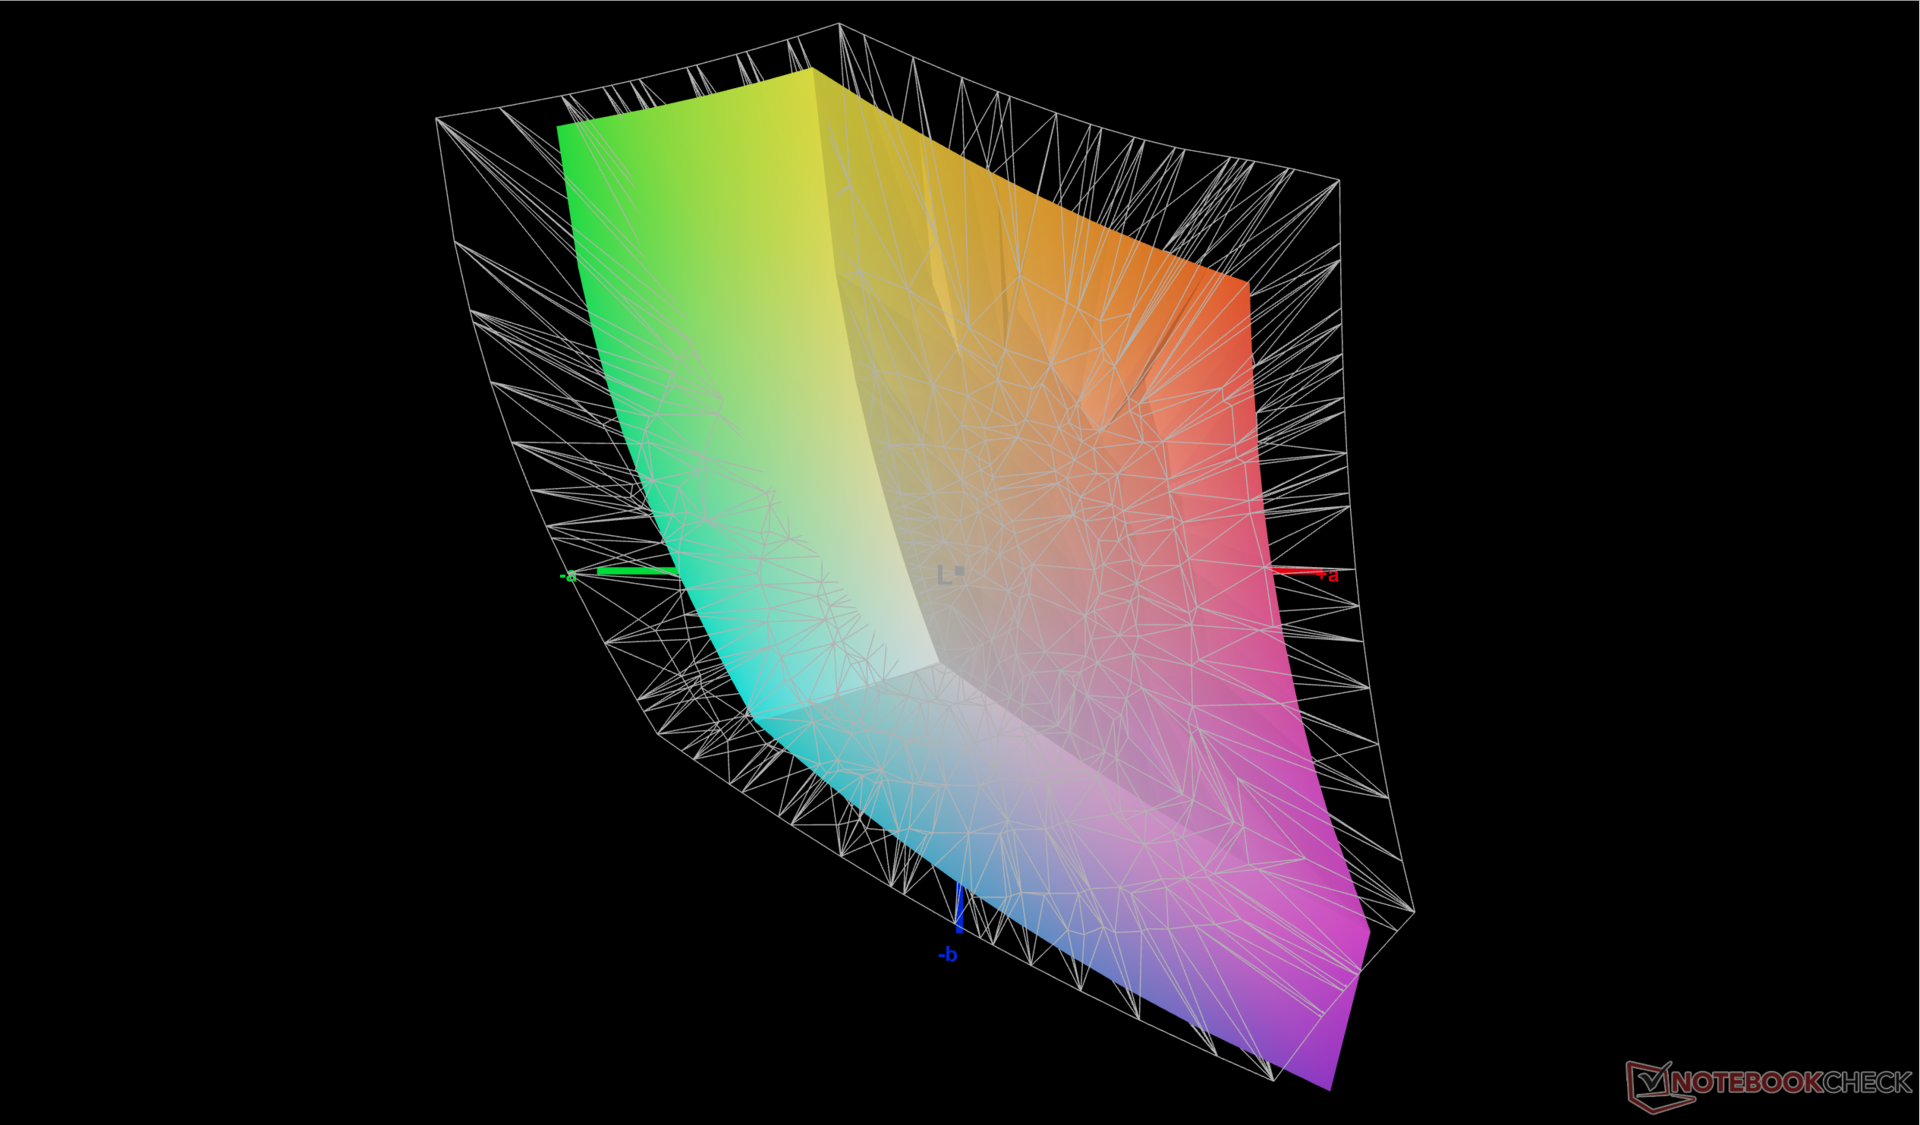
A tela não está muito bem calibrada fora da caixa, o que é uma pena por causa de sua cobertura relativamente ampla >90 por cento sRGB. Os valores padrão de escala de cinza média e DeltaE colorido de 5,5 e 6,31 melhorariam para apenas 2,1 e 1,44, respectivamente, após calibrarmos nós mesmos o painel. Recomendamos aplicar nosso perfil de ICM calibrado acima para obter cores mais precisas do display.
Exibir tempos de resposta
| ↔ Tempo de resposta preto para branco | ||
|---|---|---|
| 18.7 ms ... ascensão ↗ e queda ↘ combinadas | ↗ 9.1 ms ascensão | 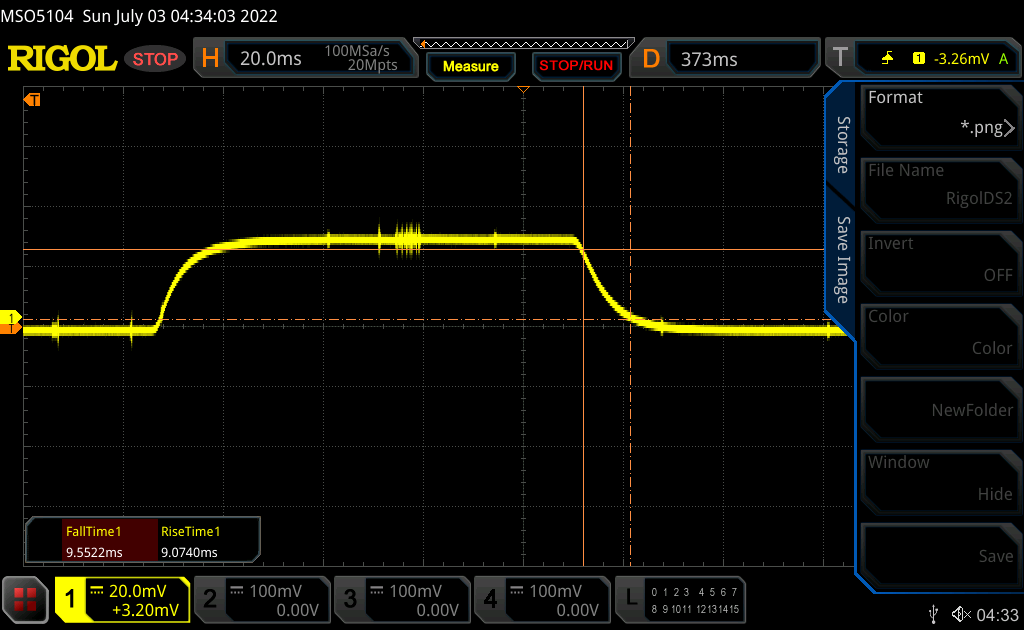 |
| ↘ 9.6 ms queda | ||
| A tela mostra boas taxas de resposta em nossos testes, mas pode ser muito lenta para jogadores competitivos. Em comparação, todos os dispositivos testados variam de 0.1 (mínimo) a 240 (máximo) ms. » 42 % de todos os dispositivos são melhores. Isso significa que o tempo de resposta medido é semelhante à média de todos os dispositivos testados (19.8 ms). | ||
| ↔ Tempo de resposta 50% cinza a 80% cinza | ||
| 21.2 ms ... ascensão ↗ e queda ↘ combinadas | ↗ 9.5 ms ascensão | 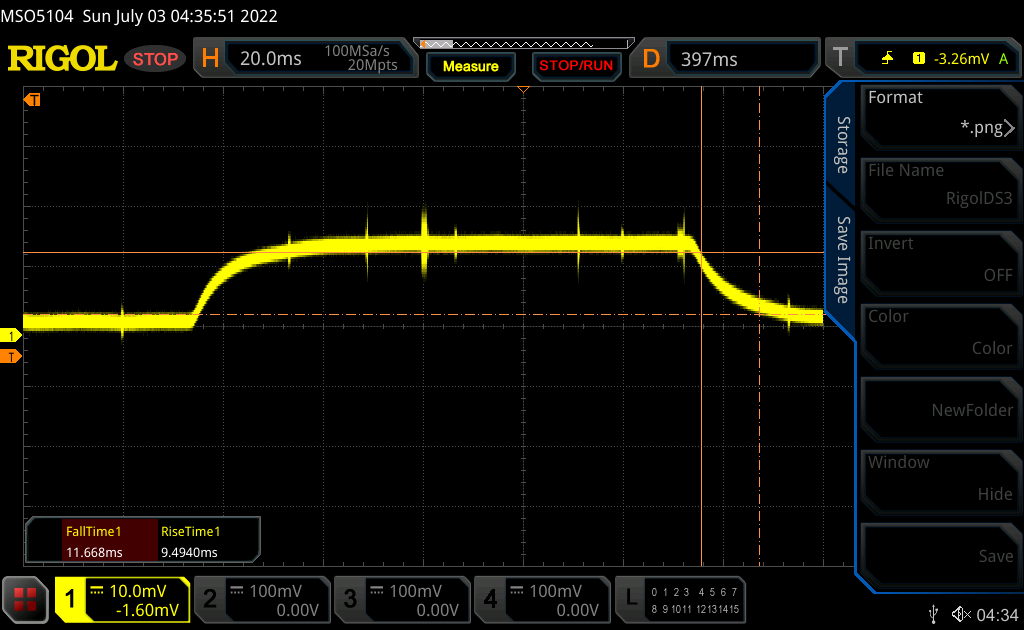 |
| ↘ 11.7 ms queda | ||
| A tela mostra boas taxas de resposta em nossos testes, mas pode ser muito lenta para jogadores competitivos. Em comparação, todos os dispositivos testados variam de 0.165 (mínimo) a 636 (máximo) ms. » 33 % de todos os dispositivos são melhores. Isso significa que o tempo de resposta medido é melhor que a média de todos os dispositivos testados (31 ms). | ||
Cintilação da tela / PWM (modulação por largura de pulso)
| Tela tremeluzindo / PWM não detectado | 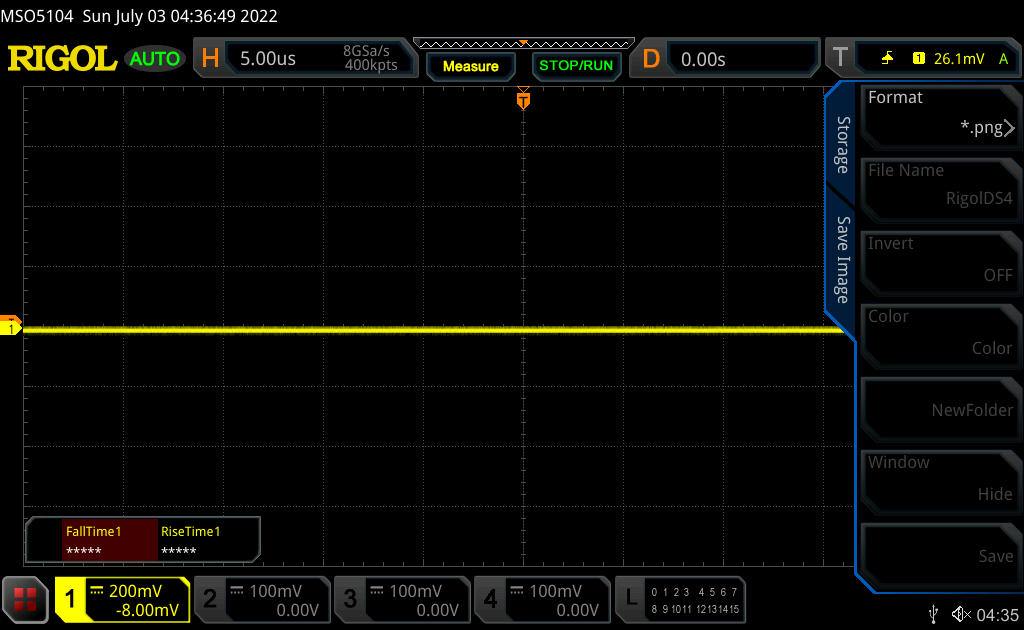 | ||
[pwm_comparison] Em comparação: 52 % de todos os dispositivos testados não usam PWM para escurecer a tela. Se PWM foi detectado, uma média de 7757 (mínimo: 5 - máximo: 343500) Hz foi medida. | |||
Com um máximo de 400 lata, o visor é suficientemente brilhante para ser visto confortavelmente quando está à sombra. Uma iluminação ambiente mais brilhante lavará as cores ou produzirá um brilho muito forte na tela de toque brilhante.


Desempenho - Vermelho ou Azul?
Condições de teste
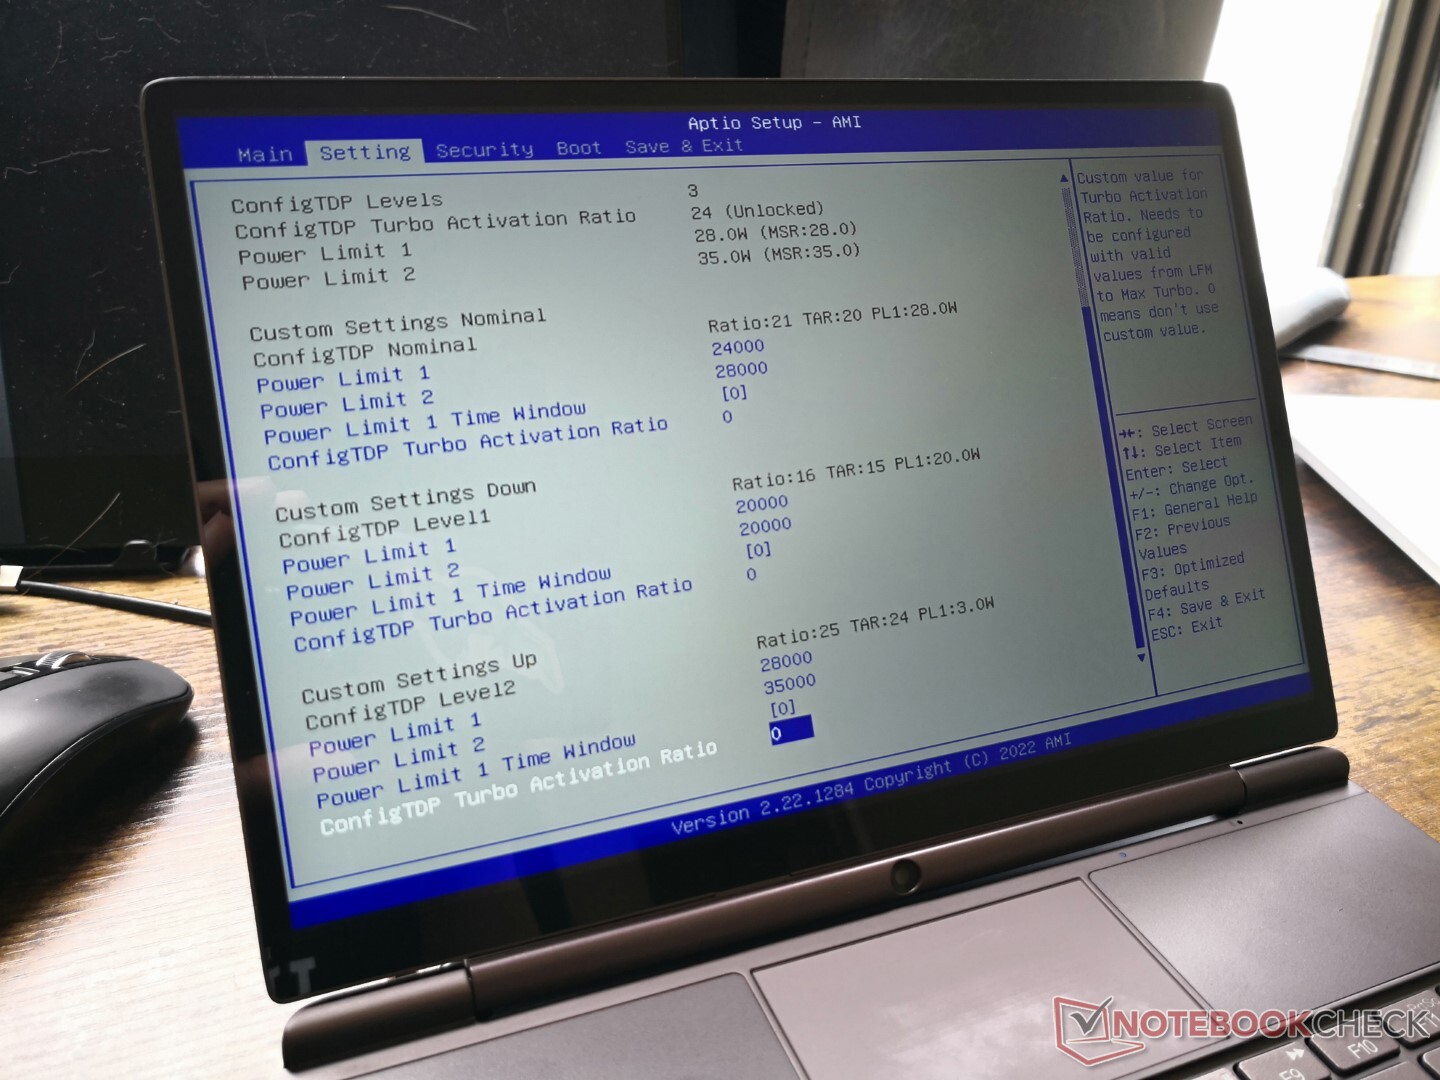
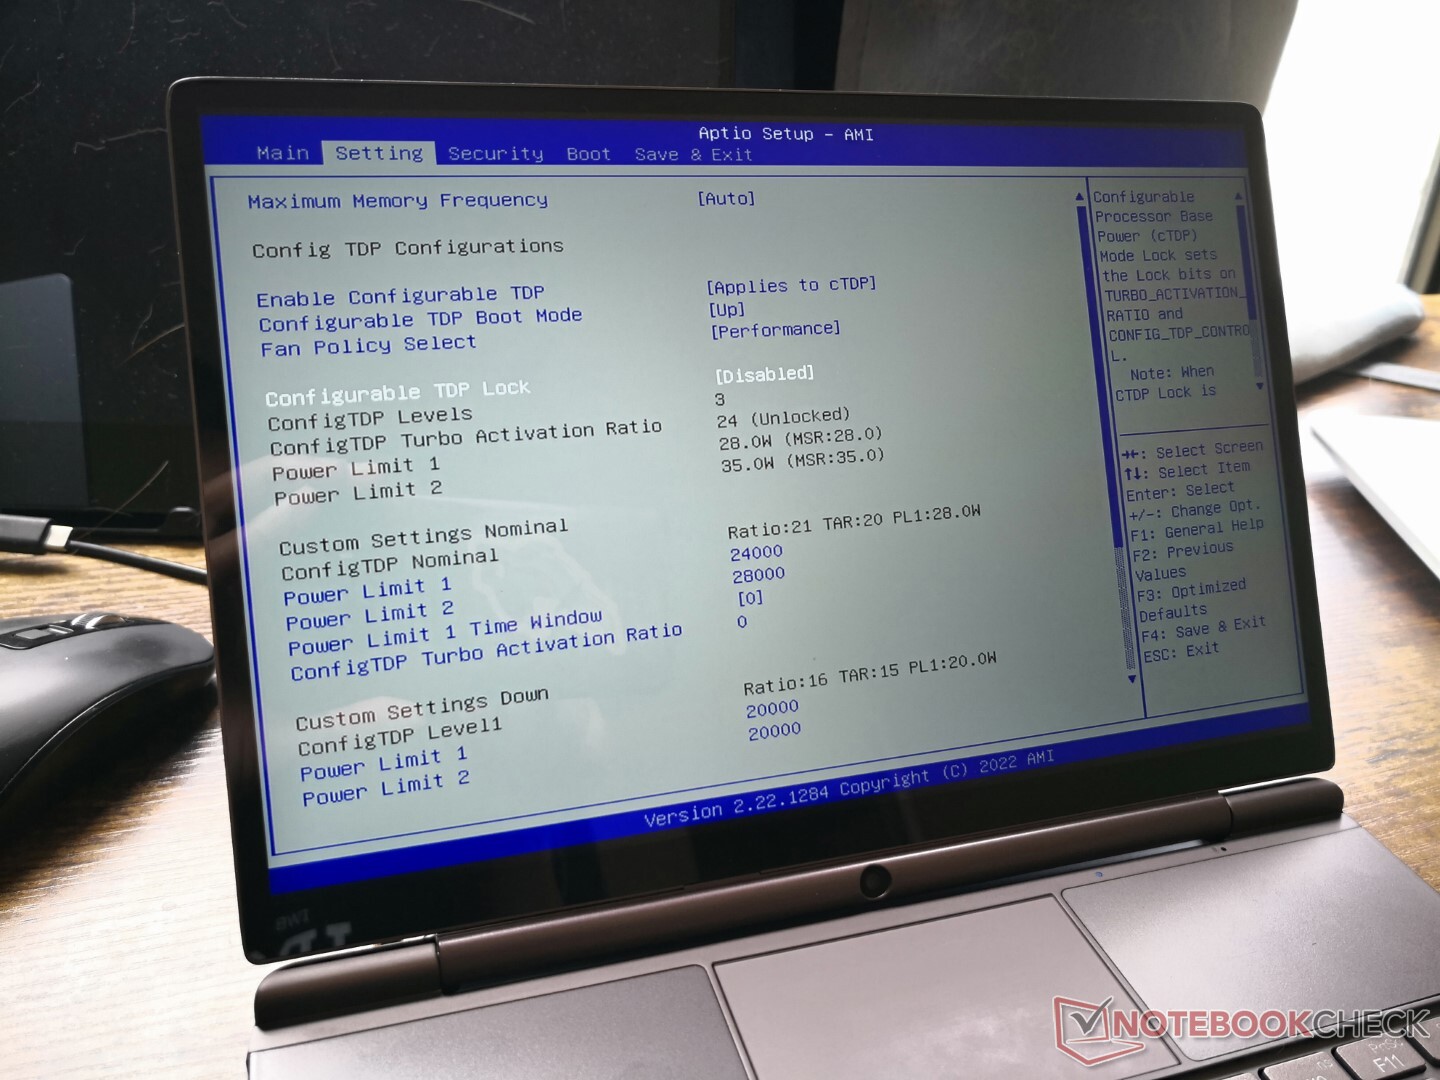
Assim como em outros produtos GPD, a tela BIOS oferece configurações de TDP configuráveis. Os três modos predefinidos são Nominal, Down e Up, cada um com níveis variáveis de alvos PL1 e PL2, conforme descrito abaixo
- Nominal: PL1=24 W, PL2=28 W
- Abaixo: PL1=20 W, PL2=20 W
- Para cima: PL1=28 W, PL2=35 W
Configuramos nossa unidade para a predefinição Up e a Política de Ventiladores para o Desempenho antes de executar quaisquer benchmarks de desempenho abaixo. Também ativamos a configuração "Turbo" no teclado e nos certificamos de que o Windows também estava no modo Desempenho.
Processador
O desempenho da CPU de múltiplas roscas é aproximadamente 15% mais lento do que a média do laptop em nosso banco de dados equipado com o mesmo Núcleo i7-1260P processador. Por outro lado, o desempenho de uma única linha é cerca de 10 a 15 mais rápido do que a média. Há definitivamente um sentimento de que o Win Max 2 não está explorando totalmente as capacidades da nova CPU Intel do 12º gênero a este respeito, mas ainda é significativamente mais rápido do que as opções de CPU do 11º gênero mais antigas, como encontradas no GPD Win 3 ou no Pocket 3 em 50% ou mais. Se você quer o melhor que o Core i7-1260P tem a oferecer, no entanto, então talvez queira olhar para laptops de pleno direito como o Dell Inspiron 16 7620 2 em 1 que pode operar a mesma CPU até 40 por cento mais rápido.
Muitas CPUs AMD Zen 3 são capazes de oferecer um desempenho ligeiramente mais rápido de múltiplas roscas, mas um desempenho mais lento de uma única rosca do que nosso Core i7-1260P no Win Max 2, incluindo oRyzen 5 5500Uryzen 7 5700U, ou mesmo o mais antigo Zen 2 Ryzen 7 4800U. Optando pelo Ryzen 7 6800U A SKU aumentará o desempenho de múltiplas roscas em 50%, enquanto o desempenho de uma única rosca diminuirá em quase 20%.
Cinebench R15 Multi Loop
Cinebench R23: Multi Core | Single Core
Cinebench R15: CPU Multi 64Bit | CPU Single 64Bit
Blender: v2.79 BMW27 CPU
7-Zip 18.03: 7z b 4 | 7z b 4 -mmt1
Geekbench 5.5: Multi-Core | Single-Core
HWBOT x265 Benchmark v2.2: 4k Preset
LibreOffice : 20 Documents To PDF
R Benchmark 2.5: Overall mean
Cinebench R23: Multi Core | Single Core
Cinebench R15: CPU Multi 64Bit | CPU Single 64Bit
Blender: v2.79 BMW27 CPU
7-Zip 18.03: 7z b 4 | 7z b 4 -mmt1
Geekbench 5.5: Multi-Core | Single-Core
HWBOT x265 Benchmark v2.2: 4k Preset
LibreOffice : 20 Documents To PDF
R Benchmark 2.5: Overall mean
* ... menor é melhor
AIDA64: FP32 Ray-Trace | FPU Julia | CPU SHA3 | CPU Queen | FPU SinJulia | FPU Mandel | CPU AES | CPU ZLib | FP64 Ray-Trace | CPU PhotoWorxx
| Performance rating | |
| GPD Win Max 2021 | |
| Média Intel Core i7-1260P | |
| Lenovo Yoga 9 14IAP7 82LU0001US | |
| GPD Win Max 2 | |
| GPD Pocket 3 | |
| AIDA64 / FP32 Ray-Trace | |
| GPD Win Max 2021 | |
| Média Intel Core i7-1260P (2176 - 10898, n=26) | |
| Lenovo Yoga 9 14IAP7 82LU0001US | |
| GPD Pocket 3 | |
| GPD Win Max 2 | |
| AIDA64 / FPU Julia | |
| GPD Win Max 2021 | |
| Média Intel Core i7-1260P (11015 - 56906, n=26) | |
| Lenovo Yoga 9 14IAP7 82LU0001US | |
| GPD Pocket 3 | |
| GPD Win Max 2 | |
| AIDA64 / CPU SHA3 | |
| Lenovo Yoga 9 14IAP7 82LU0001US | |
| Média Intel Core i7-1260P (669 - 2709, n=26) | |
| GPD Win Max 2021 | |
| GPD Pocket 3 | |
| GPD Win Max 2 | |
| AIDA64 / CPU Queen | |
| GPD Win Max 2021 | |
| Lenovo Yoga 9 14IAP7 82LU0001US | |
| Média Intel Core i7-1260P (42571 - 82493, n=26) | |
| GPD Win Max 2 | |
| GPD Pocket 3 | |
| AIDA64 / FPU SinJulia | |
| GPD Win Max 2021 | |
| Lenovo Yoga 9 14IAP7 82LU0001US | |
| GPD Win Max 2 | |
| Média Intel Core i7-1260P (2901 - 6975, n=26) | |
| GPD Pocket 3 | |
| AIDA64 / FPU Mandel | |
| GPD Win Max 2021 | |
| Média Intel Core i7-1260P (5950 - 26376, n=26) | |
| Lenovo Yoga 9 14IAP7 82LU0001US | |
| GPD Pocket 3 | |
| GPD Win Max 2 | |
| AIDA64 / CPU AES | |
| GPD Pocket 3 | |
| GPD Win Max 2021 | |
| GPD Win Max 2 | |
| Média Intel Core i7-1260P (16041 - 92356, n=26) | |
| Lenovo Yoga 9 14IAP7 82LU0001US | |
| AIDA64 / CPU ZLib | |
| Lenovo Yoga 9 14IAP7 82LU0001US | |
| Média Intel Core i7-1260P (259 - 771, n=26) | |
| GPD Win Max 2021 | |
| GPD Win Max 2 | |
| GPD Pocket 3 | |
| AIDA64 / FP64 Ray-Trace | |
| GPD Win Max 2021 | |
| Média Intel Core i7-1260P (1237 - 5858, n=26) | |
| Lenovo Yoga 9 14IAP7 82LU0001US | |
| GPD Pocket 3 | |
| GPD Win Max 2 | |
| AIDA64 / CPU PhotoWorxx | |
| Lenovo Yoga 9 14IAP7 82LU0001US | |
| GPD Win Max 2 | |
| GPD Pocket 3 | |
| Média Intel Core i7-1260P (13261 - 43652, n=26) | |
| GPD Win Max 2021 | |
Desempenho do sistema
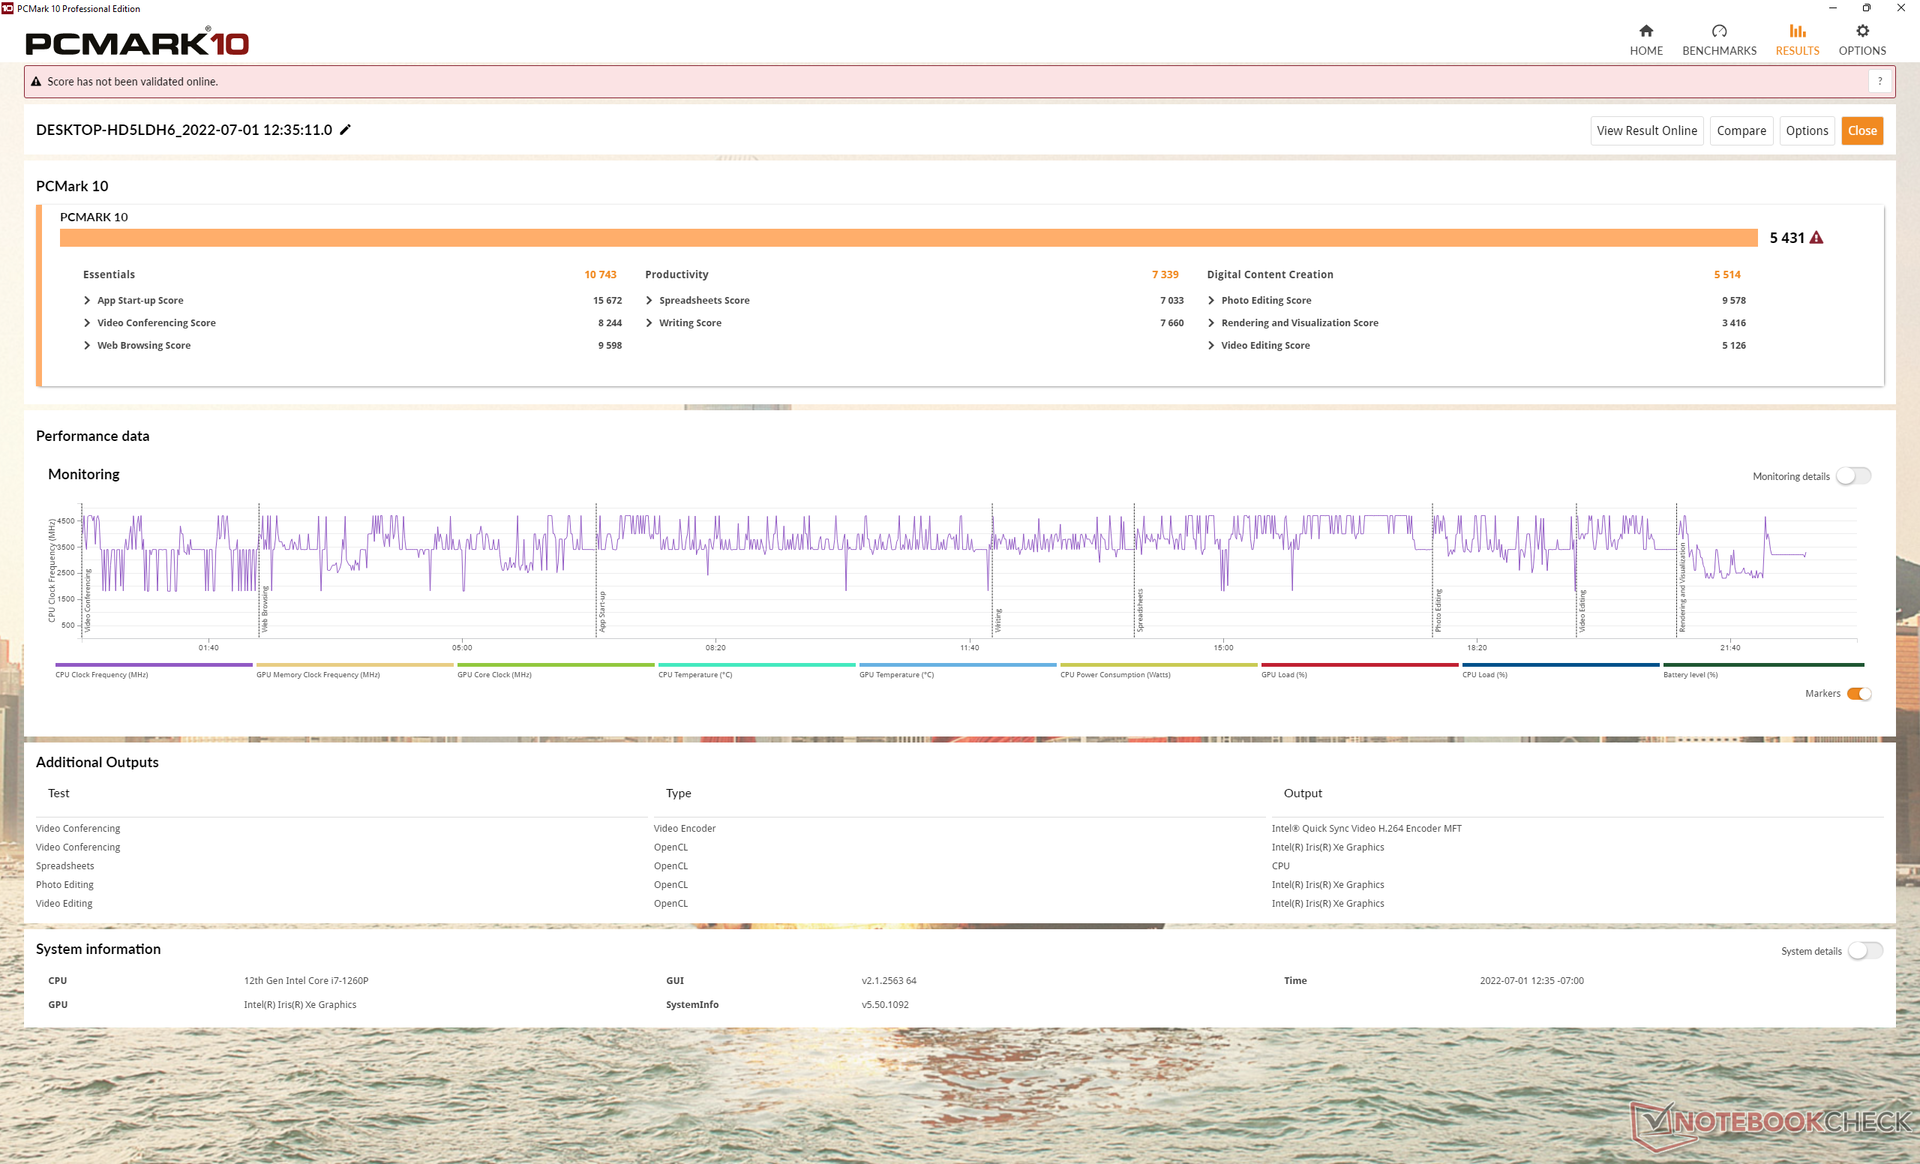
As pontuações PCMark 10 são geralmente mais altas do que qualquer produto GPD que veio antes de nosso Win Max 2 para estar essencialmente em pé de igualdade com laptops de tamanho normal como o Dell Inspiron 16 7620 2 em 1. Curiosamente, o Win Max original, alimentado pela AMD, tem uma produtividade mais alta, provavelmente devido ao seu desempenho mais rápido da CPU multi-portátil.
CrossMark: Overall | Productivity | Creativity | Responsiveness
| PCMark 10 / Score | |
| Média Intel Core i7-1260P, Intel Iris Xe Graphics G7 96EUs (4796 - 6068, n=17) | |
| GPD Win Max 2 | |
| GPD Win Max 2021 | |
| GPD Pocket 3 | |
| GPD Win 3 | |
| Microsoft Surface Go 3 Core i3 | |
| Lenovo IdeaPad Flex 3 11IGL05 | |
| PCMark 10 / Essentials | |
| GPD Win Max 2 | |
| GPD Pocket 3 | |
| Média Intel Core i7-1260P, Intel Iris Xe Graphics G7 96EUs (9260 - 11251, n=17) | |
| GPD Win 3 | |
| GPD Win Max 2021 | |
| Microsoft Surface Go 3 Core i3 | |
| Lenovo IdeaPad Flex 3 11IGL05 | |
| PCMark 10 / Productivity | |
| GPD Win Max 2021 | |
| GPD Pocket 3 | |
| GPD Win Max 2 | |
| Média Intel Core i7-1260P, Intel Iris Xe Graphics G7 96EUs (6167 - 8629, n=17) | |
| GPD Win 3 | |
| Microsoft Surface Go 3 Core i3 | |
| Lenovo IdeaPad Flex 3 11IGL05 | |
| PCMark 10 / Digital Content Creation | |
| Média Intel Core i7-1260P, Intel Iris Xe Graphics G7 96EUs (5231 - 6908, n=17) | |
| GPD Win Max 2 | |
| GPD Win Max 2021 | |
| GPD Pocket 3 | |
| GPD Win 3 | |
| Microsoft Surface Go 3 Core i3 | |
| Lenovo IdeaPad Flex 3 11IGL05 | |
| CrossMark / Overall | |
| GPD Win Max 2 | |
| Média Intel Core i7-1260P, Intel Iris Xe Graphics G7 96EUs (1484 - 1811, n=16) | |
| CrossMark / Productivity | |
| GPD Win Max 2 | |
| Média Intel Core i7-1260P, Intel Iris Xe Graphics G7 96EUs (1486 - 1755, n=16) | |
| CrossMark / Creativity | |
| Média Intel Core i7-1260P, Intel Iris Xe Graphics G7 96EUs (1451 - 1872, n=16) | |
| GPD Win Max 2 | |
| CrossMark / Responsiveness | |
| GPD Win Max 2 | |
| Média Intel Core i7-1260P, Intel Iris Xe Graphics G7 96EUs (1253 - 1807, n=16) | |
| PCMark 10 Score | 5431 pontos | |
Ajuda | ||
| AIDA64 / Memory Copy | |
| GPD Win Max 2 | |
| GPD Pocket 3 | |
| Média Intel Core i7-1260P (25125 - 71544, n=25) | |
| GPD Win Max 2021 | |
| AIDA64 / Memory Read | |
| GPD Win Max 2 | |
| Média Intel Core i7-1260P (24983 - 72065, n=25) | |
| GPD Pocket 3 | |
| GPD Win Max 2021 | |
| AIDA64 / Memory Write | |
| GPD Win Max 2 | |
| GPD Pocket 3 | |
| Média Intel Core i7-1260P (23512 - 66799, n=25) | |
| GPD Win Max 2021 | |
| AIDA64 / Memory Latency | |
| GPD Win Max 2021 | |
| GPD Win Max 2 | |
| GPD Pocket 3 | |
| Média Intel Core i7-1260P (77.9 - 118.4, n=21) | |
| Microsoft Surface Go 3 Core i3 | |
* ... menor é melhor
Latência do DPC
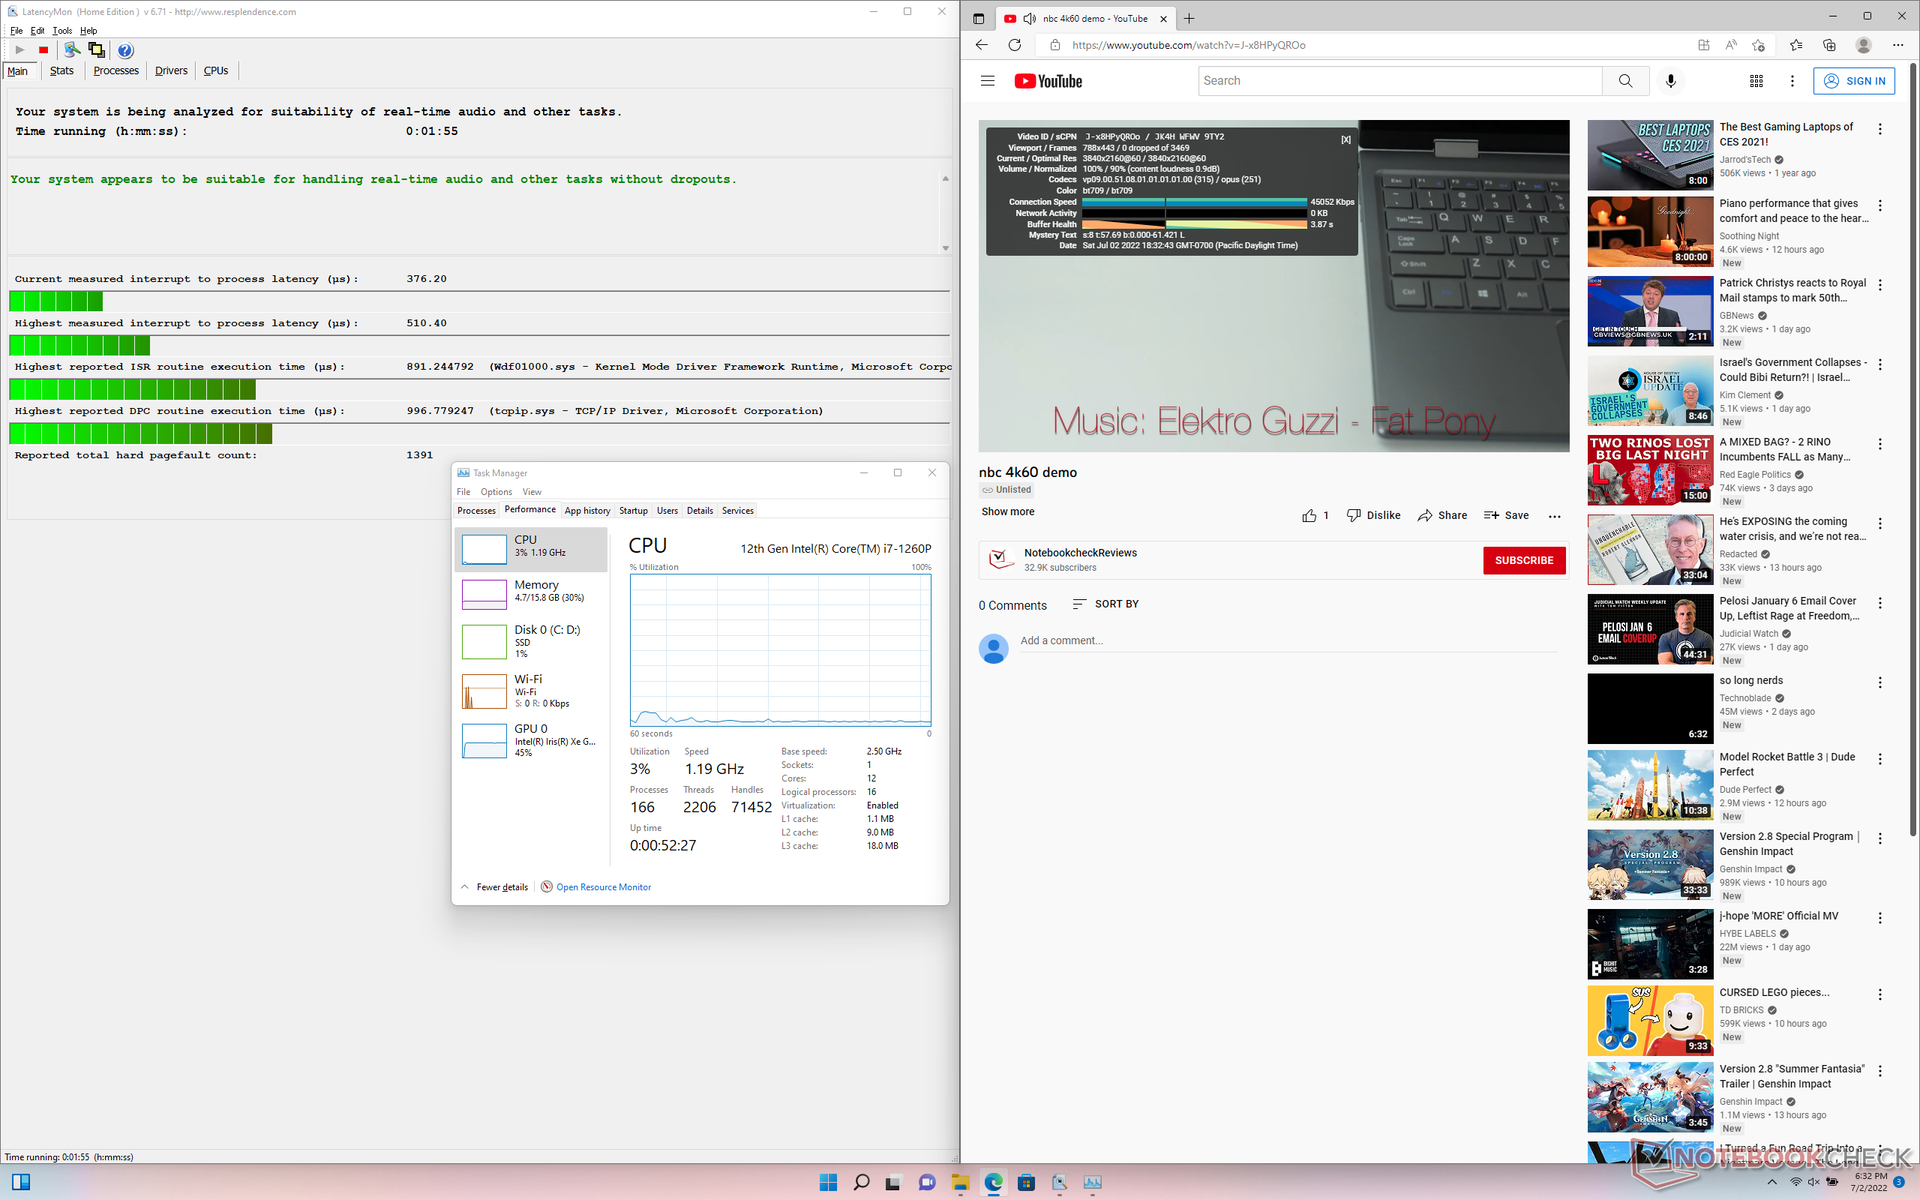
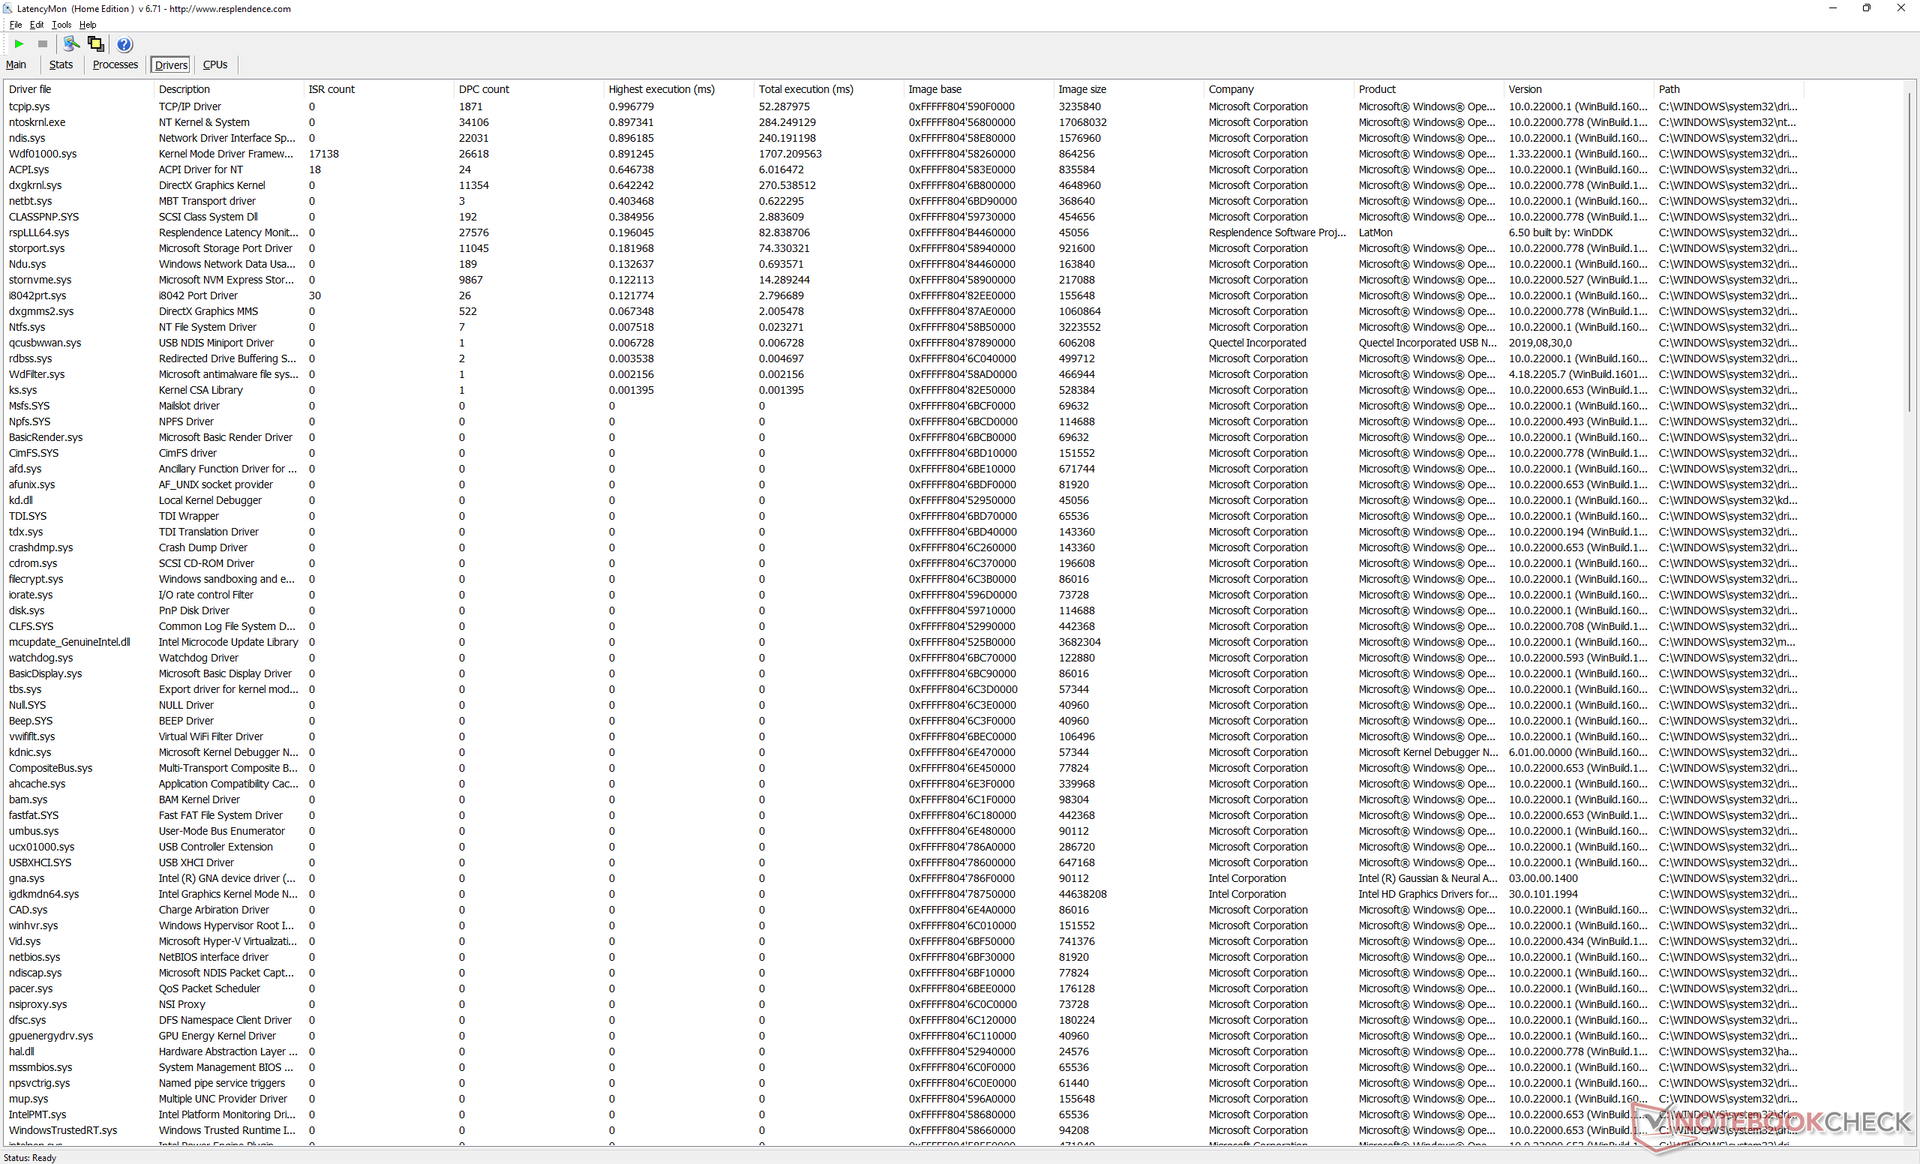
LatencyMon não mostra problemas de DPC ao abrir várias abas do navegador em nossa página inicial ou ao executar Prime95. a reprodução de vídeo 4K a 60 FPS também é suave, sem queda de quadros.
| DPC Latencies / LatencyMon - interrupt to process latency (max), Web, Youtube, Prime95 | |
| Microsoft Surface Go 3 Core i3 | |
| GPD Win Max 2021 | |
| Lenovo IdeaPad Flex 3 11IGL05 | |
| GPD Win 3 | |
| GPD Pocket 3 | |
| GPD Win Max 2 | |
* ... menor é melhor
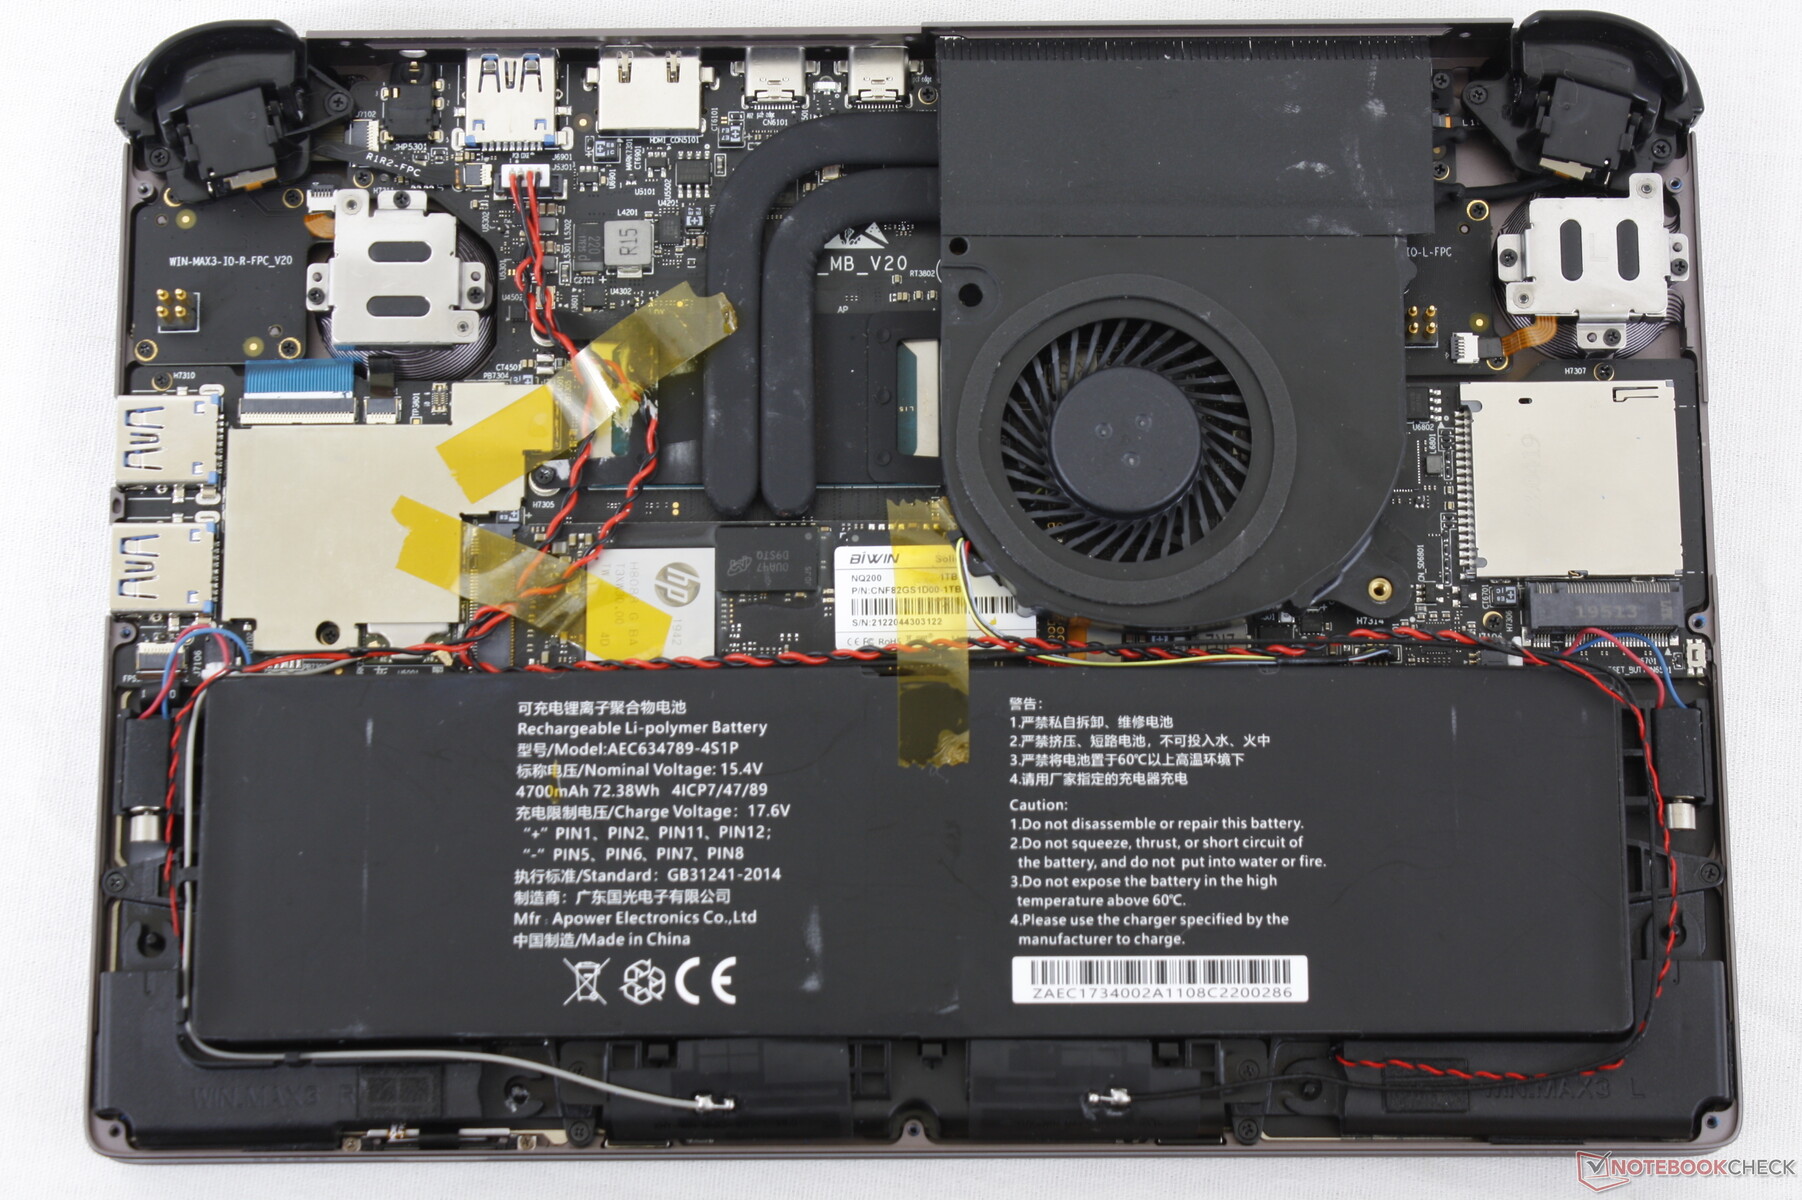
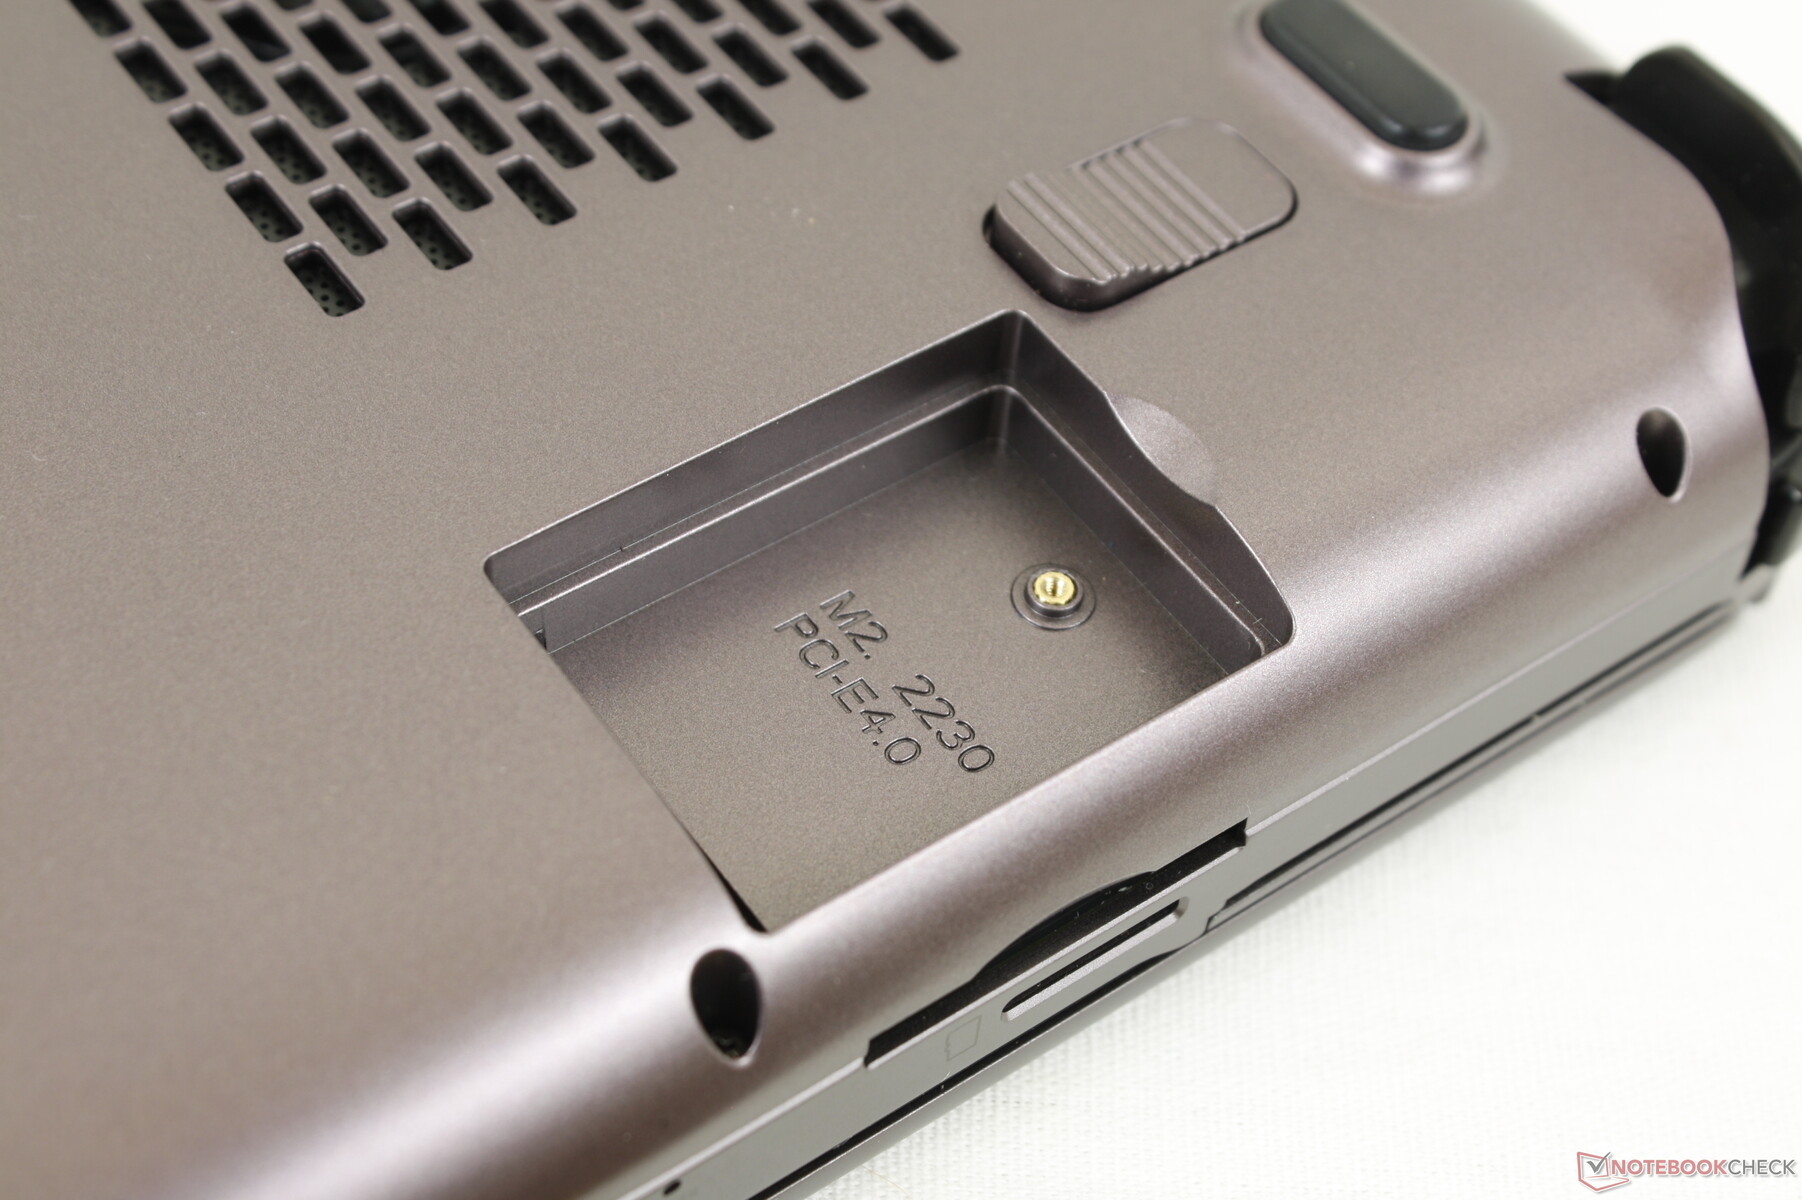
Dispositivos de armazenamento - Suporte PCIe3 e PCIe4
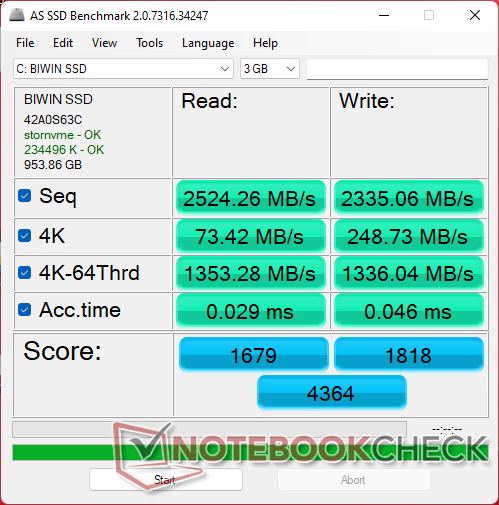
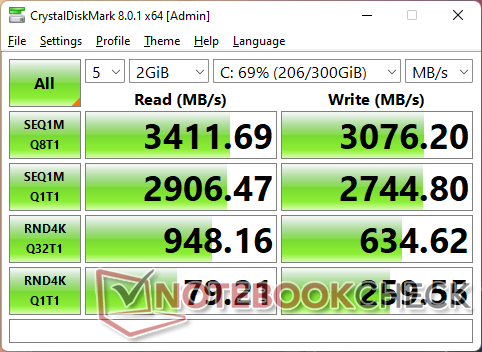
O modelo pode suportar até duas PCIe4 x4 SSDs, embora nossa unidade seja fornecida com um 1 TB BiWin NQ200 Unidade PCIe3 x4. Mesmo assim, nossa unidade PCIe3 teria problemas para manter taxas de transferência acima de 3300 MB/s, como mostra nosso teste de loop DiskSpd abaixo, devido a limitações térmicas. Se você decidir instalar um drive PCIe4 x4, então não espere que ele funcione com suas especificações máximas anunciadas por longos períodos.

| Drive Performance rating - Percent | |
| GPD Win Max 2 | |
| Média BiWin NQ200 1TB CNF82GS1D00-1TB | |
| GPD Pocket 3 | |
| GPD Win 3 | |
| GPD Win Max 2021 | |
| Microsoft Surface Go 3 Core i3 | |
| Lenovo IdeaPad Flex 3 11IGL05 | |
* ... menor é melhor
Disk Throttling: DiskSpd Read Loop, Queue Depth 8
GPU Performance - Iris Xe é mais lenta que a Radeon 680M
Apesar do desempenho mais lento do que o esperado da CPU, o desempenho gráfico permanece excelente. os resultados do 3DMark são 15% a 20% superiores à média dos portáteis em nosso banco de dados equipados com o mesmo Iris Xe 96 EUs GPU. Isto é bom o suficiente para poder rodar alguns jogos 3D antigos a 1080p e 30 FPS em configurações médias a altas, incluindo Witcher 3mas recomendamos baixar as configurações e a vsync envolvente para suavizar a experiência de jogo. É lamentável que a tela não suporte a sincronização adaptativa, pois tal característica teria ajudado tremendamente quando se jogava.
Quando comparado com o GPD Win 3 rodando no Iris Xe 80 EU, nosso Win Max 2 pode oferecer um desempenho gráfico 15 a 30 por cento mais rápido. Optando pelo AMD Radeon 680M A SKU irá aumentar o desempenho gráfico em 20 a 30% em relação à nossa SKU Intel.
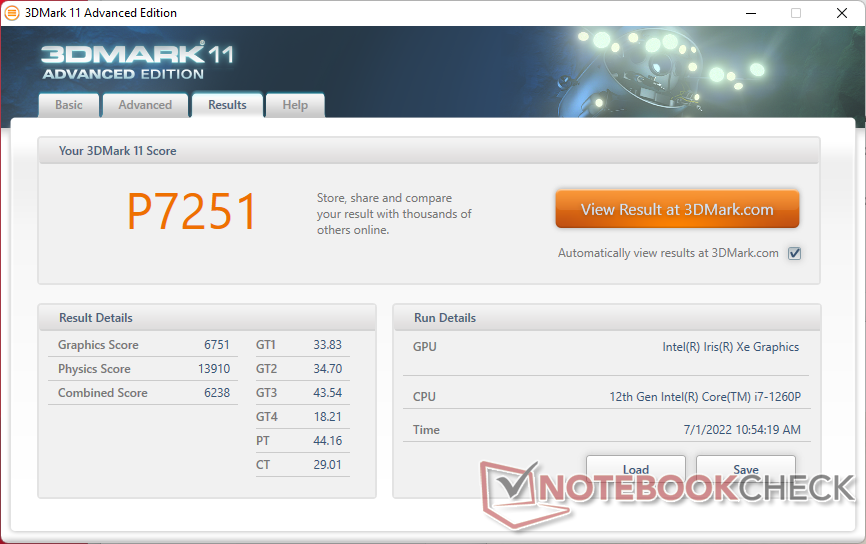
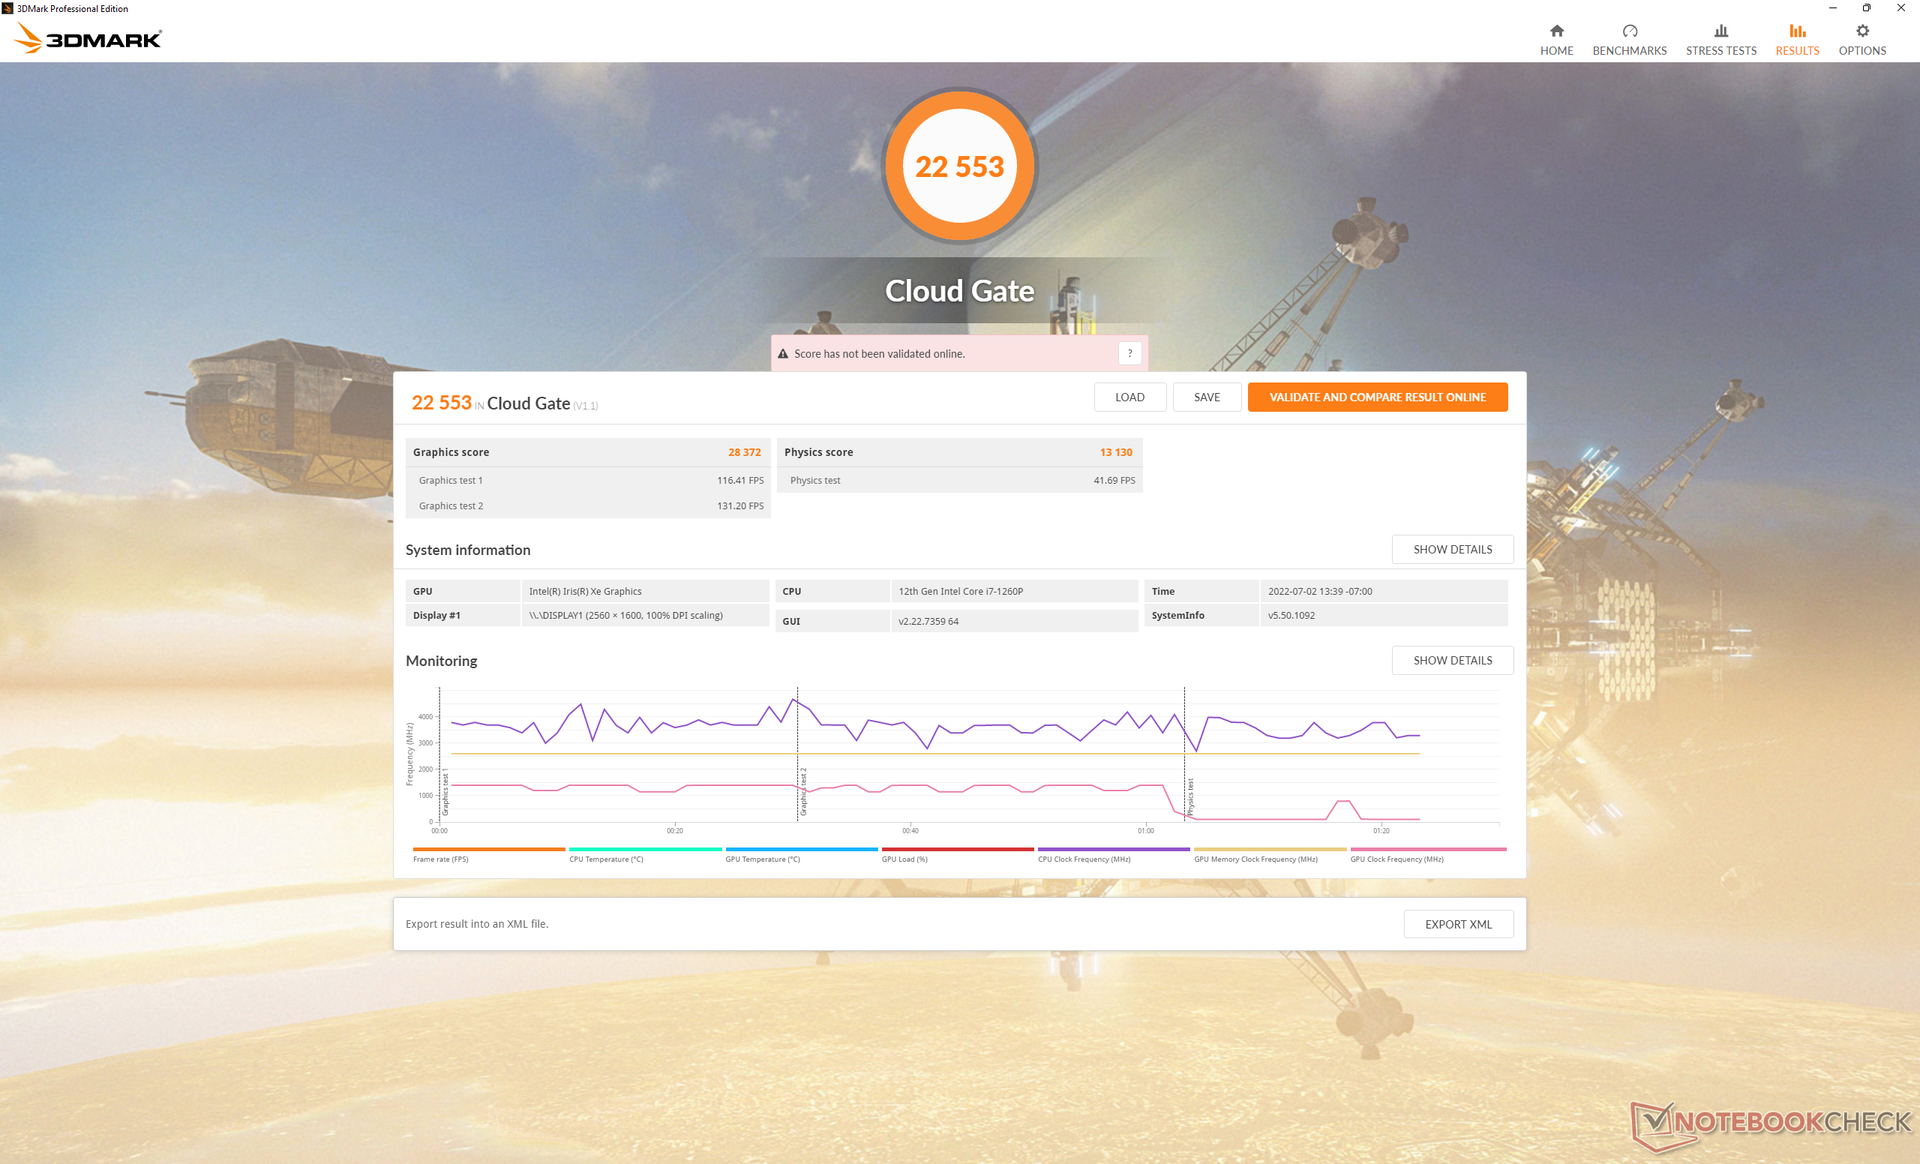
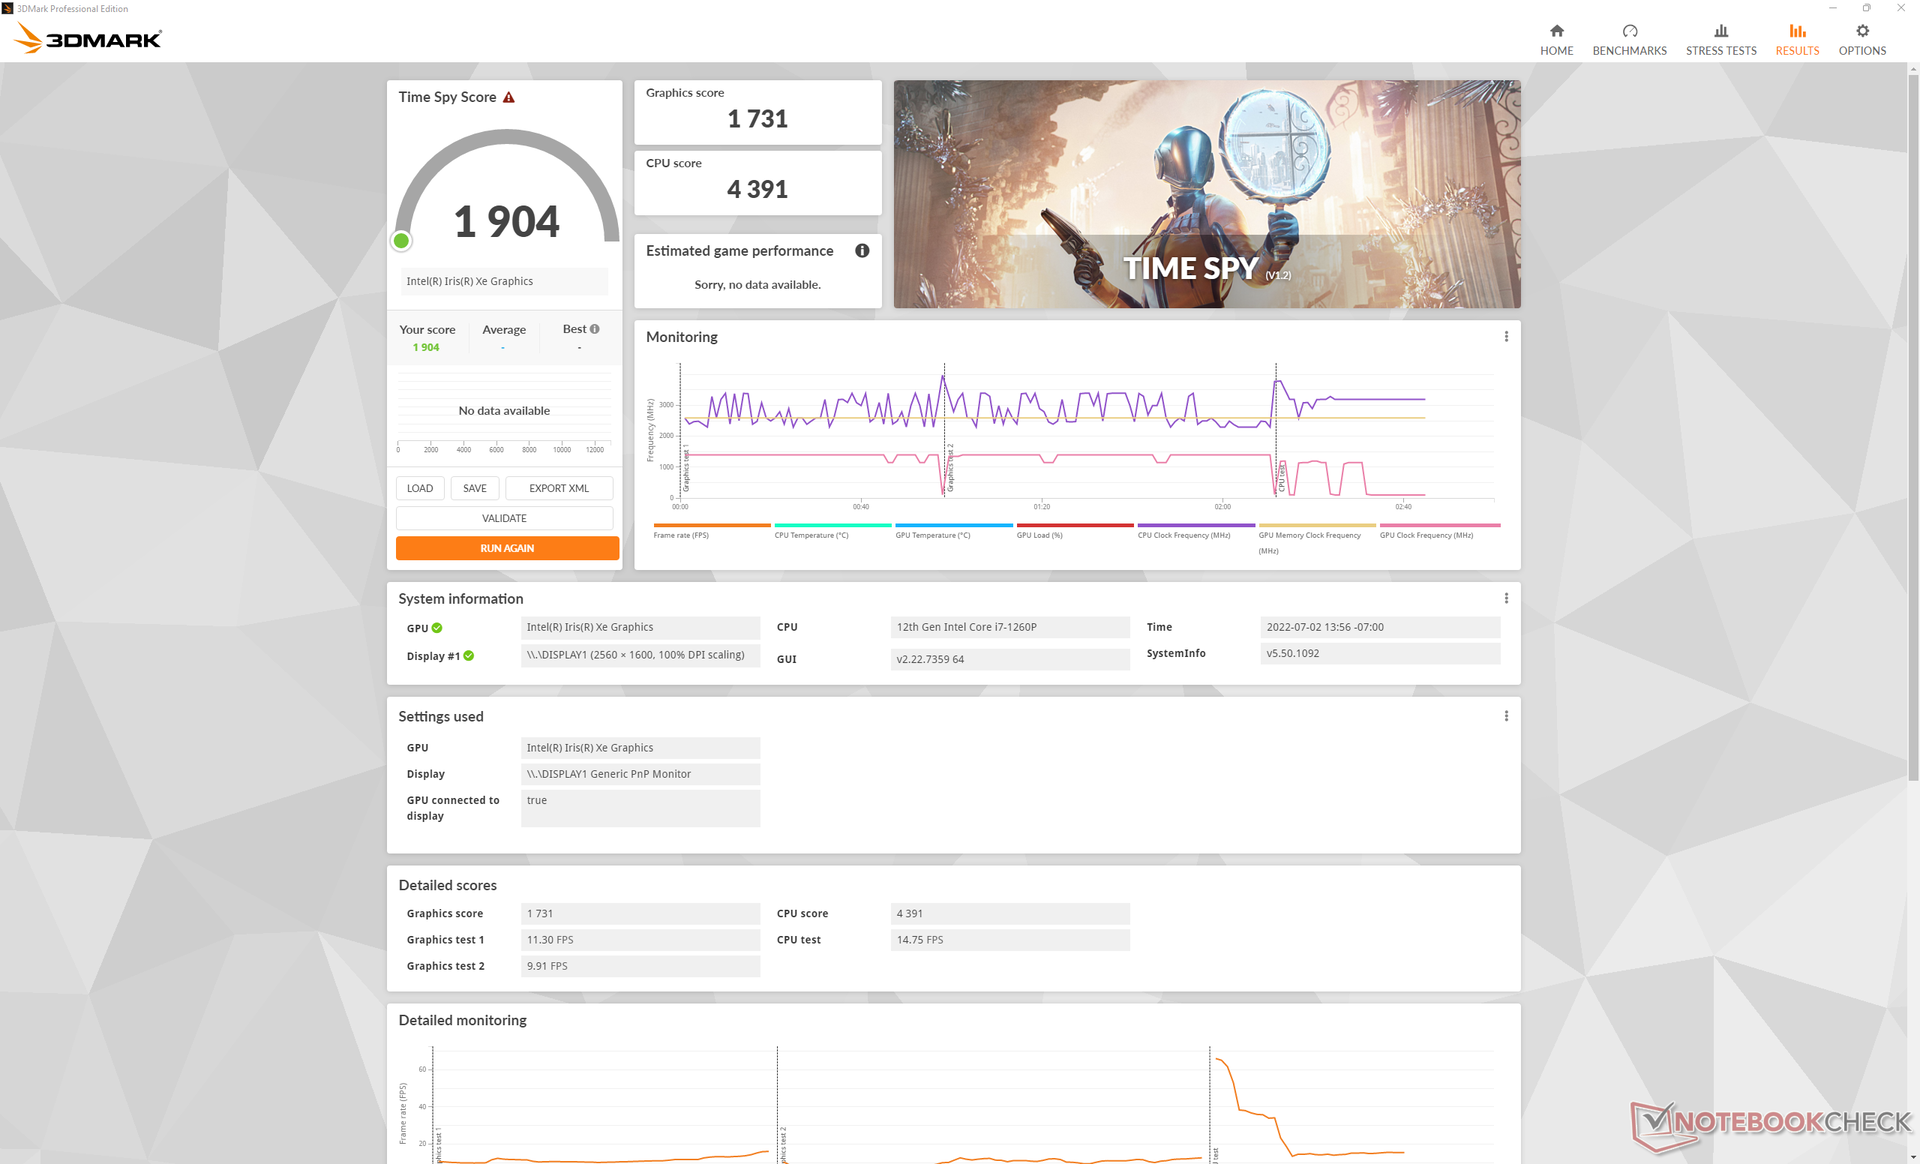
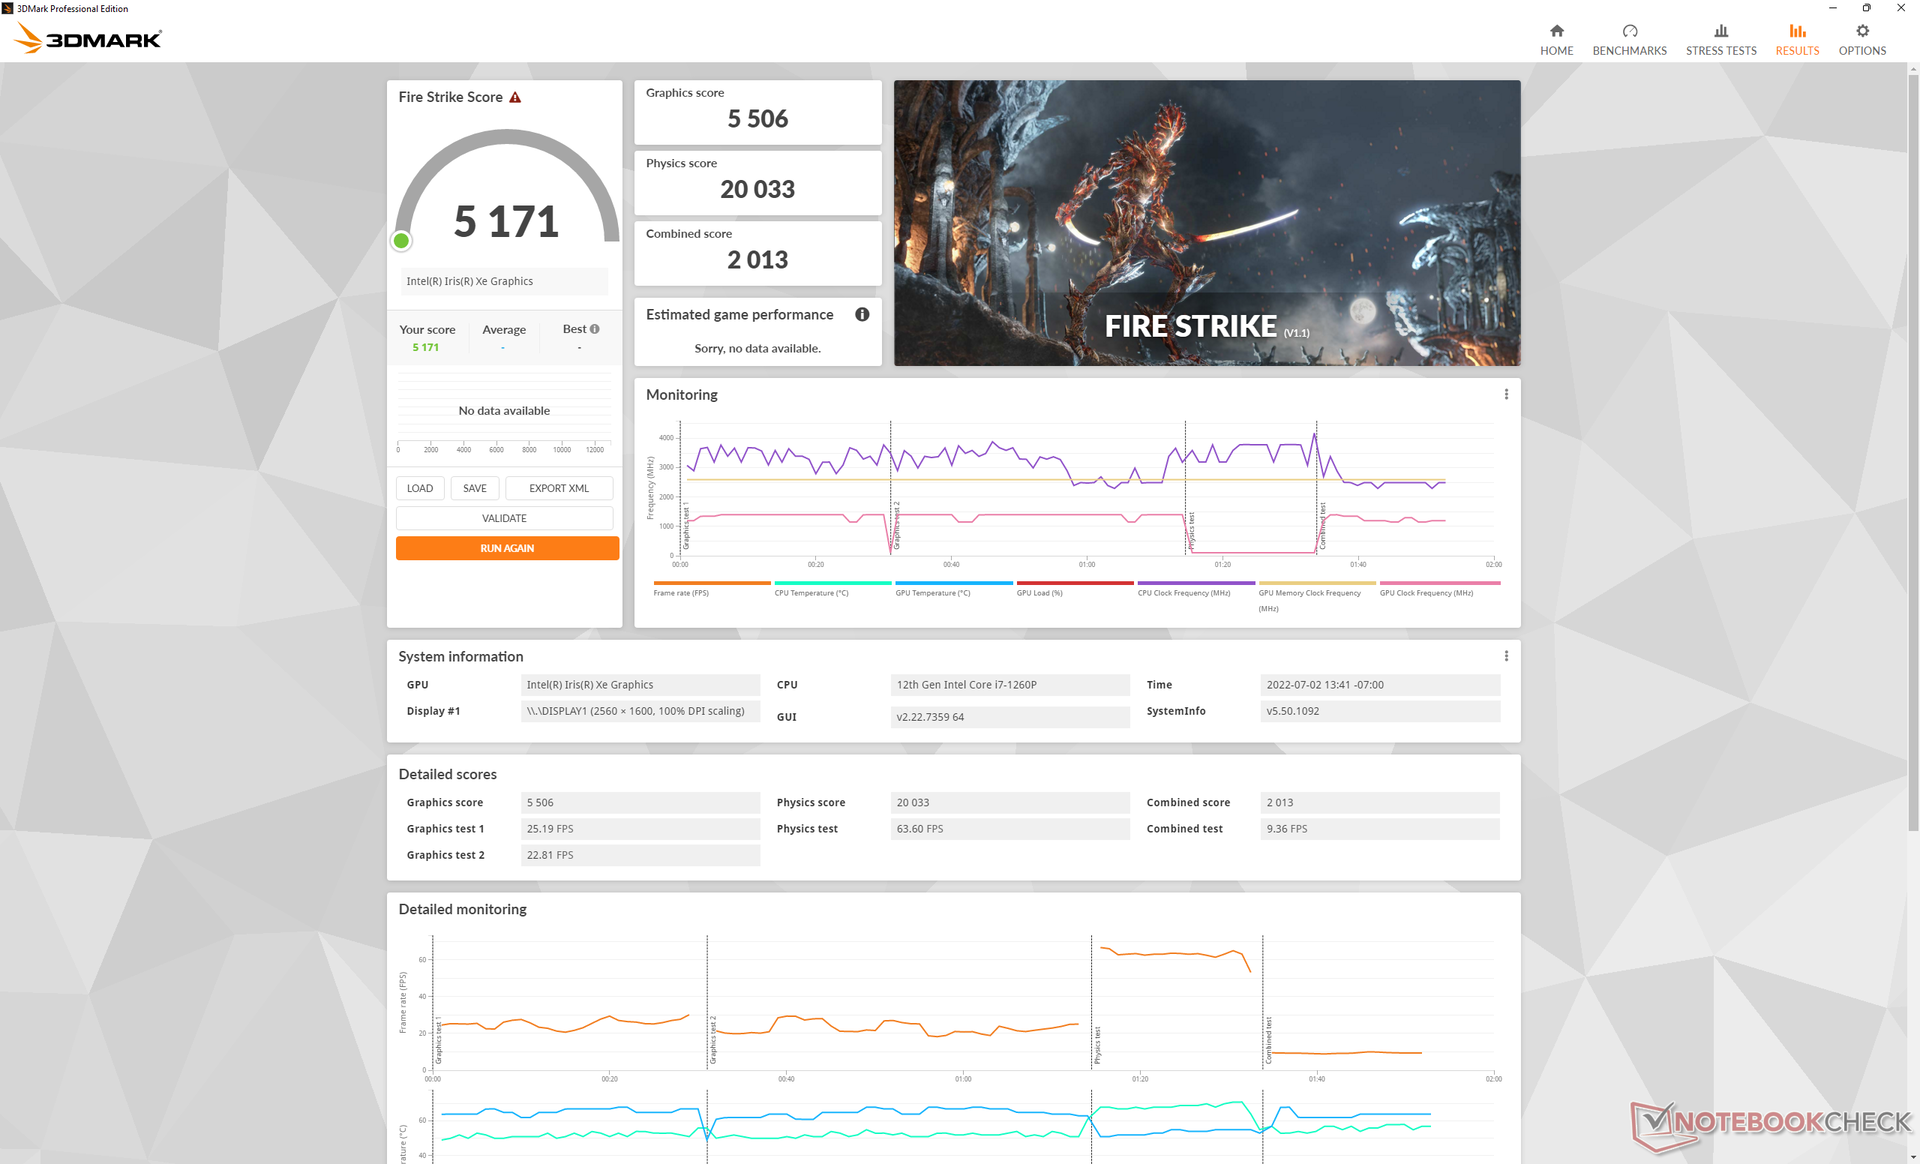
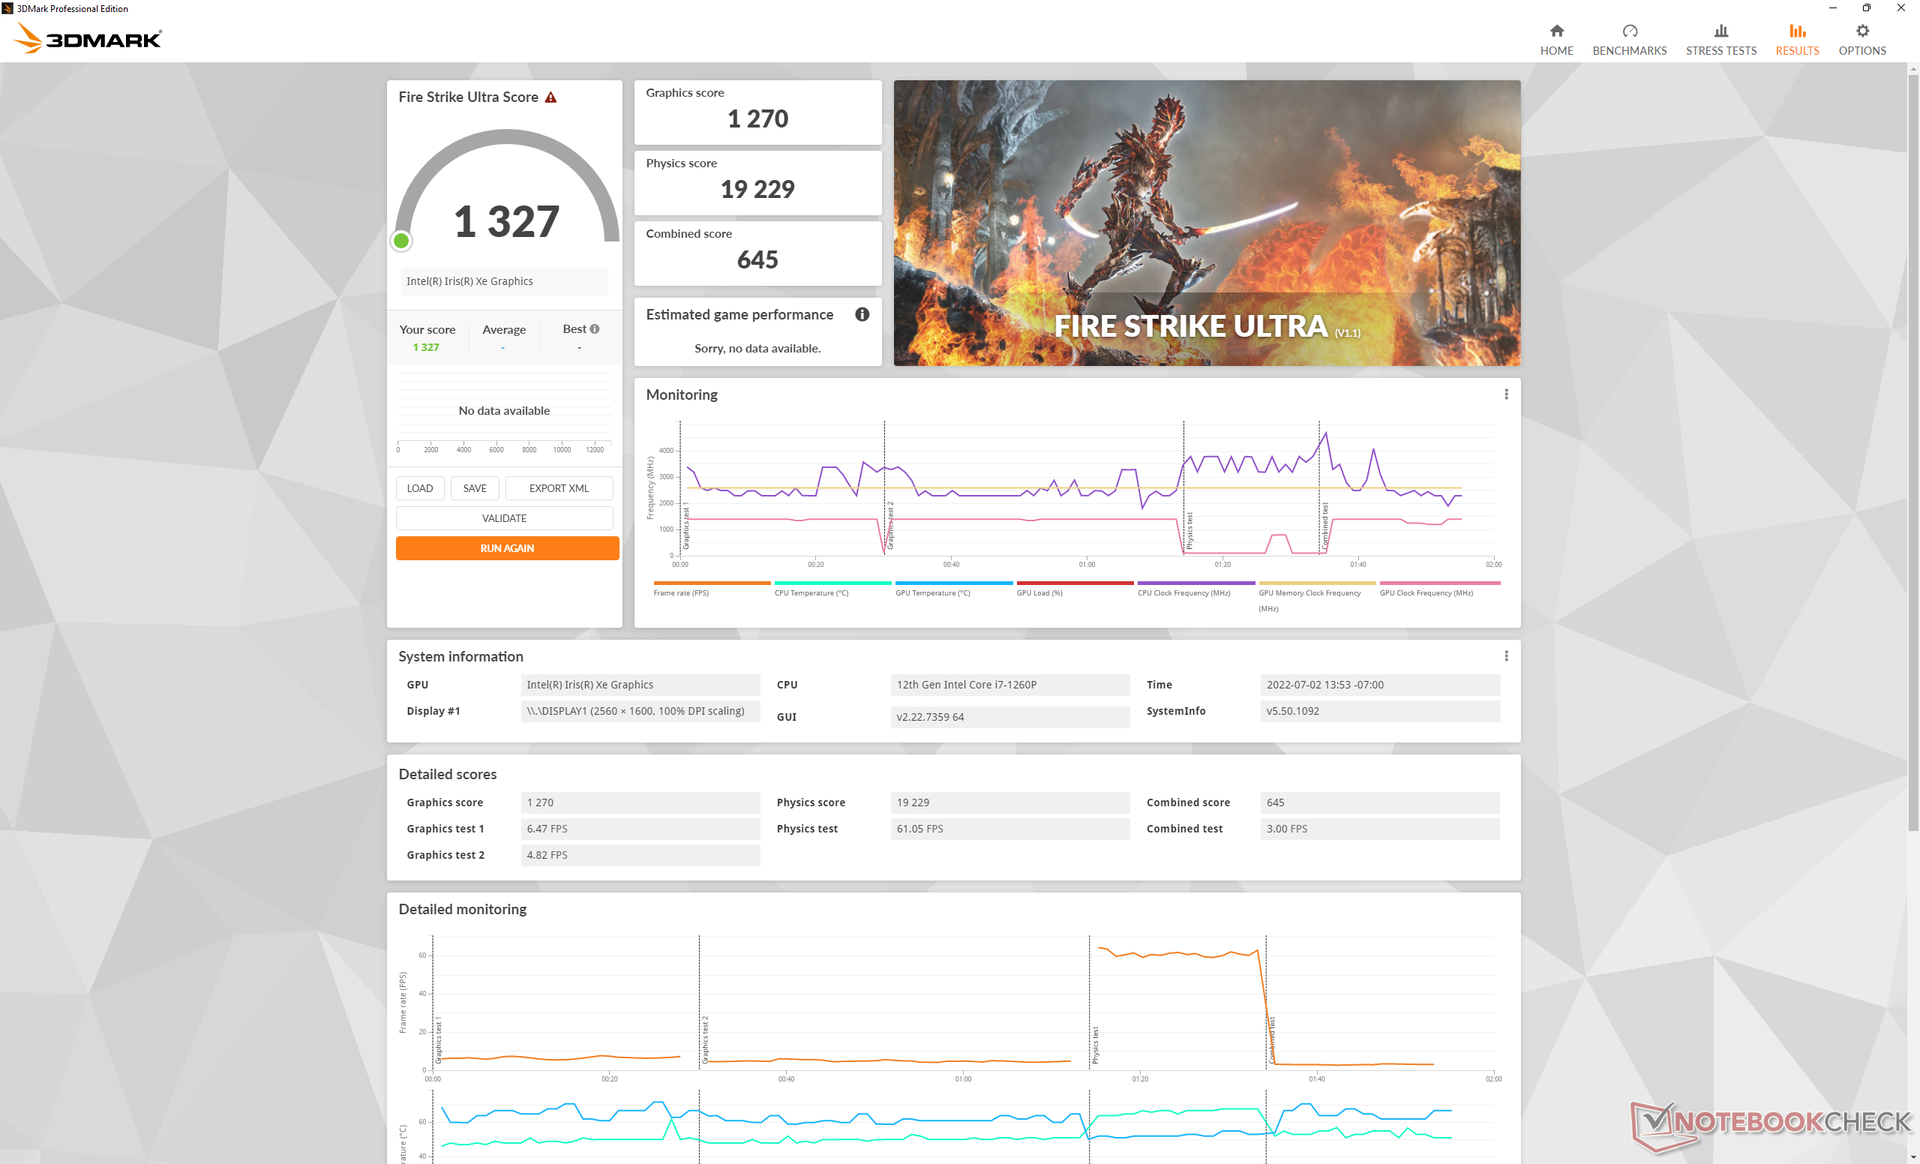
| 3DMark 11 Performance | 7251 pontos | |
| 3DMark Cloud Gate Standard Score | 22553 pontos | |
| 3DMark Fire Strike Score | 5171 pontos | |
| 3DMark Time Spy Score | 1904 pontos | |
Ajuda | ||
| Cyberpunk 2077 1.6 | |
| 1280x720 Low Preset | |
| Asus Zenbook S 13 OLED | |
| GPD Win Max 2 | |
| Média Intel Iris Xe Graphics G7 96EUs (20.6 - 44.7, n=17) | |
| 1920x1080 Low Preset | |
| Asus Zenbook S 13 OLED | |
| GPD Win Max 2 | |
| Média Intel Iris Xe Graphics G7 96EUs (13 - 25.9, n=42) | |
| 1920x1080 Medium Preset | |
| Asus Zenbook S 13 OLED | |
| GPD Win Max 2 | |
| Média Intel Iris Xe Graphics G7 96EUs (10.8 - 21.7, n=37) | |
| 1920x1080 High Preset | |
| Asus Zenbook S 13 OLED | |
| GPD Win Max 2 | |
| Média Intel Iris Xe Graphics G7 96EUs (9.8 - 16.9, n=34) | |
| 1920x1080 Ultra Preset | |
| Asus Zenbook S 13 OLED | |
| GPD Win Max 2 | |
| Média Intel Iris Xe Graphics G7 96EUs (7.4 - 16.8, n=32) | |
Witcher 3 FPS Chart
| baixo | média | alto | ultra | QHD | |
|---|---|---|---|---|---|
| GTA V (2015) | 107.9 | 95.2 | 23 | 9.96 | 6.6 |
| The Witcher 3 (2015) | 84.7 | 57 | 31.4 | 14.6 | |
| Dota 2 Reborn (2015) | 105.9 | 80.8 | 63.5 | 58.2 | |
| Final Fantasy XV Benchmark (2018) | 43.1 | 24.3 | 17.5 | ||
| X-Plane 11.11 (2018) | 47.7 | 35 | 32.2 | ||
| Strange Brigade (2018) | 85.1 | 42.1 | 33.8 | 27.3 | 20.1 |
| Cyberpunk 2077 1.6 (2022) | 20.4 | 17.3 | 13.3 | 10.7 |
Emissões
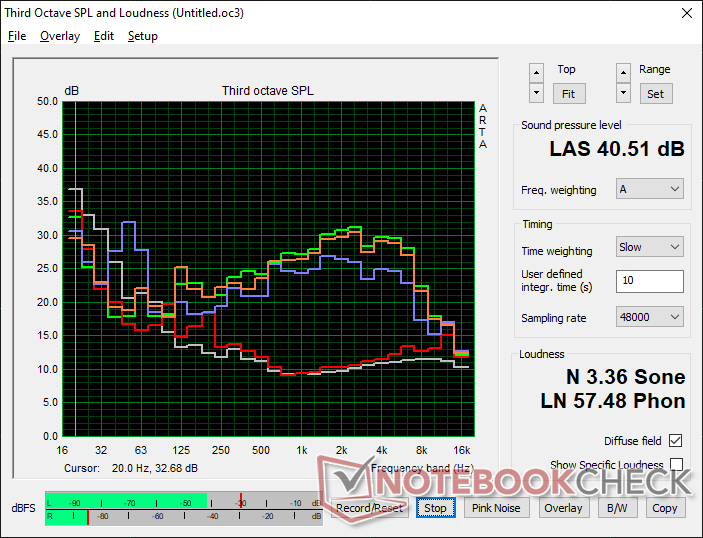
Ruído do sistema - Definitivamente mais alto do que o Nintendo Switch
O ruído dos ventiladores tende a permanecer entre 22,7 dB(A) e 28,5 dB(A) contra um fundo de 22,6 dB(A) durante a navegação ou streaming de vídeo. Embora não seja barulhento ou particularmente incômodo, as mudanças de RPM podem ser repentinas e perceptíveis.
Ao rodar Witcher 3 no modo turbo ventilador, o ruído do ventilador seria muito mais silencioso do que o que experimentamos no Win Max 2021, onde o ruído do ventilador poderia chegar a 49 dB(A). A faixa baixa de 40 dB(A) é típica de muitos laptops da série U quando se opera com cargas pesadas, mas o ruído é novamente mais perceptível no Win Max 2 devido à alta freqüência do ventilador de pequeno diâmetro e ao fato de que o dispositivo é mantido mais próximo do usuário durante o jogo. Achamos que o nível de ruído é aceitável em espaços públicos como trens.
Barulho
| Ocioso |
| 23.7 / 23.7 / 28.5 dB |
| Carga |
| 36.5 / 40.5 dB |
 | ||
30 dB silencioso 40 dB(A) audível 50 dB(A) ruidosamente alto |
||
min: | ||
| GPD Win Max 2 Iris Xe G7 96EUs, i7-1260P, BiWin NQ200 1TB CNF82GS1D00-1TB | GPD Pocket 3 Iris Xe G7 96EUs, i7-1195G7, BiWin NQ200 1TB CNF82GS1D00-1TB | GPD Win Max 2021 Vega 8, R7 4800U, BIWIN NS200 512GB CNF82GS1G00-512 | GPD Win 3 Iris Xe G7 80EUs, i5-1135G7, BIWIN NS200 1TB CNF82GS1G02-1TB | Lenovo Yoga 9 14IAP7 82LU0001US Iris Xe G7 96EUs, i7-1260P, Samsung PM9A1 MZVL2512HCJQ | |
|---|---|---|---|---|---|
| Noise | -2% | -13% | -15% | 1% | |
| desligado / ambiente * (dB) | 22.6 | 23.4 -4% | 23.3 -3% | 27.4 -21% | 22.9 -1% |
| Idle Minimum * (dB) | 23.7 | 24.3 -3% | 26.6 -12% | 29.1 -23% | 23.3 2% |
| Idle Average * (dB) | 23.7 | 25.6 -8% | 26.6 -12% | 29.1 -23% | 23.5 1% |
| Idle Maximum * (dB) | 28.5 | 25.6 10% | 26.6 7% | 29.1 -2% | 23.5 18% |
| Load Average * (dB) | 36.5 | 38.3 -5% | 46.9 -28% | 40.7 -12% | 33.2 9% |
| Witcher 3 ultra * (dB) | 39.8 | 40.7 -2% | 49 -23% | 42.8 -8% | 44.9 -13% |
| Load Maximum * (dB) | 40.5 | 40.7 -0% | 49.2 -21% | 46.3 -14% | 44.6 -10% |
* ... menor é melhor
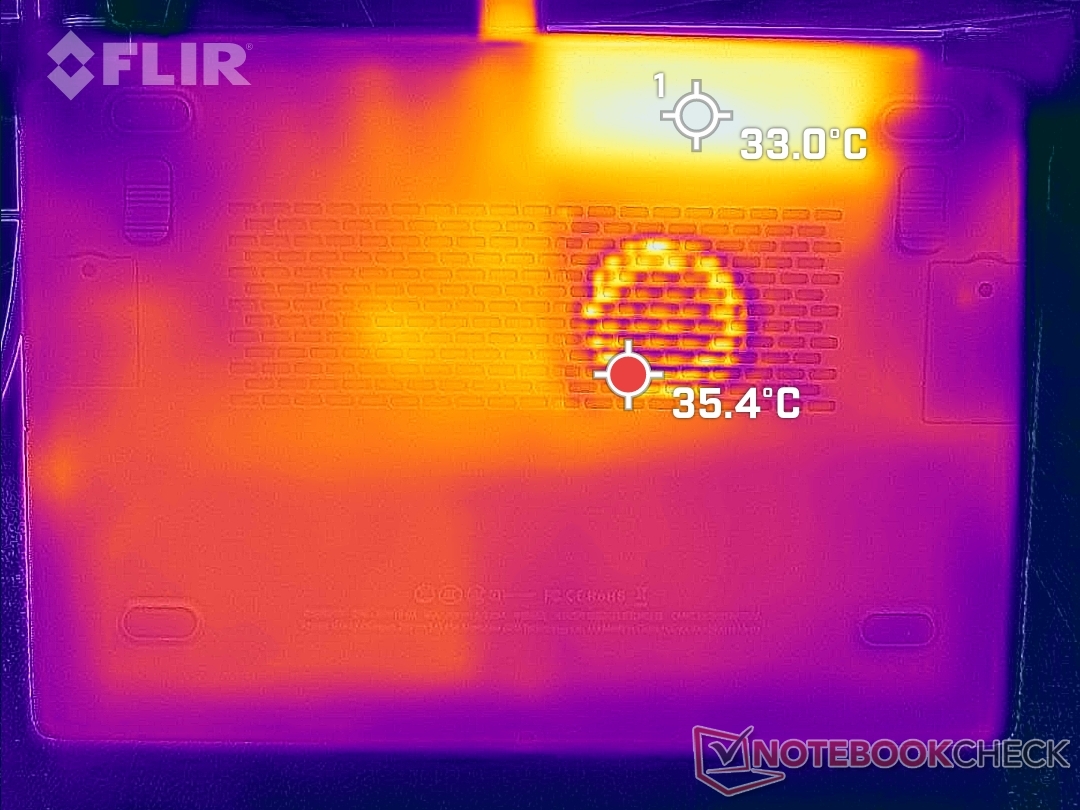
Temperatura - Nunca muito morno
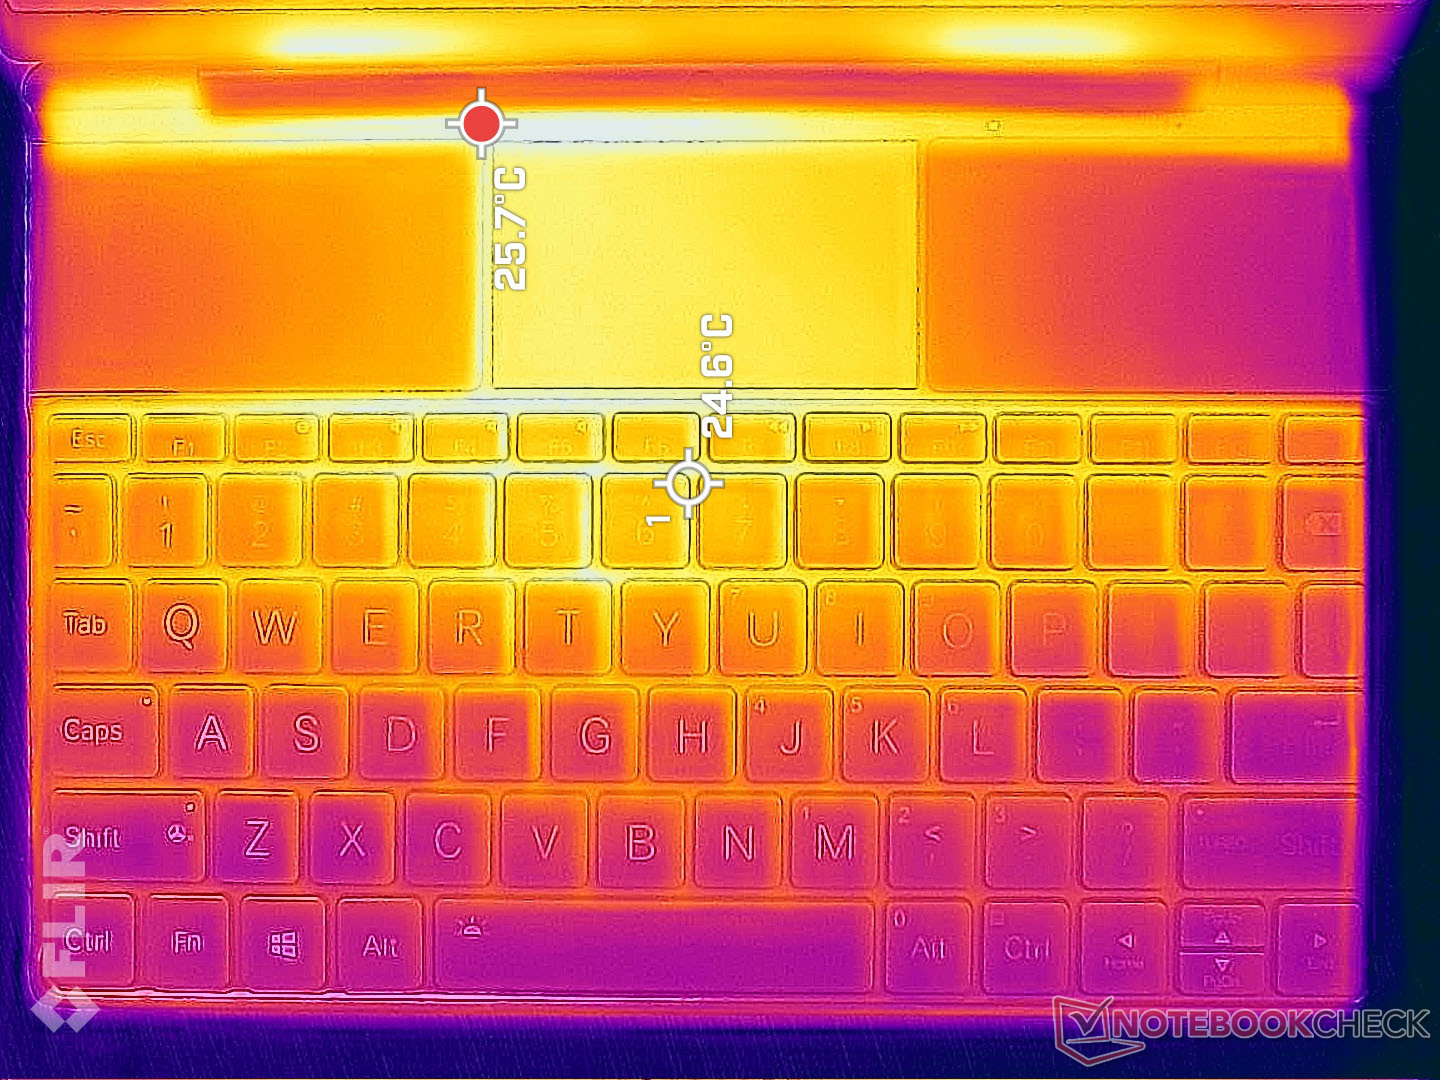
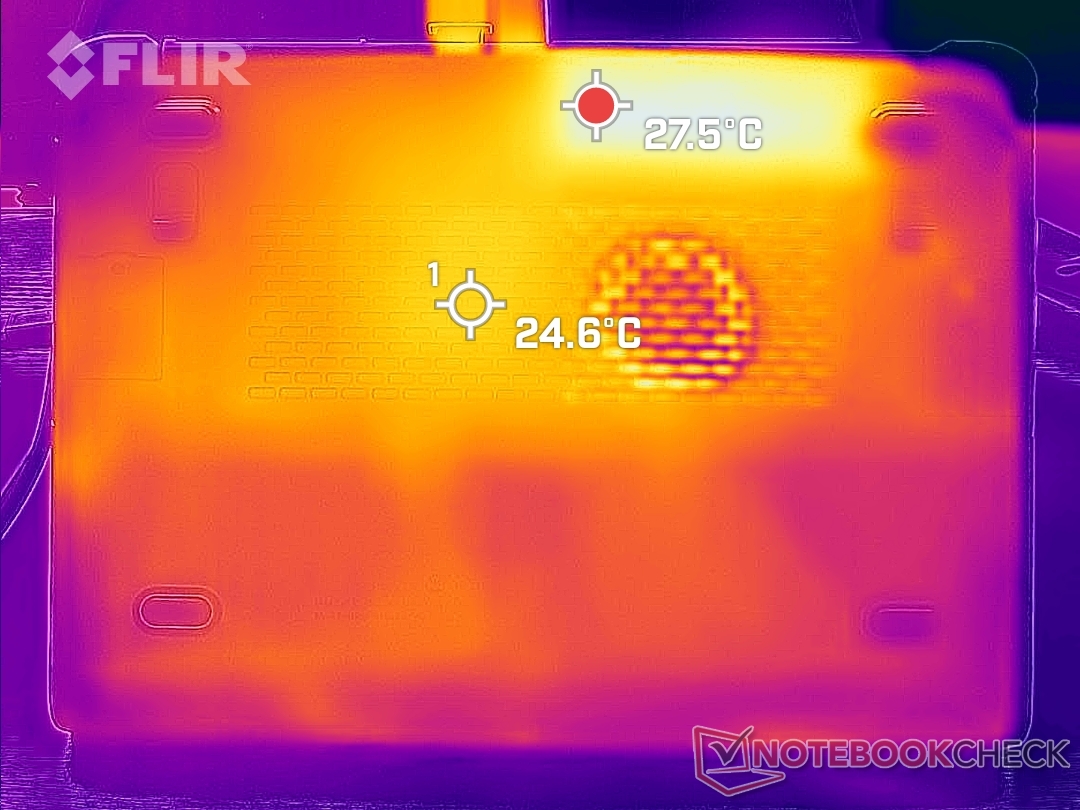
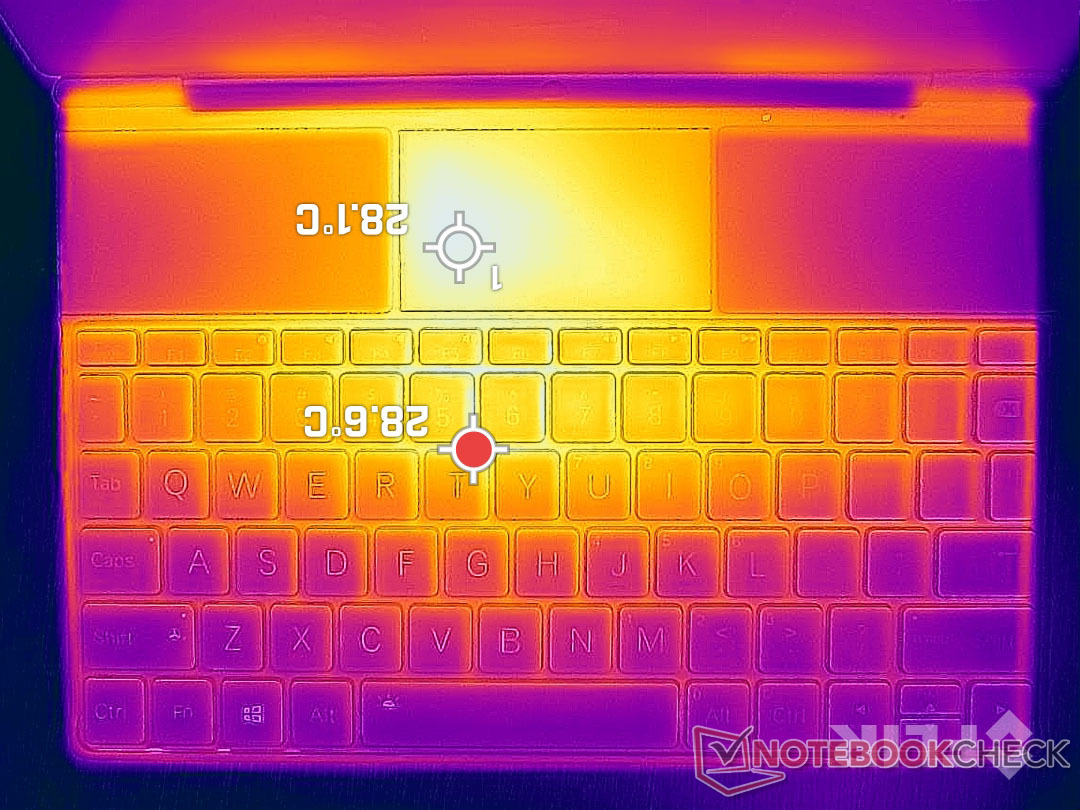
Muito parecido com o que observamos no Win Max 2021, o Win Max 2 de 2022 funciona surpreendentemente frio em relação ao seu pequeno tamanho e CPU da série Core-P do 12º gênero. Ao jogar, os pontos quentes perto da parte de trás da unidade alcançariam apenas 28 C e 33 C nos lados superior e inferior, respectivamente. Somos capazes de lidar com os joysticks e botões integrados sem que eles se sintam desconfortavelmente quentes.
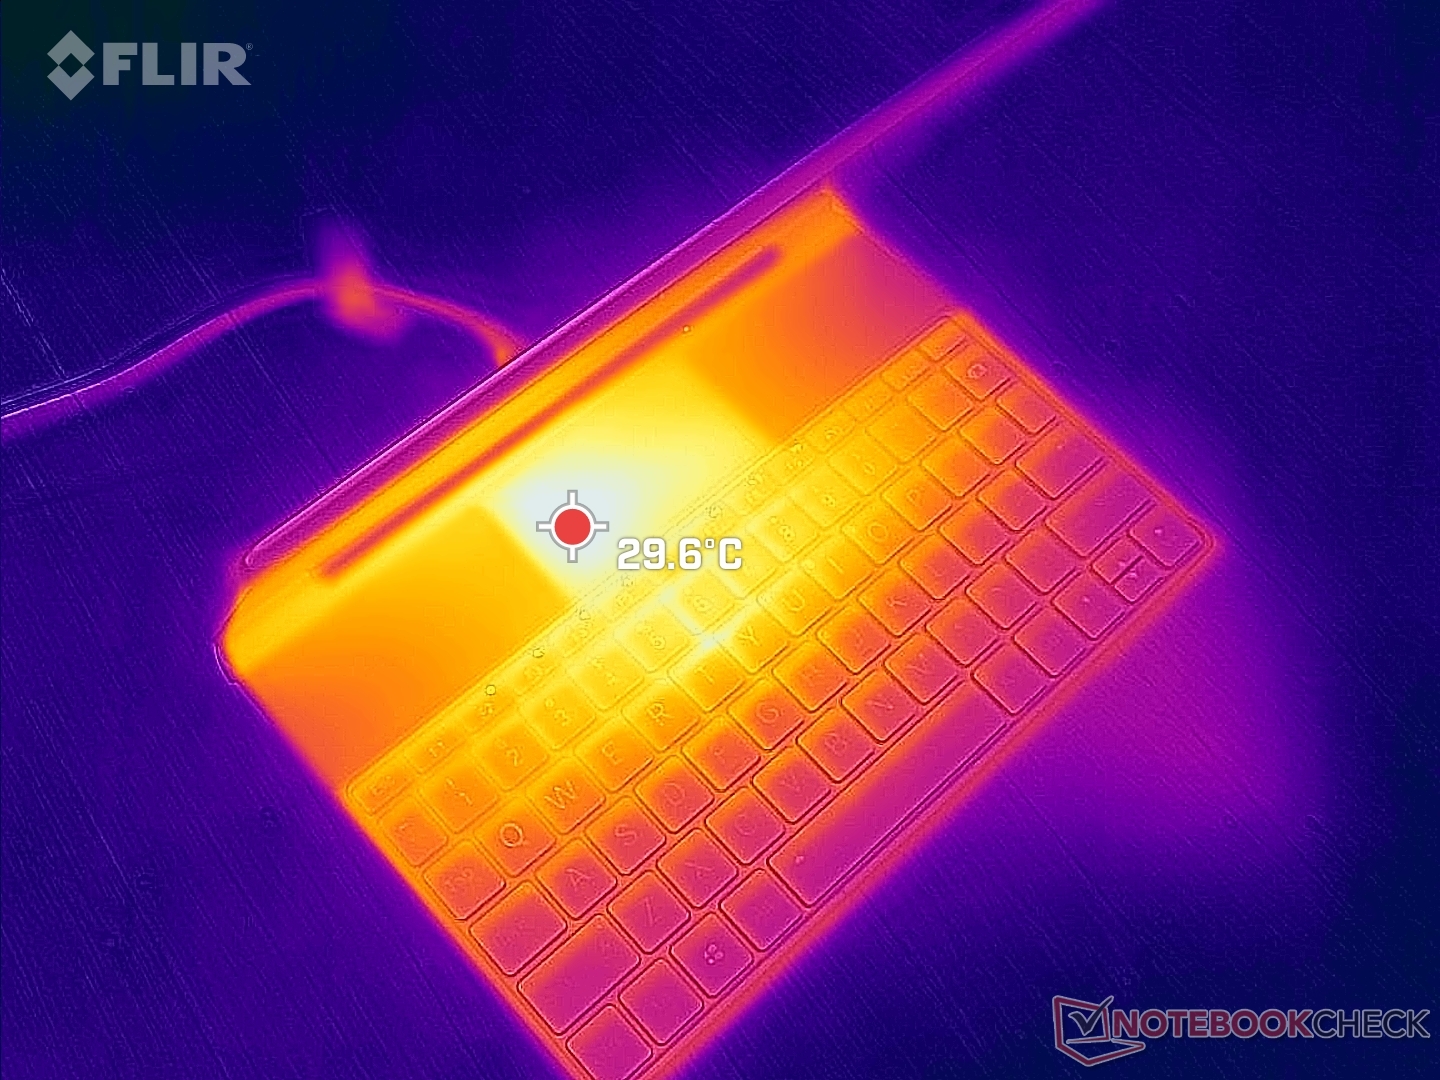
(+) A temperatura máxima no lado superior é 28.6 °C / 83 F, em comparação com a média de 35.9 °C / 97 F , variando de 21.4 a 59 °C para a classe Subnotebook.
(+) A parte inferior aquece até um máximo de 33 °C / 91 F, em comparação com a média de 39.2 °C / 103 F
(+) Em uso inativo, a temperatura média para o lado superior é 22.3 °C / 72 F, em comparação com a média do dispositivo de 30.8 °C / ### class_avg_f### F.
(+) Os apoios para as mãos e o touchpad são mais frios que a temperatura da pele, com um máximo de 21.4 °C / 70.5 F e, portanto, são frios ao toque.
(+) A temperatura média da área do apoio para as mãos de dispositivos semelhantes foi 28.2 °C / 82.8 F (+6.8 °C / 12.3 F).
| GPD Win Max 2 Intel Core i7-1260P, Intel Iris Xe Graphics G7 96EUs | GPD Pocket 3 Intel Core i7-1195G7, Intel Iris Xe Graphics G7 96EUs | GPD Win Max 2021 AMD Ryzen 7 4800U, AMD Radeon RX Vega 8 (Ryzen 4000/5000) | Microsoft Surface Go 3 Core i3 Intel Core i3-10100Y, Intel UHD Graphics 615 | Lenovo IdeaPad Flex 3 11IGL05 Intel Celeron N4020, Intel UHD Graphics 600 | |
|---|---|---|---|---|---|
| Heat | -30% | -17% | -21% | -16% | |
| Maximum Upper Side * (°C) | 28.6 | 40.4 -41% | 38 -33% | 46.1 -61% | 37.4 -31% |
| Maximum Bottom * (°C) | 33 | 39.4 -19% | 36.4 -10% | 42.7 -29% | 41.4 -25% |
| Idle Upper Side * (°C) | 24.6 | 32.6 -33% | 30 -22% | 25 -2% | 27.2 -11% |
| Idle Bottom * (°C) | 27.6 | 34.4 -25% | 28 -1% | 25 9% | 27 2% |
* ... menor é melhor
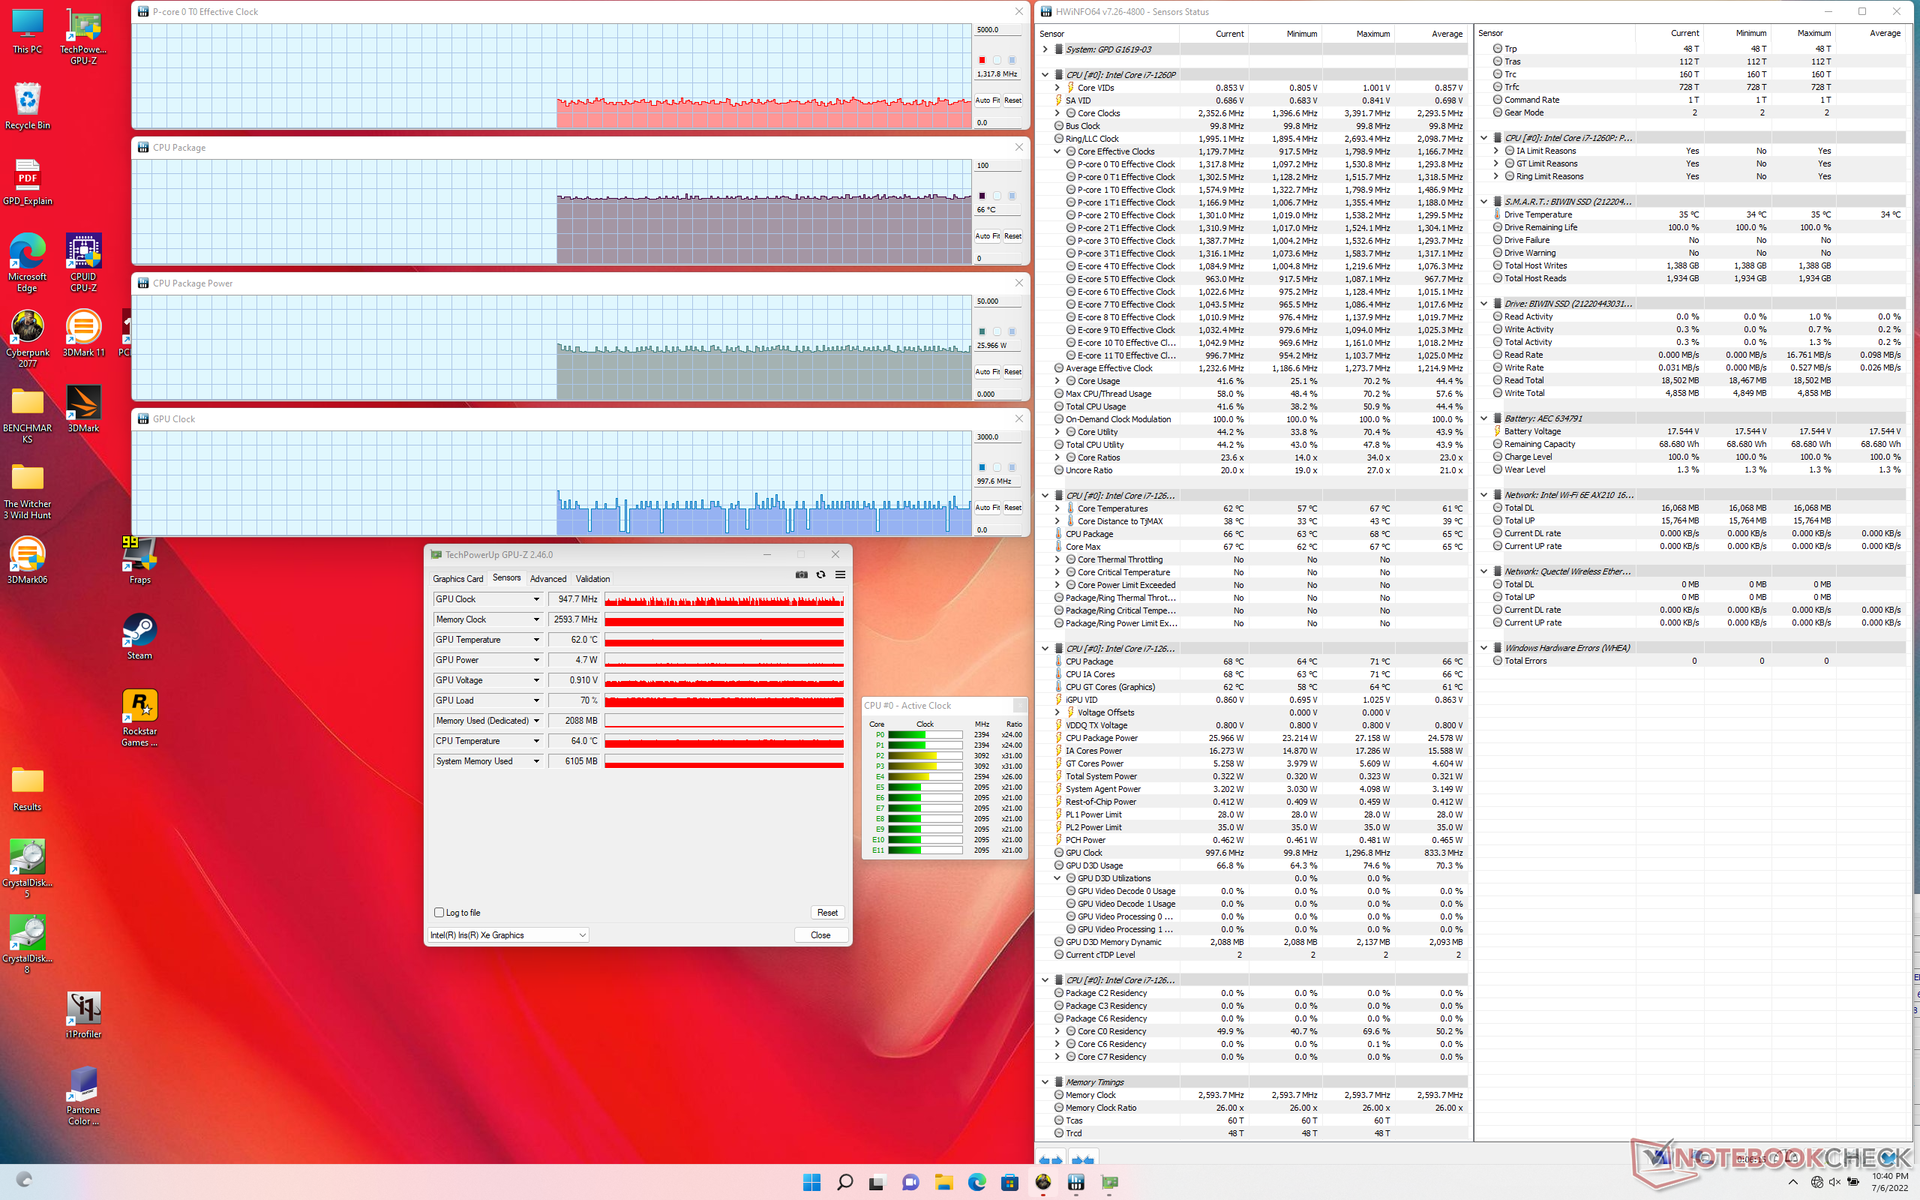
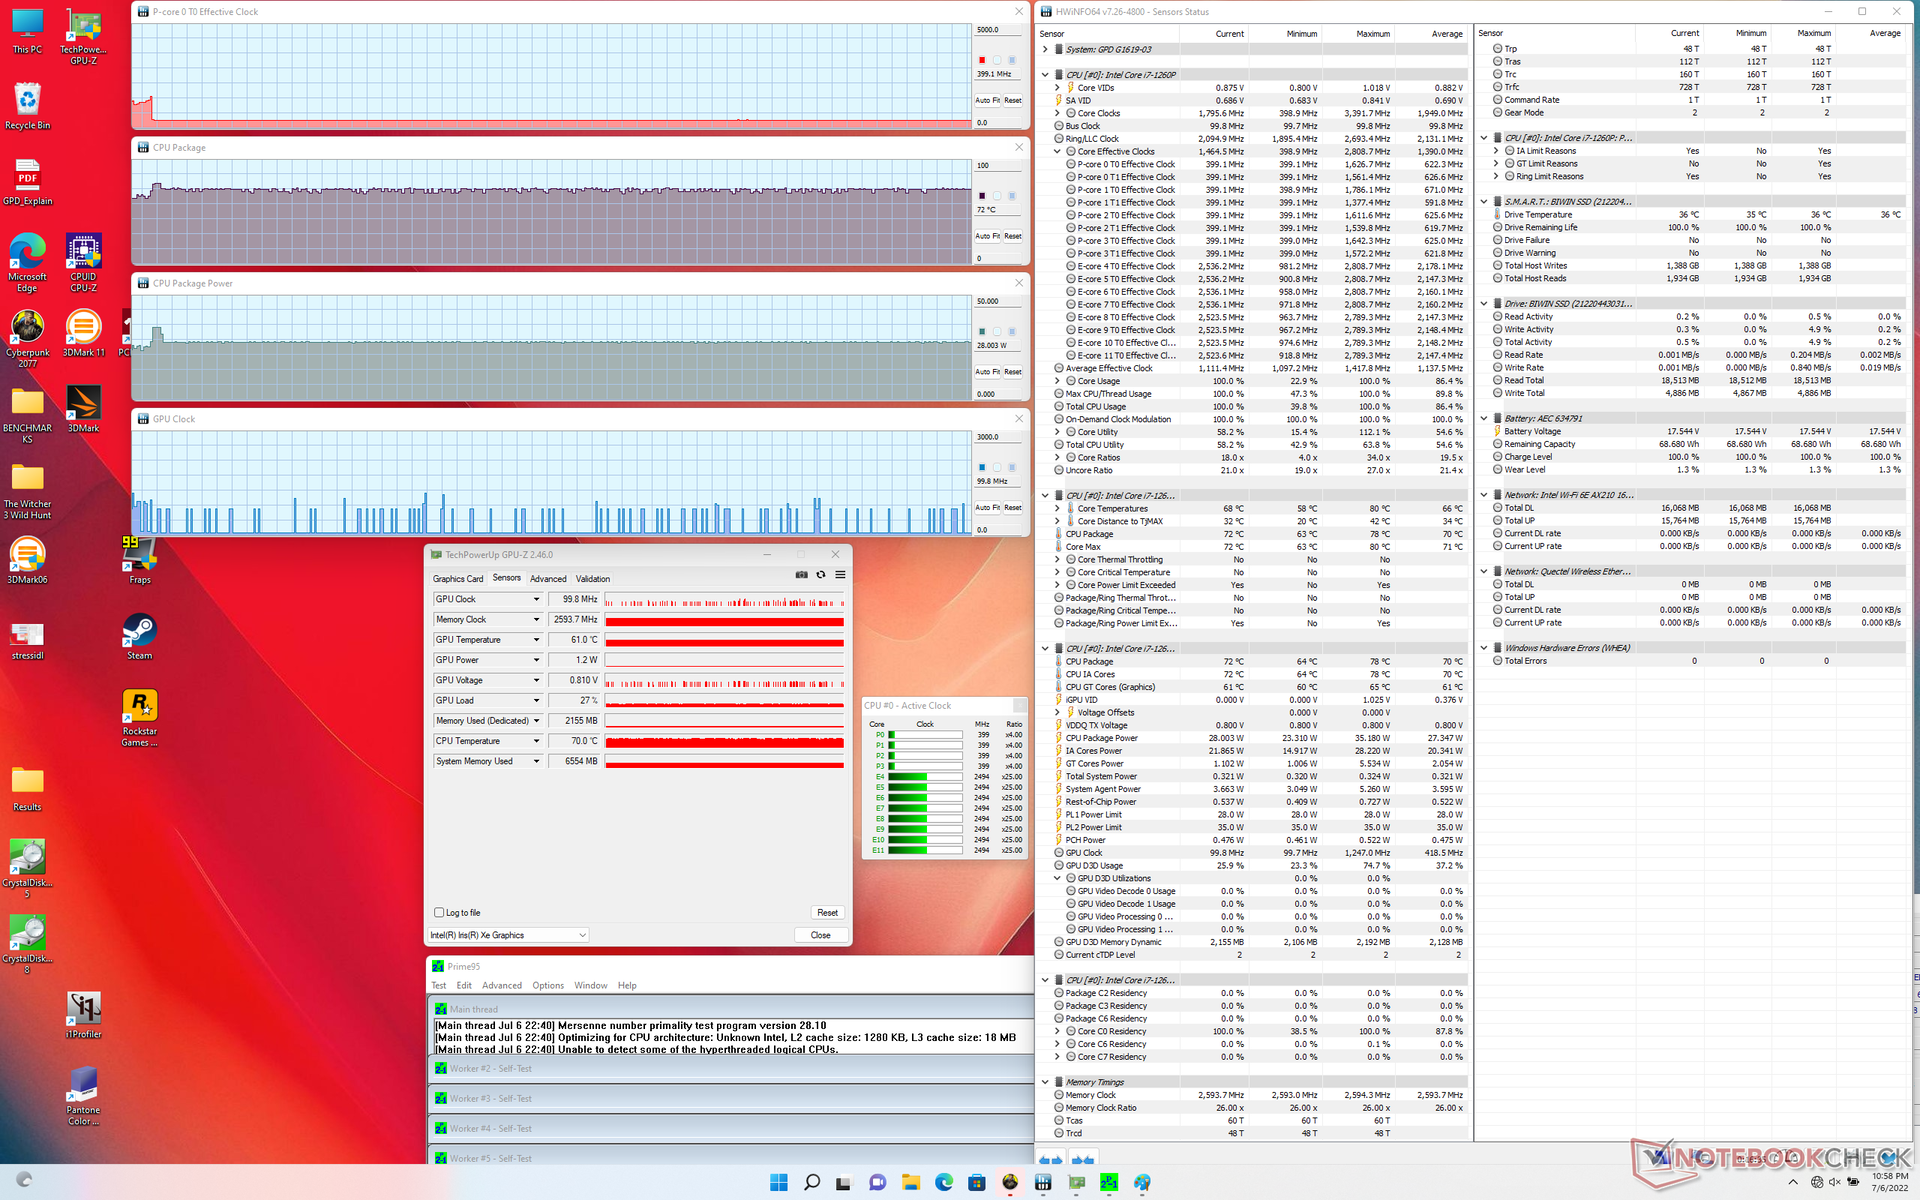
Teste de estresse
Iniciar Prime95 para enfatizar a CPU revela algo incomum: o desempenho dos núcleos P diminuiria para apenas 400 MHz enquanto os eficientes núcleos E funcionariam a 2,5 GHz. Em comparação, rodando este mesmo teste no Lenovo Yoga 9 14 equipados com a mesma CPU mostrariam todos os núcleos P e E-cores rodando na faixa de 1,7 a 1,9 GHz. Este comportamento é a causa provável do desempenho multitarefa mais lento do que a média registrada acima.
O consumo de energia do pacote de CPU chegaria a 35 W durante os primeiros segundos antes de se estabilizar em 28 W depois disso, o que corresponde às configurações pré-definidas da BIOS. Em comparação, a mesma CPU no sistema Lenovo acima mencionado aumentaria para 64 W antes de se estabilizar em 28 W.
Ao rodar Witcher 3a temperatura e as taxas de relógio GPU se estabilizariam em 898 MHz e 71 C, respectivamente, em comparação com 1147 MHz e 65 C na Lenovo. Conseqüentemente, a Lenovo também é capaz de oferecer resultados 3 a 5 por cento mais altos 3DMark que nosso GPD.
O funcionamento com bateria não irá reduzir o desempenho da CPU ou GPU. Nossas pontuações 3DMark 11 permaneceriam essencialmente as mesmas entre a bateria e a rede.
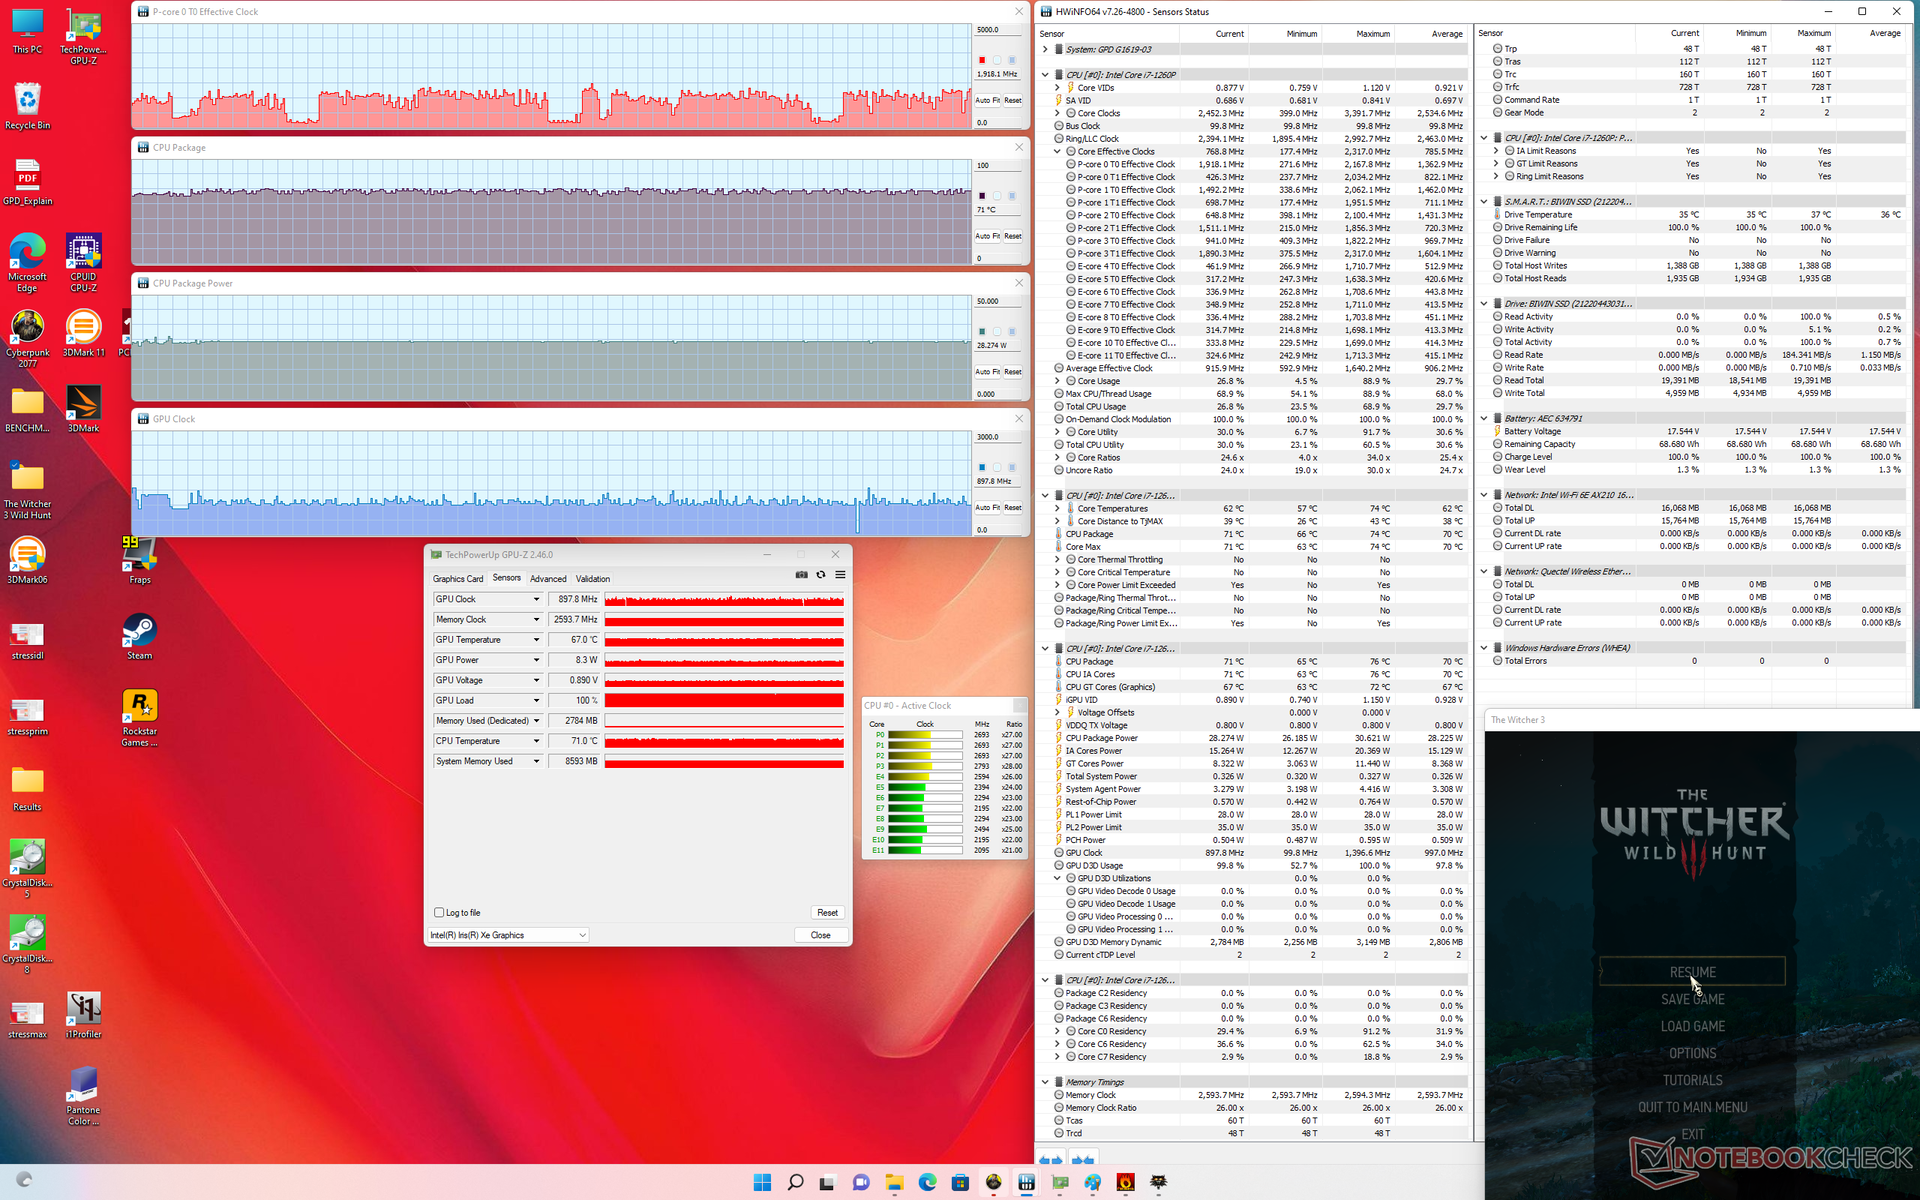
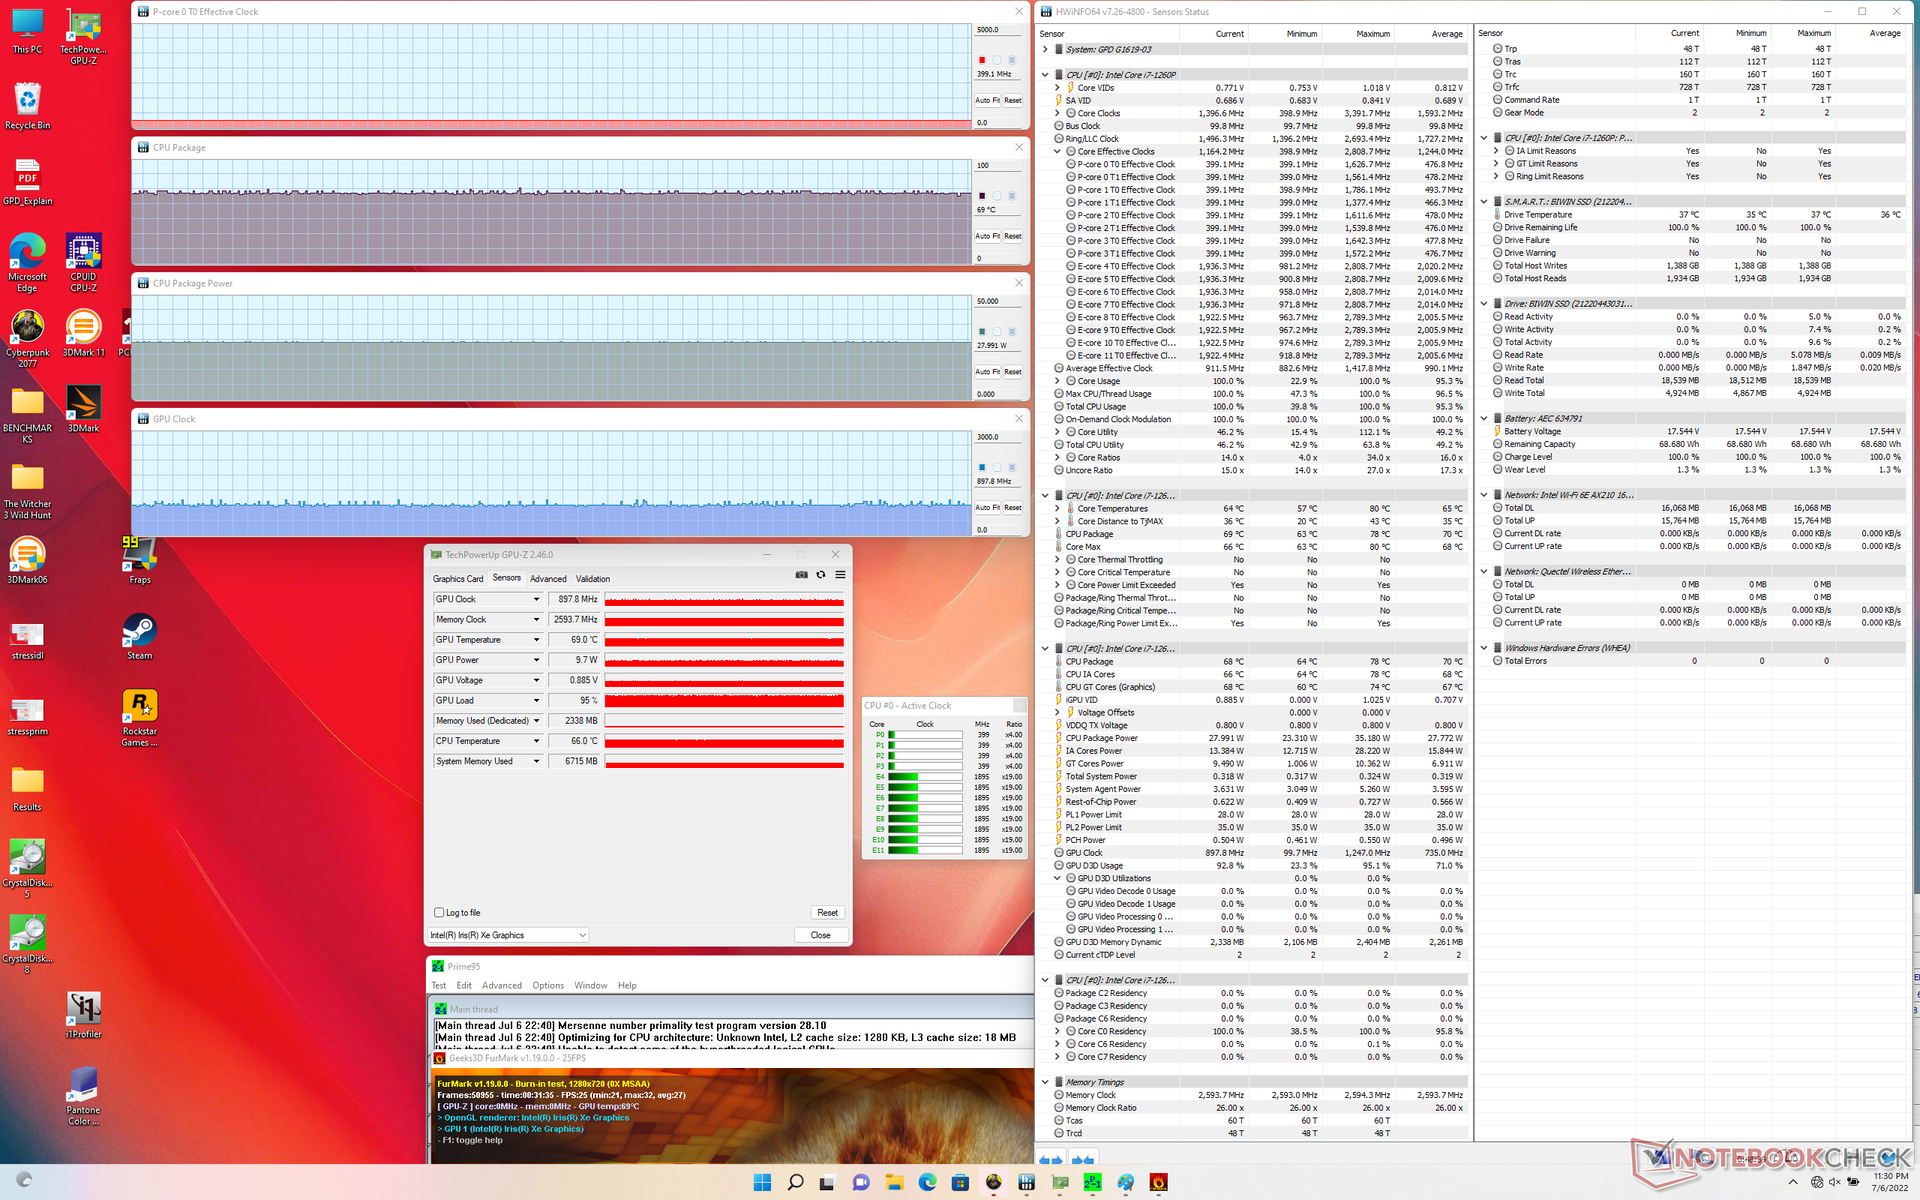
| Relógio CPU (GHz) | Relógio GPU (MHz) | Temperatura média da CPU (°C) | |
| System Idle | -- | -- | 66 |
| Prime95 Stress | 0.4 | -- | 72 |
| Prime95 + FurMark Stress | 0.4 | 898 | 69 |
| Witcher 3 Estresse | ~0.4 - 2.0 | 898 | 71 |
Oradores
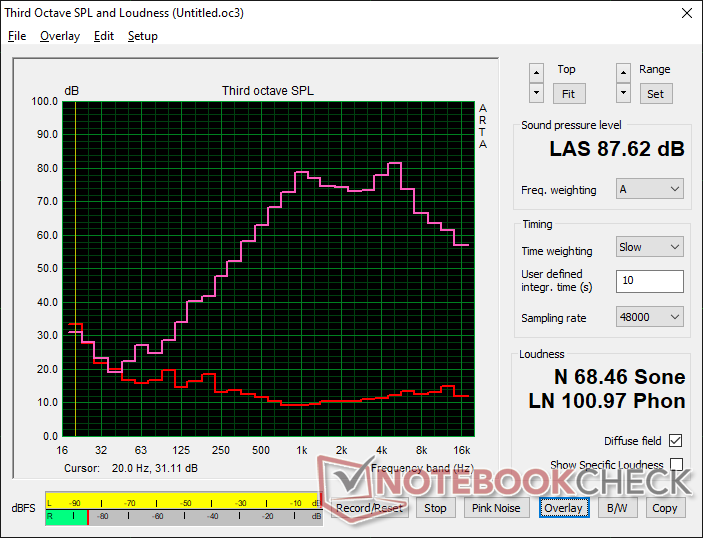
GPD Win Max 2 análise de áudio
(+) | os alto-falantes podem tocar relativamente alto (###valor### dB)
Graves 100 - 315Hz
(-) | quase nenhum baixo - em média 27.6% menor que a mediana
(±) | a linearidade dos graves é média (8.2% delta para a frequência anterior)
Médios 400 - 2.000 Hz
(±) | médios mais altos - em média 6.4% maior que a mediana
(+) | médios são lineares (6.9% delta para frequência anterior)
Altos 2 - 16 kHz
(±) | máximos mais altos - em média 6.4% maior que a mediana
(±) | a linearidade dos máximos é média (7% delta para frequência anterior)
Geral 100 - 16.000 Hz
(±) | a linearidade do som geral é média (21.3% diferença em relação à mediana)
Comparado com a mesma classe
» 72% de todos os dispositivos testados nesta classe foram melhores, 5% semelhantes, 23% piores
» O melhor teve um delta de 5%, a média foi 18%, o pior foi 53%
Comparado com todos os dispositivos testados
» 59% de todos os dispositivos testados foram melhores, 7% semelhantes, 33% piores
» O melhor teve um delta de 4%, a média foi 23%, o pior foi 134%
Apple MacBook Pro 16 2021 M1 Pro análise de áudio
(+) | os alto-falantes podem tocar relativamente alto (###valor### dB)
Graves 100 - 315Hz
(+) | bons graves - apenas 3.8% longe da mediana
(+) | o baixo é linear (5.2% delta para a frequência anterior)
Médios 400 - 2.000 Hz
(+) | médios equilibrados - apenas 1.3% longe da mediana
(+) | médios são lineares (2.1% delta para frequência anterior)
Altos 2 - 16 kHz
(+) | agudos equilibrados - apenas 1.9% longe da mediana
(+) | os máximos são lineares (2.7% delta da frequência anterior)
Geral 100 - 16.000 Hz
(+) | o som geral é linear (4.6% diferença em relação à mediana)
Comparado com a mesma classe
» 0% de todos os dispositivos testados nesta classe foram melhores, 0% semelhantes, 100% piores
» O melhor teve um delta de 5%, a média foi 17%, o pior foi 45%
Comparado com todos os dispositivos testados
» 0% de todos os dispositivos testados foram melhores, 0% semelhantes, 100% piores
» O melhor teve um delta de 4%, a média foi 23%, o pior foi 134%
Gestão de energia
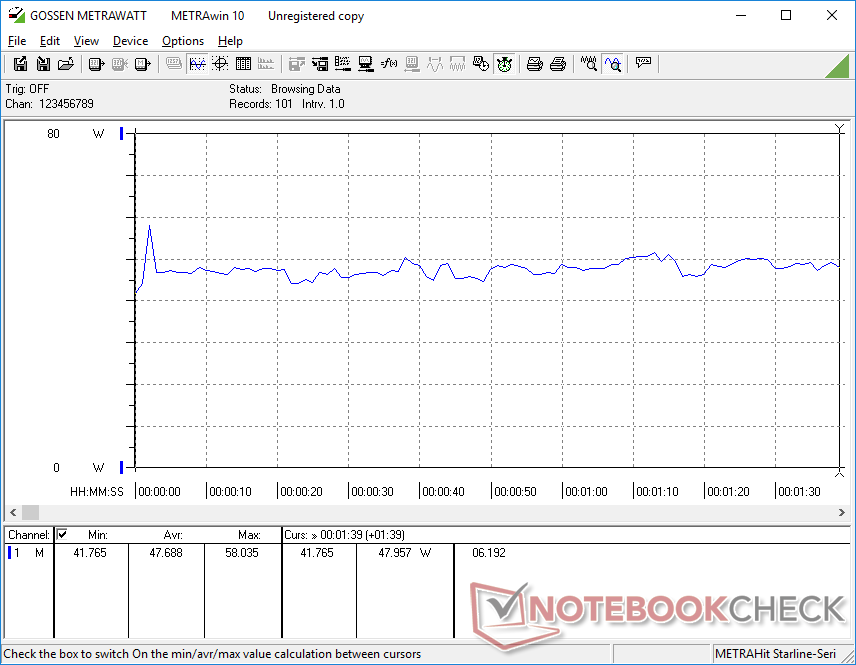
Consumo de energia - Alto desempenho, alto custo de energia
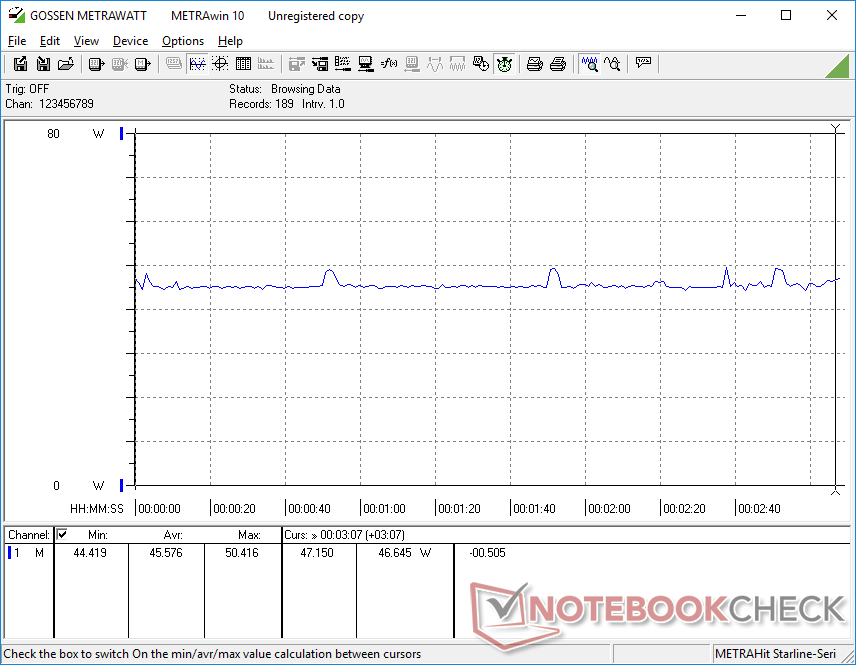
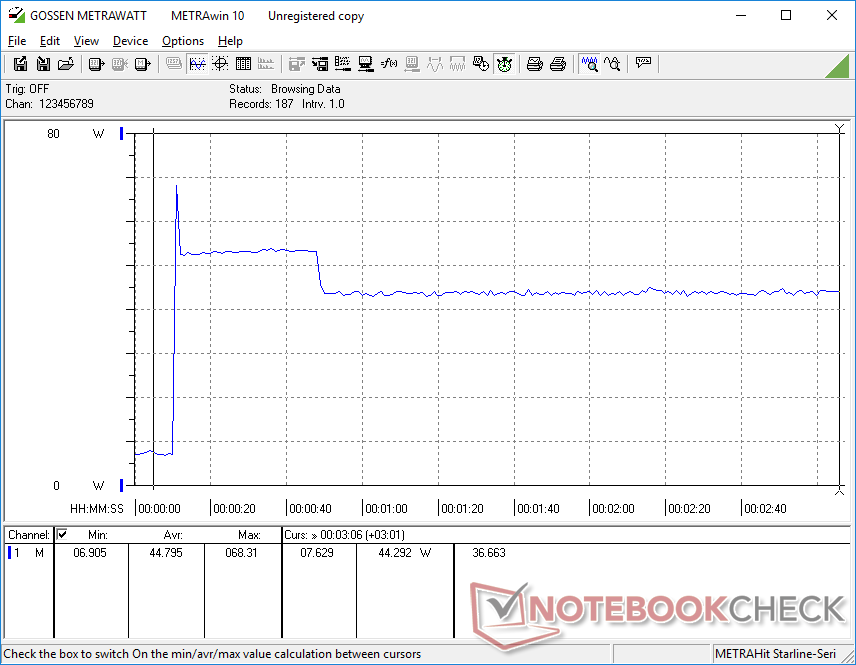
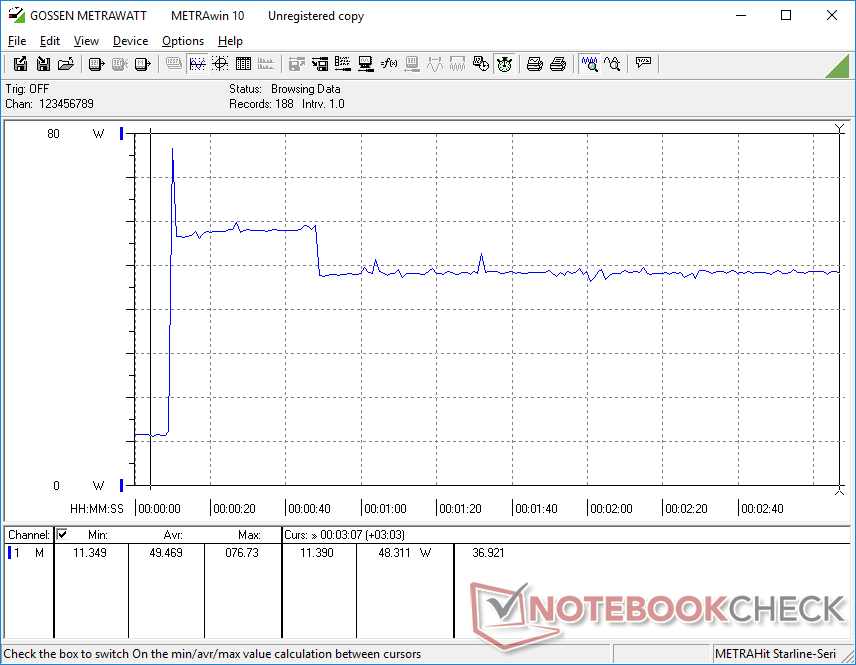
O consumo de energia é maior em toda a linha quando comparado aos produtos GPD do ano passado, devido ao tamanho maior da tela, maior resolução nativa e processador Intel 12th gen mais exigente. Rodando Witcher 3 seria cerca de 46 W para ser quase 60% maior do que no Win 3 com uma CPU da 11ª geração Tiger Lake-U. Felizmente, o fabricante contabilizou o maior consumo de energia instalando uma bateria maior no Win Max 2, como mostra a próxima seção abaixo
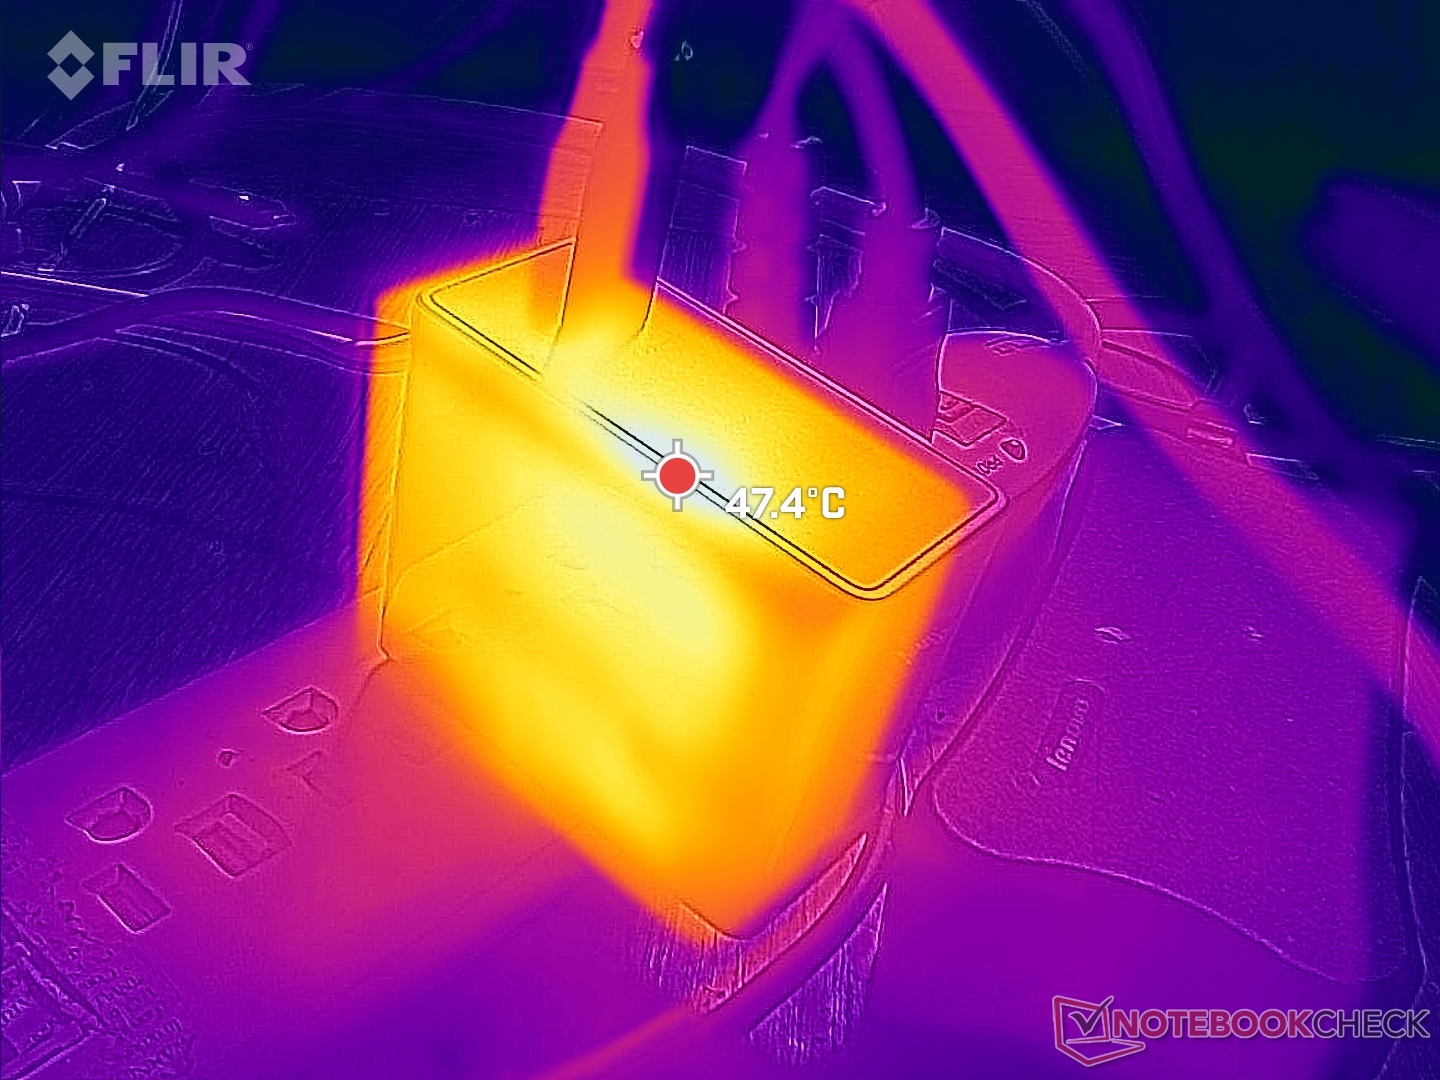
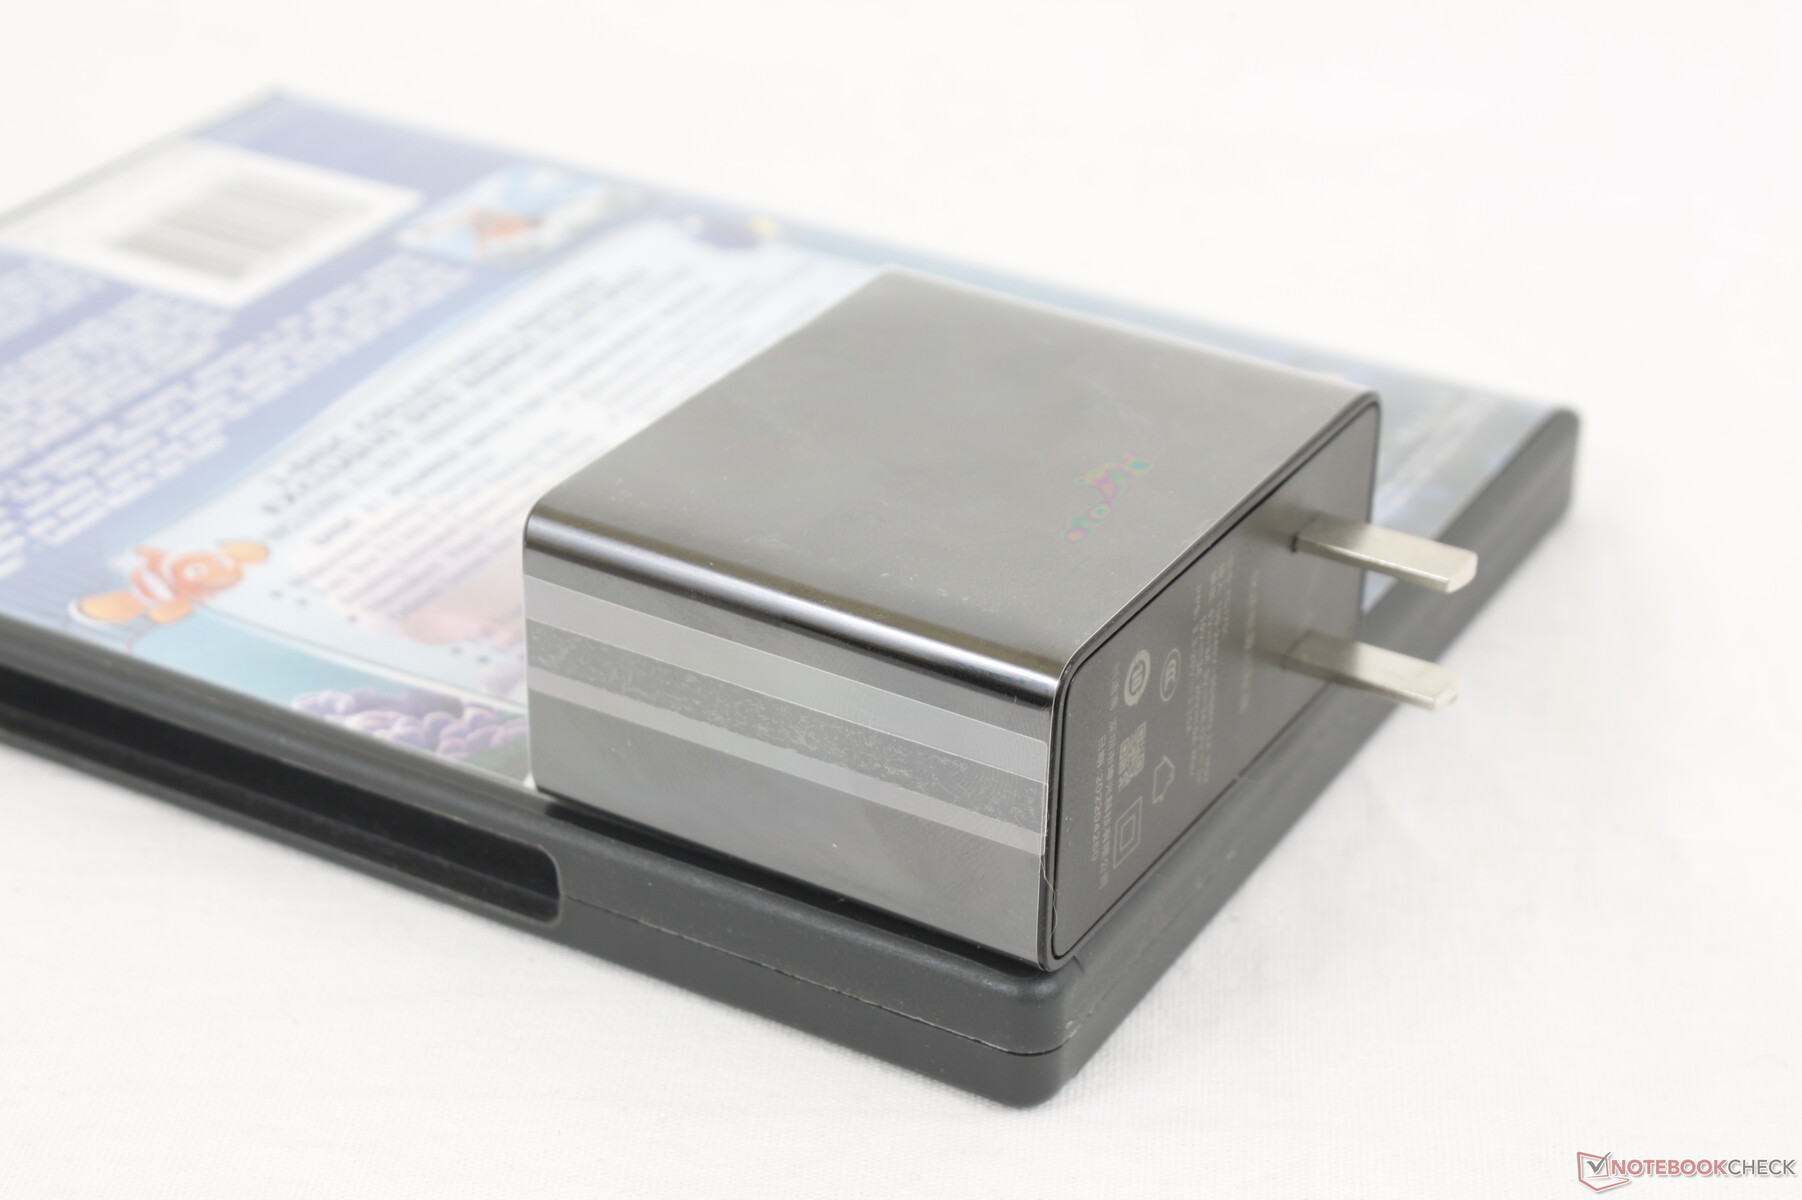
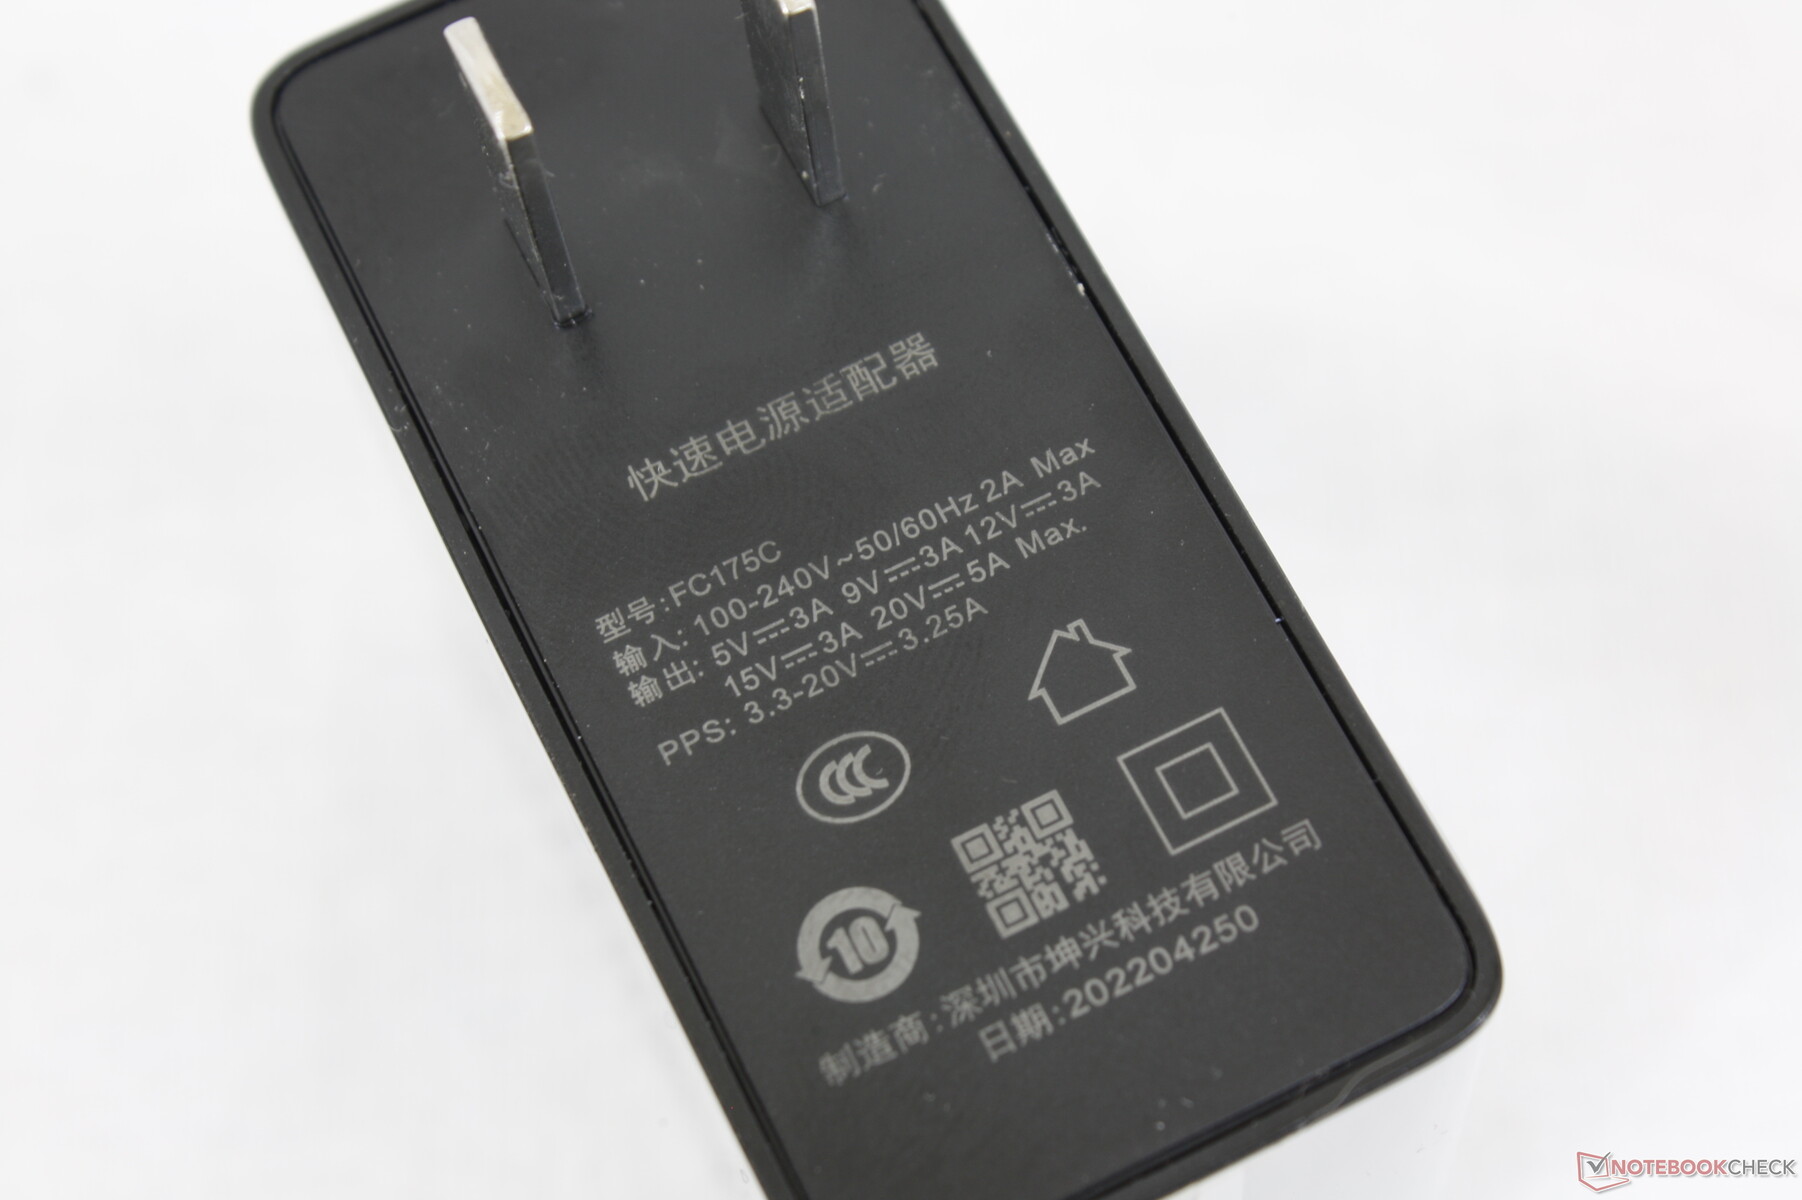
Somos capazes de registrar um consumo máximo temporário de 76 W do pequeno (~6,6 x 5,3 x 3,2 cm) adaptador USB-C AC de 100 W. O adaptador também pode ser usado para carregar rapidamente a maioria dos outros dispositivos USB-C.
| desligado | |
| Ocioso | |
| Carga |
|
Key:
min: | |
| GPD Win Max 2 i7-1260P, Iris Xe G7 96EUs, BiWin NQ200 1TB CNF82GS1D00-1TB, IPS, 2560x1600, 10.1" | GPD Pocket 3 i7-1195G7, Iris Xe G7 96EUs, BiWin NQ200 1TB CNF82GS1D00-1TB, IPS, 1920x1200, 8" | GPD Win Max 2021 R7 4800U, Vega 8, BIWIN NS200 512GB CNF82GS1G00-512, IPS, 1280x800, 8" | GPD Win 3 i5-1135G7, Iris Xe G7 80EUs, BIWIN NS200 1TB CNF82GS1G02-1TB, IPS, 1280x720, 5.5" | Microsoft Surface Go 3 Core i3 i3-10100Y, UHD Graphics 615, SK hynix HFB1M8MQ331C0MR, IPS , 1920x1280, 10.5" | Lenovo IdeaPad Flex 3 11IGL05 Celeron N4020, UHD Graphics 600, SanDisk DA4064, IPS LED, 1366x768, 11.6" | |
|---|---|---|---|---|---|---|
| Power Consumption | 1% | 28% | 45% | 55% | 66% | |
| Idle Minimum * (Watt) | 5.8 | 9.6 -66% | 5.2 10% | 2.9 50% | 2.6 55% | 2.4 59% |
| Idle Average * (Watt) | 10.2 | 11 -8% | 6.5 36% | 4.5 56% | 5.1 50% | 4.5 56% |
| Idle Maximum * (Watt) | 11.5 | 11.8 -3% | 7.4 36% | 4.5 61% | 5.9 49% | 4.6 60% |
| Load Average * (Watt) | 47.7 | 39 18% | 37.2 22% | 38.5 19% | 22.9 52% | 12.8 73% |
| Witcher 3 ultra * (Watt) | 45.6 | 36.4 20% | 38.1 16% | 28.9 37% | ||
| Load Maximum * (Watt) | 76.8 | 42 45% | 39 49% | 41.4 46% | 24.6 68% | 14.3 81% |
* ... menor é melhor
Power Consumption Witcher 3 / Stresstest
Power Consumption external Monitor
Vida útil da bateria - Ótimo para o tamanho
A bateria de 70 Wh é grande para um fator de forma tão pequeno. Em comparação, a original 2021 Win Max ou 11,6 polegadas Lenovo IdeaPad Flex 3 11 o laptop seria enviado com baterias menores de 57 Wh e 37 Wh, respectivamente
Os usuários podem esperar que quase 9 horas de navegação no mundo real sejam tão longas ou até mais longas do que a maioria dos Ultrabooks atuais sob cargas similares. O tempo de jogo é muito mais curto, no entanto, em apenas 2 a 3 horas
O carregamento da capacidade vazia à plena com o adaptador AC incluído leva aproximadamente 1,5 horas.
| GPD Win Max 2 i7-1260P, Iris Xe G7 96EUs, 70 Wh | GPD Pocket 3 i7-1195G7, Iris Xe G7 96EUs, 39 Wh | GPD Win Max 2021 R7 4800U, Vega 8, 57 Wh | GPD Win 3 i5-1135G7, Iris Xe G7 80EUs, 44 Wh | Microsoft Surface Go 3 Core i3 i3-10100Y, UHD Graphics 615, 28 Wh | Lenovo IdeaPad Flex 3 11IGL05 Celeron N4020, UHD Graphics 600, 37.5 Wh | |
|---|---|---|---|---|---|---|
| Duração da bateria | -31% | 7% | 3% | -20% | 7% | |
| Reader / Idle (h) | 15.4 | |||||
| WiFi v1.3 (h) | 8.7 | 6 -31% | 9.3 7% | 11.3 30% | 7 -20% | 9.3 7% |
| Load (h) | 1.7 | 1.3 -24% |
Pro
Contra
Veredicto - Bom com a Intel, Melhor com a AMD
Não ficamos muito impressionados com o original 2021 Win Max. Embora tenha sido divertido brincar, também foi difícil olhar além de sua estreita gama de cores, perceptível fantasma, layout de teclado estranho, design de chassis rangente, Wi-Fi lento e falta de uma webcam integrada. O Win Max 2 de 2022 tratou de todas estas preocupações para uma experiência que se sente digna de seu preço pedido. Os usuários estão recebendo muito mais de um chassi tão pequeno em termos de desempenho, qualidade de exibição e conectividade. Mesmo que você não pretenda jogar muito no Win Max 2, sua tela tátil de alta resolução, 4G LTE, excelente capacidade de acoplamento e tamanho compacto podem certamente vir a ser úteis para outros cenários de uso
O GPD Win Max 2 faz muitas coisas bem ao oferecer tanto as opções Intel e AMD e um chassi de maior qualidade com uma vibrante tela sensível ao toque IPS 1600p.
Se você for jogar, no entanto, você vai querer ter em mente que o AMD SKU pode oferecer um desempenho mais rápido pelo mesmo preço, ao custo de derrubar o suporte a Thunderbolt. O sistema relativamente pesado e o posicionamento subótimo dos joysticks tornam o manuseio mais cansativo do que em um Switch Nintendo mais leve ou Ganhe 3. Algumas escolhas de design estranhas, como as portas USB e HDMI de cabeça para baixo, o cabo de fita WAN de difícil conexão e a incapacidade de desativar facilmente os botões de ombro são alguns pequenos aborrecimentos para lidar. Adoraríamos ver OLED 120 Hz no futuro e talvez até um design mais leve para jogos de mão mais confortáveis.
Preço e Disponibilidade
O GPD está executando um Indiegogo para o Win Max 2 a partir desta escrita. Tanto a Intel como a AMD SKUs devem ser lançadas até setembro por US$ 1000 cada.
GPD Win Max 2
- 07/09/2022 v7 (old)
Allen Ngo
Price comparison

