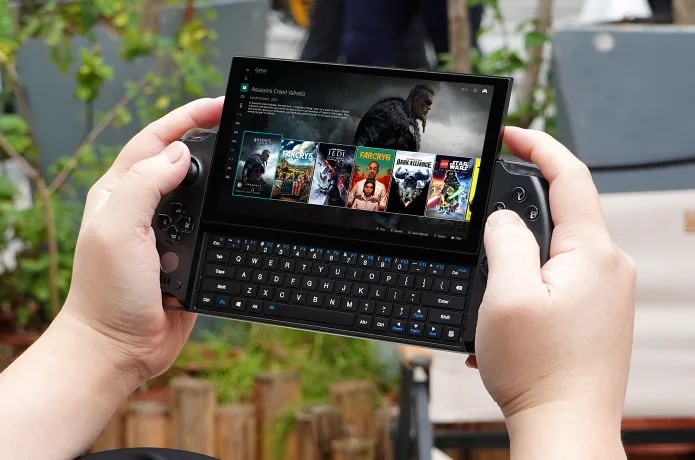
GPD Win 4 revisão PC de mão: 1080p Ryzen 7 jogando na palma de sua mão
O PC Windows portátil 2023 GPD Win 4 é o sucessor direto do 2021 Win 3. Além da troca do processador Intel da 11ª geração para o mais potente AMD Zen 3+, seu design também foi totalmente reformulado do zero para ser uma máquina globalmente mais forte, como nossa revisão mostrará.
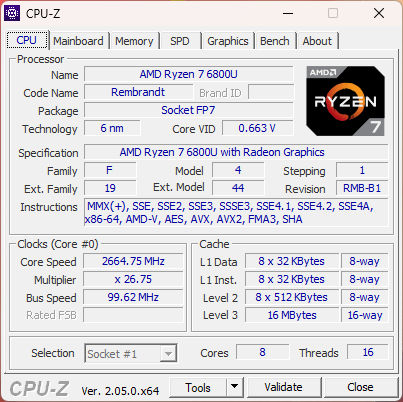
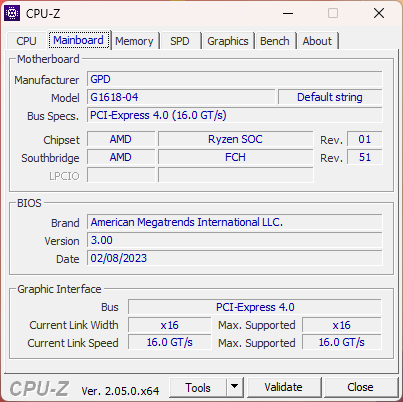
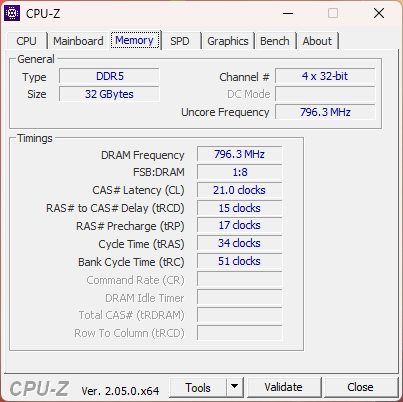
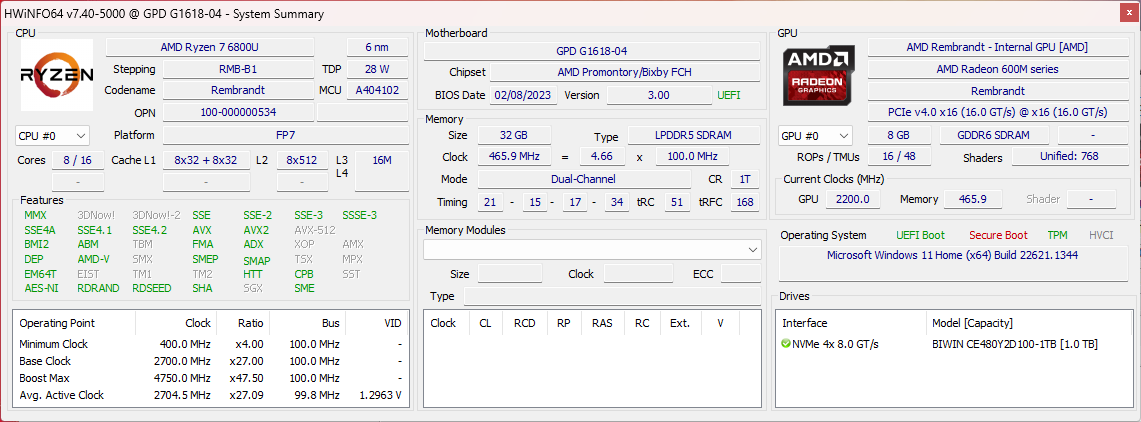
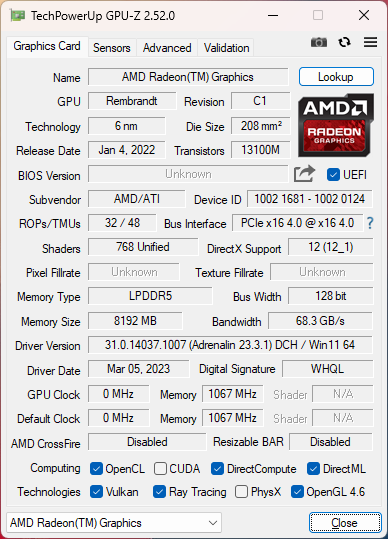
O Win 4 utiliza o mesmo Ryzen 7 6800U como encontrado no navio de bandeira Ultrabooks como o Asus ZenBook S13. Todas as configurações no momento diferem apenas em RAM (16 ou 32 GB LPDDR5-6400) e capacidade SSD (1 ou 2 TB) enquanto o processador AMD e a tela sensível ao toque IPS de 6 polegadas de 1080p permanecem estáticos. Mais informações fornecidas pelo fabricante sobre o Win 4 podem ser encontradas em sua página Indiegogo.
Os concorrentes incluem o Steam Deck, Nintendo Switch, e o OneXPlayer. Nossas comparações abaixo incluem também os sub-portáteis alimentados pela série U.
Mais revisões do GPD:
Possíveis concorrentes em comparação
Avaliação | Data | Modelo | Peso | Altura | Size | Resolução | Preço |
|---|---|---|---|---|---|---|---|
| 80.3 % v7 (old) | 03/2023 | GPD Win 4 R7 6800U, Radeon 680M | 607 g | 28 mm | 6.00" | 1920x1080 | |
| 84.5 % v7 (old) | 07/2022 | GPD Win Max 2 i7-1260P, Iris Xe G7 96EUs | 1 kg | 23 mm | 10.10" | 2560x1600 | |
v (old) | 01/2021 | GPD Win 3 i5-1135G7, Iris Xe G7 80EUs | 553 g | 27 mm | 5.50" | 1280x720 | |
| 85.5 % v7 (old) | 11/2020 | Razer Blade Stealth i7-1165G7 GTX 1650 Ti Max-Q i7-1165G7, GeForce GTX 1650 Ti Max-Q | 1.4 kg | 15.3 mm | 13.30" | 1920x1080 | |
| 90.1 % v7 (old) | 11/2022 | Dell XPS 13 9315 2-in-1 Core i5-1230U i5-1230U, Iris Xe G7 80EUs | 764 g | 7.4 mm | 13.00" | 2880x1920 | |
| 90.1 % v7 (old) | 07/2022 | Asus Zenbook S 13 OLED R7 6800U, Radeon 680M | 1.1 kg | 14.9 mm | 13.30" | 2880x1800 |
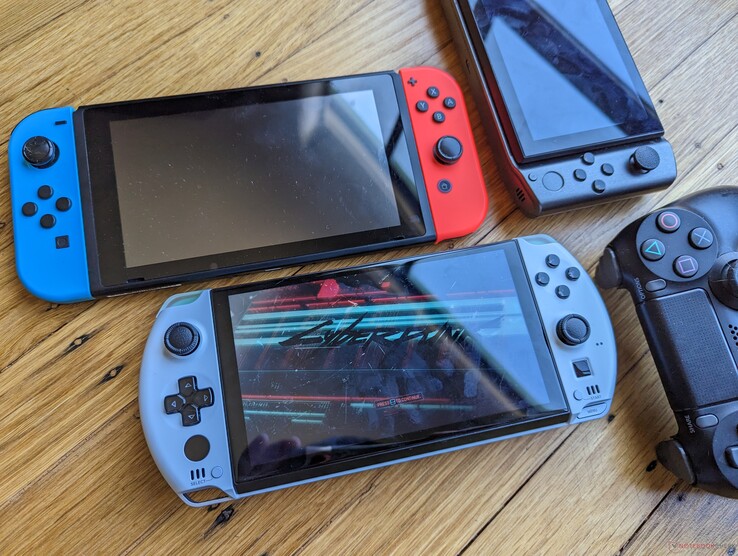
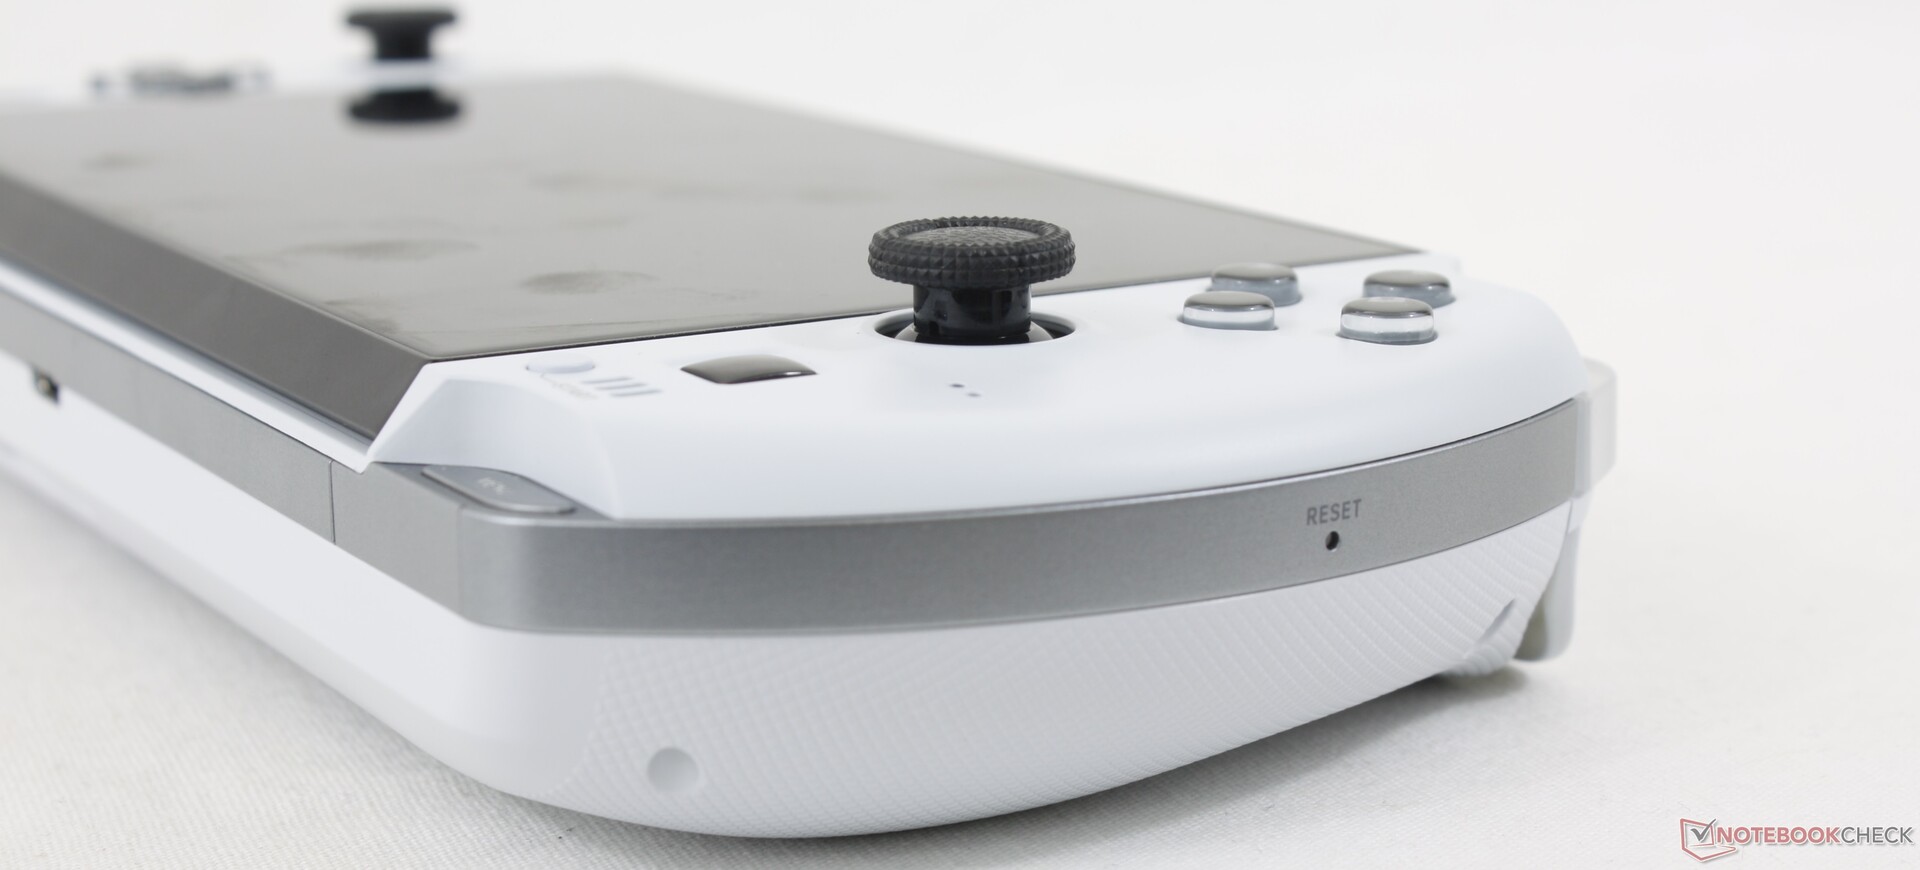
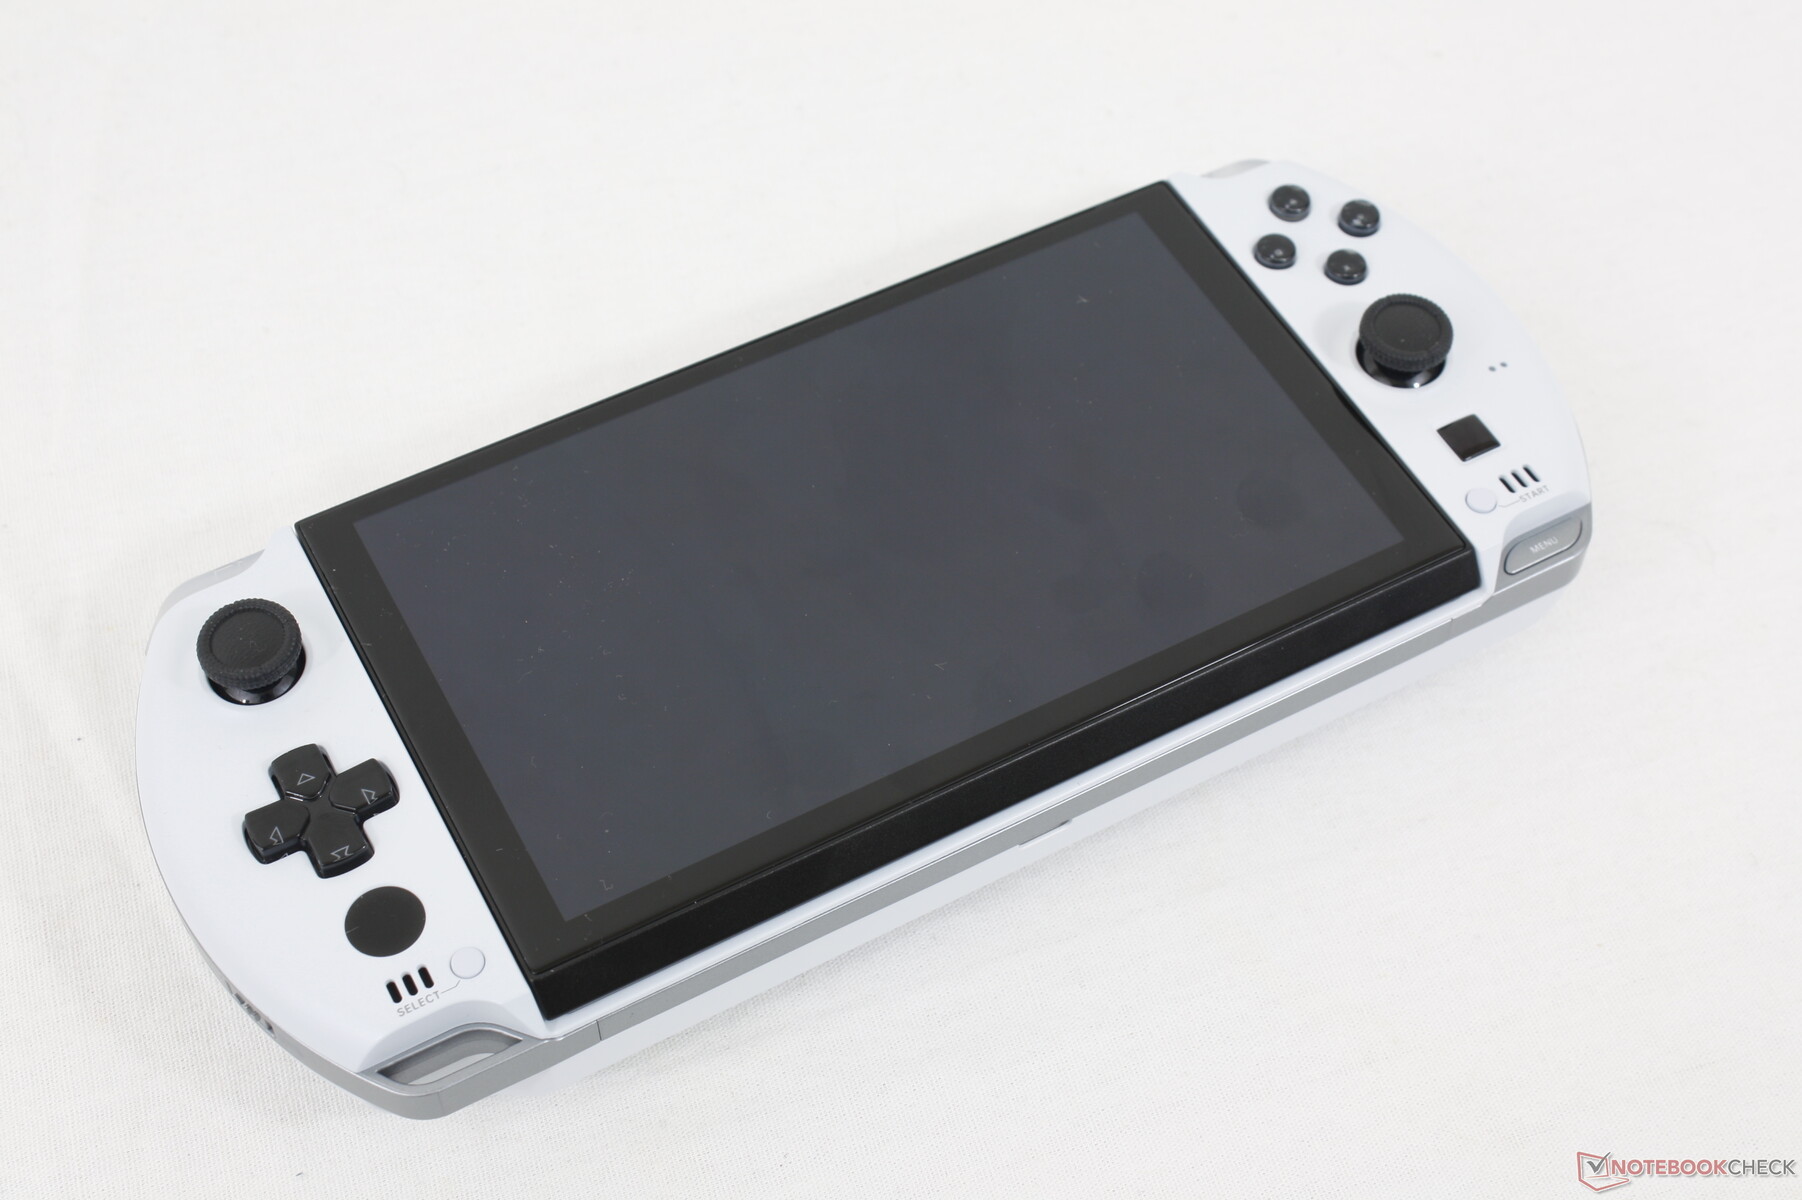
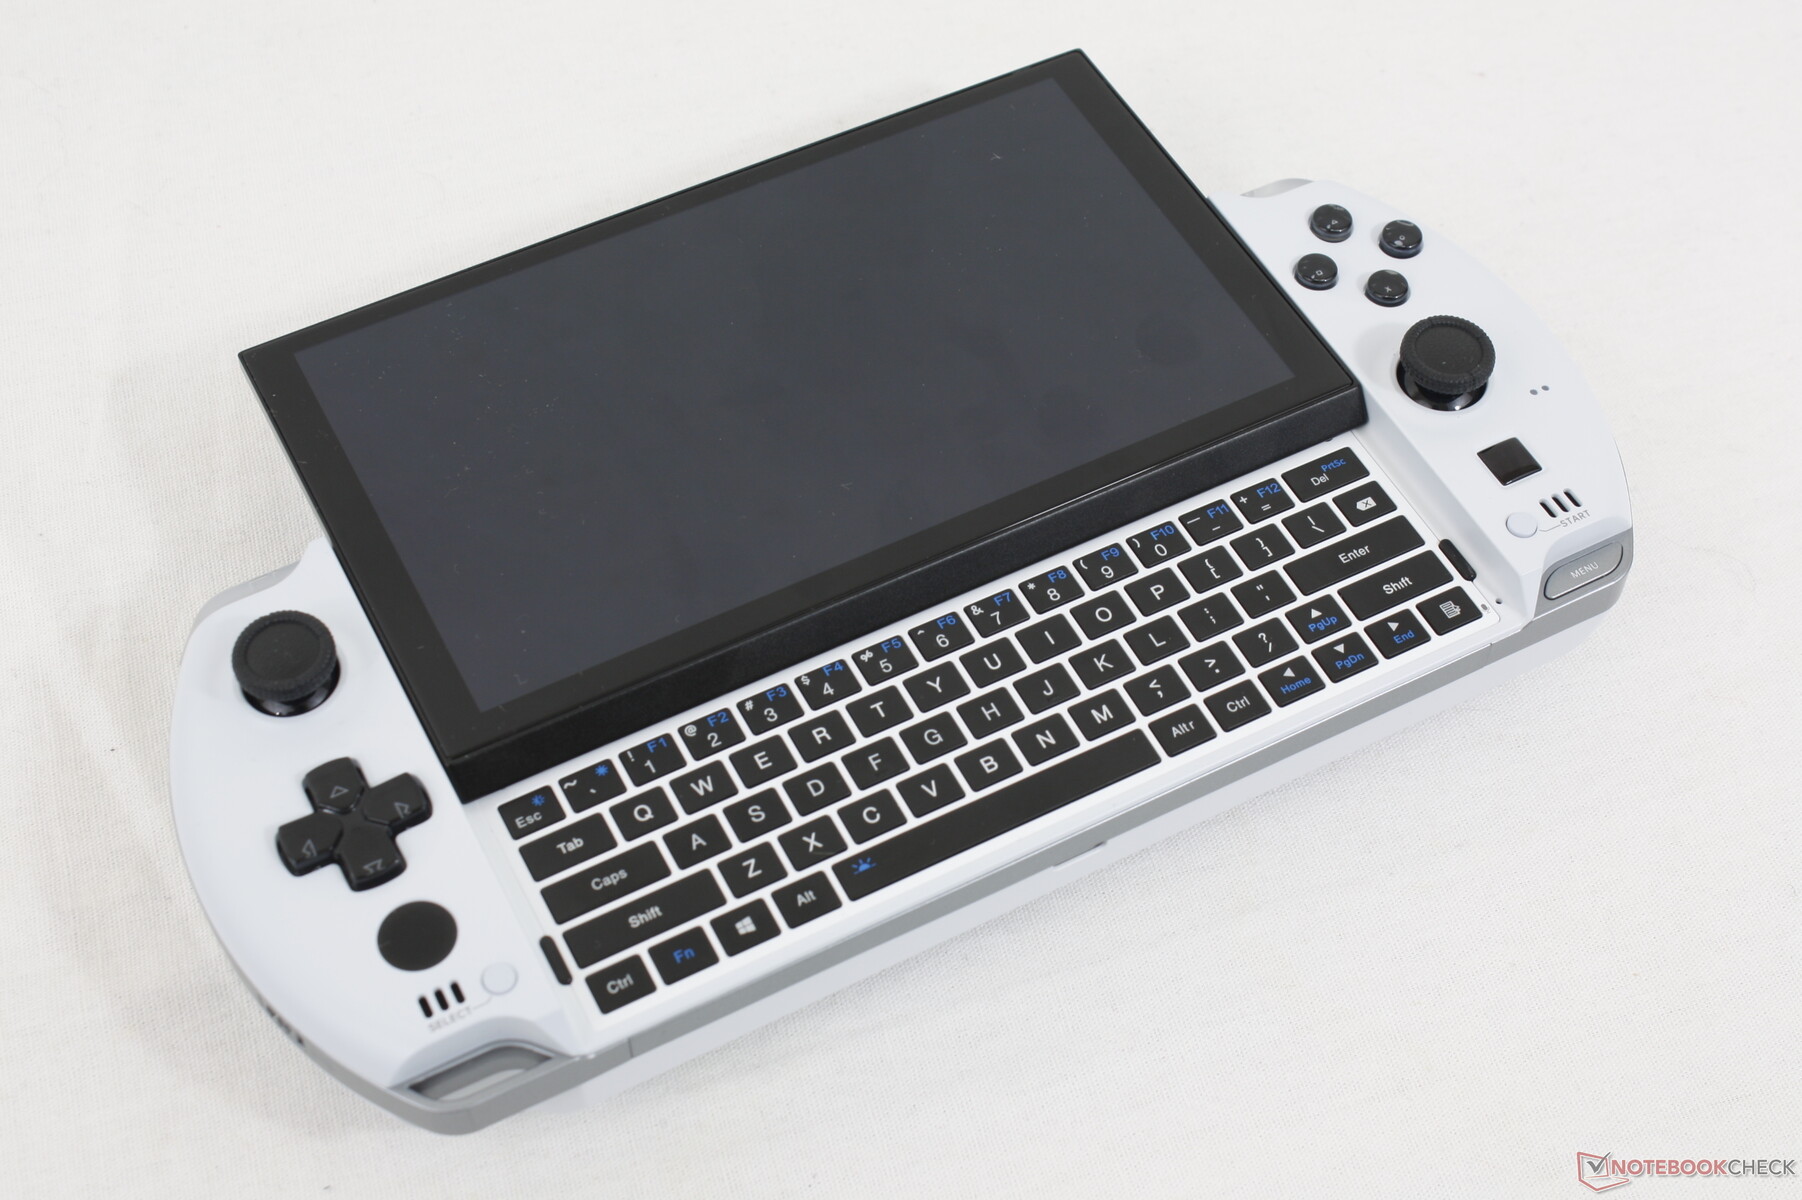
Estojo - Parece uma Vita, Pica como um interruptor
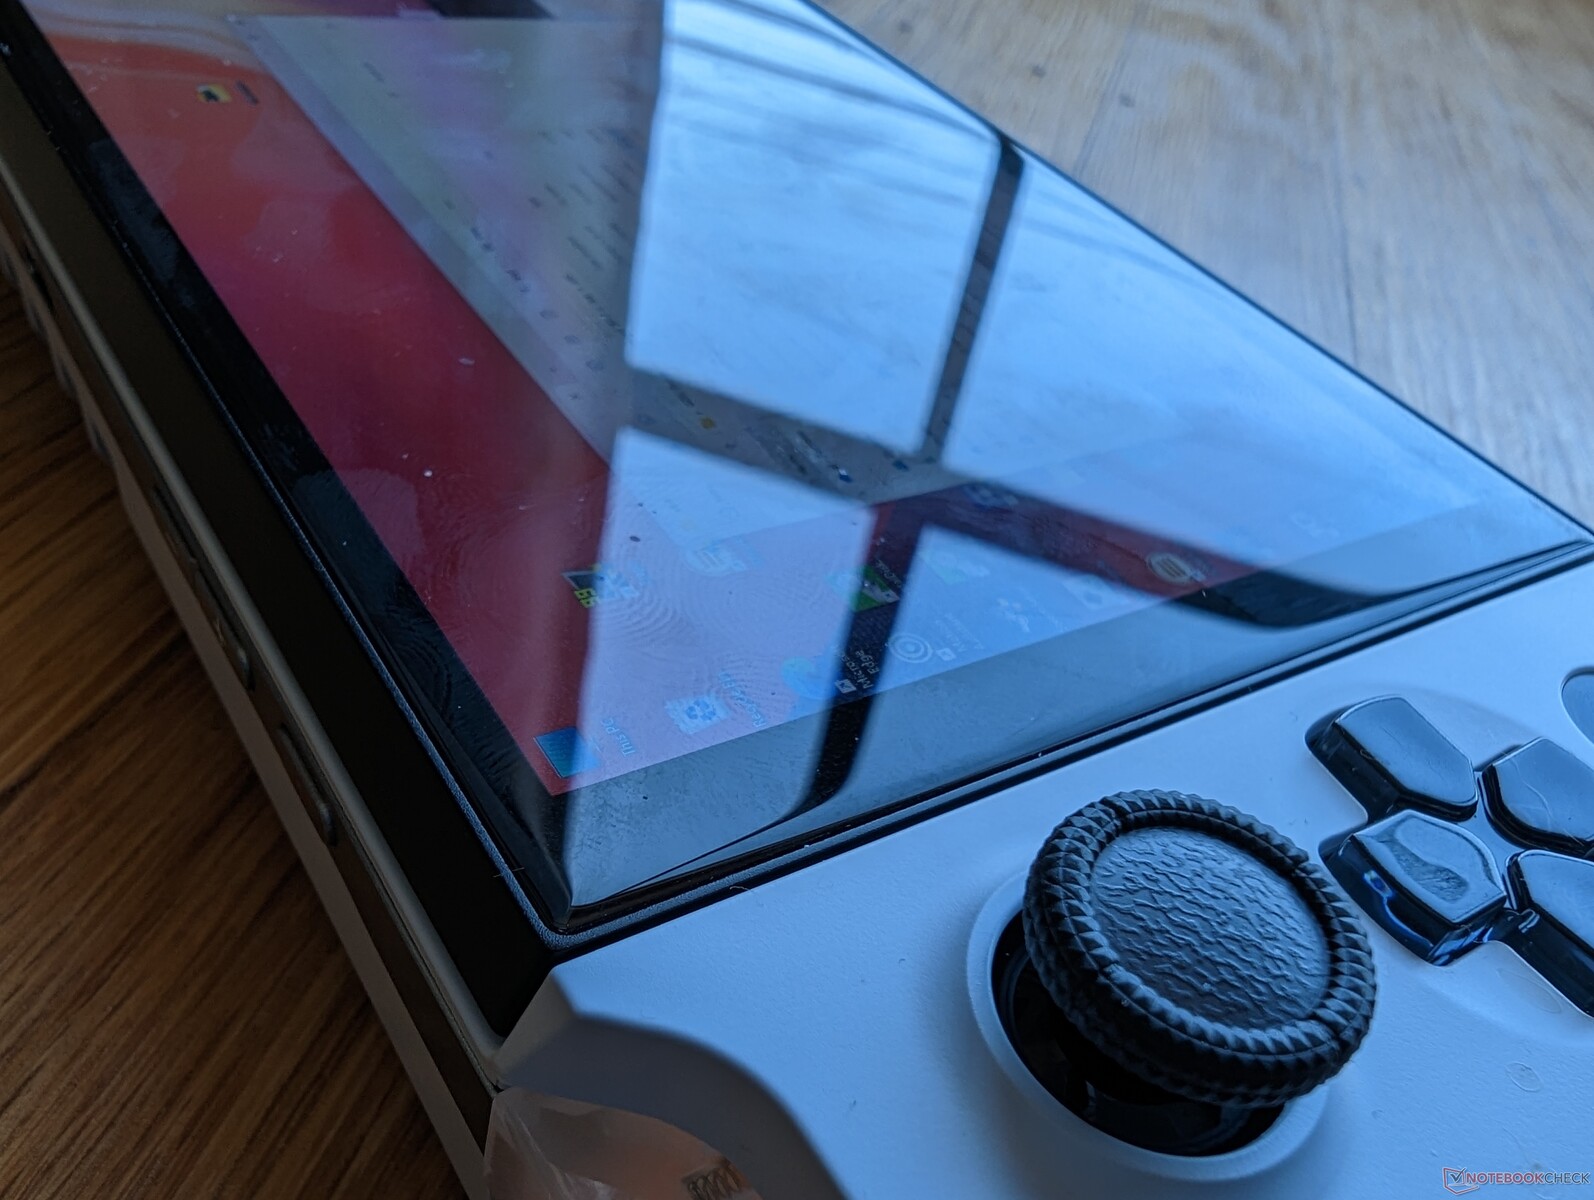
O chassi consiste de liga de magnésio cinza, plástico ABS na cor branca ou preta, e proteção borda a borda Gorilla Glass 5 para a tela tátil. O design geral é uma evolução do Win 3 enquanto incorpora recursos dos portáteis Sony e Nintendo. Sua forma e tamanho do gamepad, por exemplo, são similares ao PSP e ao Switch, respectivamente. O resultado final é um visual mais atrativo e mais jogável do que o Win 3 de saída.
A rigidez do chassi foi boa no Win 3 e agora é ainda melhor no Win 4. Nossa unidade exibiria mínima flexibilidade ou torção e nenhum defeito de montagem ou folgas, apesar de todos os diferentes materiais e peças móveis que compõem o case. Há alguns rangidos audíveis ao aplicar pressão nas costas, mas não é de grande preocupação. A qualidade geral de construção poderia passar como um dispositivo manual oficial de qualquer um dos principais desenvolvedores de jogos.
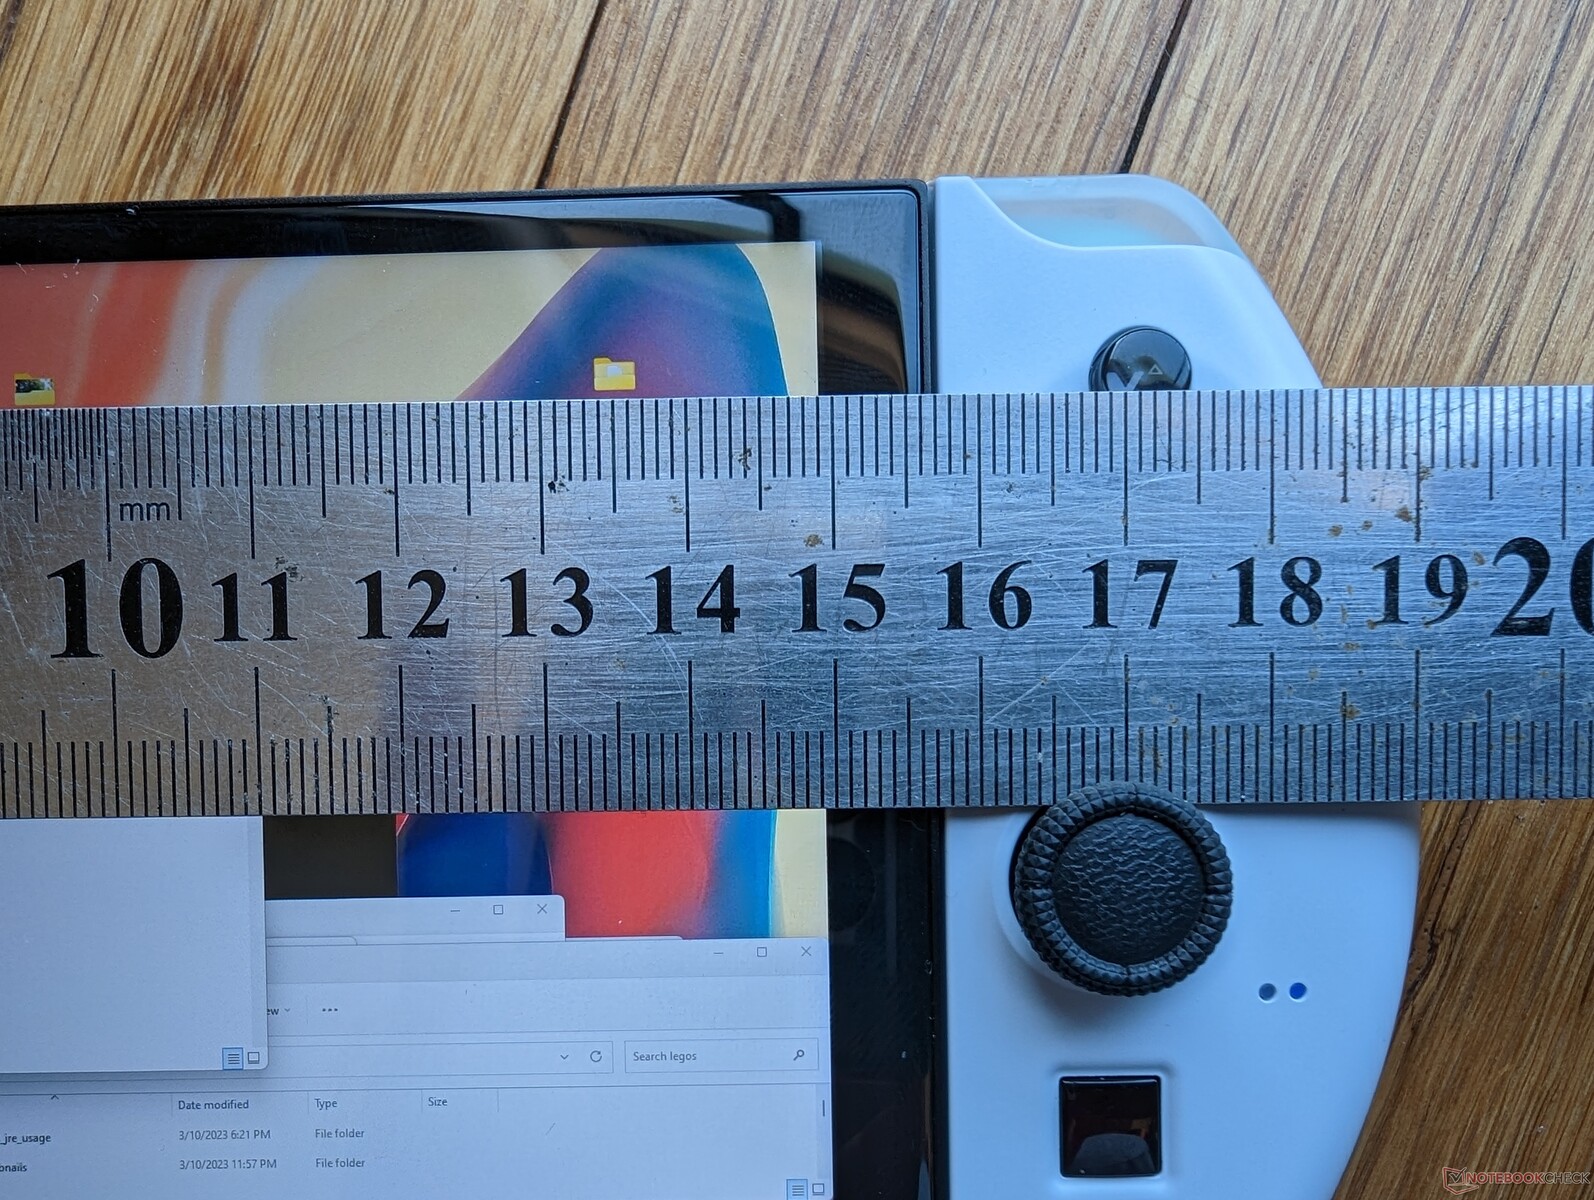
O modelo é mais grosso, maior e mais pesado do que o Win 3 mais antigo, como mostra nosso quadro comparativo de tamanhos abaixo. Em troca, os usuários obtêm uma tela maior de 6 polegadas, hardware muito mais potente, mais portas e uma construção mais forte. Este é certamente um dispositivo portátil mais adequado para uma bolsa ou bolsa do que para um bolso de calças.
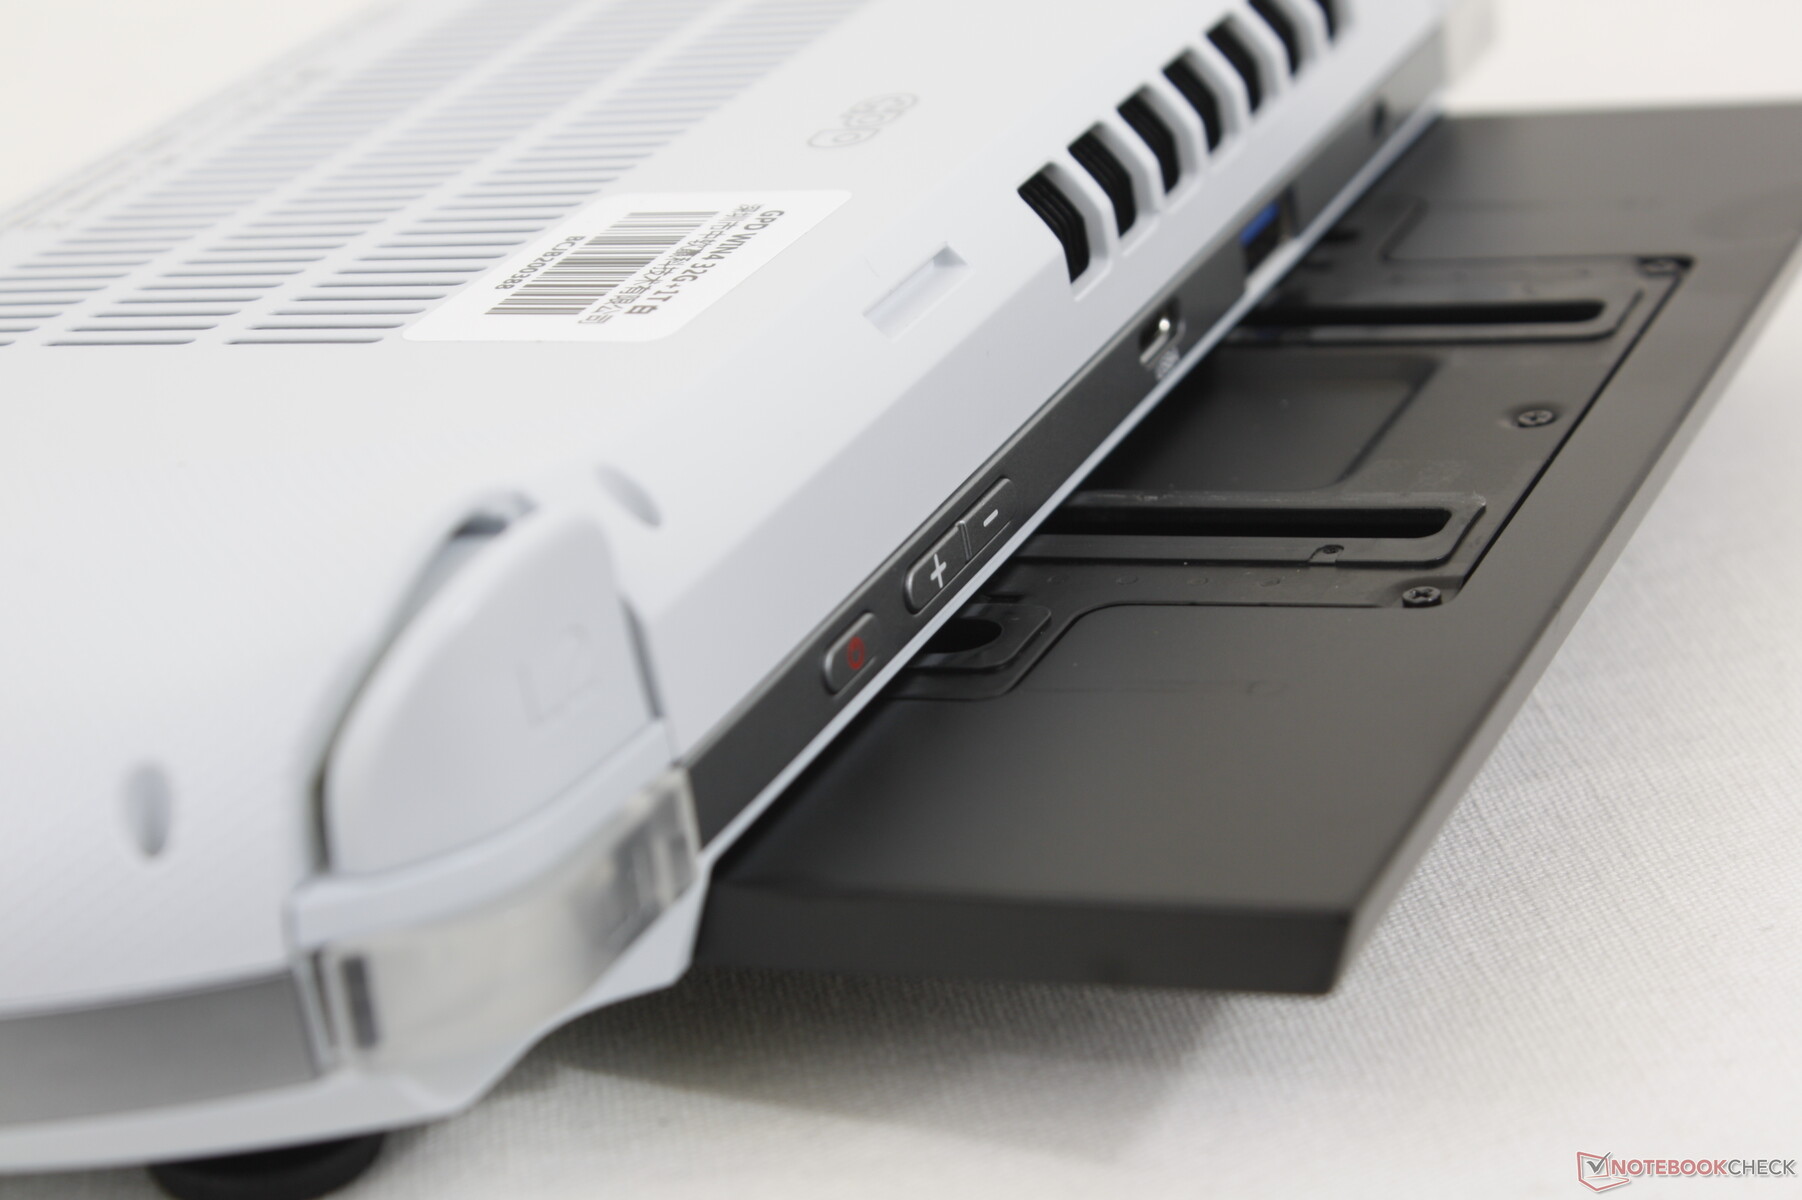
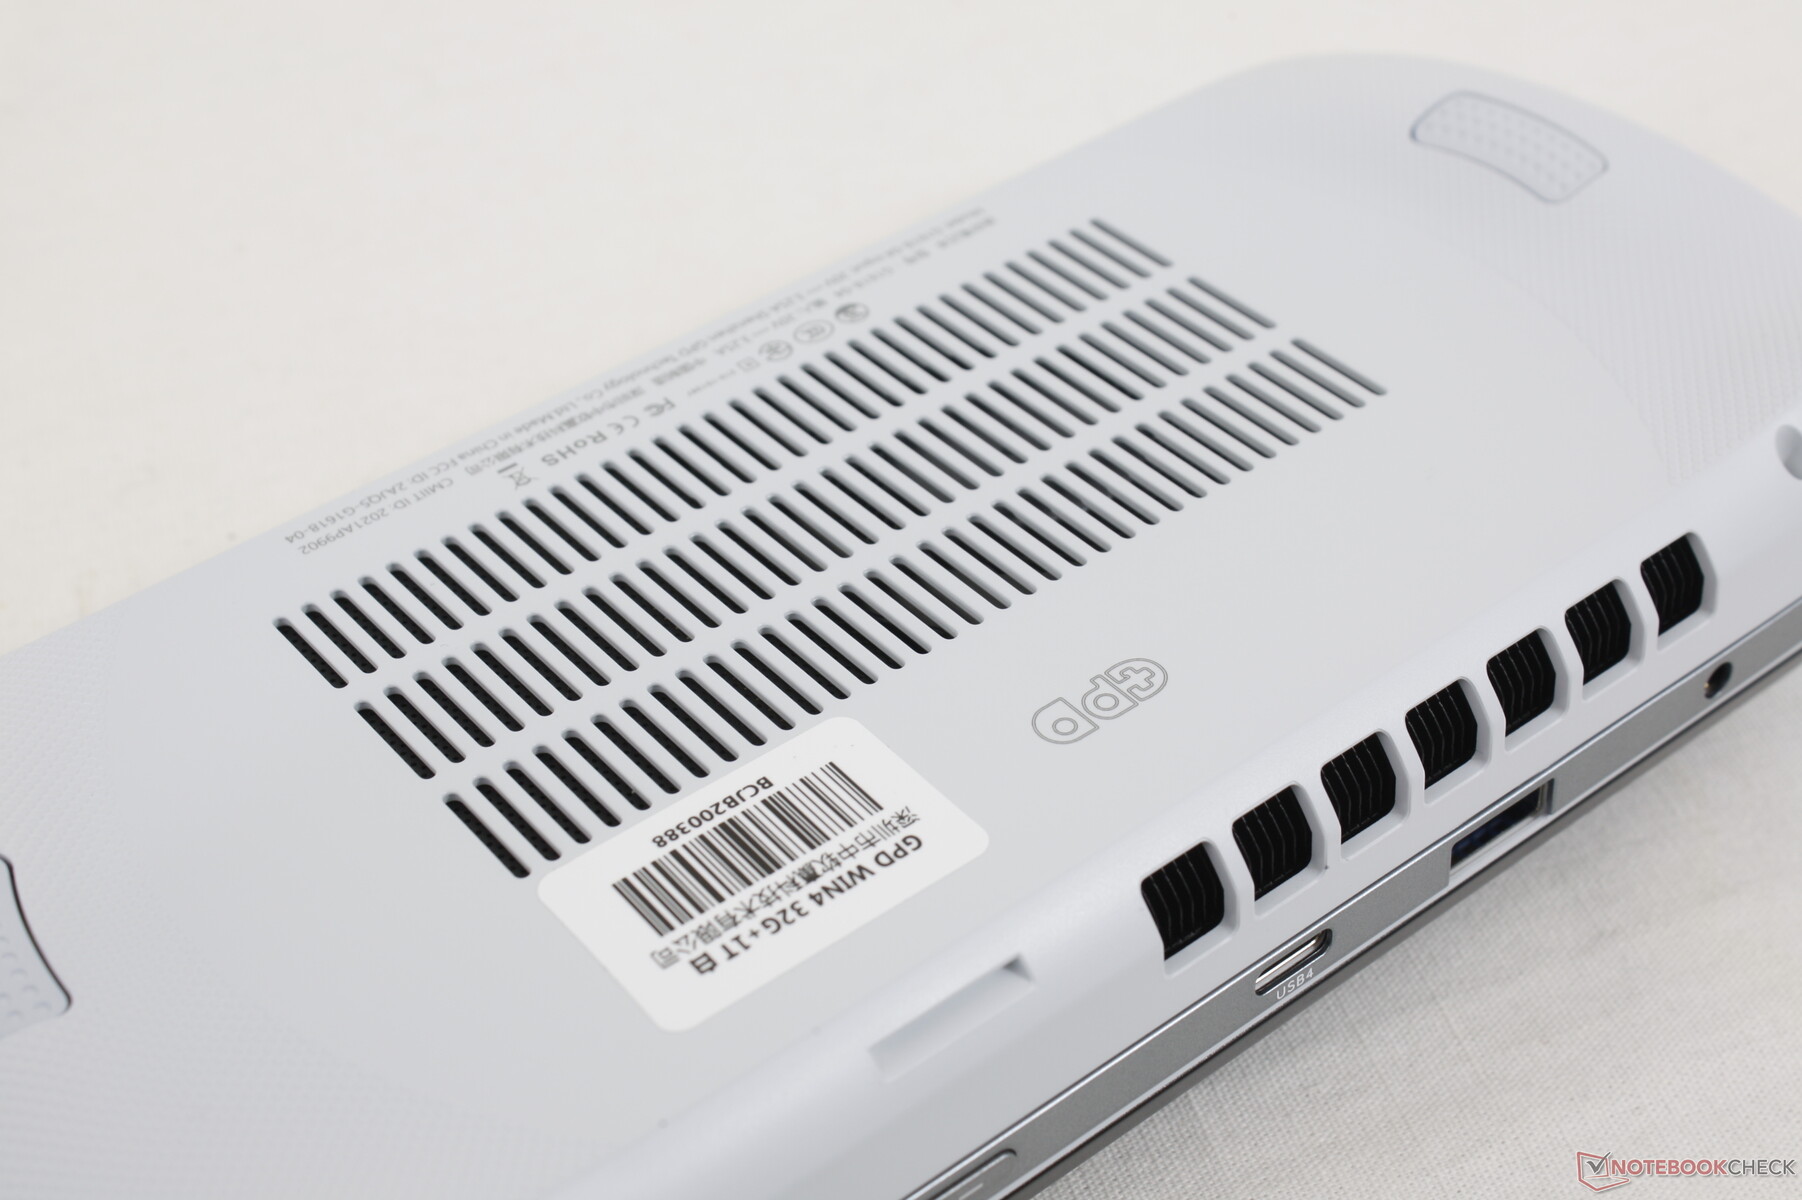
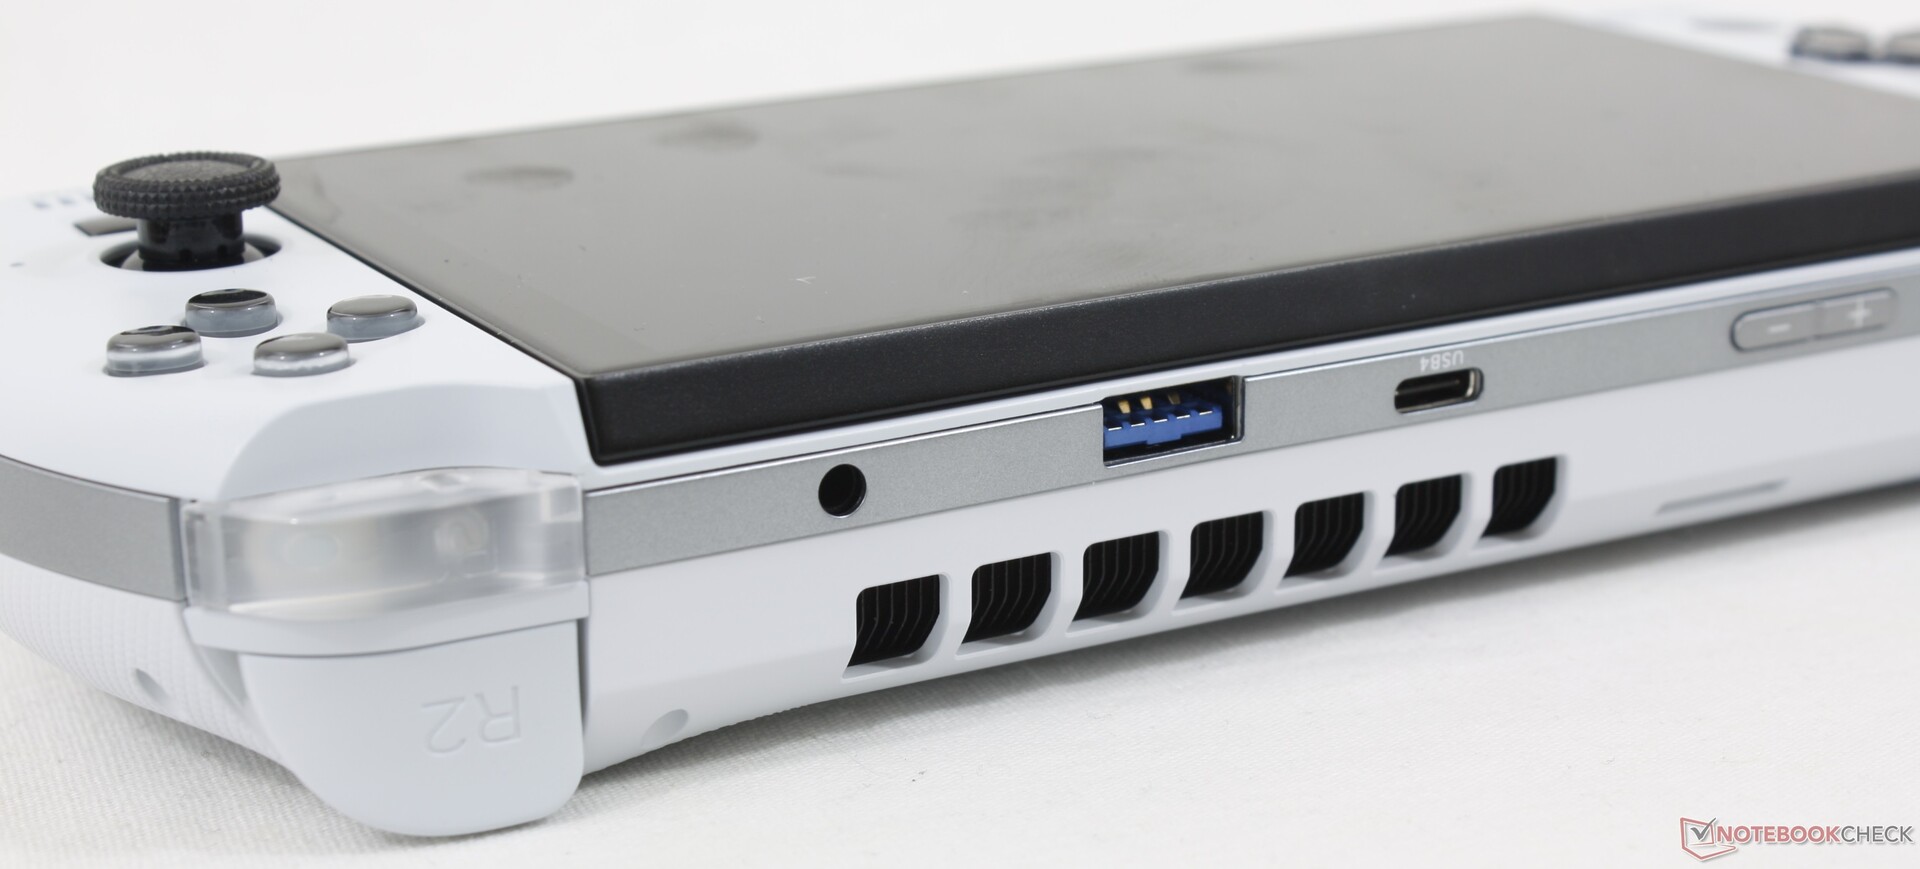
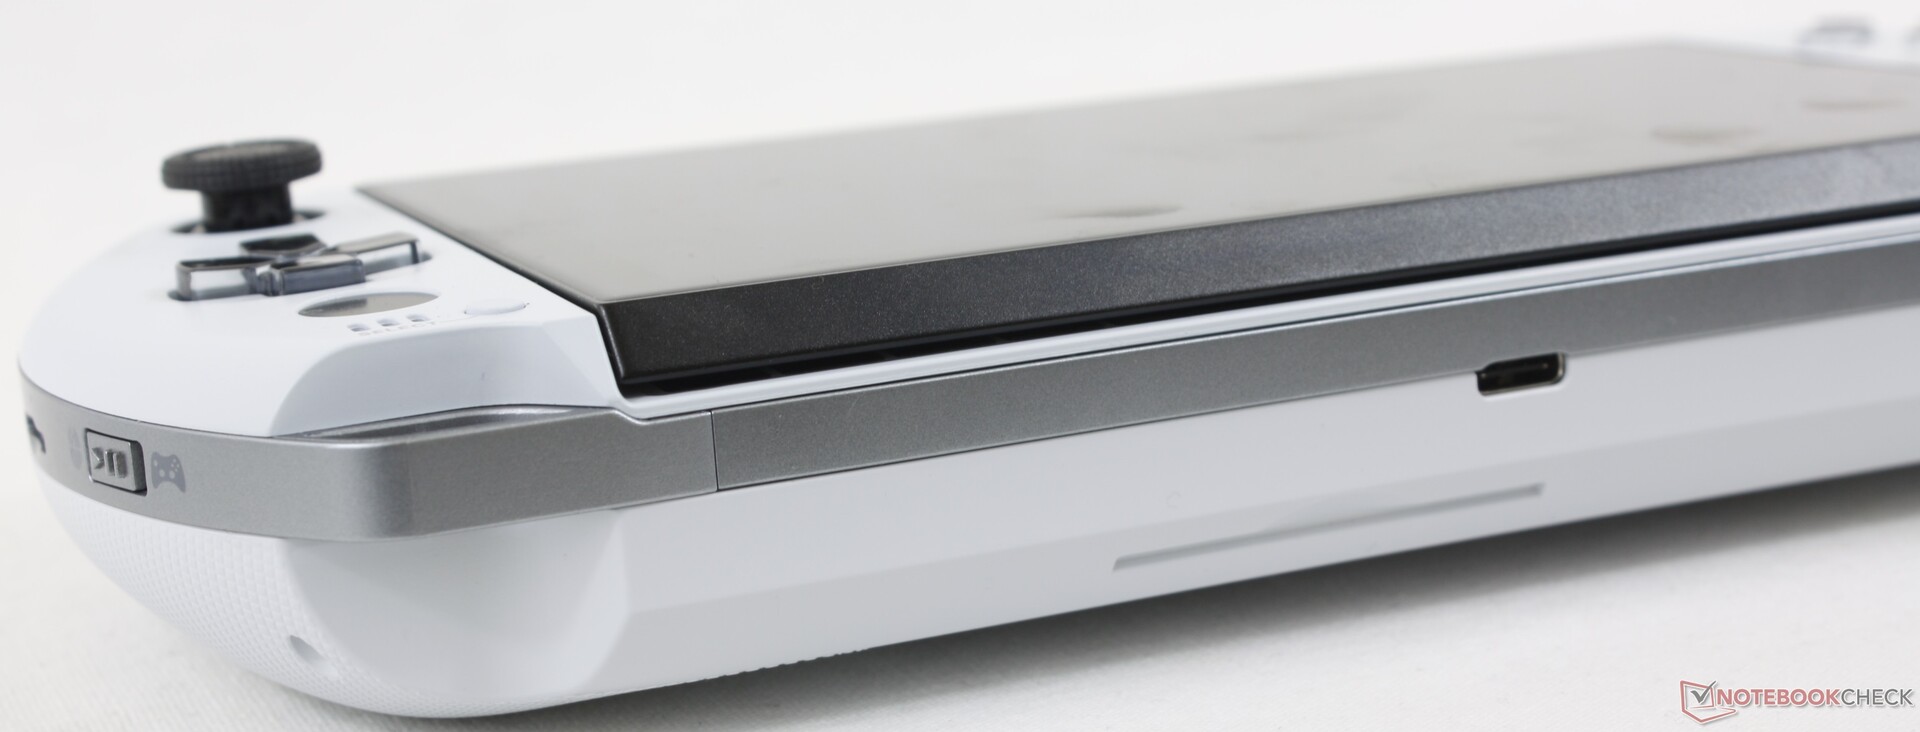
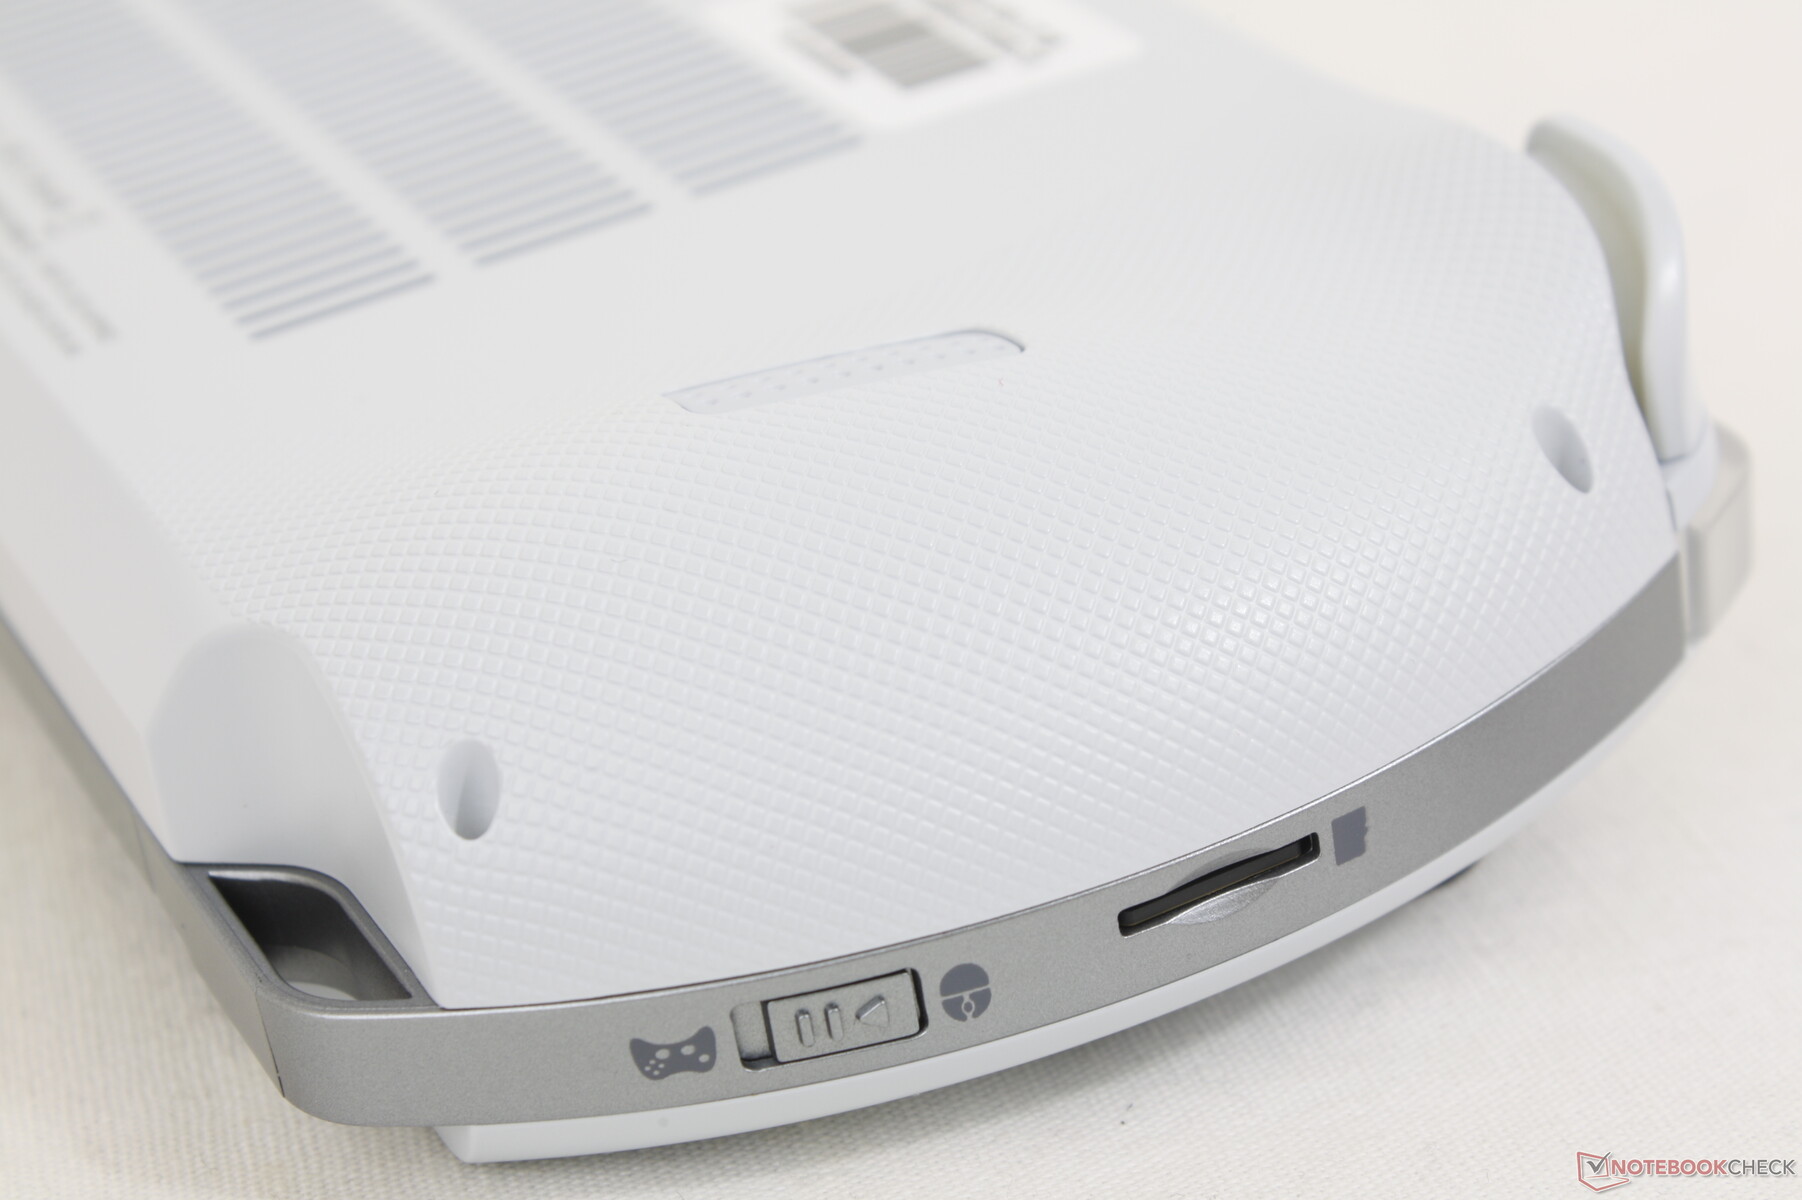
Conectividade - Sim, as eGPUs são suportadas!
O modelo integra duas portas USB-C e uma USB-A. A porta USB-C superior suporta USB4, o que significa que o sistema é compatível com as estações de ancoragem externas da GPU. Caso contrário, ambas as portas USB-C podem ser usadas para carregar ou conectar a monitores externos, enquanto o Nintendo Switch só pode ser recarregado através de sua porta USB-C na parte inferior.
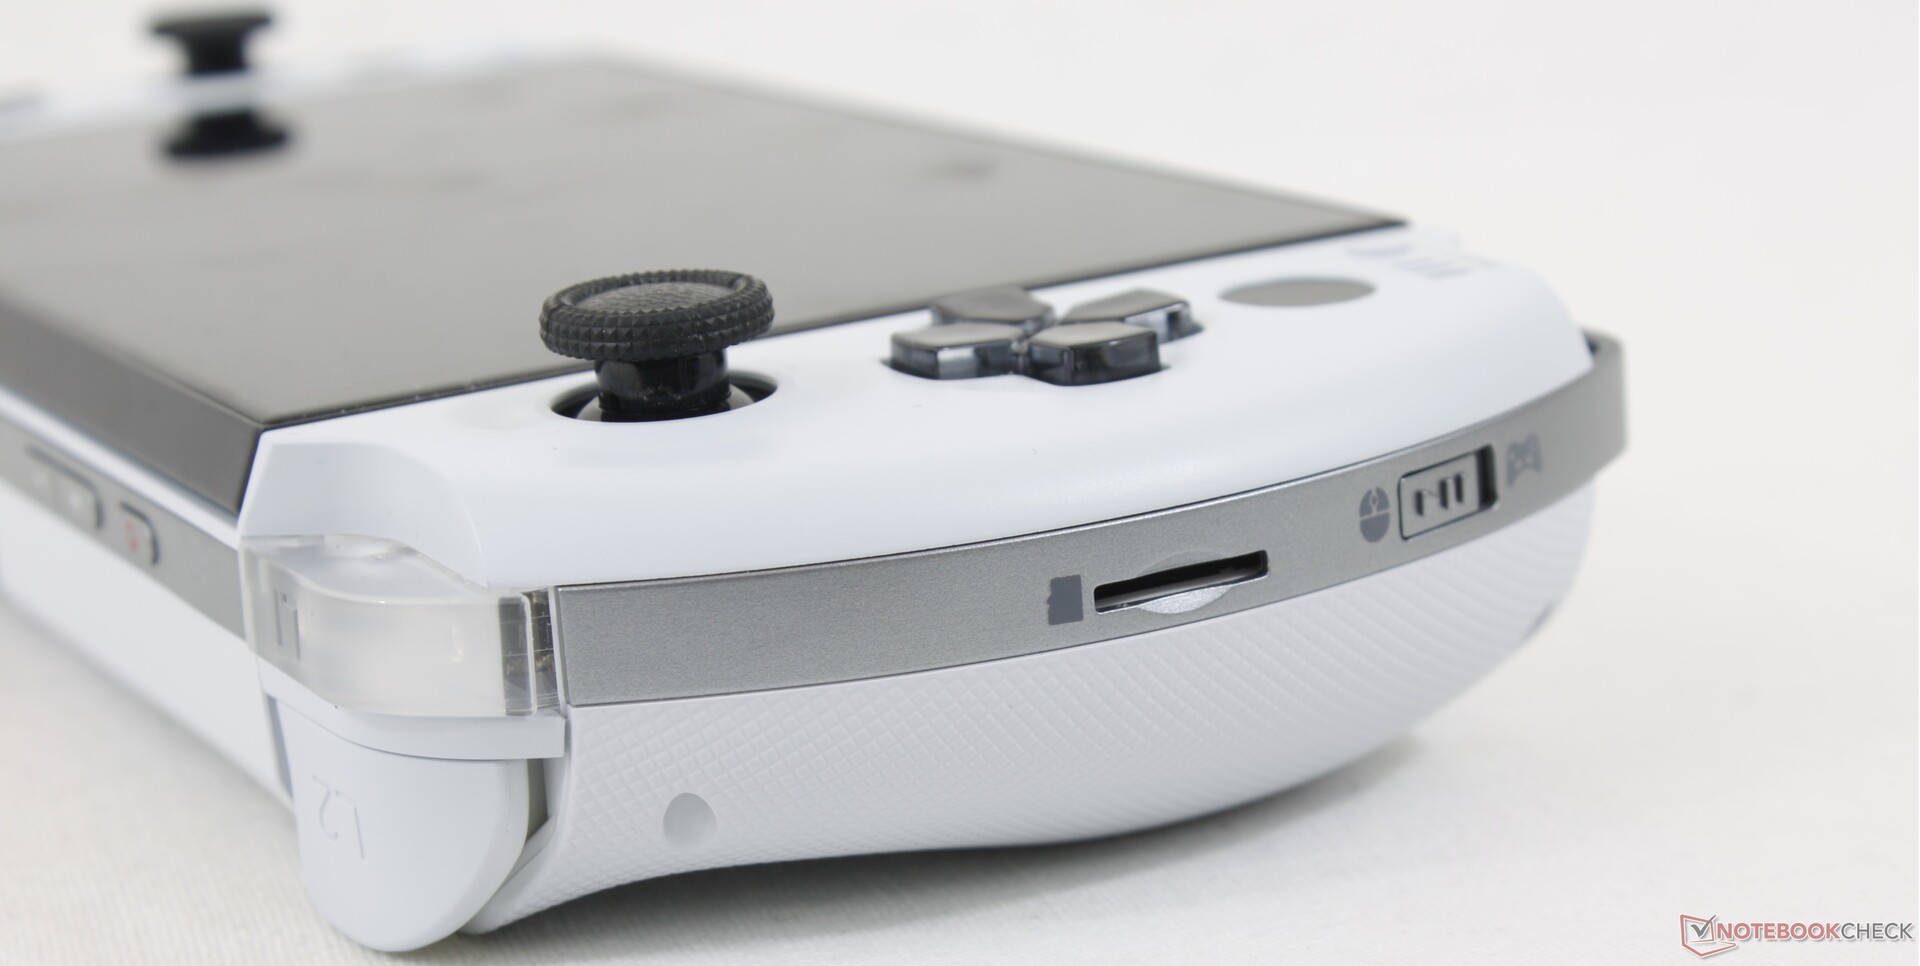
Leitor de cartões SD
O leitor MicroSD com mola volta do Win 3. O desempenho é decente apesar de ser metade da velocidade do leitor MicroSD no Ganhe MAX 2. No entanto, é útil para transferir os jogos para o Win 4.
| SD Card Reader | |
| average JPG Copy Test (av. of 3 runs) | |
| GPD Win Max 2 (Toshiba Exceria Pro SDXC 64 GB UHS-II) | |
| GPD Win 3 (Toshiba Exceria Pro M501 32 GB UHS-II) | |
| GPD Win 4 (AV Pro SD microSD 128 GB V60) | |
| maximum AS SSD Seq Read Test (1GB) | |
| GPD Win Max 2 (Toshiba Exceria Pro SDXC 64 GB UHS-II) | |
| GPD Win 4 (AV Pro SD microSD 128 GB V60) | |
| GPD Win 3 (Toshiba Exceria Pro M501 32 GB UHS-II) | |
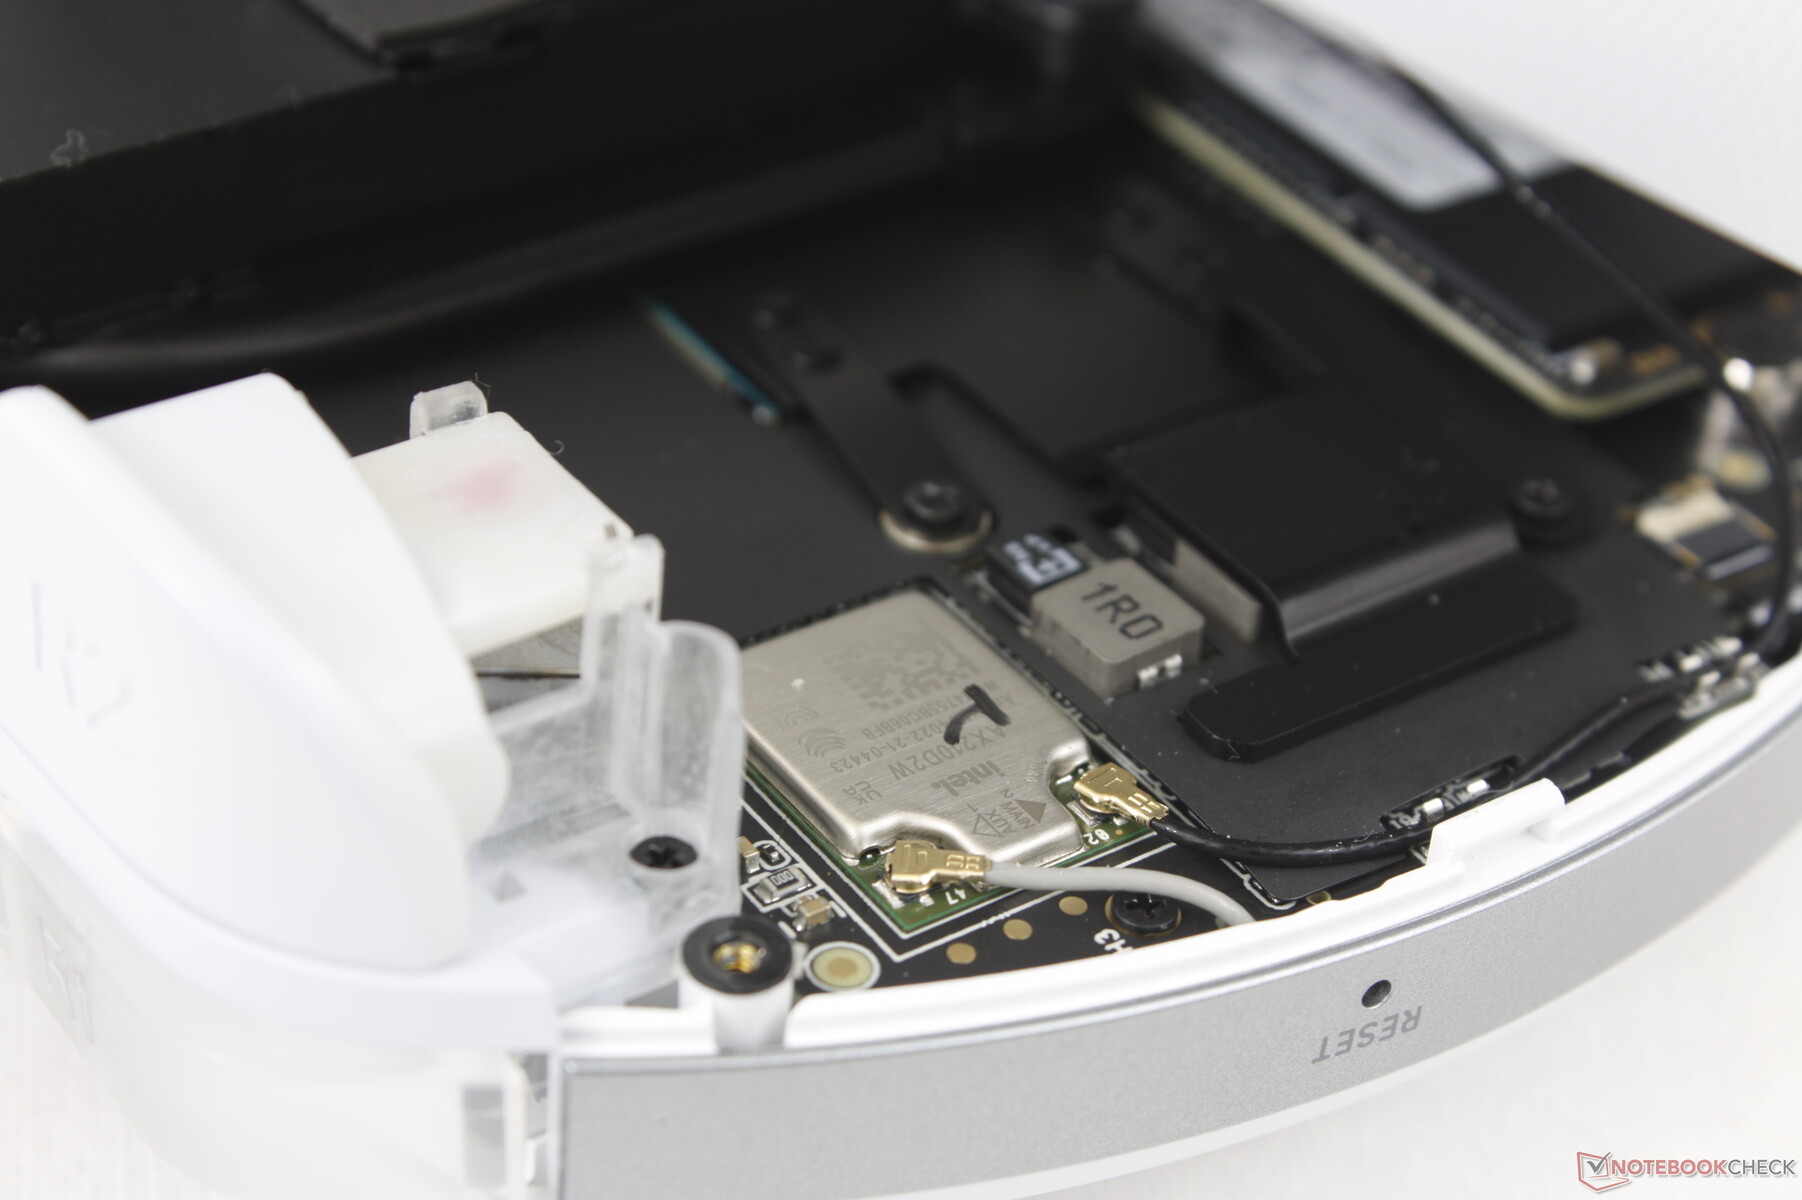
Comunicação
Um Intel AX210 vem como padrão para compatibilidade com Wi-Fi 6E. O Wi-Fi 6E não é necessariamente sempre mais rápido que o Wi-Fi 6 em termos de taxas de transferência no mundo real, mas se beneficia da latência reduzida que pode ajudar na transmissão de jogos.
| Networking | |
| iperf3 transmit AX12 | |
| GPD Win 3 | |
| Razer Blade Stealth i7-1165G7 GTX 1650 Ti Max-Q | |
| iperf3 receive AX12 | |
| Razer Blade Stealth i7-1165G7 GTX 1650 Ti Max-Q | |
| GPD Win 3 | |
| iperf3 transmit AXE11000 | |
| Asus Zenbook S 13 OLED | |
| GPD Win 4 | |
| iperf3 receive AXE11000 | |
| Asus Zenbook S 13 OLED | |
| GPD Win 4 | |
| iperf3 transmit AXE11000 6GHz | |
| GPD Win Max 2 | |
| Dell XPS 13 9315 2-in-1 Core i5-1230U | |
| GPD Win 4 | |
| iperf3 receive AXE11000 6GHz | |
| GPD Win Max 2 | |
| Dell XPS 13 9315 2-in-1 Core i5-1230U | |
| GPD Win 4 | |
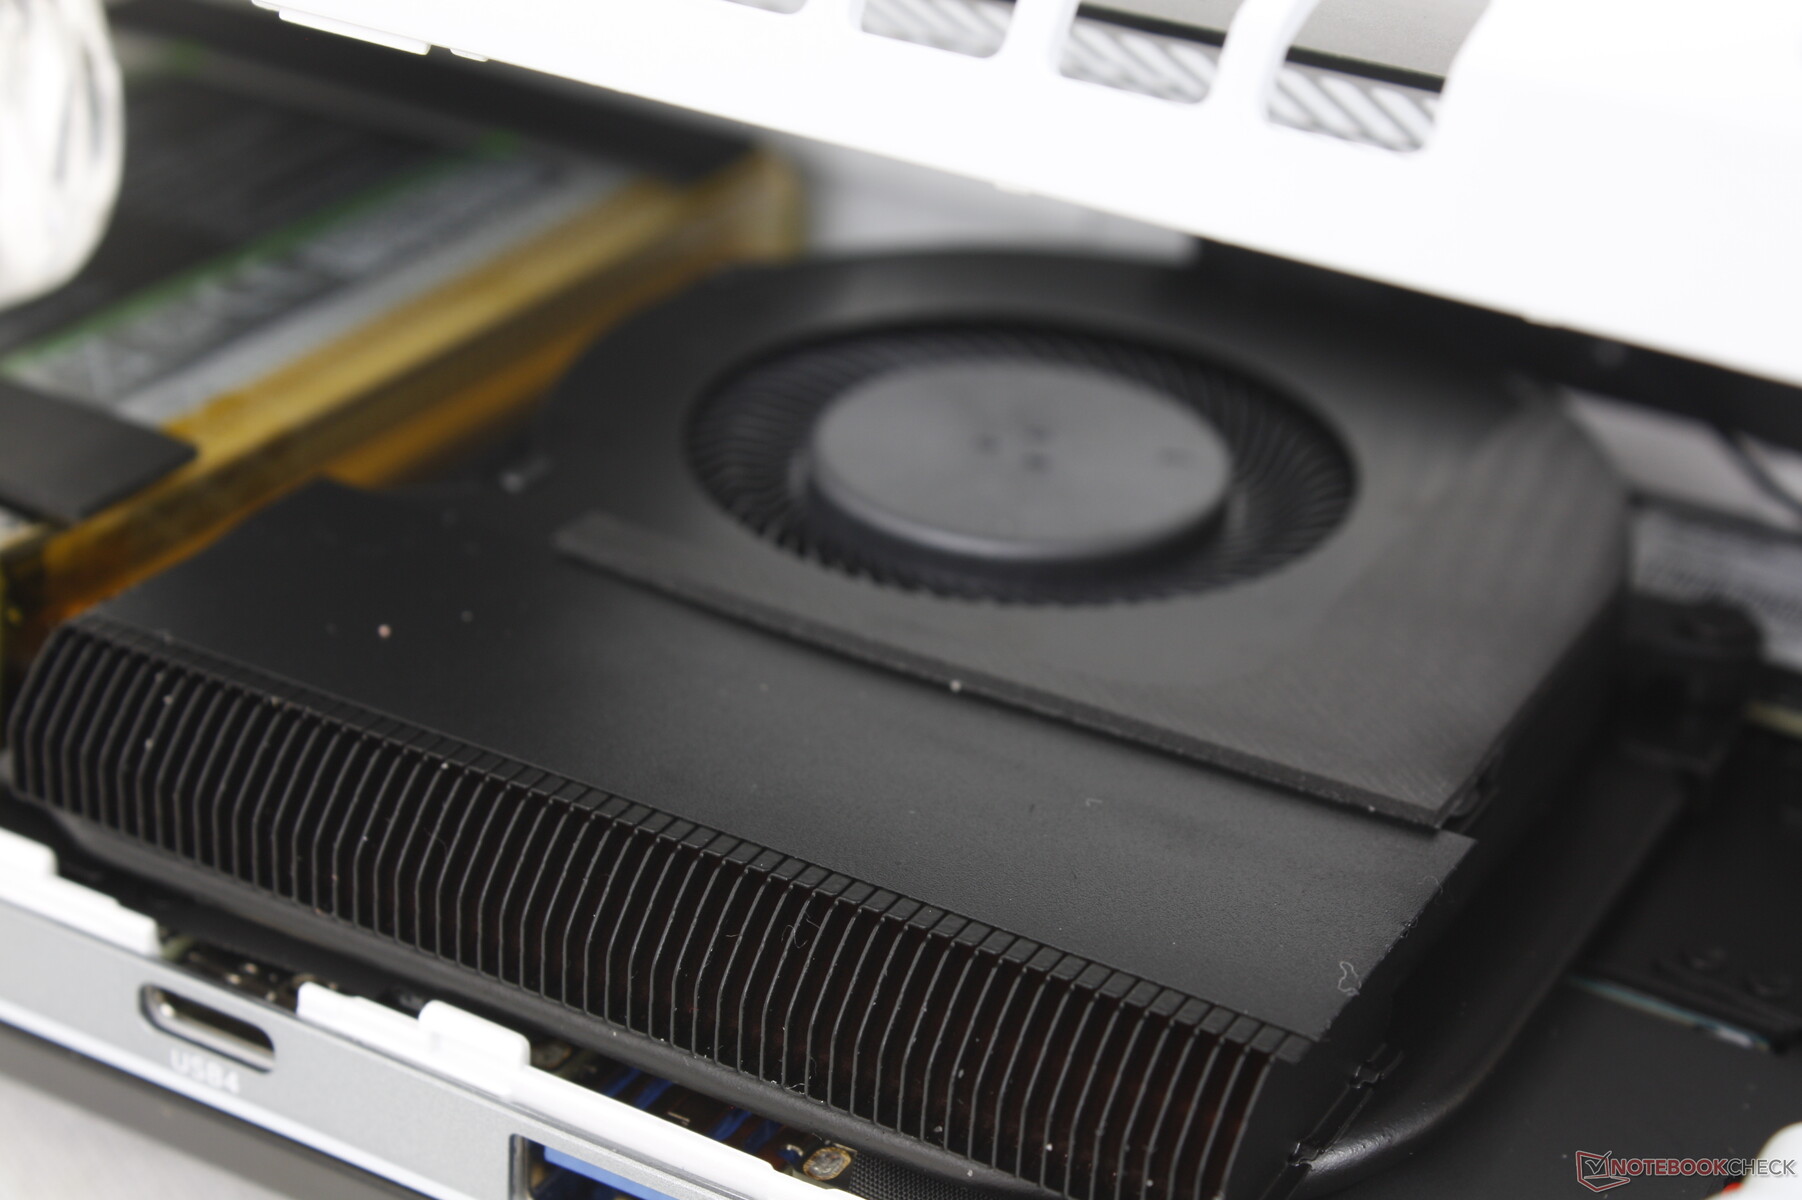
Manutenção
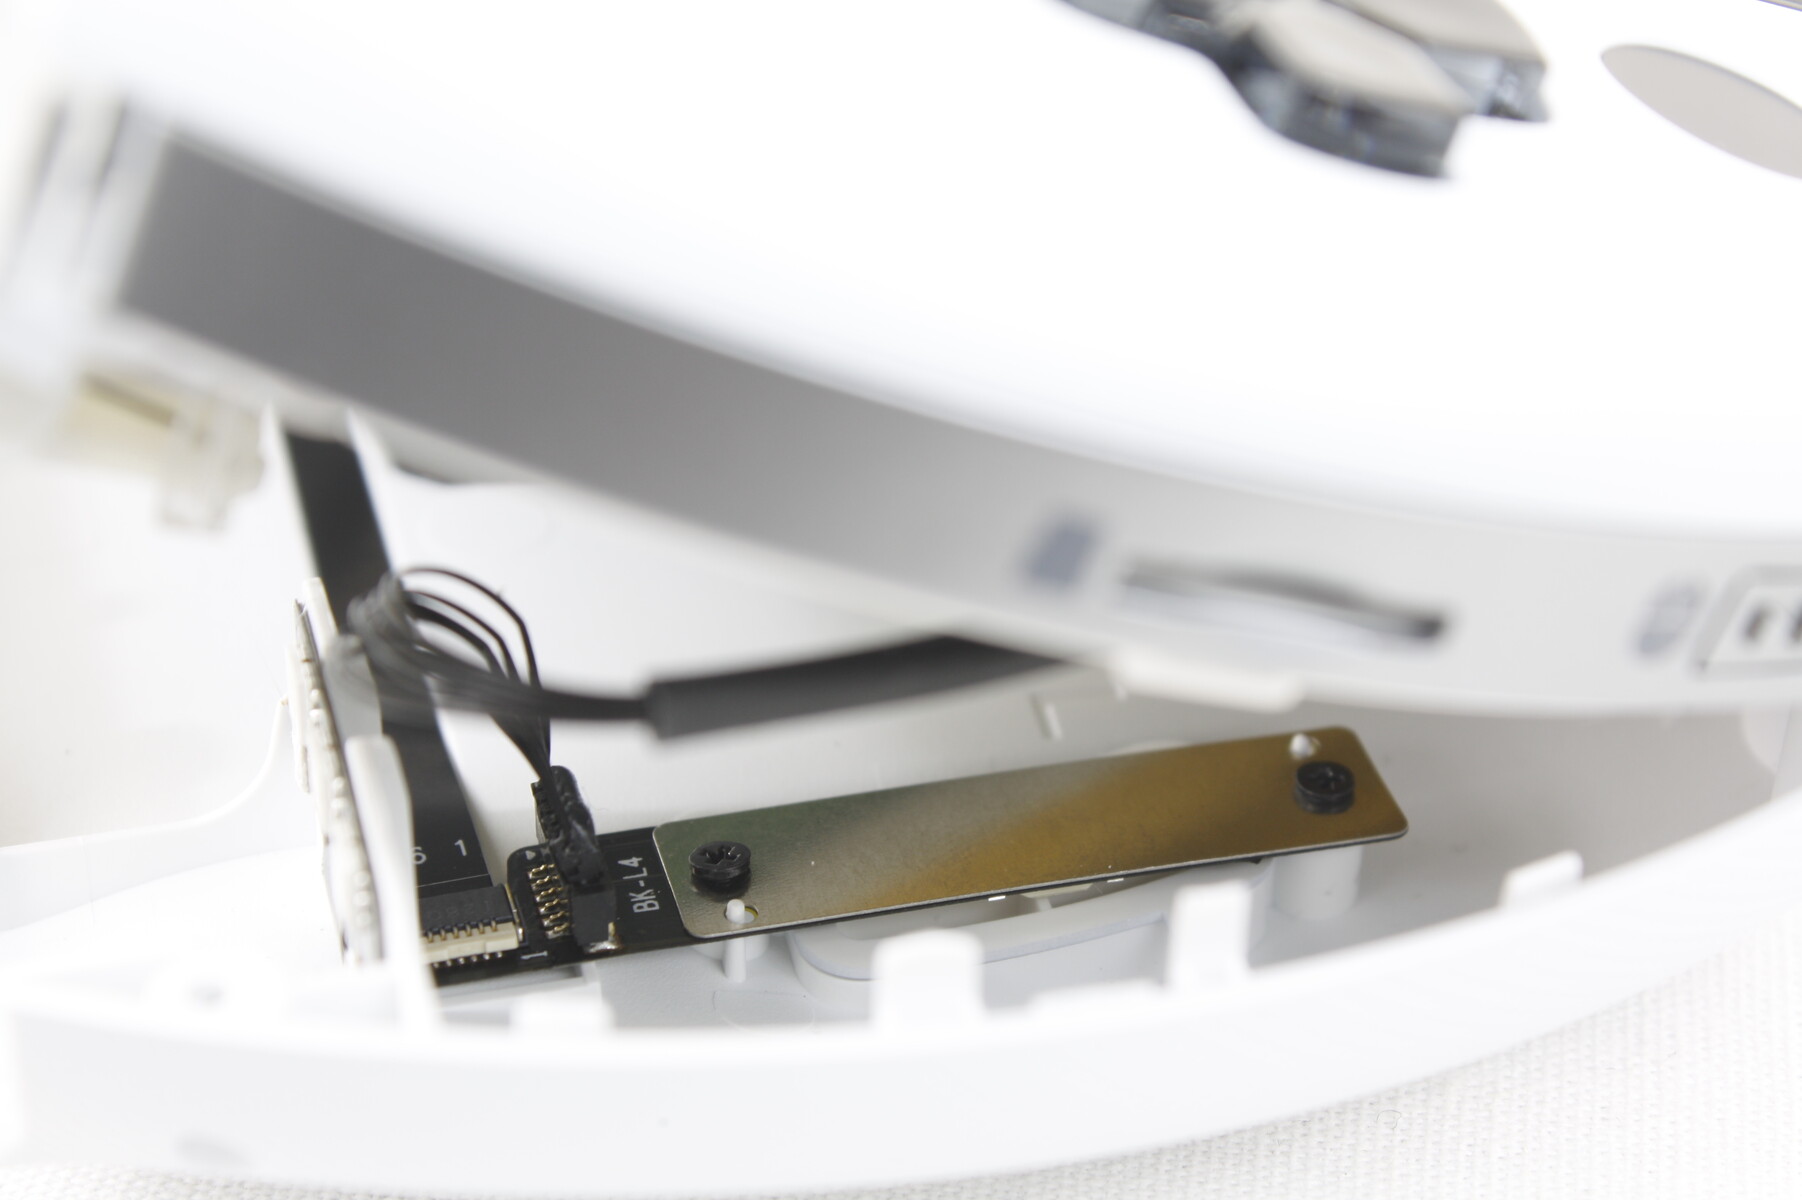
O painel traseiro de plástico é fixado por seis parafusos muito pequenos da Philips. Infelizmente em nossa unidade, as travas ao redor das bordas do painel traseiro são extremamente apertadas e difíceis de remover sem danificar a unidade, o que é uma pena porque o GPD Win 3 era de outra forma fácil de reparar. Podemos ver que o M.2 2280 SSD é removível enquanto os módulos WLAN e RAM são soldados.
Tenha em mente que o painel traseiro é conectado à placa-mãe através de um cabo de fita frágil por causa dos botões traseiros. Assim, você ainda teria que ter cuidado para não arrancar o painel traseiro ou correr o risco de danificar os botões.
Acessórios e Garantia
Não há acessórios incluídos na caixa do varejo, exceto o adaptador AC e a papelada. Os extras opcionais incluem um adaptador LTE 4G montado na parte traseira e uma estação de acoplamento USB-C oficial. É uma pena que o modelo que não vem com uma caixa de transporte gratuito ou protetor de tela.
A garantia padrão limitada de um ano do fabricante se aplica se adquirido nos EUA.
Dispositivos de entrada
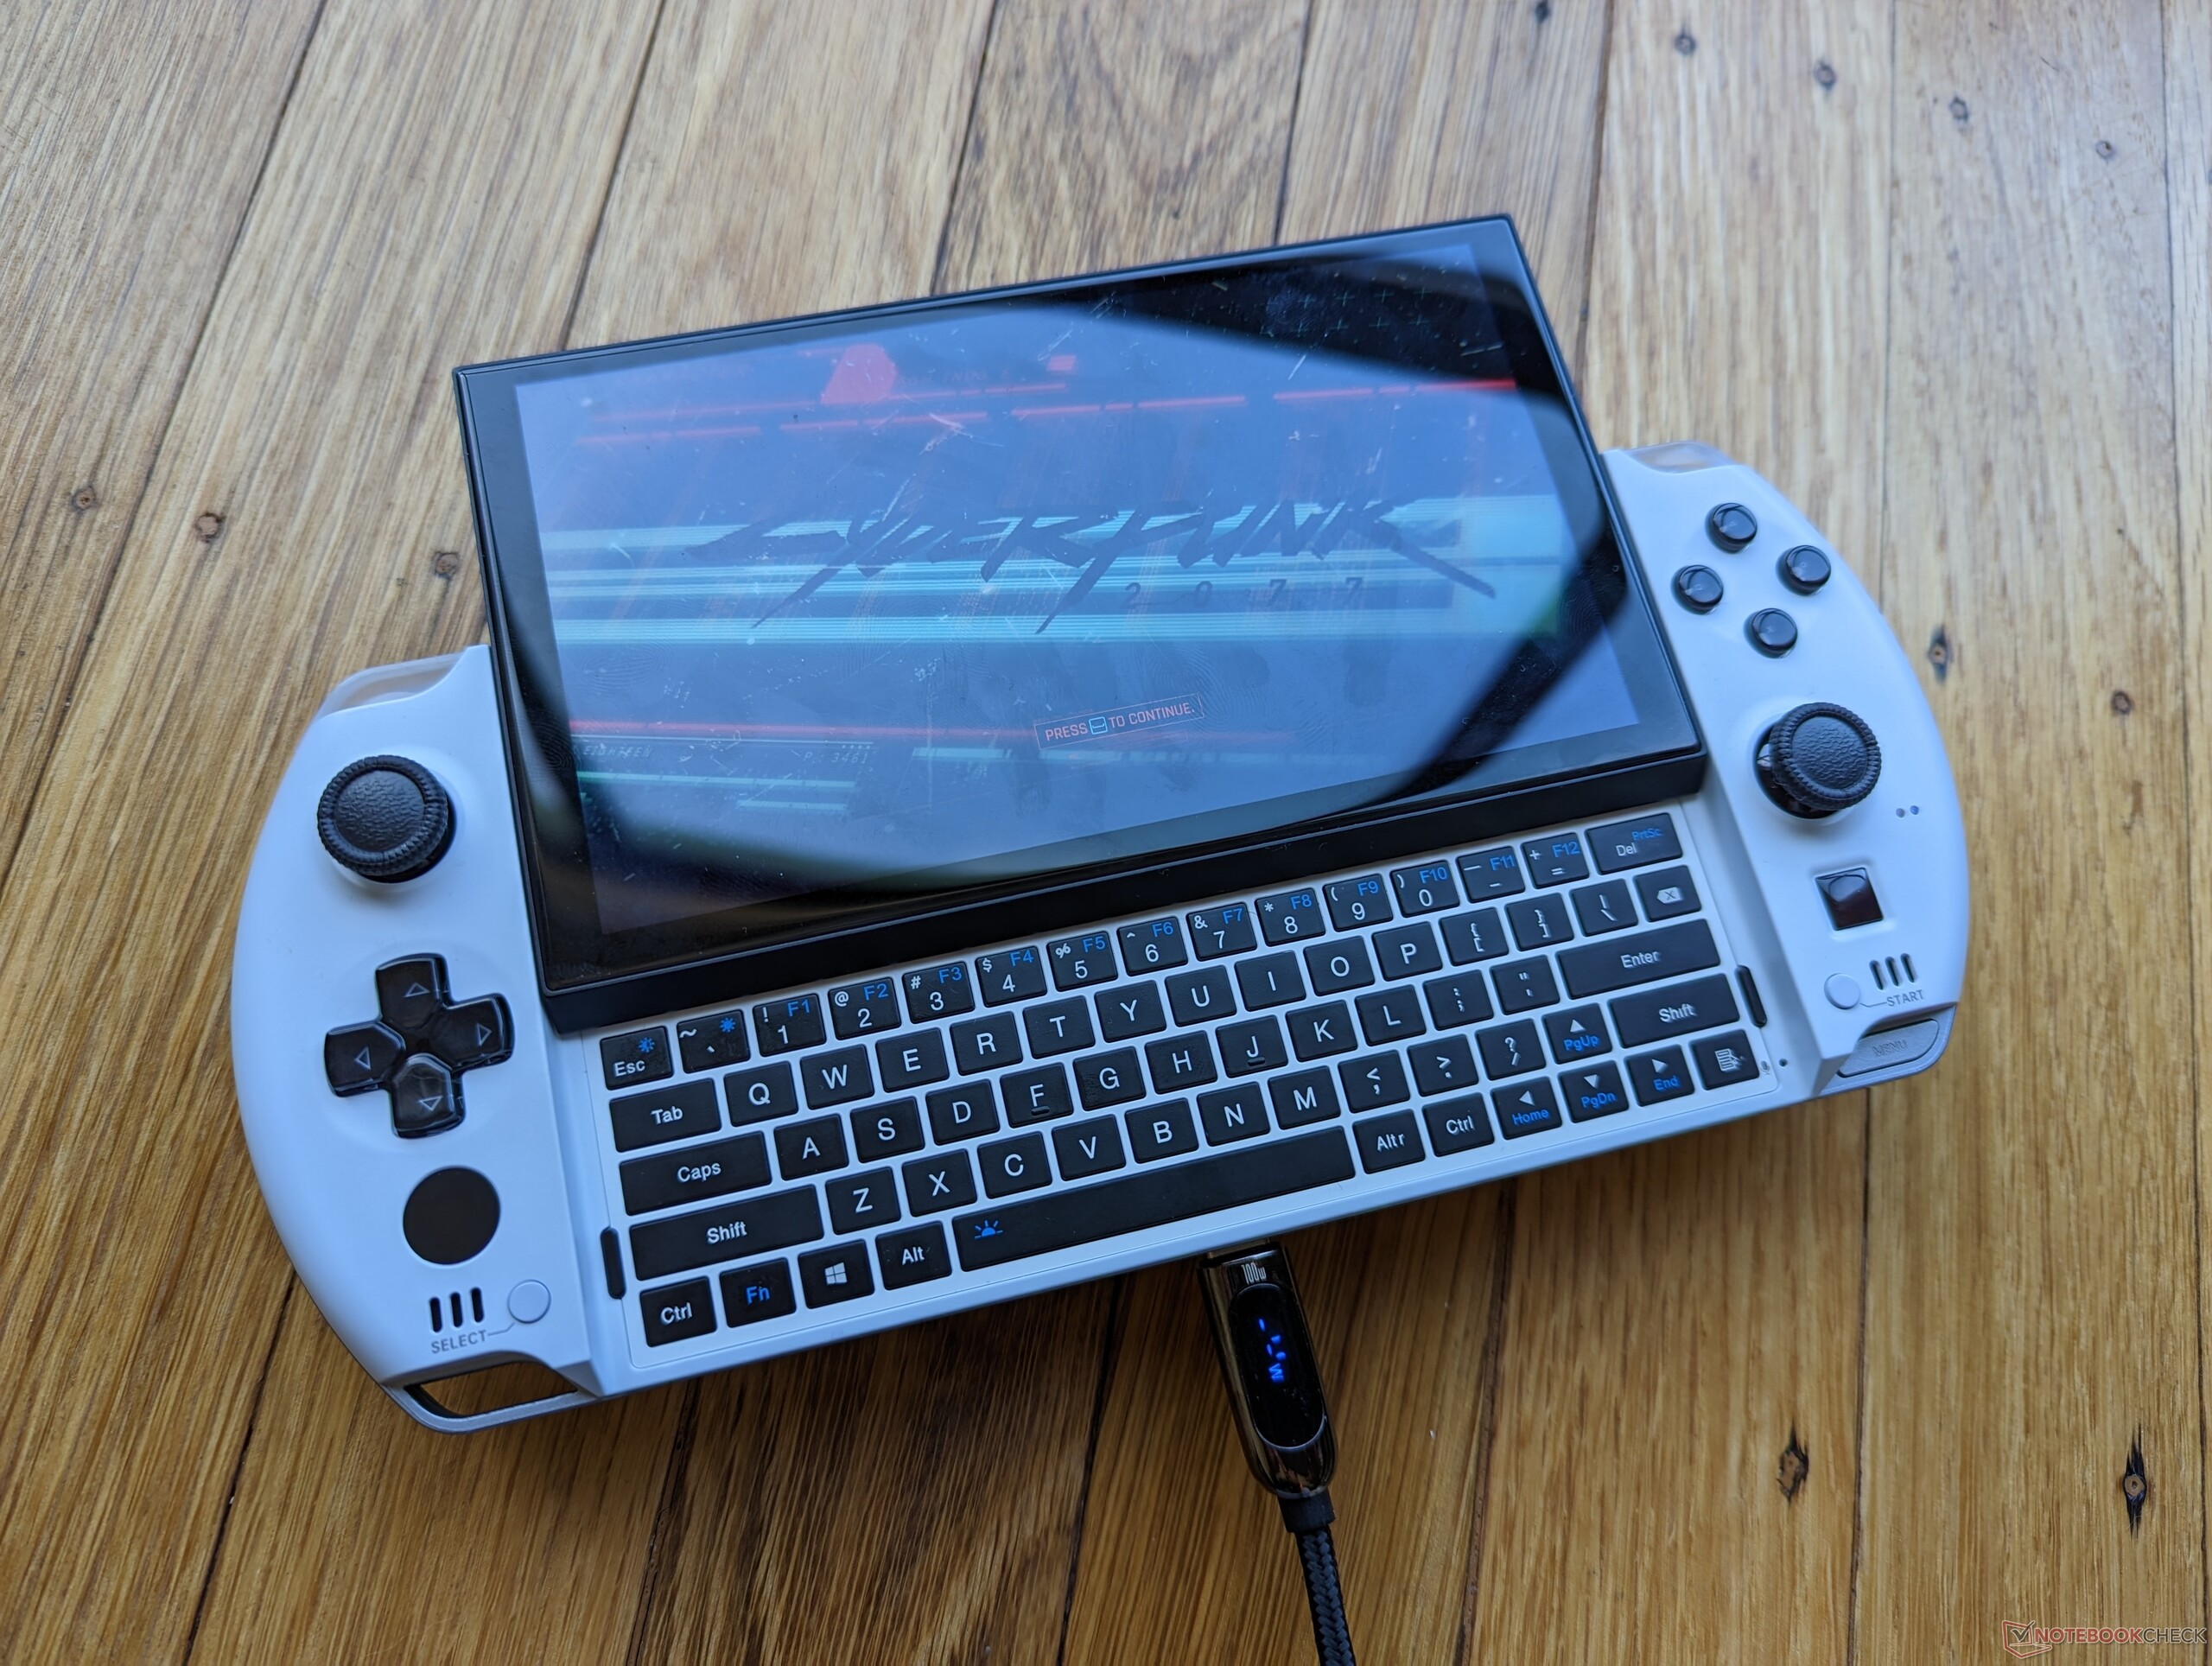
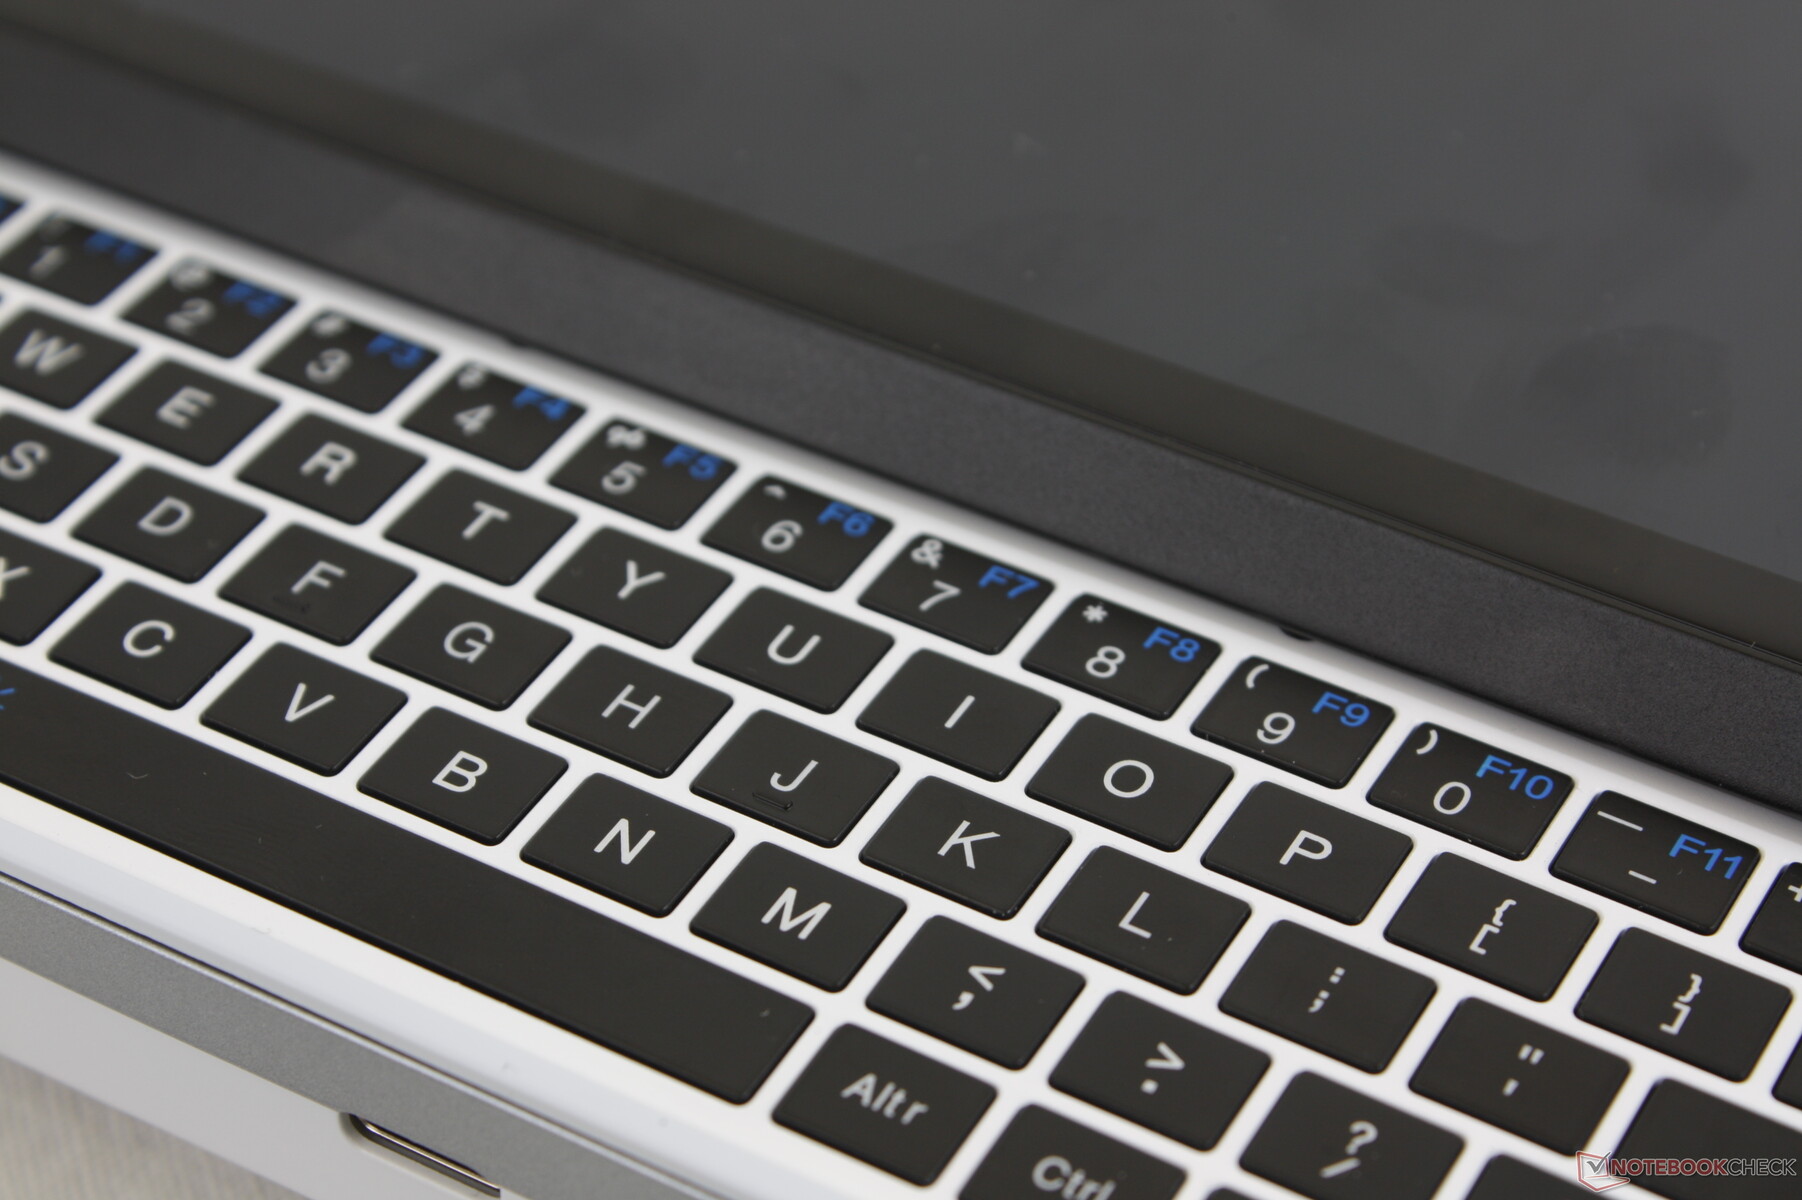
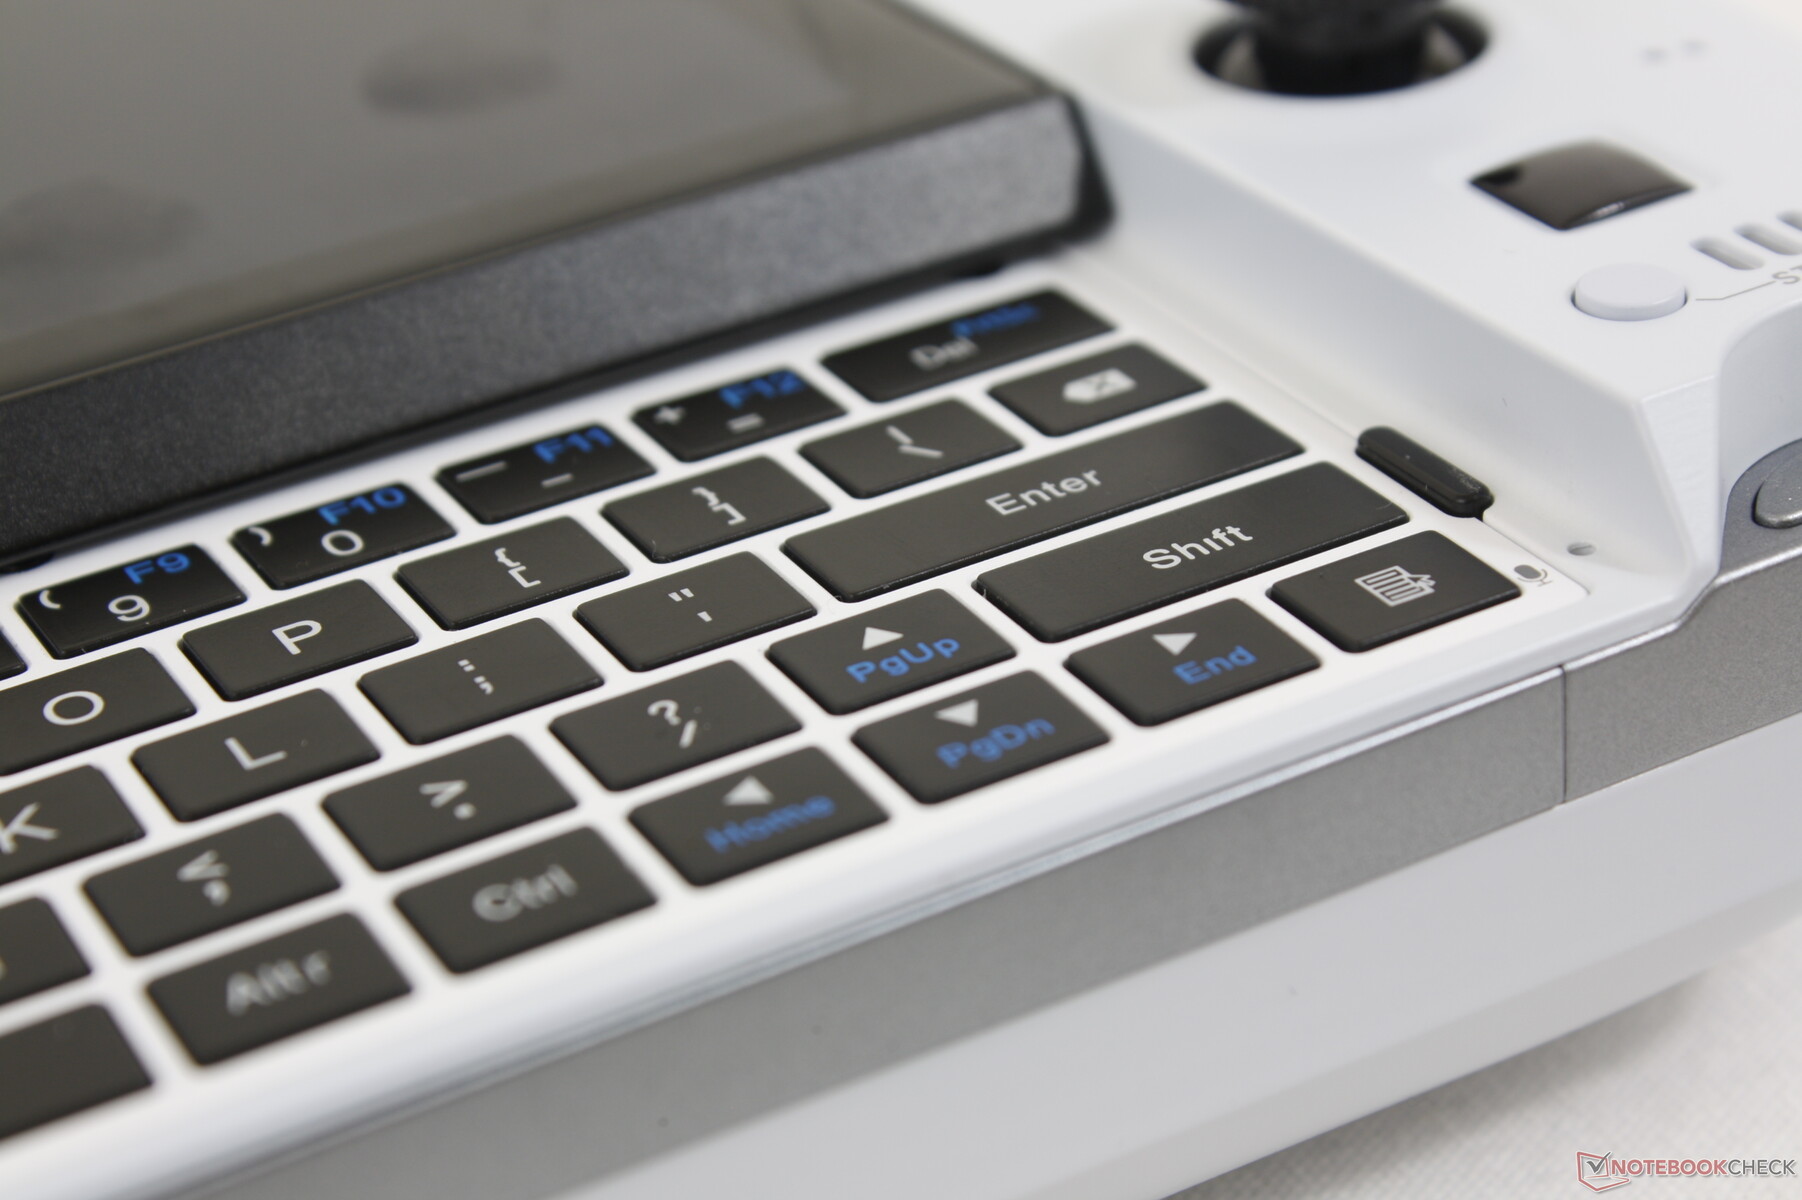
Teclado - Mais Confiável que o Win 3
O teclado foi completamente reformulado de teclas sensíveis ao toque no Win 3 para teclas físicas táteis no Win 4. Elas são clicáveis para melhor feedback, mas a velocidade de digitação ainda é muito mais lenta do que um teclado típico de tela sensível ao toque ou smartphone. Elas são boas o suficiente apenas para as entradas ocasionais.
Note que o bug que experimentamos no Win 3 foi corrigido no Win 4; deslizando a tela para cima e para baixo não pressiona mais nenhum botão no teclado.
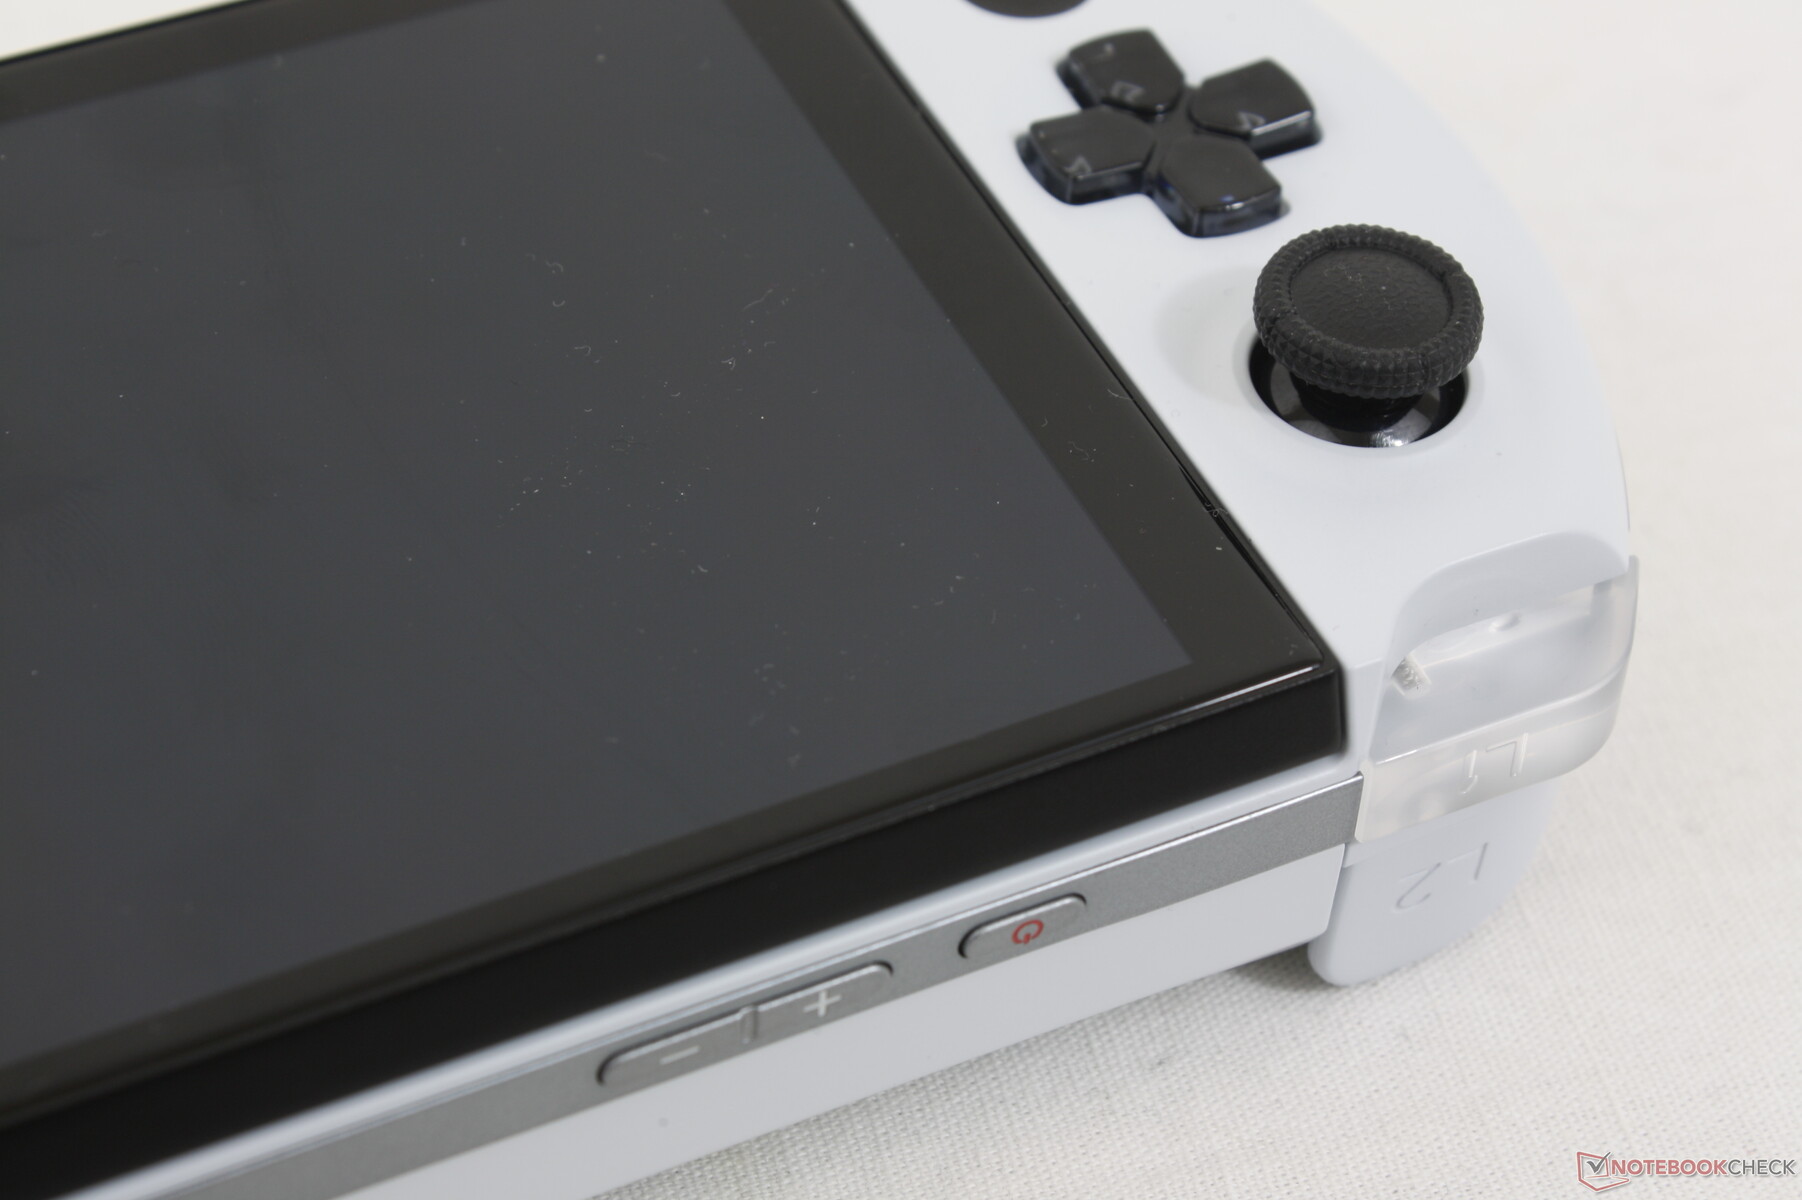
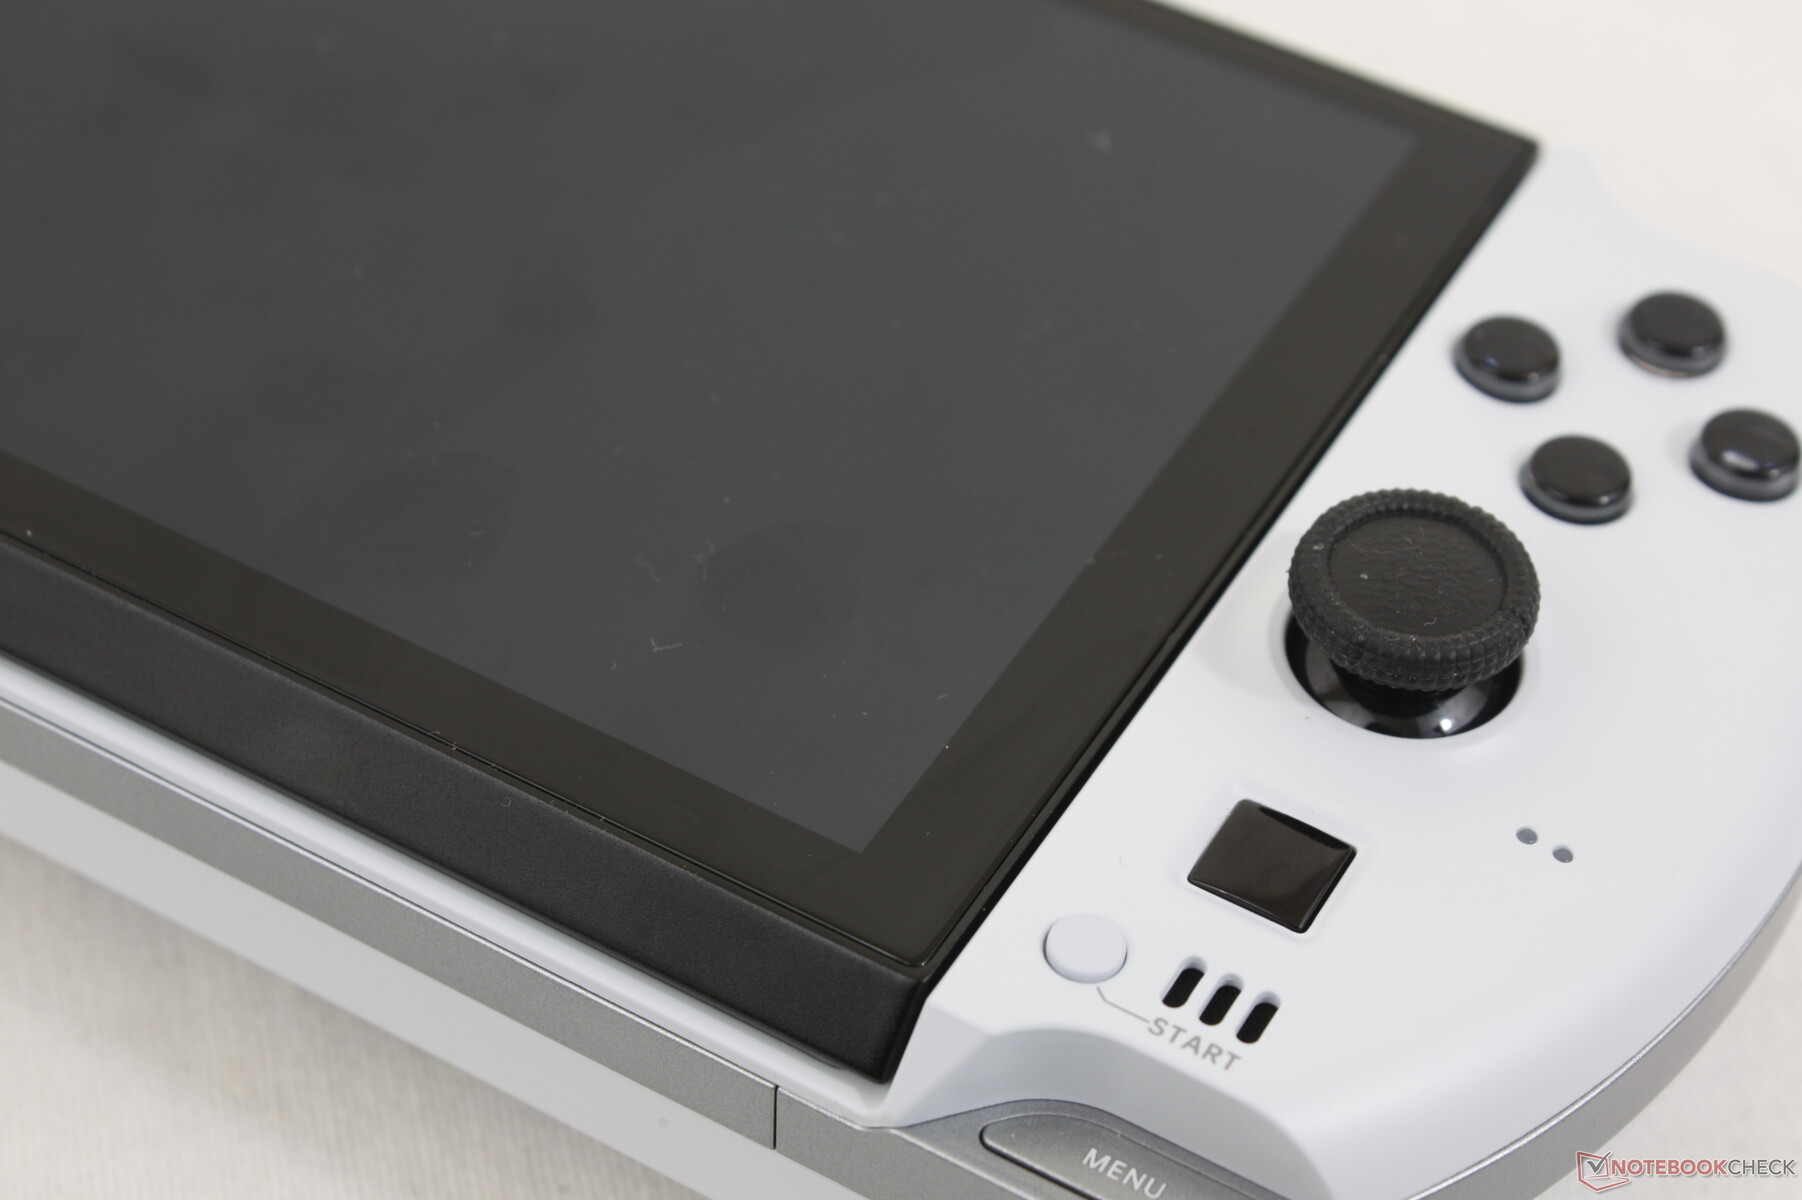
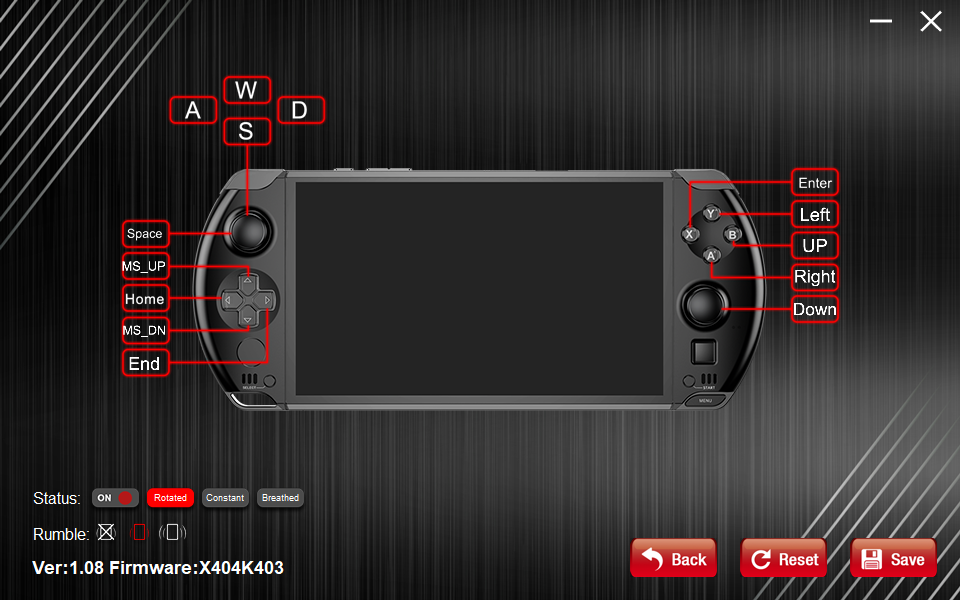
Gamepad - Como jogar em um Switch
Não é uma coincidência que os joysticks e botões do Win 4 sejam exatamente do mesmo tamanho que os do Nintendo Switch. Afinal de contas, por que mudar algo que já funciona no console portátil mais popular? A principal vantagem aqui é que se você estiver confortável jogando no Switch, então o gamepad Win 4 vai se sentir muito familiarizado. Por outro lado, os usuários que acharem os botões do Switch muito pequenos ou apertados não vão encontrar uma experiência melhor no Win 4. Em vez disso, nossa principal preocupação é que os botões do gamepad não sejam removíveis e, portanto, qualquer desgaste ao longo do tempo pode ser difícil de ser reparado, enquanto os controladores do console podem ser substituídos a baixo custo.
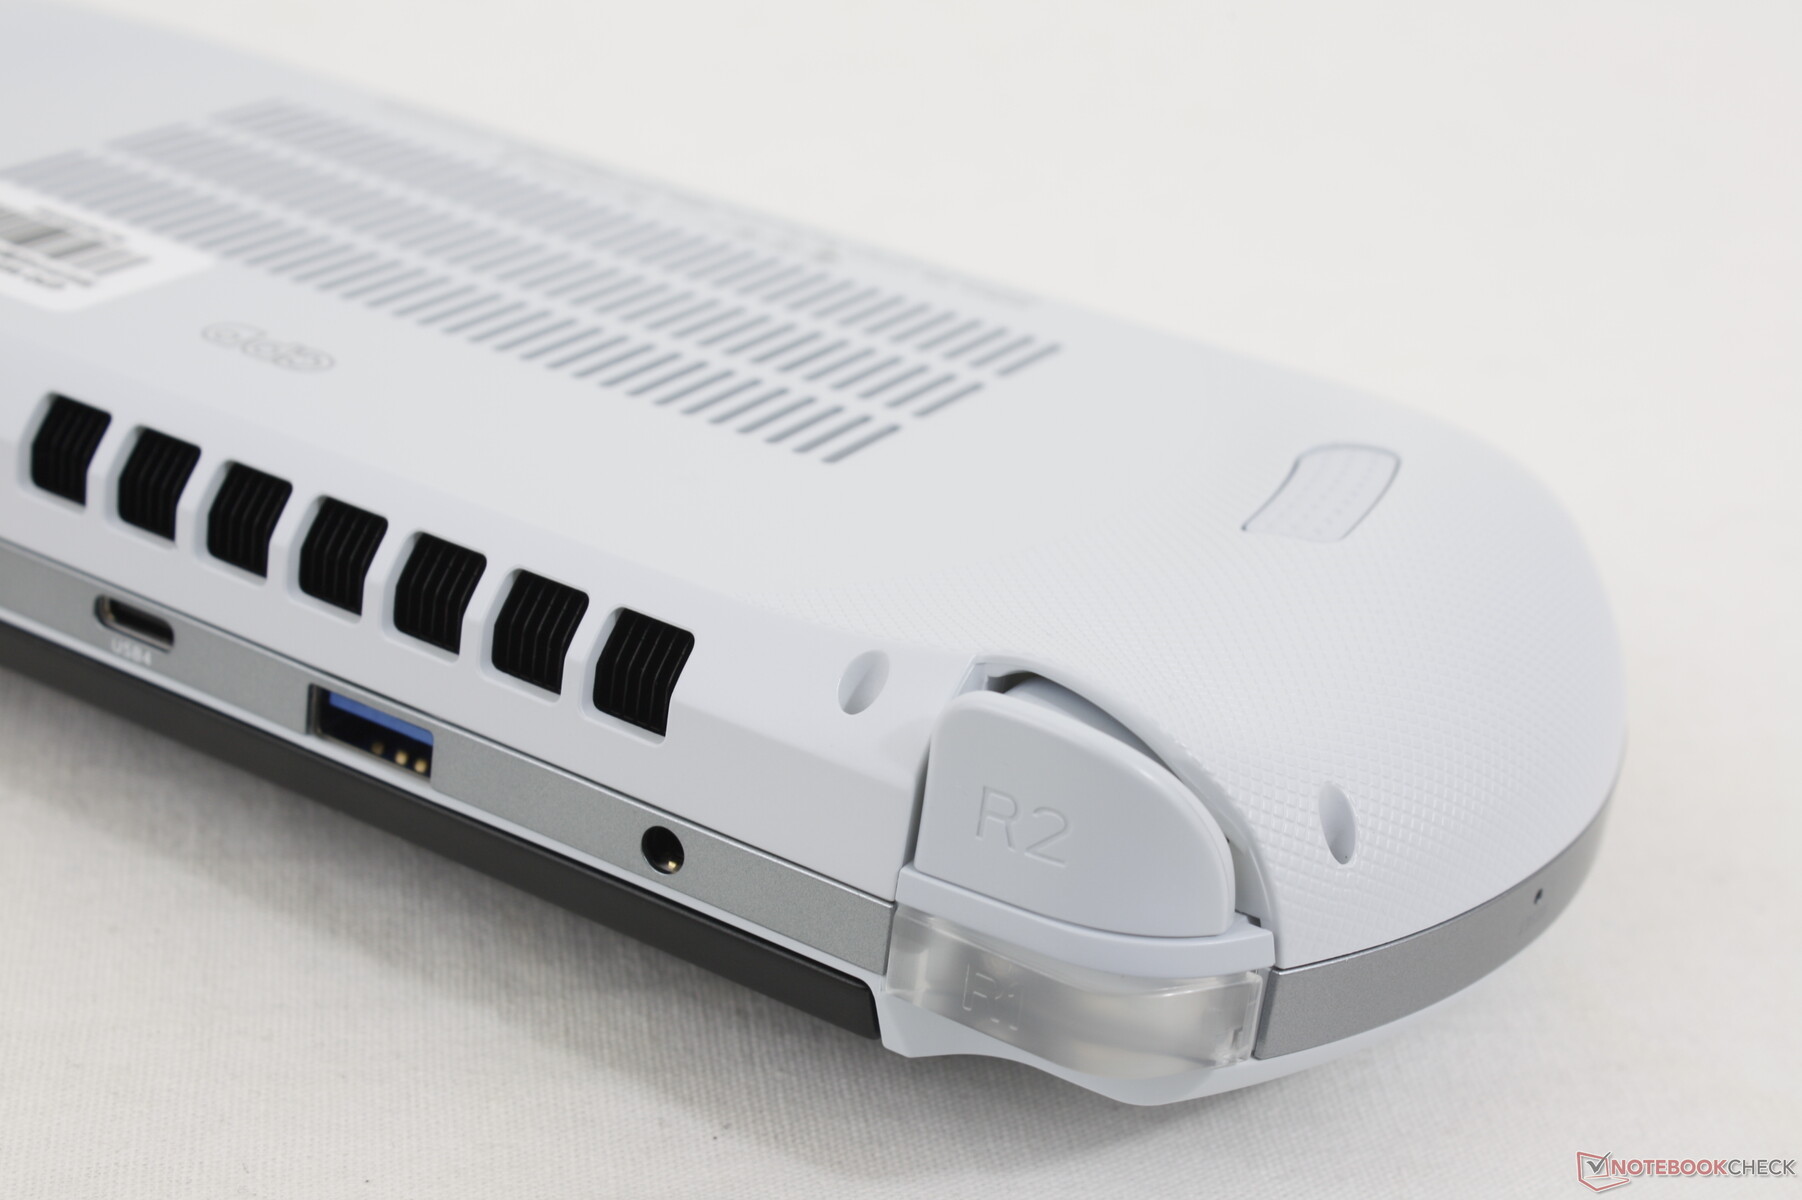
Os dois botões de ombro traseiros (L2, R2) têm mais viagens do que os mesmos botões no Interruptor. É uma pequena, mas notável melhoria para aproximar um pouco mais a experiência do controlador de um XBox normal ou do gamepad PS.
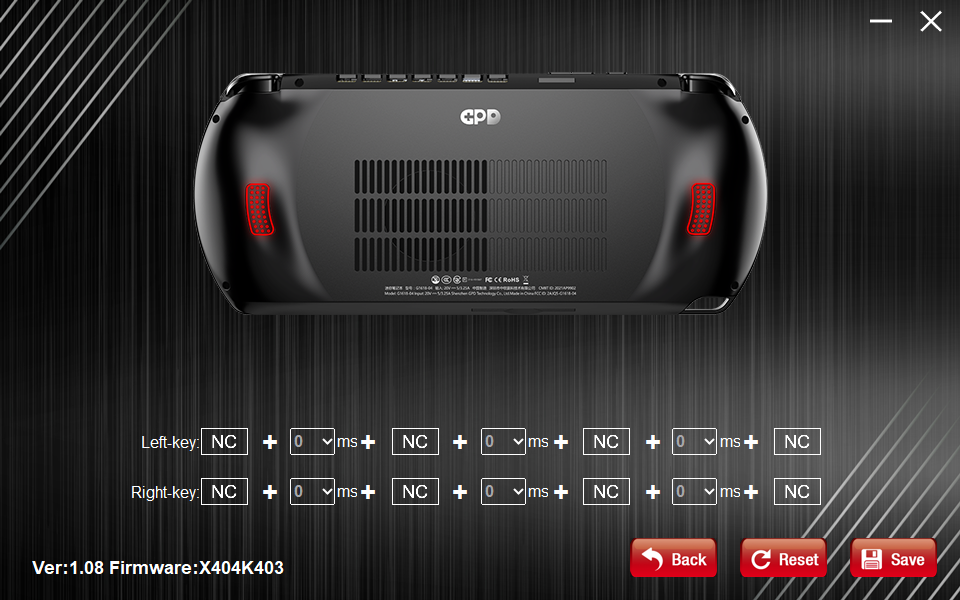
Há dois modos para o gamepad muito parecidos com o do Win 3: Mouse e Gamepad. Se no modo Mouse, os botões do gamepad são pré-mapeados para as seguintes teclas, como mostra a captura de tela abaixo. Se no modo Gamepad, o Windows reconhecerá o gamepad como um controlador XBox padrão para compatibilidade automática com Steam e outros títulos. Em ambos os casos, o software pré-instalado WinControls permite que os usuários refaçam os botões conforme necessário.
Nenhum dos botões do gamepad é retroiluminado, exceto os botões de ombro L1 e R1.
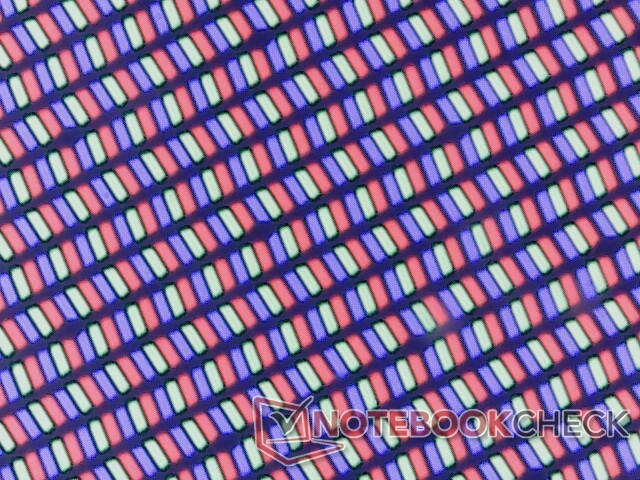
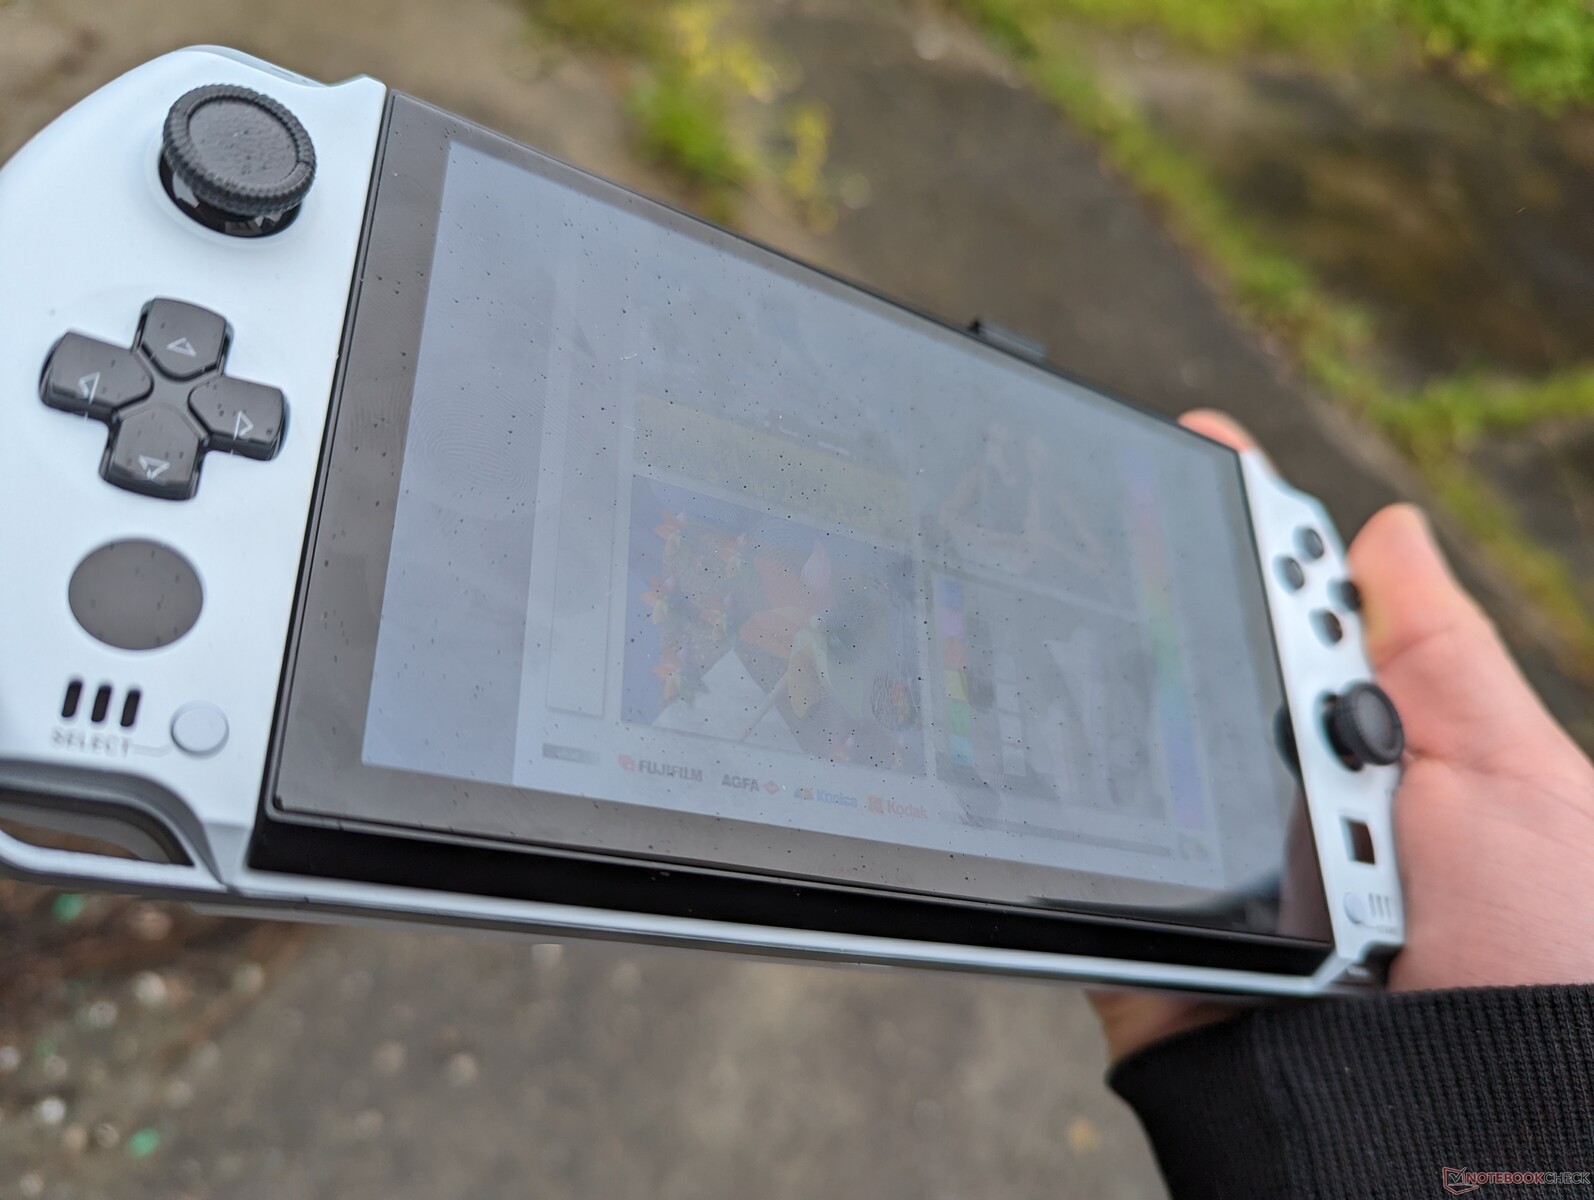
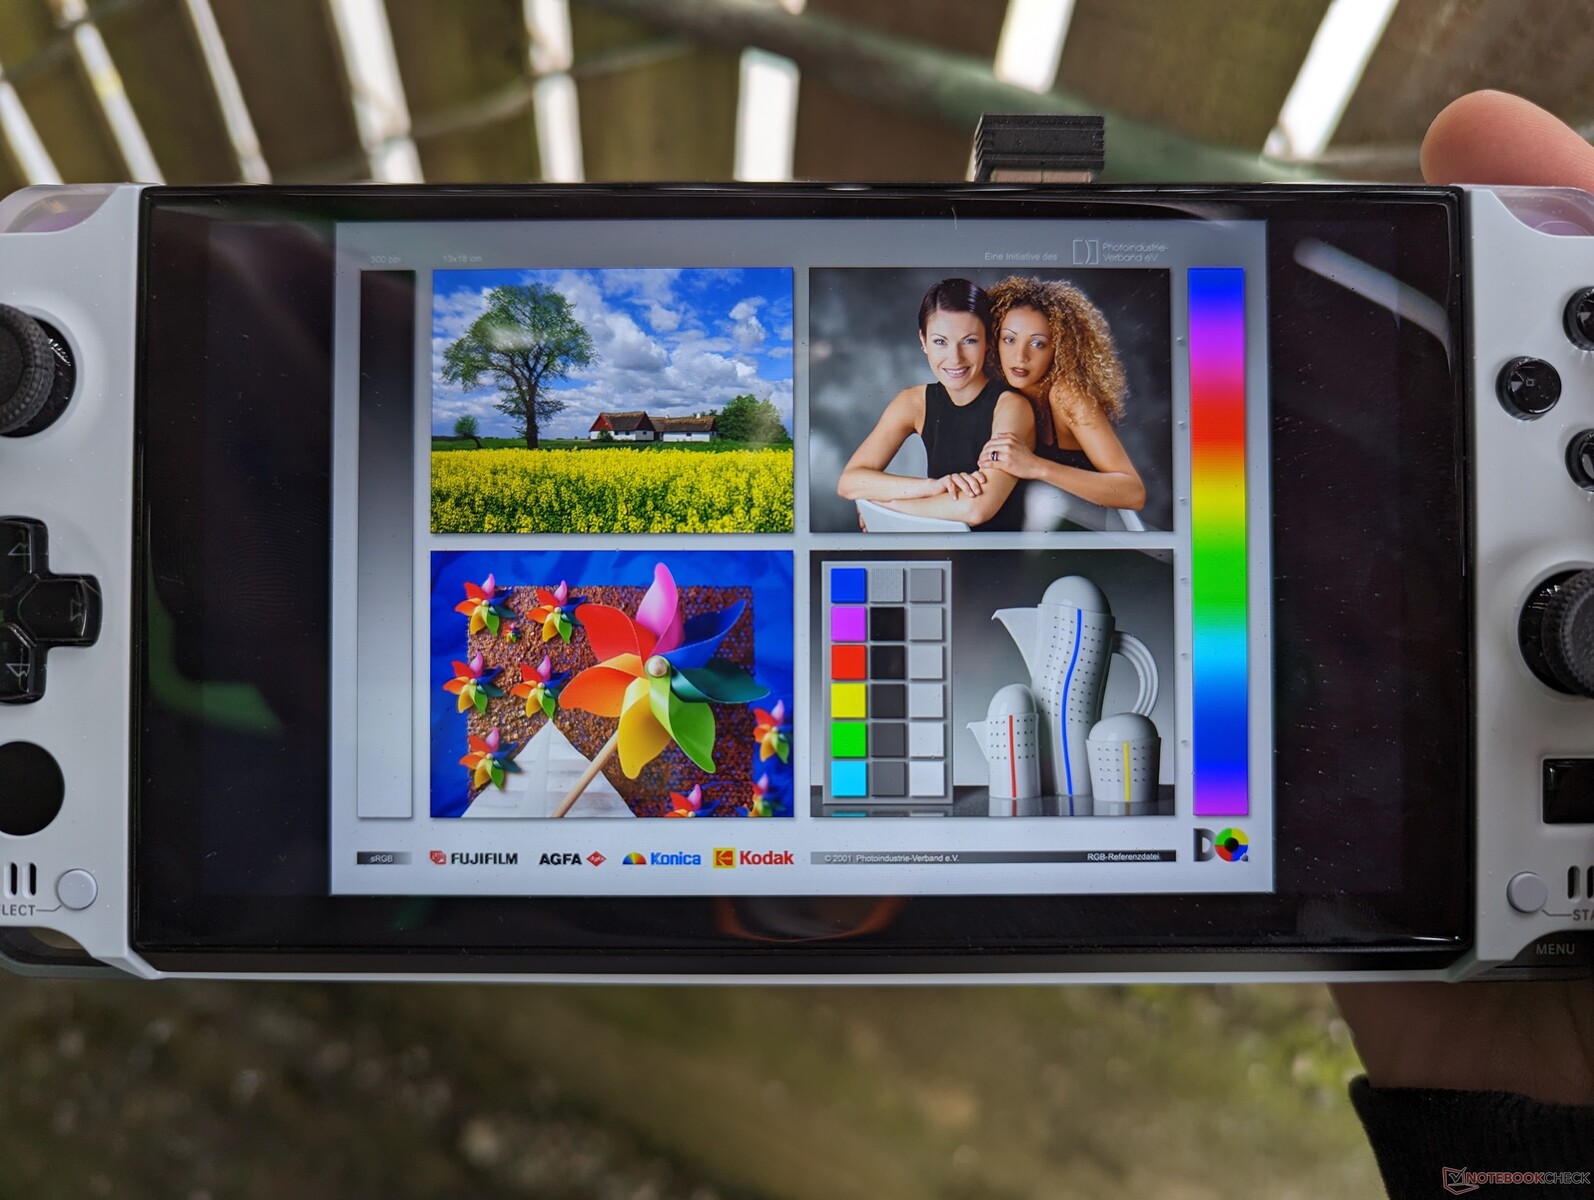
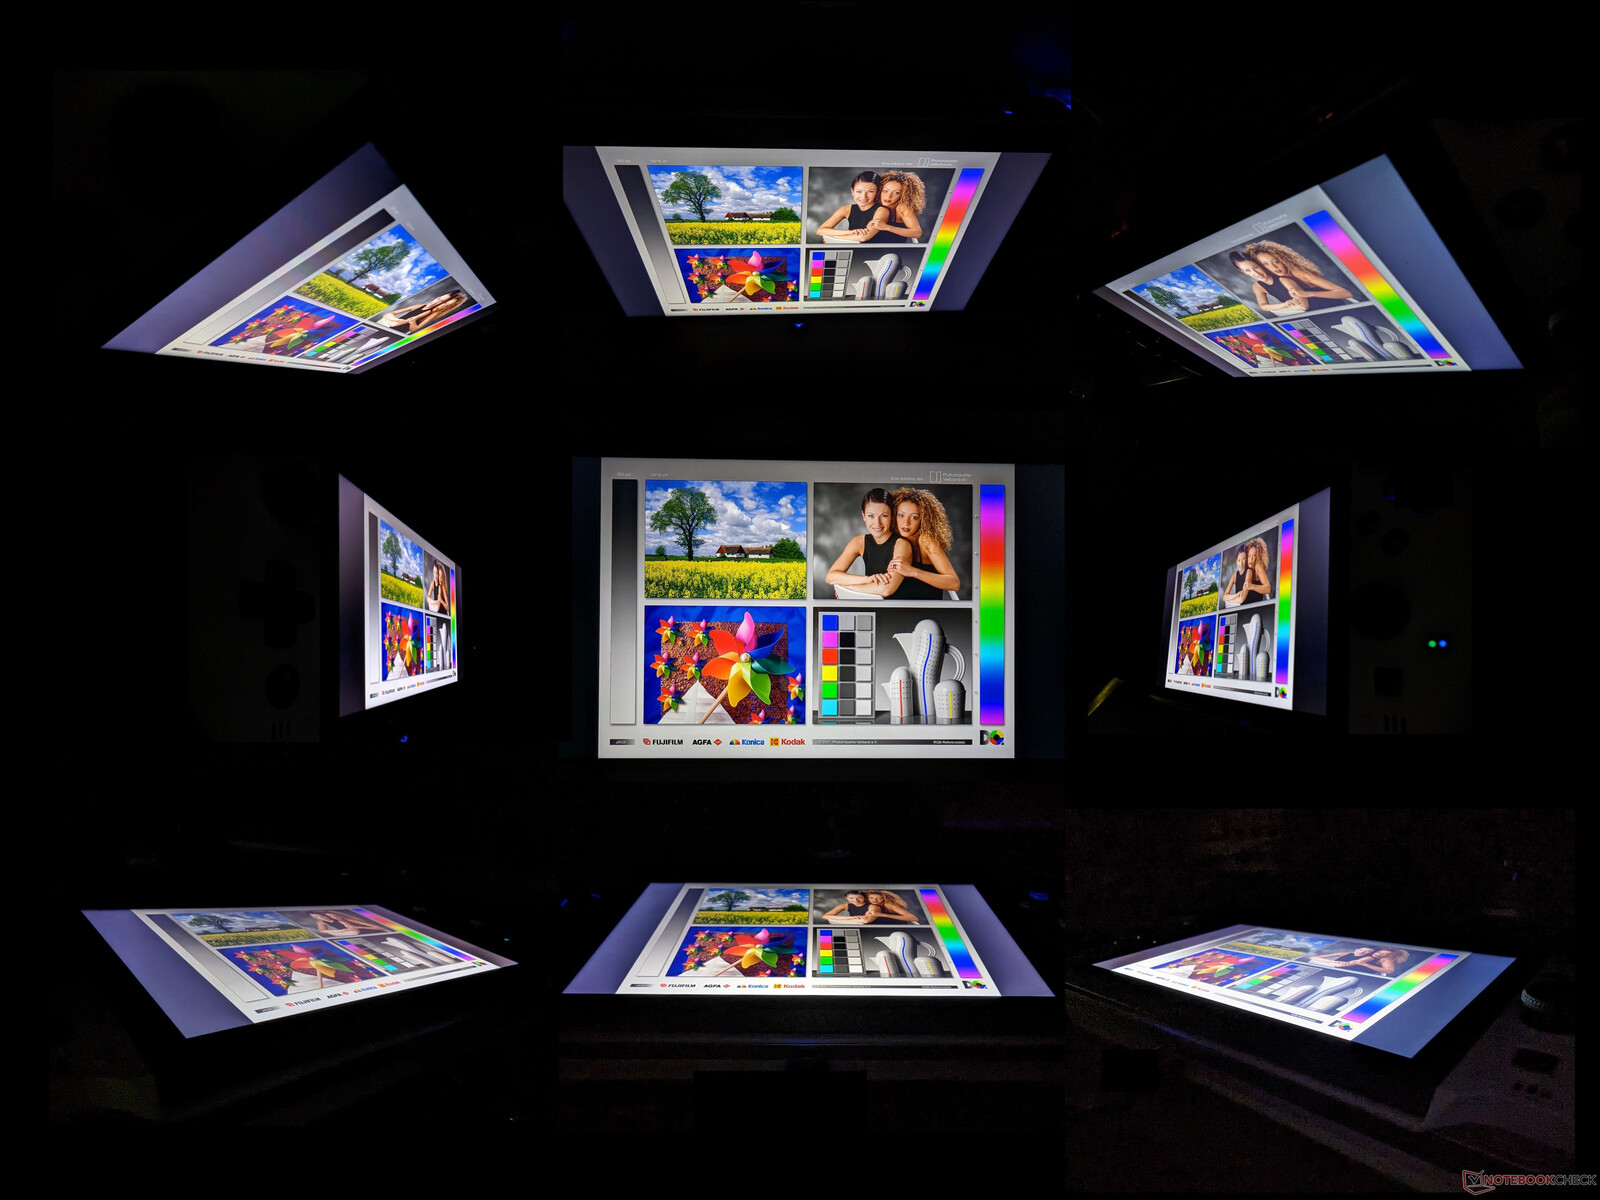
Display - Full 1080p IPS a 60 Hz
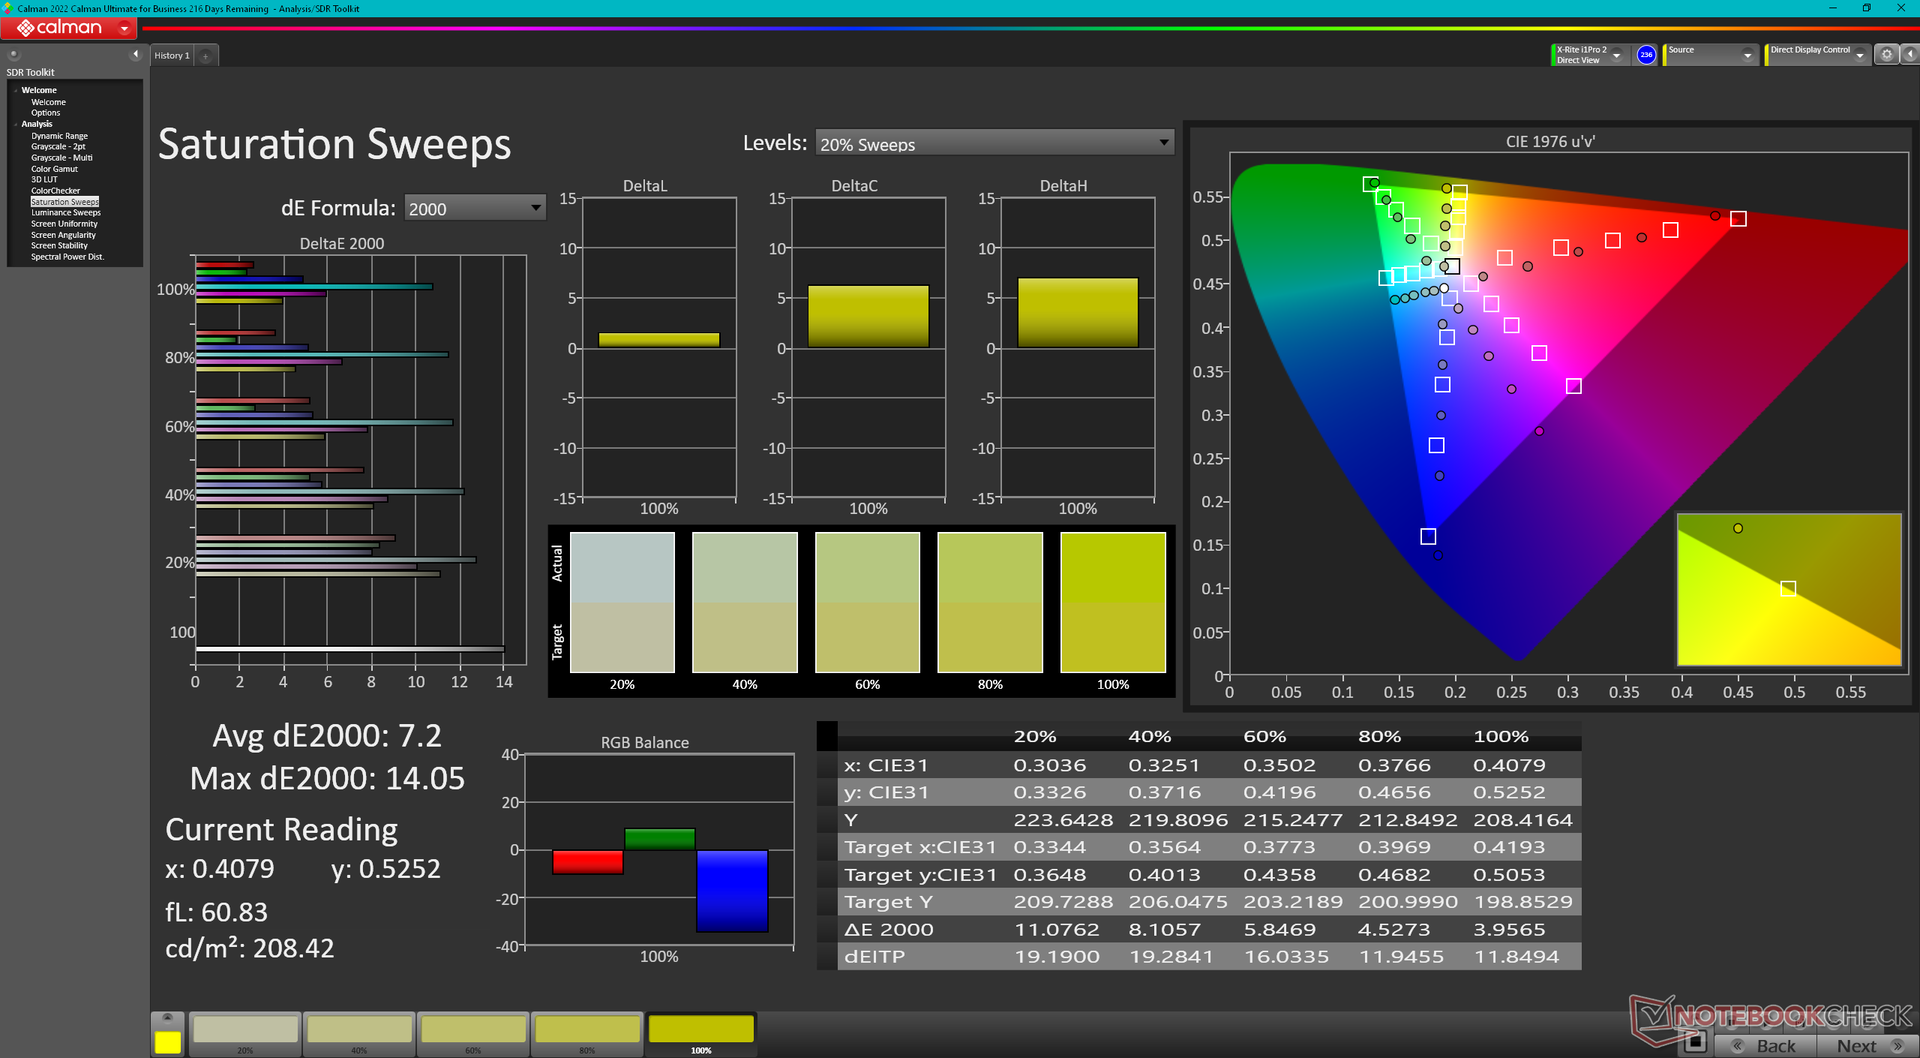
Uma grande desvantagem para o Win 3 foi seu pequeno tamanho de tela de apenas 5,5 polegadas. Muitos títulos de PC não são otimizados para telas tão pequenas e, portanto, os ícones HUDs e UI muitas vezes apareceriam minúsculos. O Win 4 aborda esta preocupação com uma tela maior de 6 polegadas e uma resolução nativa superior de 1080p. Os tempos de resposta em preto e branco também são mais rápidos, enquanto a gama de cores e a relação de contraste permanecem aproximadamente as mesmas do Win 3. A tela IPS pode não ser laminada como no iPad Pro, mas é, no entanto, muito nítida e de alta qualidade.
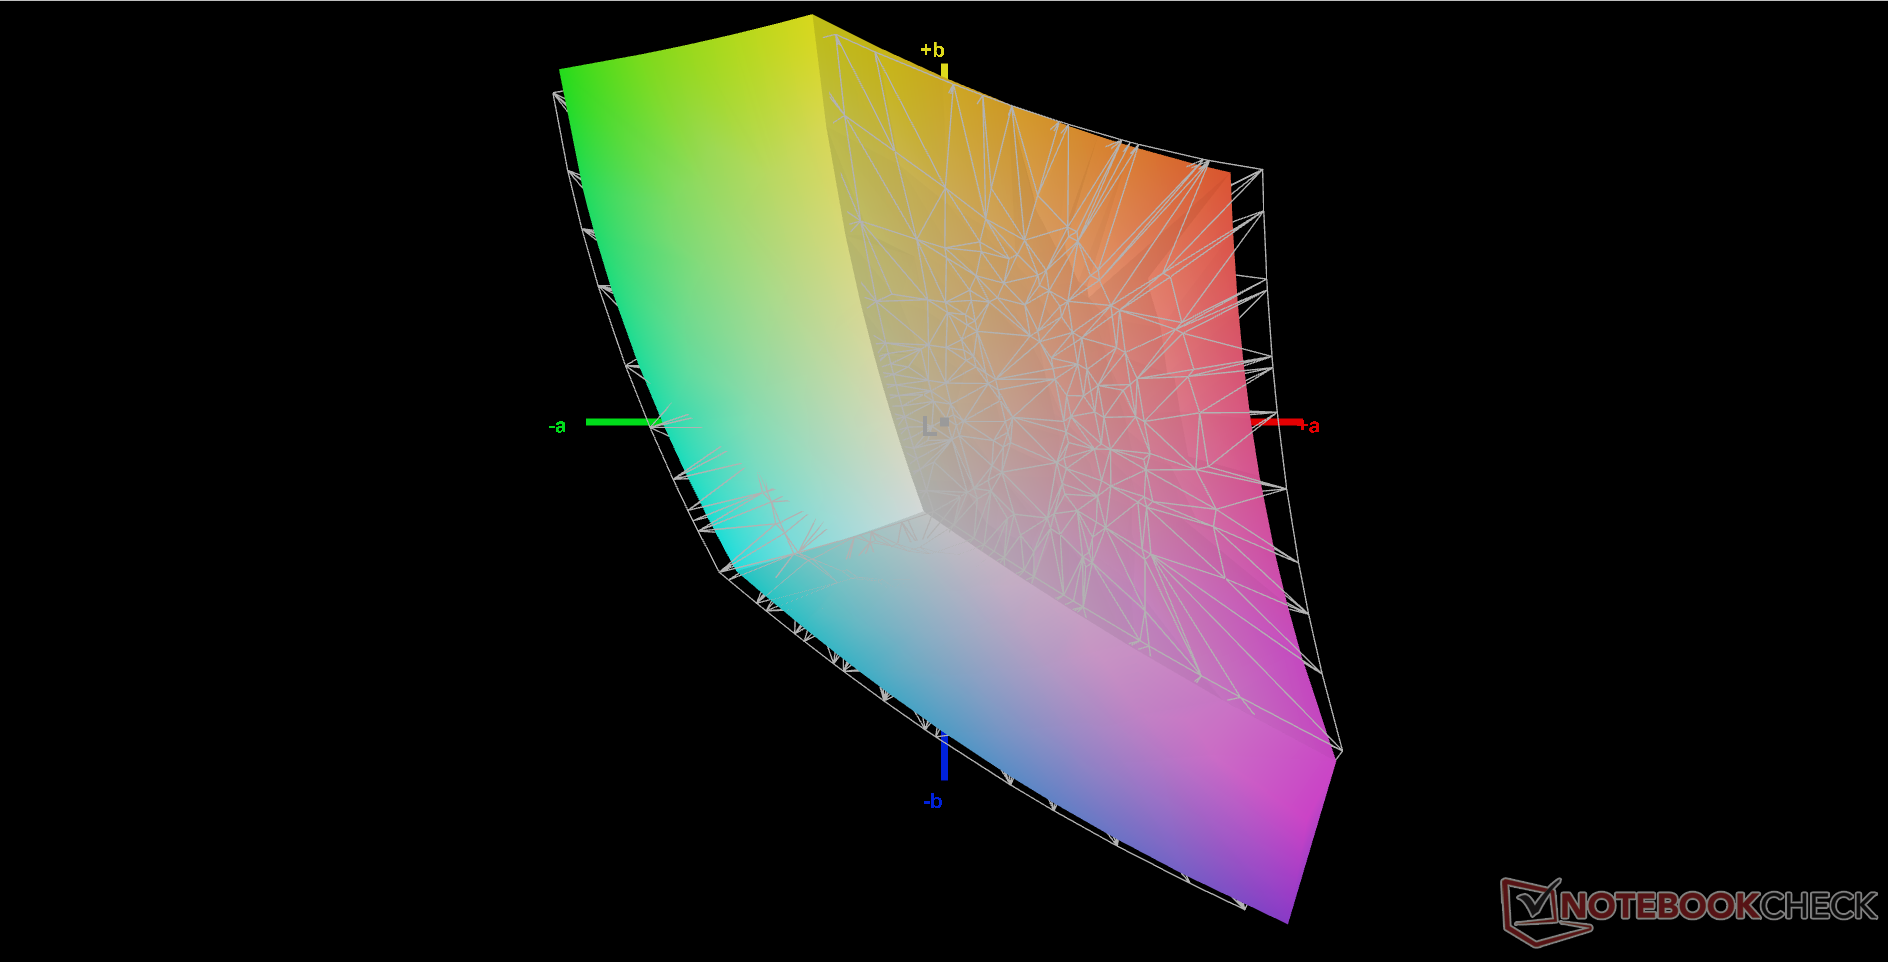
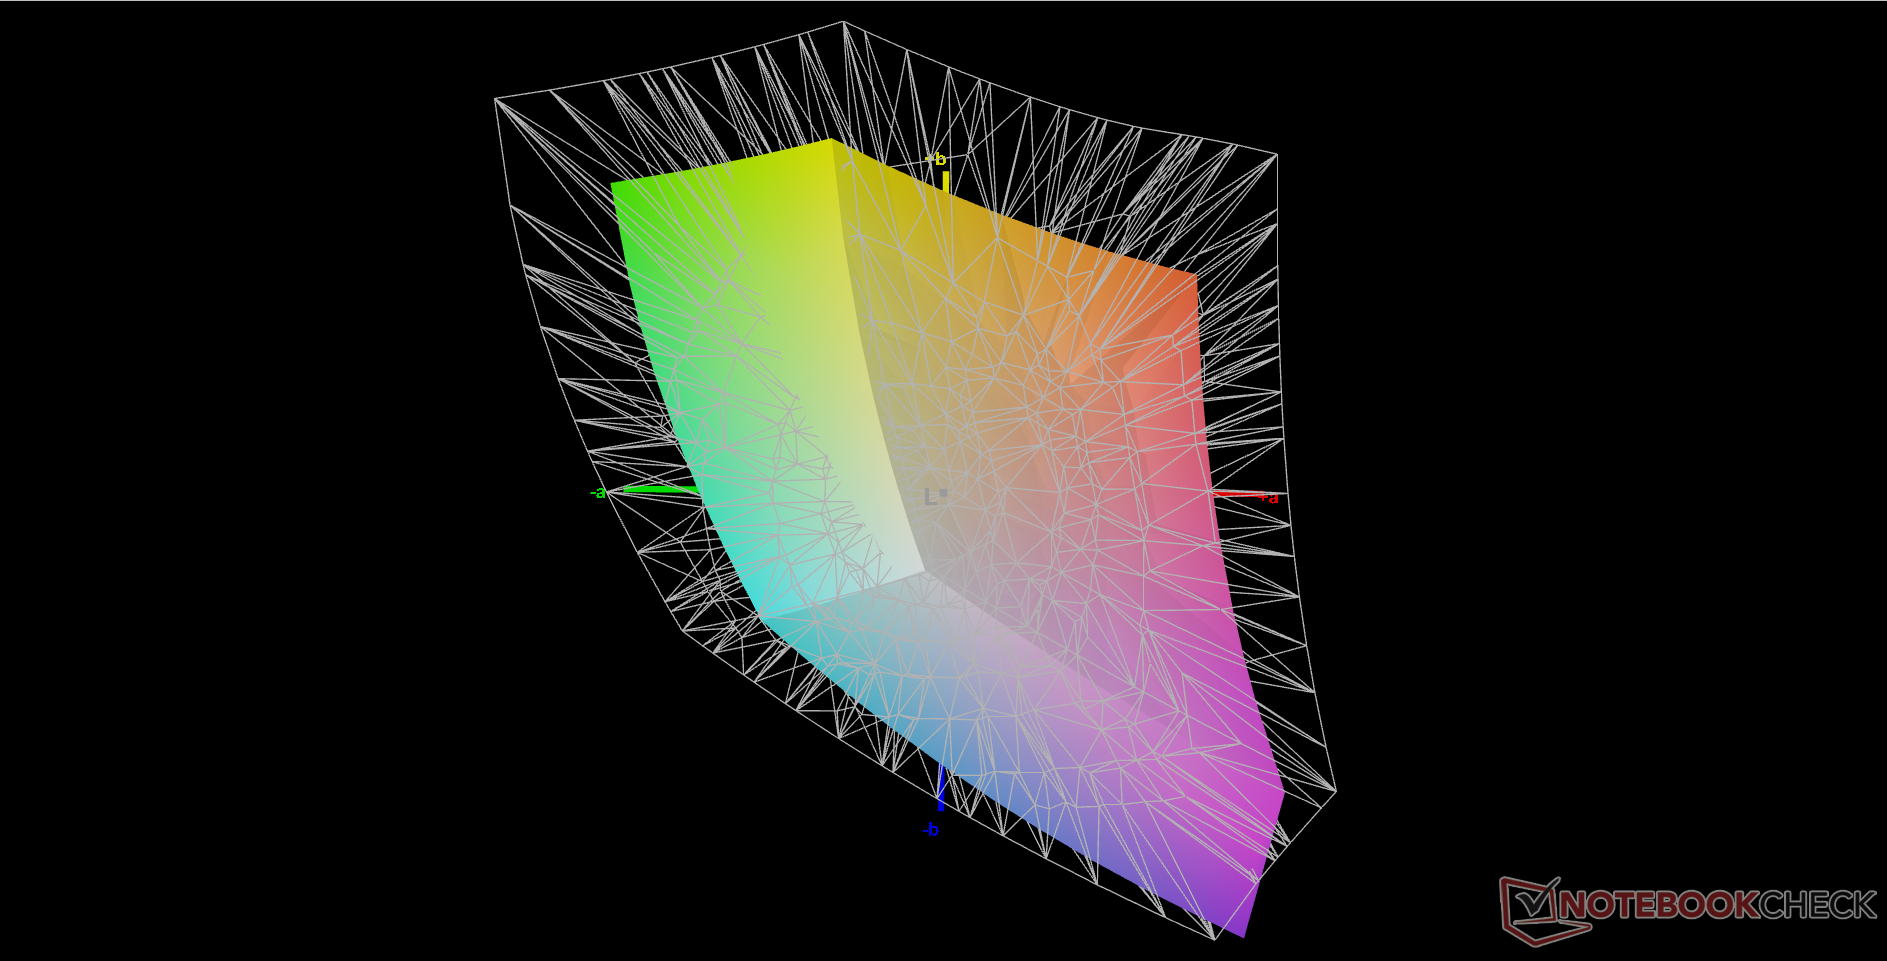
A gama de ~90 por cento sRGB permite cores profundas que rivalizam com muitos monitores de portáteis de gama média a alta. Infelizmente não há opções OLED que teriam expandido ainda mais as cores para cobrir o P3.
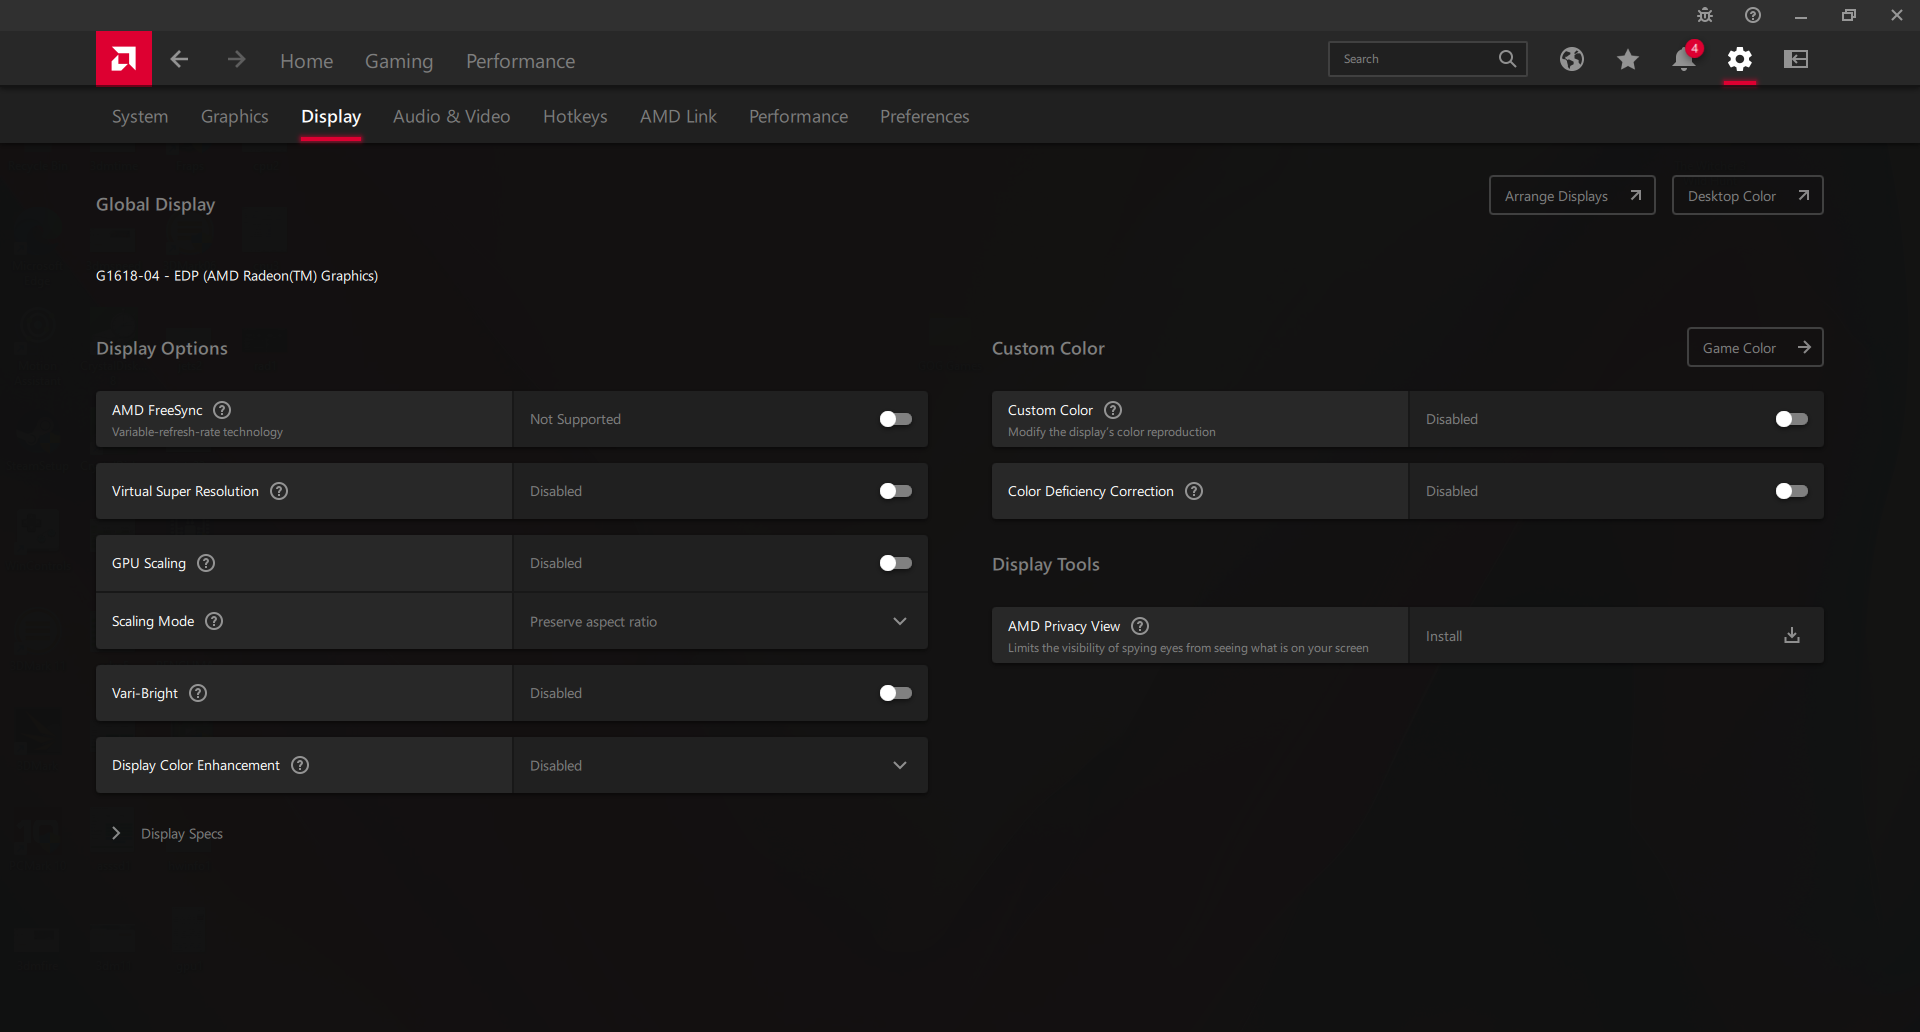
Vale notar que a tela não suporta sincronização adaptativa ou FreeSync. Esta característica teria sido perfeita para o sistema, considerando que o Radeon 680M freqüentemente funciona na faixa de 40 a 60 FPS a 1080p.
| |||||||||||||||||||||||||
iluminação: 81 %
iluminação com acumulador: 413.1 cd/m²
Contraste: 1059:1 (Preto: 0.39 cd/m²)
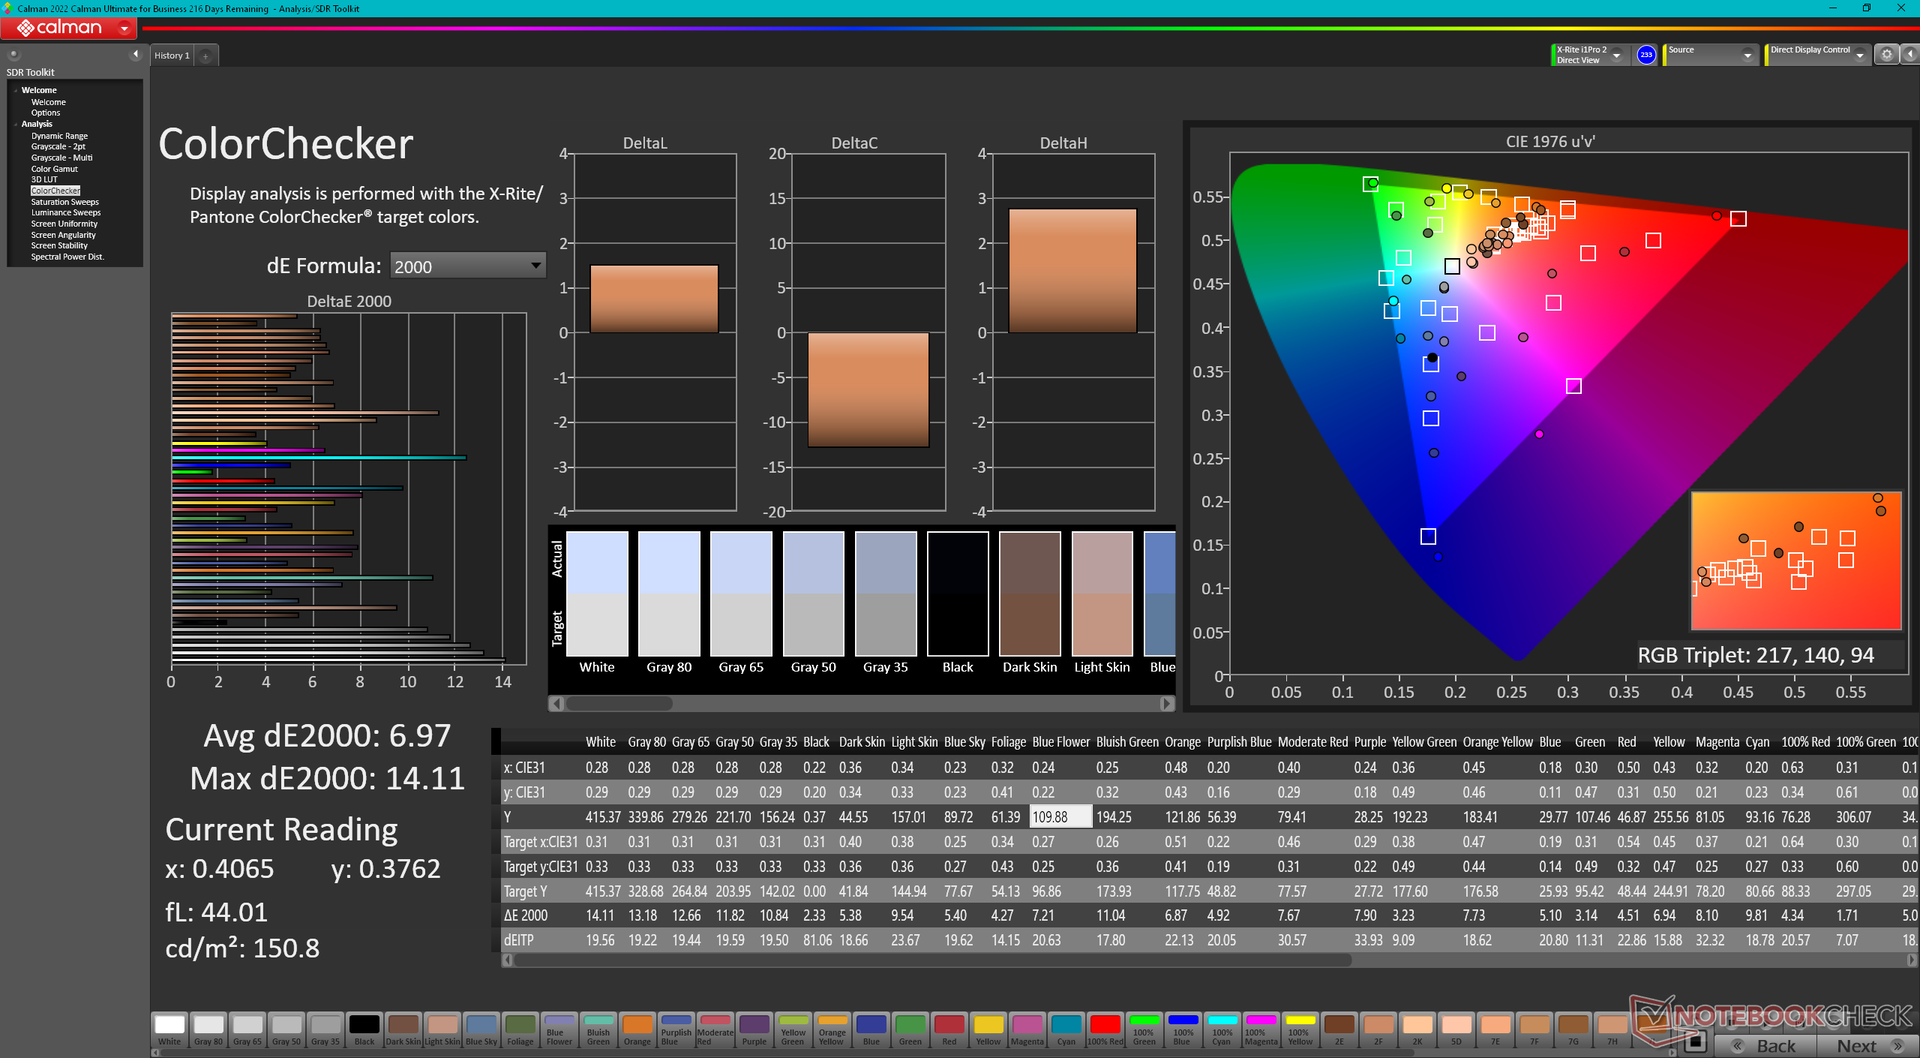
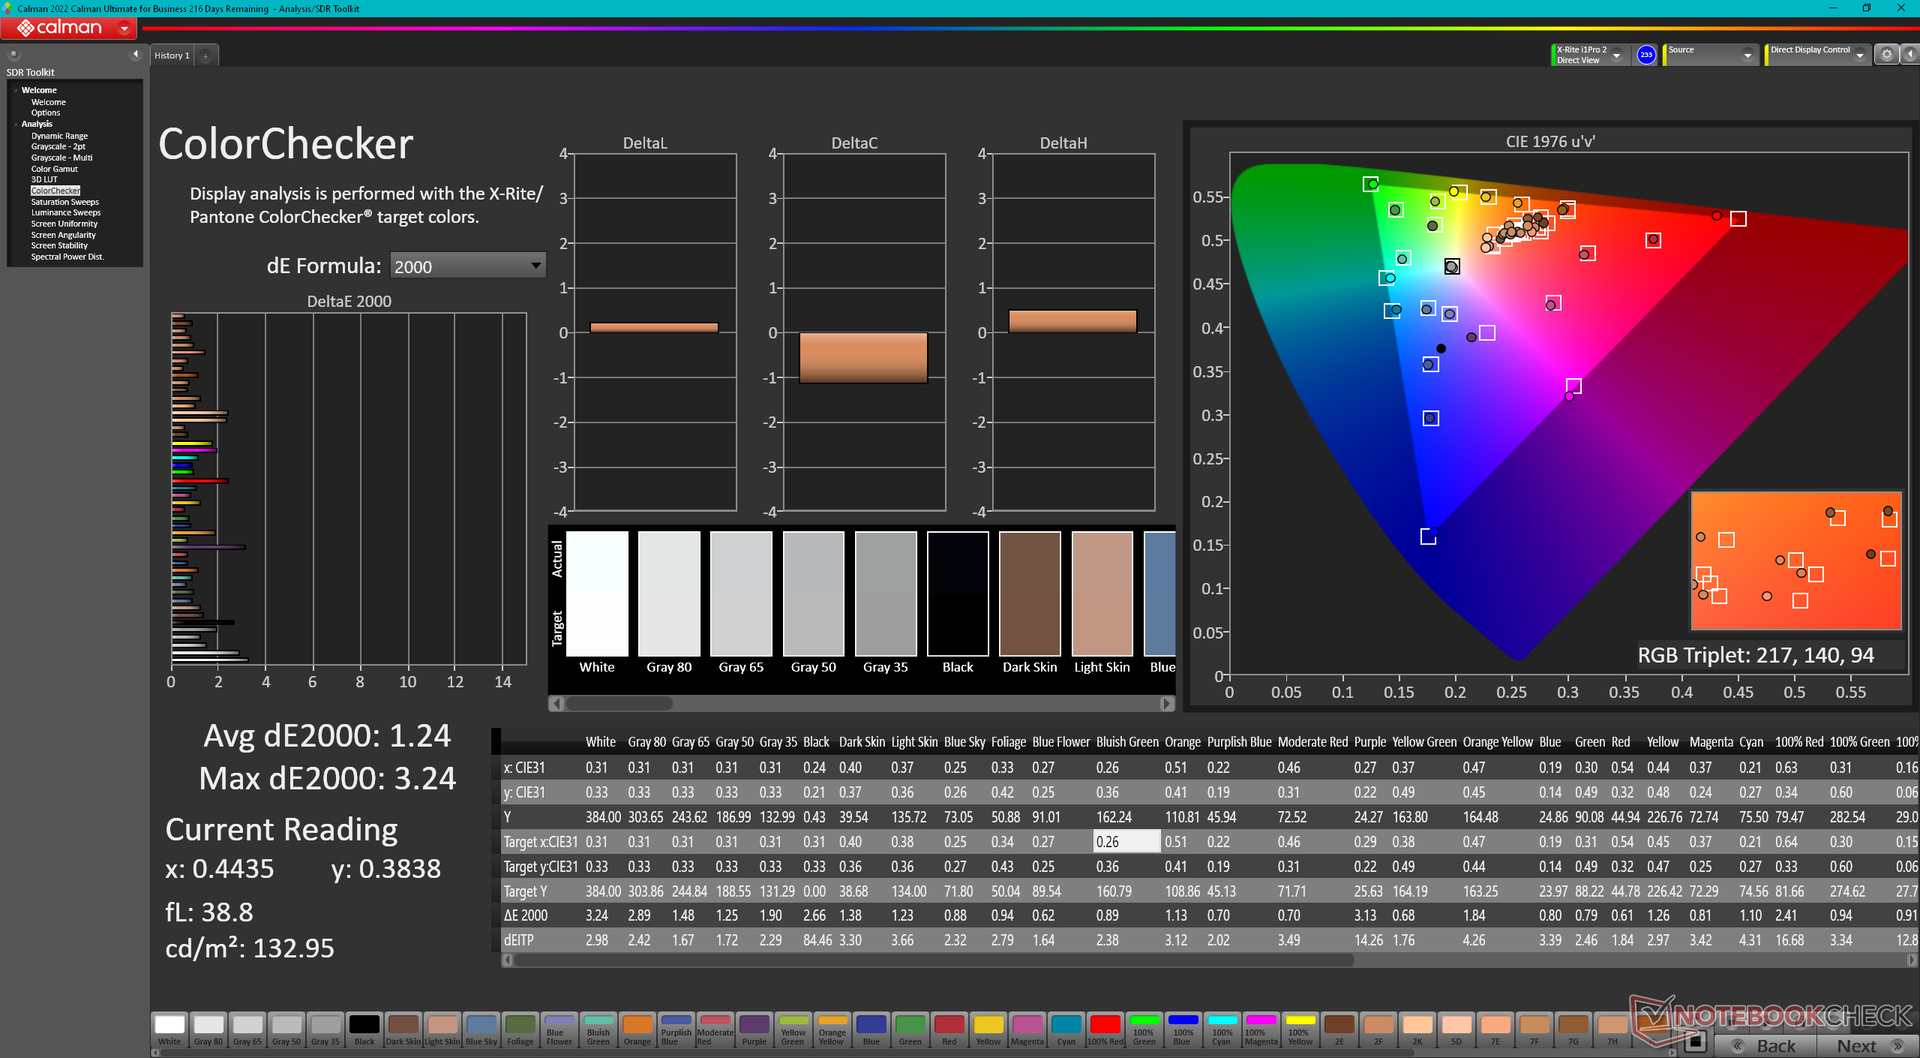
ΔE ColorChecker Calman: 6.97 | ∀{0.5-29.43 Ø4.72}
calibrated: 1.24
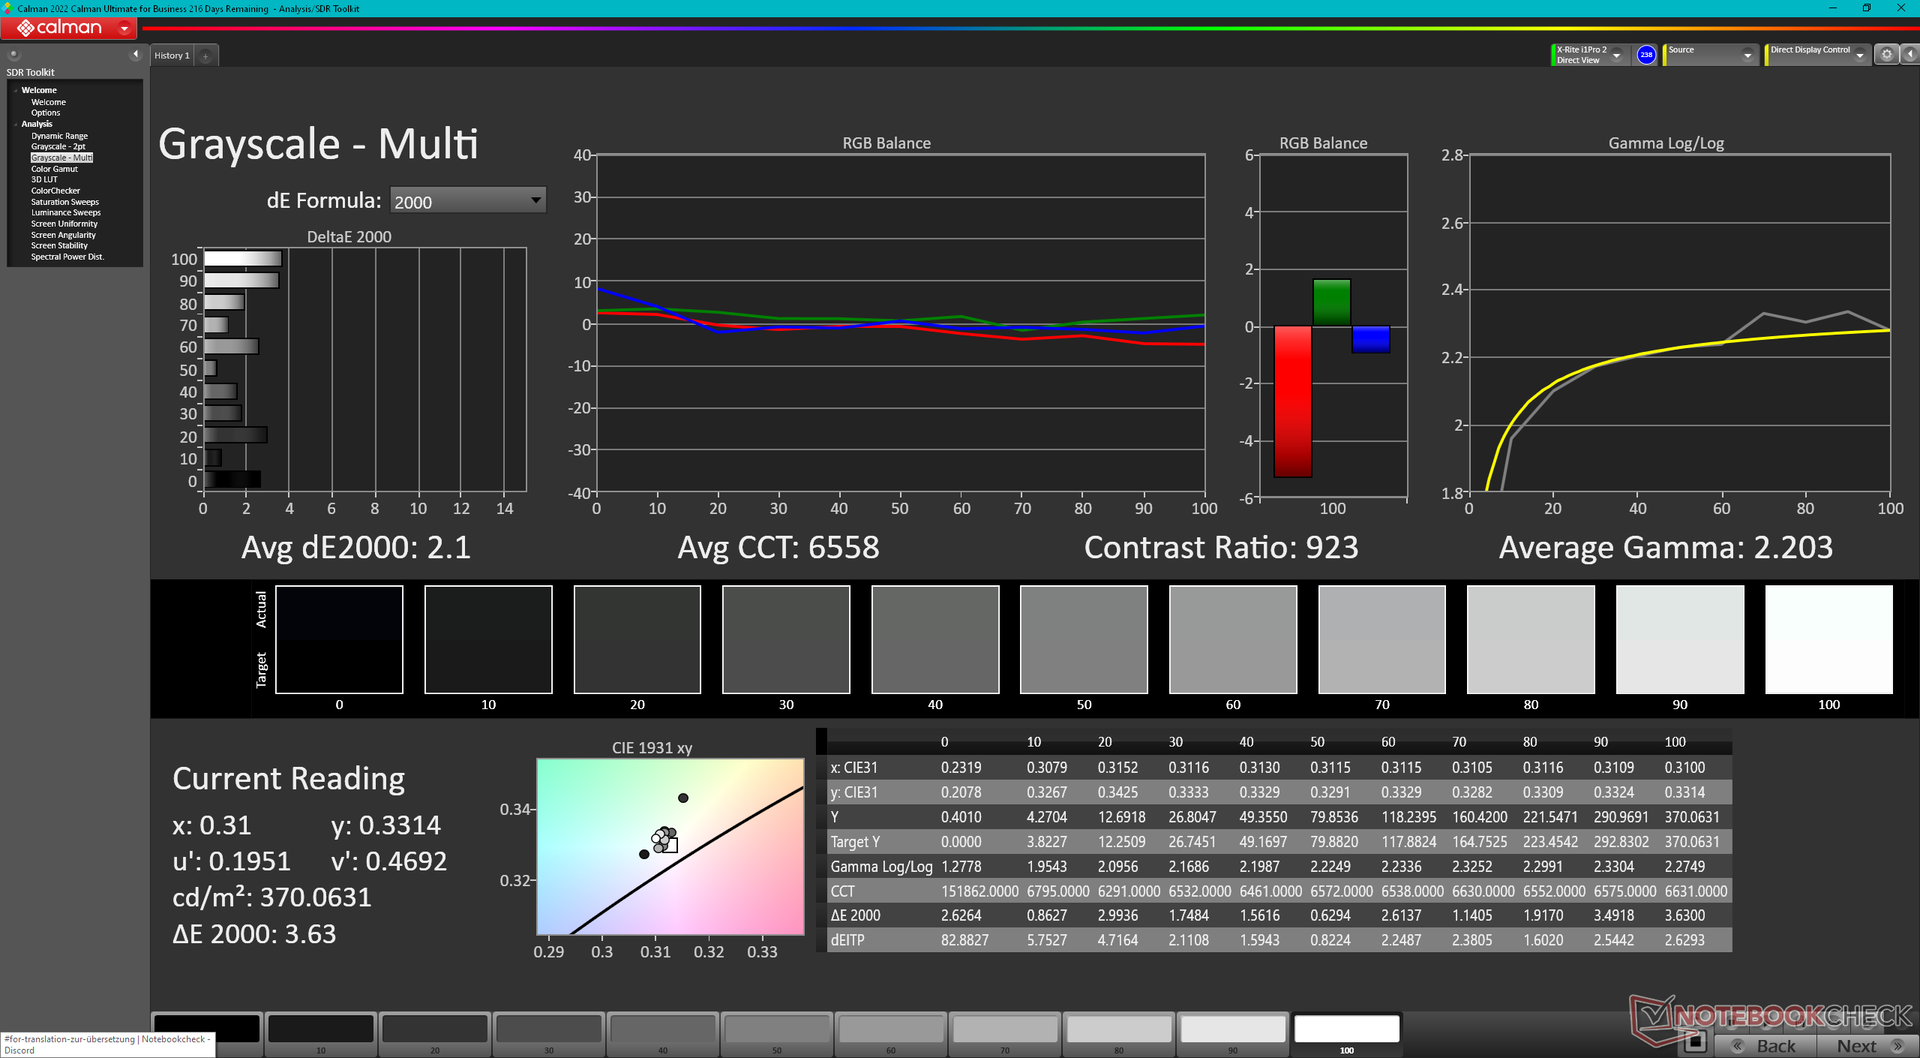
ΔE Greyscale Calman: 9.9 | ∀{0.09-98 Ø4.97}
64.6% AdobeRGB 1998 (Argyll 3D)
92% sRGB (Argyll 3D)
63.1% Display P3 (Argyll 3D)
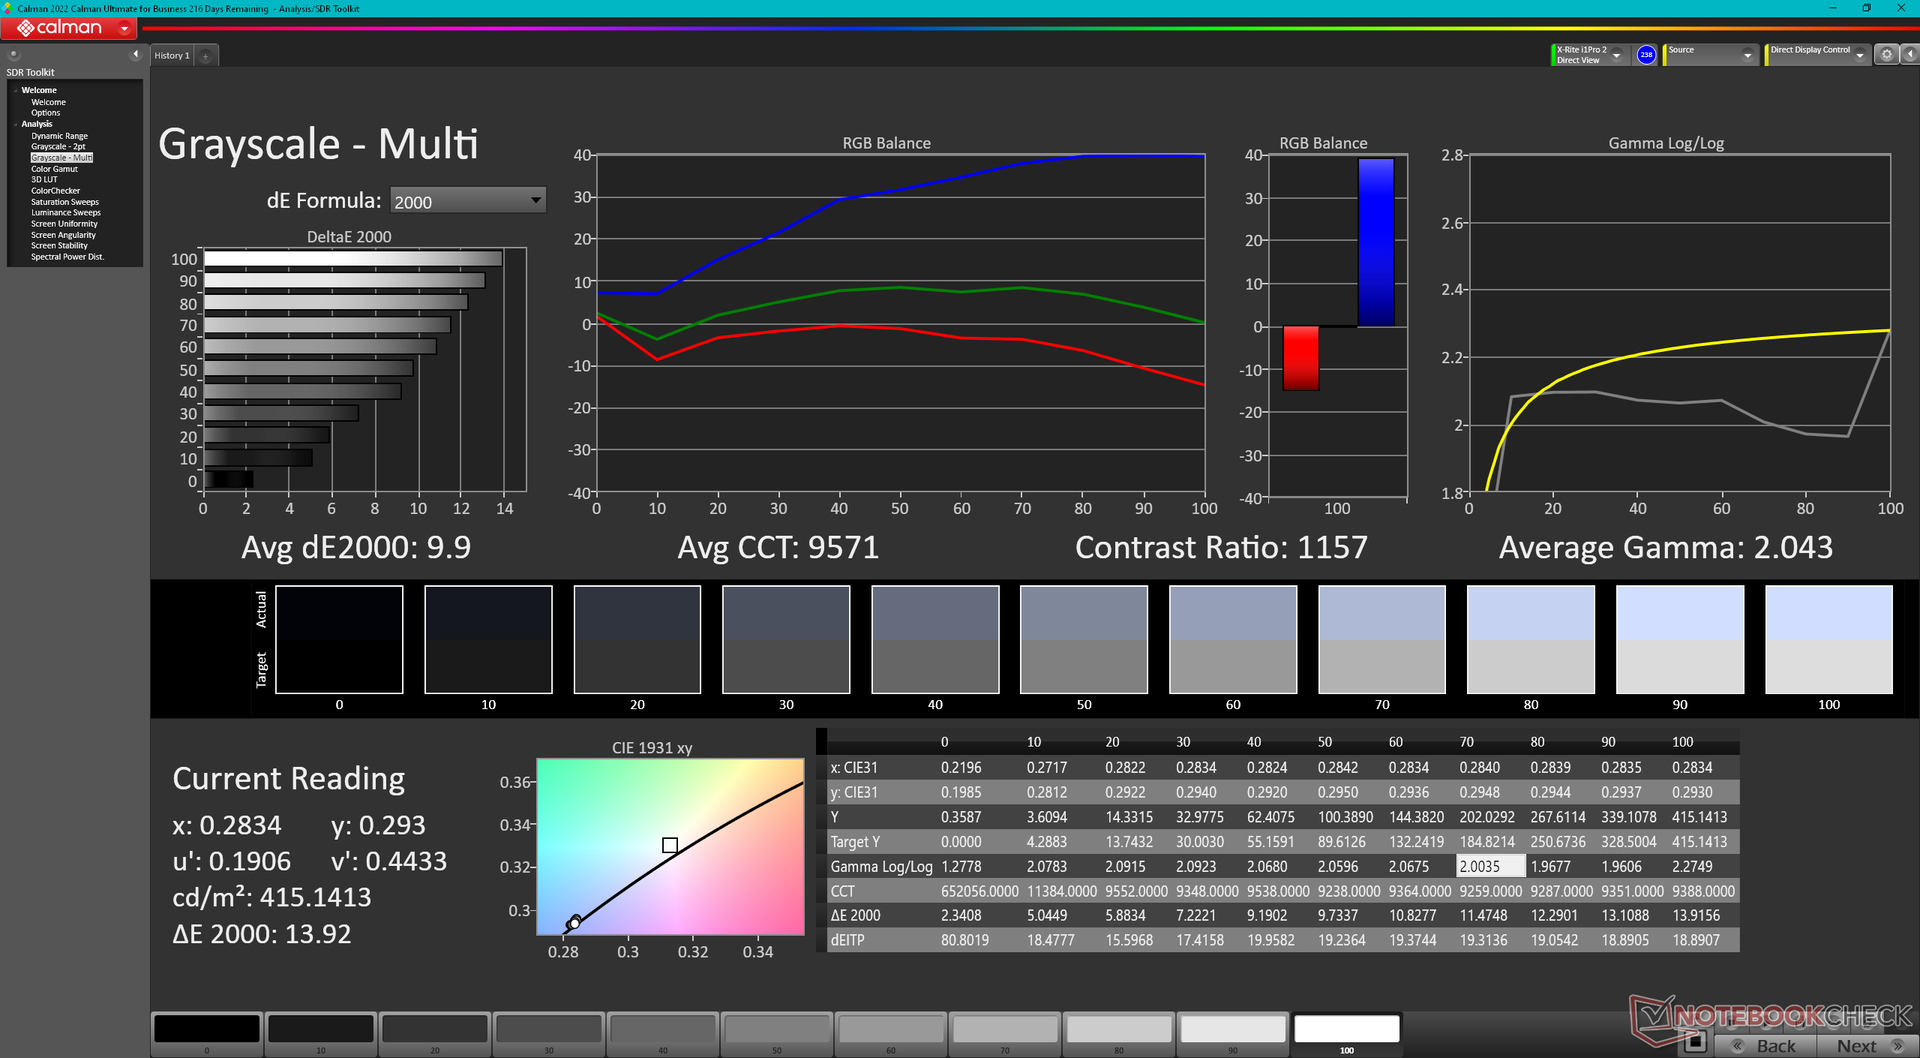
Gamma: 2.04
CCT: 9571 K
| GPD Win 4 G1618-04, IPS, 1920x1080, 6" | GPD Win Max 2 Toshiba HX_10.1_LCD, IPS, 2560x1600, 10.1" | GPD Win 3 IPS, 1280x720, 5.5" | Razer Blade Stealth i7-1165G7 GTX 1650 Ti Max-Q Sharp LQ133M1JW46, IPS, 1920x1080, 13.3" | Dell XPS 13 9315 2-in-1 Core i5-1230U BOE NE13A1M, IPS, 2880x1920, 13" | Asus Zenbook S 13 OLED SDC4172, OLED, 2880x1800, 13.3" | |
|---|---|---|---|---|---|---|
| Display | 4% | -5% | 5% | 11% | 39% | |
| Display P3 Coverage (%) | 63.1 | 69.8 11% | 59.5 -6% | 66 5% | 70.7 12% | 99.8 58% |
| sRGB Coverage (%) | 92 | 91 -1% | 89.6 -3% | 97.4 6% | 99.8 8% | 100 9% |
| AdobeRGB 1998 Coverage (%) | 64.6 | 66.6 3% | 61.4 -5% | 67.1 4% | 72.6 12% | 97.8 51% |
| Response Times | 16% | -36% | -98% | -42% | 92% | |
| Response Time Grey 50% / Grey 80% * (ms) | 26.8 ? | 21.2 ? 21% | 40 ? -49% | 57.6 ? -115% | 44 ? -64% | 2.1 ? 92% |
| Response Time Black / White * (ms) | 20.9 ? | 18.7 ? 11% | 25.6 ? -22% | 37.6 ? -80% | 24.8 ? -19% | 1.68 ? 92% |
| PWM Frequency (Hz) | 240.4 ? | |||||
| Screen | 8% | -9% | 24% | 41% | 196% | |
| Brightness middle (cd/m²) | 413.1 | 396.7 -4% | 468.8 13% | 356.8 -14% | 507 23% | 336 -19% |
| Brightness (cd/m²) | 407 | 381 -6% | 460 13% | 336 -17% | 486 19% | 338 -17% |
| Brightness Distribution (%) | 81 | 89 10% | 93 15% | 88 9% | 87 7% | 99 22% |
| Black Level * (cd/m²) | 0.39 | 0.36 8% | 0.45 -15% | 0.34 13% | 0.34 13% | 0.02 95% |
| Contrast (:1) | 1059 | 1102 4% | 1042 -2% | 1049 -1% | 1491 41% | 16800 1486% |
| Colorchecker dE 2000 * | 6.97 | 6.31 9% | 9 -29% | 1.63 77% | 2.04 71% | 1.8 74% |
| Colorchecker dE 2000 max. * | 14.11 | 10.23 27% | 15.5 -10% | 5.03 64% | 3.1 78% | 3.8 73% |
| Colorchecker dE 2000 calibrated * | 1.24 | 1.44 -16% | 1.91 -54% | 1.08 13% | 0.86 31% | 1.8 -45% |
| Greyscale dE 2000 * | 9.9 | 5.5 44% | 10.9 -10% | 3 70% | 1.8 82% | 0.9 91% |
| Gamma | 2.04 108% | 2.17 101% | 2.13 103% | 2.23 99% | 2.12 104% | 2.22 99% |
| CCT | 9571 68% | 7502 87% | 10972 59% | 6434 101% | 6561 99% | 6580 99% |
| Color Space (Percent of AdobeRGB 1998) (%) | 56.6 | 62 | ||||
| Color Space (Percent of sRGB) (%) | 89.2 | 97.6 | ||||
| Média Total (Programa/Configurações) | 9% /
9% | -17% /
-12% | -23% /
2% | 3% /
22% | 109% /
147% |
* ... menor é melhor
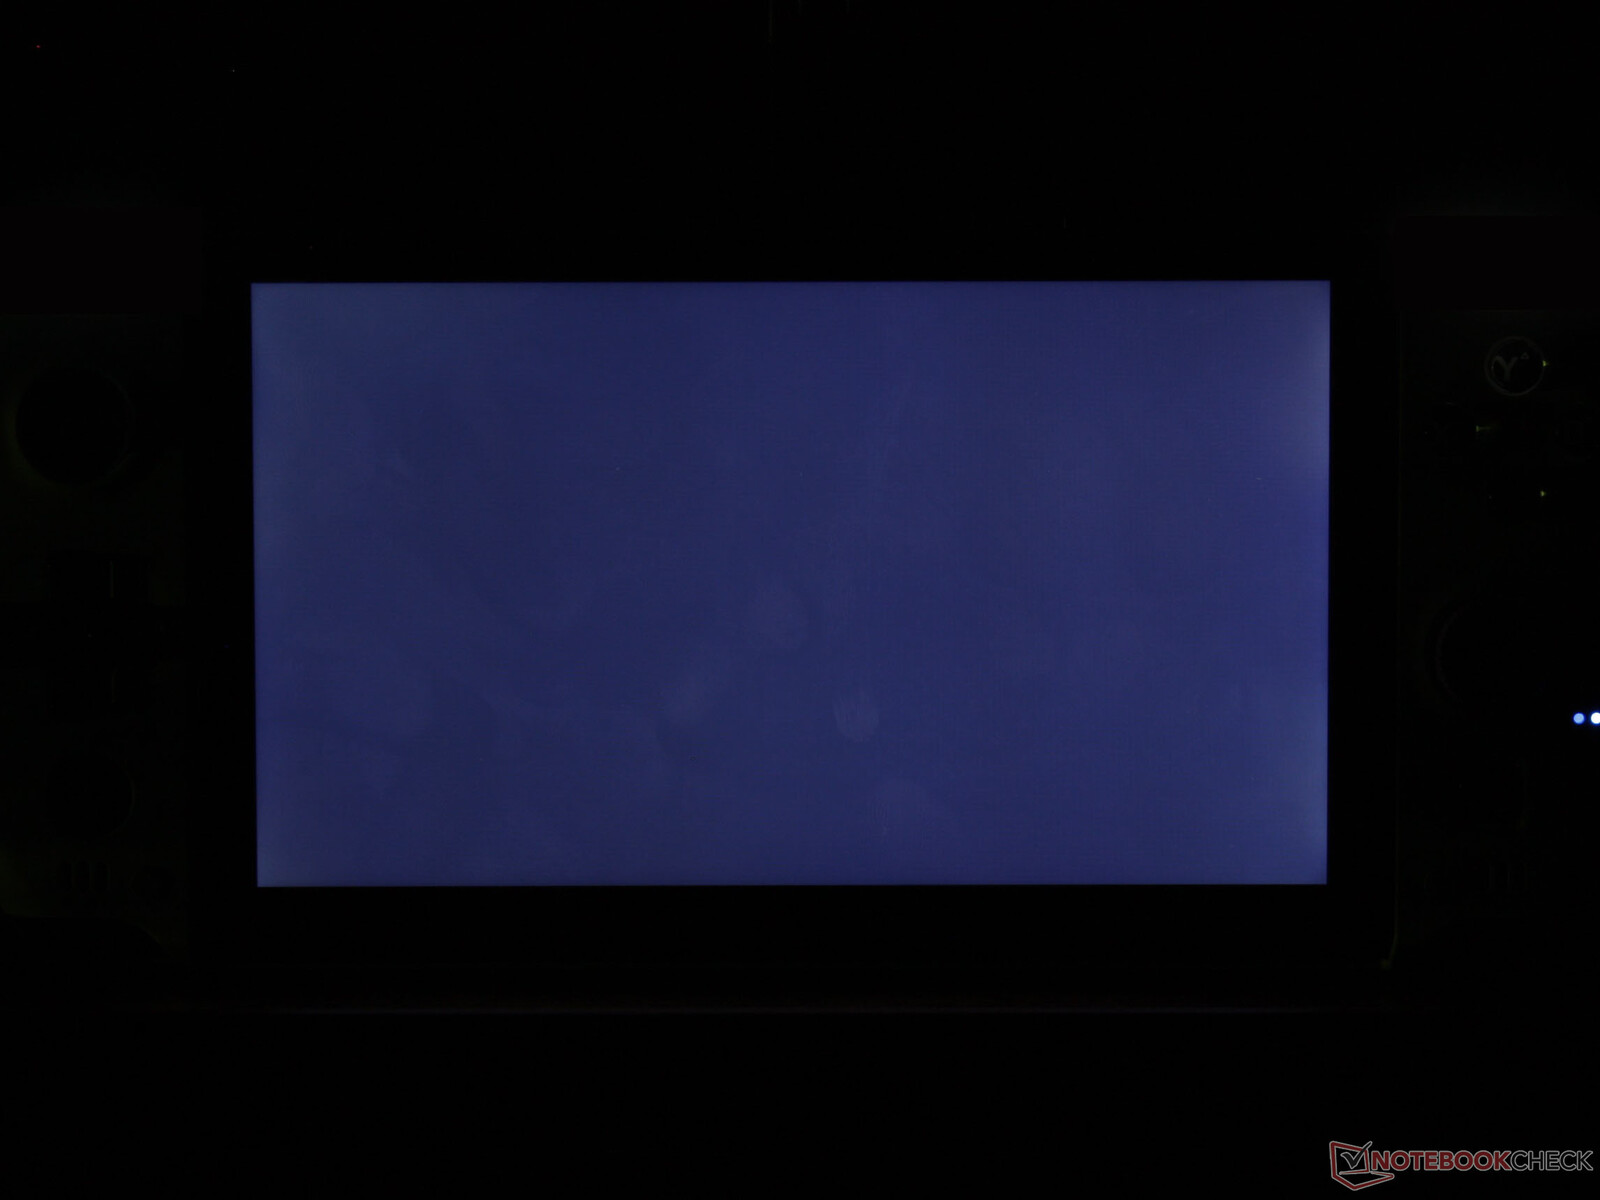
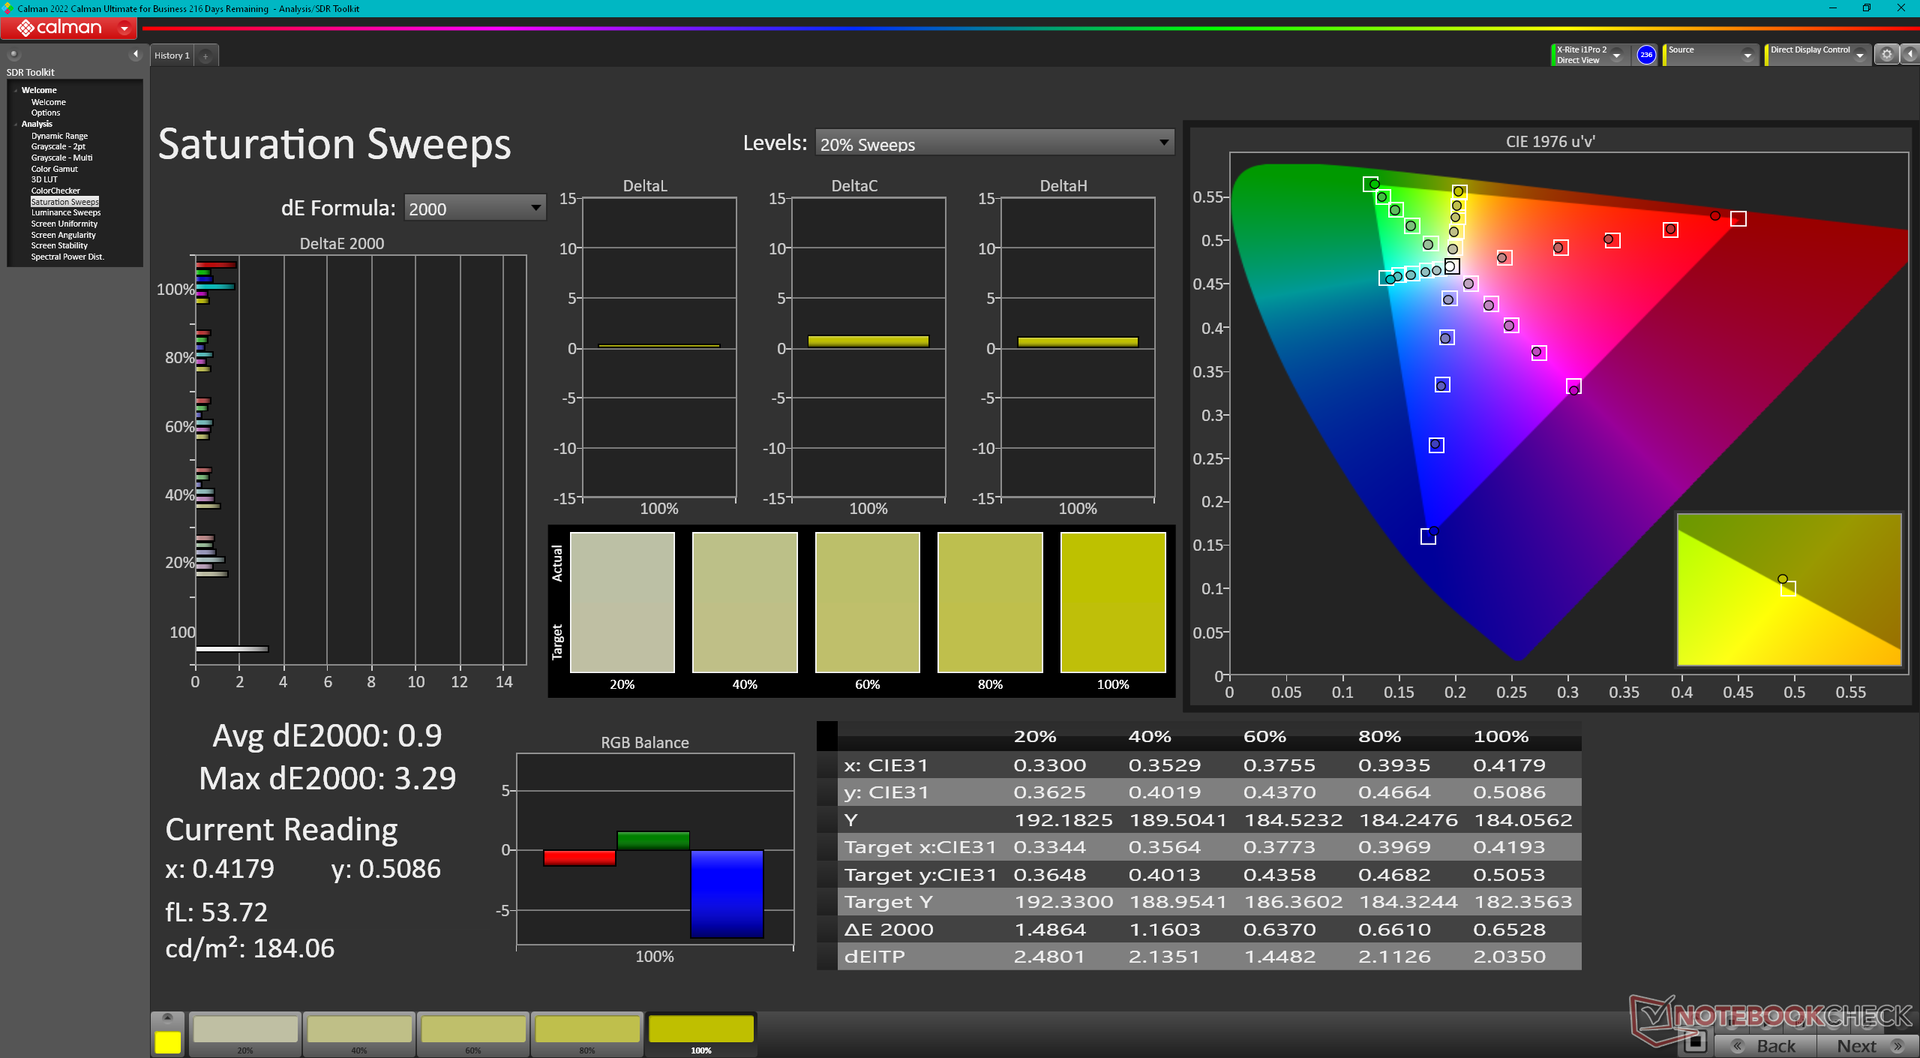
O display é mal calibrado fora da caixa. A temperatura da cor, em particular, é muito fria a 9571 e por isso a tela aparece excessivamente azul. Calibrar a tela nós mesmos com um colorímetro X-Rite melhoraria significativamente os valores médios de escala de cinza e deltaE de cor de 9,9 e 6,97 para apenas 2,1 e 1,24, respectivamente. Recomendamos aplicar nosso perfil de ICM calibrado acima para obter mais cores sRGB-acuradas do display.
Exibir tempos de resposta
| ↔ Tempo de resposta preto para branco | ||
|---|---|---|
| 20.9 ms ... ascensão ↗ e queda ↘ combinadas | ↗ 11.4 ms ascensão | 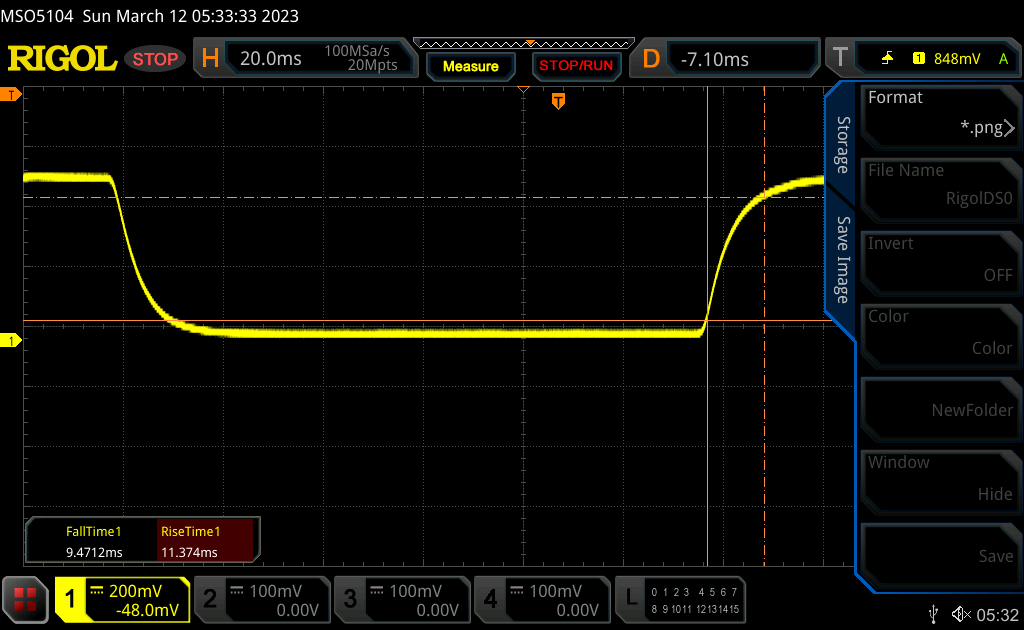 |
| ↘ 9.5 ms queda | ||
| A tela mostra boas taxas de resposta em nossos testes, mas pode ser muito lenta para jogadores competitivos. Em comparação, todos os dispositivos testados variam de 0.1 (mínimo) a 240 (máximo) ms. » 47 % de todos os dispositivos são melhores. Isso significa que o tempo de resposta medido é semelhante à média de todos os dispositivos testados (19.8 ms). | ||
| ↔ Tempo de resposta 50% cinza a 80% cinza | ||
| 26.8 ms ... ascensão ↗ e queda ↘ combinadas | ↗ 12.5 ms ascensão | 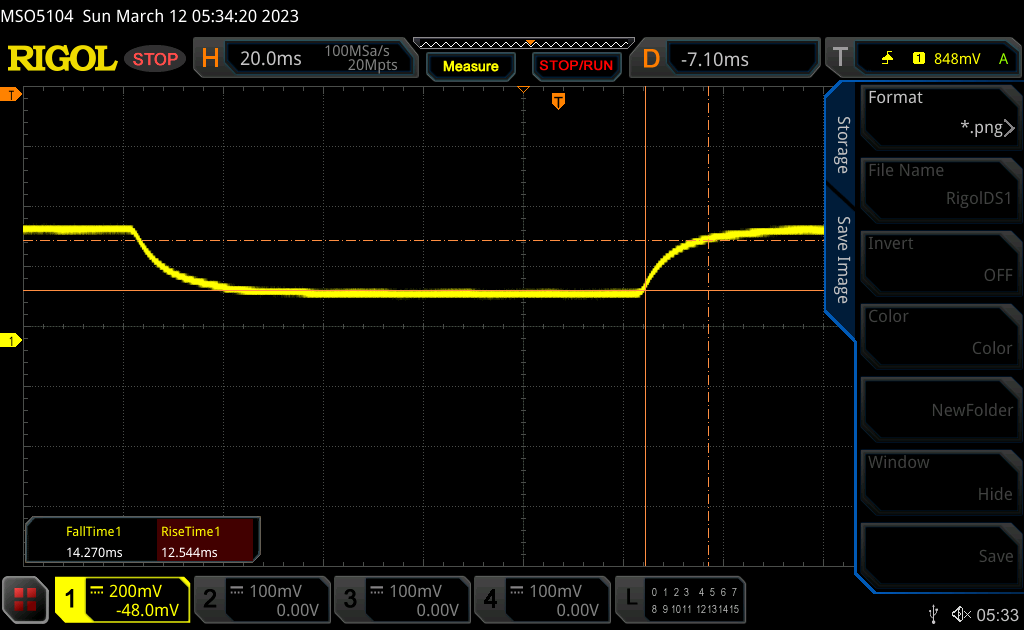 |
| ↘ 14.3 ms queda | ||
| A tela mostra taxas de resposta relativamente lentas em nossos testes e pode ser muito lenta para os jogadores. Em comparação, todos os dispositivos testados variam de 0.165 (mínimo) a 636 (máximo) ms. » 37 % de todos os dispositivos são melhores. Isso significa que o tempo de resposta medido é melhor que a média de todos os dispositivos testados (31 ms). | ||
Cintilação da tela / PWM (modulação por largura de pulso)
| Tela tremeluzindo / PWM não detectado | 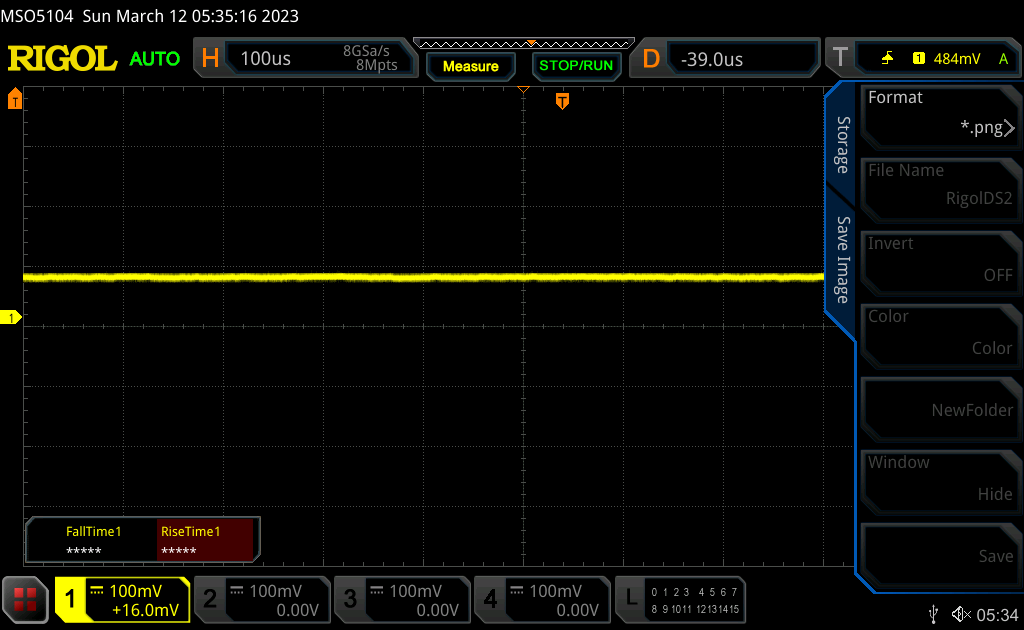 | ||
[pwm_comparison] Em comparação: 52 % de todos os dispositivos testados não usam PWM para escurecer a tela. Se PWM foi detectado, uma média de 7769 (mínimo: 5 - máximo: 343500) Hz foi medida. | |||
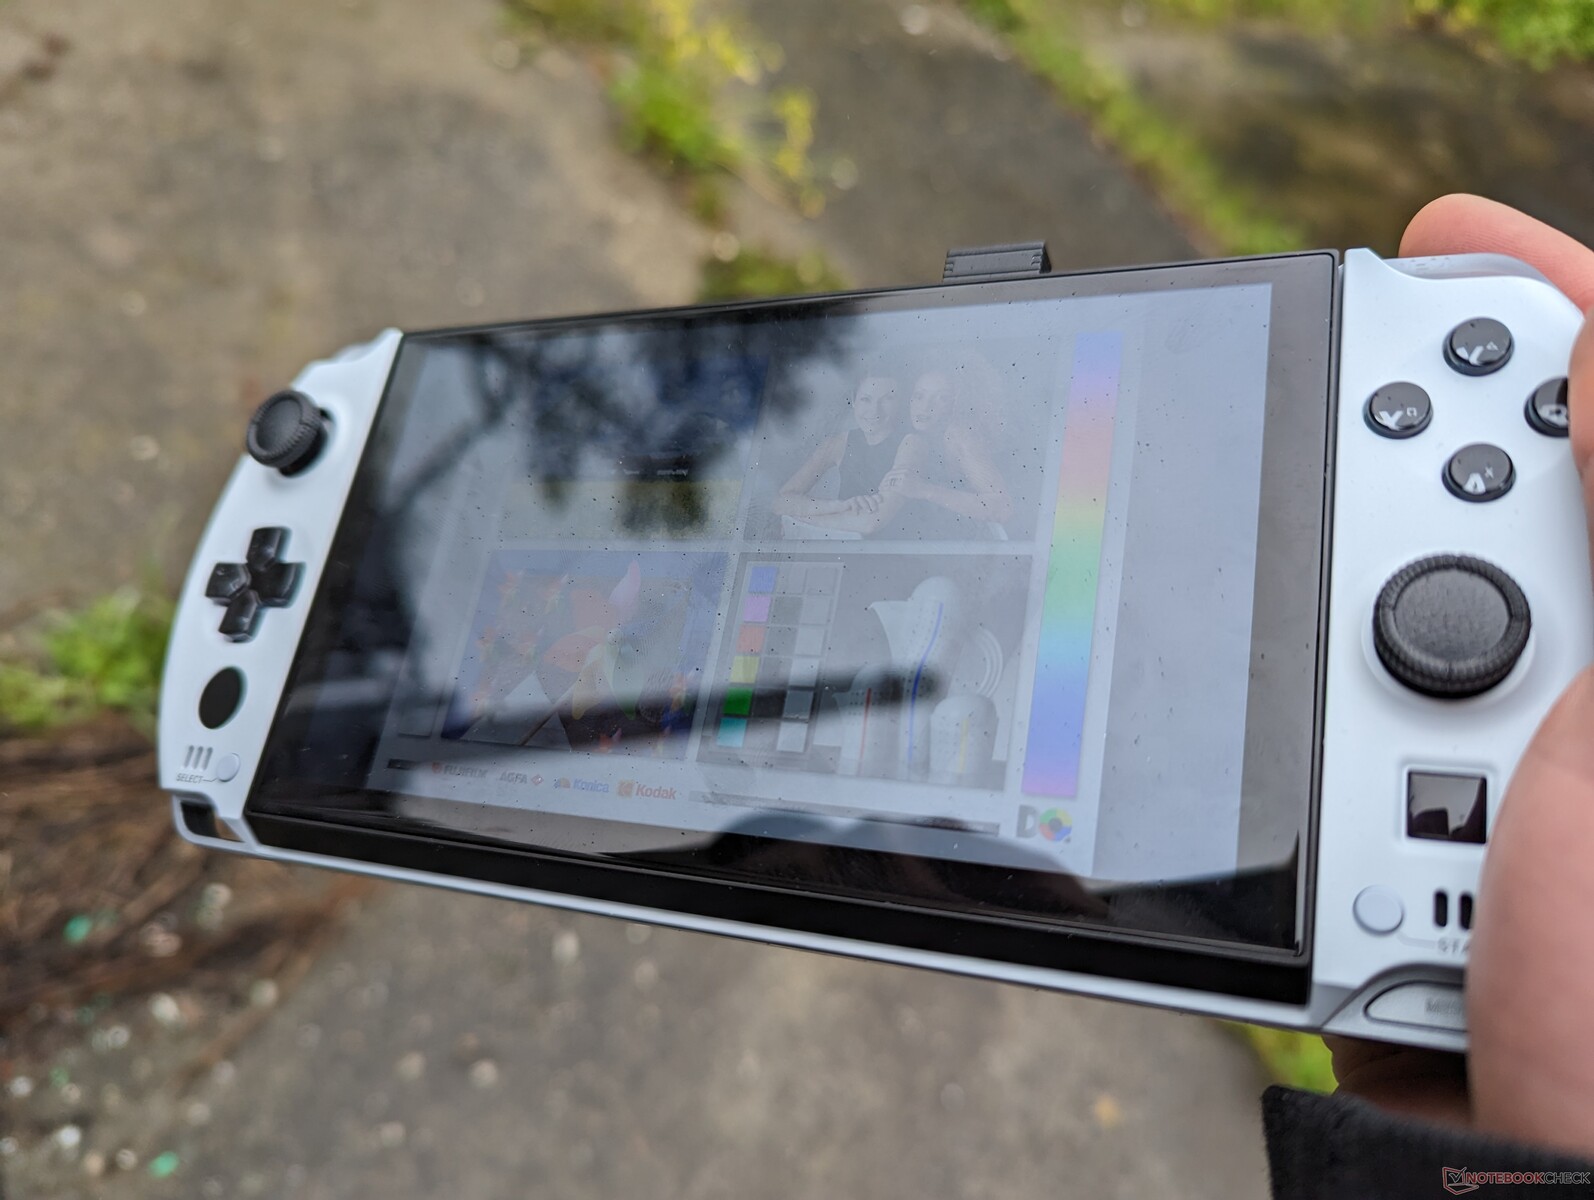
A visibilidade ao ar livre é muito boa se estiver sob a sombra. Qualquer coisa mais brilhante, porém, e o brilho se torna um problema na tela brilhante. A tela de 400-nit não é tão brilhante como na maioria dos smartphones populares onde as telas podem atingir 1000 nits ou mais.
Desempenho - O mesmo poder que os últimos Ultrabooks
Condições de teste
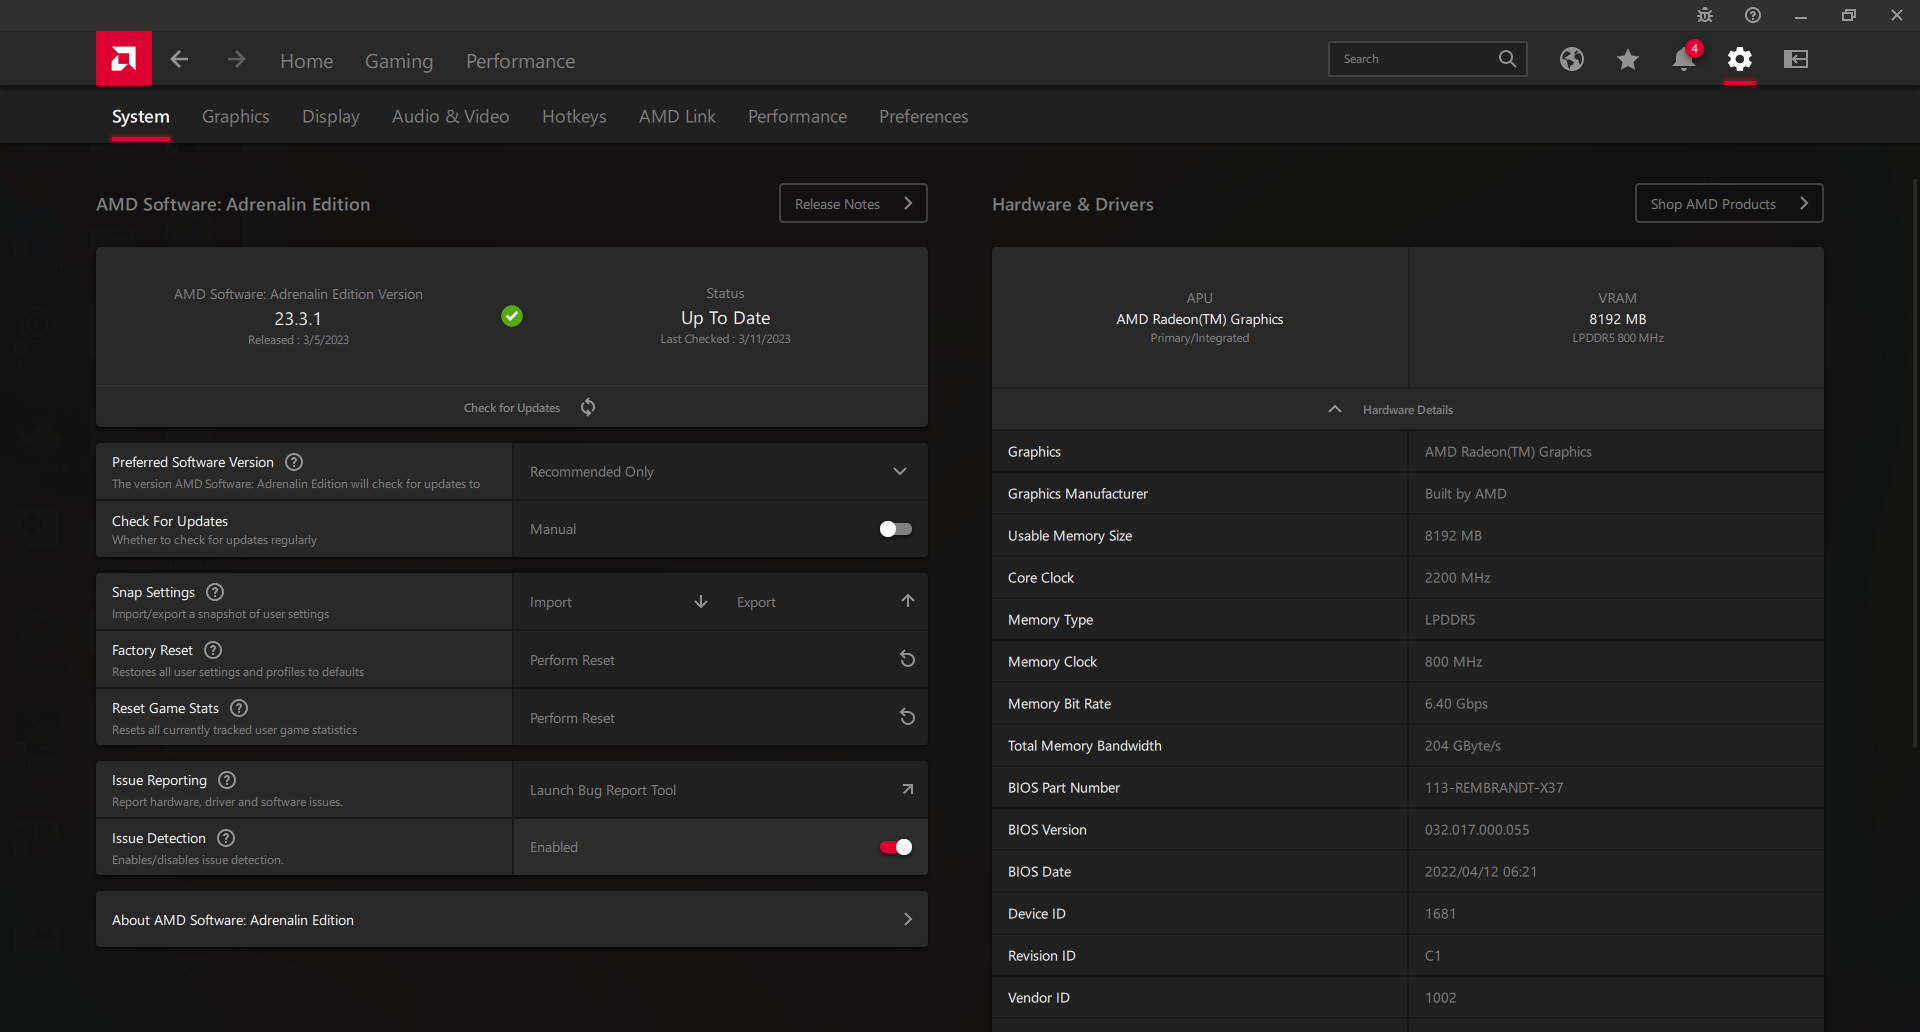
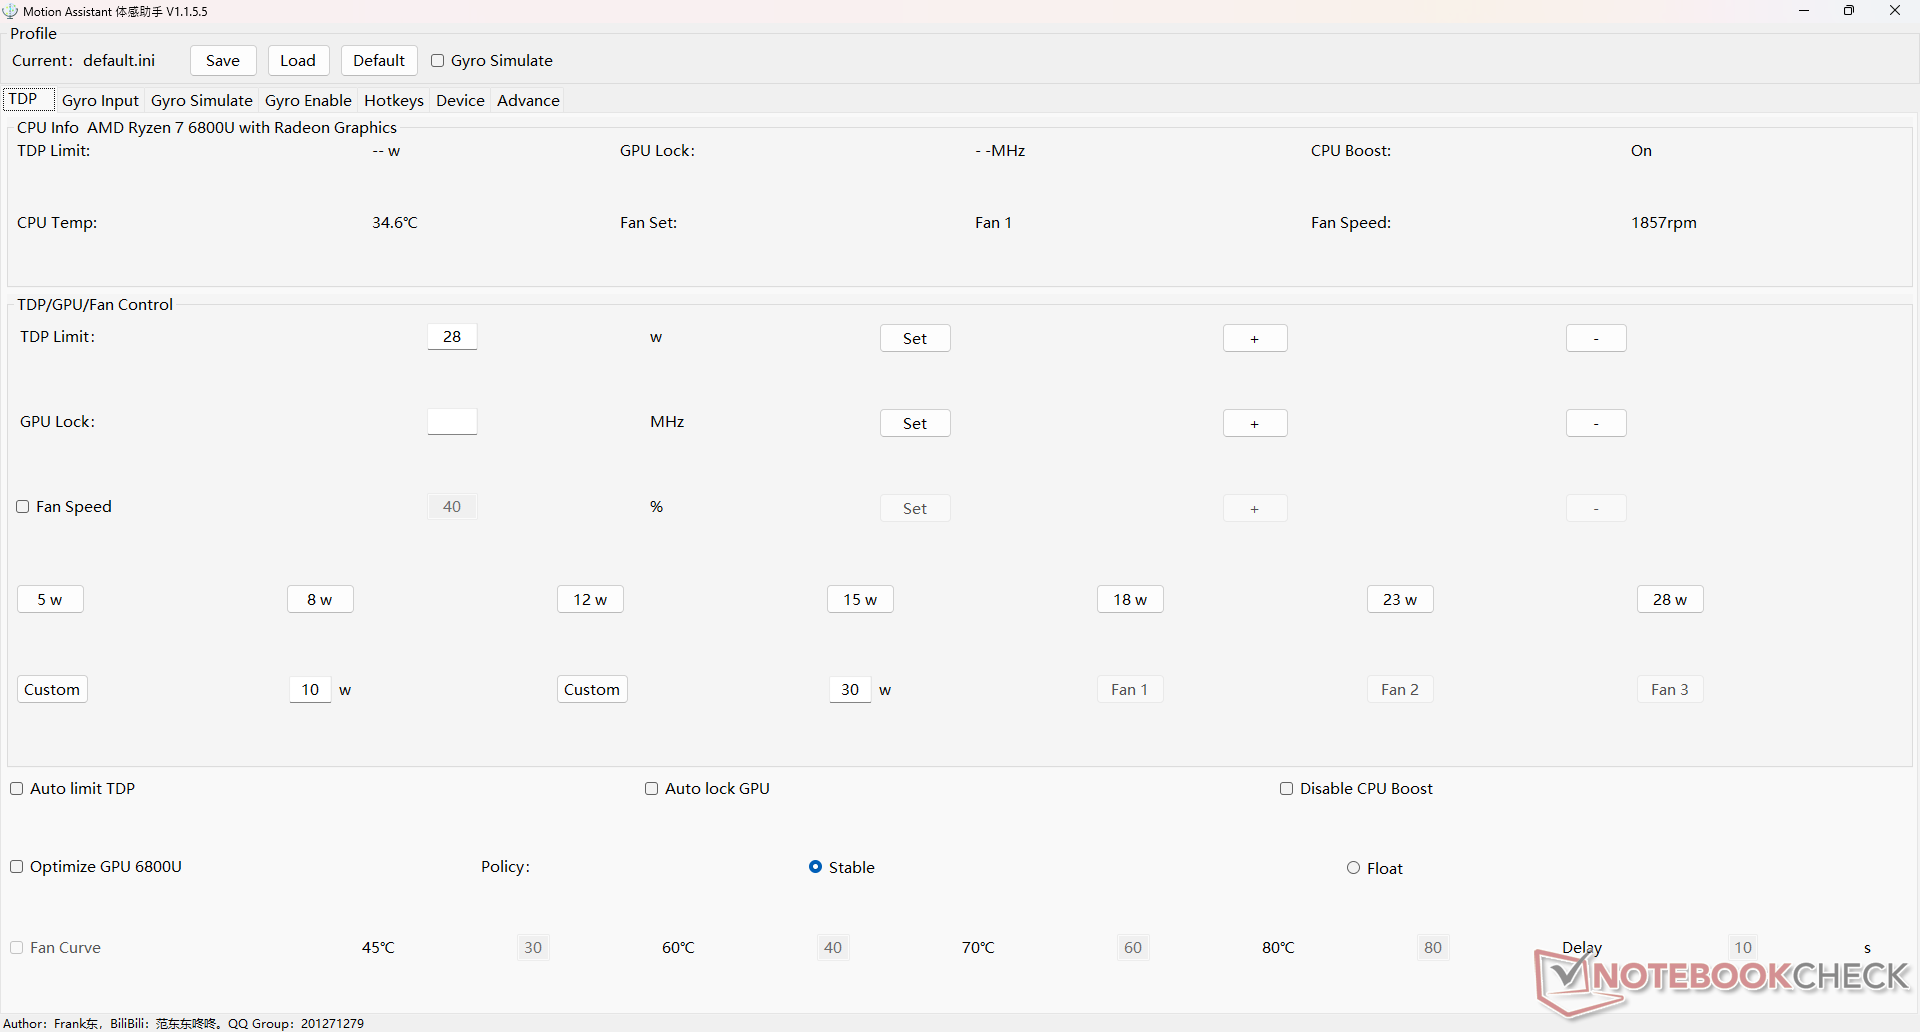
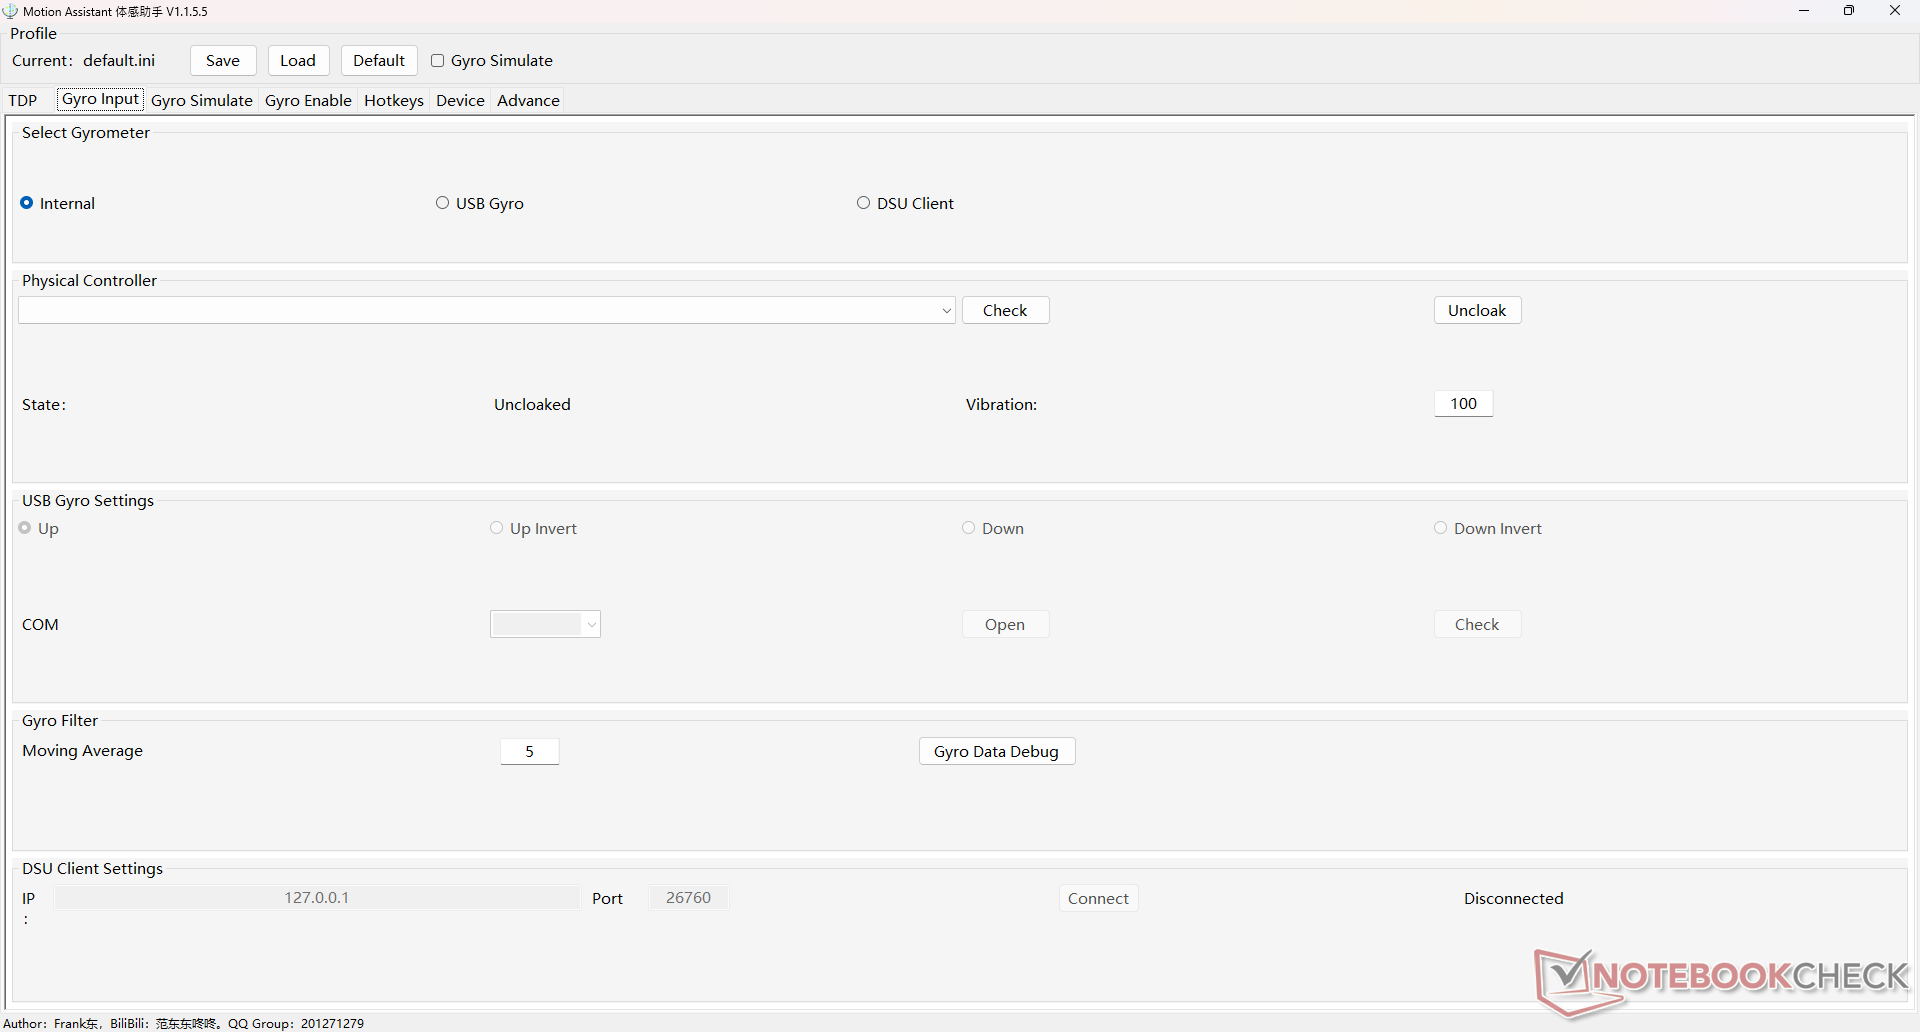
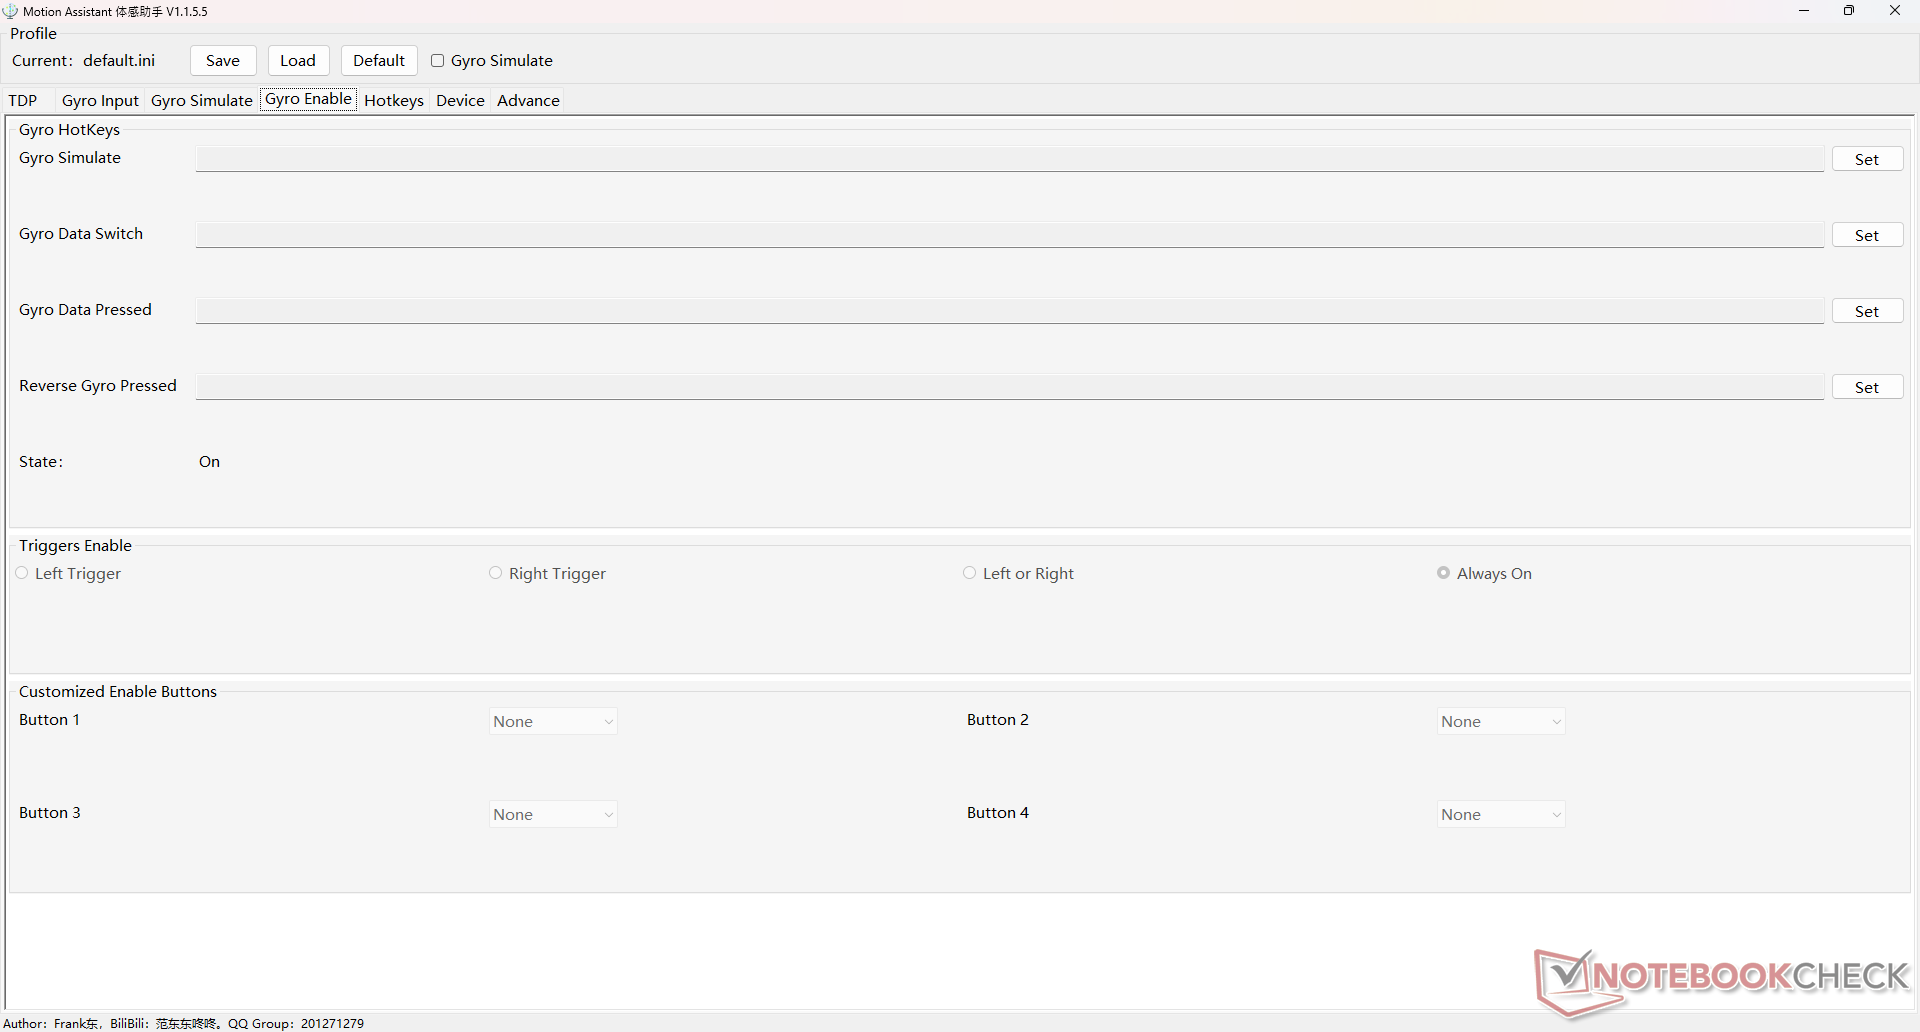
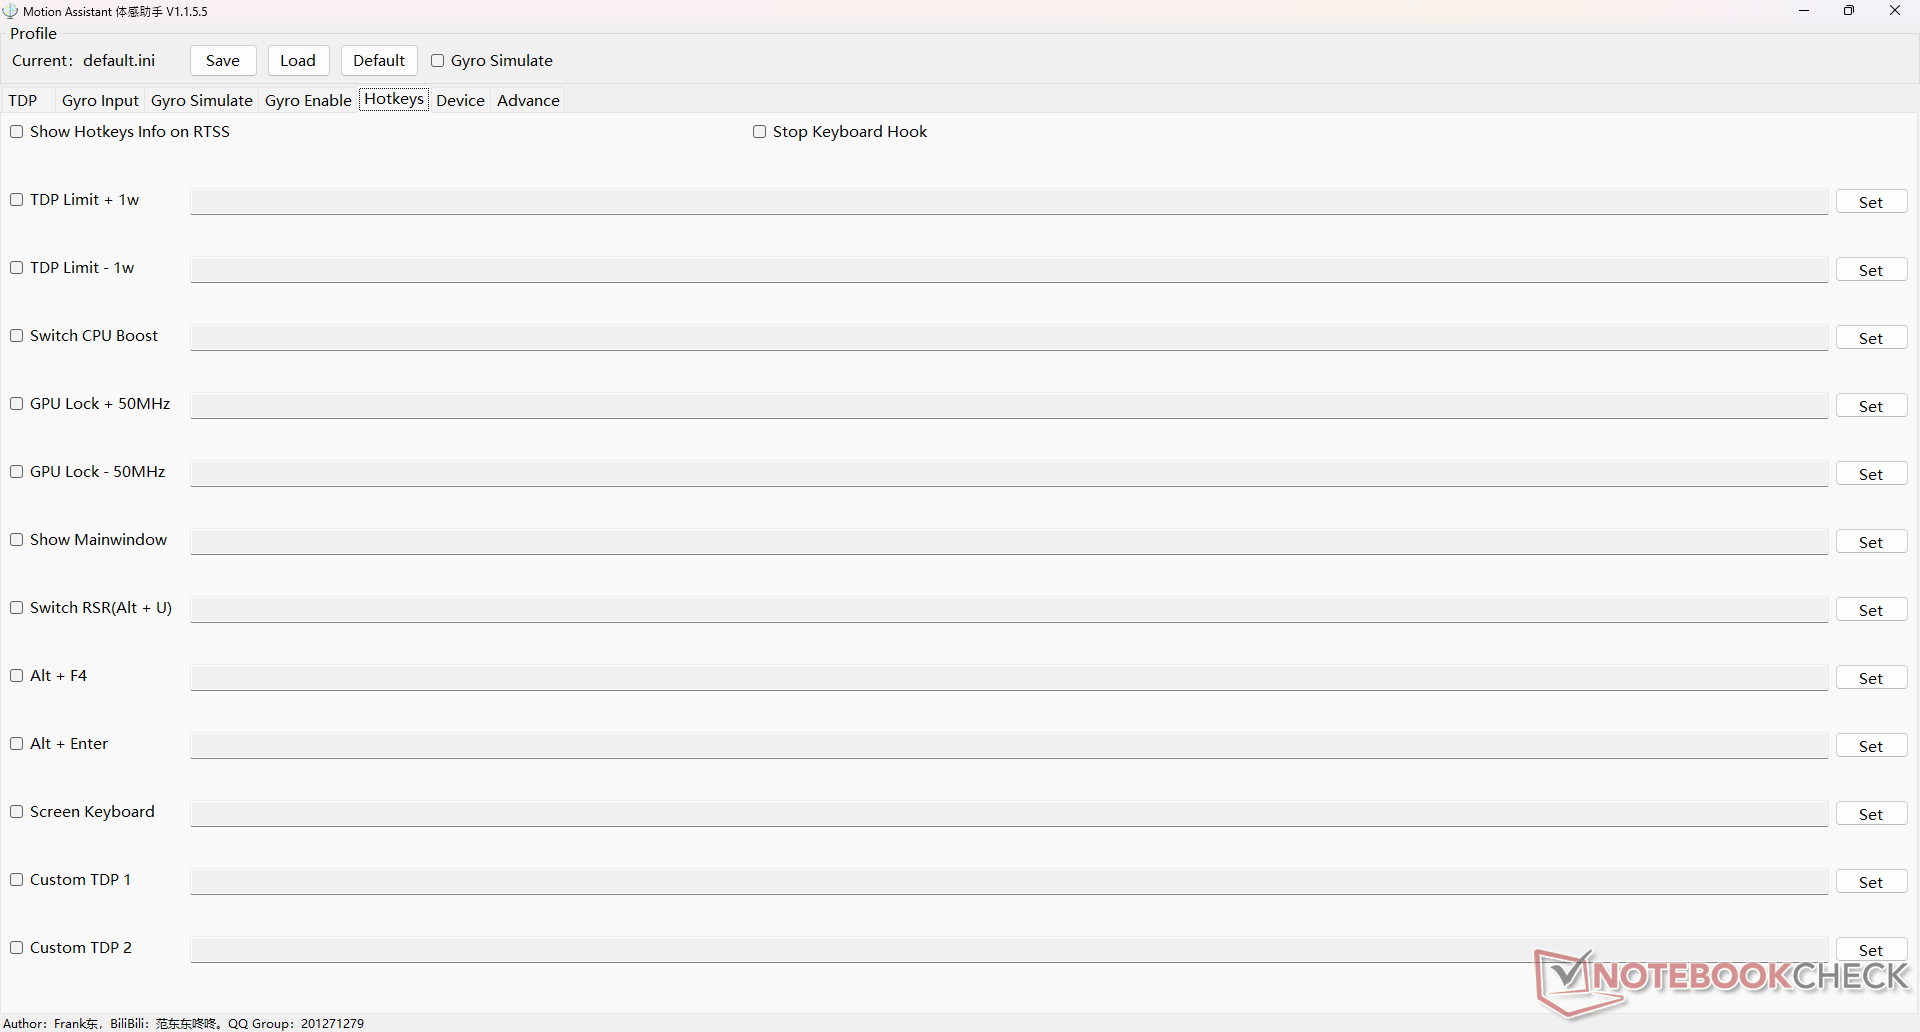
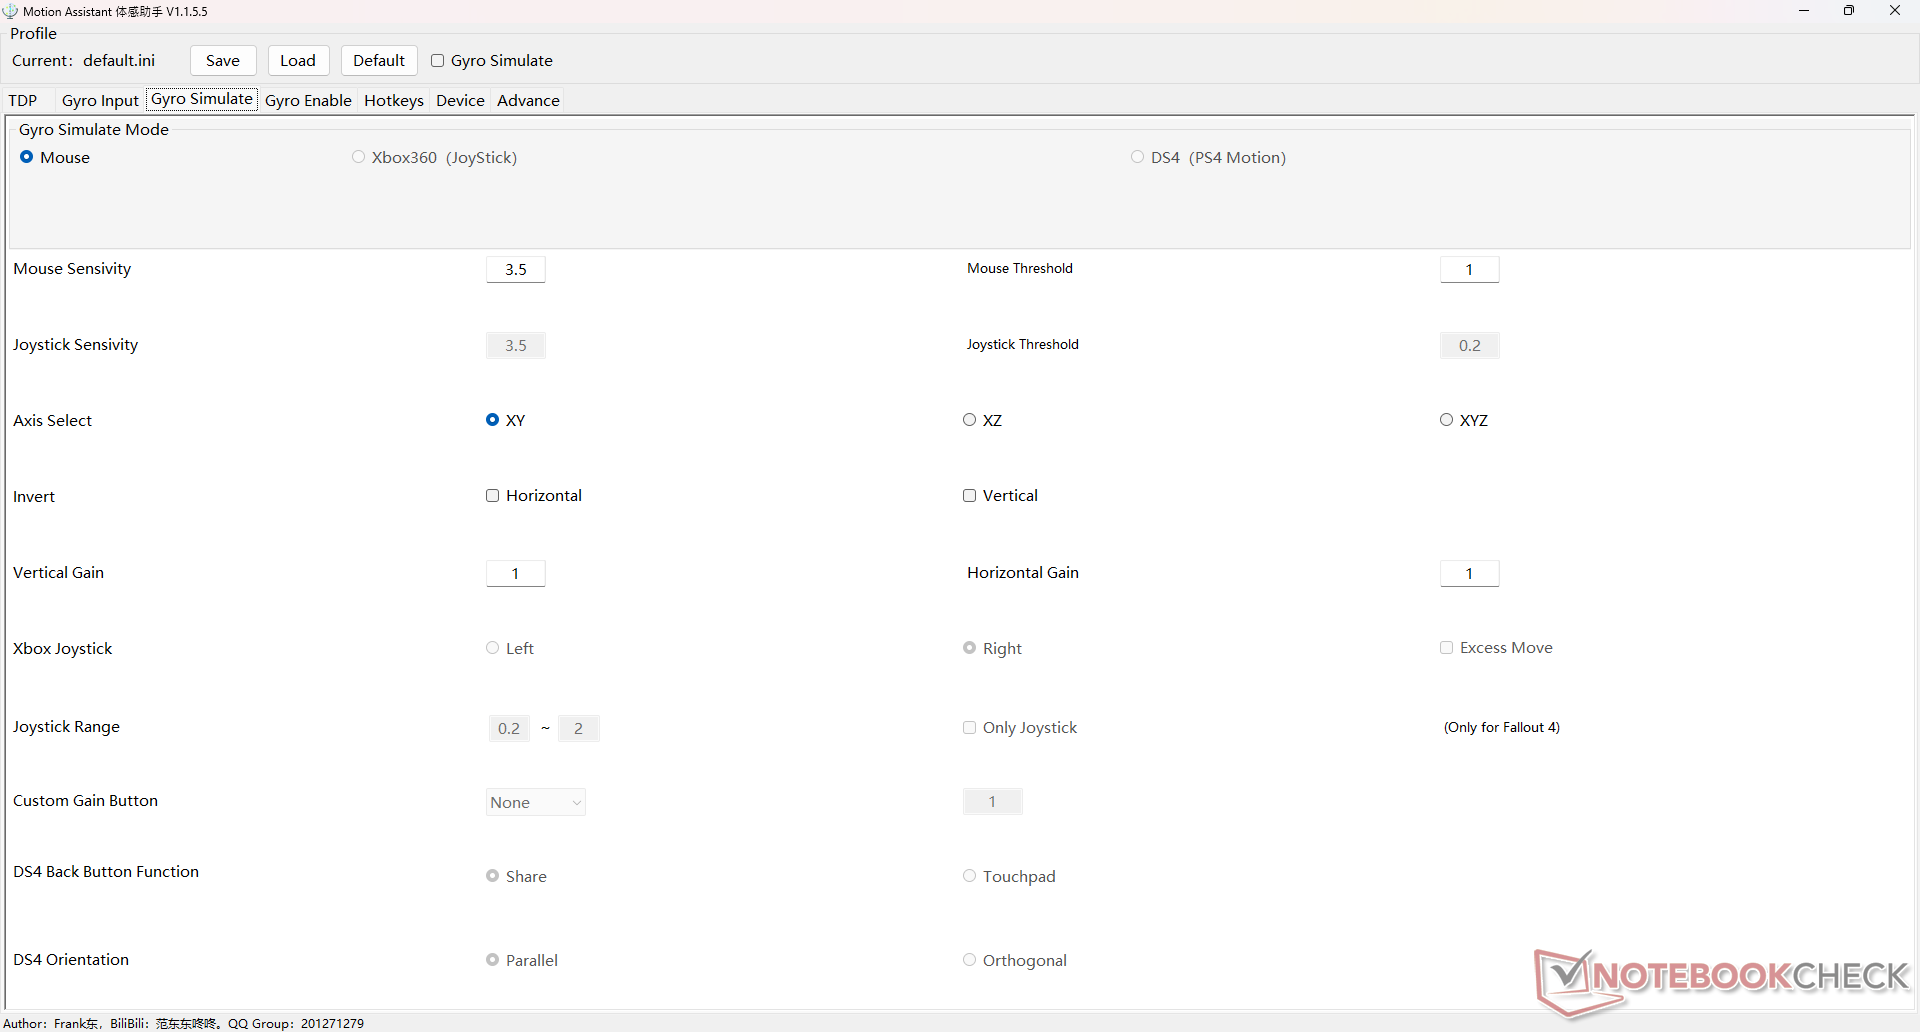
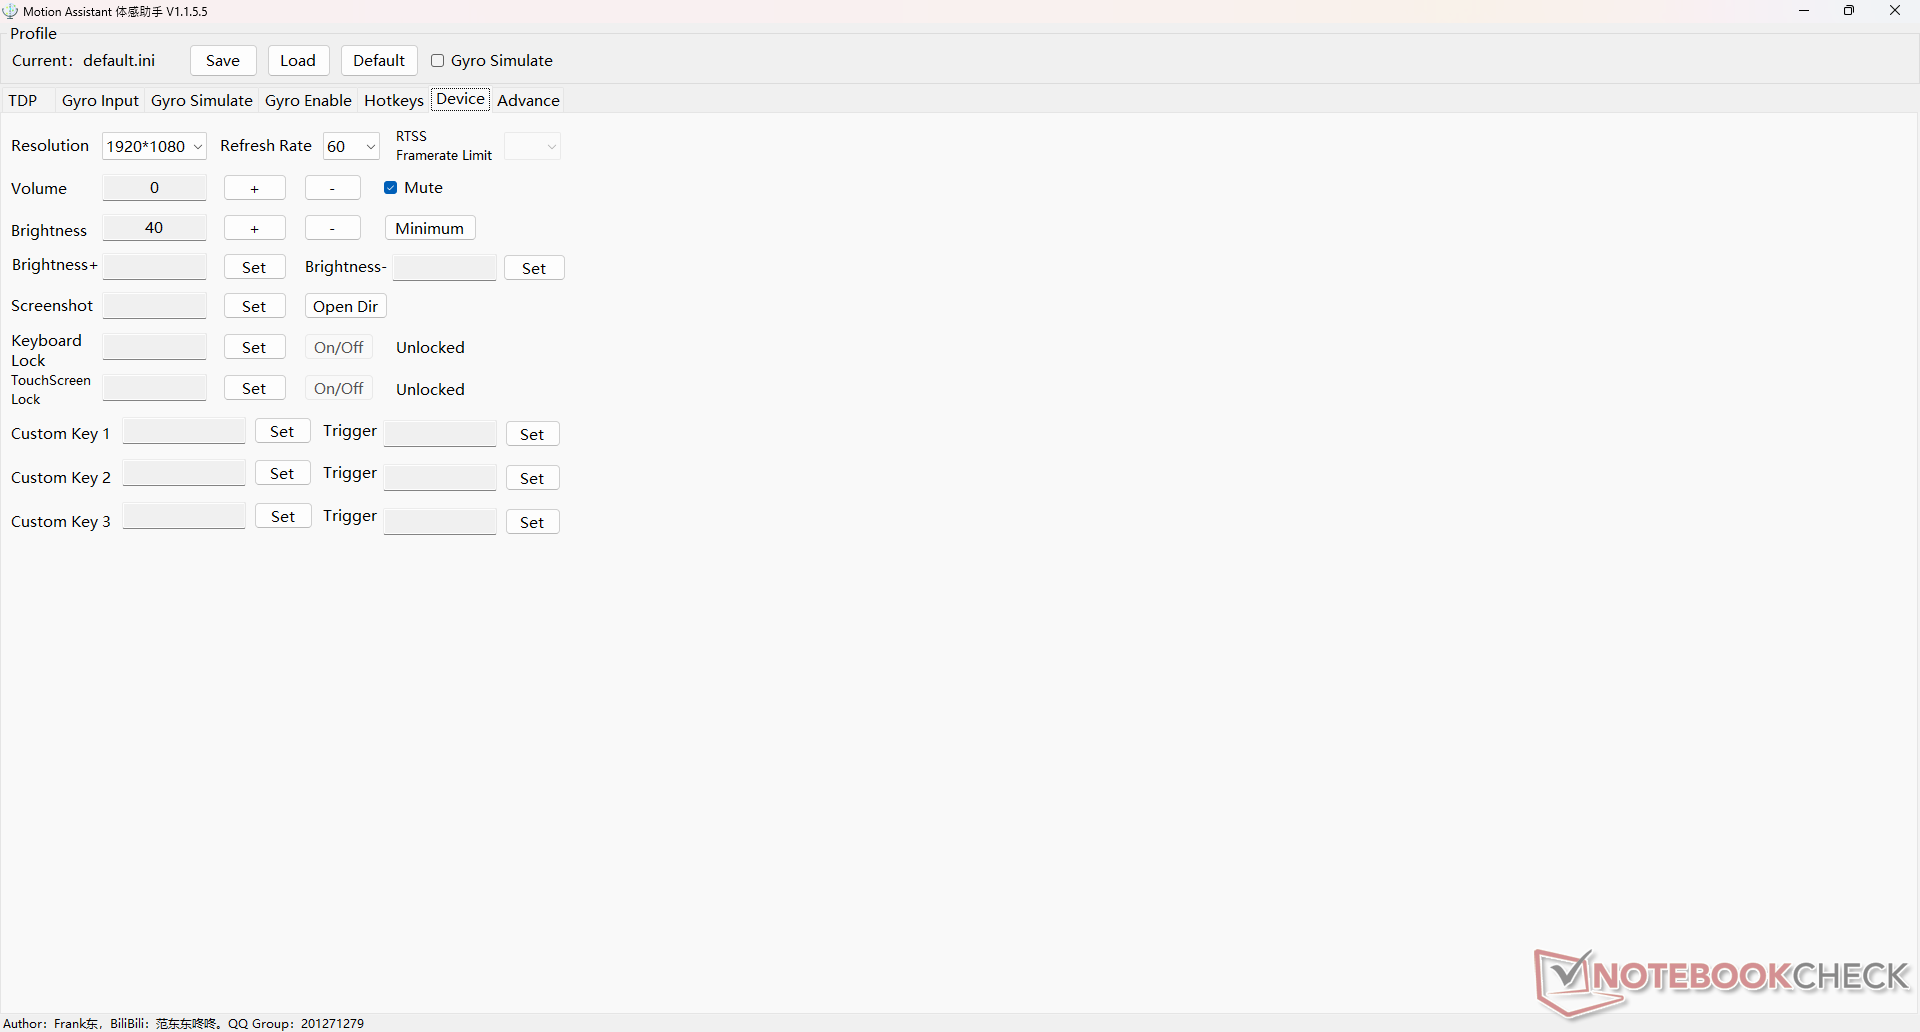
Configuramos o Windows para o modo Performance e Motion Assistant para 28 W antes de executar quaisquer benchmarks abaixo. Recomendamos que os usuários se acostumem ao Motion Assistant, pois ele é o software do centro de controle para o Win 4. As telas abaixo mostram as opções que o Motion Assistant tem a oferecer.
Processador
O Ryzen 7 6800U é um dos processadores da série U mais rápidos do mercado. É a mesma CPU que alimenta muitos dos mais recentes Ultrabooks, incluindo oLenovo Yoga 7 14 ouHP EliteBook 845 G9. O desempenho bruto multi-fio é mais de 2x mais rápido do que oNúcleo i5-1135G7 na geração anterior GPD Win 3.
A sustentabilidade do desempenho, no entanto, poderia ser um pouco melhor. A execução do CineBench R15 xT em um loop resultaria em uma pontuação inicial de 1776 pontos antes de cair constantemente e se estabilizar em um déficit de desempenho de 18%. OAsus Zenbook S13que carrega a mesma CPU, é capaz de manter taxas de relógio mais altas por períodos mais longos.
Cinebench R15 Multi Loop
Cinebench R23: Multi Core | Single Core
Cinebench R20: CPU (Multi Core) | CPU (Single Core)
Cinebench R15: CPU Multi 64Bit | CPU Single 64Bit
Blender: v2.79 BMW27 CPU
7-Zip 18.03: 7z b 4 | 7z b 4 -mmt1
Geekbench 5.5: Multi-Core | Single-Core
HWBOT x265 Benchmark v2.2: 4k Preset
LibreOffice : 20 Documents To PDF
R Benchmark 2.5: Overall mean
* ... menor é melhor
AIDA64: FP32 Ray-Trace | FPU Julia | CPU SHA3 | CPU Queen | FPU SinJulia | FPU Mandel | CPU AES | CPU ZLib | FP64 Ray-Trace | CPU PhotoWorxx
| Performance rating | |
| Média AMD Ryzen 7 6800U | |
| GPD Win 4 | |
| Asus Zenbook S 13 OLED | |
| Dell XPS 13 9315 2-in-1 Core i5-1230U | |
| GPD Win Max 2 | |
| AIDA64 / FP32 Ray-Trace | |
| Média AMD Ryzen 7 6800U (10902 - 12818, n=6) | |
| GPD Win 4 | |
| Asus Zenbook S 13 OLED | |
| Dell XPS 13 9315 2-in-1 Core i5-1230U | |
| GPD Win Max 2 | |
| AIDA64 / FPU Julia | |
| Média AMD Ryzen 7 6800U (67503 - 84031, n=6) | |
| GPD Win 4 | |
| Asus Zenbook S 13 OLED | |
| Dell XPS 13 9315 2-in-1 Core i5-1230U | |
| GPD Win Max 2 | |
| AIDA64 / CPU SHA3 | |
| Média AMD Ryzen 7 6800U (2296 - 2818, n=6) | |
| GPD Win 4 | |
| Asus Zenbook S 13 OLED | |
| Dell XPS 13 9315 2-in-1 Core i5-1230U | |
| GPD Win Max 2 | |
| AIDA64 / CPU Queen | |
| GPD Win 4 | |
| Média AMD Ryzen 7 6800U (62082 - 96306, n=6) | |
| Asus Zenbook S 13 OLED | |
| GPD Win Max 2 | |
| Dell XPS 13 9315 2-in-1 Core i5-1230U | |
| AIDA64 / FPU SinJulia | |
| GPD Win 4 | |
| Média AMD Ryzen 7 6800U (7753 - 11982, n=6) | |
| Asus Zenbook S 13 OLED | |
| GPD Win Max 2 | |
| Dell XPS 13 9315 2-in-1 Core i5-1230U | |
| AIDA64 / FPU Mandel | |
| Média AMD Ryzen 7 6800U (37417 - 45748, n=6) | |
| GPD Win 4 | |
| Asus Zenbook S 13 OLED | |
| Dell XPS 13 9315 2-in-1 Core i5-1230U | |
| GPD Win Max 2 | |
| AIDA64 / CPU AES | |
| GPD Win 4 | |
| Asus Zenbook S 13 OLED | |
| Média AMD Ryzen 7 6800U (50547 - 115681, n=6) | |
| GPD Win Max 2 | |
| Dell XPS 13 9315 2-in-1 Core i5-1230U | |
| AIDA64 / CPU ZLib | |
| Média AMD Ryzen 7 6800U (554 - 755, n=6) | |
| GPD Win 4 | |
| Asus Zenbook S 13 OLED | |
| GPD Win Max 2 | |
| Dell XPS 13 9315 2-in-1 Core i5-1230U | |
| AIDA64 / FP64 Ray-Trace | |
| Média AMD Ryzen 7 6800U (5825 - 6694, n=6) | |
| GPD Win 4 | |
| Asus Zenbook S 13 OLED | |
| Dell XPS 13 9315 2-in-1 Core i5-1230U | |
| GPD Win Max 2 | |
| AIDA64 / CPU PhotoWorxx | |
| Dell XPS 13 9315 2-in-1 Core i5-1230U | |
| GPD Win Max 2 | |
| GPD Win 4 | |
| Média AMD Ryzen 7 6800U (24728 - 27274, n=6) | |
| Asus Zenbook S 13 OLED | |
Desempenho do sistema
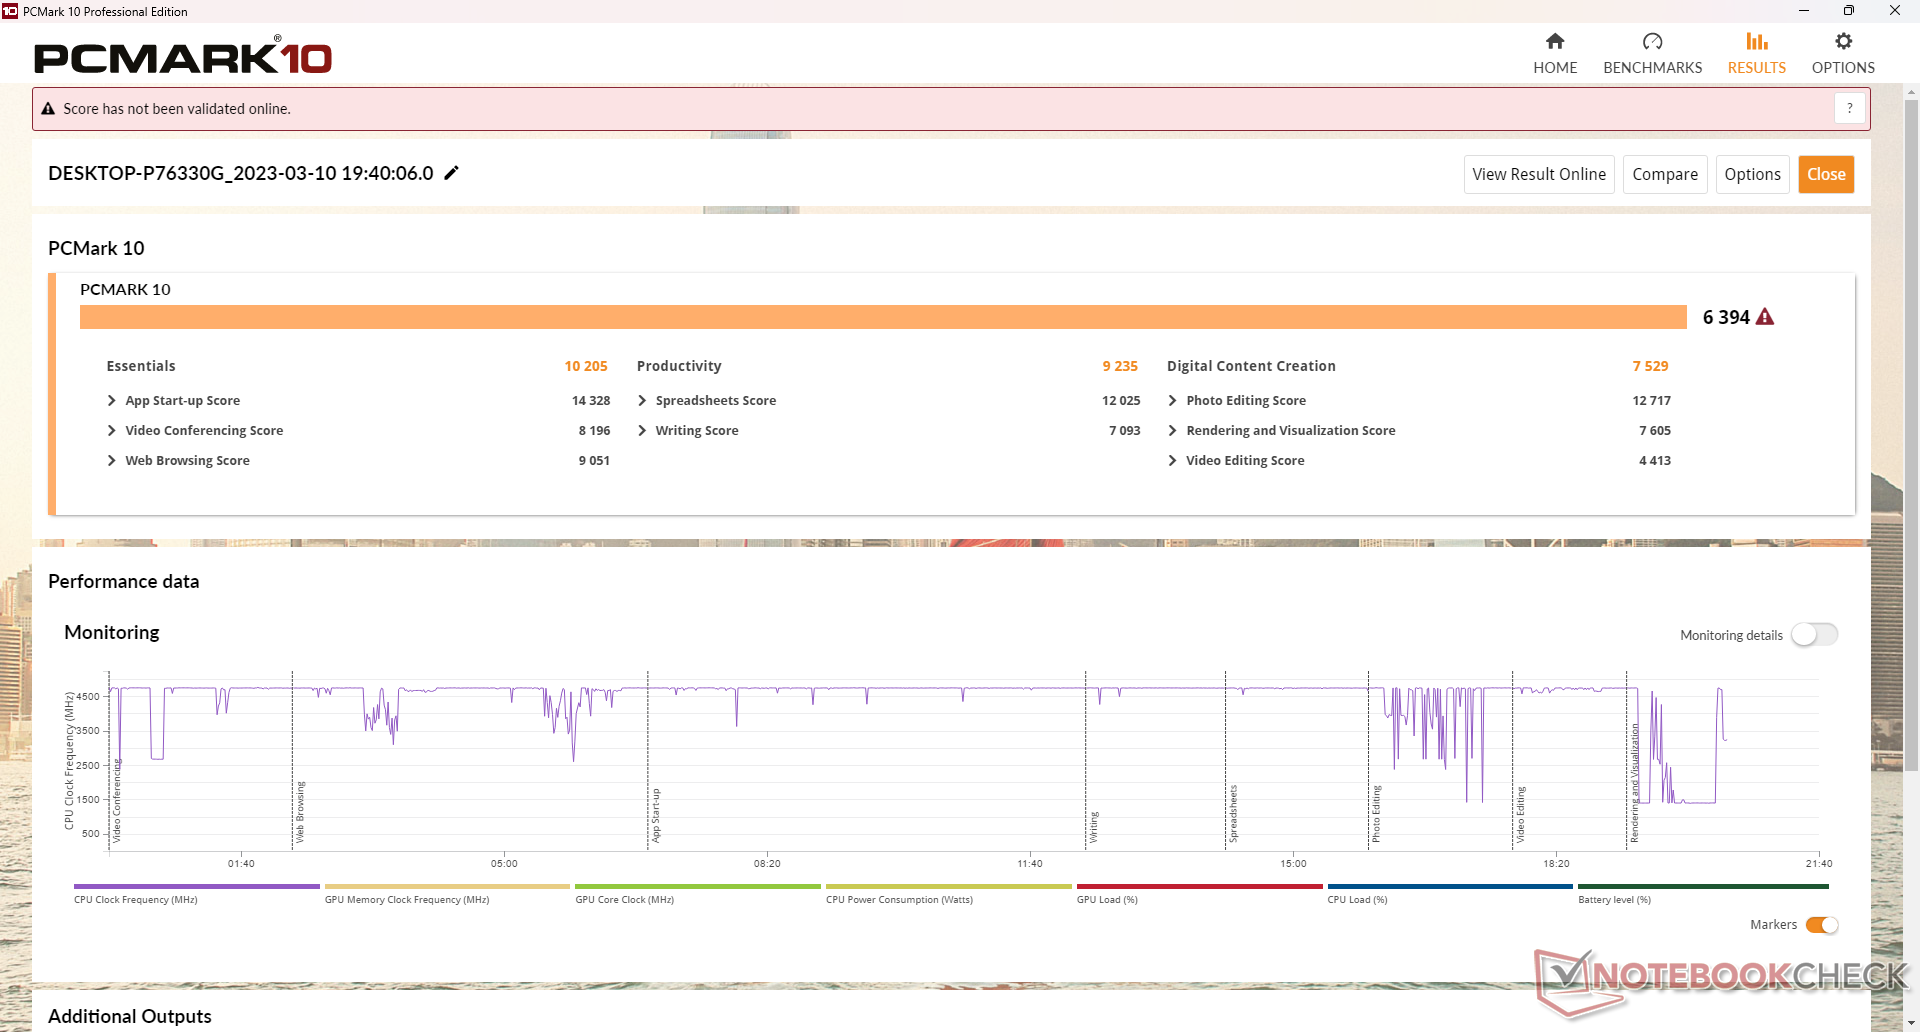
Os resultados do PCMark 10 são comparáveis aos dos mais recentes Ultrabooks da série U, enquanto estão bem à frente dos mais antigos Win 3.
CrossMark: Overall | Productivity | Creativity | Responsiveness
| PCMark 10 / Score | |
| GPD Win 4 | |
| Asus Zenbook S 13 OLED | |
| Média AMD Ryzen 7 6800U, AMD Radeon 680M (5057 - 6639, n=7) | |
| Razer Blade Stealth i7-1165G7 GTX 1650 Ti Max-Q | |
| GPD Win Max 2 | |
| Dell XPS 13 9315 2-in-1 Core i5-1230U | |
| GPD Win 3 | |
| PCMark 10 / Essentials | |
| GPD Win Max 2 | |
| Asus Zenbook S 13 OLED | |
| GPD Win 4 | |
| Dell XPS 13 9315 2-in-1 Core i5-1230U | |
| Média AMD Ryzen 7 6800U, AMD Radeon 680M (8143 - 10766, n=6) | |
| GPD Win 3 | |
| Razer Blade Stealth i7-1165G7 GTX 1650 Ti Max-Q | |
| PCMark 10 / Productivity | |
| GPD Win 4 | |
| Asus Zenbook S 13 OLED | |
| Razer Blade Stealth i7-1165G7 GTX 1650 Ti Max-Q | |
| Média AMD Ryzen 7 6800U, AMD Radeon 680M (6089 - 9328, n=6) | |
| GPD Win Max 2 | |
| Dell XPS 13 9315 2-in-1 Core i5-1230U | |
| GPD Win 3 | |
| PCMark 10 / Digital Content Creation | |
| GPD Win 4 | |
| Média AMD Ryzen 7 6800U, AMD Radeon 680M (6066 - 8144, n=6) | |
| Asus Zenbook S 13 OLED | |
| Razer Blade Stealth i7-1165G7 GTX 1650 Ti Max-Q | |
| GPD Win Max 2 | |
| Dell XPS 13 9315 2-in-1 Core i5-1230U | |
| GPD Win 3 | |
| CrossMark / Overall | |
| GPD Win Max 2 | |
| GPD Win 4 | |
| Asus Zenbook S 13 OLED | |
| Média AMD Ryzen 7 6800U, AMD Radeon 680M (1009 - 1575, n=7) | |
| Dell XPS 13 9315 2-in-1 Core i5-1230U | |
| CrossMark / Productivity | |
| GPD Win Max 2 | |
| GPD Win 4 | |
| Asus Zenbook S 13 OLED | |
| Média AMD Ryzen 7 6800U, AMD Radeon 680M (971 - 1596, n=7) | |
| Dell XPS 13 9315 2-in-1 Core i5-1230U | |
| CrossMark / Creativity | |
| GPD Win Max 2 | |
| GPD Win 4 | |
| Asus Zenbook S 13 OLED | |
| Média AMD Ryzen 7 6800U, AMD Radeon 680M (1054 - 1686, n=7) | |
| Dell XPS 13 9315 2-in-1 Core i5-1230U | |
| CrossMark / Responsiveness | |
| GPD Win Max 2 | |
| GPD Win 4 | |
| Média AMD Ryzen 7 6800U, AMD Radeon 680M (994 - 1473, n=7) | |
| Asus Zenbook S 13 OLED | |
| Dell XPS 13 9315 2-in-1 Core i5-1230U | |
| PCMark 10 Score | 6394 pontos | |
Ajuda | ||
| AIDA64 / Memory Copy | |
| GPD Win Max 2 | |
| Dell XPS 13 9315 2-in-1 Core i5-1230U | |
| GPD Win 4 | |
| Média AMD Ryzen 7 6800U (47010 - 52159, n=6) | |
| Asus Zenbook S 13 OLED | |
| AIDA64 / Memory Read | |
| GPD Win Max 2 | |
| Dell XPS 13 9315 2-in-1 Core i5-1230U | |
| GPD Win 4 | |
| Média AMD Ryzen 7 6800U (39197 - 45084, n=6) | |
| Asus Zenbook S 13 OLED | |
| AIDA64 / Memory Write | |
| Dell XPS 13 9315 2-in-1 Core i5-1230U | |
| GPD Win Max 2 | |
| GPD Win 4 | |
| Média AMD Ryzen 7 6800U (48723 - 51117, n=6) | |
| Asus Zenbook S 13 OLED | |
| AIDA64 / Memory Latency | |
| Asus Zenbook S 13 OLED | |
| Média AMD Ryzen 7 6800U (106.3 - 123.1, n=6) | |
| GPD Win 4 | |
| GPD Win Max 2 | |
| Dell XPS 13 9315 2-in-1 Core i5-1230U | |
* ... menor é melhor
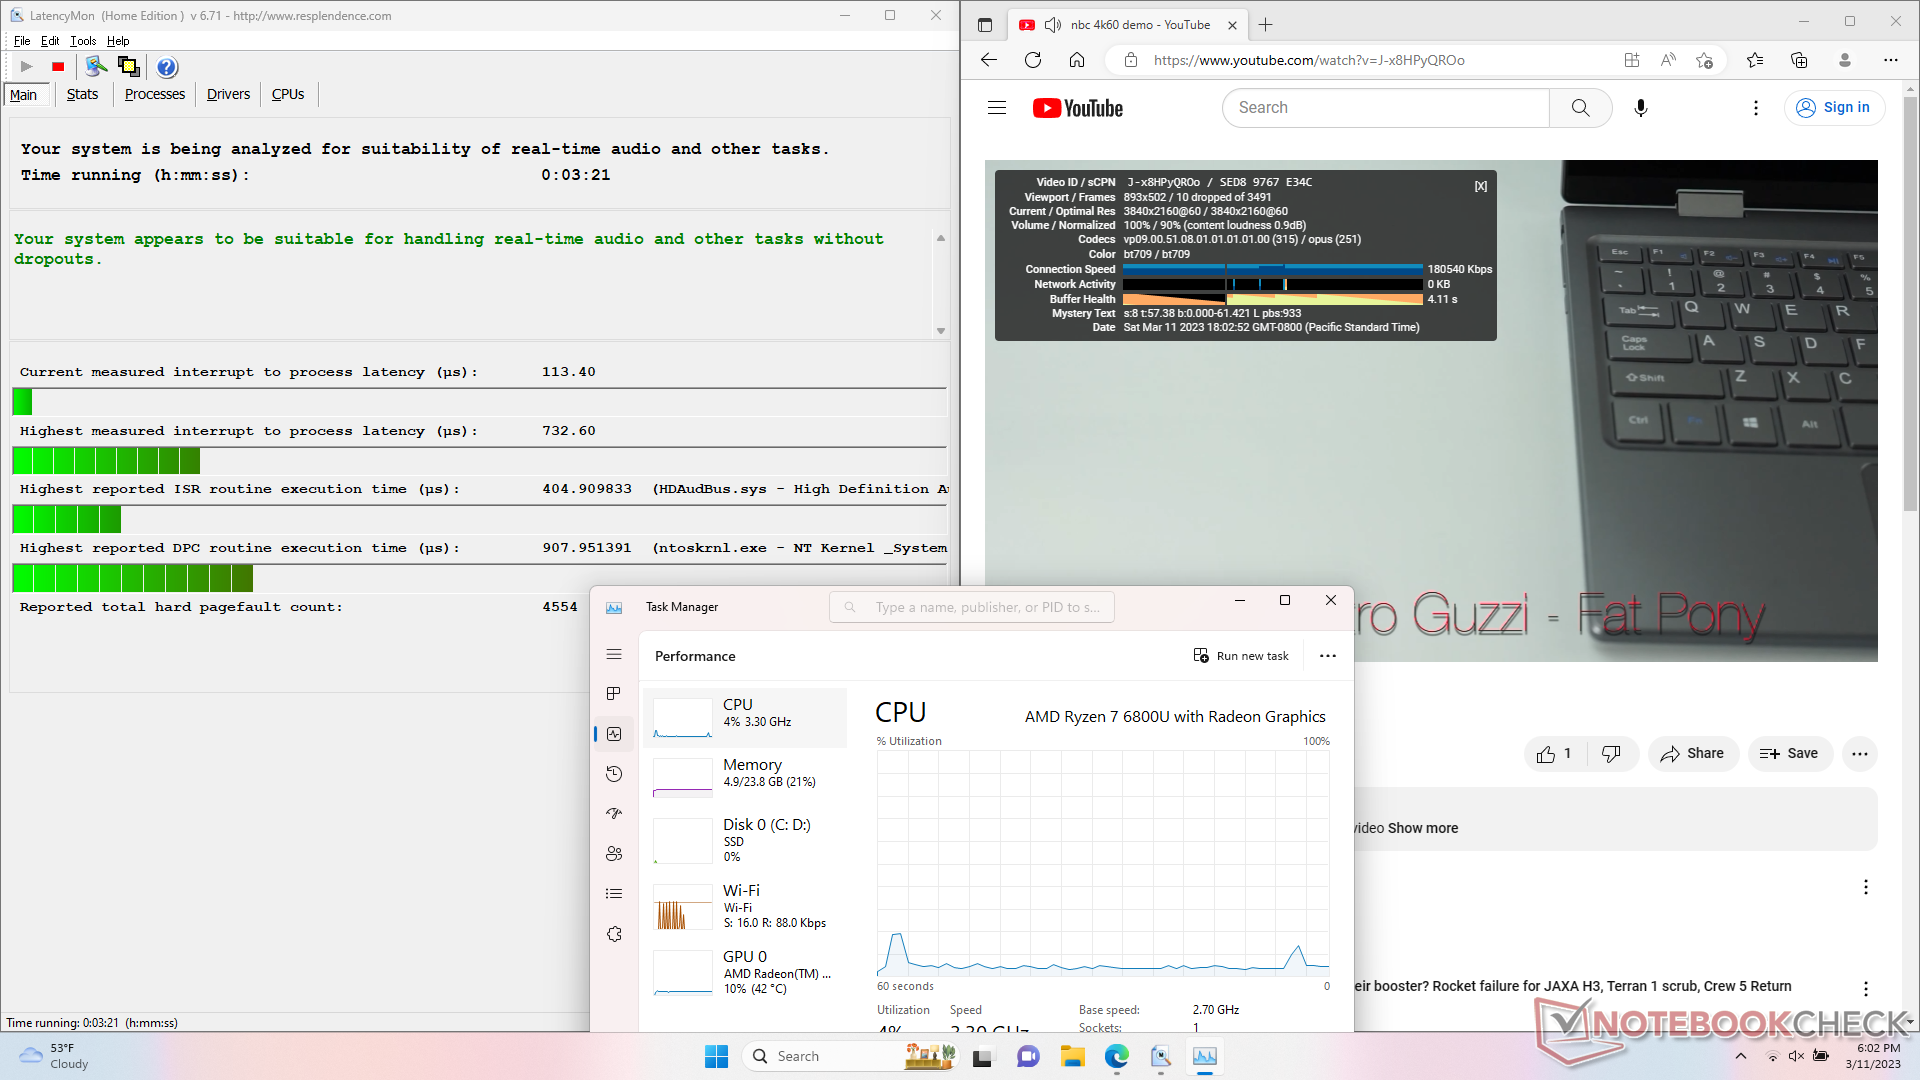
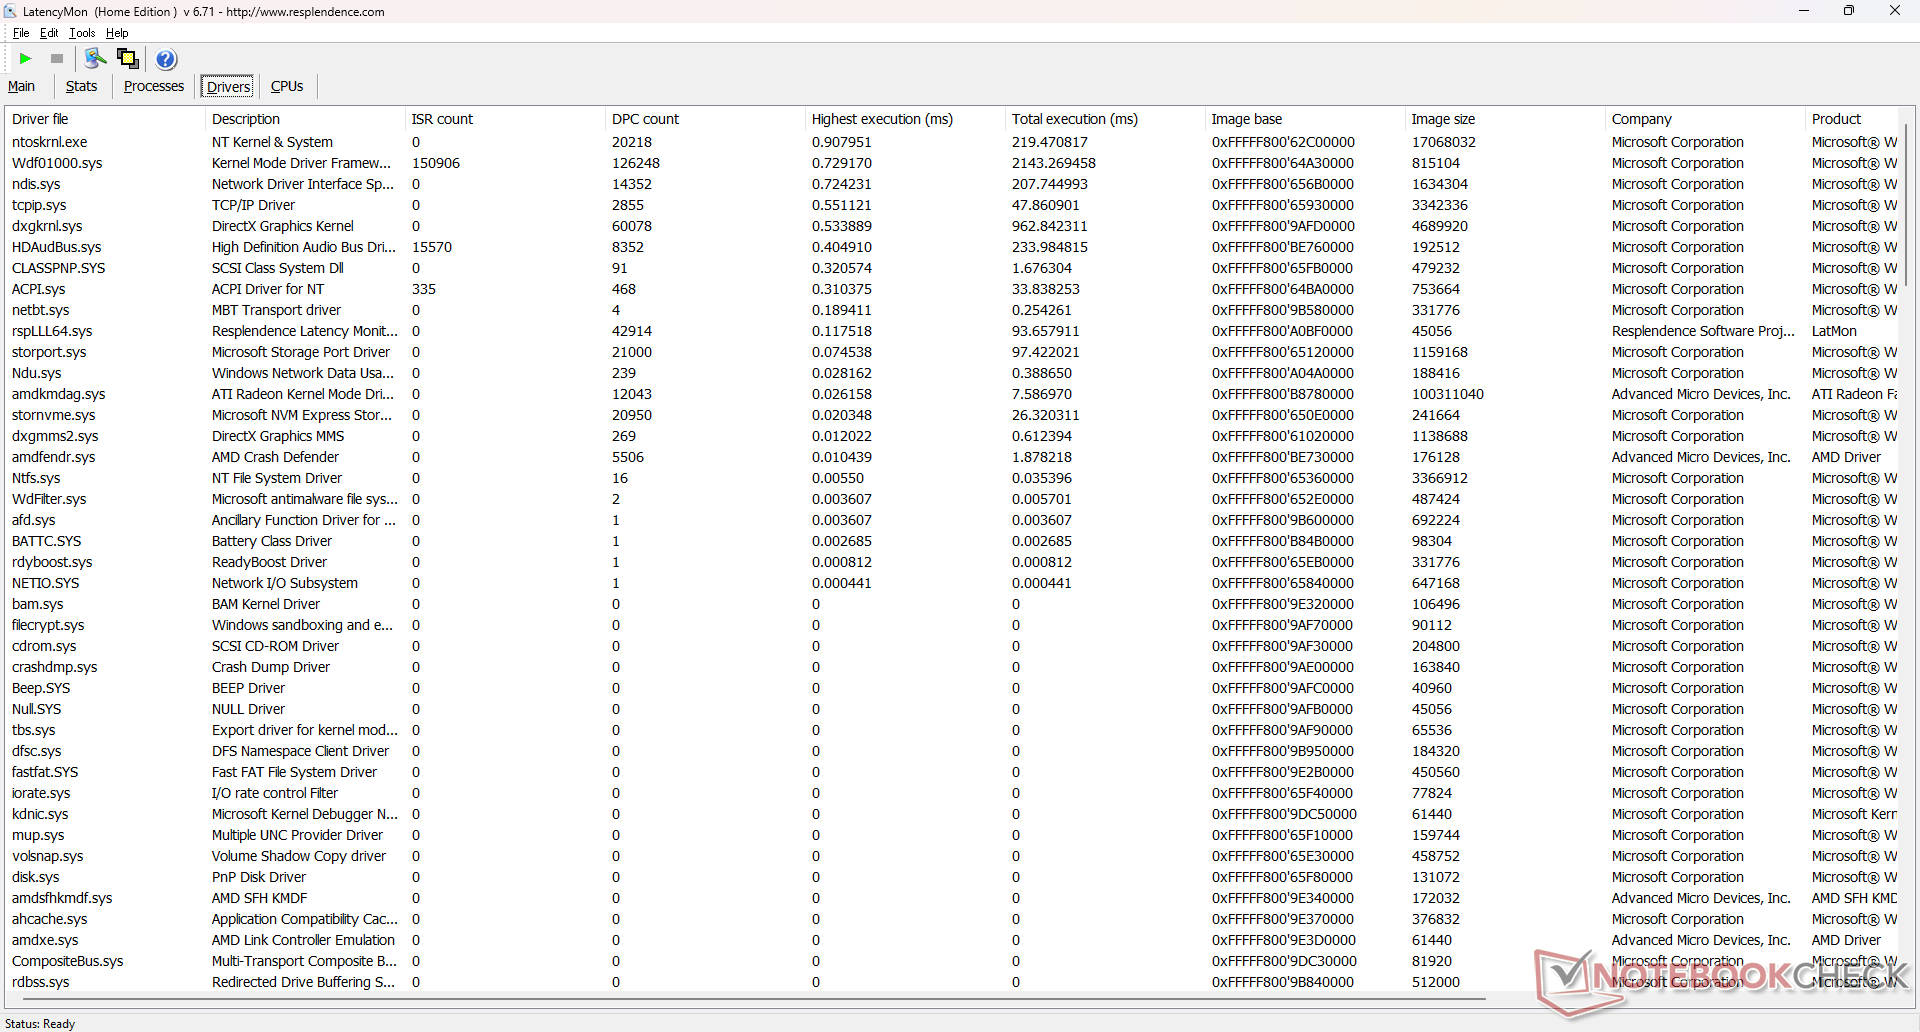
Latência do DPC
A LatencyMon não mostra grandes problemas de DPC ao abrir várias abas do navegador em nossa página inicial. No entanto, somos capazes de gravar alguns quadros descartados durante nosso teste de reprodução de vídeo 4K60, mesmo após múltiplas tentativas. As quedas são infrequentes e na maioria das vezes imperceptíveis, mas não deveriam estar ocorrendo de forma alguma, dado o hardware subjacente.
| DPC Latencies / LatencyMon - interrupt to process latency (max), Web, Youtube, Prime95 | |
| Dell XPS 13 9315 2-in-1 Core i5-1230U | |
| Razer Blade Stealth i7-1165G7 GTX 1650 Ti Max-Q | |
| GPD Win 3 | |
| GPD Win 4 | |
| Asus Zenbook S 13 OLED | |
| GPD Win Max 2 | |
* ... menor é melhor
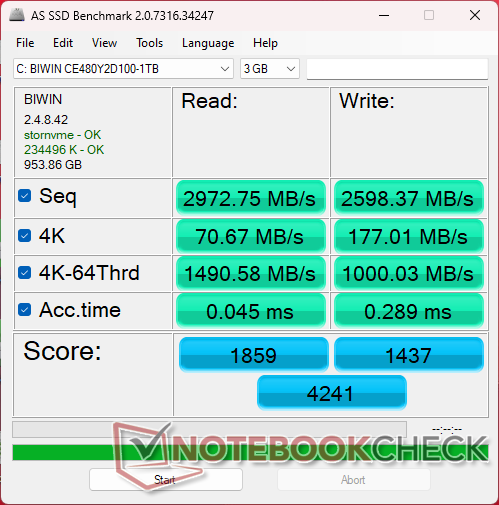
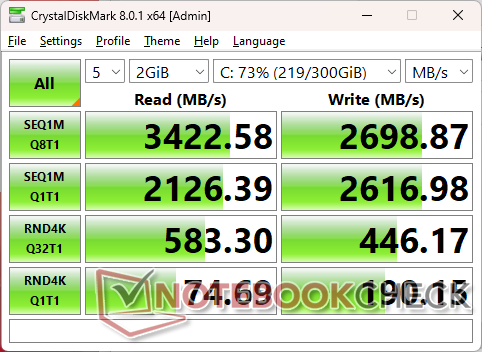
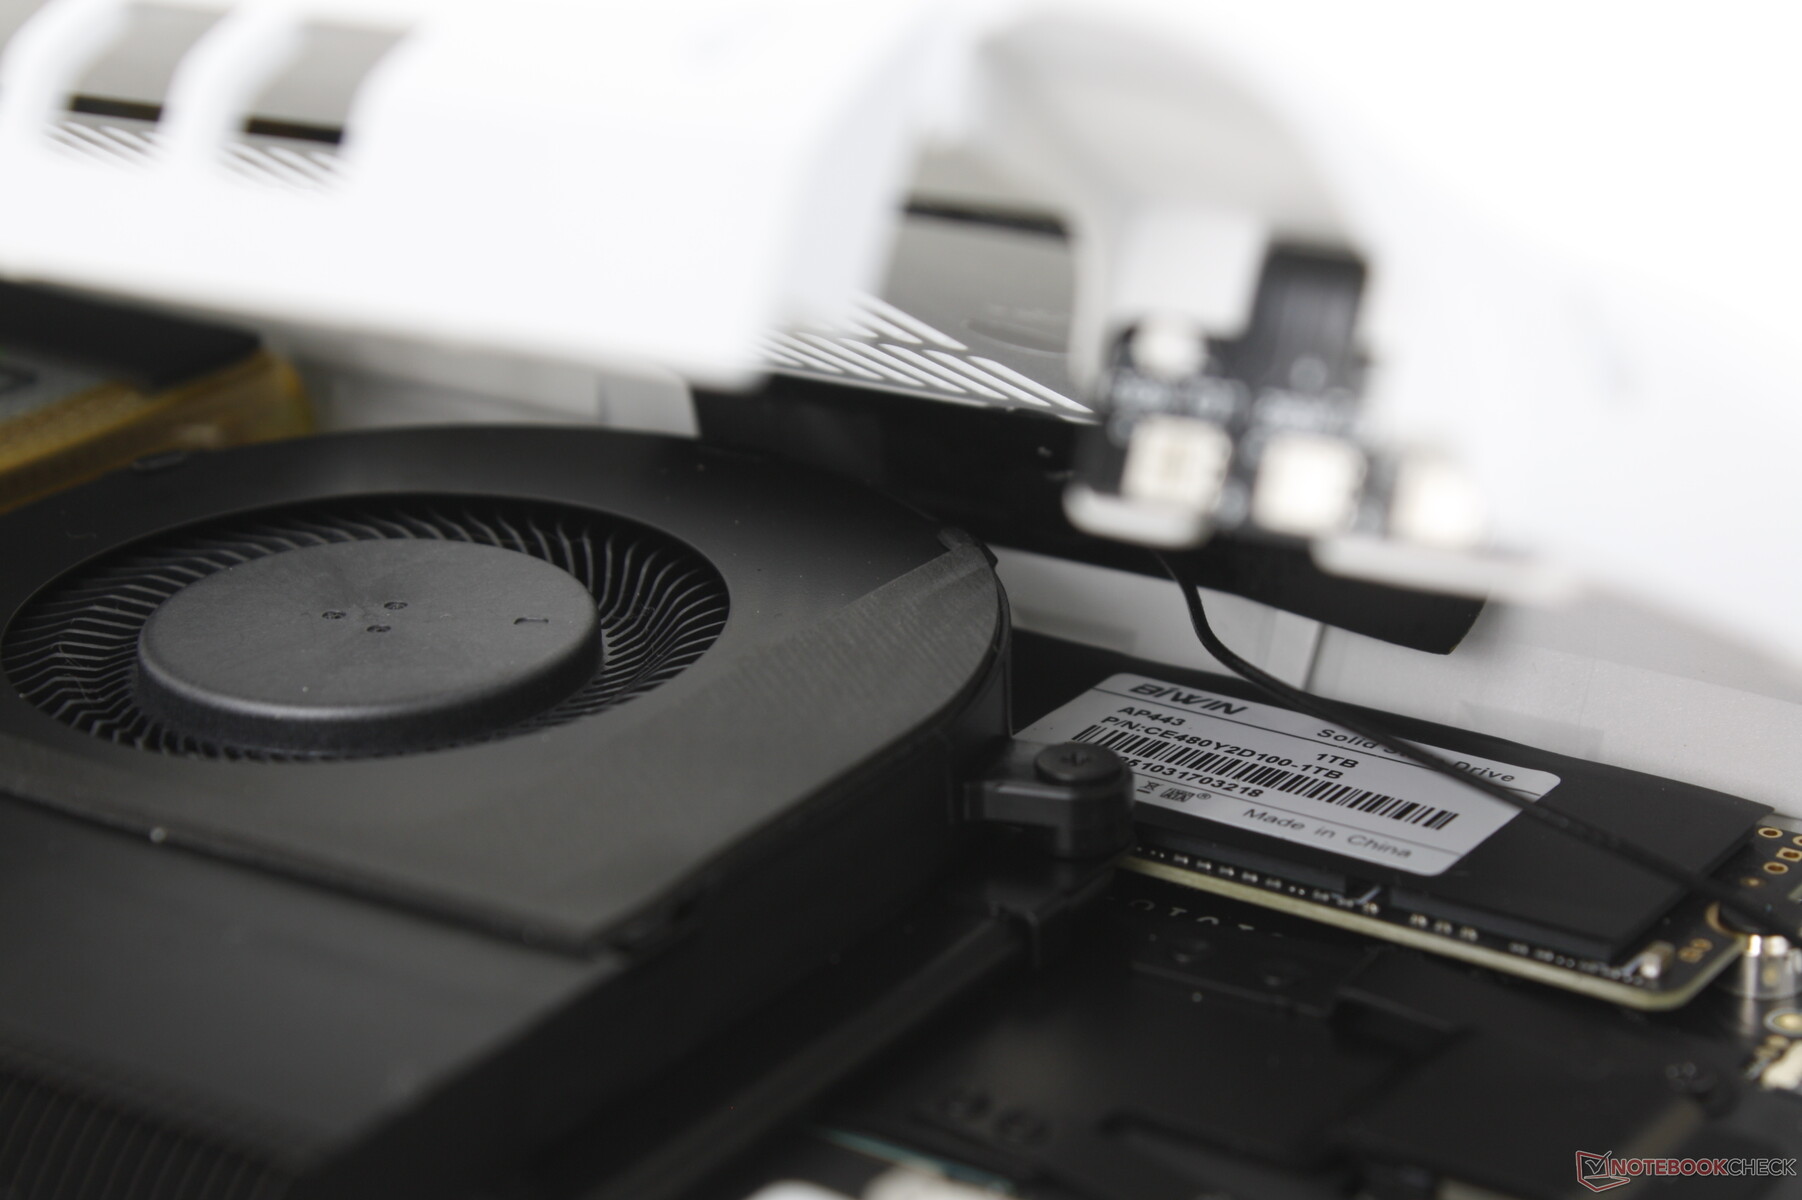
Dispositivos de armazenamento
Enquanto o chipset da placa-mãe suporta drives PCIe4 x4 M.2 2280 NVMe, a unidade é fornecida com um drive PCIe3 mais lento. Isto não é um problema, uma vez que o modelo não inclui um espalhador de calor para o SSD e, portanto, um drive PCIe4 x4 rápido provavelmente teria sido estrangulado de qualquer forma. O 1 TB Biwin PCIe3 SSD em nossa unidade não apresenta nenhum estrangulamento de desempenho com o tempo.

| Drive Performance rating - Percent | |
| Asus Zenbook S 13 OLED | |
| GPD Win Max 2 | |
| GPD Win 4 | |
| GPD Win 3 | |
| Razer Blade Stealth i7-1165G7 GTX 1650 Ti Max-Q | |
| Dell XPS 13 9315 2-in-1 Core i5-1230U | |
* ... menor é melhor
Disk Throttling: DiskSpd Read Loop, Queue Depth 8
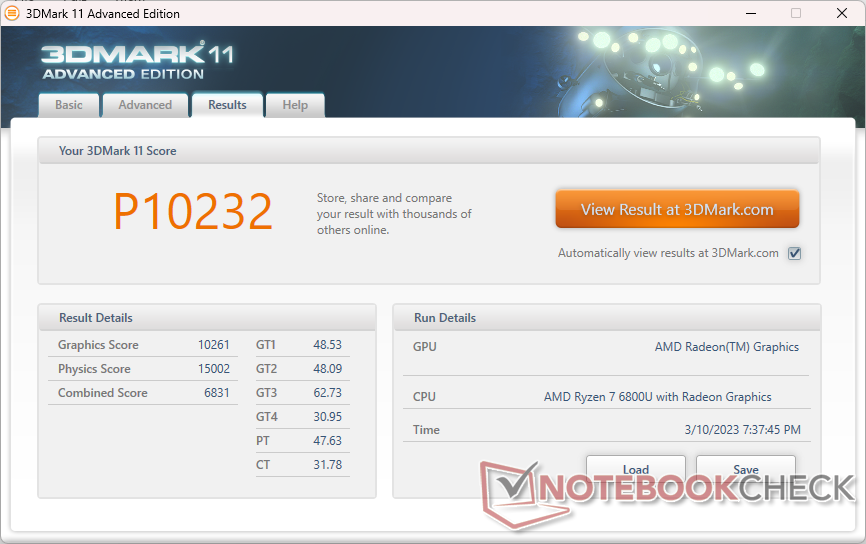
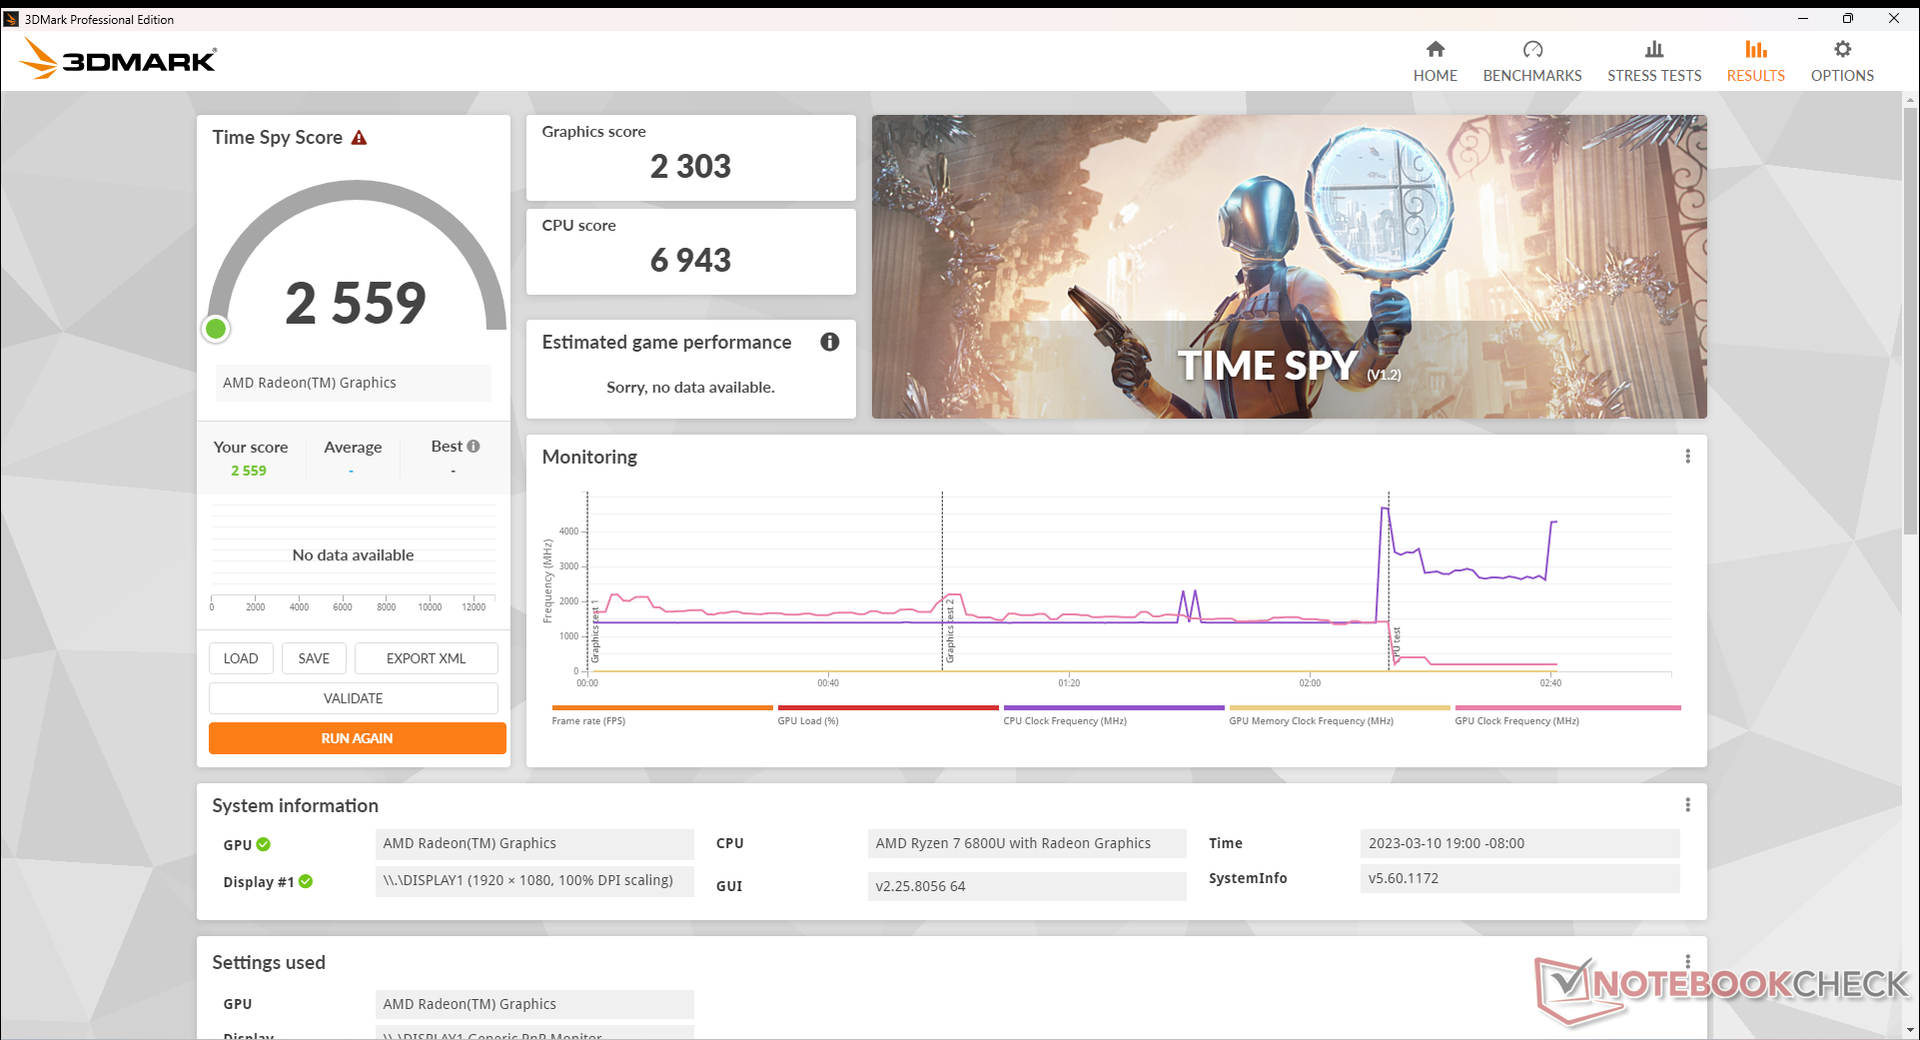
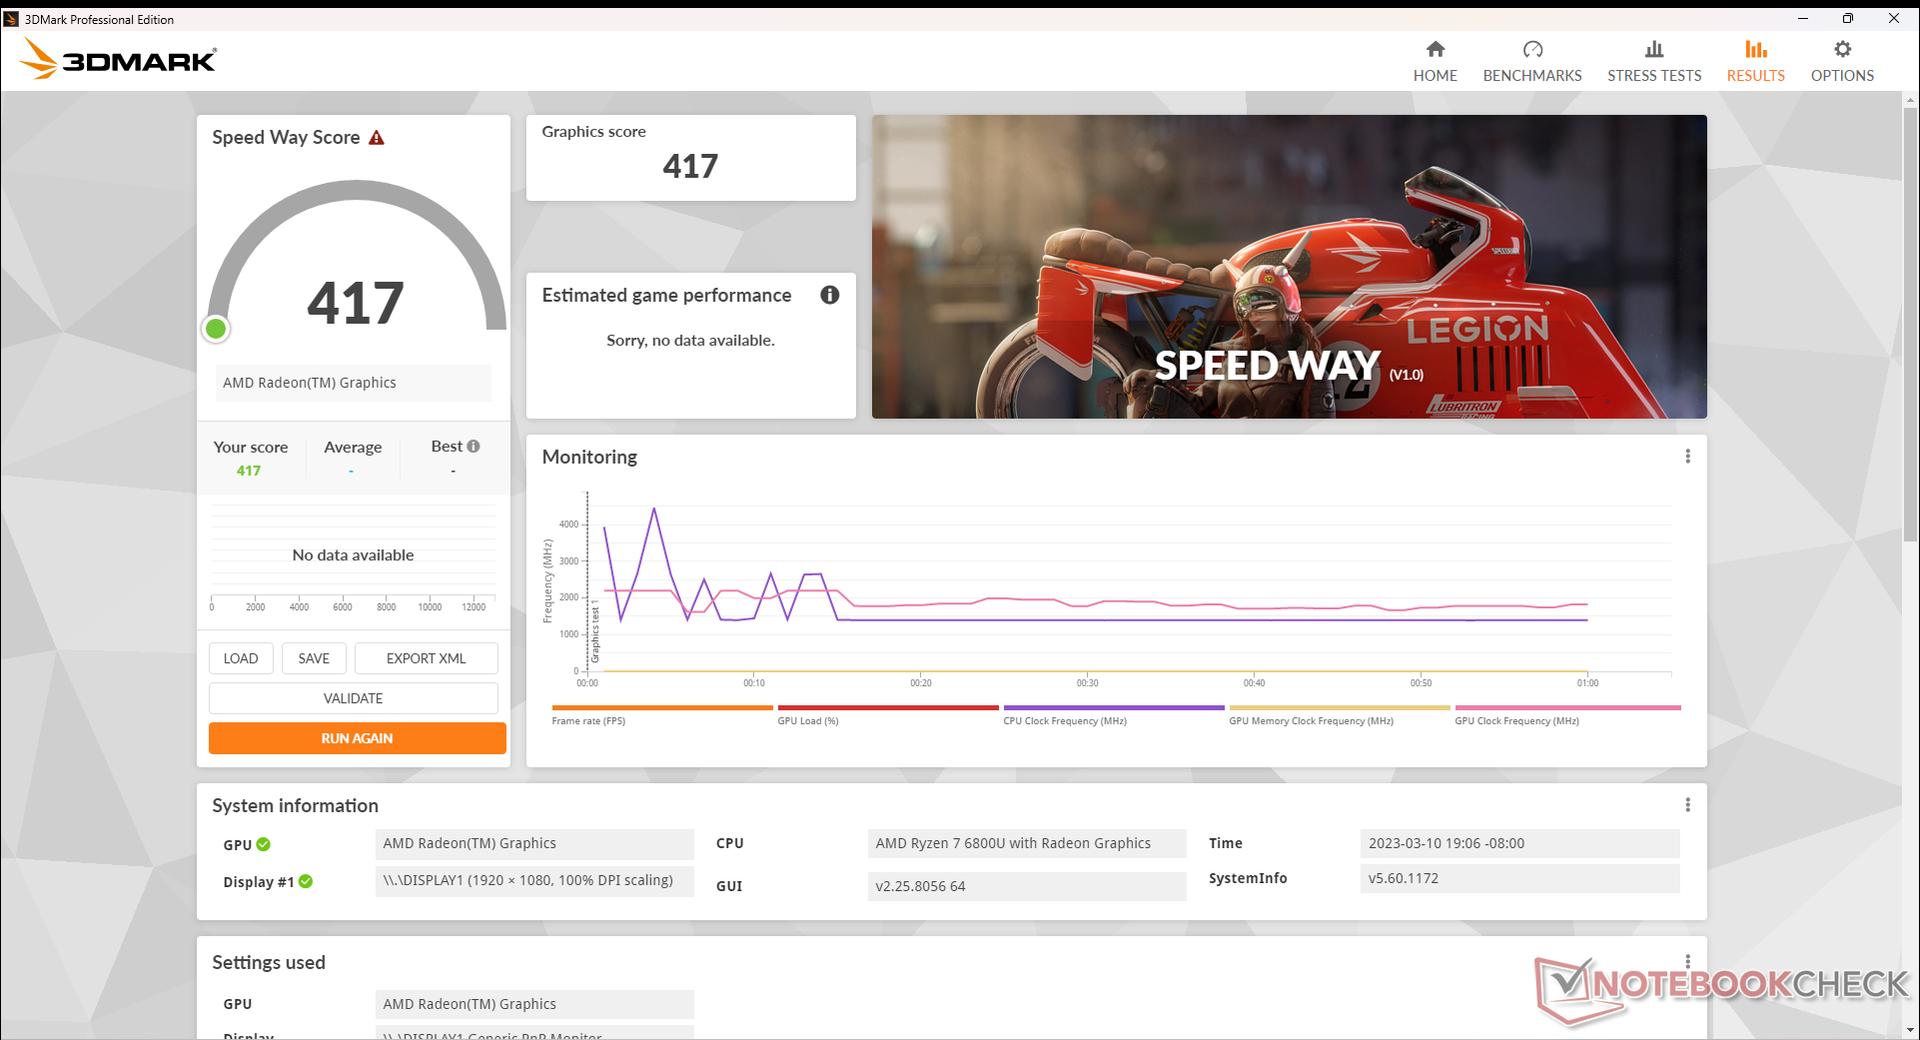
GPU Performance - A Radeon 680M é excelente para jogos portáteis
O Radeon 680M é atualmente a GPU integrada mais rápida do mercado. Quando comparada à concorrência, aGráfica Iris Xe G7 96EUsa solução AMD é 40 a 45% mais rápida ou cerca de 80% mais rápida do que a última geração Radeon RX série Vega 8.
A maioria dos jogos são jogáveis (>30 FPS) com a resolução nativa de 1080p, incluindo até mesmo jogos exigentes como Cyberpunk 2077 ou Final Fantasy XV em configurações inferiores. Recomendamos a redução da qualidade da textura e/ou anti-aliasing para melhorar a taxa de quadros, uma vez que estas características gráficas são muito menos impactantes em telas de tamanho pequeno.
| 3DMark 11 - 1280x720 Performance GPU | |
| MSI RTX 2060 Gaming Z 6G | |
| Desktop PC Intel Xeon E5 2680v4 KFA2 GTX 1060 6GB | |
| Lenovo Slim 7 Pro X 14ARH7 | |
| Razer Blade Stealth i7-1165G7 GTX 1650 Ti Max-Q | |
| GPD Win 4 | |
| Média AMD Radeon 680M (6858 - 11755, n=39) | |
| Asus Zenbook S 13 OLED | |
| GPD Win Max 2 | |
| HP Spectre x360 2-in-1 16-f1075ng | |
| HP Spectre x360 13.5 14t-ef000 | |
| GPD Win 3 | |
| HP Pavilion Aero 13 be0097nr | |
| Infinix INBook X2 | |
| Dell XPS 13 9315 2-in-1 Core i5-1230U | |
| 3DMark 11 Performance | 10232 pontos | |
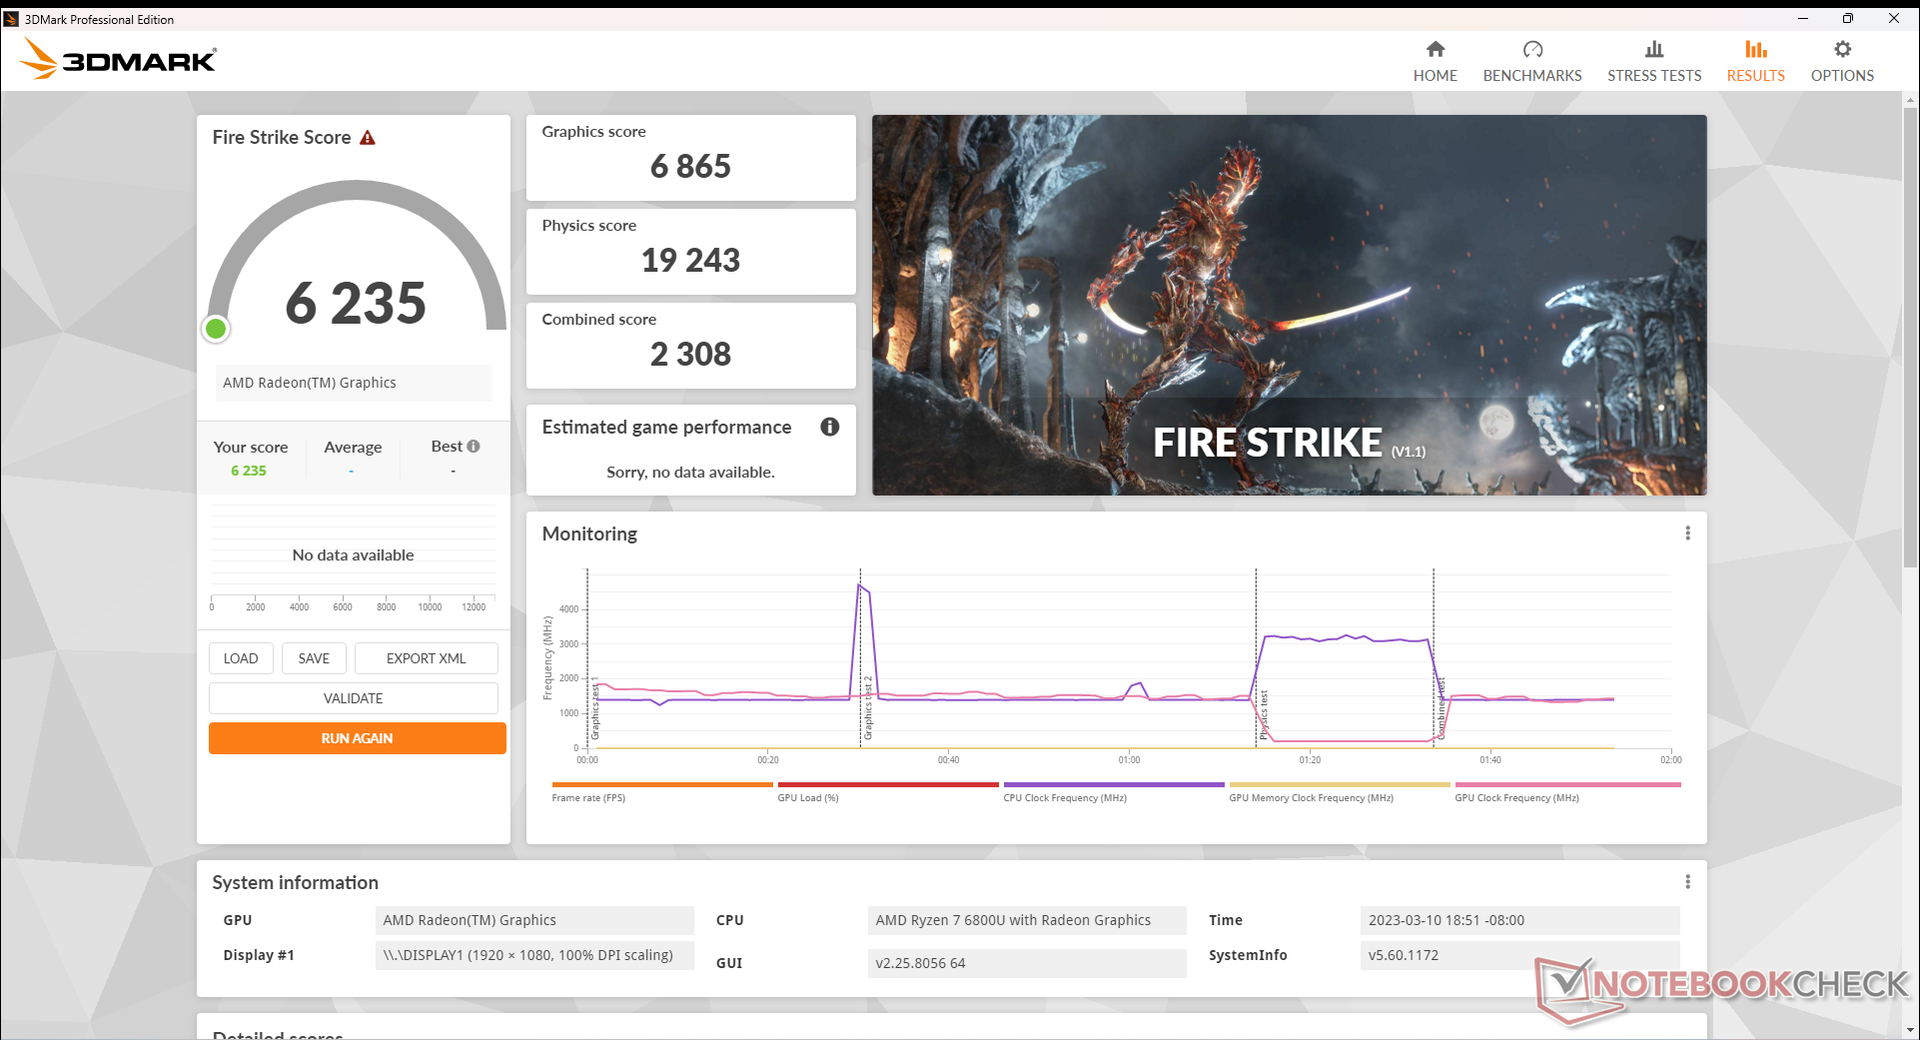
| 3DMark Fire Strike Score | 6235 pontos | |
| 3DMark Time Spy Score | 2559 pontos | |
Ajuda | ||
| Blender | |
| v3.3 Classroom HIP/AMD | |
| Média AMD Radeon 680M (270 - 555, n=34) | |
| GPD Win 4 | |
| v3.3 Classroom OPTIX/RTX | |
| Lenovo Slim 7 Pro X 14ARH7 | |
| MSI Summit E16 Flip A12UDT-031 | |
| v3.3 Classroom CUDA | |
| Lenovo Slim 7 Pro X 14ARH7 | |
| MSI Summit E16 Flip A12UDT-031 | |
| v3.3 Classroom CPU | |
| Dell XPS 13 9315 2-in-1 Core i5-1230U | |
| HP Spectre x360 13.5 14t-ef000 | |
| MSI Summit E16 Flip A12UDT-031 | |
| GPD Win 4 | |
| Média AMD Radeon 680M (389 - 980, n=37) | |
| HP Spectre x360 2-in-1 16-f1075ng | |
| Lenovo Slim 7 Pro X 14ARH7 | |
* ... menor é melhor
| F1 22 | |
| 1280x720 Ultra Low Preset AA:T AF:16x | |
| GPD Win 4 | |
| Média AMD Radeon 680M (75.5 - 147.3, n=19) | |
| HP Spectre x360 2-in-1 16-f1075ng | |
| 1920x1080 Low Preset AA:T AF:16x | |
| GPD Win 4 | |
| Média AMD Radeon 680M (44.1 - 85.4, n=25) | |
| HP Spectre x360 2-in-1 16-f1075ng | |
| 1920x1080 Medium Preset AA:T AF:16x | |
| GPD Win 4 | |
| Média AMD Radeon 680M (38 - 75.1, n=25) | |
| HP Spectre x360 2-in-1 16-f1075ng | |
| 1920x1080 High Preset AA:T AF:16x | |
| GPD Win 4 | |
| Média AMD Radeon 680M (30 - 56.2, n=25) | |
| HP Spectre x360 2-in-1 16-f1075ng | |
| 1920x1080 Ultra High Preset AA:T AF:16x | |
| HP Spectre x360 2-in-1 16-f1075ng | |
| GPD Win 4 | |
| Média AMD Radeon 680M (7.85 - 14.7, n=22) | |
Manejando em Witcher 3 para testar a estabilidade da taxa de quadros revelaria problemas significativos. Como mostra o gráfico abaixo, o desempenho começaria alto em mais de 80 FPS antes de cair constantemente para 65 FPS com flutuações constantes. Embora a queda de desempenho ao longo do tempo não seja incomum, as flutuações são anormais e resultam em microgaguez periódica durante a jogabilidade. Testamos isto duas vezes só para ter certeza e os resultados não melhorariam. A utilização não otimizada da CPU de tarefas ou aplicações de fundo é tipicamente a causa de tal comportamento quando se joga.
Witcher 3 FPS Chart
| baixo | média | alto | ultra | |
|---|---|---|---|---|
| GTA V (2015) | 140.3 | 127.6 | 51.4 | 24.8 |
| The Witcher 3 (2015) | 94.3 | 63.8 | 37.5 | 22.8 |
| Dota 2 Reborn (2015) | 120.2 | 100.1 | 76.4 | 67.2 |
| Final Fantasy XV Benchmark (2018) | 57.1 | 32.7 | 23.9 | |
| X-Plane 11.11 (2018) | 56.2 | 41.4 | 33.5 | |
| Strange Brigade (2018) | 145.7 | 57.5 | 47.8 | 41.5 |
| Cyberpunk 2077 1.6 (2022) | 37.7 | 28.9 | 21.6 | 16.7 |
| F1 22 (2022) | 78.1 | 70.4 | 51.5 | 12.6 |
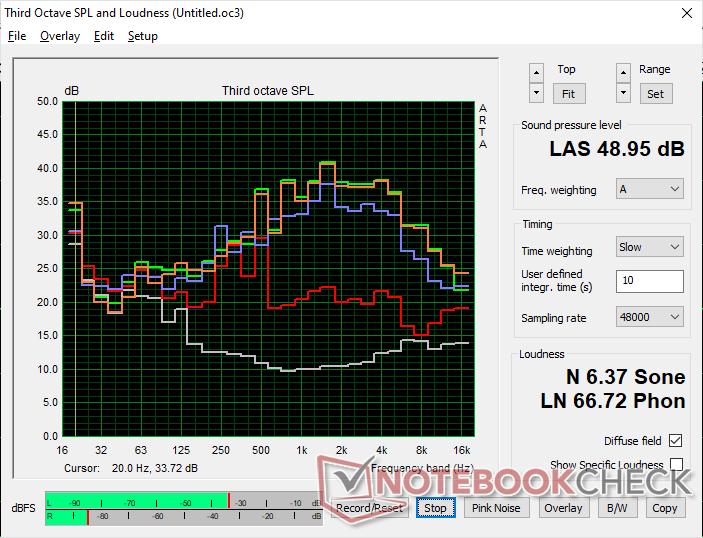
Emissões - Quase sempre audíveis
Ruído do sistema
O ventilador interno está sempre funcionando, não importa a carga na tela. Quando ociosos na área de trabalho, por exemplo, o ruído do ventilador oscilaria em torno de 31 dB(A) contra um fundo de 24 dB(A) que já é mais alto que muitos laptops em condições de inatividade similares. Os usuários devem esperar um zumbido silencioso, mas perceptível, ao navegar ou assistir vídeos.
Executar cargas mais altas como jogos induzirá um ruído do ventilador de pouco menos de 49 dB(A). Ao considerar que a maioria dos Ultrabooks e laptops para jogos topam em cerca de 40 dB(A) e 50 dB(A), respectivamente, o Win 4 está, infelizmente, mais próximo de um laptop para jogos do que um Ultrabook em termos de ruído. Não recomendamos entrar sorrateiramente em uma sessão de jogo com o Win 4 durante a aula.
Barulho
| Ocioso |
| 31.2 / 31.2 / 33.5 dB |
| Carga |
| 45.5 / 49 dB |
 | ||
30 dB silencioso 40 dB(A) audível 50 dB(A) ruidosamente alto |
||
min: | ||
| GPD Win 4 Radeon 680M, R7 6800U, BiWin CE480Y2D100-1TB | GPD Win Max 2 Iris Xe G7 96EUs, i7-1260P, BiWin NQ200 1TB CNF82GS1D00-1TB | GPD Win 3 Iris Xe G7 80EUs, i5-1135G7, BIWIN NS200 1TB CNF82GS1G02-1TB | Razer Blade Stealth i7-1165G7 GTX 1650 Ti Max-Q GeForce GTX 1650 Ti Max-Q, i7-1165G7, Samsung SSD PM981a MZVLB512HBJQ | Dell XPS 13 9315 2-in-1 Core i5-1230U Iris Xe G7 80EUs, i5-1230U | Asus Zenbook S 13 OLED Radeon 680M, R7 6800U, Samsung PM9A1 MZVL21T0HCLR | |
|---|---|---|---|---|---|---|
| Noise | 18% | 6% | 11% | 19% | ||
| desligado / ambiente * (dB) | 24 | 22.6 6% | 27.4 -14% | 25.3 -5% | 24 -0% | |
| Idle Minimum * (dB) | 31.2 | 23.7 24% | 29.1 7% | 25.3 19% | 24 23% | |
| Idle Average * (dB) | 31.2 | 23.7 24% | 29.1 7% | 25.3 19% | 24 23% | |
| Idle Maximum * (dB) | 33.5 | 28.5 15% | 29.1 13% | 27 19% | 24 28% | |
| Load Average * (dB) | 45.5 | 36.5 20% | 40.7 11% | 47.9 -5% | 33.1 27% | |
| Witcher 3 ultra * (dB) | 48.6 | 39.8 18% | 42.8 12% | 38.4 21% | 40.2 17% | |
| Load Maximum * (dB) | 49 | 40.5 17% | 46.3 6% | 45.9 6% | 41.7 15% |
* ... menor é melhor
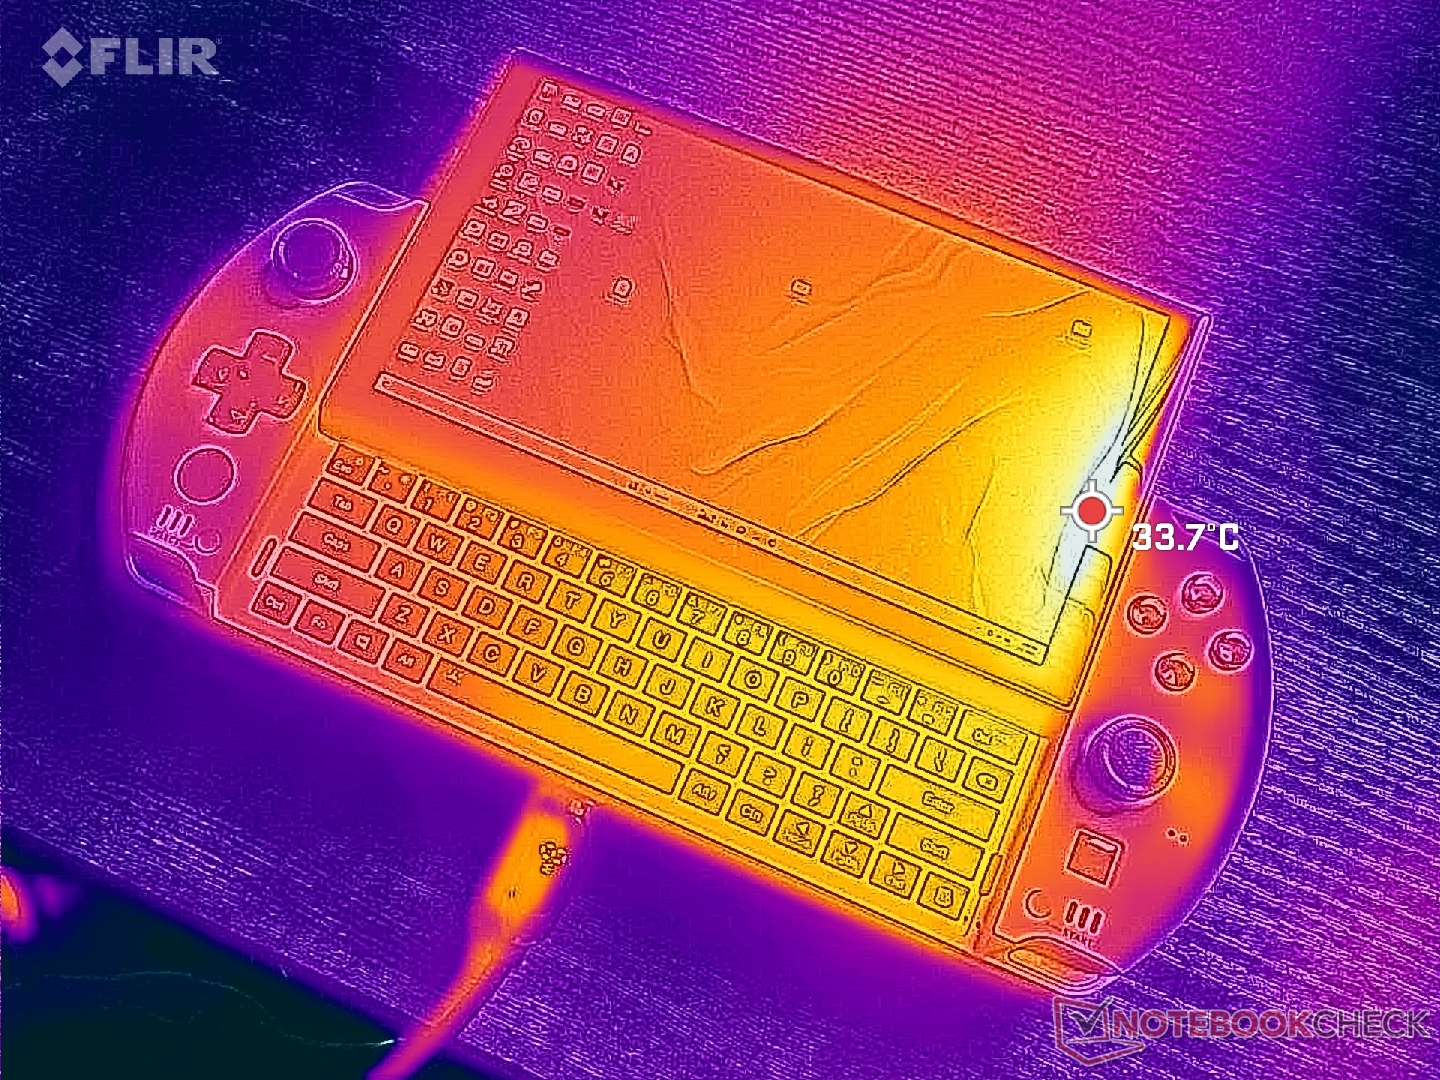
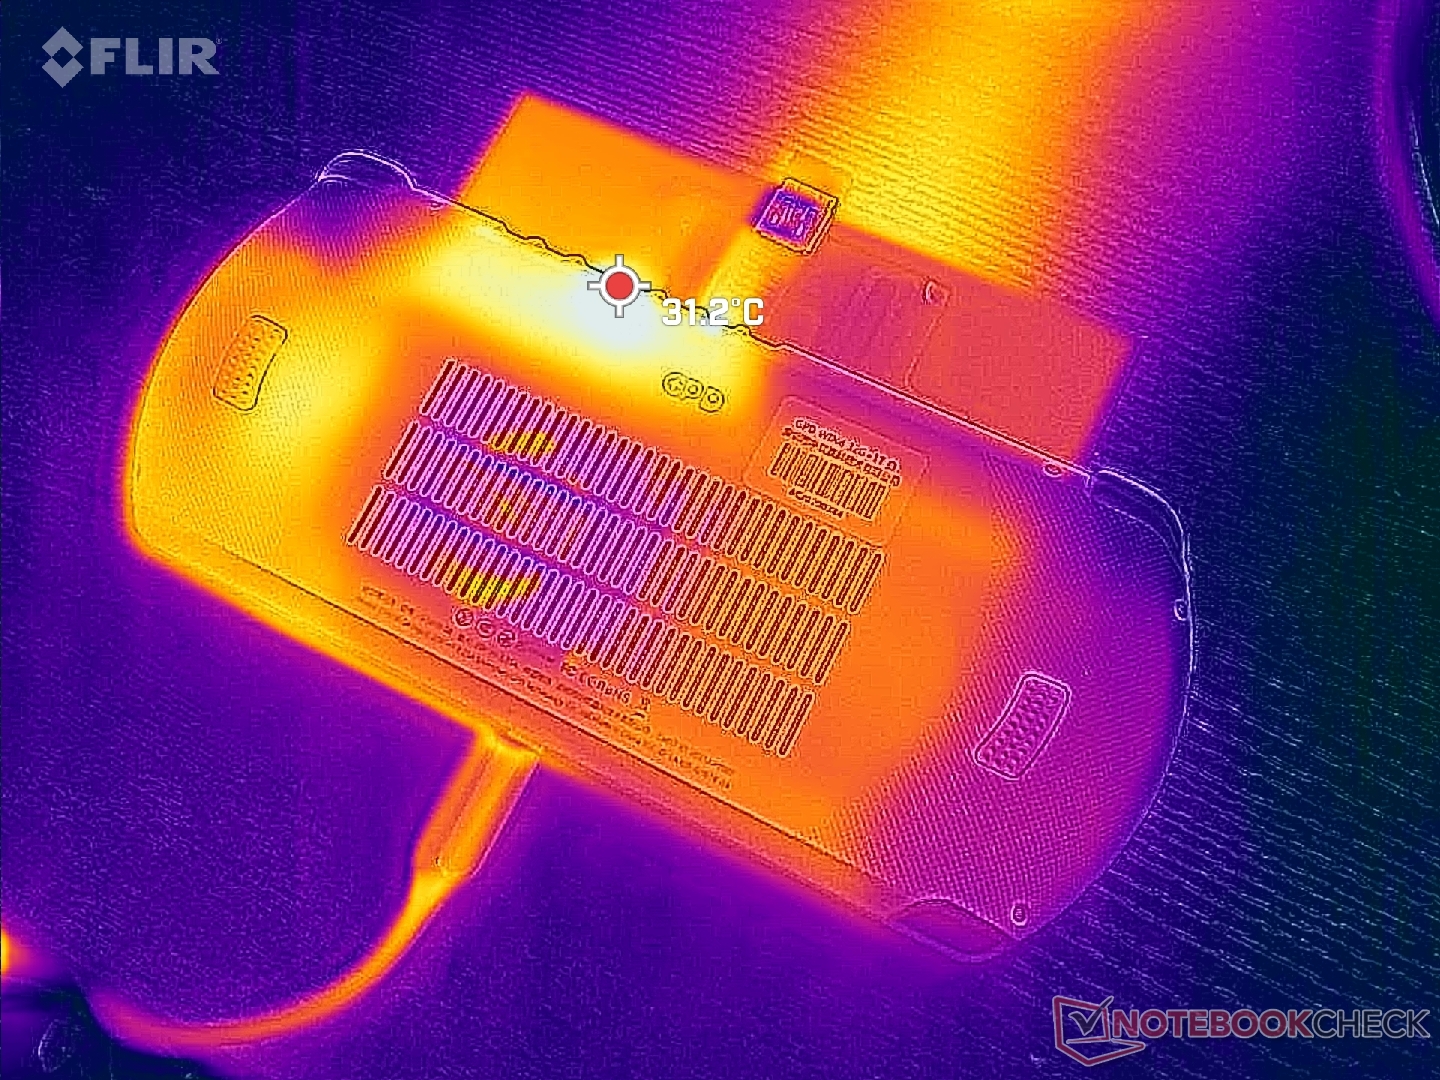
Temperatura
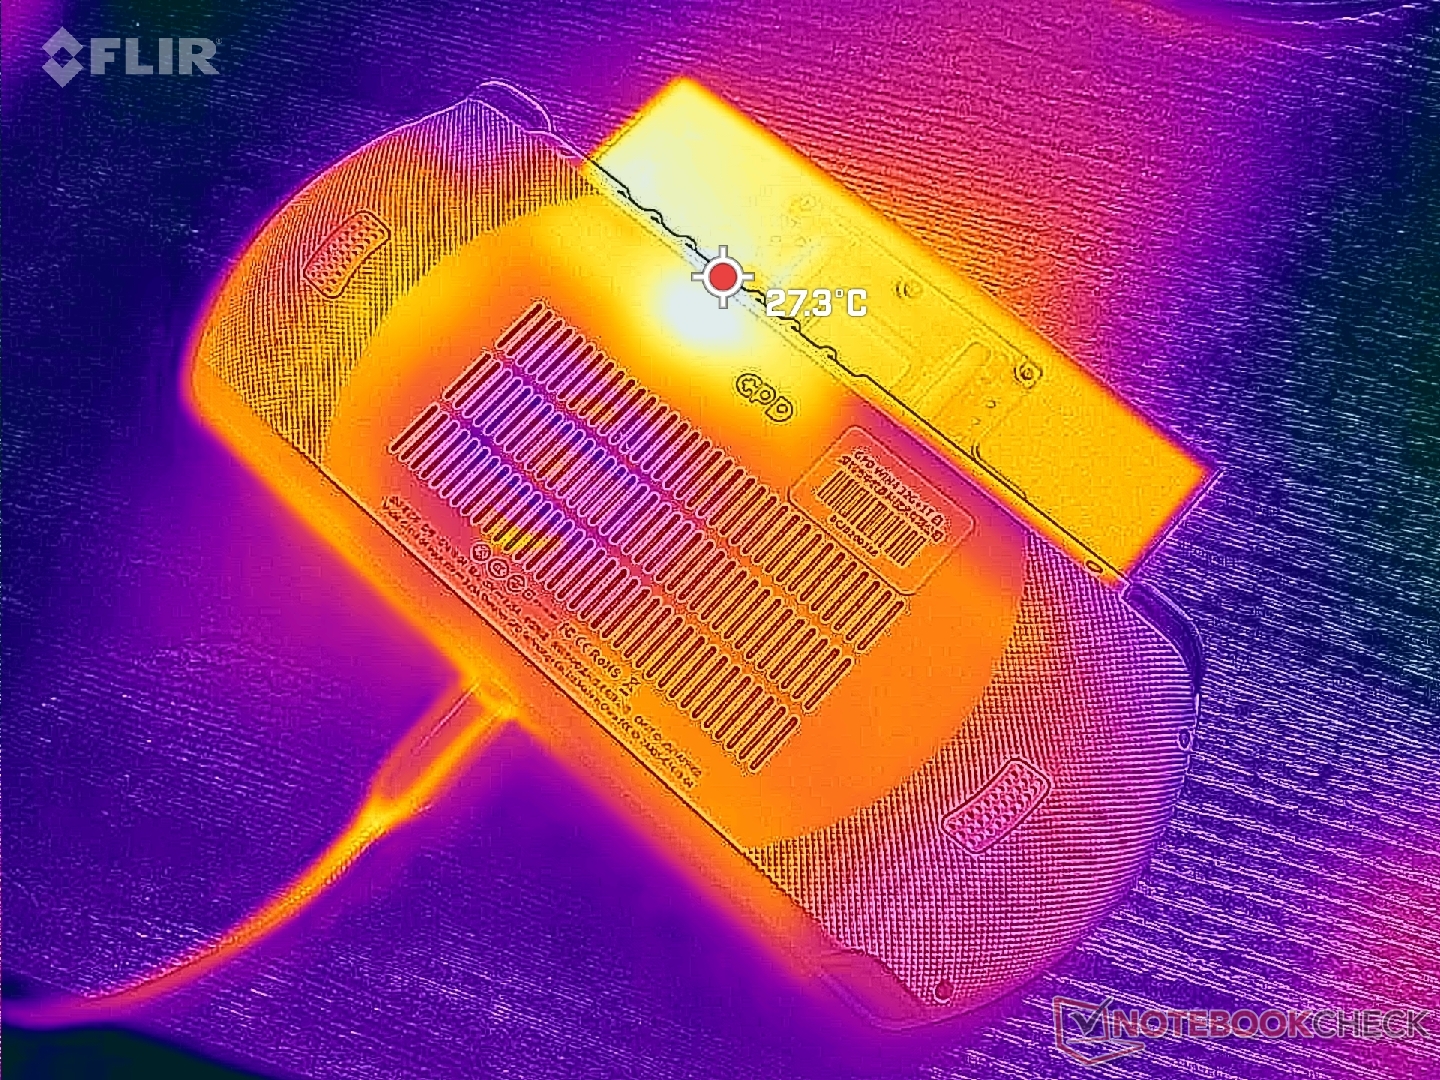
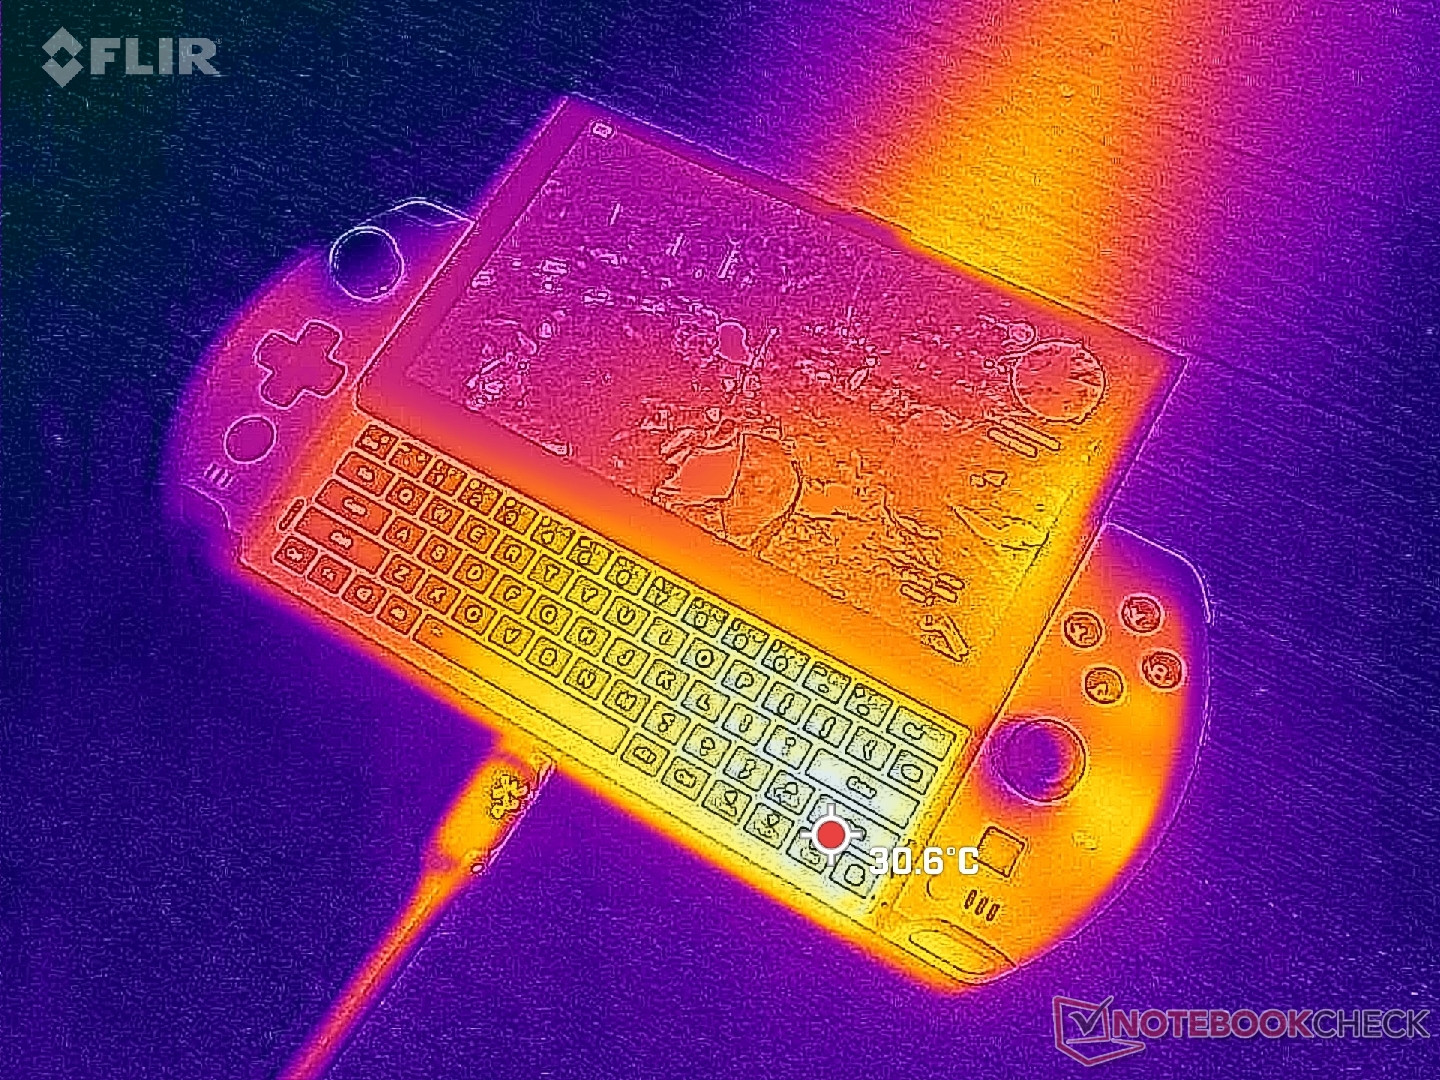
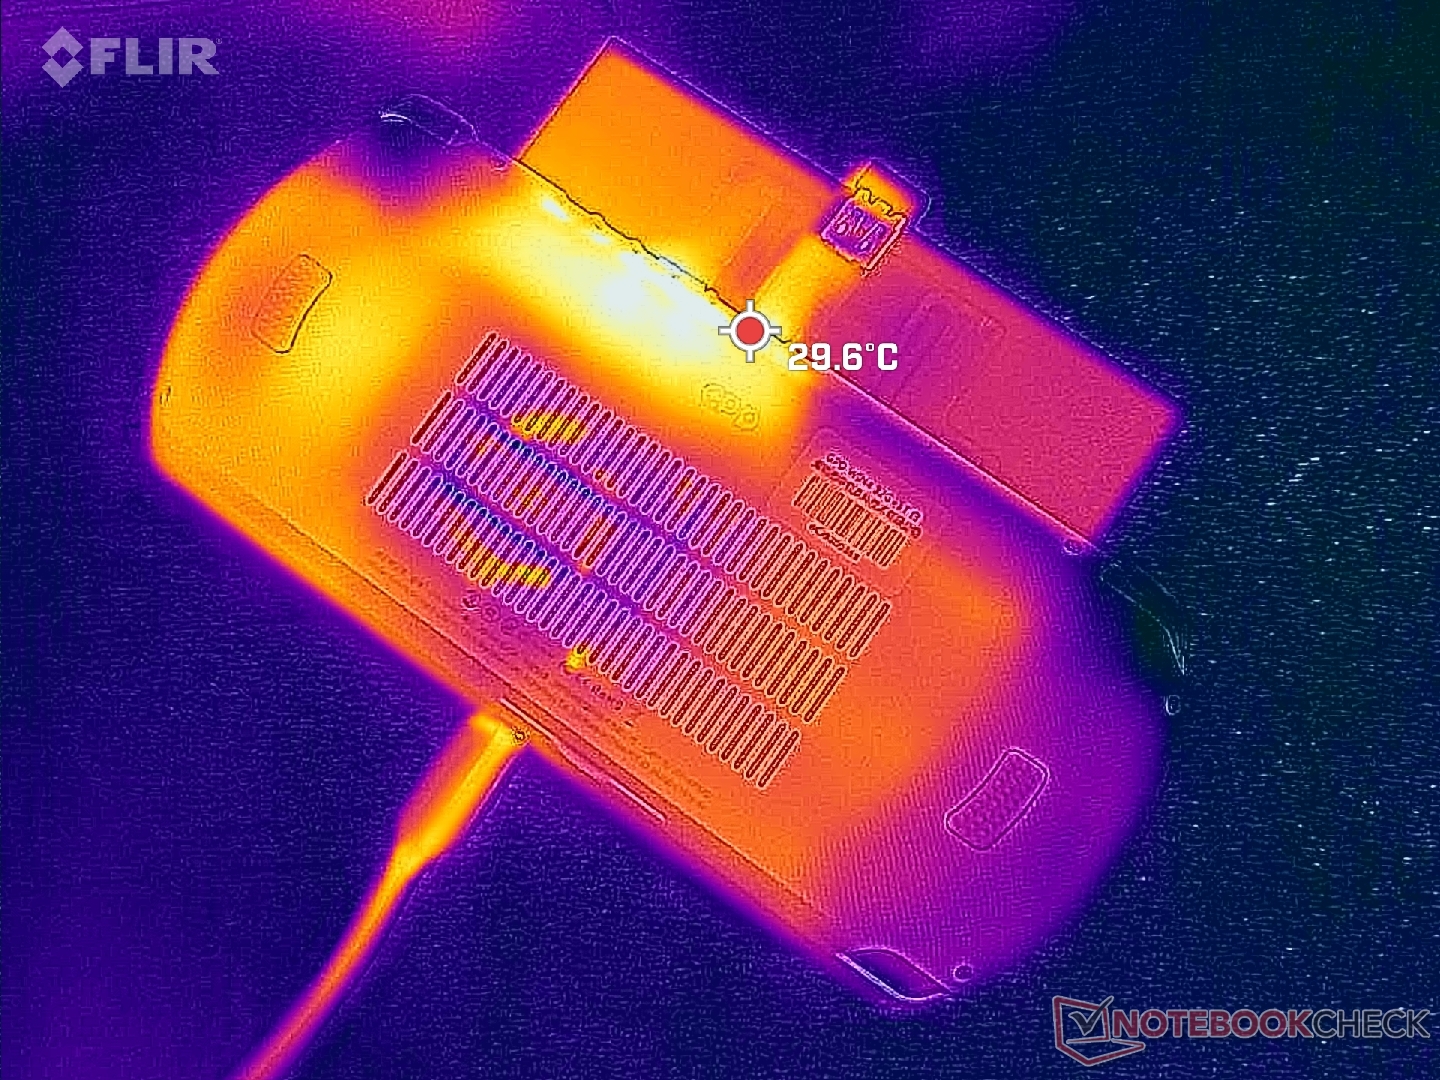
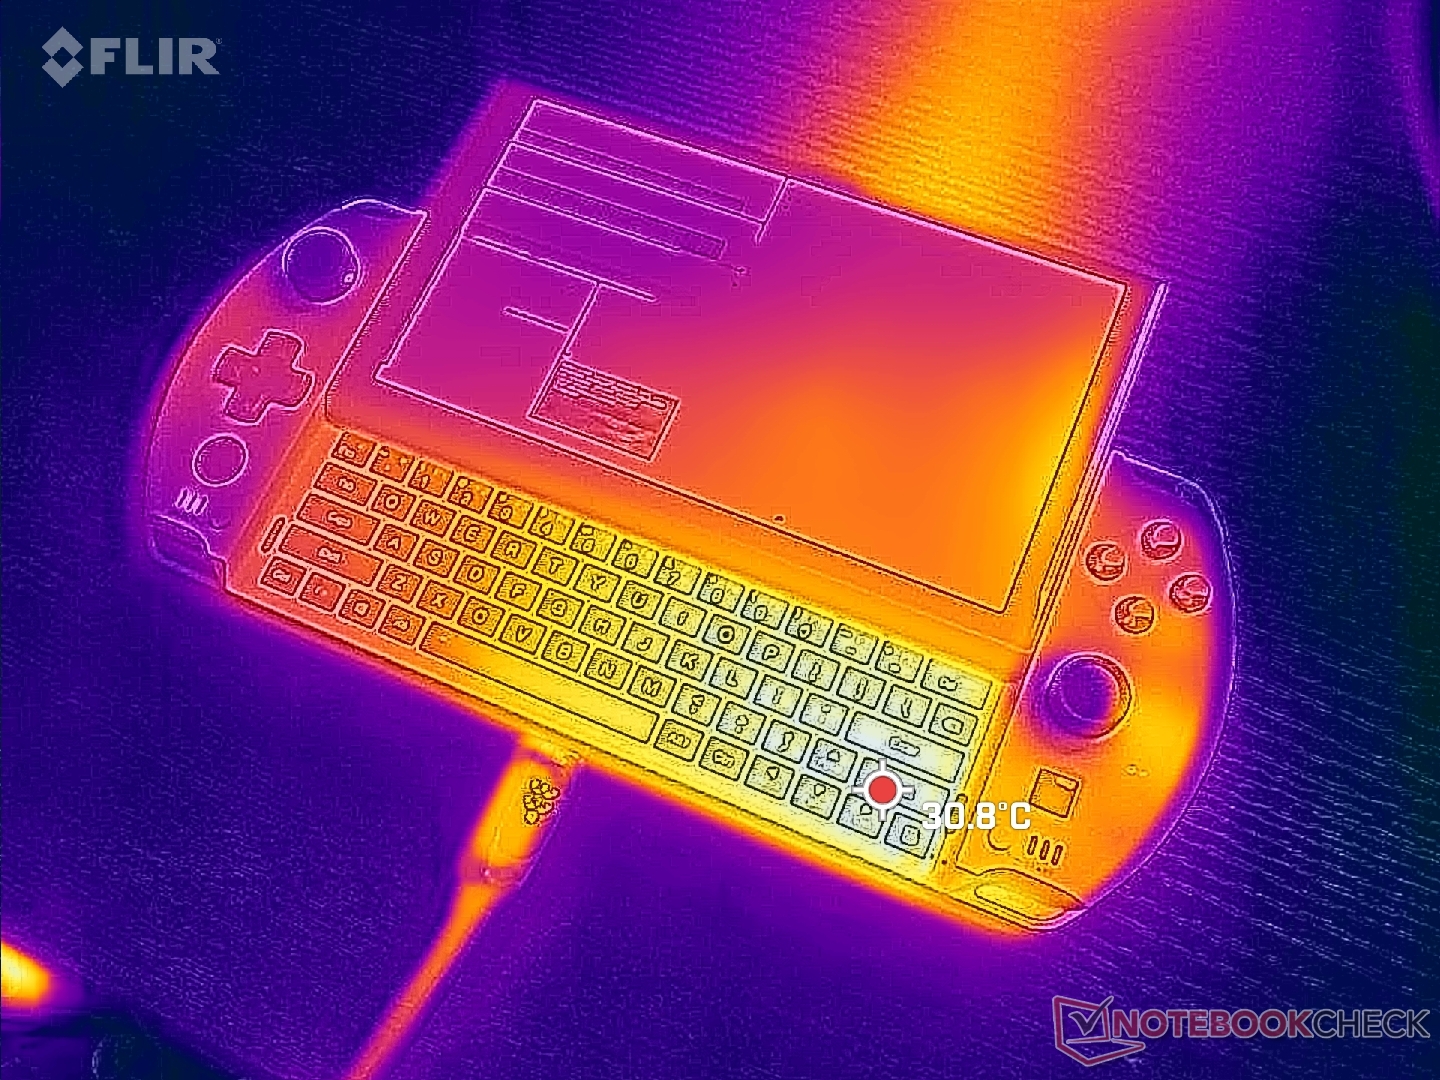
As temperaturas superficiais nunca são desconfortavelmente quentes, apesar do alto desempenho por volume. Embora o sistema seja menor do que um laptop tradicional, ele ainda é bastante grosso e, portanto, as temperaturas de superfície não são tão quentes quanto se poderia esperar.
O lado direito da unidade é sempre mais quente que o lado esquerdo em alguns graus C. Não é incômodo, mas é perceptível durante a jogabilidade. O excesso de calor sai da borda superior da unidade muito parecido com no Switch.
(+) A temperatura máxima no lado superior é 35 °C / 95 F, em comparação com a média de 35.9 °C / 97 F , variando de 21.4 a 59 °C para a classe Subnotebook.
(+) A parte inferior aquece até um máximo de 26.8 °C / 80 F, em comparação com a média de 39.2 °C / 103 F
(+) Em uso inativo, a temperatura média para o lado superior é 26 °C / 79 F, em comparação com a média do dispositivo de 30.8 °C / ### class_avg_f### F.
(+) Jogando The Witcher 3, a temperatura média para o lado superior é 28.1 °C / 83 F, em comparação com a média do dispositivo de 30.8 °C / ## #class_avg_f### F.
(+) Os apoios para as mãos e o touchpad estão atingindo a temperatura máxima da pele (32.2 °C / 90 F) e, portanto, não estão quentes.
(-) A temperatura média da área do apoio para as mãos de dispositivos semelhantes foi 28.2 °C / 82.8 F (-4 °C / -7.2 F).
| GPD Win 4 AMD Ryzen 7 6800U, AMD Radeon 680M | GPD Win Max 2 Intel Core i7-1260P, Intel Iris Xe Graphics G7 96EUs | Razer Blade Stealth i7-1165G7 GTX 1650 Ti Max-Q Intel Core i7-1165G7, NVIDIA GeForce GTX 1650 Ti Max-Q | Dell XPS 13 9315 2-in-1 Core i5-1230U Intel Core i5-1230U, Intel Iris Xe Graphics G7 80EUs | Asus Zenbook S 13 OLED AMD Ryzen 7 6800U, AMD Radeon 680M | |
|---|---|---|---|---|---|
| Heat | -1% | -40% | -17% | -37% | |
| Maximum Upper Side * (°C) | 35 | 28.6 18% | 44 -26% | 41.8 -19% | 47.9 -37% |
| Maximum Bottom * (°C) | 26.8 | 33 -23% | 47.4 -77% | 38.2 -43% | 56.1 -109% |
| Idle Upper Side * (°C) | 28.4 | 24.6 13% | 32.2 -13% | 27.4 4% | 26.8 6% |
| Idle Bottom * (°C) | 25 | 27.6 -10% | 36 -44% | 27.2 -9% | 27.3 -9% |
* ... menor é melhor
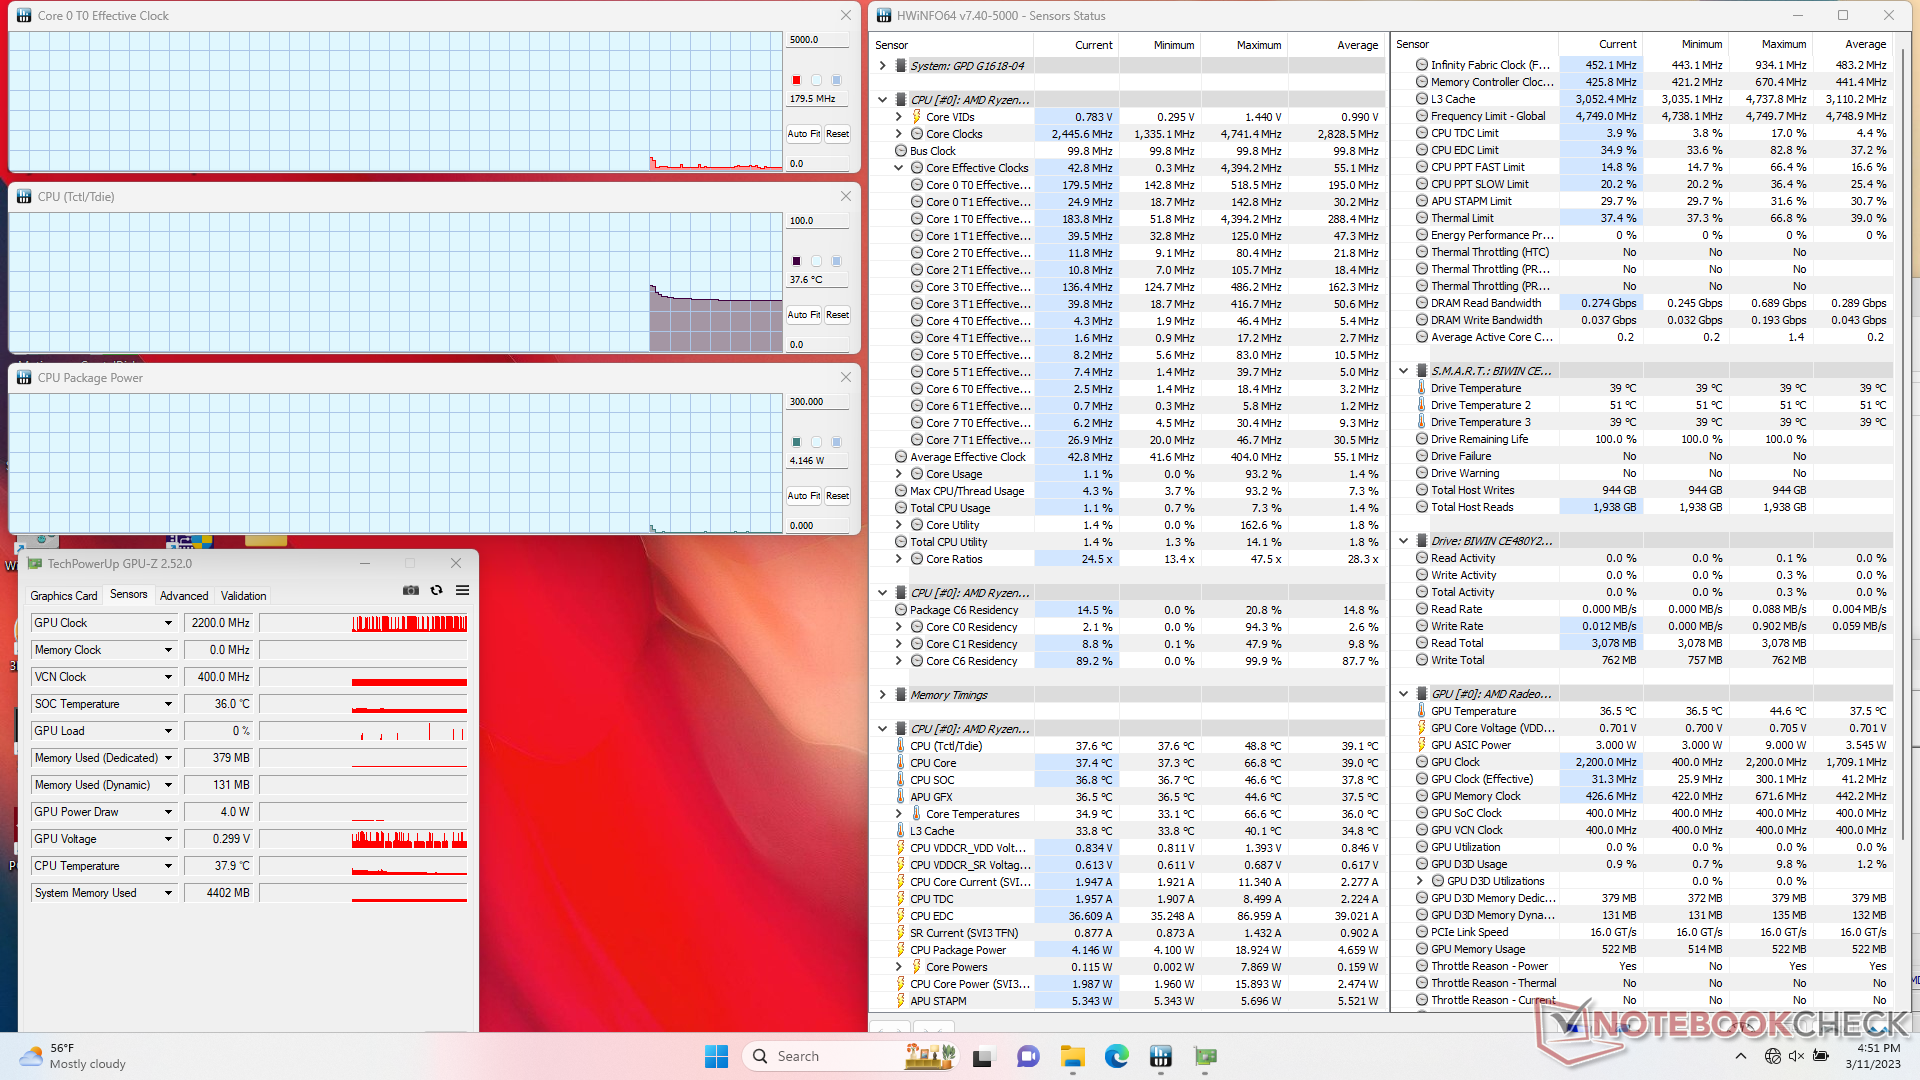
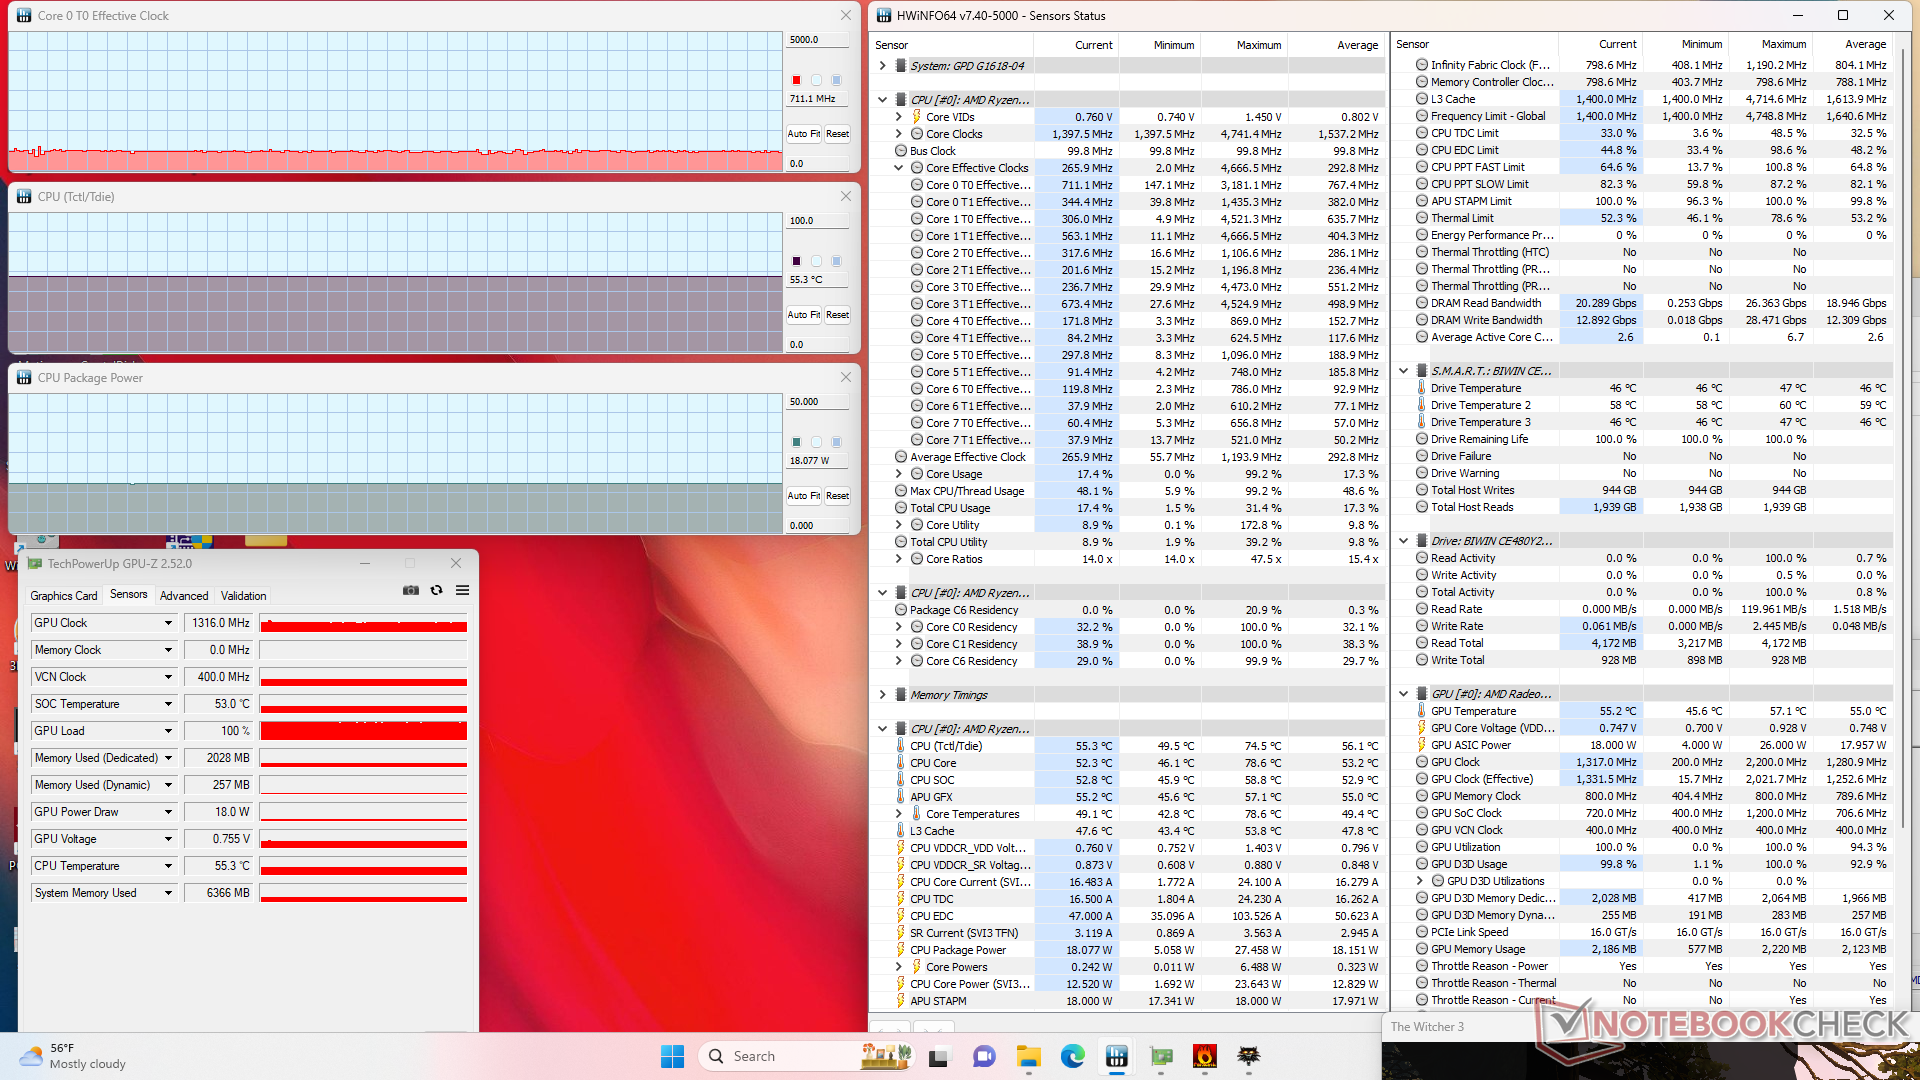
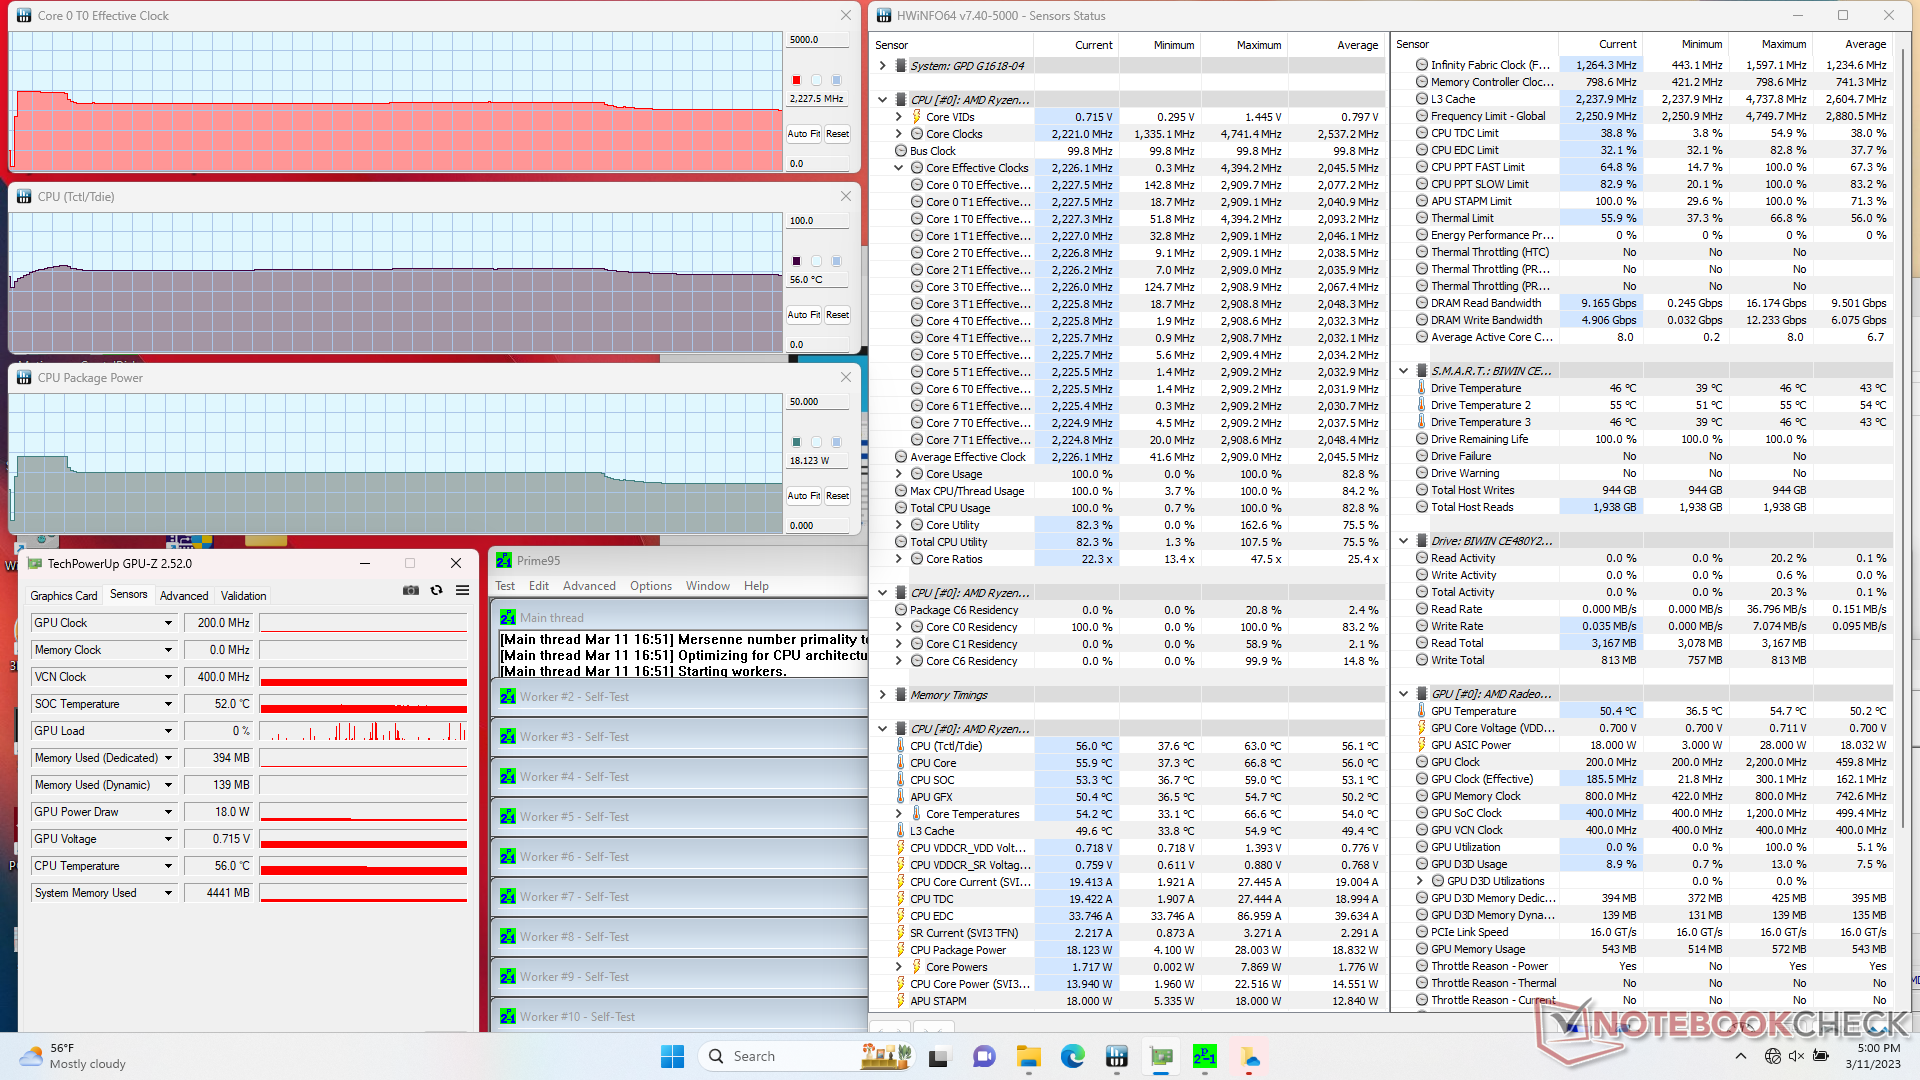
Teste de estresse
Ao executar Prime95 para enfatizar a CPU, as taxas de clock e o consumo de energia da placa aumentariam para 2,9 GHz e 28 W, respectivamente, durando cerca de 30 segundos ou até que a temperatura central atingisse 63 C. Depois disso, as taxas de clock e o consumo de energia da placa diminuiriam constantemente antes de estabilizarem em cerca de 2,3 GHz e 18 W, respectivamente. A temperatura central é relativamente baixa a 57 C, apesar dos altos níveis de estresse; repetindo este teste em um sistema Intel Lenovo IdeaPad Flex 7i 14 resultaria em uma temperatura central estável mais alta de 71 C.
As taxas de relógio e temperatura da GPU se estabilizariam em 1316 MHz e 55 C, respectivamente, quando em funcionamento Witcher 3. As temperaturas centrais são surpreendentemente conservadoras, mesmo quando ajustadas para o modo Performance.
O funcionamento com bateria não limita o desempenho. Um teste 3DMark 11 com baterias retornaria essencialmente as mesmas pontuações de CPU e GPU como se estivesse funcionando na rede elétrica.
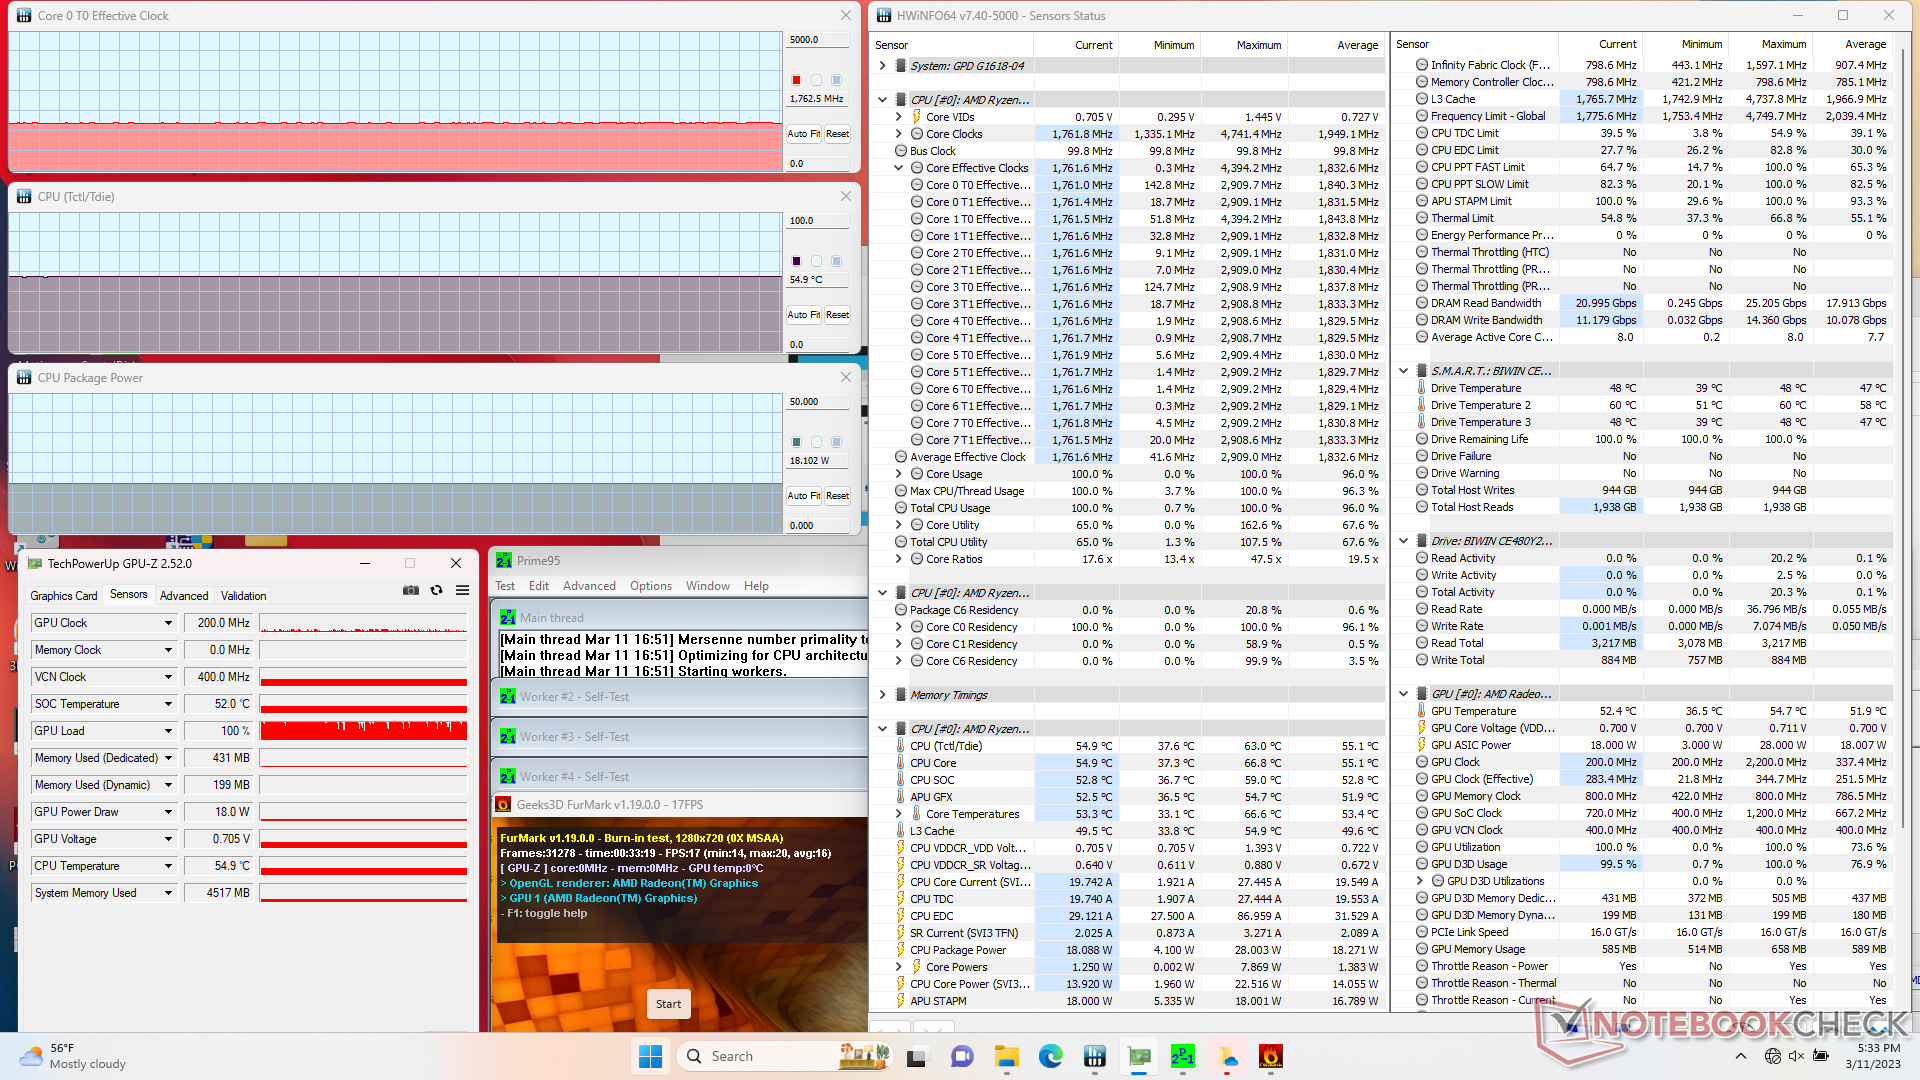
| Relógio CPU (GHz) | Relógio GPU (MHz) | Temperatura média da CPU (°C) | |
| System Idle | -- | -- | 38 |
| Prime95 Stress | 2.2 | -- | 56 |
| Prime95 + FurMark Stress | 1.8 | 200 | 55 |
| Witcher 3 Estresse | 0.7 | 1316 | 55 |
Oradores
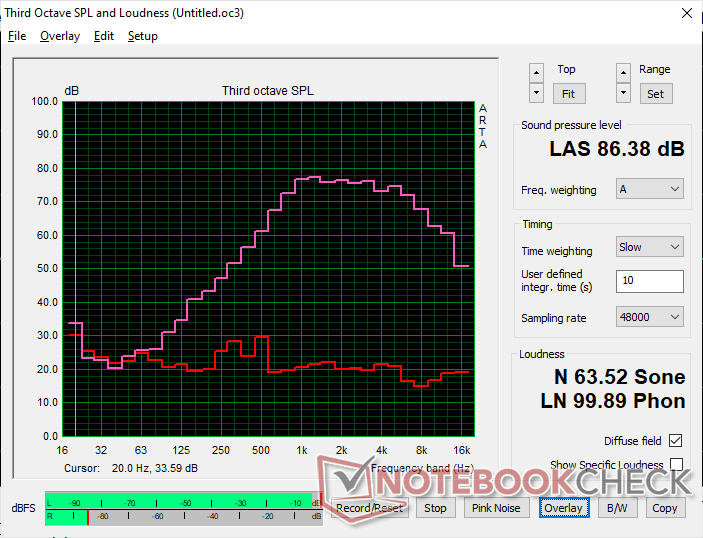
GPD Win 4 análise de áudio
(+) | os alto-falantes podem tocar relativamente alto (###valor### dB)
Graves 100 - 315Hz
(-) | quase nenhum baixo - em média 26.1% menor que a mediana
(±) | a linearidade dos graves é média (9.1% delta para a frequência anterior)
Médios 400 - 2.000 Hz
(±) | médios mais altos - em média 7.3% maior que a mediana
(±) | a linearidade dos médios é média (7.4% delta para frequência anterior)
Altos 2 - 16 kHz
(±) | máximos mais altos - em média 5.6% maior que a mediana
(+) | os máximos são lineares (5.4% delta da frequência anterior)
Geral 100 - 16.000 Hz
(±) | a linearidade do som geral é média (25.6% diferença em relação à mediana)
Comparado com a mesma classe
» 86% de todos os dispositivos testados nesta classe foram melhores, 3% semelhantes, 11% piores
» O melhor teve um delta de 5%, a média foi 18%, o pior foi 53%
Comparado com todos os dispositivos testados
» 79% de todos os dispositivos testados foram melhores, 4% semelhantes, 17% piores
» O melhor teve um delta de 4%, a média foi 24%, o pior foi 134%
Apple MacBook Pro 16 2021 M1 Pro análise de áudio
(+) | os alto-falantes podem tocar relativamente alto (###valor### dB)
Graves 100 - 315Hz
(+) | bons graves - apenas 3.8% longe da mediana
(+) | o baixo é linear (5.2% delta para a frequência anterior)
Médios 400 - 2.000 Hz
(+) | médios equilibrados - apenas 1.3% longe da mediana
(+) | médios são lineares (2.1% delta para frequência anterior)
Altos 2 - 16 kHz
(+) | agudos equilibrados - apenas 1.9% longe da mediana
(+) | os máximos são lineares (2.7% delta da frequência anterior)
Geral 100 - 16.000 Hz
(+) | o som geral é linear (4.6% diferença em relação à mediana)
Comparado com a mesma classe
» 0% de todos os dispositivos testados nesta classe foram melhores, 0% semelhantes, 100% piores
» O melhor teve um delta de 5%, a média foi 17%, o pior foi 45%
Comparado com todos os dispositivos testados
» 0% de todos os dispositivos testados foram melhores, 0% semelhantes, 100% piores
» O melhor teve um delta de 4%, a média foi 24%, o pior foi 134%
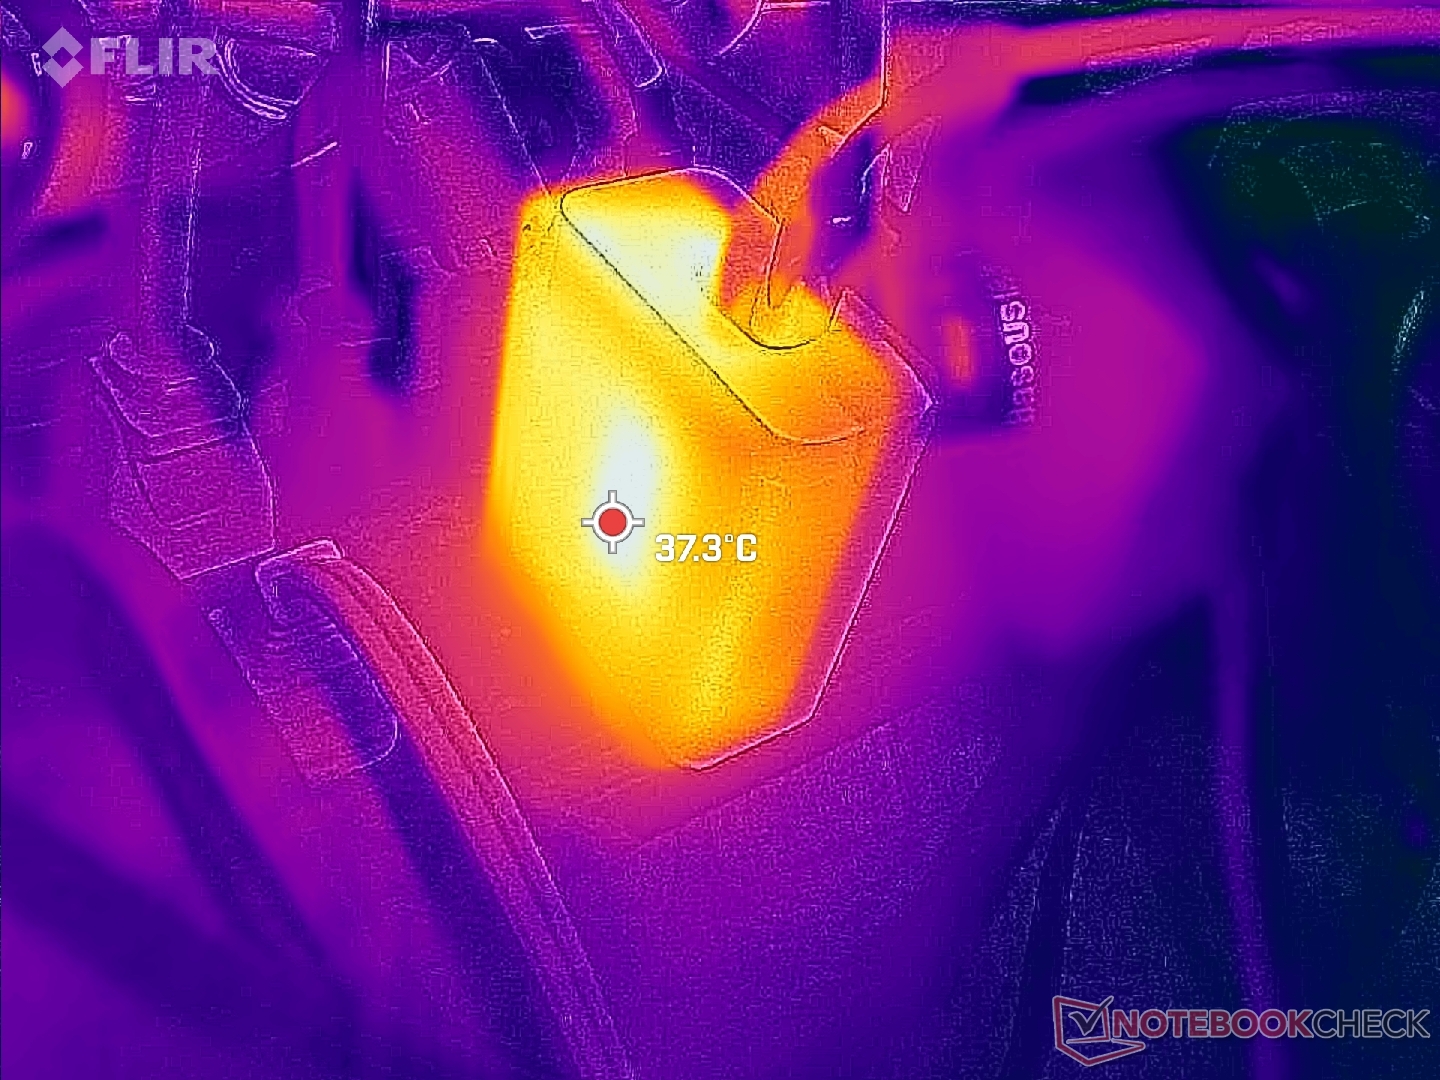
Gerenciamento de energia - Faminto de energia para o tamanho
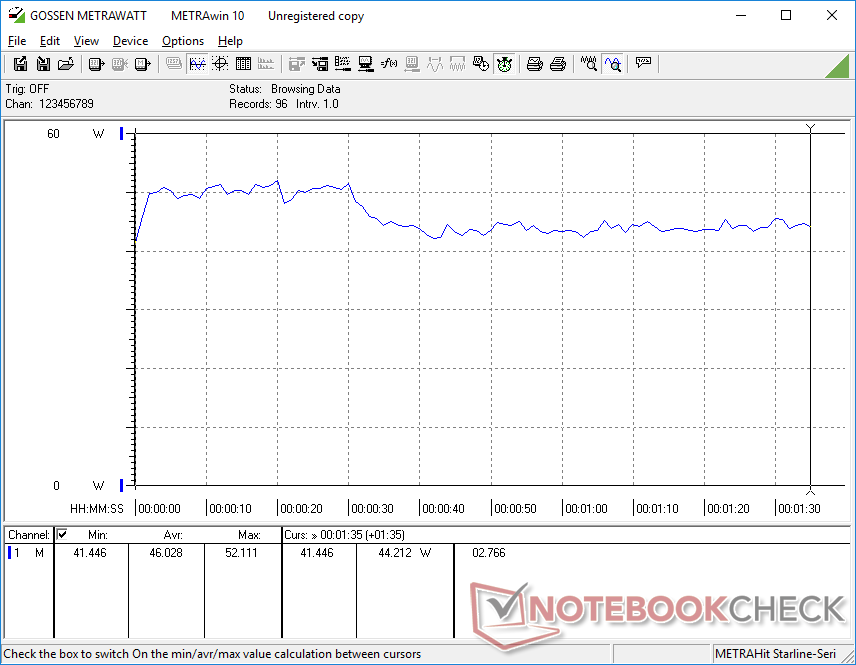
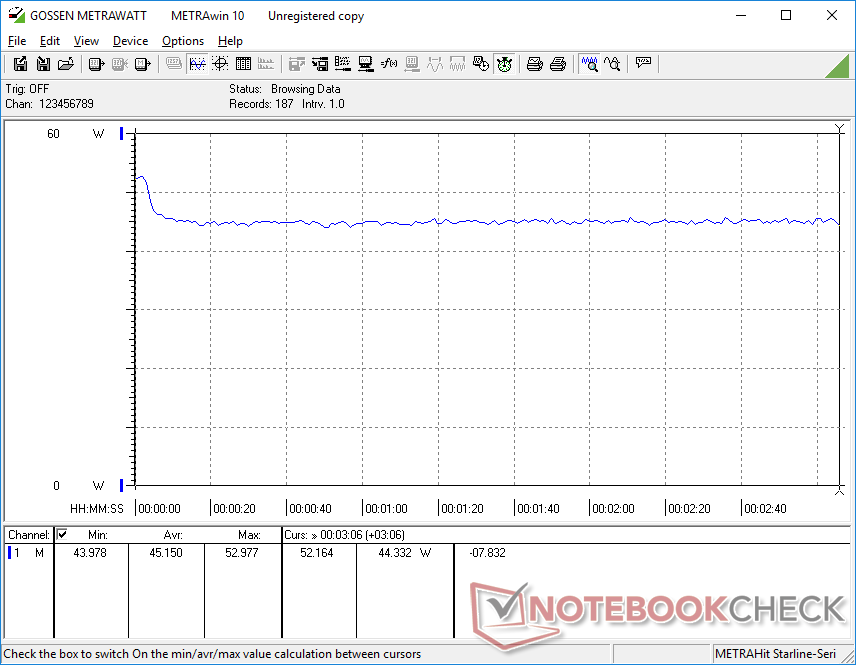
Consumo de energia
O consumo total de energia é maior que o Win 3 e muitos Ultrabooks da série U, principalmente devido à CPU Ryzen 7 e à tela sensível ao toque maior e de maior resolução. Por exemplo, os jogos exigem 20 a 55 por cento mais energia do que no Core i5-powered Win 3, mas isto é compensado pelo desempenho 2x mais rápido da CPU e 1,5x mais rápido da GPU sobre o i5-1135G7. Simplesmente ocioso nas demandas de desktop entre 7 W e 13 W, o que é similar a muitos Ultrabooks.
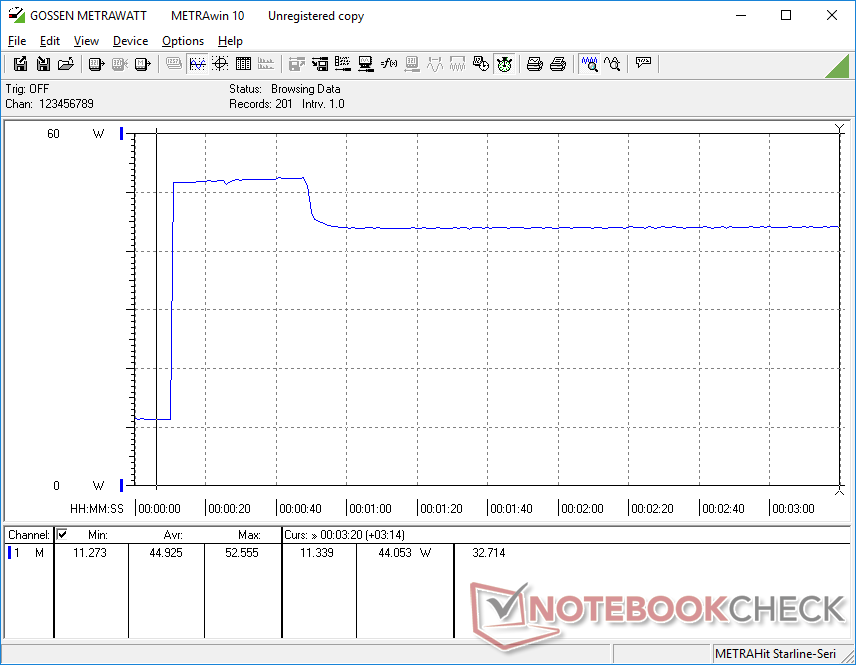
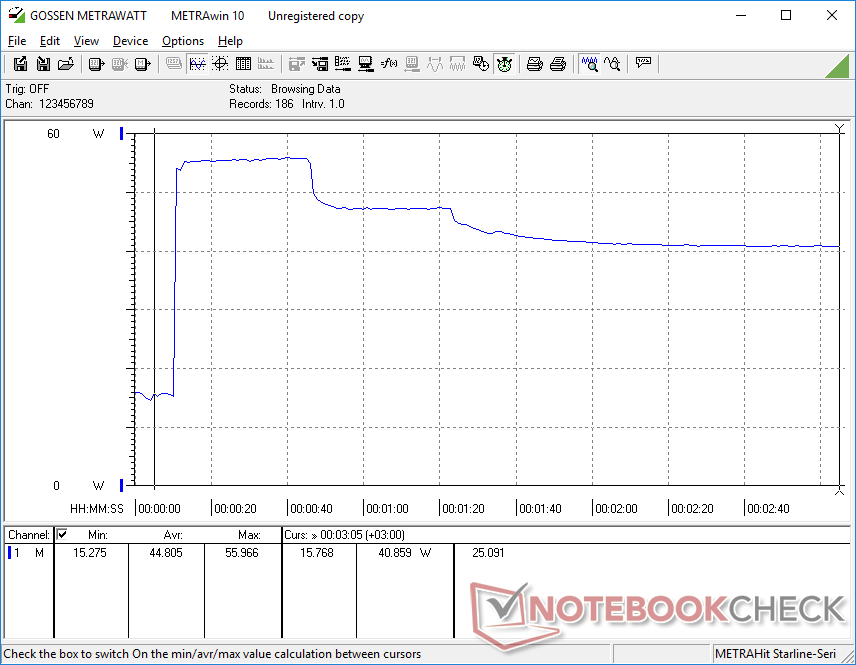
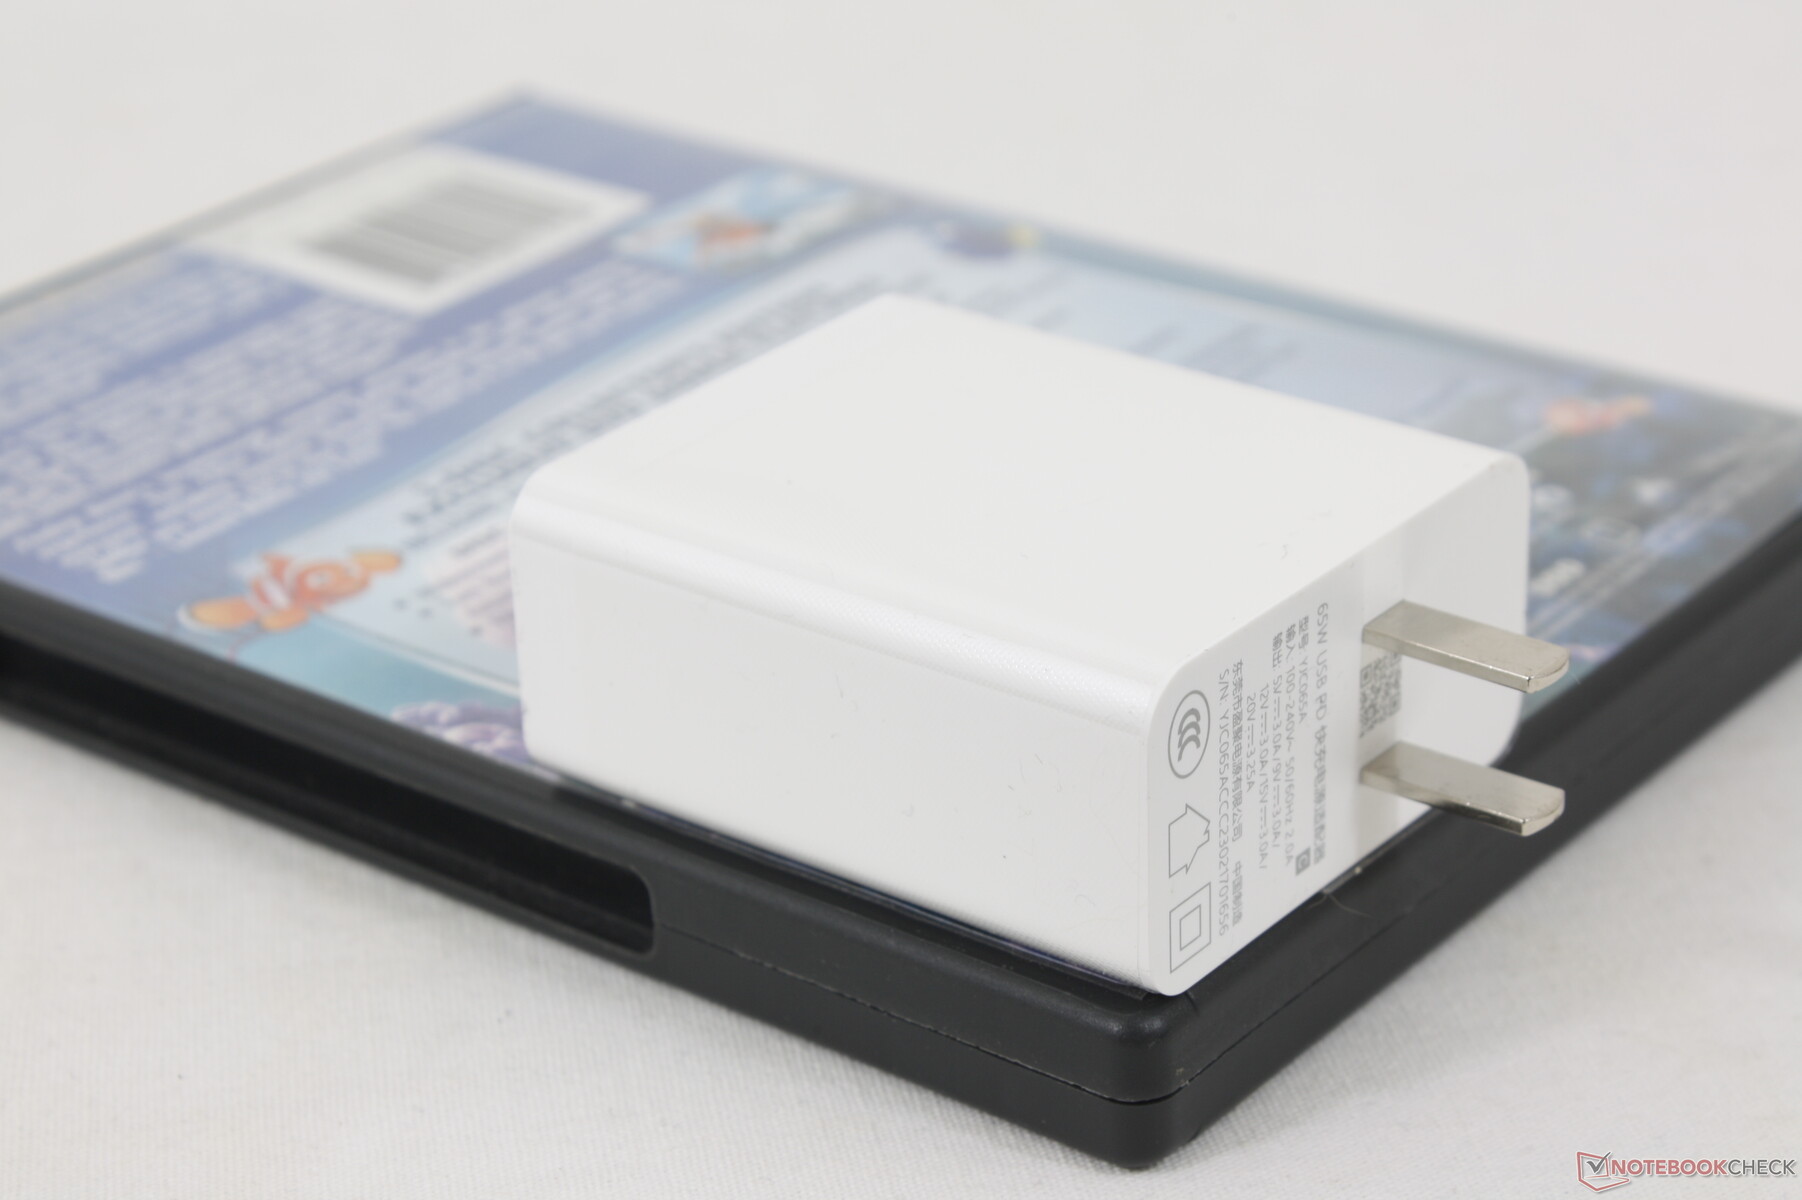
Somos capazes de medir um consumo máximo temporário de 56 W do pequeno (~6,4 x 5,5 x 2,8 cm) adaptador USB-C AC de 65 W quando o processador está em 100% de utilização. Esta taxa cai após alguns segundos de estresse, como mostram os gráficos abaixo, devido ao limitado potencial de aumento da CPU do modelo. Os pinos do adaptador AC infelizmente não são retráteis.
| desligado | |
| Ocioso | |
| Carga |
|
Key:
min: | |
| GPD Win 4 R7 6800U, Radeon 680M, BiWin CE480Y2D100-1TB, IPS, 1920x1080, 6" | GPD Win Max 2 i7-1260P, Iris Xe G7 96EUs, BiWin NQ200 1TB CNF82GS1D00-1TB, IPS, 2560x1600, 10.1" | GPD Win 3 i5-1135G7, Iris Xe G7 80EUs, BIWIN NS200 1TB CNF82GS1G02-1TB, IPS, 1280x720, 5.5" | Razer Blade Stealth i7-1165G7 GTX 1650 Ti Max-Q i7-1165G7, GeForce GTX 1650 Ti Max-Q, Samsung SSD PM981a MZVLB512HBJQ, IPS, 1920x1080, 13.3" | Dell XPS 13 9315 2-in-1 Core i5-1230U i5-1230U, Iris Xe G7 80EUs, , IPS, 2880x1920, 13" | Asus Zenbook S 13 OLED R7 6800U, Radeon 680M, Samsung PM9A1 MZVL21T0HCLR, OLED, 2880x1800, 13.3" | |
|---|---|---|---|---|---|---|
| Power Consumption | 2% | 45% | -20% | 32% | 18% | |
| Idle Minimum * (Watt) | 7.5 | 5.8 23% | 2.9 61% | 4 47% | 5.2 31% | 4.8 36% |
| Idle Average * (Watt) | 12.4 | 10.2 18% | 4.5 64% | 6.3 49% | 7.9 36% | 8.7 30% |
| Idle Maximum * (Watt) | 13 | 11.5 12% | 4.5 65% | 14.5 -12% | 8 38% | 10.1 22% |
| Load Average * (Watt) | 46 | 47.7 -4% | 38.5 16% | 79.2 -72% | 31.2 32% | 45.6 1% |
| Witcher 3 ultra * (Watt) | 45.2 | 45.6 -1% | 28.9 36% | 68.2 -51% | 28.2 38% | 42.4 6% |
| Load Maximum * (Watt) | 56 | 76.8 -37% | 41.4 26% | 99.4 -78% | 47.6 15% | 49.5 12% |
* ... menor é melhor
Power Consumption Witcher 3 / Stresstest
Power Consumption external Monitor
Vida útil da bateria
A capacidade da bateria permanece quase idêntica à do Win 3 apesar do desempenho mais rápido e do tamanho geral maior do Win 4. Assim, talvez não seja surpreendente que a vida útil da bateria do Win 4 seja várias horas mais curta. Somos capazes de registrar um tempo total de execução de 7,5 horas ao navegar na web a 150-nit de brilho e apenas 77 minutos ao rodar jogos exigentes na configuração de brilho máximo.
O carregamento da capacidade vazia para a capacidade total leva cerca de 90 minutos, como na maioria dos Ultrabooks. Tenha em mente que a taxa de carga diminui se simultaneamente aos jogos.
| GPD Win 4 R7 6800U, Radeon 680M, 46 Wh | GPD Win Max 2 i7-1260P, Iris Xe G7 96EUs, 70 Wh | GPD Win 3 i5-1135G7, Iris Xe G7 80EUs, 44 Wh | Razer Blade Stealth i7-1165G7 GTX 1650 Ti Max-Q i7-1165G7, GeForce GTX 1650 Ti Max-Q, 53.1 Wh | Dell XPS 13 9315 2-in-1 Core i5-1230U i5-1230U, Iris Xe G7 80EUs, 49.5 Wh | Asus Zenbook S 13 OLED R7 6800U, Radeon 680M, 67 Wh | |
|---|---|---|---|---|---|---|
| Duração da bateria | 35% | 26% | 66% | 38% | 54% | |
| Reader / Idle (h) | 9.7 | 15.4 59% | 20.6 112% | 13.6 40% | ||
| WiFi v1.3 (h) | 7.5 | 8.7 16% | 11.3 51% | 9 20% | 9 20% | 9.2 23% |
| Load (h) | 1.3 | 1.7 31% | 1.3 0% | 2 54% | 2.4 85% | |
| H.264 (h) | 15.2 |
Pro
Contra
Veredicto - Fazendo o Deck a Vapor parecer ultrapassado
O Win 4 é uma melhoria maciça sobre o Win 3 em quase todos os aspectos. A tela é maior, os controles são mais táteis, o design é mais forte e mais atraente, o teclado é mais confiável e o desempenho é marcadamente mais rápido. Você pode colocar um logotipo PS na frente e isso provavelmente enganaria mais do que alguns olhos.
A nova tela, o desempenho e o teclado físico integrado contribuem para o peso mais pesado, o perfil mais grosso e o ruído mais alto do ventilador do Win 4, que são os três maiores inconvenientes do modelo. Ele pode ser solidamente construído, mas outros portáteis para jogos como o Switch ou OneXPlayer são mais finos e leves para facilitar o tempo de jogo em movimento. Mesmo assim, ele ainda tem uma perna contra o Steam Deck que é mais lento e mais volumoso do que a solução GPD.
O GPD Win 4 combina a poderosa GPU AMD Radeon 680M com a melhor qualidade de construção para um dispositivo portátil que ofusca o Steam Deck em quase todos os sentidos.
As duas características ausentes do Win 4 são sua fraca capacidade de atendimento ao usuário final e a falta de suporte do FreeSync. O design densamente embalado torna difícil substituir o SSD interno ou qualquer botão potencialmente quebrado, enquanto o FreeSync teria melhorado a experiência de jogo sem qualquer hardware adicional. Para que conste, a tela tem um modo nativo de 40 Hz se os usuários quiserem atingir 40 FPS para que a tela se rasgue com menos freqüência.
Algo que deve ser absolutamente corrigido é a baixa estabilidade da taxa de quadros ou a micro gagueira quando se joga. A maioria dos Ultrabooks e especialmente os laptops para jogos não exibem este problema e esperamos o mesmo de um dispositivo portátil onde os jogos são o ponto-chave de venda.
Para modelos futuros, gostaríamos de ver o GPD incorporar ainda mais tecnologia da geração atual de laptops para jogos para minimizar a espessura e o peso potencial. Uma mudança para pasta térmica de metal líquido, refrigeração por câmara de vapor e um ventilador interno de maior diâmetro, por exemplo, poderia permitir um maior desempenho por volume. Até então, o GPD Win 4 é facilmente um dos melhores e mais rápidos portáteis para jogos baseados no Windows atualmente disponíveis.
Preço e Disponibilidade
A página do Indiegogo para o Win 4 está agora ao vivo com as remessas iniciais começando em março de 2023. As configurações começam em pouco menos de $1000 USD por 16 GB de RAM e 1 TB SSD até $1300 pelo dobro da RAM e armazenamento.
Transparência
A seleção dos dispositivos a serem analisados é feita pela nossa equipe editorial. A amostra de teste foi fornecida ao autor como empréstimo pelo fabricante ou varejista para fins desta revisão. O credor não teve influência nesta revisão, nem o fabricante recebeu uma cópia desta revisão antes da publicação. Não houve obrigação de publicar esta revisão. Como empresa de mídia independente, a Notebookcheck não está sujeita à autoridade de fabricantes, varejistas ou editores.
É assim que o Notebookcheck está testando
Todos os anos, o Notebookcheck analisa de forma independente centenas de laptops e smartphones usando procedimentos padronizados para garantir que todos os resultados sejam comparáveis. Desenvolvemos continuamente nossos métodos de teste há cerca de 20 anos e definimos padrões da indústria no processo. Em nossos laboratórios de teste, equipamentos de medição de alta qualidade são utilizados por técnicos e editores experientes. Esses testes envolvem um processo de validação em vários estágios. Nosso complexo sistema de classificação é baseado em centenas de medições e benchmarks bem fundamentados, o que mantém a objetividade.Price comparison

