MSI Crosshair 15 Rainbow Six Extraction Edition Review: Capaz de QHD 165 Hz midranger além do tema

Os laptops com tema de jogo são difíceis de ser encontrados hoje em dia. Alienware celebrado o lançamento de Cyberpunk 2077 com um tema m17 R3 na época, mas isso era mais uma pele para ajeitar o design. Com o Crosshair 15, a MSI projetou o laptop desde o chão para imbuir o Rainbow Six da Ubisoft: Vibrações de extração em todos os aspectos do design.
O que acontece com os laptops temáticos a jogos é que eles apelam apenas para um nicho de audiência investido no jogo em particular. O Rainbow Six: Extração ganhou críticas mistas de críticos e fãs, então um laptop temático neste jogo pode não despertar o interesse de todos à primeira vista.
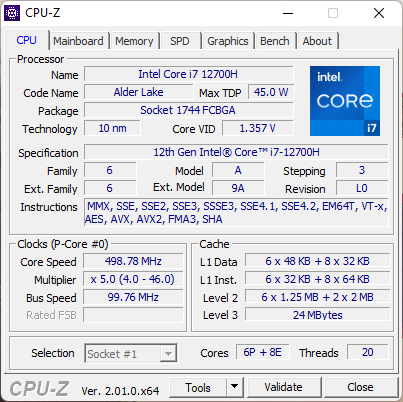
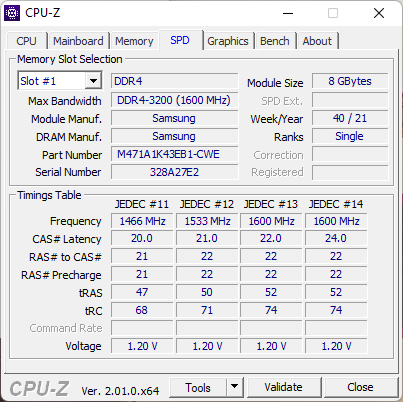
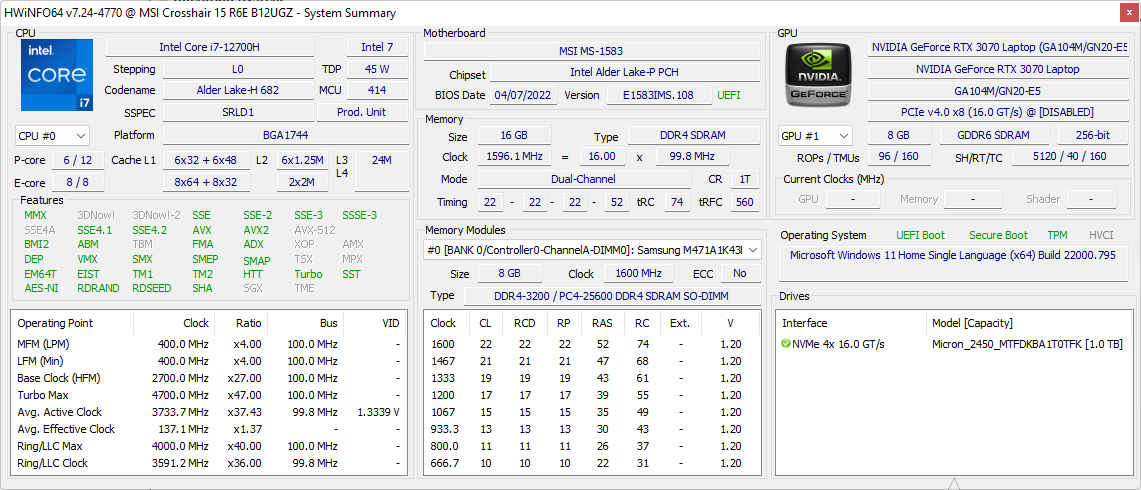
Indo além da temática, porém, descobrimos que a MSI tem muito a oferecer no pacote. Nosso MSI Crosshair 15 Rainbow Six: Extraction Edition (R6E) veio equipada com um Intel Core i7-12700H processador, Nvidia GeForce RTX 3070 GPU para notebook, 16 GB DDR4-3200 RAM, um SSD NVMe de 1 TB, e um display QHD de 165 Hz
A combinação de uma CPU Alder Lake-H e a GPU para notebook RTX 3070 não é vista com freqüência, dado que a Nvidia suplantou esta GPU com a GPU para notebook RTX 3070 Ti. No entanto, esta configuração do Crosshair 15 o fará voltar por ₹1,90,990 (US$ 2.312) na Índia.
Nesta revisão, avaliamos o MSI Crosshair 15 Rainbow Six: Extraction Edition e veja como ele se sai contra a concorrência como um laptop de médio alcance superior para jogos.
Possíveis concorrentes em comparação
Avaliação | Data | Modelo | Peso | Altura | Size | Resolução | Preço |
|---|---|---|---|---|---|---|---|
| 85.8 % v7 (old) | 12/2022 | MSI Crosshair 15 R6E B12UGZ-050 i7-12700H, GeForce RTX 3070 Laptop GPU | 2.5 kg | 26.9 mm | 15.60" | 2560x1440 | |
| 84.5 % v7 (old) | 02/2022 | MSI Stealth GS66 12UGS i7-12700H, GeForce RTX 3070 Ti Laptop GPU | 2.2 kg | 19.8 mm | 15.60" | 2560x1440 | |
| 88 % v7 (old) | 03/2022 | Lenovo Legion 5 Pro 16 G7 i7 RTX 3070Ti i7-12700H, GeForce RTX 3070 Ti Laptop GPU | 2.6 kg | 26.6 mm | 16.00" | 2560x1600 | |
| 80.3 % v7 (old) | 06/2022 | MSI Katana GF66 12UGS i7-12700H, GeForce RTX 3070 Ti Laptop GPU | 2.3 kg | 27.5 mm | 15.60" | 1920x1080 | |
| 80.7 % v7 (old) | 04/2022 | MSI Pulse GL66 12UEK i9-12900H, GeForce RTX 3060 Laptop GPU | 2.3 kg | 25 mm | 15.60" | 1920x1080 | |
| 84 % v7 (old) | 06/2022 | Acer Nitro 5 AN515-58-72QR i7-12700H, GeForce RTX 3070 Ti Laptop GPU | 2.5 kg | 26.8 mm | 15.60" | 2560x1440 | |
| 85.5 % v7 (old) | 12/2022 | Aorus 15 XE5 i7-12700H, GeForce RTX 3070 Ti Laptop GPU | 2.3 kg | 24 mm | 15.60" | 2560x1440 | |
| 88.4 % v7 (old) | 07/2022 | Schenker XMG Neo 15 (i7-12700H, RTX 3080 Ti) i7-12700H, GeForce RTX 3080 Ti Laptop GPU | 2.3 kg | 26.6 mm | 15.60" | 2560x1440 | |
| 85.8 % v7 (old) | 07/2022 | Asus TUF Dash F15 FX517ZR i7-12650H, GeForce RTX 3070 Laptop GPU | 2 kg | 20.7 mm | 15.60" | 2560x1440 | |
| 88 % v7 (old) | 11/2022 | Schenker XMG Neo 15 (Ryzen 9 6900HX, RTX 3070 Ti) R9 6900HX, GeForce RTX 3070 Ti Laptop GPU | 2.3 kg | 26.6 mm | 15.60" | 2560x1440 |
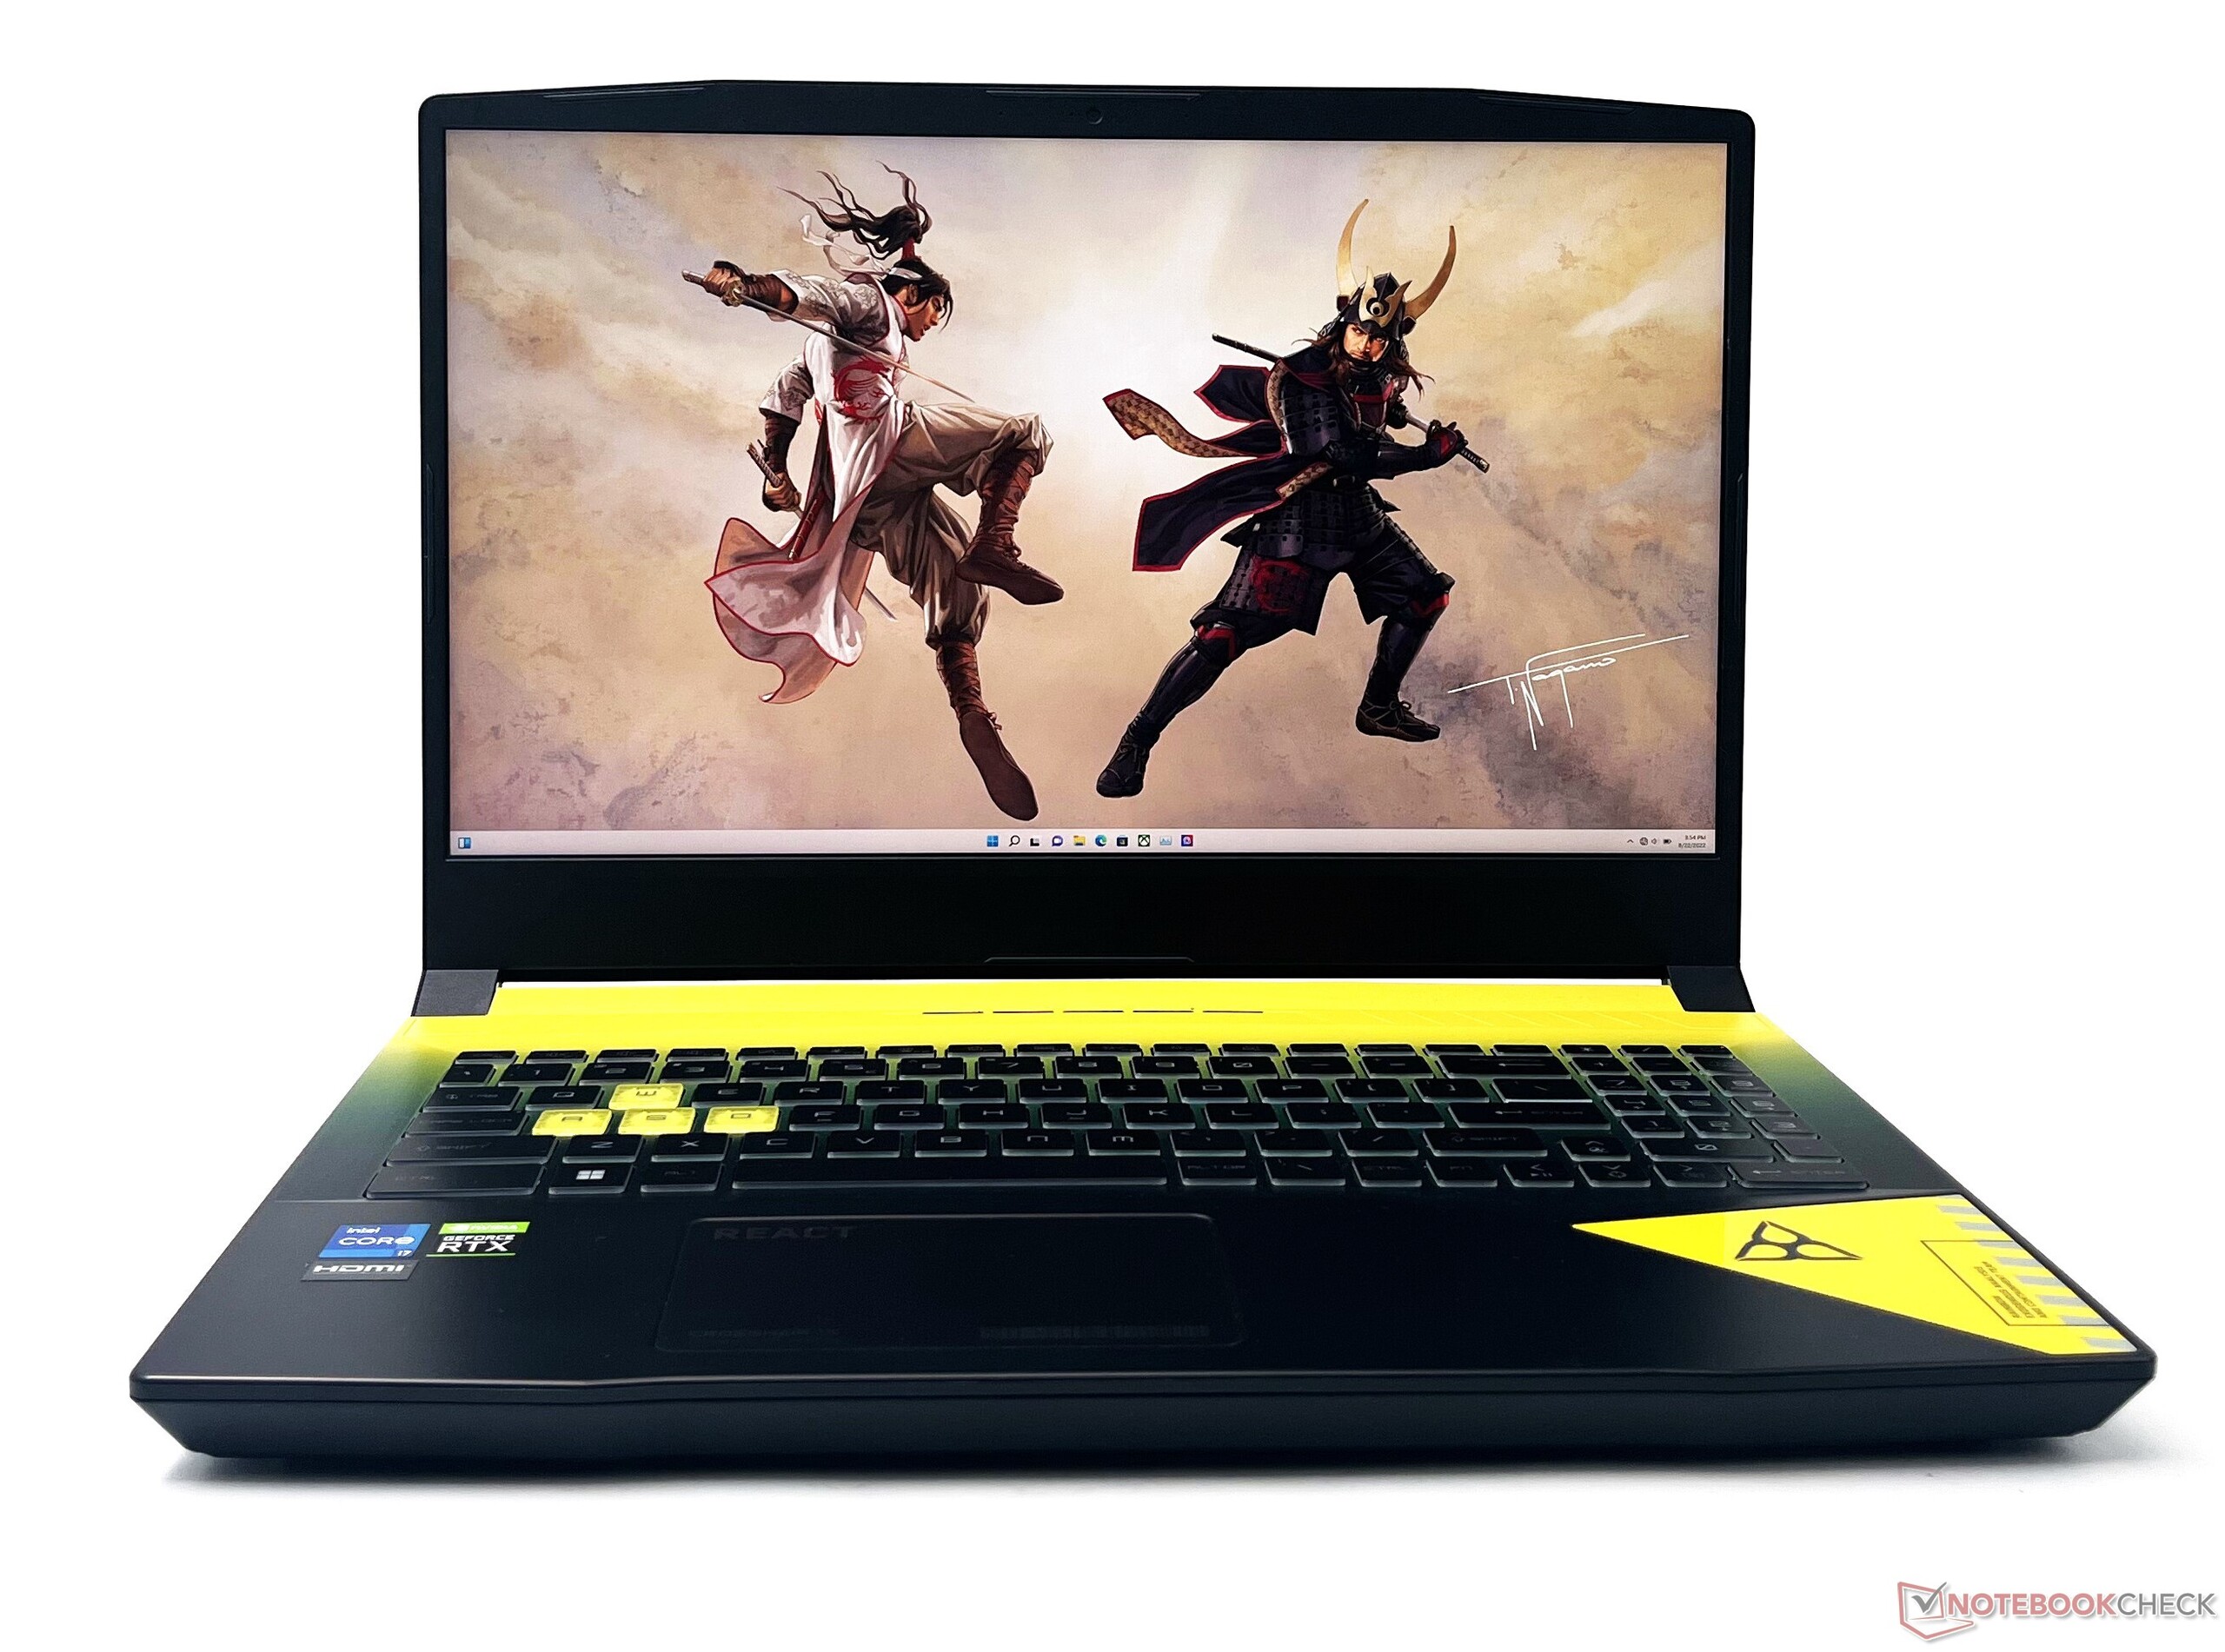
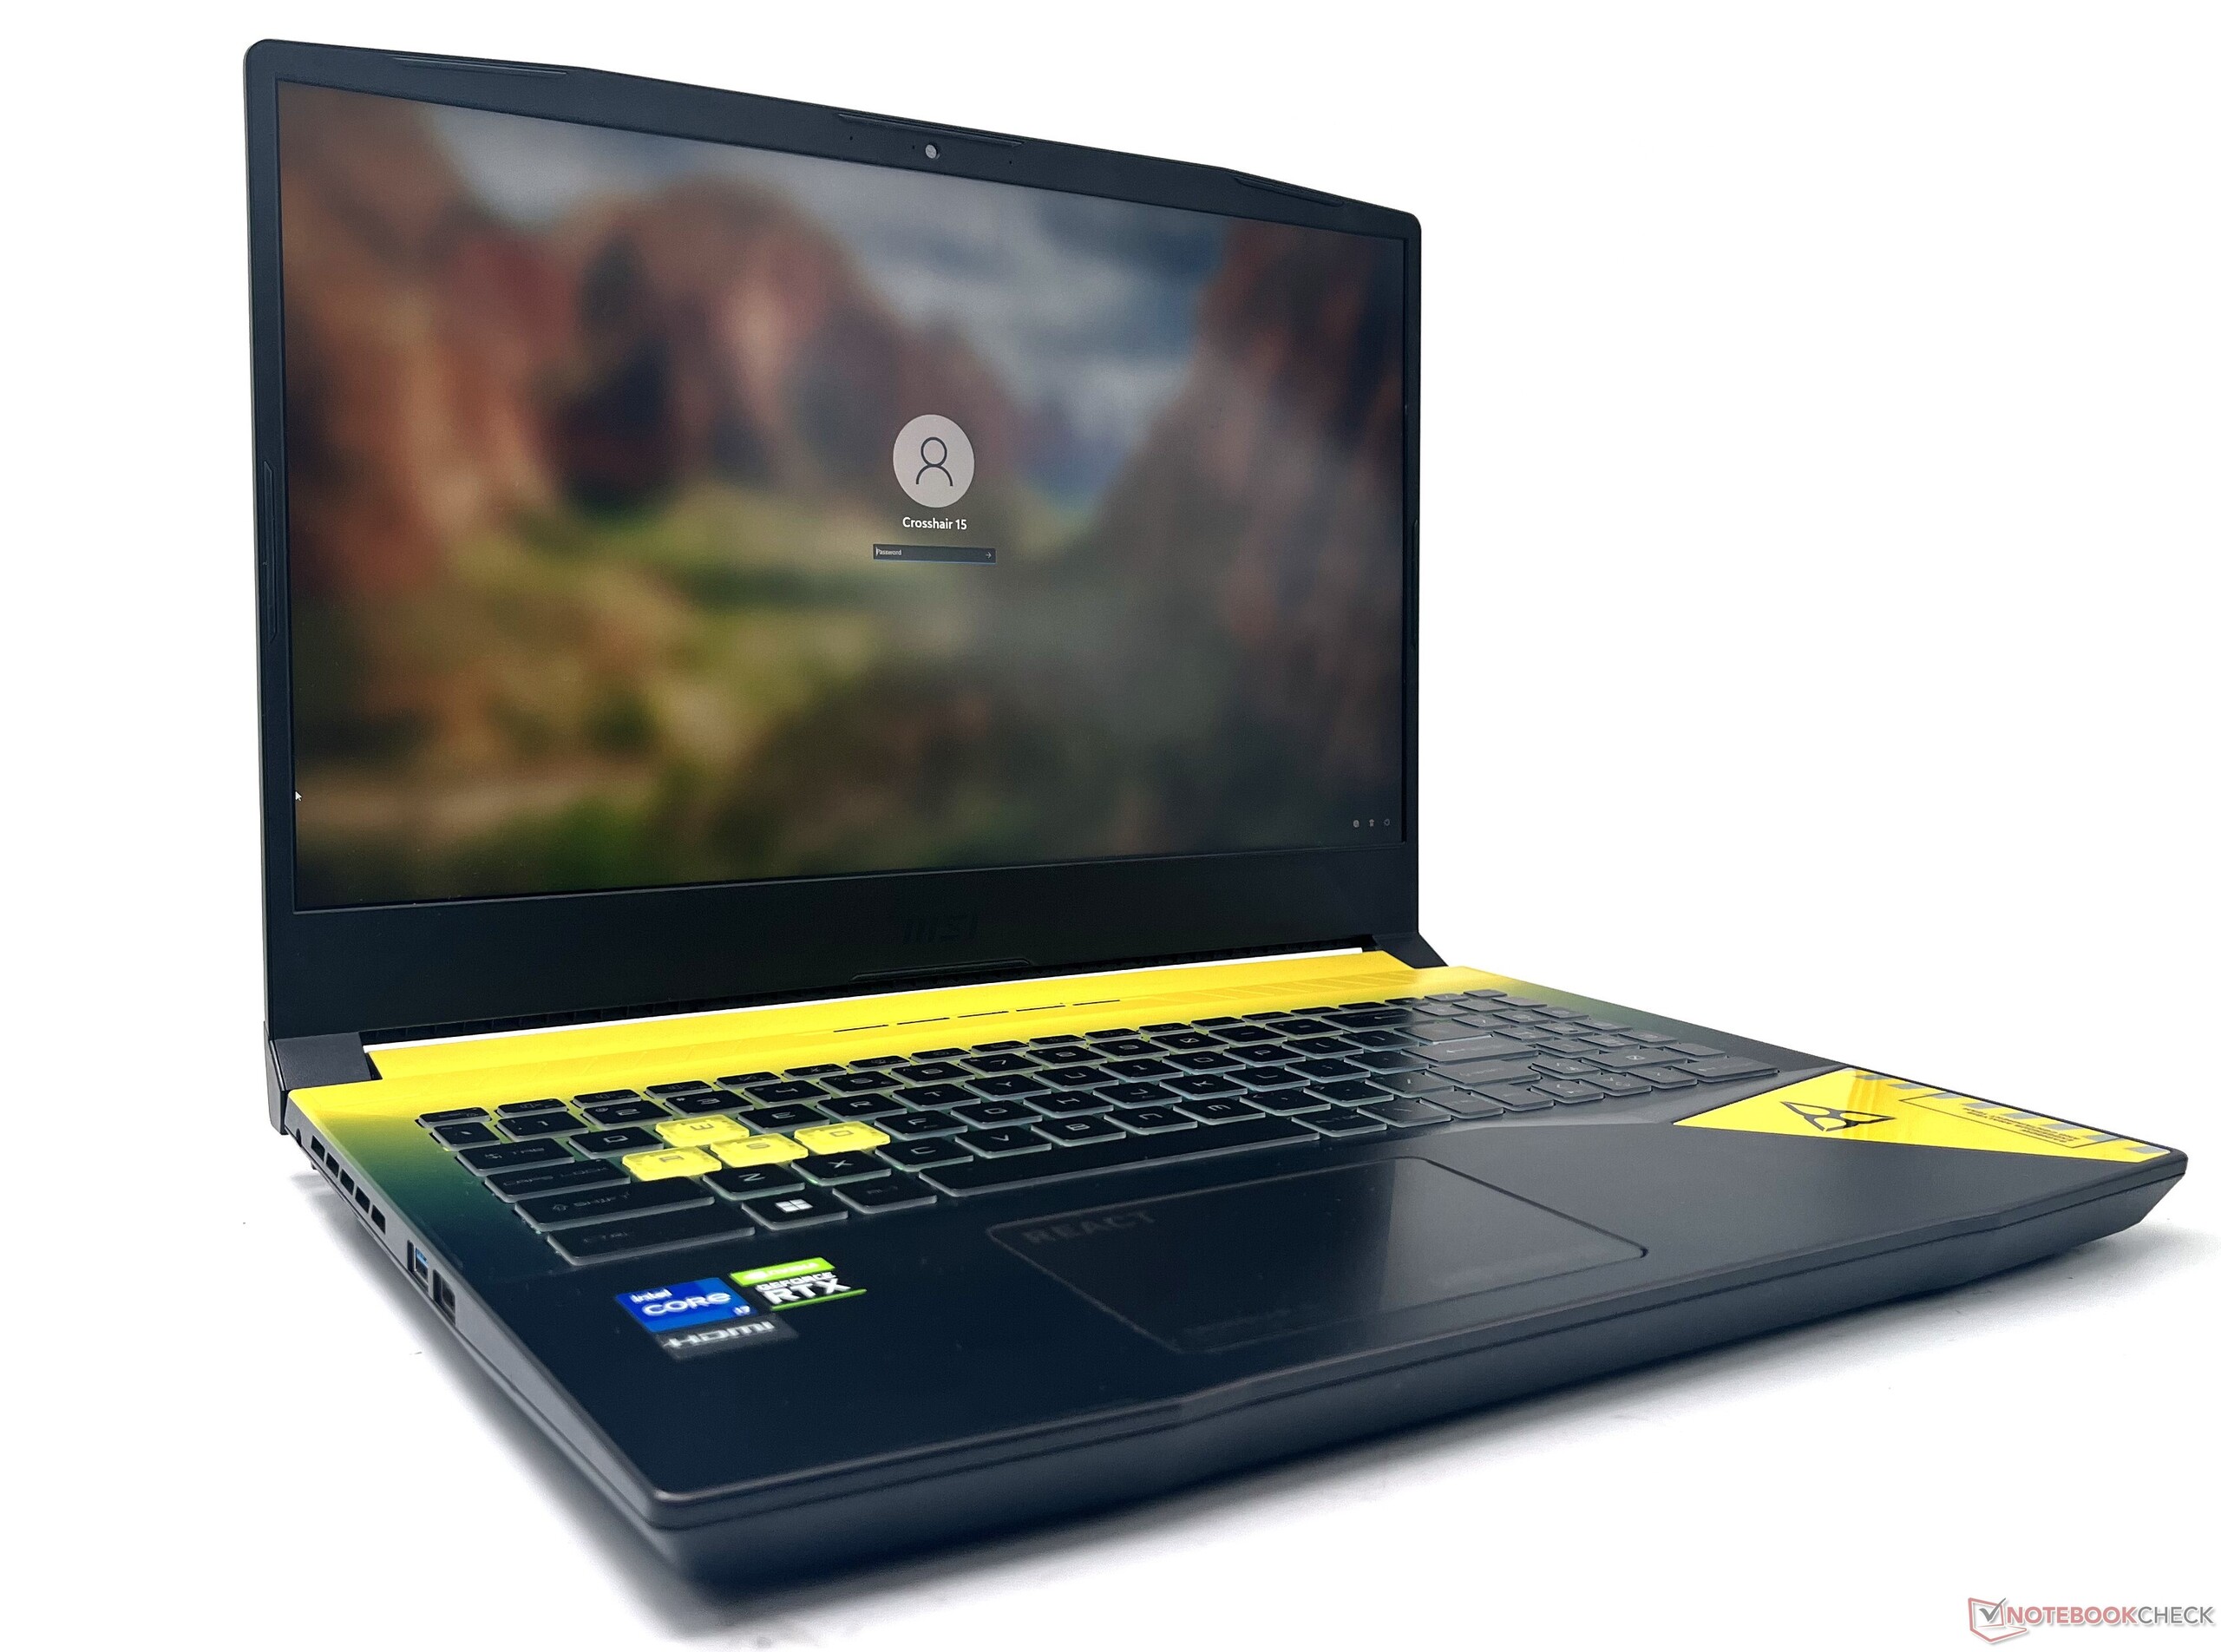
Estojo: Pulso GL66 pintado em Rainbow Six: Cores de extração
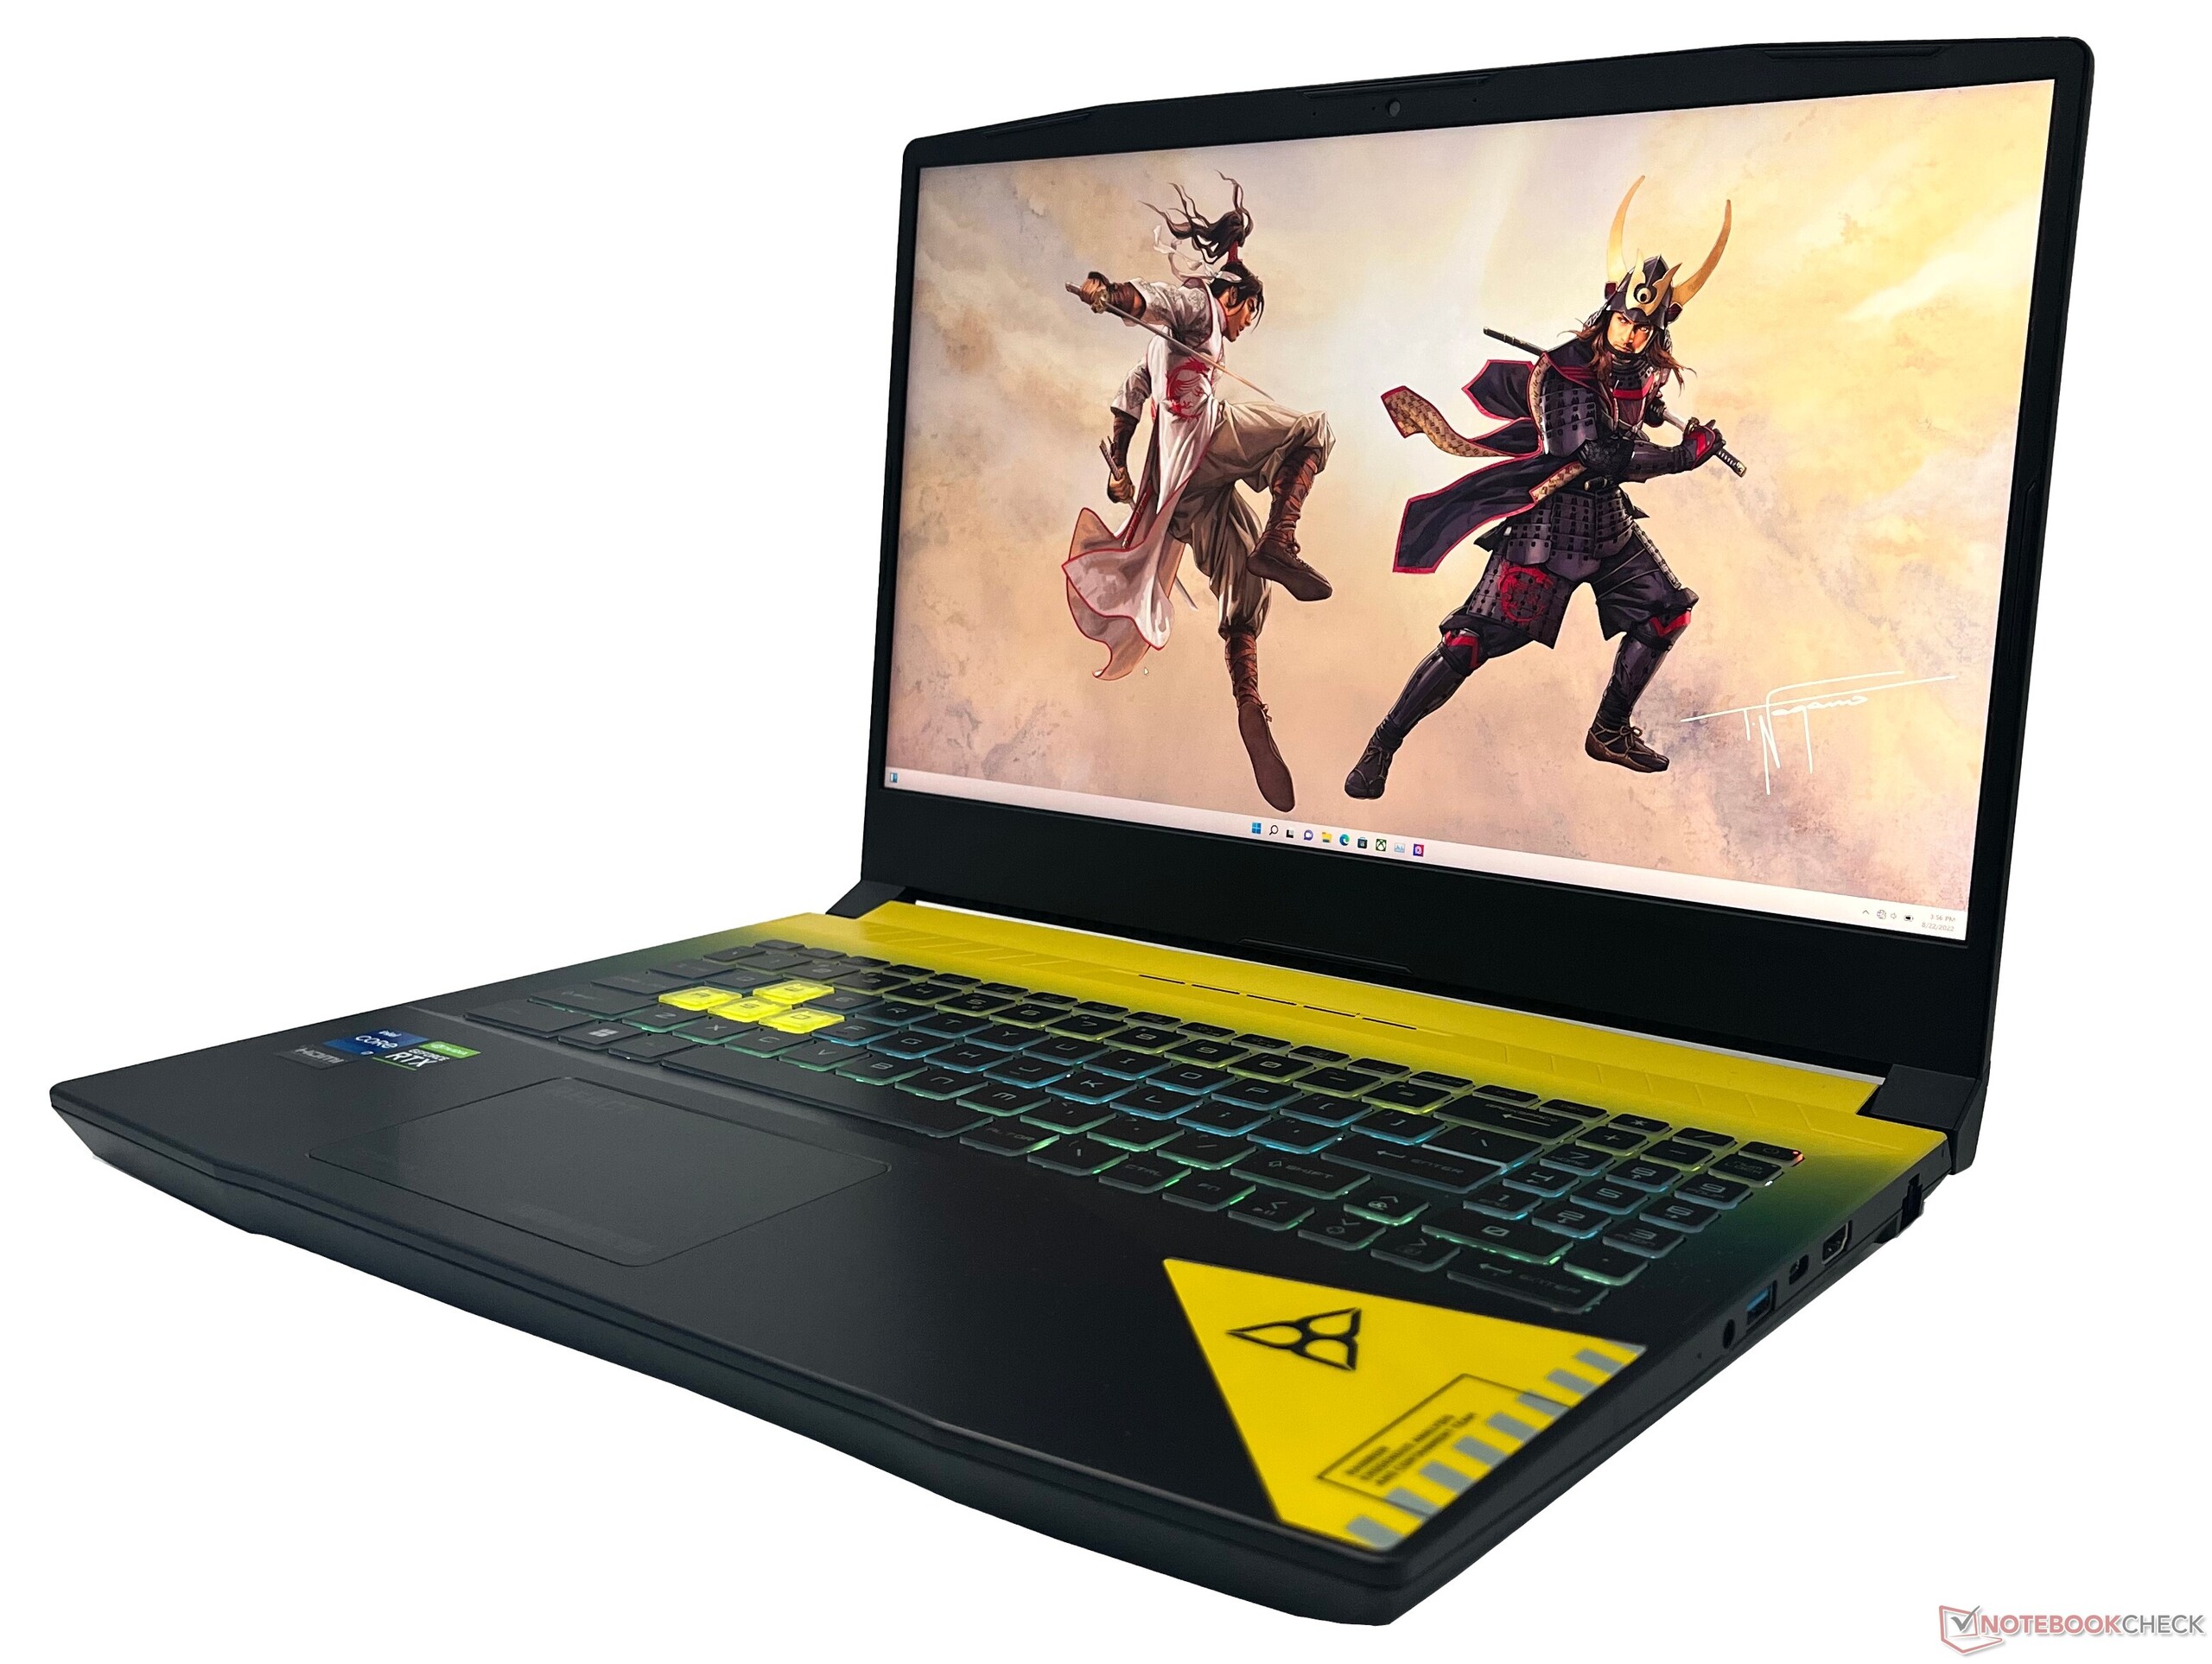
O chassi do MSI Crosshair 15 R6E é feito principalmente de plástico. A construção não exala realmente nenhuma vibração premium, mas se sente robusta - o suficiente para o uso diário. Há uma flexibilidade notável no deck do teclado, mas isso não impediu o uso regular.
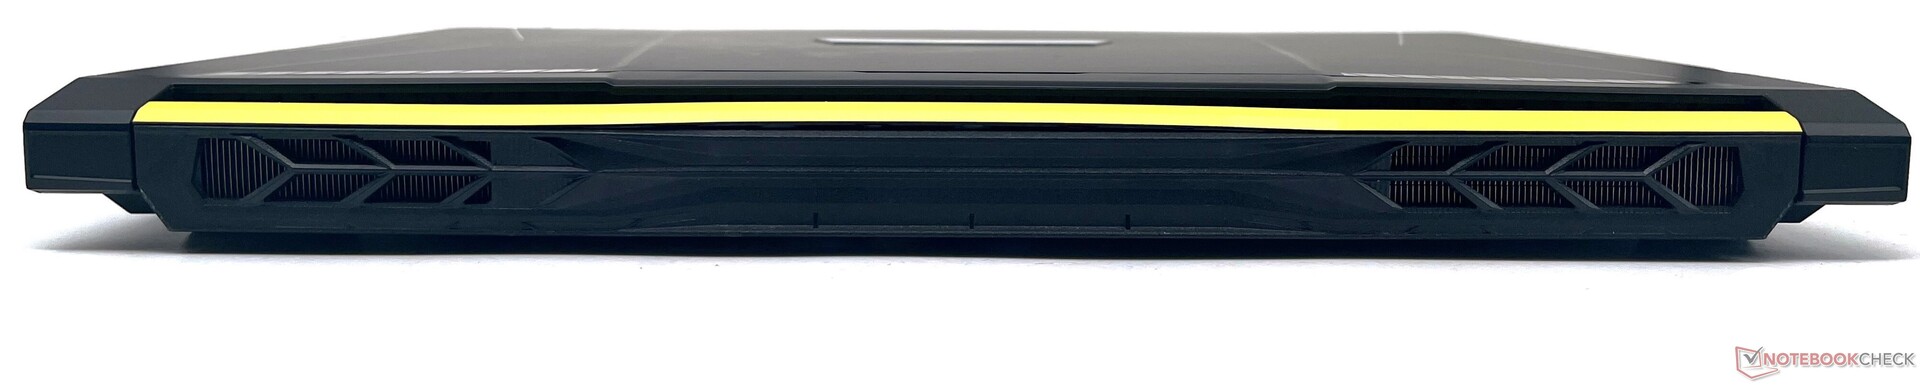
O Crosshair 15 R6E faz uso extensivo de um esquema de cor amarelo-preto de dois tons e os elementos do design REACT do jogo desde a embalagem até o chassi, proclamando assim seu Rainbow Six: Fidelidade à extração.
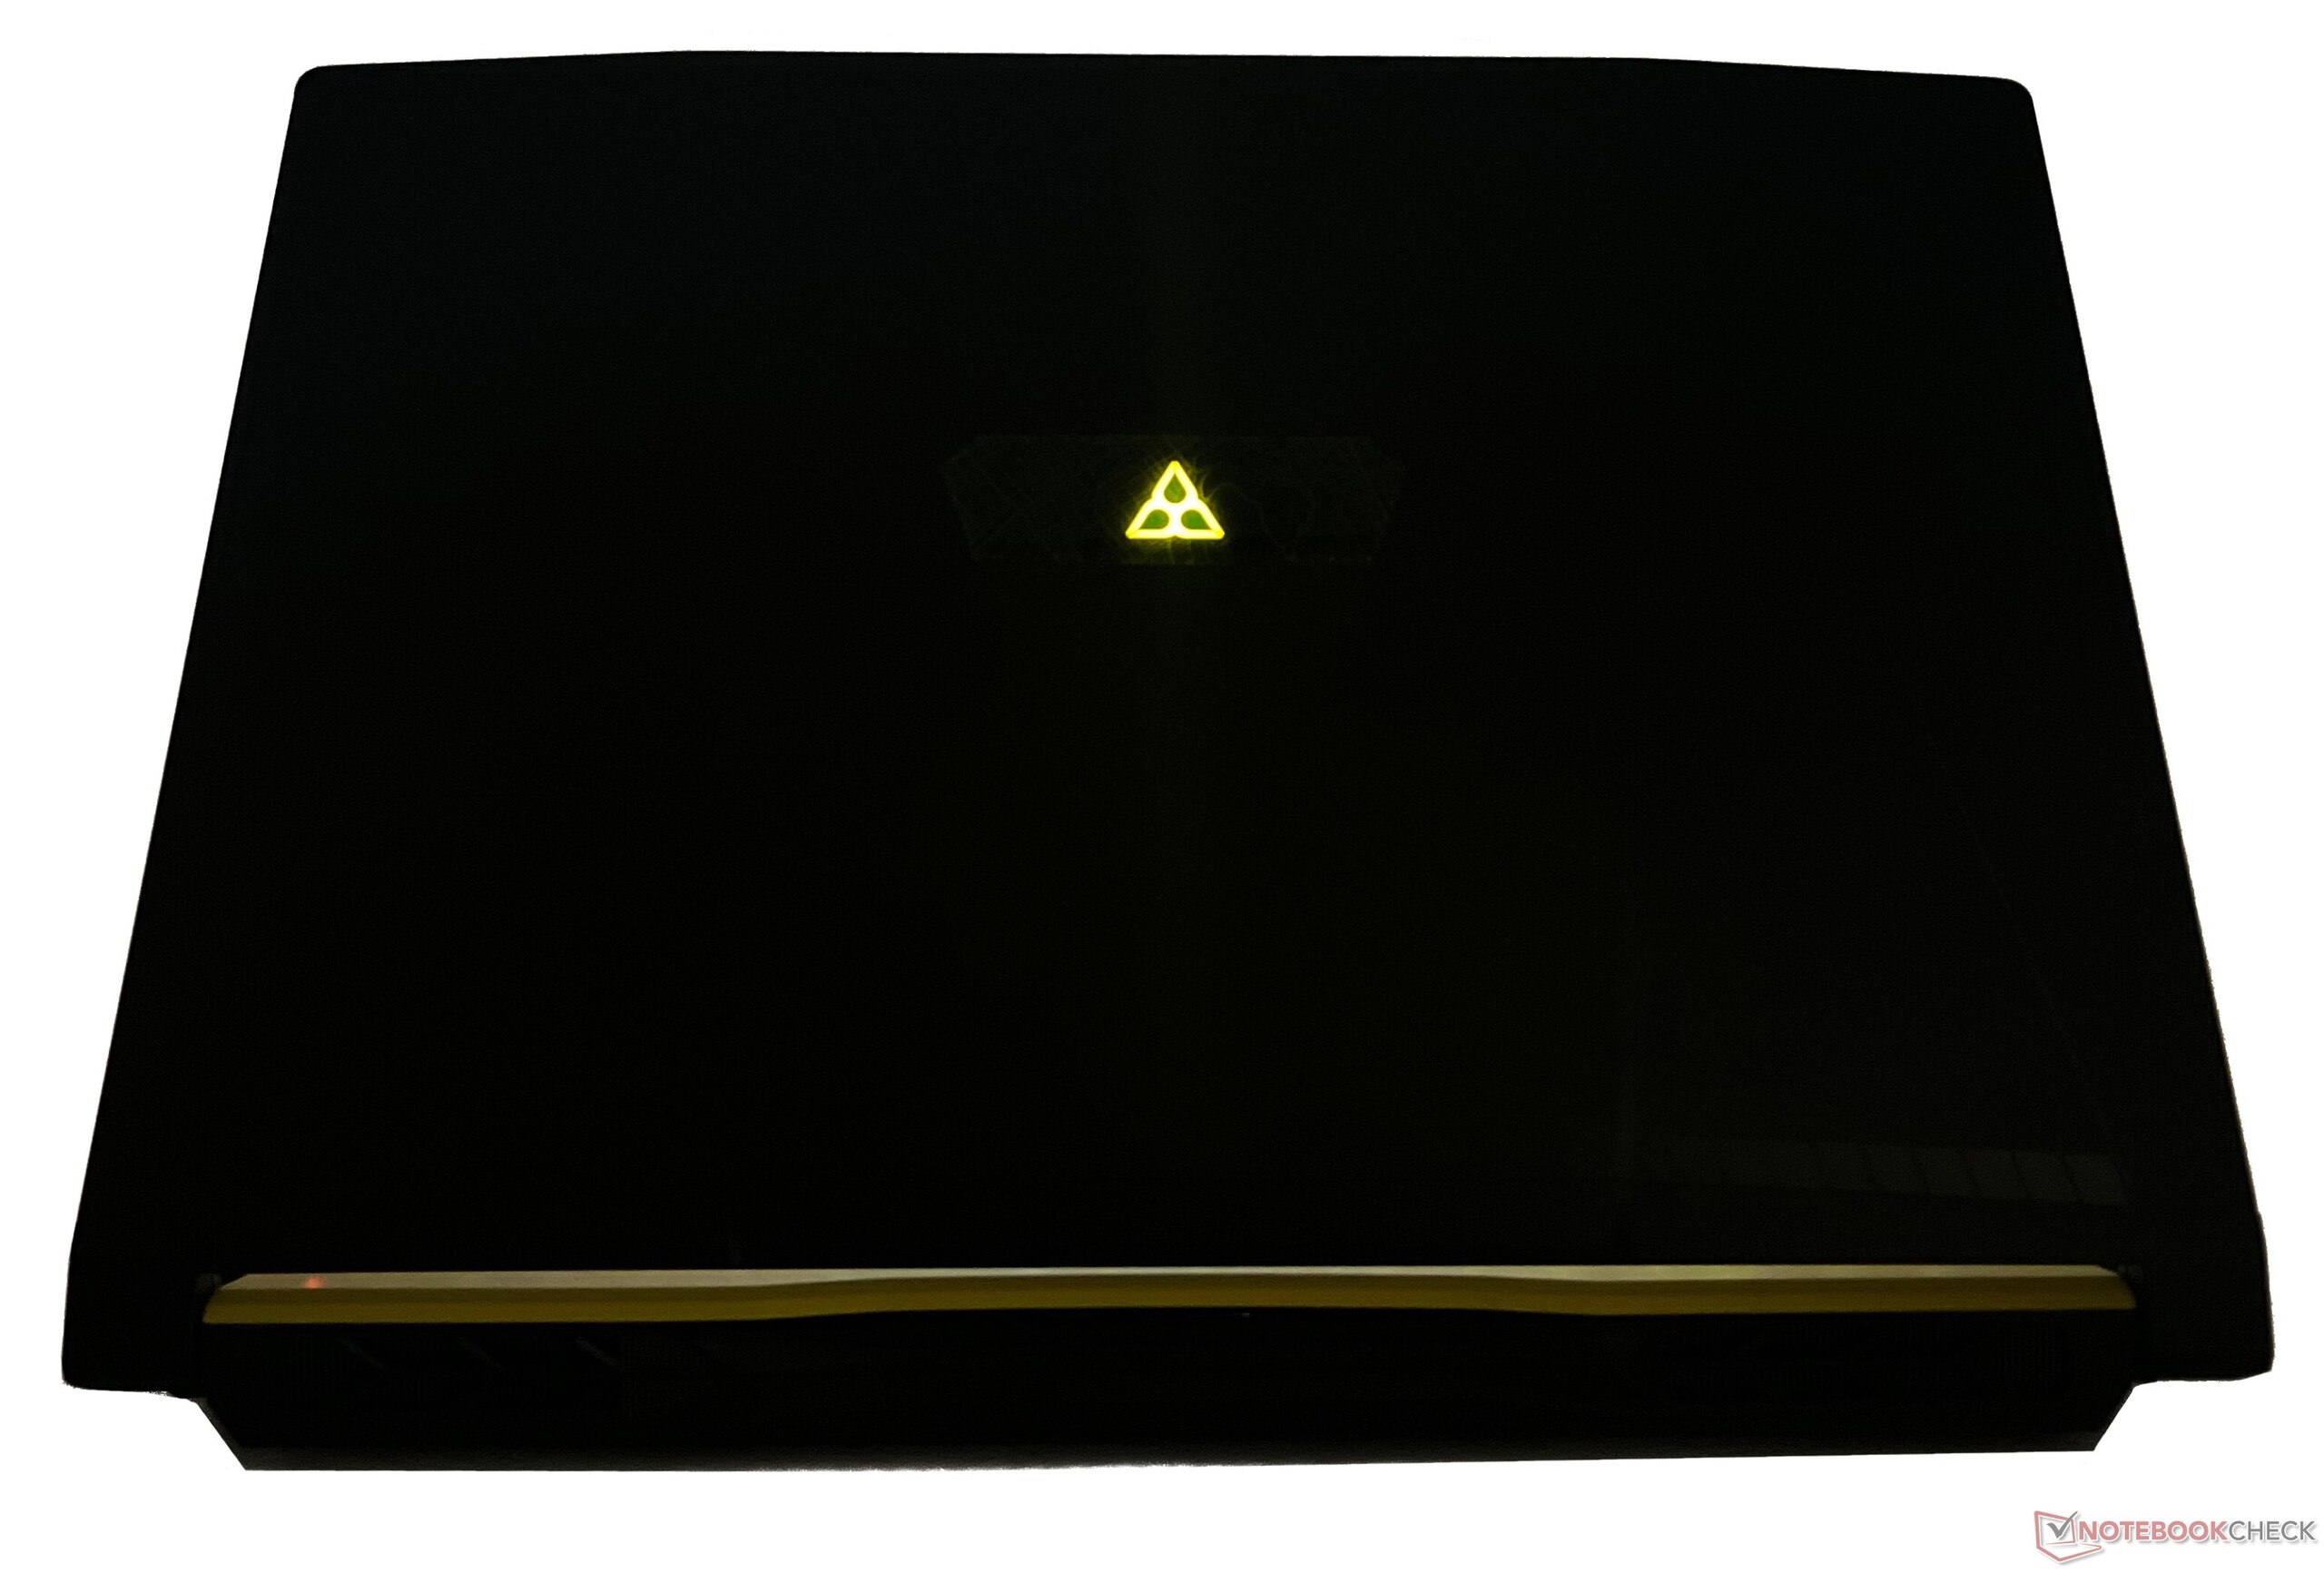
Assim, a MSI até mesmo substituiu seu logotipo pelo do jogo na parte de trás da tela. O Arco-Íris Seis: O logotipo de extração não é muito grande, mas é visível o suficiente e brilha em amarelo brilhante. Não há padrões de iluminação RGB, então você terá que se contentar com o esquema de cores em oferta.
Com uma espessura de 26,9 mm, não é o laptop mais fino de sua classe - o crédito vai para a MSI Stealth GS66 e o Lâmina Razer 15. Ainda assim, ele é portátil o suficiente para ser colocado em uma mochila e o peso de 2,5 kg também não parece muito pesado.
No total, o MSI Crosshair 15 Rainbow Six: O chassi da Extraction Edition é decentemente construído pelo preço e essencialmente se apresenta como uma remontagem do Pulso GL66e, de muitas maneiras, o Katana GF66com uma nova camada de tinta.
Conectividade: Cobre apenas o essencial
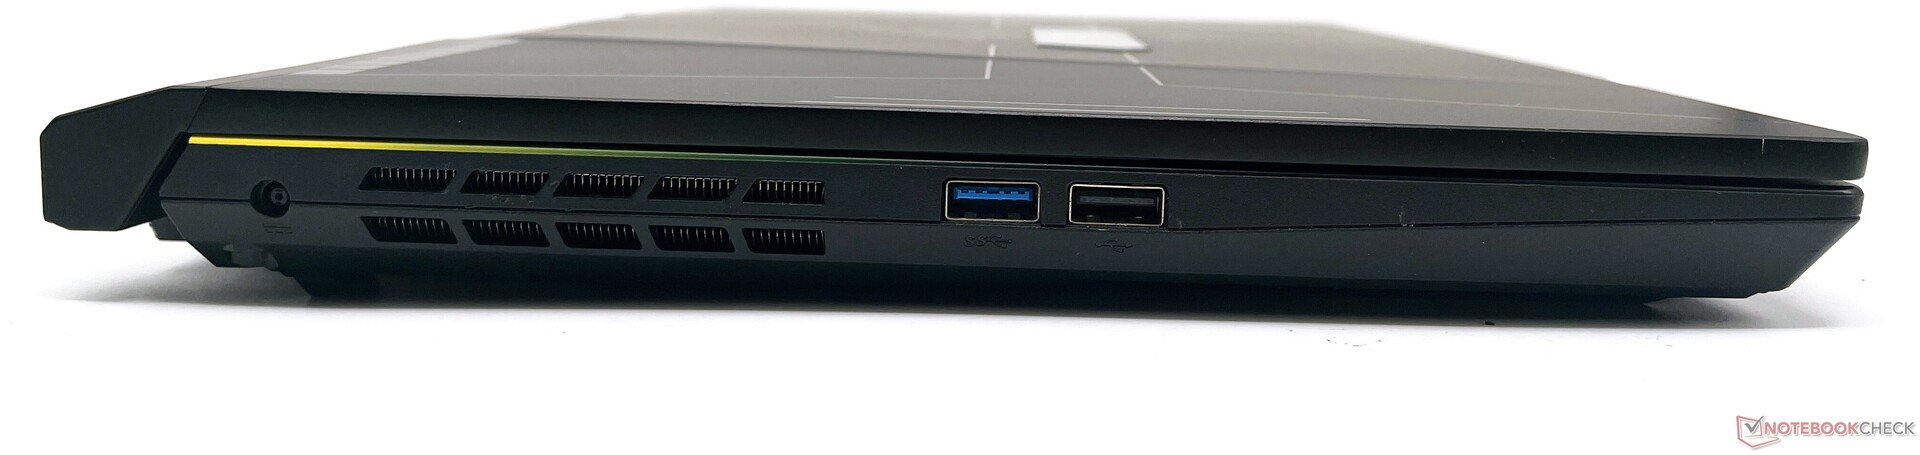
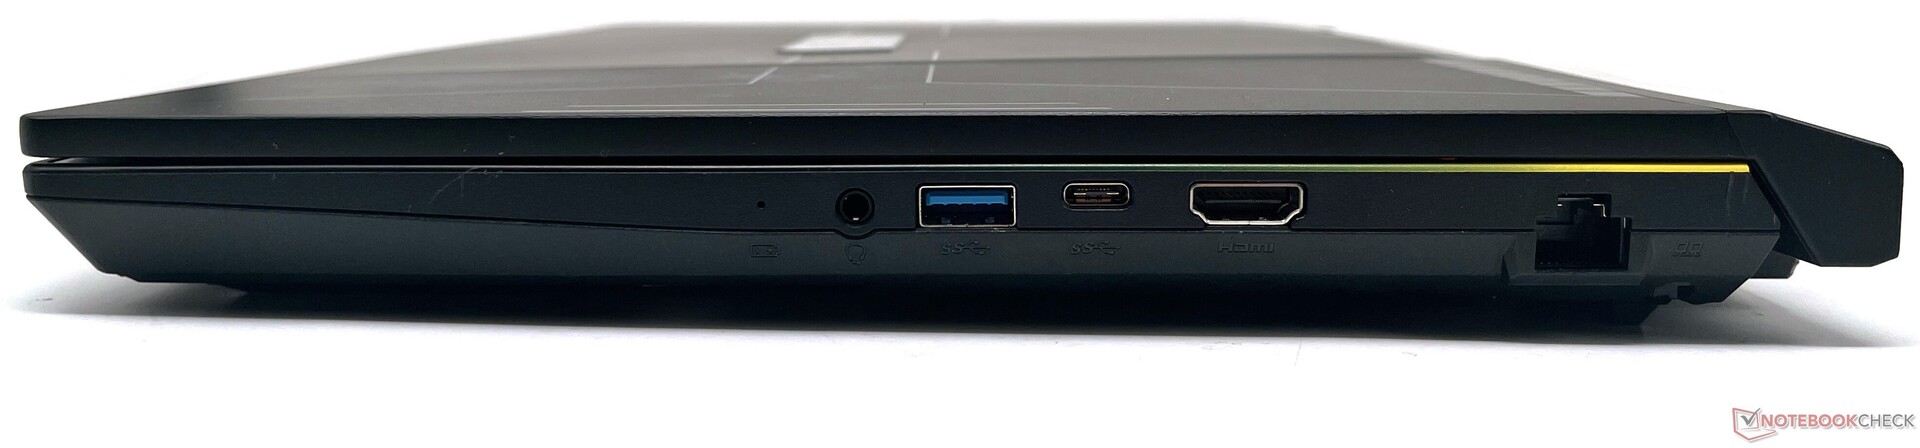
O Crosshair 15 R6E não oferece uma extensa seleção de portos, mas o essencial está coberto. À esquerda, temos as portas USB 3.2 Gen1 Tipo A e USB 2.0 Tipo A. À direita, temos um conector de áudio combinado de 3,5 mm, outro USB 3.2 Gen1 Tipo A, uma porta USB 3.2 Gen1 Tipo C, saída HDMI, e Gigabit Ethernet
A porta HDMI suporta apenas a saída de 4K 60 Hz. Não há leitor de cartões, Thunderbolt 4, ou slot de trava Kensington disponível.
A colocação da porta não é realmente ideal, uma vez que a maioria delas está localizada do lado direito do dispositivo. As portas do lado esquerdo poderiam usar algum espaçamento adicional, uma vez que uma boa quantidade de espaço permanece inutilizada. Dito isto, não há impedimentos ao conectar vários periféricos.
Comunicação
O Crosshair 15 R6E vem equipado com um módulo Intel Wi-Fi 6 AX201 WLAN com Bluetooth 5.2. O laptop ocupa a parte inferior de nossos gráficos Wi-Fi com o roteador de referência Asus ROG Rapture GT-AXE11000.
Dito isto, sua produção ainda é melhor do que a do Pulse GL66. As velocidades de recepção são bastante estáveis, mas notamos quedas durante a transmissão.
| Networking / iperf3 transmit AXE11000 | |
| Schenker XMG Neo 15 (i7-12700H, RTX 3080 Ti) | |
| Acer Nitro 5 AN515-58-72QR | |
| Schenker XMG Neo 15 (Ryzen 9 6900HX, RTX 3070 Ti) | |
| MSI Katana GF66 12UGS | |
| Asus TUF Dash F15 FX517ZR | |
| Média Intel Wi-Fi 6 AX201 (438 - 1715, n=74) | |
| Média da turma Gaming (560 - 1862, n=88, últimos 2 anos) | |
| MSI Crosshair 15 R6E B12UGZ-050 | |
| Networking / iperf3 receive AXE11000 | |
| Acer Nitro 5 AN515-58-72QR | |
| MSI Katana GF66 12UGS | |
| Schenker XMG Neo 15 (i7-12700H, RTX 3080 Ti) | |
| Asus TUF Dash F15 FX517ZR | |
| MSI Stealth GS66 12UGS | |
| Schenker XMG Neo 15 (Ryzen 9 6900HX, RTX 3070 Ti) | |
| Média da turma Gaming (680 - 1745, n=88, últimos 2 anos) | |
| Média Intel Wi-Fi 6 AX201 (390 - 1734, n=79) | |
| MSI Crosshair 15 R6E B12UGZ-050 | |
| Networking / iperf3 transmit AX12 | |
| Lenovo Legion 5 Pro 16 G7 i7 RTX 3070Ti | |
| Média Intel Wi-Fi 6 AX201 (49.8 - 1775, n=324) | |
| MSI Pulse GL66 12UEK | |
| Networking / iperf3 receive AX12 | |
| Lenovo Legion 5 Pro 16 G7 i7 RTX 3070Ti | |
| Média Intel Wi-Fi 6 AX201 (136 - 1743, n=324) | |
| MSI Pulse GL66 12UEK | |
Webcam
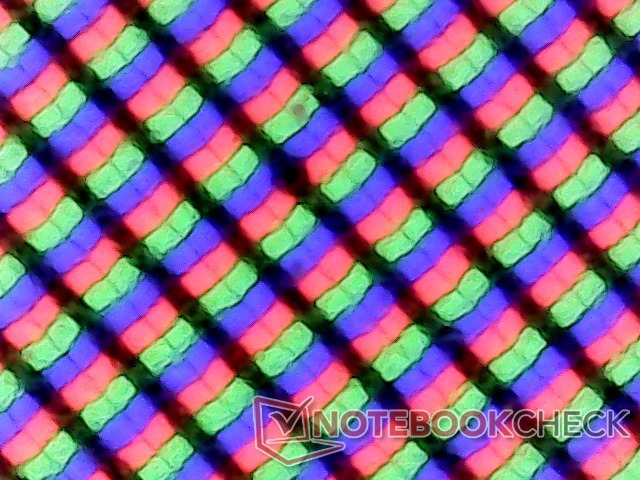
A webcam de 720p é quase que útil para uma ou duas chamadas de vídeo ocasionais. Como notado em nosso Passaporte ColorChecker e na tabela de teste abaixo, a webcam do Crosshair 15 mostra muito ruído e uma falta de nitidez geral.
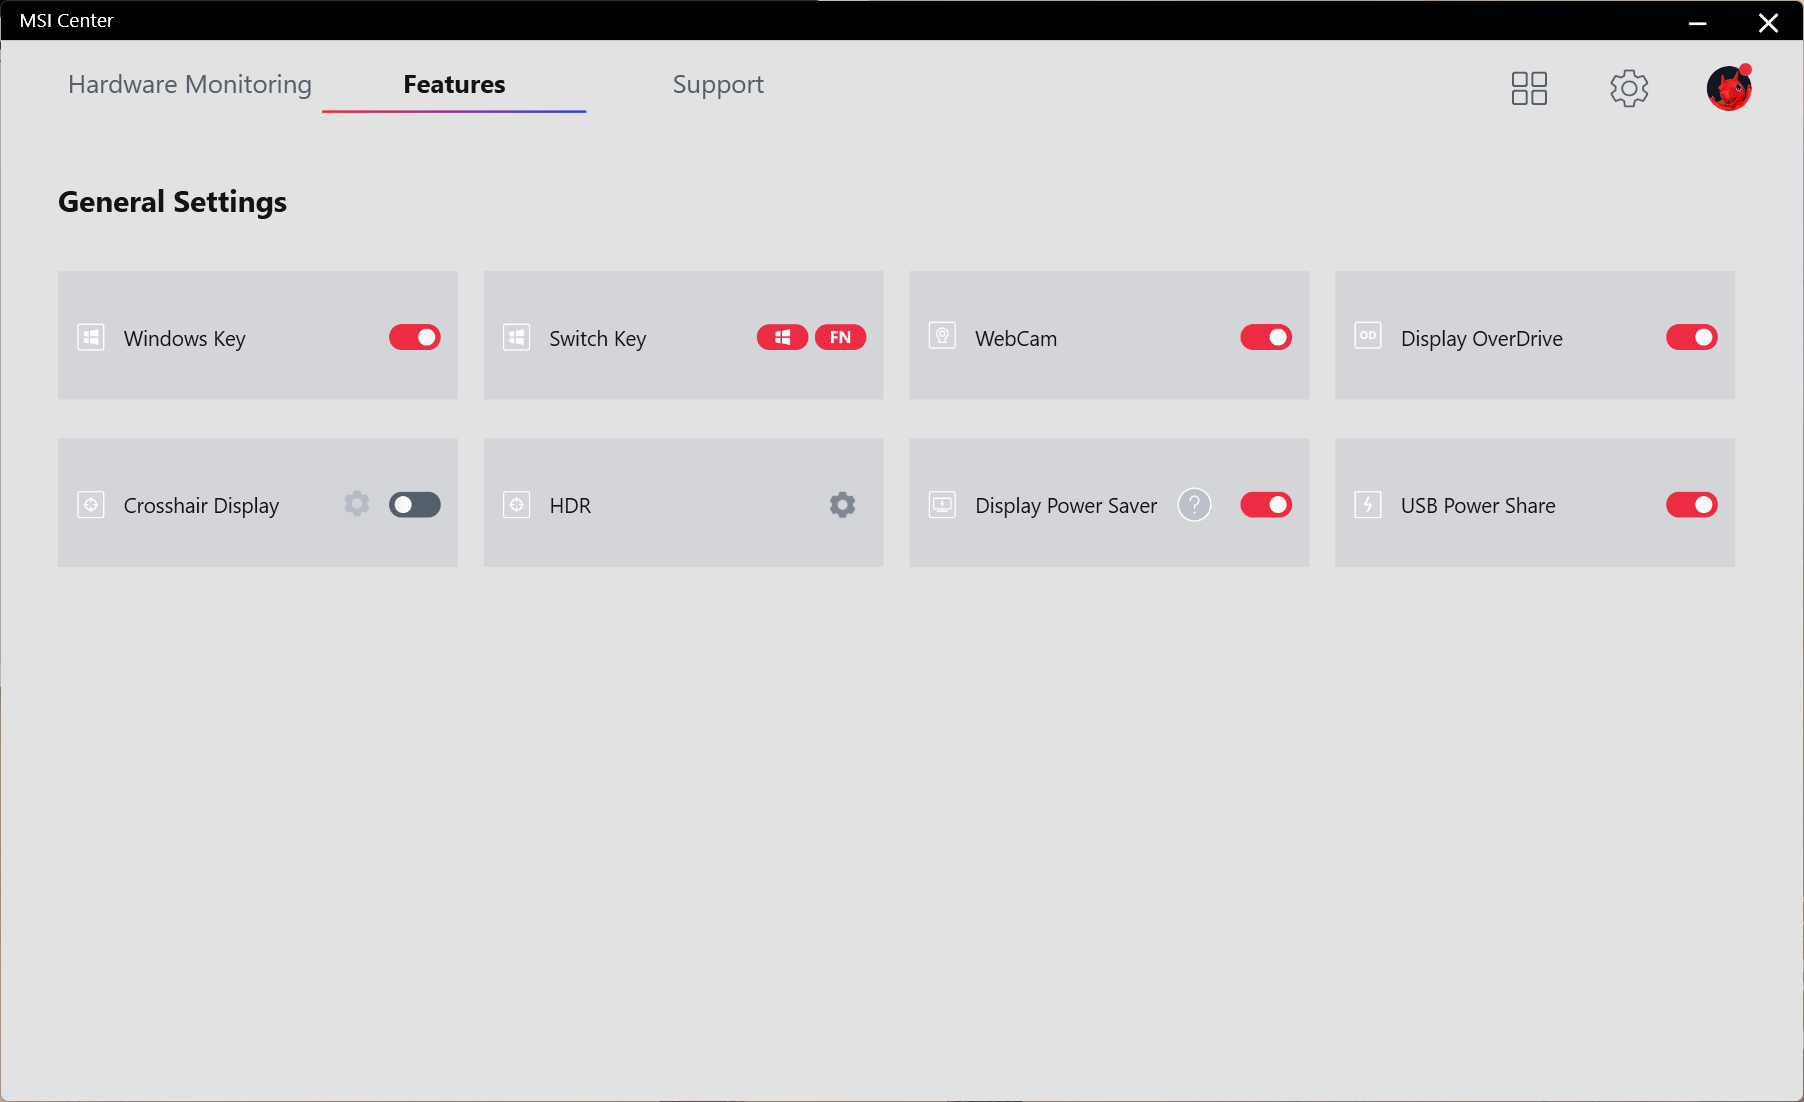
Não há obturador de privacidade física disponível, mas é possível ativar ou desativar a webcam usando o atalho na tecla de função F6 ou via MSI Center.


Segurança
Não há nenhum login biométrico disponível no Crosshair 15 R6E. O único componente de segurança importante a bordo é o módulo TPM 2.0.
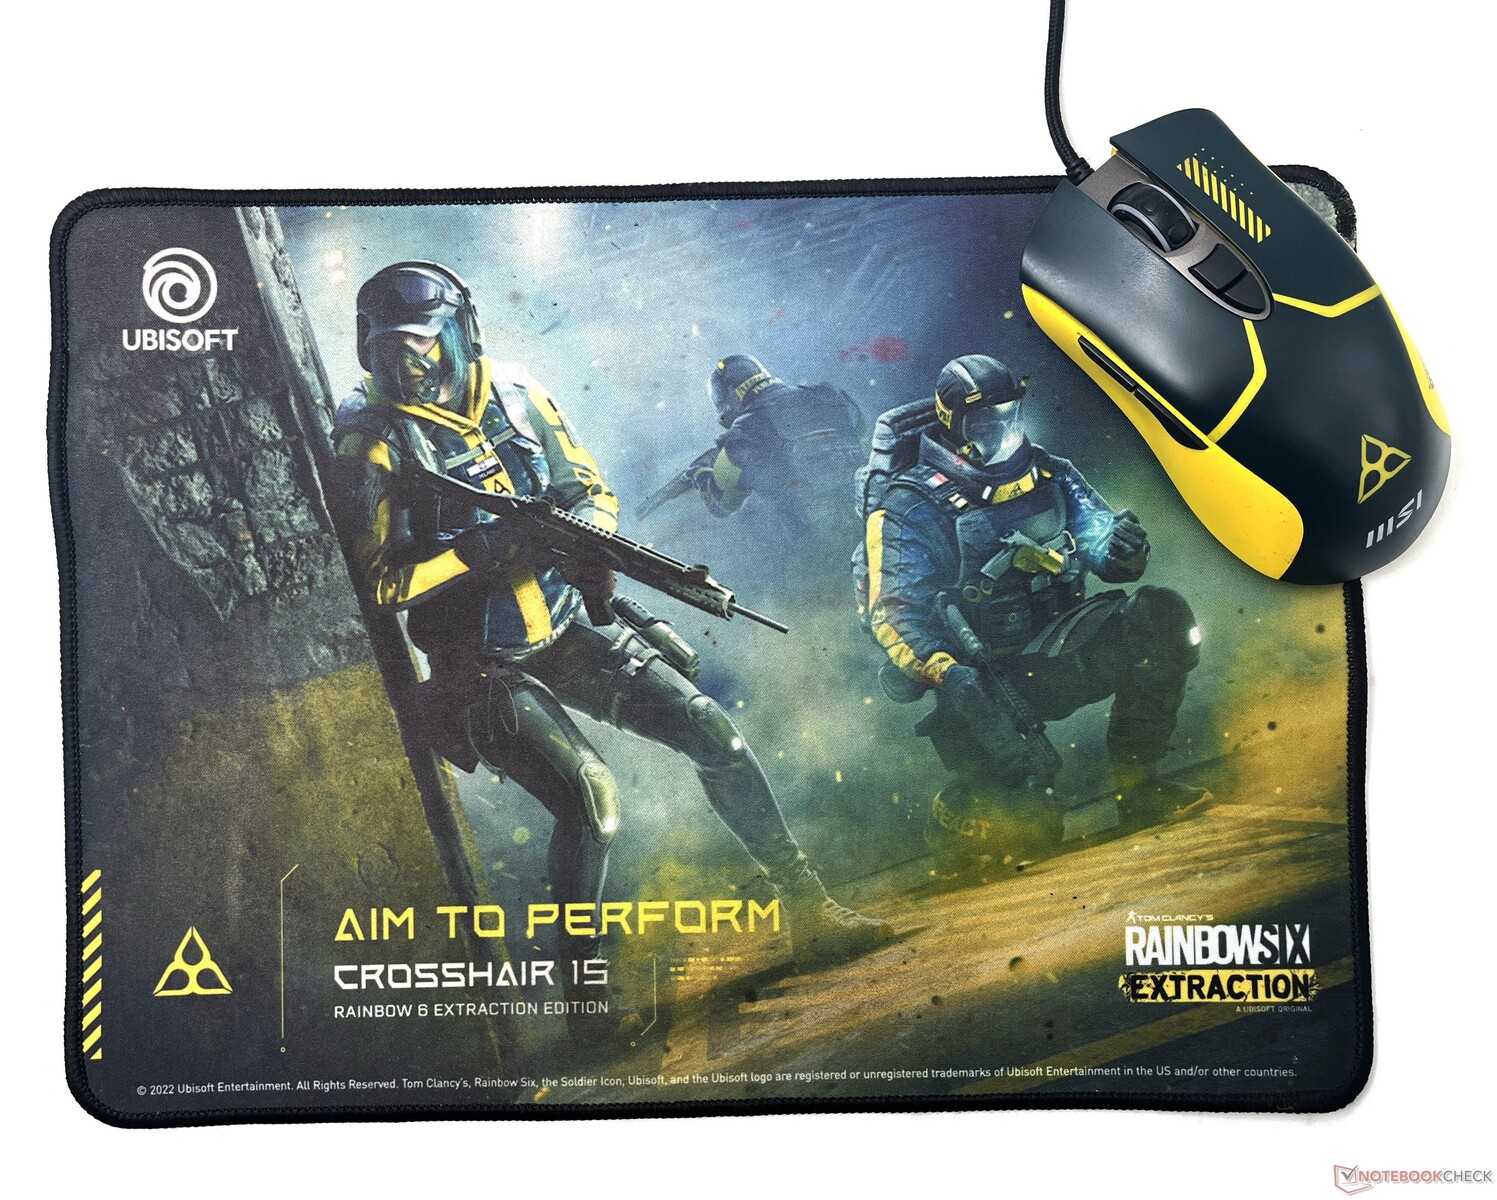
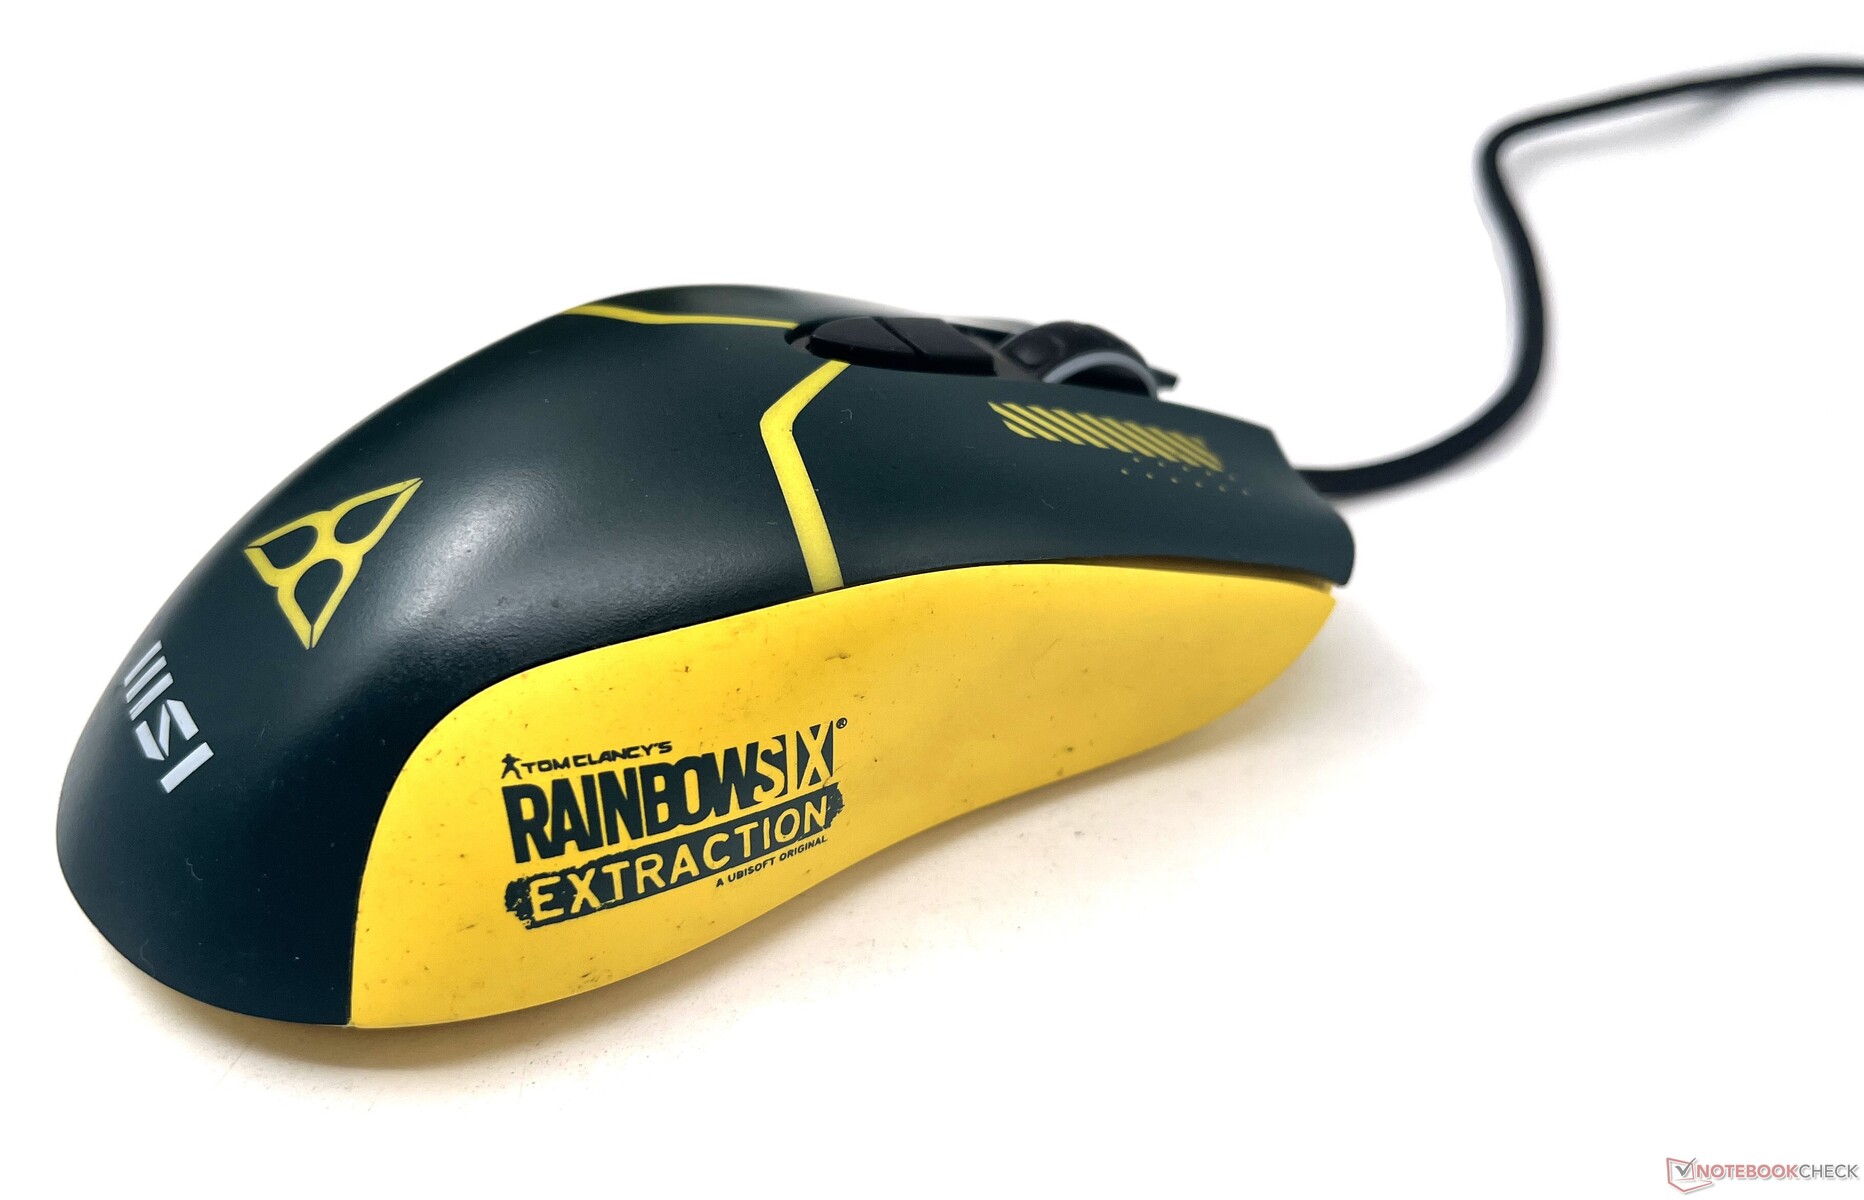
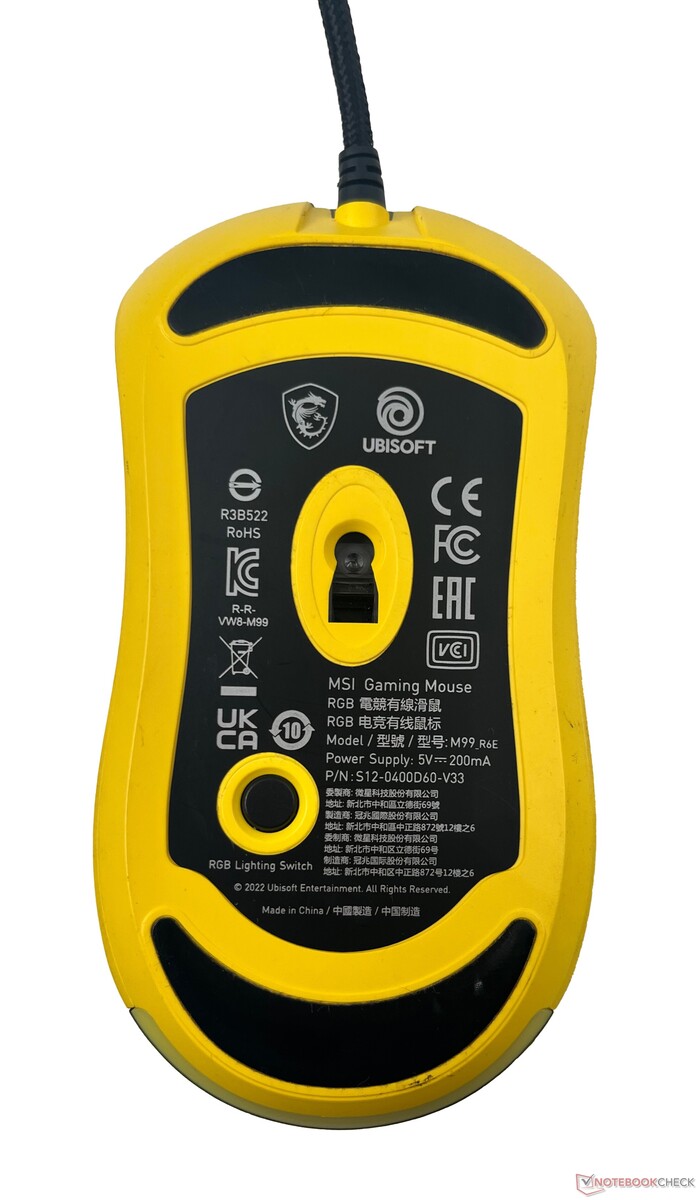
Acessórios
A MSI tenta puxá-lo ainda mais para dentro dos Seis Arco-Íris: Universo de extração com alguns acessórios adicionais. Um mouse pad e um mouse temático de jogo no jogo estão incluídos no pacote. Os compradores também podem resgatar uma cópia gratuita do Rainbow Six: Extraction Deluxe Edition via Ubisoft.
O mouse é uma versão personalizada do MSI M99. O mouse usa um sensor Avago 3050 com uma resolução de 4.000 DPI e uma taxa de votação de 500 Hz. Obviamente não está na liga de um Corsair IronClaw RGB ou mesmo o Mad Catz R.A.T. Airmas ainda é uma oferta gratuita decente.
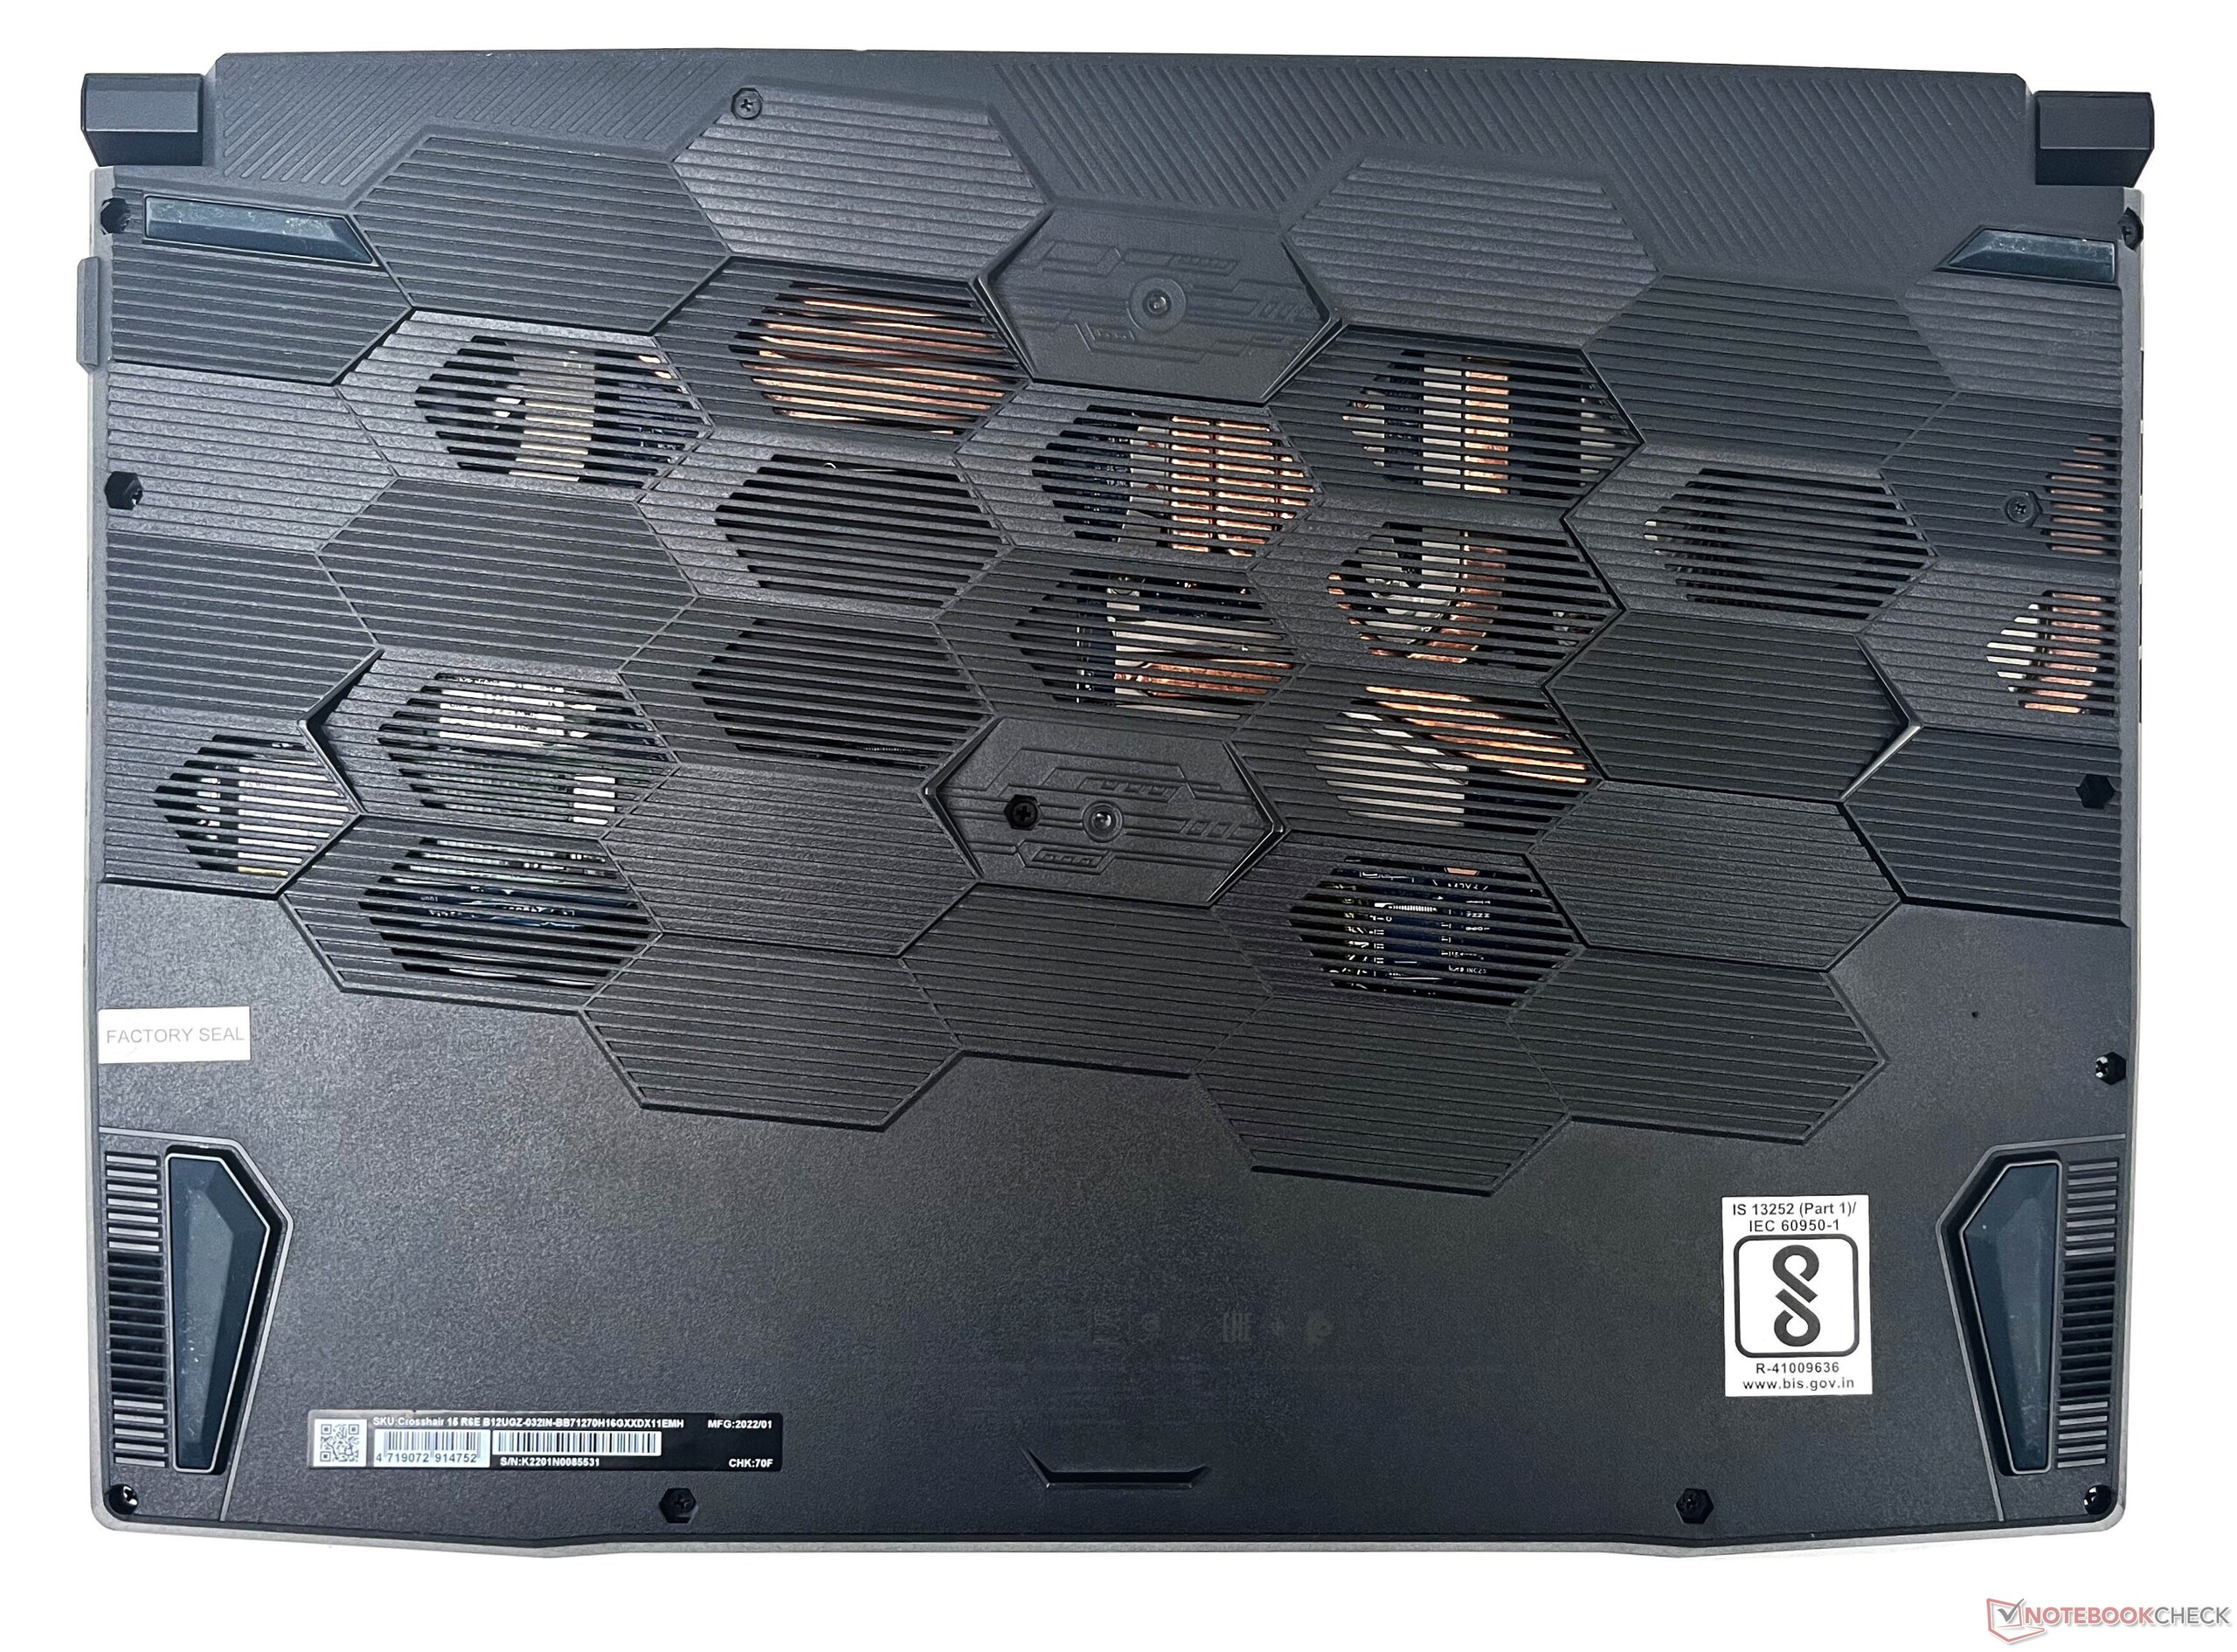
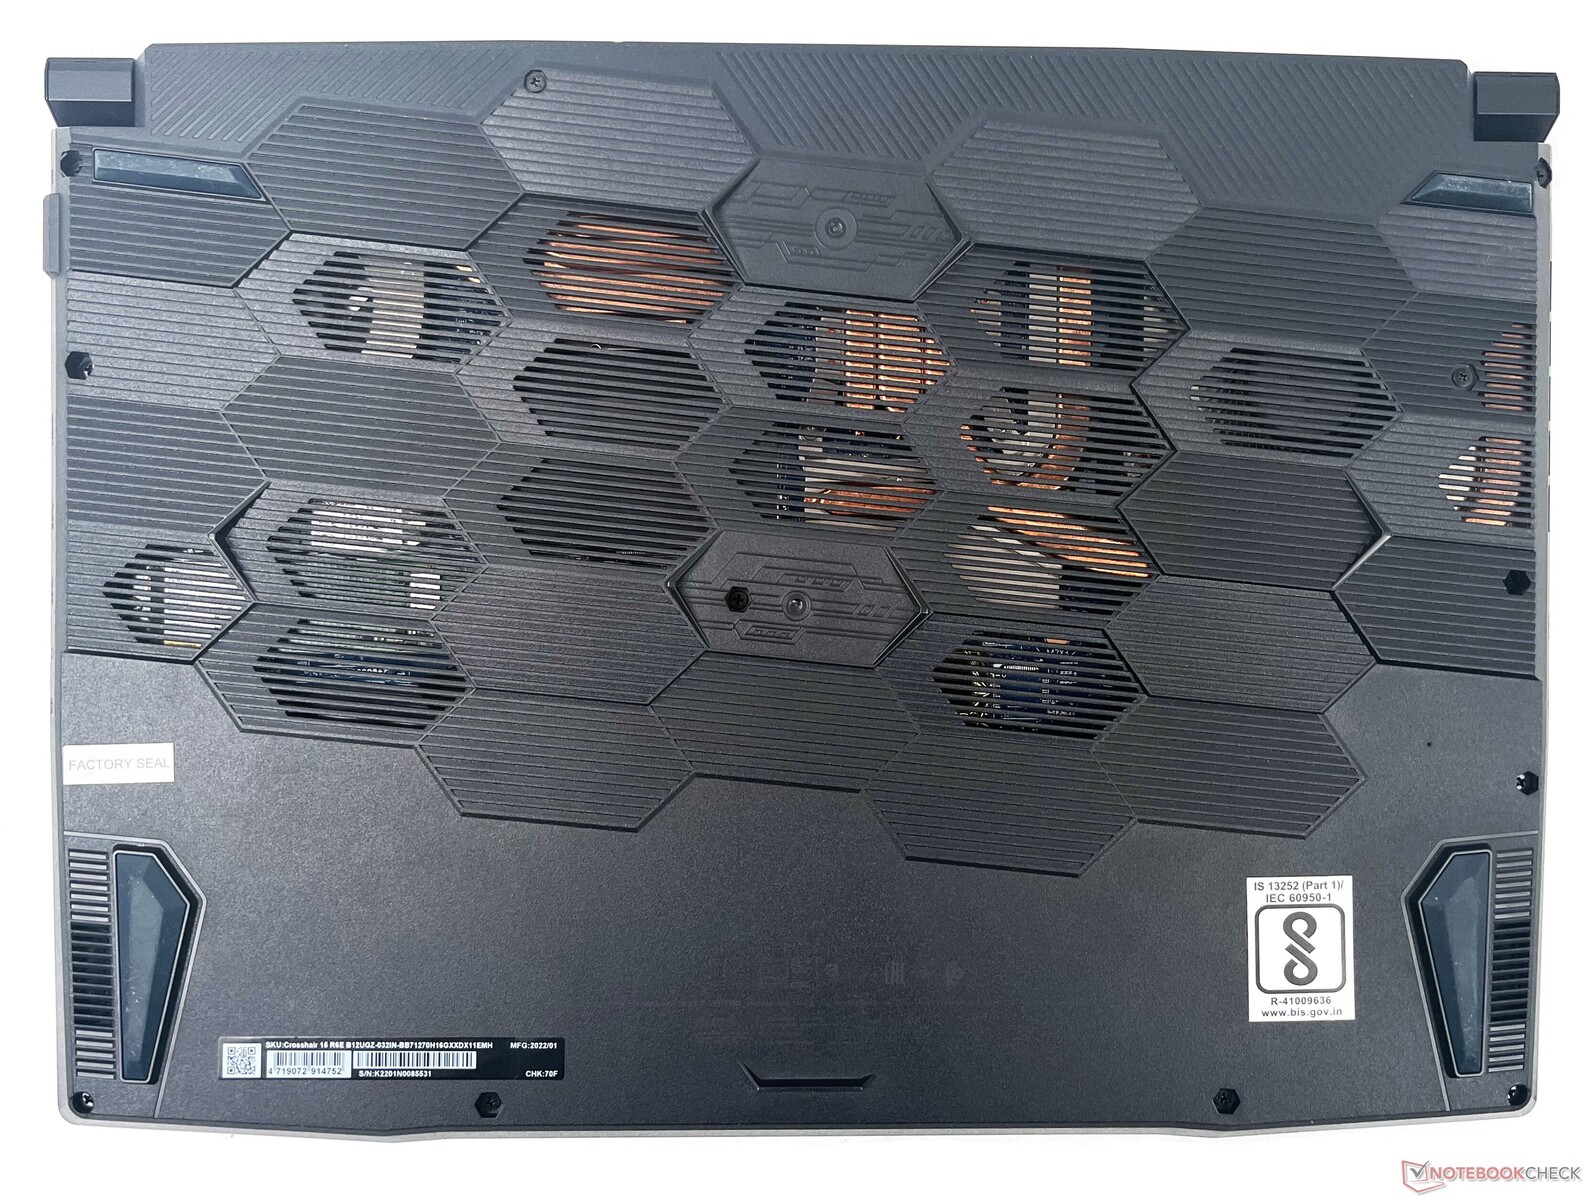
Manutenção
Como é norma com as amostras de revisão MSI, fomos impedidos de remover o adesivo do Selo de Fábrica que esconde um dos parafusos. Dito isto, abrir o painel traseiro é bastante simples e os usuários devem ser capazes de realizar atualizações sem problemas.
Garantia
A MSI oferece uma garantia de dois anos para o Crosshair 15 R6E que também inclui um ano de seguro de viagem global nos centros de serviço autorizados da MSI.
Dispositivos de entrada: Cores de retroiluminação temáticas fixas
Teclado
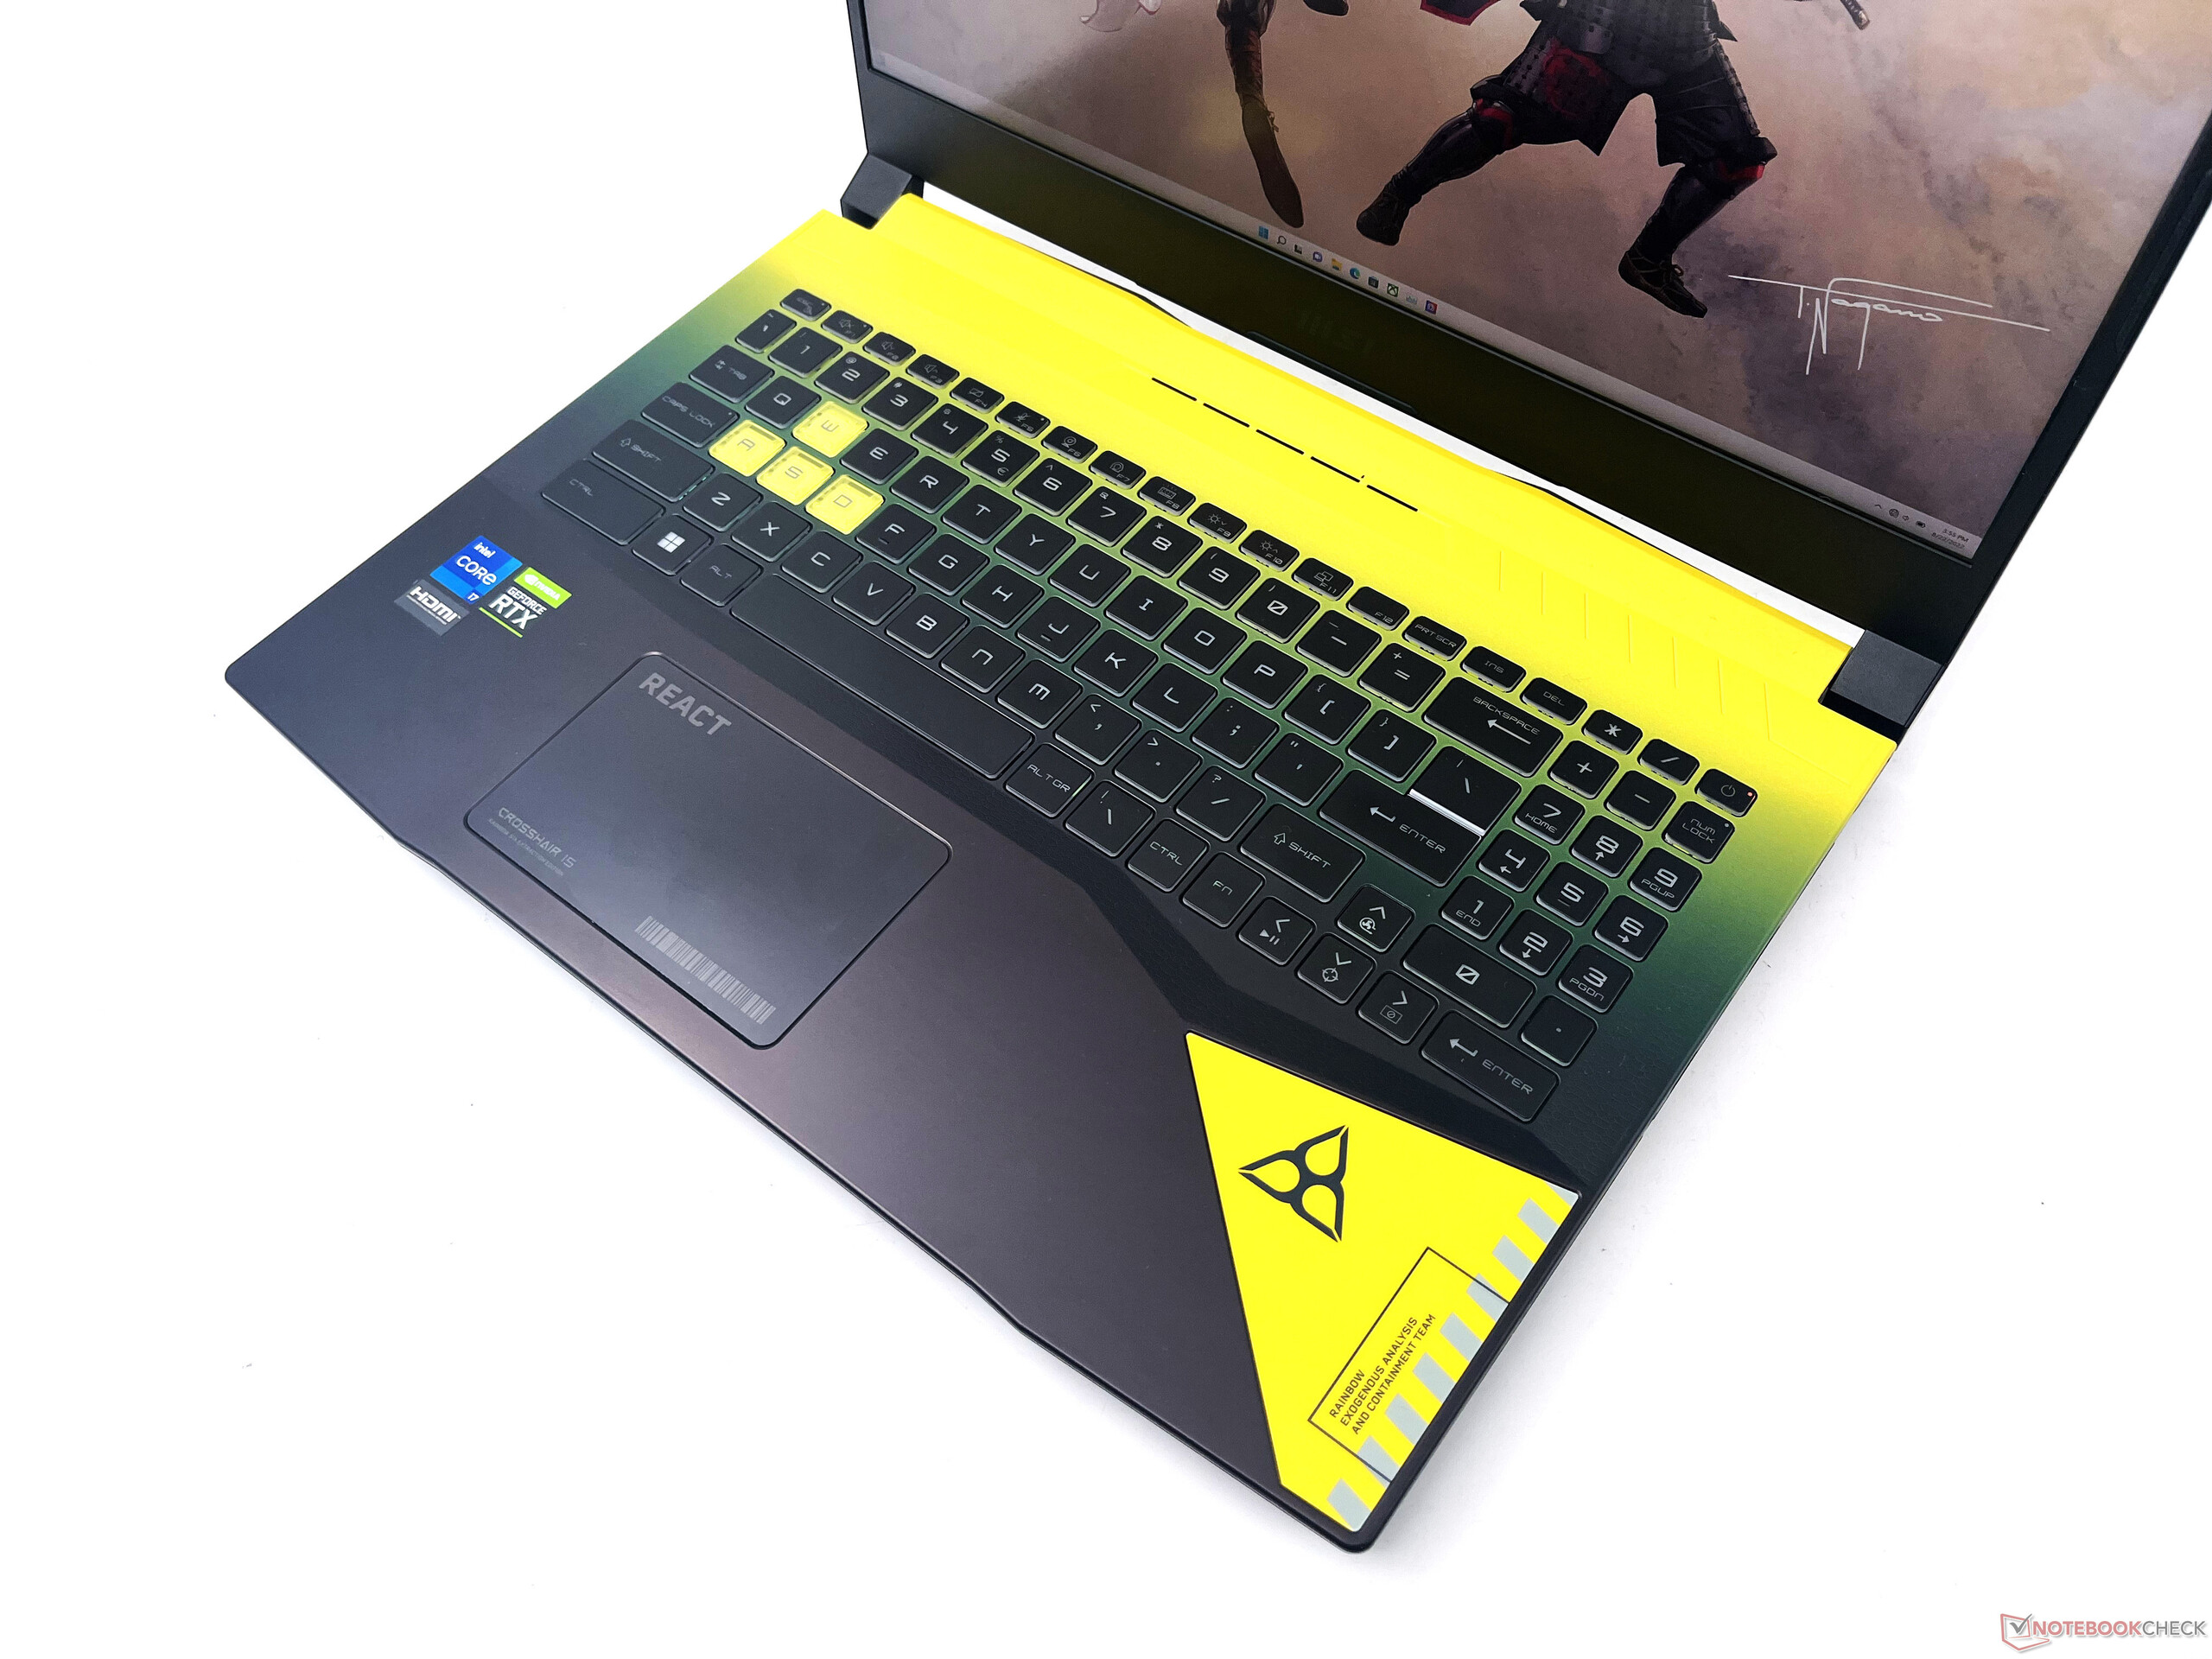
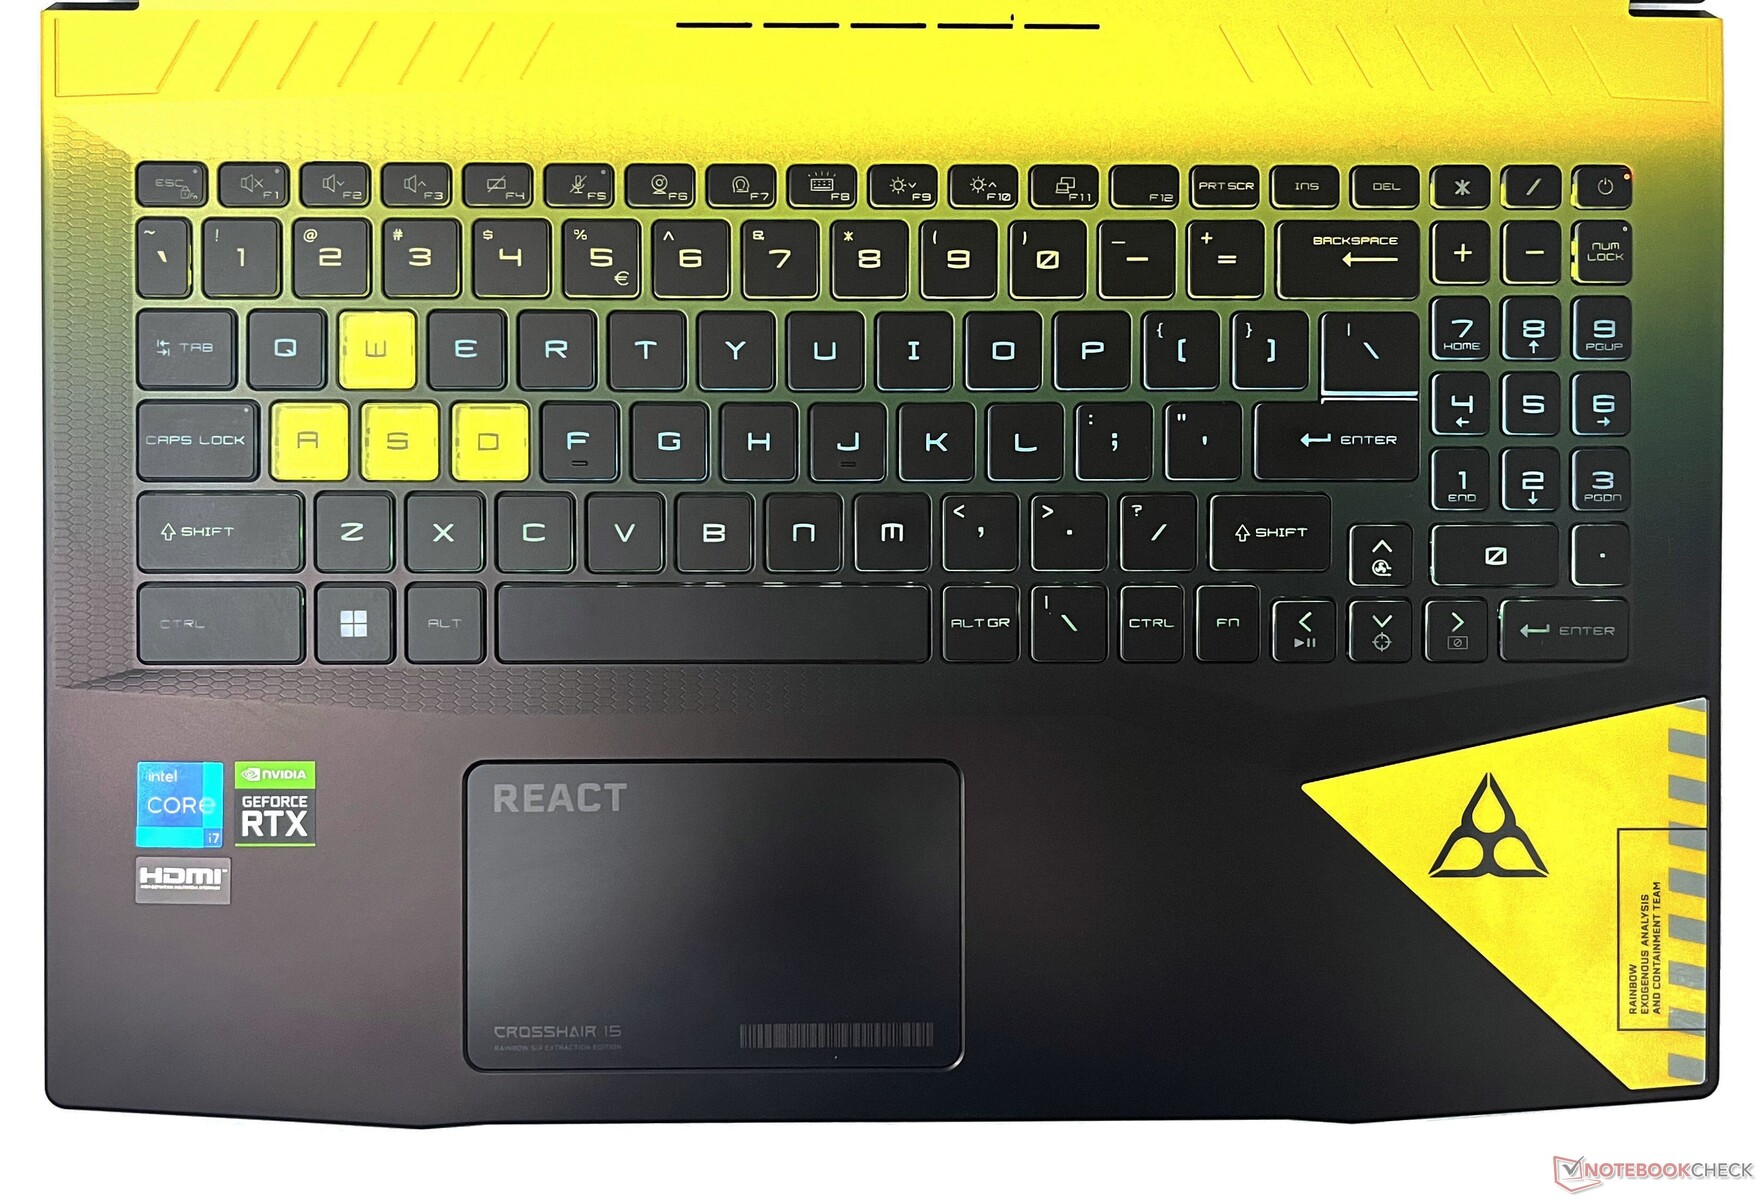
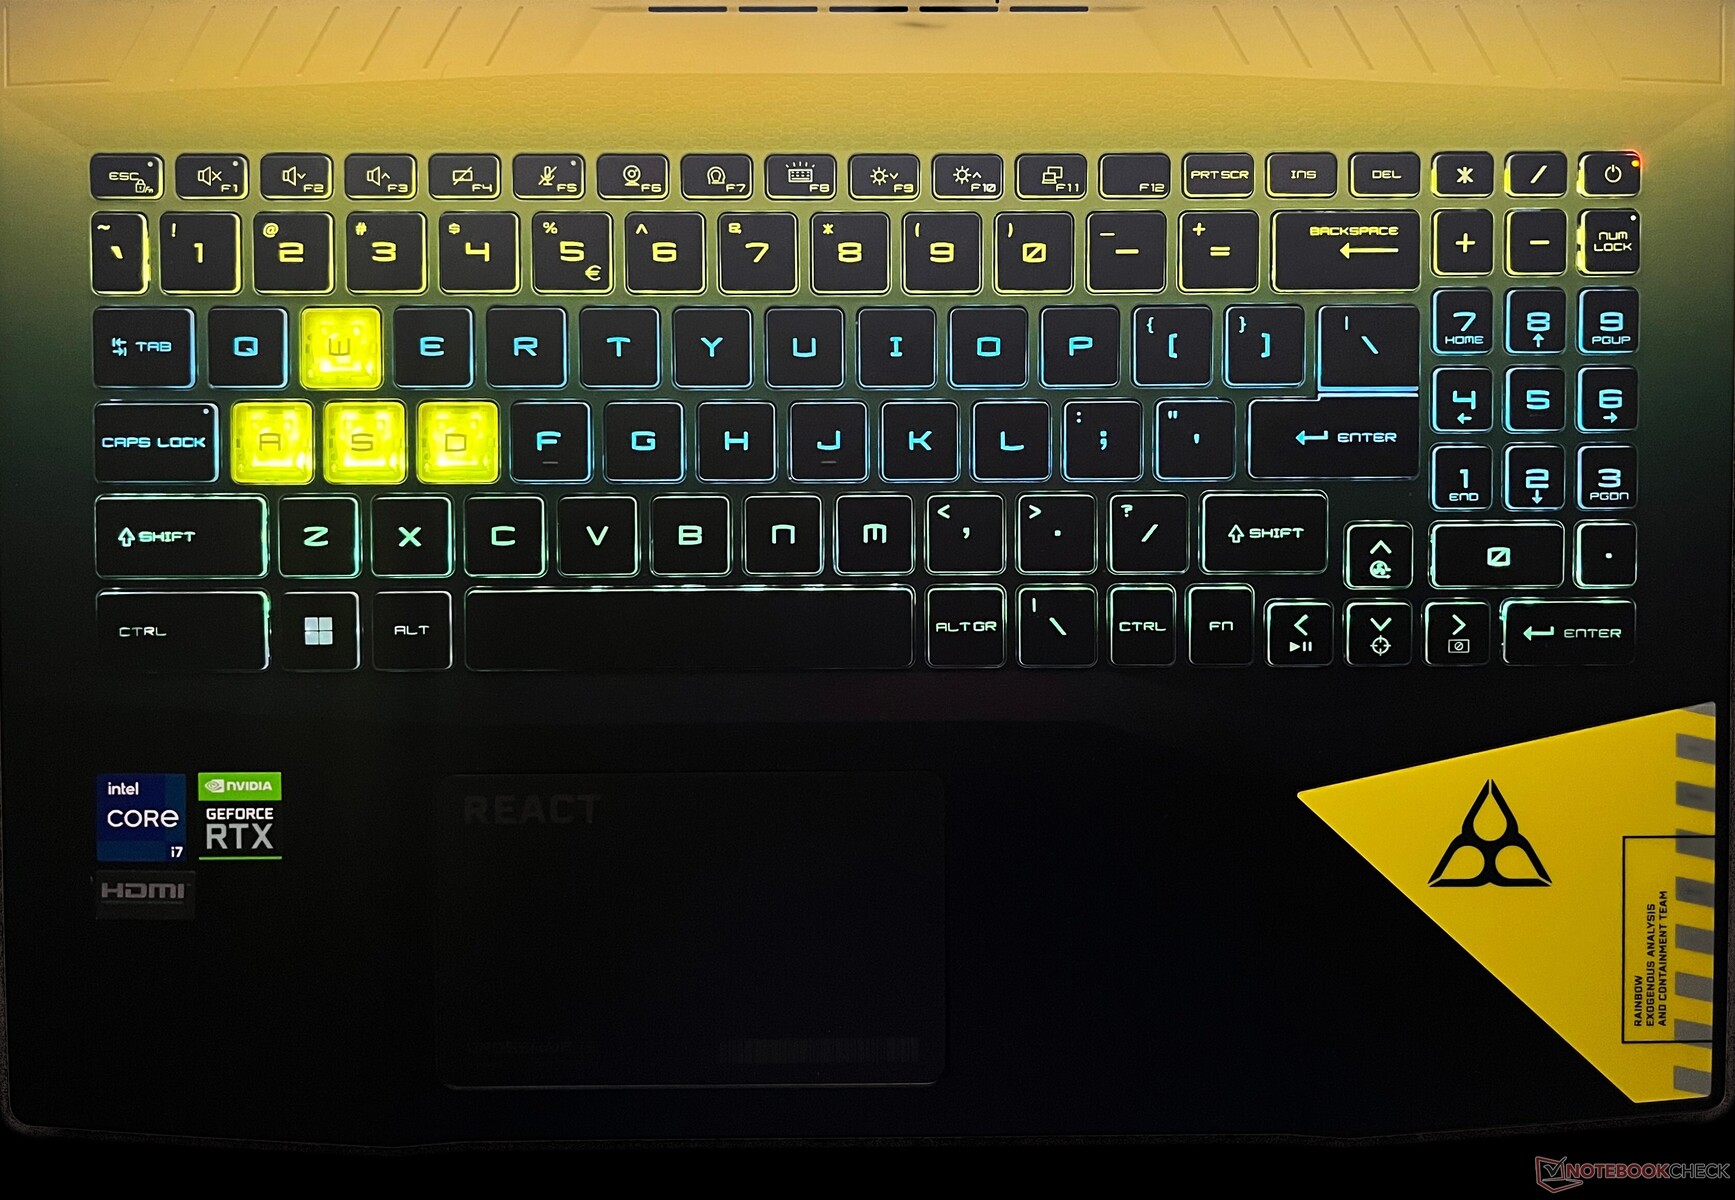
O teclado do Crosshair 15 R6E não apresenta RGB ou qualquer uma das características da SteelSeries, mas a MSI incorporou o que ela chama de teclado Spectrum Backlight. Essencialmente, as luzes do teclado são inspiradas - você adivinhou - no Rainbow Six: Jogo de extração com cores amarelas e azuis
Cada tecla tem iluminação fixa que não pode ser personalizada, embora a intensidade da própria luz de fundo geral possa ser ajustada através de um atalho de teclado. As teclas têm um bom percurso de 1,7 mm e um feedback tátil decente
A inclusão do teclado numérico é bem-vinda, e as teclas de setas não são apertadas. As funções secundárias são felizmente iluminadas, o que as torna fáceis de reconhecer no escuro.
Se você é novo nos laptops MSI, você deve tomar nota da difícil colocação da tecla Fn à direita, ao invés de sua posição habitual.
Touchpad
O touchpad de 10,5 cm x 6,5 cm recebe o logotipo REACT do jogo e o rótulo Crosshair 15. Em termos de funcionalidade, ele é semelhante aos touchpads que vimos com seus primos Pulse e Katana.
A resposta do touchpad é boa e os gestos funcionam bem graças aos drivers do Windows Precision. Os botões esquerdo e direito do mouse estão nivelados com o touchpad e clicam sem esforço, embora com algum ruído.
Mostrar: Painel QHD 165 Hz com ampla cobertura de gama de cores e sem PWM
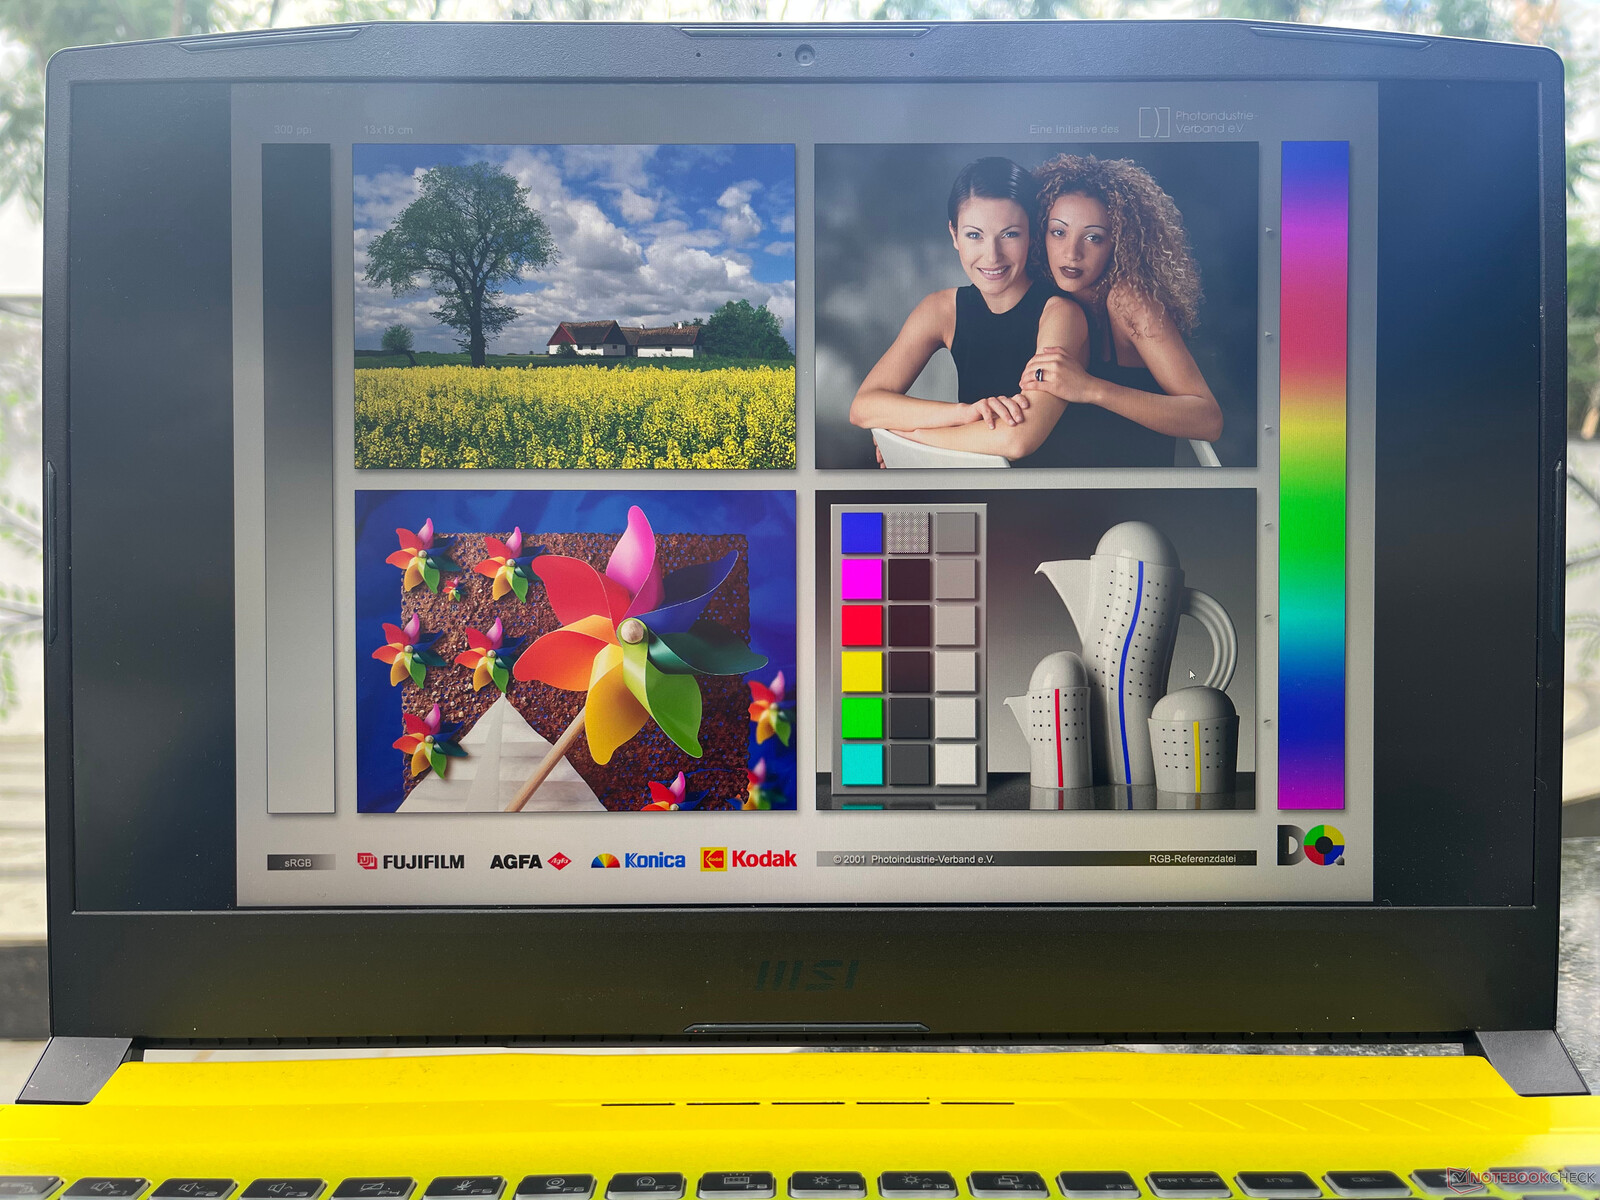
A MSI oferece um painel de nível IPS QHD de 15,6 polegadas com uma taxa de atualização de 165 Hz em ambas as SKUs Crosshair 15 R6E. Não há suporte para HDR10 ou Dolby Vision. Registramos um brilho máximo de 342 lêndeas, que devem poder ser utilizadas em interiores.
Uma distribuição de 89% de luminosidade e uma relação de contraste medida de 1069:1 oferecem uma experiência de visualização decente. Isto é semelhante ao que tínhamos observado anteriormente com o Asus ROG Zephyrus G15 e o Acer Nitro 5que utilizam o mesmo painel.
Entretanto, vemos um sangramento significativo de luz de fundo perto dos cantos inferiores do visor.

| |||||||||||||||||||||||||
iluminação: 89 %
iluminação com acumulador: 341 cd/m²
Contraste: 1069:1 (Preto: 0.32 cd/m²)
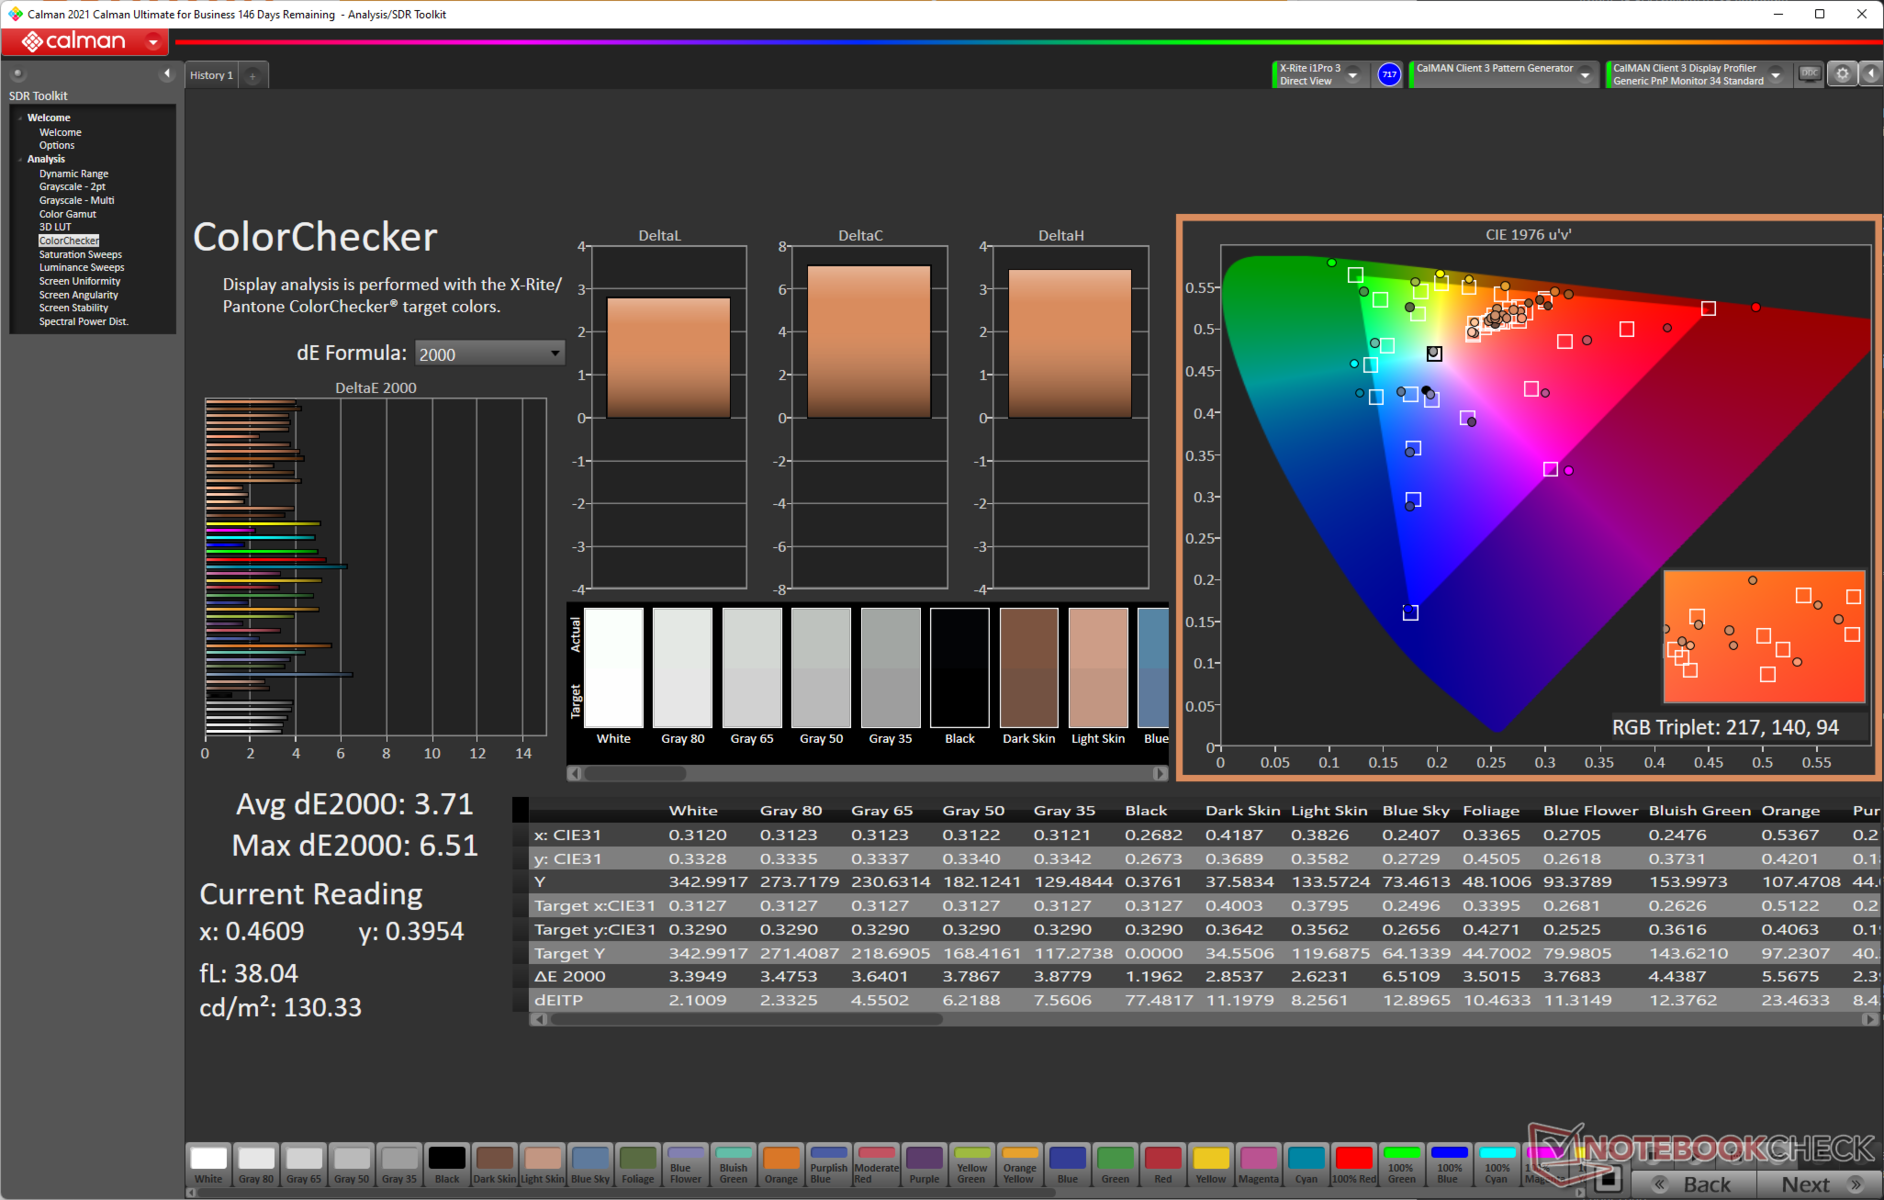
ΔE ColorChecker Calman: 3.71 | ∀{0.5-29.43 Ø4.71}
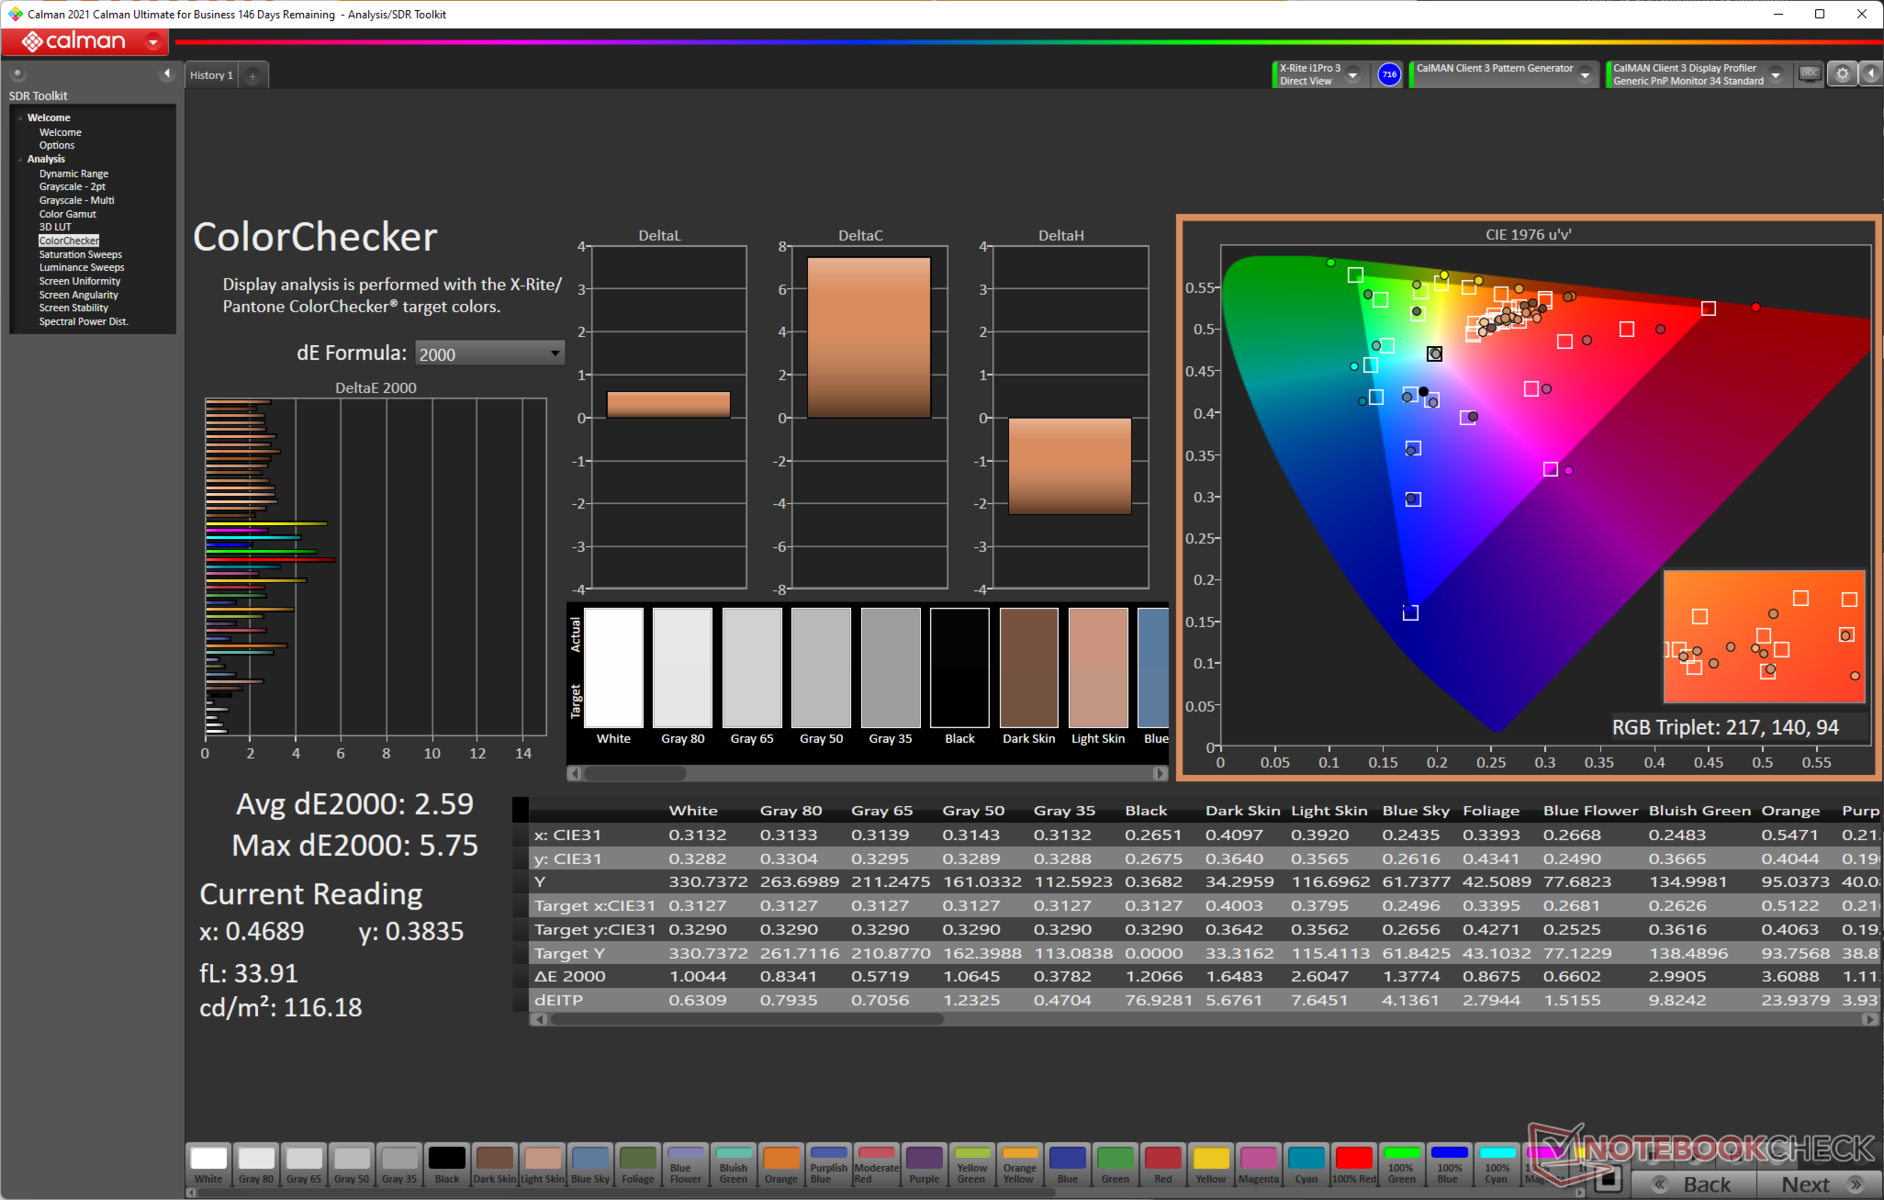
calibrated: 2.59
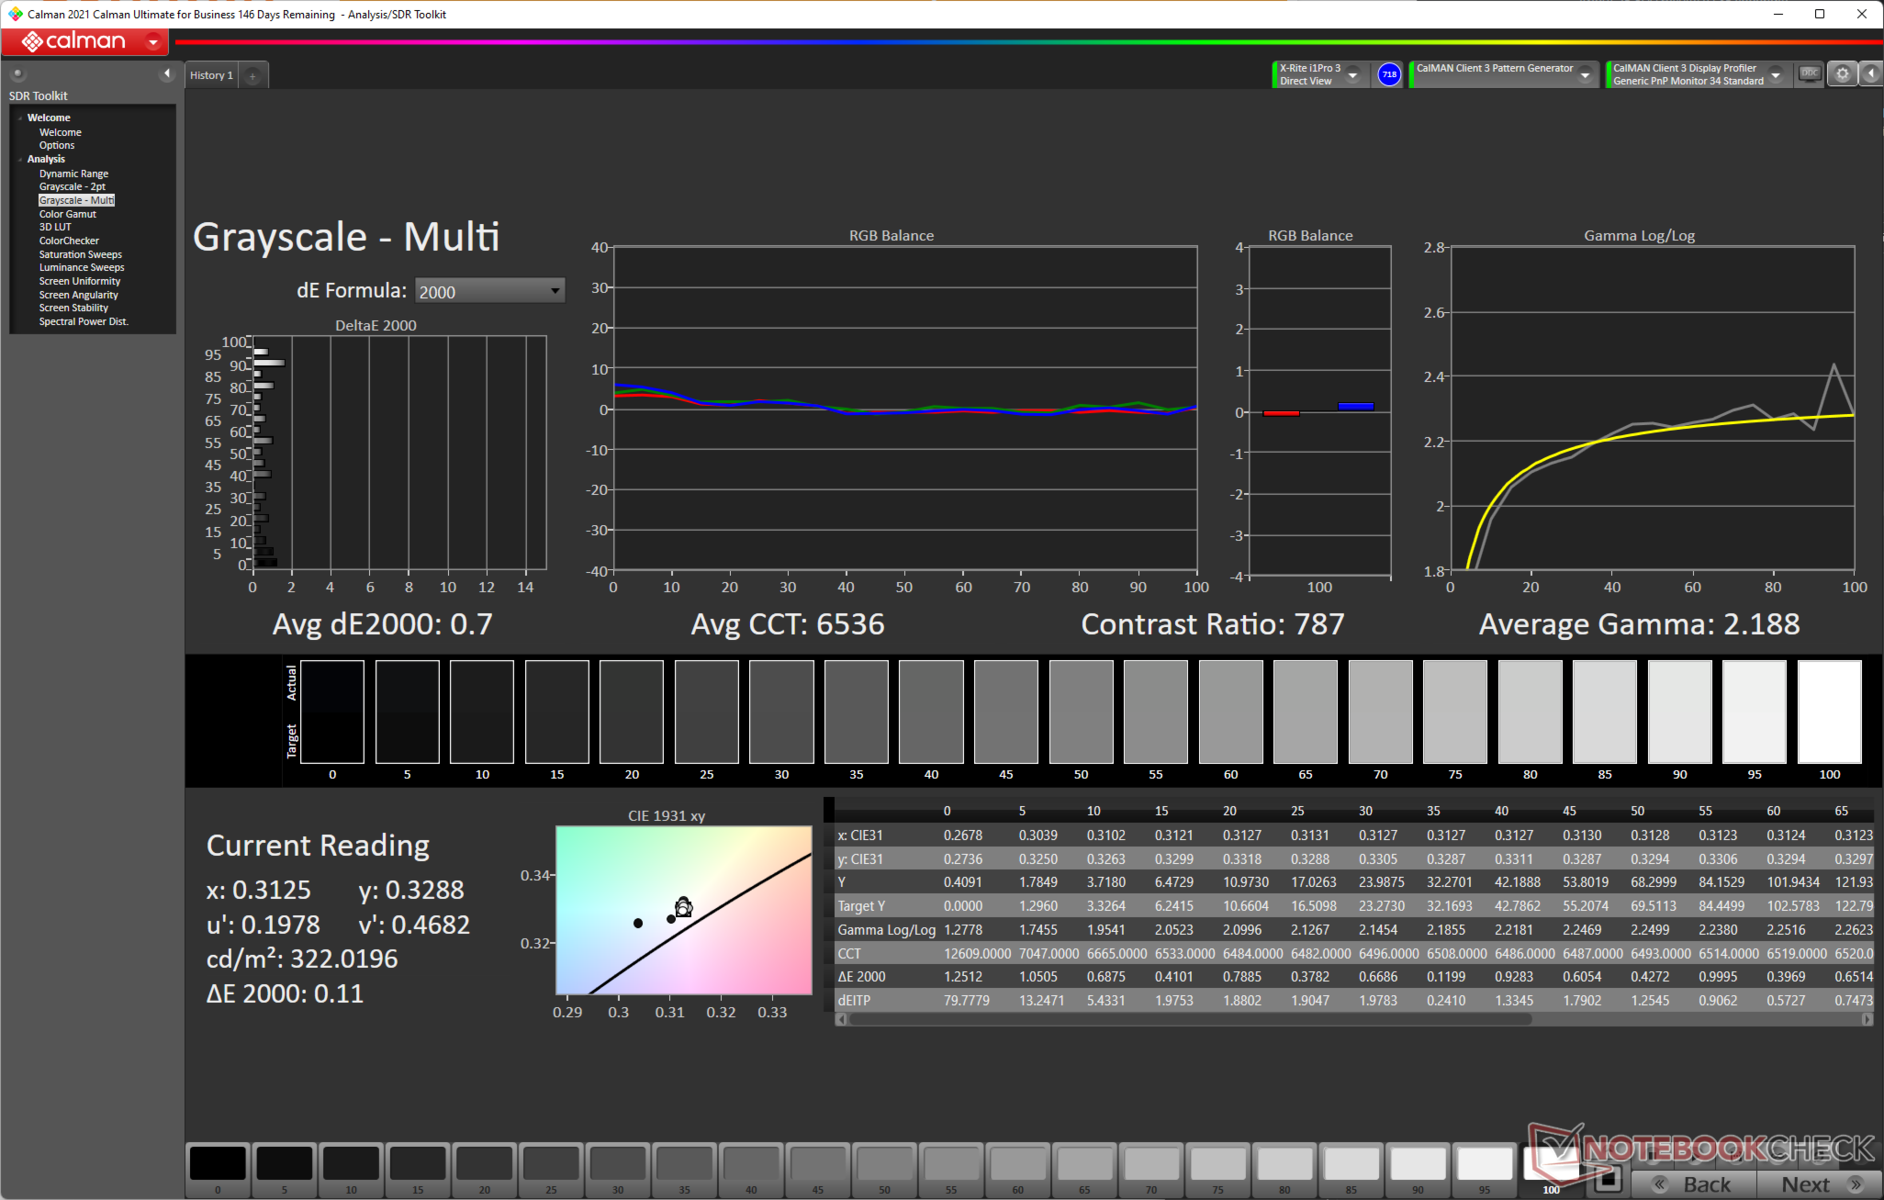
ΔE Greyscale Calman: 3 | ∀{0.09-98 Ø4.96}
84.7% AdobeRGB 1998 (Argyll 3D)
99.8% sRGB (Argyll 3D)
94.8% Display P3 (Argyll 3D)
Gamma: 2.07
CCT: 6621 K
| MSI Crosshair 15 R6E B12UGZ-050 CMN N156KME-GNA, IPS-Level, 2560x1440, 15.6" | MSI Stealth GS66 12UGS Sharp LQ156T1JW04 (SHP153C), IPS-Level, 2560x1440, 15.6" | Lenovo Legion 5 Pro 16 G7 i7 RTX 3070Ti NE160QDM-NY1, IPS, 2560x1600, 16" | Acer Nitro 5 AN515-58-72QR Chi Mei N156KME-GNA, IPS, 2560x1440, 15.6" | Schenker XMG Neo 15 (Ryzen 9 6900HX, RTX 3070 Ti) BOE0A67, IPS, 2560x1440, 15.6" | |
|---|---|---|---|---|---|
| Display | 1% | -15% | 1% | -15% | |
| Display P3 Coverage (%) | 94.8 | 96.4 2% | 68.7 -28% | 95.6 1% | 68.9 -27% |
| sRGB Coverage (%) | 99.8 | 99.7 0% | 97.6 -2% | 99.8 0% | 97.7 -2% |
| AdobeRGB 1998 Coverage (%) | 84.7 | 85.6 1% | 70.9 -16% | 85.2 1% | 70.4 -17% |
| Response Times | -8% | -112% | -110% | -70% | |
| Response Time Grey 50% / Grey 80% * (ms) | 5.36 ? | 6 ? -12% | 17.6 ? -228% | 15.7 ? -193% | 12.4 ? -131% |
| Response Time Black / White * (ms) | 8.04 ? | 8.4 ? -4% | 7.6 ? 5% | 10.2 ? -27% | 8.8 ? -9% |
| PWM Frequency (Hz) | |||||
| Screen | -13% | 25% | -1% | 14% | |
| Brightness middle (cd/m²) | 342 | 272 -20% | 502 47% | 332 -3% | 370 8% |
| Brightness (cd/m²) | 326 | 253 -22% | 491 51% | 303 -7% | 343 5% |
| Brightness Distribution (%) | 89 | 87 -2% | 91 2% | 86 -3% | 82 -8% |
| Black Level * (cd/m²) | 0.32 | 0.25 22% | 0.37 -16% | 0.29 9% | 0.28 12% |
| Contrast (:1) | 1069 | 1088 2% | 1357 27% | 1145 7% | 1321 24% |
| Colorchecker dE 2000 * | 3.71 | 3.73 -1% | 2.7 27% | 3.61 3% | 2.31 38% |
| Colorchecker dE 2000 max. * | 6.51 | 9.43 -45% | 4.5 31% | 7.71 -18% | 4.03 38% |
| Colorchecker dE 2000 calibrated * | 2.59 | 0.98 62% | 1.4 46% | 0.59 77% | |
| Greyscale dE 2000 * | 3 | 6.5 -117% | 2.7 10% | 5.2 -73% | 3.28 -9% |
| Gamma | 2.07 106% | 2.172 101% | 2.44 90% | 2.155 102% | 2.47 89% |
| CCT | 6621 98% | 6485 100% | 6326 103% | 6724 97% | 6206 105% |
| Média Total (Programa/Configurações) | -7% /
-10% | -34% /
-3% | -37% /
-16% | -24% /
-6% |
* ... menor é melhor
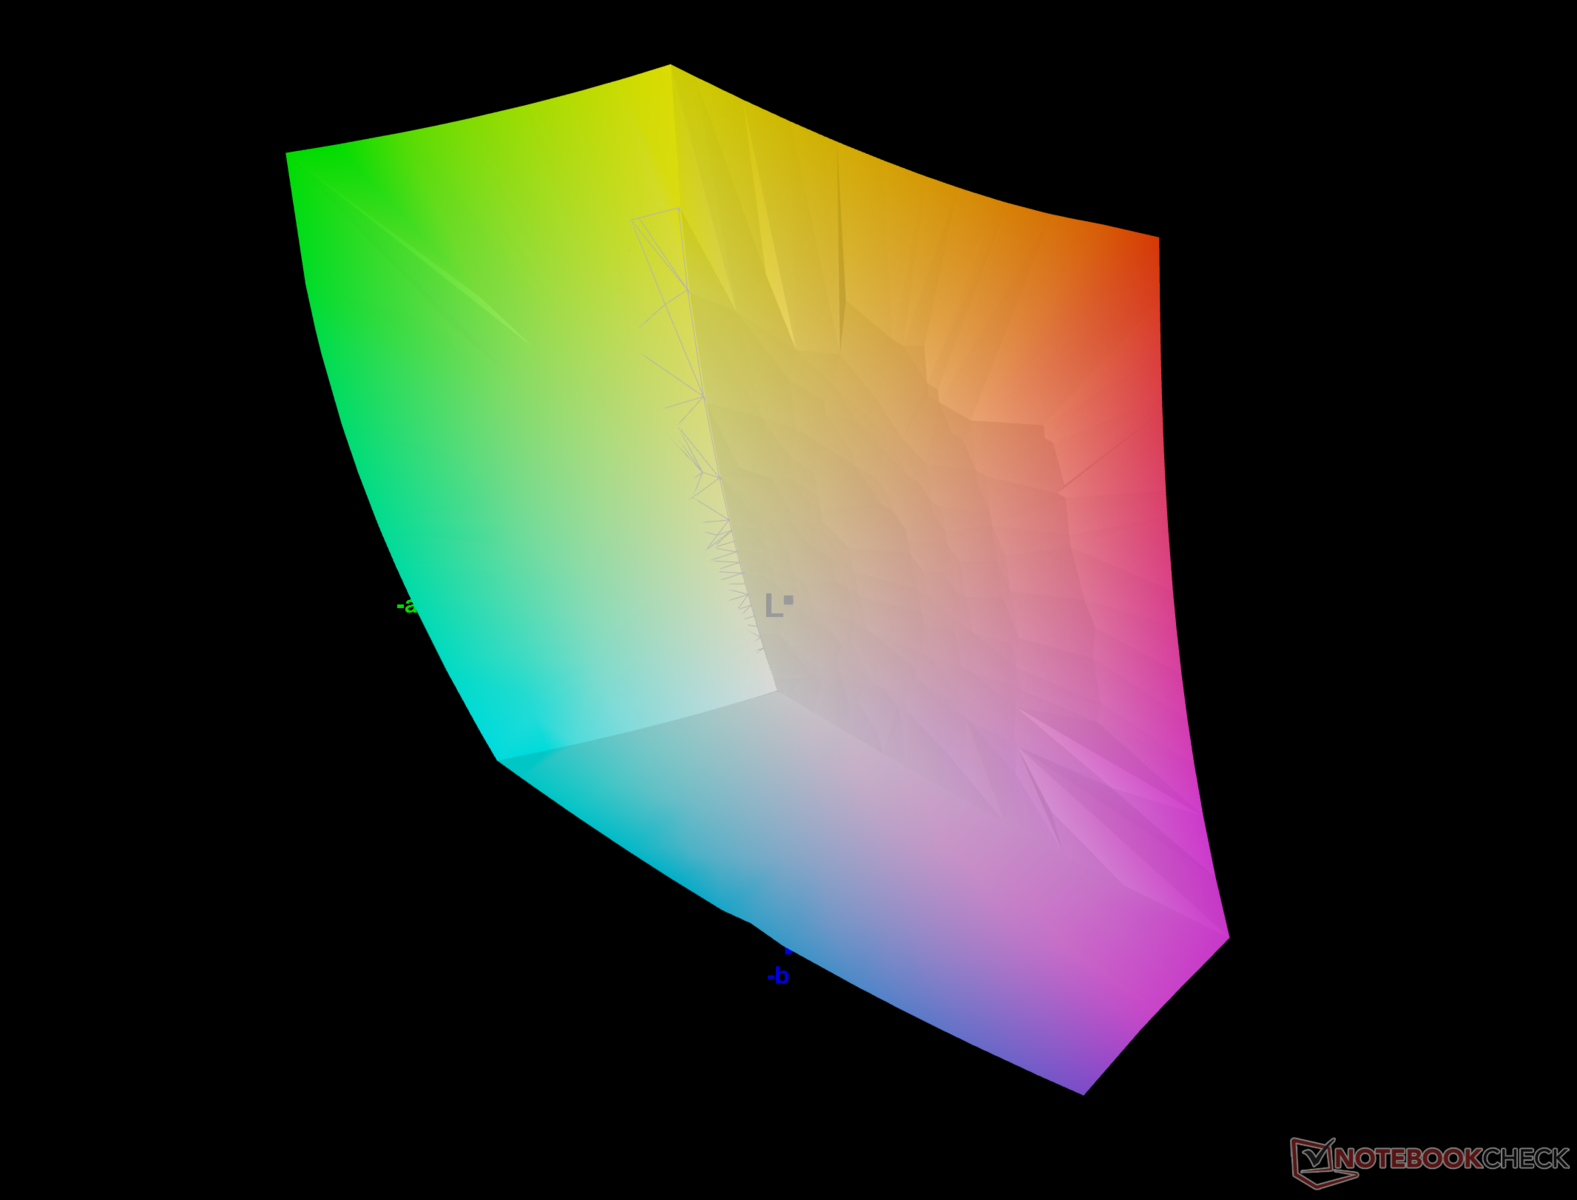
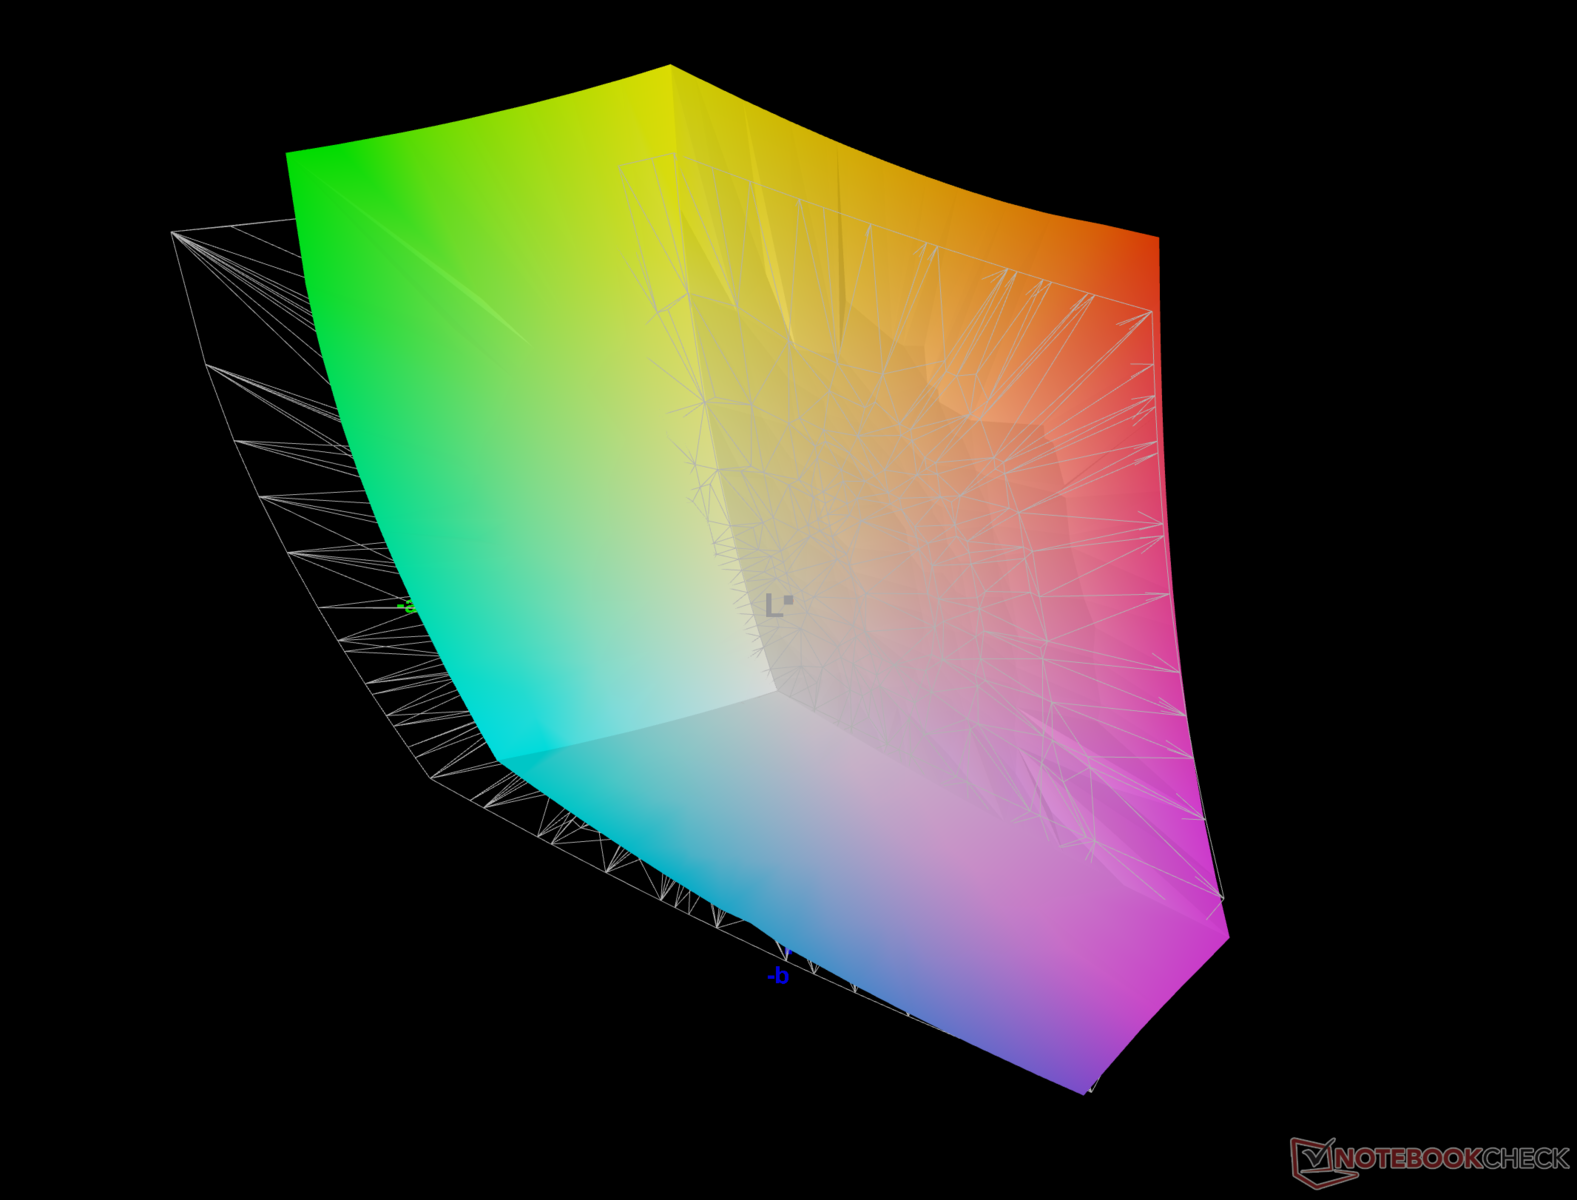
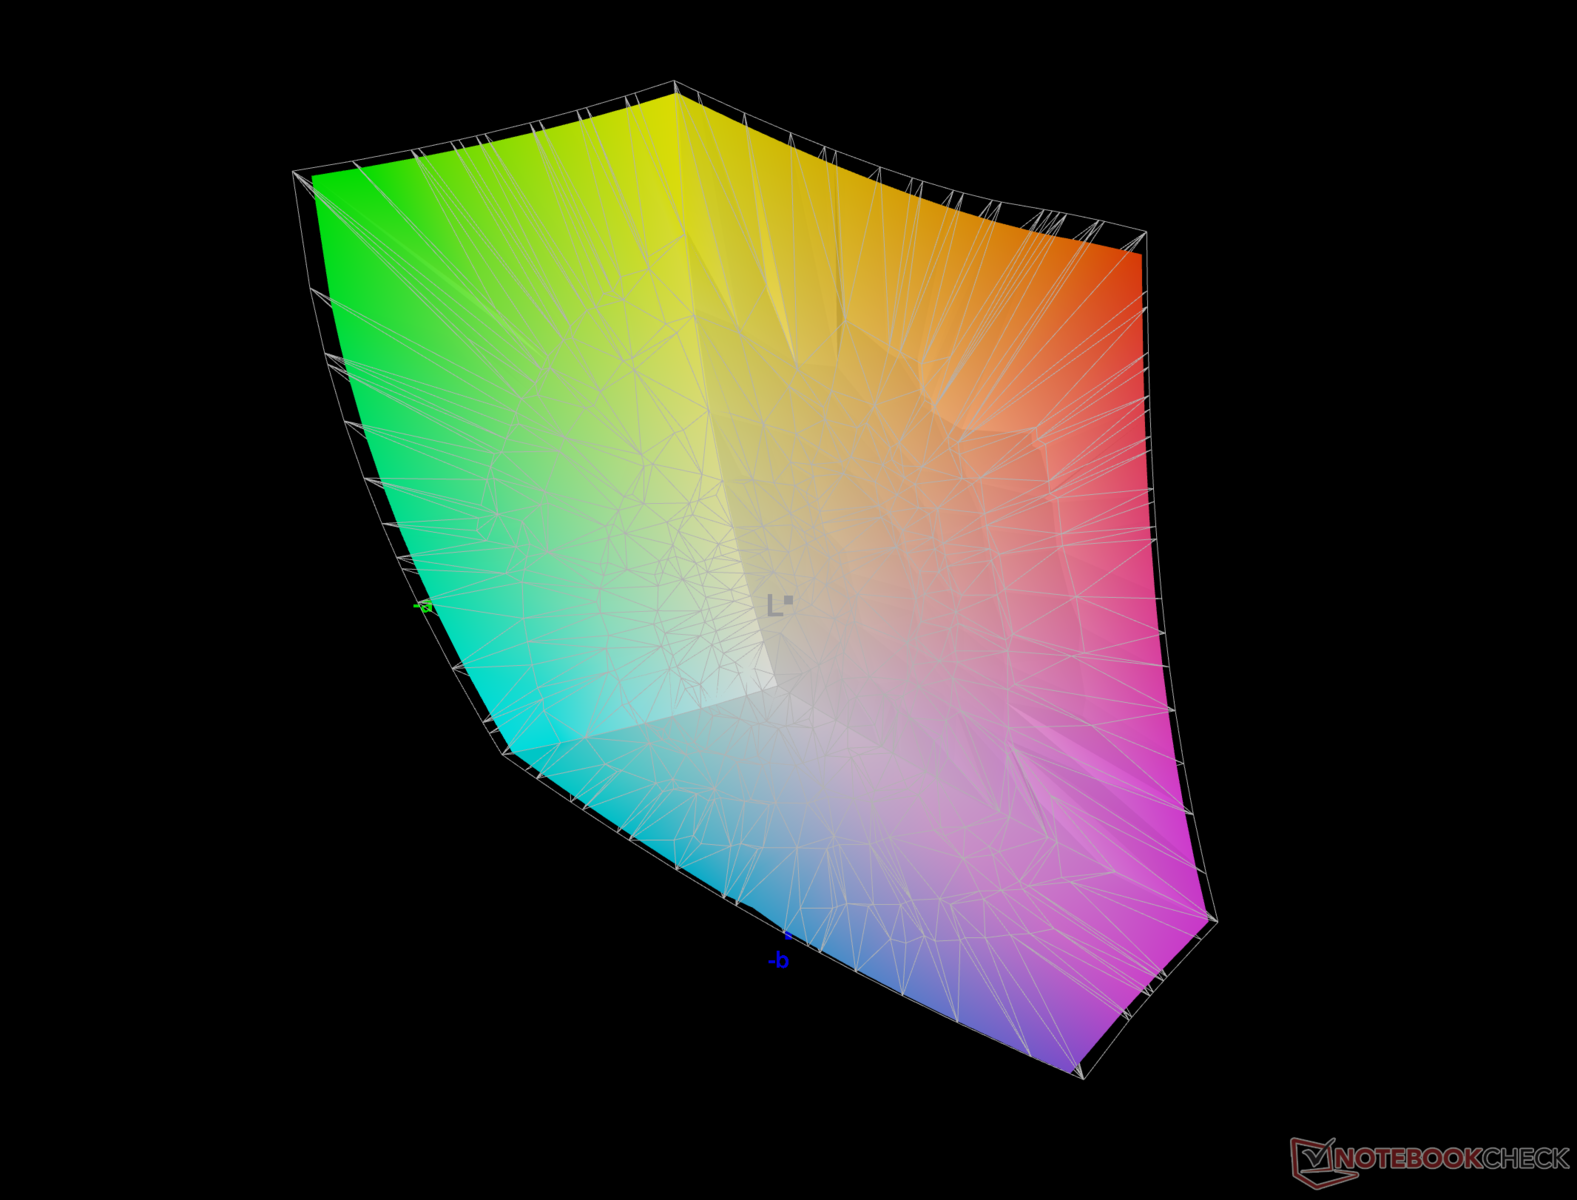
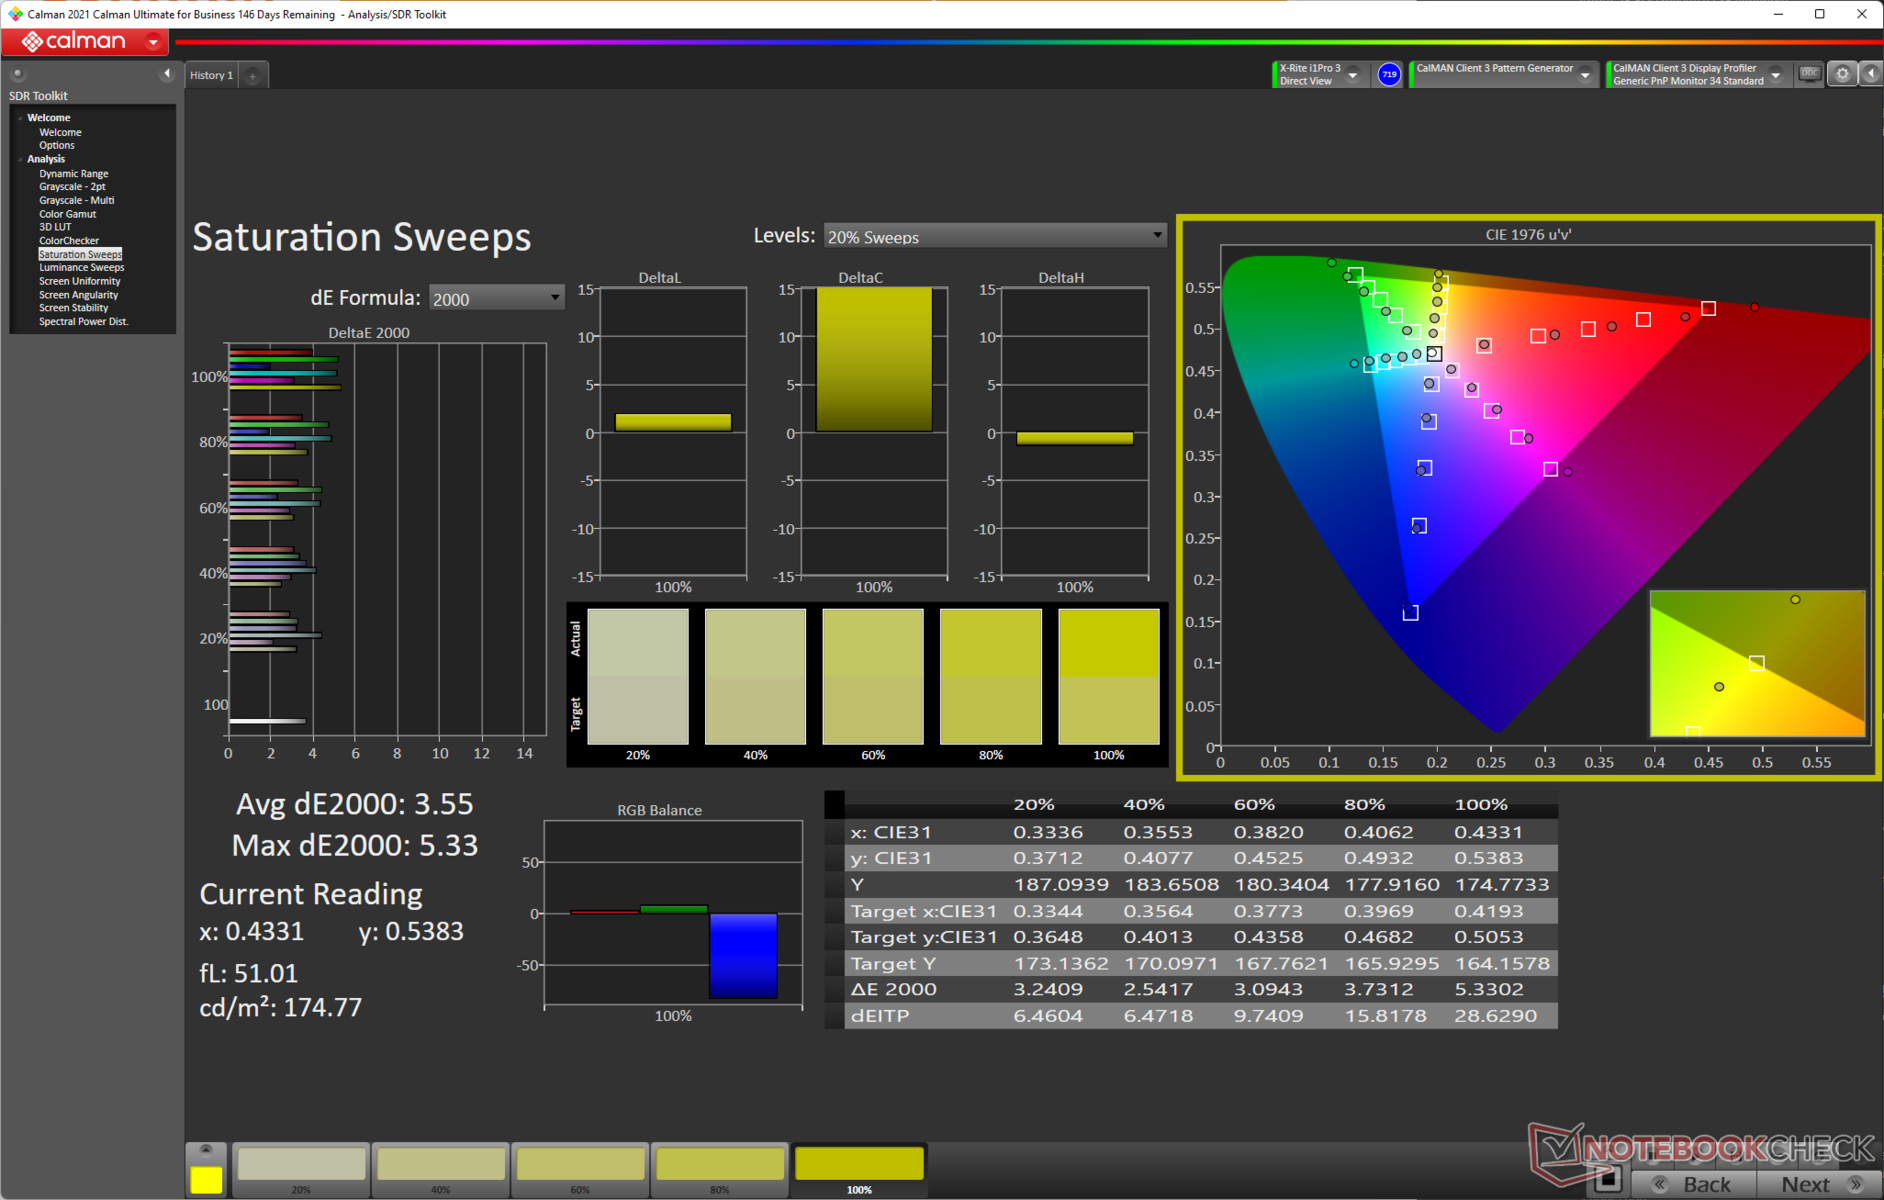
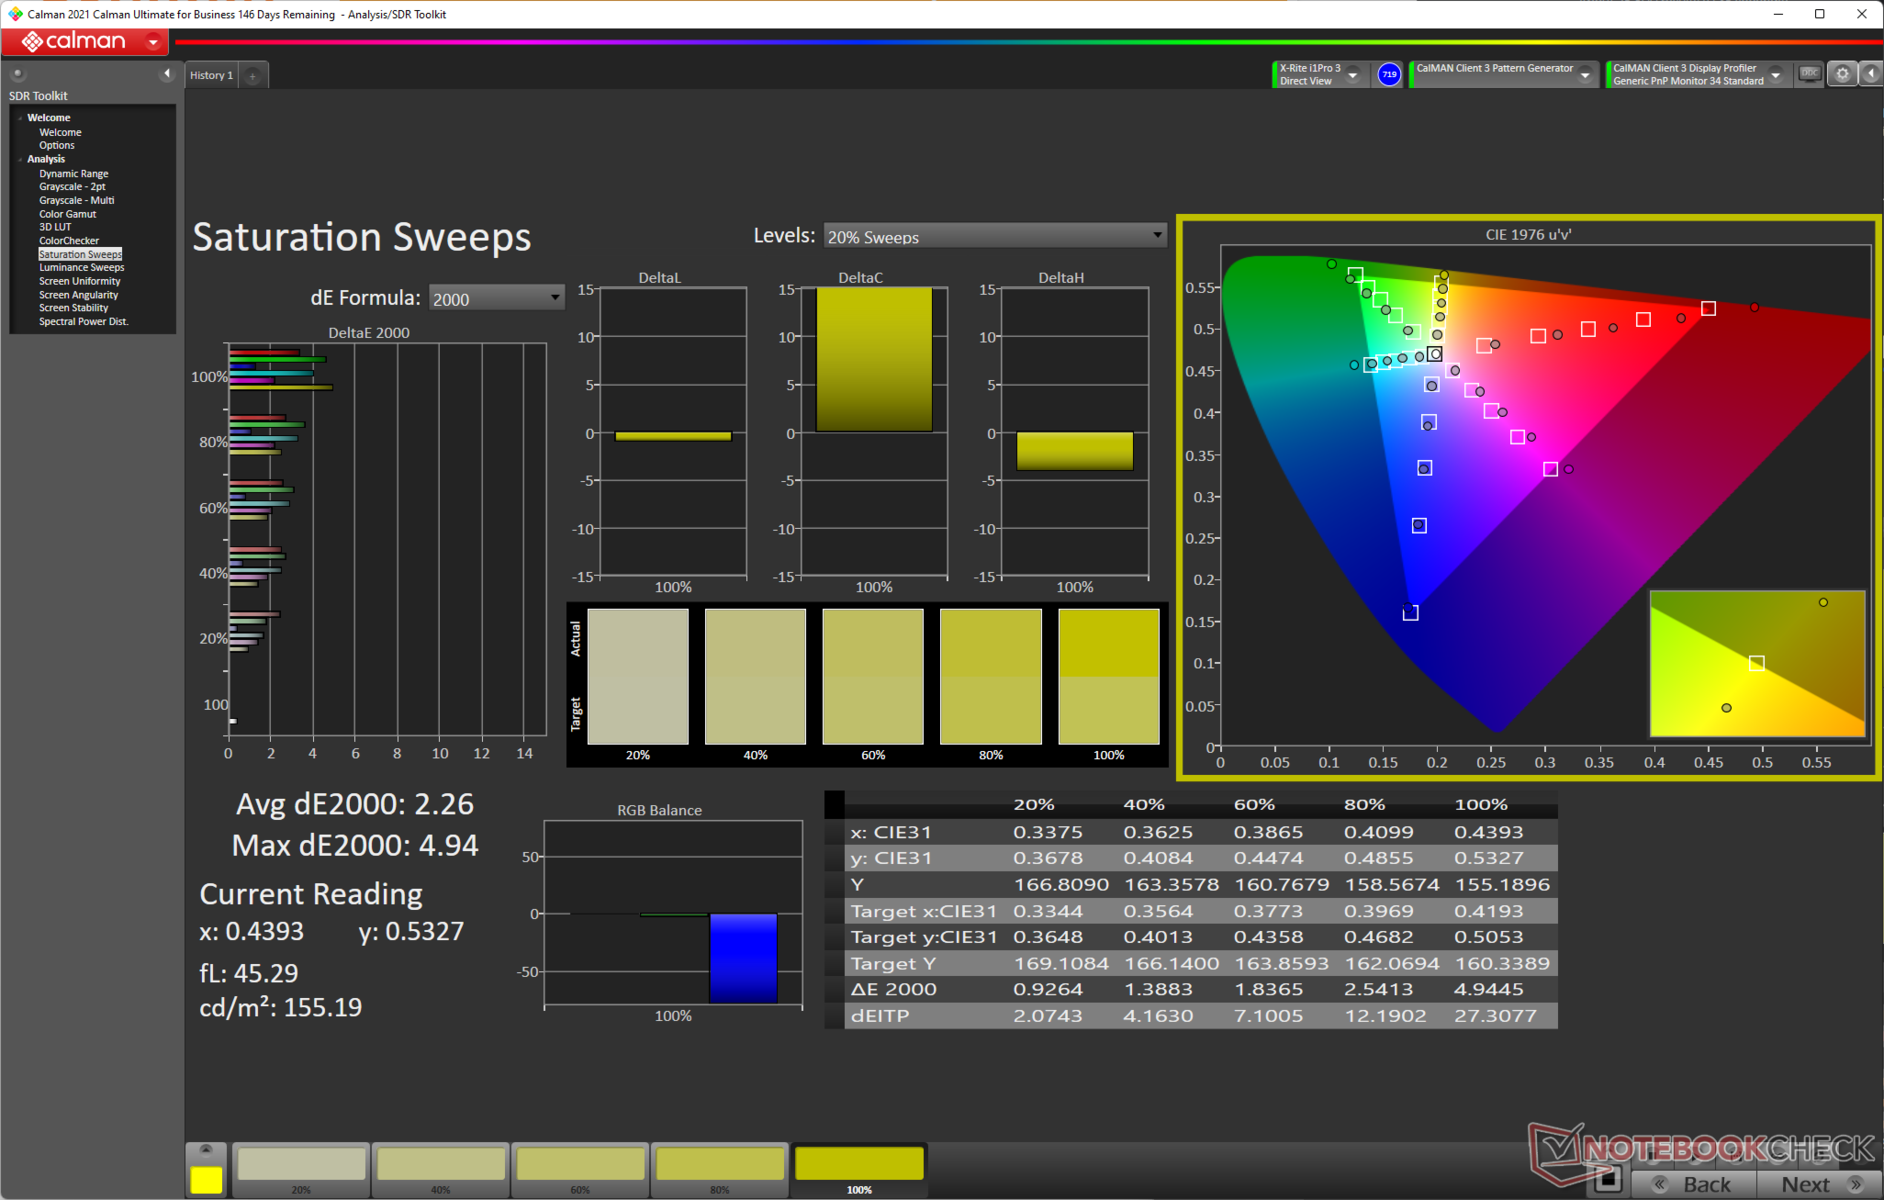
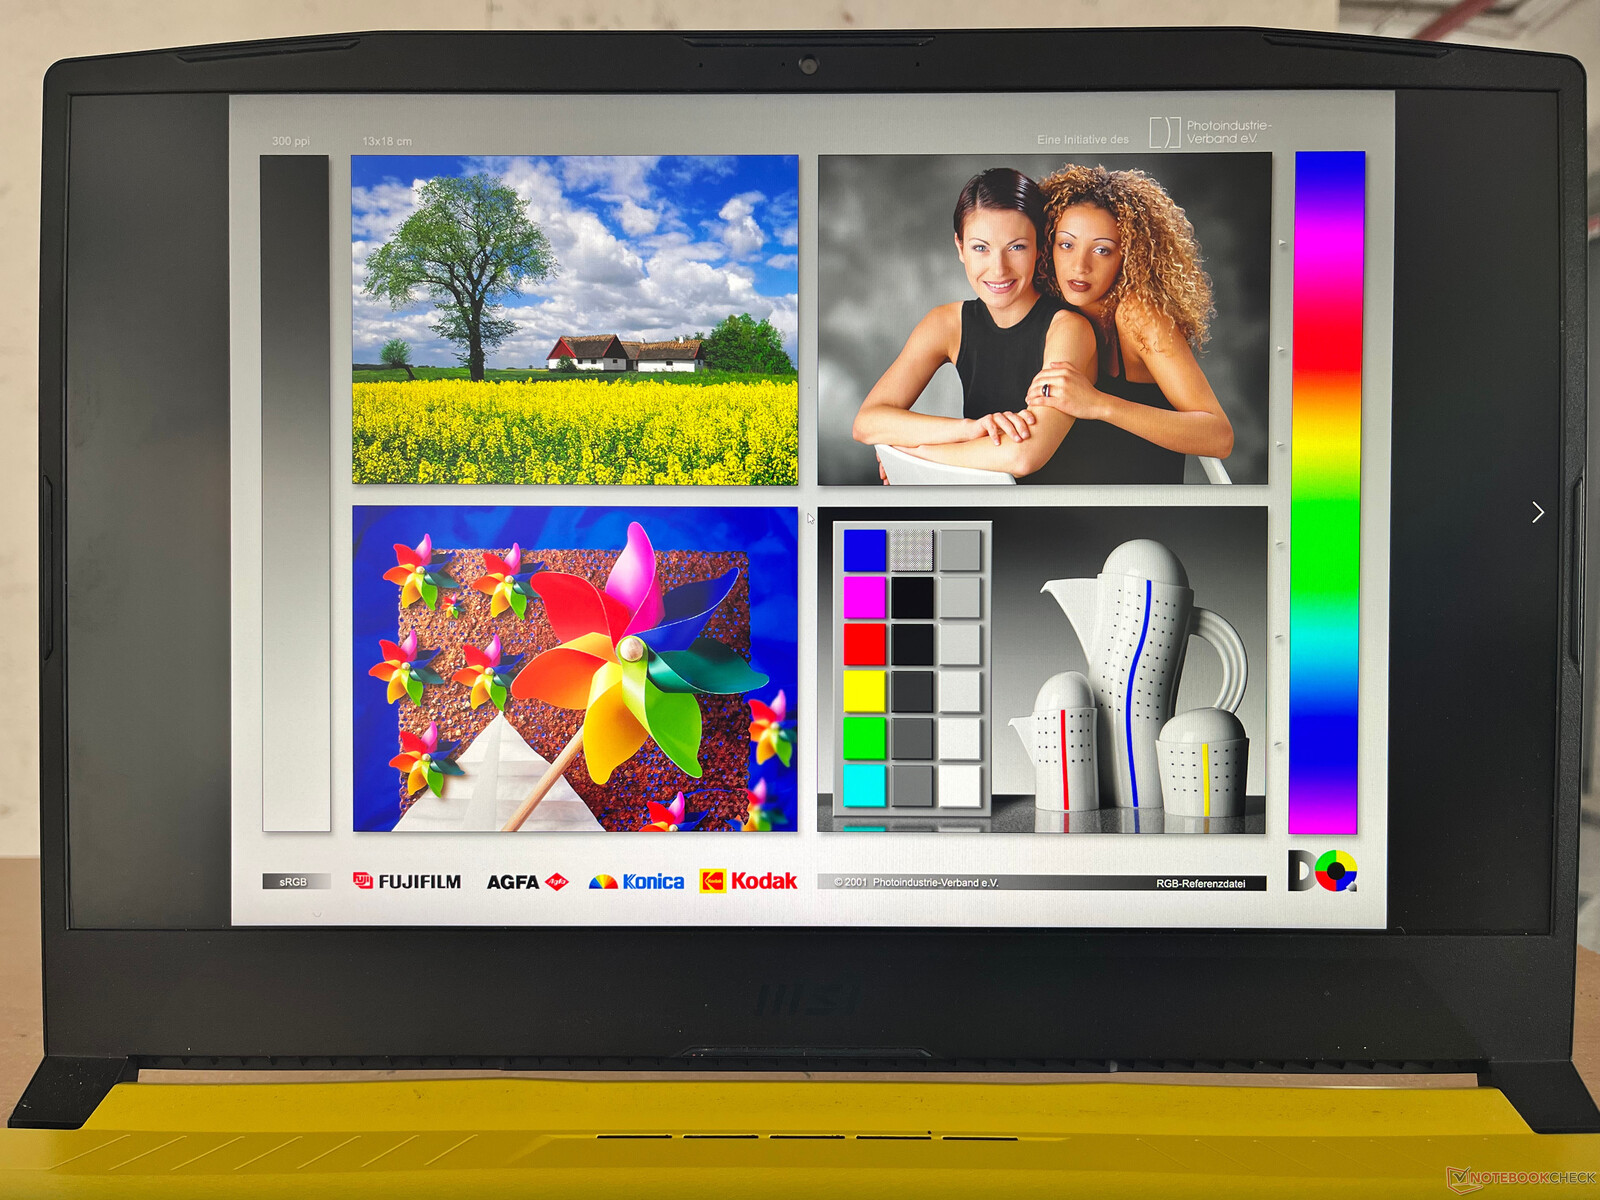
A MSI alega que o painel do Crosshair 15 pode cobrir 100% do espaço de cor DCI-P3. Em nossos testes, descobrimos que ele pode fazer quase 95% de Display P3, o que deve despertar o interesse dos criadores de conteúdo. O painel cobre a gama completa de cores sRGB. A cobertura Adobe RGB também é bastante decente, com quase 85%.
Observamos que a cobertura da gama de cores é comparável à da Acer Nitro 5 e Aorus 15 XE5que também ostenta o mesmo painel Chi Mei N156KME-GNA. É bom ver os fabricantes finalmente considerando o bom desempenho das cores a estes preços.
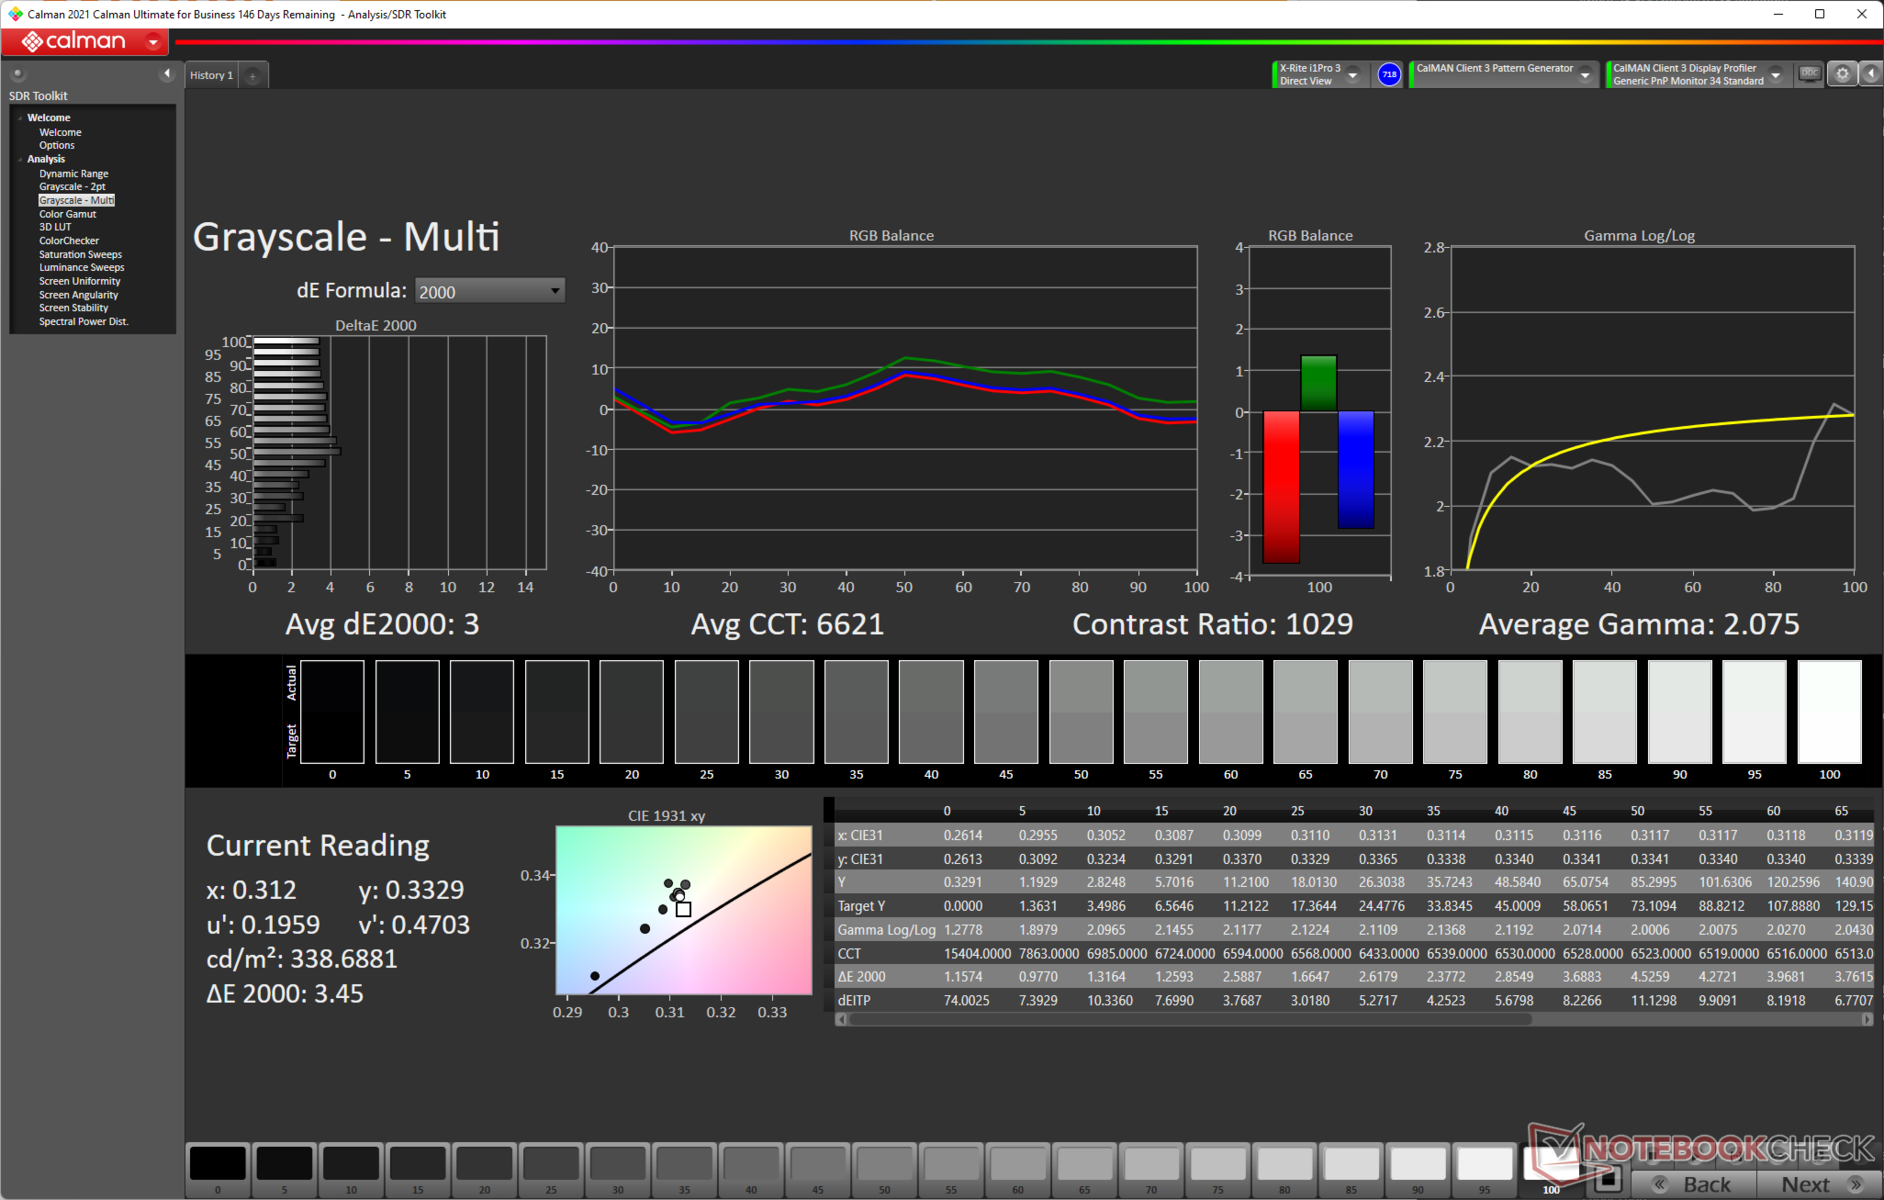
A precisão de cor out-of-the-box é definitivamente atendida com um Delta E em escala de cinza de 3 e um Delta E ColorChecker médio de 3,71
Nossa rotina de calibração com o espectrofotômetro X-rite i1Basic Pro 3 e o software de calibração de cores Calman Ultimate da Portrait Displays resulta em uma redução significativa da escala de cinza Delta E de 0,7 e uma melhora perceptível média do Delta E para 2,59 no ColorChecker. Desvios maiores são vistos com a cor vermelha.
O arquivo ICC calibrado pode ser baixado a partir do link acima.
Exibir tempos de resposta
| ↔ Tempo de resposta preto para branco | ||
|---|---|---|
| 8.04 ms ... ascensão ↗ e queda ↘ combinadas | ↗ 4.72 ms ascensão | 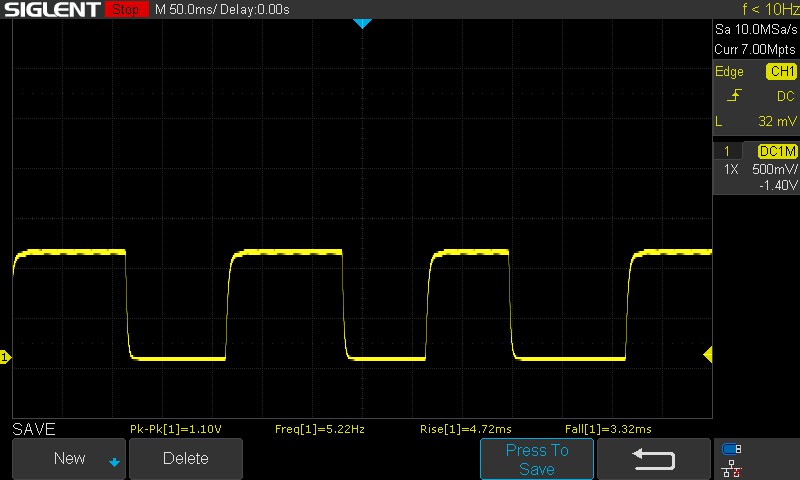 |
| ↘ 3.32 ms queda | ||
| A tela mostra taxas de resposta rápidas em nossos testes e deve ser adequada para jogos. Em comparação, todos os dispositivos testados variam de 0.1 (mínimo) a 240 (máximo) ms. » 24 % de todos os dispositivos são melhores. Isso significa que o tempo de resposta medido é melhor que a média de todos os dispositivos testados (19.8 ms). | ||
| ↔ Tempo de resposta 50% cinza a 80% cinza | ||
| 5.36 ms ... ascensão ↗ e queda ↘ combinadas | ↗ 2.71 ms ascensão | 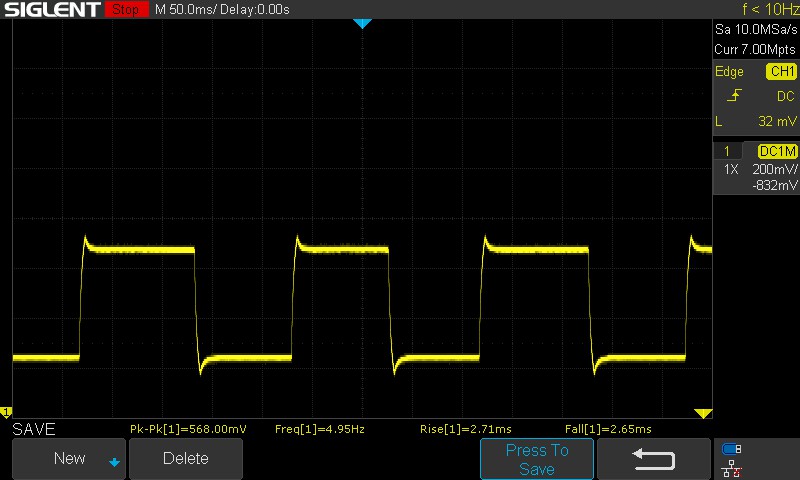 |
| ↘ 2.65 ms queda | ||
| A tela mostra taxas de resposta muito rápidas em nossos testes e deve ser muito adequada para jogos em ritmo acelerado. Em comparação, todos os dispositivos testados variam de 0.165 (mínimo) a 636 (máximo) ms. » 18 % de todos os dispositivos são melhores. Isso significa que o tempo de resposta medido é melhor que a média de todos os dispositivos testados (31 ms). | ||
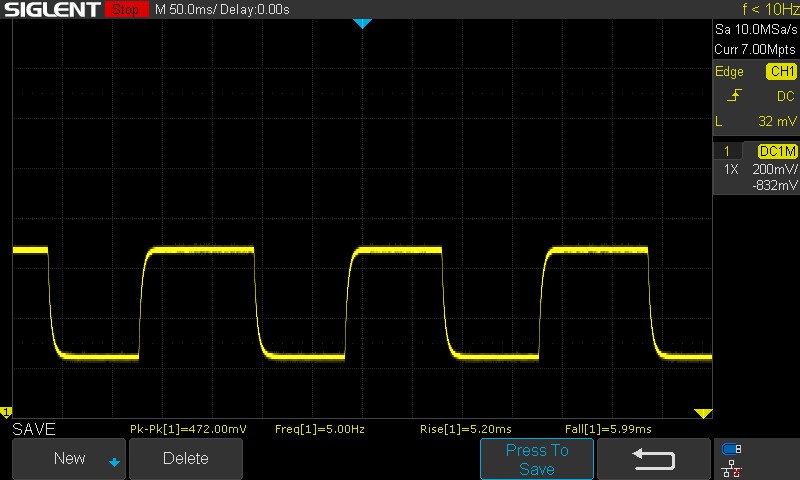
Os tempos de resposta são decentes, embora tivéssemos gostado de ver valores mais baixos para a transição 100% preto para 100% branco
O painel usa overdrive por padrão, que é visto como uma "buzina" no padrão osciloscópio cinza 50% a 80% cinza.
Sem o overdrive ativado, este valor pode aumentar para 11,19 ms.
Cintilação da tela / PWM (modulação por largura de pulso)
| Tela tremeluzindo / PWM não detectado | ≤ 100 % configuração de brilho | 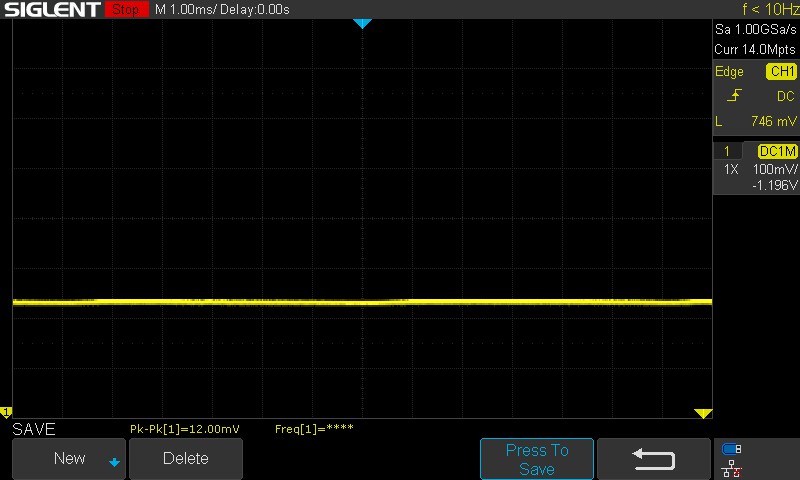 | |
[pwm_comparison] Em comparação: 52 % de todos os dispositivos testados não usam PWM para escurecer a tela. Se PWM foi detectado, uma média de 7757 (mínimo: 5 - máximo: 343500) Hz foi medida. | |||
Não observamos PWM piscando em todos os níveis de brilho testados, então isso é uma coisa a menos para se preocupar durante longas horas de trabalho ou sessões de jogo.
Confira nosso artigo sobre "Por que a Modulação da Largura de Pulso (PWM) é uma dor de cabeça tão grande?", e também nosso Tabela de classificação da PWM para comparações entre todos os dispositivos revisados.
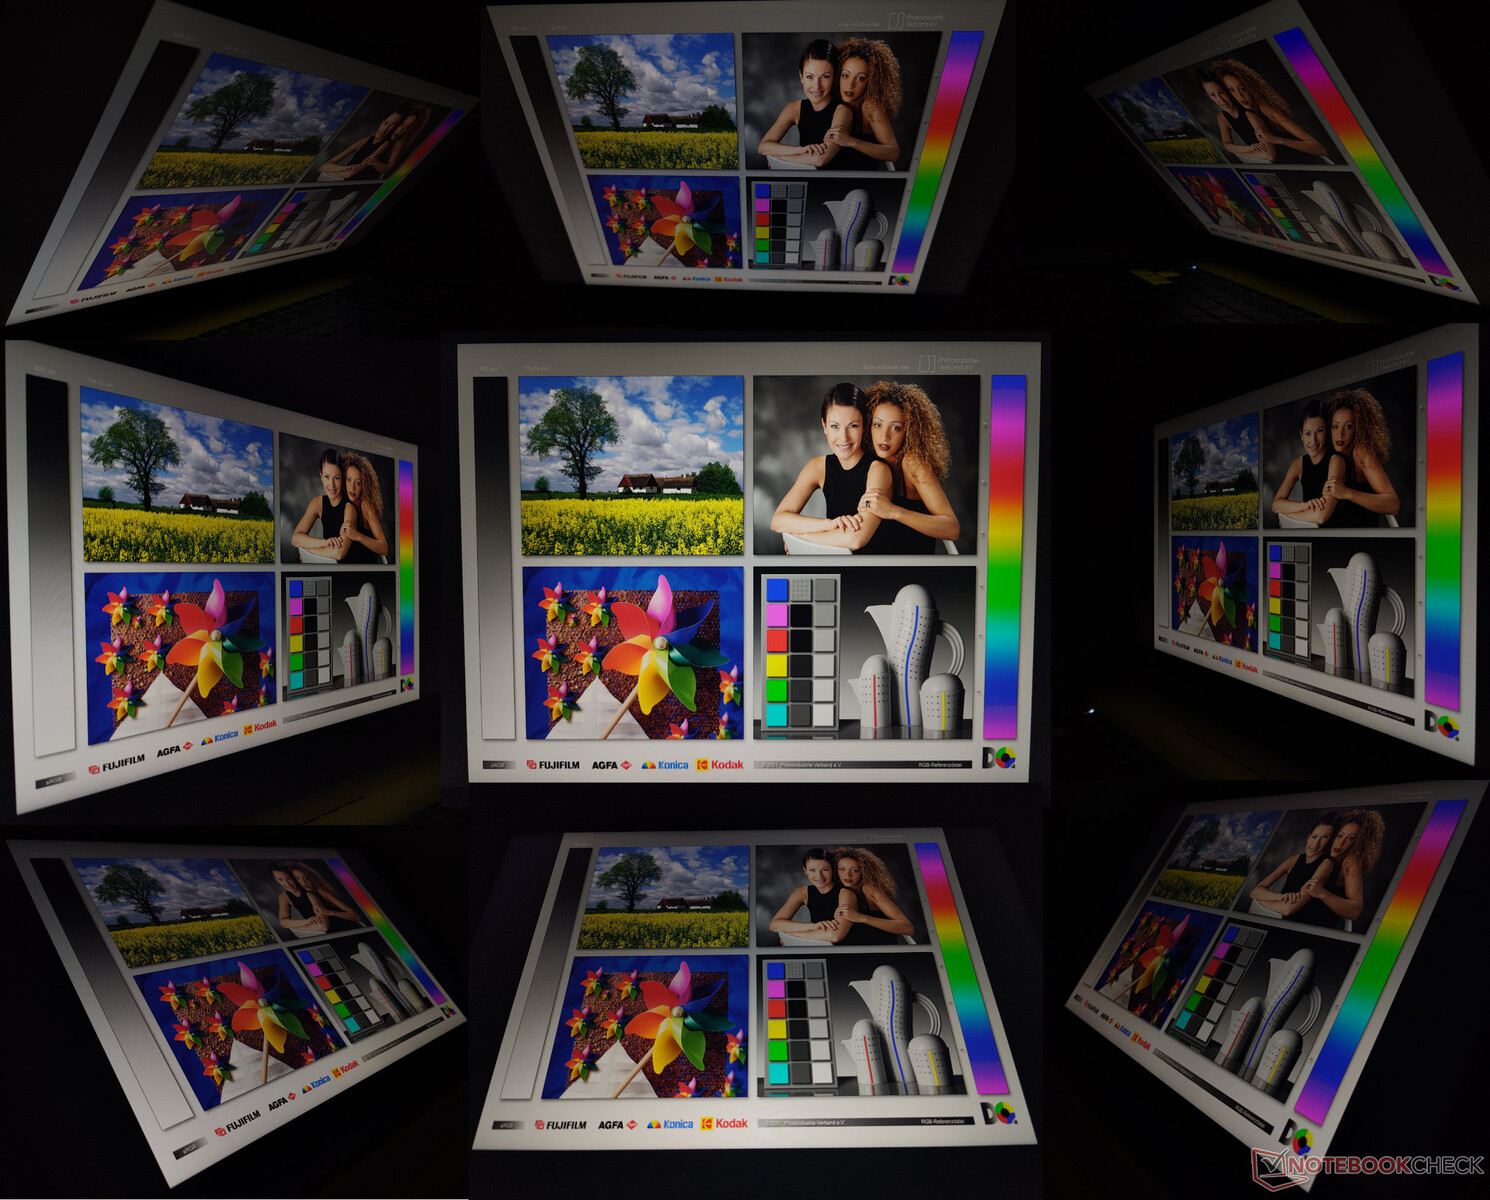
A visualização ao ar livre é legível desde que não haja luz solar caindo diretamente sobre o visor. Os ângulos de visão não são particularmente impressionantes, no entanto. Observamos perda de brilho e cor em ângulos de visão extremos.
Desempenho: Não é o Core i7-12700H mais rápido que já vimos
Nossa unidade Crosshair 15 R6E é alimentada por um Intel Core i7-12700H e um processador de 140 W Nvidia GeForce RTX 3070 GPU para notebook. Os compradores também têm a opção de configurar o laptop com um GPU para notebook RTX 3060 ou opções de CPU até o Alder Lake Core i9.

Condições de teste
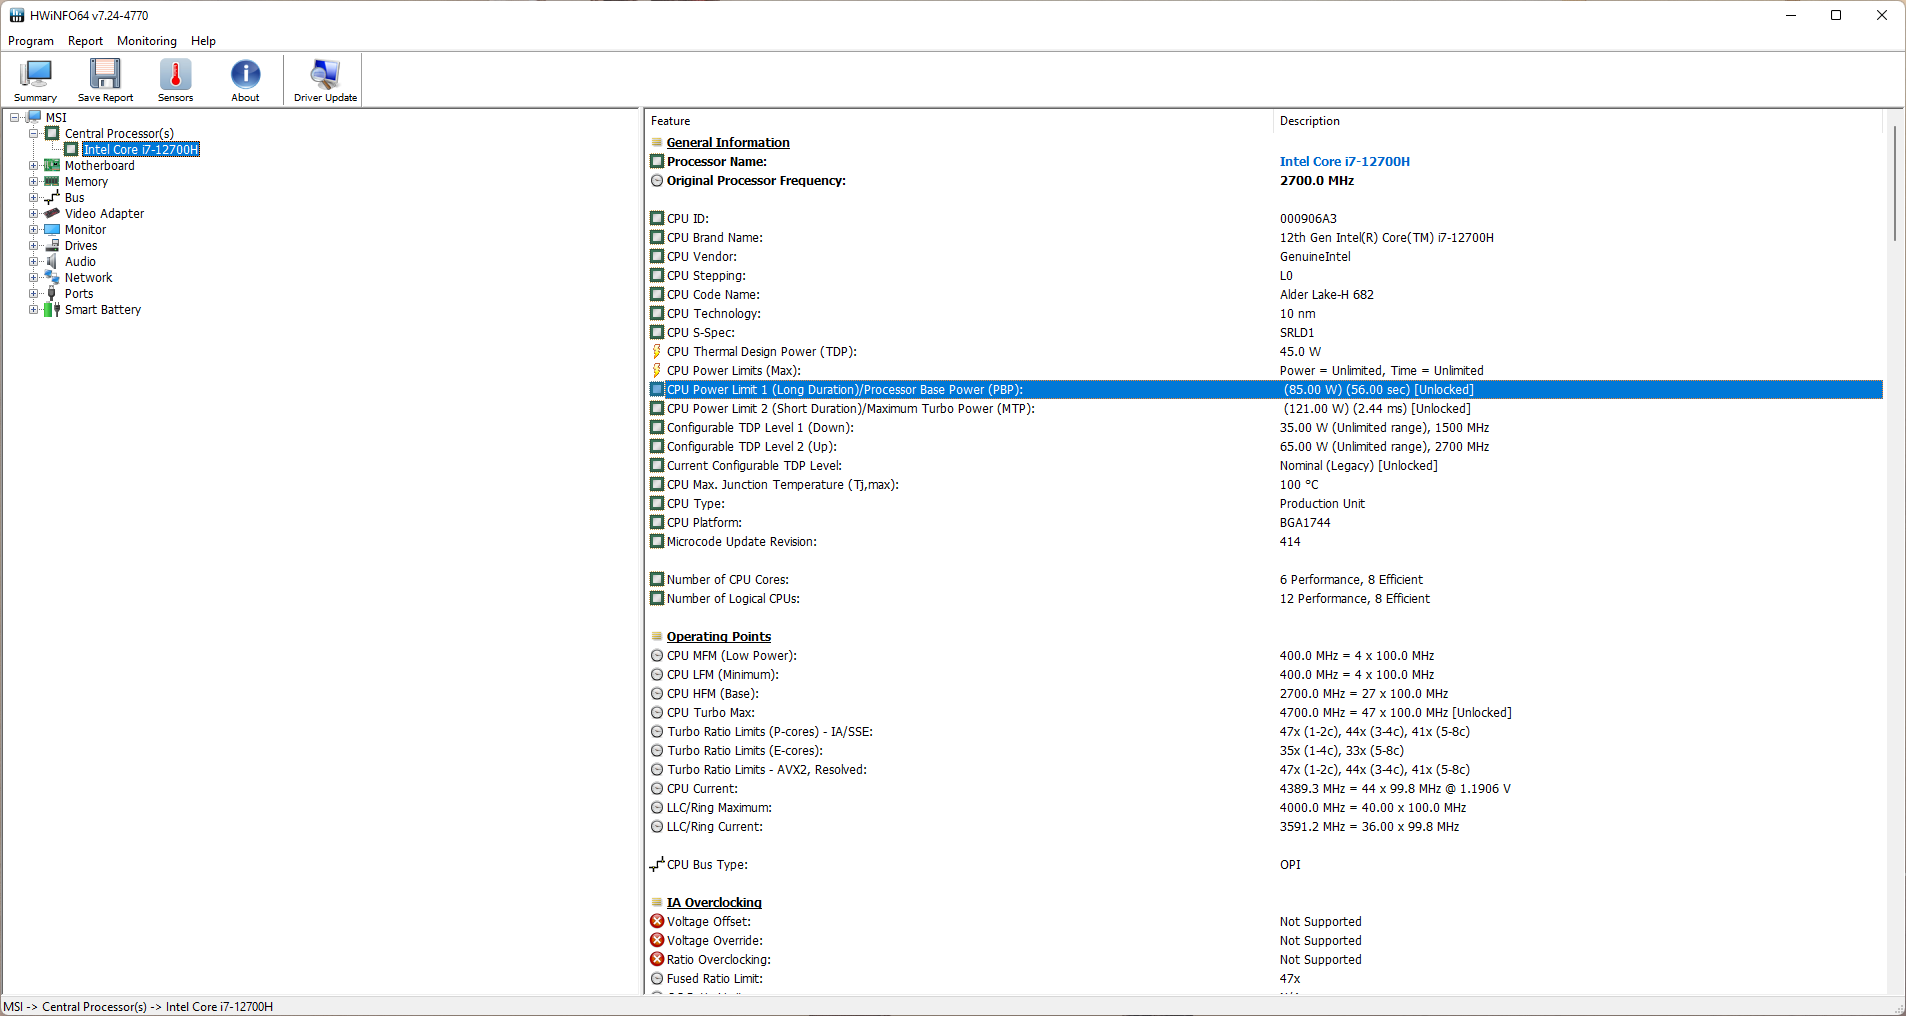
O MSI Center oferece um balcão único para ajustar vários parâmetros de desempenho do Crosshair 15 R6E. Utilizamos a predefinição de Desempenho Extremo para deixar o Core i7-12700H flexionar totalmente seus músculos. Isto permite que o processador funcione com um PL1 de 85 W e um PL2 de 121 W. Não há opção de comutação MUX disponível para o dGPU.
Todos os testes foram realizados no perfil de Desempenho Extremo, a menos que especificado de outra forma.
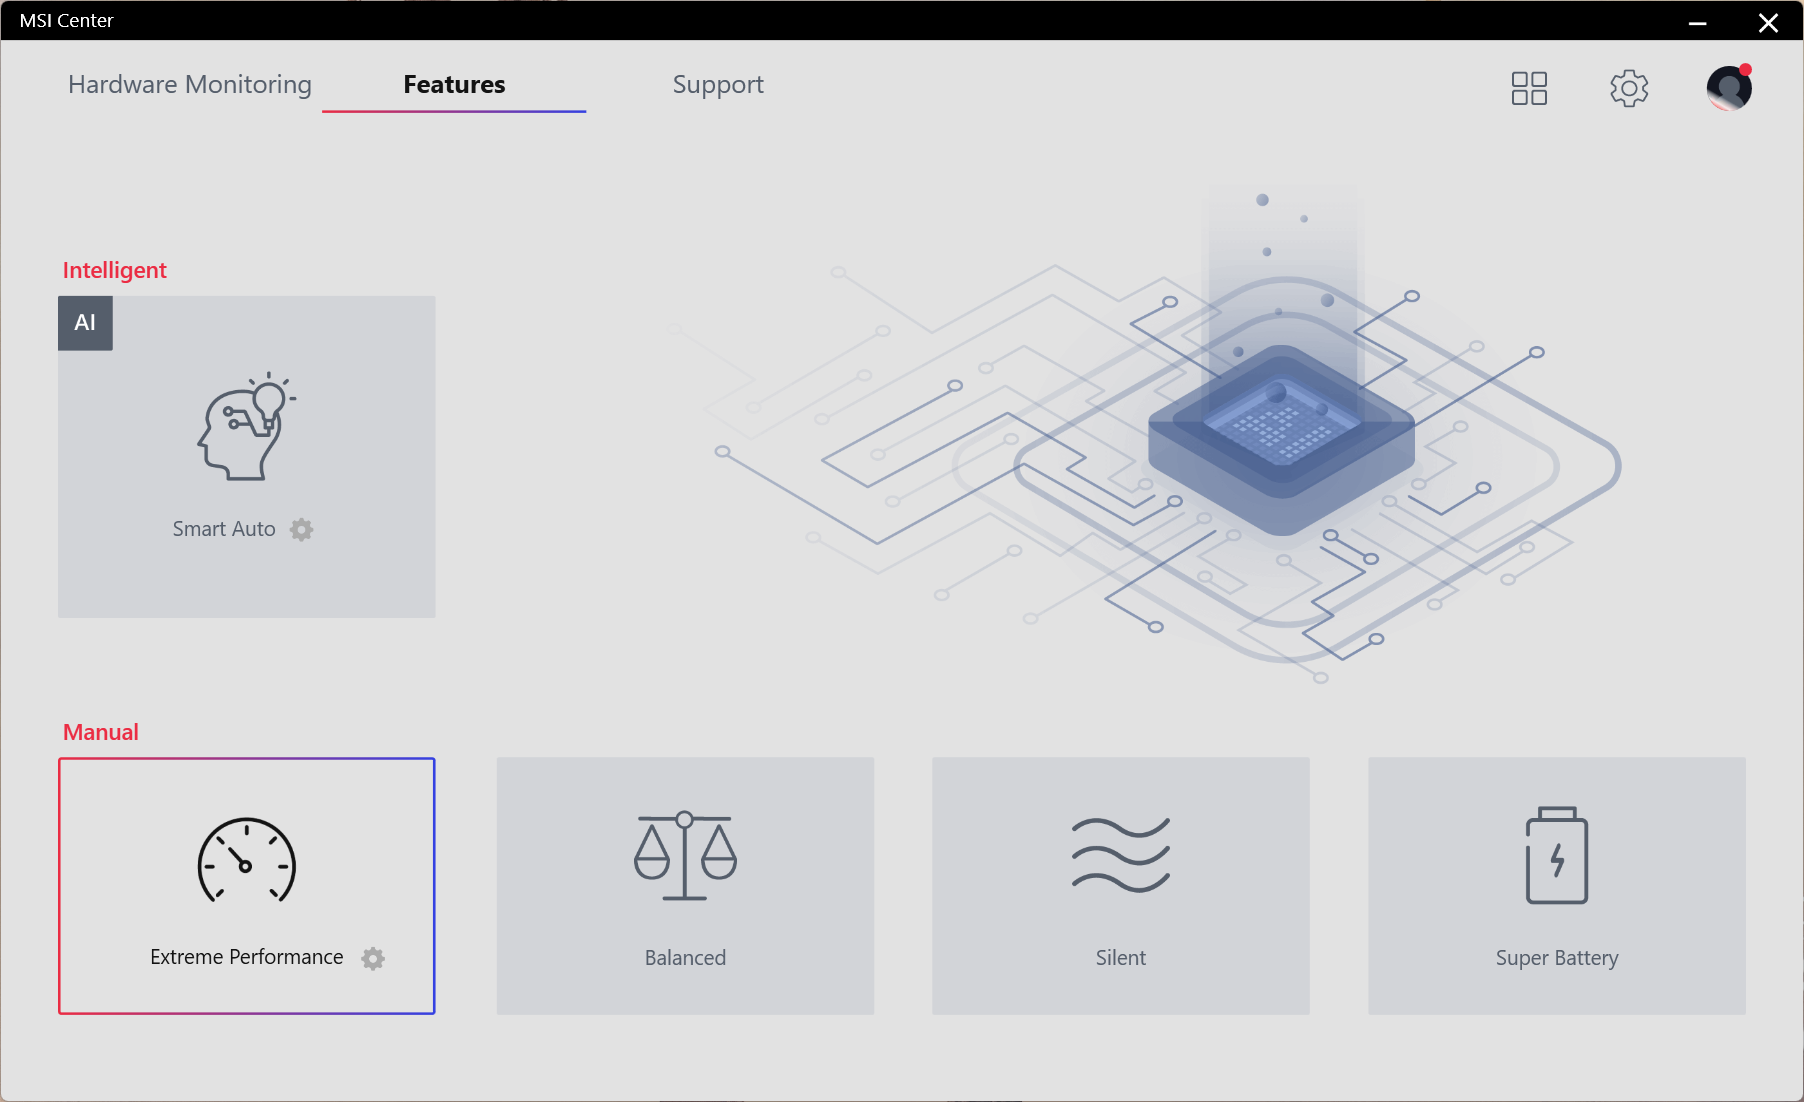
A tabela abaixo mostra como a potência base do processador (PBP, PL1) e a potência turbo máxima (MTP, PL2) mudam a cada modo de desempenho. O perfil balanceado deve atender à maioria das necessidades. Aqueles que desejam extrair o máximo desempenho possível do Core i7-12700H podem optar pelo modo de Desempenho Extremo.
| Performance Mode | PL1 (PBP) / Tau | PL2 (MTP) / Tau |
|---|---|---|
| Super Bateria | 13 W / 56 s | 121 W / 2,44 ms |
| Silencioso | 23 W / 56 s | 121 W / 2,44 ms |
| Equilibrado | 38 W / 56 s | 121 W / 2,44 ms |
| Desempenho Extremo | 85 W / 56 s | 121 W / 2,44 ms |
Processador
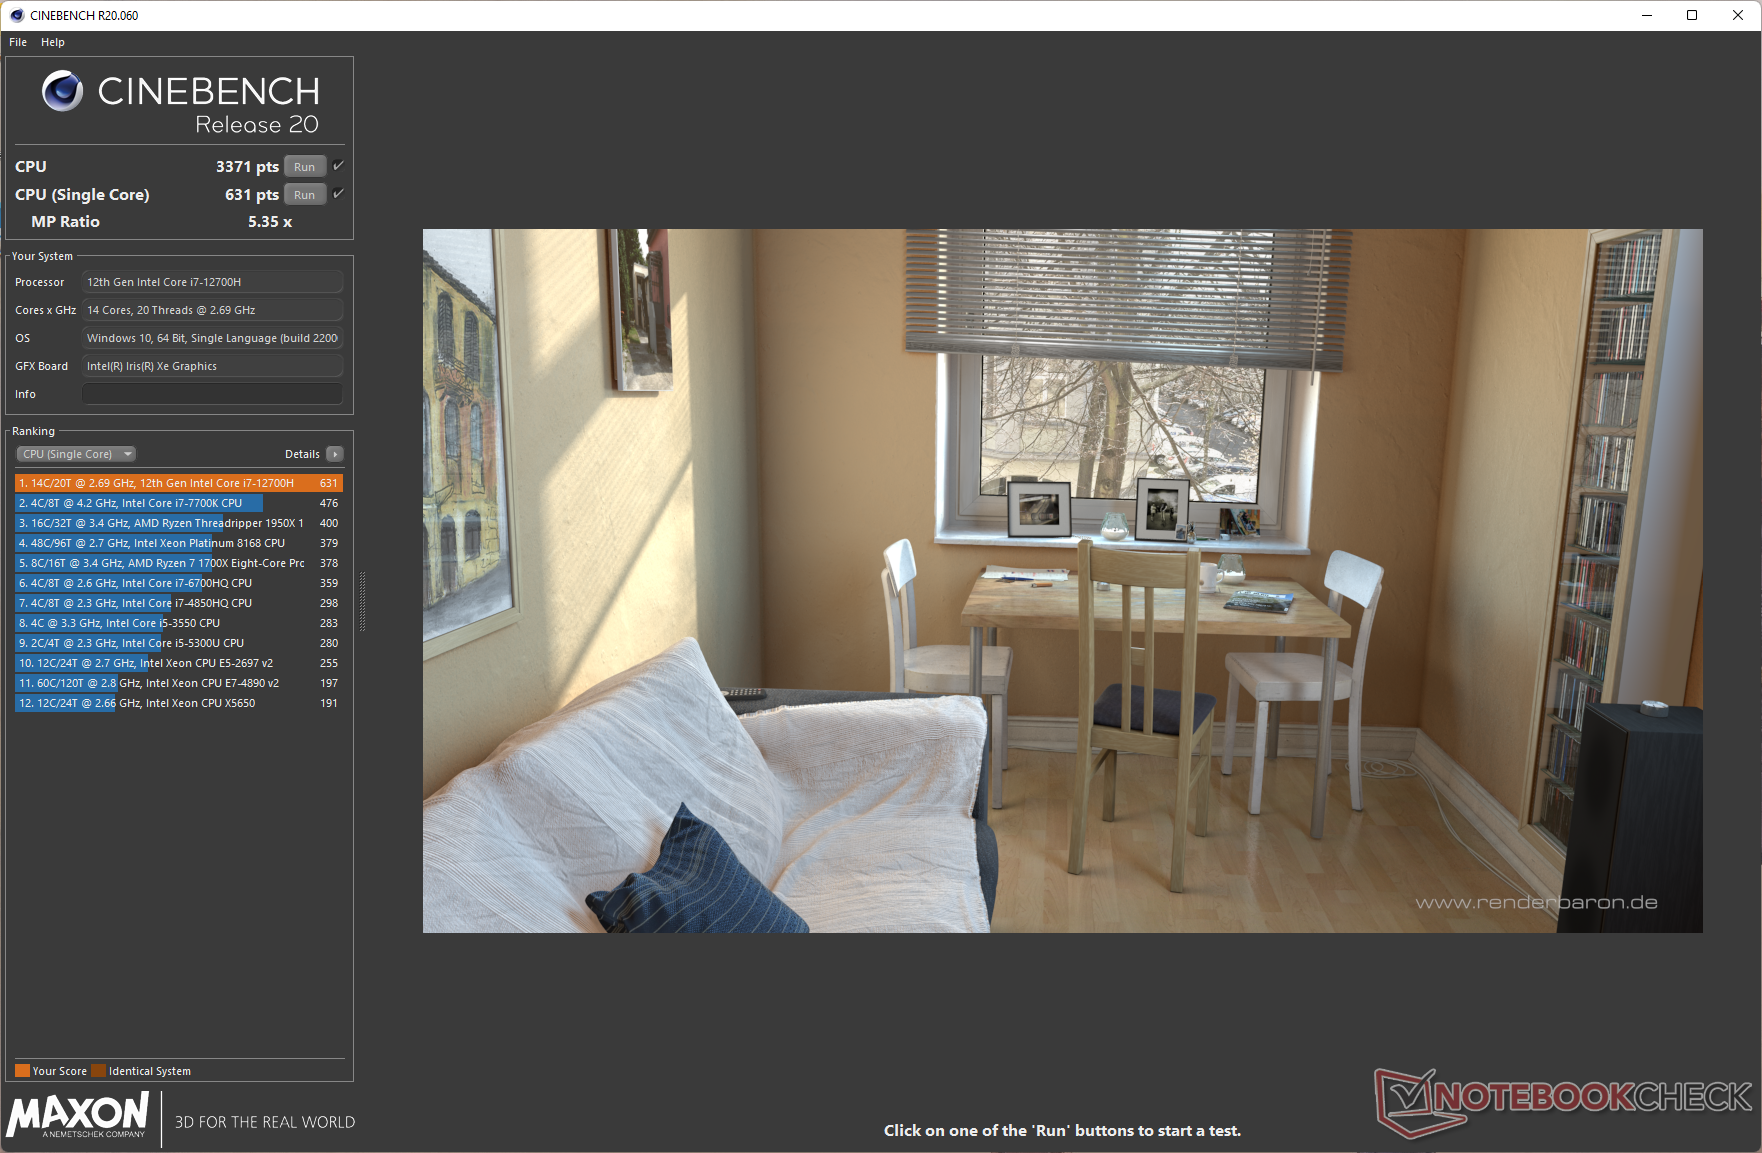
O Core i7-12700H é um processador Alder Lake-H com seis P-cores e oito E-cores. O Crosshair 15 R6E é capaz de permitir um desempenho decente sustentado para este processador em nosso teste de loop multi-núcleo Cinebench R15, igual ao do AMD Ryzen 9 6900HX no Schenker XMG Neo 15.
Este não é o Core i7-12700H mais rápido que já vimos, no entanto. A implementação do processador no MSI Stealth GS66 e Lenovo Legion 5i Pro 16 G7 obtém melhores pontuações devido aos valores PL1 e PL2 mais altos.
Cinebench R15 Multi Loop
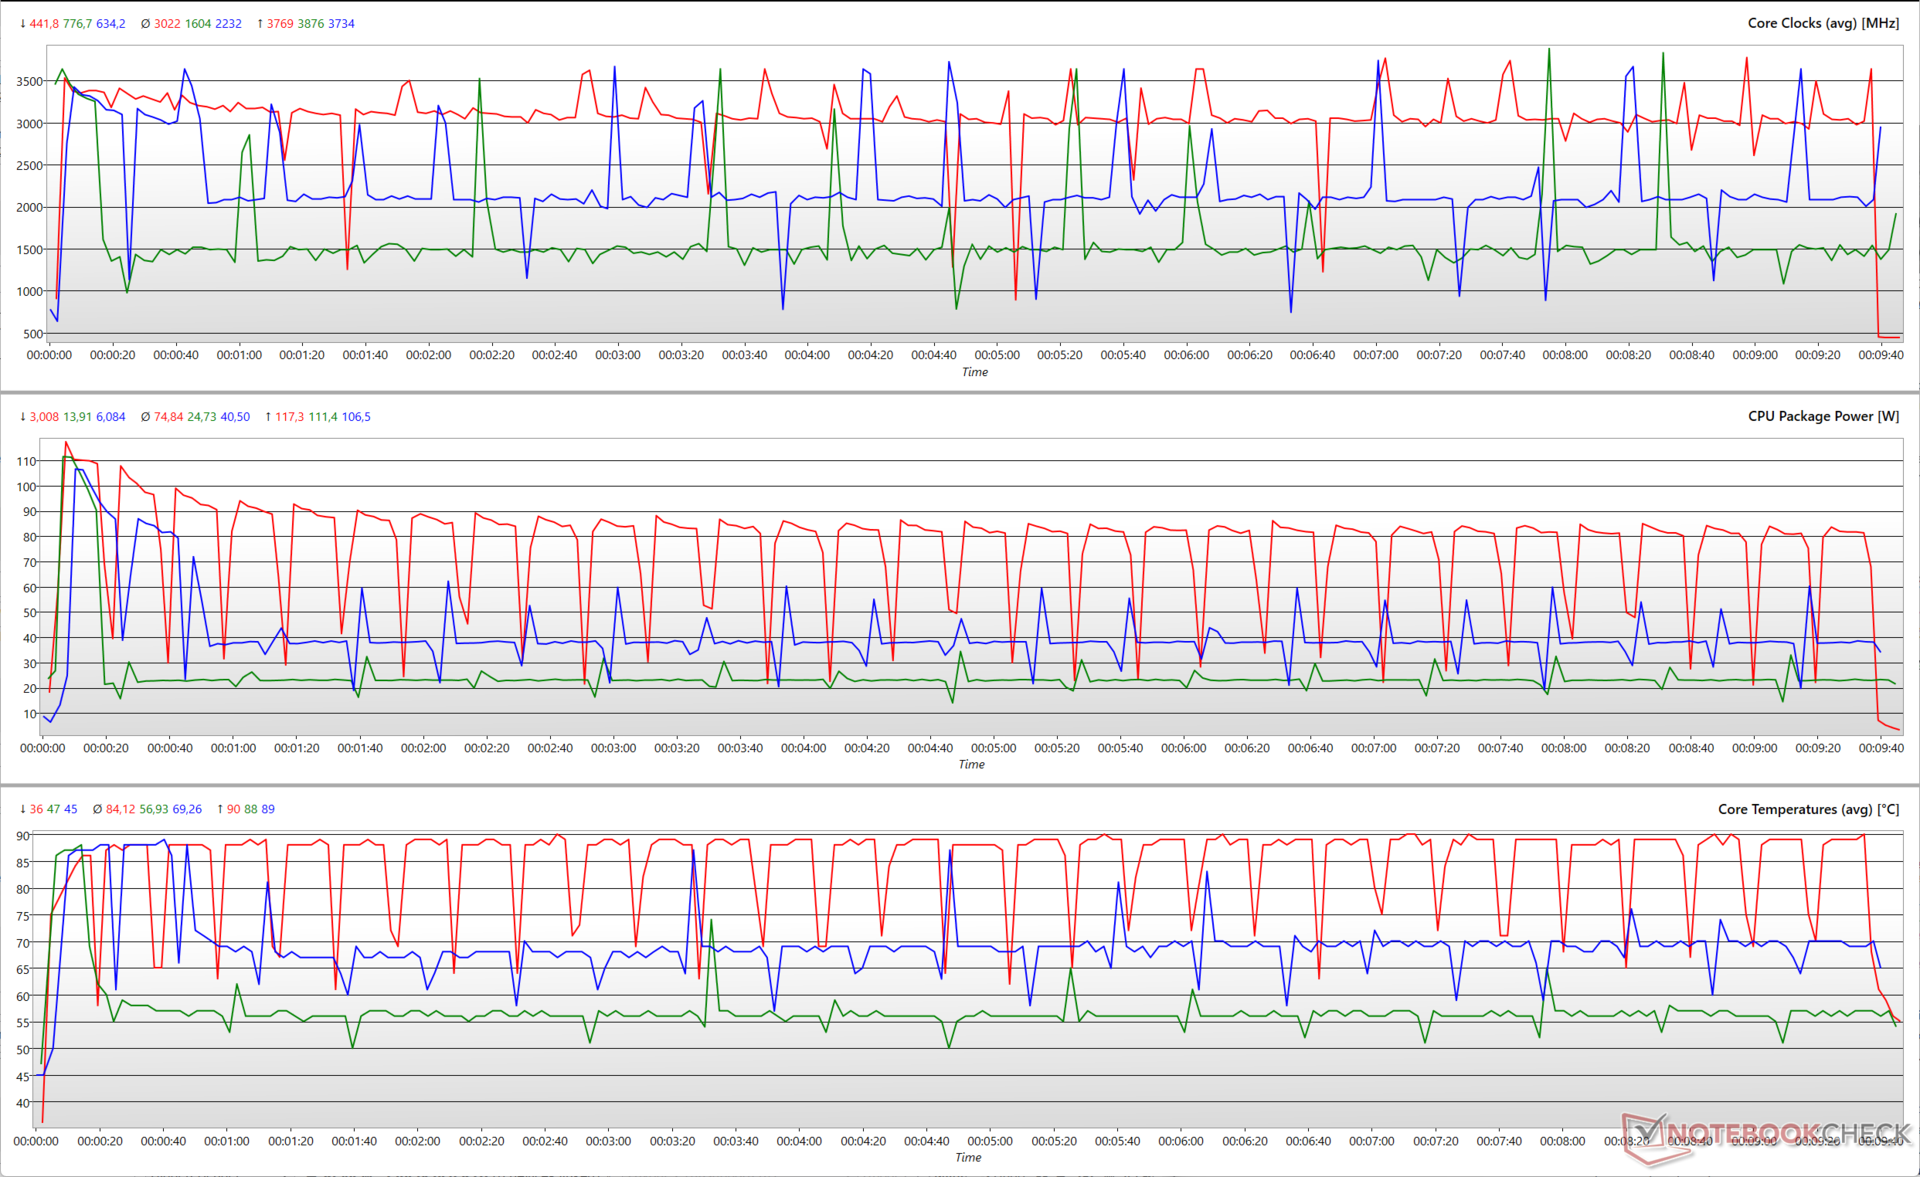
O gráfico a seguir ilustra como os parâmetros da CPU variam durante um teste de loop multi-core Cinebench R15. Como o PL2 de 121 W permanece inalterado em todos os três modos de desempenho, o Core i7-12700H é capaz de impulsionar até perto de 3,8 GHz levando em consideração tanto os núcleos P como E. Os núcleos P e E podem impulsionar individualmente até 4,6 GHz e 3,5 GHz, respectivamente.
Enquanto a potência de pico do pacote e as temperaturas do núcleo são mais ou menos similares nos modos de desempenho testados, os valores médios mostram diferenças marcantes. A potência média do pacote durante a corrida é próxima a 75 W no modo de desempenho extremo com temperaturas em torno da marca de 84 °C. O ajuste Equilibrado tem temperaturas médias em torno de 69 °C para uma potência média da embalagem de 40,5 W
O modo silencioso tem as menores emissões na comparação com uma potência média da embalagem próxima a 25 W e temperaturas médias do núcleo próximas a 57 °C.
Embora o desempenho multi-core tenha um impacto de 15% quando comparado ao Core i7-12700H na Lenovo Legion 5i Pro 16 G7, o Crosshair 15 R6E está apenas cerca de 8% atrás no desempenho geral da CPU.
O Crosshair 15 R6E é 13% mais rápido do que o Ryzen 9 6900HX XMG Neo 15, mas este último obtém uma classificação de desempenho 32% mais alta nos testes AIDA64.
O desempenho do Cinebench R20 multi-core diminui em 45% na energia da bateria, embora as pontuações de um só núcleo sejam reduzidas em apenas 10%.
Cinebench R23: Multi Core | Single Core
Cinebench R20: CPU (Multi Core) | CPU (Single Core)
Cinebench R15: CPU Multi 64Bit | CPU Single 64Bit
Blender: v2.79 BMW27 CPU
7-Zip 18.03: 7z b 4 | 7z b 4 -mmt1
Geekbench 5.5: Multi-Core | Single-Core
HWBOT x265 Benchmark v2.2: 4k Preset
LibreOffice : 20 Documents To PDF
R Benchmark 2.5: Overall mean
| Cinebench R20 / CPU (Multi Core) | |
| Média da turma Gaming (4029 - 16433, n=106, últimos 2 anos) | |
| Lenovo Legion 5 Pro 16 G7 i7 RTX 3070Ti | |
| Schenker XMG Neo 15 (i7-12700H, RTX 3080 Ti) | |
| MSI Pulse GL66 12UEK | |
| MSI Stealth GS66 12UGS | |
| Acer Nitro 5 AN515-58-72QR | |
| MSI Katana GF66 12UGS | |
| MSI Crosshair 15 R6E B12UGZ-050 | |
| Aorus 15 XE5 | |
| Média Intel Core i7-12700H (1576 - 7407, n=64) | |
| Schenker XMG Neo 15 (Ryzen 9 6900HX, RTX 3070 Ti) | |
| Asus TUF Dash F15 FX517ZR | |
| Cinebench R20 / CPU (Single Core) | |
| Média da turma Gaming (442 - 913, n=106, últimos 2 anos) | |
| MSI Pulse GL66 12UEK | |
| MSI Katana GF66 12UGS | |
| Lenovo Legion 5 Pro 16 G7 i7 RTX 3070Ti | |
| Asus TUF Dash F15 FX517ZR | |
| MSI Crosshair 15 R6E B12UGZ-050 | |
| Acer Nitro 5 AN515-58-72QR | |
| MSI Stealth GS66 12UGS | |
| Schenker XMG Neo 15 (i7-12700H, RTX 3080 Ti) | |
| Aorus 15 XE5 | |
| Média Intel Core i7-12700H (300 - 704, n=64) | |
| Schenker XMG Neo 15 (Ryzen 9 6900HX, RTX 3070 Ti) | |
| HWBOT x265 Benchmark v2.2 / 4k Preset | |
| Média da turma Gaming (11.5 - 44.4, n=105, últimos 2 anos) | |
| Lenovo Legion 5 Pro 16 G7 i7 RTX 3070Ti | |
| Schenker XMG Neo 15 (i7-12700H, RTX 3080 Ti) | |
| MSI Stealth GS66 12UGS | |
| MSI Pulse GL66 12UEK | |
| Acer Nitro 5 AN515-58-72QR | |
| MSI Crosshair 15 R6E B12UGZ-050 | |
| Schenker XMG Neo 15 (Ryzen 9 6900HX, RTX 3070 Ti) | |
| Asus TUF Dash F15 FX517ZR | |
| Média Intel Core i7-12700H (4.67 - 21.8, n=64) | |
| Aorus 15 XE5 | |
| MSI Katana GF66 12UGS | |
| LibreOffice / 20 Documents To PDF | |
| Schenker XMG Neo 15 (Ryzen 9 6900HX, RTX 3070 Ti) | |
| Média da turma Gaming (33.2 - 88.8, n=105, últimos 2 anos) | |
| Schenker XMG Neo 15 (i7-12700H, RTX 3080 Ti) | |
| Média Intel Core i7-12700H (34.2 - 95.3, n=63) | |
| MSI Crosshair 15 R6E B12UGZ-050 | |
| Lenovo Legion 5 Pro 16 G7 i7 RTX 3070Ti | |
| MSI Pulse GL66 12UEK | |
| Acer Nitro 5 AN515-58-72QR | |
| MSI Stealth GS66 12UGS | |
| Asus TUF Dash F15 FX517ZR | |
| Aorus 15 XE5 | |
| MSI Katana GF66 12UGS | |
* ... menor é melhor
AIDA64: FP32 Ray-Trace | FPU Julia | CPU SHA3 | CPU Queen | FPU SinJulia | FPU Mandel | CPU AES | CPU ZLib | FP64 Ray-Trace | CPU PhotoWorxx
Confira nossos dedicados Intel Core i7-12700H para mais informações e comparações de desempenho.
Desempenho do sistema
Os dispositivos concorrentes são capazes de superar o Crosshair 15 R6E na pontuação PCMark 10, mas não por muito. O CrossMark vê o Crosshair 15 R6E apresentar um desempenho muito melhor
Os testes AIDA64 vêem a trilha do Crosshair 15 R6E atrás de outros laptops Core i7-12700H. Não tivemos nenhuma preocupação especial com o desempenho nas tarefas diárias de produtividade ou navegação na web
CrossMark: Overall | Productivity | Creativity | Responsiveness
| PCMark 10 / Score | |
| Média da turma Gaming (5828 - 12414, n=93, últimos 2 anos) | |
| Aorus 15 XE5 | |
| MSI Stealth GS66 12UGS | |
| Schenker XMG Neo 15 (i7-12700H, RTX 3080 Ti) | |
| Lenovo Legion 5 Pro 16 G7 i7 RTX 3070Ti | |
| MSI Katana GF66 12UGS | |
| Média Intel Core i7-12700H, NVIDIA GeForce RTX 3070 Laptop GPU (7082 - 7647, n=2) | |
| Schenker XMG Neo 15 (Ryzen 9 6900HX, RTX 3070 Ti) | |
| MSI Pulse GL66 12UEK | |
| MSI Crosshair 15 R6E B12UGZ-050 | |
| Acer Nitro 5 AN515-58-72QR | |
| Asus TUF Dash F15 FX517ZR | |
| PCMark 10 / Essentials | |
| MSI Stealth GS66 12UGS | |
| Aorus 15 XE5 | |
| Média da turma Gaming (8810 - 11935, n=97, últimos 2 anos) | |
| Schenker XMG Neo 15 (i7-12700H, RTX 3080 Ti) | |
| Média Intel Core i7-12700H, NVIDIA GeForce RTX 3070 Laptop GPU (10076 - 10926, n=2) | |
| Schenker XMG Neo 15 (Ryzen 9 6900HX, RTX 3070 Ti) | |
| MSI Pulse GL66 12UEK | |
| MSI Katana GF66 12UGS | |
| MSI Crosshair 15 R6E B12UGZ-050 | |
| Asus TUF Dash F15 FX517ZR | |
| Lenovo Legion 5 Pro 16 G7 i7 RTX 3070Ti | |
| Acer Nitro 5 AN515-58-72QR | |
| PCMark 10 / Productivity | |
| Média da turma Gaming (6845 - 25323, n=95, últimos 2 anos) | |
| Aorus 15 XE5 | |
| MSI Katana GF66 12UGS | |
| Lenovo Legion 5 Pro 16 G7 i7 RTX 3070Ti | |
| MSI Pulse GL66 12UEK | |
| Média Intel Core i7-12700H, NVIDIA GeForce RTX 3070 Laptop GPU (9460 - 9877, n=2) | |
| Schenker XMG Neo 15 (Ryzen 9 6900HX, RTX 3070 Ti) | |
| Asus TUF Dash F15 FX517ZR | |
| MSI Stealth GS66 12UGS | |
| MSI Crosshair 15 R6E B12UGZ-050 | |
| Schenker XMG Neo 15 (i7-12700H, RTX 3080 Ti) | |
| Acer Nitro 5 AN515-58-72QR | |
| PCMark 10 / Digital Content Creation | |
| Média da turma Gaming (7602 - 19954, n=95, últimos 2 anos) | |
| Schenker XMG Neo 15 (i7-12700H, RTX 3080 Ti) | |
| Lenovo Legion 5 Pro 16 G7 i7 RTX 3070Ti | |
| MSI Stealth GS66 12UGS | |
| Aorus 15 XE5 | |
| MSI Katana GF66 12UGS | |
| Média Intel Core i7-12700H, NVIDIA GeForce RTX 3070 Laptop GPU (10113 - 11245, n=2) | |
| Acer Nitro 5 AN515-58-72QR | |
| MSI Crosshair 15 R6E B12UGZ-050 | |
| Schenker XMG Neo 15 (Ryzen 9 6900HX, RTX 3070 Ti) | |
| MSI Pulse GL66 12UEK | |
| Asus TUF Dash F15 FX517ZR | |
| CrossMark / Overall | |
| MSI Pulse GL66 12UEK | |
| MSI Crosshair 15 R6E B12UGZ-050 | |
| Média da turma Gaming (1366 - 2409, n=94, últimos 2 anos) | |
| Lenovo Legion 5 Pro 16 G7 i7 RTX 3070Ti | |
| Aorus 15 XE5 | |
| MSI Katana GF66 12UGS | |
| Média Intel Core i7-12700H, NVIDIA GeForce RTX 3070 Laptop GPU (1844 - 2003, n=2) | |
| Asus TUF Dash F15 FX517ZR | |
| Schenker XMG Neo 15 (i7-12700H, RTX 3080 Ti) | |
| Acer Nitro 5 AN515-58-72QR | |
| Schenker XMG Neo 15 (Ryzen 9 6900HX, RTX 3070 Ti) | |
| CrossMark / Productivity | |
| MSI Pulse GL66 12UEK | |
| MSI Crosshair 15 R6E B12UGZ-050 | |
| MSI Katana GF66 12UGS | |
| Aorus 15 XE5 | |
| Média Intel Core i7-12700H, NVIDIA GeForce RTX 3070 Laptop GPU (1785 - 1971, n=2) | |
| Lenovo Legion 5 Pro 16 G7 i7 RTX 3070Ti | |
| Média da turma Gaming (1386 - 2254, n=94, últimos 2 anos) | |
| Acer Nitro 5 AN515-58-72QR | |
| Asus TUF Dash F15 FX517ZR | |
| Schenker XMG Neo 15 (i7-12700H, RTX 3080 Ti) | |
| Schenker XMG Neo 15 (Ryzen 9 6900HX, RTX 3070 Ti) | |
| CrossMark / Creativity | |
| Média da turma Gaming (1343 - 2786, n=94, últimos 2 anos) | |
| MSI Pulse GL66 12UEK | |
| Lenovo Legion 5 Pro 16 G7 i7 RTX 3070Ti | |
| Schenker XMG Neo 15 (i7-12700H, RTX 3080 Ti) | |
| Asus TUF Dash F15 FX517ZR | |
| Aorus 15 XE5 | |
| MSI Crosshair 15 R6E B12UGZ-050 | |
| Média Intel Core i7-12700H, NVIDIA GeForce RTX 3070 Laptop GPU (1912 - 1979, n=2) | |
| MSI Katana GF66 12UGS | |
| Acer Nitro 5 AN515-58-72QR | |
| Schenker XMG Neo 15 (Ryzen 9 6900HX, RTX 3070 Ti) | |
| CrossMark / Responsiveness | |
| MSI Pulse GL66 12UEK | |
| MSI Crosshair 15 R6E B12UGZ-050 | |
| MSI Katana GF66 12UGS | |
| Aorus 15 XE5 | |
| Média Intel Core i7-12700H, NVIDIA GeForce RTX 3070 Laptop GPU (1824 - 2182, n=2) | |
| Lenovo Legion 5 Pro 16 G7 i7 RTX 3070Ti | |
| Média da turma Gaming (1226 - 2334, n=94, últimos 2 anos) | |
| Acer Nitro 5 AN515-58-72QR | |
| Asus TUF Dash F15 FX517ZR | |
| Schenker XMG Neo 15 (i7-12700H, RTX 3080 Ti) | |
| Schenker XMG Neo 15 (Ryzen 9 6900HX, RTX 3070 Ti) | |
| PCMark 8 Home Score Accelerated v2 | 6083 pontos | |
| PCMark 8 Creative Score Accelerated v2 | 9960 pontos | |
| PCMark 8 Work Score Accelerated v2 | 6346 pontos | |
| PCMark 10 Score | 7082 pontos | |
Ajuda | ||
* ... menor é melhor
Latência do DPC
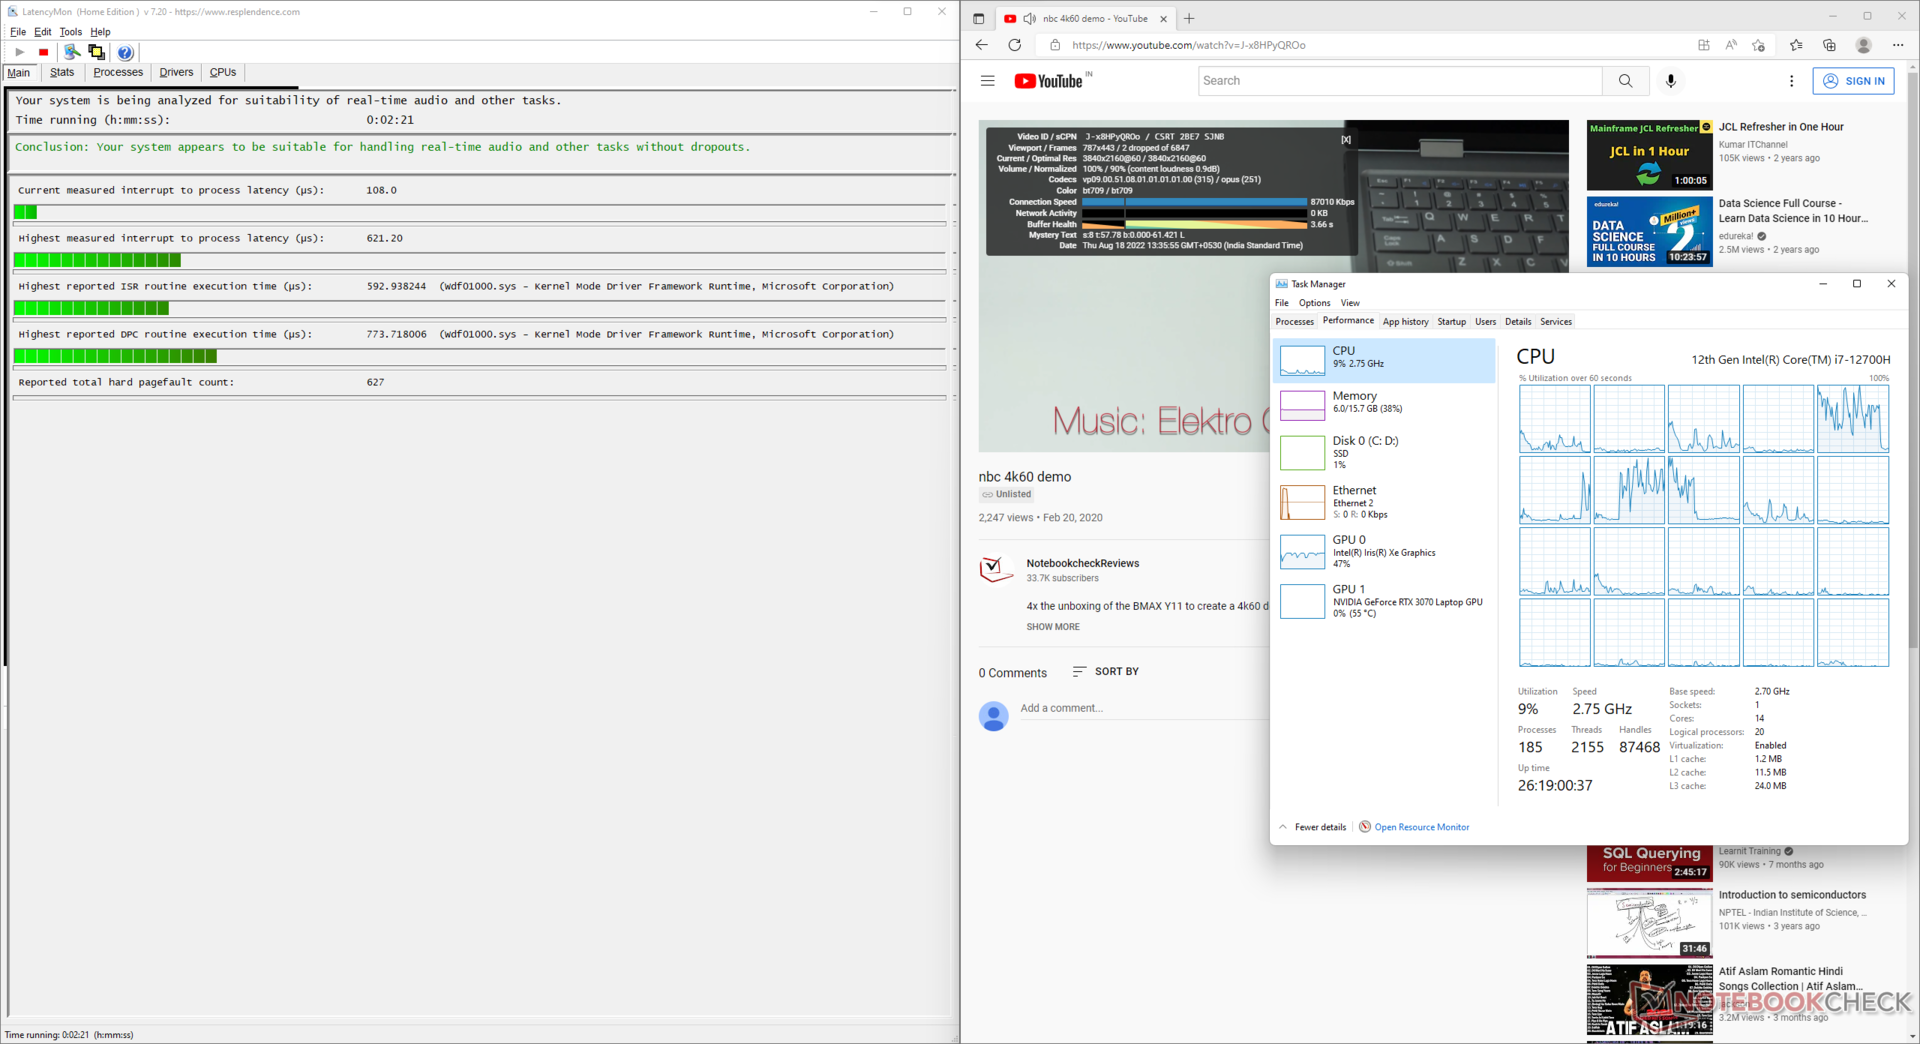
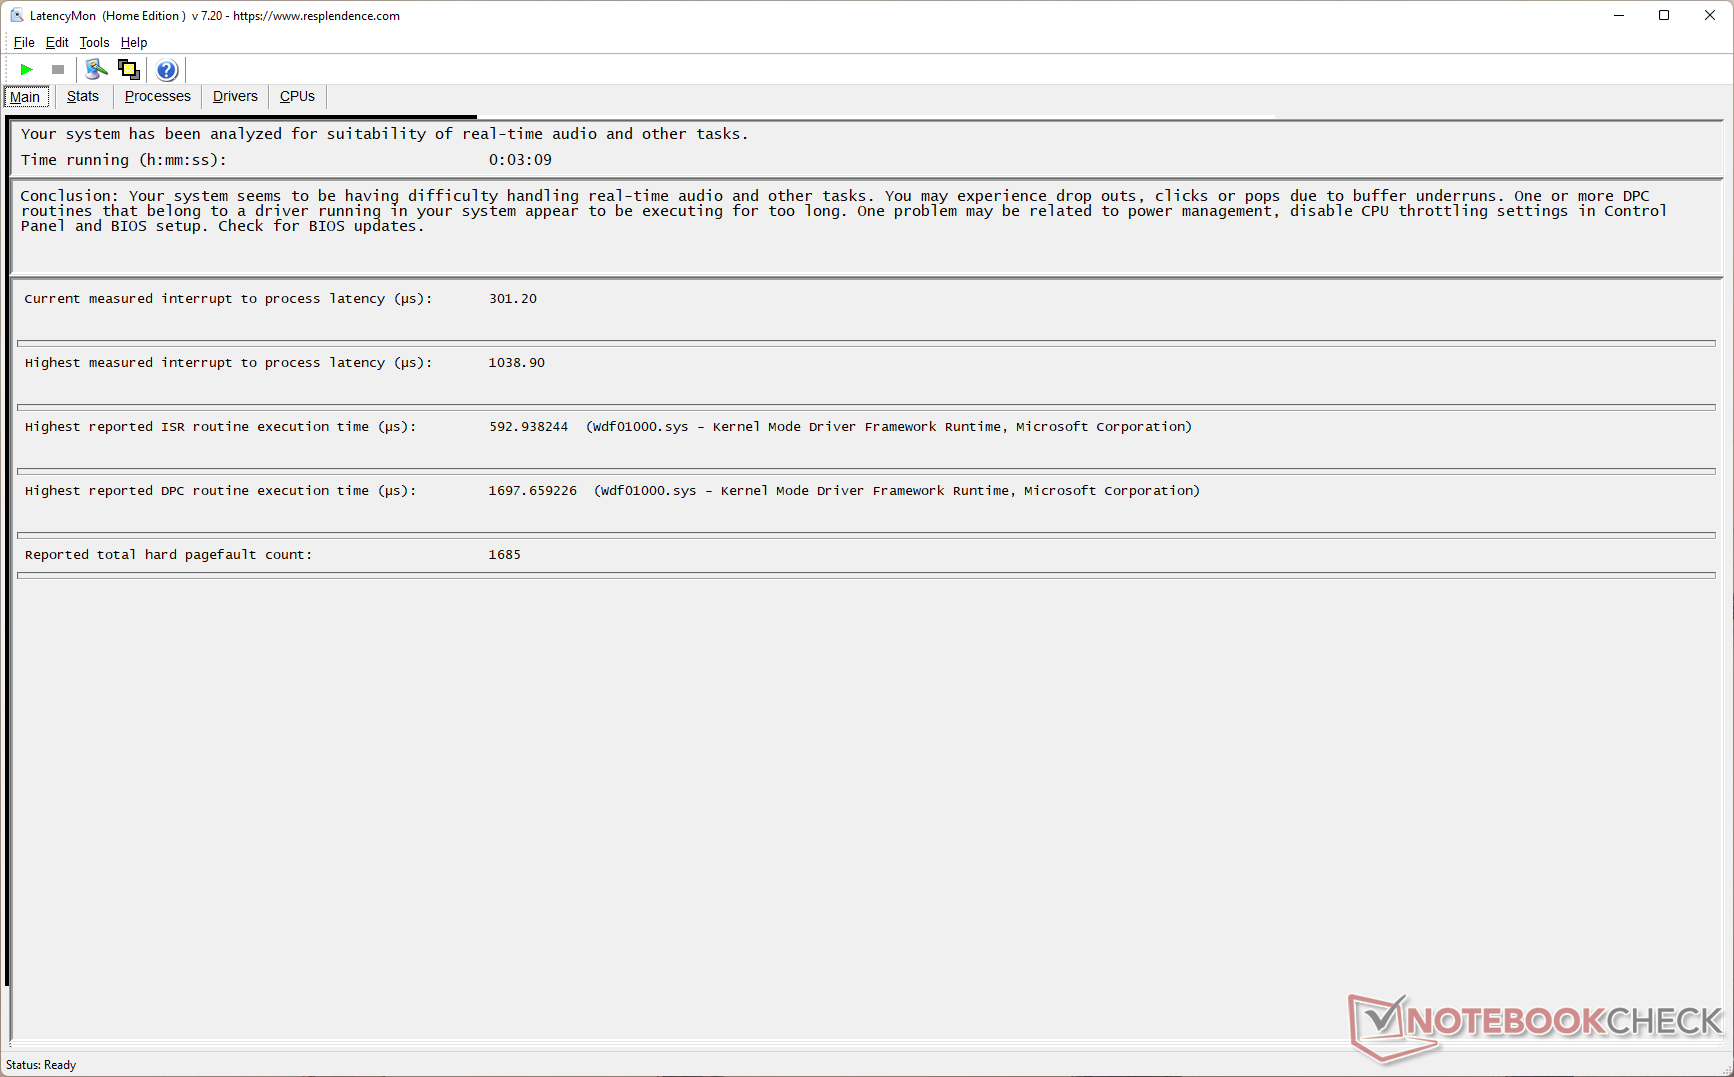
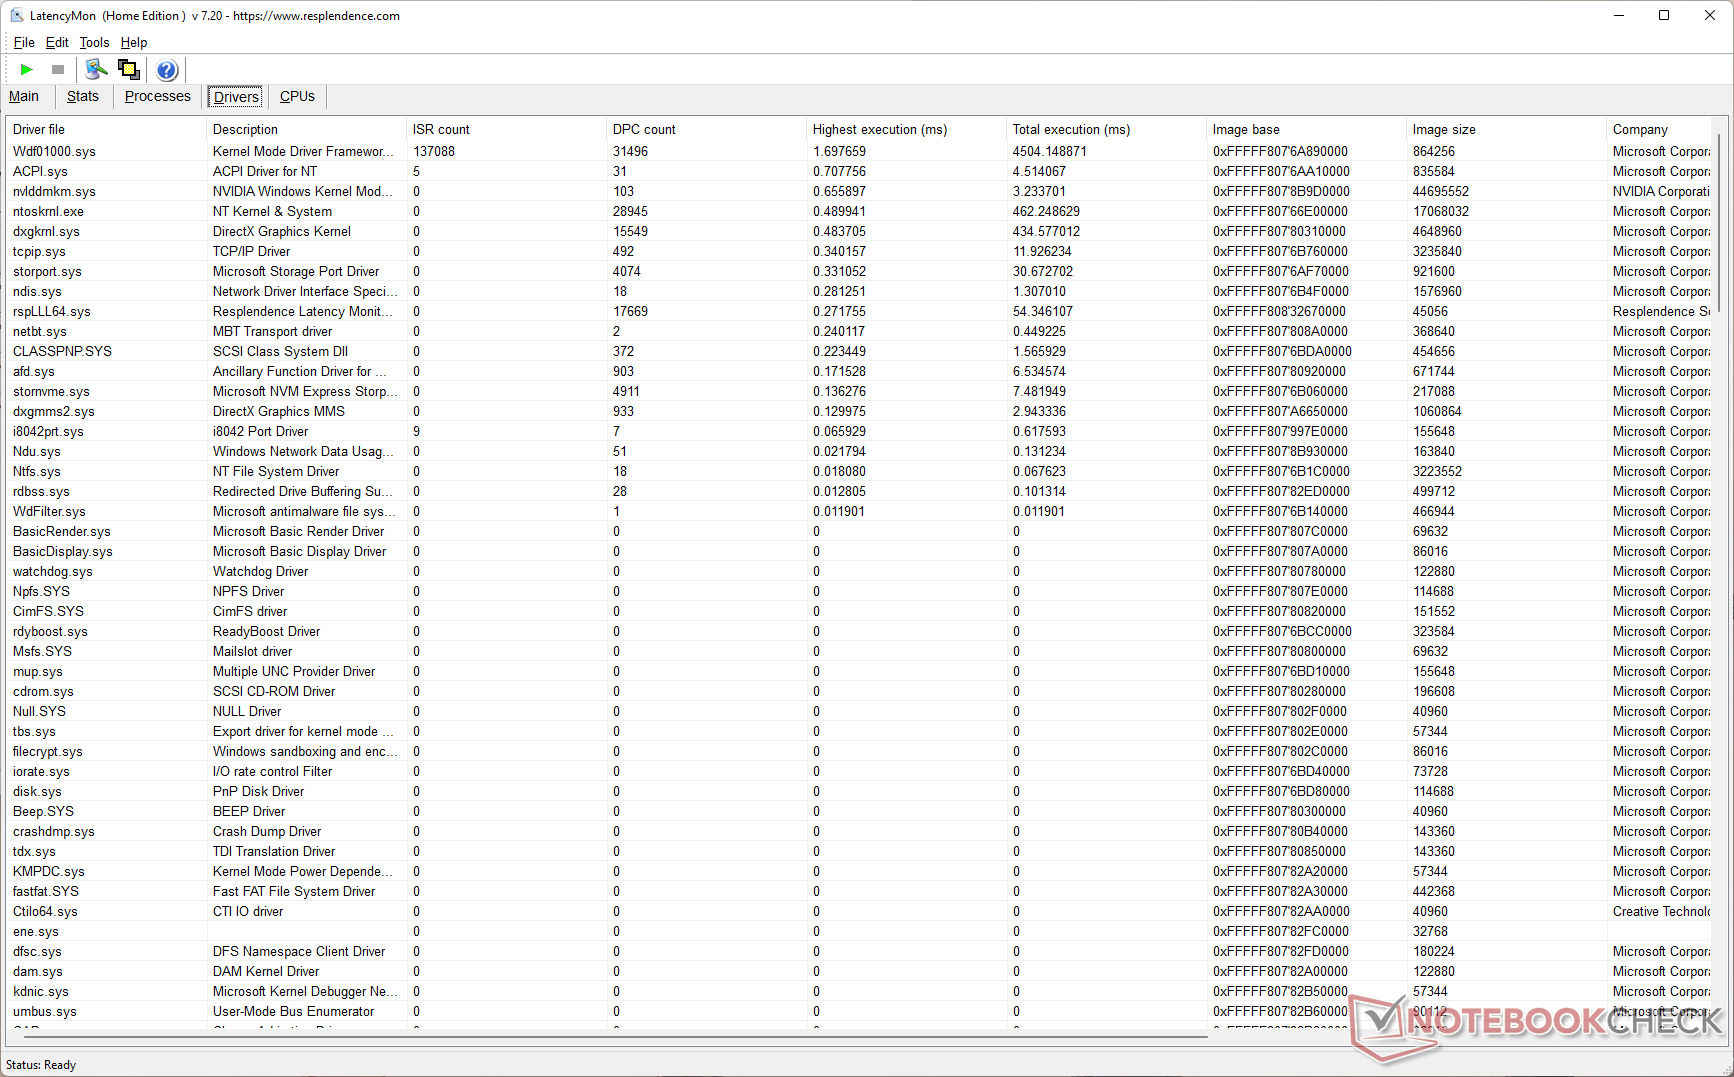
Nosso teste padronizado LatencyMon vê o Crosshair 15 R6E ter uma latência DPC um pouco maior do que outros laptops com núcleo i7-12700H. Observamos um aumento da latência após executar o teste Prime95 de grandes FFTs no local, seguindo nosso benchmark do YouTube
O Windows Kernel Mode Driver Framework parece ser a razão para o aumento dos valores de latência.
| DPC Latencies / LatencyMon - interrupt to process latency (max), Web, Youtube, Prime95 | |
| Schenker XMG Neo 15 (i7-12700H, RTX 3080 Ti) | |
| MSI Stealth GS66 12UGS | |
| Schenker XMG Neo 15 (Ryzen 9 6900HX, RTX 3070 Ti) | |
| Aorus 15 XE5 | |
| MSI Crosshair 15 R6E B12UGZ-050 | |
| MSI Pulse GL66 12UEK | |
| Acer Nitro 5 AN515-58-72QR | |
| Lenovo Legion 5 Pro 16 G7 i7 RTX 3070Ti | |
| MSI Katana GF66 12UGS | |
| Asus TUF Dash F15 FX517ZR | |
* ... menor é melhor
Mais comparações de latência entre dispositivos revisados podem ser encontradas em nosso Ranking de Latência DPC página.
Dispositivos de armazenamento
O Micron 2450 1 TB NVMe PCIe SSD não bate nenhum recorde de velocidade. O Crosshair 15 R6E tem dois slots NVMe M.2 e o próprio drive Micron suporta PCIe Gen 4, mas o desempenho está mais em linha com as velocidades da PCIe Gen 3. Dito isto, o drive é capaz de se aproximar de suas especificações de E/S nominal na maior parte das vezes.
O drive não apresenta estrangulamento em nosso teste de loop de leitura DiskSpd a uma profundidade de fila de 8. Não há espaço para adicionar uma expansão de armazenamento SATA de 2,5 polegadas.

* ... menor é melhor
Disk Throttling: DiskSpd Read Loop, Queue Depth 8
Desempenho da GPU
Nossa unidade de teste Crosshair 15 R6E utiliza uma GPU portátil RTX 3070 de 140 W com 8 GB GDDR6 VRAM. A MSI não especifica o Dynamic Boost exato para esta GPU.
a performance da 3DMark está por trás de alguns RTX 3070 Ti-computadores portáteis movidos a energia, mas não muito. O Crosshair 15 R6E segue o RTX 3080 Ti-xMG Neo 15 em 11% e 13% no 3DMark Fire Strike Gráficos e Time Spy Testes gráficos, respectivamente.
O Asus TUF Dash F15 com o mesmo GPU é 19% mais lento que o do Crosshair 15 R6E devido a um TGP de 105 W inferior.
| 3DMark 11 Performance | 30240 pontos | |
| 3DMark Ice Storm Standard Score | 158460 pontos | |
| 3DMark Cloud Gate Standard Score | 56797 pontos | |
| 3DMark Fire Strike Score | 24233 pontos | |
| 3DMark Fire Strike Extreme Score | 12959 pontos | |
| 3DMark Time Spy Score | 10496 pontos | |
Ajuda | ||
O Crosshair 15 R6E leva 42% e 33% menos vezes em Blender Classroom Optix e Classroom CUDA, respectivamente, quando comparado com os tempos médios registrados para a GPU do notebook RTX 3070.
| Blender / v3.3 Classroom OPTIX/RTX | |
| Asus TUF Dash F15 FX517ZR | |
| Média NVIDIA GeForce RTX 3070 Laptop GPU (26 - 30, n=8) | |
| MSI Crosshair 15 R6E B12UGZ-050 | |
| Aorus 15 XE5 | |
| Schenker XMG Neo 15 (Ryzen 9 6900HX, RTX 3070 Ti) | |
| Média da turma Gaming (9 - 32, n=106, últimos 2 anos) | |
| Blender / v3.3 Classroom CUDA | |
| Asus TUF Dash F15 FX517ZR | |
| Média NVIDIA GeForce RTX 3070 Laptop GPU (43 - 51, n=9) | |
| MSI Crosshair 15 R6E B12UGZ-050 | |
| Aorus 15 XE5 | |
| Schenker XMG Neo 15 (Ryzen 9 6900HX, RTX 3070 Ti) | |
| Média da turma Gaming (15 - 228, n=106, últimos 2 anos) | |
| Blender / v3.3 Classroom CPU | |
| Média NVIDIA GeForce RTX 3070 Laptop GPU (329 - 698, n=12) | |
| Asus TUF Dash F15 FX517ZR | |
| Aorus 15 XE5 | |
| MSI Crosshair 15 R6E B12UGZ-050 | |
| Schenker XMG Neo 15 (Ryzen 9 6900HX, RTX 3070 Ti) | |
| Média da turma Gaming (122 - 565, n=102, últimos 2 anos) | |
* ... menor é melhor
Desempenho nos jogos
O desempenho em jogos testados em 1080p Ultra está apenas cerca de 8% atrás do RTX 3080 Ti-powered XMG Neo 15. A Lenovo Legion 5i Pro 16 G7 com um RTX 3070 Ti mostra pistas perceptíveis sobre o Crosshair 15 R6E na maioria dos jogos, particularmente no QHD Ultra.
O RTX 3080 Ti-powered XMG Neo 15 pode ser até 17% em Far Cry 5 QHD Ultra, mas este delta aumenta para 45% em O Witcher 3 a 1080p de altura. Em Rainbow Six: Extração, o Crosshair 15 R6E mostra boas pistas em 1080p e QHD Ultra sobre o Stealth GS66 com uma GPU RTX 3070 Ti Laptop.
| F1 2021 | |
| 1920x1080 High Preset AA:T AF:16x | |
| Lenovo Legion 5 Pro 16 G7 i7 RTX 3070Ti | |
| MSI Stealth GS66 12UGS | |
| MSI Crosshair 15 R6E B12UGZ-050 | |
| Média NVIDIA GeForce RTX 3070 Laptop GPU (66.1 - 256, n=16) | |
| Asus TUF Dash F15 FX517ZR | |
| Acer Nitro 5 AN515-58-72QR | |
| 1920x1080 Ultra High Preset + Raytracing AA:T AF:16x | |
| Lenovo Legion 5 Pro 16 G7 i7 RTX 3070Ti | |
| MSI Crosshair 15 R6E B12UGZ-050 | |
| MSI Stealth GS66 12UGS | |
| Acer Nitro 5 AN515-58-72QR | |
| Média NVIDIA GeForce RTX 3070 Laptop GPU (33.1 - 123.1, n=23) | |
| Asus TUF Dash F15 FX517ZR | |
| 2560x1440 Ultra High Preset + Raytracing AA:T AF:16x | |
| Lenovo Legion 5 Pro 16 G7 i7 RTX 3070Ti | |
| MSI Crosshair 15 R6E B12UGZ-050 | |
| Média NVIDIA GeForce RTX 3070 Laptop GPU (67.1 - 90.2, n=11) | |
| Acer Nitro 5 AN515-58-72QR | |
| MSI Stealth GS66 12UGS | |
| Asus TUF Dash F15 FX517ZR | |
| Rainbow Six Extraction | |
| 1920x1080 High Preset (with Fixed Resolution Quality) | |
| Média NVIDIA GeForce RTX 3070 Laptop GPU (171 - 202, n=4) | |
| MSI Stealth GS66 12UGS | |
| MSI Crosshair 15 R6E B12UGZ-050 | |
| 1920x1080 Ultra Preset (with Fixed Resolution Quality) | |
| MSI Crosshair 15 R6E B12UGZ-050 | |
| Média NVIDIA GeForce RTX 3070 Laptop GPU (149 - 157, n=4) | |
| MSI Stealth GS66 12UGS | |
| 2560x1440 Ultra Preset (with Fixed Resolution Quality) | |
| MSI Crosshair 15 R6E B12UGZ-050 | |
| Média NVIDIA GeForce RTX 3070 Laptop GPU (97 - 103, n=3) | |
| MSI Stealth GS66 12UGS | |
A Carta de FPS Witcher 3
A GPU do laptop RTX 3070 mostra bom desempenho sustentado no The Witcher 3 a 1080p Ultra com o personagem permanecendo estacionário durante a duração do teste. Vemos flutuações na taxa de quadros, mas elas não são muito drásticas.
| baixo | média | alto | ultra | QHD | 4K | |
|---|---|---|---|---|---|---|
| GTA V (2015) | 184.2 | 182 | 173.8 | 113.7 | 97.1 | |
| The Witcher 3 (2015) | 368 | 294 | 168 | 105.7 | ||
| Dota 2 Reborn (2015) | 177.7 | 161.4 | 150.4 | 142.7 | 127.2 | |
| Final Fantasy XV Benchmark (2018) | 166.6 | 127.5 | 98 | 79 | 46.9 | |
| X-Plane 11.11 (2018) | 150.1 | 133.1 | 106.3 | 98.7 | ||
| Far Cry 5 (2018) | 137 | 125 | 122 | 118 | 99 | |
| Strange Brigade (2018) | 444 | 251 | 211 | 185.5 | 140.5 | |
| F1 2021 (2021) | 319 | 228 | 192.6 | 115.4 | 86.3 | |
| Rainbow Six Extraction (2022) | 225 | 189 | 171 | 155 | 103 | |
| Cyberpunk 2077 1.6 (2022) | 123 | 111.6 | 90.8 | 76.9 | 49.5 |
Confira nossos dedicados Nvidia GeForce RTX 3070 GPU para notebook para mais informações e comparações de desempenho.
Emissões: Níveis de ruído toleráveis no perfil Equilibrado
Ruído do sistema
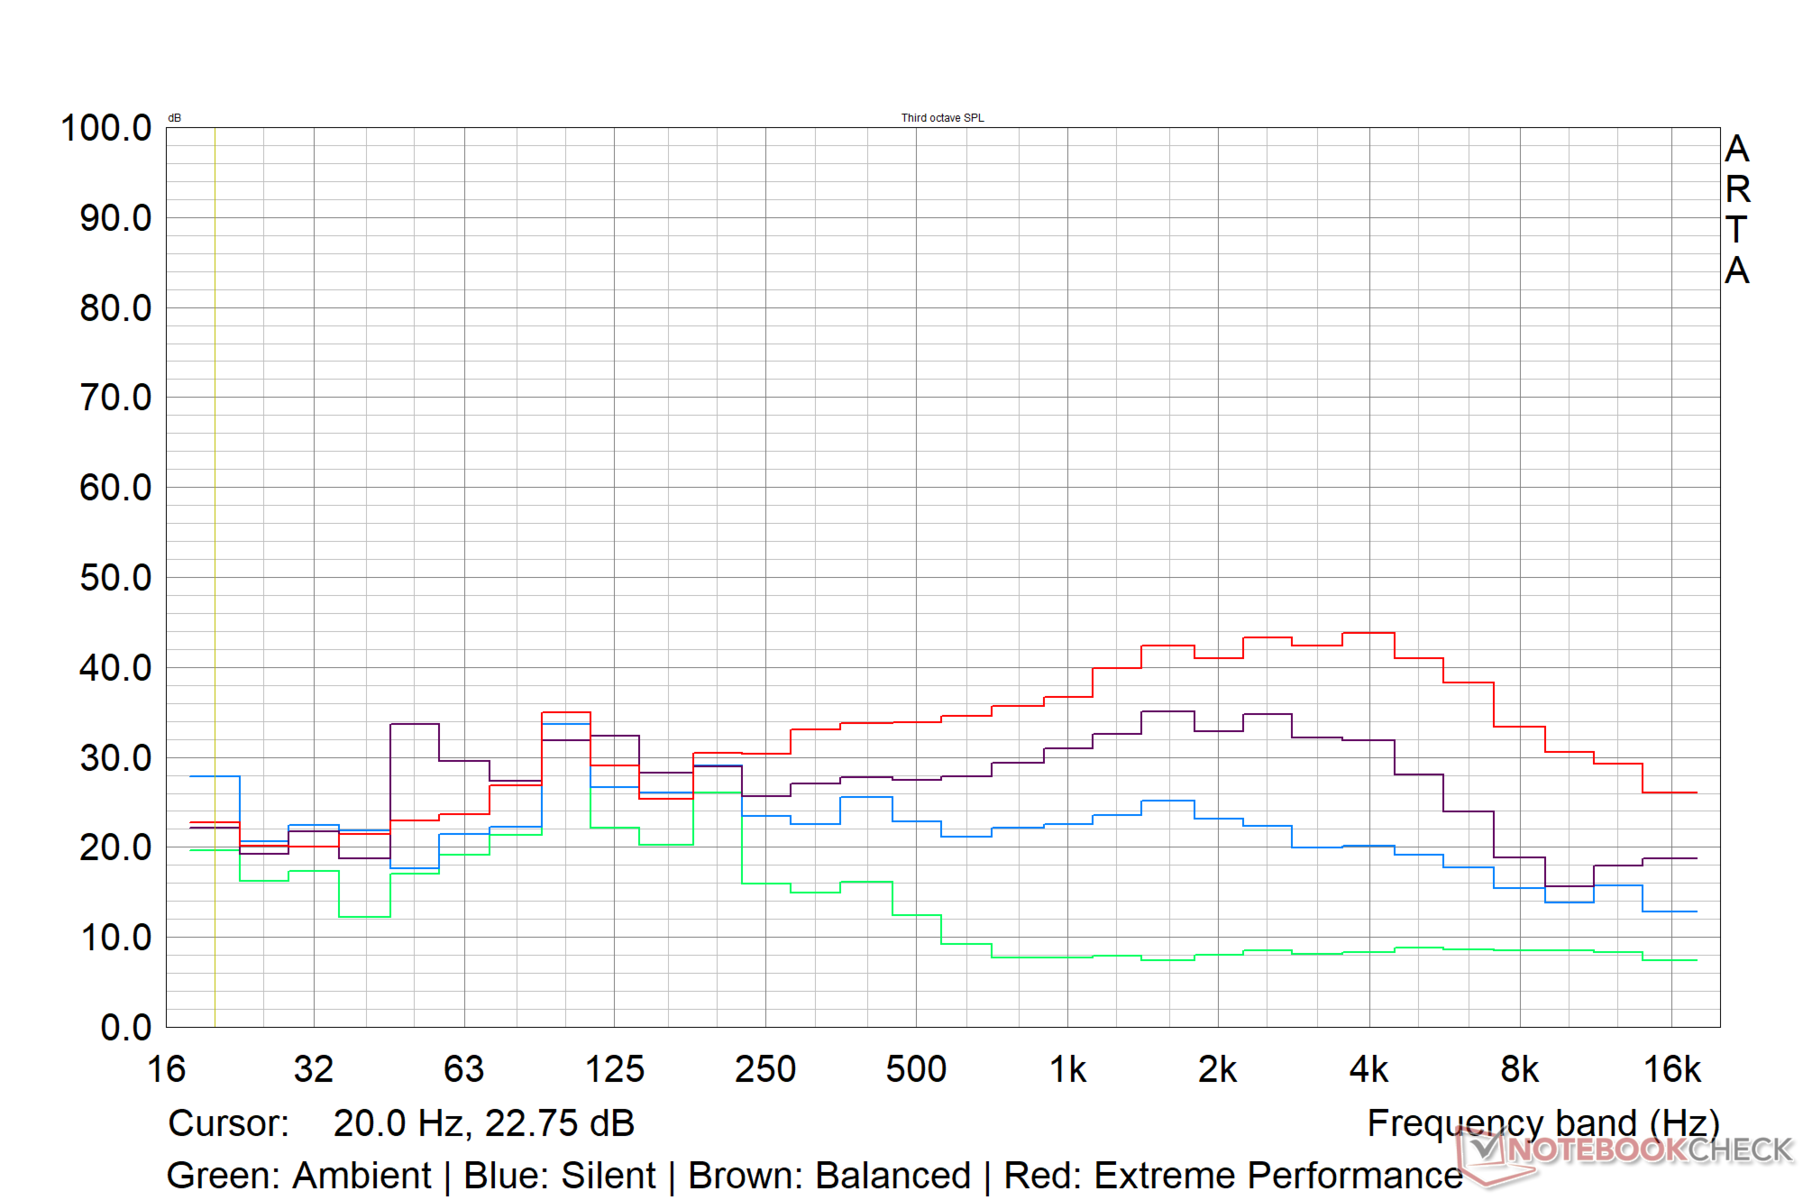
O ruído do ventilador no ajuste padrão Equilibrado é bastante tolerável, mesmo sob carga. A MSI parece ter limitado o ruído máximo do ventilador do Crosshair 15 R6E a cerca de 45 db(A) neste modo.
O ajuste de Desempenho Extremo vê o nível de pressão sonora (SPL) aumentar para a marca de 52 dB(A). O SPL é limitado a menos de 40 dB(A) no perfil Silent.
| Ajuste de desempenho | dB(A) | Carga Média dB(A) | Carga Máxima dB(A) | O Witcher 3 dB(A) |
|---|---|---|---|---|
| Silencioso | 25,98 | 33,09 | 37,69 | 34 |
| Equilibrado | 26,14 | 44,33 | 43,20 | 43,34 |
| Desempenho extremo | 26,14 | 50,07 | 52,66 | 52,43 |
Barulho
| Ocioso |
| 26.14 / 26.14 / 26.14 dB |
| Carga |
| 44.33 / 43.2 dB |
 | ||
30 dB silencioso 40 dB(A) audível 50 dB(A) ruidosamente alto |
||
min: | ||
| MSI Crosshair 15 R6E B12UGZ-050 Intel Core i7-12700H, NVIDIA GeForce RTX 3070 Laptop GPU | MSI Stealth GS66 12UGS Intel Core i7-12700H, NVIDIA GeForce RTX 3070 Ti Laptop GPU | Lenovo Legion 5 Pro 16 G7 i7 RTX 3070Ti Intel Core i7-12700H, NVIDIA GeForce RTX 3070 Ti Laptop GPU | Asus TUF Dash F15 FX517ZR Intel Core i7-12650H, NVIDIA GeForce RTX 3070 Laptop GPU | Schenker XMG Neo 15 (Ryzen 9 6900HX, RTX 3070 Ti) AMD Ryzen 9 6900HX, NVIDIA GeForce RTX 3070 Ti Laptop GPU | |
|---|---|---|---|---|---|
| Noise | -14% | -12% | -13% | -7% | |
| desligado / ambiente * (dB) | 22.82 | 24 -5% | 24.6 -8% | 26 -14% | 23 -1% |
| Idle Minimum * (dB) | 26.14 | 31 -19% | 28.4 -9% | 26 1% | 23 12% |
| Idle Average * (dB) | 26.14 | 32 -22% | 28.4 -9% | 32 -22% | 25.82 1% |
| Idle Maximum * (dB) | 26.14 | 35 -34% | 28.4 -9% | 33 -26% | 27.3 -4% |
| Load Average * (dB) | 44.33 | 48 -8% | 49.4 -11% | 48 -8% | 42.7 4% |
| Witcher 3 ultra * (dB) | 43.3 | 43 1% | 49.4 -14% | 47 -9% | 56 -29% |
| Load Maximum * (dB) | 43.2 | 48 -11% | 54.7 -27% | 49 -13% | 56 -30% |
* ... menor é melhor
Temperatura
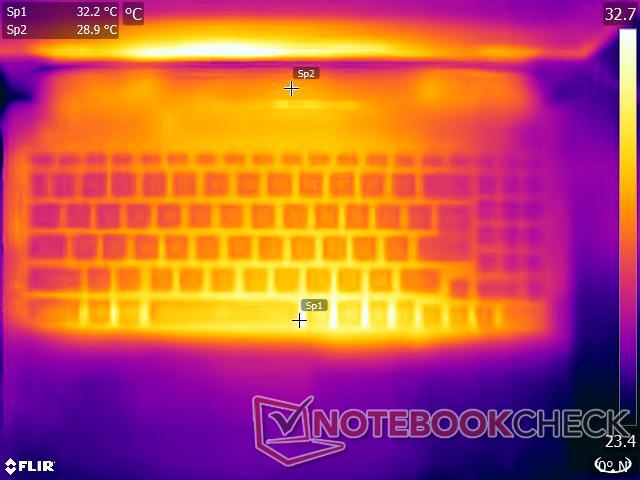
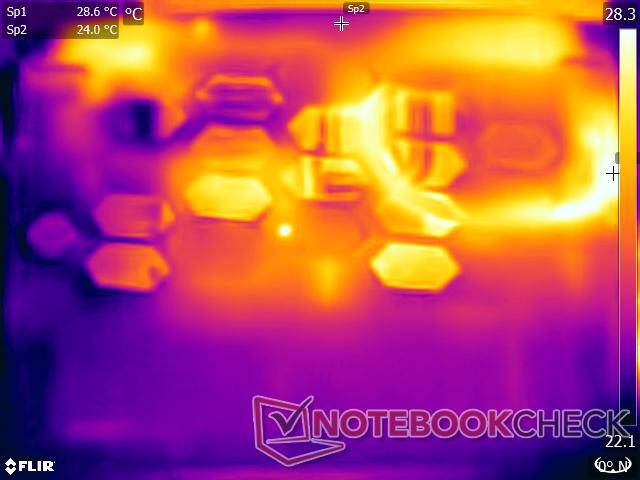
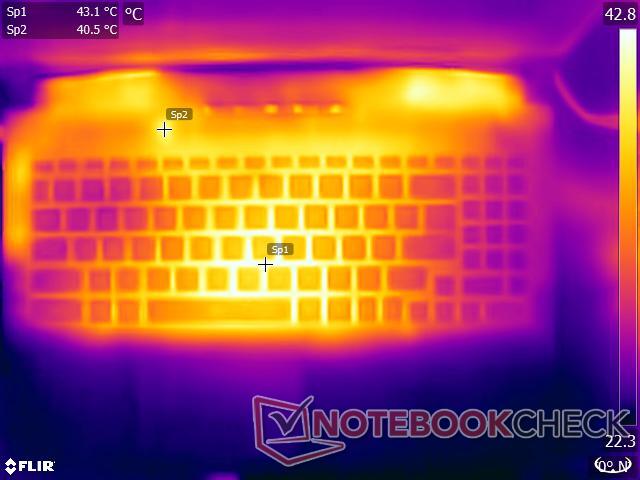
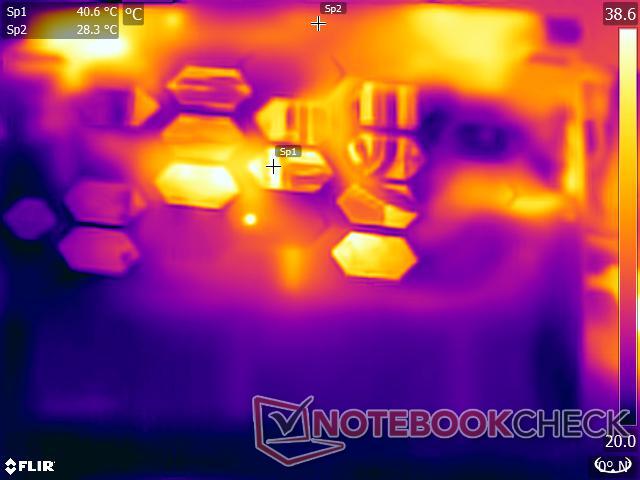
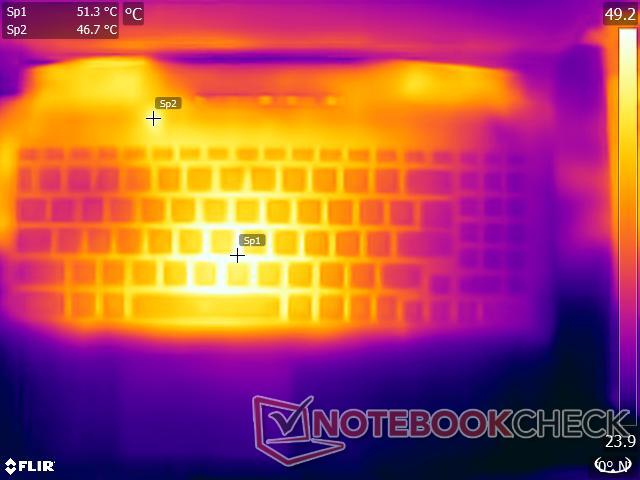
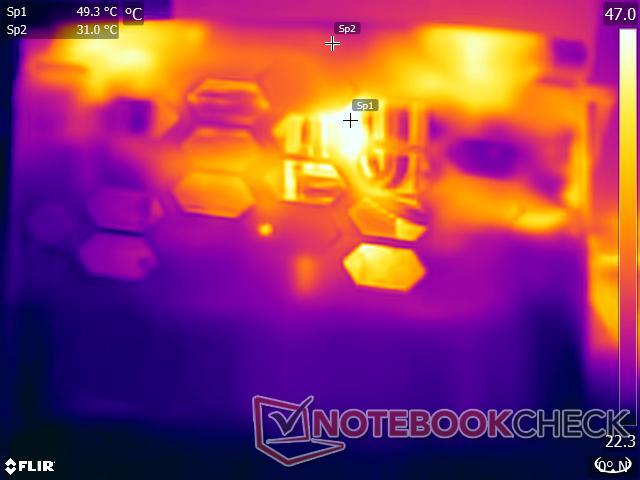
As temperaturas de superfície são toleráveis durante a maioria das tarefas de produtividade que não empurram a CPU e a GPU para seus limites. Sob uma carga combinada de Prime95 e FurMark, registramos temperaturas de superfície até a marca de 48 °C em ambos os lados da unidade. Isto aumenta para quase 55 °C, ao mesmo tempo em que se enfatiza com o The Witcher 3 a 1080p Ultra
O touchpad e as áreas de repouso das palmas permanecem relativamente frias durante todo o teste.
(-) A temperatura máxima no lado superior é 48.4 °C / 119 F, em comparação com a média de 40.4 °C / 105 F , variando de 21.2 a 68.8 °C para a classe Gaming.
(-) A parte inferior aquece até um máximo de 48.2 °C / 119 F, em comparação com a média de 43.2 °C / 110 F
(+) Em uso inativo, a temperatura média para o lado superior é 30.6 °C / 87 F, em comparação com a média do dispositivo de 33.9 °C / ### class_avg_f### F.
(-) Jogando The Witcher 3, a temperatura média para o lado superior é 43.5 °C / 110 F, em comparação com a média do dispositivo de 33.9 °C / ## #class_avg_f### F.
(+) Os apoios para as mãos e o touchpad estão atingindo a temperatura máxima da pele (32.8 °C / 91 F) e, portanto, não estão quentes.
(-) A temperatura média da área do apoio para as mãos de dispositivos semelhantes foi 28.8 °C / 83.8 F (-4 °C / -7.2 F).
Embora nossos testes de estresse representem cenários extremos, recomendamos a opção pelos modos de desempenho Silencioso ou Equilibrado caso você deseje usar o dispositivo na volta.
| MSI Crosshair 15 R6E B12UGZ-050 Intel Core i7-12700H, NVIDIA GeForce RTX 3070 Laptop GPU | MSI Stealth GS66 12UGS Intel Core i7-12700H, NVIDIA GeForce RTX 3070 Ti Laptop GPU | Lenovo Legion 5 Pro 16 G7 i7 RTX 3070Ti Intel Core i7-12700H, NVIDIA GeForce RTX 3070 Ti Laptop GPU | Asus TUF Dash F15 FX517ZR Intel Core i7-12650H, NVIDIA GeForce RTX 3070 Laptop GPU | Schenker XMG Neo 15 (Ryzen 9 6900HX, RTX 3070 Ti) AMD Ryzen 9 6900HX, NVIDIA GeForce RTX 3070 Ti Laptop GPU | |
|---|---|---|---|---|---|
| Heat | 2% | -1% | -6% | 6% | |
| Maximum Upper Side * (°C) | 48.4 | 54 -12% | 45.3 6% | 52 -7% | 41 15% |
| Maximum Bottom * (°C) | 48.2 | 59 -22% | 61.2 -27% | 52 -8% | 57 -18% |
| Idle Upper Side * (°C) | 34 | 26 24% | 28.6 16% | 33 3% | 28 18% |
| Idle Bottom * (°C) | 32.4 | 27 17% | 31.4 3% | 36 -11% | 30 7% |
* ... menor é melhor
Teste de estresse
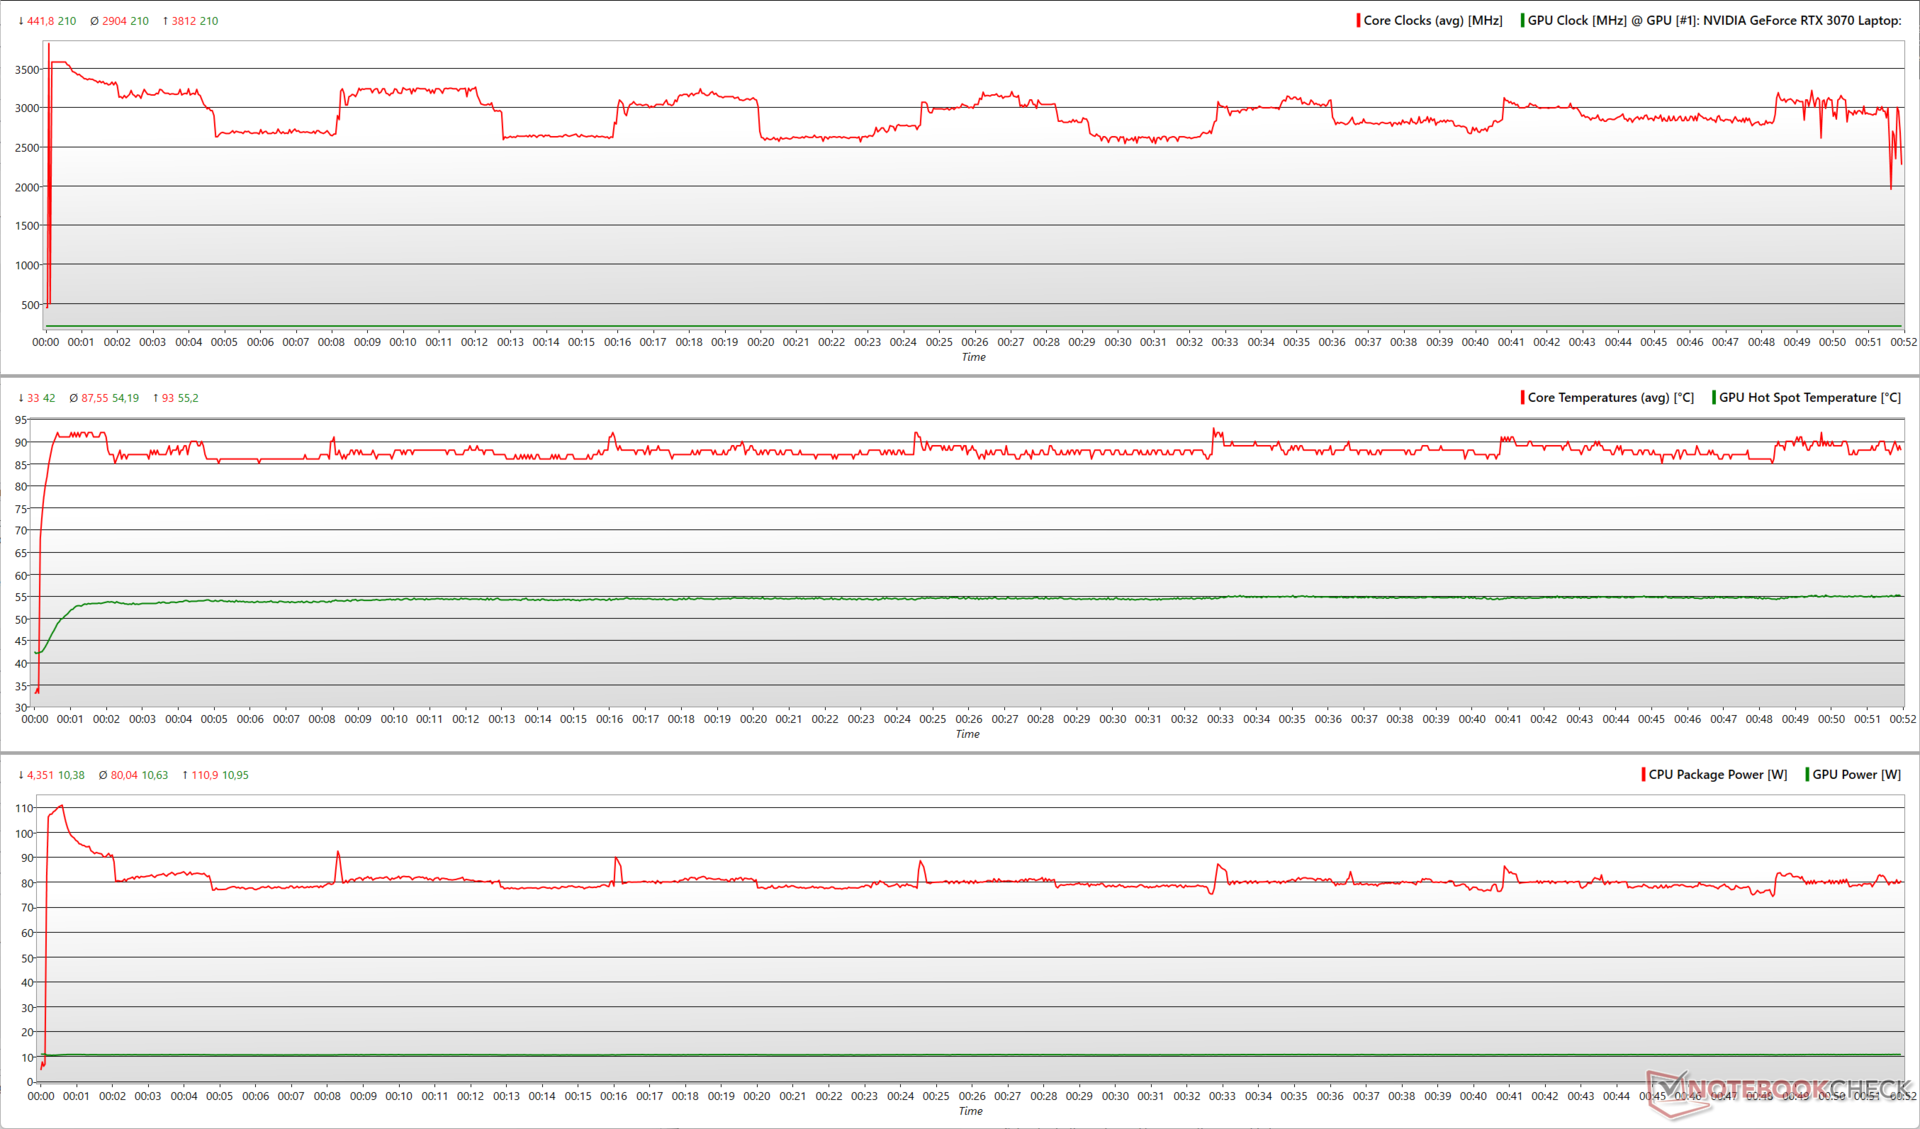
Durante o estresse Prime95, vemos que o Core i7-12700H é capaz de impulsionar até 3,8 GHz enquanto consome 111 W. Entretanto, a média dos relógios core está mais na faixa de 2,9 GHz com a potência média do pacote em torno de 80 W. O processador pode atingir até 93 °C durante este estresse.
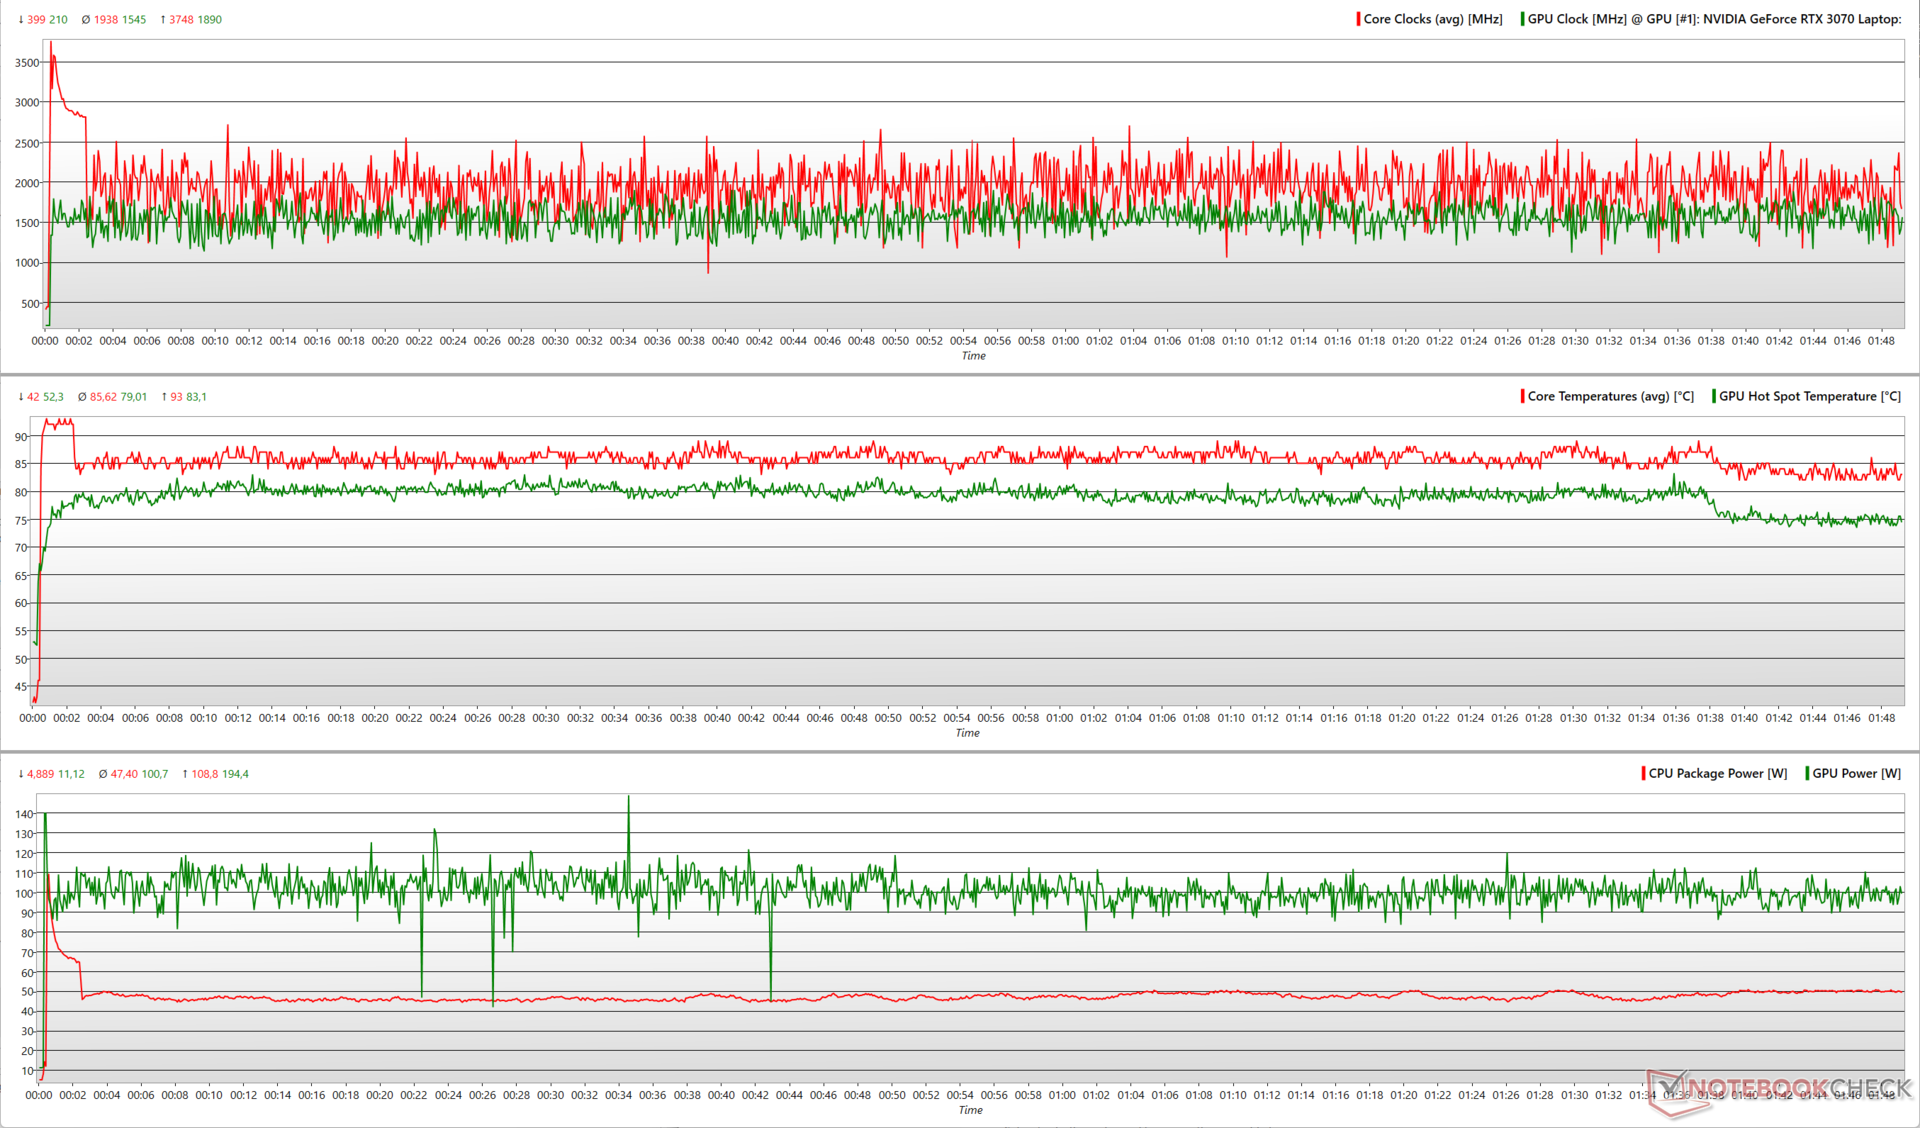
A adição do FurMark faz com que o Crosshair 15 R6E transfira uma parte do orçamento total de energia para o RTX 3070. Isto resulta em uma redução da média dos relógios centrais da CPU para 1,9 GHz com a queda na potência média do pacote para 47,4 W. O RTX 3070 é capaz de atingir perto de seu pico de 1,9 GHz e sustentar a 1,54 GHz. Ao fazer isso, a GPU consome perto de 195 W de potência de pico e uma média de cerca de 101 W. As temperaturas médias da CPU e da GPU ficam em torno de 85,6 °C e 79 °C, respectivamente.
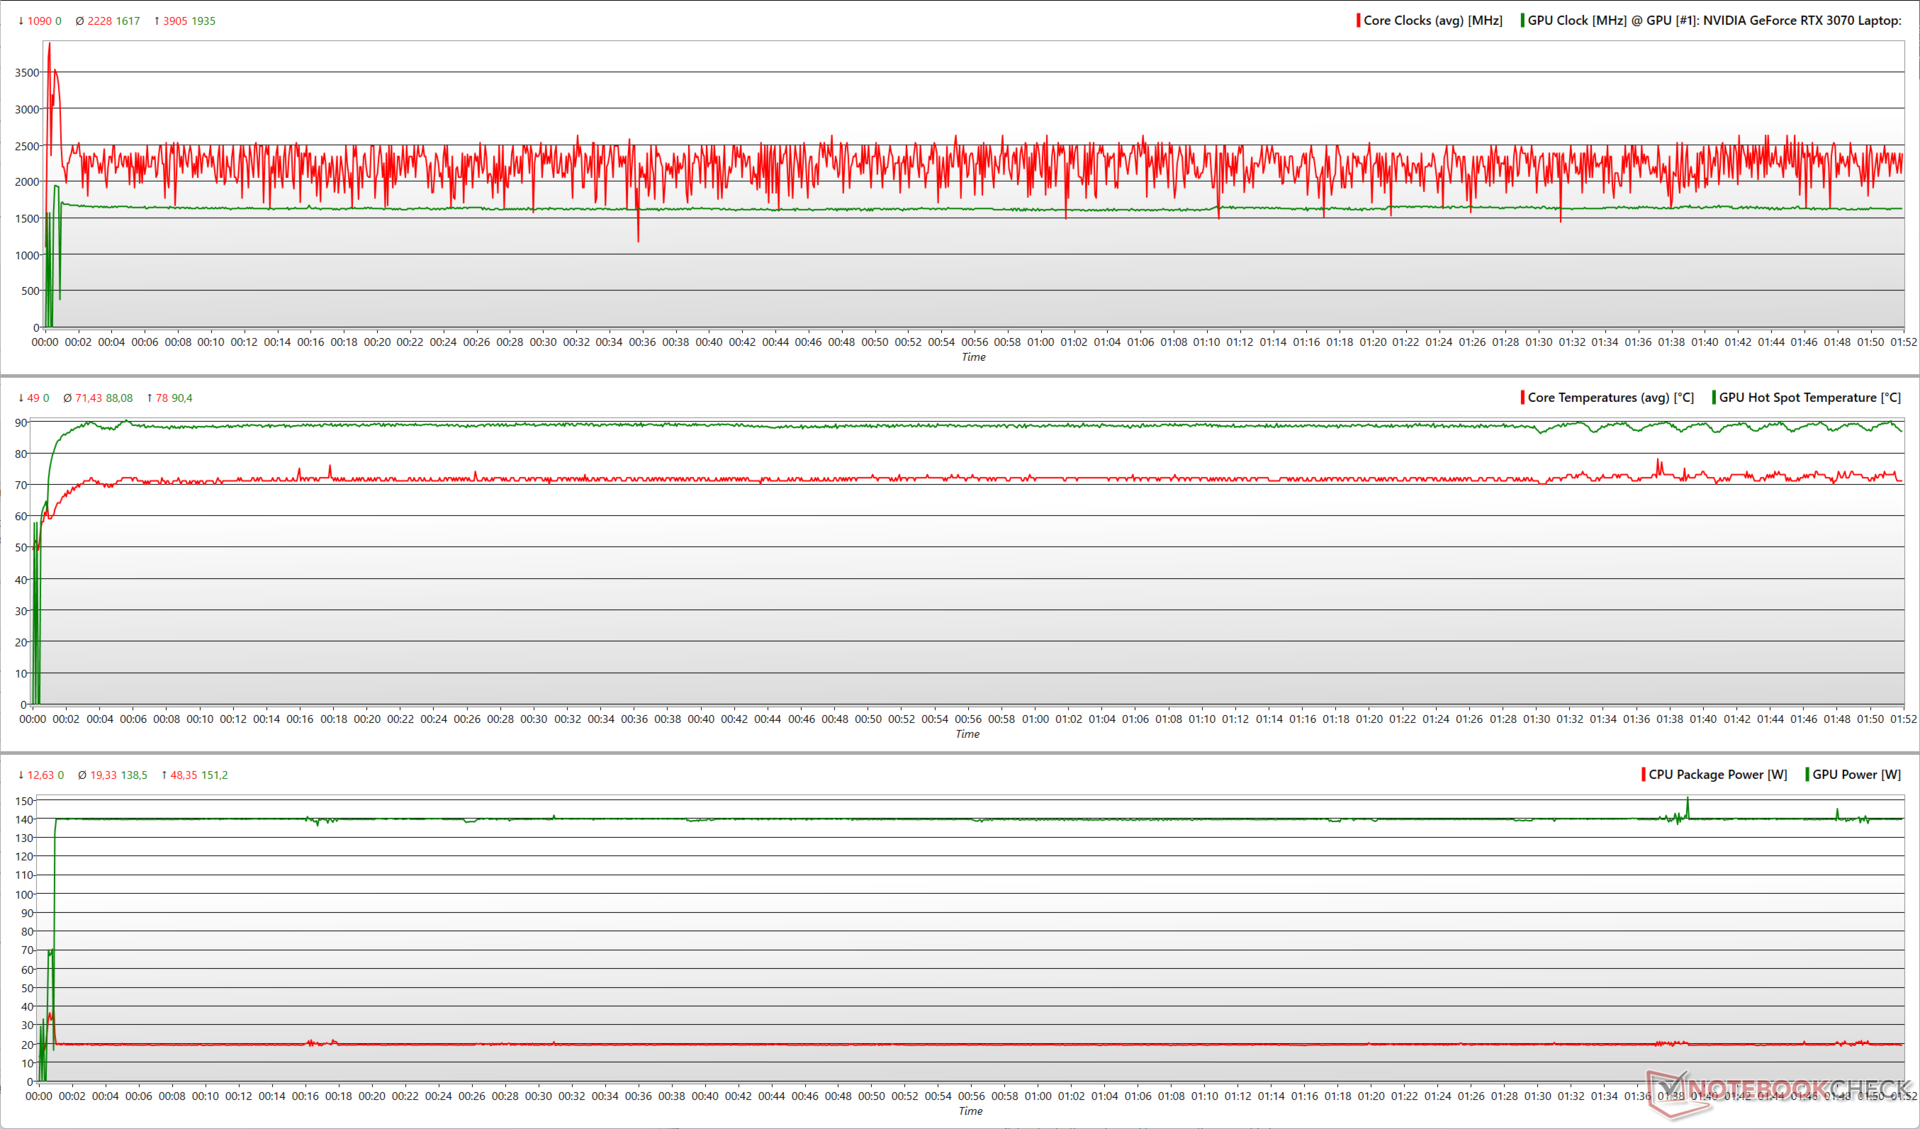
A tensão Witcher 3 a 1080p Ultra vê uma distribuição mais equitativa de potência, com o Core i7-12700H agora podendo trabalhar a velocidades médias de 2,2 GHz e o RTX 3070 também aumentando ligeiramente para 1,6 GHz. O relógio GPU médio mais alto vem à custa de um maior consumo médio de energia a 138,5 W
É interessante observar que o Core i7-12700H é capaz de atingir um relógio mais alto com pouco menos de 20 W de potência média do pacote. As temperaturas médias durante a costa de estresse Witcher 3 em torno dos 71,4 °C e 88 °C para a CPU e GPU, respectivamente.
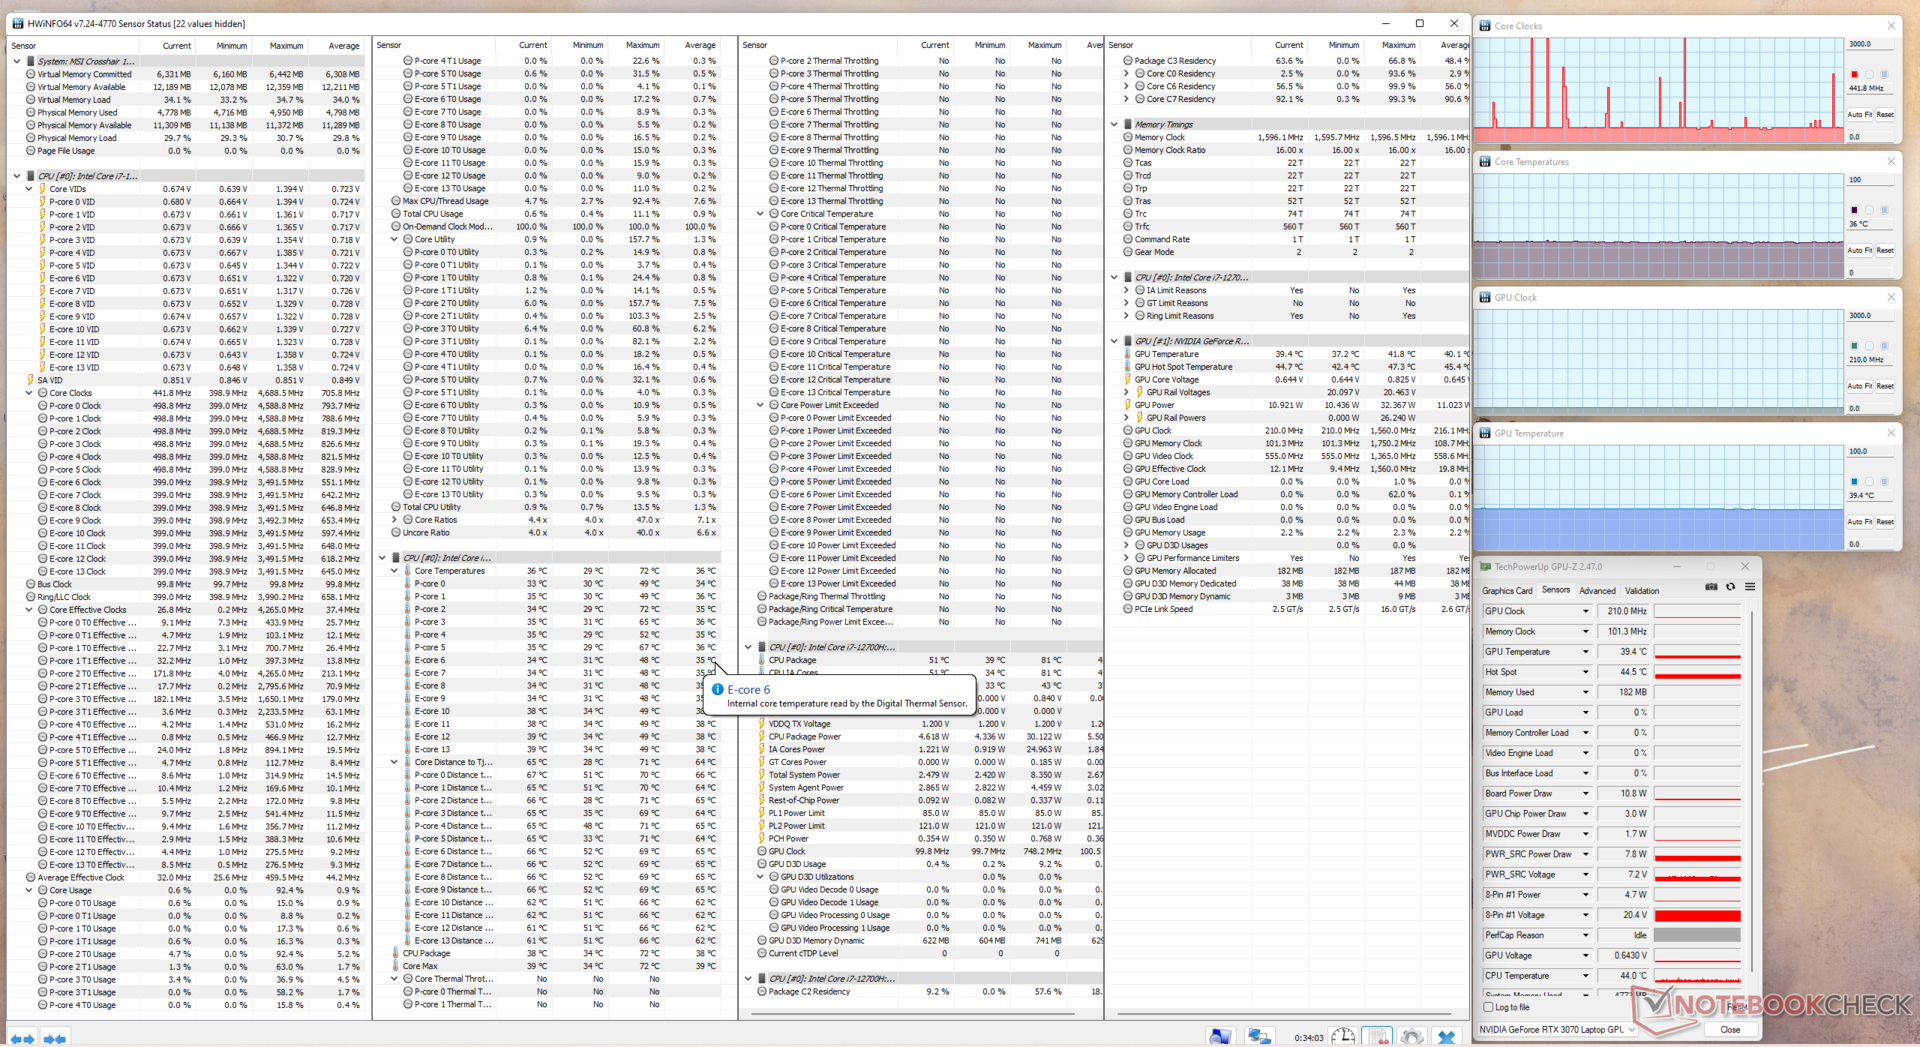
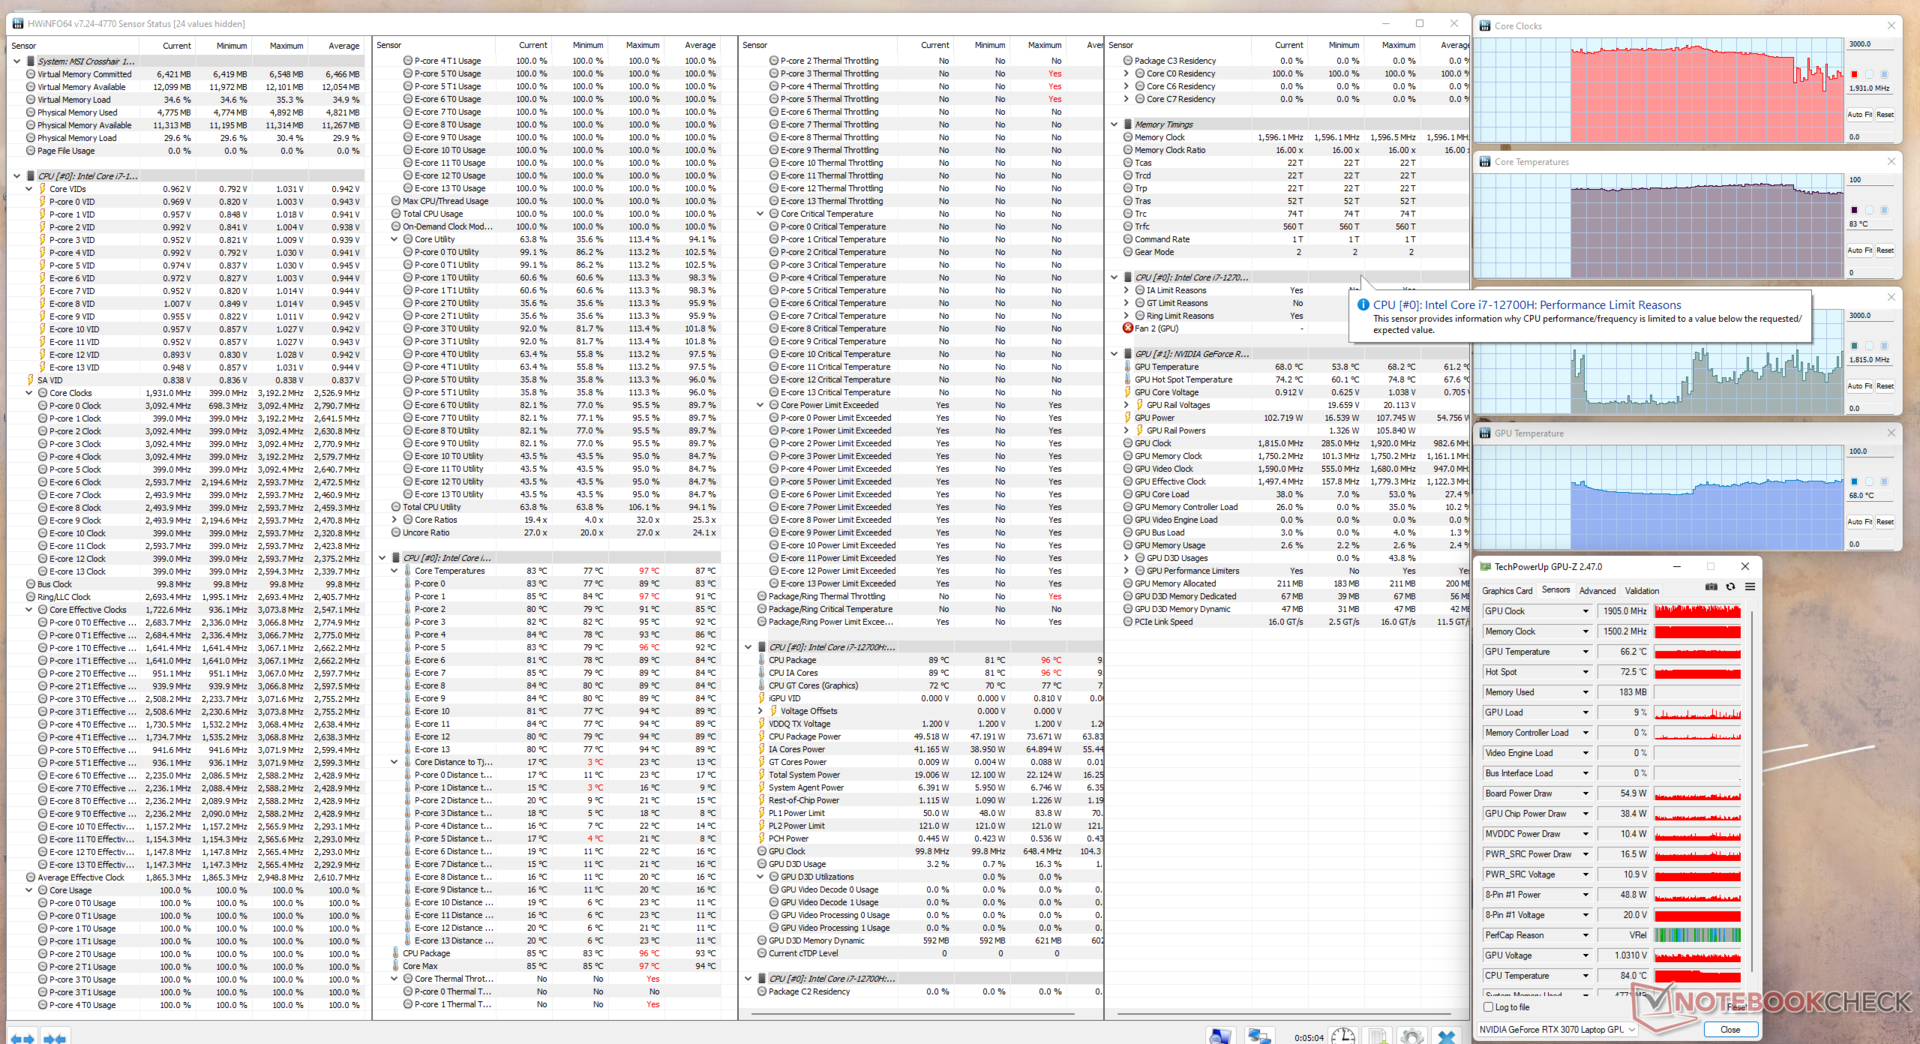
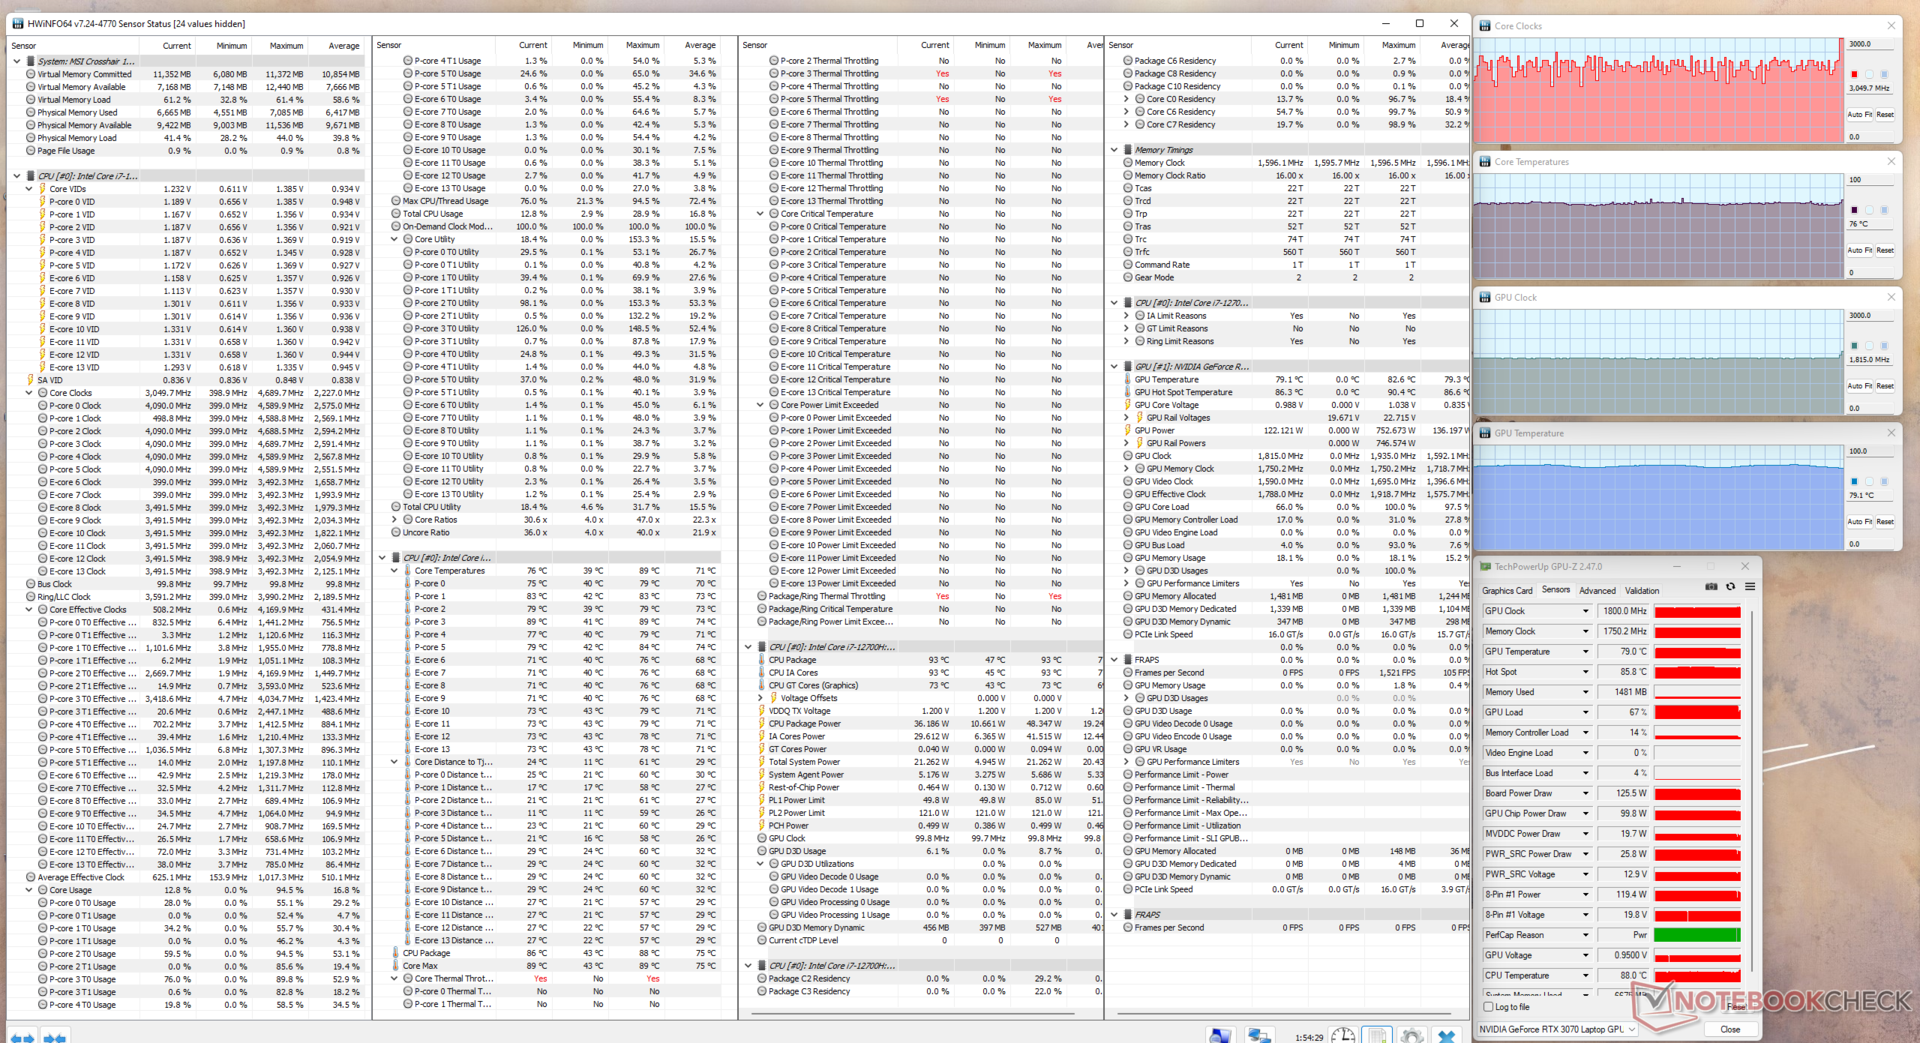
| Teste de estresse | Relógio da CPU (GHz) | Relógio da GPU (MHz) | Temperatura média da CPU (°C) | Temperatura média da GPU (°C) |
| Sistema ocioso | 0.4 | 210 | 36 | 40.1 |
| Prime95 | 2.53 | 210 | 51 | 41.3 |
| Prime95 + FurMark | 1.93 | 1.81 | 87 | 61.2 |
| O Witcher 3 | 3.04 | 1.81 | 71 | 79.3 |
Oradores
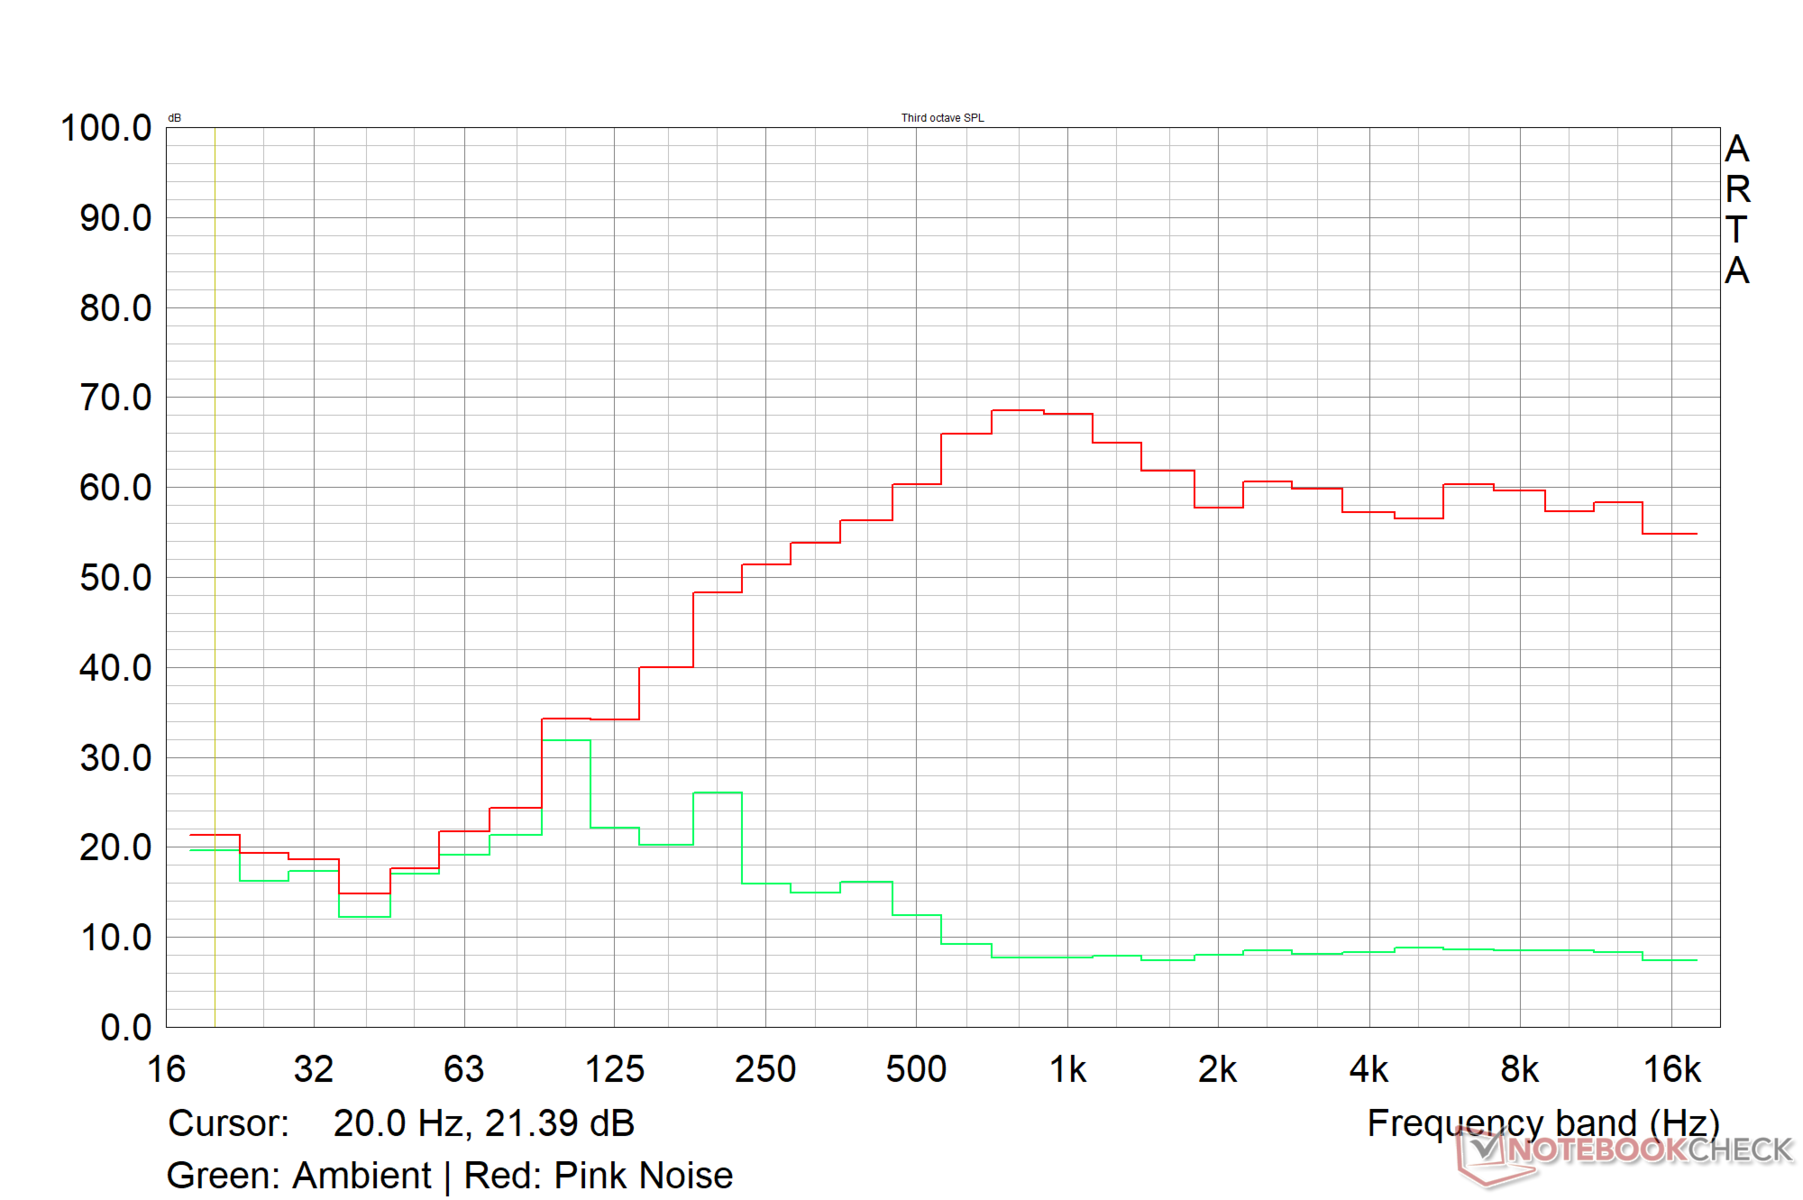
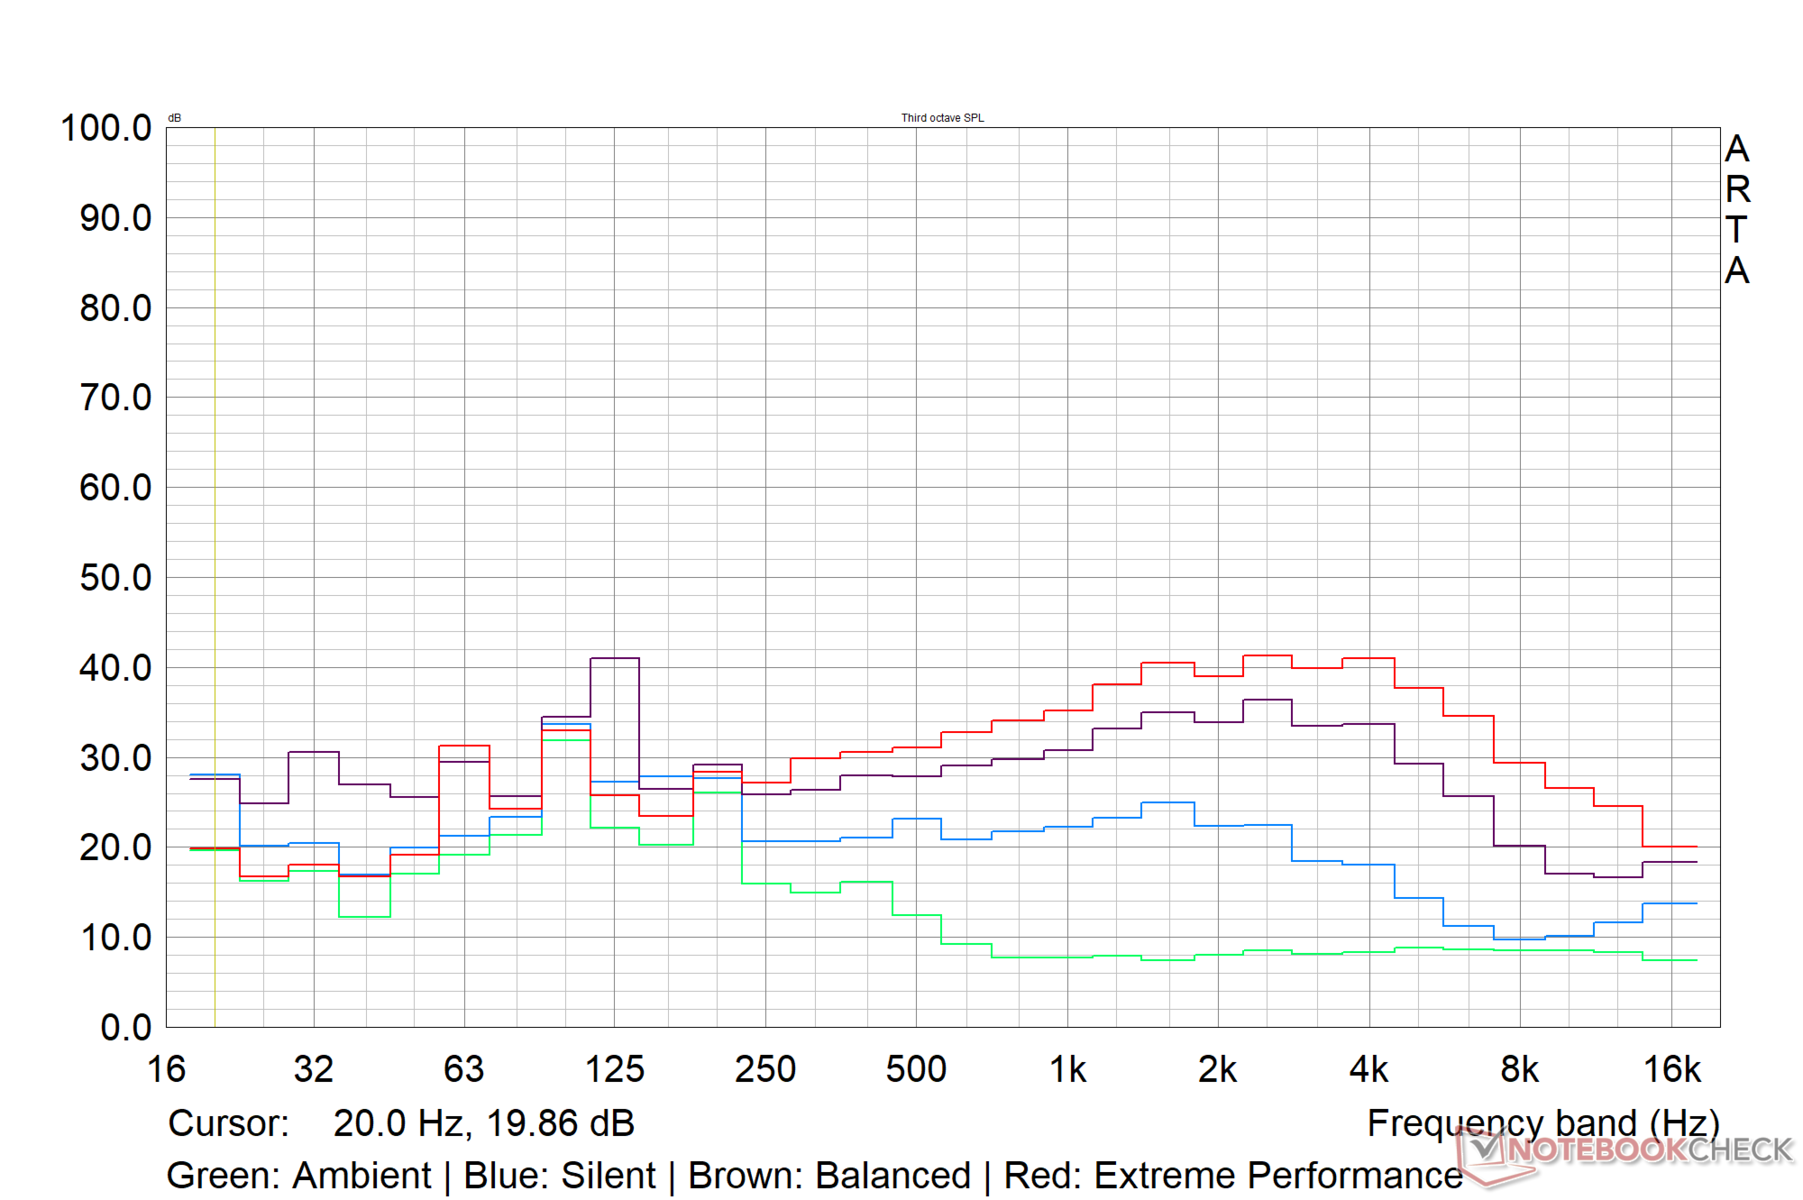
O Crosshair 15 R6E possui alto-falantes de 2x 2W que produzem uma altura de 74,6 dB(A). A resposta dos graves é transitável, mas as médias e altas são claramente discerníveis sem distorção. A qualidade do som é praticamente utilizável para consumo multimídia básico em uma sala de tamanho médio.
O áudio externo pode ser conectado via Bluetooth 5.2 ou pela tomada de áudio combinada de 3,5 mm.
MSI Crosshair 15 R6E B12UGZ-050 análise de áudio
(±) | o volume do alto-falante é médio, mas bom (###valor### dB)
Graves 100 - 315Hz
(±) | graves reduzidos - em média 14.1% menor que a mediana
(±) | a linearidade dos graves é média (10% delta para a frequência anterior)
Médios 400 - 2.000 Hz
(±) | médios mais altos - em média 5.6% maior que a mediana
(+) | médios são lineares (6.5% delta para frequência anterior)
Altos 2 - 16 kHz
(+) | agudos equilibrados - apenas 1.7% longe da mediana
(+) | os máximos são lineares (4% delta da frequência anterior)
Geral 100 - 16.000 Hz
(±) | a linearidade do som geral é média (15.1% diferença em relação à mediana)
Comparado com a mesma classe
» 32% de todos os dispositivos testados nesta classe foram melhores, 6% semelhantes, 62% piores
» O melhor teve um delta de 6%, a média foi 18%, o pior foi 132%
Comparado com todos os dispositivos testados
» 21% de todos os dispositivos testados foram melhores, 4% semelhantes, 75% piores
» O melhor teve um delta de 4%, a média foi 23%, o pior foi 134%
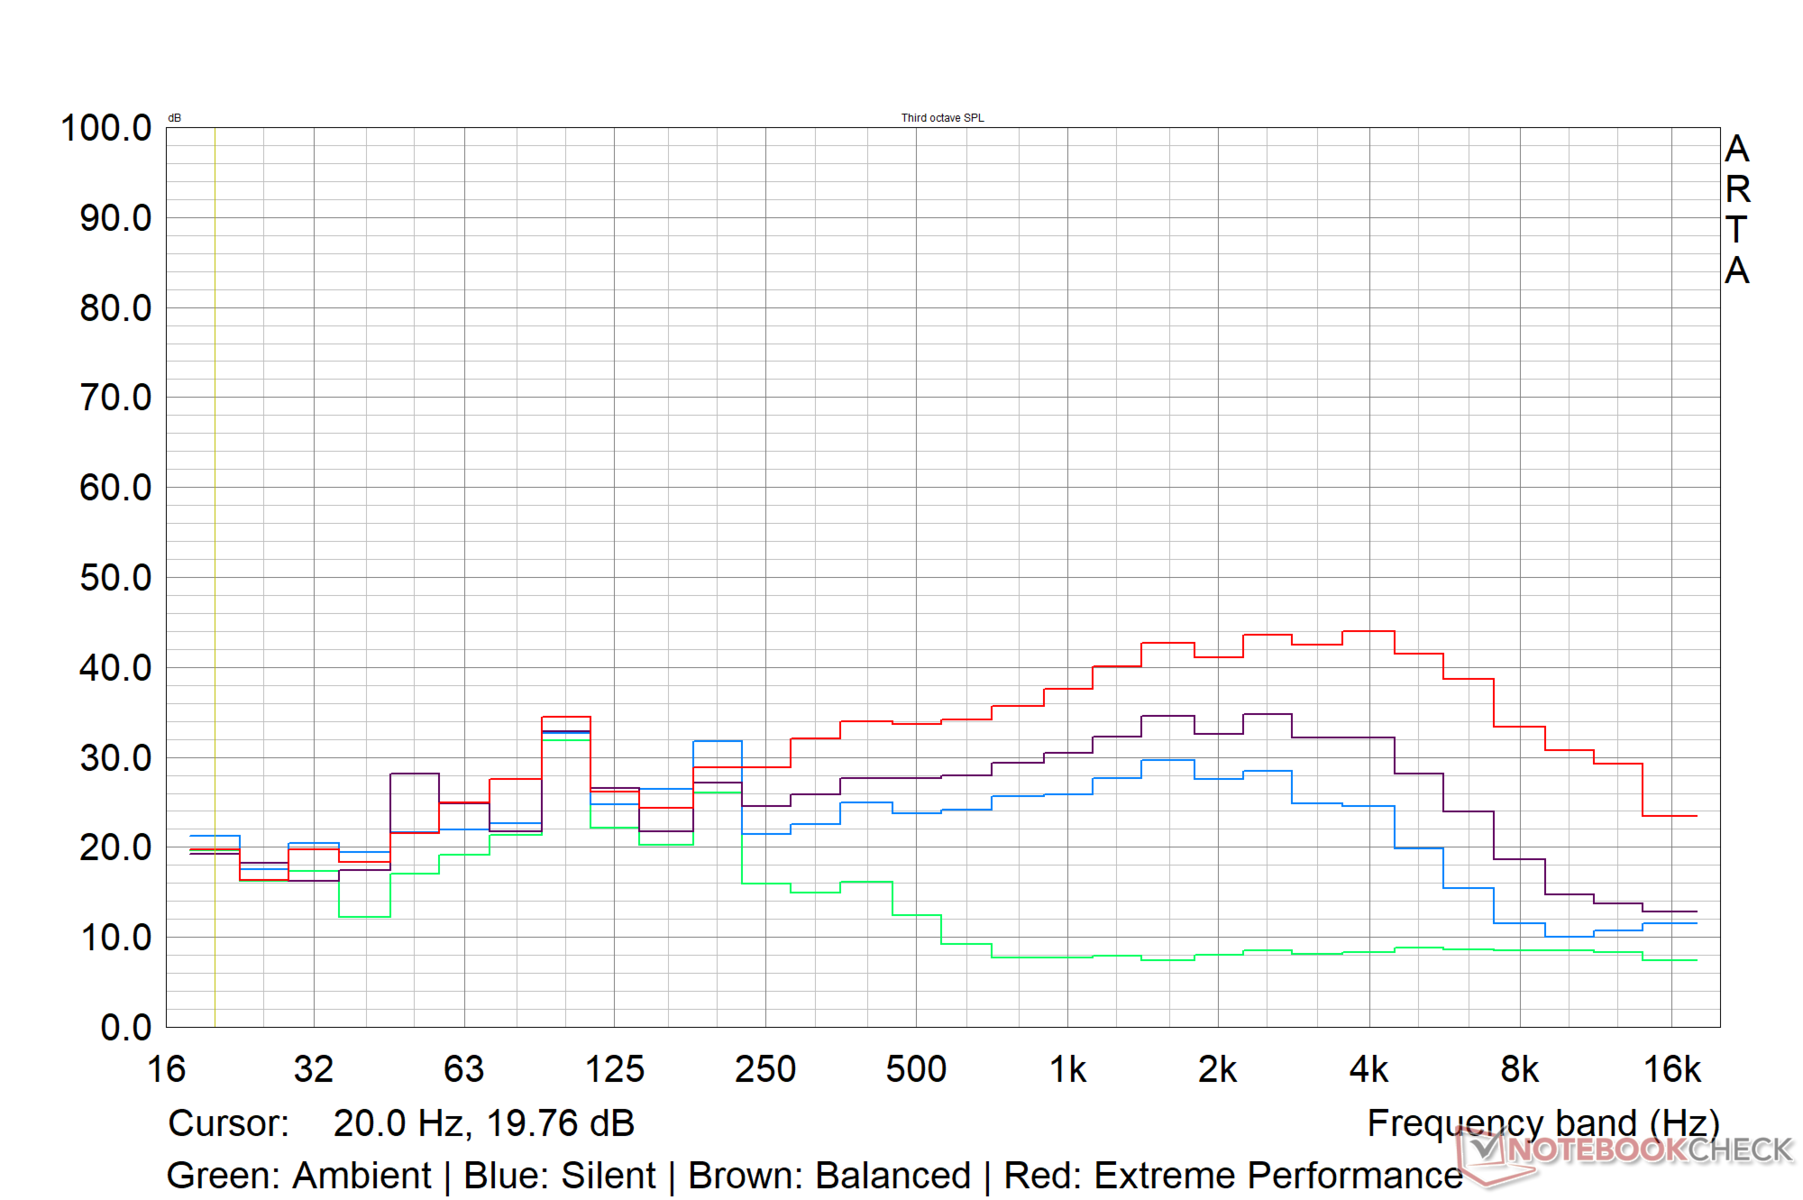
Apple MacBook Pro 16 2021 M1 Pro análise de áudio
(+) | os alto-falantes podem tocar relativamente alto (###valor### dB)
Graves 100 - 315Hz
(+) | bons graves - apenas 3.8% longe da mediana
(+) | o baixo é linear (5.2% delta para a frequência anterior)
Médios 400 - 2.000 Hz
(+) | médios equilibrados - apenas 1.3% longe da mediana
(+) | médios são lineares (2.1% delta para frequência anterior)
Altos 2 - 16 kHz
(+) | agudos equilibrados - apenas 1.9% longe da mediana
(+) | os máximos são lineares (2.7% delta da frequência anterior)
Geral 100 - 16.000 Hz
(+) | o som geral é linear (4.6% diferença em relação à mediana)
Comparado com a mesma classe
» 0% de todos os dispositivos testados nesta classe foram melhores, 0% semelhantes, 100% piores
» O melhor teve um delta de 5%, a média foi 17%, o pior foi 45%
Comparado com todos os dispositivos testados
» 0% de todos os dispositivos testados foram melhores, 0% semelhantes, 100% piores
» O melhor teve um delta de 4%, a média foi 23%, o pior foi 134%
Gestão de energia: Alta potência de extração com carga máxima
Consumo de energia
Mesmo no perfil de desempenho extremo, o consumo de energia parece relativamente econômico para o hardware em oferta. O Asus TUF Dash F15 é 30% mais econômico do que o Crosshair 15 R6E em carga máxima e os testes Witcher 3 devido a sua CPU e GPU de menor potência
A fonte de alimentação é classificada em 240 W, mas observamos uma potência de até 290 W durante uma carga combinada Prime95 e FurMark. O consumo de energia flutuante durante esta corrida está em linha com os relógios de CPU e GPU flutuantes que tínhamos observado durante o teste de tensão acima.
| desligado | |
| Ocioso | |
| Carga |
|
Key:
min: | |
| MSI Crosshair 15 R6E B12UGZ-050 i7-12700H, GeForce RTX 3070 Laptop GPU, IPS-Level, 2560x1440, 15.6" | MSI Stealth GS66 12UGS i7-12700H, GeForce RTX 3070 Ti Laptop GPU, IPS-Level, 2560x1440, 15.6" | Lenovo Legion 5 Pro 16 G7 i7 RTX 3070Ti i7-12700H, GeForce RTX 3070 Ti Laptop GPU, IPS, 2560x1600, 16" | Asus TUF Dash F15 FX517ZR i7-12650H, GeForce RTX 3070 Laptop GPU, IPS, 2560x1440, 15.6" | Schenker XMG Neo 15 (Ryzen 9 6900HX, RTX 3070 Ti) R9 6900HX, GeForce RTX 3070 Ti Laptop GPU, IPS, 2560x1440, 15.6" | Média NVIDIA GeForce RTX 3070 Laptop GPU | Média da turma Gaming | |
|---|---|---|---|---|---|---|---|
| Power Consumption | -7% | -10% | 2% | -11% | -36% | -25% | |
| Idle Minimum * (Watt) | 9.6 | 11 -15% | 8.6 10% | 10 -4% | 13 -35% | 15.6 ? -63% | 13 ? -35% |
| Idle Average * (Watt) | 14.1 | 16 -13% | 17.6 -25% | 14 1% | 17 -21% | 20.1 ? -43% | 19 ? -35% |
| Idle Maximum * (Watt) | 14.96 | 23 -54% | 18.5 -24% | 20 -34% | 20 -34% | 29.4 ? -97% | 24.6 ? -64% |
| Load Average * (Watt) | 107.3 | 110 -3% | 110 -3% | 122 -14% | 89 17% | 110.8 ? -3% | 110.7 ? -3% |
| Witcher 3 ultra * (Watt) | 197 | 151 23% | 227 -15% | 138.6 30% | 200 -2% | ||
| Load Maximum * (Watt) | 289.93 | 230 21% | 294.6 -2% | 189 35% | 260 10% | 214 ? 26% | 259 ? 11% |
* ... menor é melhor
Power Consumption - The Witcher 3 / Stress test
Power Consumption - External monitor
Vida útil da bateria
Os testes de bateria foram realizados no perfil Equilibrado com a taxa de atualização do display ajustada para 60 Hz. Nosso Crosshair 15 R6E B12UGZ veio equipado com uma bateria de 4 células 90 WHr que oferece tempos de funcionamento decentes em nosso teste de navegação Wi-Fi padronizado a 150 nits. O backup da reprodução de vídeo está a apenas 9 horas da marca de 150 nits com todos os rádios desligados.
A MSI também oferece a variante Crosshair R6E B12UEZ que vem com uma bateria de 3 células de 56,5 WHr.
| MSI Crosshair 15 R6E B12UGZ-050 i7-12700H, GeForce RTX 3070 Laptop GPU, 90 Wh | MSI Stealth GS66 12UGS i7-12700H, GeForce RTX 3070 Ti Laptop GPU, 99.9 Wh | Lenovo Legion 5 Pro 16 G7 i7 RTX 3070Ti i7-12700H, GeForce RTX 3070 Ti Laptop GPU, 80 Wh | Asus TUF Dash F15 FX517ZR i7-12650H, GeForce RTX 3070 Laptop GPU, 76 Wh | Schenker XMG Neo 15 (Ryzen 9 6900HX, RTX 3070 Ti) R9 6900HX, GeForce RTX 3070 Ti Laptop GPU, 93 Wh | Média da turma Gaming | |
|---|---|---|---|---|---|---|
| Duração da bateria | 4% | -35% | 18% | 34% | 5% | |
| H.264 (h) | 8.9 | 6.3 -29% | 5.8 -35% | 10.7 20% | 8.32 ? -7% | |
| WiFi v1.3 (h) | 7.3 | 5.4 -26% | 5.4 -26% | 7 -4% | 10.9 49% | 7.11 ? -3% |
| Witcher 3 ultra (h) | 1.6 | |||||
| Load (h) | 1.2 | 1.6 33% | 0.6 -50% | 2.3 92% | 1.6 33% | 1.502 ? 25% |
| Reader / Idle (h) | 7.8 | 10.8 | 8.27 ? |
Pro
Contra
Veredicto: Pulsar o GL66 que faz muitas coisas certas

Os laptops temáticos em jogos específicos geralmente têm apelo limitado além dos fãs do referido jogo. O MSI Crosshair 15 Rainbow Six: Extraction Edition, que recebeu o nome de "eponymously named after Ubisoft's popular co-op FPS franchise", é o único Crosshair 15 oferecido este ano
O chassi é essencialmente uma remontagem do Pulse GL66 com elementos de design muito emprestados do jogo. A MSI chegou ao ponto de substituir seu próprio logotipo na tampa da vitrine pela do Rainbow Six: Extração. Você também recebe algumas guloseimas na caixa, incluindo um mouse com tema de jogo, um mouse pad e uma cópia de luxo do próprio jogo
Como tal, o Crosshair 15 R6E herda algumas deficiências do design do Pulse GL66, tais como flex no deck do teclado e uma distribuição portuária não-ideal. Entretanto, o laptop vem com um display QHD 165 Hz altamente funcional que deve ser um bom augúrio tanto para o jogo quanto para a criação de conteúdo.
O MSI Crosshair 15 Rainbow Six: O design da extração pode encontrar apelo limitado, mas sob a pele você obtém um midranger altamente capaz com boas características de exibição e emissões toleráveis"
A implementação do Crosshair 15 R6E do Core i7-12700H não é a mais rápida que já vimos. O MSI Stealth GS66 e o Lenovo Legion 5i Pro 16 G7 com o mesmo processador têm um desempenho visivelmente melhor em testes multi-core. O desempenho geral do Crosshair 15 R6E em jogos pode ser melhor ou igual a alguns laptops RTX 3070 Ti-powered, tais como o Schenker XMG Neo 15, Acer Nitro 5e MSI Katana GF66
As emissões térmicas e sonoras são amplamente toleráveis desde que você esteja bem com o perfil de desempenho Equilibrado. No entanto, o consumo de energia está do lado mais alto, especialmente com o consumo de energia sob carga máxima e jogos
Mesmo que você não seja um fã do jogo, o MSI Crosshair 15 Rainbow Six: Extraction Edition merece uma consideração levando em conta o desempenho em oferta e os preços relativos à concorrência.
Preço e Disponibilidade
O MSI Crosshair 15 Rainbow Six: Extraction Edition está disponível em Amazon US por US$ 2.149. Na Índia, o varejo de laptops em torno da marca ₹1,90,990, mas atualmente está listado como esgotado em Amazon India e Flipkart.
MSI Crosshair 15 R6E B12UGZ-050
- 12/19/2022 v7 (old)
Vaidyanathan Subramaniam
Price comparison

