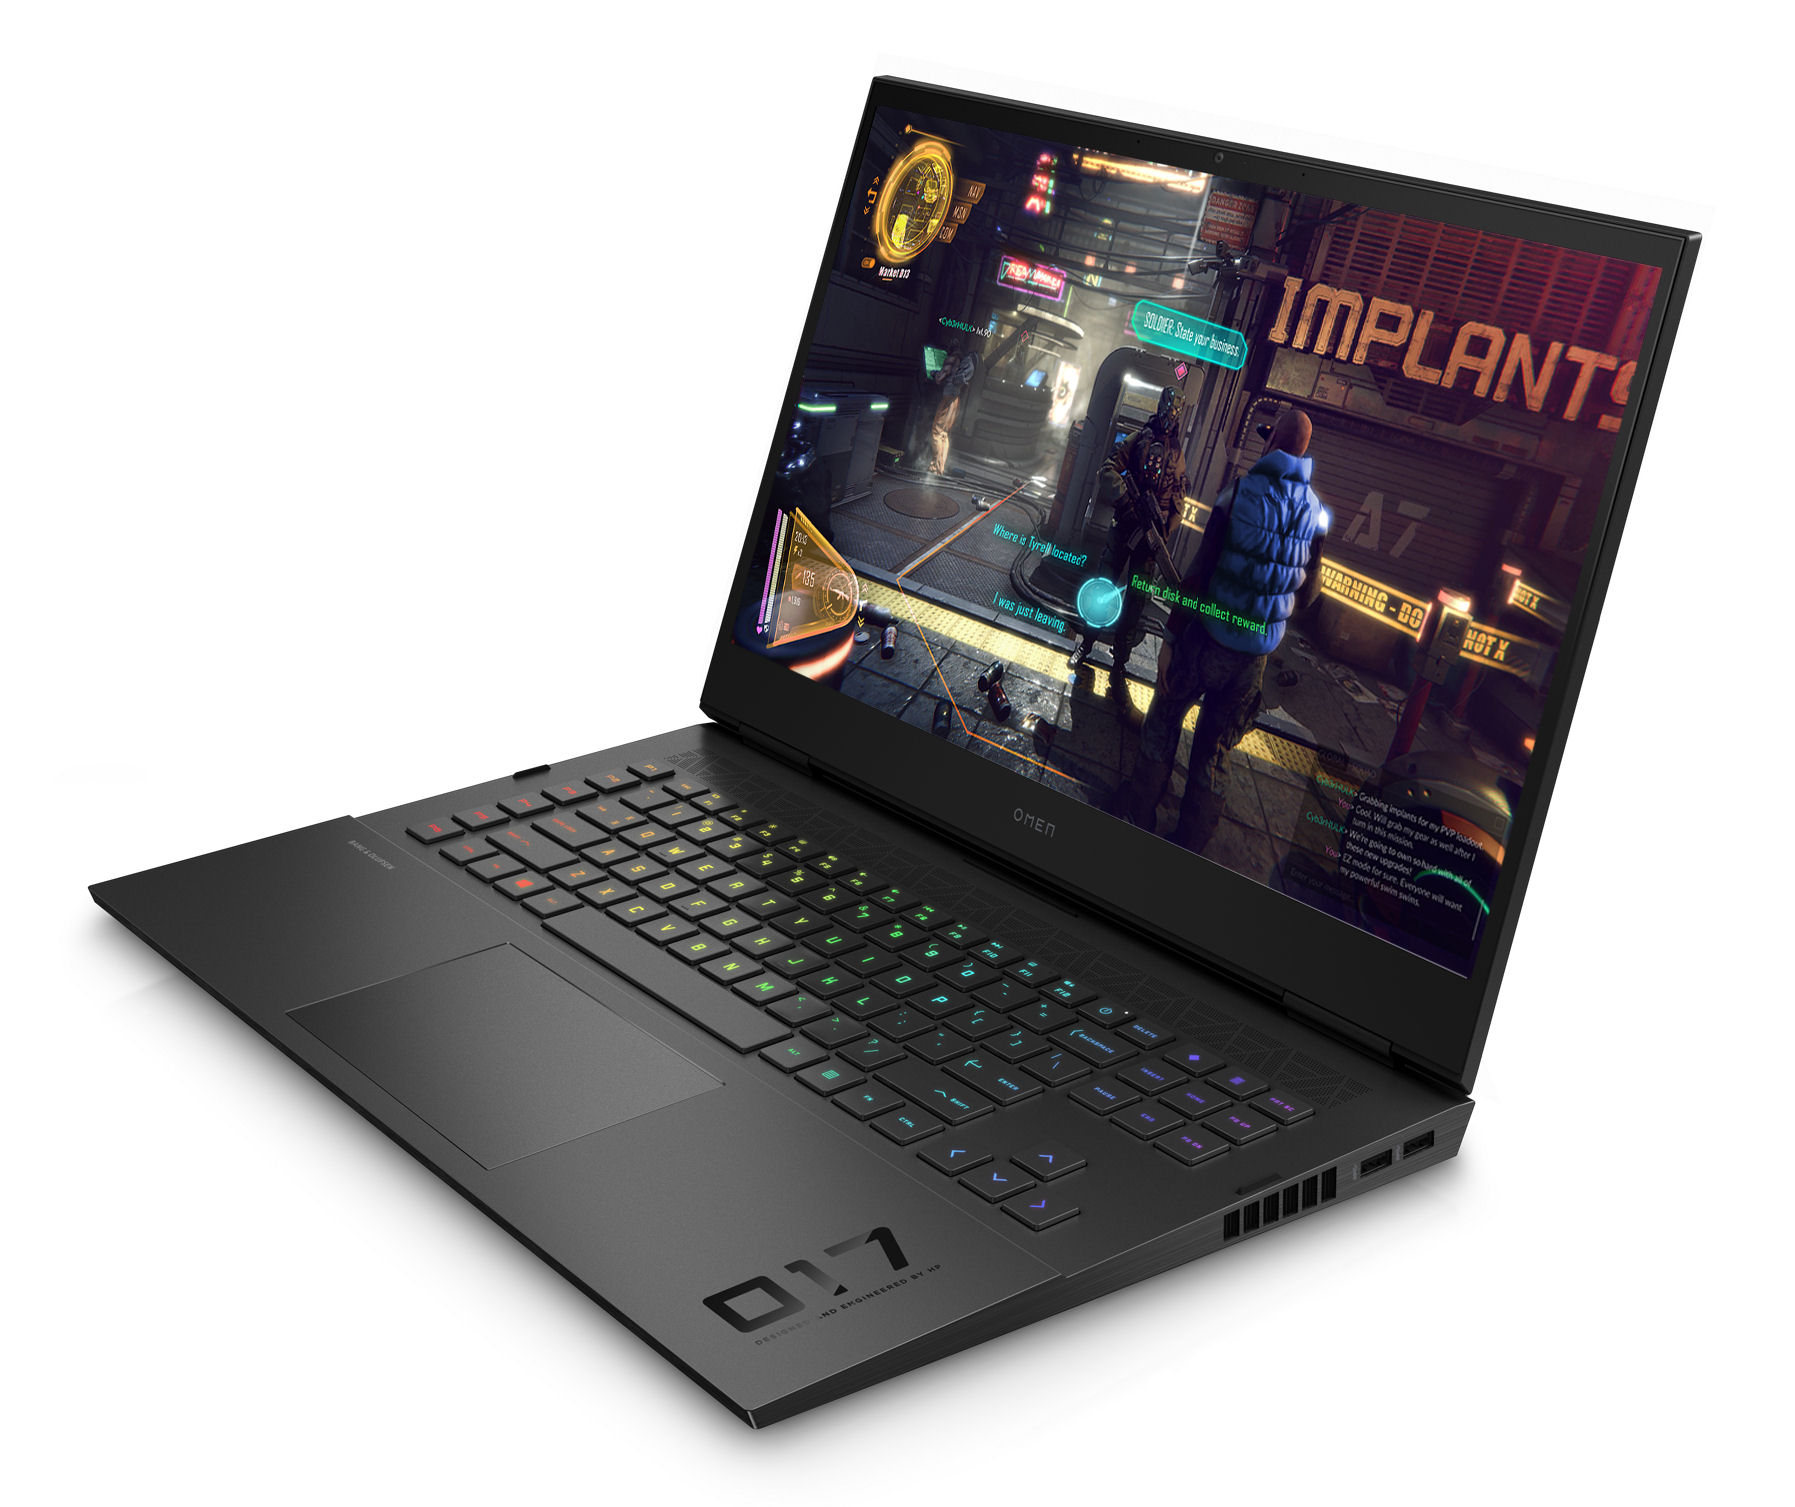
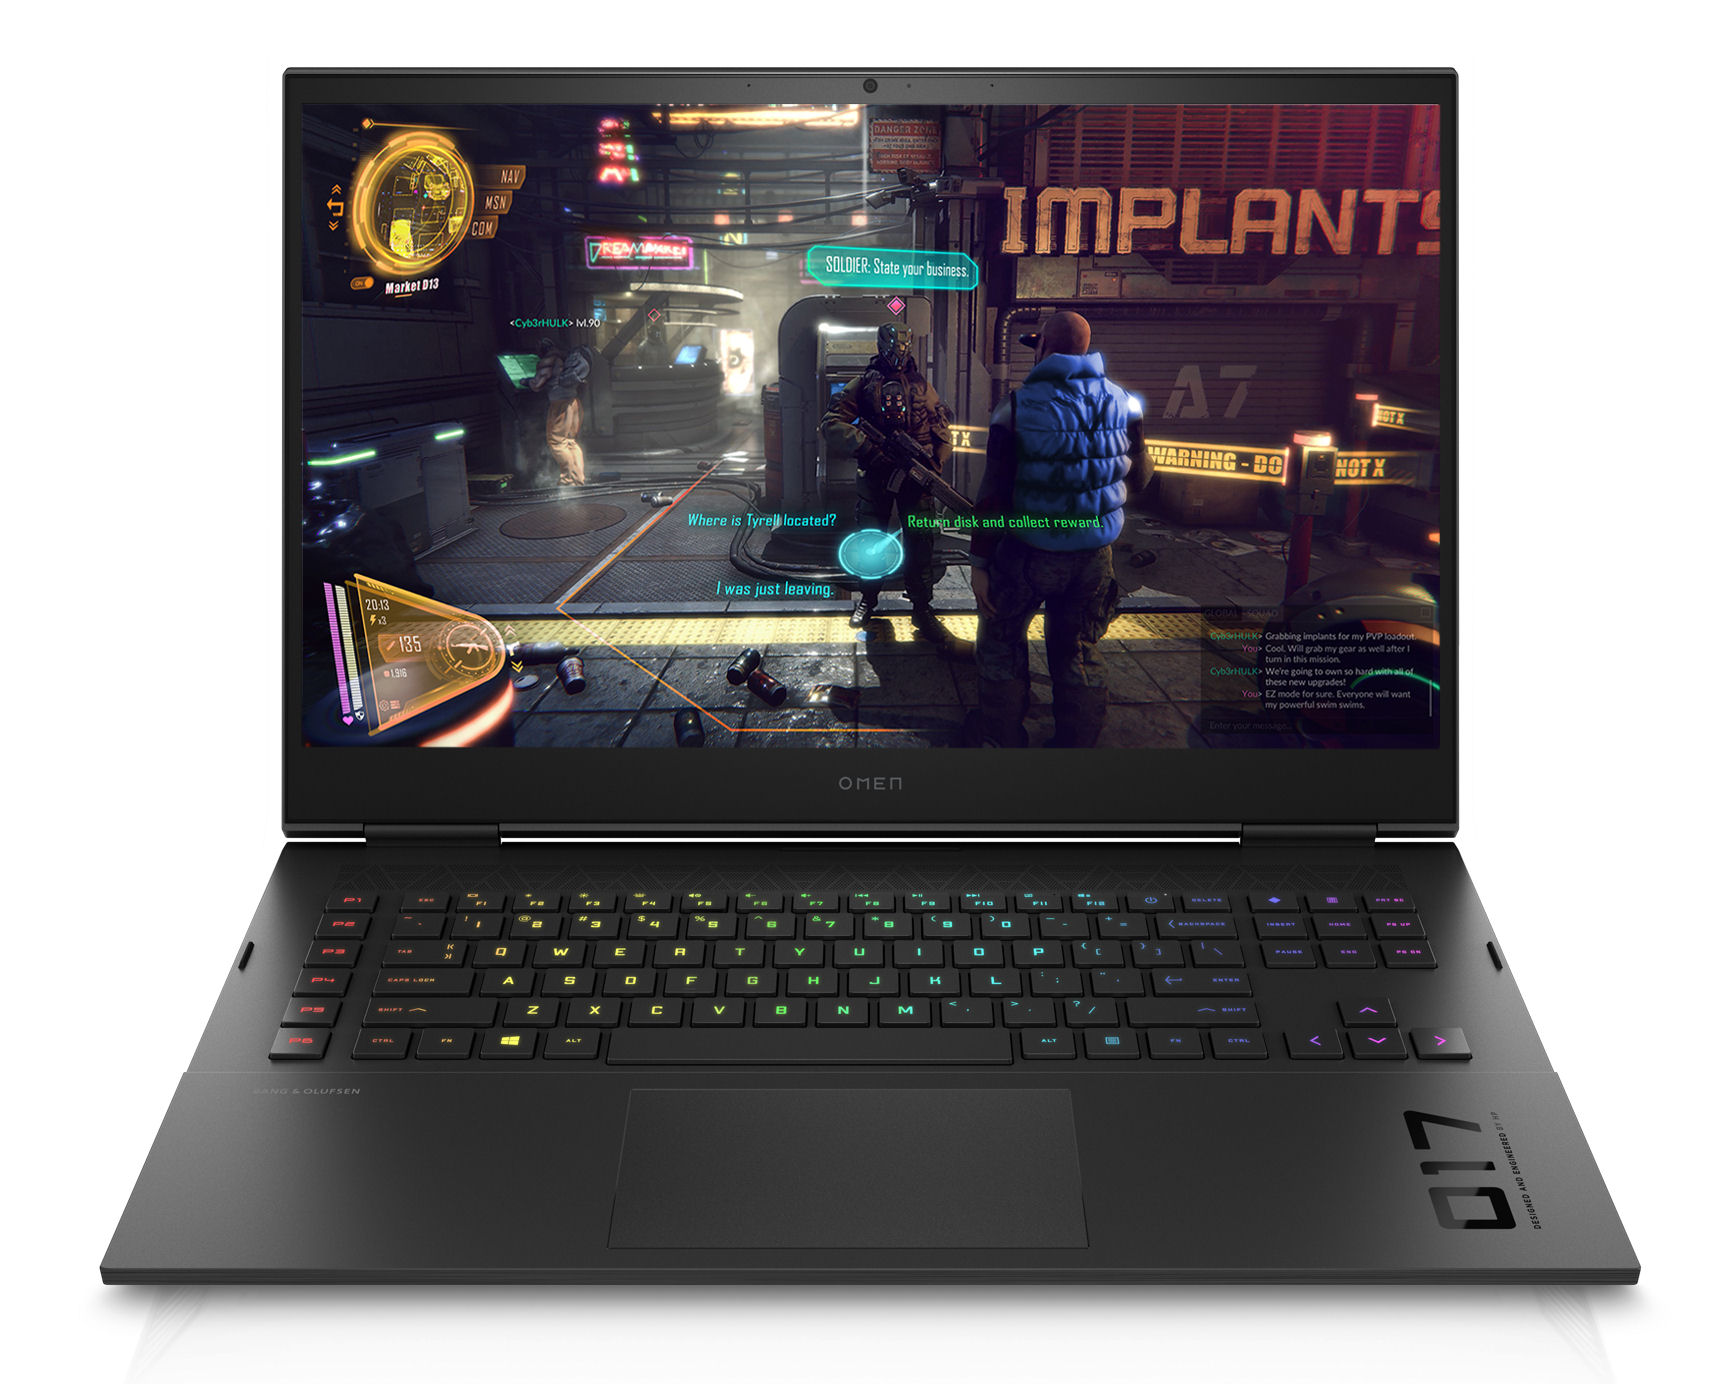
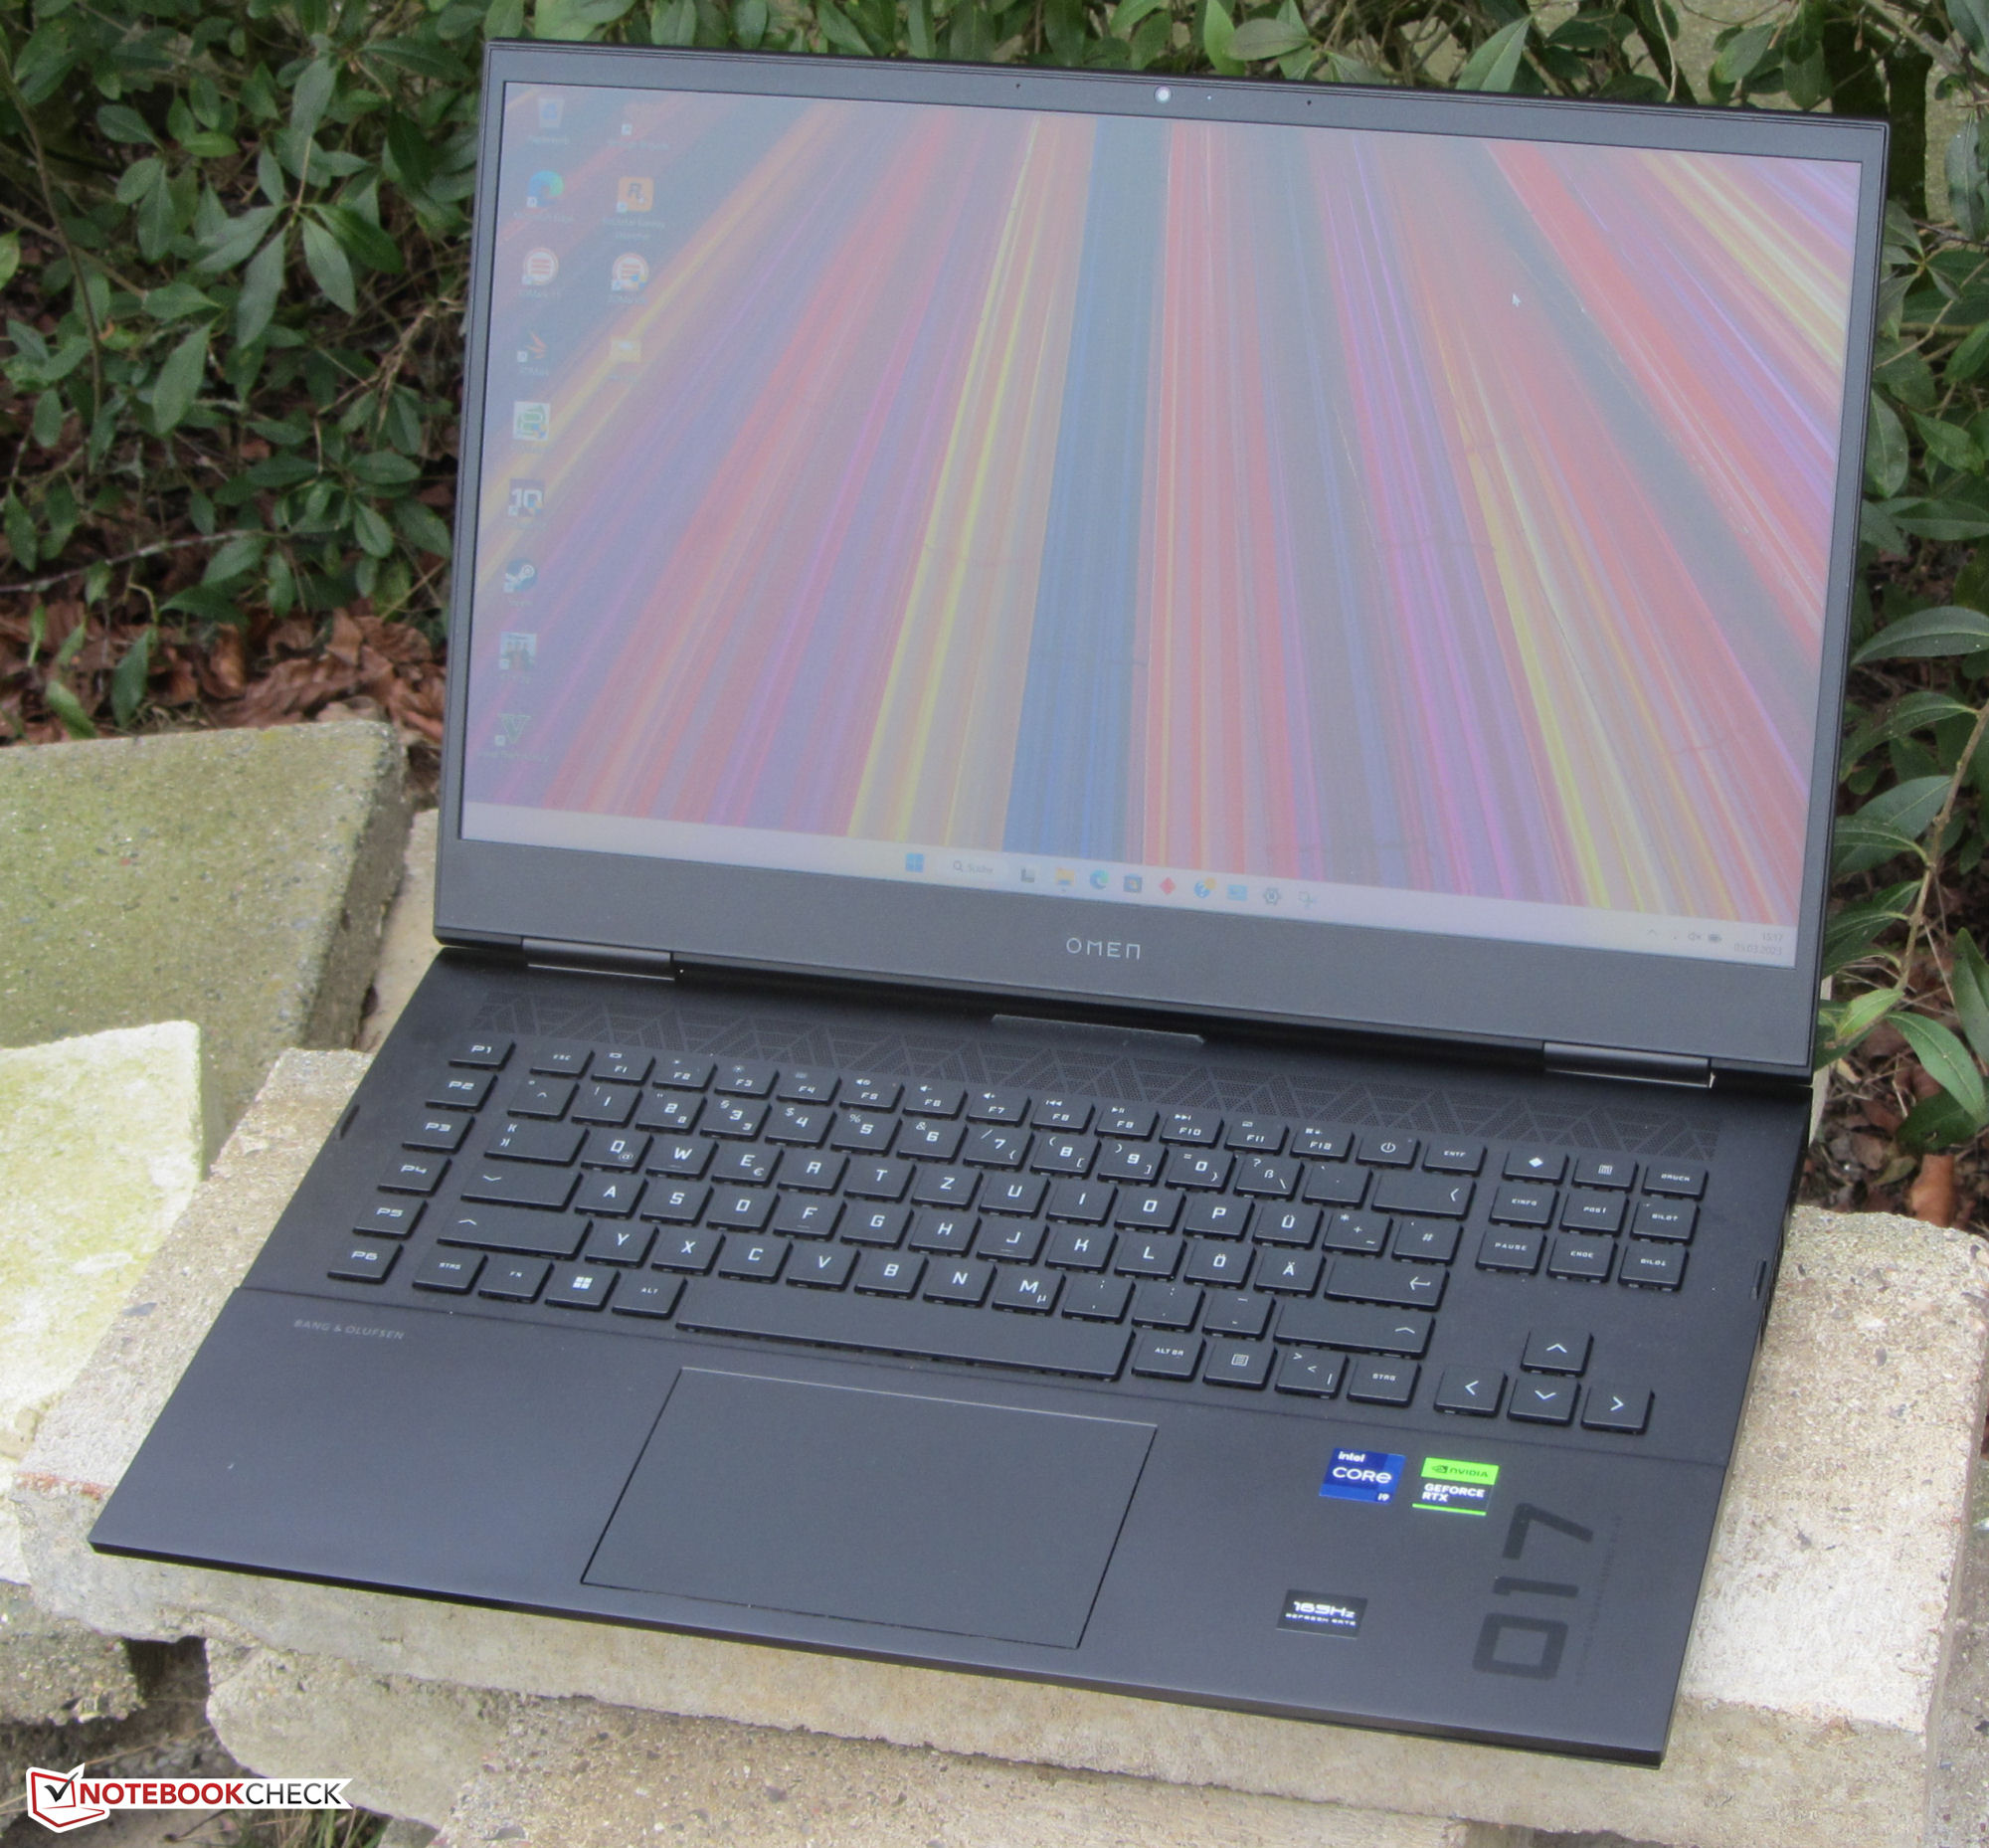
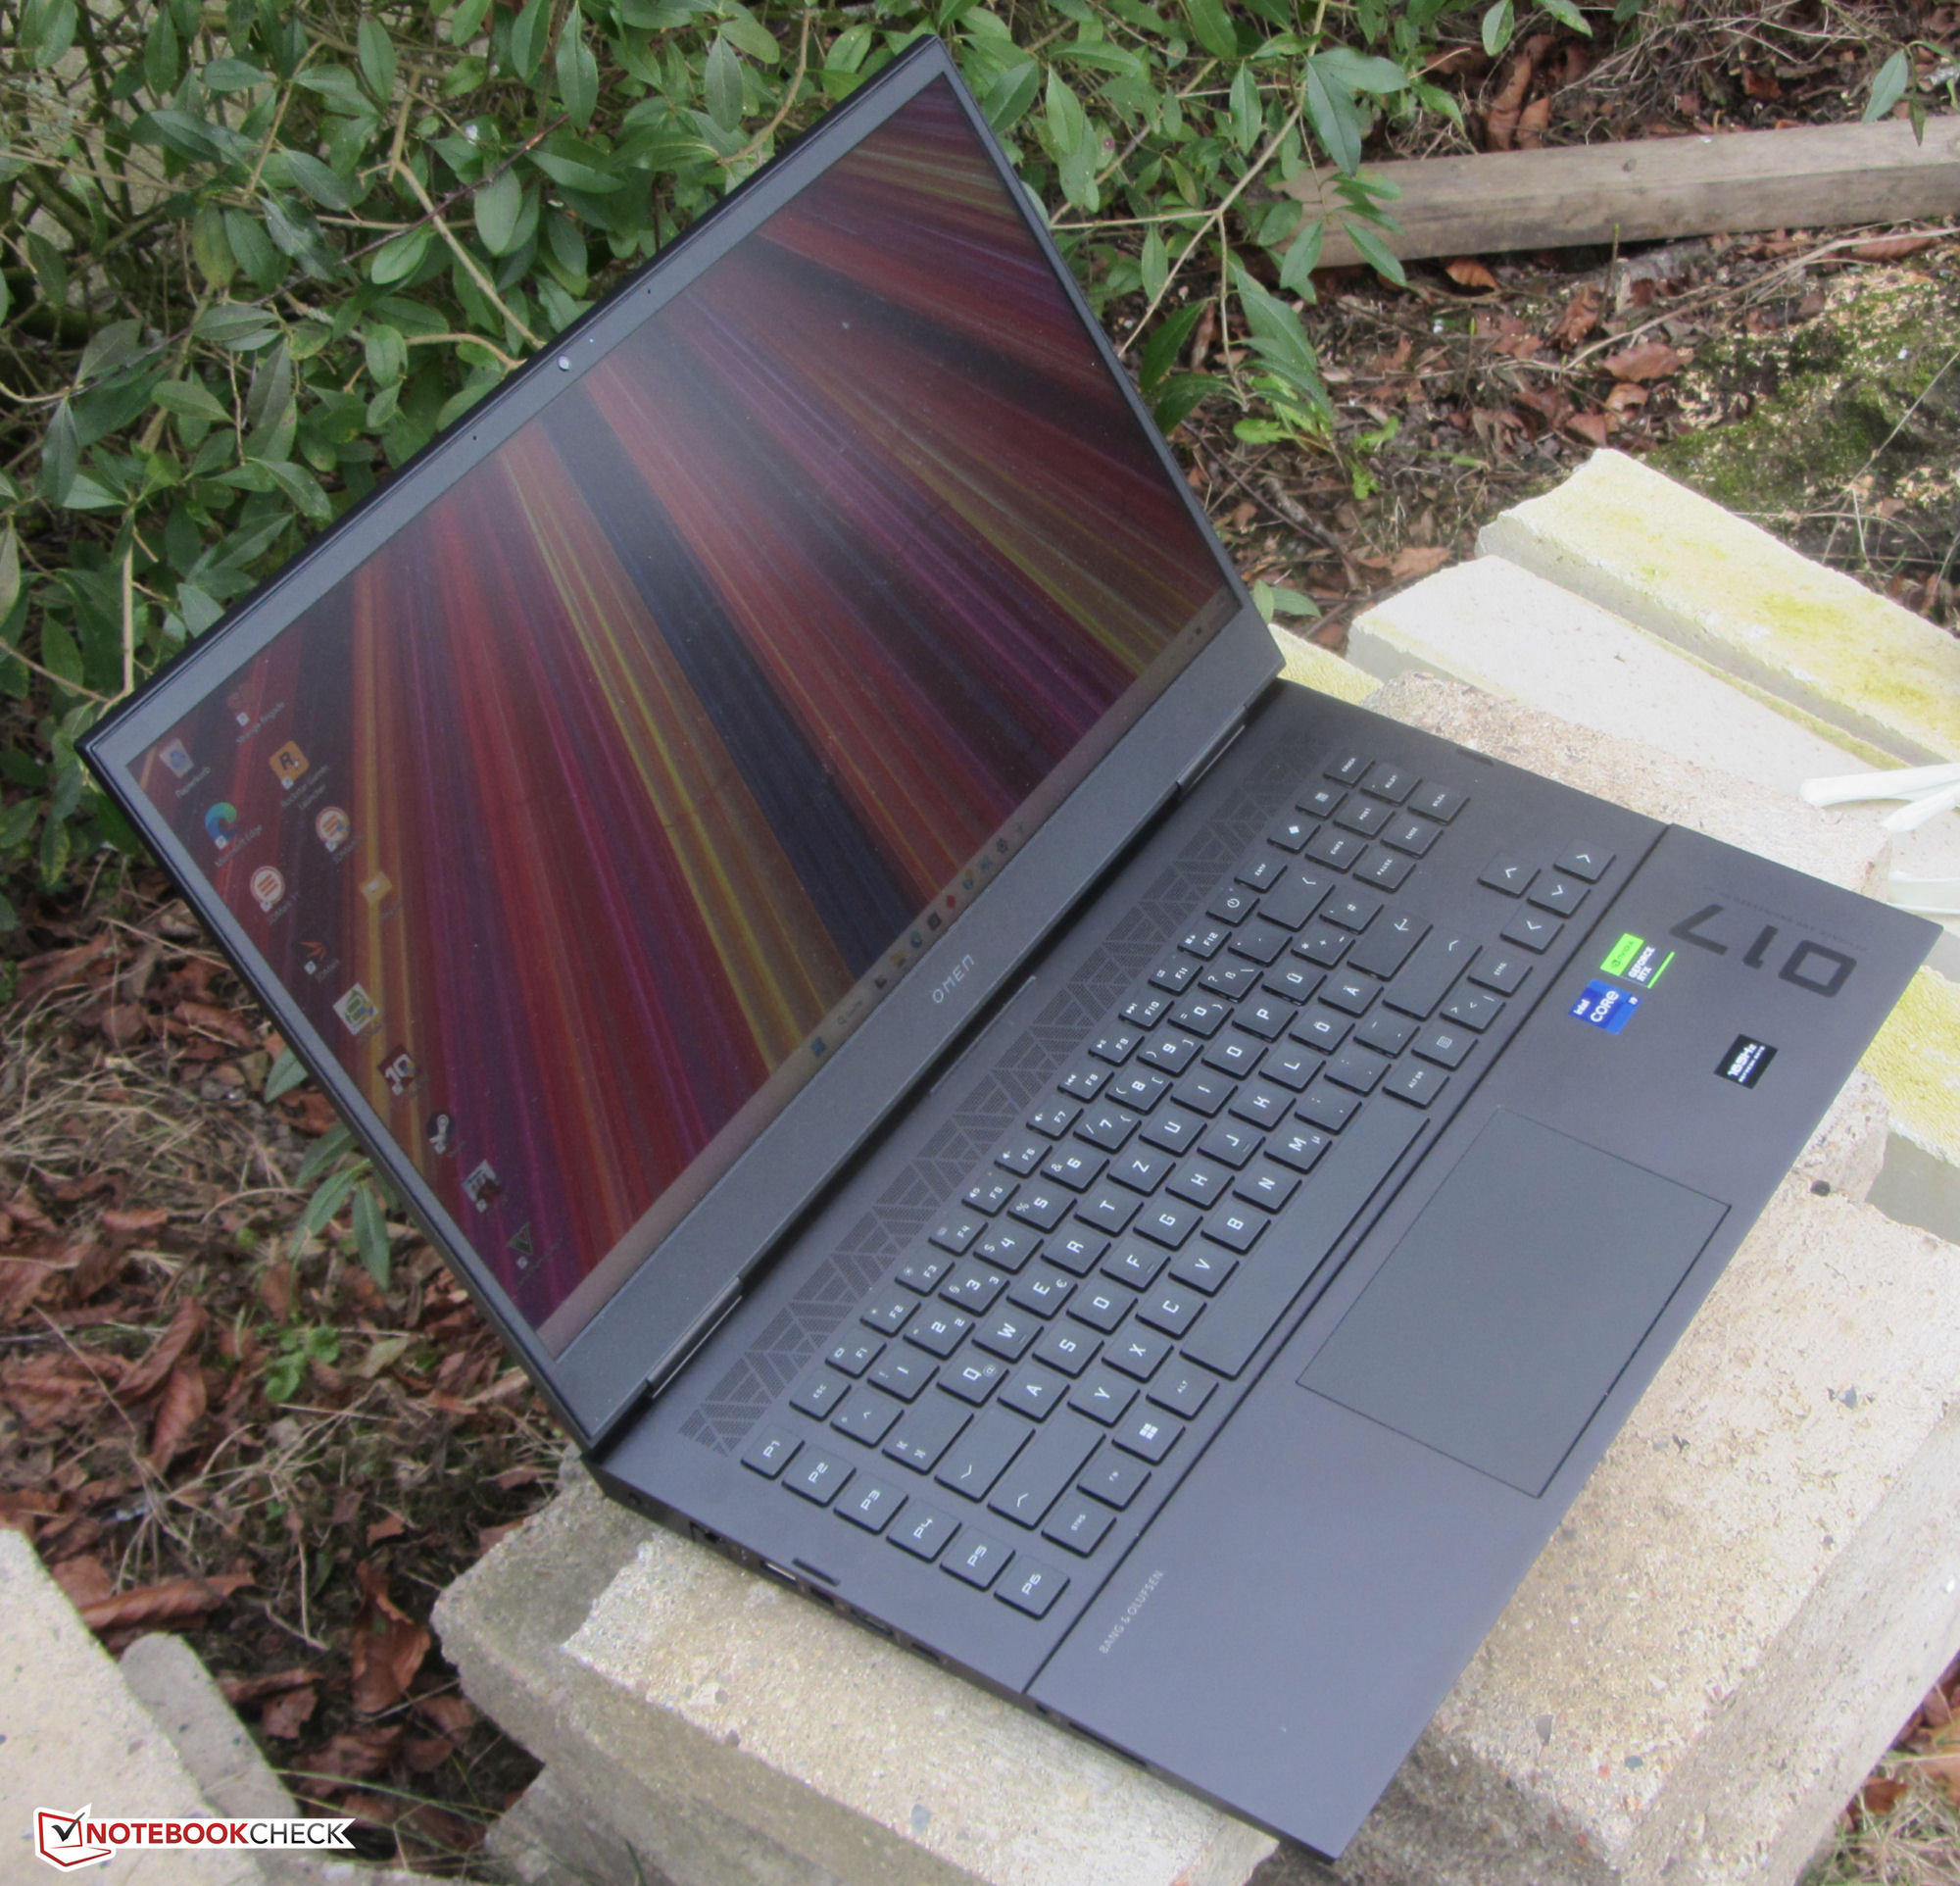
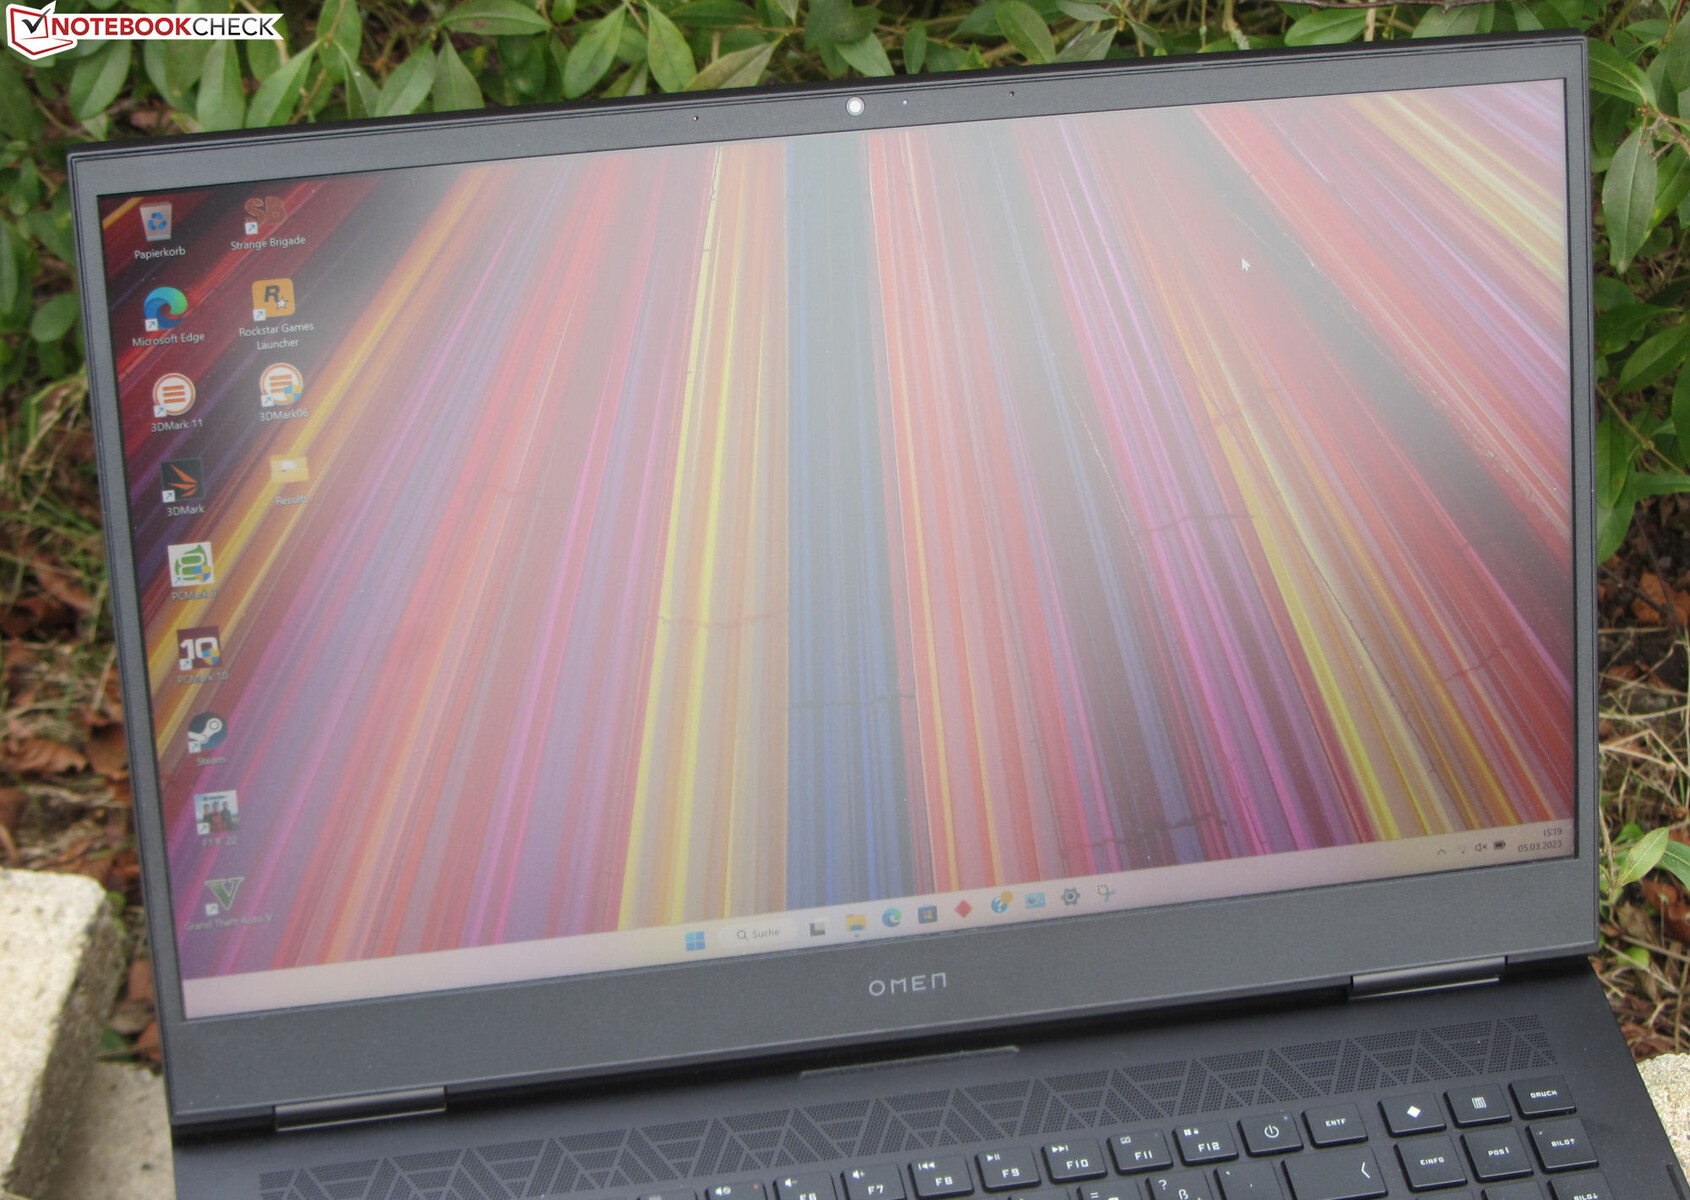
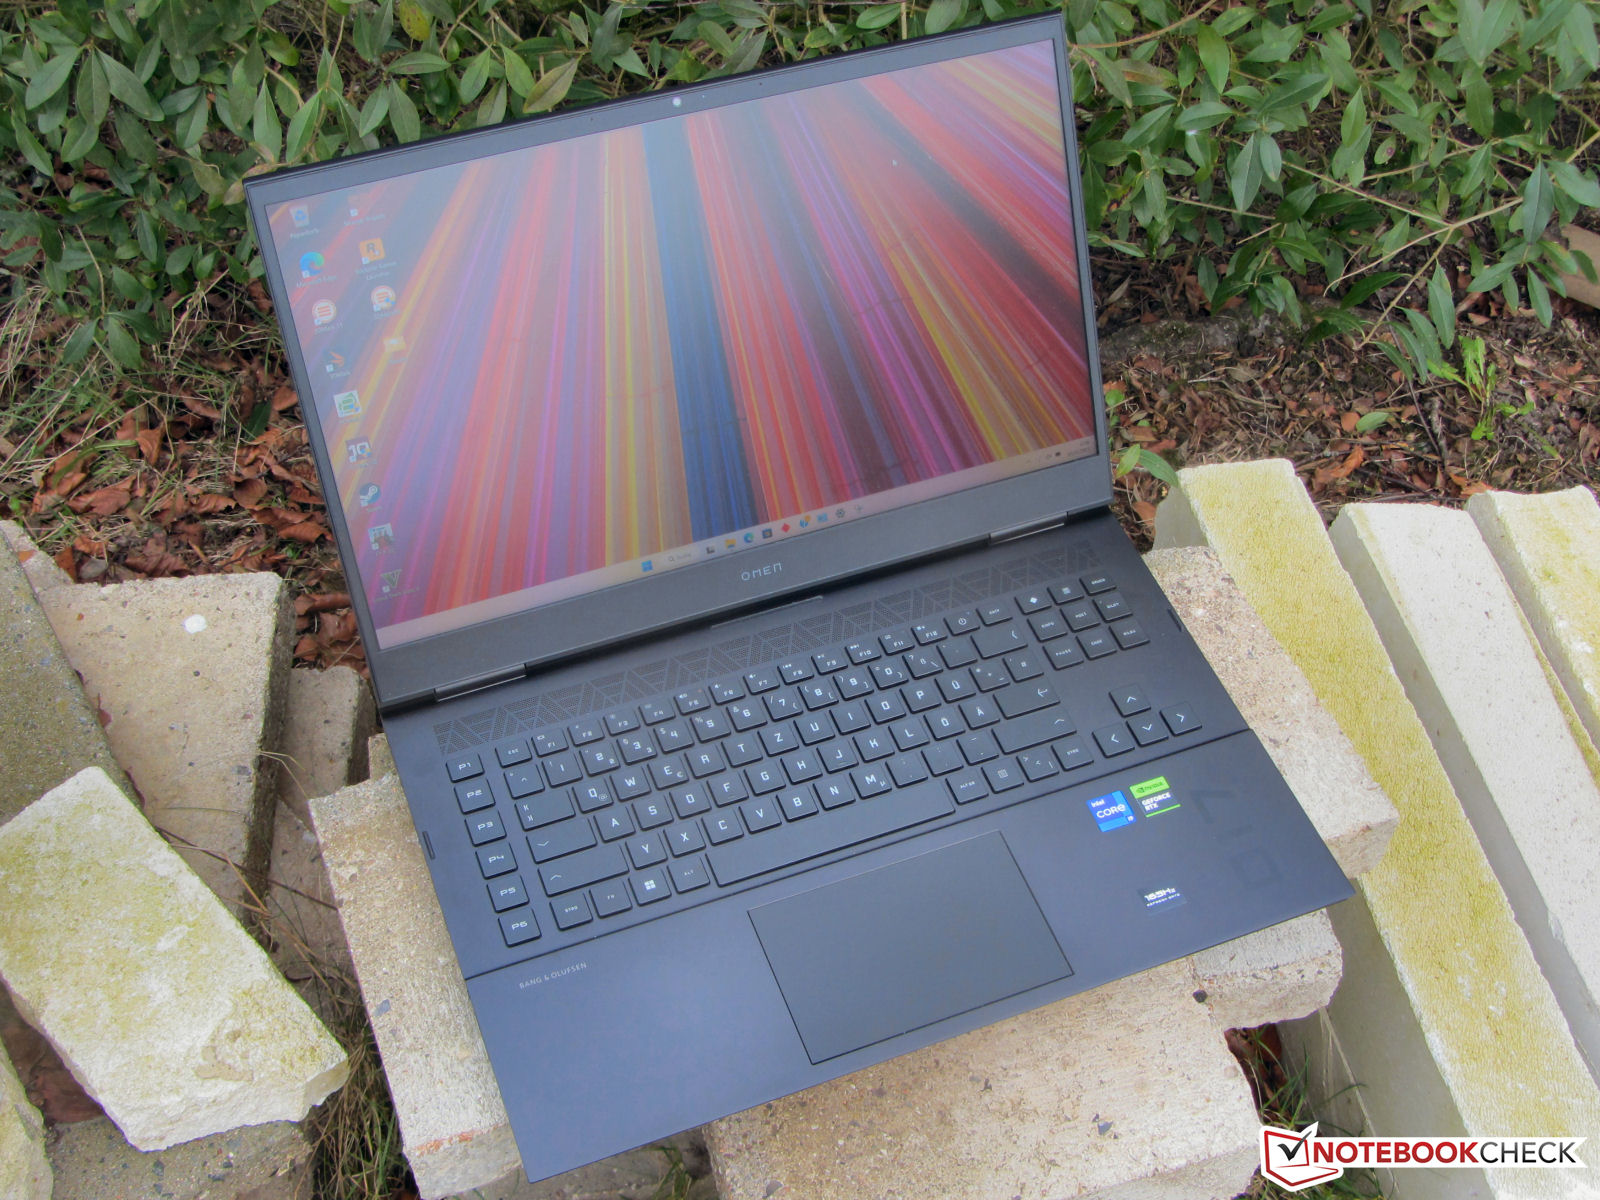
Revisão HP Omen 17 (2023): O laptop para jogos usa RTX 4080

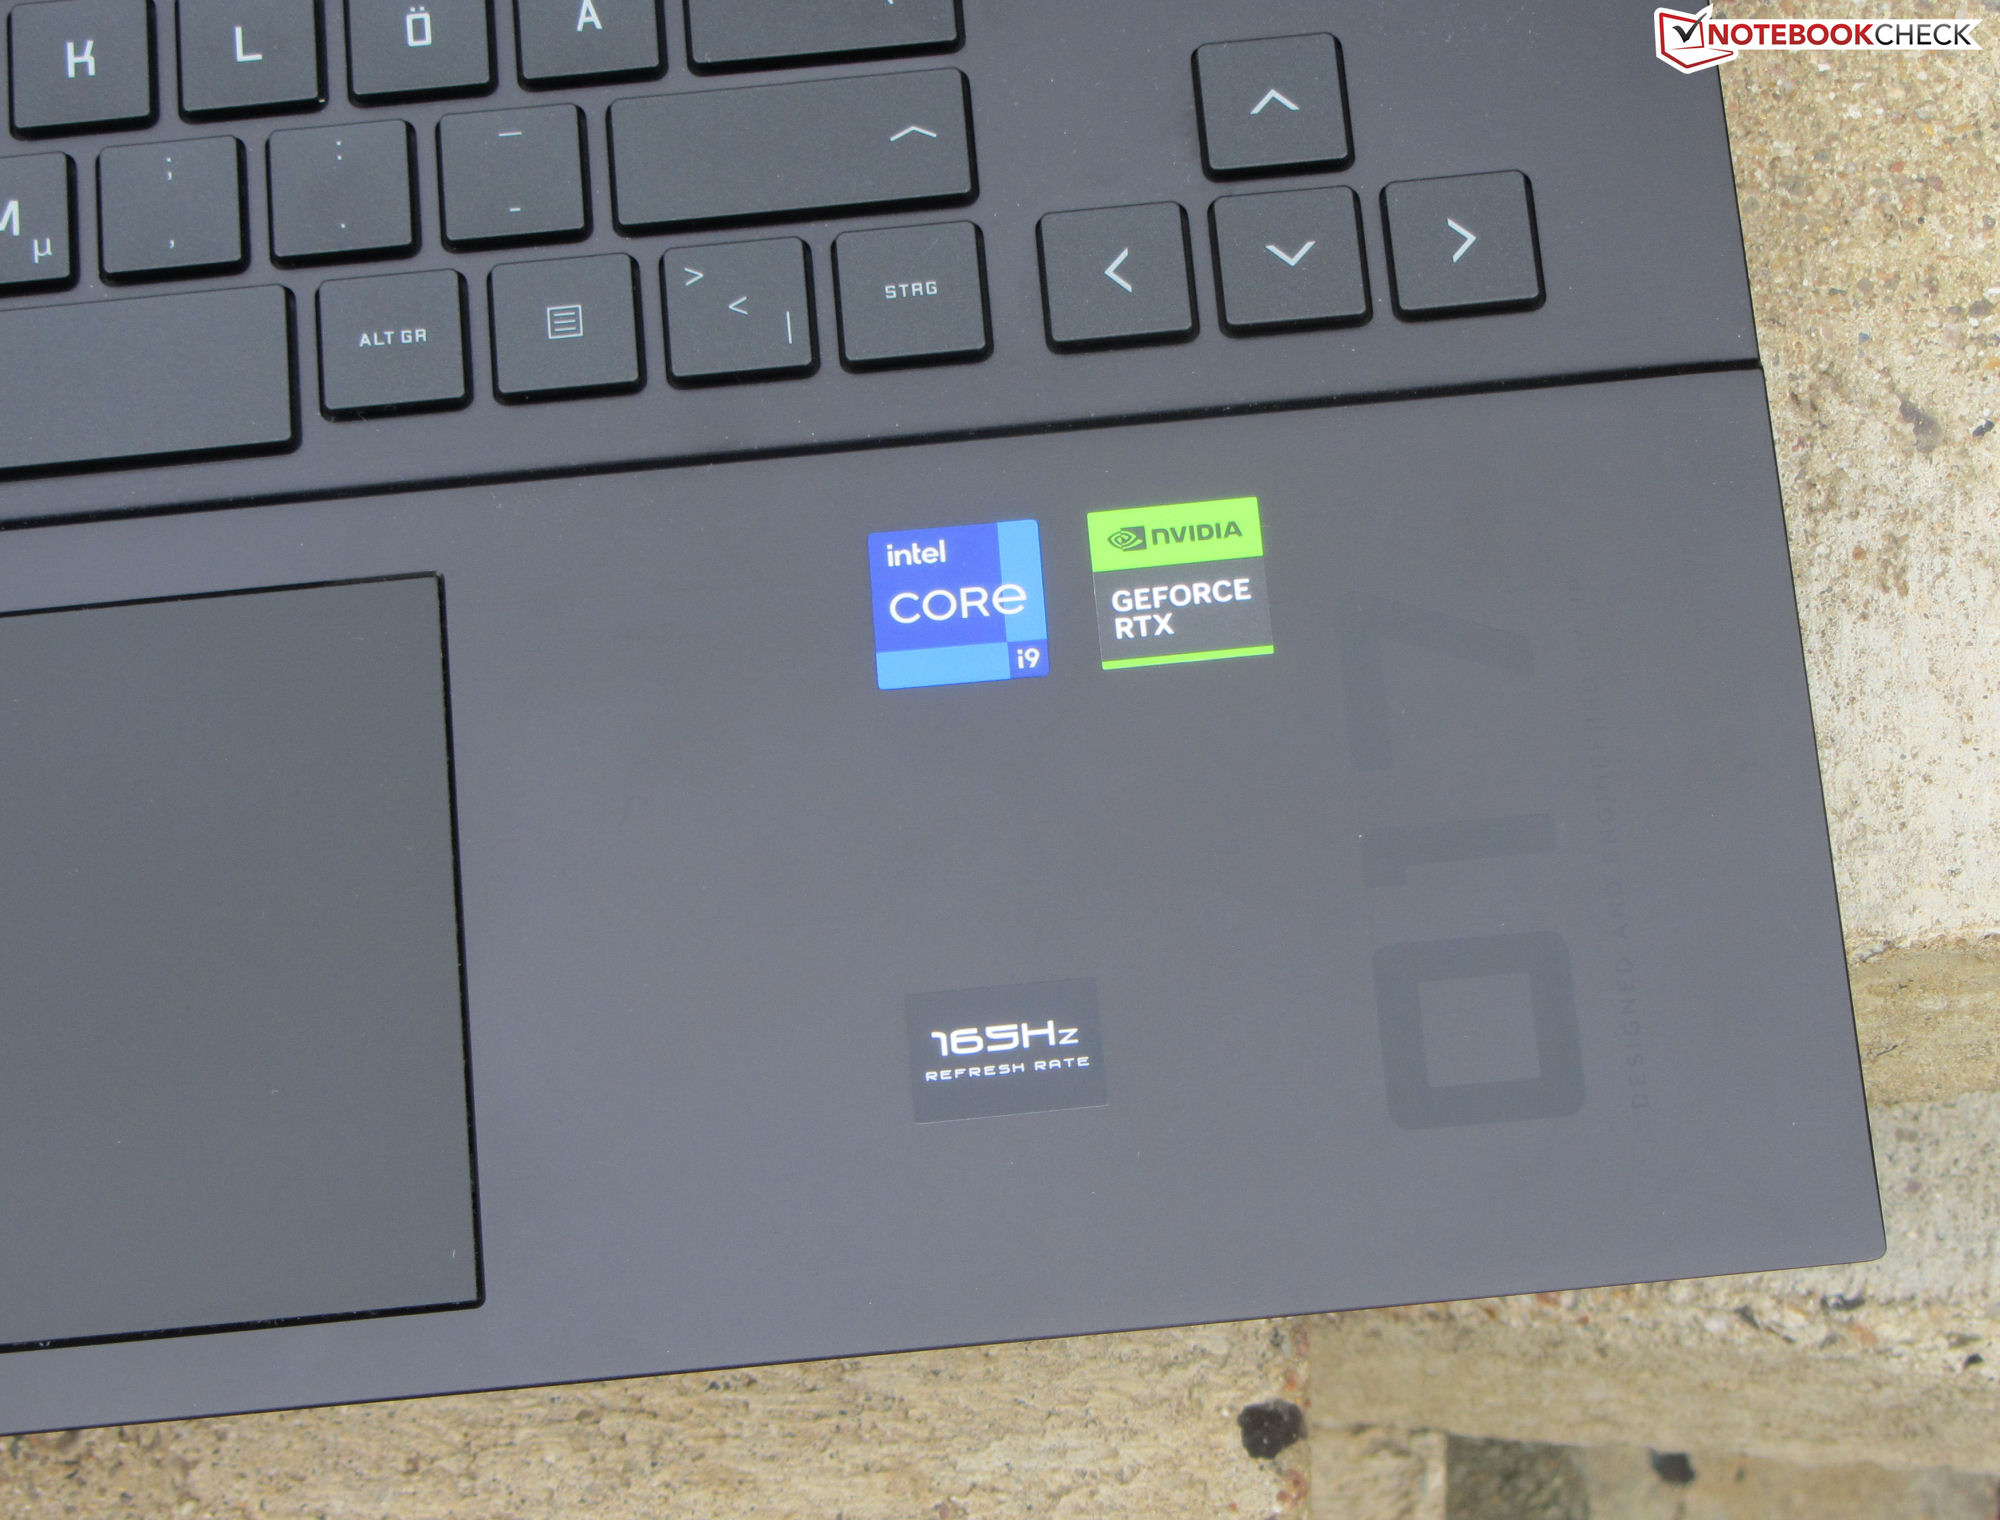
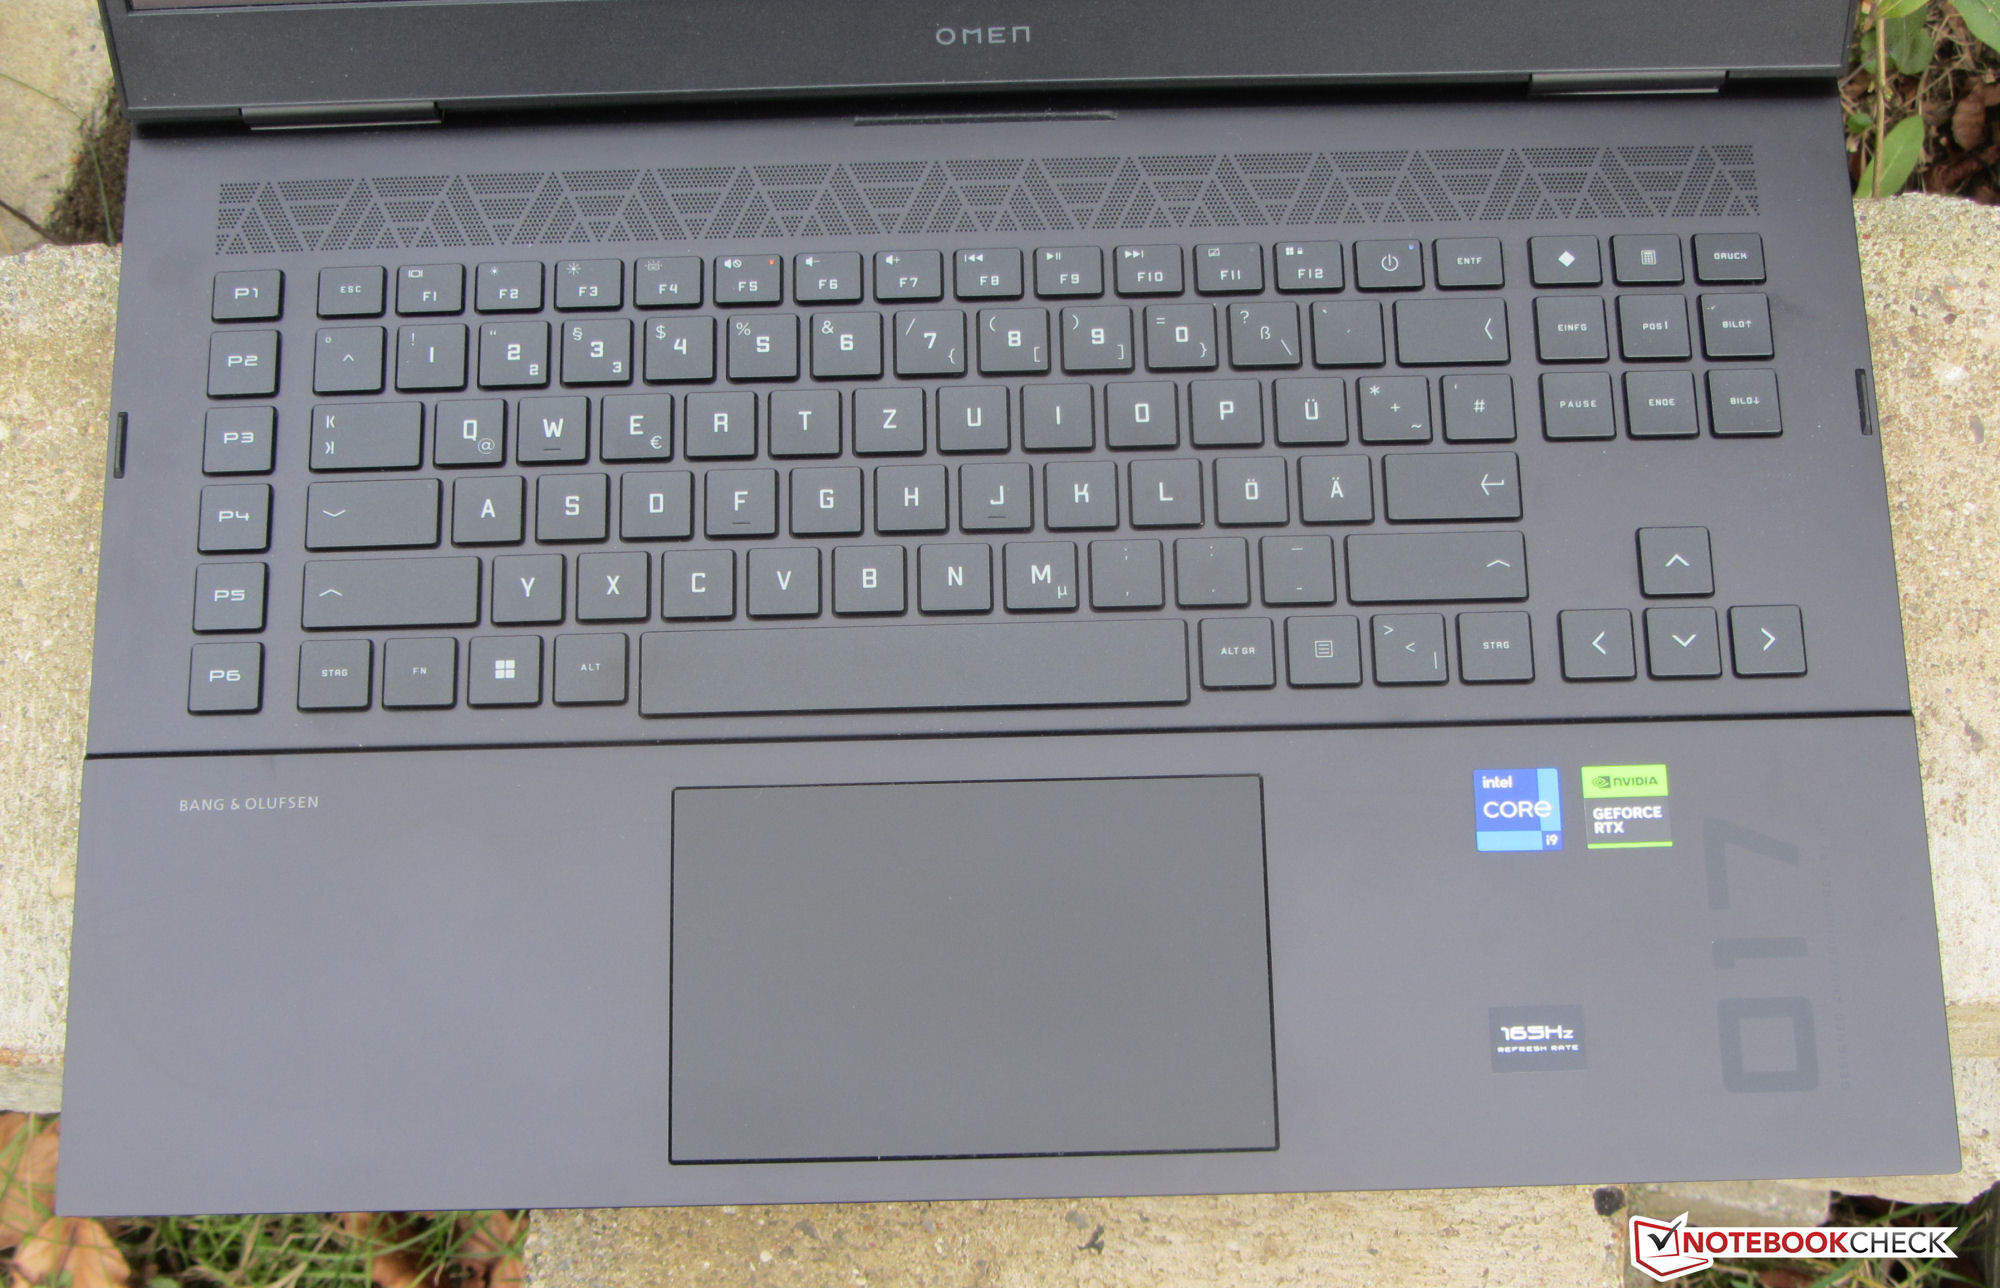
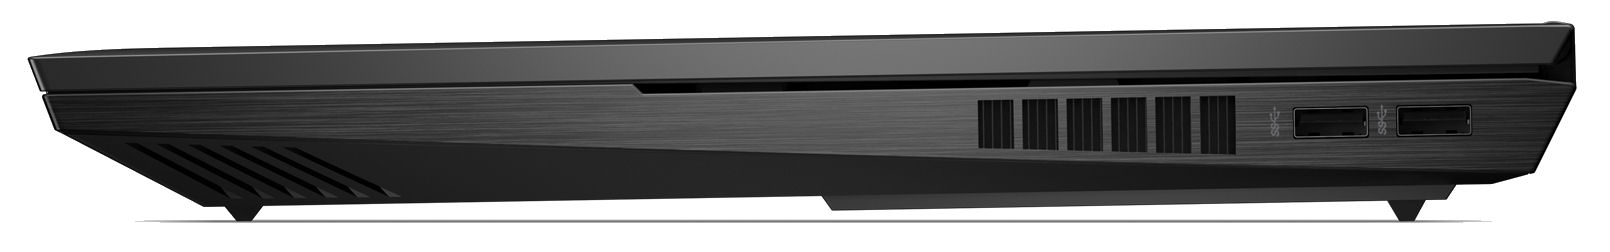
O modelo 2023 do Omen 17, que é um laptop de alto nível para jogos, usa o mesmo caso que já conhecemos do antecessor, mas inclui o hardware atual: O laptop é executado por Raptor Lake e Ada Lovelace chips. A HP combina um Core i9 com uma GPU RTX 4080, pedindo quase 3.300 euros ($3.582) para o pacote completo. Os concorrentes incluem laptops tais como o Alienware m17 R5oLâmina Razer 16 (Início de 2023)oAsus ROG Strix G16 G614JZe o Lenovo Legion Pro 7 16IRX8H.
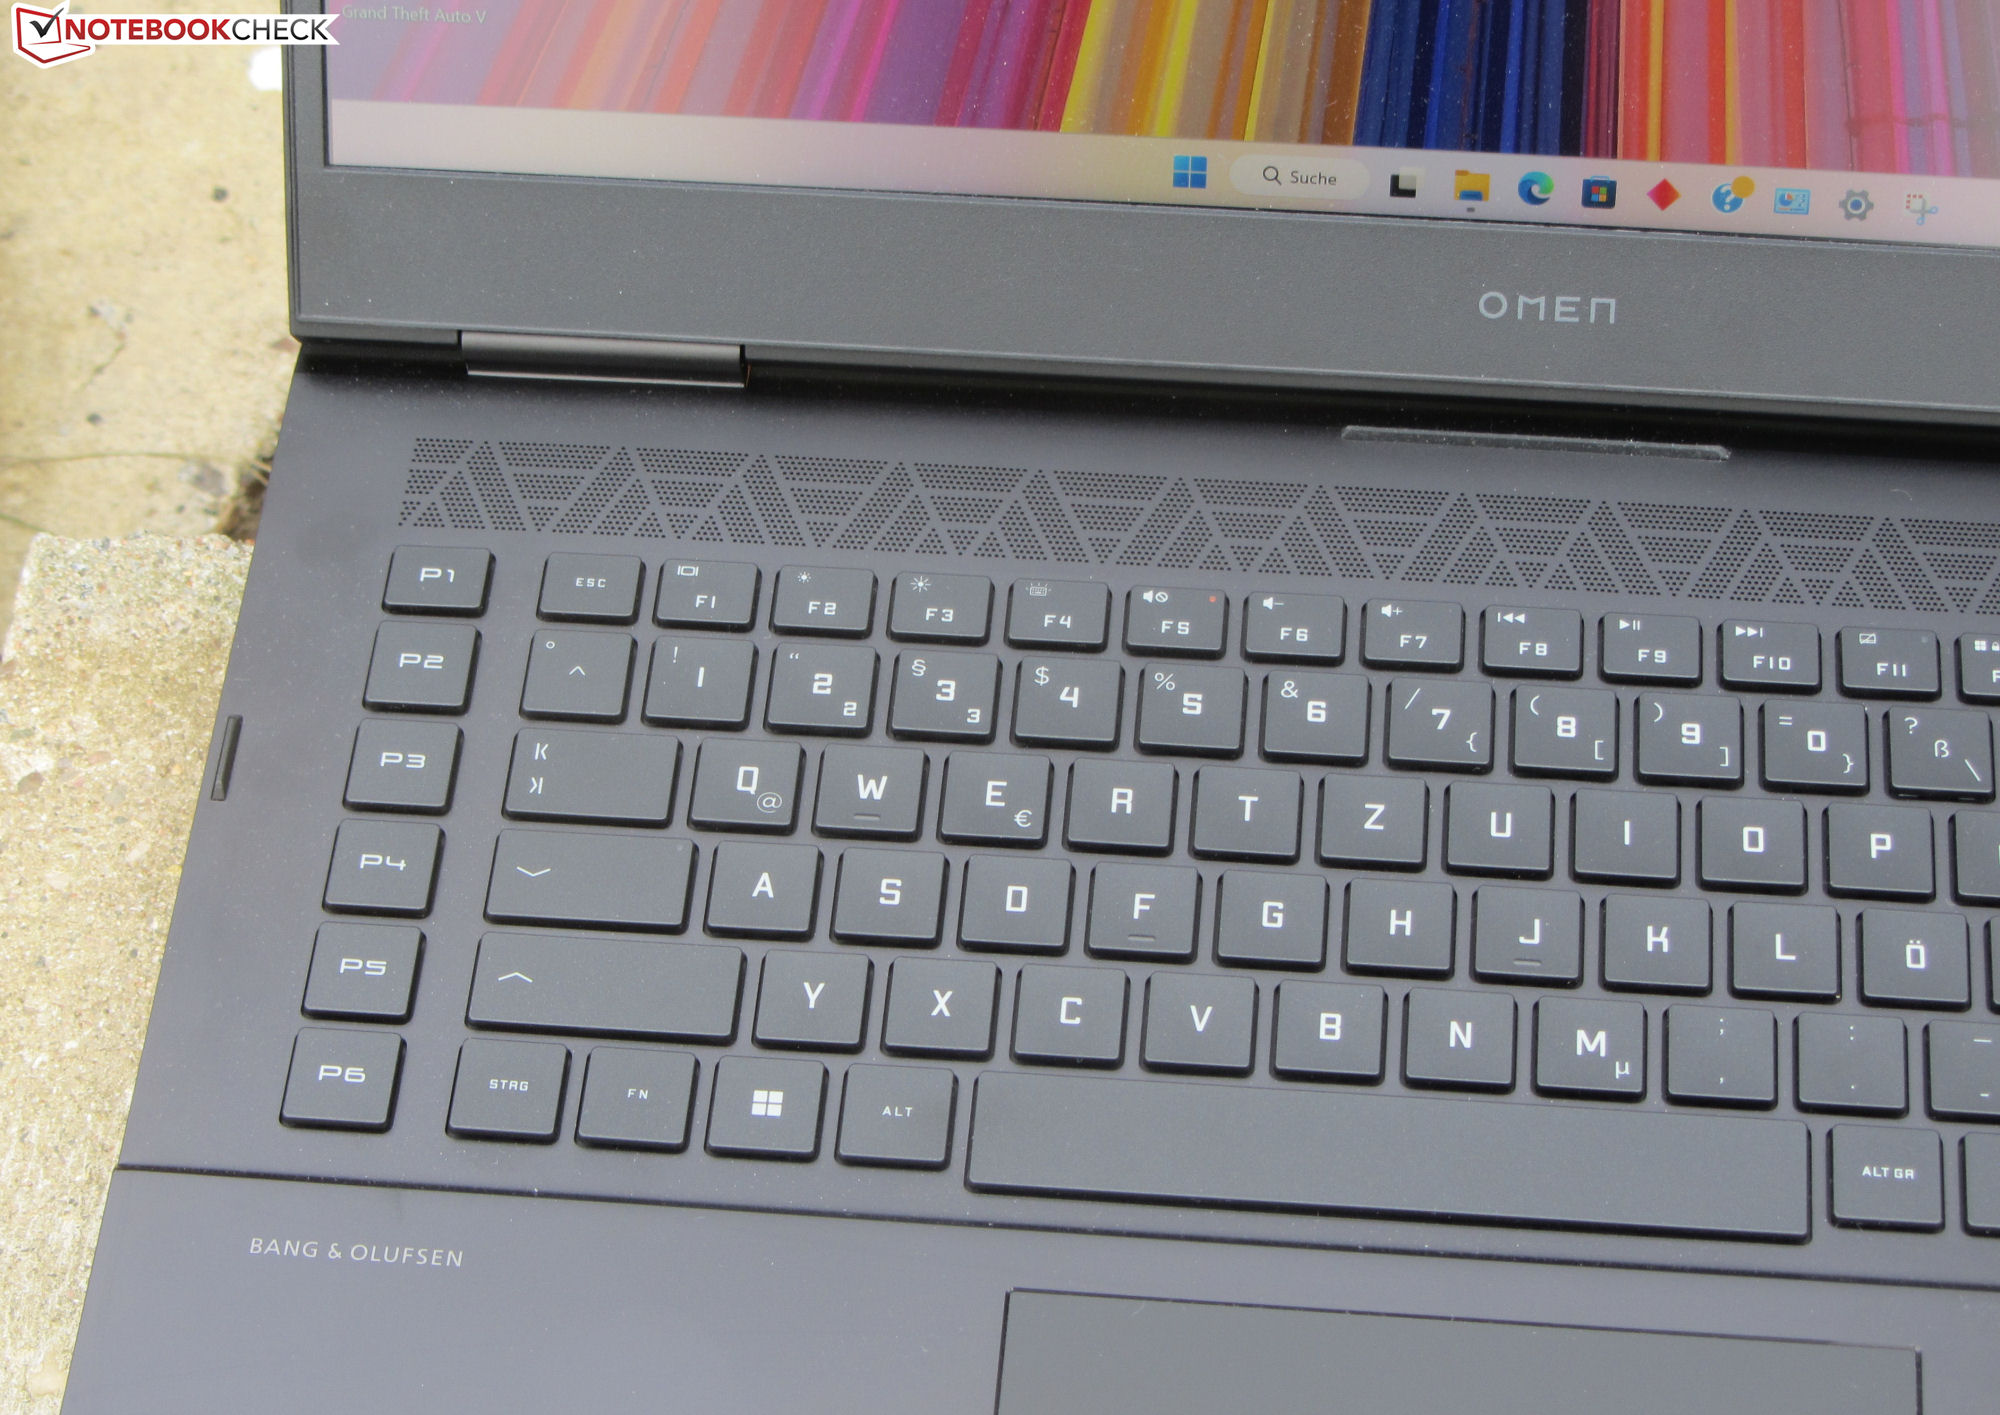
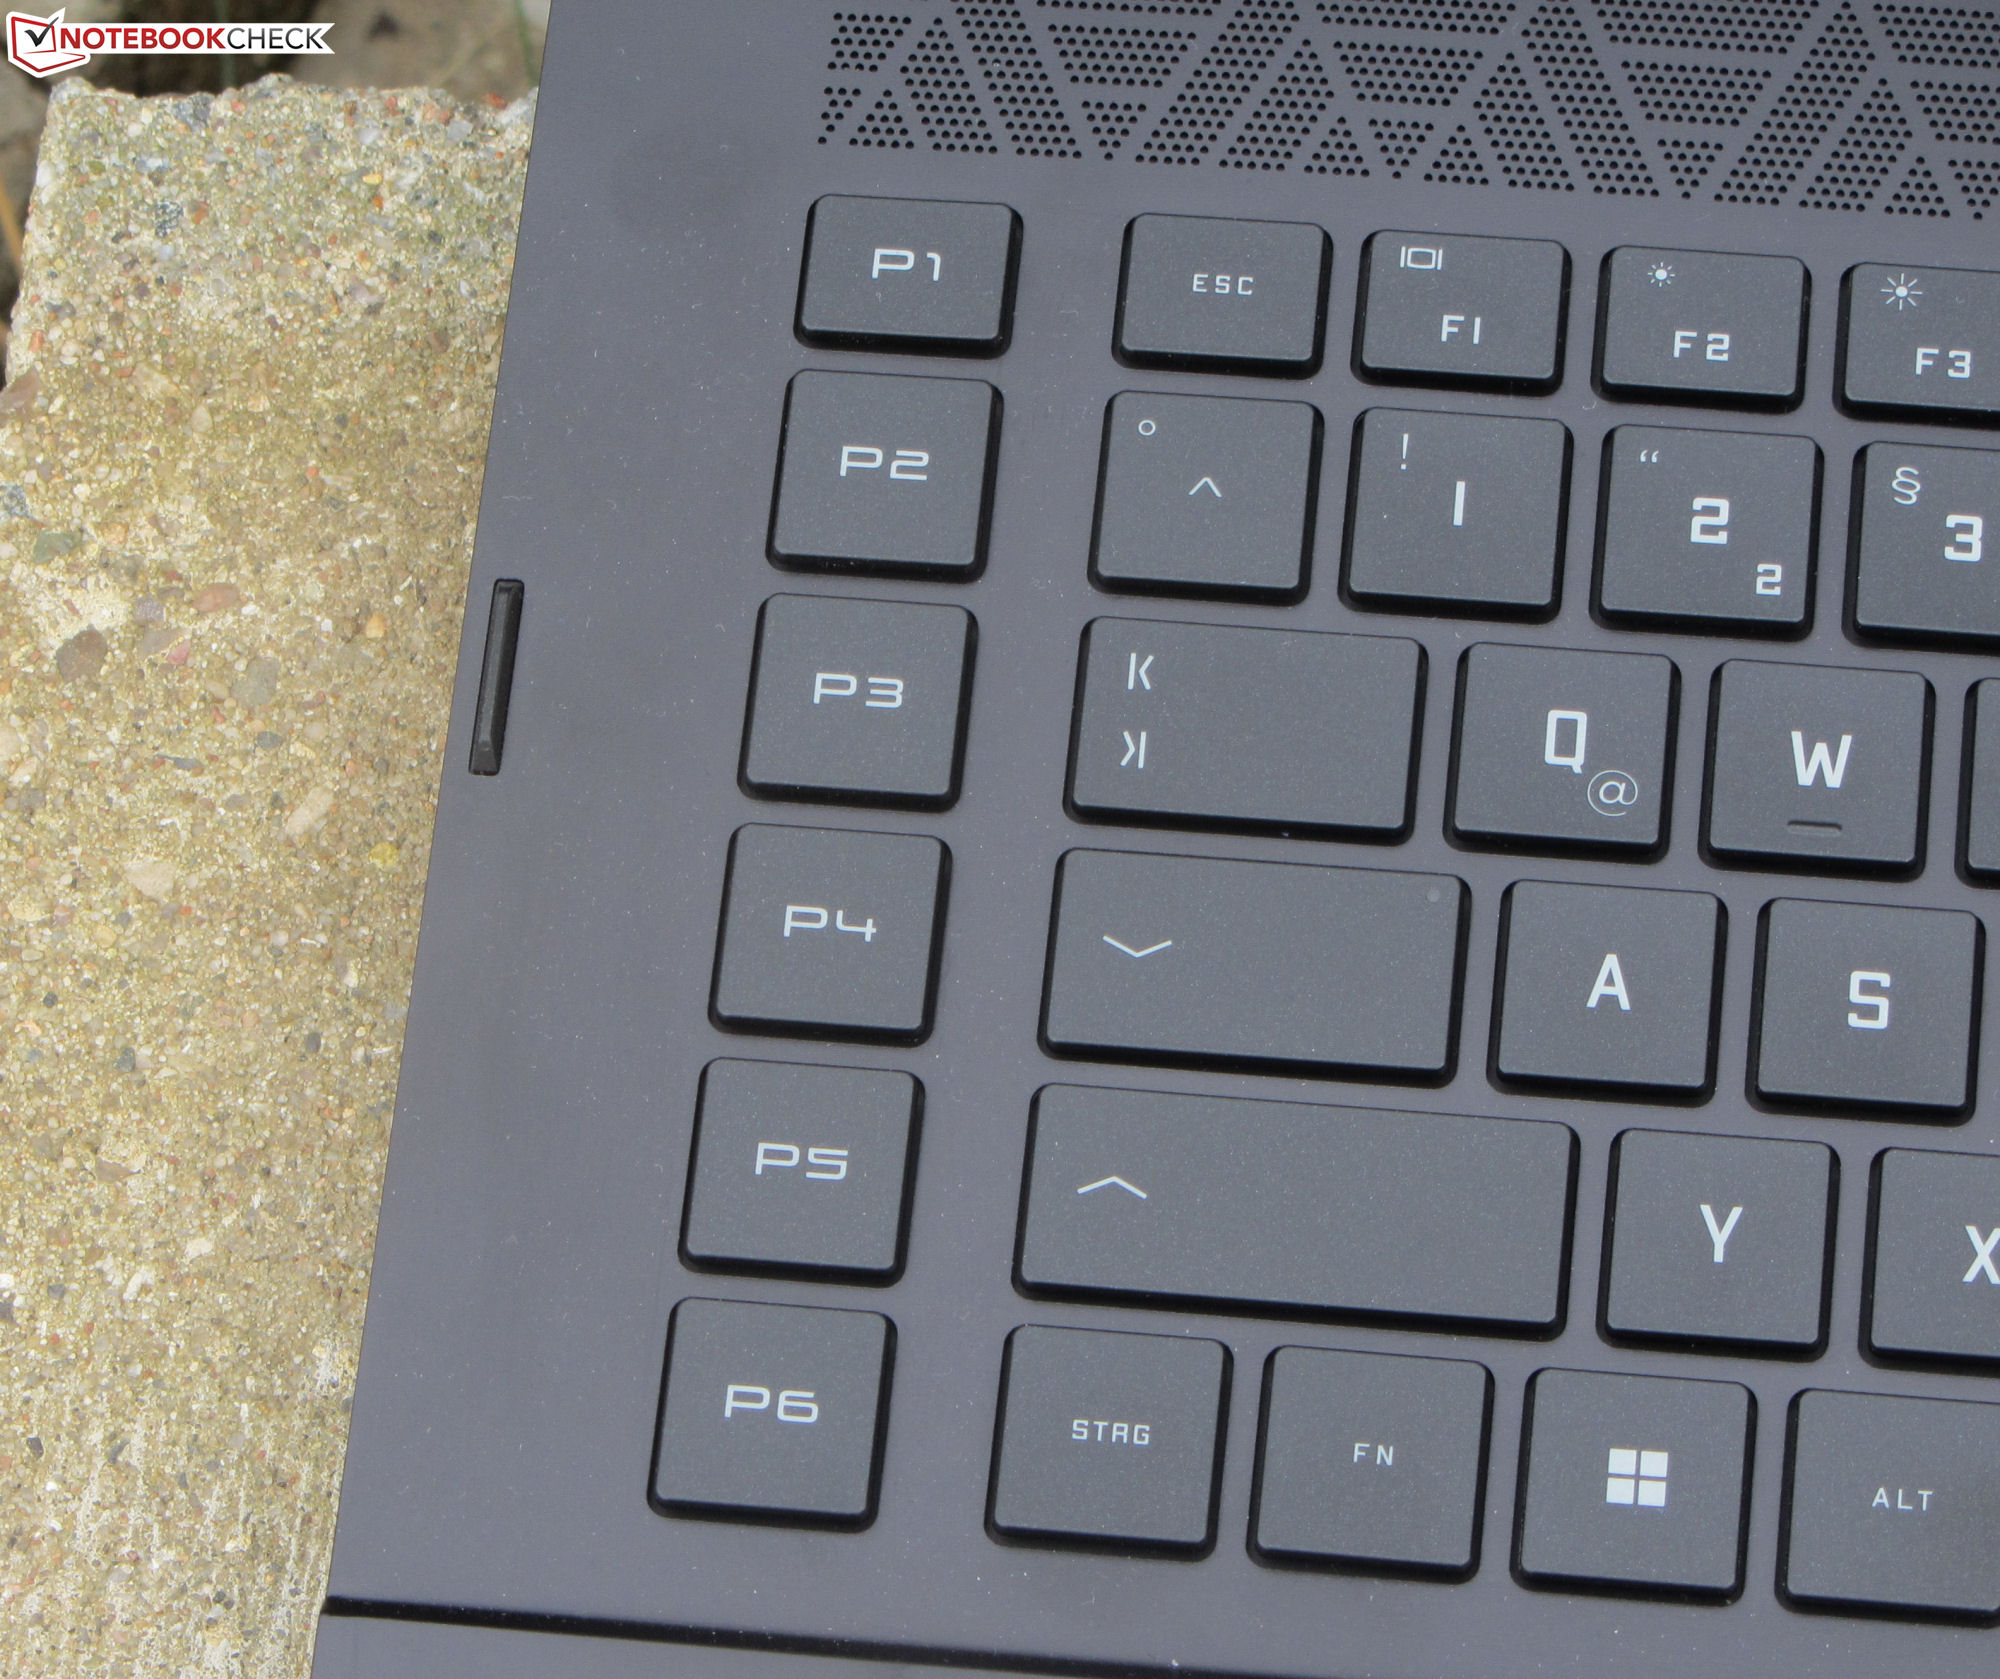
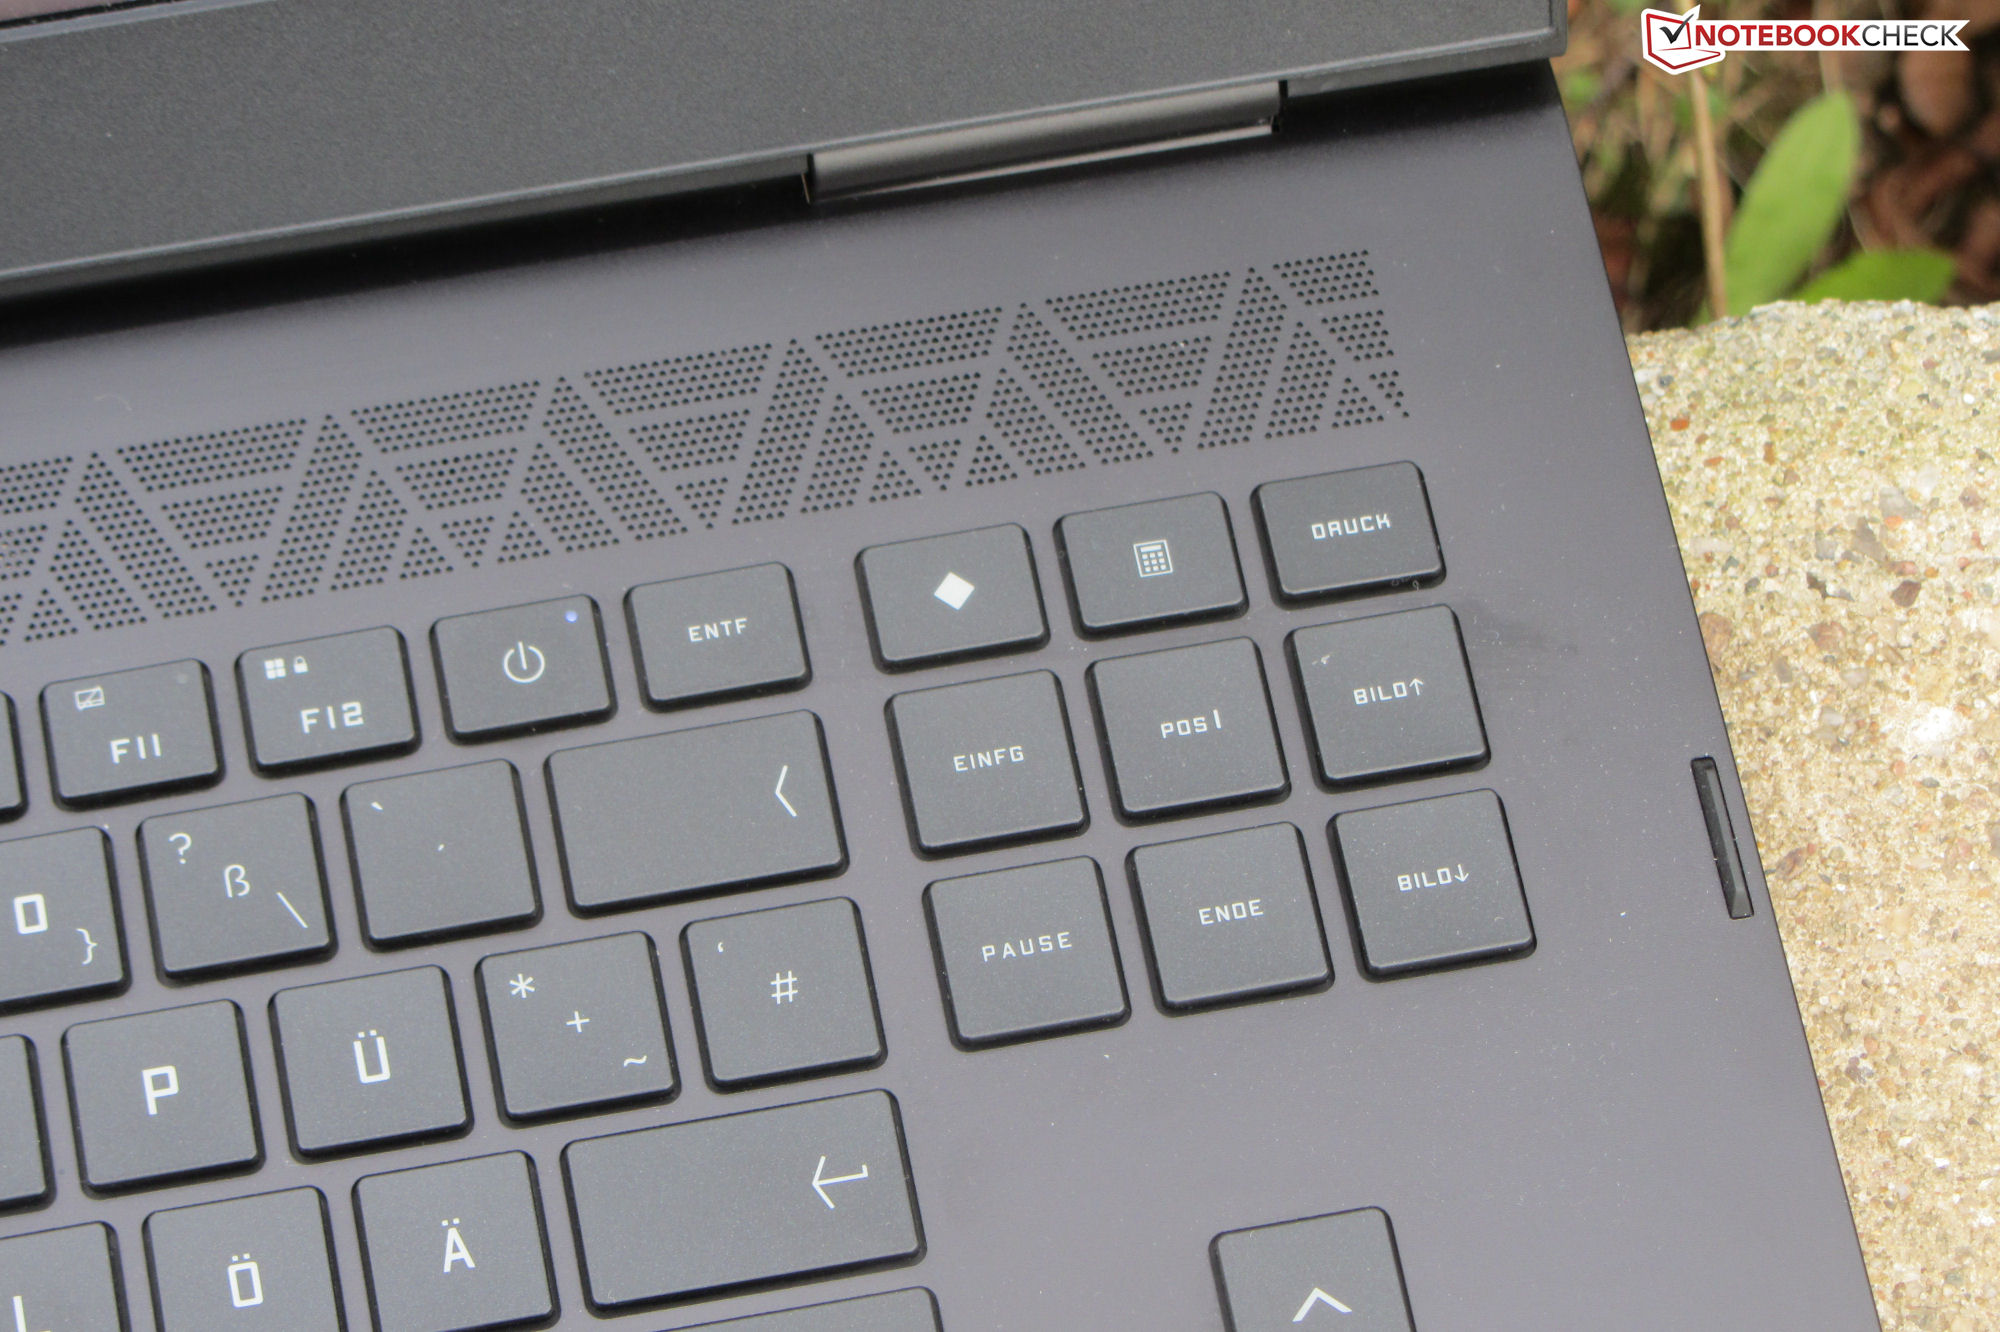
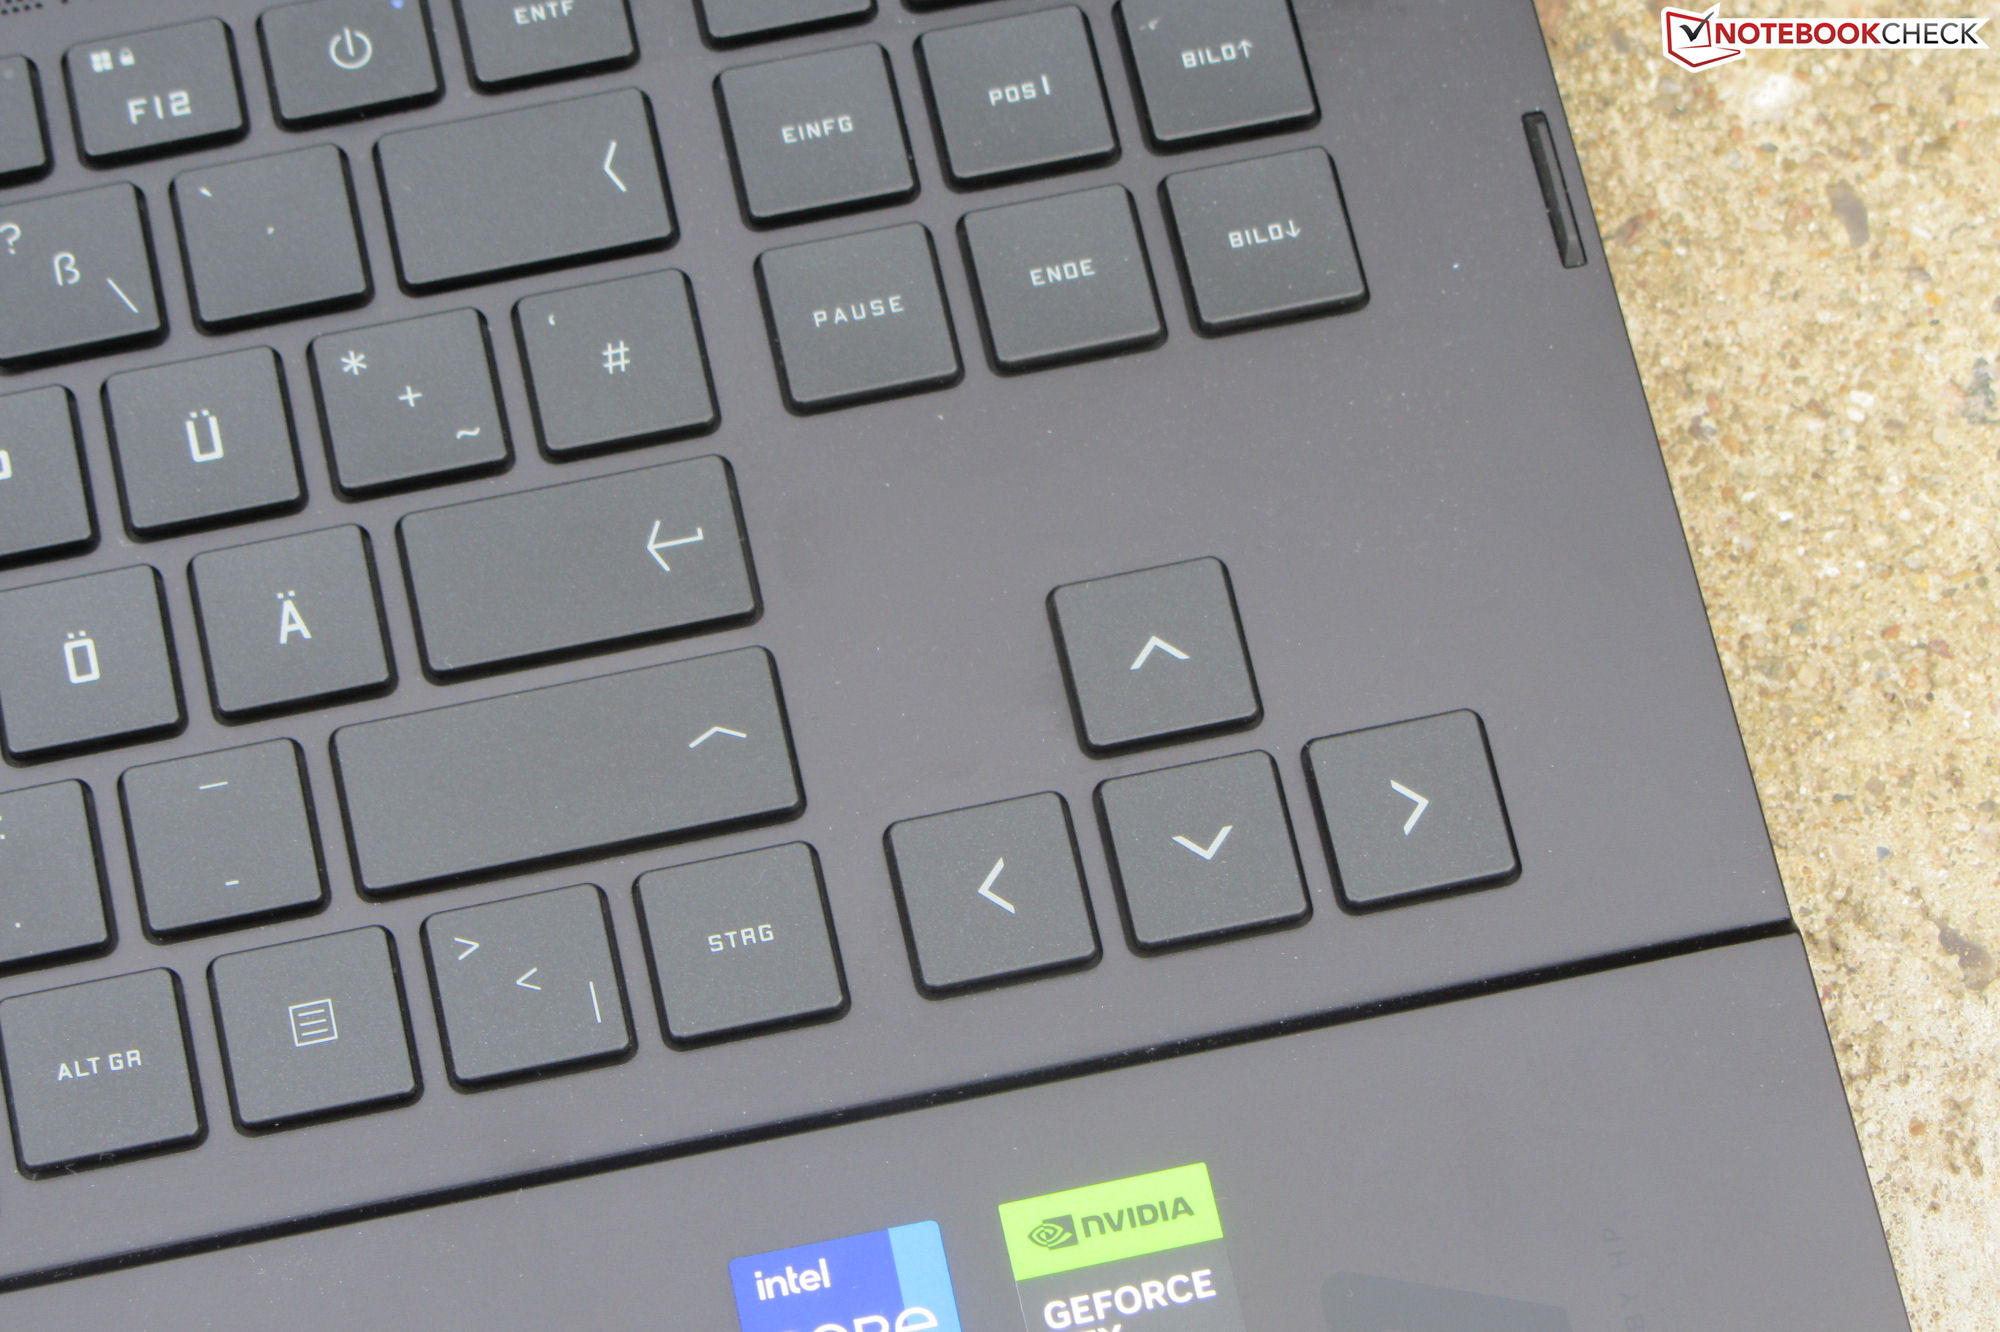
Você pode encontrar informações sobre a caixa, equipamentos, dispositivos de entrada e alto-falantes em nosso revisão do modelo antecessorque é idêntico nesses aspectos.
Possíveis concorrentes em comparação
Avaliação | Data | Modelo | Peso | Altura | Size | Resolução | Preço |
|---|---|---|---|---|---|---|---|
| 85.4 % v7 (old) | 03/2023 | HP Omen 17-ck2097ng i9-13900HX, GeForce RTX 4080 Laptop GPU | 2.8 kg | 27 mm | 17.30" | 2560x1440 | |
| 86.1 % v7 (old) | 01/2023 | Alienware m17 R5 (R9 6900HX, RX 6850M XT) R9 6900HX, Radeon RX 6850M XT | 3.4 kg | 26.7 mm | 17.00" | 3840x2160 | |
| 91.2 % v7 (old) | 02/2023 | Razer Blade 16 Early 2023 i9-13950HX, GeForce RTX 4080 Laptop GPU | 2.4 kg | 21.99 mm | 16.00" | 2560x1600 | |
| 89.4 % v7 (old) | 02/2023 | Lenovo Legion Pro 7 16IRX8H i9-13900HX, GeForce RTX 4080 Laptop GPU | 2.7 kg | 26 mm | 16.00" | 2560x1600 | |
| 88.4 % v7 (old) | 03/2023 | Asus ROG Strix G16 G614JZ i9-13980HX, GeForce RTX 4080 Laptop GPU | 2.4 kg | 30.4 mm | 16.00" | 2560x1600 |
| SD Card Reader | |
| average JPG Copy Test (av. of 3 runs) | |
| Média da turma Gaming (20.9 - 210, n=54, últimos 2 anos) | |
| Razer Blade 16 Early 2023 (AV PRO microSD 128 GB V60) | |
| HP Omen 17-ck2097ng (AV PRO microSD 128 GB V60) | |
| maximum AS SSD Seq Read Test (1GB) | |
| Razer Blade 16 Early 2023 (AV PRO microSD 128 GB V60) | |
| Média da turma Gaming (25.5 - 261, n=51, últimos 2 anos) | |
| HP Omen 17-ck2097ng (AV PRO microSD 128 GB V60) | |


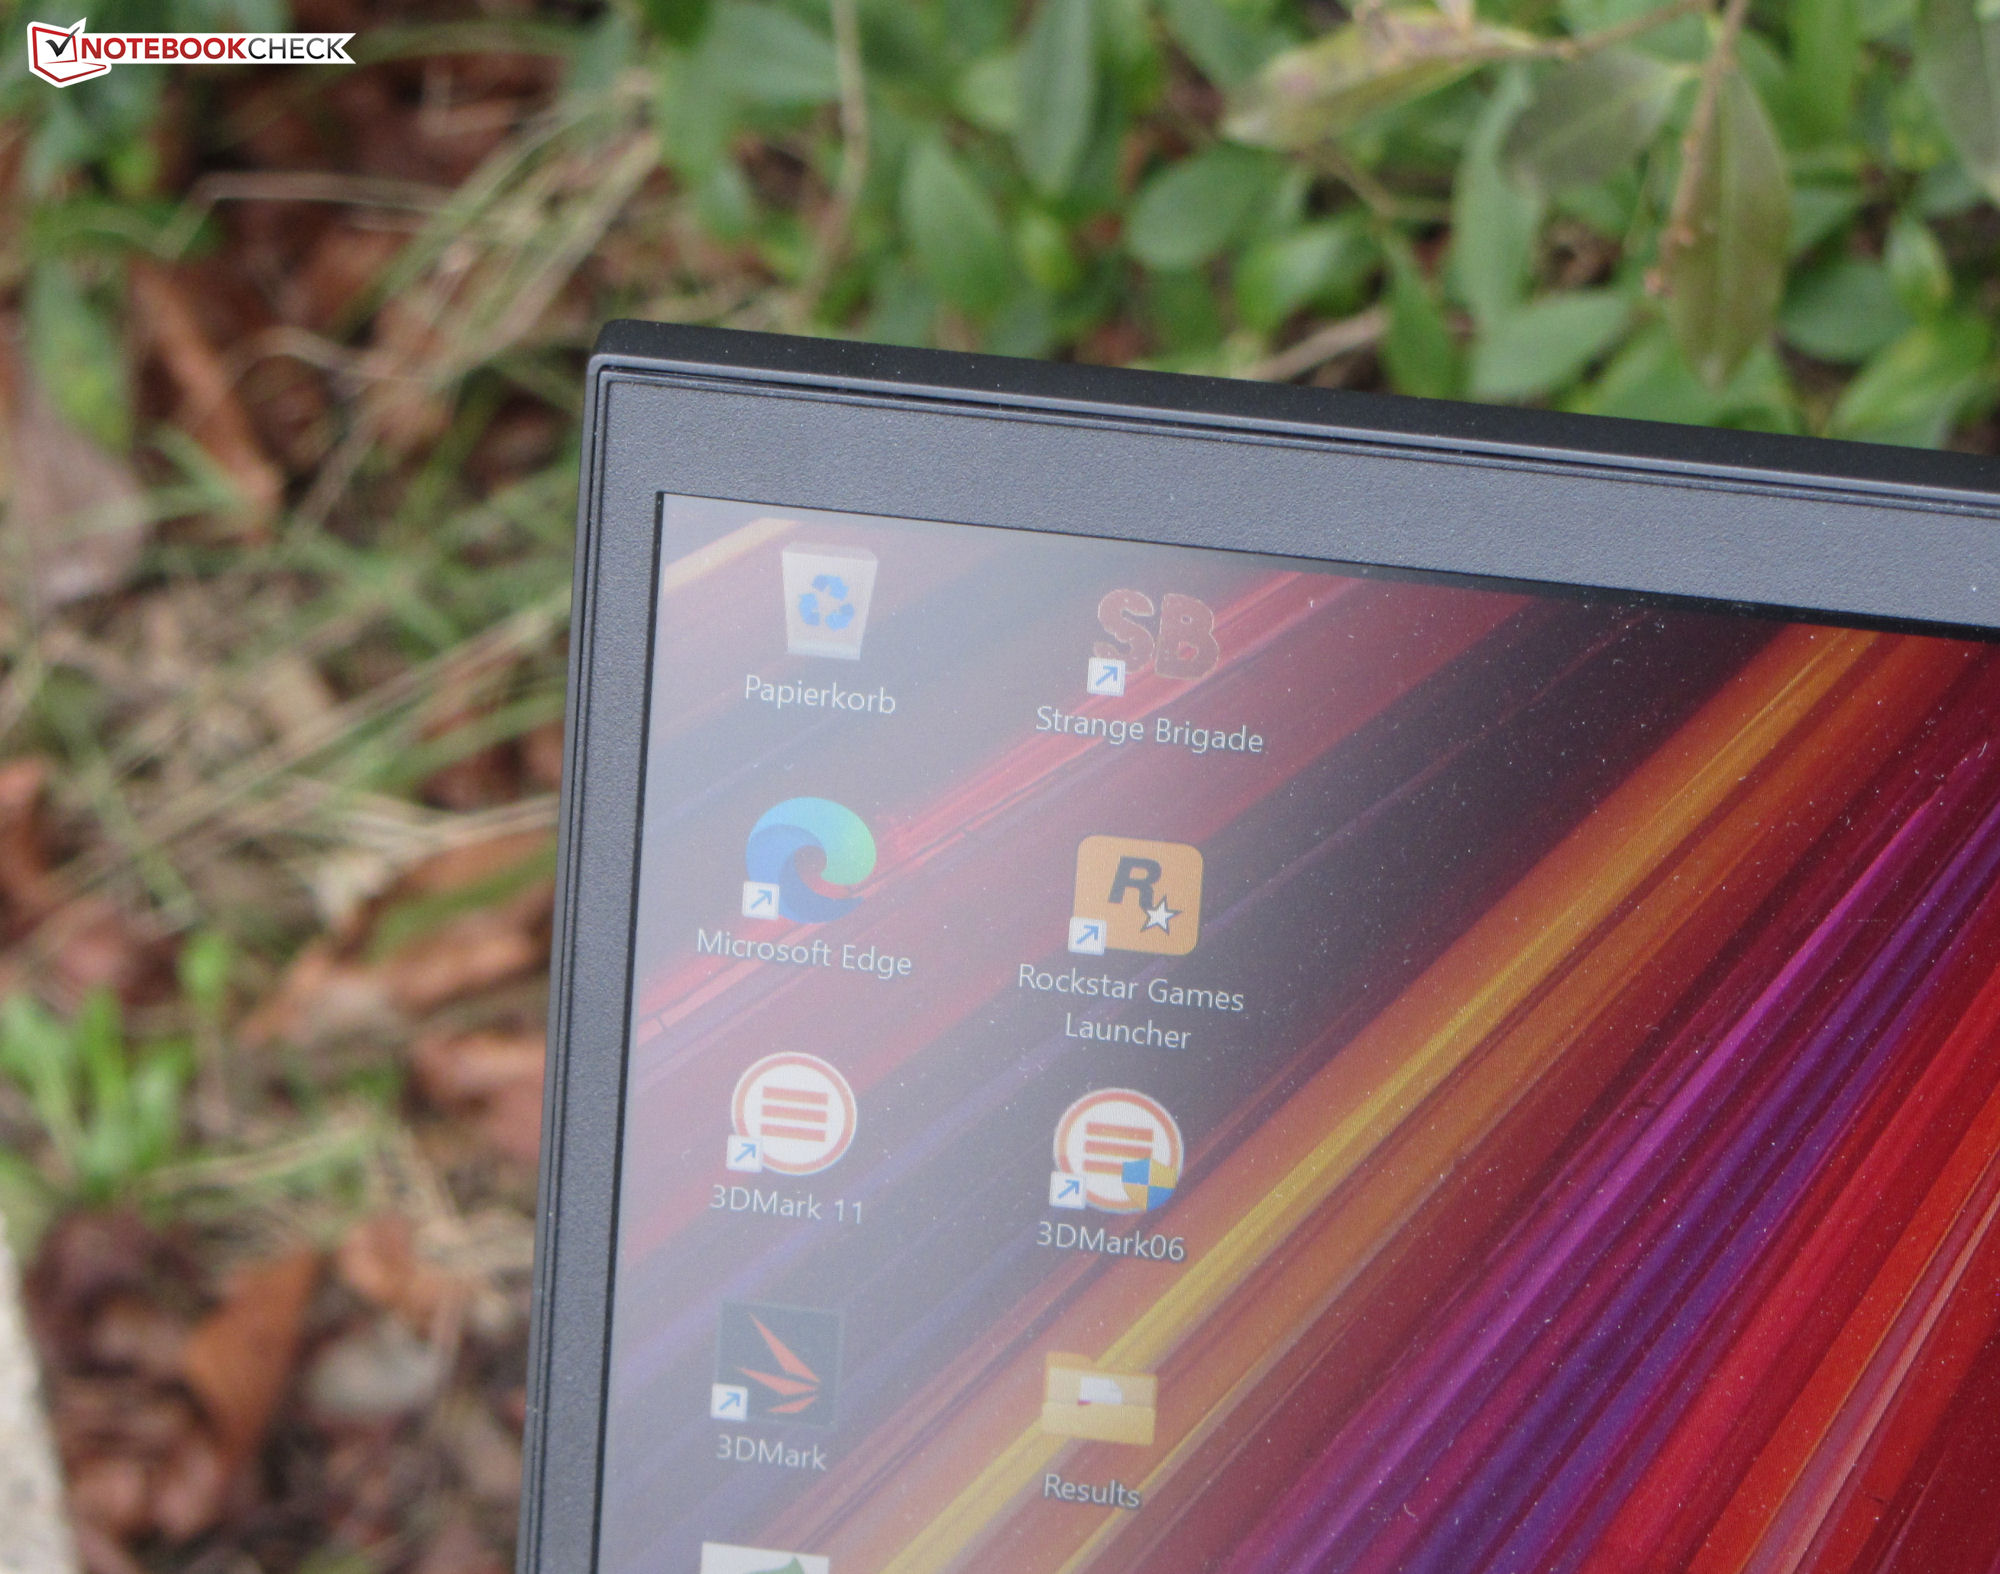
Display - QHD incluindo cobertura sRGB
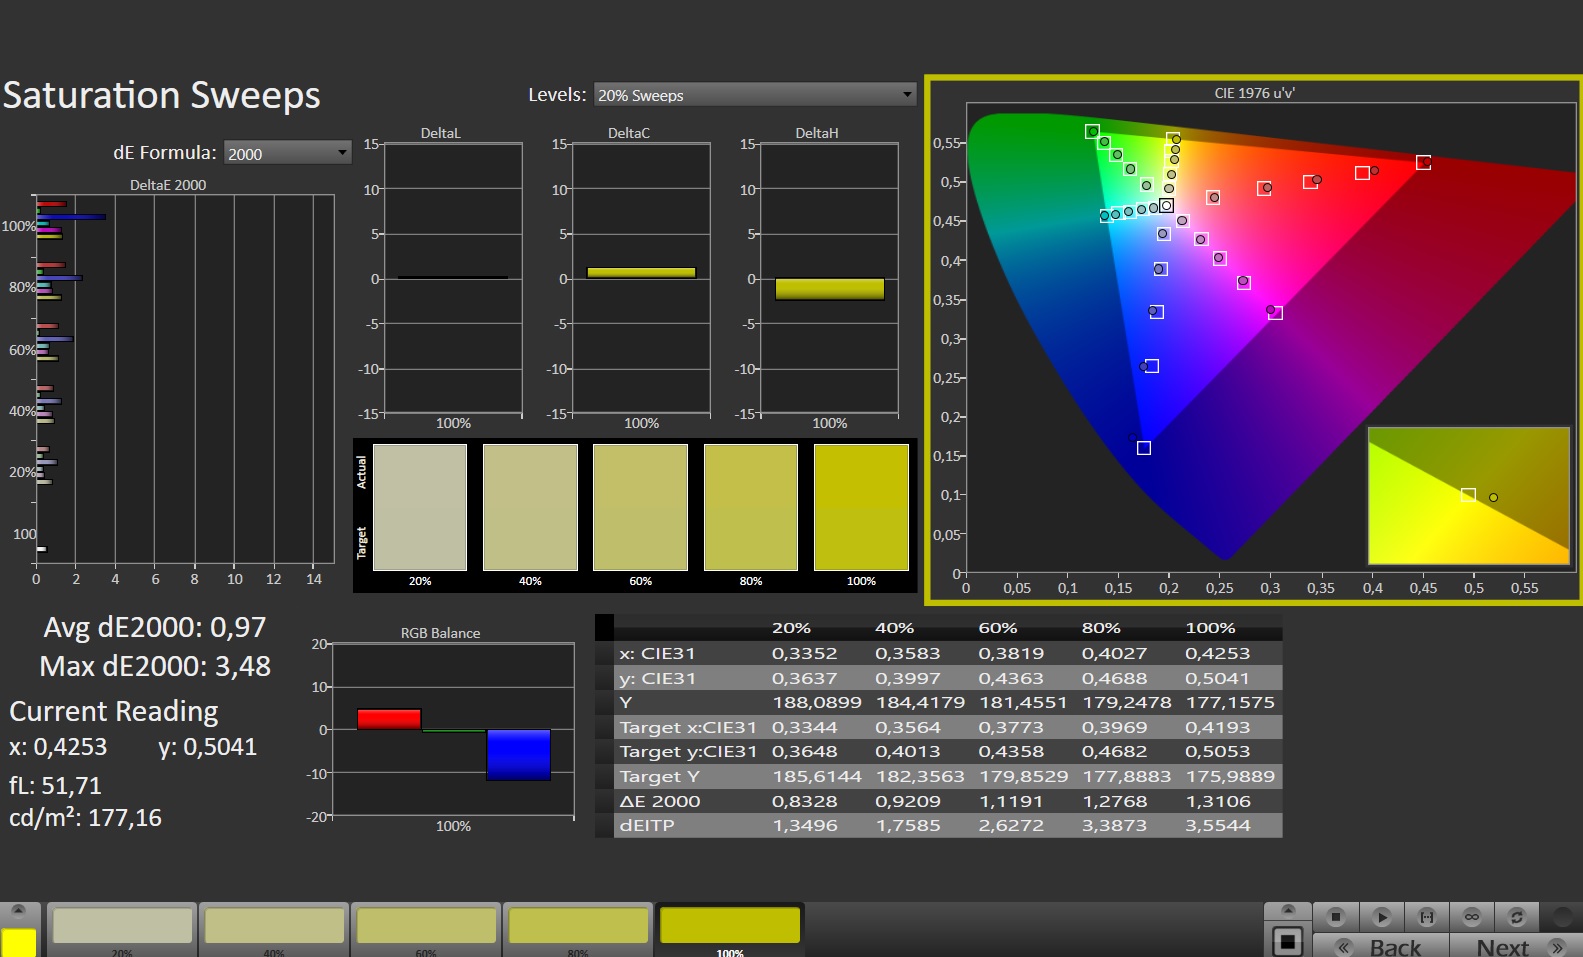
Enquanto neste ponto muitos concorrentes preferem usar displays 16:10, a HP permanece fiel ao formato 16:9 no Omen. Uma característica positiva é que o painel 165-Hz responsivo não mostra nenhum PWM cintilando em qualquer nível de brilho.
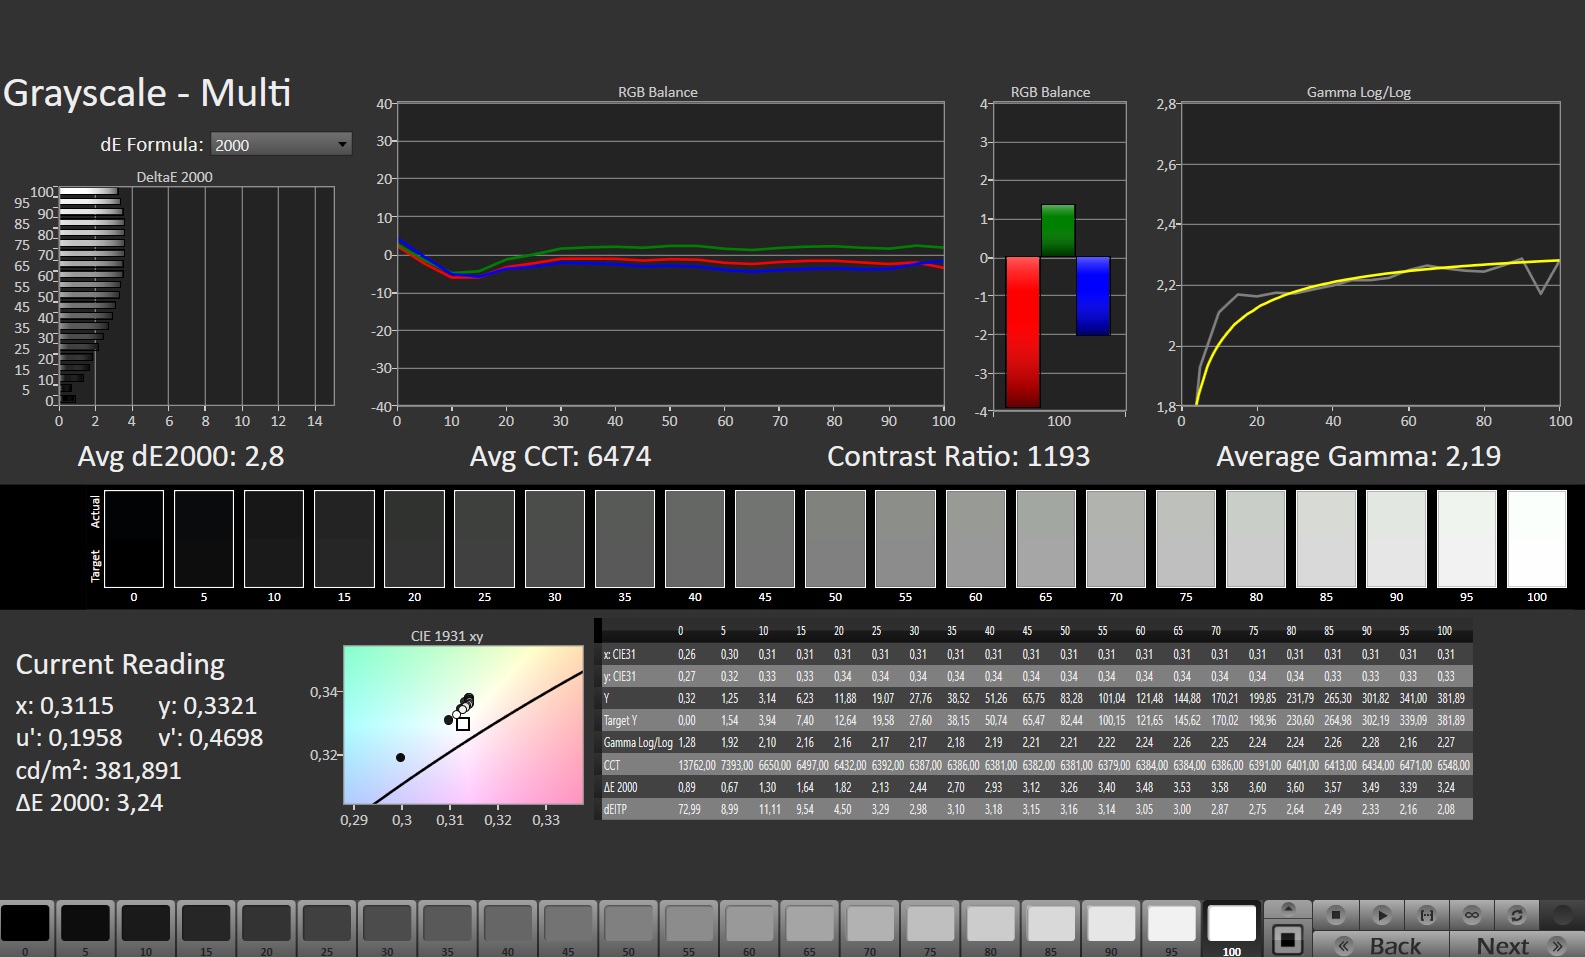
O brilho e o contraste da tela mate de 17,3 polegadas (2.560 x 1.440 pixels) satisfazem os requisitos (> 300 cd/m² e 1.000:1). Entretanto, o display Omen oferece o menor brilho entre os displays de nossos concorrentes. O Legion 7 Pro tem aqui o painel mais brilhante.
| |||||||||||||||||||||||||
iluminação: 90 %
iluminação com acumulador: 371 cd/m²
Contraste: 1159:1 (Preto: 0.32 cd/m²)
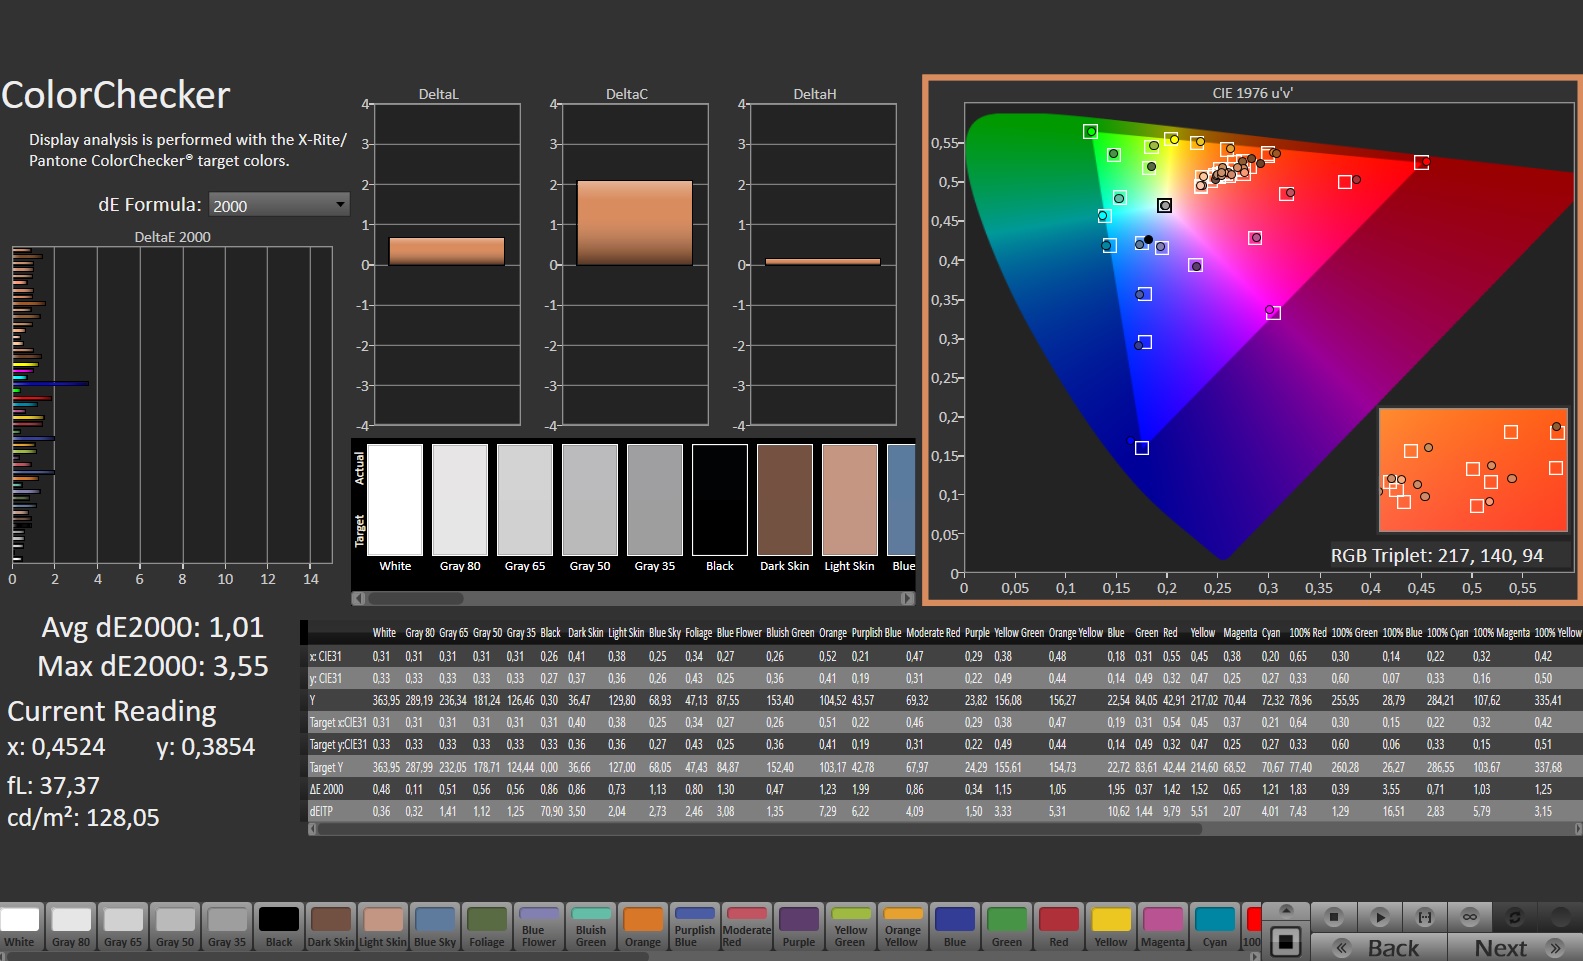
ΔE ColorChecker Calman: 1.74 | ∀{0.5-29.43 Ø4.71}
calibrated: 1.01
ΔE Greyscale Calman: 2.8 | ∀{0.09-98 Ø4.96}
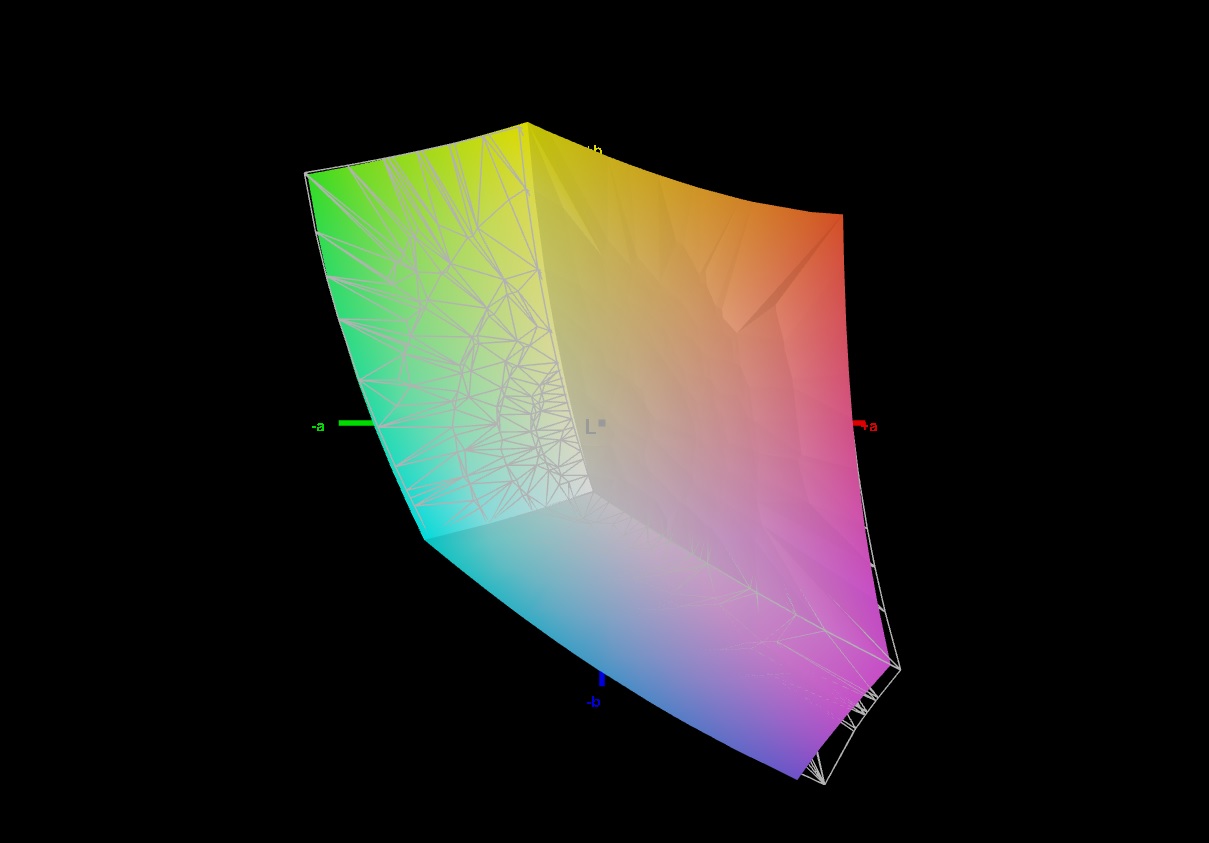
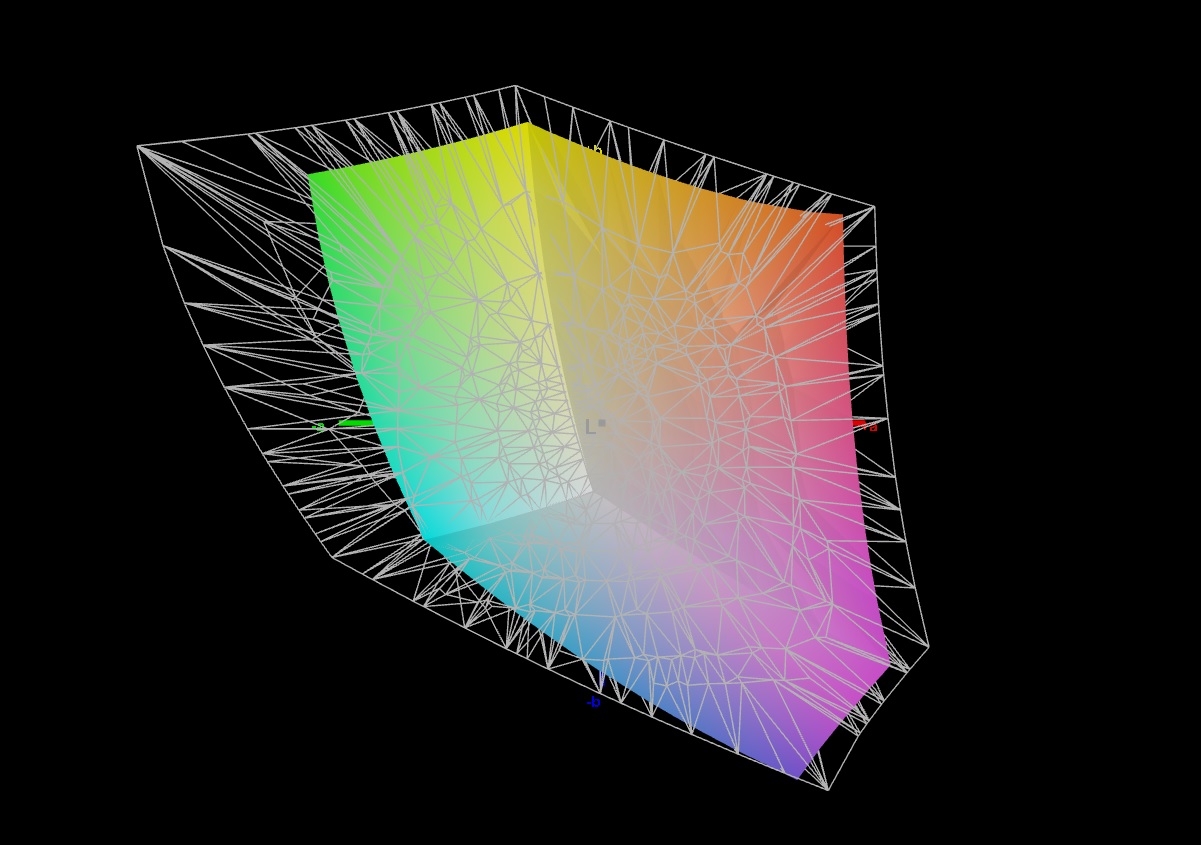
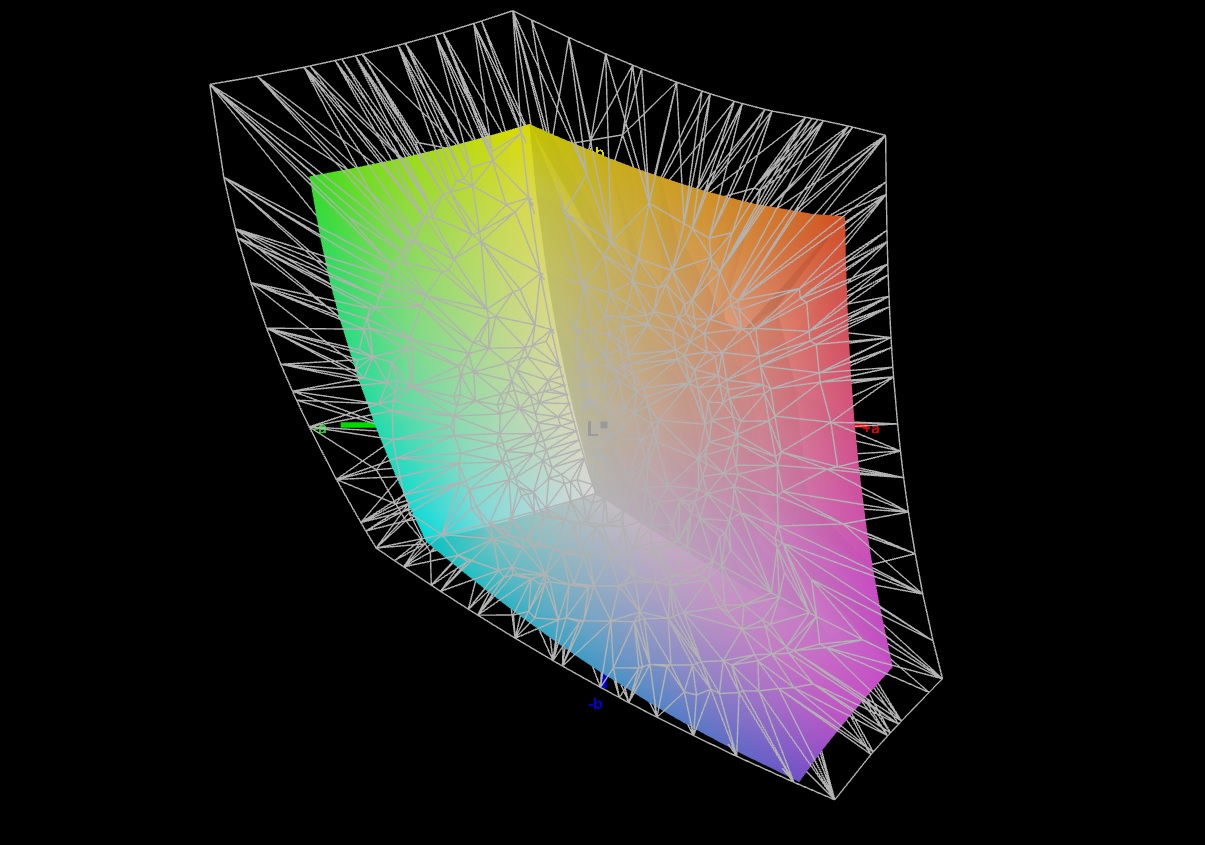
69.6% AdobeRGB 1998 (Argyll 3D)
97.6% sRGB (Argyll 3D)
67.4% Display P3 (Argyll 3D)
Gamma: 2.19
CCT: 6474 K
| HP Omen 17-ck2097ng BOE BOE09BF, IPS, 2560x1440, 17.3" | Alienware m17 R5 (R9 6900HX, RX 6850M XT) AU Optronics AUODBA3, IPS, 3840x2160, 17" | Razer Blade 16 Early 2023 CSOT T3 MNG007DA4-1, IPS, 2560x1600, 16" | Lenovo Legion Pro 7 16IRX8H MNG007DA2-3 (CSO1628), IPS, 2560x1600, 16" | Asus ROG Strix G16 G614JZ TL160ADMP03-0, IPS, 2560x1600, 16" | HP Omen 17-ck1075ng BOE09EE, IPS, 1920x1080, 17.3" | |
|---|---|---|---|---|---|---|
| Display | 24% | 26% | 2% | 23% | -11% | |
| Display P3 Coverage (%) | 67.4 | 97.2 44% | 98.5 46% | 69.1 3% | 97 44% | 59.03 -12% |
| sRGB Coverage (%) | 97.6 | 99.6 2% | 100 2% | 99.7 2% | 99.9 2% | 87.46 -10% |
| AdobeRGB 1998 Coverage (%) | 69.6 | 88.4 27% | 89.7 29% | 71.2 2% | 84.9 22% | 61.04 -12% |
| Response Times | -18% | 12% | 28% | 47% | -1% | |
| Response Time Grey 50% / Grey 80% * (ms) | 15.6 ? | 16.4 ? -5% | 6.6 ? 58% | 12.3 ? 21% | 5.1 ? 67% | 14 ? 10% |
| Response Time Black / White * (ms) | 8.9 ? | 11.6 ? -30% | 12 ? -35% | 5.9 ? 34% | 6.6 ? 26% | 10 ? -12% |
| PWM Frequency (Hz) | 100 ? | |||||
| Screen | -88% | -12% | 25% | 3% | -15% | |
| Brightness middle (cd/m²) | 371 | 484 30% | 456.8 23% | 511 38% | 470 27% | 321 -13% |
| Brightness (cd/m²) | 350 | 449 28% | 437 25% | 469 34% | 459 31% | 302 -14% |
| Brightness Distribution (%) | 90 | 87 -3% | 83 -8% | 86 -4% | 93 3% | 84 -7% |
| Black Level * (cd/m²) | 0.32 | 0.55 -72% | 0.35 -9% | 0.4 -25% | 0.42 -31% | 0.41 -28% |
| Contrast (:1) | 1159 | 880 -24% | 1305 13% | 1278 10% | 1119 -3% | 783 -32% |
| Colorchecker dE 2000 * | 1.74 | 4.8 -176% | 3.7 -113% | 0.95 45% | 1.86 -7% | 1.62 7% |
| Colorchecker dE 2000 max. * | 3.59 | 7.48 -108% | 6.42 -79% | 2.07 42% | 3.87 -8% | 4.08 -14% |
| Colorchecker dE 2000 calibrated * | 1.01 | 4.74 -369% | 0.66 35% | 0.91 10% | 0.93 8% | 1.93 -91% |
| Greyscale dE 2000 * | 2.8 | 5.5 -96% | 2.6 7% | 0.6 79% | 2.7 4% | 1.24 56% |
| Gamma | 2.19 100% | 2.42 91% | 2.3 96% | 2.176 101% | 2.246 98% | 2.41 91% |
| CCT | 6474 100% | 6148 106% | 6108 106% | 6545 99% | 6711 97% | 6261 104% |
| Média Total (Programa/Configurações) | -27% /
-54% | 9% /
-0% | 18% /
21% | 24% /
13% | -9% /
-12% |
* ... menor é melhor
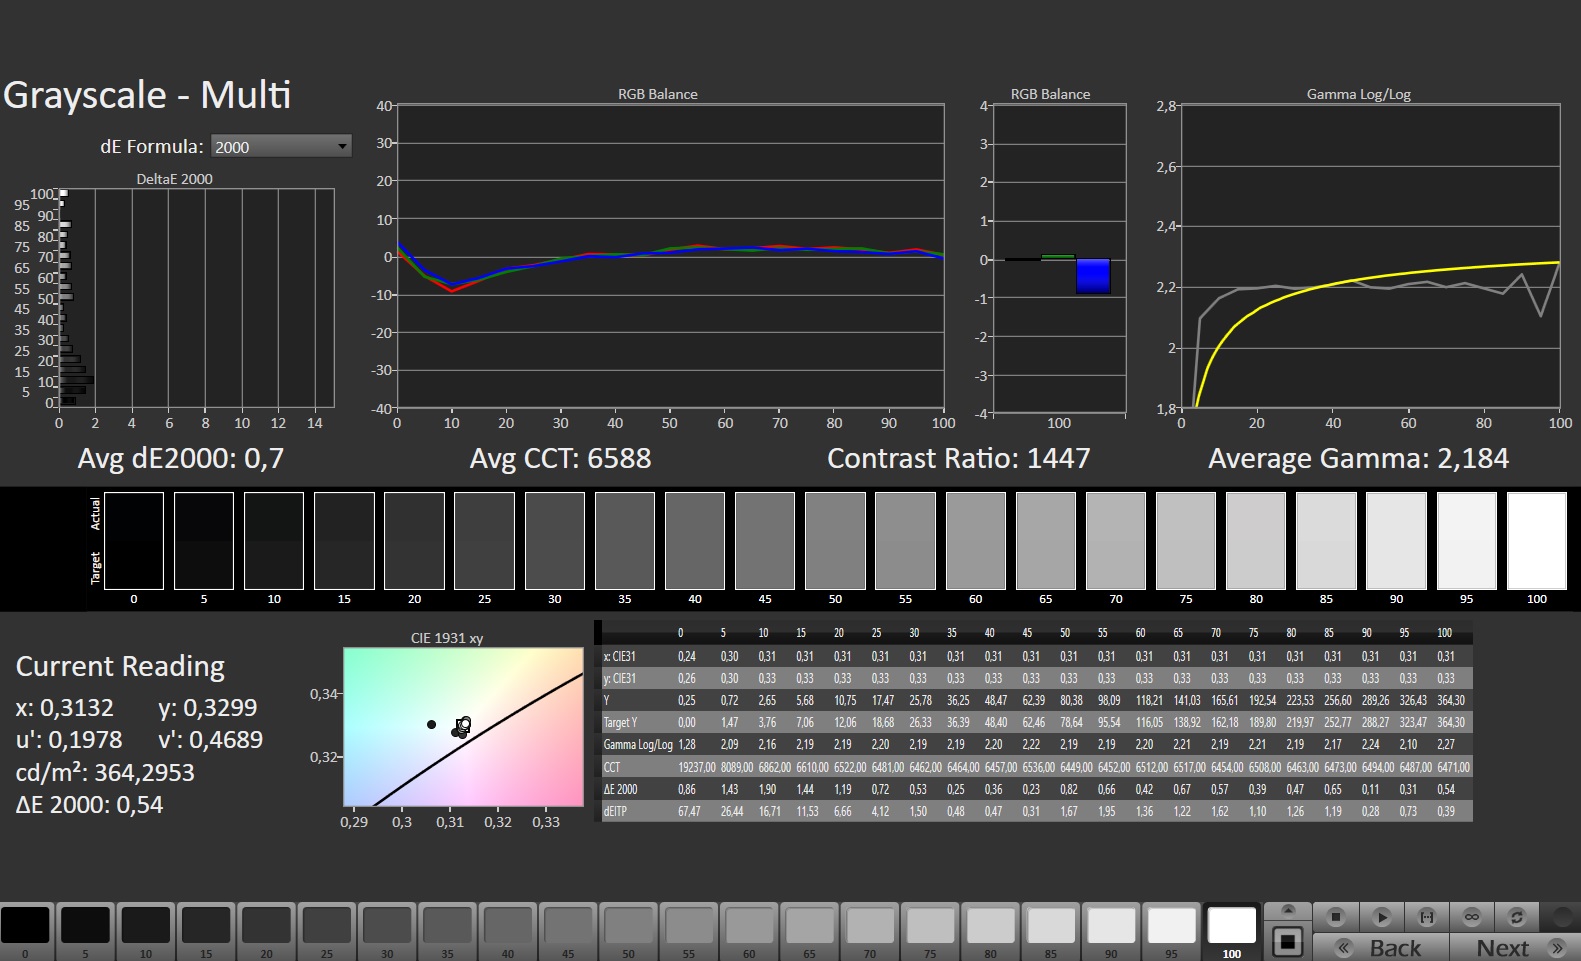
No estado de entrega, a reprodução da cor já é muito boa e pode ser melhorada ainda mais com uma calibração, o que faz com que o desvio da cor caia de 1,74 para 1 (valor alvo < 3). Além disso, a escala de cinza também é então reproduzida de forma mais uniforme.
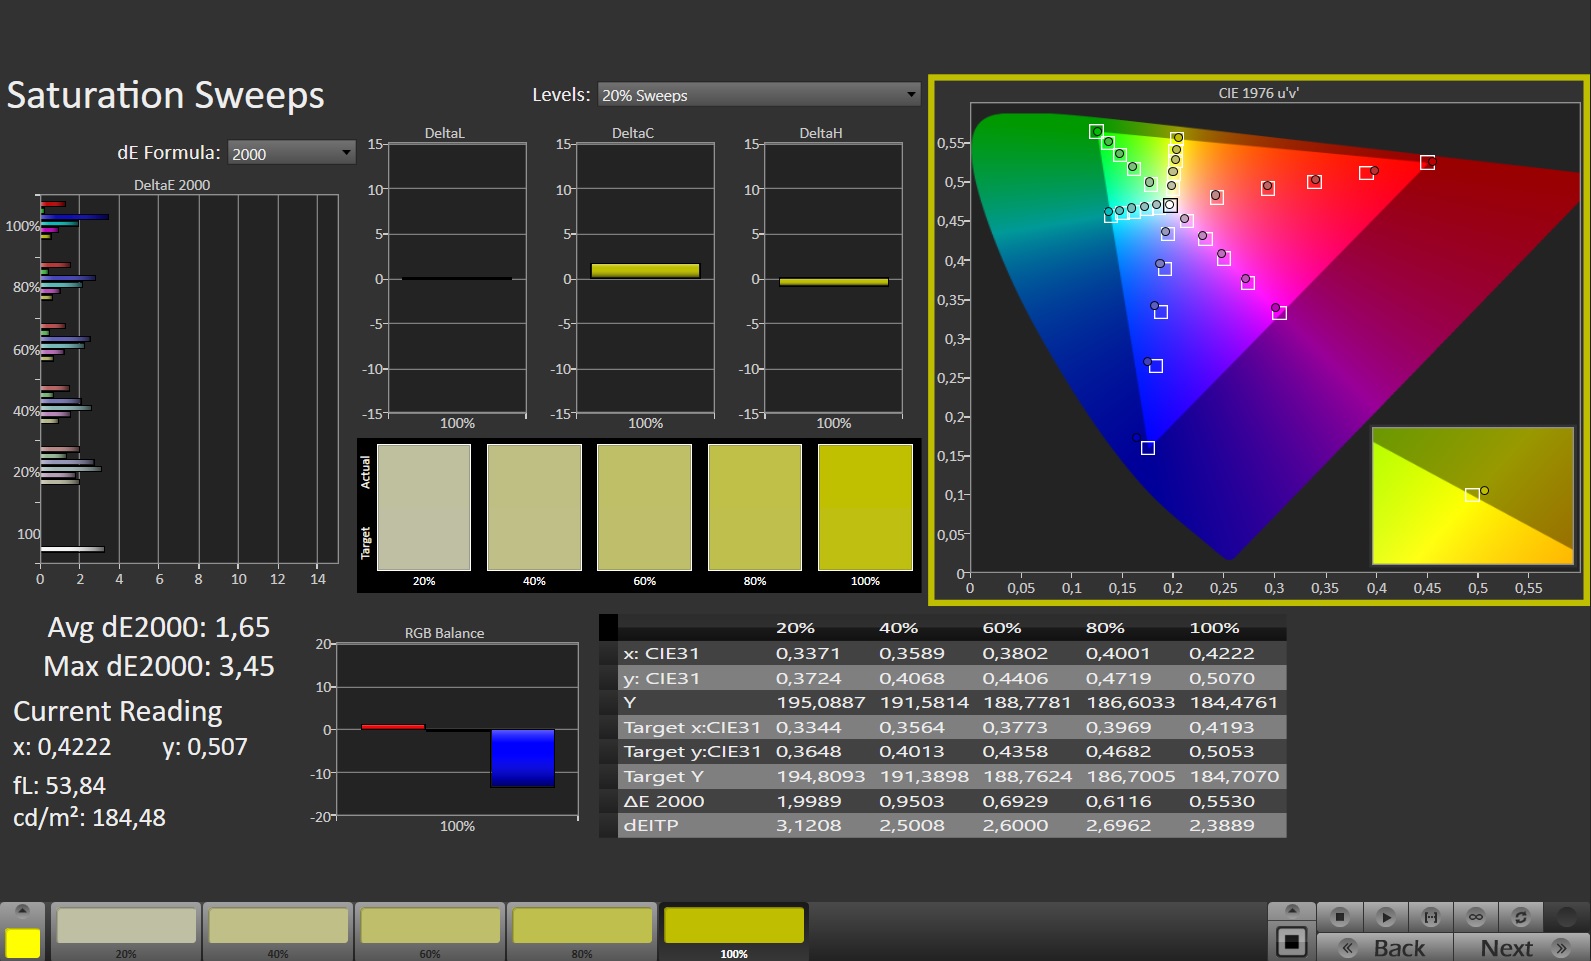
O visor é capaz de cobrir o espaço de cor sRGB quase completamente, mas não os espaços de cor AdobeRGB e DCI-P3. Os mostradores da maioria dos concorrentes têm melhor desempenho aqui, com apenas o painel do Legionque variam no mesmo nível.

Exibir tempos de resposta
| ↔ Tempo de resposta preto para branco | ||
|---|---|---|
| 8.9 ms ... ascensão ↗ e queda ↘ combinadas | ↗ 3.7 ms ascensão | 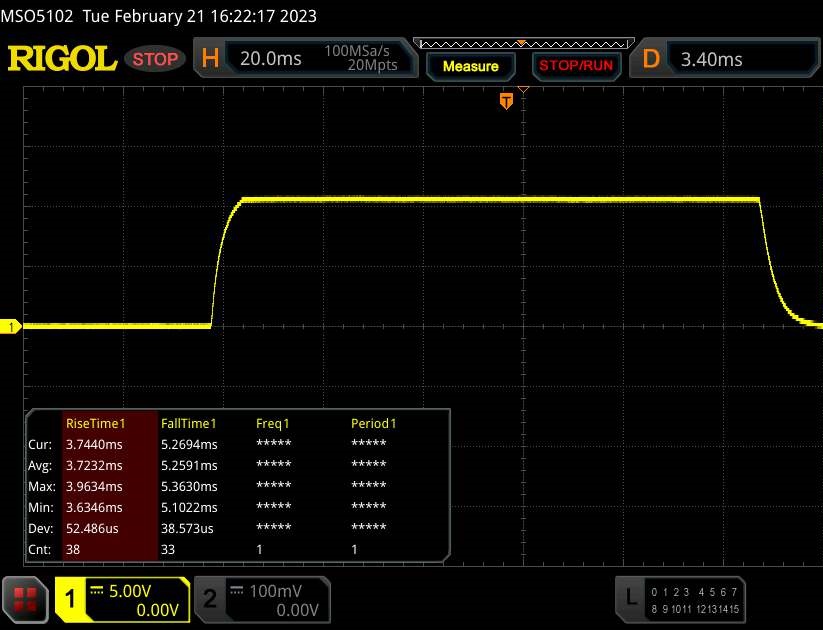 |
| ↘ 5.2 ms queda | ||
| A tela mostra taxas de resposta rápidas em nossos testes e deve ser adequada para jogos. Em comparação, todos os dispositivos testados variam de 0.1 (mínimo) a 240 (máximo) ms. » 25 % de todos os dispositivos são melhores. Isso significa que o tempo de resposta medido é melhor que a média de todos os dispositivos testados (19.8 ms). | ||
| ↔ Tempo de resposta 50% cinza a 80% cinza | ||
| 15.6 ms ... ascensão ↗ e queda ↘ combinadas | ↗ 7.3 ms ascensão | 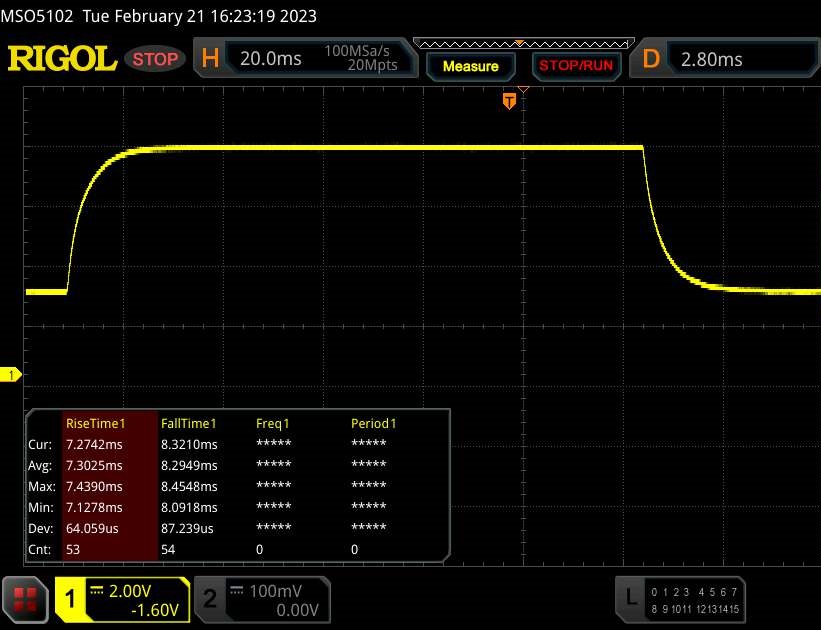 |
| ↘ 8.3 ms queda | ||
| A tela mostra boas taxas de resposta em nossos testes, mas pode ser muito lenta para jogadores competitivos. Em comparação, todos os dispositivos testados variam de 0.165 (mínimo) a 636 (máximo) ms. » 30 % de todos os dispositivos são melhores. Isso significa que o tempo de resposta medido é melhor que a média de todos os dispositivos testados (31 ms). | ||
Cintilação da tela / PWM (modulação por largura de pulso)
| Tela tremeluzindo / PWM não detectado | 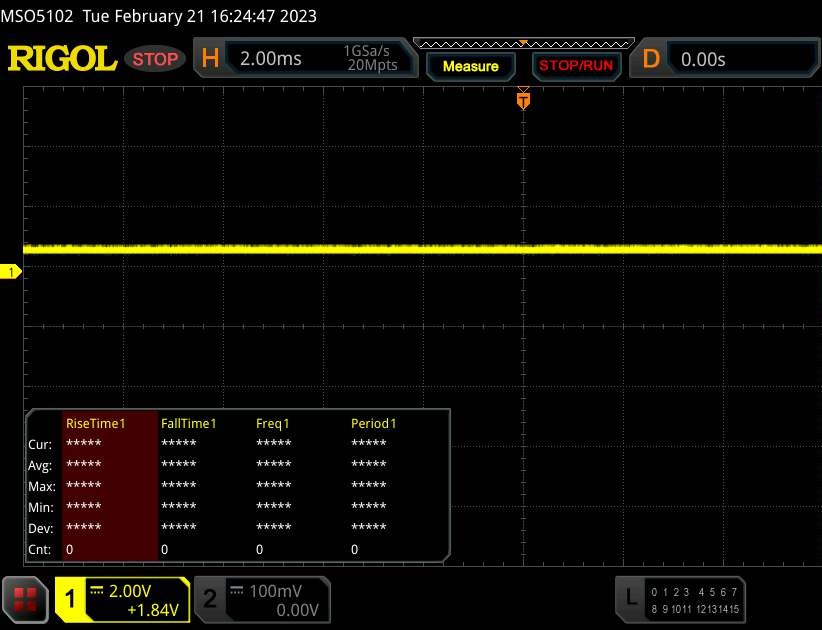 | ||
[pwm_comparison] Em comparação: 52 % de todos os dispositivos testados não usam PWM para escurecer a tela. Se PWM foi detectado, uma média de 7754 (mínimo: 5 - máximo: 343500) Hz foi medida. | |||
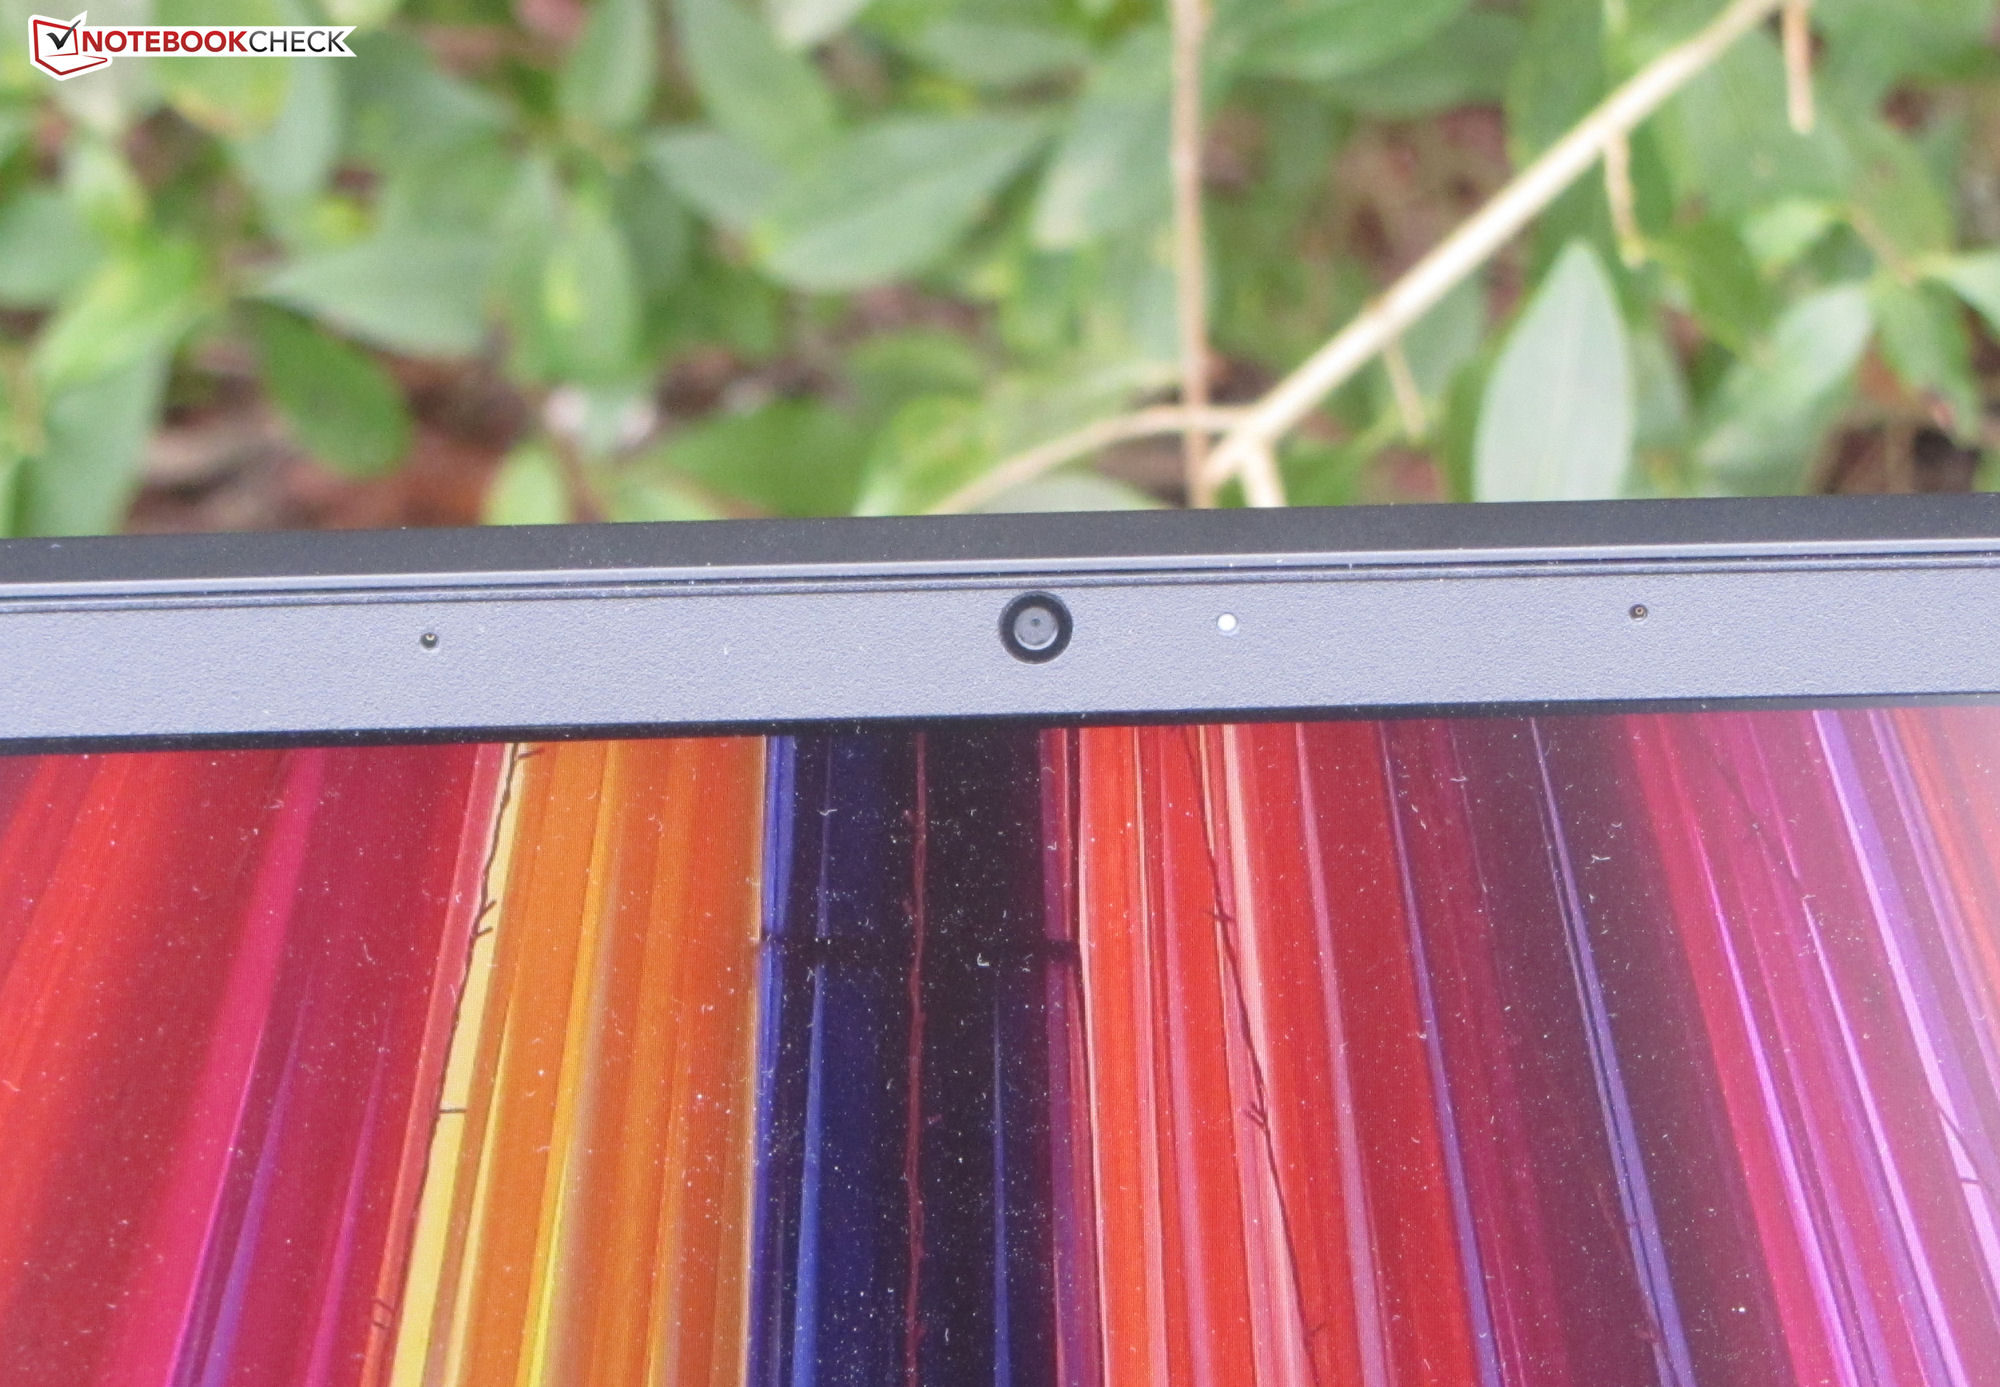
Os ângulos de visão do painel IPS são estáveis, de modo que pode ser lido de qualquer ângulo de visão. O display pode ser lido ao ar livre, desde que não haja luz solar direta.

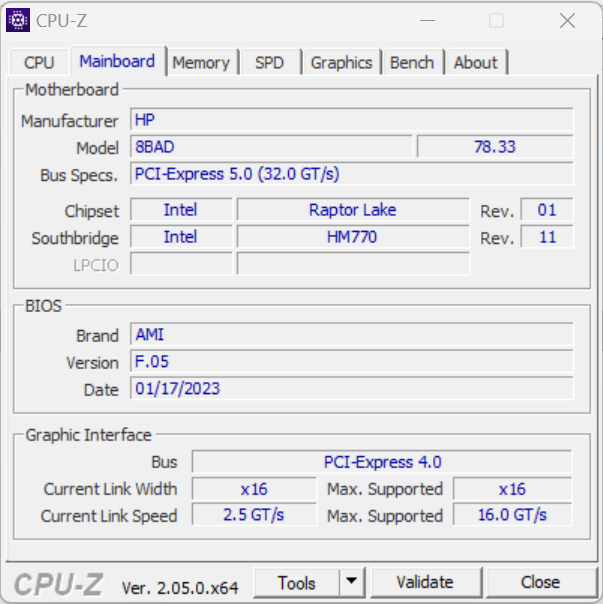
Desempenho - O laptop HP oferece hardware poderoso
Com o Omen 17, a Hewlett Packard oferece um laptop de 17,3 polegadas que é direcionado para jogos QHD, mas também atinge uma boa figura em outras áreas de aplicação que exigem um alto desempenho. O desempenho computacional necessário é fornecido pelos chips Raptor Lake e Ada Lovelace. Nossa unidade de teste do Omen está disponível por cerca de 3.300 euros (~$3.582).
Condições de teste
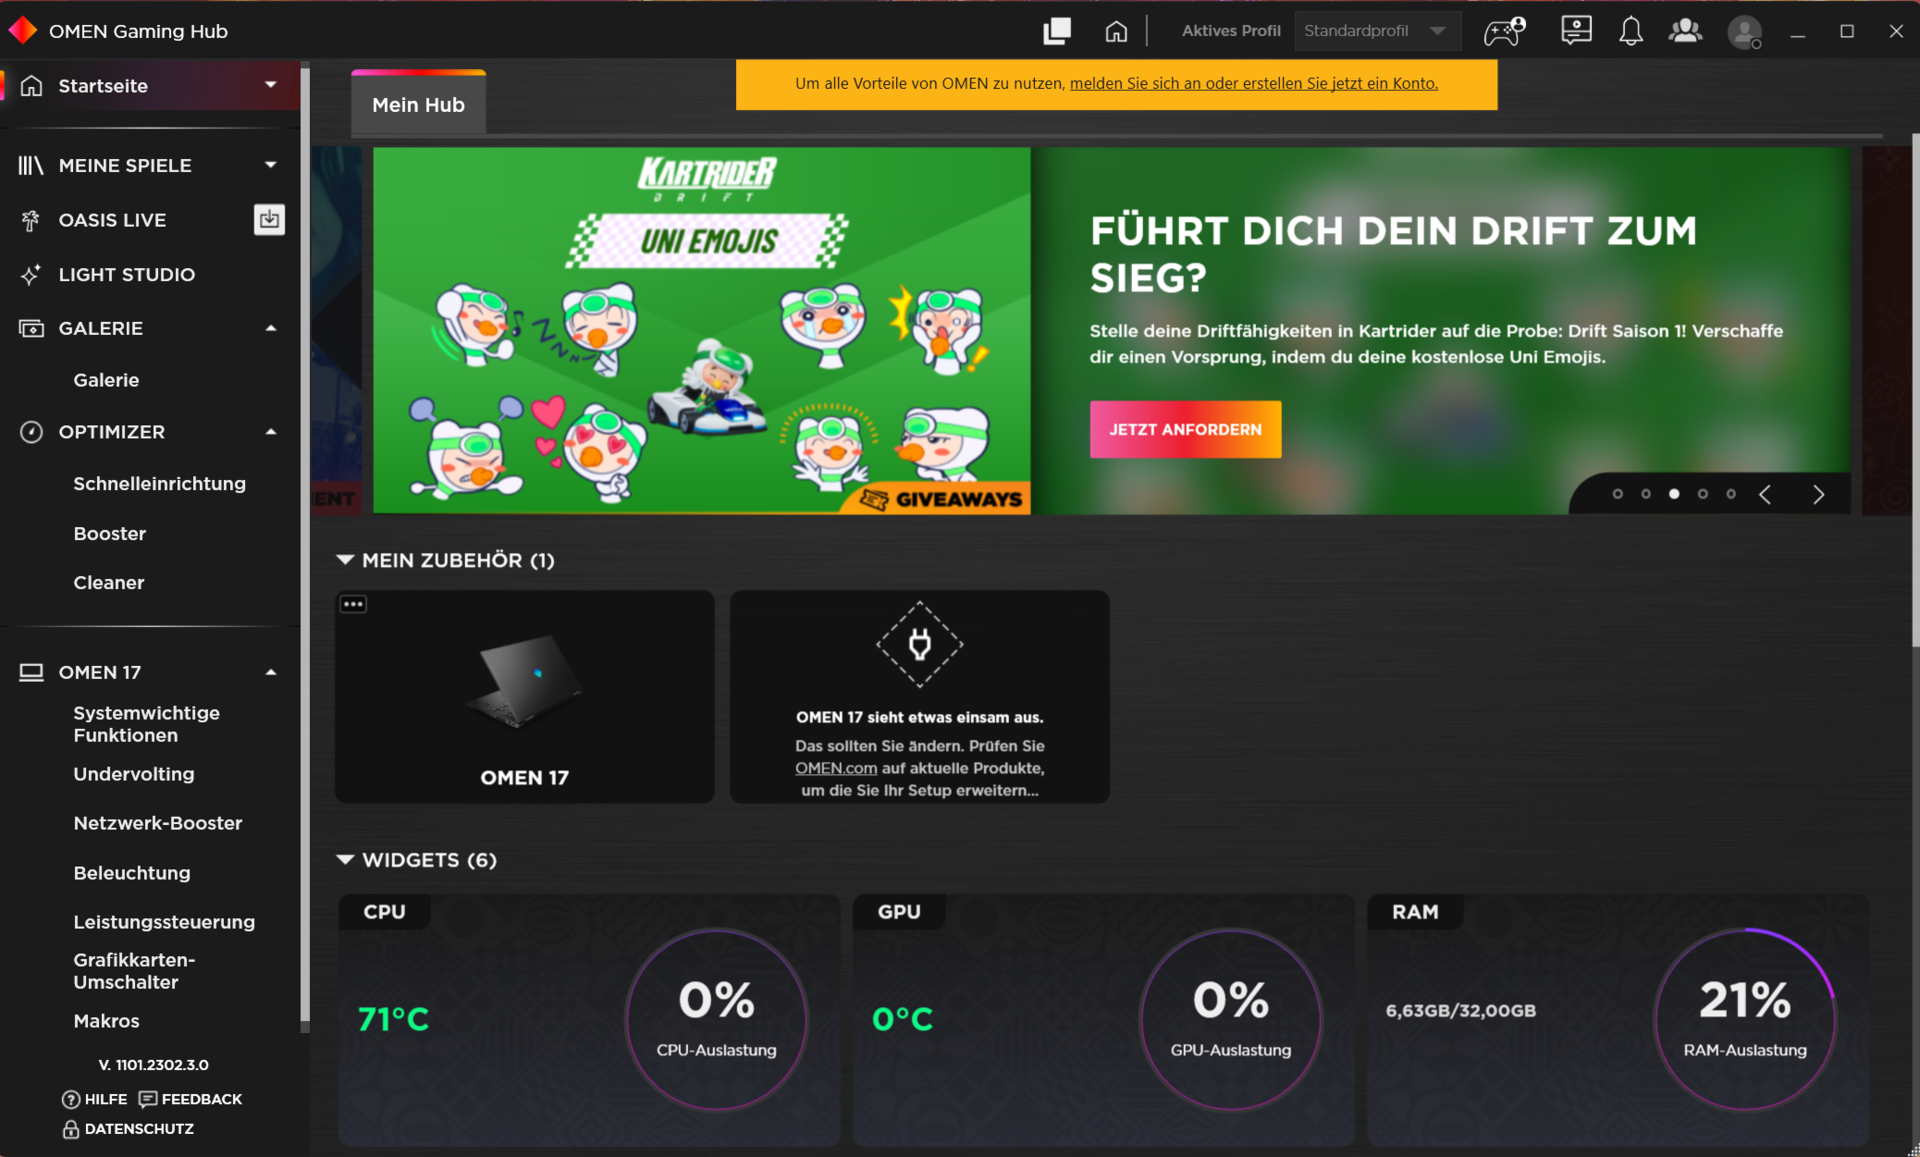
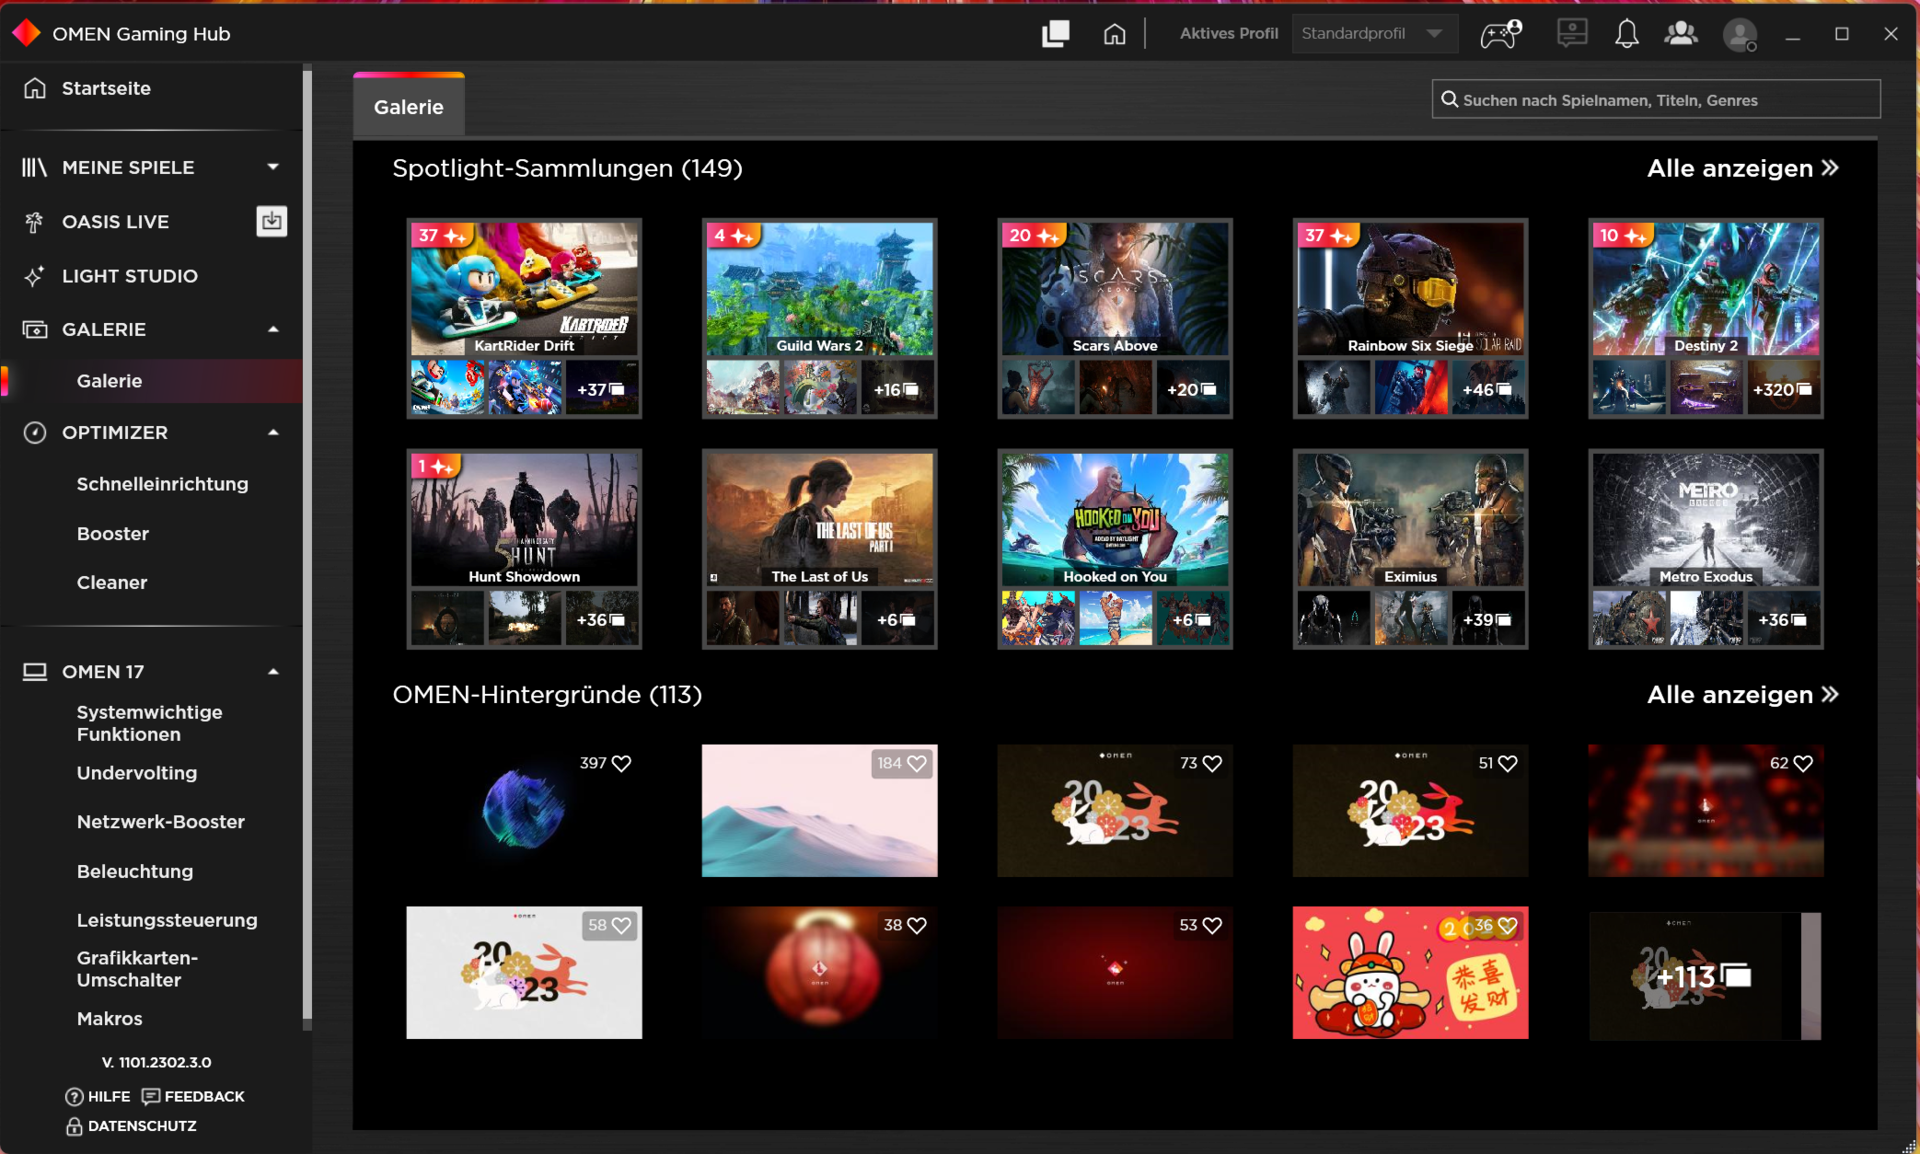
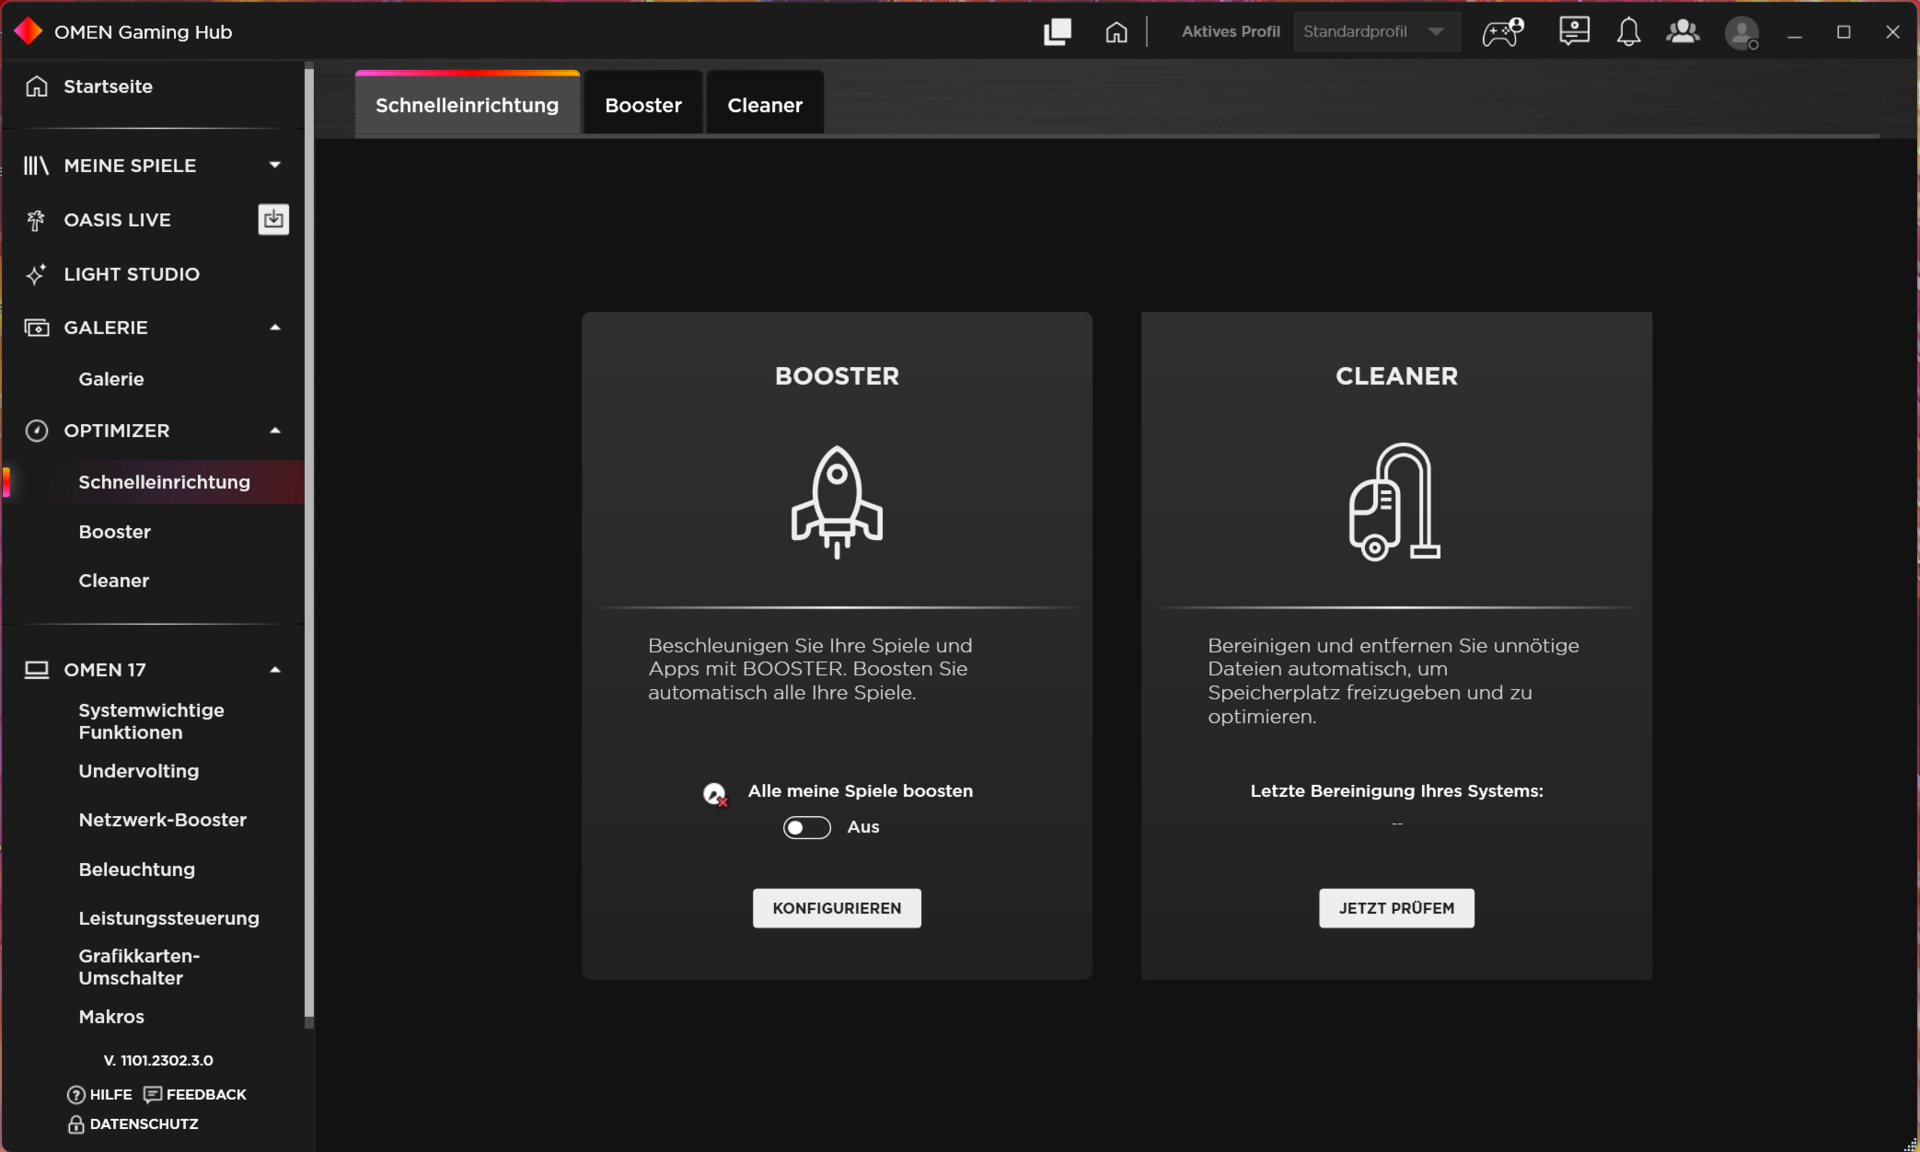
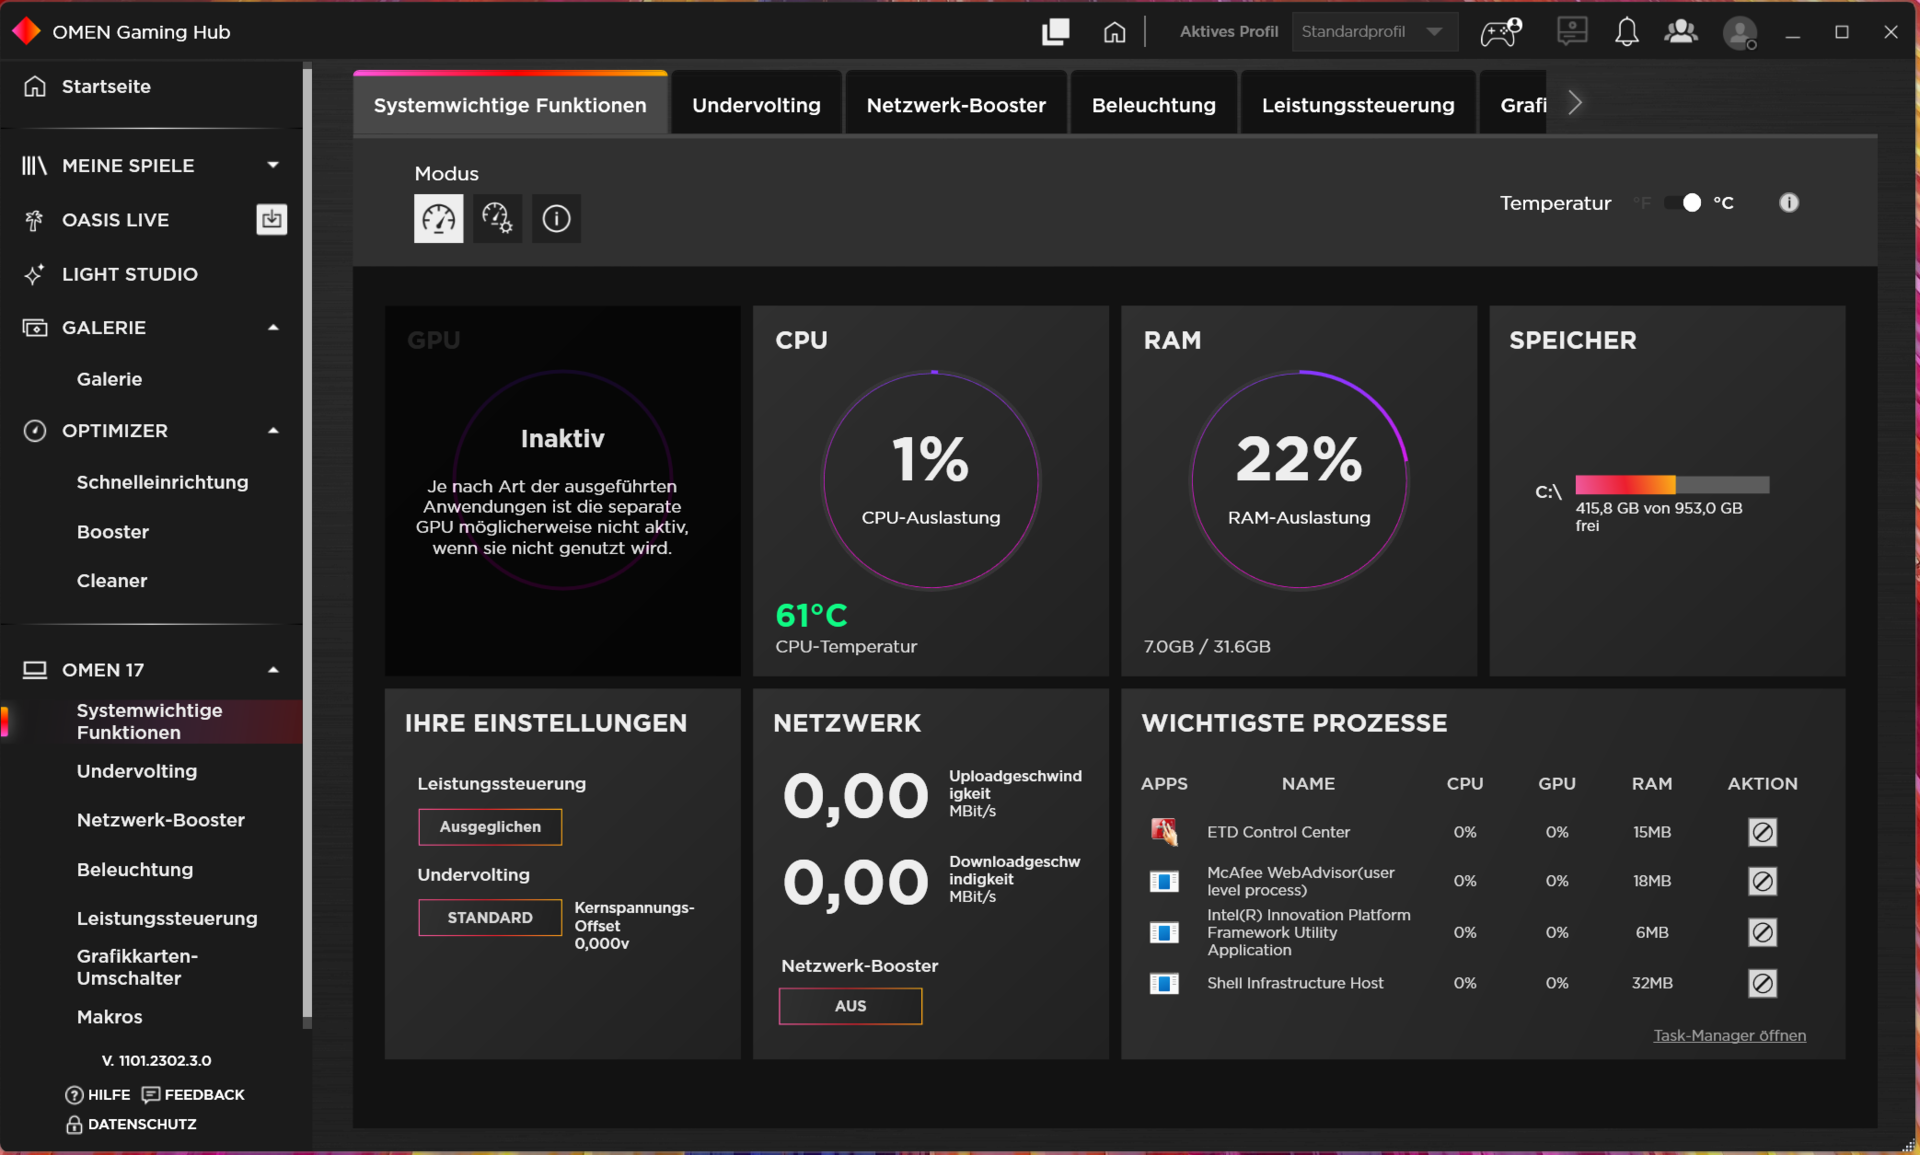
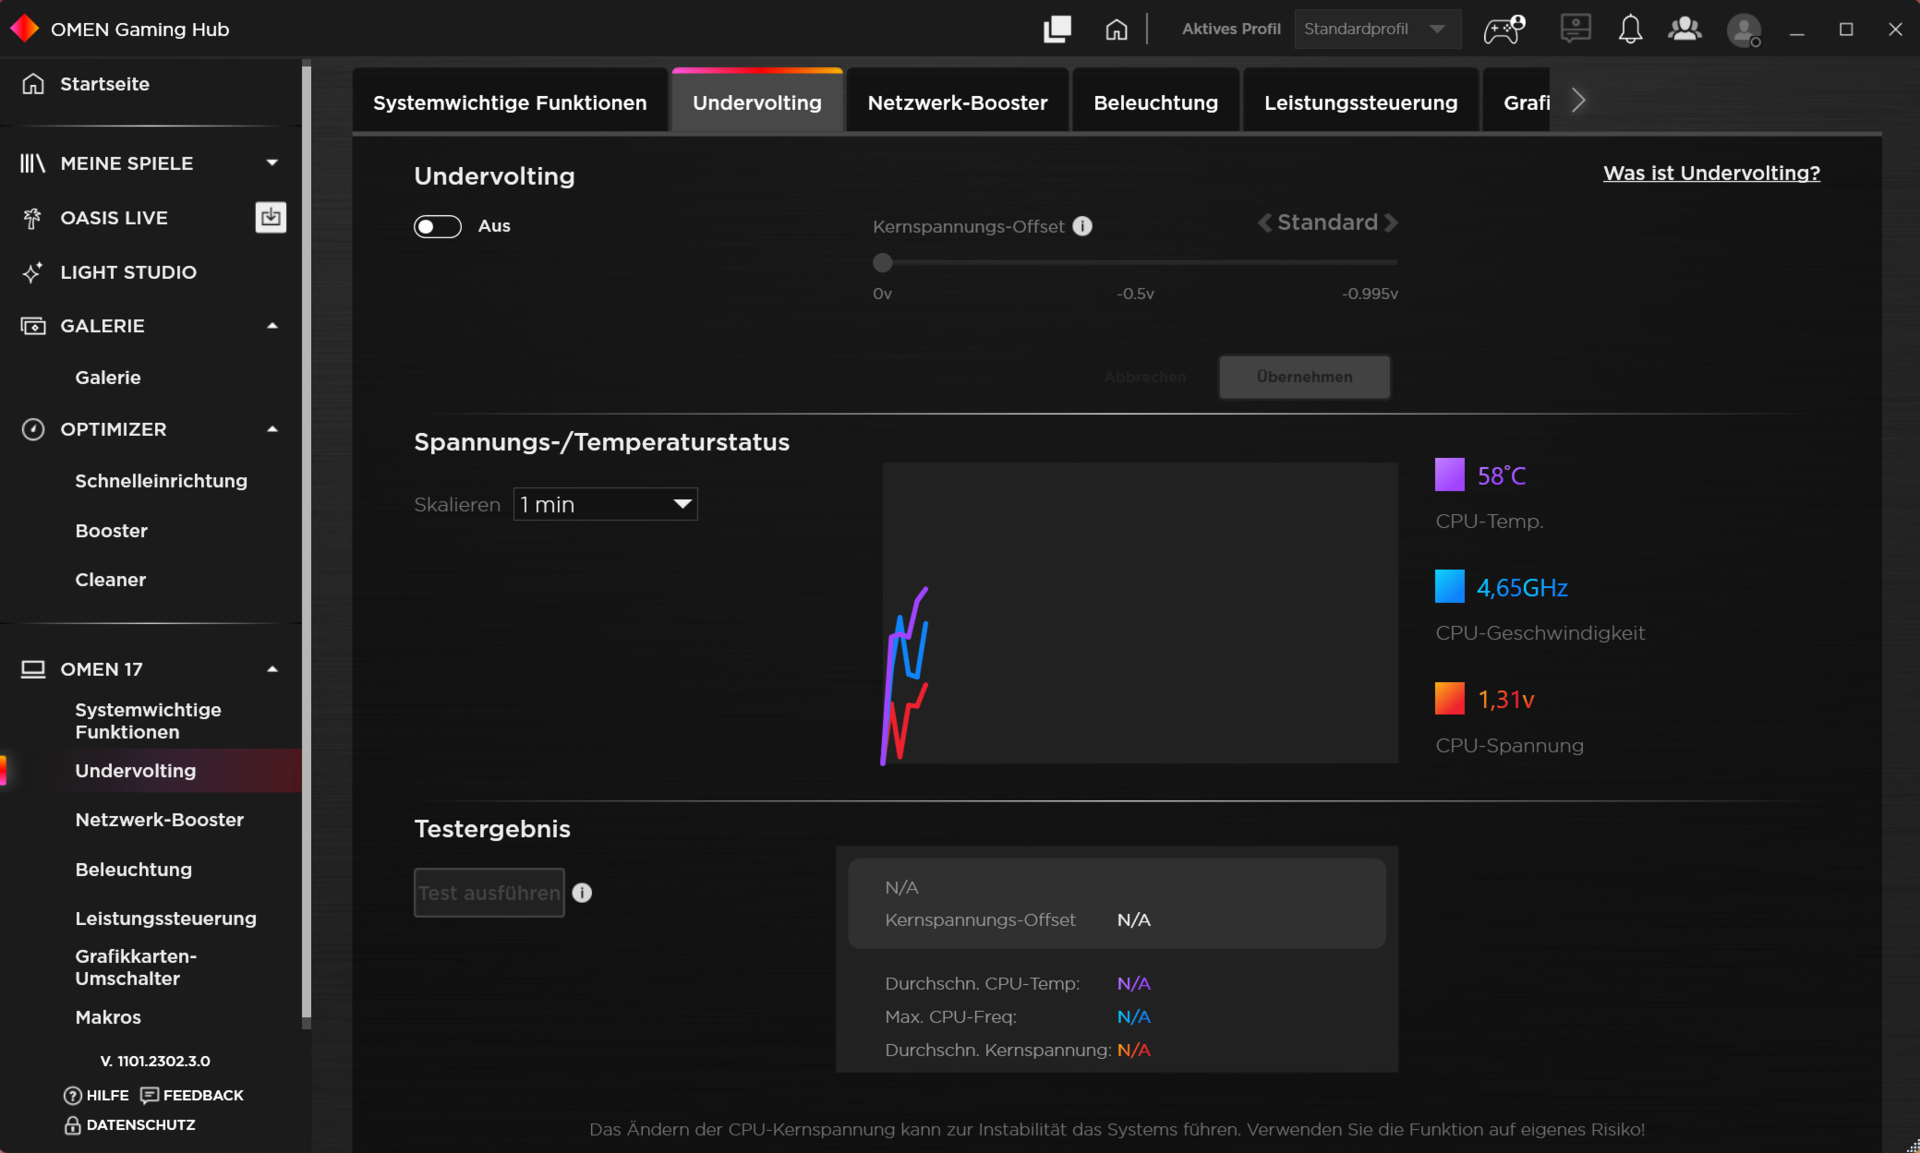
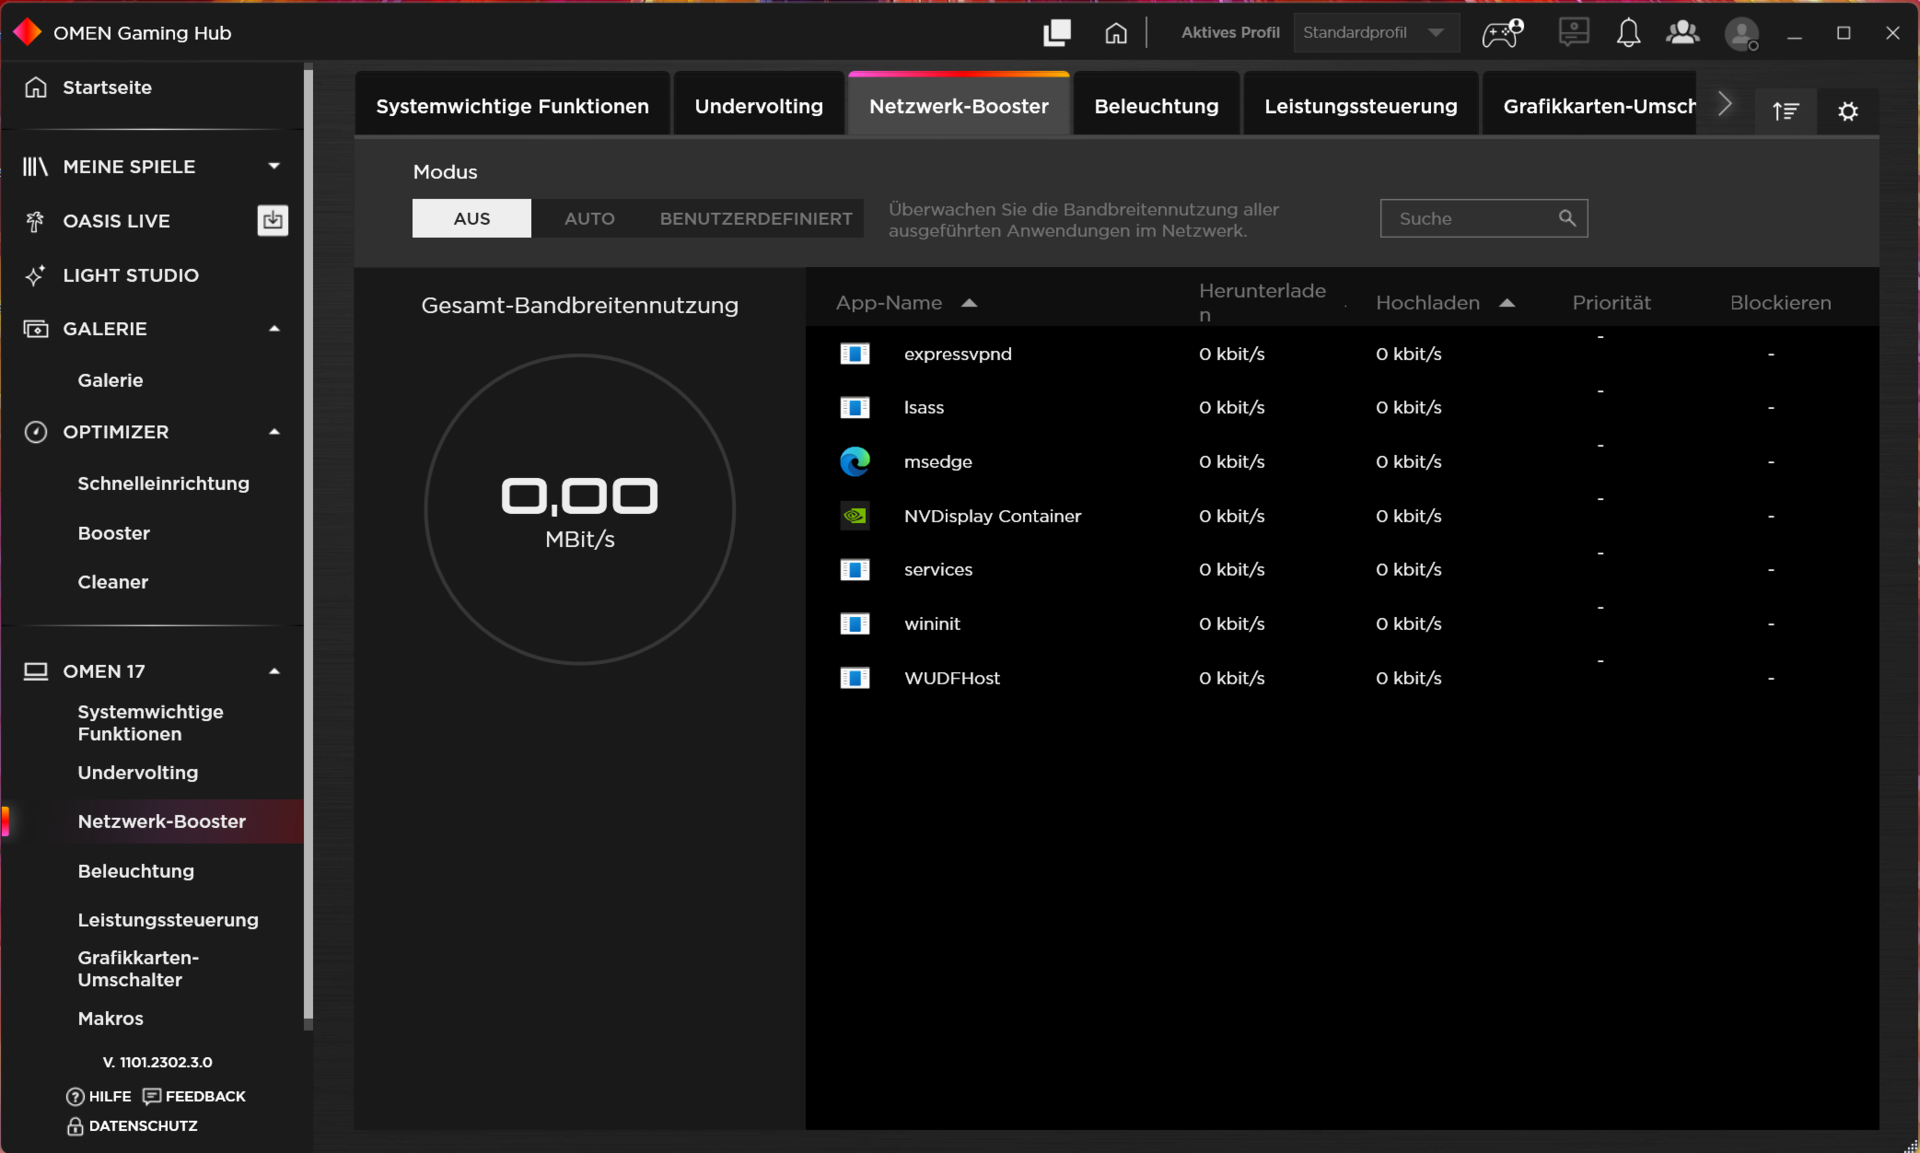
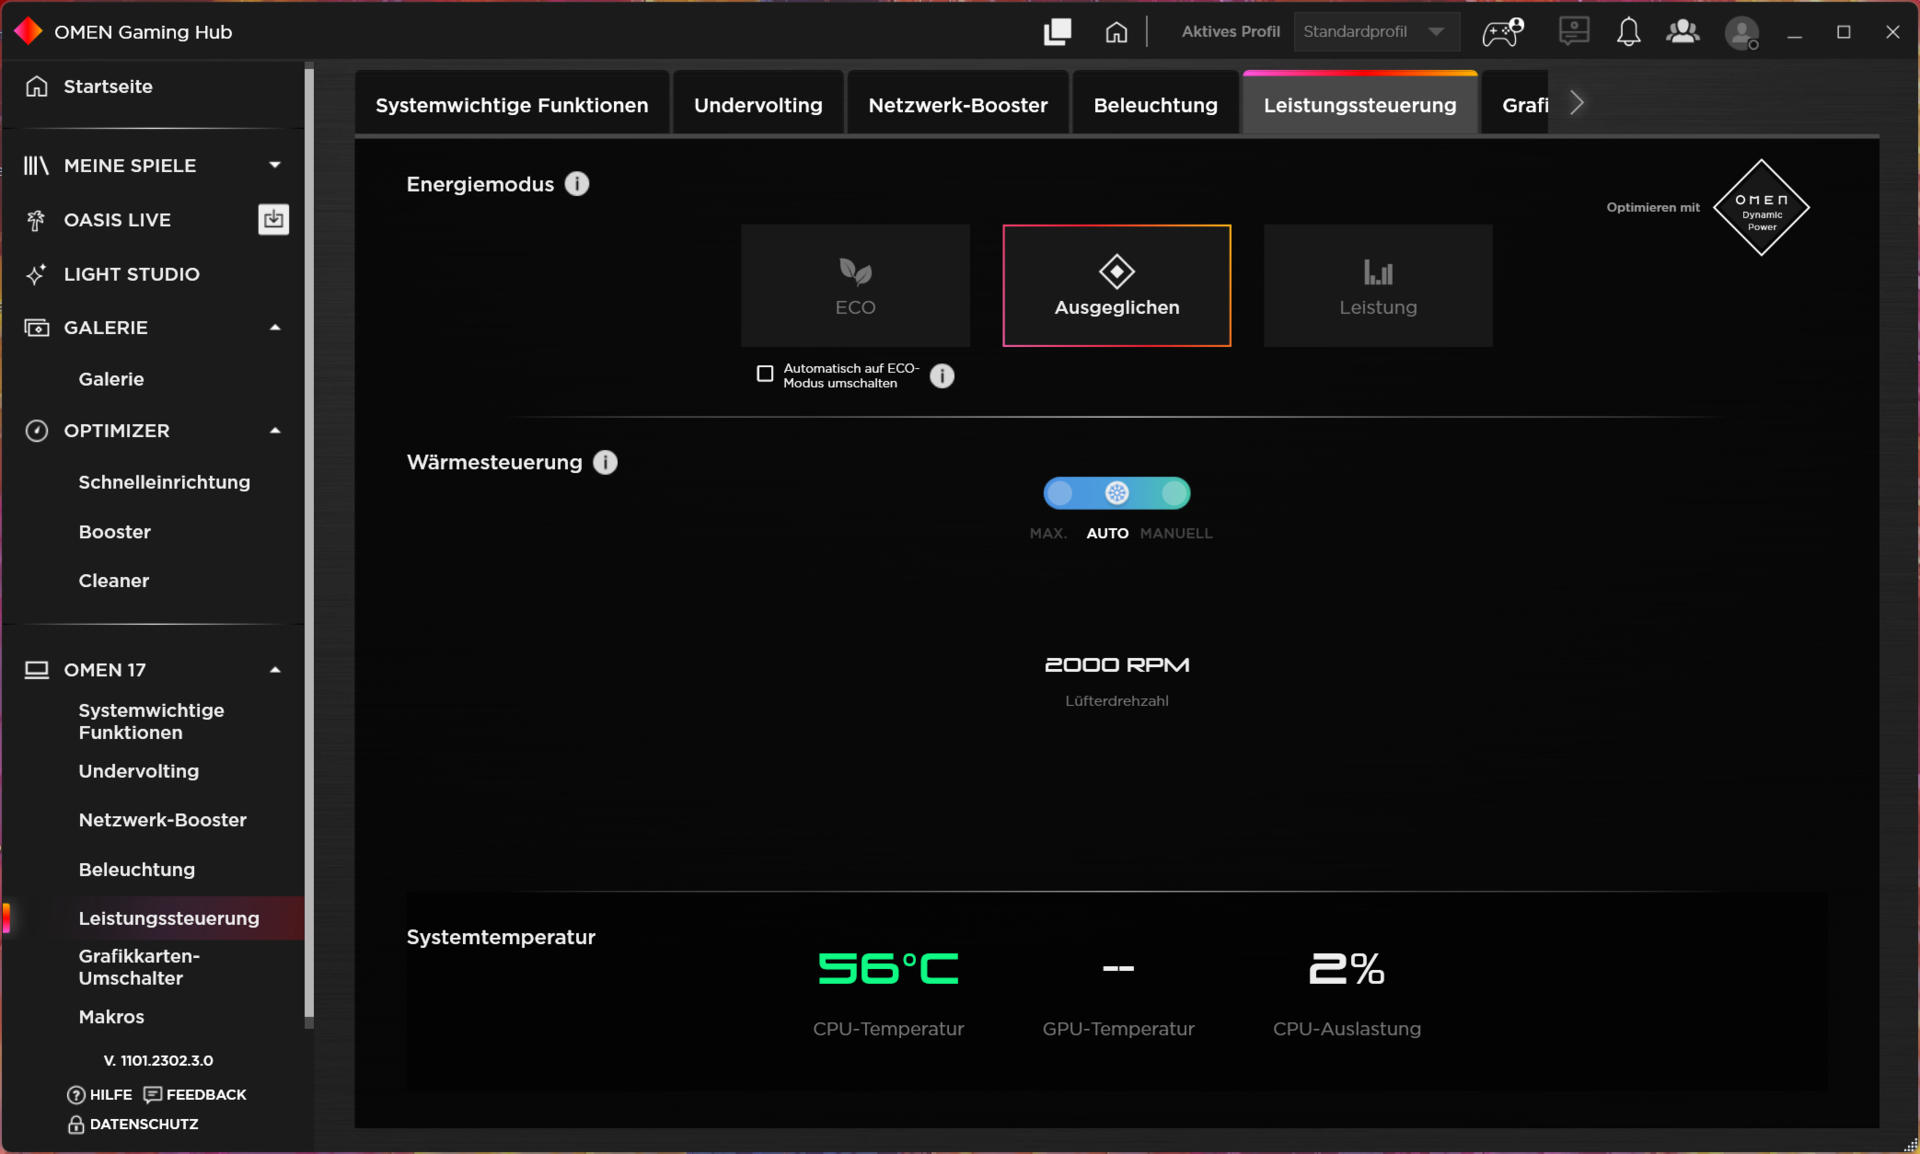
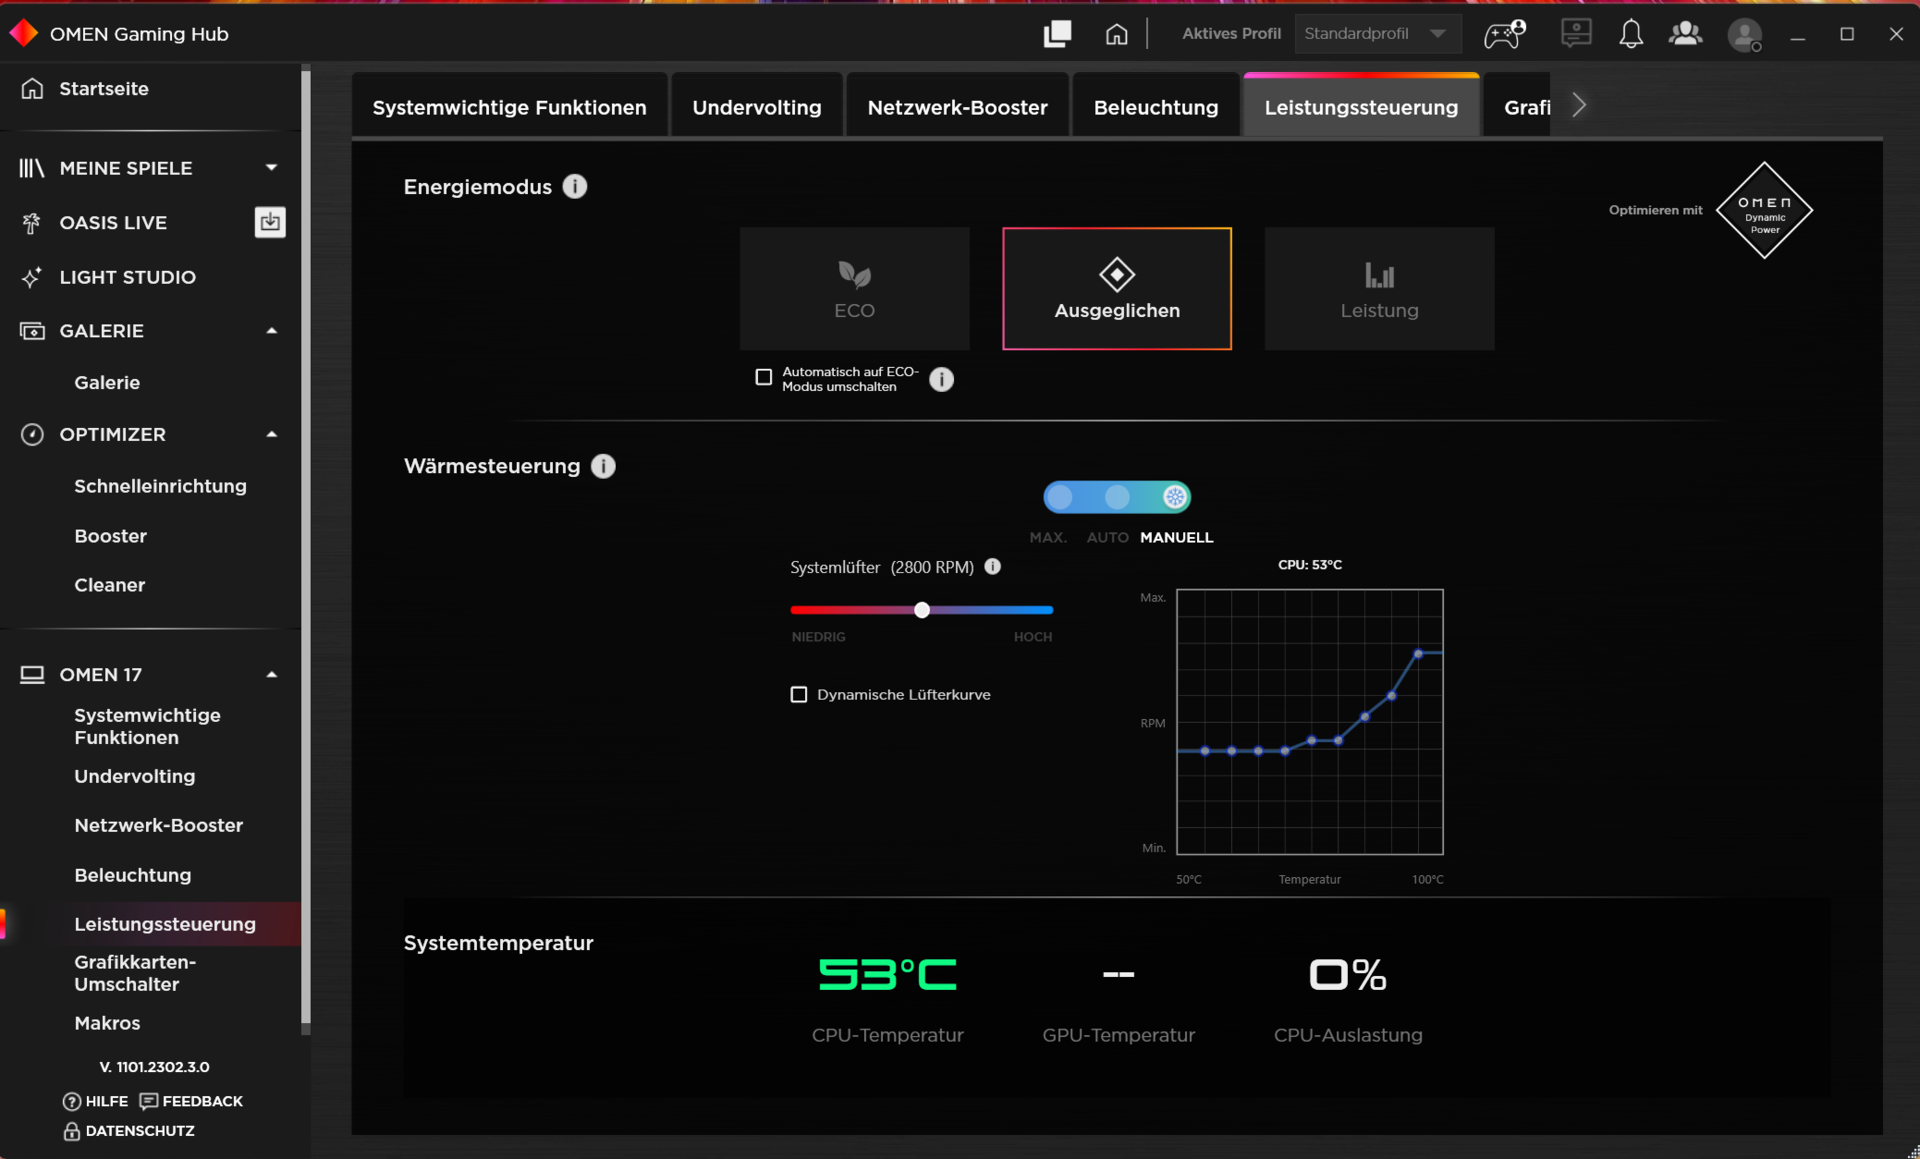
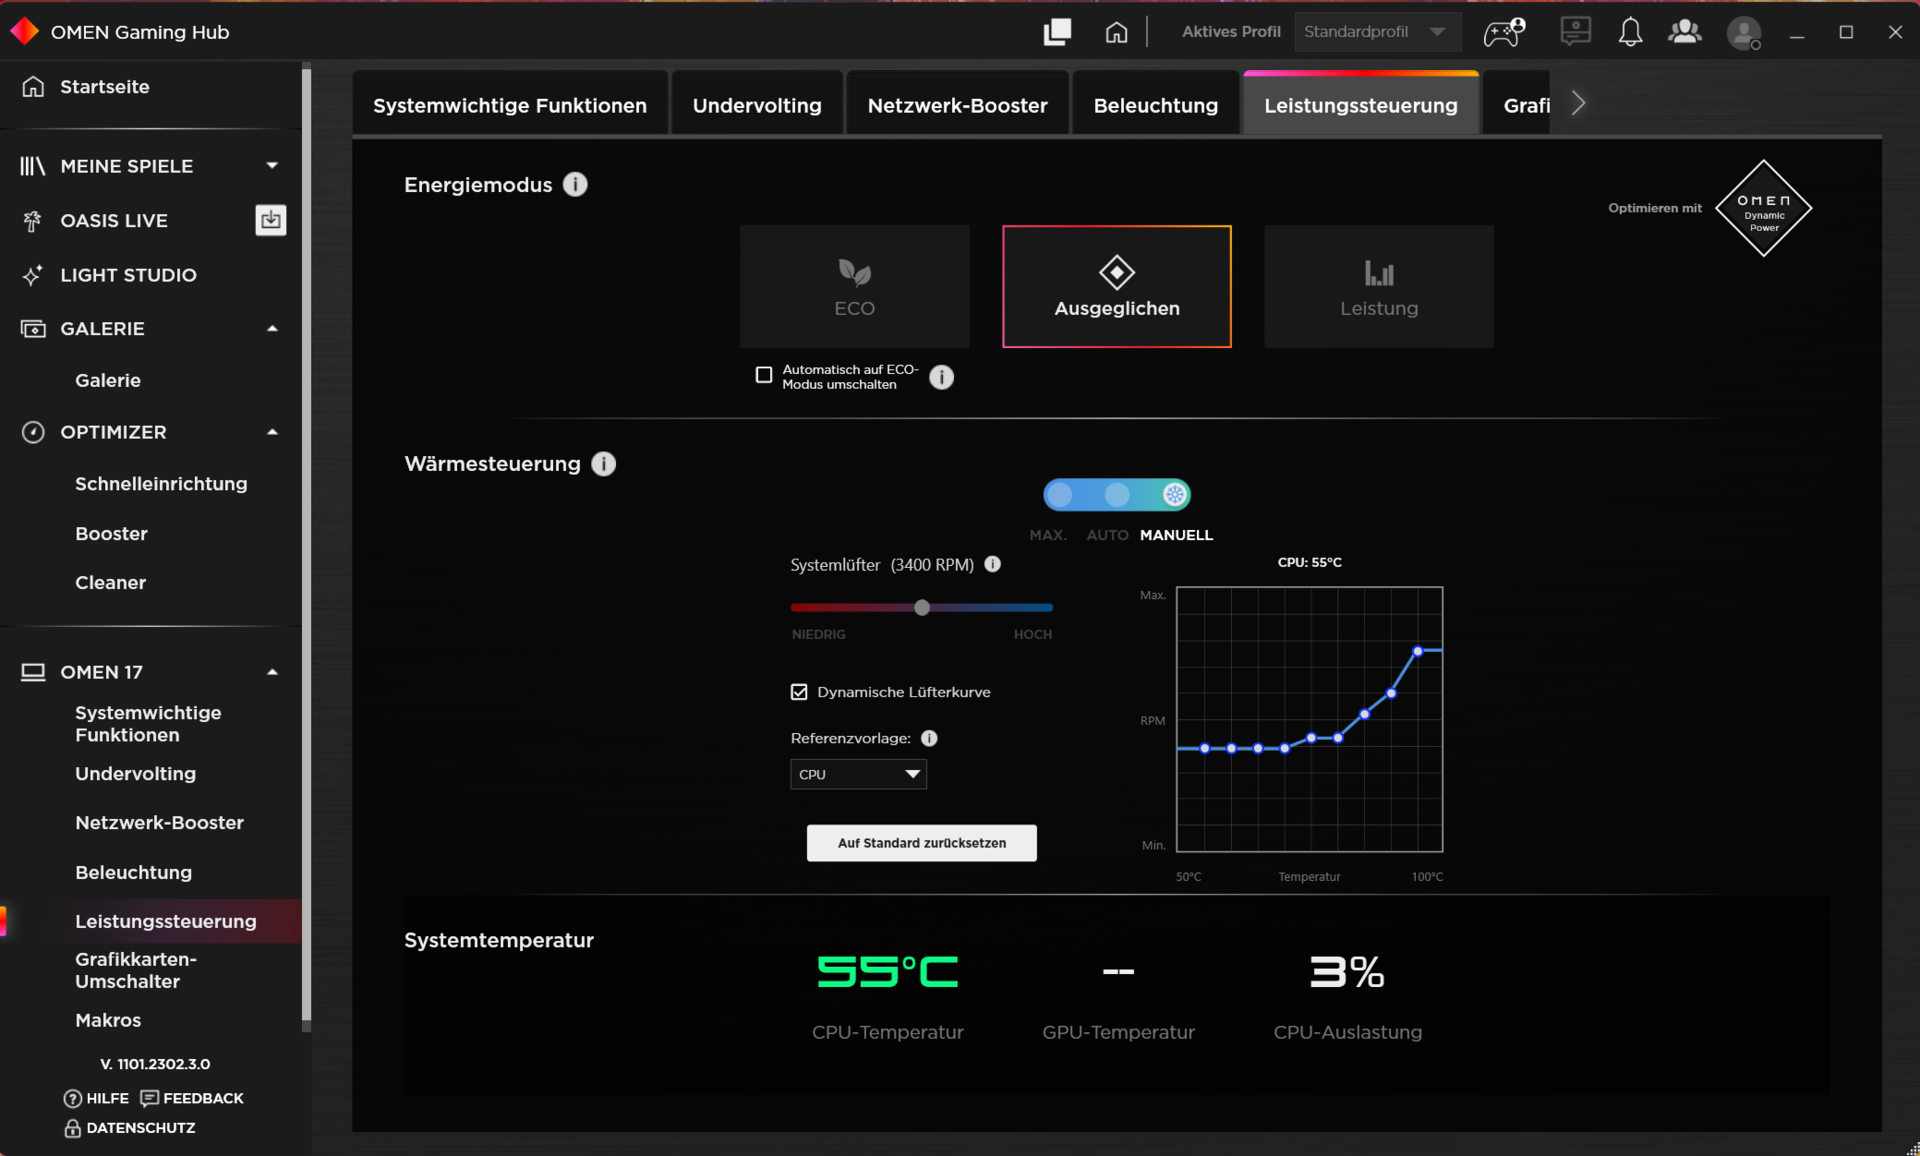
O software pré-instalado Omen Gaming Hub representa o centro de controle do laptop. Além de selecionar um modo de alimentação (ver tabela), ele também permite subvoltar a CPU e configurar uma curva individual do ventilador. Como o modo "Performance" criou alguns problemas em nossa unidade de teste (gagueira estranha e queda de performance), usamos principalmente o modo de potência "Balanceada" junto com o controle automático do ventilador. O Optimus foi ativado.
| Desempenho | Equilibrado | Eco | |
|---|---|---|---|
| Limite de potência 1 | 100 Watt | 55 Watt | 55 Watt |
| Limite de potência 2 | 130 Watt | 130 Watt | 130 Watt |
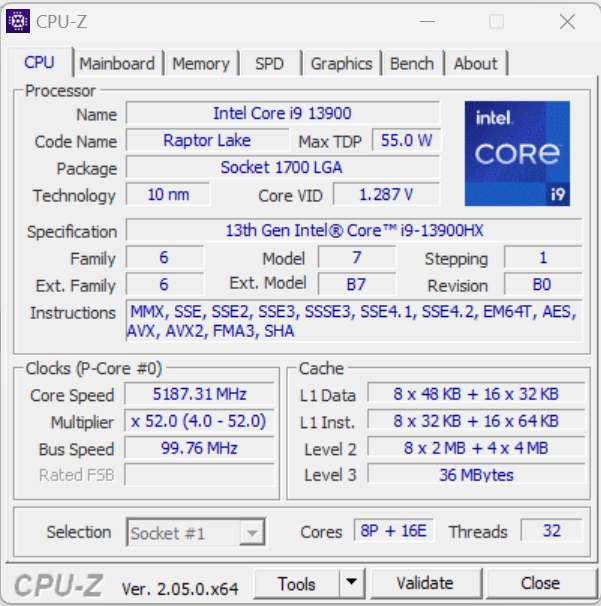
Processador
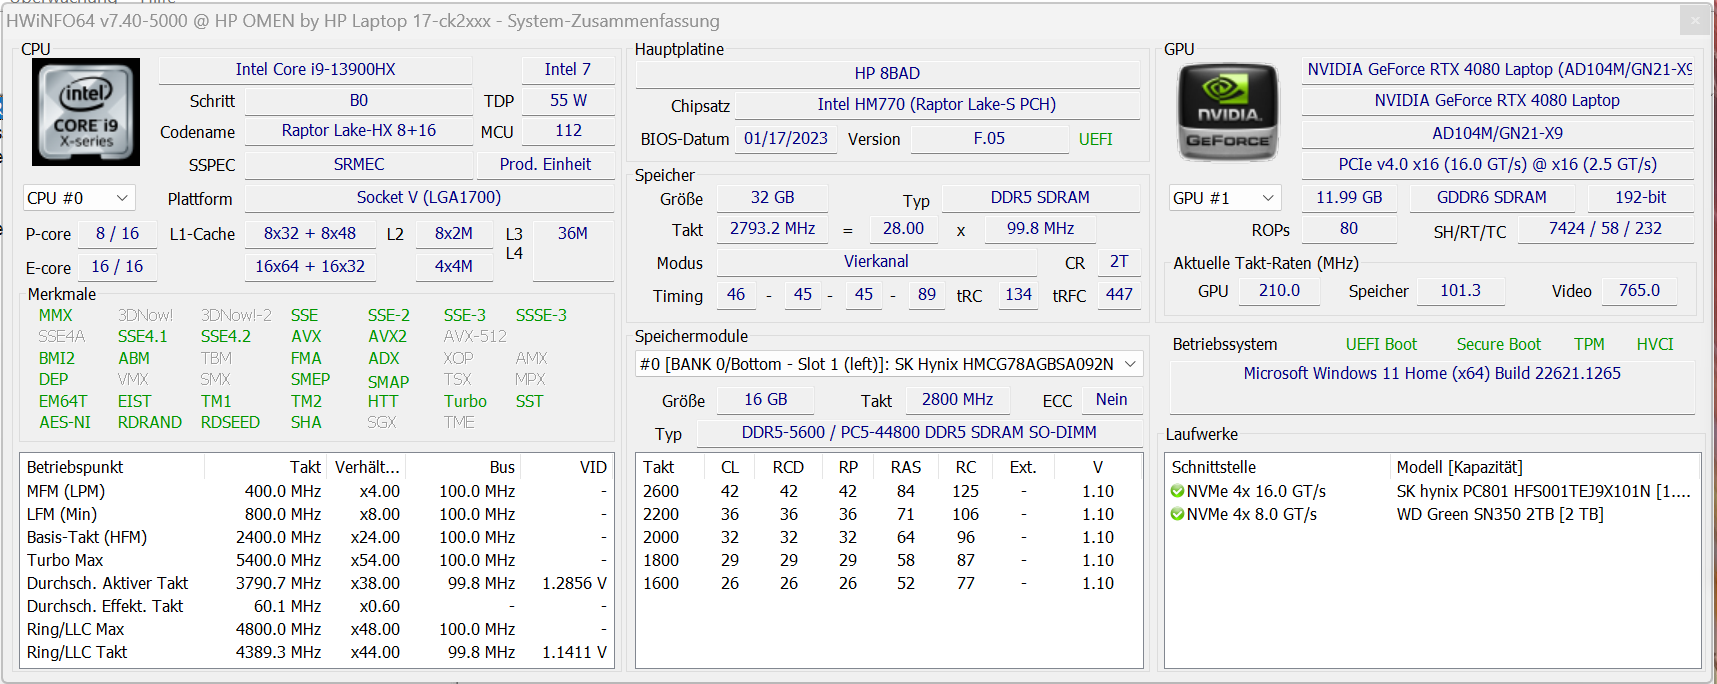
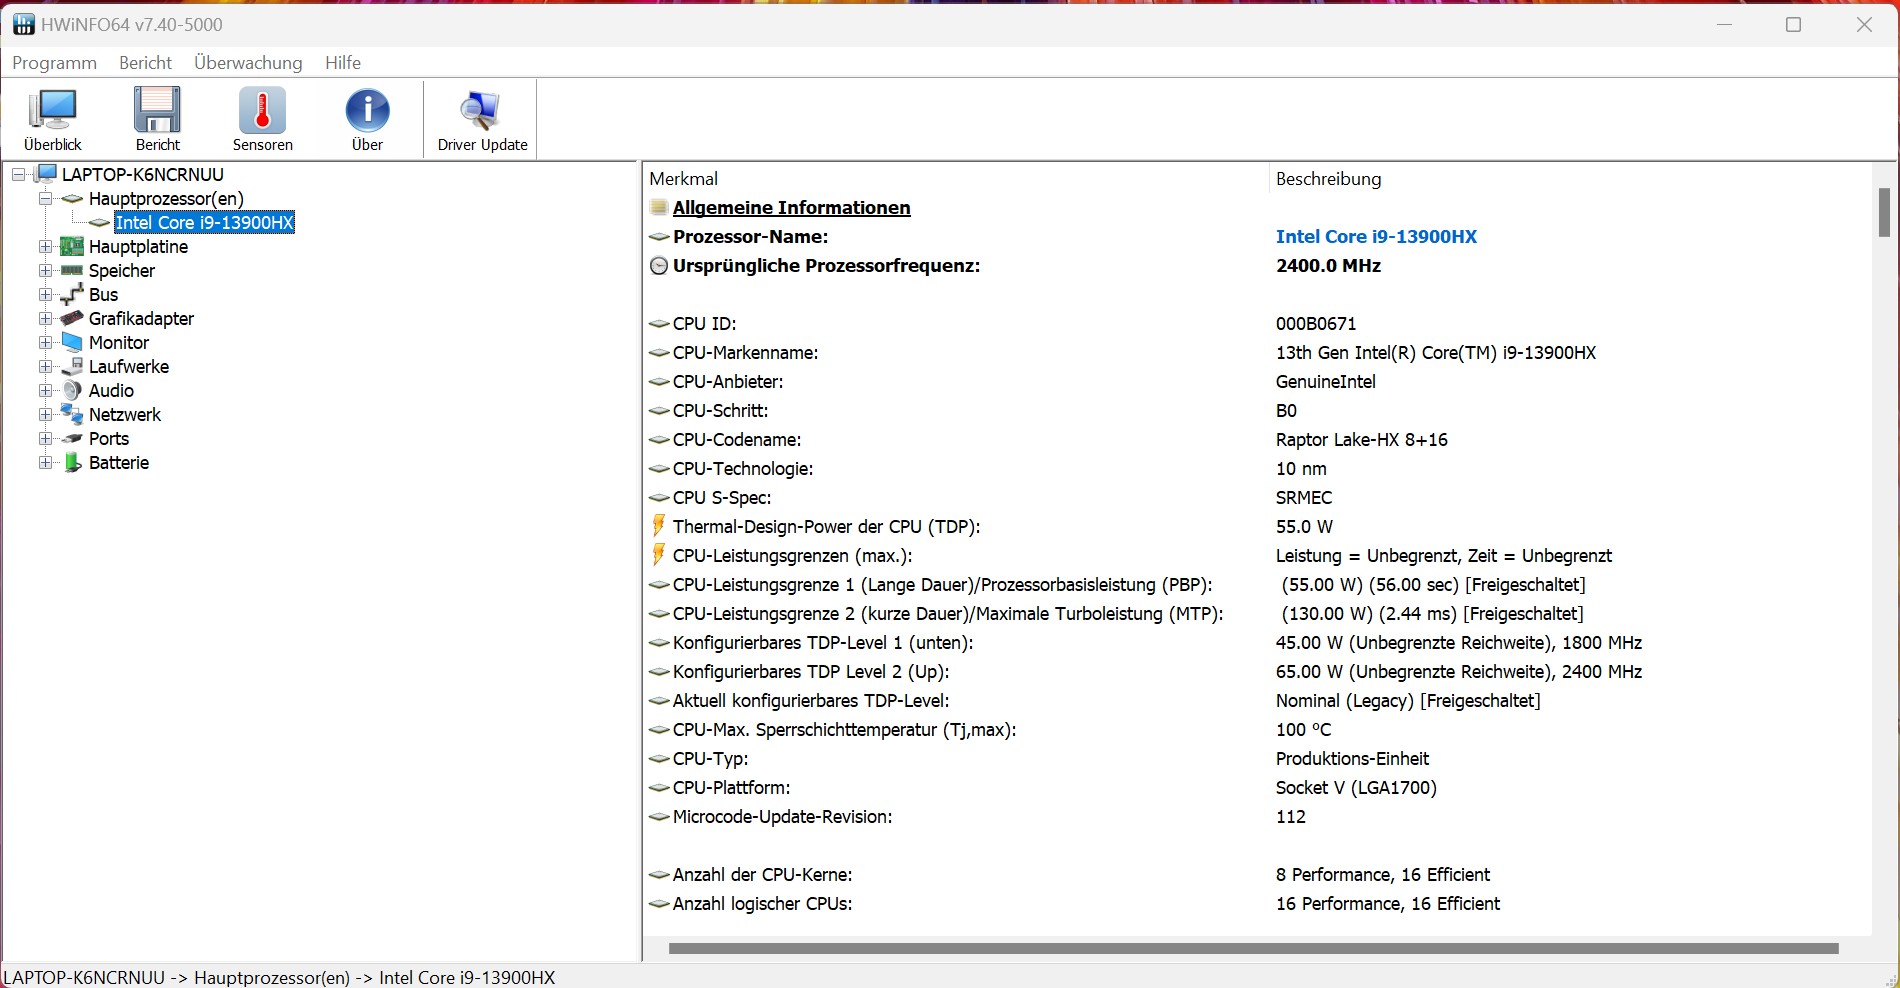
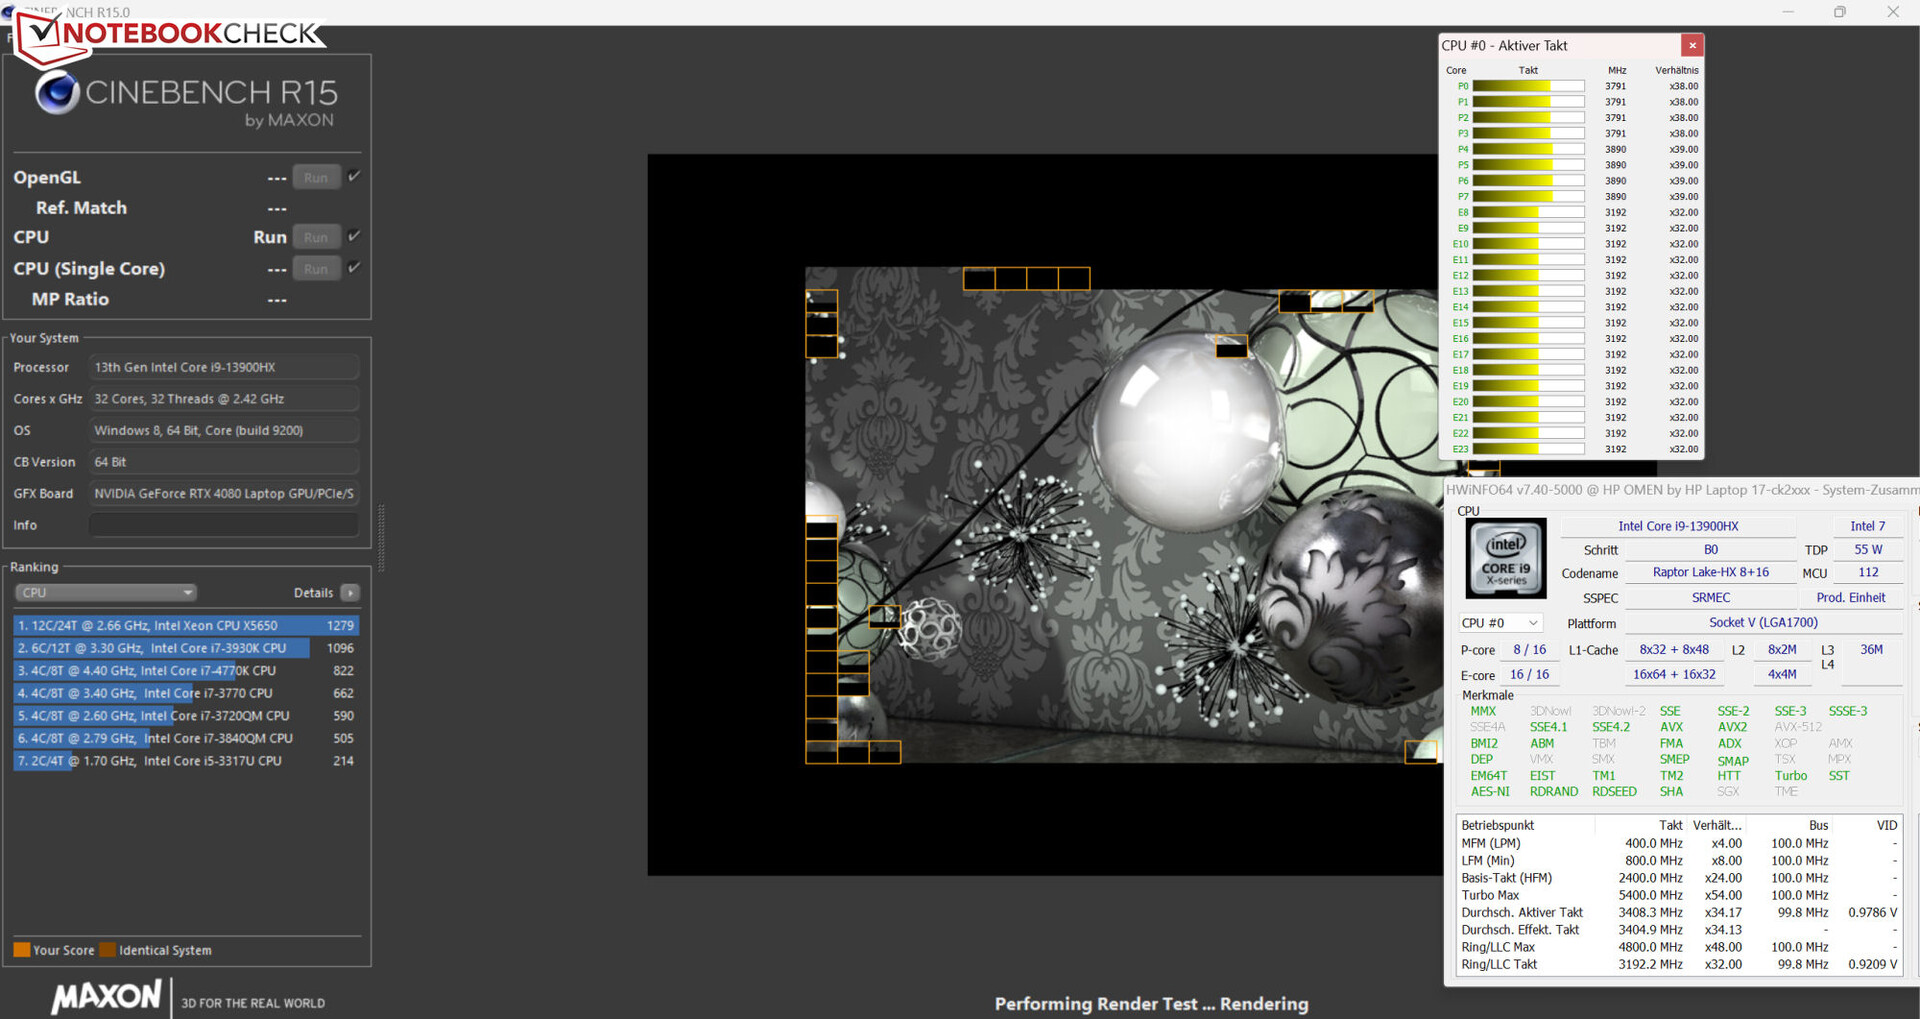
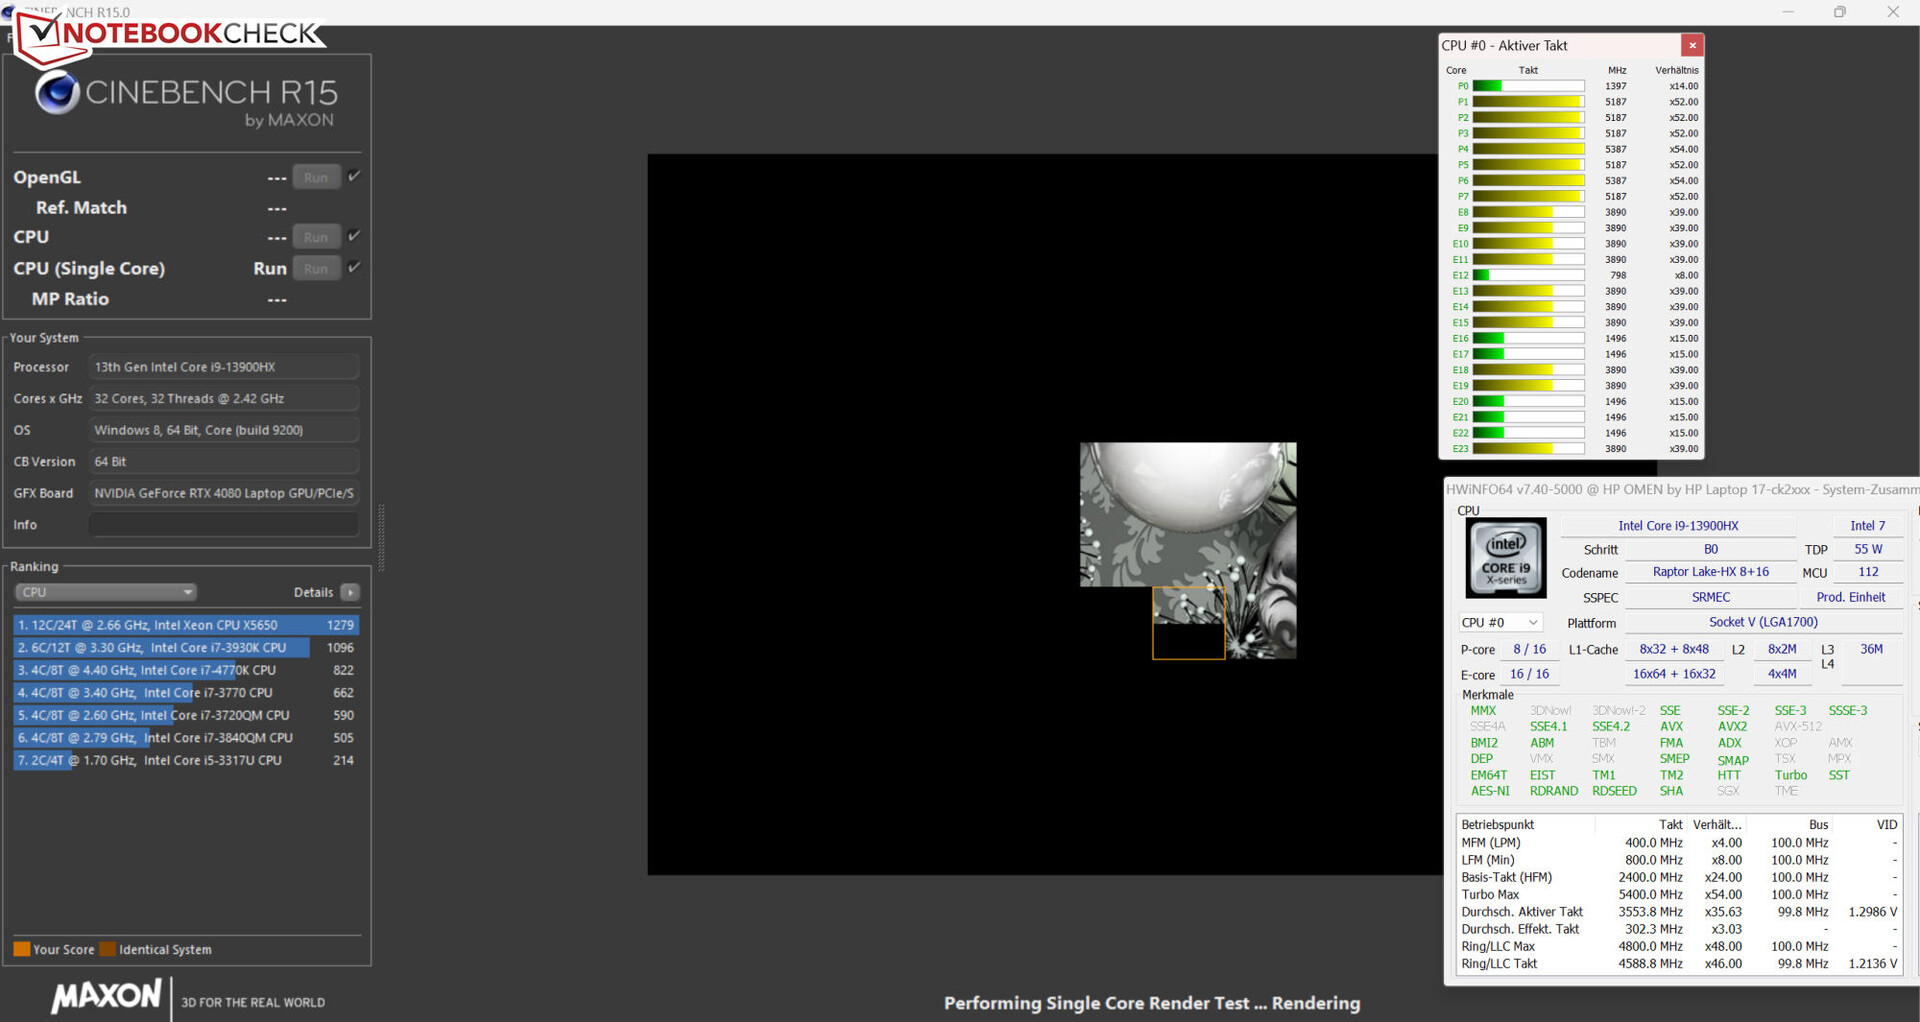
ONúcleo i9-13900HX(Raptor Lake) consiste em dezesseis núcleos de eficiência (sem hiperthreading, 1,6 a 3,9 GHz) e oito núcleos de desempenho (hiperthreading, 2,2 a 5,4 GHz), resultando em um total de 32 núcleos de CPU lógica.
Na operação de rede, o processador passa pelos testes de CPU do benchmark Cinebench R15 com velocidades de relógio de média-alta a alta (multi-tarefa) e alta a máxima (rosca única). Enquanto o desempenho de rosca única (254 pontos) cai ligeiramente na operação com bateria, a queda no desempenho de rosca múltipla é significativa (1.303 pontos).
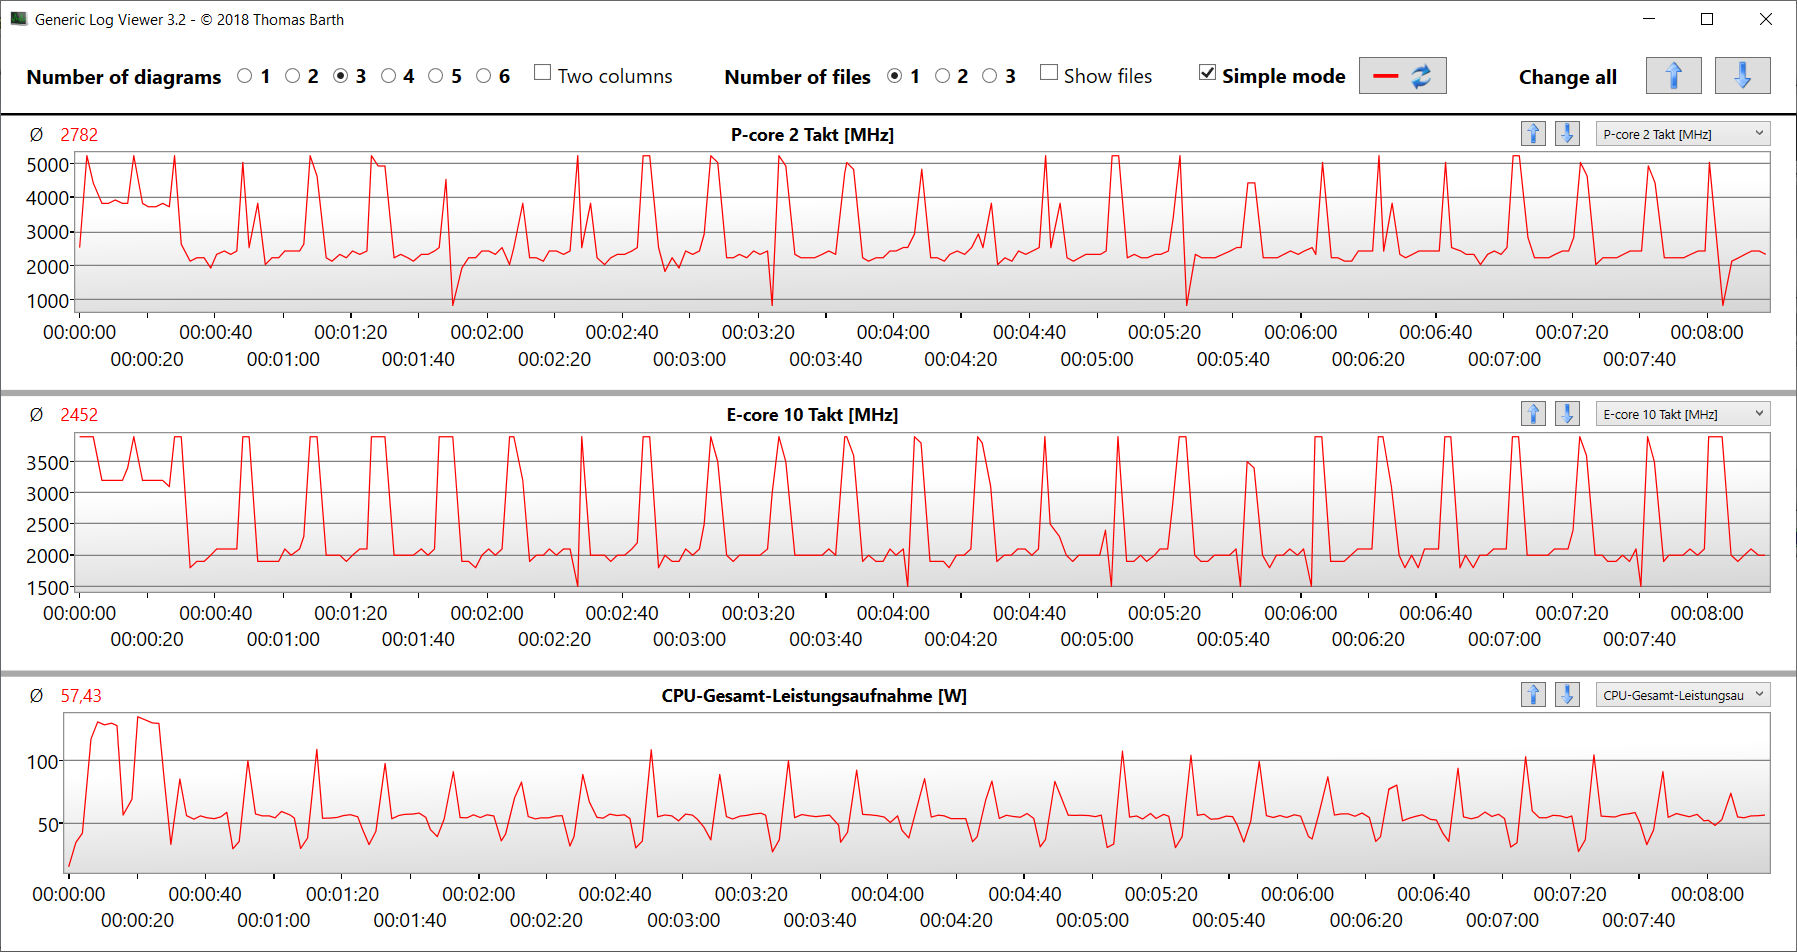
Os resultados de referência variam no nível (linha única) da média para a CPU ou abaixo (multi-linha). Em geral, o modo "Desempenho" resulta apenas em uma ligeira vantagem de desempenho, sendo que os benchmarks da AIDA são os que mais lucram. Por outro lado, também fará com que a velocidade da CPU permaneça em um nível elevado sob carga multi-tarefa constante, como mostra o teste de loop CB15.
Cinebench R15 Multi Constant Load Test
| CPU Performance rating - Percent | |
| Lenovo Legion Pro 7 16IRX8H | |
| Asus ROG Strix G16 G614JZ | |
| HP Omen 17-ck2097ng | |
| Média Intel Core i9-13900HX | |
| HP Omen 17-ck2097ng | |
| Razer Blade 16 Early 2023 | |
| Média da turma Gaming | |
| Alienware m17 R5 (R9 6900HX, RX 6850M XT) | |
| Cinebench R20 | |
| CPU (Multi Core) | |
| Asus ROG Strix G16 G614JZ | |
| Lenovo Legion Pro 7 16IRX8H | |
| Média Intel Core i9-13900HX (9152 - 12541, n=21) | |
| HP Omen 17-ck2097ng (Leistung) | |
| Média da turma Gaming (4029 - 16433, n=106, últimos 2 anos) | |
| HP Omen 17-ck2097ng | |
| Razer Blade 16 Early 2023 | |
| Alienware m17 R5 (R9 6900HX, RX 6850M XT) | |
| CPU (Single Core) | |
| Asus ROG Strix G16 G614JZ | |
| HP Omen 17-ck2097ng | |
| HP Omen 17-ck2097ng (Leistung) | |
| Lenovo Legion Pro 7 16IRX8H | |
| Média Intel Core i9-13900HX (722 - 810, n=21) | |
| Média da turma Gaming (442 - 913, n=106, últimos 2 anos) | |
| Razer Blade 16 Early 2023 | |
| Alienware m17 R5 (R9 6900HX, RX 6850M XT) | |
| Cinebench R15 | |
| CPU Multi 64Bit | |
| Lenovo Legion Pro 7 16IRX8H | |
| Asus ROG Strix G16 G614JZ (turbo) | |
| Asus ROG Strix G16 G614JZ | |
| Razer Blade 16 Early 2023 | |
| Média Intel Core i9-13900HX (3913 - 4970, n=22) | |
| HP Omen 17-ck2097ng (Leistung) | |
| HP Omen 17-ck2097ng | |
| Média da turma Gaming (1578 - 6330, n=105, últimos 2 anos) | |
| Alienware m17 R5 (R9 6900HX, RX 6850M XT) | |
| CPU Single 64Bit | |
| Asus ROG Strix G16 G614JZ | |
| Asus ROG Strix G16 G614JZ (turbo) | |
| Lenovo Legion Pro 7 16IRX8H | |
| HP Omen 17-ck2097ng | |
| HP Omen 17-ck2097ng (Leistung) | |
| Média da turma Gaming (188.8 - 350, n=106, últimos 2 anos) | |
| Média Intel Core i9-13900HX (247 - 304, n=22) | |
| Razer Blade 16 Early 2023 | |
| Alienware m17 R5 (R9 6900HX, RX 6850M XT) | |
| Blender - v2.79 BMW27 CPU | |
| Alienware m17 R5 (R9 6900HX, RX 6850M XT) | |
| HP Omen 17-ck2097ng | |
| Média da turma Gaming (79 - 330, n=104, últimos 2 anos) | |
| Média Intel Core i9-13900HX (101 - 153, n=22) | |
| Razer Blade 16 Early 2023 | |
| HP Omen 17-ck2097ng (Leistung) | |
| Asus ROG Strix G16 G614JZ | |
| Lenovo Legion Pro 7 16IRX8H | |
| HWBOT x265 Benchmark v2.2 - 4k Preset | |
| Lenovo Legion Pro 7 16IRX8H | |
| HP Omen 17-ck2097ng (Leistung) | |
| Asus ROG Strix G16 G614JZ | |
| Média Intel Core i9-13900HX (23.5 - 34.4, n=22) | |
| Média da turma Gaming (11.5 - 44.4, n=105, últimos 2 anos) | |
| Razer Blade 16 Early 2023 | |
| HP Omen 17-ck2097ng | |
| Alienware m17 R5 (R9 6900HX, RX 6850M XT) | |
| LibreOffice - 20 Documents To PDF | |
| Alienware m17 R5 (R9 6900HX, RX 6850M XT) | |
| Média da turma Gaming (33.2 - 88.8, n=105, últimos 2 anos) | |
| Asus ROG Strix G16 G614JZ | |
| Razer Blade 16 Early 2023 | |
| HP Omen 17-ck2097ng | |
| Lenovo Legion Pro 7 16IRX8H | |
| Média Intel Core i9-13900HX (32.8 - 51.1, n=21) | |
| HP Omen 17-ck2097ng (Leistung) | |
| R Benchmark 2.5 - Overall mean | |
| Alienware m17 R5 (R9 6900HX, RX 6850M XT) | |
| Média da turma Gaming (0.3439 - 0.759, n=106, últimos 2 anos) | |
| Razer Blade 16 Early 2023 | |
| Média Intel Core i9-13900HX (0.375 - 0.4564, n=22) | |
| Lenovo Legion Pro 7 16IRX8H | |
| HP Omen 17-ck2097ng (Leistung) | |
| Asus ROG Strix G16 G614JZ | |
| HP Omen 17-ck2097ng | |
* ... menor é melhor
AIDA64: FP32 Ray-Trace | FPU Julia | CPU SHA3 | CPU Queen | FPU SinJulia | FPU Mandel | CPU AES | CPU ZLib | FP64 Ray-Trace | CPU PhotoWorxx
| Performance rating | |
| Lenovo Legion Pro 7 16IRX8H | |
| Asus ROG Strix G16 G614JZ | |
| Média da turma Gaming | |
| Média Intel Core i9-13900HX | |
| HP Omen 17-ck2097ng | |
| Razer Blade 16 Early 2023 | |
| HP Omen 17-ck2097ng | |
| Alienware m17 R5 (R9 6900HX, RX 6850M XT) | |
| AIDA64 / FP32 Ray-Trace | |
| Média da turma Gaming (10227 - 85542, n=105, últimos 2 anos) | |
| Asus ROG Strix G16 G614JZ (v6.75.6100) | |
| Lenovo Legion Pro 7 16IRX8H (v6.85.6300) | |
| Razer Blade 16 Early 2023 (v6.85.6300) | |
| Razer Blade 16 Early 2023 (v8.20.8100) | |
| Razer Blade 16 Early 2023 (v6.92.6600) | |
| Média Intel Core i9-13900HX (17589 - 27615, n=22) | |
| HP Omen 17-ck2097ng (v6.75.6100, Leistung) | |
| HP Omen 17-ck2097ng (v6.75.6100) | |
| Alienware m17 R5 (R9 6900HX, RX 6850M XT) (v6.75.6100) | |
| AIDA64 / FPU Julia | |
| Média da turma Gaming (51376 - 238426, n=105, últimos 2 anos) | |
| Lenovo Legion Pro 7 16IRX8H (v6.85.6300) | |
| Asus ROG Strix G16 G614JZ (v6.75.6100) | |
| Razer Blade 16 Early 2023 (v6.85.6300) | |
| Razer Blade 16 Early 2023 (v8.20.8100) | |
| Razer Blade 16 Early 2023 (v6.92.6600) | |
| Média Intel Core i9-13900HX (88686 - 137015, n=22) | |
| HP Omen 17-ck2097ng (v6.75.6100, Leistung) | |
| Alienware m17 R5 (R9 6900HX, RX 6850M XT) (v6.75.6100) | |
| HP Omen 17-ck2097ng (v6.75.6100) | |
| AIDA64 / CPU SHA3 | |
| Lenovo Legion Pro 7 16IRX8H (v6.85.6300) | |
| Asus ROG Strix G16 G614JZ (v6.75.6100) | |
| Média da turma Gaming (2180 - 10115, n=105, últimos 2 anos) | |
| Razer Blade 16 Early 2023 (v6.85.6300) | |
| Razer Blade 16 Early 2023 (v6.92.6600) | |
| Razer Blade 16 Early 2023 (v8.20.8100) | |
| Média Intel Core i9-13900HX (4362 - 7029, n=22) | |
| HP Omen 17-ck2097ng (v6.75.6100, Leistung) | |
| HP Omen 17-ck2097ng (v6.75.6100) | |
| Alienware m17 R5 (R9 6900HX, RX 6850M XT) (v6.75.6100) | |
| AIDA64 / CPU Queen | |
| Asus ROG Strix G16 G614JZ (v6.75.6100) | |
| Razer Blade 16 Early 2023 (v6.92.6600) | |
| Razer Blade 16 Early 2023 (v6.85.6300) | |
| HP Omen 17-ck2097ng | |
| Lenovo Legion Pro 7 16IRX8H (v6.85.6300) | |
| Média Intel Core i9-13900HX (125644 - 141385, n=22) | |
| HP Omen 17-ck2097ng (v6.75.6100, Leistung) | |
| Média da turma Gaming (49785 - 173351, n=90, últimos 2 anos) | |
| Alienware m17 R5 (R9 6900HX, RX 6850M XT) (v6.75.6100) | |
| AIDA64 / FPU SinJulia | |
| Asus ROG Strix G16 G614JZ (v6.75.6100) | |
| Razer Blade 16 Early 2023 (v6.85.6300) | |
| Razer Blade 16 Early 2023 (v8.20.8100) | |
| Razer Blade 16 Early 2023 (v6.92.6600) | |
| Lenovo Legion Pro 7 16IRX8H (v6.85.6300) | |
| HP Omen 17-ck2097ng (v6.75.6100, Leistung) | |
| Média Intel Core i9-13900HX (12334 - 17179, n=22) | |
| Média da turma Gaming (4424 - 33636, n=105, últimos 2 anos) | |
| Alienware m17 R5 (R9 6900HX, RX 6850M XT) (v6.75.6100) | |
| HP Omen 17-ck2097ng (v6.75.6100) | |
| AIDA64 / FPU Mandel | |
| Média da turma Gaming (25115 - 128721, n=105, últimos 2 anos) | |
| Lenovo Legion Pro 7 16IRX8H (v6.85.6300) | |
| Asus ROG Strix G16 G614JZ (v6.75.6100) | |
| Razer Blade 16 Early 2023 (v6.85.6300) | |
| Razer Blade 16 Early 2023 (v8.20.8100) | |
| Razer Blade 16 Early 2023 (v6.92.6600) | |
| Média Intel Core i9-13900HX (43850 - 69202, n=22) | |
| HP Omen 17-ck2097ng (v6.75.6100, Leistung) | |
| Alienware m17 R5 (R9 6900HX, RX 6850M XT) (v6.75.6100) | |
| HP Omen 17-ck2097ng (v6.75.6100) | |
| AIDA64 / CPU AES | |
| Razer Blade 16 Early 2023 (v6.92.6600) | |
| Razer Blade 16 Early 2023 (v8.20.8100) | |
| Razer Blade 16 Early 2023 (v6.85.6300) | |
| Média Intel Core i9-13900HX (89413 - 237881, n=22) | |
| Asus ROG Strix G16 G614JZ (v6.75.6100) | |
| Lenovo Legion Pro 7 16IRX8H (v6.85.6300) | |
| HP Omen 17-ck2097ng (v6.75.6100, Leistung) | |
| Média da turma Gaming (39258 - 247074, n=105, últimos 2 anos) | |
| HP Omen 17-ck2097ng (v6.75.6100) | |
| Alienware m17 R5 (R9 6900HX, RX 6850M XT) (v6.75.6100) | |
| AIDA64 / CPU ZLib | |
| Lenovo Legion Pro 7 16IRX8H (v6.85.6300) | |
| Asus ROG Strix G16 G614JZ (v6.75.6100) | |
| Razer Blade 16 Early 2023 (v6.85.6300) | |
| Razer Blade 16 Early 2023 (v6.92.6600) | |
| Razer Blade 16 Early 2023 (v8.20.8100) | |
| Média Intel Core i9-13900HX (1284 - 1958, n=22) | |
| HP Omen 17-ck2097ng (v6.75.6100, Leistung) | |
| Média da turma Gaming (574 - 2531, n=105, últimos 2 anos) | |
| HP Omen 17-ck2097ng (v6.75.6100) | |
| Alienware m17 R5 (R9 6900HX, RX 6850M XT) (v6.75.6100) | |
| AIDA64 / FP64 Ray-Trace | |
| Média da turma Gaming (5509 - 45446, n=105, últimos 2 anos) | |
| Lenovo Legion Pro 7 16IRX8H (v6.85.6300) | |
| Asus ROG Strix G16 G614JZ (v6.75.6100) | |
| Razer Blade 16 Early 2023 (v6.85.6300) | |
| Razer Blade 16 Early 2023 (v6.92.6600) | |
| Razer Blade 16 Early 2023 (v8.20.8100) | |
| Média Intel Core i9-13900HX (9481 - 15279, n=22) | |
| HP Omen 17-ck2097ng (v6.75.6100, Leistung) | |
| HP Omen 17-ck2097ng (v6.75.6100) | |
| Alienware m17 R5 (R9 6900HX, RX 6850M XT) (v6.75.6100) | |
| AIDA64 / CPU PhotoWorxx | |
| Razer Blade 16 Early 2023 (v6.85.6300) | |
| Razer Blade 16 Early 2023 (v6.92.6600) | |
| Razer Blade 16 Early 2023 (v8.20.8100) | |
| HP Omen 17-ck2097ng (v6.75.6100) | |
| HP Omen 17-ck2097ng (v6.75.6100, Leistung) | |
| Lenovo Legion Pro 7 16IRX8H (v6.85.6300) | |
| Média Intel Core i9-13900HX (42994 - 51994, n=22) | |
| Média da turma Gaming (12271 - 89891, n=105, últimos 2 anos) | |
| Asus ROG Strix G16 G614JZ (v6.75.6100) | |
| Alienware m17 R5 (R9 6900HX, RX 6850M XT) (v6.75.6100) | |
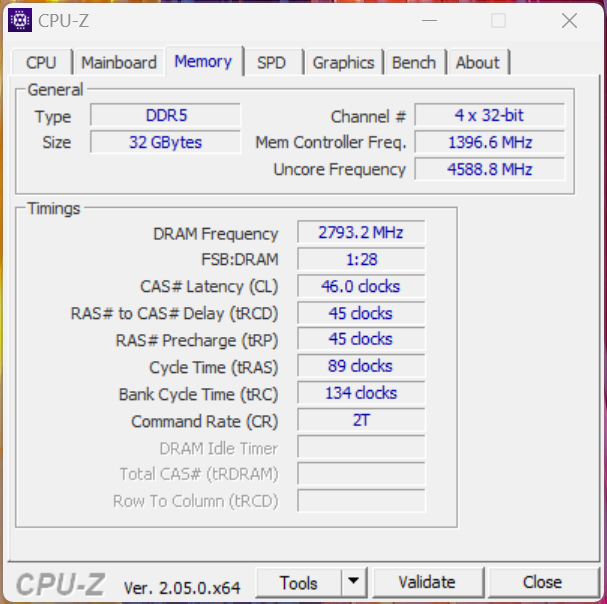
Desempenho do sistema
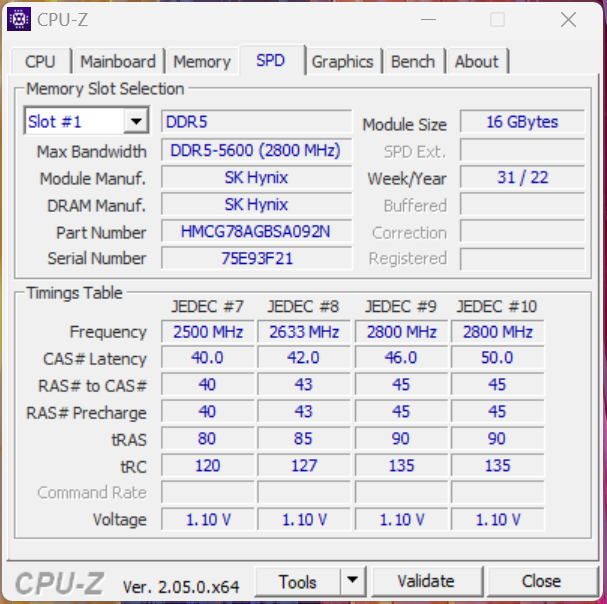
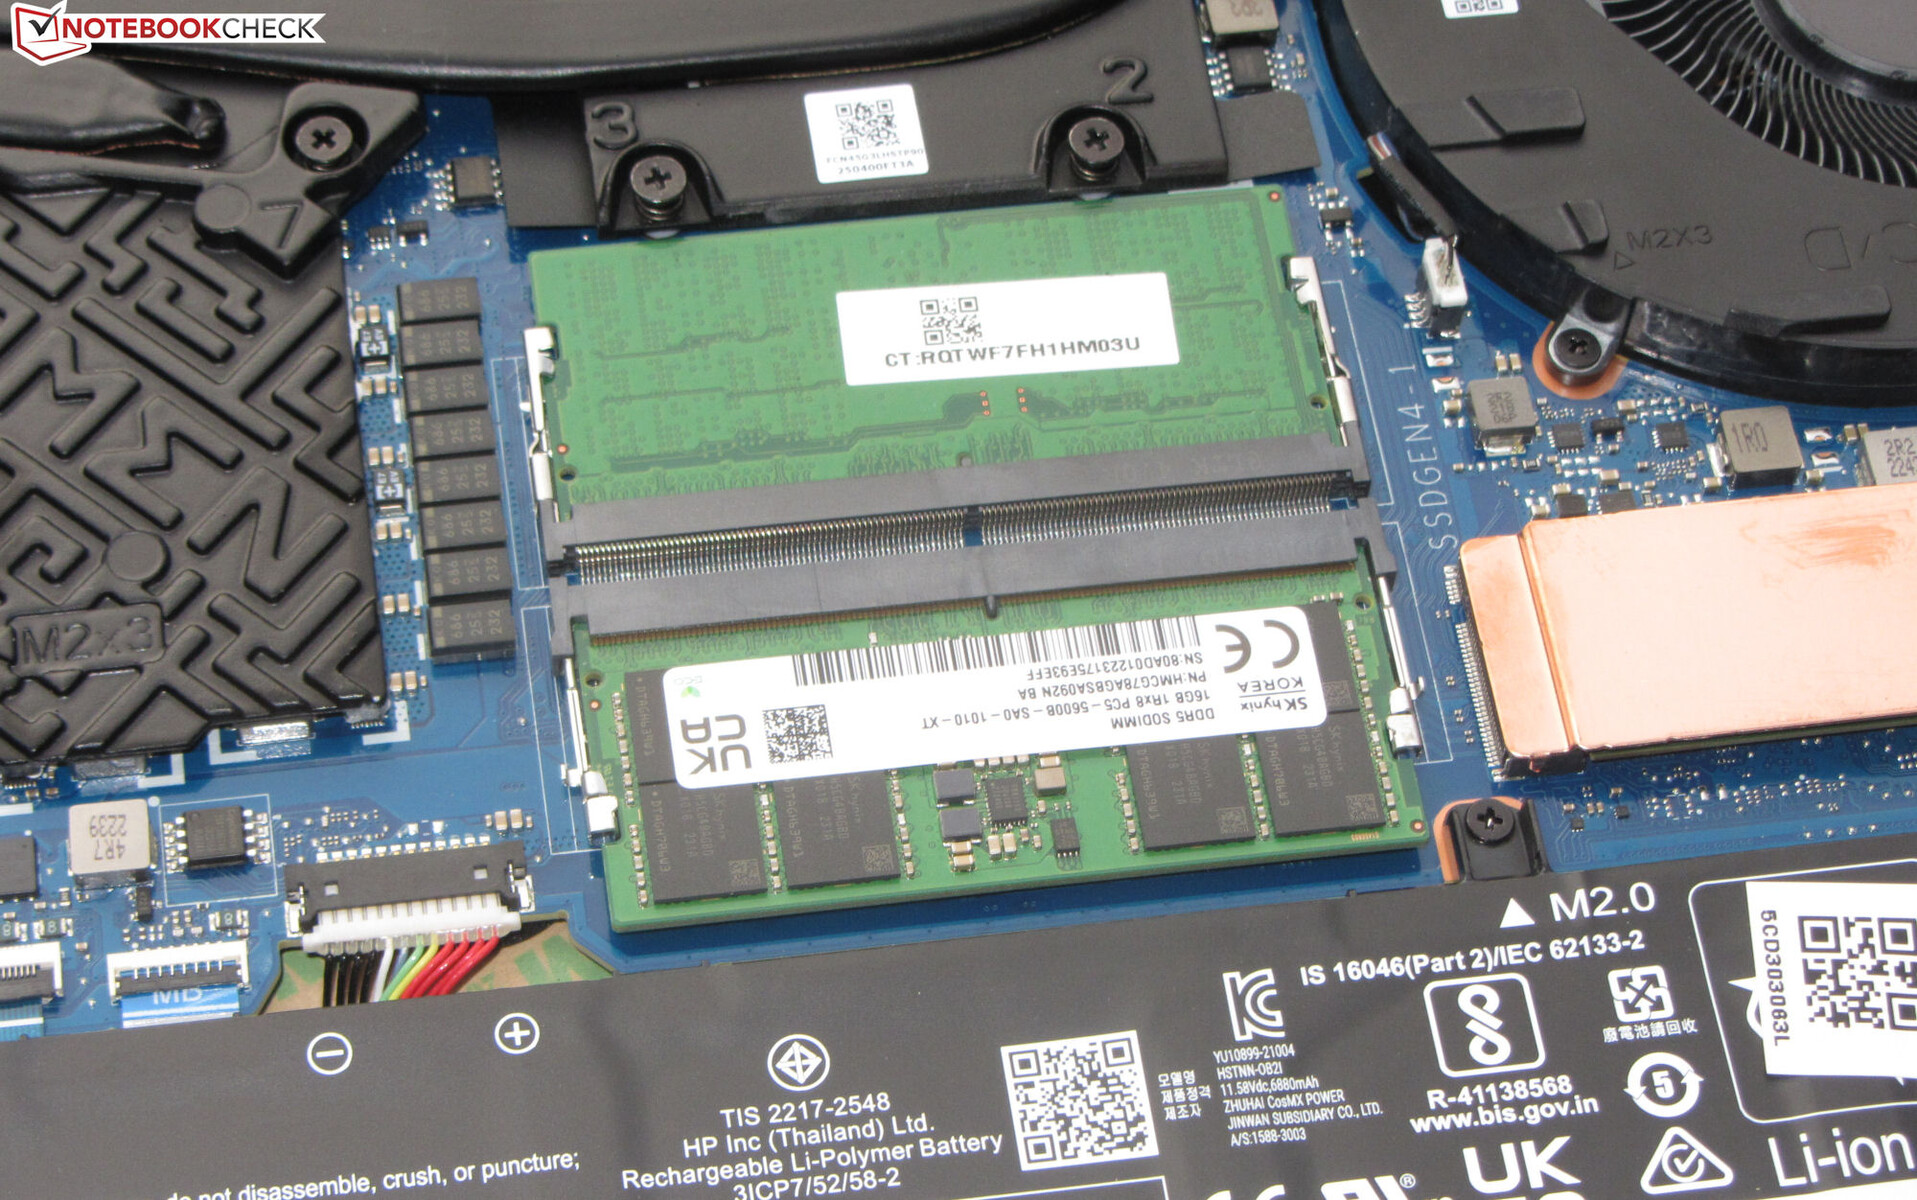
O sistema em bom funcionamento oferece desempenho computacional suficiente para áreas de aplicação ávidas de energia, tais como renderização e jogos. As taxas de transferência da faixa de memória de trabalho em níveis normais para armazenamento DDR5-5600. Elas são acompanhadas de bons resultados PC-Mark.
CrossMark: Overall | Productivity | Creativity | Responsiveness
| PCMark 10 / Score | |
| Média da turma Gaming (5828 - 12414, n=93, últimos 2 anos) | |
| Média Intel Core i9-13900HX, NVIDIA GeForce RTX 4080 Laptop GPU (7609 - 8549, n=3) | |
| Razer Blade 16 Early 2023 | |
| Lenovo Legion Pro 7 16IRX8H | |
| HP Omen 17-ck2097ng | |
| Alienware m17 R5 (R9 6900HX, RX 6850M XT) | |
| Asus ROG Strix G16 G614JZ | |
| PCMark 10 / Essentials | |
| Asus ROG Strix G16 G614JZ | |
| HP Omen 17-ck2097ng | |
| Lenovo Legion Pro 7 16IRX8H | |
| Média Intel Core i9-13900HX, NVIDIA GeForce RTX 4080 Laptop GPU (10982 - 11824, n=3) | |
| Razer Blade 16 Early 2023 | |
| Média da turma Gaming (8810 - 11935, n=97, últimos 2 anos) | |
| Alienware m17 R5 (R9 6900HX, RX 6850M XT) | |
| PCMark 10 / Productivity | |
| Média da turma Gaming (6845 - 25323, n=95, últimos 2 anos) | |
| Lenovo Legion Pro 7 16IRX8H | |
| Média Intel Core i9-13900HX, NVIDIA GeForce RTX 4080 Laptop GPU (9976 - 10788, n=3) | |
| HP Omen 17-ck2097ng | |
| Alienware m17 R5 (R9 6900HX, RX 6850M XT) | |
| Razer Blade 16 Early 2023 | |
| Asus ROG Strix G16 G614JZ | |
| PCMark 10 / Digital Content Creation | |
| Razer Blade 16 Early 2023 | |
| Média da turma Gaming (7602 - 19954, n=95, últimos 2 anos) | |
| Média Intel Core i9-13900HX, NVIDIA GeForce RTX 4080 Laptop GPU (10135 - 14720, n=3) | |
| Alienware m17 R5 (R9 6900HX, RX 6850M XT) | |
| Asus ROG Strix G16 G614JZ | |
| Lenovo Legion Pro 7 16IRX8H | |
| HP Omen 17-ck2097ng | |
| CrossMark / Overall | |
| Asus ROG Strix G16 G614JZ | |
| Média Intel Core i9-13900HX, NVIDIA GeForce RTX 4080 Laptop GPU (1991 - 2194, n=2) | |
| HP Omen 17-ck2097ng | |
| Média da turma Gaming (1366 - 2409, n=94, últimos 2 anos) | |
| Alienware m17 R5 (R9 6900HX, RX 6850M XT) | |
| Razer Blade 16 Early 2023 | |
| CrossMark / Productivity | |
| Asus ROG Strix G16 G614JZ | |
| Média Intel Core i9-13900HX, NVIDIA GeForce RTX 4080 Laptop GPU (1828 - 2059, n=2) | |
| Média da turma Gaming (1386 - 2254, n=94, últimos 2 anos) | |
| HP Omen 17-ck2097ng | |
| Alienware m17 R5 (R9 6900HX, RX 6850M XT) | |
| Razer Blade 16 Early 2023 | |
| CrossMark / Creativity | |
| Asus ROG Strix G16 G614JZ | |
| Média Intel Core i9-13900HX, NVIDIA GeForce RTX 4080 Laptop GPU (2239 - 2411, n=2) | |
| Média da turma Gaming (1343 - 2786, n=94, últimos 2 anos) | |
| HP Omen 17-ck2097ng | |
| Razer Blade 16 Early 2023 | |
| Alienware m17 R5 (R9 6900HX, RX 6850M XT) | |
| CrossMark / Responsiveness | |
| Asus ROG Strix G16 G614JZ | |
| Média Intel Core i9-13900HX, NVIDIA GeForce RTX 4080 Laptop GPU (1808 - 1998, n=2) | |
| HP Omen 17-ck2097ng | |
| Média da turma Gaming (1226 - 2334, n=94, últimos 2 anos) | |
| Razer Blade 16 Early 2023 | |
| Alienware m17 R5 (R9 6900HX, RX 6850M XT) | |
| PCMark 8 Home Score Accelerated v2 | 5074 pontos | |
| PCMark 8 Work Score Accelerated v2 | 6244 pontos | |
| PCMark 10 Score | 7609 pontos | |
Ajuda | ||
| AIDA64 / Memory Copy | |
| Razer Blade 16 Early 2023 | |
| Razer Blade 16 Early 2023 | |
| Razer Blade 16 Early 2023 | |
| HP Omen 17-ck2097ng | |
| Lenovo Legion Pro 7 16IRX8H | |
| Média Intel Core i9-13900HX (67716 - 79193, n=22) | |
| Média da turma Gaming (21750 - 129946, n=105, últimos 2 anos) | |
| Asus ROG Strix G16 G614JZ | |
| HP Omen 17-ck1075ng | |
| Alienware m17 R5 (R9 6900HX, RX 6850M XT) | |
| AIDA64 / Memory Read | |
| Razer Blade 16 Early 2023 | |
| Razer Blade 16 Early 2023 | |
| Razer Blade 16 Early 2023 | |
| HP Omen 17-ck2097ng | |
| Lenovo Legion Pro 7 16IRX8H | |
| Média Intel Core i9-13900HX (73998 - 88462, n=22) | |
| Média da turma Gaming (22956 - 118858, n=105, últimos 2 anos) | |
| Asus ROG Strix G16 G614JZ | |
| HP Omen 17-ck1075ng | |
| Alienware m17 R5 (R9 6900HX, RX 6850M XT) | |
| AIDA64 / Memory Write | |
| Razer Blade 16 Early 2023 | |
| Razer Blade 16 Early 2023 | |
| Razer Blade 16 Early 2023 | |
| HP Omen 17-ck2097ng | |
| Média da turma Gaming (22297 - 135096, n=105, últimos 2 anos) | |
| Média Intel Core i9-13900HX (65472 - 77045, n=22) | |
| Lenovo Legion Pro 7 16IRX8H | |
| Asus ROG Strix G16 G614JZ | |
| HP Omen 17-ck1075ng | |
| Alienware m17 R5 (R9 6900HX, RX 6850M XT) | |
| AIDA64 / Memory Latency | |
| Média da turma Gaming (75.3 - 259, n=105, últimos 2 anos) | |
| HP Omen 17-ck1075ng | |
| Razer Blade 16 Early 2023 | |
| Razer Blade 16 Early 2023 | |
| Razer Blade 16 Early 2023 | |
| Alienware m17 R5 (R9 6900HX, RX 6850M XT) | |
| Asus ROG Strix G16 G614JZ | |
| Média Intel Core i9-13900HX (75.3 - 91.1, n=22) | |
| HP Omen 17-ck2097ng | |
| Lenovo Legion Pro 7 16IRX8H | |
* ... menor é melhor
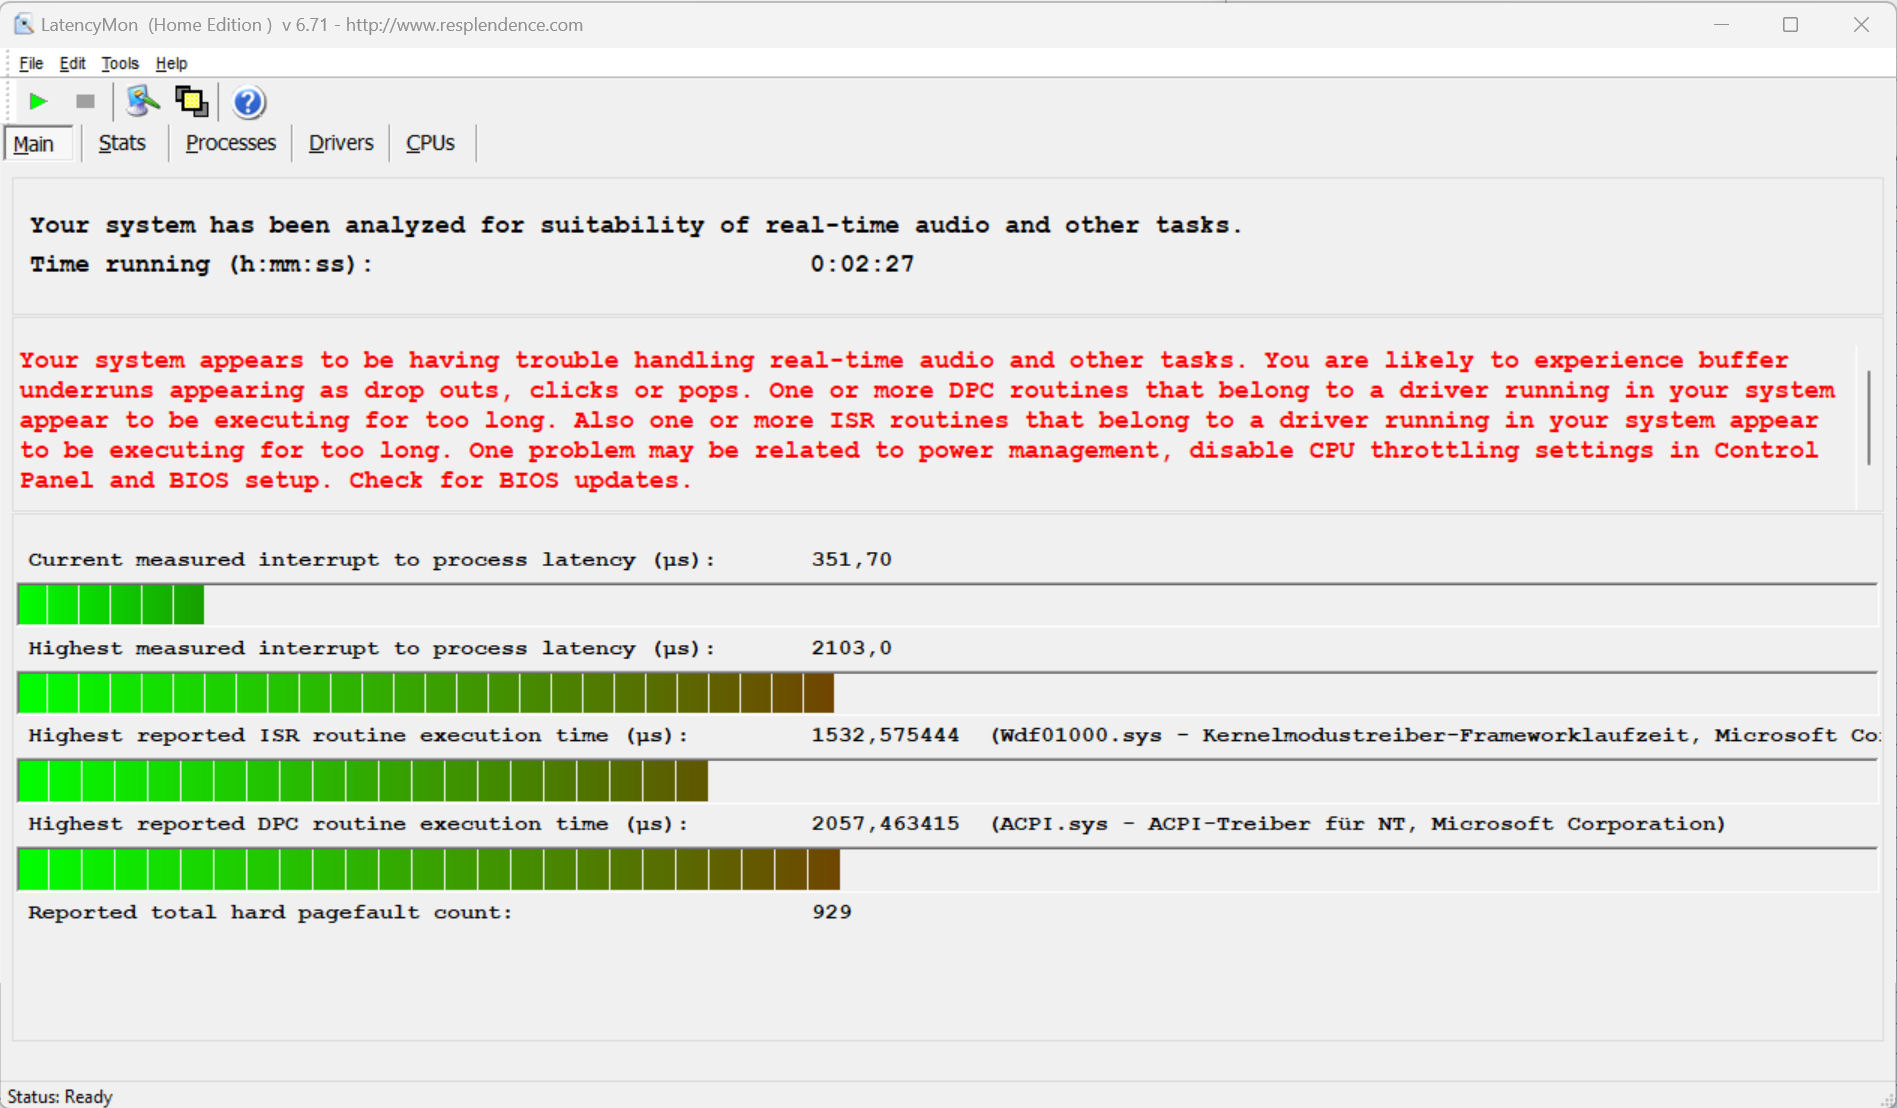
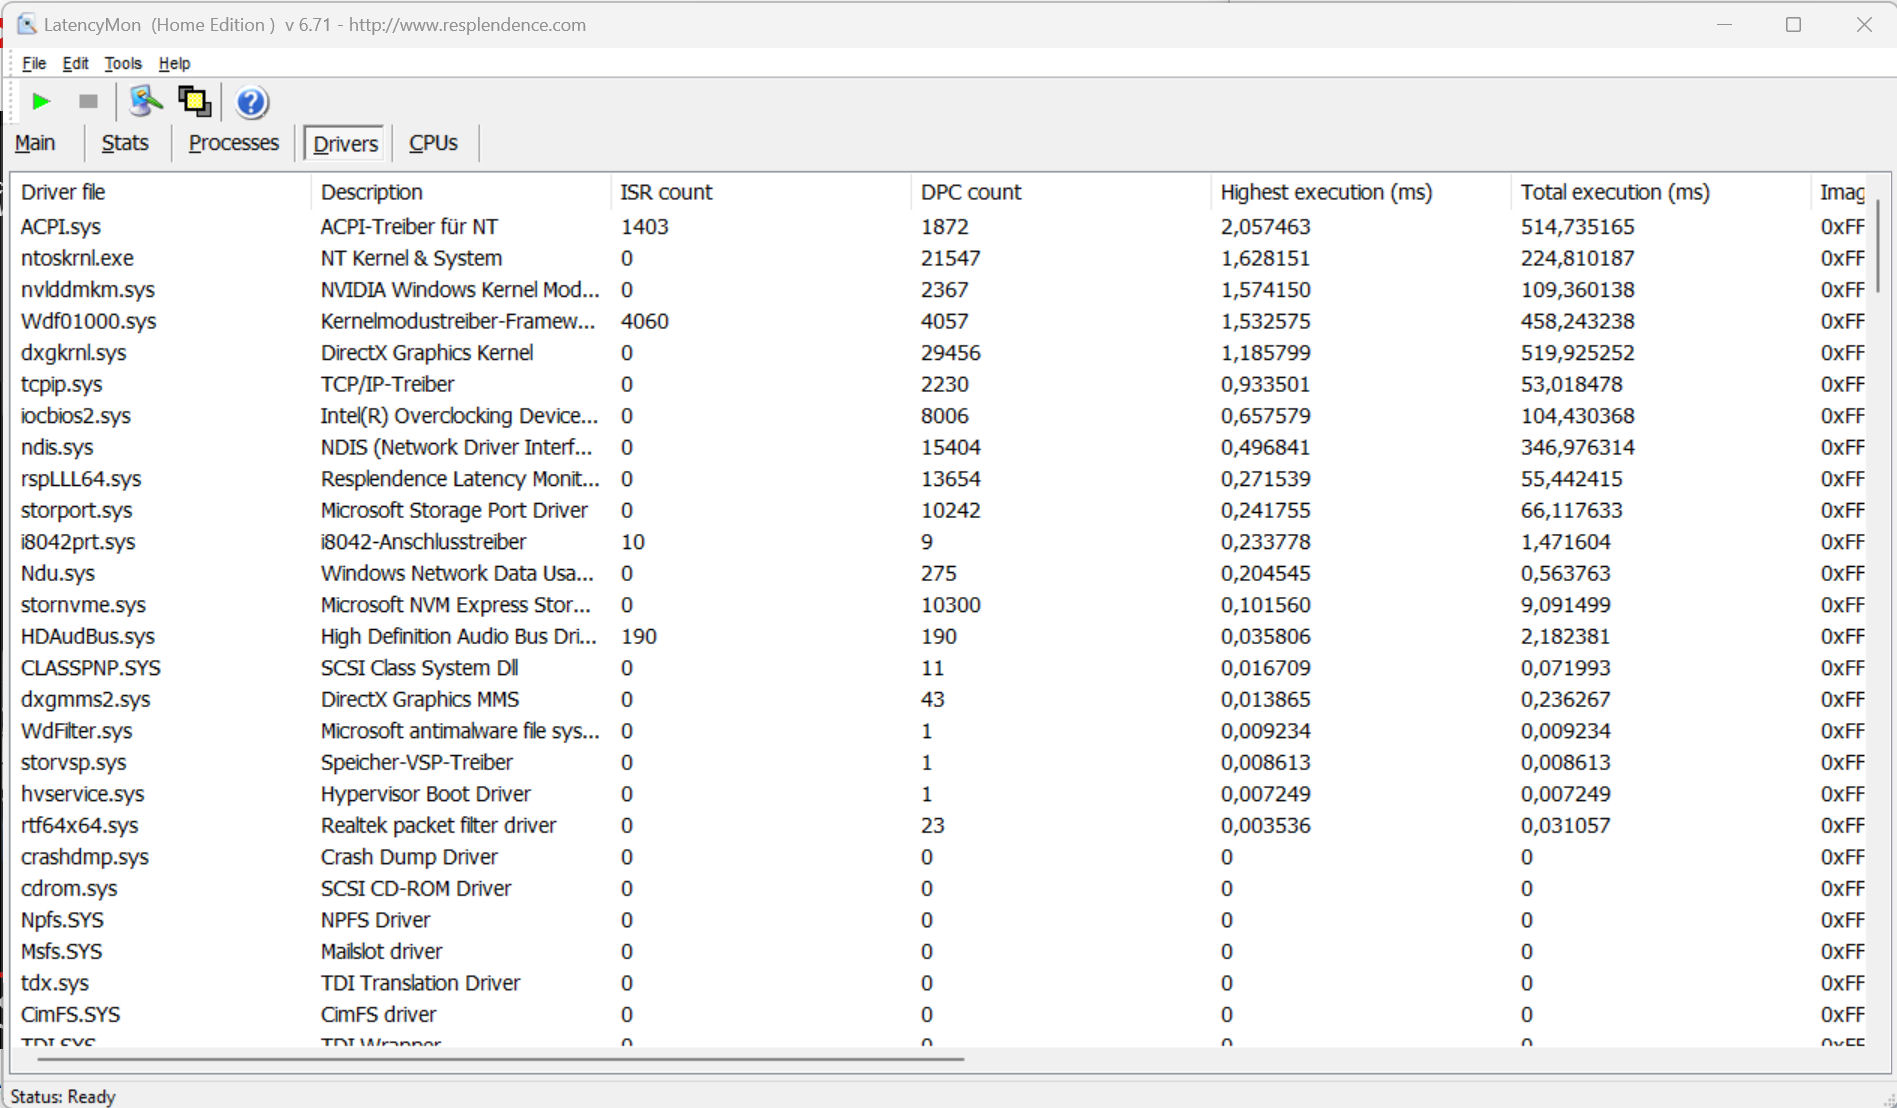
Latências DPC
O teste padronizado do Monitor de Latência (navegação na web, reprodução de vídeo 4k, carga alta Prime95) revela algum comportamento conspícuo. O sistema não parece ser adequado para o processamento de vídeo e áudio em tempo real. Futuras atualizações de software podem levar a algumas melhorias ou tornar as coisas ainda piores.
| DPC Latencies / LatencyMon - interrupt to process latency (max), Web, Youtube, Prime95 | |
| Asus ROG Strix G16 G614JZ | |
| Razer Blade 16 Early 2023 | |
| HP Omen 17-ck2097ng | |
| Alienware m17 R5 (R9 6900HX, RX 6850M XT) | |
| Lenovo Legion Pro 7 16IRX8H | |
* ... menor é melhor
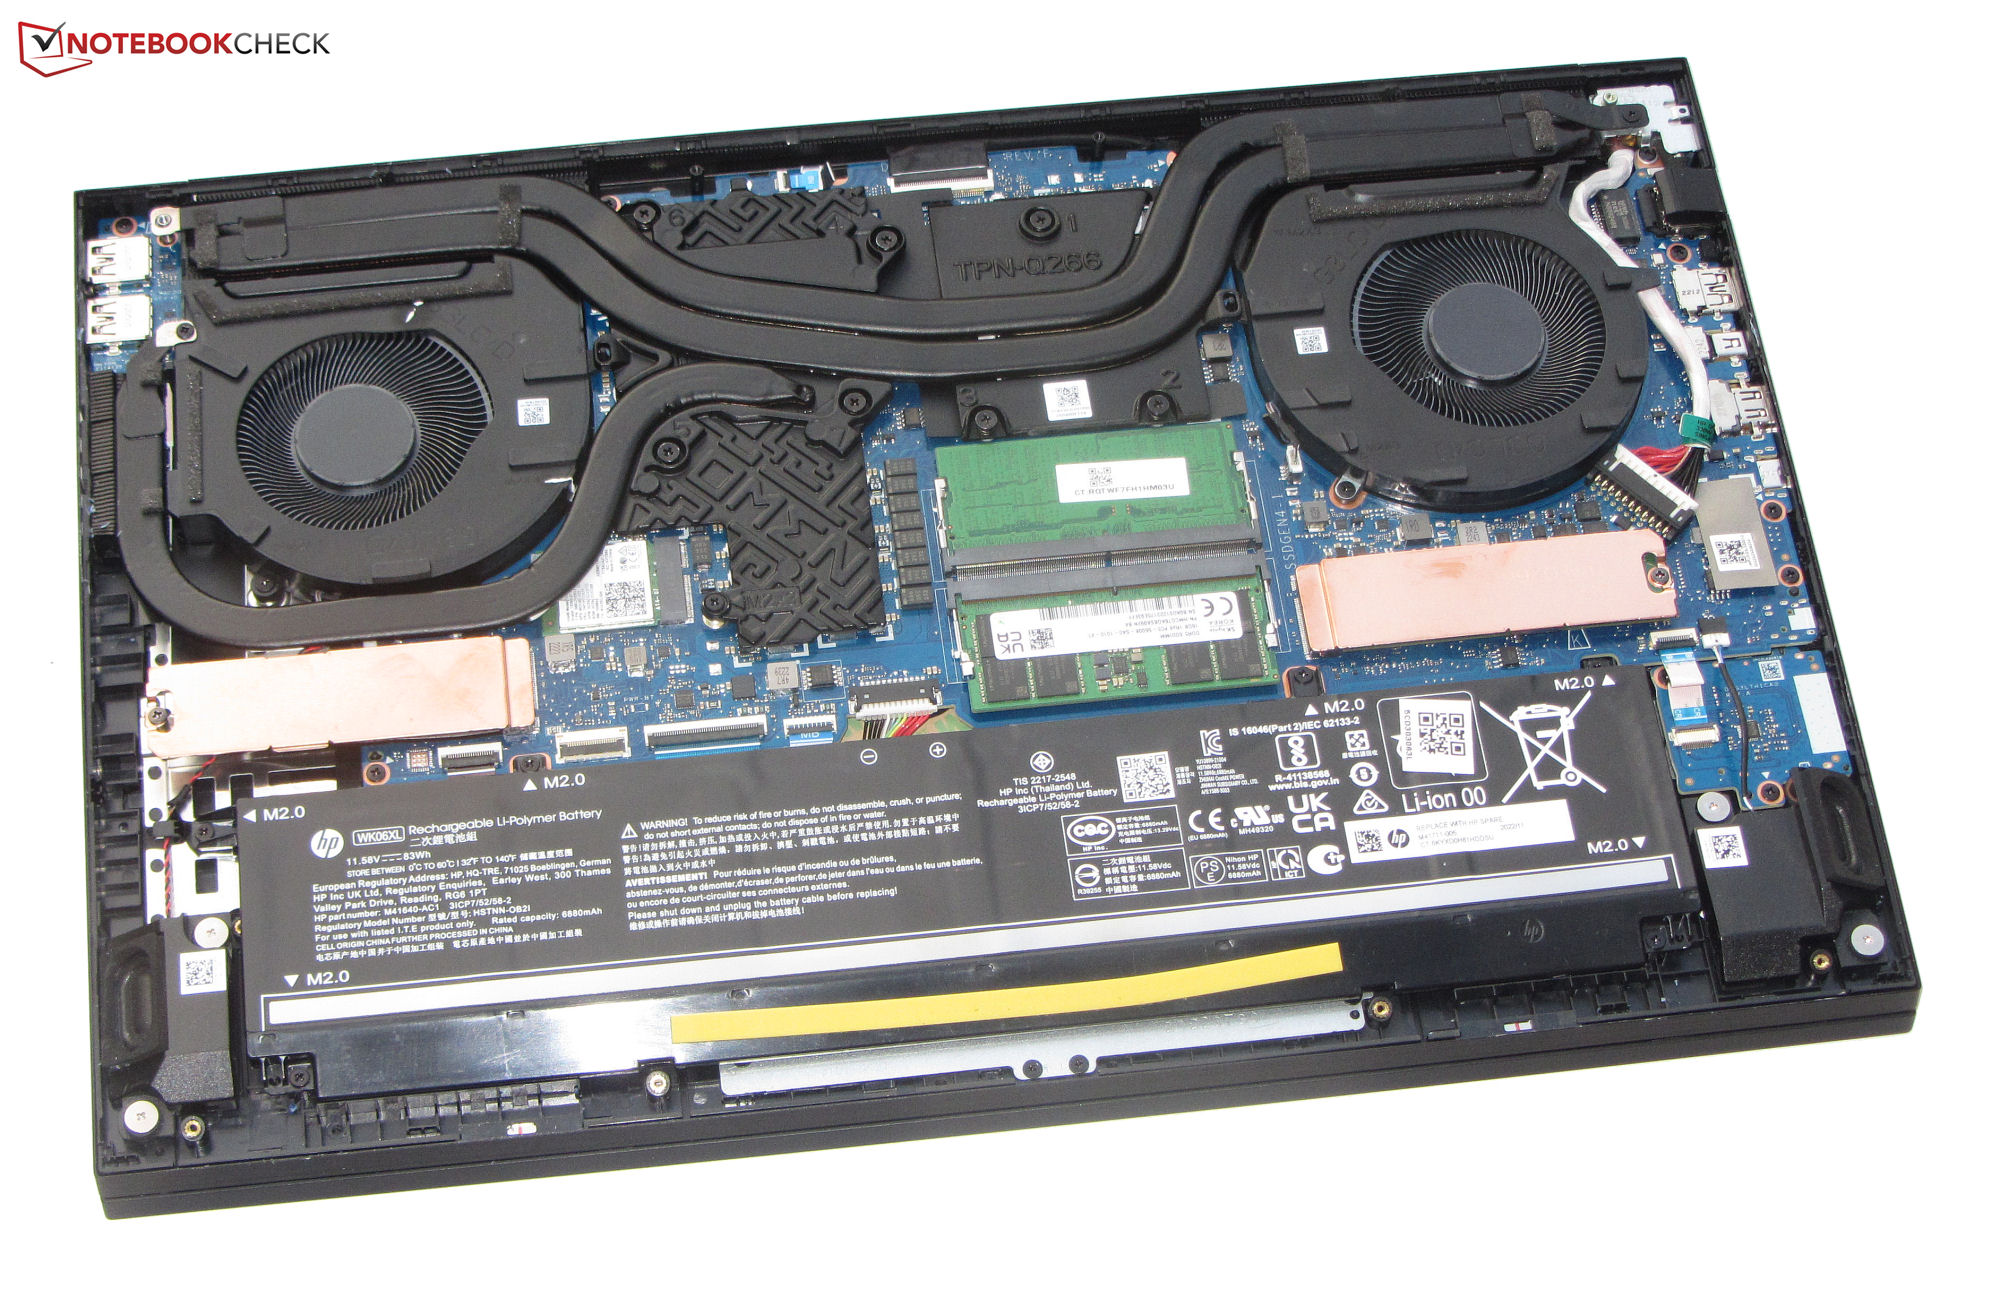
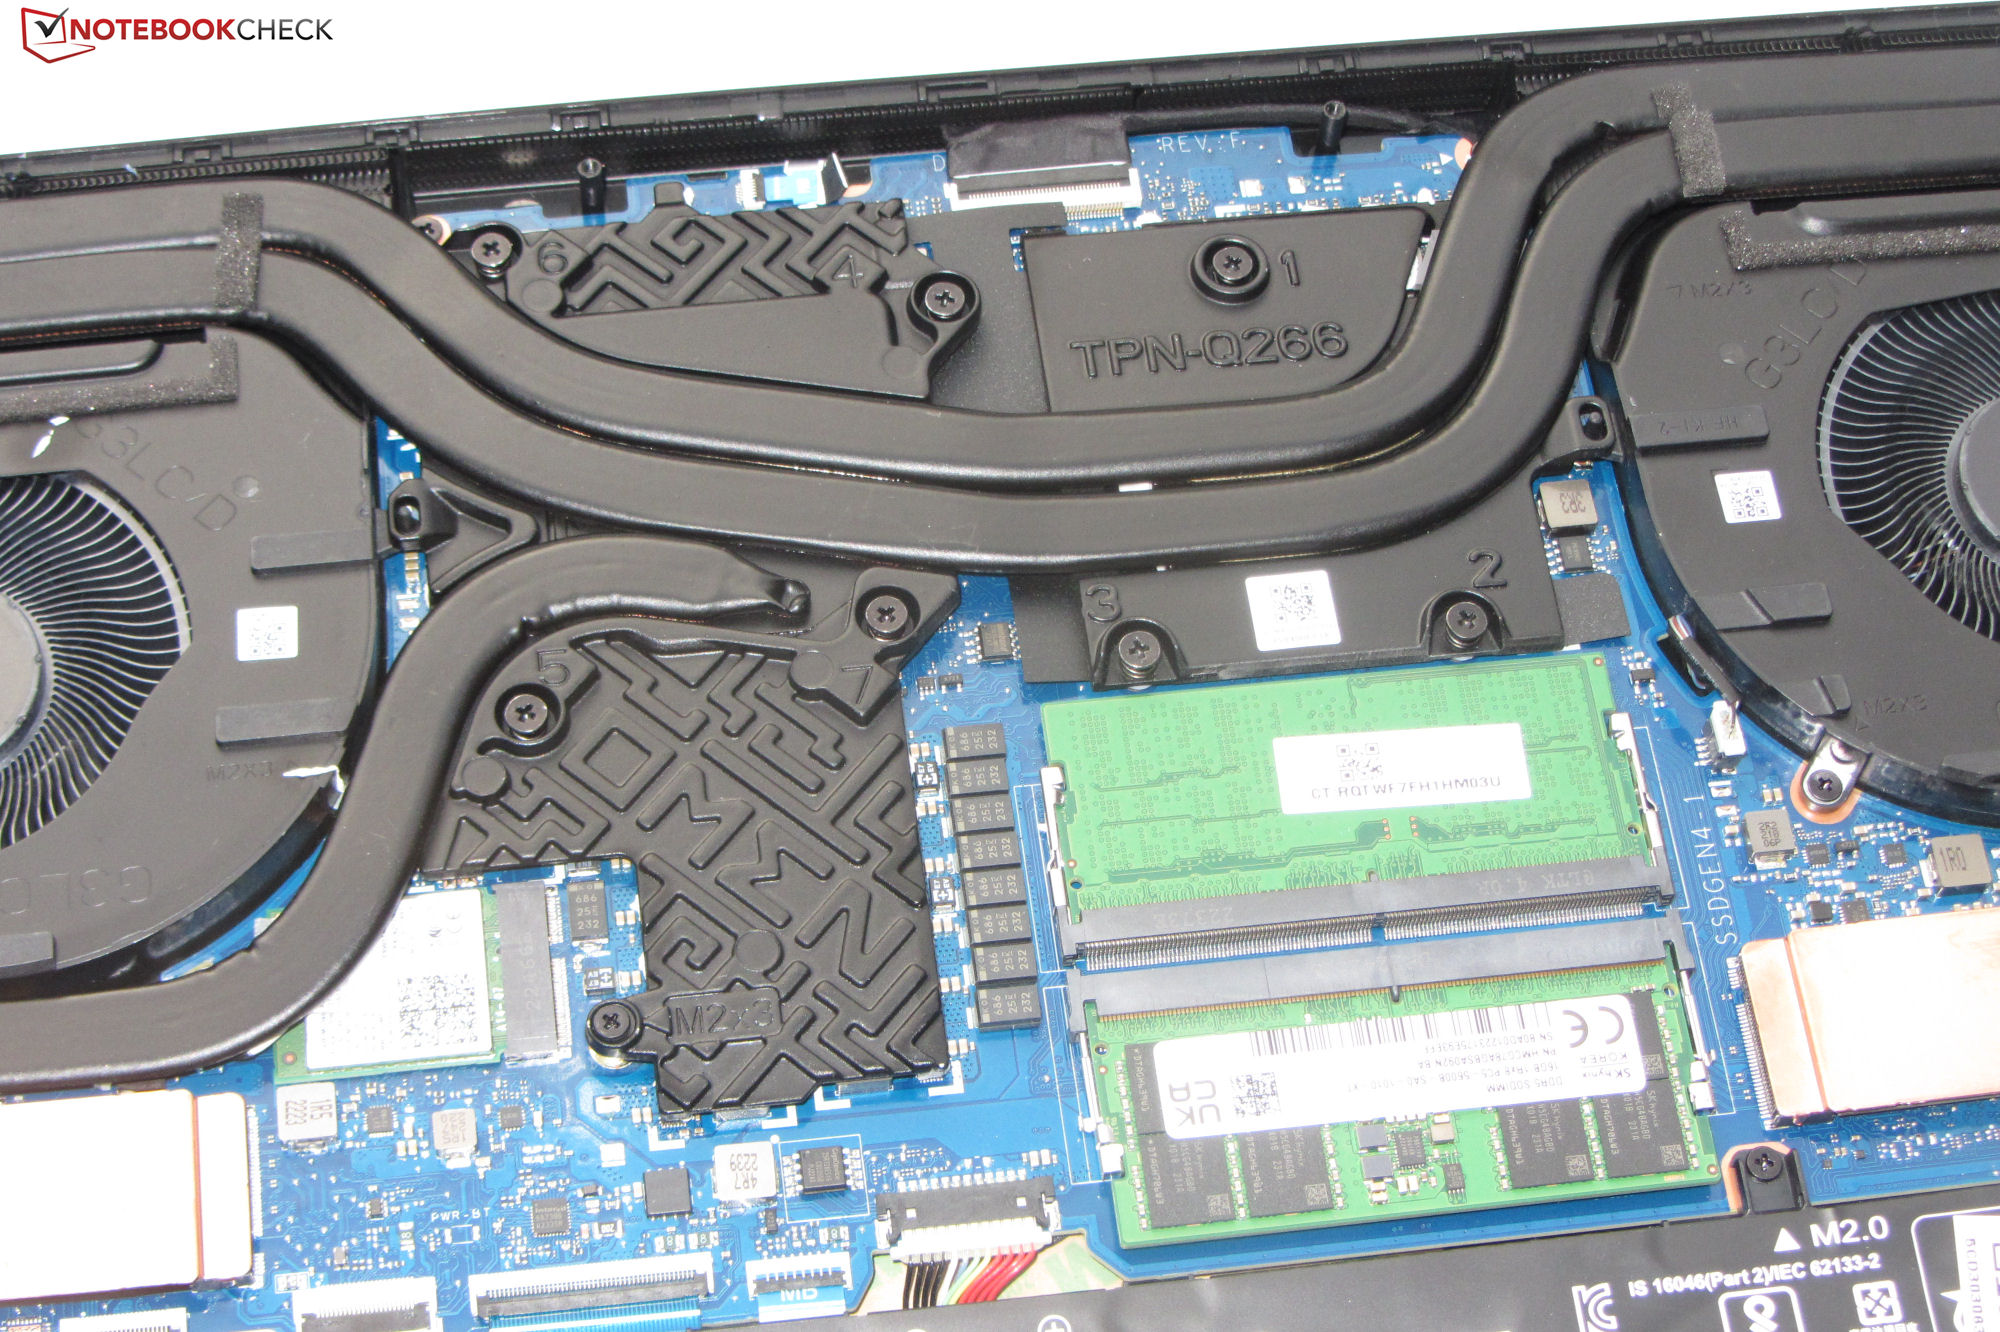
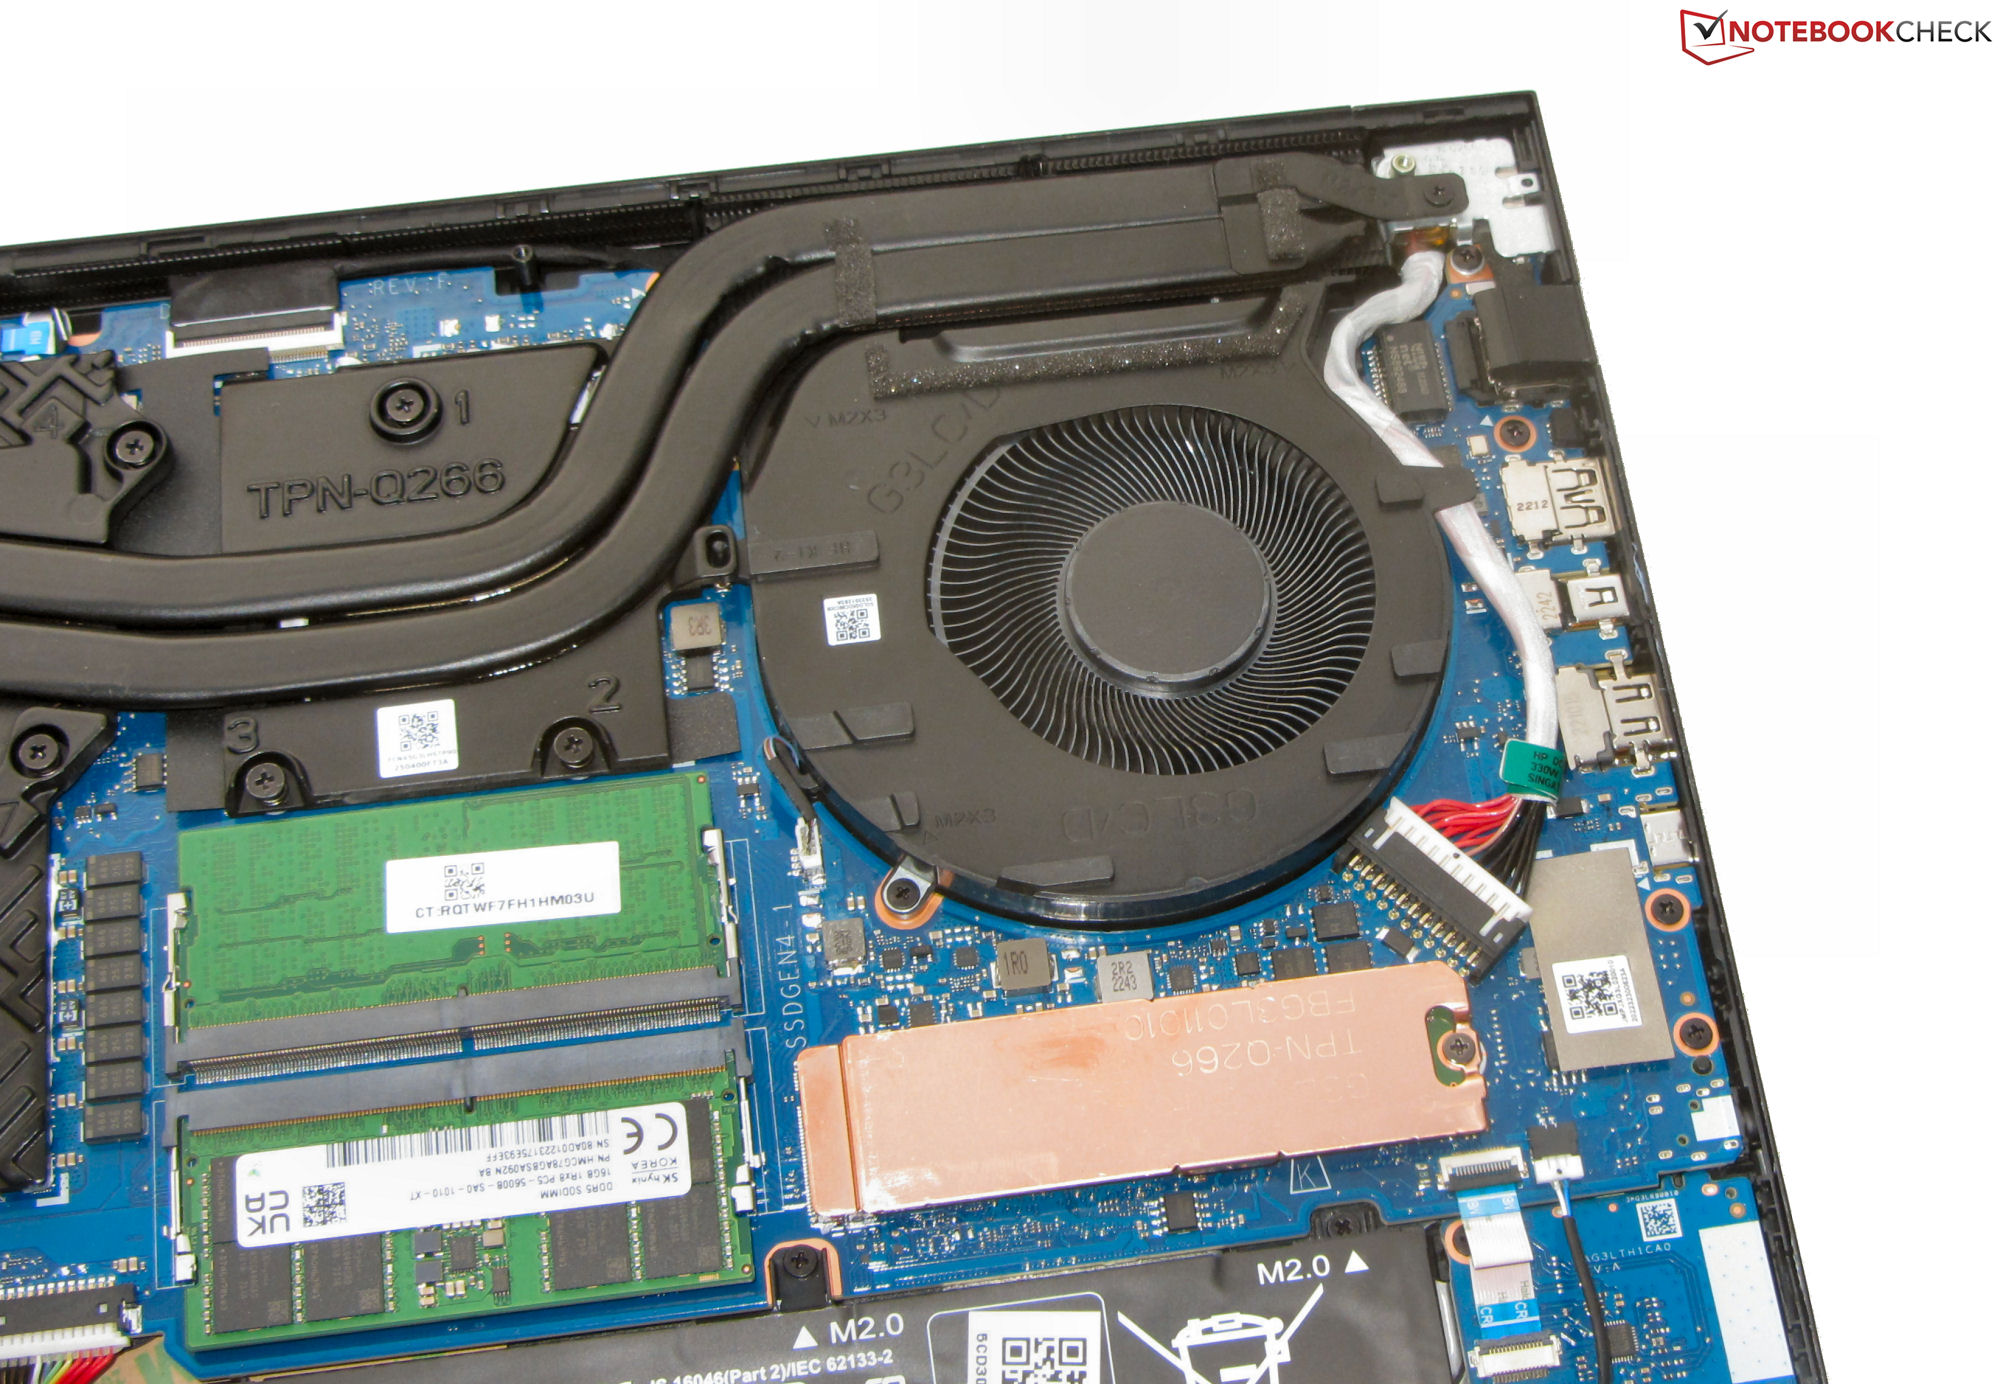
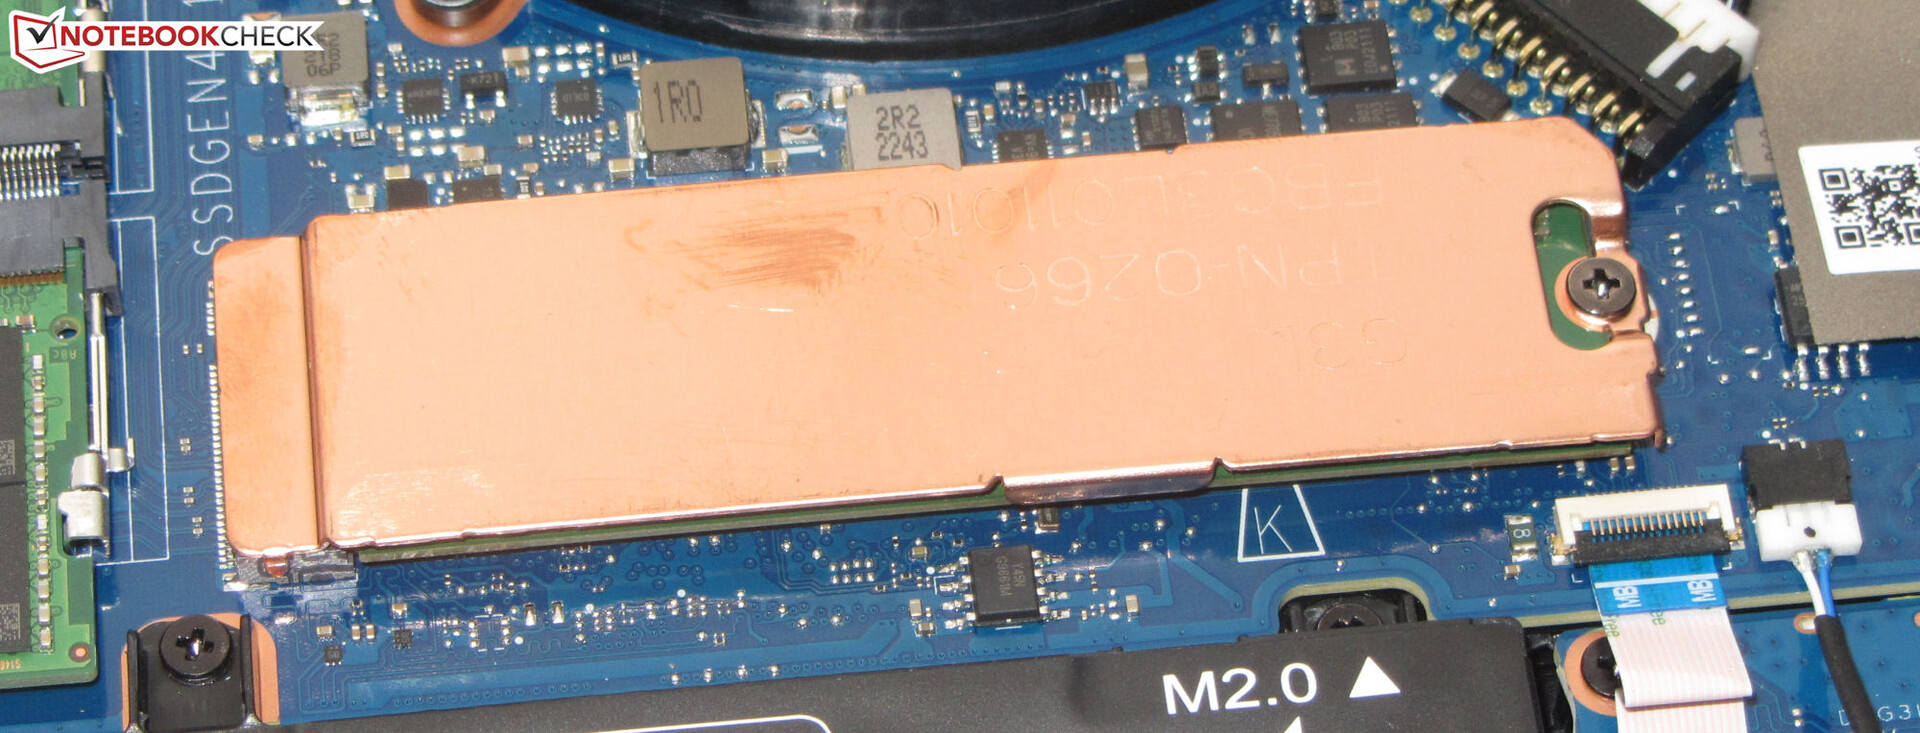
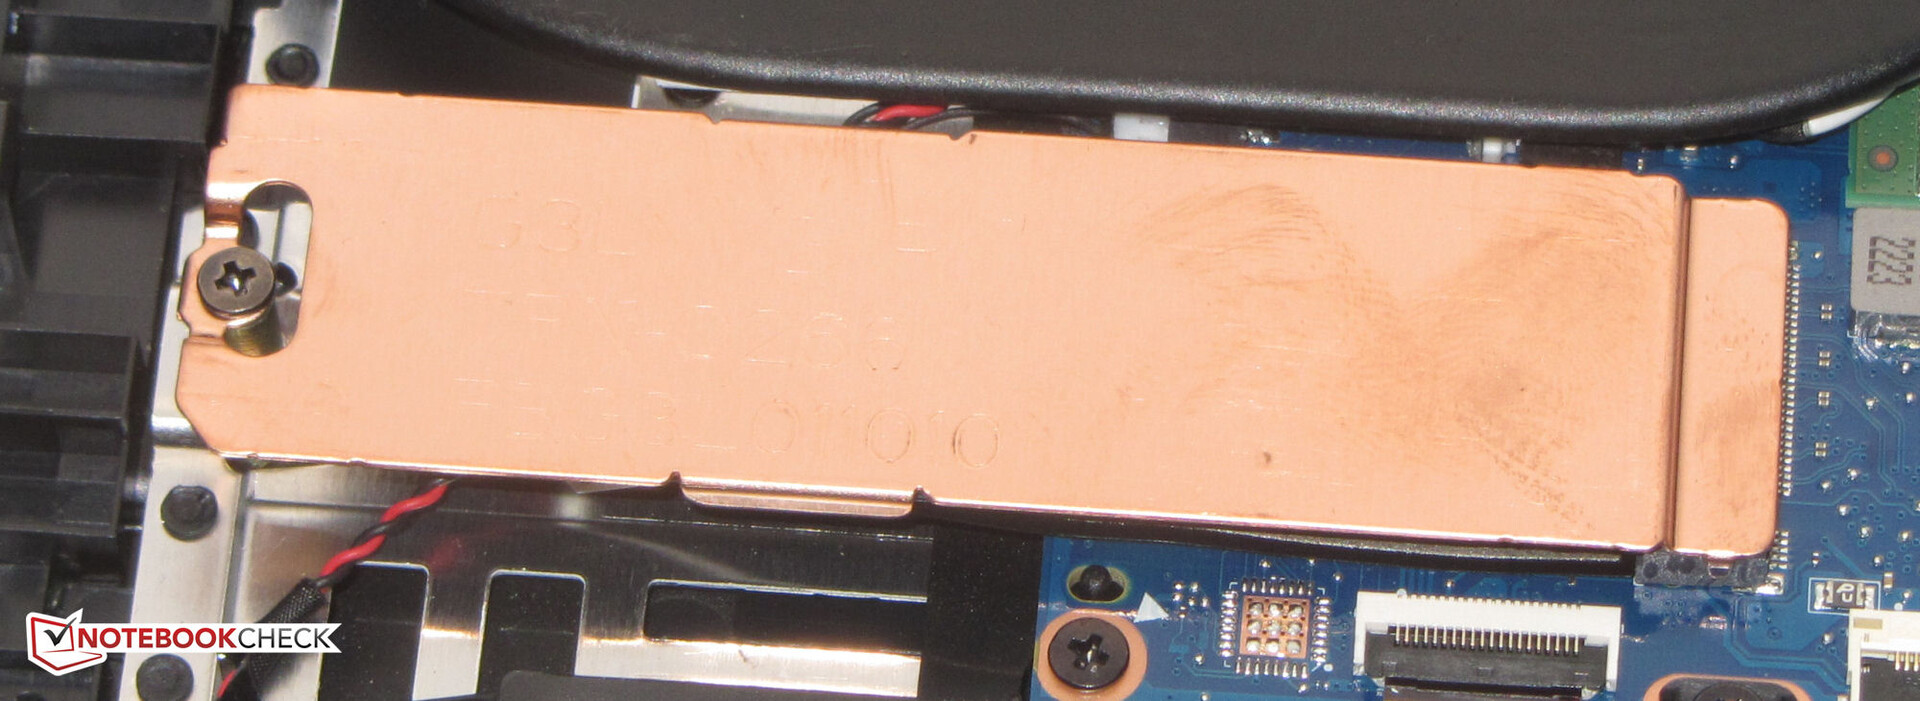
Solução de armazenamento
A Omen oferece espaço para duas SSDs PCIe 4 no formato M.2-2280. O PCIe 4 SSD (1 TB) da SK Hynix que é usado aqui oferece taxas de transferência muito boas. Entretanto, nas partes posteriores do loop do DiskSpd, observamos algumas quedas ocasionais de desempenho, provavelmente devido à estrangulamento térmico.

* ... menor é melhor
Disk Throttling: DiskSpd Read Loop, Queue Depth 8
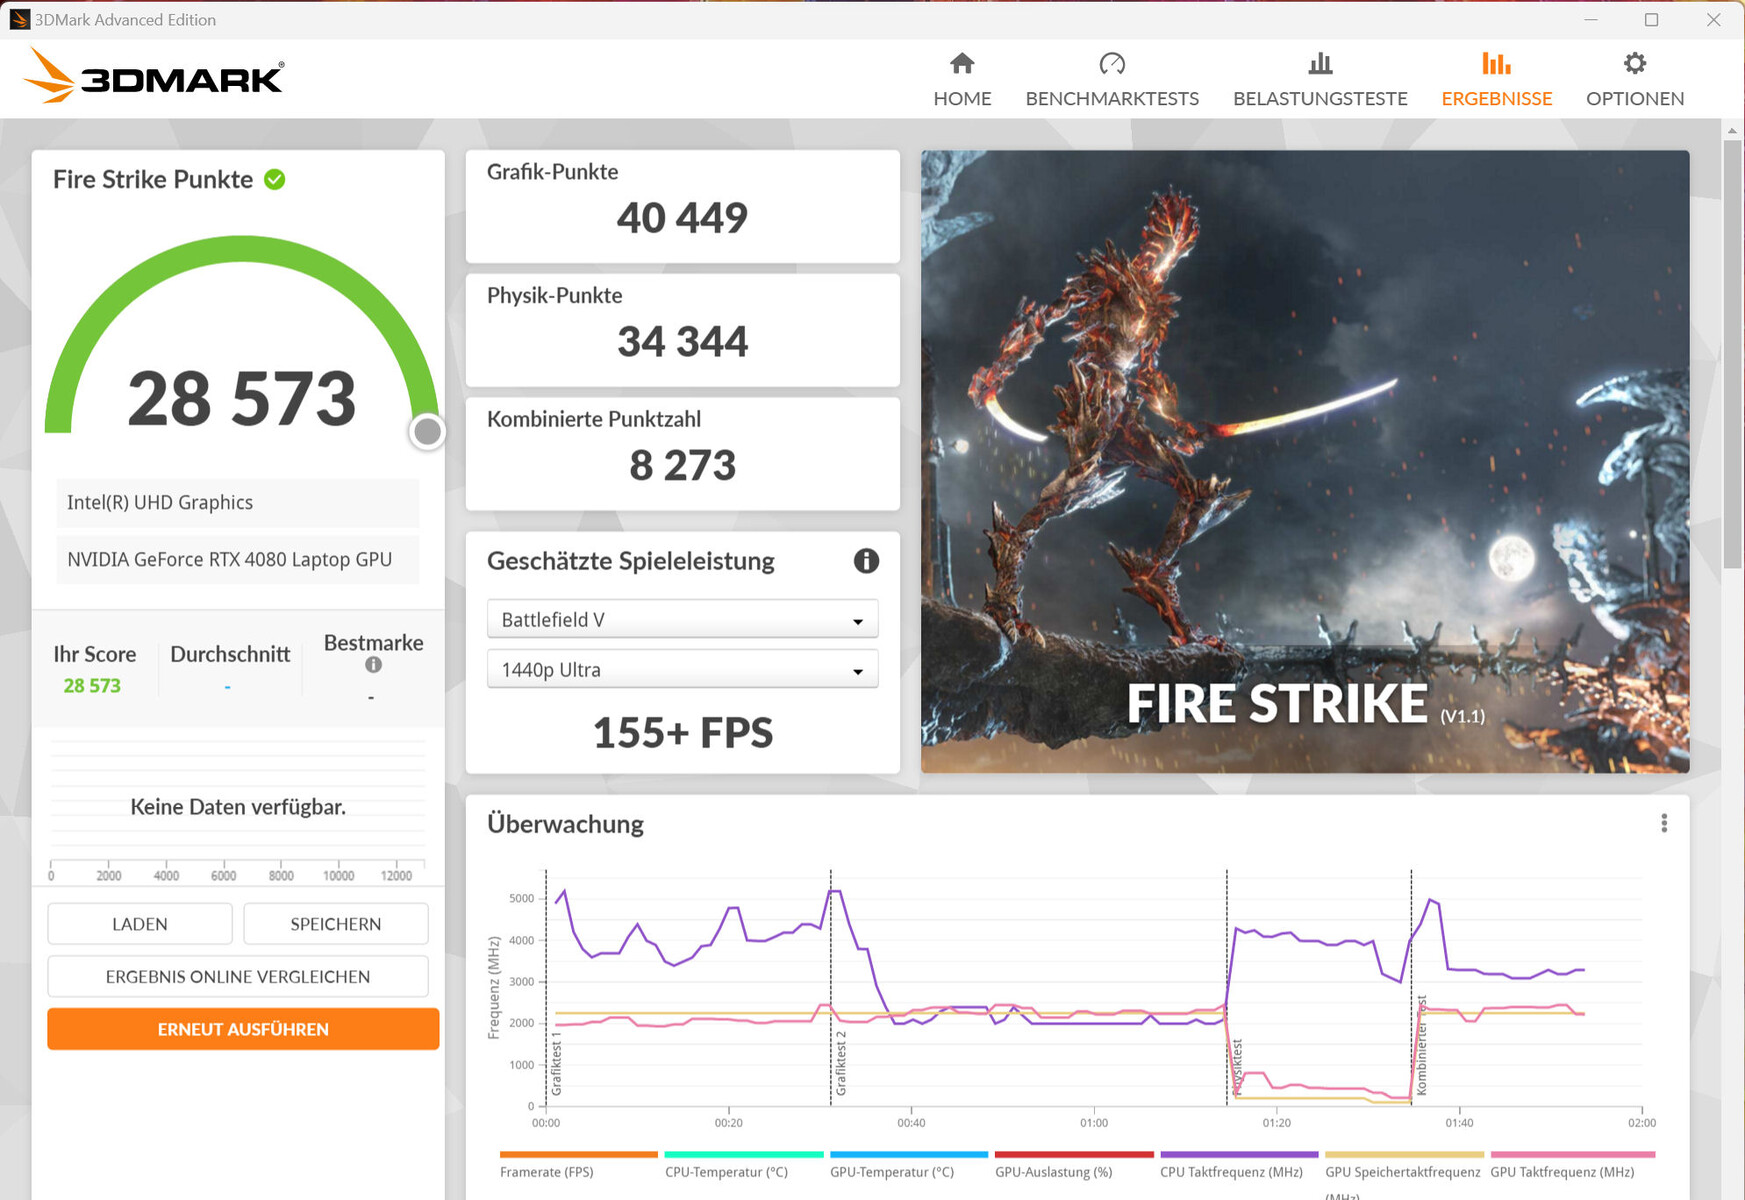
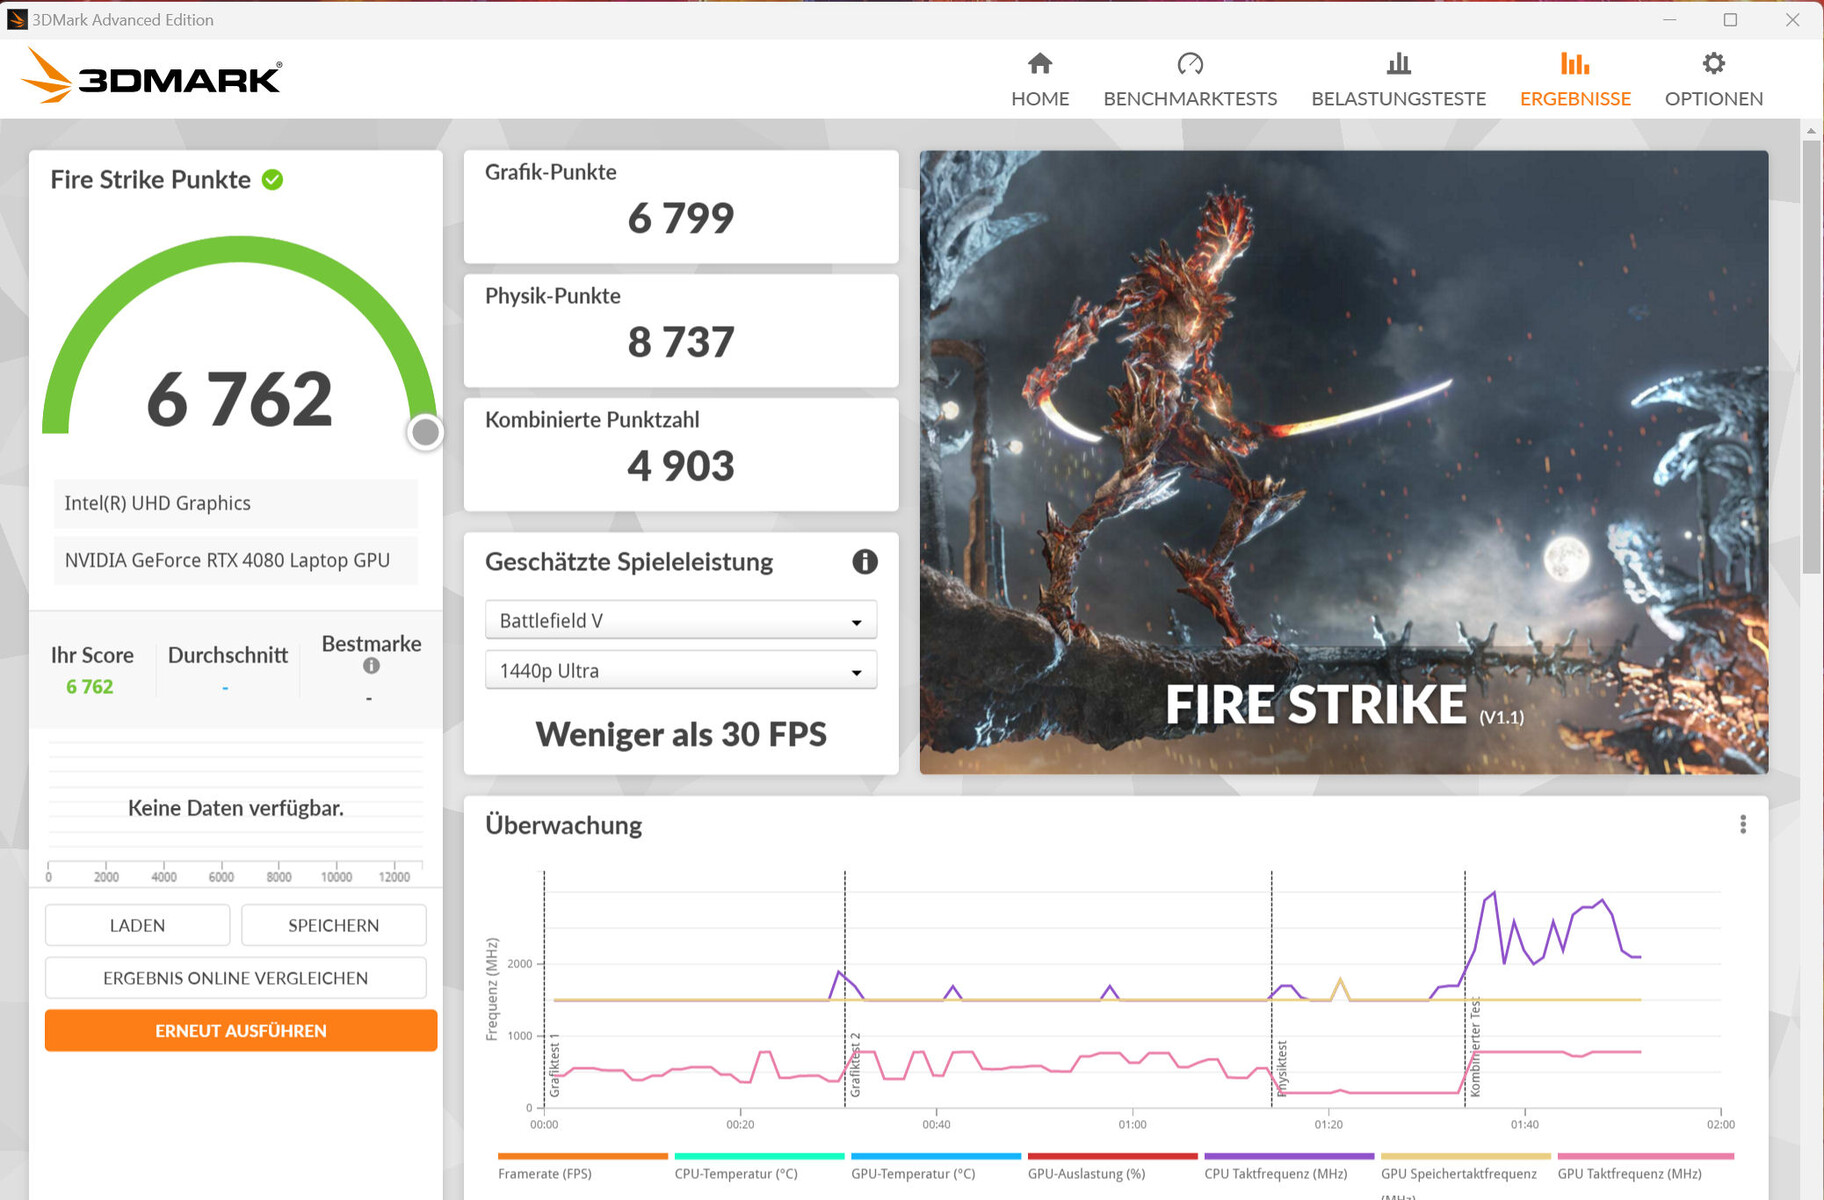
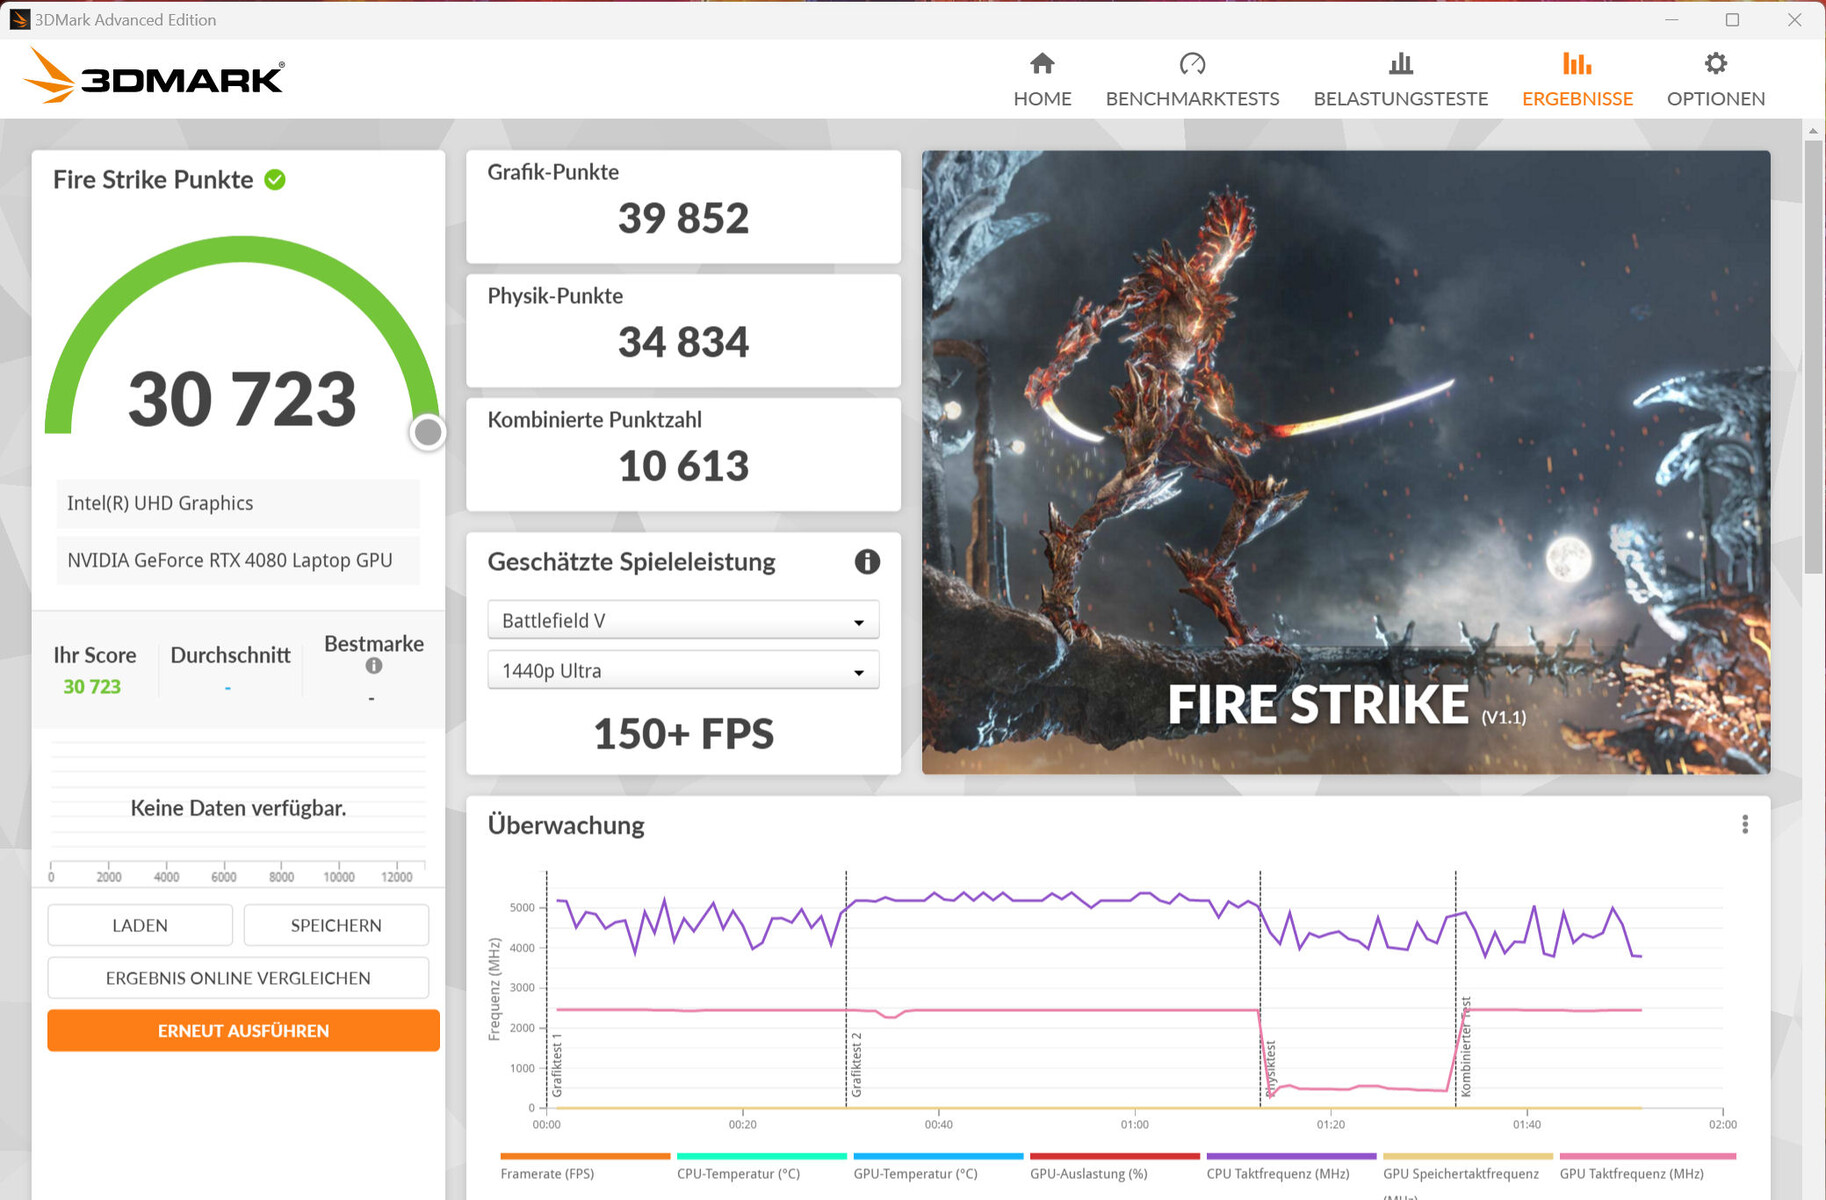
Placa Gráfica
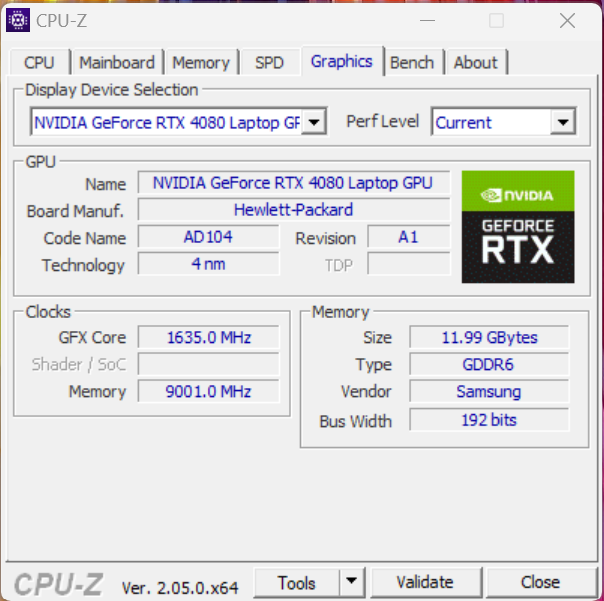
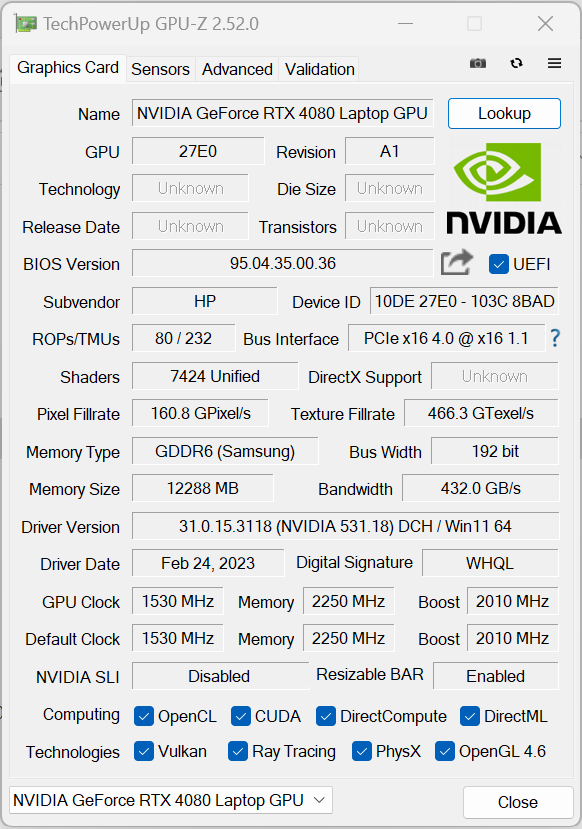
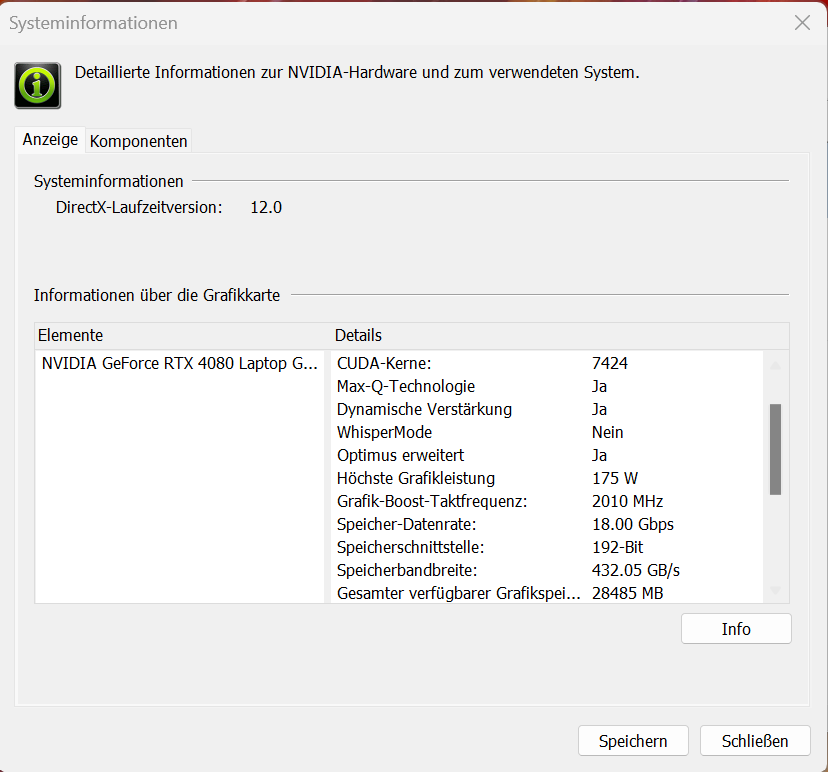
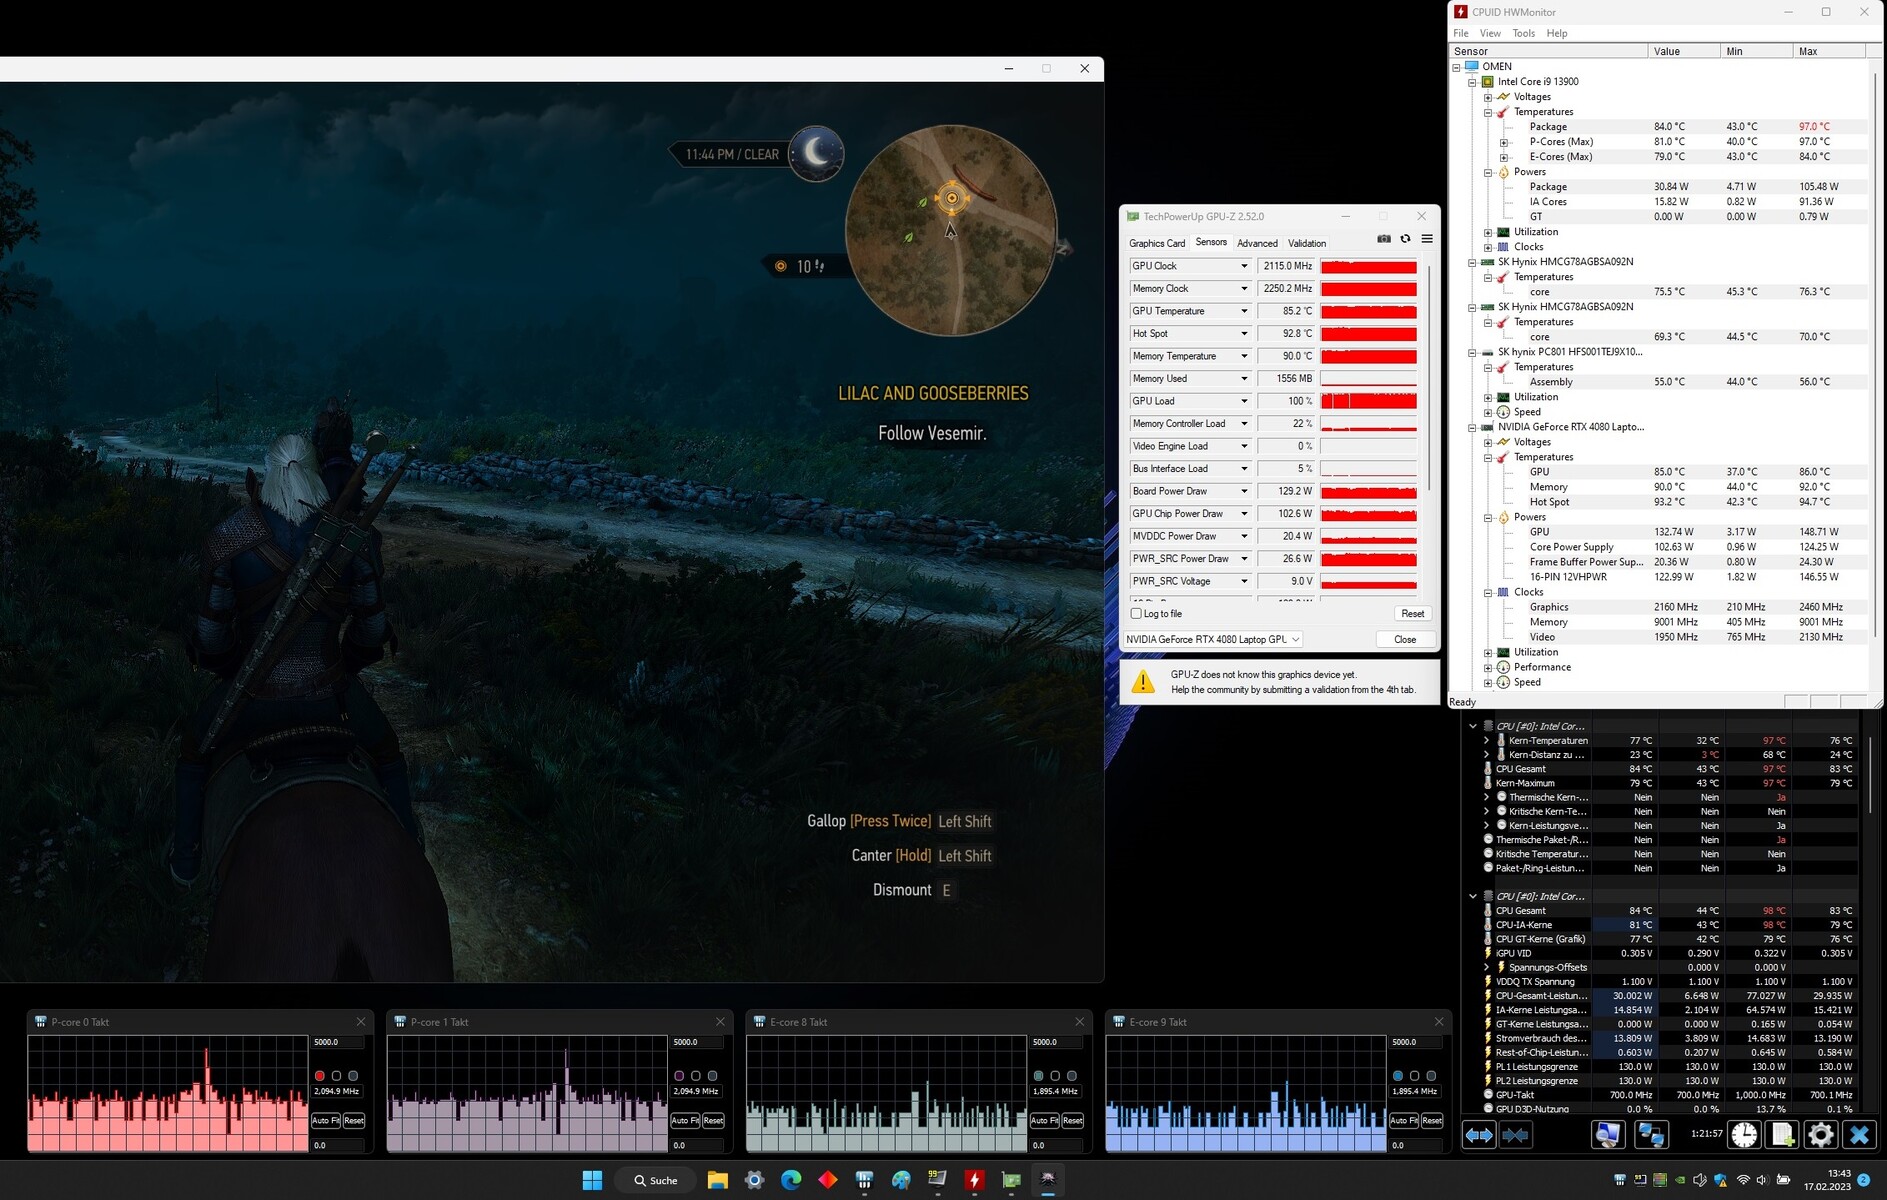
Com oGeForce RTX 4080gPU para laptop, a HP usa o atual número dois do portfólio de GPU móvel da Nvidia. Ela tem 7.424 shaders, um ônibus de 192 bits, e é capaz de usar o rápido armazenamento GDDR6 (12.288 MB). O RTX 4080 é configurado com um TGP de 175 watts (150 W + 25 W Dynamic Boost), que é o máximo configurável de acordo com a Nvidia. De acordo com nosso teste The Witcher 3, o TGP não é totalmente utilizado.
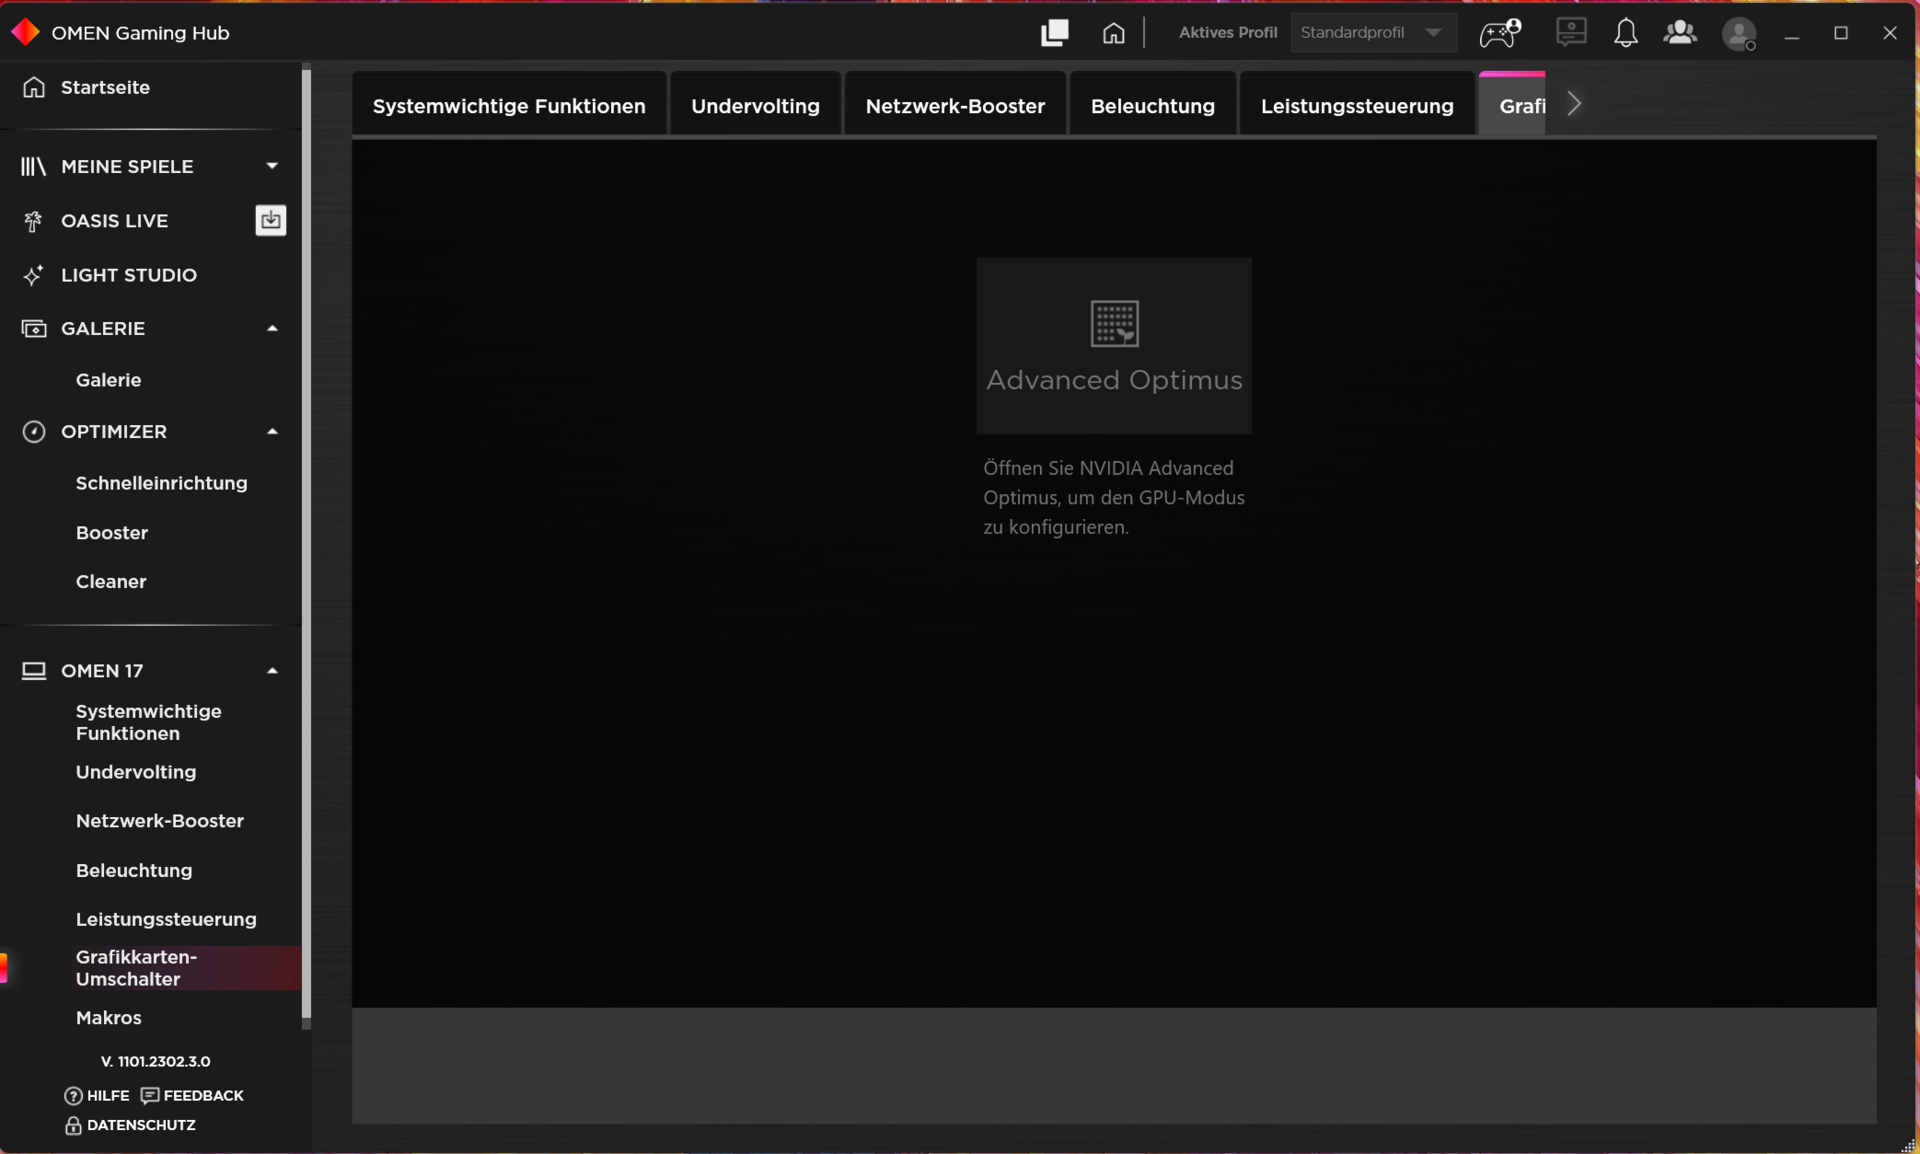
Os resultados de referência variam abaixo da média das GPUs RTX 4080 que testamos até agora. O perfil "Performance" levará a alguns pequenos aumentos ocasionais na performance gráfica. O modo dGPU não levará a nenhuma outra melhoria. A troca entre o dGPU e o Optimus não requer reinício - o Optimus avançado é suportado.
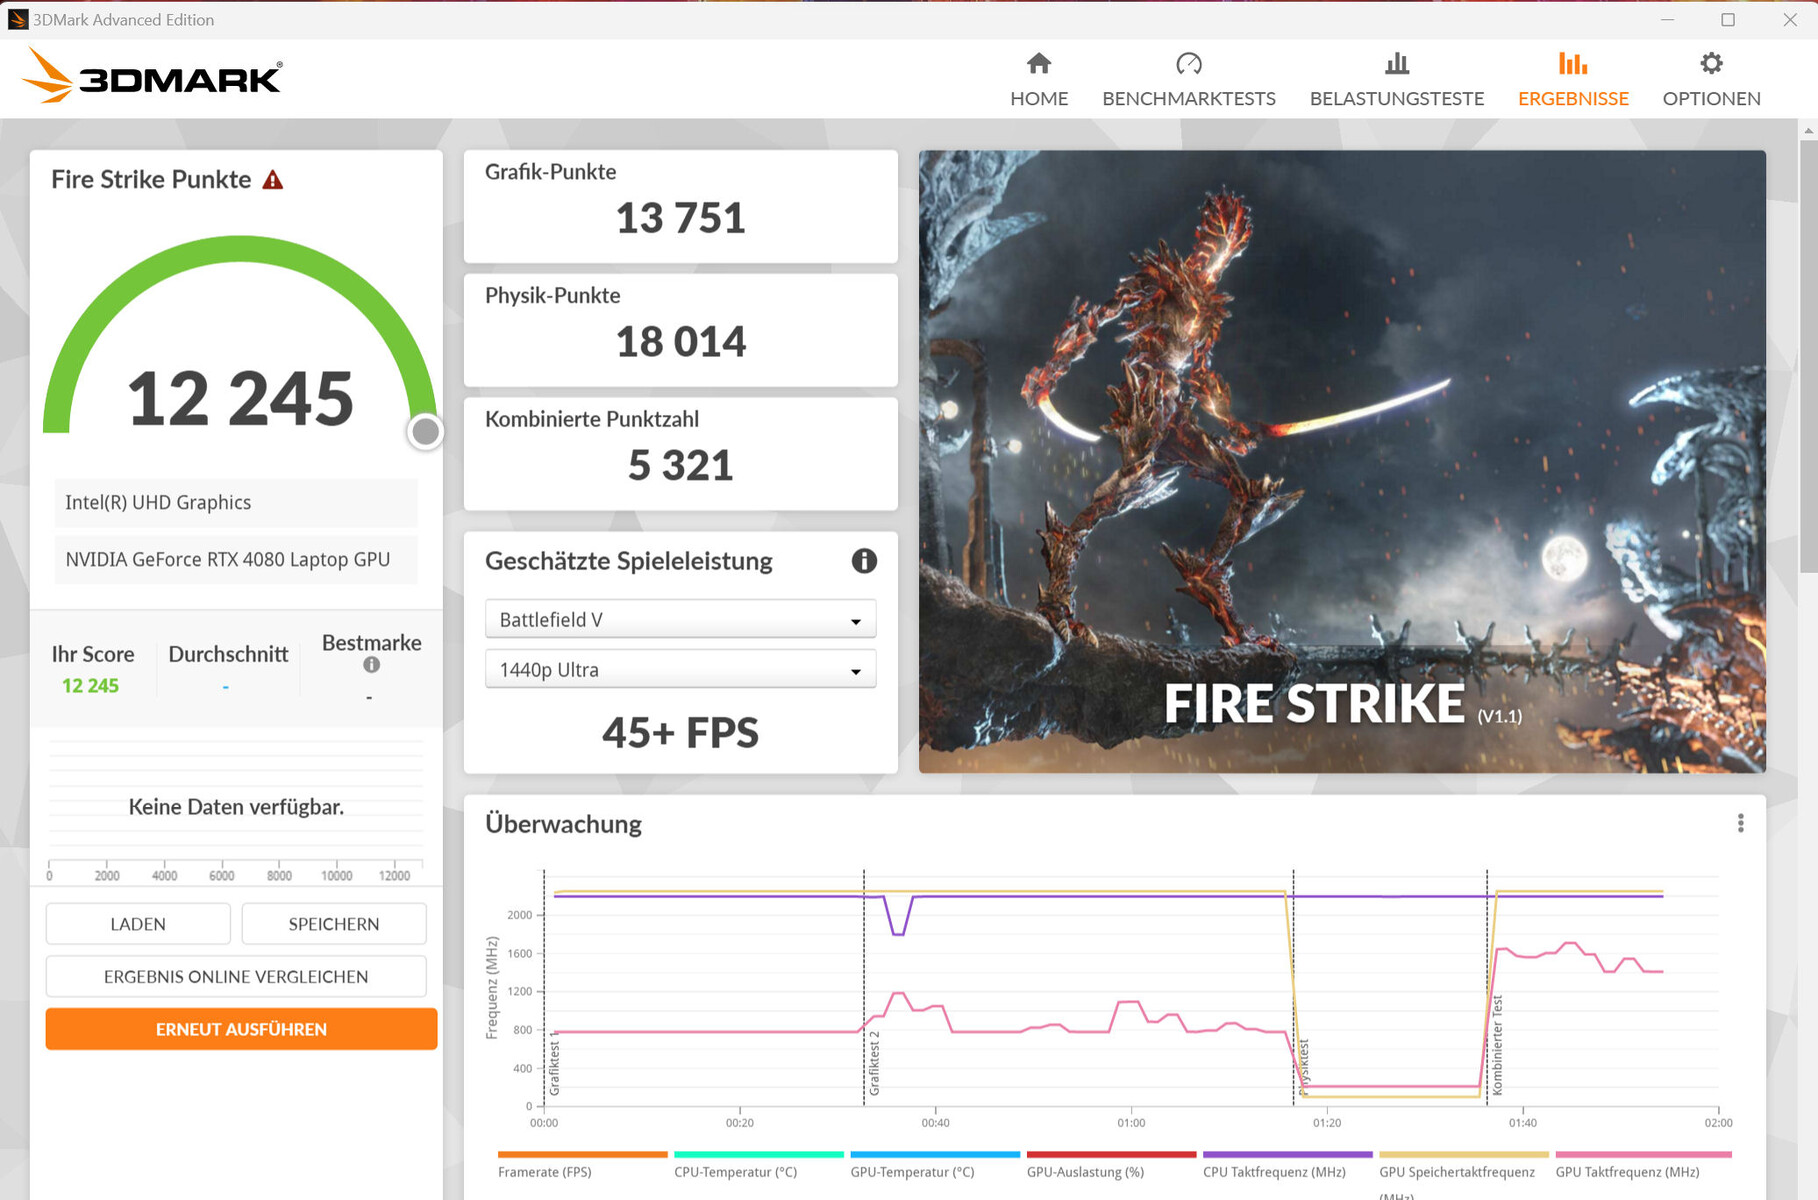
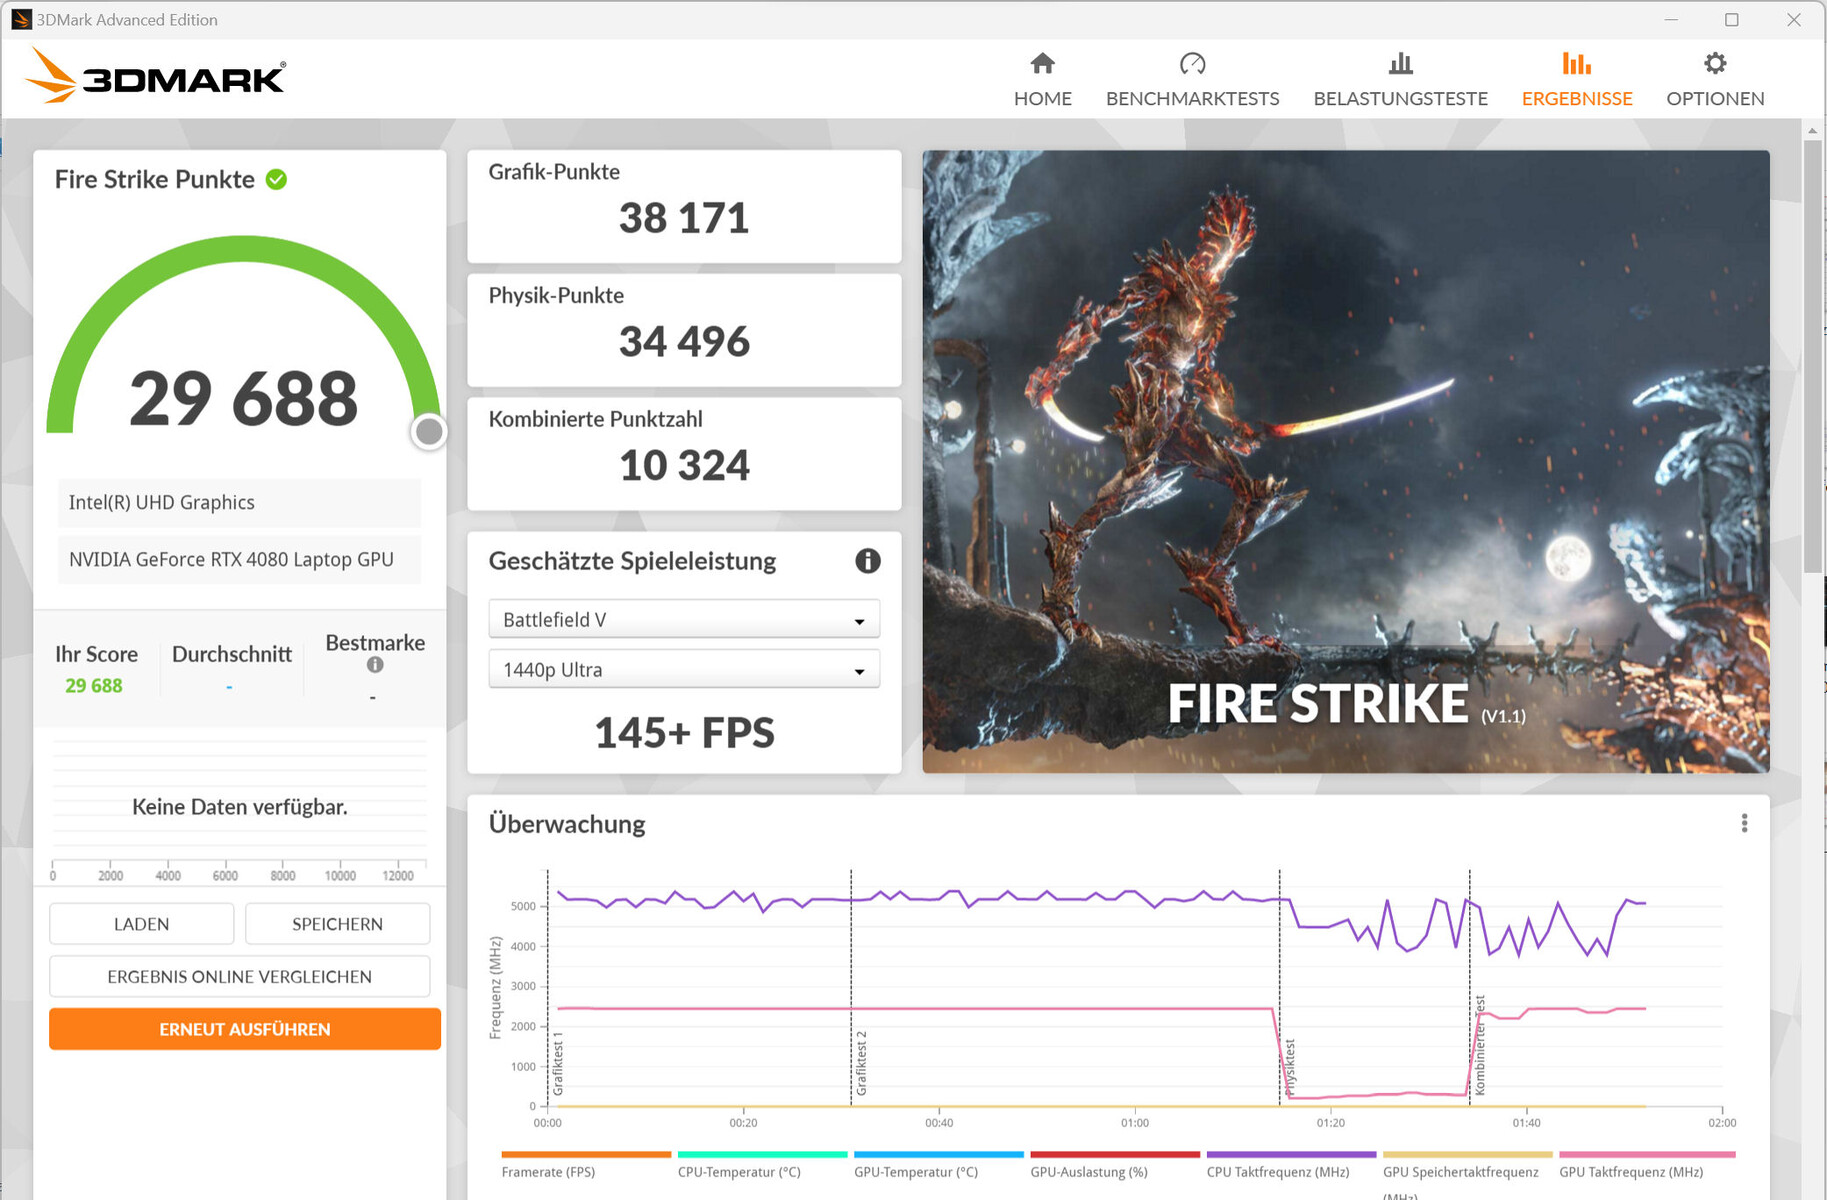
| 3DMark Performance rating - Percent | |
| Asus ROG Strix G16 G614JZ | |
| Lenovo Legion Pro 7 16IRX8H | |
| Razer Blade 16 Early 2023 -1! | |
| Média NVIDIA GeForce RTX 4080 Laptop GPU | |
| HP Omen 17-ck2097ng | |
| HP Omen 17-ck2097ng | |
| HP Omen 17-ck2097ng | |
| Média da turma Gaming | |
| Alienware m17 R5 (R9 6900HX, RX 6850M XT) | |
| 3DMark 11 - 1280x720 Performance GPU | |
| Lenovo Legion Pro 7 16IRX8H | |
| HP Omen 17-ck2097ng (Leistung) | |
| Asus ROG Strix G16 G614JZ | |
| Média NVIDIA GeForce RTX 4080 Laptop GPU (45199 - 63128, n=24) | |
| Razer Blade 16 Early 2023 | |
| HP Omen 17-ck2097ng | |
| HP Omen 17-ck2097ng (Leistung, dGPU) | |
| Média da turma Gaming (21841 - 80022, n=104, últimos 2 anos) | |
| Alienware m17 R5 (R9 6900HX, RX 6850M XT) | |
| Blender | |
| v3.3 Classroom OPTIX/RTX | |
| Média da turma Gaming (9 - 32, n=106, últimos 2 anos) | |
| HP Omen 17-ck2097ng (3.3.3) | |
| Média NVIDIA GeForce RTX 4080 Laptop GPU (13 - 20, n=22) | |
| Razer Blade 16 Early 2023 (3.3.3) | |
| Lenovo Legion Pro 7 16IRX8H (3.3.3) | |
| Asus ROG Strix G16 G614JZ (3.3.3) | |
| HP Omen 17-ck2097ng (3.3.3, Leistung) | |
| v3.3 Classroom CUDA | |
| Média da turma Gaming (15 - 228, n=106, últimos 2 anos) | |
| Lenovo Legion Pro 7 16IRX8H (3.3.3) | |
| HP Omen 17-ck2097ng (3.3.3, Leistung) | |
| Média NVIDIA GeForce RTX 4080 Laptop GPU (21 - 28, n=23) | |
| Razer Blade 16 Early 2023 (3.3.3) | |
| HP Omen 17-ck2097ng (3.3.3) | |
| Asus ROG Strix G16 G614JZ (3.3.3) | |
| HP Omen 17-ck2097ng (3.3.3, dGPU, Leistung) | |
| V-Ray 5 Benchmark | |
| GPU RTX | |
| Média da turma Gaming (1146 - 4363, n=33, últimos 2 anos) | |
| HP Omen 17-ck2097ng (5.0.1) | |
| HP Omen 17-ck2097ng (5.0.1, dGPU, Leistung) | |
| Razer Blade 16 Early 2023 (5.0.1) | |
| HP Omen 17-ck2097ng (5.0.1, Leistung) | |
| Média NVIDIA GeForce RTX 4080 Laptop GPU (2128 - 2843, n=17) | |
| GPU CUDA | |
| Média da turma Gaming (887 - 3288, n=33, últimos 2 anos) | |
| HP Omen 17-ck2097ng (5.0.1, dGPU, Leistung) | |
| HP Omen 17-ck2097ng (5.0.1, Leistung) | |
| HP Omen 17-ck2097ng (5.0.1) | |
| Média NVIDIA GeForce RTX 4080 Laptop GPU (1647 - 2112, n=17) | |
| Razer Blade 16 Early 2023 (5.0.1) | |
| CPU | |
| Média da turma Gaming (5864 - 30302, n=32, últimos 2 anos) | |
| HP Omen 17-ck2097ng (5.0.1, Leistung) | |
| Razer Blade 16 Early 2023 (5.0.1) | |
| HP Omen 17-ck2097ng (5.0.1, dGPU, Leistung) | |
| Média NVIDIA GeForce RTX 4080 Laptop GPU (11906 - 21823, n=17) | |
| HP Omen 17-ck2097ng (5.0.1) | |
| V-Ray Benchmark Next 4.10 | |
| GPU | |
| HP Omen 17-ck2097ng (v4.10.07, Leistung) | |
| Asus ROG Strix G16 G614JZ (v4.10.07 ) | |
| Lenovo Legion Pro 7 16IRX8H (v4.10.07 ) | |
| HP Omen 17-ck2097ng (v4.10.07 ) | |
| Média NVIDIA GeForce RTX 4080 Laptop GPU (812 - 1036, n=16) | |
| HP Omen 17-ck2097ng (v4.10.07, dGPU, Leistung) | |
| Média da turma Gaming (427 - 1627, n=99, últimos 2 anos) | |
| Alienware m17 R5 (R9 6900HX, RX 6850M XT) (v4.10.07 ) | |
| CPU | |
| Lenovo Legion Pro 7 16IRX8H (v4.10.07 ) | |
| Asus ROG Strix G16 G614JZ (v4.10.07 ) | |
| HP Omen 17-ck2097ng (v4.10.07, Leistung) | |
| Média NVIDIA GeForce RTX 4080 Laptop GPU (19636 - 31653, n=16) | |
| Média da turma Gaming (10048 - 45327, n=97, últimos 2 anos) | |
| HP Omen 17-ck2097ng (v4.10.07, dGPU, Leistung) | |
| HP Omen 17-ck2097ng (v4.10.07 ) | |
| Alienware m17 R5 (R9 6900HX, RX 6850M XT) (v4.10.07 ) | |
| Geekbench 5.5 - OpenCL Score | |
| Asus ROG Strix G16 G614JZ | |
| HP Omen 17-ck2097ng (Leistung) | |
| HP Omen 17-ck2097ng (dGPU, Leistung) | |
| Razer Blade 16 Early 2023 | |
| HP Omen 17-ck2097ng | |
| Média NVIDIA GeForce RTX 4080 Laptop GPU (146413 - 189320, n=23) | |
| Média da turma Gaming (80702 - 277970, n=101, últimos 2 anos) | |
| Lenovo Legion Pro 7 16IRX8H | |
| Alienware m17 R5 (R9 6900HX, RX 6850M XT) | |
| Geekbench 6.0 - GPU OpenCL 6.0 | |
| Média da turma Gaming (155885 - 241981, n=3, últimos 2 anos) | |
| HP Omen 17-ck2097ng | |
| Média NVIDIA GeForce RTX 4080 Laptop GPU (153564 - 175235, n=3) | |
* ... menor é melhor
Desempenho nos jogos
O Omen, que é direcionado para jogos de QHD em configurações altas a máximas, também permite resoluções mais altas quando o monitor correspondente é conectado. As taxas de quadros dos jogos que testamos variam abaixo da média de todas as GPUs RTX 4080 que testamos até agora. O perfil de "Performance" leva a um aumento das taxas de quadros que está ligeiramente acima da média. Em alguns jogos, o modo dGPU é capaz de proporcionar um aumento adicional.
| Performance rating - Percent | |
| Asus ROG Strix G16 G614JZ | |
| Razer Blade 16 Early 2023 | |
| Lenovo Legion Pro 7 16IRX8H | |
| HP Omen 17-ck2097ng | |
| HP Omen 17-ck2097ng | |
| Média NVIDIA GeForce RTX 4080 Laptop GPU | |
| Média da turma Gaming | |
| HP Omen 17-ck2097ng | |
| Alienware m17 R5 (R9 6900HX, RX 6850M XT) | |
| The Witcher 3 - 1920x1080 Ultra Graphics & Postprocessing (HBAO+) | |
| Média da turma Gaming (104.7 - 240, n=7, últimos 2 anos) | |
| Lenovo Legion Pro 7 16IRX8H | |
| Razer Blade 16 Early 2023 | |
| Asus ROG Strix G16 G614JZ | |
| HP Omen 17-ck2097ng (dGPU) | |
| HP Omen 17-ck2097ng (Leistung) | |
| Média NVIDIA GeForce RTX 4080 Laptop GPU (130.4 - 186.1, n=20) | |
| HP Omen 17-ck2097ng | |
| Alienware m17 R5 (R9 6900HX, RX 6850M XT) | |
| GTA V - 1920x1080 Highest AA:4xMSAA + FX AF:16x | |
| Asus ROG Strix G16 G614JZ | |
| Lenovo Legion Pro 7 16IRX8H | |
| Razer Blade 16 Early 2023 | |
| Média da turma Gaming (48.3 - 186.9, n=94, últimos 2 anos) | |
| Média NVIDIA GeForce RTX 4080 Laptop GPU (102.9 - 152.7, n=21) | |
| HP Omen 17-ck2097ng (Leistung) | |
| HP Omen 17-ck2097ng (dGPU, Leistung) | |
| HP Omen 17-ck2097ng | |
| Alienware m17 R5 (R9 6900HX, RX 6850M XT) | |
| Final Fantasy XV Benchmark - 1920x1080 High Quality | |
| Asus ROG Strix G16 G614JZ (1.3) | |
| HP Omen 17-ck2097ng (1.3, dGPU, Leistung) | |
| HP Omen 17-ck2097ng (1.3, Leistung) | |
| Lenovo Legion Pro 7 16IRX8H (1.3) | |
| Média NVIDIA GeForce RTX 4080 Laptop GPU (129 - 182.1, n=23) | |
| Razer Blade 16 Early 2023 (1.3) | |
| Média da turma Gaming (41 - 215, n=95, últimos 2 anos) | |
| HP Omen 17-ck2097ng (1.3) | |
| Alienware m17 R5 (R9 6900HX, RX 6850M XT) (1.3) | |
| Strange Brigade - 1920x1080 ultra AA:ultra AF:16 | |
| Asus ROG Strix G16 G614JZ (1.47.22.14 D3D12) | |
| HP Omen 17-ck2097ng (1.47.22.14 D3D12, dGPU, Leistung) | |
| Razer Blade 16 Early 2023 (1.47.22.14 D3D12) | |
| Lenovo Legion Pro 7 16IRX8H (1.47.22.14 D3D12) | |
| Média NVIDIA GeForce RTX 4080 Laptop GPU (239 - 357, n=22) | |
| HP Omen 17-ck2097ng (1.47.22.14 D3D12, Leistung) | |
| Média da turma Gaming (76.3 - 458, n=87, últimos 2 anos) | |
| HP Omen 17-ck2097ng (1.47.22.14 D3D12) | |
| Alienware m17 R5 (R9 6900HX, RX 6850M XT) (1.47.22.14 D3D12) | |
| Dota 2 Reborn - 1920x1080 ultra (3/3) best looking | |
| Razer Blade 16 Early 2023 | |
| Asus ROG Strix G16 G614JZ | |
| Lenovo Legion Pro 7 16IRX8H | |
| HP Omen 17-ck2097ng (Leistung) | |
| HP Omen 17-ck2097ng (dGPU, Leistung) | |
| Média NVIDIA GeForce RTX 4080 Laptop GPU (133 - 194.7, n=23) | |
| HP Omen 17-ck2097ng | |
| Média da turma Gaming (84.8 - 248, n=107, últimos 2 anos) | |
| Alienware m17 R5 (R9 6900HX, RX 6850M XT) | |
| X-Plane 11.11 - 1920x1080 high (fps_test=3) | |
| Asus ROG Strix G16 G614JZ | |
| Razer Blade 16 Early 2023 | |
| Lenovo Legion Pro 7 16IRX8H | |
| HP Omen 17-ck2097ng (dGPU, Leistung) | |
| Média NVIDIA GeForce RTX 4080 Laptop GPU (89.3 - 143.5, n=25) | |
| HP Omen 17-ck2097ng (Leistung) | |
| HP Omen 17-ck2097ng | |
| Média da turma Gaming (55.5 - 143.5, n=109, últimos 2 anos) | |
| Alienware m17 R5 (R9 6900HX, RX 6850M XT) | |
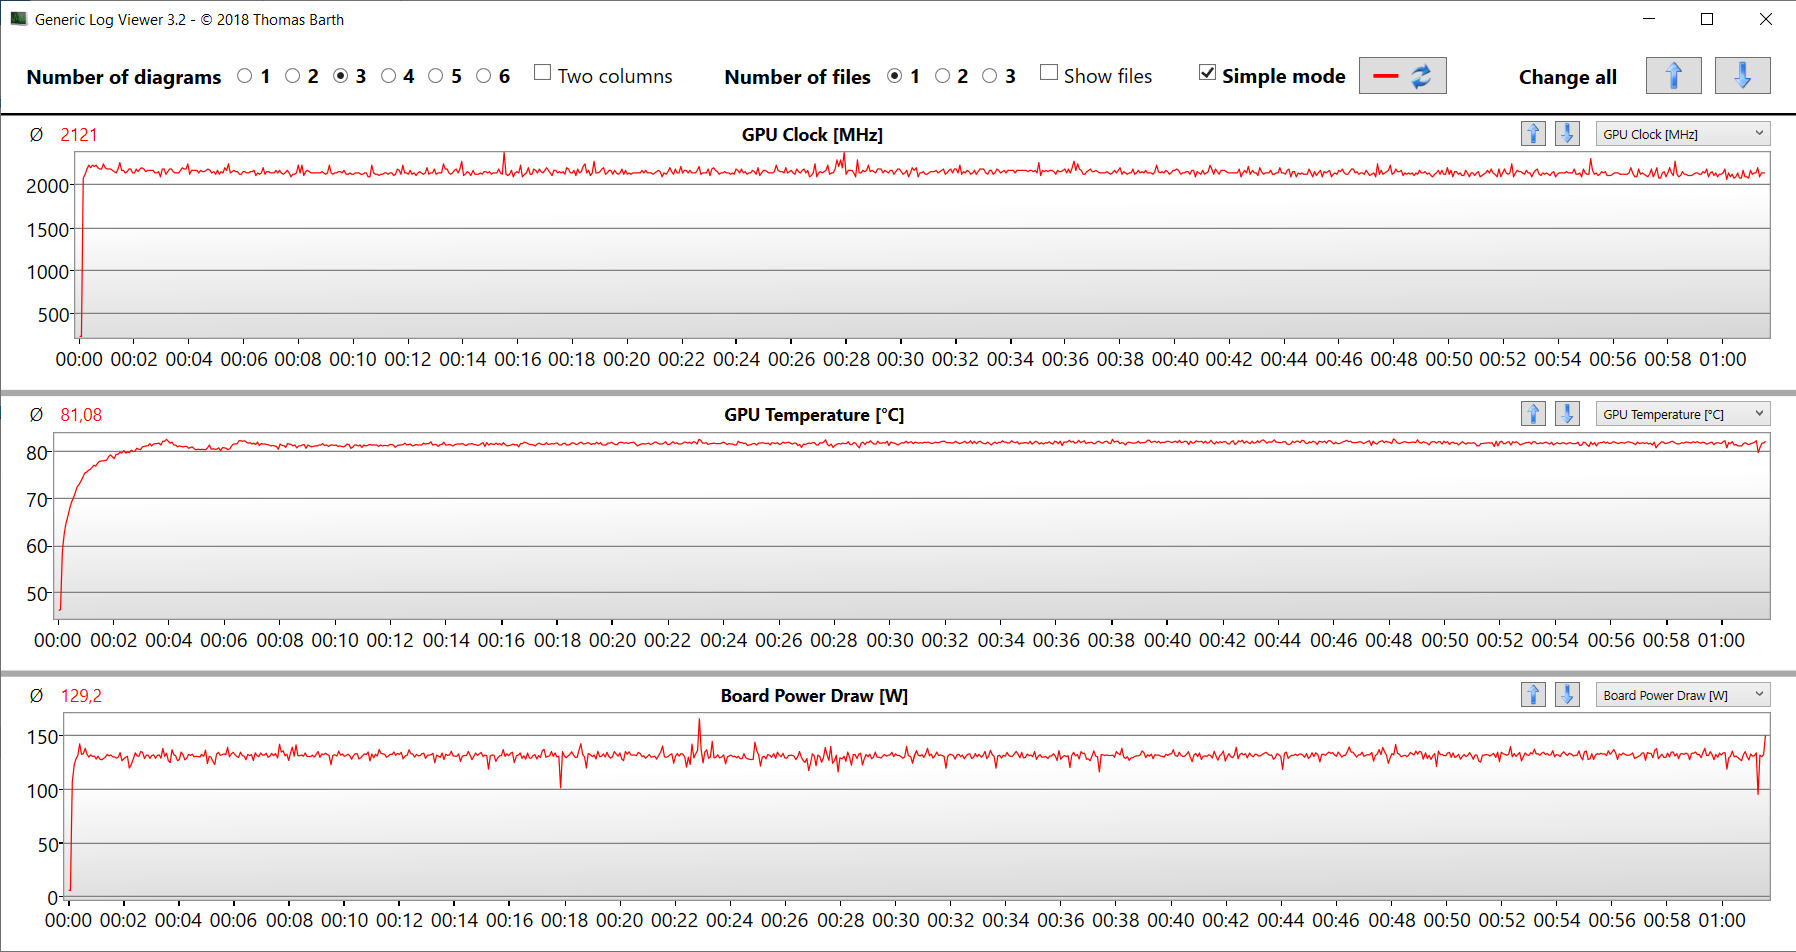
A fim de avaliar se as taxas de quadros permanecem constantes em grande parte durante um período de tempo mais longo, executamos o jogo "The Witcher 3" por cerca de 60 minutos em resolução Full-HD e ajustes de qualidade máxima. O personagem do jogo não é movido durante este tempo. Não notamos nenhuma queda nas taxas de quadros.
The Witcher 3 FPS Chart
| baixo | média | alto | ultra | QHD | |
|---|---|---|---|---|---|
| GTA V (2015) | 183.8 | 183.1 | 175.5 | 121.1 | 116 |
| The Witcher 3 (2015) | 459.7 | 400.5 | 287.8 | 164 | |
| Dota 2 Reborn (2015) | 206 | 180.5 | 167.2 | 155.3 | |
| Final Fantasy XV Benchmark (2018) | 192.4 | 173 | 145.4 | 117.5 | |
| X-Plane 11.11 (2018) | 169 | 146.9 | 119.4 | ||
| Far Cry 5 (2018) | 160 | 132 | 129 | 126 | 124 |
| Strange Brigade (2018) | 388 | 300 | 290 | 276 | 208 |
| F1 22 (2022) | 255 | 248 | 231 | 97.5 | 67.6 |
| The Callisto Protocol (2022) | 167.6 | 153.7 | 148.3 | 111.5 | 83.7 |
| Returnal (2023) | 150 | 147 | 137 | 121 | 92 |
| Atomic Heart (2023) | 170.8 | 142.3 | 121.1 | 100.3 | 79.2 |
| Company of Heroes 3 (2023) | 275 | 244.6 | 206.5 | 205.31 | 153.8 |
| Sons of the Forest (2023) | 78.1 | 75 | 74.6 | 69.7 | 66.8 |
Emissões - O laptop HP produz muito ruído
Níveis de ruídos
Na operação diária (Escritório, Internet) e durante a operação ociosa, os ventiladores em funcionamento constante são claramente audíveis. Sob carga pesada (teste de estresse, The Witcher 3), o nível de ruído aumenta ainda mais e volumes de até 50 dB (A) são possíveis. O modo "Desempenho" leva a um aumento mais rápido do nível de ruído até o máximo, permanecendo a esse nível. O ruído consiste em algum assobio acompanhado por um assobio moderado.
A BIOS do Omen contém a opção "Ventilador sempre ligado" da própria HP, que é ativada por padrão. A desativação desta opção não leva a nenhuma mudança em nossa unidade de teste.
Barulho
| Ocioso |
| 31 / 32 / 33 dB |
| Carga |
| 45 / 50 dB |
 | ||
30 dB silencioso 40 dB(A) audível 50 dB(A) ruidosamente alto |
||
min: | ||
| HP Omen 17-ck2097ng i9-13900HX, GeForce RTX 4080 Laptop GPU | Alienware m17 R5 (R9 6900HX, RX 6850M XT) R9 6900HX, Radeon RX 6850M XT | Razer Blade 16 Early 2023 i9-13950HX, GeForce RTX 4080 Laptop GPU | Lenovo Legion Pro 7 16IRX8H i9-13900HX, GeForce RTX 4080 Laptop GPU | Asus ROG Strix G16 G614JZ i9-13980HX, GeForce RTX 4080 Laptop GPU | HP Omen 17-ck1075ng i7-12700H, GeForce RTX 3070 Ti Laptop GPU | |
|---|---|---|---|---|---|---|
| Noise | 11% | 12% | -2% | 2% | -2% | |
| desligado / ambiente * (dB) | 24 | 23 4% | 23 4% | 24 -0% | 25 -4% | 25.4 -6% |
| Idle Minimum * (dB) | 31 | 23 26% | 23 26% | 26 16% | 26 16% | 28 10% |
| Idle Average * (dB) | 32 | 28.11 12% | 23 28% | 28 12% | 28 12% | 28 12% |
| Idle Maximum * (dB) | 33 | 28.11 15% | 23.6 28% | 34 -3% | 30 9% | 31.2 5% |
| Load Average * (dB) | 45 | 30.62 32% | 39 13% | 47 -4% | 48 -7% | 52.2 -16% |
| Witcher 3 ultra * (dB) | 45 | 49.75 -11% | 51.6 -15% | 55 -22% | 49 -9% | 52.2 -16% |
| Load Maximum * (dB) | 50 | 50.17 -0% | 51.3 -3% | 56 -12% | 52 -4% | 52.2 -4% |
* ... menor é melhor
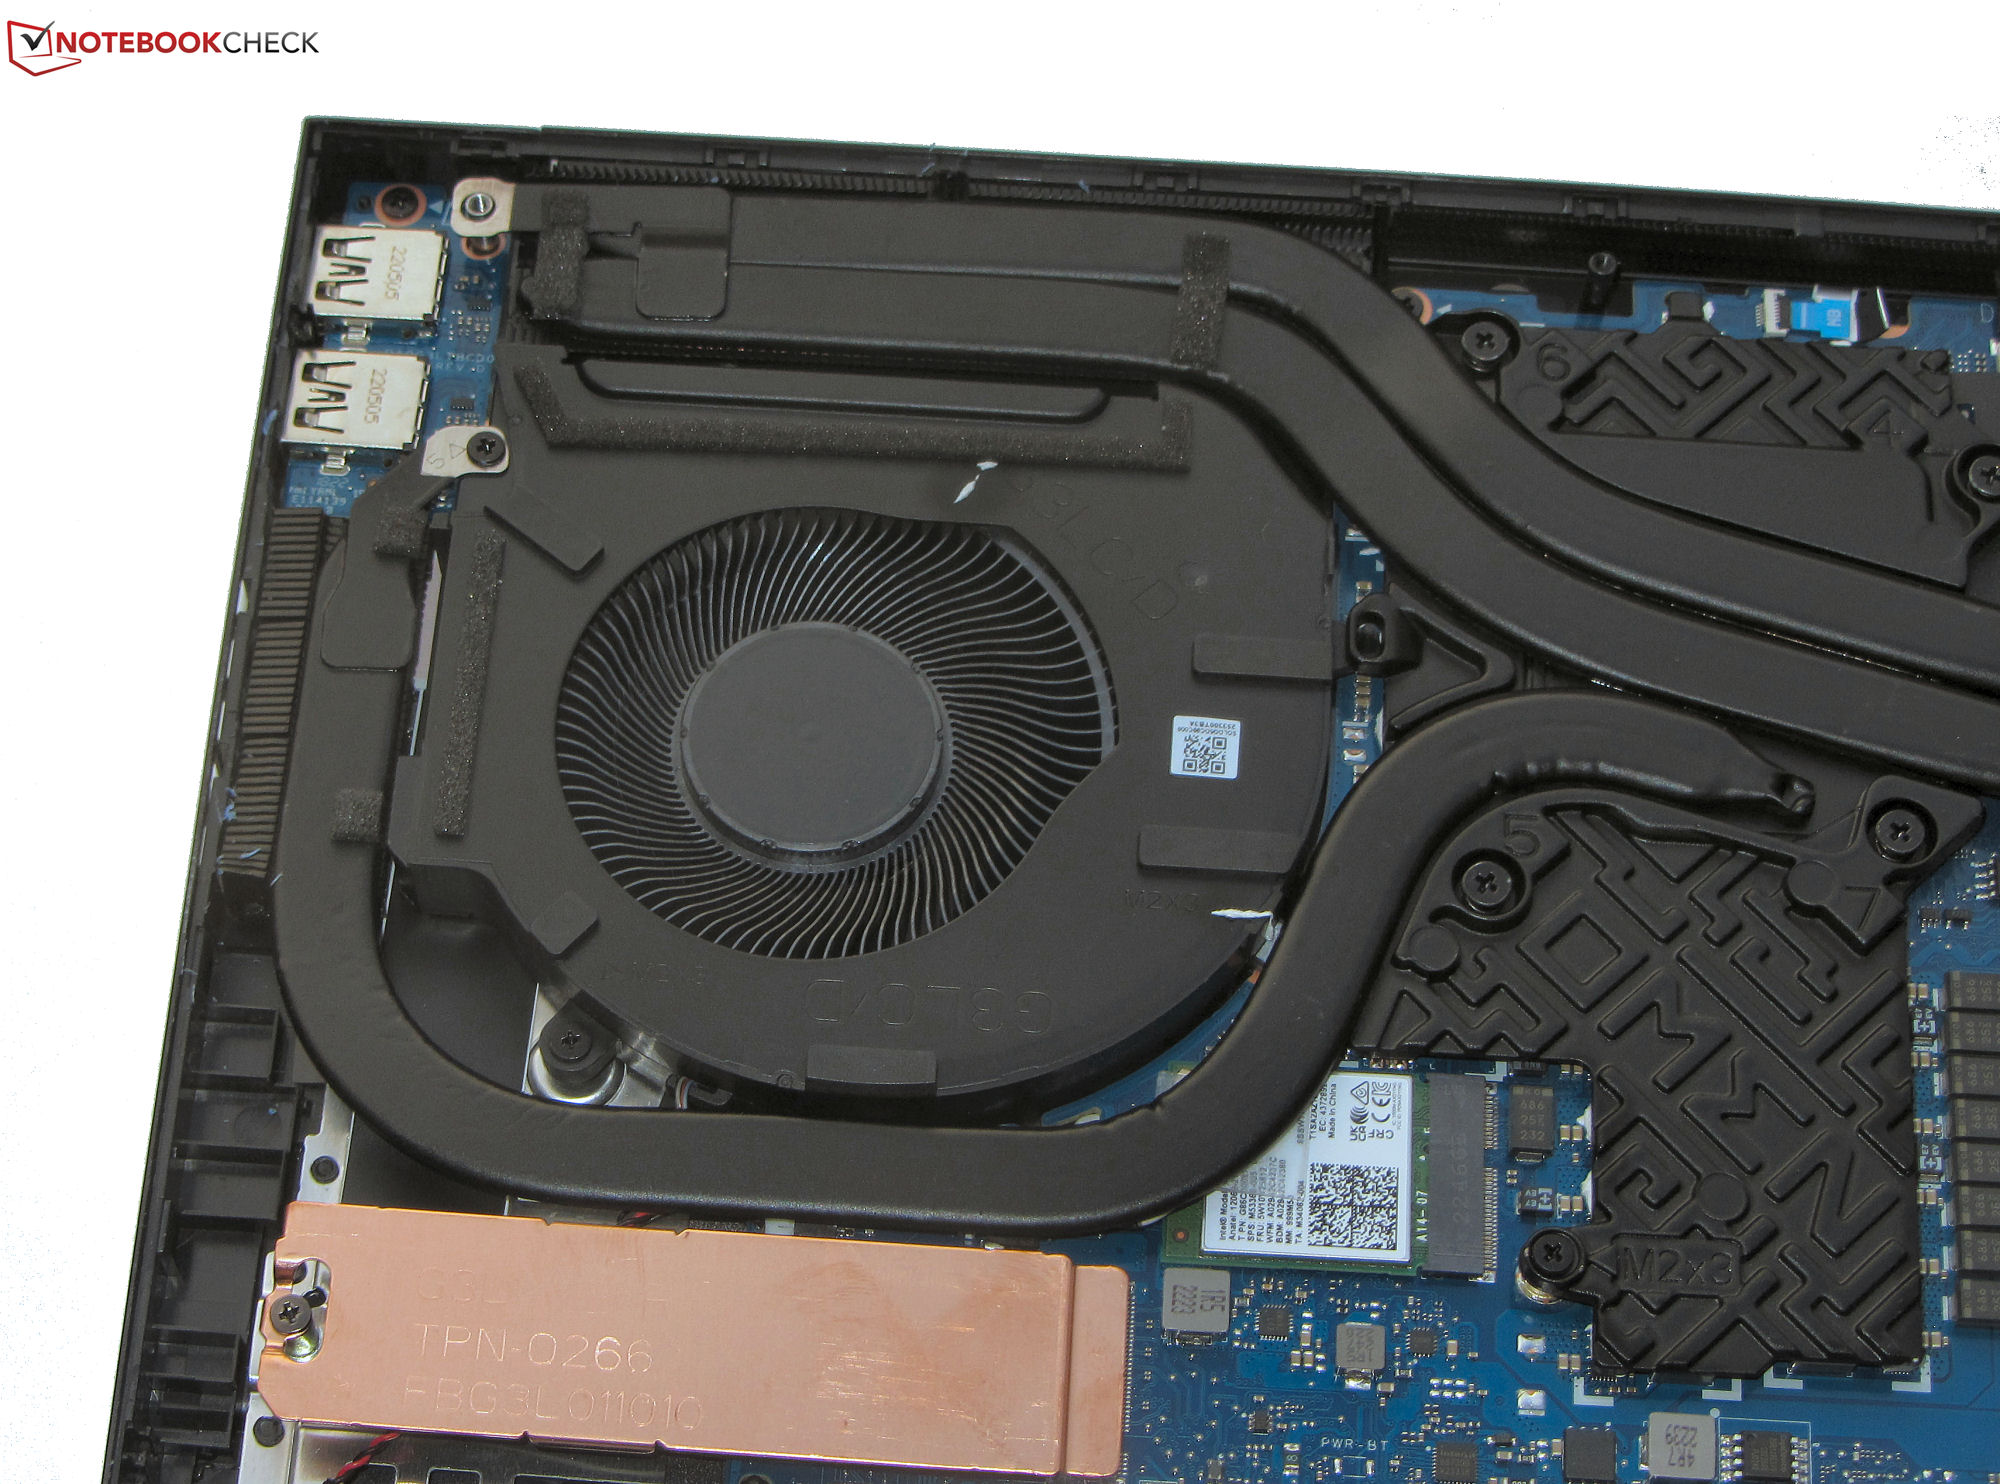
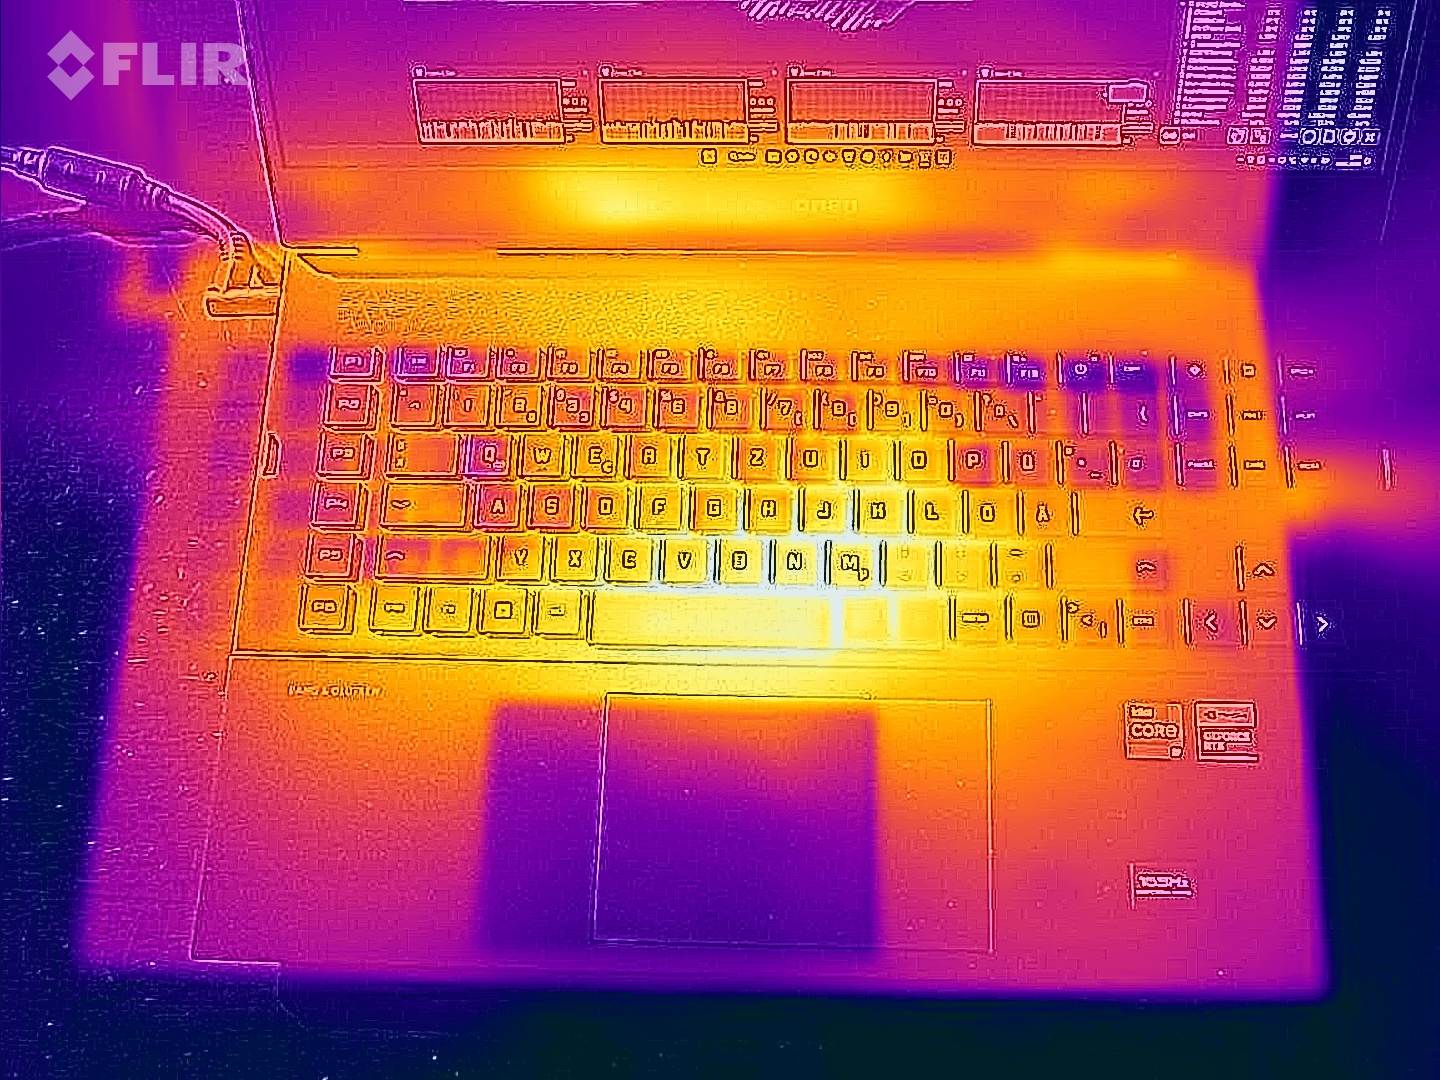
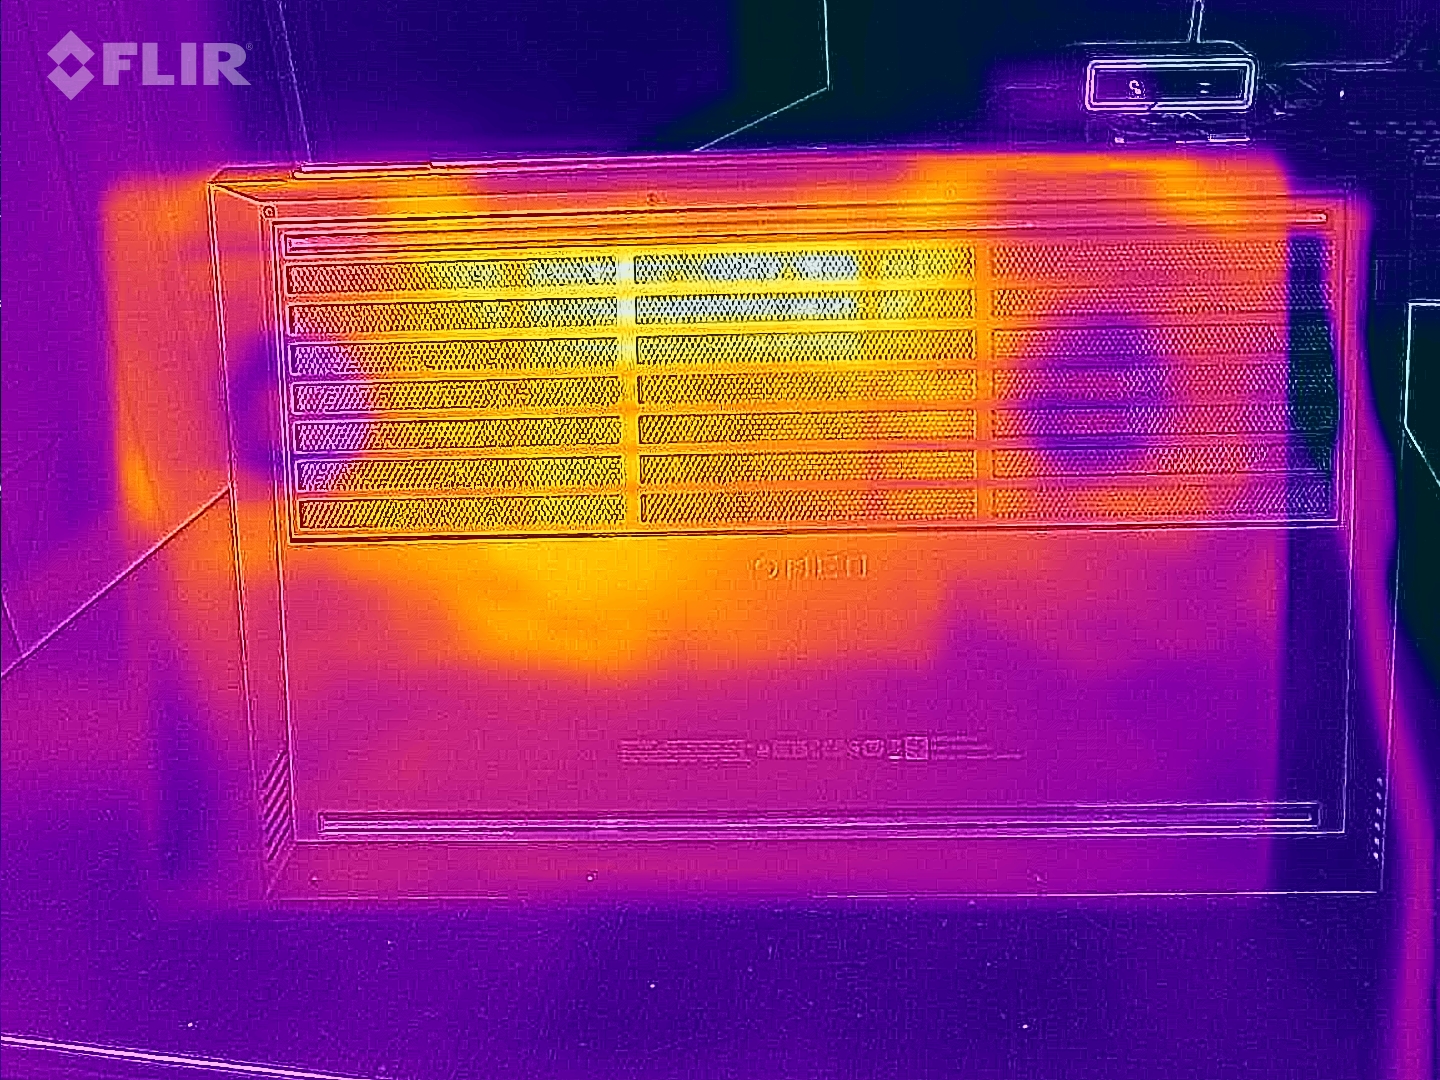
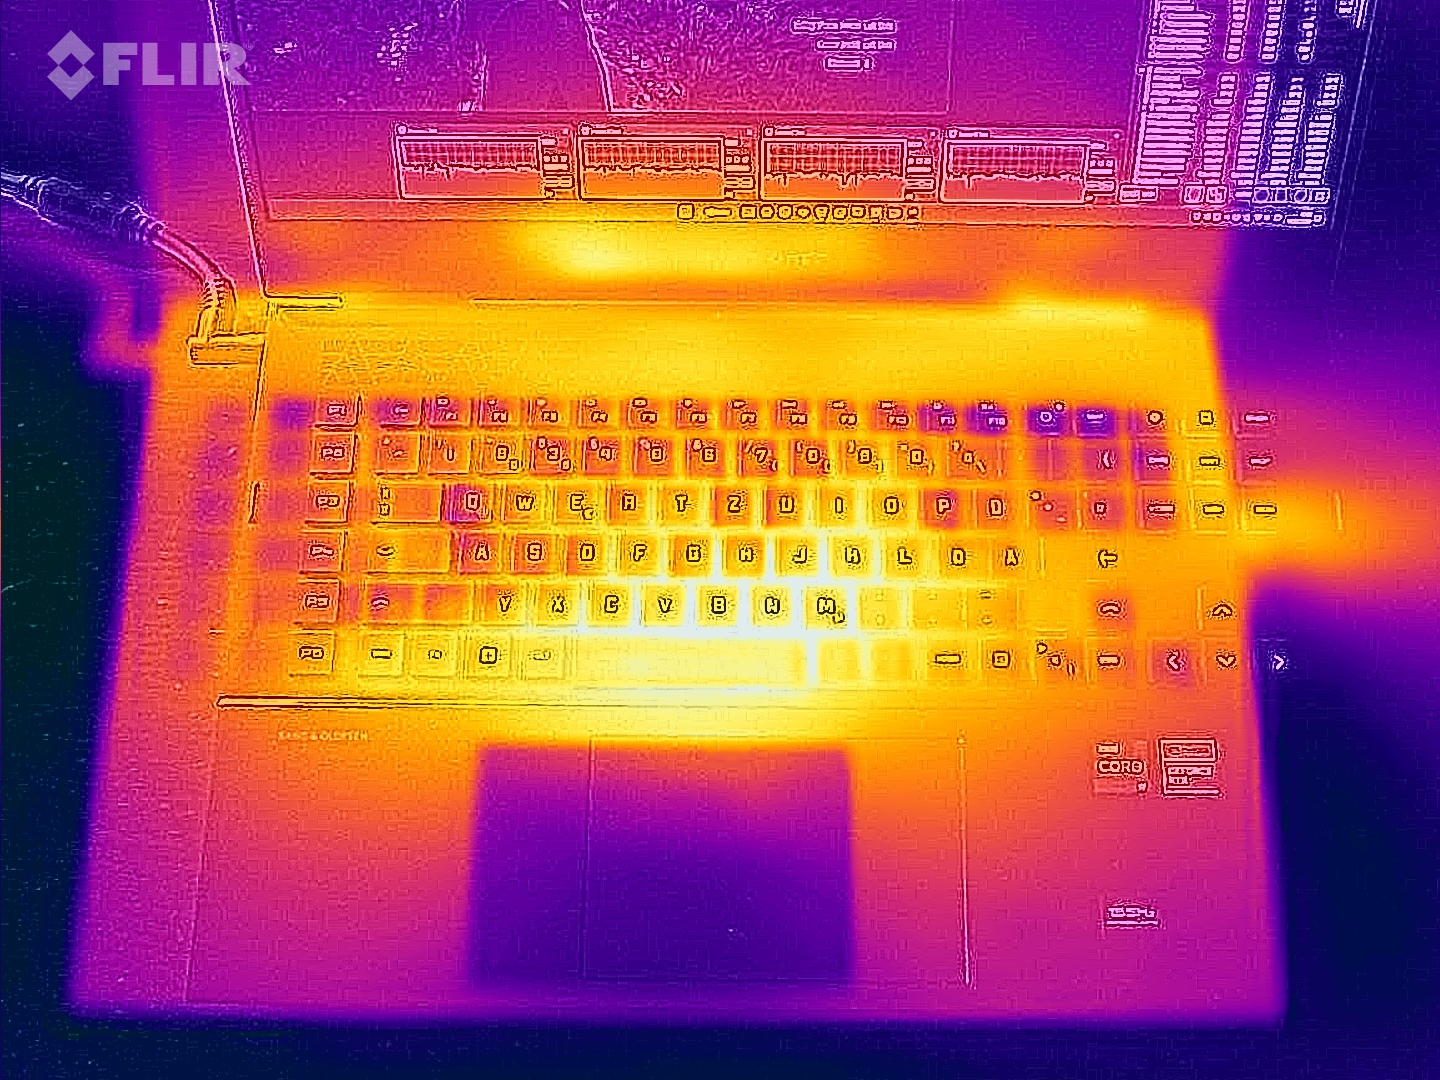
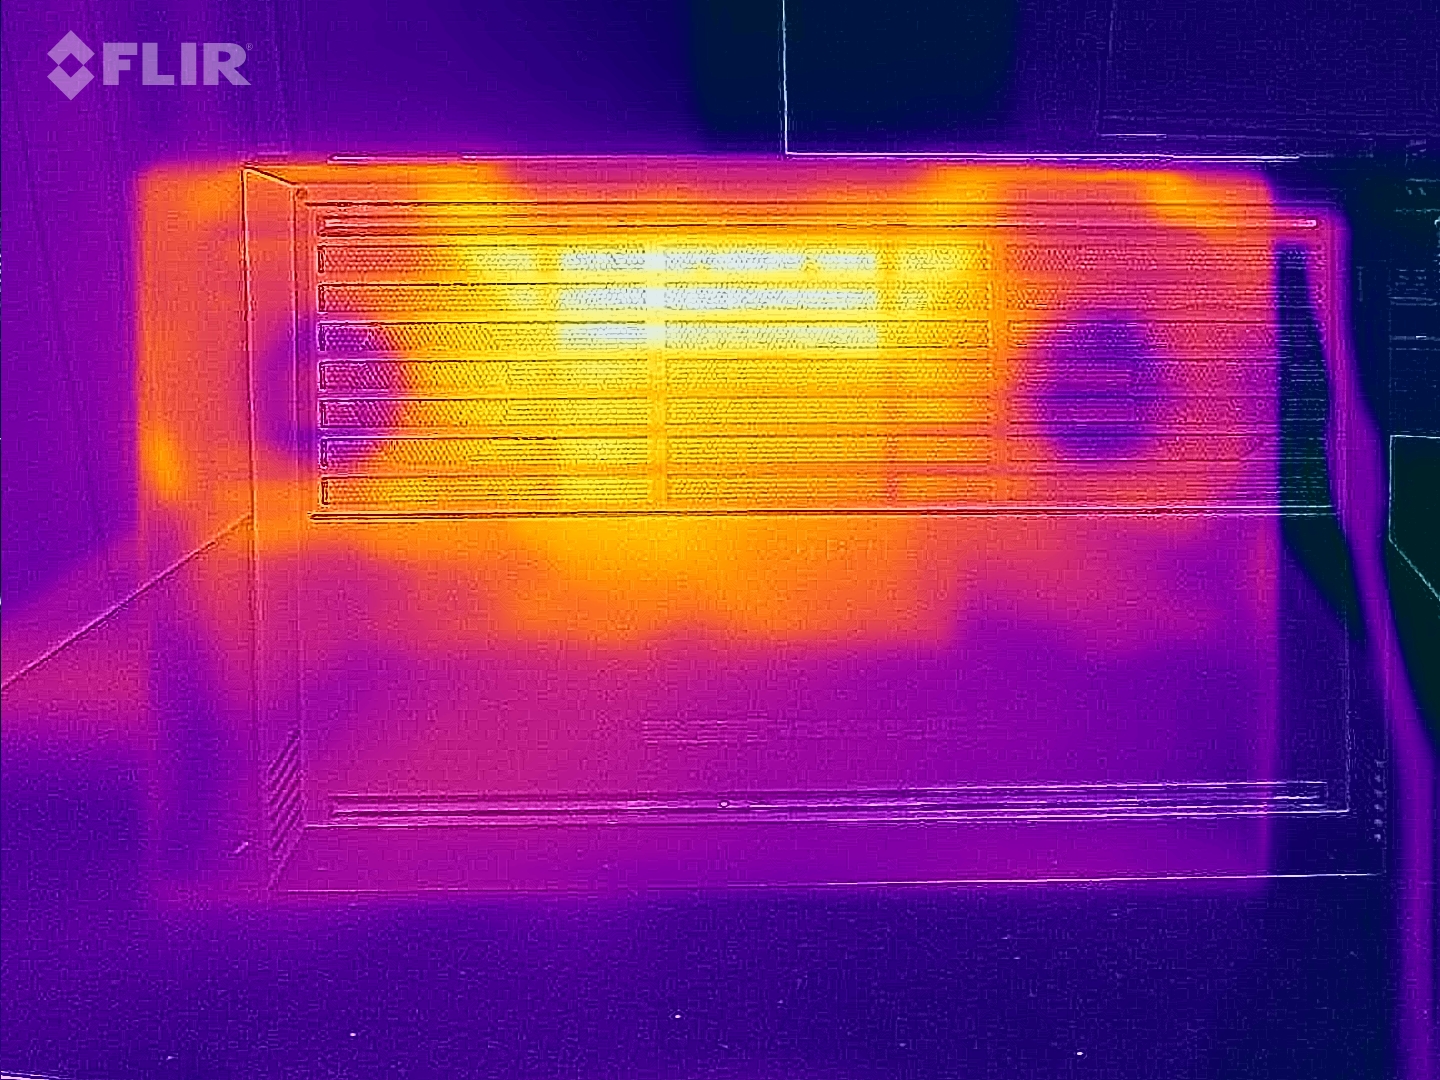
Temperaturas
No funcionamento diário (Escritório, Internet), as temperaturas do estojo permanecem dentro da faixa verde. Sob carga (teste de estresse, The Witcher 3), o laptop aquece visivelmente, mas isto permanece dentro dos limites - pelo menos na parte superior. As temperaturas da CPU não dão motivos para preocupações.
(±) A temperatura máxima no lado superior é 41 °C / 106 F, em comparação com a média de 40.4 °C / 105 F , variando de 21.2 a 68.8 °C para a classe Gaming.
(-) A parte inferior aquece até um máximo de 51 °C / 124 F, em comparação com a média de 43.2 °C / 110 F
(+) Em uso inativo, a temperatura média para o lado superior é 23.7 °C / 75 F, em comparação com a média do dispositivo de 33.9 °C / ### class_avg_f### F.
(-) Jogando The Witcher 3, a temperatura média para o lado superior é 38.2 °C / 101 F, em comparação com a média do dispositivo de 33.9 °C / ## #class_avg_f### F.
(+) Os apoios para as mãos e o touchpad estão atingindo a temperatura máxima da pele (35 °C / 95 F) e, portanto, não estão quentes.
(-) A temperatura média da área do apoio para as mãos de dispositivos semelhantes foi 28.8 °C / 83.8 F (-6.2 °C / -11.2 F).
| HP Omen 17-ck2097ng Intel Core i9-13900HX, NVIDIA GeForce RTX 4080 Laptop GPU | Alienware m17 R5 (R9 6900HX, RX 6850M XT) AMD Ryzen 9 6900HX, AMD Radeon RX 6850M XT | Razer Blade 16 Early 2023 Intel Core i9-13950HX, NVIDIA GeForce RTX 4080 Laptop GPU | Lenovo Legion Pro 7 16IRX8H Intel Core i9-13900HX, NVIDIA GeForce RTX 4080 Laptop GPU | Asus ROG Strix G16 G614JZ Intel Core i9-13980HX, NVIDIA GeForce RTX 4080 Laptop GPU | HP Omen 17-ck1075ng Intel Core i7-12700H, NVIDIA GeForce RTX 3070 Ti Laptop GPU | |
|---|---|---|---|---|---|---|
| Heat | -20% | -8% | -28% | -23% | -16% | |
| Maximum Upper Side * (°C) | 41 | 53 -29% | 40 2% | 48 -17% | 54 -32% | 31.3 24% |
| Maximum Bottom * (°C) | 51 | 56 -10% | 37.6 26% | 49 4% | 55 -8% | 43.3 15% |
| Idle Upper Side * (°C) | 24 | 30 -25% | 32.4 -35% | 40 -67% | 29 -21% | 31.3 -30% |
| Idle Bottom * (°C) | 25 | 29 -16% | 31.4 -26% | 33 -32% | 33 -32% | 43.3 -73% |
* ... menor é melhor
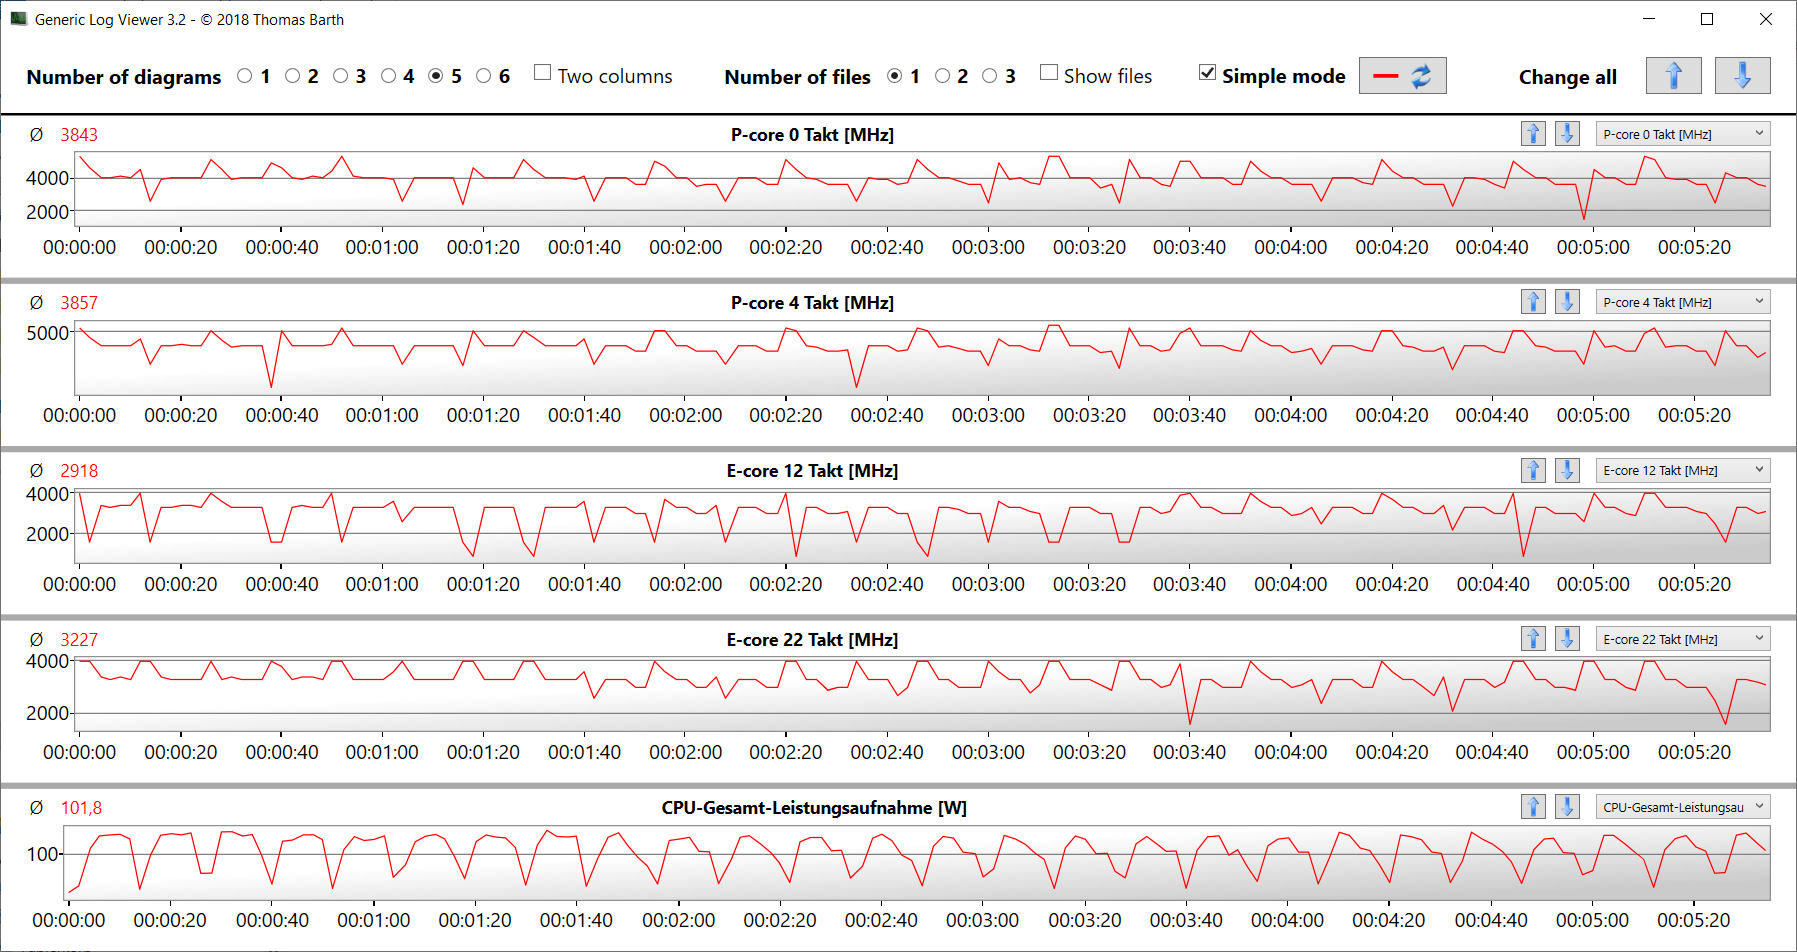
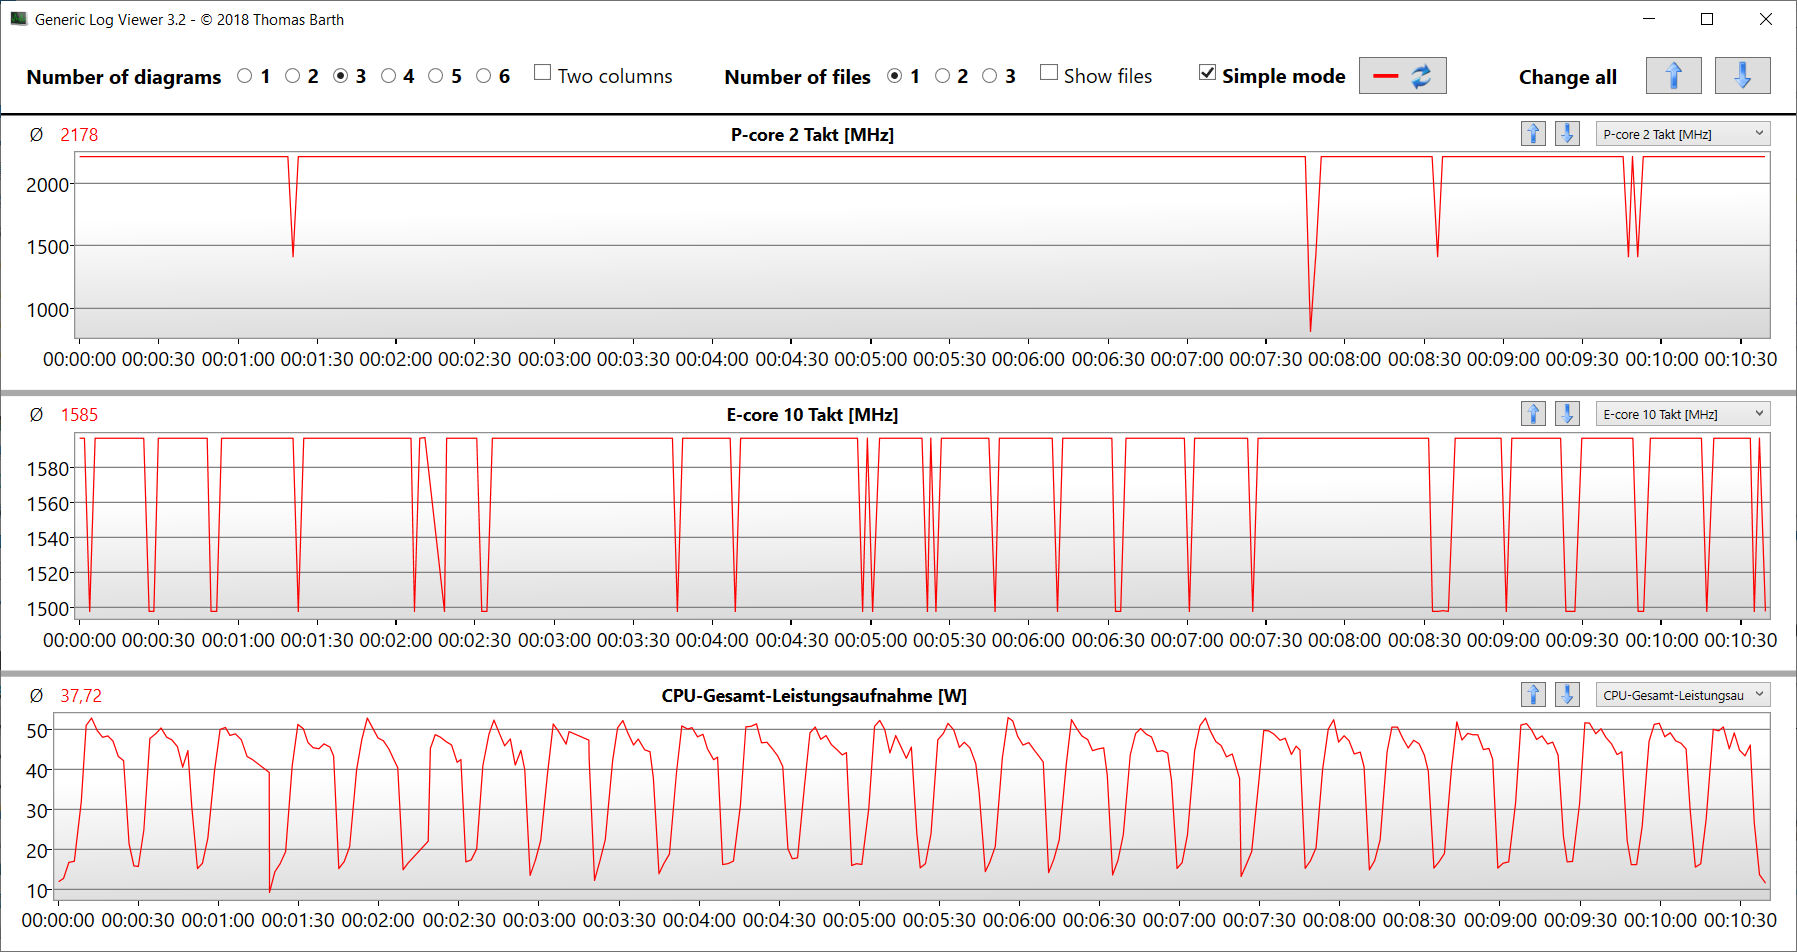
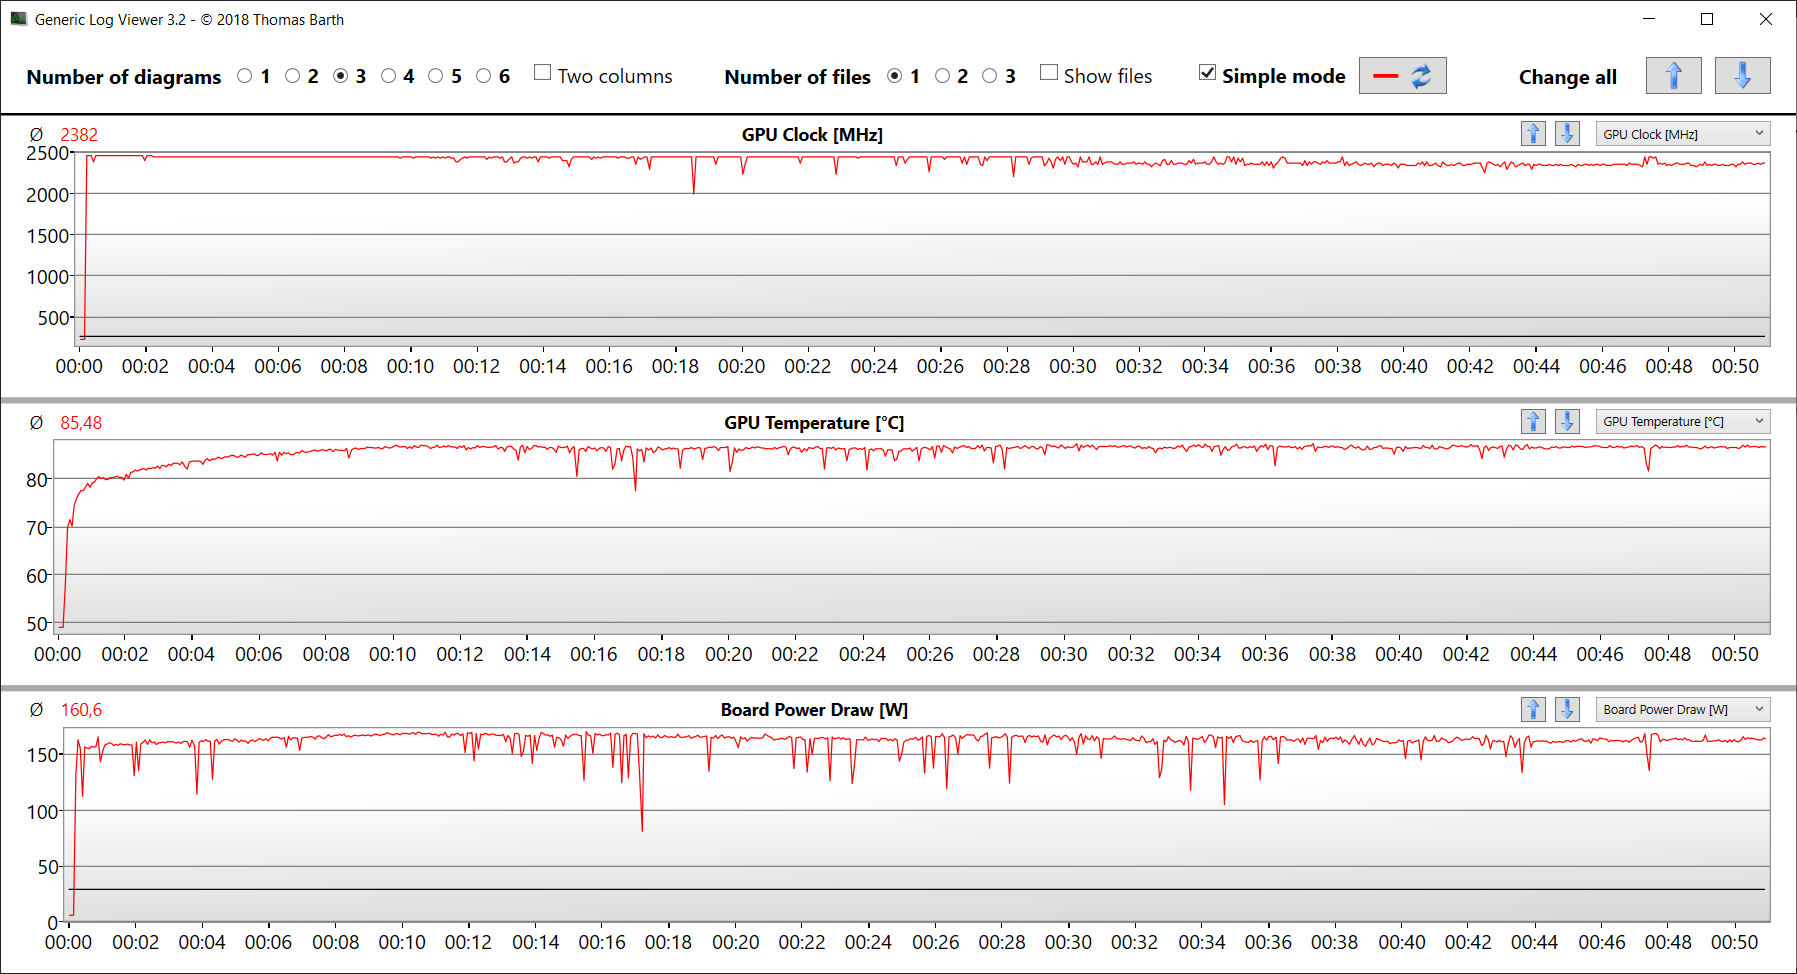
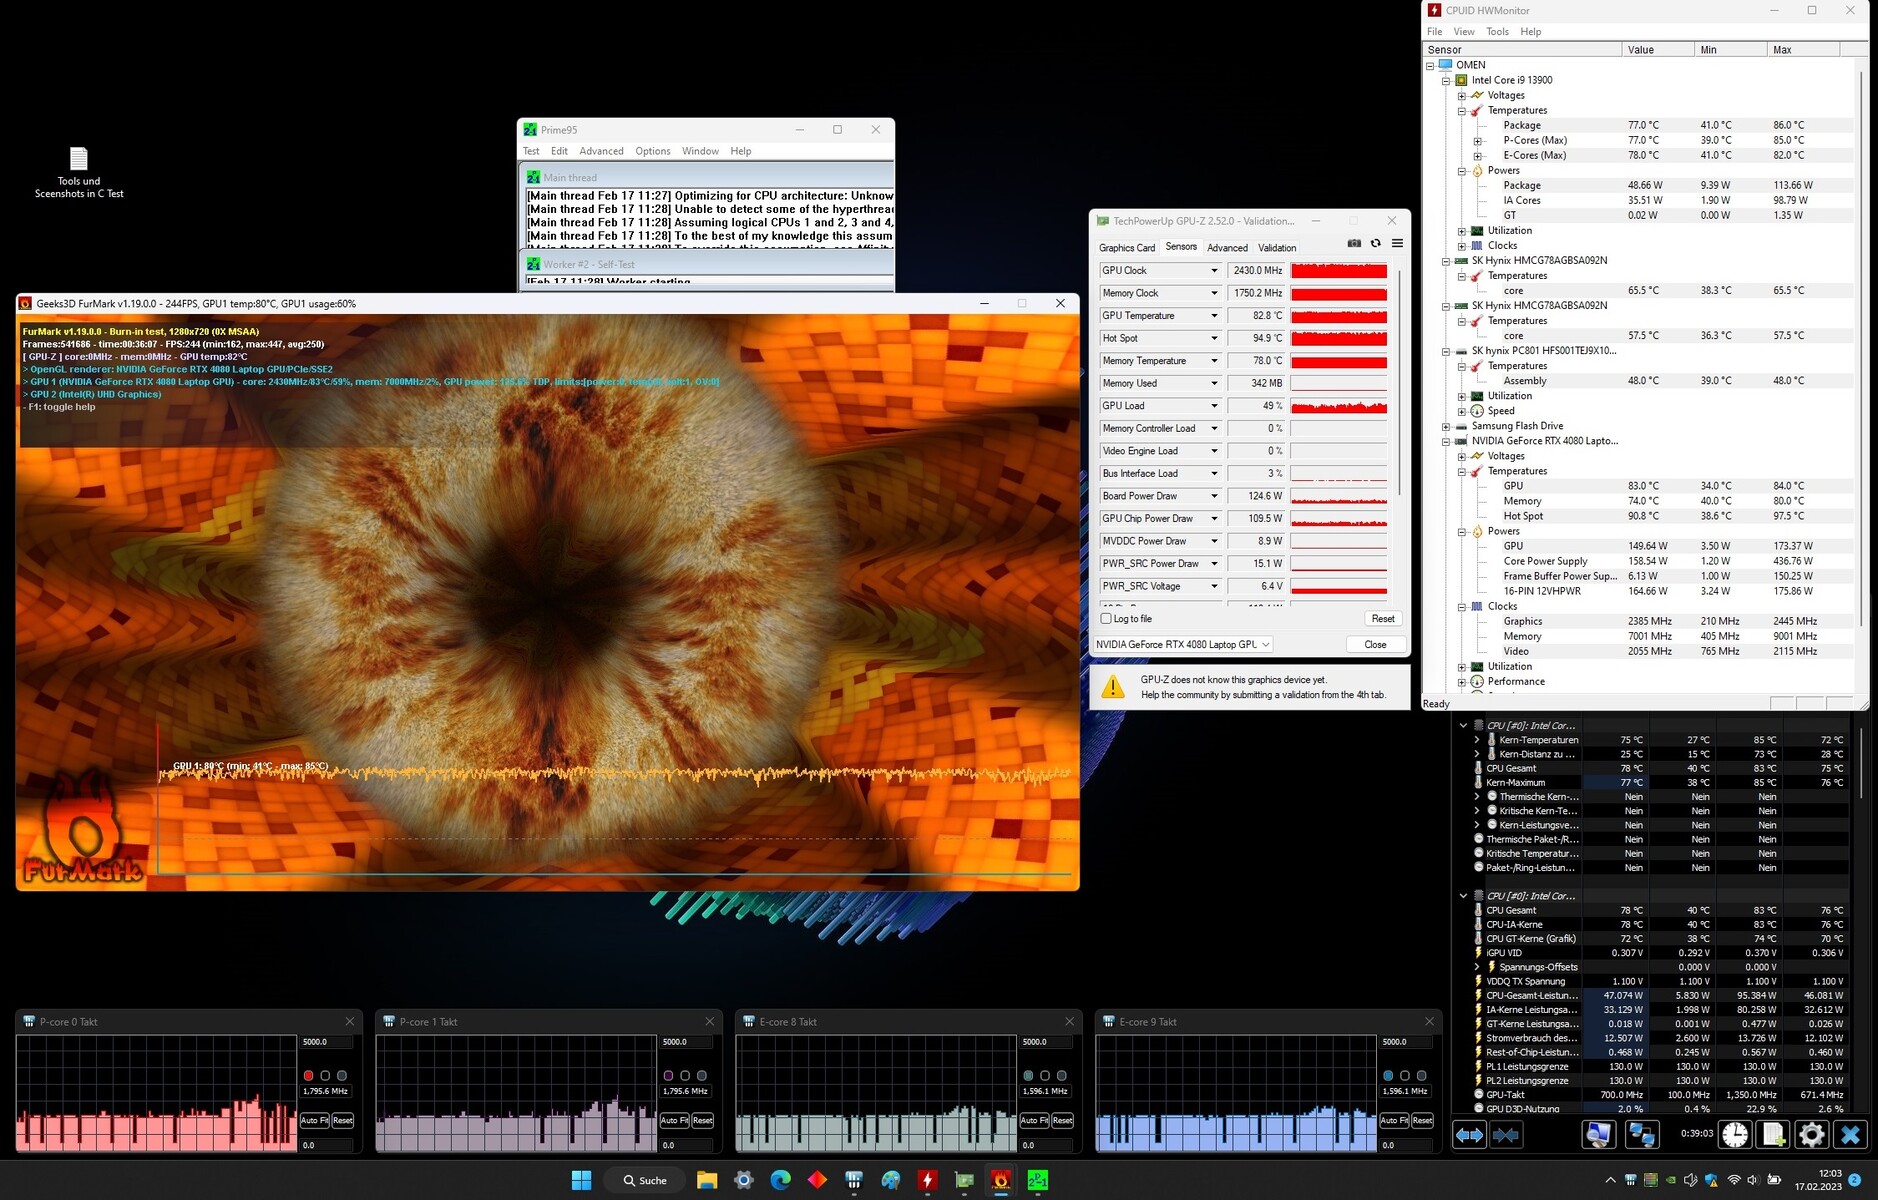
Teste de estresse
Nosso teste de estresse com Prime95 e Furmark funcionando constantemente representa um cenário extremo que usamos para avaliar a estabilidade do sistema sob carga total. A CPU (P: 3,8 GHz, E: 3,2 GHz) e a GPU (2 a 2,1 GHz) iniciam o teste com altas velocidades de clock. Depois de pouco tempo, a velocidade da CPU cai para cerca de 1,8 GHz (P núcleos) e 2 GHz (E núcleos), com a velocidade da GPU aumentando para 2,3 - 2,4 GHz ao mesmo tempo.
Oradores
Os alto-falantes estéreos produzem um som decente, mas quase não tem graves.
HP Omen 17-ck2097ng análise de áudio
(±) | o volume do alto-falante é médio, mas bom (###valor### dB)
Graves 100 - 315Hz
(-) | quase nenhum baixo - em média 21% menor que a mediana
(±) | a linearidade dos graves é média (14.6% delta para a frequência anterior)
Médios 400 - 2.000 Hz
(+) | médios equilibrados - apenas 1.4% longe da mediana
(+) | médios são lineares (2.9% delta para frequência anterior)
Altos 2 - 16 kHz
(+) | agudos equilibrados - apenas 2.2% longe da mediana
(+) | os máximos são lineares (3.8% delta da frequência anterior)
Geral 100 - 16.000 Hz
(+) | o som geral é linear (13.8% diferença em relação à mediana)
Comparado com a mesma classe
» 21% de todos os dispositivos testados nesta classe foram melhores, 7% semelhantes, 71% piores
» O melhor teve um delta de 6%, a média foi 18%, o pior foi 132%
Comparado com todos os dispositivos testados
» 15% de todos os dispositivos testados foram melhores, 4% semelhantes, 81% piores
» O melhor teve um delta de 4%, a média foi 23%, o pior foi 134%
Asus ROG Strix Scar 17 SE G733CX-LL014W análise de áudio
(±) | o volume do alto-falante é médio, mas bom (###valor### dB)
Graves 100 - 315Hz
(±) | graves reduzidos - em média 6.2% menor que a mediana
(±) | a linearidade dos graves é média (7.5% delta para a frequência anterior)
Médios 400 - 2.000 Hz
(+) | médios equilibrados - apenas 2% longe da mediana
(+) | médios são lineares (3.9% delta para frequência anterior)
Altos 2 - 16 kHz
(+) | agudos equilibrados - apenas 3.5% longe da mediana
(±) | a linearidade dos máximos é média (9.3% delta para frequência anterior)
Geral 100 - 16.000 Hz
(+) | o som geral é linear (13.6% diferença em relação à mediana)
Comparado com a mesma classe
» 20% de todos os dispositivos testados nesta classe foram melhores, 7% semelhantes, 73% piores
» O melhor teve um delta de 6%, a média foi 18%, o pior foi 132%
Comparado com todos os dispositivos testados
» 15% de todos os dispositivos testados foram melhores, 4% semelhantes, 82% piores
» O melhor teve um delta de 4%, a média foi 23%, o pior foi 134%
Gerenciamento de energia - laptop para jogos com uma fonte de alimentação de 330 watts
Consumo de energia
O consumo de energia varia em níveis normais para o hardware utilizado. Durante nosso teste Witcher 3 o consumo de energia permanece constante, e durante o teste de estresse o consumo cai após alguns minutos - a CPU é estrangulada. A fonte de alimentação incluída (330 watts) é suficientemente dimensionada.
| desligado | |
| Ocioso | |
| Carga |
|
Key:
min: | |
| HP Omen 17-ck2097ng i9-13900HX, GeForce RTX 4080 Laptop GPU | Alienware m17 R5 (R9 6900HX, RX 6850M XT) R9 6900HX, Radeon RX 6850M XT | Razer Blade 16 Early 2023 i9-13950HX, GeForce RTX 4080 Laptop GPU | Lenovo Legion Pro 7 16IRX8H i9-13900HX, GeForce RTX 4080 Laptop GPU | Asus ROG Strix G16 G614JZ i9-13980HX, GeForce RTX 4080 Laptop GPU | HP Omen 17-ck1075ng i7-12700H, GeForce RTX 3070 Ti Laptop GPU | Média NVIDIA GeForce RTX 4080 Laptop GPU | Média da turma Gaming | |
|---|---|---|---|---|---|---|---|---|
| Power Consumption | 18% | -16% | -13% | 5% | 13% | -7% | 12% | |
| Idle Minimum * (Watt) | 16 | 13 19% | 15.2 5% | 18 -13% | 10 37% | 12.2 24% | 16.9 ? -6% | 13 ? 19% |
| Idle Average * (Watt) | 20 | 16.5 17% | 22.8 -14% | 24 -20% | 16 20% | 18 10% | 22 ? -10% | 19 ? 5% |
| Idle Maximum * (Watt) | 26 | 17 35% | 49.8 -92% | 32 -23% | 27 -4% | 19.4 25% | 34.1 ? -31% | 24.6 ? 5% |
| Load Average * (Watt) | 135 | 93 31% | 121.2 10% | 130 4% | 129 4% | 128 5% | 117.9 ? 13% | 110.7 ? 18% |
| Witcher 3 ultra * (Watt) | 215 | 239 -11% | 242 -13% | 260 -21% | 247 -15% | 209 3% | ||
| Load Maximum * (Watt) | 299 | 251 16% | 273.7 8% | 320 -7% | 342 -14% | 266 11% | 297 ? 1% | 259 ? 13% |
* ... menor é melhor
Power Consumption The Witcher 3 / Stress Test
Power Consumption with External Monitor
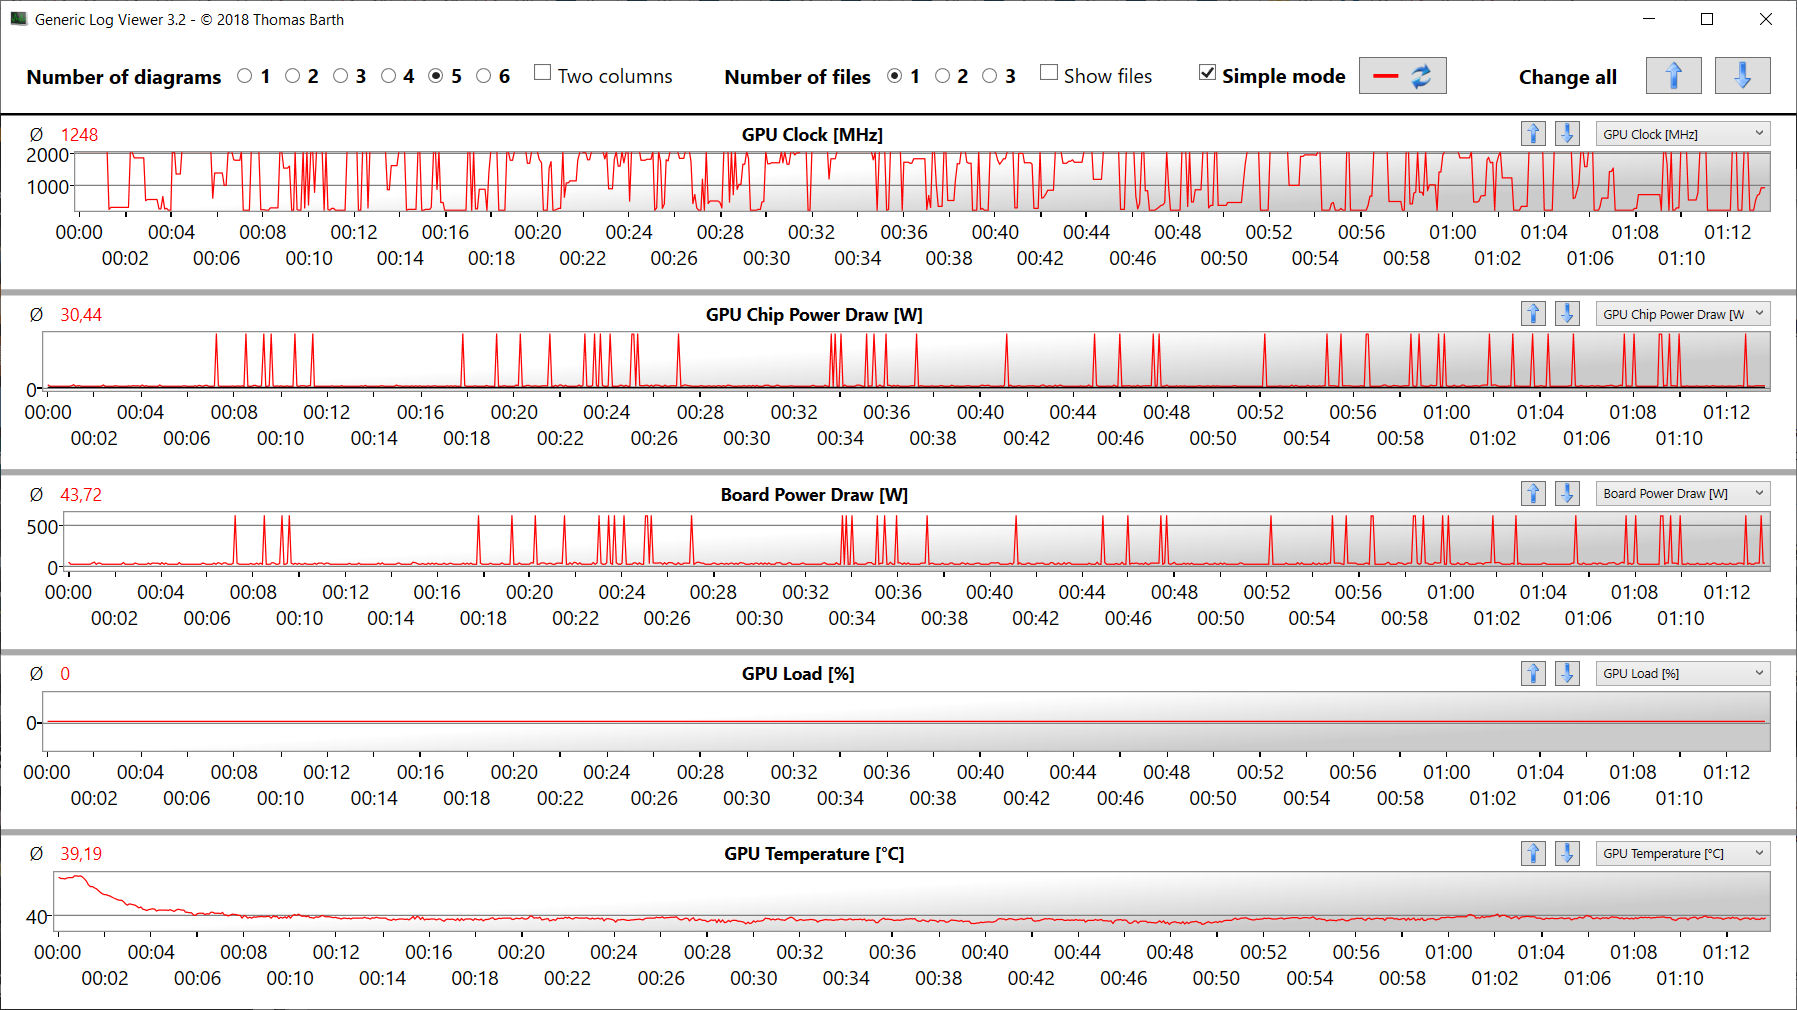
Vida útil da bateria
A vida útil da bateria do Omen não é satisfatória. Mesmo um poderoso laptop para jogos tem que ser capaz de durar mais em operação Optimus com uma bateria de 83-Wh. Não conseguimos determinar até agora se isto se deve a um problema de hardware ou software.
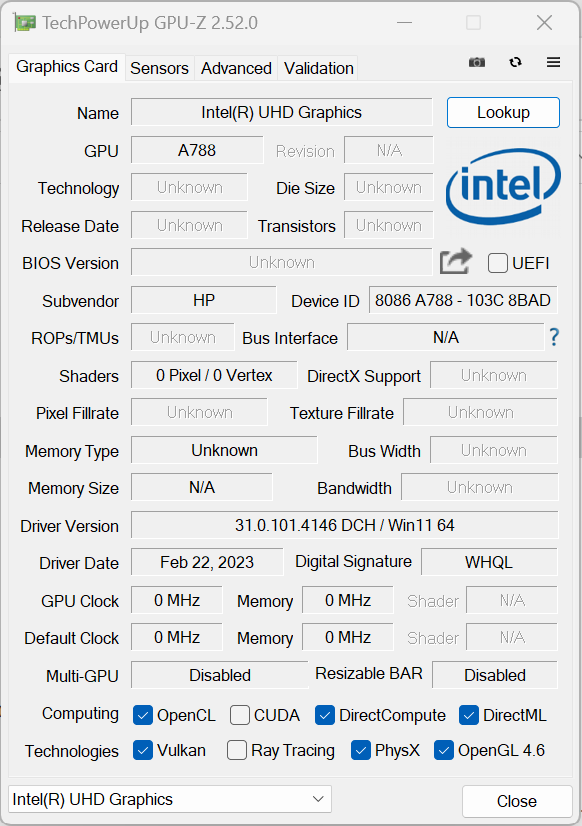
Os arquivos de registro dão uma indicação do problema: durante os testes de baixa carga (WiFi, ocioso, vídeo), a GPU GeForce deve estar inativa e deixar todo o trabalho para a iGPU. No entanto, a GPU GeForce freqüentemente roda em velocidade máxima aqui - com uma carga de 0%. De acordo com a GPU-Z, isto leva a um consumo de energia de até 45 watts.
Por esta razão, pedimos uma nova unidade de teste da HP para verificar isso, mas ainda não recebemos nenhuma. Assim que pudermos obtê-la, testaremos isto novamente.
| HP Omen 17-ck2097ng i9-13900HX, GeForce RTX 4080 Laptop GPU, 83 Wh | Alienware m17 R5 (R9 6900HX, RX 6850M XT) R9 6900HX, Radeon RX 6850M XT, 97 Wh | Razer Blade 16 Early 2023 i9-13950HX, GeForce RTX 4080 Laptop GPU, 95.2 Wh | Lenovo Legion Pro 7 16IRX8H i9-13900HX, GeForce RTX 4080 Laptop GPU, 99.9 Wh | Asus ROG Strix G16 G614JZ i9-13980HX, GeForce RTX 4080 Laptop GPU, 90 Wh | HP Omen 17-ck1075ng i7-12700H, GeForce RTX 3070 Ti Laptop GPU, 78 Wh | Média da turma Gaming | |
|---|---|---|---|---|---|---|---|
| Duração da bateria | 31% | 60% | 48% | 74% | 80% | 82% | |
| Reader / Idle (h) | 4.2 | 8.9 112% | 6.4 52% | 8.9 112% | 8.27 ? 97% | ||
| H.264 (h) | 3.7 | 4.9 32% | 8.32 ? 125% | ||||
| WiFi v1.3 (h) | 3.6 | 4.8 33% | 6.1 69% | 5.1 42% | 9.7 169% | 6.2 72% | 7.11 ? 98% |
| Load (h) | 1.4 | 1.8 29% | 1.4 0% | 2.1 50% | 1.1 -21% | 2.2 57% | 1.502 ? 7% |
| Gaming (h) | 1 |
Pro
Contra
Veredicto - Um sólido laptop de alta tecnologia para jogos
Com o Omen 17, a HP fornece um poderoso portátil para jogos QHD do segmento high-end. Com seuNúcleo i9-13900HXprocessador e GeForce RTX 4080gPU para laptop, o laptop também deve funcionar bem em outras áreas de aplicação, como processamento e renderização de vídeo. Um rápido PCIe 4 SSD (1 TB) fornece o espaço de armazenamento necessário e garante curtos tempos de carga. Há também um espaço para um segundo SSD.
O HP Omen 17 (2023) representa um sólido laptop para jogos, mas não faz pleno uso de seu potencial.
O processador e o núcleo gráfico são capazes de funcionar a velocidades de relógio constantemente altas. O desenvolvimento de ruído e calor está nos níveis altos que são normais para esta classe de laptops. No entanto, o laptop produz muito ruído no funcionamento diário.
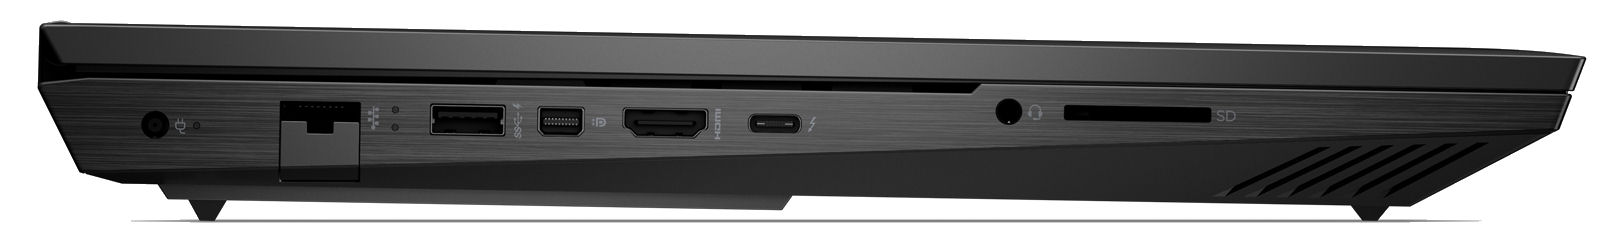
O visor mate de 17,3 polegadas (QHD, IPS, 165 Hz, sRGB) deixa uma impressão sólida. Ele tem um desempenho geral ligeiramente melhor do que o painel FHD do painel de construção similar Predecessor de Omenmas pior que a maioria dos concorrentes. Uma conexão Thunderbolt 4 oferece algumas opções de expansão (solução de ancoragem, GPU externo). Além disso, ela também pode ser usada para carregar a bateria com um carregador USB-C (mín. 65 watts, 20 V), e o fornecimento de energia é suportado.
Devido a um possível defeito, somos incapazes de fazer um julgamento final sobre a duração da bateria neste ponto. Iremos medir novamente a vida útil da bateria assim que tivermos uma unidade de reposição da HP. Como a duração da bateria dificilmente tem qualquer impacto na avaliação final de um laptop para jogos, a avaliação mudará, no máximo, apenas ligeiramente.
Como alternativa, você poderia dar uma olhada no Lenovo Legion Pro 7 16IRX8Hque é capaz de obter um desempenho superior com a mesma combinação CPU/GPU. Além disso, ele pontua com uma tela mais brilhante no formato 16:10.
Preço e Disponibilidade
O Omen 17 (2023) está disponível na HP a partir de $1499,99. Um modelo similar à nossa configuração testada, exceto por ter um i7-13700, custaria $2.429,99 nos EUA.
HP Omen 17-ck2097ng
- 03/28/2023 v7 (old)
Sascha Mölck
Transparência
A seleção dos dispositivos a serem analisados é feita pela nossa equipe editorial. A amostra de teste foi fornecida ao autor como empréstimo pelo fabricante ou varejista para fins desta revisão. O credor não teve influência nesta revisão, nem o fabricante recebeu uma cópia desta revisão antes da publicação. Não houve obrigação de publicar esta revisão. Como empresa de mídia independente, a Notebookcheck não está sujeita à autoridade de fabricantes, varejistas ou editores.
É assim que o Notebookcheck está testando
Todos os anos, o Notebookcheck analisa de forma independente centenas de laptops e smartphones usando procedimentos padronizados para garantir que todos os resultados sejam comparáveis. Desenvolvemos continuamente nossos métodos de teste há cerca de 20 anos e definimos padrões da indústria no processo. Em nossos laboratórios de teste, equipamentos de medição de alta qualidade são utilizados por técnicos e editores experientes. Esses testes envolvem um processo de validação em vários estágios. Nosso complexo sistema de classificação é baseado em centenas de medições e benchmarks bem fundamentados, o que mantém a objetividade.Price comparison

