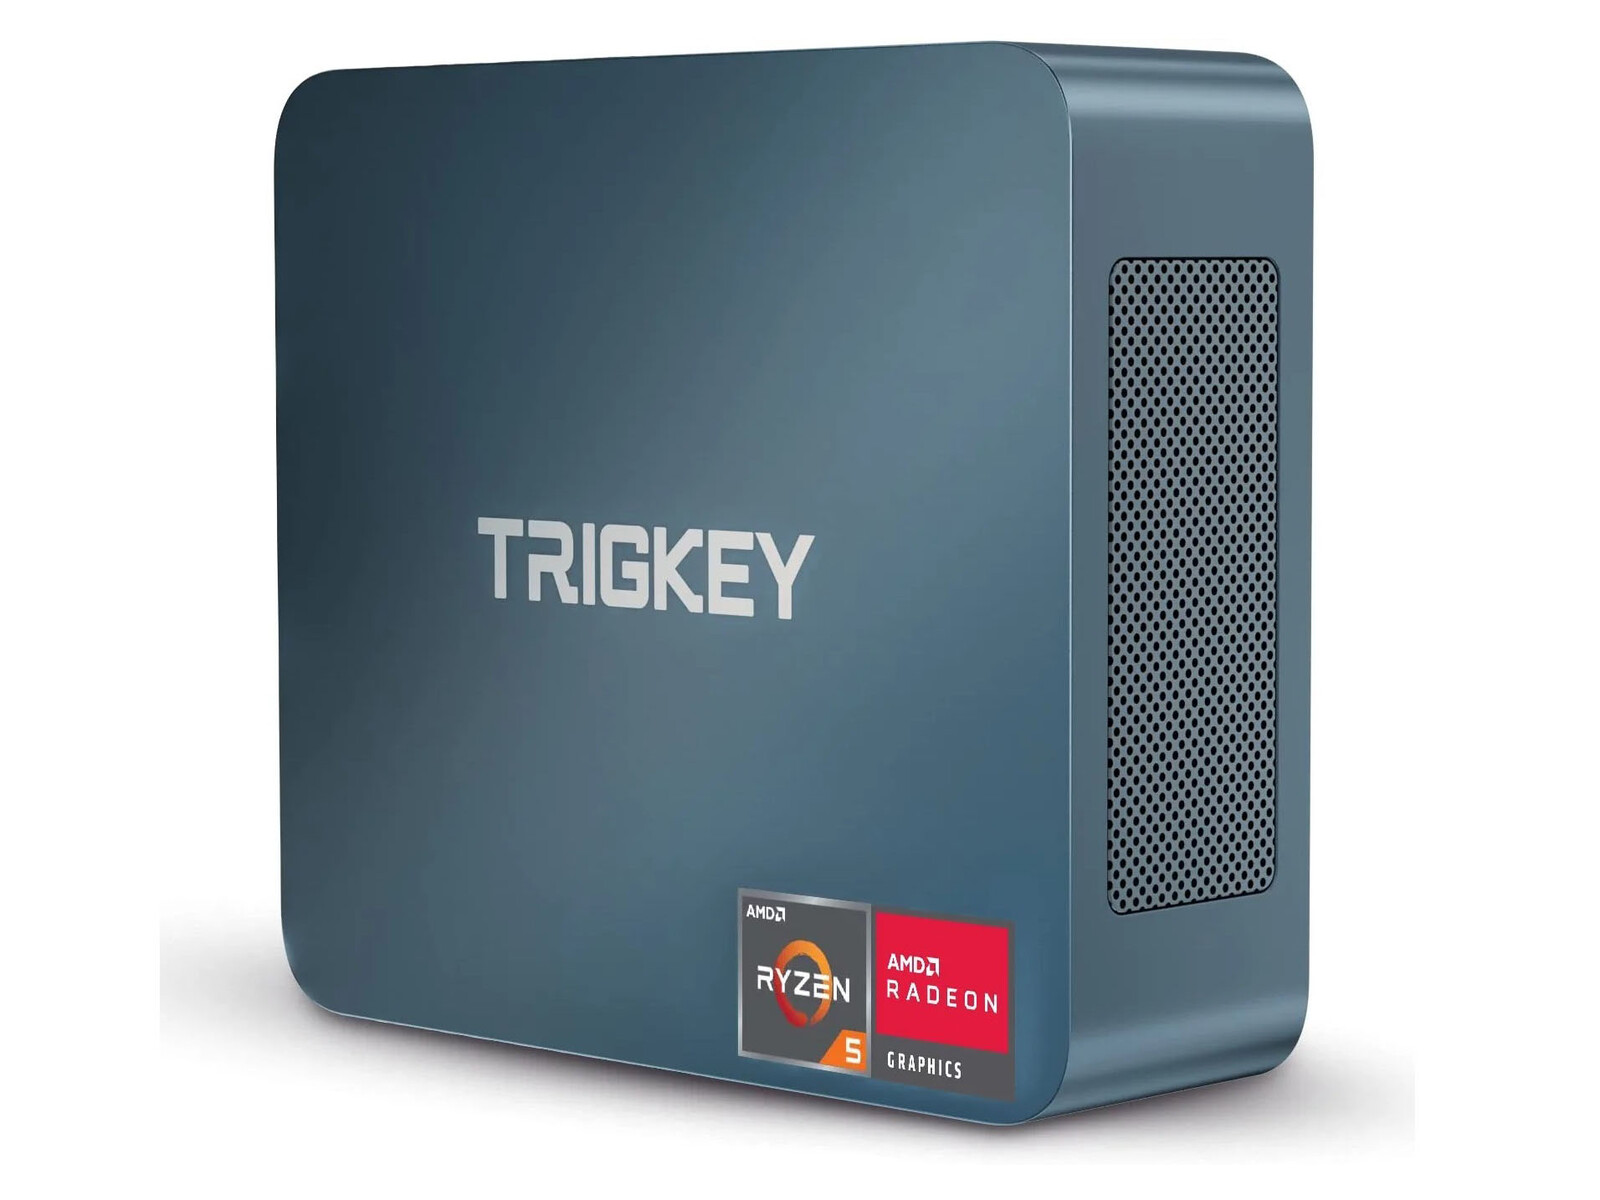
Revisão do Trigkey S3 mini PC: Desempenho do tipo i3 para o preço de um Celeron ou Atom
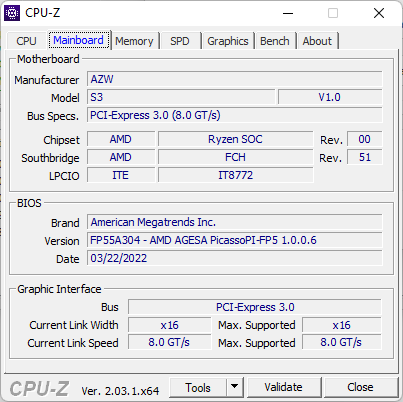
A Trigkey é especializada em mini PCs econômicos rodando em processadores mais antigos, a fim de manter os preços baixos. O S3 é um desses modelos que funcionam nos três anos de idade Ryzen 5 3550H varejo por cerca de $280 USD
Os concorrentes neste espaço incluem outros mini PCs baratos como o BMax B5 Pro, Beelink U59ou o Chuwi LarkBox.
Possíveis concorrentes em comparação
Avaliação | Data | Modelo | Peso | Altura | Size | Resolução | Preço |
|---|---|---|---|---|---|---|---|
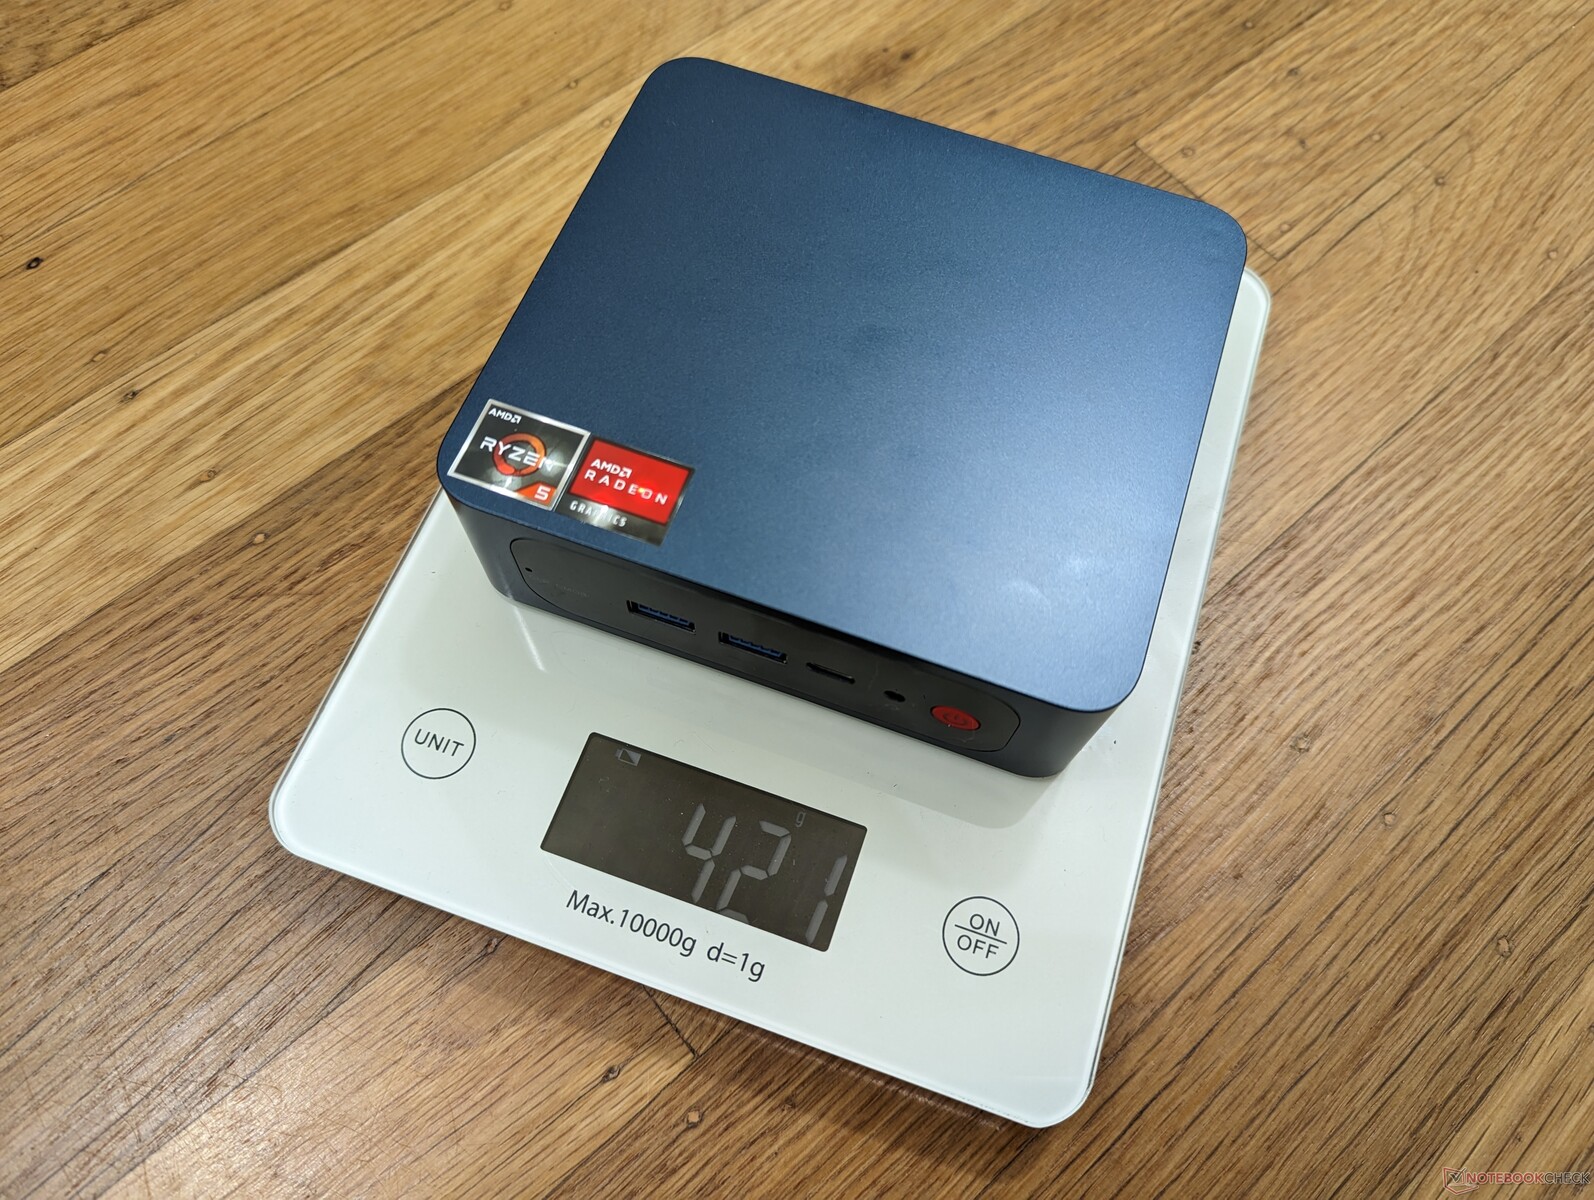
v (old) | 01/2023 | Trigkey S3 R5 3550H, Vega 8 | 419 g | 40.7 mm | x | ||
v (old) | 11/2022 | Intel NUC Pro Chassis_i7_1265U i7-1265U, Iris Xe G7 96EUs | 35 mm | x | |||
v (old) | 04/2021 | Intel NUC11TNKi5 i5-1135G7, Iris Xe G7 80EUs | 504 g | 37 mm | x | ||
v (old) | 12/2022 | Beelink SEi12 Core i5-1235U i5-1235U, Iris Xe G7 80EUs | 465 g | 42 mm | x | ||
v (old) | 09/2022 | Beelink SEi11 Pro i5-11320H, Iris Xe G7 96EUs | 440 g | 40 mm | x | ||
v (old) | 10/2022 | Beelink SER Pro Ryzen 5 5600H R5 5600H, Vega 7 | 498 g | 42 mm | x |
Caso
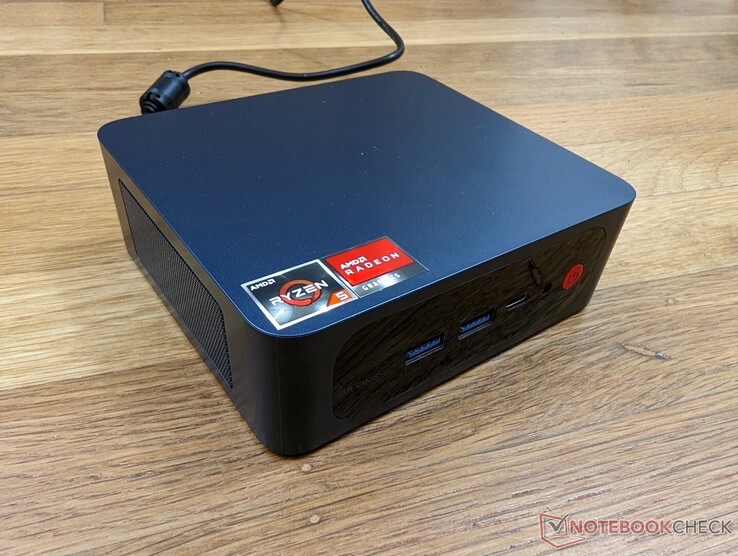
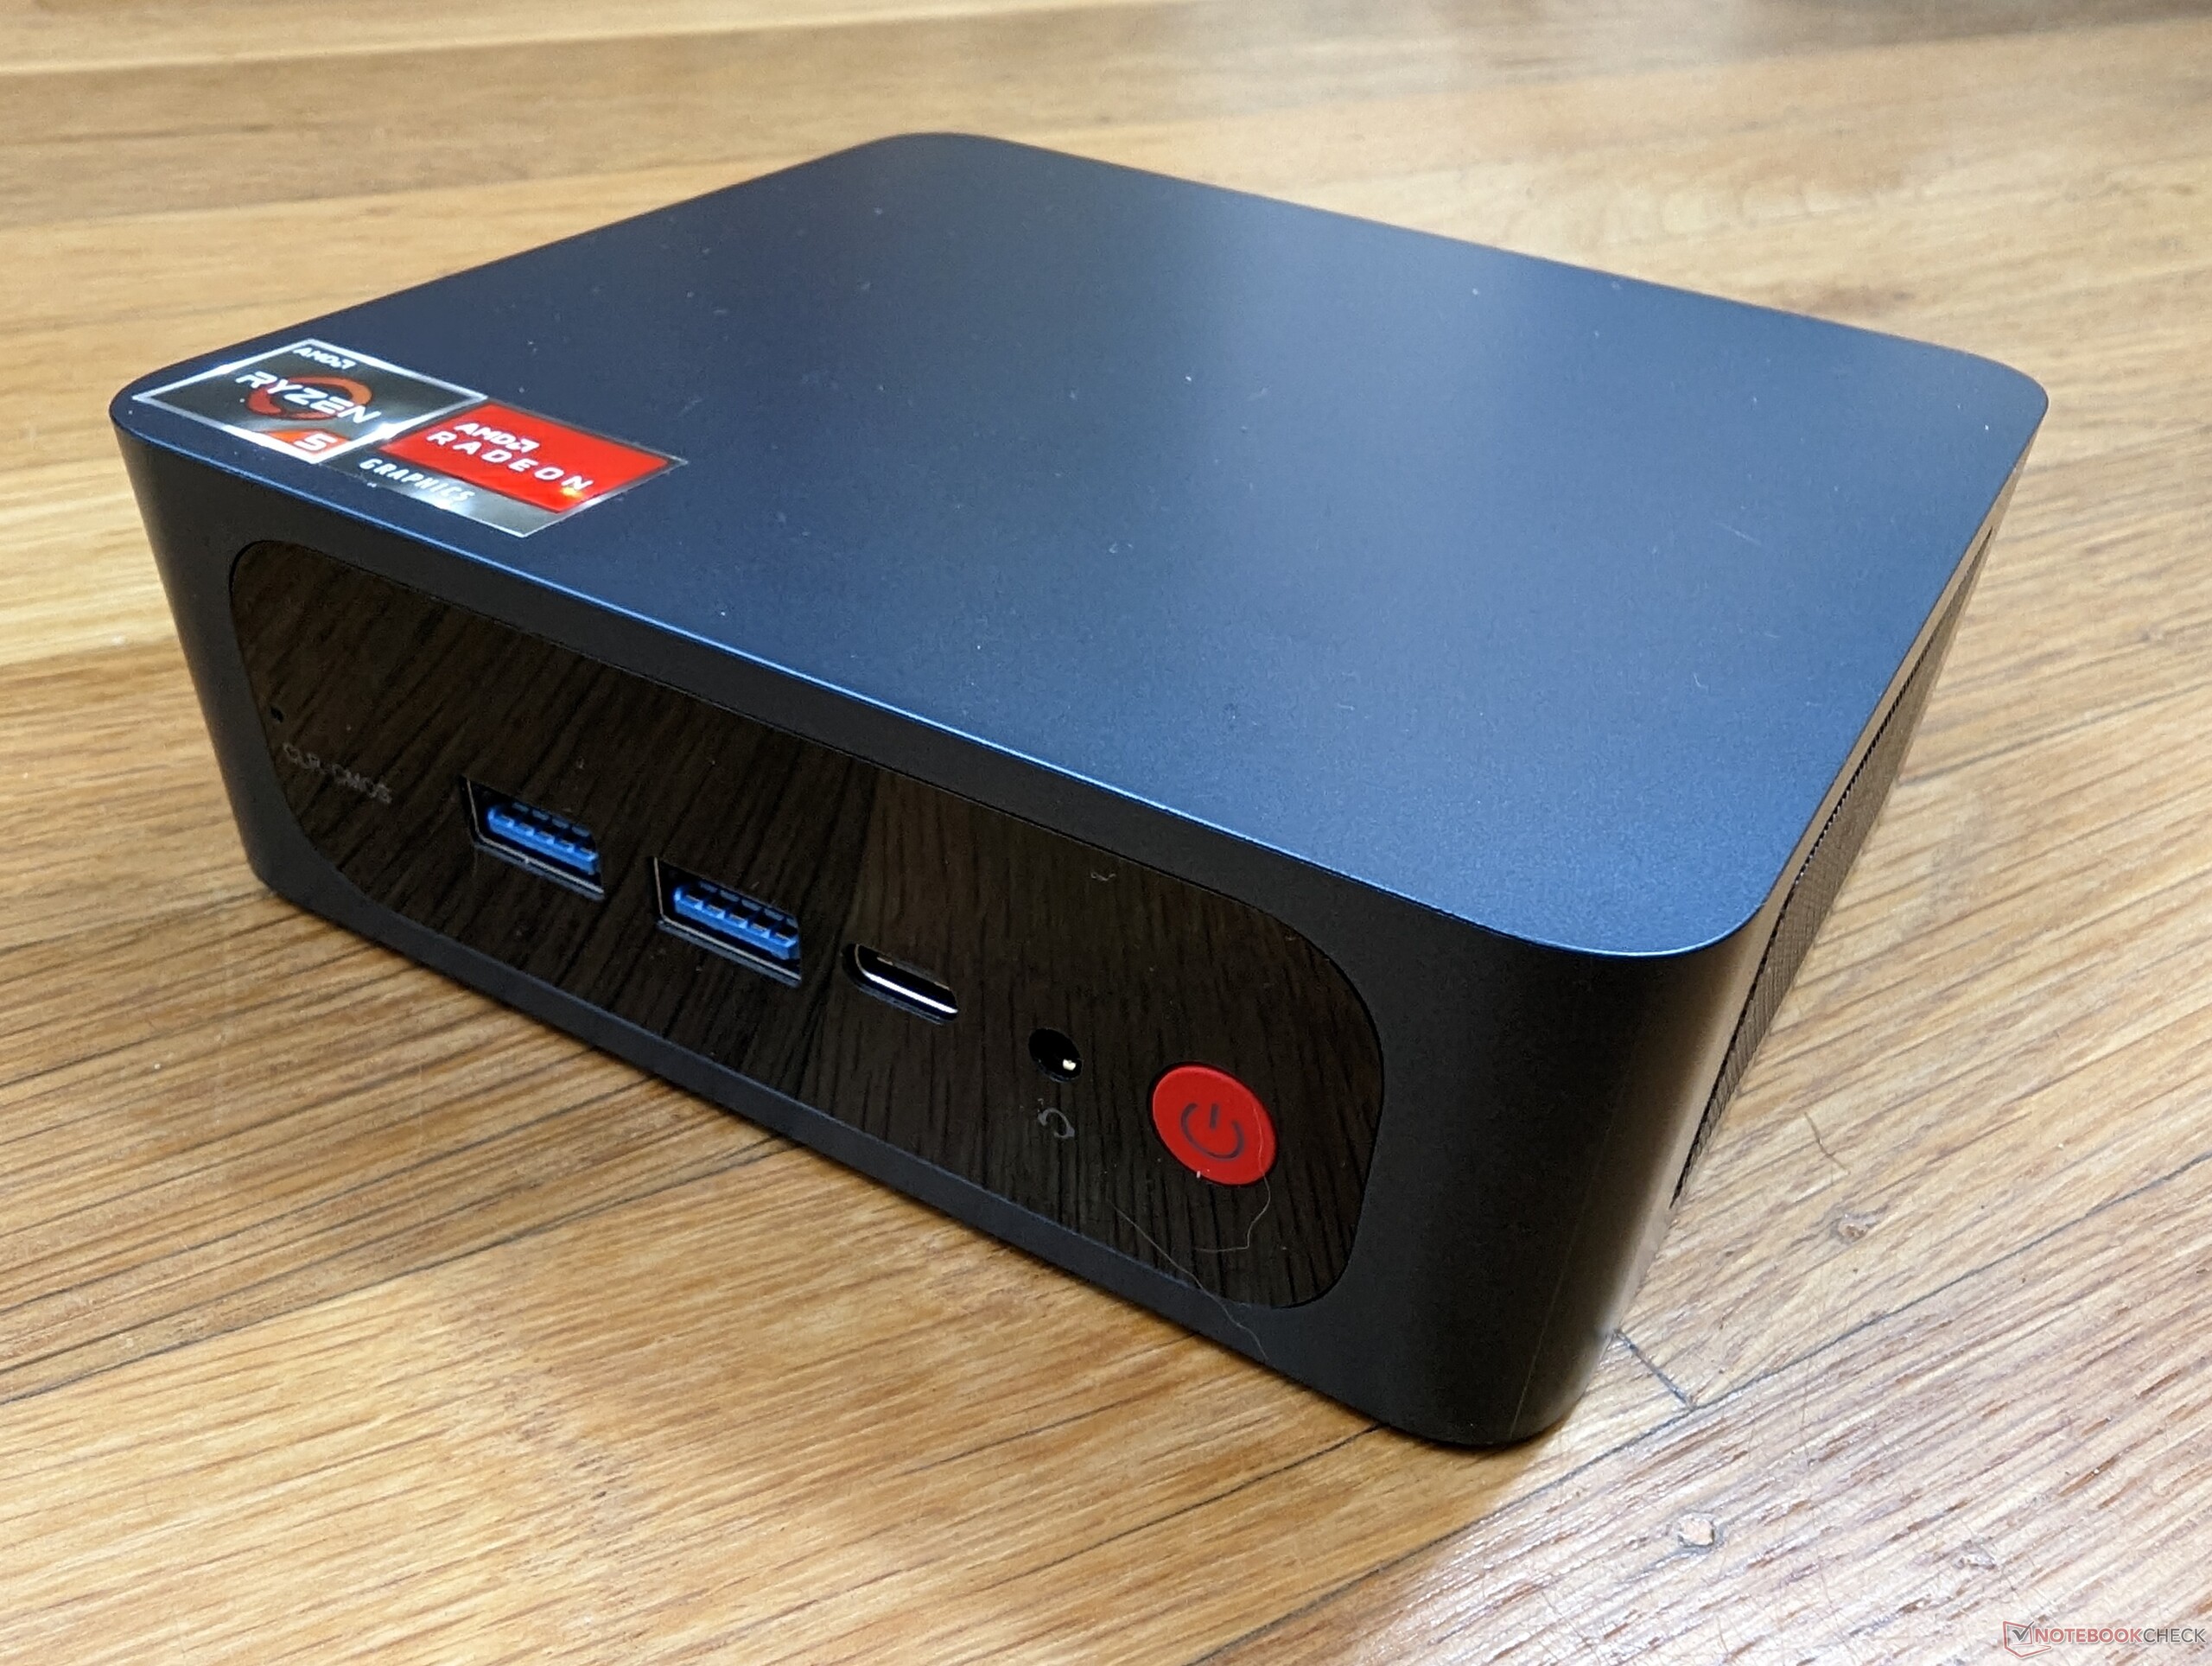
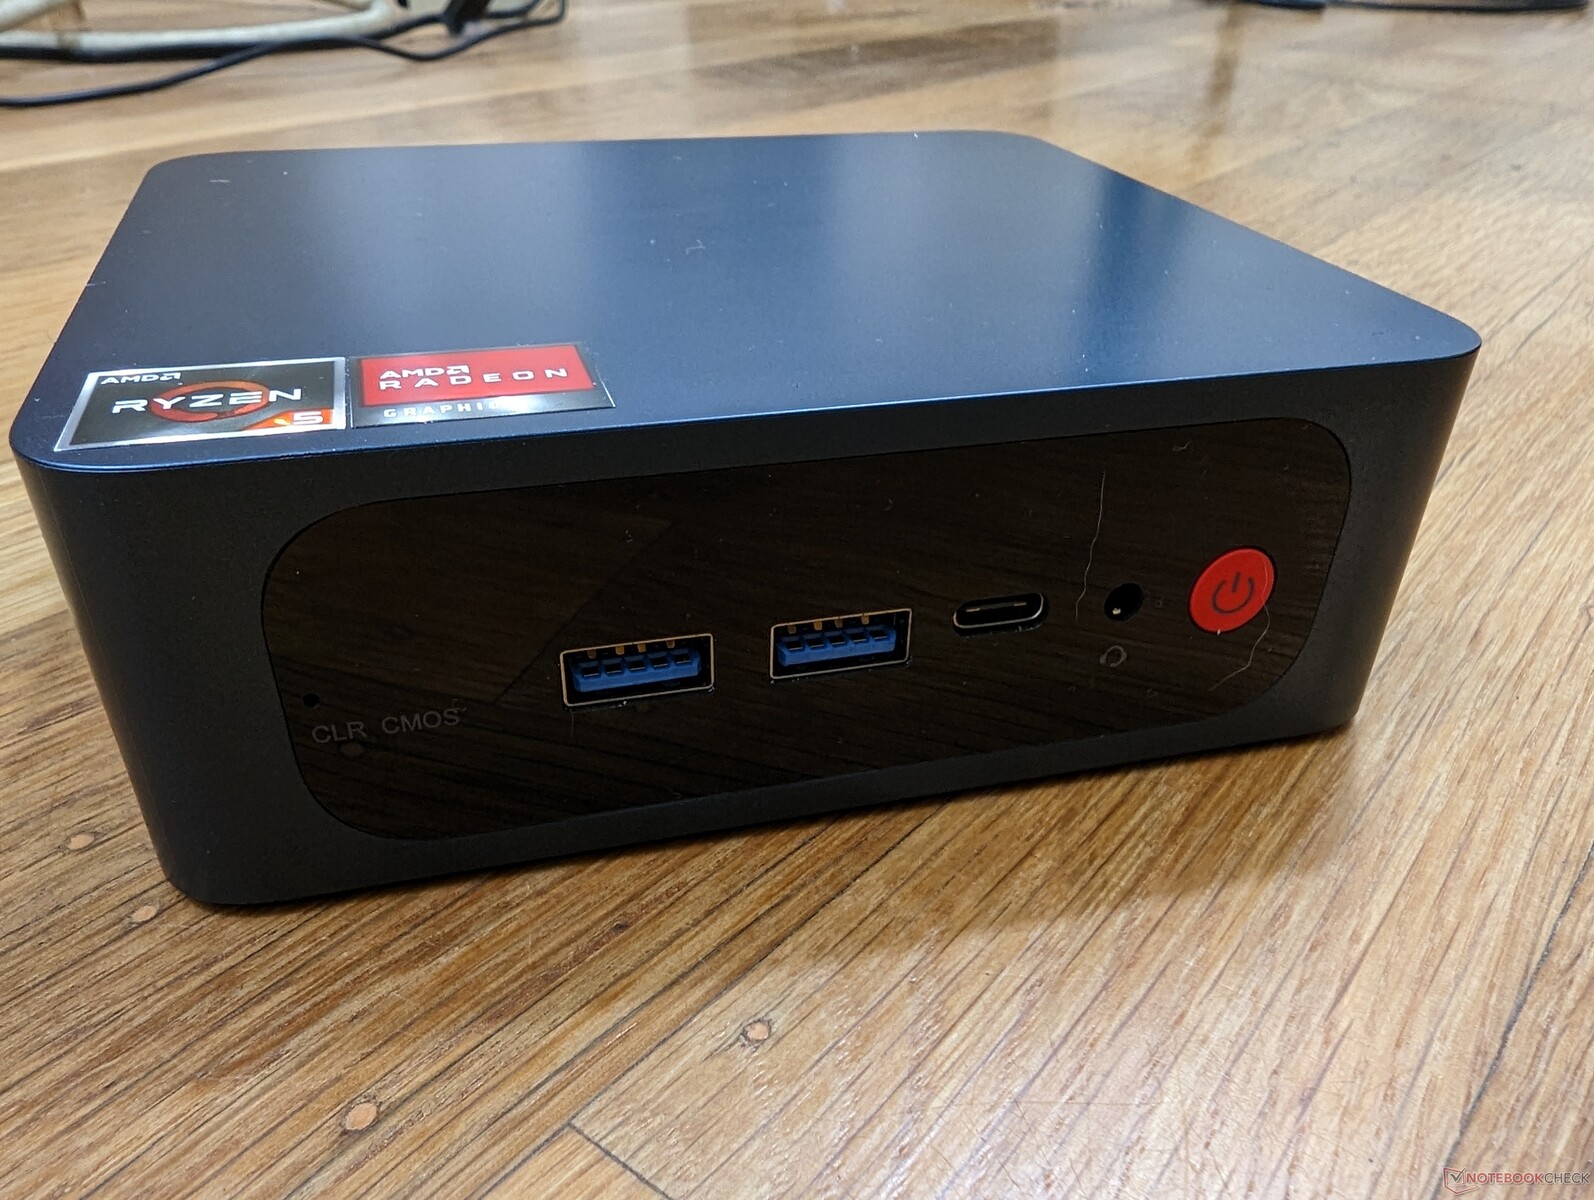
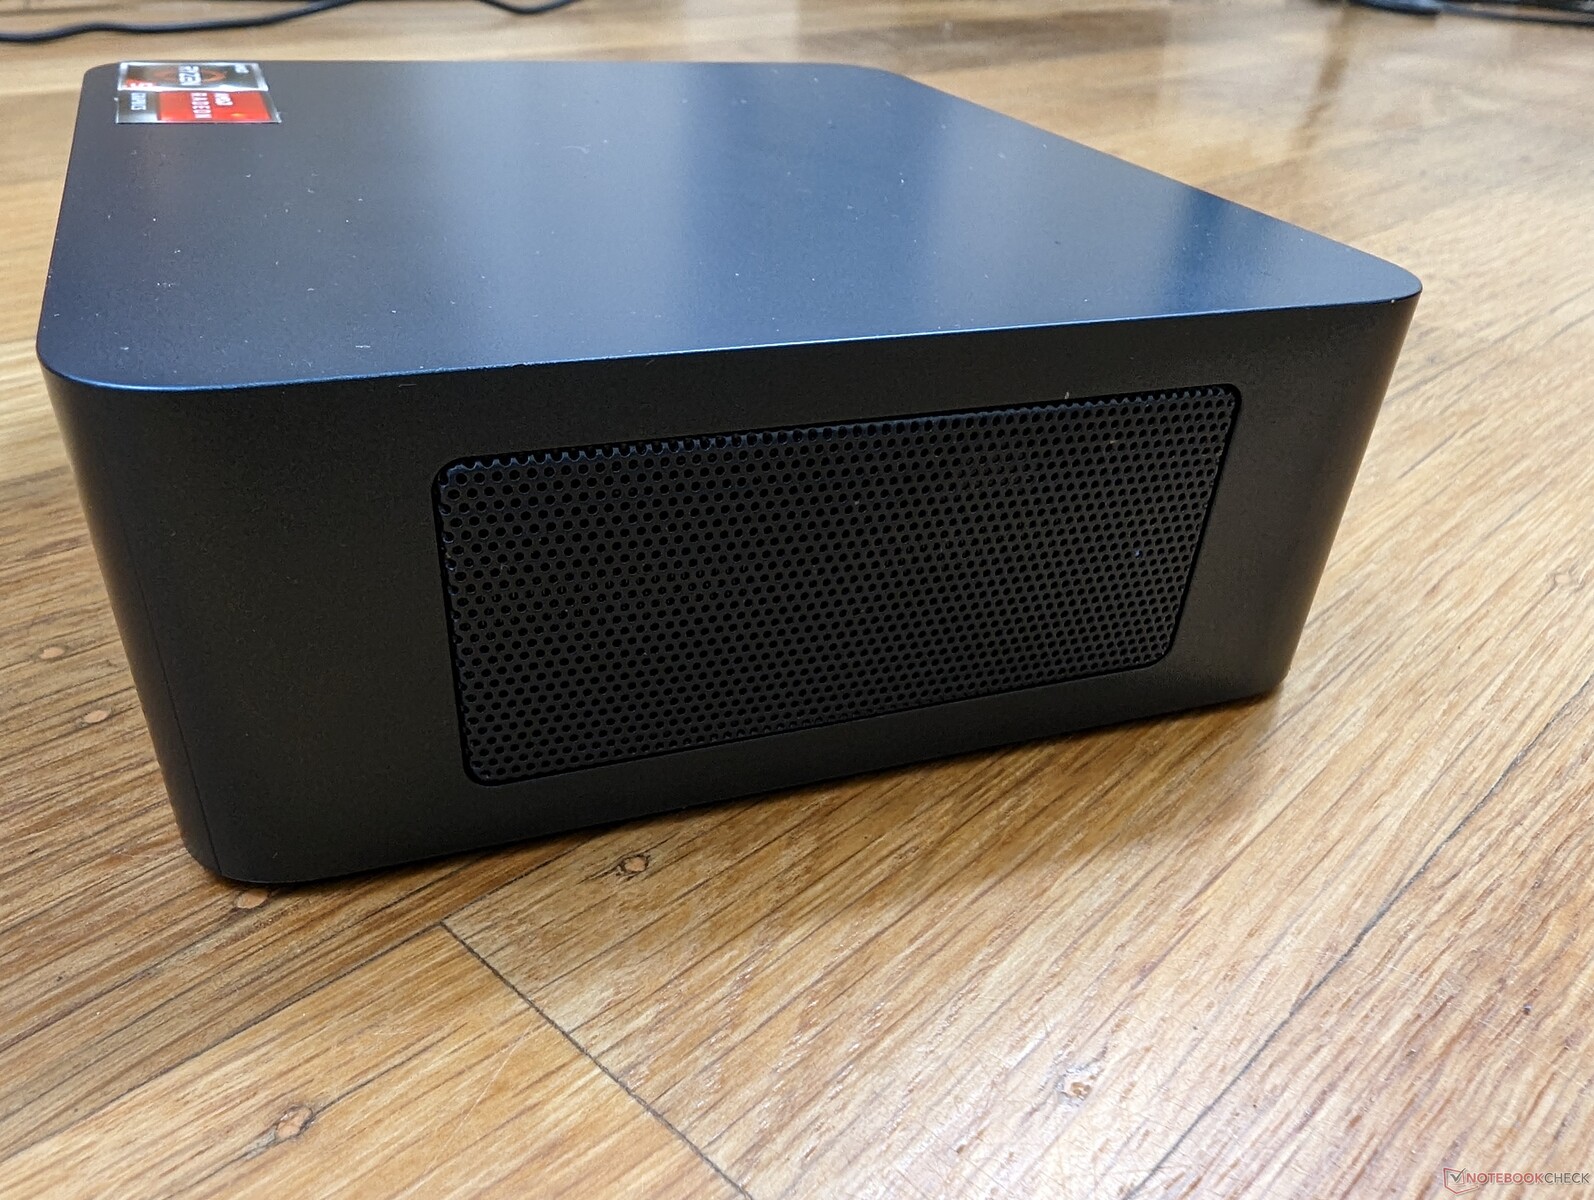
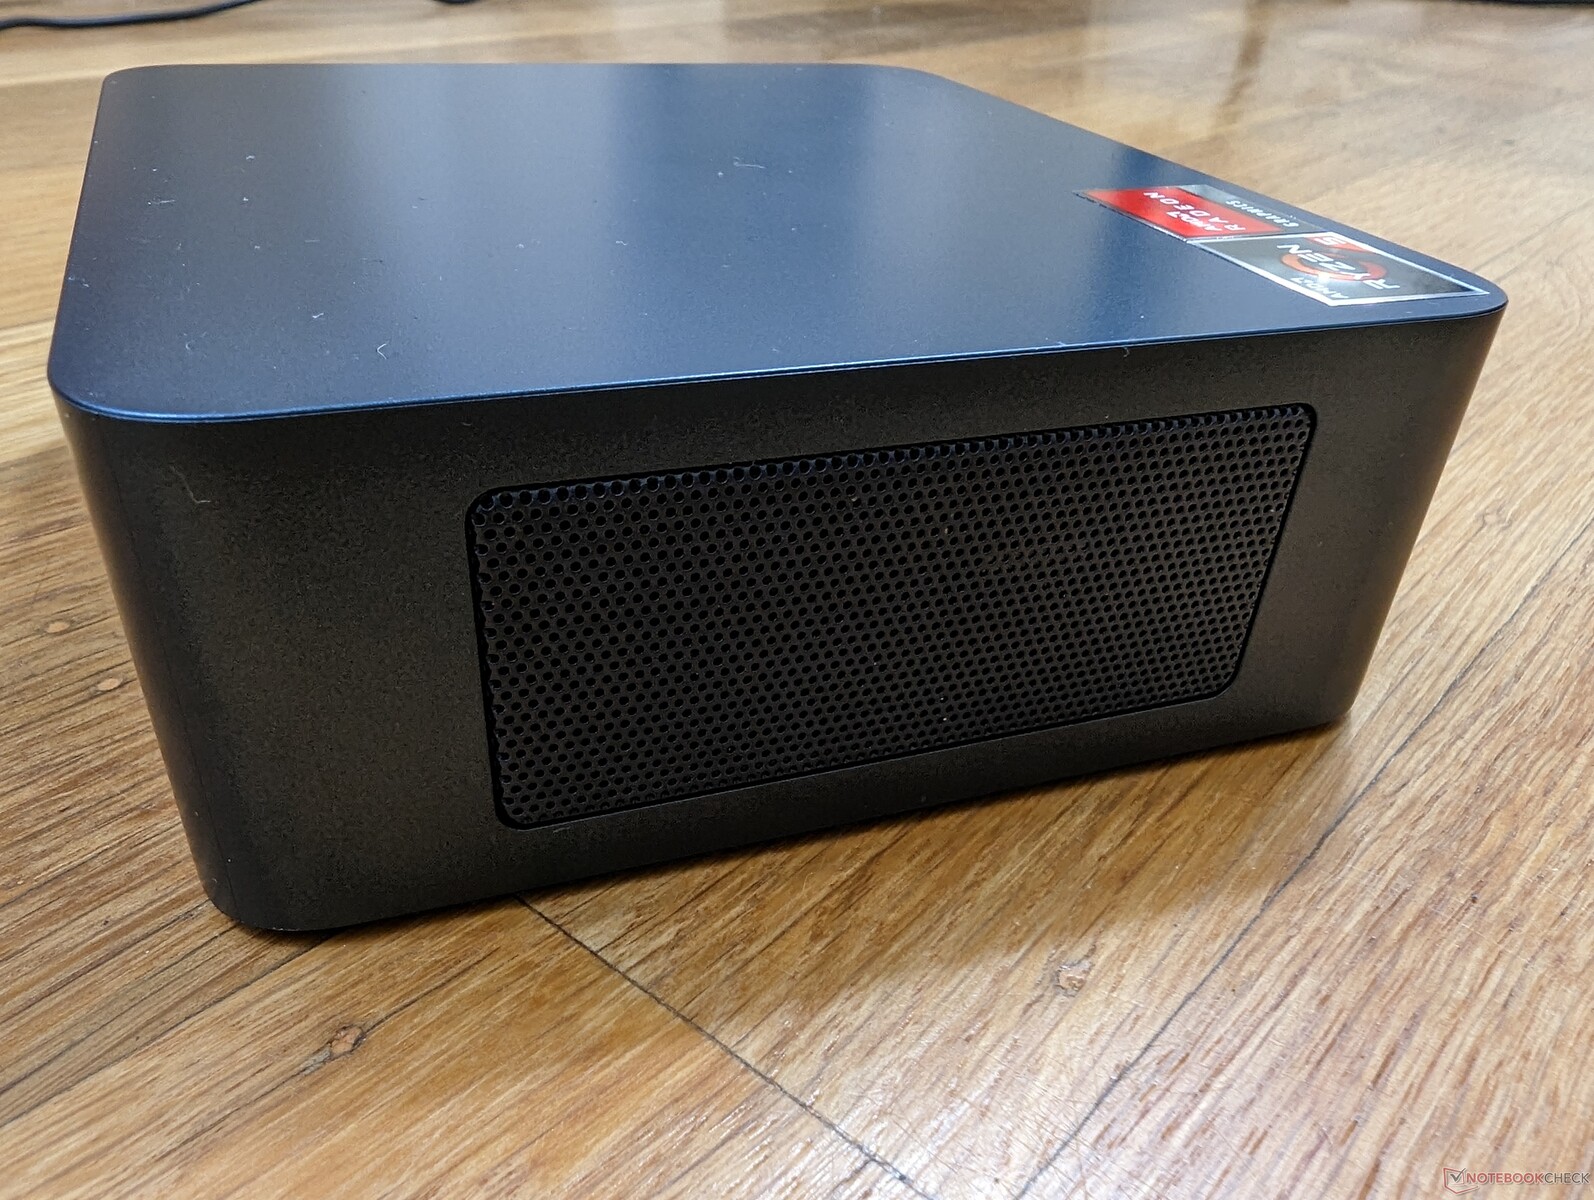
O chassi plástico tem forma semelhante à do Beelink SEi8 mas com várias diferenças superficiais. O topo, por exemplo, agora está todo fosco e nivelado com as bordas das laterais para um visual mais limpo. As opções de porta e a manutenção são de outra forma quase idênticas.
Conectividade
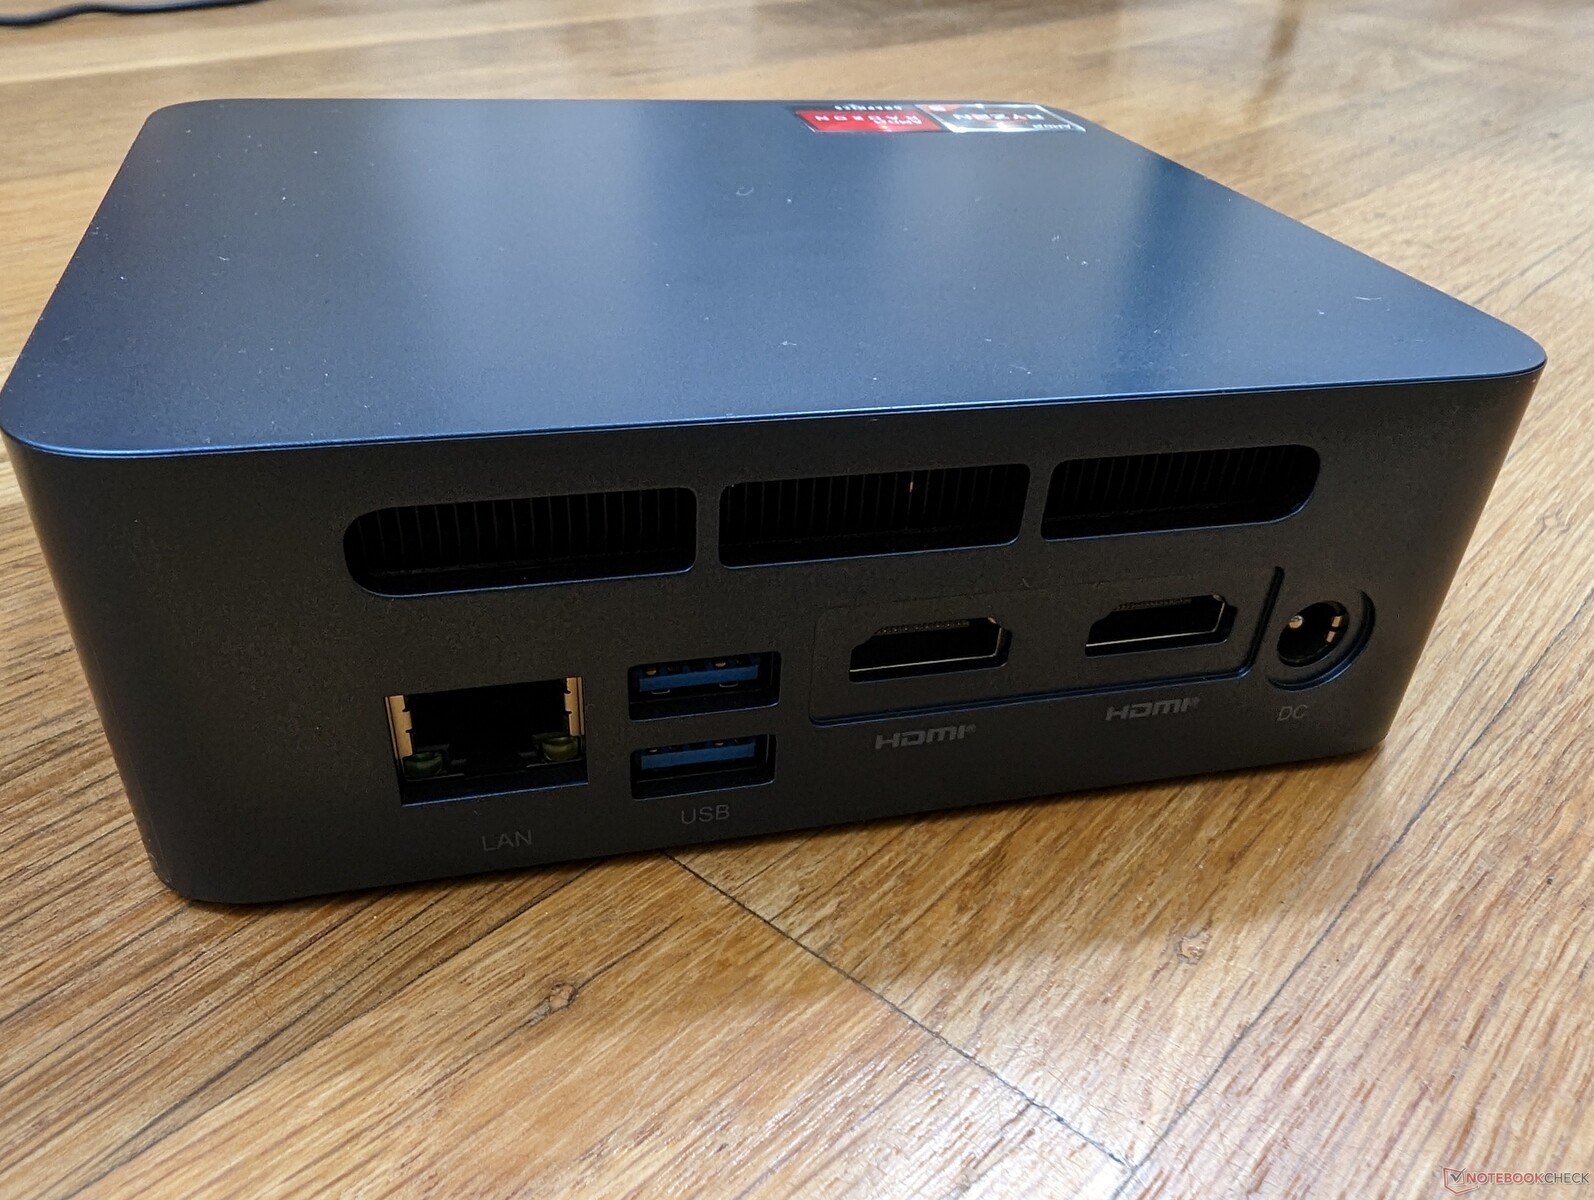
As opções de porta são abundantes, mas a única porta USB-C parece ser apenas para dados ou para carregar dispositivos externos. Nosso monitor externo USB-C não funcionaria com a Trigkey.
Comunicação
O sistema é fornecido com os módulos mais antigos 1x1 Intel Dual Band Wireless-AC 3165 para taxas de transferência que são apenas uma fração do que os modernos módulos Wi-Fi 6 e 6E são capazes de fazer. No entanto, o desempenho é estável e suficiente para 1080p streaming e navegação.
| Networking | |
| iperf3 transmit AX12 | |
| Intel NUC11TNKi5 | |
| iperf3 receive AX12 | |
| Intel NUC11TNKi5 | |
| iperf3 receive AXE11000 6GHz | |
| Intel NUC Pro Chassis_i7_1265U | |
| Beelink SER Pro Ryzen 5 5600H | |
| Beelink SEi11 Pro | |
| iperf3 receive AXE11000 | |
| Beelink SEi12 Core i5-1235U | |
| Trigkey S3 | |
| iperf3 transmit AXE11000 | |
| Beelink SEi12 Core i5-1235U | |
| Trigkey S3 | |
| iperf3 transmit AXE11000 6GHz | |
| Intel NUC Pro Chassis_i7_1265U | |
| Beelink SER Pro Ryzen 5 5600H | |
| Beelink SEi11 Pro | |
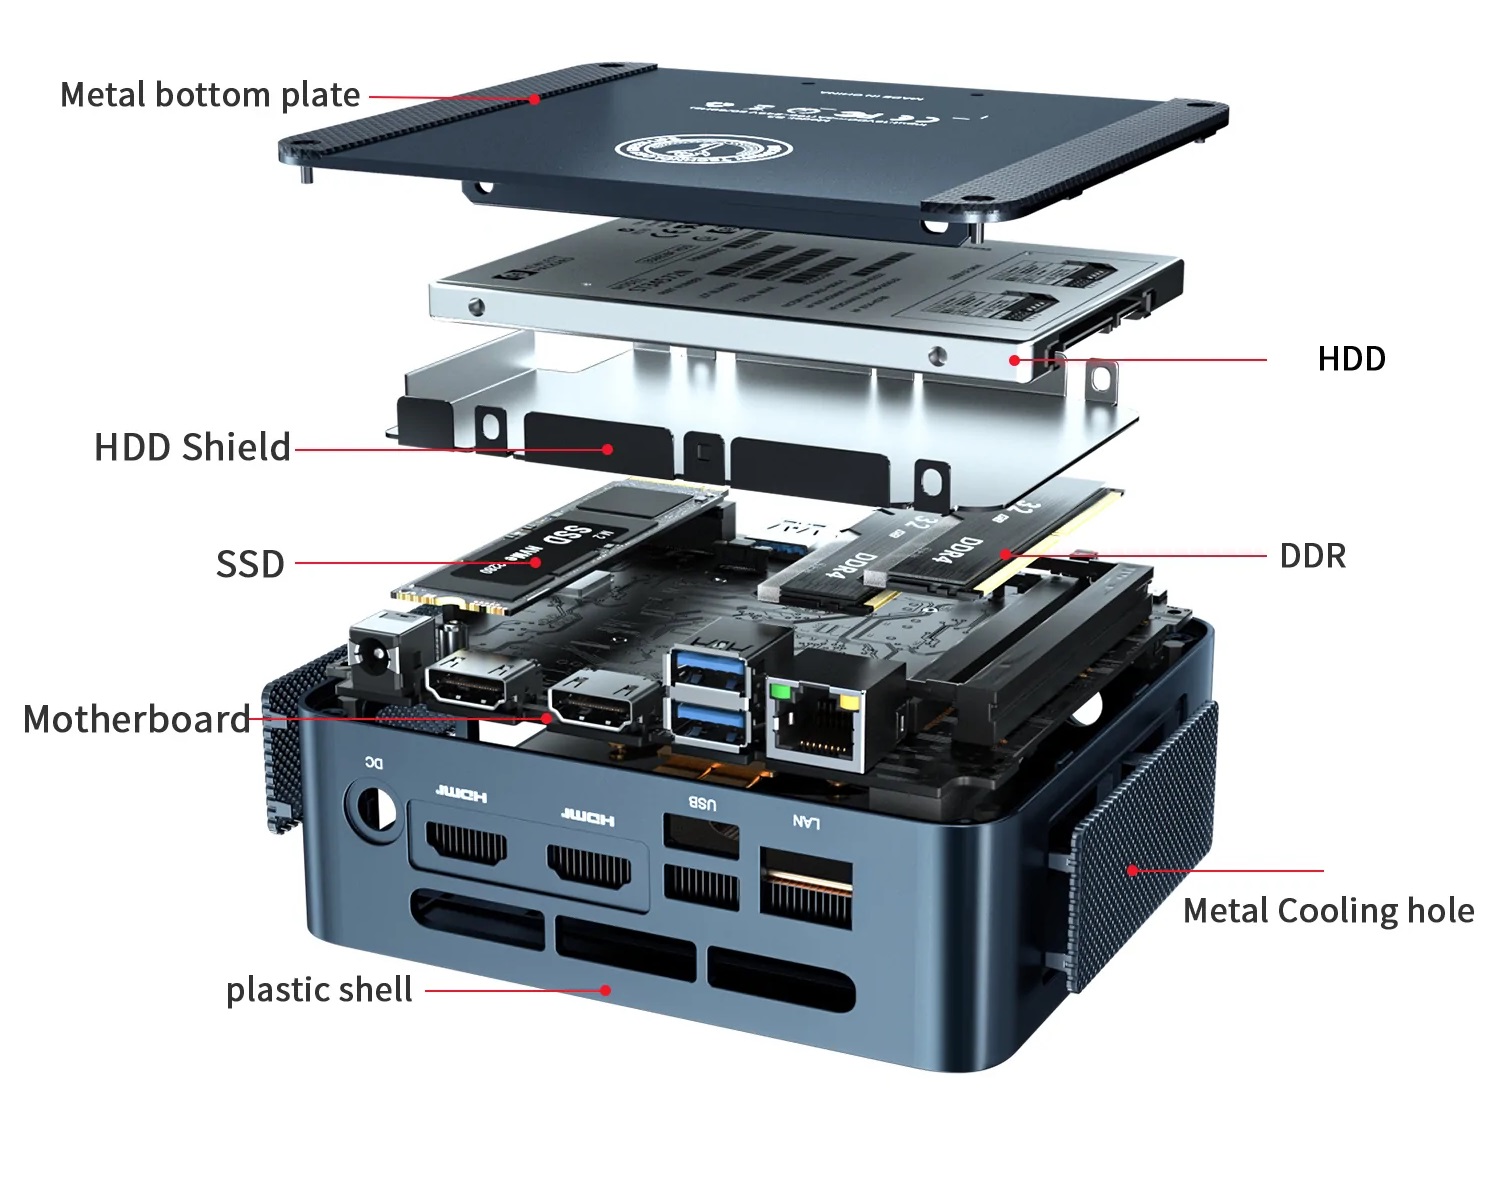
Manutenção
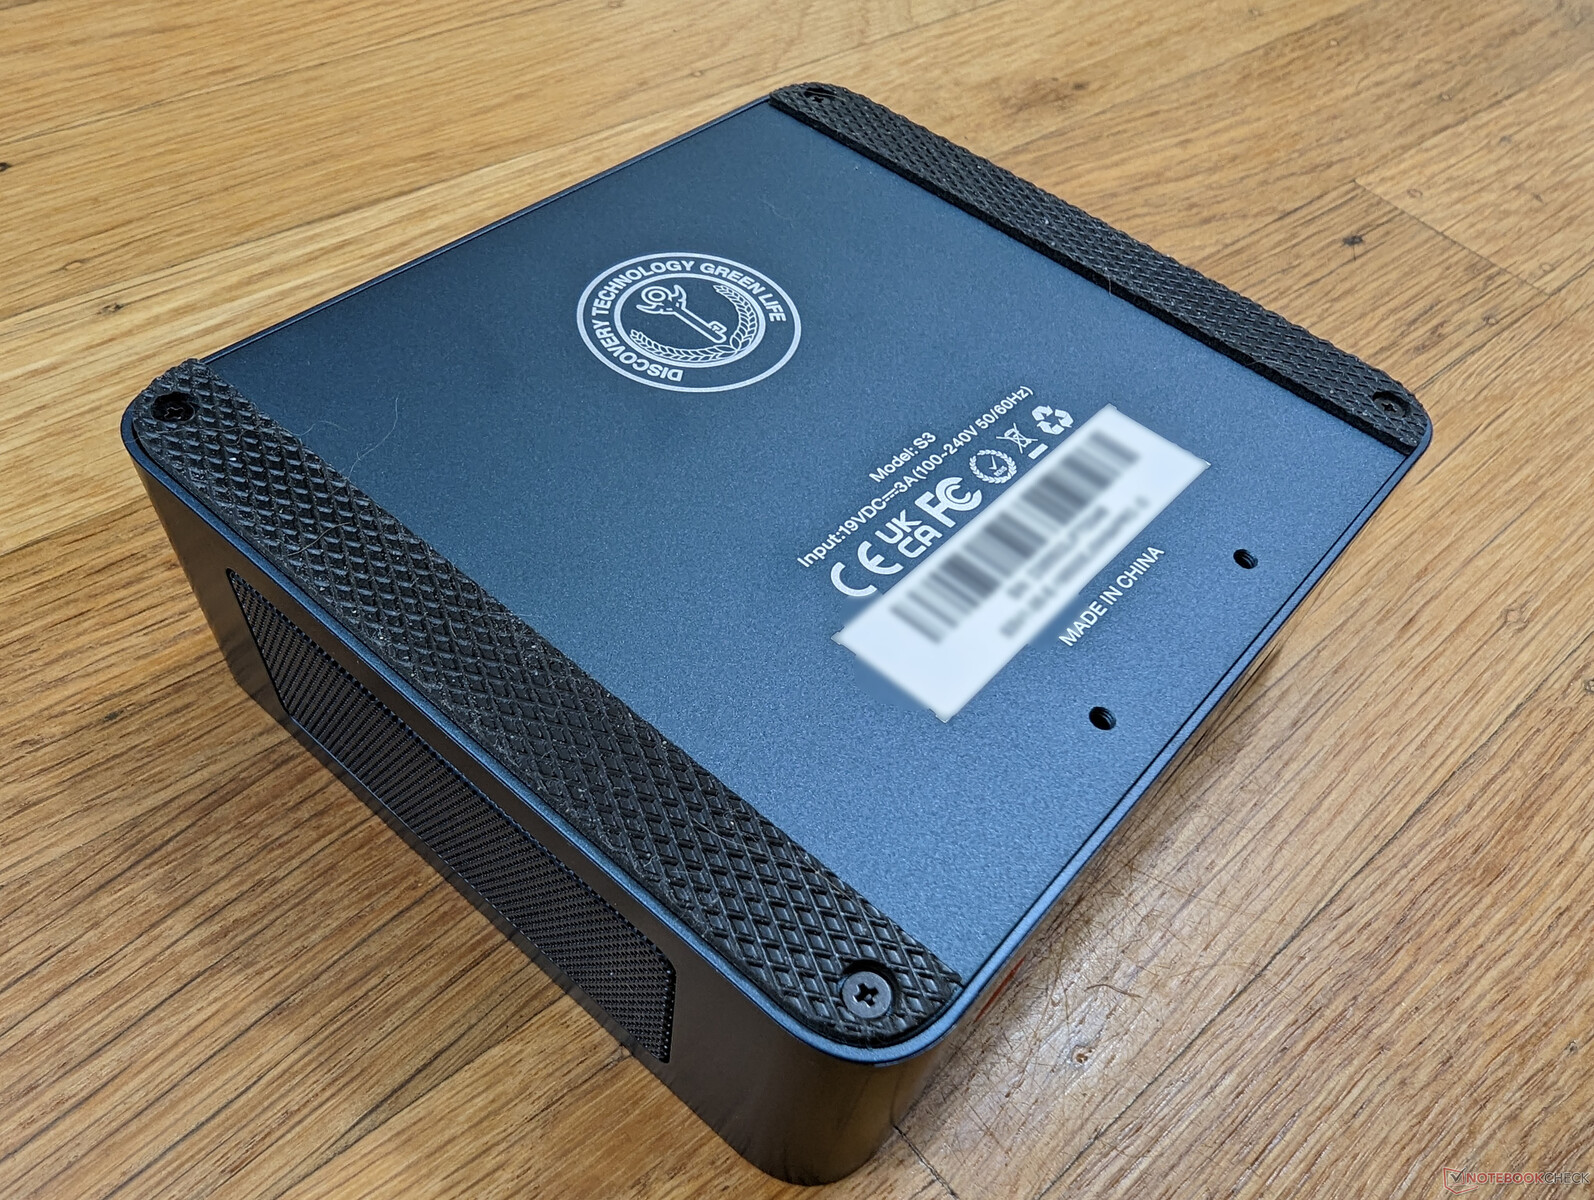
O painel inferior é suposto sair facilmente, mas os parafusos são macios e podem sair mais facilmente do que na maioria dos outros mini PCs. Isto infelizmente ocorreu em nossa unidade e por isso recomendamos que os proprietários sejam muito cuidadosos na manutenção da unidade. Em comparação, a Intel NUC tem parafusos de polegar para uma manutenção mais rápida sem ferramentas.
Acessórios e Garantia
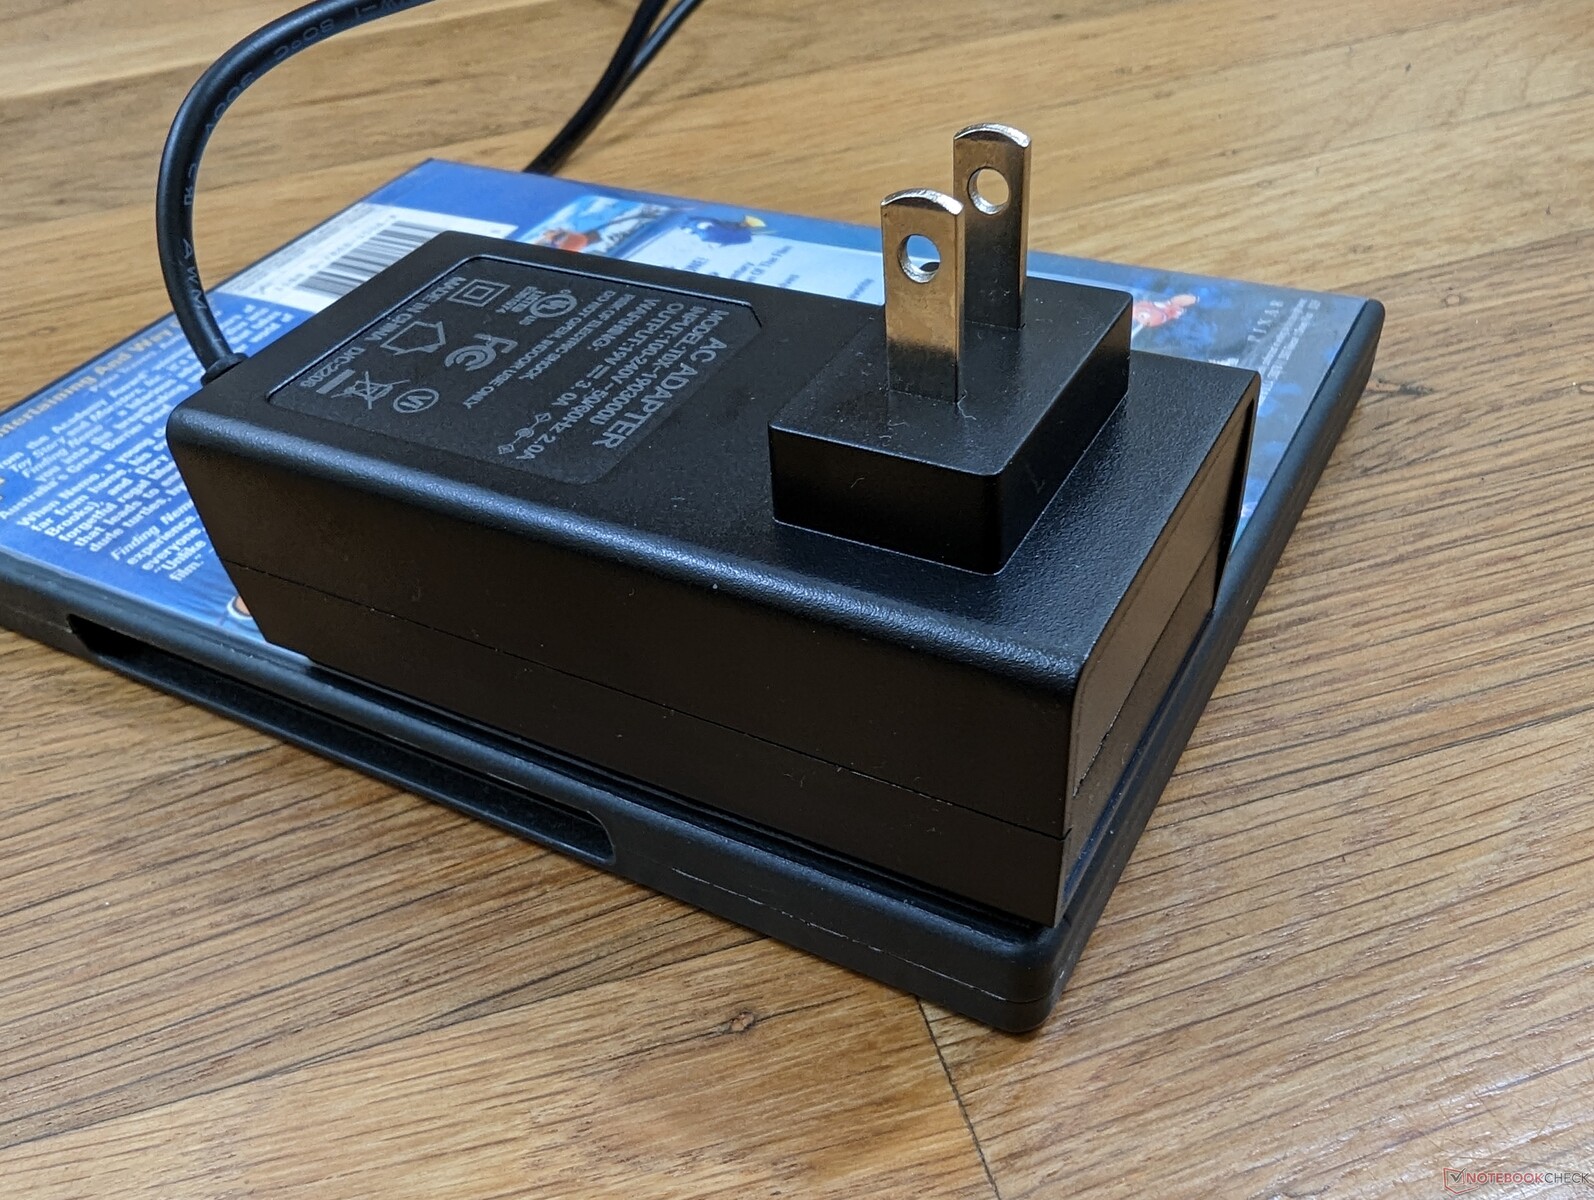
A caixa de varejo inclui um suporte montado na parede, adaptador AC, manual do usuário e dois cabos HDMI. Aplica-se a habitual garantia limitada de um ano do fabricante.
Desempenho
Condições de teste
Configuramos o Windows para o modo Performance antes de executar quaisquer benchmarks abaixo. O sistema não vem com nenhuma aplicação do tipo "centro de controle" pré-instalado para ajustar perfis de potência.
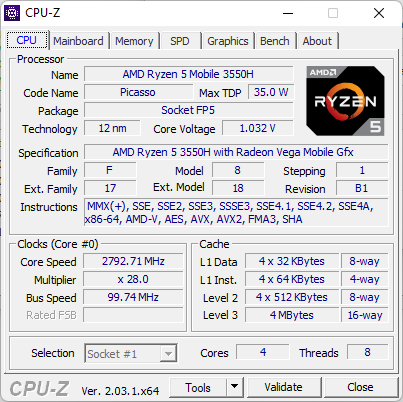
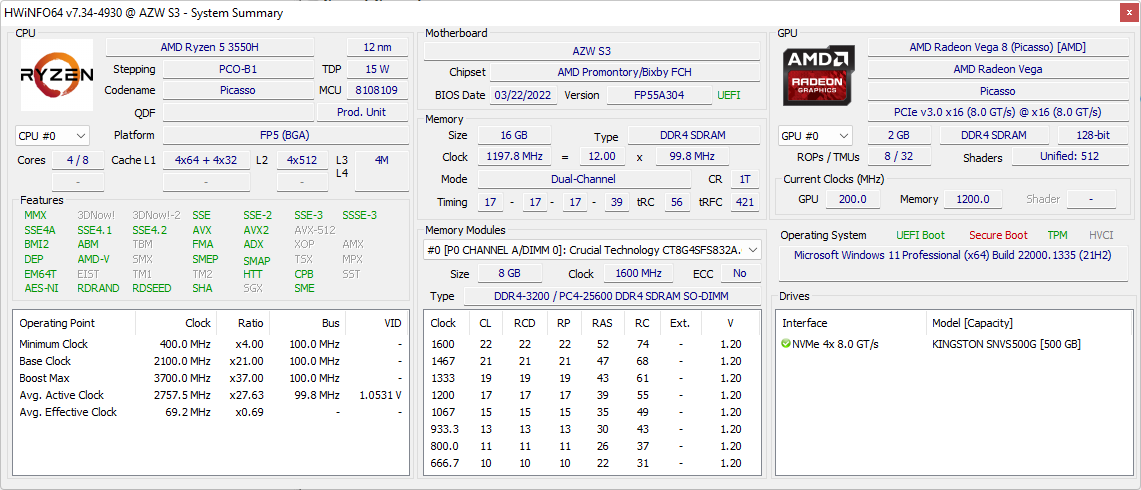
Processador
O desempenho geral da CPU é muito mais lento do que qualquer CPU Intel Core i5 ou i7 série U da 11ª ou 12ª geração, mas ainda assim notavelmente mais rápido do que qualquer solução Celeron ou Atom atualmente no mercado. Assim, a Ryzen 5 3550H em nosso Trigkey é mais comparável a um PC baseado em Intel Core i3 ou ao muito mais antigo Núcleo i5-8260U. É uma pena que o fabricante não tenha optado pelo Ryzen 7 4800U ao invés disso, como a CPU Zen 2 é uma atualização maciça sobre a série Zen+ H.
Cinebench R15 Multi Loop
Cinebench R20: CPU (Multi Core) | CPU (Single Core)
Cinebench R23: Multi Core | Single Core
Cinebench R15: CPU Multi 64Bit | CPU Single 64Bit
Blender: v2.79 BMW27 CPU
7-Zip 18.03: 7z b 4 | 7z b 4 -mmt1
Geekbench 5.5: Multi-Core | Single-Core
HWBOT x265 Benchmark v2.2: 4k Preset
LibreOffice : 20 Documents To PDF
R Benchmark 2.5: Overall mean
| CPU Performance rating | |
| Beelink GTR6 | |
| Intel NUC 12 Pro Kit NUC12WSKi7 | |
| Intel NUC Pro Chassis_i7_1265U | |
| Beelink SEi12 Core i5-1235U | |
| Beelink SER Pro Ryzen 5 5600H | |
| Beelink SEi11 Pro | |
| Intel NUC Pro Chassis_i7_1185G7 | |
| Prime Computer PrimeBook Circular-i7-1165G7 | |
| Minipc Union NiPoGi CK10 - 10810U | |
| Beelink SER3 -2! | |
| Média AMD Ryzen 5 3550H | |
| Trigkey S3 | |
| MSI Cubi 5 10M -8! | |
| Beelink SEi8 | |
| BMAX B5 Pro G7H8 | |
| Beelink U59 N5105 | |
| Geekom MiniAir 11 Special Edition | |
| Chuwi LapBook Plus -6! | |
| Chuwi Hi10 Air -12! | |
| Cinebench R20 / CPU (Multi Core) | |
| Beelink GTR6 | |
| Intel NUC 12 Pro Kit NUC12WSKi7 | |
| Intel NUC Pro Chassis_i7_1265U | |
| Beelink SEi12 Core i5-1235U | |
| Beelink SER Pro Ryzen 5 5600H | |
| Beelink SEi11 Pro | |
| Prime Computer PrimeBook Circular-i7-1165G7 | |
| Intel NUC Pro Chassis_i7_1185G7 | |
| Média AMD Ryzen 5 3550H (1421 - 1728, n=8) | |
| Beelink SER3 | |
| Minipc Union NiPoGi CK10 - 10810U | |
| BMAX B5 Pro G7H8 | |
| Trigkey S3 | |
| Geekom MiniAir 11 Special Edition | |
| Beelink U59 N5105 | |
| Beelink SEi8 | |
| MSI Cubi 5 10M | |
| Chuwi LapBook Plus | |
| Cinebench R20 / CPU (Single Core) | |
| Intel NUC 12 Pro Kit NUC12WSKi7 | |
| Intel NUC Pro Chassis_i7_1265U | |
| Beelink GTR6 | |
| Beelink SEi12 Core i5-1235U | |
| Prime Computer PrimeBook Circular-i7-1165G7 | |
| Beelink SEi11 Pro | |
| Intel NUC Pro Chassis_i7_1185G7 | |
| Beelink SER Pro Ryzen 5 5600H | |
| Minipc Union NiPoGi CK10 - 10810U | |
| MSI Cubi 5 10M | |
| BMAX B5 Pro G7H8 | |
| Beelink SER3 | |
| Trigkey S3 | |
| Média AMD Ryzen 5 3550H (331 - 370, n=8) | |
| Beelink SEi8 | |
| Beelink U59 N5105 | |
| Geekom MiniAir 11 Special Edition | |
| Chuwi LapBook Plus | |
| Cinebench R23 / Single Core | |
| Intel NUC 12 Pro Kit NUC12WSKi7 | |
| Intel NUC Pro Chassis_i7_1265U | |
| Beelink SEi12 Core i5-1235U | |
| Beelink GTR6 | |
| Prime Computer PrimeBook Circular-i7-1165G7 | |
| Beelink SEi11 Pro | |
| Intel NUC Pro Chassis_i7_1185G7 | |
| Beelink SER Pro Ryzen 5 5600H | |
| Minipc Union NiPoGi CK10 - 10810U | |
| MSI Cubi 5 10M | |
| Beelink SER3 | |
| Trigkey S3 | |
| Beelink SEi8 | |
| Média AMD Ryzen 5 3550H (850 - 922, n=2) | |
| BMAX B5 Pro G7H8 | |
| Beelink U59 N5105 | |
| Geekom MiniAir 11 Special Edition | |
| Cinebench R15 / CPU Multi 64Bit | |
| Beelink GTR6 | |
| Intel NUC 12 Pro Kit NUC12WSKi7 | |
| Beelink SEi12 Core i5-1235U | |
| Intel NUC Pro Chassis_i7_1265U | |
| Beelink SER Pro Ryzen 5 5600H | |
| Beelink SEi11 Pro | |
| Prime Computer PrimeBook Circular-i7-1165G7 | |
| Intel NUC Pro Chassis_i7_1185G7 | |
| Média AMD Ryzen 5 3550H (635 - 769, n=11) | |
| Beelink SER3 | |
| Trigkey S3 | |
| BMAX B5 Pro G7H8 | |
| Minipc Union NiPoGi CK10 - 10810U | |
| Geekom MiniAir 11 Special Edition | |
| Beelink U59 N5105 | |
| Beelink SEi8 | |
| MSI Cubi 5 10M | |
| Chuwi LapBook Plus | |
| Chuwi Hi10 Air | |
| Cinebench R15 / CPU Single 64Bit | |
| Intel NUC 12 Pro Kit NUC12WSKi7 | |
| Beelink GTR6 | |
| Intel NUC Pro Chassis_i7_1265U | |
| Beelink SEi12 Core i5-1235U | |
| Prime Computer PrimeBook Circular-i7-1165G7 | |
| Beelink SER Pro Ryzen 5 5600H | |
| Intel NUC Pro Chassis_i7_1185G7 | |
| Beelink SEi11 Pro | |
| Minipc Union NiPoGi CK10 - 10810U | |
| MSI Cubi 5 10M | |
| BMAX B5 Pro G7H8 | |
| Beelink SER3 | |
| Trigkey S3 | |
| Média AMD Ryzen 5 3550H (77 - 146, n=11) | |
| Beelink SEi8 | |
| Beelink U59 N5105 | |
| Geekom MiniAir 11 Special Edition | |
| Chuwi LapBook Plus | |
| Chuwi Hi10 Air | |
| Geekbench 5.5 / Multi-Core | |
| Intel NUC 12 Pro Kit NUC12WSKi7 | |
| Beelink GTR6 | |
| Intel NUC Pro Chassis_i7_1265U | |
| Beelink SEi12 Core i5-1235U | |
| Beelink SER Pro Ryzen 5 5600H | |
| Intel NUC Pro Chassis_i7_1185G7 | |
| Beelink SEi11 Pro | |
| Prime Computer PrimeBook Circular-i7-1165G7 | |
| Minipc Union NiPoGi CK10 - 10810U | |
| Média AMD Ryzen 5 3550H (3162 - 3486, n=5) | |
| Trigkey S3 | |
| Beelink U59 N5105 | |
| Geekom MiniAir 11 Special Edition | |
| Beelink SEi8 | |
| BMAX B5 Pro G7H8 | |
| Geekbench 5.5 / Single-Core | |
| Intel NUC 12 Pro Kit NUC12WSKi7 | |
| Intel NUC Pro Chassis_i7_1265U | |
| Beelink GTR6 | |
| Beelink SEi12 Core i5-1235U | |
| Prime Computer PrimeBook Circular-i7-1165G7 | |
| Beelink SEi11 Pro | |
| Intel NUC Pro Chassis_i7_1185G7 | |
| Beelink SER Pro Ryzen 5 5600H | |
| Minipc Union NiPoGi CK10 - 10810U | |
| Trigkey S3 | |
| Média AMD Ryzen 5 3550H (880 - 907, n=5) | |
| Beelink SEi8 | |
| Geekom MiniAir 11 Special Edition | |
| Beelink U59 N5105 | |
| BMAX B5 Pro G7H8 | |
| HWBOT x265 Benchmark v2.2 / 4k Preset | |
| Beelink GTR6 | |
| Intel NUC 12 Pro Kit NUC12WSKi7 | |
| Beelink SER Pro Ryzen 5 5600H | |
| Intel NUC Pro Chassis_i7_1265U | |
| Beelink SEi12 Core i5-1235U | |
| Beelink SEi11 Pro | |
| Intel NUC Pro Chassis_i7_1185G7 | |
| Minipc Union NiPoGi CK10 - 10810U | |
| Prime Computer PrimeBook Circular-i7-1165G7 | |
| Beelink SER3 | |
| Média AMD Ryzen 5 3550H (3.7 - 4.43, n=5) | |
| Trigkey S3 | |
| Beelink SEi8 | |
| Geekom MiniAir 11 Special Edition | |
| Beelink U59 N5105 | |
| BMAX B5 Pro G7H8 | |
| Chuwi LapBook Plus | |
| LibreOffice / 20 Documents To PDF | |
| BMAX B5 Pro G7H8 | |
| Geekom MiniAir 11 Special Edition | |
| Beelink U59 N5105 | |
| Trigkey S3 | |
| Beelink SER3 | |
| Média AMD Ryzen 5 3550H (73.3 - 92.7, n=4) | |
| Beelink SEi8 | |
| Minipc Union NiPoGi CK10 - 10810U | |
| Beelink SER Pro Ryzen 5 5600H | |
| Prime Computer PrimeBook Circular-i7-1165G7 | |
| Beelink SEi11 Pro | |
| Intel NUC Pro Chassis_i7_1265U | |
| Beelink SEi12 Core i5-1235U | |
| Intel NUC Pro Chassis_i7_1185G7 | |
| Beelink GTR6 | |
| Intel NUC 12 Pro Kit NUC12WSKi7 | |
| R Benchmark 2.5 / Overall mean | |
| BMAX B5 Pro G7H8 | |
| Geekom MiniAir 11 Special Edition | |
| Beelink U59 N5105 | |
| Beelink SEi8 | |
| Média AMD Ryzen 5 3550H (0.732 - 0.752, n=4) | |
| Trigkey S3 | |
| Beelink SER3 | |
| Minipc Union NiPoGi CK10 - 10810U | |
| Prime Computer PrimeBook Circular-i7-1165G7 | |
| Intel NUC Pro Chassis_i7_1185G7 | |
| Beelink SEi11 Pro | |
| Beelink SER Pro Ryzen 5 5600H | |
| Beelink SEi12 Core i5-1235U | |
| Intel NUC Pro Chassis_i7_1265U | |
| Intel NUC 12 Pro Kit NUC12WSKi7 | |
| Beelink GTR6 | |
Cinebench R20: CPU (Multi Core) | CPU (Single Core)
Cinebench R23: Multi Core | Single Core
Cinebench R15: CPU Multi 64Bit | CPU Single 64Bit
Blender: v2.79 BMW27 CPU
7-Zip 18.03: 7z b 4 | 7z b 4 -mmt1
Geekbench 5.5: Multi-Core | Single-Core
HWBOT x265 Benchmark v2.2: 4k Preset
LibreOffice : 20 Documents To PDF
R Benchmark 2.5: Overall mean
* ... menor é melhor
| Blender | |
| v3.3 Classroom HIP/AMD | |
| Trigkey S3 | |
| Média AMD Radeon RX Vega 8 (Ryzen 2000/3000) (n=1) | |
| v3.3 Classroom CPU | |
| Trigkey S3 | |
| Média AMD Radeon RX Vega 8 (Ryzen 2000/3000) (n=1) | |
| Beelink SEi11 Pro | |
| Beelink SEi12 Core i5-1235U | |
| Intel NUC Pro Chassis_i7_1265U | |
| Beelink SER Pro Ryzen 5 5600H | |
* ... menor é melhor
AIDA64: FP32 Ray-Trace | FPU Julia | CPU SHA3 | CPU Queen | FPU SinJulia | FPU Mandel | CPU AES | CPU ZLib | FP64 Ray-Trace | CPU PhotoWorxx
| Performance rating | |
| Beelink SER Pro Ryzen 5 5600H | |
| Intel NUC Pro Chassis_i7_1265U | |
| Beelink SEi12 Core i5-1235U | |
| Beelink SEi11 Pro | |
| Intel NUC11TNKi5 | |
| Média AMD Ryzen 5 3550H | |
| Trigkey S3 | |
| AIDA64 / FP32 Ray-Trace | |
| Beelink SER Pro Ryzen 5 5600H | |
| Beelink SEi11 Pro | |
| Intel NUC Pro Chassis_i7_1265U | |
| Beelink SEi12 Core i5-1235U | |
| Intel NUC11TNKi5 | |
| Média AMD Ryzen 5 3550H (2996 - 3607, n=5) | |
| Trigkey S3 | |
| AIDA64 / FPU Julia | |
| Beelink SER Pro Ryzen 5 5600H | |
| Intel NUC Pro Chassis_i7_1265U | |
| Beelink SEi12 Core i5-1235U | |
| Beelink SEi11 Pro | |
| Intel NUC11TNKi5 | |
| Média AMD Ryzen 5 3550H (16278 - 18781, n=5) | |
| Trigkey S3 | |
| AIDA64 / CPU SHA3 | |
| Beelink SER Pro Ryzen 5 5600H | |
| Beelink SEi11 Pro | |
| Intel NUC Pro Chassis_i7_1265U | |
| Beelink SEi12 Core i5-1235U | |
| Intel NUC11TNKi5 | |
| Média AMD Ryzen 5 3550H (847 - 983, n=4) | |
| Trigkey S3 | |
| AIDA64 / CPU Queen | |
| Beelink SER Pro Ryzen 5 5600H | |
| Intel NUC Pro Chassis_i7_1265U | |
| Beelink SEi12 Core i5-1235U | |
| Beelink SEi11 Pro | |
| Intel NUC11TNKi5 | |
| Média AMD Ryzen 5 3550H (42017 - 48622, n=5) | |
| Trigkey S3 | |
| AIDA64 / FPU SinJulia | |
| Beelink SER Pro Ryzen 5 5600H | |
| Média AMD Ryzen 5 3550H (5386 - 6316, n=5) | |
| Trigkey S3 | |
| Intel NUC Pro Chassis_i7_1265U | |
| Beelink SEi11 Pro | |
| Beelink SEi12 Core i5-1235U | |
| Intel NUC11TNKi5 | |
| AIDA64 / FPU Mandel | |
| Beelink SER Pro Ryzen 5 5600H | |
| Intel NUC Pro Chassis_i7_1265U | |
| Beelink SEi11 Pro | |
| Intel NUC11TNKi5 | |
| Beelink SEi12 Core i5-1235U | |
| Média AMD Ryzen 5 3550H (8460 - 9767, n=5) | |
| Trigkey S3 | |
| AIDA64 / CPU AES | |
| Beelink SER Pro Ryzen 5 5600H | |
| Beelink SEi11 Pro | |
| Beelink SEi12 Core i5-1235U | |
| Intel NUC11TNKi5 | |
| Intel NUC Pro Chassis_i7_1265U | |
| Média AMD Ryzen 5 3550H (27486 - 32316, n=5) | |
| Trigkey S3 | |
| AIDA64 / CPU ZLib | |
| Beelink SEi12 Core i5-1235U | |
| Intel NUC Pro Chassis_i7_1265U | |
| Beelink SER Pro Ryzen 5 5600H | |
| Intel NUC11TNKi5 | |
| Beelink SEi11 Pro | |
| Média AMD Ryzen 5 3550H (299 - 352, n=5) | |
| Trigkey S3 | |
| AIDA64 / FP64 Ray-Trace | |
| Beelink SER Pro Ryzen 5 5600H | |
| Intel NUC Pro Chassis_i7_1265U | |
| Beelink SEi11 Pro | |
| Intel NUC11TNKi5 | |
| Beelink SEi12 Core i5-1235U | |
| Média AMD Ryzen 5 3550H (1584 - 1914, n=5) | |
| Trigkey S3 | |
| AIDA64 / CPU PhotoWorxx | |
| Intel NUC Pro Chassis_i7_1265U | |
| Beelink SEi12 Core i5-1235U | |
| Beelink SEi11 Pro | |
| Beelink SER Pro Ryzen 5 5600H | |
| Intel NUC11TNKi5 | |
| Trigkey S3 | |
| Média AMD Ryzen 5 3550H (14325 - 17838, n=5) | |
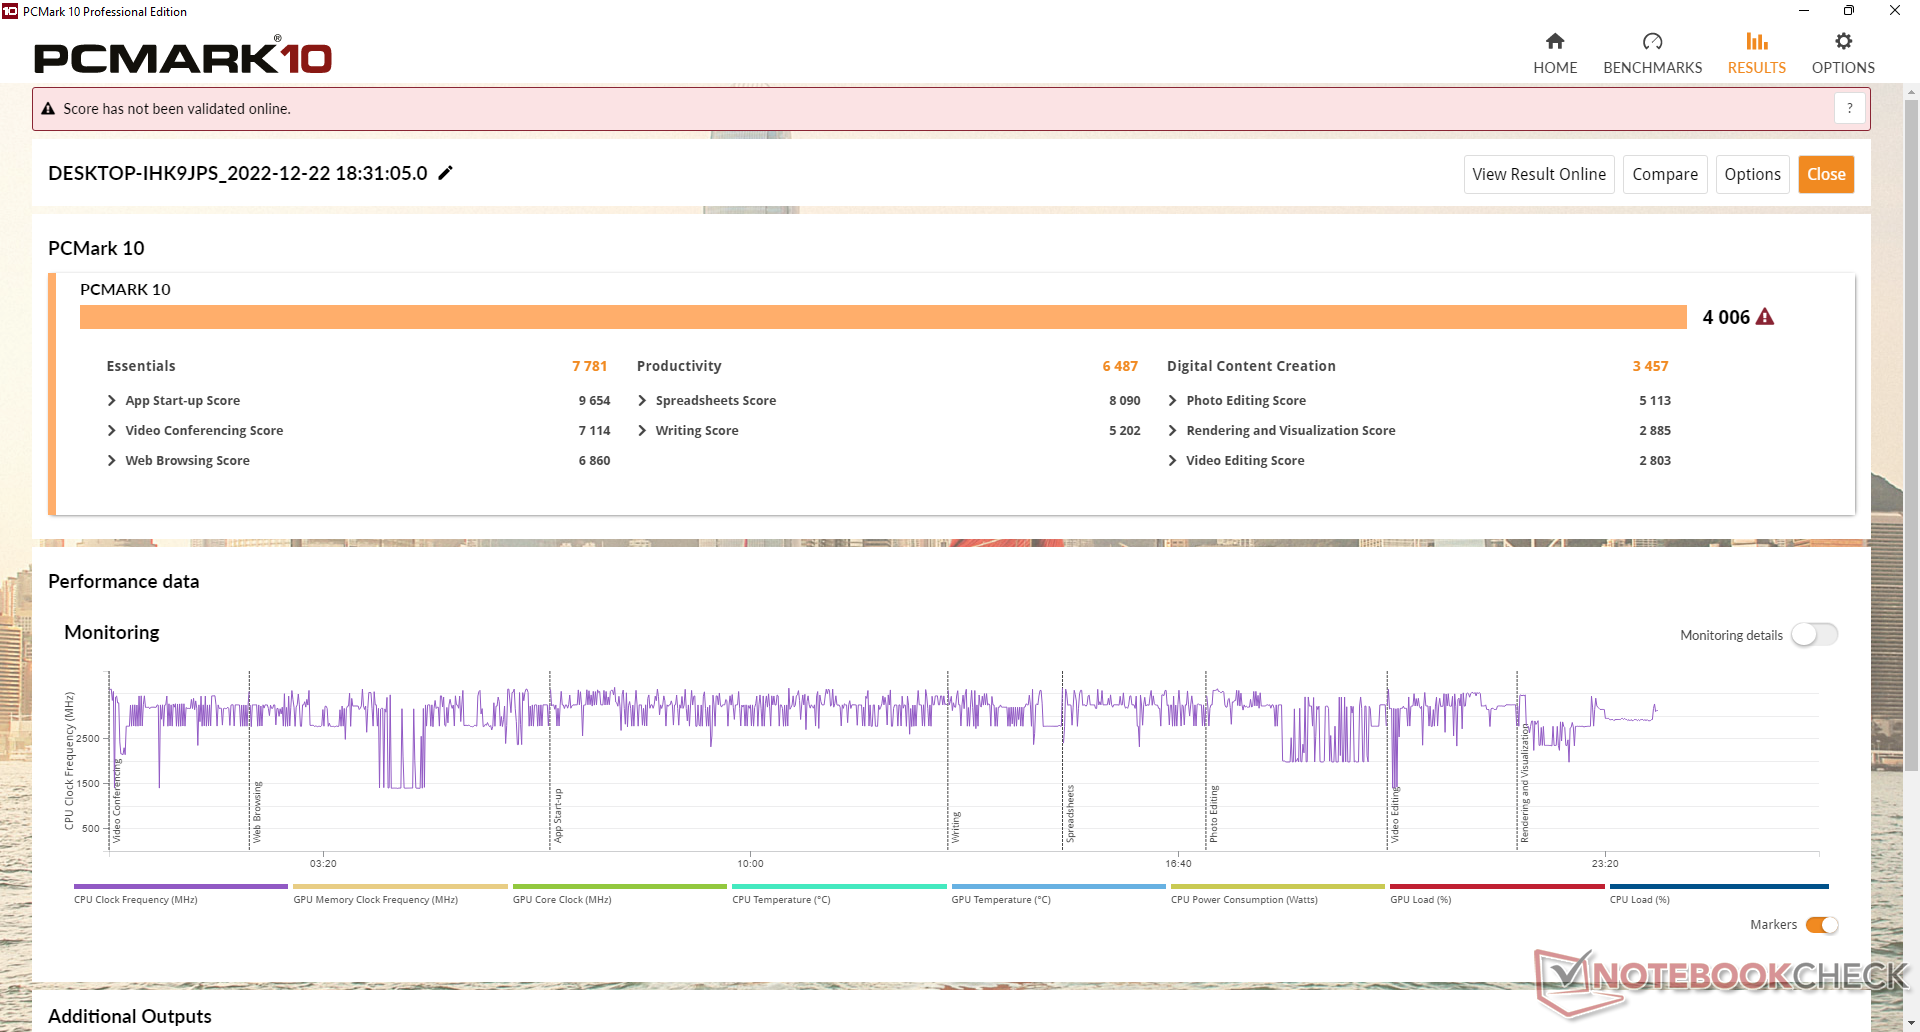
Desempenho do sistema
Como esperado, os resultados da PCMark estão entre mini PCs mais lentos alimentados por CPUs Celeron ou Atom e mini PCs mais rápidos alimentados por CPUs mais modernas da 11ª ou 12ª geração da Intel.
CrossMark: Overall | Productivity | Creativity | Responsiveness
| PCMark 10 / Score | |
| Beelink SER Pro Ryzen 5 5600H | |
| Beelink SEi12 Core i5-1235U | |
| Intel NUC Pro Chassis_i7_1265U | |
| Beelink SEi11 Pro | |
| Intel NUC11TNKi5 | |
| Média AMD Ryzen 5 3550H, AMD Radeon RX Vega 8 (Ryzen 2000/3000) (4006 - 4307, n=4) | |
| Trigkey S3 | |
| Beelink U59 N5105 | |
| Chuwi LapBook Plus | |
| PCMark 10 / Essentials | |
| Beelink SEi12 Core i5-1235U | |
| Beelink SER Pro Ryzen 5 5600H | |
| Beelink SEi11 Pro | |
| Intel NUC Pro Chassis_i7_1265U | |
| Intel NUC11TNKi5 | |
| Média AMD Ryzen 5 3550H, AMD Radeon RX Vega 8 (Ryzen 2000/3000) (7781 - 8579, n=4) | |
| Trigkey S3 | |
| Beelink U59 N5105 | |
| Chuwi LapBook Plus | |
| PCMark 10 / Productivity | |
| Beelink SER Pro Ryzen 5 5600H | |
| Beelink SEi12 Core i5-1235U | |
| Intel NUC Pro Chassis_i7_1265U | |
| Beelink SEi11 Pro | |
| Trigkey S3 | |
| Média AMD Ryzen 5 3550H, AMD Radeon RX Vega 8 (Ryzen 2000/3000) (5995 - 6487, n=4) | |
| Intel NUC11TNKi5 | |
| Beelink U59 N5105 | |
| Chuwi LapBook Plus | |
| PCMark 10 / Digital Content Creation | |
| Intel NUC Pro Chassis_i7_1265U | |
| Beelink SER Pro Ryzen 5 5600H | |
| Beelink SEi12 Core i5-1235U | |
| Beelink SEi11 Pro | |
| Intel NUC11TNKi5 | |
| Média AMD Ryzen 5 3550H, AMD Radeon RX Vega 8 (Ryzen 2000/3000) (3457 - 3947, n=4) | |
| Trigkey S3 | |
| Beelink U59 N5105 | |
| Chuwi LapBook Plus | |
| CrossMark / Overall | |
| Beelink SEi12 Core i5-1235U | |
| Intel NUC Pro Chassis_i7_1265U | |
| Beelink SEi11 Pro | |
| Beelink SER Pro Ryzen 5 5600H | |
| Trigkey S3 | |
| Média AMD Ryzen 5 3550H, AMD Radeon RX Vega 8 (Ryzen 2000/3000) (n=1) | |
| Beelink U59 N5105 | |
| CrossMark / Productivity | |
| Beelink SEi12 Core i5-1235U | |
| Intel NUC Pro Chassis_i7_1265U | |
| Beelink SEi11 Pro | |
| Beelink SER Pro Ryzen 5 5600H | |
| Trigkey S3 | |
| Média AMD Ryzen 5 3550H, AMD Radeon RX Vega 8 (Ryzen 2000/3000) (n=1) | |
| Beelink U59 N5105 | |
| CrossMark / Creativity | |
| Intel NUC Pro Chassis_i7_1265U | |
| Beelink SEi12 Core i5-1235U | |
| Beelink SER Pro Ryzen 5 5600H | |
| Beelink SEi11 Pro | |
| Trigkey S3 | |
| Média AMD Ryzen 5 3550H, AMD Radeon RX Vega 8 (Ryzen 2000/3000) (n=1) | |
| Beelink U59 N5105 | |
| CrossMark / Responsiveness | |
| Beelink SEi12 Core i5-1235U | |
| Beelink SEi11 Pro | |
| Intel NUC Pro Chassis_i7_1265U | |
| Beelink SER Pro Ryzen 5 5600H | |
| Trigkey S3 | |
| Média AMD Ryzen 5 3550H, AMD Radeon RX Vega 8 (Ryzen 2000/3000) (n=1) | |
| Beelink U59 N5105 | |
| PCMark 10 Score | 4006 pontos | |
Ajuda | ||
| AIDA64 / Memory Copy | |
| Intel NUC Pro Chassis_i7_1265U | |
| Beelink SEi12 Core i5-1235U | |
| Beelink SER Pro Ryzen 5 5600H | |
| Beelink SEi11 Pro | |
| Trigkey S3 | |
| Média AMD Ryzen 5 3550H (28887 - 32188, n=5) | |
| Intel NUC11TNKi5 | |
| AIDA64 / Memory Read | |
| Intel NUC Pro Chassis_i7_1265U | |
| Beelink SER Pro Ryzen 5 5600H | |
| Beelink SEi12 Core i5-1235U | |
| Beelink SEi11 Pro | |
| Trigkey S3 | |
| Média AMD Ryzen 5 3550H (31862 - 35172, n=5) | |
| Intel NUC11TNKi5 | |
| AIDA64 / Memory Write | |
| Intel NUC Pro Chassis_i7_1265U | |
| Beelink SEi11 Pro | |
| Beelink SEi12 Core i5-1235U | |
| Beelink SER Pro Ryzen 5 5600H | |
| Trigkey S3 | |
| Média AMD Ryzen 5 3550H (32493 - 35847, n=5) | |
| Intel NUC11TNKi5 | |
| AIDA64 / Memory Latency | |
| Média AMD Ryzen 5 3550H (95 - 120, n=5) | |
| Intel NUC Pro Chassis_i7_1265U | |
| Trigkey S3 | |
| Beelink SEi12 Core i5-1235U | |
| Intel NUC11TNKi5 | |
| Beelink SEi11 Pro | |
| Beelink SER Pro Ryzen 5 5600H | |
* ... menor é melhor
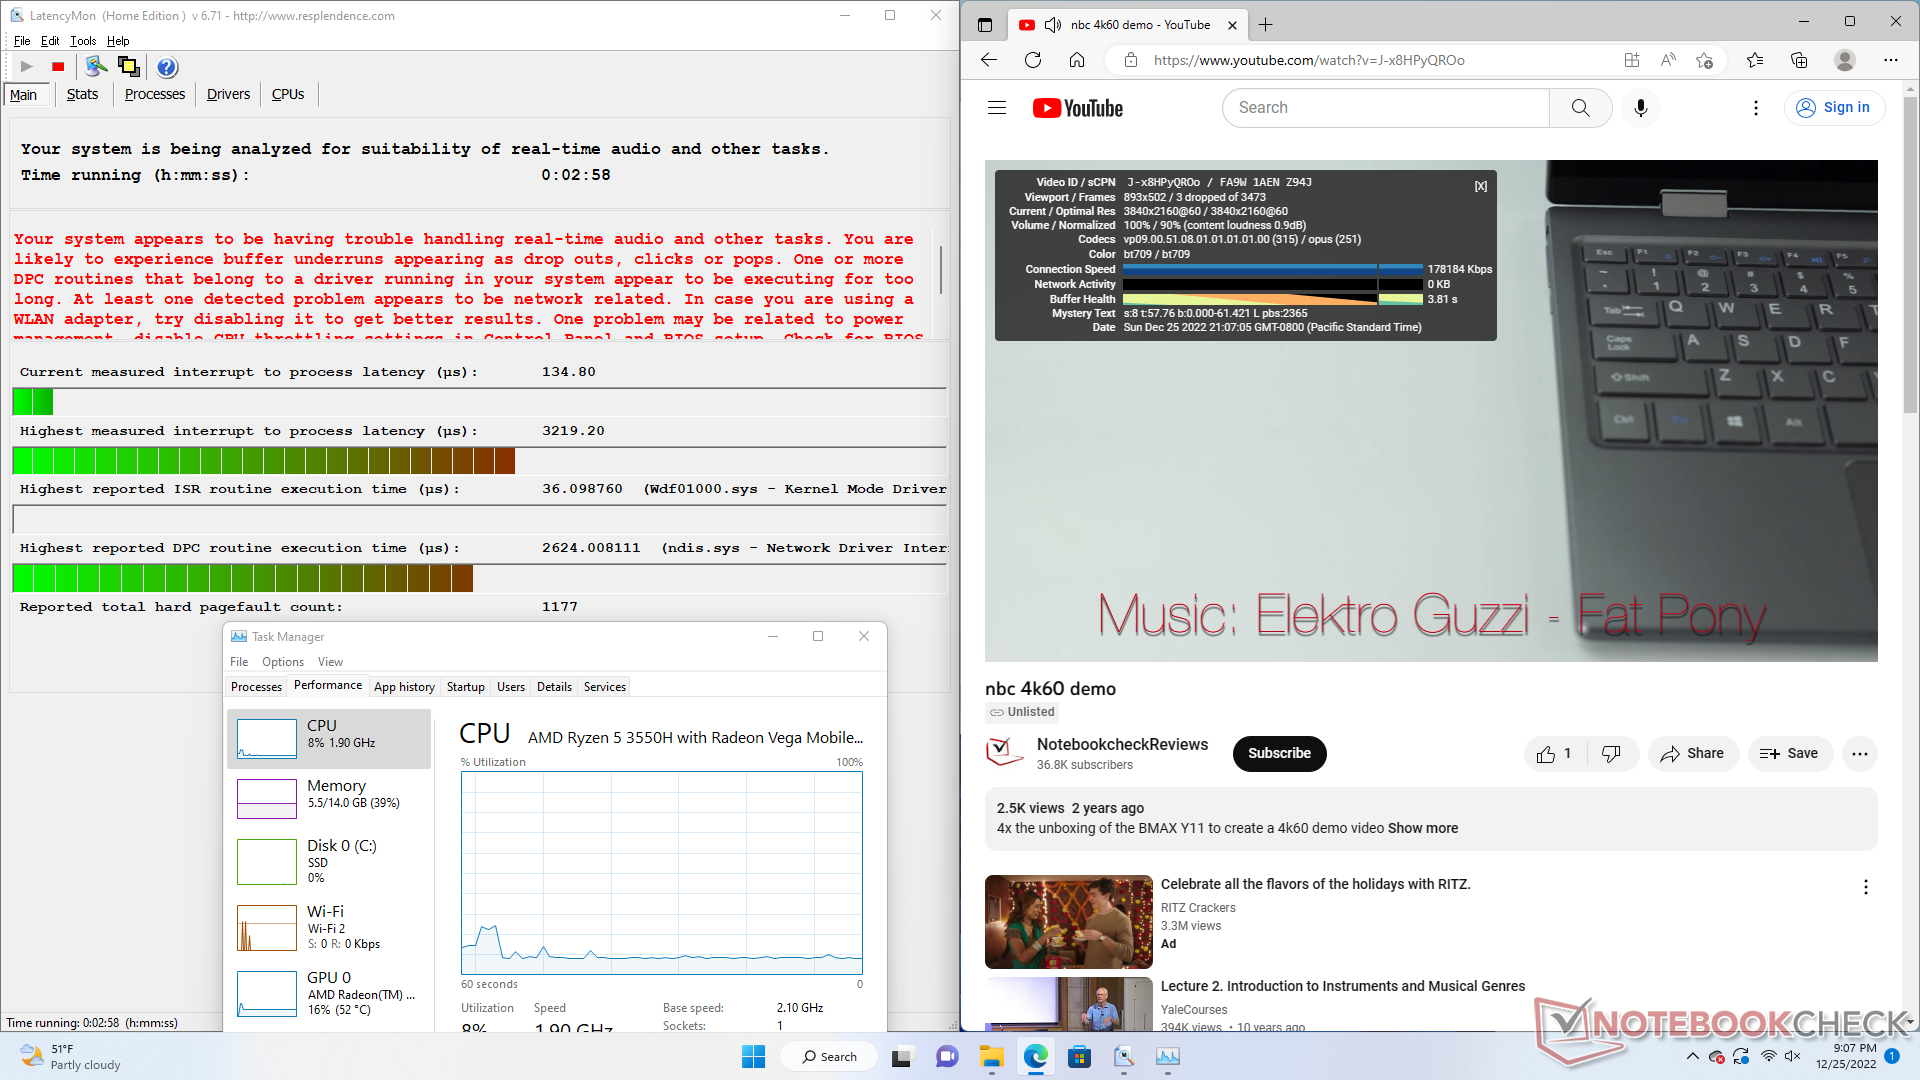
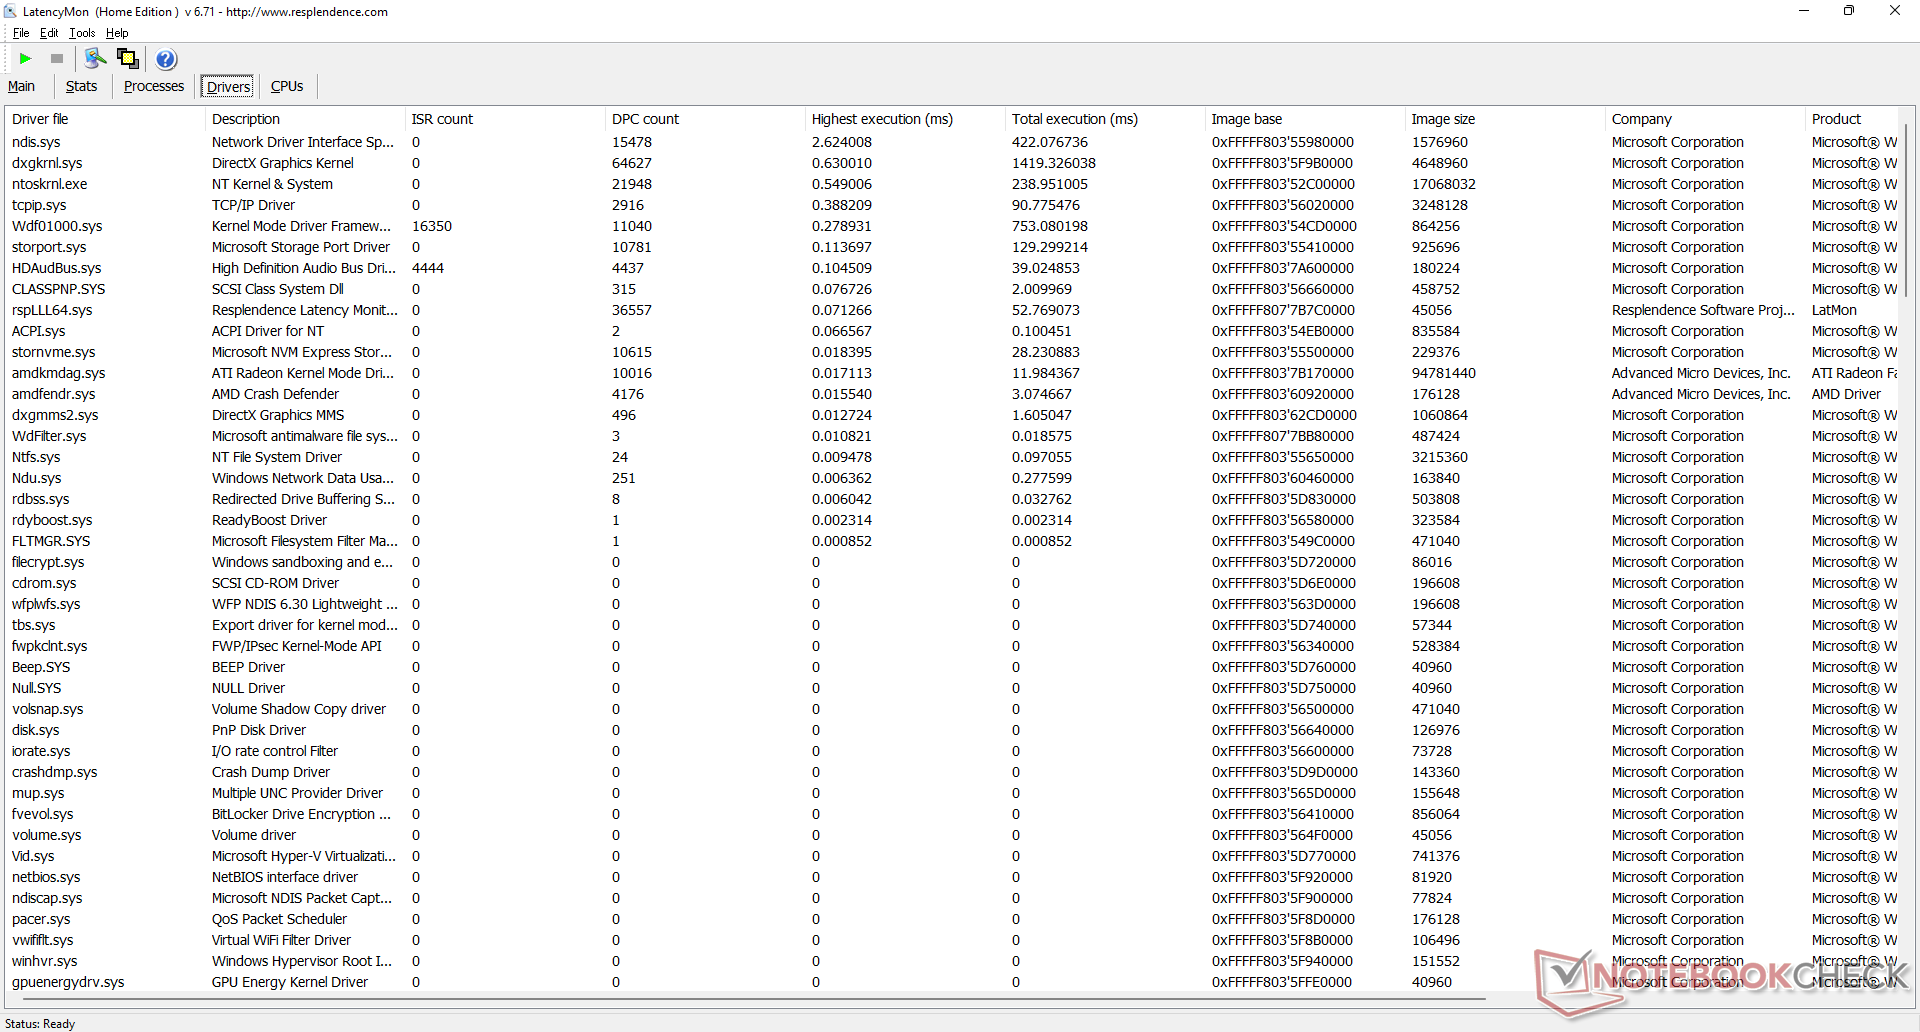
Latência do DPC
LatencyMon revela problemas de DPC ao abrir várias abas do navegador em nossa página inicial. a reprodução do vídeo de 4K a 60 FPS é, em sua maioria, suave, com apenas 3 quadros descartados durante nosso vídeo de teste de minutos.
| DPC Latencies / LatencyMon - interrupt to process latency (max), Web, Youtube, Prime95 | |
| Trigkey S3 | |
| Intel NUC Pro Chassis_i7_1265U | |
| Beelink SEi12 Core i5-1235U | |
| Beelink SER Pro Ryzen 5 5600H | |
| Intel NUC11TNKi5 | |
| Beelink SEi11 Pro | |
* ... menor é melhor
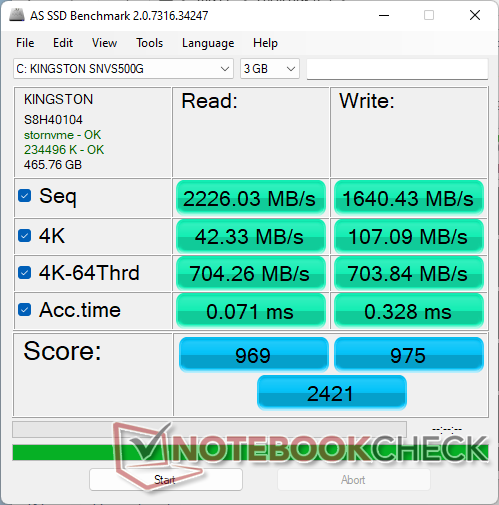
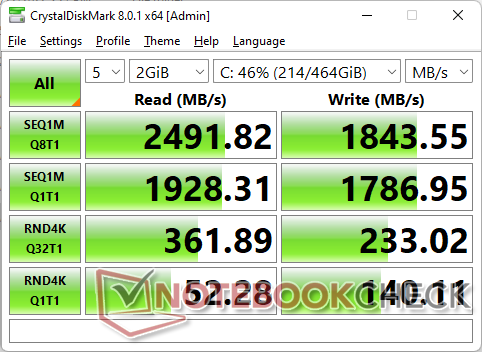
Dispositivos de armazenamento
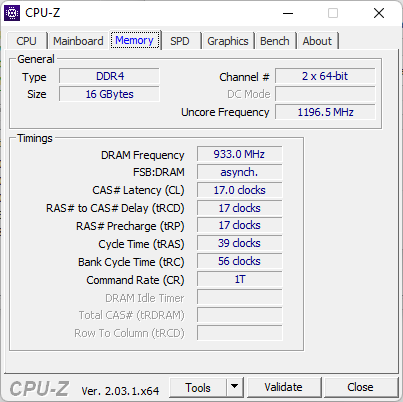
O Trigkey usa o mesmoKingston NV1 SNVS/500GCN M.2 2280 NVMe SSD como encontrado em muitos mini PCs Beelink, tais como o SEi11 Pro ou SER Pro. Esta é uma unidade PCIe3 x4 de orçamento com taxas máximas de transferência sustentadas de cerca de 2500 MB/s. Os usuários podem instalar um M.2 SSD e um drive SATA III de 2,5 polegadas se conseguirem abrir o painel inferior.

| Drive Performance rating - Percent | |
| Beelink SEi12 Core i5-1235U | |
| Intel NUC Pro Chassis_i7_1265U | |
| Beelink SEi11 Pro | |
| Beelink SER Pro Ryzen 5 5600H -11! | |
| Trigkey S3 | |
| Intel NUC11TNKi5 | |
* ... menor é melhor
Disk Throttling: DiskSpd Read Loop, Queue Depth 8
Desempenho da GPU
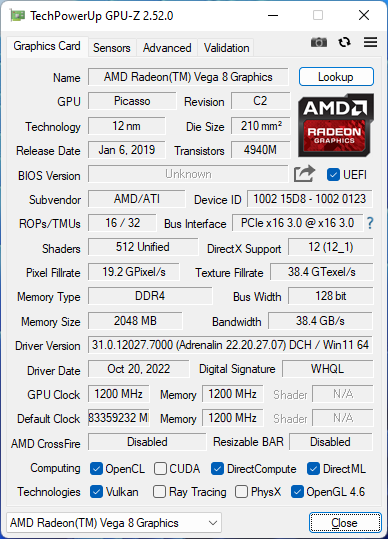
O desempenho gráfico bruto é aproximadamente 2x superior ao do UHD Graphics 620 comumente encontrado em CPUs Intel do 10º gênero ou mais antigas. Não é suficiente para alimentar a maioria dos jogos, mas cada pedaço ajuda quando se está transmitindo ou rodando em displays de maior resolução.
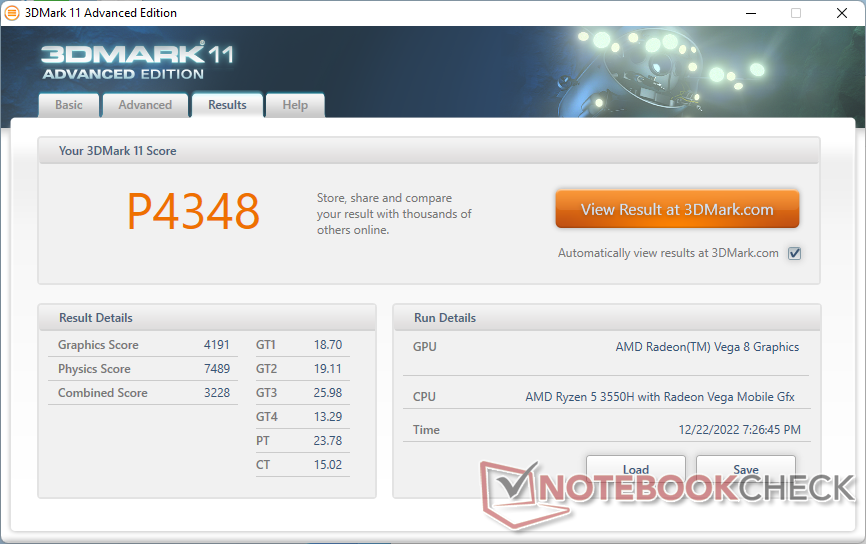
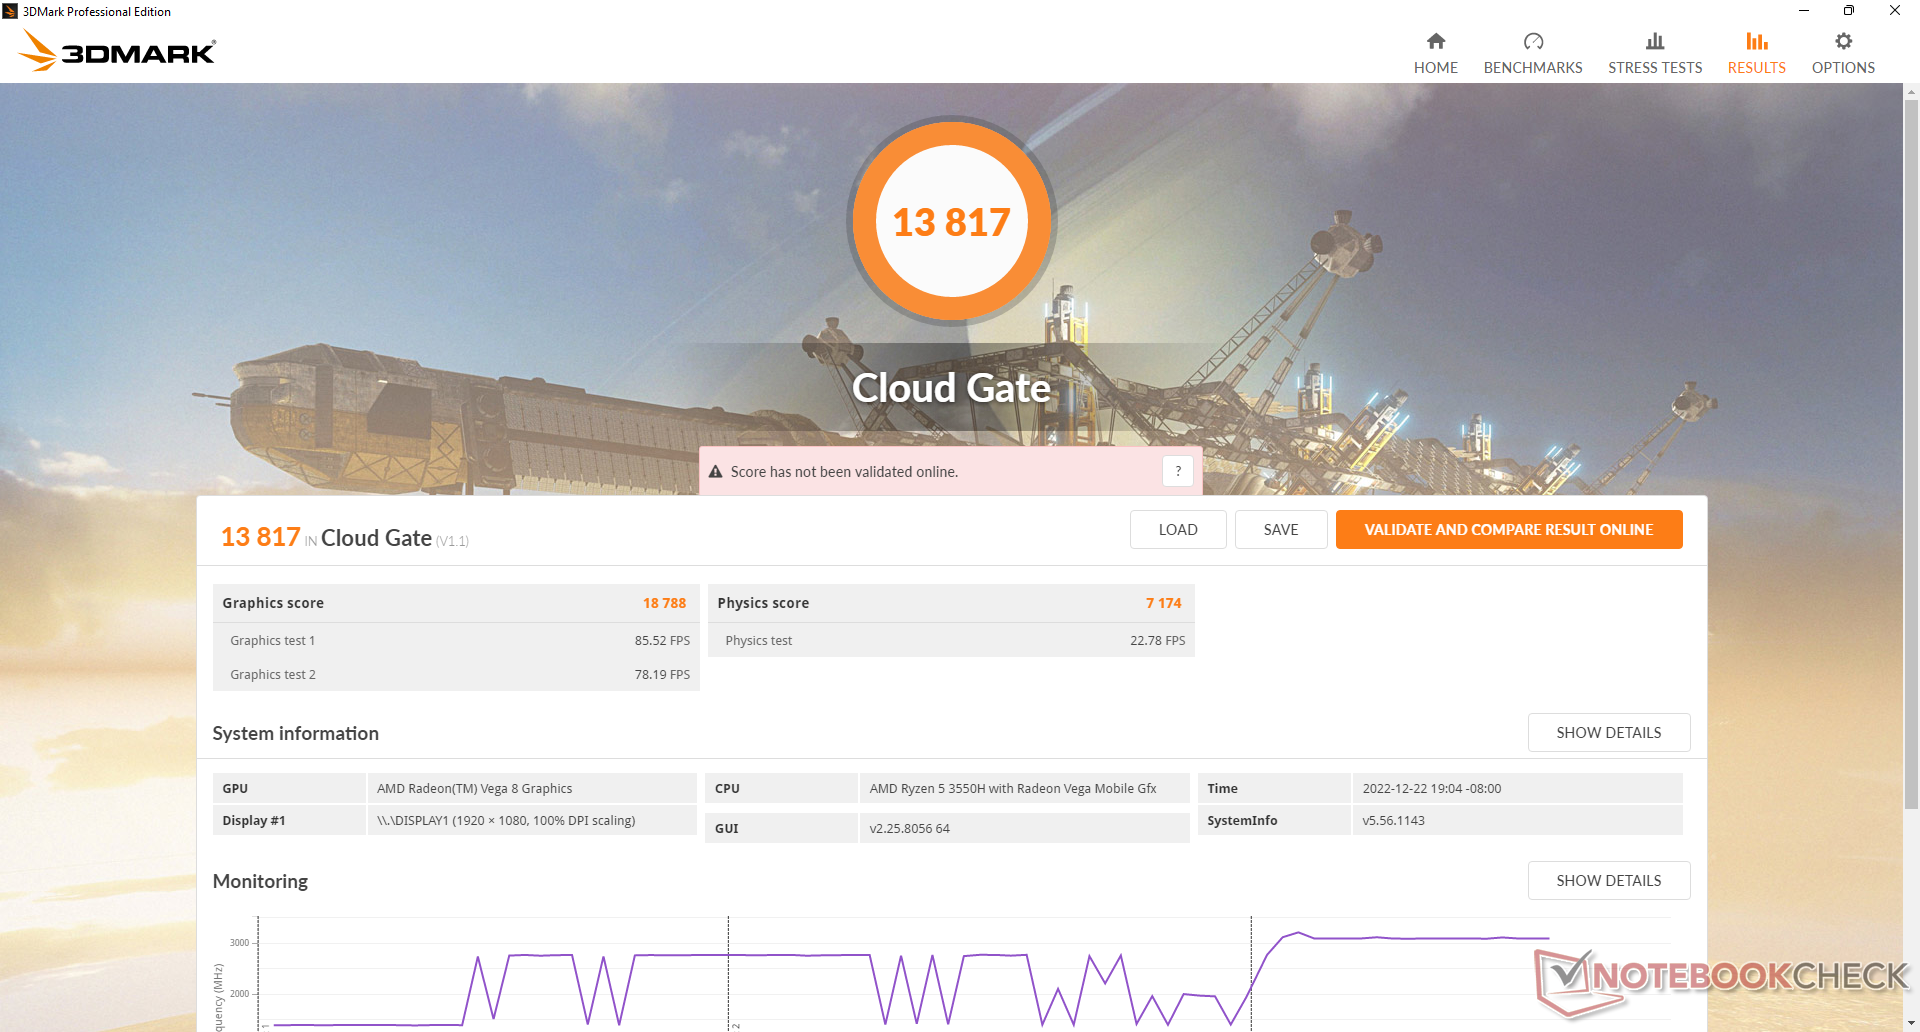
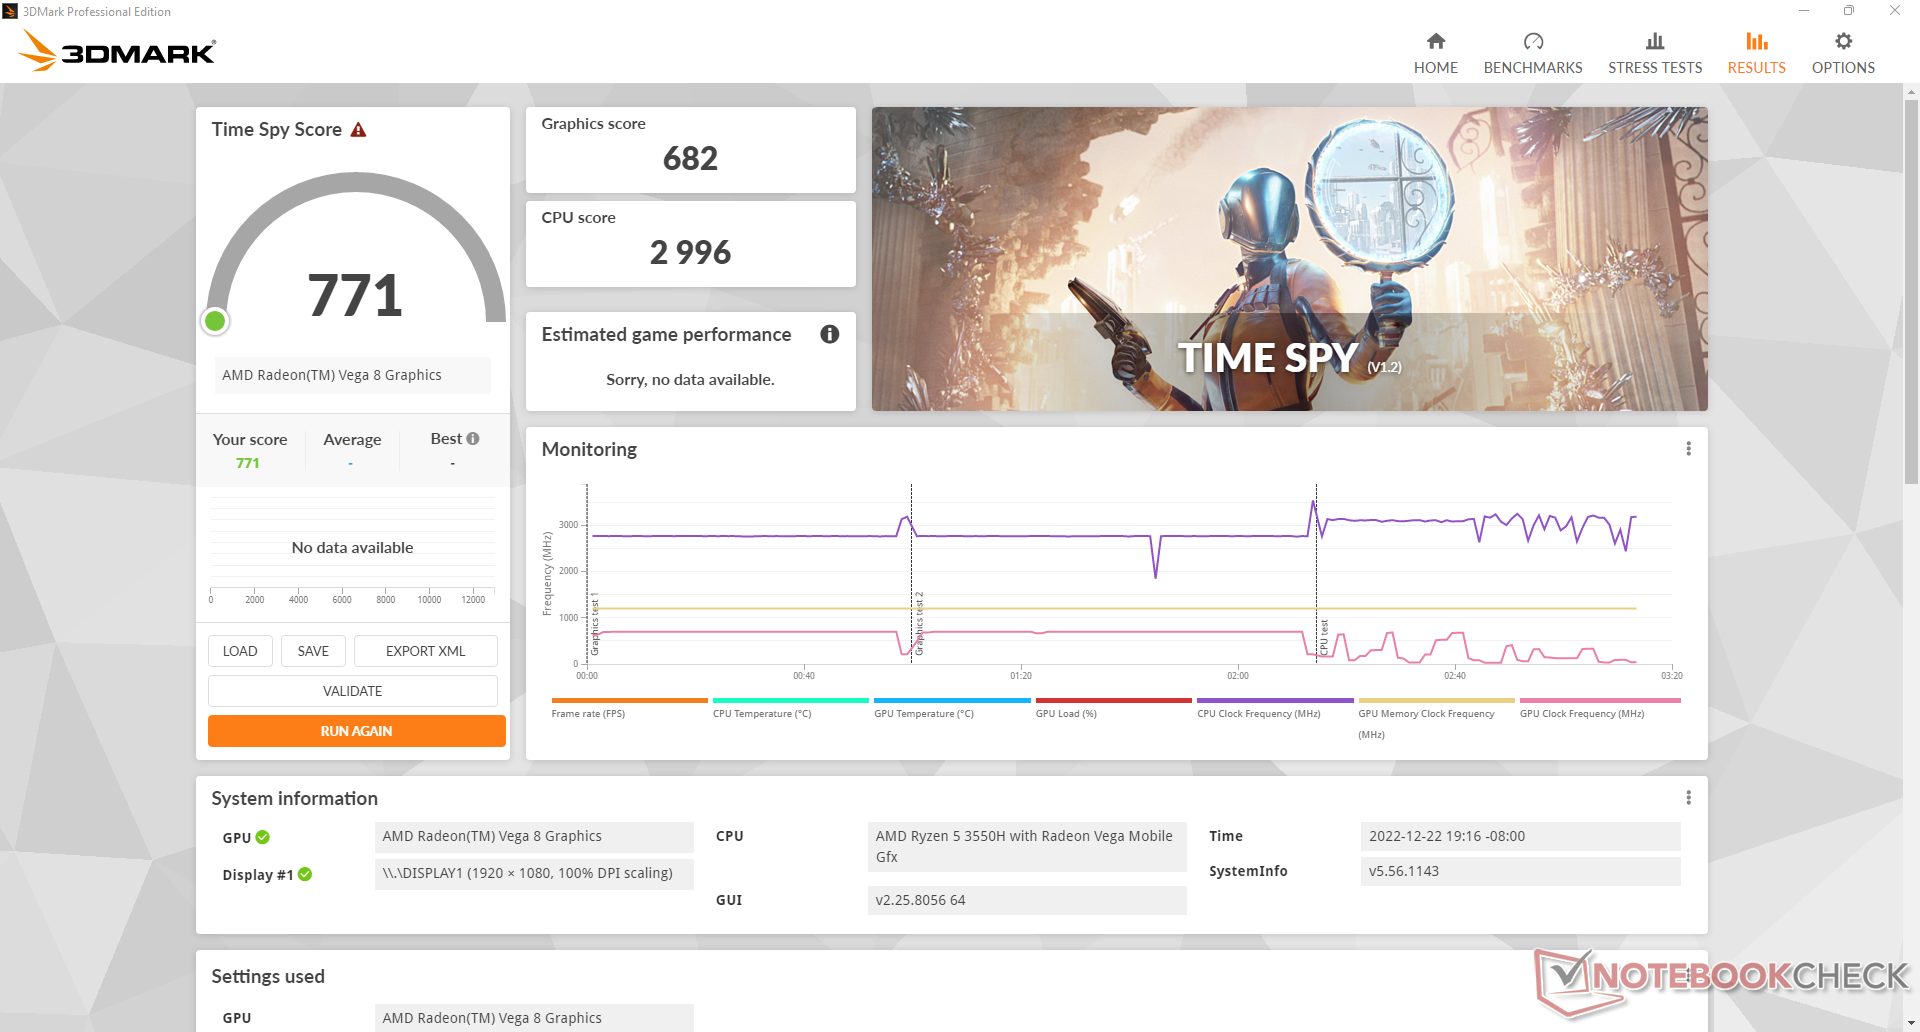
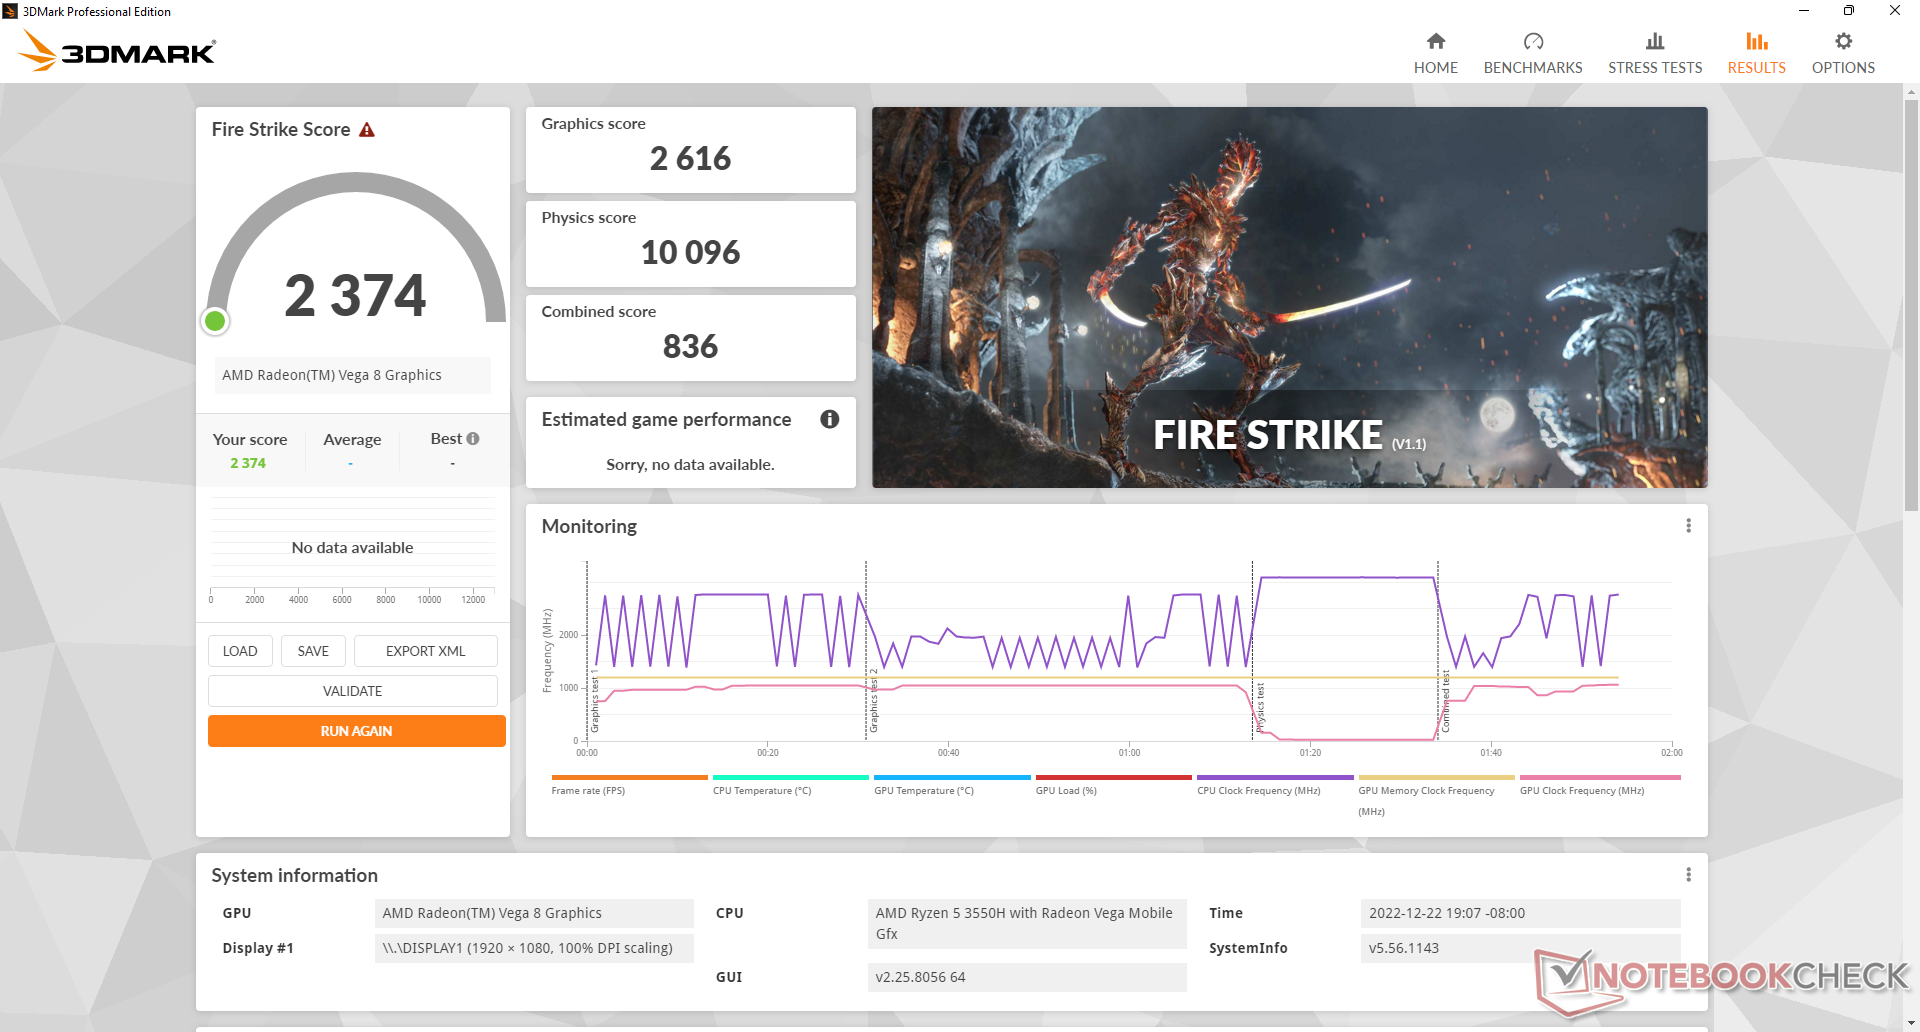
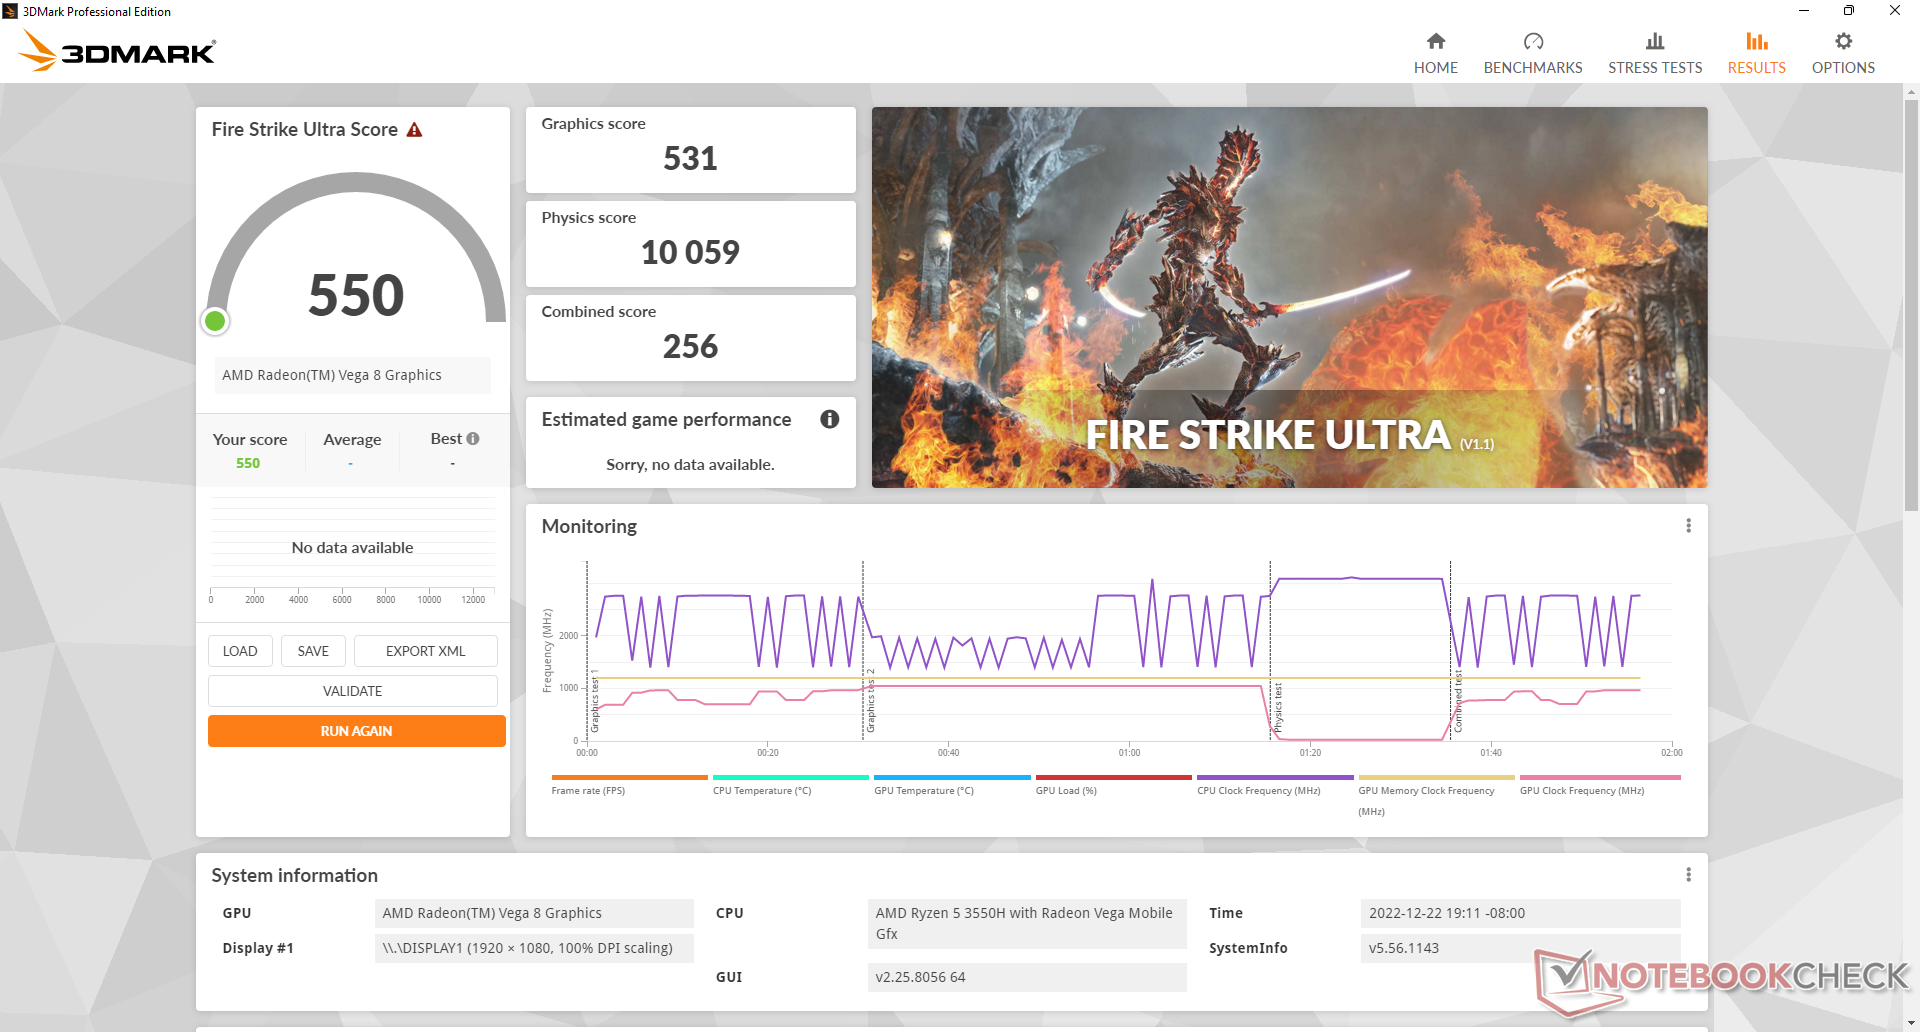
| 3DMark 11 Performance | 4348 pontos | |
| 3DMark Cloud Gate Standard Score | 13817 pontos | |
| 3DMark Fire Strike Score | 2374 pontos | |
| 3DMark Time Spy Score | 771 pontos | |
Ajuda | ||
Manejando em Witcher 3 mostra taxas de moldura que periodicamente chegam a 30 FPS por curtos períodos antes da recuperação. Este comportamento sugere uma má otimização ou interrupção da atividade de fundo que poderia potencialmente levar à queda de quadros ao transmitir outros conteúdos.
Witcher 3 FPS Chart
| baixo | média | alto | ultra | |
|---|---|---|---|---|
| GTA V (2015) | 81.2 | 72.3 | 21.8 | 10.3 |
| The Witcher 3 (2015) | 50.7 | 33.8 | 18.3 | 10.1 |
| Dota 2 Reborn (2015) | 73 | 64.4 | 40.7 | 37.8 |
| Final Fantasy XV Benchmark (2018) | 27.2 | 13.8 | 9.68 | |
| X-Plane 11.11 (2018) | 11.5 | 10.5 | 9.58 | |
| Strange Brigade (2018) | 65.5 | 21.8 | 17.5 | 14.6 |
| Cyberpunk 2077 1.6 (2022) | 10.8 | 8.6 | 6.3 | 5 |
Emissões
Ruído do sistema
O ruído dos ventiladores é surpreendentemente silencioso para ser um forte destaque do S3. Só conseguimos atingir um máximo de pouco mais de 31 dB(A) quando executamos cargas exigentes em comparação com 40 dB(A) ou mais em mini PCs mais rápidos como o Beelink SEi12 ou o Beelink SER Pro.
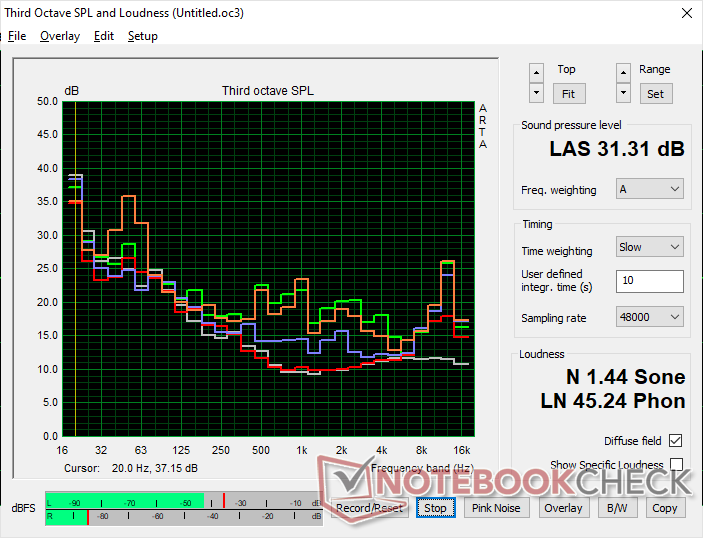
Barulho
| Ocioso |
| 24.5 / 24.5 / 24.5 dB |
| Carga |
| 27.1 / 31.3 dB |
 | ||
30 dB silencioso 40 dB(A) audível 50 dB(A) ruidosamente alto |
||
min: | ||
| Trigkey S3 Vega 8, R5 3550H, Kingston NV1 SNVS/500GCN | Intel NUC Pro Chassis_i7_1265U Iris Xe G7 96EUs, i7-1265U, WDC PC SN720 SDAQNTW-512G | Intel NUC11TNKi5 Iris Xe G7 80EUs, i5-1135G7, Transcend M.2 SSD 430S TS512GMTS430S | Beelink SEi12 Core i5-1235U Iris Xe G7 80EUs, i5-1235U, Kingston NV1 SNVS/500GCN | Beelink SEi11 Pro Iris Xe G7 96EUs, i5-11320H, Kingston NV1 SNVS/500GCN | Beelink SER Pro Ryzen 5 5600H Vega 7, R5 5600H, Kingston NV1 SNVS/500GCN | |
|---|---|---|---|---|---|---|
| Noise | -36% | -36% | -13% | -9% | -10% | |
| desligado / ambiente * (dB) | 23.2 | 30.5 -31% | 24.8 -7% | 23.3 -0% | 22.8 2% | 22.8 2% |
| Idle Minimum * (dB) | 24.5 | 31.4 -28% | 35.6 -45% | 27.8 -13% | 24.7 -1% | 26.1 -7% |
| Idle Average * (dB) | 24.5 | 31.4 -28% | 35.6 -45% | 27.8 -13% | 24.7 -1% | 26.1 -7% |
| Idle Maximum * (dB) | 24.5 | 31.4 -28% | 35.6 -45% | 27.8 -13% | 25.3 -3% | 28.7 -17% |
| Load Average * (dB) | 27.1 | 43.8 -62% | 36.2 -34% | 32 -18% | 33.2 -23% | 32.3 -19% |
| Witcher 3 ultra * (dB) | 30.6 | 38 -24% | 34.1 -11% | 34.5 -13% | 32.8 -7% | |
| Load Maximum * (dB) | 31.3 | 44 -41% | 47.6 -52% | 39.2 -25% | 37.8 -21% | 36.4 -16% |
* ... menor é melhor
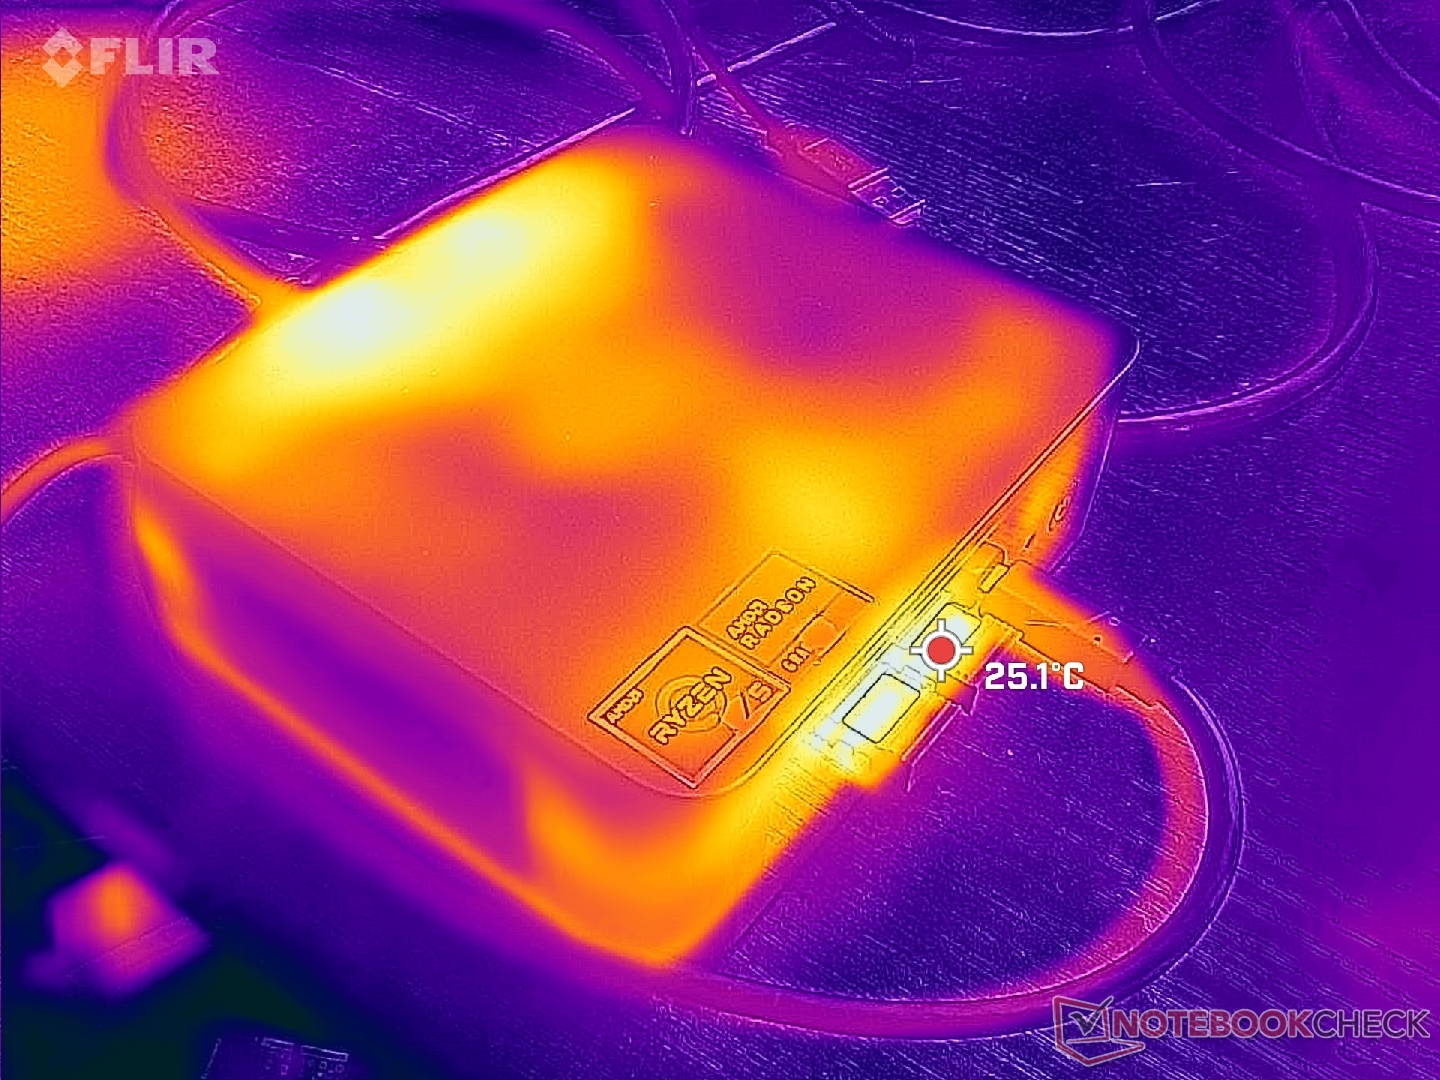
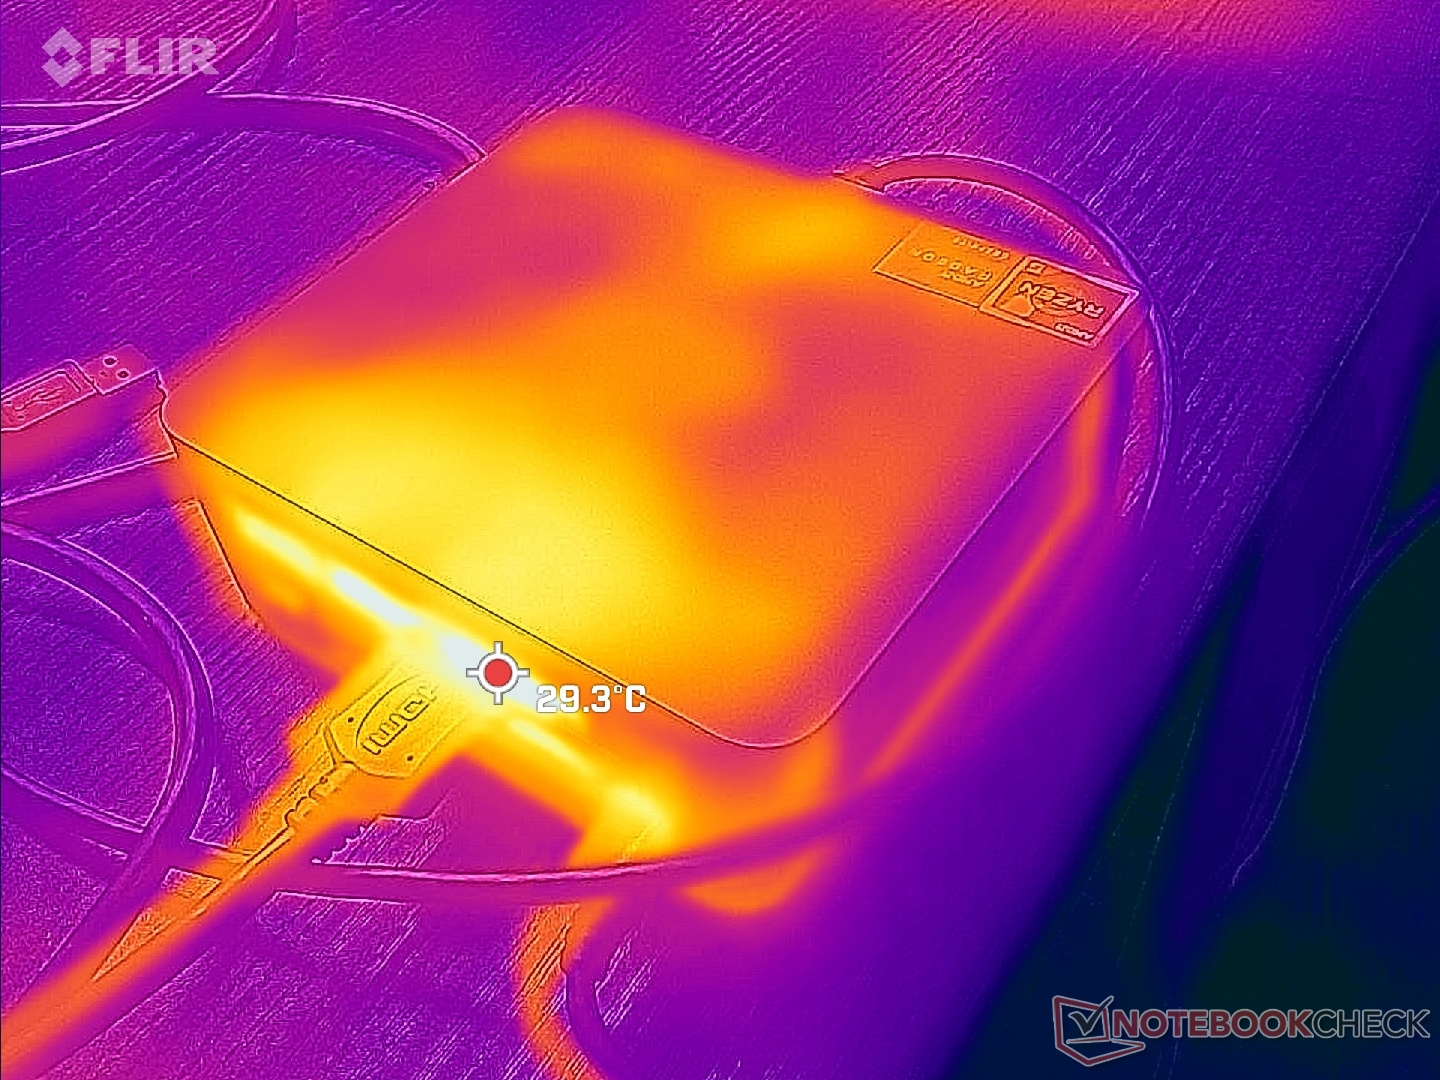
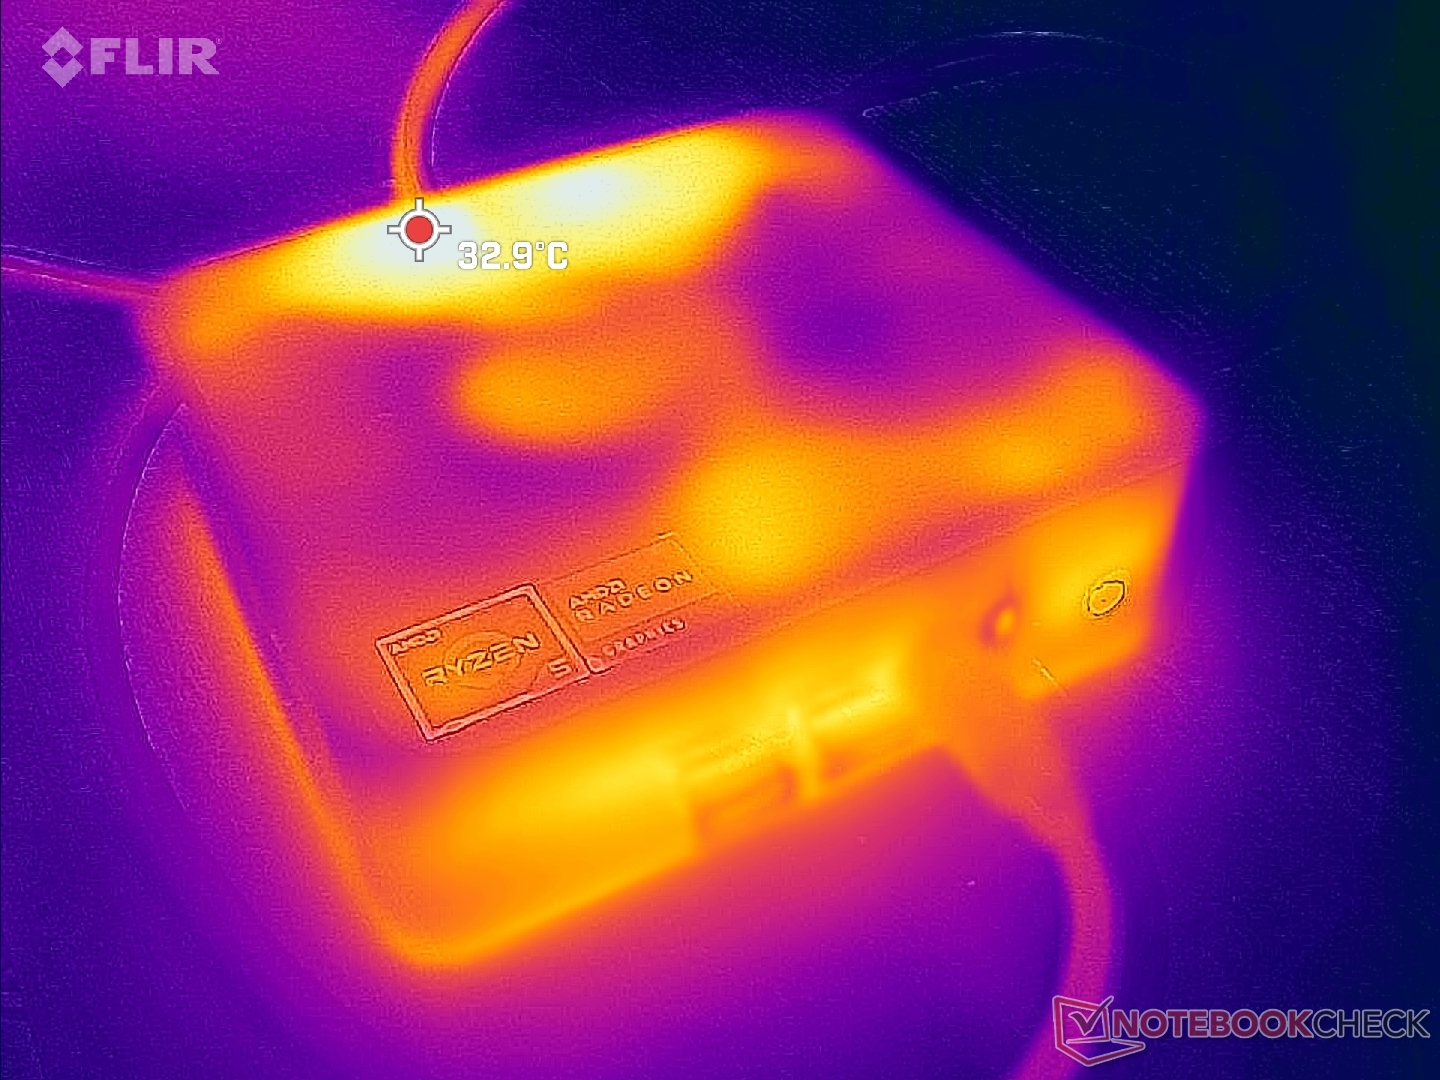
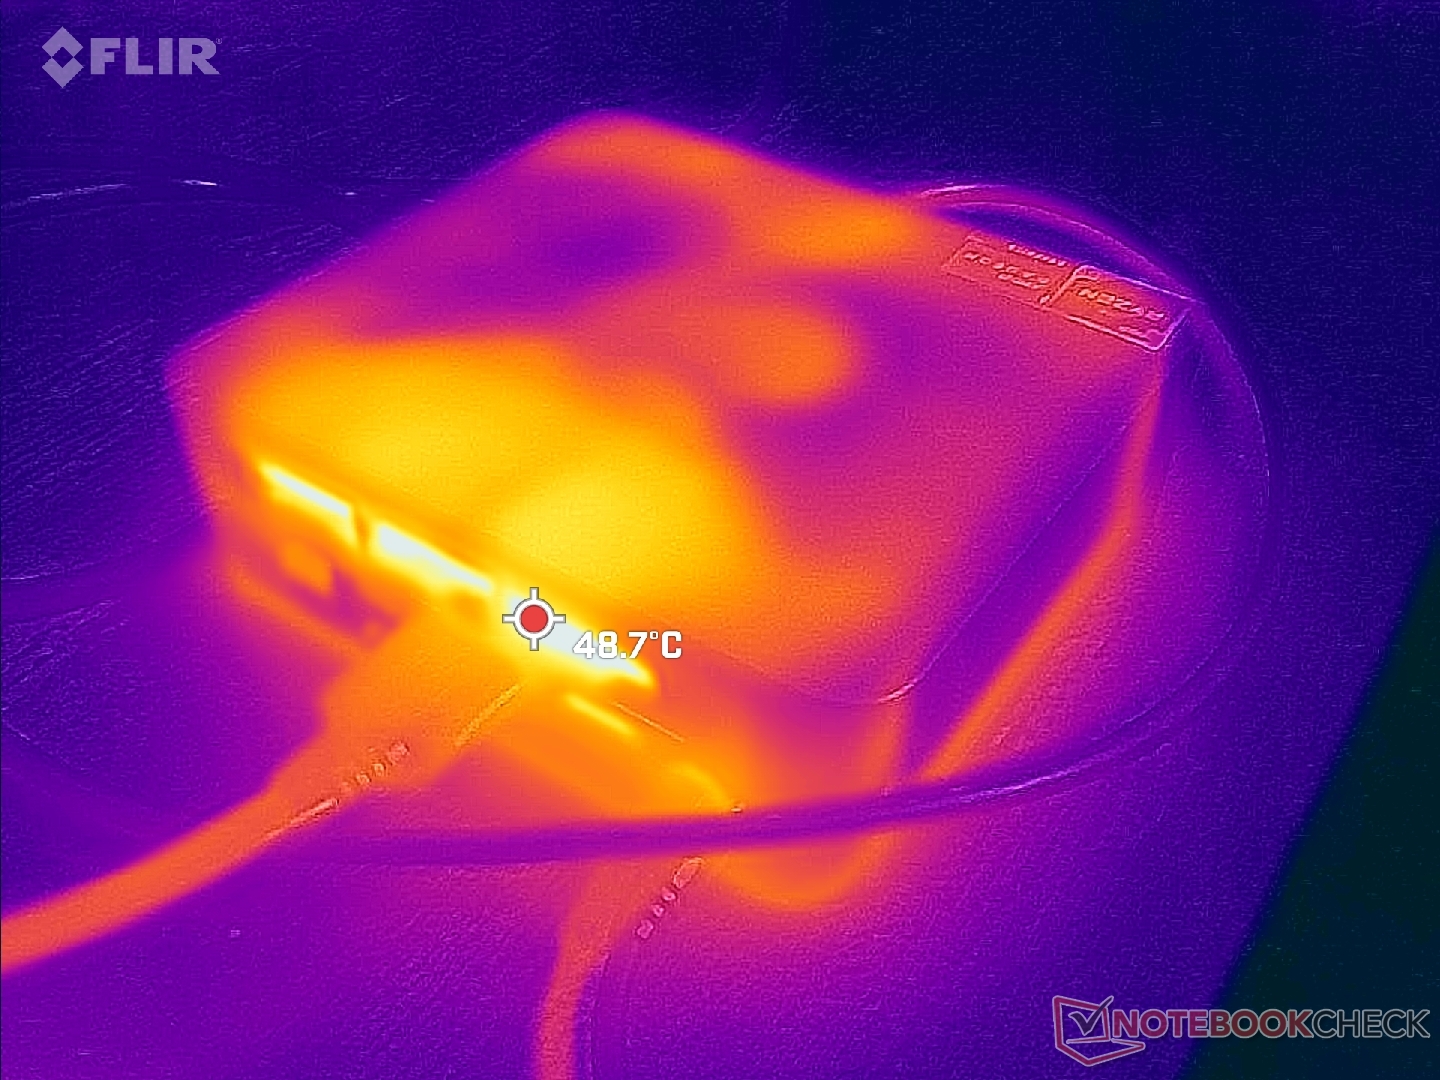
Temperatura
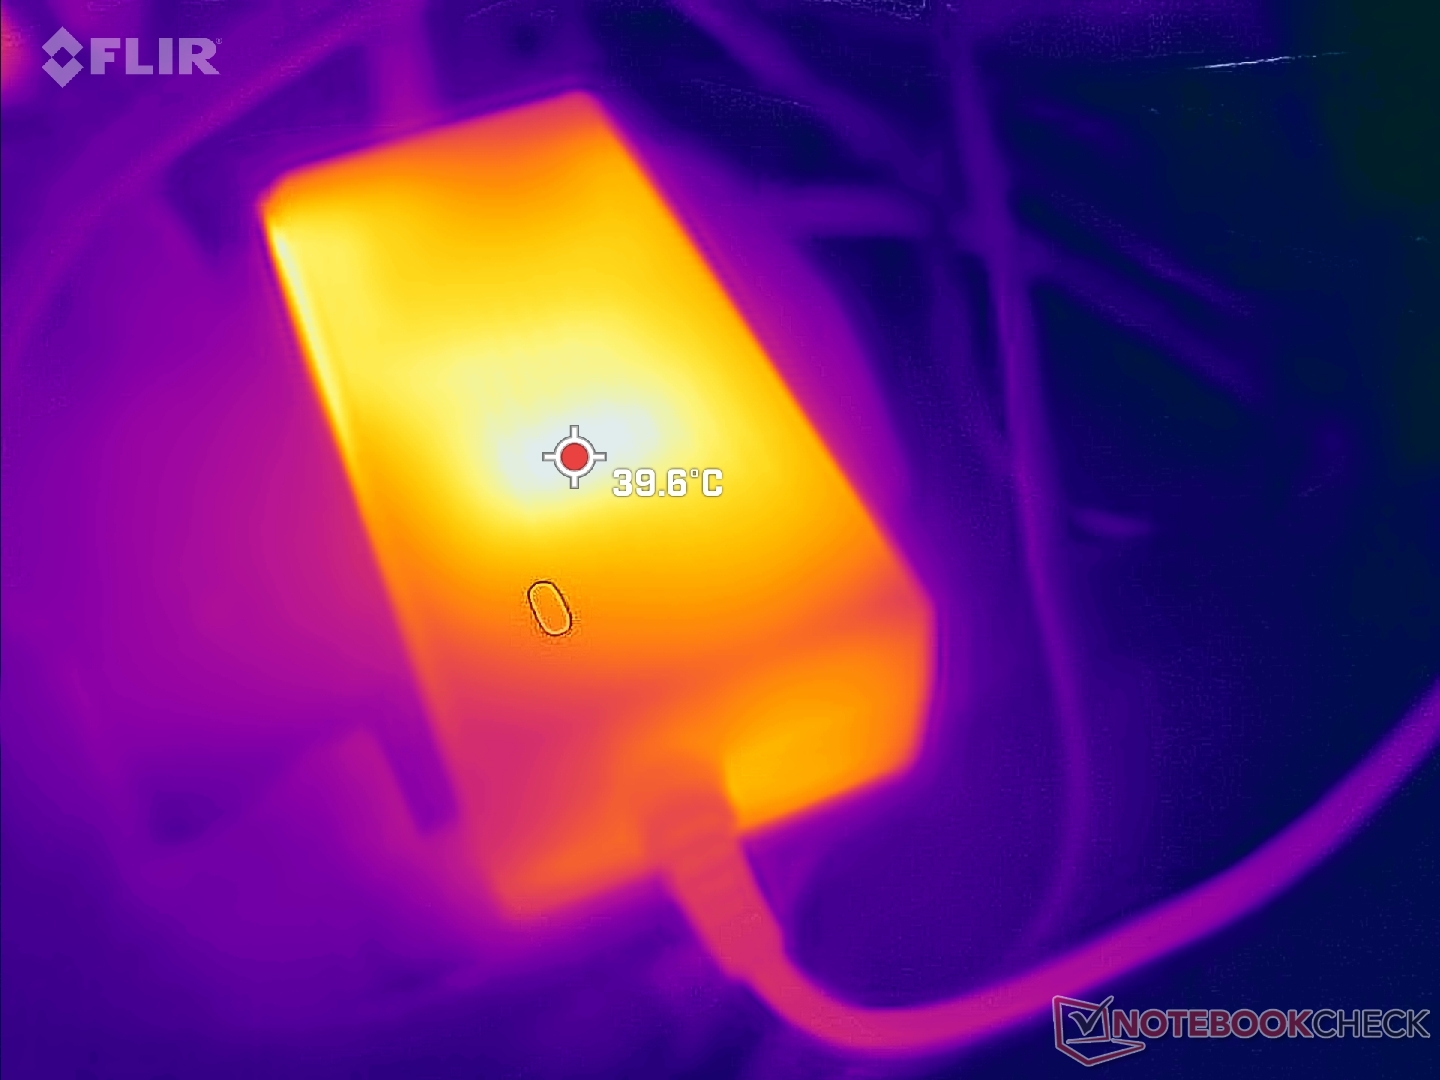
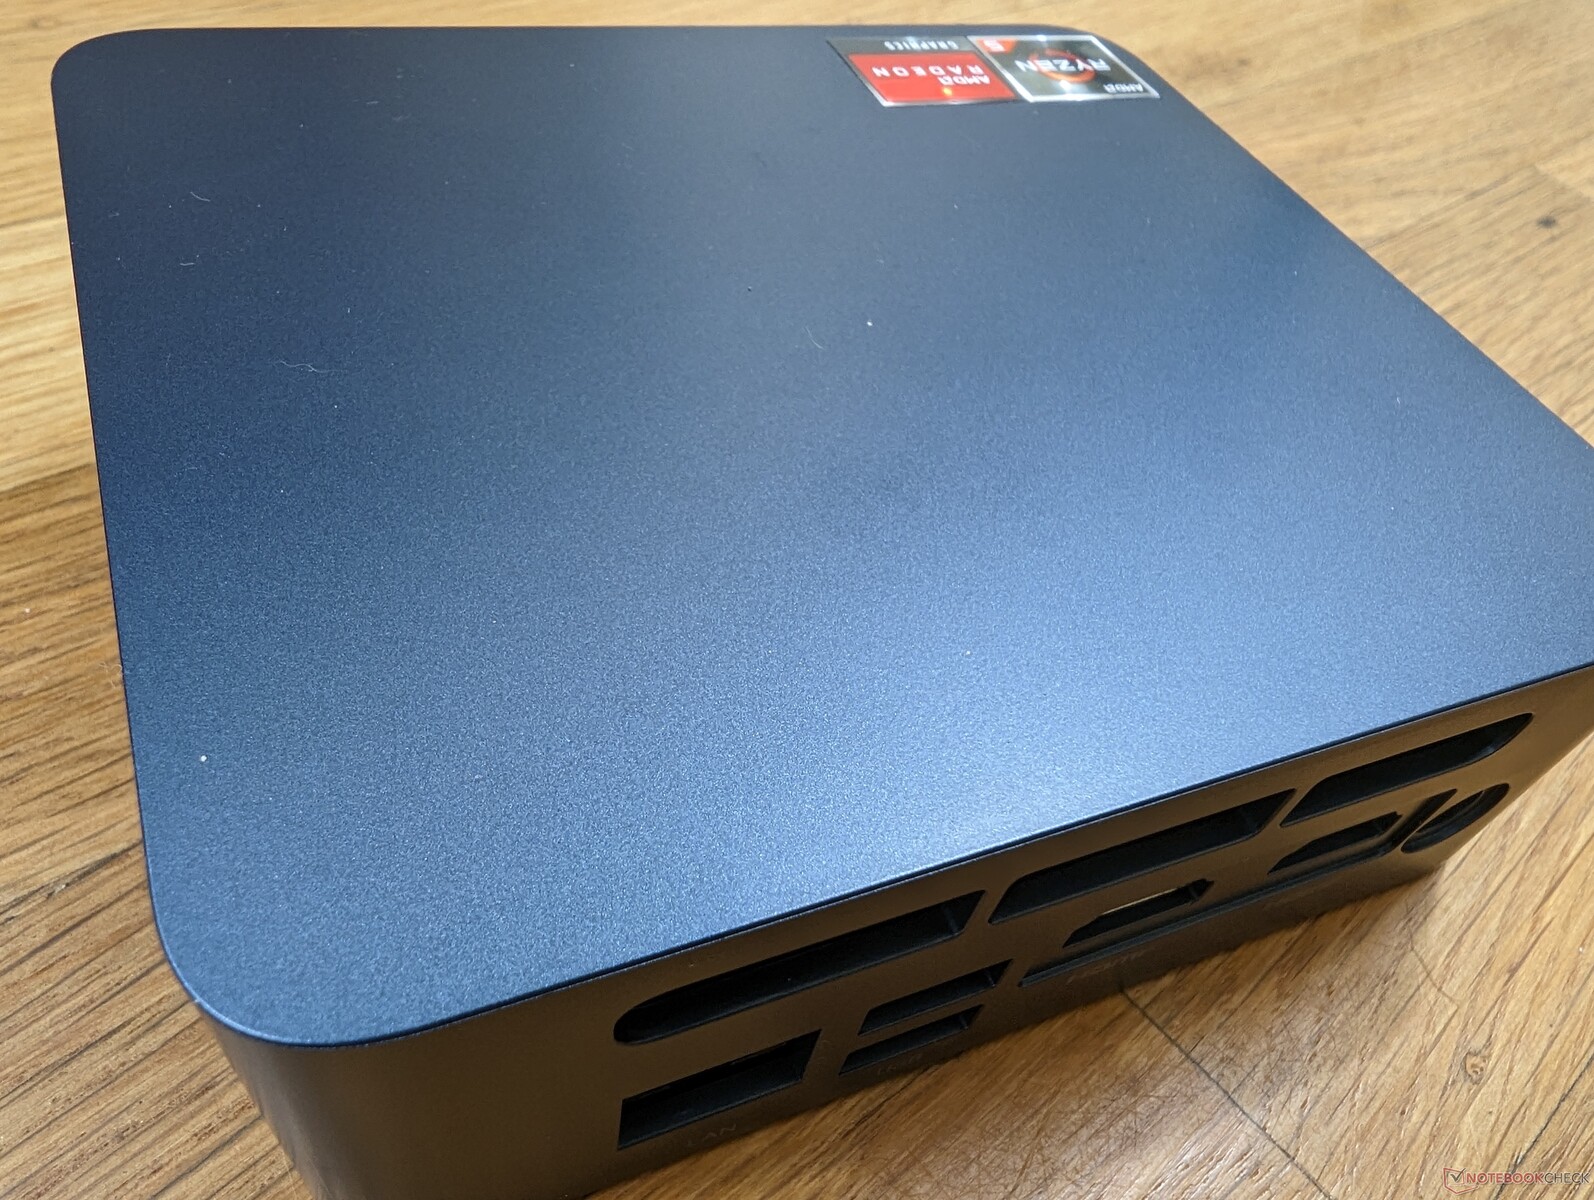
As temperaturas superficiais são as mais quentes em direção à traseira, onde o ar quente escapa. O ar frio entra pelos lados e não pelo topo, ao contrário do SEi12 do Beelink, o que significa que é seguro colocar itens como papel em cima do mini PC sem impedir o fluxo de ar.
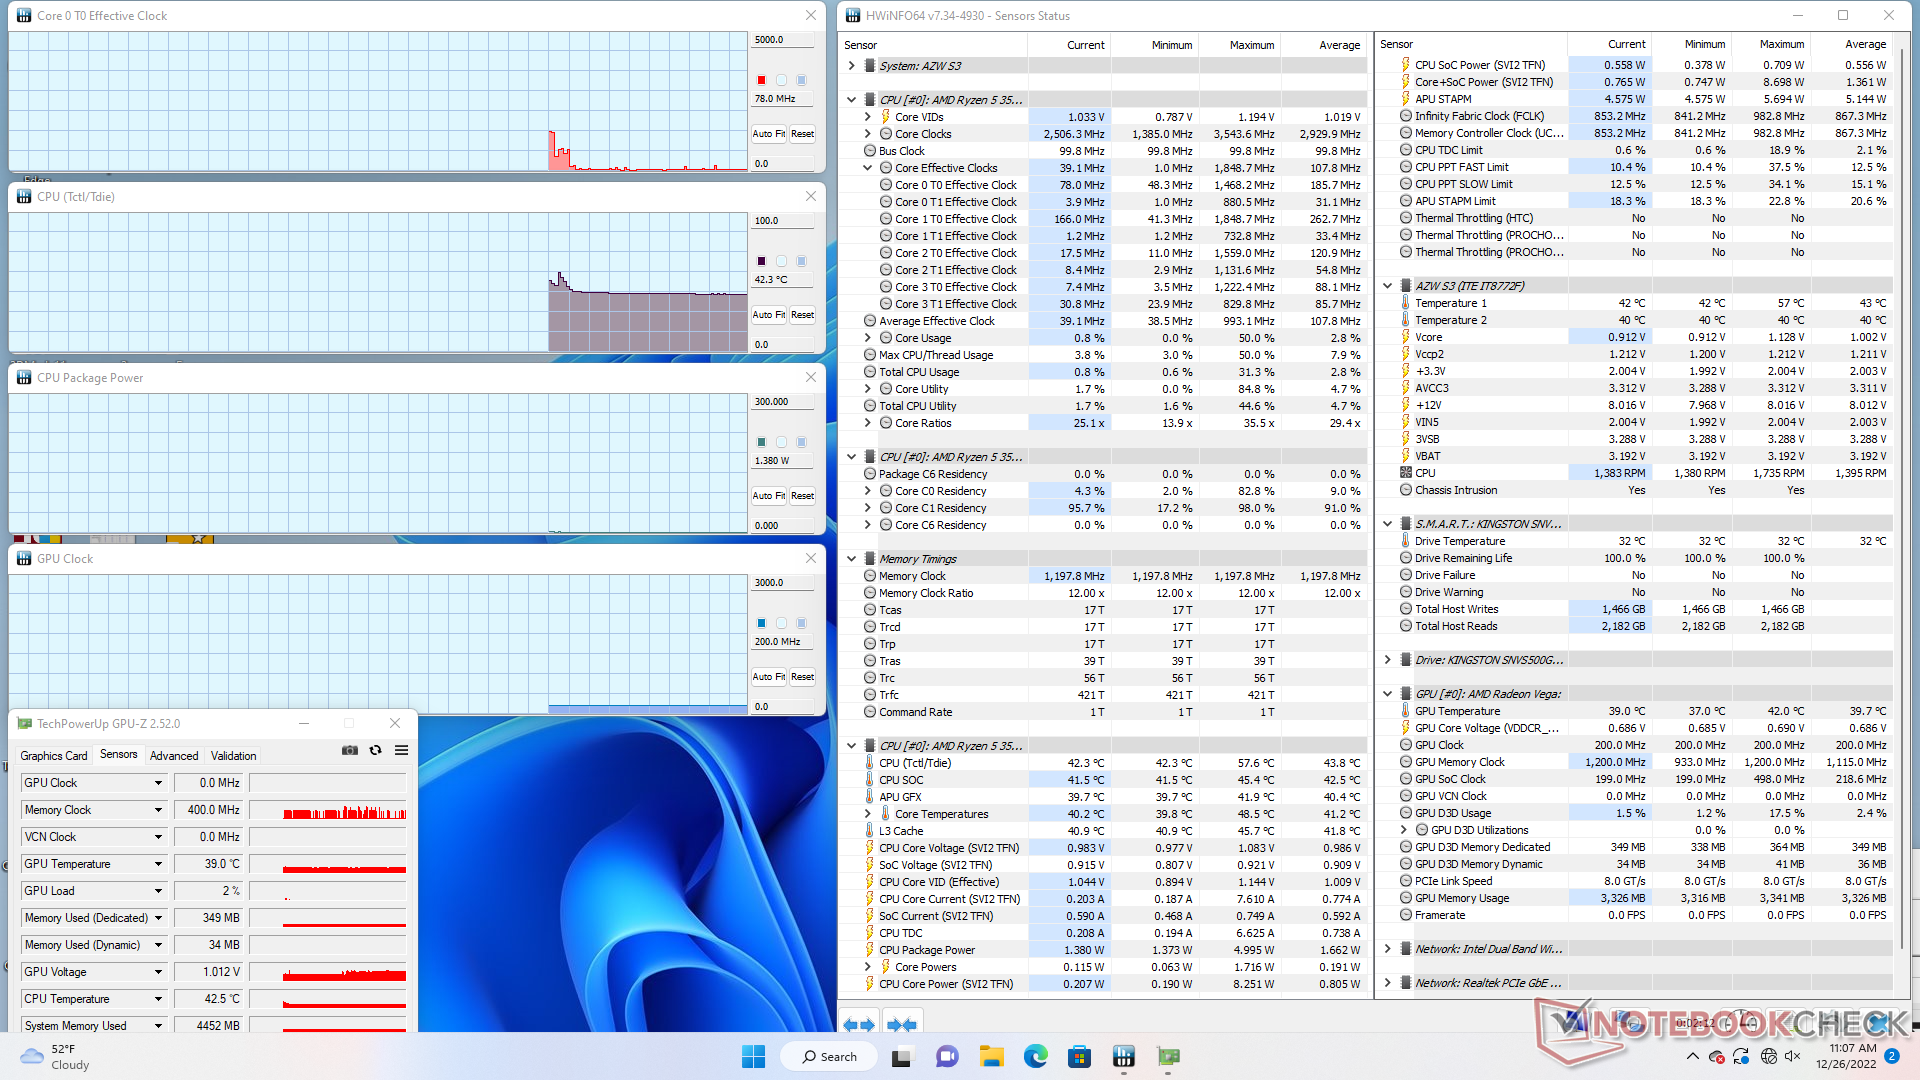
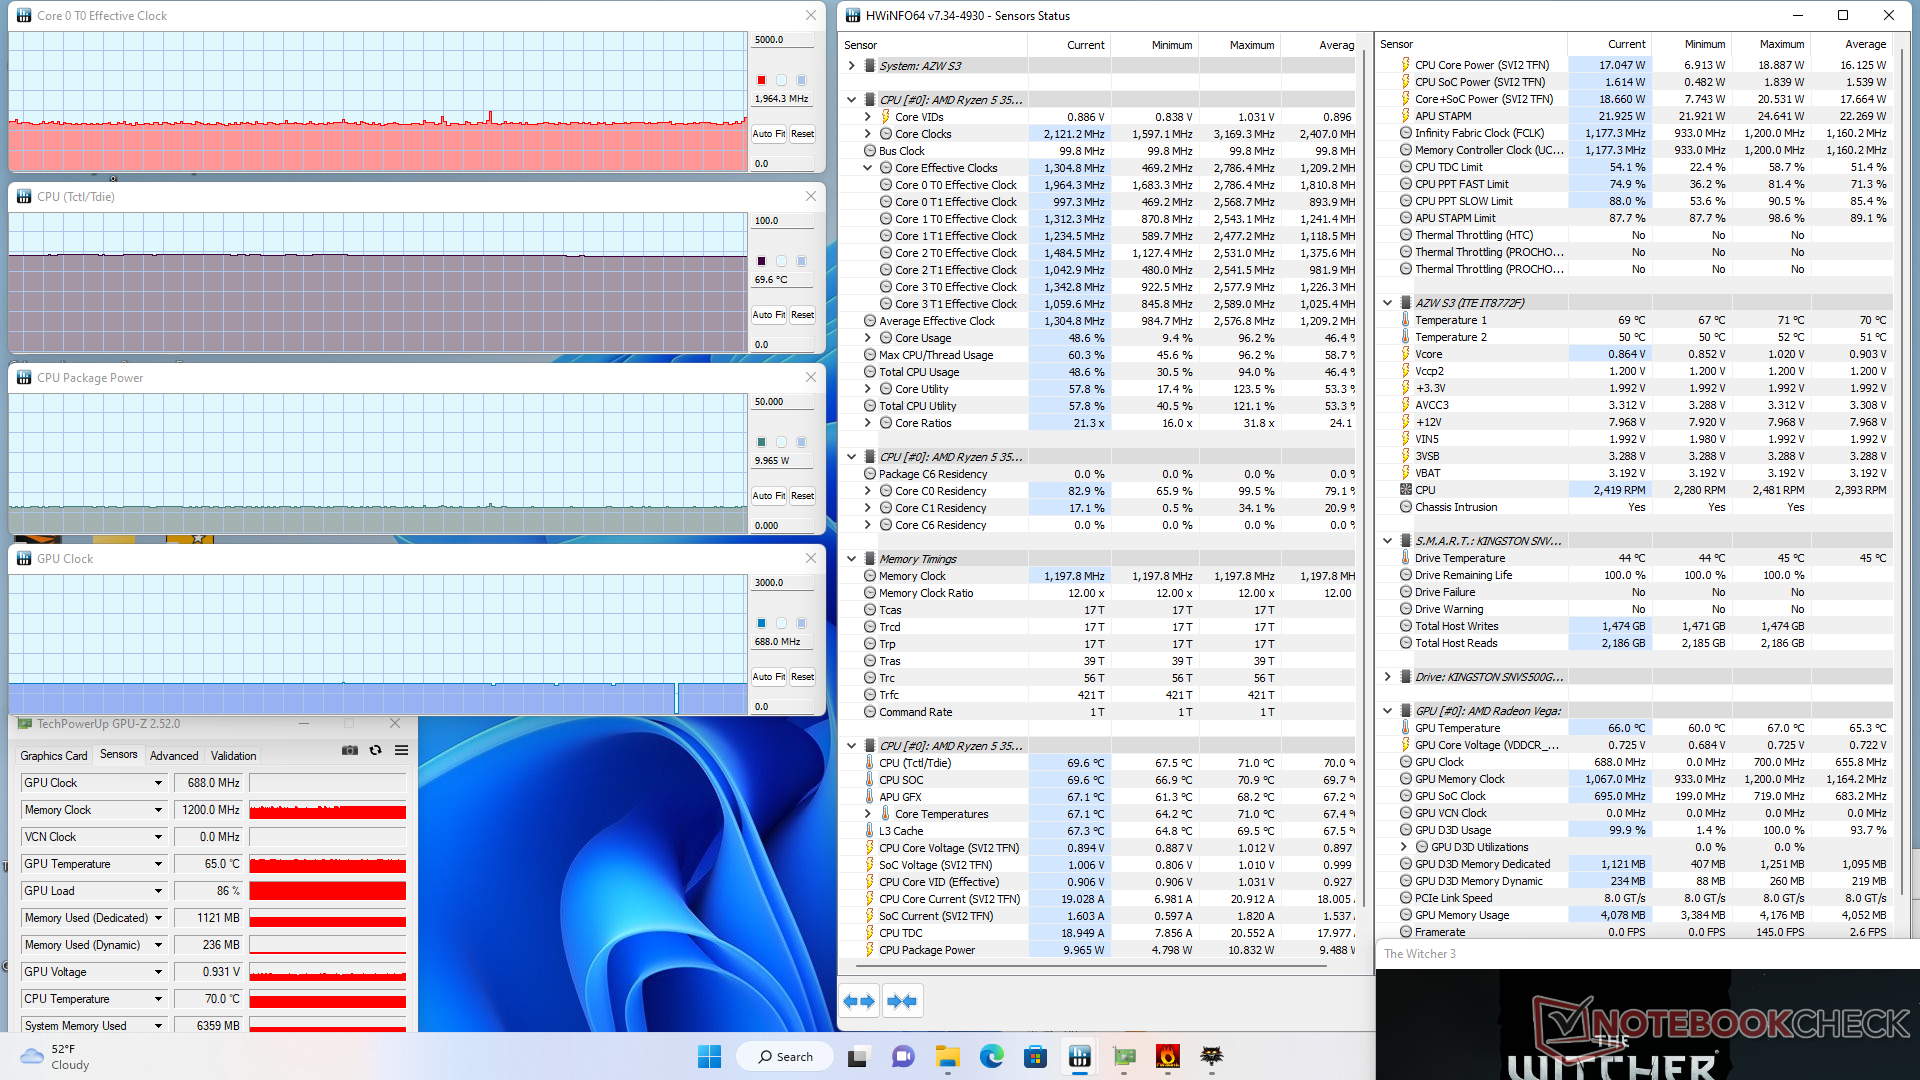
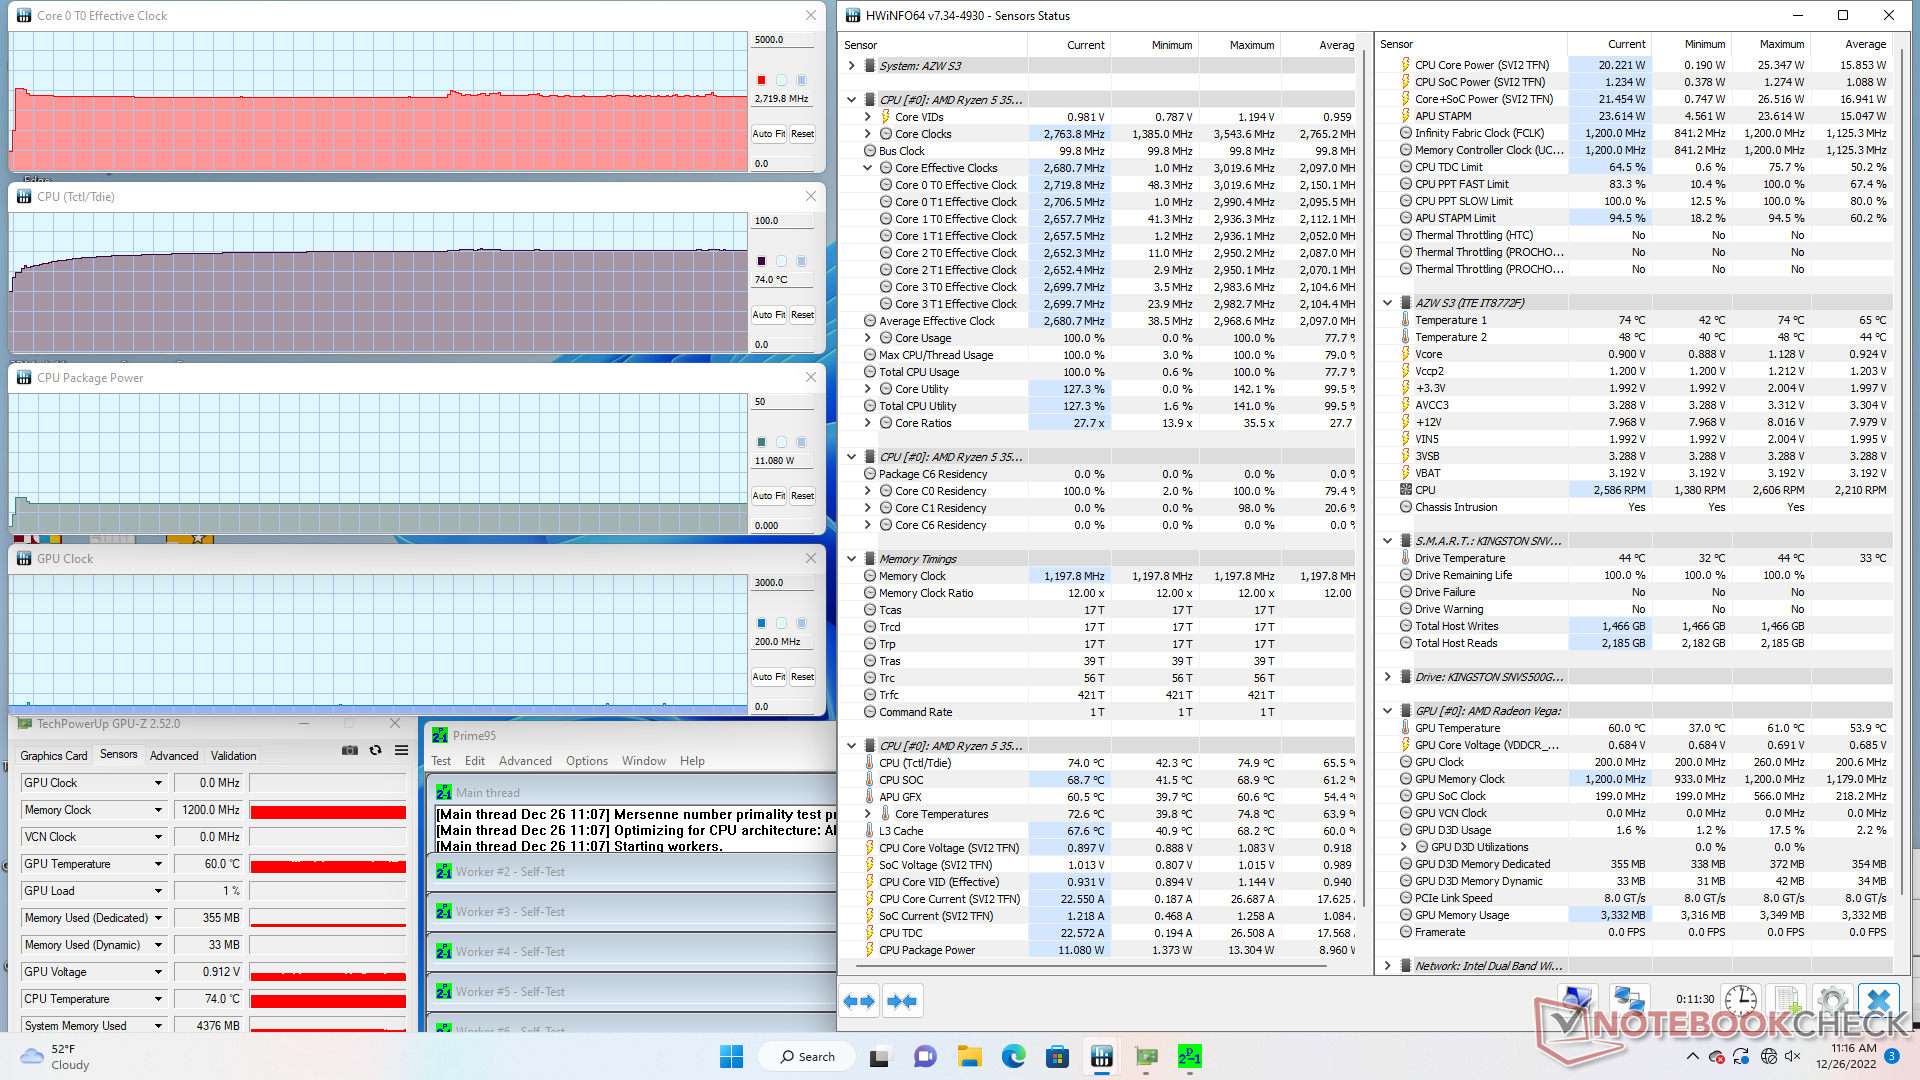
Teste de estresse
Ao executar Prime95 para enfatizar a CPU, as taxas de clock da CPU e o consumo de energia da placa aumentariam para 3 GHz e 13 W, respectivamente, antes de cair alguns segundos depois e se estabilizar em 2,7 GHz, 11 W e 74 C. A temperatura central se estabilizaria em 70 C quando em funcionamento Witcher 3 que é comparável ao Beelink SEi12 em condições de teste semelhantes, mas ainda mais quentes do que noIntel NUC11TNKi5 Pro.
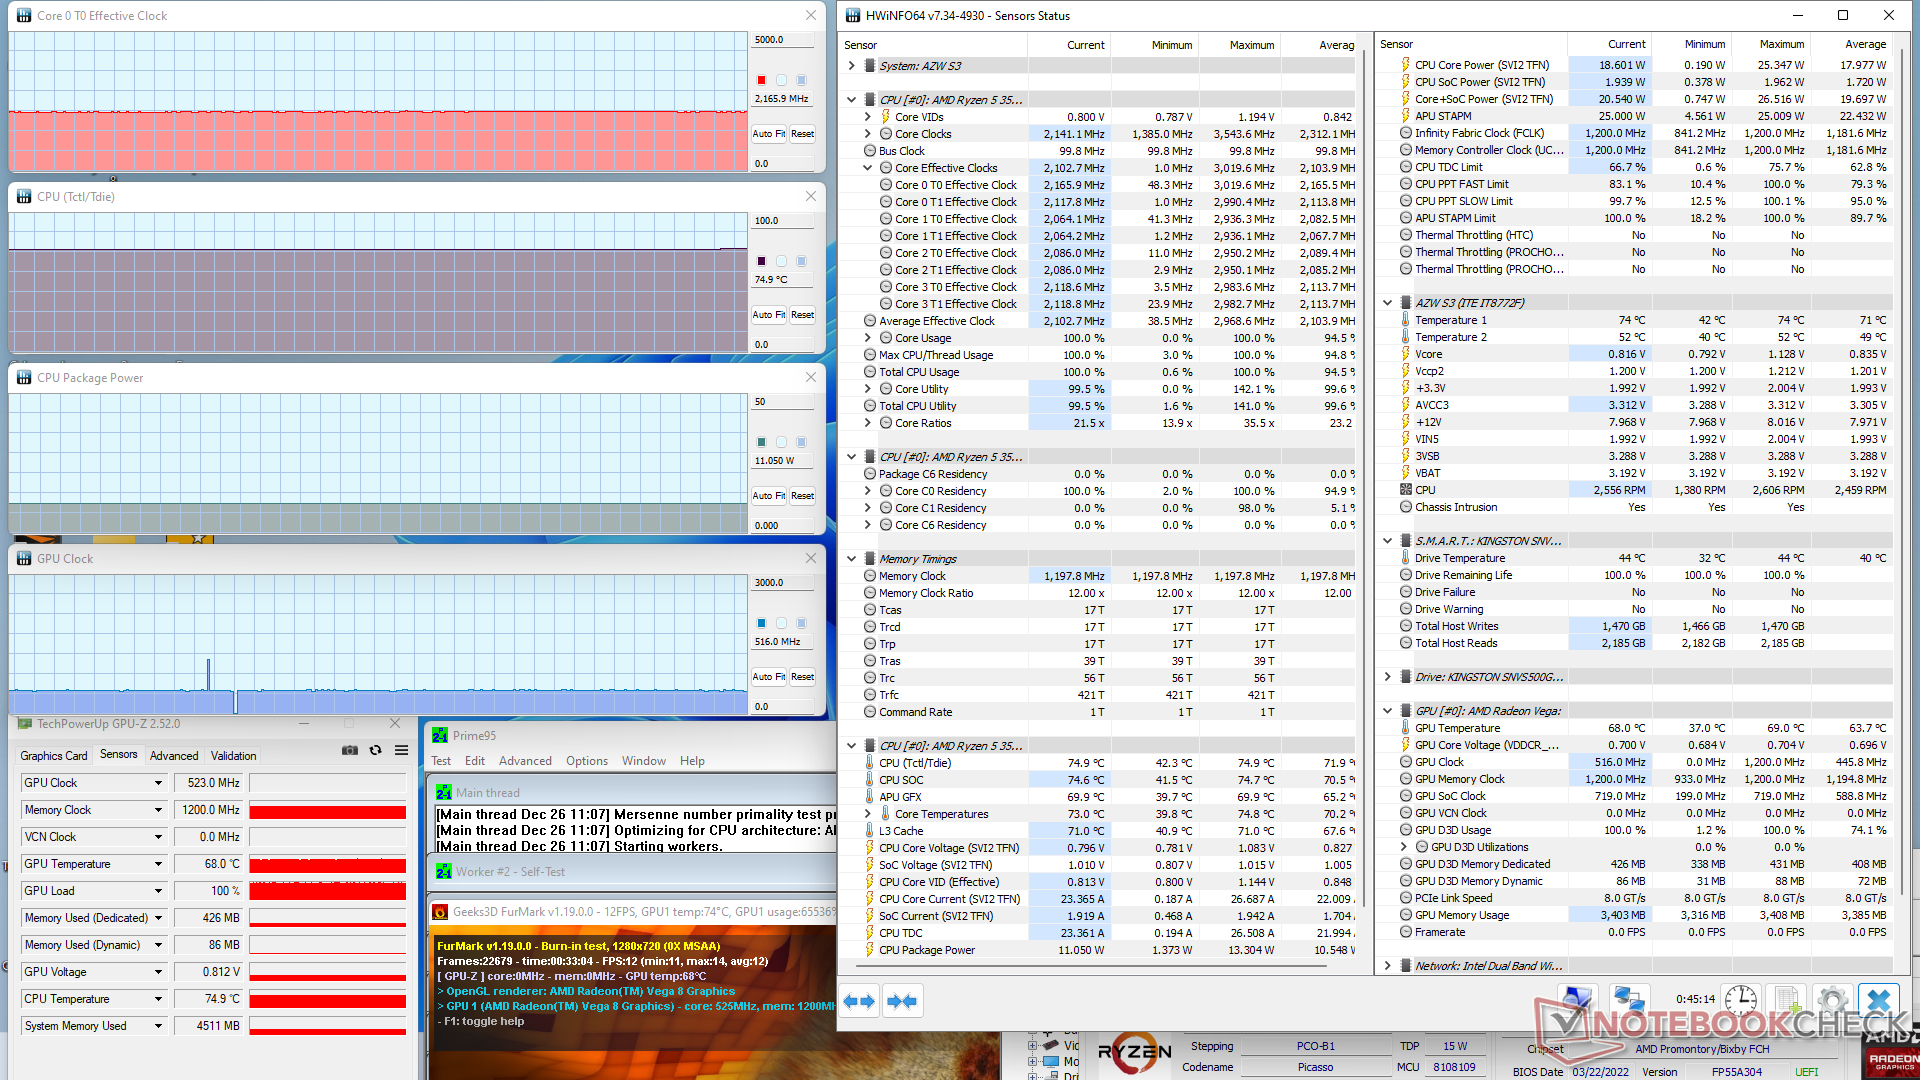
| Relógio CPU (GHz) | Relógio GPU (MHz) | Temperatura média da CPU (°C) | |
| System Idle | -- | -- | 42 |
| Prime95 Stress | 2.7 | -- | 74 |
| Prime95 + FurMark Stress | 2.2 | 523 | 75 |
| Witcher 3 Estresse | 2.0 | 688 | 70 |
Gestão de energia
Consumo de energia
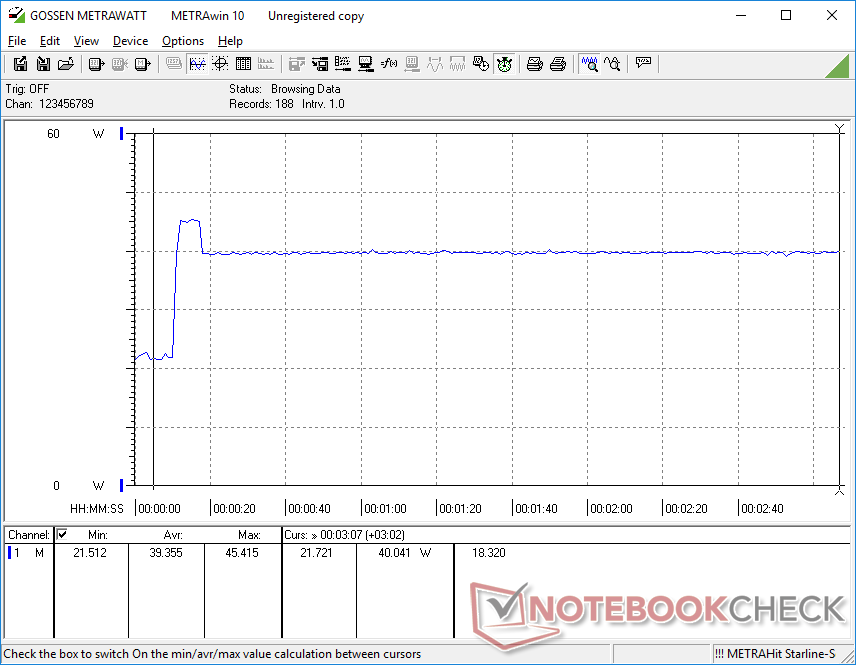
O consumo de energia é relativamente alto em até 22 W, comparado à metade do consumo nos mini PCs da série U como o Intel NUC11 ou o Beelink SEi12, o que não é inesperado, dado que o S3 é alimentado por um processador mais antigo da série H. A situação se inverte quando se executa cargas maiores como jogos, apesar do desempenho gráfico mais lento do Radeon Vega 8 integrado. O desempenho geral por watt é pouco surpreendente dado que a série Zen+ tem alguns anos de idade.
| desligado | |
| Ocioso | |
| Carga |
|
Key:
min: | |
| Trigkey S3 R5 3550H, Vega 8, Kingston NV1 SNVS/500GCN, , x, | GMK NucBox 2 i5-8259U, Iris Plus Graphics 655, Netac S930E8/256GPN, , x, | Intel NUC11TNKi5 i5-1135G7, Iris Xe G7 80EUs, Transcend M.2 SSD 430S TS512GMTS430S, , x, | Beelink SEi12 Core i5-1235U i5-1235U, Iris Xe G7 80EUs, Kingston NV1 SNVS/500GCN, , x, | Beelink SEi11 Pro i5-11320H, Iris Xe G7 96EUs, Kingston NV1 SNVS/500GCN, , x, | Beelink SER Pro Ryzen 5 5600H R5 5600H, Vega 7, Kingston NV1 SNVS/500GCN, , x, | |
|---|---|---|---|---|---|---|
| Power Consumption | 32% | 2% | -35% | 3% | 21% | |
| Idle Minimum * (Watt) | 11.3 | 6.1 46% | 11.5 -2% | 15.8 -40% | 9.8 13% | 5.4 52% |
| Idle Average * (Watt) | 21.8 | 6.8 69% | 12.4 43% | 16.8 23% | 10.3 53% | 8.2 62% |
| Idle Maximum * (Watt) | 22.2 | 7.3 67% | 12.9 42% | 17 23% | 10.5 53% | 8.3 63% |
| Load Average * (Watt) | 39.7 | 46.3 -17% | 40.7 -3% | 54.4 -37% | 54.2 -37% | 49.3 -24% |
| Witcher 3 ultra * (Watt) | 37.5 | 43.9 -17% | 50.7 -35% | 53.1 -42% | 46.1 -23% | |
| Load Maximum * (Watt) | 48.9 | 50.7 -4% | 73.5 -50% | 119.1 -144% | 59 -21% | 50.2 -3% |
* ... menor é melhor
Power Consumption Witcher 3 / Stresstest
Power Consumption external Monitor
Pro
Contra
Veredicto - Mais rápido que Celeron ou Alternativas Atômicas
Quando se olha para mini PCs na faixa de menos de 300 dólares, é comum se contentar com Intel Celeron ou Atom-powered uma vez que tais processadores são mais lentos e mais baratos do que as opções Core usuais. CPUs rápidas não são realmente necessárias para a maioria dos propósitos HTPC básicos, mas as CPUs Celeron e Atom são notórias por serem lentas demais, mesmo para esforços multitarefa mínimos. É aqui que a Trigkey S3 entra como sua CPU Ryzen 5 3550H pode proporcionar aquele desempenho extra sem a necessidade de aumentar os preços.
O Trigkey S3 oferece um desempenho semelhante ao Core i3 pelo preço de um Atom ou Celeron mini PC.
A principal desvantagem é que o Ryzen 5 3550H é uma CPU mais antiga e por isso requer um pouco mais de energia para funcionar em muitas situações do que as últimas opções da série U. Mesmo assim, o ruído do ventilador não é, felizmente, mais alto, apesar do maior consumo de energia.
Preço e Disponibilidade
O Trigkey S3 está agora sendo enviado na Amazônia por US$ 280.
Price comparison

