Schenker XMG Neo 17 (2020, Tongfang GM7MPHS) Revisão: O Overboost liberta o processador Core-i7

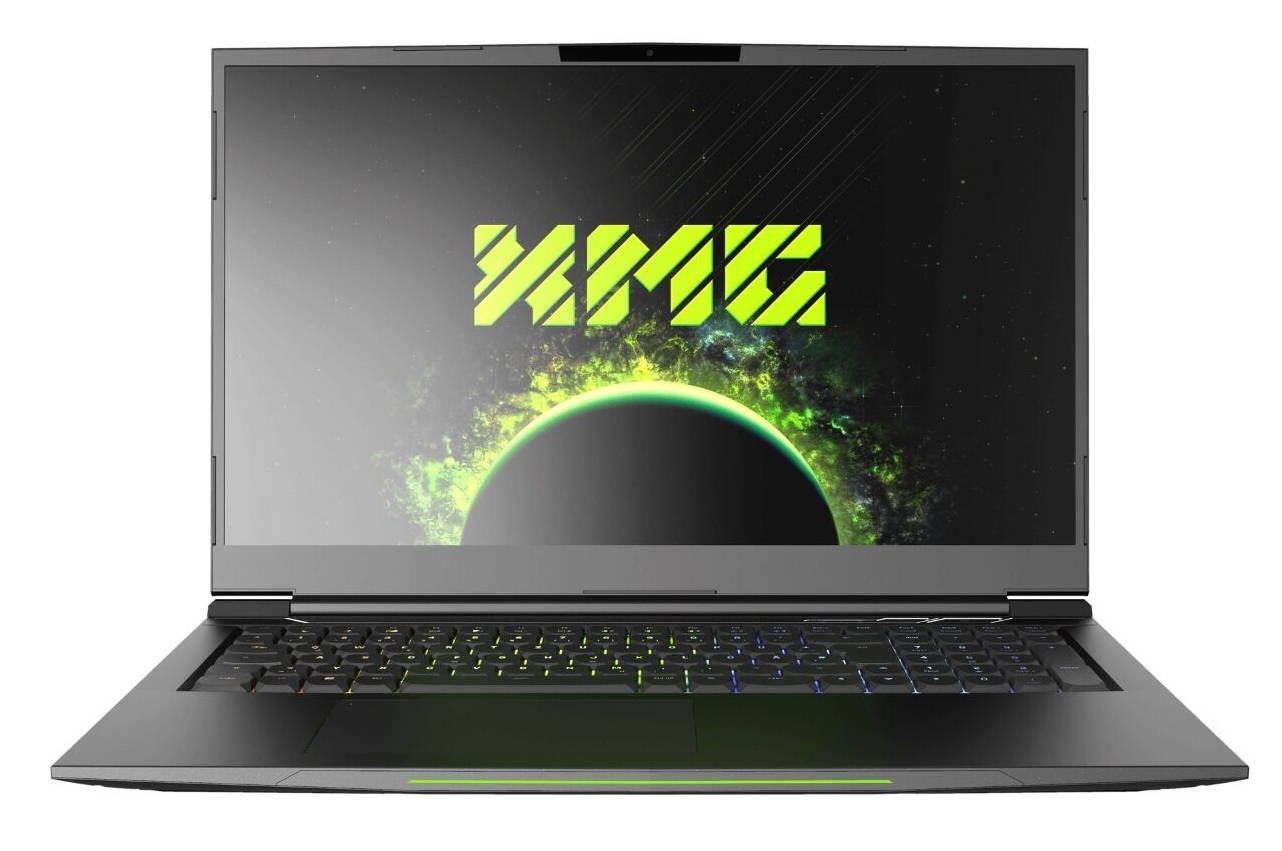
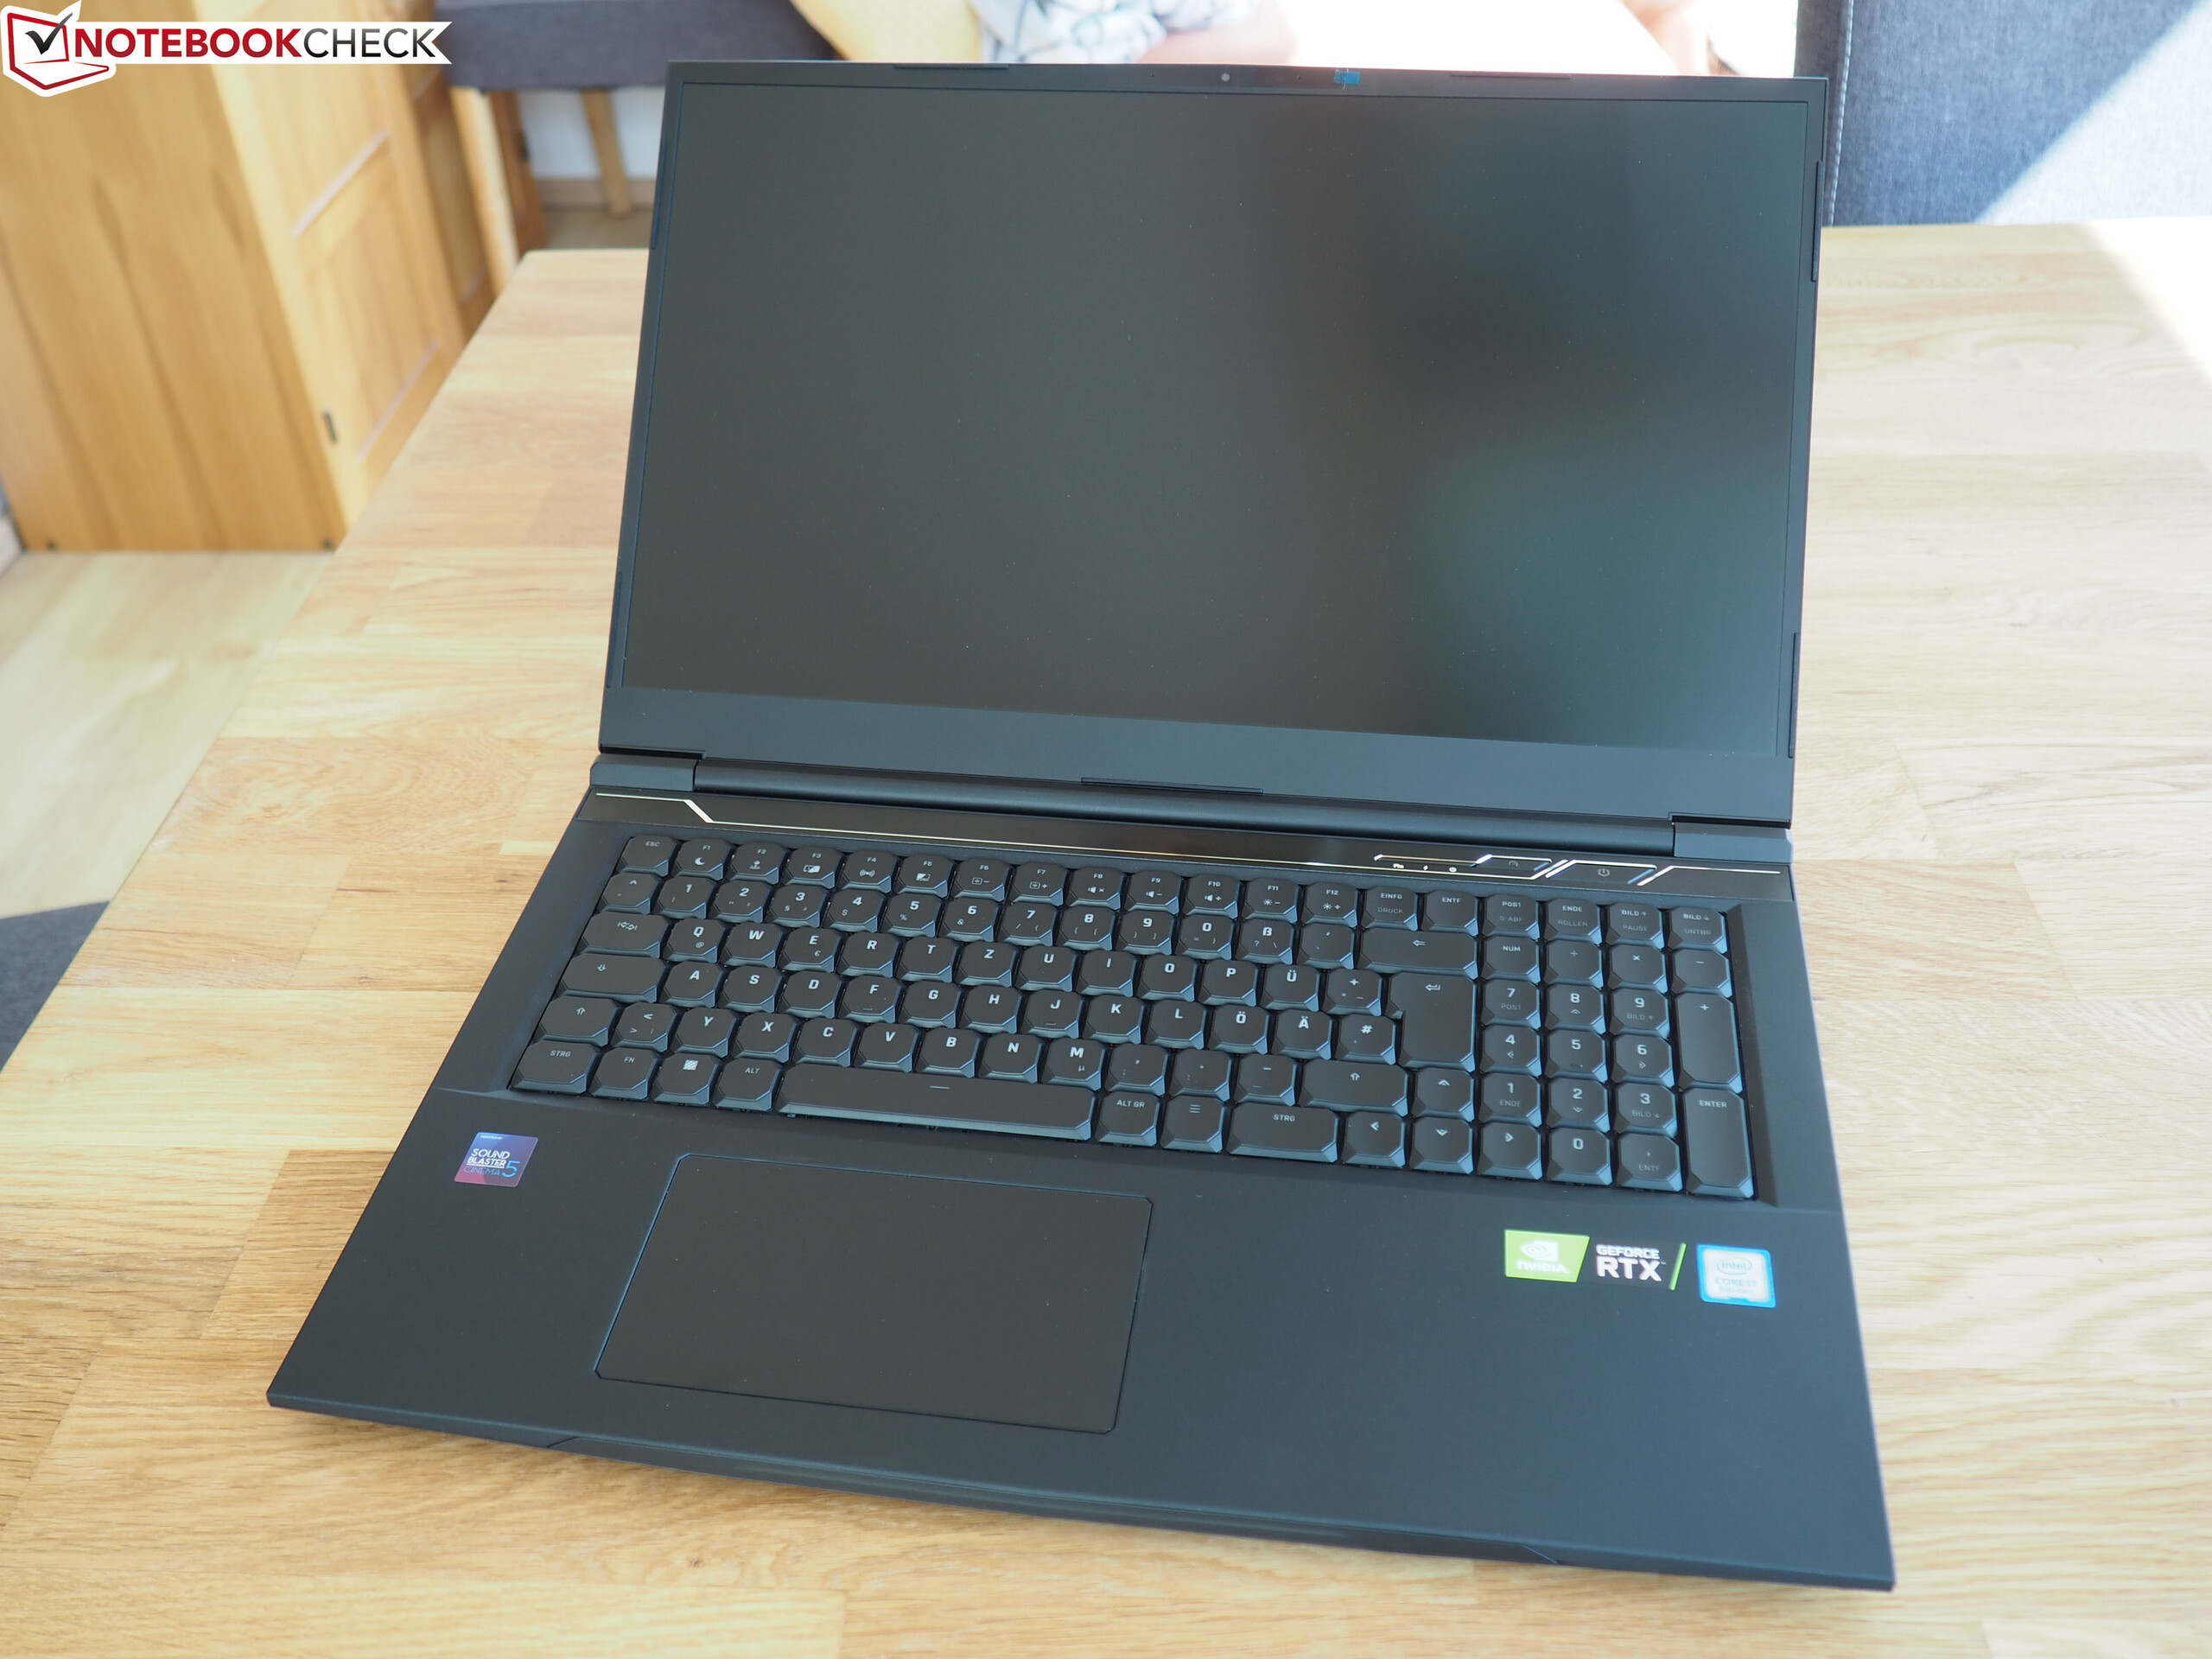
Com o XMG Neo 17, a Schenker oferece um notebook para jogos de 17,3 polegadas que é equipado com hardware poderoso. A unidade de teste que nos foi disponibilizada é executada por um processador Core i7-10875H octa-core e uma Super GPU GeForce RTX-2070. Os concorrentes incluem o Acer Predator Helios 300 PH317-54, o MSIGL75 10SFR, o Asus Strix G17 G712LWS, e o Aorus 17G XB.
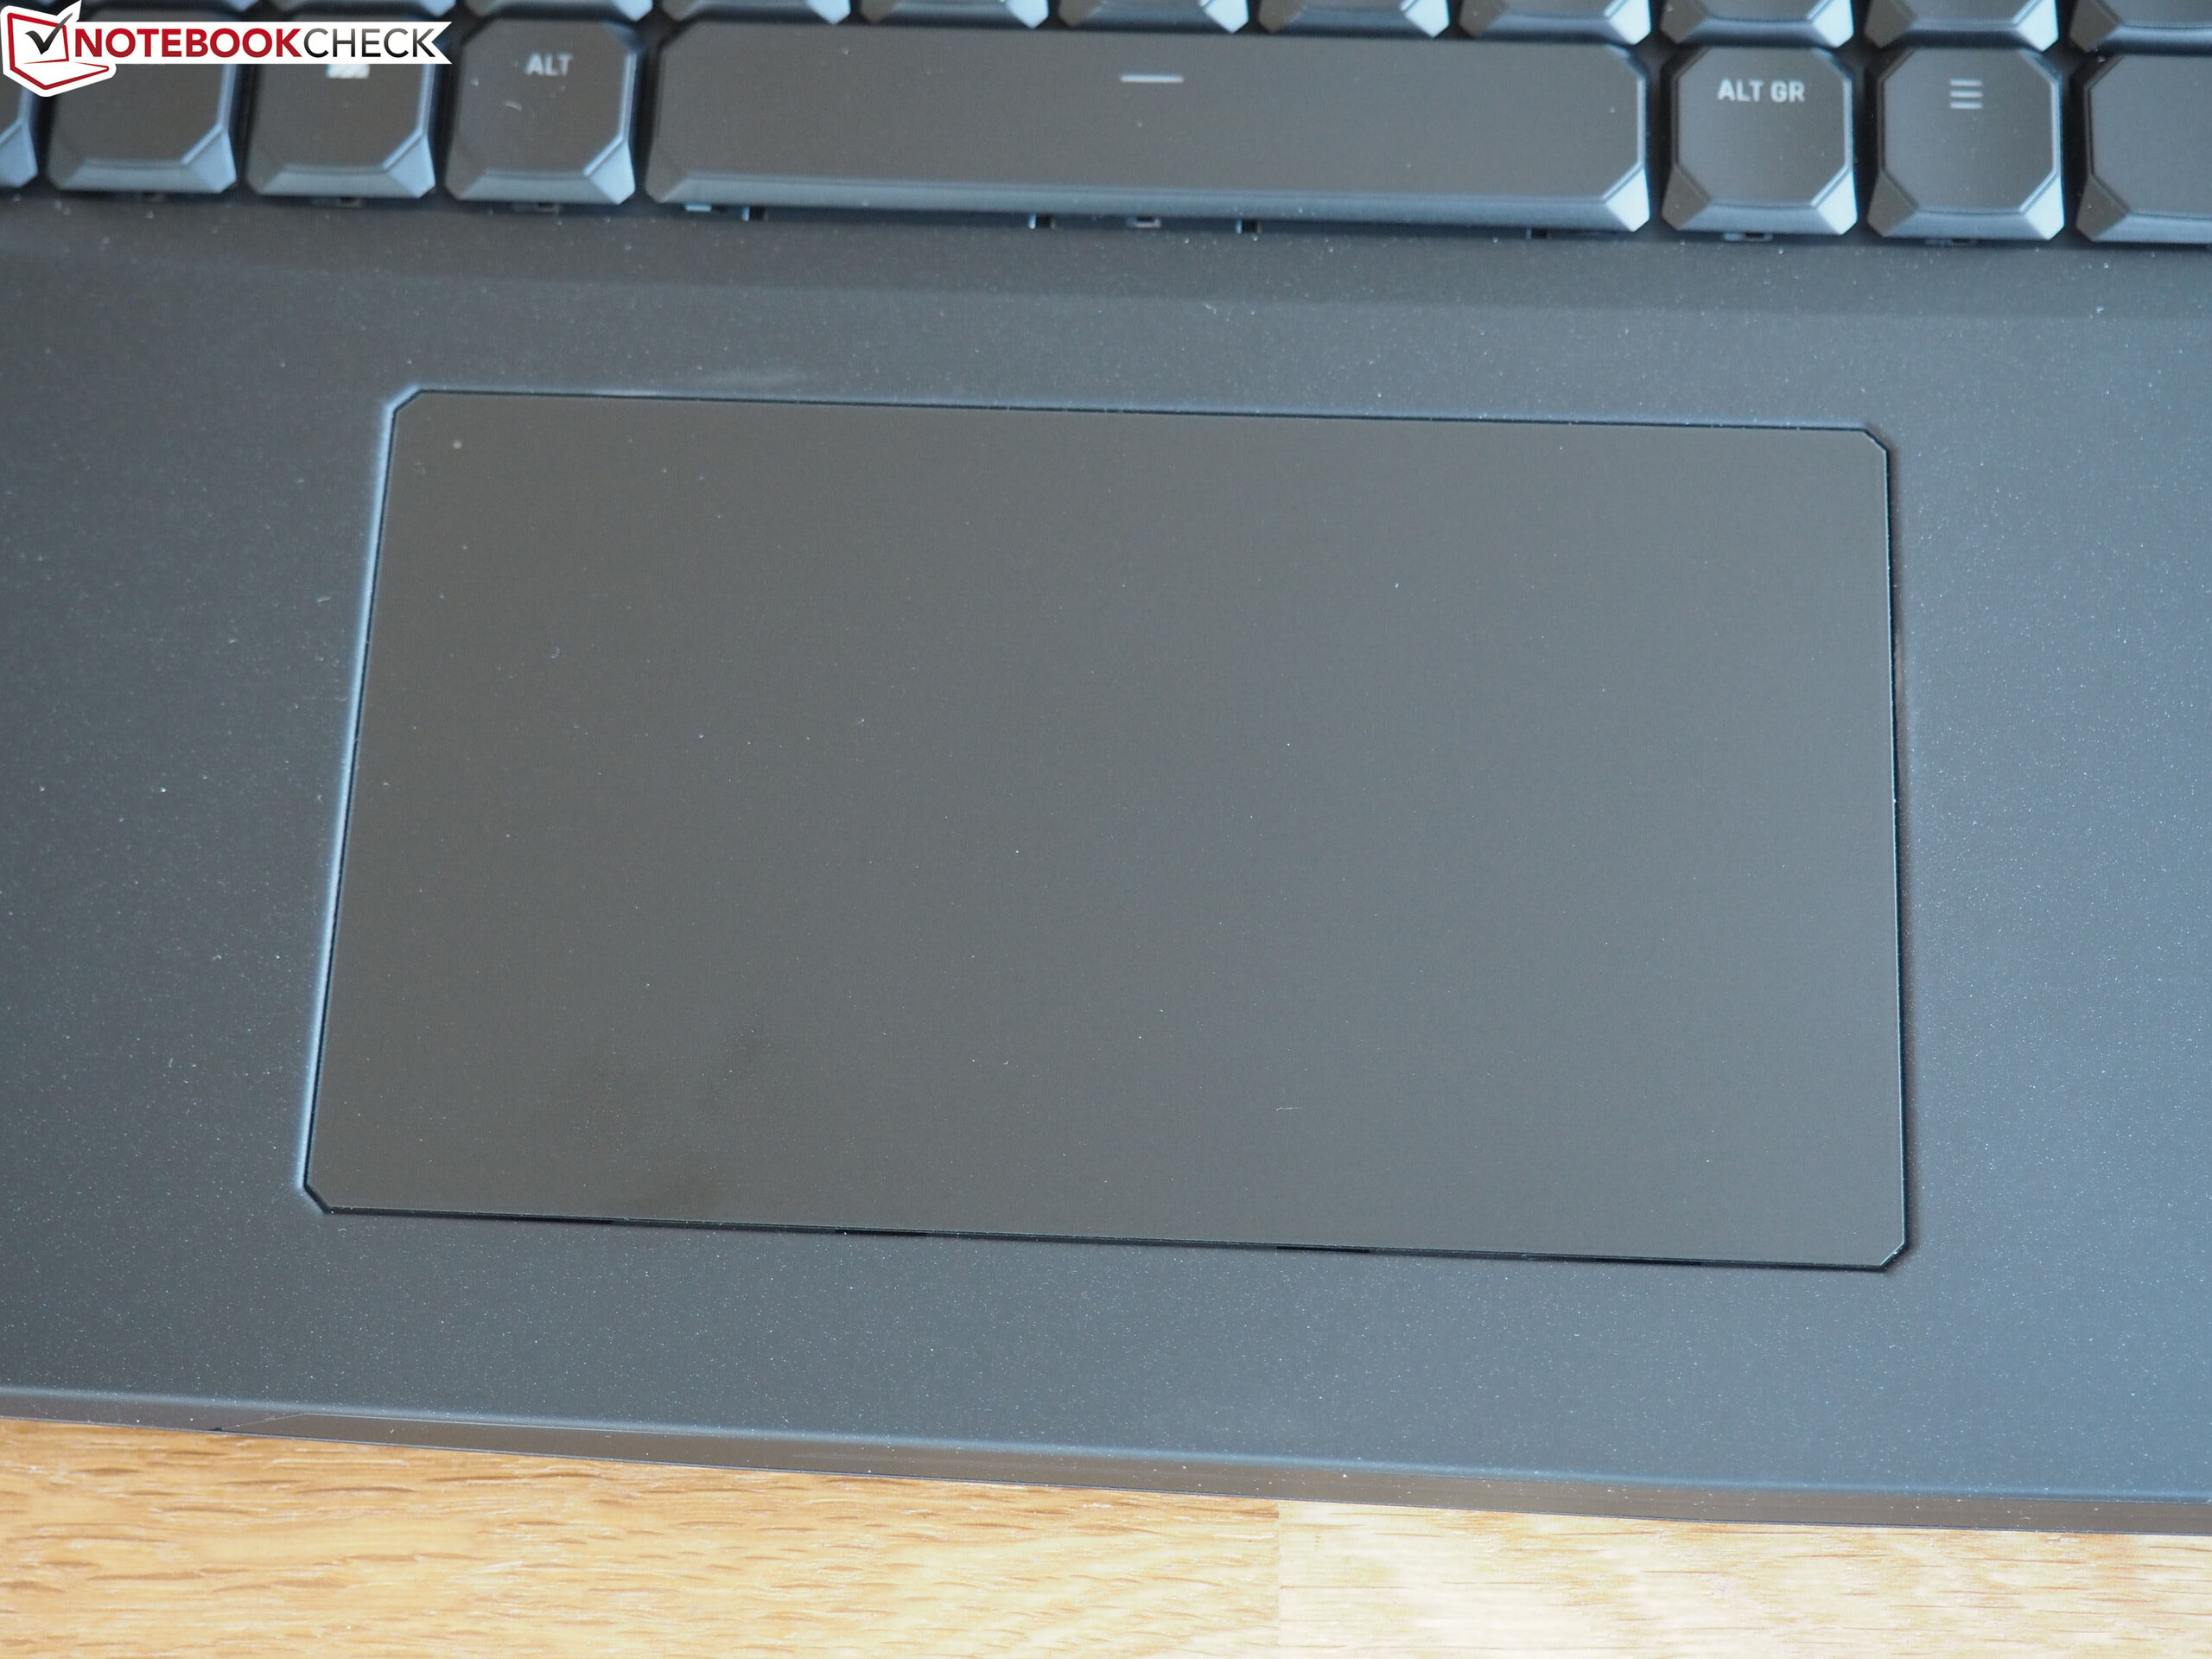
Como o dispositivo compartilha uma construção idêntica com seu predecessor, não discutiremos novamente o caso, equipamento de conexão, dispositivos de entrada ou alto-falantes, exceto quando houver algumas diferenças. Você pode encontrar as informações correspondentes em nossa revisão do Schenker XMG Neo 17 (Tongfang GK7CP7S).
Avaliação | Data | Modelo | Peso | Altura | Size | Resolução | Preço |
|---|---|---|---|---|---|---|---|
| 85.8 % v7 (old) | 11/2020 | Schenker XMG Neo 17 Comet Lake i7-10875H, GeForce RTX 2070 Super Mobile | 2.6 kg | 27.45 mm | 17.30" | 1920x1080 | |
| 83.6 % v7 (old) | 10/2020 | Acer Predator Helios 300 PH317-54-75G8 i7-10750H, GeForce RTX 2060 Mobile | 2.8 kg | 25 mm | 17.30" | 1920x1080 | |
| 83.5 % v7 (old) | 08/2020 | MSI GL75 10SFR i7-10750H, GeForce RTX 2070 Mobile | 2.6 kg | 28 mm | 17.30" | 1920x1080 | |
| 83.1 % v7 (old) | 10/2020 | Asus Strix G17 G712LWS i7-10750H, GeForce RTX 2070 Super Mobile | 2.8 kg | 26.5 mm | 17.30" | 1920x1080 | |
| 86.5 % v7 (old) | 05/2020 | Aorus 17G XB i7-10875H, GeForce RTX 2070 Super Max-Q | 2.7 kg | 26 mm | 17.30" | 1920x1080 |
Equipamento - Neo 17 agora com Thunderbolt 3
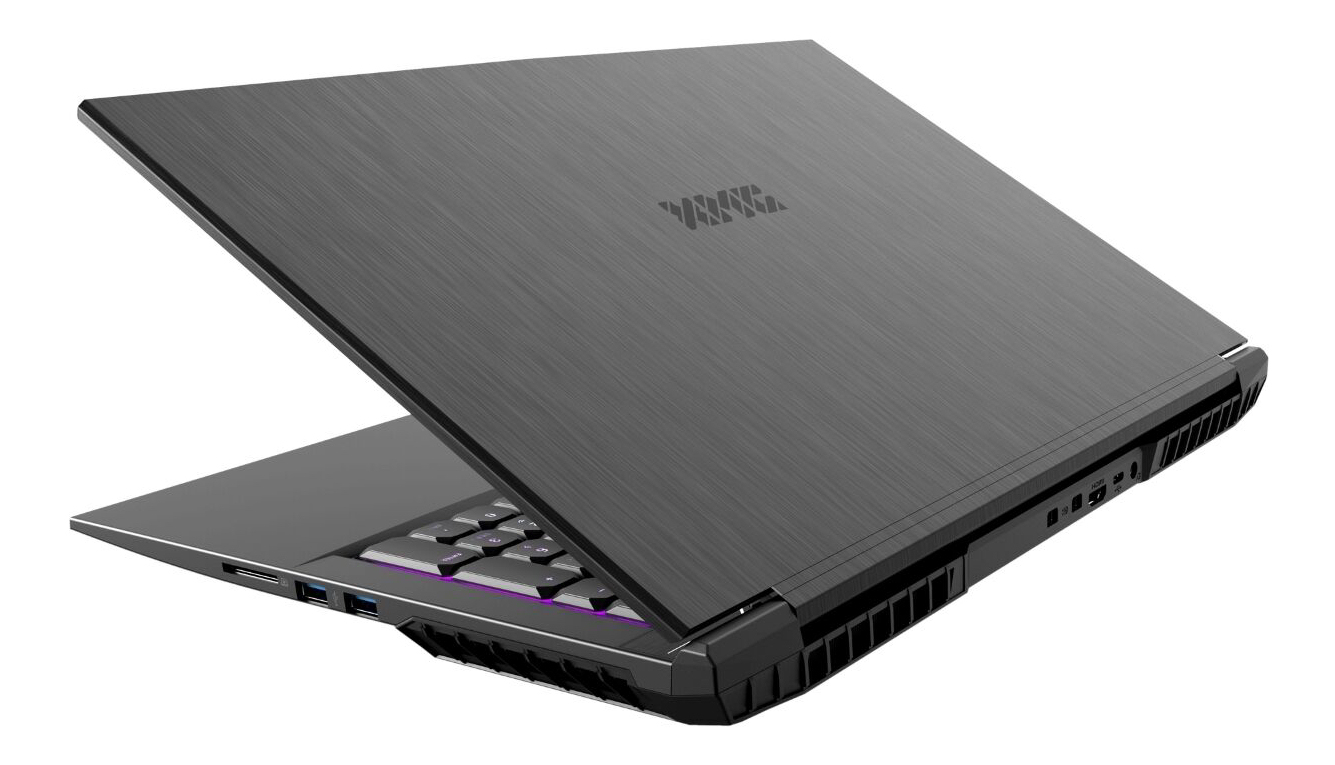
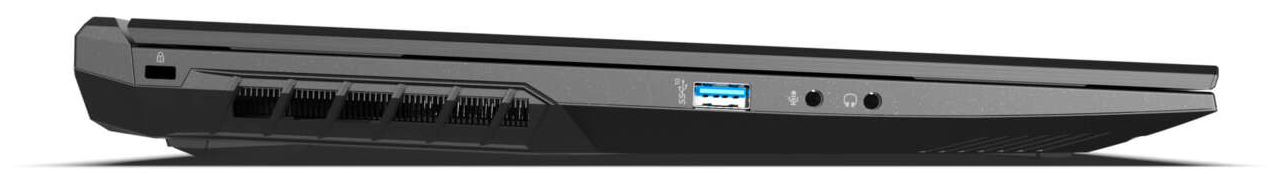
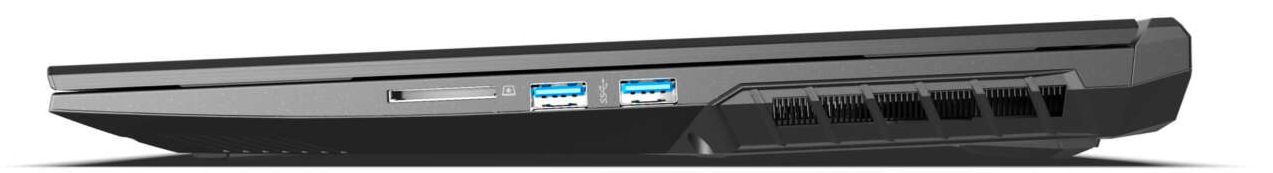
Em termos de conexões, algumas coisas mudaram em relação ao modelo anterior: os dois Mini DisplayPorts foram substituídos por uma conexão Thunderbolt 3 (DisplayPort-via-USB-C é suportado). Segundo Schenker, você pode conectar dois monitores (em série/MST) à conexão TB3. Um adaptador USB-Type-C-to-DisplayPort está incluído. Além disso, a conexão USB 2.0 foi atualizada para uma conexão USB 3.2 Gen 2 (Tipo A)

Equipamento de conexão

| SD Card Reader | |
| average JPG Copy Test (av. of 3 runs) | |
| Aorus 17G XB (Toshiba Exceria Pro SDXC 64 GB UHS-II) | |
| Média da turma Gaming (20.9 - 210, n=54, últimos 2 anos) | |
| Schenker XMG Neo 17 Comet Lake (Toshiba Exceria Pro SDXC 64 GB UHS-II) | |
| Schenker XMG Neo 17 (Toshiba Exceria Pro SDXC 64 GB UHS-II) | |
| Schenker XMG Neo 17 XNE17M19 (Toshiba Exceria Pro SDXC 64 GB UHS-II) | |
| MSI GL75 10SFR (Toshiba Exceria Pro SDXC 64 GB UHS-II) | |
| maximum AS SSD Seq Read Test (1GB) | |
| Aorus 17G XB (Toshiba Exceria Pro SDXC 64 GB UHS-II) | |
| Média da turma Gaming (25.5 - 261, n=51, últimos 2 anos) | |
| Schenker XMG Neo 17 (Toshiba Exceria Pro SDXC 64 GB UHS-II) | |
| Schenker XMG Neo 17 XNE17M19 (Toshiba Exceria Pro SDXC 64 GB UHS-II) | |
| Schenker XMG Neo 17 Comet Lake (Toshiba Exceria Pro SDXC 64 GB UHS-II) | |
| MSI GL75 10SFR (Toshiba Exceria Pro SDXC 64 GB UHS-II) | |


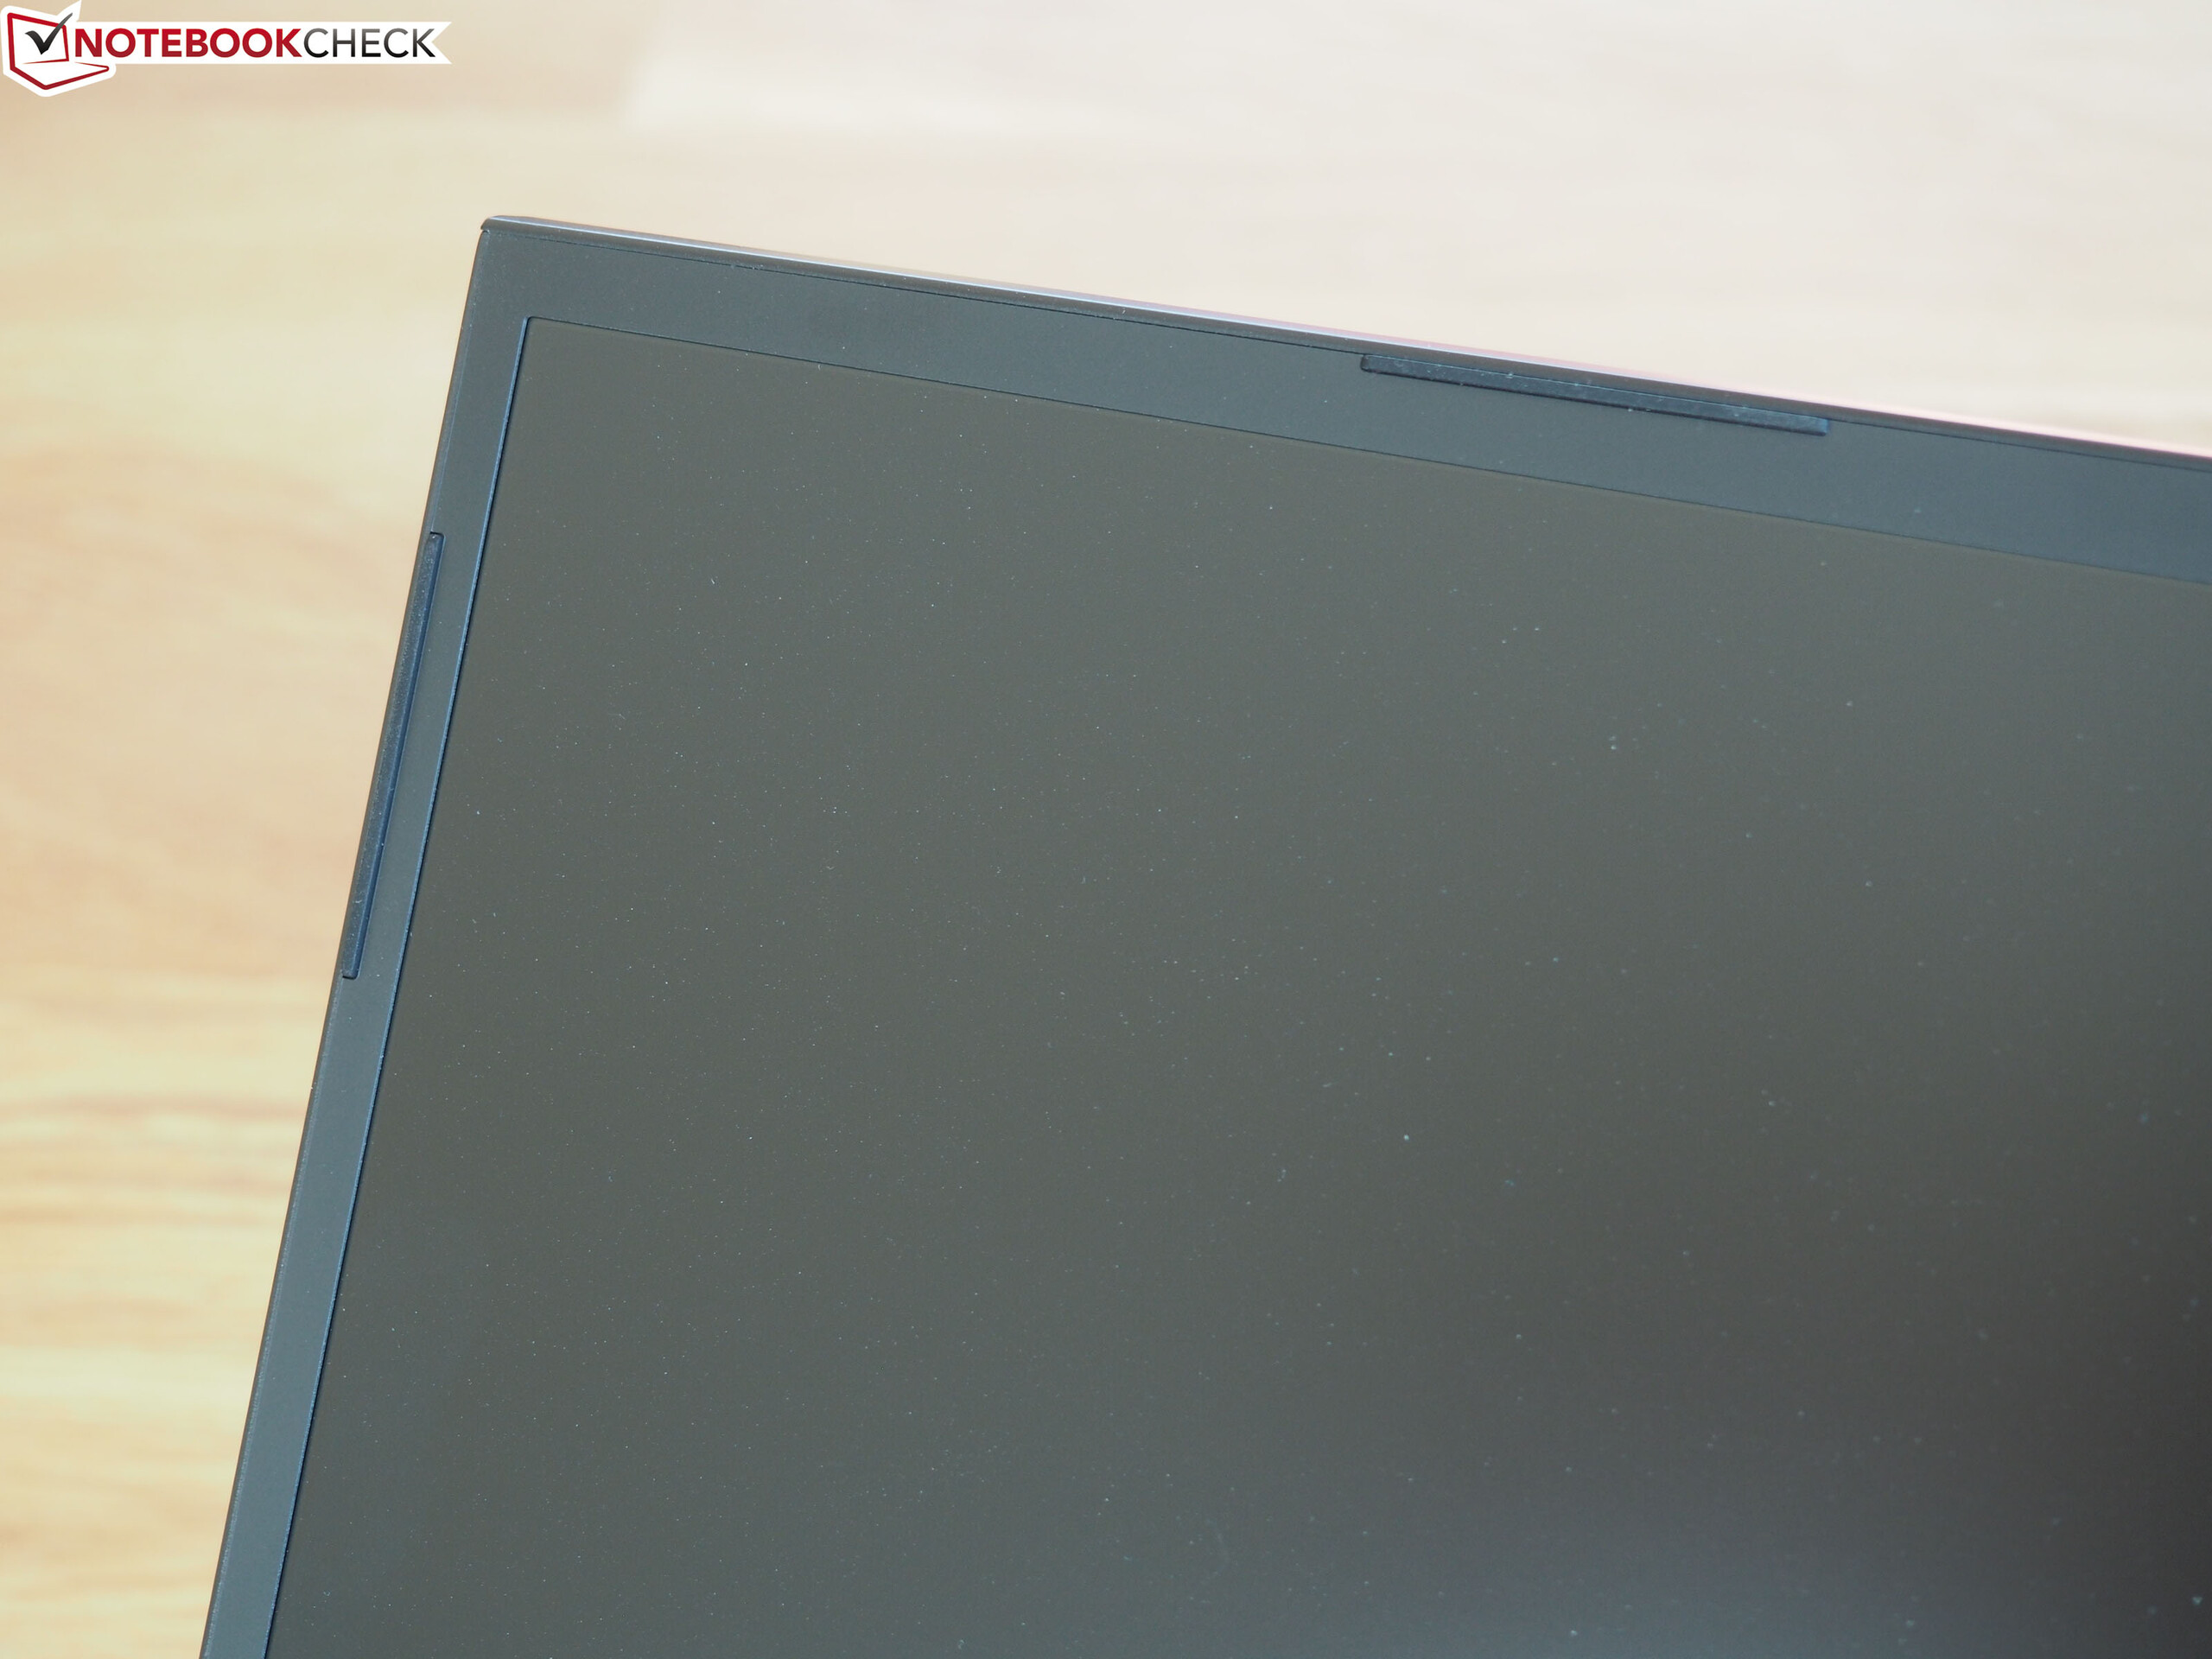
Visor - painel IPS 240 Hz
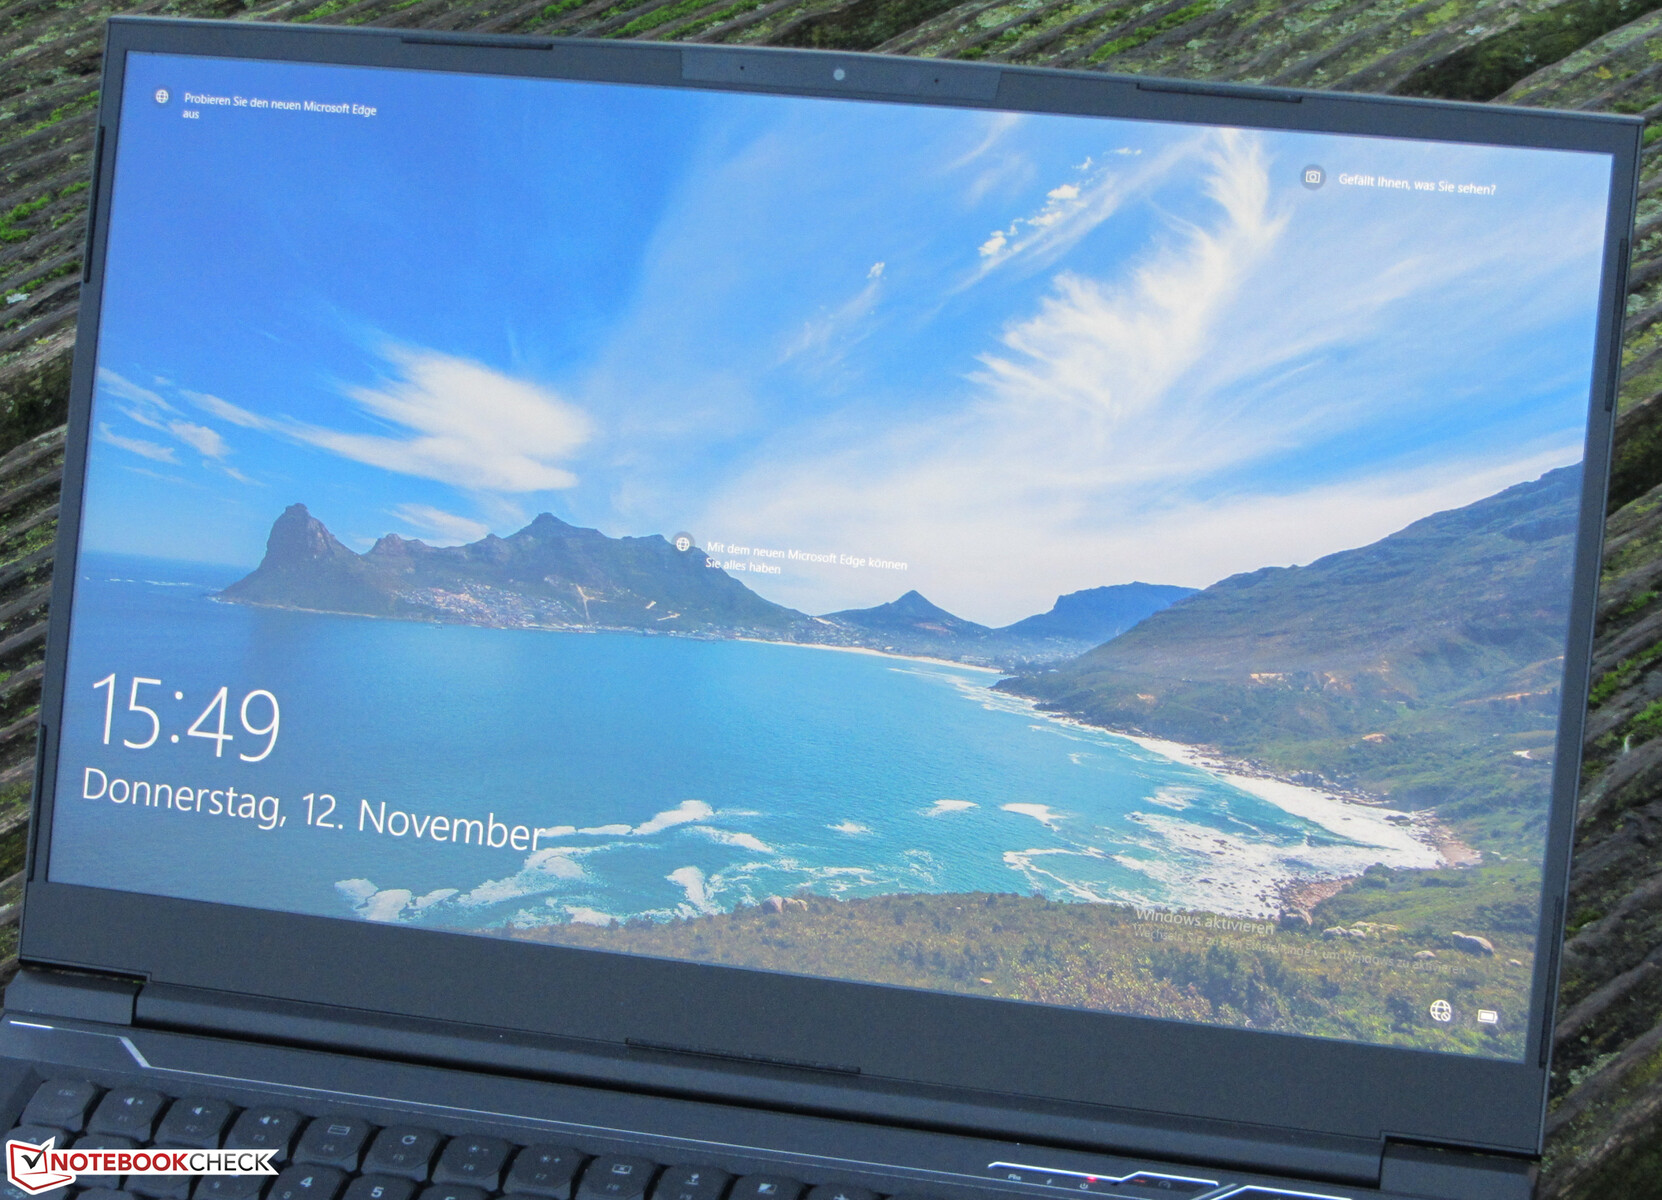
A tela mate de 17,3 polegadas do Neo 17 oferece uma resolução nativa de 1920 x 1080 pixels. O brilho (305,4 cd/m²) e o contraste (1022:1) se revelam bons. O painel de 240-Hz oferece curtos tempos de resposta. Outro ponto positivo é a falta de qualquer cintilação do PWM.
| |||||||||||||||||||||||||
iluminação: 87 %
iluminação com acumulador: 327 cd/m²
Contraste: 1022:1 (Preto: 0.32 cd/m²)
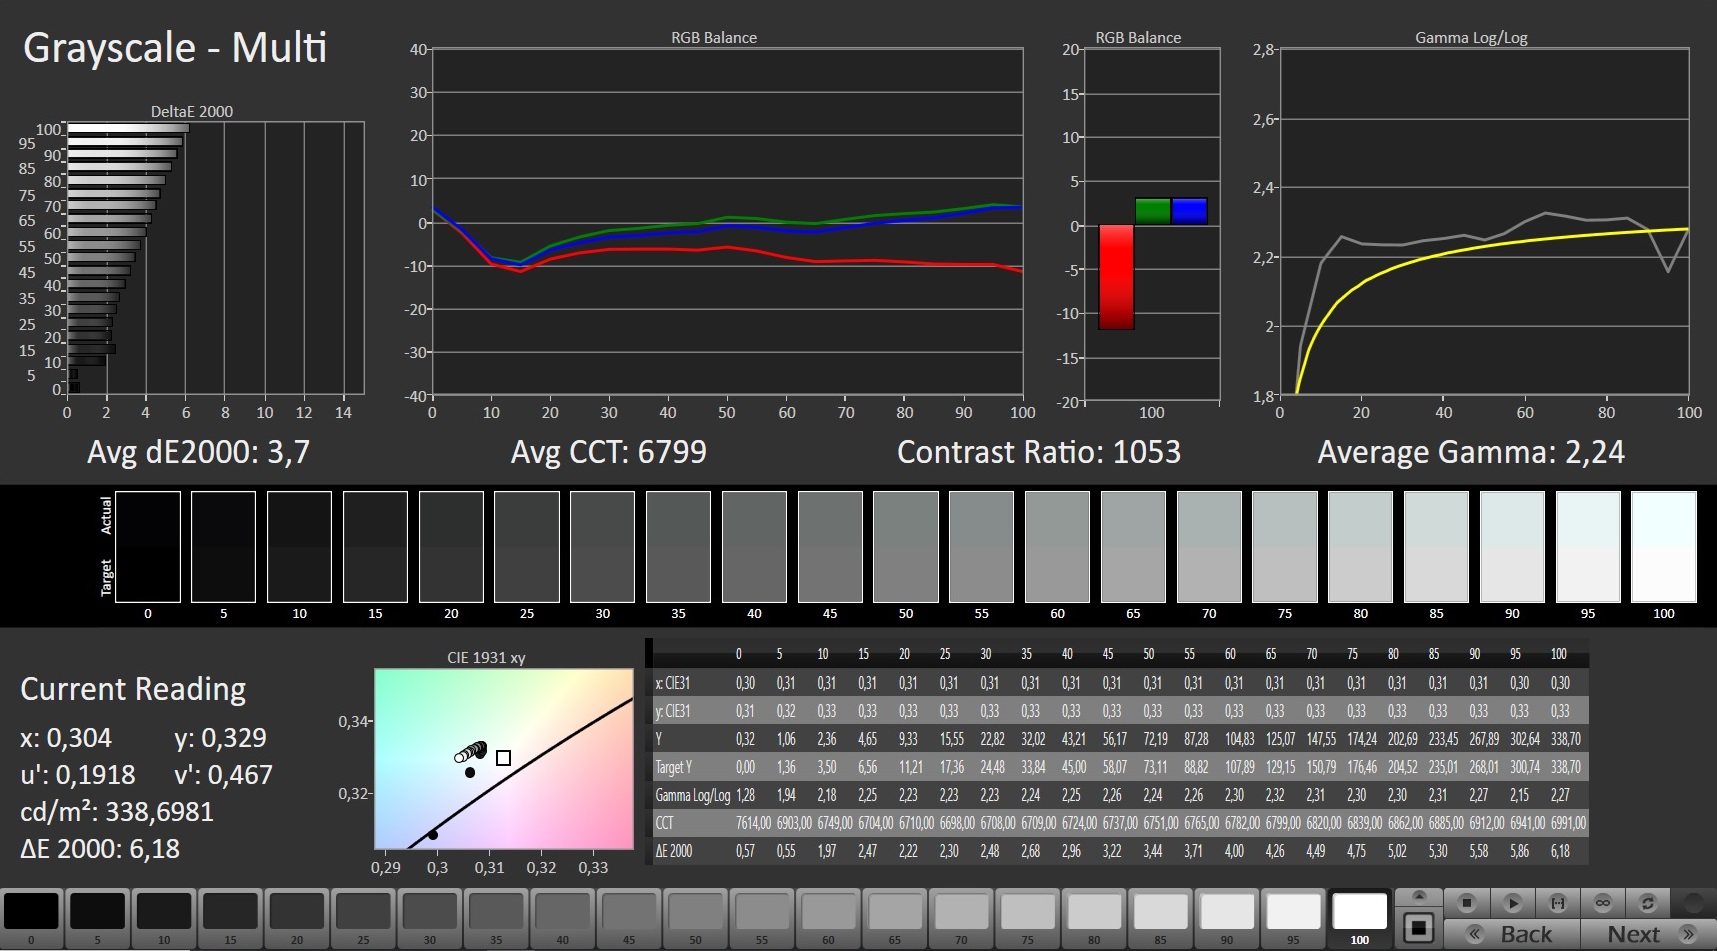
ΔE ColorChecker Calman: 2.16 | ∀{0.5-29.43 Ø4.72}
calibrated: 0.89
ΔE Greyscale Calman: 3.7 | ∀{0.09-98 Ø4.97}
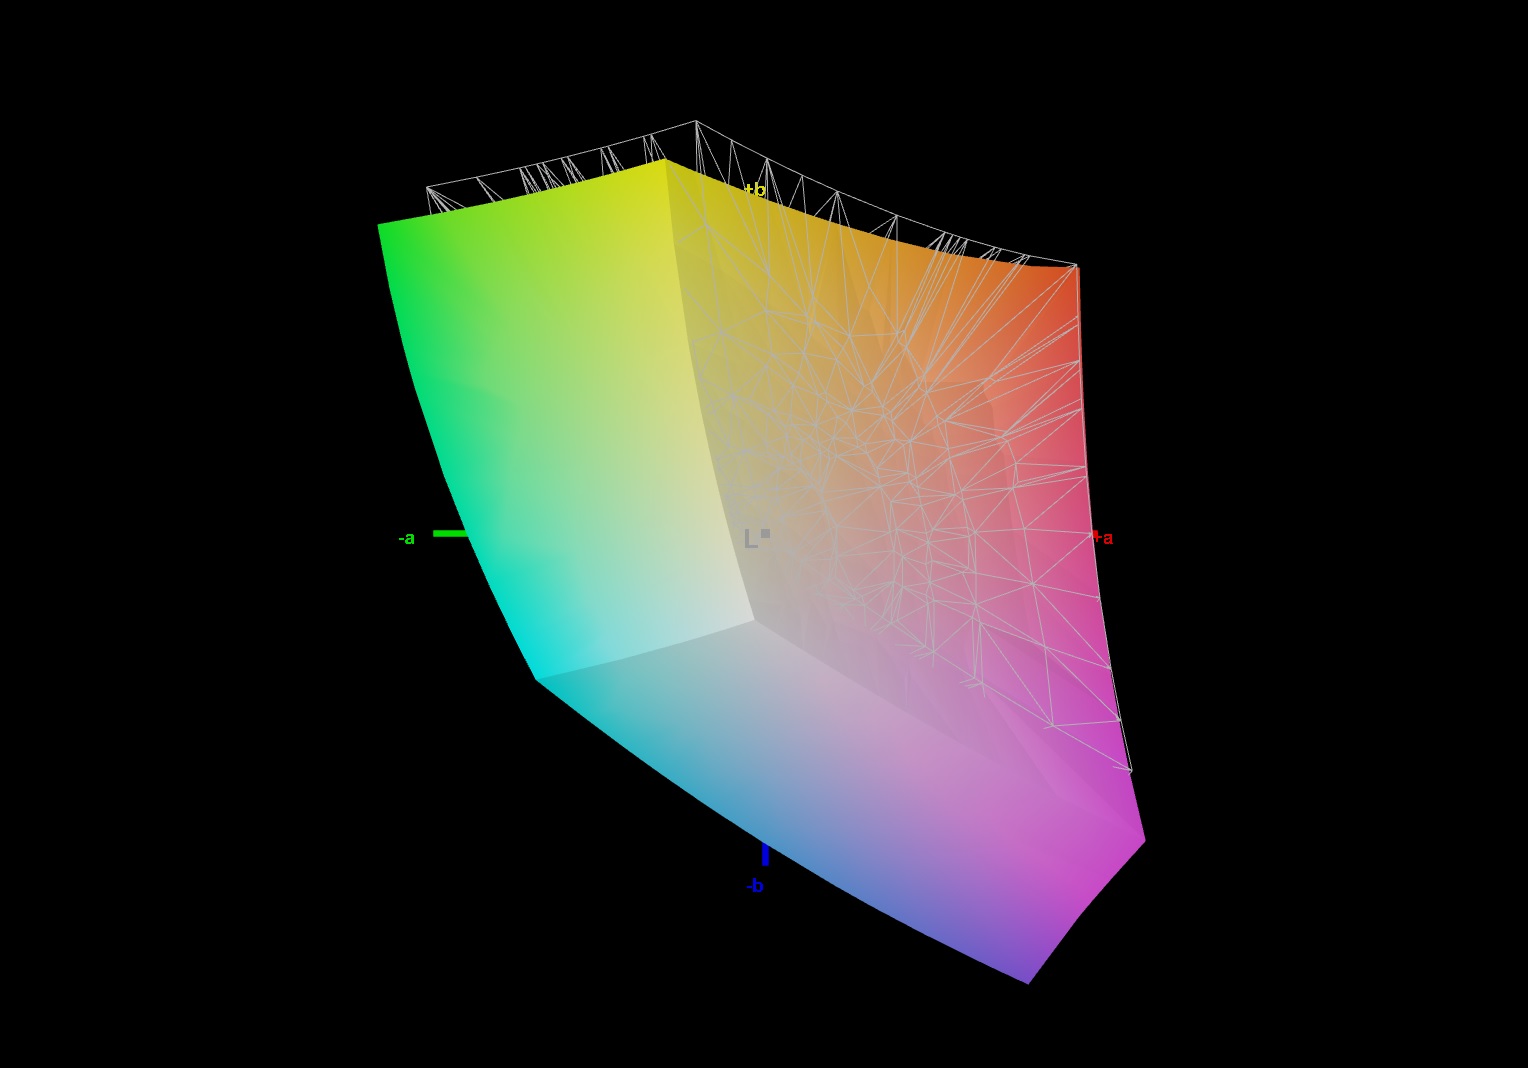
93% sRGB (Argyll 1.6.3 3D)
71% AdobeRGB 1998 (Argyll 1.6.3 3D)
70.9% AdobeRGB 1998 (Argyll 3D)
99.2% sRGB (Argyll 3D)
69.4% Display P3 (Argyll 3D)
Gamma: 2.24
CCT: 6799 K
| Schenker XMG Neo 17 Comet Lake BOE HF NE173FHM-NZ1, IPS, 1920x1080, 17.3" | Schenker XMG Neo 17 BOEhydis NV173FHM-N44 (BOE07B6), IPS, 1920x1080, 17.3" | Schenker XMG Neo 17 XNE17M19 LG LP173WFG-SPB1 (LGD0615), IPS, 1920x1080, 17.3" | Acer Predator Helios 300 PH317-54-75G8 Chi Mei N173HCE-G33, IPS, 1920x1080, 17.3" | MSI GL75 10SFR Chi Mei N173HCE-G33, IPS, 1920x1080, 17.3" | Asus Strix G17 G712LWS LG Philips LP173WFG-SPB3, IPS, 1920x1080, 17.3" | Aorus 17G XB AU Optronics B173HAN05.0 (AUO509D), IPS, 1920x1080, 17.3" | |
|---|---|---|---|---|---|---|---|
| Display | -6% | -6% | -8% | -6% | -5% | 1% | |
| Display P3 Coverage (%) | 69.4 | 65.2 -6% | 64.6 -7% | 62.6 -10% | 63.9 -8% | 65.2 -6% | 70.6 2% |
| sRGB Coverage (%) | 99.2 | 92.2 -7% | 95.6 -4% | 94.3 -5% | 96.2 -3% | 96.8 -2% | 97.2 -2% |
| AdobeRGB 1998 Coverage (%) | 70.9 | 66.5 -6% | 65.6 -7% | 64.7 -9% | 66 -7% | 66.4 -6% | 72.8 3% |
| Response Times | -81% | -63% | -61% | -26% | -48% | -68% | |
| Response Time Grey 50% / Grey 80% * (ms) | 10.8 ? | 18.8 ? -74% | 15.6 ? -44% | 16.4 ? -52% | 12 ? -11% | 14.4 ? -33% | 16 ? -48% |
| Response Time Black / White * (ms) | 6.4 ? | 12 ? -88% | 11.6 ? -81% | 10.8 ? -69% | 9 ? -41% | 10.4 ? -63% | 12 ? -88% |
| PWM Frequency (Hz) | 971 ? | 24510 ? | 208 ? | ||||
| Screen | -5% | -15% | 23% | 1% | -8% | 17% | |
| Brightness middle (cd/m²) | 327 | 304 -7% | 318 -3% | 322 -2% | 333 2% | 323 -1% | 293 -10% |
| Brightness (cd/m²) | 305 | 289 -5% | 286 -6% | 308 1% | 309 1% | 300 -2% | 285 -7% |
| Brightness Distribution (%) | 87 | 90 3% | 86 -1% | 92 6% | 86 -1% | 89 2% | 95 9% |
| Black Level * (cd/m²) | 0.32 | 0.26 19% | 0.23 28% | 0.18 44% | 0.215 33% | 0.31 3% | 0.24 25% |
| Contrast (:1) | 1022 | 1169 14% | 1383 35% | 1789 75% | 1549 52% | 1042 2% | 1221 19% |
| Colorchecker dE 2000 * | 2.16 | 2.65 -23% | 3.89 -80% | 1.53 29% | 1.98 8% | 3.01 -39% | 1.27 41% |
| Colorchecker dE 2000 max. * | 6.14 | 6.11 -0% | 10.56 -72% | 3.14 49% | 4.34 29% | 7.65 -25% | 2.24 64% |
| Colorchecker dE 2000 calibrated * | 0.89 | 1.5 -69% | 1.03 -16% | 0.74 17% | 2.01 -126% | 1 -12% | 1.06 -19% |
| Greyscale dE 2000 * | 3.7 | 2.75 26% | 5.3 -43% | 1.9 49% | 2.97 20% | 3.8 -3% | 1.34 64% |
| Gamma | 2.24 98% | 2.46 89% | 2.46 89% | 2.144 103% | 2.41 91% | 2.154 102% | 2.38 92% |
| CCT | 6799 96% | 6763 96% | 7462 87% | 6809 95% | 6750 96% | 7507 87% | 6542 99% |
| Color Space (Percent of AdobeRGB 1998) (%) | 71 | 60 -15% | 60 -15% | 65 -8% | 61 -14% | 66 -7% | 73 3% |
| Color Space (Percent of sRGB) (%) | 93 | 92 -1% | 96 3% | 87 -6% | 96 3% | 90 -3% | 94 1% |
| Média Total (Programa/Configurações) | -31% /
-15% | -28% /
-20% | -15% /
7% | -10% /
-4% | -20% /
-12% | -17% /
4% |
* ... menor é melhor
Exibir tempos de resposta
| ↔ Tempo de resposta preto para branco | ||
|---|---|---|
| 6.4 ms ... ascensão ↗ e queda ↘ combinadas | ↗ 3 ms ascensão | 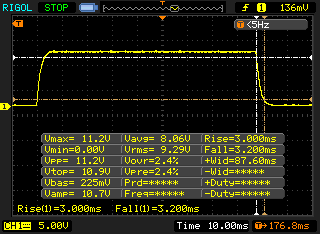 |
| ↘ 3.2 ms queda | ||
| A tela mostra taxas de resposta muito rápidas em nossos testes e deve ser muito adequada para jogos em ritmo acelerado. Em comparação, todos os dispositivos testados variam de 0.1 (mínimo) a 240 (máximo) ms. » 20 % de todos os dispositivos são melhores. Isso significa que o tempo de resposta medido é melhor que a média de todos os dispositivos testados (19.8 ms). | ||
| ↔ Tempo de resposta 50% cinza a 80% cinza | ||
| 10.8 ms ... ascensão ↗ e queda ↘ combinadas | ↗ 5.6 ms ascensão | 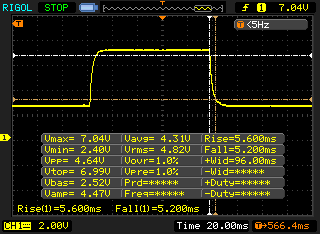 |
| ↘ 5.2 ms queda | ||
| A tela mostra boas taxas de resposta em nossos testes, mas pode ser muito lenta para jogadores competitivos. Em comparação, todos os dispositivos testados variam de 0.165 (mínimo) a 636 (máximo) ms. » 25 % de todos os dispositivos são melhores. Isso significa que o tempo de resposta medido é melhor que a média de todos os dispositivos testados (31 ms). | ||
Cintilação da tela / PWM (modulação por largura de pulso)
| Tela tremeluzindo / PWM não detectado |  | ||
[pwm_comparison] Em comparação: 52 % de todos os dispositivos testados não usam PWM para escurecer a tela. Se PWM foi detectado, uma média de 7747 (mínimo: 5 - máximo: 343500) Hz foi medida. | |||
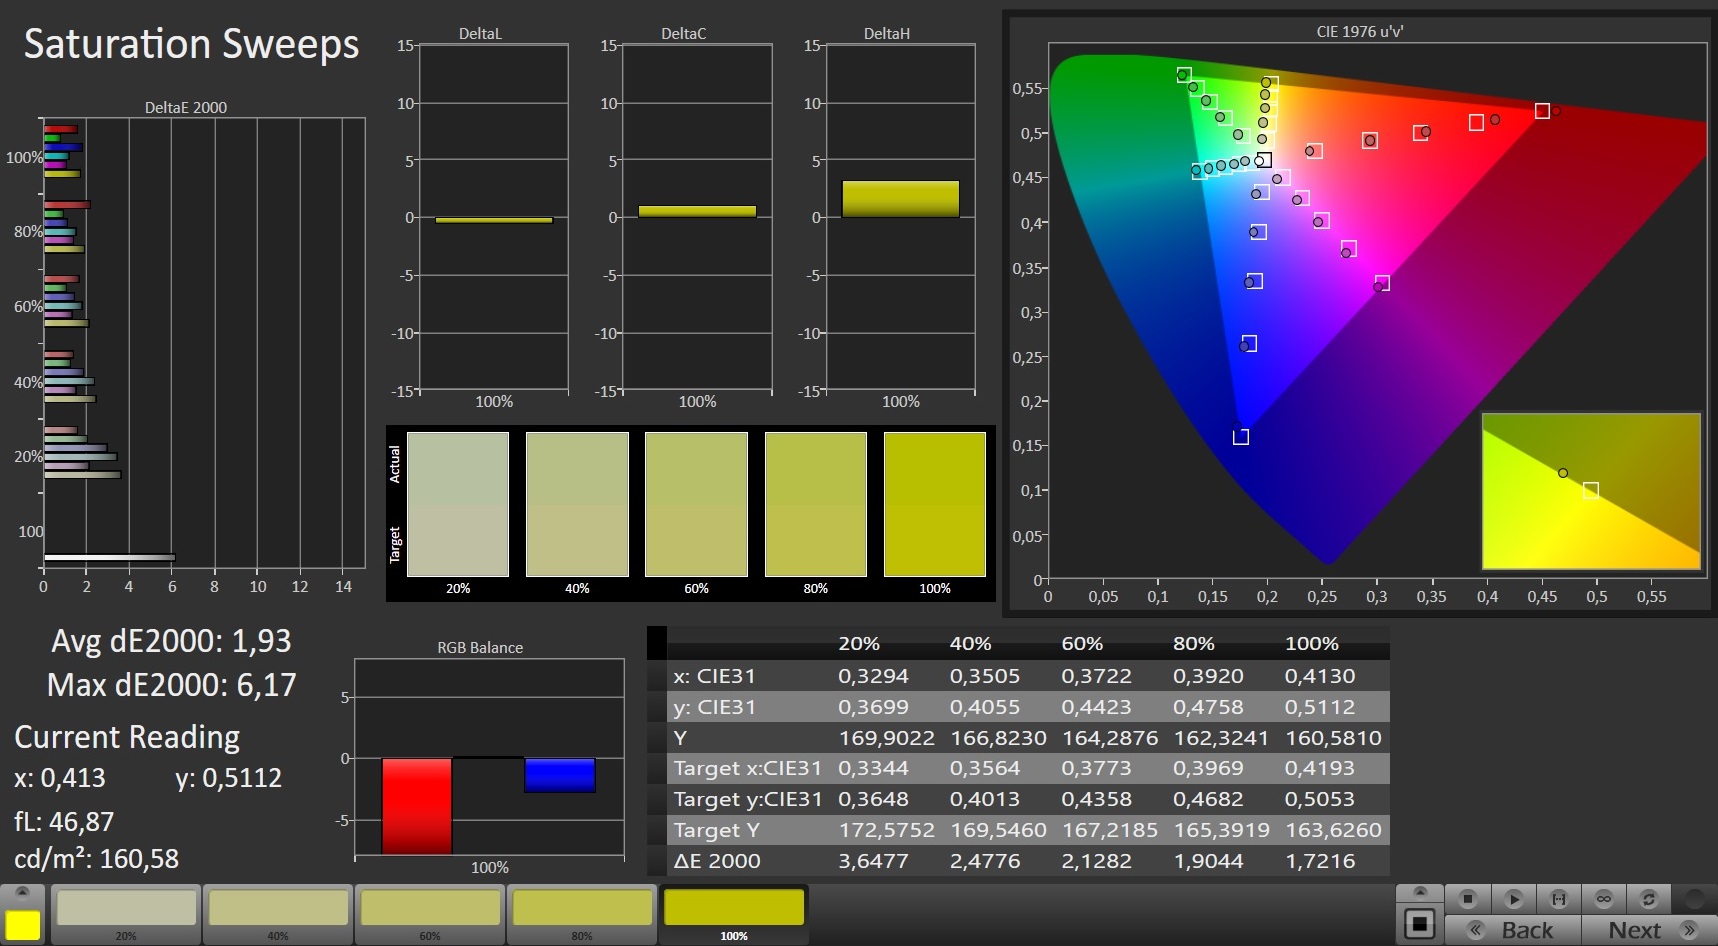
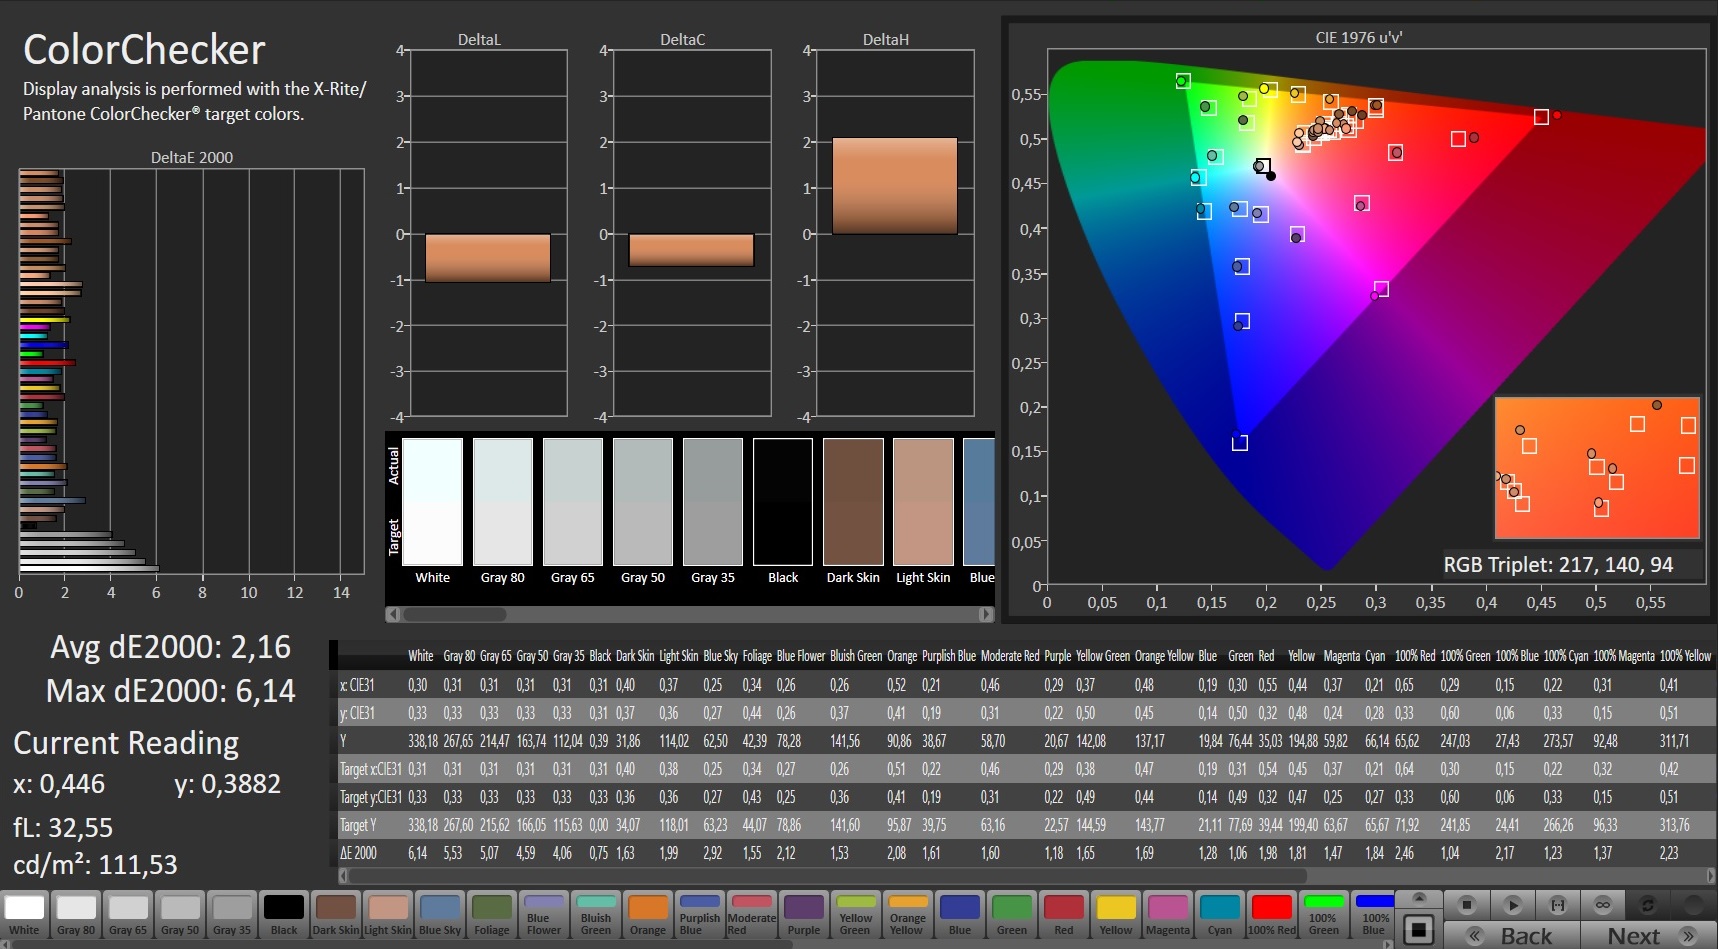
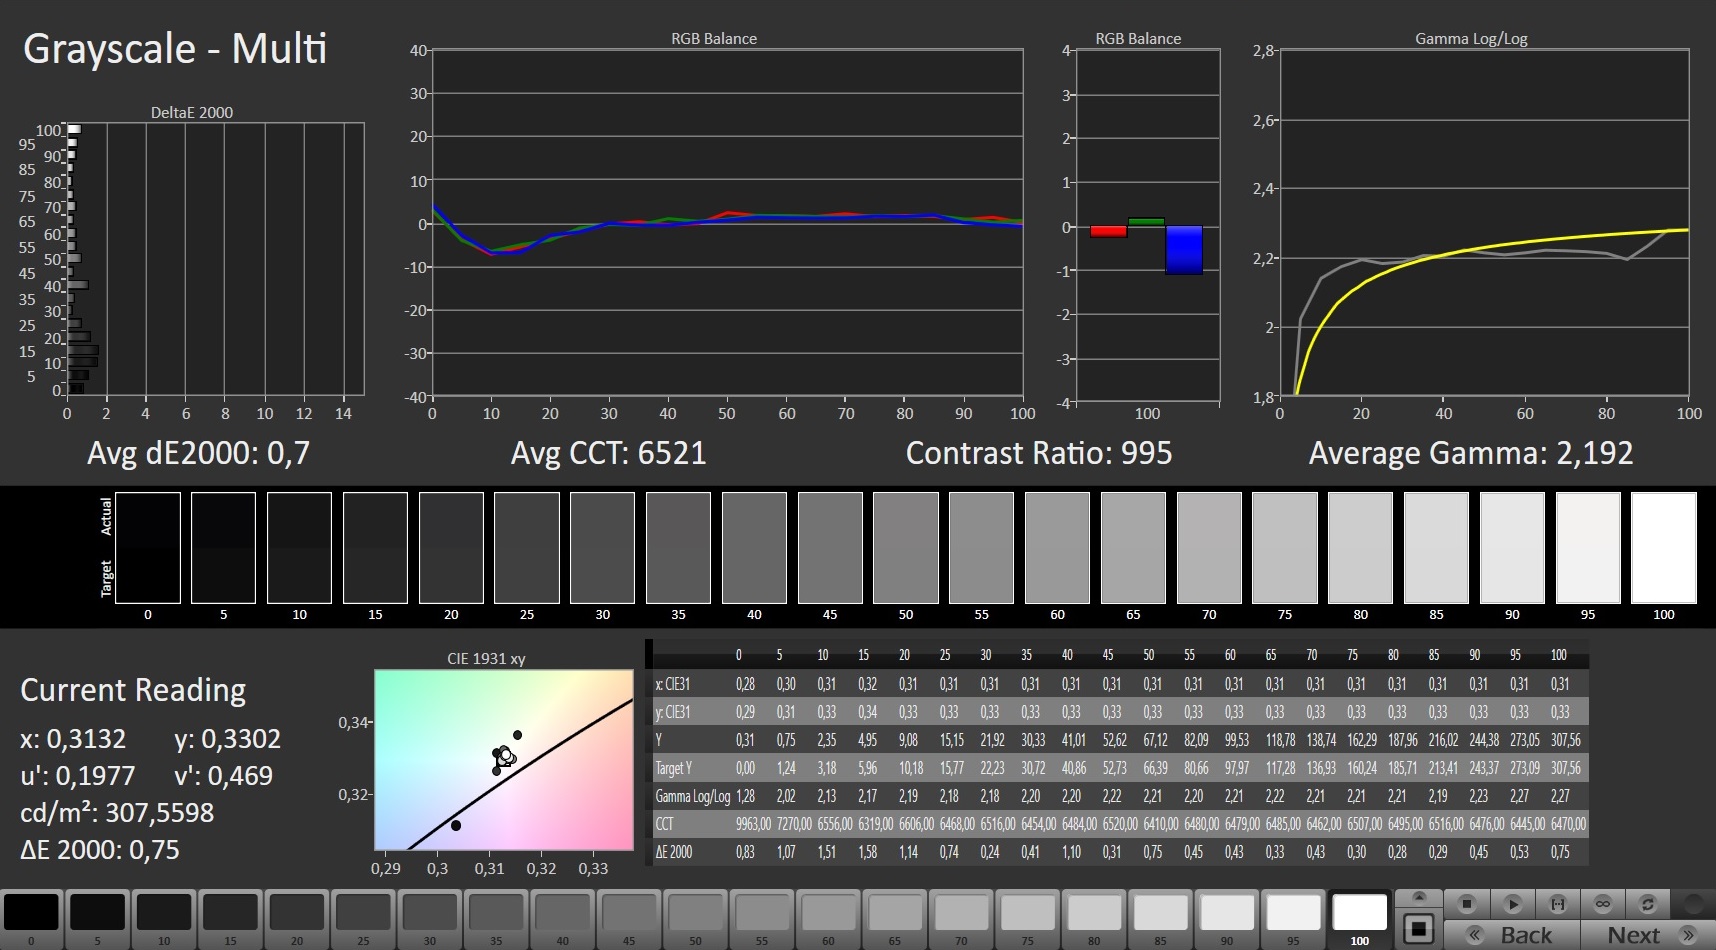
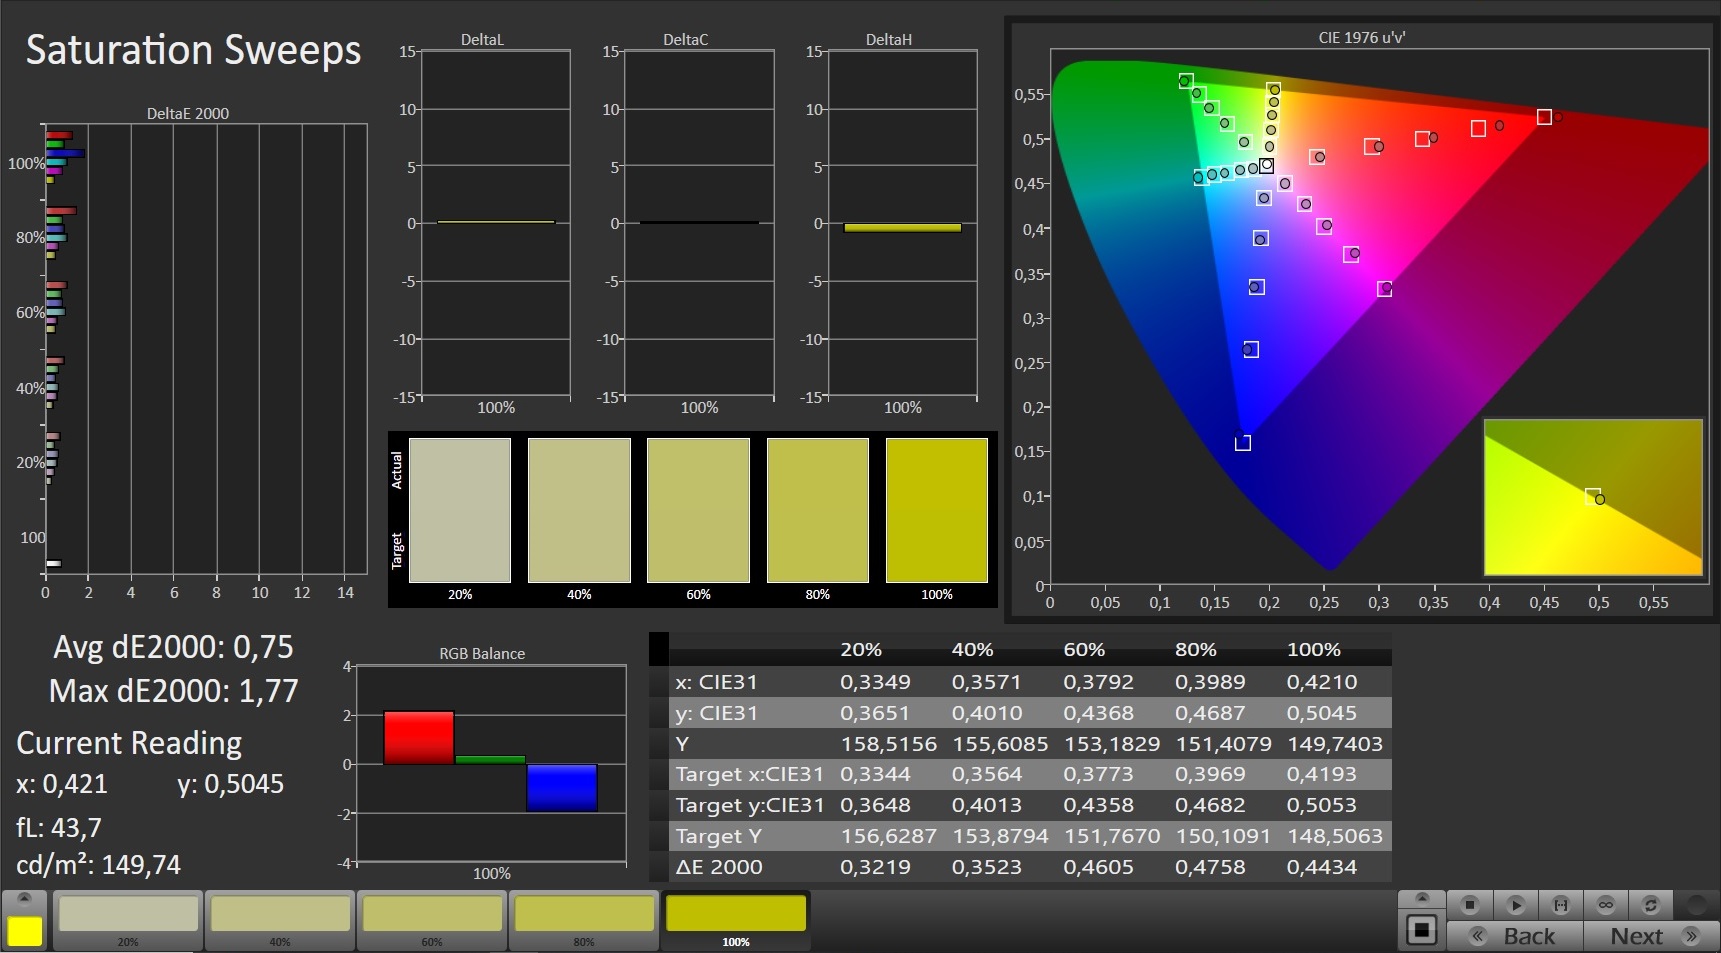
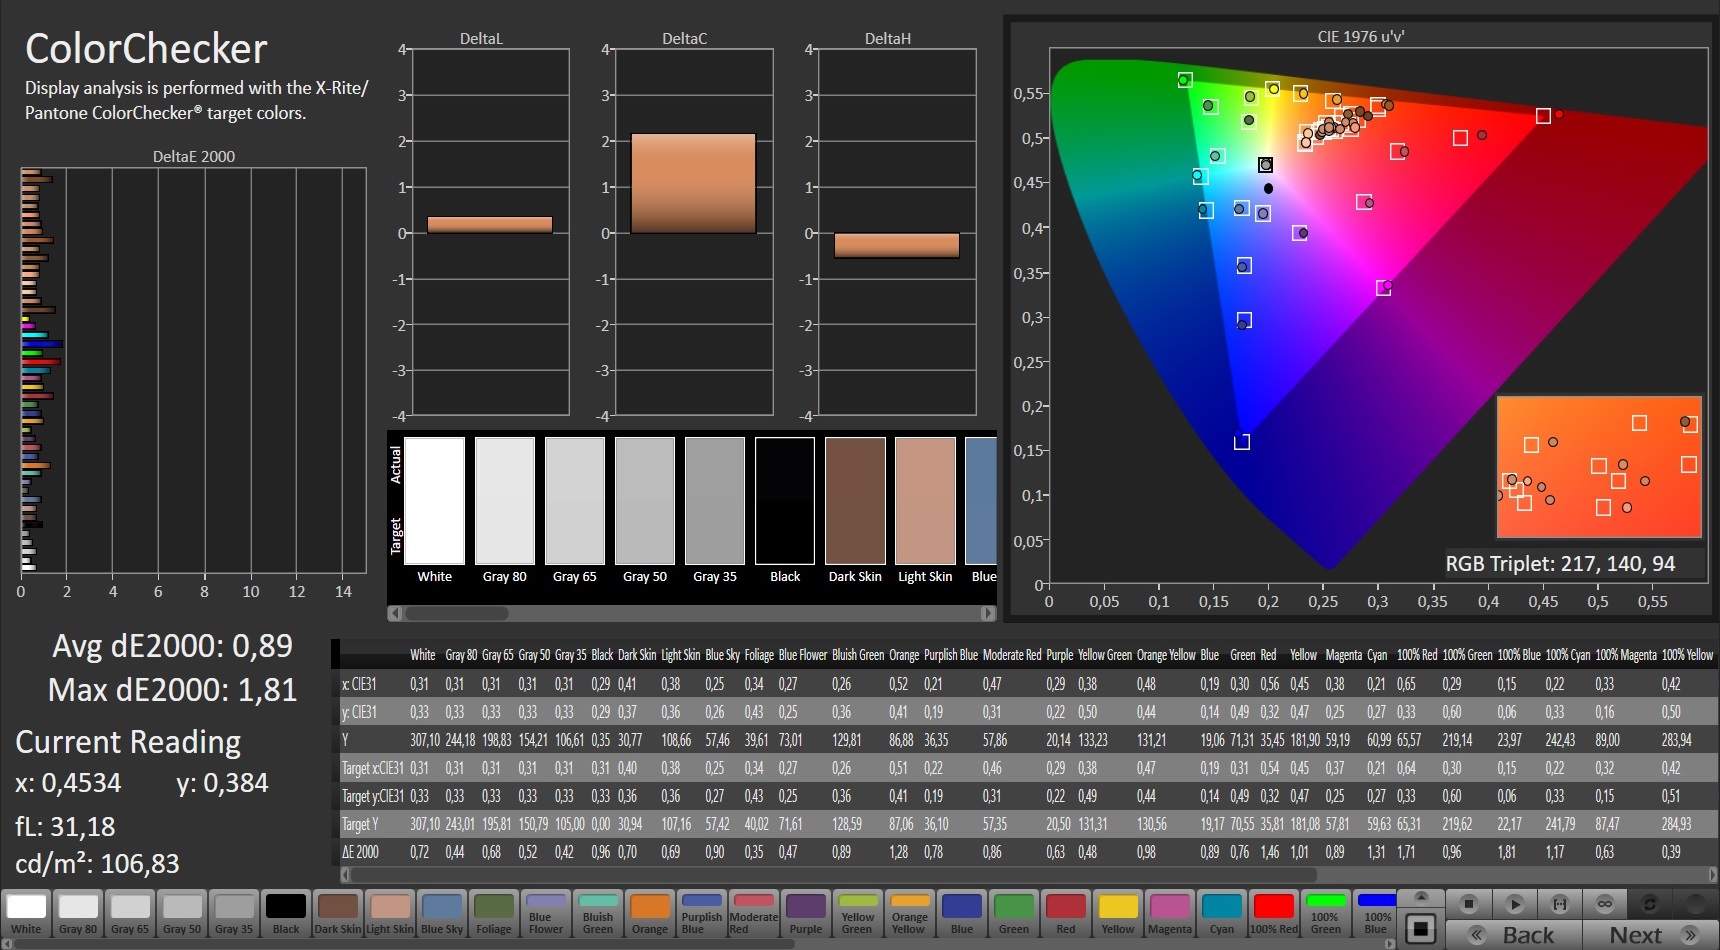
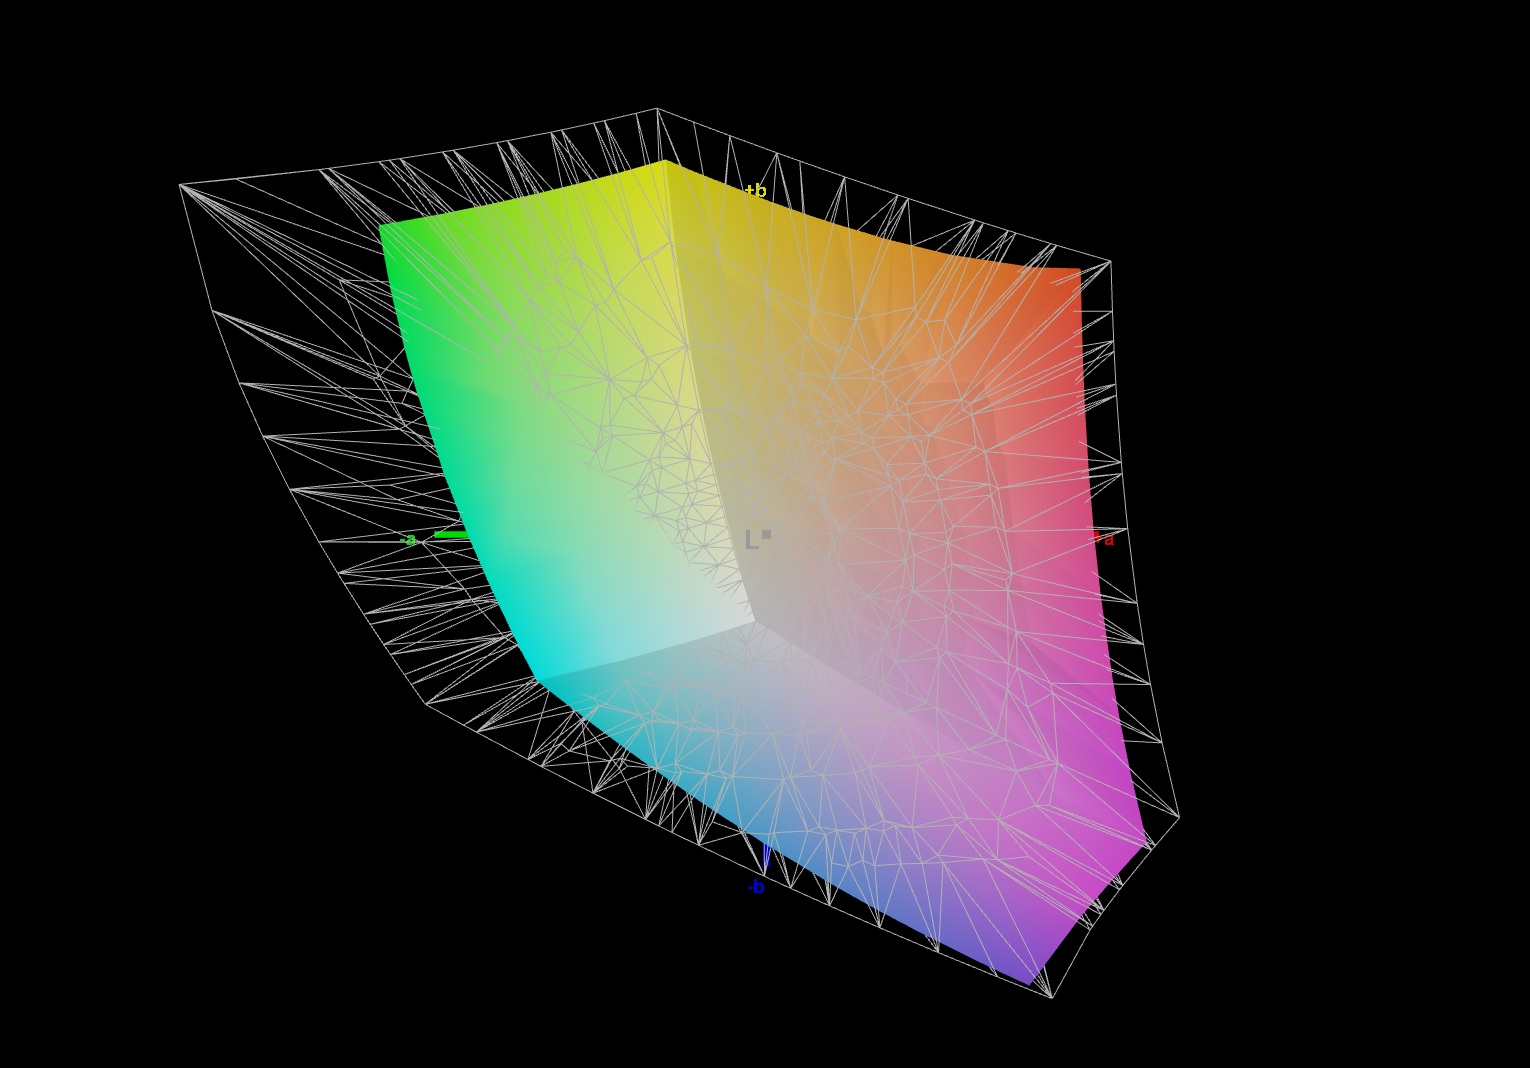
O display mostra uma boa reprodução de cores. Com um desvio de cor de 2,16, o objetivo do Delta-E menor que 3 é alcançado. O mostrador não sofre de uma coloração azul. Uma calibração ainda traz melhorias adicionais com o desvio de cor caindo para 0,89 e o mostrador em escala de cinza se tornando mais equilibrado. Os espaços de cor AdobeRGB (71%) e sRGB (93%) não são completamente cobertos.
A Schenker equipou o laptop com um painel IPS com ângulos de visão estáveis, permitindo que você leia o conteúdo da tela de qualquer ângulo. No exterior, você pode ler o conteúdo da tela quando a luz do sol não estiver muito brilhante.
Desempenho - Suficiente para os próximos anos
Com o Neo 17, Schenker oferece um laptop para jogos de 17,3 polegadas que traz todos os jogos atuais para a tela suavemente e também atinge uma boa figura em outras áreas de aplicação. Você teria que pagar cerca de 2349 euros (~$2781) por nossa unidade de teste. O dispositivo pode ser configurado individualmente na loja online da Schenker
Condições de teste
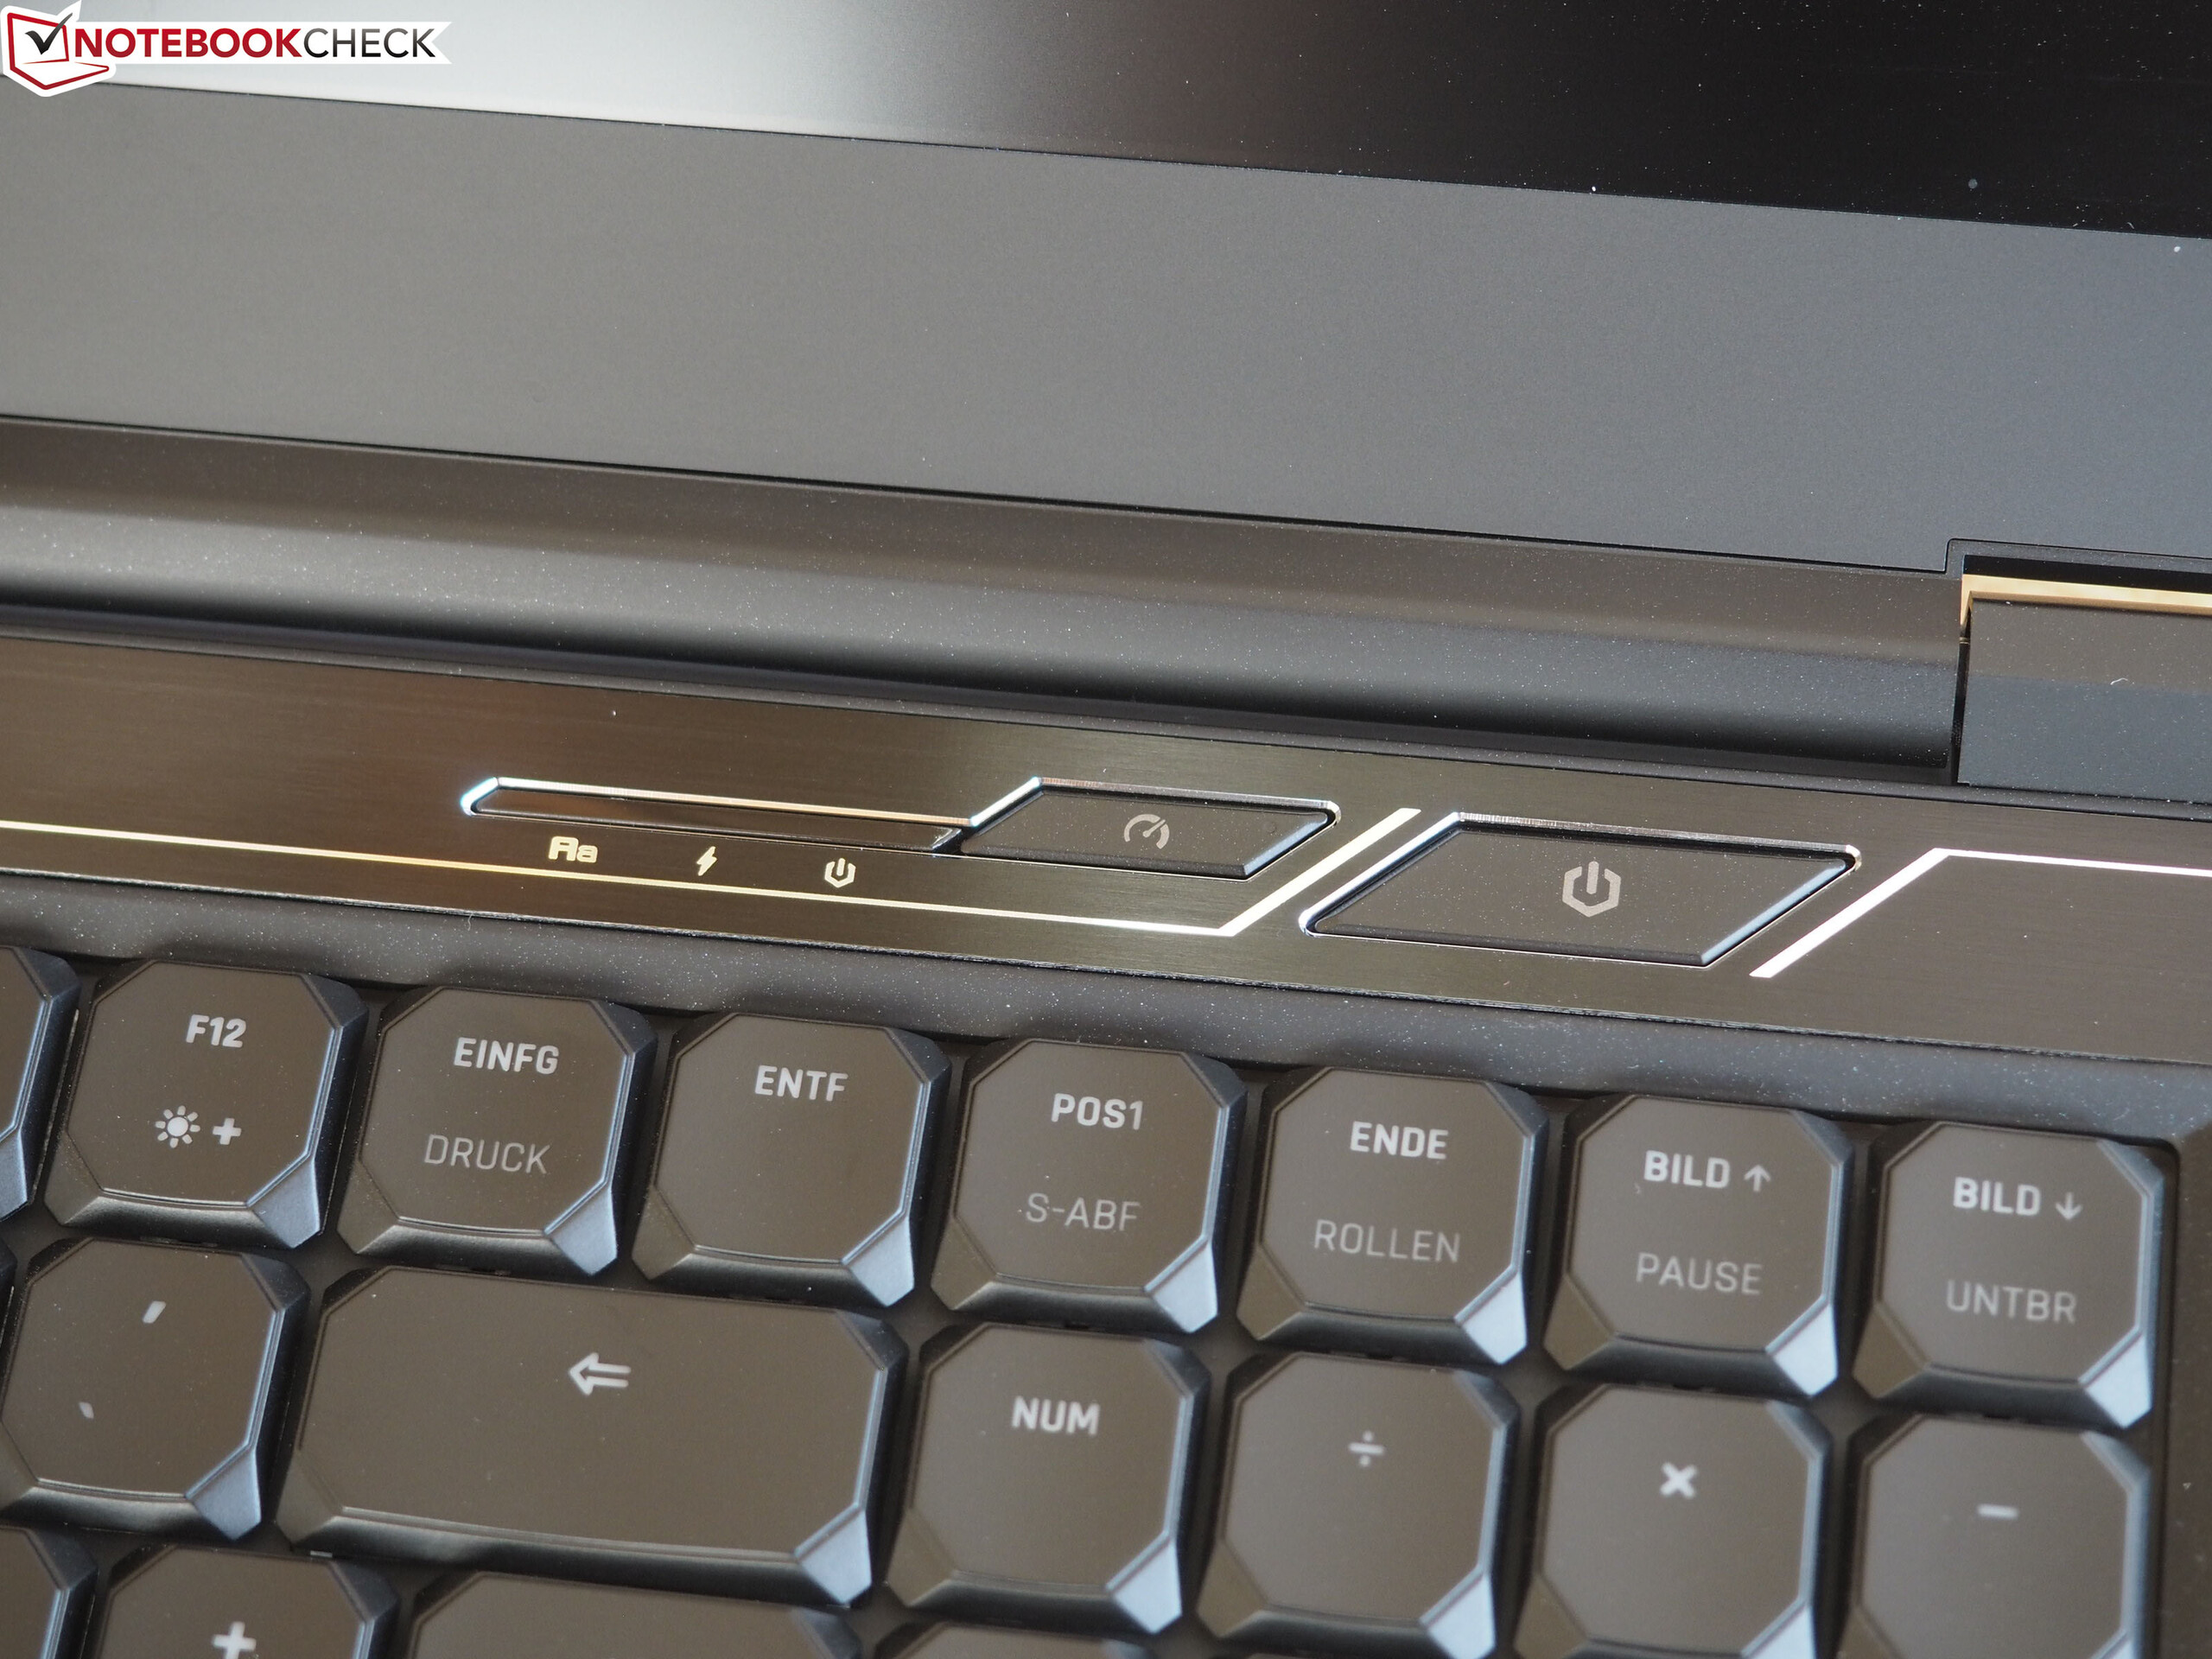
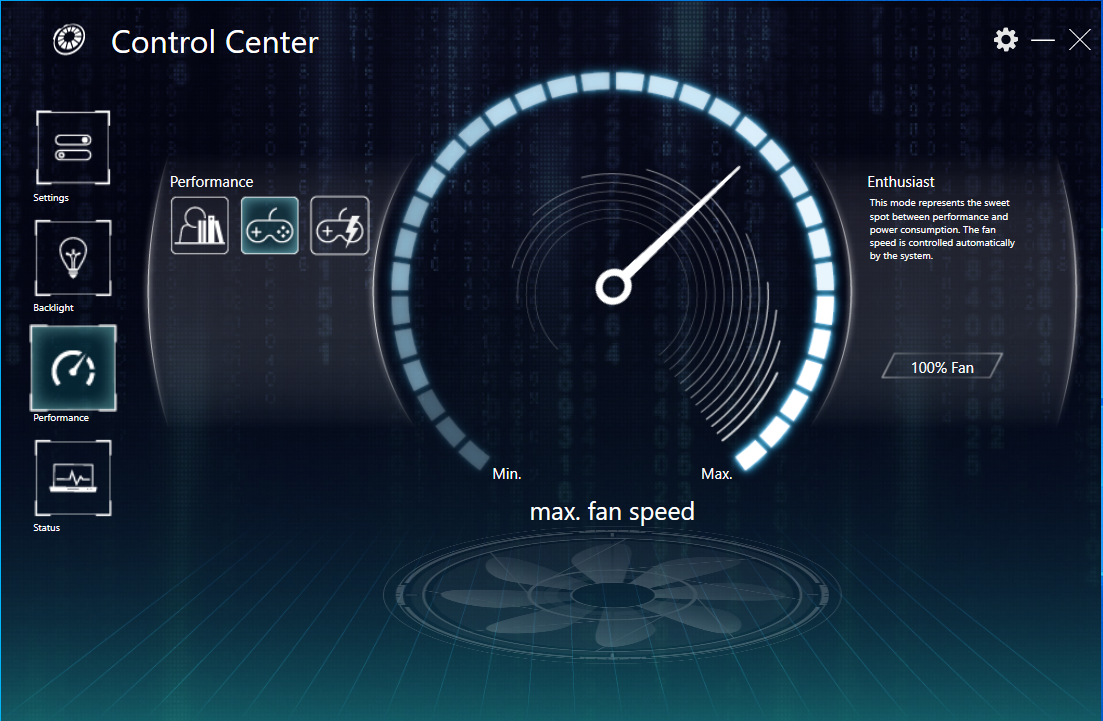
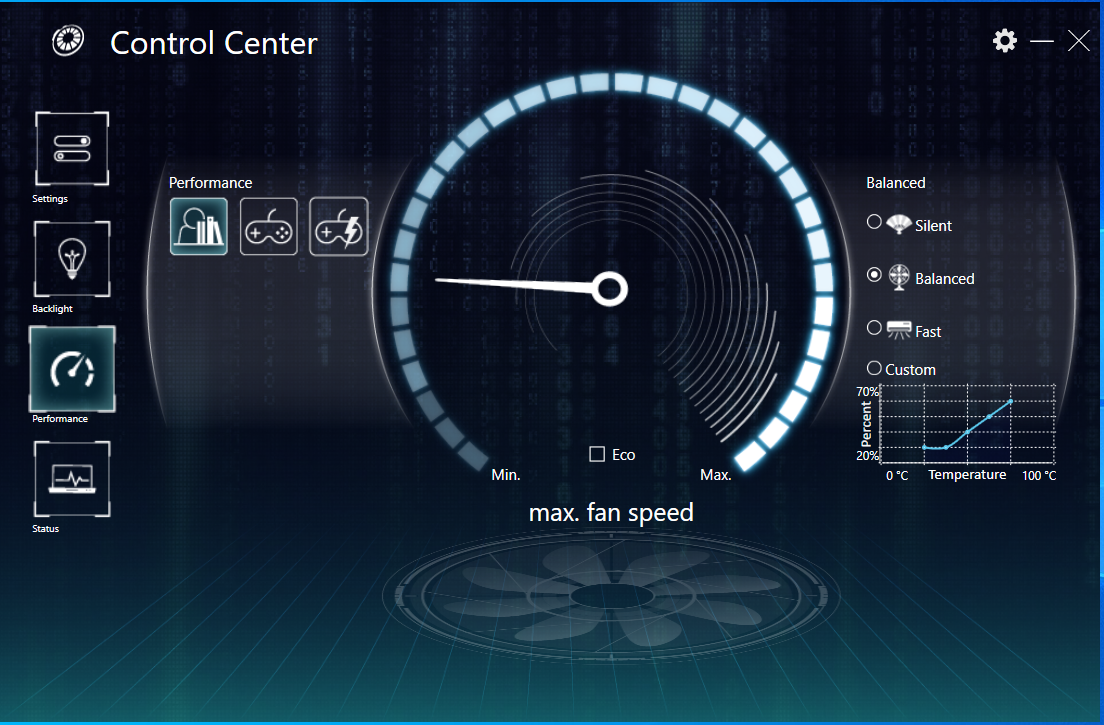
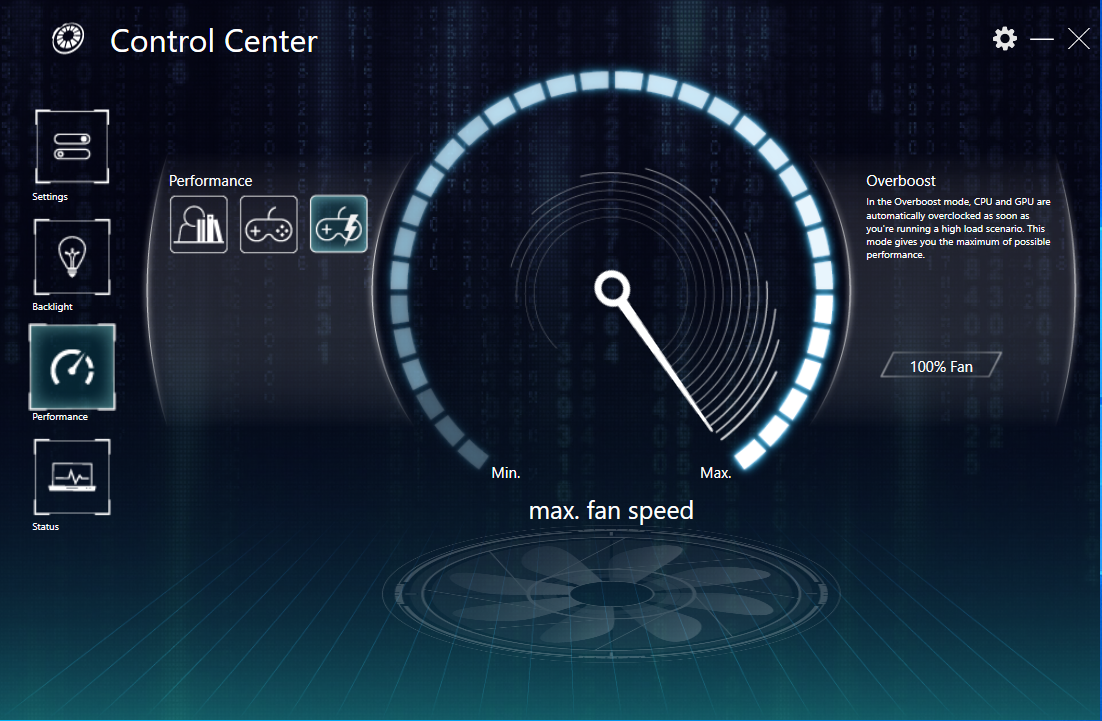
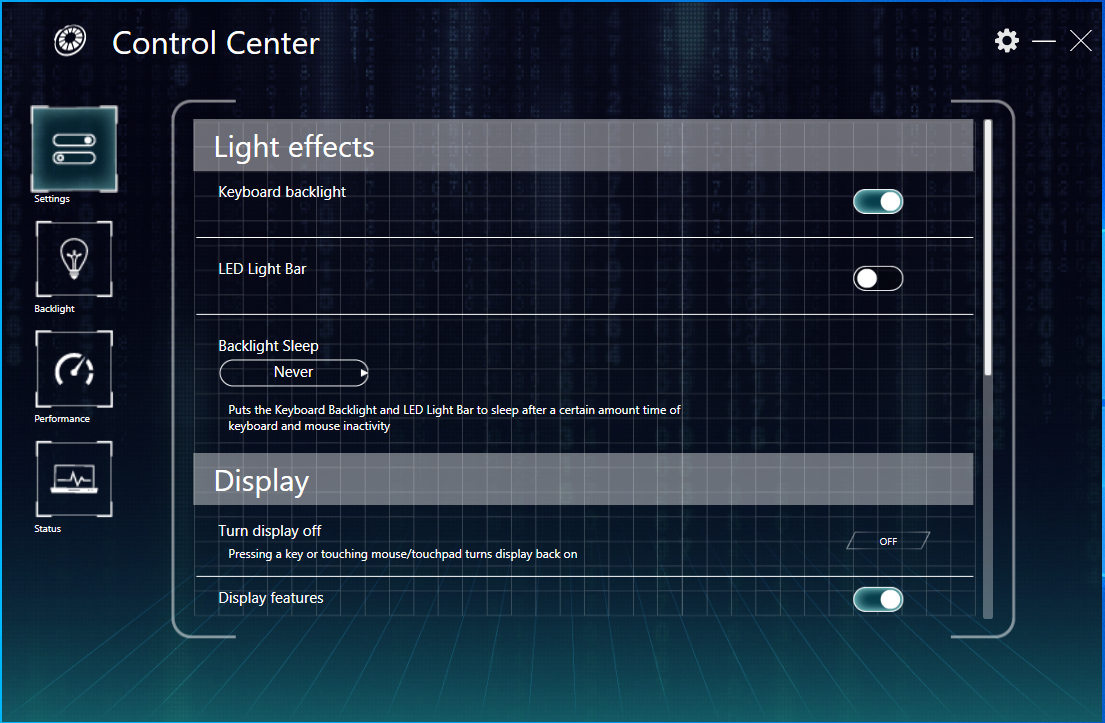
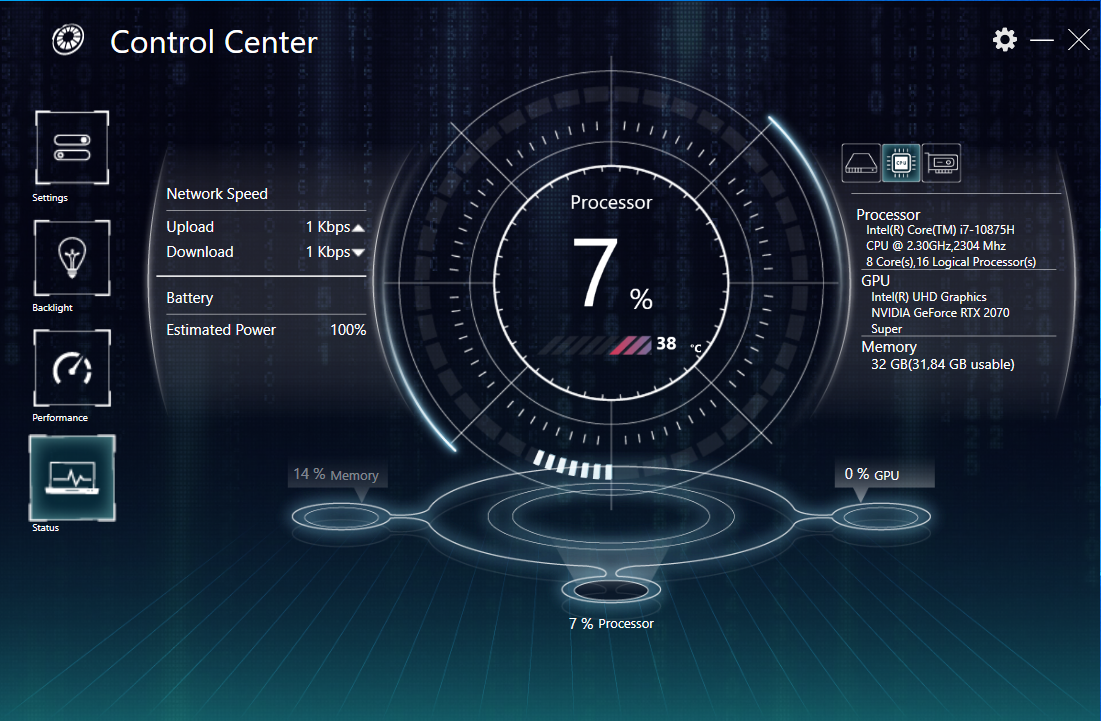
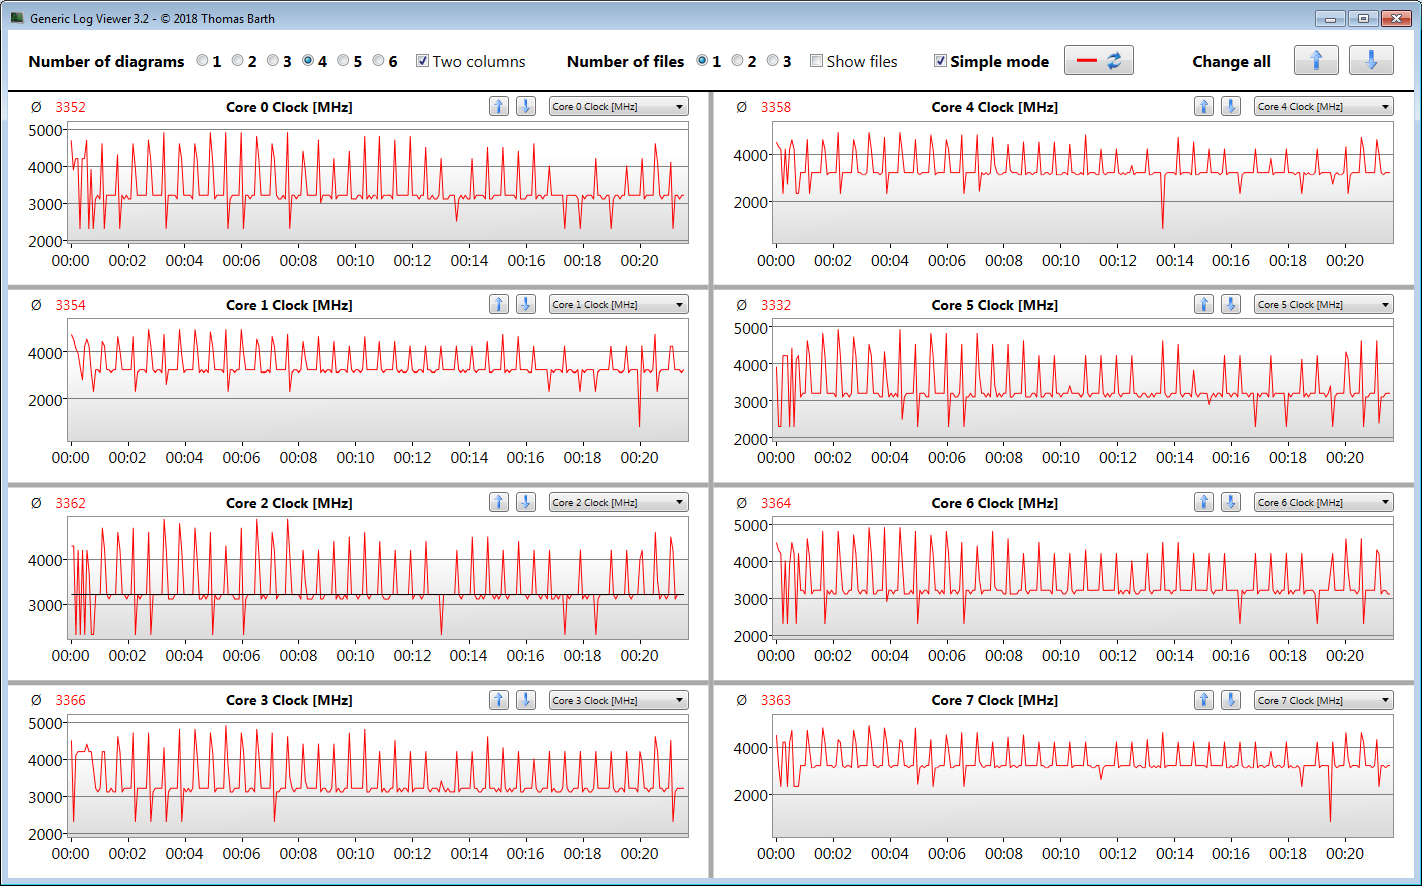
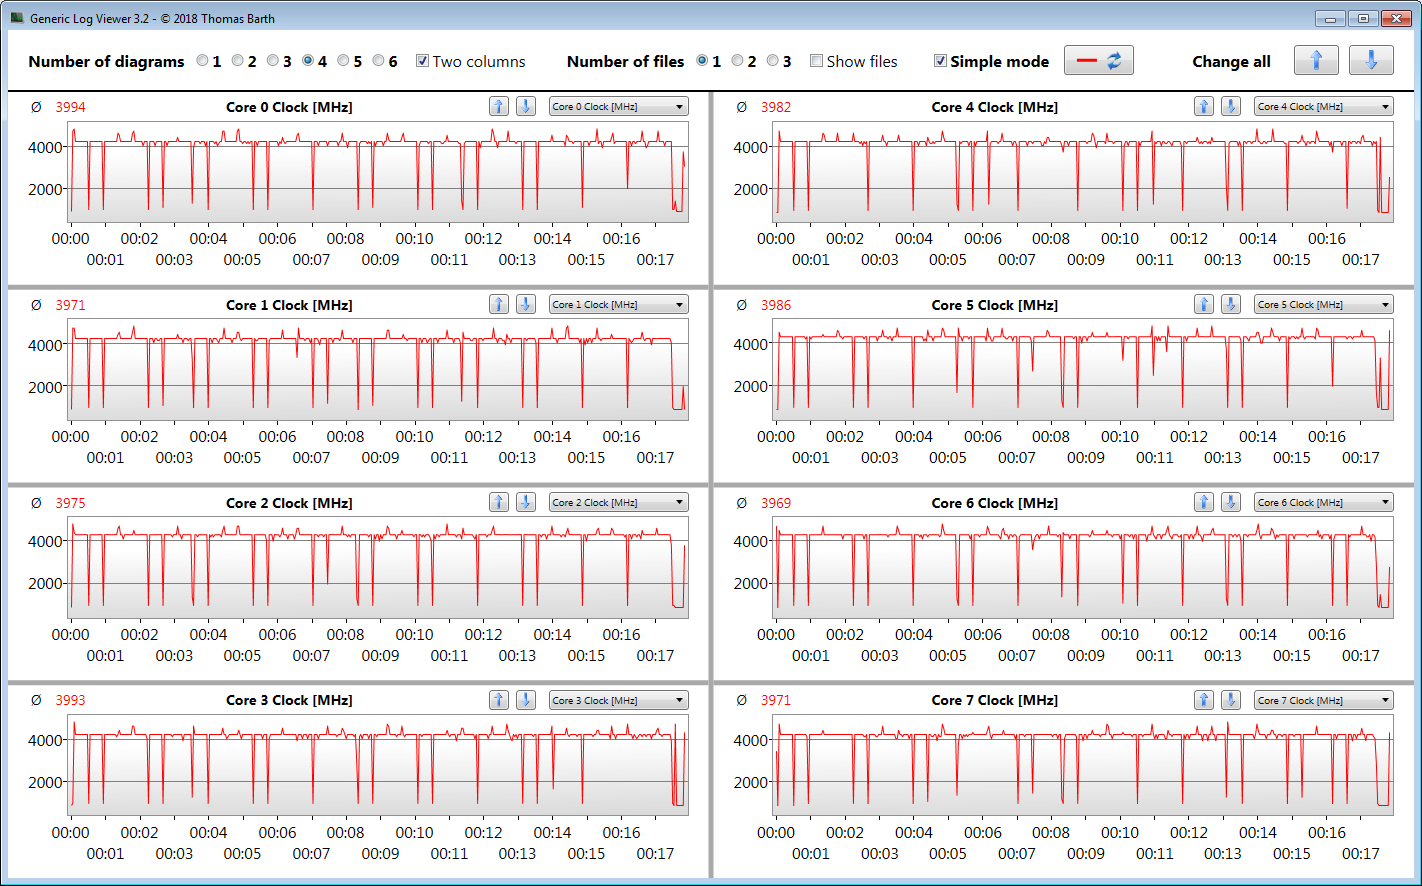
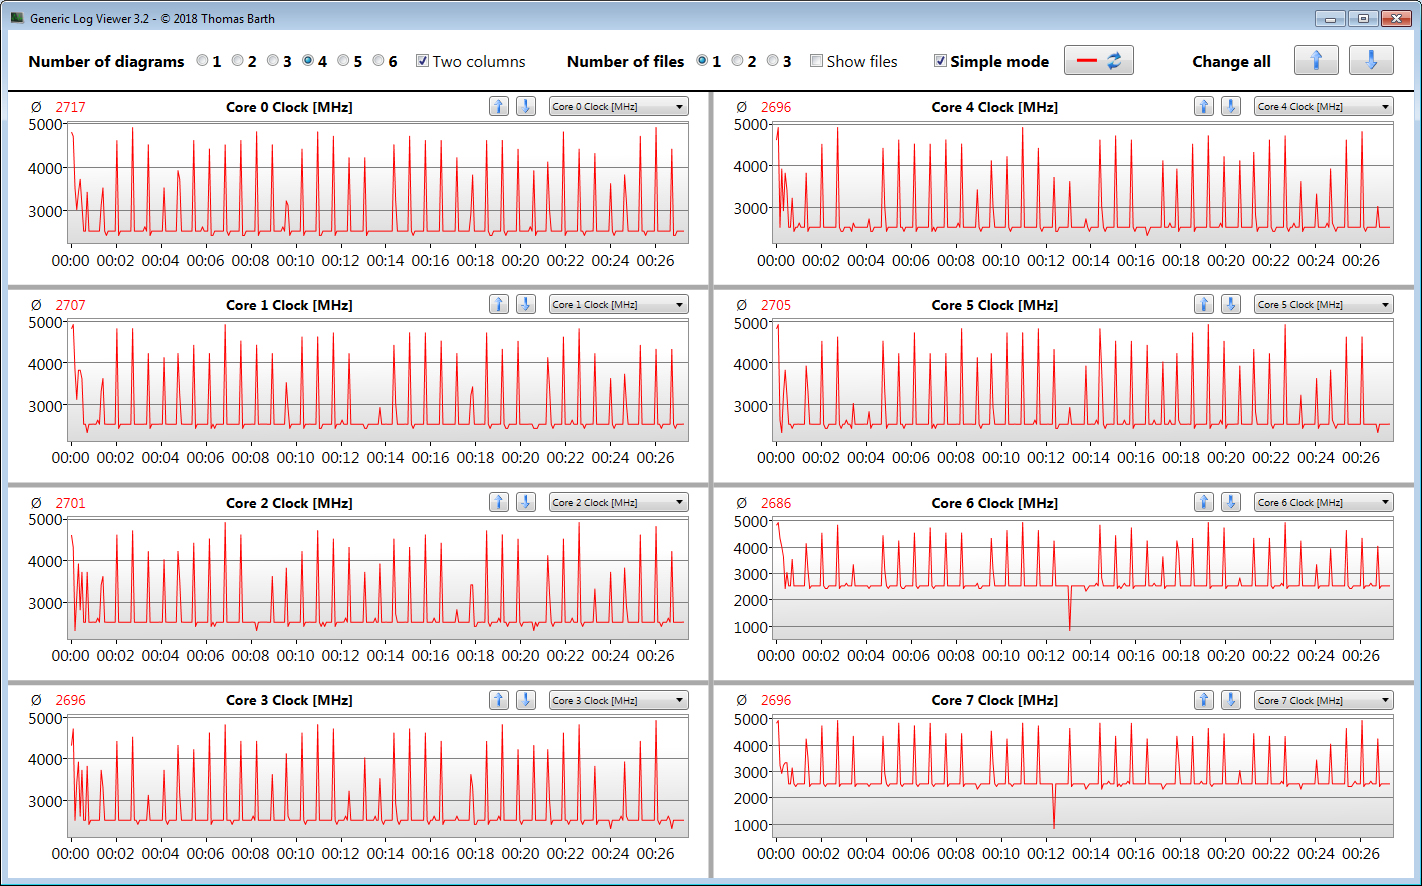
O Centro de Controle pré-instalado fornece uma visão geral do status do sistema e permite ajustar a iluminação do teclado, bem como escolher um perfil de desempenho ("Balanced", "Enthusiast", ou "Overboost"). Fizemos nosso teste com o perfil "Enthusiast" e o controle automático do ventilador ativado. Também executamos vários benchmarks com o perfil "Overboost" ativado. Você pode encontrar os resultados nos gráficos de comparação.

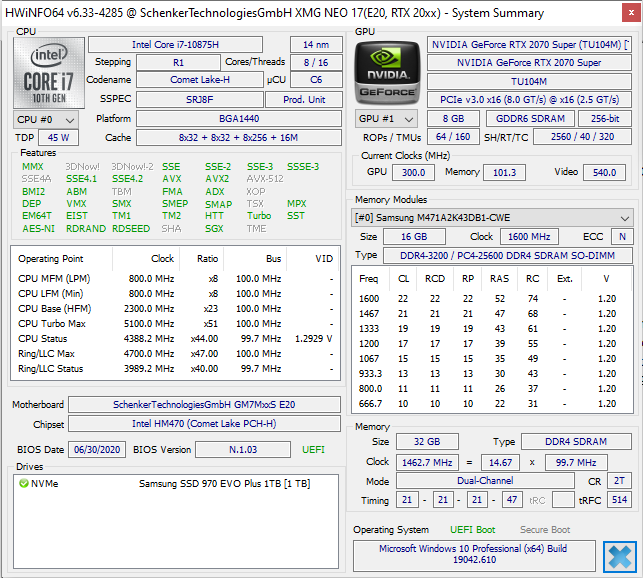
Processador
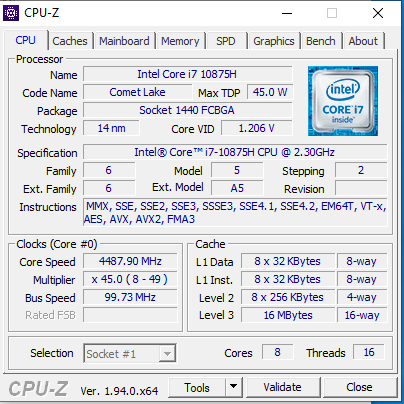
O processador Corei7-10875H octa-core(Comet Lake) funciona a uma velocidade de relógio básica de 2,3 GHz, que pode ser aumentada via Turbo para 4,3 GHz (oito núcleos) ou até 5,1 GHz (um núcleo). Suporta hiperthreading (dois Threads rodando por núcleo).
A CPU passa pelo teste multi-tarefa do benchmark Cinebench R15 em velocidades de relógio entre 2,2 e 4,2 GHz e o teste de rosca única com entre 4 e 5,1 GHz. Na operação com bateria, a velocidade está entre 2,7 e 2,8 GHz (multifios) e entre 2,4 e 4,2 GHz (mono-fios).
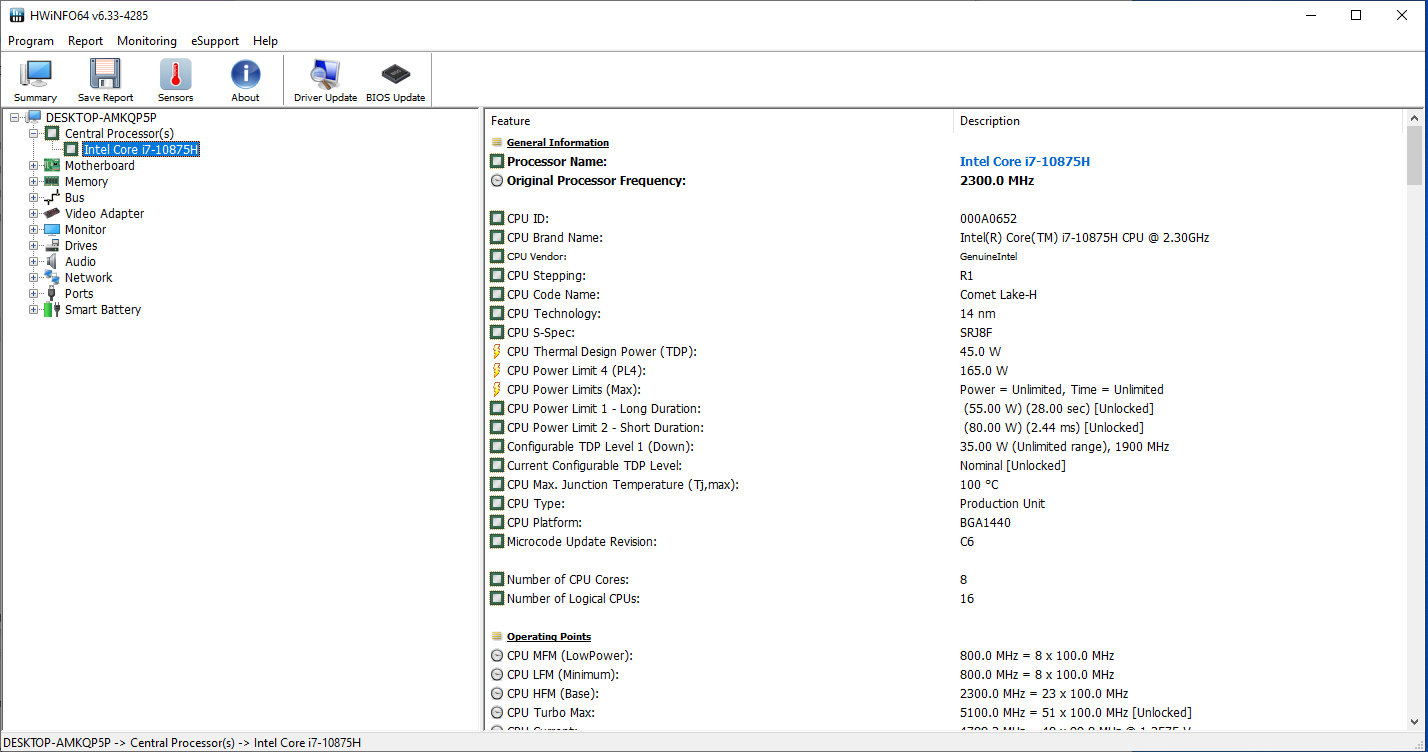
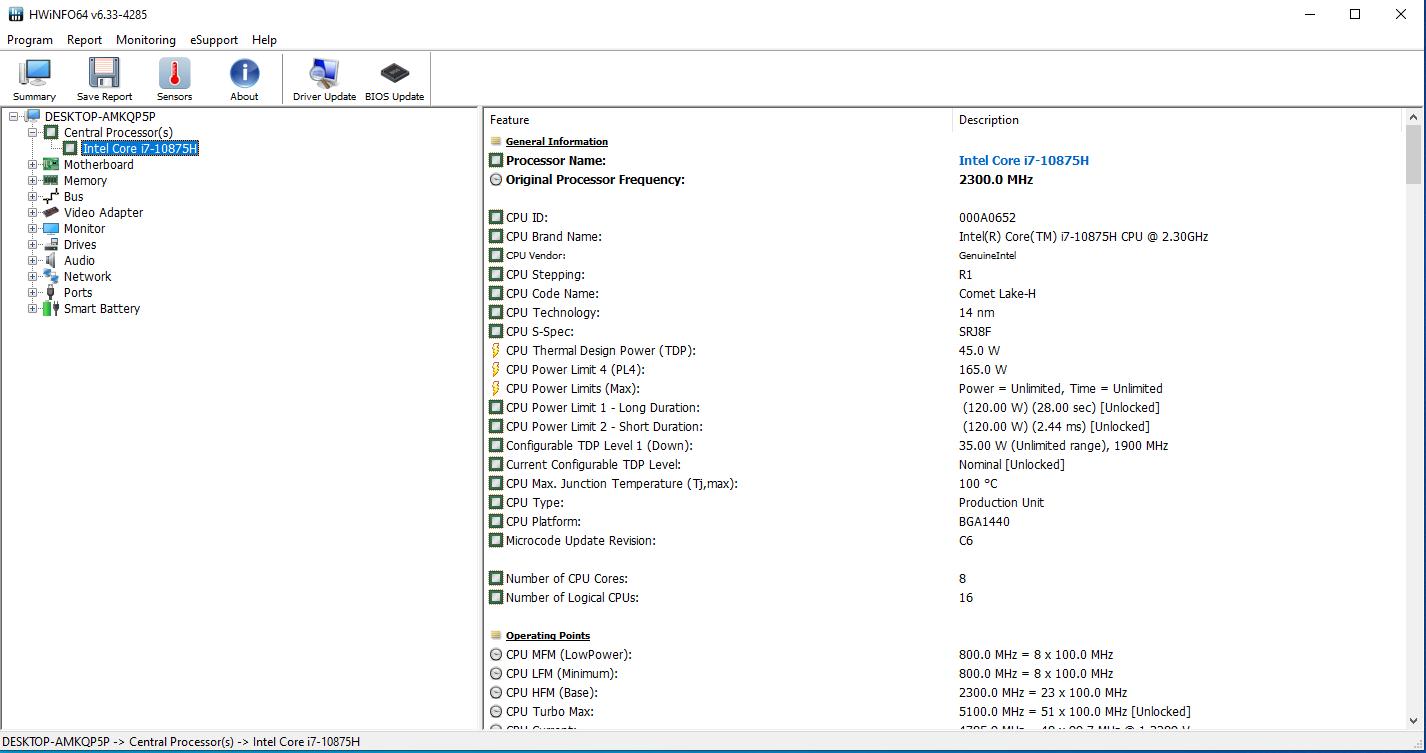
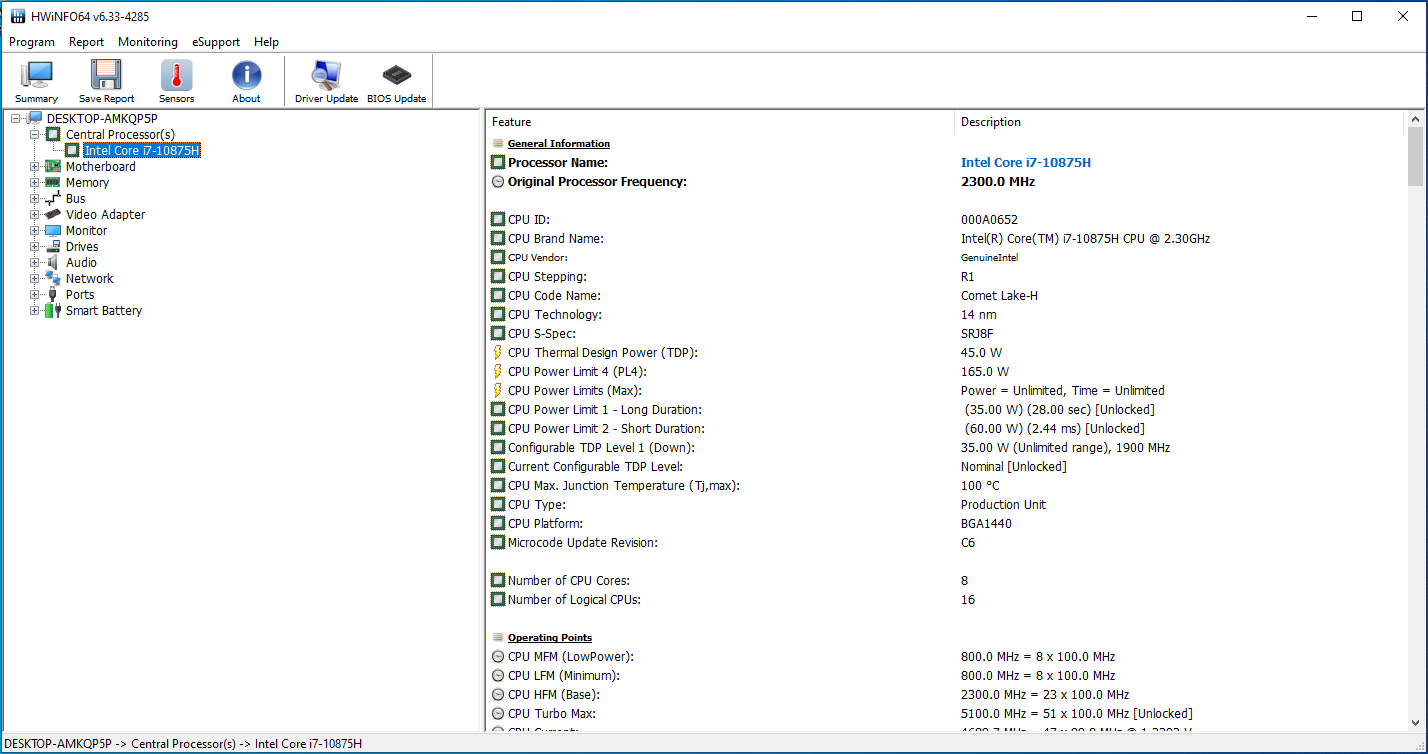
Avaliamos se a CPU Turbo também é utilizada constantemente na operação de rede elétrica executando o teste multi-tarefa do benchmark Cinebench R15 por pelo menos 30 minutos em um loop constante. Em direção à terceira corrida, os resultados caem ligeiramente, mas depois permanecem em um nível constante. O Turbo é usado, e o modo "Overboost" permite aumentar significativamente a velocidade do relógio Turbo.
| Cinebench R15 | |
| CPU Single 64Bit | |
| Média da turma Gaming (188.8 - 344, n=105, últimos 2 anos) | |
| Schenker XMG Neo 17 Comet Lake | |
| Schenker XMG Neo 17 Comet Lake (Overboost) | |
| Média Intel Core i7-10875H (190 - 220, n=37) | |
| Aorus 17G XB | |
| Asus Strix G17 G712LWS | |
| Acer Predator Helios 300 PH317-54-75G8 | |
| Schenker XMG Neo 17 XNE17M19 | |
| MSI GL75 10SFR | |
| Schenker XMG Neo 17 | |
| CPU Multi 64Bit | |
| Média da turma Gaming (1578 - 6271, n=104, últimos 2 anos) | |
| Aorus 17G XB | |
| Schenker XMG Neo 17 Comet Lake (Overboost) | |
| Média Intel Core i7-10875H (1003 - 1833, n=38) | |
| Schenker XMG Neo 17 Comet Lake | |
| Asus Strix G17 G712LWS | |
| Acer Predator Helios 300 PH317-54-75G8 | |
| MSI GL75 10SFR | |
| Schenker XMG Neo 17 XNE17M19 | |
| Schenker XMG Neo 17 | |
| Blender - v2.79 BMW27 CPU | |
| MSI GL75 10SFR | |
| Acer Predator Helios 300 PH317-54-75G8 | |
| Asus Strix G17 G712LWS | |
| Média Intel Core i7-10875H (259 - 535, n=30) | |
| Schenker XMG Neo 17 Comet Lake | |
| Aorus 17G XB | |
| Schenker XMG Neo 17 Comet Lake (Overboost) | |
| Média da turma Gaming (80 - 330, n=103, últimos 2 anos) | |
| 7-Zip 18.03 | |
| 7z b 4 -mmt1 | |
| Média da turma Gaming (4199 - 7436, n=104, últimos 2 anos) | |
| Schenker XMG Neo 17 Comet Lake | |
| Schenker XMG Neo 17 Comet Lake (Overboost) | |
| Média Intel Core i7-10875H (5071 - 5780, n=31) | |
| Aorus 17G XB | |
| Acer Predator Helios 300 PH317-54-75G8 | |
| MSI GL75 10SFR | |
| Asus Strix G17 G712LWS | |
| 7z b 4 | |
| Média da turma Gaming (33491 - 148086, n=104, últimos 2 anos) | |
| Schenker XMG Neo 17 Comet Lake (Overboost) | |
| Aorus 17G XB | |
| Schenker XMG Neo 17 Comet Lake | |
| Média Intel Core i7-10875H (29844 - 49562, n=31) | |
| Asus Strix G17 G712LWS | |
| MSI GL75 10SFR | |
| Acer Predator Helios 300 PH317-54-75G8 | |
| Cinebench R20 | |
| CPU (Single Core) | |
| Média da turma Gaming (442 - 904, n=105, últimos 2 anos) | |
| Schenker XMG Neo 17 Comet Lake | |
| Schenker XMG Neo 17 Comet Lake (Overboost) | |
| Asus Strix G17 G712LWS | |
| Aorus 17G XB | |
| Média Intel Core i7-10875H (430 - 524, n=32) | |
| MSI GL75 10SFR | |
| Acer Predator Helios 300 PH317-54-75G8 | |
| Schenker XMG Neo 17 XNE17M19 | |
| CPU (Multi Core) | |
| Média da turma Gaming (4029 - 16108, n=105, últimos 2 anos) | |
| Schenker XMG Neo 17 Comet Lake (Overboost) | |
| Aorus 17G XB | |
| Média Intel Core i7-10875H (1986 - 4176, n=32) | |
| Schenker XMG Neo 17 Comet Lake | |
| Asus Strix G17 G712LWS | |
| Acer Predator Helios 300 PH317-54-75G8 | |
| MSI GL75 10SFR | |
| Schenker XMG Neo 17 XNE17M19 | |
| Geekbench 5.5 | |
| Single-Core | |
| Média da turma Gaming (986 - 2474, n=104, últimos 2 anos) | |
| Schenker XMG Neo 17 Comet Lake | |
| Schenker XMG Neo 17 Comet Lake (Overboost) | |
| Média Intel Core i7-10875H (1233 - 1371, n=29) | |
| Aorus 17G XB | |
| MSI GL75 10SFR | |
| Asus Strix G17 G712LWS | |
| Acer Predator Helios 300 PH317-54-75G8 | |
| Multi-Core | |
| Média da turma Gaming (6460 - 27010, n=104, últimos 2 anos) | |
| Schenker XMG Neo 17 Comet Lake (Overboost) | |
| Aorus 17G XB | |
| Média Intel Core i7-10875H (5715 - 8620, n=29) | |
| Schenker XMG Neo 17 Comet Lake | |
| Asus Strix G17 G712LWS | |
| Acer Predator Helios 300 PH317-54-75G8 | |
| MSI GL75 10SFR | |
| HWBOT x265 Benchmark v2.2 - 4k Preset | |
| Média da turma Gaming (11.5 - 44.3, n=104, últimos 2 anos) | |
| Schenker XMG Neo 17 Comet Lake (Overboost) | |
| Aorus 17G XB | |
| Schenker XMG Neo 17 Comet Lake | |
| Média Intel Core i7-10875H (7.27 - 14.1, n=27) | |
| Asus Strix G17 G712LWS | |
| Acer Predator Helios 300 PH317-54-75G8 | |
| MSI GL75 10SFR | |
| LibreOffice - 20 Documents To PDF | |
| Asus Strix G17 G712LWS | |
| Acer Predator Helios 300 PH317-54-75G8 | |
| Aorus 17G XB | |
| Schenker XMG Neo 17 Comet Lake | |
| MSI GL75 10SFR | |
| Média Intel Core i7-10875H (30.2 - 84.3, n=30) | |
| Média da turma Gaming (33.2 - 88.8, n=104, últimos 2 anos) | |
| Schenker XMG Neo 17 Comet Lake (Overboost) | |
| R Benchmark 2.5 - Overall mean | |
| Acer Predator Helios 300 PH317-54-75G8 | |
| Asus Strix G17 G712LWS | |
| MSI GL75 10SFR | |
| Aorus 17G XB | |
| Média Intel Core i7-10875H (0.546 - 0.662, n=29) | |
| Schenker XMG Neo 17 Comet Lake (Overboost) | |
| Schenker XMG Neo 17 Comet Lake | |
| Média da turma Gaming (0.3439 - 0.759, n=105, últimos 2 anos) | |
* ... menor é melhor
Desempenho do sistema
O sistema funciona rápido e sem problemas e não tivemos nenhum problema. Os resultados do PC-Mark confirmam que o laptop oferece desempenho computacional suficiente para todas as áreas habituais de aplicação
| PCMark 8 Home Score Accelerated v2 | 4405 pontos | |
| PCMark 8 Creative Score Accelerated v2 | 6494 pontos | |
| PCMark 8 Work Score Accelerated v2 | 5803 pontos | |
| PCMark 10 Score | 5747 pontos | |
Ajuda | ||
Latências DPC
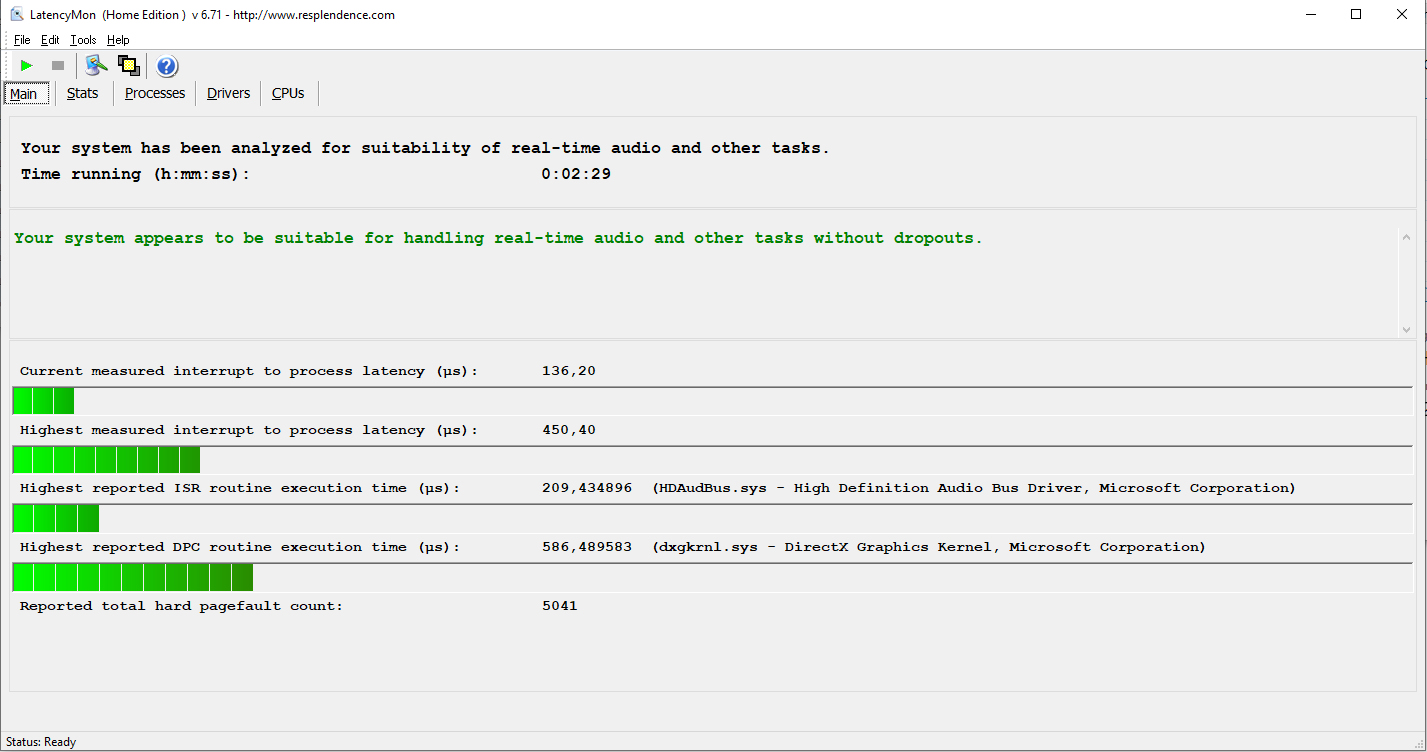
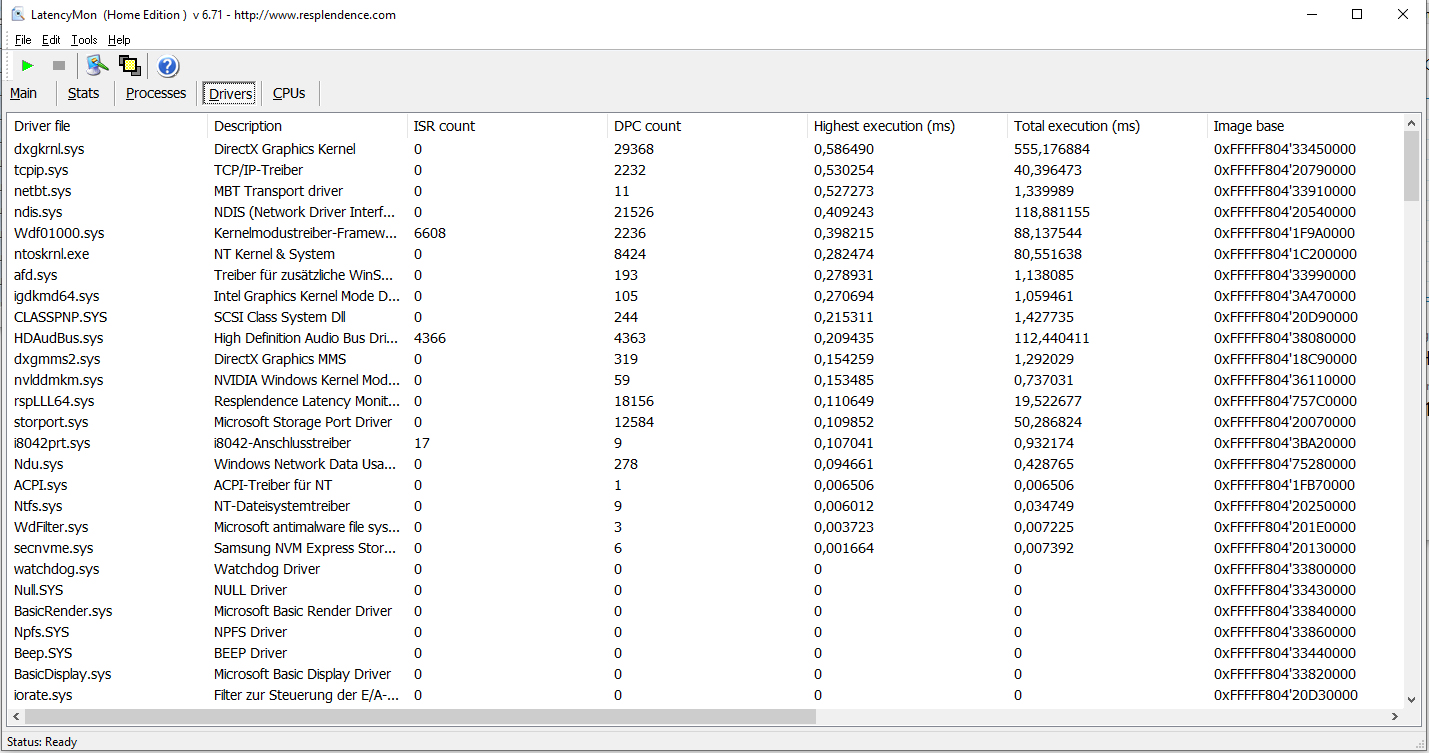
| DPC Latencies / LatencyMon - interrupt to process latency (max), Web, Youtube, Prime95 | |
| Aorus 17G XB | |
| Asus Strix G17 G712LWS | |
| MSI GL75 10SFR | |
| Acer Predator Helios 300 PH317-54-75G8 | |
| Schenker XMG Neo 17 Comet Lake | |
* ... menor é melhor
Solução de armazenamento
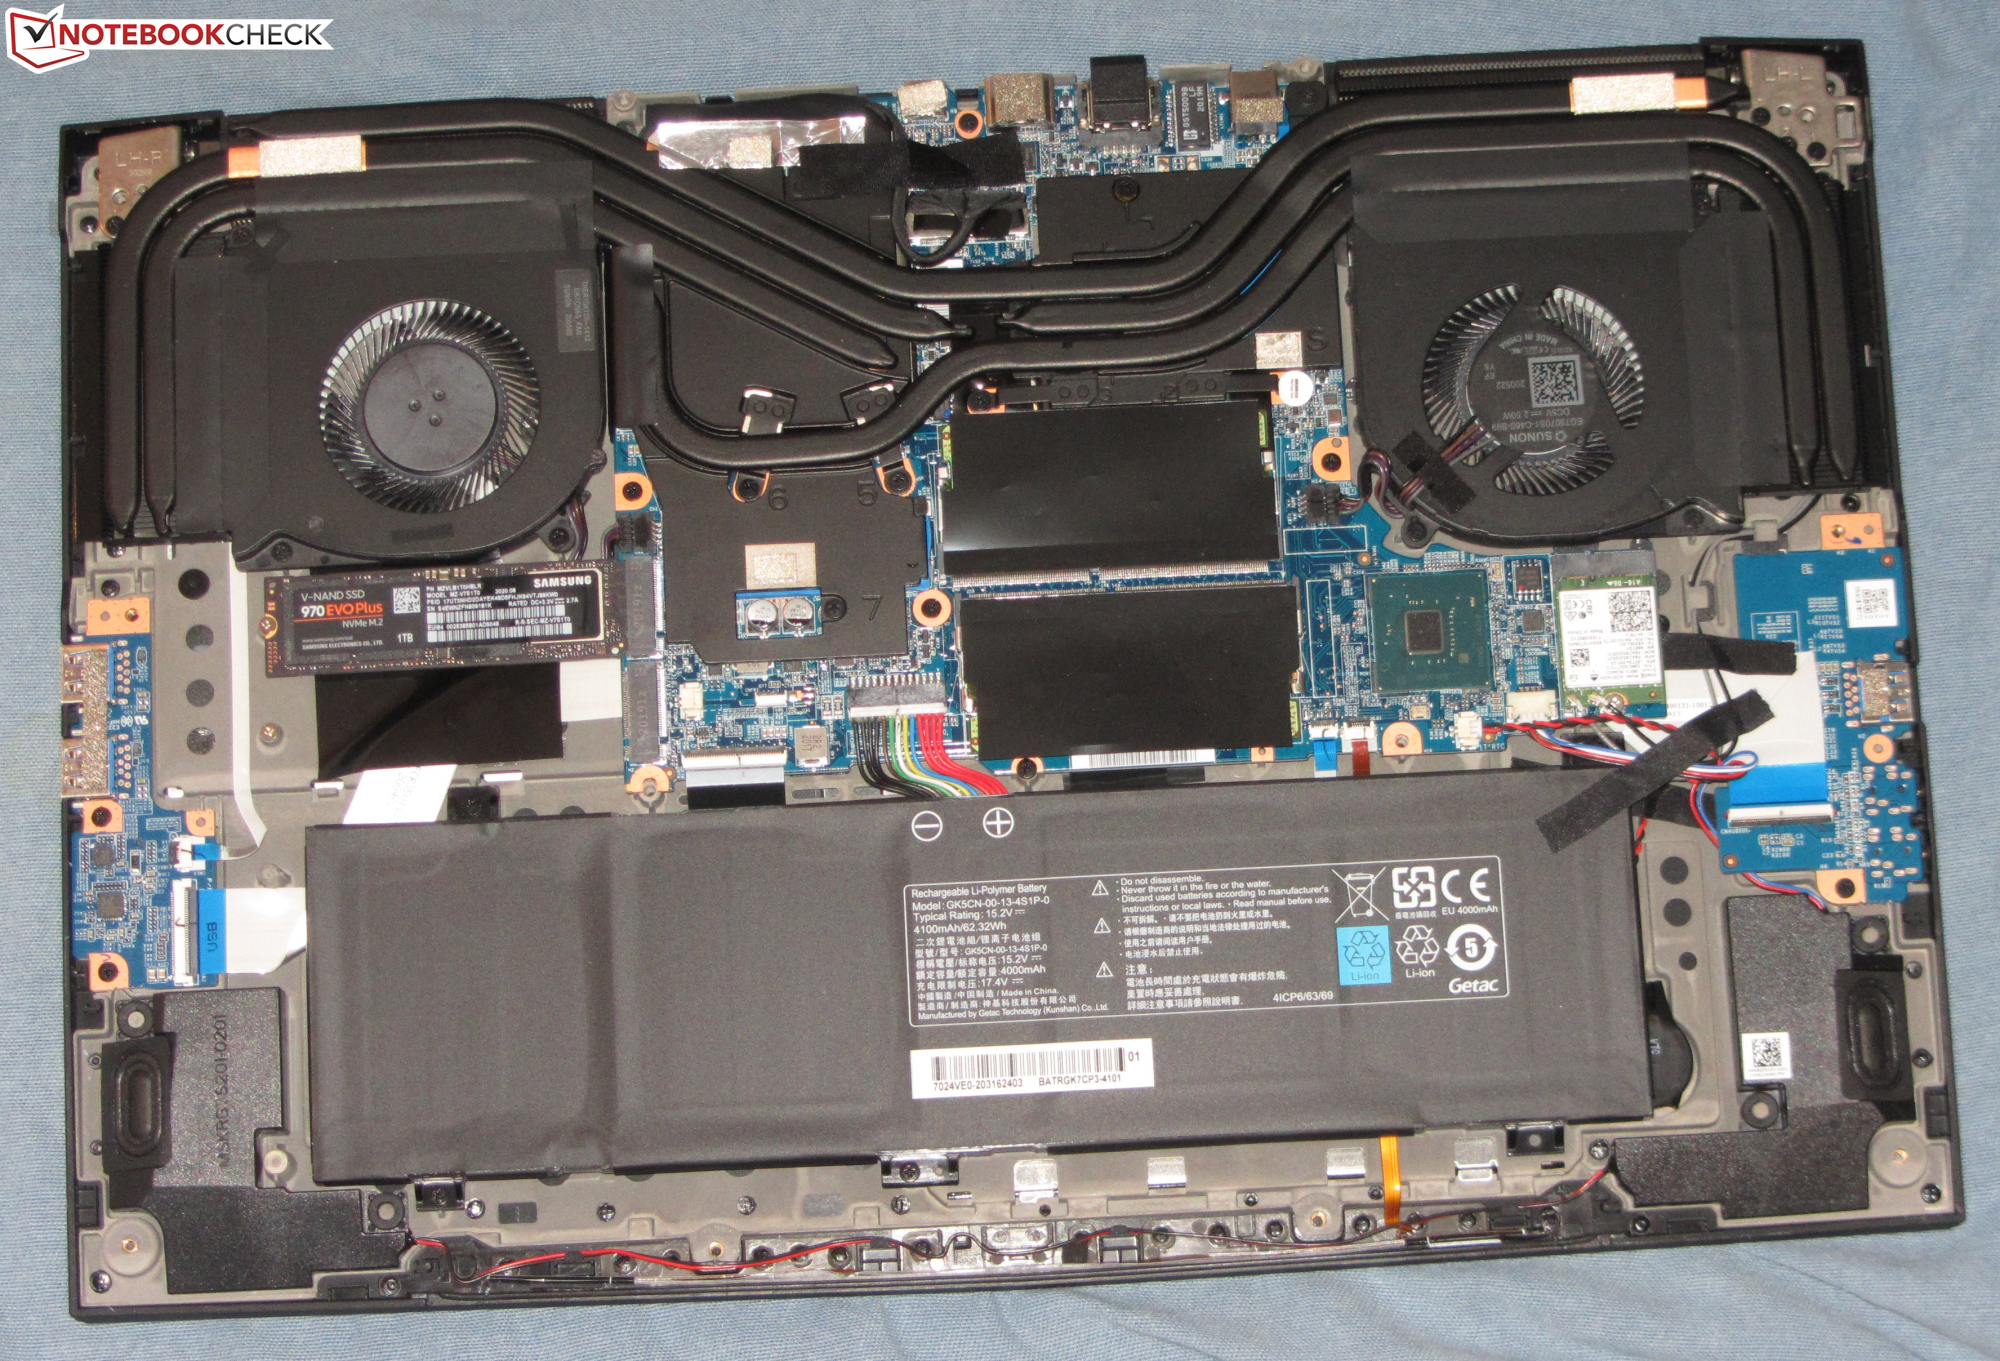
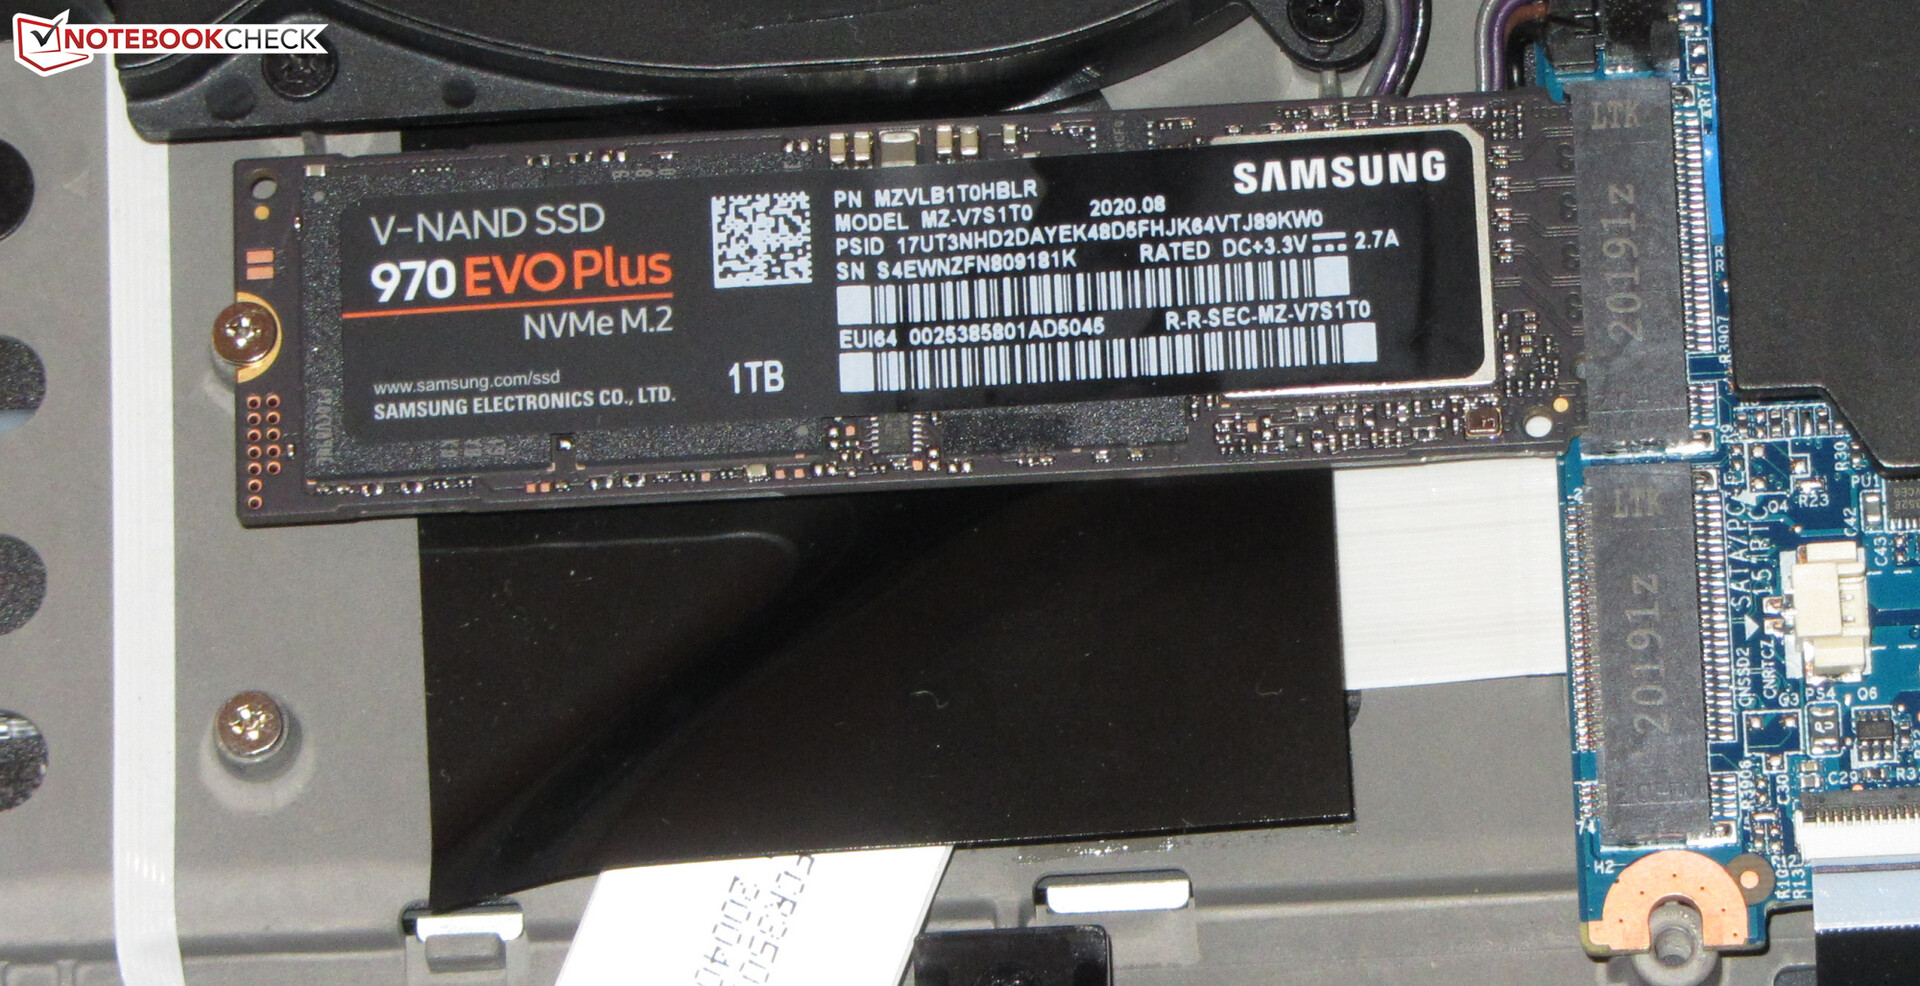
Um dos dois slots M.2-2280 (1x NVMe, 1x NVMe/SATA; RAID 0/1) está equipado com um 1-TB NVMe SSD da Samsung, o que proporciona excelentes taxas de transferência.
Embora geralmente o laptop ainda ofereça espaço para um meio de armazenamento de 2,5 polegadas, pois nossa unidade de teste está equipada com a maior das duas baterias disponíveis (46 Wh, 62 Wh), a bateria está ocupando o espaço adicional

| Schenker XMG Neo 17 Comet Lake Samsung SSD 970 EVO Plus 1TB | Schenker XMG Neo 17 Samsung SSD 970 EVO Plus 1TB | Acer Predator Helios 300 PH317-54-75G8 WDC PC SN730 SDBQNTY-1T00 | MSI GL75 10SFR Lite-On CL1-8D512 | Asus Strix G17 G712LWS Intel SSD 660p 1TB SSDPEKNW010T8 | Aorus 17G XB Samsung SSD PM981a MZVLB512HBJQ | Média Samsung SSD 970 EVO Plus 1TB | Média da turma Gaming | |
|---|---|---|---|---|---|---|---|---|
| CrystalDiskMark 5.2 / 6 | -31% | -10% | -28% | -25% | -9% | -3% | 48% | |
| Write 4K (MB/s) | 158.6 | 92.7 -42% | 141.9 -11% | 132.2 -17% | 141.1 -11% | 123.4 -22% | 155.5 ? -2% | 199.6 ? 26% |
| Read 4K (MB/s) | 53.6 | 41.4 -23% | 48.75 -9% | 45.62 -15% | 60.9 14% | 45.02 -16% | 51.6 ? -4% | 78.6 ? 47% |
| Write Seq (MB/s) | 2671 | 1363 -49% | 2734 2% | 1511 -43% | 1681 -37% | 2526 -5% | 2660 ? 0% | 3758 ? 41% |
| Read Seq (MB/s) | 2130 | 1259 -41% | 1921 -10% | 1890 -11% | 1602 -25% | 2062 -3% | 2390 ? 12% | 3633 ? 71% |
| Write 4K Q32T1 (MB/s) | 525 | 289.7 -45% | 422.6 -20% | 375.9 -28% | 406.6 -23% | 497.9 -5% | 447 ? -15% | 614 ? 17% |
| Read 4K Q32T1 (MB/s) | 609 | 337.5 -45% | 509 -16% | 525 -14% | 470.2 -23% | 579 -5% | 544 ? -11% | 710 ? 17% |
| Write Seq Q32T1 (MB/s) | 3308 | 3332 1% | 3055 -8% | 1505 -55% | 1759 -47% | 2982 -10% | 3296 ? 0% | 5333 ? 61% |
| Read Seq Q32T1 (MB/s) | 3557 | 3477 -2% | 3257 -8% | 2008 -44% | 1932 -46% | 3440 -3% | 3551 ? 0% | 7102 ? 100% |
| AS SSD | -7% | -12% | -63% | -42% | -16% | 5% | 36% | |
| Seq Read (MB/s) | 2882 | 2359 -18% | 2828 -2% | 1923 -33% | 1778 -38% | 1791 -38% | 2800 ? -3% | 5567 ? 93% |
| Seq Write (MB/s) | 2764 | 2469 -11% | 2677 -3% | 1065 -61% | 1478 -47% | 2193 -21% | 2633 ? -5% | 3949 ? 43% |
| 4K Read (MB/s) | 55.9 | 53.5 -4% | 39.94 -29% | 25.43 -55% | 49.76 -11% | 50.7 -9% | 51.2 ? -8% | 71 ? 27% |
| 4K Write (MB/s) | 129.4 | 117.6 -9% | 100.9 -22% | 101.9 -21% | 117.9 -9% | 116.8 -10% | 131.2 ? 1% | 216 ? 67% |
| 4K-64 Read (MB/s) | 1793 | 1579 -12% | 1562 -13% | 477.9 -73% | 591 -67% | 1525 -15% | 1839 ? 3% | 1623 ? -9% |
| 4K-64 Write (MB/s) | 2140 | 2048 -4% | 1867 -13% | 563 -74% | 875 -59% | 1958 -9% | 2144 ? 0% | 2952 ? 38% |
| Access Time Read * (ms) | 0.054 | 0.048 11% | 0.053 2% | 0.082 -52% | 0.07 -30% | 0.04528 ? 16% | 0.06402 ? -19% | |
| Access Time Write * (ms) | 0.03 | 0.03 -0% | 0.037 -23% | 0.126 -320% | 0.041 -37% | 0.032 -7% | 0.03128 ? -4% | 0.03815 ? -27% |
| Score Read (Points) | 2137 | 1869 -13% | 1885 -12% | 696 -67% | 818 -62% | 1755 -18% | 2171 ? 2% | 2250 ? 5% |
| Score Write (Points) | 2546 | 2413 -5% | 2236 -12% | 771 -70% | 1140 -55% | 2294 -10% | 2539 ? 0% | 3562 ? 40% |
| Score Total (Points) | 5774 | 5248 -9% | 5076 -12% | 1785 -69% | 2377 -59% | 4972 -14% | 5812 ? 1% | 6891 ? 19% |
| Copy ISO MB/s (MB/s) | 2189 | 1870 -15% | 1710 -22% | 1495 -32% | 2133 ? -3% | 3154 ? 44% | ||
| Copy Program MB/s (MB/s) | 625 | 545 -13% | 465.3 -26% | 446 -29% | 698 ? 12% | 979 ? 57% | ||
| Copy Game MB/s (MB/s) | 936 | 1083 16% | 1042 11% | 697 -26% | 1521 ? 63% | 2105 ? 125% | ||
| Média Total (Programa/Configurações) | -19% /
-17% | -11% /
-11% | -46% /
-50% | -34% /
-36% | -13% /
-13% | 1% /
3% | 42% /
40% |
* ... menor é melhor
Constant Speed Reading: DiskSpd Read Loop, Queue Depth 8
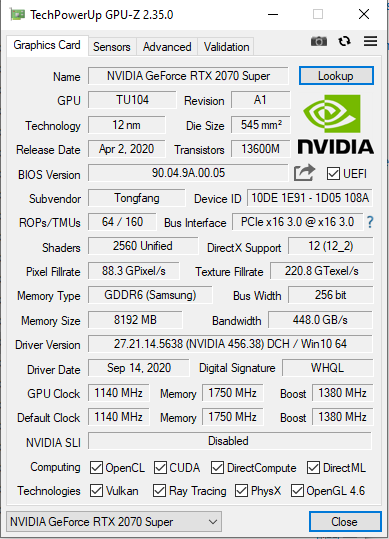
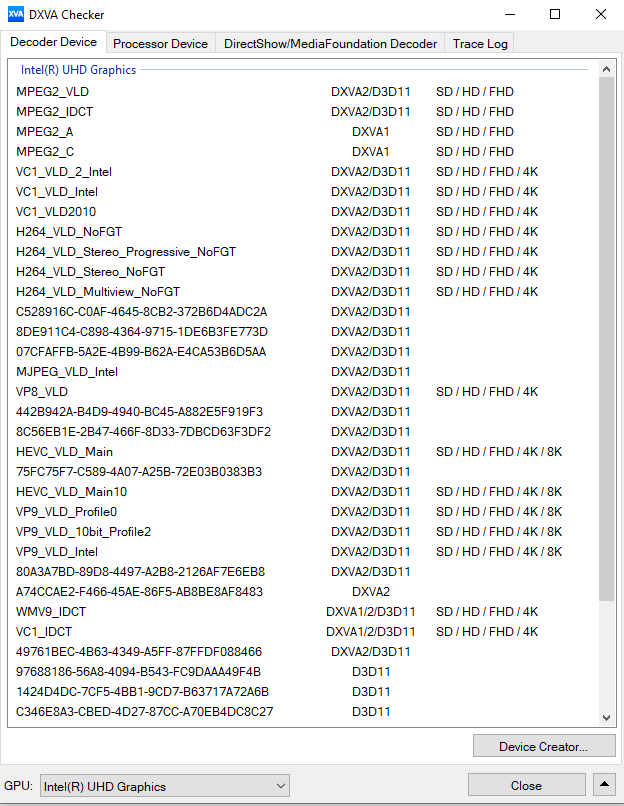
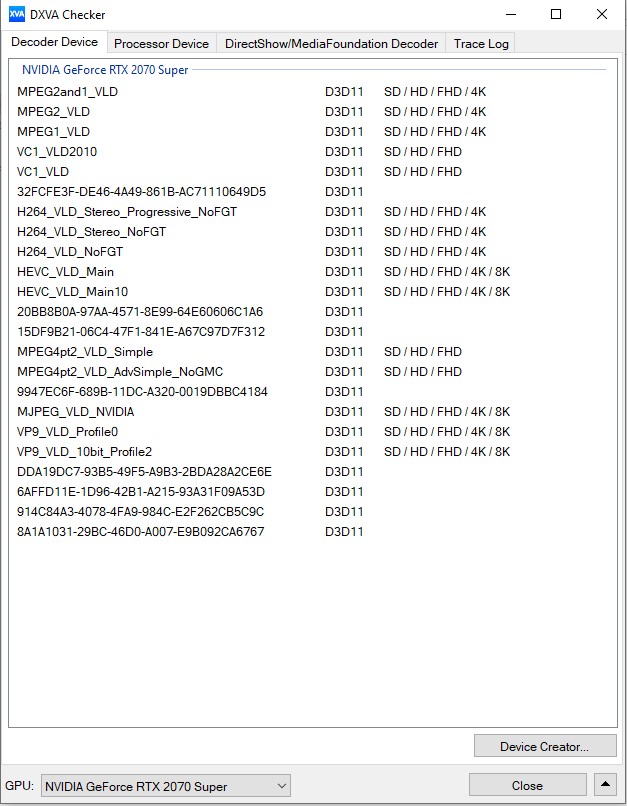
Placa Gráfica
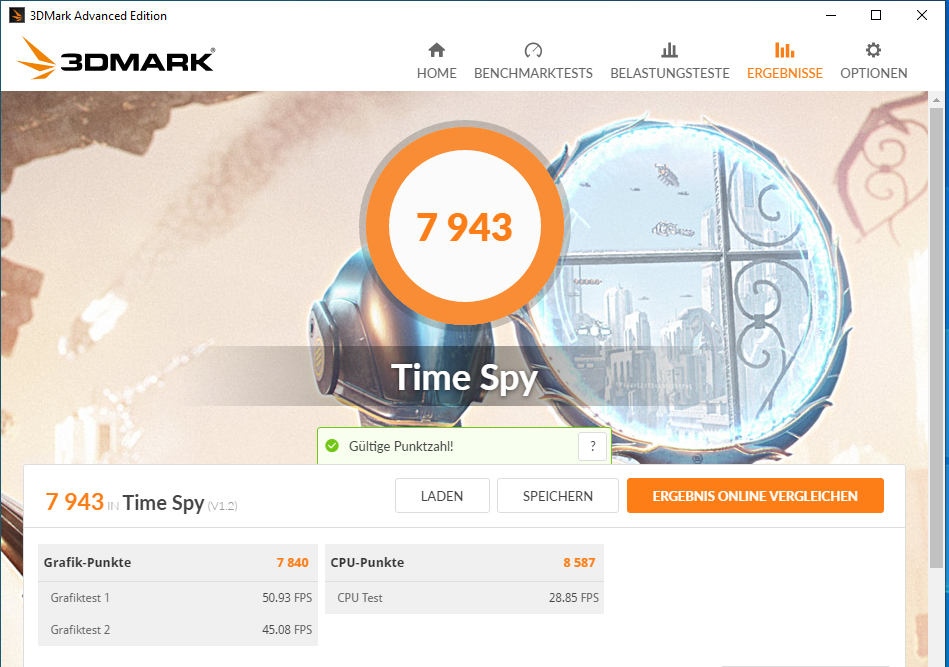
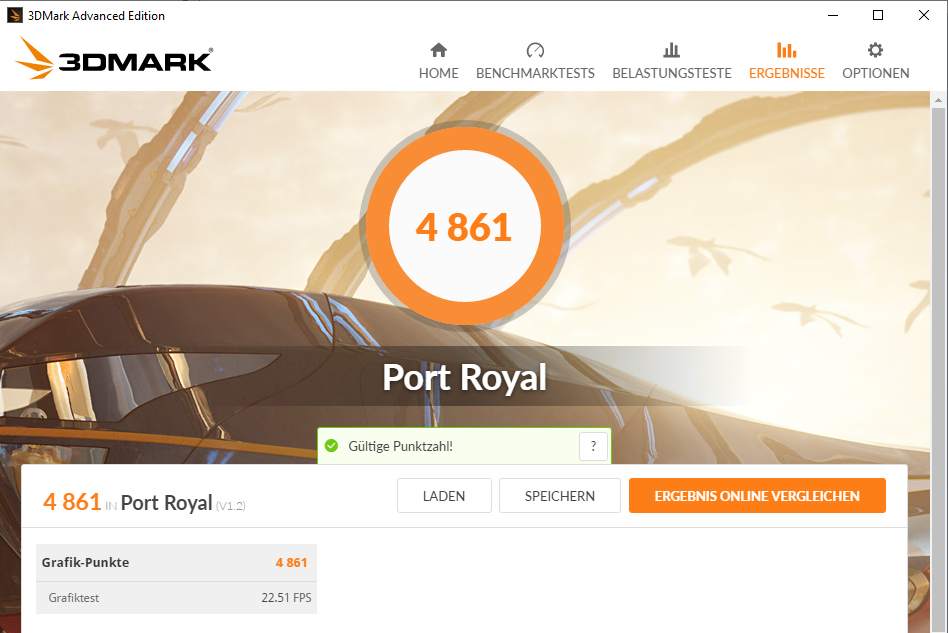
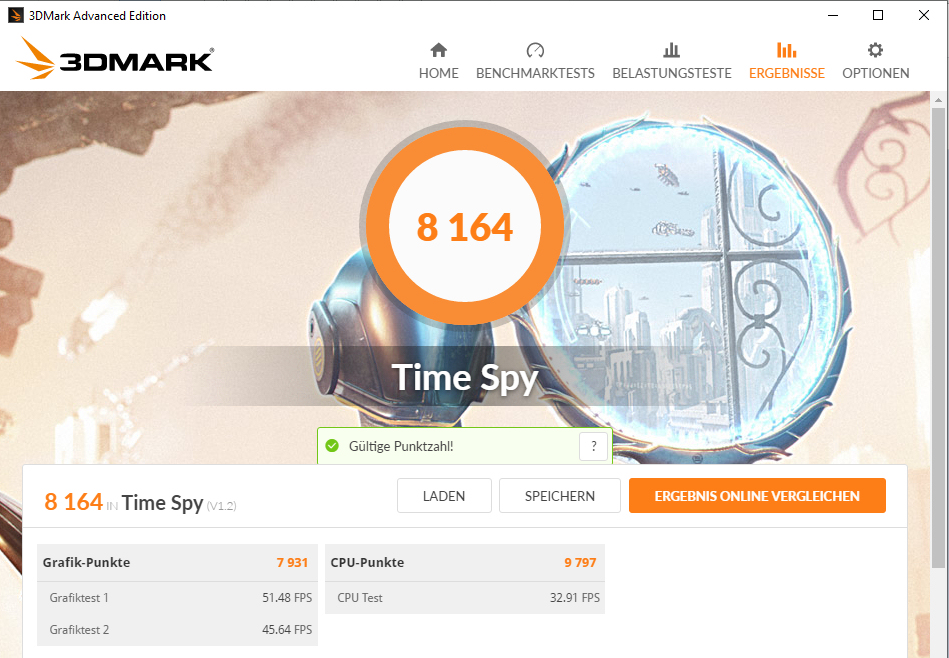
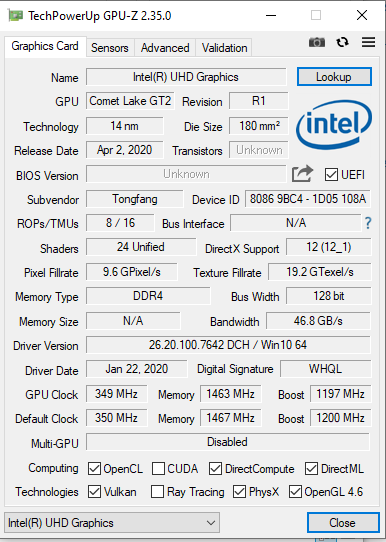
A GeForceRTX-2070 Super núcleo gráfico (Turing) pertence ao poderoso GPU high end, e é acompanhada por um rápido armazenamento GDDR6 (8192 GB). Os resultados 3D-Mark variam a um nível normal para a GPU utilizada. O modo "Overboost" leva a um aumento na performance gráfica. A GPU UHD Graphics-630 integrada ao processador está ativa, e o laptop usa a solução de comutação gráfica Optimus da Nvidia
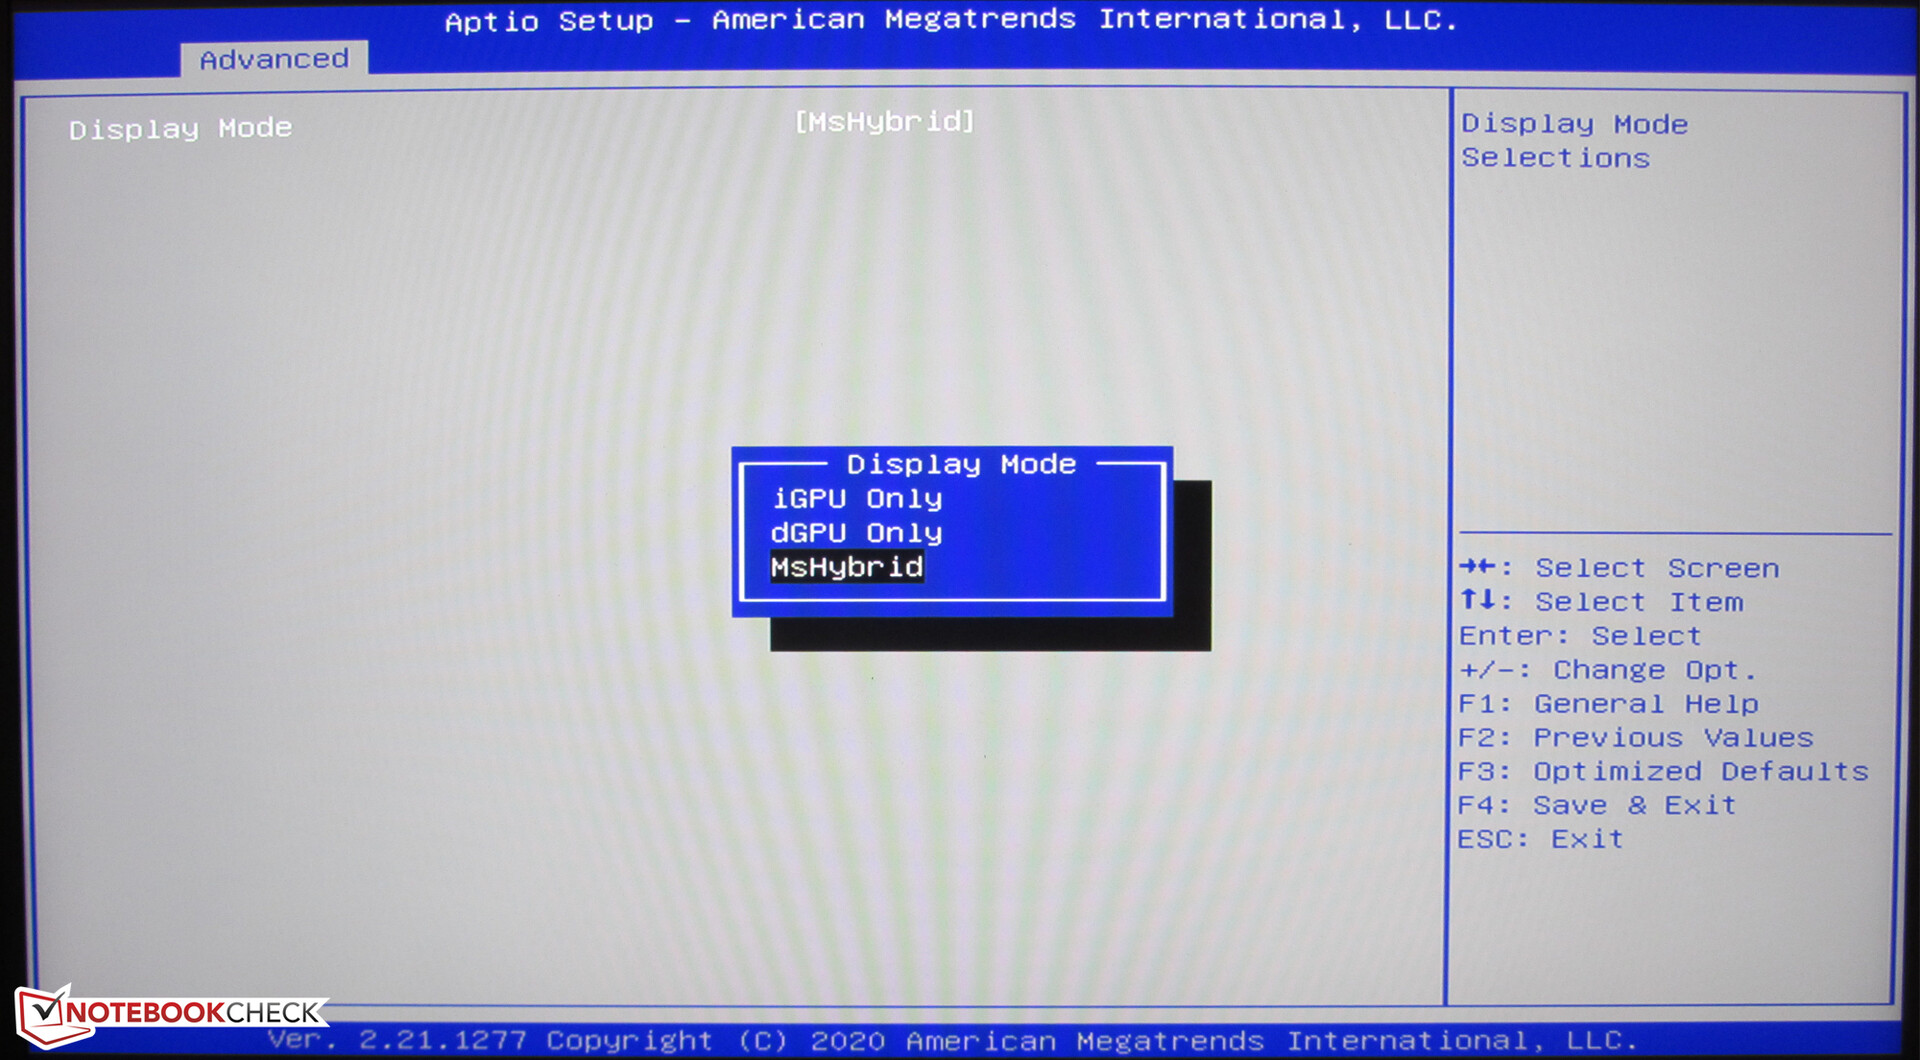
Não é absolutamente necessário utilizar Optimus. A BIOS do laptop oferece as três opções "MSHybrid" (= Optimus), "iGPU Only" (= UHD Graphics 630), e "dGPU Only" (= 2070 Super). Portanto, há uma opção para conectar diretamente a tela à GPU GeForce.
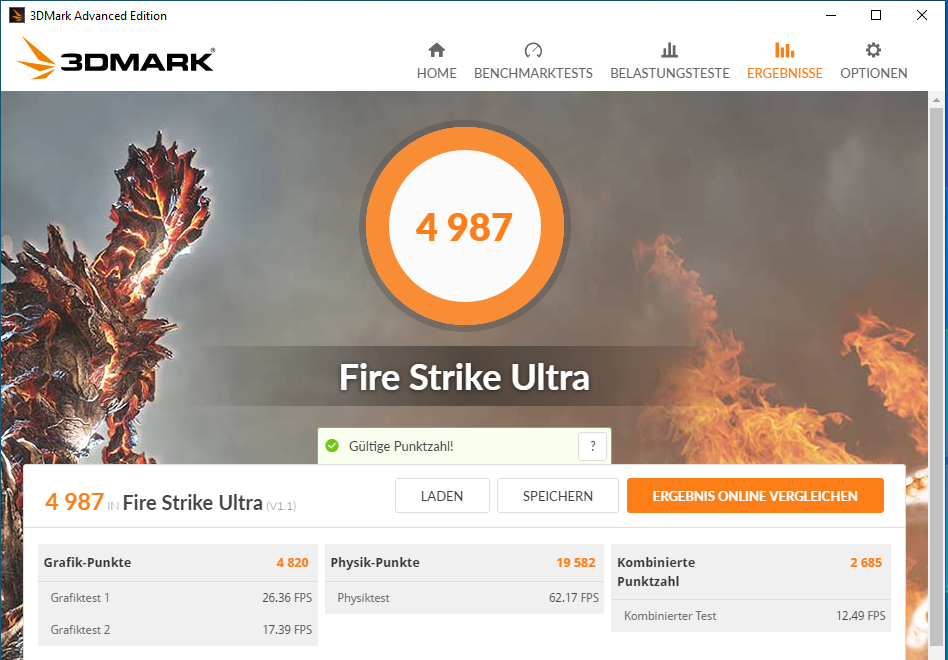


| 3DMark 11 Performance | 24031 pontos | |
| 3DMark Cloud Gate Standard Score | 46745 pontos | |
| 3DMark Fire Strike Score | 18229 pontos | |
| 3DMark Time Spy Score | 7943 pontos | |
Ajuda | ||
Desempenho nos jogos
O Neo 17 traz todos os jogos atuais suavemente para a tela em resolução Full HD e em configurações de qualidade máxima, e o hardware também é capaz de lidar com resoluções mais altas (se você conectar o monitor correspondente). O modo "Overboost" não leva a nenhum aumento nas taxas de quadros (ver quadro comparativo).
| The Witcher 3 - 1920x1080 Ultra Graphics & Postprocessing (HBAO+) | |
| Média da turma Gaming (104.7 - 240, n=6, últimos 2 anos) | |
| Schenker XMG Neo 17 Comet Lake | |
| Asus Strix G17 G712LWS | |
| Média NVIDIA GeForce RTX 2070 Super Mobile (76.3 - 94.6, n=8) | |
| MSI GL75 10SFR | |
| Aorus 17G XB | |
| Schenker XMG Neo 17 | |
| Acer Predator Helios 300 PH317-54-75G8 | |
| Schenker XMG Neo 17 XNE17M19 | |
| Serious Sam 4 - 1920x1080 Ultra (DX12) AA:2xMS | |
| Média NVIDIA GeForce RTX 2070 Super Mobile (71.1 - 82.1, n=4) | |
| Schenker XMG Neo 17 Comet Lake | |
| Asus Strix G17 G712LWS | |
| Acer Predator Helios 300 PH317-54-75G8 | |
| Mafia Definitive Edition - 1920x1080 High Preset | |
| Schenker XMG Neo 17 Comet Lake | |
| Média NVIDIA GeForce RTX 2070 Super Mobile (92 - 96.6, n=2) | |
| Asus Strix G17 G712LWS | |
| Acer Predator Helios 300 PH317-54-75G8 | |
| Doom Eternal - 1920x1080 Ultra Preset | |
| Média NVIDIA GeForce RTX 2070 Super Mobile (151 - 190.4, n=5) | |
| Asus Strix G17 G712LWS | |
| Schenker XMG Neo 17 Comet Lake | |
| MSI GL75 10SFR | |
| Acer Predator Helios 300 PH317-54-75G8 | |
| Watch Dogs Legion - 1920x1080 Ultra Preset (DX12) | |
| Média NVIDIA GeForce RTX 2070 Super Mobile (59.3 - 64, n=4) | |
| Schenker XMG Neo 17 Comet Lake (Overboost) | |
| Schenker XMG Neo 17 Comet Lake | |
| Dirt 5 - 1920x1080 Ultra High Preset | |
| Média NVIDIA GeForce RTX 2070 Super Mobile (45.5 - 68.6, n=3) | |
| Schenker XMG Neo 17 Comet Lake | |
| Flight Simulator 2020 - 1920x1080 Ultra AA:TAA AF:16x | |
| Schenker XMG Neo 17 Comet Lake (Overboost) | |
| Schenker XMG Neo 17 Comet Lake | |
| Média NVIDIA GeForce RTX 2070 Super Mobile (37.8 - 43.8, n=3) | |
| Asus Strix G17 G712LWS | |
| Acer Predator Helios 300 PH317-54-75G8 | |
A fim de avaliar se as taxas de quadros permanecem constantes durante longos períodos de tempo, executamos o jogo"The Witcher 3" por cerca de 60 minutos em resolução Full-HD e em configurações de qualidade máxima, sem mover o personagem do jogo. Não notamos nenhuma queda nas taxas de quadros.
| baixo | média | alto | ultra | |
|---|---|---|---|---|
| The Witcher 3 (2015) | 274 | 247.1 | 162.9 | 90.8 |
| Doom Eternal (2020) | 234.1 | 171.5 | 151.9 | 151 |
| Horizon Zero Dawn (2020) | 152 | 129 | 116 | 98 |
| Flight Simulator 2020 (2020) | 71.2 | 61.7 | 53.3 | 42.1 |
| Serious Sam 4 (2020) | 122 | 93.7 | 87.8 | 72.5 |
| Mafia Definitive Edition (2020) | 149.5 | 106 | 96.6 | |
| Watch Dogs Legion (2020) | 112.2 | 102.7 | 90.1 | 59.3 |
| Dirt 5 (2020) | 157 | 91 | 73.6 | 45.5 |
| Assassin´s Creed Valhalla (2020) | 122 | 83 | 71 | 60 |
Emissions and Power Management - The XMG Neo offers only a mediocre battery life
Emissões sonoras
Durante a operação ociosa, os dois ventiladores funcionam principalmente em baixas velocidades. Ocasionalmente eles se desligam e há silêncio. Sob carga, os ventiladores fazem marcha lenta e registramos níveis máximos de ruído de 52 dB(A) (teste de estresse) e 50 dB(A)( Witcher 3o teste ). O uso de um fone de ouvido se recomenda.
Barulho
| Ocioso |
| 26 / 30 / 33 dB |
| Carga |
| 50 / 52 dB |
 | ||
30 dB silencioso 40 dB(A) audível 50 dB(A) ruidosamente alto |
||
min: | ||
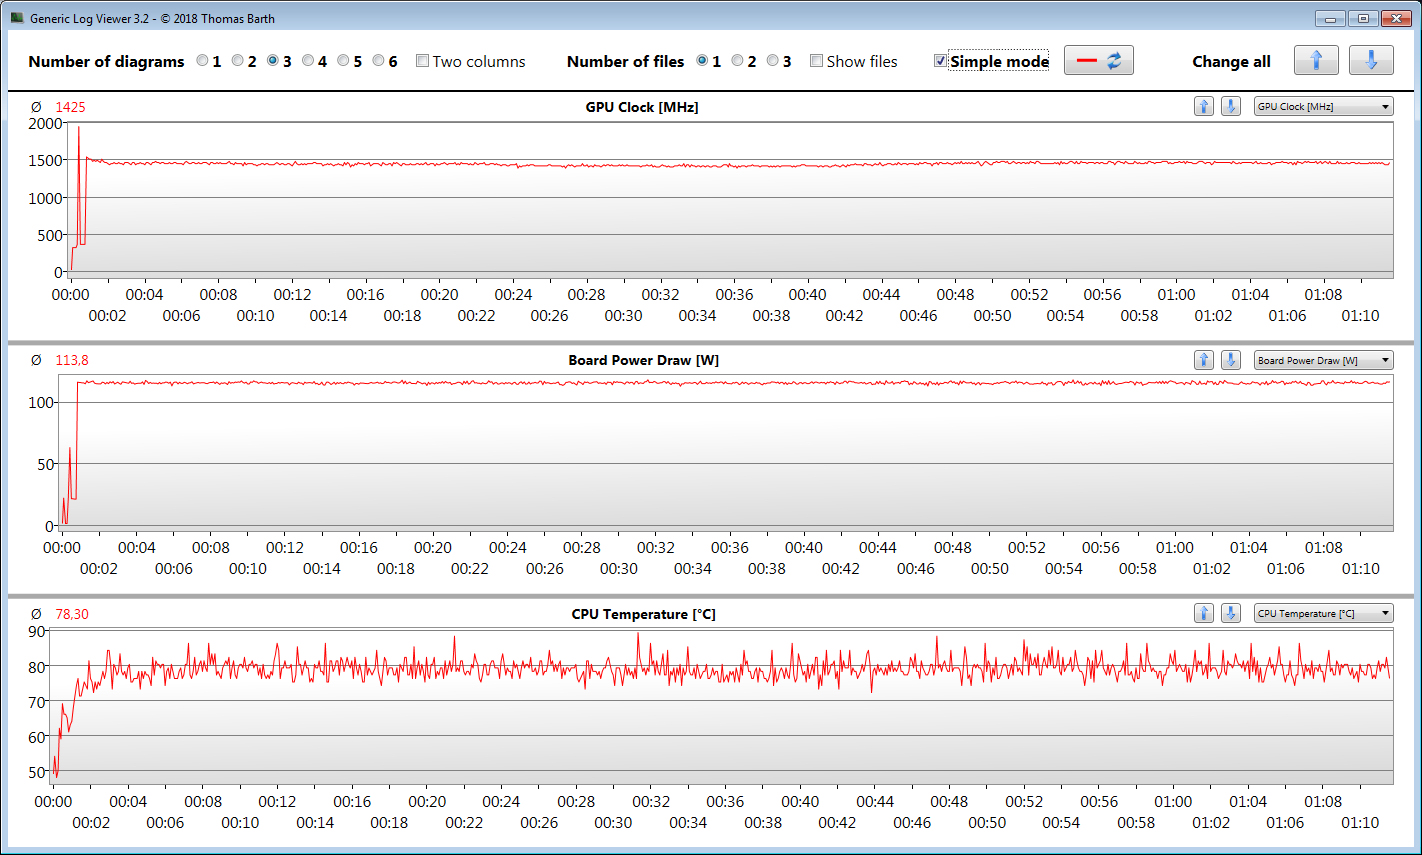
Temperatura
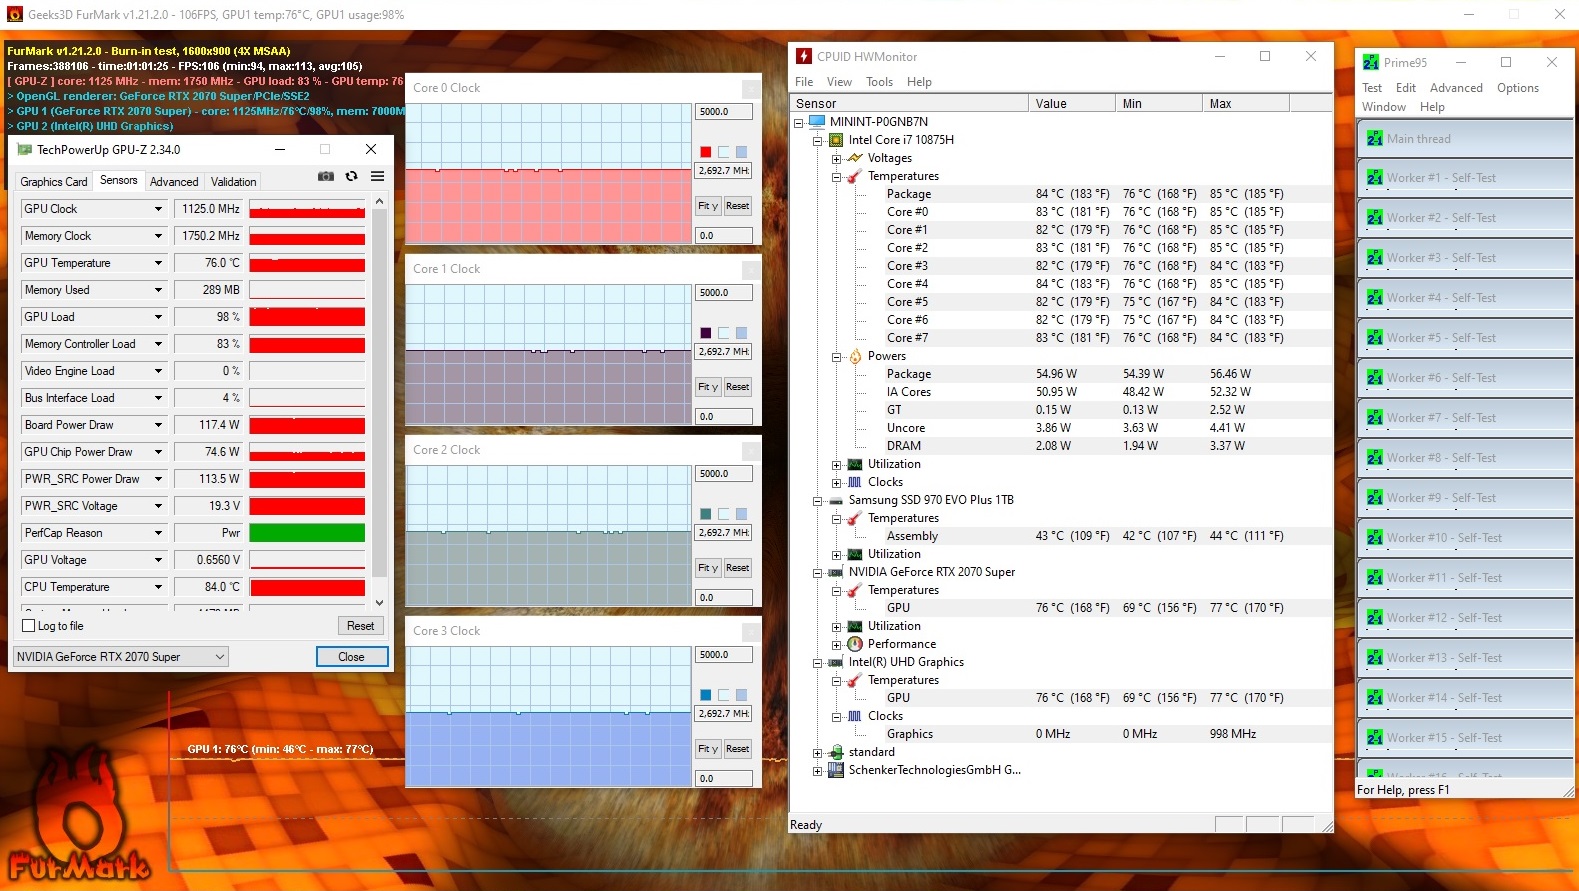
A CPU e GPU passam por nosso teste de estresse (com Prime95 e Furmark funcionando por pelo menos uma hora) a 2,7 GHz e 1125 MHz respectivamente. O teste de estresse representa um cenário extremo. Estamos usando este teste para avaliar se o sistema também permanece estável sob carga total.
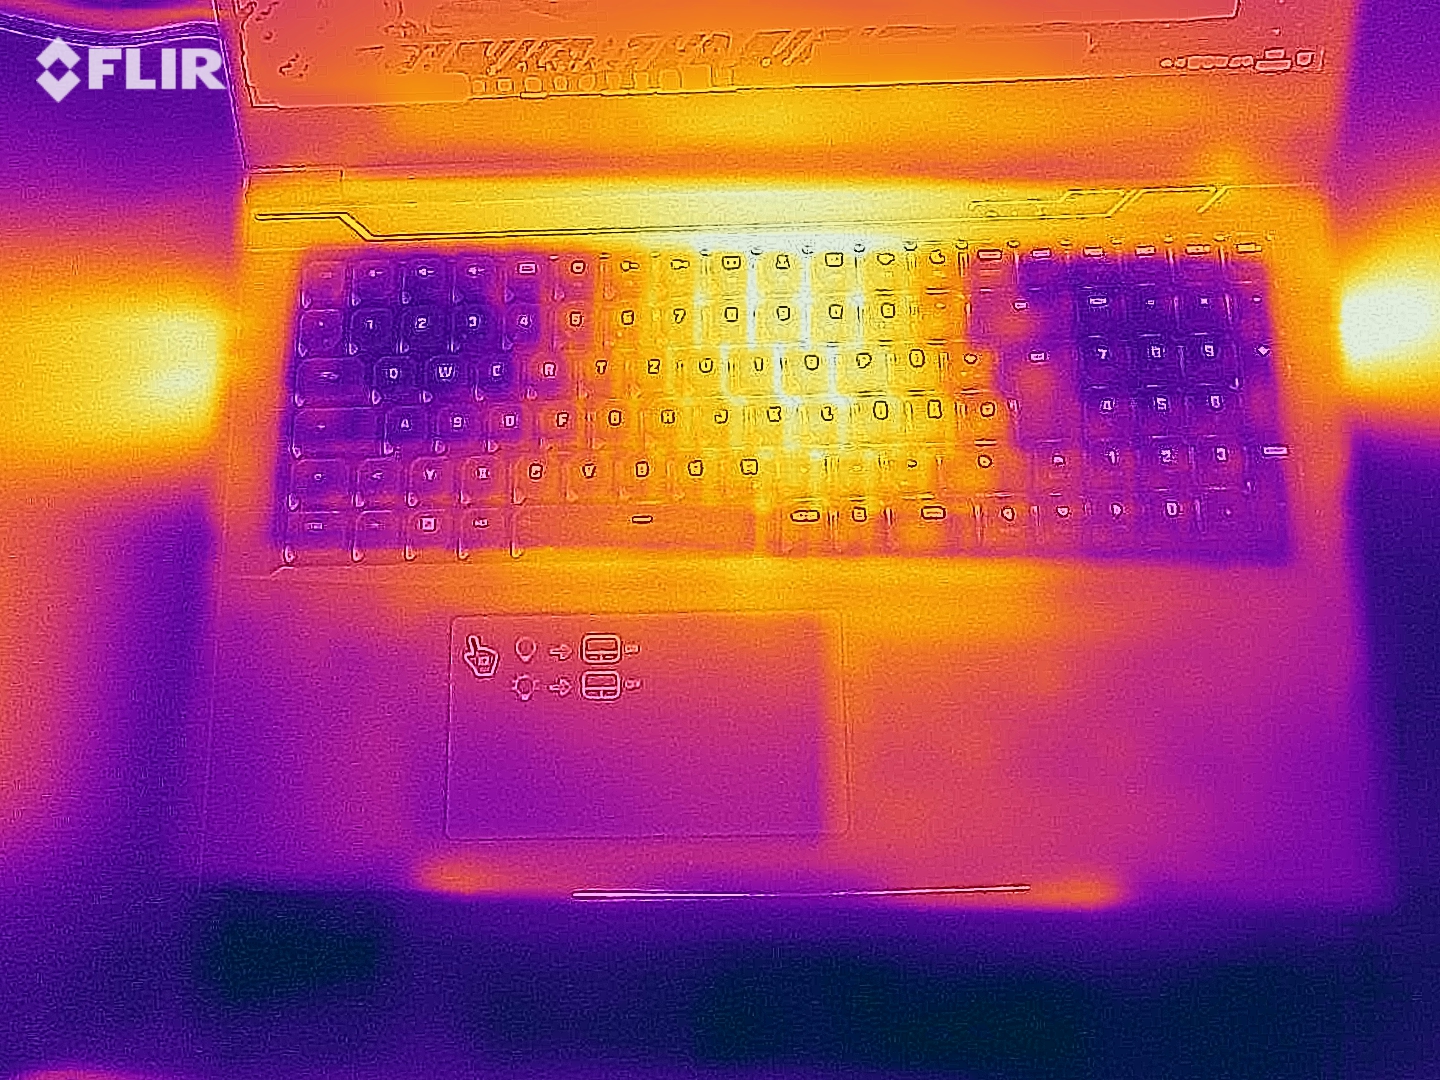
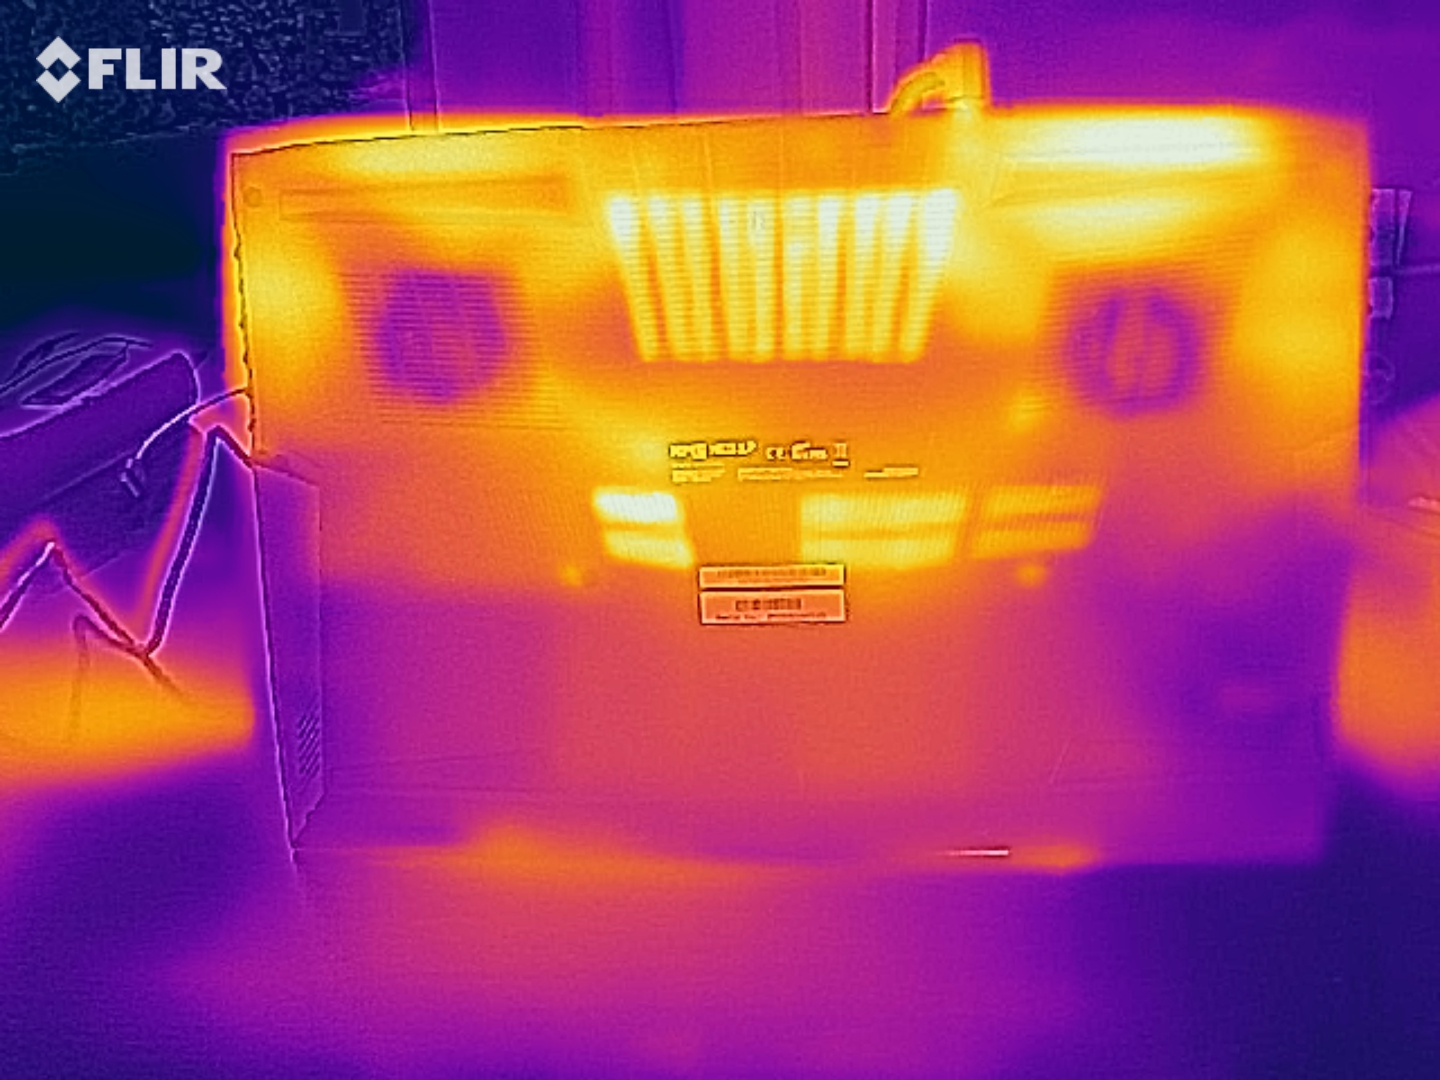
O laptop aquece visivelmente. Durante o teste de estresse, medimos temperaturas na faixa de 50 graus Celsius (122 °F) em alguns pontos de medição. O desenvolvimento do calor acaba sendo ligeiramente menor durante a execução do nosso teste Witcher 3. No entanto, não se deve colocar o dispositivo no colo. No funcionamento diário, as temperaturas permanecem dentro da faixa verde
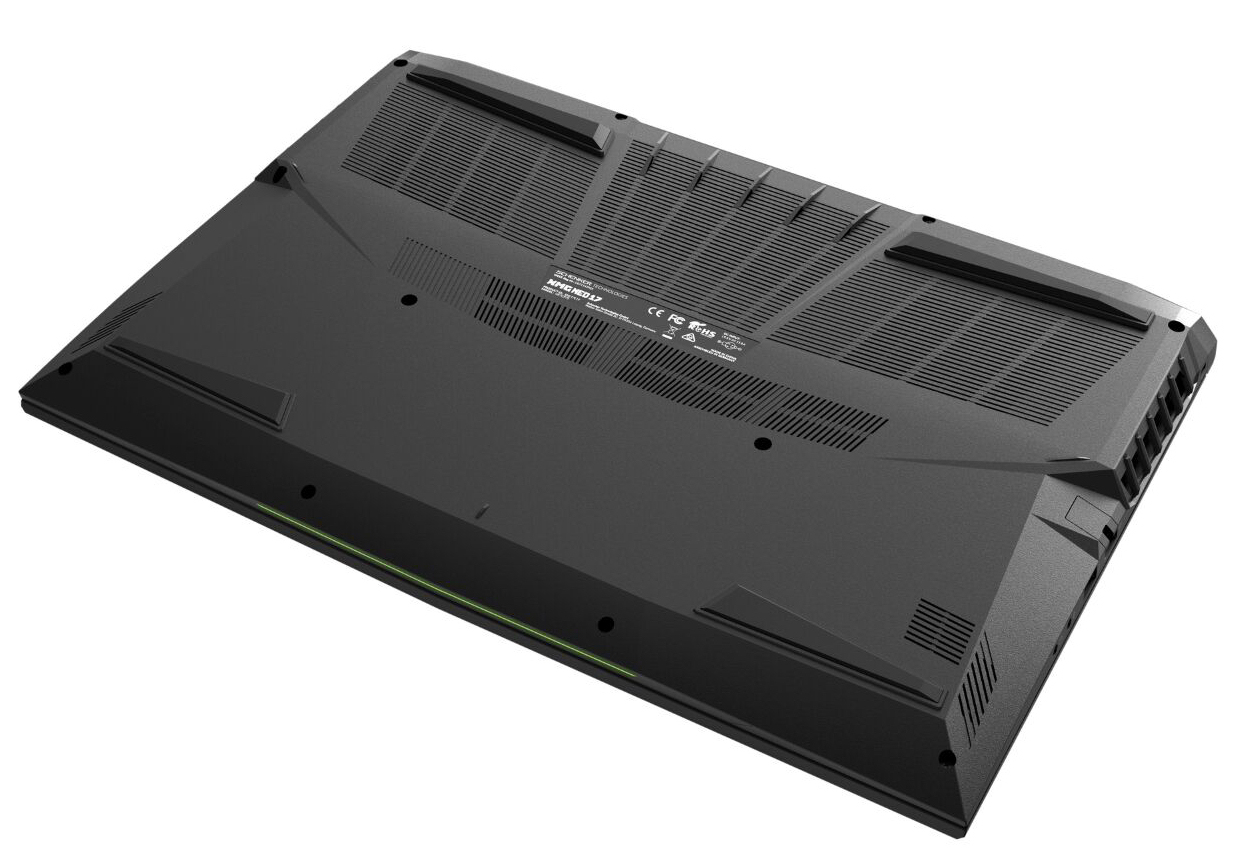
(-) A temperatura máxima no lado superior é 48 °C / 118 F, em comparação com a média de 40.4 °C / 105 F , variando de 21.2 a 68.8 °C para a classe Gaming.
(-) A parte inferior aquece até um máximo de 54 °C / 129 F, em comparação com a média de 43.2 °C / 110 F
(+) Em uso inativo, a temperatura média para o lado superior é 29.1 °C / 84 F, em comparação com a média do dispositivo de 33.9 °C / ### class_avg_f### F.
(-) Jogando The Witcher 3, a temperatura média para o lado superior é 41.6 °C / 107 F, em comparação com a média do dispositivo de 33.9 °C / ## #class_avg_f### F.
(±) Os apoios para as mãos e o touchpad podem ficar muito quentes ao toque, com um máximo de 39 °C / 102.2 F.
(-) A temperatura média da área do apoio para as mãos de dispositivos semelhantes foi 28.8 °C / 83.8 F (-10.2 °C / -18.4 F).
Oradores
Schenker XMG Neo 17 Comet Lake análise de áudio
(+) | os alto-falantes podem tocar relativamente alto (###valor### dB)
Graves 100 - 315Hz
(-) | quase nenhum baixo - em média 25.2% menor que a mediana
(±) | a linearidade dos graves é média (12.7% delta para a frequência anterior)
Médios 400 - 2.000 Hz
(+) | médios equilibrados - apenas 3.3% longe da mediana
(+) | médios são lineares (4.4% delta para frequência anterior)
Altos 2 - 16 kHz
(+) | agudos equilibrados - apenas 2.8% longe da mediana
(±) | a linearidade dos máximos é média (7.8% delta para frequência anterior)
Geral 100 - 16.000 Hz
(±) | a linearidade do som geral é média (17.1% diferença em relação à mediana)
Comparado com a mesma classe
» 46% de todos os dispositivos testados nesta classe foram melhores, 12% semelhantes, 43% piores
» O melhor teve um delta de 6%, a média foi 18%, o pior foi 132%
Comparado com todos os dispositivos testados
» 31% de todos os dispositivos testados foram melhores, 8% semelhantes, 61% piores
» O melhor teve um delta de 4%, a média foi 23%, o pior foi 134%
Consumo de energia
Em operação ociosa, registramos um consumo máximo de energia de 29 watts. O teste de estresse e nossoteste Witcher 3 levam a um aumento no consumo de até 258 watts e uma média de 199 watts, respectivamente
| desligado | |
| Ocioso | |
| Carga |
|
Key:
min: | |
Vida útil da bateria
A vida útil da bateria não ganha nenhum elogio. O laptop de 17,3 polegadas dura 3:47 horas em nosso teste WLAN (carregando websites usando um script e com um brilho de tela de cerca de 150 cd/m²). A capacidade adicional da bateria (62 Wh em vez de 46 Wh) em comparação com os modelos de 2019 que testamos não dá nenhuma vantagem ao atual Neo 17
Pro
Contra
Veredicto
Graças ao processador Corei7-10875H octa-core, GeForce RTX 2070-Super núcleo gráfico, e 32 GB de memória de trabalho, o XMG Neo 17 está equipado para qualquer desafio possível. O hardware é capaz de trazer todos os jogos de computador atuais para a tela com suavidade, sem a necessidade de qualquer compromisso.
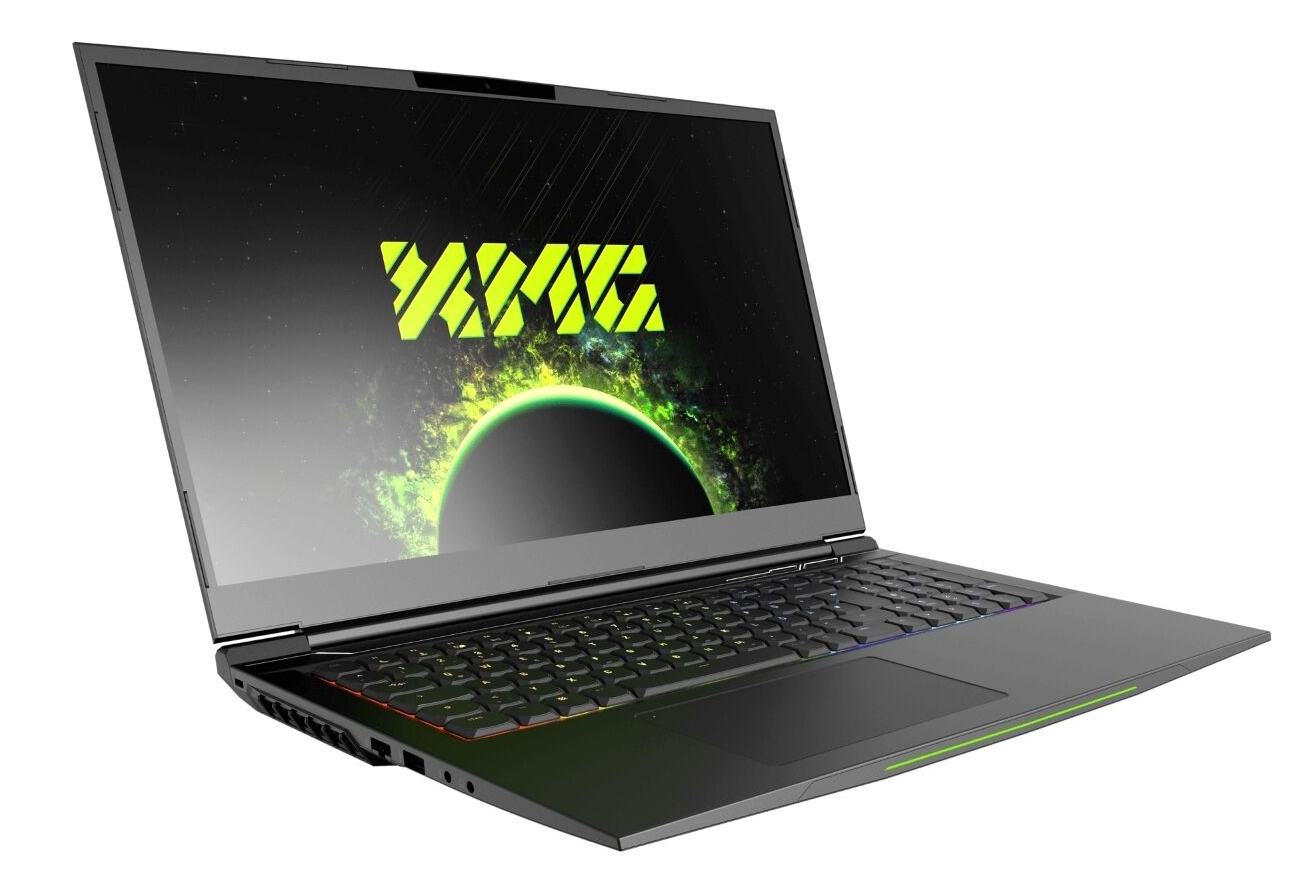
Com o XMG Neo 17 (2020), a Schenkerfornece umlaptop parajogos extremamente poderoso, cuja aparência moderada permite utilizá-lo no escritório
Se você ficar sem espaço de armazenamento com o SSD 1-TB NVMe incorporado, uma atualização é possível, uma vez que o laptop oferece espaço para dois SSD M.2-2280 (1x NVMe, 1x NVMe/SATA; RAID 0/1). A tela muito ágil (FHD, IPS, 240 Hz) pontua com uma boa reprodução de cores e uma cobertura de espaço de cores aceitável. O brilho e o contraste preenchem os requisitos, mas a duração da bateria se torna medíocre.
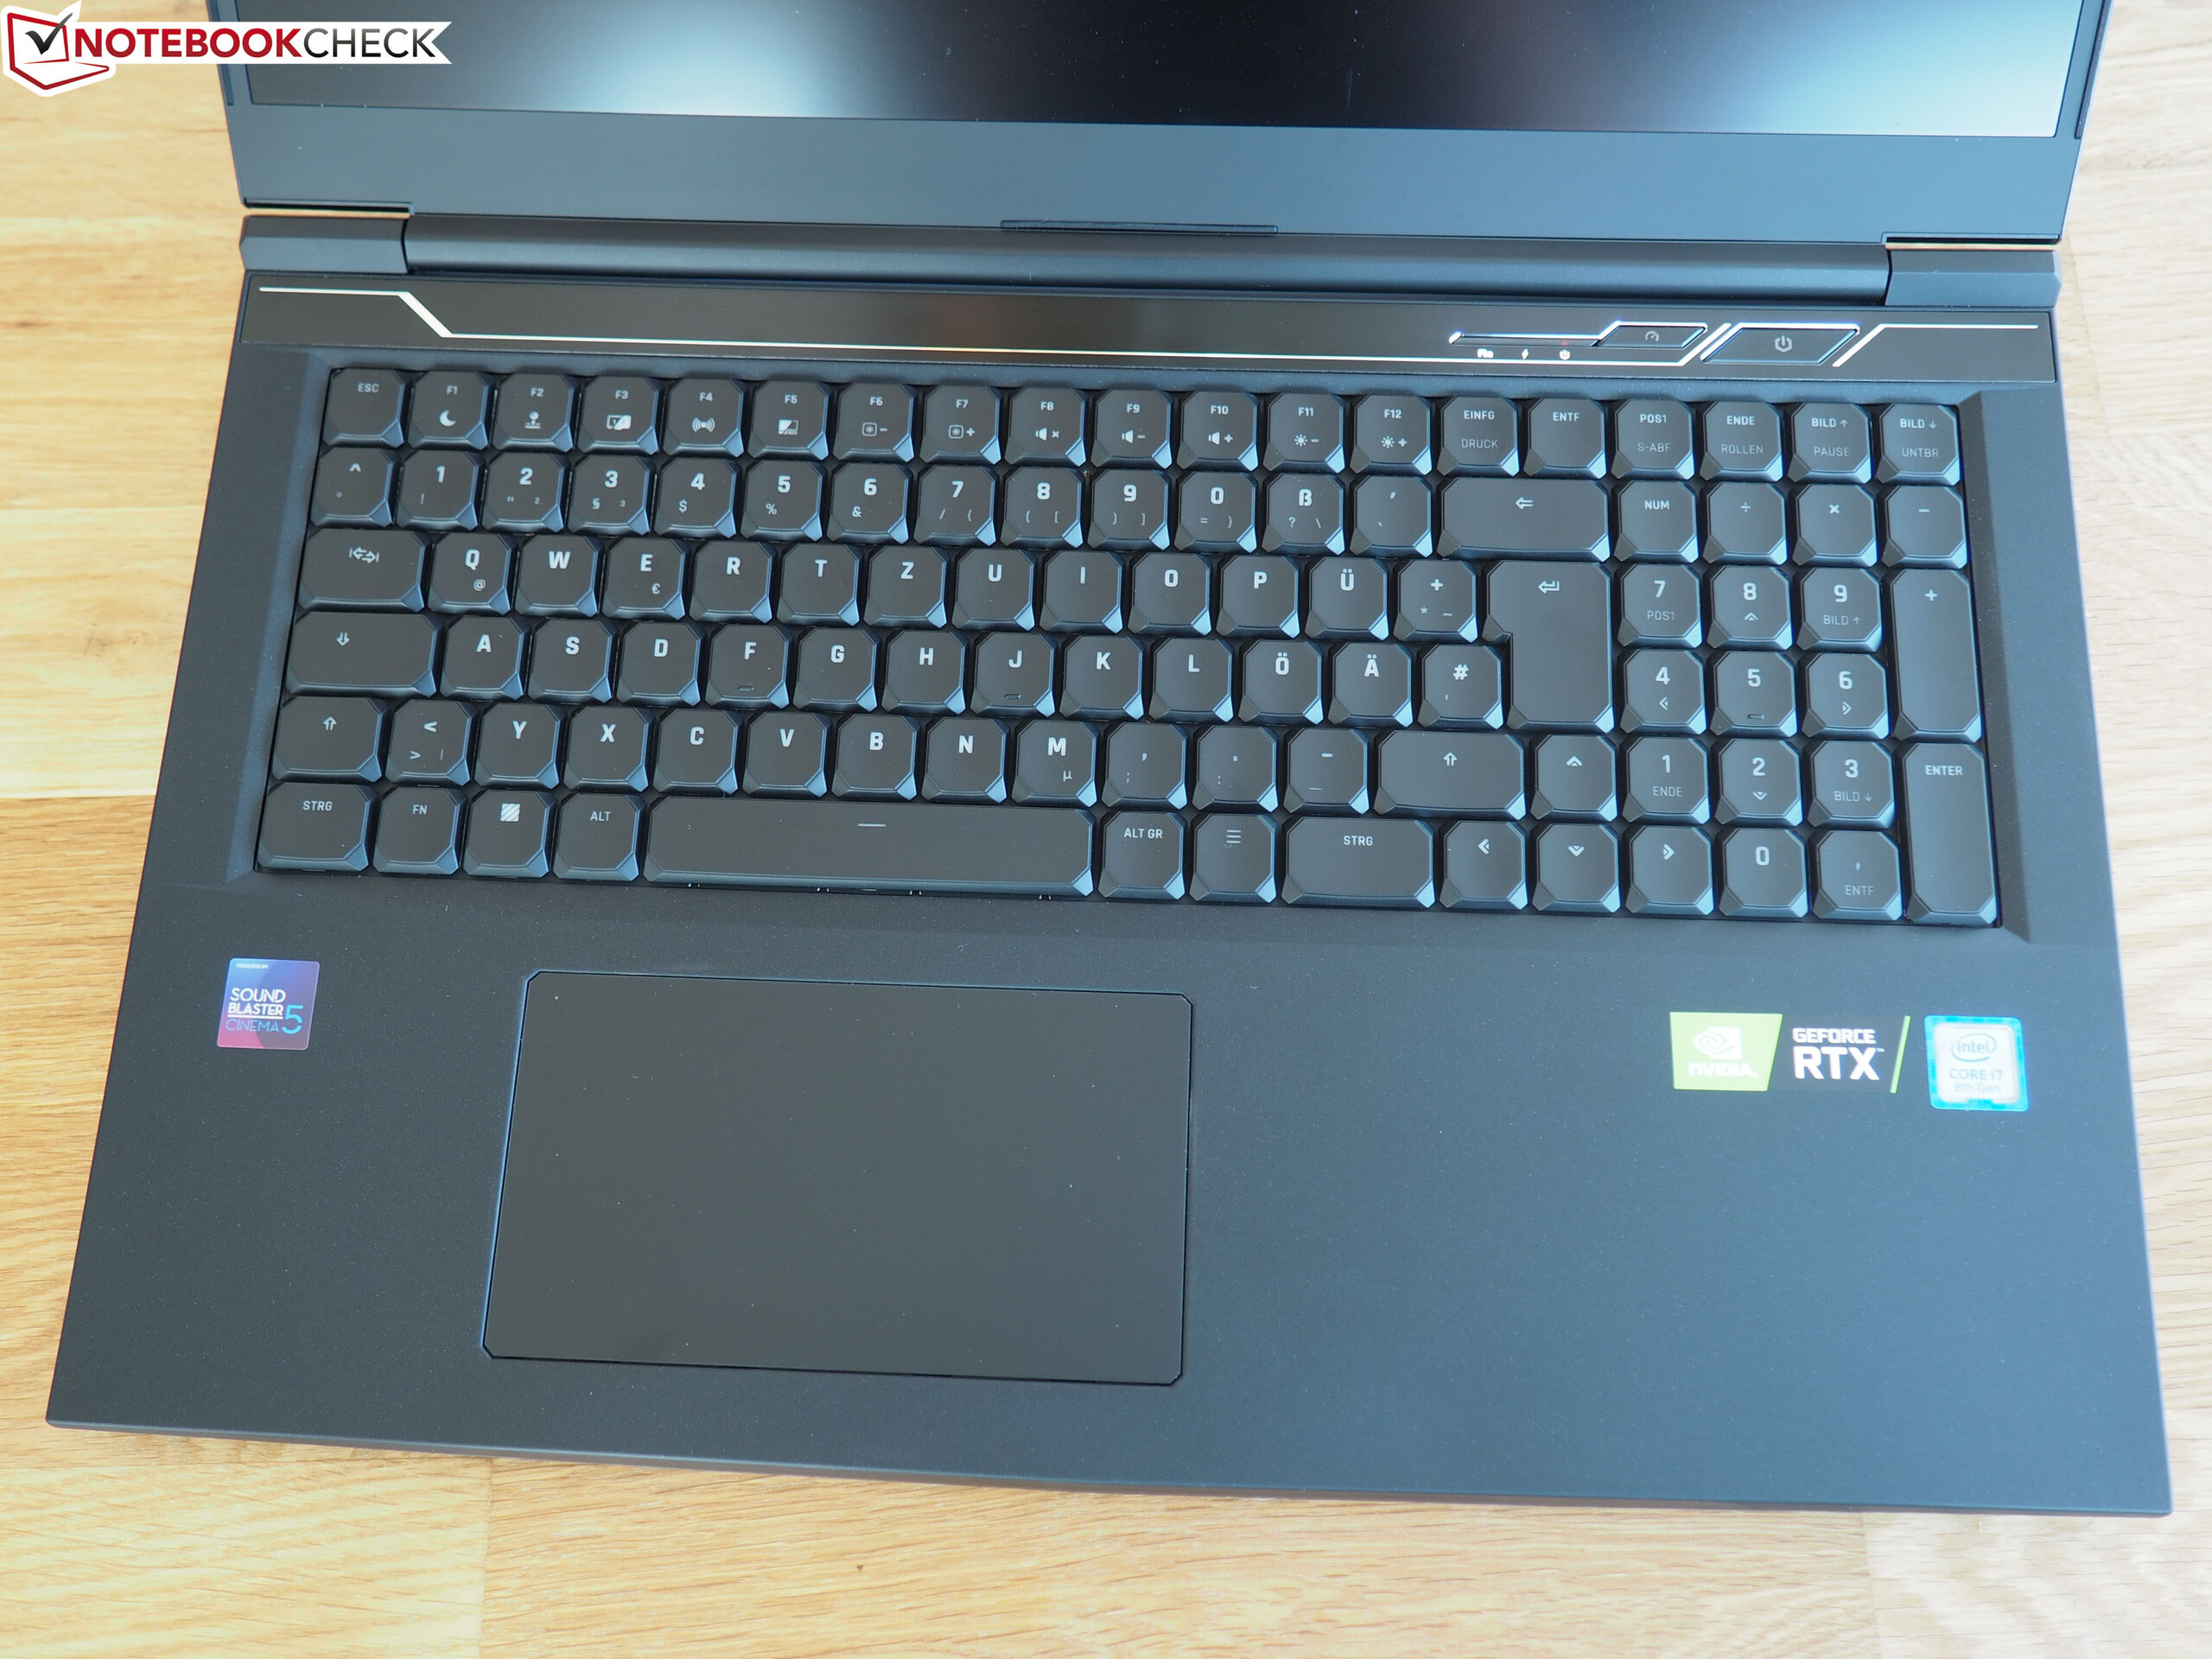
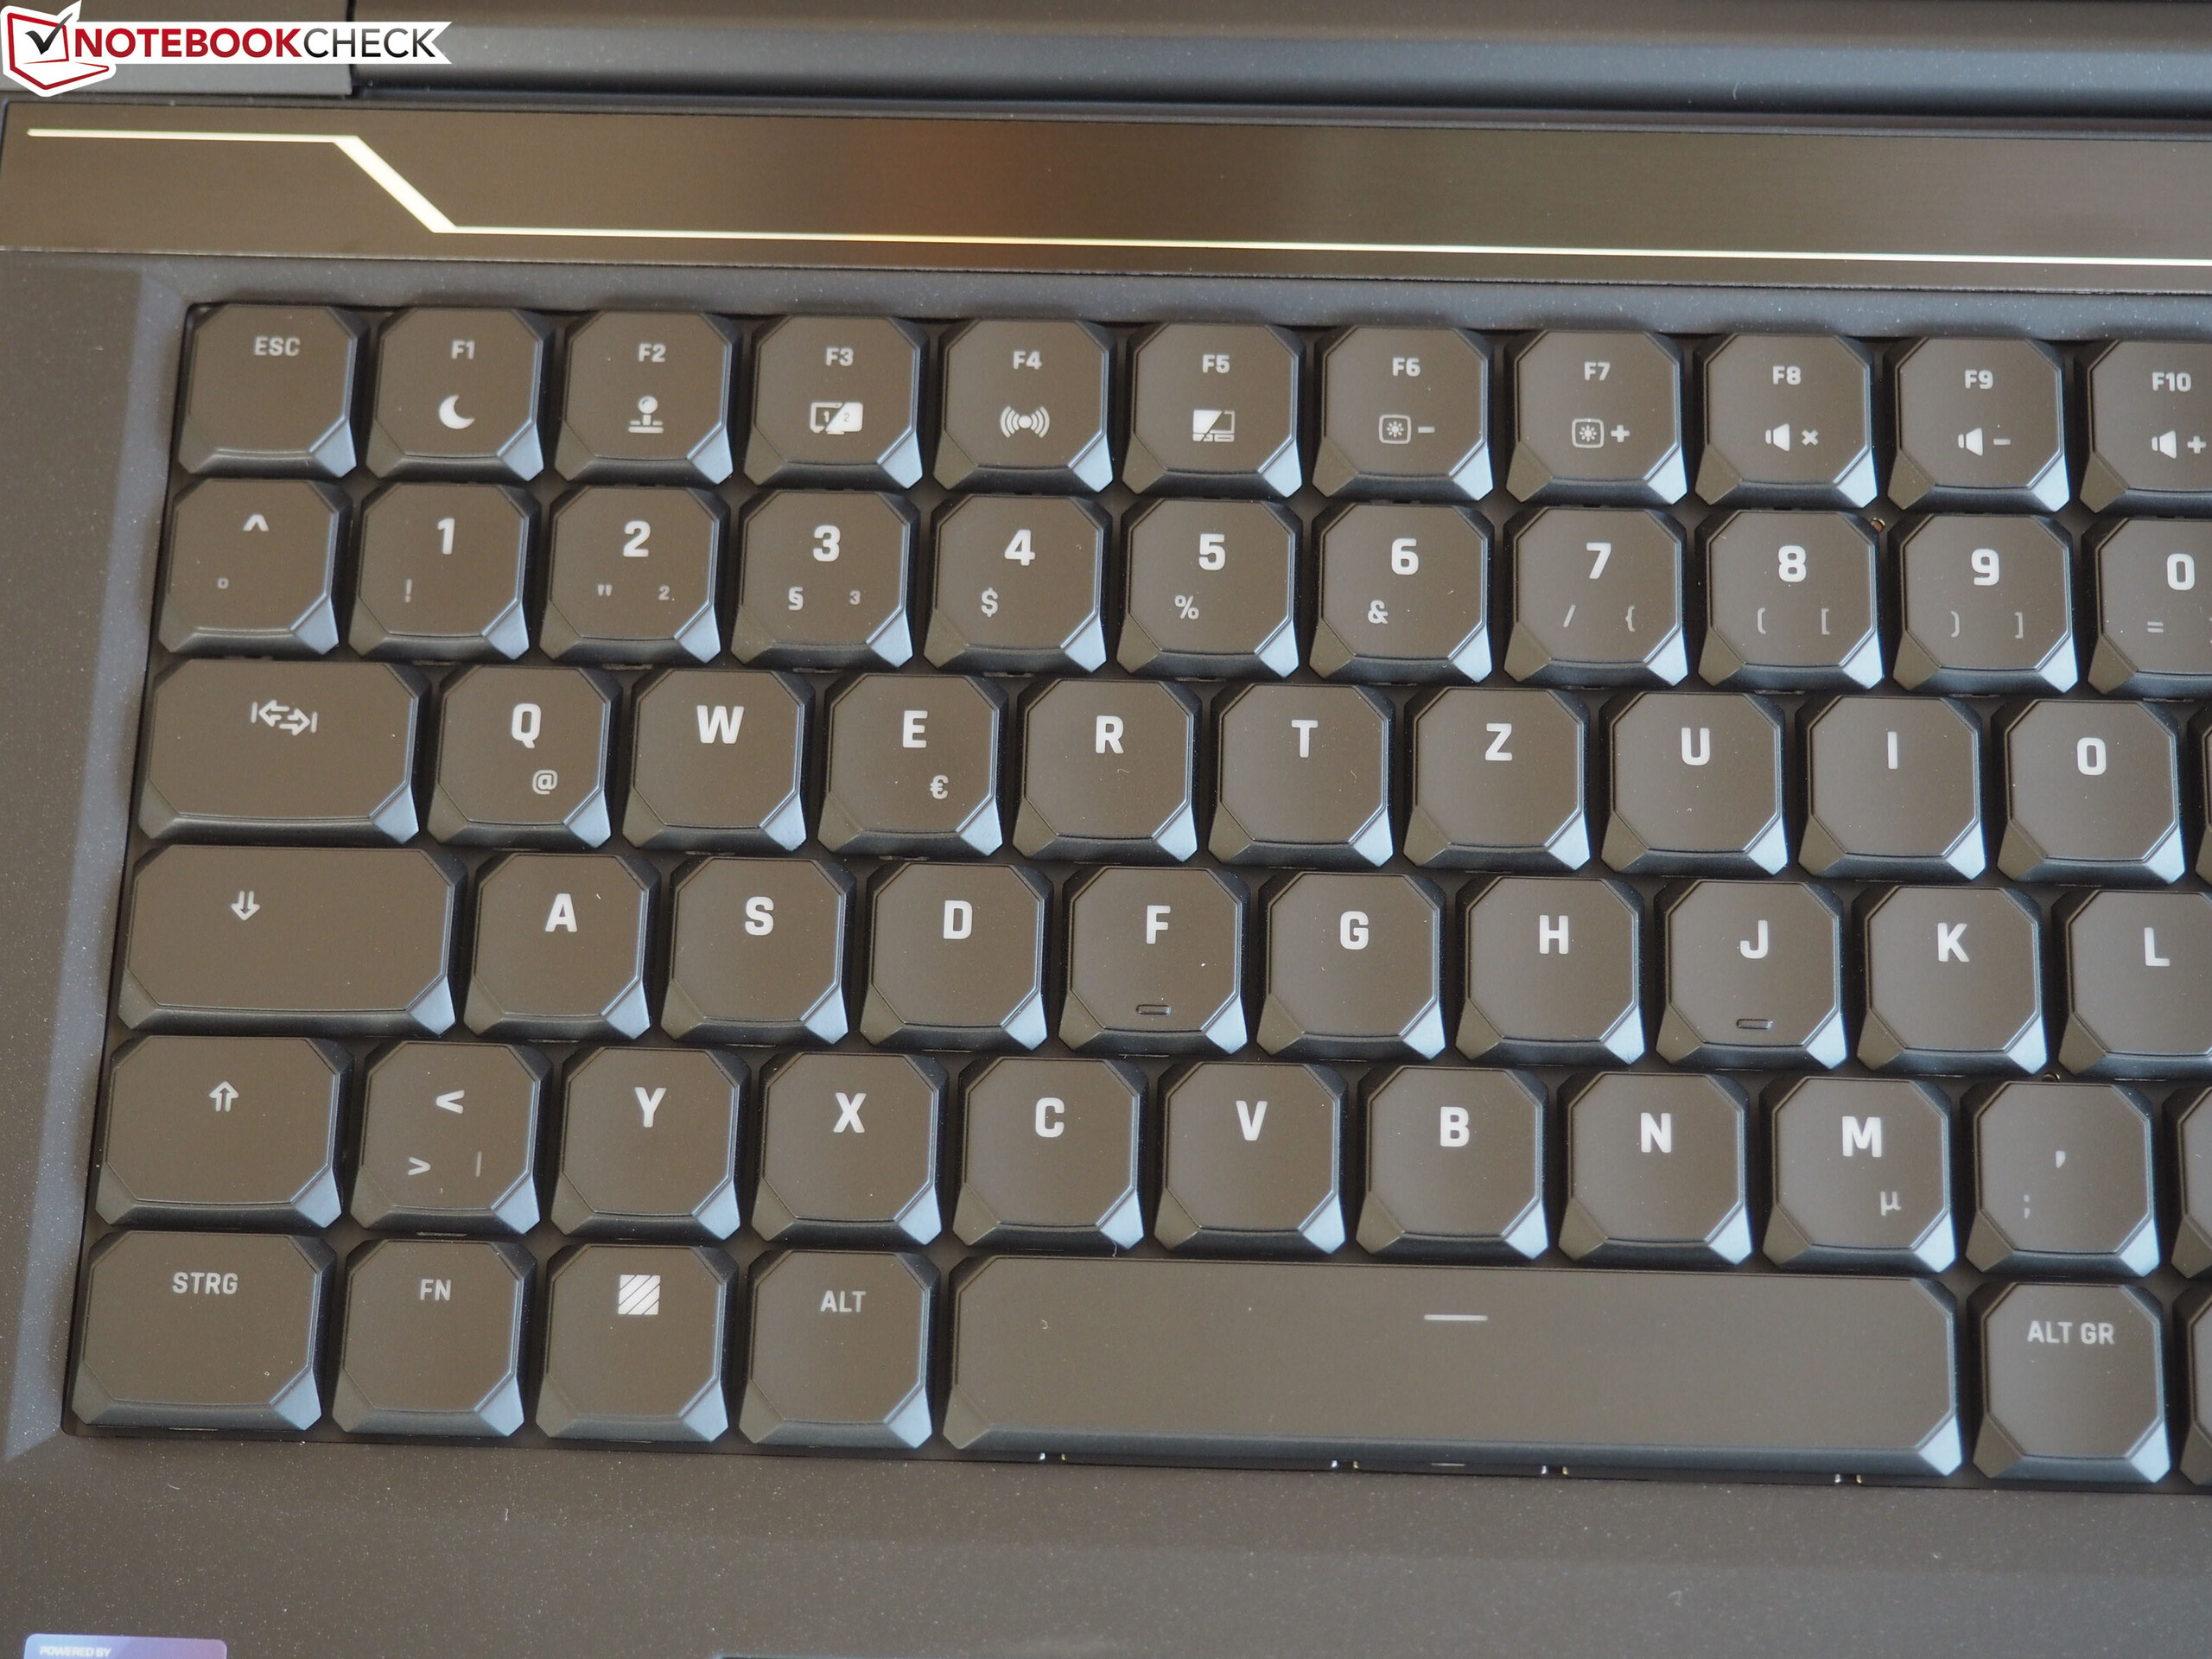
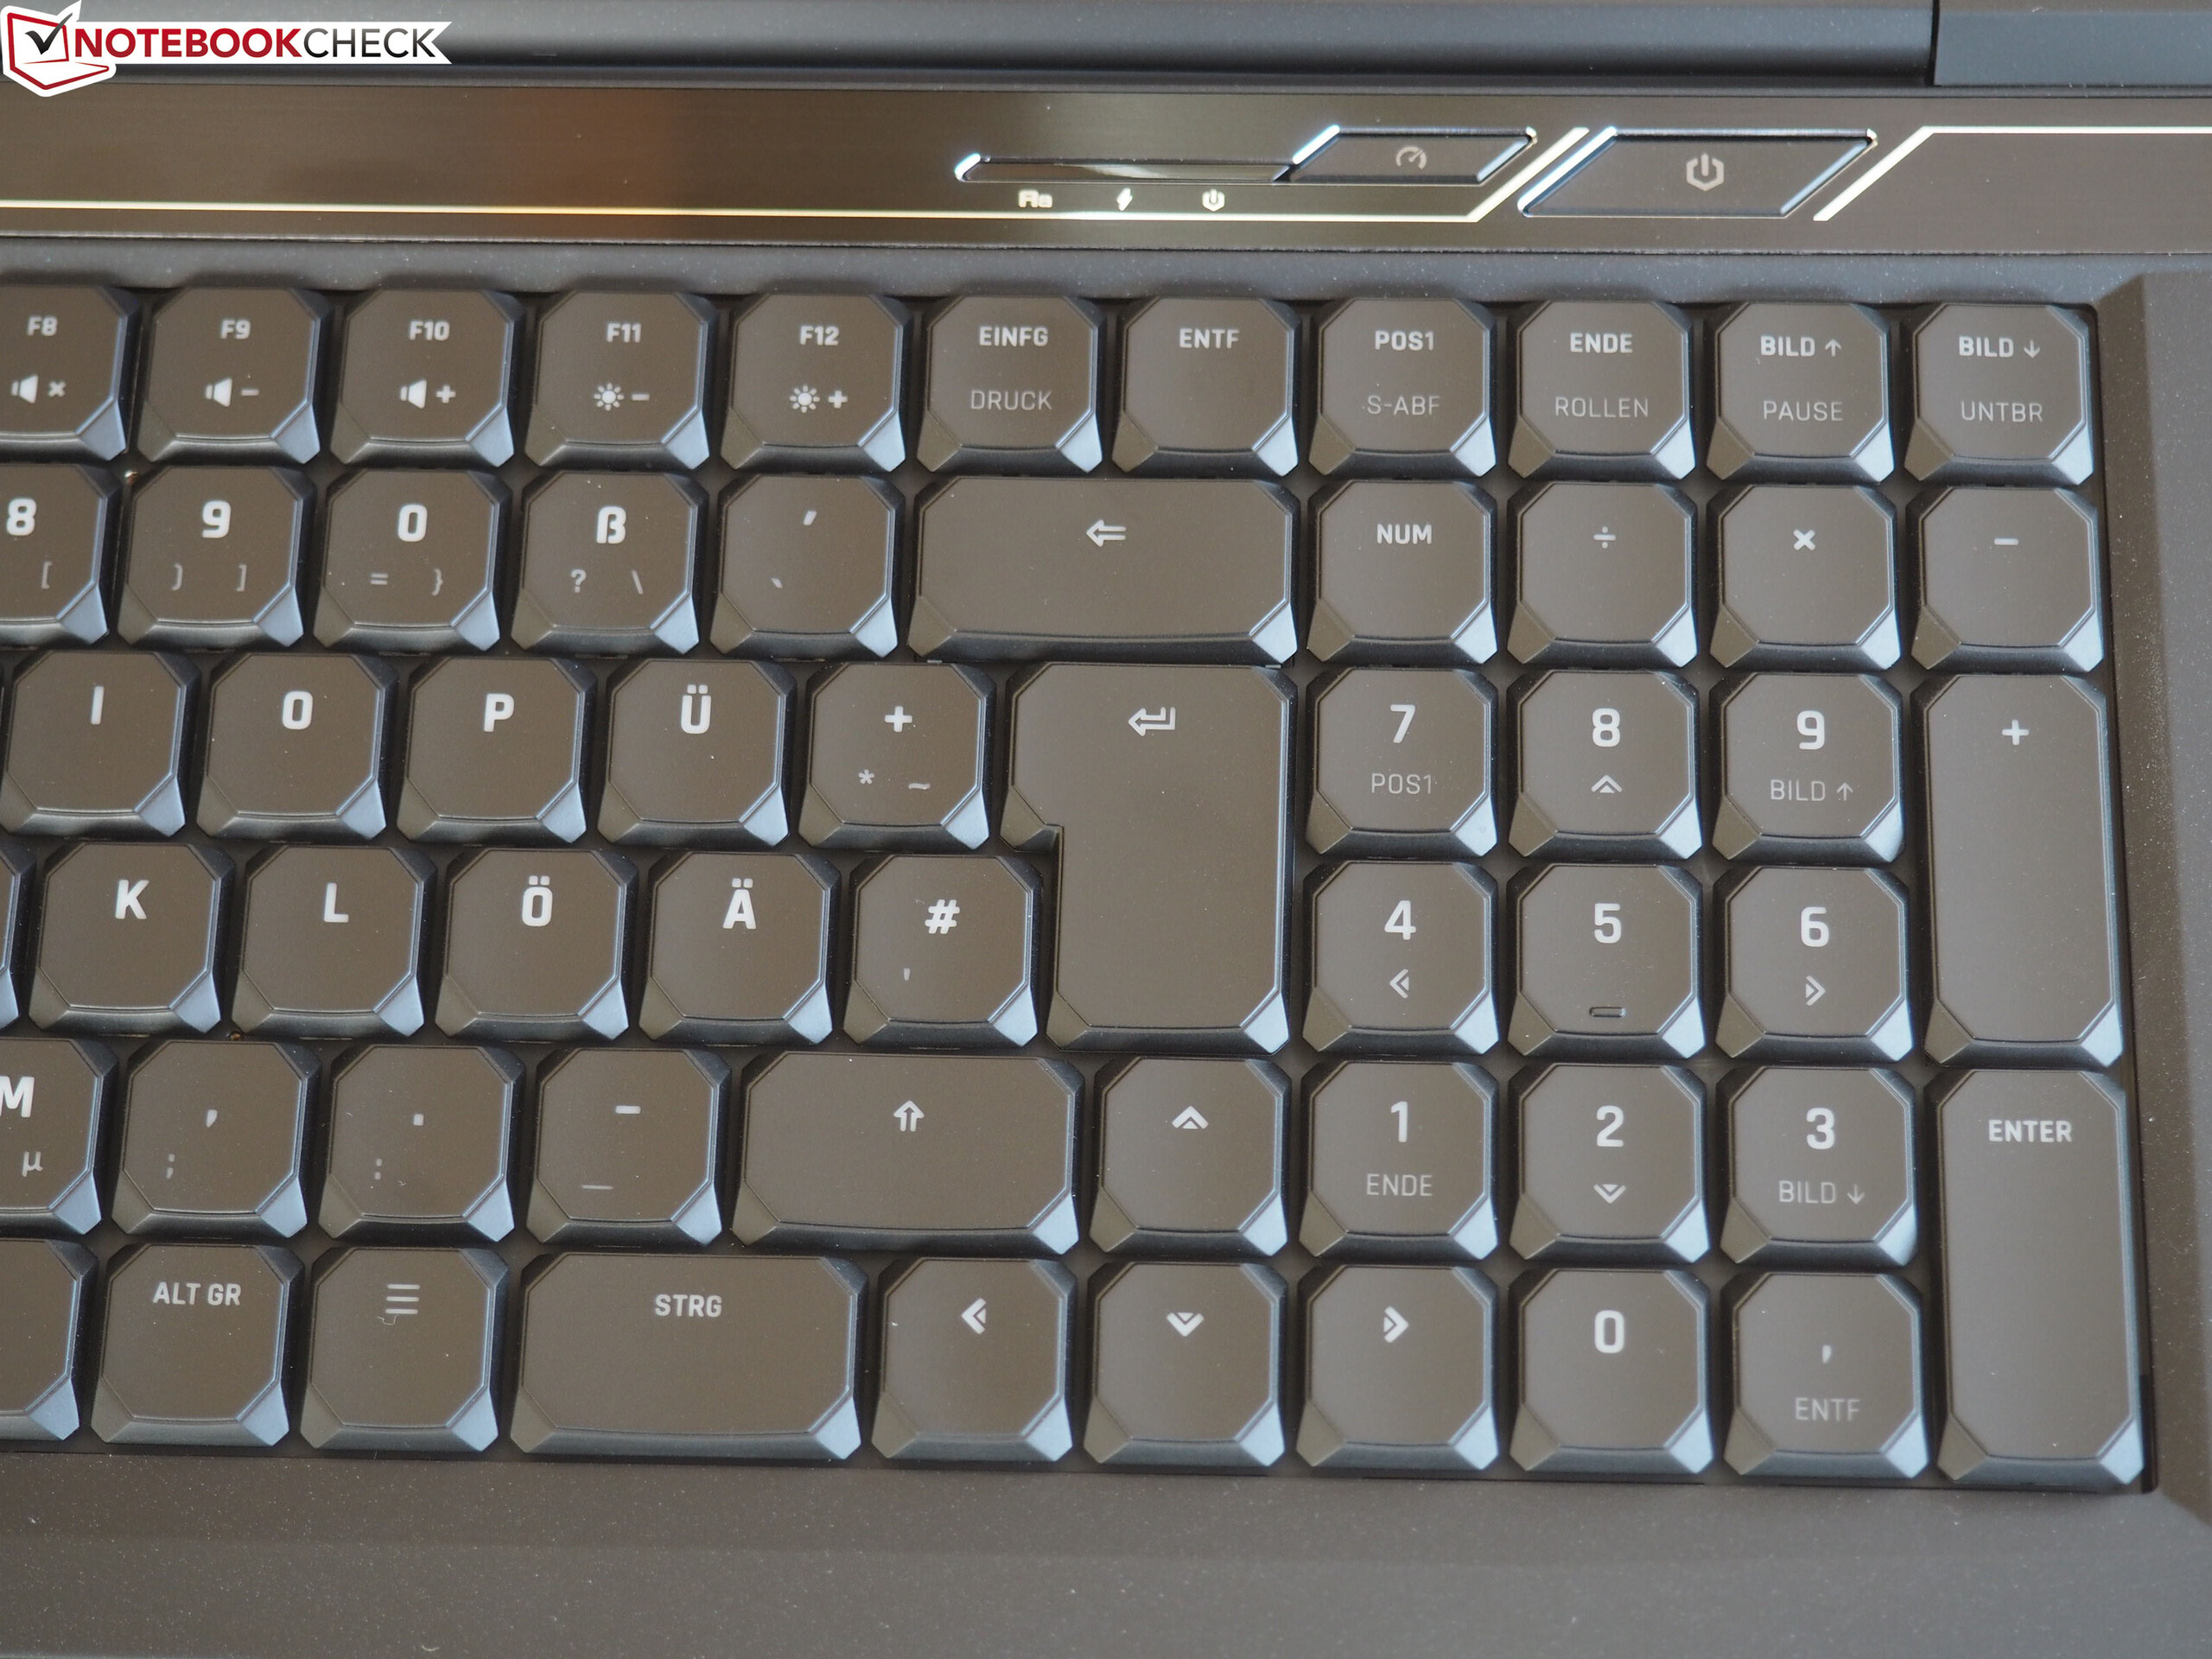
O teclado mecânico (com iluminação RGB) deixou uma boa impressão e representará um importante ponto de compra para muitos compradores potenciais. A conexão Thunderbolt 3 que foi adicionada em comparação com a predecessora permite conectar uma extensa solução de acoplamento ou uma GPU externa.
Schenker XMG Neo 17 Comet Lake
- 11/27/2020 v7 (old)
Sascha Mölck
Price comparison

