Estreia do Intel Core i9-12900H: Revisão de laptop Uniwill Technology GM7AG8P
A Intel finalmente respondeu à impressionante série Zen 3 H móvel da AMD com sua plataforma Alder Lake-H do 12º gênero. A Schenker e a Uniwill Technology nos forneceram um dos primeiros laptops a carregar o 12o. gênero Core i9-12900H com base no chassi GM7AG8P. A Schenker ainda não ofereceu publicamente esta configuração exata a partir desta escrita, mas as opções de varejo podem vir em uma data posterior.
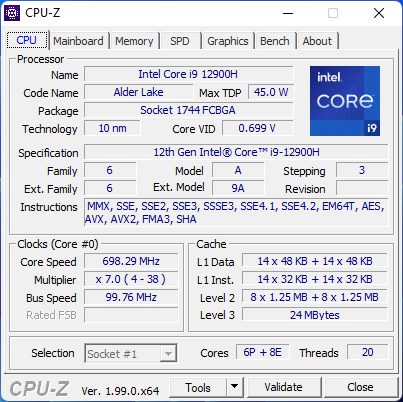
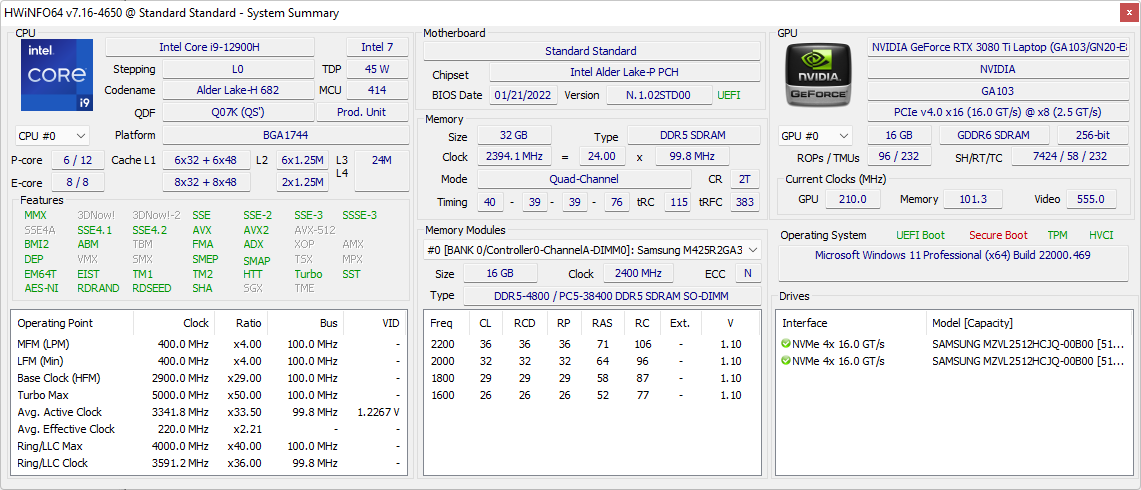
Nossa unidade de teste vem com a já mencionada CPU Core i9, nova GeForce RTX 3080 Ti GPU, DDR5-4800 RAM e tela IPS 165 Hz 1440p (QHD). Esta revisão se concentrará na performance para mostrar o que os usuários podem esperar da nova CPU Intel e GPU Nvidia quando comparada com suas respectivas GPUs de última geração.
Mais revisões Schenker:
Possíveis concorrentes em comparação
Avaliação | Data | Modelo | Peso | Altura | Size | Resolução | Preço |
|---|---|---|---|---|---|---|---|
| 86.9 % v7 (old) | 02/2022 | Schenker Uniwill Technology GM7AG8P i9-12900H, GeForce RTX 3080 Ti Laptop GPU | 2.3 kg | 20 mm | 17.30" | 2560x1440 | |
| 87.4 % v7 (old) | 09/2021 | Schenker XMG NEO 17 GM7TG8S i7-11800H, GeForce RTX 3080 Laptop GPU | 2.6 kg | 27.45 mm | 17.30" | 2560x1440 | |
| 89 % v7 (old) | 09/2021 | Alienware x17 RTX 3080 P48E i7-11800H, GeForce RTX 3080 Laptop GPU | 3.2 kg | 21.4 mm | 17.30" | 3840x2160 | |
| 89.4 % v7 (old) | 09/2021 | Razer Blade 17 RTX 3070 i7-11800H, GeForce RTX 3070 Laptop GPU | 2.8 kg | 19.9 mm | 17.30" | 1920x1080 | |
| 86.2 % v7 (old) | 09/2021 | MSI GS76 Stealth 11UH i9-11900H, GeForce RTX 3080 Laptop GPU | 2.4 kg | 20 mm | 17.30" | 3840x2160 | |
| 87.8 % v7 (old) | 09/2021 | Maingear Vector Pro MG-VCP17 i7-11800H, GeForce RTX 3080 Laptop GPU | 2.3 kg | 19.81 mm | 17.30" | 2560x1440 |
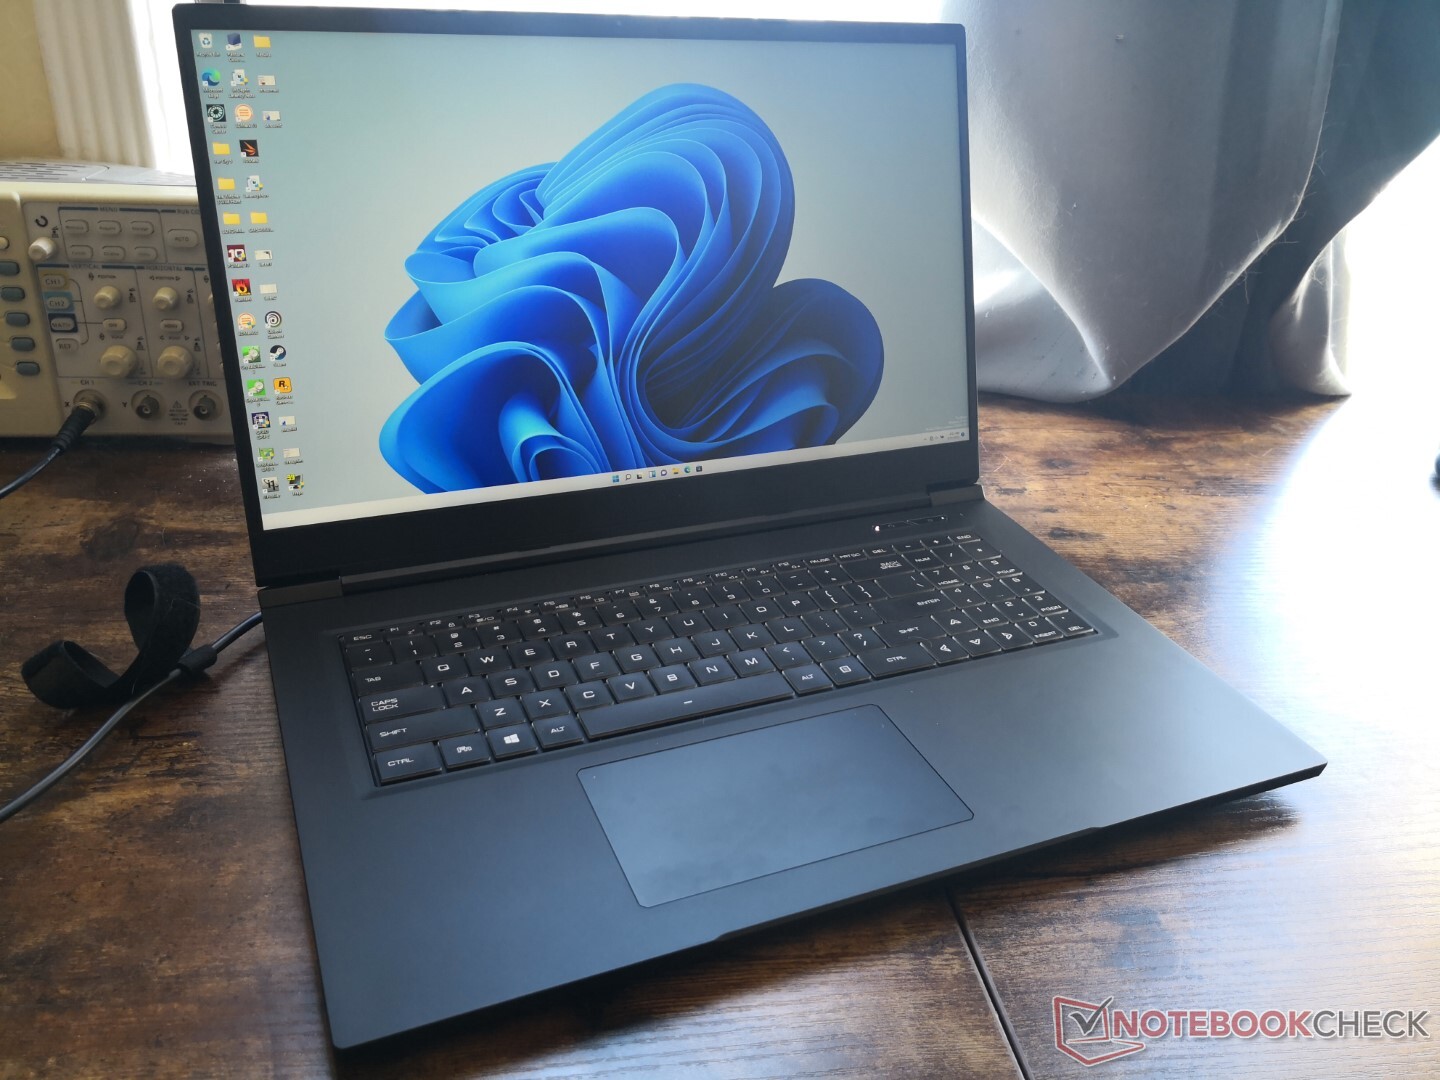
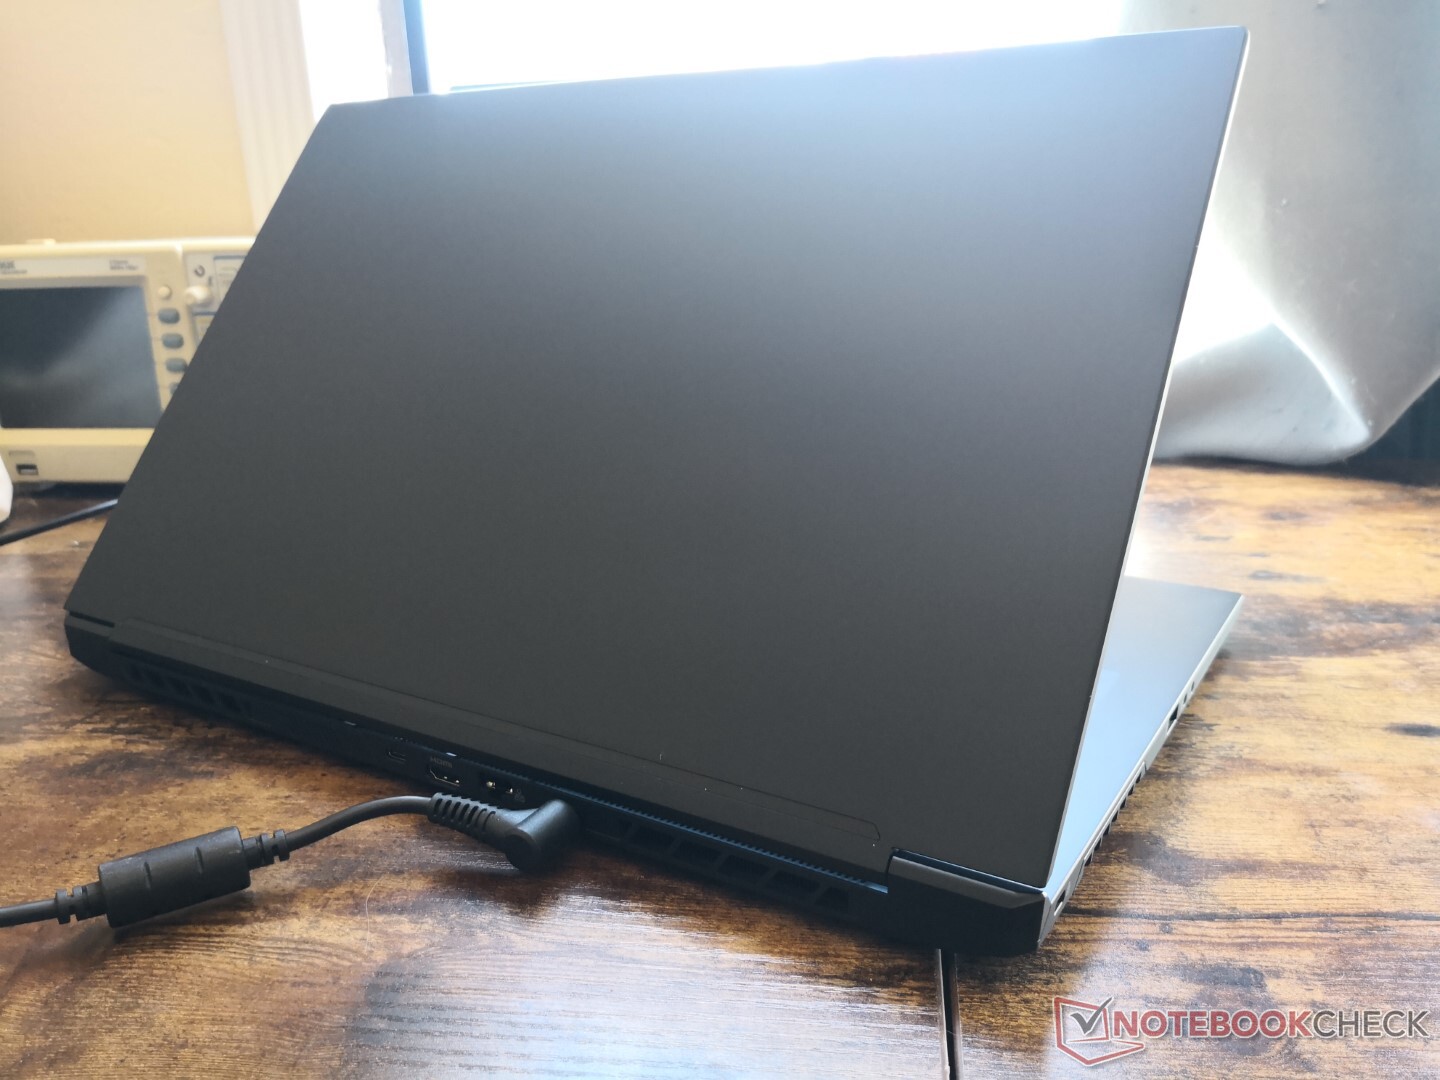
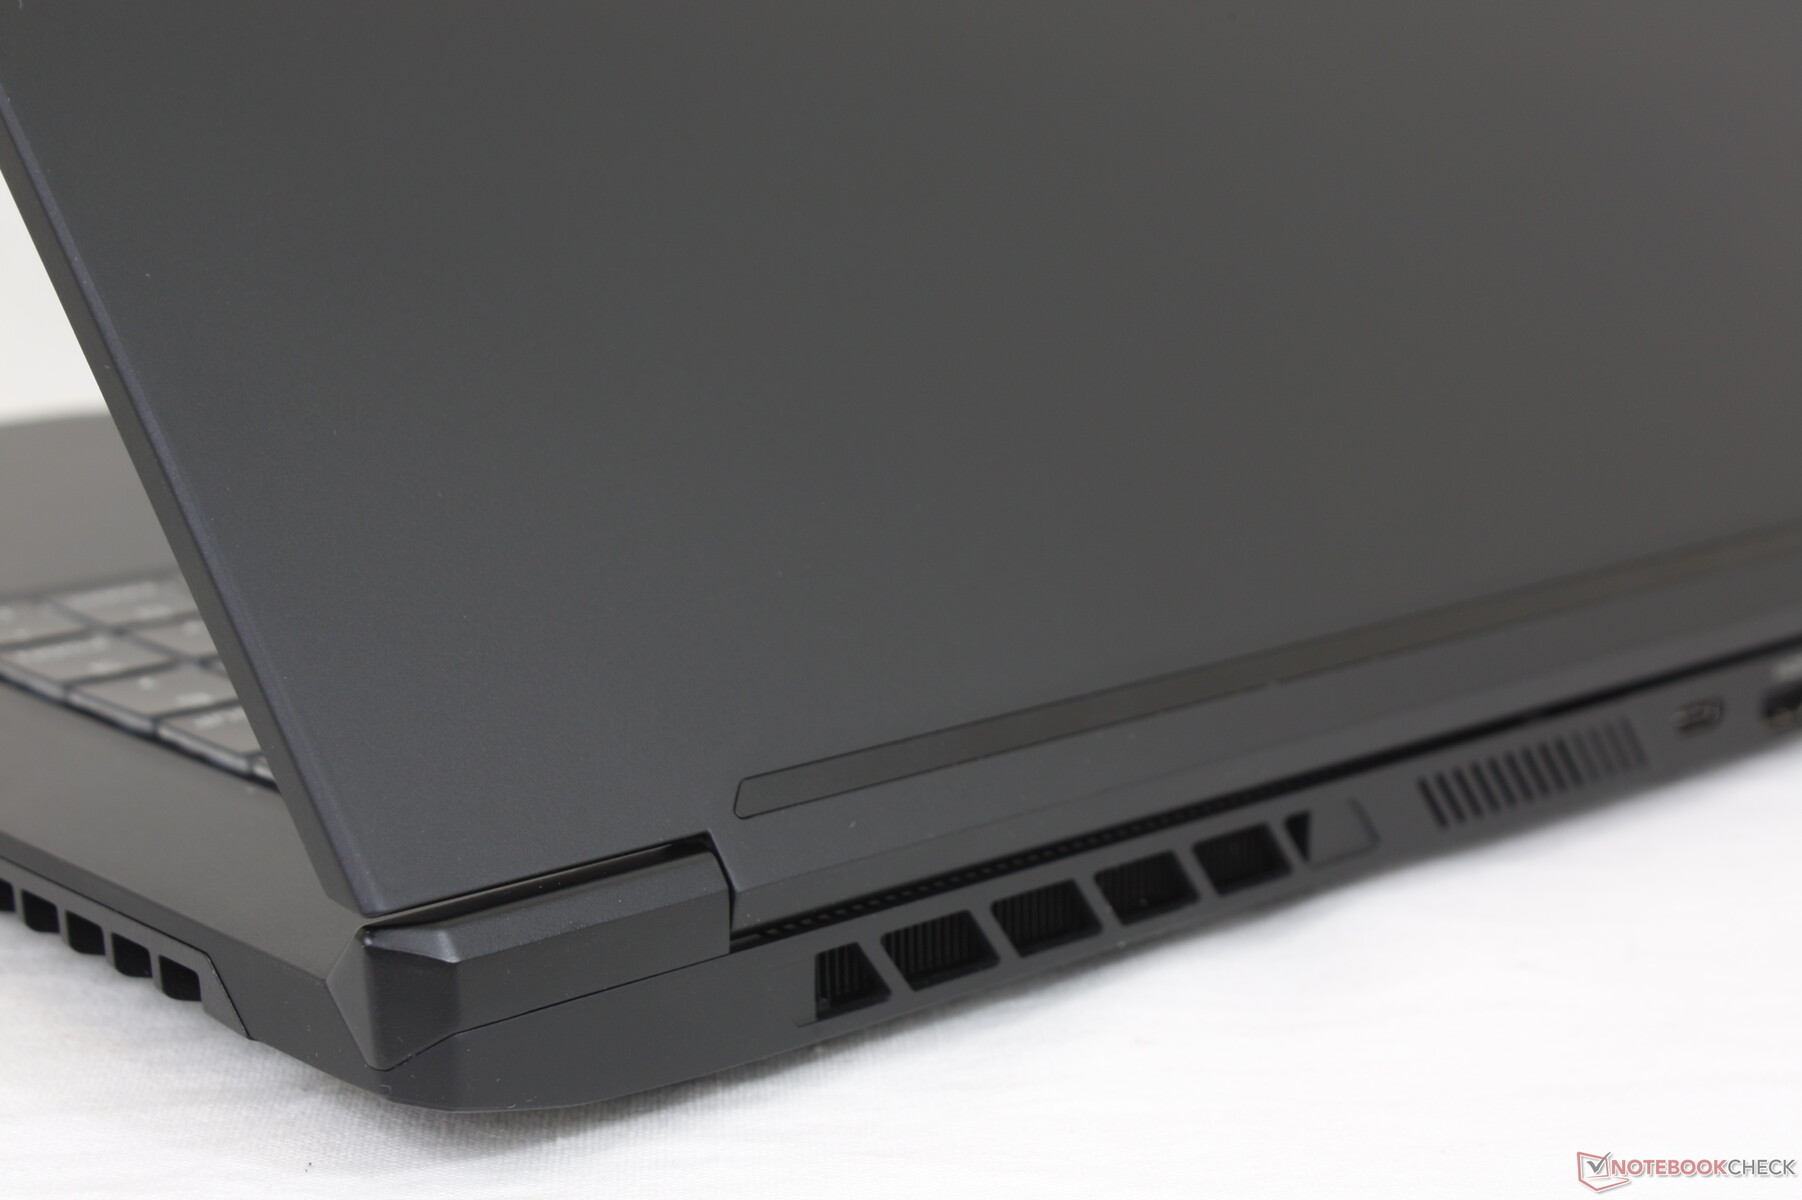
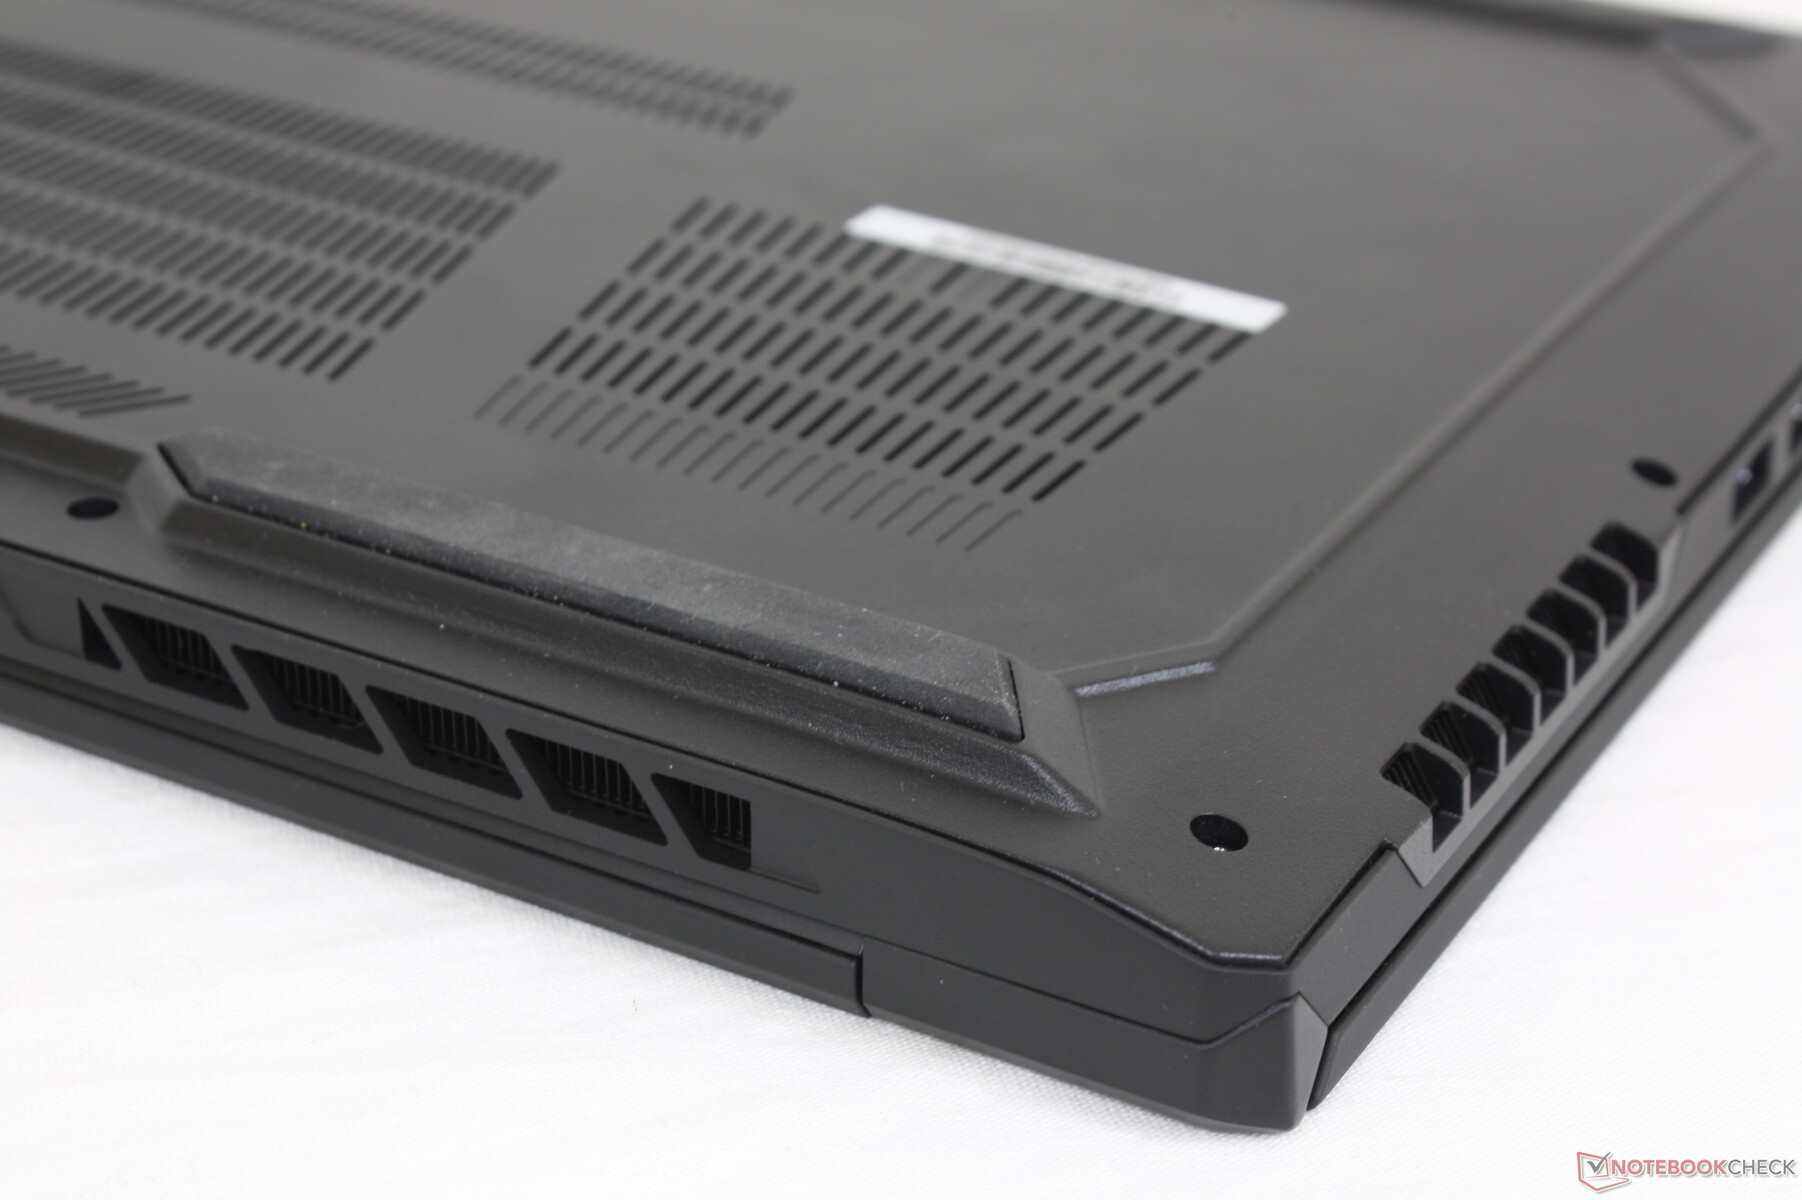
Estojo - Tongfang típico
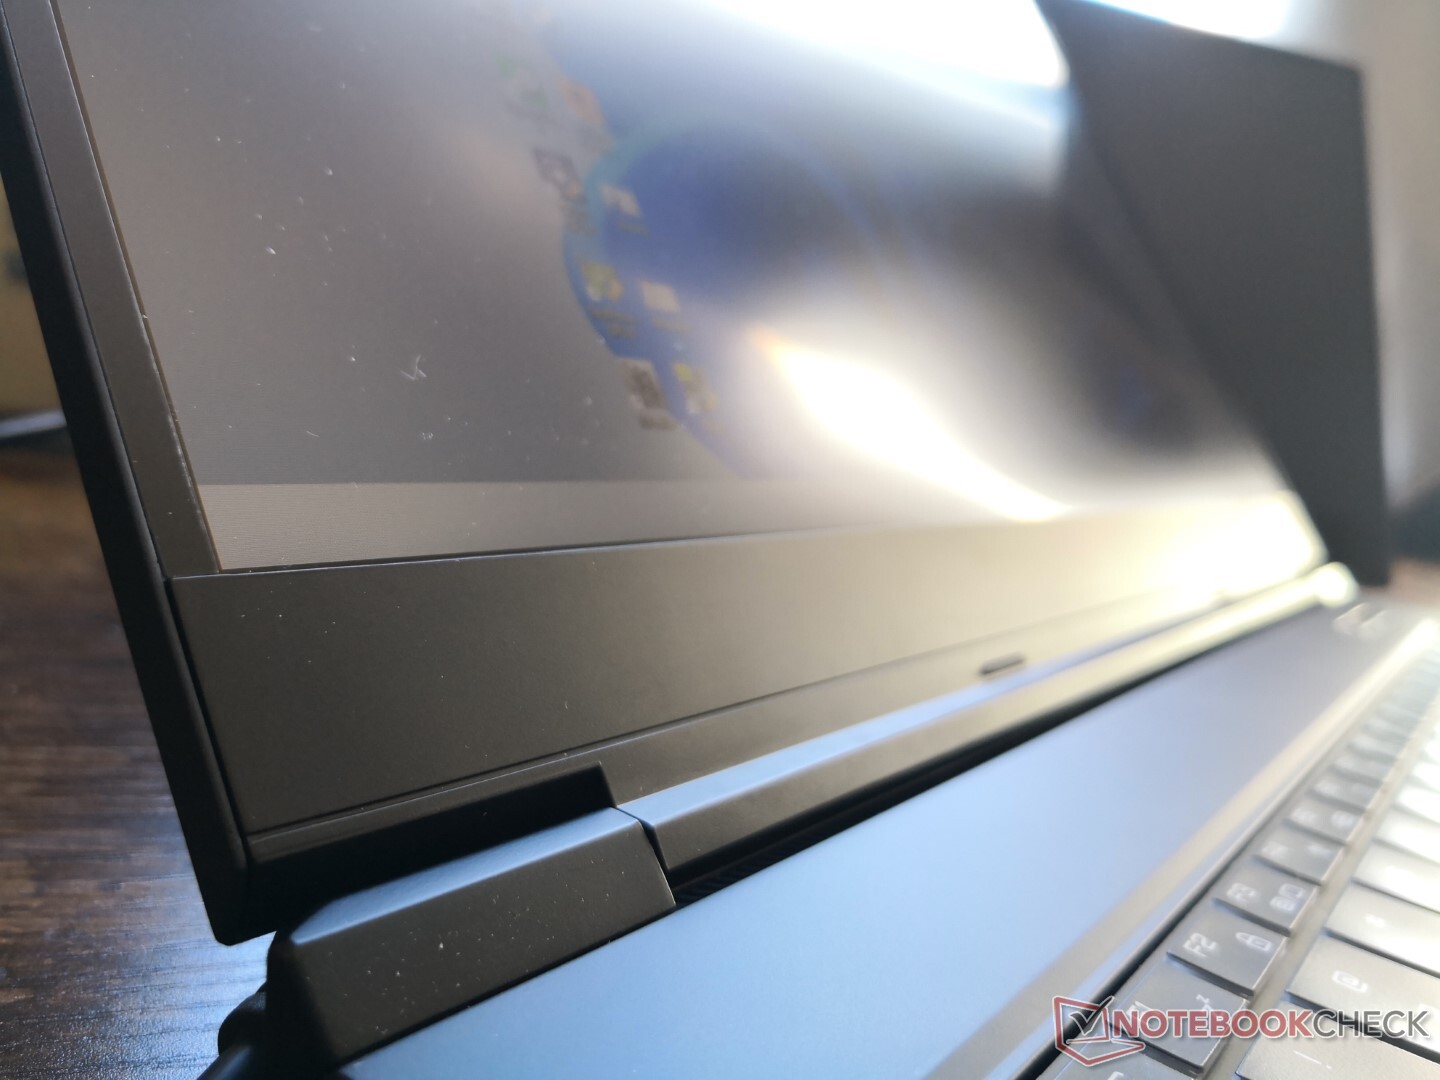
Anteriormente conhecida como Tongfang, a Uniwill Technology utiliza materiais e projetos similares em muitos de seus laptops e estações de trabalho móveis para jogos. Neste caso, o GM7AG8P tem muito em comum com o XMG Neo 17 e XMG Pro 17 em termos de características, rigidez e textura, mesmo que suas dimensões, aparências e tamanhos sejam ligeiramente diferentes. As dimensões gerais são quase idênticas às do Razer Blade Pro 17, pesando 500 gramas a menos, principalmente devido à falta de um resfriador de câmara de vapor para o GM7AG8P.
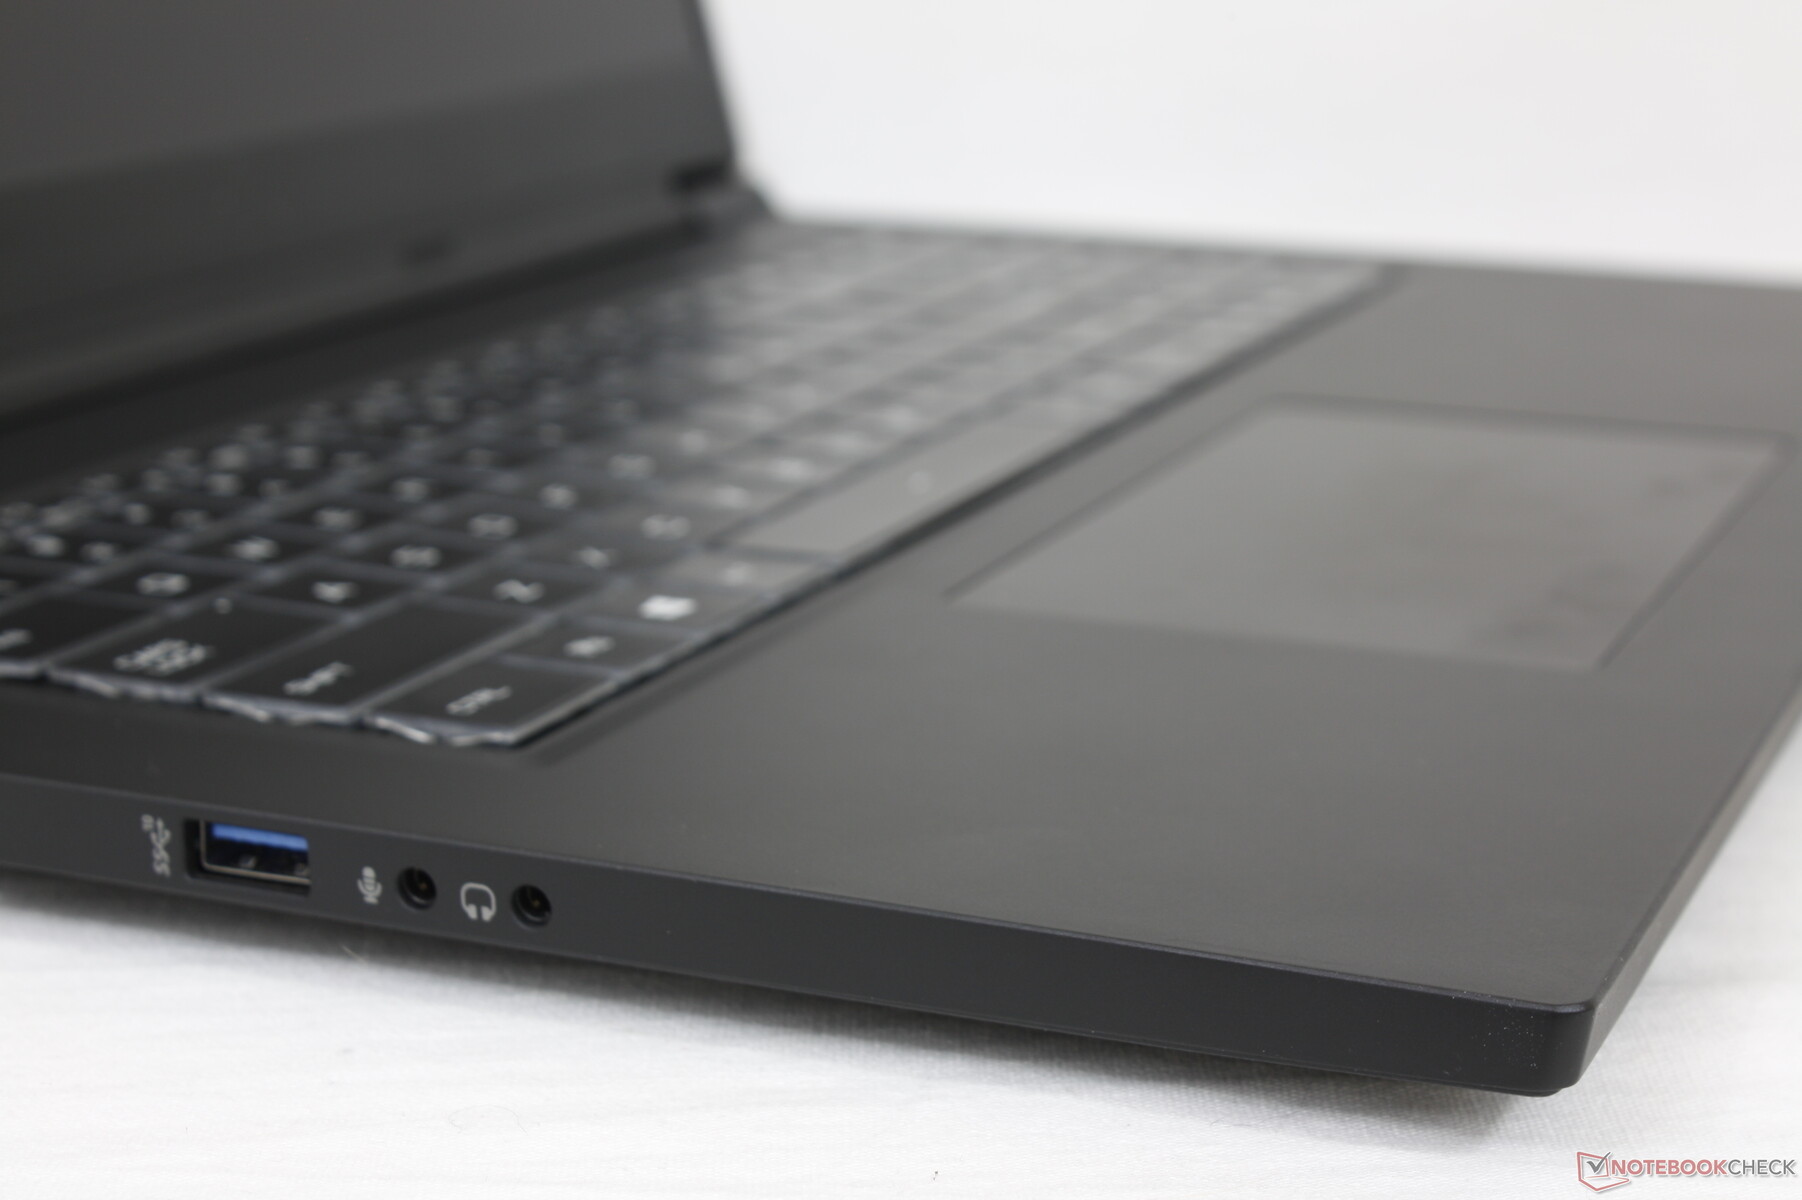
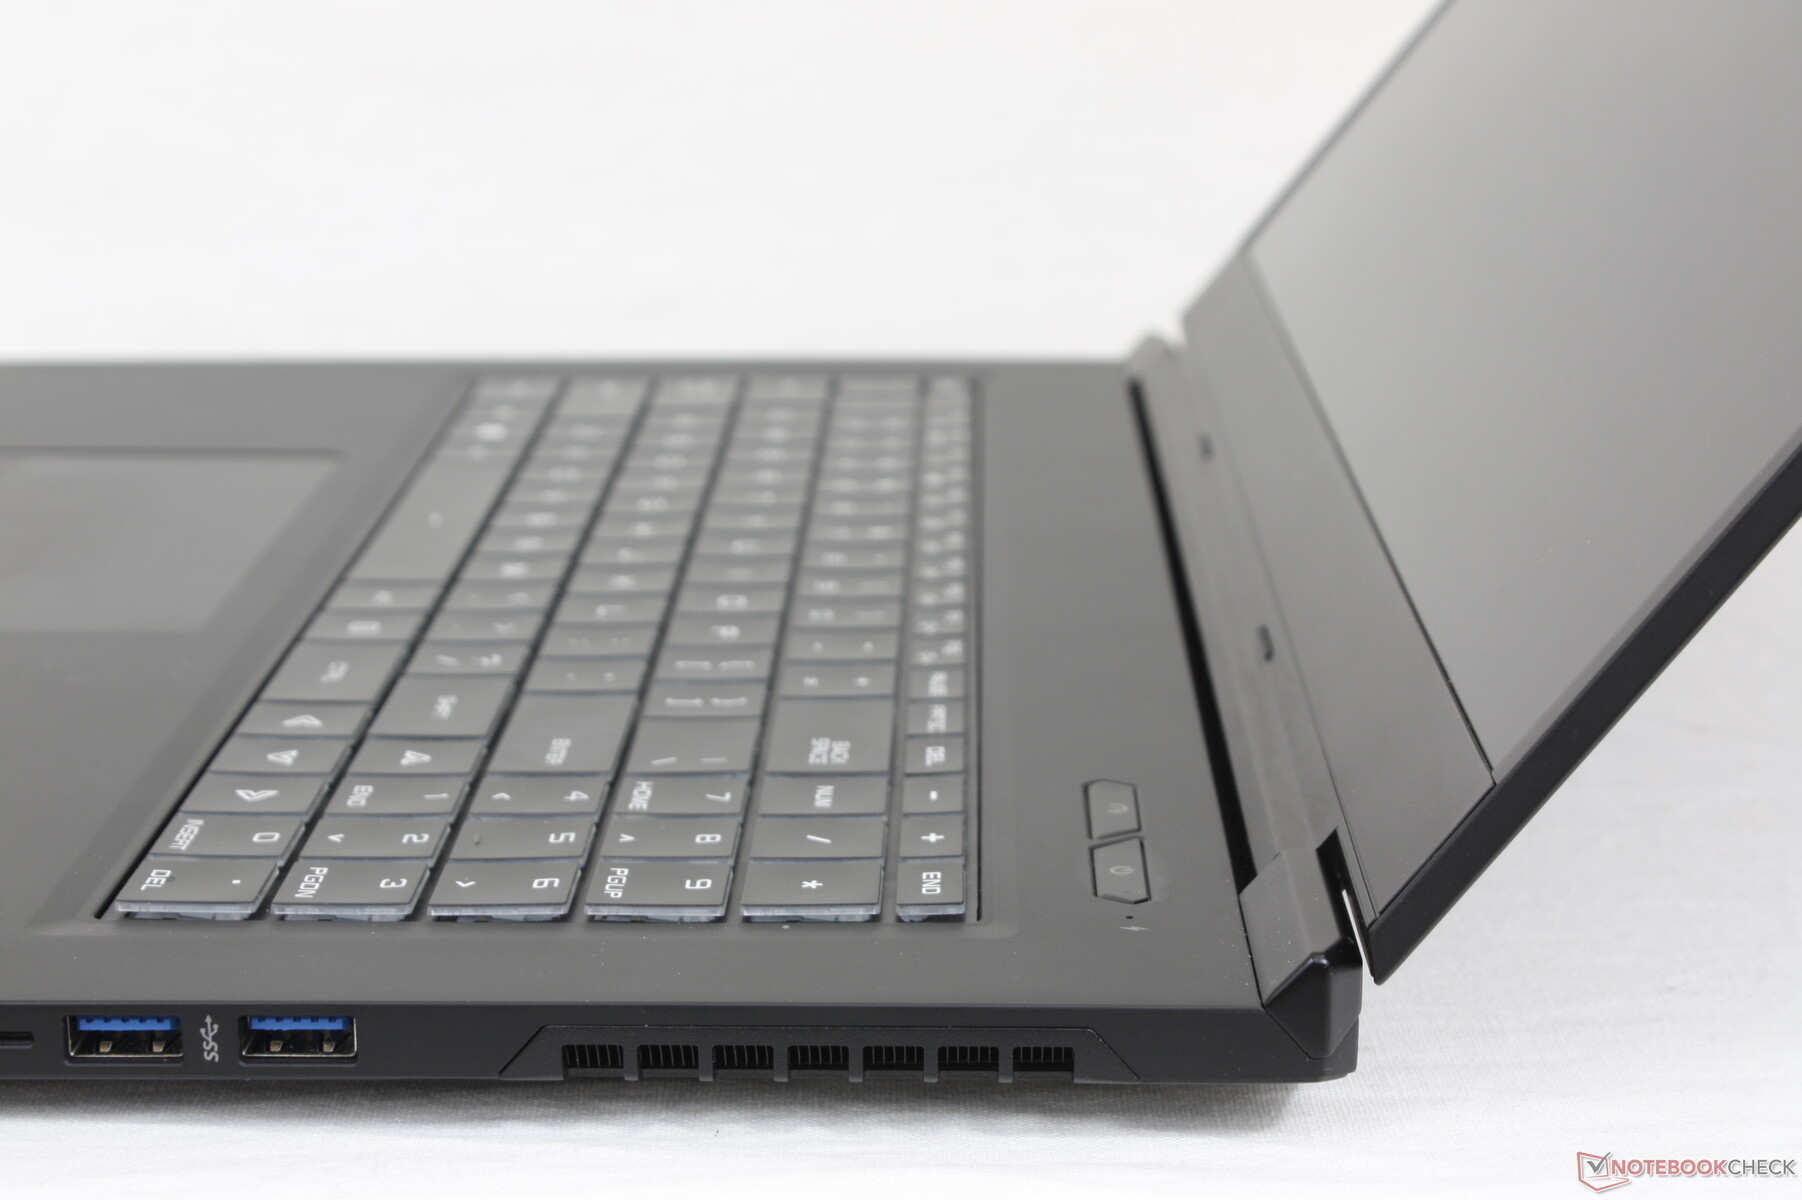
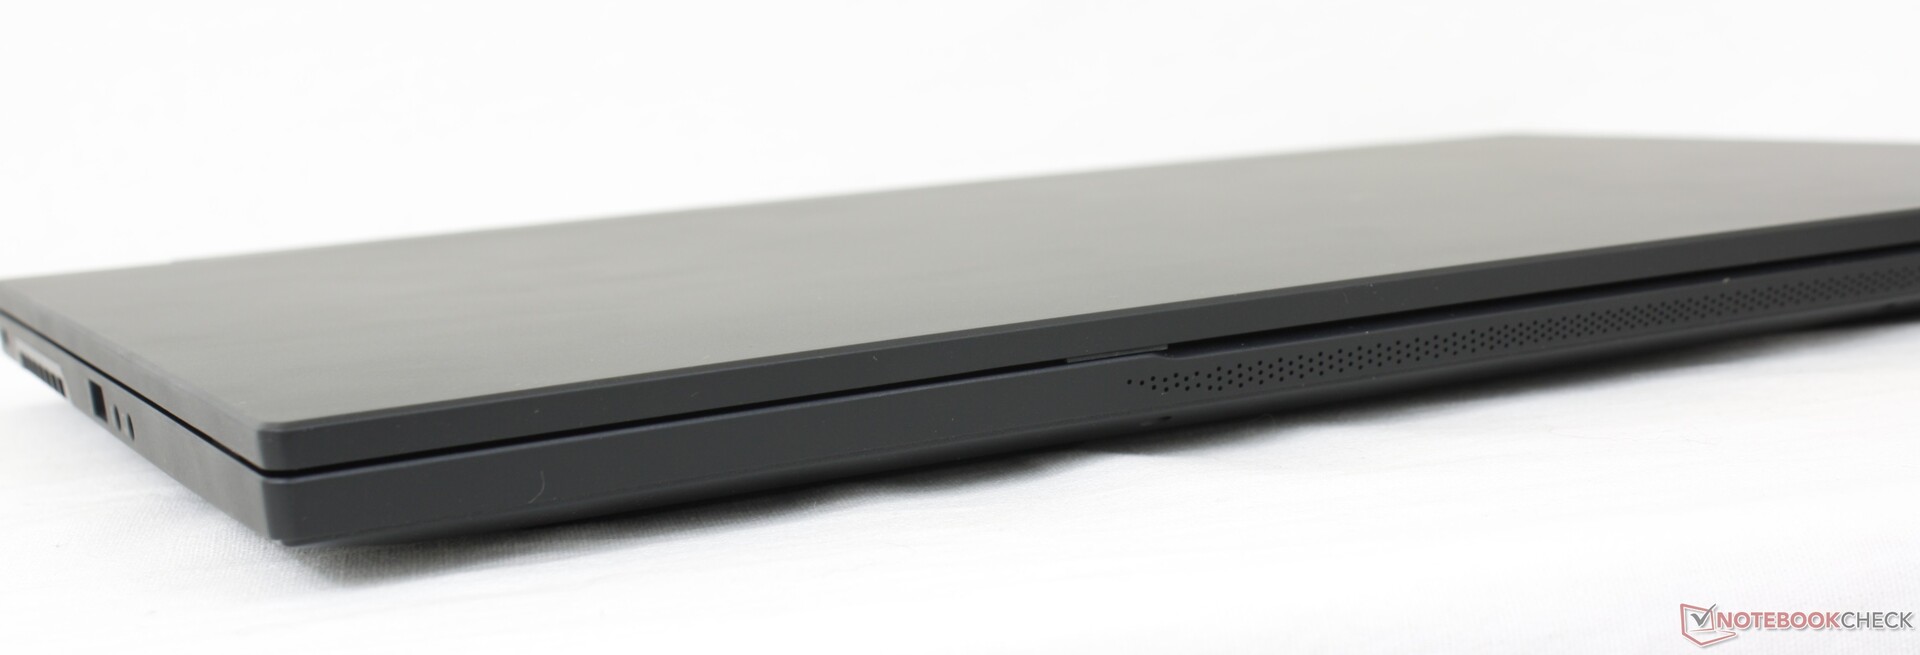
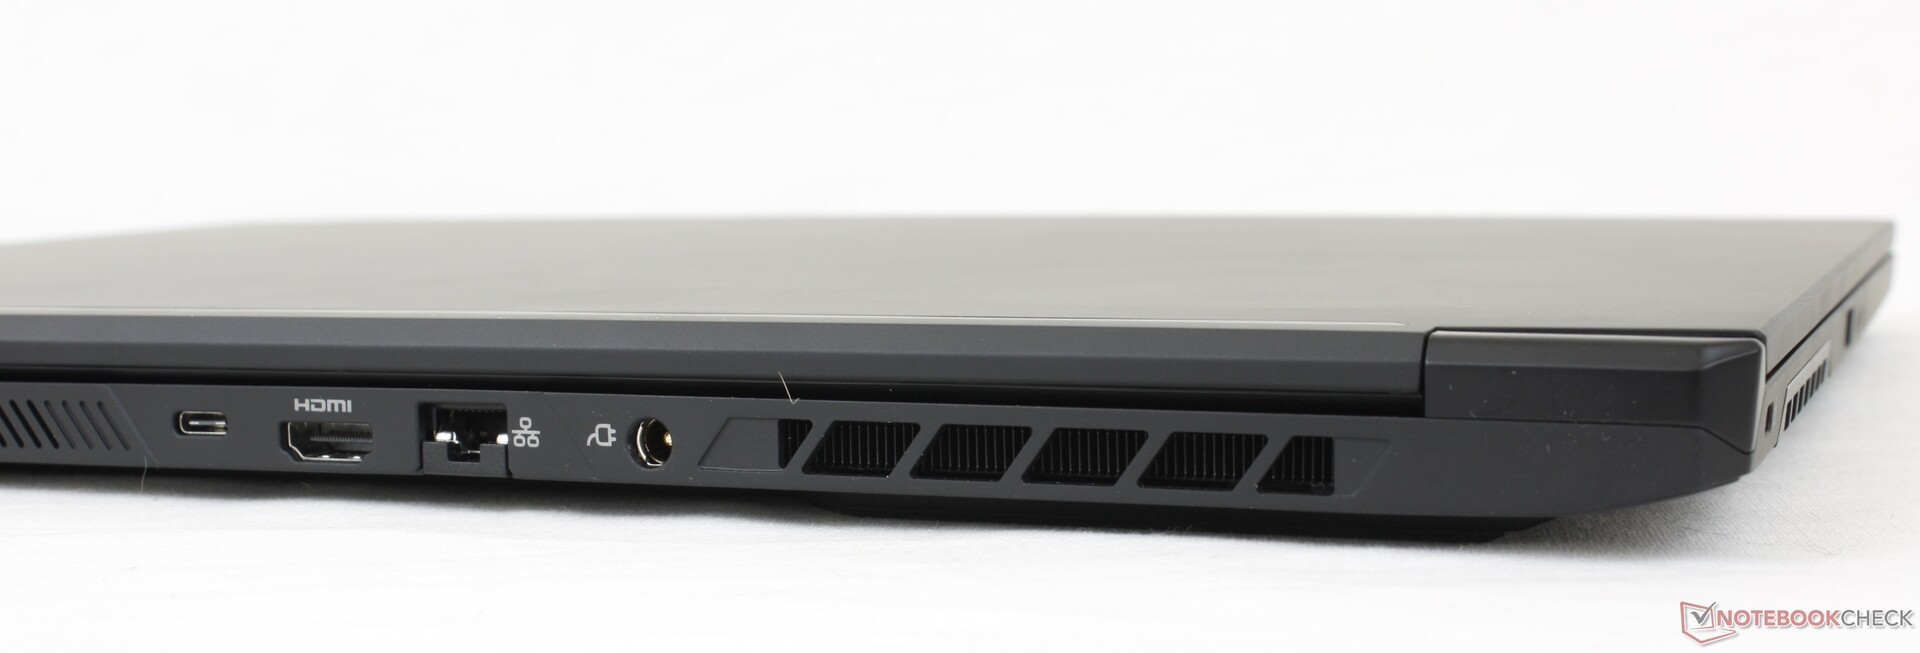
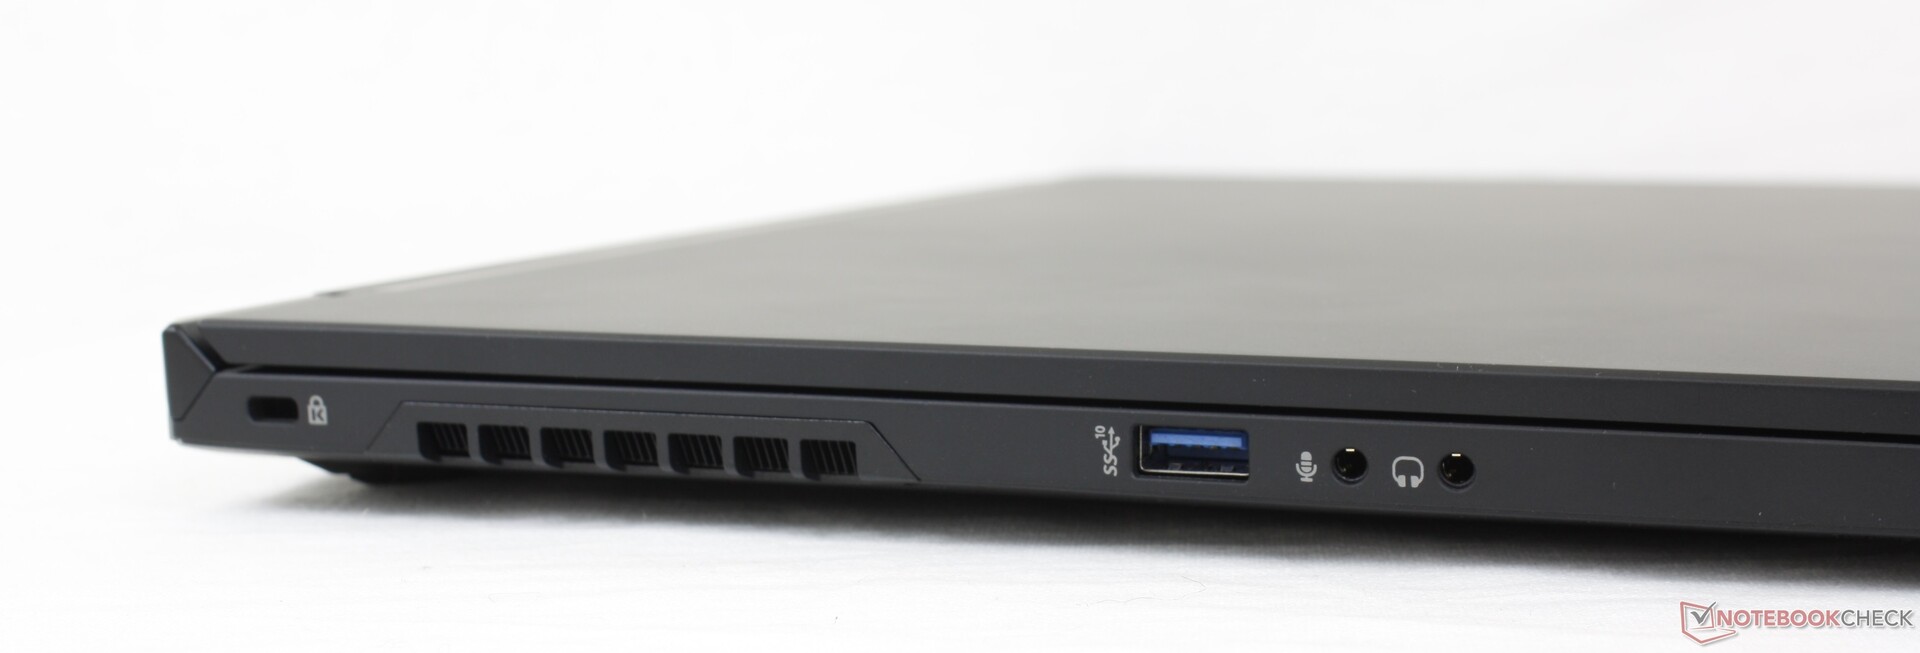
Conectividade - Thunderbolt 4... Às vezes
As opções de porto são essencialmente idênticas ao Schenker XMG Neo 17, mas com algumas diferenças importantes. O GM7AG8P usa um leitor de cartões MicroSD menor, por exemplo, enquanto que o Thunderbolt 4 e a compatibilidade externa G-Sync/Adaptive Sync só serão ativados quando rodando no modo MSHybrid.
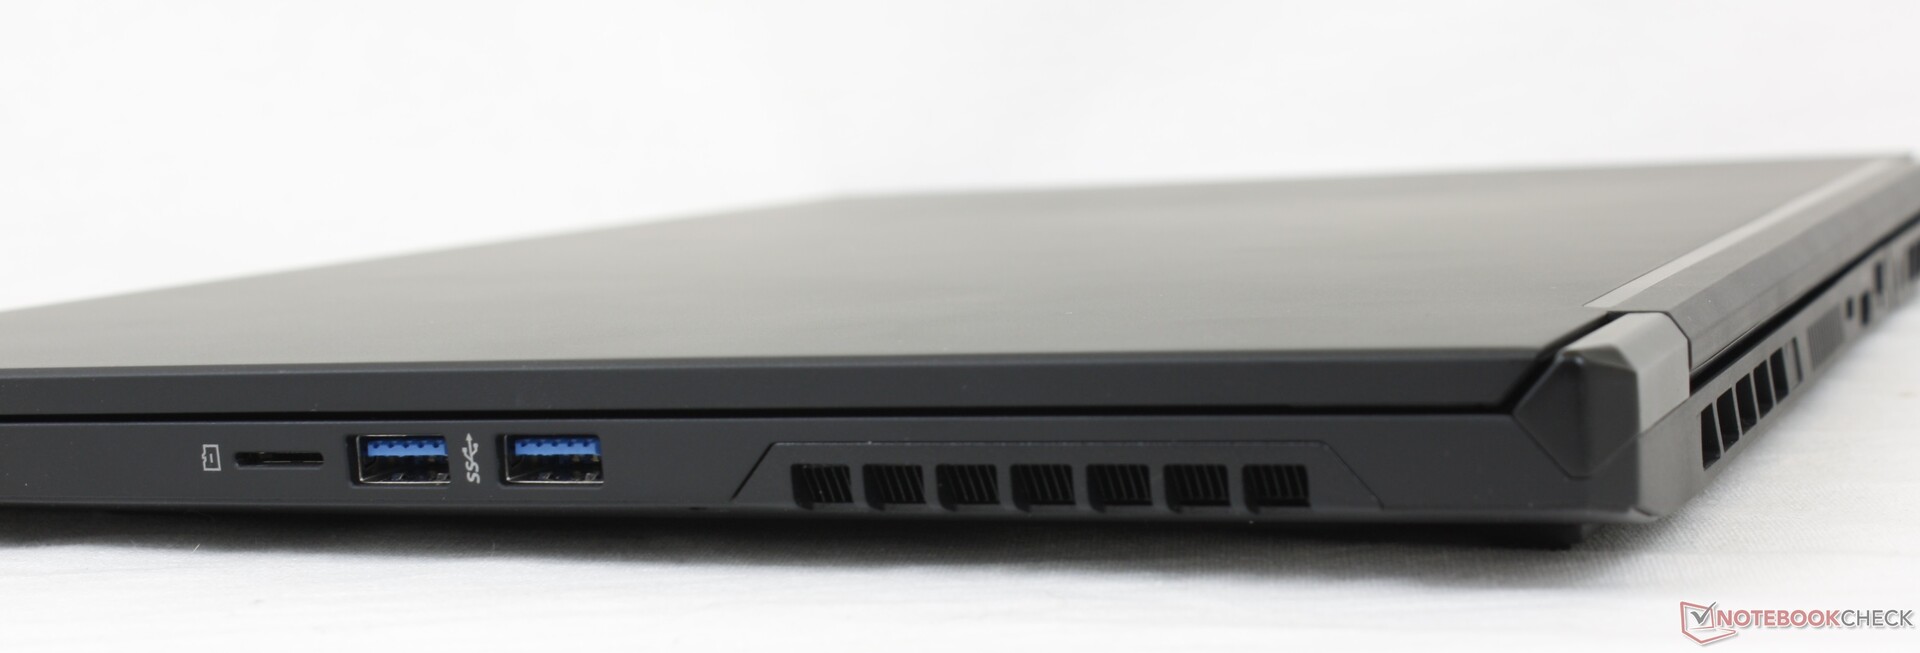
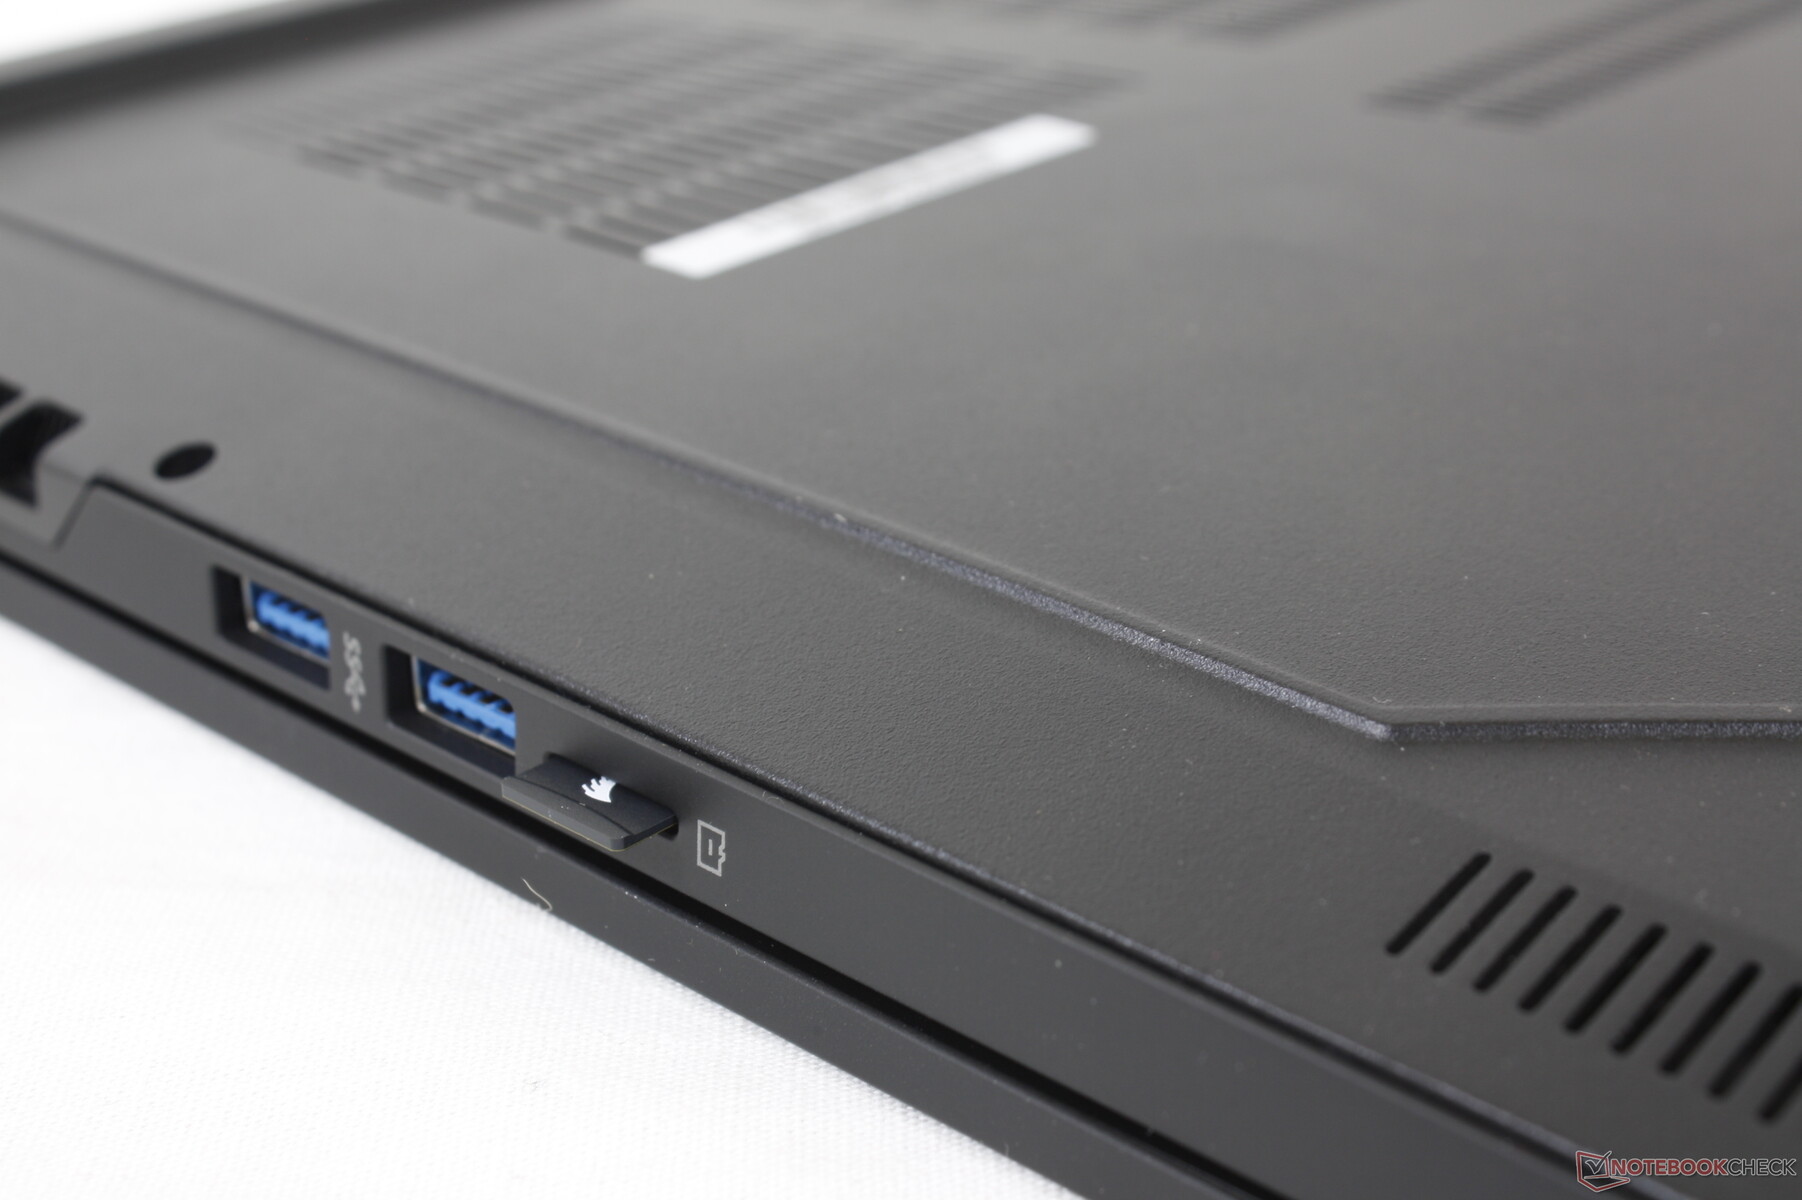
Leitor de cartões SD - Somente MicroSD
O sistema integra um leitor MicroSD apesar do grande fator de forma de 17,3 polegadas. Além disso, ao contrário da maioria dos outros leitores MicroSD, o do GM7AG8P não é carregado por mola e um cartão totalmente inserido também deve ser inserido de cabeça para baixo. As taxas de transferência são médias, pois leva cerca de 15 segundos para mover 1 GB de imagens de nossa placa de teste UHS-II em comparação com a metade do últimoLâmina Razer 17.
| SD Card Reader | |
| average JPG Copy Test (av. of 3 runs) | |
| Razer Blade 17 RTX 3070 (AV Pro V60) | |
| MSI GS76 Stealth 11UH (AV PRO microSD 128 GB V60) | |
| Alienware x17 RTX 3080 P48E (AV Pro V60) | |
| Maingear Vector Pro MG-VCP17 (AV Pro V60) | |
| Schenker XMG NEO 17 GM7TG8S | |
| Schenker Uniwill Technology GM7AG8P (AV Pro V60) | |
| maximum AS SSD Seq Read Test (1GB) | |
| Alienware x17 RTX 3080 P48E (AV Pro V60) | |
| MSI GS76 Stealth 11UH (AV PRO microSD 128 GB V60) | |
| Razer Blade 17 RTX 3070 (AV Pro V60) | |
| Schenker XMG NEO 17 GM7TG8S | |
| Maingear Vector Pro MG-VCP17 (AV Pro V60) | |
| Schenker Uniwill Technology GM7AG8P (AV Pro V60) | |
Comunicação
Webcam
A qualidade da câmera é fraca, apesar do sensor de 2 MP. As imagens são mais granulosas do que o esperado, mesmo pelos padrões já baixos da webcam do laptop
O IR está incorporado para suporte ao Windows Olá.


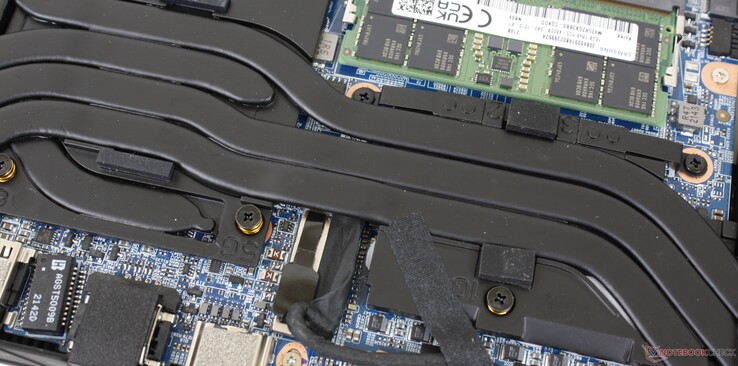
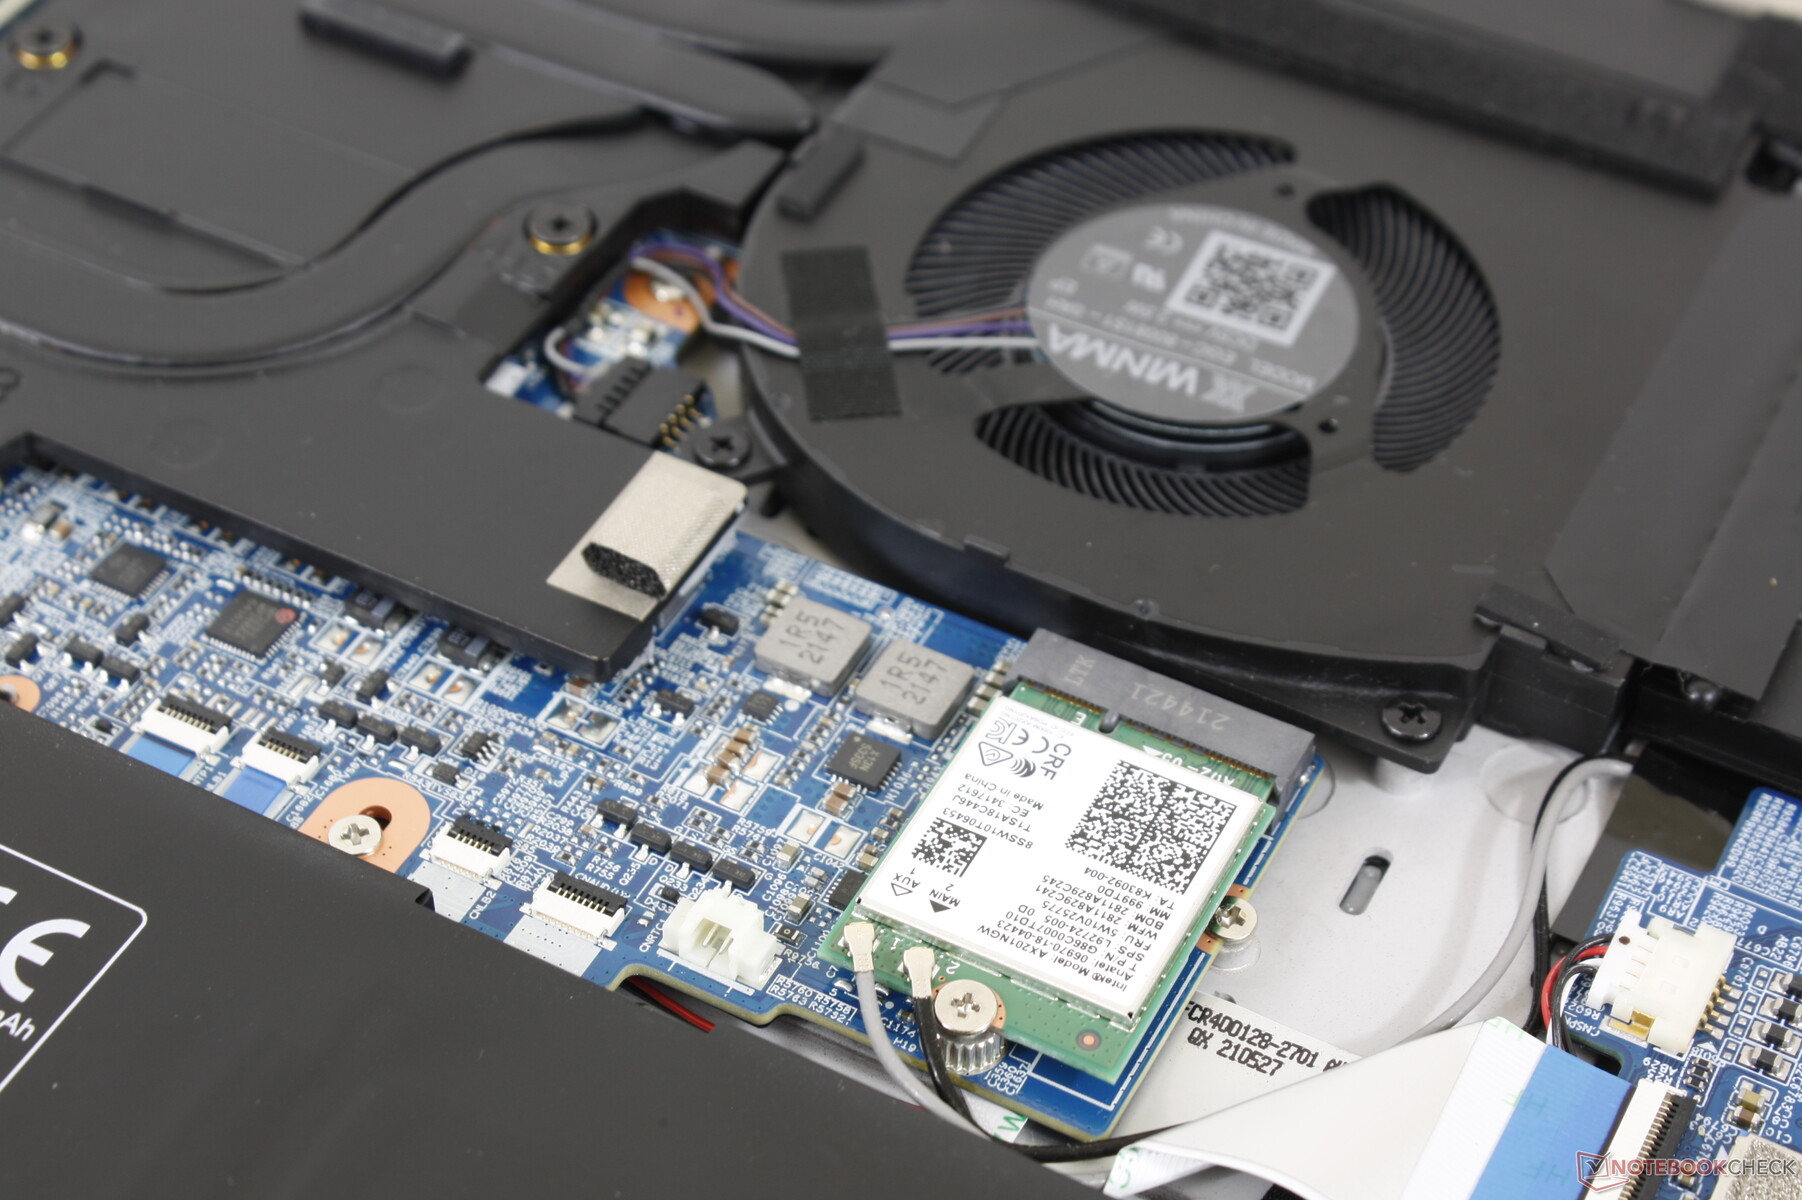
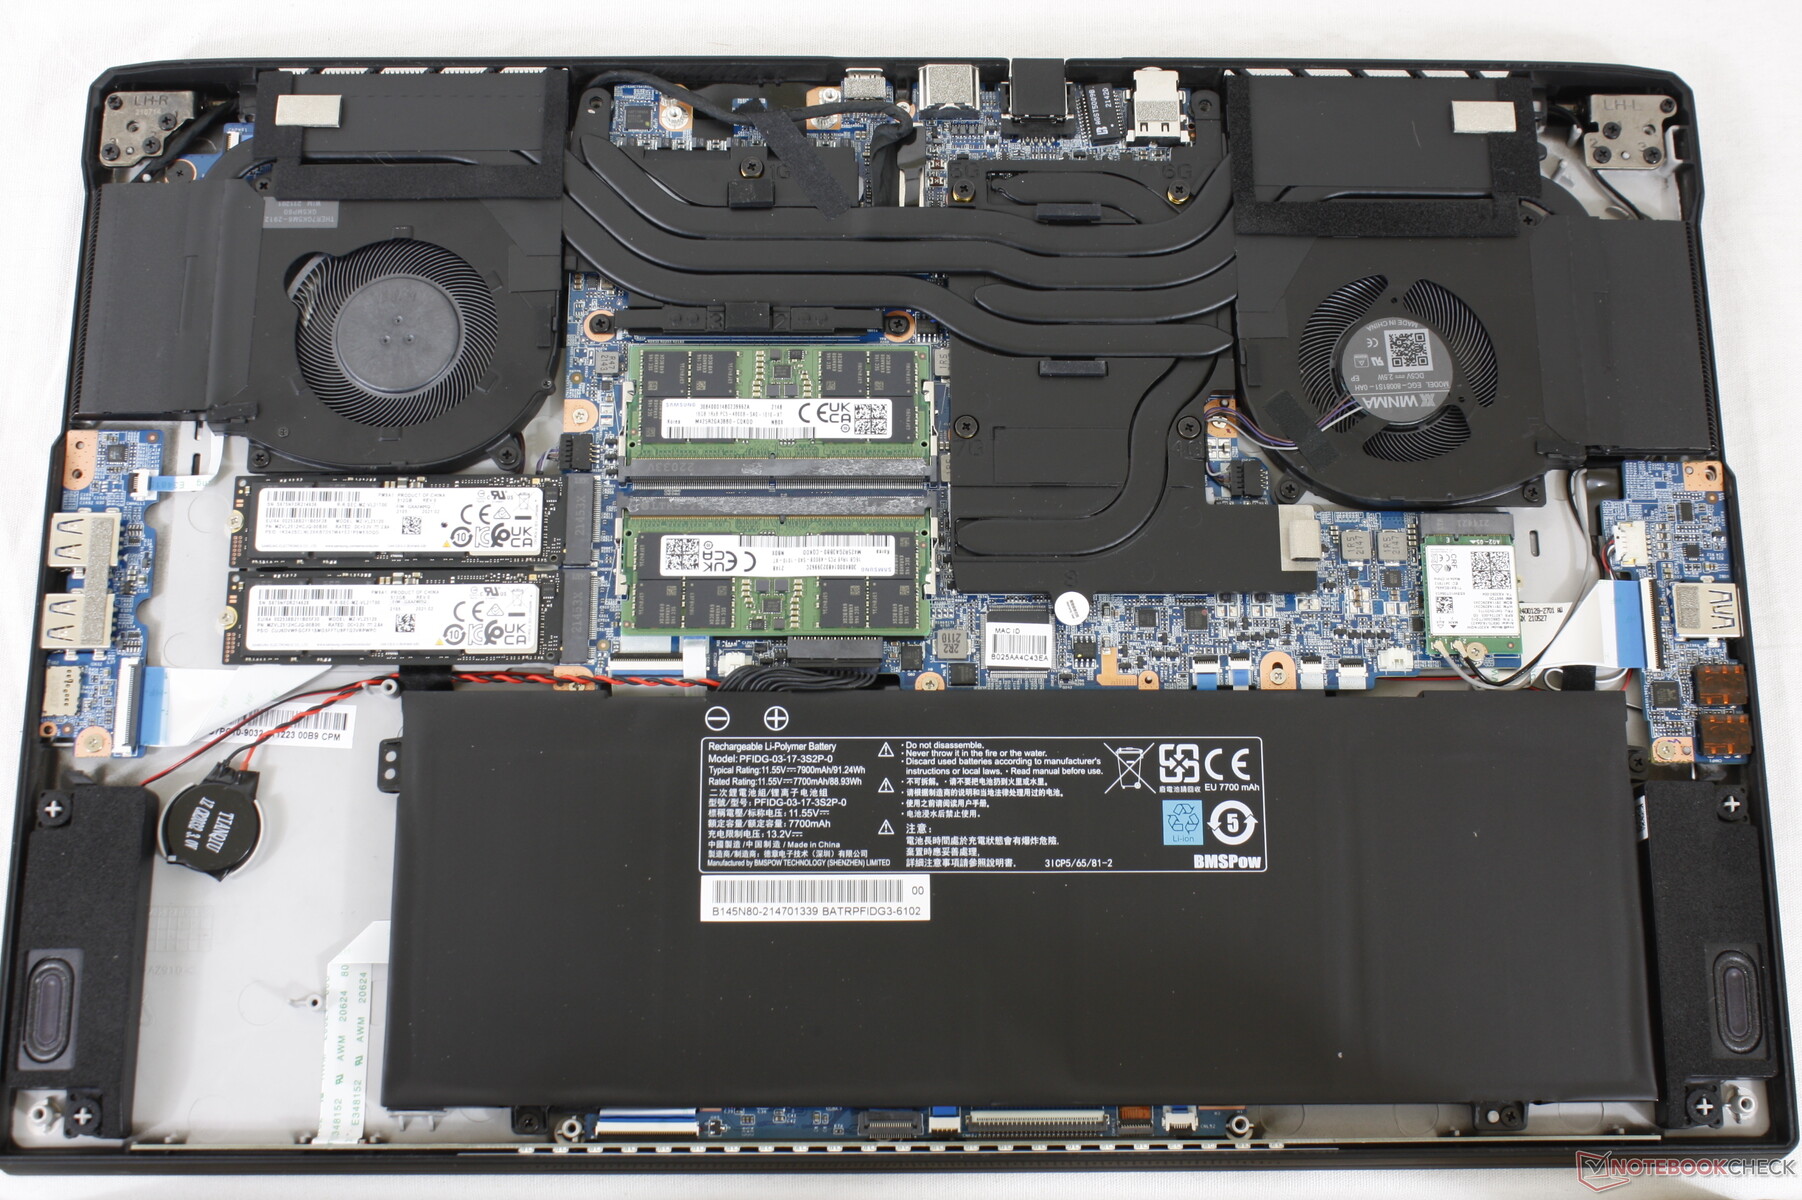
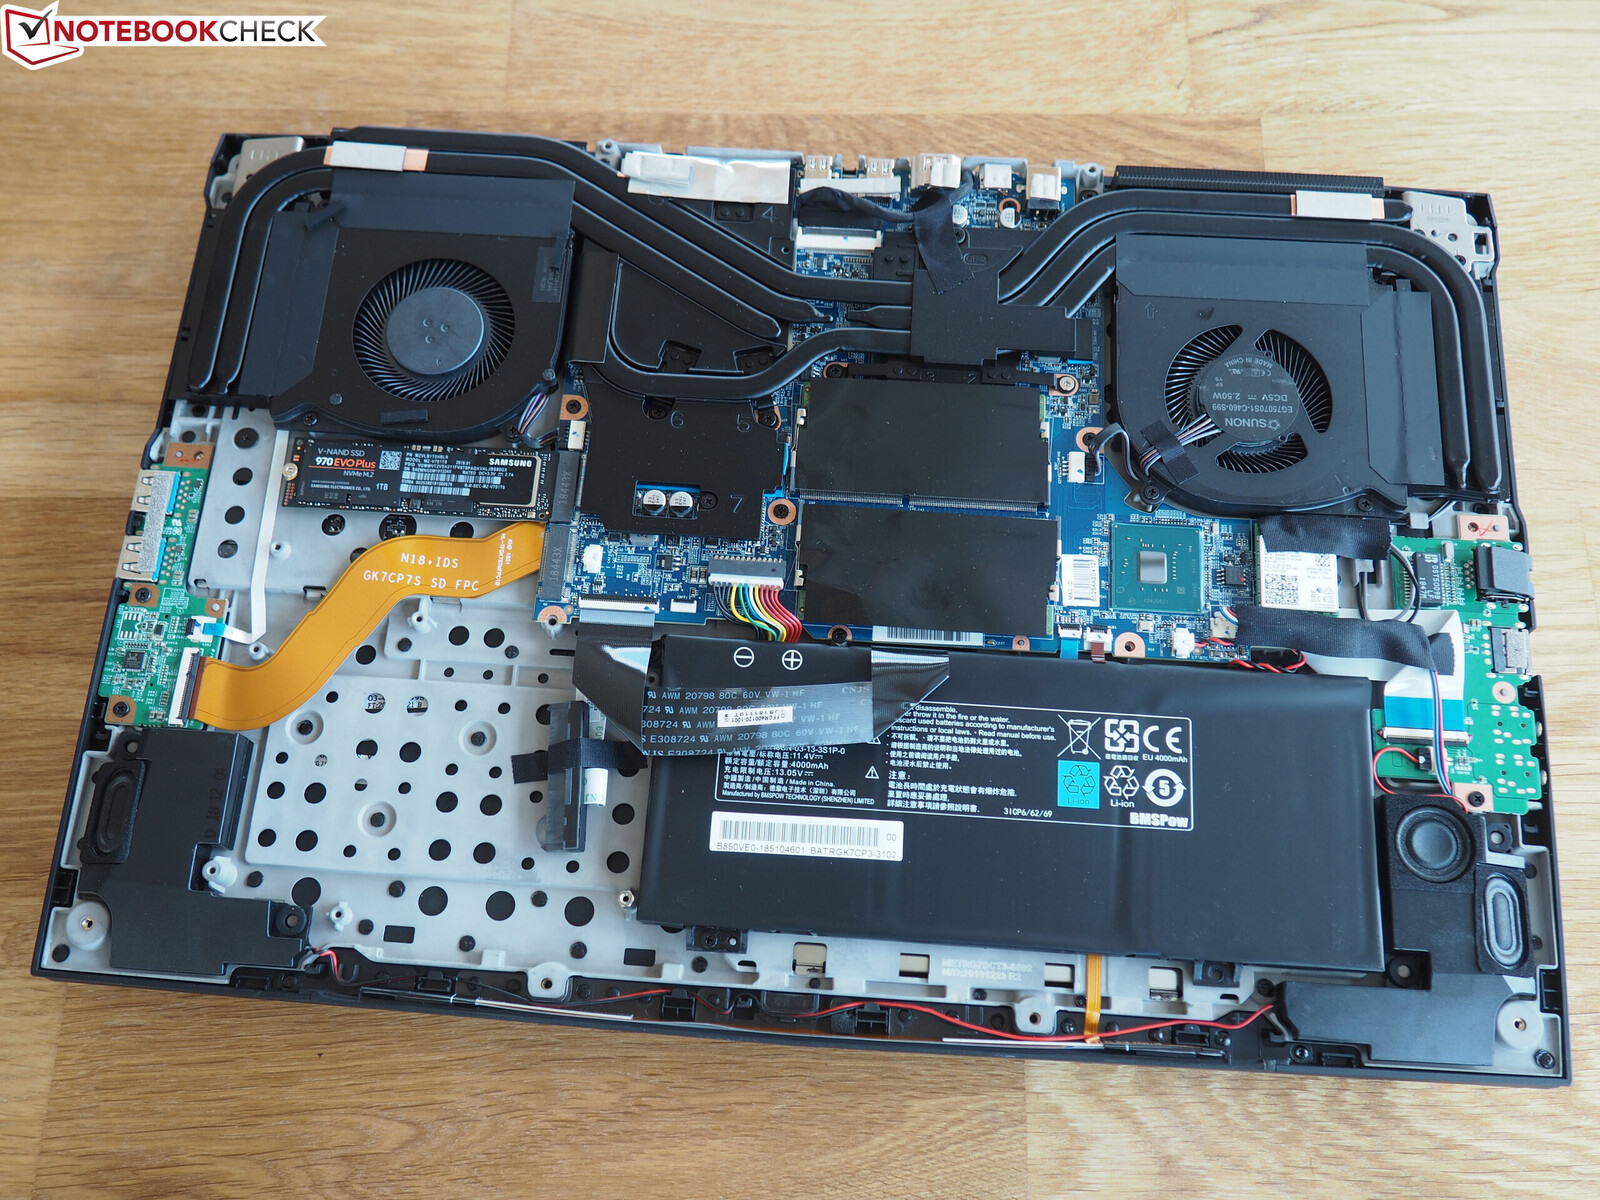
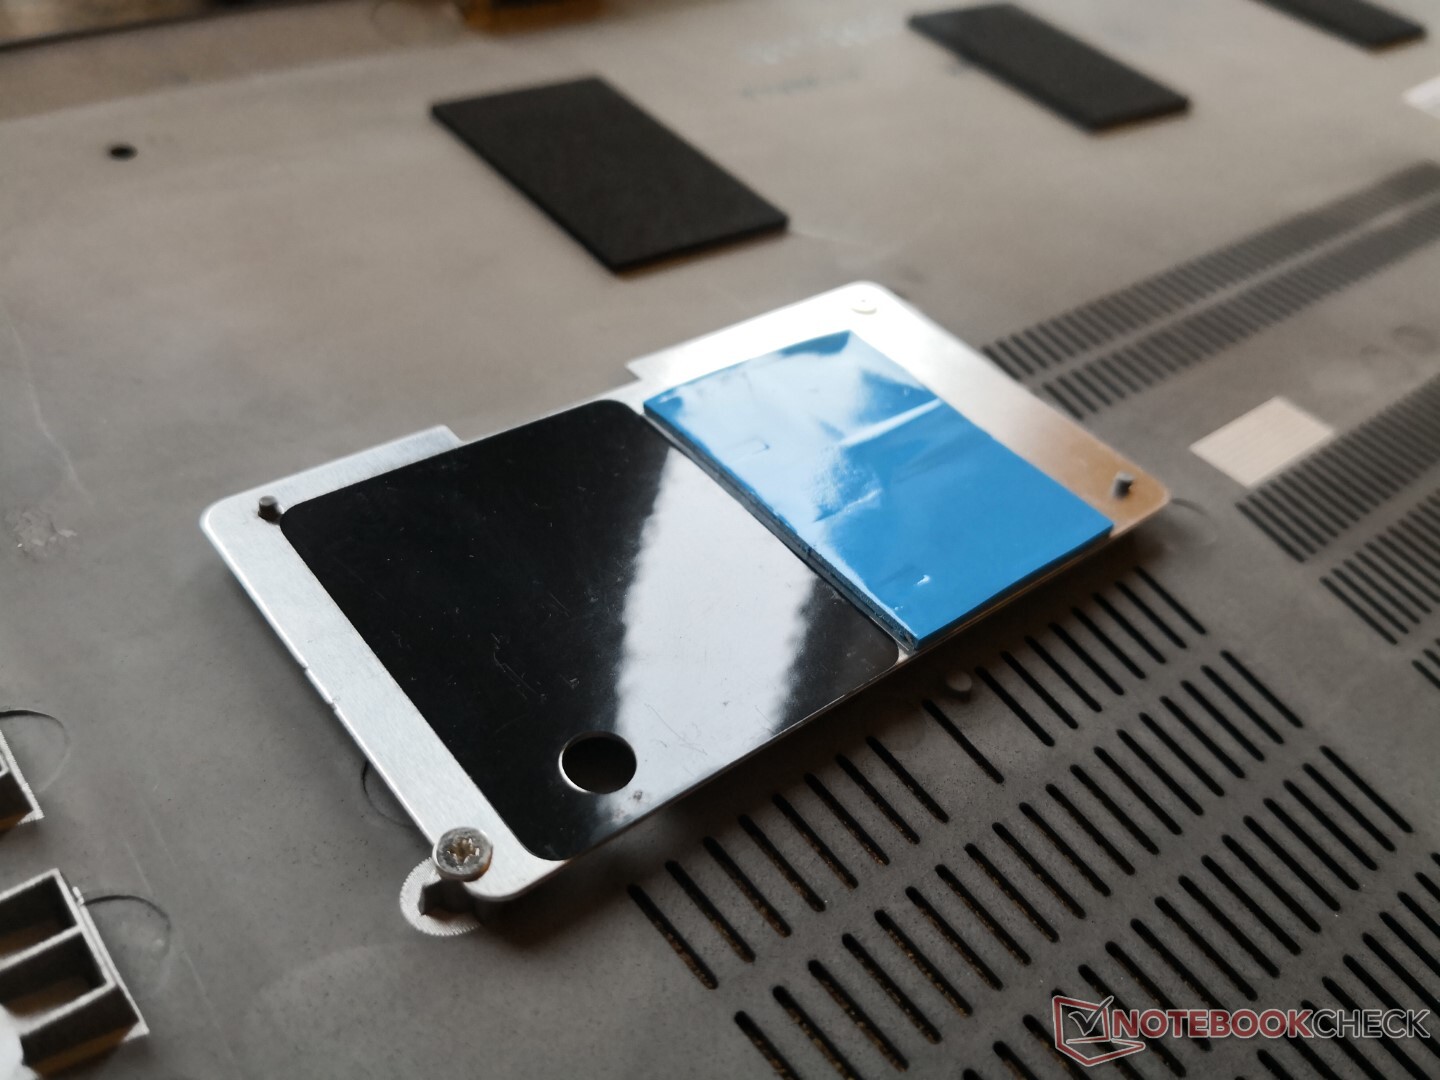
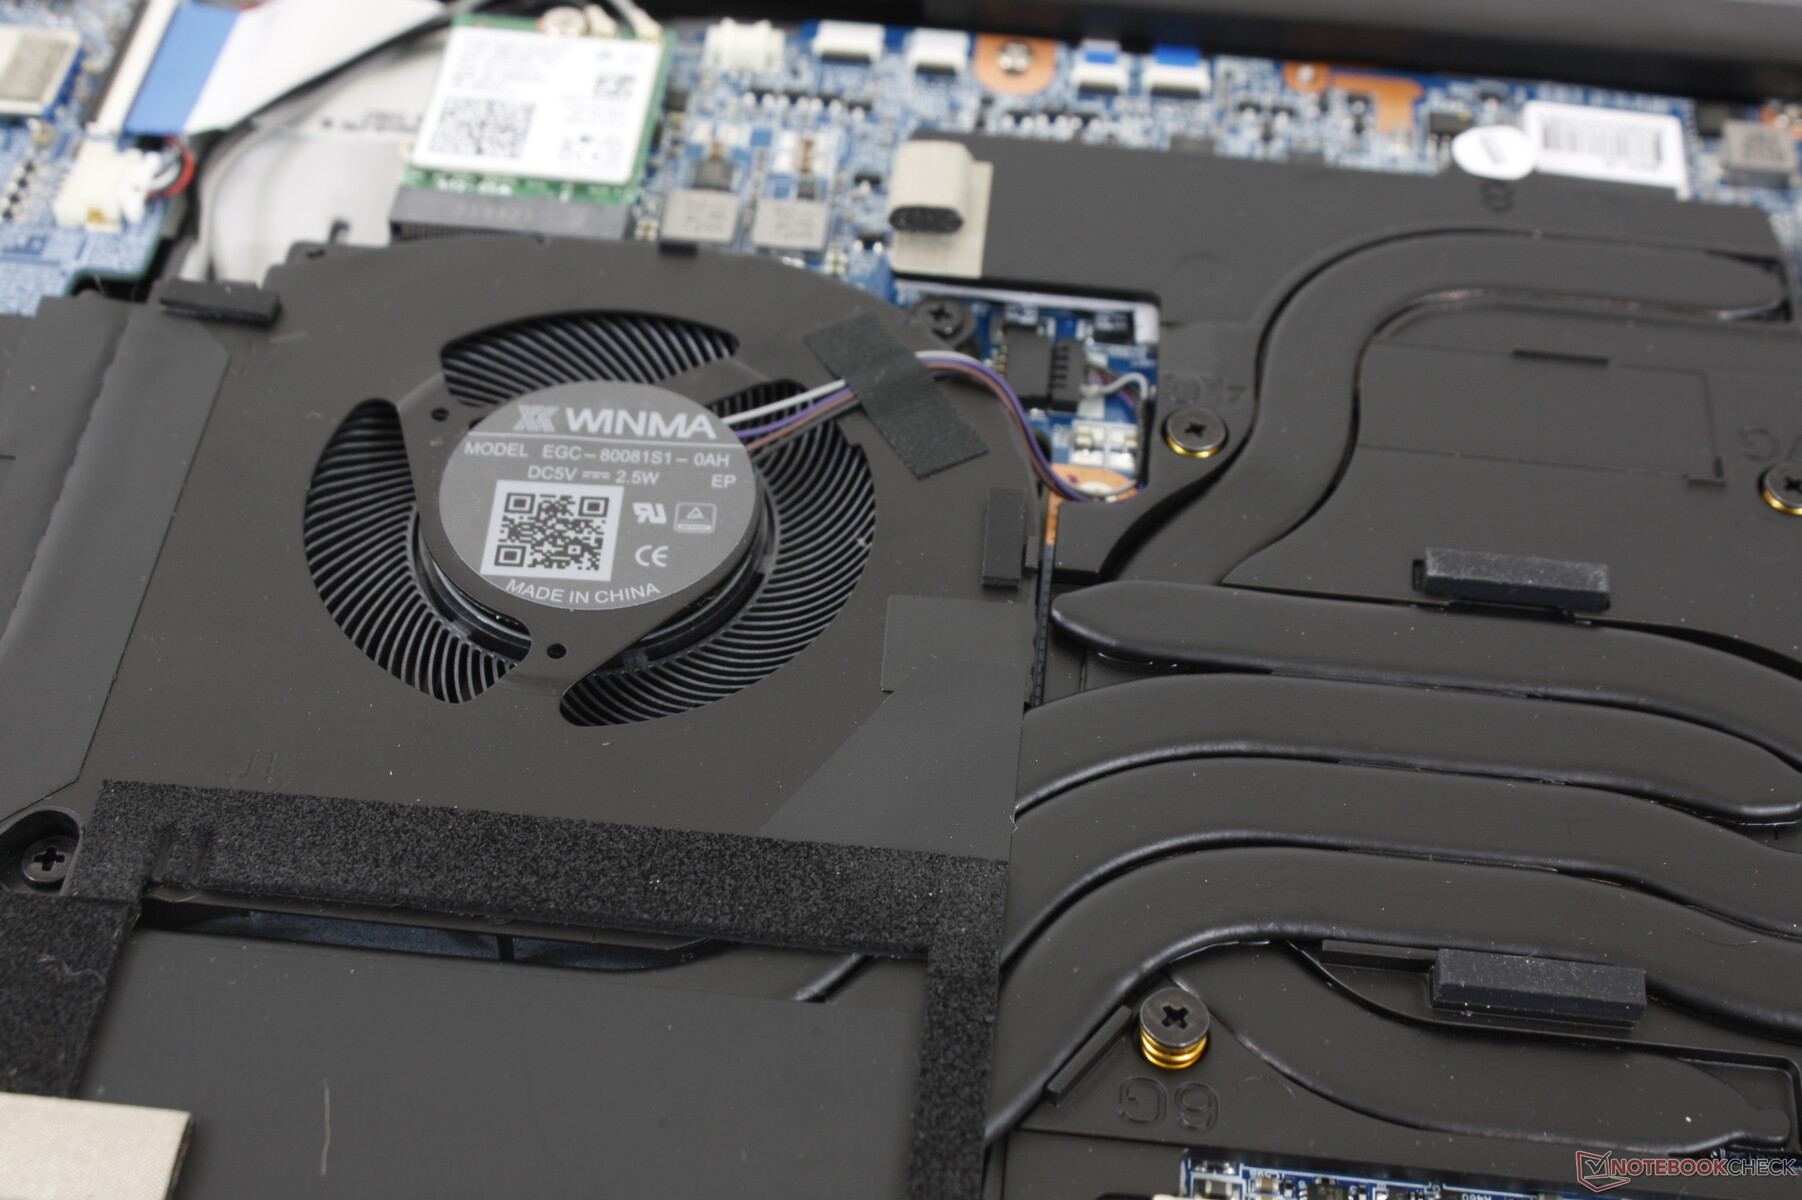
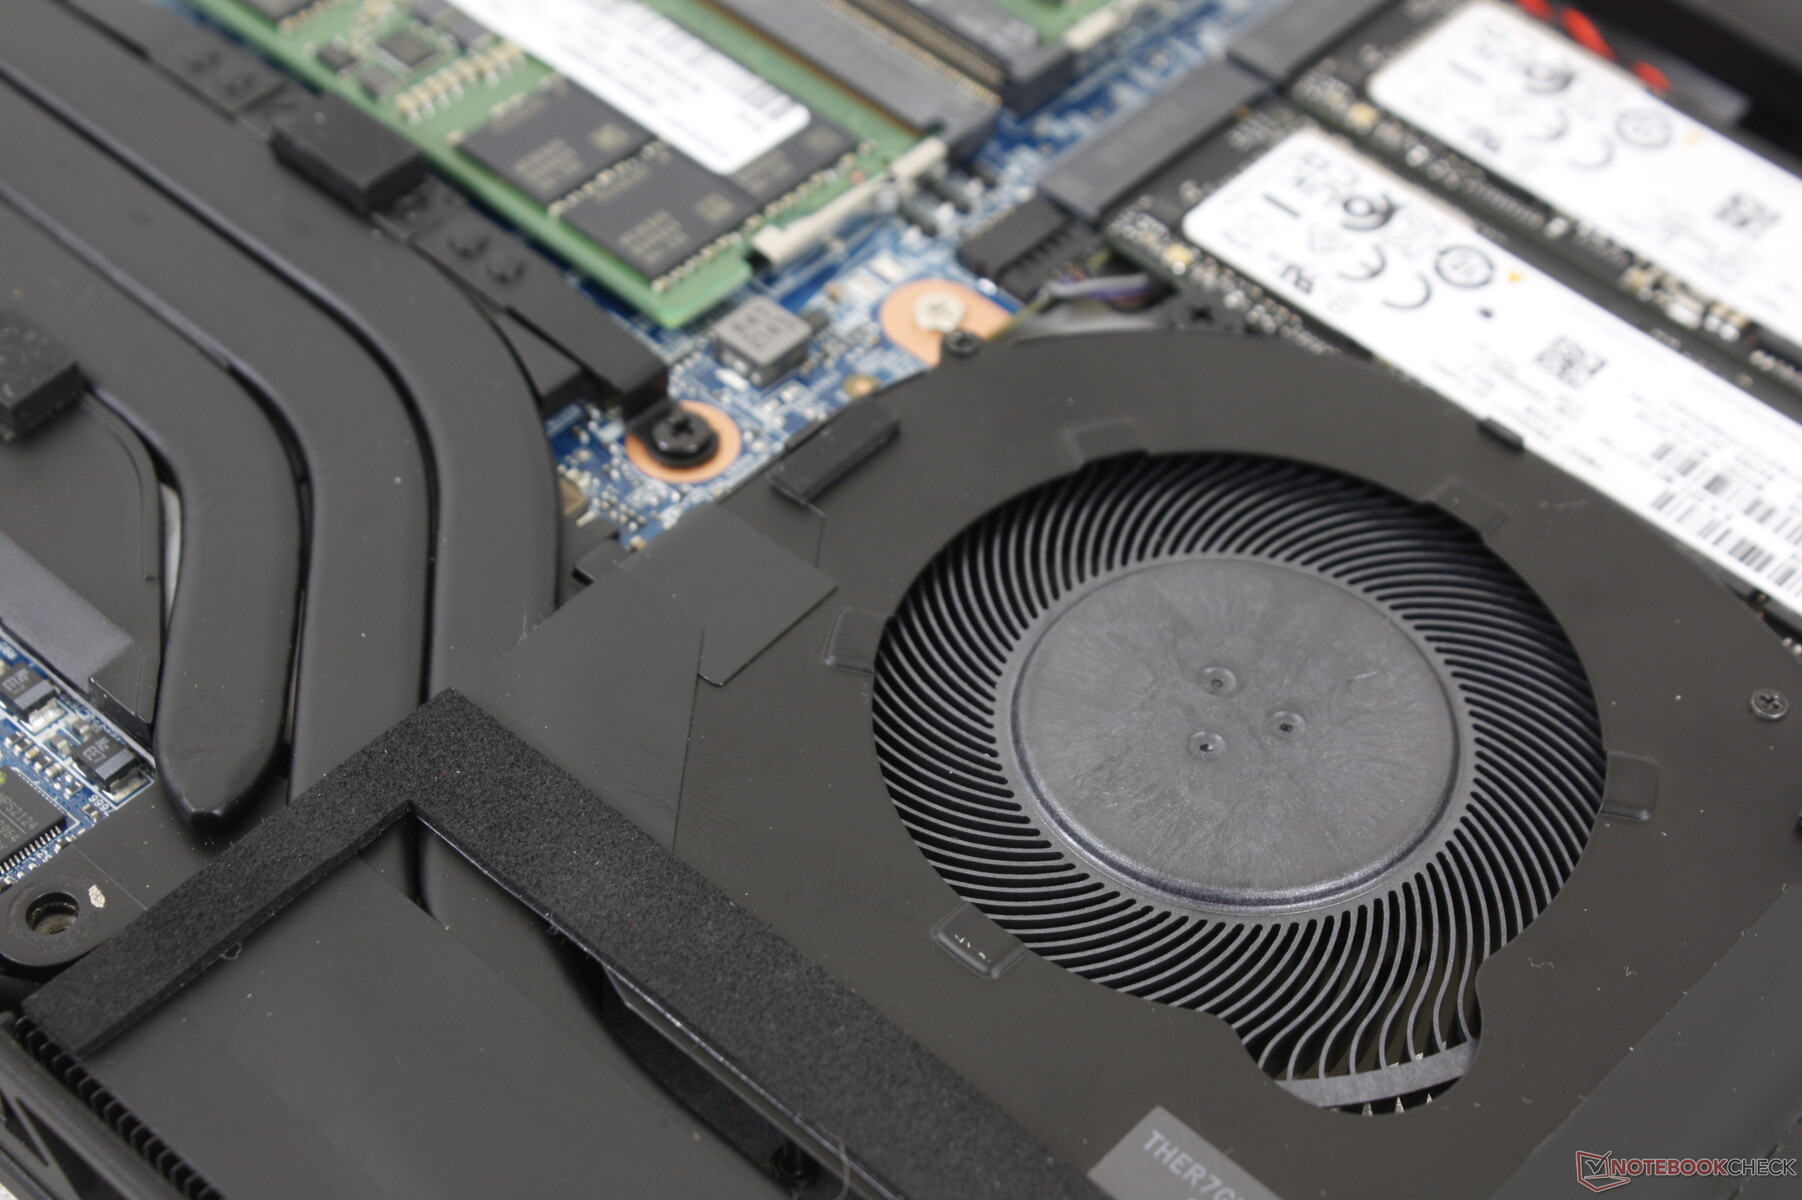
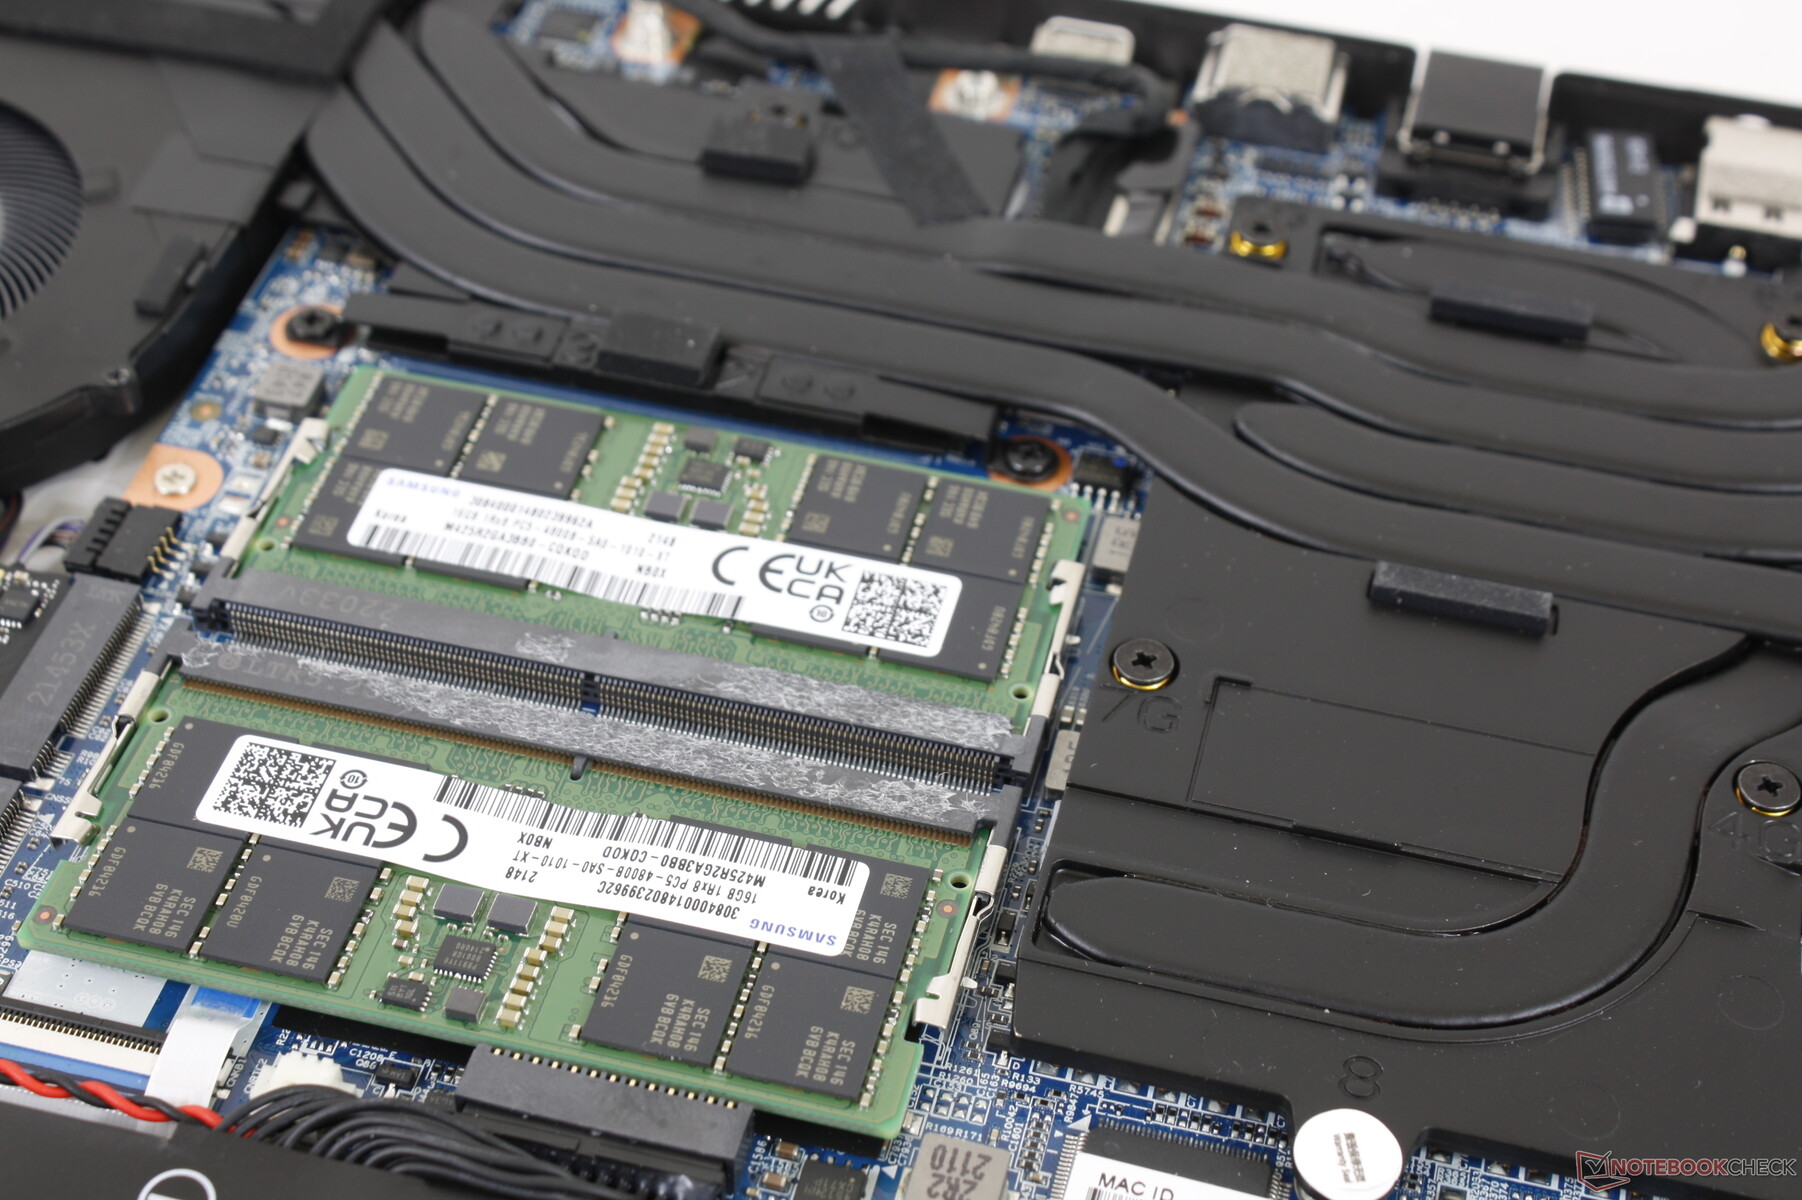
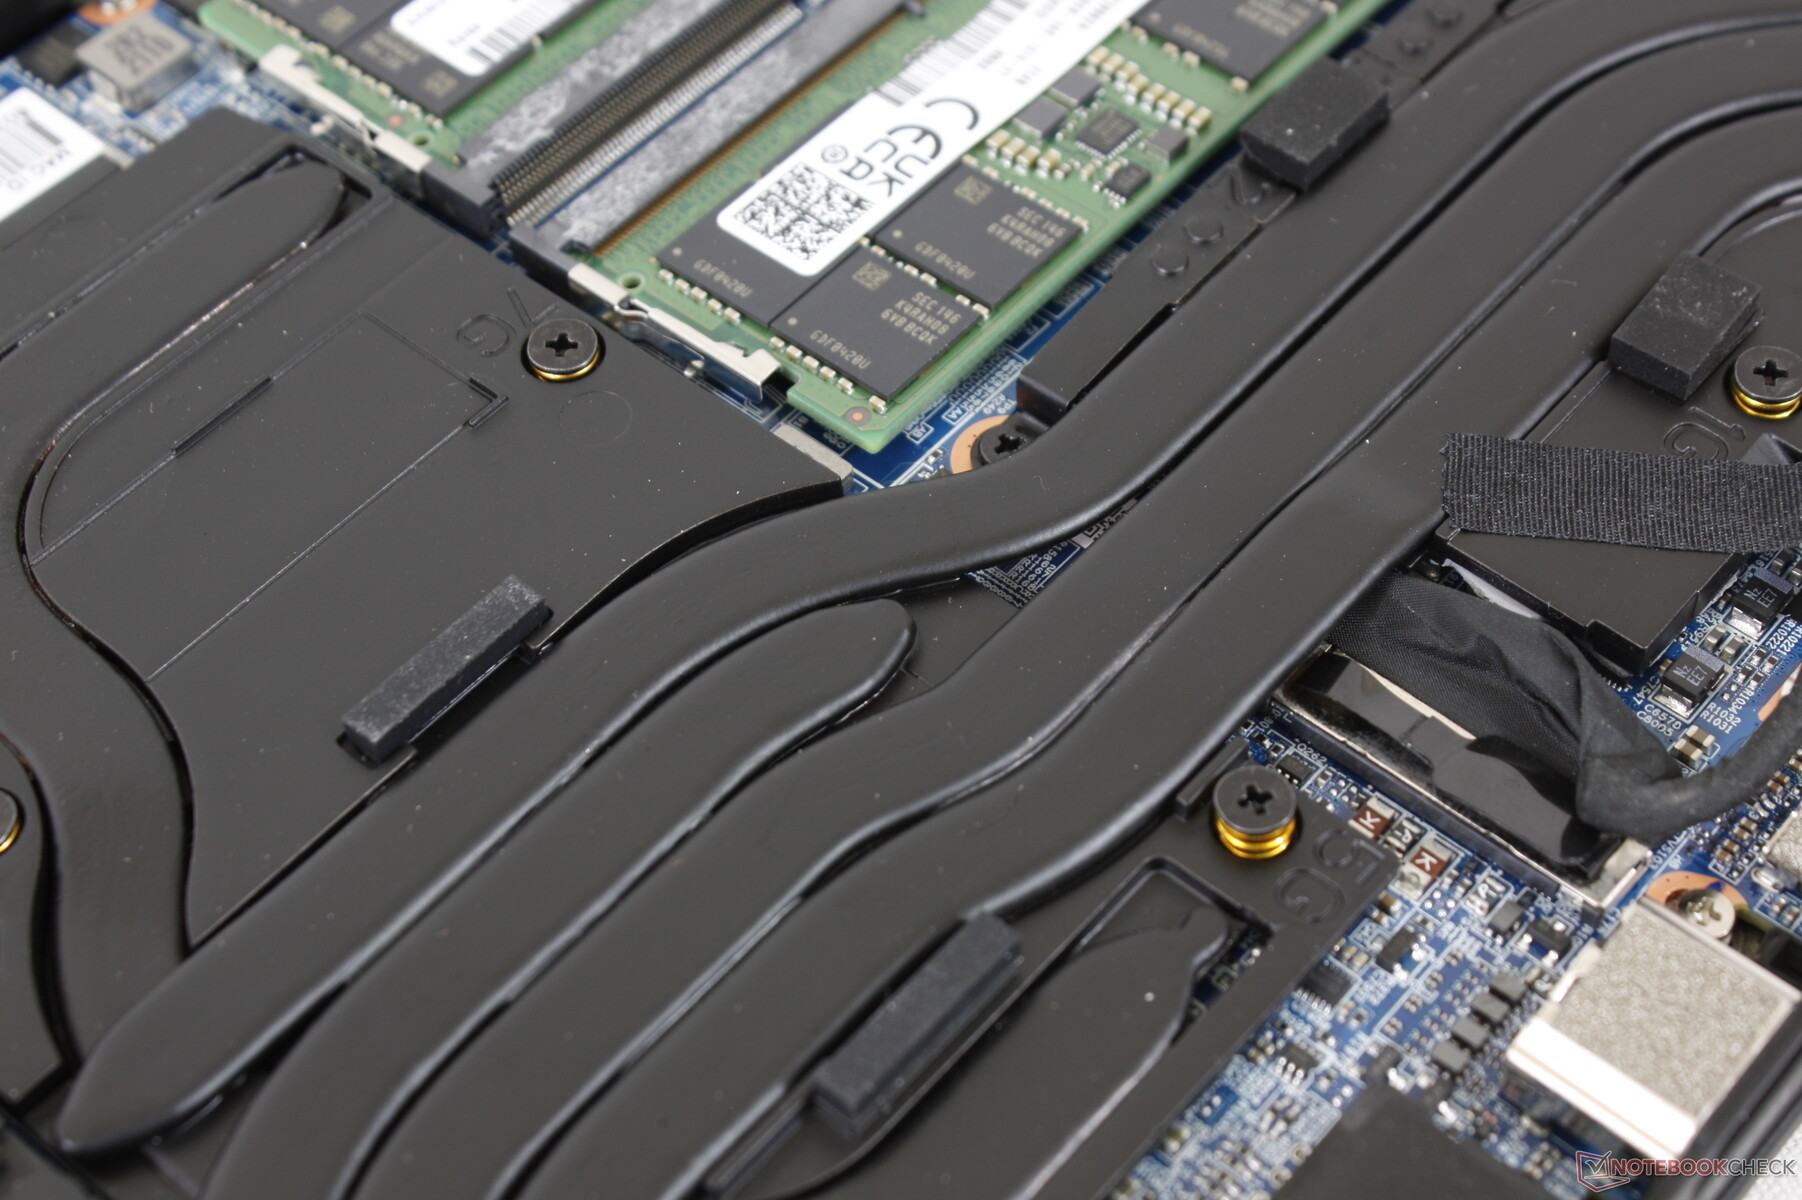
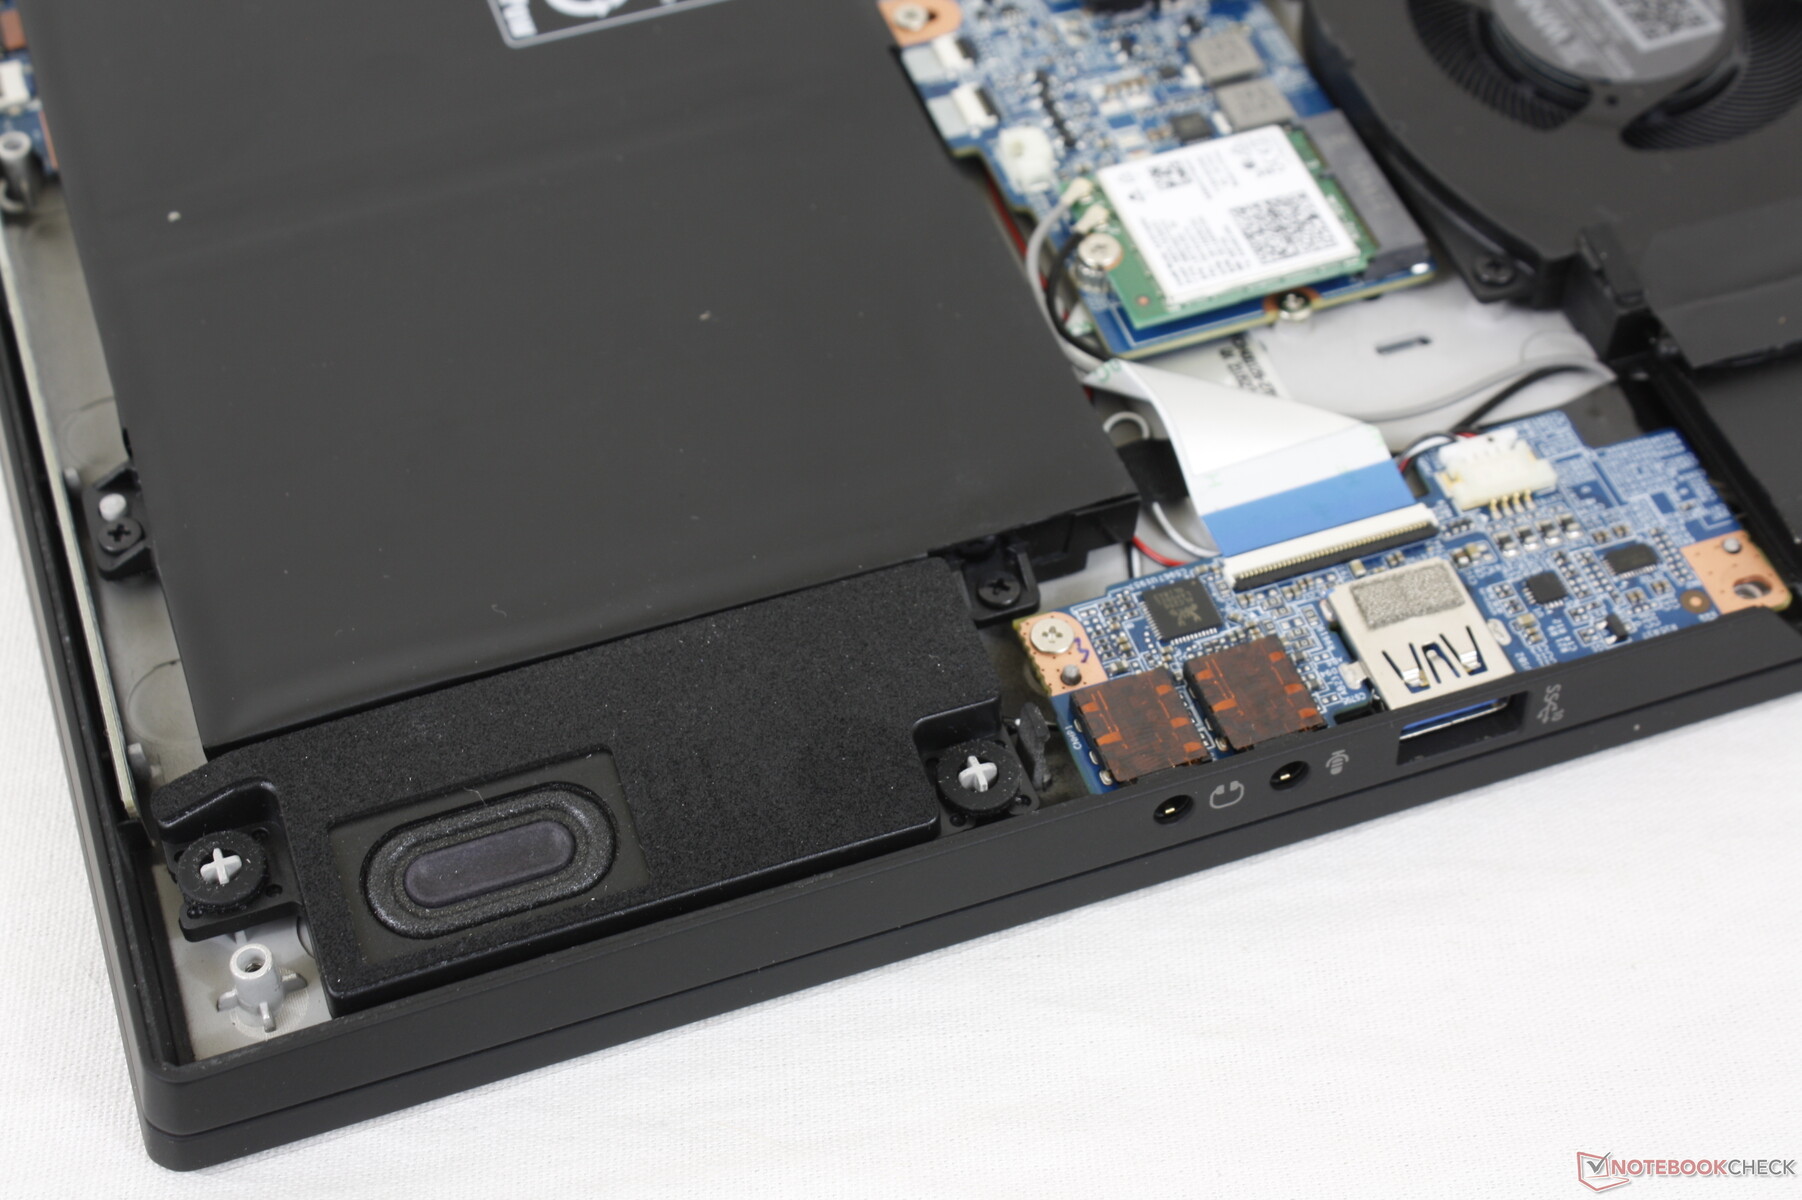
Manutenção
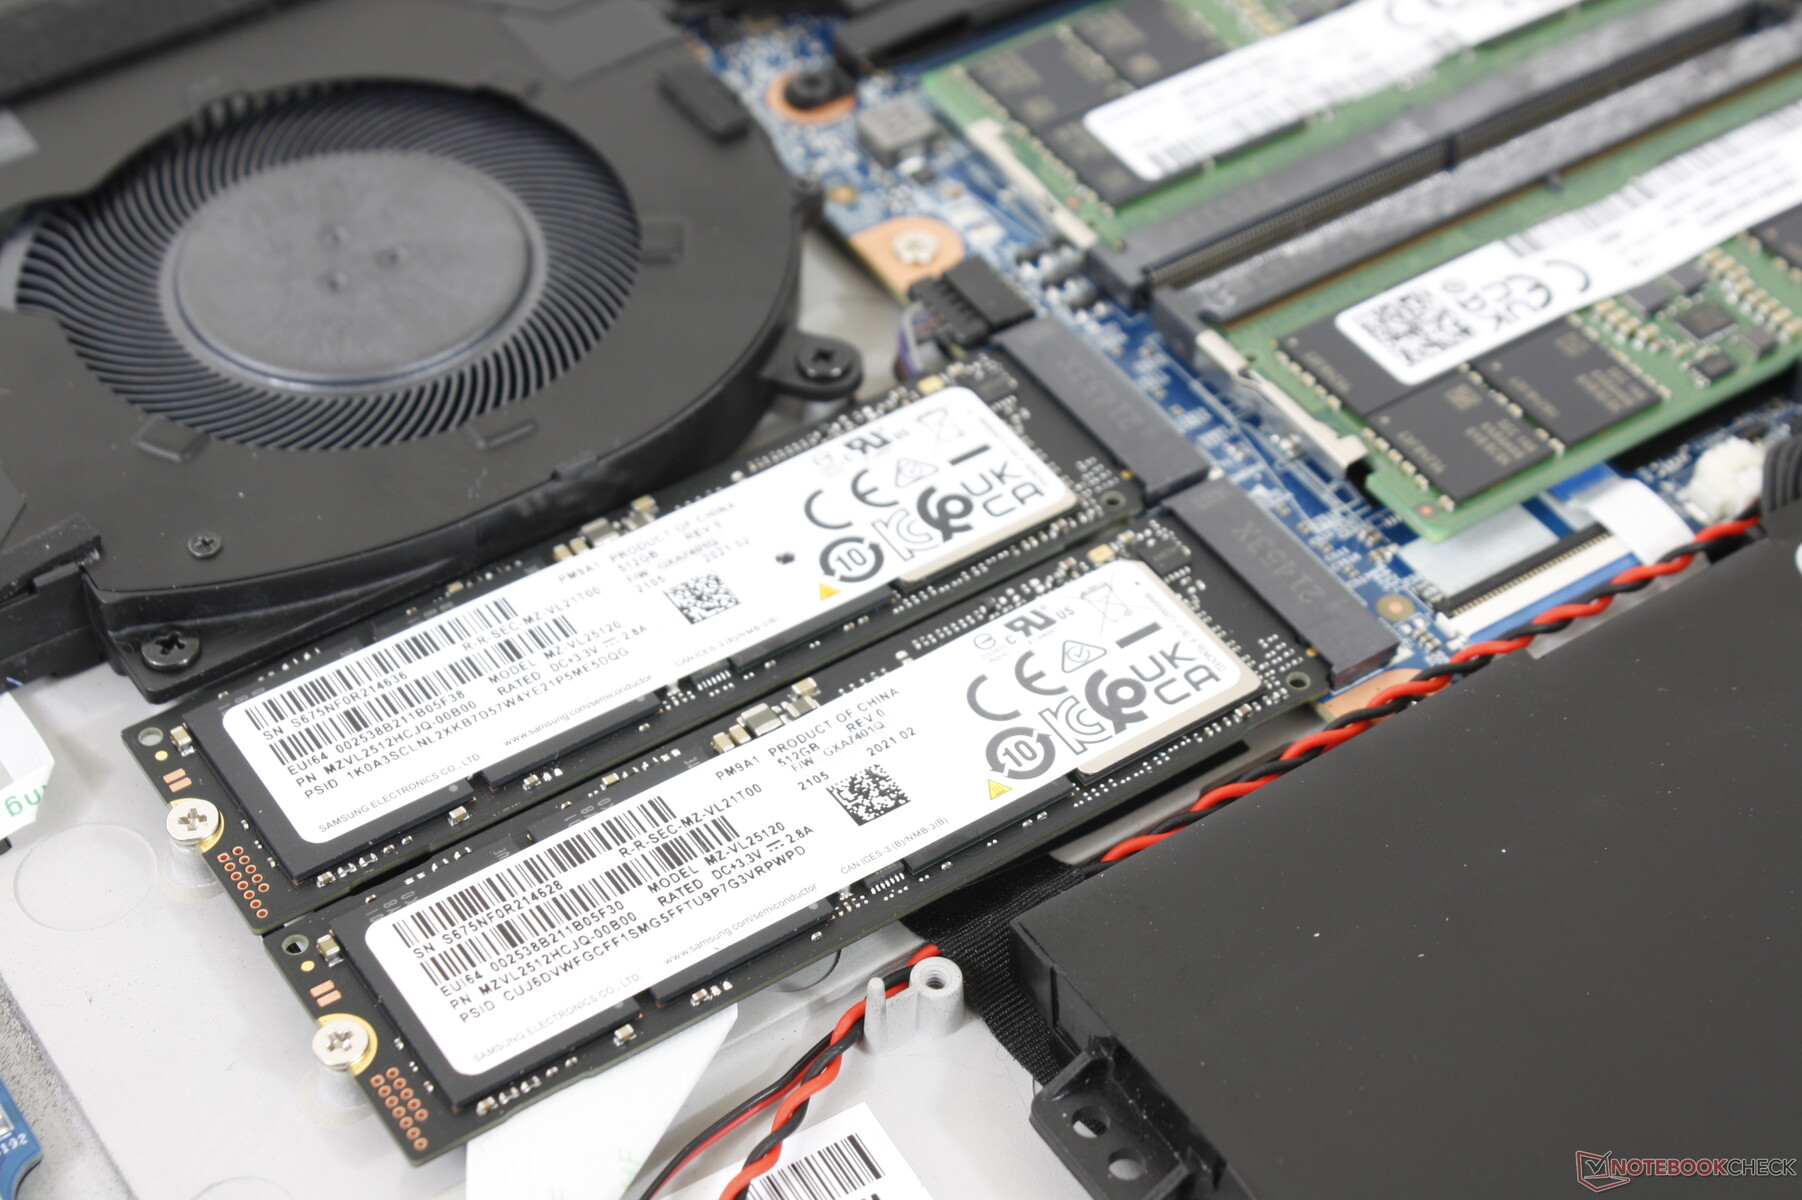
O painel inferior é fixado por 10 parafusos Philips para facilitar a manutenção. Os usuários têm acesso direto aos dois compartimentos de armazenamento M.2 2280, ambos os slots SODIMM, as baterias principais e o módulo WLAN.
Acessórios e Garantia
Não há extras na caixa além do adaptador AC e da papelada. A garantia padrão do fabricante se aplica de um a dois anos, dependendo da região
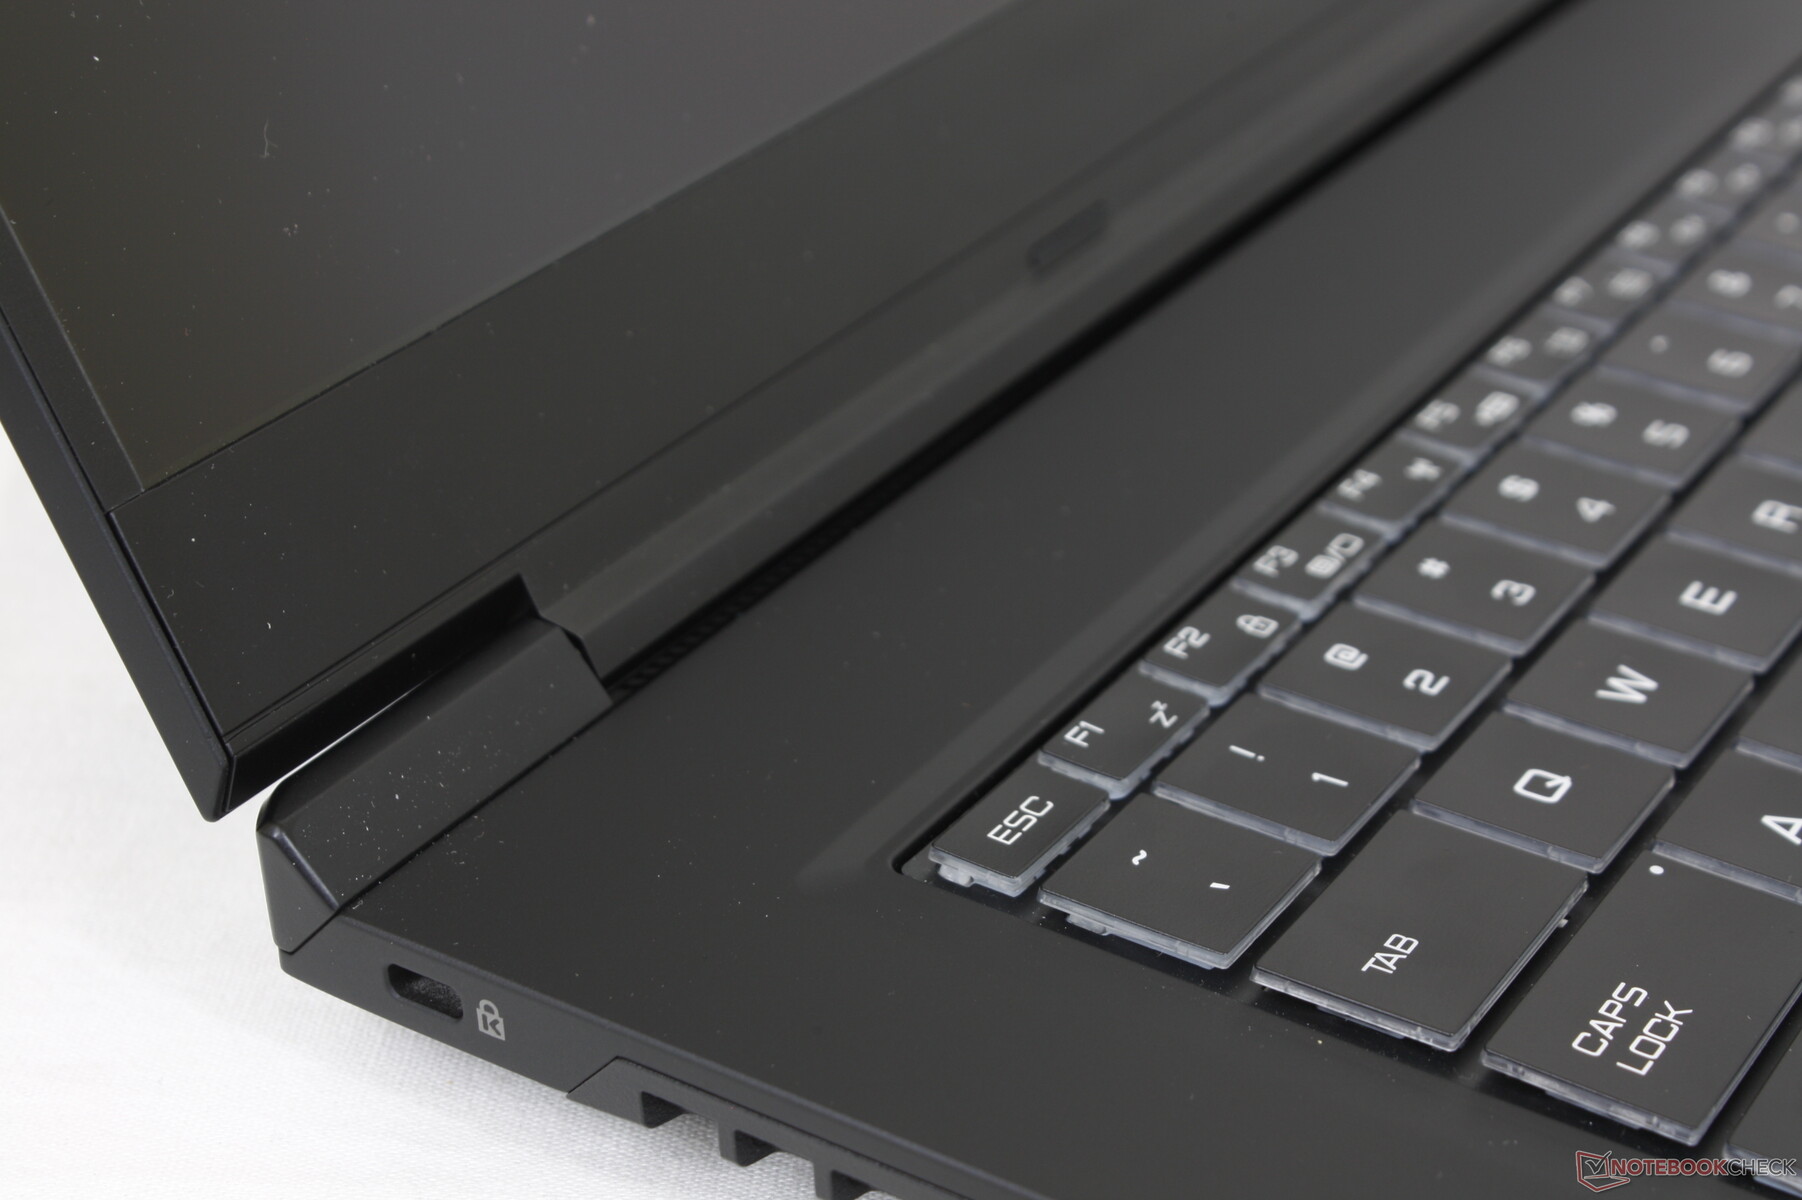
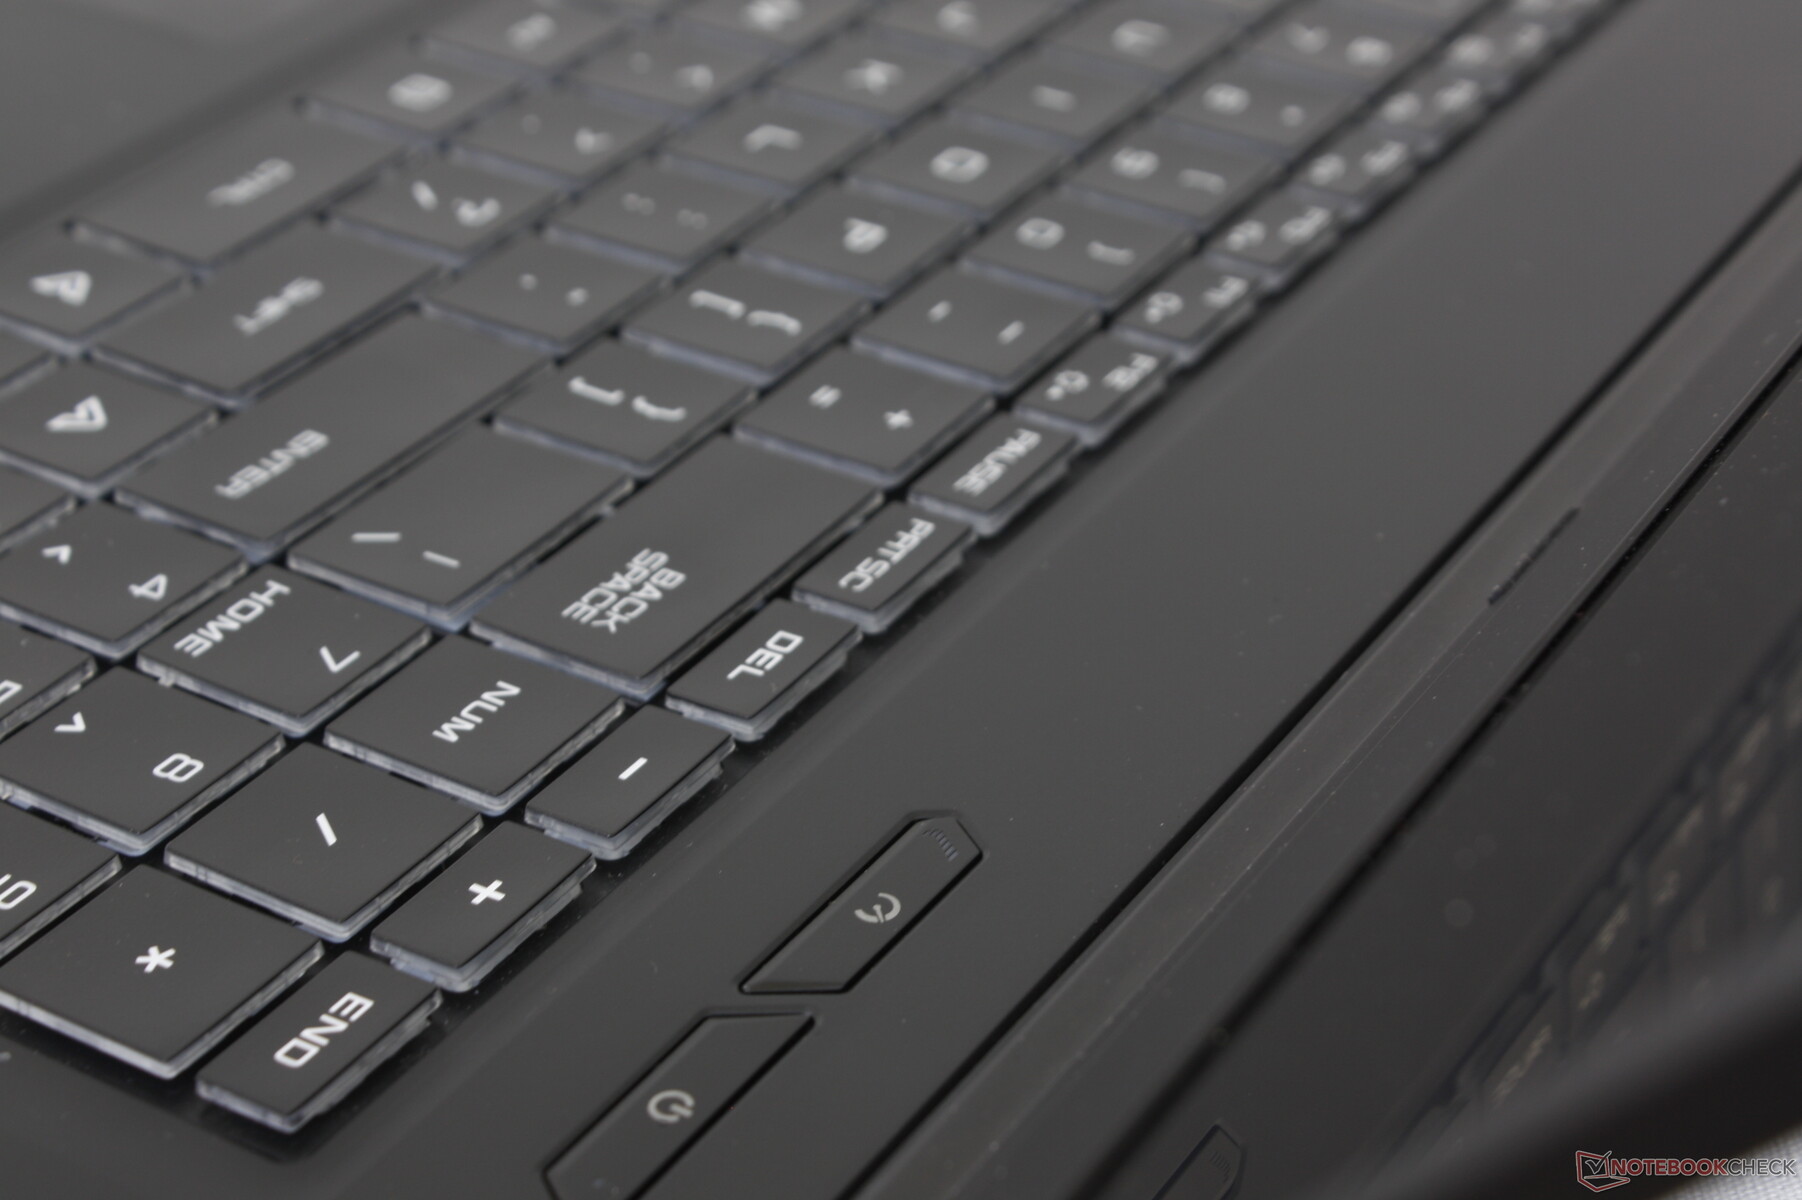
Dispositivos de entrada
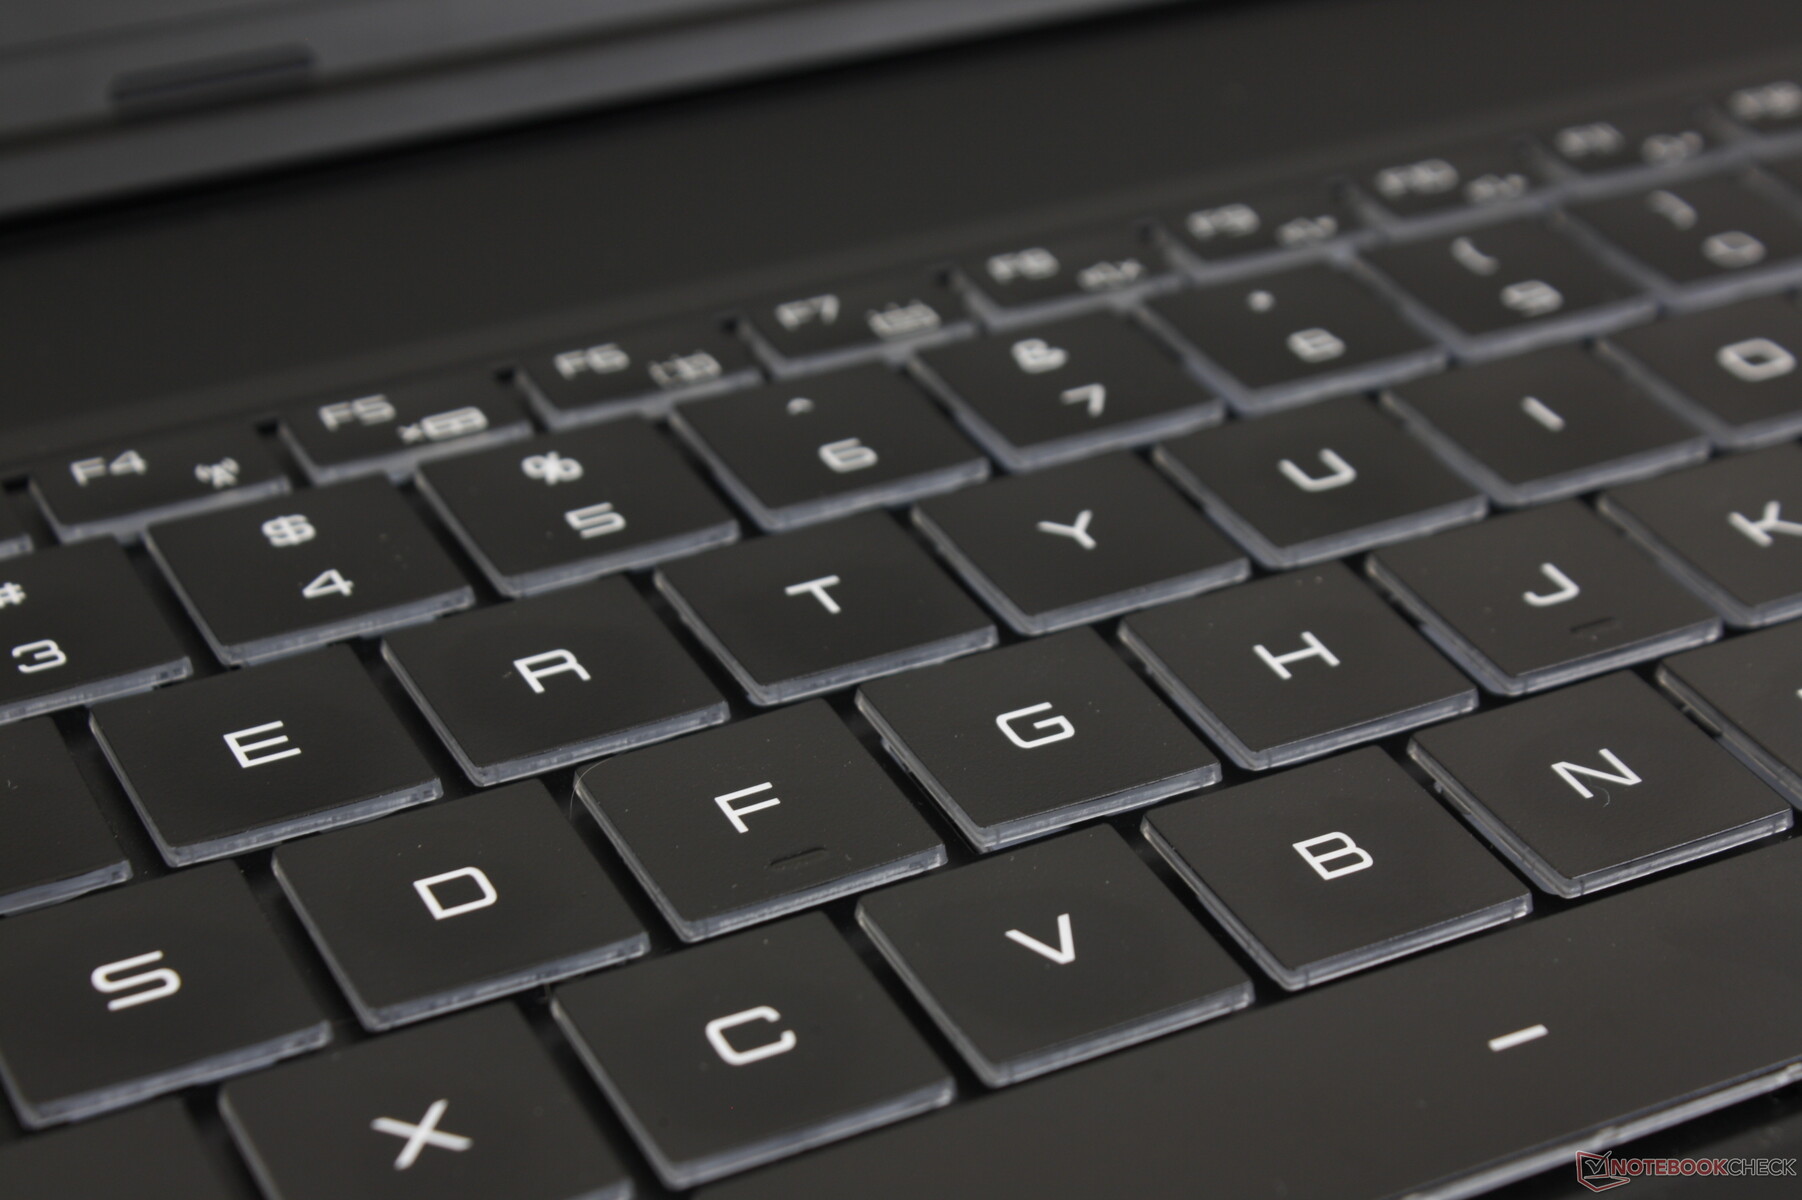
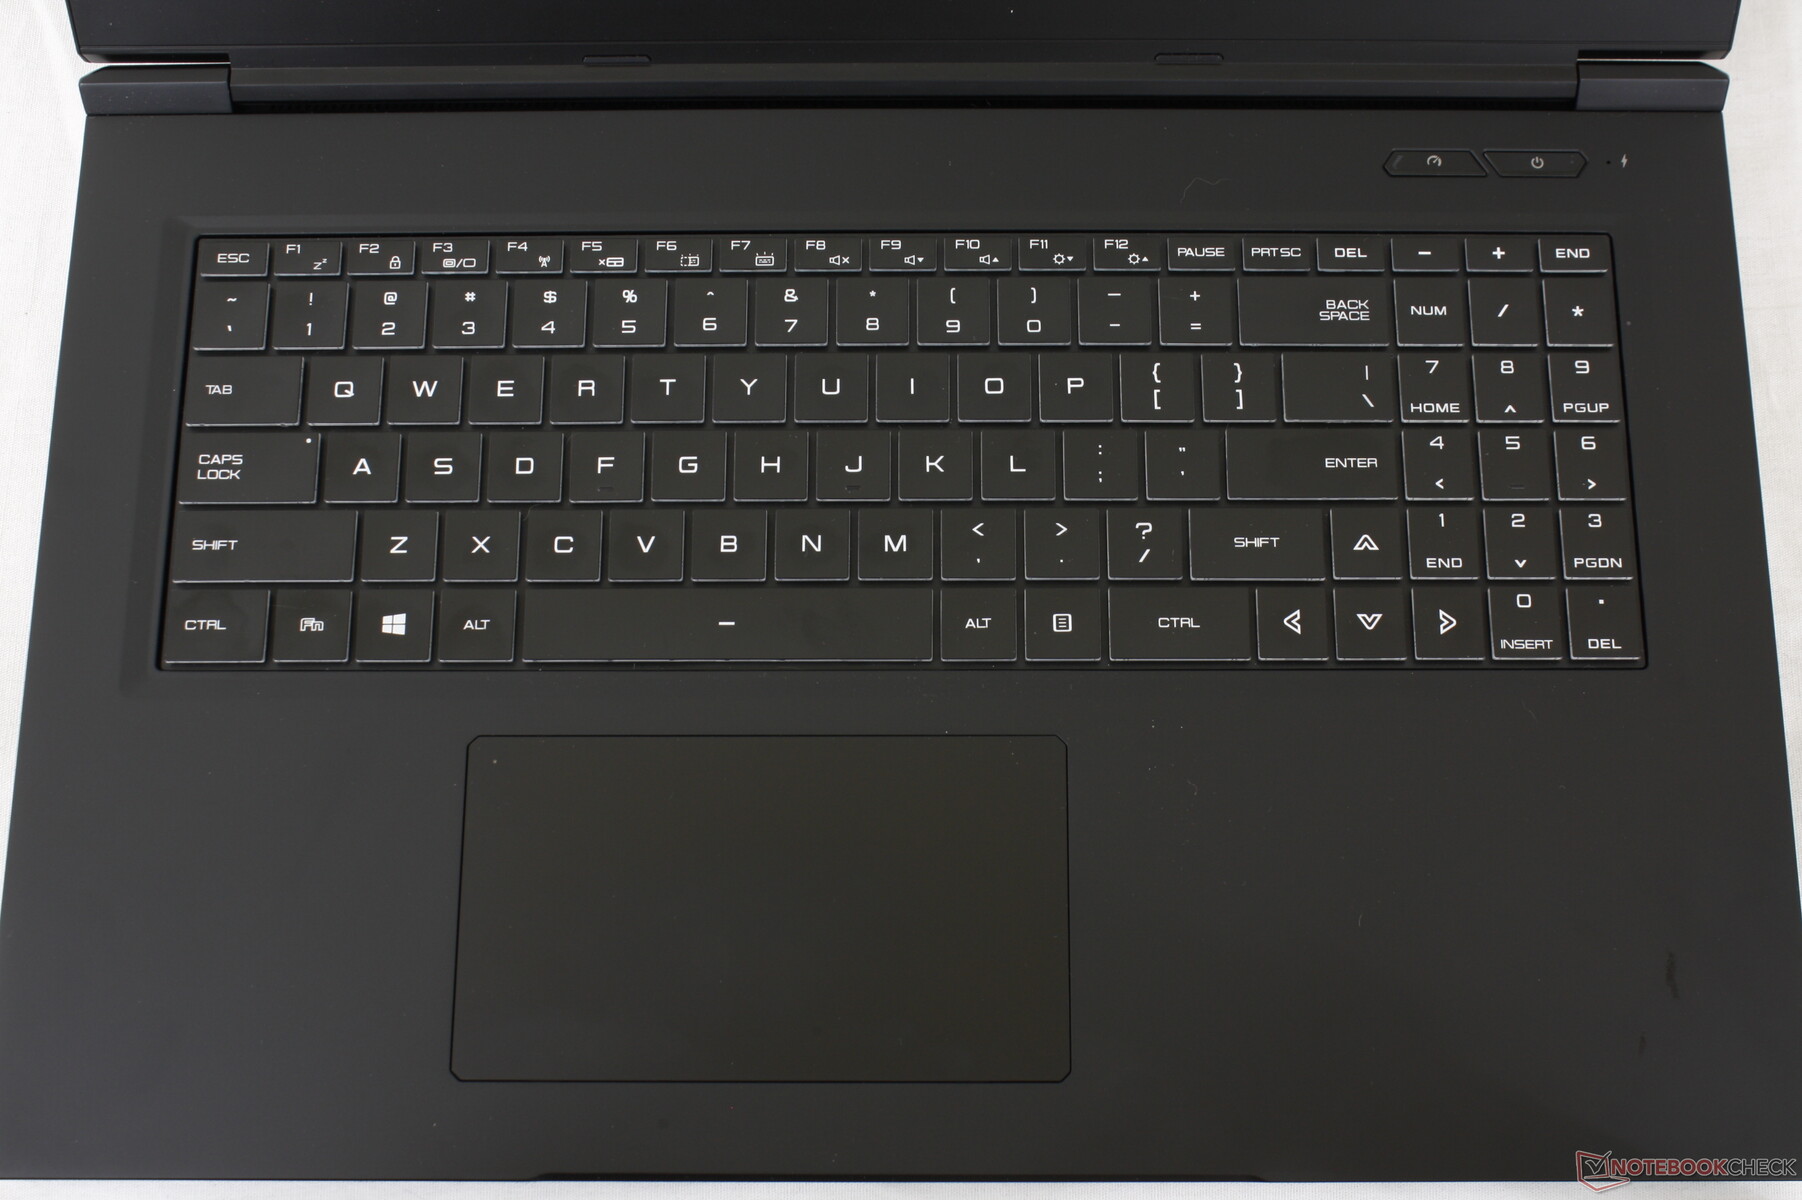
Teclado
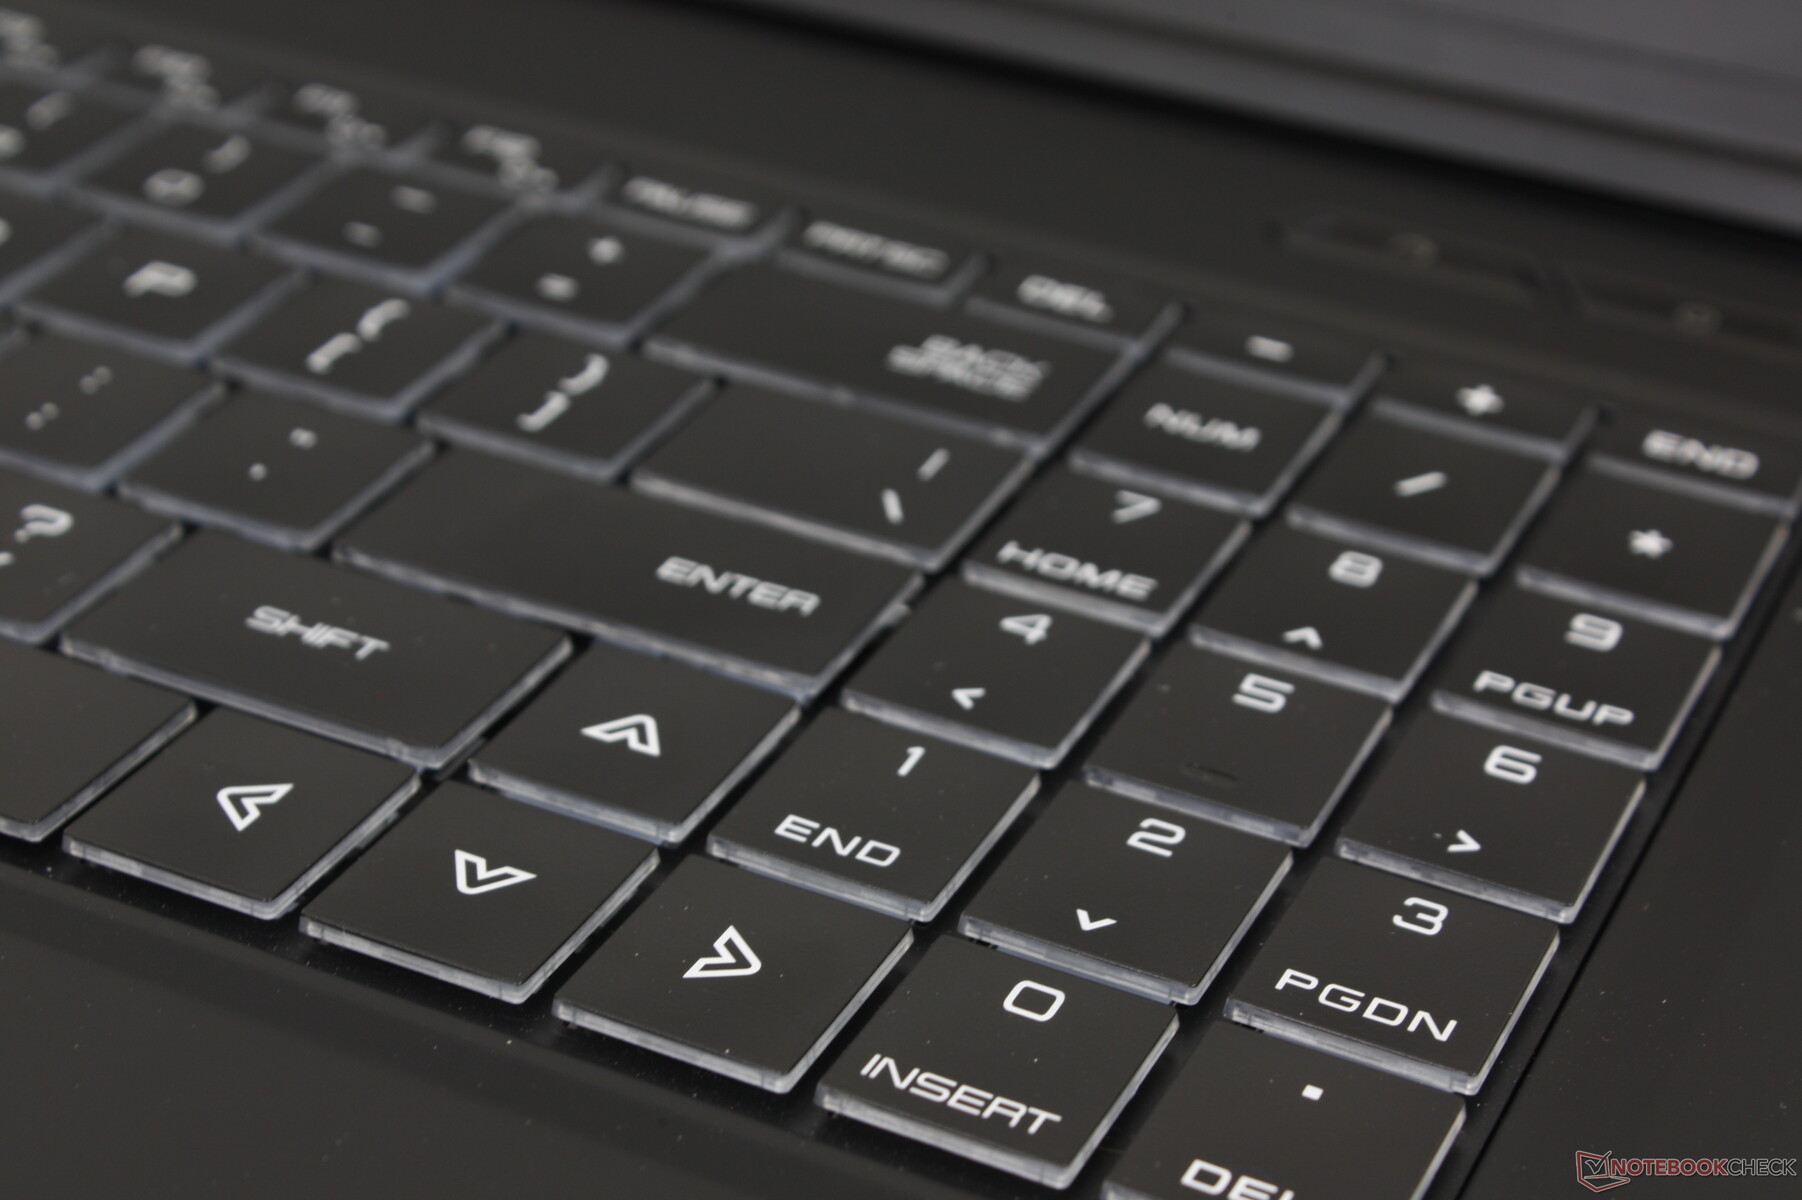
O GM7AG8P usa chaves tradicionais baseadas em membrana mais parecidas com o XMG Core 17 ou XMG Pro 17 do que as chaves mecânicas do XMG Neo 17. Ao contrário das chaves tradicionais no XMG Core 17 ou XMG Pro 17, no entanto, as chaves aqui são fisicamente maiores para serem mais fáceis de digitar. O feedback das chaves é uniforme com um ruído relativamente silencioso entre todas as chaves, mas desejamos que as viagens e o feedback pudessem ter sido mais firmes de modo geral.
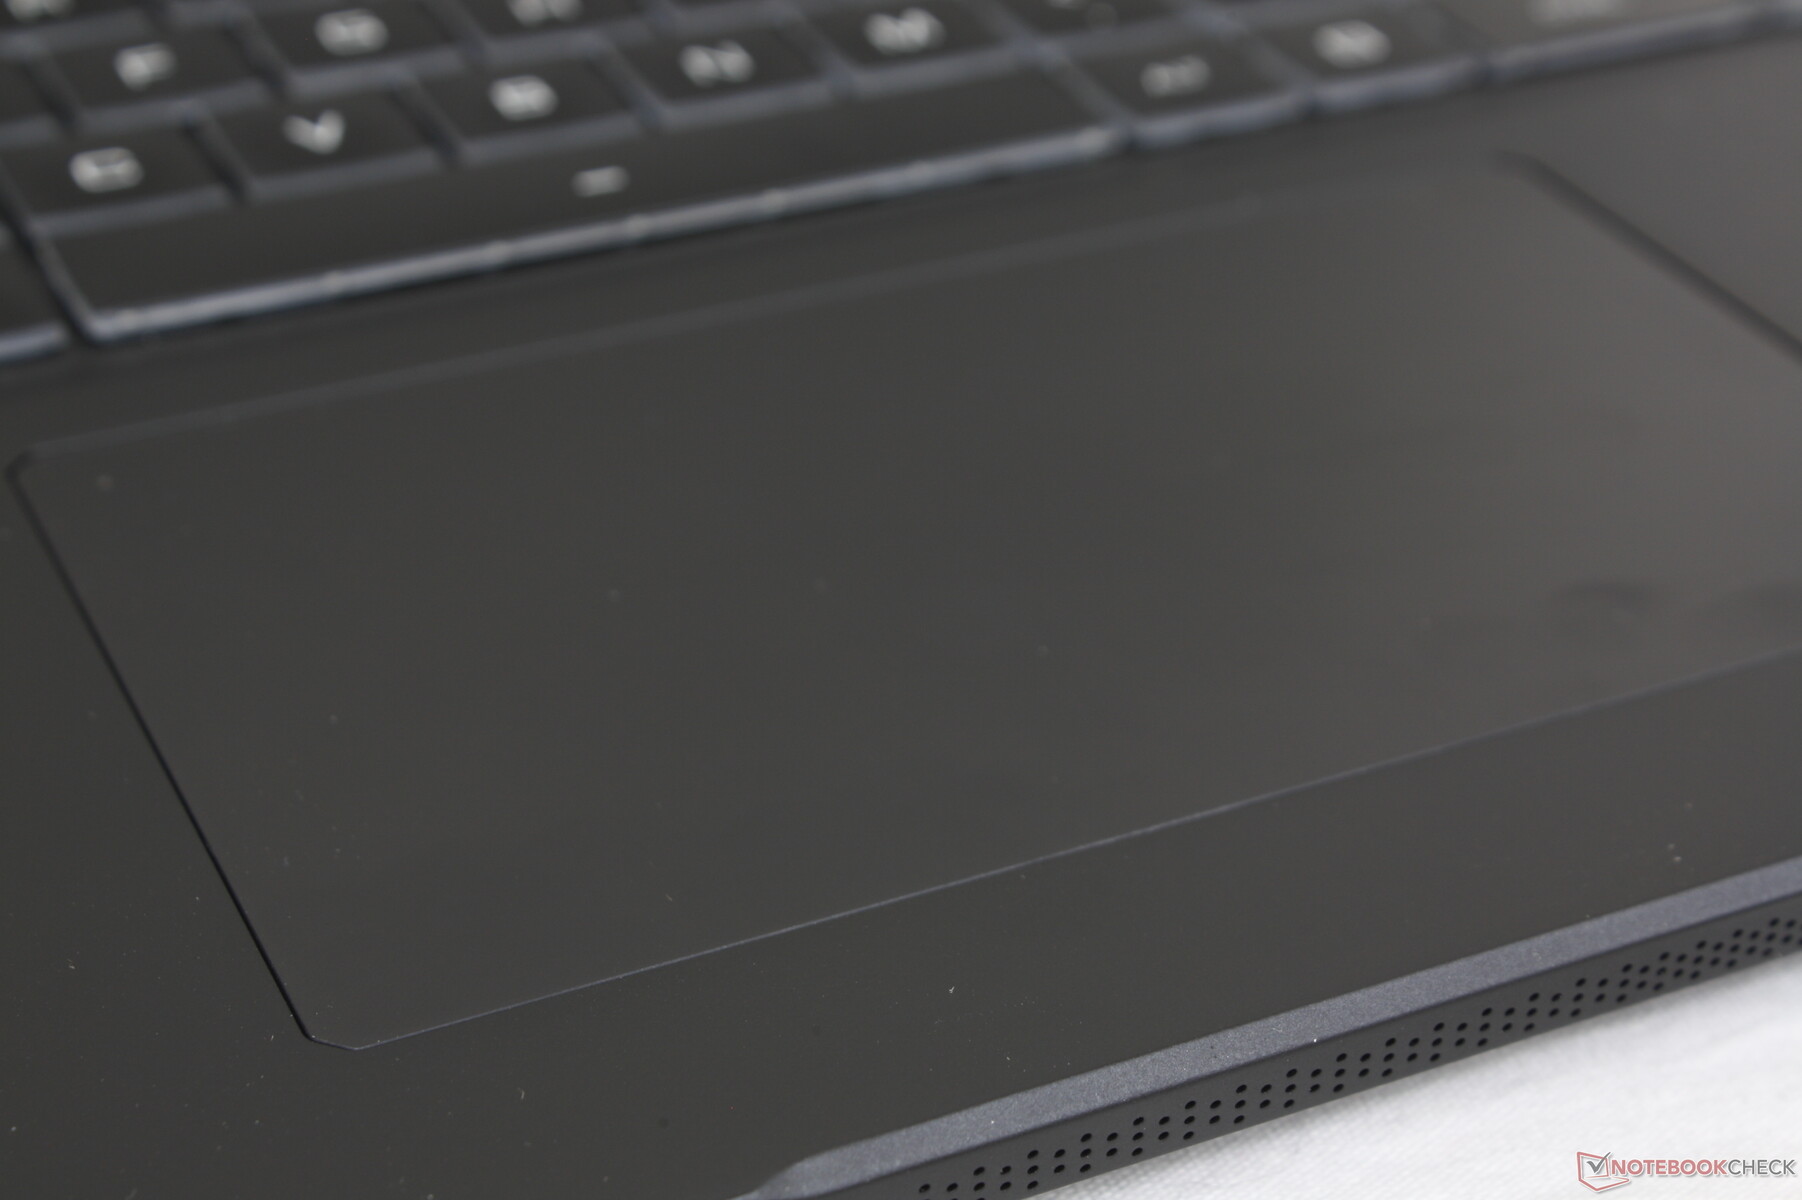
Touchpad
O clickpad é quase do mesmo tamanho do Blade Pro 17 (13,3 x 7,6 cm vs. 13 x 8 cm) mas com um clique mais firme e mais alto quando pressionado. As propriedades de deslizamento são suaves com pouca ou nenhuma aderência, mesmo quando se move o cursor a velocidades mais lentas.
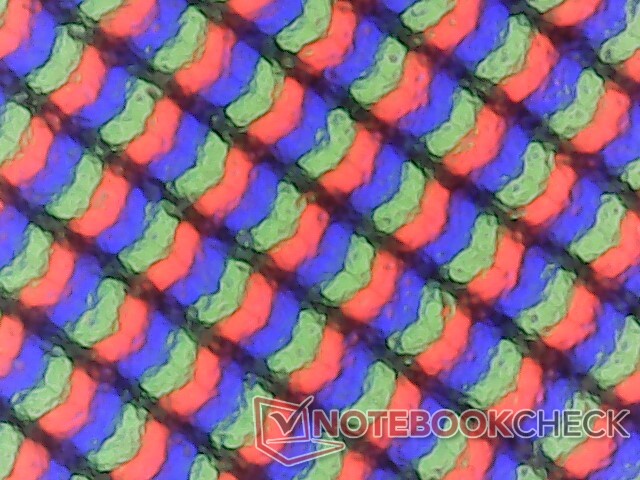
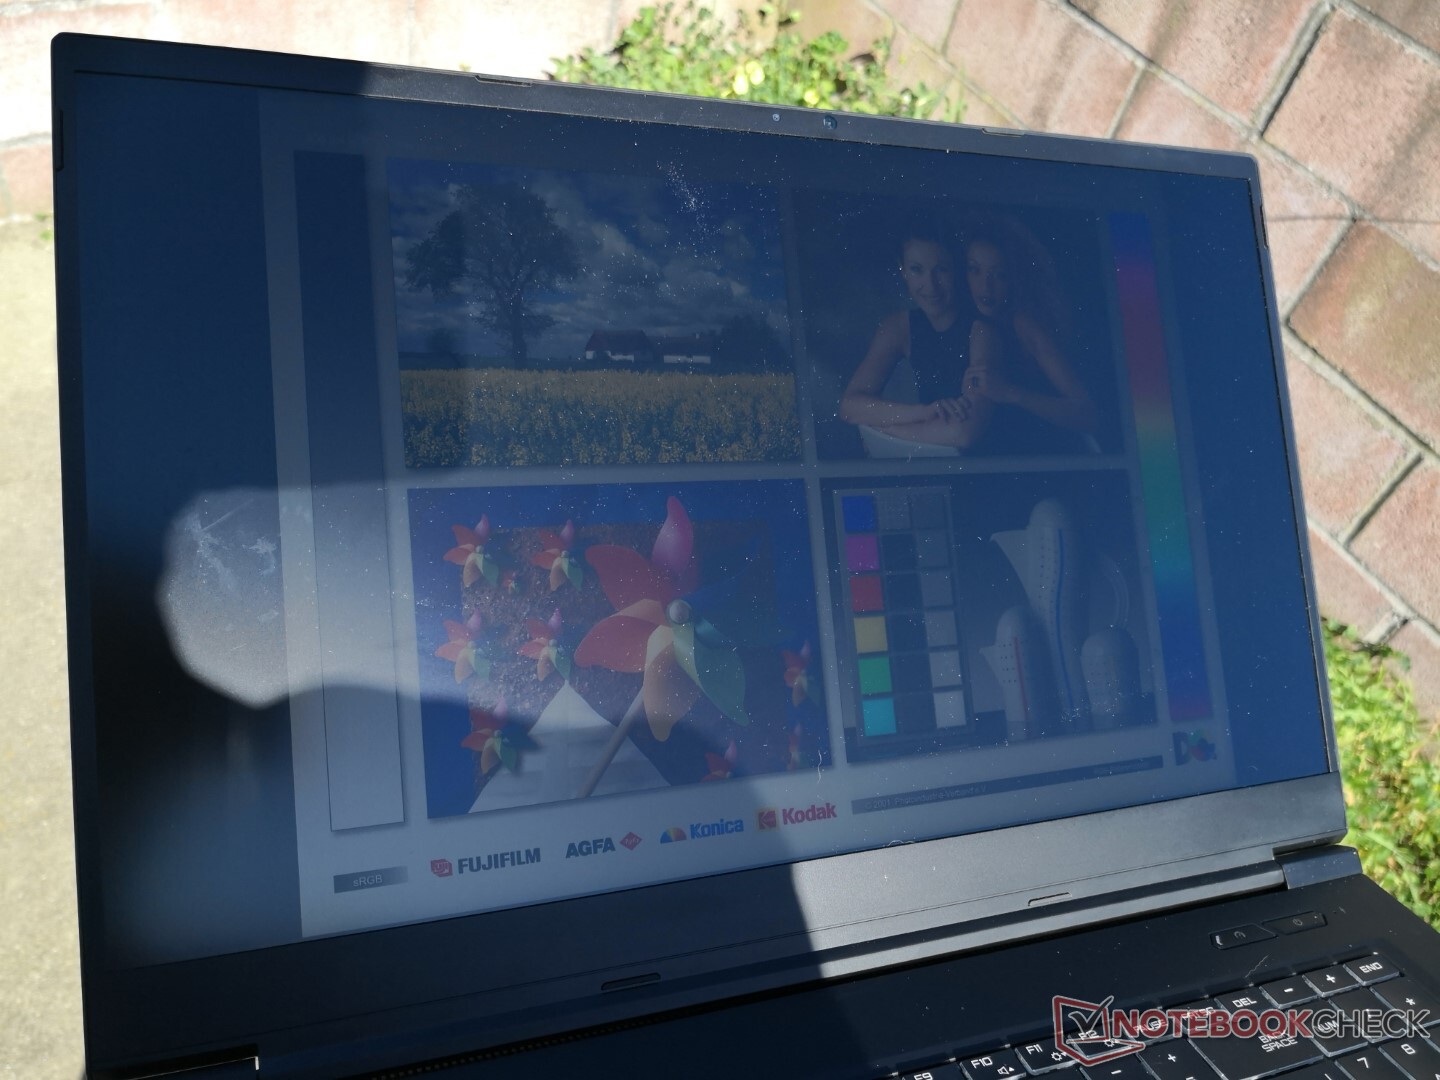
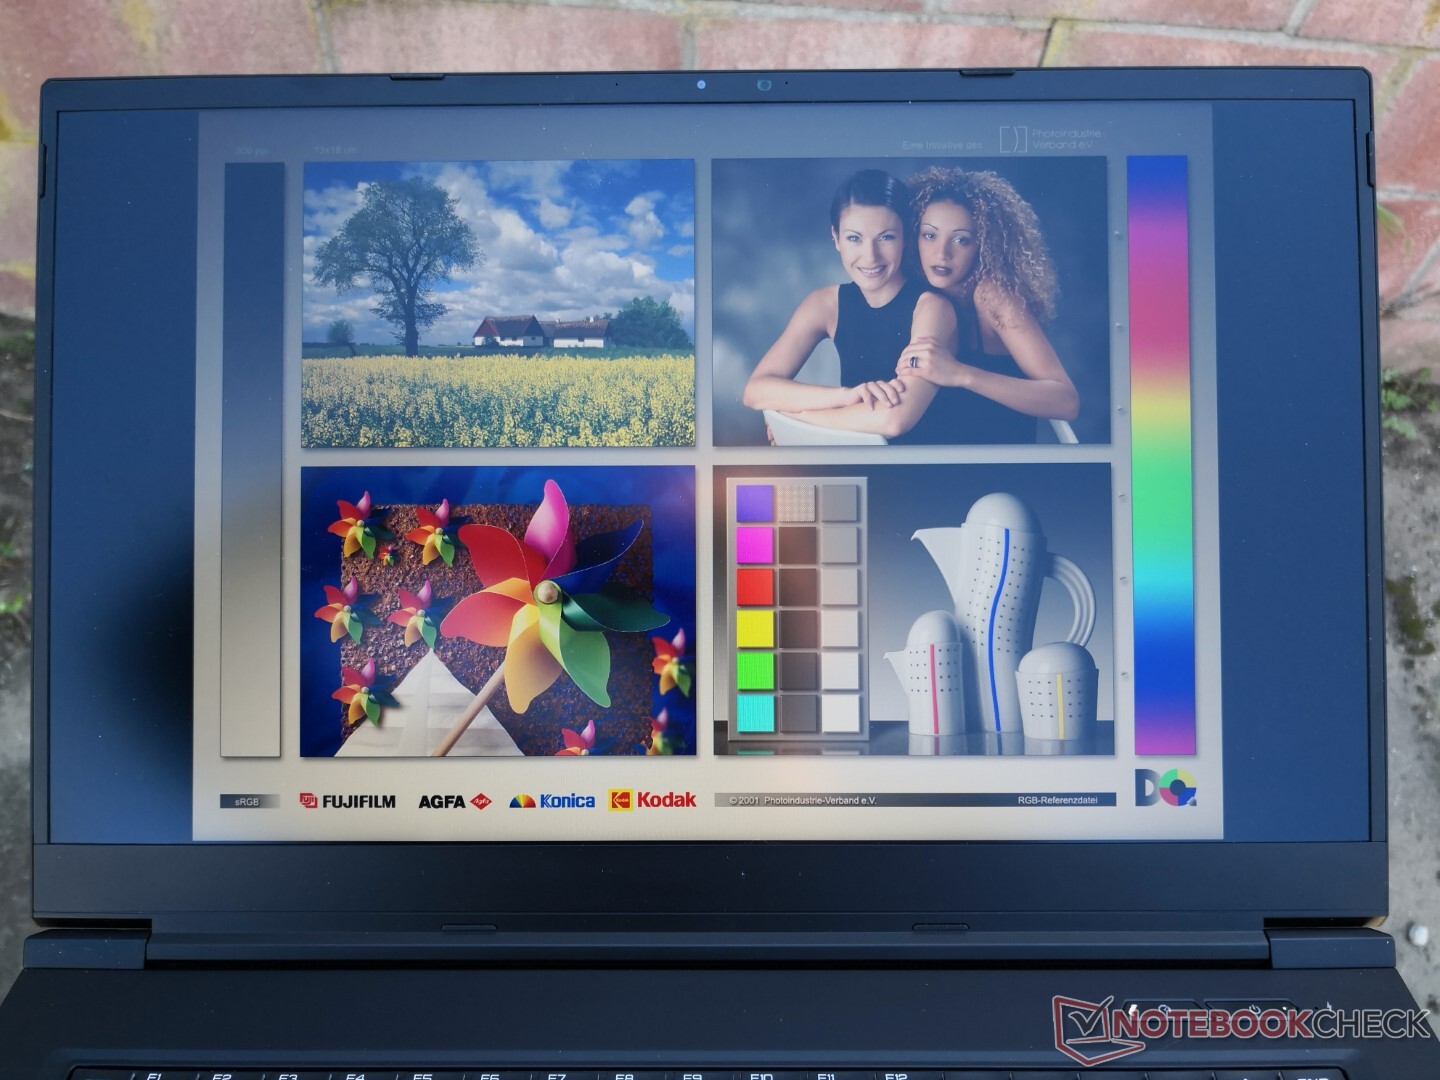
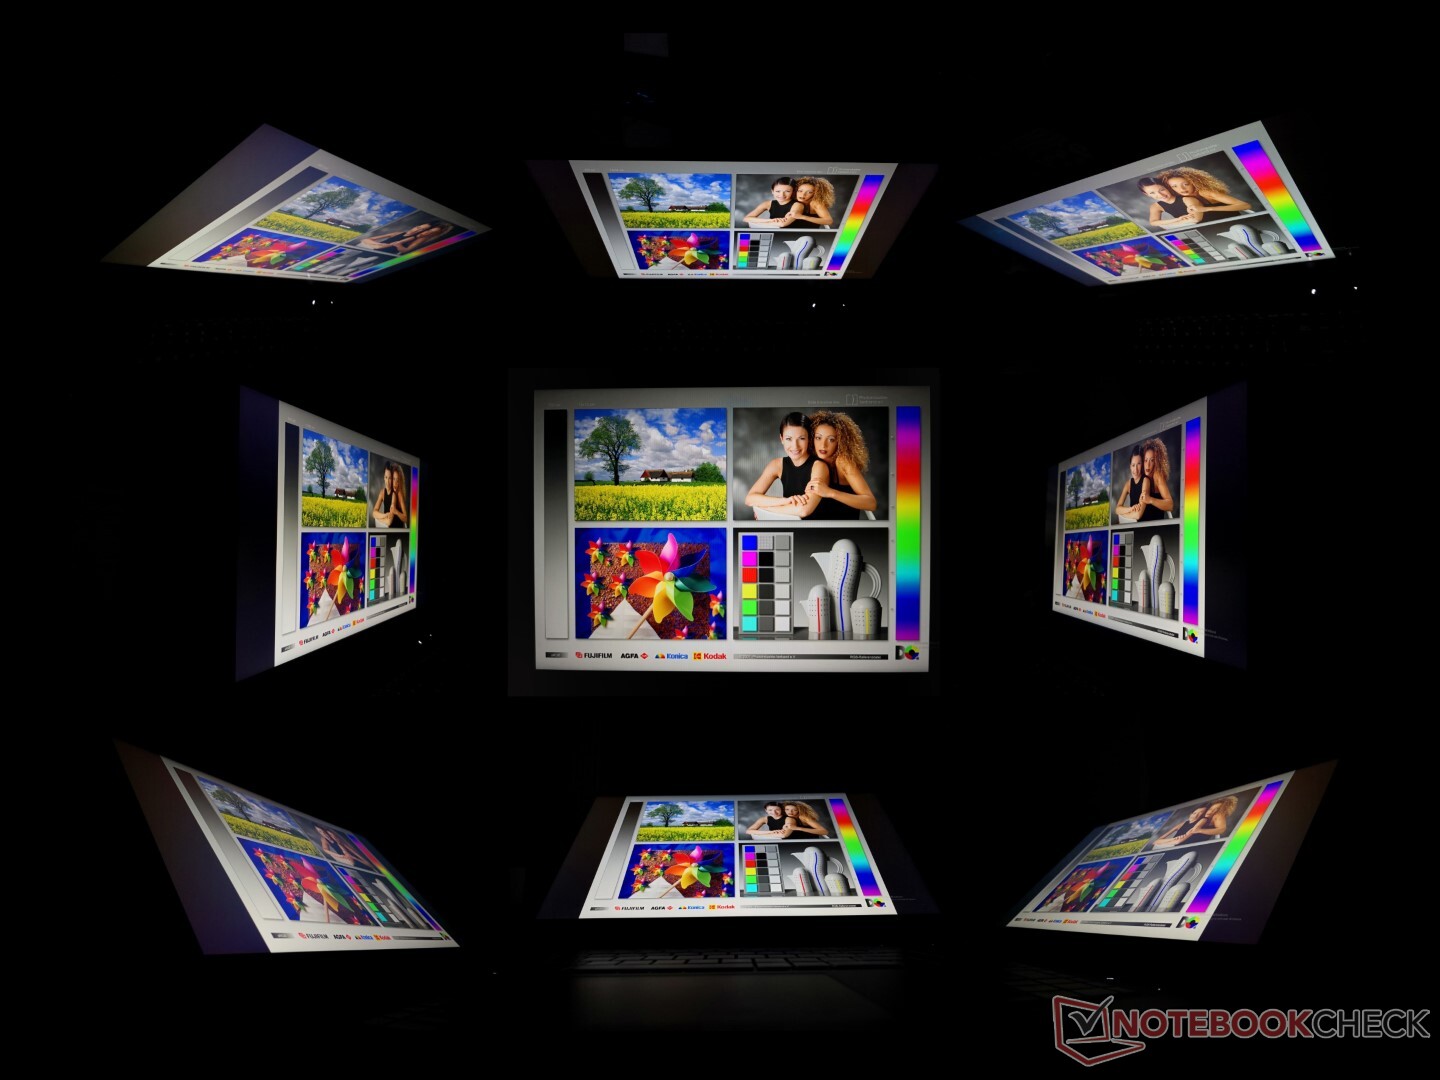
Display - Rápido e Colorido
Nossa unidade de teste GM7AG8P está usando exatamente o mesmo controlador de display BOE0977 e o painel IPS NE173QHM-NY2 como encontrado no ano passadoSchenker XMG Neo 17 GM7TG8S. Assim, a experiência de visualização e os atributos de exibição entre esses dois laptops são muito semelhantes, incluindo a resolução nativa de 1440p, tempos de resposta rápidos, relação de contraste ~1000:1, taxa de atualização de 165 Hz e cobertura total de sRGB. A luminosidade máxima continua sendo de pouco menos de 400 lêndeas também.
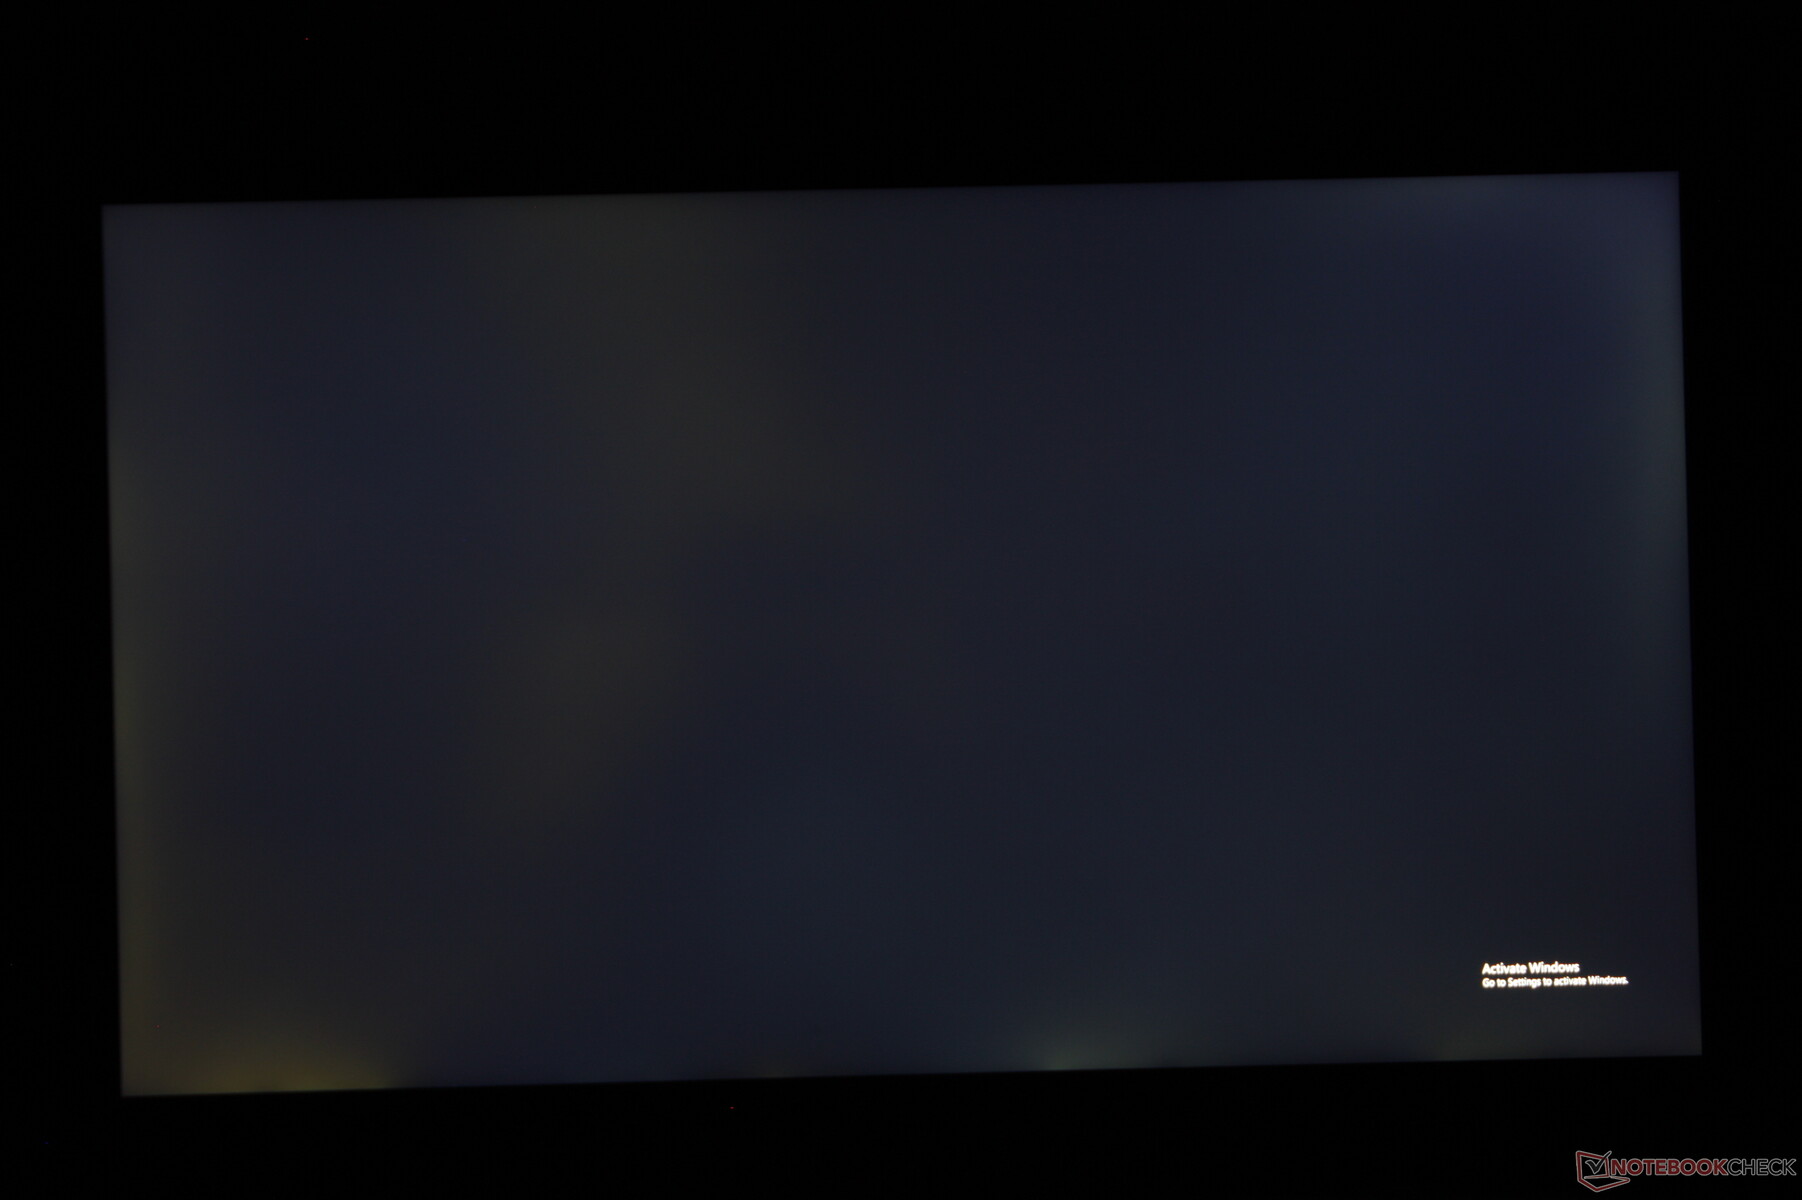
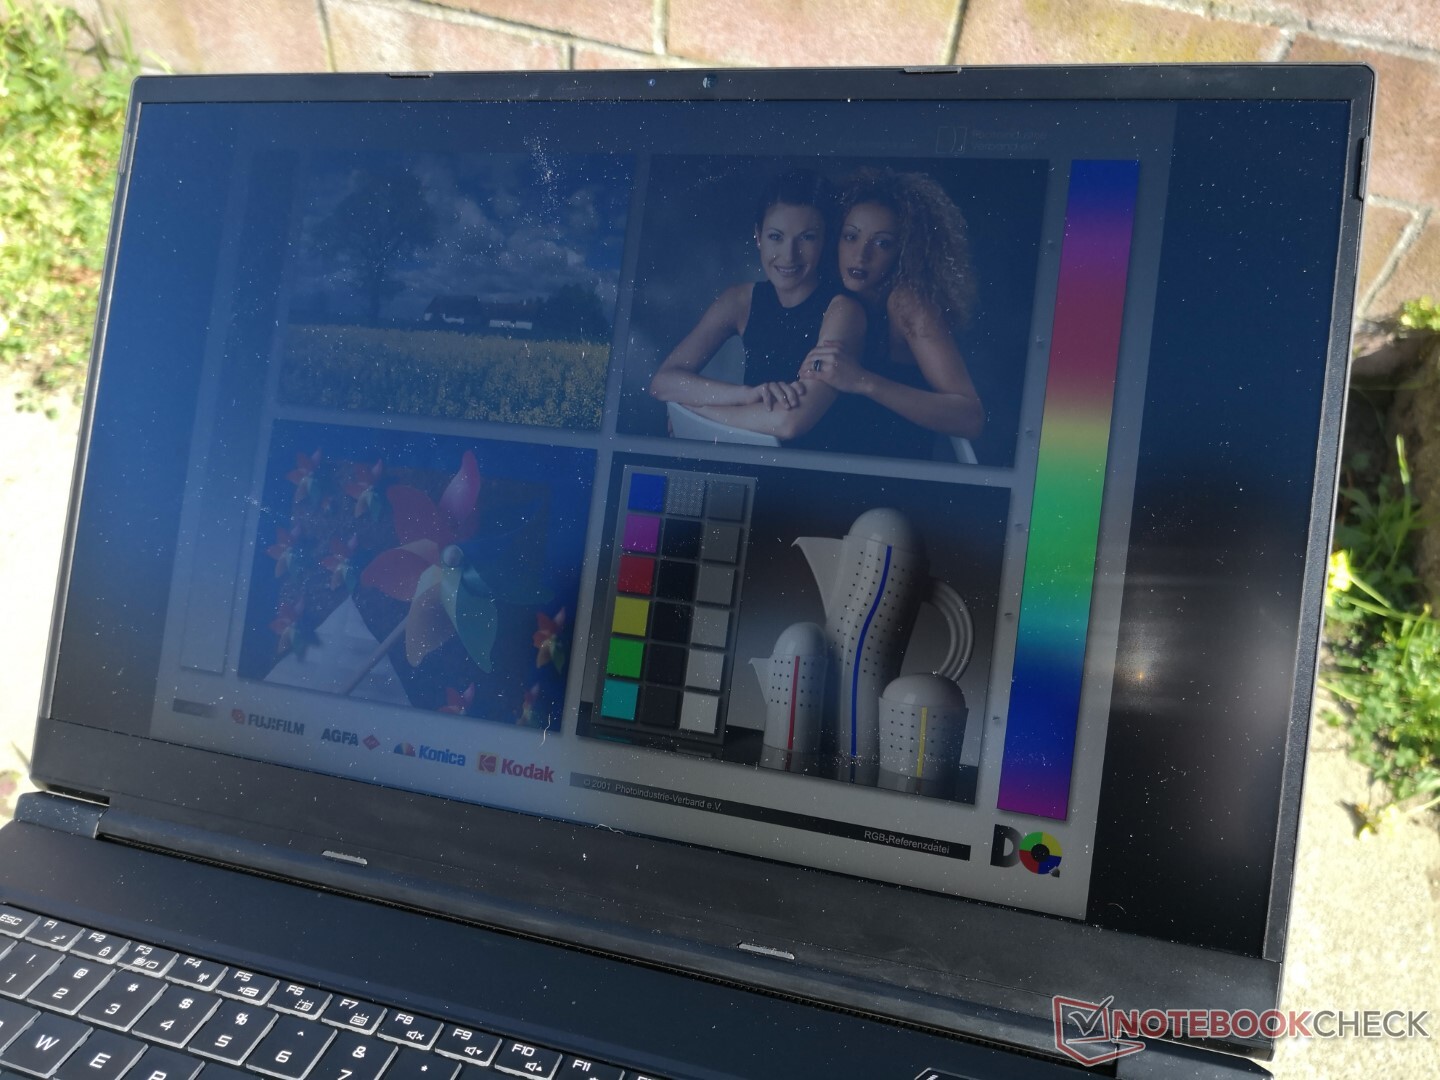
O sangramento de luz de fundo em nossa unidade de teste particular poderia ser melhorado, como mostra nossa imagem abaixo. Embora seja de se esperar algum sangramento do IPS, nossa unidade exibiria mais do que gostaríamos.
| |||||||||||||||||||||||||
iluminação: 86 %
iluminação com acumulador: 387.1 cd/m²
Contraste: 1210:1 (Preto: 0.32 cd/m²)
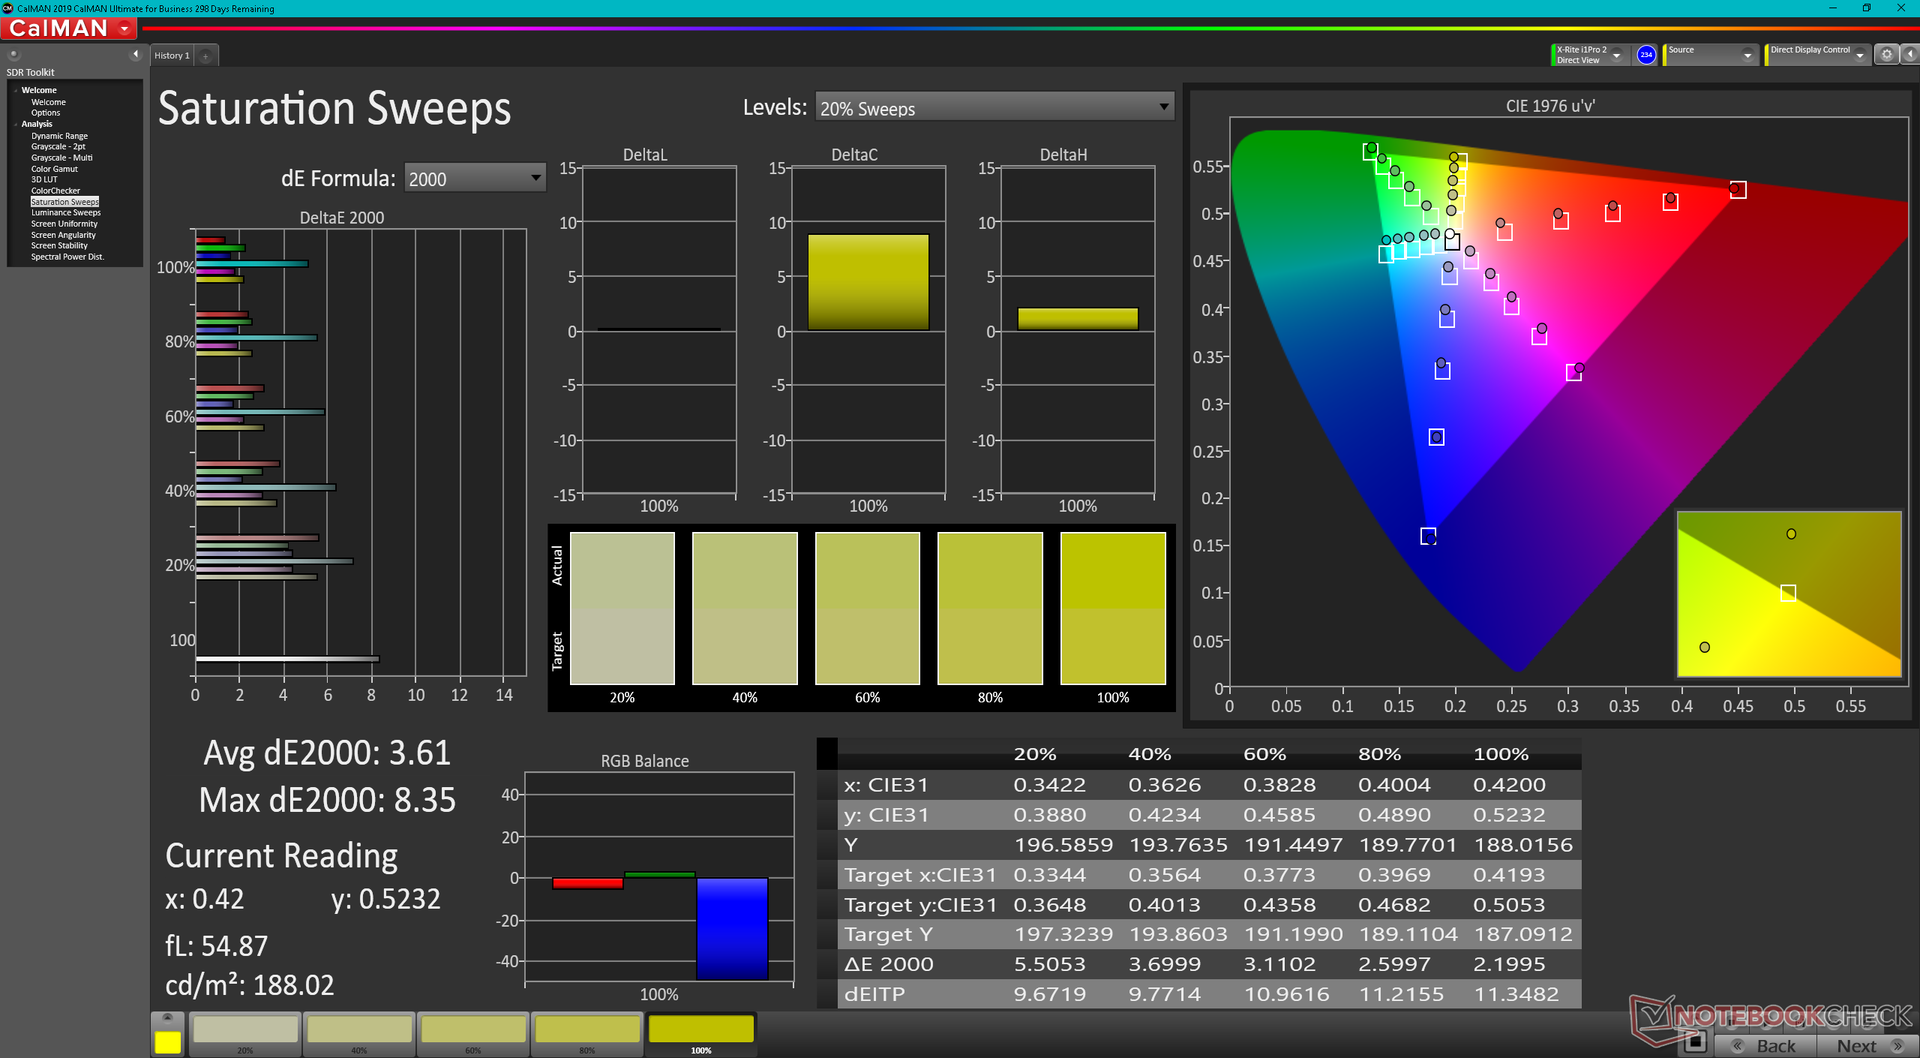
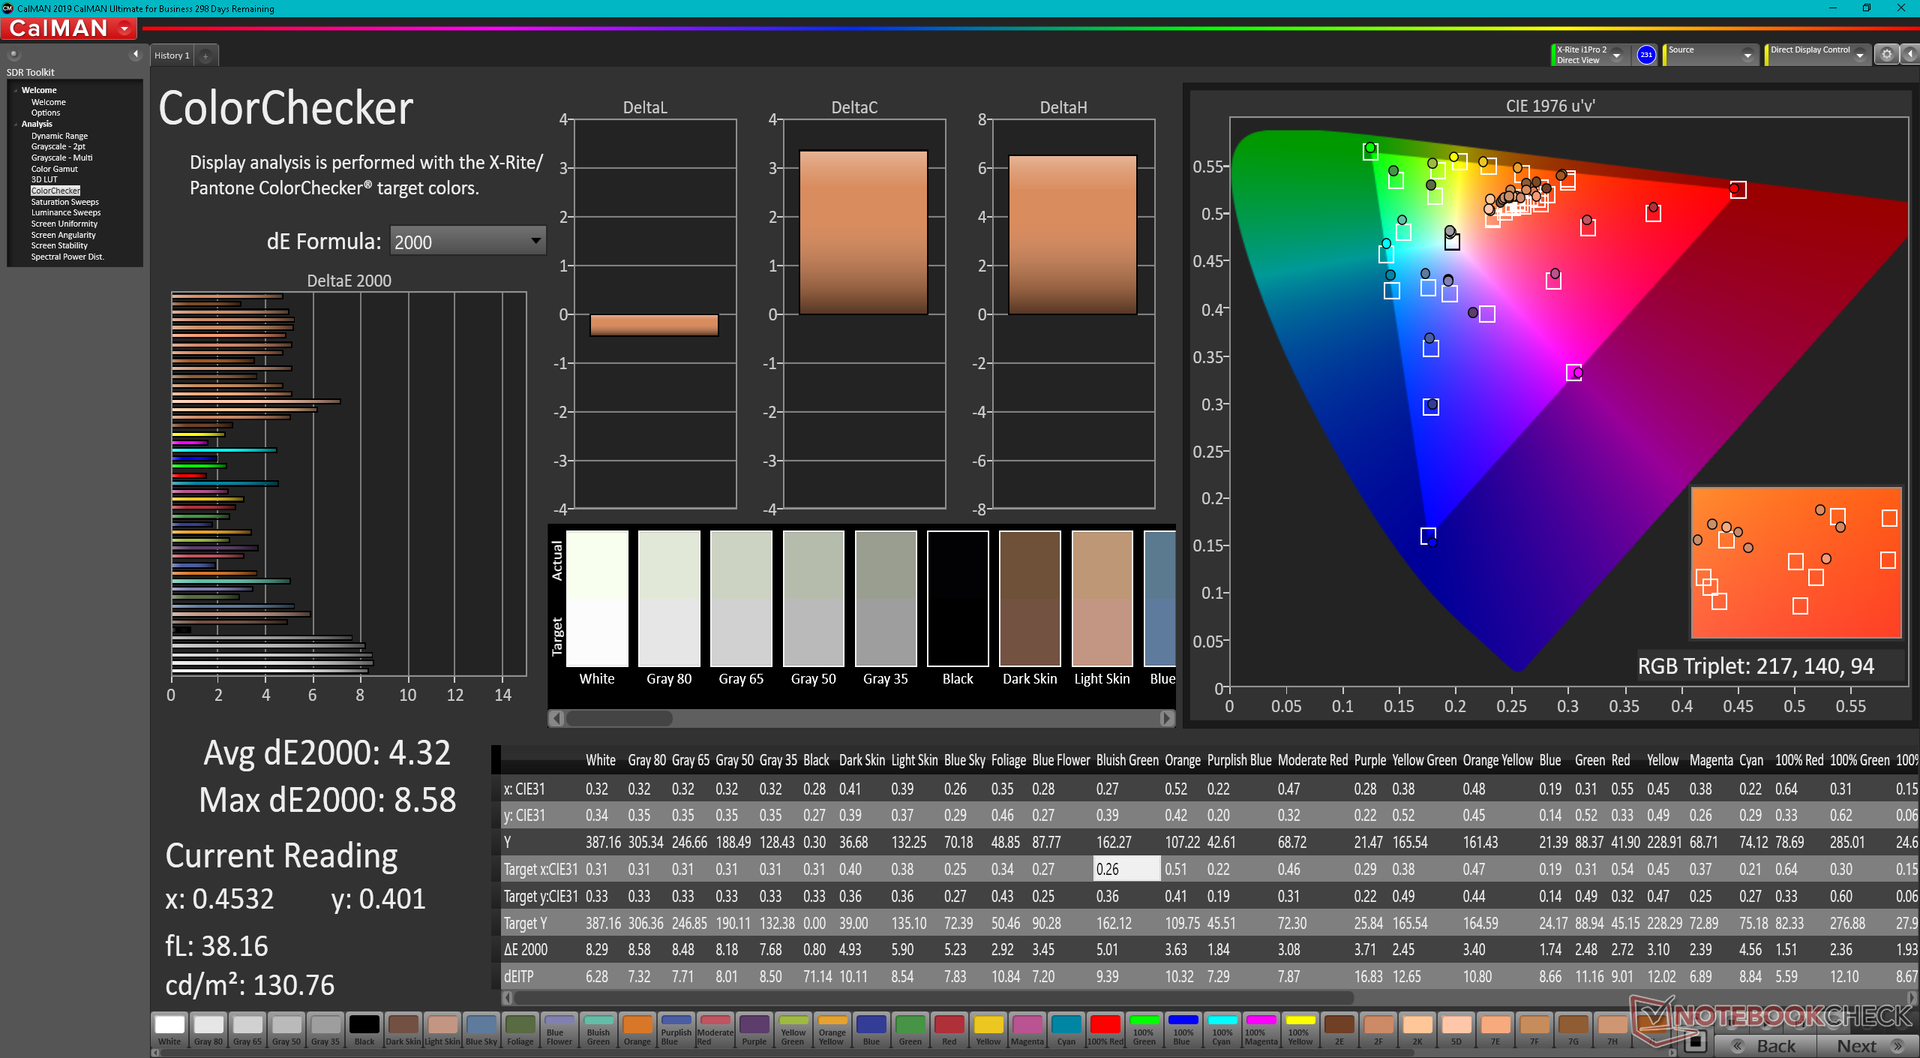
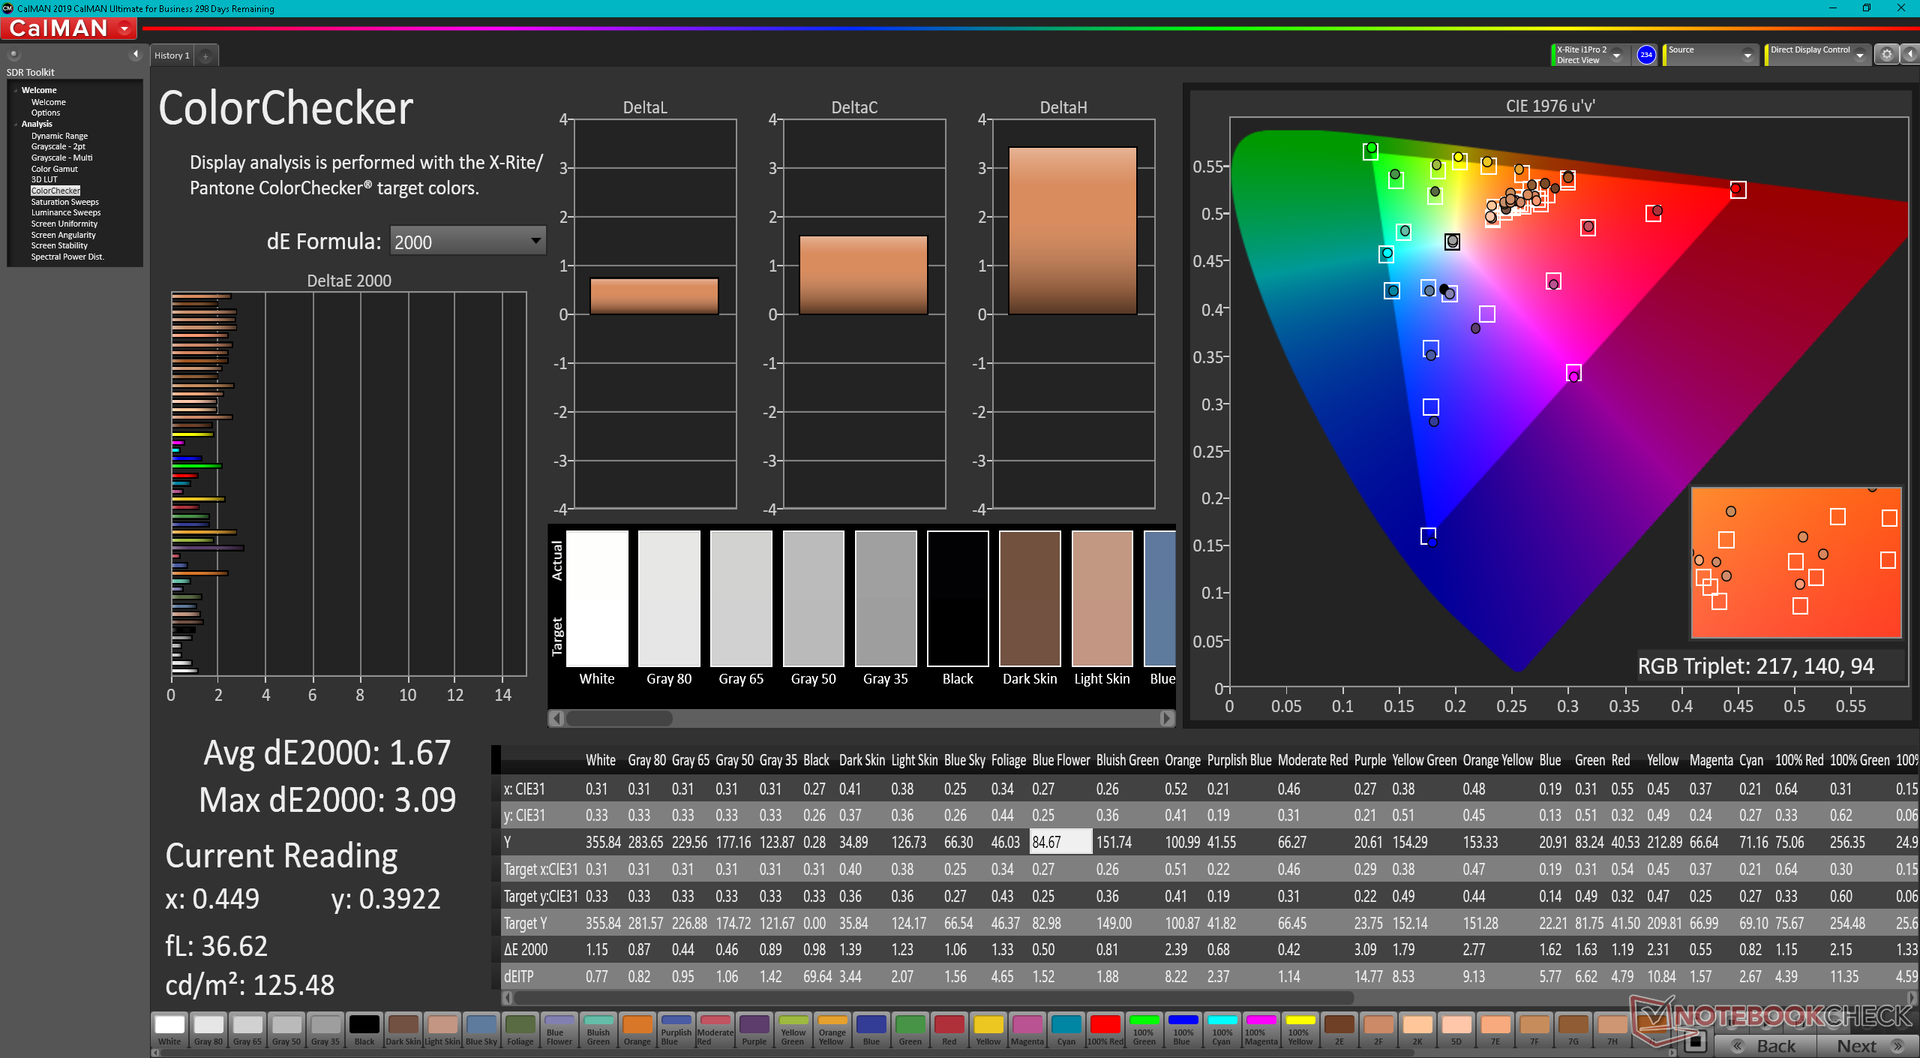
ΔE ColorChecker Calman: 4.32 | ∀{0.5-29.43 Ø4.71}
calibrated: 1.67
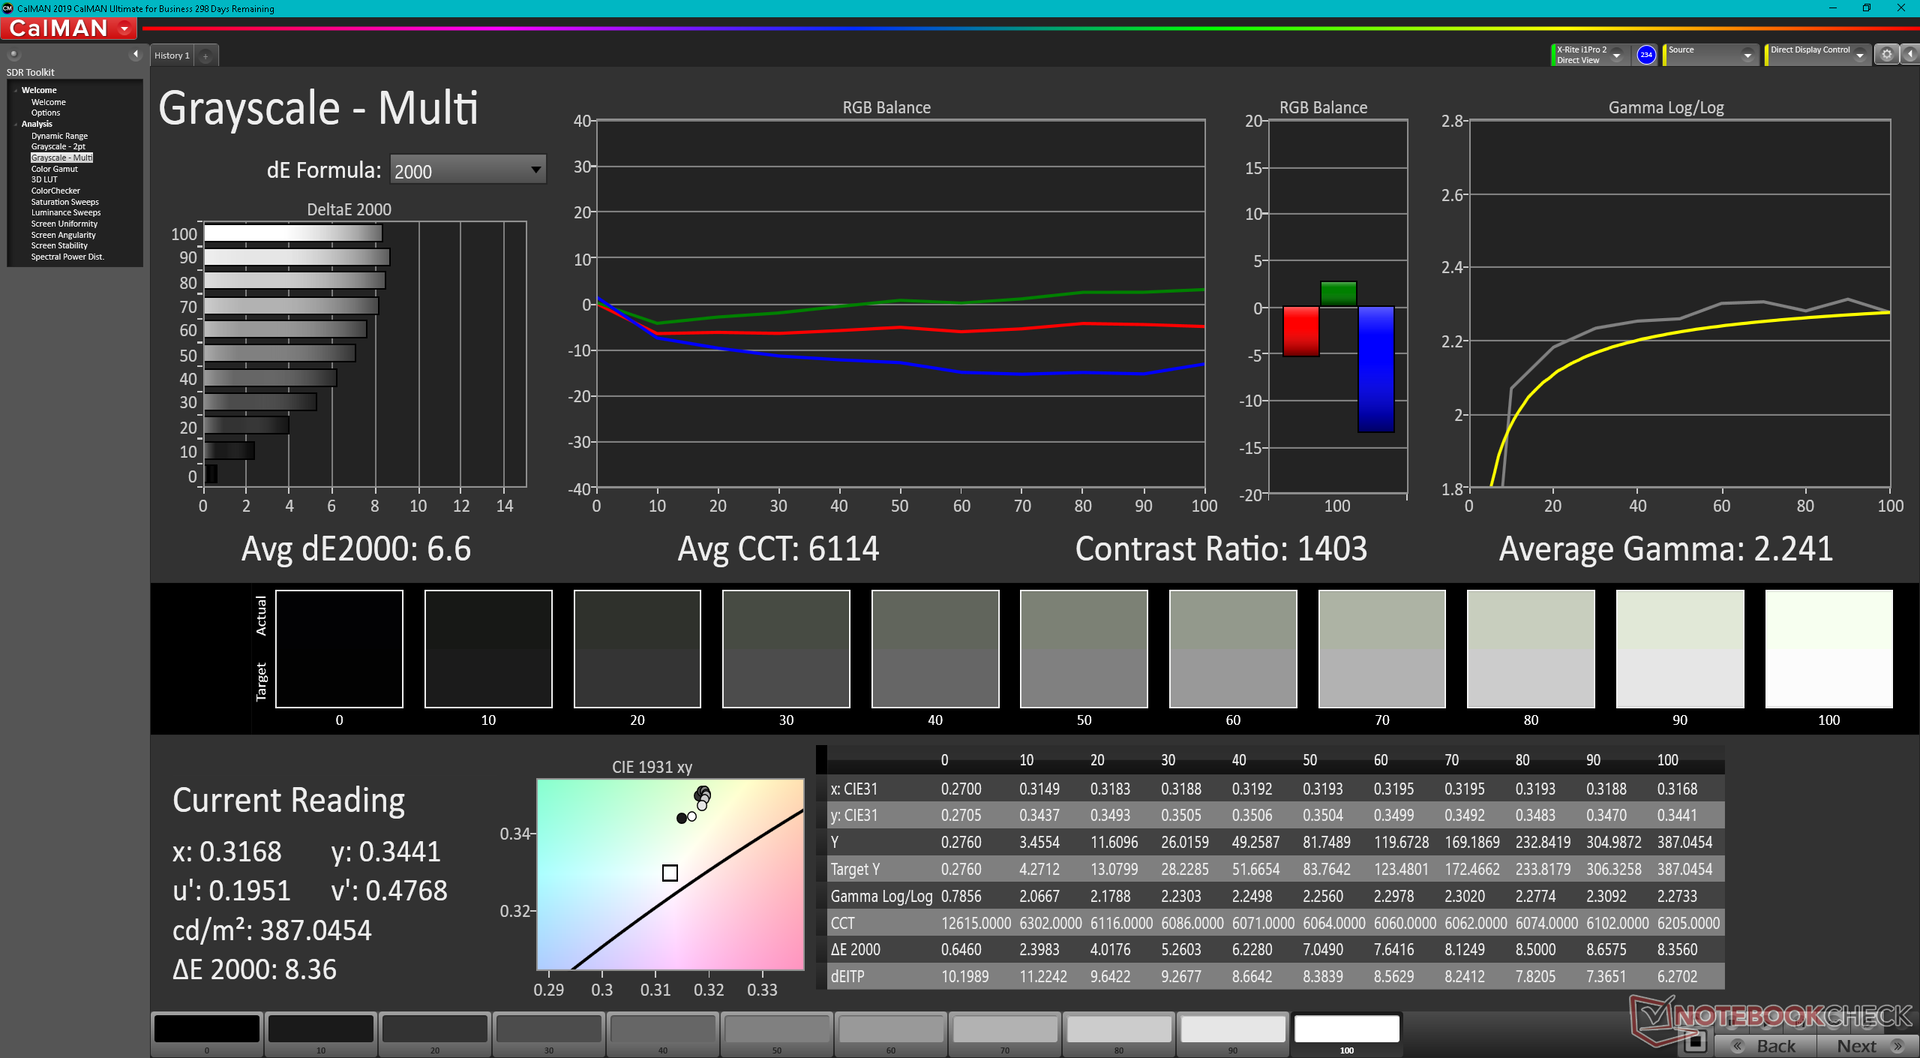
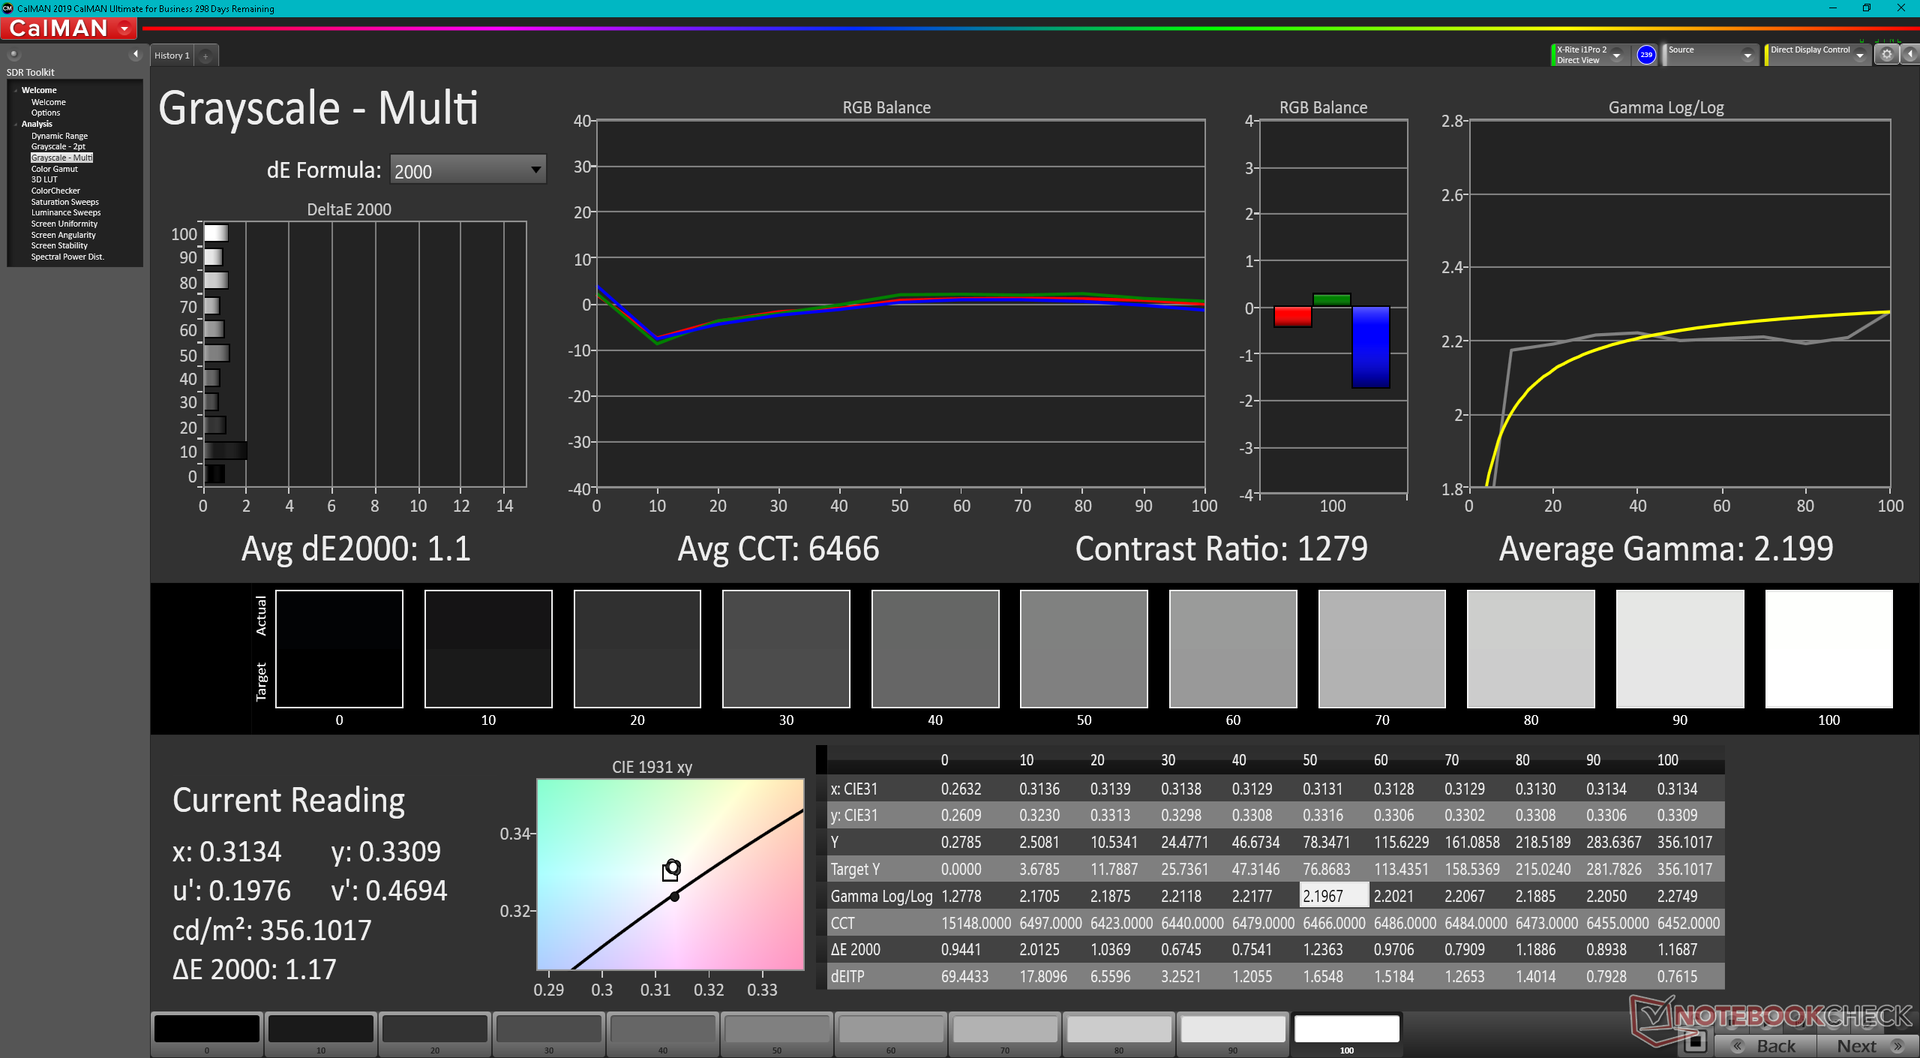
ΔE Greyscale Calman: 6.6 | ∀{0.09-98 Ø4.96}
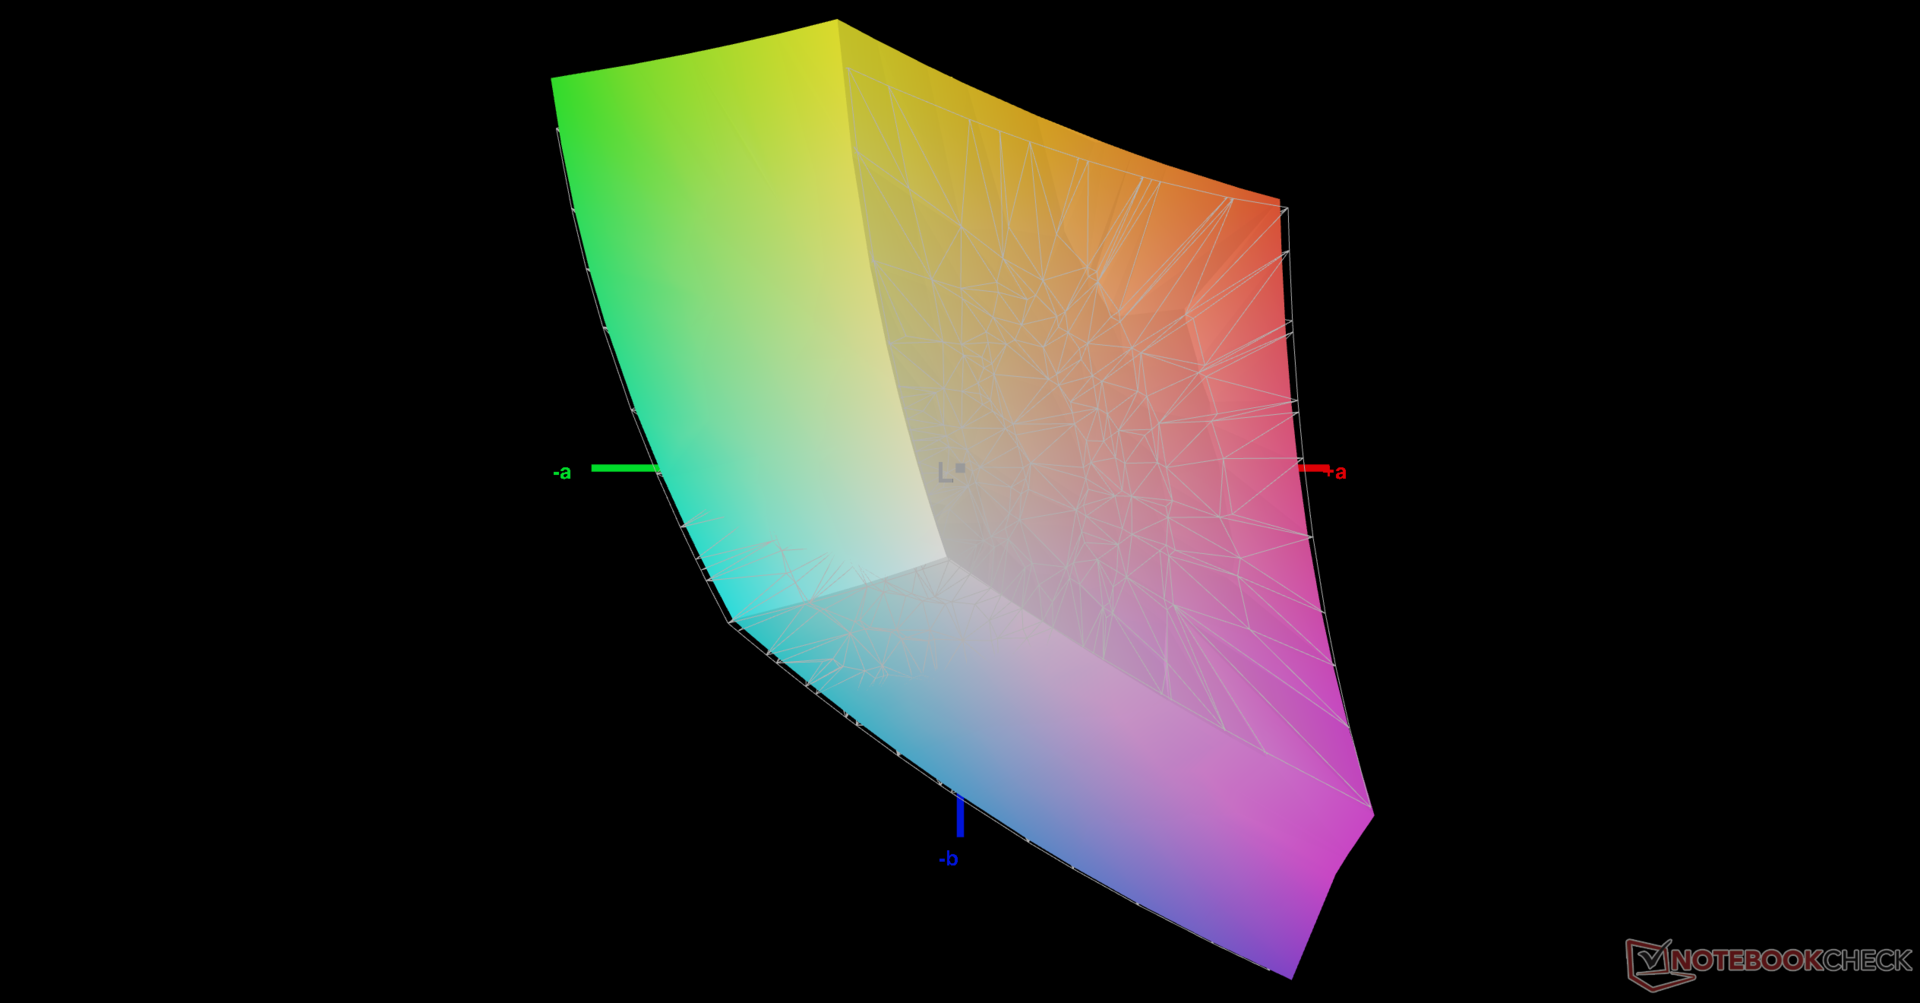
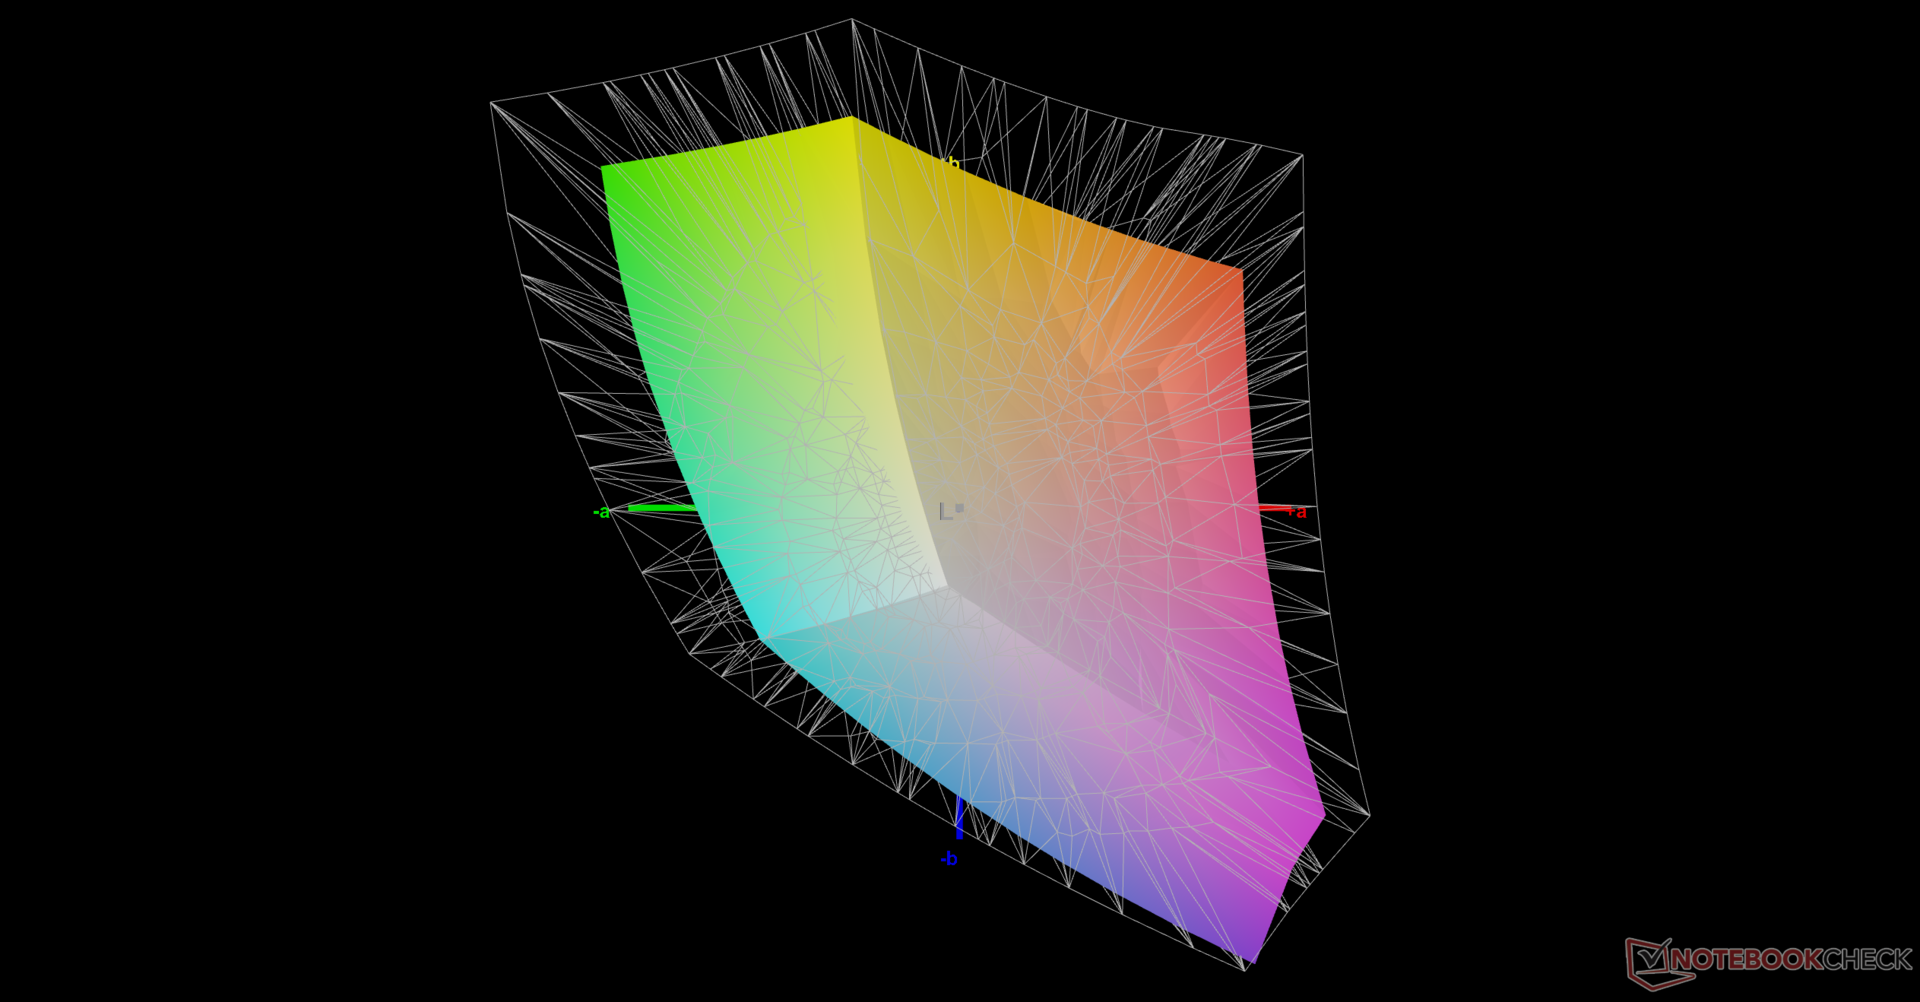
70.7% AdobeRGB 1998 (Argyll 3D)
97.8% sRGB (Argyll 3D)
68.9% Display P3 (Argyll 3D)
Gamma: 2.24
CCT: 6114 K
| Schenker Uniwill Technology GM7AG8P BOE NE173QHM-NY2, IPS, 2560x1440, 17.3" | Schenker XMG NEO 17 GM7TG8S BOE0977 (NE173QHM-NY2), IPS, 2560x1440, 17.3" | Alienware x17 RTX 3080 P48E AU Optronics B173ZAN, IPS, 3840x2160, 17.3" | Razer Blade 17 RTX 3070 AU Optronics B173HAN05.4, IPS, 1920x1080, 17.3" | MSI GS76 Stealth 11UH AUO B173ZAN06.1 (AUODE95), IPS, 3840x2160, 17.3" | Maingear Vector Pro MG-VCP17 BOE NE173QHM-NY2, IPS, 2560x1440, 17.3" | |
|---|---|---|---|---|---|---|
| Display | -3% | 24% | 3% | -7% | 2% | |
| Display P3 Coverage (%) | 68.9 | 67.1 -3% | 88.3 28% | 71.7 4% | 63 -9% | 70.7 3% |
| sRGB Coverage (%) | 97.8 | 96.3 -2% | 100 2% | 98.8 1% | 94.8 -3% | 99.4 2% |
| AdobeRGB 1998 Coverage (%) | 70.7 | 68.6 -3% | 100 41% | 73.6 4% | 65 -8% | 71.7 1% |
| Response Times | 16% | 14% | 54% | 47% | 4% | |
| Response Time Grey 50% / Grey 80% * (ms) | 14.8 ? | 15.2 -3% | 14.4 ? 3% | 4.2 ? 72% | 8.8 ? 41% | 15.6 ? -5% |
| Response Time Black / White * (ms) | 13.6 ? | 8.8 35% | 10.4 ? 24% | 8.8 ? 35% | 6.4 ? 53% | 12 ? 12% |
| PWM Frequency (Hz) | ||||||
| Screen | 18% | 11% | -9% | 22% | 9% | |
| Brightness middle (cd/m²) | 387.1 | 396 2% | 438.7 13% | 323.3 -16% | 474 22% | 389.7 1% |
| Brightness (cd/m²) | 361 | 366 1% | 435 20% | 315 -13% | 454 26% | 363 1% |
| Brightness Distribution (%) | 86 | 82 -5% | 91 6% | 91 6% | 88 2% | 84 -2% |
| Black Level * (cd/m²) | 0.32 | 0.45 -41% | 0.48 -50% | 0.33 -3% | 0.46 -44% | 0.47 -47% |
| Contrast (:1) | 1210 | 880 -27% | 914 -24% | 980 -19% | 1030 -15% | 829 -31% |
| Colorchecker dE 2000 * | 4.32 | 1.43 67% | 4.34 -0% | 4.59 -6% | 1.5 65% | 1.93 55% |
| Colorchecker dE 2000 max. * | 8.58 | 2.2 74% | 7.3 15% | 10.82 -26% | 5.59 35% | 6.84 20% |
| Colorchecker dE 2000 calibrated * | 1.67 | 1.34 20% | 0.72 57% | 1.4 16% | 0.86 49% | 1.31 22% |
| Greyscale dE 2000 * | 6.6 | 1.8 73% | 2.4 64% | 7.9 -20% | 2.8 58% | 2.4 64% |
| Gamma | 2.24 98% | 2.4 92% | 2.09 105% | 2.28 96% | 2.158 102% | 2.12 104% |
| CCT | 6114 106% | 6489 100% | 6413 101% | 5941 109% | 6597 99% | 6658 98% |
| Média Total (Programa/Configurações) | 10% /
13% | 16% /
14% | 16% /
3% | 21% /
19% | 5% /
7% |
* ... menor é melhor
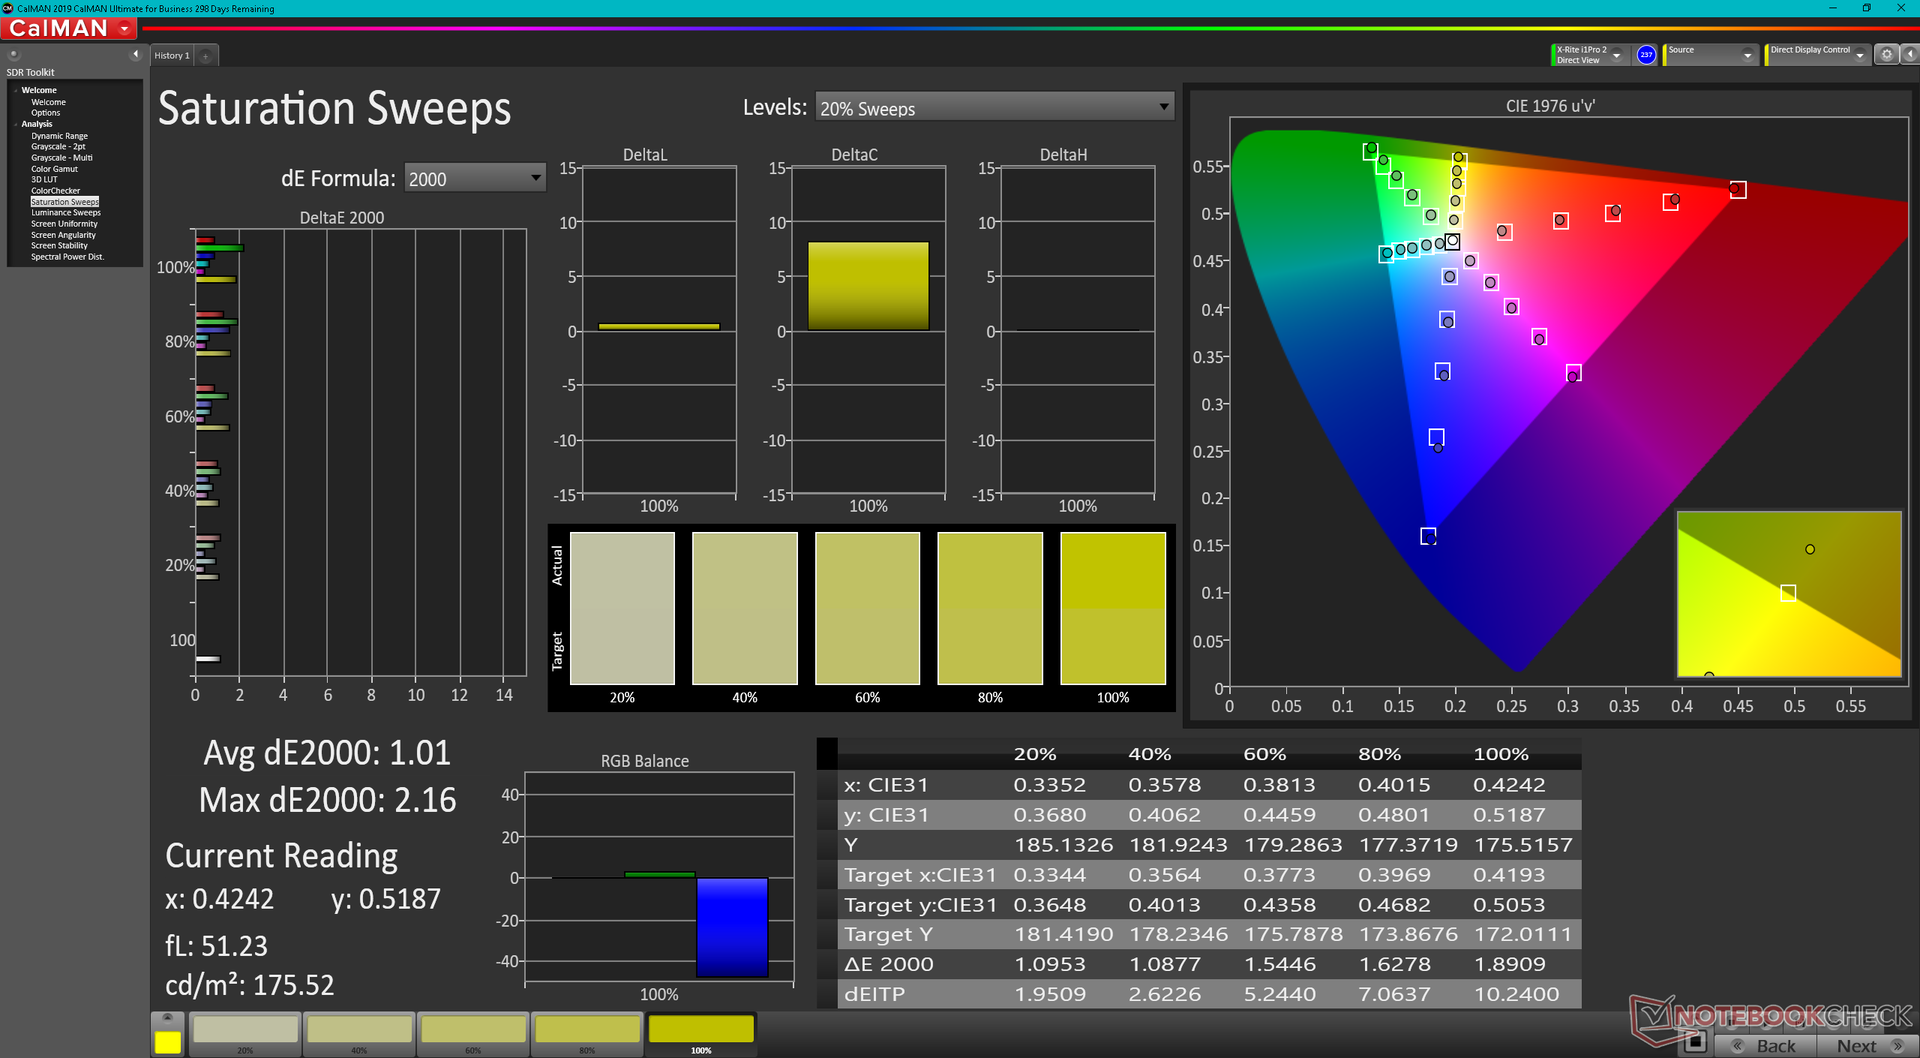
A escala de cinza não é bem calibrada fora da caixa com seu valor médio deltaE relativamente alto de 6,6 devido à temperatura de cor quente de cerca de 6100K. Uma vez calibrados com nosso colorímetro X-Rite, tanto a escala de cinza quanto o ColorChecker melhorariam com valores finais médios de deltaE de apenas 1,1 e 1,67, respectivamente
Exibir tempos de resposta
| ↔ Tempo de resposta preto para branco | ||
|---|---|---|
| 13.6 ms ... ascensão ↗ e queda ↘ combinadas | ↗ 7.6 ms ascensão | 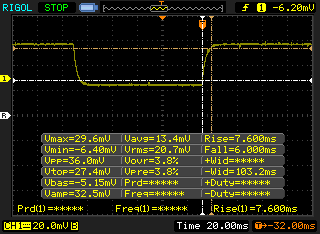 |
| ↘ 6 ms queda | ||
| A tela mostra boas taxas de resposta em nossos testes, mas pode ser muito lenta para jogadores competitivos. Em comparação, todos os dispositivos testados variam de 0.1 (mínimo) a 240 (máximo) ms. » 34 % de todos os dispositivos são melhores. Isso significa que o tempo de resposta medido é melhor que a média de todos os dispositivos testados (19.8 ms). | ||
| ↔ Tempo de resposta 50% cinza a 80% cinza | ||
| 14.8 ms ... ascensão ↗ e queda ↘ combinadas | ↗ 8 ms ascensão | 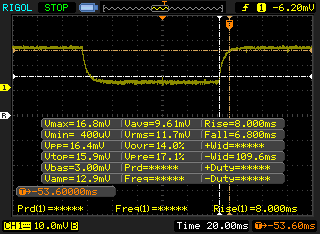 |
| ↘ 6.8 ms queda | ||
| A tela mostra boas taxas de resposta em nossos testes, mas pode ser muito lenta para jogadores competitivos. Em comparação, todos os dispositivos testados variam de 0.165 (mínimo) a 636 (máximo) ms. » 29 % de todos os dispositivos são melhores. Isso significa que o tempo de resposta medido é melhor que a média de todos os dispositivos testados (31 ms). | ||
Cintilação da tela / PWM (modulação por largura de pulso)
| Tela tremeluzindo / PWM não detectado | 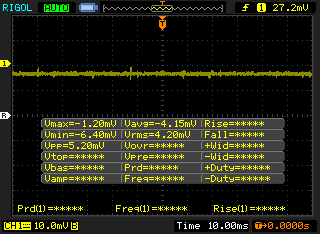 | ||
[pwm_comparison] Em comparação: 52 % de todos os dispositivos testados não usam PWM para escurecer a tela. Se PWM foi detectado, uma média de 7757 (mínimo: 5 - máximo: 343500) Hz foi medida. | |||
Desempenho - Extremo para o tamanho
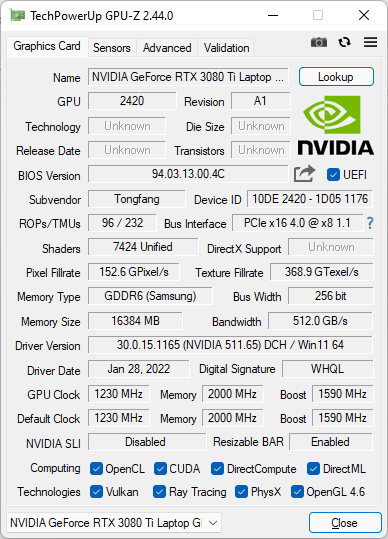
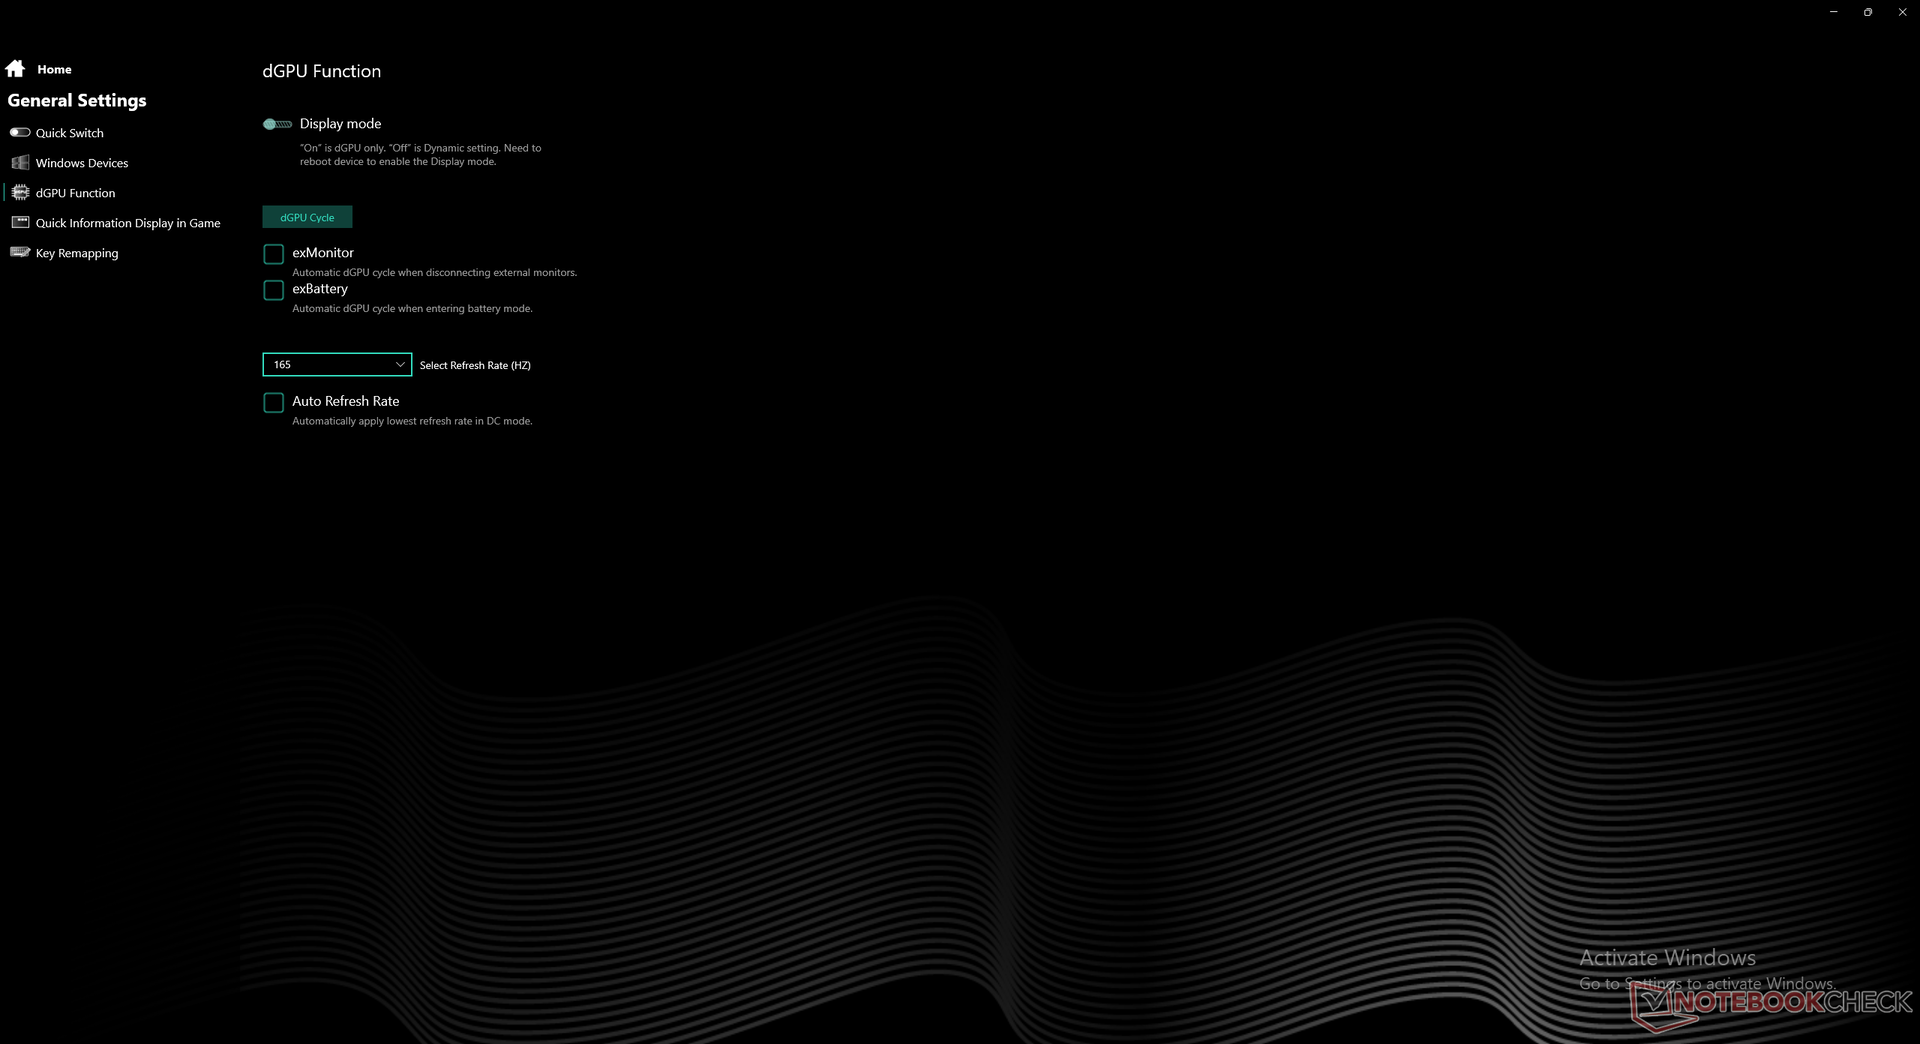
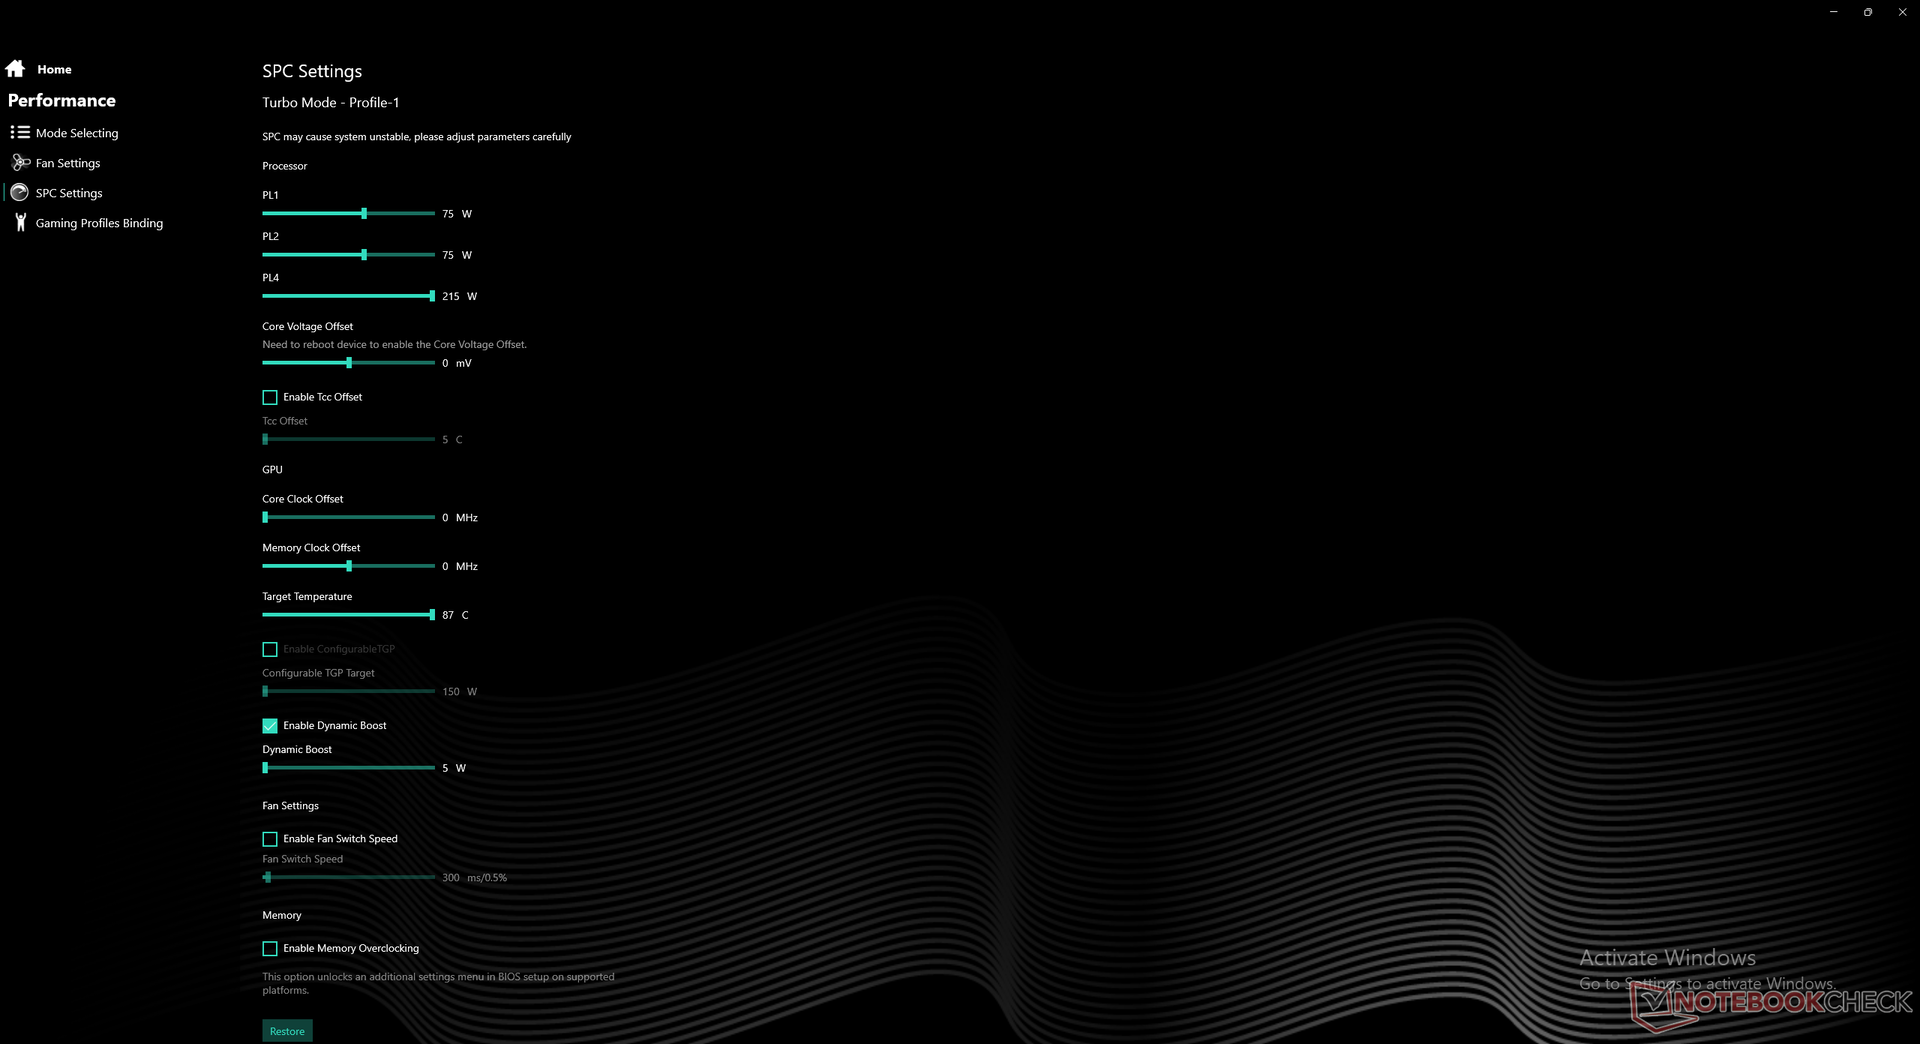
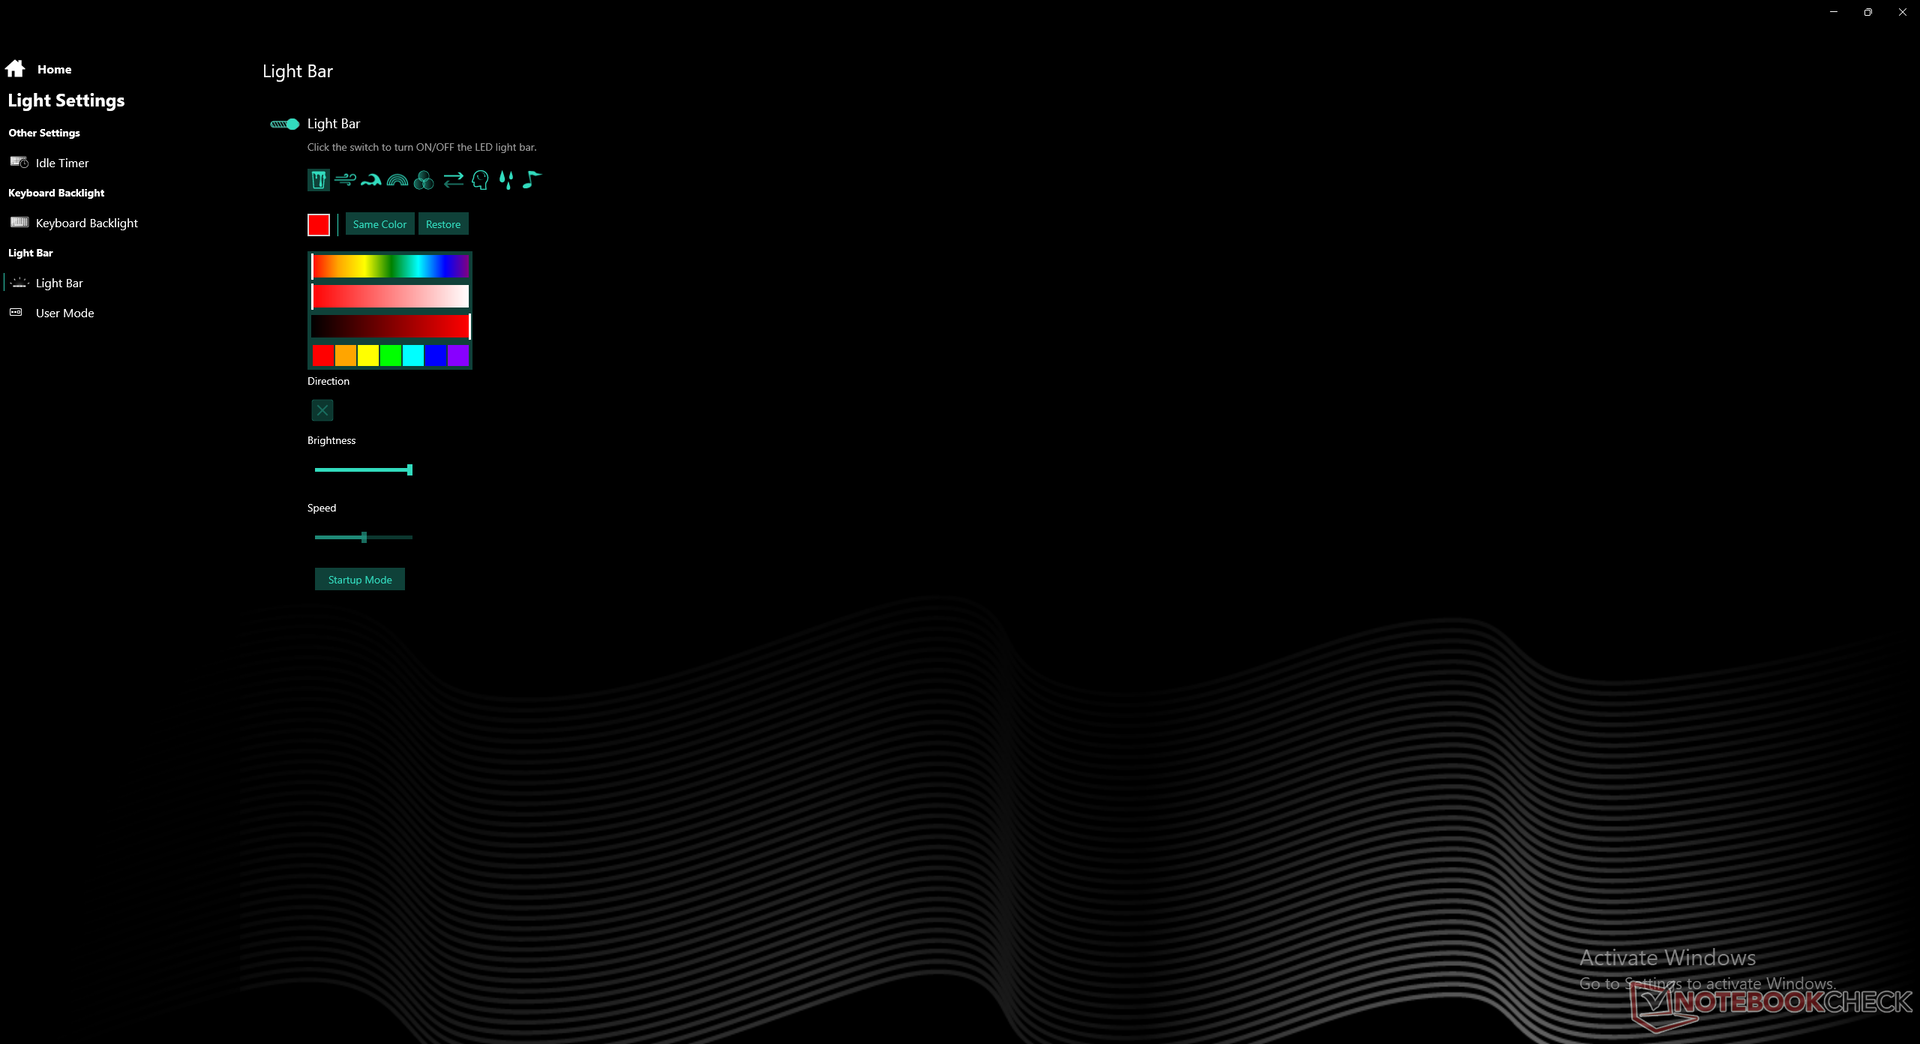
O Advanced Optimus (ou Optimus 2.0) não está disponível, o que significa que os usuários terão que alternar entre GPU discreto e MSHybrid manualmente via BIOS. Além disso, tenha em mente que a GPU GeForce RTX 3080 Ti é definida para 150 W TGP por padrão, embora o Painel de Controle Nvidia declare que é capaz de atingir até 175 W. Os usuários terão que definir manualmente a GPU para 175 W através do software do Centro de Controle incluído
Condições de teste
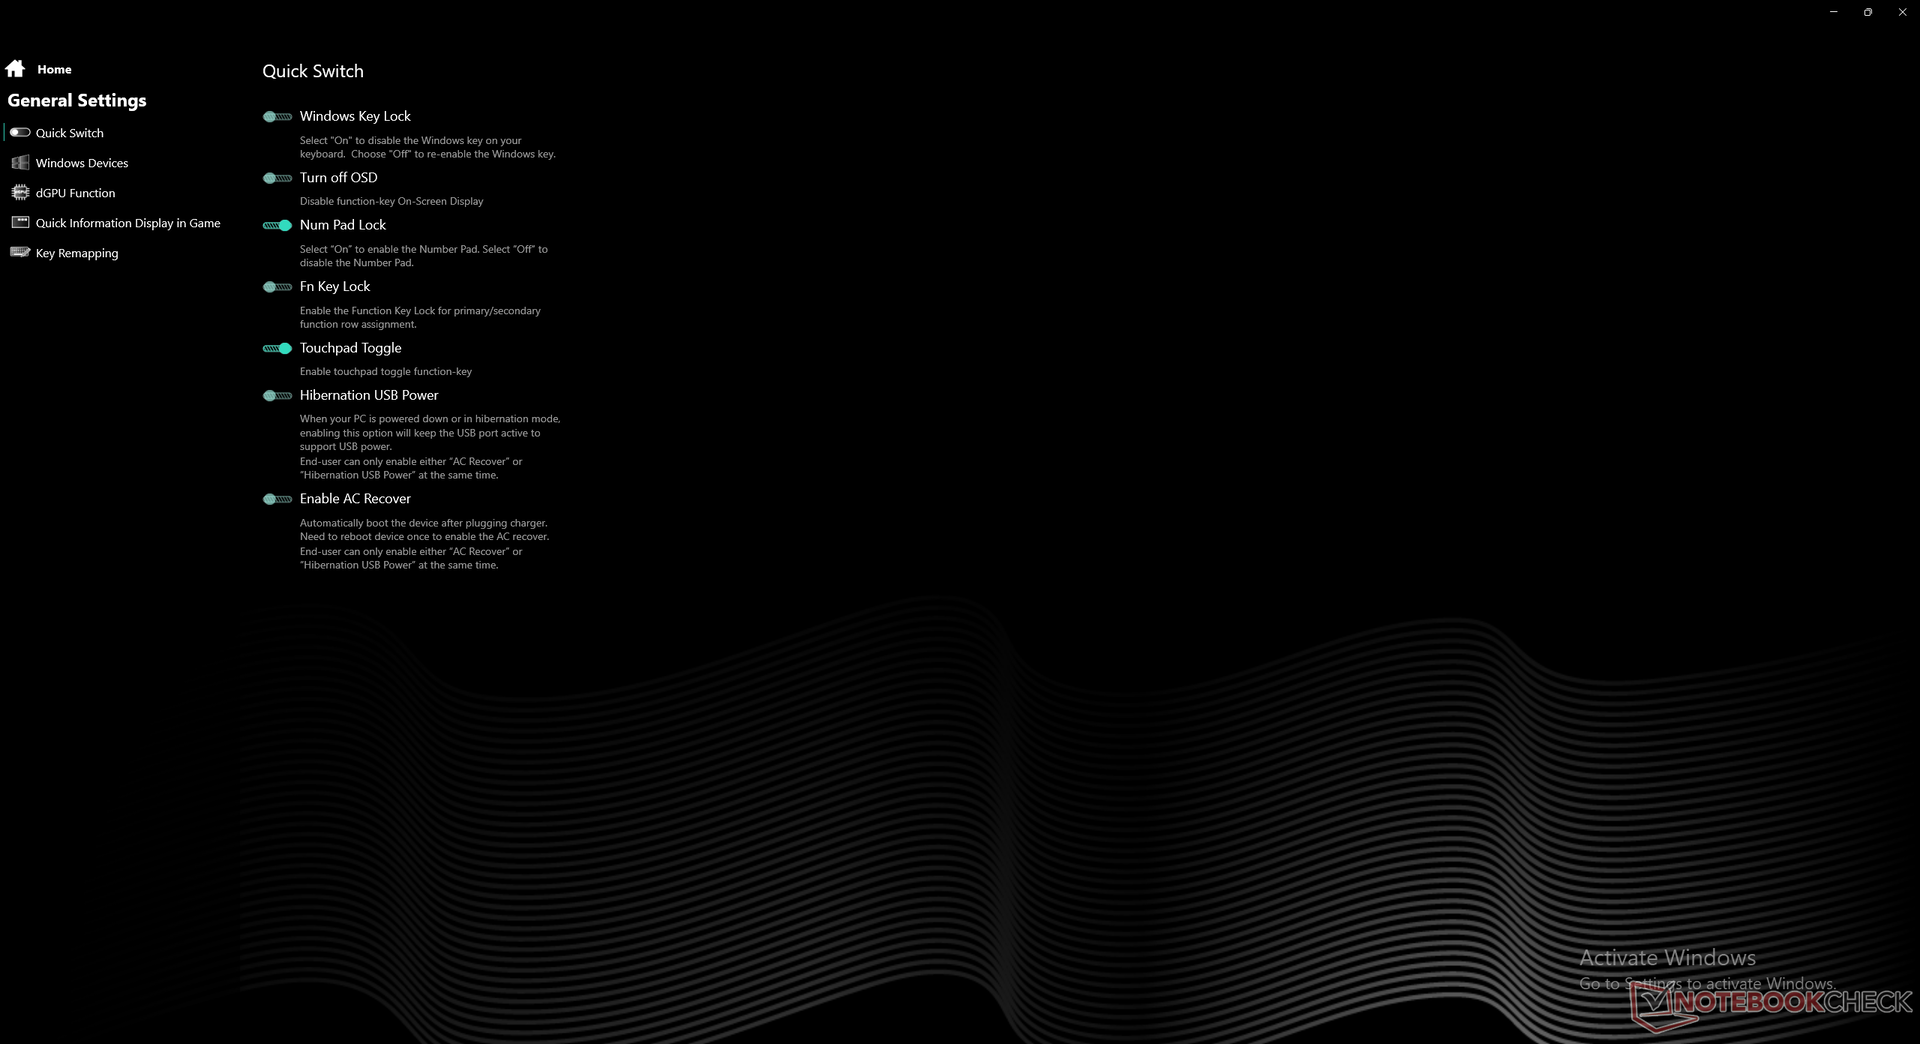
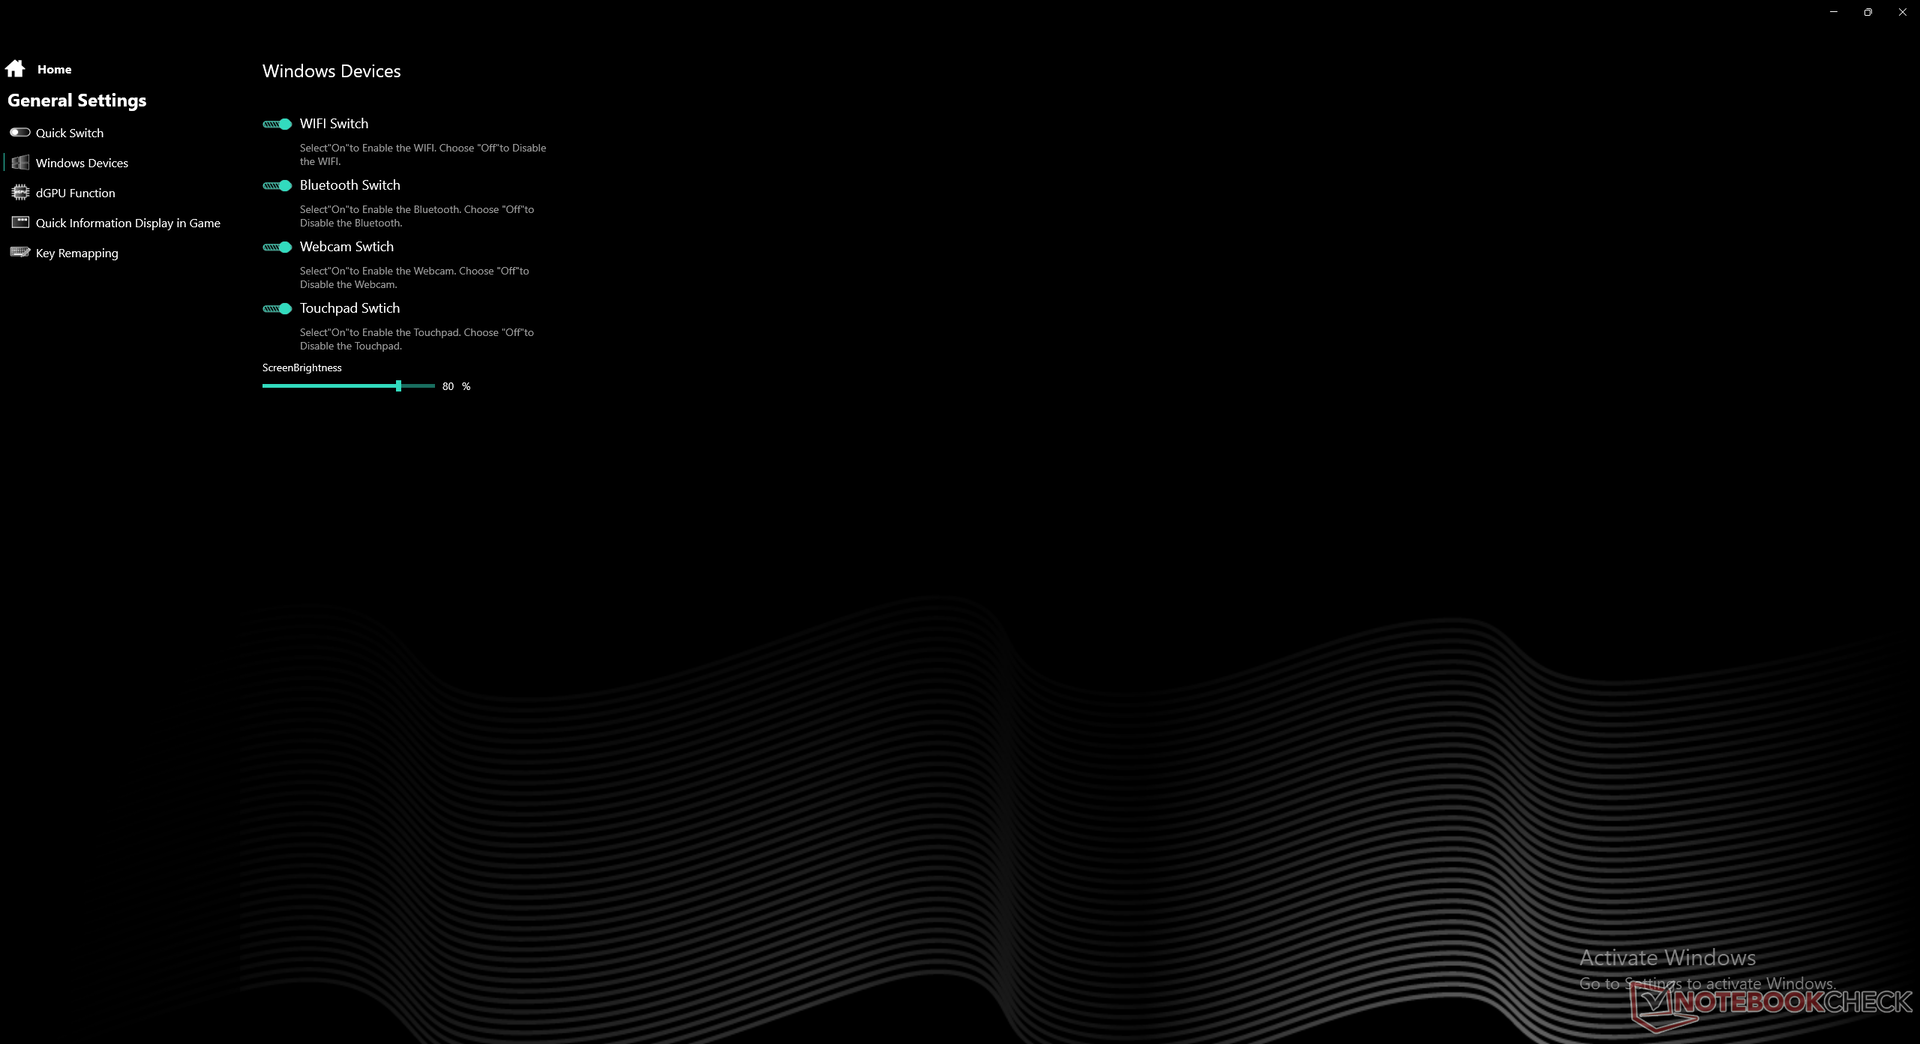
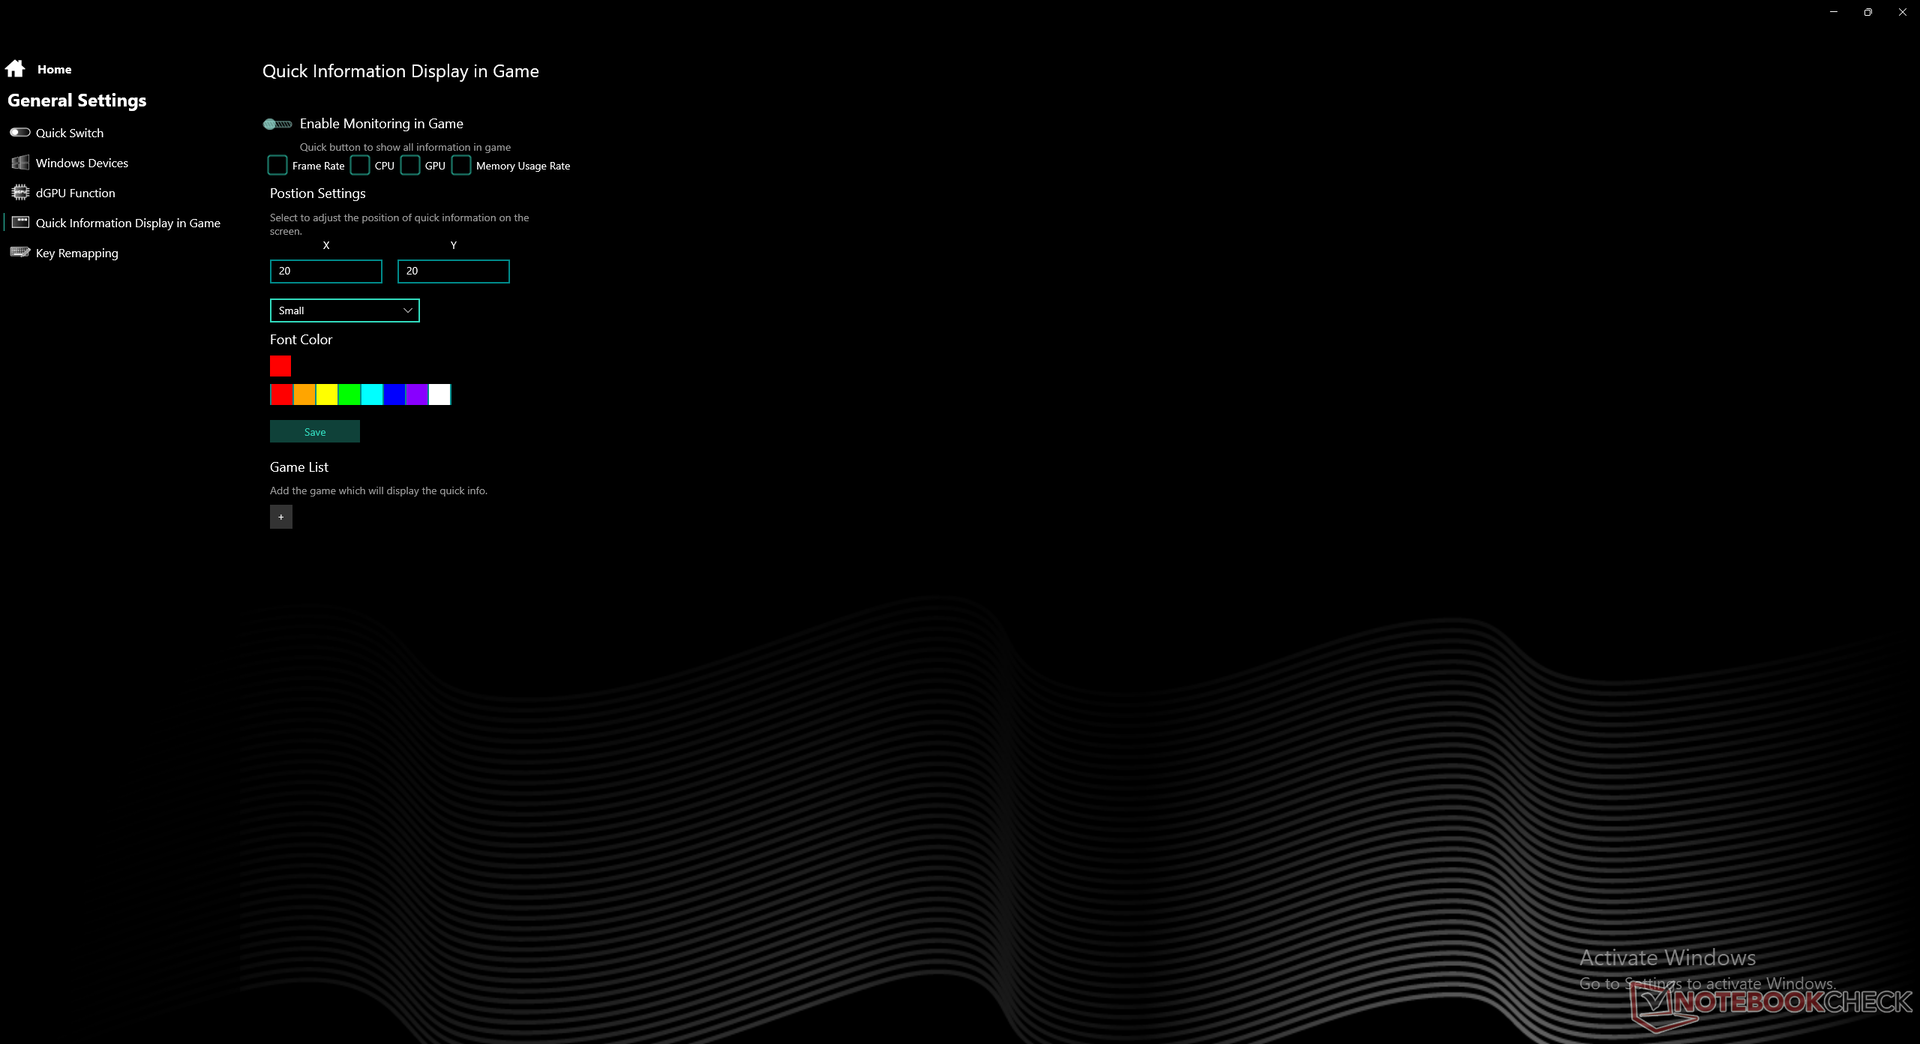
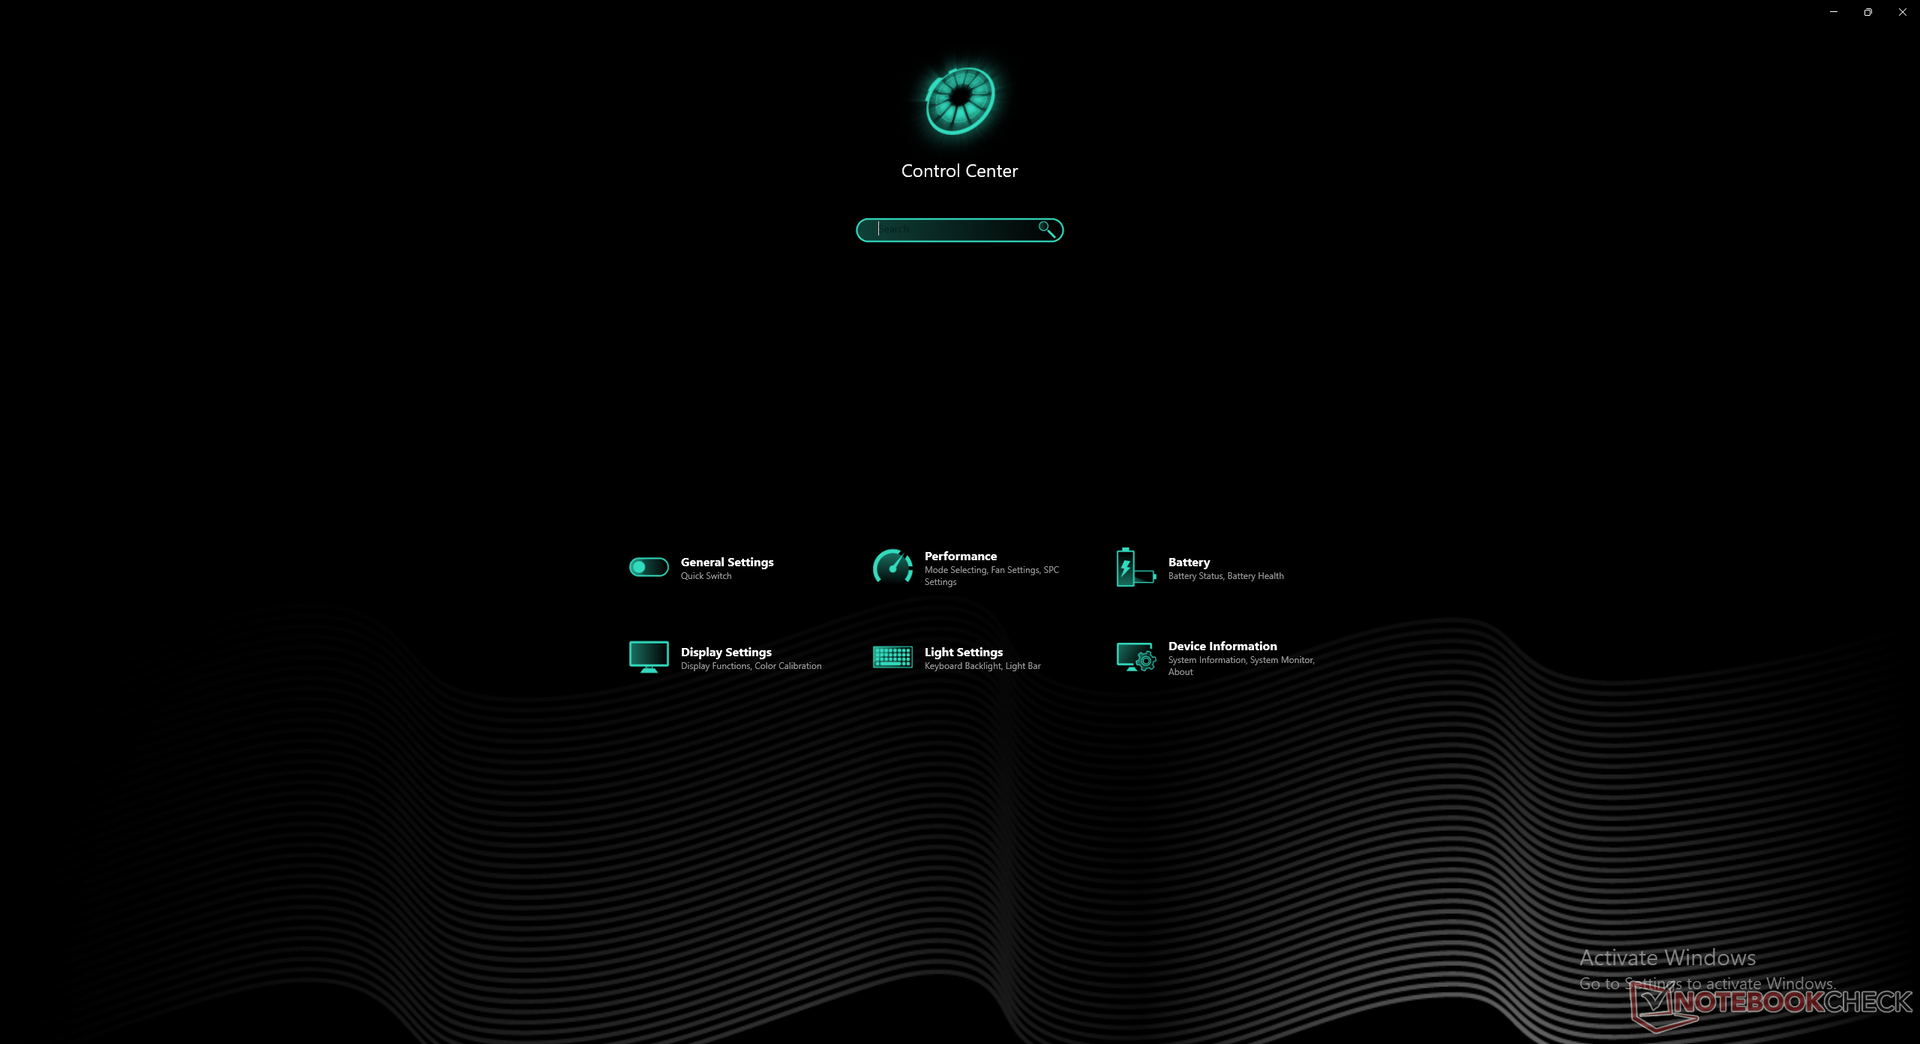
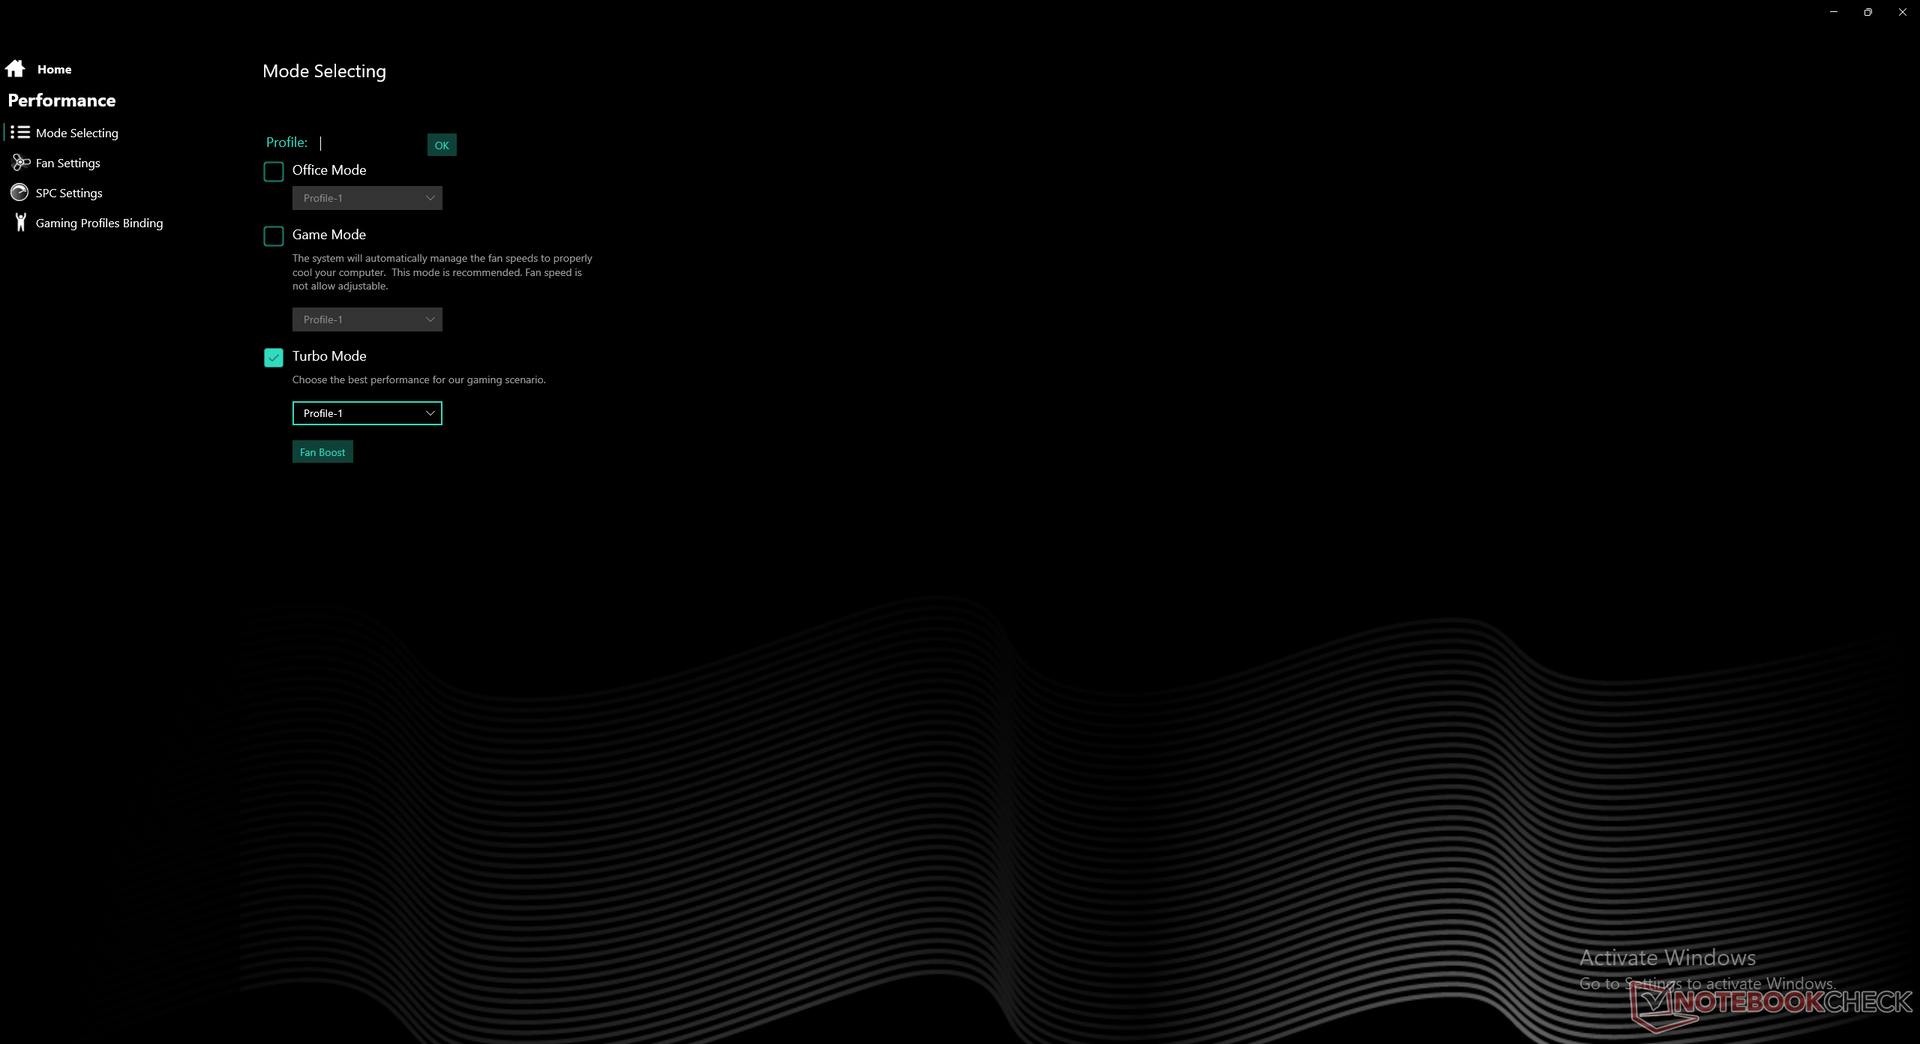
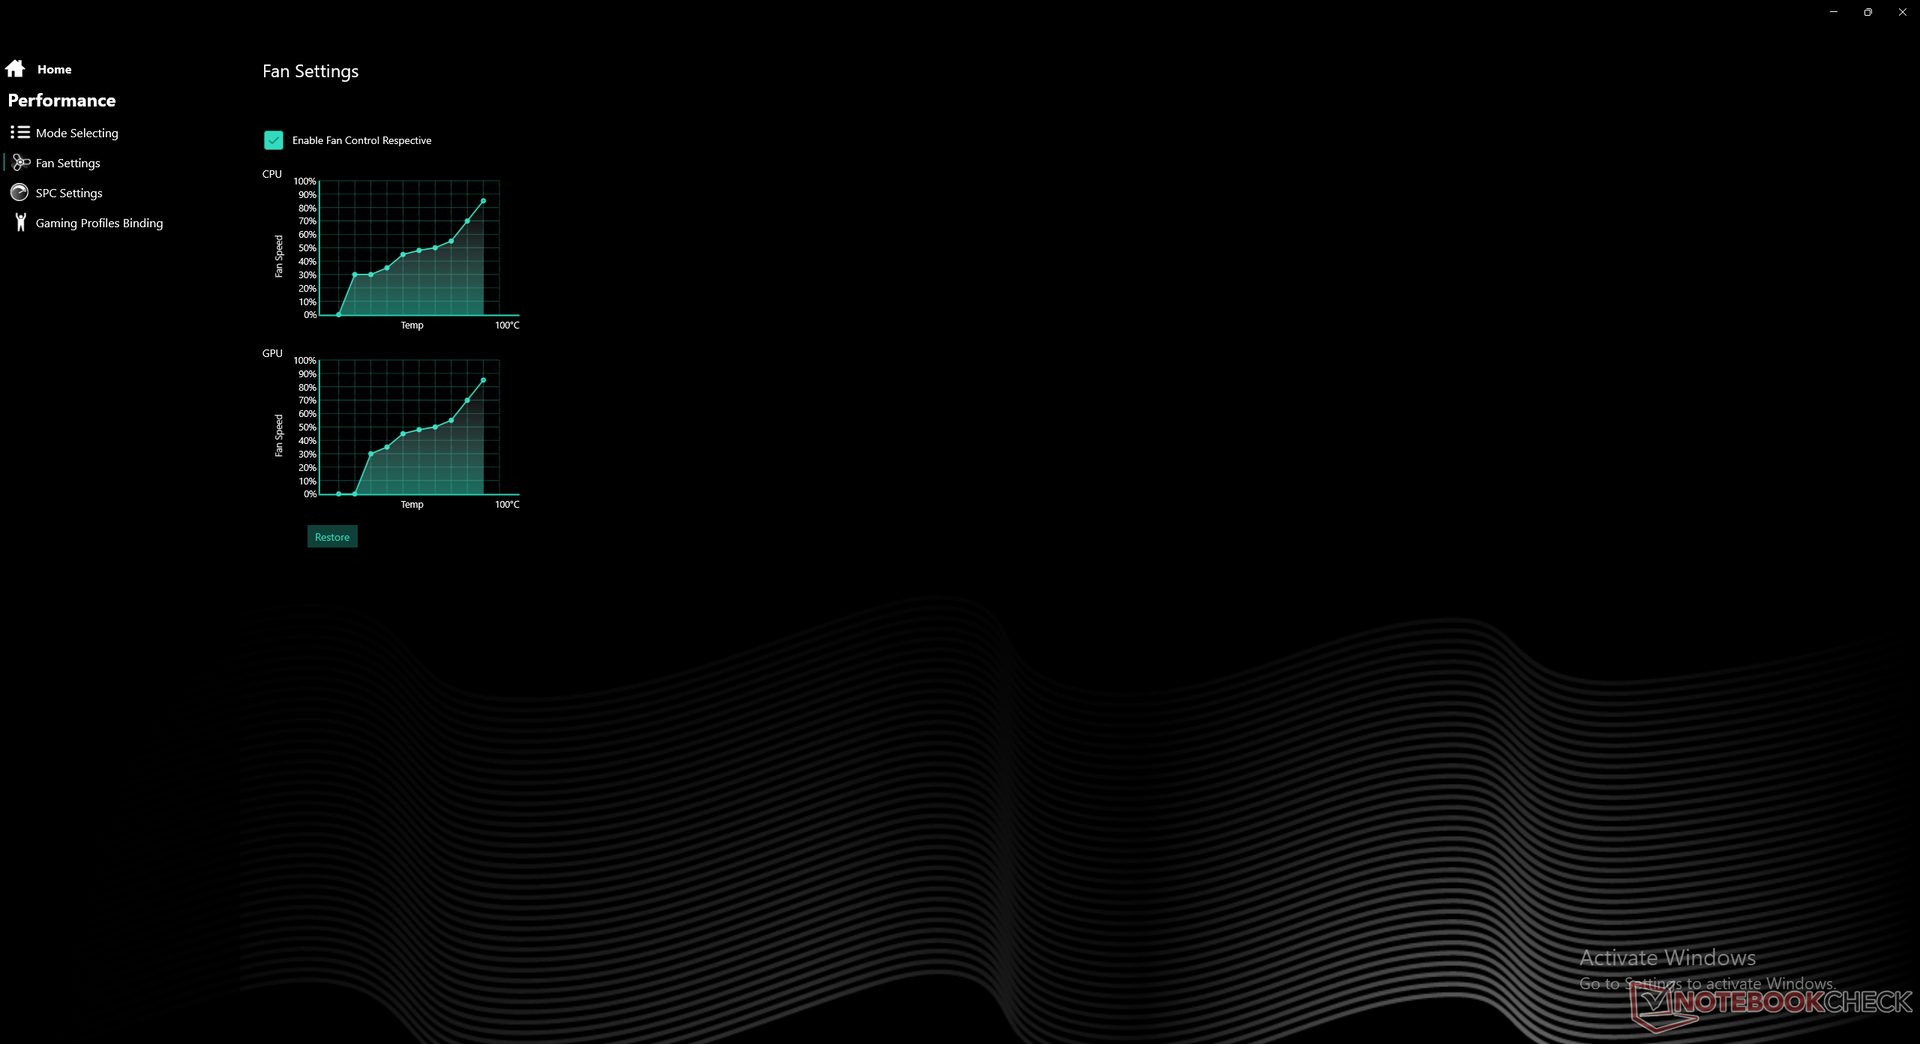
Definimos nossa unidade com as configurações padrão de BIOS e Centro de Controle antes de executar qualquer referência de desempenho abaixo, embora com o perfil de potência Turbo ativo. Recomendamos que os usuários se familiarizem com o Centro de Controle, pois características importantes são combinadas aqui.
Processador - Melhorias perceptíveis de Gen-to-Gen
O desempenho bruto da CPU é apenas 9% mais lento do que o da Núcleo i9-12900HK como encontrado no novo MSI GE76. Quando comparado com a última geração Núcleo i9-11900H que o Núcleo i9-12900H diretamente substitui, os usuários podem esperar um aumento de desempenho de uma e várias roscas de cerca de 20% e 30%, respectivamente. Este aumento é suficiente para impulsionar a nova CPU Intel acima da Ryzen 7 5800H e Ryzen 9 5900HX que são algumas das CPUs Zen 3 móveis mais rápidas.
Detalhes adicionais sobre a plataforma Alder Lake podem ser encontrados em nossa visão geral aqui.
Cinebench R15 Multi Loop
Cinebench R23: Multi Core | Single Core
Cinebench R20: CPU (Multi Core) | CPU (Single Core)
Cinebench R15: CPU Multi 64Bit | CPU Single 64Bit
Blender: v2.79 BMW27 CPU
7-Zip 18.03: 7z b 4 | 7z b 4 -mmt1
Geekbench 5.5: Multi-Core | Single-Core
HWBOT x265 Benchmark v2.2: 4k Preset
LibreOffice : 20 Documents To PDF
R Benchmark 2.5: Overall mean
| CPU Performance rating | |
| Média da turma Gaming | |
| MSI GE76 Raider | |
| Schenker Uniwill Technology GM7AG8P | |
| Média Intel Core i9-12900H | |
| Schenker XMG Ultra 17 Rocket Lake | |
| MSI WE76 11UM-456 -1! | |
| MSI GS76 Stealth 11UH | |
| Medion Erazer Beast X25 | |
| Schenker XMG Apex 17 M21 | |
| Gigabyte A7 X1 | |
| Maingear Vector Pro MG-VCP17 -2! | |
| Alienware m17 R4 | |
| Lenovo ThinkPad P73-20QR0030GE | |
| Schenker XMG Core 17 (Early 2021) | |
| Acer Aspire 5 A517-52G-79Z5 | |
Cinebench R23: Multi Core | Single Core
Cinebench R20: CPU (Multi Core) | CPU (Single Core)
Cinebench R15: CPU Multi 64Bit | CPU Single 64Bit
Blender: v2.79 BMW27 CPU
7-Zip 18.03: 7z b 4 | 7z b 4 -mmt1
Geekbench 5.5: Multi-Core | Single-Core
HWBOT x265 Benchmark v2.2: 4k Preset
LibreOffice : 20 Documents To PDF
R Benchmark 2.5: Overall mean
* ... menor é melhor
| AIDA64 / FP32 Ray-Trace | |
| Schenker Uniwill Technology GM7AG8P | |
| AIDA64 / FPU Julia | |
| Schenker Uniwill Technology GM7AG8P | |
| AIDA64 / CPU SHA3 | |
| Schenker Uniwill Technology GM7AG8P | |
| AIDA64 / CPU Queen | |
| Schenker Uniwill Technology GM7AG8P | |
| AIDA64 / FPU SinJulia | |
| Schenker Uniwill Technology GM7AG8P | |
| AIDA64 / FPU Mandel | |
| Schenker Uniwill Technology GM7AG8P | |
| AIDA64 / CPU AES | |
| Schenker Uniwill Technology GM7AG8P | |
| AIDA64 / CPU ZLib | |
| Schenker Uniwill Technology GM7AG8P | |
| Schenker XMG NEO 17 GM7TG8S | |
| Maingear Vector Pro MG-VCP17 | |
| Razer Blade 17 RTX 3070 | |
| Alienware x17 RTX 3080 P48E | |
| AIDA64 / FP64 Ray-Trace | |
| Schenker Uniwill Technology GM7AG8P | |
| AIDA64 / CPU PhotoWorxx | |
| Schenker Uniwill Technology GM7AG8P | |
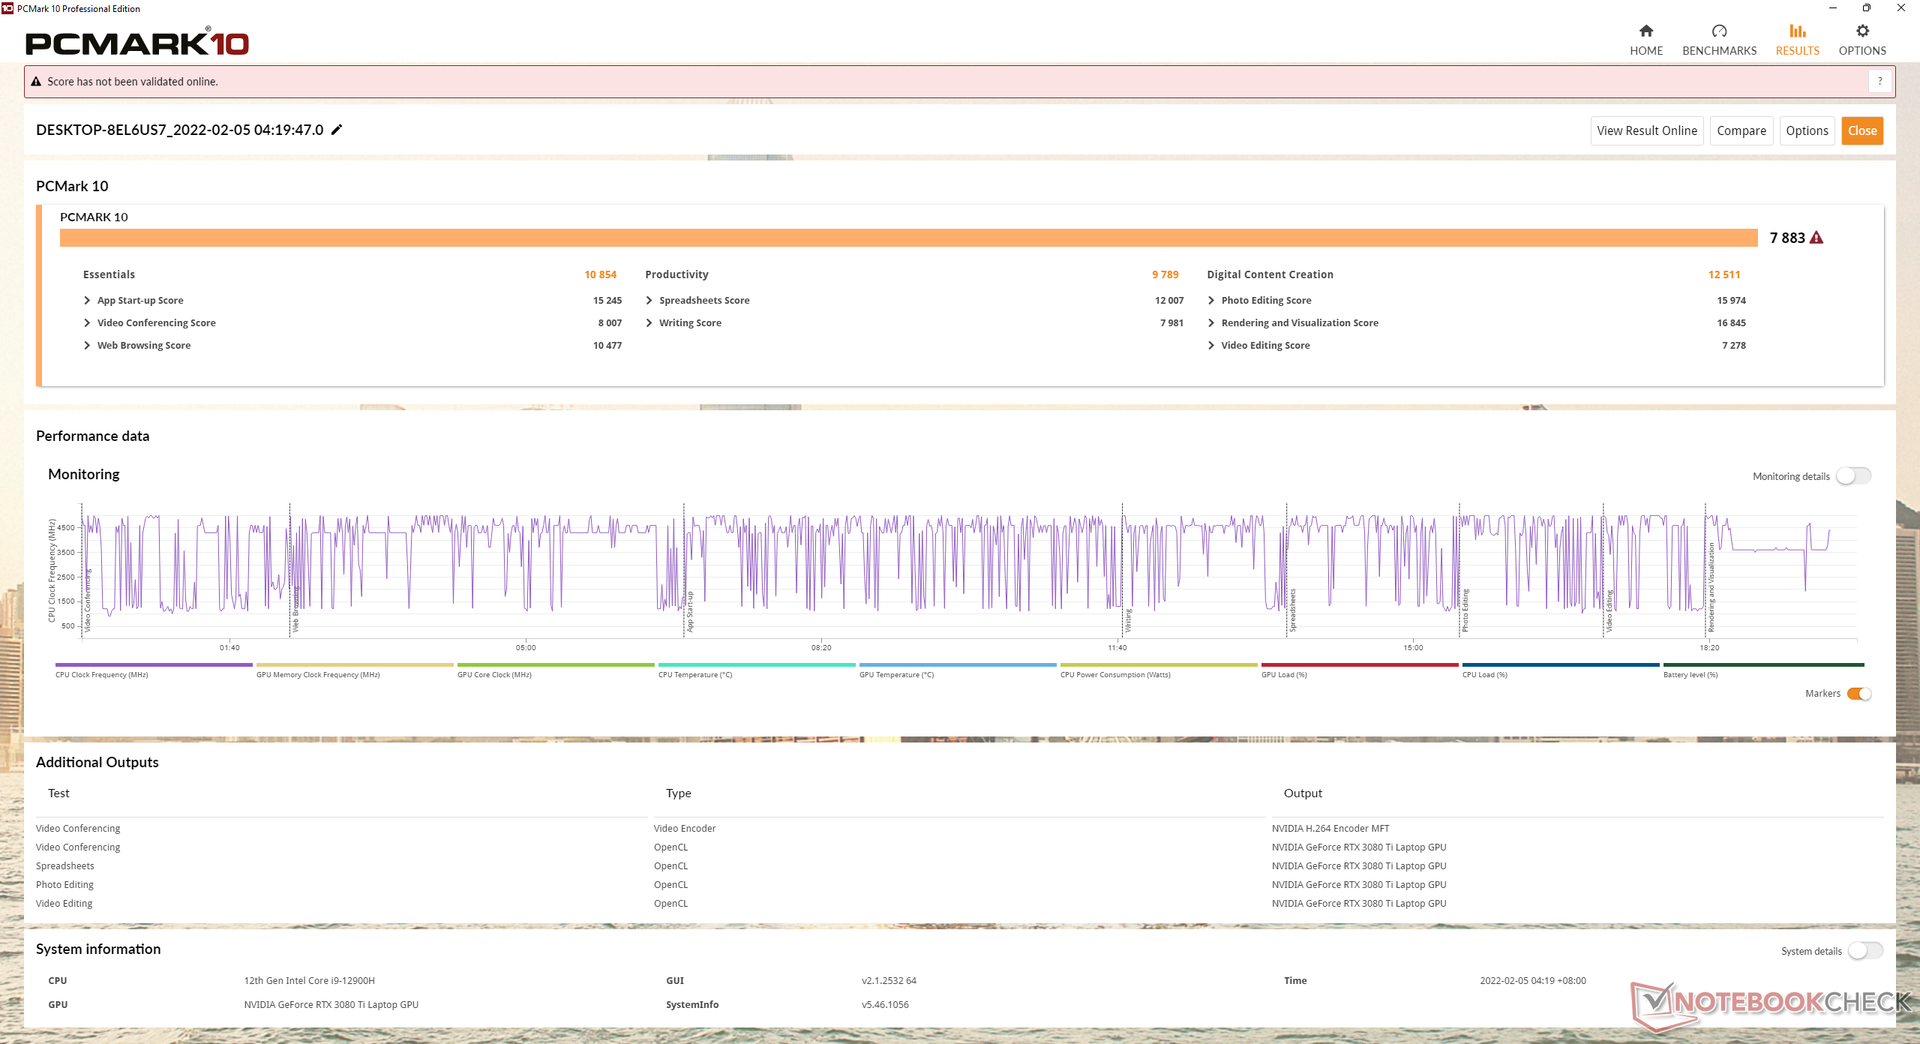
Desempenho do sistema
As pontuações PCMark são algumas das mais altas em nosso banco de dados, competindo essencialmente com o Schenker XMG Ultra 17, equipado com o Core i9-11900K de mesa.
| PCMark 10 / Score | |
| Schenker XMG Ultra 17 Rocket Lake | |
| Schenker Uniwill Technology GM7AG8P | |
| Média Intel Core i9-12900H, NVIDIA GeForce RTX 3080 Ti Laptop GPU (7139 - 8083, n=6) | |
| Eurocom Sky X4C i9-9900KS | |
| Schenker XMG Ultra 17 Comet Lake | |
| Schenker XMG NEO 17 GM7TG8S | |
| Schenker XMG Apex 17 M21 | |
| PCMark 10 / Essentials | |
| Eurocom Sky X4C i9-9900KS | |
| Schenker XMG Ultra 17 Rocket Lake | |
| Schenker Uniwill Technology GM7AG8P | |
| Média Intel Core i9-12900H, NVIDIA GeForce RTX 3080 Ti Laptop GPU (10254 - 11178, n=6) | |
| Schenker XMG Ultra 17 Comet Lake | |
| Schenker XMG NEO 17 GM7TG8S | |
| Schenker XMG Apex 17 M21 | |
| PCMark 10 / Productivity | |
| Média Intel Core i9-12900H, NVIDIA GeForce RTX 3080 Ti Laptop GPU (9102 - 11186, n=6) | |
| Schenker XMG Ultra 17 Rocket Lake | |
| Schenker Uniwill Technology GM7AG8P | |
| Schenker XMG NEO 17 GM7TG8S | |
| Schenker XMG Apex 17 M21 | |
| Eurocom Sky X4C i9-9900KS | |
| Schenker XMG Ultra 17 Comet Lake | |
| PCMark 10 / Digital Content Creation | |
| Schenker Uniwill Technology GM7AG8P | |
| Schenker XMG Ultra 17 Rocket Lake | |
| Schenker XMG Ultra 17 Comet Lake | |
| Média Intel Core i9-12900H, NVIDIA GeForce RTX 3080 Ti Laptop GPU (9847 - 12627, n=6) | |
| Eurocom Sky X4C i9-9900KS | |
| Schenker XMG NEO 17 GM7TG8S | |
| Schenker XMG Apex 17 M21 | |
| PCMark 10 Score | 7883 pontos | |
Ajuda | ||
| AIDA64 / Memory Copy | |
| MSI GE76 Raider | |
| Schenker Uniwill Technology GM7AG8P | |
| Schenker XMG Pro 17 (Late 2021, RTX 3080) | |
| Schenker XMG Apex 17 M21 | |
| AIDA64 / Memory Read | |
| MSI GE76 Raider | |
| Schenker Uniwill Technology GM7AG8P | |
| Schenker XMG Pro 17 (Late 2021, RTX 3080) | |
| Schenker XMG Apex 17 M21 | |
| AIDA64 / Memory Write | |
| Schenker Uniwill Technology GM7AG8P | |
| MSI GE76 Raider | |
| Schenker XMG Apex 17 M21 | |
| Schenker XMG Pro 17 (Late 2021, RTX 3080) | |
| AIDA64 / Memory Latency | |
| MSI GE76 Raider | |
| Schenker XMG Pro 17 (Late 2021, RTX 3080) | |
| Schenker XMG Apex 17 M21 | |
| Razer Blade 17 RTX 3070 | |
| Alienware x17 RTX 3080 P48E | |
| Schenker Uniwill Technology GM7AG8P | |
* ... menor é melhor
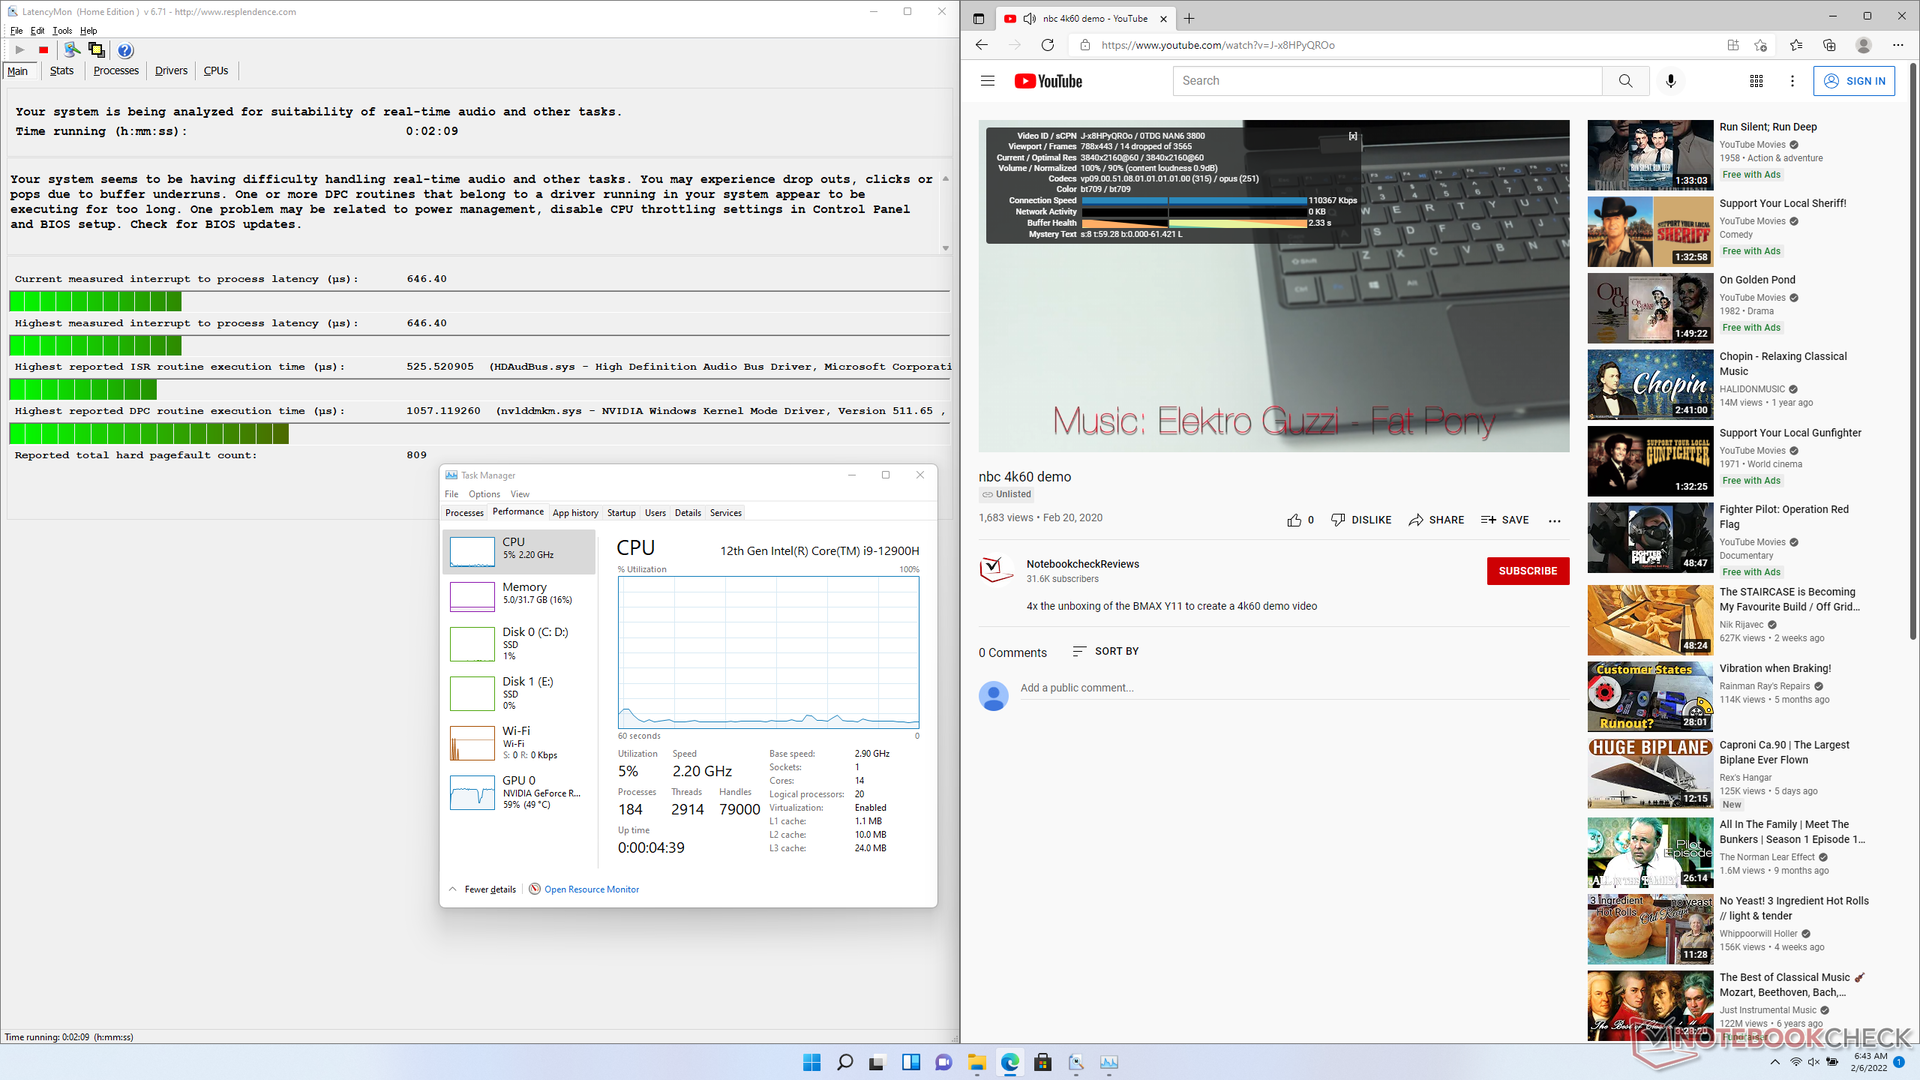
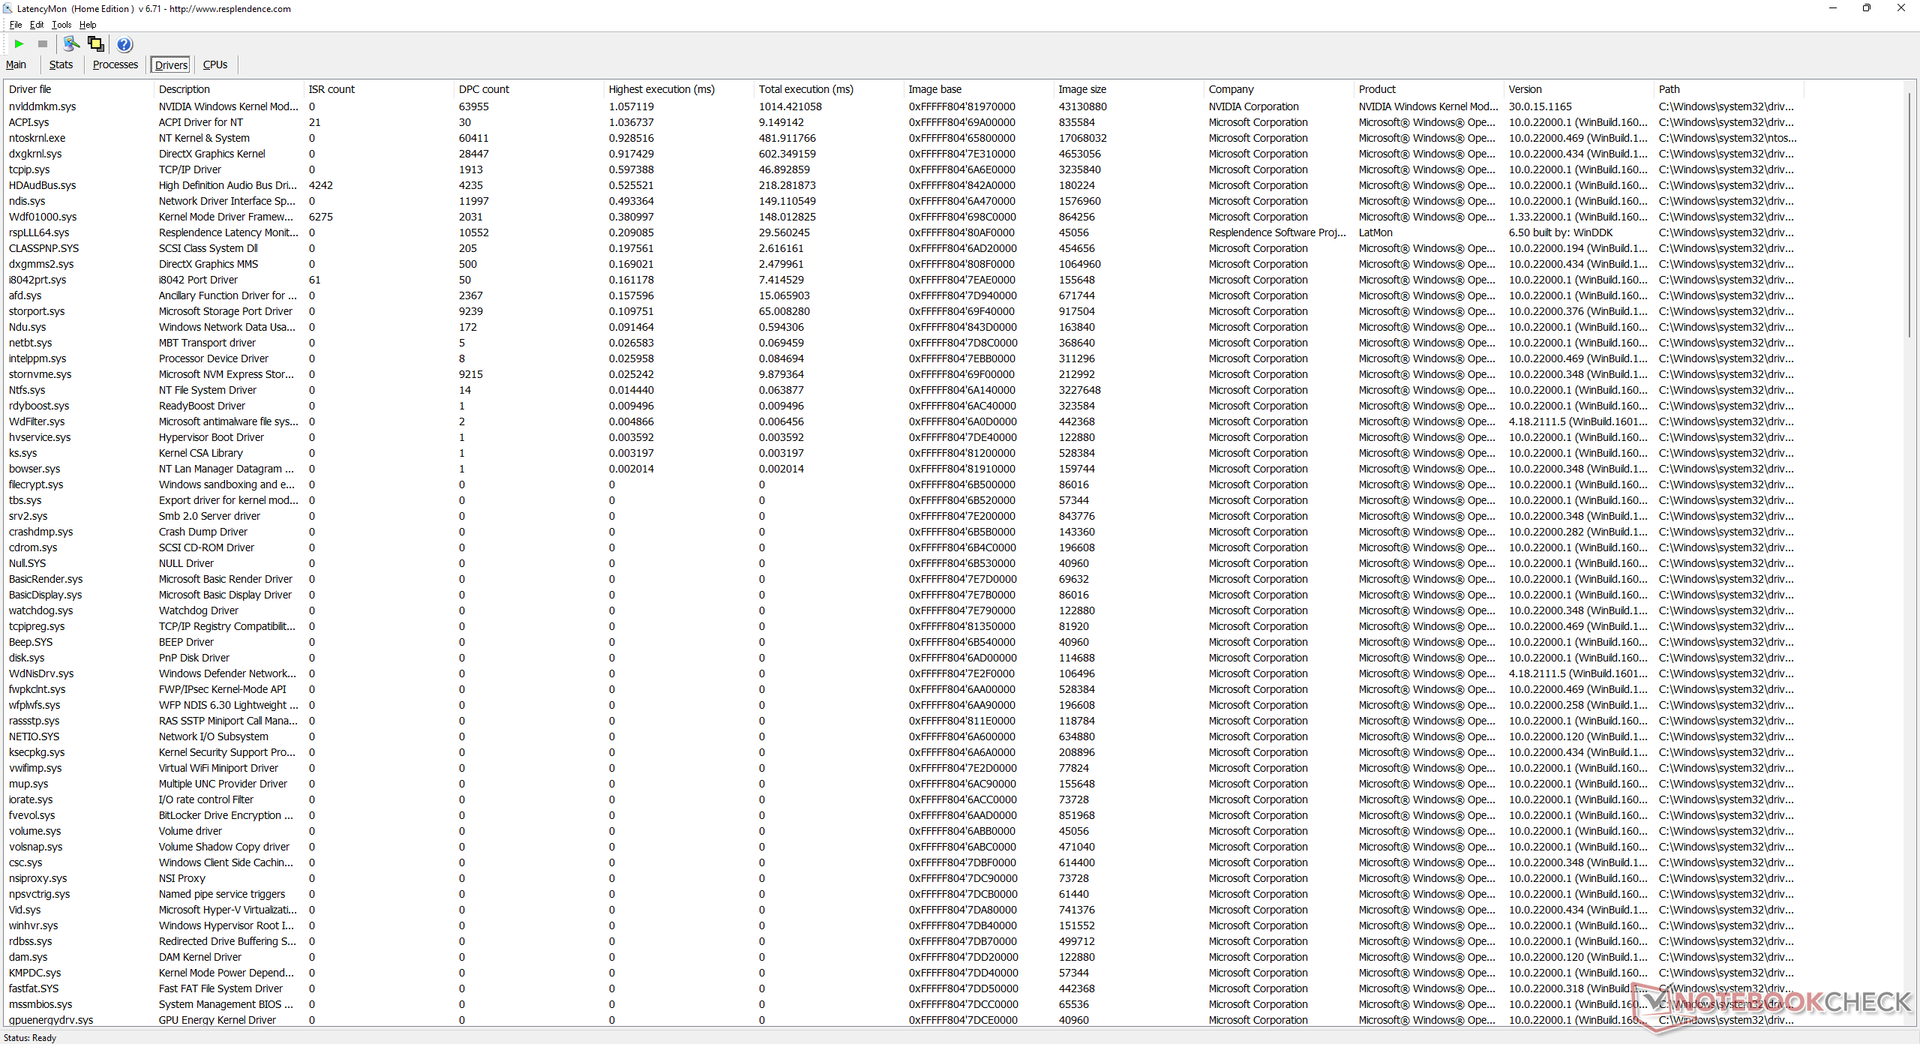
Latência do DPC
LatencyMon mostra pequenos problemas de DPC ao abrir várias abas em nossa página inicial. a reprodução de vídeo de 4K a 60 FPS é suave, mas não perfeita, já que somos capazes de gravar 14 quadros descartados durante nosso teste de vídeo de minutos.
| DPC Latencies / LatencyMon - interrupt to process latency (max), Web, Youtube, Prime95 | |
| Schenker XMG NEO 17 GM7TG8S | |
| Alienware x17 RTX 3080 P48E | |
| MSI GS76 Stealth 11UH | |
| Schenker Uniwill Technology GM7AG8P | |
| Maingear Vector Pro MG-VCP17 | |
| Razer Blade 17 RTX 3070 | |
* ... menor é melhor
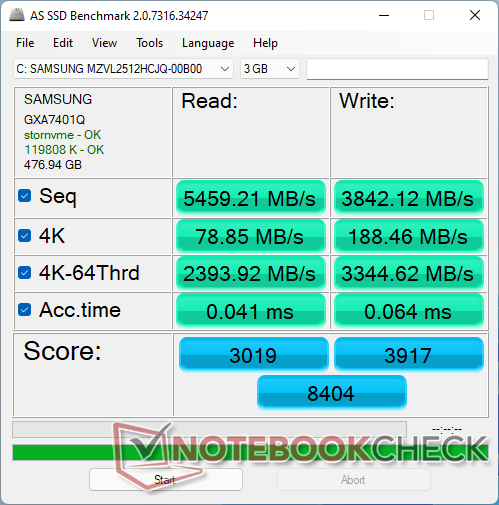
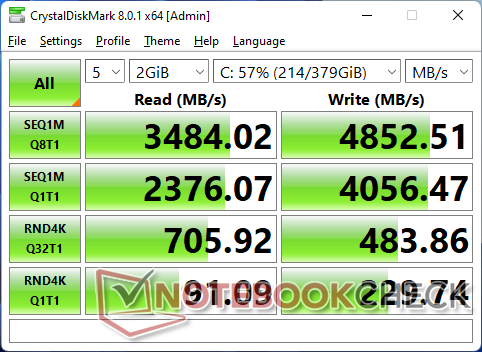
Dispositivos de armazenamento - 2x M.2 PCIe4 x4 NVMe SSDs
Os 512 GB Samsung PM9A1 oferece taxas sequenciais de leitura e escrita de até 6900 MB/s e 5000 MB/s, respectivamente. Somos capazes de chegar perto das velocidades máximas ao executar o DiskSpd em loop, mas o desempenho acabaria caindo de um penhasco para "apenas" 3200 MB/s no final de nosso teste, como mostra o gráfico abaixo. Os resultados sugerem que o drive é incapaz de manter o desempenho máximo por longos períodos potencialmente devido a limitações de temperatura.

| Drive Performance rating - Percent | |
| Maingear Vector Pro MG-VCP17 | |
| Schenker XMG NEO 17 GM7TG8S | |
| MSI GS76 Stealth 11UH | |
| Schenker Uniwill Technology GM7AG8P | |
| Razer Blade 17 RTX 3070 | |
| Alienware x17 RTX 3080 P48E | |
* ... menor é melhor
Disk Throttling: DiskSpd Read Loop, Queue Depth 8
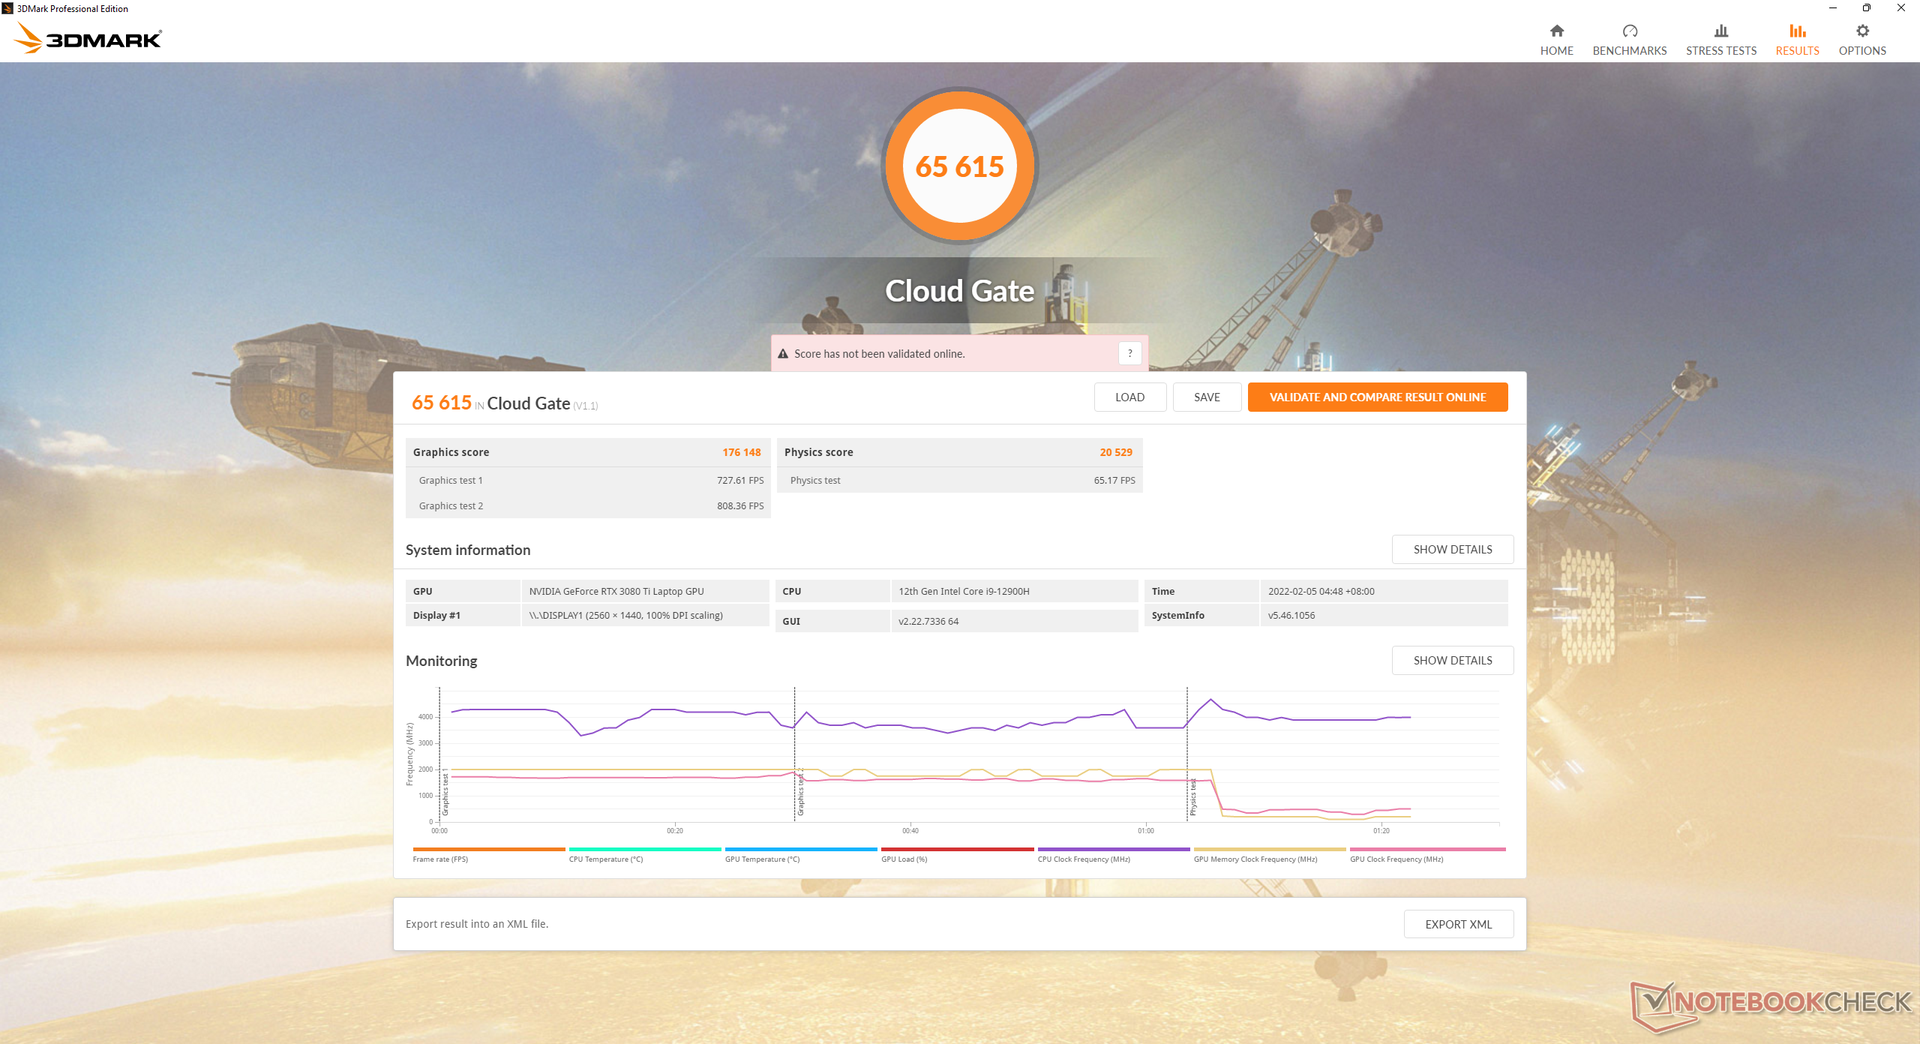
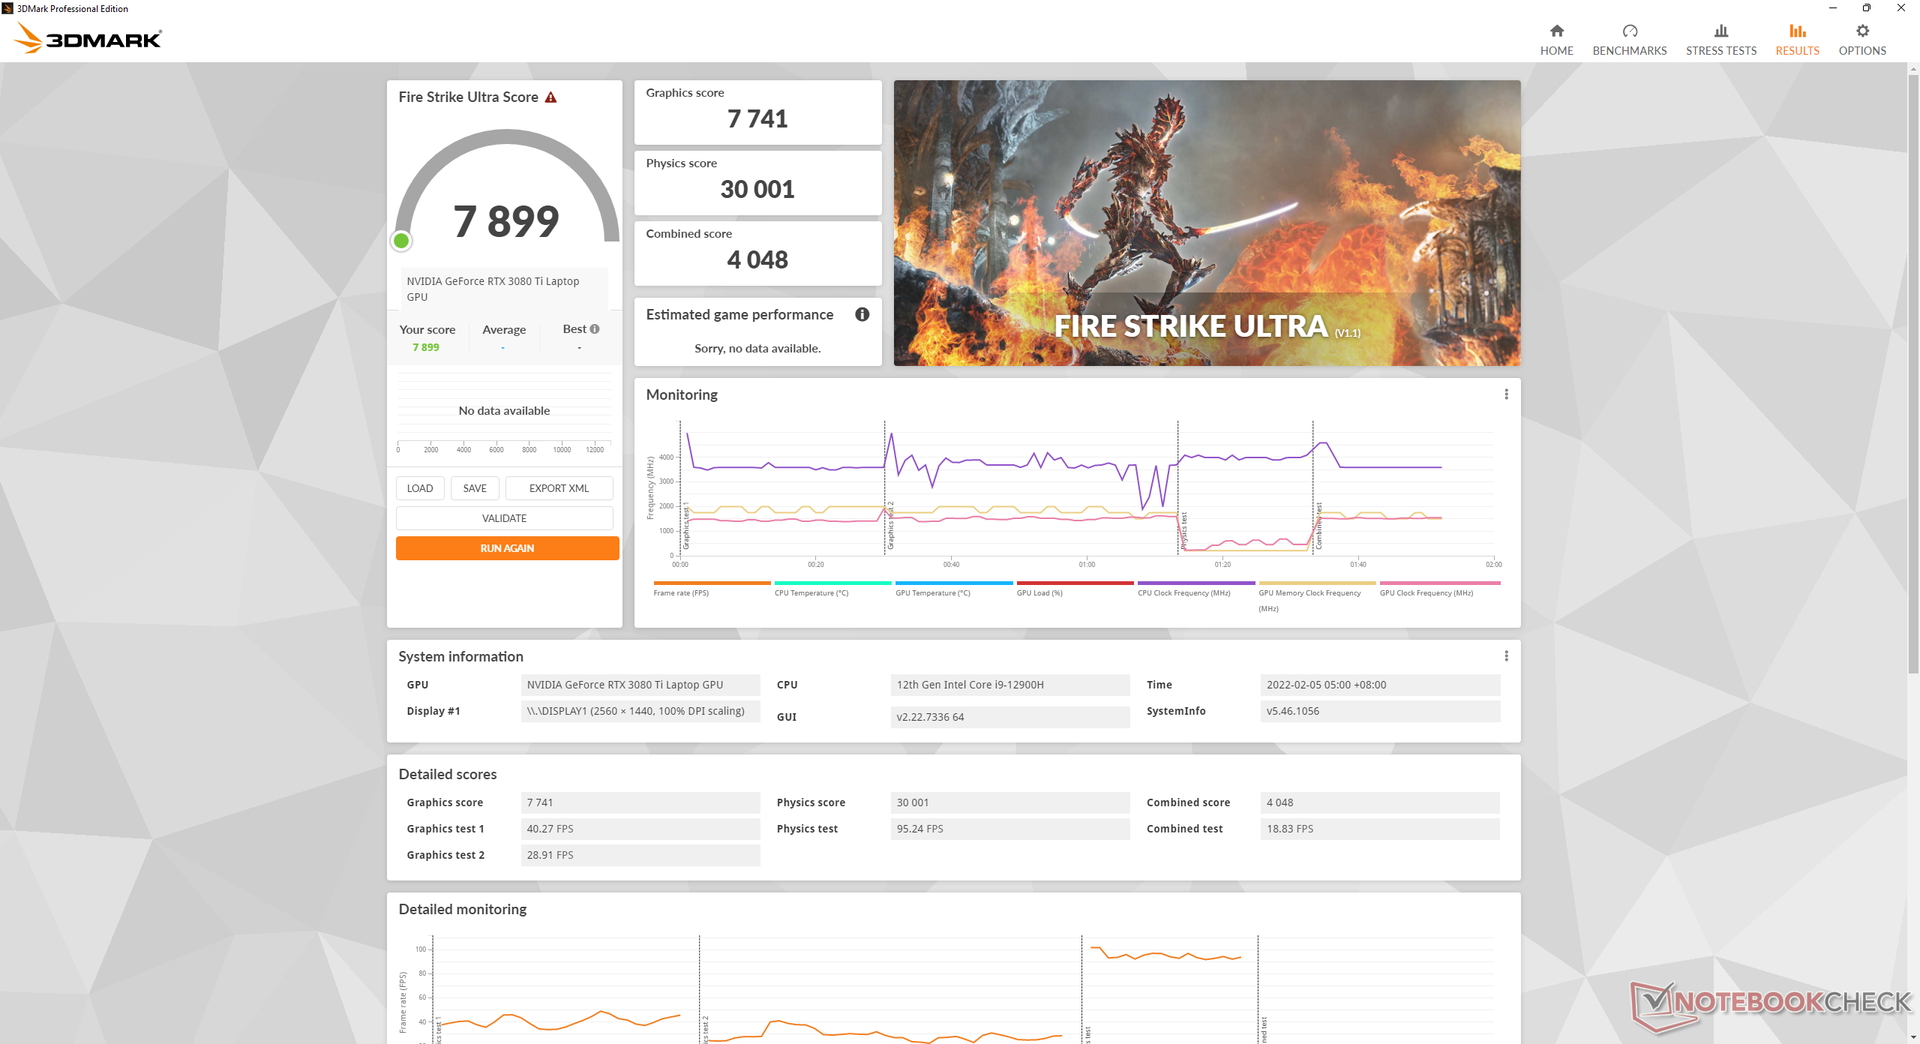
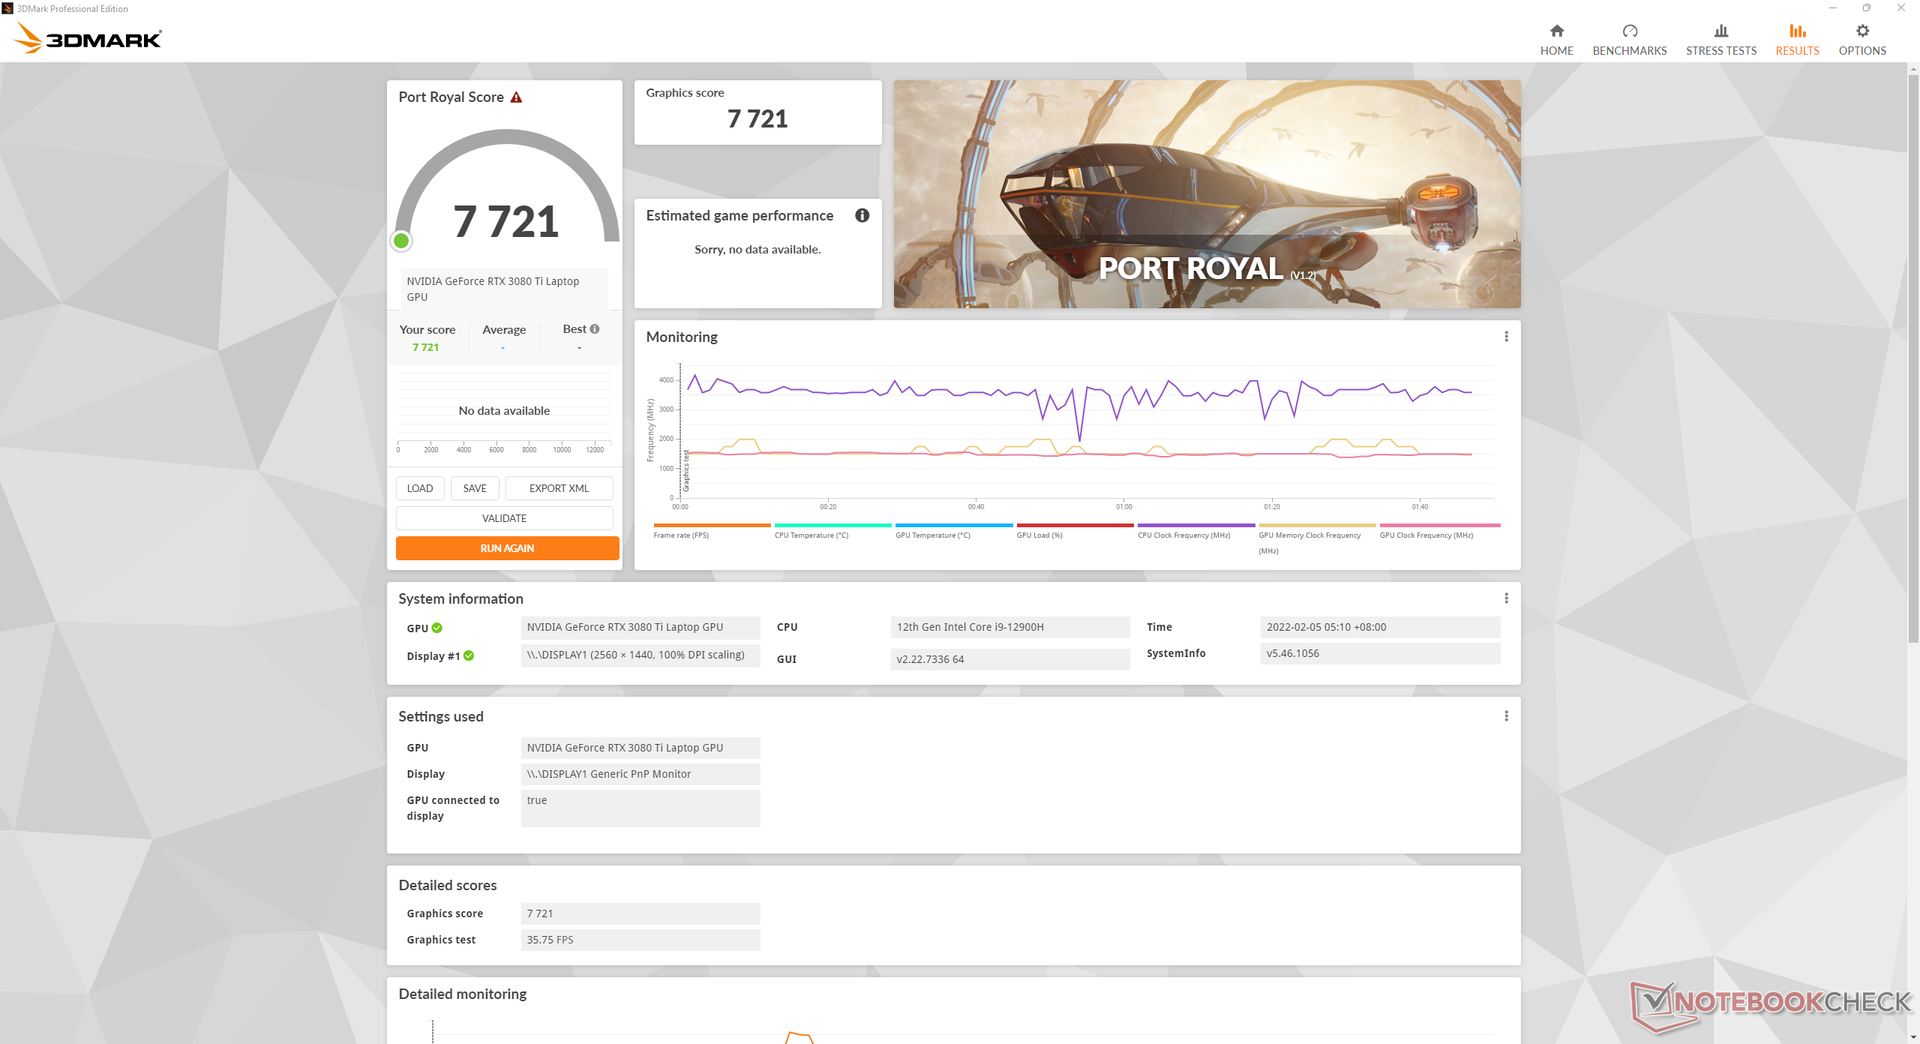
GPU Performance - Um pouco melhor que o móvel GeForce RTX 3080
Assim como o desktop GeForce RTX 3080 Ti é cerca de 10% mais rápido que o desktop GeForce RTX 3080, o laptop GeForce RTX 3080 Ti é apenas cerca de 10% mais rápido que o laptop GeForce RTX 3080. Espere que o desempenho seja mais semelhante ao do desktop GeForce RTX 3070, que é um ajuste perfeito para o display nativo QHD 165 Hz.
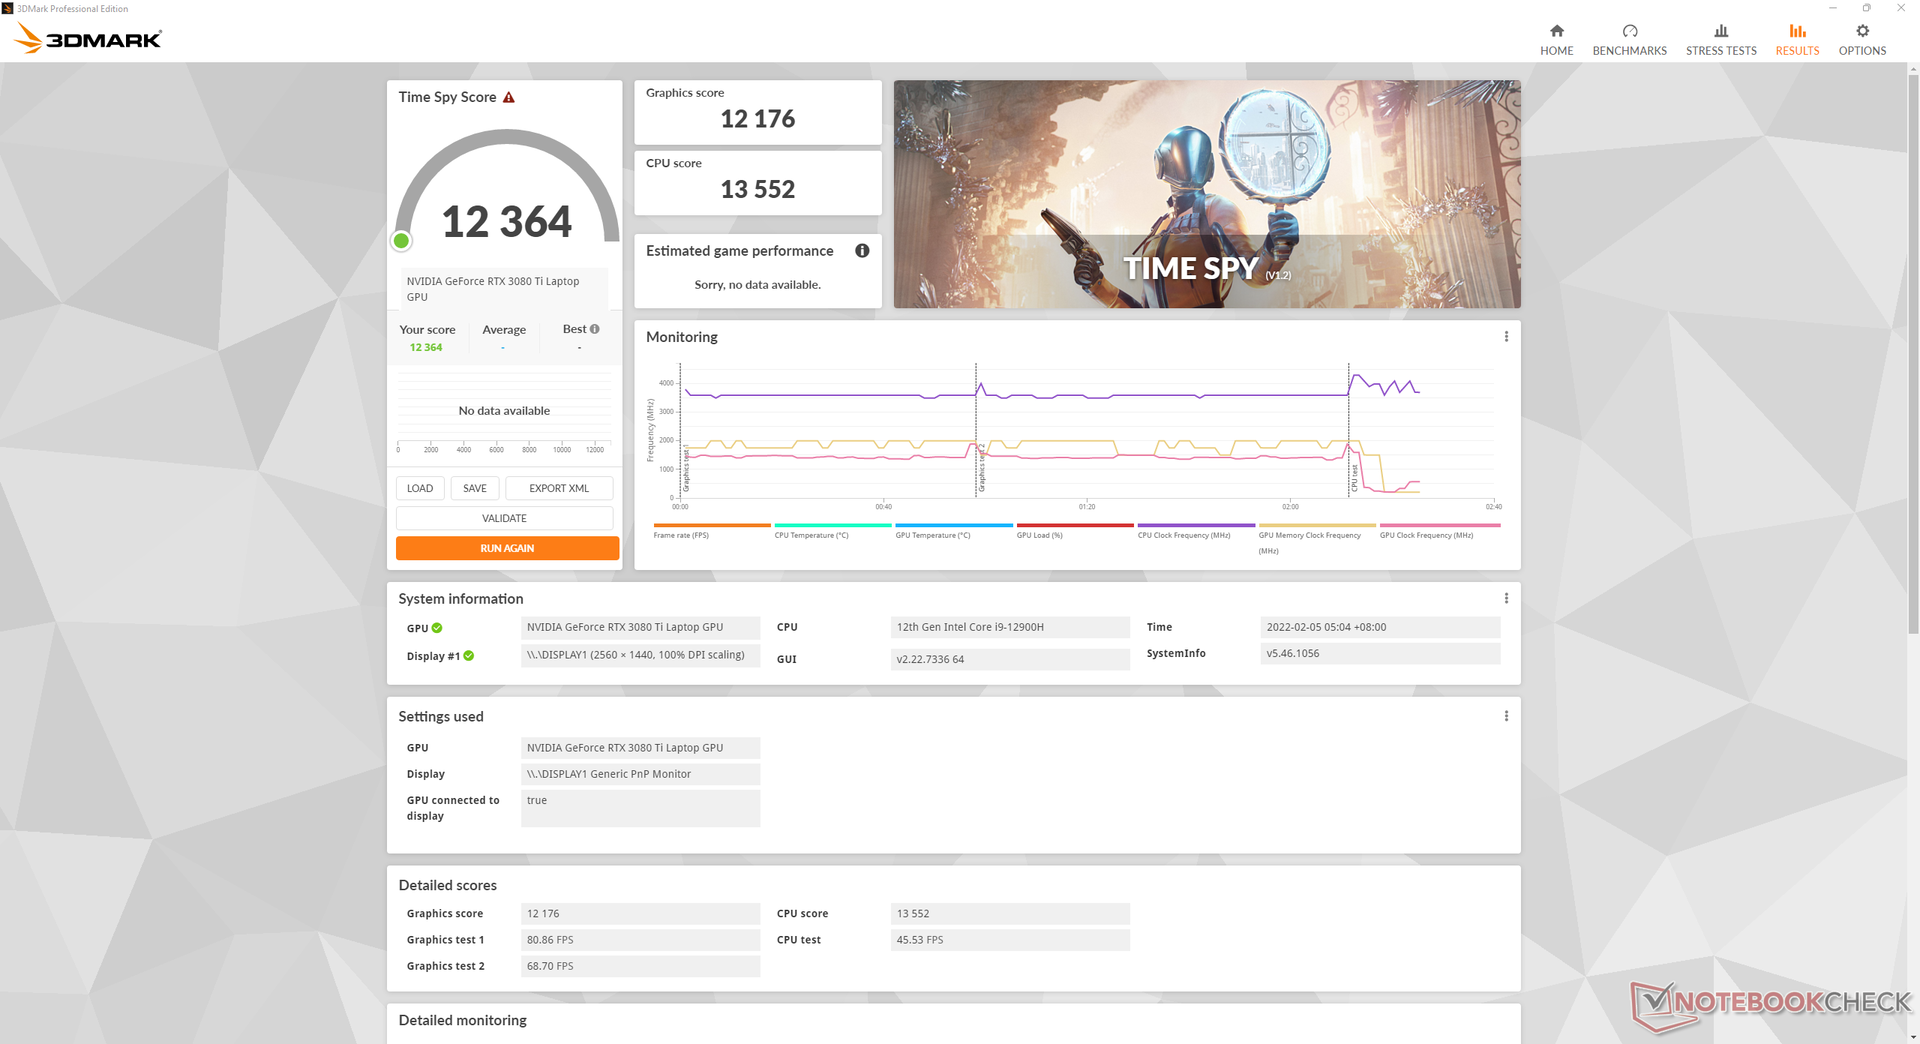
A execução no modo MSHybrid em vez do modo dGPU resultaria em uma pontuação 1,2% menor Time Spy GPU (12176 vs. 12020 pontos) para mostrar que a queda de performance ao mudar para MSHybrid é quase insignificante.
Ao configurar a GPU para 175 W via Centro de Controle, nossa pontuação gráfica Time Spy aumentaria para 12714 pontos para um aumento de performance de apenas 4 a 5%.
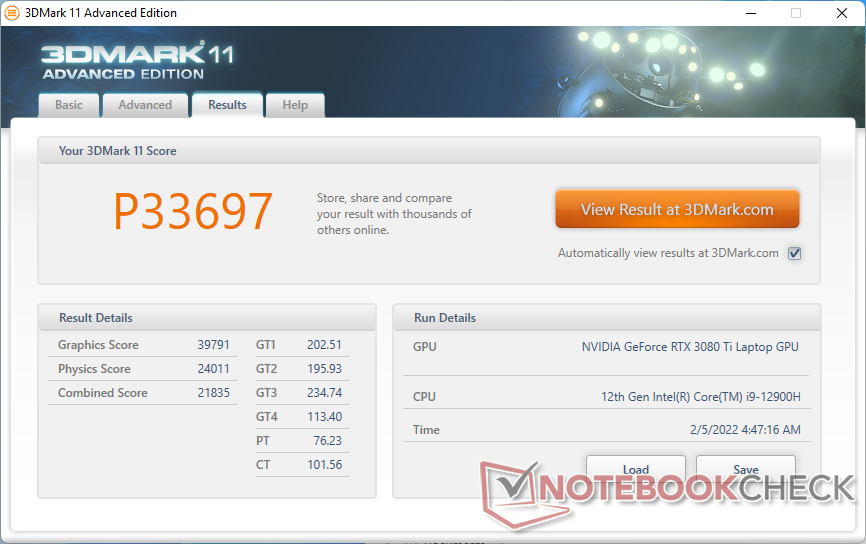
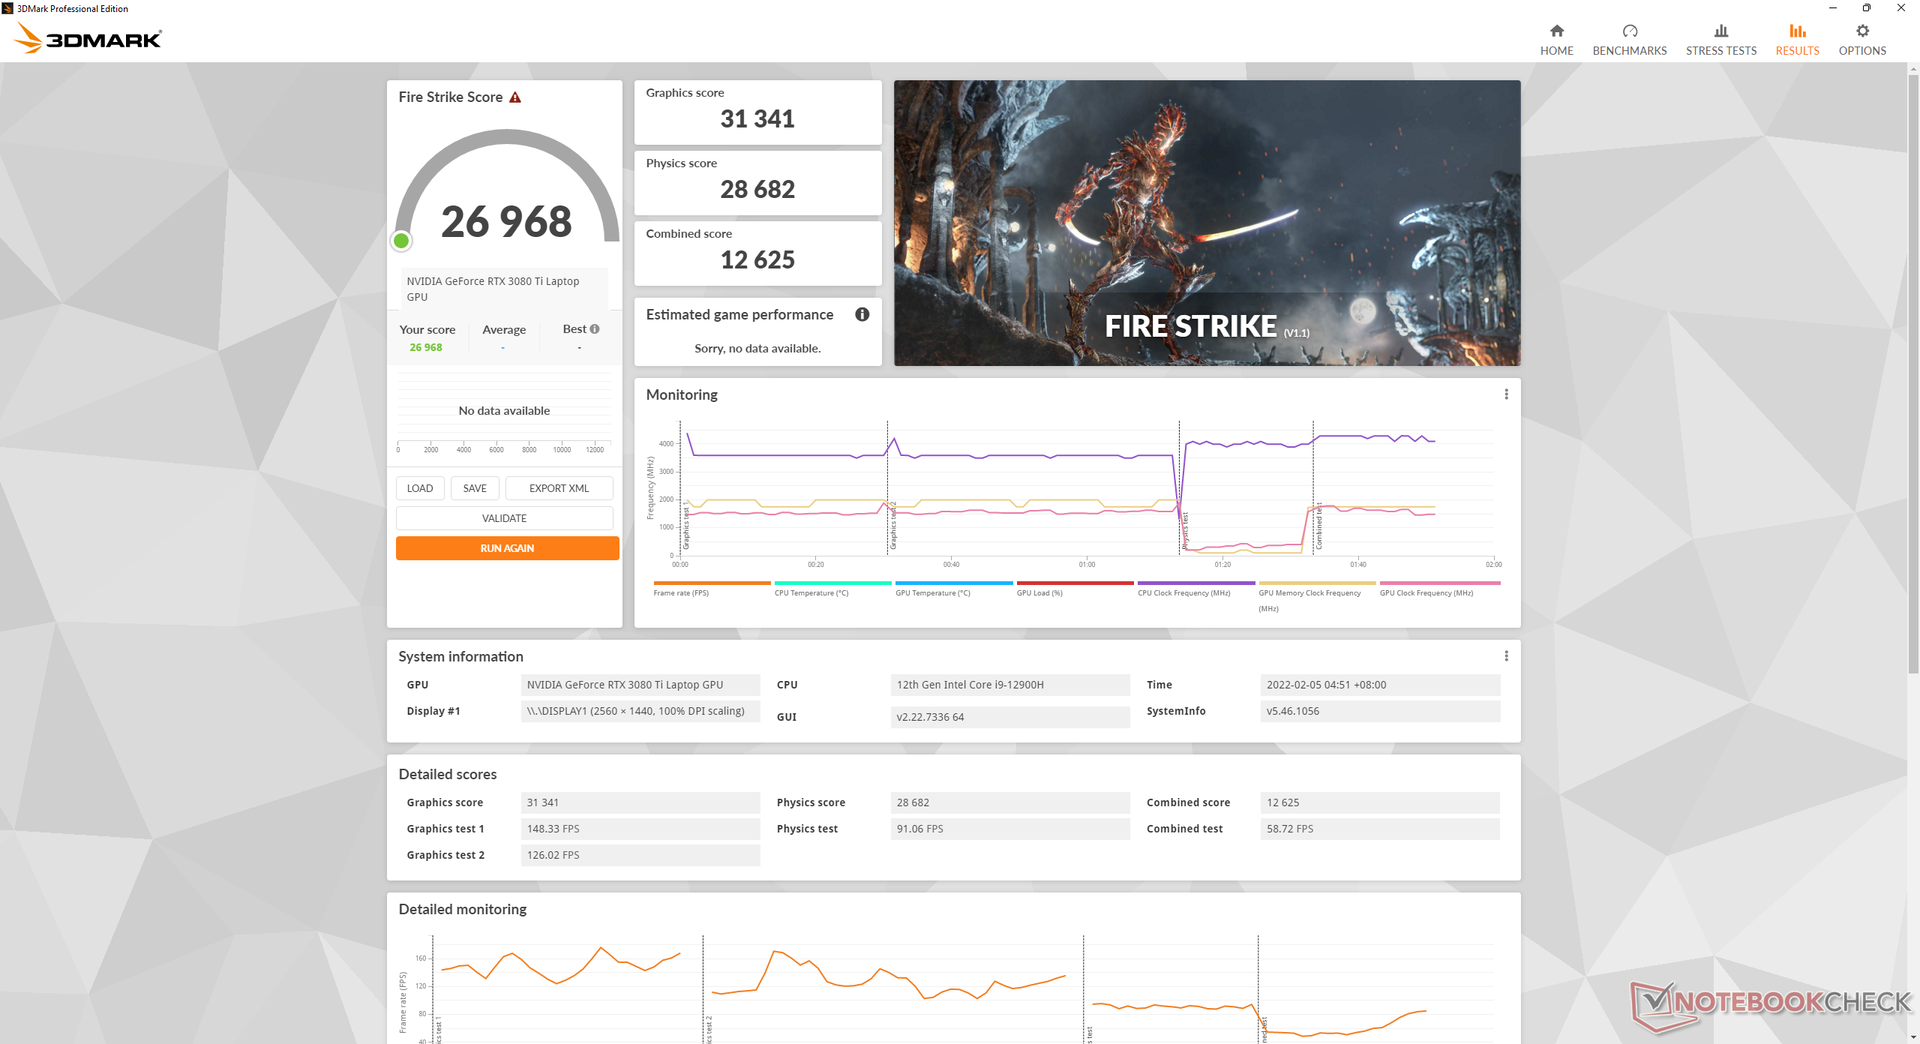
| 3DMark 11 Performance | 33697 pontos | |
| 3DMark Cloud Gate Standard Score | 65615 pontos | |
| 3DMark Fire Strike Score | 26968 pontos | |
| 3DMark Time Spy Score | 12364 pontos | |
Ajuda | ||
Witcher 3 FPS Chart
| baixo | média | alto | ultra | QHD | |
|---|---|---|---|---|---|
| GTA V (2015) | 186 | 183 | 179 | 125 | 111 |
| The Witcher 3 (2015) | 472.4 | 368.4 | 236.3 | 117.2 | |
| Dota 2 Reborn (2015) | 186 | 172 | 166 | 159 | |
| Final Fantasy XV Benchmark (2018) | 167 | 155 | 117 | ||
| X-Plane 11.11 (2018) | 160 | 142 | 107 | ||
| Far Cry 5 (2018) | 186 | 160 | 150 | 138 | 120 |
| Strange Brigade (2018) | 472 | 290 | 231 | 203 | 151 |
| Hunt Showdown (2020) | 243.2 | 197.9 | 167.6 | 103.6 | |
| Doom Eternal (2020) | 491.8 | 321.3 | 292.4 | 279 | 210.6 |
| Gears Tactics (2020) | 366.3 | 270 | 195.5 | 136.5 | 97.1 |
| Horizon Zero Dawn (2020) | 162 | 141 | 130 | 118 | 98 |
| Watch Dogs Legion (2020) | 137 | 128 | 116 | 84 | 64 |
| Dirt 5 (2020) | 217.5 | 167.8 | 136.8 | 105.4 | 85.6 |
| Assassin´s Creed Valhalla (2020) | 166 | 118 | 99 | 85 | 68 |
| Hitman 3 (2021) | 297.5 | 228.9 | 211.9 | 201.8 | 133.9 |
| F1 2021 (2021) | 364 | 328 | 271 | 103 | 71 |
| Far Cry 6 (2021) | 158 | 131 | 117 | 107 | 88 |
| Guardians of the Galaxy (2021) | 157 | 157 | 157 | 152 | 122 |
| Riders Republic (2021) | 207 | 159 | 133 | 122 | 90 |
| Halo Infinite (2021) | 260.3 | 165.7 | 146.7 | 137.3 | 96.3 |
| God of War (2022) | 158.5 | 135.2 | 110.1 | 79 | 64.4 |
Emissões
Ruído do sistema - Sem surpresas, em voz alta
Como a maioria dos outros laptops para jogos, não é necessária muita atividade na tela para fazer girar os ventiladores internos. Ações pouco exigentes como navegação na web ou streaming de vídeo fariam com que o ruído dos ventiladores subisse para 30,8 dB(A) contra um fundo silencioso de 23,1 dB(A). O aumento do ruído é perceptível, mas os ajustes de RPM dos ventiladores são geralmente graduais em vez de acentuados no GM7AG8P para ser mais tolerável.
A execução de cargas mais altas como jogos resultaria em níveis de ruído muito similares ao que observamos no XMG Neo 17 GM7TG8S. Esperar que o ruído do ventilador esteja na faixa de 50 dB(A) de baixa a média em tais condições, que é uma faixa comum para os laptops de jogos dos entusiastas. Os ventiladores podem ser tão barulhentos que recomendamos o uso de fones de ouvido ao jogar títulos como Fortnite, onde tacos de áudio mais silenciosos são vitais para a jogabilidade.
Barulho
| Ocioso |
| 28.1 / 28.1 / 30.8 dB |
| Carga |
| 39.1 / 52.5 dB |
 | ||
30 dB silencioso 40 dB(A) audível 50 dB(A) ruidosamente alto |
||
min: | ||
| Schenker Uniwill Technology GM7AG8P GeForce RTX 3080 Ti Laptop GPU, i9-12900H, Samsung PM9A1 MZVL2512HCJQ | Schenker XMG NEO 17 GM7TG8S GeForce RTX 3080 Laptop GPU, i7-11800H, Samsung SSD 980 Pro 1TB MZ-V8P1T0BW | Alienware x17 RTX 3080 P48E GeForce RTX 3080 Laptop GPU, i7-11800H, 2x WDC PC SN730 SDBPNTY-1T00 (RAID 0) | Razer Blade 17 RTX 3070 GeForce RTX 3070 Laptop GPU, i7-11800H, Samsung PM9A1 MZVL21T0HCLR | MSI GS76 Stealth 11UH GeForce RTX 3080 Laptop GPU, i9-11900H, Samsung PM9A1 MZVL22T0HBLB | Maingear Vector Pro MG-VCP17 GeForce RTX 3080 Laptop GPU, i7-11800H, Samsung PM9A1 MZVL21T0HCLR | |
|---|---|---|---|---|---|---|
| Noise | 7% | 6% | 4% | -2% | 6% | |
| desligado / ambiente * (dB) | 23.1 | 23 -0% | 24.9 -8% | 24.2 -5% | 24 -4% | 23.8 -3% |
| Idle Minimum * (dB) | 28.1 | 23 18% | 24.9 11% | 24.7 12% | 24 15% | 23.9 15% |
| Idle Average * (dB) | 28.1 | 23 18% | 24.9 11% | 24.7 12% | 25 11% | 23.9 15% |
| Idle Maximum * (dB) | 30.8 | 23 25% | 29.6 4% | 24.7 20% | 42 -36% | 23.9 22% |
| Load Average * (dB) | 39.1 | 39.5 -1% | 31.1 20% | 44.3 -13% | 46 -18% | 38 3% |
| Witcher 3 ultra * (dB) | 52.4 | 54.5 -4% | 49.7 5% | 56.3 -7% | 48 8% | 55.9 -7% |
| Load Maximum * (dB) | 52.5 | 55.09 -5% | 54.8 -4% | 47.7 9% | 48 9% | 55.9 -6% |
* ... menor é melhor
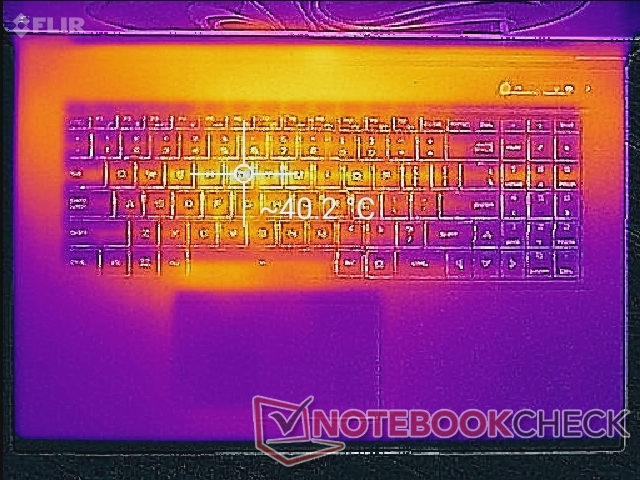
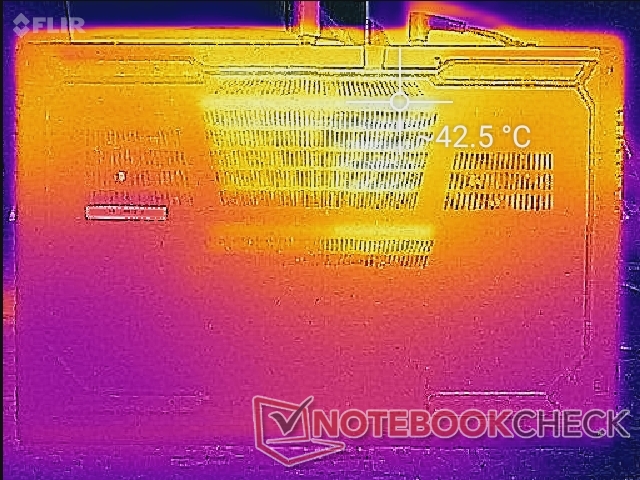
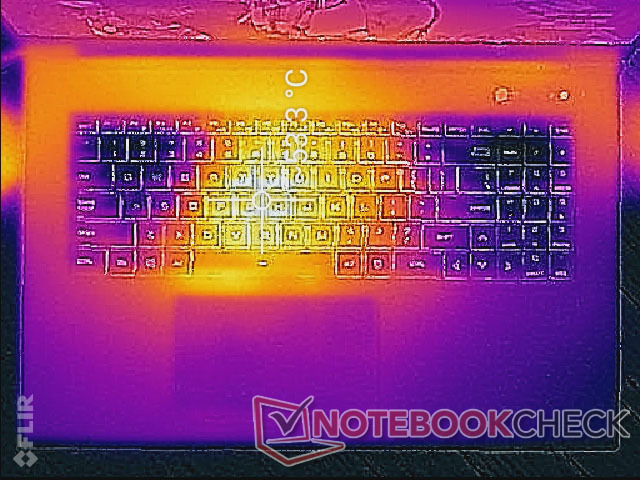
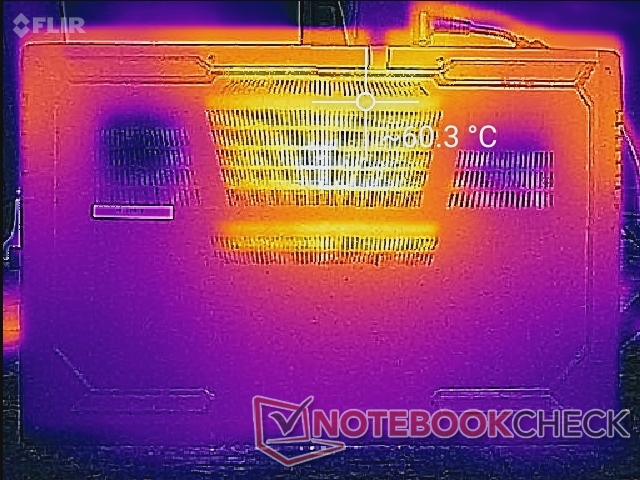
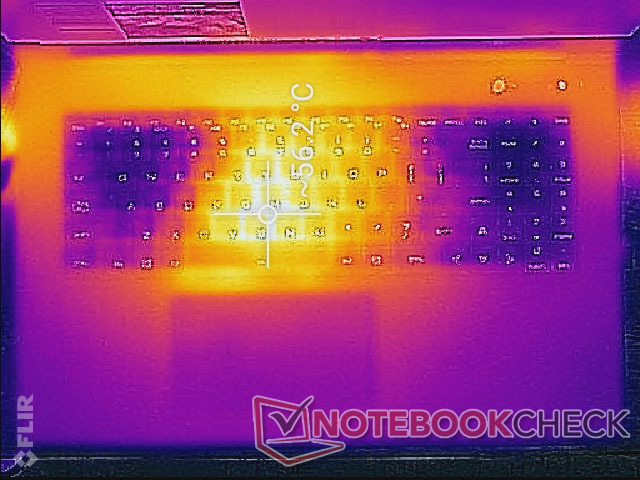
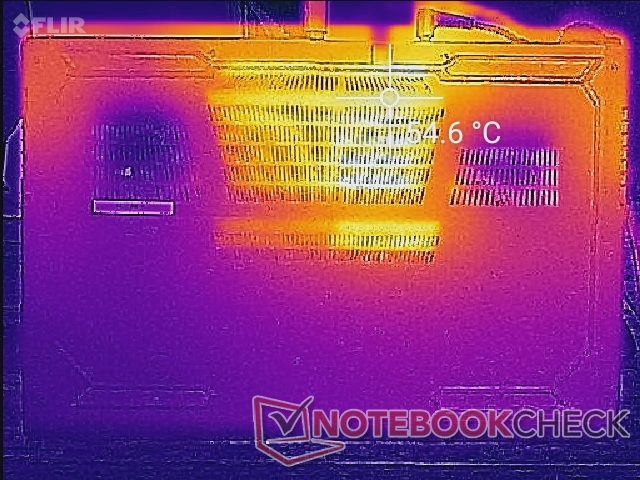
Temperatura - Centro quente, cantos frios
As temperaturas superficiais serão sempre bastante quentes em direção às áreas centrais do chassi. Quando ocioso na área de trabalho sem outras aplicações em execução, por exemplo, o centro do teclado e a parte traseira do painel inferior podem ser tão quentes quanto 40 C. Estas mesmas áreas podem aquecer até 57 C ao executar aplicações mais exigentes, como jogos
A temperatura média da superfície é geralmente mais fria do que a da concorrência Razer Blade Pro 17 que usa um chassi de liga de magnésio em vez de plástico ABS. Assim, os restos da palma de nossa GM7AG8P conseguem permanecer mais frios e confortáveis do que na Razer quando se joga a mais de alguns graus C.
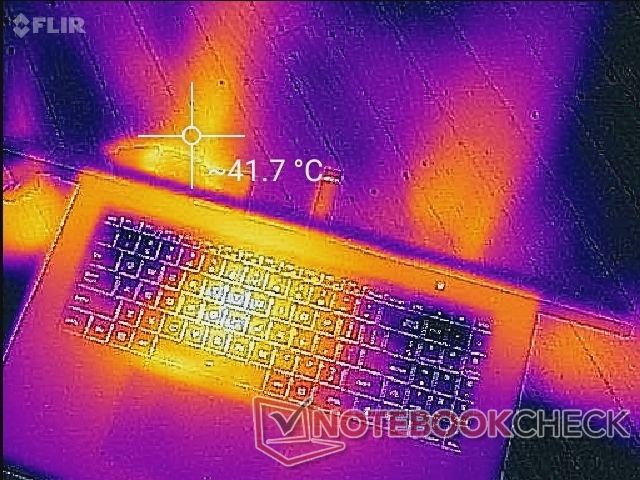
(-) A temperatura máxima no lado superior é 56.8 °C / 134 F, em comparação com a média de 40.4 °C / 105 F , variando de 21.2 a 68.8 °C para a classe Gaming.
(-) A parte inferior aquece até um máximo de 60.2 °C / 140 F, em comparação com a média de 43.2 °C / 110 F
(+) Em uso inativo, a temperatura média para o lado superior é 31.1 °C / 88 F, em comparação com a média do dispositivo de 33.9 °C / ### class_avg_f### F.
(±) Jogando The Witcher 3, a temperatura média para o lado superior é 35.3 °C / 96 F, em comparação com a média do dispositivo de 33.9 °C / ## #class_avg_f### F.
(+) Os apoios para as mãos e o touchpad são mais frios que a temperatura da pele, com um máximo de 30.2 °C / 86.4 F e, portanto, são frios ao toque.
(±) A temperatura média da área do apoio para as mãos de dispositivos semelhantes foi 28.8 °C / 83.8 F (-1.4 °C / -2.6 F).
| Schenker Uniwill Technology GM7AG8P Intel Core i9-12900H, NVIDIA GeForce RTX 3080 Ti Laptop GPU | Schenker XMG NEO 17 GM7TG8S Intel Core i7-11800H, NVIDIA GeForce RTX 3080 Laptop GPU | Alienware x17 RTX 3080 P48E Intel Core i7-11800H, NVIDIA GeForce RTX 3080 Laptop GPU | Razer Blade 17 RTX 3070 Intel Core i7-11800H, NVIDIA GeForce RTX 3070 Laptop GPU | MSI GS76 Stealth 11UH Intel Core i9-11900H, NVIDIA GeForce RTX 3080 Laptop GPU | Maingear Vector Pro MG-VCP17 Intel Core i7-11800H, NVIDIA GeForce RTX 3080 Laptop GPU | |
|---|---|---|---|---|---|---|
| Heat | 8% | 13% | 19% | 20% | 7% | |
| Maximum Upper Side * (°C) | 56.8 | 51 10% | 58.4 -3% | 41 28% | 49 14% | 54.2 5% |
| Maximum Bottom * (°C) | 60.2 | 62 -3% | 49 19% | 47.2 22% | 57 5% | 52.2 13% |
| Idle Upper Side * (°C) | 40.2 | 35 13% | 33.6 16% | 33.2 17% | 28 30% | 37.4 7% |
| Idle Bottom * (°C) | 43 | 38 12% | 34.6 20% | 39 9% | 30 30% | 41.4 4% |
* ... menor é melhor
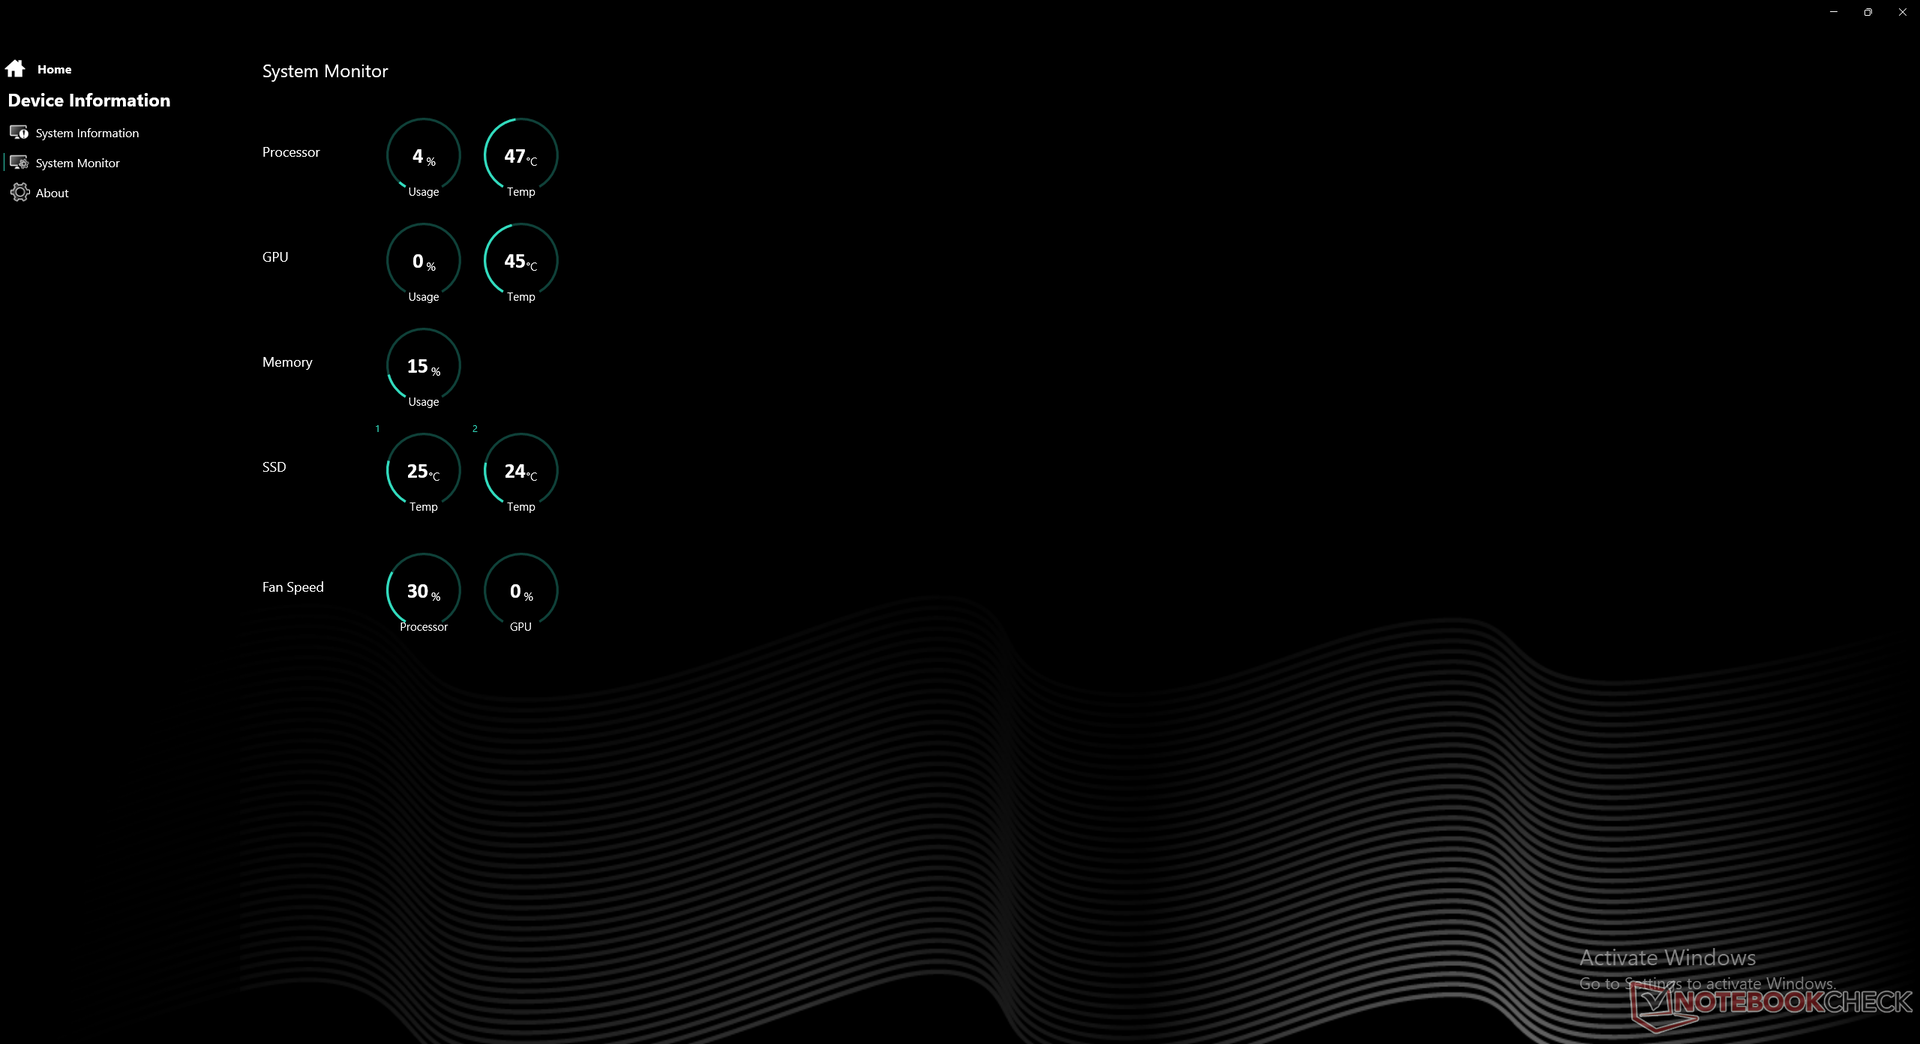
Teste de estresse
Rodar Prime95 para enfatizar a CPU resultaria em um aumento da taxa de clock até a faixa de 3,2 a 3,6 GHz e a uma temperatura central estável de 80 C. A potência do pacote de CPU também se estabilizaria em 75 W indefinidamente, que é a configuração padrão do TDP. Os usuários podem aumentar os limites do PL1 e PL2 até 120 W cada um através do Centro de Controle, se desejado.
Rodando Witcher 3 com o dGPU ajustado para o padrão 150 W resultaria em uma temperatura estável de GPU de 76 C e um consumo de energia da placa de cerca de 150 W de acordo com o GPU-Z. Se ajustado para 175 W via Centro de Controle, o relógio de memória aumentaria de 1750 MHz para 1800 MHz enquanto a temperatura da GPU também aumentaria de 76 C para 86 C. O consumo de energia da placa seria estável em torno de 170 W ou apenas a um máximo de 175 W. Curiosamente, as taxas de relógio GPU permaneceriam na faixa de 1500 - 1600 MHz em ambos os modos TGP de 150 W ou 175 W.
O funcionamento com energia de bateria limitará o desempenho em um grau maior do que o esperado. Um teste Time Spy no dGPU e baterias retornaria pontuações de Física e Gráficos de apenas 7150 e 897 pontos, respectivamente, em comparação com 13552 e 12176 pontos quando em rede, mesmo com o modo Nvidia Whisper 2.0 e Battery Boost desativados.
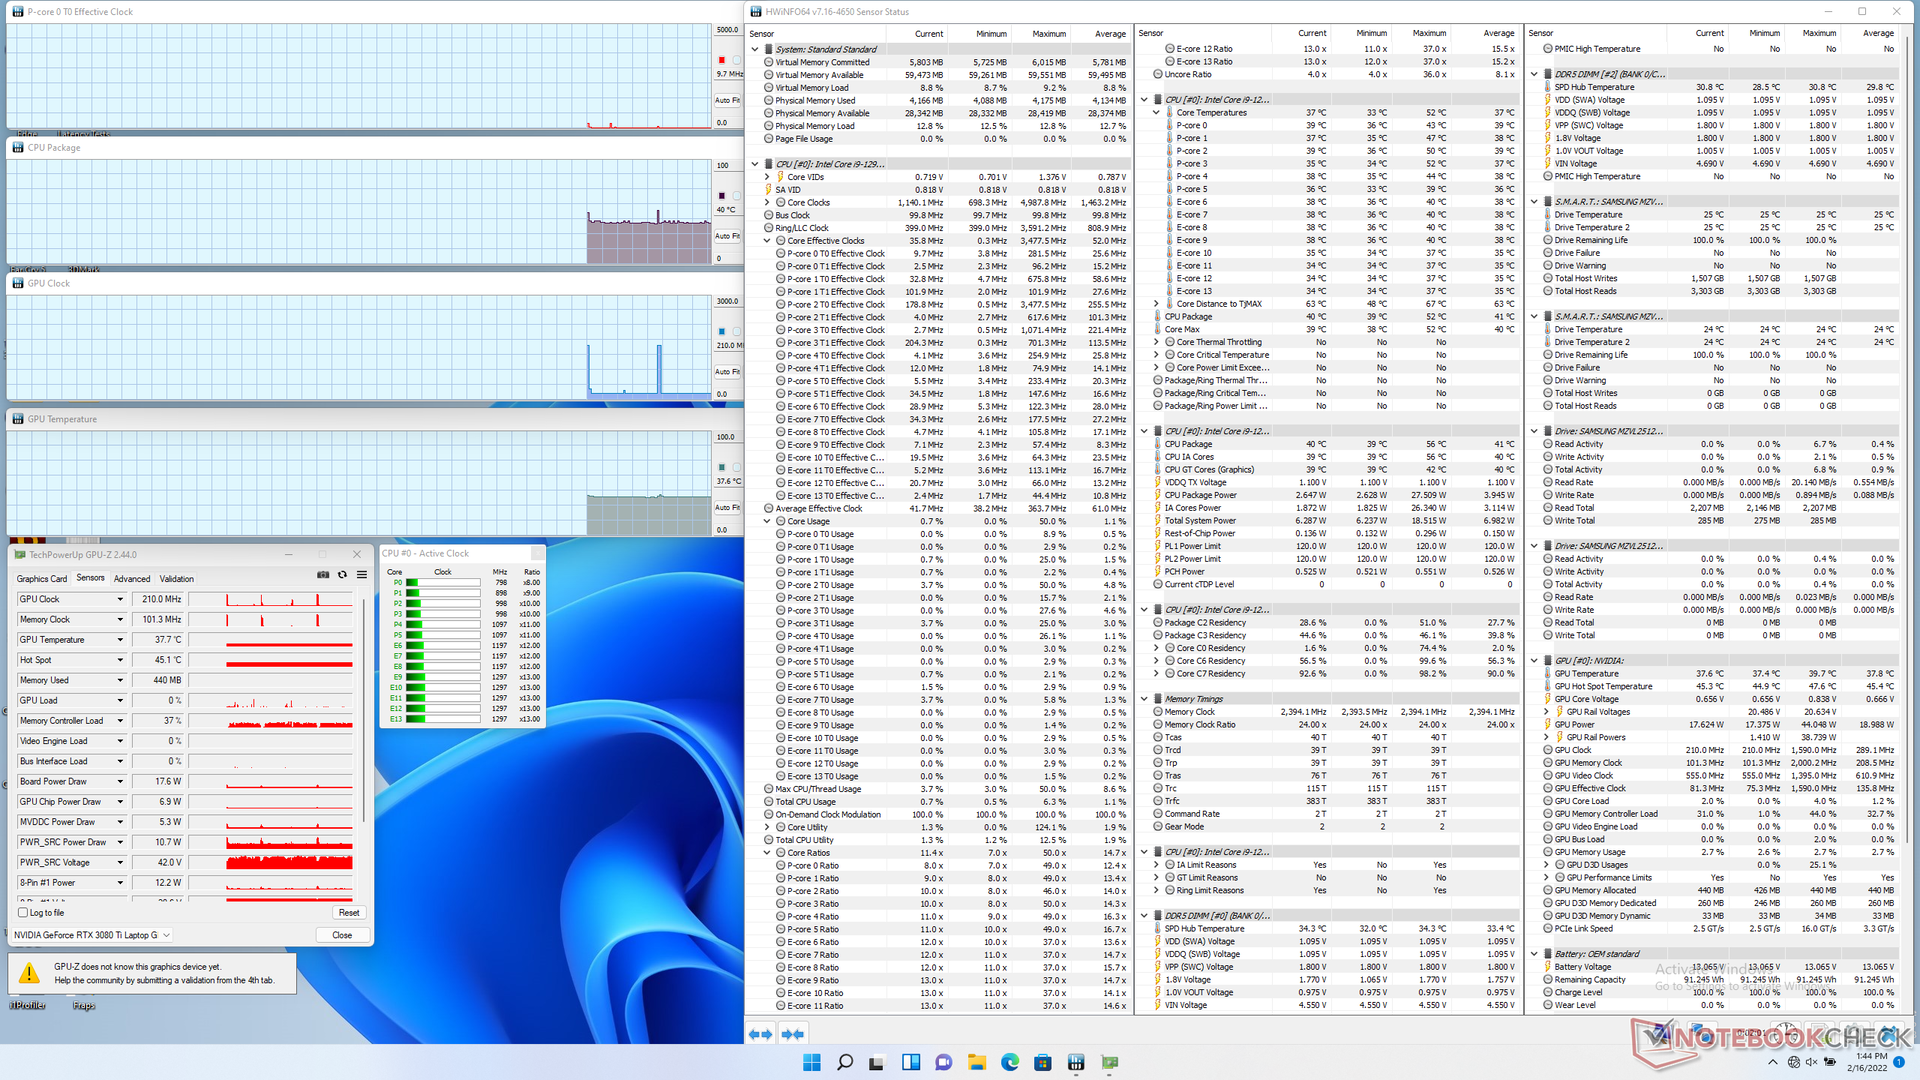
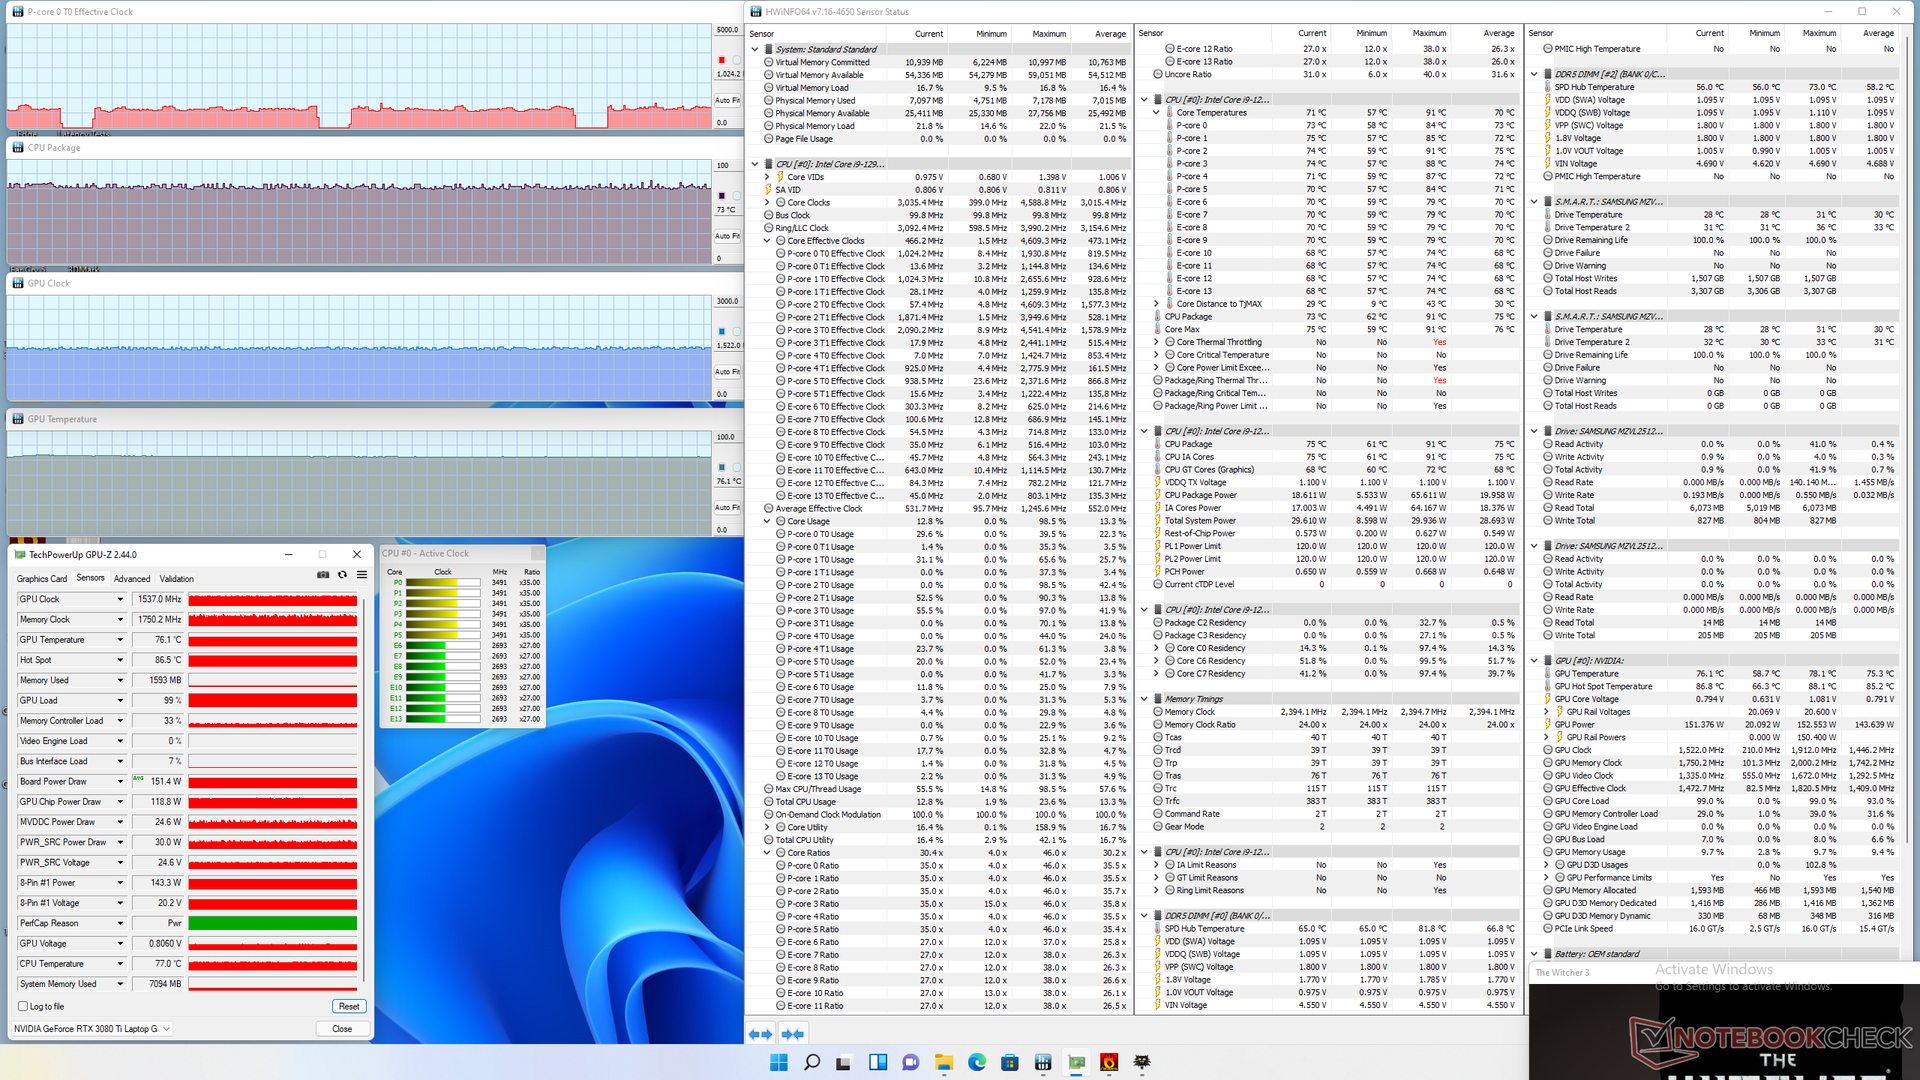
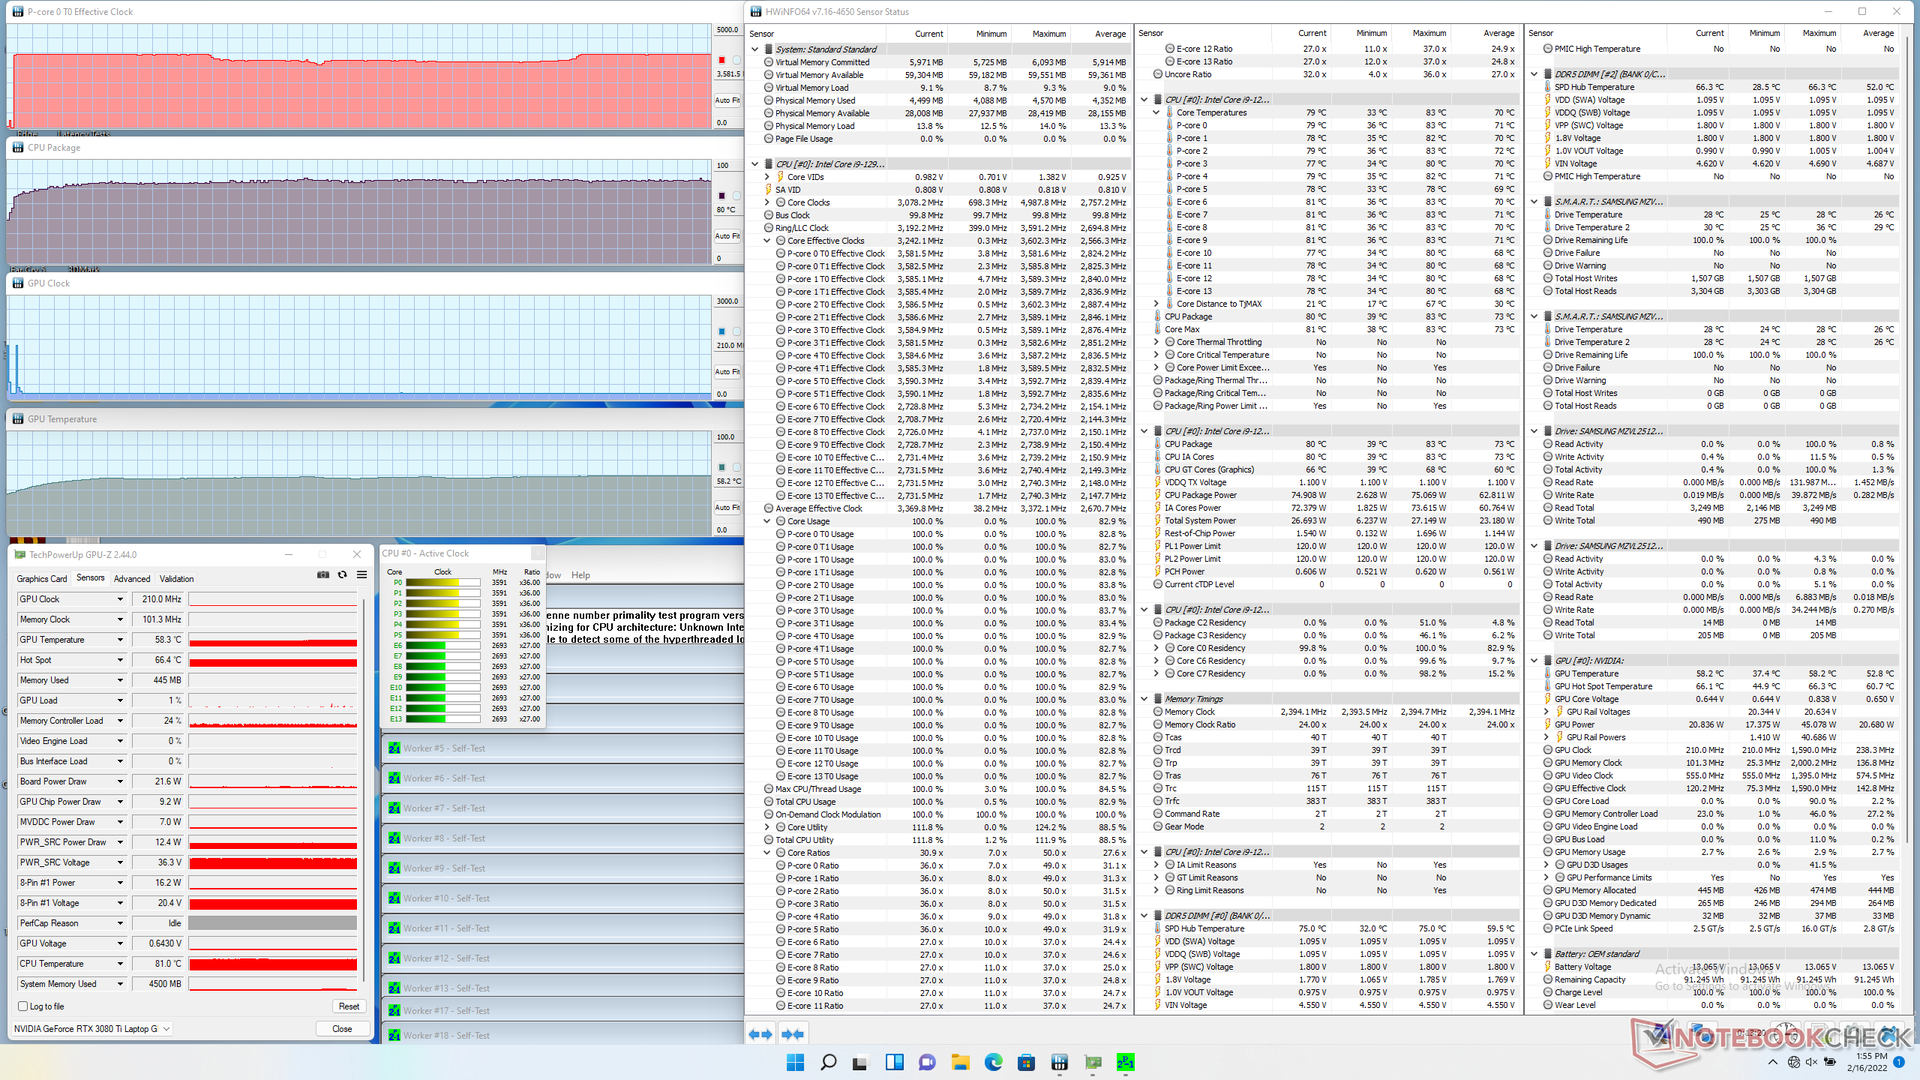
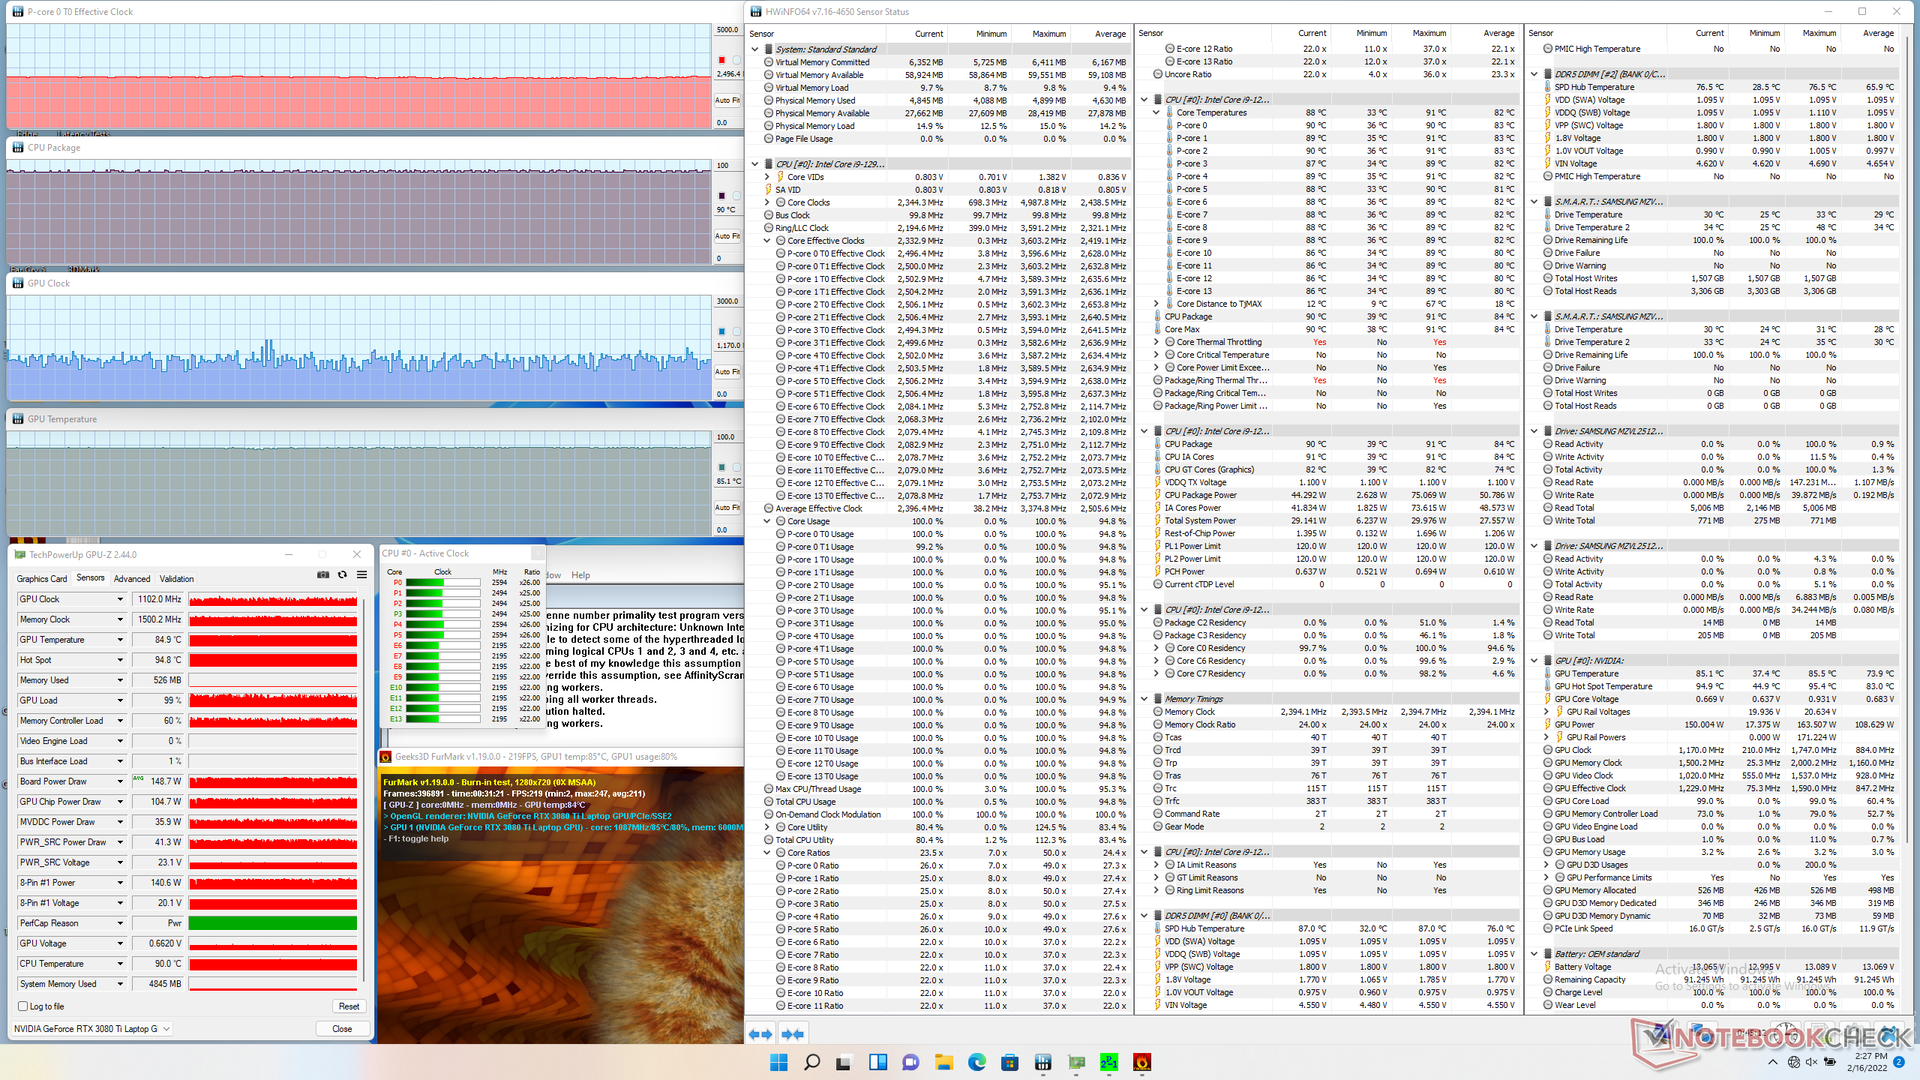
| Relógio CPU (GHz) | Relógio GPU (MHz) | Temperatura média da CPU (°C) | Temperatura média da GPU (°C) | |
| Sistema ocioso | -- | -- | 40 | 38 |
| Prime95 Stress | 3.2 - 3.6 | -- | 80 | 58 |
| Prime95 + FurMark Stress | 2.5 | ~1102 | 90 | 85 |
| Witcher 3 Stress (150 W TGP modo) | ~1.0 | ~1537 | 73 | 76 |
Oradores
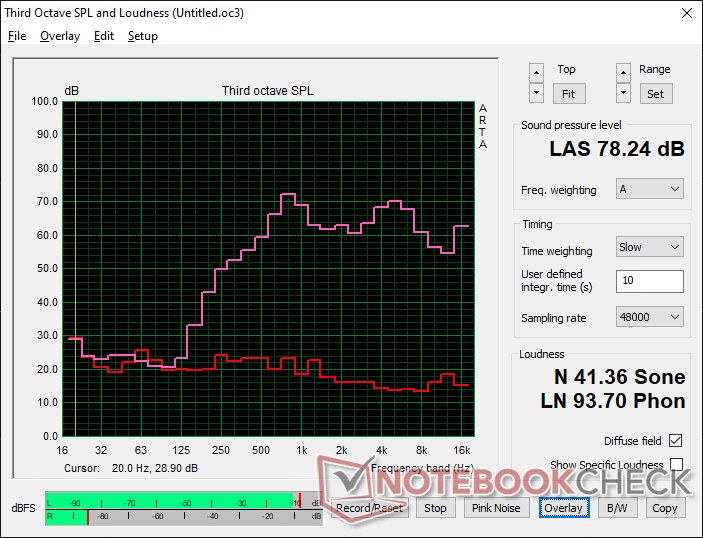
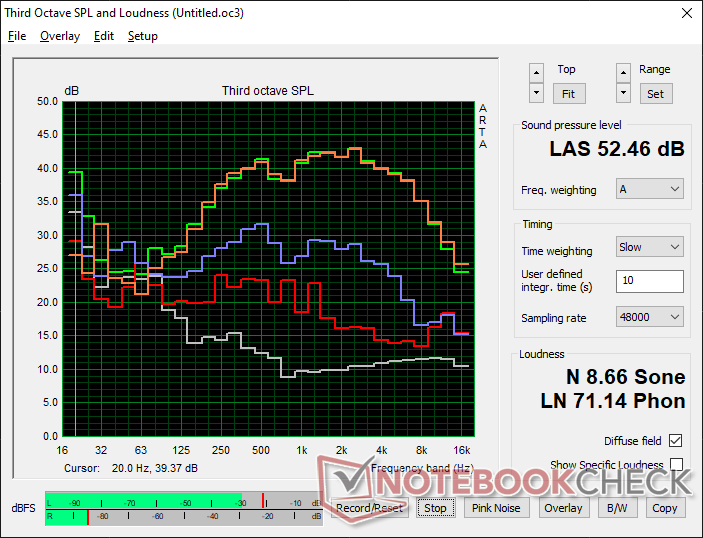
Schenker Uniwill Technology GM7AG8P análise de áudio
(±) | o volume do alto-falante é médio, mas bom (###valor### dB)
Graves 100 - 315Hz
(-) | quase nenhum baixo - em média 23.7% menor que a mediana
(±) | a linearidade dos graves é média (12.8% delta para a frequência anterior)
Médios 400 - 2.000 Hz
(+) | médios equilibrados - apenas 4.6% longe da mediana
(±) | a linearidade dos médios é média (9.2% delta para frequência anterior)
Altos 2 - 16 kHz
(+) | agudos equilibrados - apenas 4.5% longe da mediana
(±) | a linearidade dos máximos é média (8.6% delta para frequência anterior)
Geral 100 - 16.000 Hz
(±) | a linearidade do som geral é média (24.1% diferença em relação à mediana)
Comparado com a mesma classe
» 87% de todos os dispositivos testados nesta classe foram melhores, 4% semelhantes, 9% piores
» O melhor teve um delta de 6%, a média foi 18%, o pior foi 132%
Comparado com todos os dispositivos testados
» 73% de todos os dispositivos testados foram melhores, 6% semelhantes, 21% piores
» O melhor teve um delta de 4%, a média foi 23%, o pior foi 134%
Apple MacBook Pro 16 2021 M1 Pro análise de áudio
(+) | os alto-falantes podem tocar relativamente alto (###valor### dB)
Graves 100 - 315Hz
(+) | bons graves - apenas 3.8% longe da mediana
(+) | o baixo é linear (5.2% delta para a frequência anterior)
Médios 400 - 2.000 Hz
(+) | médios equilibrados - apenas 1.3% longe da mediana
(+) | médios são lineares (2.1% delta para frequência anterior)
Altos 2 - 16 kHz
(+) | agudos equilibrados - apenas 1.9% longe da mediana
(+) | os máximos são lineares (2.7% delta da frequência anterior)
Geral 100 - 16.000 Hz
(+) | o som geral é linear (4.6% diferença em relação à mediana)
Comparado com a mesma classe
» 0% de todos os dispositivos testados nesta classe foram melhores, 0% semelhantes, 100% piores
» O melhor teve um delta de 5%, a média foi 17%, o pior foi 45%
Comparado com todos os dispositivos testados
» 0% de todos os dispositivos testados foram melhores, 0% semelhantes, 100% piores
» O melhor teve um delta de 4%, a média foi 23%, o pior foi 134%
Gestão de energia
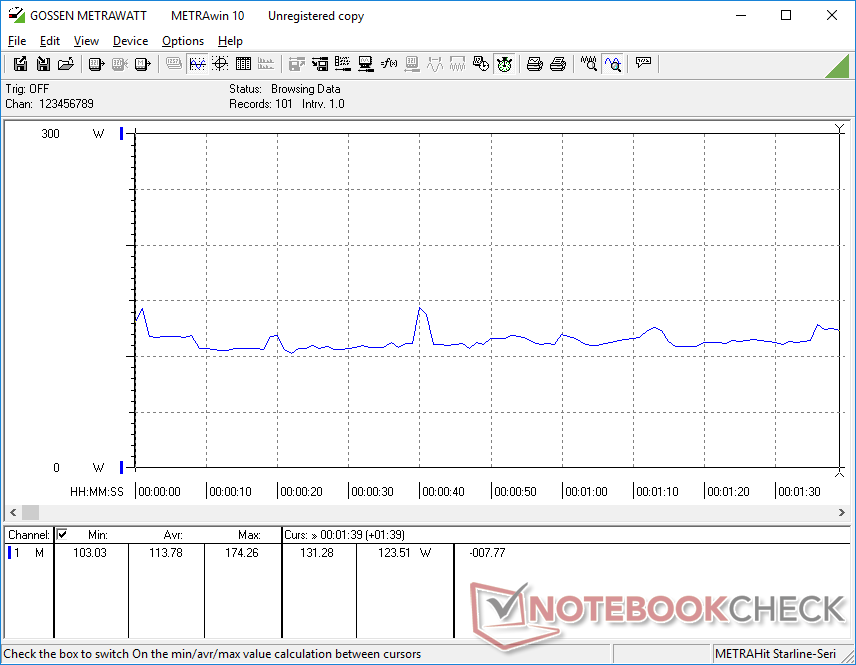
Consumo de energia - Componentes exigentes
Nossos benchmarks acima mostram uma melhoria de 20 a 30% no desempenho da CPU e um aumento de 10% no desempenho da GPU sobre o Core i9-11900H e GeForce RTX 3080, respectivamente, como encontrado noSchenker XMG Neo 17 GM7TG8S. No entanto, as medições do Metrahit mostram que nosso GM7AG8P está com um pouco mais de fome de energia do que no antigo GM7TG8S quando em condições semelhantes. A execução do Prime95, em particular, consome cerca de 10 a 15% mais energia no GM7AG8P, o que significa que o aumento acima mencionado no desempenho da CPU não é exatamente gratuito. O desempenho por watt com o Alder Lake-H não é, portanto, muito maior quando comparado ao Tiger Lake-H.
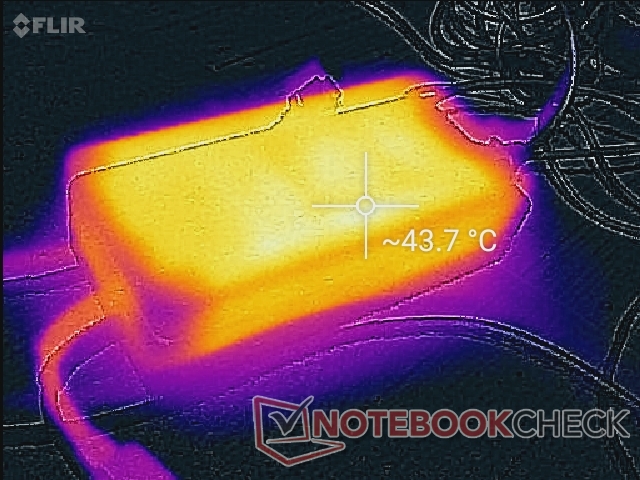
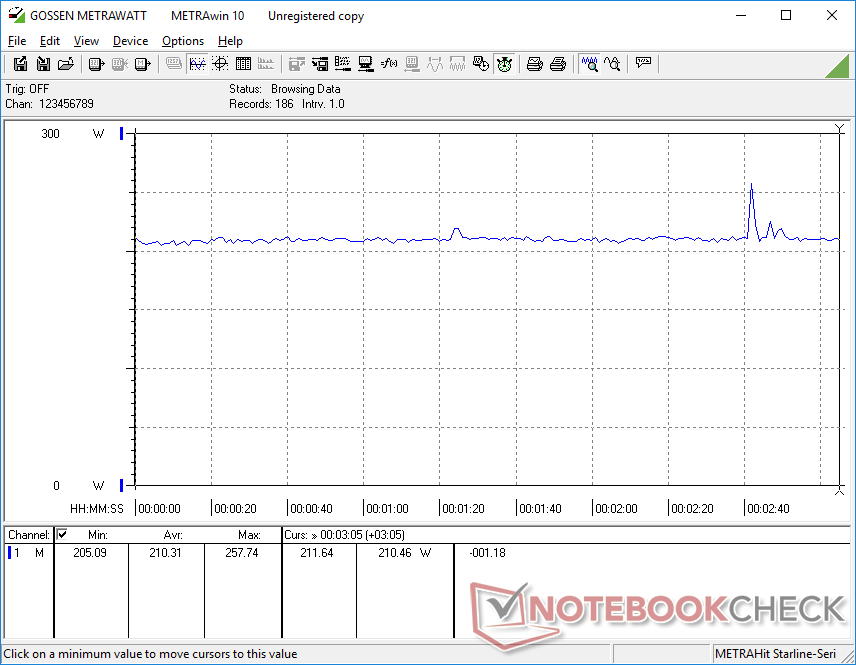
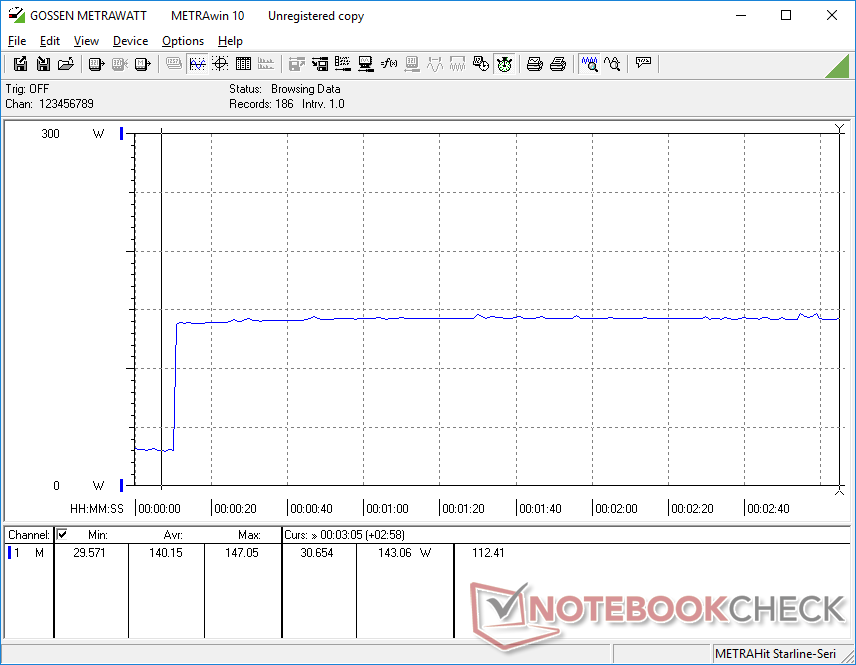
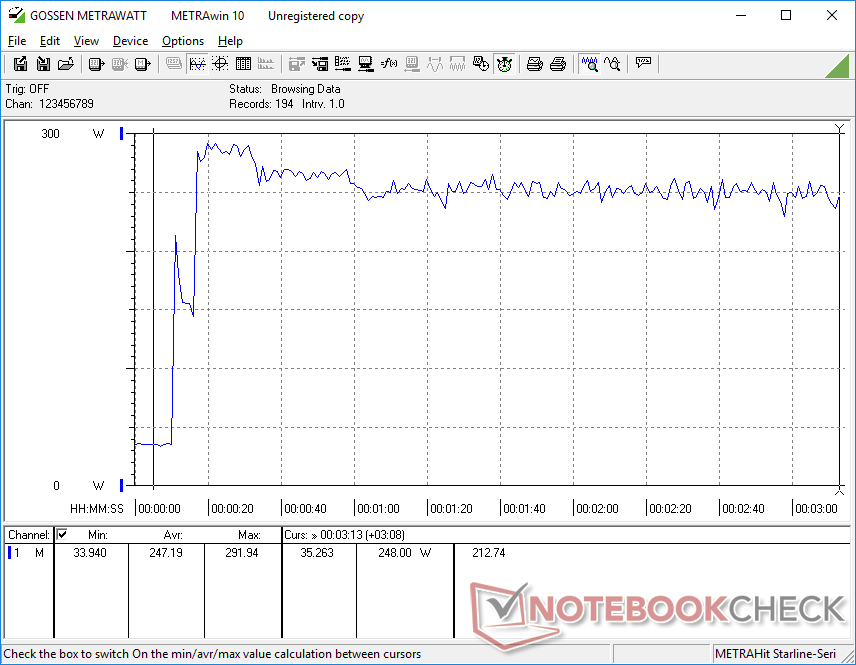
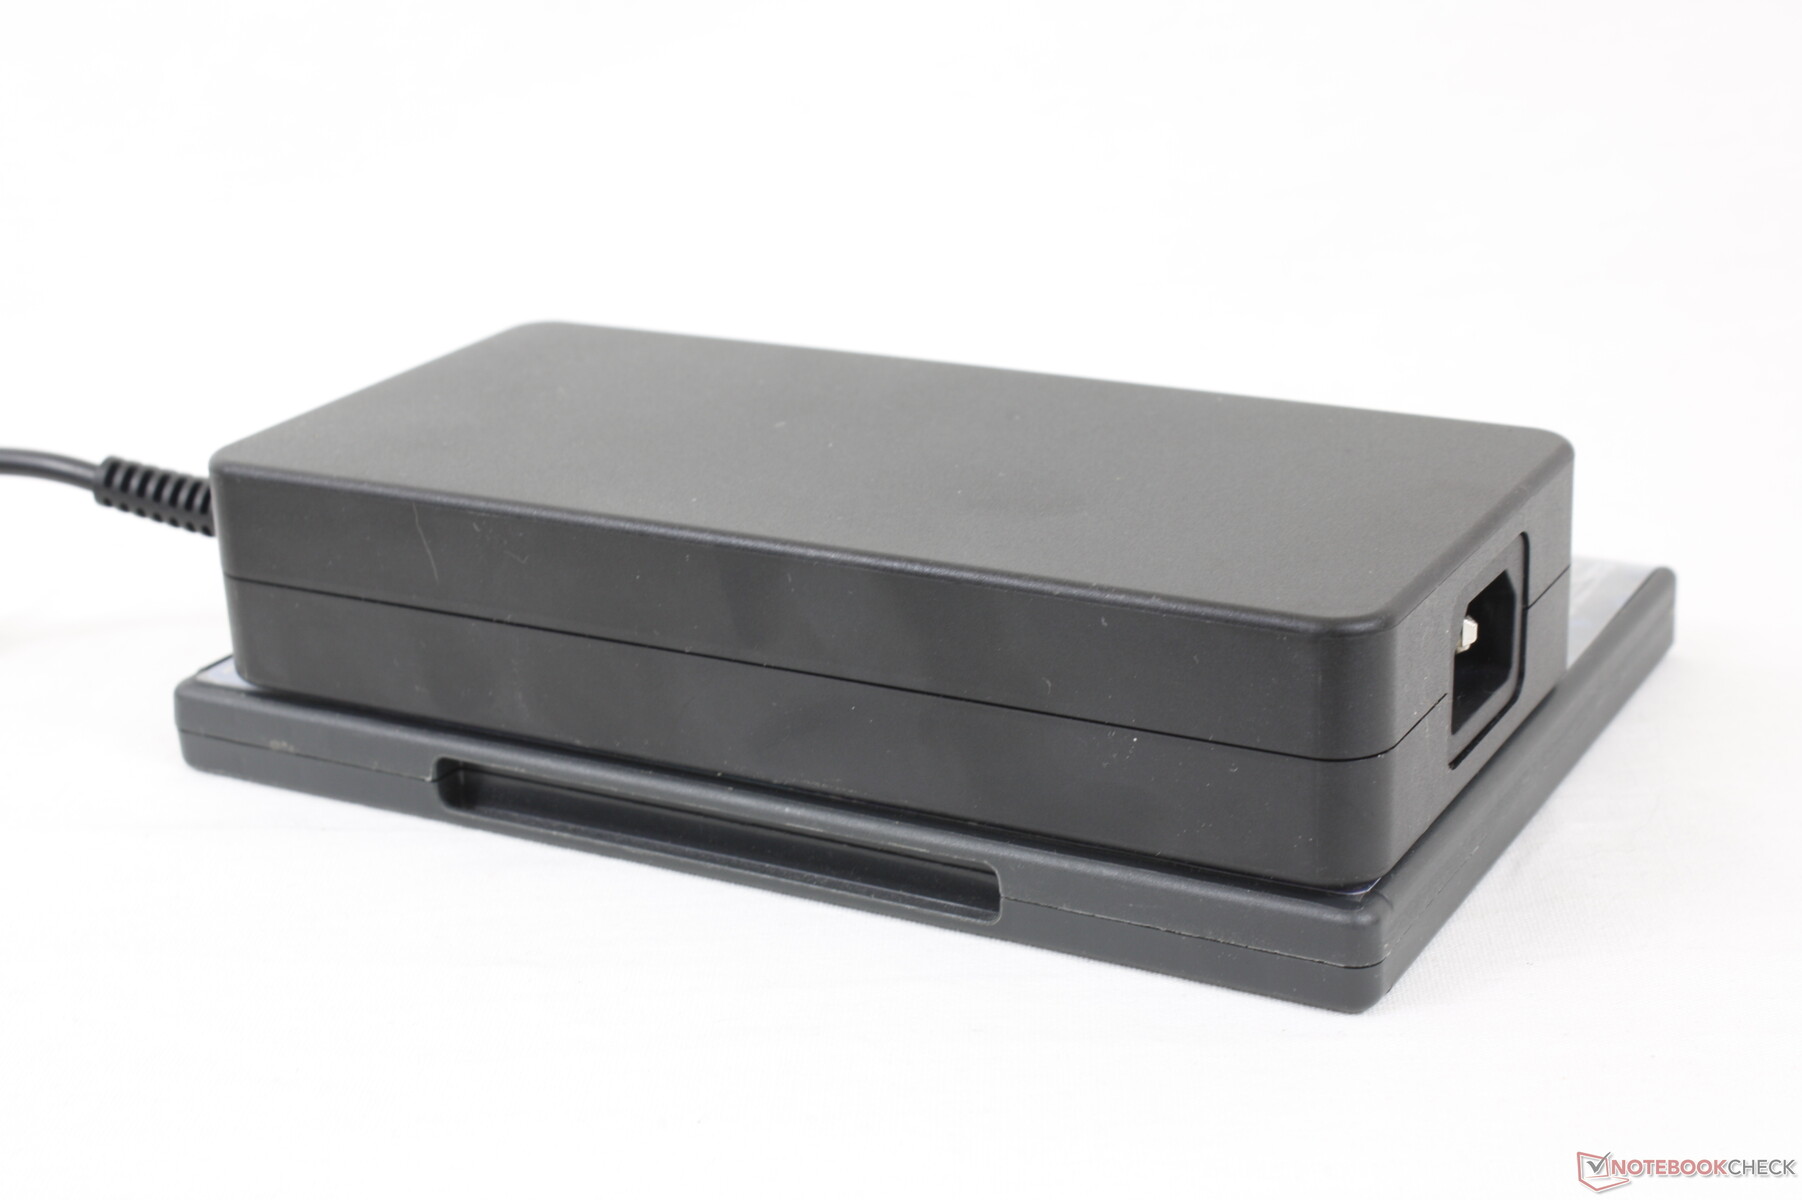
Podemos registrar um draw máximo temporário de 292 W do grande (~18 x 8,5 x 3,5 cm) adaptador CA de 280 W ao executar simultaneamente Prime95 e FurMark stress. Espere que este máximo seja ainda maior em 20 W ou mais se ajustar manualmente a GPU para o modo 175 W. Esta taxa duraria cerca de 20 segundos antes de cair e se estabilizar em torno de 250 W, como mostra nossa captura de tela abaixo, provavelmente devido a limitações térmicas.
| desligado | |
| Ocioso | |
| Carga |
|
Key:
min: | |
| Schenker Uniwill Technology GM7AG8P i9-12900H, GeForce RTX 3080 Ti Laptop GPU, Samsung PM9A1 MZVL2512HCJQ, IPS, 2560x1440, 17.3" | Schenker XMG NEO 17 GM7TG8S i7-11800H, GeForce RTX 3080 Laptop GPU, Samsung SSD 980 Pro 1TB MZ-V8P1T0BW, IPS, 2560x1440, 17.3" | Alienware x17 RTX 3080 P48E i7-11800H, GeForce RTX 3080 Laptop GPU, 2x WDC PC SN730 SDBPNTY-1T00 (RAID 0), IPS, 3840x2160, 17.3" | Razer Blade 17 RTX 3070 i7-11800H, GeForce RTX 3070 Laptop GPU, Samsung PM9A1 MZVL21T0HCLR, IPS, 1920x1080, 17.3" | MSI GS76 Stealth 11UH i9-11900H, GeForce RTX 3080 Laptop GPU, Samsung PM9A1 MZVL22T0HBLB, IPS, 3840x2160, 17.3" | Maingear Vector Pro MG-VCP17 i7-11800H, GeForce RTX 3080 Laptop GPU, Samsung PM9A1 MZVL21T0HCLR, IPS, 2560x1440, 17.3" | |
|---|---|---|---|---|---|---|
| Power Consumption | 18% | 9% | 11% | 29% | 28% | |
| Idle Minimum * (Watt) | 29.7 | 19 36% | 10.2 66% | 20.9 30% | 14 53% | 11 63% |
| Idle Average * (Watt) | 33.6 | 25 26% | 21.2 37% | 25.1 25% | 19 43% | 15.6 54% |
| Idle Maximum * (Watt) | 35.5 | 28 21% | 48.4 -36% | 45 -27% | 31 13% | 34 4% |
| Load Average * (Watt) | 113.8 | 105 8% | 118.7 -4% | 102 10% | 97 15% | 81.2 29% |
| Witcher 3 ultra * (Watt) | 210 | 223 -6% | 249 -19% | 189 10% | 156 26% | 204 3% |
| Load Maximum * (Watt) | 292 | 226 23% | 262 10% | 234.8 20% | 231 21% | 257.3 12% |
* ... menor é melhor
Power Consumption Witcher 3 / Stresstest
Power Consumption external Monitor
Vida útil da bateria
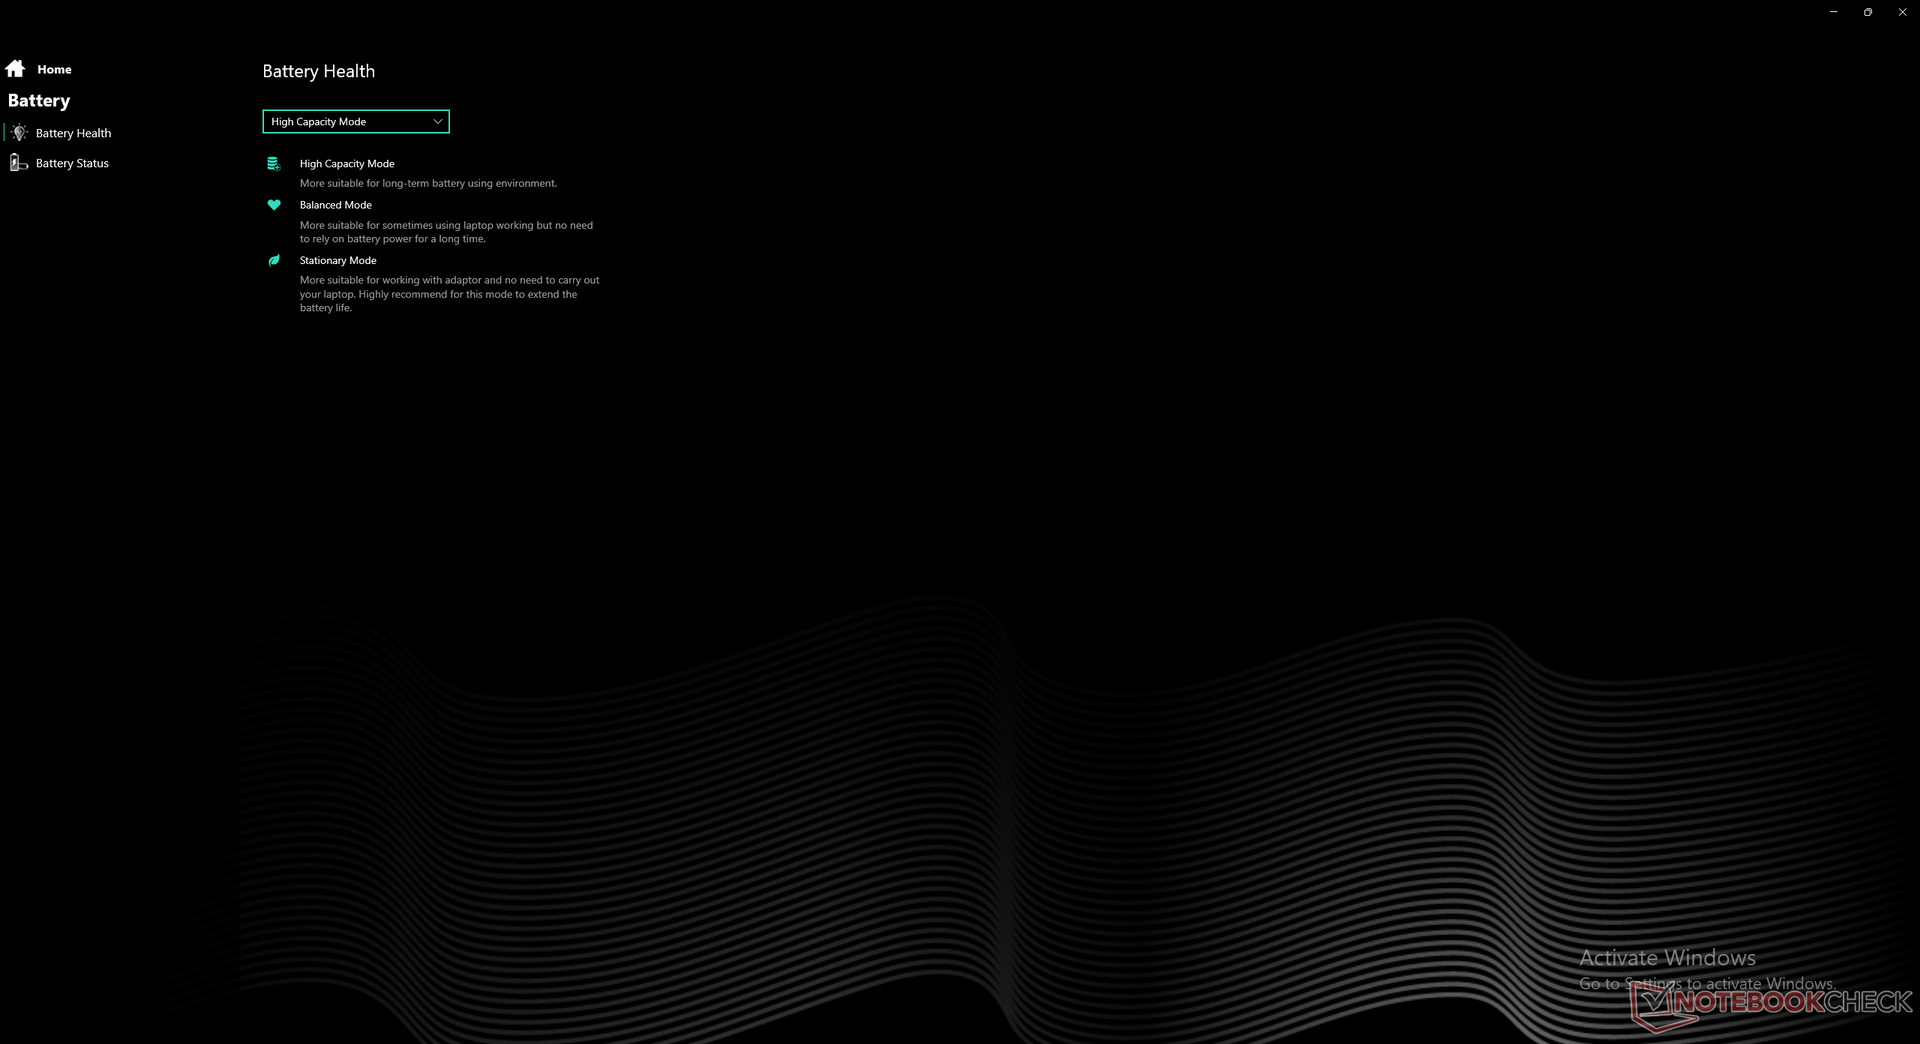
A bateria integrada é relativamente grande a 91 Wh comparada com apenas 62 W no XMG Neo 17 com Intel do 11º gênero. No entanto, a vida útil da bateria ainda é medíocre na melhor das hipóteses, com apenas 3 horas de uso da WLAN no mundo real, mesmo quando configurada para os perfis de potência Balanceado ou Office.
A carga do vazio ao cheio com o adaptador AC incluído é muito mais lenta do que o esperado às 3 horas. Em outras palavras, o sistema leva tanto tempo para carregar quanto para drenar quando se navega na web. A maioria dos Ultrabooks e outros laptops para jogos pode recarregar totalmente em 2 horas ou mais rápido.
Infelizmente, o sistema não pode recarregar através de adaptadores USB-C de terceiros, ao contrário do Razer Blade Pro e da maioria dos outros laptops para jogos da Asus ou Alienware.
| Schenker Uniwill Technology GM7AG8P i9-12900H, GeForce RTX 3080 Ti Laptop GPU, 91 Wh | Schenker XMG NEO 17 GM7TG8S i7-11800H, GeForce RTX 3080 Laptop GPU, 62 Wh | Alienware x17 RTX 3080 P48E i7-11800H, GeForce RTX 3080 Laptop GPU, 87 Wh | Razer Blade 17 RTX 3070 i7-11800H, GeForce RTX 3070 Laptop GPU, 70 Wh | MSI GS76 Stealth 11UH i9-11900H, GeForce RTX 3080 Laptop GPU, 99.9 Wh | Maingear Vector Pro MG-VCP17 i7-11800H, GeForce RTX 3080 Laptop GPU, 91 Wh | |
|---|---|---|---|---|---|---|
| Duração da bateria | -18% | -28% | -10% | -7% | 8% | |
| Reader / Idle (h) | 7 | 6.7 | 9.9 | |||
| WiFi v1.3 (h) | 6.4 | 3.7 -42% | 5.9 -8% | 5.2 -19% | 6.4 0% | 6.9 8% |
| Load (h) | 1.5 | 1.6 7% | 0.8 -47% | 1.5 0% | 1.3 -13% | |
| H.264 (h) | 3.7 |
Pro
Contra
Veredicto - Desempenho muito alto por volume
O móvel GeForce RTX 3070 Ti e RTX 3080 Ti foram introduzidos para prolongar a vida útil da série GeForce RTX 3000 antes do inevitável lançamento da série móvel GeForce 4000. Até então, entretanto, o móvel RTX 3080 Ti pode proporcionar o impulso extra de desempenho que os entusiastas estão desejando. Mesmo que a GPU seja apenas marginalmente mais rápida que o móvel RTX 3080 Ti, ainda é impressionante ver um modelo ultraleve como o GM7AG8P superar uma alternativa muito mais grossa e pesada como o MSI GE76 10UH com o RTX 3080 mais antigo
Talvez o aspecto mais notável do GM7AG8P seja sua capacidade de sustentar um alvo TGP de 150+ W, apesar de seu perfil esbelto e peso relativamente baixo. O Razer Blade Pro e MSI GS76 Stealtha Uniwill Technology conseguiu encaixar uma GPU mais potente do que inicialmente esperávamos, com base em nossa experiência com outros laptops ultramarinos para jogos
A CPU e GPU são algumas das mais rápidas para qualquer laptop para jogos, independentemente do tamanho e peso, mas o volumoso adaptador AC de 280 W retira o design fino e portátil do laptop.
Quanto ao Núcleo i9-12900H CPU, o aumento de desempenho sobre a Núcleo i9-11900H é mais significativo do que o salto de um RTX 3080 móvel para o RTX 3080 Ti móvel. A melhoria de gen para gen é suficientemente grande para deslocar confortavelmente a série AMD Zen 3 H como a CPU superior para laptops de jogos
Um dos maiores inconvenientes do GM7AG8P é seu grande tijolo de 280 W que é necessário para alimentar os exigentes processadores internos. Com quase um quilograma completo, o adaptador e os cabos associados são tão pesados quanto cerca de Ultrabooks de 15,6 polegadas. É uma pena que o sistema não possa ser recarregado via USB-C, o que obriga os proprietários a carregar o adaptador volumoso com eles durante a viagem. Em contraste, os computadores portáteis Asus ROG Zephyrus e Alienware podem ser recarregados através de adaptadores USB-C de terceiros. Espere um alto ruído de ventilador também quando estiver jogando, o que é uma característica comum entre todos os laptops de jogos nesta categoria em particular.
Preço e Disponibilidade
A Uniwill Technology GM7AG8P ainda não está amplamente disponível para compra. Revendedores como Schenker e Eluktronics podem adotar o chassi em uma data futura com especificações similares
Schenker Uniwill Technology GM7AG8P
- 02/22/2022 v7 (old)
Allen Ngo
Price comparison

