 Deutsch
 English
 Español
 Français
 Italiano
 Nederlands
 Polski
 Português
 Русский
 Türkçe
 Svenska
 Chinese
 Magyar
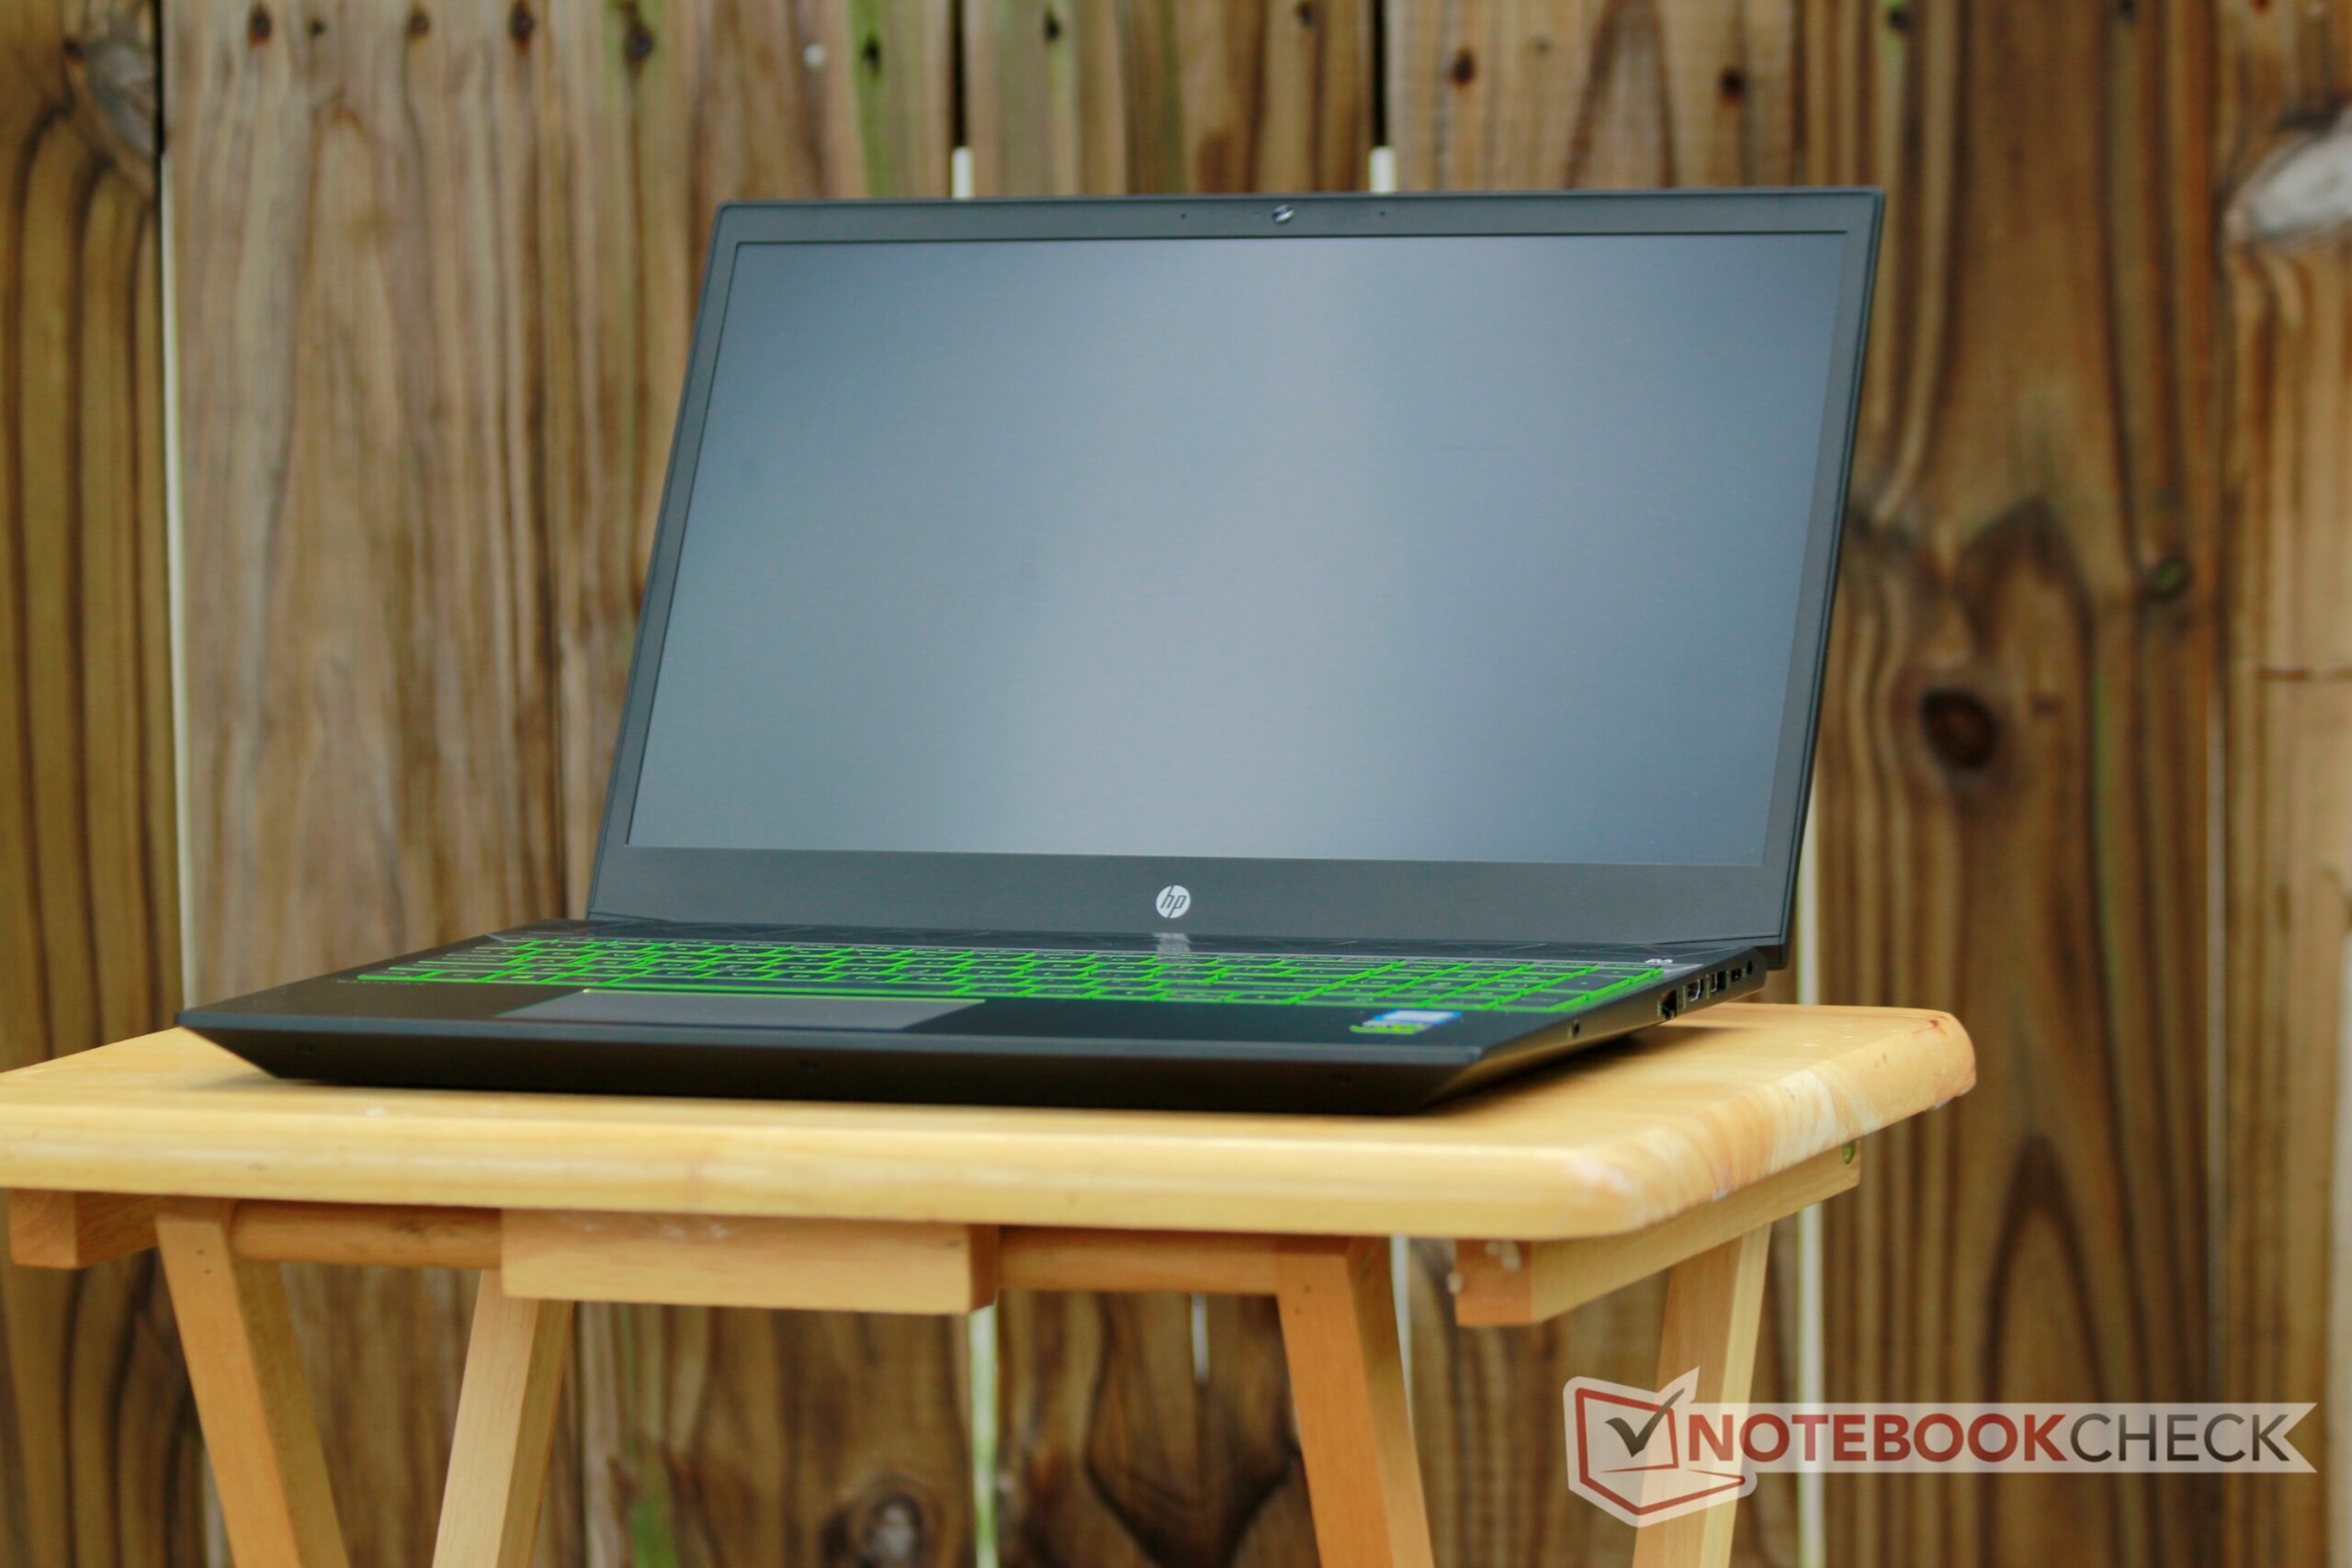
Breve Análise do Portátil HP Pavilion Gaming 15t (i7-8750H, GTX 1060 3 GB)
| SD Card Reader | |
| average JPG Copy Test (av. of 3 runs) | |
| Average of class Gaming (19 - 202, n=100, last 2 years) | |
| HP Pavilion Gaming 15t-cx0000 (Toshiba Exceria Pro SDXC 64 GB UHS-II) | |
| HP Omen 15-dc0001ng (Toshiba Exceria Pro SDXC 64 GB UHS-II) | |
| Asus FX503VM-EH73 (Toshiba Exceria Pro SDXC 64 GB UHS-II) | |
| Acer Predator Helios 300 PH317-52-51M6 (Toshiba Exceria Pro SDXC 64 GB UHS-II) | |
| MSI GV62 8RE-016US (Toshiba Exceria Pro SDXC 64 GB UHS-II) | |
| Dell G7 15-7588 (Toshiba Exceria Pro SDXC 64 GB UHS-II) | |
| maximum AS SSD Seq Read Test (1GB) | |
| Average of class Gaming (25.8 - 269, n=94, last 2 years) | |
| HP Omen 15-dc0001ng (Toshiba Exceria Pro SDXC 64 GB UHS-II) | |
| Asus FX503VM-EH73 (Toshiba Exceria Pro SDXC 64 GB UHS-II) | |
| Acer Predator Helios 300 PH317-52-51M6 (Toshiba Exceria Pro SDXC 64 GB UHS-II) | |
| HP Pavilion Gaming 15t-cx0000 (Toshiba Exceria Pro SDXC 64 GB UHS-II) | |
| Dell G7 15-7588 (Toshiba Exceria Pro SDXC 64 GB UHS-II) | |
| MSI GV62 8RE-016US (Toshiba Exceria Pro SDXC 64 GB UHS-II) | |
| |||||||||||||||||||||||||
iluminação: 85 %
iluminação com acumulador: 357.5 cd/m²
Contraste: 993:1 (Preto: 0.36 cd/m²)
ΔE Color 4.19 | 0.5-29.43 Ø5, calibrated: 3.2
ΔE Greyscale 3.5 | 0.57-98 Ø5.3
91% sRGB (Argyll 1.6.3 3D)
60% AdobeRGB 1998 (Argyll 1.6.3 3D)
67.1% AdobeRGB 1998 (Argyll 2.2.0 3D)
91.7% sRGB (Argyll 2.2.0 3D)
66.5% Display P3 (Argyll 2.2.0 3D)
Gamma: 2.324
| HP Pavilion Gaming 15t-cx0000 AU Optronics AUO82ED, IPS, 15.60, 1920x1080 | Dell G7 15-7588 LG Philips LGD053F, IPS, 15.60, 1920x1080 | Acer Predator Helios 300 PH317-52-51M6 LG Philips LP173WF4-SPF5 (LGD056D), IPS, 17.30, 1920x1080 | Lenovo Legion Y530-15ICH B156HAN02.1, IPS, 15.60, 1920x1080 | Asus FX503VM-EH73 AU Optronics B156HAN06.1, IPS, 15.60, 1920x1080 | HP Omen 15-dc0001ng BOE07A1, IPS, 15.60, 1920x1080 | MSI GV62 8RE-016US LG Philips LGD0590, IPS, 15.60, 1920x1080 | |
|---|---|---|---|---|---|---|---|
| Display | -41% | -4% | -40% | -42% | -38% | -38% | |
| Display P3 Coverage | 66.5 | 37.82 -43% | 67.1 1% | 38.31 -42% | 37.48 -44% | 39.64 -40% | 39.58 -40% |
| sRGB Coverage | 91.7 | 56.2 -39% | 86.1 -6% | 57.3 -38% | 56.3 -39% | 59 -36% | 59.5 -35% |
| AdobeRGB 1998 Coverage | 67.1 | 39.2 -42% | 63 -6% | 39.58 -41% | 38.72 -42% | 40.95 -39% | 40.91 -39% |
| Response Times | -130% | -101% | -169% | -146% | -179% | -104% | |
| Response Time Grey 50% / Grey 80% * | 17.6 ? | 38.8 ? -120% | 36 ? -105% | 43.6 ? -148% | 36.8 ? -109% | 47.2 ? -168% | 33.2 ? -89% |
| Response Time Black / White * | 11.2 ? | 26.8 ? -139% | 22 ? -96% | 32.4 ? -189% | 31.6 ? -182% | 32.4 ? -189% | 24.4 ? -118% |
| PWM Frequency | 122000 ? | 200 ? | |||||
| Screen | -61% | -20% | -34% | -34% | -14% | -35% | |
| Brightness middle | 357.5 | 250.9 -30% | 365 2% | 282.8 -21% | 235.9 -34% | 275 -23% | 268.7 -25% |
| Brightness | 351 | 246 -30% | 341 -3% | 264 -25% | 235 -33% | 254 -28% | 246 -30% |
| Brightness Distribution | 85 | 89 5% | 89 5% | 88 4% | 91 7% | 90 6% | 82 -4% |
| Black Level * | 0.36 | 0.34 6% | 0.32 11% | 0.42 -17% | 0.27 25% | 0.27 25% | 0.42 -17% |
| Contrast | 993 | 738 -26% | 1141 15% | 673 -32% | 874 -12% | 1019 3% | 640 -36% |
| Colorchecker dE 2000 * | 4.19 | 7.34 -75% | 6.51 -55% | 4.93 -18% | 4.81 -15% | 4.62 -10% | 4.79 -14% |
| Colorchecker dE 2000 max. * | 6.97 | 28.66 -311% | 12.32 -77% | 17.65 -153% | 21.55 -209% | 8.05 -15% | 18.13 -160% |
| Colorchecker dE 2000 calibrated * | 3.2 | 4.42 -38% | 2.9 9% | 4.07 -27% | 3.59 -12% | 4.31 -35% | |
| Greyscale dE 2000 * | 3.5 | 6.8 -94% | 7.65 -119% | 3.8 -9% | 3.1 11% | 4.31 -23% | 3.1 11% |
| Gamma | 2.324 95% | 2.164 102% | 2.64 83% | 2.449 90% | 2.31 95% | 2.49 88% | 2.28 96% |
| CCT | 7028 92% | 6780 96% | 8066 81% | 6112 106% | 6984 93% | 7000 93% | 7049 92% |
| Color Space (Percent of AdobeRGB 1998) | 60 | 36 -40% | 56 -7% | 36 -40% | 36 -40% | 38 -37% | 38 -37% |
| Color Space (Percent of sRGB) | 91 | 56 -38% | 86 -5% | 57 -37% | 56 -38% | 59 -35% | 59 -35% |
| Total Average (Program / Settings) | -77% /
-66% | -42% /
-27% | -81% /
-52% | -74% /
-50% | -77% /
-39% | -59% /
-44% |
* ... smaller is better
Display Response Times
| ↔ Response Time Black to White | ||
|---|---|---|
| 11.2 ms ... rise ↗ and fall ↘ combined | ↗ 6 ms rise | 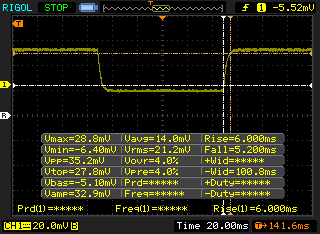 |
| ↘ 5.2 ms fall | ||
| The screen shows good response rates in our tests, but may be too slow for competitive gamers. In comparison, all tested devices range from 0.1 (minimum) to 240 (maximum) ms. » 25 % of all devices are better. This means that the measured response time is better than the average of all tested devices (21.5 ms). | ||
| ↔ Response Time 50% Grey to 80% Grey | ||
| 17.6 ms ... rise ↗ and fall ↘ combined | ↗ 9.2 ms rise | 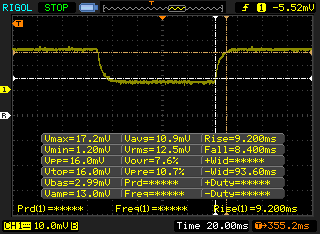 |
| ↘ 8.4 ms fall | ||
| The screen shows good response rates in our tests, but may be too slow for competitive gamers. In comparison, all tested devices range from 0.2 (minimum) to 636 (maximum) ms. » 26 % of all devices are better. This means that the measured response time is better than the average of all tested devices (33.7 ms). | ||
Screen Flickering / PWM (Pulse-Width Modulation)
| Screen flickering / PWM not detected | 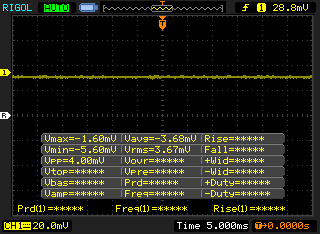 | ||
In comparison: 53 % of all tested devices do not use PWM to dim the display. If PWM was detected, an average of 17903 (minimum: 5 - maximum: 3846000) Hz was measured. | |||
| wPrime 2.10 - 1024m | |
| HP ProBook 645 G4 3UP62EA | |
| Average of class Gaming (116.8 - 1021, n=14, last 2 years) | |
| Asus FX503VM-EH73 | |
| HP Pavilion Gaming 15t-cx0000 | |
| Average Intel Core i7-8750H (125.5 - 180.5, n=6) | |
* ... smaller is better
| PCMark 8 Home Score Accelerated v2 | 4606 pontos | |
| PCMark 8 Work Score Accelerated v2 | 5308 pontos | |
| PCMark 10 Score | 4724 pontos | |
Ajuda | ||
| HP Pavilion Gaming 15t-cx0000 Samsung SSD PM981 MZVLB512HAJQ | Dell G7 15-7588 SK hynix SC311 SATA | Acer Predator Helios 300 PH317-52-51M6 Hynix HFS128G39TND | Lenovo Legion Y530-15ICH Toshiba KBG30ZMT128G | Asus FX503VM-EH73 SanDisk SD8SN8U128G1002 | HP Omen 15-dc0001ng Toshiba KBG30ZMV128G | MSI GV62 8RE-016US Samsung PM871b MZNLN128HAHQ | Average Samsung SSD PM981 MZVLB512HAJQ | |
|---|---|---|---|---|---|---|---|---|
| AS SSD | -87% | -120% | -212% | -92% | -117% | -73% | -3% | |
| Copy Game MB/s | 223.2 | 122.6 | 1057 ? | |||||
| Copy Program MB/s | 126.9 | 69.2 | 454 ? | |||||
| Copy ISO MB/s | 460.8 | 170.5 | 1755 ? | |||||
| Score Total | 4113 | 528 -87% | 811 -80% | 838 -80% | 798 -81% | 670 -84% | 703 -83% | 3966 ? -4% |
| Score Write | 2087 | 181 -91% | 196 -91% | 128 -94% | 178 -91% | 195 -91% | 207 -90% | 1780 ? -15% |
| Score Read | 1319 | 233 -82% | 414 -69% | 497 -62% | 411 -69% | 343 -74% | 334 -75% | 1451 ? 10% |
| Access Time Write * | 0.038 | 0.068 -79% | 0.259 -582% | 0.287 -655% | 0.09 -137% | 0.227 -497% | 0.057 -50% | 0.08337 ? -119% |
| Access Time Read * | 0.051 | 0.161 -216% | 0.626 -1127% | 0.17 -233% | 0.177 -247% | 0.113 -122% | 0.05092 ? -0% | |
| 4K-64 Write | 1808 | 99.6 -94% | 120.1 -93% | 78.9 -96% | 95.5 -95% | 103.6 -94% | 129.4 -93% | 1504 ? -17% |
| 4K-64 Read | 1160 | 158.8 -86% | 336.6 -71% | 335.3 -71% | 343.4 -70% | 187.8 -84% | 257.7 -78% | 1203 ? 4% |
| 4K Write | 95.9 | 59.8 -38% | 62.7 -35% | 35.74 -63% | 46.48 -52% | 79.3 -17% | 63.5 -34% | 112 ? 17% |
| 4K Read | 35.03 | 23.66 -32% | 26.5 -24% | 38.71 11% | 20.44 -42% | 31.48 -10% | 26.23 -25% | 50.5 ? 44% |
| Seq Write | 1829 | 220.3 -88% | 128.2 -93% | 131.6 -93% | 328.4 -82% | 123.5 -93% | 138.1 -92% | 1637 ? -10% |
| Seq Read | 1235 | 506 -59% | 513 -58% | 1231 0% | 476.3 -61% | 1238 0% | 503 -59% | 1976 ? 60% |
* ... smaller is better

| 3DMark | |
| 1280x720 Cloud Gate Standard Graphics | |
| Average of class Gaming (15902 - 193851, n=140, last 2 years) | |
| HP Omen 17t-3AW55AV_1 | |
| MSI GS73 Stealth 8RF-011 | |
| MSI GV62 8RE-016US | |
| Dell G7 15-7588 | |
| HP Pavilion Gaming 15t-cx0000 | |
| Average NVIDIA GeForce GTX 1060 Max-Q (42781 - 81720, n=10) | |
| HP Omen 15-dc0001ng | |
| MSI GL63 8RC-069US | |
| HP Spectre x360 15-ch000 | |
| 1920x1080 Fire Strike Graphics | |
| Average of class Gaming (781 - 53059, n=236, last 2 years) | |
| HP Omen 17t-3AW55AV_1 | |
| MSI GS73 Stealth 8RF-011 | |
| MSI GV62 8RE-016US | |
| Dell G7 15-7588 | |
| Average NVIDIA GeForce GTX 1060 Max-Q (9992 - 11366, n=10) | |
| HP Pavilion Gaming 15t-cx0000 | |
| HP Omen 15-dc0001ng | |
| HP Spectre x360 15-ch000 | |
| MSI GL63 8RC-069US | |
| 3DMark 06 Standard Score | 34189 pontos | |
| 3DMark 11 Performance | 12774 pontos | |
| 3DMark Cloud Gate Standard Score | 31926 pontos | |
| 3DMark Fire Strike Score | 9348 pontos | |
Ajuda | ||
| baixo | média | alto | ultra | |
| BioShock Infinite (2013) | 327 | 231 | 215 | 102 |
| The Witcher 3 (2015) | 50 | |||
| Rise of the Tomb Raider (2016) | 168 | 111 | 63 | 54 |
| Rocket League (2017) | 250 | 216 | 155 |
Barulho
| Ocioso |
| 32.2 / 32.4 / 32.4 dB |
| Carga |
| 40.2 / 47.2 dB |
 | ||
30 dB silencioso 40 dB(A) audível 50 dB(A) ruidosamente alto |
||
min: | ||
| HP Pavilion Gaming 15t-cx0000 GeForce GTX 1060 Max-Q, i7-8750H, Samsung SSD PM981 MZVLB512HAJQ | Dell G7 15-7588 GeForce GTX 1060 Max-Q, i7-8750H, SK hynix SC311 SATA | Acer Predator Helios 300 PH317-52-51M6 GeForce GTX 1050 Ti Mobile, i5-8300H, Hynix HFS128G39TND | Lenovo Legion Y530-15ICH GeForce GTX 1050 Ti Mobile, i5-8300H, Toshiba KBG30ZMT128G | Asus FX503VM-EH73 GeForce GTX 1060 Mobile, i7-7700HQ, SanDisk SD8SN8U128G1002 | HP Omen 15-dc0001ng GeForce GTX 1050 Ti Mobile, i5-8300H, Toshiba KBG30ZMV128G | MSI GV62 8RE-016US GeForce GTX 1060 Mobile, i5-8300H, Samsung PM871b MZNLN128HAHQ | |
|---|---|---|---|---|---|---|---|
| Noise | 2% | -1% | 8% | 1% | -5% | -6% | |
| off / environment * | 28.3 | 28.1 1% | 29 -2% | 28 1% | 27.8 2% | 29 -2% | 28.2 -0% |
| Idle Minimum * | 32.2 | 29 10% | 29 10% | 28 13% | 29.6 8% | 29 10% | 33.5 -4% |
| Idle Average * | 32.4 | 29 10% | 31 4% | 28 14% | 29.6 9% | 33 -2% | 33.5 -3% |
| Idle Maximum * | 32.4 | 29.2 10% | 33 -2% | 28.5 12% | 29.6 9% | 41 -27% | 33.7 -4% |
| Load Average * | 40.2 | 40.6 -1% | 45 -12% | 34.9 13% | 37.3 7% | 44 -9% | 41 -2% |
| Witcher 3 ultra * | 45 | 49.8 -11% | 45 -0% | 40 11% | 49.8 -11% | 47 -4% | 52.3 -16% |
| Load Maximum * | 47.2 | 49.8 -6% | 51 -8% | 49.6 -5% | 53.7 -14% | 49 -4% | 52.3 -11% |
* ... smaller is better
(-) The maximum temperature on the upper side is 46 °C / 115 F, compared to the average of 40.4 °C / 105 F, ranging from 21.2 to 68.8 °C for the class Gaming.
(-) The bottom heats up to a maximum of 52 °C / 126 F, compared to the average of 43.2 °C / 110 F
(+) In idle usage, the average temperature for the upper side is 28.1 °C / 83 F, compared to the device average of 33.8 °C / 93 F.
(-) Playing The Witcher 3, the average temperature for the upper side is 38.1 °C / 101 F, compared to the device average of 33.8 °C / 93 F.
(+) The palmrests and touchpad are reaching skin temperature as a maximum (32.4 °C / 90.3 F) and are therefore not hot.
(-) The average temperature of the palmrest area of similar devices was 28.9 °C / 84 F (-3.5 °C / -6.3 F).
HP Pavilion Gaming 15t-cx0000 audio analysis
(-) | not very loud speakers (69.7 dB)
Bass 100 - 315 Hz
(-) | nearly no bass - on average 17.8% lower than median
(±) | linearity of bass is average (14.1% delta to prev. frequency)
Mids 400 - 2000 Hz
(+) | balanced mids - only 3.3% away from median
(+) | mids are linear (6.4% delta to prev. frequency)
Highs 2 - 16 kHz
(+) | balanced highs - only 2.1% away from median
(+) | highs are linear (6% delta to prev. frequency)
Overall 100 - 16.000 Hz
(±) | linearity of overall sound is average (22% difference to median)
Compared to same class
» 76% of all tested devices in this class were better, 7% similar, 17% worse
» The best had a delta of 6%, average was 18%, worst was 132%
Compared to all devices tested
» 58% of all tested devices were better, 7% similar, 35% worse
» The best had a delta of 4%, average was 25%, worst was 134%
Dell G7 15-7588 audio analysis
(±) | speaker loudness is average but good (74.8 dB)
Bass 100 - 315 Hz
(-) | nearly no bass - on average 16.7% lower than median
(±) | linearity of bass is average (11.8% delta to prev. frequency)
Mids 400 - 2000 Hz
(+) | balanced mids - only 4.6% away from median
(±) | linearity of mids is average (7.1% delta to prev. frequency)
Highs 2 - 16 kHz
(+) | balanced highs - only 4.8% away from median
(±) | linearity of highs is average (10.7% delta to prev. frequency)
Overall 100 - 16.000 Hz
(±) | linearity of overall sound is average (21.1% difference to median)
Compared to same class
» 73% of all tested devices in this class were better, 4% similar, 23% worse
» The best had a delta of 6%, average was 18%, worst was 132%
Compared to all devices tested
» 53% of all tested devices were better, 7% similar, 40% worse
» The best had a delta of 4%, average was 25%, worst was 134%
| desligado | |
| Ocioso | |
| Carga |
|
| HP Pavilion Gaming 15t-cx0000 i7-8750H, GeForce GTX 1060 Max-Q, Samsung SSD PM981 MZVLB512HAJQ, IPS, 1920x1080, 15.60 | Dell G7 15-7588 i7-8750H, GeForce GTX 1060 Max-Q, SK hynix SC311 SATA, IPS, 1920x1080, 15.60 | Acer Predator Helios 300 PH317-52-51M6 i5-8300H, GeForce GTX 1050 Ti Mobile, Hynix HFS128G39TND, IPS, 1920x1080, 17.30 | Lenovo Legion Y530-15ICH i5-8300H, GeForce GTX 1050 Ti Mobile, Toshiba KBG30ZMT128G, IPS, 1920x1080, 15.60 | Asus FX503VM-EH73 i7-7700HQ, GeForce GTX 1060 Mobile, SanDisk SD8SN8U128G1002, IPS, 1920x1080, 15.60 | HP Omen 15-dc0001ng i5-8300H, GeForce GTX 1050 Ti Mobile, Toshiba KBG30ZMV128G, IPS, 1920x1080, 15.60 | MSI GV62 8RE-016US i5-8300H, GeForce GTX 1060 Mobile, Samsung PM871b MZNLN128HAHQ, IPS, 1920x1080, 15.60 | |
|---|---|---|---|---|---|---|---|
| Power Consumption | 6% | 3% | 5% | -28% | -28% | -32% | |
| Idle Minimum * | 6 | 5.5 8% | 6 -0% | 4.5 25% | 12.8 -113% | 12 -100% | 9.38 -56% |
| Idle Average * | 11.2 | 7.6 32% | 9 20% | 10 11% | 15.4 -38% | 14 -25% | 15.95 -42% |
| Idle Maximum * | 13.3 | 9 32% | 13 2% | 13.8 -4% | 15.9 -20% | 18 -35% | 18.46 -39% |
| Load Average * | 89.2 | 94 -5% | 95 -7% | 92.5 -4% | 78 13% | 92 -3% | 95.68 -7% |
| Witcher 3 ultra * | 101.9 | 116.3 -14% | 102 -0% | 108.1 -6% | 107.3 -5% | 100 2% | 135.6 -33% |
| Load Maximum * | 134.5 | 154.4 -15% | 134 -0% | 123.2 8% | 143.4 -7% | 142 -6% | 156.98 -17% |
* ... smaller is better
| HP Pavilion Gaming 15t-cx0000 i7-8750H, GeForce GTX 1060 Max-Q, 70 Wh | Dell G7 15-7588 i7-8750H, GeForce GTX 1060 Max-Q, 56 Wh | Acer Predator Helios 300 PH317-52-51M6 i5-8300H, GeForce GTX 1050 Ti Mobile, 48 Wh | Lenovo Legion Y530-15ICH i5-8300H, GeForce GTX 1050 Ti Mobile, 52.5 Wh | Asus FX503VM-EH73 i7-7700HQ, GeForce GTX 1060 Mobile, 64 Wh | HP Omen 15-dc0001ng i5-8300H, GeForce GTX 1050 Ti Mobile, 70 Wh | MSI GV62 8RE-016US i5-8300H, GeForce GTX 1060 Mobile, 41 Wh | |
|---|---|---|---|---|---|---|---|
| Battery Runtime | 32% | 16% | -35% | -28% | 27% | -45% | |
| Reader / Idle | 478 | 656 37% | 710 49% | 340 -29% | 626 31% | 315 -34% | |
| WiFi v1.3 | 375 | 452 21% | 354 -6% | 245 -35% | 276 -26% | 514 37% | 207 -45% |
| Load | 95 | 132 39% | 100 5% | 67 -29% | 106 12% | 42 -56% |
Pro
Contra
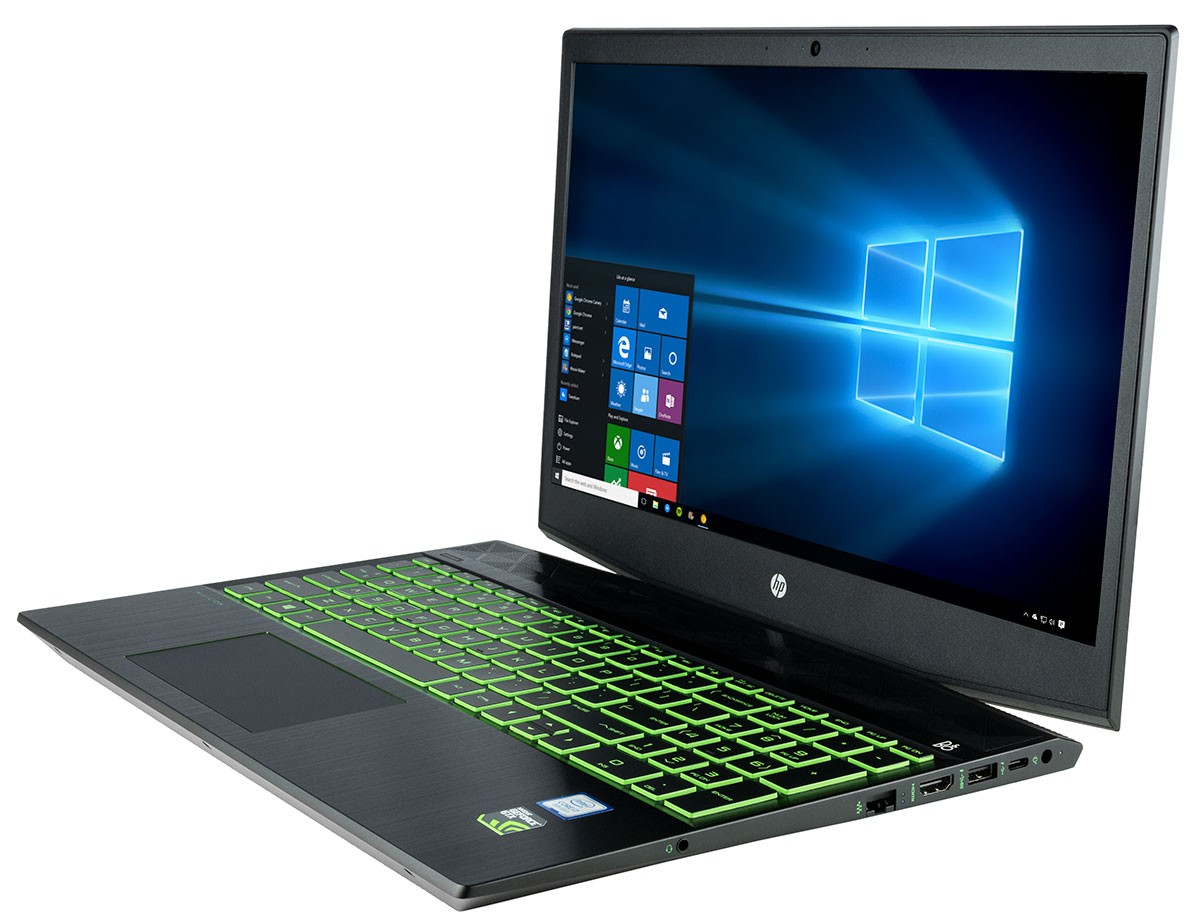

O HP Pavilion Gaming 15t é uma pacote misto. Enquanto ele consegue trazer alguns recursos interessantes para o espaço de portáteis de jogos de gama média, fica aquém em outros aspectos. Por exemplo, opções de tela de 144 Hz são quase inéditas nesta faixa de preços e dão ao Pavilion Gaming 15t uma vantagem significante sobre seus rivais. Por outro lado, o desempenho fraco da CPU e o afogamento térmico agem contra o portátil.
O Pavilion Gaming 15t é essencialmente uma versão econômica do HP Omen 15. O Pavilion compartilha alguns recursos com a linha Omen, como a tela de 144 Hz, e os disponibiliza a um preço mais baixo. O Omen 15t tem melhor qualidade de construção e componentes de maior qualidade, mas estes têm um custo maior.
Fora dos concorrentes internos da HP, há dois obstáculos principais para o Pavilion Gaming 15t: Dell e Lenovo. O Dell G7 e o Legion Y530 da Lenovo são excelentes portáteis de jogos de gama média que oferecem desempenho similar a preços semelhantes. O G7 tem tudo o que o Pavilion oferece, com o benefício de melhor qualidade de construção, maior duração da bateria e melhor desempenho, além de melhor gerenciamento de calor. A principal vantagem do Pavilion Gaming 15t é a tela de alta taxa de atualização. O Pavilion Gaming 15t também é mais compacto e leve que o G7, o que pode ser atraente para os jogadores que estão sempre em movimento.
Em suma, a HP criou um portátil competitivo que fica aquém em algumas áreas-chave, mas é, no geral, uma máquina de jogos competente. Se você quiser jogar de forma econômica, existem melhores opções no mercado. No entanto, se uma tela de 144 Hz lhe agrada, pode valer a quantia extra de $100-200 para comprar o Pavilion Gaming 15t.
HP Pavilion Gaming 15t-cx0000
-
09/15/2018 v6(old)
Sam Medley
Pricecompare
