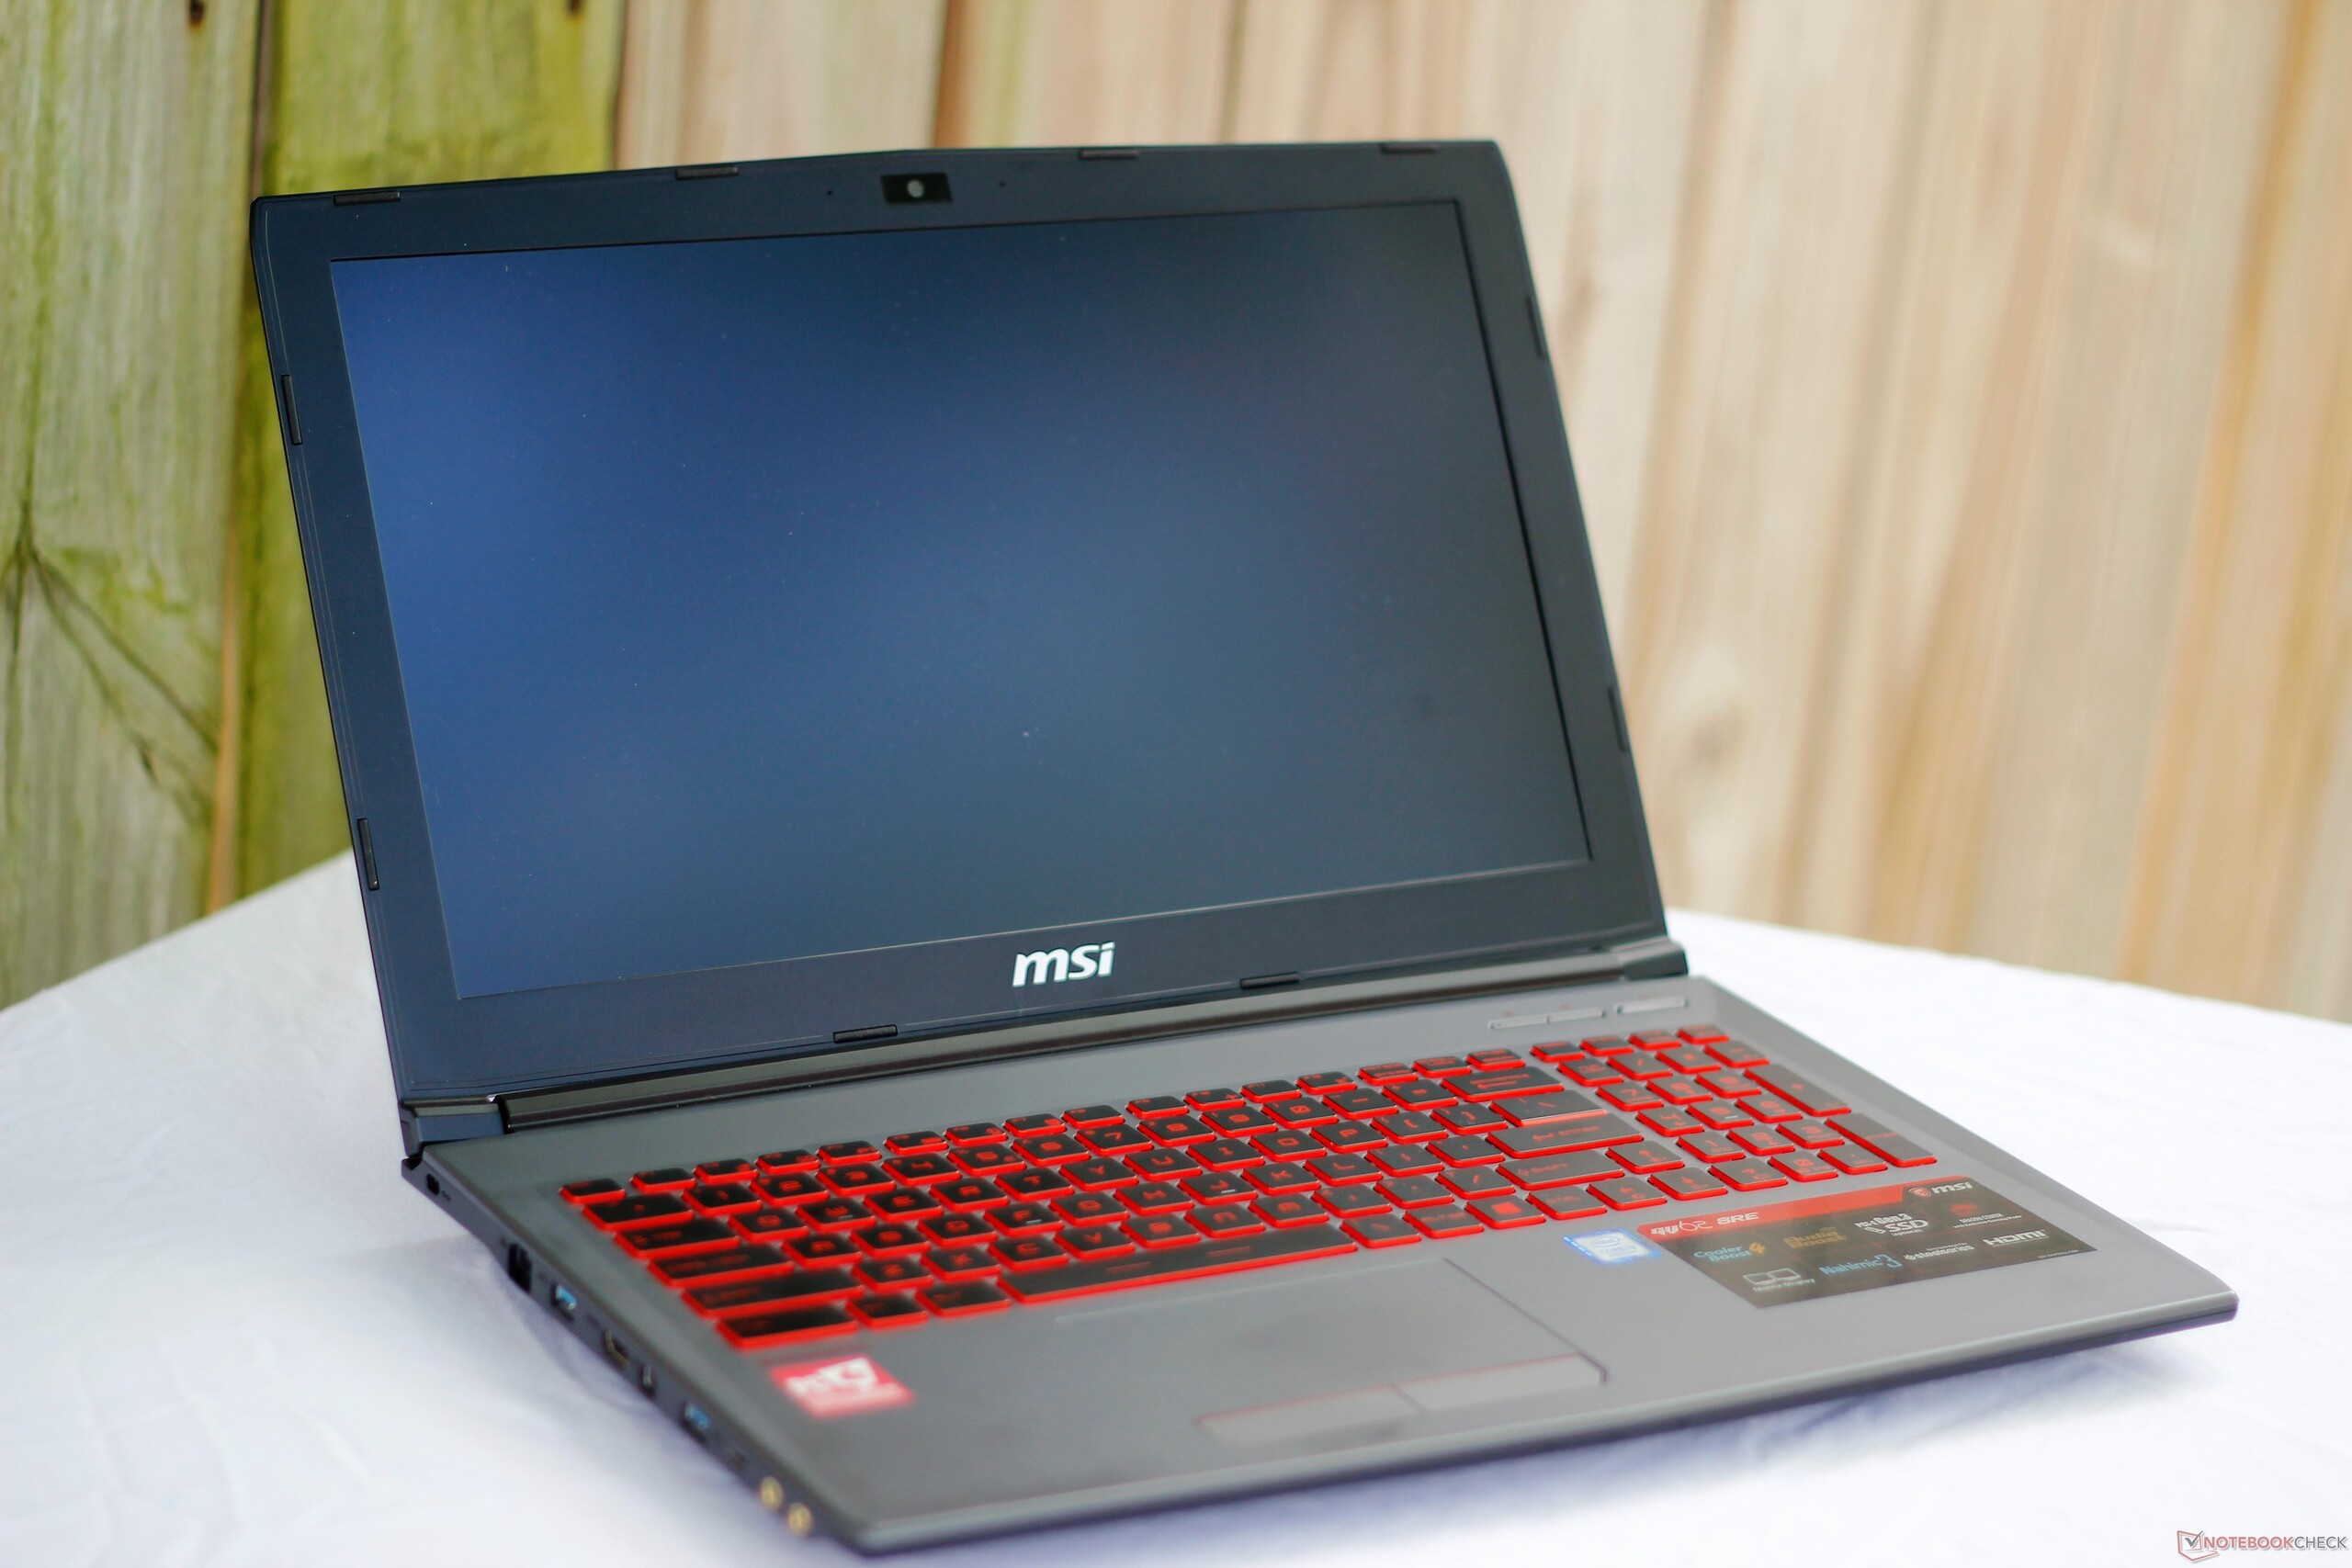
Breve Análise do Portátil MSI GV62 8RE (i5-8300H, GTX 1060, FHD)
| SD Card Reader | |
| average JPG Copy Test (av. of 3 runs) | |
| Média da turma Gaming (20.9 - 210, n=54, últimos 2 anos) | |
| Acer Predator Helios 300 PH317-52-51M6 (Toshiba Exceria Pro SDXC 64 GB UHS-II) | |
| Dell Inspiron 15 7000 7577 4K (Toshiba Exceria Pro SDXC 64 GB UHS-II) | |
| MSI GV62 8RE-016US (Toshiba Exceria Pro SDXC 64 GB UHS-II) | |
| MSI GF62VR 7RF-877 (Toshiba Exceria Pro SDXC 64 GB UHS-II) | |
| Dell G5 15 5587 (Toshiba Exceria Pro SDXC 64 GB UHS-II) | |
| maximum AS SSD Seq Read Test (1GB) | |
| Média da turma Gaming (25.5 - 261, n=51, últimos 2 anos) | |
| Acer Predator Helios 300 PH317-52-51M6 (Toshiba Exceria Pro SDXC 64 GB UHS-II) | |
| Dell G5 15 5587 (Toshiba Exceria Pro SDXC 64 GB UHS-II) | |
| MSI GV62 8RE-016US (Toshiba Exceria Pro SDXC 64 GB UHS-II) | |
| Dell Inspiron 15 7000 7577 4K (Toshiba Exceria Pro SDXC 64 GB UHS-II) | |
| MSI GF62VR 7RF-877 (Toshiba Exceria Pro SDXC 64 GB UHS-II) | |
| |||||||||||||||||||||||||
iluminação: 82 %
iluminação com acumulador: 268.7 cd/m²
Contraste: 640:1 (Preto: 0.42 cd/m²)
ΔE ColorChecker Calman: 4.79 | ∀{0.5-29.43 Ø4.71}
calibrated: 4.31
ΔE Greyscale Calman: 3.1 | ∀{0.09-98 Ø4.96}
59% sRGB (Argyll 1.6.3 3D)
38% AdobeRGB 1998 (Argyll 1.6.3 3D)
40.91% AdobeRGB 1998 (Argyll 3D)
59.5% sRGB (Argyll 3D)
39.58% Display P3 (Argyll 3D)
Gamma: 2.28
CCT: 7049 K
| MSI GV62 8RE-016US LG Philips LGD0590, IPS, 15.6", 1920x1080 | Dell Inspiron 15 7000 7577 4K Name: AU Optronics B156ZAN, IPS, 15.6", 3840x2160 | MSI GF62VR 7RF-877 Chi Mei N156HGA-EAL, TN LED, 15.6", 1920x1080 | Lenovo Legion Y520-15IKBN 80WK0042GE LG Philips LP156WF6-SPK3, IPS, 15.6", 1920x1080 | Acer Predator Helios 300 PH317-52-51M6 LG Philips LP173WF4-SPF5 (LGD056D), IPS, 17.3", 1920x1080 | Dell G5 15 5587 LGD053F, 156WF6, IPS, 15.6", 1920x1080 | |
|---|---|---|---|---|---|---|
| Display | 69% | 96% | -1% | 56% | -4% | |
| Display P3 Coverage (%) | 39.58 | 68.4 73% | 85.6 116% | 39.01 -1% | 67.1 70% | 38.13 -4% |
| sRGB Coverage (%) | 59.5 | 97.1 63% | 99.9 68% | 58.4 -2% | 86.1 45% | 56.8 -5% |
| AdobeRGB 1998 Coverage (%) | 40.91 | 69.6 70% | 83.9 105% | 40.34 -1% | 63 54% | 39.47 -4% |
| Response Times | -11% | -25% | -18% | 1% | 2% | |
| Response Time Grey 50% / Grey 80% * (ms) | 33.2 ? | 35.2 ? -6% | 49.6 ? -49% | 39 ? -17% | 36 ? -8% | 33 ? 1% |
| Response Time Black / White * (ms) | 24.4 ? | 28.4 ? -16% | 24.4 ? -0% | 29 ? -19% | 22 ? 10% | 24 ? 2% |
| PWM Frequency (Hz) | 25510 ? | 21000 ? | 122000 ? | |||
| Screen | 24% | -36% | -3% | 15% | -8% | |
| Brightness middle (cd/m²) | 268.7 | 322.9 20% | 223.9 -17% | 283 5% | 365 36% | 229 -15% |
| Brightness (cd/m²) | 246 | 309 26% | 208 -15% | 281 14% | 341 39% | 224 -9% |
| Brightness Distribution (%) | 82 | 90 10% | 88 7% | 91 11% | 89 9% | 87 6% |
| Black Level * (cd/m²) | 0.42 | 0.36 14% | 0.56 -33% | 0.39 7% | 0.32 24% | 0.28 33% |
| Contrast (:1) | 640 | 897 40% | 400 -37% | 726 13% | 1141 78% | 818 28% |
| Colorchecker dE 2000 * | 4.79 | 3.99 17% | 9.7 -103% | 6.1 -27% | 6.51 -36% | 6.1 -27% |
| Colorchecker dE 2000 max. * | 18.13 | 8.97 51% | 19.7 -9% | 11.08 39% | 12.32 32% | 12.2 33% |
| Colorchecker dE 2000 calibrated * | 4.31 | 2.9 33% | 6.12 -42% | |||
| Greyscale dE 2000 * | 3.1 | 5.3 -71% | 12.9 -316% | 5.69 -84% | 7.65 -147% | 5.68 -83% |
| Gamma | 2.28 96% | 2.041 108% | 2.18 101% | 2.44 90% | 2.64 83% | 2.4 92% |
| CCT | 7049 92% | 6941 94% | 15225 43% | 6702 97% | 8066 81% | 6989 93% |
| Color Space (Percent of AdobeRGB 1998) (%) | 38 | 62.9 66% | 75 97% | 37 -3% | 56 47% | 36 -5% |
| Color Space (Percent of sRGB) (%) | 59 | 96.8 64% | 100 69% | 58 -2% | 86 46% | 57 -3% |
| Média Total (Programa/Configurações) | 27% /
28% | 12% /
-8% | -7% /
-4% | 24% /
21% | -3% /
-6% |
* ... menor é melhor
Exibir tempos de resposta
| ↔ Tempo de resposta preto para branco | ||
|---|---|---|
| 24.4 ms ... ascensão ↗ e queda ↘ combinadas | ↗ 13.6 ms ascensão | 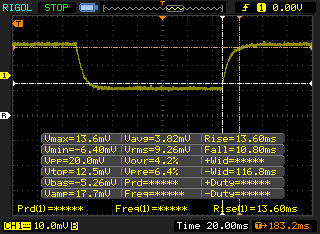 |
| ↘ 10.8 ms queda | ||
| A tela mostra boas taxas de resposta em nossos testes, mas pode ser muito lenta para jogadores competitivos. Em comparação, todos os dispositivos testados variam de 0.1 (mínimo) a 240 (máximo) ms. » 58 % de todos os dispositivos são melhores. Isso significa que o tempo de resposta medido é pior que a média de todos os dispositivos testados (19.8 ms). | ||
| ↔ Tempo de resposta 50% cinza a 80% cinza | ||
| 33.2 ms ... ascensão ↗ e queda ↘ combinadas | ↗ 16.4 ms ascensão | 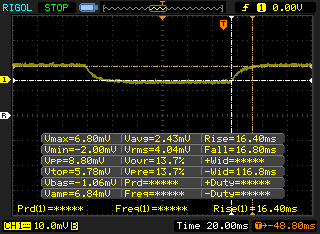 |
| ↘ 16.8 ms queda | ||
| A tela mostra taxas de resposta lentas em nossos testes e será insatisfatória para os jogadores. Em comparação, todos os dispositivos testados variam de 0.165 (mínimo) a 636 (máximo) ms. » 46 % de todos os dispositivos são melhores. Isso significa que o tempo de resposta medido é semelhante à média de todos os dispositivos testados (31 ms). | ||
Cintilação da tela / PWM (modulação por largura de pulso)
| Tela tremeluzindo / PWM não detectado | 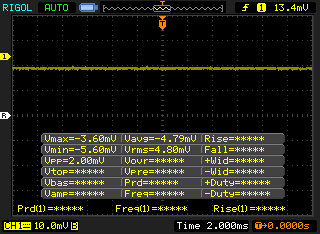 | ||
[pwm_comparison] Em comparação: 52 % de todos os dispositivos testados não usam PWM para escurecer a tela. Se PWM foi detectado, uma média de 7754 (mínimo: 5 - máximo: 343500) Hz foi medida. | |||
* ... menor é melhor
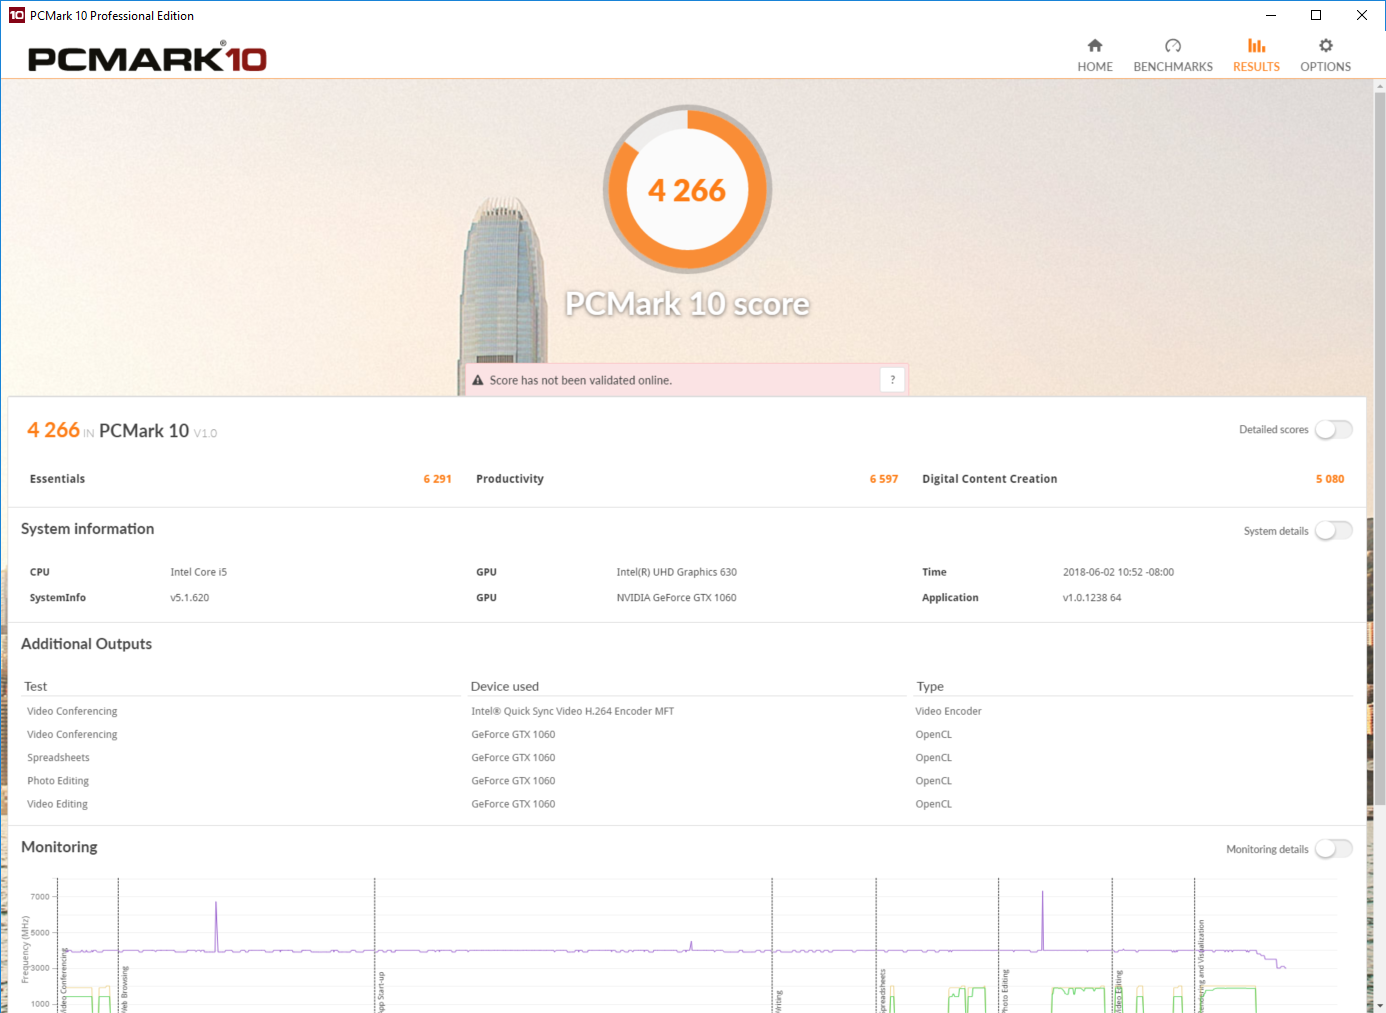
| PCMark 8 Home Score Accelerated v2 | 3896 pontos | |
| PCMark 8 Creative Score Accelerated v2 | 5251 pontos | |
| PCMark 8 Work Score Accelerated v2 | 5098 pontos | |
| PCMark 10 Score | 4266 pontos | |
Ajuda | ||
| MSI GV62 8RE-016US Samsung PM871b MZNLN128HAHQ | MSI GF62VR 7RF-877 Intel SSD 600p SSDPEKKW256G7 | Dell Inspiron 15 7000 7577 4K SK hynix SC311 M.2 | Lenovo Legion Y520-15IKBN 80WK0042GE Samsung PM961 NVMe MZVLW128HEGR | Acer Predator Helios 300 PH317-52-51M6 Hynix HFS128G39TND | Dell G5 15 5587 SK hynix SC311 M.2 | Média Samsung PM871b MZNLN128HAHQ | |
|---|---|---|---|---|---|---|---|
| AS SSD | 160% | 20% | 133% | -30% | -2% | 34% | |
| Copy Game MB/s (MB/s) | 122.6 | 471.7 285% | 185.4 51% | 197.3 61% | 130.9 7% | 160.6 ? 31% | |
| Copy Program MB/s (MB/s) | 69.2 | 286.5 314% | 142.2 105% | 127.3 84% | 95.7 38% | 134.7 ? 95% | |
| Copy ISO MB/s (MB/s) | 170.5 | 1069 527% | 363.6 113% | 497.6 192% | 146.6 -14% | 299 ? 75% | |
| Score Total (Points) | 703 | 1324 88% | 578 -18% | 1434 104% | 811 15% | 557 -21% | 774 ? 10% |
| Score Write (Points) | 207 | 693 235% | 227 10% | 368 78% | 196 -5% | 199 -4% | 262 ? 27% |
| Score Read (Points) | 334 | 448 34% | 234 -30% | 746 123% | 414 24% | 240 -28% | 335 ? 0% |
| Access Time Write * (ms) | 0.057 | 0.03 47% | 0.058 -2% | 0.032 44% | 0.259 -354% | 0.066 -16% | 0.05417 ? 5% |
| Access Time Read * (ms) | 0.113 | 0.09 20% | 0.126 -12% | 0.07 38% | 0.128 -13% | 0.1102 ? 2% | |
| 4K-64 Write (MB/s) | 129.4 | 551 326% | 127.2 -2% | 158.6 23% | 120.1 -7% | 112.4 -13% | 149.2 ? 15% |
| 4K-64 Read (MB/s) | 257.7 | 280.1 9% | 156.6 -39% | 463.2 80% | 336.6 31% | 164.1 -36% | 256 ? -1% |
| 4K Write (MB/s) | 63.5 | 118.3 86% | 74 17% | 127.9 101% | 62.7 -1% | 62.2 -2% | 73.1 ? 15% |
| 4K Read (MB/s) | 26.23 | 31.27 19% | 26.24 0% | 46.98 79% | 26.5 1% | 24.44 -7% | 29.1 ? 11% |
| Seq Write (MB/s) | 138.1 | 234.9 70% | 259.9 88% | 814 489% | 128.2 -7% | 243.7 76% | 398 ? 188% |
| Seq Read (MB/s) | 503 | 1371 173% | 508 1% | 2362 370% | 513 2% | 511 2% | 496 ? -1% |
* ... menor é melhor

| 3DMark 11 Performance | 12532 pontos | |
| 3DMark Cloud Gate Standard Score | 27973 pontos | |
| 3DMark Fire Strike Score | 10198 pontos | |
Ajuda | ||
| Rise of the Tomb Raider | |
| 1920x1080 Very High Preset AA:FX AF:16x (classificar por valor) | |
| MSI GV62 8RE-016US | |
| Dell Inspiron 15 7000 7577 4K | |
| MSI GF62VR 7RF-877 | |
| Dell G5 15 5587 | |
| Média NVIDIA GeForce GTX 1060 Mobile (51 - 68.8, n=37) | |
| 1920x1080 High Preset AA:FX AF:4x (classificar por valor) | |
| MSI GV62 8RE-016US | |
| MSI GF62VR 7RF-877 | |
| Dell G5 15 5587 | |
| Média NVIDIA GeForce GTX 1060 Mobile (65.3 - 82, n=24) | |
| 1366x768 Medium Preset AF:2x (classificar por valor) | |
| MSI GV62 8RE-016US | |
| Dell G5 15 5587 | |
| Média NVIDIA GeForce GTX 1060 Mobile (82.2 - 140, n=14) | |
| Middle-earth: Shadow of War | |
| 1920x1080 Ultra Preset AA:T (classificar por valor) | |
| MSI GV62 8RE-016US | |
| Dell Inspiron 15 7000 7577 4K | |
| Média NVIDIA GeForce GTX 1060 Mobile (52 - 54, n=5) | |
| 1920x1080 High Preset AA:T (classificar por valor) | |
| MSI GV62 8RE-016US | |
| Dell Inspiron 15 7000 7577 4K | |
| Média NVIDIA GeForce GTX 1060 Mobile (58 - 74, n=4) | |
| 1920x1080 Medium Preset AA:T (classificar por valor) | |
| MSI GV62 8RE-016US | |
| Dell Inspiron 15 7000 7577 4K | |
| Média NVIDIA GeForce GTX 1060 Mobile (79 - 97, n=2) | |
| baixo | média | alto | ultra | |
|---|---|---|---|---|
| BioShock Infinite (2013) | 234 | 205 | 187 | 112 |
| The Witcher 3 (2015) | 163 | 121 | 67 | 42 |
| Rise of the Tomb Raider (2016) | 162 | 125 | 73 | 59 |
| Middle-earth: Shadow of War (2017) | 110 | 79 | 58 | 52 |
Barulho
| Ocioso |
| 33.5 / 33.5 / 33.7 dB |
| Carga |
| 41 / 52.3 dB |
 | ||
30 dB silencioso 40 dB(A) audível 50 dB(A) ruidosamente alto |
||
min: | ||
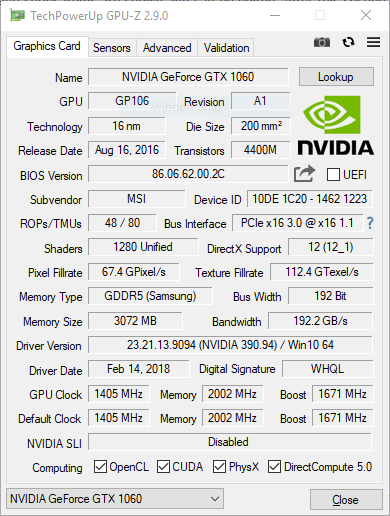
| MSI GV62 8RE-016US GeForce GTX 1060 Mobile, i5-8300H, Samsung PM871b MZNLN128HAHQ | MSI GF62VR 7RF-877 GeForce GTX 1060 Mobile, i7-7700HQ, Intel SSD 600p SSDPEKKW256G7 | Dell Inspiron 15 7000 7577 4K GeForce GTX 1060 Max-Q, i7-7700HQ, SK hynix SC311 M.2 | Lenovo Legion Y520-15IKBN 80WK0042GE GeForce GTX 1050 Ti Mobile, i5-7300HQ, Samsung PM961 NVMe MZVLW128HEGR | Acer Predator Helios 300 PH317-52-51M6 GeForce GTX 1050 Ti Mobile, i5-8300H, Hynix HFS128G39TND | Dell G5 15 5587 GeForce GTX 1060 Max-Q, i5-8300H, SK hynix SC311 M.2 | |
|---|---|---|---|---|---|---|
| Noise | 1% | 11% | 10% | 4% | 8% | |
| desligado / ambiente * (dB) | 28.2 | 28.1 -0% | 28.5 -1% | 30.6 -9% | 29 -3% | 30.3 -7% |
| Idle Minimum * (dB) | 33.5 | 33.5 -0% | 28.8 14% | 31.9 5% | 29 13% | 31.1 7% |
| Idle Average * (dB) | 33.5 | 33.5 -0% | 29.2 13% | 31.9 5% | 31 7% | 31.1 7% |
| Idle Maximum * (dB) | 33.7 | 33.5 1% | 29.2 13% | 31.9 5% | 33 2% | 34.2 -1% |
| Load Average * (dB) | 41 | 41.3 -1% | 34.6 16% | 34.6 16% | 45 -10% | 34.9 15% |
| Witcher 3 ultra * (dB) | 52.3 | 48.5 7% | 44.1 16% | 39.3 25% | 45 14% | 42.7 18% |
| Load Maximum * (dB) | 52.3 | 53.5 -2% | 49.3 6% | 41.7 20% | 51 2% | 44 16% |
* ... menor é melhor
(-) A temperatura máxima no lado superior é 47 °C / 117 F, em comparação com a média de 40.4 °C / 105 F , variando de 21.2 a 68.8 °C para a classe Gaming.
(-) A parte inferior aquece até um máximo de 45.6 °C / 114 F, em comparação com a média de 43.2 °C / 110 F
(+) Em uso inativo, a temperatura média para o lado superior é 27.2 °C / 81 F, em comparação com a média do dispositivo de 33.9 °C / ### class_avg_f### F.
(±) Jogando The Witcher 3, a temperatura média para o lado superior é 36.3 °C / 97 F, em comparação com a média do dispositivo de 33.9 °C / ## #class_avg_f### F.
(±) Os apoios para as mãos e o touchpad podem ficar muito quentes ao toque, com um máximo de 38.4 °C / 101.1 F.
(-) A temperatura média da área do apoio para as mãos de dispositivos semelhantes foi 28.8 °C / 83.8 F (-9.6 °C / -17.3 F).
MSI GV62 8RE-016US análise de áudio
(±) | o volume do alto-falante é médio, mas bom (###valor### dB)
Graves 100 - 315Hz
(-) | quase nenhum baixo - em média 28.2% menor que a mediana
(±) | a linearidade dos graves é média (11% delta para a frequência anterior)
Médios 400 - 2.000 Hz
(±) | médios mais altos - em média 6.4% maior que a mediana
(±) | a linearidade dos médios é média (8.9% delta para frequência anterior)
Altos 2 - 16 kHz
(±) | máximos mais altos - em média 5.6% maior que a mediana
(±) | a linearidade dos máximos é média (7.6% delta para frequência anterior)
Geral 100 - 16.000 Hz
(±) | a linearidade do som geral é média (27.3% diferença em relação à mediana)
Comparado com a mesma classe
» 93% de todos os dispositivos testados nesta classe foram melhores, 1% semelhantes, 5% piores
» O melhor teve um delta de 6%, a média foi 18%, o pior foi 132%
Comparado com todos os dispositivos testados
» 83% de todos os dispositivos testados foram melhores, 4% semelhantes, 13% piores
» O melhor teve um delta de 4%, a média foi 23%, o pior foi 134%
Dell G5 15 5587 análise de áudio
(-) | alto-falantes não muito altos (###valor### dB)
Graves 100 - 315Hz
(±) | graves reduzidos - em média 12.5% menor que a mediana
(+) | o baixo é linear (5.9% delta para a frequência anterior)
Médios 400 - 2.000 Hz
(+) | médios equilibrados - apenas 4.6% longe da mediana
(+) | médios são lineares (5.1% delta para frequência anterior)
Altos 2 - 16 kHz
(+) | agudos equilibrados - apenas 1.1% longe da mediana
(+) | os máximos são lineares (3.6% delta da frequência anterior)
Geral 100 - 16.000 Hz
(+) | o som geral é linear (14.9% diferença em relação à mediana)
Comparado com a mesma classe
» 30% de todos os dispositivos testados nesta classe foram melhores, 7% semelhantes, 63% piores
» O melhor teve um delta de 6%, a média foi 18%, o pior foi 132%
Comparado com todos os dispositivos testados
» 20% de todos os dispositivos testados foram melhores, 4% semelhantes, 76% piores
» O melhor teve um delta de 4%, a média foi 23%, o pior foi 134%
| desligado | |
| Ocioso | |
| Carga |
|
Key:
min: | |
| MSI GV62 8RE-016US i5-8300H, GeForce GTX 1060 Mobile, Samsung PM871b MZNLN128HAHQ, IPS, 1920x1080, 15.6" | MSI GF62VR 7RF-877 i7-7700HQ, GeForce GTX 1060 Mobile, Intel SSD 600p SSDPEKKW256G7, TN LED, 1920x1080, 15.6" | Dell Inspiron 15 7000 7577 4K i7-7700HQ, GeForce GTX 1060 Max-Q, SK hynix SC311 M.2, IPS, 3840x2160, 15.6" | Lenovo Legion Y520-15IKBN 80WK0042GE i5-7300HQ, GeForce GTX 1050 Ti Mobile, Samsung PM961 NVMe MZVLW128HEGR, IPS, 1920x1080, 15.6" | Acer Predator Helios 300 PH317-52-51M6 i5-8300H, GeForce GTX 1050 Ti Mobile, Hynix HFS128G39TND, IPS, 1920x1080, 17.3" | Dell G5 15 5587 i5-8300H, GeForce GTX 1060 Max-Q, SK hynix SC311 M.2, IPS, 1920x1080, 15.6" | |
|---|---|---|---|---|---|---|
| Power Consumption | -12% | 31% | 40% | 25% | 30% | |
| Idle Minimum * (Watt) | 9.38 | 16.2 -73% | 5.5 41% | 5.2 45% | 6 36% | 4.9 48% |
| Idle Average * (Watt) | 15.95 | 18.2 -14% | 10.5 34% | 8.3 48% | 9 44% | 8.5 47% |
| Idle Maximum * (Watt) | 18.46 | 18.9 -2% | 10.9 41% | 10.1 45% | 13 30% | 9.1 51% |
| Load Average * (Watt) | 95.68 | 82.7 14% | 72 25% | 62.7 34% | 95 1% | 90.7 5% |
| Witcher 3 ultra * (Watt) | 135.6 | 125.7 7% | 97.4 28% | 94 31% | 102 25% | 110 19% |
| Load Maximum * (Watt) | 156.98 | 162.3 -3% | 130.4 17% | 100 36% | 134 15% | 144 8% |
* ... menor é melhor
| MSI GV62 8RE-016US i5-8300H, GeForce GTX 1060 Mobile, 41 Wh | MSI GF62VR 7RF-877 i7-7700HQ, GeForce GTX 1060 Mobile, 41 Wh | Dell Inspiron 15 7000 7577 4K i7-7700HQ, GeForce GTX 1060 Max-Q, 56 Wh | Lenovo Legion Y520-15IKBN 80WK0042GE i5-7300HQ, GeForce GTX 1050 Ti Mobile, 45 Wh | Acer Predator Helios 300 PH317-52-51M6 i5-8300H, GeForce GTX 1050 Ti Mobile, 48 Wh | Dell G5 15 5587 i5-8300H, GeForce GTX 1060 Max-Q, 56 Wh | |
|---|---|---|---|---|---|---|
| Duração da bateria | -31% | 86% | 83% | 112% | 141% | |
| Reader / Idle (h) | 5.3 | 2.8 -47% | 10 89% | 10.6 100% | 11.8 123% | 11.8 123% |
| WiFi v1.3 (h) | 3.5 | 1.9 -46% | 5.4 54% | 5.2 49% | 5.9 69% | 6.5 86% |
| Load (h) | 0.7 | 0.7 0% | 1.5 114% | 1.4 100% | 1.7 143% | 2.2 214% |
Pro
Contra
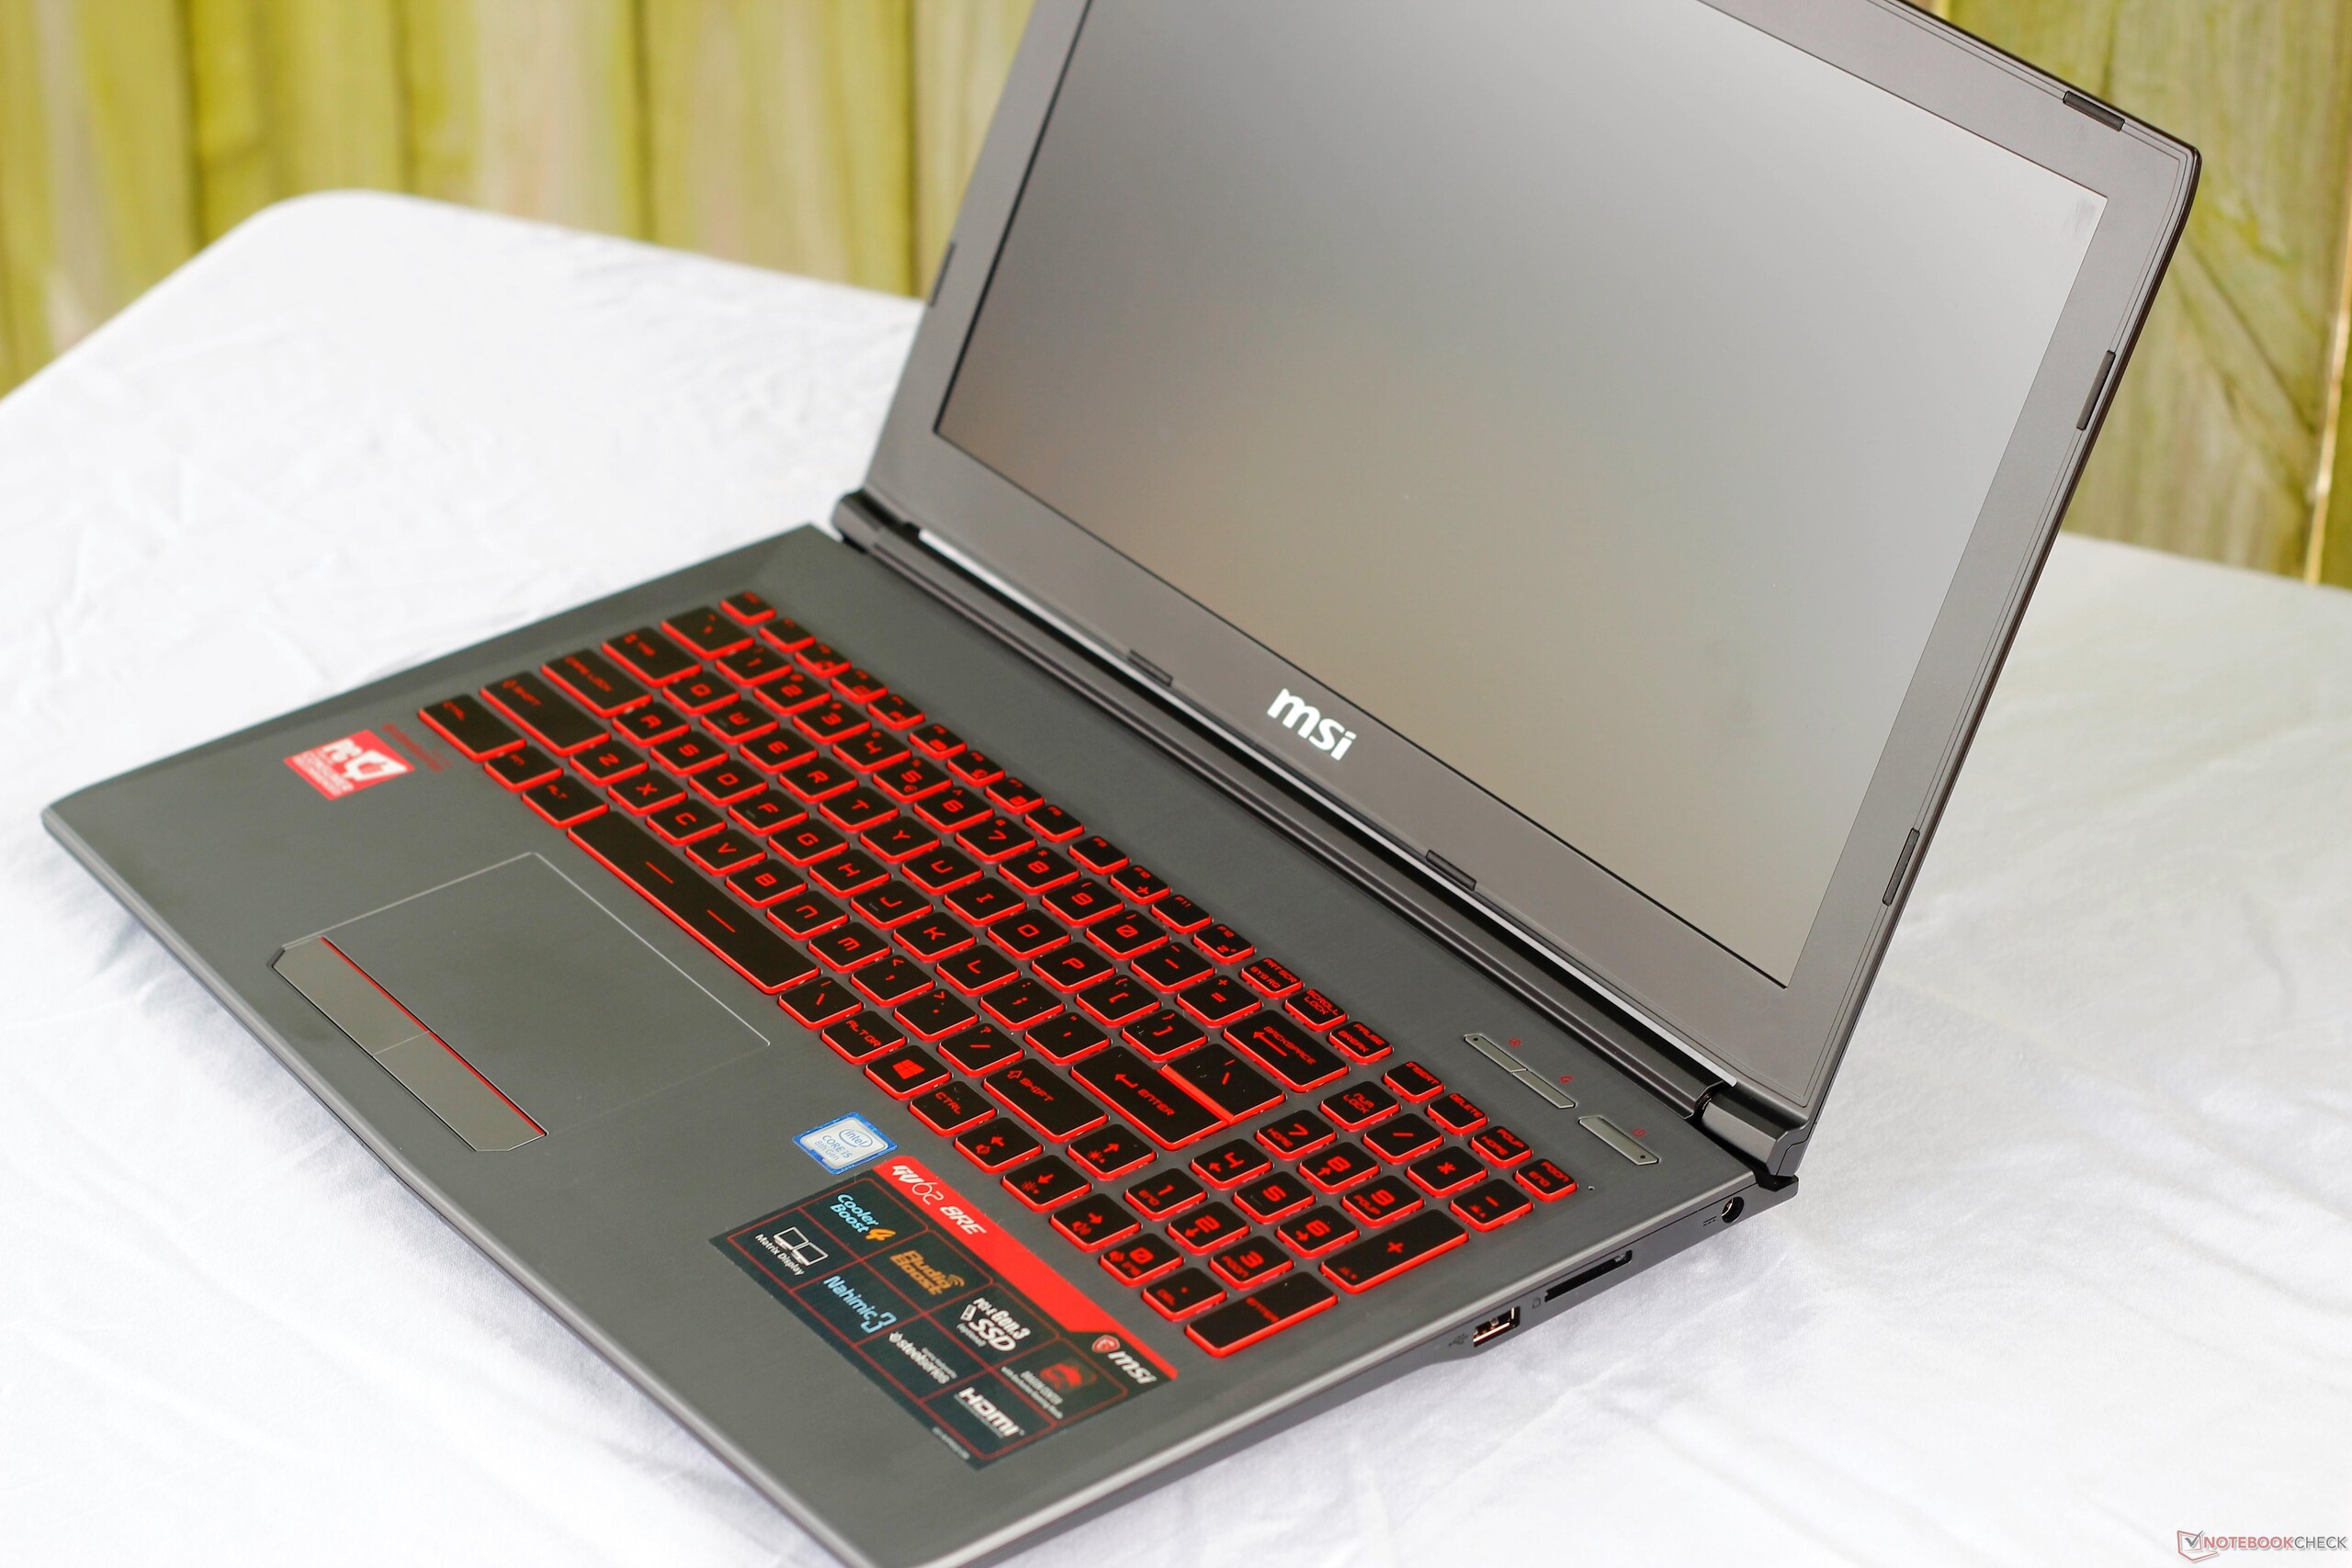
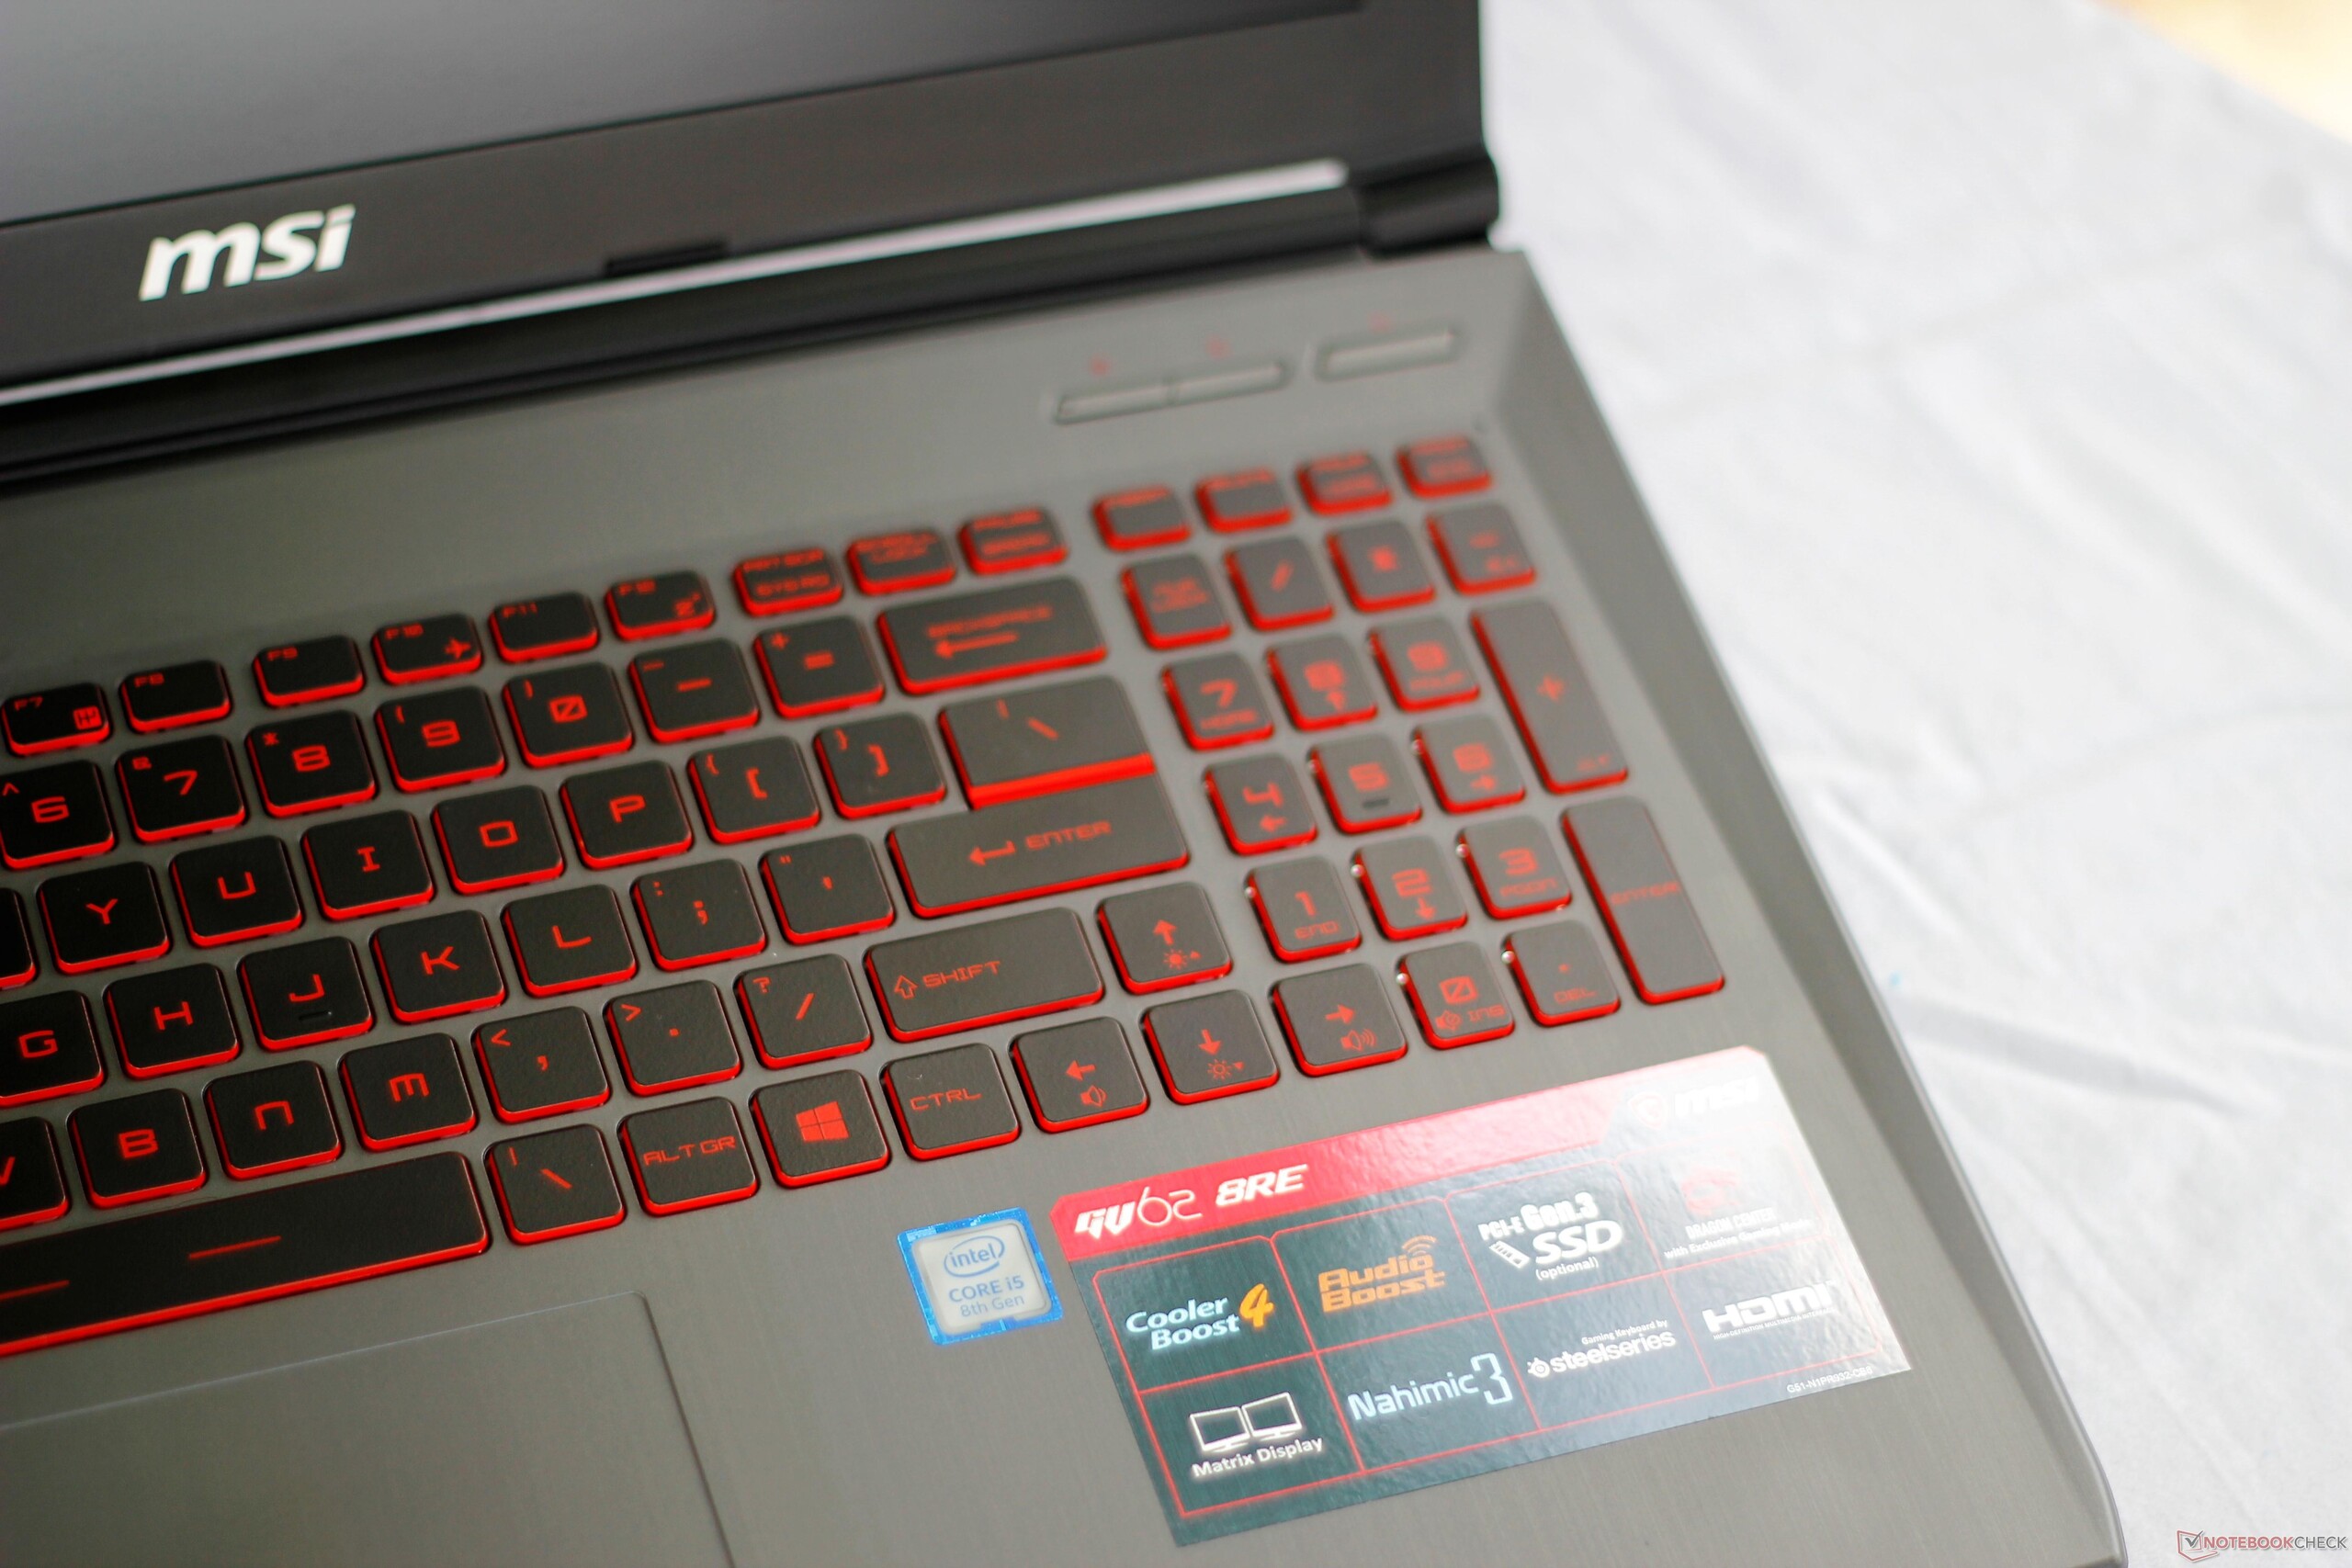
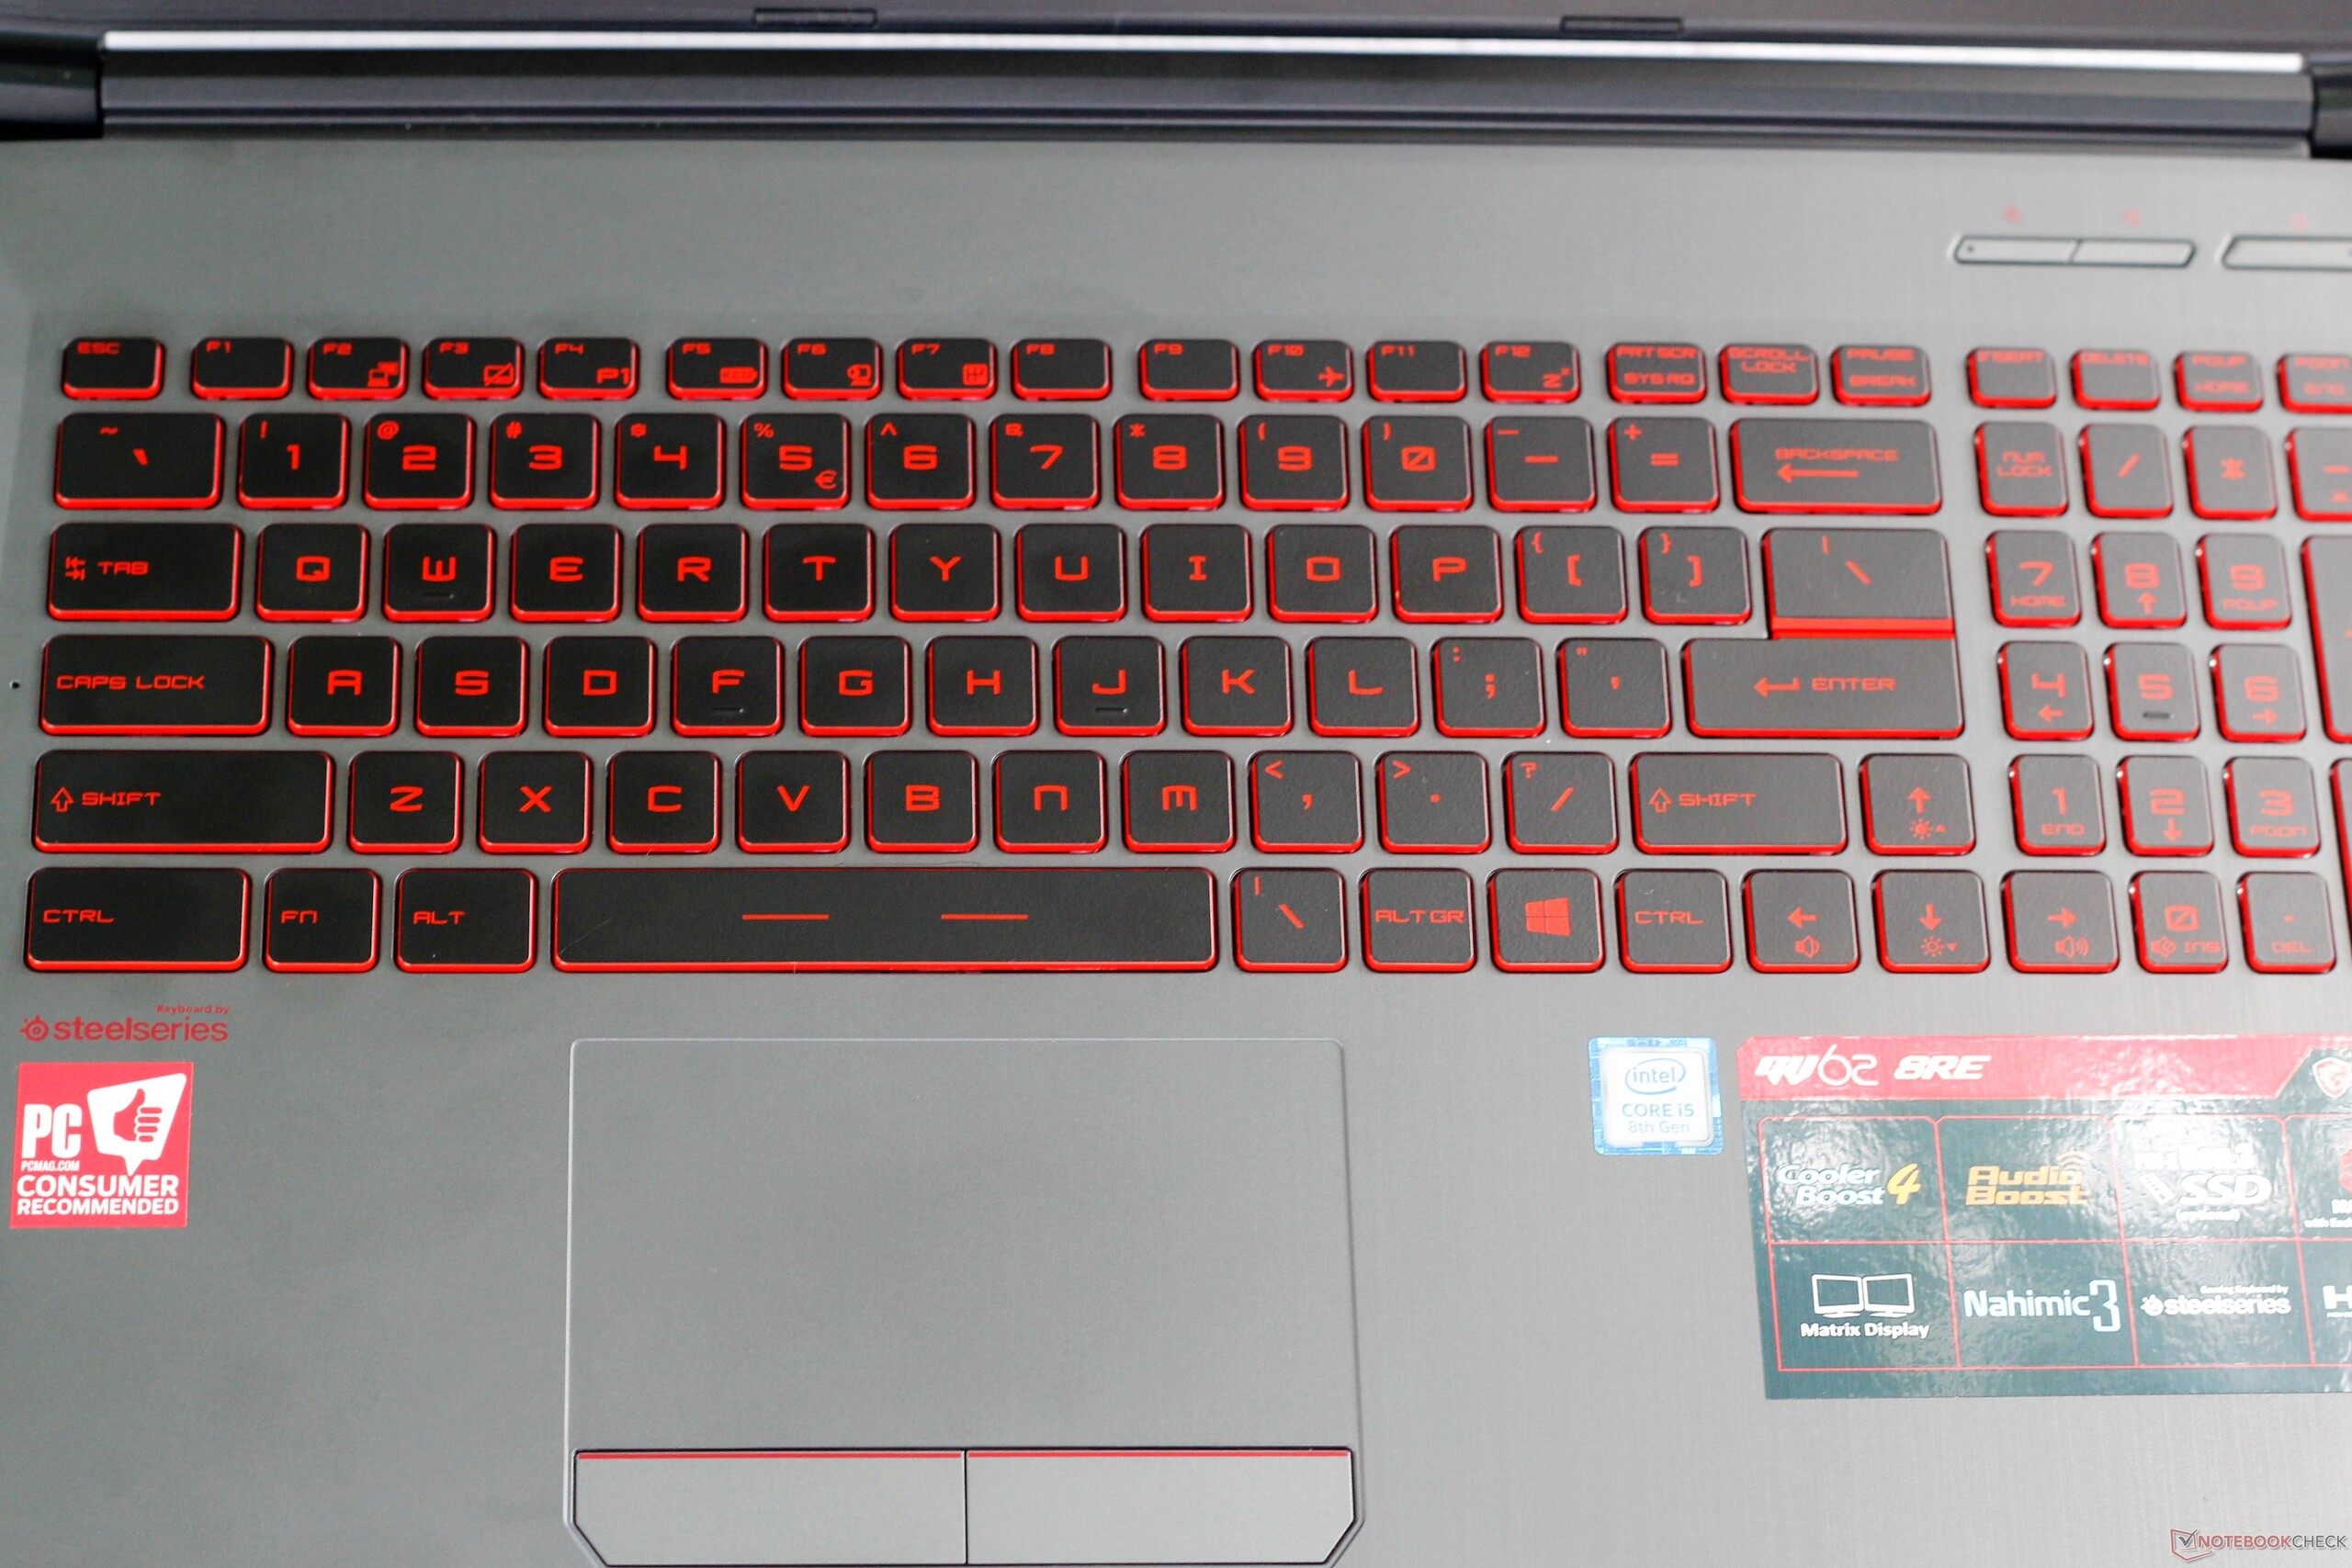
A MSI é conhecida por oferecer várias opções para atender praticamente qualquer necessidade, mas, neste momento, elas podem estar saturando seu próprio mercado. Caso em questão: modelo de teste de hoje. O GV62 tem tão pouco a oferecer que já não pode ser encontrado em suas outras linhas. O GV62 é uma cópia quase-carbono do GF62VR, o GE62VR, o GL62VR e o GP62VR, todos atualmente oferecidos pela MSI através de vários varejistas online. As carcaças são as mesmas, os teclados são os mesmos, as soluções de resfriamento são as mesmas, as seleções de portas são as mesmas e assim por diante. As principais diferenças estão nas especificações. Mesmo assim, todas essas linhas oferecem configurações semelhantes (se não exatamente as mesmas).
Além dos outros portáteis da MSI, o GV62 é um portátil de jogos de nível básico bastante competente. Por USD $1.050, marca muitas caixas de verificação, especialmente quando se trata de desempenho. O Core i5-8300H é uma ótima combinação para a GTX 1060, uma GPU que não é encontrada frequentemente em portáteis abaixo dos $1.200. Em comparação com outros portáteis de jogos de nível de entrada com preços ao redor de $1.000, o GV62 oferece mais desempenho nos jogos e cargas de trabalho multi-threaded. No entanto, este desempenho melhorado vem com o custo no design da carcaça, na qualidade da tela, e na duração da bateria.
O GV62 talvez seja um dispositivo redundante, mas ainda é uma boa opção para jogadores com um orçamento apertado. A MSI tem uma boa resposta para os atuais reis dos jogos de orçamento, o Acer Predator Helios 300 e o Dell Inspiron 15 7577..., e qualquer um destes portáteis são um boa opção pelo preço. Os portáteis de jogos de orçamento nunca foram melhores.
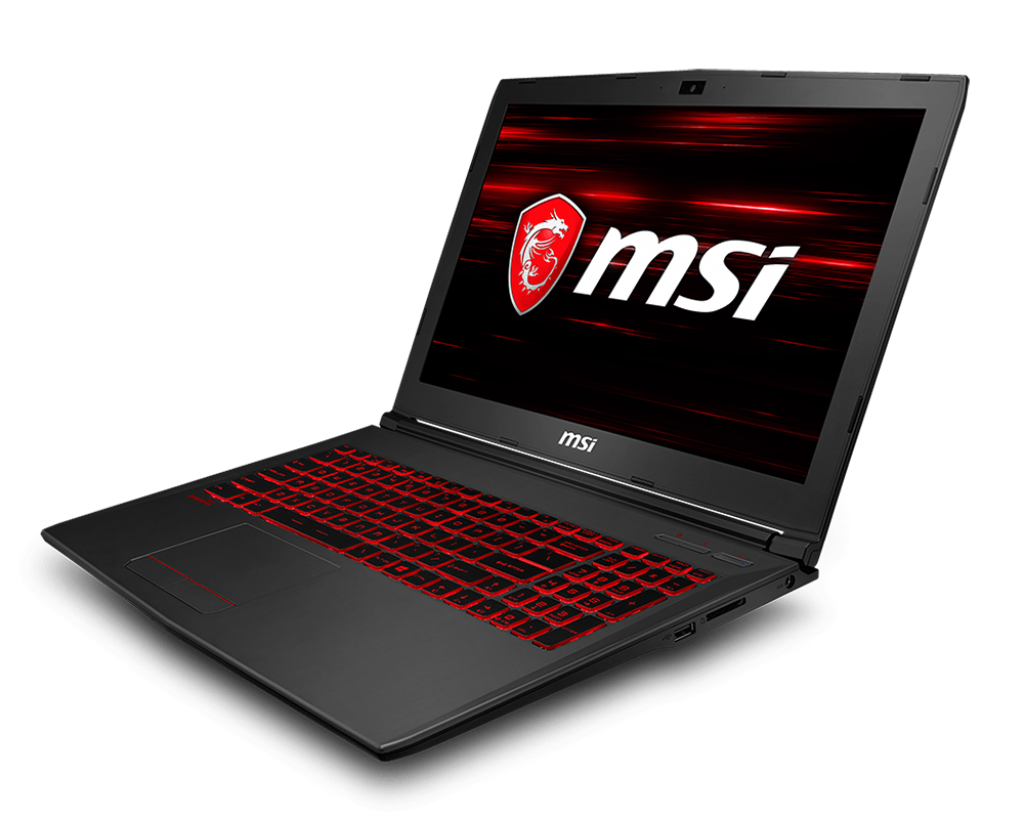
MSI GV62 8RE-016US
- 06/21/2018 v6 (old)
Sam Medley
Price comparison
