Notebookcheck Logo

Análise do AMD Ryzen 5 7600 65 W: O ponto ideal para jogos de médio porte de US$ 220 que supera o Core i9-12900K e todas as CPUs Zen 3 em um único núcleo

Zen para o resto de nós. O AMD Ryzen 5 7600 é uma CPU Raphael de 65 W que tem como objetivo reduzir a barreira para jogos AAA e tarefas de criação de conteúdo. Nesta análise, testamos a SKU Zen 4 de nível básico da AMD, vemos como ela se compara à concorrência, incluindo a Intel Raptor Lake e a Alder Lake, juntamente com outras ofertas Zen 3 e Zen 4, e avaliamos se essa pode ser uma CPU viável para sua próxima construção convencional.
Análise do AMD Ryzen 5 7600

A AMD apresentou a família Ryzen 7000 de 65 W visando pontos de preço econômicos na CES 2023. Essas CPUs são praticamente idênticas às CPUs Ryzen 7000X, com exceção dos clocks de impulso ligeiramente mais baixos, e vêm com suporte para overclocking.

Anteriormente, analisamos o AMD Ryzen 7 7700 como uma das primeiras peças não X de 65 W. Agora, vamos analisar o Ryzen 5 7600 de nível básico. Em breve, faremos uma análise do Ryzen 9 7900 topo de linha.


Uma visão geral dos processadores para desktop AMD 'Raphael' Zen 4 Ryzen 7000

AMD Ryzen 7000 SKU Cores / Threads Clock base Turbo Clock Cache L2 Cache L3 TDP PPT Preço de lançamento
AMD Ryzen 9 7950X3D 16 / 32 4,2 GHz 5,7 GHz 16x 1 MB 128 MB 120 W 162 W US$699
AMD Ryzen 9 7950X 16 / 32 4,5 GHz 5,7 GHz 16x 1 MB 64 MB 170 W 230 W US$699
AMD Ryzen 9 7900X 12 / 24 4,7 GHz 5,6 GHz 12x 1 MB 64 MB 170 W 230 W US$549
AMD Ryzen 9 7900 12 / 24 3,7 GHz 5,4 GHz 12x 1 MB 64 MB 65 W 88 W US$429
AMD Ryzen 7 7700X 8 / 16 4,5 GHz 5,4 GHz 8x 1 MB 32 MB 105 W 142 W US$399
AMD Ryzen 7 7700 8 / 16 3,8 GHz 5,3 GHz 8x 1 MB 32 MB 65 W 88 W US$329
AMD Ryzen 5 7600X 6 / 12 4,7 GHz 5,3 GHz 6x 1 MB 32 MB 105 W 142 W US$299
AMD Ryzen 5 7600 6/ 12 3,8 GHz 5,1 GHz 6x1 MB 32 MB 65 W 88 W US$229

O Ryzen 5 7600 oferece seis núcleos e 12 threads com um clock de impulso de 5,1 GHz (contra o impulso de 5,3 GHz doRyzen 5 7600X). A CPU é classificada com um TDP de 65 W e atualmente está sendo vendida no varejo por ₹22.997 (US$281,5) no mercado indiano.

A AMD inclui um cooler Wraith Stealth na caixa, juntamente com uma garantia de três anos.

O banco de testes: Uma combinação de Ryzen 5 7600 e RTX 4090

Nosso banco de testes para o AMD Ryzen 5 7600 é baseado no novo chipset B650. Isso inclui os seguintes componentes:

  • Banco de testes Cooler Master MasterFrame 700
  • Asus TUF Gaming B650-Plus executando a versão 1222 do BIOS
  • Nvidia GeForce RTX 4090 Founders Edition
  • SSD Kingston Fury Renegade 1 TB NVMe para benchmarks e jogos
  • 2x 16 GB de RAM Kingston Fury Beast RGB DDR5-6000 com temporizações 36-38-38-80 a 1,35 V
  • Monitor Gigabyte M28U 4K 144 Hz
  • Cooler Master MasterLiquid ML360L V2 ARGB AIO cooler
  • PSU Thermaltake ToughPower Grand RGB de 850 W
  • Uma nova instalação do Windows 11 22H2 com os patches e drivers mais recentes

Gostaríamos de agradecer à AMD por fornecer a CPU Ryzen 5 7600 e o kit de memória DDR5 da Kingston, e à Asus pela placa-mãe TUF Gaming B650-Plus e o SSD da Kingston. Também gostaríamos de agradecer à Nvidia pela GPU RTX 4090, à Gigabyte pelo monitor M28U e, finalmente, à Cooler Master pela bancada de teste e pelo cooler AIO.

Observação: estamos em processo de transição de nossa GPU escolhida, da RTX 3090 para a RTX 4090, para testes de CPU em desktops. Dessa forma, as comparações sintéticas em 3D e em jogos usando a RTX 4090 estão disponíveis apenas para um número limitado de CPUs no momento. Esperamos testar mais CPUs com a RTX 4090 nos próximos dias.

Os benchmarks somente de CPU não devem ser afetados por essa alteração.

Benchmarks de CPU: supera todas as CPUs Zen 3 e Core i9-12900K em um único núcleo

O AMD Ryzen 5 7600 de 6C/12T com 65 W consegue ser um pouco mais rápido do que o 8C/16T Ryzen 7 5800X com 105 W em desempenho cumulativo da CPU, mas fica atrás do Ryzen 5 7600X em cerca de 7% devido aos clocks de impulso mais baixos.

Embora vejamos avanços de 11% em comparação com o Intel Core i5-12600Ka CPU também fica atrás do Core i5-13600K em 15%.

O Cinebench R20 e o Cinebench R23 mostram o Ryzen 5 7600 superando facilmente todas as CPUs Zen 3, incluindo o Ryzen 9 5950X, em um único núcleo. A AMD tem demonstrado consistentemente um excelente desempenho de núcleo único com o Zen 4, e vemos que o Ryzen 5 7600 está apenas 8% e 10% atrás do carro-chefe Ryzen 9 7950X e Ryzen 9 7950X3D peças, respectivamente, nos testes mencionados acima.

Embora os testes do Cinebench mostrem um delta considerável entre o Ryzen 5 7600 e o Core i9-13900K em desempenho de núcleo único, vemos essa diferença diminuir significativamente no Geekbench. Aqui, o Ryzen 5 7600 consegue superar o Core i9-12900K, que opera com uma potência base de processador (PBP) muito maior, de 125 W.

As pontuações de vários núcleos e a CPU do Blender são prejudicadas devido à menor contagem de núcleos e threads. No entanto, vemos ganhos muito bons em relação ao Ryzen 5 5600X e apenas uma deficiência marginal em comparação com o Ryzen 5 7600X, dependendo do benchmark.

Performance Rating - Percent
AMD Ryzen 9 7950X
88.8 pt
Intel Core i9-13900K
88.7 pt
AMD Ryzen 9 7950X3D
87.4 pt
AMD Ryzen 9 7950X ECO 105 W -12!
83.9 pt
AMD Ryzen 9 7900X
77.6 pt
AMD Ryzen 9 7950X ECO 65 W -14!
75.6 pt
AMD Ryzen 9 5950X
69 pt
AMD Ryzen 7 7700X
66.6 pt
Intel Core i5-13600K
65.2 pt
Intel Core i9-12900K
65.2 pt
AMD Ryzen 7 7700
64.1 pt
AMD Ryzen 7 7700X ECO 65 W -12!
63.5 pt
AMD Ryzen 9 5900X -2!
61.6 pt
AMD Ryzen 5 7600X
60.2 pt
AMD Ryzen 5 7600
55.7 pt
AMD Ryzen 7 5800X
54.3 pt
Intel Core i5-12600K
50.3 pt
AMD Ryzen 7 5800X3D
49.4 pt
AMD Ryzen 5 5600X
45.5 pt
Cinebench R23
Single Core
Intel Core i9-13900K
2267 Points +22%
AMD Ryzen 9 7950X3D
2053 Points +11%
AMD Ryzen 9 7900X
2039 Points +10%
AMD Ryzen 9 7950X
2017 Points +9%
Intel Core i5-13600K
2010 Points +9%
AMD Ryzen 9 7950X ECO 65 W
2001 Points +8%
AMD Ryzen 9 7950X ECO 105 W
1999 Points +8%
Intel Core i9-12900K
1998 Points +8%
AMD Ryzen 7 7700X ECO 65 W
1988 Points +7%
AMD Ryzen 7 7700X
1986 Points +7%
AMD Ryzen 5 7600X
1967 Points +6%
AMD Ryzen 7 7700
1930 Points +4%
Intel Core i5-12600K
1907 Points +3%
AMD Ryzen 5 7600
1852 Points
AMD Ryzen 9 5950X
1649 Points -11%
AMD Ryzen 9 5900X
1568 Points -15%
AMD Ryzen 7 5800X
1554 Points -16%
AMD Ryzen 5 5600X
1541 Points -17%
AMD Ryzen 7 5800X3D
1452 Points -22%
Multi Core
Intel Core i9-13900K
40103 Points +215%
AMD Ryzen 9 7950X
38248 Points +200%
AMD Ryzen 9 7950X3D
36291 Points +185%
AMD Ryzen 9 7950X ECO 105 W
35693 Points +180%
AMD Ryzen 9 7950X ECO 65 W
29882 Points +135%
AMD Ryzen 9 7900X
29480 Points +131%
AMD Ryzen 9 5950X
27062 Points +113%
Intel Core i9-12900K
27005 Points +112%
Intel Core i5-13600K
24268 Points +91%
AMD Ryzen 9 5900X
20634 Points +62%
AMD Ryzen 7 7700X
19509 Points +53%
AMD Ryzen 7 7700
18760 Points +47%
AMD Ryzen 7 7700X ECO 65 W
18667 Points +47%
Intel Core i5-12600K
17491 Points +37%
AMD Ryzen 5 7600X
15322 Points +20%
AMD Ryzen 7 5800X
15241 Points +20%
AMD Ryzen 7 5800X3D
14317 Points +12%
AMD Ryzen 5 7600
12735 Points
AMD Ryzen 5 5600X
11838 Points -7%
Cinebench R20
CPU (Single Core)
Intel Core i9-13900K
828 Points +14%
AMD Ryzen 9 7950X3D
795 Points +10%
AMD Ryzen 9 7900X
786 Points +9%
AMD Ryzen 9 7950X
783 Points +8%
AMD Ryzen 9 7950X ECO 65 W
778 Points +7%
AMD Ryzen 9 7950X ECO 105 W
776 Points +7%
Intel Core i5-13600K
775 Points +7%
AMD Ryzen 7 7700X ECO 65 W
773 Points +7%
AMD Ryzen 7 7700X
772 Points +7%
Intel Core i9-12900K
766 Points +6%
AMD Ryzen 5 7600X
761 Points +5%
AMD Ryzen 7 7700
750 Points +4%
Intel Core i5-12600K
734 Points +1%
AMD Ryzen 5 7600
724 Points
AMD Ryzen 9 5950X
641 Points -11%
AMD Ryzen 9 5900X
639 Points -12%
AMD Ryzen 7 5800X
625 Points -14%
AMD Ryzen 5 5600X
601 Points -17%
AMD Ryzen 7 5800X3D
566 Points -22%
CPU (Multi Core)
Intel Core i9-13900K
15181 Points +177%
AMD Ryzen 9 7950X
14891 Points +171%
AMD Ryzen 9 7950X3D
14188 Points +159%
AMD Ryzen 9 7950X ECO 105 W
13945 Points +154%
AMD Ryzen 9 7950X ECO 65 W
11727 Points +114%
AMD Ryzen 9 7900X
11563 Points +111%
AMD Ryzen 9 5950X
10482 Points +91%
Intel Core i9-12900K
10240 Points +87%
Intel Core i5-13600K
9265 Points +69%
AMD Ryzen 9 5900X
8629 Points +57%
AMD Ryzen 7 7700X
7617 Points +39%
AMD Ryzen 7 7700X ECO 65 W
7308 Points +33%
AMD Ryzen 7 7700
7259 Points +32%
Intel Core i5-12600K
6692 Points +22%
AMD Ryzen 7 5800X
6068 Points +11%
AMD Ryzen 5 7600X
5985 Points +9%
AMD Ryzen 5 7600
5487 Points
AMD Ryzen 7 5800X3D
5479 Points 0%
AMD Ryzen 5 5600X
4567 Points -17%
Cinebench R15
CPU Single 64Bit
Intel Core i9-13900K
327 Points +10%
AMD Ryzen 9 7950X3D
326 Points +9%
AMD Ryzen 9 7900X
324 Points +9%
AMD Ryzen 9 7950X
317 Points +6%
AMD Ryzen 9 7950X ECO 105 W
316 Points +6%
AMD Ryzen 7 7700X ECO 65 W
316 Points +6%
AMD Ryzen 5 7600X
315 Points +6%
AMD Ryzen 9 7950X ECO 65 W
315 Points +6%
AMD Ryzen 7 7700X
314 Points +5%
AMD Ryzen 7 7700
308 Points +3%
AMD Ryzen 5 7600
298 Points
Intel Core i5-13600K
289 Points -3%
Intel Core i9-12900K
286 Points -4%
Intel Core i5-12600K
275 Points -8%
AMD Ryzen 9 5950X
272 Points -9%
AMD Ryzen 9 5900X
271 Points -9%
AMD Ryzen 7 5800X
266 Points -11%
AMD Ryzen 5 5600X
254 Points -15%
AMD Ryzen 7 5800X3D
241 Points -19%
CPU Multi 64Bit
AMD Ryzen 9 7950X
6236 (6091.06min - 6236.36max) Points +167%
Intel Core i9-13900K
6191 Points +165%
AMD Ryzen 9 7950X3D
5974 Points +155%
AMD Ryzen 9 7950X ECO 105 W
5800 (5721.64min - 5799.62max) Points +148%
AMD Ryzen 9 7900X
4856 Points +108%
AMD Ryzen 9 7950X ECO 65 W
4836 (4772.13min - 4835.59max) Points +107%
AMD Ryzen 9 5950X
4492 Points +92%
Intel Core i9-12900K
4057 Points +73%
AMD Ryzen 9 5900X
3717 Points +59%
Intel Core i5-13600K
3643 Points +56%
AMD Ryzen 7 7700X
3191 (3116.72min - 3191.32max) Points +36%
AMD Ryzen 7 7700
3047 (2985.74min - 3046.92max) Points +30%
AMD Ryzen 7 7700X ECO 65 W
3036 (2977.74min - 3035.82max) Points +30%
AMD Ryzen 7 5800X
2616 Points +12%
Intel Core i5-12600K
2555 Points +9%
AMD Ryzen 5 7600X
2507 Points +7%
AMD Ryzen 7 5800X3D
2413 (2388.2min - 2413.42max) Points +3%
AMD Ryzen 5 7600
2339 (2319.92min - 2338.77max) Points
AMD Ryzen 5 5600X
1968 Points -16%
Blender - v2.79 BMW27 CPU
AMD Ryzen 5 5600X
260.2 Seconds * -19%
AMD Ryzen 5 7600
219 Seconds *
AMD Ryzen 7 5800X3D
212.6 Seconds * +3%
AMD Ryzen 5 7600X
203 Seconds * +7%
AMD Ryzen 7 5800X
196.8 Seconds * +10%
Intel Core i5-12600K
189.5 Seconds * +13%
AMD Ryzen 7 7700X ECO 65 W
166 Seconds * +24%
AMD Ryzen 7 7700
166 Seconds * +24%
AMD Ryzen 7 7700X
160 Seconds * +27%
AMD Ryzen 9 5900X
141 Seconds * +36%
Intel Core i5-13600K
135 Seconds * +38%
Intel Core i9-12900K
121.1 Seconds * +45%
AMD Ryzen 9 5950X
112.8 Seconds * +48%
AMD Ryzen 9 7900X
106 Seconds * +52%
AMD Ryzen 9 7950X ECO 65 W
103 Seconds * +53%
AMD Ryzen 9 7950X ECO 105 W
87 Seconds * +60%
AMD Ryzen 9 7950X3D
86 Seconds * +61%
AMD Ryzen 9 7950X
82 Seconds * +63%
Intel Core i9-13900K
80 Seconds * +63%
wPrime 2.10
32m
Intel Core i9-12900K
4.924 s * -61%
Intel Core i5-12600K
4.725 s * -54%
AMD Ryzen 5 5600X
3.891 s * -27%
AMD Ryzen 7 5800X3D
3.648 s * -19%
AMD Ryzen 5 7600
3.059 s *
AMD Ryzen 7 5800X
3.037 s * +1%
AMD Ryzen 5 7600X
2.78 s * +9%
AMD Ryzen 7 7700
2.72 s * +11%
AMD Ryzen 9 5950X
2.538 s * +17%
Intel Core i5-13600K
2.527 s * +17%
AMD Ryzen 7 7700X
2.154 s * +30%
AMD Ryzen 9 7950X3D
2.007 s * +34%
Intel Core i9-13900K
1.818 s * +41%
AMD Ryzen 9 7900X
1.781 s * +42%
AMD Ryzen 9 7950X
1.557 s * +49%
1024m
Intel Core i5-12600K
202.7 s * -142%
Intel Core i9-12900K
190.6 s * -127%
Intel Core i5-13600K
177.592 s * -112%
AMD Ryzen 5 5600X
113.9 s * -36%
AMD Ryzen 7 5800X3D
92.572 s * -10%
AMD Ryzen 7 5800X
86.1 s * -3%
AMD Ryzen 5 7600
83.811 s *
Intel Core i9-13900K
79.738 s * +5%
AMD Ryzen 5 7600X
74.491 s * +11%
AMD Ryzen 9 5950X
64.9 s * +23%
AMD Ryzen 7 7700
62.625 s * +25%
AMD Ryzen 7 7700X
61.148 s * +27%
AMD Ryzen 9 7900X
39.954 s * +52%
AMD Ryzen 9 7950X3D
33.879 s * +60%
AMD Ryzen 9 7950X
30.427 s * +64%
X264 HD Benchmark 4.0
Pass 1
Intel Core i9-13900K
412 (410min - 417max) fps +19%
AMD Ryzen 9 7950X3D
392.5 (391min - 397max) fps +13%
Intel Core i5-13600K
388 (386min - 388max) fps +12%
AMD Ryzen 9 7950X
383 (381min - 386max) fps +10%
AMD Ryzen 9 7900X
376 (369min - 378max) fps +8%
AMD Ryzen 7 7700X
373.5 (363min - 381max) fps +8%
Intel Core i9-12900K
368.5 (366min - 369max) fps +6%
AMD Ryzen 7 7700
368 (359min - 370max) fps +6%
AMD Ryzen 5 7600X
367 (363min - 371max) fps +6%
AMD Ryzen 5 7600
347 (345min - 352max) fps
AMD Ryzen 7 5800X
339 (338min - 341max) fps -2%
AMD Ryzen 9 5950X
338.5 (337min - 340max) fps -2%
AMD Ryzen 9 5900X
335 (325min - 337max) fps -3%
Intel Core i5-12600K
333.5 (332min - 336max) fps -4%
AMD Ryzen 5 5600X
320 (319min - 321max) fps -8%
AMD Ryzen 7 5800X3D
292 (290min - 295max) fps -16%
Pass 2
AMD Ryzen 9 7950X
274 (272min - 274max) fps +99%
Intel Core i9-13900K
267 (266min - 271max) fps +94%
AMD Ryzen 9 7950X3D
265.5 (263min - 266max) fps +93%
AMD Ryzen 9 7900X
241 (240min - 242max) fps +75%
AMD Ryzen 9 5950X
221 (220min - 221max) fps +60%
Intel Core i9-12900K
206 (206min - 206max) fps +49%
Intel Core i5-13600K
199 (198.5min - 199.4max) fps +44%
AMD Ryzen 9 5900X
191 (190min - 192max) fps +39%
AMD Ryzen 7 7700X
181.2 (181min - 181.4max) fps +31%
AMD Ryzen 7 7700
174.95 (174.4min - 175.5max) fps +27%
AMD Ryzen 7 5800X
152 (151min - 152max) fps +10%
Intel Core i5-12600K
148 (147min - 148max) fps +7%
AMD Ryzen 5 7600X
147.8 (147.7min - 147.9max) fps +7%
AMD Ryzen 7 5800X3D
138.25 (137.7min - 138.6max) fps 0%
AMD Ryzen 5 7600
137.8 (136.9min - 137.9max) fps
AMD Ryzen 5 5600X
117 (117min - 117max) fps -15%
WinRAR - Result
AMD Ryzen 9 7900X
17225 KB/s +23%
AMD Ryzen 5 7600X
16178 KB/s +15%
AMD Ryzen 9 7950X3D
15779 KB/s +12%
AMD Ryzen 7 5800X
15604 KB/s +11%
AMD Ryzen 9 7950X
15449 KB/s +10%
AMD Ryzen 7 7700X
14879 KB/s +6%
AMD Ryzen 7 7700
14860 KB/s +6%
Intel Core i9-13900K
14836 KB/s +6%
AMD Ryzen 7 5800X3D
14431 KB/s +3%
AMD Ryzen 5 7600
14038 KB/s
AMD Ryzen 9 5900X
13361 KB/s -5%
AMD Ryzen 5 5600X
13282 KB/s -5%
AMD Ryzen 9 5950X
12503 KB/s -11%
Intel Core i5-13600K
10937 KB/s -22%
Intel Core i9-12900K
10792 KB/s -23%
Intel Core i5-12600K
6239 KB/s -56%
TrueCrypt
AES Mean 100MB
AMD Ryzen 9 7950X
32.5 GB/s +160%
Intel Core i9-13900K
27 GB/s +116%
AMD Ryzen 9 5950X
26.9 GB/s +115%
AMD Ryzen 9 7950X3D
26.9 GB/s +115%
AMD Ryzen 9 5900X
21.2 GB/s +70%
Intel Core i5-13600K
18.8 GB/s +50%
Intel Core i9-12900K
18.5 GB/s +48%
AMD Ryzen 7 7700X
17.5 GB/s +40%
AMD Ryzen 7 7700
15.9 GB/s +27%
AMD Ryzen 7 5800X
15 GB/s +20%
AMD Ryzen 9 7900X
14.8 GB/s +18%
AMD Ryzen 7 5800X3D
13.8 GB/s +10%
AMD Ryzen 5 7600X
13.2 GB/s +6%
Intel Core i5-12600K
12.8 GB/s +2%
AMD Ryzen 5 7600
12.5 GB/s
AMD Ryzen 5 5600X
10.7 GB/s -14%
Twofish Mean 100MB
Intel Core i9-13900K
5.4 GB/s +238%
AMD Ryzen 9 7950X
4.6 GB/s +188%
AMD Ryzen 9 7950X3D
4.2 GB/s +163%
AMD Ryzen 9 5950X
3.7 GB/s +131%
Intel Core i9-12900K
3.7 GB/s +131%
Intel Core i5-13600K
3.1 GB/s +94%
AMD Ryzen 9 5900X
2.9 GB/s +81%
AMD Ryzen 9 7900X
2.8 GB/s +75%
AMD Ryzen 7 7700X
2.3 GB/s +44%
AMD Ryzen 7 7700
2.3 GB/s +44%
Intel Core i5-12600K
2.2 GB/s +38%
AMD Ryzen 7 5800X
2 GB/s +25%
AMD Ryzen 7 5800X3D
1.9 GB/s +19%
AMD Ryzen 5 7600X
1.8 GB/s +13%
AMD Ryzen 5 7600
1.6 GB/s
AMD Ryzen 5 5600X
1.5 GB/s -6%
Serpent Mean 100MB
Intel Core i9-13900K
3 GB/s +173%
AMD Ryzen 9 7950X
2.9 GB/s +164%
AMD Ryzen 9 7950X3D
2.8 GB/s +155%
AMD Ryzen 9 5950X
2.4 GB/s +118%
Intel Core i9-12900K
1.9 GB/s +73%
AMD Ryzen 9 5900X
1.8 GB/s +64%
Intel Core i5-13600K
1.7 GB/s +55%
AMD Ryzen 9 7900X
1.5 GB/s +36%
AMD Ryzen 7 7700
1.5 GB/s +36%
AMD Ryzen 7 7700X
1.4 GB/s +27%
AMD Ryzen 7 5800X
1.3 GB/s +18%
Intel Core i5-12600K
1.3 GB/s +18%
AMD Ryzen 7 5800X3D
1.2 GB/s +9%
AMD Ryzen 5 7600X
1.1 GB/s 0%
AMD Ryzen 5 7600
1.1 GB/s
AMD Ryzen 5 5600X
0.938 GB/s -15%
Geekbench 5.5
Single-Core
AMD Ryzen 9 7950X3D
2311 Points +11%
Intel Core i9-13900K
2290 Points +10%
AMD Ryzen 9 7900X
2274 Points +9%
AMD Ryzen 9 7950X ECO 65 W
2252 Points +8%
AMD Ryzen 9 7950X ECO 105 W
2250 Points +8%
AMD Ryzen 9 7950X
2241 Points +7%
AMD Ryzen 7 7700X
2218 Points +6%
AMD Ryzen 7 7700X ECO 65 W
2218 Points +6%
AMD Ryzen 5 7600X
2205 Points +6%
AMD Ryzen 7 7700
2161 Points +3%
AMD Ryzen 5 7600
2088 Points
Intel Core i9-12900K
2042 Points -2%
Intel Core i5-13600K
1967 Points -6%
Intel Core i5-12600K
1904 Points -9%
AMD Ryzen 9 5950X
1682 Points -19%
AMD Ryzen 9 5900X
1669 Points -20%
AMD Ryzen 7 5800X
1665 Points -20%
AMD Ryzen 5 5600X
1657 Points -21%
AMD Ryzen 7 5800X3D
1622 Points -22%
Multi-Core
AMD Ryzen 9 7950X3D
24343 Points +119%
Intel Core i9-13900K
24157 Points +118%
AMD Ryzen 9 7950X
23948 Points +116%
AMD Ryzen 9 7950X ECO 105 W
22921 Points +107%
AMD Ryzen 9 7950X ECO 65 W
20496 Points +85%
AMD Ryzen 9 7900X
19987 Points +80%
Intel Core i9-12900K
17854 Points +61%
AMD Ryzen 9 5950X
16891 Points +52%
Intel Core i5-13600K
16651 Points +50%
AMD Ryzen 7 7700X
14373 Points +30%
AMD Ryzen 7 7700
13929 Points +26%
AMD Ryzen 7 7700X ECO 65 W
13889 Points +25%
AMD Ryzen 9 5900X
12990 Points +17%
Intel Core i5-12600K
12797 Points +15%
AMD Ryzen 5 7600X
11917 Points +7%
AMD Ryzen 7 5800X
11354 Points +2%
AMD Ryzen 5 7600
11095 Points
AMD Ryzen 7 5800X3D
10856 Points -2%
AMD Ryzen 5 5600X
8980 Points -19%
Geekbench 5.0
5.0 Single-Core
Intel Core i9-13900K
2214 Points +10%
AMD Ryzen 9 7900X
2194 Points +9%
AMD Ryzen 9 7950X3D
2183 Points +9%
AMD Ryzen 9 7950X
2156 Points +8%
AMD Ryzen 5 7600X
2126 Points +6%
AMD Ryzen 7 7700X
2123 Points +6%
AMD Ryzen 7 7700
2078 Points +4%
AMD Ryzen 5 7600
2005 Points
Intel Core i9-12900K
1968 Points -2%
Intel Core i5-13600K
1931 Points -4%
Intel Core i5-12600K
1821 Points -9%
AMD Ryzen 9 5950X
1683 Points -16%
AMD Ryzen 7 5800X
1673 Points -17%
AMD Ryzen 9 5900X
1667 Points -17%
AMD Ryzen 5 5600X
1587 Points -21%
AMD Ryzen 7 5800X3D
1526 Points -24%
5.0 Multi-Core
Intel Core i9-13900K
24021 Points +124%
AMD Ryzen 9 7950X3D
23720 Points +121%
AMD Ryzen 9 7950X
22891 Points +113%
AMD Ryzen 9 7900X
19975 Points +86%
Intel Core i9-12900K
17959 Points +67%
Intel Core i5-13600K
16635 Points +55%
AMD Ryzen 9 5950X
16570 Points +54%
AMD Ryzen 7 7700X
14215 Points +32%
AMD Ryzen 7 7700
13869 Points +29%
AMD Ryzen 9 5900X
12974 Points +21%
Intel Core i5-12600K
12746 Points +19%
AMD Ryzen 5 7600X
11880 Points +11%
AMD Ryzen 7 5800X
11246 Points +5%
AMD Ryzen 7 5800X3D
10836 Points +1%
AMD Ryzen 5 7600
10745 Points
AMD Ryzen 5 5600X
8926 Points -17%
Geekbench 4.4
64 Bit Single-Core Score
Intel Core i9-13900K
9598 Points +14%
AMD Ryzen 9 7950X3D
9240 Points +9%
AMD Ryzen 9 7900X
9193 Points +9%
AMD Ryzen 9 7950X
9023 Points +7%
AMD Ryzen 7 7700X
8991 Points +6%
AMD Ryzen 5 7600X
8926 Points +6%
AMD Ryzen 7 7700
8753 Points +4%
Intel Core i9-12900K
8665 Points +3%
Intel Core i5-13600K
8618 Points +2%
AMD Ryzen 5 7600
8453 Points
Intel Core i5-12600K
8223 Points -3%
AMD Ryzen 7 5800X
7333 Points -13%
AMD Ryzen 9 5900X
7297 Points -14%
AMD Ryzen 9 5950X
7216 Points -15%
AMD Ryzen 7 5800X3D
7187 Points -15%
AMD Ryzen 5 5600X
6953 Points -18%
64 Bit Multi-Core Score
AMD Ryzen 9 7950X3D
87922 Points +99%
Intel Core i9-13900K
86695 Points +96%
AMD Ryzen 9 7950X
85554 Points +93%
AMD Ryzen 9 7900X
74731 Points +69%
Intel Core i9-12900K
63583 Points +44%
AMD Ryzen 9 5950X
63233 Points +43%
Intel Core i5-13600K
60407 Points +37%
AMD Ryzen 7 7700X
56909 Points +29%
AMD Ryzen 7 7700
55542 Points +26%
AMD Ryzen 9 5900X
51794 Points +17%
AMD Ryzen 5 7600X
47407 Points +7%
Intel Core i5-12600K
46557 Points +5%
AMD Ryzen 5 7600
44221 Points
AMD Ryzen 7 5800X
44131 Points 0%
AMD Ryzen 7 5800X3D
43687 Points -1%
AMD Ryzen 5 5600X
35617 Points -19%
7-Zip 18.03
7z b 4
AMD Ryzen 9 7950X3D
159341 MIPS +147%
AMD Ryzen 9 7950X
158242 MIPS +145%
AMD Ryzen 9 7950X ECO 105 W
151967 MIPS +135%
Intel Core i9-13900K
147068 MIPS +128%
AMD Ryzen 9 5950X
127792 MIPS +98%
AMD Ryzen 9 7900X
124975 MIPS +93%
Intel Core i9-12900K
97671 MIPS +51%
AMD Ryzen 9 5900X
95123 MIPS +47%
Intel Core i5-13600K
89647 MIPS +39%
AMD Ryzen 7 7700X
85789 MIPS +33%
AMD Ryzen 7 7700X ECO 65 W
85624 MIPS +33%
AMD Ryzen 7 7700
85260 MIPS +32%
AMD Ryzen 7 5800X
74306 MIPS +15%
AMD Ryzen 7 5800X3D
69518 MIPS +8%
AMD Ryzen 5 7600X
69291 MIPS +7%
AMD Ryzen 5 7600
64613 MIPS
Intel Core i5-12600K
64260 MIPS -1%
AMD Ryzen 5 5600X
56607 MIPS -12%
7z b 4 -mmt1
AMD Ryzen 9 7950X3D
8321 MIPS +10%
AMD Ryzen 9 7900X
8282 MIPS +9%
AMD Ryzen 9 7950X
8211 MIPS +9%
AMD Ryzen 9 7950X ECO 105 W
8176 MIPS +8%
AMD Ryzen 7 7700X
8096 MIPS +7%
AMD Ryzen 5 7600X
8063 MIPS +7%
AMD Ryzen 7 7700X ECO 65 W
8052 MIPS +6%
AMD Ryzen 7 7700
7880 MIPS +4%
AMD Ryzen 5 7600
7566 MIPS
Intel Core i9-13900K
7272 MIPS -4%
AMD Ryzen 9 5950X
6974 MIPS -8%
AMD Ryzen 7 5800X
6970 MIPS -8%
AMD Ryzen 7 5800X3D
6799 MIPS -10%
AMD Ryzen 9 5900X
6785 MIPS -10%
AMD Ryzen 5 5600X
6594 MIPS -13%
Intel Core i9-12900K
6571 MIPS -13%
Intel Core i5-13600K
6502 MIPS -14%
Intel Core i5-12600K
5944 MIPS -21%
HWBOT x265 Benchmark v2.2 - 4k Preset
AMD Ryzen 9 7950X
44 fps +126%
Intel Core i9-13900K
42.6 fps +118%
AMD Ryzen 9 7950X3D
42.4 fps +117%
AMD Ryzen 9 7950X ECO 105 W
41.7 fps +114%
AMD Ryzen 9 7900X
36.2 fps +86%
AMD Ryzen 9 7950X ECO 65 W
36.2 fps +86%
AMD Ryzen 9 5950X
31.8 fps +63%
Intel Core i5-12600K
30.1 fps +54%
Intel Core i9-12900K
30 fps +54%
Intel Core i5-13600K
27.6 fps +42%
AMD Ryzen 7 7700X
26.1 fps +34%
AMD Ryzen 9 5900X
25.5 fps +31%
AMD Ryzen 7 7700
25 fps +28%
AMD Ryzen 7 7700X ECO 65 W
24.8 fps +27%
AMD Ryzen 5 7600X
21.1 fps +8%
AMD Ryzen 7 5800X
20.8 fps +7%
AMD Ryzen 5 7600
19.5 fps
AMD Ryzen 7 5800X3D
19.1 fps -2%
AMD Ryzen 5 5600X
15.7 fps -19%
R Benchmark 2.5 - Overall mean
AMD Ryzen 7 5800X3D
0.4784 sec * -18%
AMD Ryzen 5 5600X
0.4778 sec * -18%
AMD Ryzen 9 5950X
0.4556 sec * -13%
AMD Ryzen 9 5900X
0.4513 sec * -12%
AMD Ryzen 7 5800X
0.4509 sec * -11%
Intel Core i5-12600K
0.4456 sec * -10%
Intel Core i9-12900K
0.4216 sec * -4%
Intel Core i5-13600K
0.405 sec * -0%
AMD Ryzen 5 7600
0.4047 sec *
AMD Ryzen 7 7700
0.4022 sec * +1%
AMD Ryzen 7 7700X ECO 65 W
0.383 sec * +5%
AMD Ryzen 9 7950X
0.3776 sec * +7%
AMD Ryzen 9 7950X ECO 65 W
0.3773 sec * +7%
AMD Ryzen 9 7950X ECO 105 W
0.3769 sec * +7%
AMD Ryzen 7 7700X
0.3758 sec * +7%
AMD Ryzen 5 7600X
0.3749 sec * +7%
AMD Ryzen 9 7900X
0.3736 sec * +8%
AMD Ryzen 9 7950X3D
0.372 sec * +8%
Intel Core i9-13900K
0.3539 sec * +13%
LibreOffice - 20 Documents To PDF
Intel Core i5-12600K
71.8 s * -91%
AMD Ryzen 7 5800X3D
55 s * -47%
AMD Ryzen 9 5900X
47.65 s * -27%
AMD Ryzen 9 5950X
45.97 s * -23%
AMD Ryzen 5 5600X
45.14 s * -20%
AMD Ryzen 7 5800X
43.31 s * -15%
Intel Core i9-12900K
40.6 s * -8%
AMD Ryzen 7 7700
39.5 s * -5%
AMD Ryzen 9 7950X3D
38.6 s * -3%
AMD Ryzen 5 7600
37.5 s *
AMD Ryzen 5 7600X
36.8 s * +2%
Intel Core i9-13900K
36.6 s * +2%
AMD Ryzen 9 7950X
36.6 s * +2%
Intel Core i5-13600K
35 s * +7%
AMD Ryzen 9 7900X
34.9 s * +7%
AMD Ryzen 7 7700X ECO 65 W
34.1 s * +9%
AMD Ryzen 7 7700X
33.6 s * +10%
AMD Ryzen 9 7950X ECO 65 W
33.1 s * +12%
AMD Ryzen 9 7950X ECO 105 W
33 s * +12%

* ... smaller is better

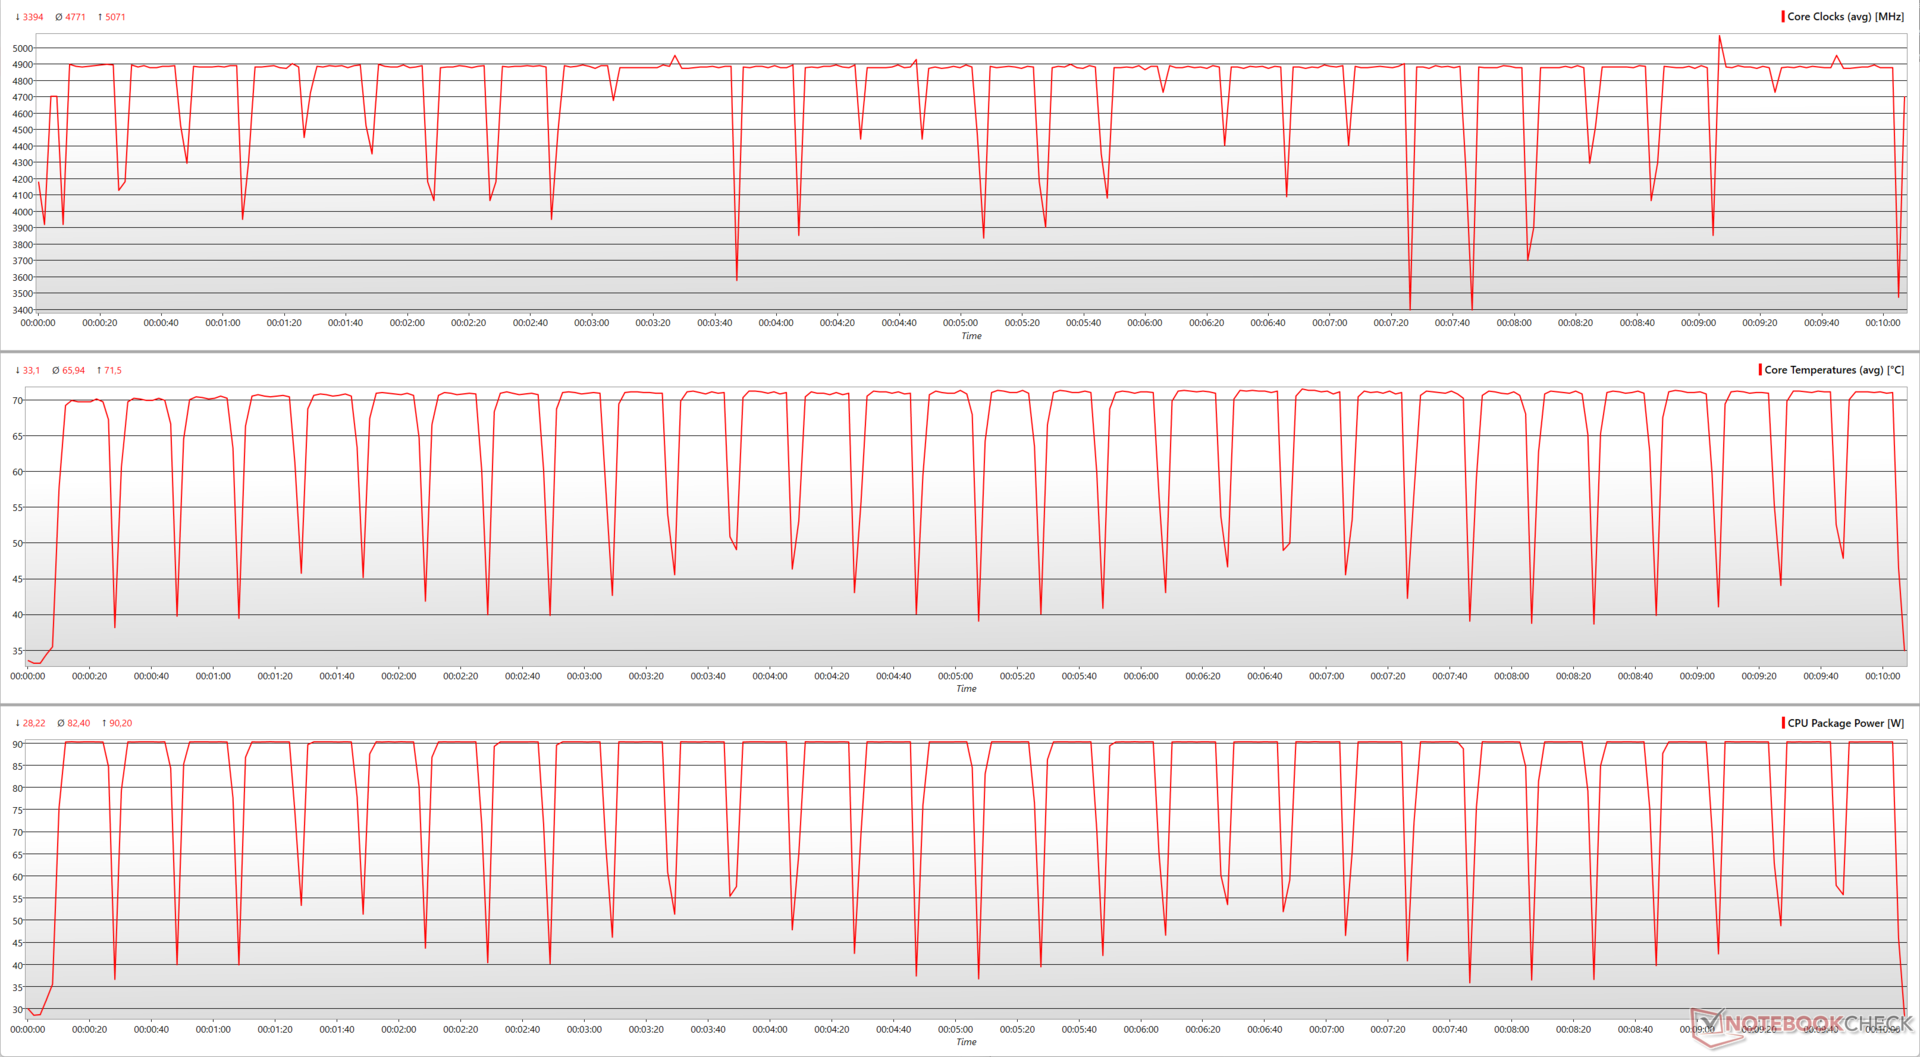
Cinebench R15 Multi Loop

A AMD fornece coolers Wraith na caixa para os processadores Ryzen 7000 de 65 W. Nossa unidade Ryzen 5 7600 veio com um cooler Wraith Stealth de baixo perfil. O Wraith Stealth pode dar conta do recado se você estiver usando a CPU apenas para tarefas básicas e multimídia.

Recomendamos o uso de um cooler AIO capaz se você quiser usar a CPU para qualquer fluxo de trabalho exigente.

O Ryzen 5 7600 apresentou excelente desempenho sustentado sem qualquer estrangulamento em nosso teste de loop de vários núcleos Cinebench R15 quando usado junto com o cooler AIO Cooler Master MasterLiquid ML360L V2 ARGB.

03156309451260157518902205252028353150346537804095441047255040535556705985Tooltip
AMD Ryzen 5 7600 AMD Ryzen 5 7600: Ø2330 (2319.92-2338.77)
AMD Ryzen 9 7950X AMD Ryzen 9 7950X: Ø6157 (6091.06-6236.36)
Intel Core i9-13900K Intel Core i9-13900K: Ø6182 (6045.95-6213.11)
AMD Ryzen 9 7950X3D AMD Ryzen 9 7950X3D: Ø5942 (5923.29-5966.59)
Intel Core i5-12600K Intel Core i5-12600K: Ø2545 (2497.35-2570.36)
Intel Core i5-13600K Intel Core i5-13600K: Ø3620 (3607.83-3632.07)

O Ryzen 5 7600 pode aumentar momentaneamente até um pico de 5,07 GHz durante esse teste, o que está próximo do clock de aumento nominal de 5,1 GHz. No entanto, a velocidade média do clock do núcleo durante a execução está em torno da marca de 4,8 GHz.

A potência do pacote atinge consistentemente 90,2 W durante cada loop, com as temperaturas do núcleo chegando a 71,5 °C. O TjMax de 95 °C não é atingido durante a execução, mas há espaço térmico suficiente para que o Precision Boost 2 faça sua mágica.

AMD Ryzen 5 7600: Parâmetros da CPU durante o loop de múltiplos núcleos do Cinebench R15
Cinebench R10 Rendering Multiple CPUs 32Bit
46166
Cinebench R10 Shading 32Bit
15780
Cinebench R10 Rendering Single 32Bit
8122
Cinebench R11.5 CPU Multi 64Bit
26.4 Points
Cinebench R11.5 OpenGL 64Bit
190.02 fps
Cinebench R11.5 CPU Single 64Bit
3.51 Points
Cinebench R15 CPU Single 64Bit
298 Points
Cinebench R15 Ref. Match 64Bit
99.6 %
Cinebench R15 OpenGL 64Bit
344 fps
Cinebench R15 CPU Multi 64Bit
2339 Points
Ajuda

Desempenho do sistema: Não há grandes problemas com o Ryzen 5 7600

O Ryzen 5 7600 é capaz de superar o Ryzen 9 5900X no 3DMark 11 Physics, embora o 3DMark Time Spy Physics seja uma tarefa um pouco difícil para esse chip.

No AIDA64, o Ryzen 5 7600 é capaz de superar seu primo da série X e outros chips Zen 3 e Alder Lake em vários benchmarks de CPU.

Por algum motivo, o CrossMark não funcionou bem em nosso sistema de teste. No entanto, o desempenho geral do sistema e a capacidade de resposta não são um problema com o Ryzen 5 7600.

3DMark 11 - 1280x720 Performance Physics
AMD Ryzen 9 7950X3D
36991 Points +55%
AMD Ryzen 9 7950X
34239 Points +44%
Intel Core i9-13900K
32273 Points +35%
AMD Ryzen 7 7700X
31467 Points +32%
AMD Ryzen 7 7700
30945 Points +30%
Intel Core i5-13600K
30480 Points +28%
AMD Ryzen 9 7900X
28618 Points +20%
Intel Core i9-12900K
28211 Points +18%
AMD Ryzen 7 5800X3D
27236 Points +14%
AMD Ryzen 5 7600X
25396 Points +6%
AMD Ryzen 9 5950X
25367 Points +6%
Intel Core i5-12600K
25017 Points +5%
AMD Ryzen 5 7600
23854 Points
AMD Ryzen 9 5900X
23423 Points -2%
AMD Ryzen 7 5800X
23381 Points -2%
AMD Ryzen 5 5600X
19649 Points -18%
3DMark - 2560x1440 Time Spy CPU
Intel Core i9-13900K
19392 Points +97%
Intel Core i9-12900K
18431 Points +88%
AMD Ryzen 9 7950X3D
17206 Points +75%
Intel Core i5-13600K
17124 Points +74%
AMD Ryzen 9 7900X
16616 Points +69%
AMD Ryzen 9 7950X
15856 Points +61%
AMD Ryzen 7 7700X
14182 Points +44%
AMD Ryzen 7 7700
13918 Points +42%
Intel Core i5-12600K
13869 Points +41%
AMD Ryzen 9 5950X
13650 Points +39%
AMD Ryzen 9 5900X
12633 Points +29%
AMD Ryzen 7 5800X3D
11809 Points +20%
AMD Ryzen 7 5800X
11599 Points +18%
AMD Ryzen 5 7600X
10458 Points +7%
AMD Ryzen 5 7600
9819 Points
AMD Ryzen 5 5600X
8911 Points -9%
AIDA64
FP32 Ray-Trace
AMD Ryzen 9 7950X
62786 KRay/s +171%
AMD Ryzen 9 7950X3D
58359 KRay/s +152%
AMD Ryzen 9 7950X
57844 KRay/s +150%
AMD Ryzen 9 7950X
47514 KRay/s +105%
Intel Core i9-13900K
36939 KRay/s +60%
AMD Ryzen 9 7900X
33676 KRay/s +45%
AMD Ryzen 7 7700X
32035 KRay/s +38%
AMD Ryzen 7 7700
29867 KRay/s +29%
AMD Ryzen 7 7700X
29659 KRay/s +28%
AMD Ryzen 9 5950X
28150 KRay/s +22%
Intel Core i5-13600K
23446 KRay/s +1%
AMD Ryzen 9 5900X
23391 KRay/s +1%
AMD Ryzen 5 7600
23151 KRay/s
AMD Ryzen 5 7600X
17633 KRay/s -24%
AMD Ryzen 7 5800X
17545 KRay/s -24%
AMD Ryzen 7 5800X3D
17125 KRay/s -26%
Intel Core i9-12900K
13266 KRay/s -43%
AMD Ryzen 5 5600X
12482 KRay/s -46%
Intel Core i5-12600K
8243 KRay/s -64%
FPU Julia
AMD Ryzen 9 7950X
264044 Points +171%
AMD Ryzen 9 7950X
251718 Points +159%
AMD Ryzen 9 7950X3D
245308 Points +152%
AMD Ryzen 9 7950X
212888 Points +119%
AMD Ryzen 9 7900X
201995 Points +108%
Intel Core i9-13900K
183390 Points +88%
AMD Ryzen 9 5950X
144072 Points +48%
AMD Ryzen 7 7700X
133006 Points +37%
AMD Ryzen 7 7700X
128425 Points +32%
AMD Ryzen 7 7700
128212 Points +32%
AMD Ryzen 9 5900X
114330 Points +17%
Intel Core i5-13600K
111374 Points +14%
AMD Ryzen 5 7600X
103526 Points +6%
AMD Ryzen 7 5800X3D
103015 Points +6%
AMD Ryzen 5 7600
97332 Points
AMD Ryzen 7 5800X
82429 Points -15%
AMD Ryzen 5 5600X
61688 Points -37%
Intel Core i9-12900K
59419 Points -39%
Intel Core i5-12600K
37321 Points -62%
CPU SHA3
AMD Ryzen 9 7950X3D
11001 MB/s +172%
AMD Ryzen 9 7950X
10362 MB/s +156%
AMD Ryzen 9 7950X
9704 MB/s +140%
Intel Core i9-13900K
9180 MB/s +127%
AMD Ryzen 9 7950X
8120 MB/s +101%
AMD Ryzen 9 7900X
7018 MB/s +74%
Intel Core i5-13600K
5253 MB/s +30%
AMD Ryzen 7 7700X
5214 MB/s +29%
AMD Ryzen 7 7700X
4961 MB/s +23%
AMD Ryzen 7 7700
4956 MB/s +23%
Intel Core i9-12900K
4952 MB/s +22%
AMD Ryzen 9 5950X
4569 MB/s +13%
AMD Ryzen 5 7600
4044 MB/s
AMD Ryzen 5 7600X
3601 MB/s -11%
AMD Ryzen 9 5900X
3591 MB/s -11%
AMD Ryzen 7 5800X3D
3587 MB/s -11%
Intel Core i5-12600K
3250 MB/s -20%
AMD Ryzen 7 5800X
2542 MB/s -37%
AMD Ryzen 5 5600X
1920 MB/s -53%
CPU Queen
AMD Ryzen 9 7950X
205588 Points +104%
AMD Ryzen 9 7950X3D
199943 Points +98%
AMD Ryzen 9 7950X
196106 Points +94%
AMD Ryzen 9 7950X
173696 Points +72%
AMD Ryzen 9 7900X
172637 Points +71%
AMD Ryzen 9 5950X
164437 Points +63%
Intel Core i9-13900K
159676 Points +58%
AMD Ryzen 9 5900X
138724 Points +38%
AMD Ryzen 7 7700X
137151 Points +36%
AMD Ryzen 7 7700X
129890 Points +29%
AMD Ryzen 7 7700
129569 Points +29%
Intel Core i5-13600K
120485 Points +19%
AMD Ryzen 7 5800X
113297 Points +12%
Intel Core i9-12900K
112694 Points +12%
AMD Ryzen 5 7600X
107954 Points +7%
AMD Ryzen 7 5800X3D
104367 Points +4%
AMD Ryzen 5 7600
100827 Points
Intel Core i5-12600K
88337 Points -12%
AMD Ryzen 5 5600X
85863 Points -15%
FPU SinJulia
AMD Ryzen 9 7950X
32855 Points +181%
AMD Ryzen 9 7950X
32428 Points +177%
AMD Ryzen 9 7950X3D
32423 Points +177%
AMD Ryzen 9 7950X
29104 Points +149%
AMD Ryzen 9 5950X
26364 Points +125%
AMD Ryzen 9 7900X
24881 Points +112%
Intel Core i9-13900K
19920 Points +70%
AMD Ryzen 9 5900X
19353 Points +65%
AMD Ryzen 7 7700X
16496 Points +41%
AMD Ryzen 7 7700X
16425 Points +40%
AMD Ryzen 7 7700
16050 Points +37%
Intel Core i9-12900K
14664 Points +25%
AMD Ryzen 7 5800X
13527 Points +16%
AMD Ryzen 7 5800X3D
12794 Points +9%
AMD Ryzen 5 7600X
12774 Points +9%
Intel Core i5-13600K
12201 Points +4%
AMD Ryzen 5 7600
11709 Points
AMD Ryzen 5 5600X
10088 Points -14%
Intel Core i5-12600K
9510 Points -19%
FPU Mandel
AMD Ryzen 9 7950X
138291 Points +165%
AMD Ryzen 9 7950X
131879 Points +153%
AMD Ryzen 9 7950X3D
131740 Points +152%
AMD Ryzen 9 7950X
110698 Points +112%
AMD Ryzen 9 7900X
106620 Points +104%
Intel Core i9-13900K
91721 Points +76%
AMD Ryzen 9 5950X
78269 Points +50%
AMD Ryzen 7 7700X
69986 Points +34%
AMD Ryzen 7 7700X
67376 Points +29%
AMD Ryzen 7 7700
66267 Points +27%
AMD Ryzen 9 5900X
62547 Points +20%
Intel Core i5-13600K
57797 Points +11%
AMD Ryzen 7 5800X3D
56568 Points +8%
AMD Ryzen 5 7600X
54555 Points +5%
AMD Ryzen 5 7600
52184 Points
AMD Ryzen 7 5800X
45369 Points -13%
Intel Core i9-12900K
38042 Points -27%
AMD Ryzen 5 5600X
33927 Points -35%
Intel Core i5-12600K
24230 Points -54%
CPU AES
AMD Ryzen 9 7950X
379659 MB/s +181%
AMD Ryzen 9 7950X
370183 MB/s +174%
AMD Ryzen 9 7950X3D
364030 MB/s +170%
AMD Ryzen 9 7950X
324249 MB/s +140%
Intel Core i9-13900K
297727 MB/s +121%
AMD Ryzen 9 7900X
279956 MB/s +107%
AMD Ryzen 7 7700X
189933 MB/s +41%
AMD Ryzen 7 7700X
187326 MB/s +39%
AMD Ryzen 7 7700
185246 MB/s +37%
Intel Core i5-13600K
175556 MB/s +30%
AMD Ryzen 9 5950X
153484 MB/s +14%
AMD Ryzen 5 7600X
144365 MB/s +7%
AMD Ryzen 5 7600
134999 MB/s
AMD Ryzen 9 5900X
118228 MB/s -12%
Intel Core i9-12900K
94062 MB/s -30%
AMD Ryzen 7 5800X
82897 MB/s -39%
AMD Ryzen 7 5800X3D
66065 MB/s -51%
AMD Ryzen 5 5600X
62563 MB/s -54%
Intel Core i5-12600K
58635 MB/s -57%
CPU ZLib
Intel Core i9-13900K
2490 MB/s +179%
AMD Ryzen 9 7950X
2441 MB/s +173%
AMD Ryzen 9 7950X
2325 MB/s +160%
AMD Ryzen 9 7950X3D
2315 MB/s +159%
AMD Ryzen 9 7950X
1965 MB/s +120%
AMD Ryzen 9 7900X
1848 MB/s +107%
AMD Ryzen 9 5950X
1727 MB/s +93%
Intel Core i9-12900K
1560 MB/s +74%
Intel Core i5-13600K
1426 MB/s +60%
AMD Ryzen 9 5900X
1345 MB/s +50%
AMD Ryzen 7 7700X
1224 MB/s +37%
AMD Ryzen 7 7700X
1181 MB/s +32%
AMD Ryzen 7 7700
1181 MB/s +32%
Intel Core i5-12600K
988 MB/s +11%
AMD Ryzen 5 7600X
945 MB/s +6%
AMD Ryzen 7 5800X
942 MB/s +5%
AMD Ryzen 5 7600
894 MB/s
AMD Ryzen 7 5800X3D
890 MB/s 0%
AMD Ryzen 5 5600X
719 MB/s -20%
FP64 Ray-Trace
AMD Ryzen 9 7950X
33821 KRay/s +171%
AMD Ryzen 9 7950X3D
31732 KRay/s +154%
AMD Ryzen 9 7950X
30838 KRay/s +147%
AMD Ryzen 9 7950X
25132 KRay/s +101%
Intel Core i9-13900K
20298 KRay/s +62%
AMD Ryzen 9 7900X
18490 KRay/s +48%
AMD Ryzen 7 7700X
17051 KRay/s +36%
AMD Ryzen 7 7700
16020 KRay/s +28%
AMD Ryzen 7 7700X
15819 KRay/s +27%
AMD Ryzen 9 5950X
15213 KRay/s +22%
Intel Core i5-13600K
12806 KRay/s +2%
AMD Ryzen 9 5900X
12613 KRay/s +1%
AMD Ryzen 5 7600
12501 KRay/s
AMD Ryzen 5 7600X
9488 KRay/s -24%
AMD Ryzen 7 5800X
9469 KRay/s -24%
AMD Ryzen 7 5800X3D
9090 KRay/s -27%
Intel Core i9-12900K
8078 KRay/s -35%
AMD Ryzen 5 5600X
6894 KRay/s -45%
Intel Core i5-12600K
5149 KRay/s -59%
CPU PhotoWorxx
AMD Ryzen 9 7950X3D
53949 MPixel/s +39%
Intel Core i9-13900K
48674 MPixel/s +26%
Intel Core i5-12600K
48577 MPixel/s +26%
Intel Core i5-13600K
48434 MPixel/s +25%
Intel Core i9-12900K
48307 MPixel/s +25%
AMD Ryzen 9 7900X
40893 MPixel/s +6%
AMD Ryzen 9 7950X
40443 MPixel/s +5%
AMD Ryzen 9 7950X
40323 MPixel/s +4%
AMD Ryzen 9 7950X
40261 MPixel/s +4%
AMD Ryzen 5 7600
38698 MPixel/s
AMD Ryzen 5 7600X
32202 MPixel/s -17%
AMD Ryzen 7 7700
32185 MPixel/s -17%
AMD Ryzen 7 7700X
31910 MPixel/s -18%
AMD Ryzen 7 7700X
31859 MPixel/s -18%
AMD Ryzen 9 5950X
27530 MPixel/s -29%
AMD Ryzen 7 5800X
25309 MPixel/s -35%
AMD Ryzen 7 5800X3D
25224 MPixel/s -35%
AMD Ryzen 5 5600X
24352 MPixel/s -37%
AMD Ryzen 9 5900X
21433 MPixel/s -45%
Performance Rating - Percent
Intel Core i9-12900K -1!
93.3 pt
Intel Core i5-12600K -1!
90.6 pt
AMD Ryzen 9 7950X3D
78.5 pt
AMD Ryzen 9 7900X
73.4 pt
Intel Core i9-13900K
73 pt
AMD Ryzen 9 7950X
72.8 pt
AMD Ryzen 9 7950X
72.8 pt
AMD Ryzen 9 7950X
72.5 pt
Intel Core i5-13600K
67.9 pt
AMD Ryzen 5 7600X
66.6 pt
AMD Ryzen 9 5900X
66.3 pt
AMD Ryzen 7 7700
66.3 pt
AMD Ryzen 7 7700X
65.7 pt
AMD Ryzen 7 7700X
65.1 pt
AMD Ryzen 5 7600
64.9 pt
AMD Ryzen 9 5950X
56.8 pt
AMD Ryzen 7 5800X
53.1 pt
AMD Ryzen 5 5600X
49.3 pt
AMD Ryzen 7 5800X3D
43.7 pt
AIDA64
Memory Copy
Intel Core i9-13900K
74937 MB/s +25%
AMD Ryzen 9 7950X3D
73868 MB/s +24%
Intel Core i9-12900K
73146 MB/s +22%
Intel Core i5-13600K
71725 MB/s +20%
Intel Core i5-12600K
70749 MB/s +18%
AMD Ryzen 9 7900X
69140 MB/s +16%
AMD Ryzen 9 7950X
68962 MB/s +15%
AMD Ryzen 9 7950X
68843 MB/s +15%
AMD Ryzen 9 7950X
68526 MB/s +15%
AMD Ryzen 9 5900X
66130 MB/s +11%
AMD Ryzen 7 7700X
59963 MB/s 0%
AMD Ryzen 5 7600X
59949 MB/s 0%
AMD Ryzen 7 7700
59838 MB/s 0%
AMD Ryzen 7 7700X
59803 MB/s 0%
AMD Ryzen 5 7600
59783 MB/s
AMD Ryzen 9 5950X
59171 MB/s -1%
AMD Ryzen 7 5800X
57120 MB/s -4%
AMD Ryzen 5 5600X
53947 MB/s -10%
AMD Ryzen 7 5800X3D
49404 MB/s -17%
Memory Latency
Intel Core i5-13600K
81.1 ns * -17%
Intel Core i9-13900K
76.5 ns * -11%
AMD Ryzen 7 5800X3D
69.3 ns * -0%
AMD Ryzen 5 7600
69.2 ns *
AMD Ryzen 7 7700X
68.7 ns * +1%
AMD Ryzen 9 5950X
67.7 ns * +2%
AMD Ryzen 7 7700X
65.7 ns * +5%
AMD Ryzen 9 7950X3D
65.6 ns * +5%
AMD Ryzen 9 7950X
65.3 ns * +6%
AMD Ryzen 9 7950X
65.1 ns * +6%
AMD Ryzen 9 7950X
65.1 ns * +6%
AMD Ryzen 7 7700
64.3 ns * +7%
AMD Ryzen 5 5600X
63.9 ns * +8%
AMD Ryzen 5 7600X
63.8 ns * +8%
AMD Ryzen 9 7900X
63.3 ns * +9%
AMD Ryzen 7 5800X
60.9 ns * +12%
AMD Ryzen 9 5900X
58.4 ns * +16%
Memory Read
Intel Core i9-13900K
83883 MB/s +41%
Intel Core i9-12900K
81059 MB/s +36%
AMD Ryzen 9 7950X3D
80946 MB/s +36%
Intel Core i5-12600K
76864 MB/s +29%
AMD Ryzen 9 7950X
75798 MB/s +28%
Intel Core i5-13600K
75757 MB/s +28%
AMD Ryzen 9 7950X
75664 MB/s +27%
AMD Ryzen 9 7950X
75590 MB/s +27%
AMD Ryzen 9 7900X
75338 MB/s +27%
AMD Ryzen 9 5900X
70692 MB/s +19%
AMD Ryzen 7 5800X
63645 MB/s +7%
AMD Ryzen 9 5950X
62991 MB/s +6%
AMD Ryzen 5 7600
59405 MB/s
AMD Ryzen 7 7700X
59292 MB/s 0%
AMD Ryzen 5 5600X
59238 MB/s 0%
AMD Ryzen 7 7700X
59238 MB/s 0%
AMD Ryzen 5 7600X
59007 MB/s -1%
AMD Ryzen 7 7700
58988 MB/s -1%
AMD Ryzen 7 5800X3D
50995 MB/s -14%
Memory Write
AMD Ryzen 9 7950X3D
85951 MB/s +6%
AMD Ryzen 5 7600X
81320 MB/s 0%
AMD Ryzen 5 7600
81193 MB/s
AMD Ryzen 7 7700X
81041 MB/s 0%
AMD Ryzen 7 7700
80948 MB/s 0%
AMD Ryzen 7 7700X
80230 MB/s -1%
AMD Ryzen 9 7900X
76967 MB/s -5%
AMD Ryzen 9 7950X
76732 MB/s -5%
AMD Ryzen 9 7950X
76721 MB/s -6%
AMD Ryzen 9 7950X
76515 MB/s -6%
Intel Core i9-13900K
74140 MB/s -9%
Intel Core i5-12600K
73824 MB/s -9%
Intel Core i9-12900K
73707 MB/s -9%
Intel Core i5-13600K
73484 MB/s -9%
AMD Ryzen 9 5900X
55525 MB/s -32%
AMD Ryzen 9 5950X
48748 MB/s -40%
AMD Ryzen 7 5800X
30399 MB/s -63%
AMD Ryzen 5 5600X
28798 MB/s -65%
AMD Ryzen 7 5800X3D
28787 MB/s -65%

* ... smaller is better

desempenho em 3D e em jogos: CPU para jogos de alta capacidade

Todos os processadores Zen 4 têm se mostrado excelentes opções para jogos até o momento, e o Ryzen 5 7600 não é diferente.

Levando em conta o 3DMark 11 e o 3DMark Time Spy cumulativamente, vemos que o Ryzen 5 7600 está no mesmo nível do Core i9-13900K, mais caro e mais faminto por energia, e está logo atrás do Ryzen 9 7950X3D. Nessa comparação, o Ryzen 5 7600X parece oferecer o melhor desempenho.

Em jogos, no entanto, o Core i9-13900K tem uma vantagem perceptível sobre o Ryzen 5 de 65 W. O Ryzen 9 7950X3D se beneficia do cache 3D V, que o ajuda a aumentar o número de quadros em configurações de qualidade e resolução muito baixas.

No entanto, se você estiver procurando principalmente uma CPU para jogos para uma construção de médio porte capaz, não há como errar com o Ryzen 5 7600.

3DMark Performance Rating - Percent
AMD Ryzen 5 7600X
100 pt
AMD Ryzen 9 7950X
95.7 pt
AMD Ryzen 9 7950X3D
94.7 pt
AMD Ryzen 5 7600
91.6 pt
Intel Core i9-13900K
91.4 pt
3DMark - 2560x1440 Time Spy Graphics
AMD Ryzen 5 7600X
37251 Points +3%
AMD Ryzen 9 7950X
36836 Points +2%
AMD Ryzen 9 7950X3D
36665 Points +1%
AMD Ryzen 5 7600
36138 Points
Intel Core i9-13900K
36101 Points 0%
3DMark 11 - 1280x720 Performance GPU
AMD Ryzen 5 7600X
116361 Points +16%
AMD Ryzen 9 7950X
107723 Points +7%
AMD Ryzen 9 7950X3D
105886 Points +6%
AMD Ryzen 5 7600
100349 Points
Intel Core i9-13900K
99834 Points -1%
Gaming Performance Rating - Percent
AMD Ryzen 9 7950X3D
NVIDIA GeForce RTX 4090
96.8 pt
AMD Ryzen 9 7950X
NVIDIA GeForce RTX 4090
92.2 pt
Intel Core i9-13900K -2!
NVIDIA GeForce RTX 4090
91.9 pt
AMD Ryzen 5 7600X -2!
NVIDIA GeForce RTX 4090
91.5 pt
AMD Ryzen 5 7600
NVIDIA GeForce RTX 4090
83.7 pt
Average of class Desktop
 
61.6 pt
Cyberpunk 2077 1.6
1920x1080 Ultra Preset
AMD Ryzen 9 7950X3D
NVIDIA GeForce RTX 4090
238.2 fps +25%
Intel Core i9-13900K
NVIDIA GeForce RTX 4090
210 (121.7min) fps +10%
AMD Ryzen 9 7950X
NVIDIA GeForce RTX 4090
207 (96.4min) fps +9%
AMD Ryzen 5 7600
NVIDIA GeForce RTX 4090
190.3 (93.2min) fps
Average of class Desktop
  (72.3 - 210, n=18, last 2 years)
145.3 fps -24%
1920x1080 Low Preset
AMD Ryzen 9 7950X3D
NVIDIA GeForce RTX 4090
252 fps +24%
Intel Core i9-13900K
NVIDIA GeForce RTX 4090
241 (97.9min) fps +18%
AMD Ryzen 9 7950X
NVIDIA GeForce RTX 4090
229 (93min) fps +12%
AMD Ryzen 5 7600
NVIDIA GeForce RTX 4090
204 (73.5min) fps
Average of class Desktop
  (139 - 246, n=15, last 2 years)
195.4 fps -4%
F1 22
1920x1080 Ultra High Preset AA:T AF:16x
AMD Ryzen 5 7600X
NVIDIA GeForce RTX 4090
205 (168min, 137P1) fps +17%
AMD Ryzen 9 7950X3D
NVIDIA GeForce RTX 4090
204 (138min, 120P1) fps +16%
Intel Core i9-13900K
NVIDIA GeForce RTX 4090
199.2 (162min, 134P1) fps +13%
AMD Ryzen 9 7950X
NVIDIA GeForce RTX 4090
194.5 fps +11%
AMD Ryzen 5 7600
NVIDIA GeForce RTX 4090
175.9 (125min, 112P1) fps
Average of class Desktop
  (61.9 - 199.2, n=17, last 2 years)
143.9 fps -18%
1920x1080 Low Preset AA:T AF:16x
AMD Ryzen 9 7950X3D
NVIDIA GeForce RTX 4090
475 (338min, 264P1) fps +35%
AMD Ryzen 9 7950X
NVIDIA GeForce RTX 4090
443 (278min, 245P1) fps +25%
AMD Ryzen 5 7600X
NVIDIA GeForce RTX 4090
417 (281min, 236P1) fps +18%
Intel Core i9-13900K
NVIDIA GeForce RTX 4090
387 (269min, 215P1) fps +10%
Average of class Desktop
  (239 - 427, n=17, last 2 years)
371 fps +5%
AMD Ryzen 5 7600
NVIDIA GeForce RTX 4090
353 (238min, 207P1) fps
F1 2021 - 1920x1080 Ultra High Preset + Raytracing AA:T AF:16x
Intel Core i9-13900K
NVIDIA GeForce RTX 4090
289 (248min, 217P1) fps +14%
AMD Ryzen 5 7600X
NVIDIA GeForce RTX 4090
277 (233min, 216P1) fps +9%
AMD Ryzen 9 7950X
NVIDIA GeForce RTX 4090
271 (224min, 205P1) fps +7%
AMD Ryzen 9 7950X3D
NVIDIA GeForce RTX 4090
271 (216min, 208P1) fps +7%
AMD Ryzen 5 7600
NVIDIA GeForce RTX 4090
254 (209min, 187P1) fps
Average of class Desktop
  (21.4 - 289, n=22, last 2 years)
188.9 fps -26%
Metro Exodus
1920x1080 Ultra Quality AF:16x
AMD Ryzen 9 7950X
NVIDIA GeForce RTX 4090
201 (109.06min) fps +9%
AMD Ryzen 5 7600X
NVIDIA GeForce RTX 4090
197.7 (103.17min) fps +7%
AMD Ryzen 9 7950X3D
NVIDIA GeForce RTX 4090
193.5 (110.2min) fps +5%
Intel Core i9-13900K
NVIDIA GeForce RTX 4090
191.2 (84.99min) fps +4%
AMD Ryzen 5 7600
NVIDIA GeForce RTX 4090
184.3 (97.77min) fps
Average of class Desktop
  (5.22 - 194.7, n=25, last 2 years)
118.2 fps -36%
1280x720 Low Quality AF:4x
AMD Ryzen 5 7600X
NVIDIA GeForce RTX 4090
309 (157.23min) fps +9%
AMD Ryzen 9 7950X
NVIDIA GeForce RTX 4090
300 (162.95min) fps +6%
AMD Ryzen 9 7950X3D
NVIDIA GeForce RTX 4090
293 (157.18min) fps +3%
AMD Ryzen 5 7600
NVIDIA GeForce RTX 4090
284 (142.17min) fps
Intel Core i9-13900K
NVIDIA GeForce RTX 4090
273 (121.97min) fps -4%
Average of class Desktop
  (17.7 - 317, n=18, last 2 years)
197.7 fps -30%
The Witcher 3
1920x1080 Ultra Graphics & Postprocessing (HBAO+)
AMD Ryzen 9 7950X
NVIDIA GeForce RTX 4090
320 (30min, 161.1P0.1, 244P1) fps +16%
AMD Ryzen 5 7600X
NVIDIA GeForce RTX 4090
313 fps +13%
AMD Ryzen 9 7950X3D
NVIDIA GeForce RTX 4090
305 fps +11%
Intel Core i9-13900K
NVIDIA GeForce RTX 4090
297 (271min, 271P1) fps +8%
AMD Ryzen 5 7600
NVIDIA GeForce RTX 4090
276 (241min, 245.13P1) fps
Average of class Desktop
  (3.9 - 314, n=29, last 2 years)
162.9 fps -41%
1024x768 Low Graphics & Postprocessing
AMD Ryzen 9 7950X3D
NVIDIA GeForce RTX 4090
864.7 fps +34%
AMD Ryzen 9 7950X
NVIDIA GeForce RTX 4090
826 (23.6min, 360P0.1, 574P1) fps +28%
Intel Core i9-13900K
NVIDIA GeForce RTX 4090
747 (631min, 633.24P1) fps +16%
AMD Ryzen 5 7600X
NVIDIA GeForce RTX 4090
738 fps +14%
AMD Ryzen 5 7600
NVIDIA GeForce RTX 4090
645 (562min, 563.71P1) fps
Average of class Desktop
  (11.3 - 790, n=21, last 2 years)
430 fps -33%
Far Cry 5
1920x1080 Ultra Preset AA:T
AMD Ryzen 9 7950X3D
NVIDIA GeForce RTX 4090
248 (186min) fps +42%
Intel Core i9-13900K
NVIDIA GeForce RTX 4090
203 (153min) fps +16%
AMD Ryzen 9 7950X
NVIDIA GeForce RTX 4090
188 (136min) fps +7%
AMD Ryzen 5 7600X
NVIDIA GeForce RTX 4090
187 (141min) fps +7%
AMD Ryzen 5 7600
NVIDIA GeForce RTX 4090
175 (124min) fps
Average of class Desktop
  (8 - 219, n=22, last 2 years)
132.5 fps -24%
1280x720 Low Preset AA:T
AMD Ryzen 9 7950X3D
NVIDIA GeForce RTX 4090
299 (201min) fps +44%
AMD Ryzen 5 7600X
NVIDIA GeForce RTX 4090
241 (180min) fps +16%
Intel Core i9-13900K
NVIDIA GeForce RTX 4090
239 (191min) fps +15%
AMD Ryzen 9 7950X
NVIDIA GeForce RTX 4090
238 (182min) fps +15%
AMD Ryzen 5 7600
NVIDIA GeForce RTX 4090
207 (162min) fps
Average of class Desktop
  (8 - 259, n=20, last 2 years)
155.3 fps -25%
GTA V
1920x1080 Highest Settings possible AA:4xMSAA + FX AF:16x
Intel Core i9-13900K
NVIDIA GeForce RTX 4090
168.6 (3.72min, 142.9P1) fps +16%
AMD Ryzen 9 7950X
NVIDIA GeForce RTX 4090
162 (3.52min, 111.1P1) fps +12%
AMD Ryzen 9 7950X3D
NVIDIA GeForce RTX 4090
160.2 (11.4min, 111.1P1) fps +10%
AMD Ryzen 5 7600X
NVIDIA GeForce RTX 4090
155.6 (8.2min, 111.1P1) fps +7%
AMD Ryzen 5 7600
NVIDIA GeForce RTX 4090
145 (4.43min, 100P1) fps
Average of class Desktop
  (3.38 - 172.4, n=26, last 2 years)
121.4 fps -16%
1920x1080 Lowest Settings possible
AMD Ryzen 9 7950X3D
NVIDIA GeForce RTX 4090
188.3 (3.21min, 200P1) fps 0%
Intel Core i9-13900K
NVIDIA GeForce RTX 4090
188.1 (3.25min, 200P1) fps 0%
AMD Ryzen 9 7950X
NVIDIA GeForce RTX 4090
187.7 (2.38min, 200P1) fps 0%
AMD Ryzen 5 7600X
NVIDIA GeForce RTX 4090
187.7 (2.67min, 200P1) fps 0%
AMD Ryzen 5 7600
NVIDIA GeForce RTX 4090
187.6 (56.3min, 200P1) fps
Average of class Desktop
  (19 - 188.1, n=25, last 2 years)
159.7 fps -15%
X-Plane 11.11
1920x1080 high (fps_test=3)
AMD Ryzen 9 7950X3D
NVIDIA GeForce RTX 4090
187.1 fps +34%
Intel Core i9-13900K
NVIDIA GeForce RTX 4090
164.8 fps +18%
AMD Ryzen 9 7950X
NVIDIA GeForce RTX 4090
151.6 fps +9%
AMD Ryzen 5 7600X
NVIDIA GeForce RTX 4090
148.5 fps +7%
AMD Ryzen 5 7600
NVIDIA GeForce RTX 4090
139.4 fps
Average of class Desktop
  (4.64 - 166.3, n=31, last 2 years)
99.2 fps -29%
1280x720 low (fps_test=1)
Intel Core i9-13900K
NVIDIA GeForce RTX 4090
251 fps +18%
AMD Ryzen 9 7950X3D
NVIDIA GeForce RTX 4090
225 fps +6%
AMD Ryzen 9 7950X
NVIDIA GeForce RTX 4090
223 fps +5%
AMD Ryzen 5 7600X
NVIDIA GeForce RTX 4090
217 fps +2%
AMD Ryzen 5 7600
NVIDIA GeForce RTX 4090
212 fps
Average of class Desktop
  (7.76 - 251, n=31, last 2 years)
146.8 fps -31%
Dota 2 Reborn
1920x1080 ultra (3/3) best looking
AMD Ryzen 9 7950X3D
NVIDIA GeForce RTX 4090
252.7 (208.9min) fps +24%
Intel Core i9-13900K
NVIDIA GeForce RTX 4090
239.8 (204min) fps +18%
AMD Ryzen 9 7950X
NVIDIA GeForce RTX 4090
239.2 (203.6min) fps +18%
AMD Ryzen 5 7600X
NVIDIA GeForce RTX 4090
224.3 (189min) fps +10%
AMD Ryzen 5 7600
NVIDIA GeForce RTX 4090
203 (173.4min) fps
Average of class Desktop
  (5.2 - 246, n=33, last 2 years)
142.5 fps -30%
1280x720 min (0/3) fastest
AMD Ryzen 9 7950X3D
NVIDIA GeForce RTX 4090
314.1 (261.7min) fps +22%
AMD Ryzen 9 7950X
NVIDIA GeForce RTX 4090
310.6 (261.3min) fps +21%
Intel Core i9-13900K
NVIDIA GeForce RTX 4090
292.4 (248.2min) fps +14%
AMD Ryzen 5 7600X
NVIDIA GeForce RTX 4090
278.1 (211.4min) fps +8%
AMD Ryzen 5 7600
NVIDIA GeForce RTX 4090
257 (218.5min) fps
Average of class Desktop
  (24.3 - 303, n=33, last 2 years)
193.9 fps -25%
Strange Brigade
1920x1080 ultra AA:ultra AF:16
AMD Ryzen 5 7600X
NVIDIA GeForce RTX 4090
595 (60.2min, 433P1) fps +5%
AMD Ryzen 5 7600
NVIDIA GeForce RTX 4090
569 (124.7min, 414P1) fps
AMD Ryzen 9 7950X
NVIDIA GeForce RTX 4090
565 (104.9min, 433P1) fps -1%
AMD Ryzen 9 7950X3D
NVIDIA GeForce RTX 4090
524 (115.8min, 393P1) fps -8%
Average of class Desktop
  (13.6 - 569, n=20, last 2 years)
286 fps -50%
1280x720 lowest AF:1
AMD Ryzen 5 7600X
NVIDIA GeForce RTX 4090
780 (275min, 597P1) fps +6%
AMD Ryzen 5 7600
NVIDIA GeForce RTX 4090
736 (61.8min, 561P1) fps
AMD Ryzen 9 7950X
NVIDIA GeForce RTX 4090
698 (182.7min, 569P1) fps -5%
AMD Ryzen 9 7950X3D
NVIDIA GeForce RTX 4090
672 (259min, 529P1) fps -9%
Average of class Desktop
  (9.2 - 797, n=23, last 2 years)
428 fps -42%

AMD Ryzen 5 7600 with Nvidia GeForce RTX 4090

baixo média alto ultraQHD4K
GTA V (2015) 187.6 187.5 185 145 147.7
The Witcher 3 (2015) 645 574 547 276 275
Dota 2 Reborn (2015) 257 228 218 203 202
Final Fantasy XV Benchmark (2018) 237 237 237 237 145.9
X-Plane 11.11 (2018) 212 182.4 139.4 117.3
Far Cry 5 (2018) 207 187 182 175 170 158
Strange Brigade (2018) 736 600 580 569 509 279
Metro Exodus (2019) 284 243 221 184.3 173.6 133.6
F1 2021 (2021) 640 603 502 254 249 199.1
Cyberpunk 2077 1.6 (2022) 204 203 192.2 190.3 147.4 78.9
F1 22 (2022) 353 374 342 175.9 150 80.9

Gerenciamento de energia: Maior eficiência energética do que o Ryzen 7000 X-series

Semelhante ao que vimos anteriormente com o Ryzen 7 7700, o Ryzen 5 7600 continua a oferecer um desempenho superior por Watt no Cinebench R15 multi-core quando comparado com o Ryzen 7000 série X - 49% mais eficiente do que o Ryzen 5 7600X. Dito isso, um Ryzen 9 7950X com limite de 65 W oferece a maior eficiência energética em relação à concorrência.

O PC Ryzen 5 7600 consome a menor quantidade de energia da parede em comparação com a execução de grandes FFTs Prime95 in-place, usando apenas 134,5 W.

O Ryzen 5 7600 é visto como 11% mais eficiente do que o Ryzen 9 7950X3D no site Witcher 3 quando usado em combinação com um RTX 4090, mas fica 21% atrás na eficiência de energia de vários núcleos do Cinebench R15.


Conforme indicado anteriormente, estamos em processo de transição para a RTX 4090 como a GPU escolhida. Os testes anteriores foram realizados principalmente com uma RTX 3090 ou uma Titan RTX, mas ainda vemos a combinação do Ryzen 5 7600 com a RTX 4090 liderando os gráficos de eficiência em

e Witcher 3

a 1080p Ultra.


Power Consumption: External monitor

0255075100125150175200225250275300325350375400425Tooltip
AMD Ryzen 5 7600; Prime95 V2810 Stress (external Monitor): Ø134.5 (132.3-137.8)
AMD Ryzen 5 7600; Cinebench R15 Multi (external Monitor): Ø134.2 (132.2-134.8)
AMD Ryzen 5 7600; Cinebench R20 Single (external Monitor): Ø97.8 (96-131.3)
AMD Ryzen 5 7600; Cinebench R20 Multi (external Monitor): Ø134 (133-135.6)
AMD Ryzen 5 7600; Cinebench R23 Single (external Monitor): Ø97.4 (96-129.5)
AMD Ryzen 5 7600; Cinebench R23 Multi (external Monitor): Ø133 (132.1-134.1)
AMD Ryzen 5 7600; 1920x1080 The Witcher 3 ultra (external Monitor): Ø423 (414-442)
AMD Ryzen 5 7600; Idle 1min (external Monitor): Ø81.5 (80.5-88.6)
Power Consumption / Cinebench R15 Multi Efficiency (external Monitor)
AMD Ryzen 9 7950X ECO 65 W, NVIDIA GeForce RTX 3090
25.2 Points per Watt +45%
AMD Ryzen 9 7950X ECO 105 W, NVIDIA GeForce RTX 3090
22.1 Points per Watt +27%
AMD Ryzen 9 7950X3D, NVIDIA GeForce RTX 4090
21.9 Points per Watt +26%
AMD Ryzen 7 7700, NVIDIA GeForce RTX 3090
20.4 Points per Watt +17%
AMD Ryzen 9 5950X, NVIDIA Titan RTX
19.9 Points per Watt +14%
AMD Ryzen 5 7600, NVIDIA GeForce RTX 4090
17.4 Points per Watt
AMD Ryzen 9 7950X, NVIDIA GeForce RTX 3090
17.1 Points per Watt -2%
Average of class Desktop (10 - 26.5, n=21, last 2 years)
16.4 Points per Watt -6%
Average NVIDIA GeForce RTX 4090 (11.1 - 21.9, n=6)
16.3 Points per Watt -6%
AMD Ryzen 9 5900X, NVIDIA Titan RTX
15.8 Points per Watt -9%
AMD Ryzen 9 7900X, NVIDIA GeForce RTX 3090
15.5 Points per Watt -11%
AMD Ryzen 7 7700X ECO 65 W, NVIDIA GeForce RTX 3090
15.5 Points per Watt -11%
AMD Ryzen 7 7700X, NVIDIA GeForce RTX 3090
13.3 Points per Watt -24%
Intel Core i9-13900K, NVIDIA GeForce RTX 3090
12.9 Points per Watt -26%
Intel Core i5-13600K, NVIDIA GeForce RTX 3090
12.7 Points per Watt -27%
Intel Core i9-12900K, NVIDIA Titan RTX
12.5 Points per Watt -28%
Intel Core i5-12600K, NVIDIA Titan RTX
12.4 Points per Watt -29%
AMD Ryzen 7 5800X, NVIDIA Titan RTX
11.9 Points per Watt -32%
AMD Ryzen 5 7600X, NVIDIA GeForce RTX 3090
11.7 Points per Watt -33%
AMD Ryzen 5 5600X, NVIDIA Titan RTX
11.6 Points per Watt -33%
AMD Ryzen 7 5800X3D, NVIDIA GeForce RTX 3090 Ti
11.5 Points per Watt -34%
Power Consumption / Witcher 3 ultra Efficiency (external Monitor)
AMD Ryzen 5 7600, NVIDIA GeForce RTX 4090
0.652 fps per Watt
AMD Ryzen 9 7950X3D, NVIDIA GeForce RTX 4090
0.59 fps per Watt -10%
Average NVIDIA GeForce RTX 4090 (0.518 - 0.712, n=19)
0.587 fps per Watt -10%
Average of class Desktop (0.1429 - 0.652, n=26, last 2 years)
0.437 fps per Watt -33%
AMD Ryzen 7 7700, NVIDIA GeForce RTX 3090
0.3699 fps per Watt -43%
Intel Core i5-13600K, NVIDIA GeForce RTX 3090
0.3664 fps per Watt -44%
AMD Ryzen 5 7600X, NVIDIA GeForce RTX 3090
0.3592 fps per Watt -45%
Intel Core i5-12600K, NVIDIA Titan RTX
0.3522 fps per Watt -46%
AMD Ryzen 7 5800X3D, NVIDIA GeForce RTX 3090 Ti
0.3447 fps per Watt -47%
AMD Ryzen 5 5600X, NVIDIA Titan RTX
0.3397 fps per Watt -48%
AMD Ryzen 9 7900X, NVIDIA GeForce RTX 3090
0.3389 fps per Watt -48%
Intel Core i9-13900K, NVIDIA GeForce RTX 3090
0.3373 fps per Watt -48%
AMD Ryzen 7 7700X, NVIDIA GeForce RTX 3090
0.3341 fps per Watt -49%
AMD Ryzen 7 5800X, NVIDIA Titan RTX
0.332 fps per Watt -49%
AMD Ryzen 9 7950X ECO 105 W, NVIDIA GeForce RTX 3090
0.3286 fps per Watt -50%
AMD Ryzen 9 7950X ECO 65 W, NVIDIA GeForce RTX 3090
0.3284 fps per Watt -50%
AMD Ryzen 9 7950X, NVIDIA GeForce RTX 3090
0.325 fps per Watt -50%
AMD Ryzen 7 7700X ECO 65 W, NVIDIA GeForce RTX 3090
0.3218 fps per Watt -51%
AMD Ryzen 9 5900X, NVIDIA Titan RTX
0.3207 fps per Watt -51%
AMD Ryzen 9 5950X, NVIDIA Titan RTX
0.3201 fps per Watt -51%
Intel Core i9-12900K, NVIDIA Titan RTX
0.3002 fps per Watt -54%
Power Consumption / Cinebench R15 Multi (external Monitor)
Intel Core i9-13900K, NVIDIA GeForce RTX 3090
480 (263min, 277P1 - 553max) Watt * -258%
AMD Ryzen 9 7950X, NVIDIA GeForce RTX 3090 (Idle: 95.2 W)
364 (357min, 357P1 - 373max) Watt * -171%
Intel Core i9-12900K, NVIDIA Titan RTX (Idle: 70.5 W)
324.4 Watt * -142%
AMD Ryzen 9 7900X, NVIDIA GeForce RTX 3090
313 (214min, 221P1 - 406max) Watt * -133%
Average NVIDIA GeForce RTX 4090 (Idle: 134.2 - 548, n=13 W)
300 Watt * -124%
Intel Core i5-13600K, NVIDIA GeForce RTX 3090
286 (232min, 235P1 - 343max) Watt * -113%
AMD Ryzen 9 7950X3D, NVIDIA GeForce RTX 4090
273 (264min, 264P1 - 304max) Watt * -103%
AMD Ryzen 9 7950X ECO 105 W, NVIDIA GeForce RTX 3090 (Idle: 93.4 W)
263 (262min, 262P1 - 265max) Watt * -96%
AMD Ryzen 7 7700X, NVIDIA GeForce RTX 3090 (Idle: 89.8 W)
240 (236min, 236P1 - 252max) Watt * -79%
AMD Ryzen 9 5900X, NVIDIA Titan RTX (Idle: 78.1 W)
235.8 (204min - 238max) Watt * -76%
AMD Ryzen 9 5950X, NVIDIA Titan RTX (Idle: 78 W)
226.1 (160min - 249max) Watt * -68%
AMD Ryzen 7 5800X, NVIDIA Titan RTX (Idle: 77.5 W)
220.7 (219min - 222max) Watt * -64%
AMD Ryzen 5 7600X, NVIDIA GeForce RTX 3090
215 (134.8min, 135.6P1 - 259max) Watt * -60%
AMD Ryzen 7 5800X3D, NVIDIA GeForce RTX 3090 Ti (Idle: 102 W)
209 (208min, 208P1 - 212max) Watt * -56%
Intel Core i5-12600K, NVIDIA Titan RTX (Idle: 70.45 W)
205.9 (145min - 213max) Watt * -53%
AMD Ryzen 7 7700X ECO 65 W, NVIDIA GeForce RTX 3090
196.1 (195.3min, 195.3P1 - 196.7max) Watt * -46%
AMD Ryzen 9 7950X ECO 65 W, NVIDIA GeForce RTX 3090 (Idle: 93.1 W)
191.9 (191.1min, 191.1P1 - 192.5max) Watt * -43%
AMD Ryzen 5 5600X, NVIDIA Titan RTX (Idle: 79.23 W)
170.1 (165min - 210max) Watt * -27%
Average of class Desktop (Idle: 10.4 - 428, n=22, last 2 years W)
156 Watt * -16%
AMD Ryzen 7 7700, NVIDIA GeForce RTX 3090 (Idle: 73.4 W)
149.4 (148.6min, 148.6P1 - 150.3max) Watt * -11%
AMD Ryzen 5 7600, NVIDIA GeForce RTX 4090 (Idle: 81.5 W)
134.2 (132.2min, 132.4P1 - 134.8max) Watt *
Power Consumption / Prime95 V2810 Stress (external Monitor)
Intel Core i9-13900K, NVIDIA GeForce RTX 3090
471 (414min, 427P1 - 561max) Watt * -250%
Intel Core i5-13600K, NVIDIA GeForce RTX 3090
348 (283min, 288P1 - 496max) Watt * -159%
AMD Ryzen 9 7950X, NVIDIA GeForce RTX 3090 (Idle: 95.2 W)
335 (311min, 312P1 - 364max) Watt * -149%
AMD Ryzen 9 7900X, NVIDIA GeForce RTX 3090
319 (310min, 311P1 - 357max) Watt * -137%
Average NVIDIA GeForce RTX 4090 (Idle: 134.5 - 537, n=13 W)
311 Watt * -131%
Intel Core i9-12900K, NVIDIA Titan RTX (Idle: 70.5 W)
279.6 (261min - 357max) Watt * -108%
AMD Ryzen 9 7950X3D, NVIDIA GeForce RTX 4090
276 (267min, 267P1 - 329max) Watt * -105%
Intel Core i5-12600K, NVIDIA Titan RTX (Idle: 70.45 W)
256.5 (238min - 275max) Watt * -91%
AMD Ryzen 9 7950X ECO 105 W, NVIDIA GeForce RTX 3090 (Idle: 93.4 W)
254 (247min, 247P1 - 268max) Watt * -89%
AMD Ryzen 9 5950X, NVIDIA Titan RTX (Idle: 78 W)
252.3 (227min - 259max) Watt * -88%
AMD Ryzen 7 5800X, NVIDIA Titan RTX (Idle: 77.5 W)
242.3 (222min - 254max) Watt * -80%
AMD Ryzen 9 5900X, NVIDIA Titan RTX (Idle: 78.1 W)
235.6 (211min - 284max) Watt * -75%
AMD Ryzen 7 7700X, NVIDIA GeForce RTX 3090 (Idle: 89.8 W)
230 (216min, 217P1 - 265max) Watt * -71%
AMD Ryzen 5 7600X, NVIDIA GeForce RTX 3090
227 (218min, 219P1 - 245max) Watt * -69%
AMD Ryzen 7 5800X3D, NVIDIA GeForce RTX 3090 Ti (Idle: 102 W)
226 (221min, 222P1 - 234max) Watt * -68%
AMD Ryzen 7 7700X ECO 65 W, NVIDIA GeForce RTX 3090
189.8 (184.1min, 184.2P1 - 204max) Watt * -41%
AMD Ryzen 9 7950X ECO 65 W, NVIDIA GeForce RTX 3090 (Idle: 93.1 W)
186.8 (180.7min, 180.9P1 - 201max) Watt * -39%
AMD Ryzen 5 5600X, NVIDIA Titan RTX (Idle: 79.23 W)
175.8 (170min - 179max) Watt * -31%
AMD Ryzen 7 7700, NVIDIA GeForce RTX 3090 (Idle: 73.4 W)
163.2 (156.6min, 156.8P1 - 174.5max) Watt * -21%
Average of class Desktop (Idle: 11.1 - 400, n=22, last 2 years W)
145.6 Watt * -8%
AMD Ryzen 5 7600, NVIDIA GeForce RTX 4090 (Idle: 81.5 W)
134.5 (132.3min, 132.5P1 - 137.8max) Watt *
Power Consumption / The Witcher 3 ultra (external Monitor)
AMD Ryzen 7 5800X3D, NVIDIA GeForce RTX 3090 Ti (Idle: 102 W)
561 (533min, 542P1 - 582max) Watt * -33%
AMD Ryzen 9 7900X, NVIDIA GeForce RTX 3090
555 (547min, 549P1 - 607max) Watt * -31%
AMD Ryzen 9 7950X, NVIDIA GeForce RTX 3090 (Idle: 95.2 W)
539 (534min, 535P1 - 547max) Watt * -27%
AMD Ryzen 9 7950X ECO 105 W, NVIDIA GeForce RTX 3090 (Idle: 93.4 W)
539 (252min, 535P1 - 573max) Watt * -27%
AMD Ryzen 9 7950X ECO 65 W, NVIDIA GeForce RTX 3090 (Idle: 93.1 W)
539 (534min, 534P1 - 547max) Watt * -27%
Intel Core i9-13900K, NVIDIA GeForce RTX 3090
533 (520min, 525P1 - 568max) Watt * -26%
AMD Ryzen 7 7700X ECO 65 W, NVIDIA GeForce RTX 3090
524 (515min, 517P1 - 533max) Watt * -24%
AMD Ryzen 5 7600X, NVIDIA GeForce RTX 3090
519 (510min, 513P1 - 564max) Watt * -23%
AMD Ryzen 7 7700, NVIDIA GeForce RTX 3090 (Idle: 73.4 W)
519 (511min, 512P1 - 532max) Watt * -23%
Average NVIDIA GeForce RTX 4090 (Idle: 423 - 600, n=19 W)
518 Watt * -22%
AMD Ryzen 9 7950X3D, NVIDIA GeForce RTX 4090
517 (508min, 510P1 - 539max) Watt * -22%
AMD Ryzen 7 7700X, NVIDIA GeForce RTX 3090 (Idle: 89.8 W)
516 (512min, 512P1 - 529max) Watt * -22%
Intel Core i5-13600K, NVIDIA GeForce RTX 3090
500 (491min, 493P1 - 528max) Watt * -18%
Intel Core i9-12900K, NVIDIA Titan RTX (Idle: 70.5 W)
463 (439min - 490max) Watt * -9%
AMD Ryzen 9 5950X, NVIDIA Titan RTX (Idle: 78 W)
440.5 (420min - 466max) Watt * -4%
AMD Ryzen 9 5900X, NVIDIA Titan RTX (Idle: 78.1 W)
439.6 (419min - 497max) Watt * -4%
AMD Ryzen 5 7600, NVIDIA GeForce RTX 4090 (Idle: 81.5 W)
423 (414min, 415P1 - 442max) Watt *
AMD Ryzen 7 5800X, NVIDIA Titan RTX (Idle: 77.5 W)
418.7 (403min - 452max) Watt * +1%
AMD Ryzen 5 5600X, NVIDIA Titan RTX (Idle: 79.23 W)
409.2 (381min - 434max) Watt * +3%
Intel Core i5-12600K, NVIDIA Titan RTX (Idle: 70.45 W)
408.9 (401min - 460max) Watt * +3%
Average of class Desktop (Idle: 19.1 - 569, n=37, last 2 years W)
354 Watt * +16%

* ... smaller is better

Pro

+ Supera as CPUs Zen 3 e o Core i9-12900K em um único núcleo
+ Suporte para overclocking manual e PBO
+ Altamente eficiente em termos de energia
+ IGPU RDNA 2 integrada na matriz de E/S
+ Resfriador Wraith Stealth incluído

Contra

- Não consegue se equiparar ao Core i5-13600K em benchmarks de CPU
- Não há compatibilidade com versões anteriores do DDR4; os preços do DDR5 ainda são mais altos
- O custo inicial de atualização da plataforma pode ser alto

Veredicto: Uma escolha inteligente para construções de jogos de médio porte

AMD Ryzen 5 7600. Unidade de análise cortesia da AMD Índia.

Embora os processadores Ryzen 7000 non-X de 65 W possam parecer supérfluos à primeira vista, essas CPUs oferecem uma opção viável para aqueles que buscam construções econômicas sem penalidades de desempenho perceptíveis em comparação com a série Ryzen 7000X.

A AMD conseguiu oferecer aumentos significativos de desempenho com o Ryzen 5 7600, superando a maioria das CPUs Zen 3 e até mesmo um gigante como o Intel Core i9-12900K em um único núcleo - isso também, com um TDP muito econômico de 65 W que pode chegar a 90 W sob carga. Isso também se reflete nos excelentes números de eficiência energética do processador.

O Intel Raptor Lake Core i5-13600K ainda tem a vantagem no desempenho geral da CPU, mas o Ryzen 5 custa US$ 100 a menos, de acordo com os preços atuais, e fica logo atrás do Core i5-13600K nos testes de núcleo único. O chip Intel tem a vantagem da contagem de núcleos/thread em vários núcleos, mas o impacto real disso dependerá de seu fluxo de trabalho específico.

O AMD Ryzen 5 7600 preenche todos os requisitos de uma CPU viável para jogos e criação de conteúdo a um preço que não é muito caro, apesar do gasto inicial com a plataforma Socket AM5."

Os jogos, em geral, têm sido o forte do Zen 4 desde o início. O Ryzen 5 7600 pode ser apenas cerca de 9% mais lento do que um Ryzen 9 7950X ou um Core i9-13900K em configurações mais baixas, e essa diferença pode diminuir ainda mais em configurações e resoluções de qualidade mais alta.

O processador também vem com uma iGPU RDNA 2 na matriz de E/S. Embora isso não possa realmente dar impulso a nada além de jogos básicos e casuais em 720p, ele funciona muito bem como um acelerador de hardware para codificação e decodificação de mídia. Isso também é útil nos momentos em que as estrelas não se alinham e a GPU discreta desiste de você.

Se você não se importar em engolir essa pílula e seu principal caso de uso for jogos, o Ryzen 5 7600 oferece um ótimo custo-benefício e pode manter sua placa de vídeo moderna alimentada sem gargalos perceptíveis.

Preço e disponibilidade

O AMD Ryzen 5 7600 está atualmente disponível a um preço com desconto de ₹22.997 na Amazon Índia.

Nos EUA, esse processador de 65 W pode ser adquirido por US$ 220 na Amazon US, juntamente com um pacote de jogos Star Wars: Jedi Survivor. O Ryzen 5 7600 também está sendo vendido a preço de MSRP de US$ 229 na Best Buy.

Transparency

The present review sample was made available to the author as a loan by the manufacturer or a shop for the purposes of review. The lender had no influence on this review, nor did the manufacturer receive a copy of this review before publication. There was no obligation to publish this review.

Pricecompare

Please share our article, every link counts!
> Análises e revisões de portáteis e celulares > Análises > Análises > Análise do AMD Ryzen 5 7600 65 W: O ponto ideal para jogos de médio porte de US$ 220 que supera o Core i9-12900K e todas as CPUs Zen 3 em um único núcleo
Vaidyanathan Subramaniam, 2023-04-27 (Update: 2023-04-27)