Análise do laptop HP Omen 16 2023: 145 W GeForce Desempenho da RTX 4080

O Omen 16 de 2023 é o sucessor do o modelo do ano passado com processadores Raptor Lake-H de 13ª geração mais rápidos, GPUs Nvidia Ada Lovelace RTX e um design de chassi renovado. Ele pode ser considerado um passo à frente do modelo mais econômico HP Pavilion Gaming 16.
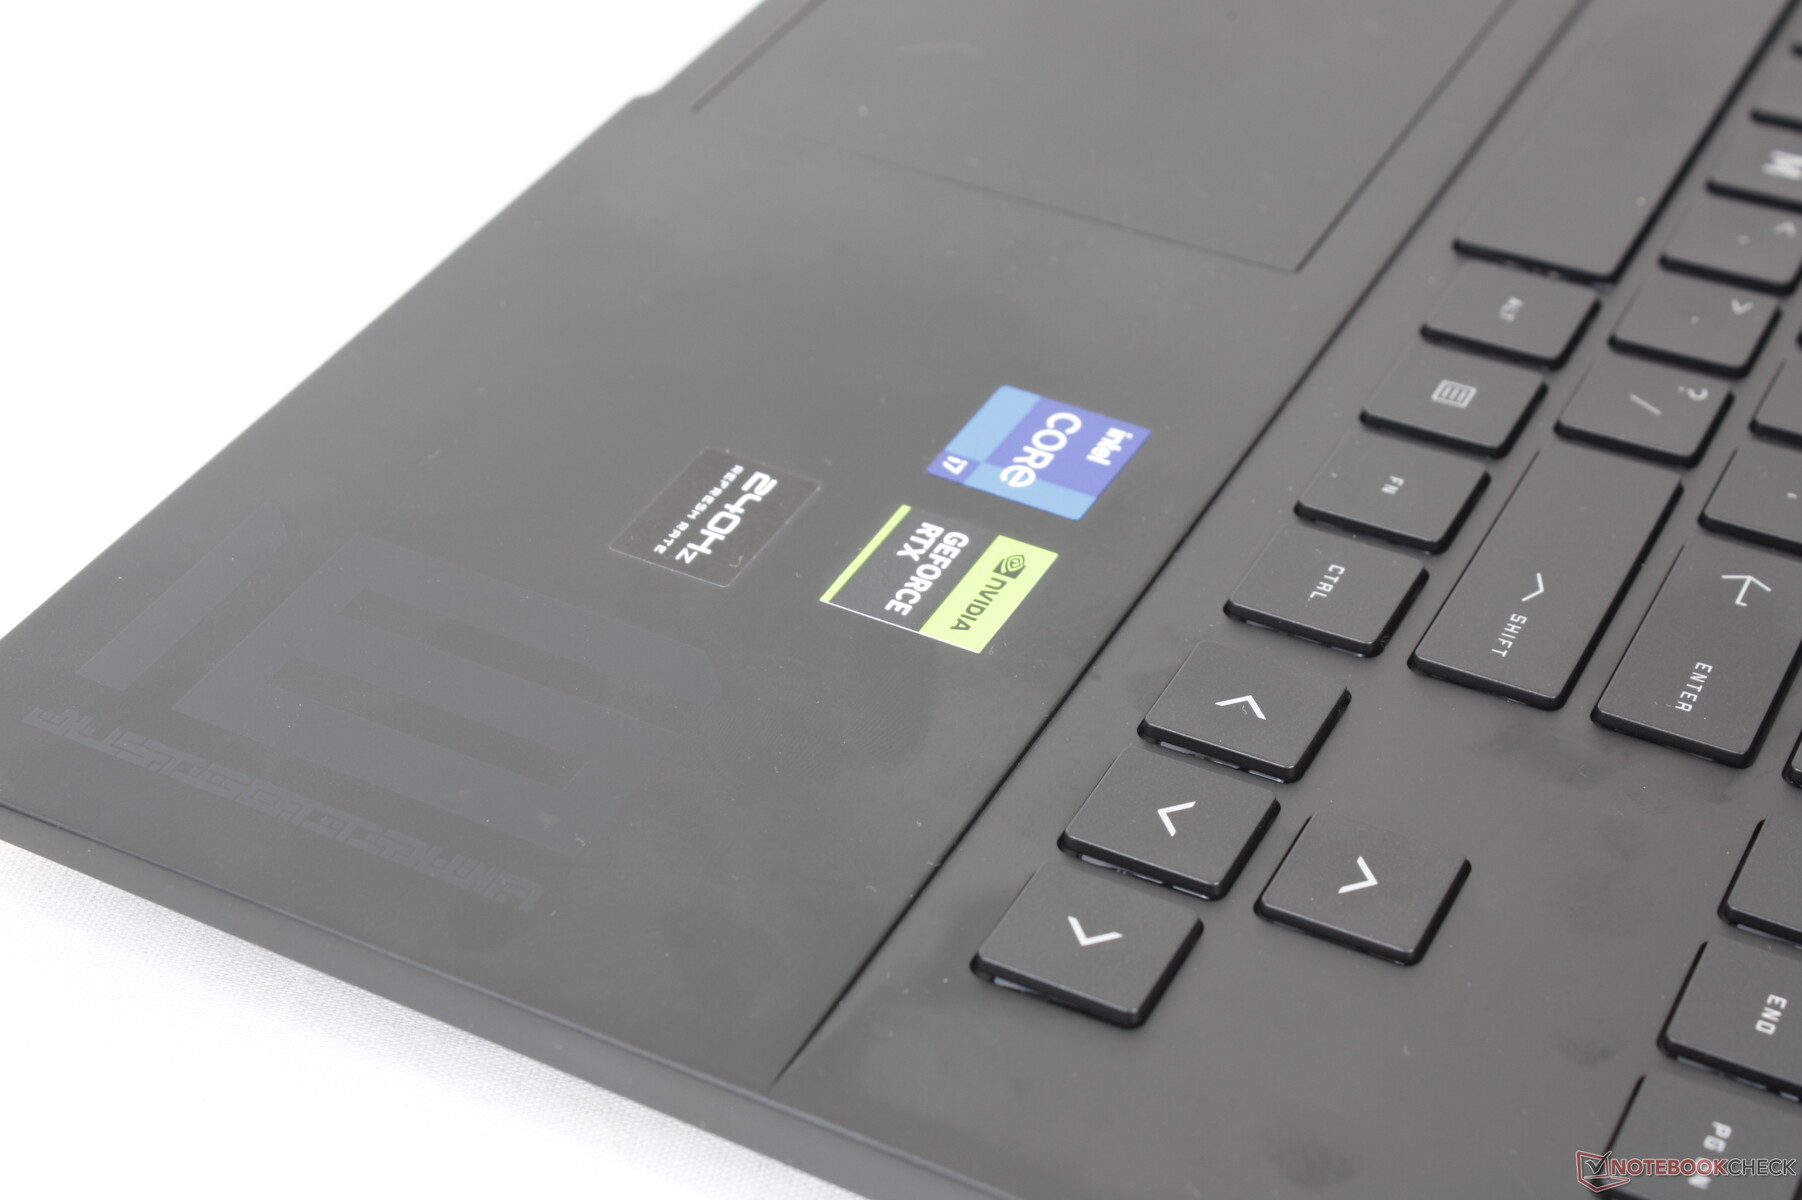
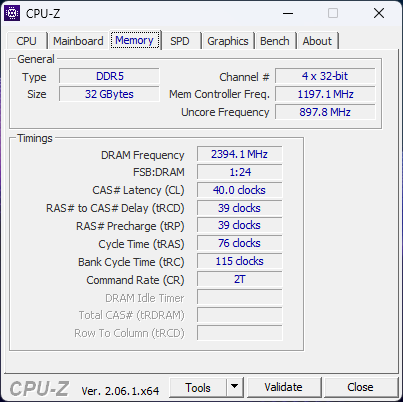
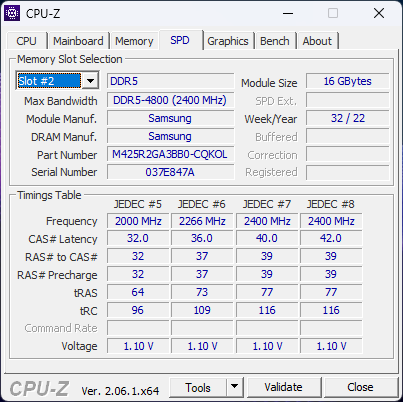
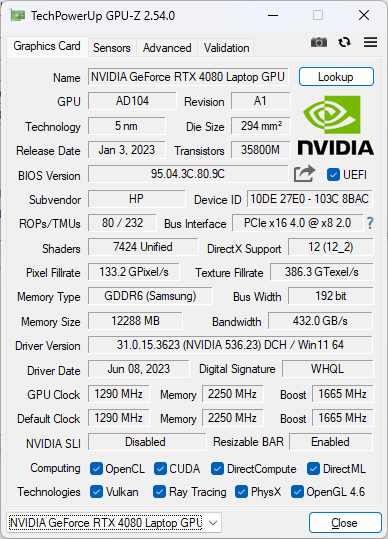
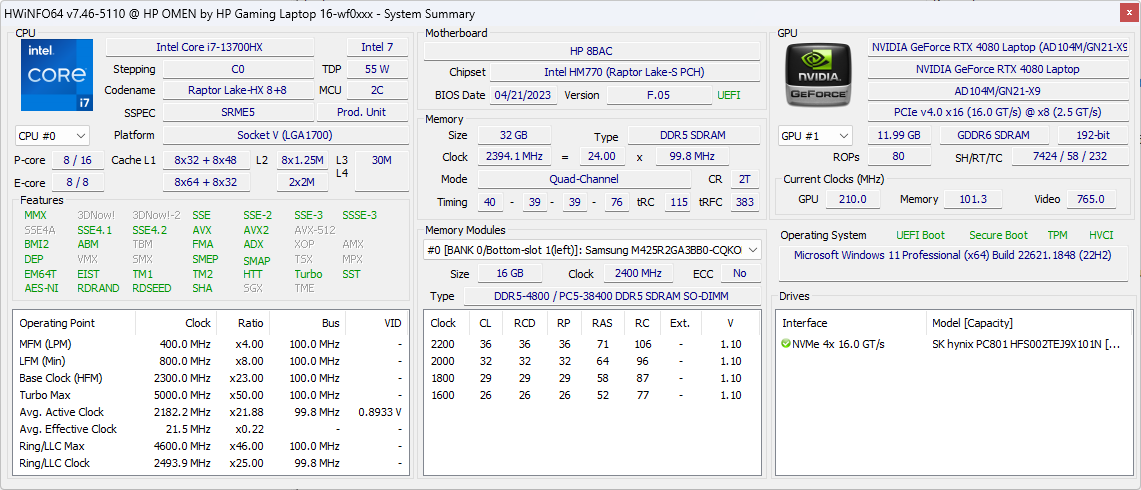
Nossa unidade de análise é a configuração mais avançada com a CPU Raptor Lake Core i7-13700HX de 13ª geração, GPU GeForce RTX 4080 de 145 W, tela IPS de 1440p240, iluminação RGB por tecla e 32 GB de RAM por pouco menos de US$ 2.600. SKUs menores com a RTX 4060, tela IPS 1080p165 e iluminação de teclado de zona única também estão disponíveis a partir de US$ 1.100. Todas as opções no momento devem vir com a mesma CPU Core i7-13700HX, no entanto. Observe que a HP abandonou as opções AMD e Radeon este ano.
As alternativas ao Omen 16 incluem outros laptops para jogos de 16 polegadas de alta qualidade, como o Alienware x16 R1,Lenovo Legion Pro 7 16,Asus ROG Strix G16ou Razer Blade 16.
Mais análises da HP:
Possíveis concorrentes em comparação
Avaliação | Data | Modelo | Peso | Altura | Size | Resolução | Preço |
|---|---|---|---|---|---|---|---|
| 87.4 % v7 (old) | 07/2023 | HP Omen 16-wf000 i7-13700HX, GeForce RTX 4080 Laptop GPU | 2.4 kg | 23.6 mm | 16.10" | 2560x1440 | |
| 86.4 % v7 (old) | 12/2022 | HP Omen 16-n0033dx R7 6800H, Radeon RX 6650M | 2.4 kg | 22.6 mm | 16.10" | 1920x1080 | |
| 88.4 % v7 (old) | 06/2023 | Alienware x16 R1 i9-13900HK, GeForce RTX 4080 Laptop GPU | 2.6 kg | 18.57 mm | 16.00" | 2560x1600 | |
| 88.8 % v7 (old) | 06/2023 | Lenovo Legion Pro 7 RTX4090 i9-13900HX, GeForce RTX 4090 Laptop GPU | 2.7 kg | 26 mm | 16.00" | 2560x1600 | |
| 88.4 % v7 (old) | 03/2023 | Asus ROG Strix G16 G614JZ i9-13980HX, GeForce RTX 4080 Laptop GPU | 2.4 kg | 30.4 mm | 16.00" | 2560x1600 | |
| 91.2 % v7 (old) | 02/2023 | Razer Blade 16 Early 2023 i9-13950HX, GeForce RTX 4080 Laptop GPU | 2.4 kg | 21.99 mm | 16.00" | 2560x1600 |
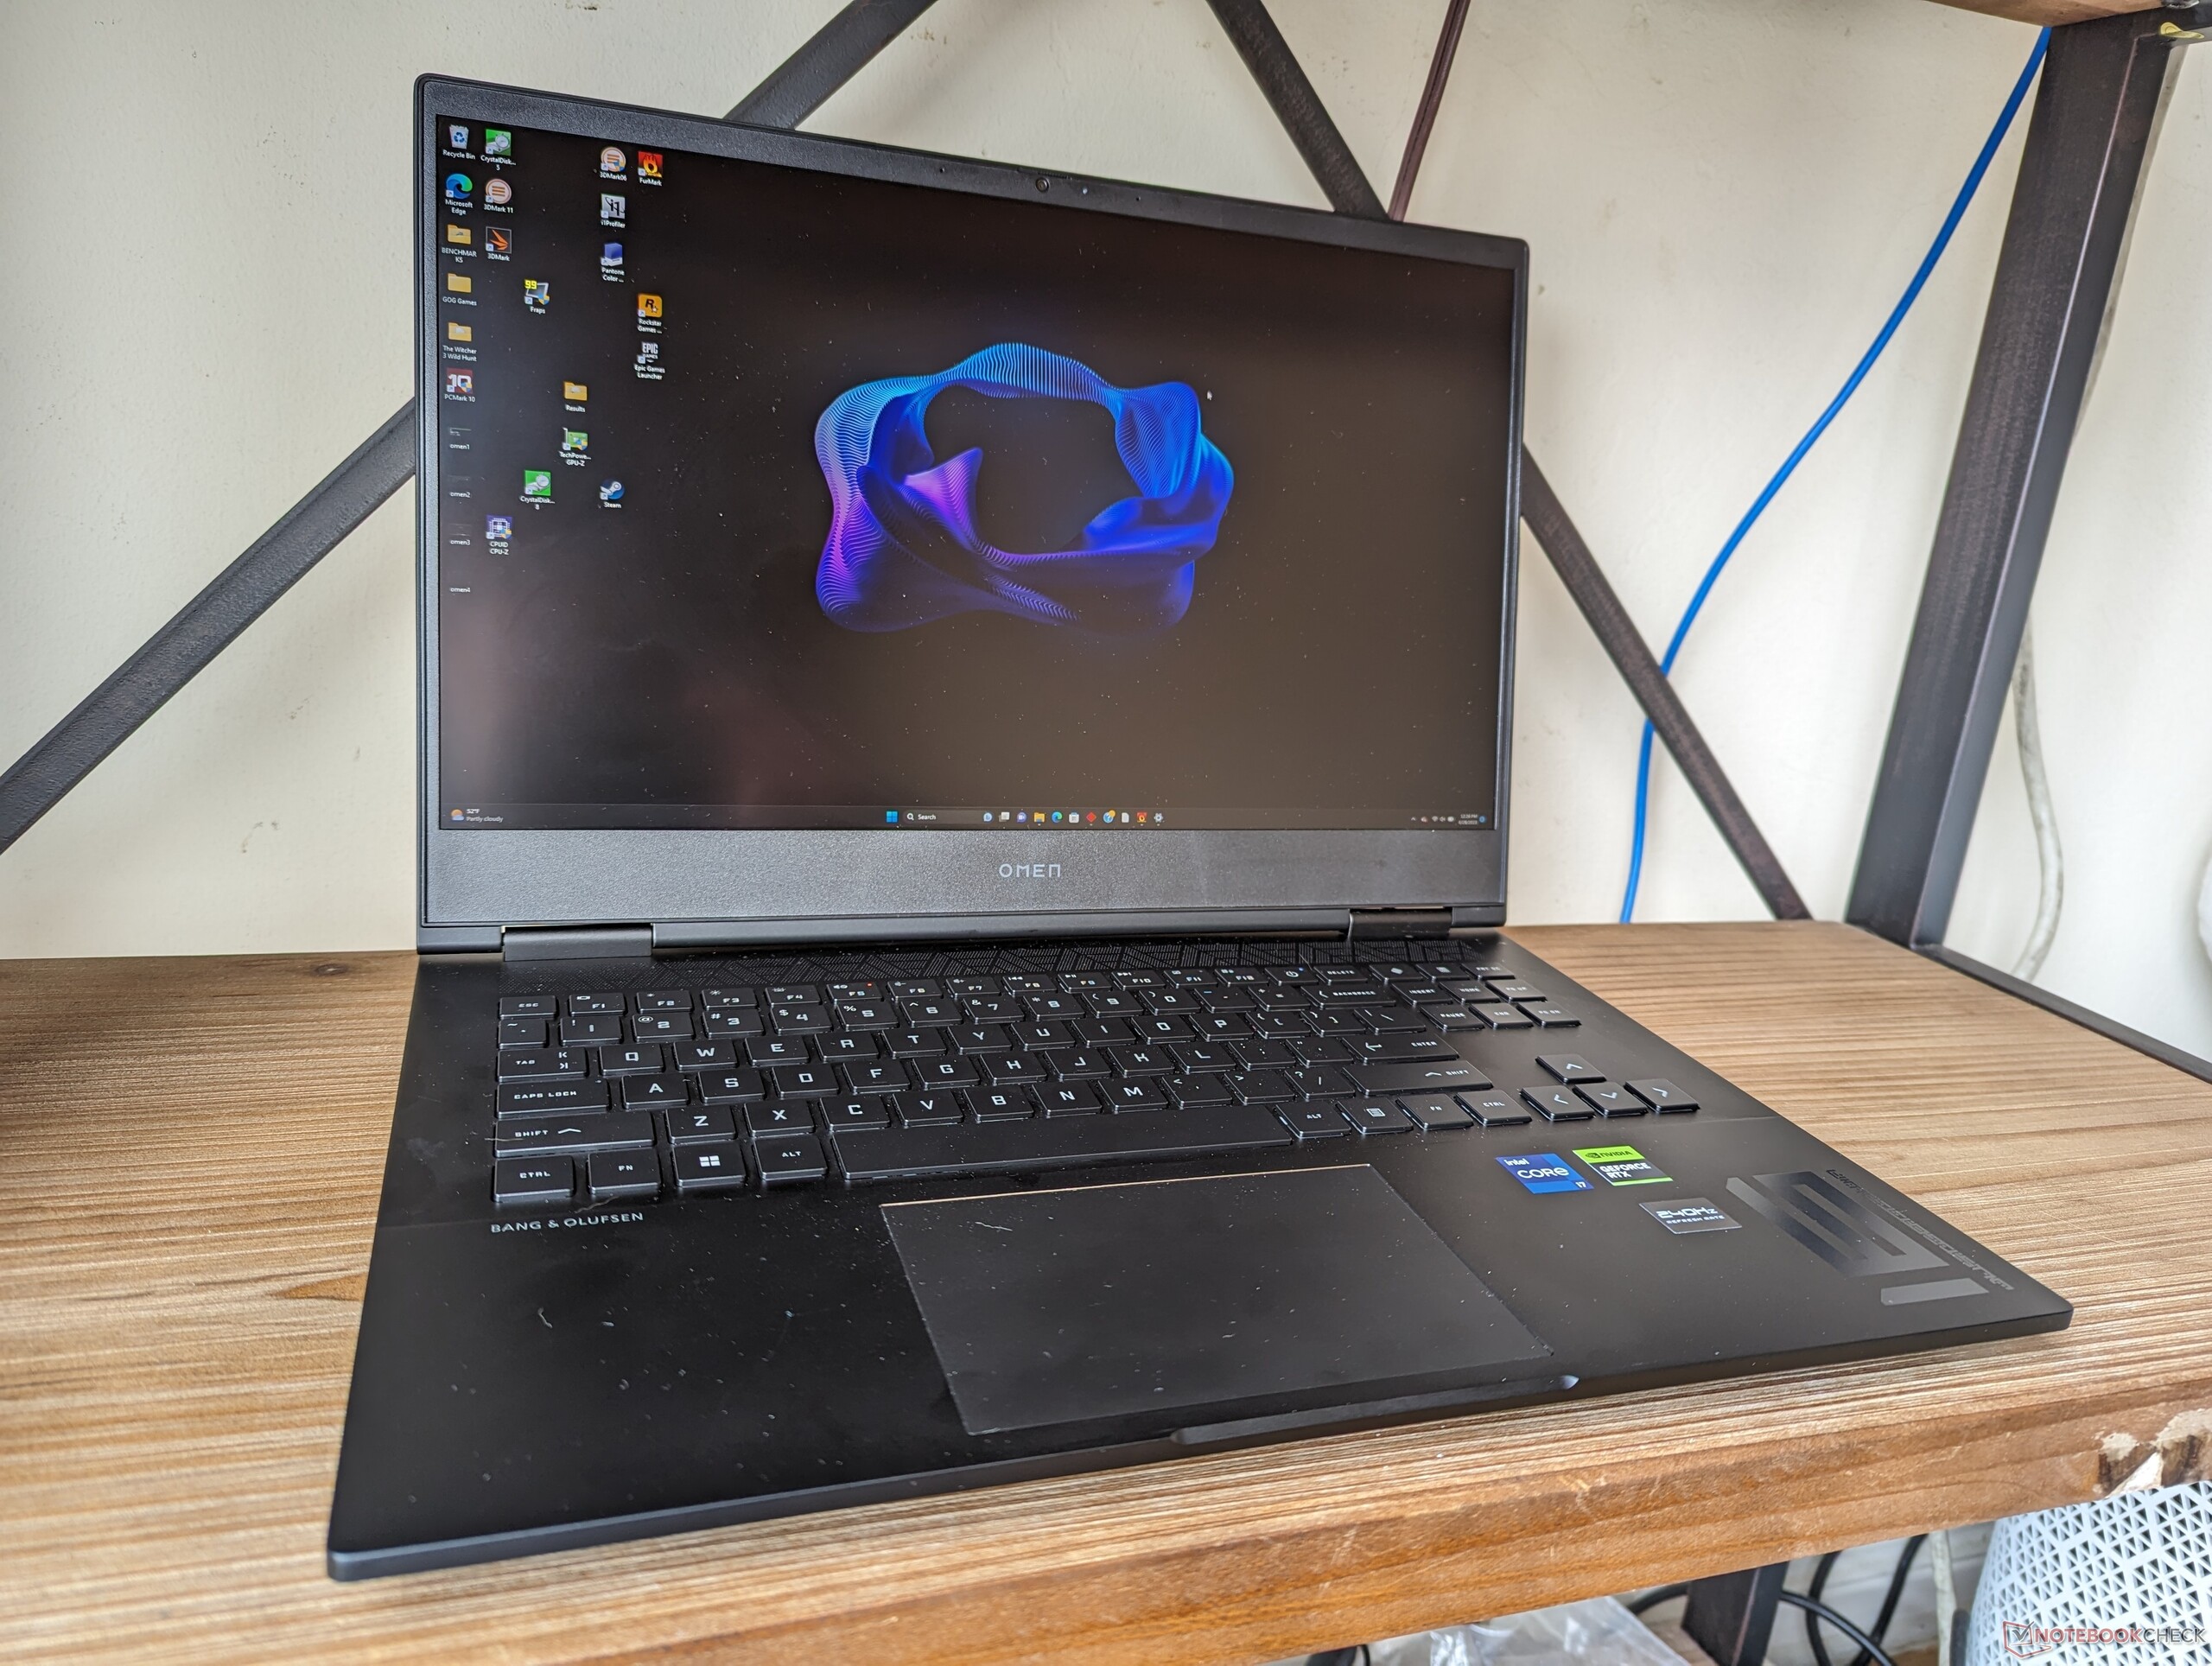
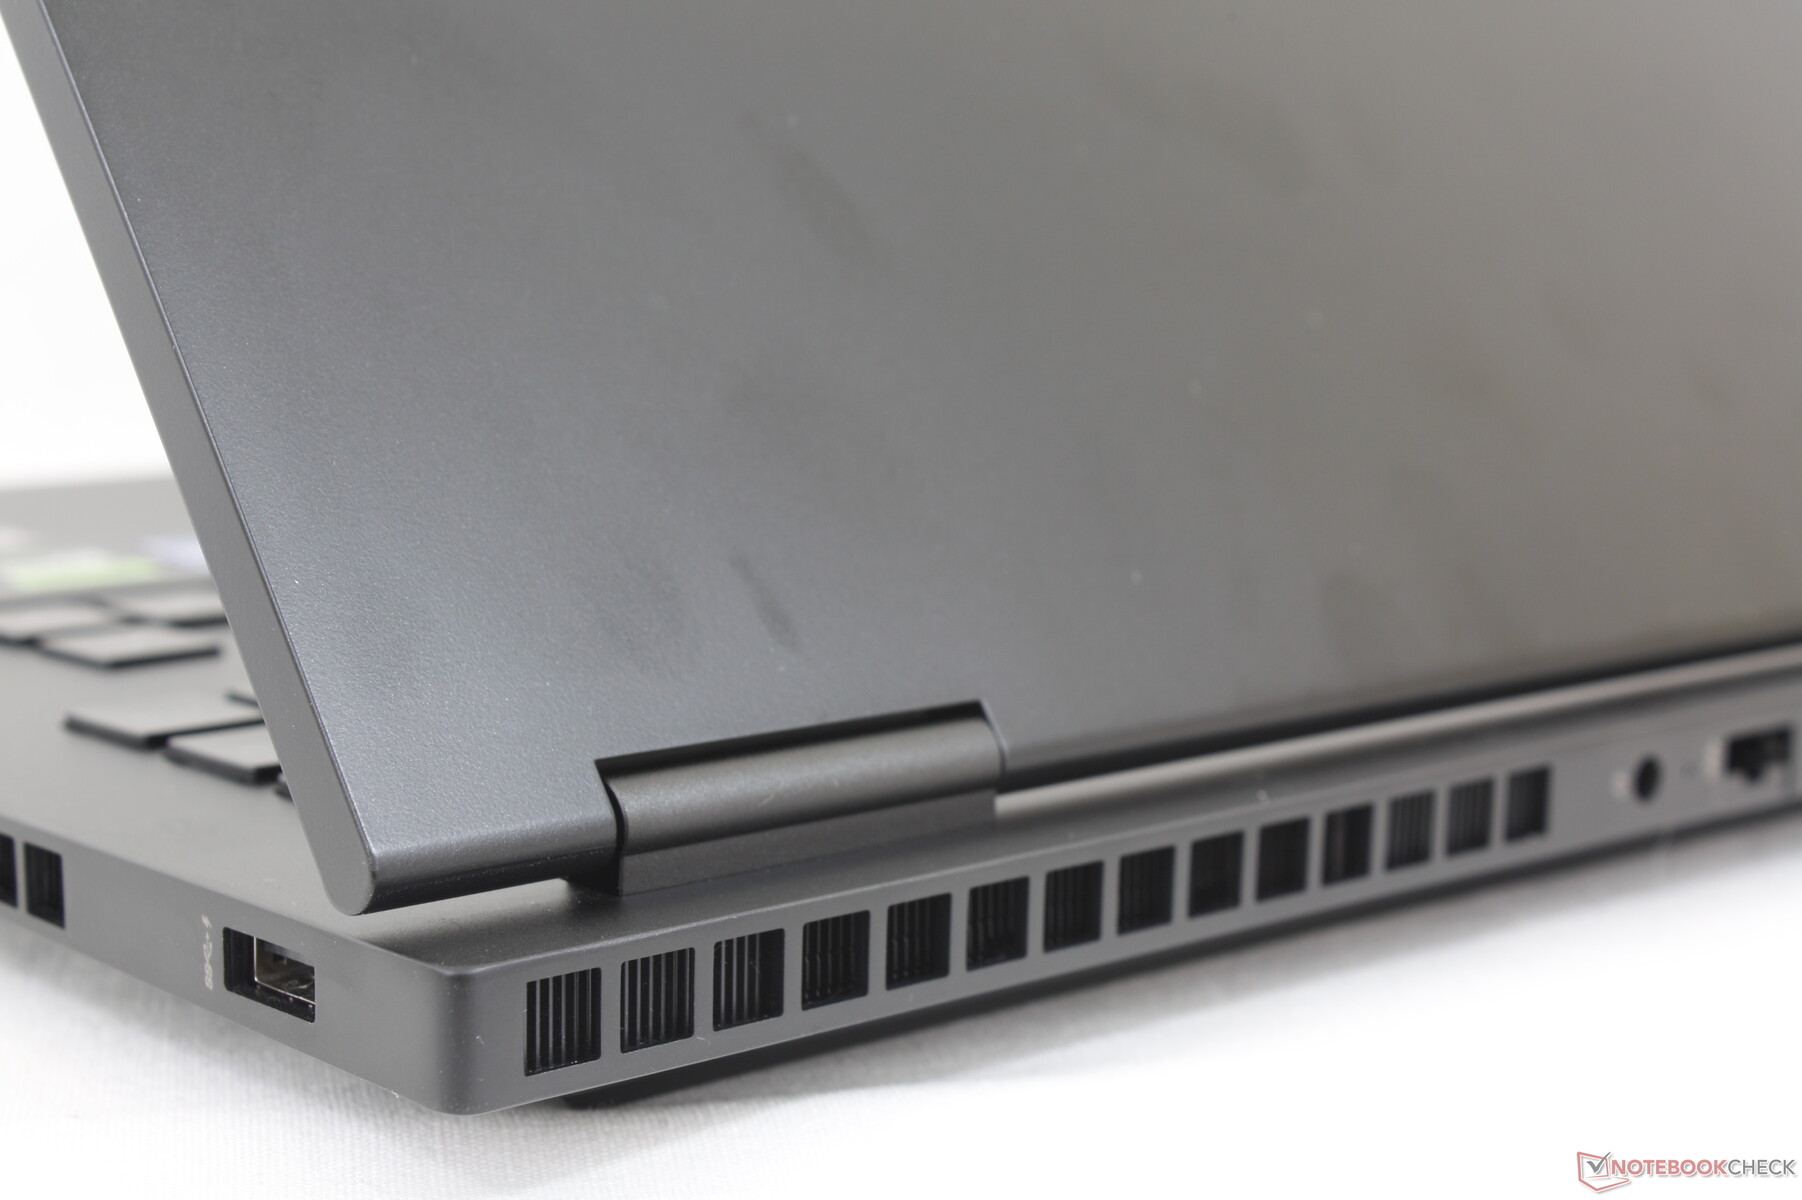
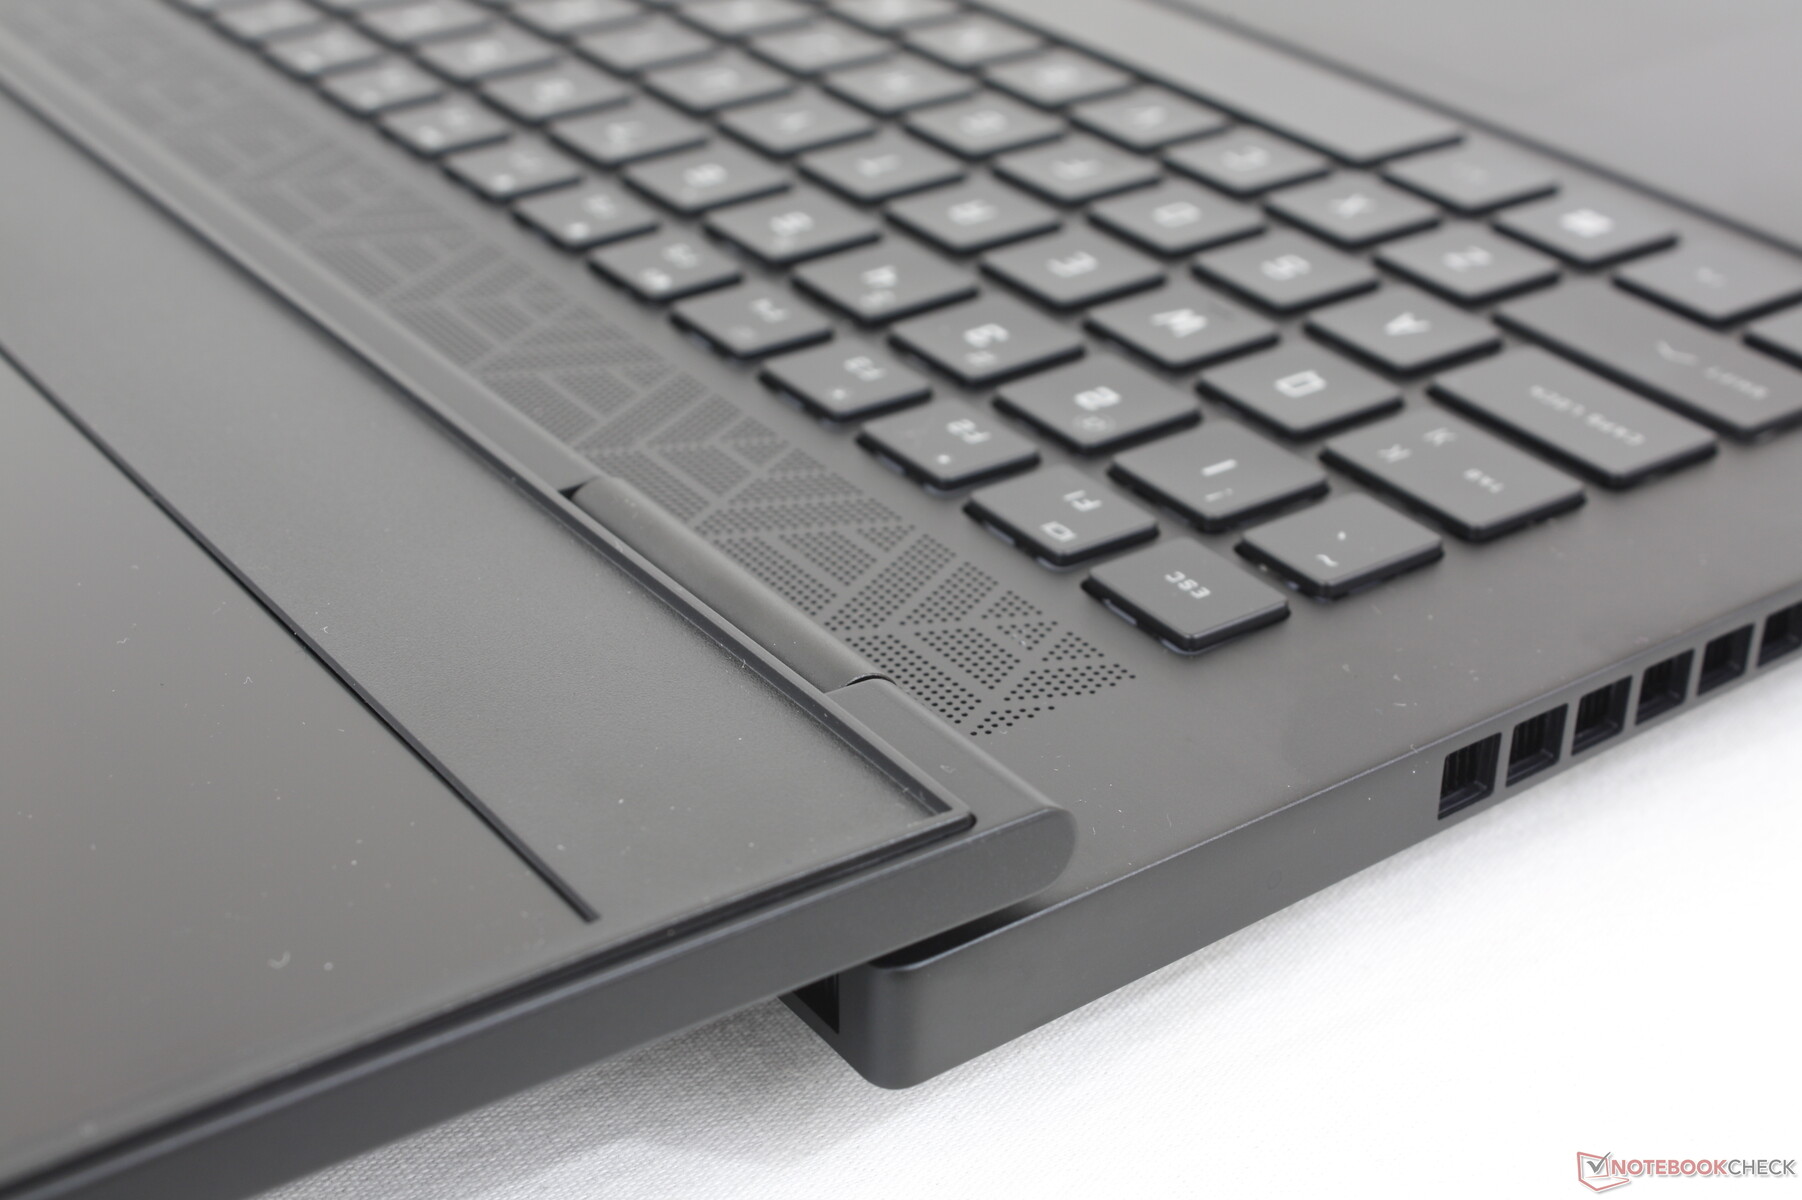
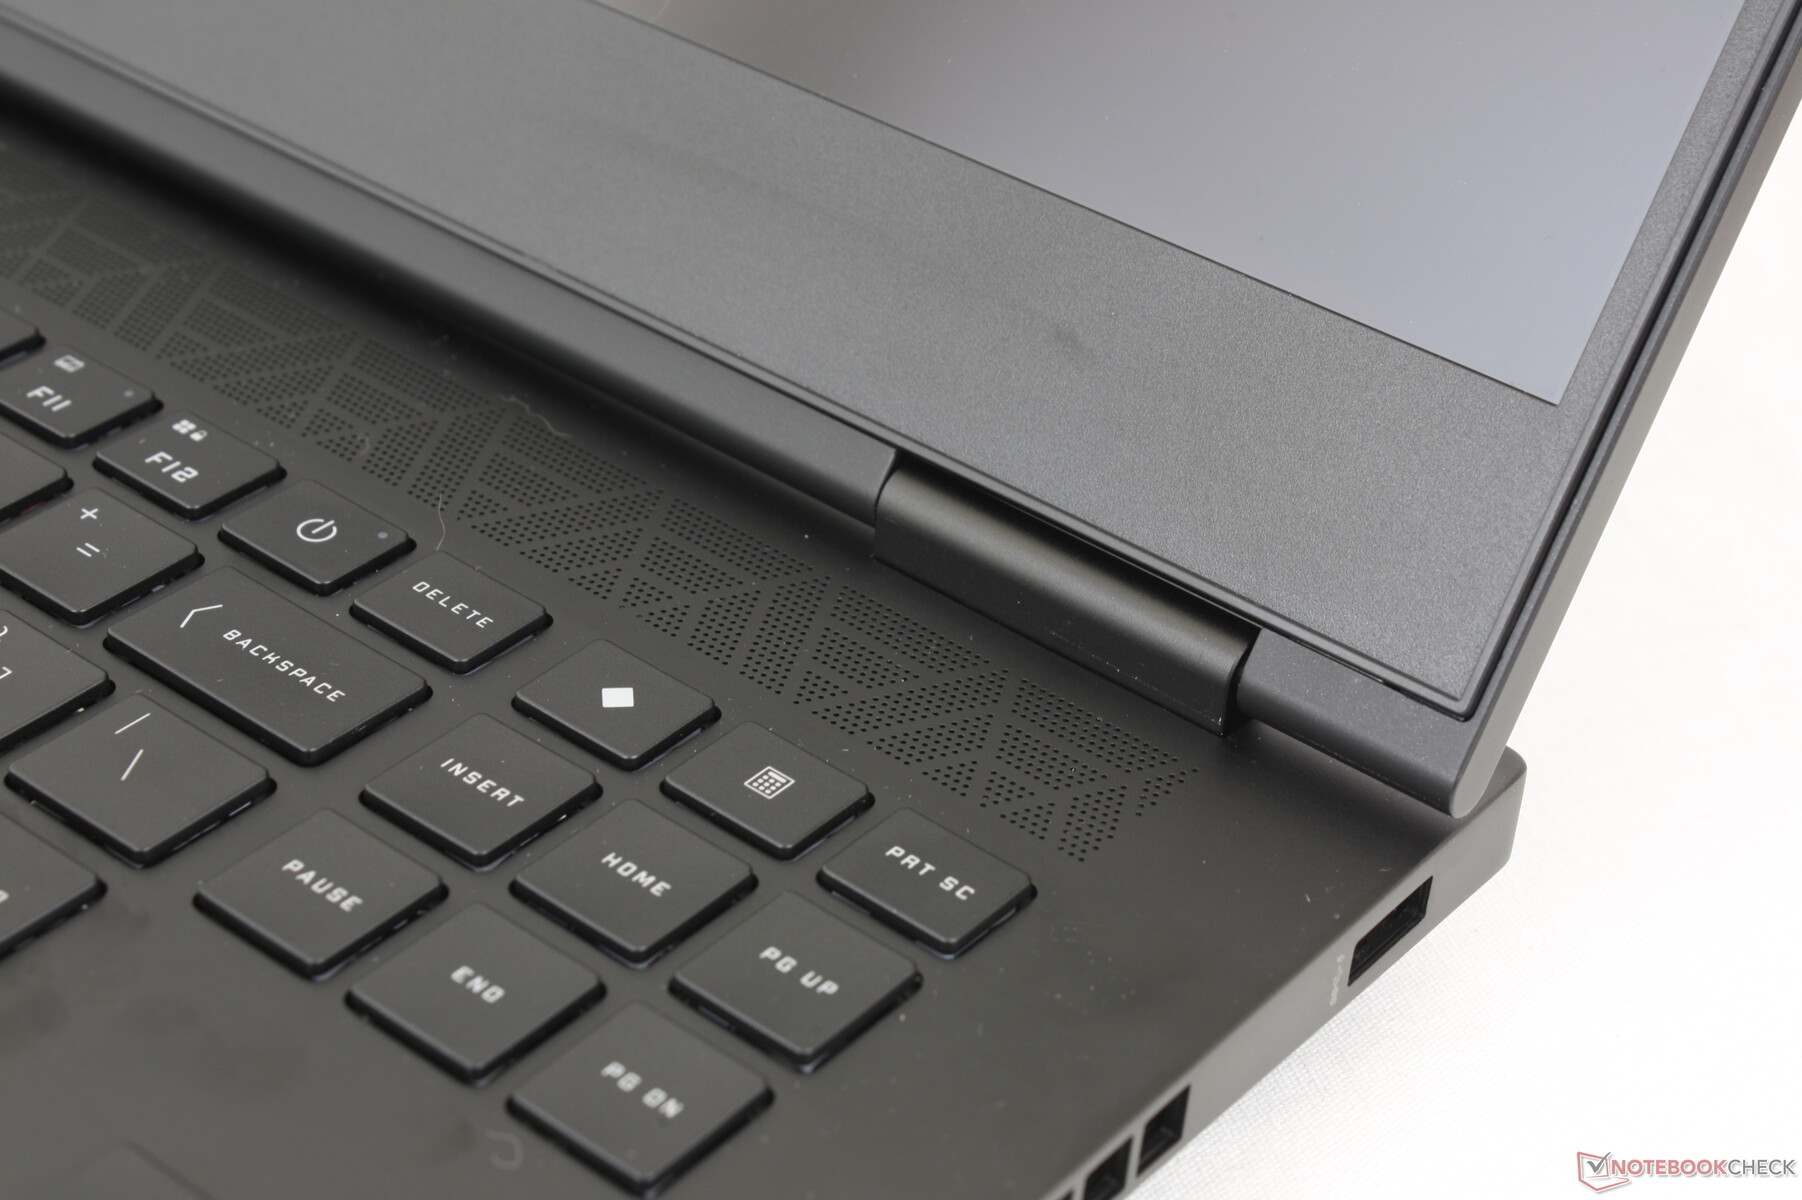
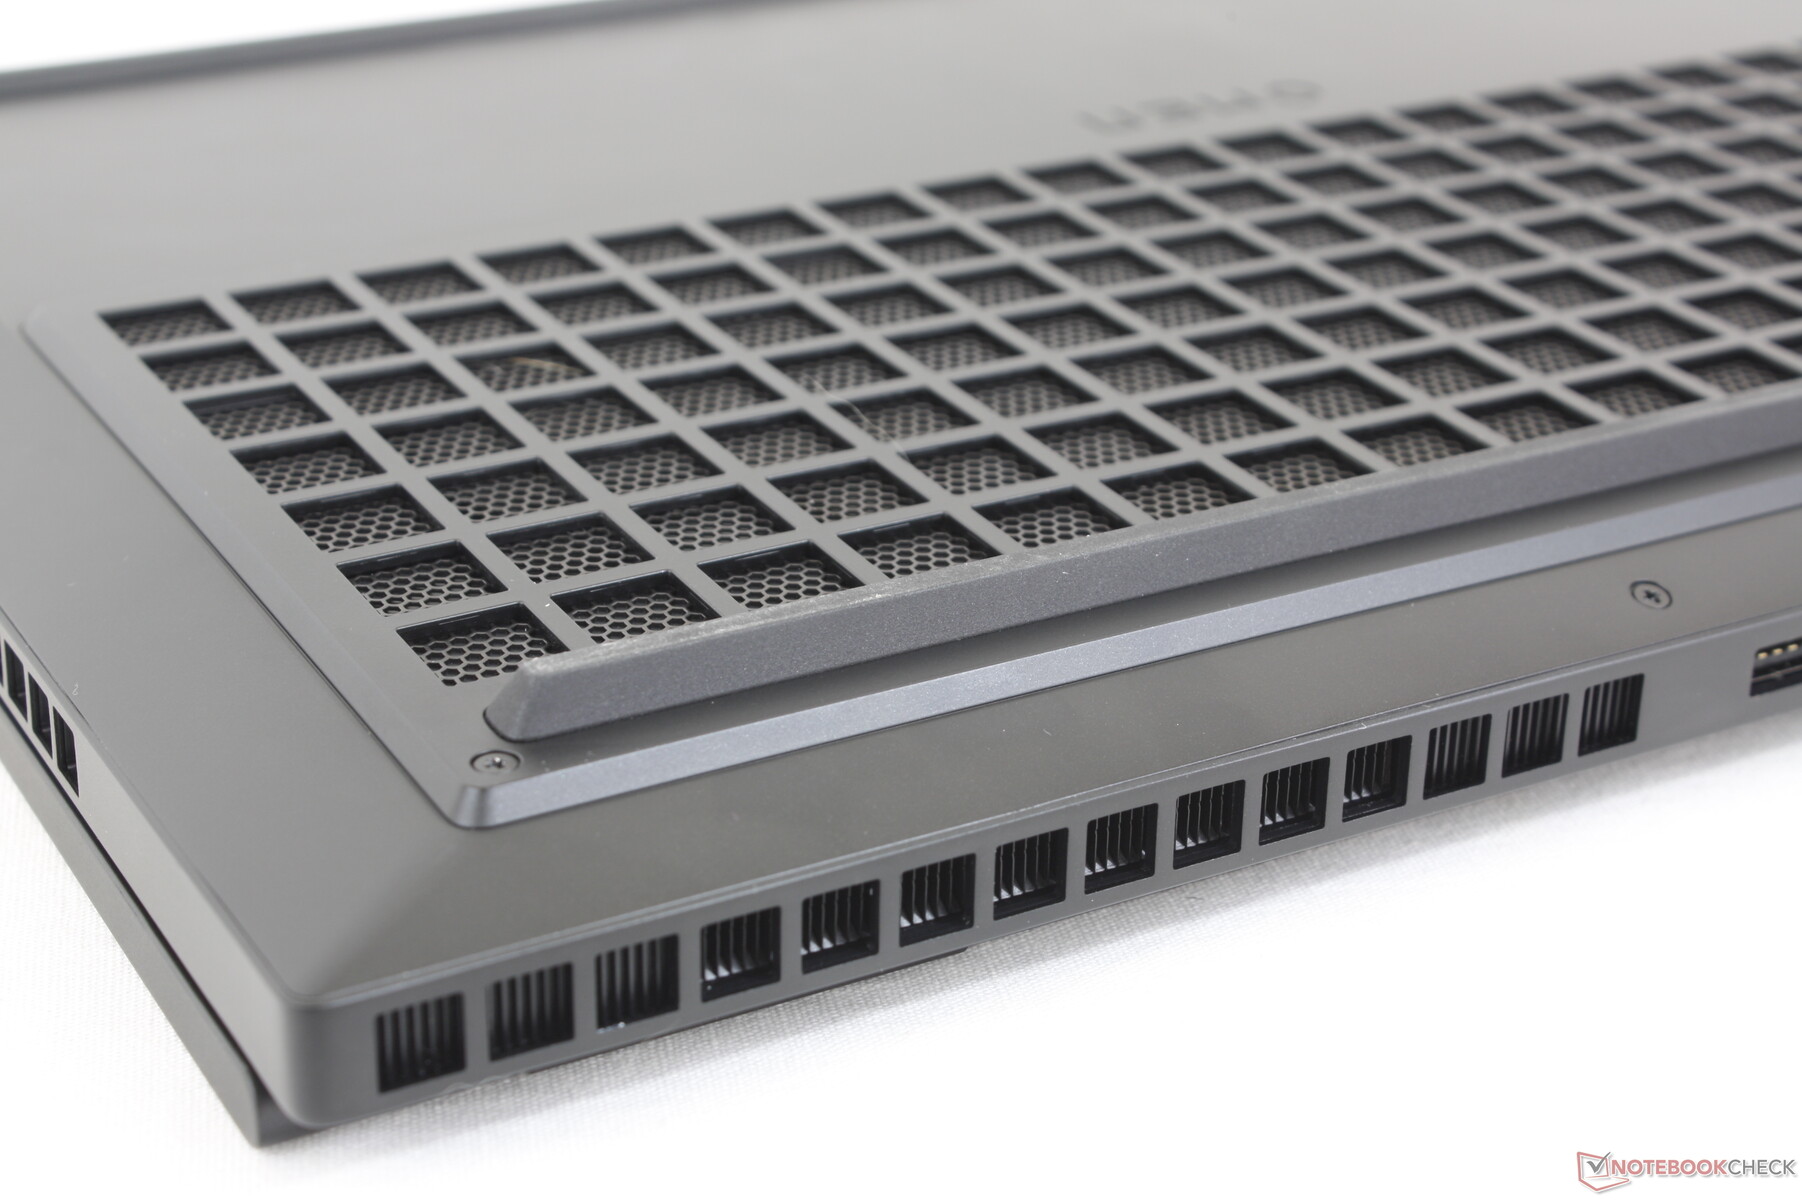
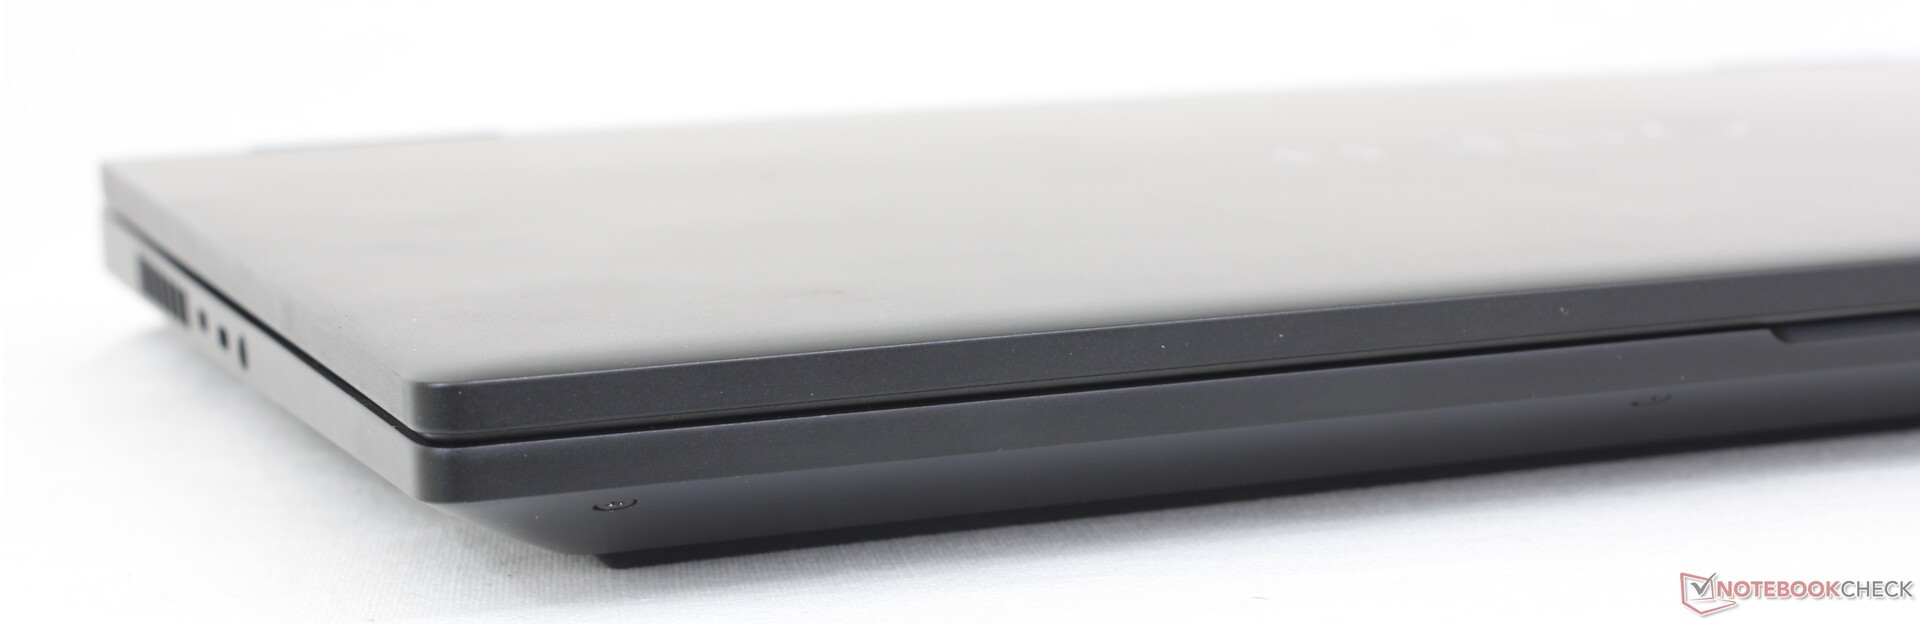
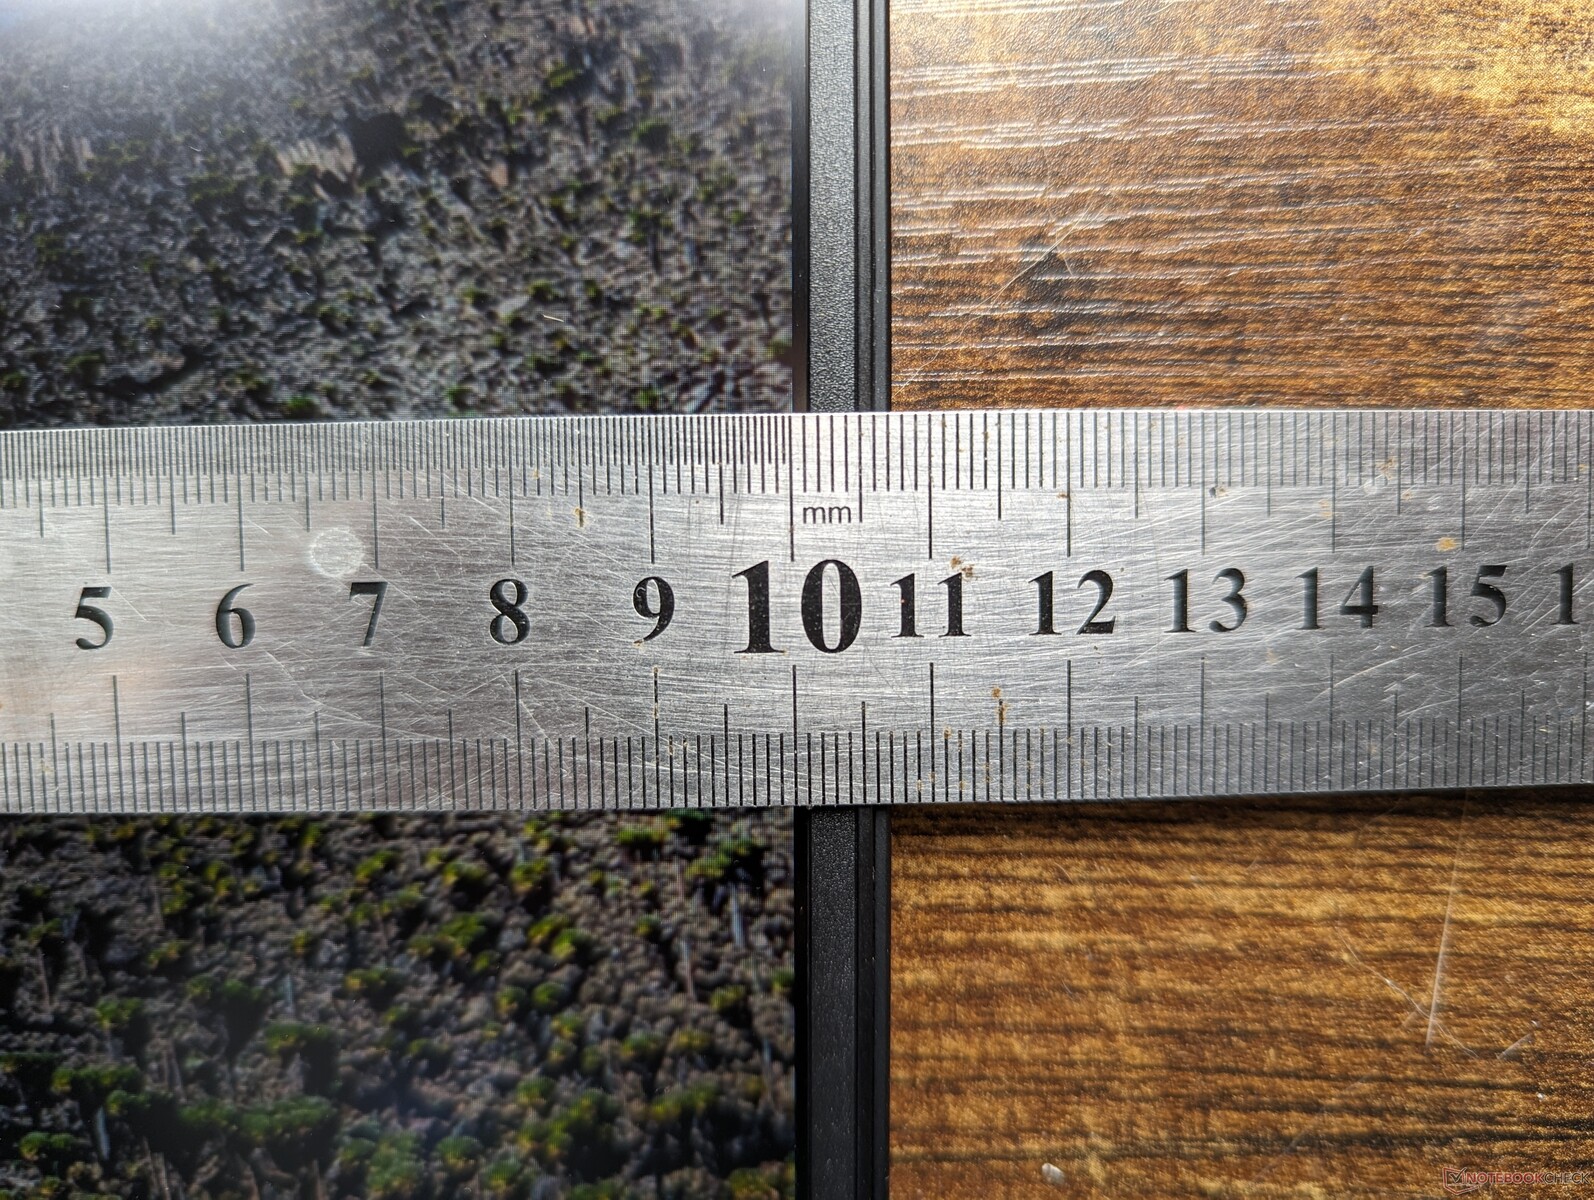
Case - Traseira estendida para melhor resfriamento
As principais atualizações visuais deste ano envolvem a traseira estendida e as grades de ventilação maiores para acomodar melhor as metas de TGP mais altas e o desempenho mais rápido. Assim, o modelo parece semelhante ao seu antecessor na parte frontal, enquanto as mudanças são muito mais perceptíveis na parte traseira. Por outro lado, os materiais metálicos e as superfícies lisas parecem idênticos entre os dois modelos.
A rigidez do chassi é muito boa, embora não seja tão firme ou inflexível quanto o Razer Blade 16. A tentativa de torcer a base e a tampa, por exemplo, resultaria em uma deformação um pouco maior no HP em comparação. Pelo menos não notamos nenhum rangido ou defeito visual em nossa unidade.
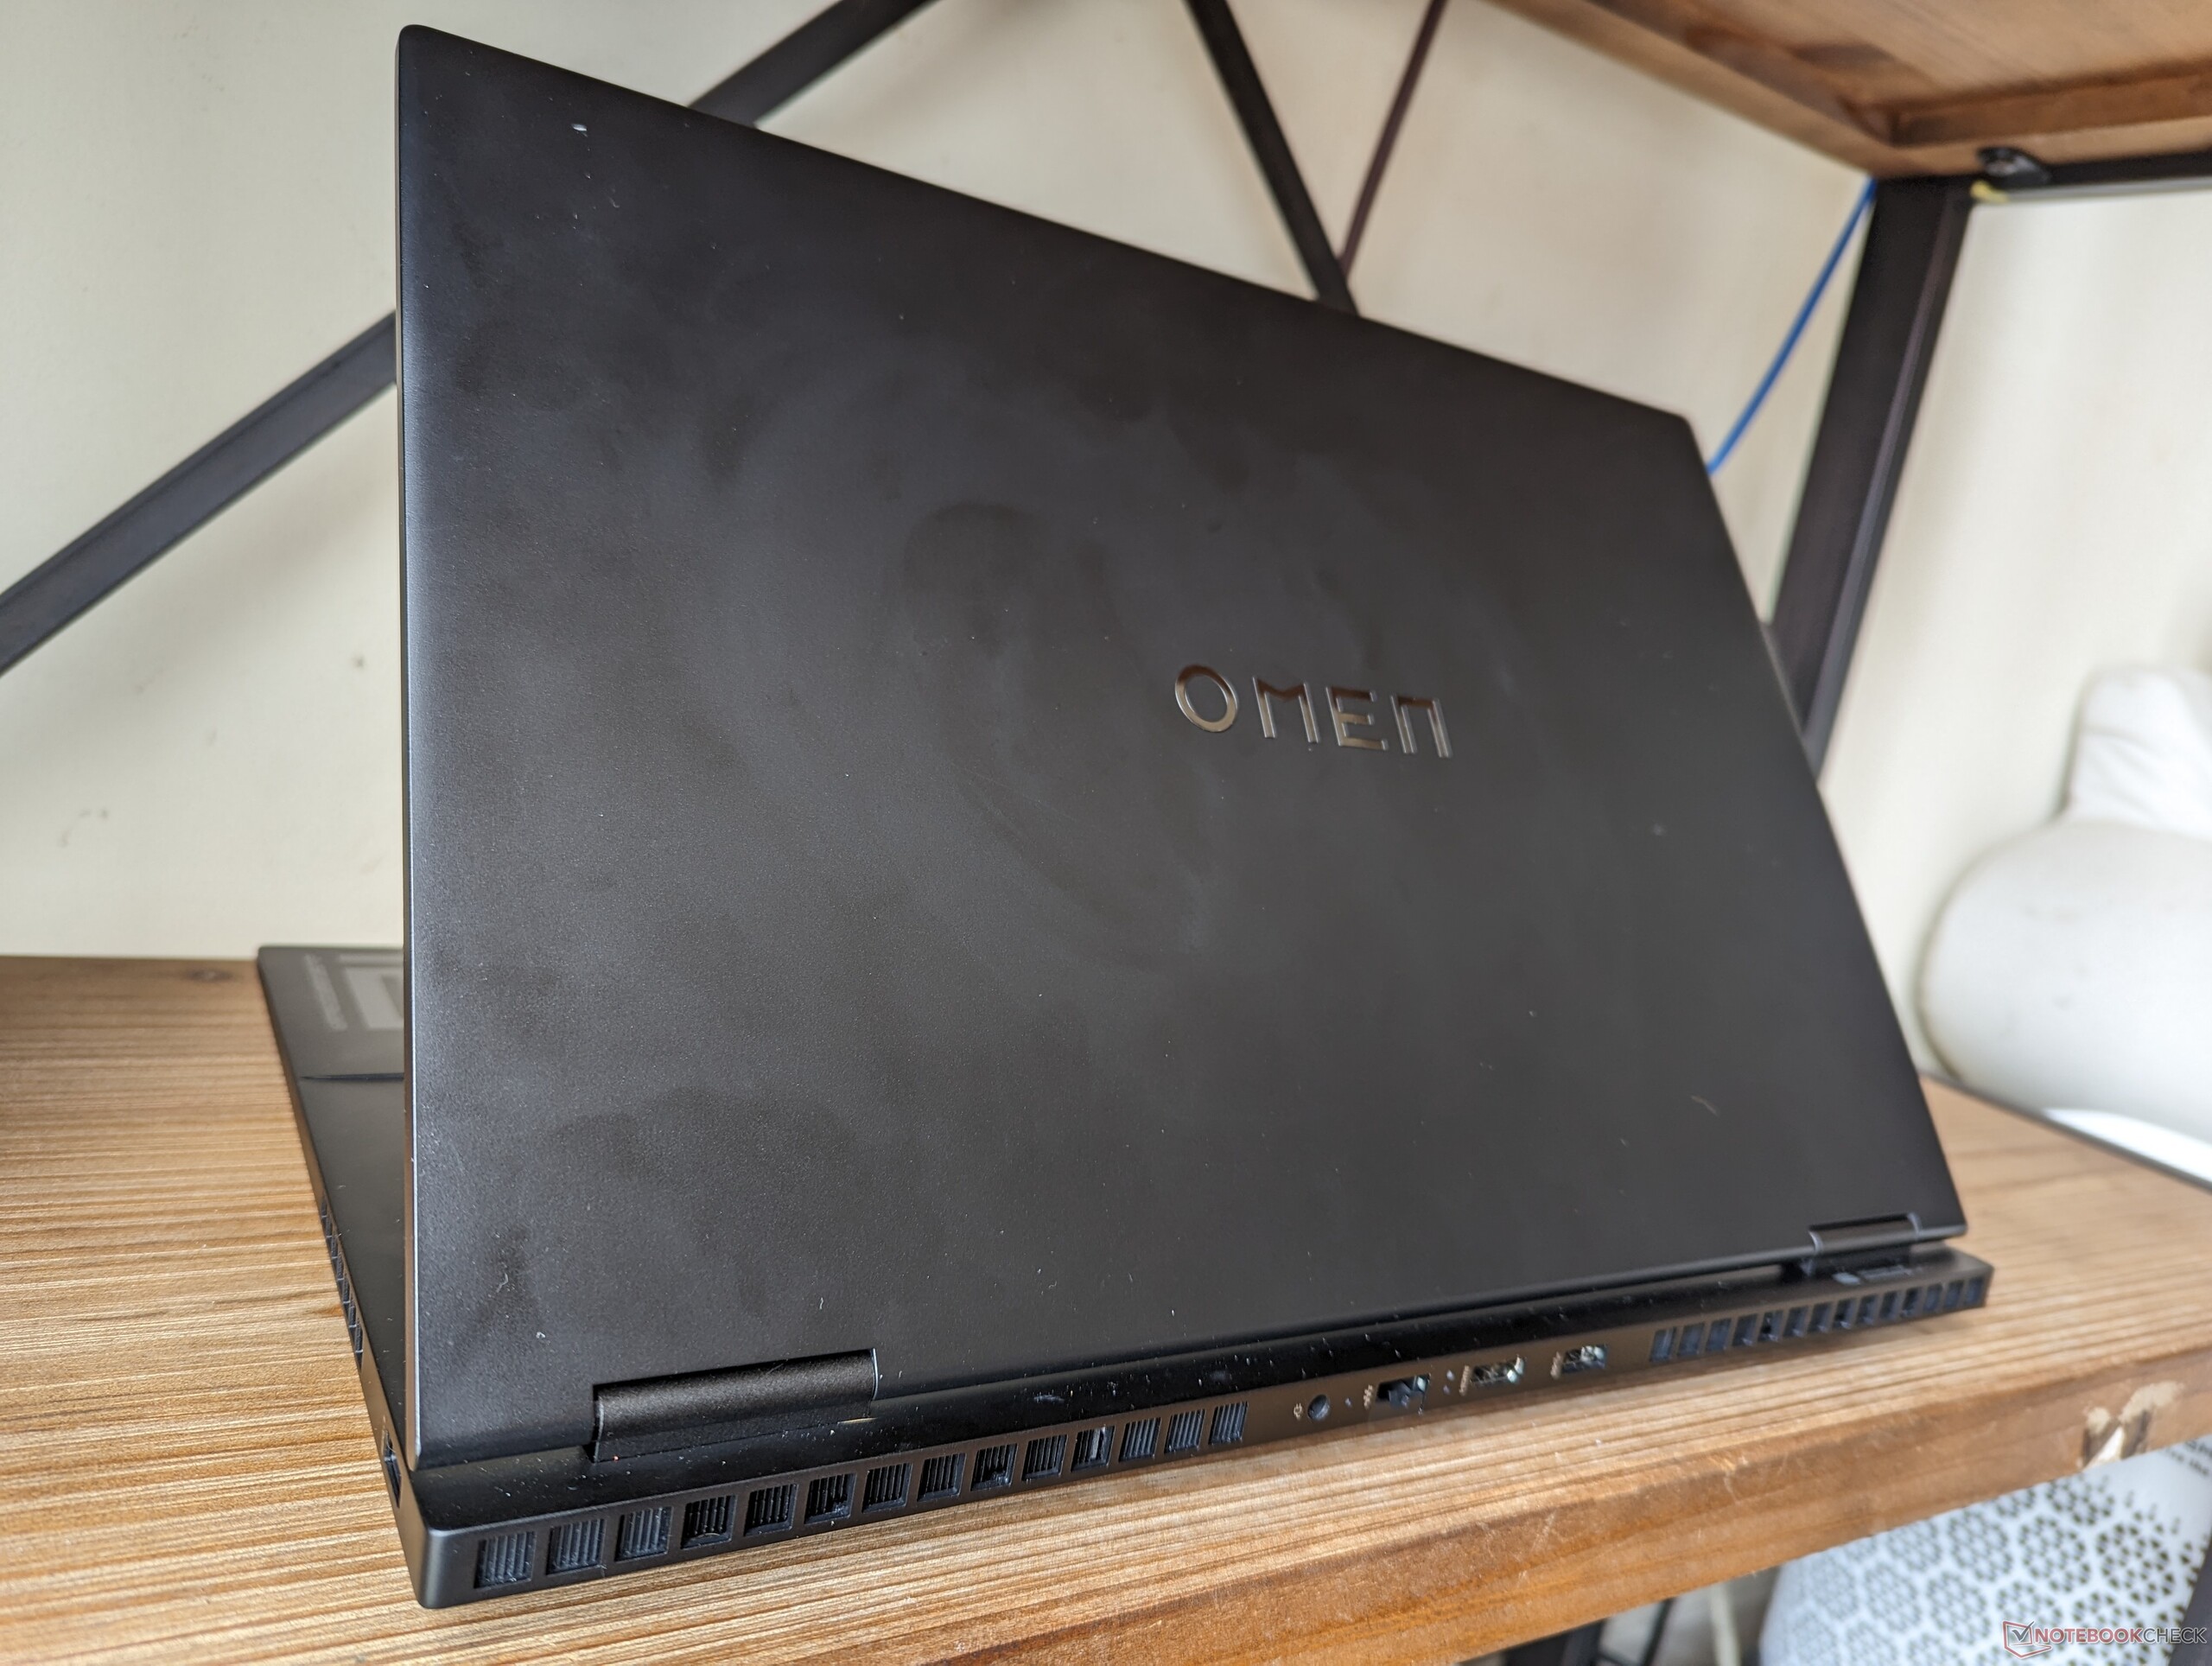
O novo Omen 16 é, na verdade, mais longo do que o design de 2022 em cerca de 11 mm devido à traseira estendida mencionada acima. Mesmo assim, o peso geral permanece praticamente o mesmo e o tamanho do sistema ainda é menor do que o doROG Strix G16, Legion Pro 7 16ou o Alienware x16 R1.
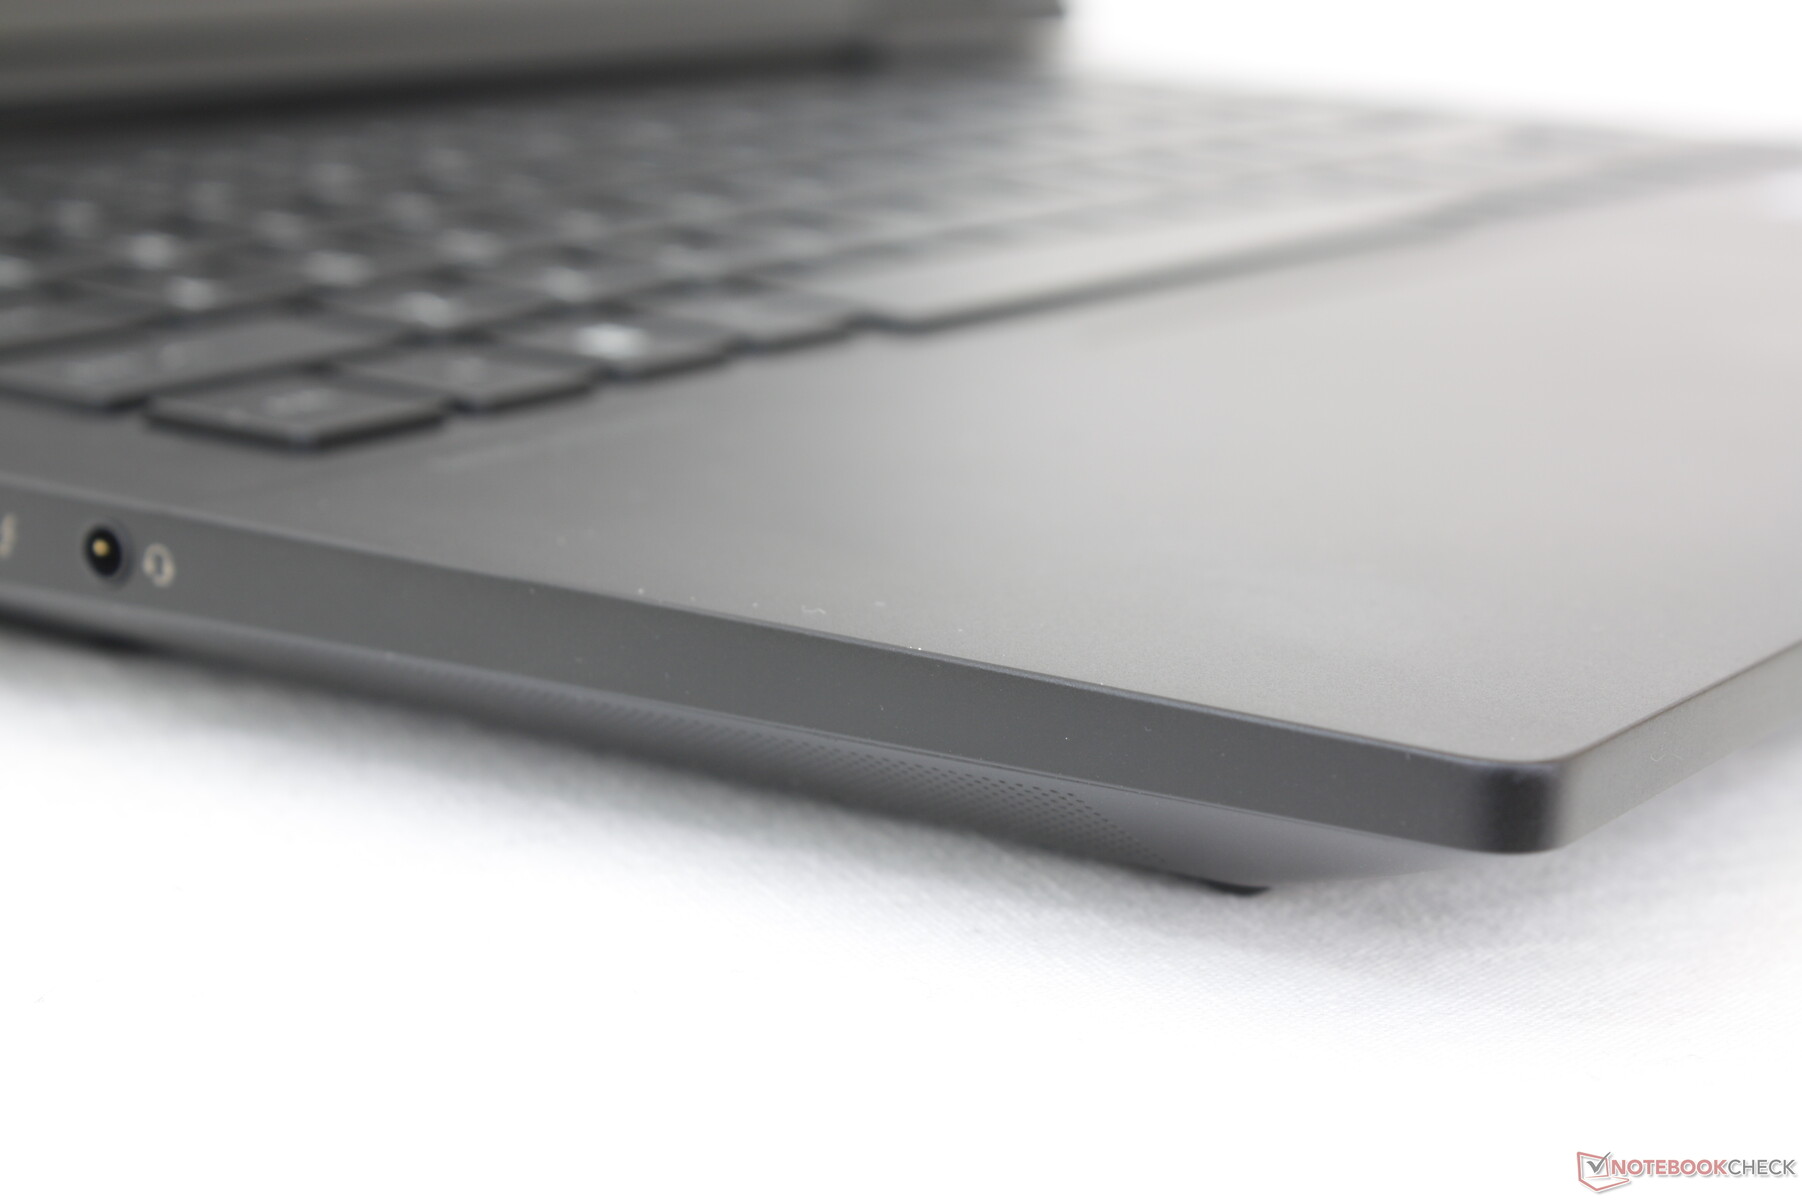
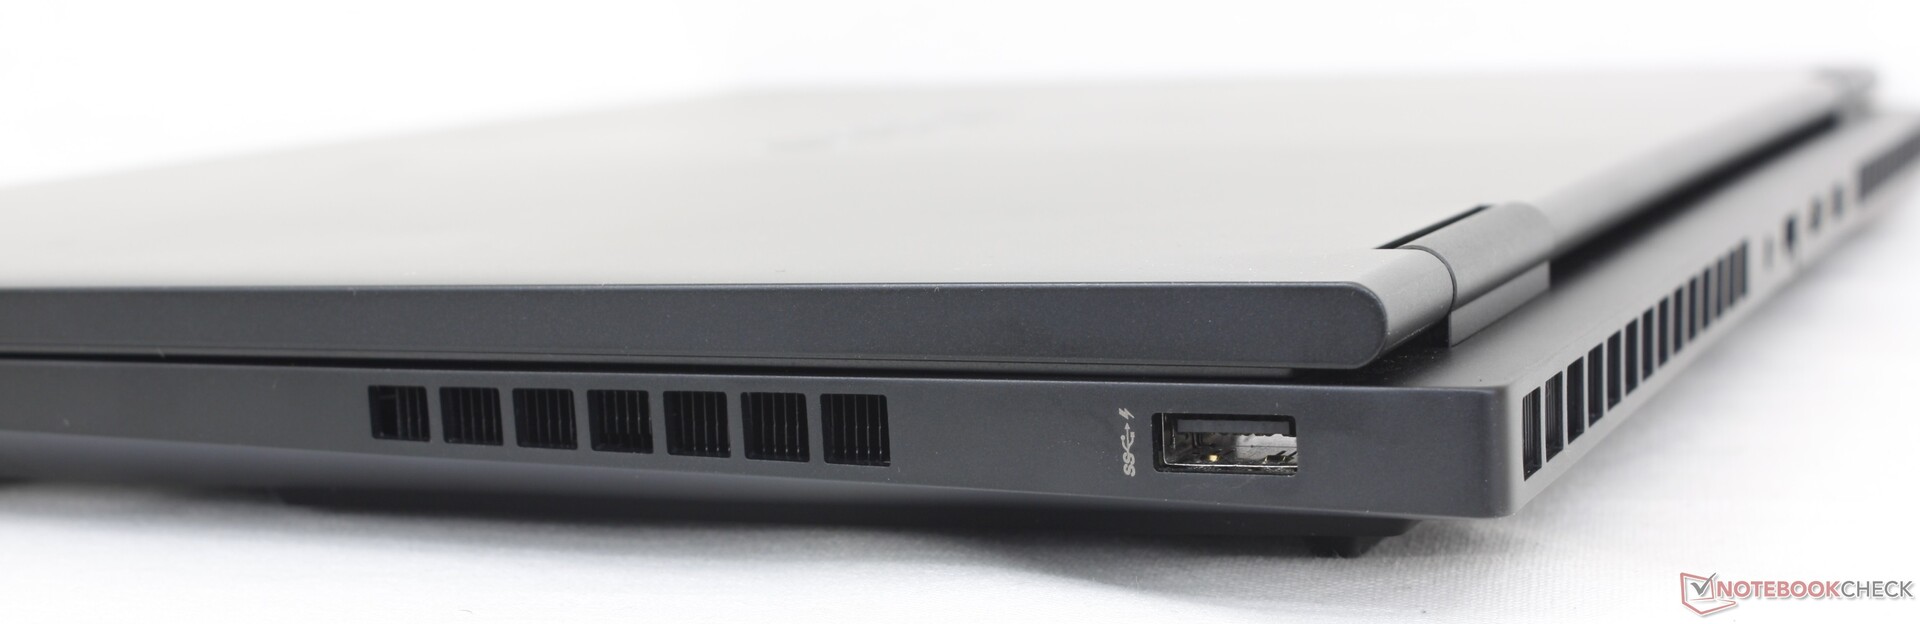
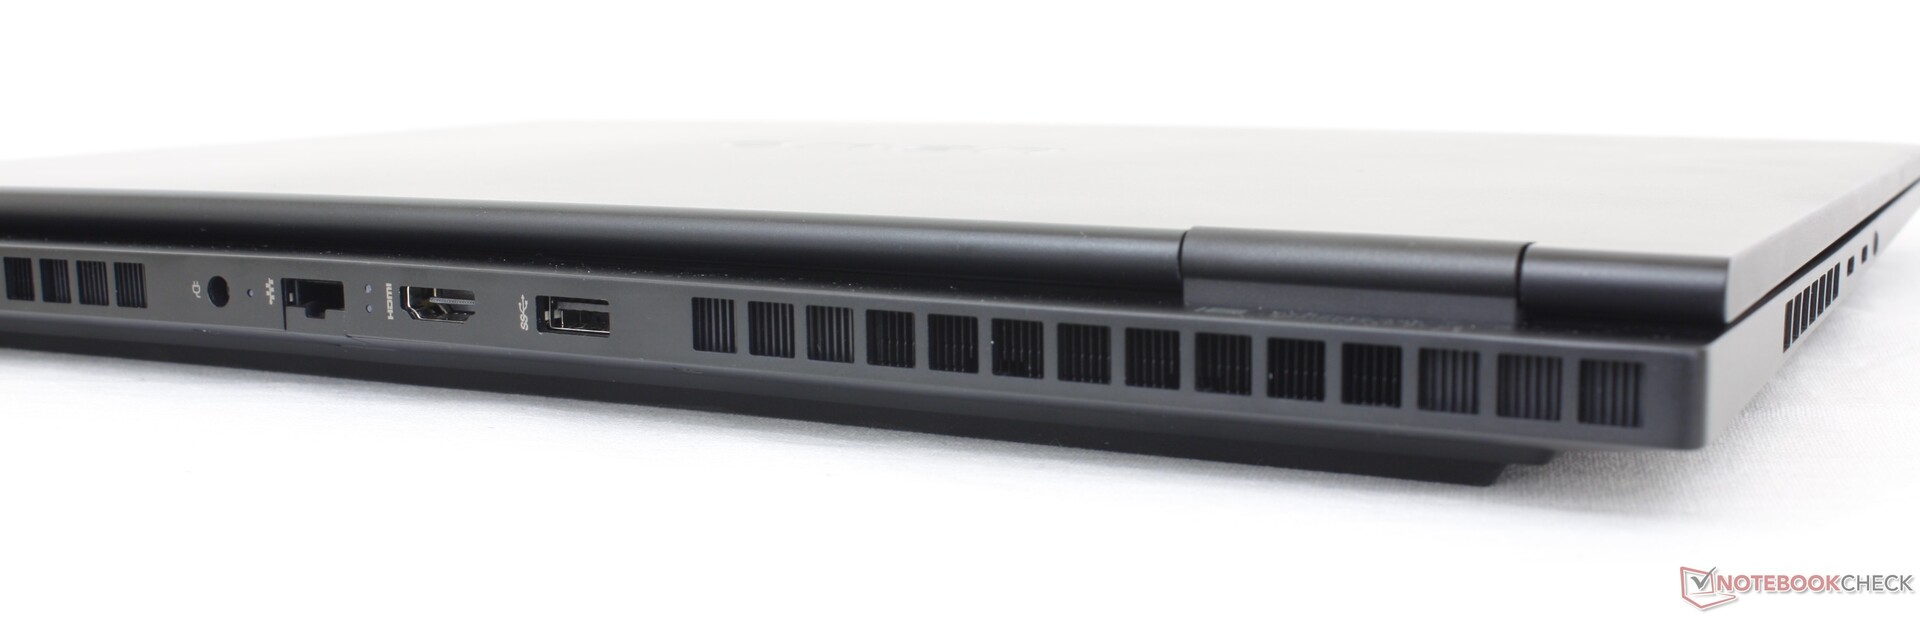
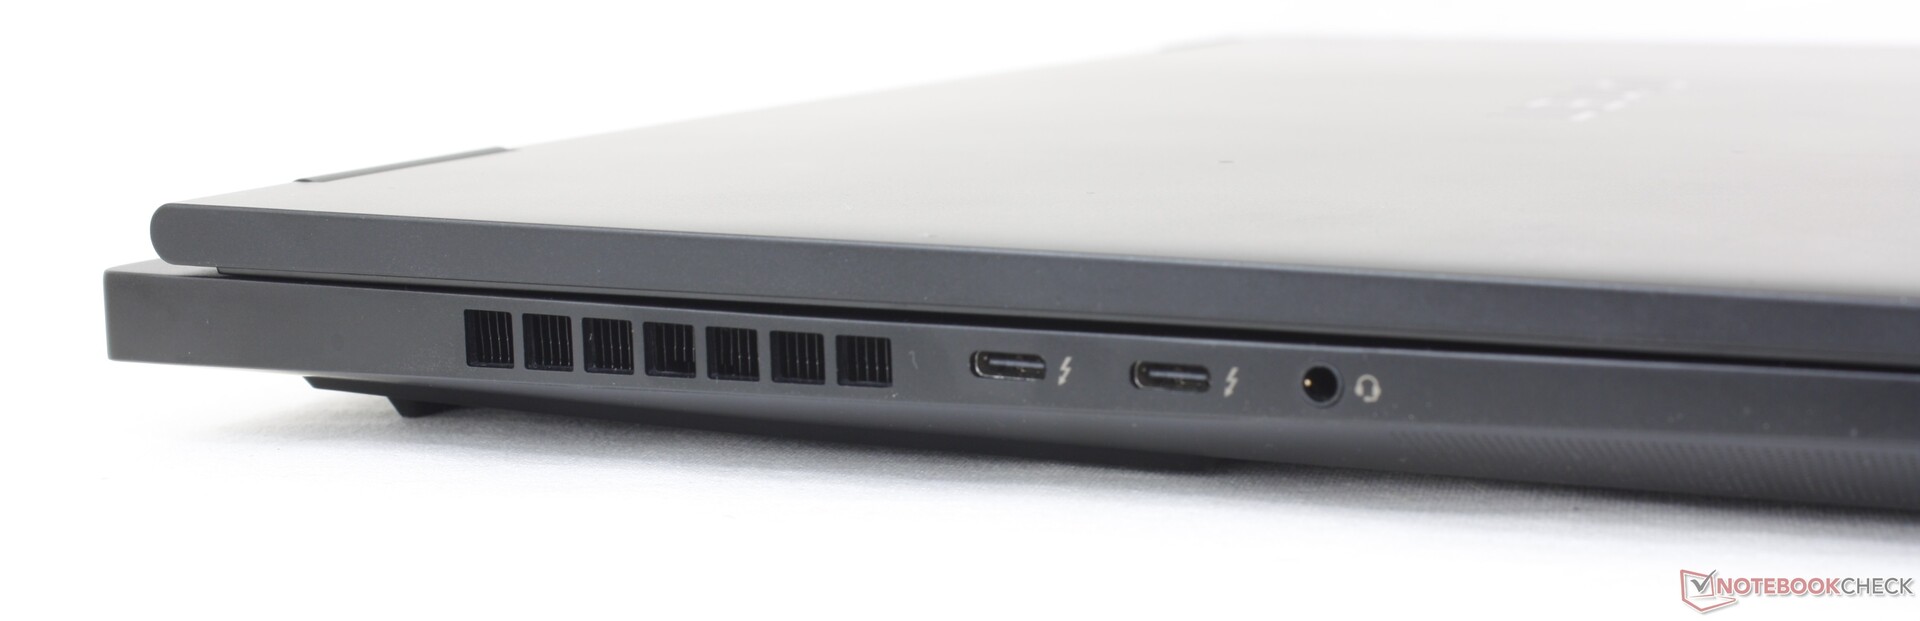
Conectividade
As opções de portas foram reduzidas em relação ao modelo do ano passado, pois agora há uma porta USB-A a menos e não há mais leitor de cartão SD. As duas portas USB-C foram realocadas da borda traseira para a borda esquerda para facilitar o acesso.
Comunicação
Um Intel AX211 é opcional para conectividade Wi-Fi6E e Bluetooth 5.3. Não tivemos problemas quando emparelhado com nossa rede Asus AXE11000 de 6 GHz.
| Networking | |
| iperf3 transmit AXE11000 | |
| Lenovo Legion Pro 7 RTX4090 | |
| Asus ROG Strix G16 G614JZ | |
| HP Omen 16-n0033dx | |
| Razer Blade 16 Early 2023 | |
| HP Omen 16-wf000 | |
| Alienware x16 R1 | |
| iperf3 receive AXE11000 | |
| Lenovo Legion Pro 7 RTX4090 | |
| Asus ROG Strix G16 G614JZ | |
| HP Omen 16-n0033dx | |
| Razer Blade 16 Early 2023 | |
| Alienware x16 R1 | |
| HP Omen 16-wf000 | |
| iperf3 transmit AXE11000 6GHz | |
| HP Omen 16-n0033dx | |
| Razer Blade 16 Early 2023 | |
| HP Omen 16-wf000 | |
| Alienware x16 R1 | |
| iperf3 receive AXE11000 6GHz | |
| Razer Blade 16 Early 2023 | |
| HP Omen 16-wf000 | |
| HP Omen 16-n0033dx | |
| Alienware x16 R1 | |
Webcam - atualização de 2 MP
Uma webcam de 2 MP vem como padrão junto com um obturador de privacidade para substituir a webcam de 1 MP no Omen 16 de 2022. O IR, no entanto, não é compatível com essa série.


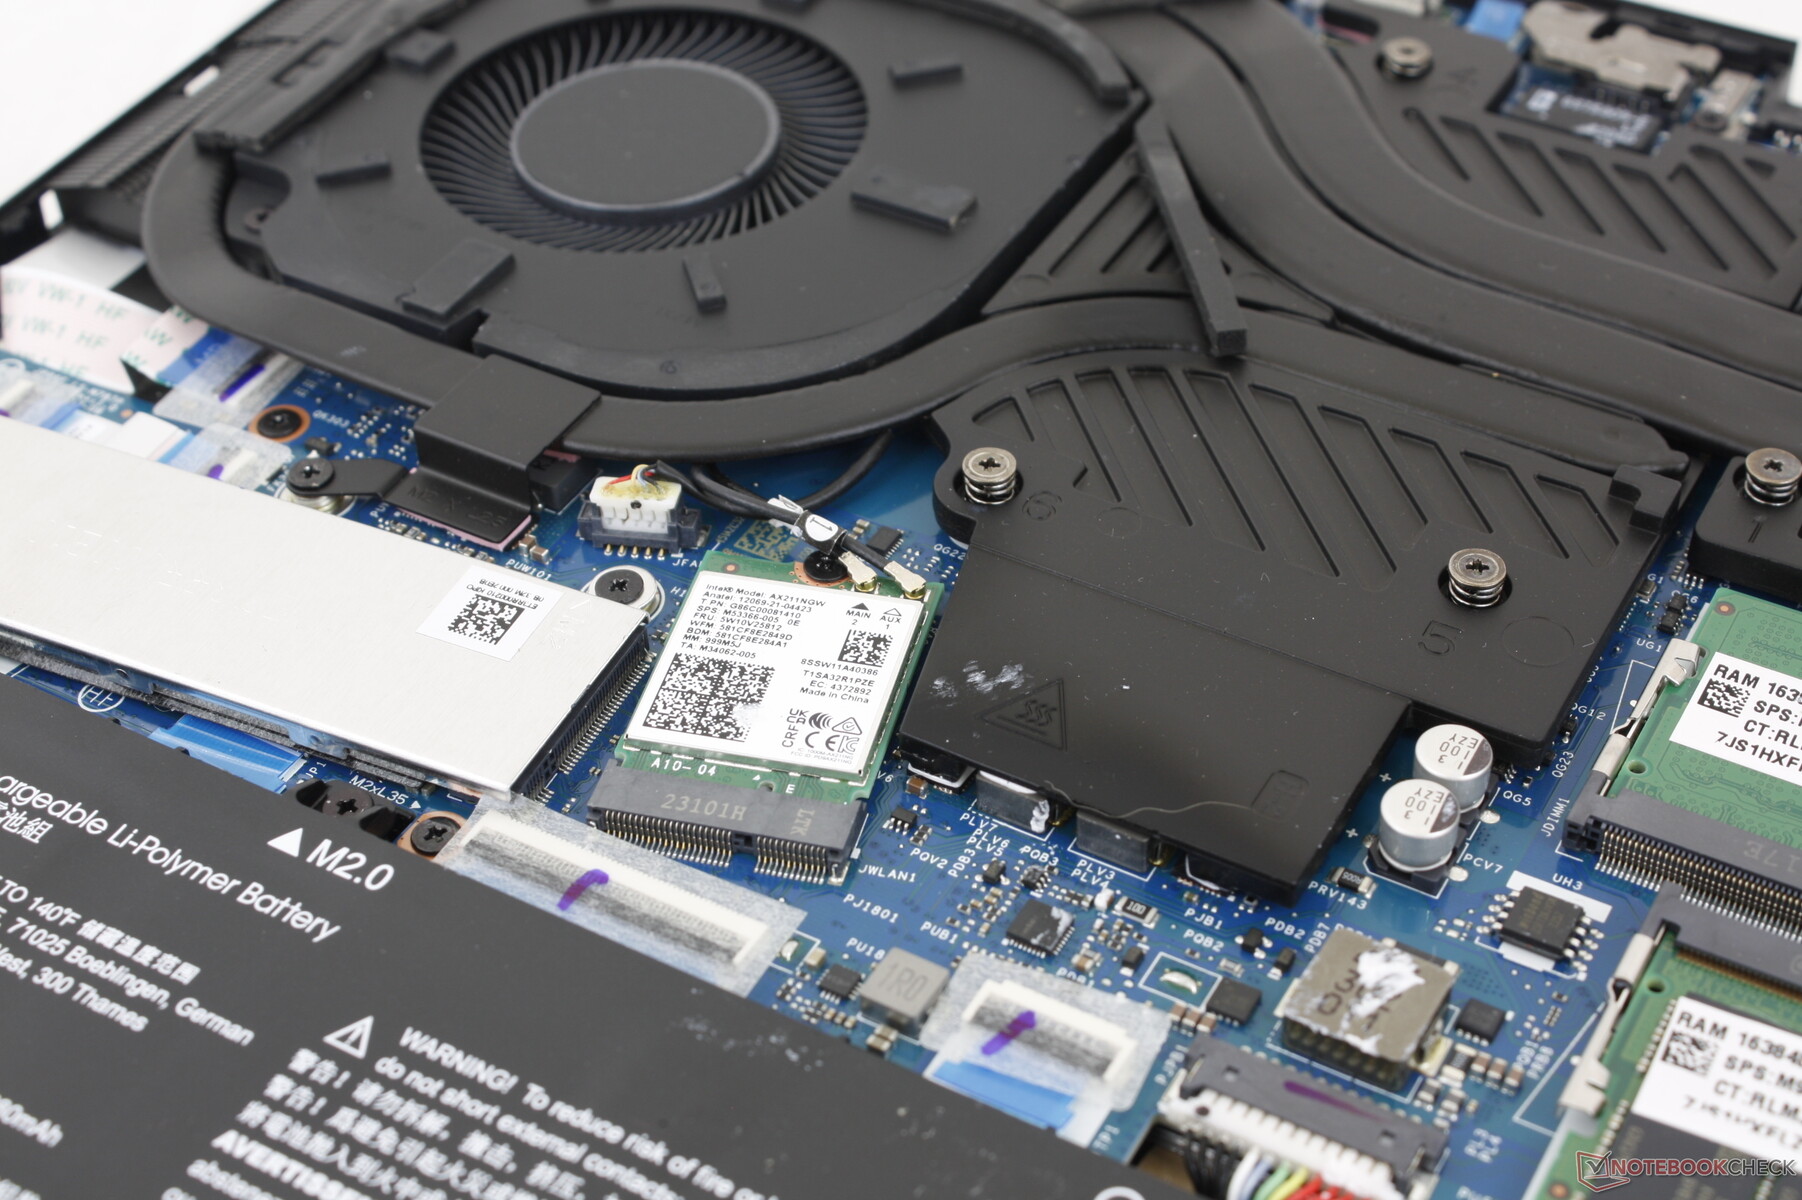
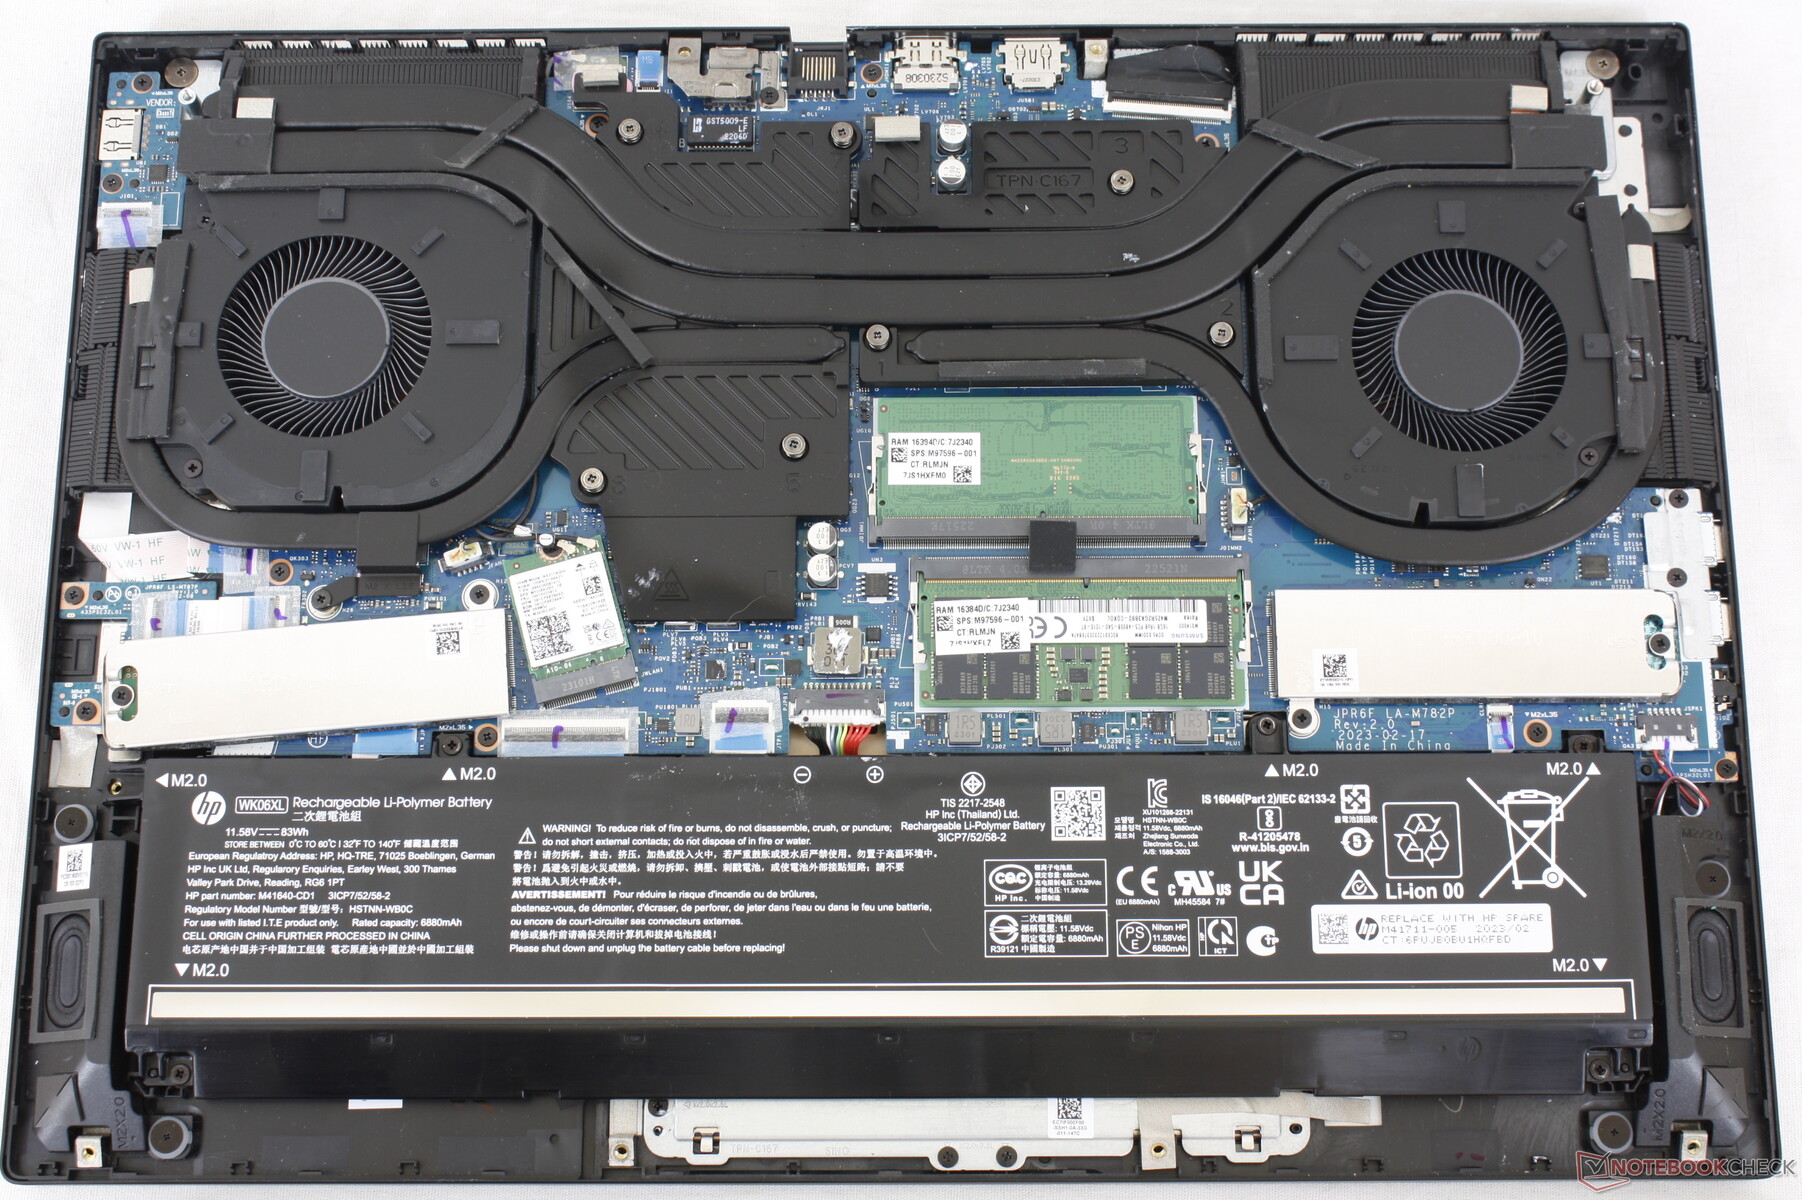
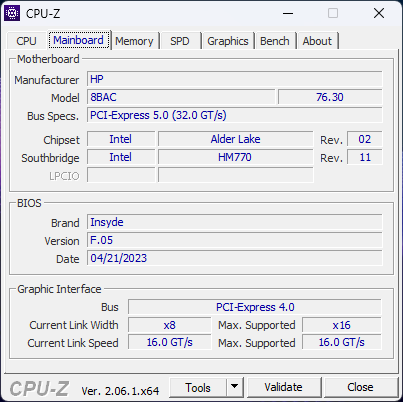
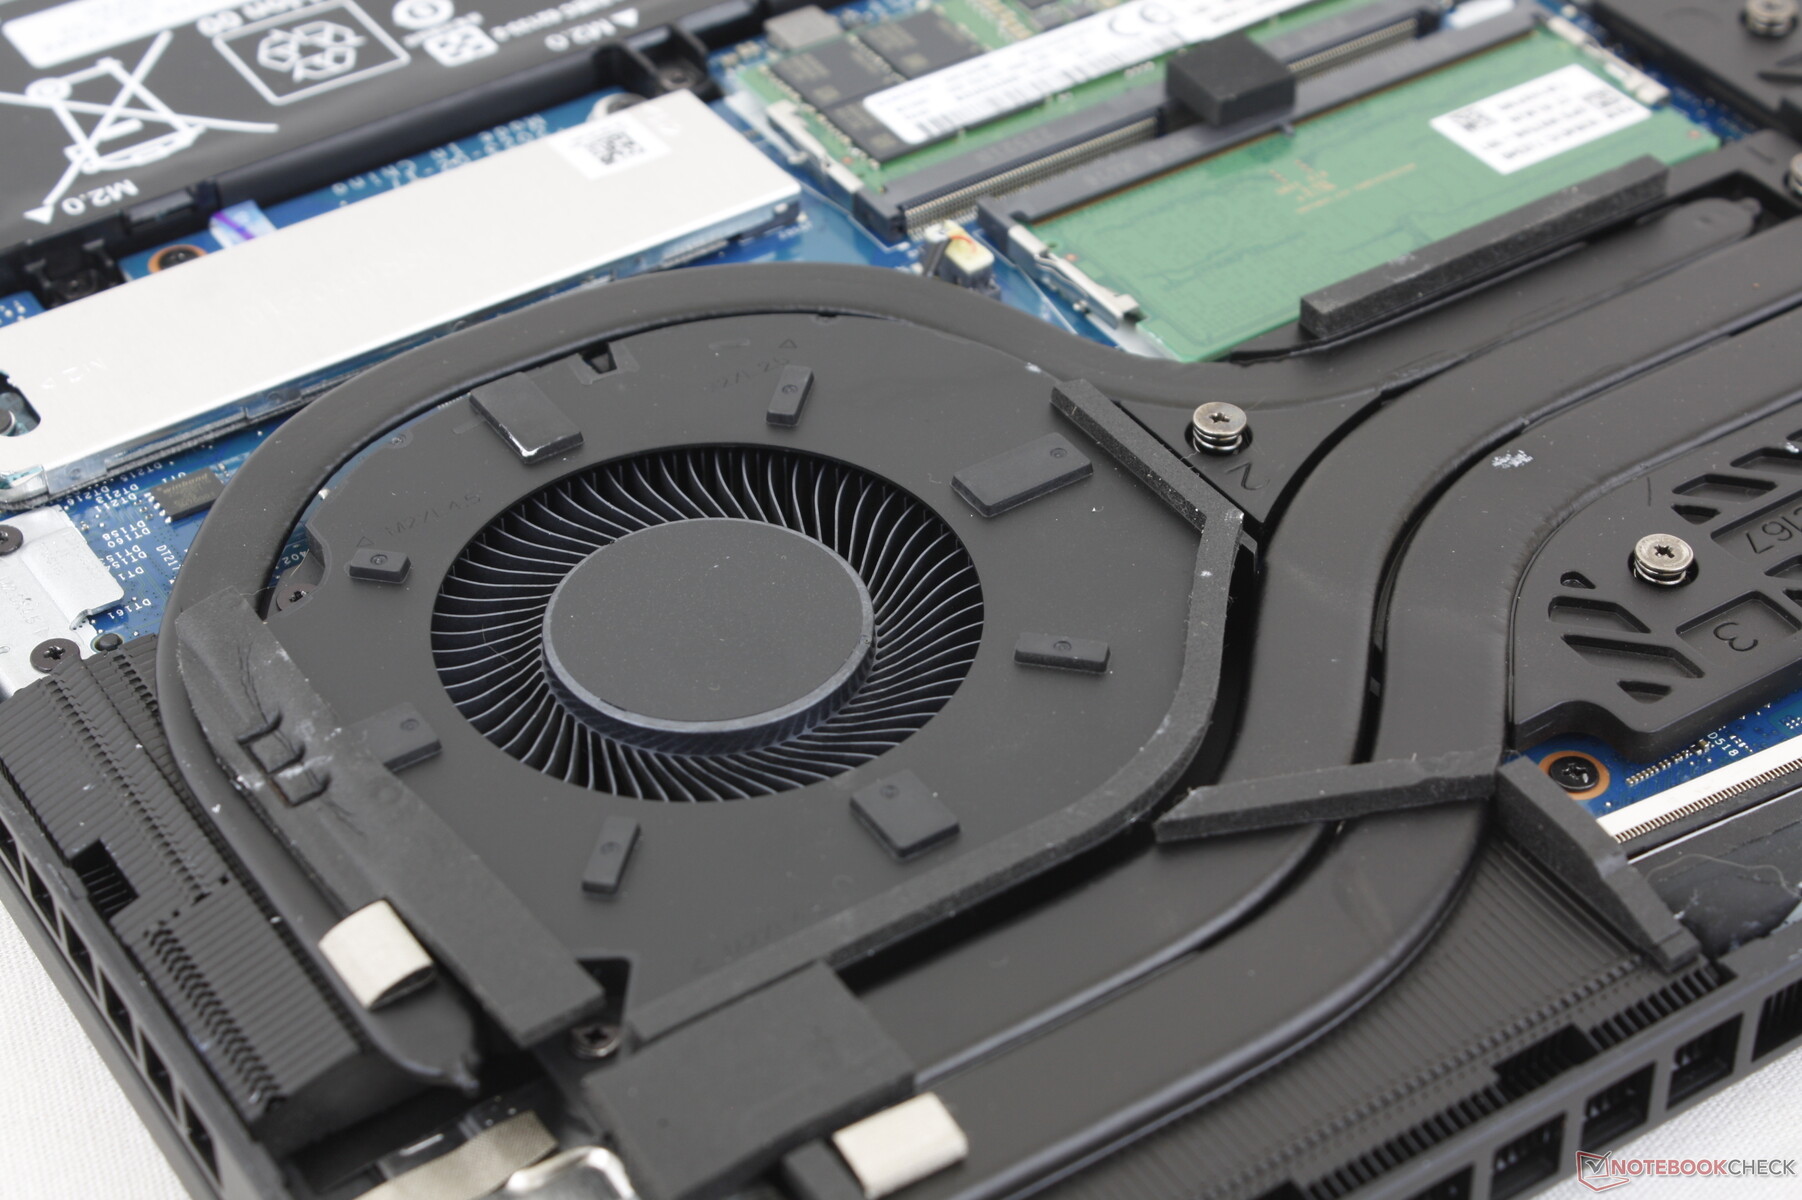
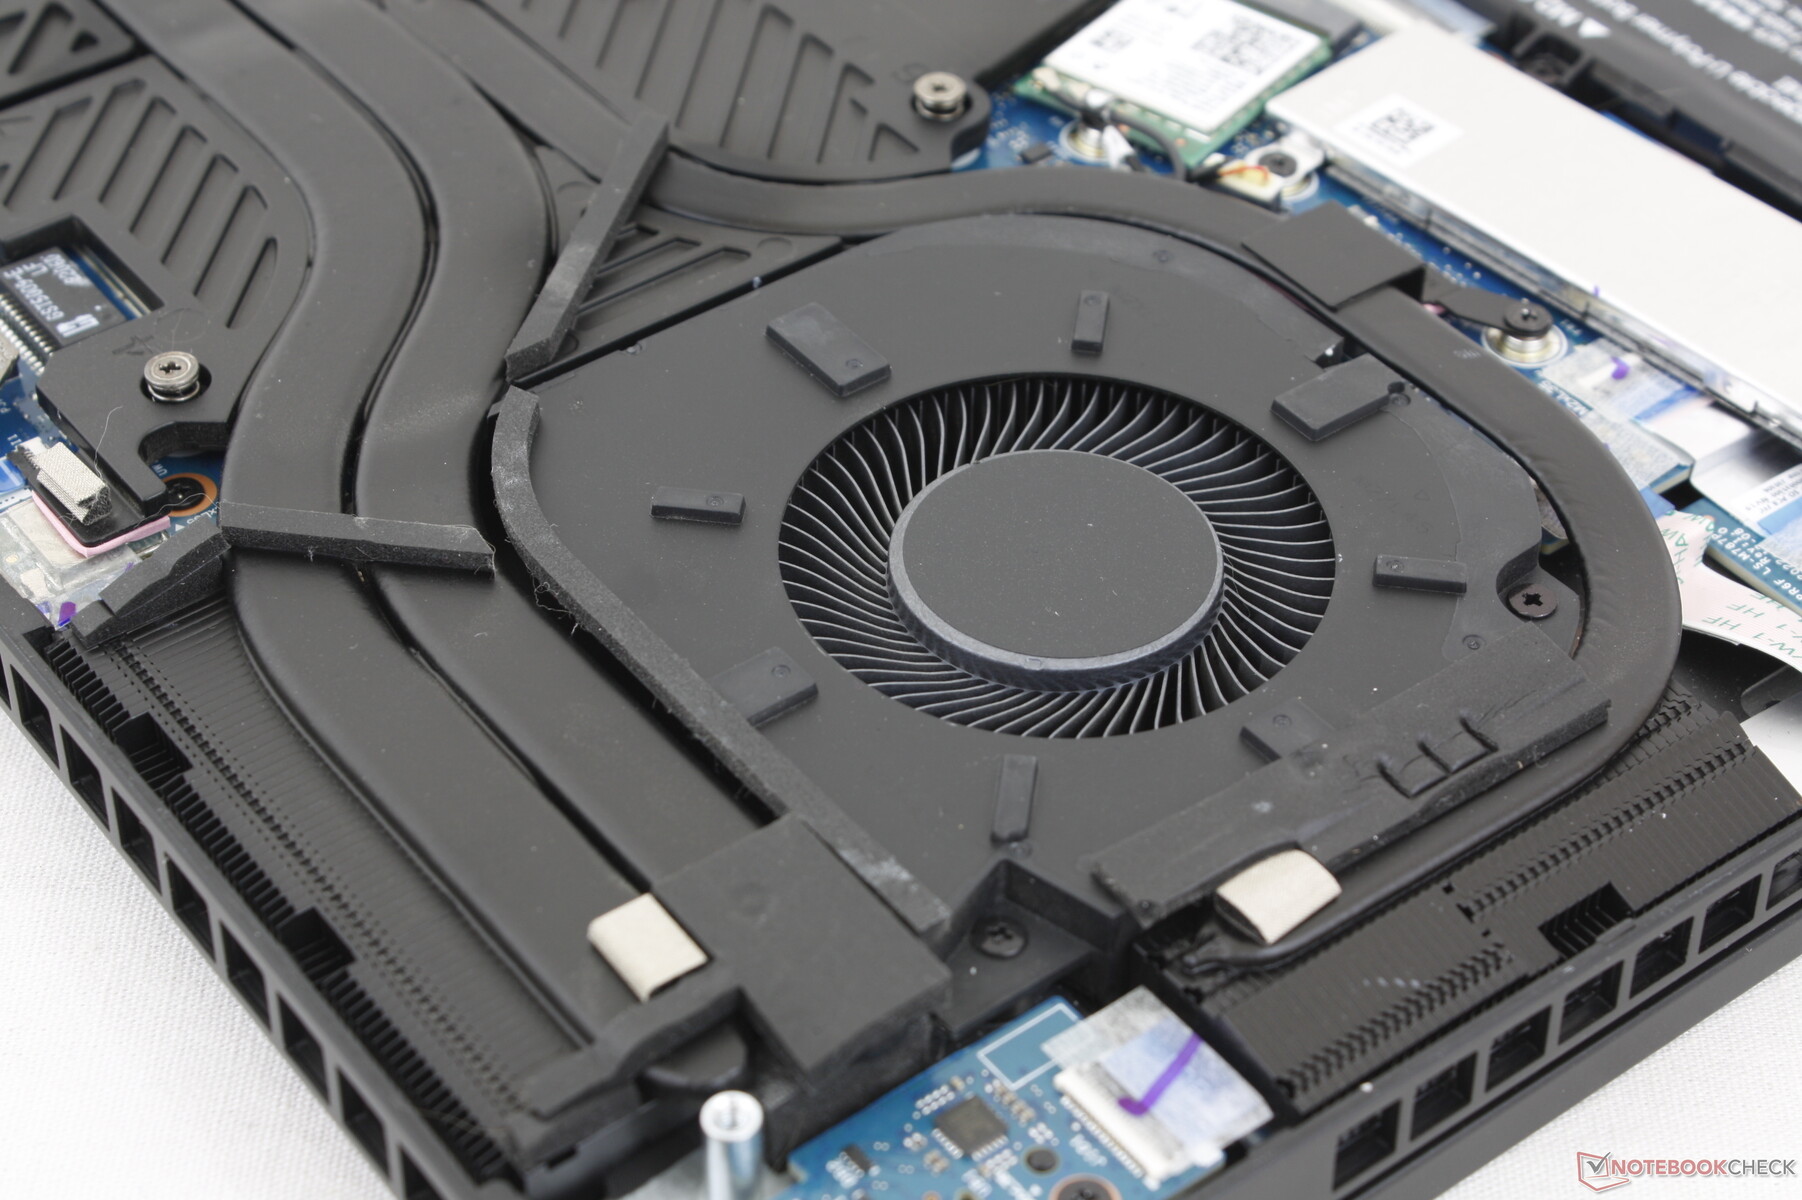
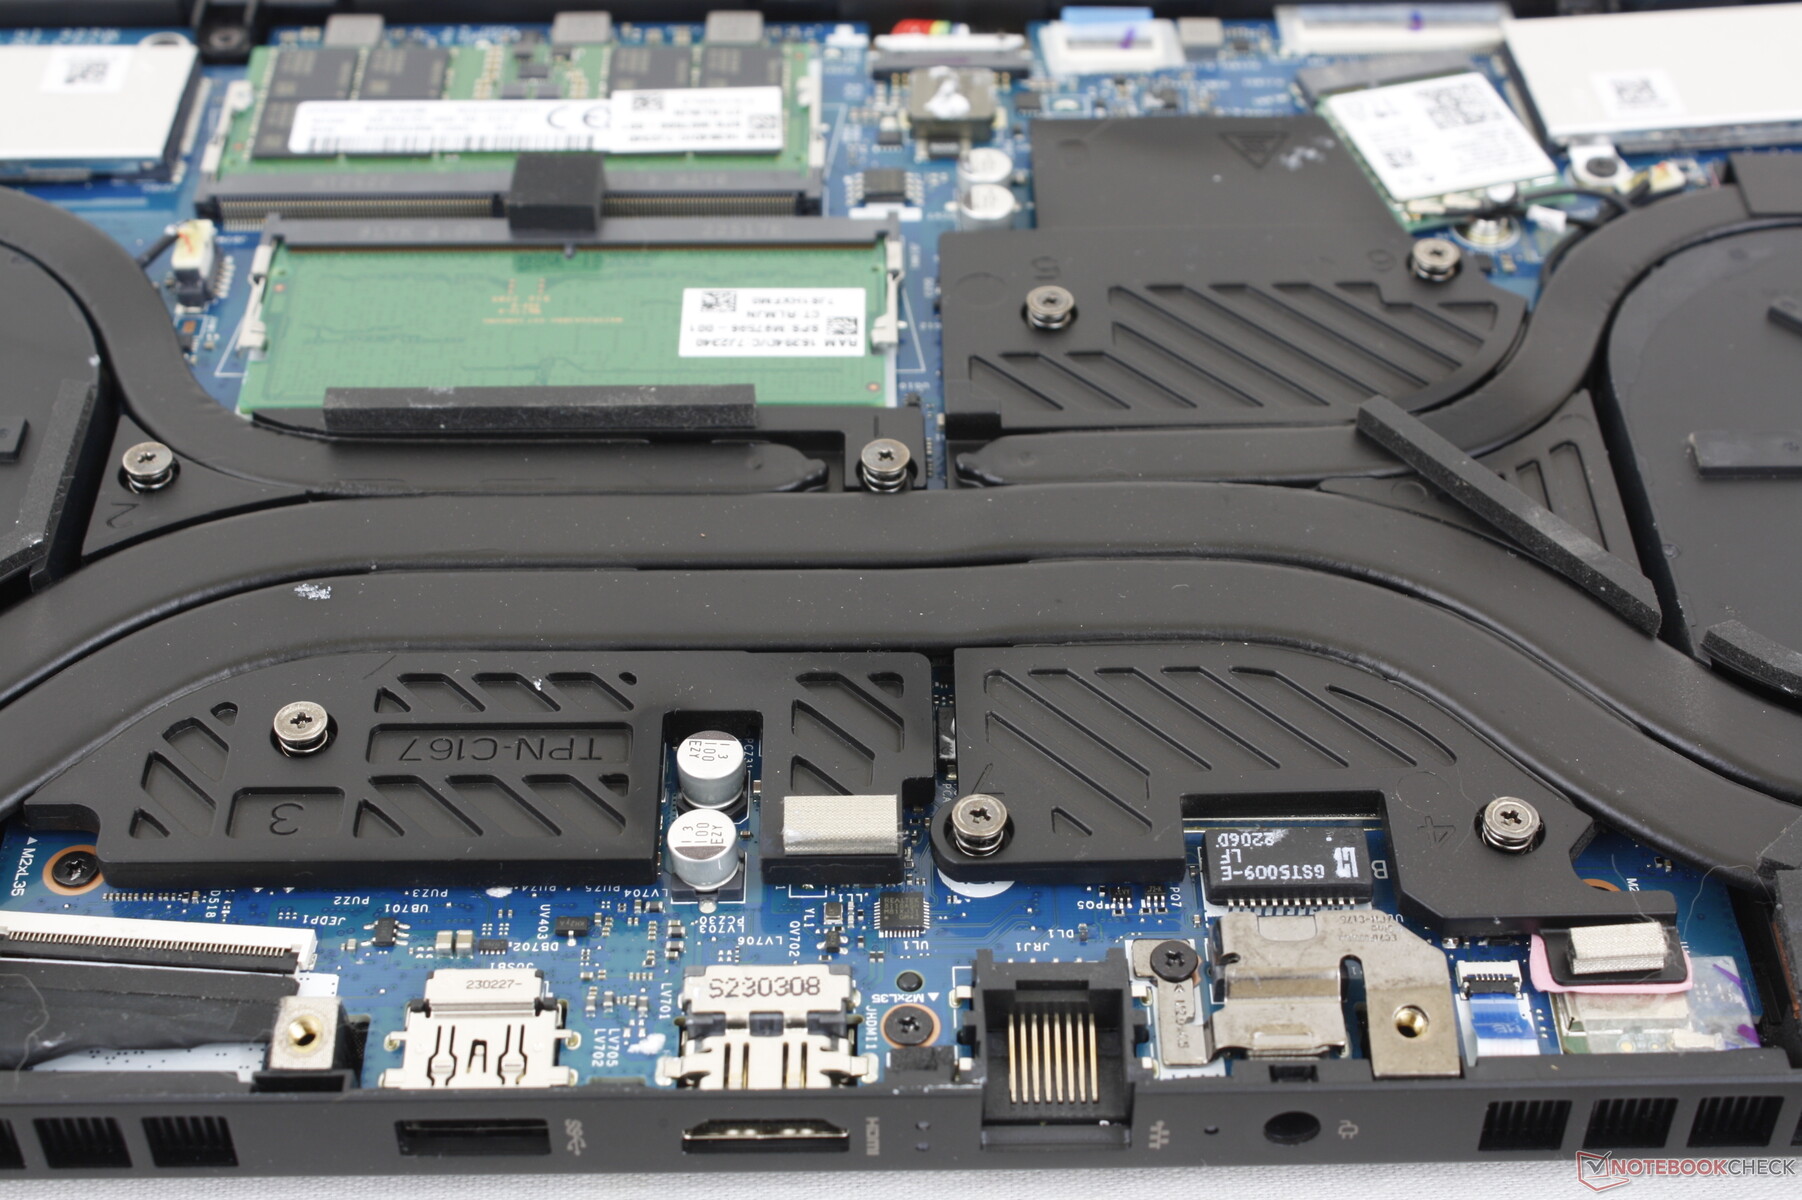
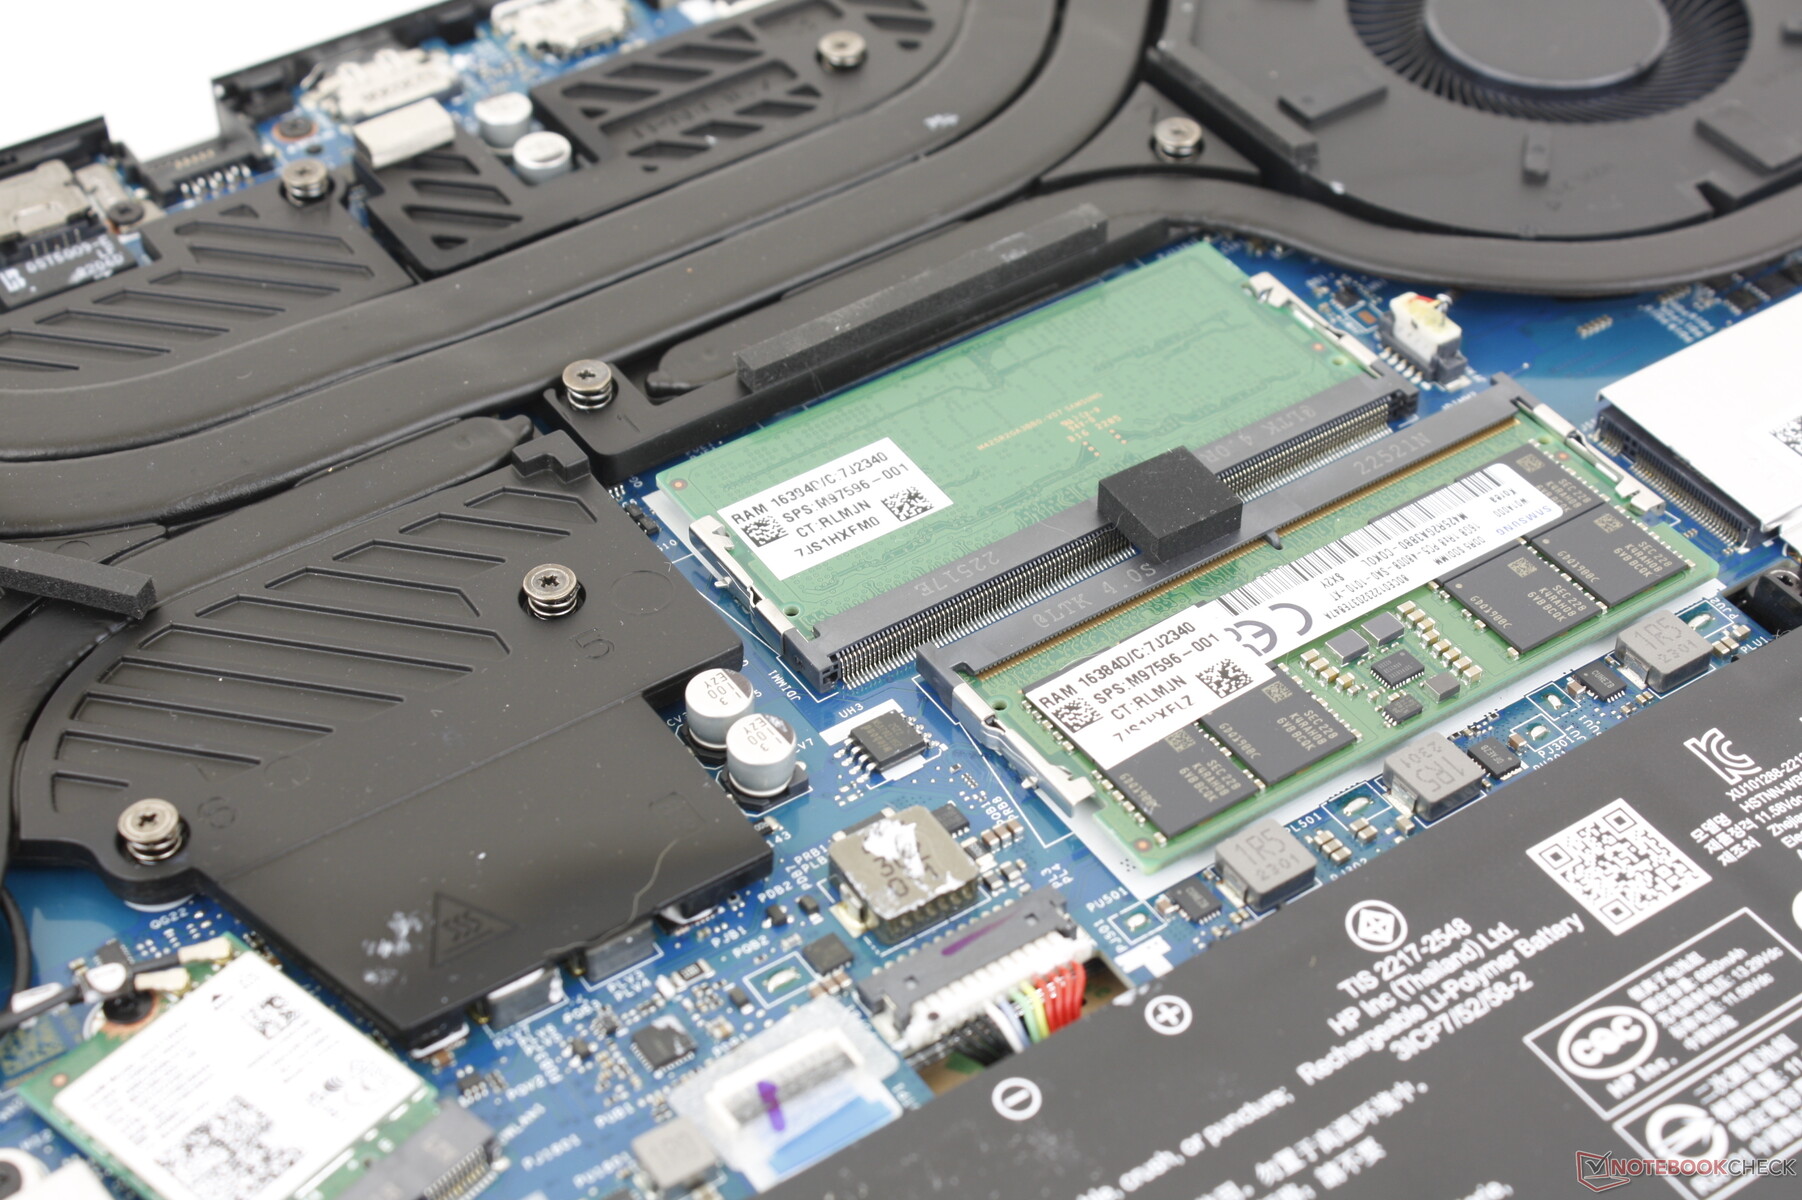
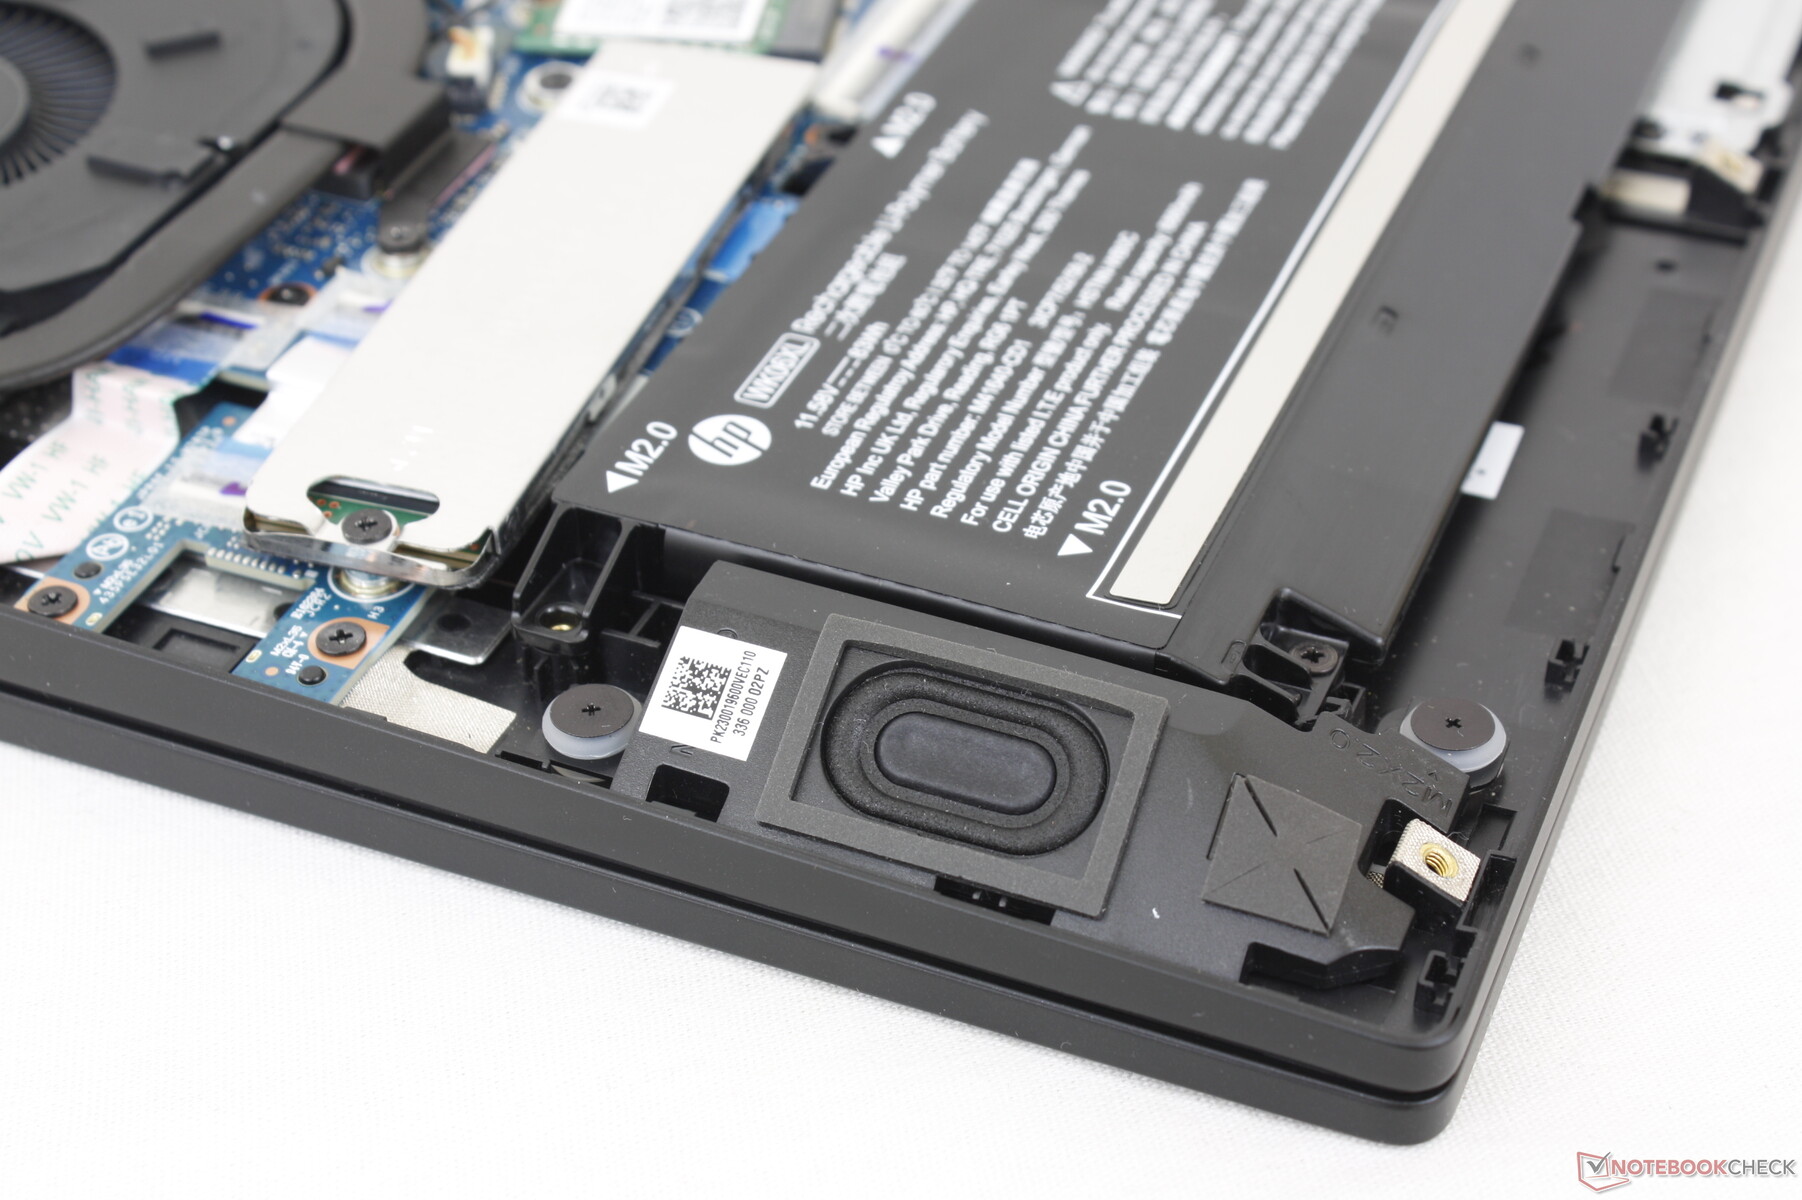
Manutenção
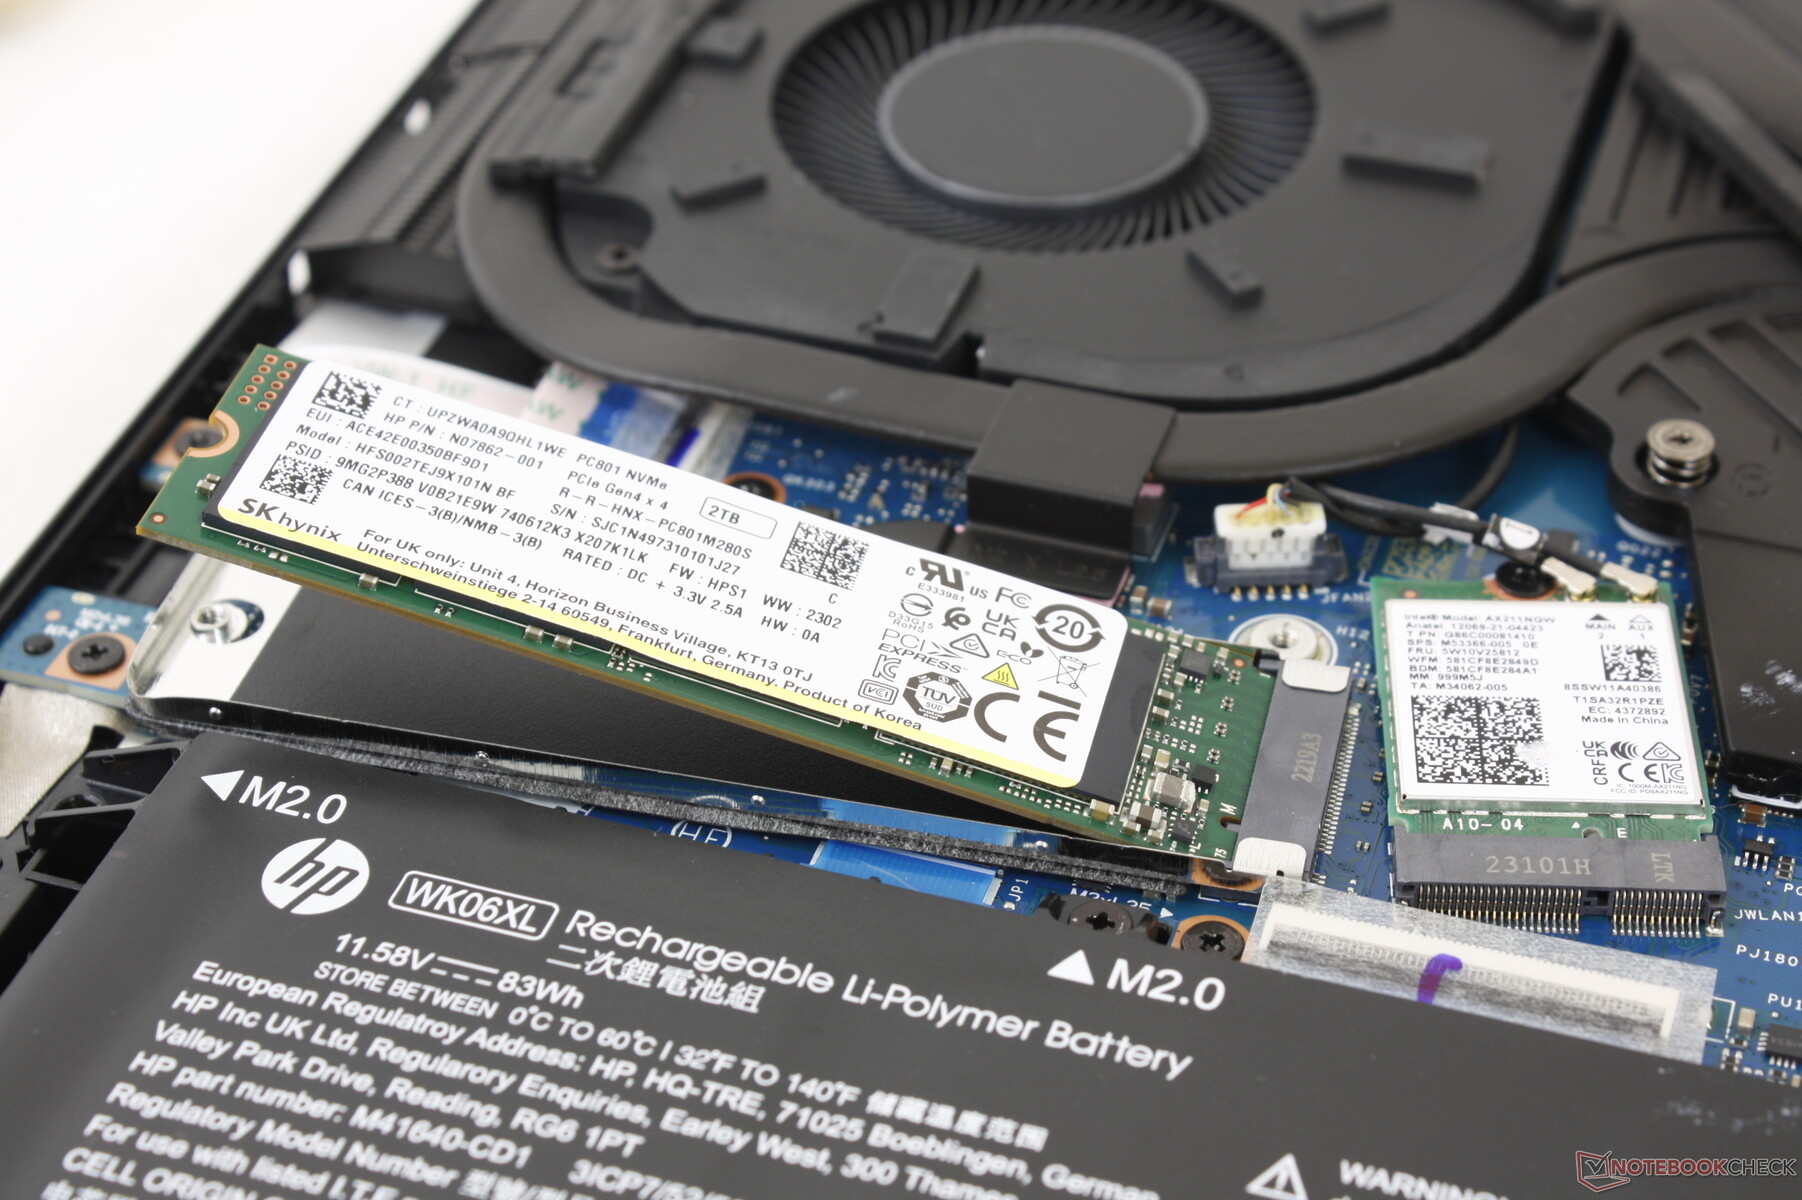
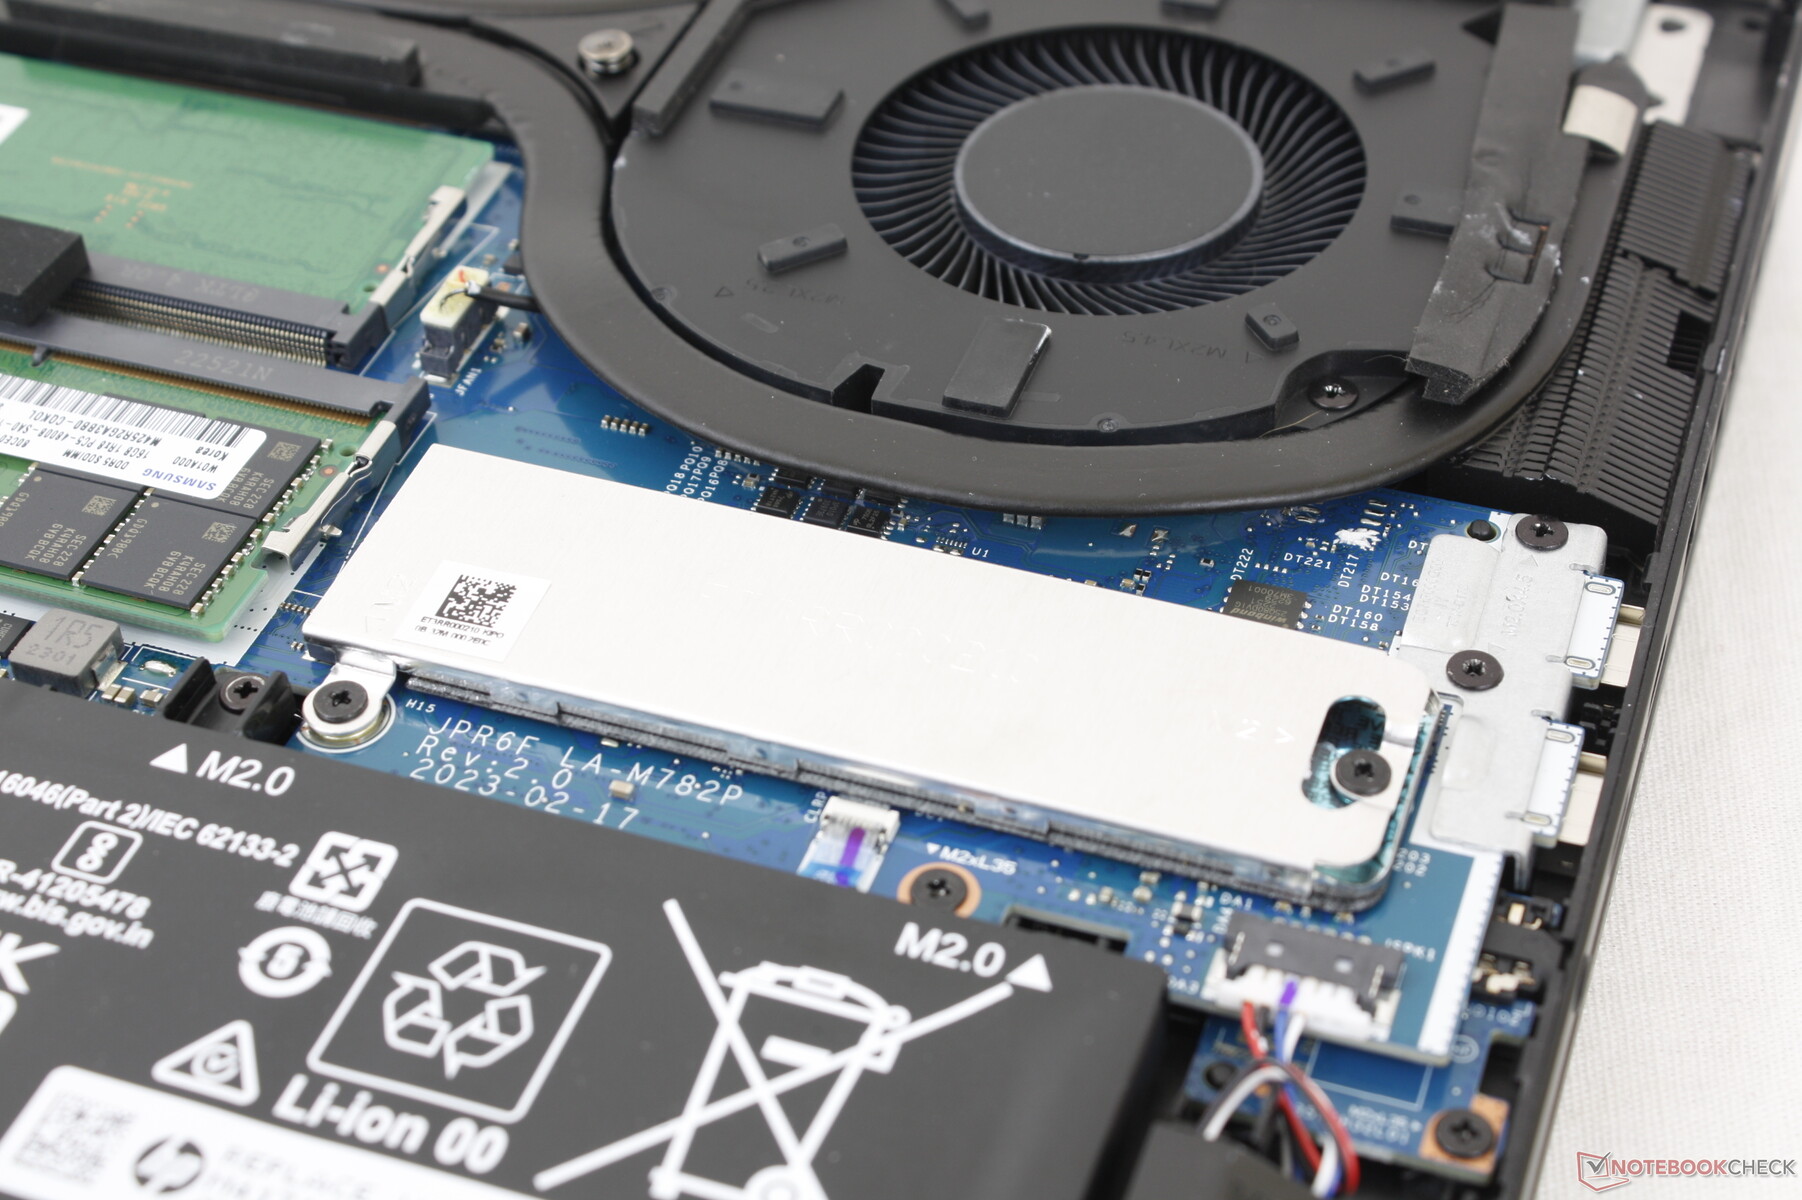
O painel inferior é fixado por seis parafusos Phillips para facilitar a remoção. Os proprietários têm acesso direto aos dois slots SSD M.2 PCIe4 x4 2280, aos dois slots SODIMM, à bateria e ao módulo WLAN removível, como no design de 2022.
Acessórios e garantia
A caixa de varejo inclui um headset sem fio HyperX Cloud II Core, se configurado com a RTX 4080. Caso contrário, a caixa de varejo inclui apenas o adaptador CA e a papelada habituais.
Uma garantia limitada de um ano do fabricante é padrão se comprada nos EUA.
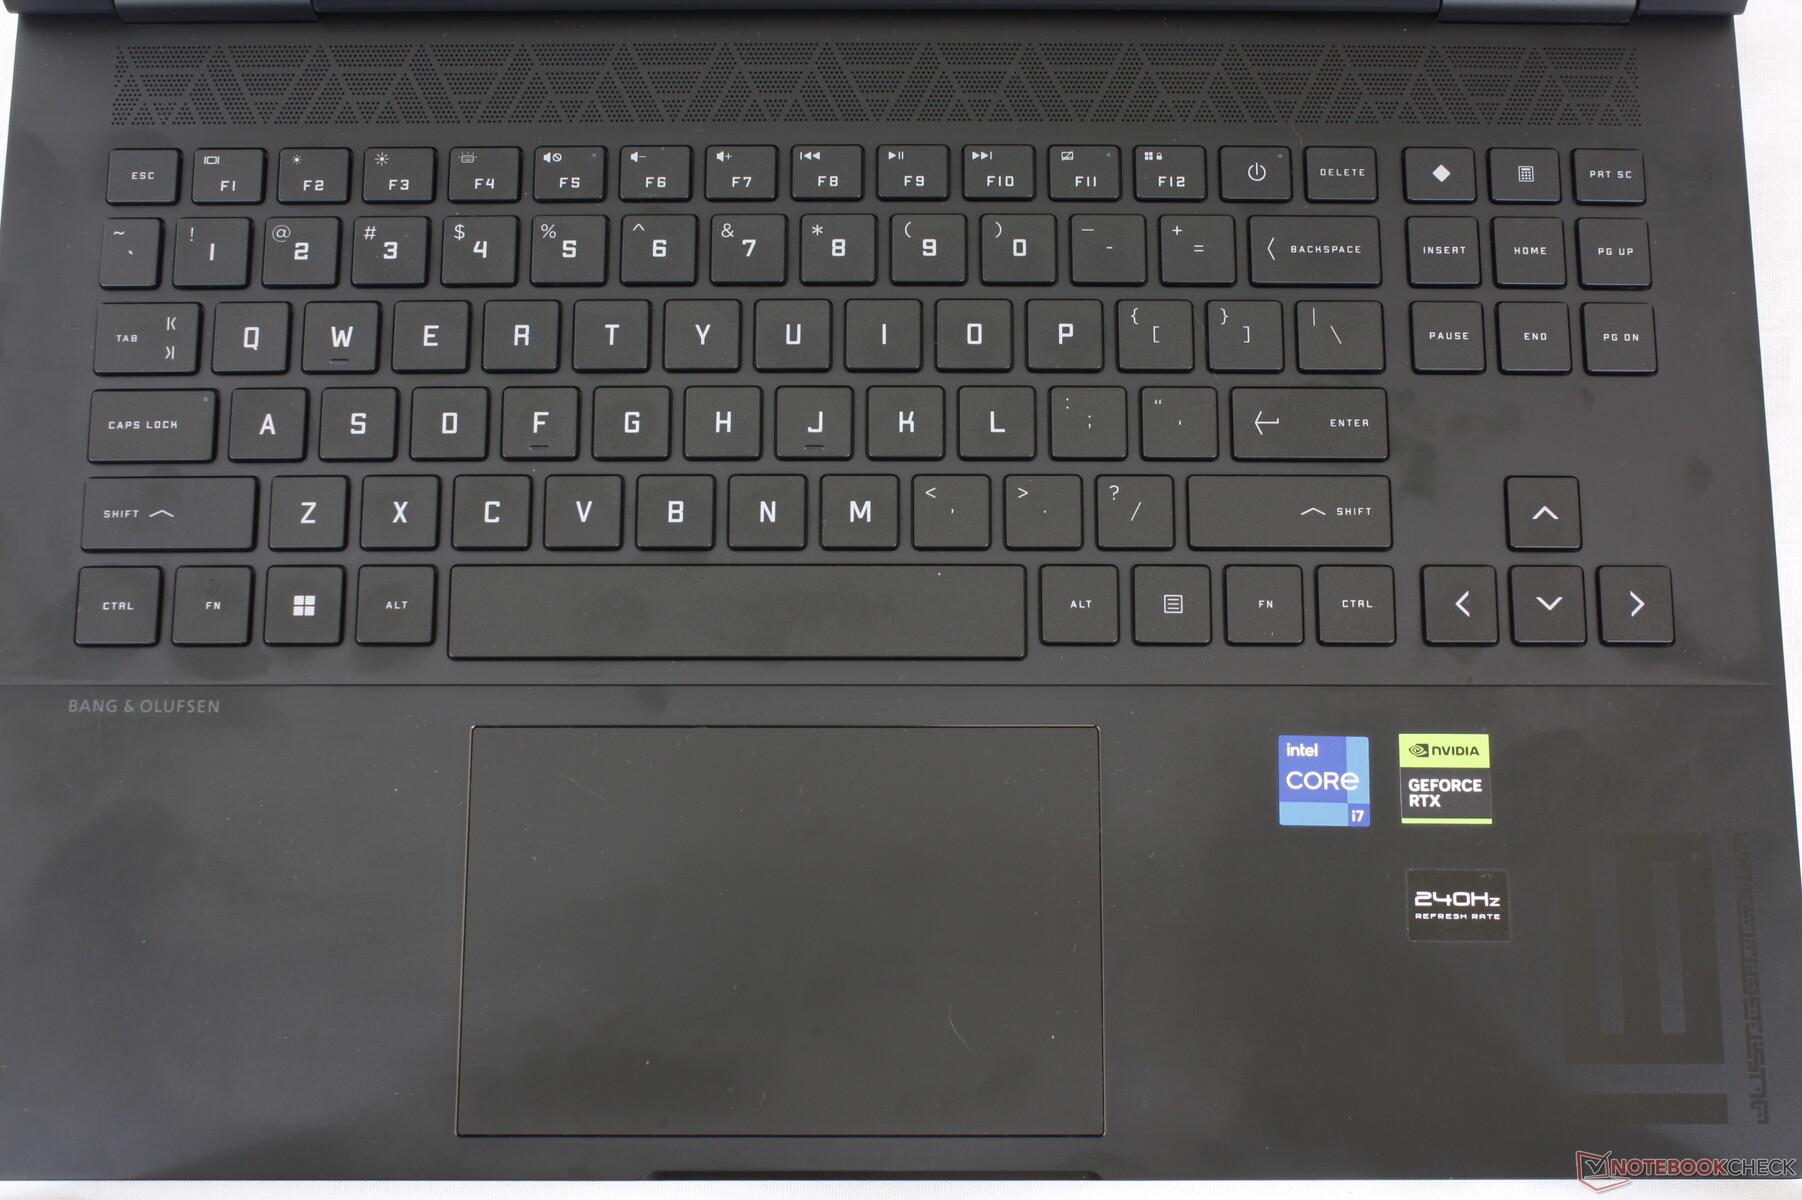
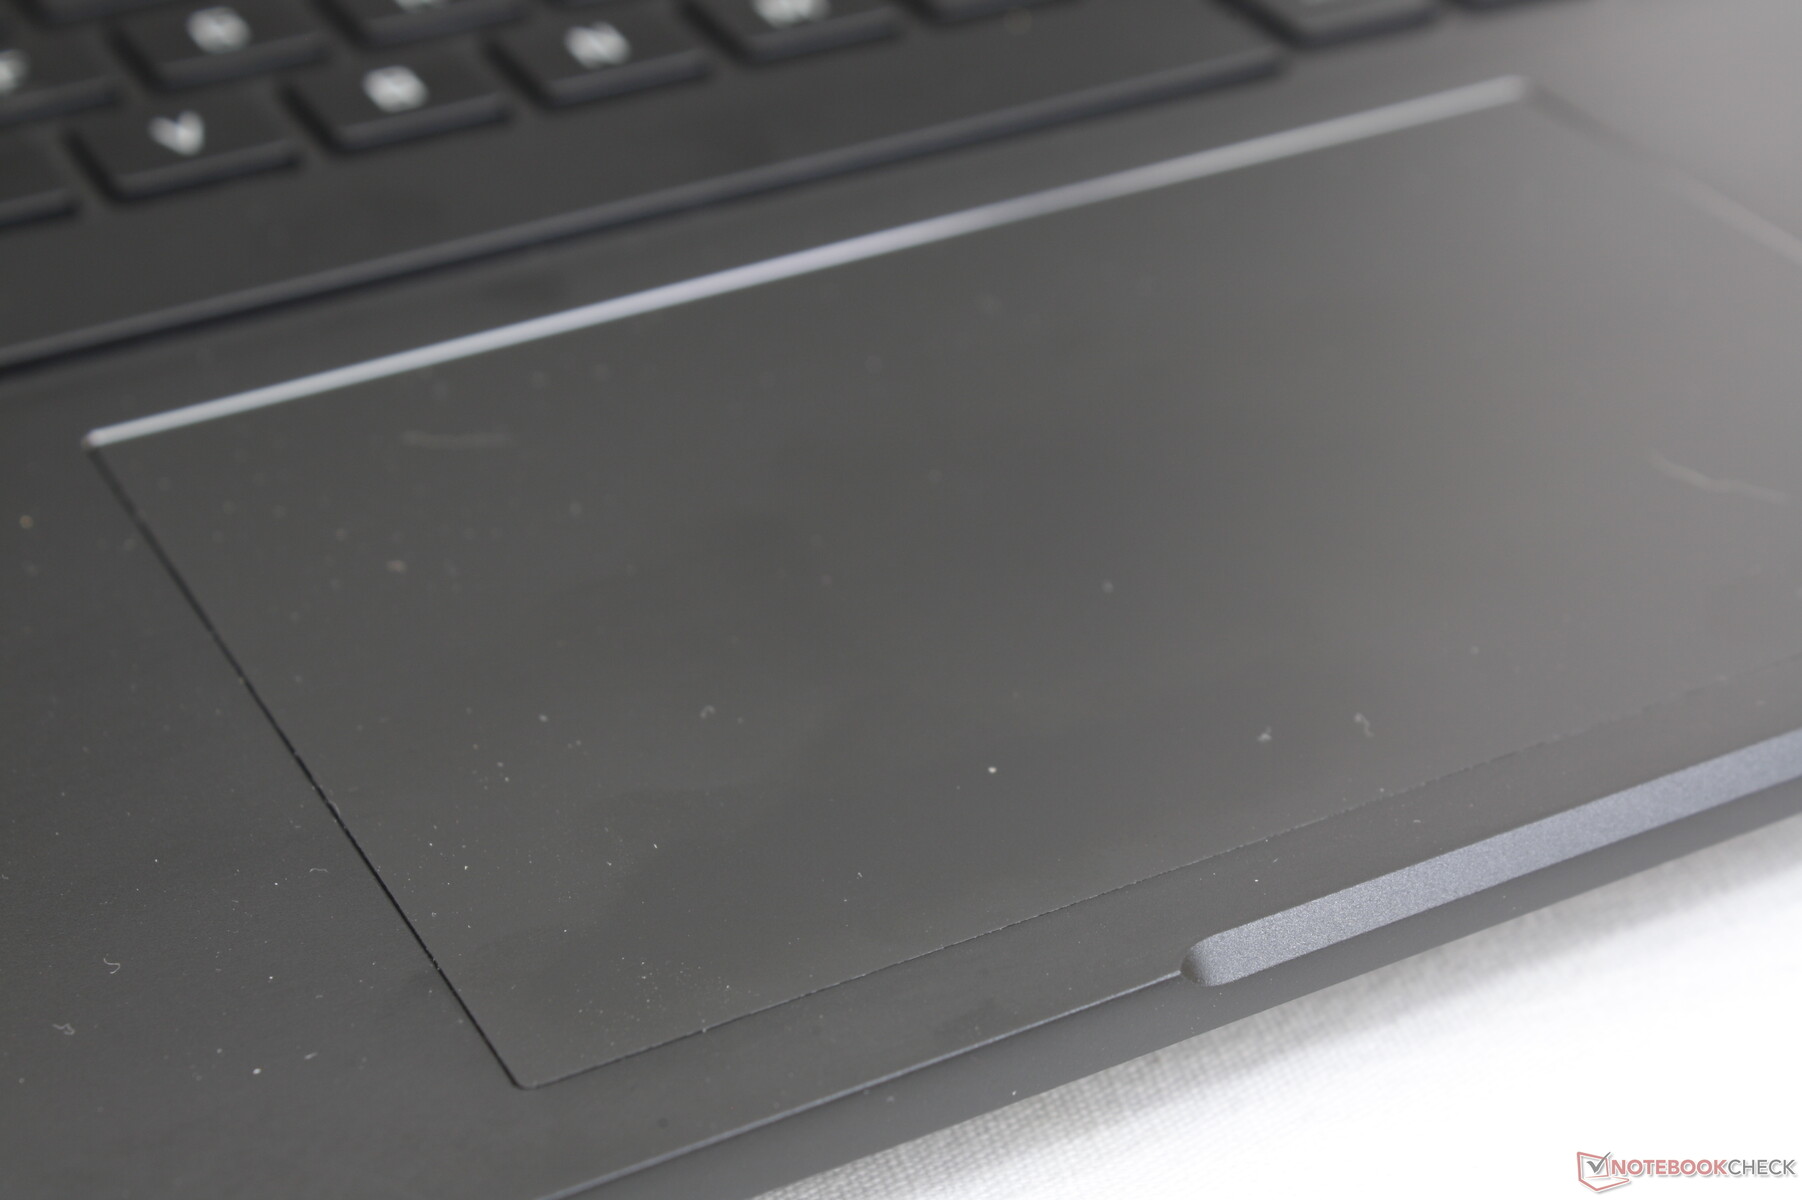
Dispositivos de entrada - Touchpad menor, mas melhor
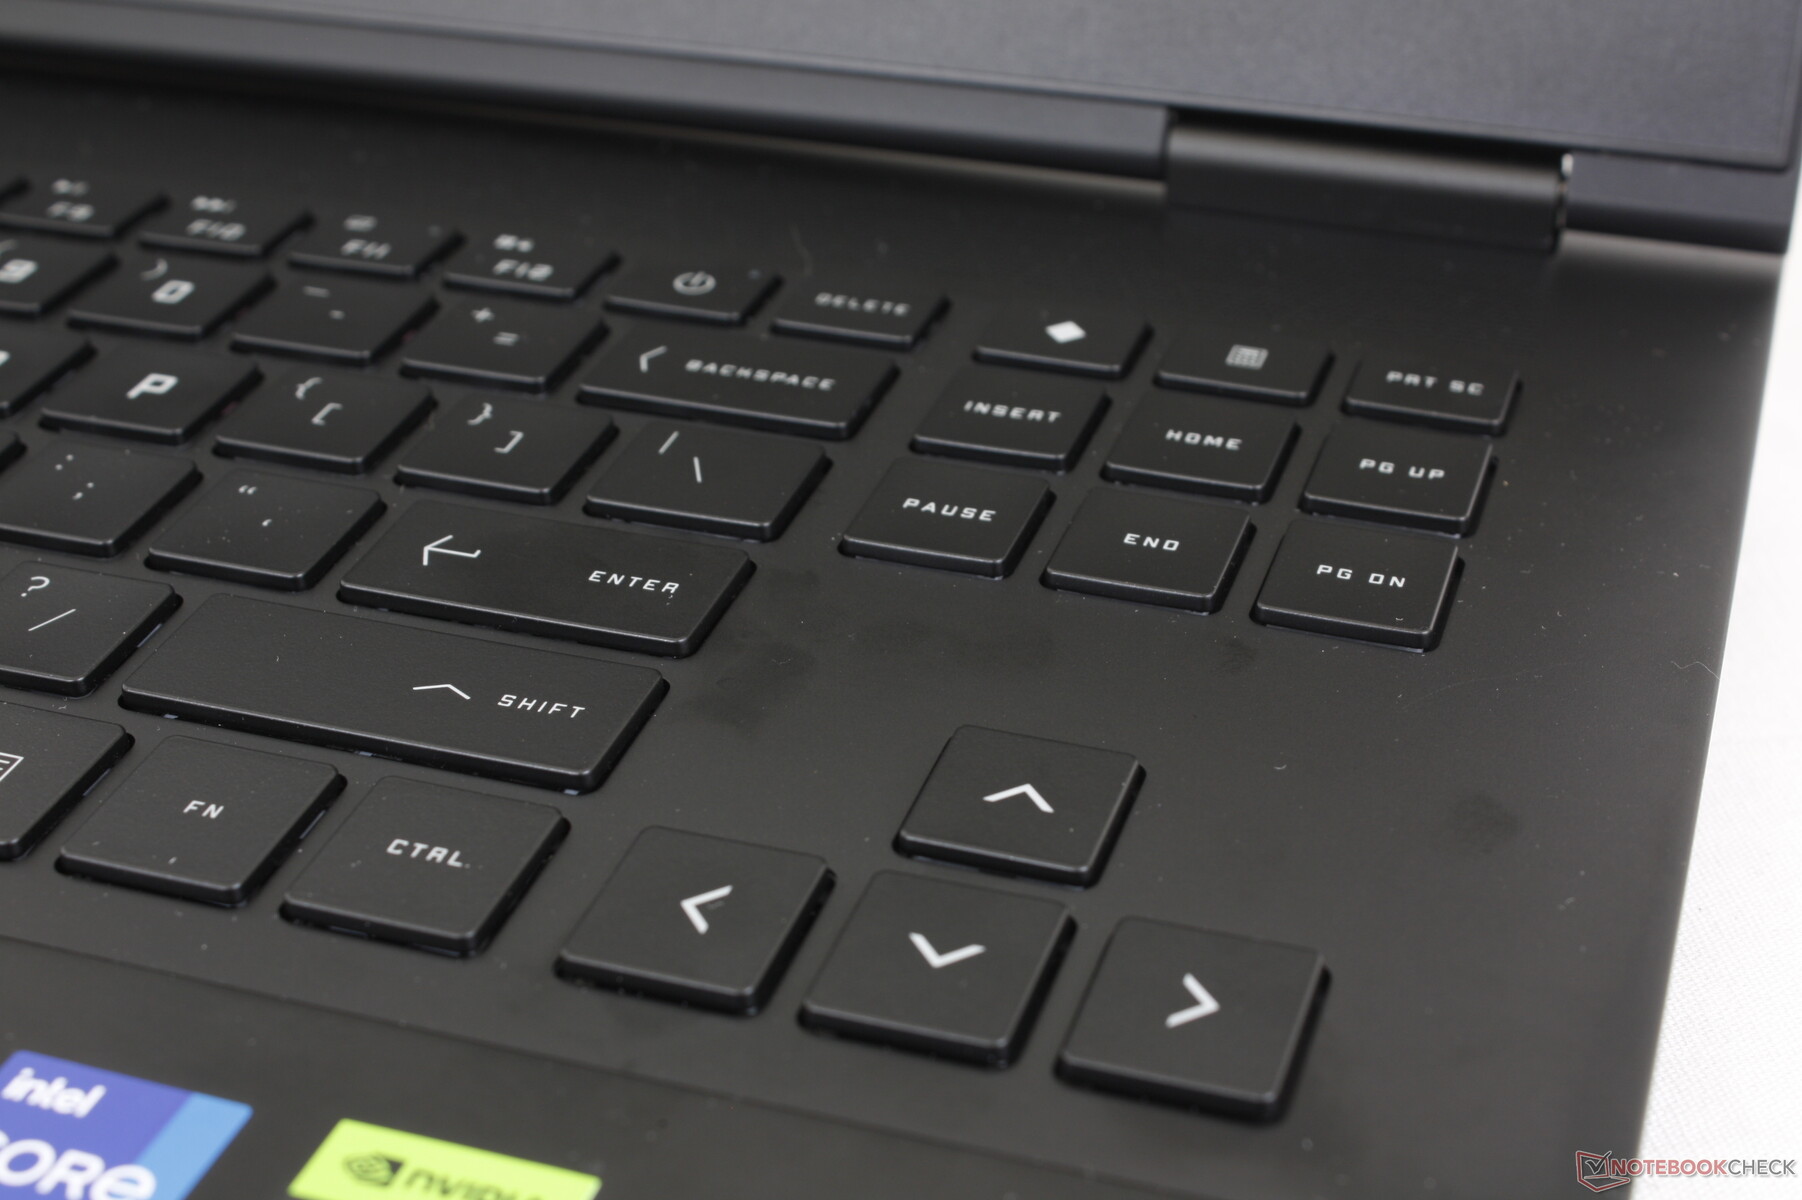
Teclado
Embora o chassi e o clickpad tenham sido reformulados, o teclado não mudou e, portanto, a experiência de digitação permanece idêntica à do Omen 16 de 2022. O feedback das teclas é satisfatório, especialmente para a tecla Space, mas a tecla Enter poderia ter sido mais firme. A digitação parece mais espaçosa aqui do que no Blade 16.
Touchpad
É interessante notar que a HP reduziu o tamanho do clickpad de 13 x 8,6 cm no 2022 Omen 16 para apenas 12,5 x 8 cm em nosso modelo 2023 mais recente. No entanto, o feedback ao pressionar sua superfície foi aprimorado para um clique mais satisfatório e audível. Portanto, não nos incomodamos muito com o tamanho menor.

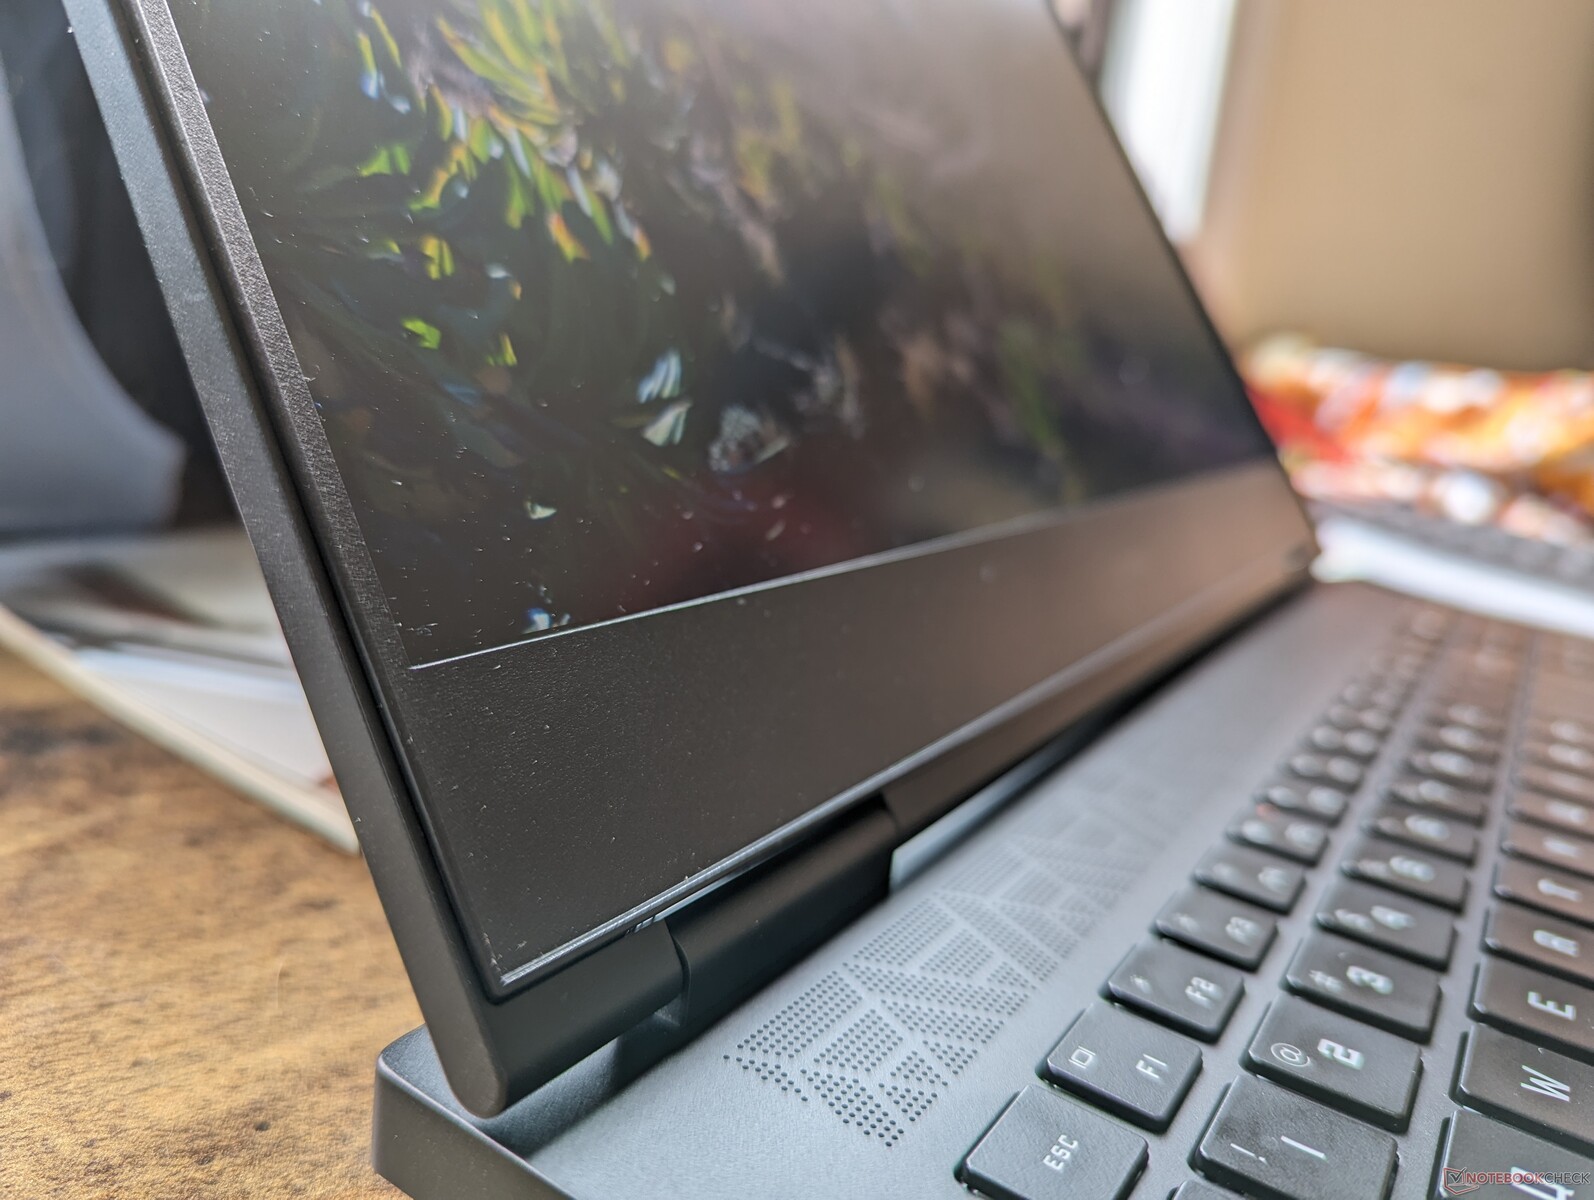
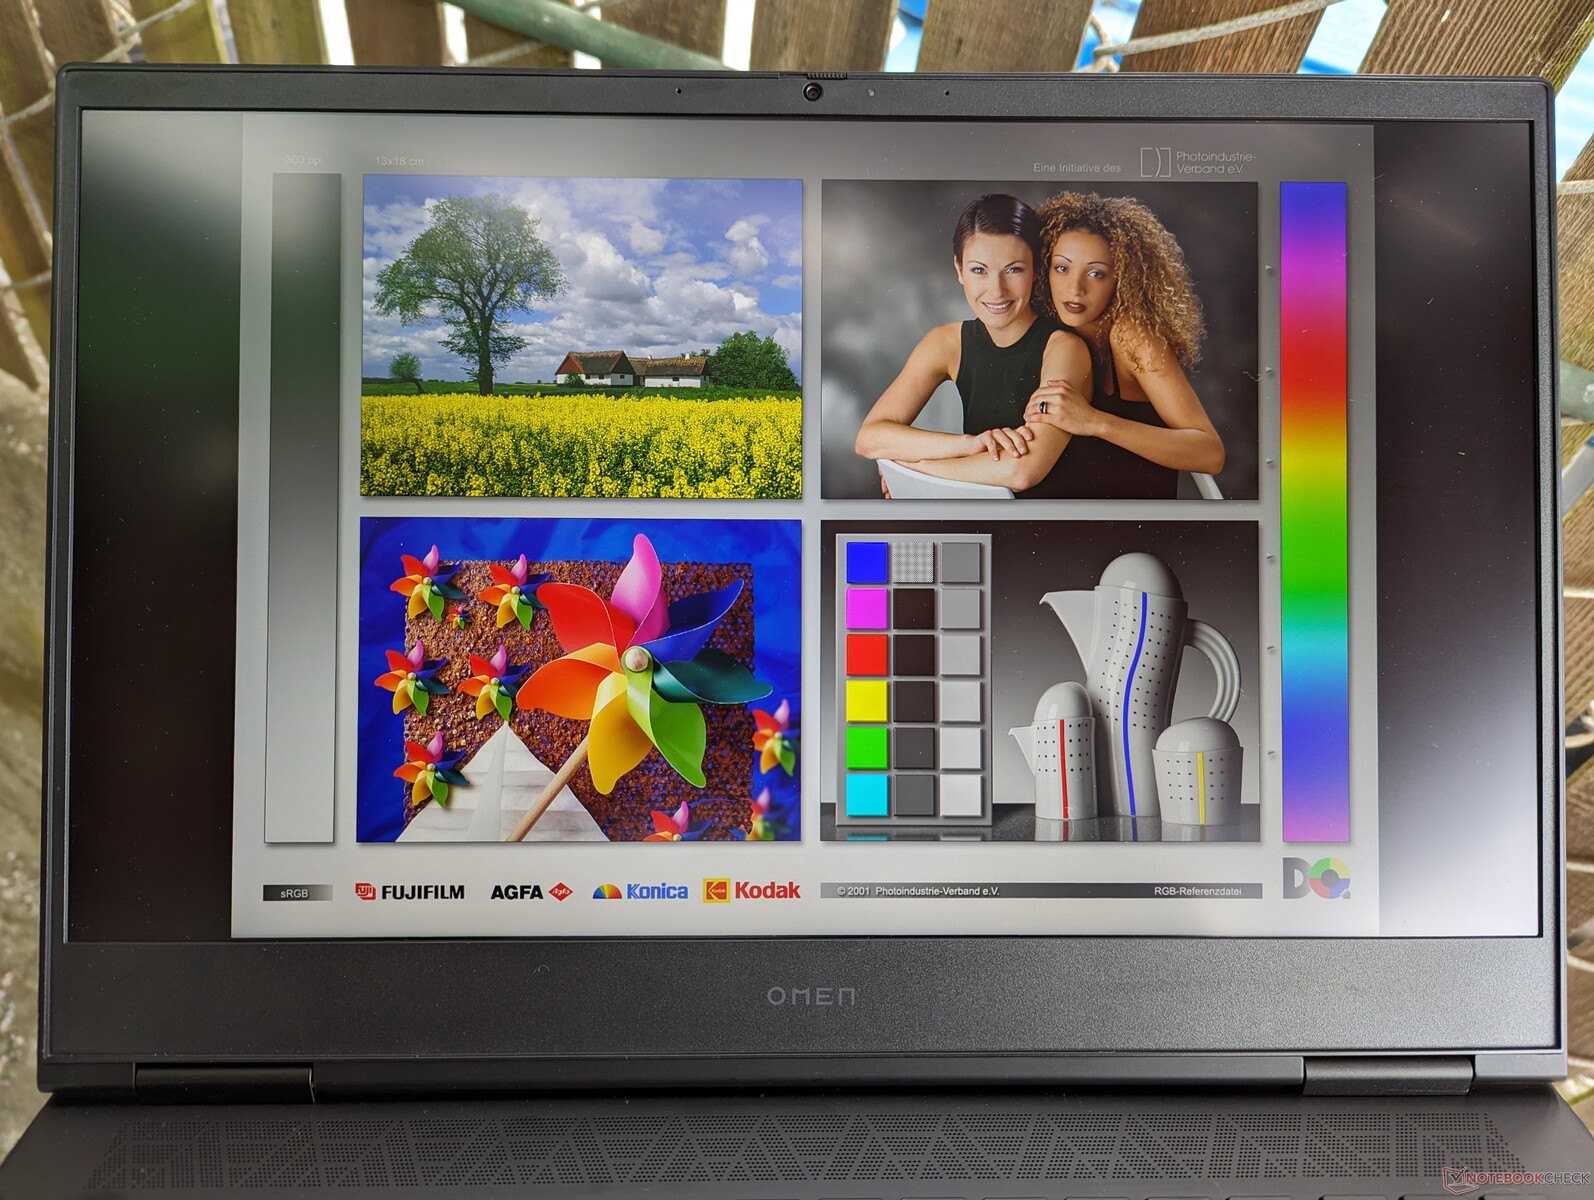
Tela - Nenhuma opção ruim
A HP oferece duas opções de tela, conforme listado abaixo. Nossas medições refletem apenas o painel em negrito.
- 1920 x 1080, 165 Hz, IPS, tempo de resposta de 7 ms, fosco, 300 nits
- 2560 x 1440, 240 Hz, IPS, tempo de resposta de 3 ms, fosco, 300 nits
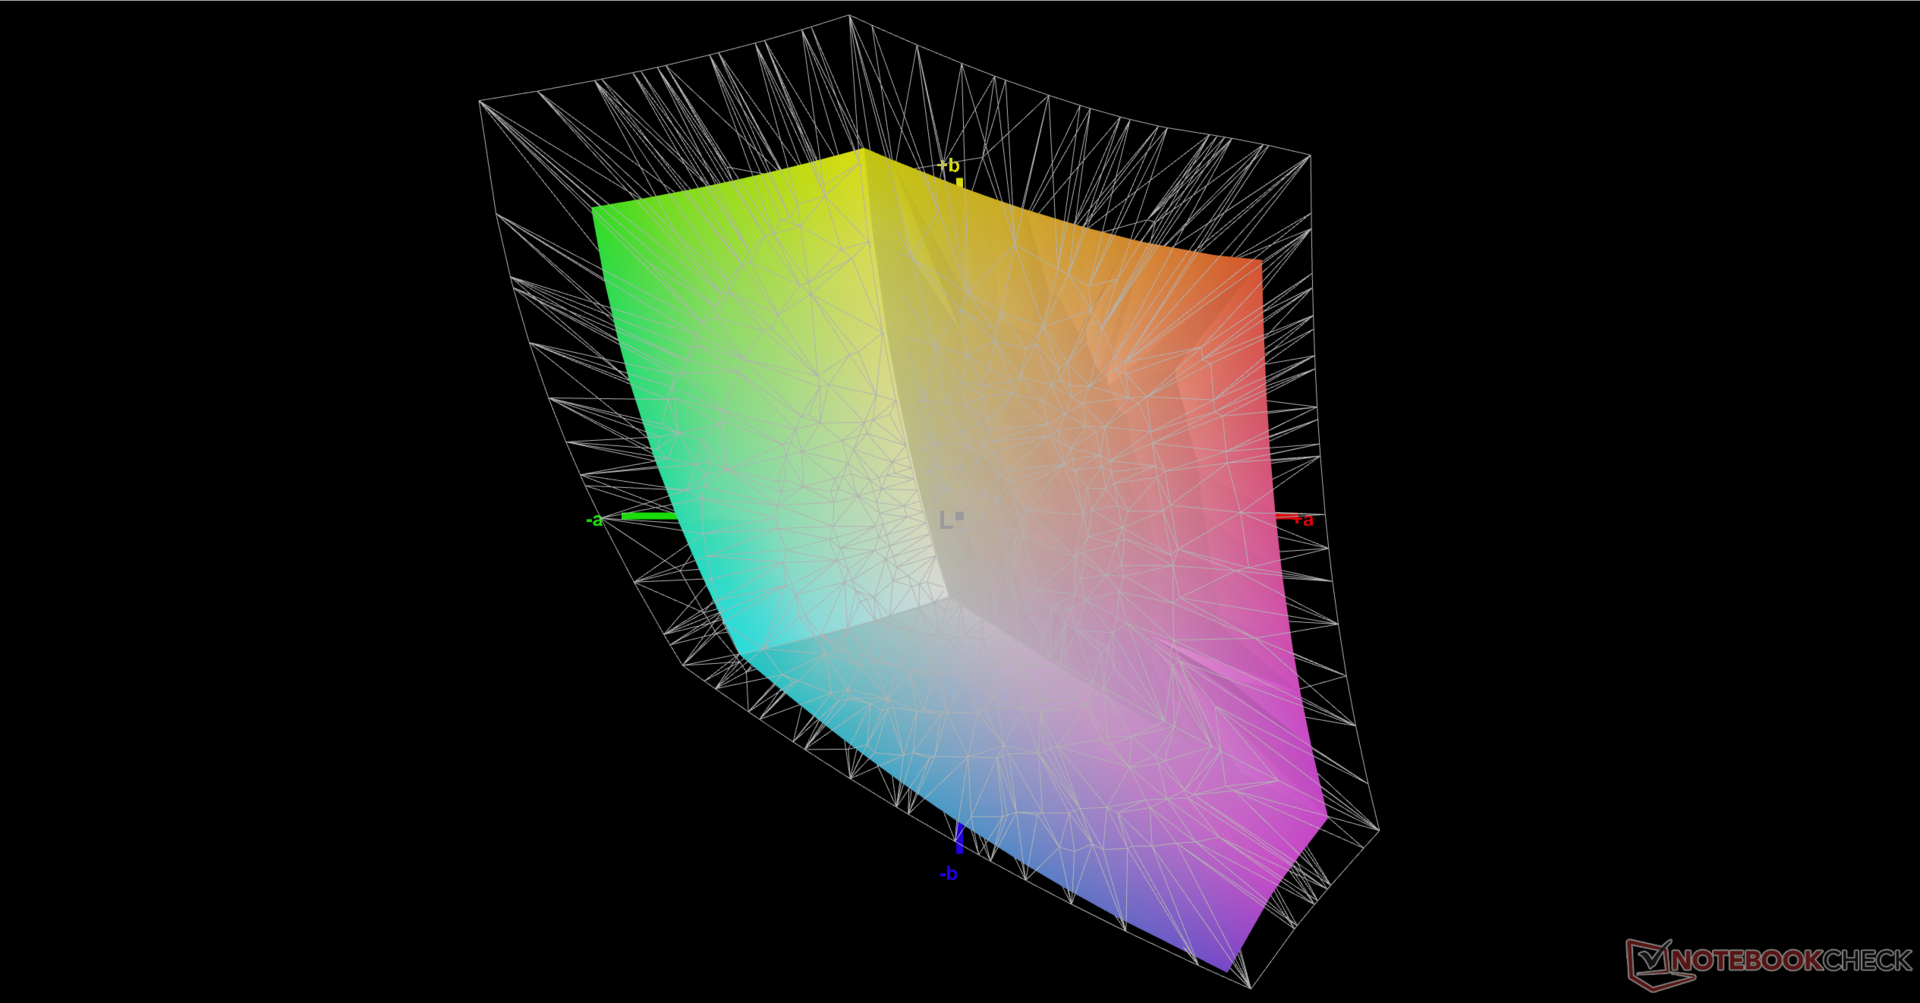
Nenhum dos painéis pode ser considerado uma opção ruim para fins de jogos, mas os jogadores de títulos de ritmo acelerado, como Overwatch 2 ou Valorant , talvez queiram considerar a opção de 1440p por seus tempos de resposta e taxas de atualização mais rápidos. A cobertura de cores é limitada a 100% sRGB, enquanto concorrentes como o Legion Pro 7 ou o ROG Strix G16 podem ter painéis DCI-P3 mais completos.
Observe que o Omen 16 é um dos poucos laptops para jogos 16:9 remanescentes em sua categoria de tamanho, pois a maioria dos outros já passou para 16:10.


| |||||||||||||||||||||||||
iluminação: 91 %
iluminação com acumulador: 310.9 cd/m²
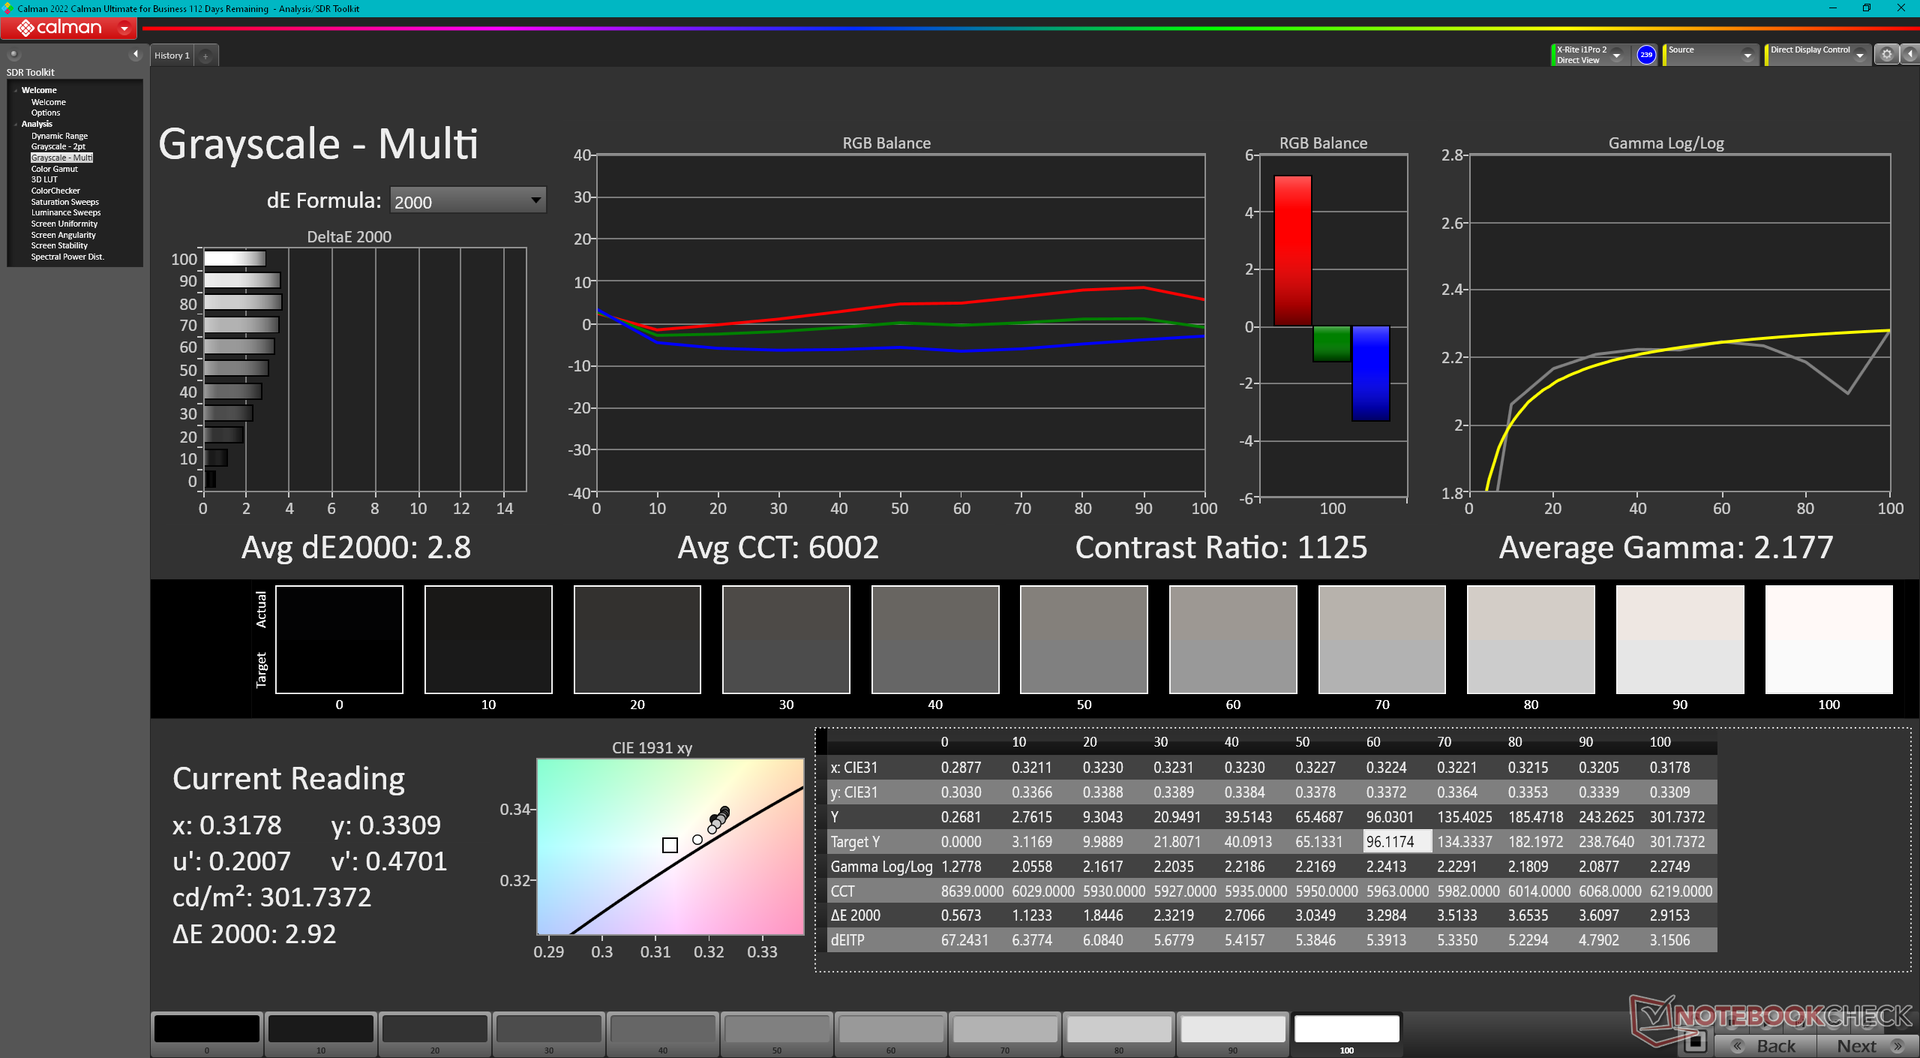
Contraste: 888:1 (Preto: 0.35 cd/m²)
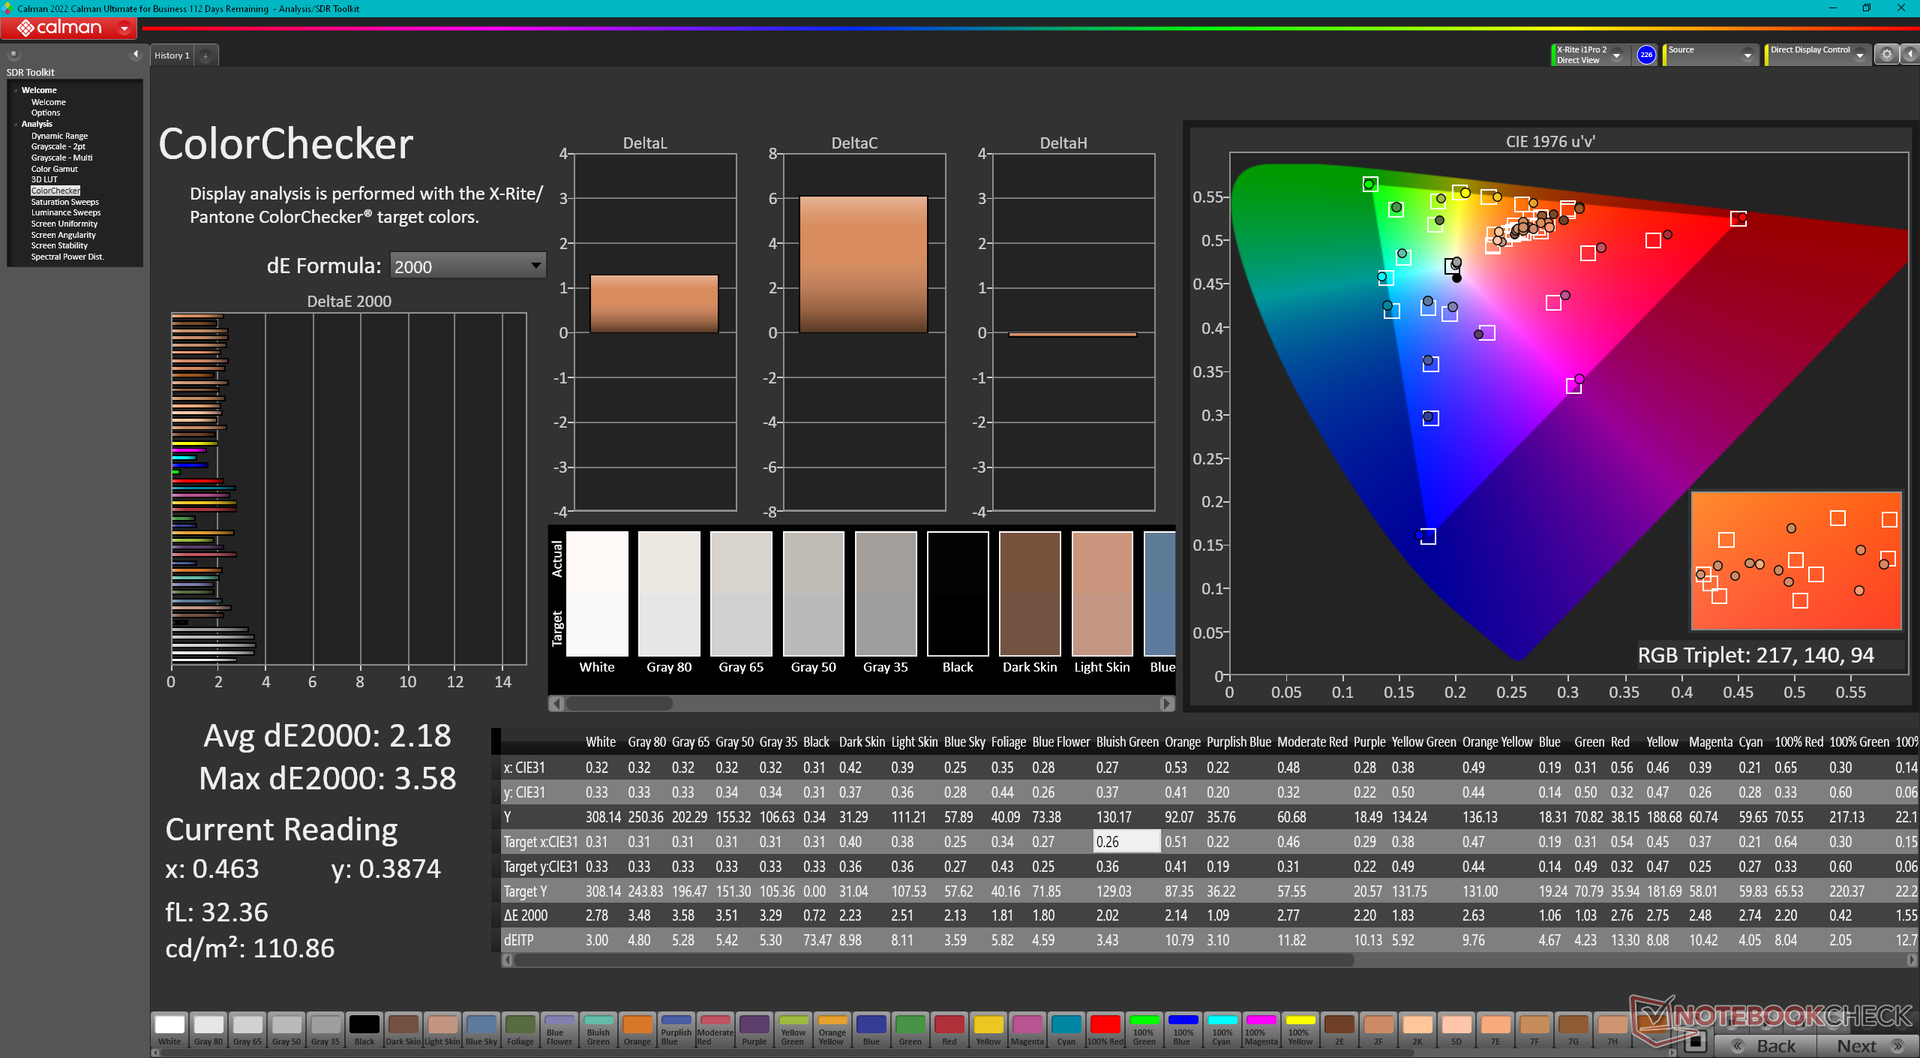
ΔE ColorChecker Calman: 2.18 | ∀{0.5-29.43 Ø4.71}
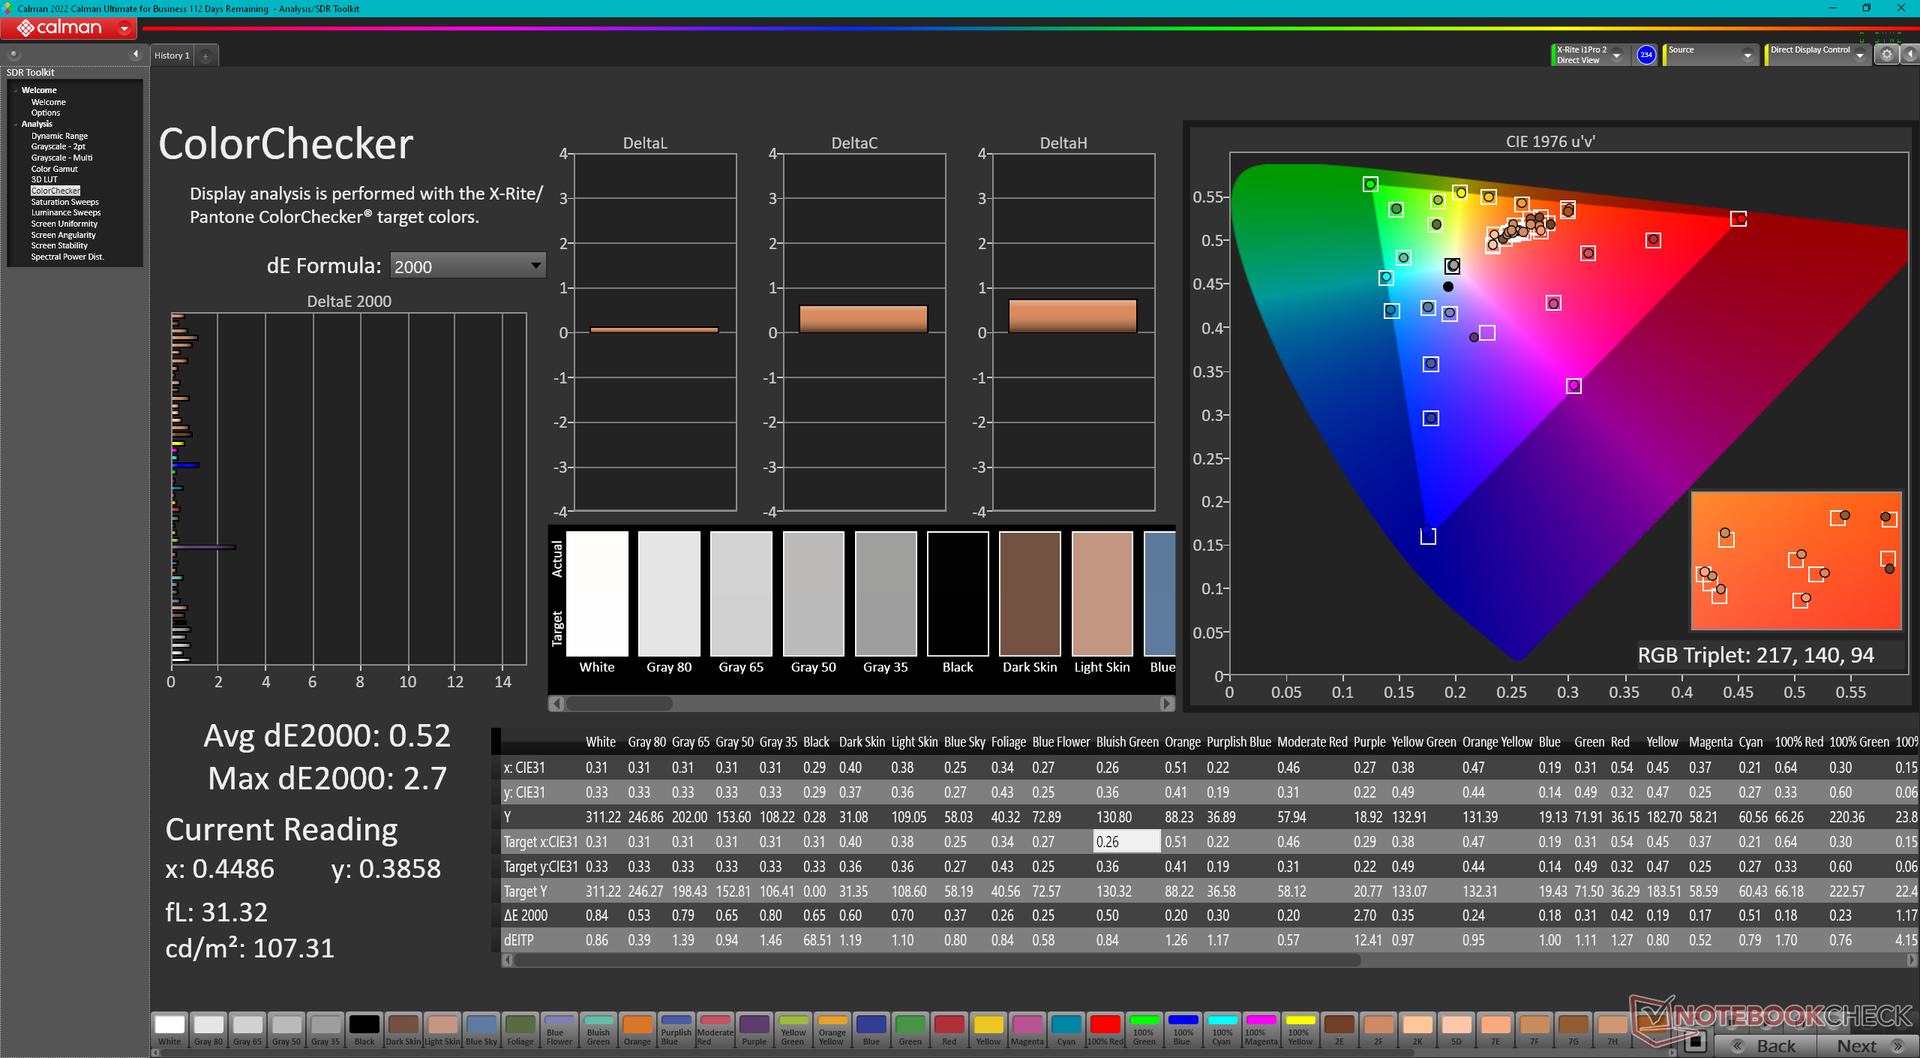
calibrated: 0.52
ΔE Greyscale Calman: 2.8 | ∀{0.09-98 Ø4.96}
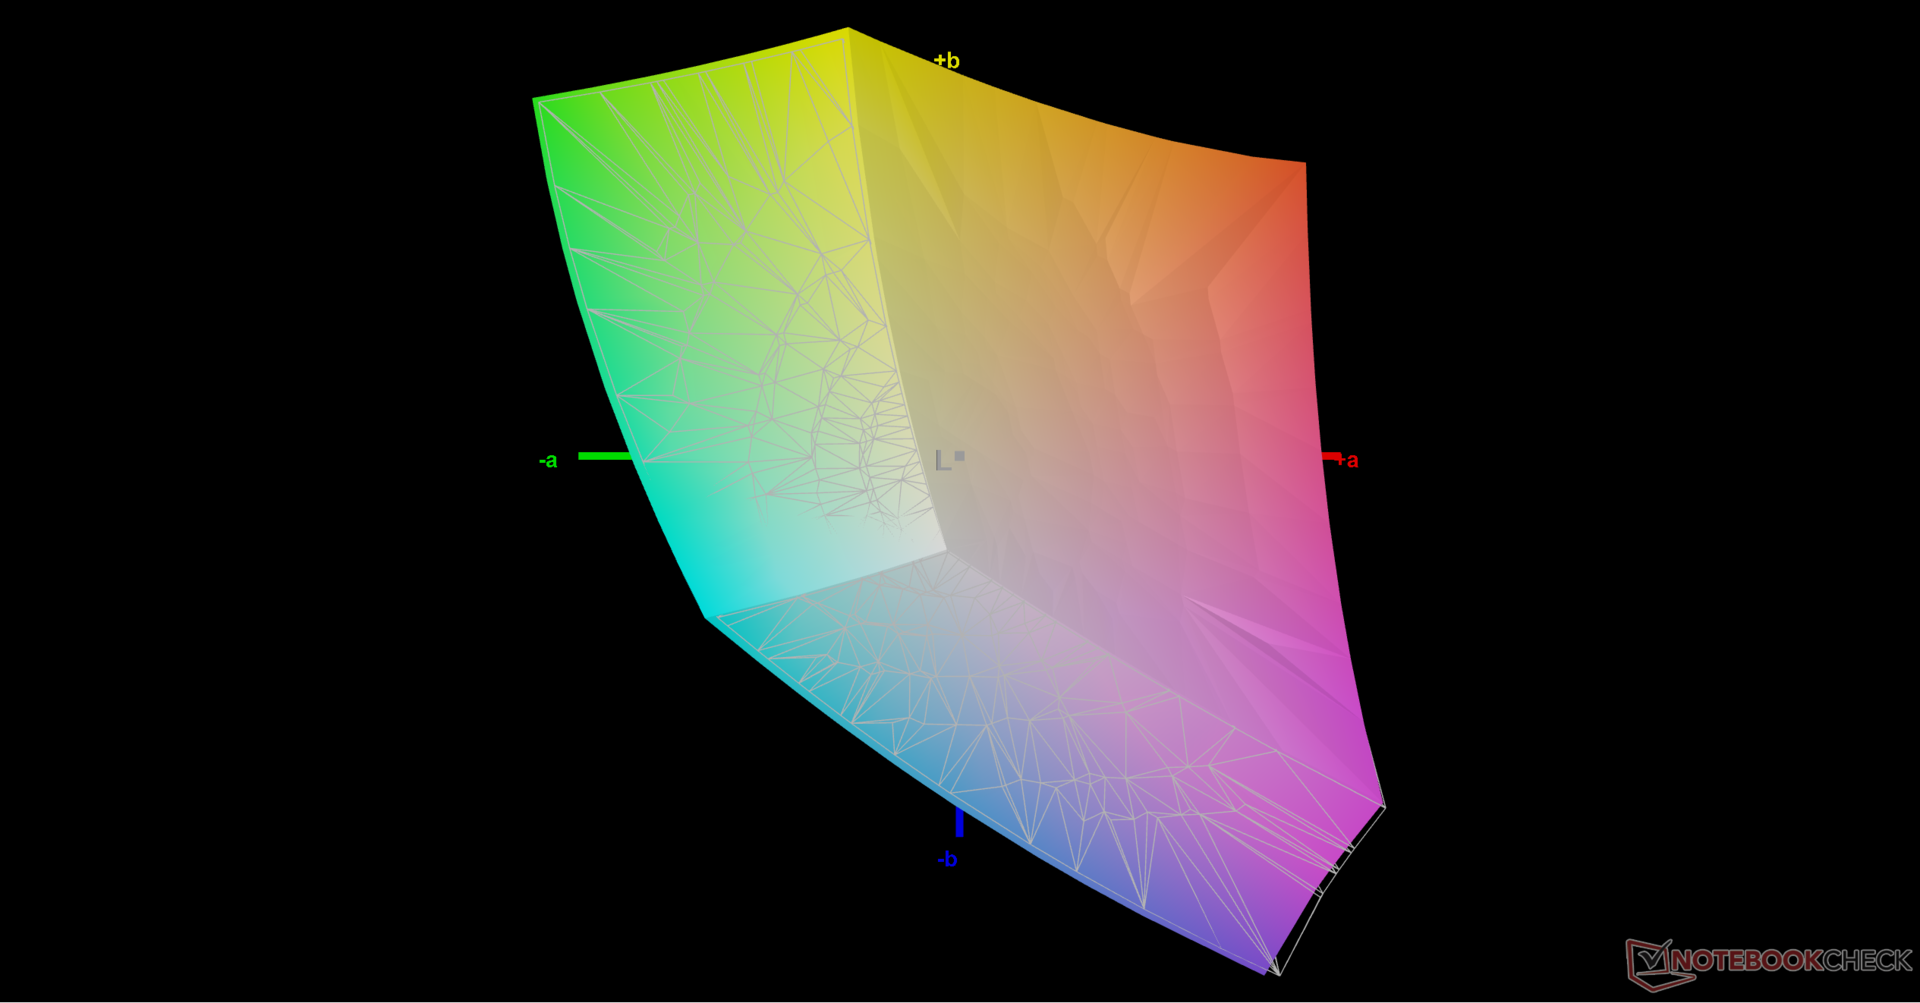
71.2% AdobeRGB 1998 (Argyll 3D)
99.2% sRGB (Argyll 3D)
69% Display P3 (Argyll 3D)
Gamma: 2.18
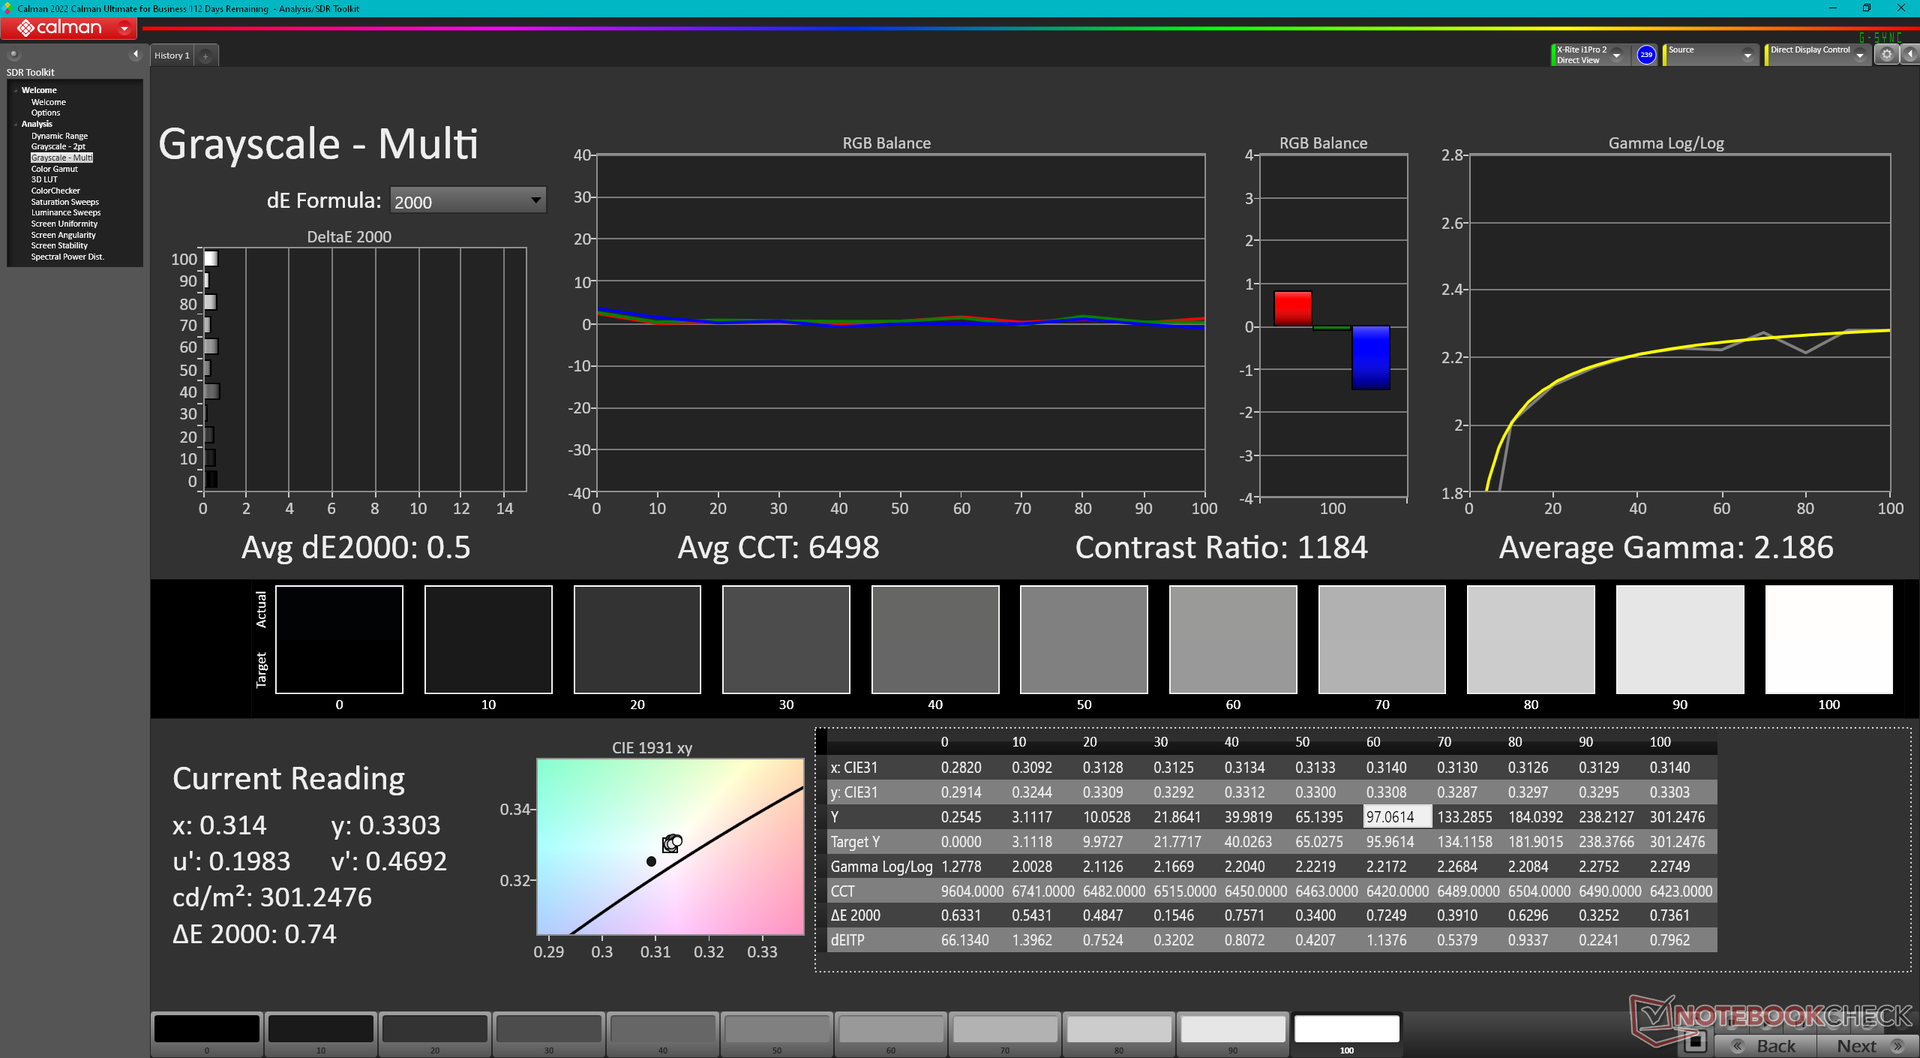
CCT: 6002 K
| HP Omen 16-wf000 BOE0B7D, IPS, 2560x1440, 16.1" | HP Omen 16-n0033dx BOE0AAE, IPS, 1920x1080, 16.1" | Alienware x16 R1 BOE NE16NZ4, IPS, 2560x1600, 16" | Lenovo Legion Pro 7 RTX4090 MNG007DA2-3 (CSO1628), IPS, 2560x1600, 16" | Asus ROG Strix G16 G614JZ TL160ADMP03-0, IPS, 2560x1600, 16" | Razer Blade 16 Early 2023 CSOT T3 MNG007DA4-1, IPS, 2560x1600, 16" | |
|---|---|---|---|---|---|---|
| Display | 4% | 23% | 1% | 20% | 23% | |
| Display P3 Coverage (%) | 69 | 74.4 8% | 99.2 44% | 69.5 1% | 97 41% | 98.5 43% |
| sRGB Coverage (%) | 99.2 | 99.2 0% | 100 1% | 99.8 1% | 99.9 1% | 100 1% |
| AdobeRGB 1998 Coverage (%) | 71.2 | 73.4 3% | 88.6 24% | 71.6 1% | 84.9 19% | 89.7 26% |
| Response Times | -149% | -9% | -42% | 11% | -34% | |
| Response Time Grey 50% / Grey 80% * (ms) | 4.6 ? | 17.6 ? -283% | 5.1 ? -11% | 10.9 ? -137% | 5.1 ? -11% | 6.6 ? -43% |
| Response Time Black / White * (ms) | 9.7 ? | 11.2 ? -15% | 10.3 ? -6% | 4.6 ? 53% | 6.6 ? 32% | 12 ? -24% |
| PWM Frequency (Hz) | ||||||
| Screen | -38% | -6% | 3% | 5% | -4% | |
| Brightness middle (cd/m²) | 310.9 | 373.3 20% | 302.2 -3% | 491 58% | 470 51% | 456.8 47% |
| Brightness (cd/m²) | 296 | 361 22% | 285 -4% | 472 59% | 459 55% | 437 48% |
| Brightness Distribution (%) | 91 | 79 -13% | 89 -2% | 91 0% | 93 2% | 83 -9% |
| Black Level * (cd/m²) | 0.35 | 0.44 -26% | 0.26 26% | 0.4 -14% | 0.42 -20% | 0.35 -0% |
| Contrast (:1) | 888 | 848 -5% | 1162 31% | 1228 38% | 1119 26% | 1305 47% |
| Colorchecker dE 2000 * | 2.18 | 2.12 3% | 1.63 25% | 1.6 27% | 1.86 15% | 3.7 -70% |
| Colorchecker dE 2000 max. * | 3.58 | 5.62 -57% | 4.13 -15% | 5.15 -44% | 3.87 -8% | 6.42 -79% |
| Colorchecker dE 2000 calibrated * | 0.52 | 2.06 -296% | 1.17 -125% | 0.97 -87% | 0.93 -79% | 0.66 -27% |
| Greyscale dE 2000 * | 2.8 | 2.5 11% | 2.5 11% | 3 -7% | 2.7 4% | 2.6 7% |
| Gamma | 2.18 101% | 2.3 96% | 2.23 99% | 2.211 100% | 2.246 98% | 2.3 96% |
| CCT | 6002 108% | 6408 101% | 6590 99% | 6979 93% | 6711 97% | 6108 106% |
| Média Total (Programa/Configurações) | -61% /
-45% | 3% /
-0% | -13% /
-4% | 12% /
9% | -5% /
-2% |
* ... menor é melhor
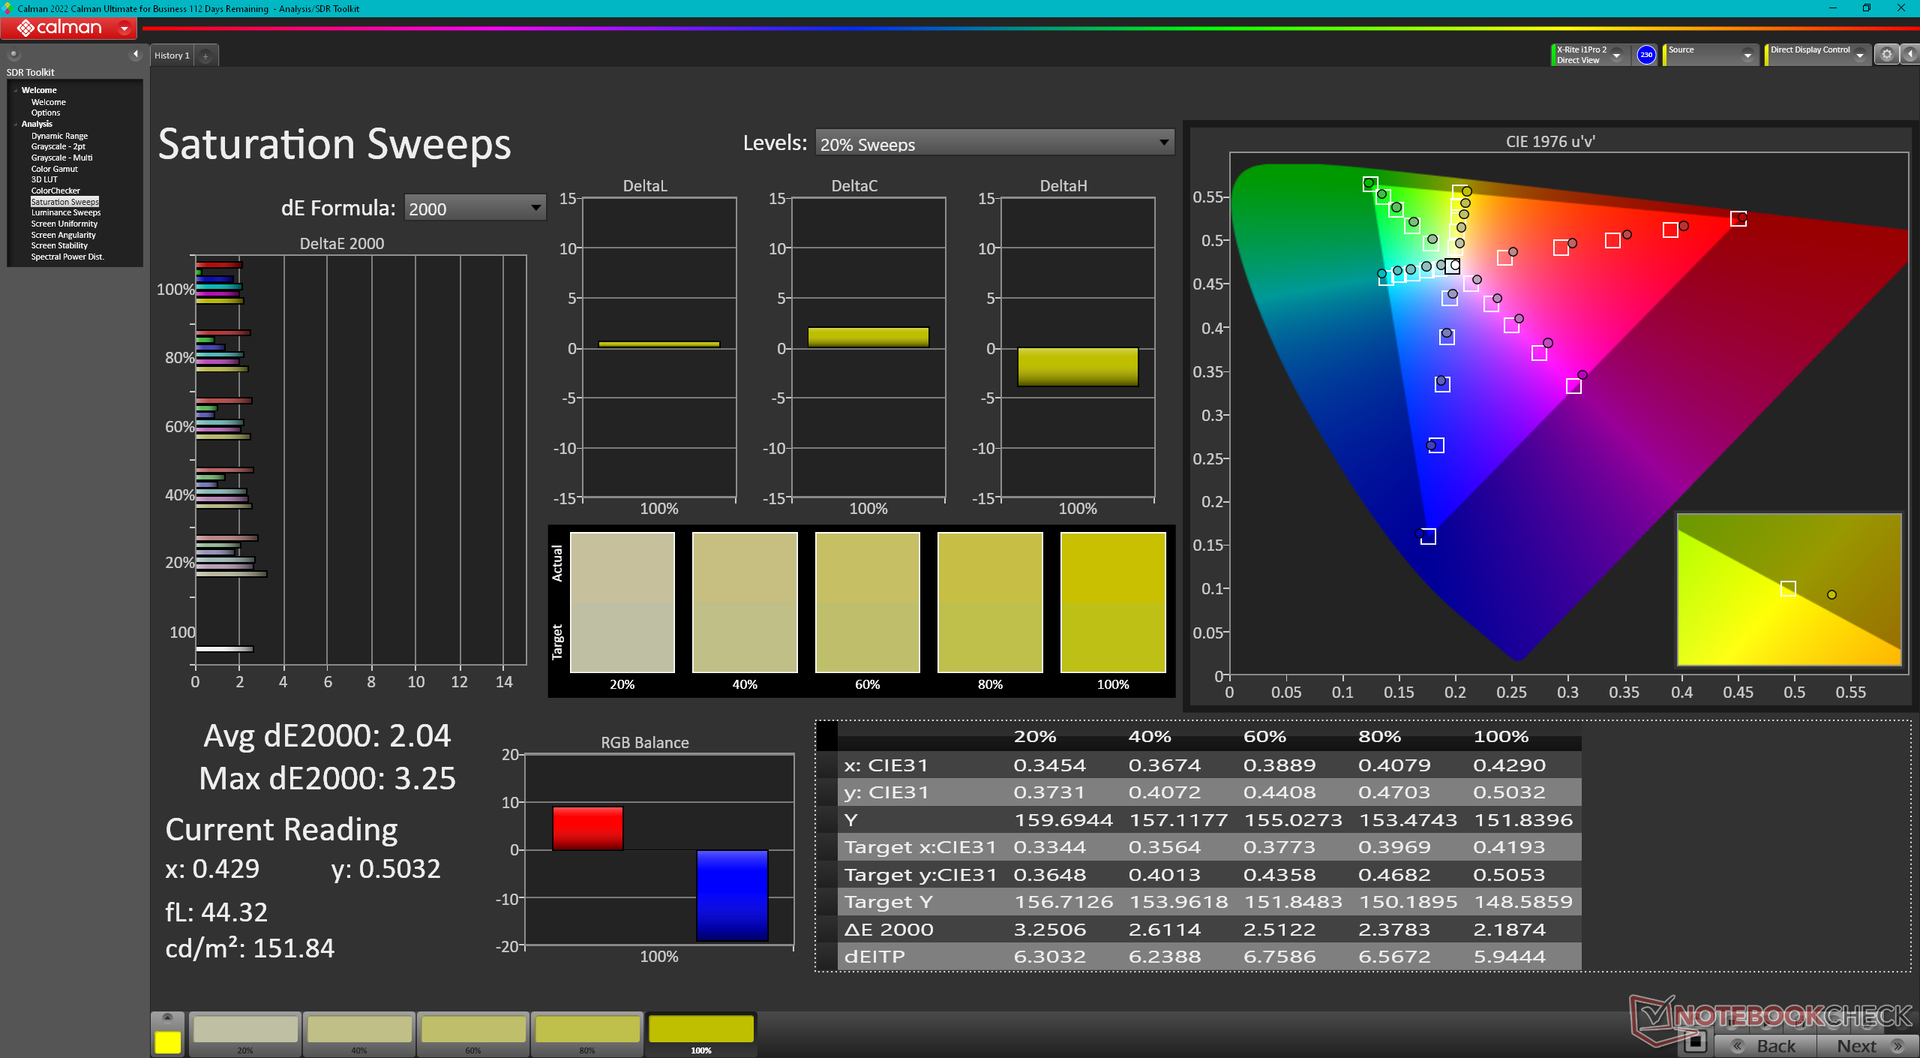
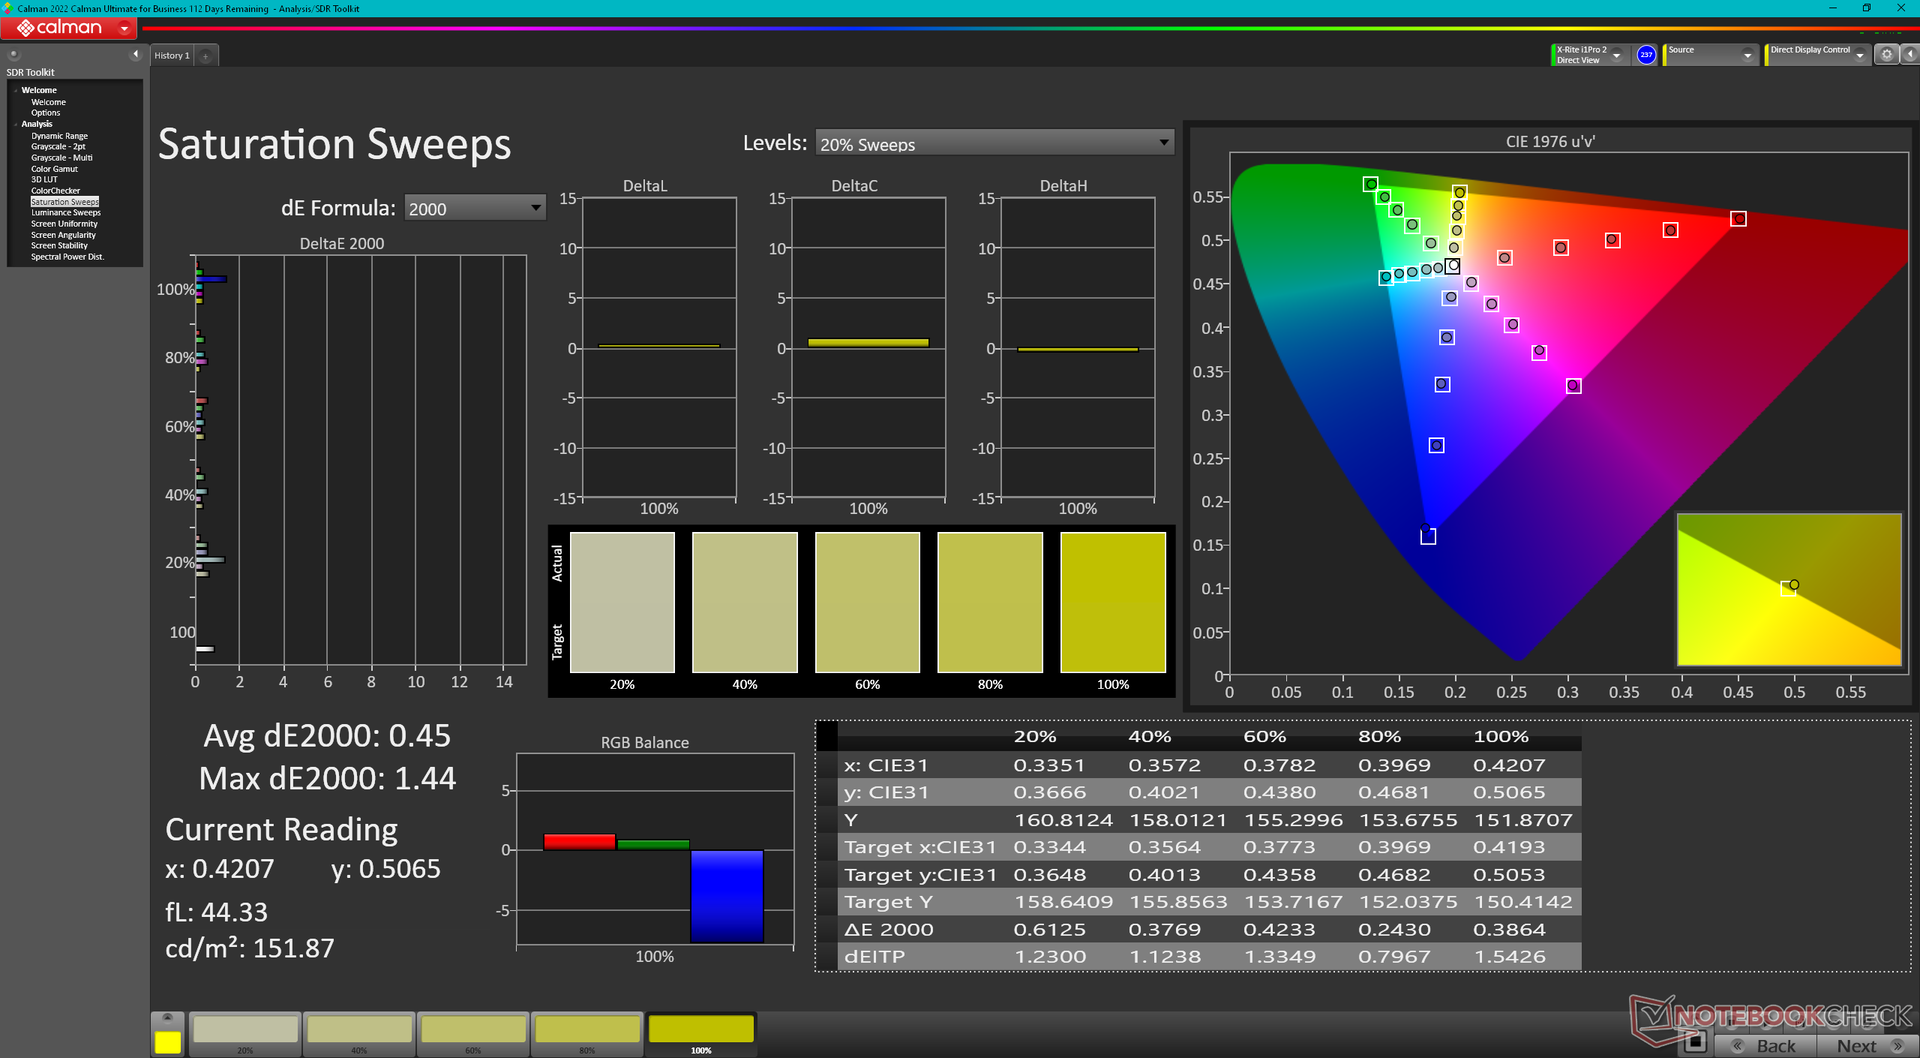
A tela é calibrada de forma decente, com valores médios de escala de cinza e deltaE de cores de 2,8 e 2,18, respectivamente. Calibrar o painel com um colorímetro X-Rite melhoraria ainda mais os valores médios para apenas 0,5 e 0,52, respectivamente. Os proprietários podem aplicar nosso perfil ICM calibrado acima, se desejarem.
Exibir tempos de resposta
| ↔ Tempo de resposta preto para branco | ||
|---|---|---|
| 9.7 ms ... ascensão ↗ e queda ↘ combinadas | ↗ 4.6 ms ascensão | 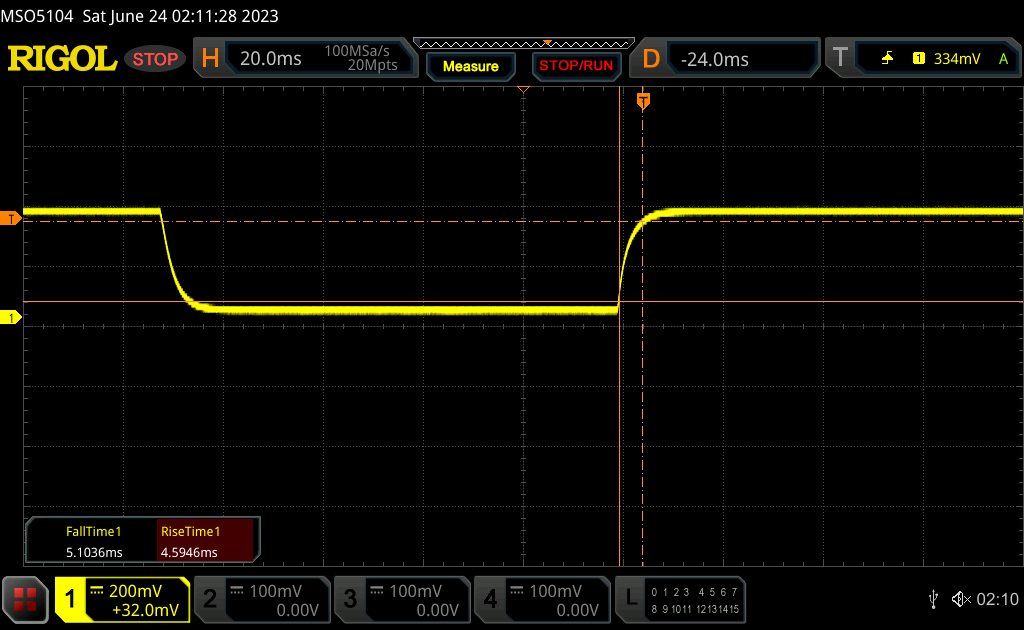 |
| ↘ 5.1 ms queda | ||
| A tela mostra taxas de resposta rápidas em nossos testes e deve ser adequada para jogos. Em comparação, todos os dispositivos testados variam de 0.1 (mínimo) a 240 (máximo) ms. » 27 % de todos os dispositivos são melhores. Isso significa que o tempo de resposta medido é melhor que a média de todos os dispositivos testados (19.8 ms). | ||
| ↔ Tempo de resposta 50% cinza a 80% cinza | ||
| 4.6 ms ... ascensão ↗ e queda ↘ combinadas | ↗ 2.1 ms ascensão | 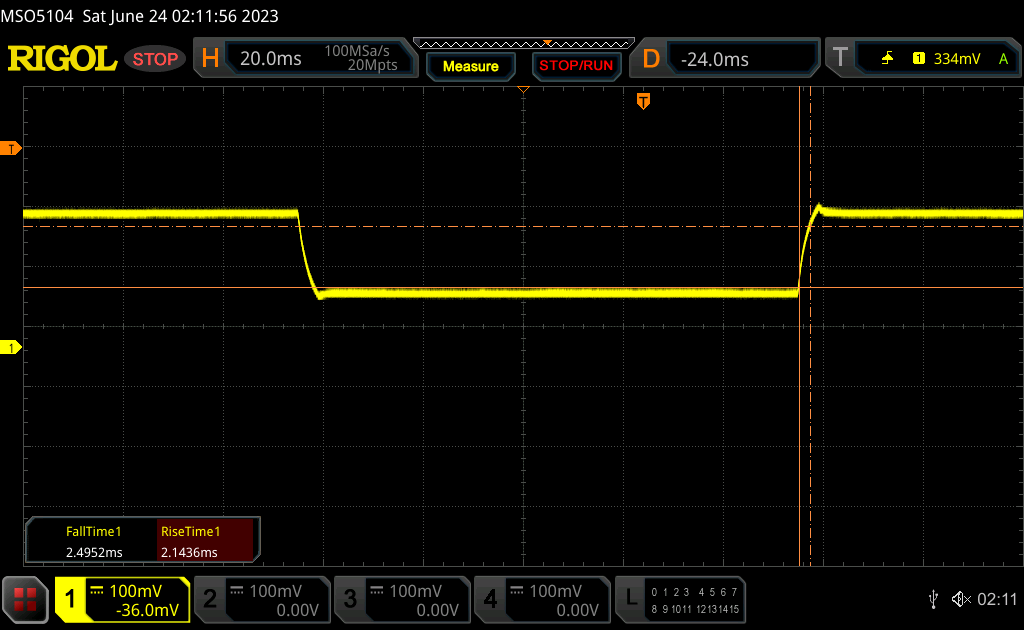 |
| ↘ 2.5 ms queda | ||
| A tela mostra taxas de resposta muito rápidas em nossos testes e deve ser muito adequada para jogos em ritmo acelerado. Em comparação, todos os dispositivos testados variam de 0.165 (mínimo) a 636 (máximo) ms. » 16 % de todos os dispositivos são melhores. Isso significa que o tempo de resposta medido é melhor que a média de todos os dispositivos testados (30.9 ms). | ||
Cintilação da tela / PWM (modulação por largura de pulso)
| Tela tremeluzindo / PWM não detectado | 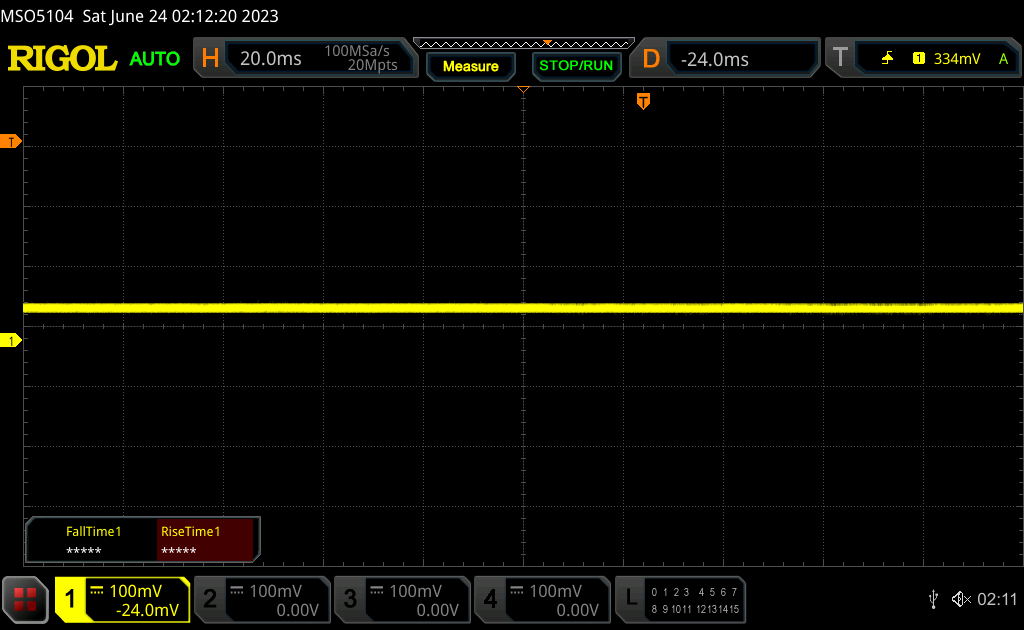 | ||
[pwm_comparison] Em comparação: 52 % de todos os dispositivos testados não usam PWM para escurecer a tela. Se PWM foi detectado, uma média de 7748 (mínimo: 5 - máximo: 343500) Hz foi medida. | |||
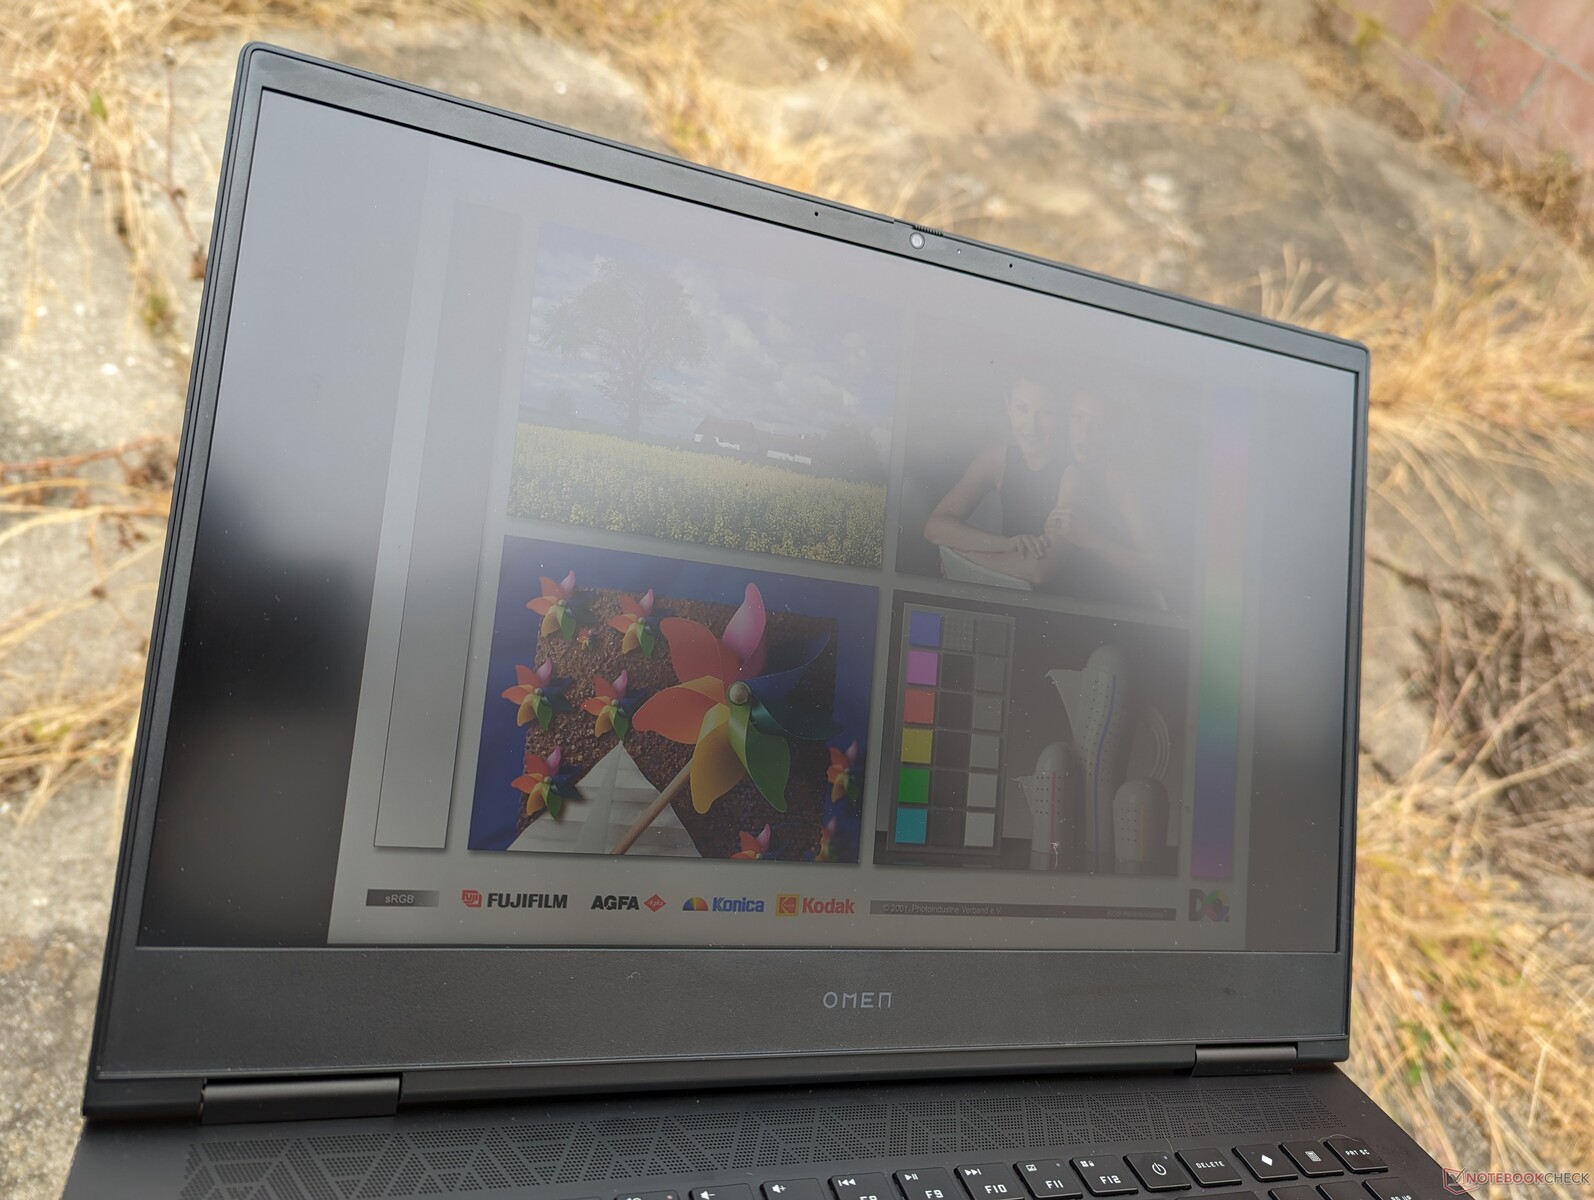
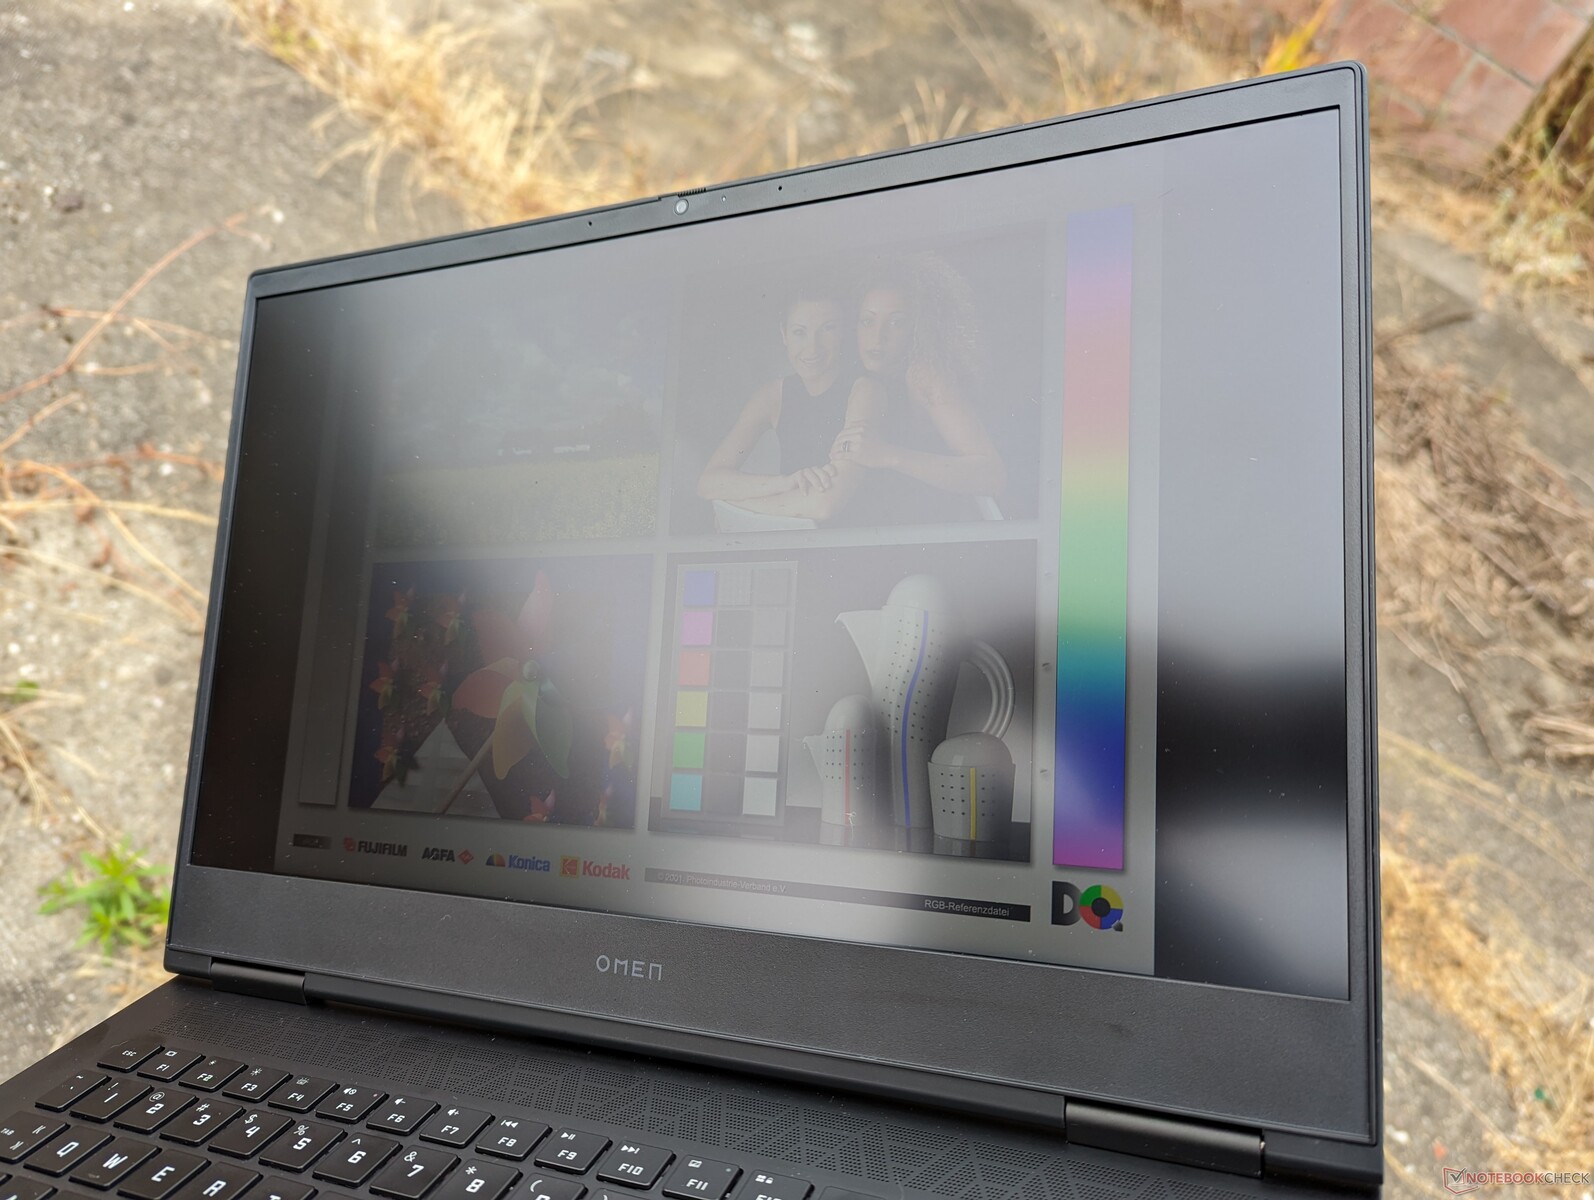
A visibilidade em ambientes externos é aceitável somente quando está sob a sombra. A tela não é tão brilhante quanto as telas do Legion Pro 7,ROG Strix G16ou doBlade 16 que são mais fáceis de ver em ambientes externos.

Desempenho - Intel Raptor Lake-H de 13ª geração
Condições de teste
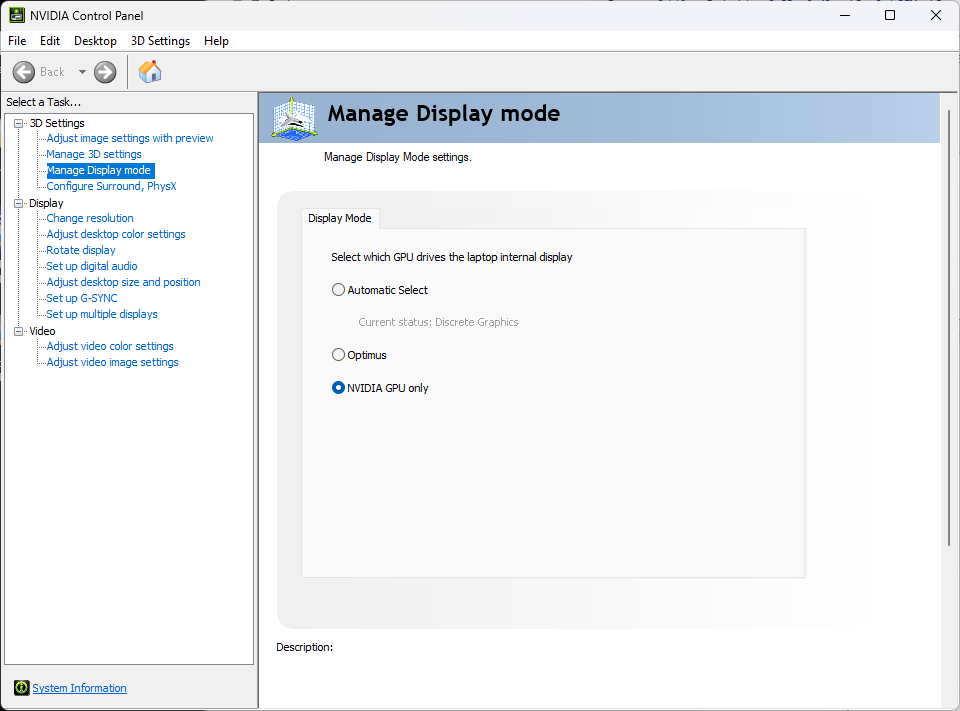
Configuramos nossa unidade para o modo dGPU por meio do painel de controle da Nvidia e para o modo Desempenho por meio do Omen Gaming Hub e do Windows antes de executar os benchmarks abaixo. Há também uma configuração de ventilador máximo, além do modo de desempenho normal. Recomendamos que os proprietários se familiarizem com o Omen Gaming Hub, pois ele é o centro de controle para ajustar perfis de energia, iluminação RGB, configurações de jogos e muito mais. O que é irritante é que as configurações do perfil de energia da HP não são sincronizadas com os perfis de energia normais do Windows.
Há suporte para Optimus avançado ou MUX e G-Sync.
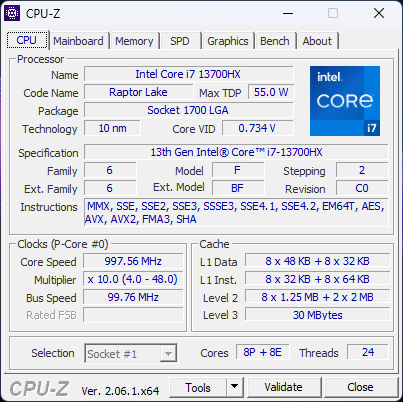
Processador
O desempenho da CPU está onde esperamos que esteja em relação a outros laptops com o mesmo Core i7-13700HX O que significa que o Omen 16 não apresenta grandes limitações de desempenho. Notavelmente, o processador está em pé de igualdade com o mais caroCore i9-13900HK no Alienware x16 R1, sendo cerca de 15 a 20% mais rápido do que o processador de 12ª geração Core i7-12700H. OCore i9-13900HX oferece um aumento muito mais significativo no desempenho, mas essa opção não está disponível nesse modelo.
Cinebench R15 Multi Loop
Cinebench R20: CPU (Multi Core) | CPU (Single Core)
Cinebench R23: Multi Core | Single Core
Cinebench R15: CPU Multi 64Bit | CPU Single 64Bit
Blender: v2.79 BMW27 CPU
7-Zip 18.03: 7z b 4 | 7z b 4 -mmt1
Geekbench 5.5: Multi-Core | Single-Core
HWBOT x265 Benchmark v2.2: 4k Preset
LibreOffice : 20 Documents To PDF
R Benchmark 2.5: Overall mean
* ... menor é melhor
AIDA64: FP32 Ray-Trace | FPU Julia | CPU SHA3 | CPU Queen | FPU SinJulia | FPU Mandel | CPU AES | CPU ZLib | FP64 Ray-Trace | CPU PhotoWorxx
| Performance rating | |
| Lenovo Legion Pro 7 RTX4090 | |
| Asus ROG Strix G16 G614JZ | |
| Razer Blade 16 Early 2023 | |
| Alienware x16 R1 | |
| Média Intel Core i7-13700HX | |
| HP Omen 16-wf000 | |
| HP Omen 16-n0033dx | |
| AIDA64 / FP32 Ray-Trace | |
| Asus ROG Strix G16 G614JZ | |
| Lenovo Legion Pro 7 RTX4090 | |
| Razer Blade 16 Early 2023 | |
| Razer Blade 16 Early 2023 | |
| Razer Blade 16 Early 2023 | |
| Média Intel Core i7-13700HX (14261 - 21999, n=11) | |
| HP Omen 16-wf000 | |
| Alienware x16 R1 | |
| HP Omen 16-n0033dx | |
| AIDA64 / CPU Queen | |
| Asus ROG Strix G16 G614JZ | |
| Lenovo Legion Pro 7 RTX4090 | |
| Razer Blade 16 Early 2023 | |
| Razer Blade 16 Early 2023 | |
| Alienware x16 R1 | |
| Média Intel Core i7-13700HX (86532 - 114717, n=11) | |
| HP Omen 16-n0033dx | |
| HP Omen 16-wf000 | |
| AIDA64 / FPU SinJulia | |
| Asus ROG Strix G16 G614JZ | |
| Razer Blade 16 Early 2023 | |
| Razer Blade 16 Early 2023 | |
| Razer Blade 16 Early 2023 | |
| Lenovo Legion Pro 7 RTX4090 | |
| HP Omen 16-n0033dx | |
| Média Intel Core i7-13700HX (9290 - 13519, n=11) | |
| HP Omen 16-wf000 | |
| Alienware x16 R1 | |
| AIDA64 / FPU Mandel | |
| Lenovo Legion Pro 7 RTX4090 | |
| Asus ROG Strix G16 G614JZ | |
| Razer Blade 16 Early 2023 | |
| Razer Blade 16 Early 2023 | |
| Razer Blade 16 Early 2023 | |
| HP Omen 16-n0033dx | |
| HP Omen 16-wf000 | |
| Média Intel Core i7-13700HX (35751 - 53484, n=11) | |
| Alienware x16 R1 | |
| AIDA64 / FP64 Ray-Trace | |
| Asus ROG Strix G16 G614JZ | |
| Lenovo Legion Pro 7 RTX4090 | |
| Razer Blade 16 Early 2023 | |
| Razer Blade 16 Early 2023 | |
| Razer Blade 16 Early 2023 | |
| Média Intel Core i7-13700HX (7728 - 11837, n=11) | |
| HP Omen 16-wf000 | |
| Alienware x16 R1 | |
| HP Omen 16-n0033dx | |
| AIDA64 / CPU PhotoWorxx | |
| Razer Blade 16 Early 2023 | |
| Razer Blade 16 Early 2023 | |
| Razer Blade 16 Early 2023 | |
| Lenovo Legion Pro 7 RTX4090 | |
| Alienware x16 R1 | |
| HP Omen 16-wf000 | |
| Asus ROG Strix G16 G614JZ | |
| Média Intel Core i7-13700HX (19678 - 42415, n=11) | |
| HP Omen 16-n0033dx | |
Desempenho do sistema
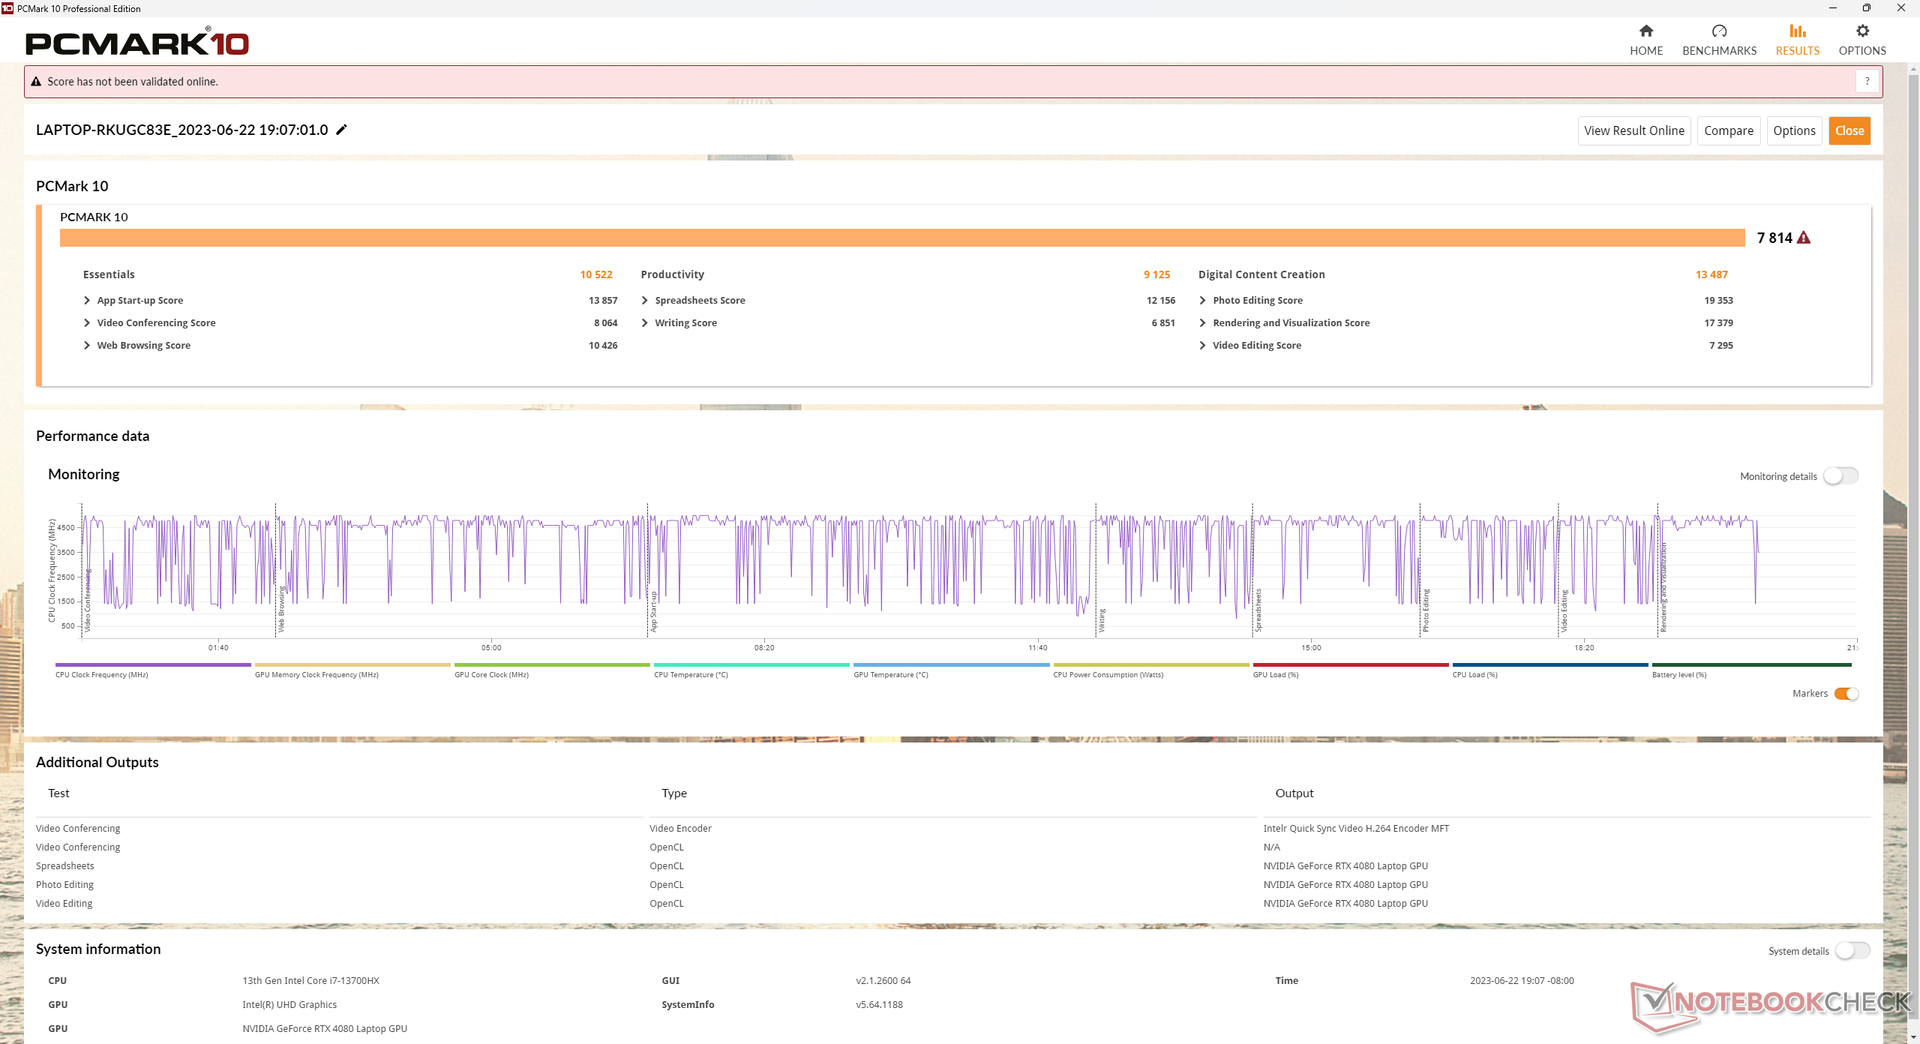
Os resultados do PCMark são melhores do que os do Omen 16 do ano passado, especialmente no subteste de criação de conteúdo digital com muita GPU, devido à nossa RTX 4080 mais rápida.
CrossMark: Overall | Productivity | Creativity | Responsiveness
| PCMark 10 / Score | |
| Alienware x16 R1 | |
| Lenovo Legion Pro 7 RTX4090 | |
| Razer Blade 16 Early 2023 | |
| HP Omen 16-wf000 | |
| Média Intel Core i7-13700HX, NVIDIA GeForce RTX 4080 Laptop GPU (n=1) | |
| Asus ROG Strix G16 G614JZ | |
| HP Omen 16-n0033dx | |
| PCMark 10 / Essentials | |
| Asus ROG Strix G16 G614JZ | |
| Alienware x16 R1 | |
| Lenovo Legion Pro 7 RTX4090 | |
| Razer Blade 16 Early 2023 | |
| HP Omen 16-wf000 | |
| Média Intel Core i7-13700HX, NVIDIA GeForce RTX 4080 Laptop GPU (n=1) | |
| HP Omen 16-n0033dx | |
| PCMark 10 / Productivity | |
| Alienware x16 R1 | |
| HP Omen 16-n0033dx | |
| HP Omen 16-wf000 | |
| Média Intel Core i7-13700HX, NVIDIA GeForce RTX 4080 Laptop GPU (n=1) | |
| Lenovo Legion Pro 7 RTX4090 | |
| Razer Blade 16 Early 2023 | |
| Asus ROG Strix G16 G614JZ | |
| PCMark 10 / Digital Content Creation | |
| Lenovo Legion Pro 7 RTX4090 | |
| Razer Blade 16 Early 2023 | |
| Alienware x16 R1 | |
| HP Omen 16-wf000 | |
| Média Intel Core i7-13700HX, NVIDIA GeForce RTX 4080 Laptop GPU (n=1) | |
| Asus ROG Strix G16 G614JZ | |
| HP Omen 16-n0033dx | |
| CrossMark / Overall | |
| Asus ROG Strix G16 G614JZ | |
| Alienware x16 R1 | |
| HP Omen 16-wf000 | |
| Média Intel Core i7-13700HX, NVIDIA GeForce RTX 4080 Laptop GPU (n=1) | |
| Razer Blade 16 Early 2023 | |
| HP Omen 16-n0033dx | |
| CrossMark / Productivity | |
| Asus ROG Strix G16 G614JZ | |
| Alienware x16 R1 | |
| HP Omen 16-wf000 | |
| Média Intel Core i7-13700HX, NVIDIA GeForce RTX 4080 Laptop GPU (n=1) | |
| HP Omen 16-n0033dx | |
| Razer Blade 16 Early 2023 | |
| CrossMark / Creativity | |
| Asus ROG Strix G16 G614JZ | |
| Alienware x16 R1 | |
| HP Omen 16-wf000 | |
| Média Intel Core i7-13700HX, NVIDIA GeForce RTX 4080 Laptop GPU (n=1) | |
| Razer Blade 16 Early 2023 | |
| HP Omen 16-n0033dx | |
| CrossMark / Responsiveness | |
| Asus ROG Strix G16 G614JZ | |
| Alienware x16 R1 | |
| HP Omen 16-wf000 | |
| Média Intel Core i7-13700HX, NVIDIA GeForce RTX 4080 Laptop GPU (n=1) | |
| Razer Blade 16 Early 2023 | |
| HP Omen 16-n0033dx | |
| PCMark 10 Score | 7814 pontos | |
Ajuda | ||
| AIDA64 / Memory Copy | |
| Razer Blade 16 Early 2023 | |
| Razer Blade 16 Early 2023 | |
| Razer Blade 16 Early 2023 | |
| Lenovo Legion Pro 7 RTX4090 | |
| Alienware x16 R1 | |
| HP Omen 16-wf000 | |
| Asus ROG Strix G16 G614JZ | |
| Média Intel Core i7-13700HX (36125 - 63990, n=11) | |
| HP Omen 16-n0033dx | |
| AIDA64 / Memory Read | |
| Lenovo Legion Pro 7 RTX4090 | |
| Razer Blade 16 Early 2023 | |
| Razer Blade 16 Early 2023 | |
| Razer Blade 16 Early 2023 | |
| Asus ROG Strix G16 G614JZ | |
| Alienware x16 R1 | |
| HP Omen 16-wf000 | |
| Média Intel Core i7-13700HX (36510 - 69729, n=11) | |
| HP Omen 16-n0033dx | |
| AIDA64 / Memory Write | |
| Alienware x16 R1 | |
| Razer Blade 16 Early 2023 | |
| Razer Blade 16 Early 2023 | |
| Razer Blade 16 Early 2023 | |
| Lenovo Legion Pro 7 RTX4090 | |
| HP Omen 16-wf000 | |
| Asus ROG Strix G16 G614JZ | |
| Média Intel Core i7-13700HX (33598 - 85675, n=11) | |
| HP Omen 16-n0033dx | |
| AIDA64 / Memory Latency | |
| Alienware x16 R1 | |
| Razer Blade 16 Early 2023 | |
| Razer Blade 16 Early 2023 | |
| Razer Blade 16 Early 2023 | |
| Asus ROG Strix G16 G614JZ | |
| HP Omen 16-n0033dx | |
| HP Omen 16-wf000 | |
| Média Intel Core i7-13700HX (81.5 - 97.9, n=11) | |
| Lenovo Legion Pro 7 RTX4090 | |
* ... menor é melhor
Latência DPC
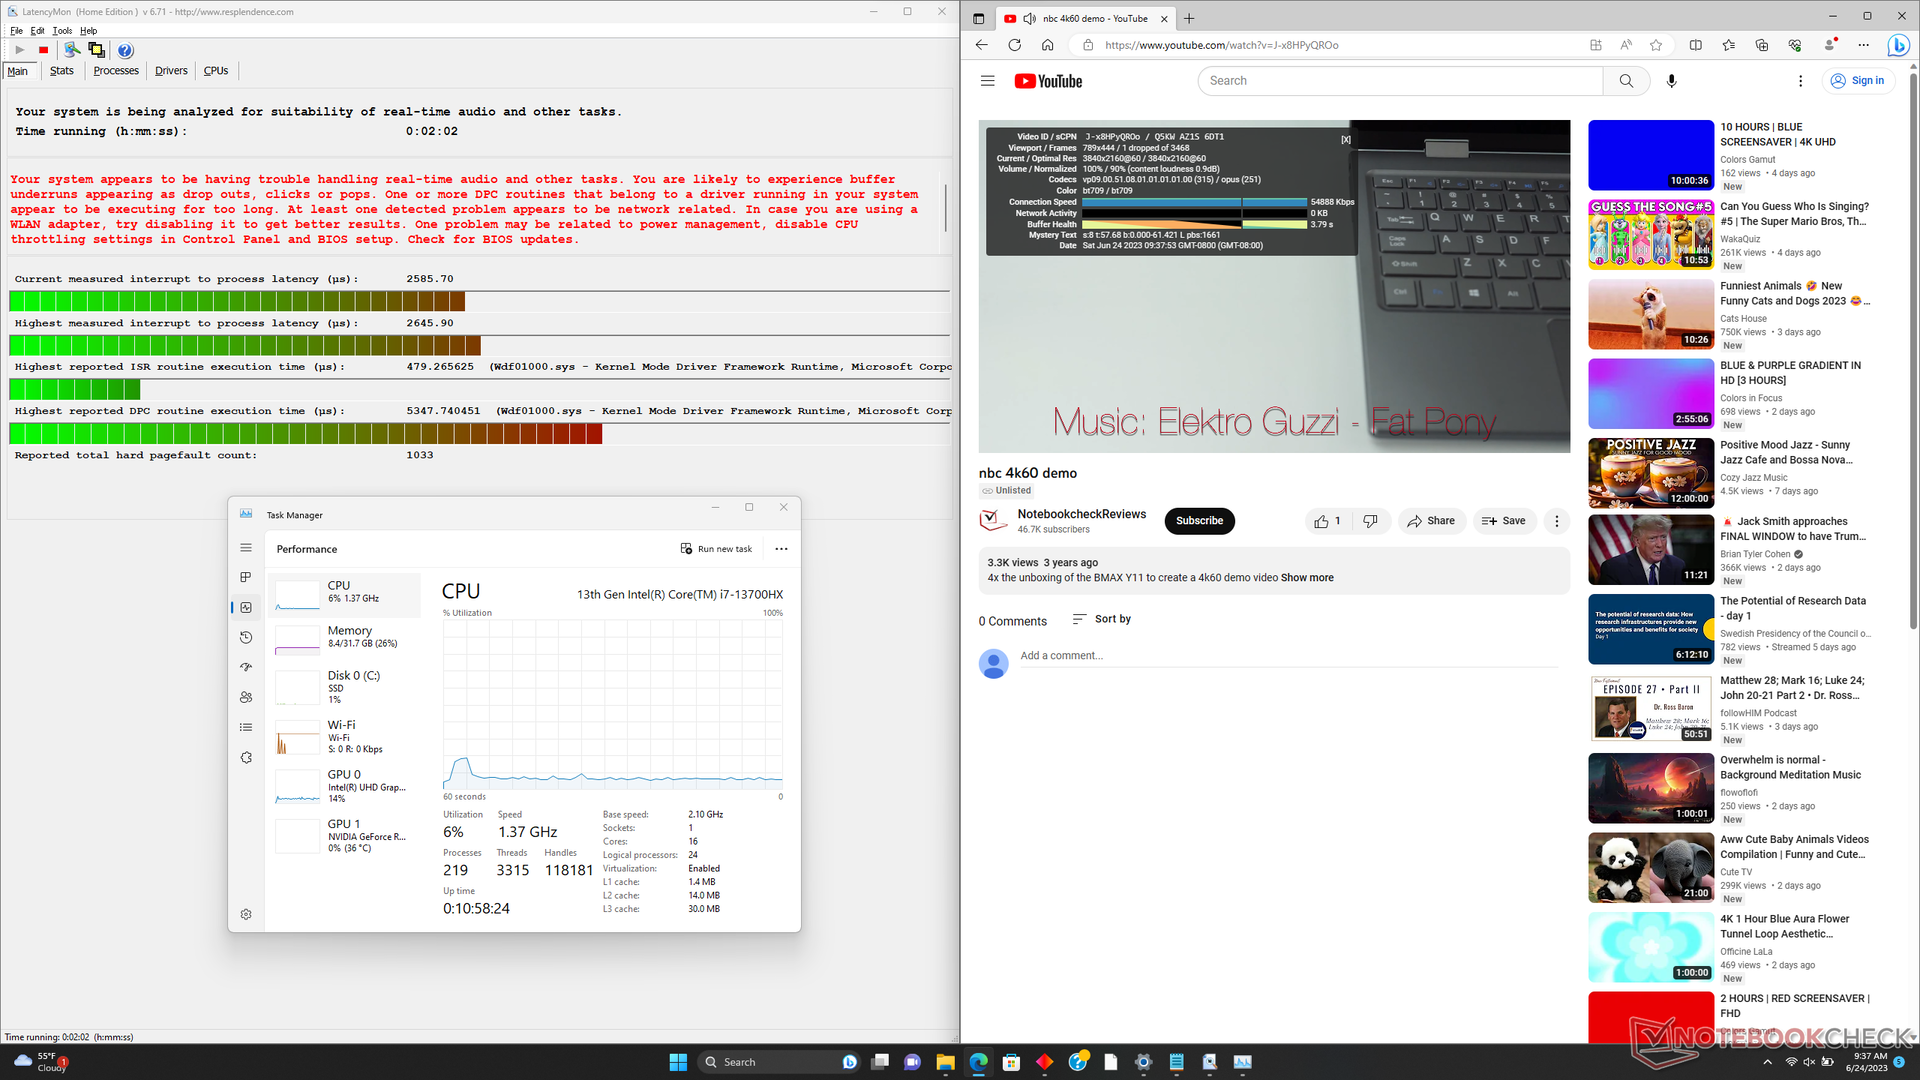
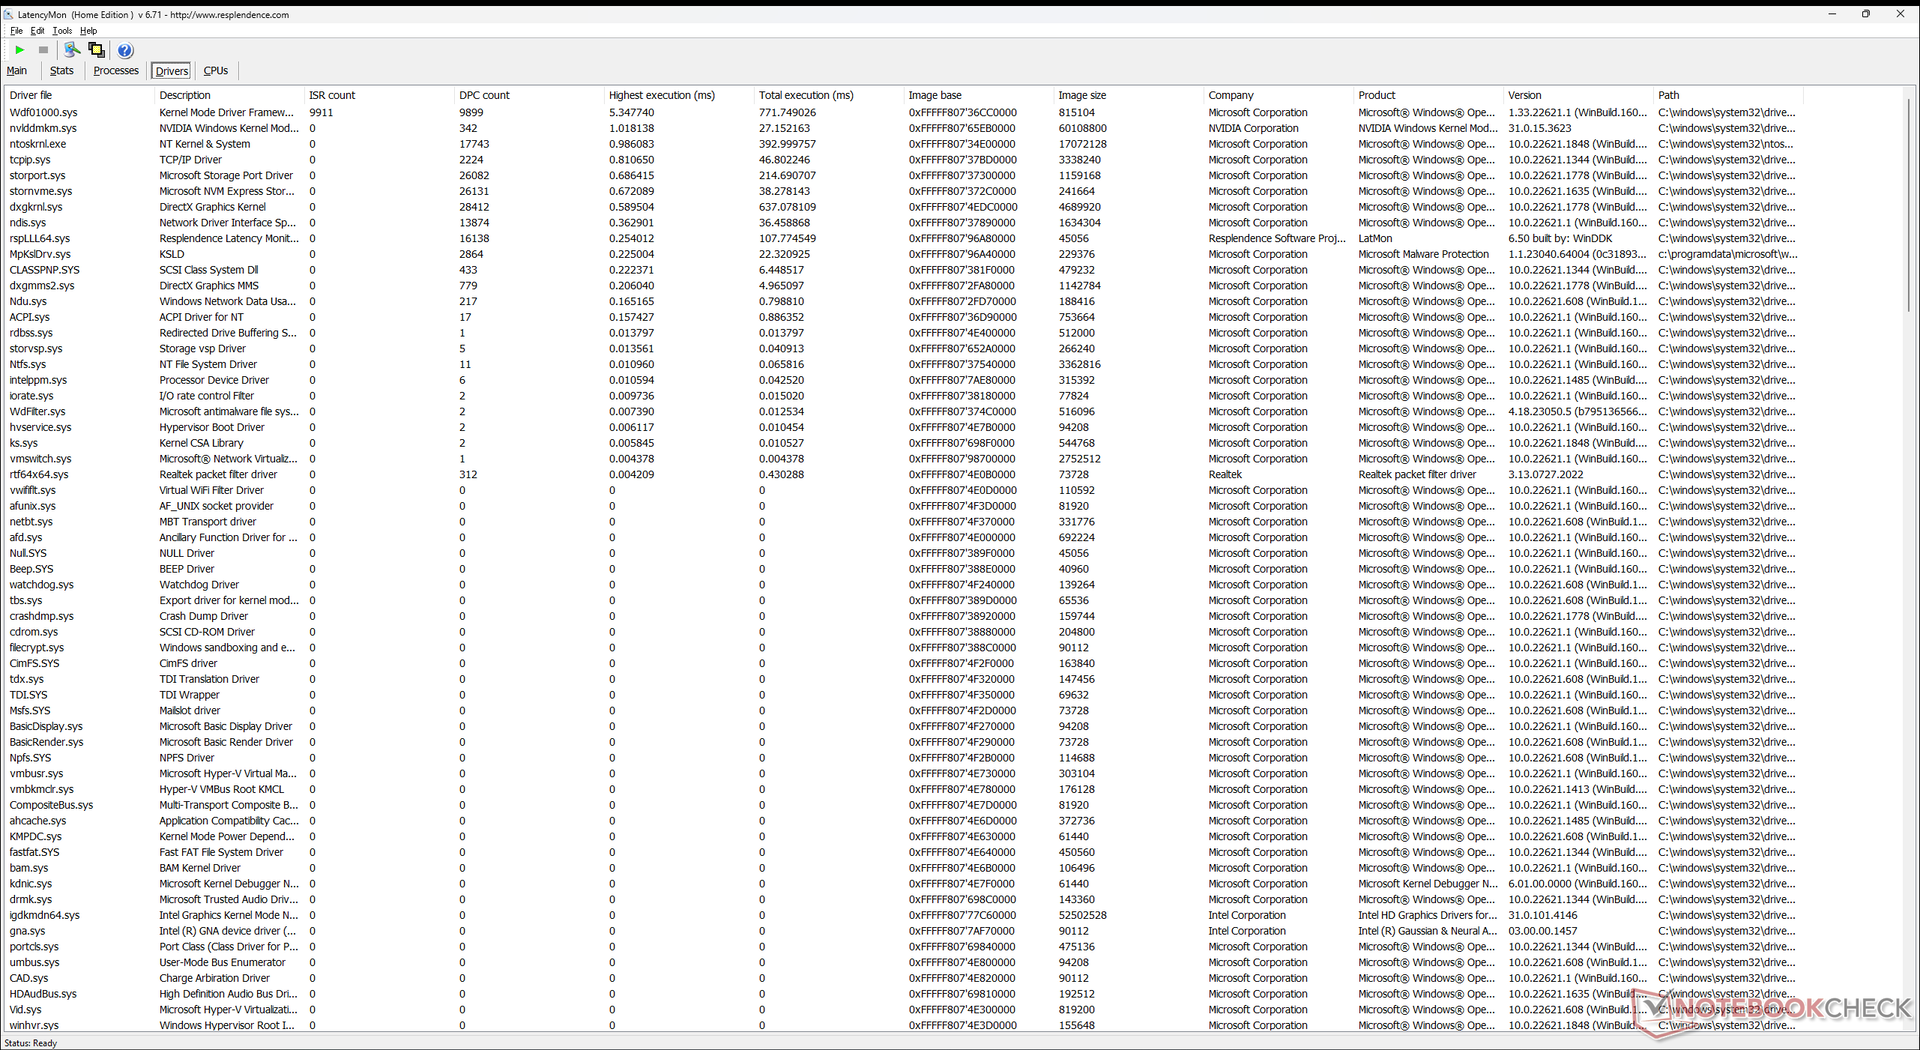
O LatencyMon revela problemas de DPC ao abrir várias guias do navegador em nossa página inicial, semelhante ao ROG Strix G16 ou Blade 16. a reprodução de vídeo 4K60 é quase perfeita, com apenas um quadro perdido durante nosso teste de vídeo de um minuto.
| DPC Latencies / LatencyMon - interrupt to process latency (max), Web, Youtube, Prime95 | |
| Lenovo Legion Pro 7 RTX4090 | |
| HP Omen 16-wf000 | |
| Asus ROG Strix G16 G614JZ | |
| Razer Blade 16 Early 2023 | |
| Alienware x16 R1 | |
| HP Omen 16-n0033dx | |
* ... menor é melhor
Dispositivos de armazenamento
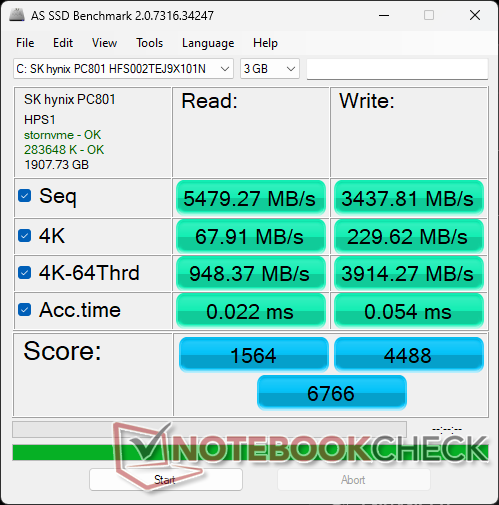
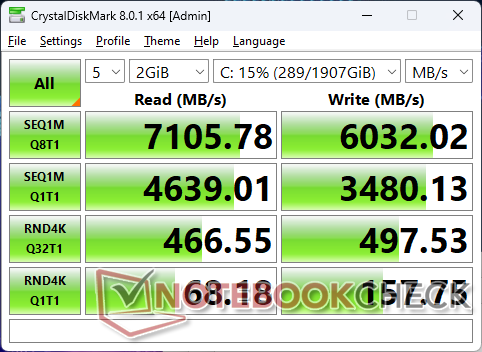
Nossa unidade de teste é fornecida com um disco rígido de 2 TBSK hynix PC801 NVMe de 2 TB para taxas de leitura e gravação sequenciais de até 7100 MB/s e 6000 MB/s, respectivamente, comparáveis ao popular Samsung PM9A1. Entretanto, as taxas de leitura e gravação em blocos menores de 4k q32 são excepcionalmente lentas, mesmo após vários testes. Apesar disso, o desempenho geral é estável quando estressado, o que sugere uma excelente dissipação de calor.

| Drive Performance rating - Percent | |
| Alienware x16 R1 | |
| Lenovo Legion Pro 7 RTX4090 | |
| HP Omen 16-wf000 | |
| Razer Blade 16 Early 2023 | |
| Asus ROG Strix G16 G614JZ | |
| HP Omen 16-n0033dx | |
* ... menor é melhor
Disk Throttling: DiskSpd Read Loop, Queue Depth 8
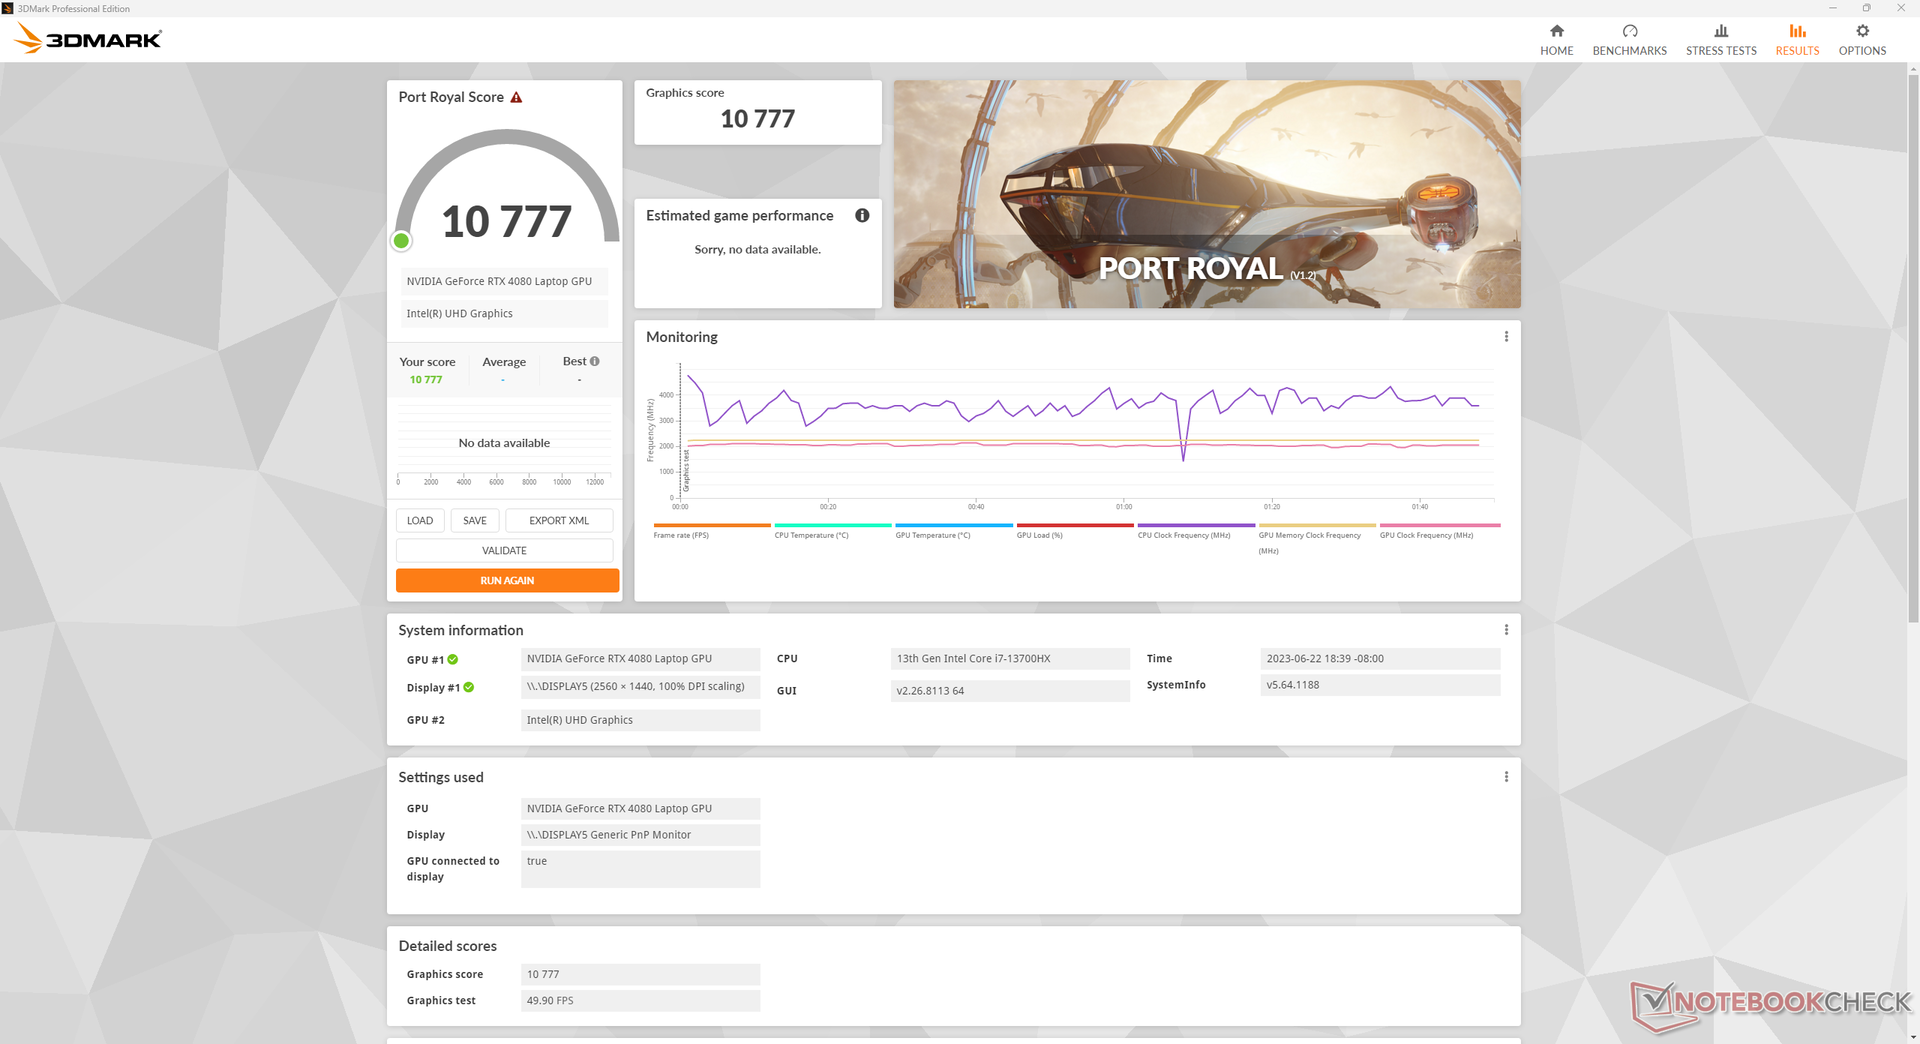
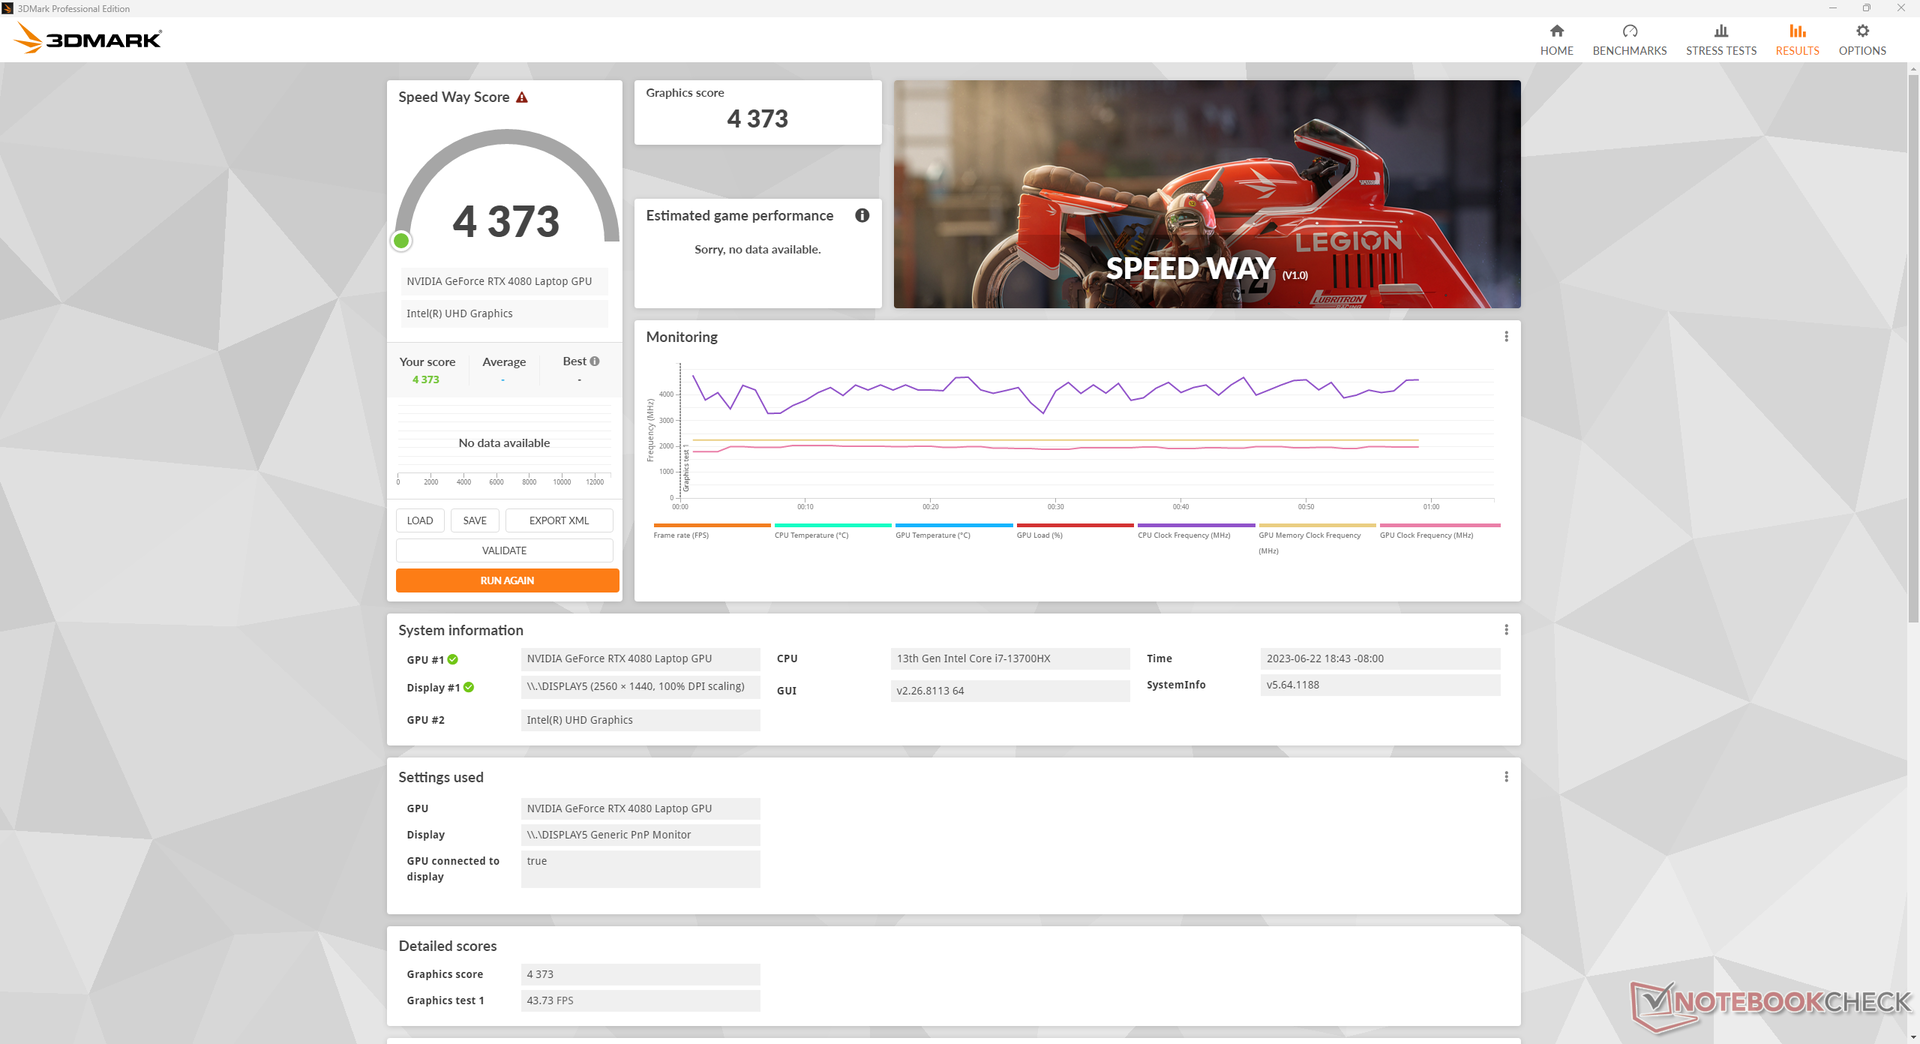
Desempenho da GPU - 145 W GeForce RTX 4080
O desempenho gráfico é excelente e comparável ao de outros laptops para jogos com a mesma GeForce RTX 4080 Com uma margem de 5%. O downgrade para a RTX 4070 ou RTX 4060 do nosso RTX 4080 deverá reduzir o desempenho gráfico em cerca de 20% e 30%, respectivamente.
Se o modo Max Fan estiver desativado, o desempenho geral sofrerá apenas um pouco, conforme mostra a tabela abaixo. O desempenho da GPU diminui em quase 15% se for definido para o modo Balanced, enquanto o impacto no desempenho da CPU é muito menos grave.
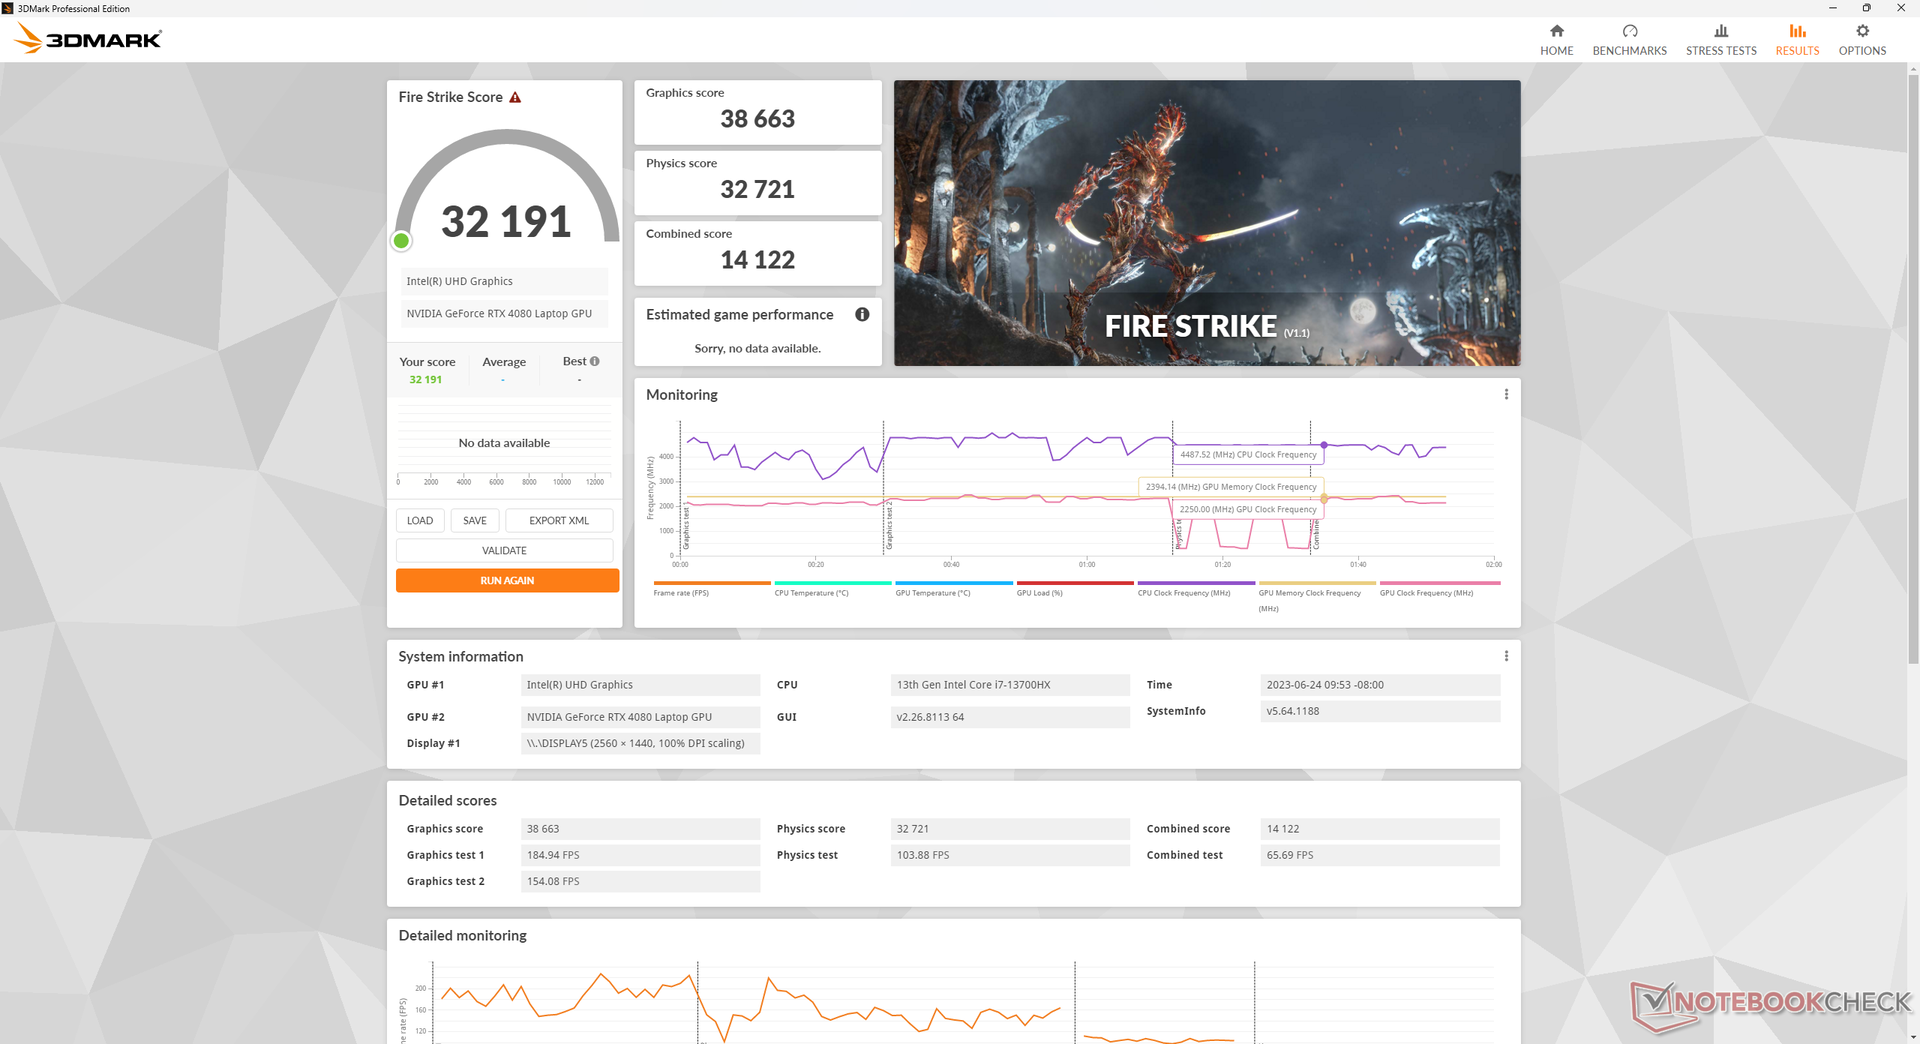
| Configuração do perfil de energia | Fire Strike Pontuação de física | Fire Strike Pontuação da GPU | Fire Strike Pontuação combinada |
| Desempenho + ventilador máximo ligado | 32721 | 38663 | 14122 |
| Desempenho + ventilador máximo desligado | 31314 (-4%) | 38142 (-1%) | 13655 (-3%) |
| Equilibrado | 31837 (-3%) | 33328 (-14%) | 12426 (-12%) |
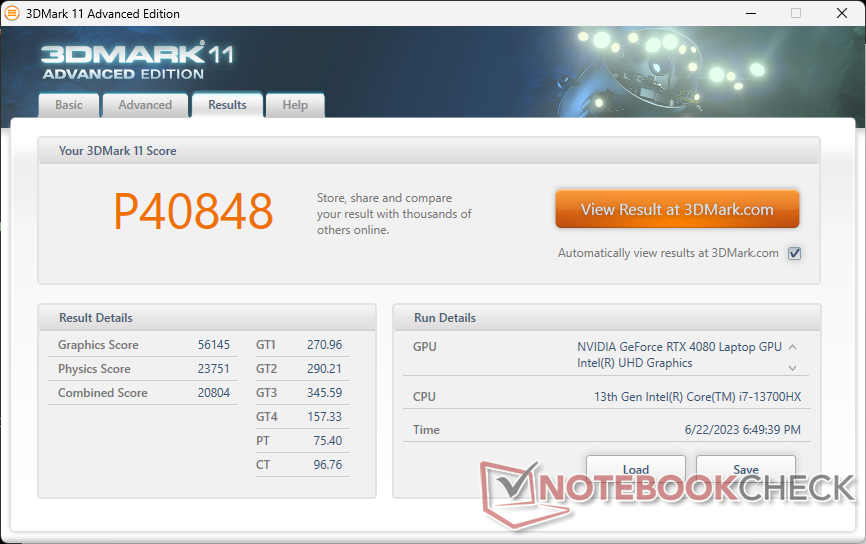
| 3DMark 11 Performance | 40848 pontos | |
| 3DMark Fire Strike Score | 32191 pontos | |
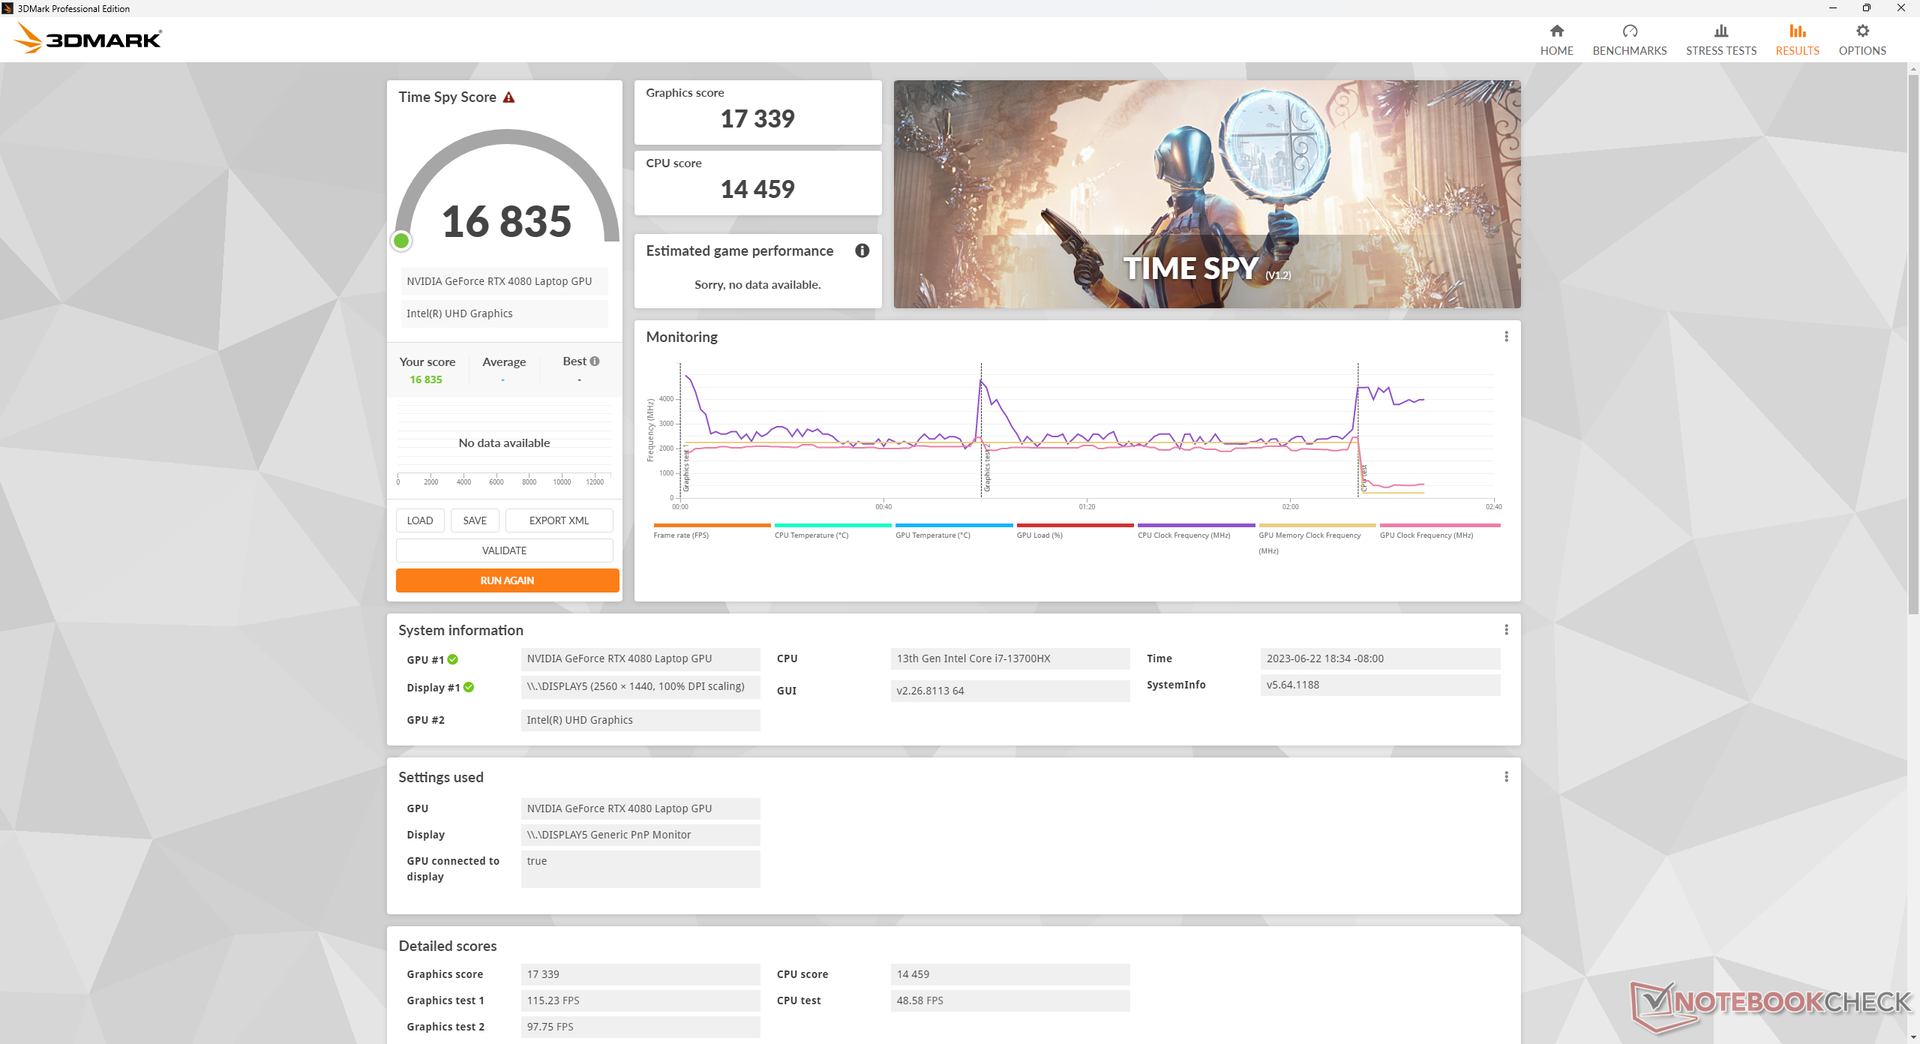
| 3DMark Time Spy Score | 16835 pontos | |
Ajuda | ||
* ... menor é melhor
Desempenho em jogos
Todos os jogos são jogáveis na resolução nativa de 1440p com taxas de quadros médias acima de 60 FPS, mesmo em jogos exigentes como Returnal. A RTX 4080 móvel combina muito bem com o painel de 1440p.
O DLSS é recomendado se você ativar a RT ou se estiver jogando em um monitor 4K externo, pois a RTX 4080 móvel é muito mais fraca do que uma rTX 4080 para desktop. As taxas de quadros médias ao executar o Cyberpunk 2077 em 4K, por exemplo, saltariam de 35 FPS com o DLSS 2 desativado para 55 FPS com o DLSS 2 ativado.
| Tiny Tina's Wonderlands | |
| 1920x1080 Low Preset (DX12) | |
| Média NVIDIA GeForce RTX 4080 Laptop GPU (221 - 353, n=6) | |
| HP Omen 16-wf000 | |
| 1920x1080 Medium Preset (DX12) | |
| Média NVIDIA GeForce RTX 4080 Laptop GPU (199.6 - 297, n=6) | |
| HP Omen 16-wf000 | |
| 1920x1080 High Preset (DX12) | |
| Média NVIDIA GeForce RTX 4080 Laptop GPU (166.7 - 213, n=6) | |
| HP Omen 16-wf000 | |
| 1920x1080 Badass Preset (DX12) | |
| Asus Zephyrus Duo 16 GX650PY-NM006W | |
| Média NVIDIA GeForce RTX 4080 Laptop GPU (112.9 - 167.1, n=9) | |
| HP Omen 16-wf000 | |
| 2560x1440 Badass Preset (DX12) | |
| Asus Zephyrus Duo 16 GX650PY-NM006W | |
| Média NVIDIA GeForce RTX 4080 Laptop GPU (85 - 114.8, n=9) | |
| HP Omen 16-wf000 | |
| 3840x2160 Badass Preset (DX12) | |
| Média NVIDIA GeForce RTX 4080 Laptop GPU (46.4 - 60.9, n=9) | |
| HP Omen 16-wf000 | |
| Returnal | |
| 1920x1080 Low Preset | |
| HP Omen 16-wf000 | |
| Média NVIDIA GeForce RTX 4080 Laptop GPU (116 - 150, n=4) | |
| 1920x1080 Medium Preset | |
| HP Omen 16-wf000 | |
| Média NVIDIA GeForce RTX 4080 Laptop GPU (117 - 148, n=4) | |
| 1920x1080 High Preset | |
| HP Omen 16-wf000 | |
| Média NVIDIA GeForce RTX 4080 Laptop GPU (114 - 137, n=4) | |
| 1920x1080 Epic Preset | |
| Média NVIDIA GeForce RTX 4080 Laptop GPU (107 - 121, n=4) | |
| HP Omen 16-wf000 | |
| 2560x1440 Epic Preset | |
| HP Omen 16-wf000 | |
| Média NVIDIA GeForce RTX 4080 Laptop GPU (79 - 92, n=4) | |
| 3840x2160 Epic Preset | |
| HP Omen 16-wf000 | |
| Média NVIDIA GeForce RTX 4080 Laptop GPU (43 - 53, n=3) | |
Witcher 3 FPS Chart
| baixo | média | alto | ultra | QHD | 4K | |
|---|---|---|---|---|---|---|
| GTA V (2015) | 184.7 | 176.8 | 171.6 | 114 | 108.6 | 142.8 |
| The Witcher 3 (2015) | 453.2 | 407 | 296.5 | 163.4 | 113.1 | |
| Dota 2 Reborn (2015) | 187.4 | 173 | 164.2 | 153.7 | 145.7 | |
| Final Fantasy XV Benchmark (2018) | 208 | 194.9 | 153.9 | 120.6 | 71.6 | |
| X-Plane 11.11 (2018) | 172.4 | 151.2 | 118.5 | 102.3 | ||
| Strange Brigade (2018) | 413 | 334 | 320 | 299 | 225 | 116.7 |
| Cyberpunk 2077 1.6 (2022) | 132.3 | 127.1 | 124.4 | 116.7 | 77.6 | 35.3 |
| Tiny Tina's Wonderlands (2022) | 260.2 | 232.5 | 177.1 | 145.2 | 102.6 | 54.4 |
| F1 22 (2022) | 261 | 260 | 245 | 100.7 | 70.7 | 35.5 |
| Returnal (2023) | 148 | 148 | 136 | 107 | 91 | 53 |
Emissões
Ruído do sistema - ainda muito alto no modo de desempenho
Os ventiladores estão sempre ativos a quase 30 dB(A) contra um fundo silencioso de 23 dB(A), independentemente da configuração ou da carga na tela. Por outro lado, as ventoinhas não precisam pulsar com tanta frequência e, portanto, o ruído da ventoinha geralmente fica na faixa baixa e relativamente discreta de 30 a 33 dB(A) ao executar cargas pouco exigentes, como streaming de vídeo.
Jogar no modo Balanceado em vez de no modo Desempenho resulta em ventoinhas visivelmente mais silenciosas, com apenas 44,2 dB(A), o que pode valer a pena a redução de 15% no desempenho gráfico. Por outro lado, o Omen 16 é um dos laptops para jogos mais barulhentos do mercado, com mais de 57 dB(A) quando configurado no modo Desempenho.
| Configuração do perfil de energia | Witcher 3 Ruído do ventilador dB(A) |
| Equilibrado | 44.2 |
| Desempenho + Ventilador máximo desligado | 57 |
| Desempenho + ventilador principal ligado | 58.3 |
Barulho
| Ocioso |
| 29.6 / 29.8 / 30.4 dB |
| Carga |
| 33.8 / 58.3 dB |
 | ||
30 dB silencioso 40 dB(A) audível 50 dB(A) ruidosamente alto |
||
min: | ||
| HP Omen 16-wf000 GeForce RTX 4080 Laptop GPU, i7-13700HX, SK hynix PC801 HFS002TEJ9X101N | HP Omen 16-n0033dx Radeon RX 6650M, R7 6800H, Samsung PM9A1 MZVL21T0HCLR | Alienware x16 R1 GeForce RTX 4080 Laptop GPU, i9-13900HK, SK hynix PC801 HFS001TEJ9X101N | Lenovo Legion Pro 7 RTX4090 GeForce RTX 4090 Laptop GPU, i9-13900HX, Samsung PM9A1 MZVL21T0HCLR | Asus ROG Strix G16 G614JZ GeForce RTX 4080 Laptop GPU, i9-13980HX, WD PC SN560 SDDPNQE-1T00 | Razer Blade 16 Early 2023 GeForce RTX 4080 Laptop GPU, i9-13950HX, SSSTC CA6-8D1024 | |
|---|---|---|---|---|---|---|
| Noise | 4% | 8% | -8% | -1% | 10% | |
| desligado / ambiente * (dB) | 23 | 24.2 -5% | 22.7 1% | 25 -9% | 25 -9% | 23 -0% |
| Idle Minimum * (dB) | 29.6 | 27.4 7% | 23.1 22% | 28 5% | 26 12% | 23 22% |
| Idle Average * (dB) | 29.8 | 27.4 8% | 25.8 13% | 30 -1% | 28 6% | 23 23% |
| Idle Maximum * (dB) | 30.4 | 28.9 5% | 25.8 15% | 38 -25% | 30 1% | 23.6 22% |
| Load Average * (dB) | 33.8 | 32.3 4% | 39.3 -16% | 48 -42% | 48 -42% | 39 -15% |
| Witcher 3 ultra * (dB) | 57 | 54.1 5% | 49.9 12% | 53 7% | 49 14% | 51.6 9% |
| Load Maximum * (dB) | 58.3 | 57.6 1% | 54.8 6% | 55 6% | 52 11% | 51.3 12% |
* ... menor é melhor
Temperatura
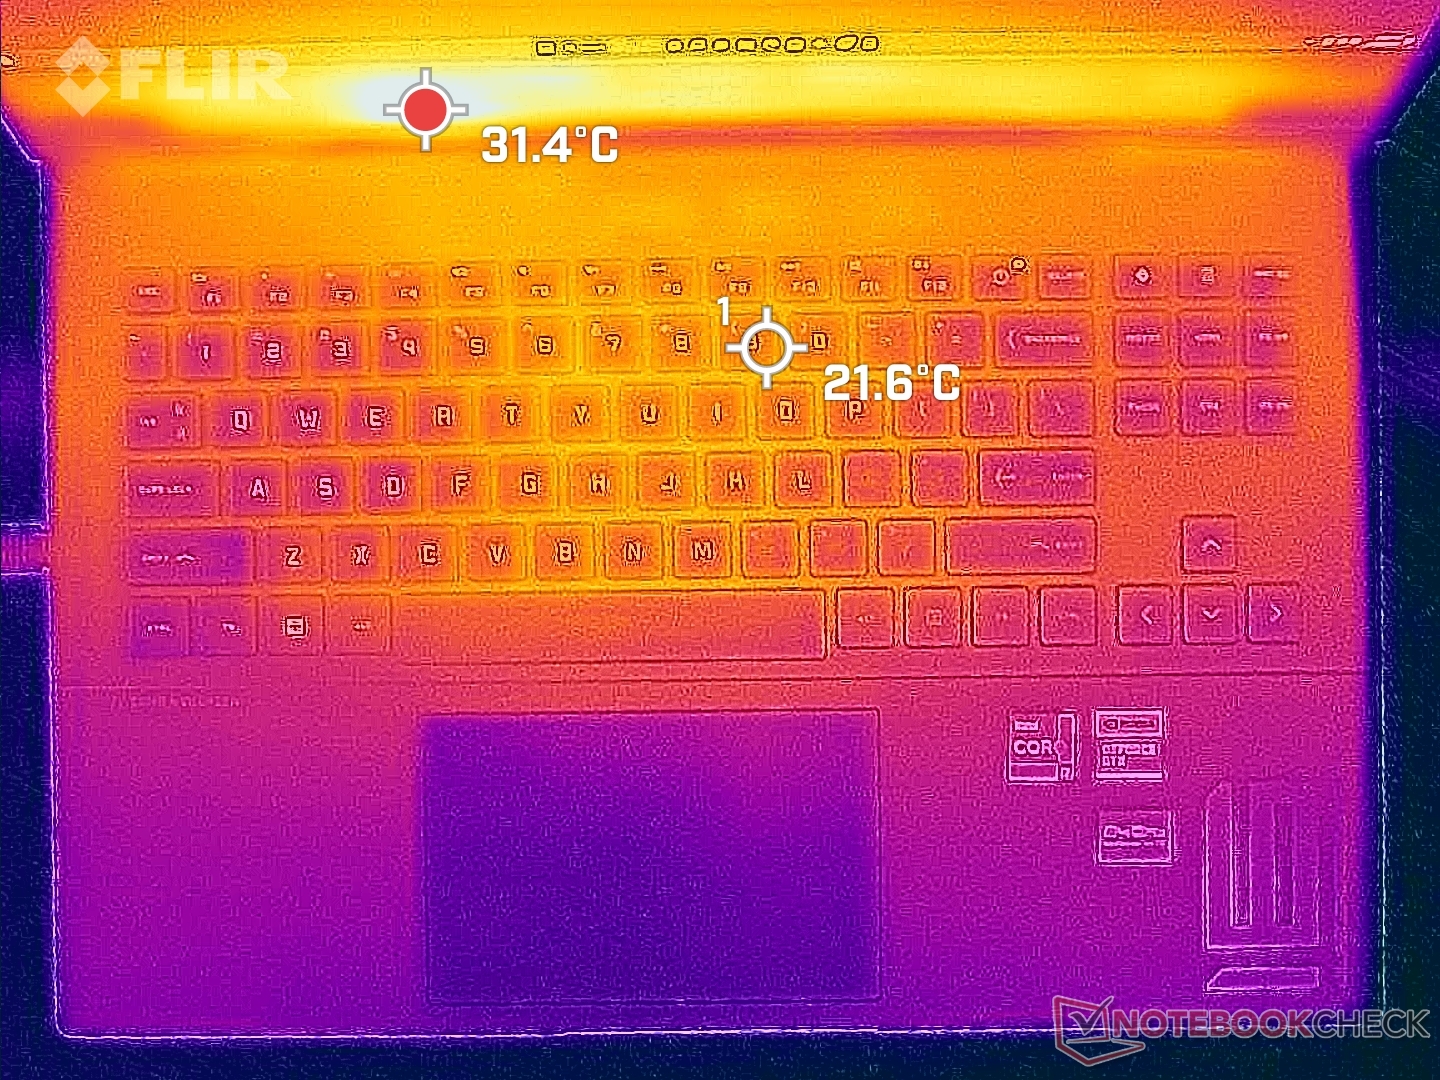
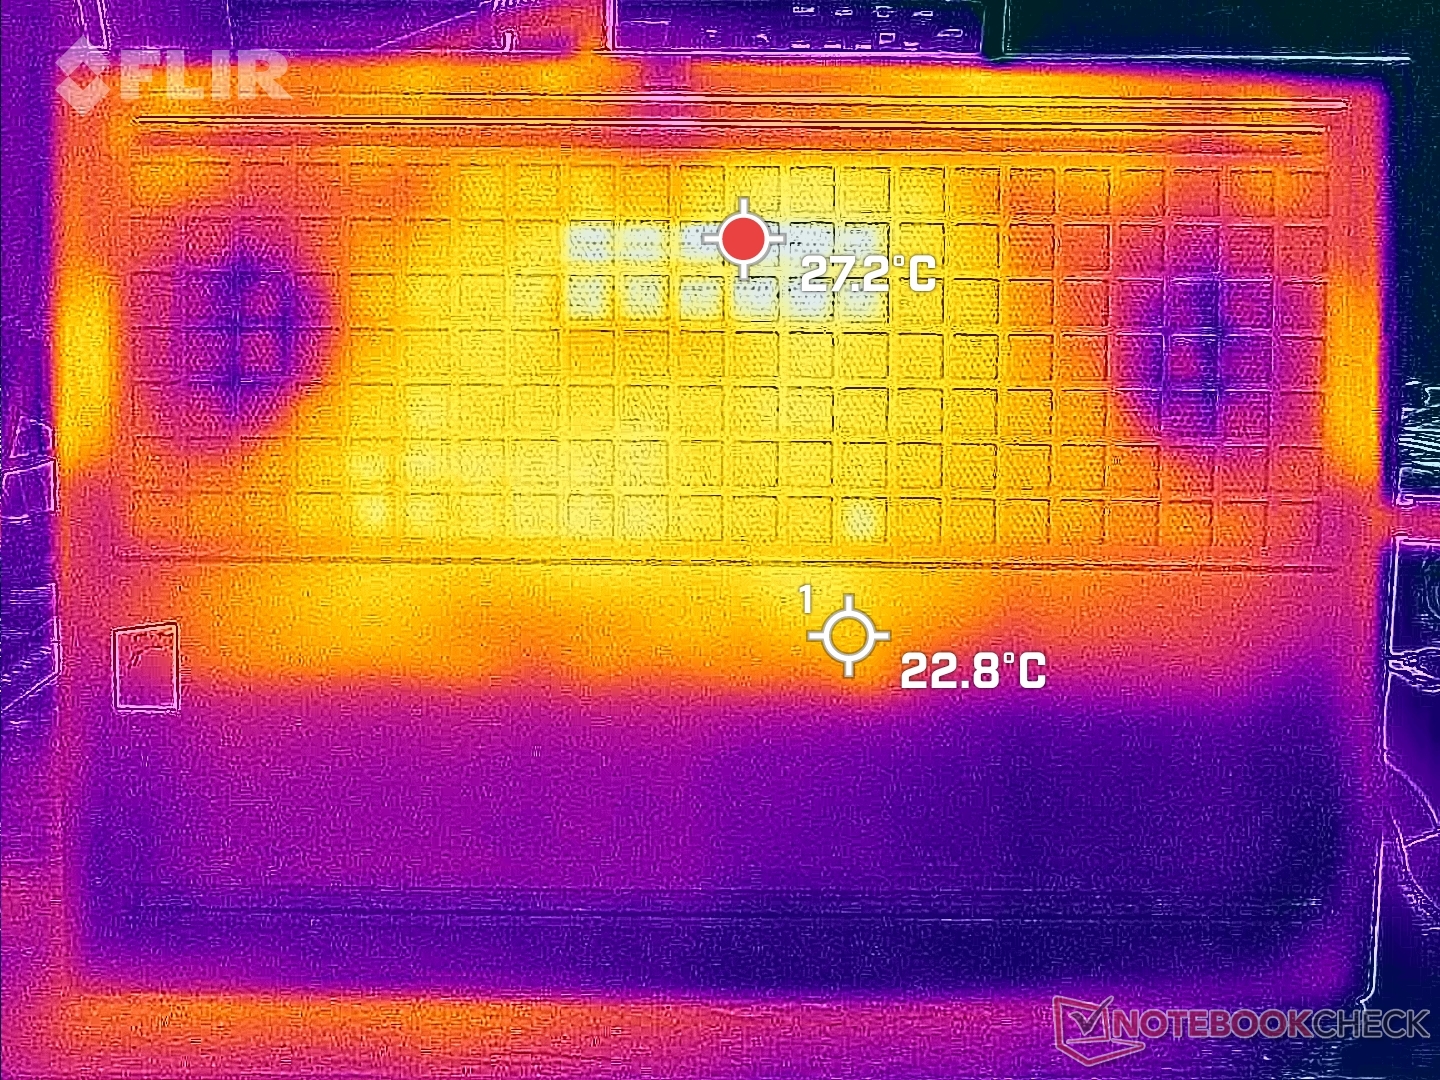
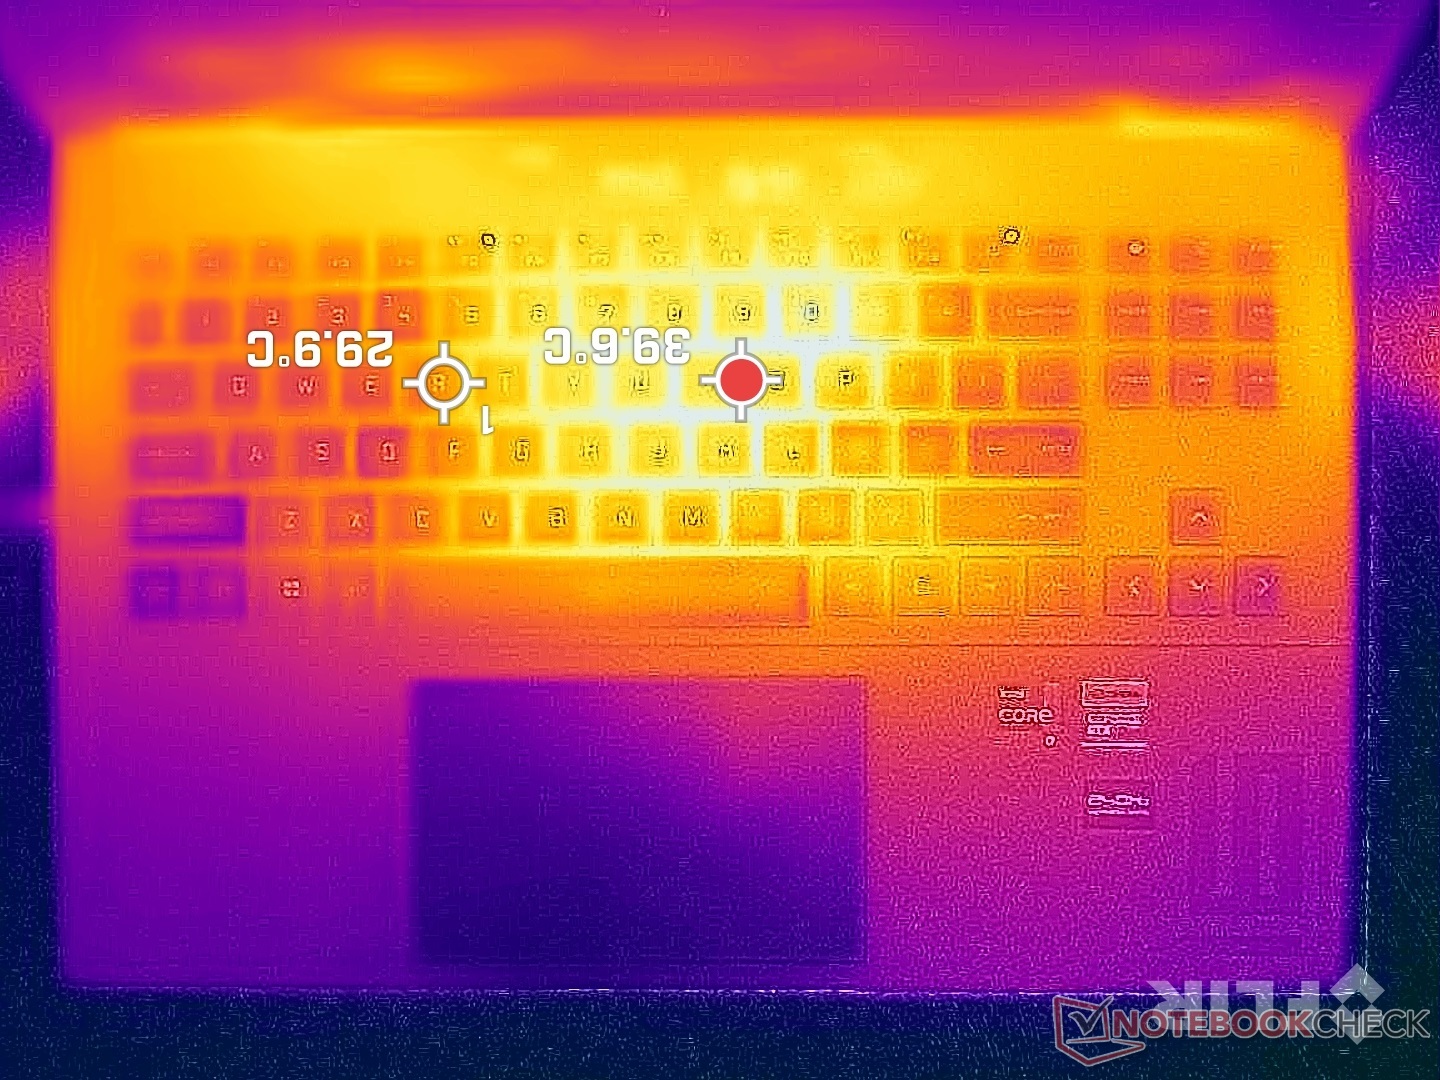
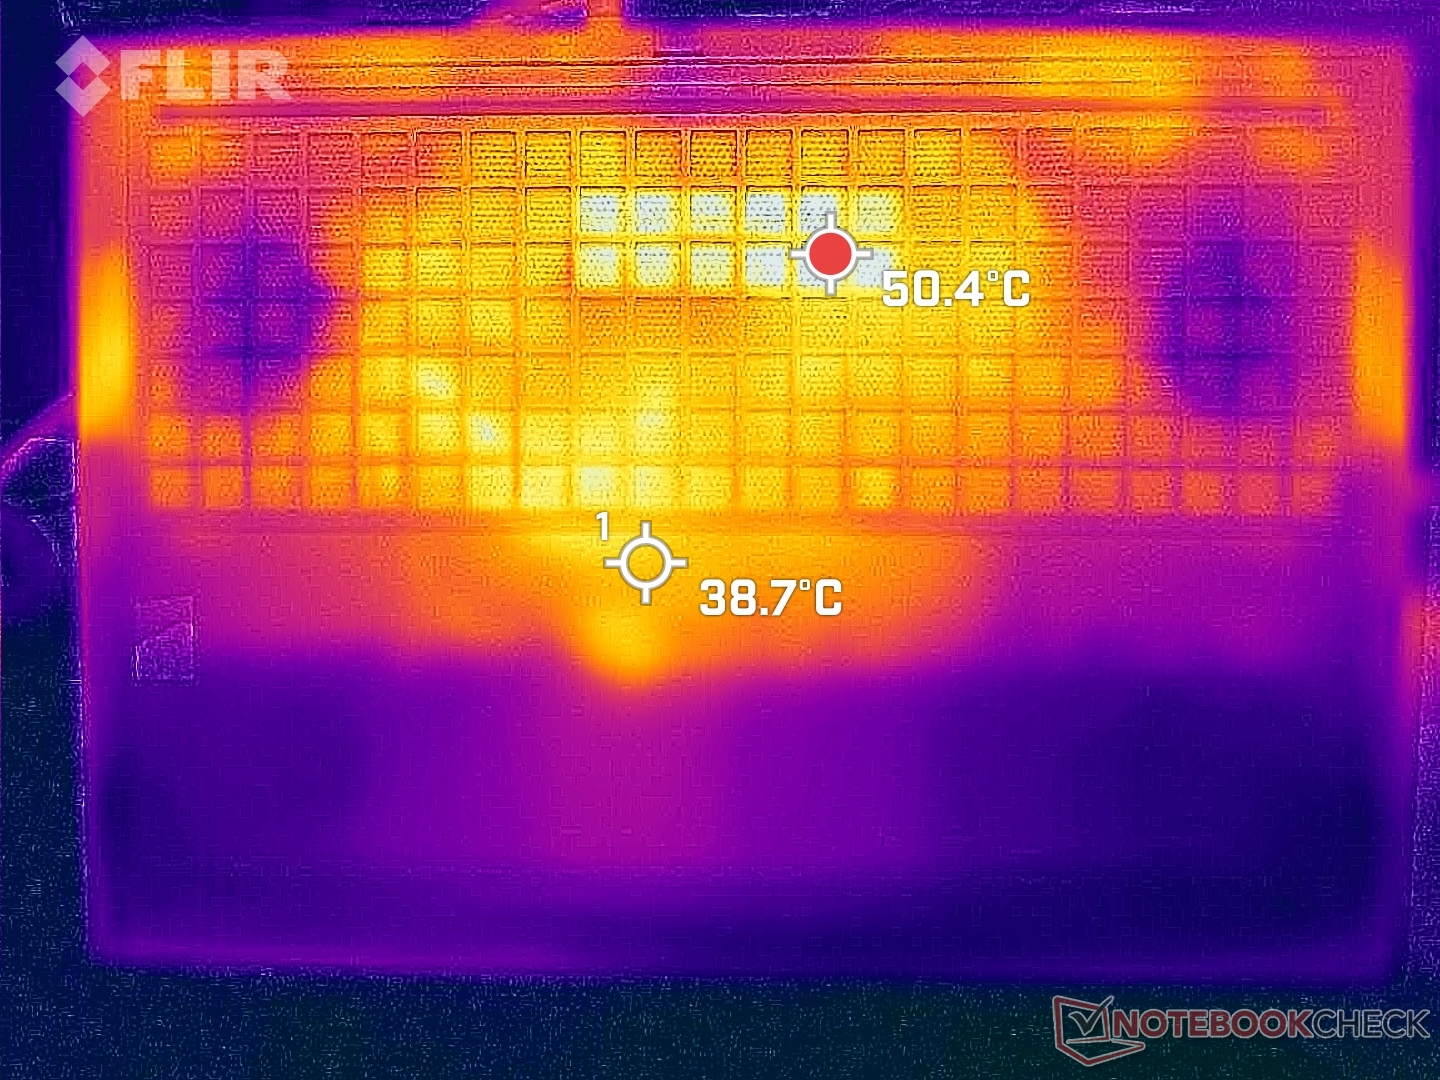
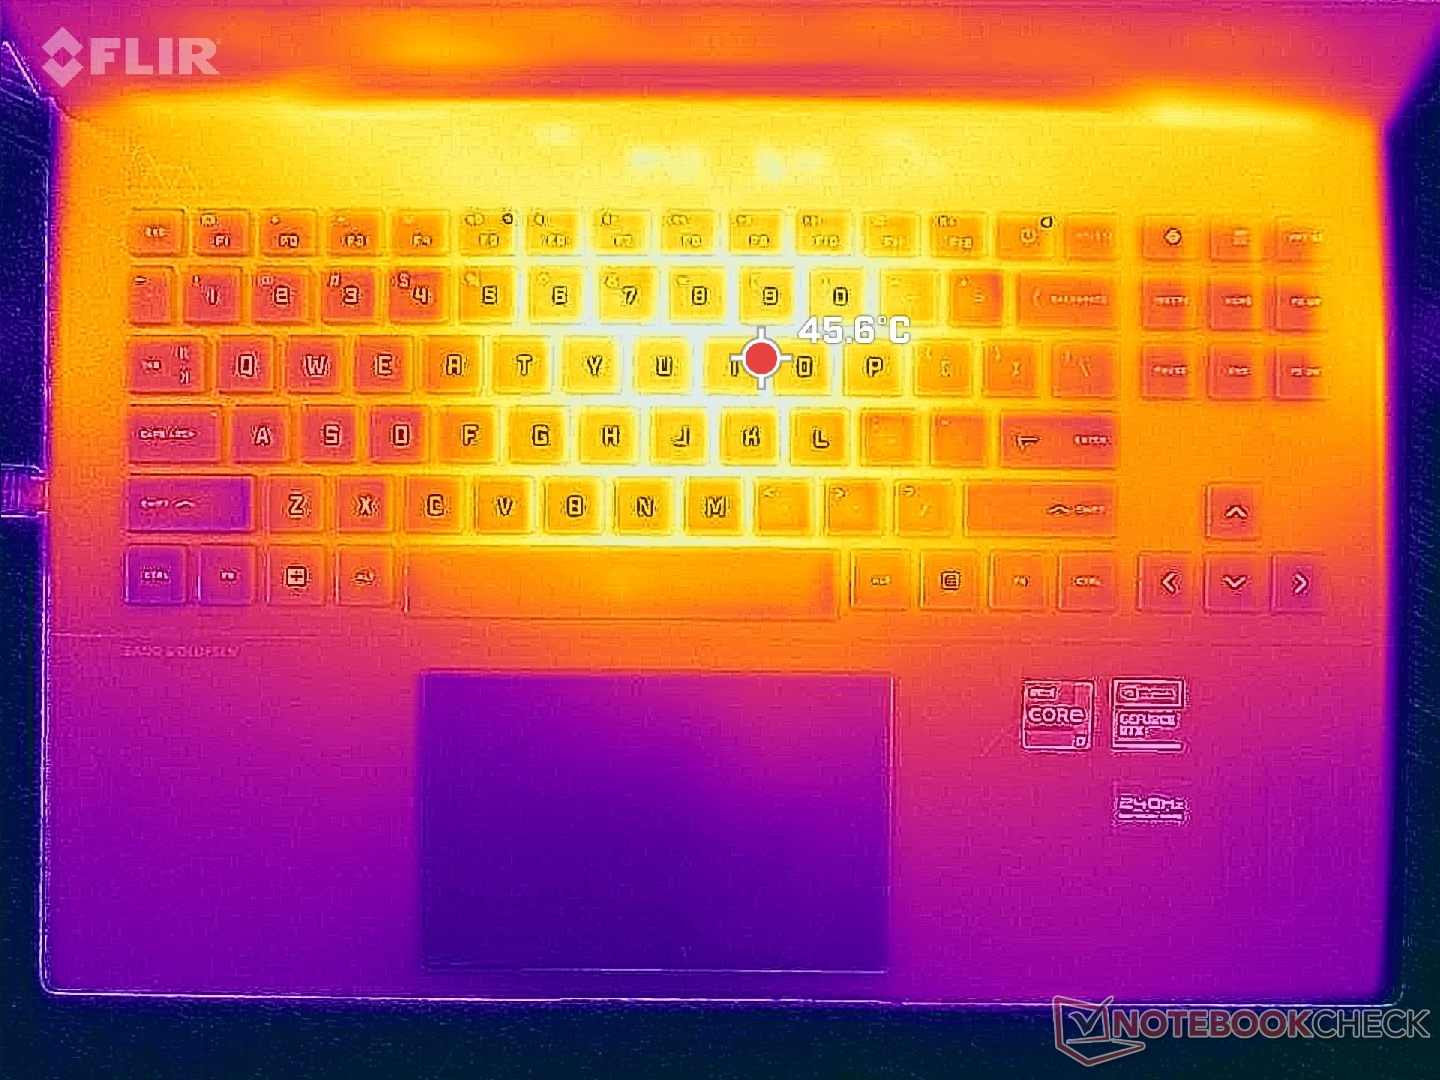
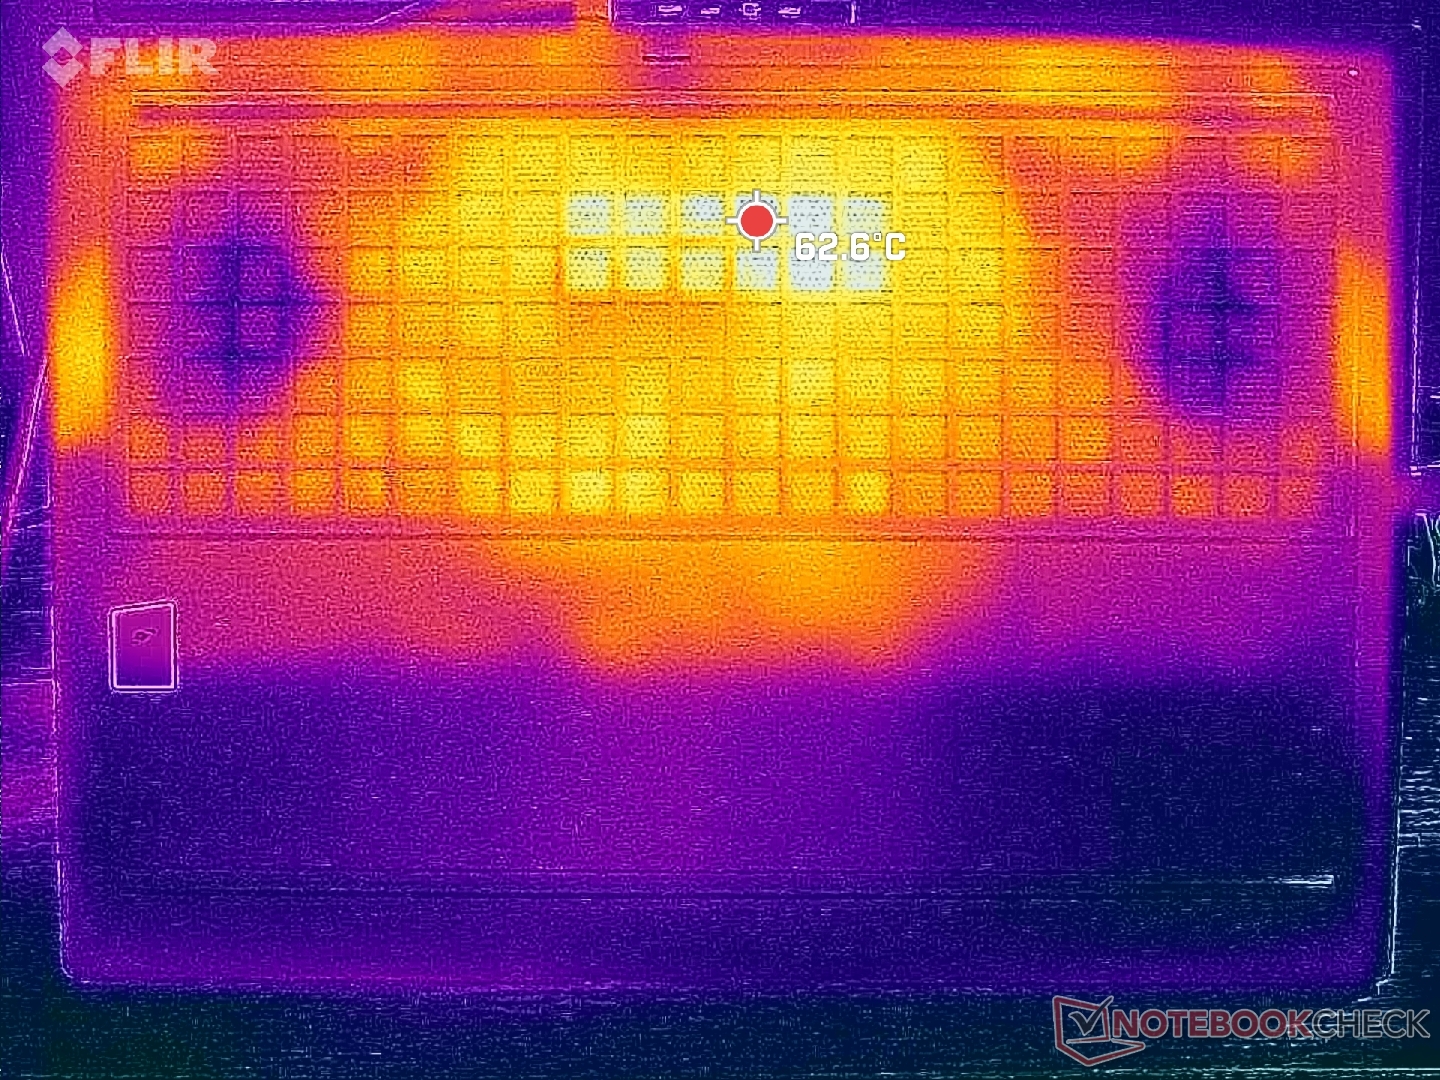
As temperaturas da superfície são simétricas, com pontos quentes mais próximos do centro do teclado. Essa região pode atingir de 40 a 45 °C durante os jogos, em comparação com 55 a 60 °C no notebook mais grosso, mais pesado e mais rápido da Lenovo Lenovo Legion Pro 7 16. As temperaturas de superfície geralmente mais frias podem ser atribuídas às grades de ventilação maiores e à meta de TGP mais baixa do design da HP.
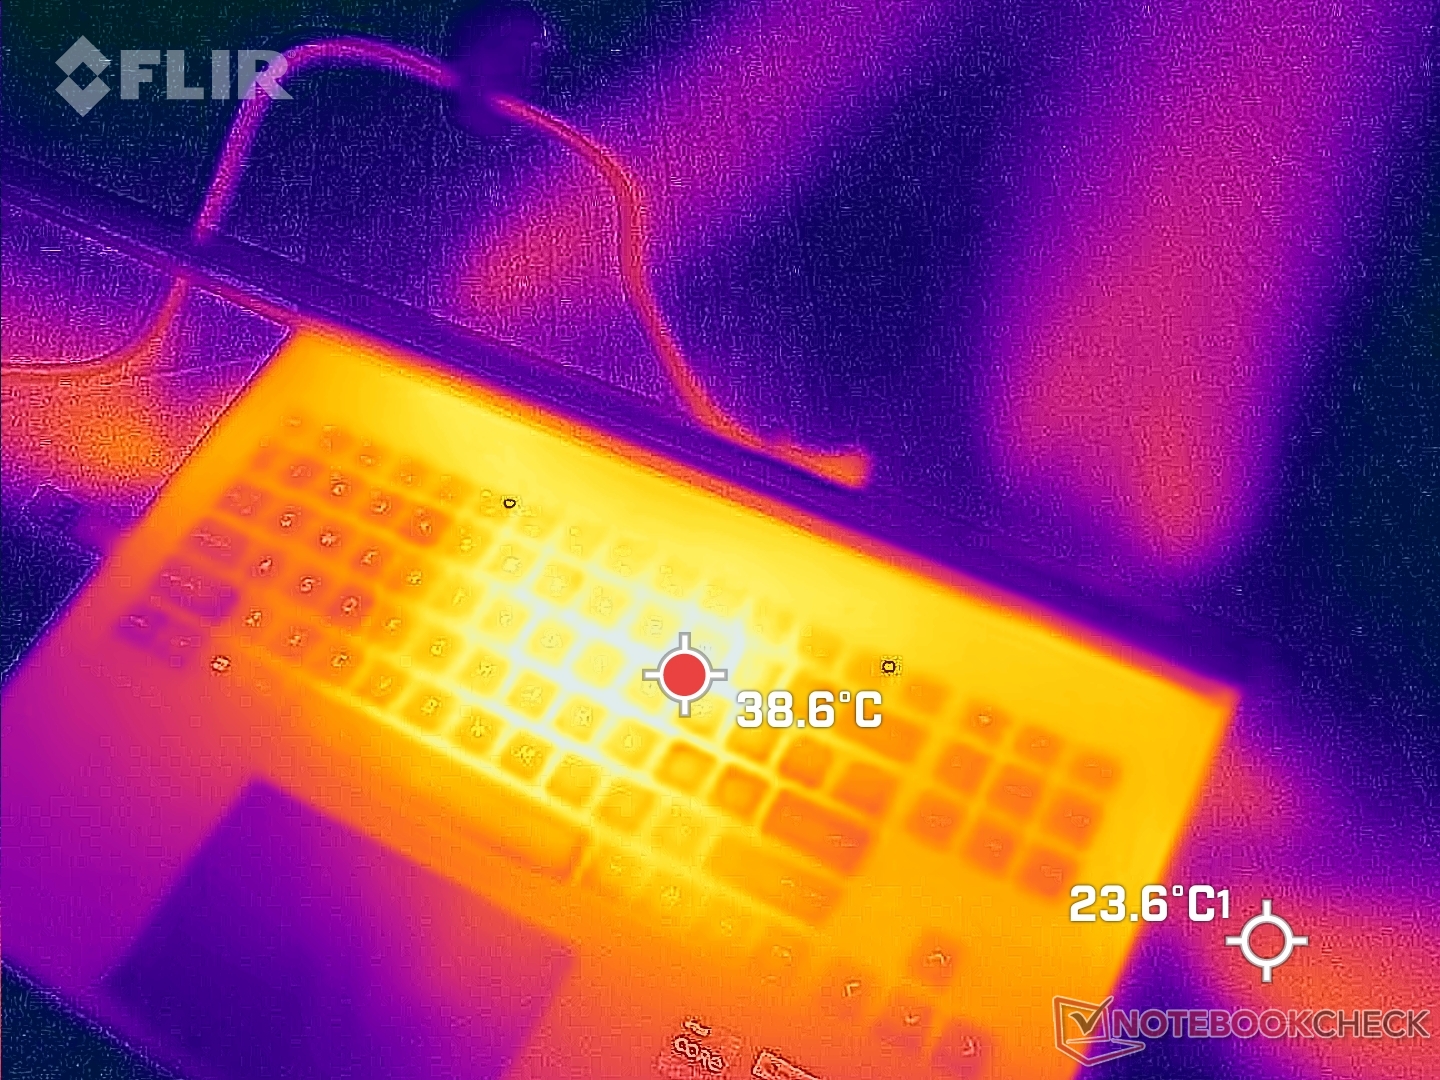
(±) A temperatura máxima no lado superior é 45 °C / 113 F, em comparação com a média de 40.4 °C / 105 F , variando de 21.2 a 68.8 °C para a classe Gaming.
(-) A parte inferior aquece até um máximo de 48.8 °C / 120 F, em comparação com a média de 43.2 °C / 110 F
(+) Em uso inativo, a temperatura média para o lado superior é 26.6 °C / 80 F, em comparação com a média do dispositivo de 33.9 °C / ### class_avg_f### F.
(±) Jogando The Witcher 3, a temperatura média para o lado superior é 33.9 °C / 93 F, em comparação com a média do dispositivo de 33.9 °C / ## #class_avg_f### F.
(+) Os apoios para as mãos e o touchpad são mais frios que a temperatura da pele, com um máximo de 31.4 °C / 88.5 F e, portanto, são frios ao toque.
(-) A temperatura média da área do apoio para as mãos de dispositivos semelhantes foi 28.8 °C / 83.8 F (-2.6 °C / -4.7 F).
| HP Omen 16-wf000 Intel Core i7-13700HX, NVIDIA GeForce RTX 4080 Laptop GPU | HP Omen 16-n0033dx AMD Ryzen 7 6800H, AMD Radeon RX 6650M | Alienware x16 R1 Intel Core i9-13900HK, NVIDIA GeForce RTX 4080 Laptop GPU | Lenovo Legion Pro 7 RTX4090 Intel Core i9-13900HX, NVIDIA GeForce RTX 4090 Laptop GPU | Asus ROG Strix G16 G614JZ Intel Core i9-13980HX, NVIDIA GeForce RTX 4080 Laptop GPU | Razer Blade 16 Early 2023 Intel Core i9-13950HX, NVIDIA GeForce RTX 4080 Laptop GPU | |
|---|---|---|---|---|---|---|
| Heat | 3% | -13% | -17% | -12% | 4% | |
| Maximum Upper Side * (°C) | 45 | 41.2 8% | 47.2 -5% | 53 -18% | 54 -20% | 40 11% |
| Maximum Bottom * (°C) | 48.8 | 53.2 -9% | 47.8 2% | 59 -21% | 55 -13% | 37.6 23% |
| Idle Upper Side * (°C) | 29.2 | 26.4 10% | 36.8 -26% | 34 -16% | 29 1% | 32.4 -11% |
| Idle Bottom * (°C) | 28.8 | 27.8 3% | 35.8 -24% | 32 -11% | 33 -15% | 31.4 -9% |
* ... menor é melhor
Teste de estresse
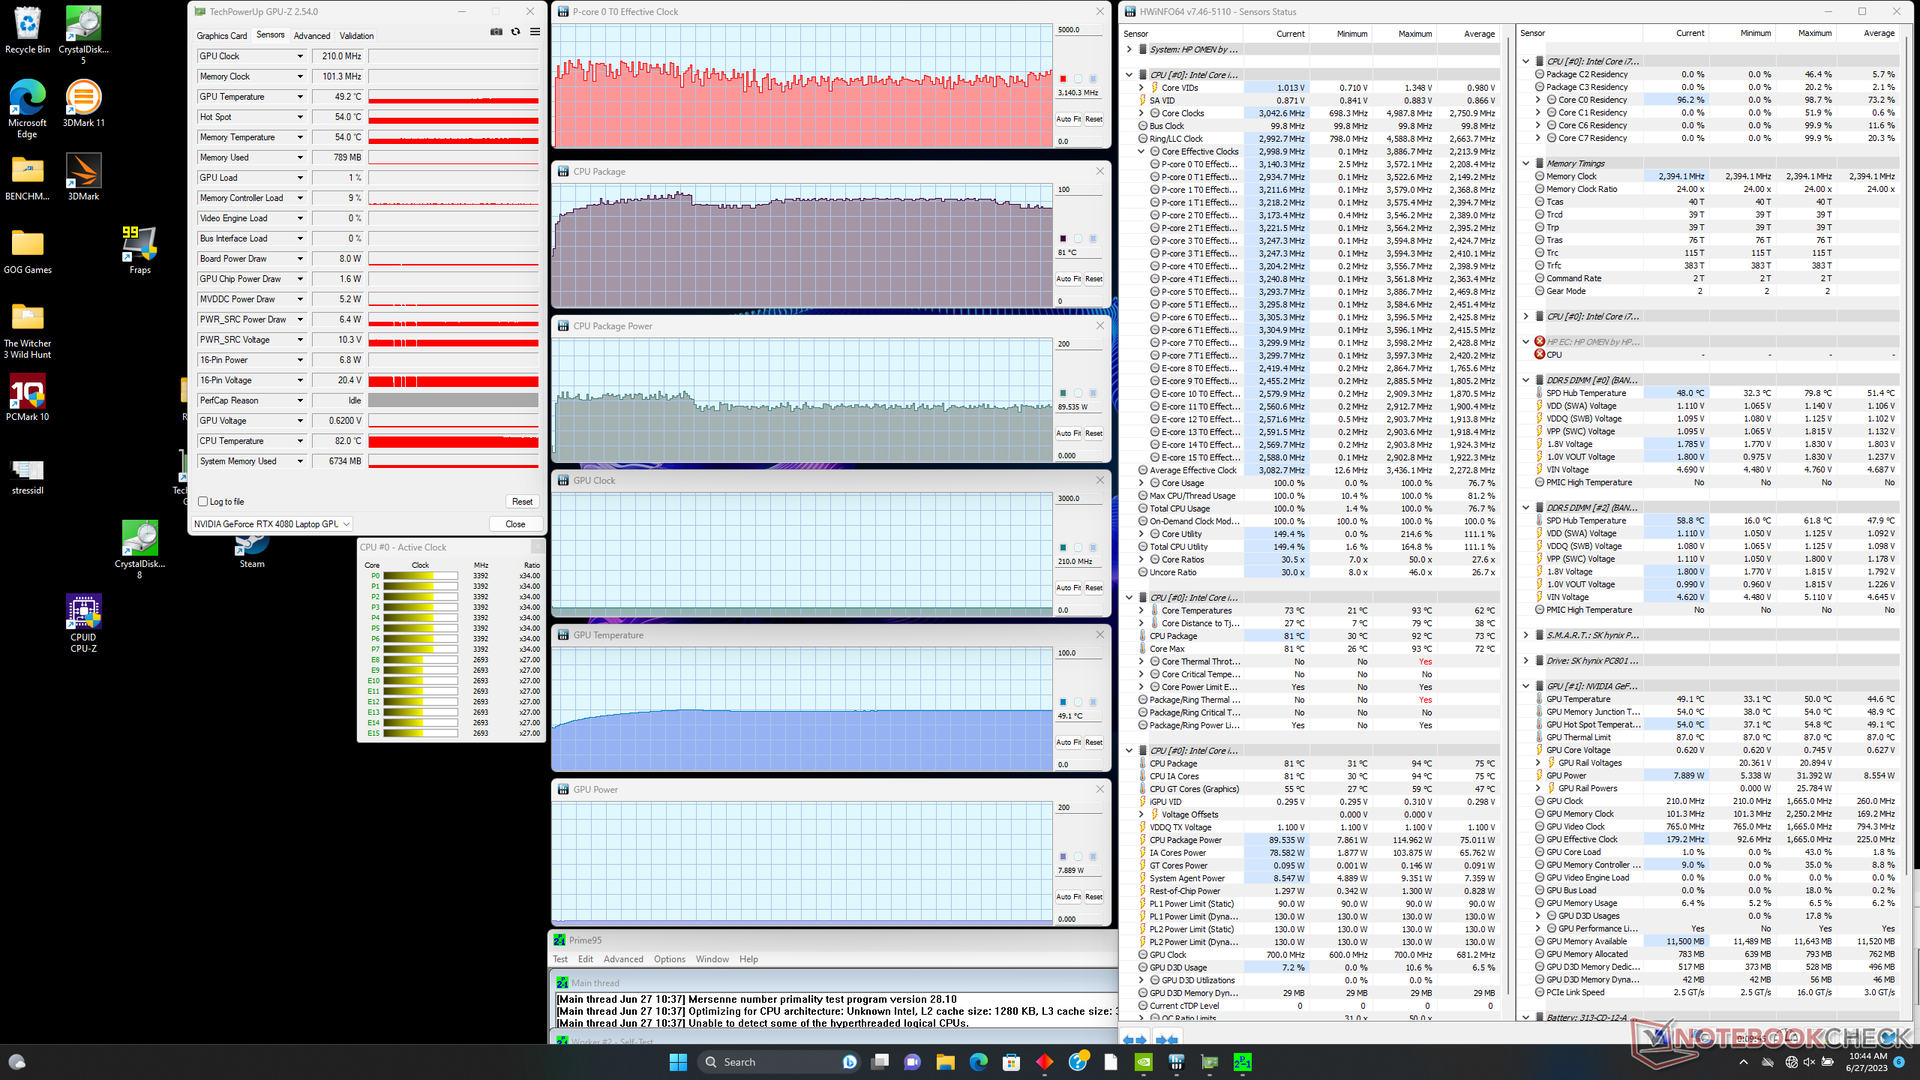
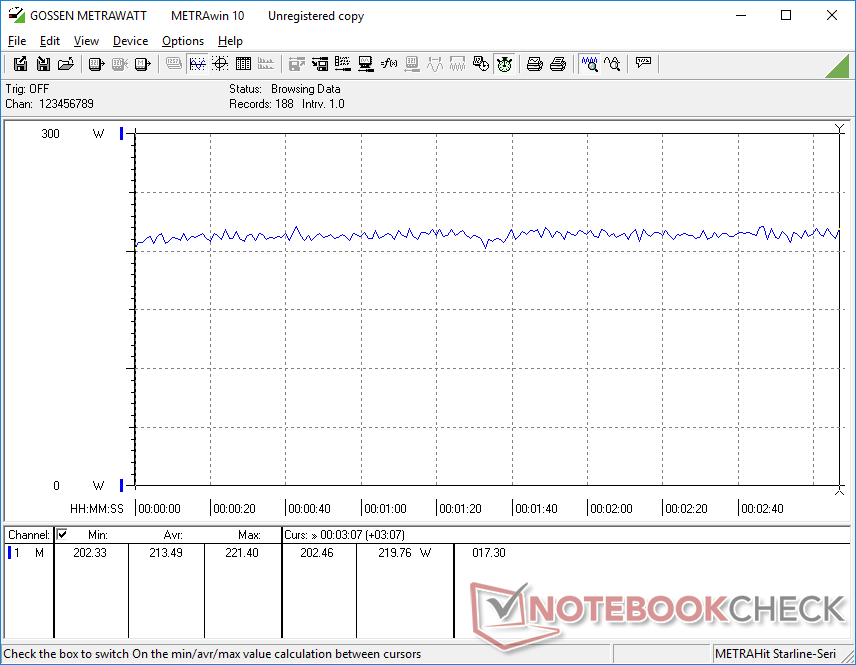
As taxas de clock da CPU e o consumo de energia da placa ao iniciar o estresse do Prime95 aumentavam para 3,4 GHz e 110 W, respectivamente, durando cerca de dois minutos ou até que a temperatura do núcleo atingisse 91 C. Depois disso, a CPU ficava em média em torno de 3,0 GHz e 90 W para manter uma faixa de temperatura mais fria entre 80 e 90 C. Essa faixa de temperatura é semelhante à que registramos no 2022 Omen 16 com tecnologia AMD e no mais rápido Blade 16.
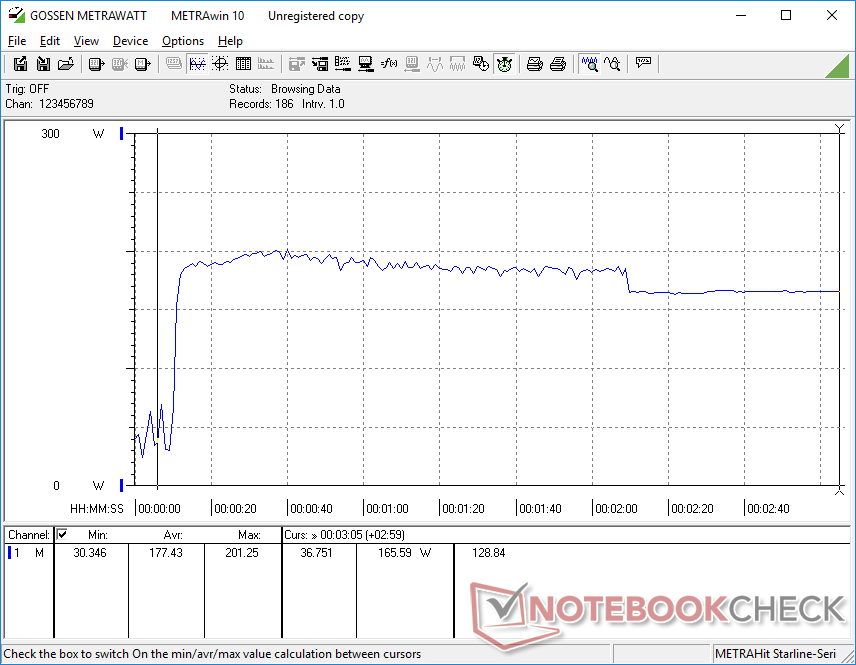
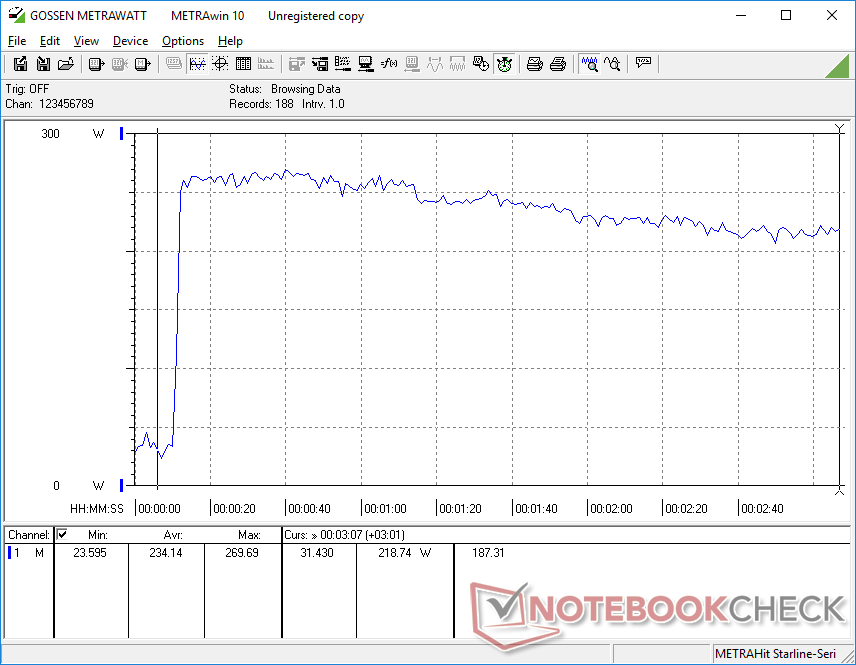
Ao executar Witcher 3 no modo Performance com o Max Fan ligado, as taxas de clock da GPU e o consumo de energia da placa seriam ligeiramente mais altos do que no modo Performance com o Max Fan desligado, conforme mostram as capturas de tela abaixo. Os resultados correspondem aos resultados do site Fire Strike acima e as temperaturas do núcleo também seriam visivelmente mais baixas com a Max Fan ligada. Portanto, você terá que ativar o modo Man Fan se quiser extrair o máximo de desempenho possível do laptop.
A execução Witcher 3 no modo Balanced limitaria o consumo de energia da placa a apenas 95 W, de um máximo de cerca de 130 a 145 W. O ruído do ventilador é mais silencioso, é claro, mas ao custo do desempenho gráfico.
A execução com a energia da bateria limita severamente o desempenho. Um teste 3DMark 11 em baterias retornaria pontuações de física e gráficos de 8347 e 10654 pontos, respectivamente, em comparação com 23751 e 56145 pontos quando ligado à rede elétrica.
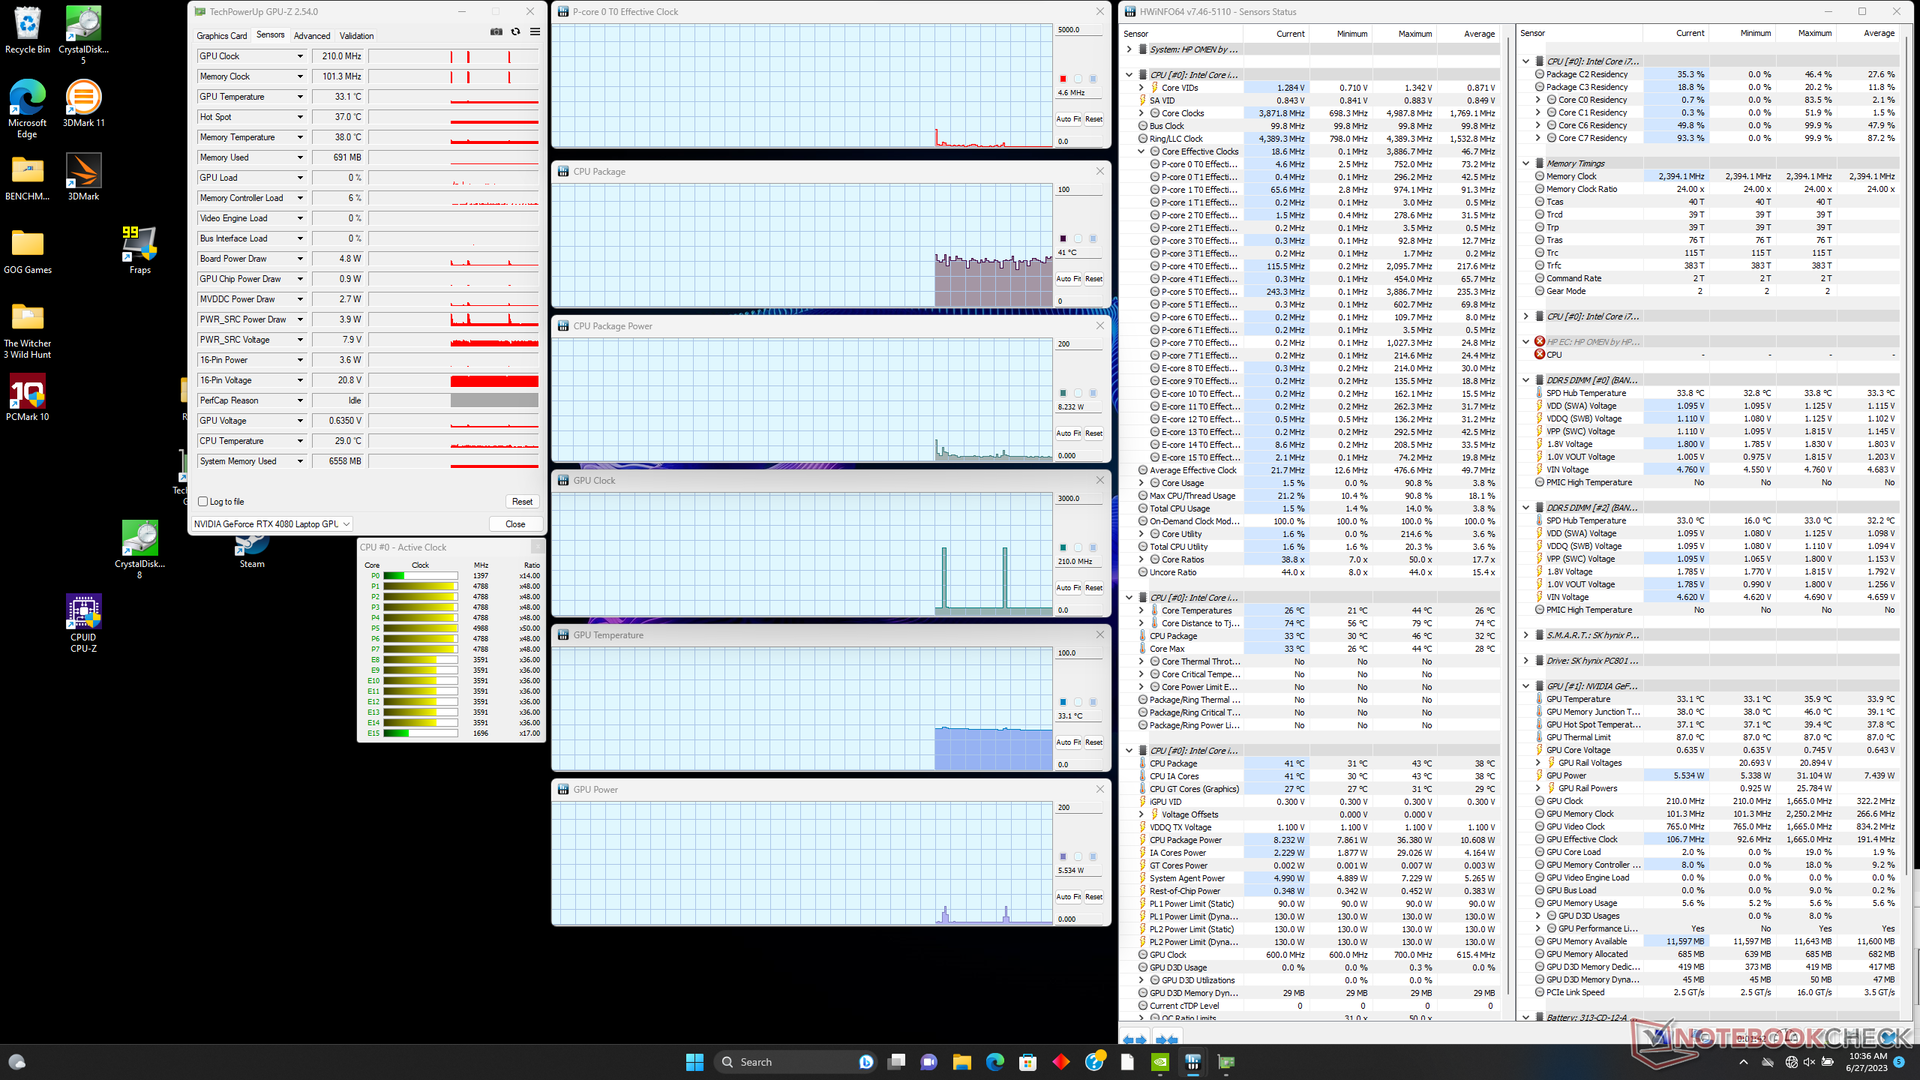
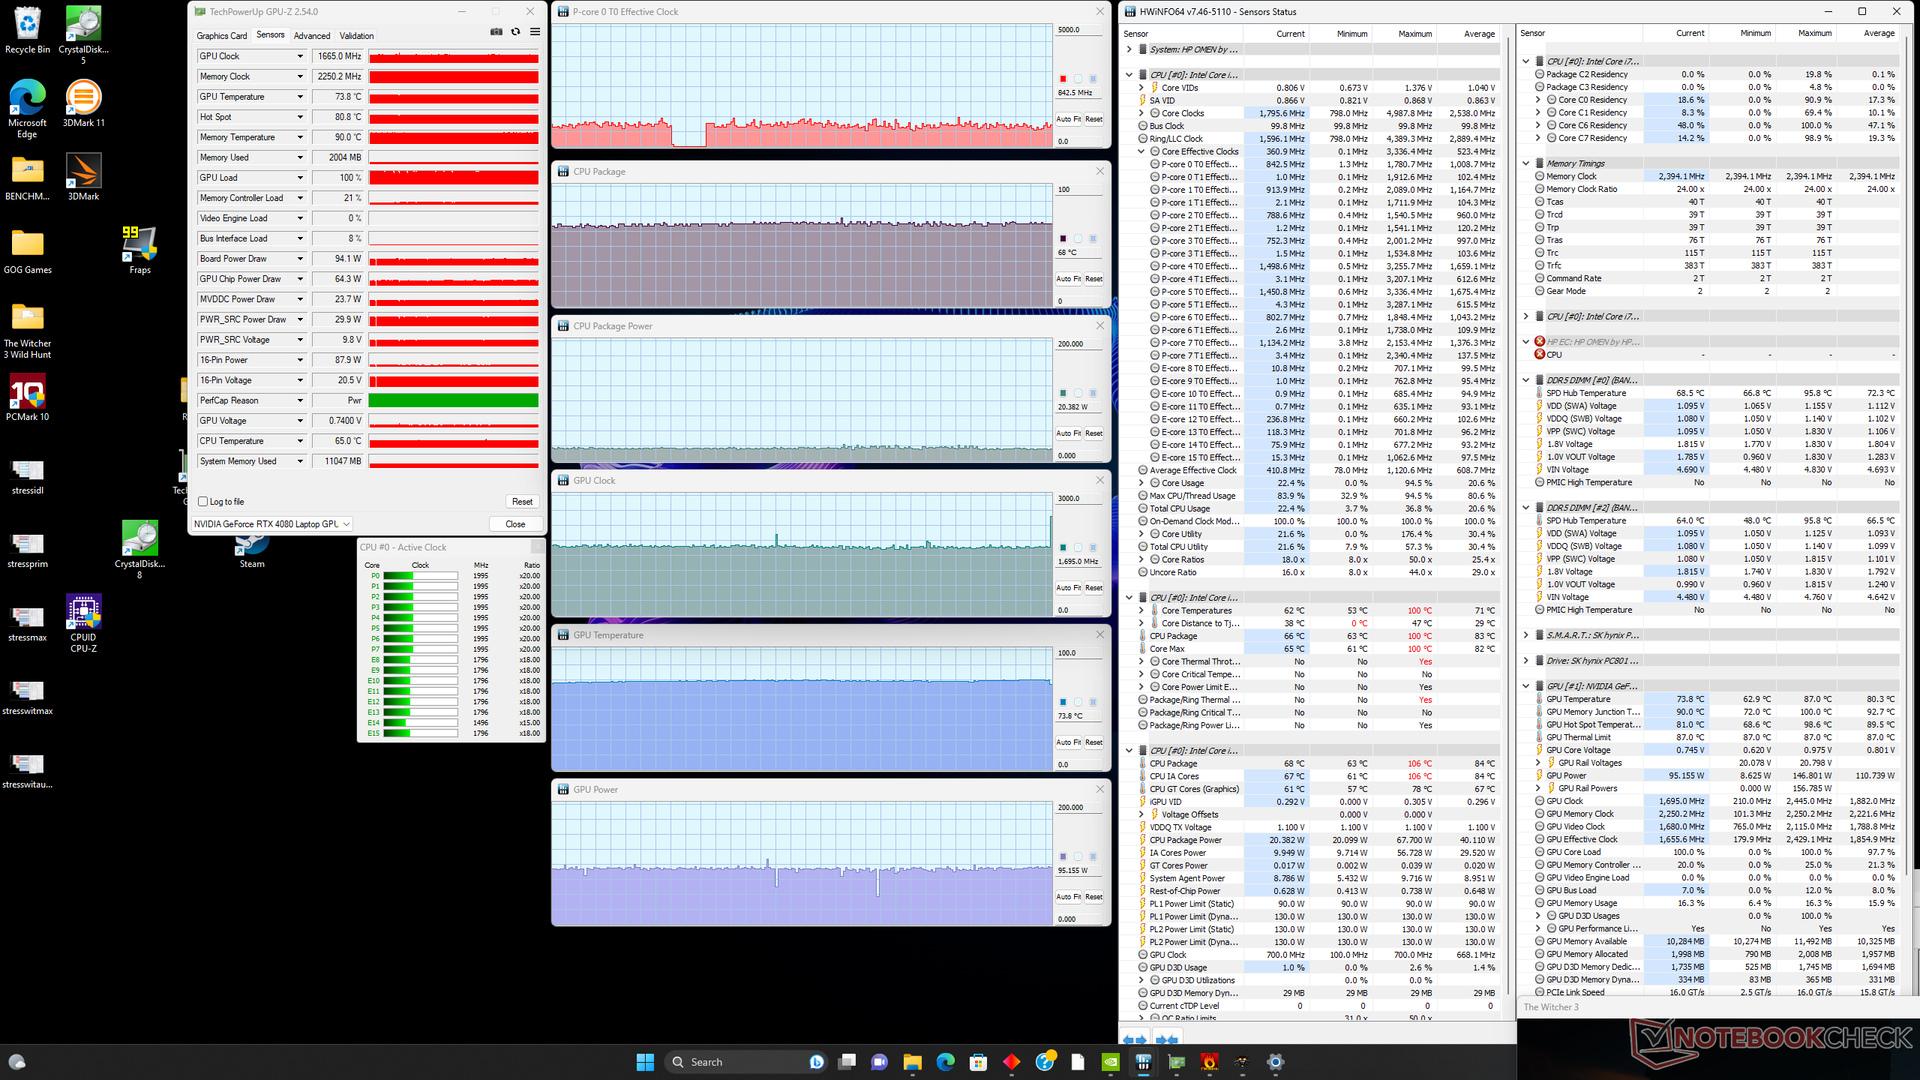
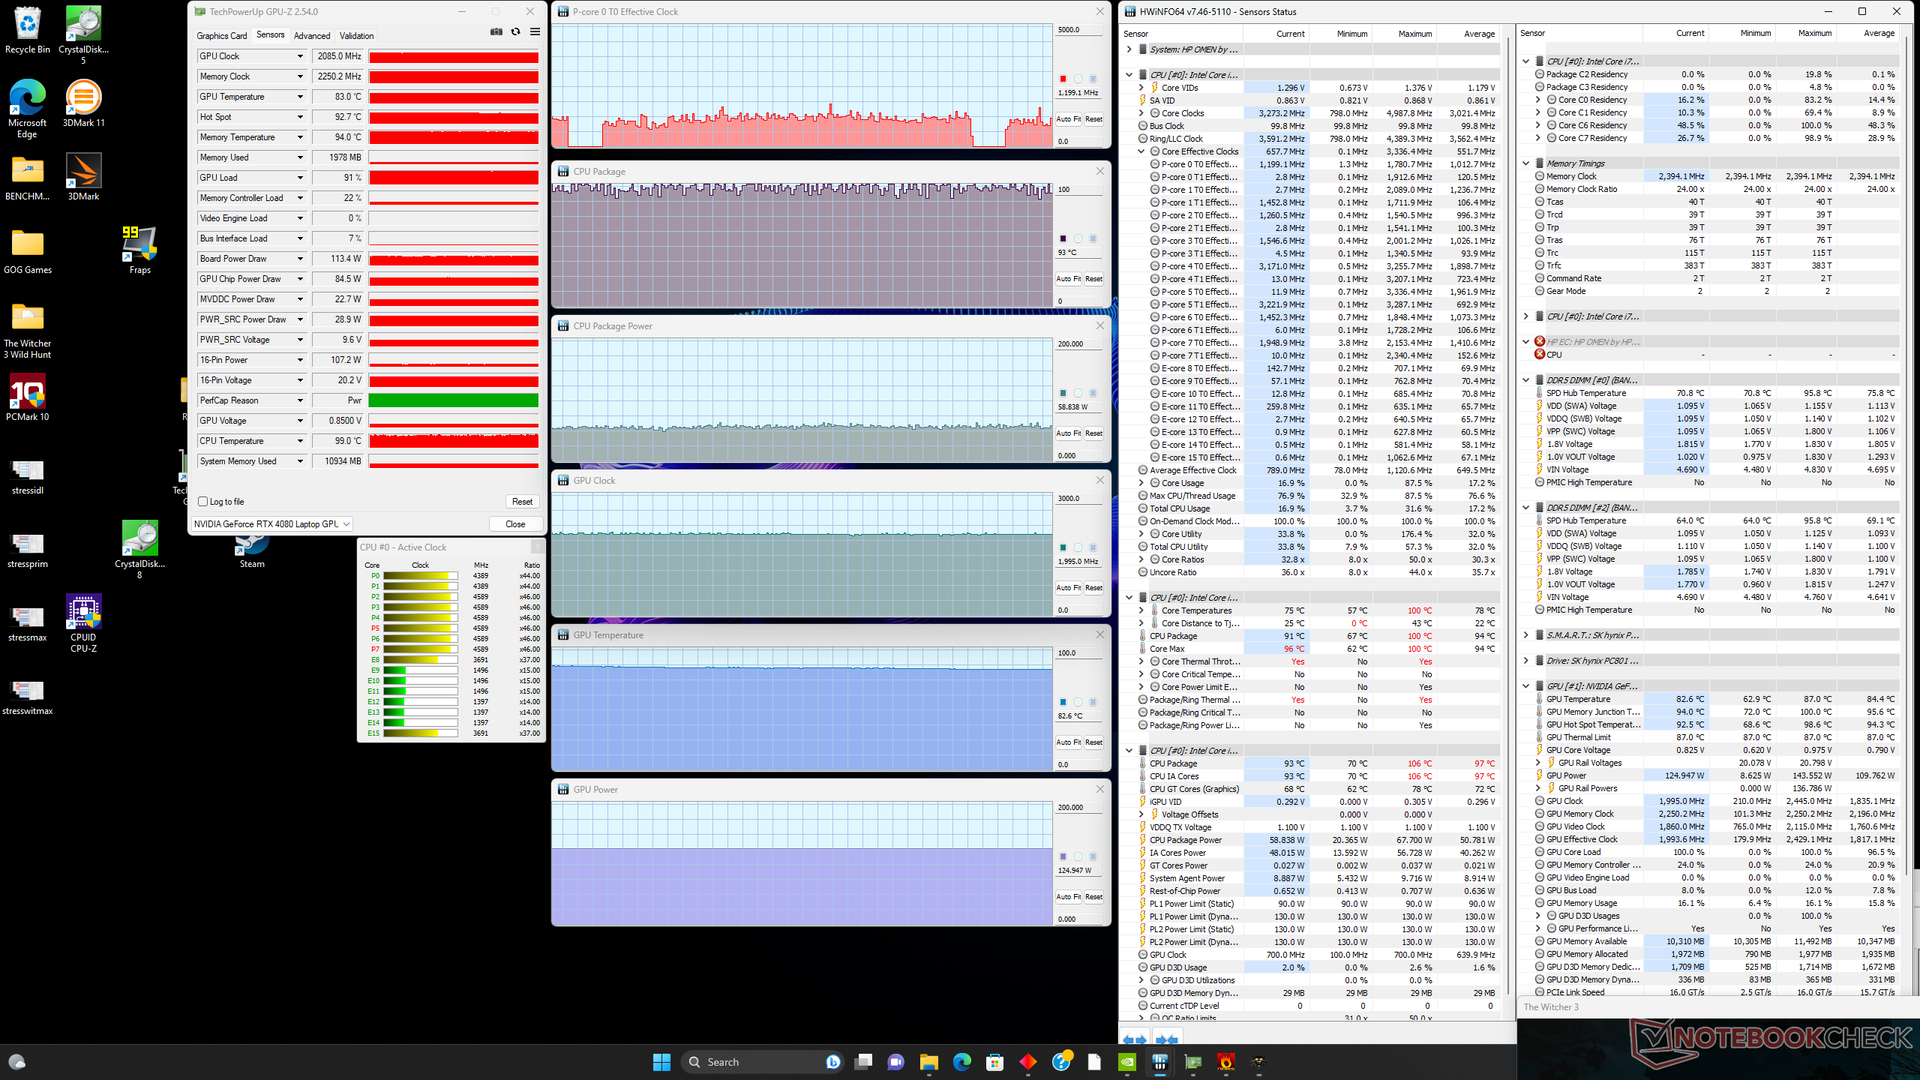
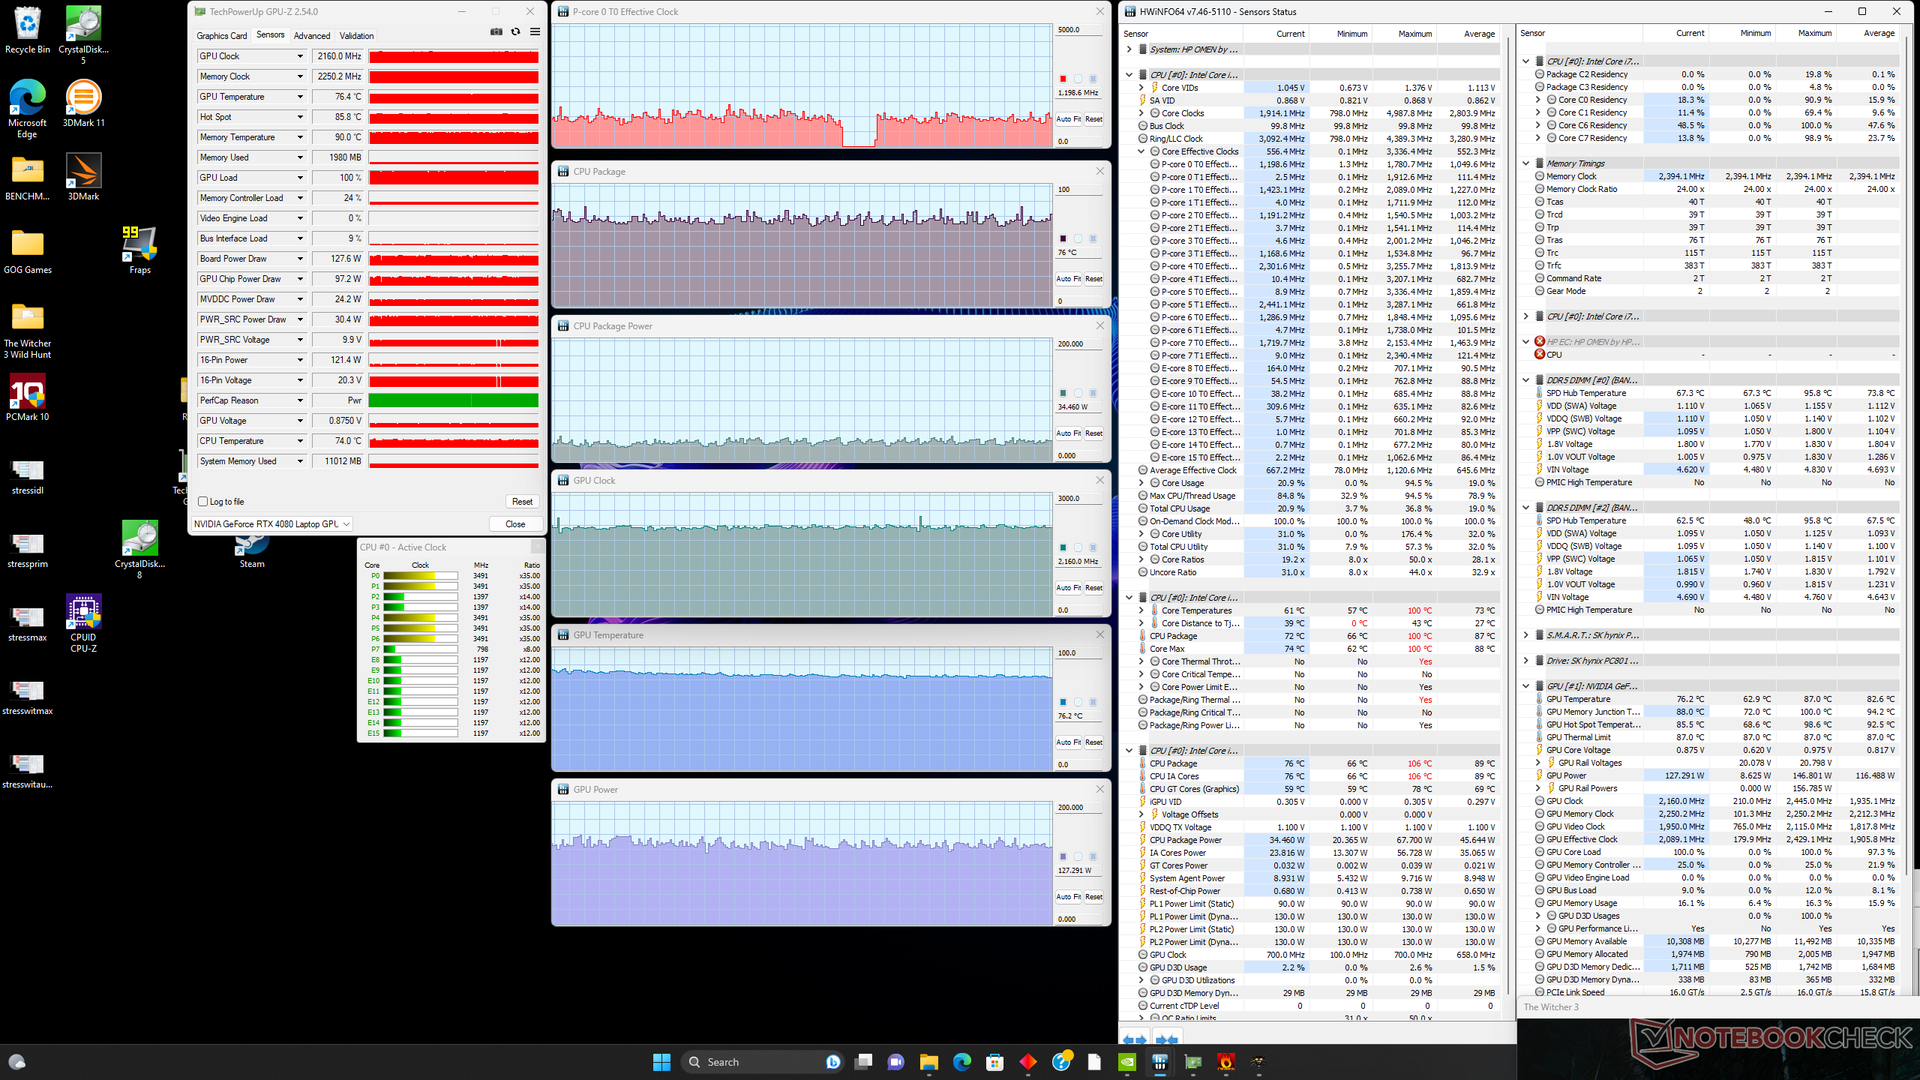
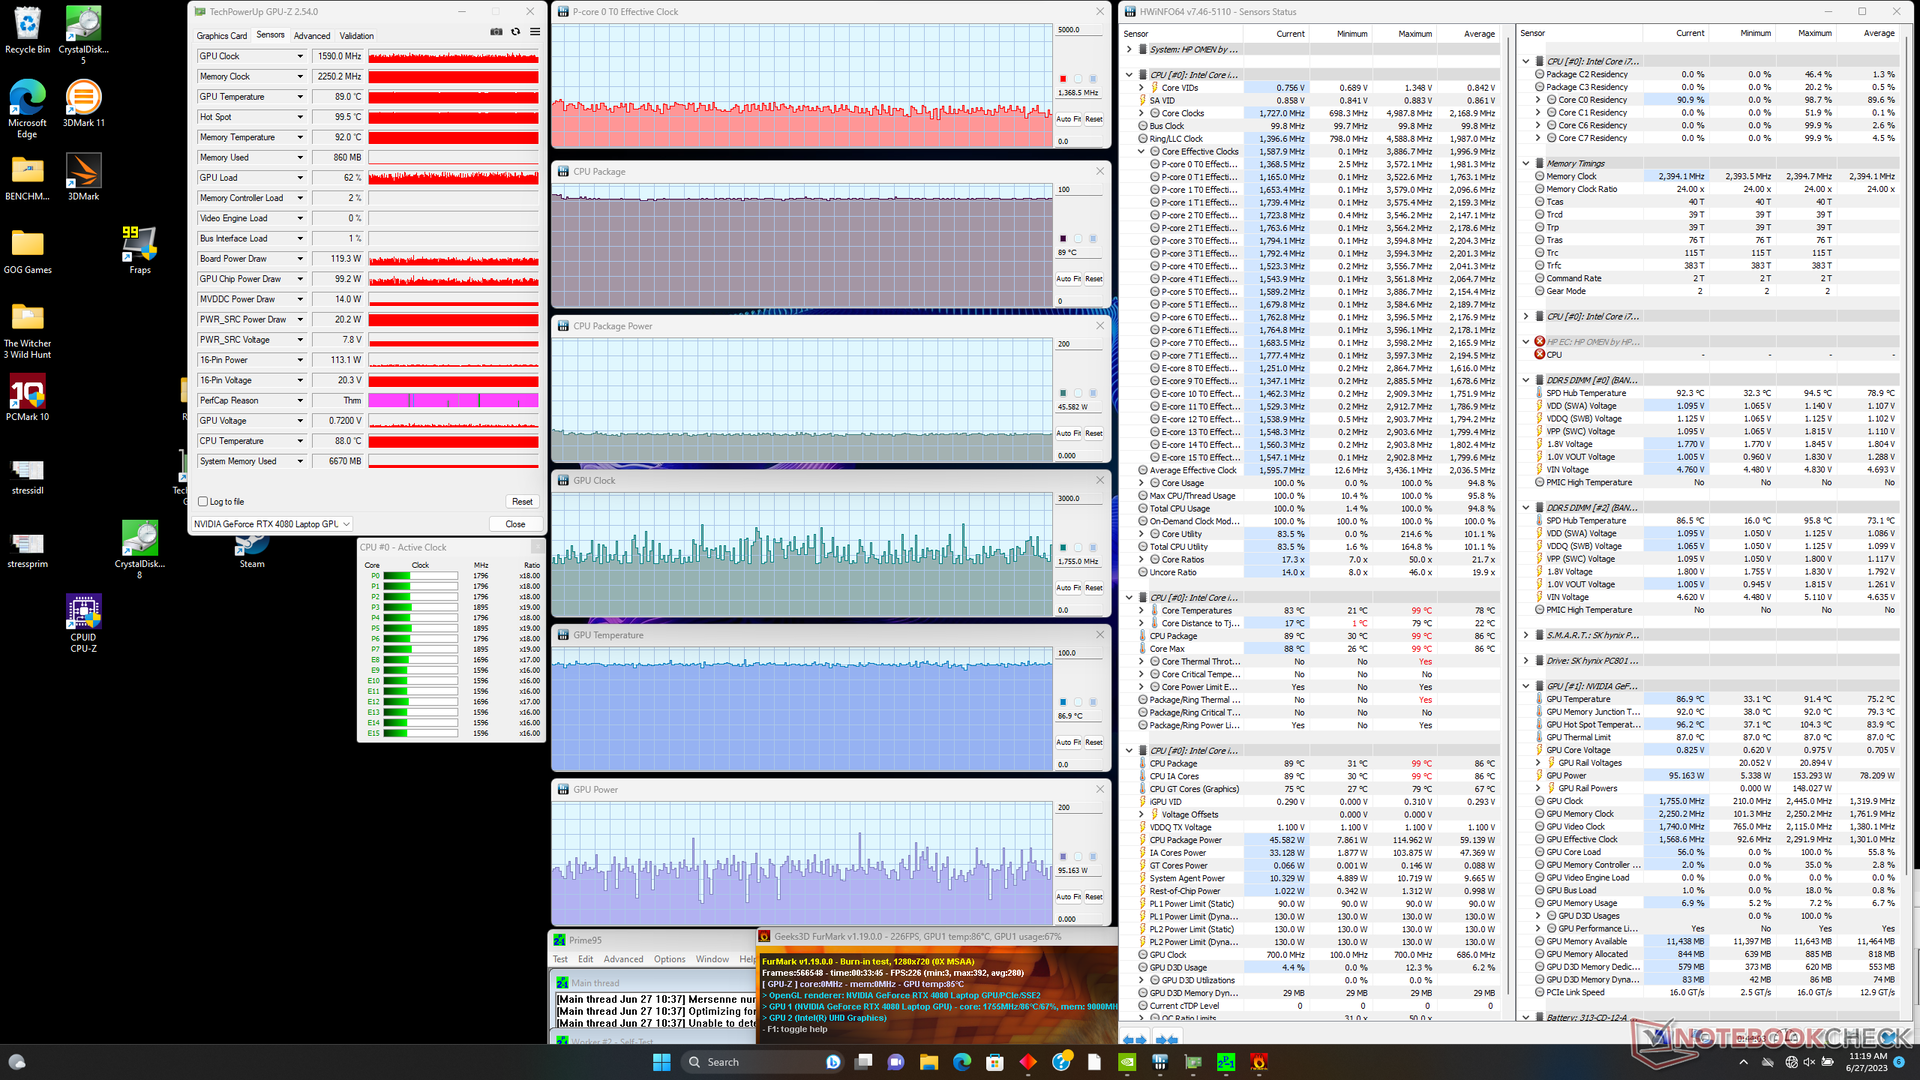
| Clock da CPU (GHz) | Clock da GPU (MHz) | Temperatura média da CPU (°C) | Temperatura média da GPU (°C) | |
| Sistema ocioso | -- | -- | 41 | 33 |
| Estresse doPrime95 | 2.4 - 3.2 | -- | 81 - 88 | 49 |
| Estresse doPrime95 + FurMark | 1,3 - 1,8 | 1300 - 2250 | 89 | 87 |
| Witcher 3 Estresse(modo balanceado) | ~0,8 | 1665 | 68 | 74 |
| Witcher 3 Estresse(modo de desempenho + ventilador máximo desligado) | ~1,2 | 2085 | ~95 | 83 |
| Witcher 3 Estresse (modo de desempenho + ventilador máximoligado) | ~1,2 | 2160 | 76 | 76 |
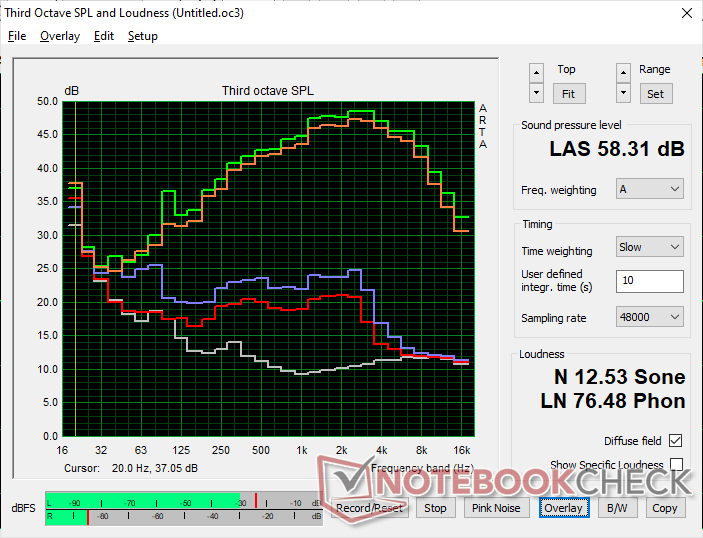
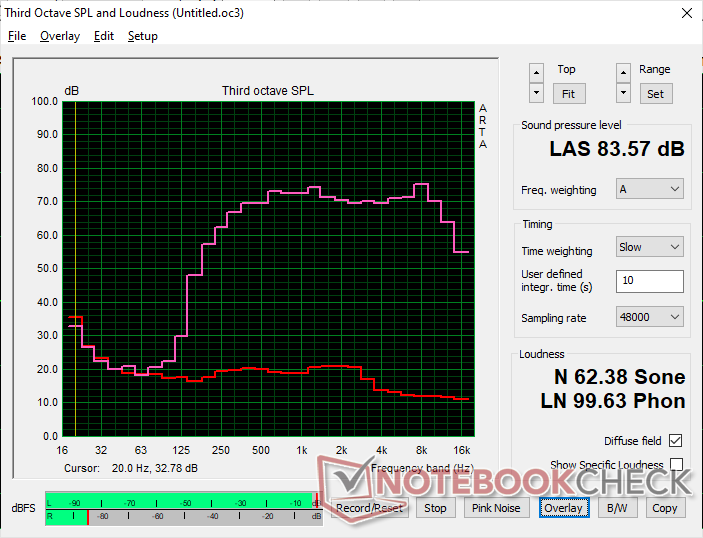
Alto-falantes
Os alto-falantes estéreo não são tão altos quanto os alto-falantes quádruplos do Alienware x16 R1mas, mesmo assim, o equilíbrio é respeitável. A qualidade do som cai sensivelmente durante os jogos devido ao alto volume dos ventiladores.
HP Omen 16-wf000 análise de áudio
(+) | os alto-falantes podem tocar relativamente alto (###valor### dB)
Graves 100 - 315Hz
(-) | quase nenhum baixo - em média 21.9% menor que a mediana
(±) | a linearidade dos graves é média (14.7% delta para a frequência anterior)
Médios 400 - 2.000 Hz
(+) | médios equilibrados - apenas 2.1% longe da mediana
(+) | médios são lineares (3% delta para frequência anterior)
Altos 2 - 16 kHz
(+) | agudos equilibrados - apenas 1.4% longe da mediana
(+) | os máximos são lineares (3.5% delta da frequência anterior)
Geral 100 - 16.000 Hz
(±) | a linearidade do som geral é média (15.3% diferença em relação à mediana)
Comparado com a mesma classe
» 34% de todos os dispositivos testados nesta classe foram melhores, 6% semelhantes, 60% piores
» O melhor teve um delta de 6%, a média foi 18%, o pior foi 132%
Comparado com todos os dispositivos testados
» 22% de todos os dispositivos testados foram melhores, 4% semelhantes, 74% piores
» O melhor teve um delta de 4%, a média foi 23%, o pior foi 134%
Apple MacBook Pro 16 2021 M1 Pro análise de áudio
(+) | os alto-falantes podem tocar relativamente alto (###valor### dB)
Graves 100 - 315Hz
(+) | bons graves - apenas 3.8% longe da mediana
(+) | o baixo é linear (5.2% delta para a frequência anterior)
Médios 400 - 2.000 Hz
(+) | médios equilibrados - apenas 1.3% longe da mediana
(+) | médios são lineares (2.1% delta para frequência anterior)
Altos 2 - 16 kHz
(+) | agudos equilibrados - apenas 1.9% longe da mediana
(+) | os máximos são lineares (2.7% delta da frequência anterior)
Geral 100 - 16.000 Hz
(+) | o som geral é linear (4.6% diferença em relação à mediana)
Comparado com a mesma classe
» 0% de todos os dispositivos testados nesta classe foram melhores, 0% semelhantes, 100% piores
» O melhor teve um delta de 5%, a média foi 17%, o pior foi 45%
Comparado com todos os dispositivos testados
» 0% de todos os dispositivos testados foram melhores, 0% semelhantes, 100% piores
» O melhor teve um delta de 4%, a média foi 23%, o pior foi 134%
Gerenciamento de energia - Bateria maior, vida útil mais curta
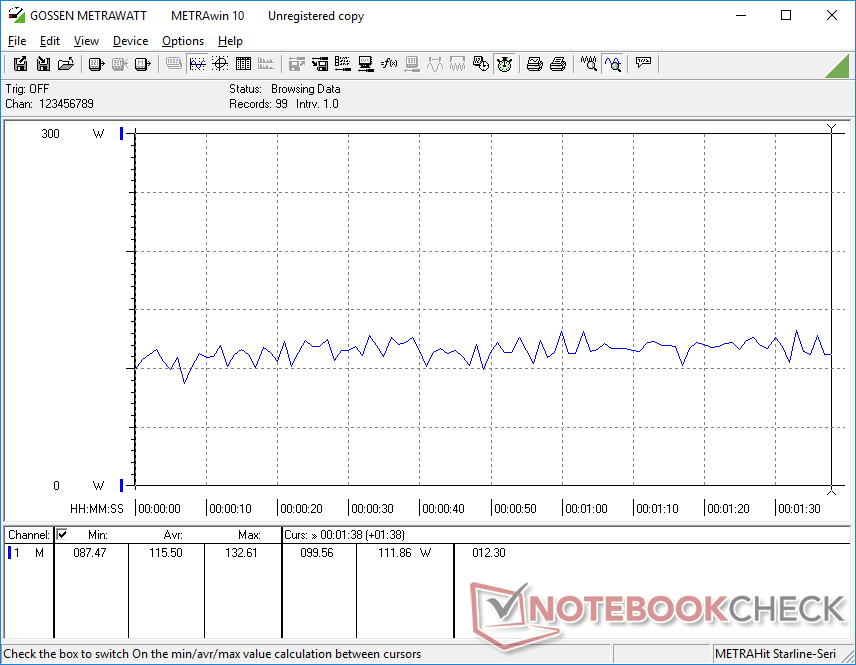
Consumo de energia
O consumo de energia quando ocioso é maior do que o esperado, mesmo quando no perfil de economia de energia com a iGPU ativa e o brilho definido como mínimo. O piso alto pode ser responsável pelos resultados mais curtos da duração da bateria na próxima seção abaixo.
Felizmente, o consumo em jogos mostra melhorias significativas em relação ao Omen 16, equipado com AMD, de 2022. Em execução Witcher 3 consome apenas 4% a mais de energia, em média, e oferece de 1,5x a 2x o desempenho da GPU da Radeon RX 6650M. Esse fato, por si só, pode explicar por que a HP decidiu abandonar qualquer opção da Radeon para o Omen 16 deste ano, já que as vantagens de desempenho por watt do Ada Lovelace são impressionantes.
Laptops concorrentes com a mesma GPU RTX 4080, como oROG Strix G16 ou o Blade 16, cada um exige cerca de 30 W a mais do que o nosso sistema HP ao executar o mesmo título. No entanto, eles também vêm com CPUs Core i9 HX muito mais rápidas para compensar.
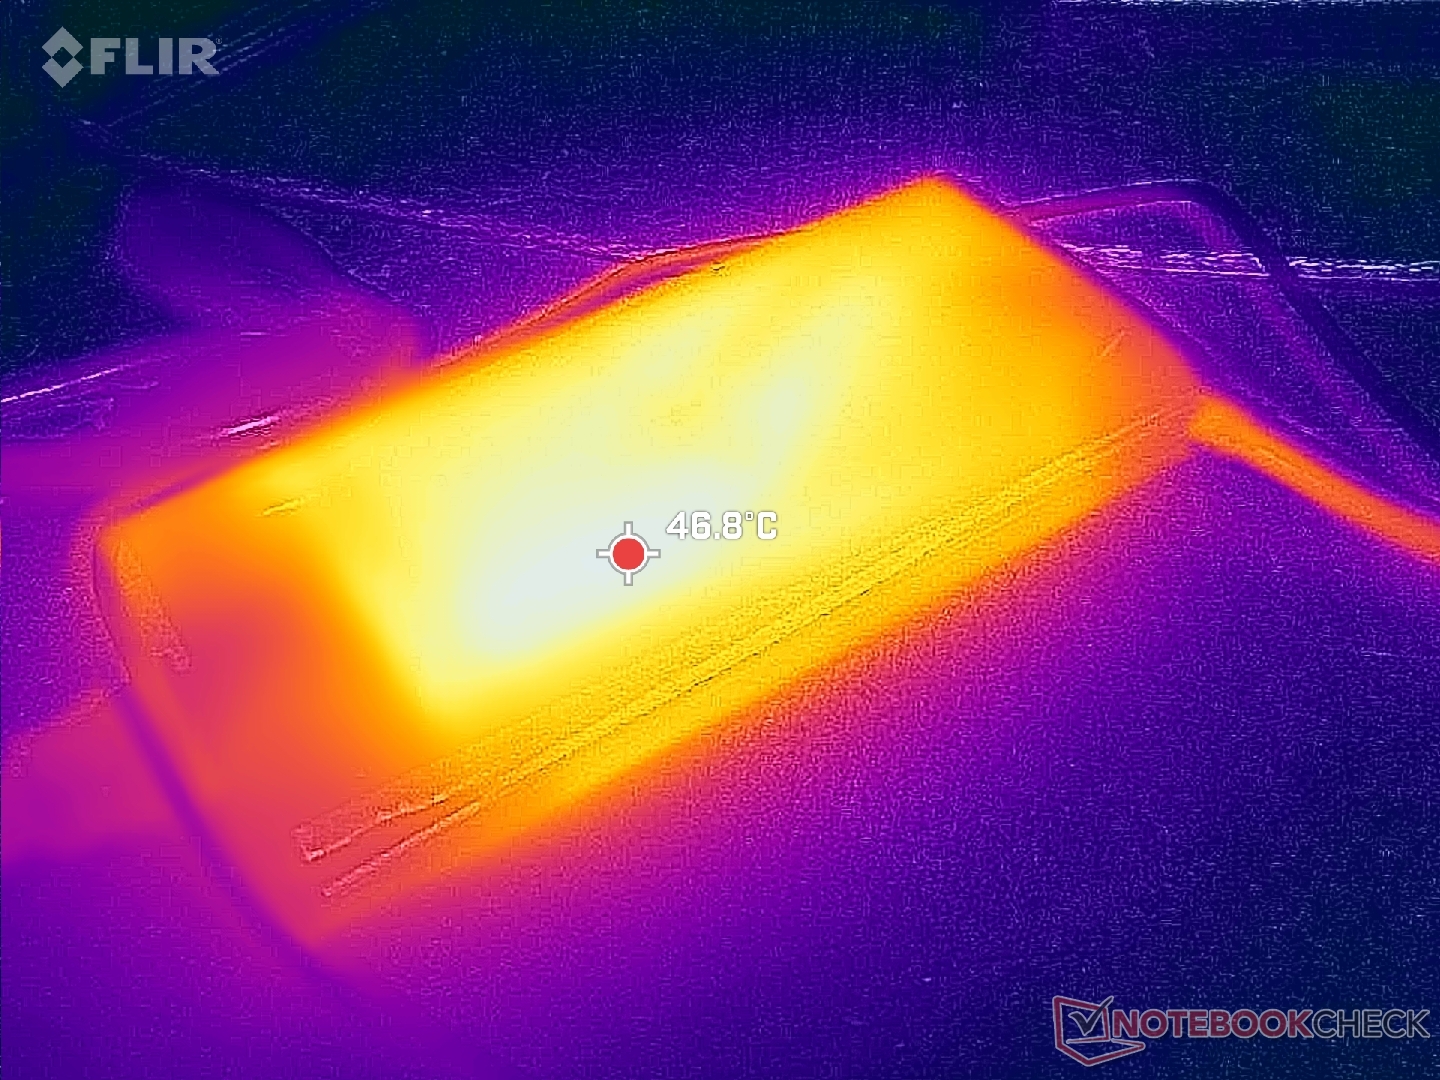
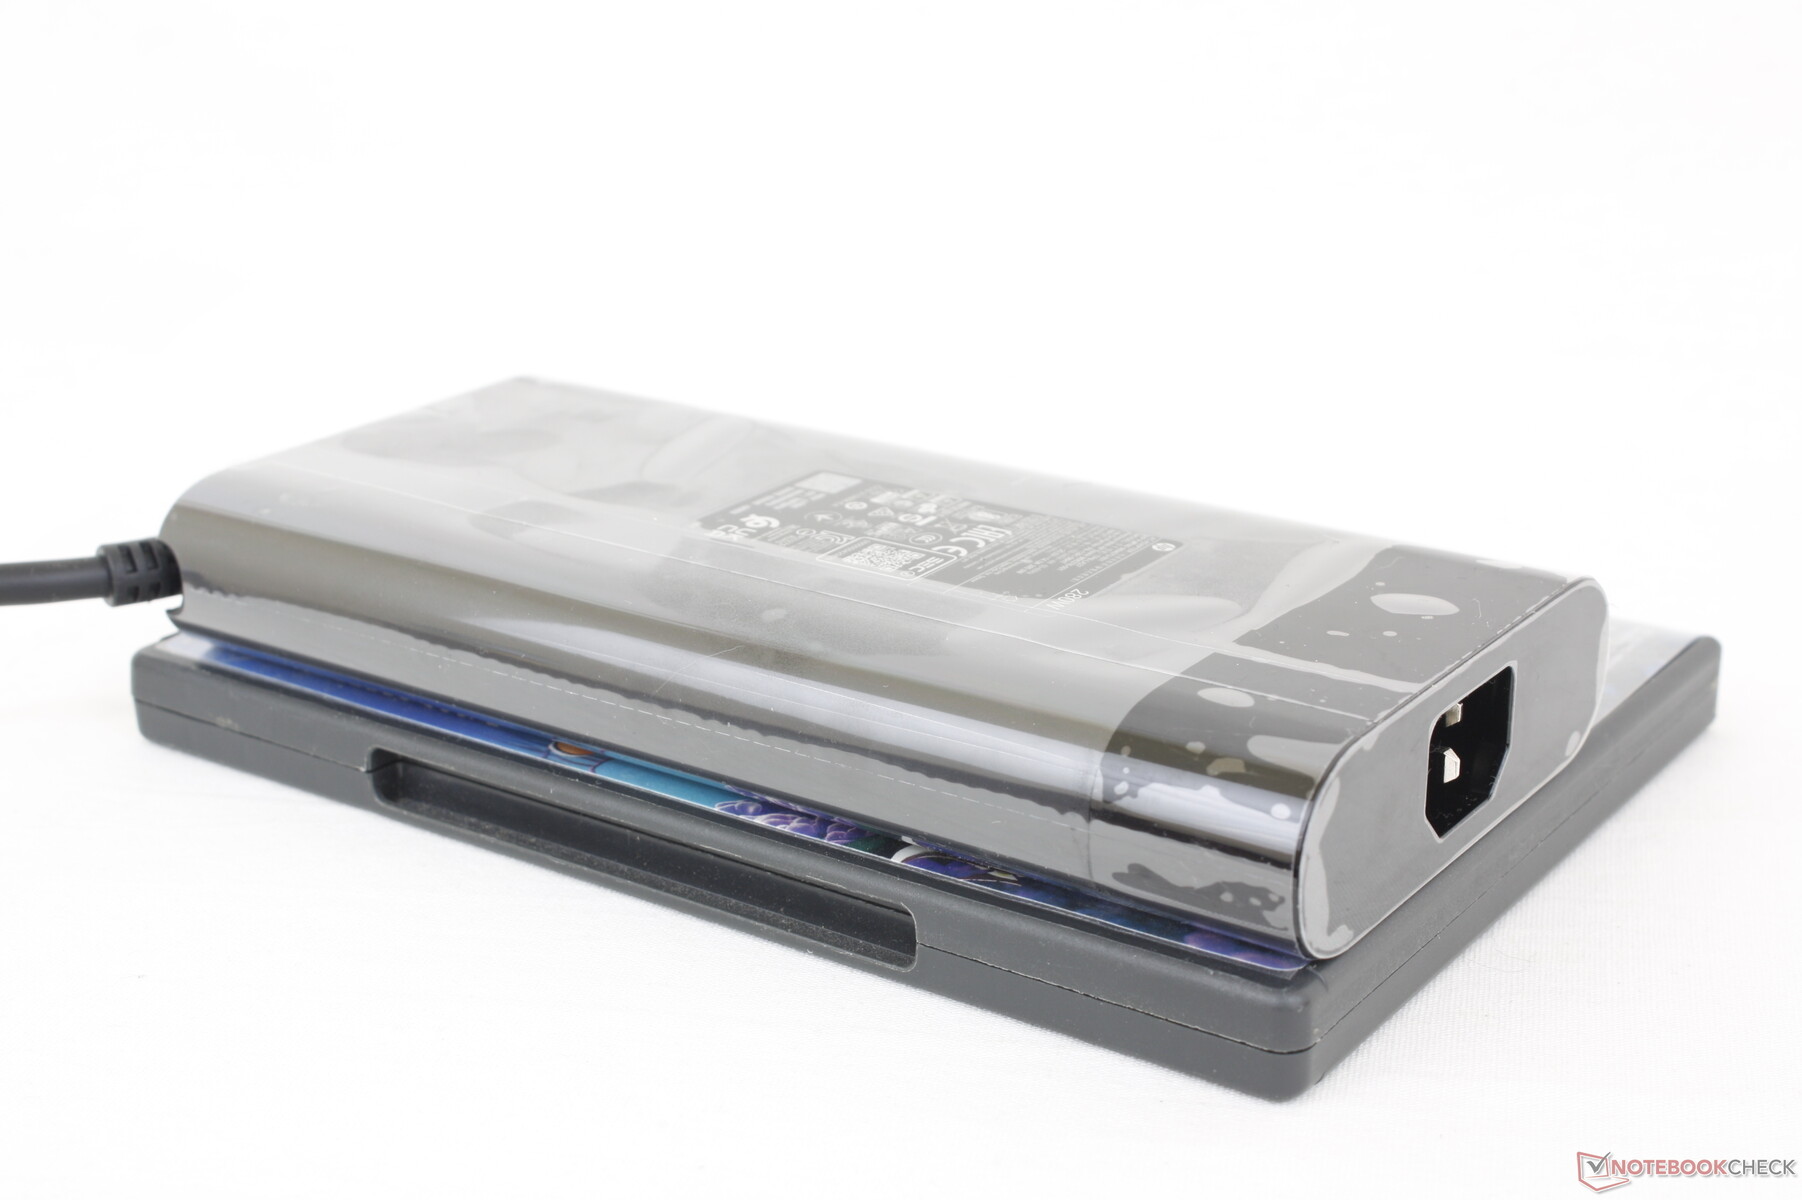
Conseguimos registrar um consumo máximo temporário de 270 W com o adaptador CA de 280 W de tamanho médio (~18 x 8,8 x 2,4 cm) quando a CPU e a GPU estão com 100% de utilização. Um adaptador CA maior, de 330 W, provavelmente teria sido um exagero.
| desligado | |
| Ocioso | |
| Carga |
|
Key:
min: | |
| HP Omen 16-wf000 i7-13700HX, GeForce RTX 4080 Laptop GPU, SK hynix PC801 HFS002TEJ9X101N, IPS, 2560x1440, 16.1" | HP Omen 16-n0033dx R7 6800H, Radeon RX 6650M, Samsung PM9A1 MZVL21T0HCLR, IPS, 1920x1080, 16.1" | Alienware x16 R1 i9-13900HK, GeForce RTX 4080 Laptop GPU, SK hynix PC801 HFS001TEJ9X101N, IPS, 2560x1600, 16" | Lenovo Legion Pro 7 RTX4090 i9-13900HX, GeForce RTX 4090 Laptop GPU, Samsung PM9A1 MZVL21T0HCLR, IPS, 2560x1600, 16" | Asus ROG Strix G16 G614JZ i9-13980HX, GeForce RTX 4080 Laptop GPU, WD PC SN560 SDDPNQE-1T00, IPS, 2560x1600, 16" | Razer Blade 16 Early 2023 i9-13950HX, GeForce RTX 4080 Laptop GPU, SSSTC CA6-8D1024, IPS, 2560x1600, 16" | |
|---|---|---|---|---|---|---|
| Power Consumption | 34% | -17% | -9% | 11% | -3% | |
| Idle Minimum * (Watt) | 21.8 | 7.9 64% | 25.2 -16% | 20 8% | 10 54% | 15.2 30% |
| Idle Average * (Watt) | 26 | 11.5 56% | 29.9 -15% | 25 4% | 16 38% | 22.8 12% |
| Idle Maximum * (Watt) | 36 | 18.3 49% | 49.8 -38% | 35 3% | 27 25% | 49.8 -38% |
| Load Average * (Watt) | 115.5 | 88.1 24% | 105.4 9% | 136 -18% | 129 -12% | 121.2 -5% |
| Witcher 3 ultra * (Watt) | 214 | 206 4% | 263 -23% | 282 -32% | 247 -15% | 242 -13% |
| Load Maximum * (Watt) | 269.7 | 246.4 9% | 313.8 -16% | 320 -19% | 342 -27% | 273.7 -1% |
* ... menor é melhor
Power Consumption Witcher 3 / Stresstest
Power Consumption external Monitor
Duração da bateria
A capacidade da bateria aumentou de 68 Wh no modelo do ano passado para 83 Wh. Infelizmente, a duração da bateria é mais curta do que antes, em quase duas horas completas. Conseguimos registrar um tempo de execução de WLAN de pouco mais de 5 horas, semelhante ao do Legion Pro 7 mesmo com o perfil de energia balanceado e a iGPU ativa.
O carregamento da capacidade vazia até a capacidade total leva cerca de 90 minutos com o adaptador CA de barril incluído. O sistema também pode ser carregado via USB-C, mas a compatibilidade não é garantida. Por exemplo, conectar nosso adaptador CA USB-C de 130 W da Dell resultaria em uma mensagem pop-up alegando incompatibilidade, enquanto nosso adaptador USB-C de 135 W da Lenovo carregaria sem problemas.
| HP Omen 16-wf000 i7-13700HX, GeForce RTX 4080 Laptop GPU, 83 Wh | HP Omen 16-n0033dx R7 6800H, Radeon RX 6650M, 68 Wh | Alienware x16 R1 i9-13900HK, GeForce RTX 4080 Laptop GPU, 90 Wh | Lenovo Legion Pro 7 RTX4090 i9-13900HX, GeForce RTX 4090 Laptop GPU, 99.9 Wh | Asus ROG Strix G16 G614JZ i9-13980HX, GeForce RTX 4080 Laptop GPU, 90 Wh | Razer Blade 16 Early 2023 i9-13950HX, GeForce RTX 4080 Laptop GPU, 95.2 Wh | |
|---|---|---|---|---|---|---|
| Duração da bateria | 40% | -18% | 0% | 45% | 36% | |
| Reader / Idle (h) | 5.5 | 10 82% | 7.3 33% | 8.9 62% | ||
| WiFi v1.3 (h) | 5.1 | 7 37% | 2.5 -51% | 5.1 0% | 9.7 90% | 6.1 20% |
| Load (h) | 1.1 | 1.1 0% | 0.7 -36% | 1.1 0% | 1.4 27% |
Pro
Contra
Veredicto - Baixa barreira de entrada para um design fino e atraente
Talvez o aspecto mais lucrativo do 2023 Omen 16 seja seu preço inicial acessível de US$ 1100 para a configuração Core i7-13700HX, RTX 4060 e 16 GB de RAM. É um chassi de médio porte superior com melhor qualidade de construção e um design mais elegante do que laptops para jogos de preço semelhante, como o MSI Katana, Dell G16 seriesou a série Série Asus TUF F. Se você estiver procurando um laptop RTX 4060 sem ter que se contentar com materiais plásticos baratos, vale a pena considerar o Omen 16.
O novo modelo é um pouco mais grosso e mais largo do que seu antecessor e também tem uma duração de bateria mais curta, mas as alterações compensam o desempenho muito mais rápido da CPU e da GPU. O peso permanece praticamente o mesmo, apesar das diferenças de tamanho, e a maioria dos jogadores pode não se importar com os tempos de execução mais curtos.
O 2023 Omen 16 tem aparência e desempenho melhores do que seu baixo preço inicial poderia sugerir.
Dois recursos notáveis que faltam no Omen 16 são o suporte a DCI-P3 e um leitor de cartão SD integrado. Esses recursos não afetam a experiência de jogo principal do sistema, mas os jogadores que também são criadores de conteúdo podem querer considerar oAlienware x16 R1 ou o Razer Blade 16 que oferecem leitores de cartão, cores mais amplas e resoluções nativas mais altas. Obviamente, essas alternativas de uso duplo também são notavelmente mais caras.
Preço e disponibilidade
O 2023 Omen 16 está sendo enviado diretamente pela HP a partir de US$ 1100 para a configuração básica RTX 4060 até US$ 2600 para nossa configuração RTX 4080, conforme analisado.
HP Omen 16-wf000
- 09/13/2023 v7 (old)
Allen Ngo
Transparência
A seleção dos dispositivos a serem analisados é feita pela nossa equipe editorial. A amostra de teste foi fornecida ao autor como empréstimo pelo fabricante ou varejista para fins desta revisão. O credor não teve influência nesta revisão, nem o fabricante recebeu uma cópia desta revisão antes da publicação. Não houve obrigação de publicar esta revisão. Como empresa de mídia independente, a Notebookcheck não está sujeita à autoridade de fabricantes, varejistas ou editores.
É assim que o Notebookcheck está testando
Todos os anos, o Notebookcheck analisa de forma independente centenas de laptops e smartphones usando procedimentos padronizados para garantir que todos os resultados sejam comparáveis. Desenvolvemos continuamente nossos métodos de teste há cerca de 20 anos e definimos padrões da indústria no processo. Em nossos laboratórios de teste, equipamentos de medição de alta qualidade são utilizados por técnicos e editores experientes. Esses testes envolvem um processo de validação em vários estágios. Nosso complexo sistema de classificação é baseado em centenas de medições e benchmarks bem fundamentados, o que mantém a objetividade.Price comparison

