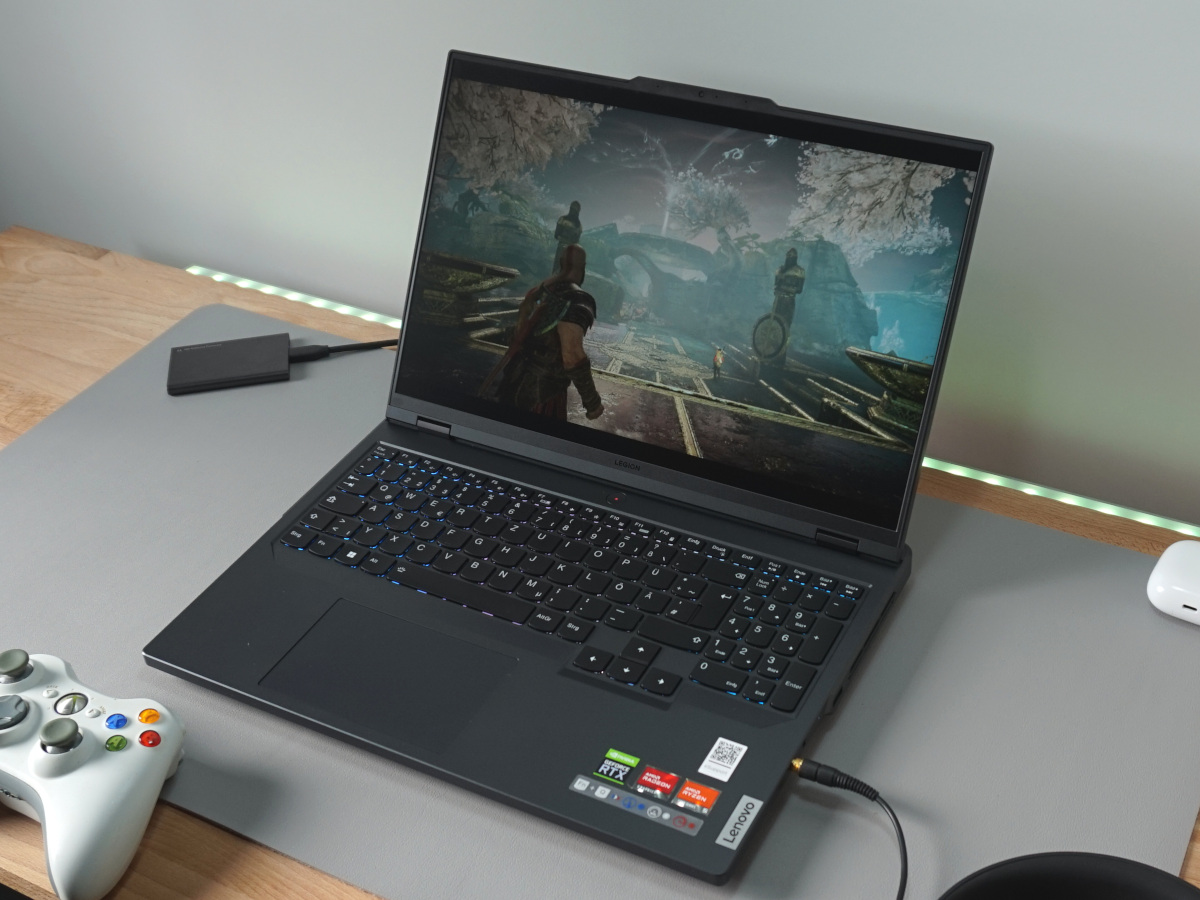
Análise do Lenovo Legion Pro 5 16ARX8: Laptop para jogos com RTX 4050 em ótimo formato
O Lenovo Legion Pro 5 16ARX8 tem desempenho suficiente para colocá-lo em algum lugar entre um laptop de nível básico e um laptop de médio porte superior. Ele pode ser configurado com um processador Ryzen 5 7645HX ou um Ryzen 7 7745HX bem como com a placa de vídeo Nividia RTX 4050, 4060 ou4070. O dispositivo custará em torno de € 1.500 a um pouco mais de € 2.000 (aproximadamente US$ 1.655 a US$ 2.200), dependendo das especificações. A tela, o SSD e a RAM também podem ser configurados.
Já analisamos anteriormente duas outras variantes desse laptop Lenovo: oLegion Pro 5 16IRX8 com um processadorIntel Core i7-13700HXe RTX 4060, bem como oPro 5 16ARX8 com umAMD Ryzen 7 7745HXe RTX 4070. Portanto, abordaremos aqui apenas brevemente o chassi, os recursos e os dispositivos de entrada. Você pode consultar as duas análises anteriores para obter mais informações.
Agora é hora de testar a configuração básica do Legion Pro 5. Com o mesmo sistema de resfriamento e chassi das variantes mais potentes, o Pro 5 16ARX8 deve ter algumas vantagens em relação a elas, pelo menos no que diz respeito à temperatura. Obviamente, a especificação básica do Legion Pro 5 também será levada aos seus limites mais facilmente em termos de desempenho. No entanto, esses limites não são tão baixos quanto a GPU de nível básico pode sugerir.
O Legion Pro 5 está competindo com modelos como oAsus TUF Gaming A16com umaAMD Radeon RX 7600Sbem como oMedion Erazer Scout E20que também vem com uma RTX 4050.
Possíveis concorrentes em comparação
Avaliação | Data | Modelo | Peso | Altura | Size | Resolução | Preço |
|---|---|---|---|---|---|---|---|
| 89 % v7 (old) | 08/2023 | Lenovo Legion Pro 5 16ARX8 (R5 7645HX, RTX 4050) R5 7645HX, GeForce RTX 4050 Laptop GPU | 2.5 kg | 27.3 mm | 16.00" | 2560x1600 | |
| 87.9 % v7 (old) | 05/2023 | Lenovo Legion Pro 5 16IRX8 i7-13700HX, GeForce RTX 4060 Laptop GPU | 2.5 kg | 26.8 mm | 16.00" | 2560x1600 | |
| 86.3 % v7 (old) | 06/2023 | Asus TUF A15 FA507 R7 7735HS, GeForce RTX 4050 Laptop GPU | 2.2 kg | 24.9 mm | 15.60" | 1920x1080 | |
| 86.2 % v7 (old) | 02/2023 | Asus TUF Gaming A16 FA617 R7 7735HS, Radeon RX 7600S | 2.2 kg | 27 mm | 16.00" | 1920x1200 | |
| 85.5 % v7 (old) | 06/2023 | Acer Nitro 5 AN517-55-5552 i5-12500H, GeForce RTX 4050 Laptop GPU | 3 kg | 28.9 mm | 17.30" | 1920x1080 | |
| 83 % v7 (old) | 05/2023 | Medion Erazer Scout E20 i7-13700H, GeForce RTX 4050 Laptop GPU | 2.8 kg | 29 mm | 17.30" | 1920x1080 |
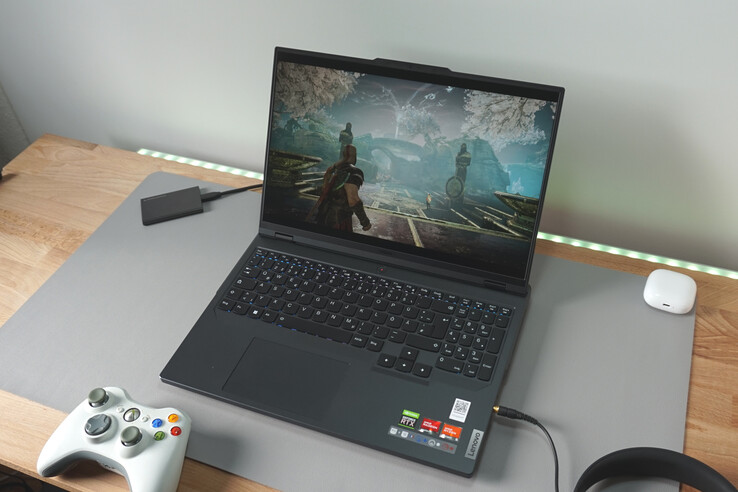
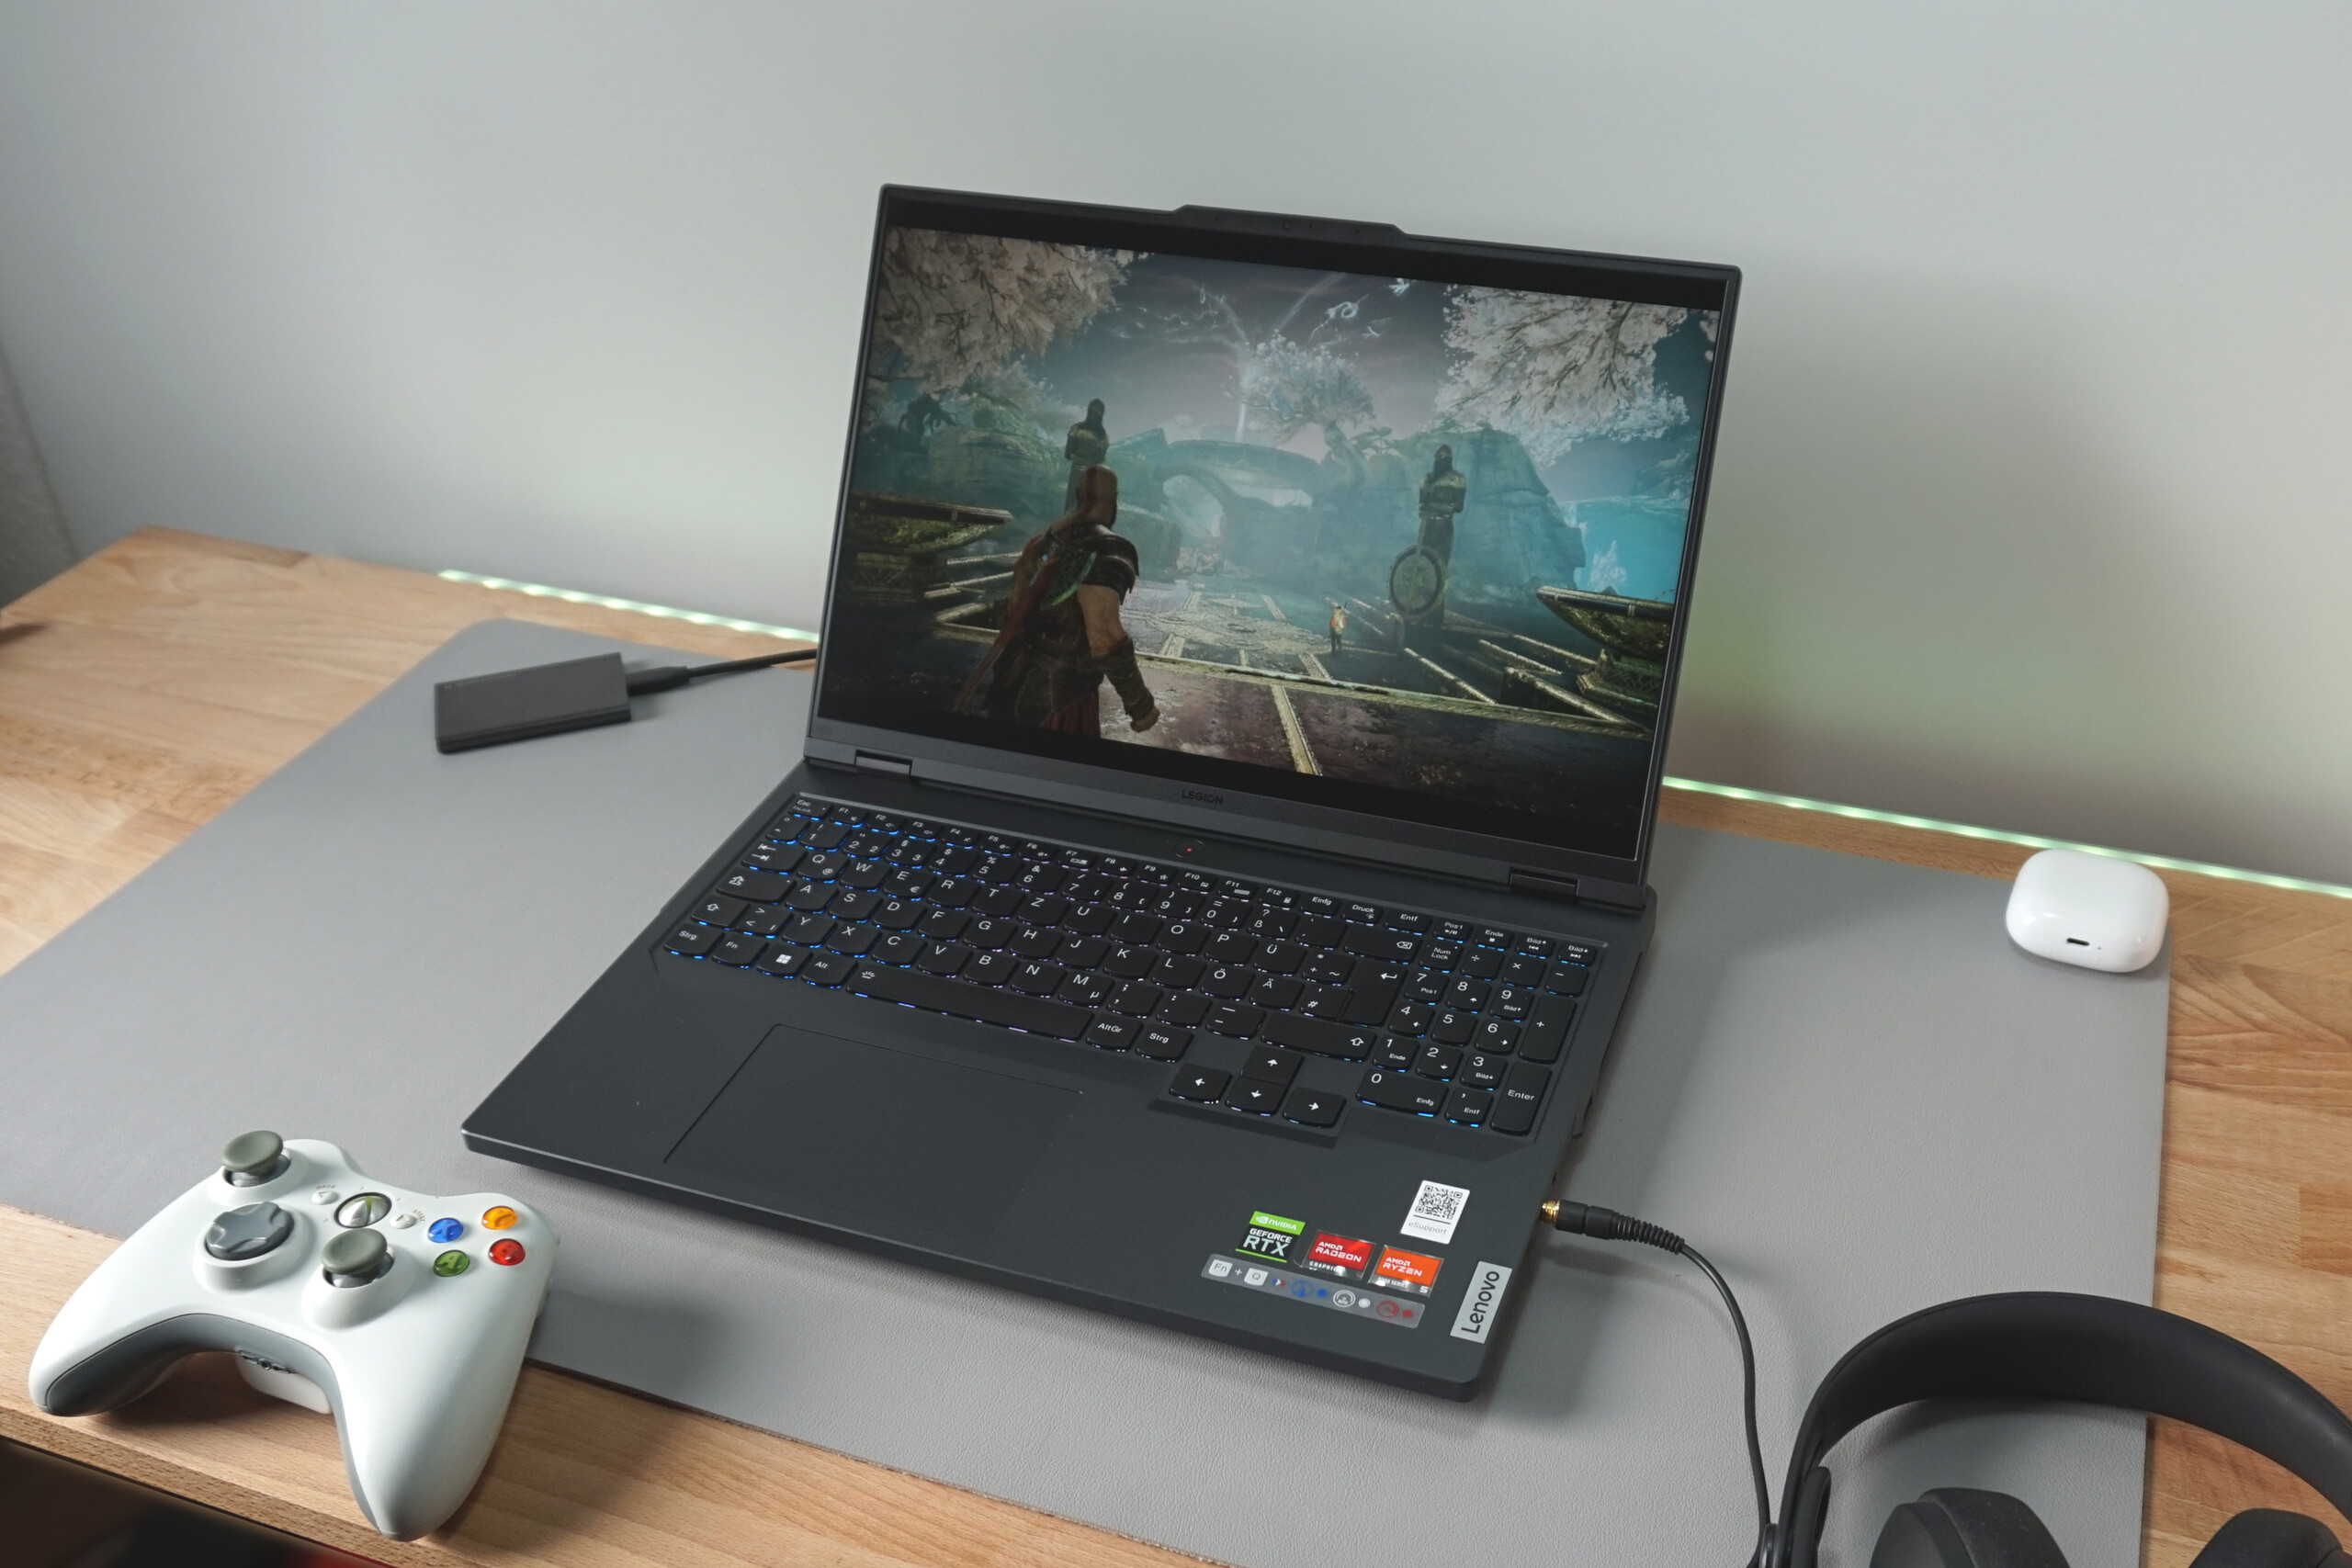
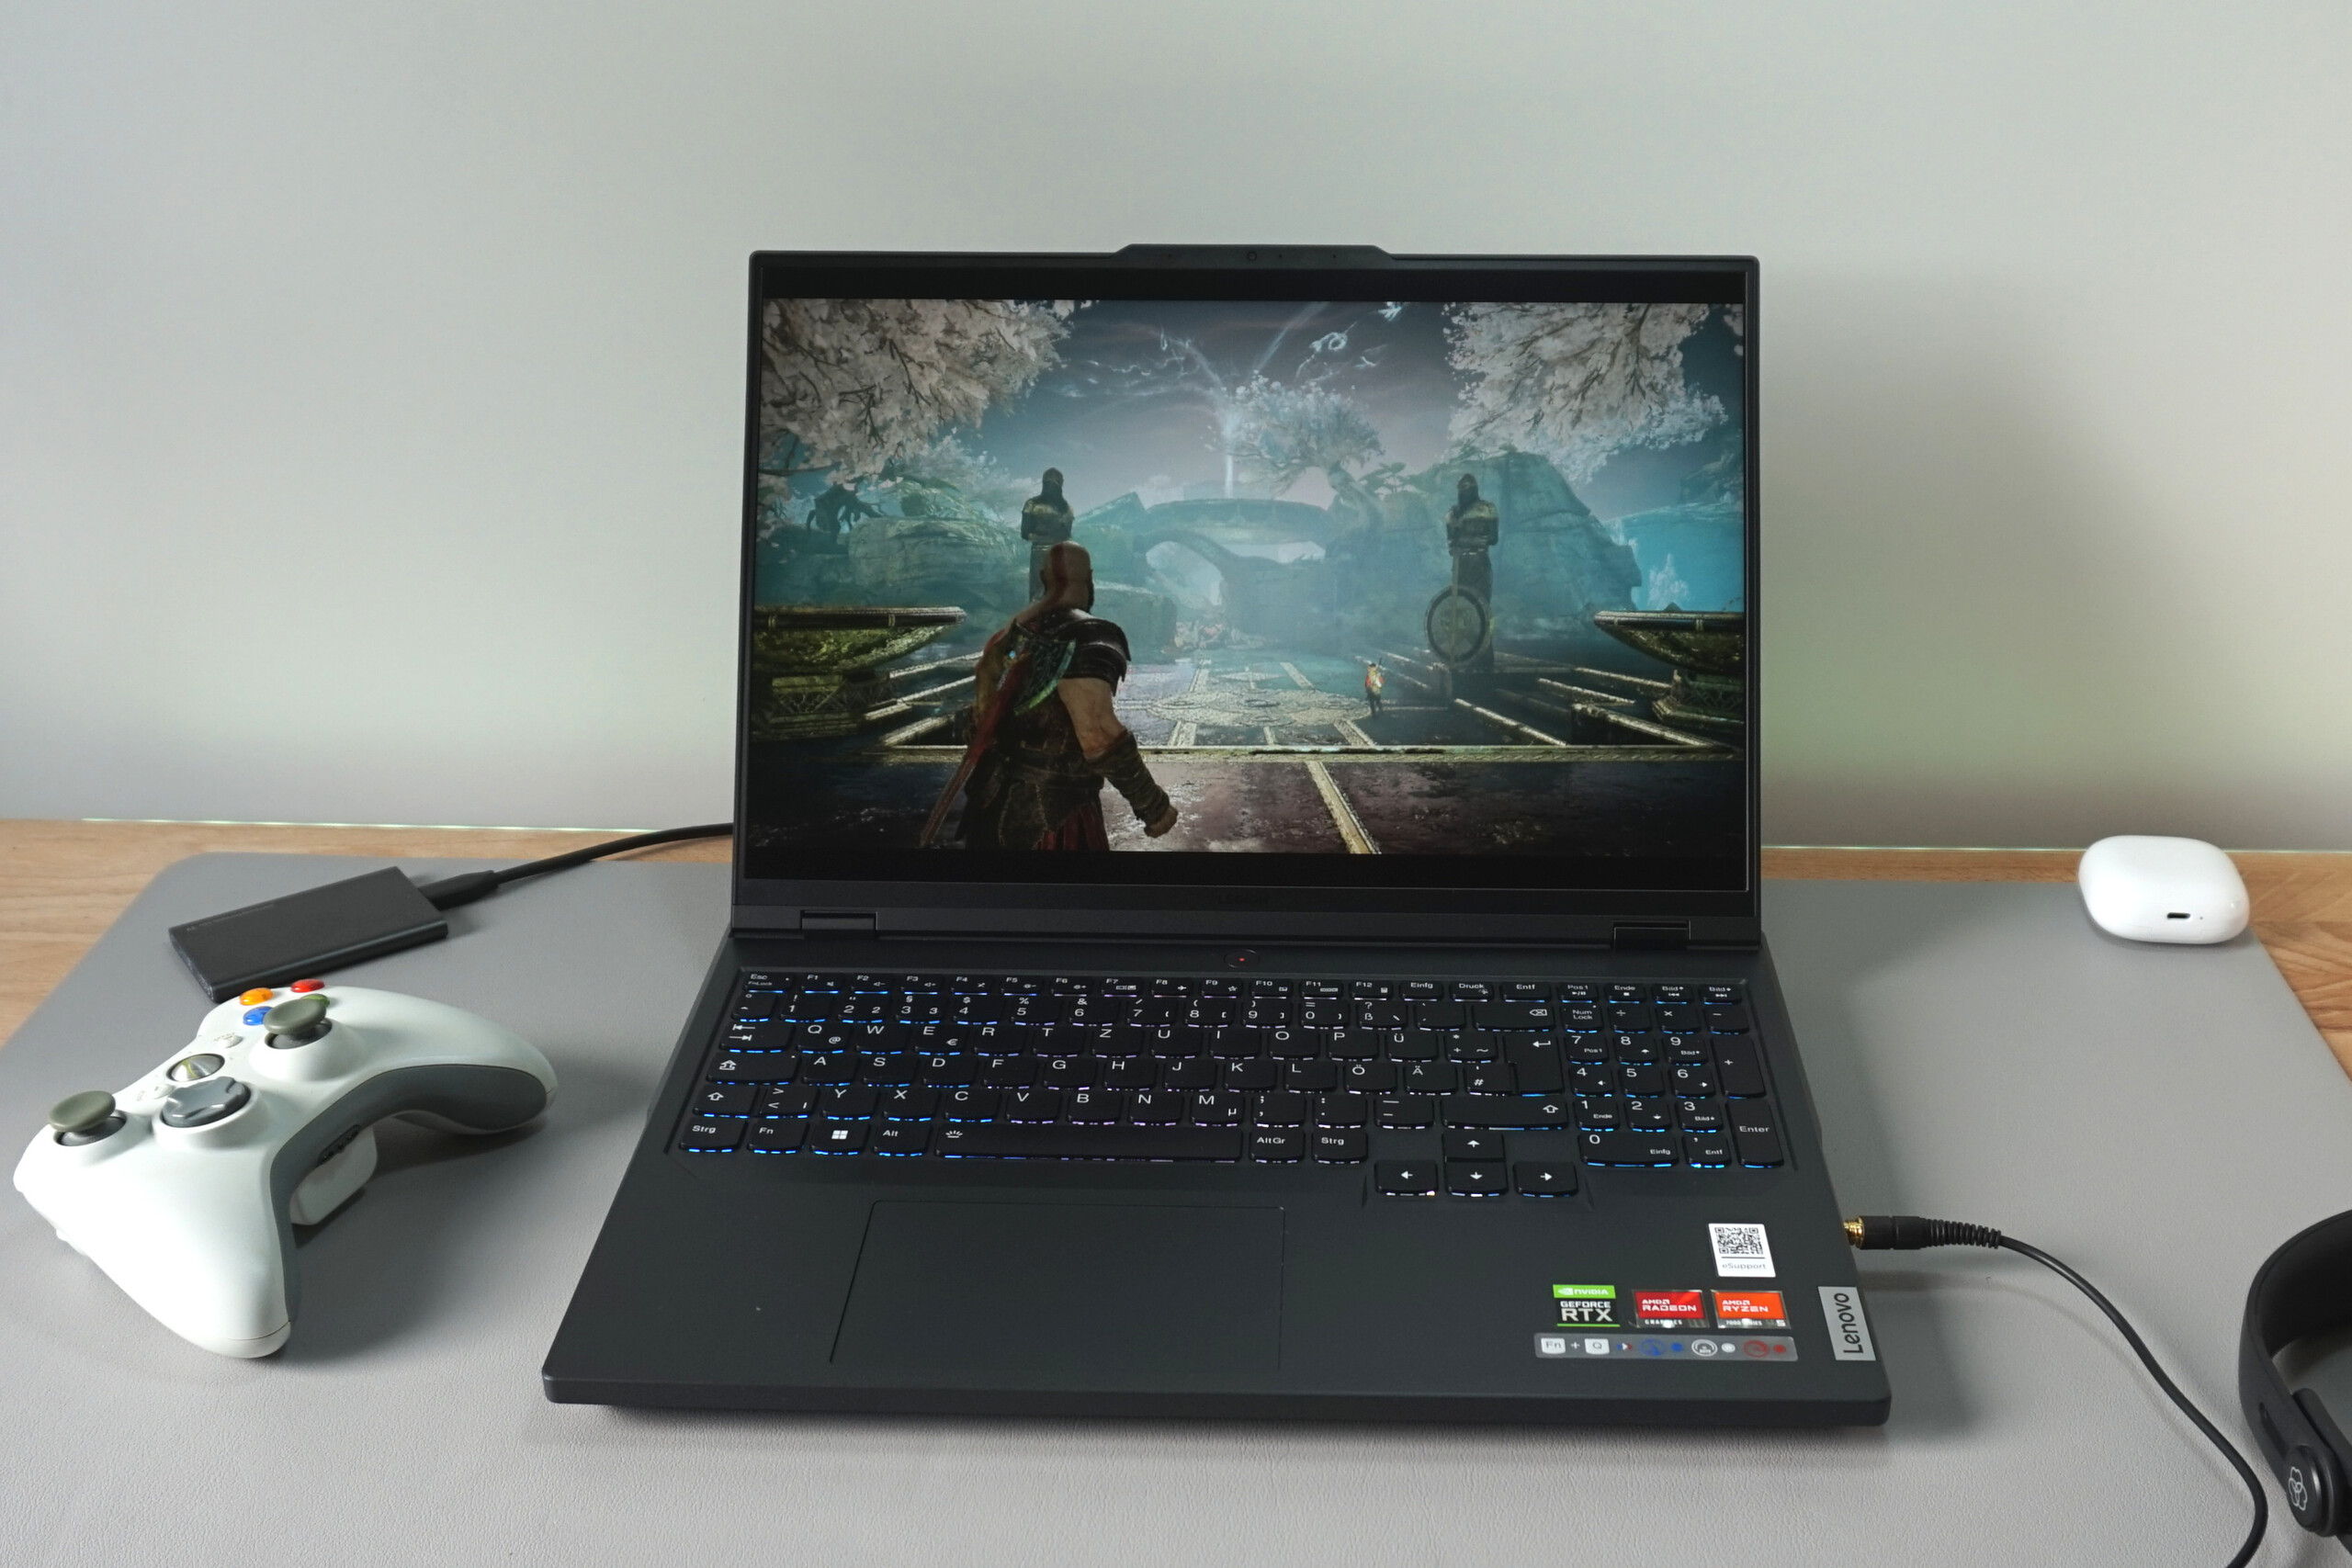
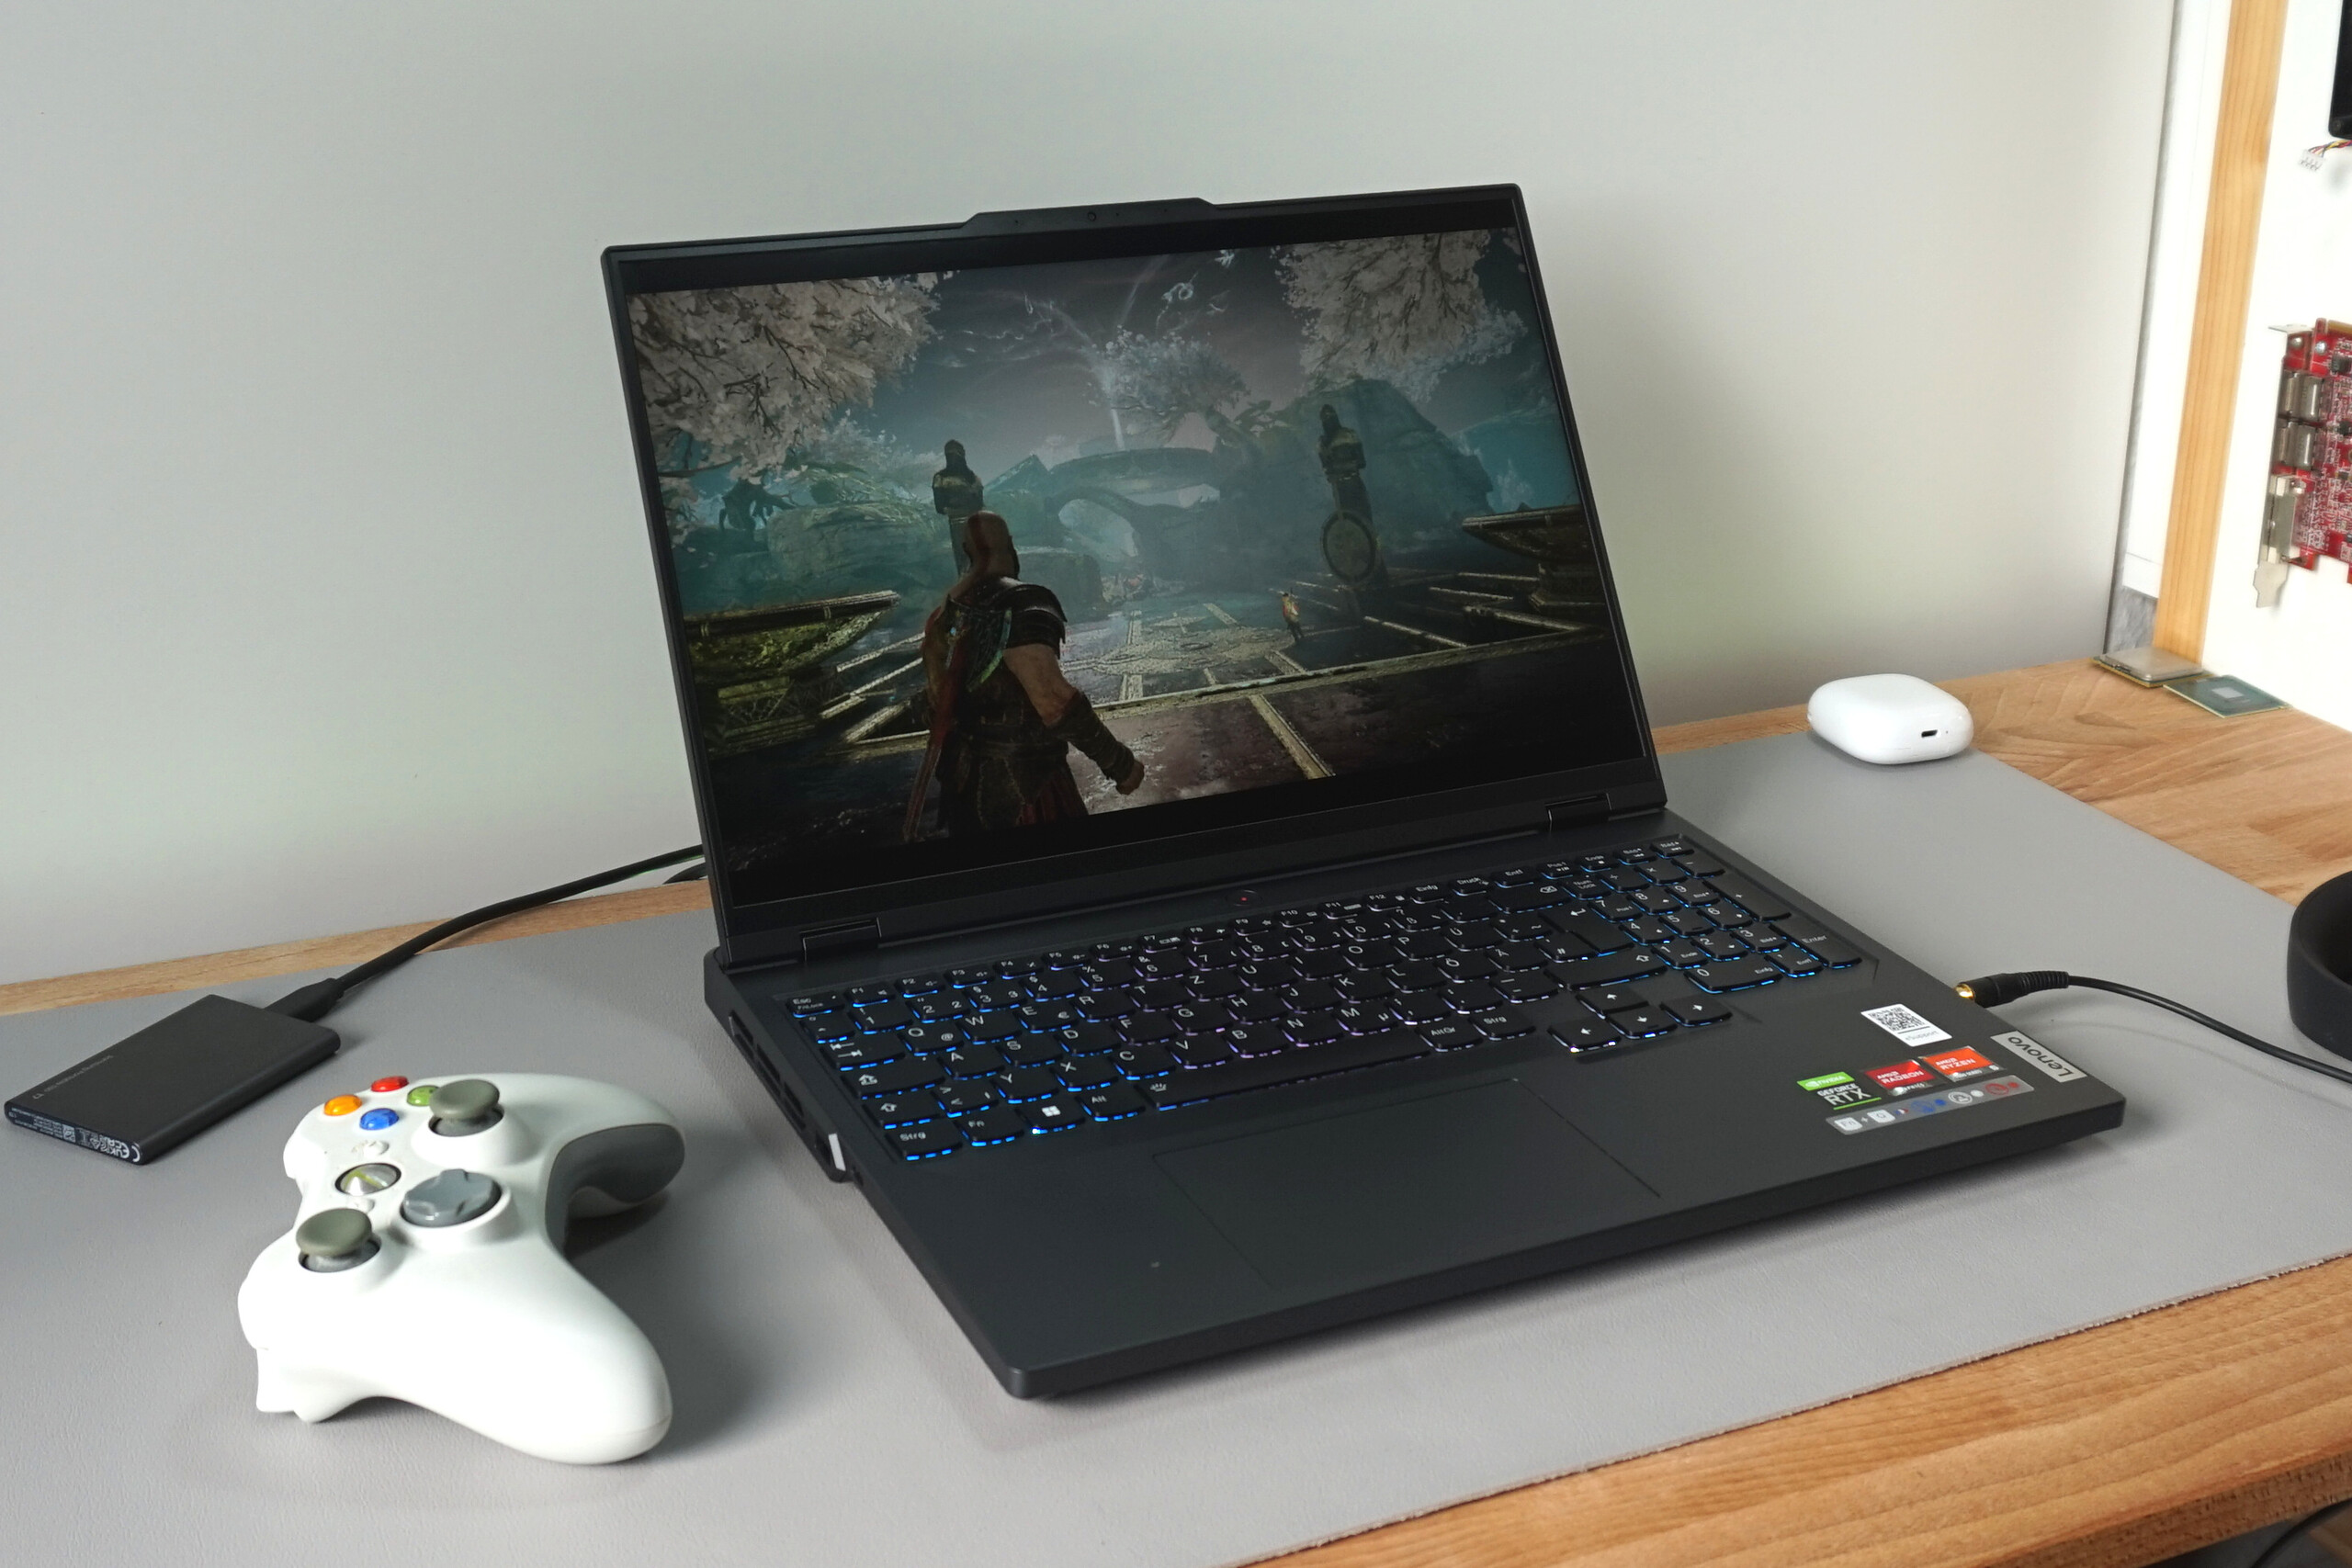
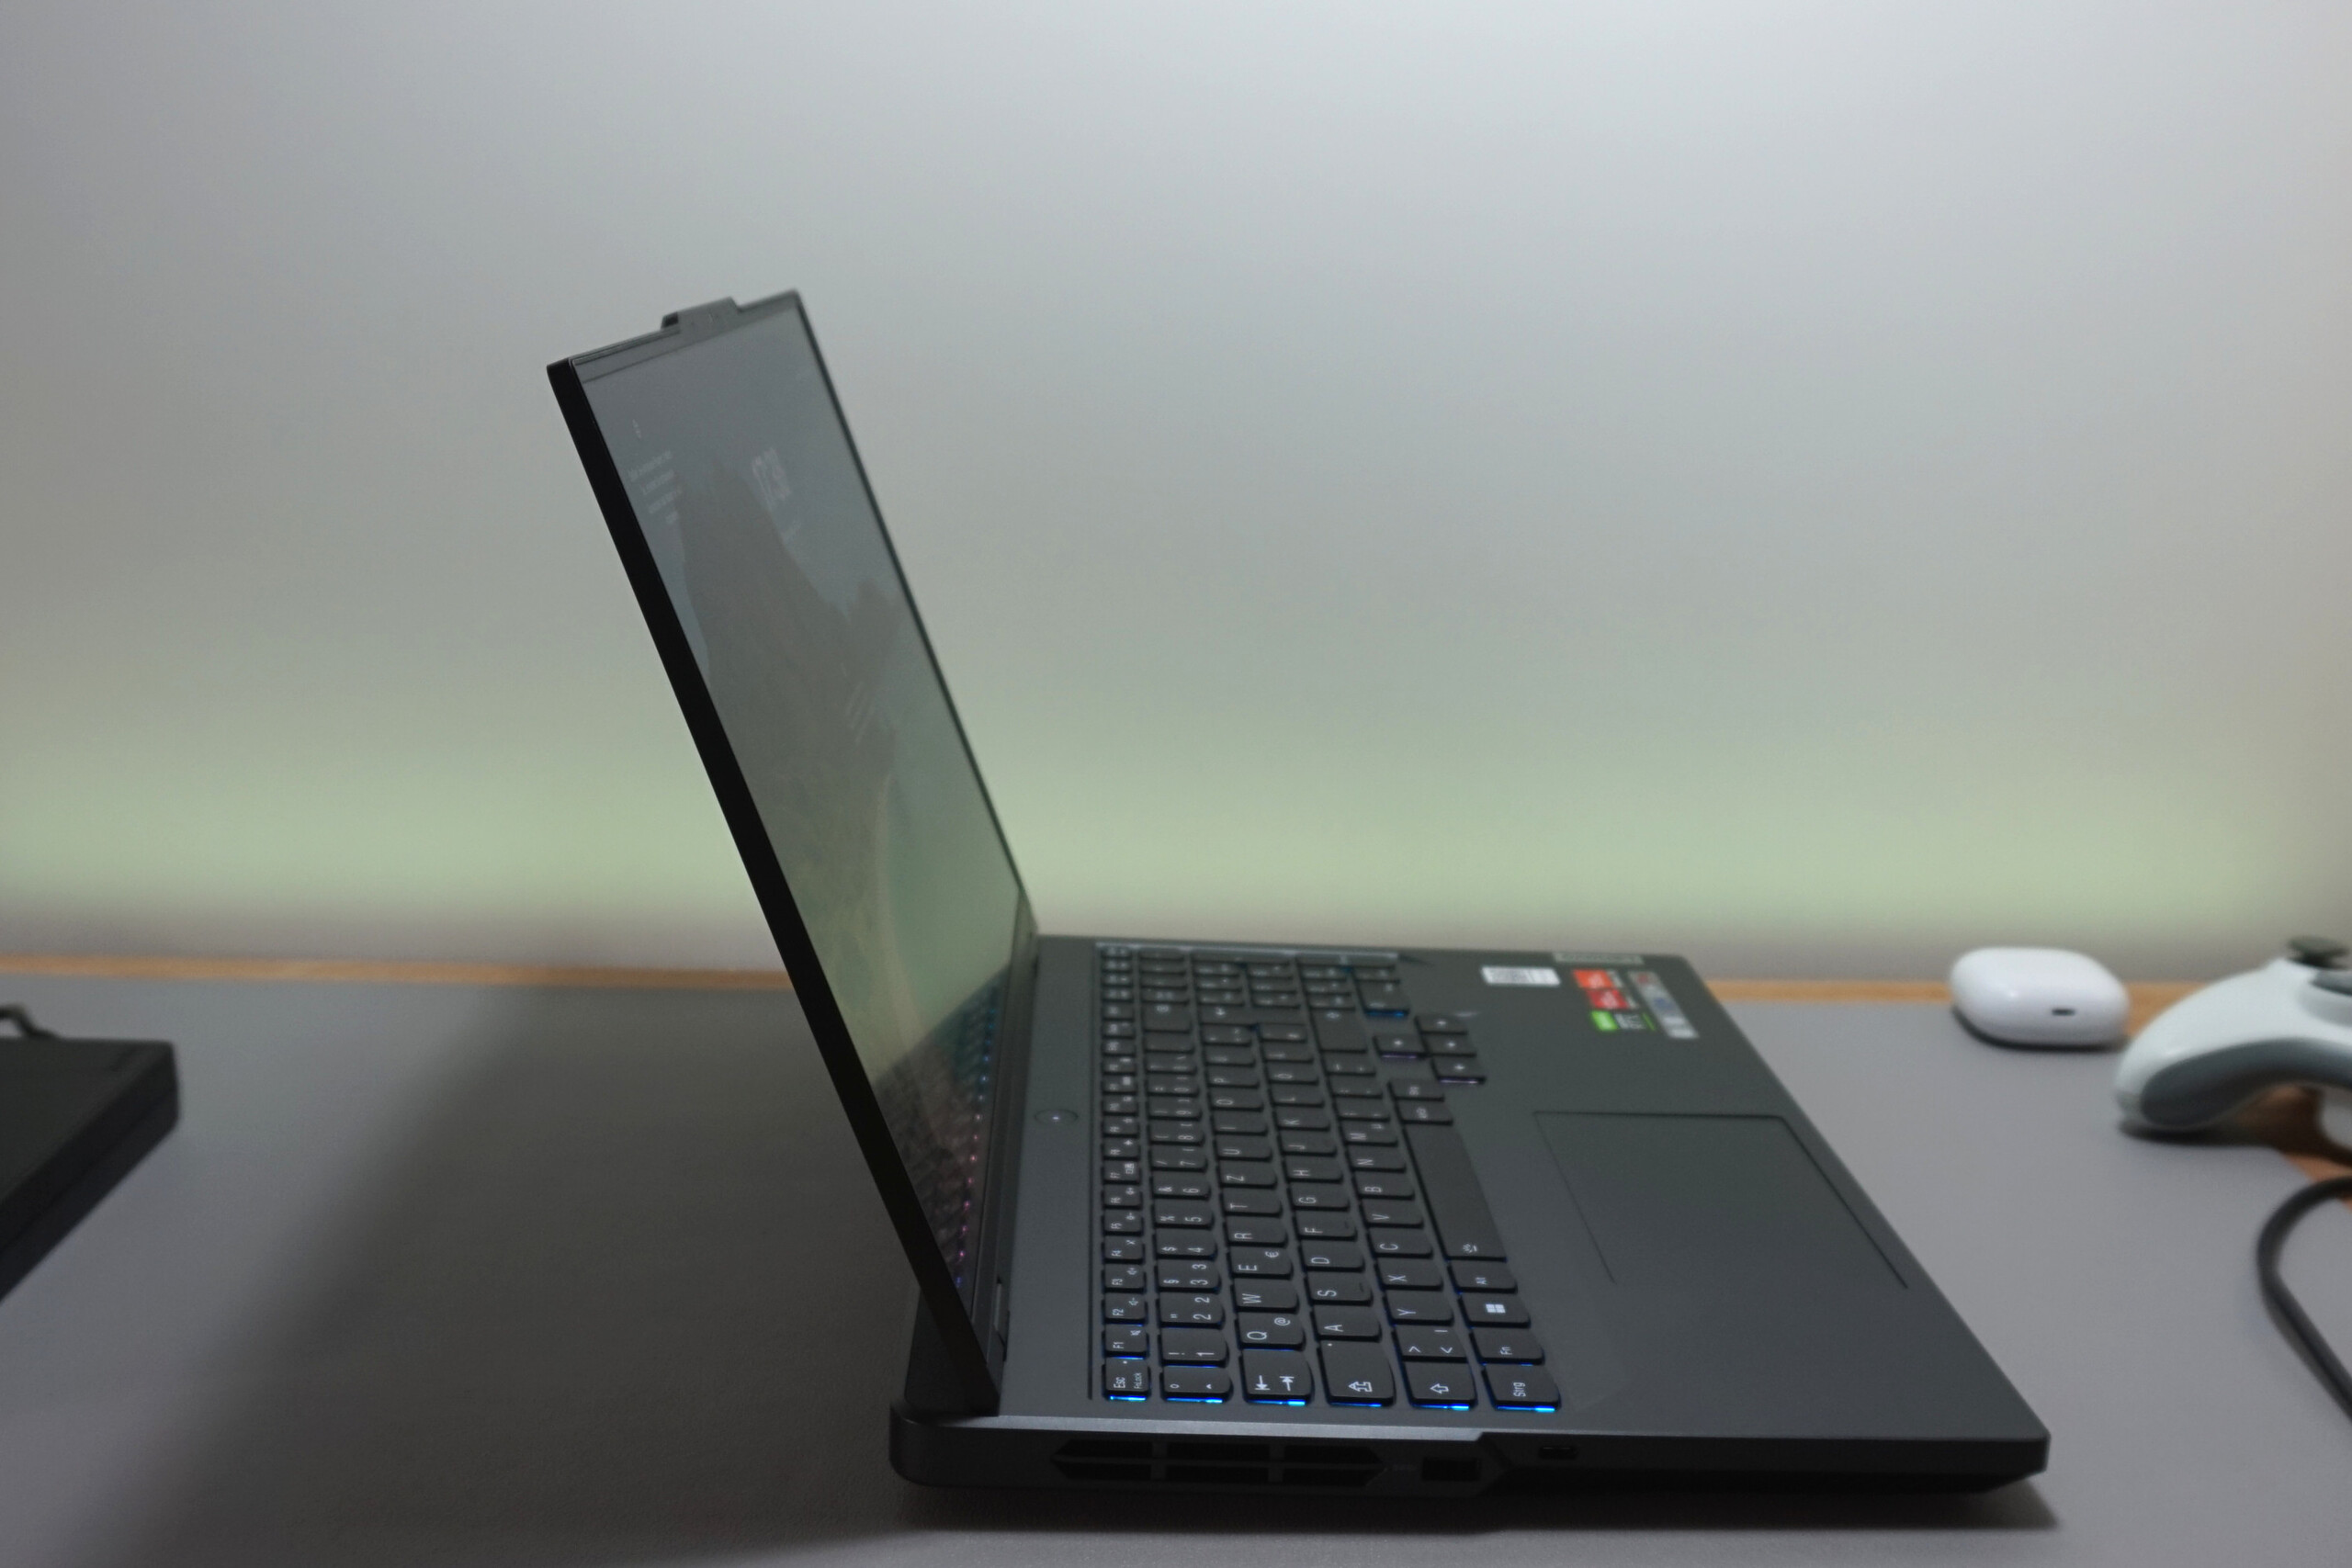
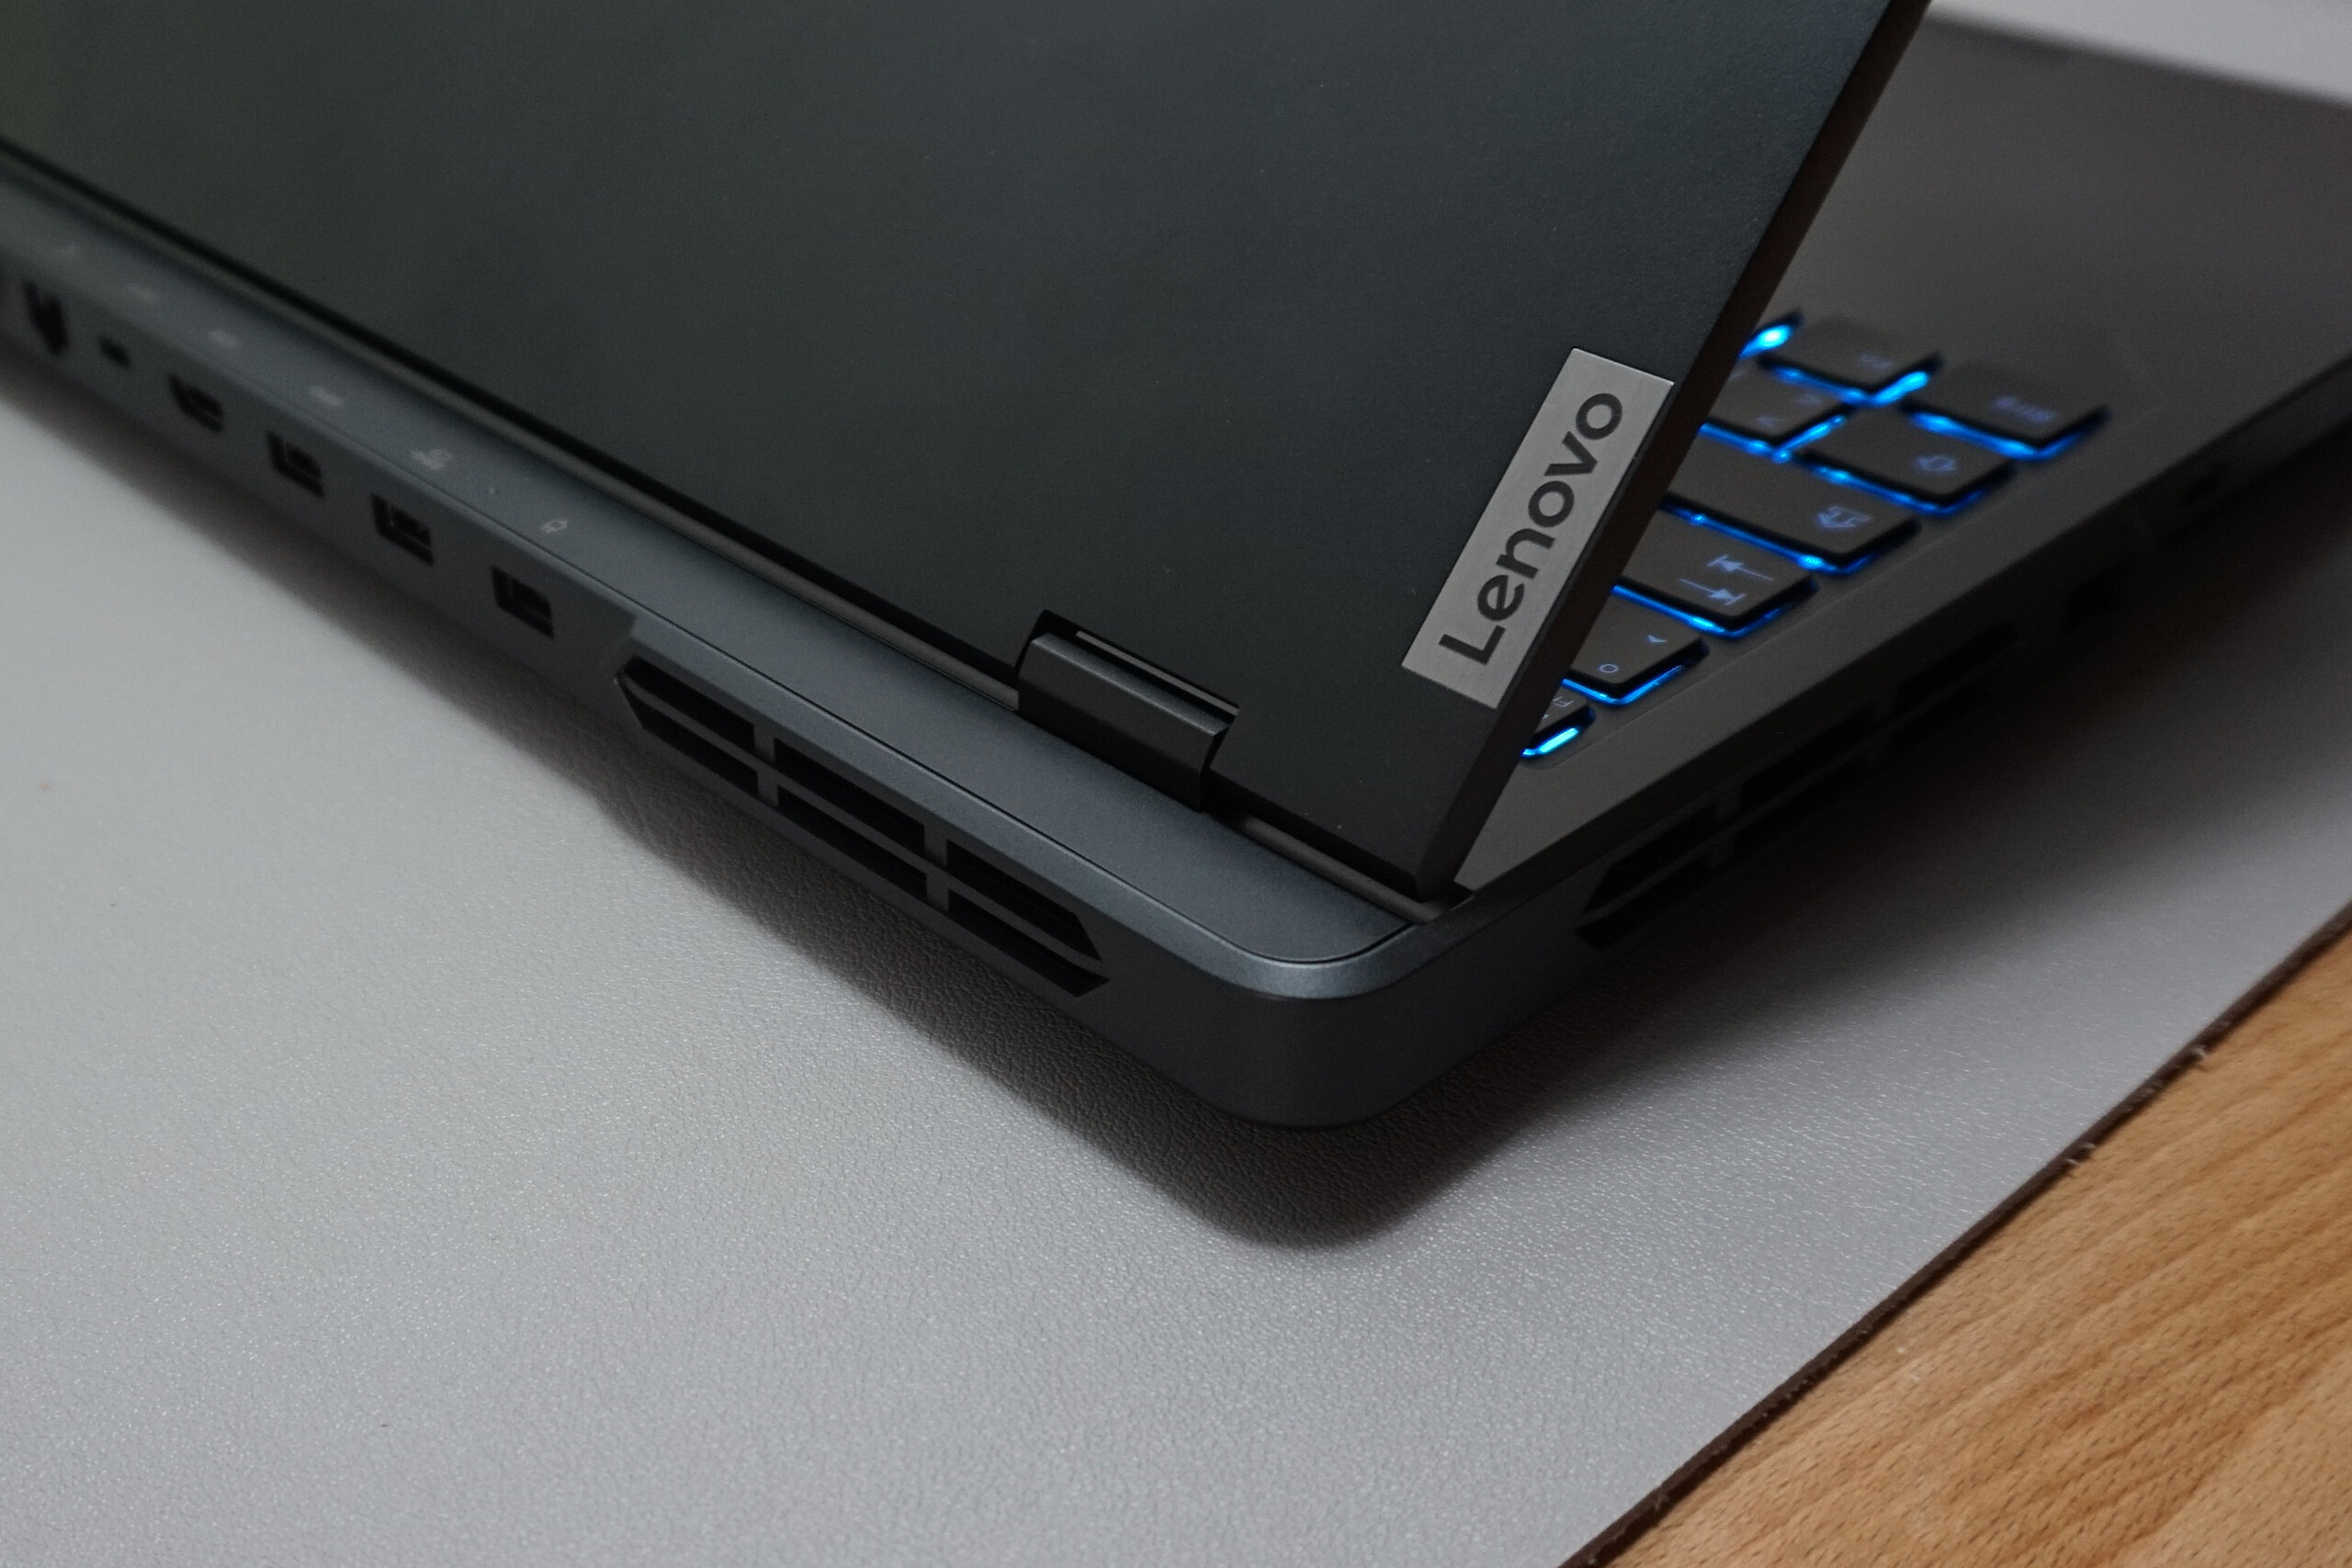
Case - Compacto Legion com design discreto
O chassi preto e limpo dispensa qualquer toque de cor ou efeitos de iluminação. Mas ele é equipado com dobradiças agradavelmente rígidas e uma moldura de metal excepcionalmente sólida. A seção da base também é suficientemente robusta.
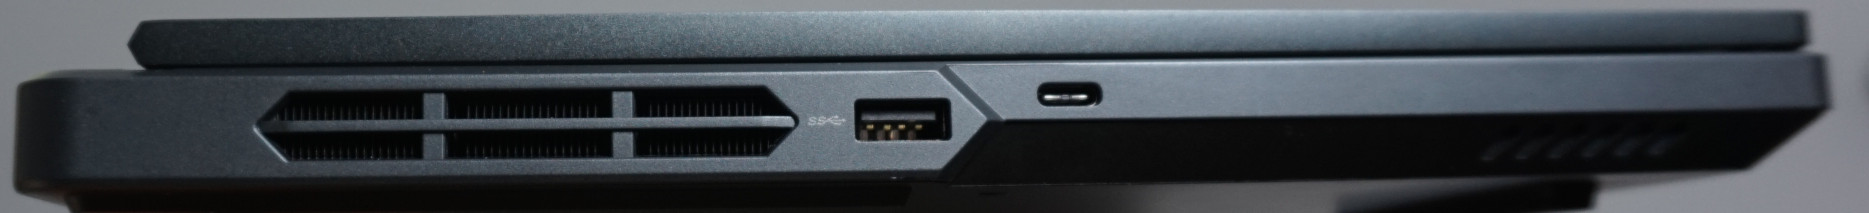
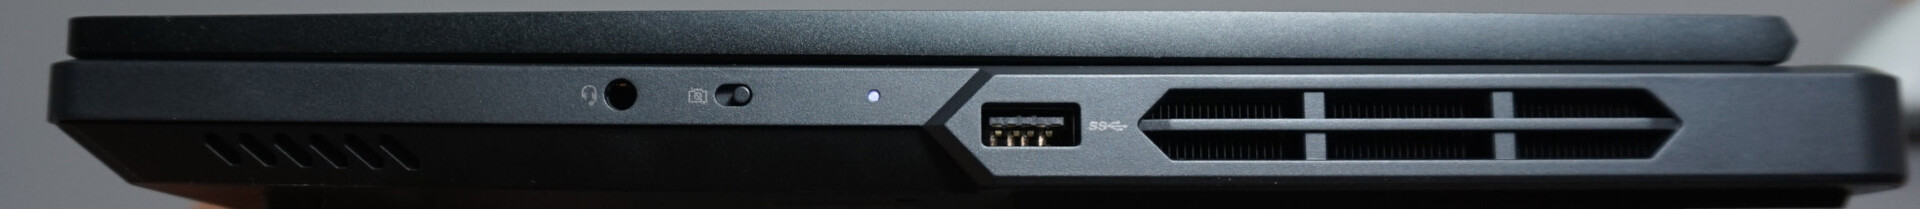
Especificações - Faltam apenas as portas de alta velocidade
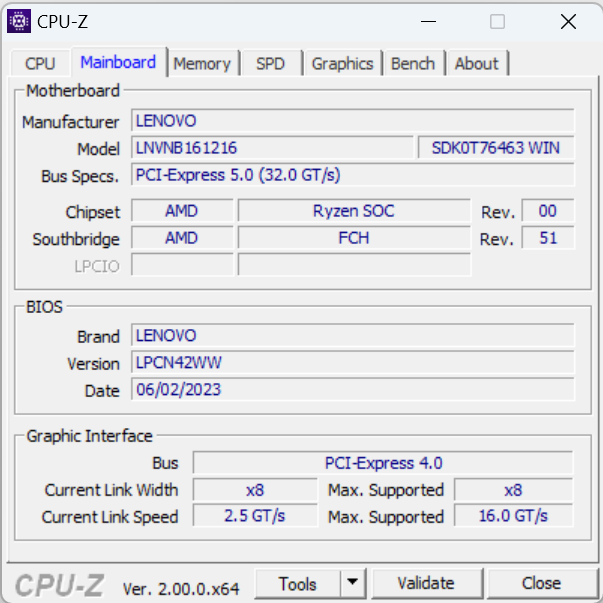
Assim como no Legion Pro 5 16IRX8, não há portas Thunderbolt no laptop. Mas isso é de se esperar de um modelo baseado na AMD. Dito isso, o dispositivo oferece três saídas de vídeo e pode ser carregado por meio da porta USB-C na parte traseira, embora esse método de carregamento não forneça a potência total necessária para jogos. Além disso, o Legion Pro 5 vem com um bom número e variedade de portas. Não há leitor de cartão integrado.
Outro recurso interessante é o interruptor mecânico no lado direito que corta a alimentação da webcam.

Webcam
A webcam Full HD oferece qualidade de imagem boa o suficiente para chamadas com vídeo e ajusta bem o brilho às condições de iluminação variáveis. O microfone é menos atraente para um modelo de matriz dupla. As vozes soam um pouco fracas e você só conseguirá um volume decente ao falar diretamente no microfone.

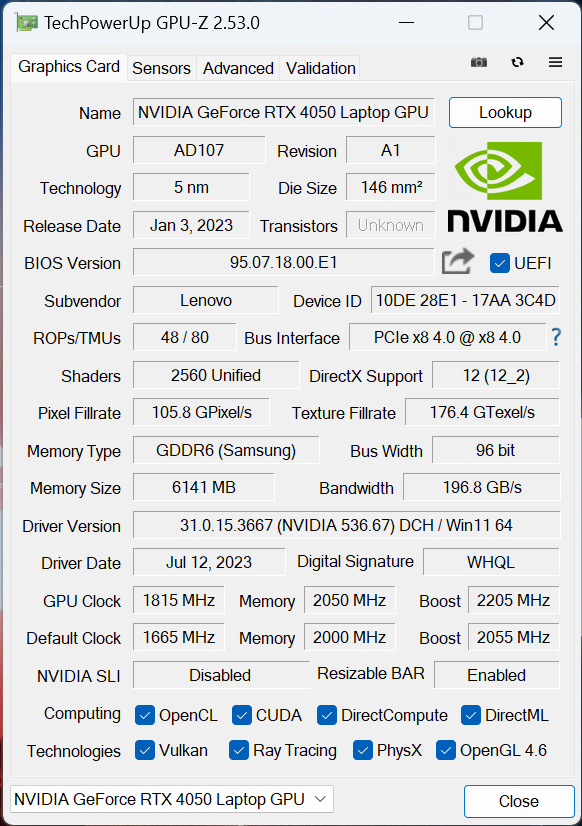
 GeForce RTX 4050 Laptop GPU, R5 7645HX, SK hynix PC801 HFS512GEJ9X115N")
 GeForce RTX 4050 Laptop GPU, R5 7645HX, SK hynix PC801 HFS512GEJ9X115N")
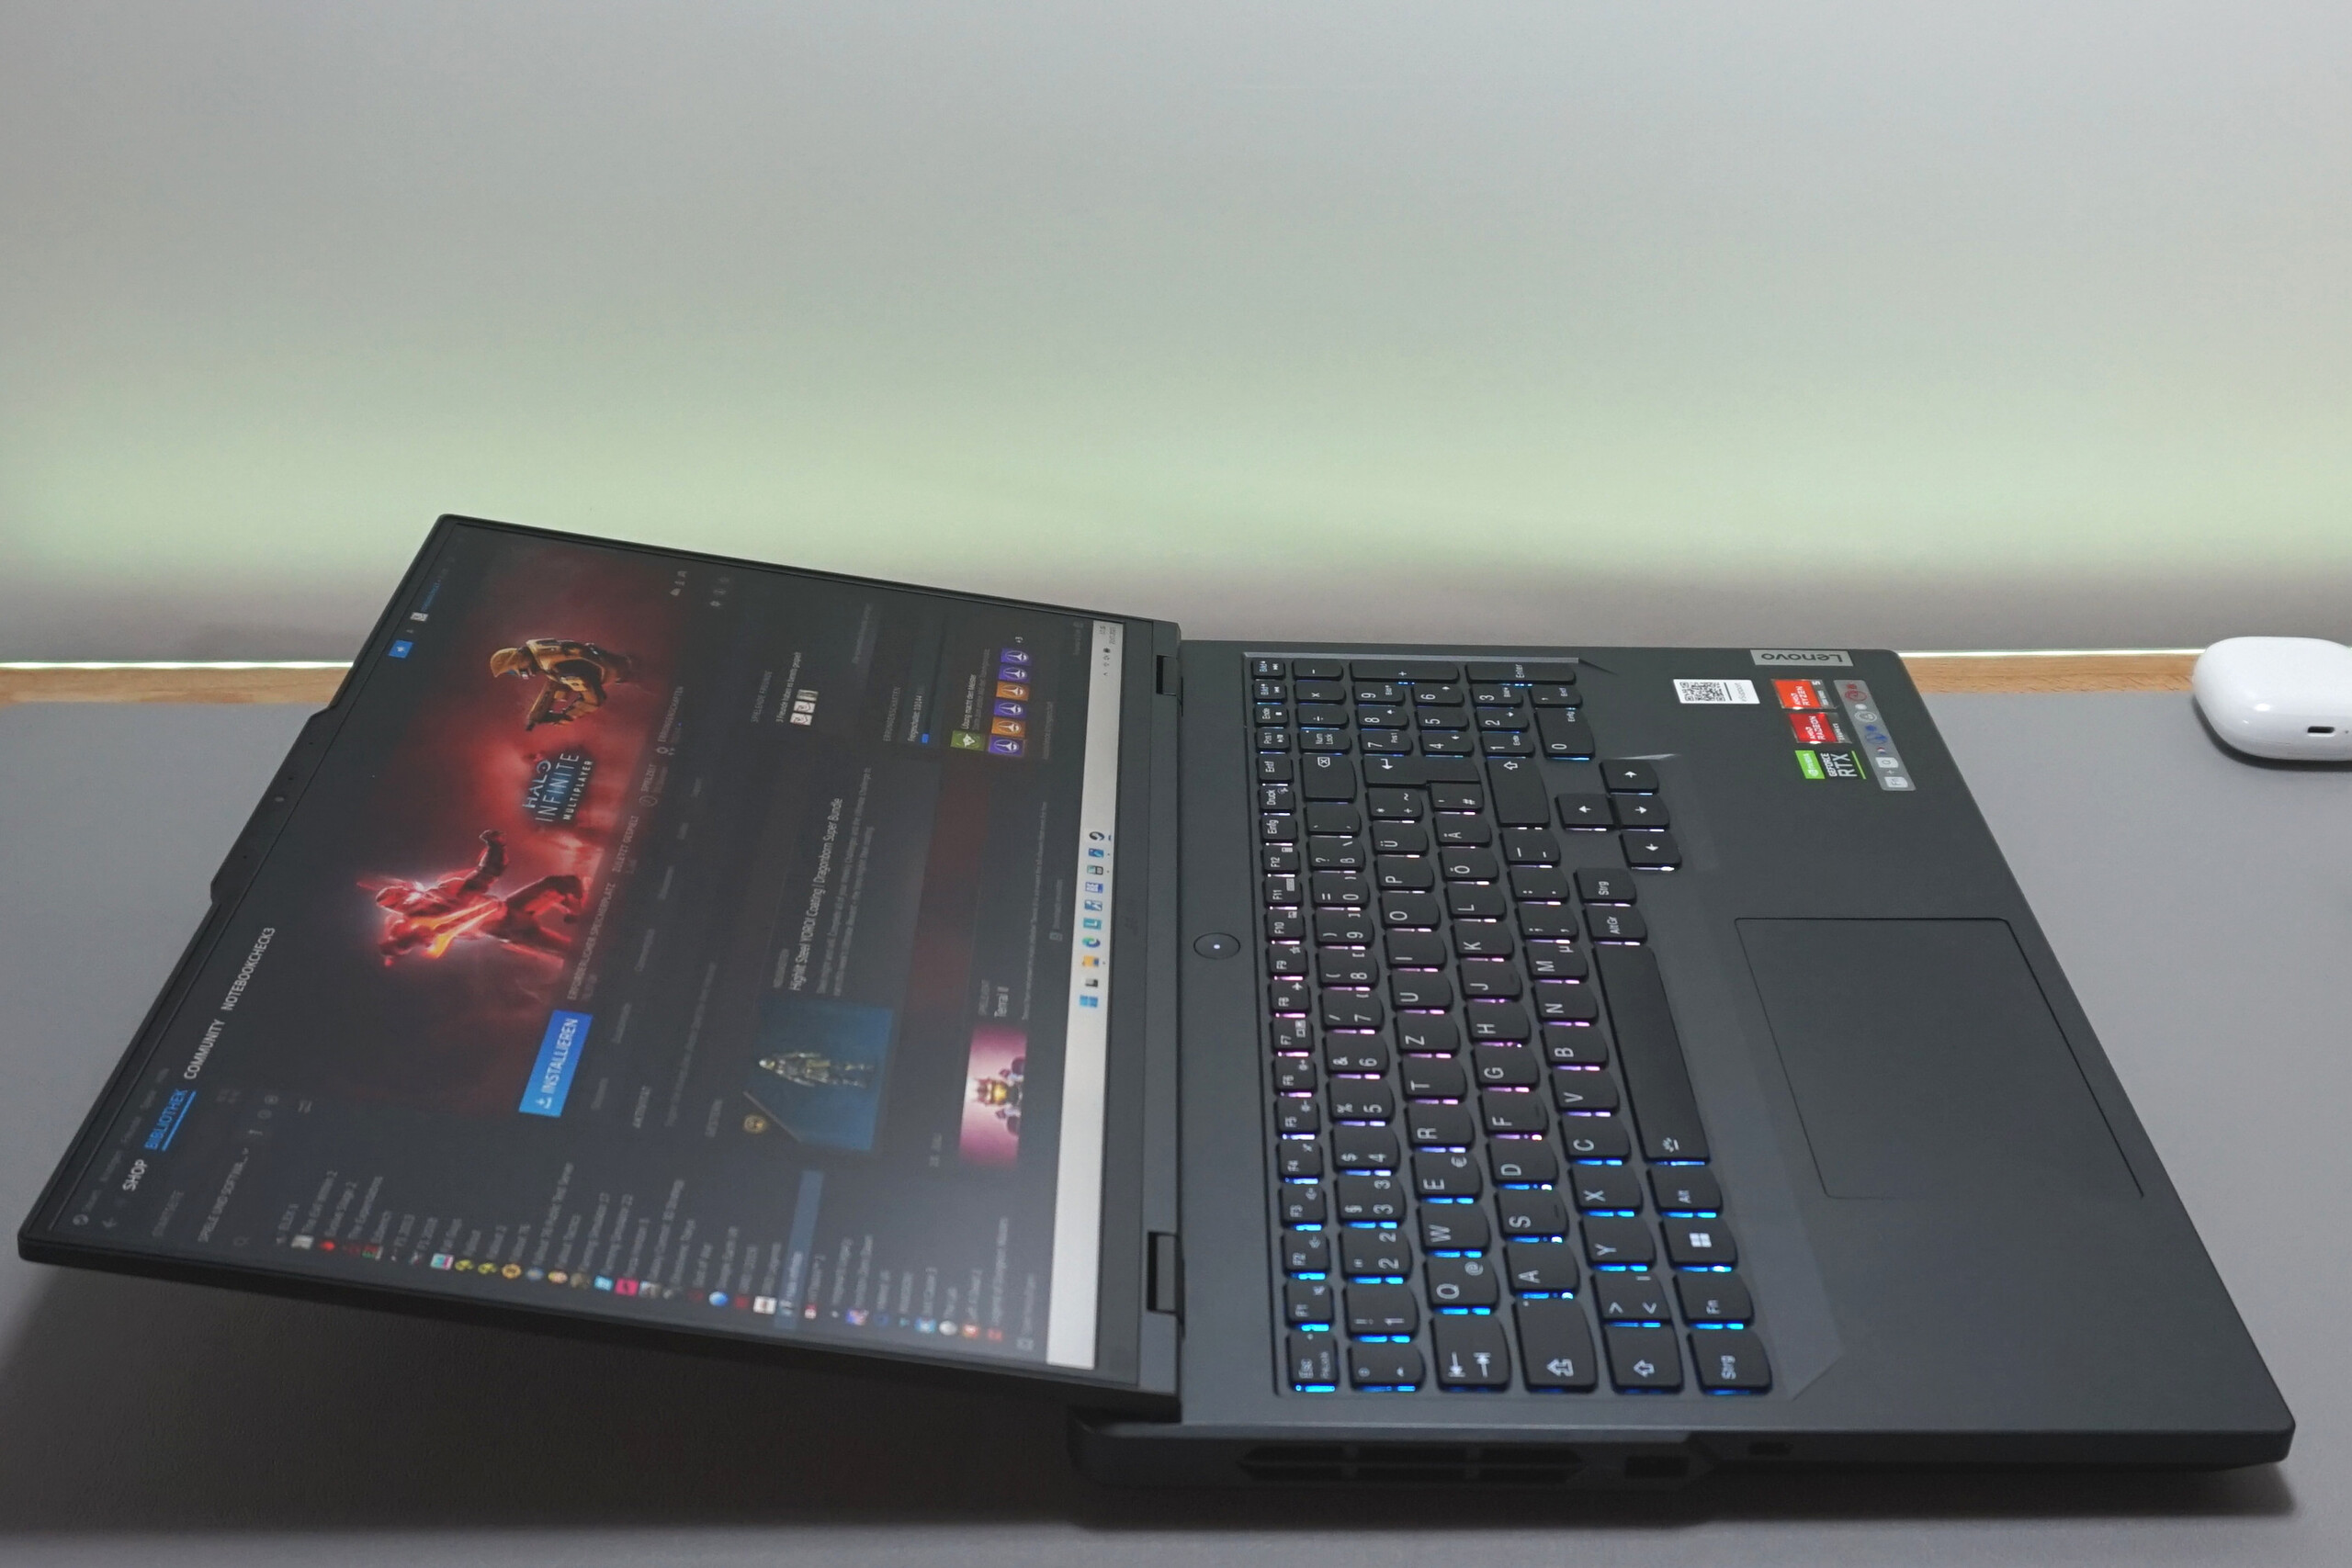
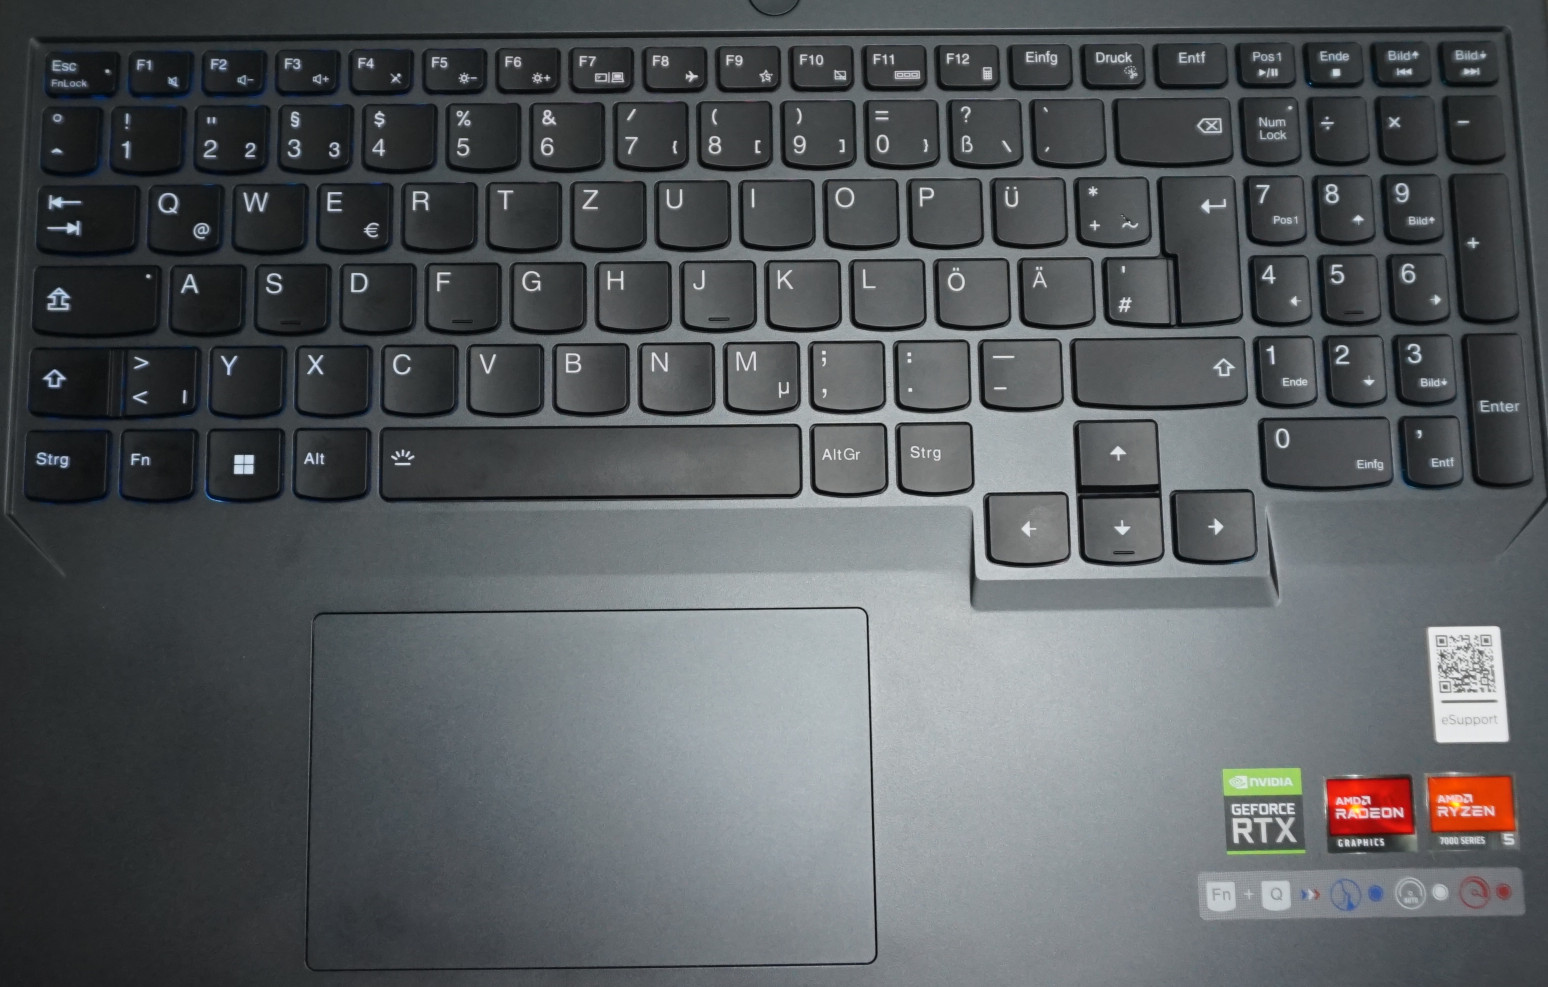
Dispositivos de entrada - Notebook para jogos com teclado confortável
Com exceção do teclado numérico ligeiramente mais estreito, o restante do teclado (incluindo as teclas de seta) é tão grande quanto um teclado de desktop comum. As teclas poderiam ter um pouco mais de deslocamento, mas oferecem um bom feedback. Não gostamos muito do touchpad. Às vezes, ele não registra um clique quando tocamos na superfície e só o faz quando pressionamos o botão fisicamente.
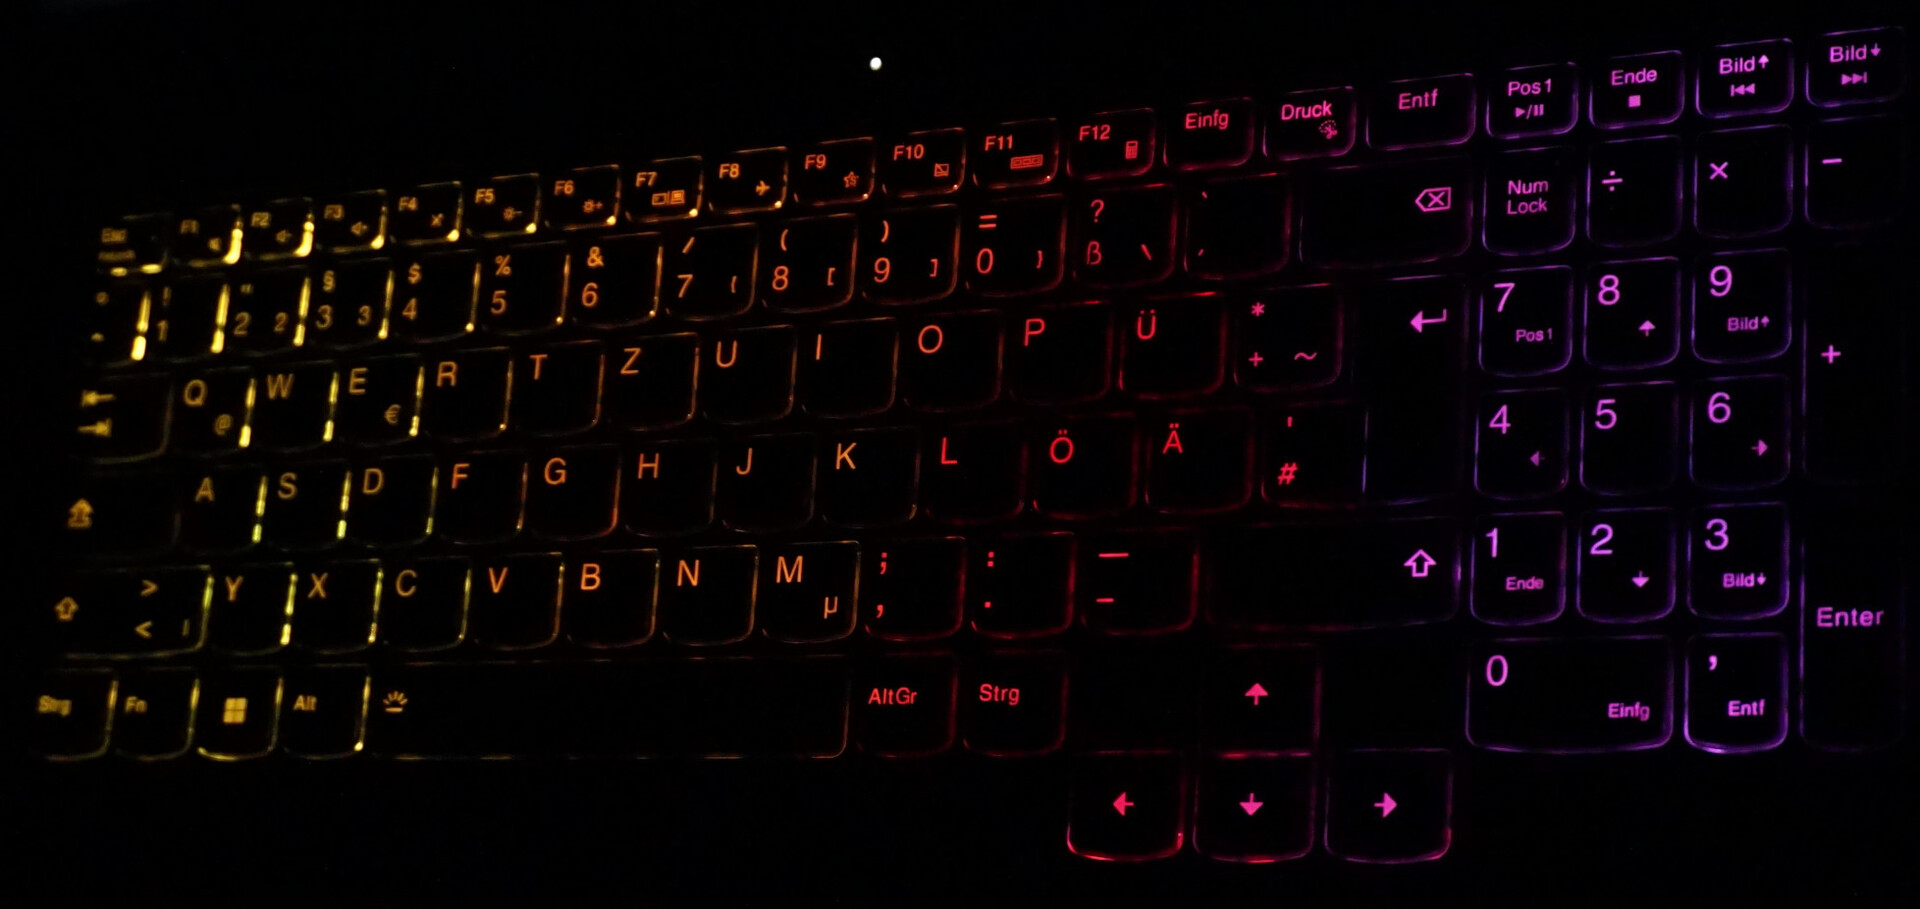
A luz de fundo do teclado oferece personalização limitada. Há apenas quatro zonas, poucas cores e ainda menos efeitos disponíveis.
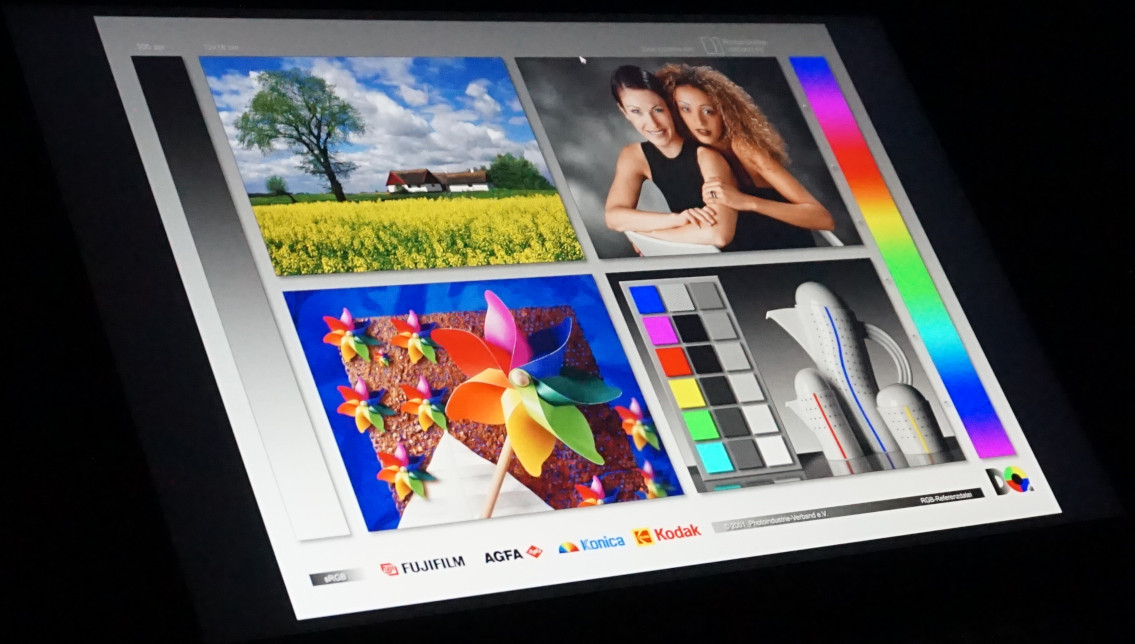
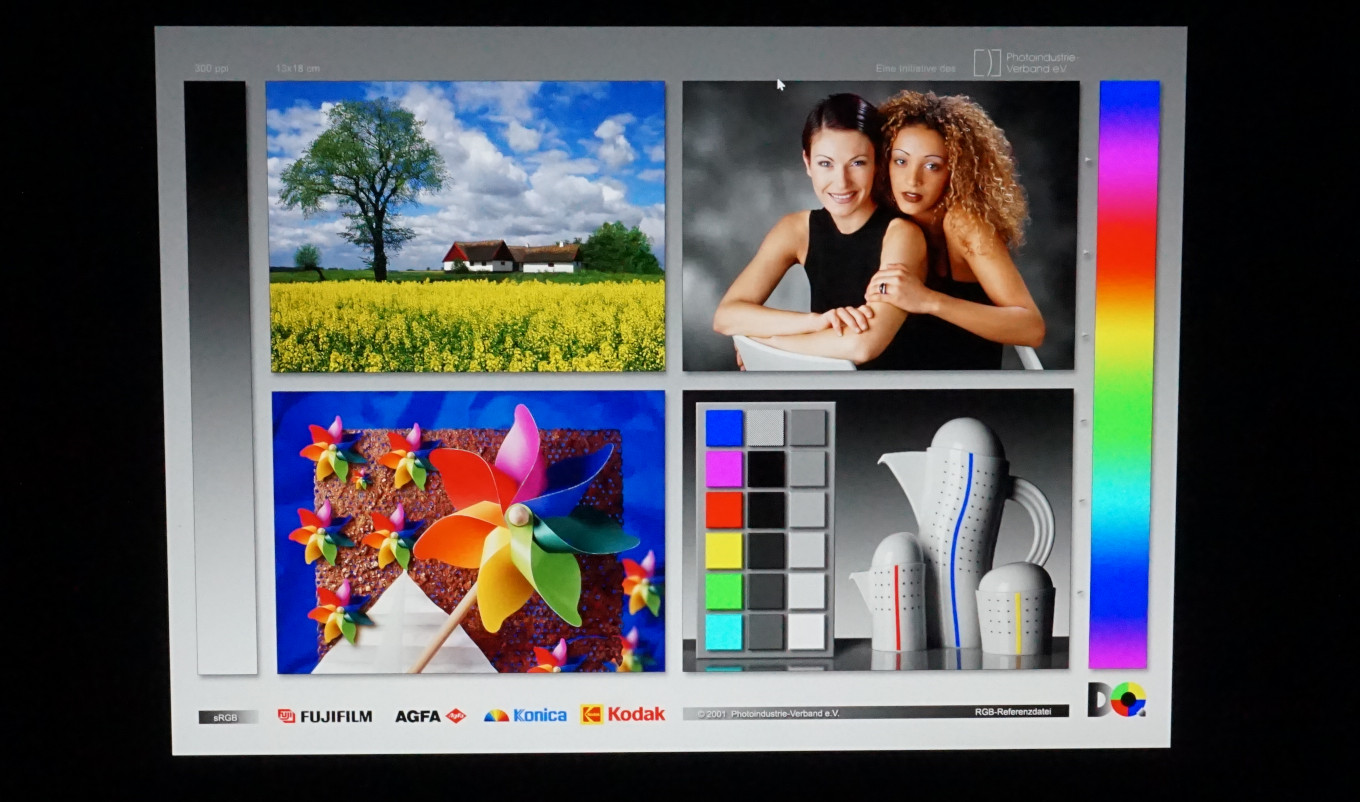
Tela - Brilhante, precisa, rápida

A tela do Legion Pro 5 preenche todos os requisitos essenciais para uma tela de jogos: taxa de atualização de 240 Hz, resolução de 2.560 por 1.600 pixels e cobertura total de sRGB. A alta contagem de pixels, juntamente com a proporção de 16:10, também permite que você edite vídeos e imagens confortavelmente. O Legion Pro 5 tem potência de computação suficiente para esses aplicativos. Dito isso, a taxa de atualização e a resolução parecem um pouco ambiciosas demais para o modelo básico com uma RTX 4050, o que você verá mais adiante na seção "Desempenho em jogos".
Outra coisa que vale a pena observar é o alto pico de brilho de mais de 500 cd/m². Isso significa que a tela pode produzir imagens brilhantes e vibrantes que se destacam mesmo em ambientes claros. No entanto, durante as sessões noturnas de jogos, essa qualidade específica tem menos impacto sobre a aparência das imagens na tela. Em um ambiente escuro, o nível de preto relativamente baixo da tela (que resulta em uma taxa de contraste meramente média) não permite pretos muito profundos em cenas mais escuras. Uma tela OLED provavelmente teria sido mais adequada.
Mas nessa faixa de preço, e especialmente para jogos, o painel IPS integrado parece ser uma excelente escolha devido à sua excelente qualidade geral de imagem. Não detectamos nenhuma oscilação de PWM e notamos apenas uma quantidade mínima de sangramento na tela.
| |||||||||||||||||||||||||
iluminação: 87 %
iluminação com acumulador: 534 cd/m²
Contraste: 936:1 (Preto: 0.58 cd/m²)
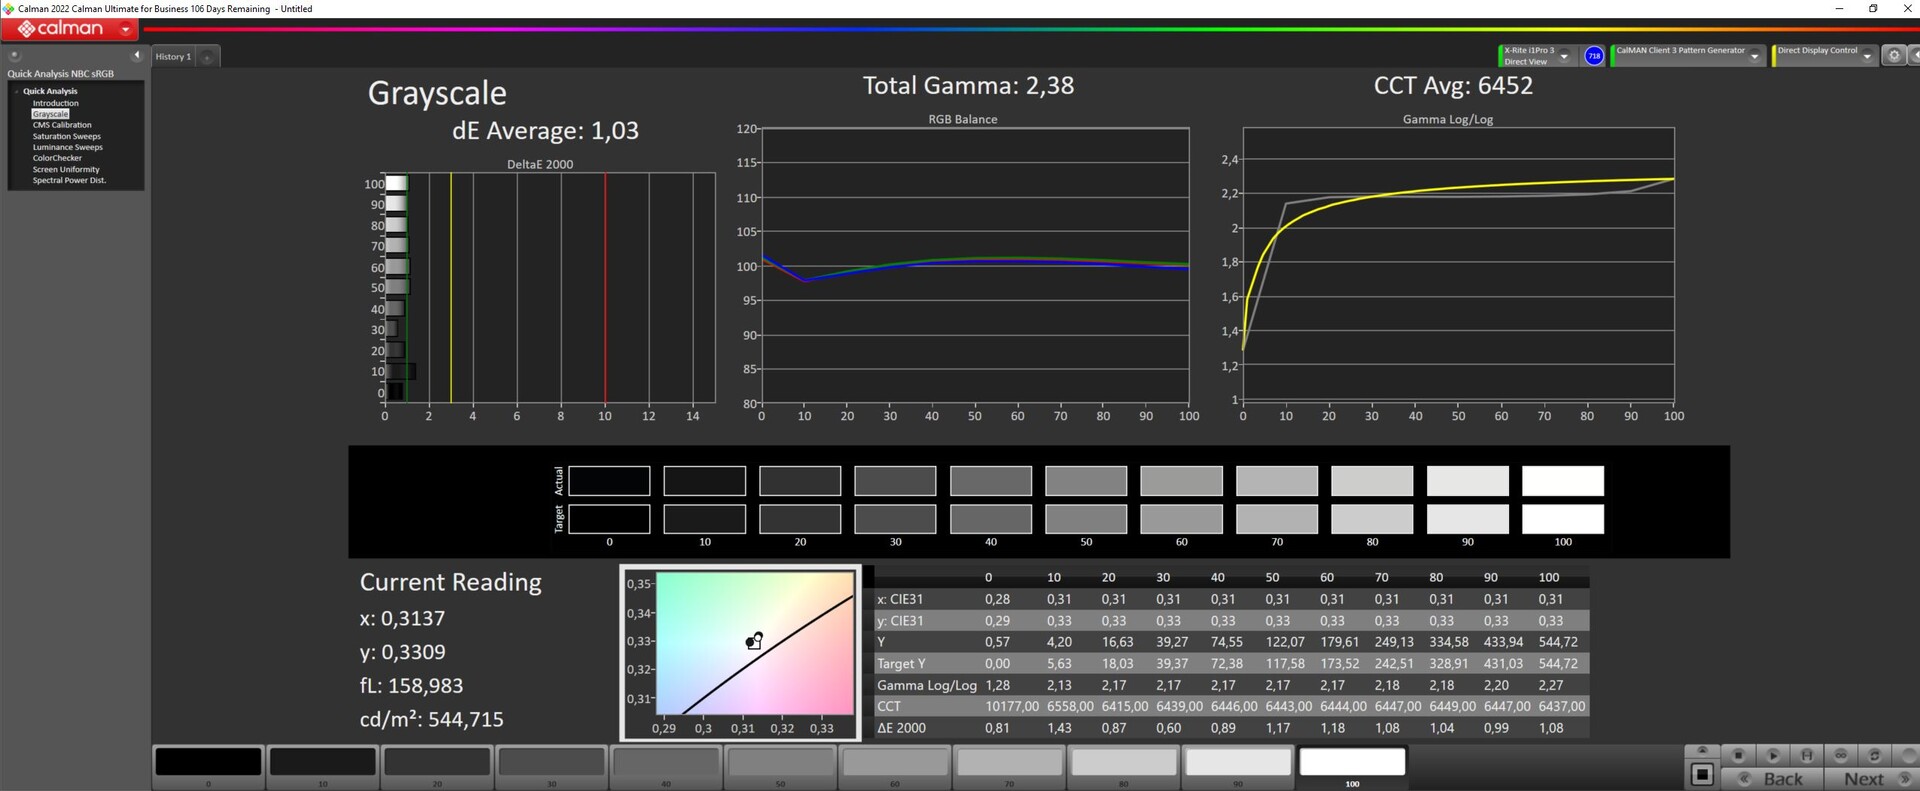
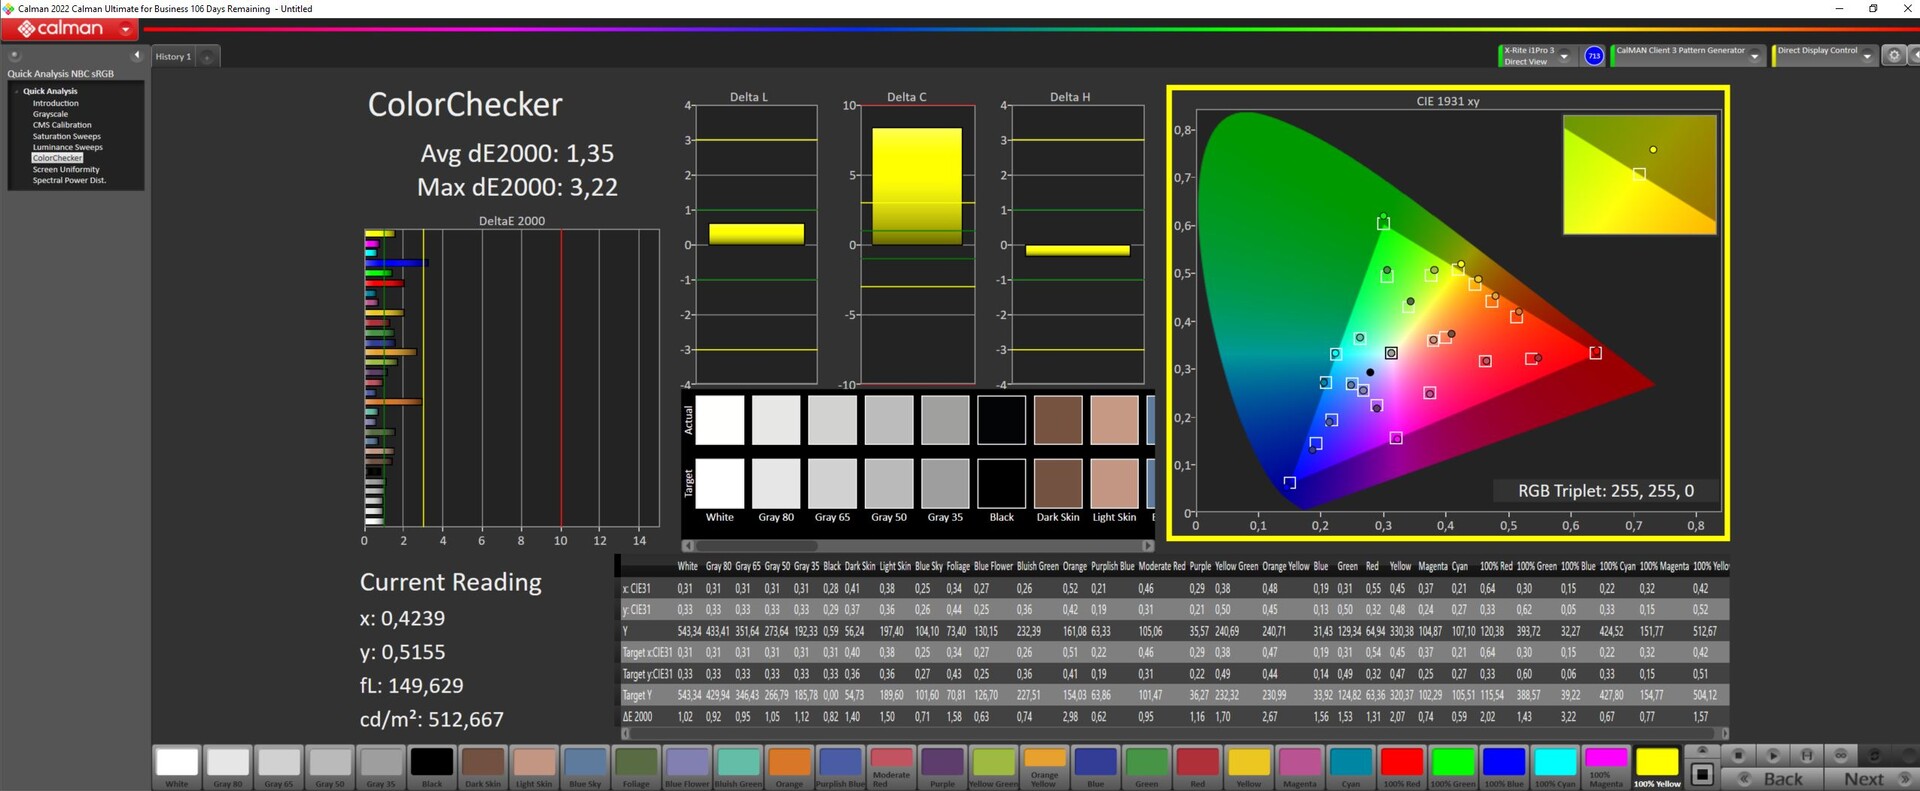
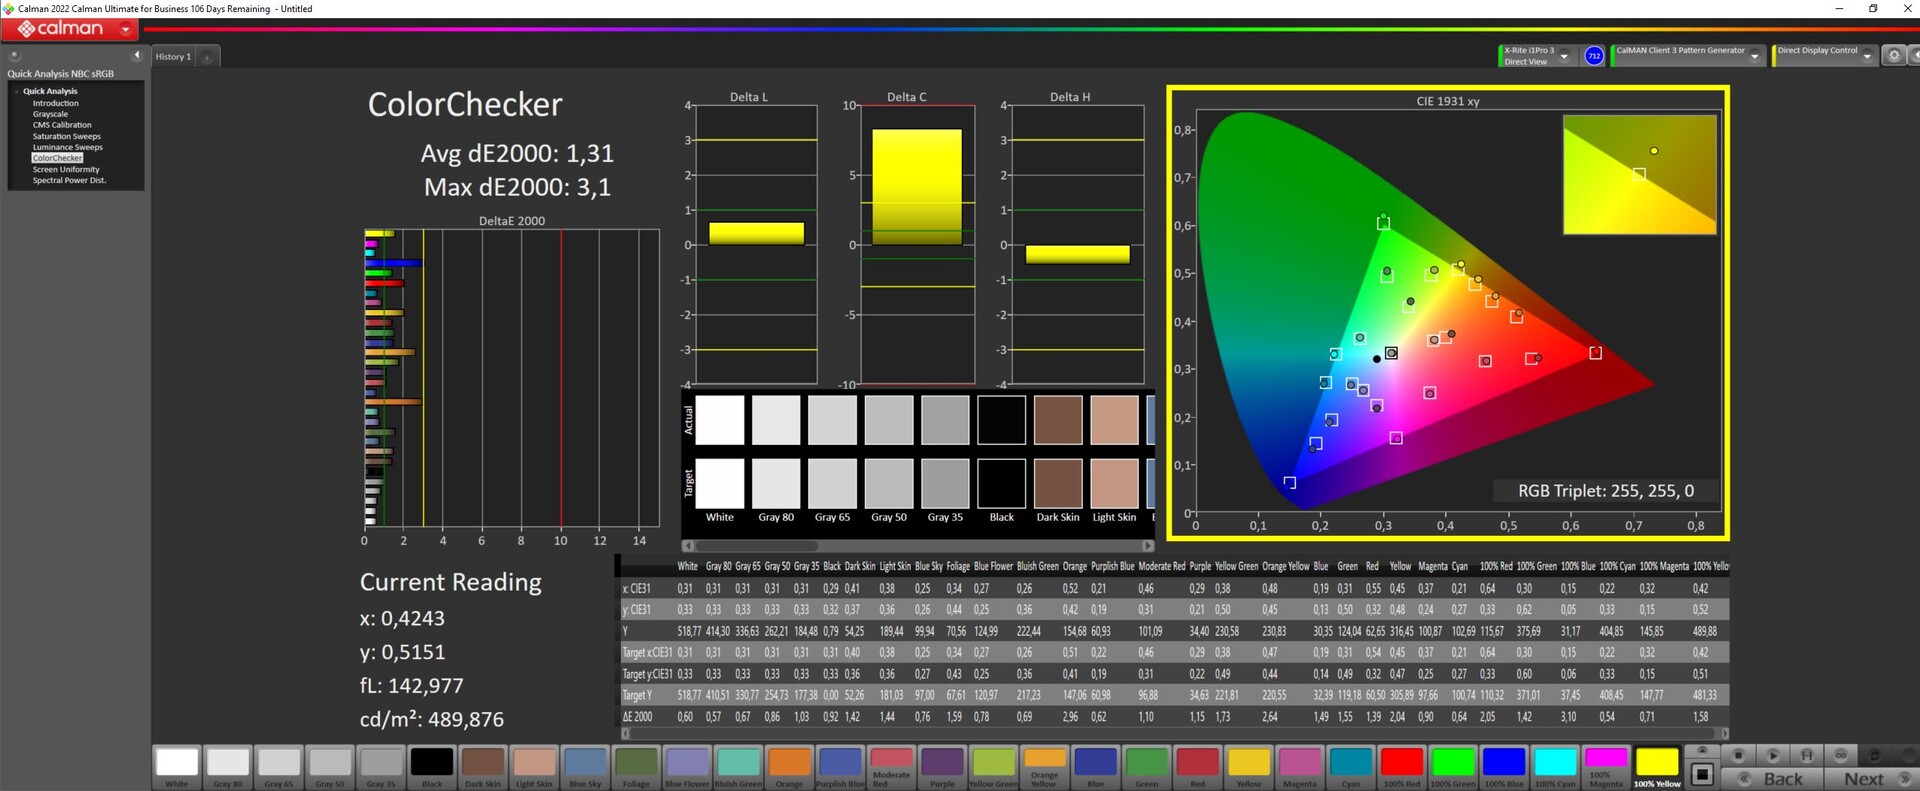
ΔE ColorChecker Calman: 1.35 | ∀{0.5-29.43 Ø4.71}
calibrated: 1.31
ΔE Greyscale Calman: 1.03 | ∀{0.09-98 Ø4.96}
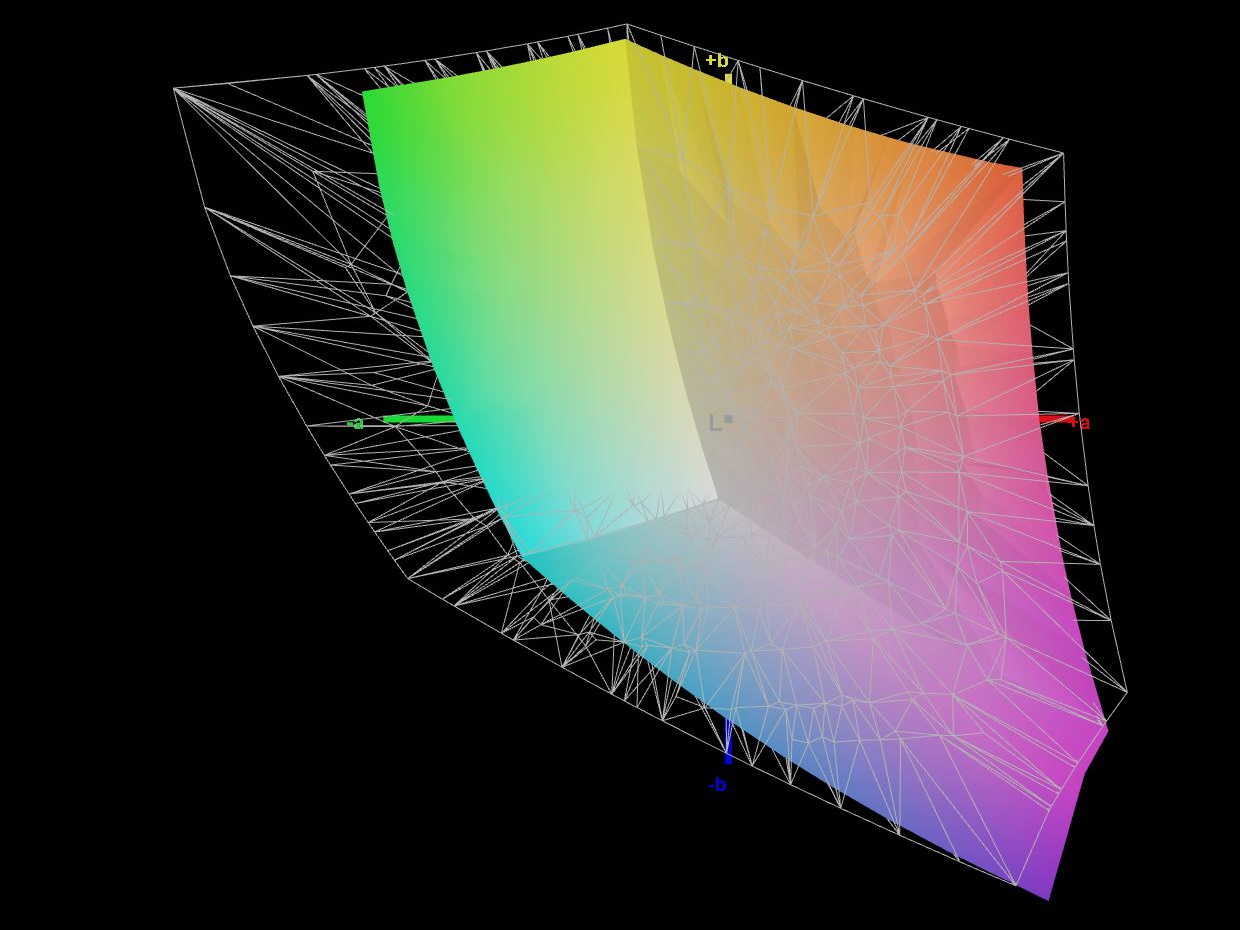
72.9% AdobeRGB 1998 (Argyll 3D)
99.8% sRGB (Argyll 3D)
71.6% Display P3 (Argyll 3D)
Gamma: 2.38
CCT: 6452 K
| Lenovo Legion Pro 5 16ARX8 (R5 7645HX, RTX 4050) CSOT T3 MNG007DA2-2, IPS, 2560x1600, 16" | Lenovo Legion Pro 5 16IRX8 AU Optronics B160QAN03.1, IPS, 2560x1600, 16" | Acer Nitro 5 AN517-55-5552 BOE0A6F NV173FHM-NX4, IPS, 1920x1080, 17.3" | Asus TUF A15 FA507 N156HMA-GA1, IPS, 1920x1080, 15.6" | Medion Erazer Scout E20 LG Philips LGD0611, IPS, 1920x1080, 17.3" | Asus TUF Gaming A16 FA617 NE160WUM-NX2 (BOE0B33), IPS-Level, 1920x1200, 16" | |
|---|---|---|---|---|---|---|
| Display | -0% | -46% | -7% | -7% | -3% | |
| Display P3 Coverage (%) | 71.6 | 71.2 -1% | 37.6 -47% | 64.9 -9% | 65.1 -9% | 69.4 -3% |
| sRGB Coverage (%) | 99.8 | 98.8 -1% | 56.4 -43% | 96.5 -3% | 96.7 -3% | 97.8 -2% |
| AdobeRGB 1998 Coverage (%) | 72.9 | 73.3 1% | 38.9 -47% | 66.6 -9% | 66.5 -9% | 70.9 -3% |
| Response Times | -61% | -110% | -227% | -62% | -68% | |
| Response Time Grey 50% / Grey 80% * (ms) | 12 ? | 14.5 ? -21% | 18 ? -50% | 30.4 ? -153% | 14.8 ? -23% | 17 ? -42% |
| Response Time Black / White * (ms) | 5.2 ? | 10.4 ? -100% | 14 ? -169% | 20.8 ? -300% | 10.4 ? -100% | 10.1 ? -94% |
| PWM Frequency (Hz) | ||||||
| Screen | -2% | -107% | -12% | -41% | -8% | |
| Brightness middle (cd/m²) | 543 | 405.7 -25% | 285 -48% | 288 -47% | 312 -43% | 308 -43% |
| Brightness (cd/m²) | 516 | 368 -29% | 257 -50% | 271 -47% | 303 -41% | 293 -43% |
| Brightness Distribution (%) | 87 | 87 0% | 81 -7% | 91 5% | 91 5% | 90 3% |
| Black Level * (cd/m²) | 0.58 | 0.38 34% | 0.58 -0% | 0.17 71% | 0.25 57% | 0.23 60% |
| Contrast (:1) | 936 | 1068 14% | 491 -48% | 1694 81% | 1248 33% | 1339 43% |
| Colorchecker dE 2000 * | 1.35 | 1.65 -22% | 4.59 -240% | 1.9 -41% | 2.65 -96% | 1.47 -9% |
| Colorchecker dE 2000 max. * | 3.22 | 4.2 -30% | 6.98 -117% | 3.3 -2% | 6.44 -100% | 2.98 7% |
| Colorchecker dE 2000 calibrated * | 1.31 | 0.53 60% | 4.82 -268% | 0.9 31% | 0.96 27% | 1.02 22% |
| Greyscale dE 2000 * | 1.03 | 1.2 -17% | 2.89 -181% | 2.7 -162% | 3.2 -211% | 2.2 -114% |
| Gamma | 2.38 92% | 2.3 96% | 2.38 92% | 2.32 95% | 2.246 98% | 2.228 99% |
| CCT | 6452 101% | 6453 101% | 7000 93% | 6535 99% | 7258 90% | 6228 104% |
| Média Total (Programa/Configurações) | -21% /
-10% | -88% /
-94% | -82% /
-42% | -37% /
-37% | -26% /
-16% |
* ... menor é melhor
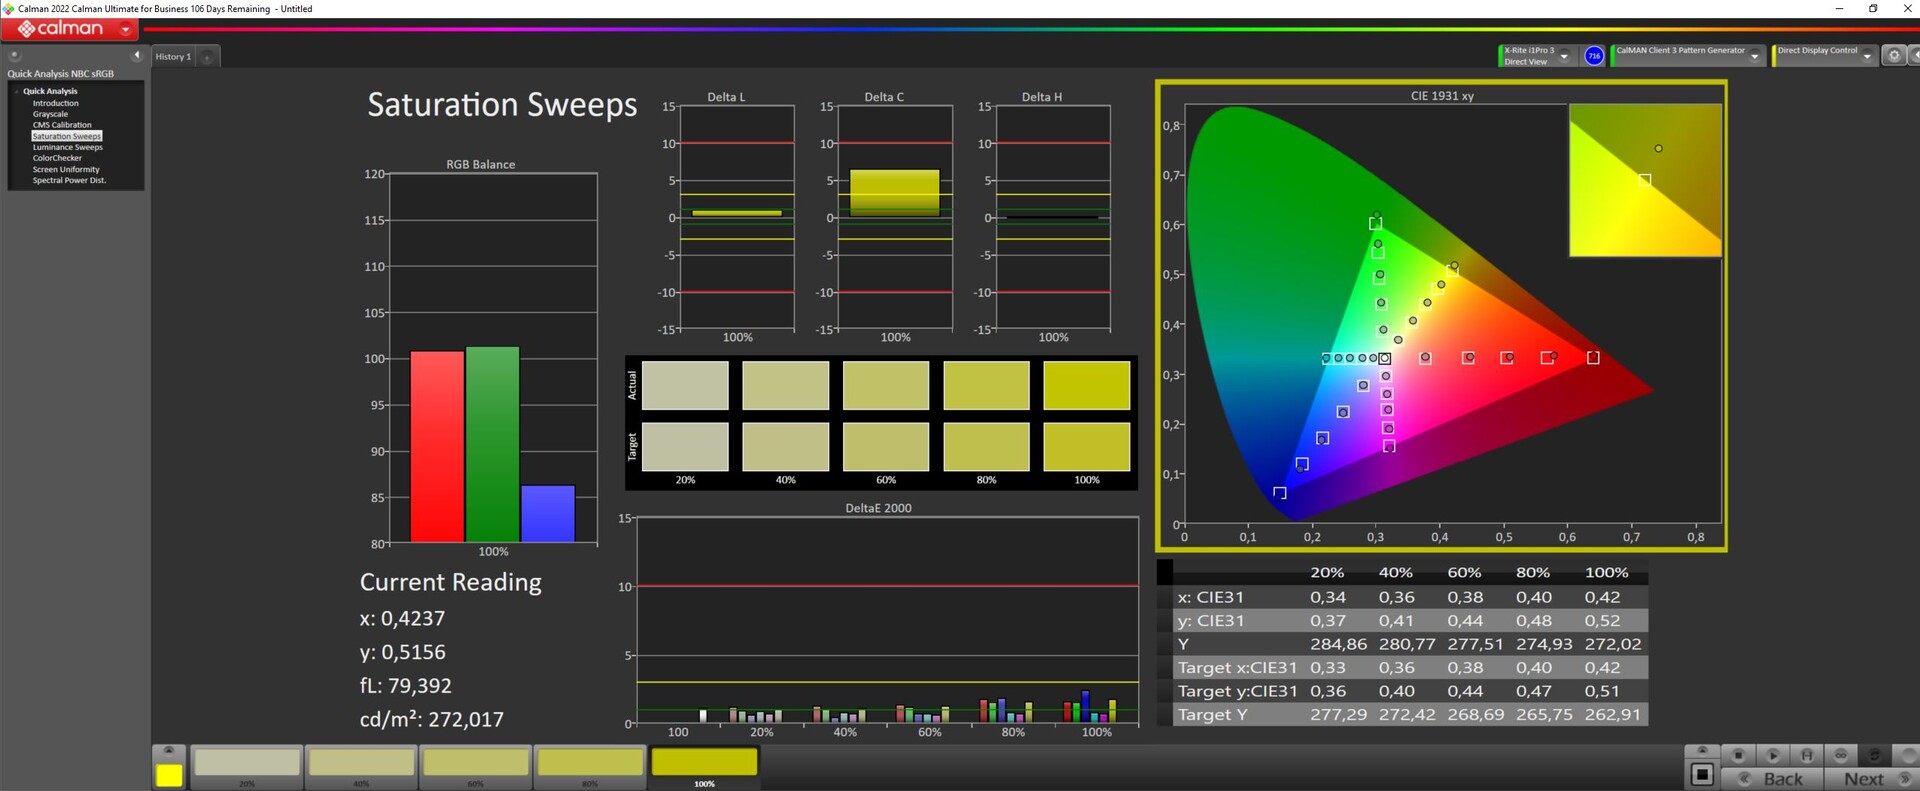
Assim como as telas dos concorrentes com especificações semelhantes, o painel do Legion Pro 5 pode reproduzir quase toda a gama sRGB e está a apenas uma fração de 100% de cobertura com base em nossas medições. A reprodução completa do AdobeRGB e do Display-P3 está além dos recursos da tela. Entretanto, isso não representa nenhuma desvantagem em um laptop para jogos. É possível até mesmo editar fotos muito bem no dispositivo, desde que você não espere que ele atenda aos padrões profissionais.
De acordo com nossas medições, o azul teve o Delta E mais alto de todas as cores. Mesmo assim, somente um par de olhos bem treinados pode perceber esse Delta E máximo. A diferença geral de cores é tão baixa que nem mesmo os monitores profissionais teriam um desempenho muito melhor. Como era de se esperar, nossa calibração não produziu nenhuma melhoria significativa.


Exibir tempos de resposta
| ↔ Tempo de resposta preto para branco | ||
|---|---|---|
| 5.2 ms ... ascensão ↗ e queda ↘ combinadas | ↗ 1.8 ms ascensão | 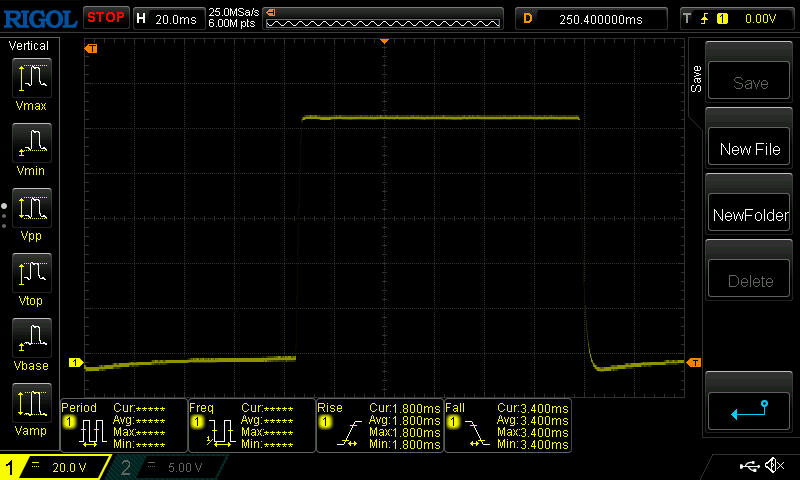 |
| ↘ 3.4 ms queda | ||
| A tela mostra taxas de resposta muito rápidas em nossos testes e deve ser muito adequada para jogos em ritmo acelerado. Em comparação, todos os dispositivos testados variam de 0.1 (mínimo) a 240 (máximo) ms. » 18 % de todos os dispositivos são melhores. Isso significa que o tempo de resposta medido é melhor que a média de todos os dispositivos testados (19.8 ms). | ||
| ↔ Tempo de resposta 50% cinza a 80% cinza | ||
| 12 ms ... ascensão ↗ e queda ↘ combinadas | ↗ 5.4 ms ascensão | 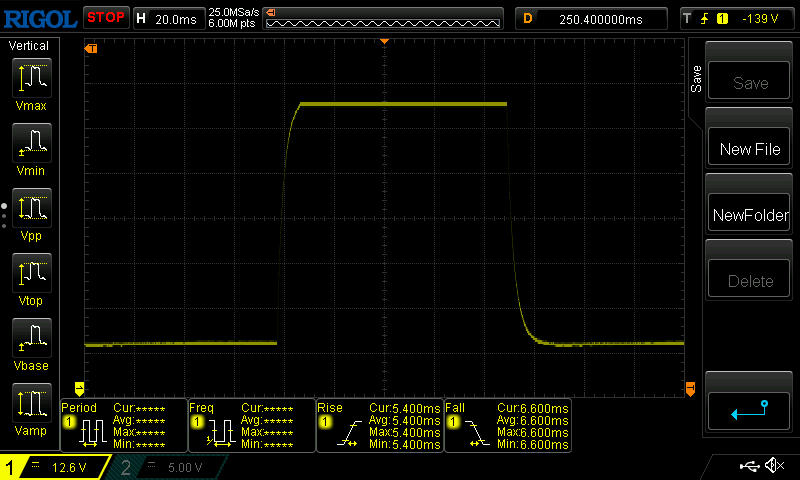 |
| ↘ 6.6 ms queda | ||
| A tela mostra boas taxas de resposta em nossos testes, mas pode ser muito lenta para jogadores competitivos. Em comparação, todos os dispositivos testados variam de 0.165 (mínimo) a 636 (máximo) ms. » 25 % de todos os dispositivos são melhores. Isso significa que o tempo de resposta medido é melhor que a média de todos os dispositivos testados (31 ms). | ||
Cintilação da tela / PWM (modulação por largura de pulso)
| Tela tremeluzindo / PWM não detectado | 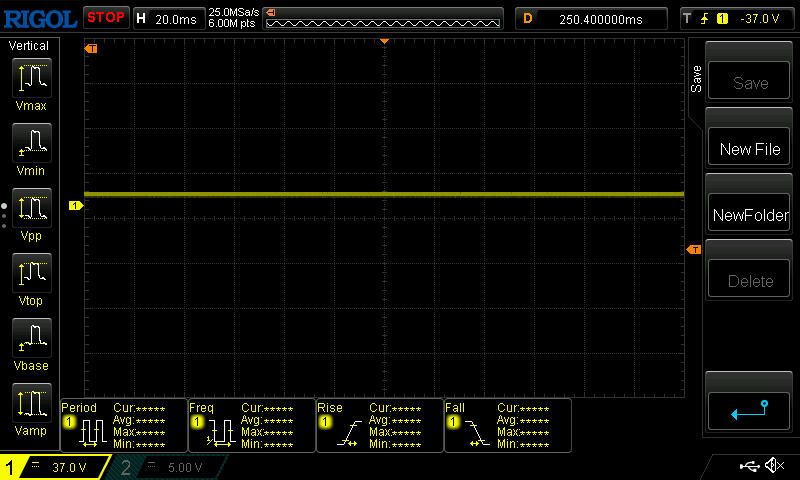 | ||
[pwm_comparison] Em comparação: 52 % de todos os dispositivos testados não usam PWM para escurecer a tela. Se PWM foi detectado, uma média de 7757 (mínimo: 5 - máximo: 343500) Hz foi medida. | |||
Graças à superfície fosca e ao alto brilho da tela, as cores e o texto são facilmente legíveis em ambientes externos, mesmo à luz do dia. Mas as cores sofrem com a luz solar direta. Fora isso, não há nada que o impeça de usar o laptop em uma varanda ou em um jardim.
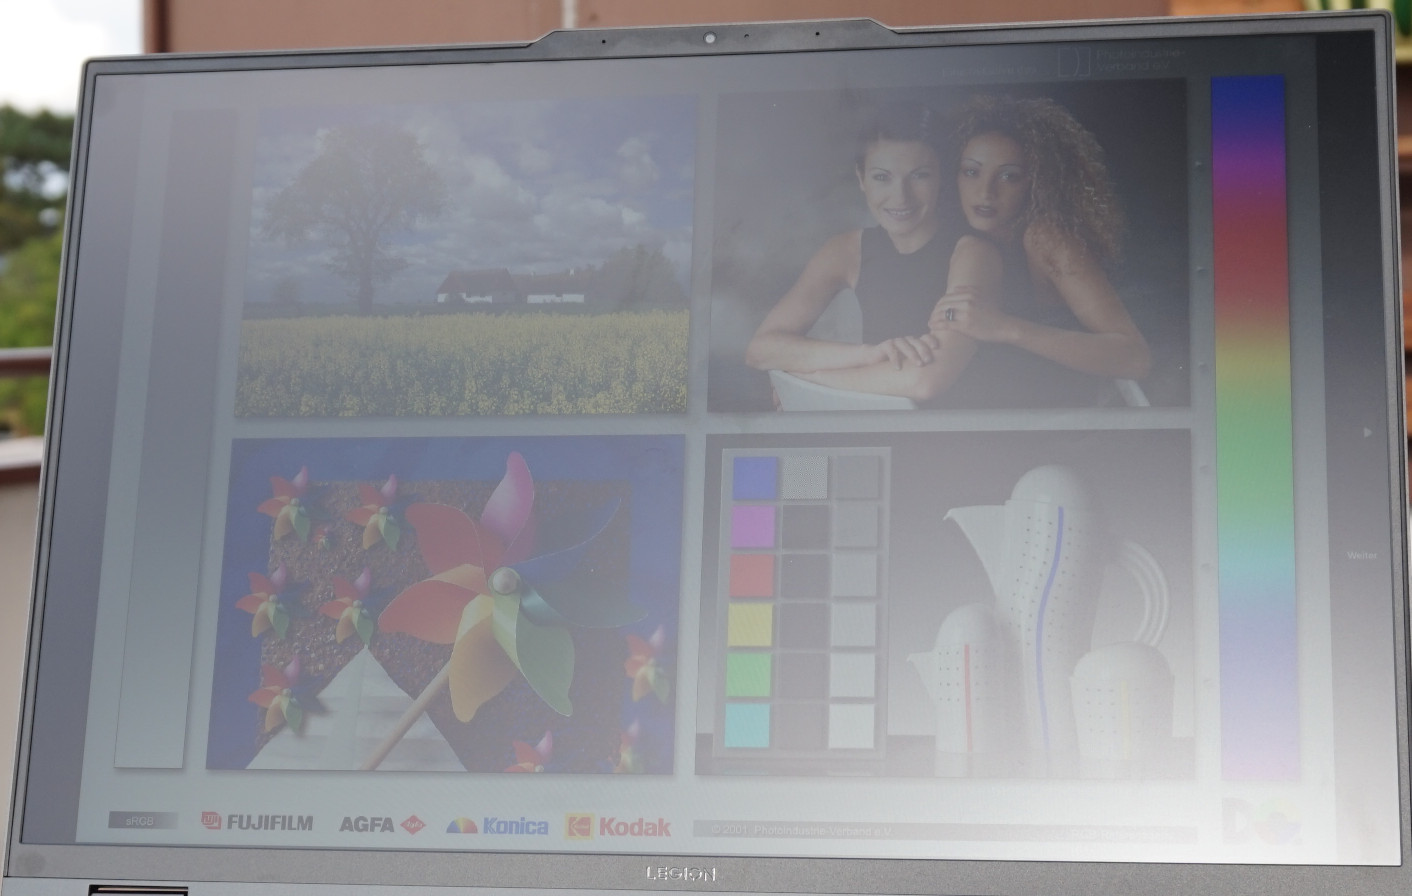
O painel IPS não apresenta nenhuma mudança de cor ou brilho, mesmo quando visto de um ângulo muito agudo.
Desempenho - altamente personalizável Legion
A configuração especificada é bastante típica para um laptop de nível básico. Equipado com umAMD Ryzen 5 7645HXuma RTX 4050 e 16 GB de RAM, o Legion Pro 5 não é necessariamente capaz de executar jogos modernos nas configurações máximas. Mas ao reduzir algumas configurações de qualidade e, idealmente, diminuir a resolução para Full HD, você quase sempre pode obter 100 FPS ou mais do laptop.
Condições de teste
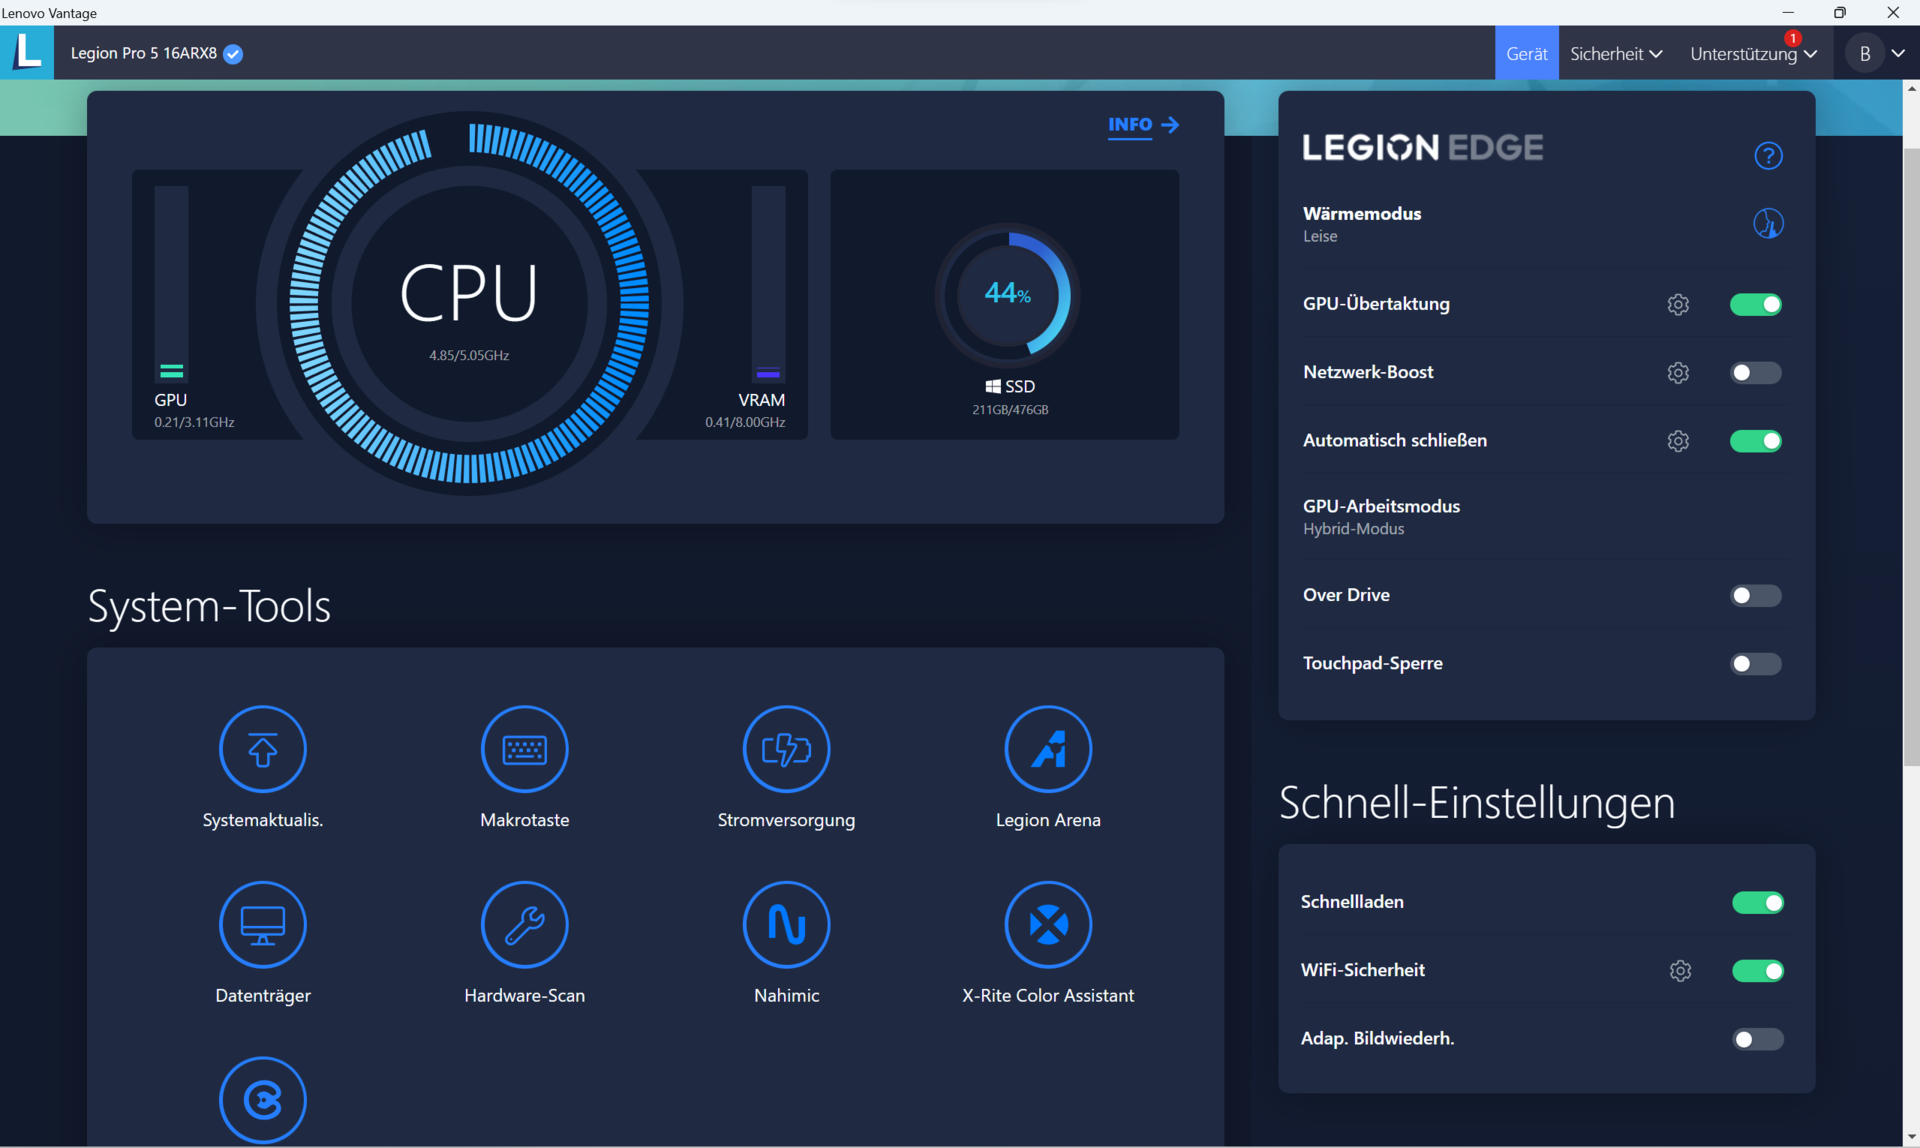
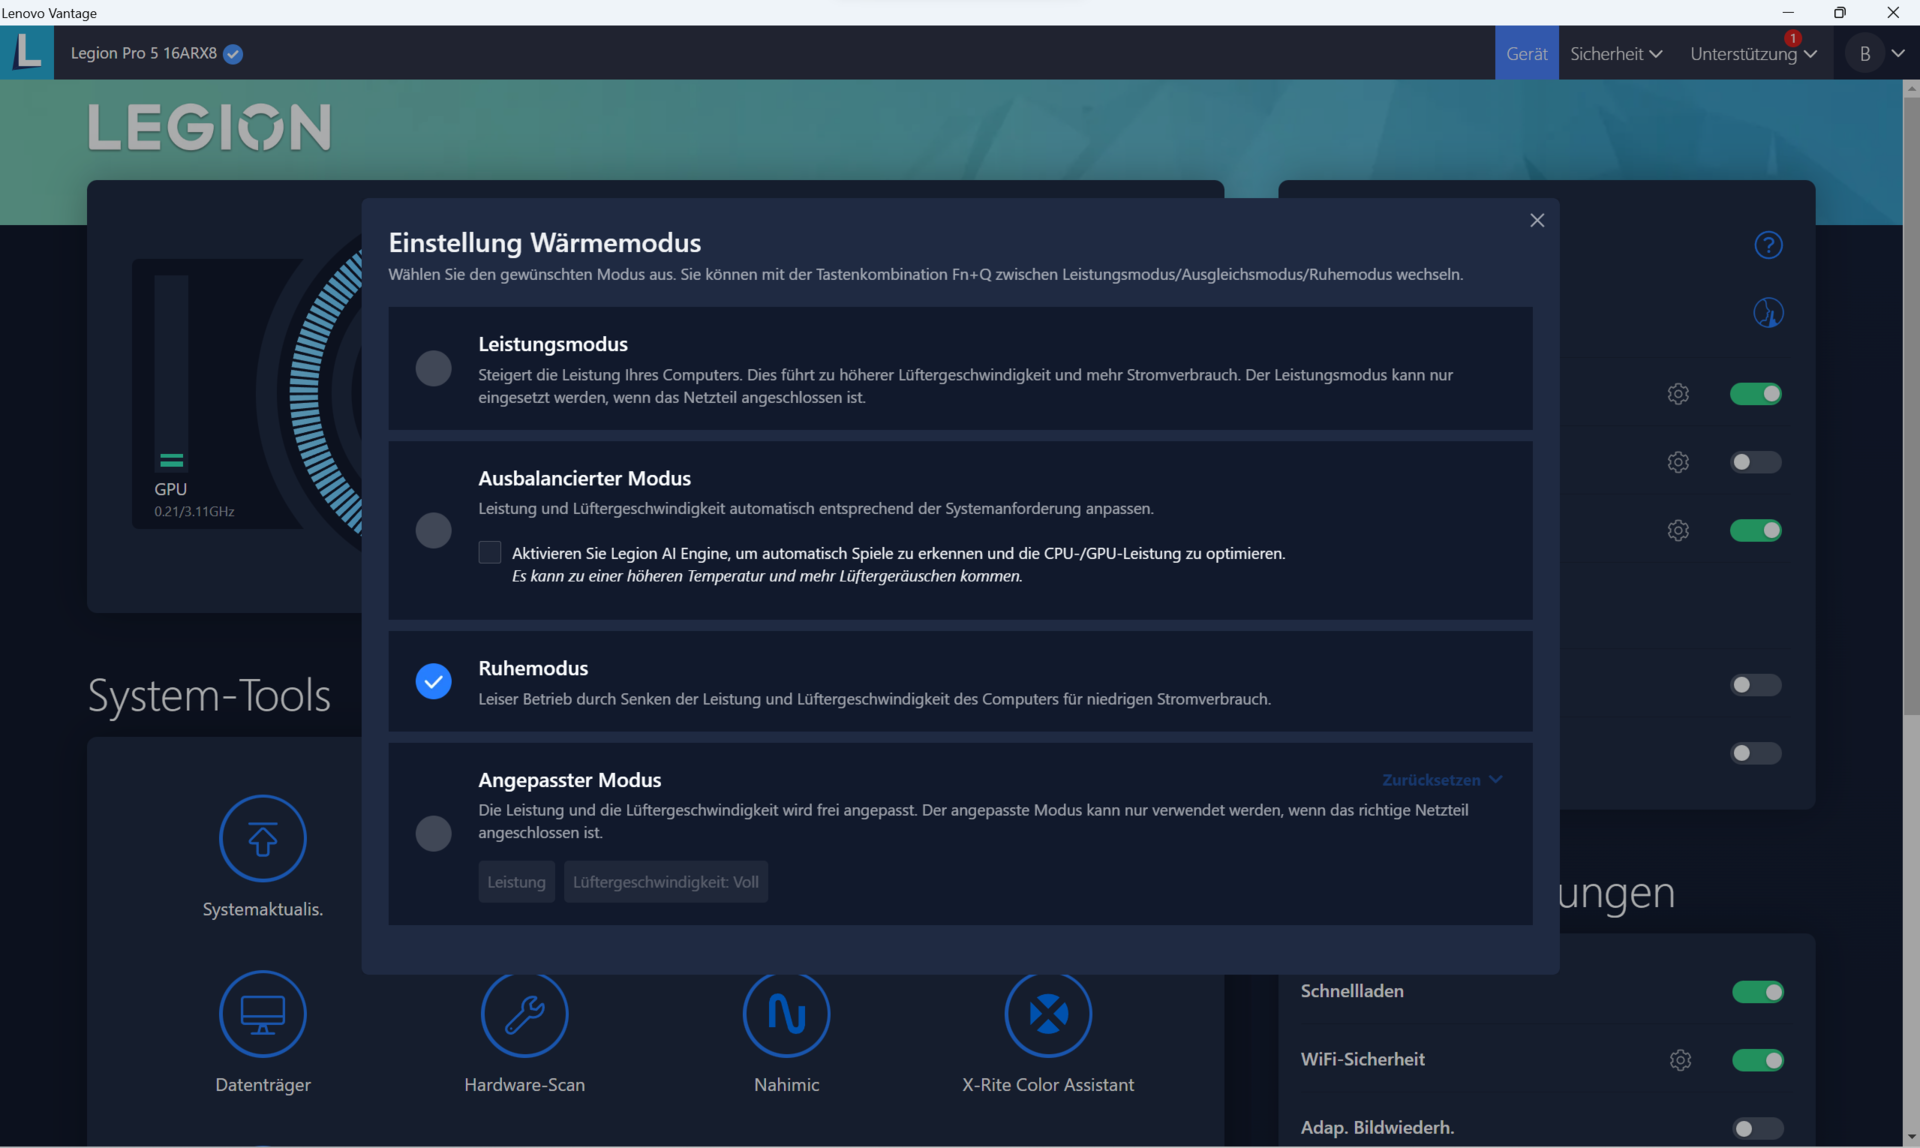
É possível alternar entre três modos de desempenho usando a combinação de teclas Fn+Q, comumente encontrada nos notebooks Lenovo. Usamos o modo "Desempenho" para nossos benchmarks e testes de jogos. Há também o modo "Silencioso", que normalmente reduz os resultados de benchmark em 20%, mas também reduz em mais da metade a quantidade de ruído do ventilador. A última predefinição é um modo inteligente "Balanced" (Equilibrado) que ajusta automaticamente as configurações conforme necessário. Durante nossos testes, esse modo nunca chegou a corresponder às configurações do modo "Performance".
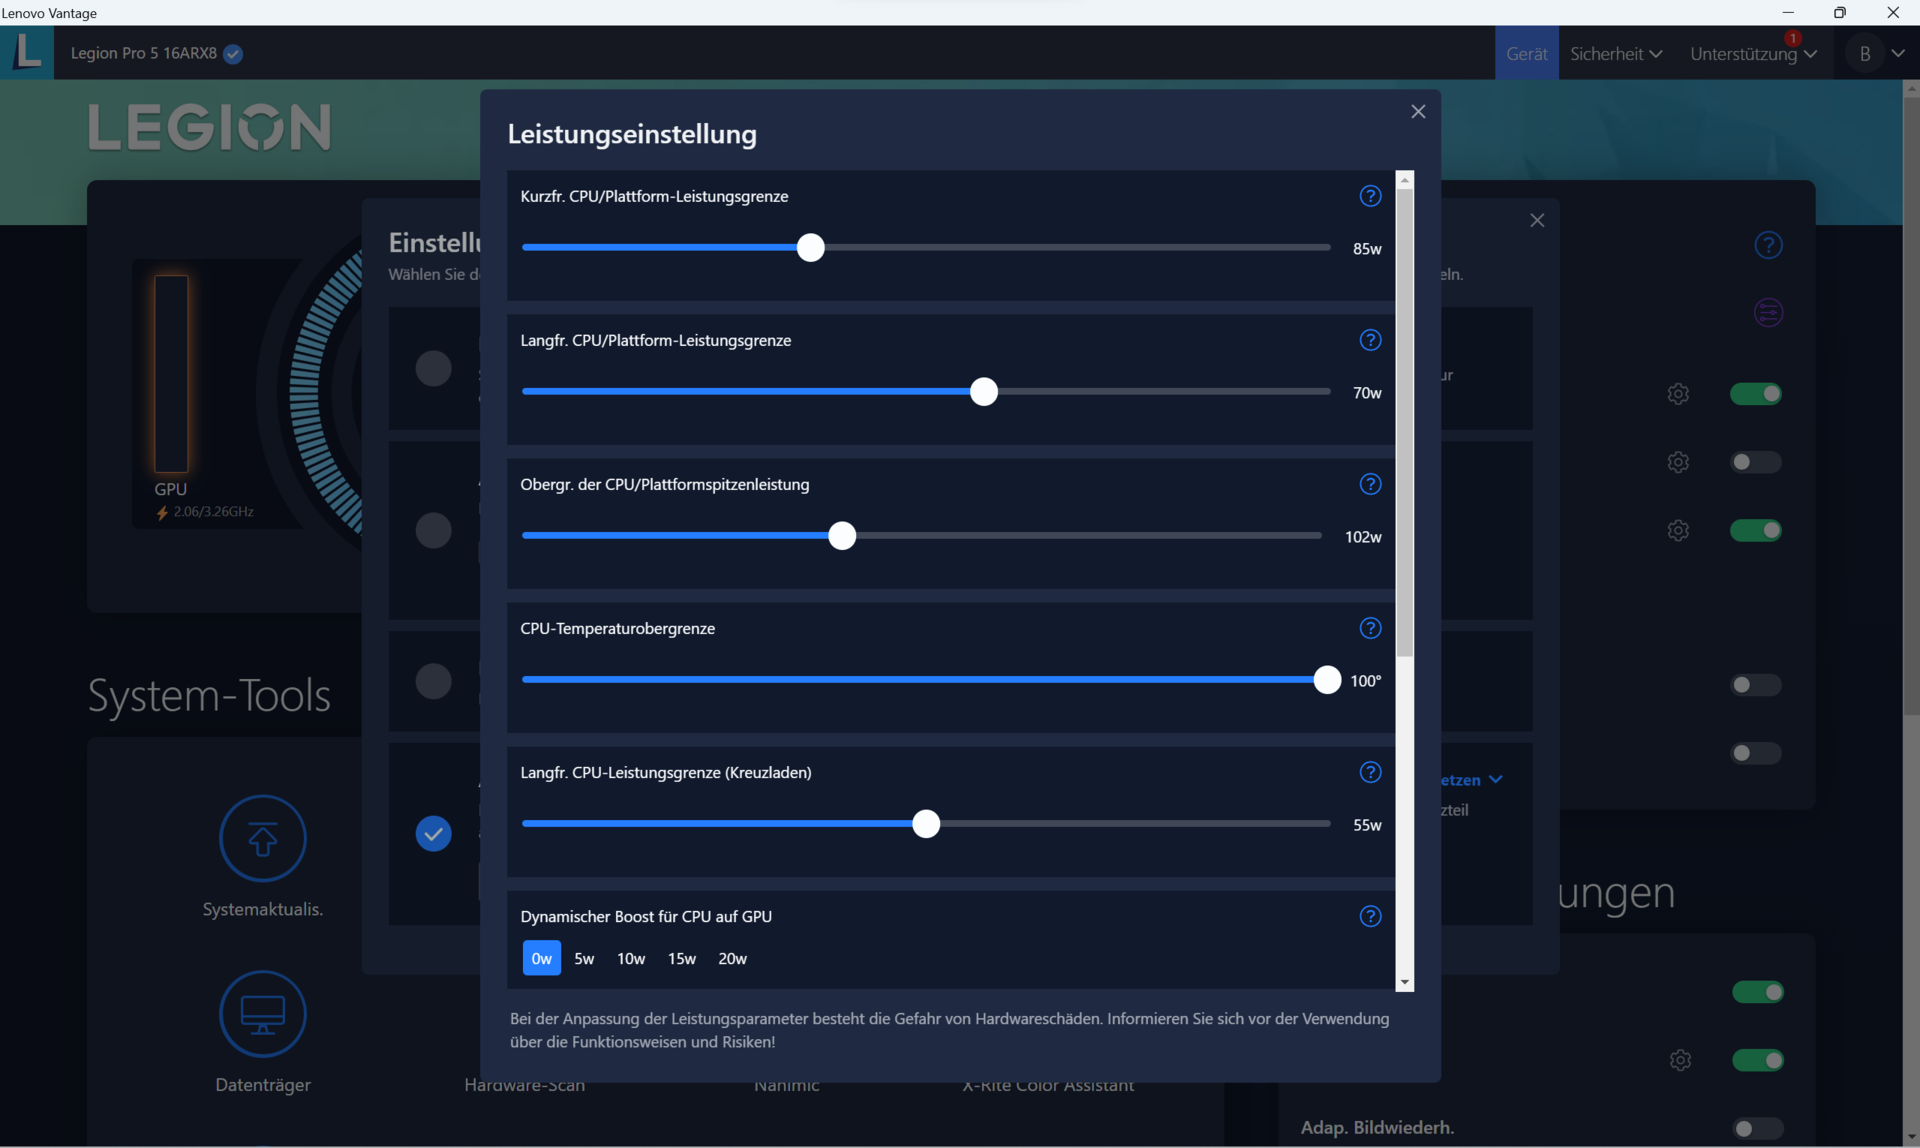
Entretanto, esses três modos representam apenas uma fração das opções disponíveis. O Lenovo Vantage permite que você ajuste manualmente todos os tipos de parâmetros da CPU e da GPU em conjunto com um perfil de ventilador personalizado. Por exemplo, você pode definir manualmente os limites de energia de curto e longo prazo do processador, a fonte de alimentação máxima para a placa de vídeo, o aumento dinâmico e até mesmo os limites máximos de temperatura.
Entre o resfriamento passivo e a alocação de energia personalizada para a GPU e a CPU, há inúmeras opções para permitir que você personalize o laptop para jogos de acordo com as suas necessidades. Tudo o que você precisa fazer é aceitar o aviso da Lenovo de que isso pode causar danos ao seu dispositivo. Além disso, nem todas as configurações resultarão na execução estável de todos os aplicativos. Dito isso, é muito possível obter bons resultados se você souber aproximadamente o que cada configuração faz e ajustar os ventiladores de acordo.
| Perfil de energia | Consumo de CPU (medido) | Consumo de GPU (medido) | ruído máximo do ventilador |
|---|---|---|---|
| Silencioso | 75/65 Watt | 50 Watt | 33 dB(A) |
| Desempenho | 90/90 Watt | 55 Watt | 39 dB(A) |
| Bateria | 54/45 Watt | 50 Watt | 36 dB(A) |
| Máximo | 145/145 Watt | 140 Watt | 50 dB(A) |
Processador
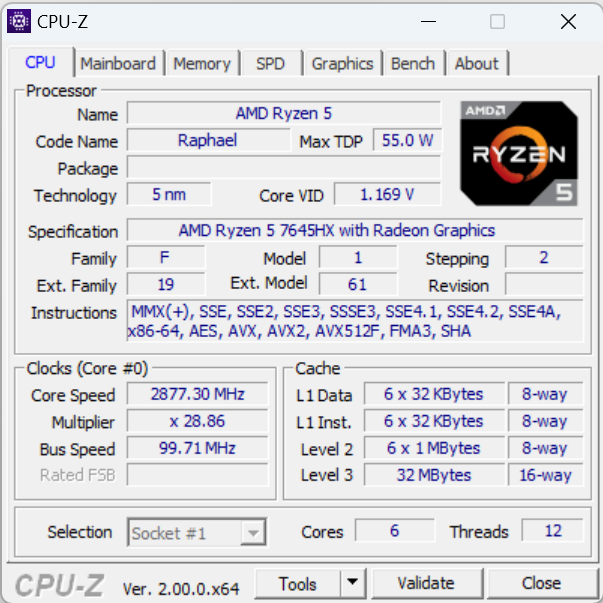
Mantendo-se fiel à linha, a 7ª geração AMD Ryzen 5 7645HX continua a se concentrar em recursos otimizados para jogos. Ele contém seis núcleos e doze threads e conta com generosos 32 MB de cache L3. Os núcleos têm uma velocidade de clock máxima decente de 5,0 GHz.
Portanto, o processador não está muito distante do processador de nível superiorIntel Core i7-13700H encontrado no Medion Erazer Scout E20. Embora o Ryzen não consiga acompanhar totalmente o ritmo das tarefas de vários núcleos, ele realmente se destaca e compensa essa deficiência nos testes de núcleo único. Nos vários benchmarks, sua pontuação geral se alinha perfeitamente com a pontuação média obtida em todos os notebooks para jogos que testamos nos últimos dois anos.
Como o processador não está recebendo a potência máxima possível e o sistema de resfriamento tem tamanho suficiente, a pontuação do Cinebench R15 do notebook permaneceu quase perfeitamente consistente durante as 25 execuções. Em comparação, o processador i7-13700H teve uma pontuação mais baixa do que o Ryzen 5 no final do teste de loop. Mesmo no modo Silencioso (linha rosa), o Legion Pro 5 conseguiu superar o Scout E20 em um período prolongado.
O desempenho também é excelente quando o Legion está usando a bateria. Entre outras coisas, a pontuação multi-core do Cinebench R23 diminuiu de 14.000 para 12.700, o que representa uma queda de menos de 10%.
Para obter mais informações e resultados, consulte nossa lista de benchmark de CPU https://www.notebookcheck.net/Mobile-Processors-Benchmark-List.2436.0.html.
Cinebench R15 Multi Sustained load
Cinebench R23: Multi Core | Single Core
Cinebench R20: CPU (Multi Core) | CPU (Single Core)
Cinebench R15: CPU Multi 64Bit | CPU Single 64Bit
Blender: v2.79 BMW27 CPU
7-Zip 18.03: 7z b 4 | 7z b 4 -mmt1
Geekbench 5.5: Multi-Core | Single-Core
HWBOT x265 Benchmark v2.2: 4k Preset
LibreOffice : 20 Documents To PDF
R Benchmark 2.5: Overall mean
| CPU Performance rating | |
| Média da turma Gaming | |
| Lenovo Legion Pro 5 16IRX8 | |
| Medion Erazer Scout E20 | |
| Lenovo Legion Pro 5 16ARX8 (R5 7645HX, RTX 4050) | |
| Média AMD Ryzen 5 7645HX | |
| Asus TUF A15 FA507 | |
| Asus TUF Gaming A16 FA617 | |
| Acer Nitro 5 AN517-55-5552 | |
| Cinebench R23 / Multi Core | |
| Média da turma Gaming (10488 - 42661, n=107, últimos 2 anos) | |
| Lenovo Legion Pro 5 16IRX8 | |
| Medion Erazer Scout E20 | |
| Acer Nitro 5 AN517-55-5552 | |
| Asus TUF Gaming A16 FA617 | |
| Lenovo Legion Pro 5 16ARX8 (R5 7645HX, RTX 4050) | |
| Média AMD Ryzen 5 7645HX (n=1) | |
| Asus TUF A15 FA507 | |
| Cinebench R23 / Single Core | |
| Média da turma Gaming (1166 - 2415, n=107, últimos 2 anos) | |
| Medion Erazer Scout E20 | |
| Lenovo Legion Pro 5 16ARX8 (R5 7645HX, RTX 4050) | |
| Média AMD Ryzen 5 7645HX (n=1) | |
| Lenovo Legion Pro 5 16IRX8 | |
| Acer Nitro 5 AN517-55-5552 | |
| Asus TUF Gaming A16 FA617 | |
| Asus TUF A15 FA507 | |
| Cinebench R20 / CPU (Multi Core) | |
| Média da turma Gaming (4029 - 16433, n=106, últimos 2 anos) | |
| Lenovo Legion Pro 5 16IRX8 | |
| Medion Erazer Scout E20 | |
| Lenovo Legion Pro 5 16ARX8 (R5 7645HX, RTX 4050) | |
| Média AMD Ryzen 5 7645HX (n=1) | |
| Asus TUF Gaming A16 FA617 | |
| Asus TUF A15 FA507 | |
| Acer Nitro 5 AN517-55-5552 | |
| Cinebench R20 / CPU (Single Core) | |
| Média da turma Gaming (442 - 913, n=106, últimos 2 anos) | |
| Medion Erazer Scout E20 | |
| Lenovo Legion Pro 5 16ARX8 (R5 7645HX, RTX 4050) | |
| Média AMD Ryzen 5 7645HX (n=1) | |
| Lenovo Legion Pro 5 16IRX8 | |
| Acer Nitro 5 AN517-55-5552 | |
| Asus TUF Gaming A16 FA617 | |
| Asus TUF A15 FA507 | |
| Cinebench R15 / CPU Multi 64Bit | |
| Média da turma Gaming (1578 - 6330, n=105, últimos 2 anos) | |
| Lenovo Legion Pro 5 16IRX8 | |
| Medion Erazer Scout E20 | |
| Asus TUF Gaming A16 FA617 | |
| Lenovo Legion Pro 5 16ARX8 (R5 7645HX, RTX 4050) | |
| Asus TUF A15 FA507 | |
| Média AMD Ryzen 5 7645HX (2148 - 2276, n=3) | |
| Acer Nitro 5 AN517-55-5552 | |
| Cinebench R15 / CPU Single 64Bit | |
| Média da turma Gaming (188.8 - 350, n=106, últimos 2 anos) | |
| Lenovo Legion Pro 5 16ARX8 (R5 7645HX, RTX 4050) | |
| Média AMD Ryzen 5 7645HX (281 - 289, n=3) | |
| Medion Erazer Scout E20 | |
| Lenovo Legion Pro 5 16IRX8 | |
| Asus TUF A15 FA507 | |
| Asus TUF Gaming A16 FA617 | |
| Acer Nitro 5 AN517-55-5552 | |
| Blender / v2.79 BMW27 CPU | |
| Acer Nitro 5 AN517-55-5552 | |
| Asus TUF Gaming A16 FA617 | |
| Lenovo Legion Pro 5 16ARX8 (R5 7645HX, RTX 4050) | |
| Média AMD Ryzen 5 7645HX (n=1) | |
| Asus TUF A15 FA507 | |
| Medion Erazer Scout E20 | |
| Lenovo Legion Pro 5 16IRX8 | |
| Média da turma Gaming (79 - 330, n=104, últimos 2 anos) | |
| 7-Zip 18.03 / 7z b 4 | |
| Média da turma Gaming (33491 - 148086, n=105, últimos 2 anos) | |
| Lenovo Legion Pro 5 16IRX8 | |
| Medion Erazer Scout E20 | |
| Asus TUF Gaming A16 FA617 | |
| Asus TUF A15 FA507 | |
| Lenovo Legion Pro 5 16ARX8 (R5 7645HX, RTX 4050) | |
| Média AMD Ryzen 5 7645HX (n=1) | |
| Acer Nitro 5 AN517-55-5552 | |
| 7-Zip 18.03 / 7z b 4 -mmt1 | |
| Lenovo Legion Pro 5 16ARX8 (R5 7645HX, RTX 4050) | |
| Média AMD Ryzen 5 7645HX (n=1) | |
| Média da turma Gaming (4199 - 7436, n=105, últimos 2 anos) | |
| Medion Erazer Scout E20 | |
| Asus TUF A15 FA507 | |
| Asus TUF Gaming A16 FA617 | |
| Lenovo Legion Pro 5 16IRX8 | |
| Acer Nitro 5 AN517-55-5552 | |
| Geekbench 5.5 / Multi-Core | |
| Média da turma Gaming (6460 - 28263, n=105, últimos 2 anos) | |
| Lenovo Legion Pro 5 16IRX8 | |
| Medion Erazer Scout E20 | |
| Lenovo Legion Pro 5 16ARX8 (R5 7645HX, RTX 4050) | |
| Média AMD Ryzen 5 7645HX (n=1) | |
| Acer Nitro 5 AN517-55-5552 | |
| Asus TUF Gaming A16 FA617 | |
| Asus TUF A15 FA507 | |
| Geekbench 5.5 / Single-Core | |
| Média da turma Gaming (986 - 2474, n=105, últimos 2 anos) | |
| Lenovo Legion Pro 5 16ARX8 (R5 7645HX, RTX 4050) | |
| Média AMD Ryzen 5 7645HX (n=1) | |
| Medion Erazer Scout E20 | |
| Lenovo Legion Pro 5 16IRX8 | |
| Asus TUF Gaming A16 FA617 | |
| Acer Nitro 5 AN517-55-5552 | |
| Asus TUF A15 FA507 | |
| HWBOT x265 Benchmark v2.2 / 4k Preset | |
| Média da turma Gaming (11.5 - 44.4, n=105, últimos 2 anos) | |
| Lenovo Legion Pro 5 16IRX8 | |
| Lenovo Legion Pro 5 16ARX8 (R5 7645HX, RTX 4050) | |
| Média AMD Ryzen 5 7645HX (n=1) | |
| Asus TUF Gaming A16 FA617 | |
| Asus TUF A15 FA507 | |
| Medion Erazer Scout E20 | |
| Acer Nitro 5 AN517-55-5552 | |
| LibreOffice / 20 Documents To PDF | |
| Asus TUF Gaming A16 FA617 | |
| Lenovo Legion Pro 5 16ARX8 (R5 7645HX, RTX 4050) | |
| Média AMD Ryzen 5 7645HX (n=1) | |
| Acer Nitro 5 AN517-55-5552 | |
| Asus TUF A15 FA507 | |
| Média da turma Gaming (33.2 - 88.8, n=105, últimos 2 anos) | |
| Medion Erazer Scout E20 | |
| Lenovo Legion Pro 5 16IRX8 | |
| R Benchmark 2.5 / Overall mean | |
| Acer Nitro 5 AN517-55-5552 | |
| Asus TUF Gaming A16 FA617 | |
| Asus TUF A15 FA507 | |
| Lenovo Legion Pro 5 16IRX8 | |
| Medion Erazer Scout E20 | |
| Lenovo Legion Pro 5 16ARX8 (R5 7645HX, RTX 4050) | |
| Média AMD Ryzen 5 7645HX (n=1) | |
| Média da turma Gaming (0.3439 - 0.759, n=106, últimos 2 anos) | |
* ... menor é melhor
AIDA64: FP32 Ray-Trace | FPU Julia | CPU SHA3 | CPU Queen | FPU SinJulia | FPU Mandel | CPU AES | CPU ZLib | FP64 Ray-Trace | CPU PhotoWorxx
| Performance rating | |
| Média da turma Gaming | |
| Lenovo Legion Pro 5 16IRX8 | |
| Lenovo Legion Pro 5 16ARX8 (R5 7645HX, RTX 4050) | |
| Média AMD Ryzen 5 7645HX | |
| Asus TUF Gaming A16 FA617 | |
| Asus TUF A15 FA507 | |
| Medion Erazer Scout E20 | |
| Acer Nitro 5 AN517-55-5552 | |
| AIDA64 / FP32 Ray-Trace | |
| Média da turma Gaming (10227 - 85542, n=105, últimos 2 anos) | |
| Lenovo Legion Pro 5 16ARX8 (R5 7645HX, RTX 4050) | |
| Média AMD Ryzen 5 7645HX (n=1) | |
| Lenovo Legion Pro 5 16IRX8 | |
| Asus TUF Gaming A16 FA617 | |
| Asus TUF A15 FA507 | |
| Medion Erazer Scout E20 | |
| Acer Nitro 5 AN517-55-5552 | |
| AIDA64 / FPU Julia | |
| Média da turma Gaming (51376 - 238426, n=105, últimos 2 anos) | |
| Lenovo Legion Pro 5 16IRX8 | |
| Asus TUF A15 FA507 | |
| Asus TUF Gaming A16 FA617 | |
| Lenovo Legion Pro 5 16ARX8 (R5 7645HX, RTX 4050) | |
| Média AMD Ryzen 5 7645HX (n=1) | |
| Medion Erazer Scout E20 | |
| Acer Nitro 5 AN517-55-5552 | |
| AIDA64 / CPU SHA3 | |
| Média da turma Gaming (2180 - 10115, n=105, últimos 2 anos) | |
| Lenovo Legion Pro 5 16IRX8 | |
| Lenovo Legion Pro 5 16ARX8 (R5 7645HX, RTX 4050) | |
| Média AMD Ryzen 5 7645HX (n=1) | |
| Asus TUF Gaming A16 FA617 | |
| Asus TUF A15 FA507 | |
| Medion Erazer Scout E20 | |
| Acer Nitro 5 AN517-55-5552 | |
| AIDA64 / CPU Queen | |
| Média da turma Gaming (49785 - 173351, n=90, últimos 2 anos) | |
| Lenovo Legion Pro 5 16IRX8 | |
| Medion Erazer Scout E20 | |
| Asus TUF Gaming A16 FA617 | |
| Asus TUF A15 FA507 | |
| Lenovo Legion Pro 5 16ARX8 (R5 7645HX, RTX 4050) | |
| Média AMD Ryzen 5 7645HX (n=1) | |
| Acer Nitro 5 AN517-55-5552 | |
| AIDA64 / FPU SinJulia | |
| Média da turma Gaming (4424 - 33636, n=105, últimos 2 anos) | |
| Lenovo Legion Pro 5 16IRX8 | |
| Asus TUF Gaming A16 FA617 | |
| Asus TUF A15 FA507 | |
| Lenovo Legion Pro 5 16ARX8 (R5 7645HX, RTX 4050) | |
| Média AMD Ryzen 5 7645HX (n=1) | |
| Medion Erazer Scout E20 | |
| Acer Nitro 5 AN517-55-5552 | |
| AIDA64 / FPU Mandel | |
| Média da turma Gaming (25115 - 128721, n=105, últimos 2 anos) | |
| Asus TUF A15 FA507 | |
| Asus TUF Gaming A16 FA617 | |
| Lenovo Legion Pro 5 16IRX8 | |
| Lenovo Legion Pro 5 16ARX8 (R5 7645HX, RTX 4050) | |
| Média AMD Ryzen 5 7645HX (n=1) | |
| Medion Erazer Scout E20 | |
| Acer Nitro 5 AN517-55-5552 | |
| AIDA64 / CPU AES | |
| Média da turma Gaming (39258 - 247074, n=105, últimos 2 anos) | |
| Lenovo Legion Pro 5 16IRX8 | |
| Medion Erazer Scout E20 | |
| Asus TUF A15 FA507 | |
| Asus TUF Gaming A16 FA617 | |
| Acer Nitro 5 AN517-55-5552 | |
| Lenovo Legion Pro 5 16ARX8 (R5 7645HX, RTX 4050) | |
| Média AMD Ryzen 5 7645HX (n=1) | |
| AIDA64 / CPU ZLib | |
| Média da turma Gaming (574 - 2531, n=105, últimos 2 anos) | |
| Lenovo Legion Pro 5 16IRX8 | |
| Medion Erazer Scout E20 | |
| Acer Nitro 5 AN517-55-5552 | |
| Asus TUF Gaming A16 FA617 | |
| Lenovo Legion Pro 5 16ARX8 (R5 7645HX, RTX 4050) | |
| Média AMD Ryzen 5 7645HX (n=1) | |
| Asus TUF A15 FA507 | |
| AIDA64 / FP64 Ray-Trace | |
| Média da turma Gaming (5509 - 45446, n=105, últimos 2 anos) | |
| Lenovo Legion Pro 5 16ARX8 (R5 7645HX, RTX 4050) | |
| Média AMD Ryzen 5 7645HX (n=1) | |
| Lenovo Legion Pro 5 16IRX8 | |
| Asus TUF Gaming A16 FA617 | |
| Asus TUF A15 FA507 | |
| Medion Erazer Scout E20 | |
| Acer Nitro 5 AN517-55-5552 | |
| AIDA64 / CPU PhotoWorxx | |
| Média da turma Gaming (12271 - 89891, n=105, últimos 2 anos) | |
| Medion Erazer Scout E20 | |
| Lenovo Legion Pro 5 16IRX8 | |
| Acer Nitro 5 AN517-55-5552 | |
| Lenovo Legion Pro 5 16ARX8 (R5 7645HX, RTX 4050) | |
| Média AMD Ryzen 5 7645HX (n=1) | |
| Asus TUF A15 FA507 | |
| Asus TUF Gaming A16 FA617 | |
Desempenho do sistema
O Legion Pro 5 16ARX8 teve uma exibição fantástica em termos de desempenho do sistema. No PCMark 10 e no CrossMark, ele obteve uma pontuação consideravelmente mais alta do que o Legion com um processador Intel Core, além de ter uma vantagem ainda maior sobre muitos laptops para jogos com especificações semelhantes.
Você perceberá isso imediatamente ao usar o Legion Pro 5. A instalação, a inicialização e a execução de programas são rápidas e imediatas. Em nenhum momento, o sistema apresentou qualquer falha perceptível. Em vez disso, ele continuou a funcionar sem problemas, mesmo quando vários programas estavam sendo executados ao mesmo tempo.
CrossMark: Overall | Productivity | Creativity | Responsiveness
| PCMark 10 / Score | |
| Média da turma Gaming (5828 - 12414, n=93, últimos 2 anos) | |
| Lenovo Legion Pro 5 16ARX8 (R5 7645HX, RTX 4050) | |
| Média AMD Ryzen 5 7645HX, NVIDIA GeForce RTX 4050 Laptop GPU (n=1) | |
| Lenovo Legion Pro 5 16IRX8 | |
| Medion Erazer Scout E20 | |
| Asus TUF Gaming A16 FA617 | |
| Asus TUF A15 FA507 | |
| Acer Nitro 5 AN517-55-5552 | |
| PCMark 10 / Essentials | |
| Lenovo Legion Pro 5 16ARX8 (R5 7645HX, RTX 4050) | |
| Média AMD Ryzen 5 7645HX, NVIDIA GeForce RTX 4050 Laptop GPU (n=1) | |
| Medion Erazer Scout E20 | |
| Lenovo Legion Pro 5 16IRX8 | |
| Média da turma Gaming (8810 - 11935, n=97, últimos 2 anos) | |
| Asus TUF Gaming A16 FA617 | |
| Asus TUF A15 FA507 | |
| Acer Nitro 5 AN517-55-5552 | |
| PCMark 10 / Productivity | |
| Média da turma Gaming (6845 - 25323, n=95, últimos 2 anos) | |
| Lenovo Legion Pro 5 16ARX8 (R5 7645HX, RTX 4050) | |
| Média AMD Ryzen 5 7645HX, NVIDIA GeForce RTX 4050 Laptop GPU (n=1) | |
| Medion Erazer Scout E20 | |
| Asus TUF Gaming A16 FA617 | |
| Asus TUF A15 FA507 | |
| Lenovo Legion Pro 5 16IRX8 | |
| Acer Nitro 5 AN517-55-5552 | |
| PCMark 10 / Digital Content Creation | |
| Média da turma Gaming (7602 - 19954, n=95, últimos 2 anos) | |
| Lenovo Legion Pro 5 16IRX8 | |
| Lenovo Legion Pro 5 16ARX8 (R5 7645HX, RTX 4050) | |
| Média AMD Ryzen 5 7645HX, NVIDIA GeForce RTX 4050 Laptop GPU (n=1) | |
| Asus TUF Gaming A16 FA617 | |
| Medion Erazer Scout E20 | |
| Asus TUF A15 FA507 | |
| Acer Nitro 5 AN517-55-5552 | |
| CrossMark / Overall | |
| Média da turma Gaming (1366 - 2409, n=94, últimos 2 anos) | |
| Lenovo Legion Pro 5 16ARX8 (R5 7645HX, RTX 4050) | |
| Média AMD Ryzen 5 7645HX, NVIDIA GeForce RTX 4050 Laptop GPU (n=1) | |
| Medion Erazer Scout E20 | |
| Acer Nitro 5 AN517-55-5552 | |
| Lenovo Legion Pro 5 16IRX8 | |
| Asus TUF A15 FA507 | |
| CrossMark / Productivity | |
| Lenovo Legion Pro 5 16ARX8 (R5 7645HX, RTX 4050) | |
| Média AMD Ryzen 5 7645HX, NVIDIA GeForce RTX 4050 Laptop GPU (n=1) | |
| Medion Erazer Scout E20 | |
| Média da turma Gaming (1386 - 2254, n=94, últimos 2 anos) | |
| Acer Nitro 5 AN517-55-5552 | |
| Lenovo Legion Pro 5 16IRX8 | |
| Asus TUF A15 FA507 | |
| CrossMark / Creativity | |
| Média da turma Gaming (1343 - 2786, n=94, últimos 2 anos) | |
| Lenovo Legion Pro 5 16ARX8 (R5 7645HX, RTX 4050) | |
| Média AMD Ryzen 5 7645HX, NVIDIA GeForce RTX 4050 Laptop GPU (n=1) | |
| Medion Erazer Scout E20 | |
| Acer Nitro 5 AN517-55-5552 | |
| Lenovo Legion Pro 5 16IRX8 | |
| Asus TUF A15 FA507 | |
| CrossMark / Responsiveness | |
| Medion Erazer Scout E20 | |
| Lenovo Legion Pro 5 16ARX8 (R5 7645HX, RTX 4050) | |
| Média AMD Ryzen 5 7645HX, NVIDIA GeForce RTX 4050 Laptop GPU (n=1) | |
| Acer Nitro 5 AN517-55-5552 | |
| Média da turma Gaming (1226 - 2334, n=94, últimos 2 anos) | |
| Lenovo Legion Pro 5 16IRX8 | |
| Asus TUF A15 FA507 | |
| PCMark 10 Score | 8105 pontos | |
Ajuda | ||
| AIDA64 / Memory Copy | |
| Média da turma Gaming (21750 - 129946, n=105, últimos 2 anos) | |
| Medion Erazer Scout E20 | |
| Lenovo Legion Pro 5 16IRX8 | |
| Asus TUF Gaming A16 FA617 | |
| Asus TUF A15 FA507 | |
| Lenovo Legion Pro 5 16ARX8 (R5 7645HX, RTX 4050) | |
| Média AMD Ryzen 5 7645HX (n=1) | |
| Acer Nitro 5 AN517-55-5552 | |
| AIDA64 / Memory Read | |
| Média da turma Gaming (22956 - 118858, n=105, últimos 2 anos) | |
| Lenovo Legion Pro 5 16IRX8 | |
| Medion Erazer Scout E20 | |
| Acer Nitro 5 AN517-55-5552 | |
| Asus TUF Gaming A16 FA617 | |
| Lenovo Legion Pro 5 16ARX8 (R5 7645HX, RTX 4050) | |
| Média AMD Ryzen 5 7645HX (n=1) | |
| Asus TUF A15 FA507 | |
| AIDA64 / Memory Write | |
| Média da turma Gaming (22297 - 135096, n=105, últimos 2 anos) | |
| Lenovo Legion Pro 5 16IRX8 | |
| Medion Erazer Scout E20 | |
| Asus TUF Gaming A16 FA617 | |
| Asus TUF A15 FA507 | |
| Lenovo Legion Pro 5 16ARX8 (R5 7645HX, RTX 4050) | |
| Média AMD Ryzen 5 7645HX (n=1) | |
| Acer Nitro 5 AN517-55-5552 | |
| AIDA64 / Memory Latency | |
| Média da turma Gaming (75.3 - 259, n=105, últimos 2 anos) | |
| Acer Nitro 5 AN517-55-5552 | |
| Medion Erazer Scout E20 | |
| Asus TUF Gaming A16 FA617 | |
| Lenovo Legion Pro 5 16ARX8 (R5 7645HX, RTX 4050) | |
| Média AMD Ryzen 5 7645HX (n=1) | |
| Asus TUF A15 FA507 | |
| Lenovo Legion Pro 5 16IRX8 | |
* ... menor é melhor
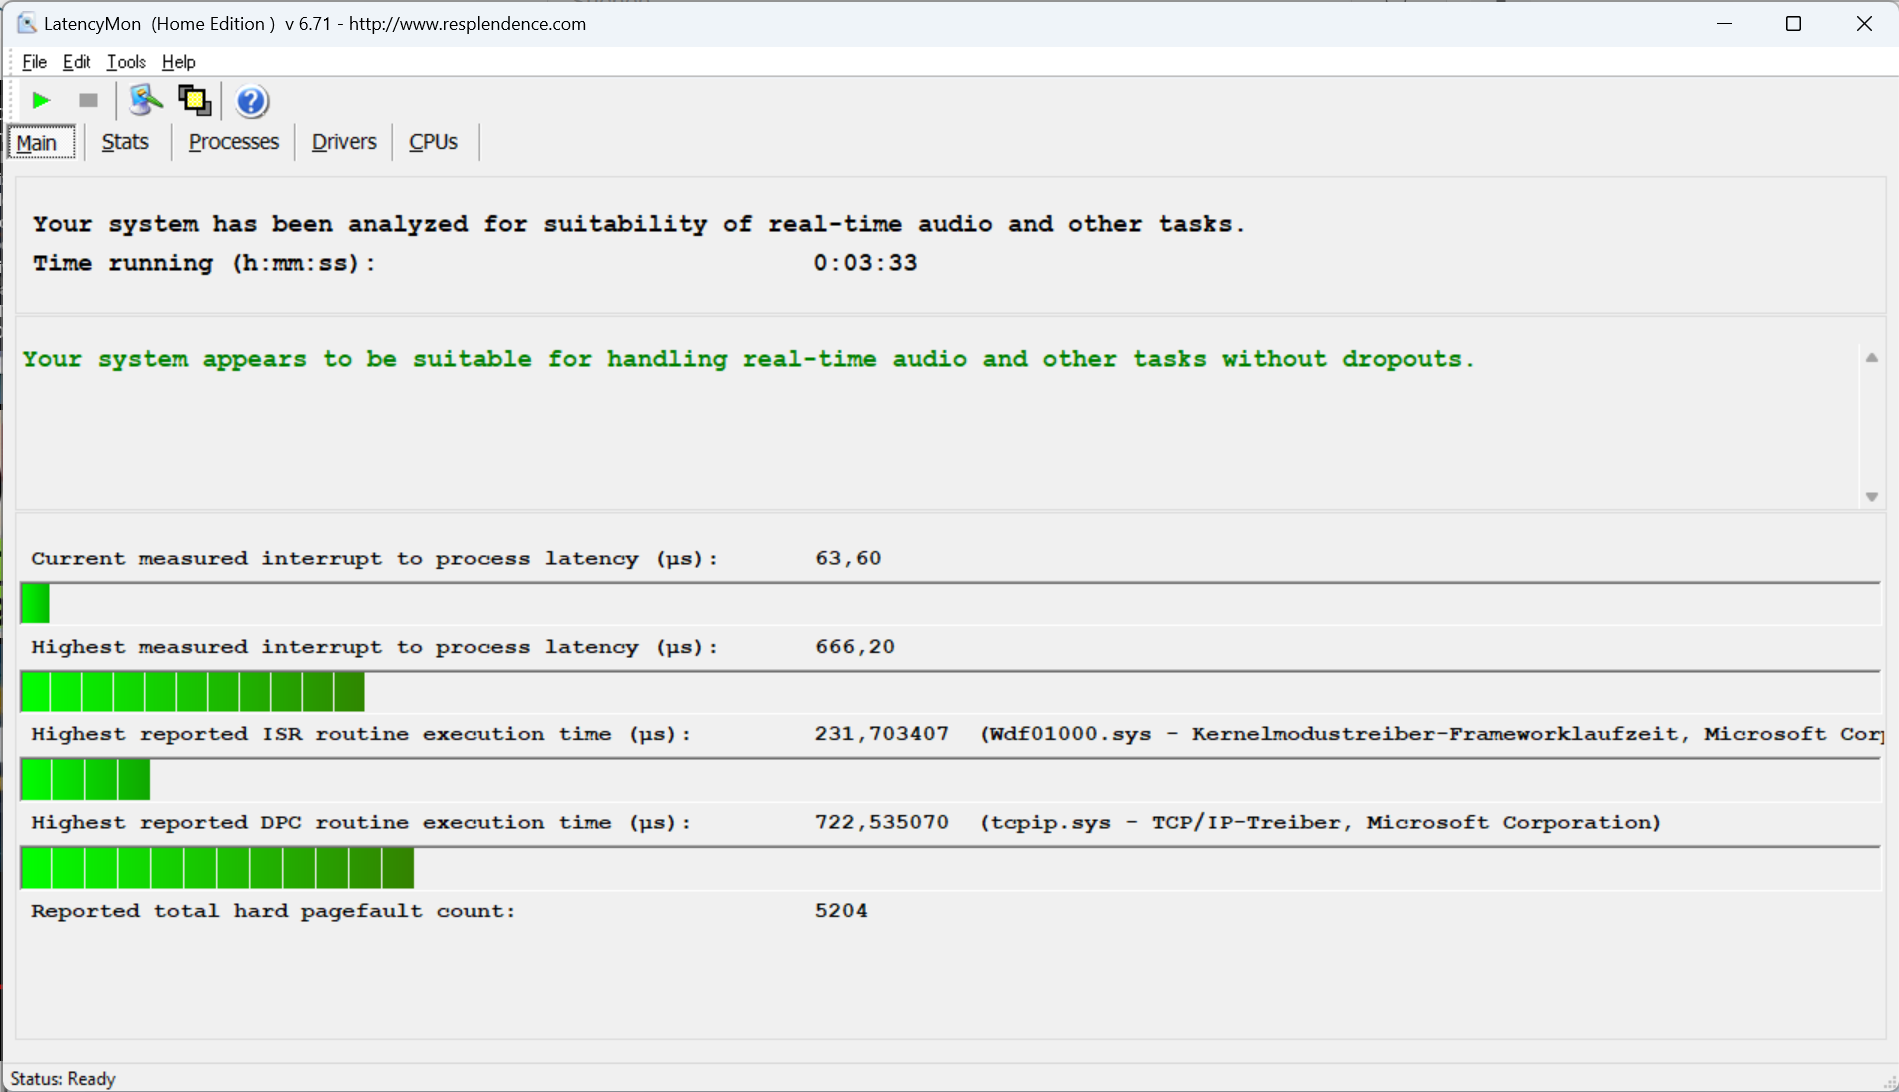
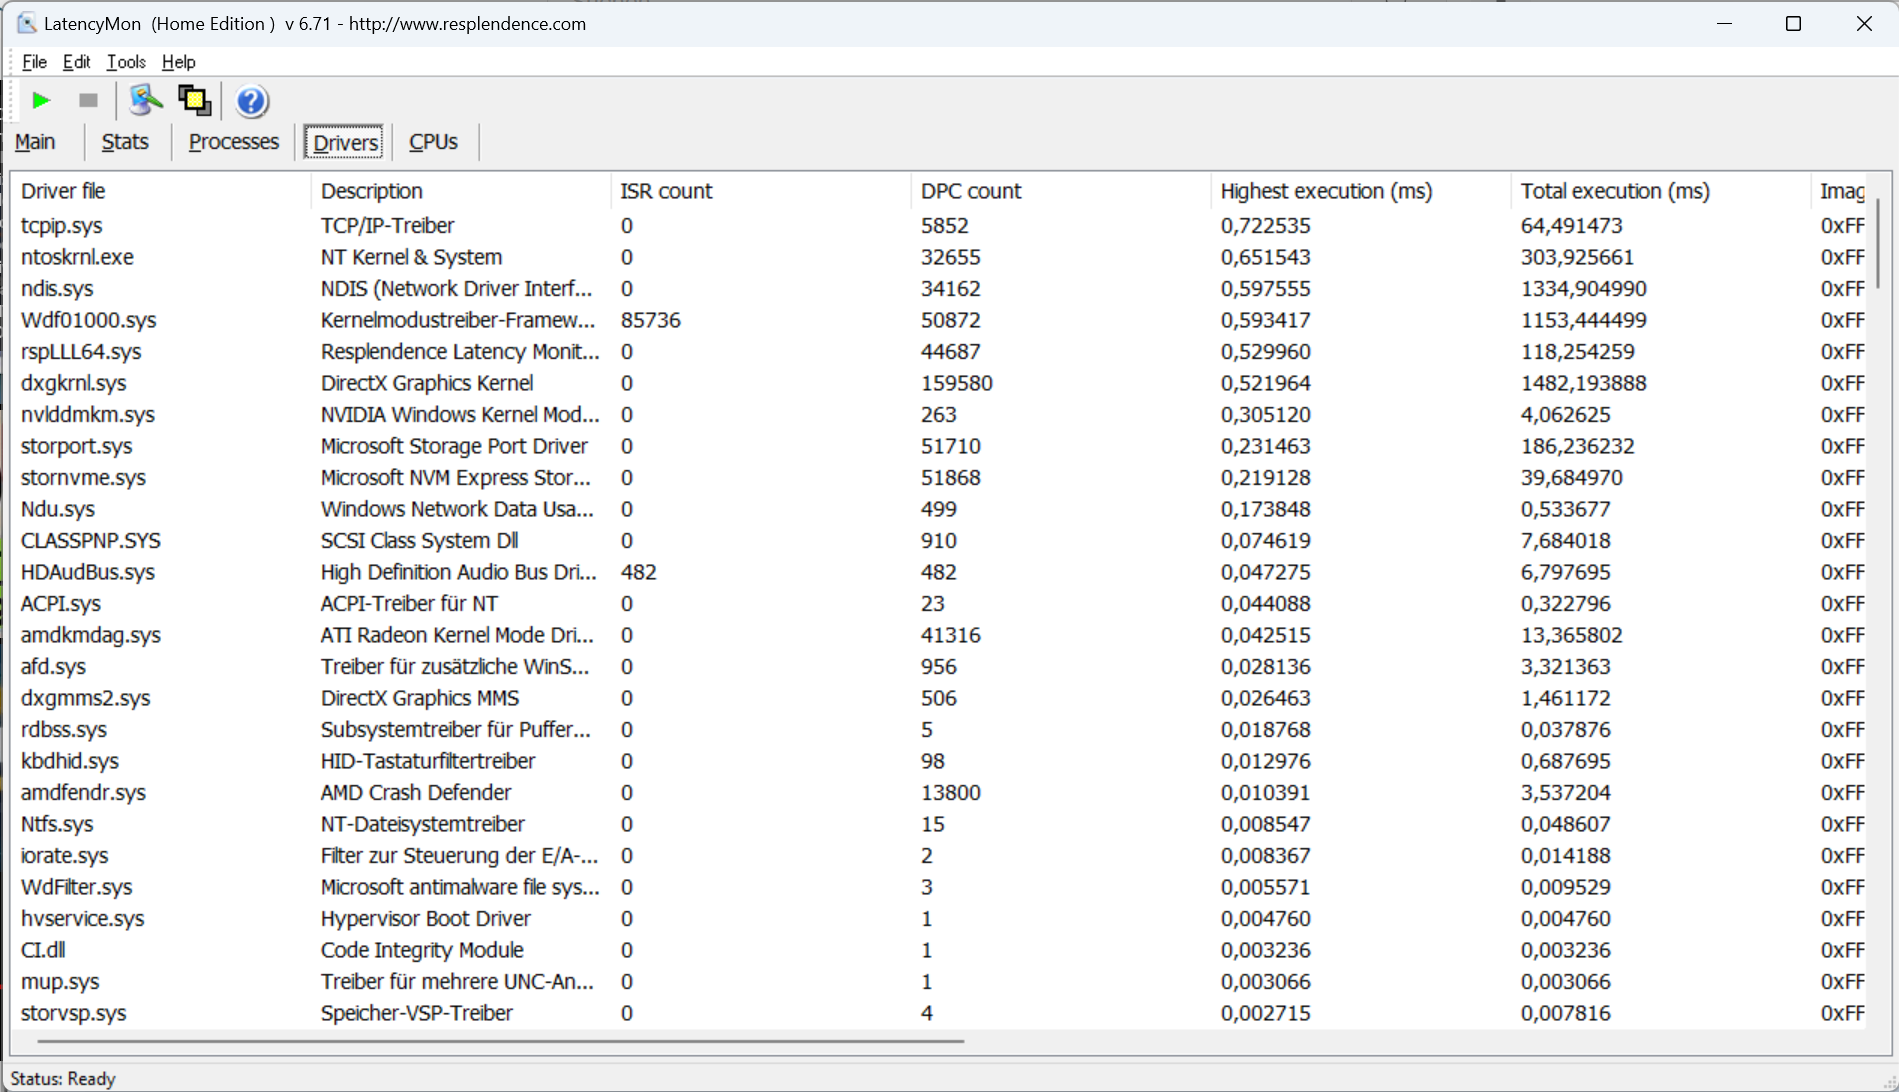
Latência DPC
Nossa impressão geral positiva continua com as latências do dispositivo. Ao contrário da maioria dos outros notebooks, o Legion Pro 5 é capaz de lidar com tarefas de áudio em tempo real, de acordo com o LatencyMon. Embora provavelmente poucas pessoas tenham planos de realizar processamento de áudio em tempo real, isso demonstra que os drivers estão bem configurados. Dito isso, a instalação de qualquer atualização ou software adicional pode alterar significativamente os resultados.
Embora não seja perfeito, os poucos quadros perdidos durante a transmissão de vídeo 4K são aceitáveis para um laptop para jogos. A iGPU (até 30% de uso) teve muito o que fazer durante o teste.
| DPC Latencies / LatencyMon - interrupt to process latency (max), Web, Youtube, Prime95 | |
| Medion Erazer Scout E20 | |
| Acer Nitro 5 AN517-55-5552 | |
| Lenovo Legion Pro 5 16IRX8 | |
| Lenovo Legion Pro 5 16ARX8 (R5 7645HX, RTX 4050) | |
| Asus TUF Gaming A16 FA617 | |
* ... menor é melhor
Armazenamento em massa
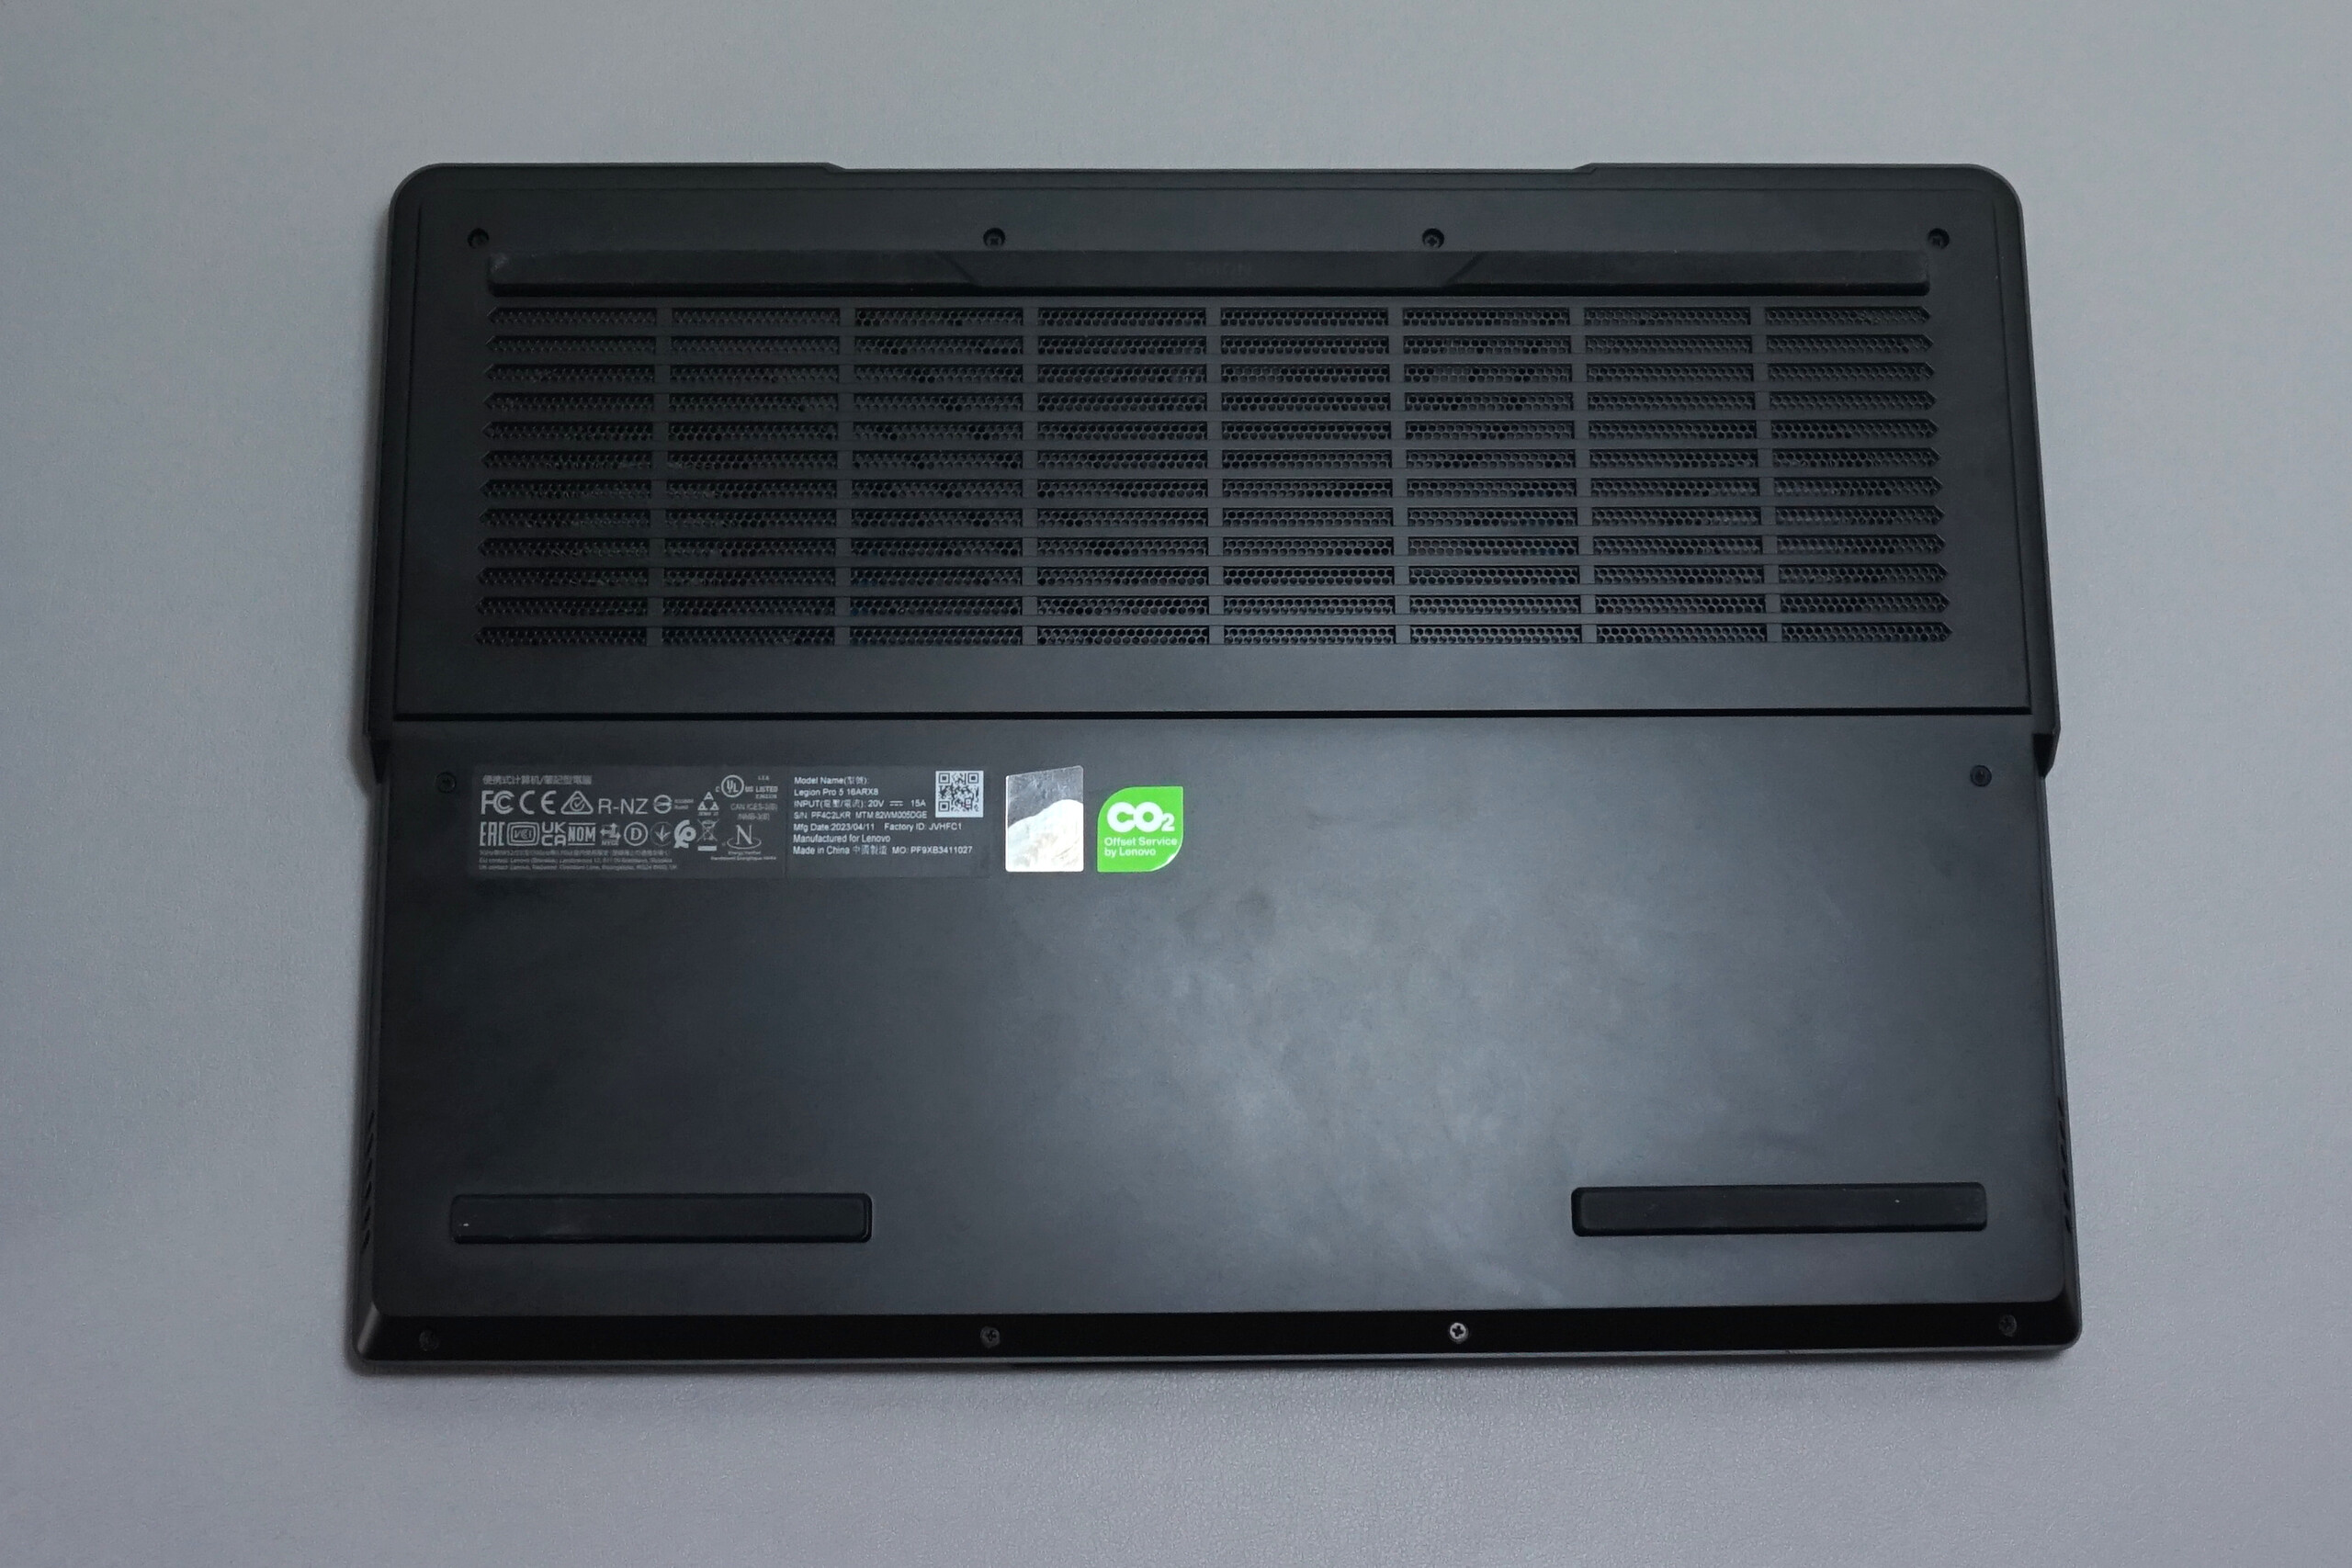
O SSD SK Hynix incluído forneceu velocidades de leitura e gravação acima da média. A unidade M.2 NVMe é capaz de fazer bom uso da interface PCIe 4.0. O único problema é que a capacidade de 512 GB é bastante insignificante. Até mesmo uma pequena coleção de jogos pode exigir rapidamente mais armazenamento do que isso. A boa notícia é que o Legion Pro 5 tem um segundo slot de SSD para permitir que você expanda facilmente a quantidade de armazenamento no sistema.

* ... menor é melhor
Sustained load Read: DiskSpd Read Loop, Queue Depth 8
Placa de vídeo
A Nvidia GeForce RTX 4050 é uma típica GPU de nível básico que é comparável a uma RTX 3060 em termos de desempenho. No entanto, com 30 núcleos RT e 80 núcleos Tensor, ela é significativamente menos bem especificada em comparação. Apesar do menor consumo de energia, a GPU ainda é capaz de manter os jogos funcionando sem problemas. Aumentar sua potência até o nível máximo permitido também não oferece nenhum aumento substancial no desempenho, como demonstramos em este artigo.
Uma grande vantagem de ter um consumo de energia menor é que a GPU produz muito menos calor, o que significa que os ventiladores não precisam trabalhar tanto e o laptop pode permanecer mais frio.
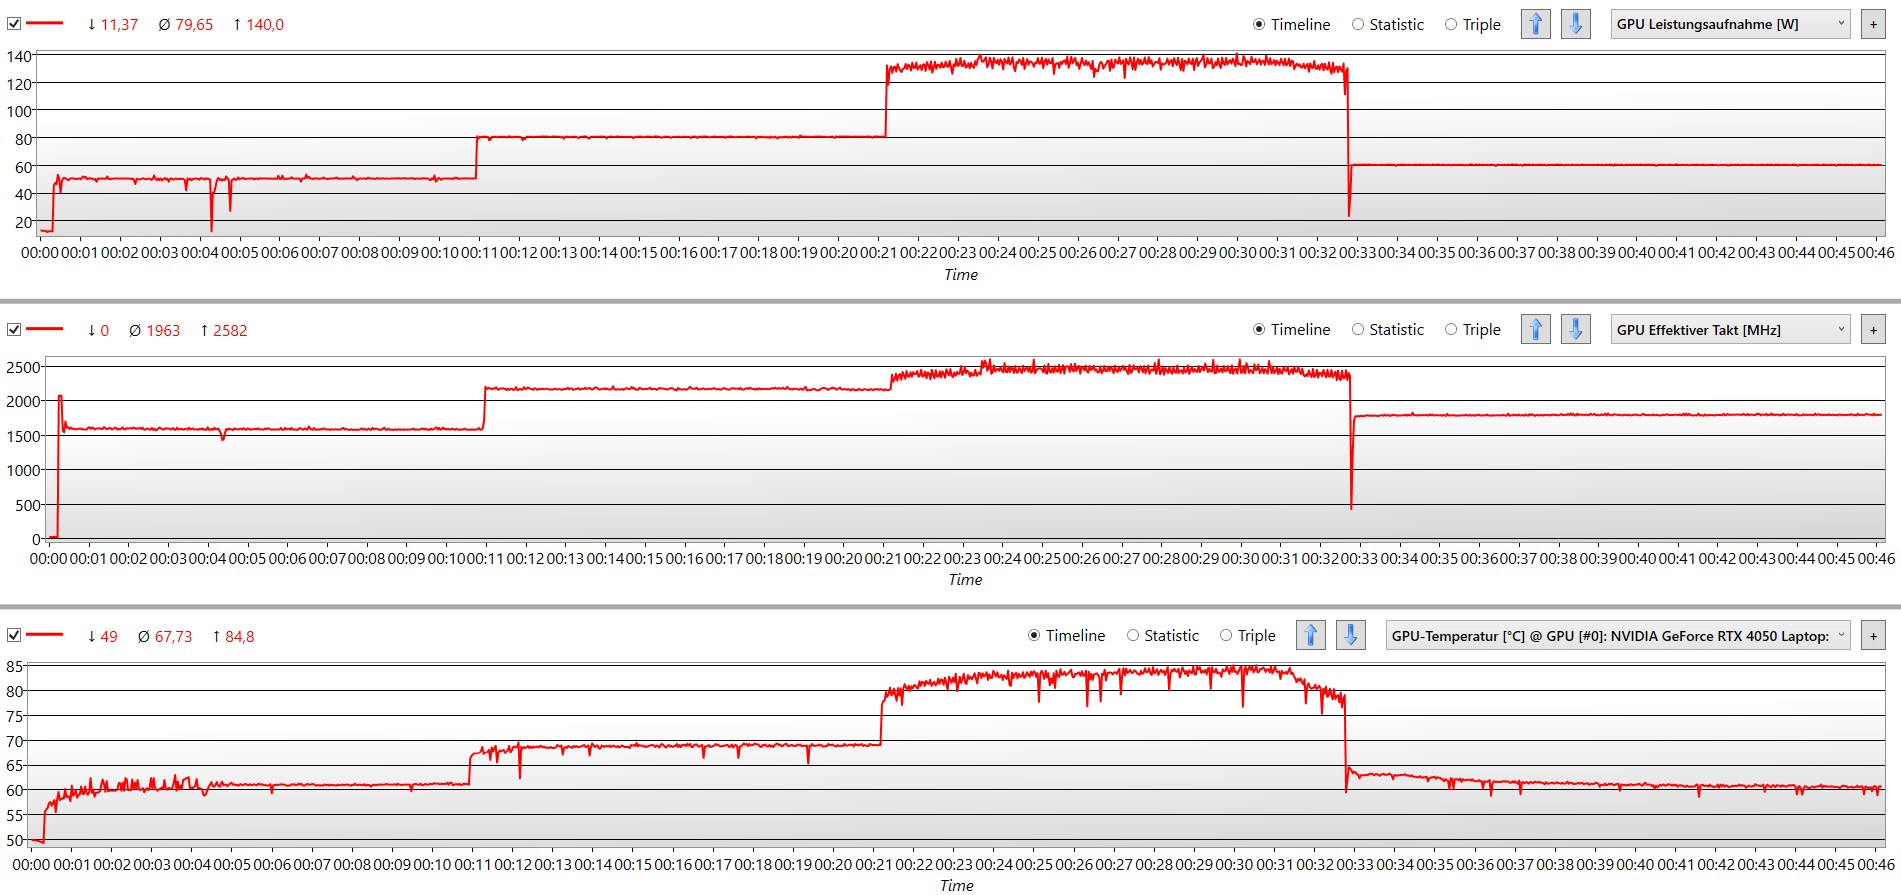
Com base em nossos testes, o Legion Pro aloca 50 W de energia para a placa de vídeo no modo silencioso; esse número é ainda maior, com 60 W de energia da bateria. O HWiNFO indicou que a GPU tem quase 130 W à sua disposição no modo Desempenho. O desempenho no 3Dmark é excepcional para uma RTX 4050. O Lenovo Legion Pro 5 16ARX8 conseguiu superar o Medion Erazer Scout E20 em cerca de 20% no 3Dmark Time Spy, mantendo o ruído da ventoinha em um nível moderado.
O software Lenovo Vantage permite que você personalize ainda mais o desempenho. Sem limitar o desempenho da GPU, é possível diminuir o consumo de energia do processador para reduzir o ruído do ventilador. Após testar várias configurações, não foi possível obter resultados melhores do que os observados no modo Desempenho.
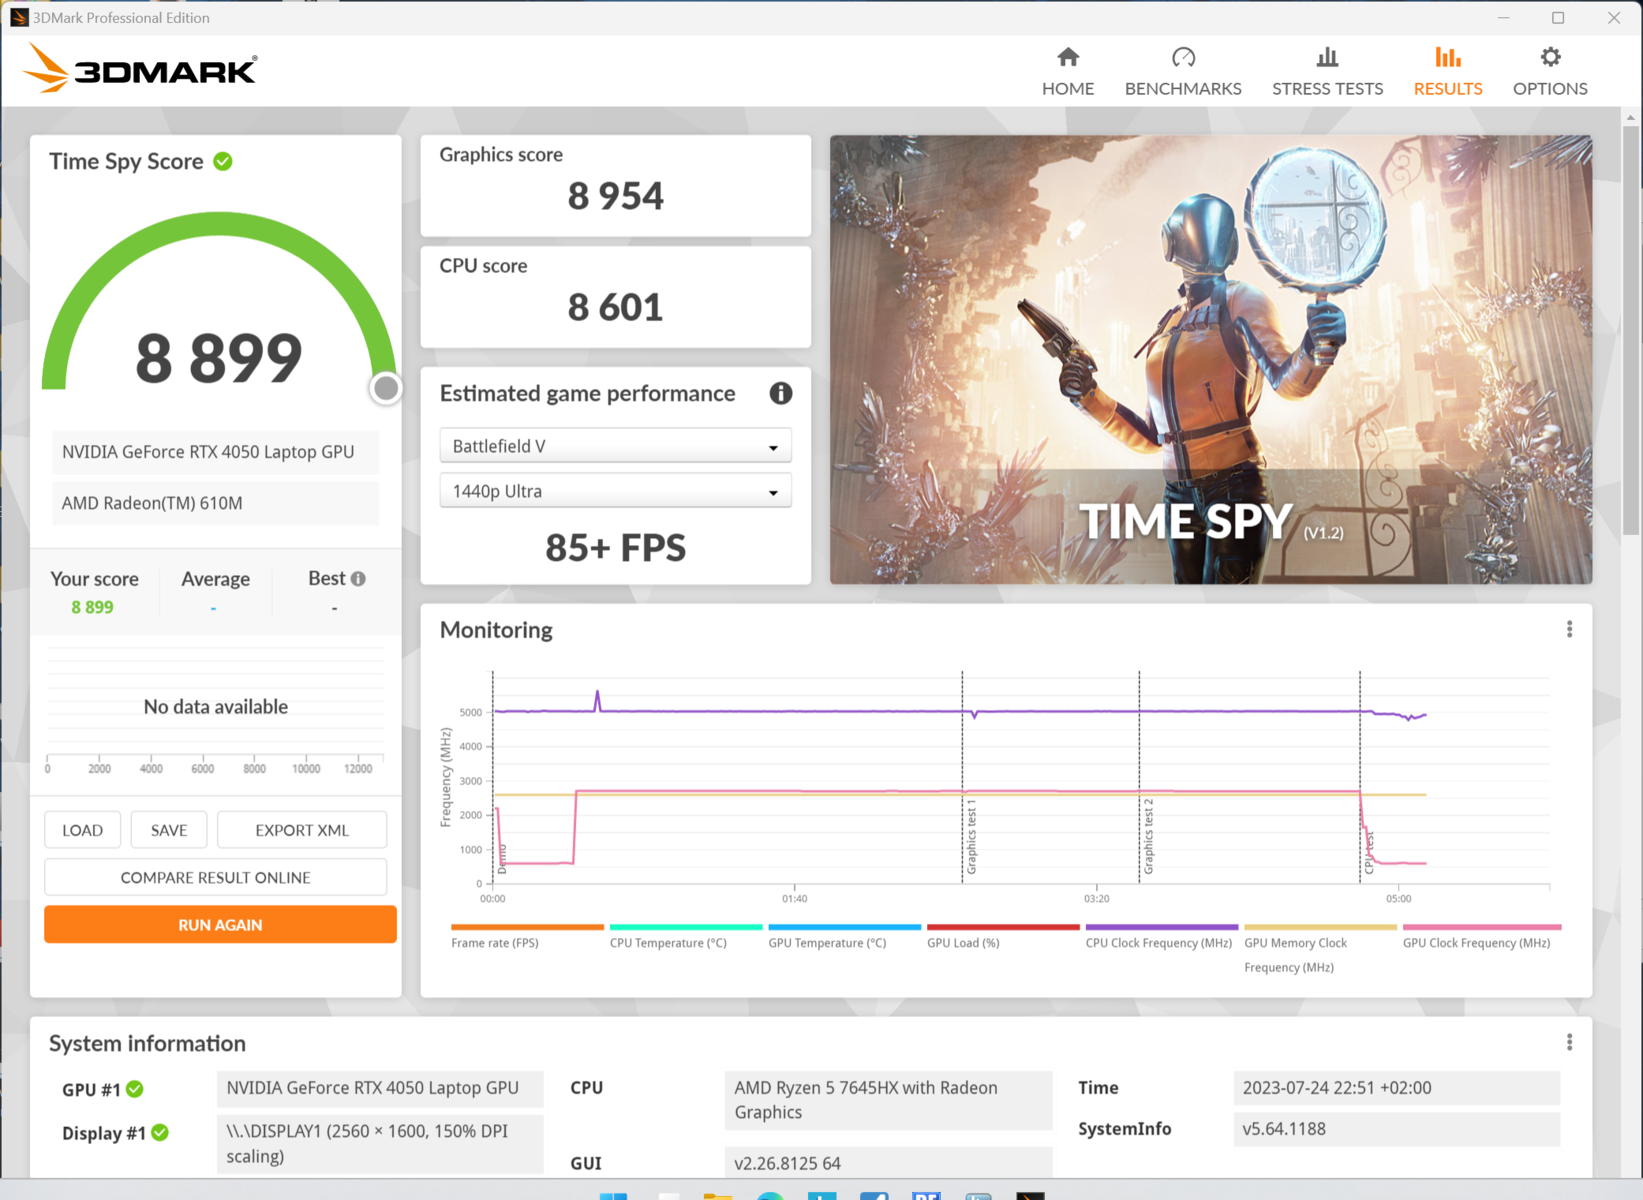

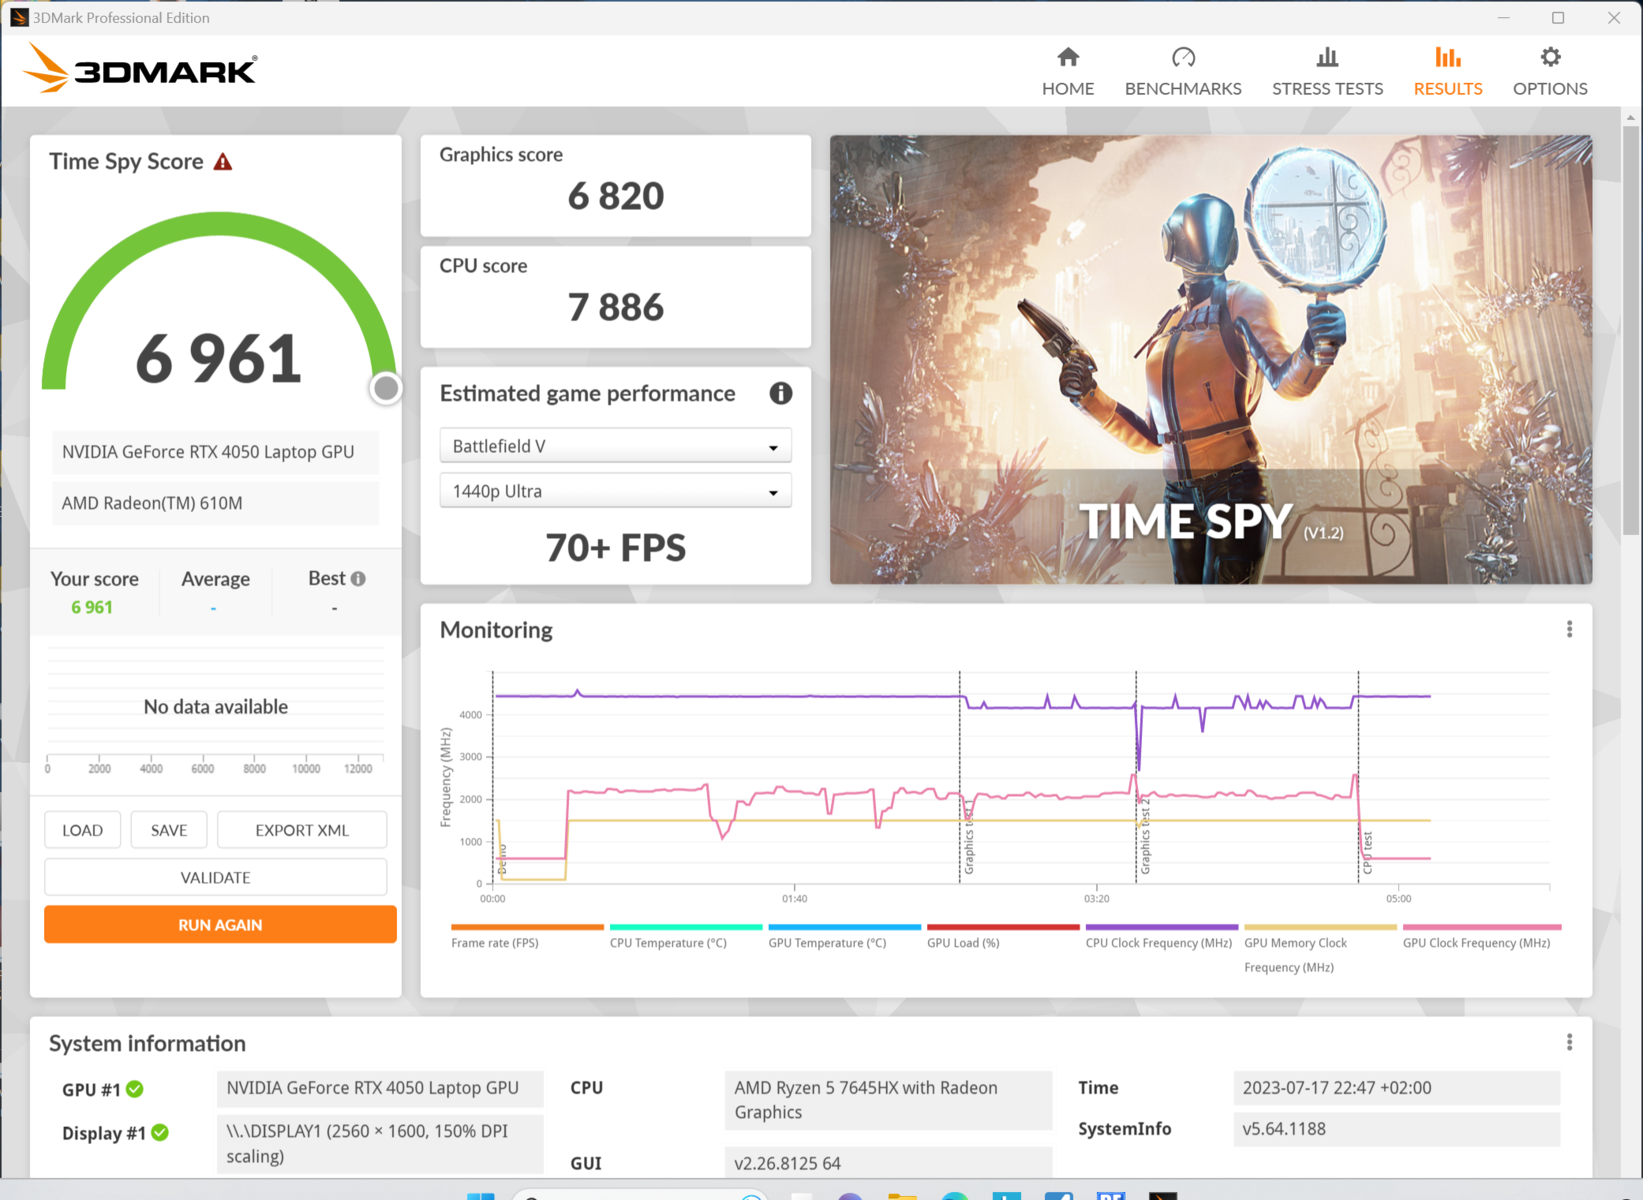
| 3DMark 11 Performance | 27506 pontos | |
| 3DMark Cloud Gate Standard Score | 54487 pontos | |
| 3DMark Fire Strike Score | 21537 pontos | |
| 3DMark Time Spy Score | 8899 pontos | |
Ajuda | ||
* ... menor é melhor
Desempenho em jogos
A execução de jogos modernos com configurações máximas e resolução nativa leva o Lenovo Legion Pro 5 aos seus limites. Em comparação com o Asus TUF A15 ou o Medion Erazer Scoutambos equipados com a RTX 4050o Legion Pro 5 teve um desempenho muito melhor em nossos benchmarks de jogos. A Lenovo conseguiu extrair 20% mais FPS da placa de vídeo em alguns casos.
Os resultados variam um pouco dependendo do jogo. Por exemplo, Star Wars Jedi: Survivor foi executado de forma consistente com FPS muito alto, mas as taxas de quadros ficaram abaixo da média em Hogwarts Legacy. Dito isso, precisamos afirmar que esses dois títulos mais recentes são muito suaves e jogáveis em configurações altas.
Na tabela abaixo, usamos os resultados do benchmark F1 23 para ilustrar a diferença entre os modos Desempenho e Silencioso. O modo Silencioso diminui o desempenho em cerca de 20%, enquanto reduz o ruído máximo do ventilador de 50 para 33 decibéis. Em outras palavras: o laptop para jogos é cerca de 70% mais silencioso no modo Silencioso e, ainda assim, permite que a maioria dos jogos seja executada sem problemas.
F1 23 nos modos Silencioso e Desempenho
| High/FHD | Ultra/FHD | Ultra/QHD | ruído máximo do ventilador | |
|---|---|---|---|---|
| Silencioso | 133 FPS | 39 FPS | 34 FPS | 33 dB(A) |
| Desempenho | 165 FPS | 51 FPS | 41 FPS | 50 dB(A) |
| The Witcher 3 - 1920x1080 Ultra Graphics & Postprocessing (HBAO+) | |
| Média da turma Gaming (104.7 - 240, n=7, últimos 2 anos) | |
| Lenovo Legion Pro 5 16IRX8 | |
| Acer Nitro 17 AN17-51-71ER | |
| Asus TUF Gaming A16 FA617 | |
| Lenovo Legion Pro 5 16ARX8 (R5 7645HX, RTX 4050) | |
| Acer Nitro 5 AN517-55-5552 | |
| Medion Erazer Scout E20 | |
| Asus TUF A15 FA507 | |
| The Witcher 3 | |
| 1920x1080 High Graphics & Postprocessing (Nvidia HairWorks Off) | |
| Média da turma Gaming (341 - 404, n=2, últimos 2 anos) | |
| Lenovo Legion Pro 5 16IRX8 | |
| Lenovo Legion Pro 5 16ARX8 (R5 7645HX, RTX 4050) | |
| Asus TUF A15 FA507 | |
| Acer Nitro 5 AN517-55-5552 | |
| Asus TUF Gaming A16 FA617 | |
| Medion Erazer Scout E20 | |
| Média NVIDIA GeForce RTX 4050 Laptop GPU (87 - 177, n=28) | |
| 1920x1080 Ultra Graphics & Postprocessing (HBAO+) | |
| Média da turma Gaming (104.7 - 240, n=7, últimos 2 anos) | |
| Lenovo Legion Pro 5 16IRX8 | |
| Asus TUF Gaming A16 FA617 | |
| Lenovo Legion Pro 5 16ARX8 (R5 7645HX, RTX 4050) | |
| Acer Nitro 5 AN517-55-5552 | |
| Medion Erazer Scout E20 | |
| Asus TUF A15 FA507 | |
| Média NVIDIA GeForce RTX 4050 Laptop GPU (18.5 - 94.7, n=40) | |
| Hogwarts Legacy | |
| 1920x1080 High Preset AA:High T | |
| Asus TUF A15 FA507 | |
| Acer Nitro 5 AN517-55-5552 | |
| Média NVIDIA GeForce RTX 4050 Laptop GPU (44.8 - 93.6, n=8) | |
| Lenovo Legion Pro 5 16ARX8 (R5 7645HX, RTX 4050) | |
| 1920x1080 Ultra Preset AA:High T | |
| Média da turma Gaming (n=1últimos 2 anos) | |
| Média NVIDIA GeForce RTX 4050 Laptop GPU (39 - 77.3, n=8) | |
| Acer Nitro 5 AN517-55-5552 | |
| Lenovo Legion Pro 5 16ARX8 (R5 7645HX, RTX 4050) | |
| Asus TUF A15 FA507 | |
O desempenho do sistema permaneceu perfeitamente estável durante nosso teste de estresse Witcher 3. As flutuações que você vê foram causadas pelo ciclo dia-noite no jogo. Como em muitos outros benchmarks, o Legion Pro 5 está marginalmente à frente dos concorrentes com a mesma GPU.
Witcher 3 FPS chart
| baixo | média | alto | ultra | QHD | |
|---|---|---|---|---|---|
| GTA V (2015) | 174.6 | 101.7 | 63 | ||
| The Witcher 3 (2015) | 177 | 89 | |||
| Dota 2 Reborn (2015) | 191.8 | 175.6 | |||
| Final Fantasy XV Benchmark (2018) | 86.3 | 62.3 | |||
| X-Plane 11.11 (2018) | 110 | ||||
| Far Cry 5 (2018) | 131 | 119 | 88 | ||
| Strange Brigade (2018) | 174.8 | 152.8 | 100.7 | ||
| Hogwarts Legacy (2023) | 64 | 52 | 35 | ||
| Sons of the Forest (2023) | 76 | 76 | 56 | ||
| Star Wars Jedi Survivor (2023) | 60 | 56 | 35 | ||
| F1 23 (2023) | 165.2 | 50.5 | 40.8 |
Emissões - Notebook para jogos silencioso e quente
Emissões de ruído
O laptop Lenovo é efetivamente inaudível quando usado para navegação na Internet, streaming de mídia e outras tarefas menos exigentes. Com apenas 24 dB, o nível de ruído que medimos é indistinguível de um ruído de fundo muito baixo.
O nível de ruído aumentou para 44 dB sob carga pesada. No mesmo cenário (Witcher 3 em Ultra/FHD), o Medion Erazer Scout E20 foi 50% mais barulhento e apresentou taxas de quadros piores. No modo silencioso, o Legion Pro não é nem metade do ruído do Scout E20 e, ainda assim, consegue atingir quase 80 FPS em Witcher 3. O laptop só atingiu o nível de ruído máximo de 50 dB durante o teste de estresse.
Se você quiser, o Legion Pro 5 pode executar jogos sem nenhum ruído de distração da ventoinha; no máximo, você ouvirá um zumbido silencioso. Isso pode ser obtido facilmente com o ajuste das várias configurações disponíveis. O laptop também nunca fica mais alto do que um ambiente de trabalho silencioso no modo Silencioso.
Barulho
| Ocioso |
| 23 / 23 / 24.42 dB |
| Carga |
| 34.94 / 50 dB |
 | ||
30 dB silencioso 40 dB(A) audível 50 dB(A) ruidosamente alto |
||
min: | ||
| Lenovo Legion Pro 5 16ARX8 (R5 7645HX, RTX 4050) GeForce RTX 4050 Laptop GPU, R5 7645HX, SK hynix PC801 HFS512GEJ9X115N | Lenovo Legion Pro 5 16IRX8 GeForce RTX 4060 Laptop GPU, i7-13700HX, SK hynix PC801 HFS512GEJ9X115N | Asus TUF A15 FA507 GeForce RTX 4050 Laptop GPU, R7 7735HS, Micron 2400 MTFDKBA512QFM | Asus TUF Gaming A16 FA617 Radeon RX 7600S, R7 7735HS, Micron 2400 MTFDKBA1T0QFM | Acer Nitro 5 AN517-55-5552 GeForce RTX 4050 Laptop GPU, i5-12500H, WDC PC SN810 512GB | Medion Erazer Scout E20 GeForce RTX 4050 Laptop GPU, i7-13700H, Phison PS5021-E21 1TB | |
|---|---|---|---|---|---|---|
| Noise | -4% | 5% | -9% | -34% | -23% | |
| desligado / ambiente * (dB) | 23 | 23 -0% | 23.3 -1% | 24 -4% | 25.7 -12% | 25 -9% |
| Idle Minimum * (dB) | 23 | 23.1 -0% | 23.3 -1% | 24 -4% | 25.7 -12% | 26 -13% |
| Idle Average * (dB) | 23 | 23.1 -0% | 23.3 -1% | 25 -9% | 31.5 -37% | 27 -17% |
| Idle Maximum * (dB) | 24.42 | 26.6 -9% | 23.3 5% | 28 -15% | 31.2 -28% | 32 -31% |
| Load Average * (dB) | 34.94 | 34.7 1% | 29.6 15% | 42 -20% | 62.9 -80% | 57 -63% |
| Witcher 3 ultra * (dB) | 43.79 | 47.6 -9% | 43 2% | 50 -14% | 50 -14% | |
| Load Maximum * (dB) | 50 | 54.8 -10% | 43 14% | 50 -0% | 67.5 -35% | 57 -14% |
* ... menor é melhor
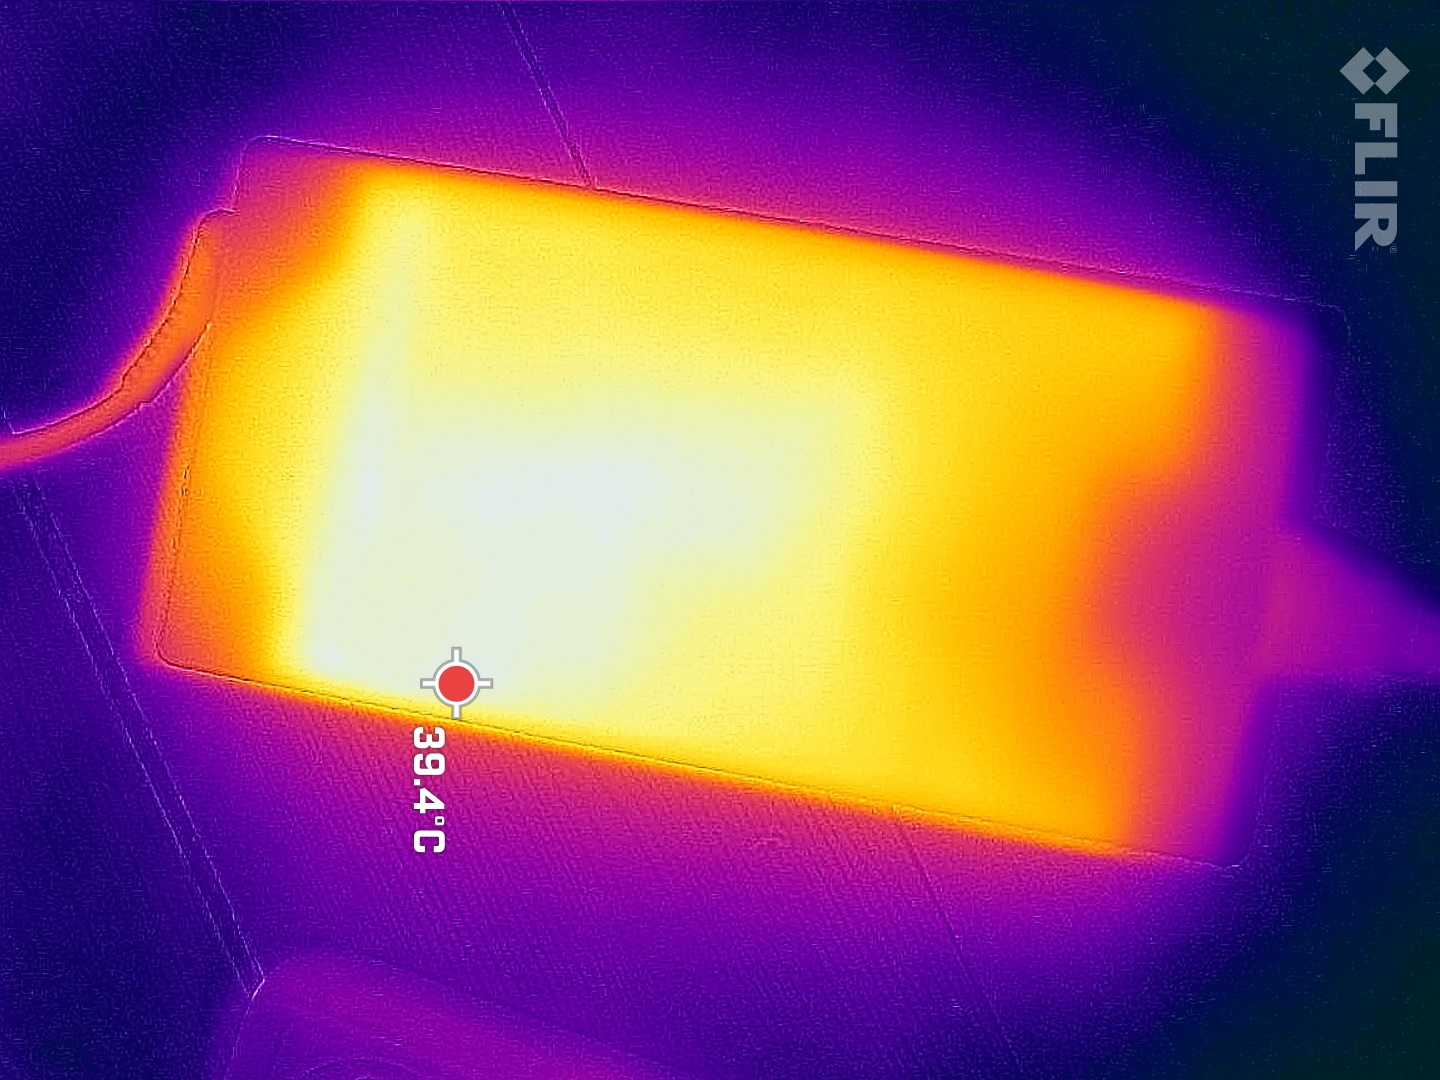
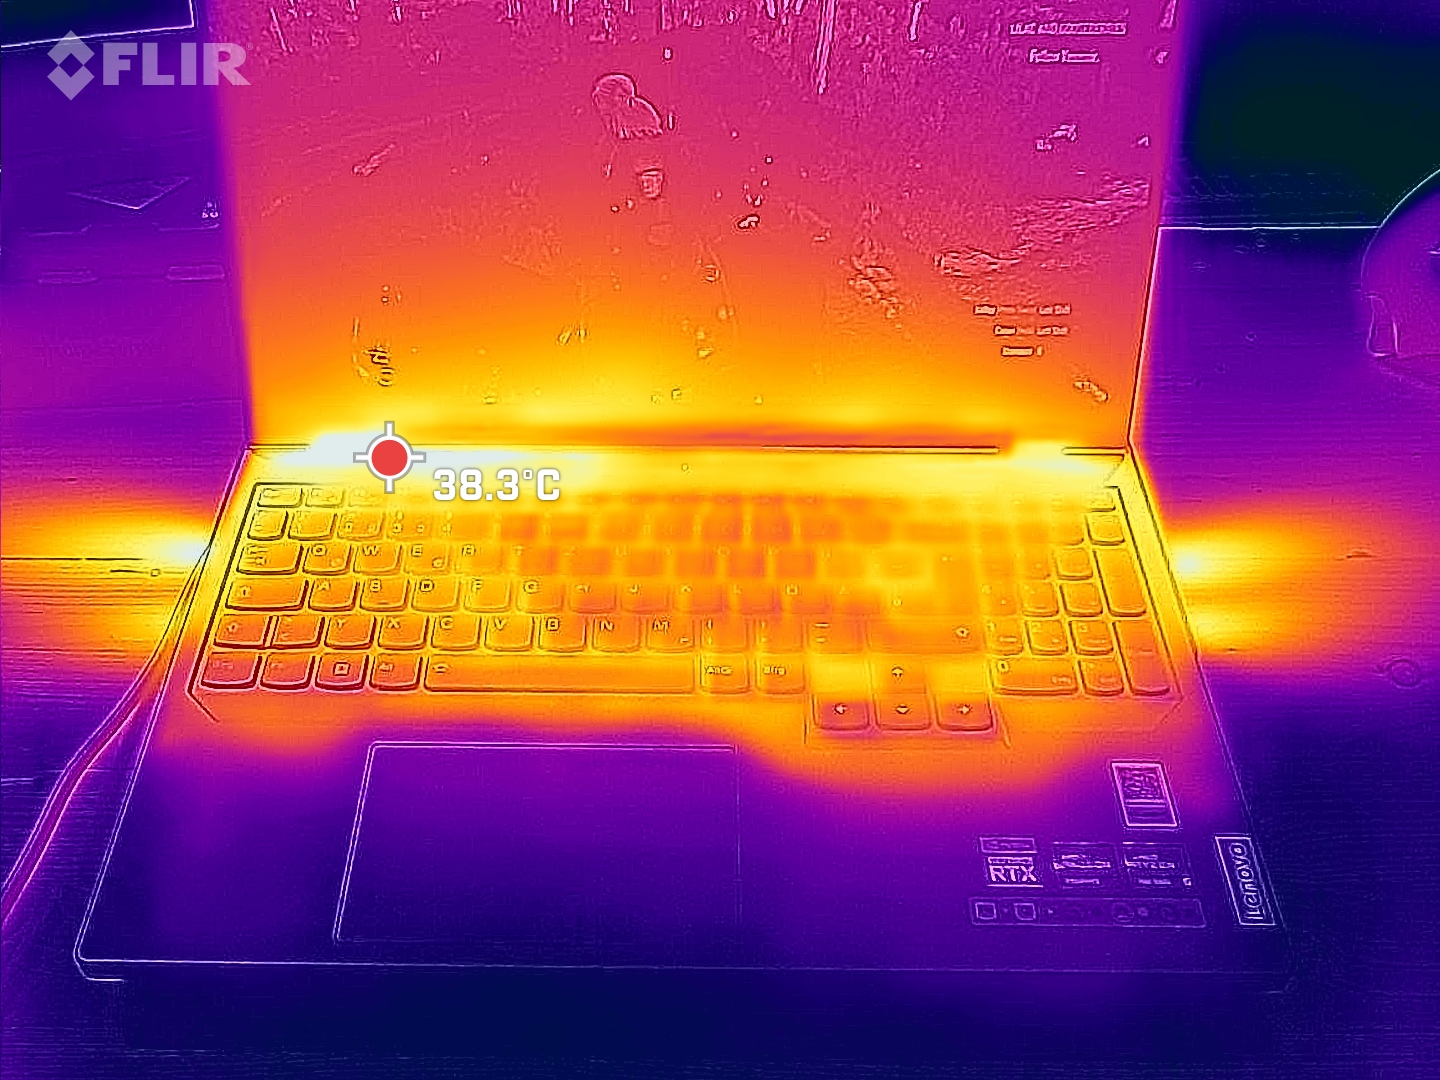
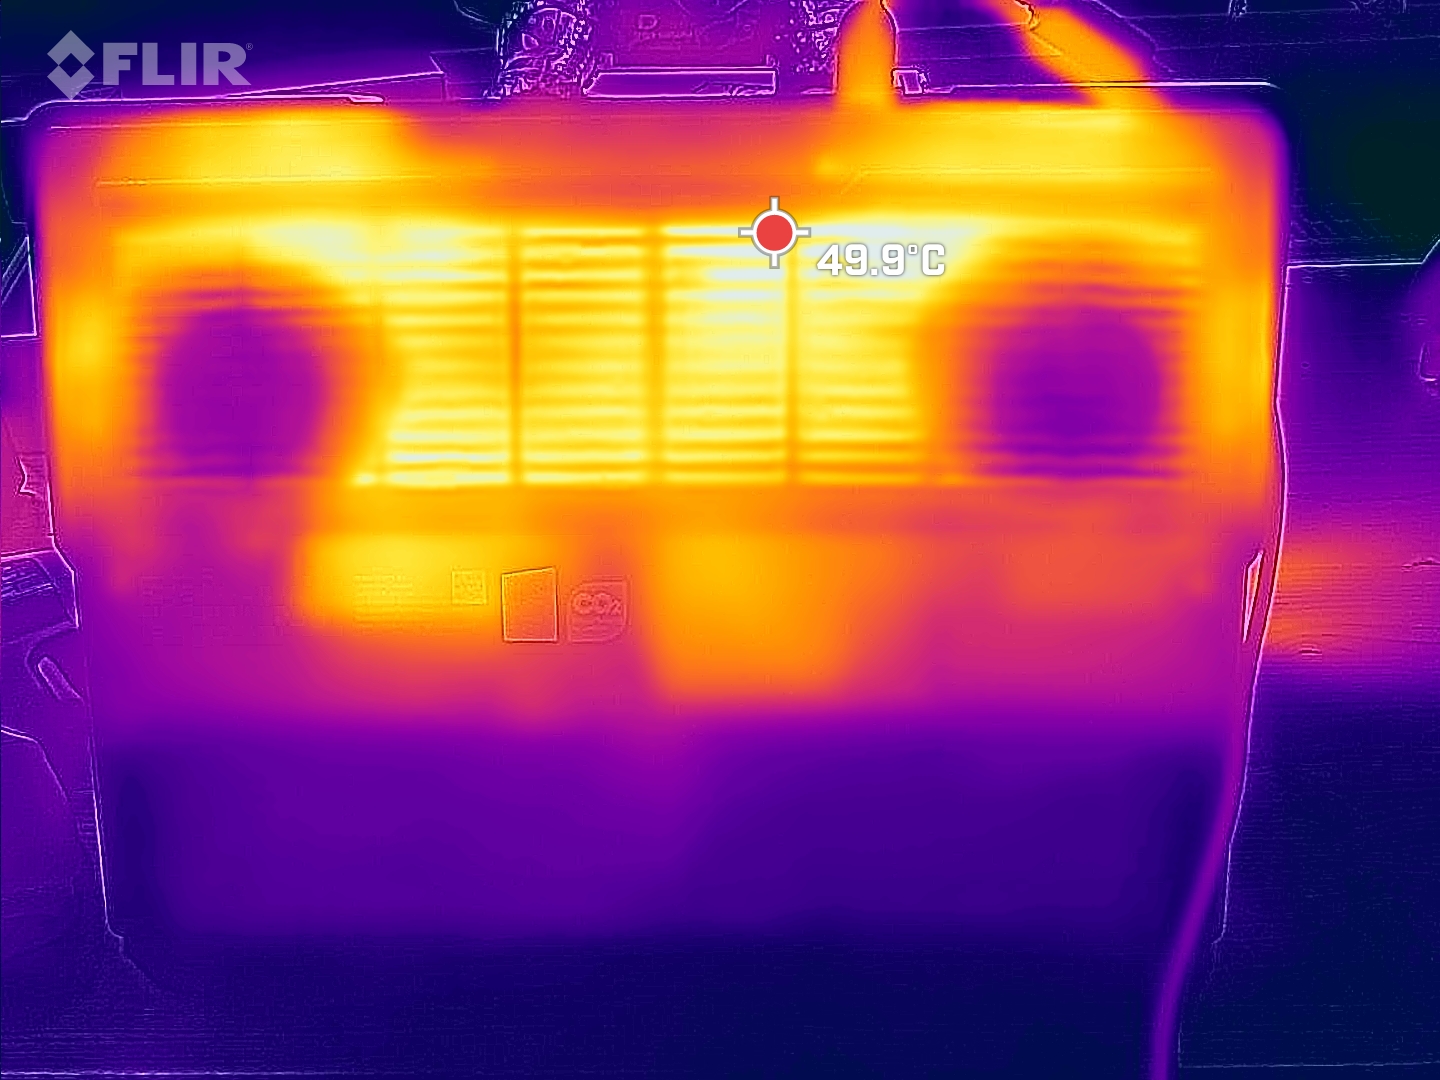
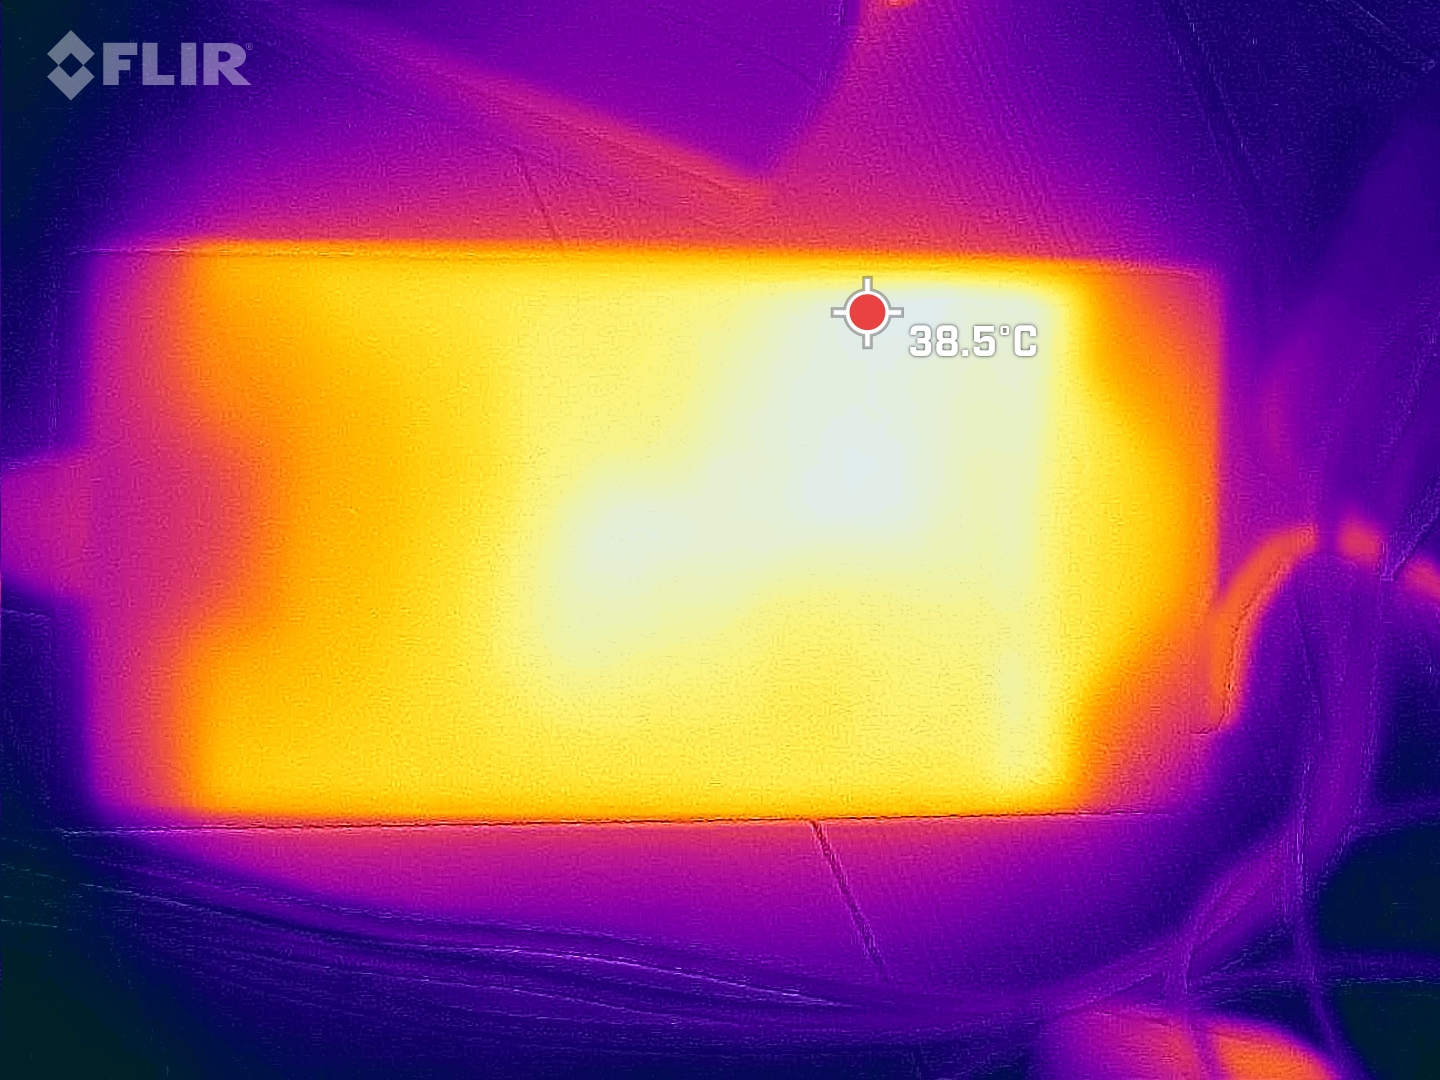
Temperatura
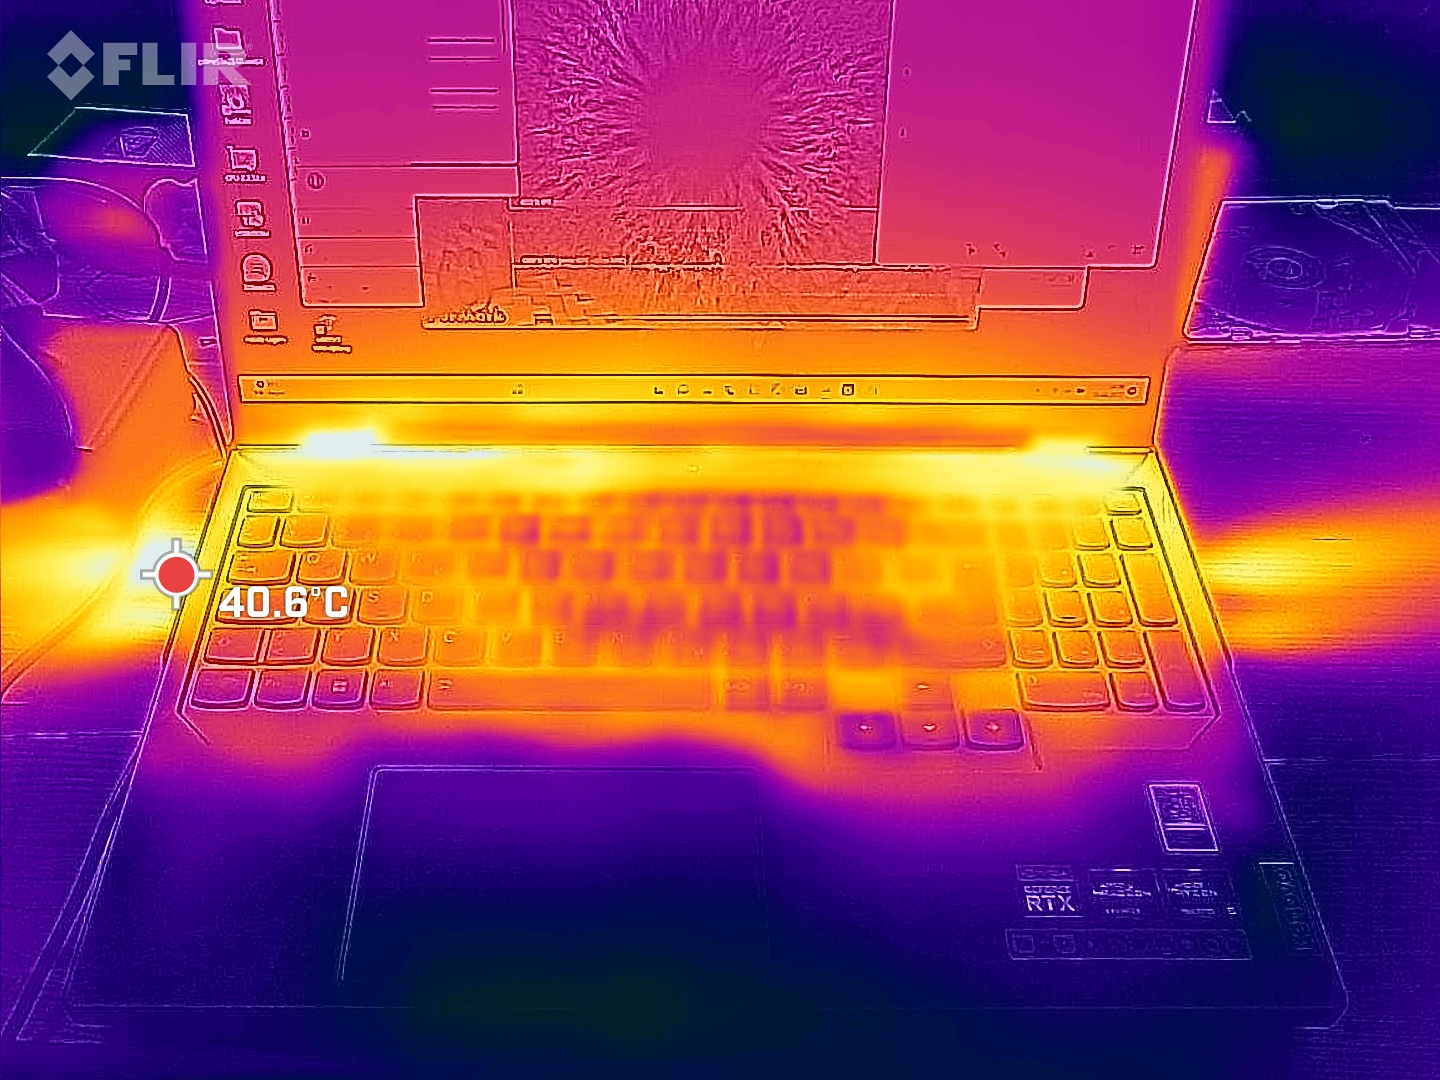
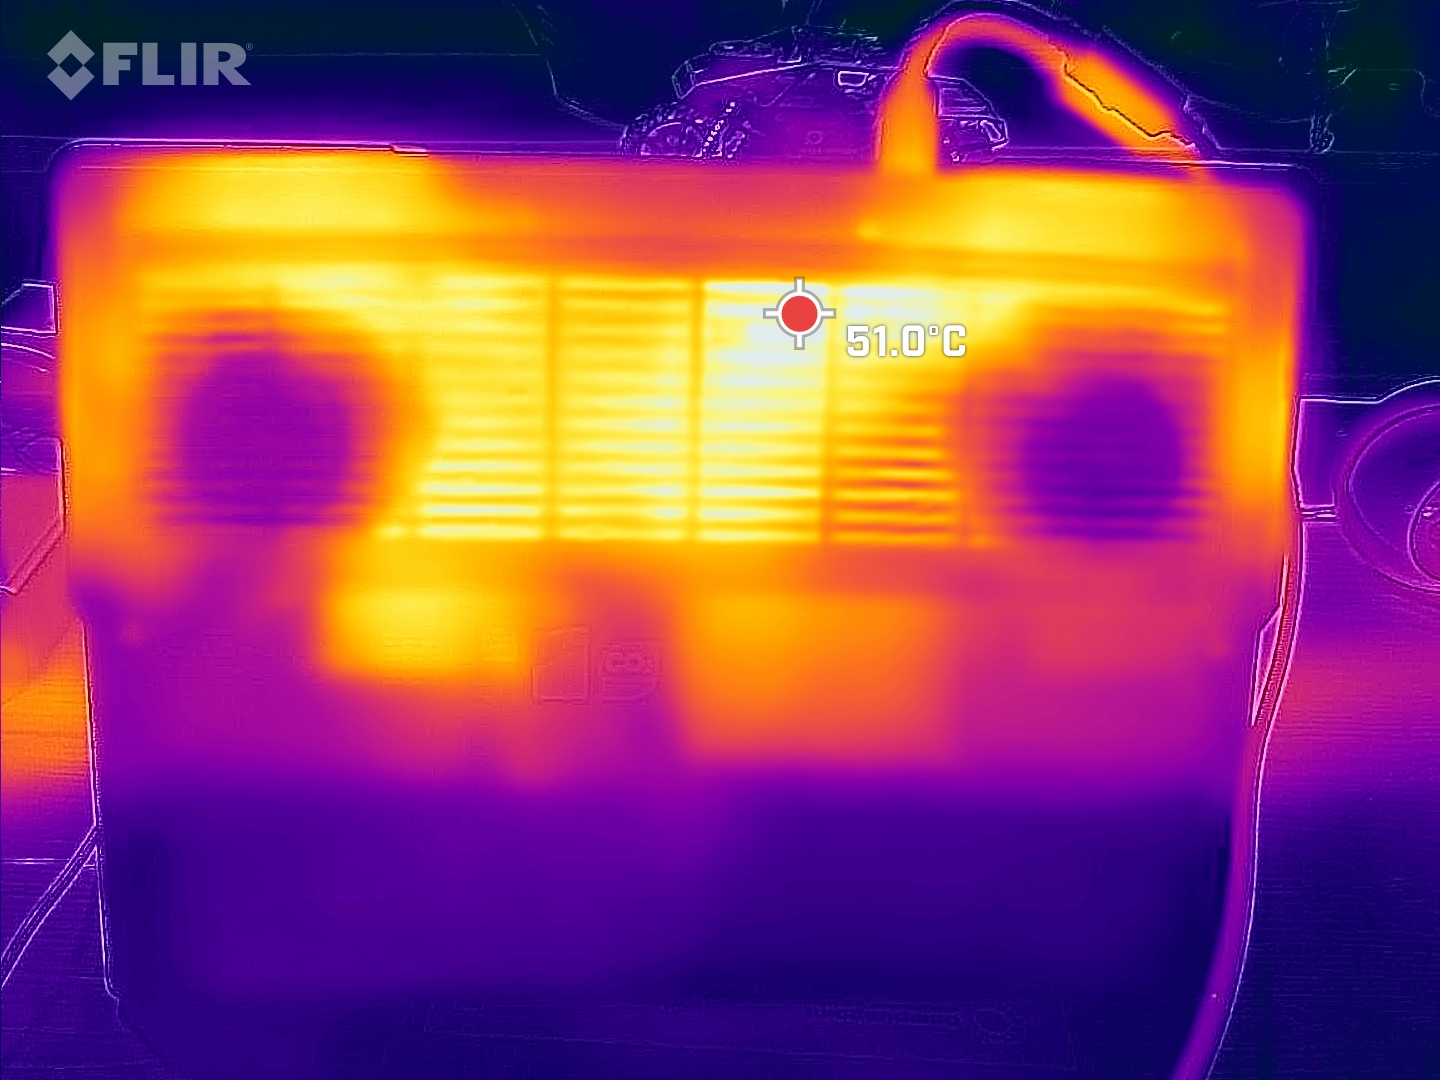
As coisas não são tão agradáveis quando se trata da parte térmica. Como as ventoinhas são quase inaudíveis durante tarefas simples, o laptop também tem uma dissipação de calor fraca. No modo inativo, medimos temperaturas de até 36°C (96,8°F) no teclado - muito quente. O ideal é que ela fique em torno de 30°C (86°F).
Dito isso, achamos que ainda é aceitável que o lado superior atinja 45°C (113°F) na carga máxima. E os apoios para as mãos conseguiram se manter frios durante todo o tempo. Somente a parte inferior do laptop ficou desagradavelmente quente a 54°C (129°F).
(±) A temperatura máxima no lado superior é 45 °C / 113 F, em comparação com a média de 40.4 °C / 105 F , variando de 21.2 a 68.8 °C para a classe Gaming.
(-) A parte inferior aquece até um máximo de 54 °C / 129 F, em comparação com a média de 43.2 °C / 110 F
(±) Em uso inativo, a temperatura média para o lado superior é 32.3 °C / 90 F, em comparação com a média do dispositivo de 33.9 °C / ### class_avg_f### F.
(±) Jogando The Witcher 3, a temperatura média para o lado superior é 35.2 °C / 95 F, em comparação com a média do dispositivo de 33.9 °C / ## #class_avg_f### F.
(+) Os apoios para as mãos e o touchpad são mais frios que a temperatura da pele, com um máximo de 31 °C / 87.8 F e, portanto, são frios ao toque.
(-) A temperatura média da área do apoio para as mãos de dispositivos semelhantes foi 28.8 °C / 83.8 F (-2.2 °C / -4 F).
| Lenovo Legion Pro 5 16ARX8 (R5 7645HX, RTX 4050) AMD Ryzen 5 7645HX, NVIDIA GeForce RTX 4050 Laptop GPU | Lenovo Legion Pro 5 16IRX8 Intel Core i7-13700HX, NVIDIA GeForce RTX 4060 Laptop GPU | Asus TUF A15 FA507 AMD Ryzen 7 7735HS, NVIDIA GeForce RTX 4050 Laptop GPU | Asus TUF Gaming A16 FA617 AMD Ryzen 7 7735HS, AMD Radeon RX 7600S | Acer Nitro 5 AN517-55-5552 Intel Core i5-12500H, NVIDIA GeForce RTX 4050 Laptop GPU | Medion Erazer Scout E20 Intel Core i7-13700H, NVIDIA GeForce RTX 4050 Laptop GPU | |
|---|---|---|---|---|---|---|
| Heat | 10% | 15% | -6% | 11% | 19% | |
| Maximum Upper Side * (°C) | 45 | 42.8 5% | 48.9 -9% | 54 -20% | 42.4 6% | 41 9% |
| Maximum Bottom * (°C) | 54 | 50 7% | 44.6 17% | 47 13% | 48.2 11% | 39 28% |
| Idle Upper Side * (°C) | 36 | 29.6 18% | 27.1 25% | 40 -11% | 31.6 12% | 31 14% |
| Idle Bottom * (°C) | 38 | 34 11% | 27.5 28% | 40 -5% | 33.1 13% | 29 24% |
* ... menor é melhor
Teste de estresse
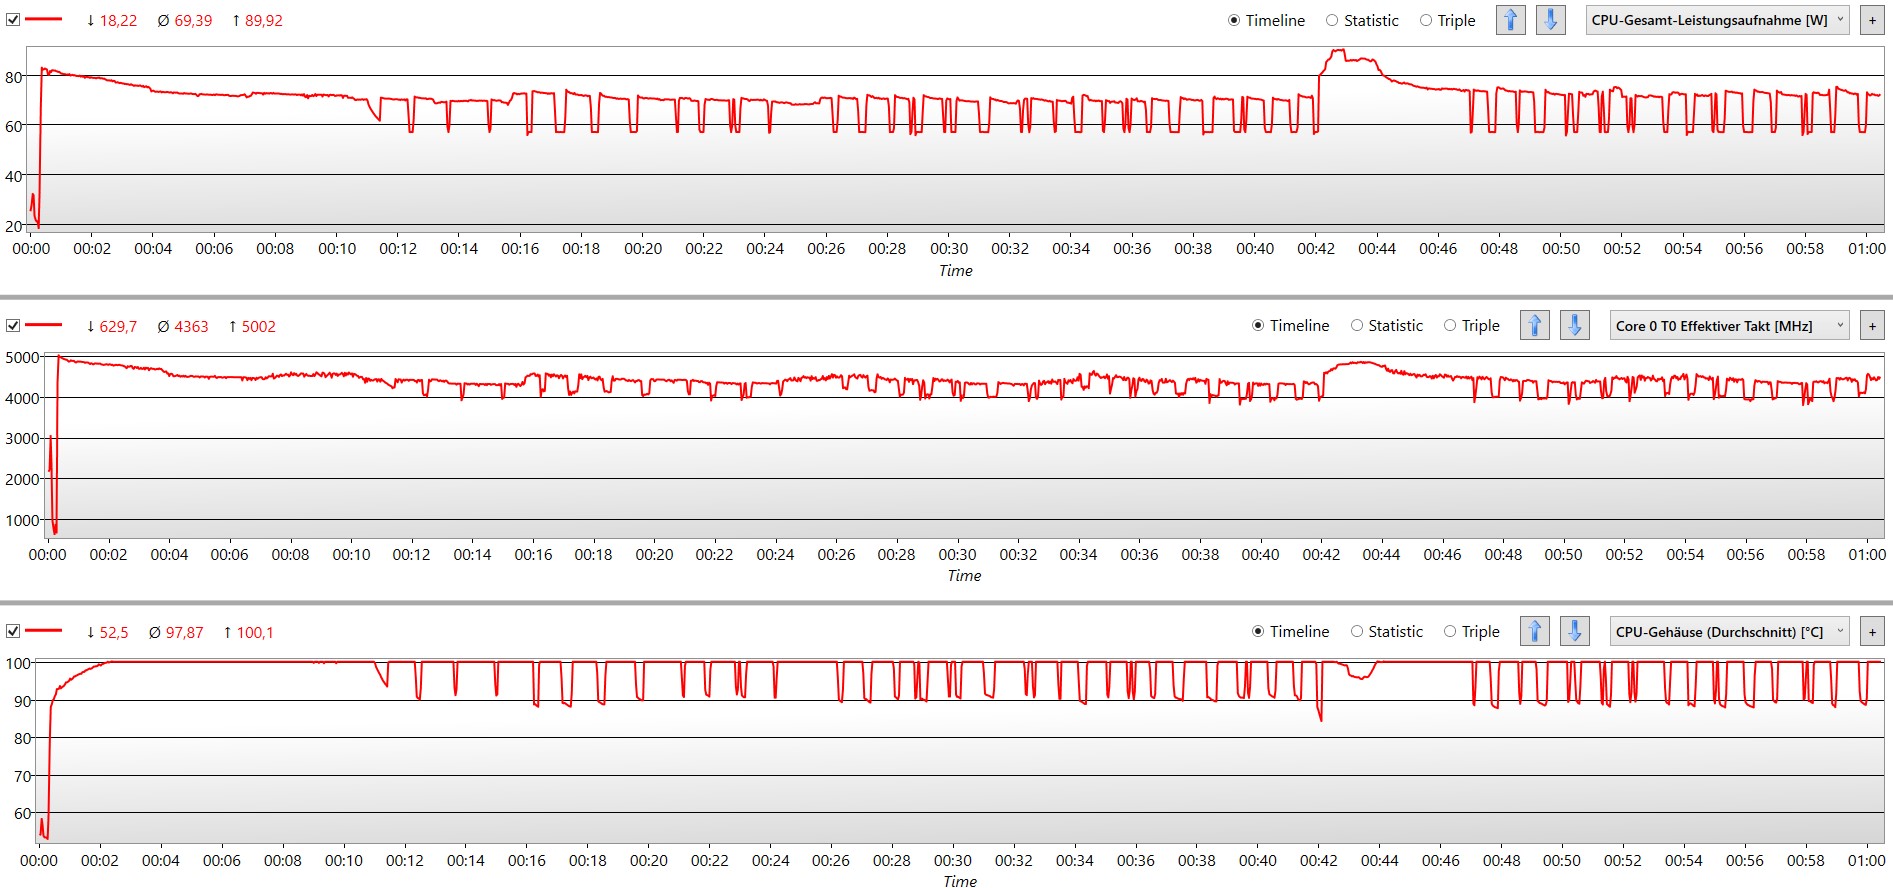
Durante o nosso teste de estresse, realizado no modo Desempenho, o desempenho do notebook se estabilizou em um nível alto depois de cair um pouco no início. A CPU conseguiu até mesmo atingir temporariamente a velocidade de clock máxima permitida de 5,0 GHz mais uma vez. Da mesma forma, é notável que o processador tenha conseguido se manter acima de 4,0 GHz de forma consistente.
O Lenovo Pro 5 foi configurado de tal forma que o consumo máximo de energia permitido é um pouco menor do que o especificado pelos fabricantes de hardware. Isso, juntamente com o impressionante resfriamento geral, ajuda o laptop a aproveitar constantemente os parâmetros especificados no modo Desempenho.
Alto-falantes
Os alto-falantes estéreo podem ser altos. Seus graves carregam até um pouco mais de potência do que o que você está acostumado a ouvir em um laptop. Em contrapartida, os graves superiores e os médios baixos são quase totalmente inexistentes. Infelizmente, isso faz com que a música soe bastante anêmica, especialmente o som de guitarras elétricas ou bateria.
Por outro lado, os drivers dos alto-falantes conseguem reproduzir vozes e vocais razoavelmente bem, embora não no nível de qualidade de bons alto-falantes. Mas isso é bom para jogos.
Lenovo Legion Pro 5 16ARX8 (R5 7645HX, RTX 4050) análise de áudio
(±) | o volume do alto-falante é médio, mas bom (###valor### dB)
Graves 100 - 315Hz
(-) | quase nenhum baixo - em média 20.9% menor que a mediana
(±) | a linearidade dos graves é média (11.7% delta para a frequência anterior)
Médios 400 - 2.000 Hz
(±) | médios mais altos - em média 6.8% maior que a mediana
(+) | médios são lineares (5.7% delta para frequência anterior)
Altos 2 - 16 kHz
(+) | agudos equilibrados - apenas 2.8% longe da mediana
(±) | a linearidade dos máximos é média (7.5% delta para frequência anterior)
Geral 100 - 16.000 Hz
(±) | a linearidade do som geral é média (21.5% diferença em relação à mediana)
Comparado com a mesma classe
» 77% de todos os dispositivos testados nesta classe foram melhores, 5% semelhantes, 18% piores
» O melhor teve um delta de 6%, a média foi 18%, o pior foi 132%
Comparado com todos os dispositivos testados
» 61% de todos os dispositivos testados foram melhores, 7% semelhantes, 32% piores
» O melhor teve um delta de 4%, a média foi 23%, o pior foi 134%
Apple MacBook Pro 16 2021 M1 Pro análise de áudio
(+) | os alto-falantes podem tocar relativamente alto (###valor### dB)
Graves 100 - 315Hz
(+) | bons graves - apenas 3.8% longe da mediana
(+) | o baixo é linear (5.2% delta para a frequência anterior)
Médios 400 - 2.000 Hz
(+) | médios equilibrados - apenas 1.3% longe da mediana
(+) | médios são lineares (2.1% delta para frequência anterior)
Altos 2 - 16 kHz
(+) | agudos equilibrados - apenas 1.9% longe da mediana
(+) | os máximos são lineares (2.7% delta da frequência anterior)
Geral 100 - 16.000 Hz
(+) | o som geral é linear (4.6% diferença em relação à mediana)
Comparado com a mesma classe
» 0% de todos os dispositivos testados nesta classe foram melhores, 0% semelhantes, 100% piores
» O melhor teve um delta de 5%, a média foi 17%, o pior foi 45%
Comparado com todos os dispositivos testados
» 0% de todos os dispositivos testados foram melhores, 0% semelhantes, 100% piores
» O melhor teve um delta de 4%, a média foi 23%, o pior foi 134%
Gerenciamento de energia - Eficiente sob carga
Consumo de energia
Os processadores da série "HX" da AMD não são capazes de cumprir sua promessa de alta eficiência. O consumo de pelo menos 13 W em modo inativo é excessivo para um laptop com especificações moderadas. O Asus TUF A15 com um processador Ryzen 7 7735HS consome apenas 8 W na mesma situação, e o igualmente potente Medion Erazer Scout E20consome apenas 5 W. Em comparação com esses notebooks para jogos com configuração semelhante, o Legion parece usar muita energia em modo inativo.
Entretanto, ele é capaz de superar muitos de seus concorrentes ao lidar com tarefas exigentes. Por exemplo, ele consumiu apenas cerca de 125 W ao executar o Witcher 3. Durante nossos testes, medimos um consumo máximo de energia de 204 W, o que significa que o adaptador de 300 W deve ser adequado para o dispositivo.
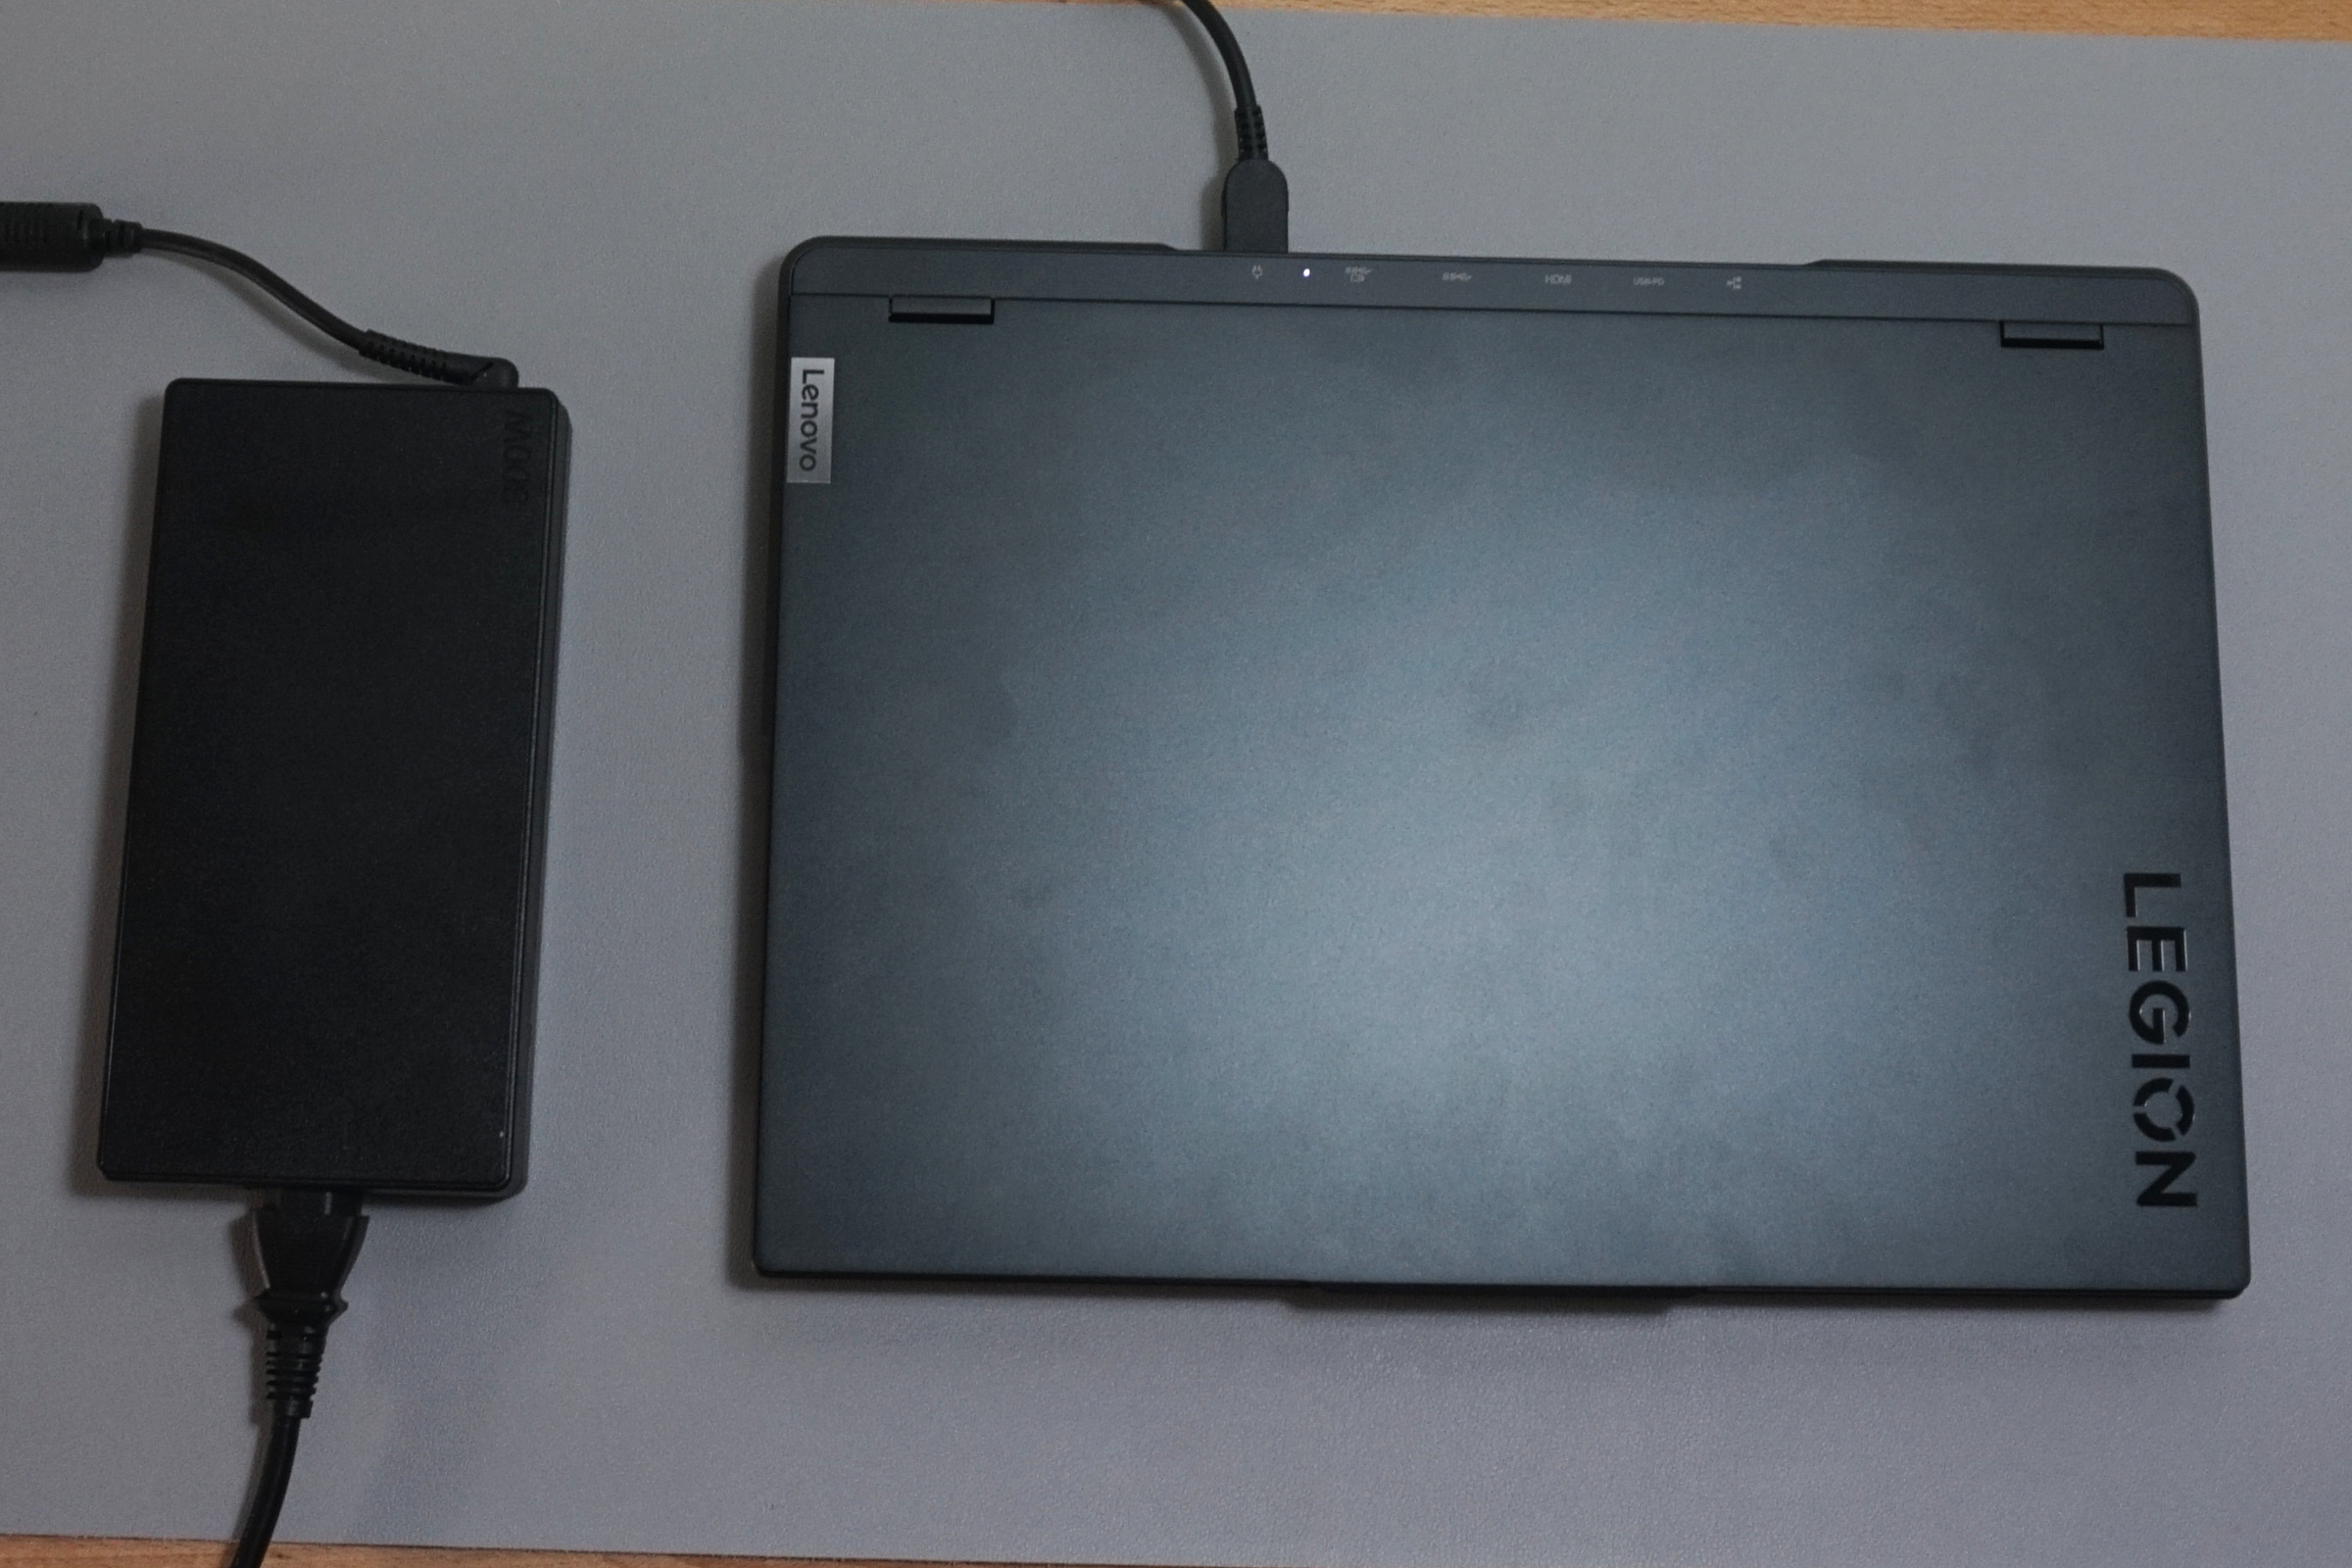
Um aspecto a ser lembrado é que o processador e a placa de vídeo sozinhos podem consumir 145 W e 115 W de energia, respectivamente, e ao mesmo tempo. Embora os usuários tenham que habilitar explicitamente esse recurso e reconhecer um aviso de segurança, também faz sentido que a Lenovo tenha incluído um carregador tão potente.
| desligado | |
| Ocioso | |
| Carga |
|
Key:
min: | |
| Lenovo Legion Pro 5 16ARX8 (R5 7645HX, RTX 4050) R5 7645HX, GeForce RTX 4050 Laptop GPU, SK hynix PC801 HFS512GEJ9X115N, IPS, 2560x1600, 16" | Lenovo Legion Pro 5 16IRX8 i7-13700HX, GeForce RTX 4060 Laptop GPU, SK hynix PC801 HFS512GEJ9X115N, IPS, 2560x1600, 16" | Asus TUF A15 FA507 R7 7735HS, GeForce RTX 4050 Laptop GPU, Micron 2400 MTFDKBA512QFM, IPS, 1920x1080, 15.6" | Asus TUF Gaming A16 FA617 R7 7735HS, Radeon RX 7600S, Micron 2400 MTFDKBA1T0QFM, IPS-Level, 1920x1200, 16" | Acer Nitro 5 AN517-55-5552 i5-12500H, GeForce RTX 4050 Laptop GPU, WDC PC SN810 512GB, IPS, 1920x1080, 17.3" | Medion Erazer Scout E20 i7-13700H, GeForce RTX 4050 Laptop GPU, Phison PS5021-E21 1TB, IPS, 1920x1080, 17.3" | Média NVIDIA GeForce RTX 4050 Laptop GPU | Média da turma Gaming | |
|---|---|---|---|---|---|---|---|---|
| Power Consumption | -47% | 22% | 15% | 3% | 14% | 13% | -13% | |
| Idle Minimum * (Watt) | 13 | 24.5 -88% | 8 38% | 8 38% | 7.6 42% | 5 62% | 9.95 ? 23% | 13 ? -0% |
| Idle Average * (Watt) | 17.4 | 29.2 -68% | 12.1 30% | 11 37% | 11.3 35% | 11 37% | 15.8 ? 9% | 19 ? -9% |
| Idle Maximum * (Watt) | 21.8 | 34.3 -57% | 12.5 43% | 16 27% | 15.4 29% | 22 -1% | 20.1 ? 8% | 24.6 ? -13% |
| Load Average * (Watt) | 96.4 | 98.7 -2% | 74.9 22% | 97 -1% | 151 -57% | 96 -0% | 88 ? 9% | 110.7 ? -15% |
| Witcher 3 ultra * (Watt) | 125 | 178.6 -43% | 136.6 -9% | 161.5 -29% | 137.8 -10% | 145.2 -16% | ||
| Load Maximum * (Watt) | 204 | 249.6 -22% | 185 9% | 168 18% | 244 -20% | 201 1% | 176.3 ? 14% | 259 ? -27% |
* ... menor é melhor
Power consumption Witcher 3 / Stress test
Power consumption with external monitor
Duração da bateria
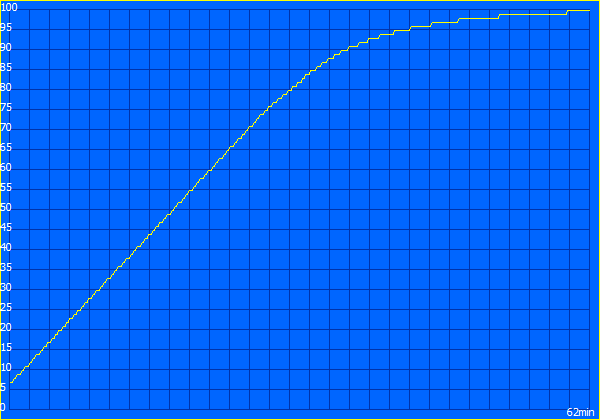
A bateria de 80 Wh não oferece uma duração espetacular devido ao consumo de energia geralmente alto da CPU. Com o brilho da tela reduzido para 150 cd/m², o laptop durou cerca de 6,5 horas em nosso teste de reprodução de vídeo e no teste de navegação na Web por Wi-Fi. Aumentar o brilho da tela até o fim reduziu a duração da bateria pela metade.
Embora 47 minutos de duração da bateria sejam extremamente curtos em Witcher 3, o desempenho em jogos está apenas alguns pontos percentuais abaixo do que o Legion é capaz de fazer quando conectado à tomada.
| Lenovo Legion Pro 5 16ARX8 (R5 7645HX, RTX 4050) R5 7645HX, GeForce RTX 4050 Laptop GPU, 80 Wh | Lenovo Legion Pro 5 16IRX8 i7-13700HX, GeForce RTX 4060 Laptop GPU, 80 Wh | Asus TUF A15 FA507 R7 7735HS, GeForce RTX 4050 Laptop GPU, 90 Wh | Asus TUF Gaming A16 FA617 R7 7735HS, Radeon RX 7600S, 90 Wh | Acer Nitro 5 AN517-55-5552 i5-12500H, GeForce RTX 4050 Laptop GPU, 90 Wh | Medion Erazer Scout E20 i7-13700H, GeForce RTX 4050 Laptop GPU, 53.35 Wh | Média da turma Gaming | |
|---|---|---|---|---|---|---|---|
| Duração da bateria | -39% | 120% | 116% | 53% | -16% | 41% | |
| H.264 (h) | 5.4 | 12.5 131% | 7.4 37% | 4.6 -15% | 8.32 ? 54% | ||
| WiFi v1.3 (h) | 5.6 | 3.4 -39% | 11.7 109% | 12.1 116% | 9.4 68% | 4.7 -16% | 7.11 ? 27% |
| Witcher 3 ultra (h) | 0.8 |
Pro
Contra
Veredicto - Silencioso, rápido ou ambos

O Lenovo Legion Pro 4 16ARX8 não tem nenhum ponto fraco grave e conseguiu nos impressionar com seu desempenho estável em jogos, tela brilhante e especificações decentes. É claro que ele não é potente o suficiente para executar os jogos mais recentes nas configurações mais altas, mas quase sempre é capaz de produzir taxas de quadros decentes. Além disso, o ruído da ventoinha é mantido consistentemente em um nível aceitável, o que significa que você não precisa necessariamente usar um par de fones de ouvido ao jogar. Essa parece ser uma combinação atraente para os jogadores casuais.
Além disso, o software Lenovo Vantage oferece opções adicionais de personalização. Com um pouco de trabalho, é possível otimizar o desempenho do laptop para seus jogos favoritos. Graças ao excelente desempenho gráfico do Legion, é possível ter um modo quase passivo voltado para a edição de fotos e vídeos. A excelente tela também facilita esse tipo de trabalho de edição, embora não em nível profissional.
A versatilidade é o seu ponto forte: o laptop é silencioso durante os jogos e, ainda assim, com apenas um clique, pode facilmente enfrentar os melhores laptops com o mesmo hardware
A combinação de uma resolução WQXGA (2.560 x 1.600) e uma taxa de atualização de 240 Hz é um pouco exagerada. A GPU não tem o desempenho necessário para tirar o máximo proveito da tela. Outro aspecto que não impressiona é a duração fraca da bateria. Da mesma forma, teria sido bom ter uma porta USB4 e um leitor de cartão no laptop. Entretanto, esses pontos fracos são fáceis de ignorar, considerando o preço modesto do Legion(um desconto adicional está disponível se você apresentar uma identificação válida de uma instituição educacional).
O Medion Erazer Scout E20 e Asus TUF Gaming A16 Advantageoferecem desempenho semelhante, mas estão alguns pontos percentuais atrás do Legion Pro 5 em quase todas as áreas. Os dois notebooks também têm telas piores e são menos personalizáveis, mais barulhentos sob carga e, pelo menos para estudantes e educadores, mais caros. Os concorrentes ainda podem aprender uma ou duas coisas com o laptop para jogos de nível básico da Lenovo.
Preço e disponibilidade
Na Alemanha, você pode comprar o Lenovo Legion Pro 5 16ARX8 (R5 7645HX, RTX 4050) diretamente da Lenovo ou do site Campuspoint por €1.500 (US$1.640). Aqueles com um documento de identidade válido podem obtê-lo por um preço com desconto de € 1.200 (US$ 1.312). Para quem está nos Estados Unidos, um modelo semelhante com 1 TB de armazenamento pode ser adquirido por US$ 1.419 na amazon.com.
Lenovo Legion Pro 5 16ARX8 (R5 7645HX, RTX 4050)
- 07/29/2023 v7 (old)
Mario Petzold
Transparência
A seleção dos dispositivos a serem analisados é feita pela nossa equipe editorial. A amostra de teste foi fornecida ao autor como empréstimo pelo fabricante ou varejista para fins desta revisão. O credor não teve influência nesta revisão, nem o fabricante recebeu uma cópia desta revisão antes da publicação. Não houve obrigação de publicar esta revisão. Como empresa de mídia independente, a Notebookcheck não está sujeita à autoridade de fabricantes, varejistas ou editores.
É assim que o Notebookcheck está testando
Todos os anos, o Notebookcheck analisa de forma independente centenas de laptops e smartphones usando procedimentos padronizados para garantir que todos os resultados sejam comparáveis. Desenvolvemos continuamente nossos métodos de teste há cerca de 20 anos e definimos padrões da indústria no processo. Em nossos laboratórios de teste, equipamentos de medição de alta qualidade são utilizados por técnicos e editores experientes. Esses testes envolvem um processo de validação em vários estágios. Nosso complexo sistema de classificação é baseado em centenas de medições e benchmarks bem fundamentados, o que mantém a objetividade.Price comparison

