Análise do Lenovo ThinkPad P16v G1 AMD - Estação de trabalho de nível básico com Zen4
A Lenovo adicionou um novo modelo de nível básico à sua linha de estações de trabalho móveis com o ThinkPad P16v G1. O laptop está disponível com processadores AMD ou Intel, e o senhor pode escolher entre gráficos integrados e as GPUs profissionais da Nvidia RTX A500, RTX 1000 e RTX 2000 Ada.
O modelo mais barato da AMD começa em cerca de € 1.400 (US$ 1.533) e apresenta um Ryzen 5 PRO 7560HS com Radeon 760M integrada, 8 GB de RAM, um SSD de 256 GB e um painel de 1080p. A variante AMD com a mais alta especificação chega a € 3.200 (US$ 3.503) e vem com um Ryzen 9 PRO 7940HSuma RTX 2000 Ada, 64 GB de RAM, 4 TB de armazenamento SSD e uma tela 4K.
Nossa unidade de análise (número de modelo 21FE0004GE) custa €2.099 (US$2.298) e é equipada com um Ryzen 7 PRO 7840HSe uma Nvidia RTX A100032 GB de RAM, um SSD de 1 TB e um painel Full HD com cobertura sRGB completa.
Possíveis concorrentes em comparação
Avaliação | Data | Modelo | Peso | Altura | Size | Resolução | Preço |
|---|---|---|---|---|---|---|---|
| 86.2 % v7 (old) | 01/2024 | Lenovo ThinkPad P16v G1 AMD R7 PRO 7840HS, RTX A1000 Laptop GPU | 2.3 kg | 24.7 mm | 16.00" | 1920x1200 | |
| 88.9 % v7 (old) | 12/2023 | HP ZBook Power 15 G10 R7 PRO 7840HS, RTX 2000 Ada Generation Laptop | 2 kg | 22.9 mm | 15.60" | 2560x1440 | |
| 87.8 % v7 (old) | 04/2023 | Lenovo ThinkPad P15v G3 21EM001AGE R7 PRO 6850H, RTX A2000 Laptop GPU | 2.2 kg | 22.7 mm | 15.60" | 3840x2160 | |
| 88.4 % v7 (old) | 10/2022 | Dell Precision 7670 i7-12850HX, RTX A2000 Laptop GPU | 2.7 kg | 24.7 mm | 16.00" | 3840x2400 | |
| 91.7 % v7 (old) | 10/2023 | Lenovo ThinkPad P1 G6-21FV000DGE i9-13900H, RTX 2000 Ada Generation Laptop | 1.9 kg | 17.5 mm | 16.00" | 2560x1600 | |
| 88.2 % v7 (old) | 02/2023 | Lenovo ThinkPad P16 G1 21D6001DMB i7-12850HX, RTX A2000 Laptop GPU | 3 kg | 30.23 mm | 16.00" | 2560x1600 |
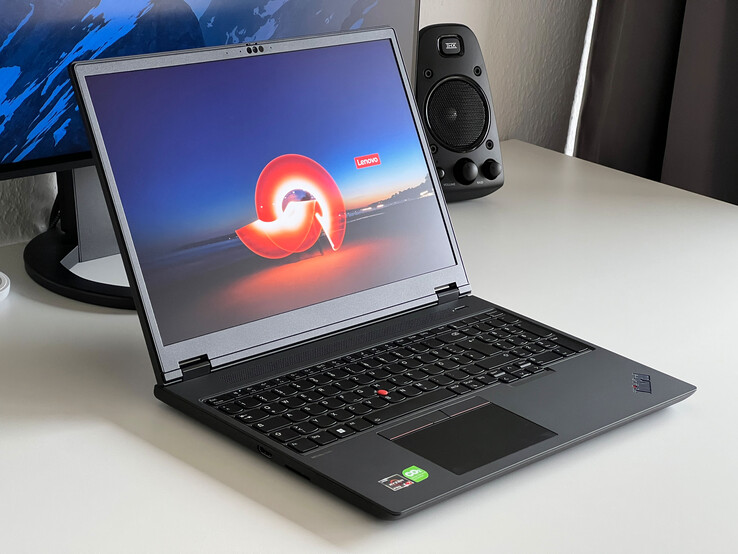
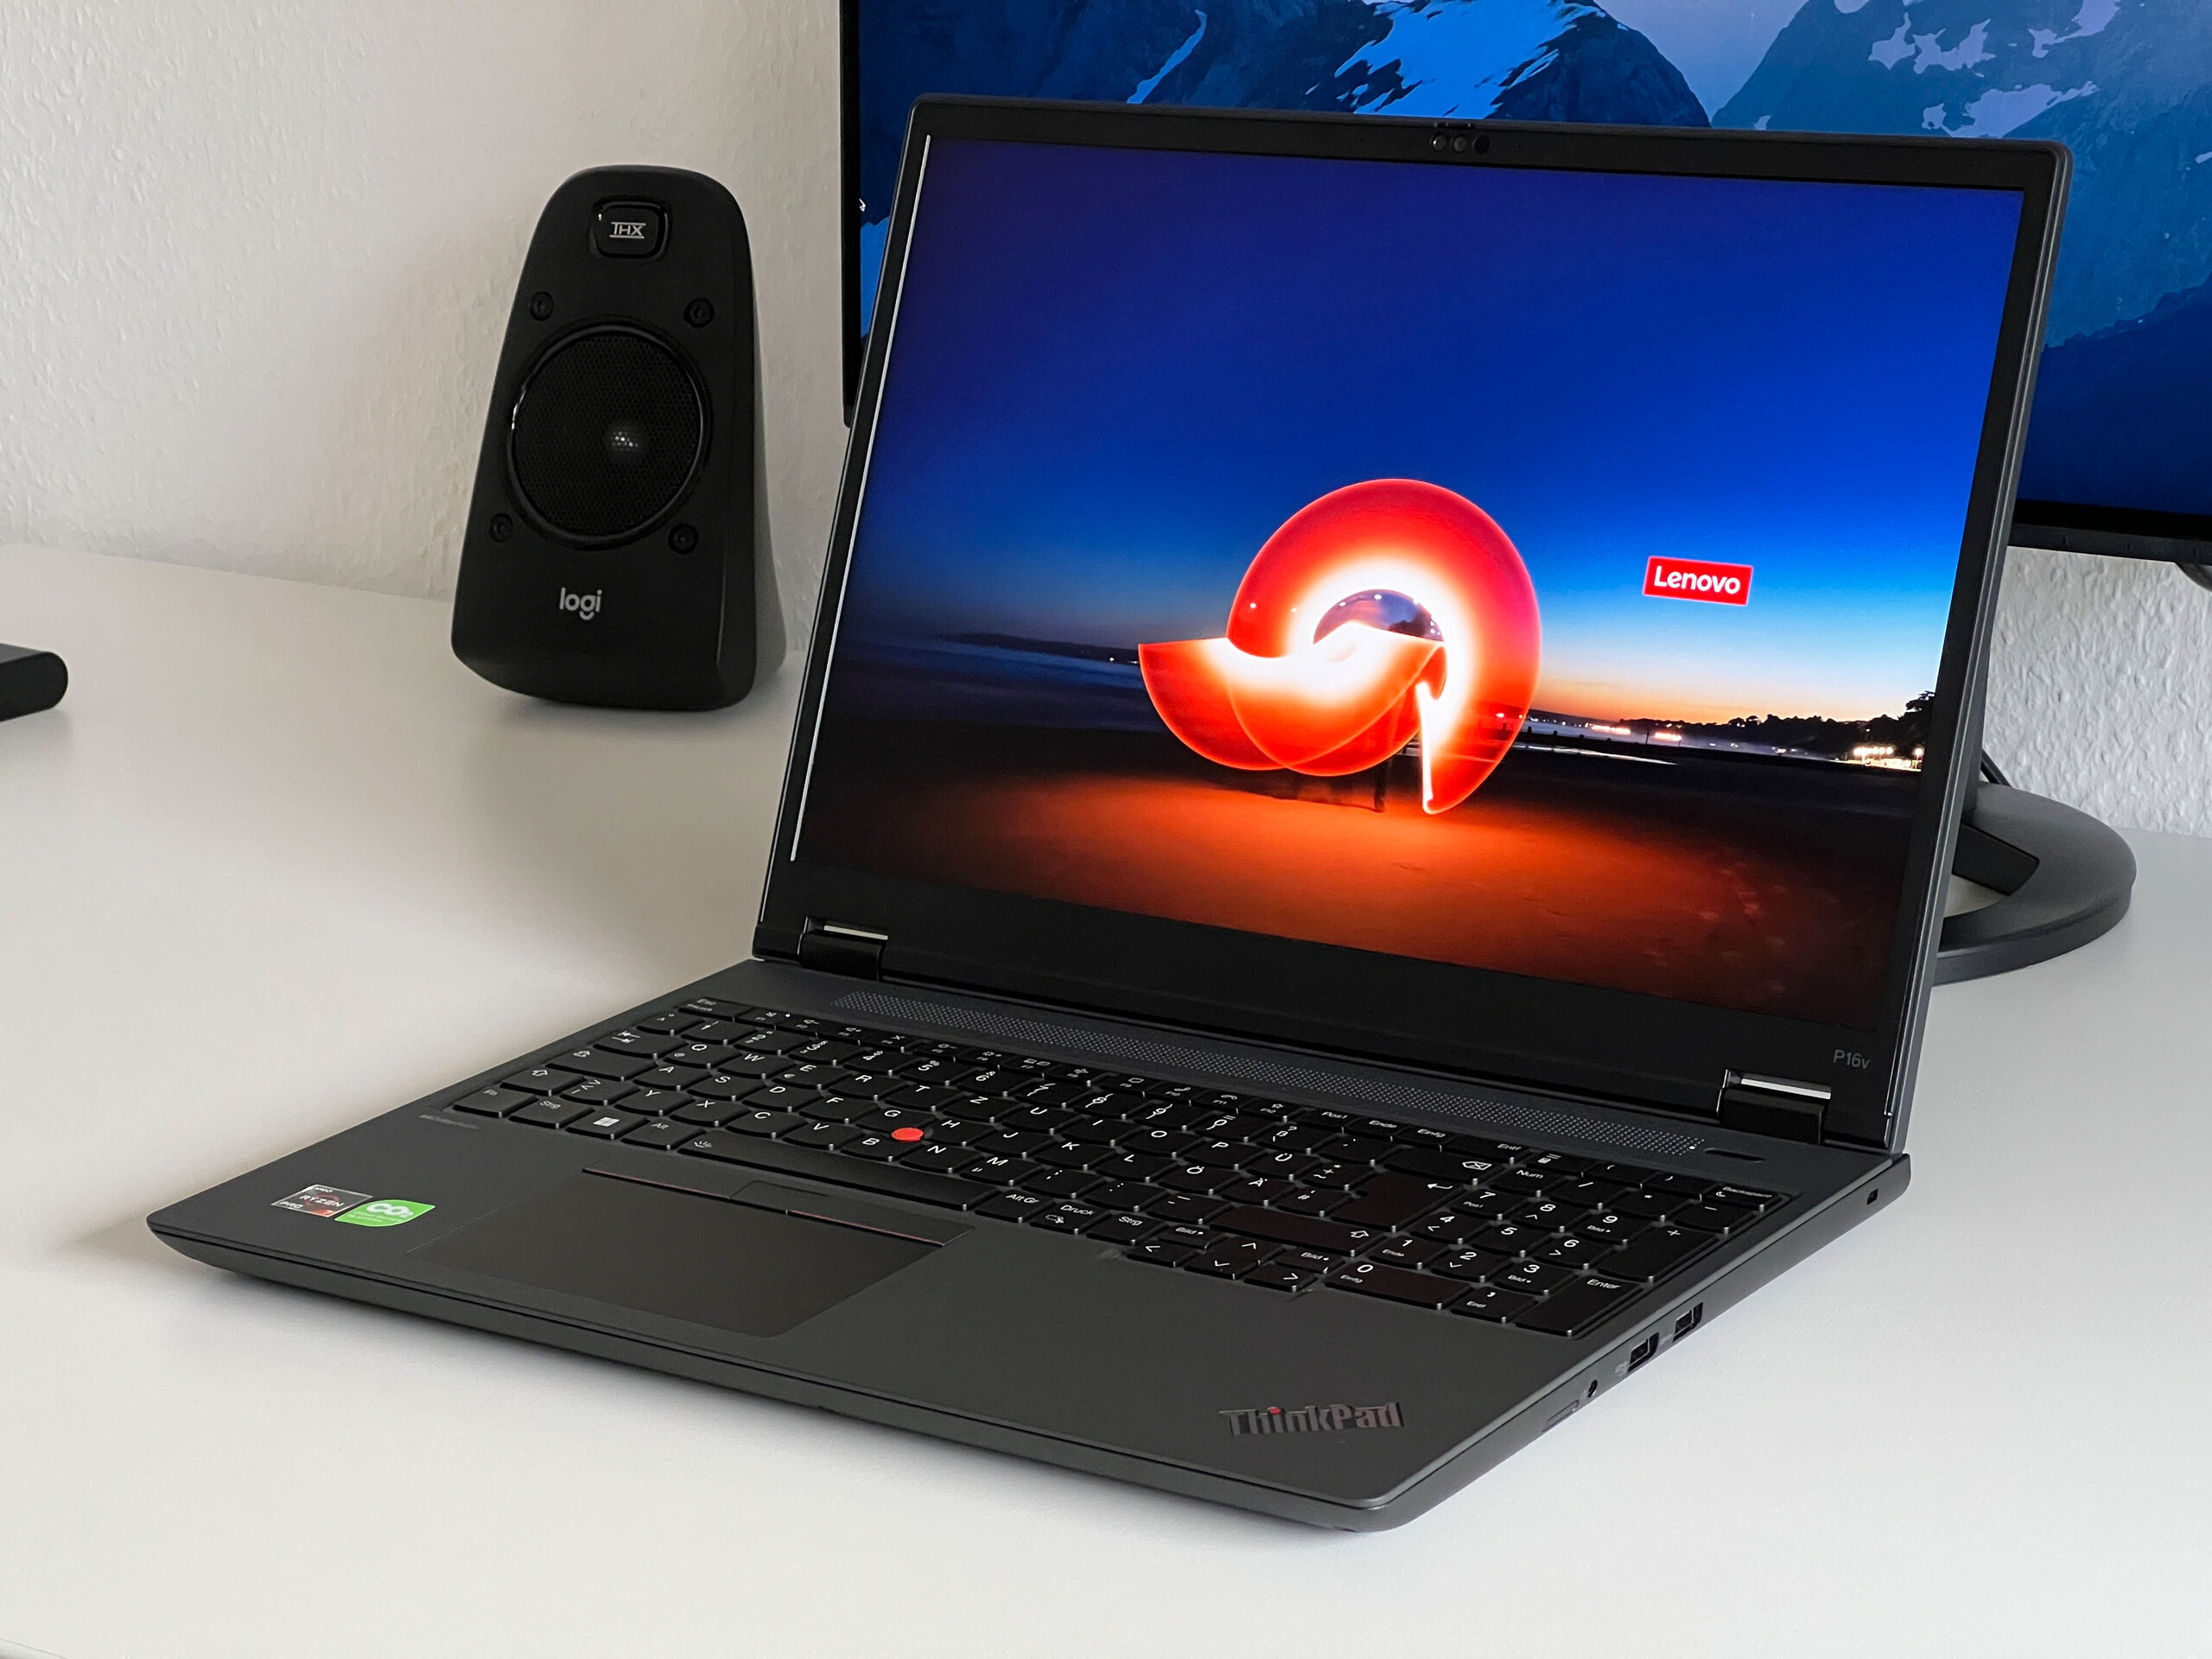
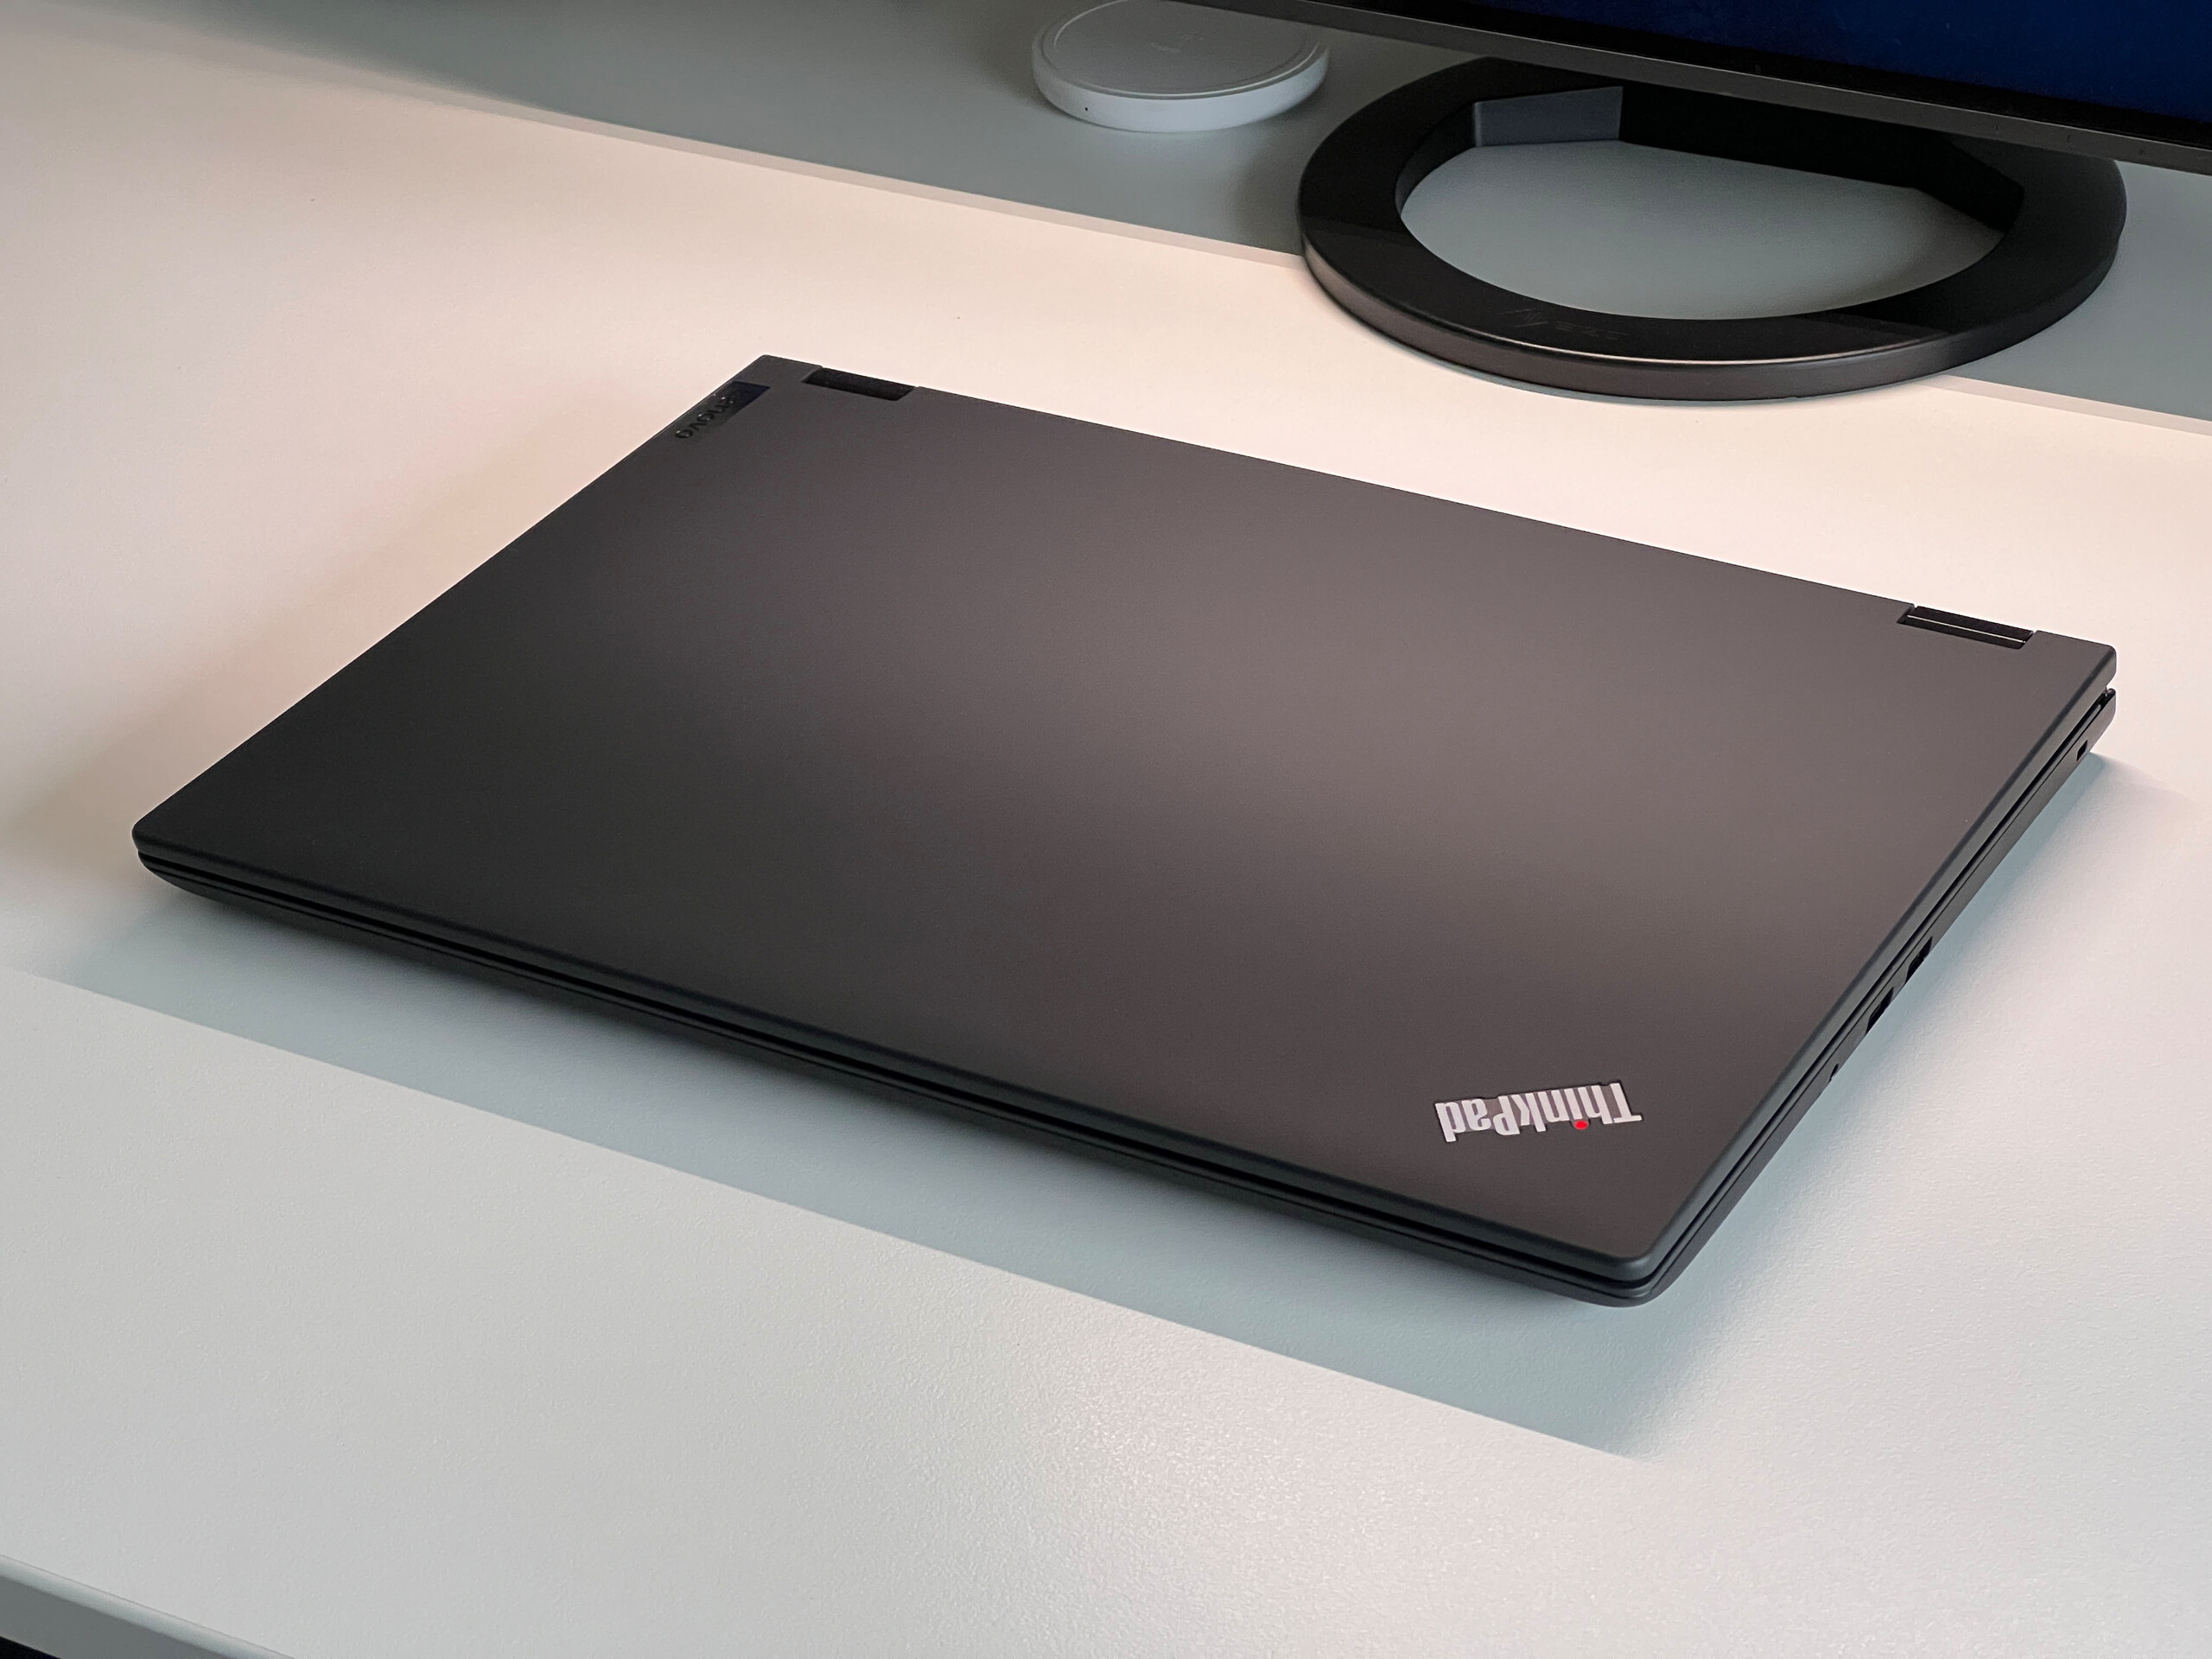
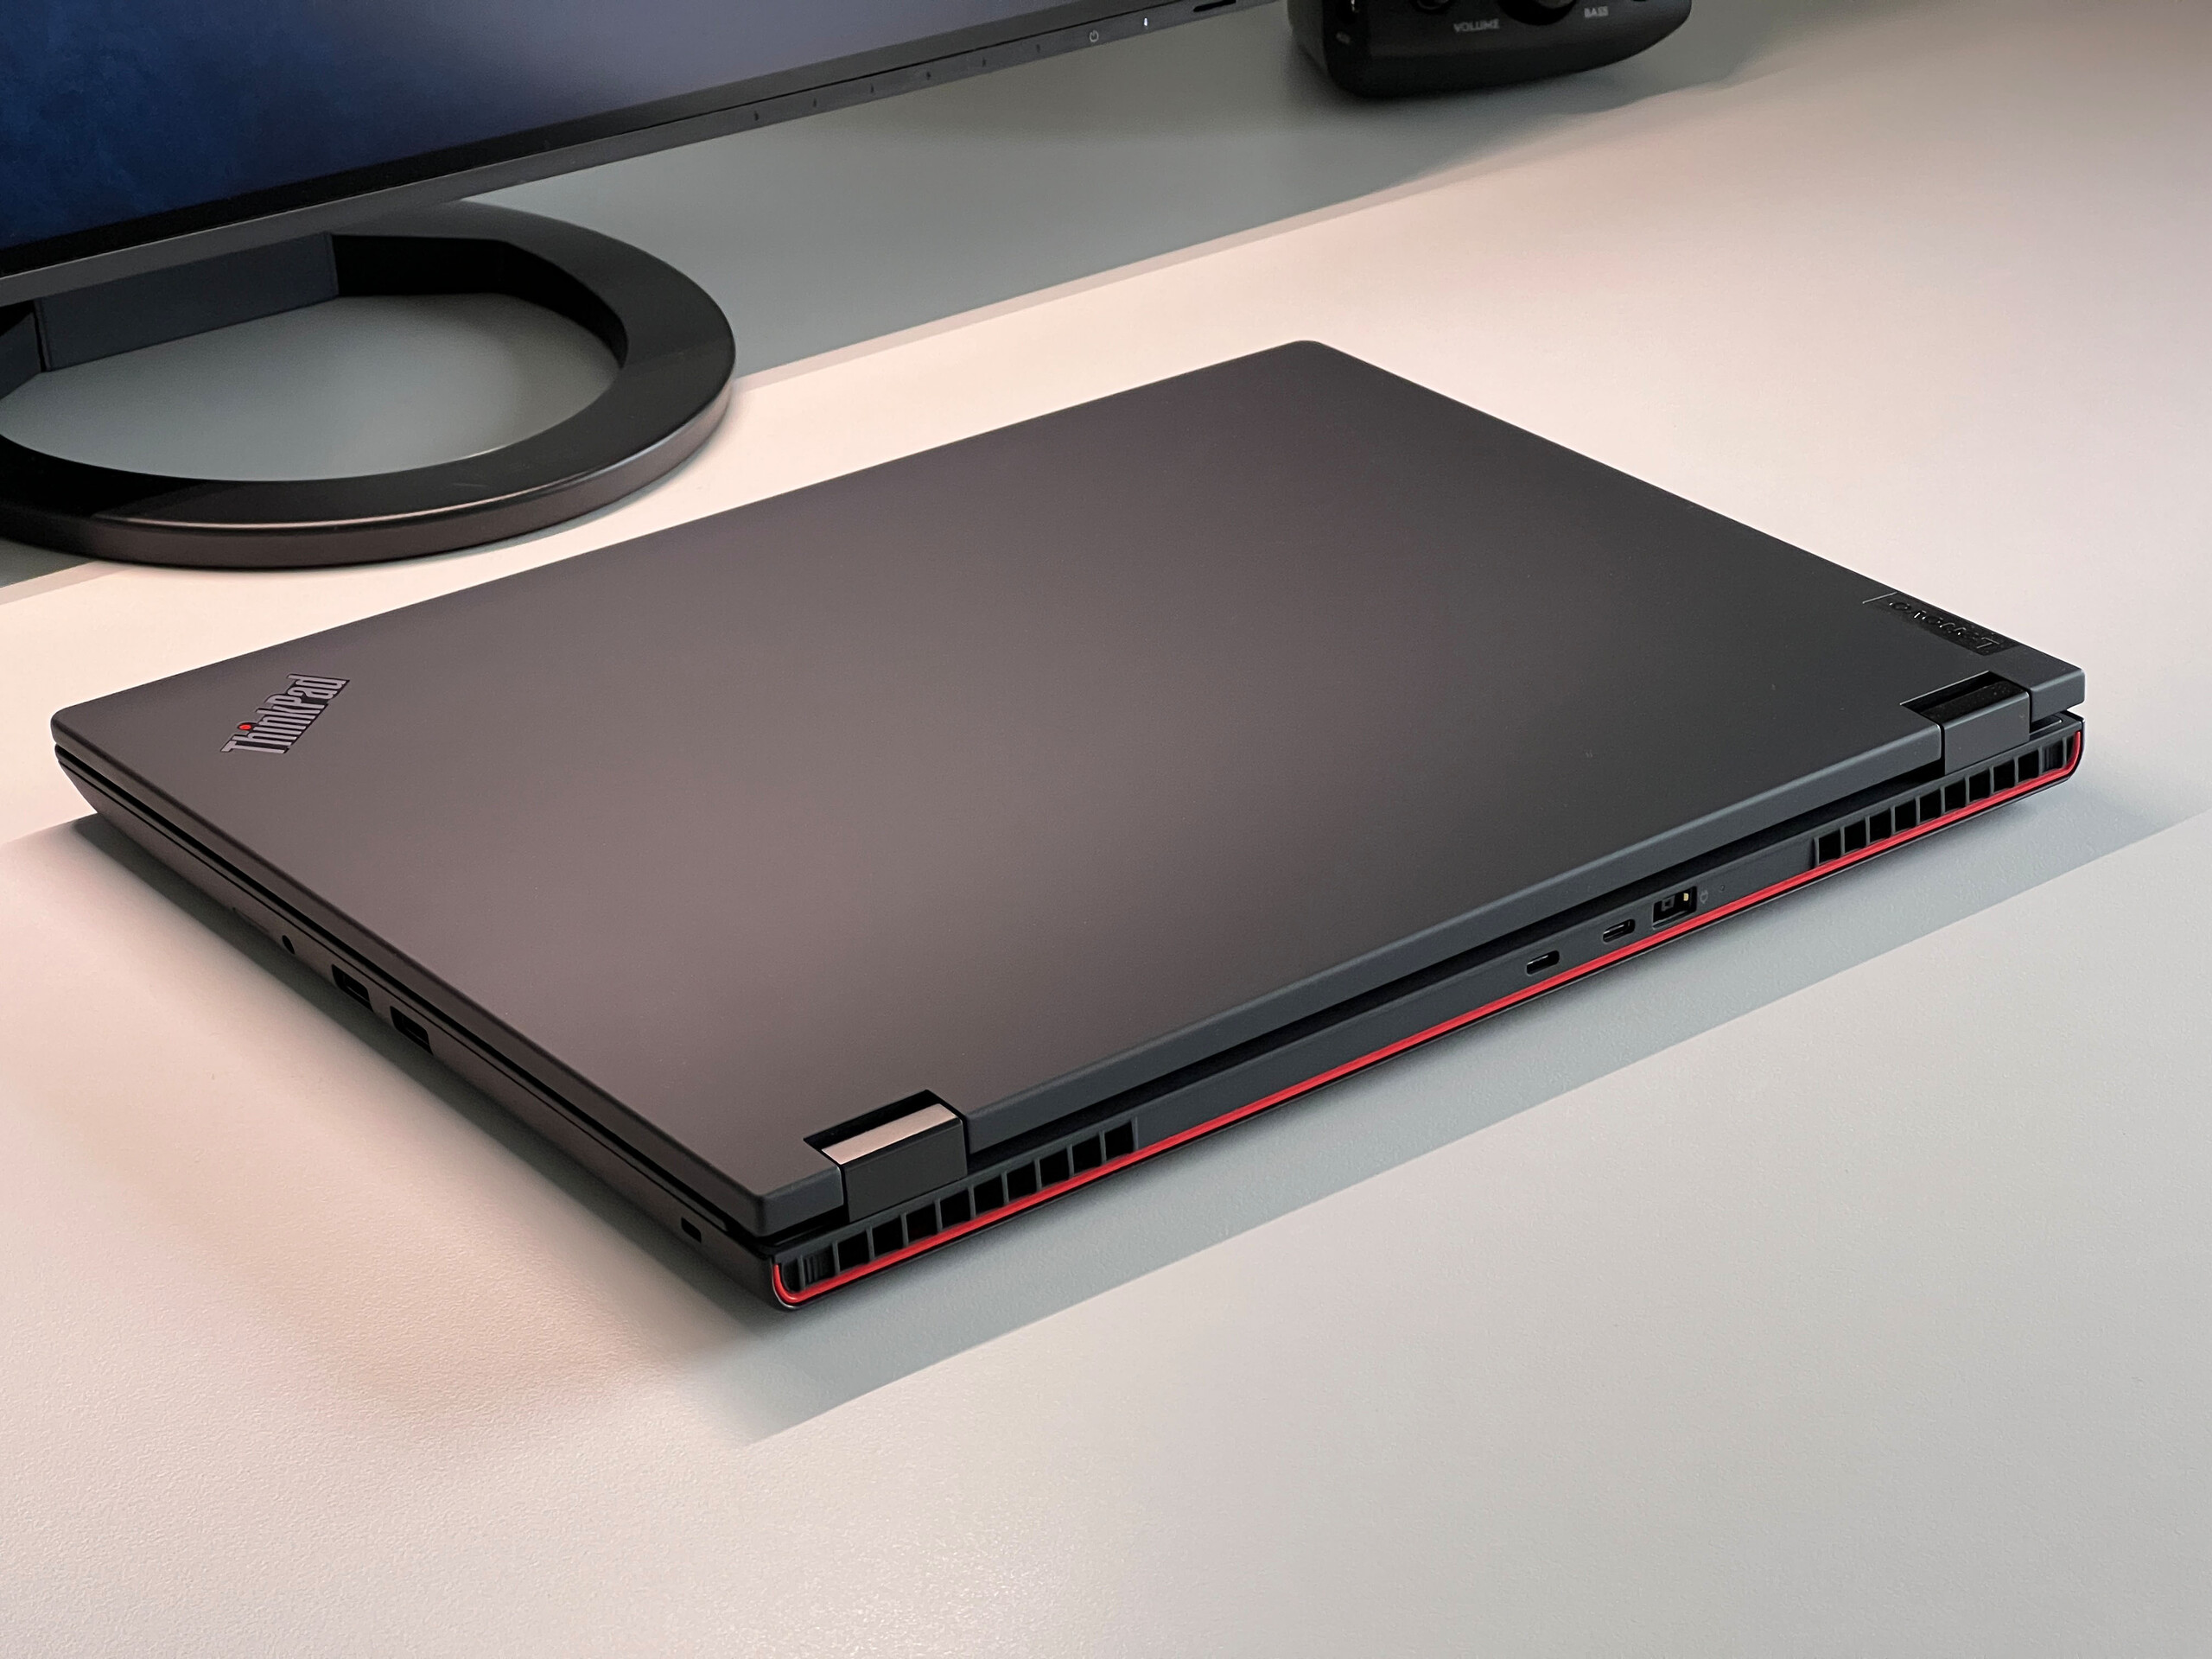
Case - ThinkPad de plástico com detalhes em vermelho
A natureza de nível básico do laptop é claramente evidente na escolha do material. A Lenovo deu ao ThinkPad P16v G1 um chassi totalmente de plástico. No entanto, tanto a tampa como a parte superior da seção da base são agradáveis e não são particularmente suscetíveis a impressões digitais. Por outro lado, a parte inferior e a moldura da tela são mais ásperas e também parecem mais baratas. Em termos de ajuste e acabamento, o concorrente HP ZBook Power definitivamente tem uma vantagem com seu chassi de metal.
Além dos elementos vermelhos habituais, como o TrackPoint e as linhas vermelhas de destaque nos botões dedicados do mouse, a Lenovo deu um passo adiante com o P16v G1, acrescentando outra linha vermelha de destaque na parte traseira do dispositivo. É claro que o gosto pessoal é sempre subjetivo, mas não temos certeza se isso é apropriado para uma estação de trabalho móvel.
O laptop é fundamentalmente robusto, mas as desvantagens são inevitáveis em relação aos modelos mais caros do ThinkPad. O meio da seção da base pode ser empurrado ligeiramente para dentro e a tampa também tem um pouco de flexibilidade. No entanto, isso não resulta em ruídos de rangidos ou distorção de imagem. As dobradiças são muito bem ajustadas, mas há uma oscilação perceptível quando o usuário ajusta o ângulo da tela. A tela também não pode ser totalmente dobrada 180 graus para trás.
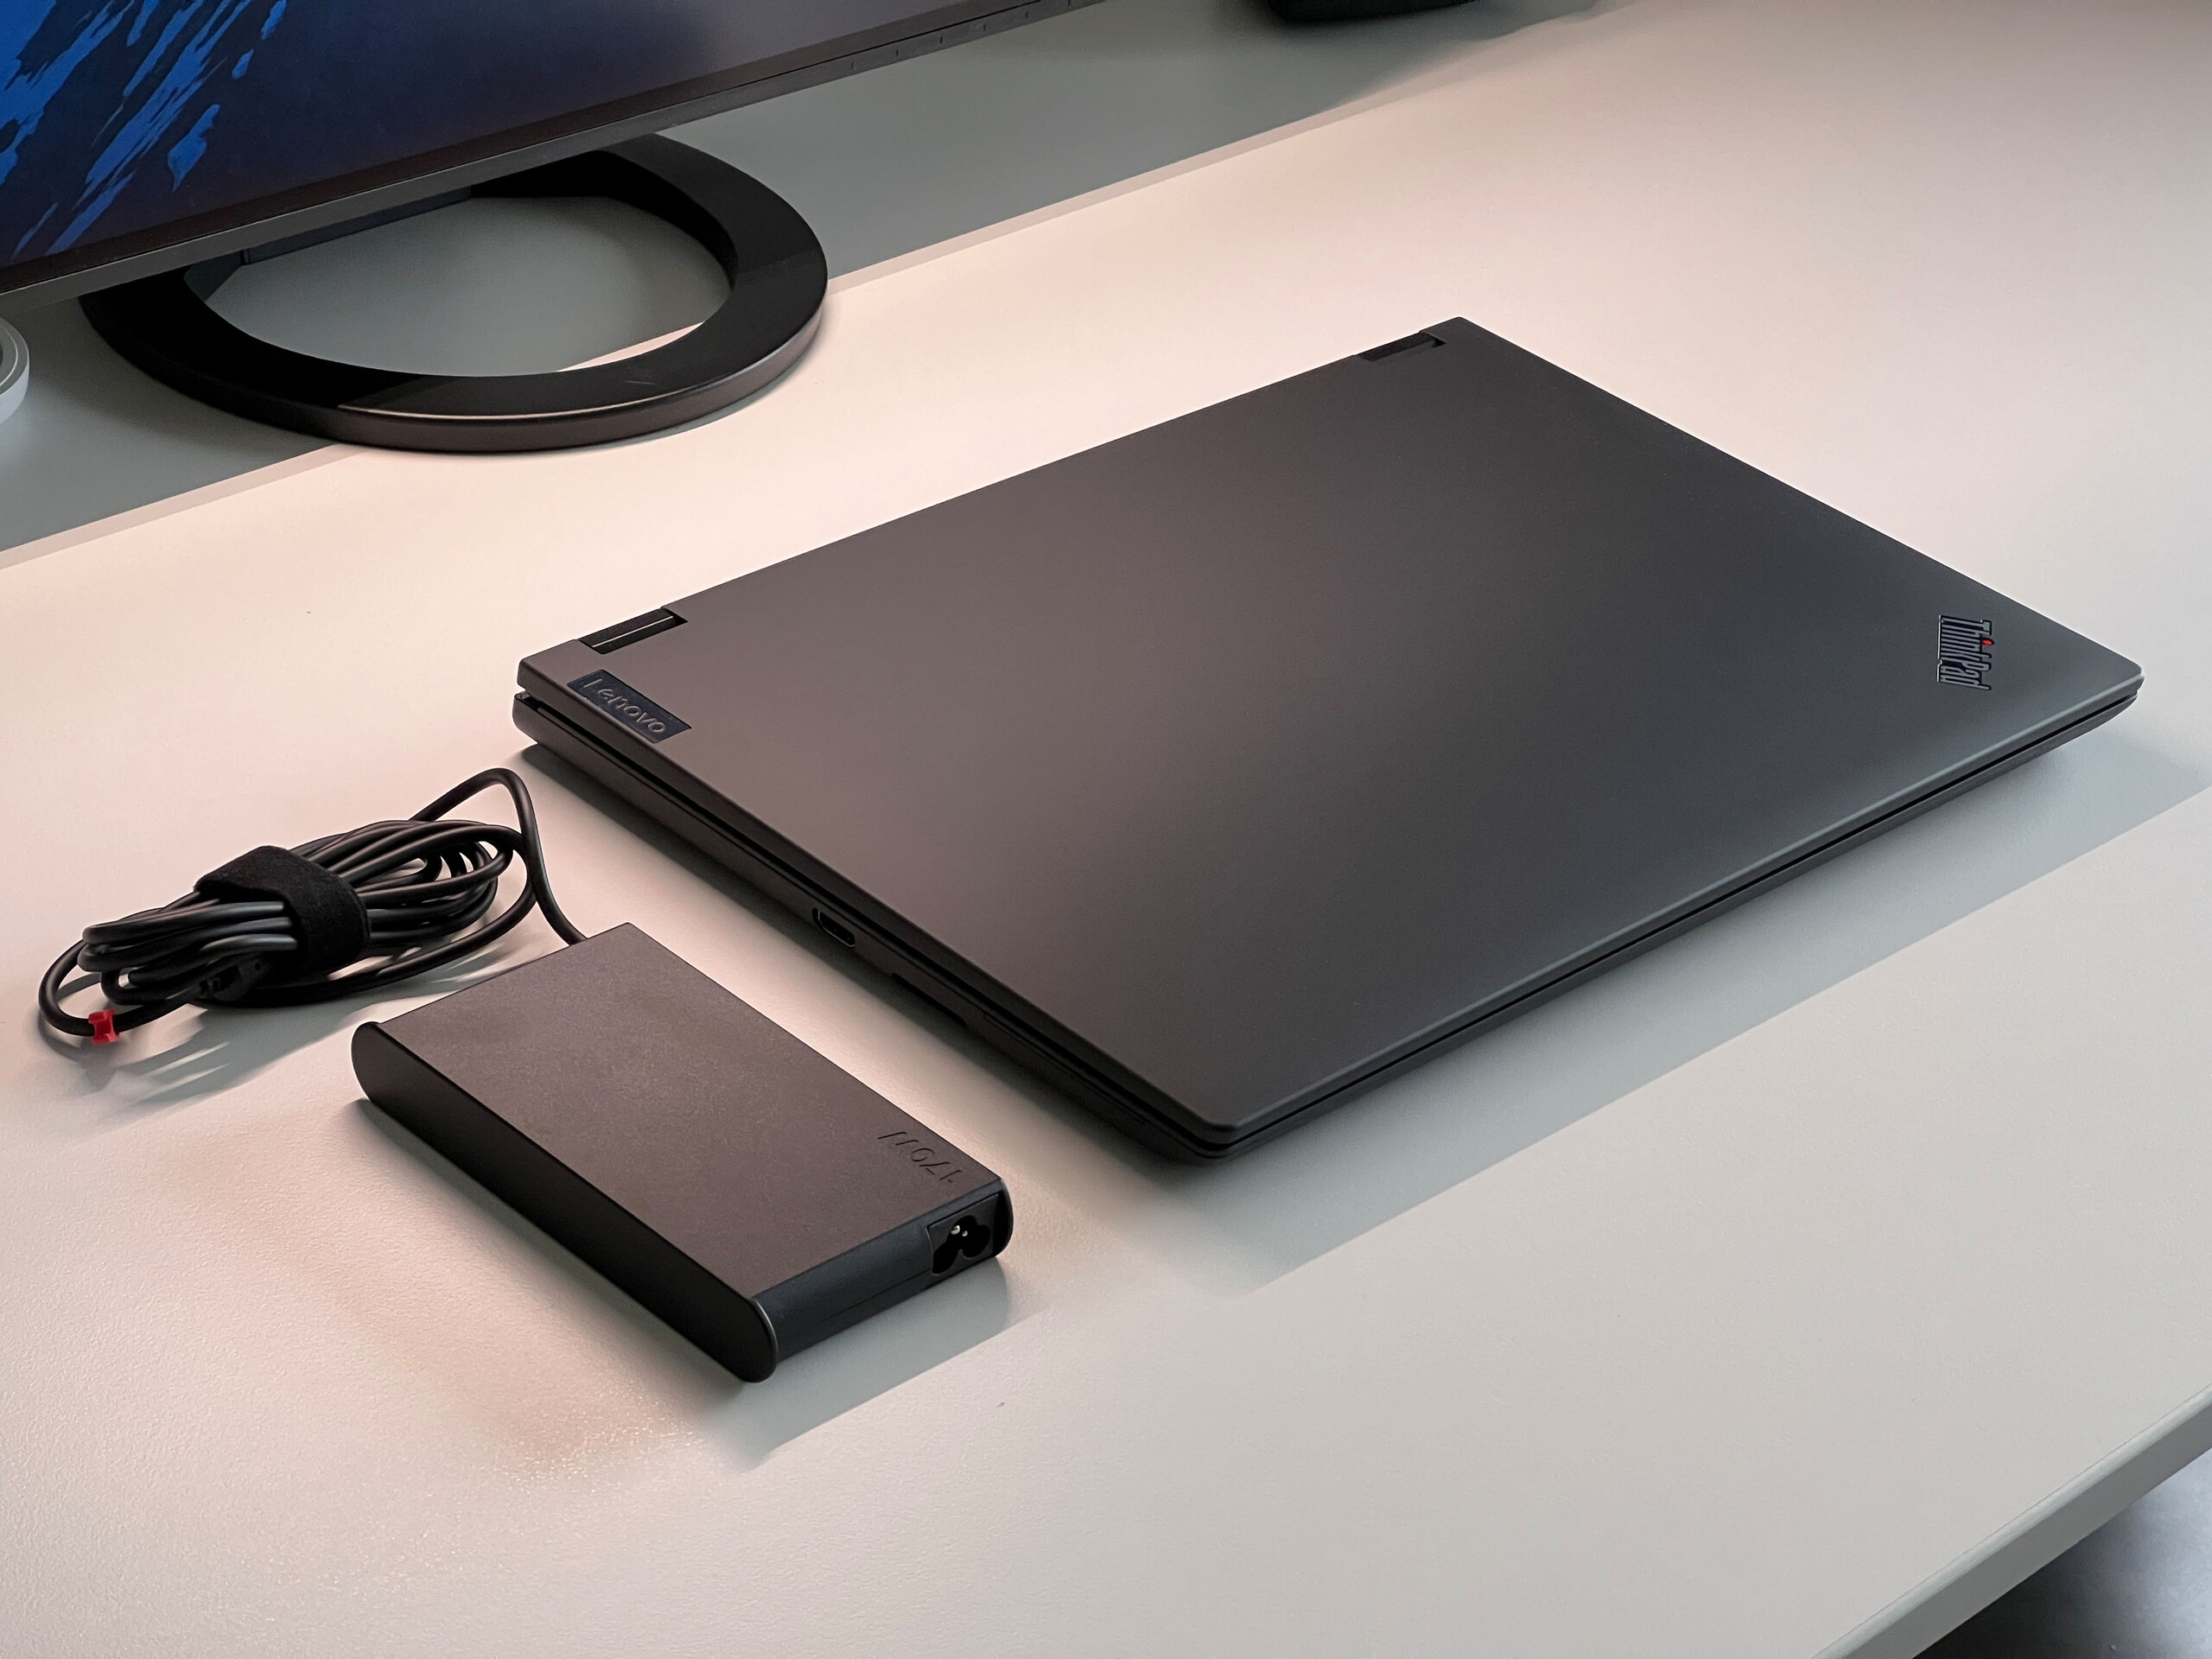
Em termos de tamanho e peso, o novo P16v G1 fica quase exatamente entre o fino ThinkPad P1 G6 e o robusto ThinkPad P16. O carregador de 170 watts pesa 554 g (1,22 lb) junto com o cabo de alimentação.
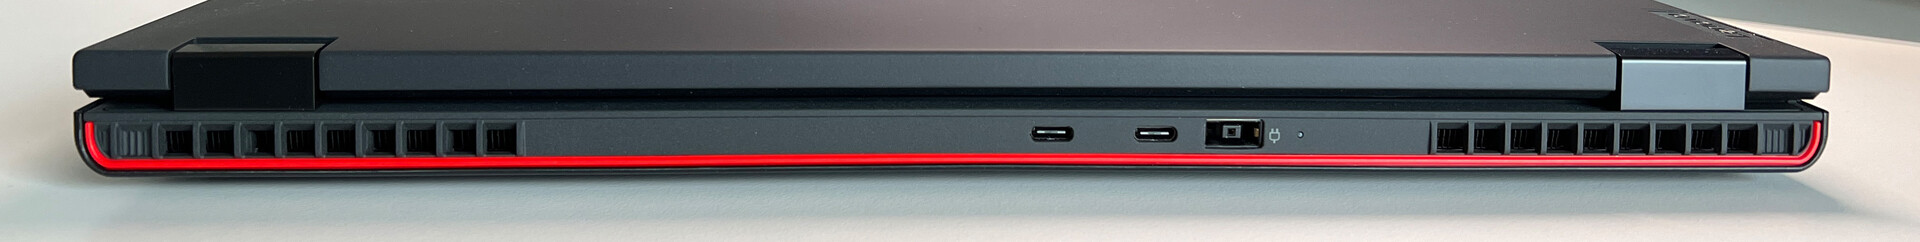
Especificações - Versão AMD com USB4
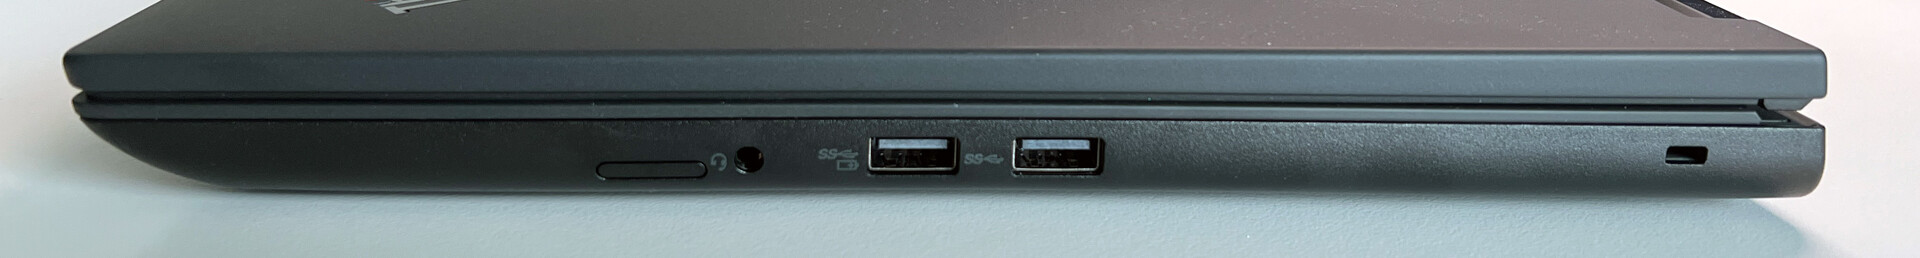
A estação de trabalho baseada na AMD apresenta duas portas USB-C modernas com suporte a USB4, ambas localizadas na parte traseira do laptop. As interfaces estão distribuídas em todos os três lados, embora essa disposição não seja ideal. Preferiríamos ter a saída HDMI na parte traseira; também teria sido bom ter pelo menos uma porta USB à esquerda. O ThinkPad P16v G1 pode ser equipado com um leitor de SmartCard opcional. No entanto, os usuários precisarão ficar sem uma porta Ethernet dedicada, que só pode ser adicionada usando um adaptador USB-C.
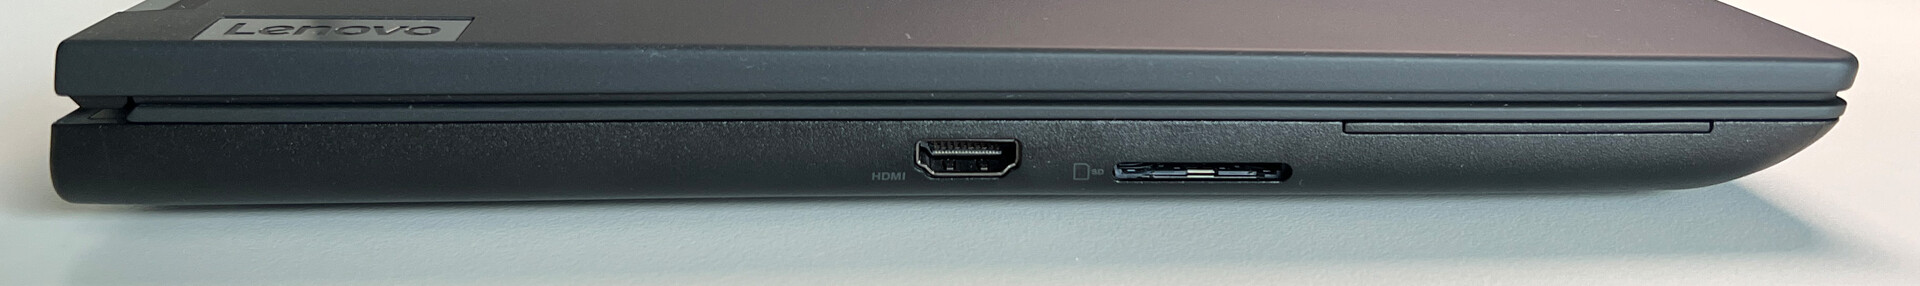
Leitor de cartão SD
O leitor de cartão SD à esquerda tem um mecanismo acionado por mola. Um cartão SD se projeta levemente para fora quando é inserido. Usando o nosso cartão de referência (Angelbird AV Pro V60), conseguimos atingir velocidades médias de transferência na faixa de 70-90 MB/s.
| SD Card Reader | |
| average JPG Copy Test (av. of 3 runs) | |
| Dell Precision 7670 (Toshiba Exceria Pro SDXC 64 GB UHS-II) | |
| Média da turma Workstation (49.6 - 681, n=14, últimos 2 anos) | |
| Lenovo ThinkPad P15v G3 21EM001AGE (AV Pro V60) | |
| Lenovo ThinkPad P1 G6-21FV000DGE (Angelbird AV Pro V60) | |
| Lenovo ThinkPad P16v G1 AMD (Angelbird AV Pro V60) | |
| Lenovo ThinkPad P16 G1 21D6001DMB (AV Pro V60) | |
| maximum AS SSD Seq Read Test (1GB) | |
| Média da turma Workstation (87.6 - 1455, n=14, últimos 2 anos) | |
| Lenovo ThinkPad P15v G3 21EM001AGE (AV Pro V60) | |
| Dell Precision 7670 (Toshiba Exceria Pro SDXC 64 GB UHS-II) | |
| Lenovo ThinkPad P16v G1 AMD (Angelbird AV Pro V60) | |
| Lenovo ThinkPad P1 G6-21FV000DGE (Angelbird AV Pro V60) | |
| Lenovo ThinkPad P16 G1 21D6001DMB (AV Pro V60) | |
Conectividade
O AMD ThinkPad é equipado com um módulo Qualcomm Wi-Fi 6E (WCN685x) que suporta o padrão Wi-Fi 6 atual, bem como o Bluetooth 5.2. Ele forneceu velocidades de transferência muito altas e estáveis quando conectado ao nosso roteador de referência da Asus.
O ThinkPad P16v G1 também pode ser configurado com um módulo WWAN (4G LTE) antes do pedido, mas isso não pode ser adicionado posteriormente porque nem o leitor de cartão SIM nem as antenas necessárias são instaladas como padrão.
| Networking | |
| Lenovo ThinkPad P16v G1 AMD | |
| iperf3 transmit AXE11000 | |
| iperf3 receive AXE11000 | |
| HP ZBook Power 15 G10 | |
| iperf3 transmit AXE11000 | |
| iperf3 receive AXE11000 | |
| iperf3 transmit AXE11000 6GHz | |
| iperf3 receive AXE11000 6GHz | |
| Lenovo ThinkPad P15v G3 21EM001AGE | |
| iperf3 transmit AXE11000 | |
| iperf3 receive AXE11000 | |
| iperf3 transmit AXE11000 6GHz | |
| iperf3 receive AXE11000 6GHz | |
| Dell Precision 7670 | |
| iperf3 transmit AXE11000 6GHz | |
| iperf3 receive AXE11000 6GHz | |
| Lenovo ThinkPad P1 G6-21FV000DGE | |
| iperf3 transmit AXE11000 | |
| iperf3 receive AXE11000 | |
| Lenovo ThinkPad P16 G1 21D6001DMB | |
| iperf3 transmit AXE11000 | |
| iperf3 receive AXE11000 | |
Webcam
Embora a Lenovo tenha instalado uma webcam de 5MP, a qualidade da imagem não é particularmente boa. Mesmo em boas condições de iluminação, as imagens não são muito melhores do que as obtidas por webcams de 1080p. Há também uma câmera IR integrada para o reconhecimento facial do Windows Hello.


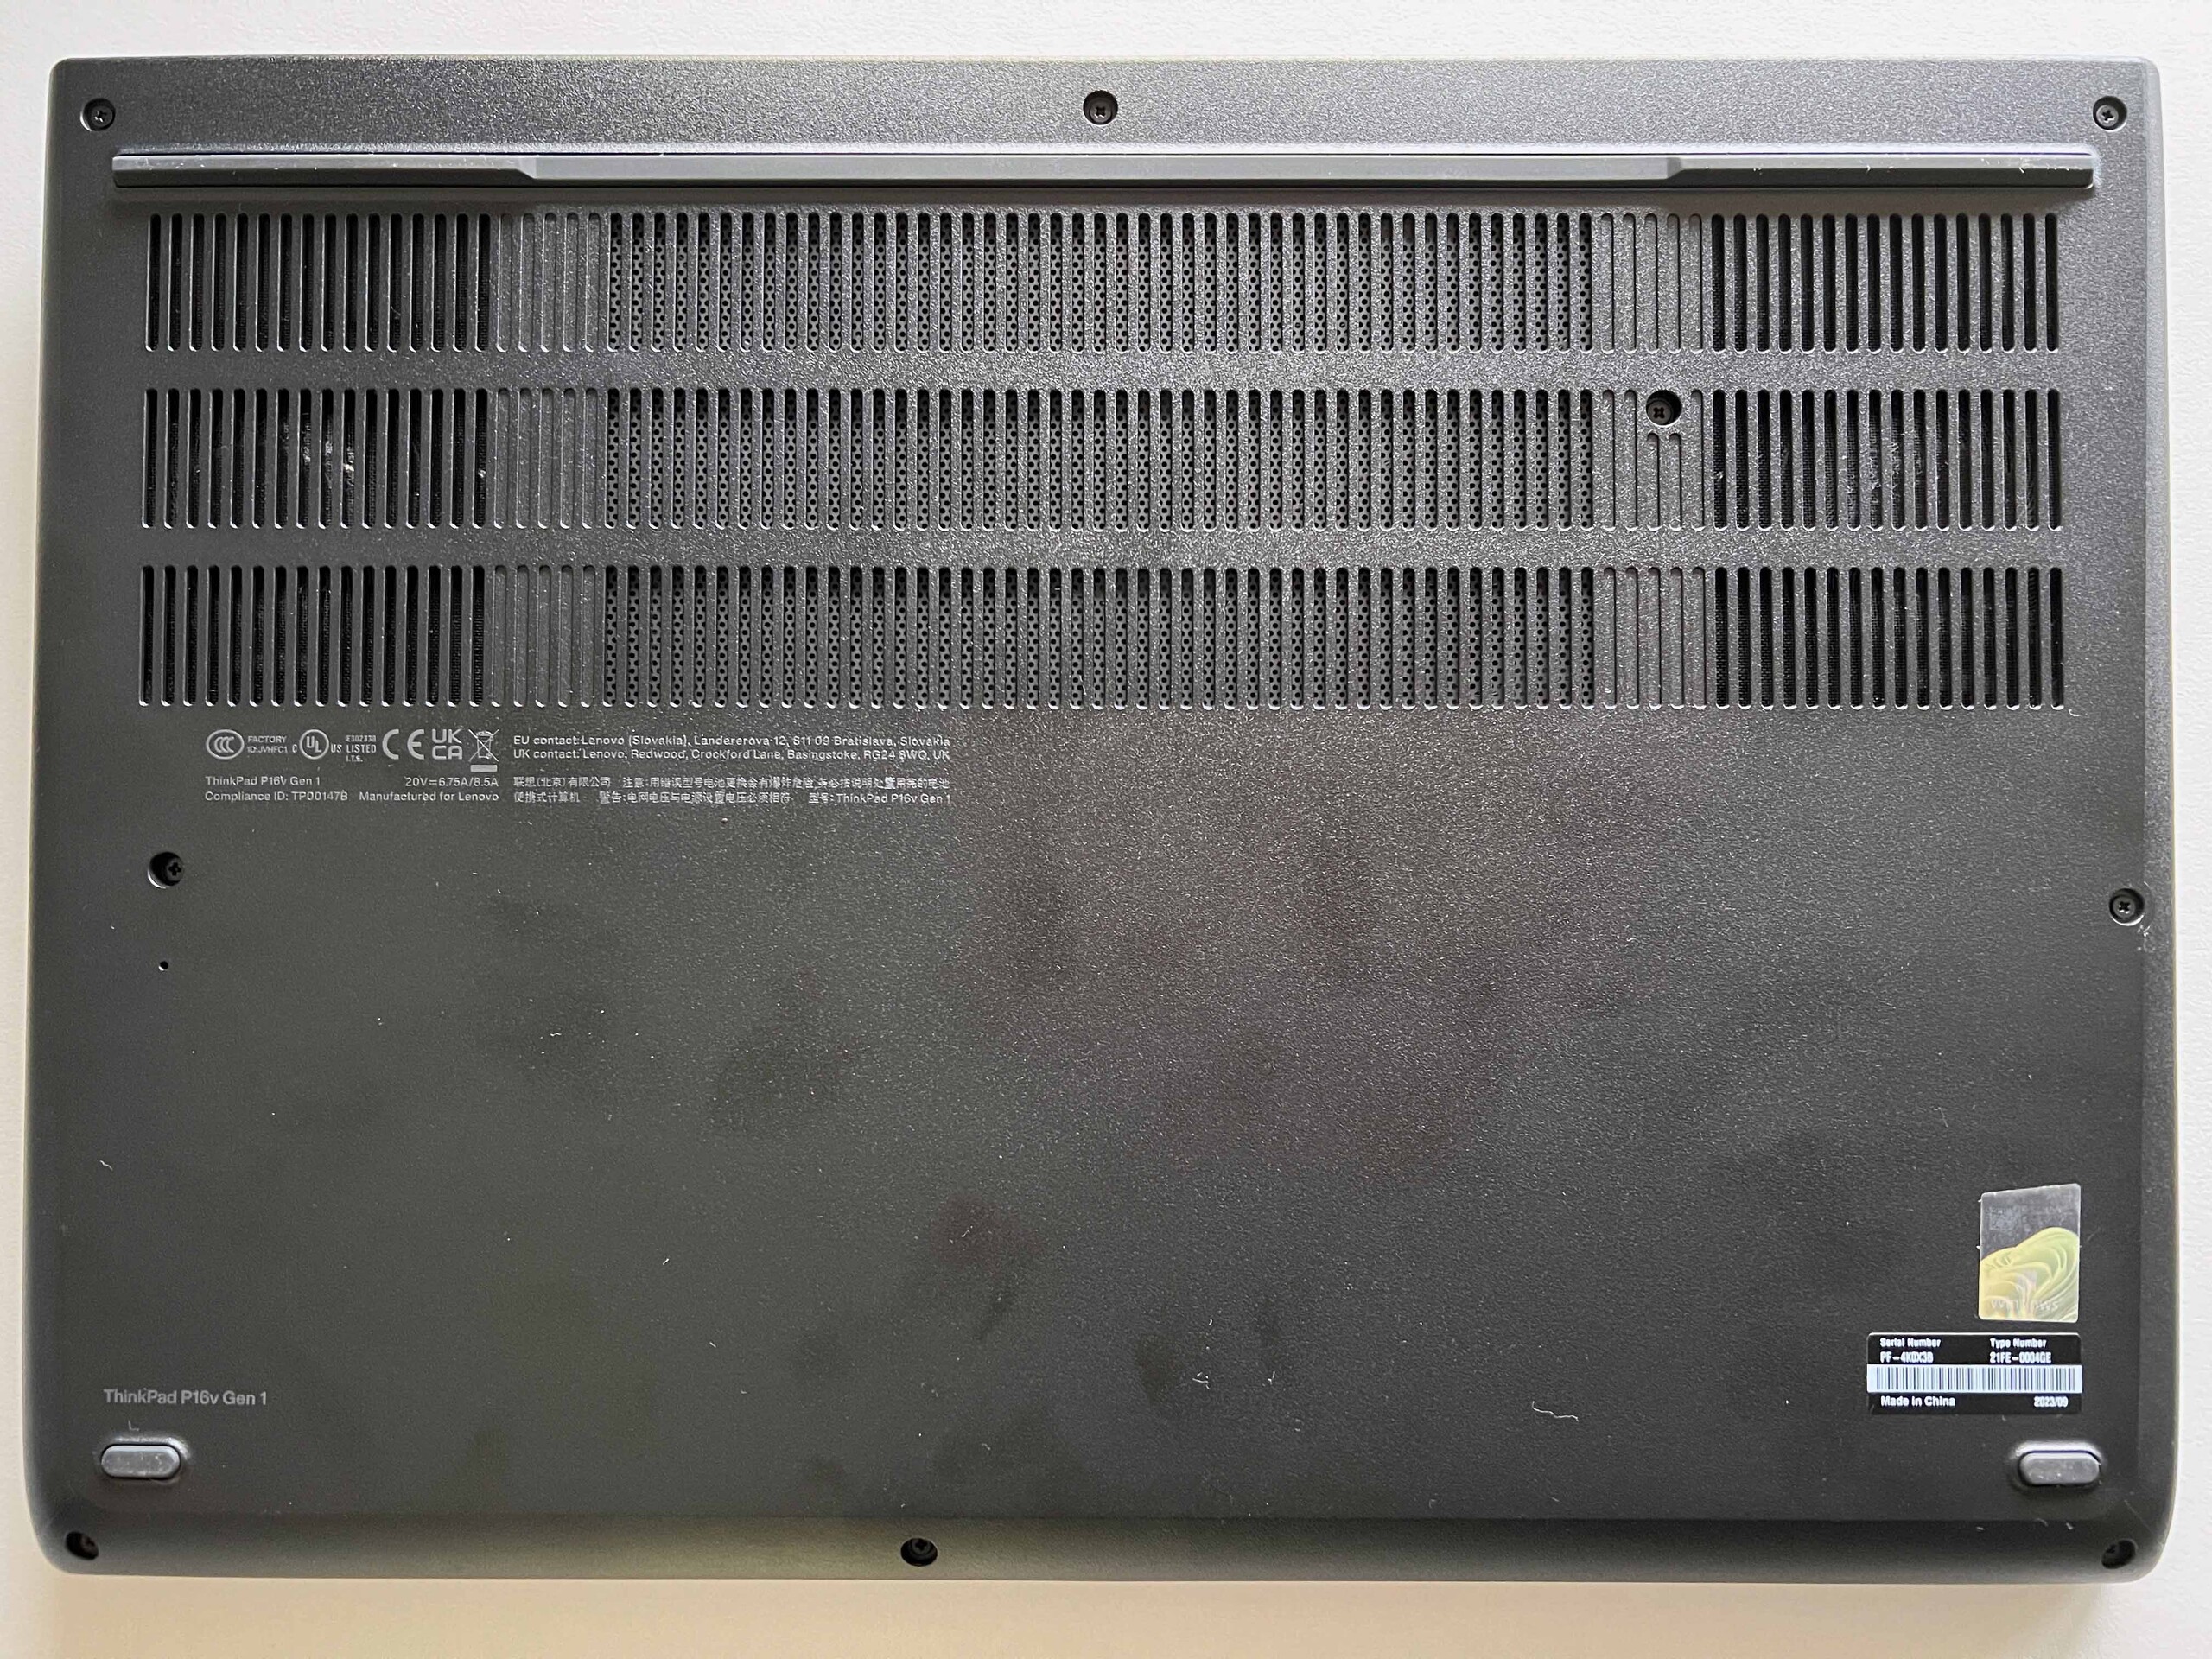
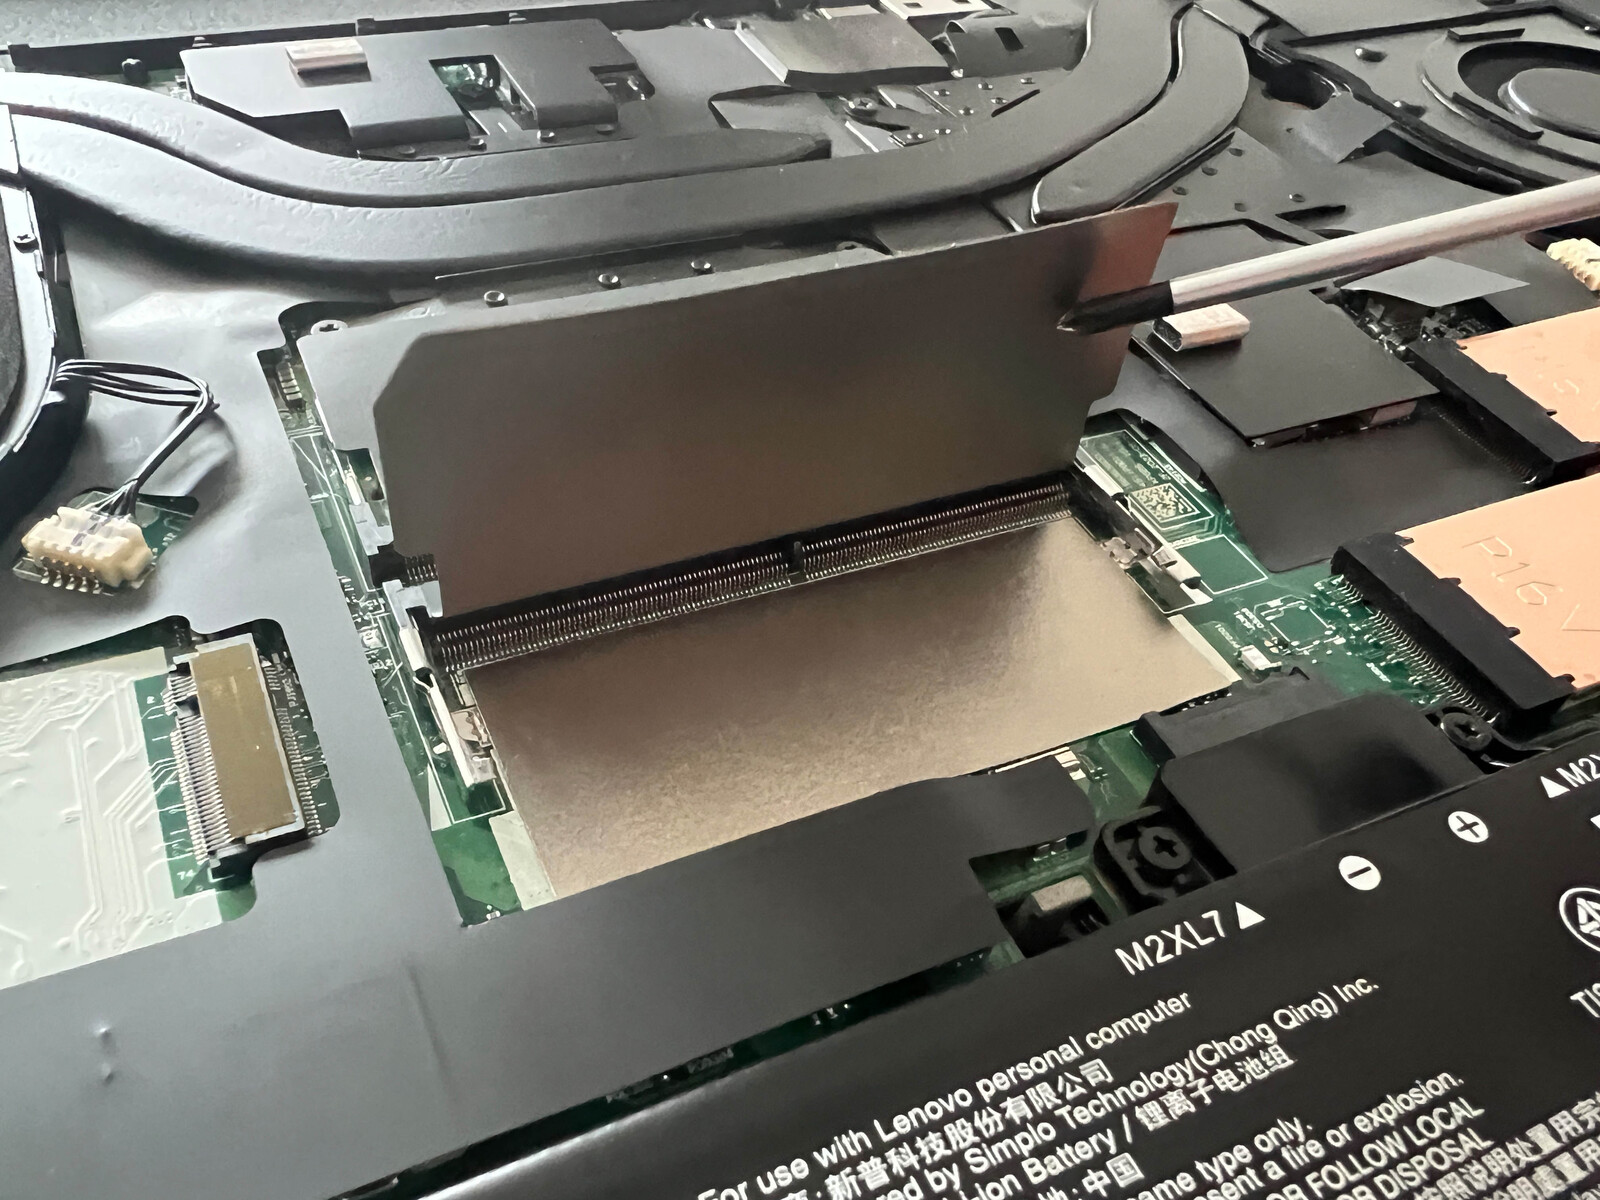
Manutenção
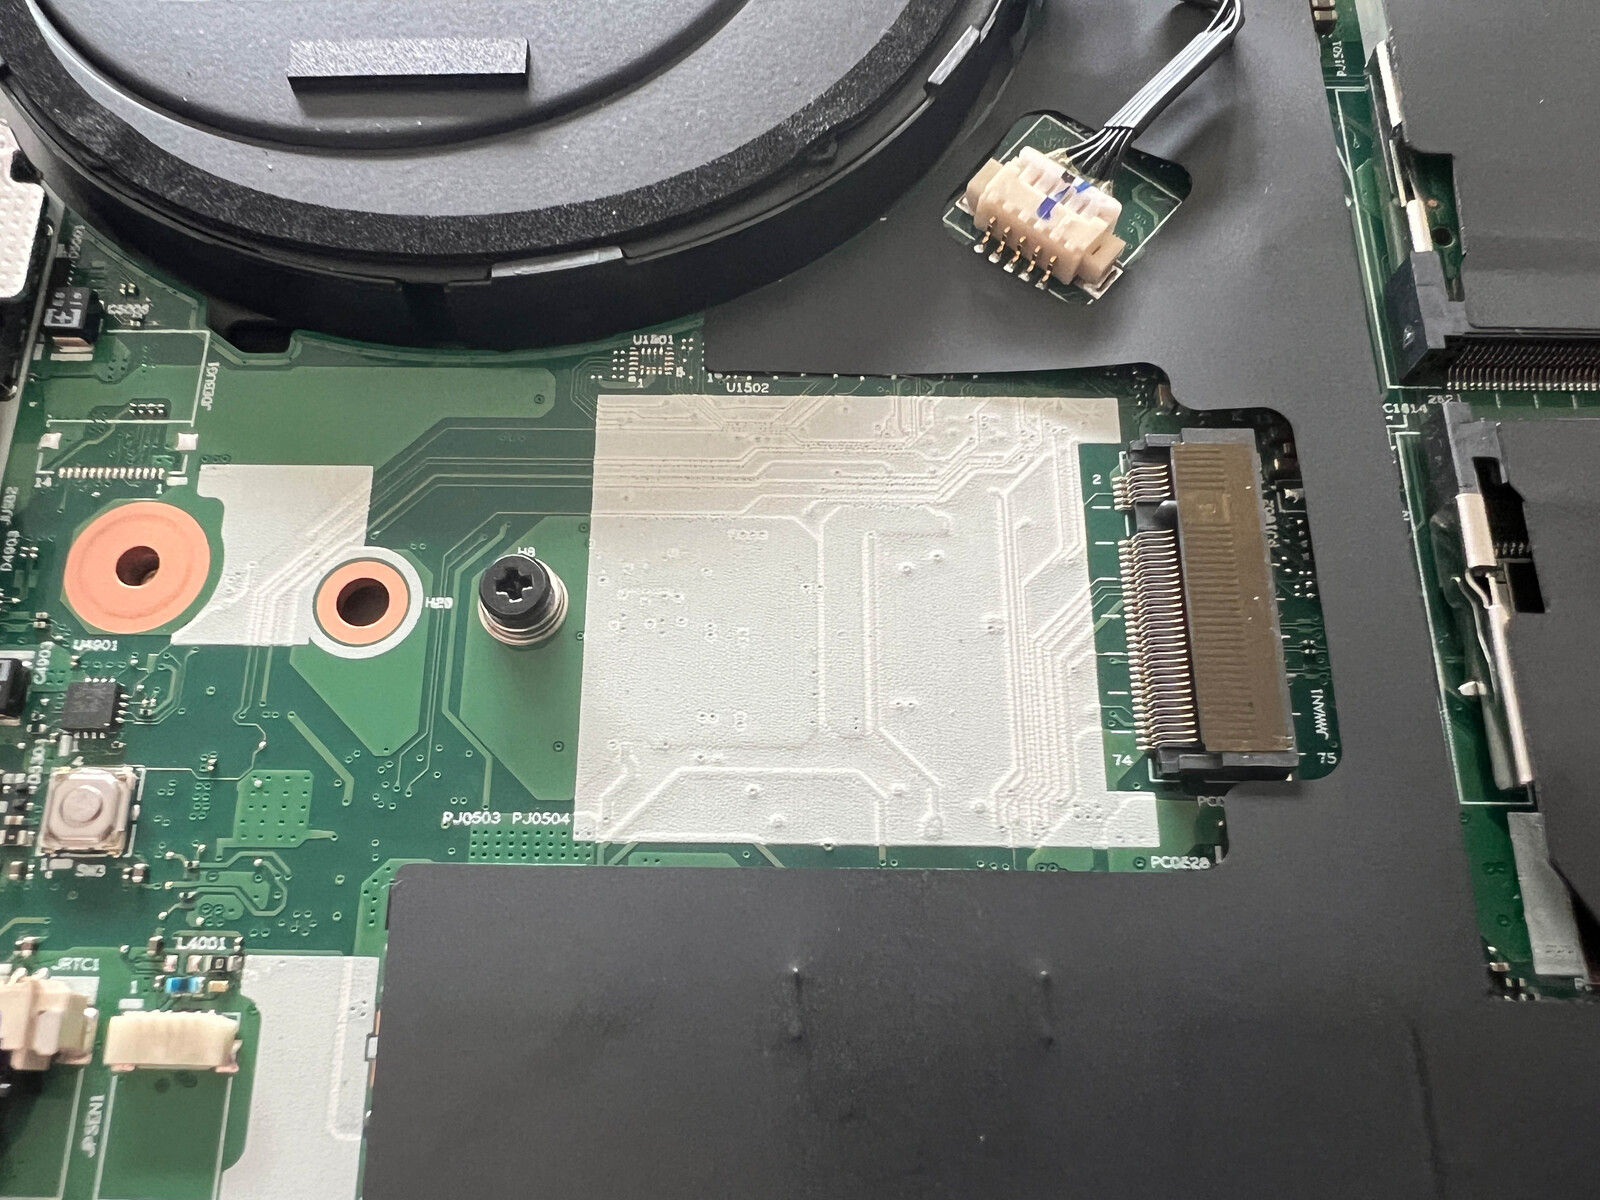
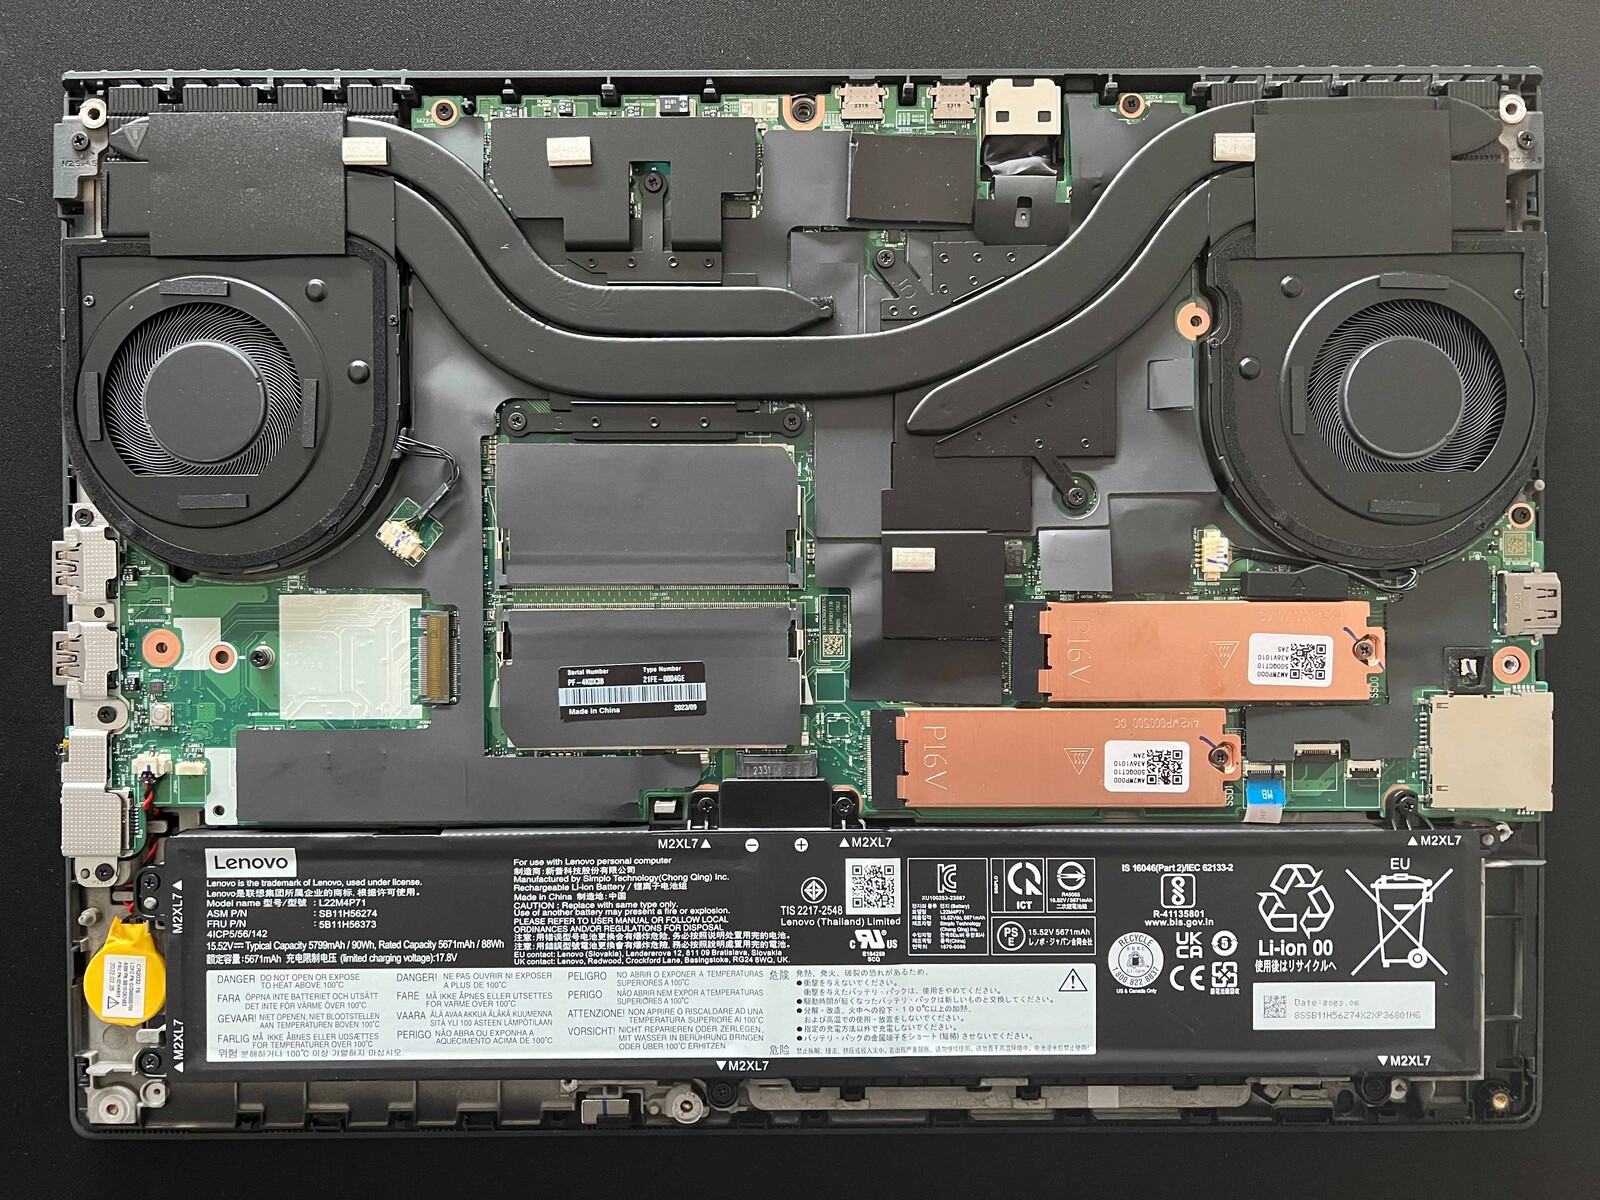
O gabinete inferior é fixado no lugar com alguns parafusos Phillips e pode ser completamente removido. A facilidade de manutenção é boa em geral. Além dos dois slots SO-DIMM para RAM, há dois slots para SSDs M.2 2280. As ventoinhas são fáceis de limpar e a bateria é apenas parafusada. Entretanto, o módulo sem fio é soldado e não pode ser substituído.
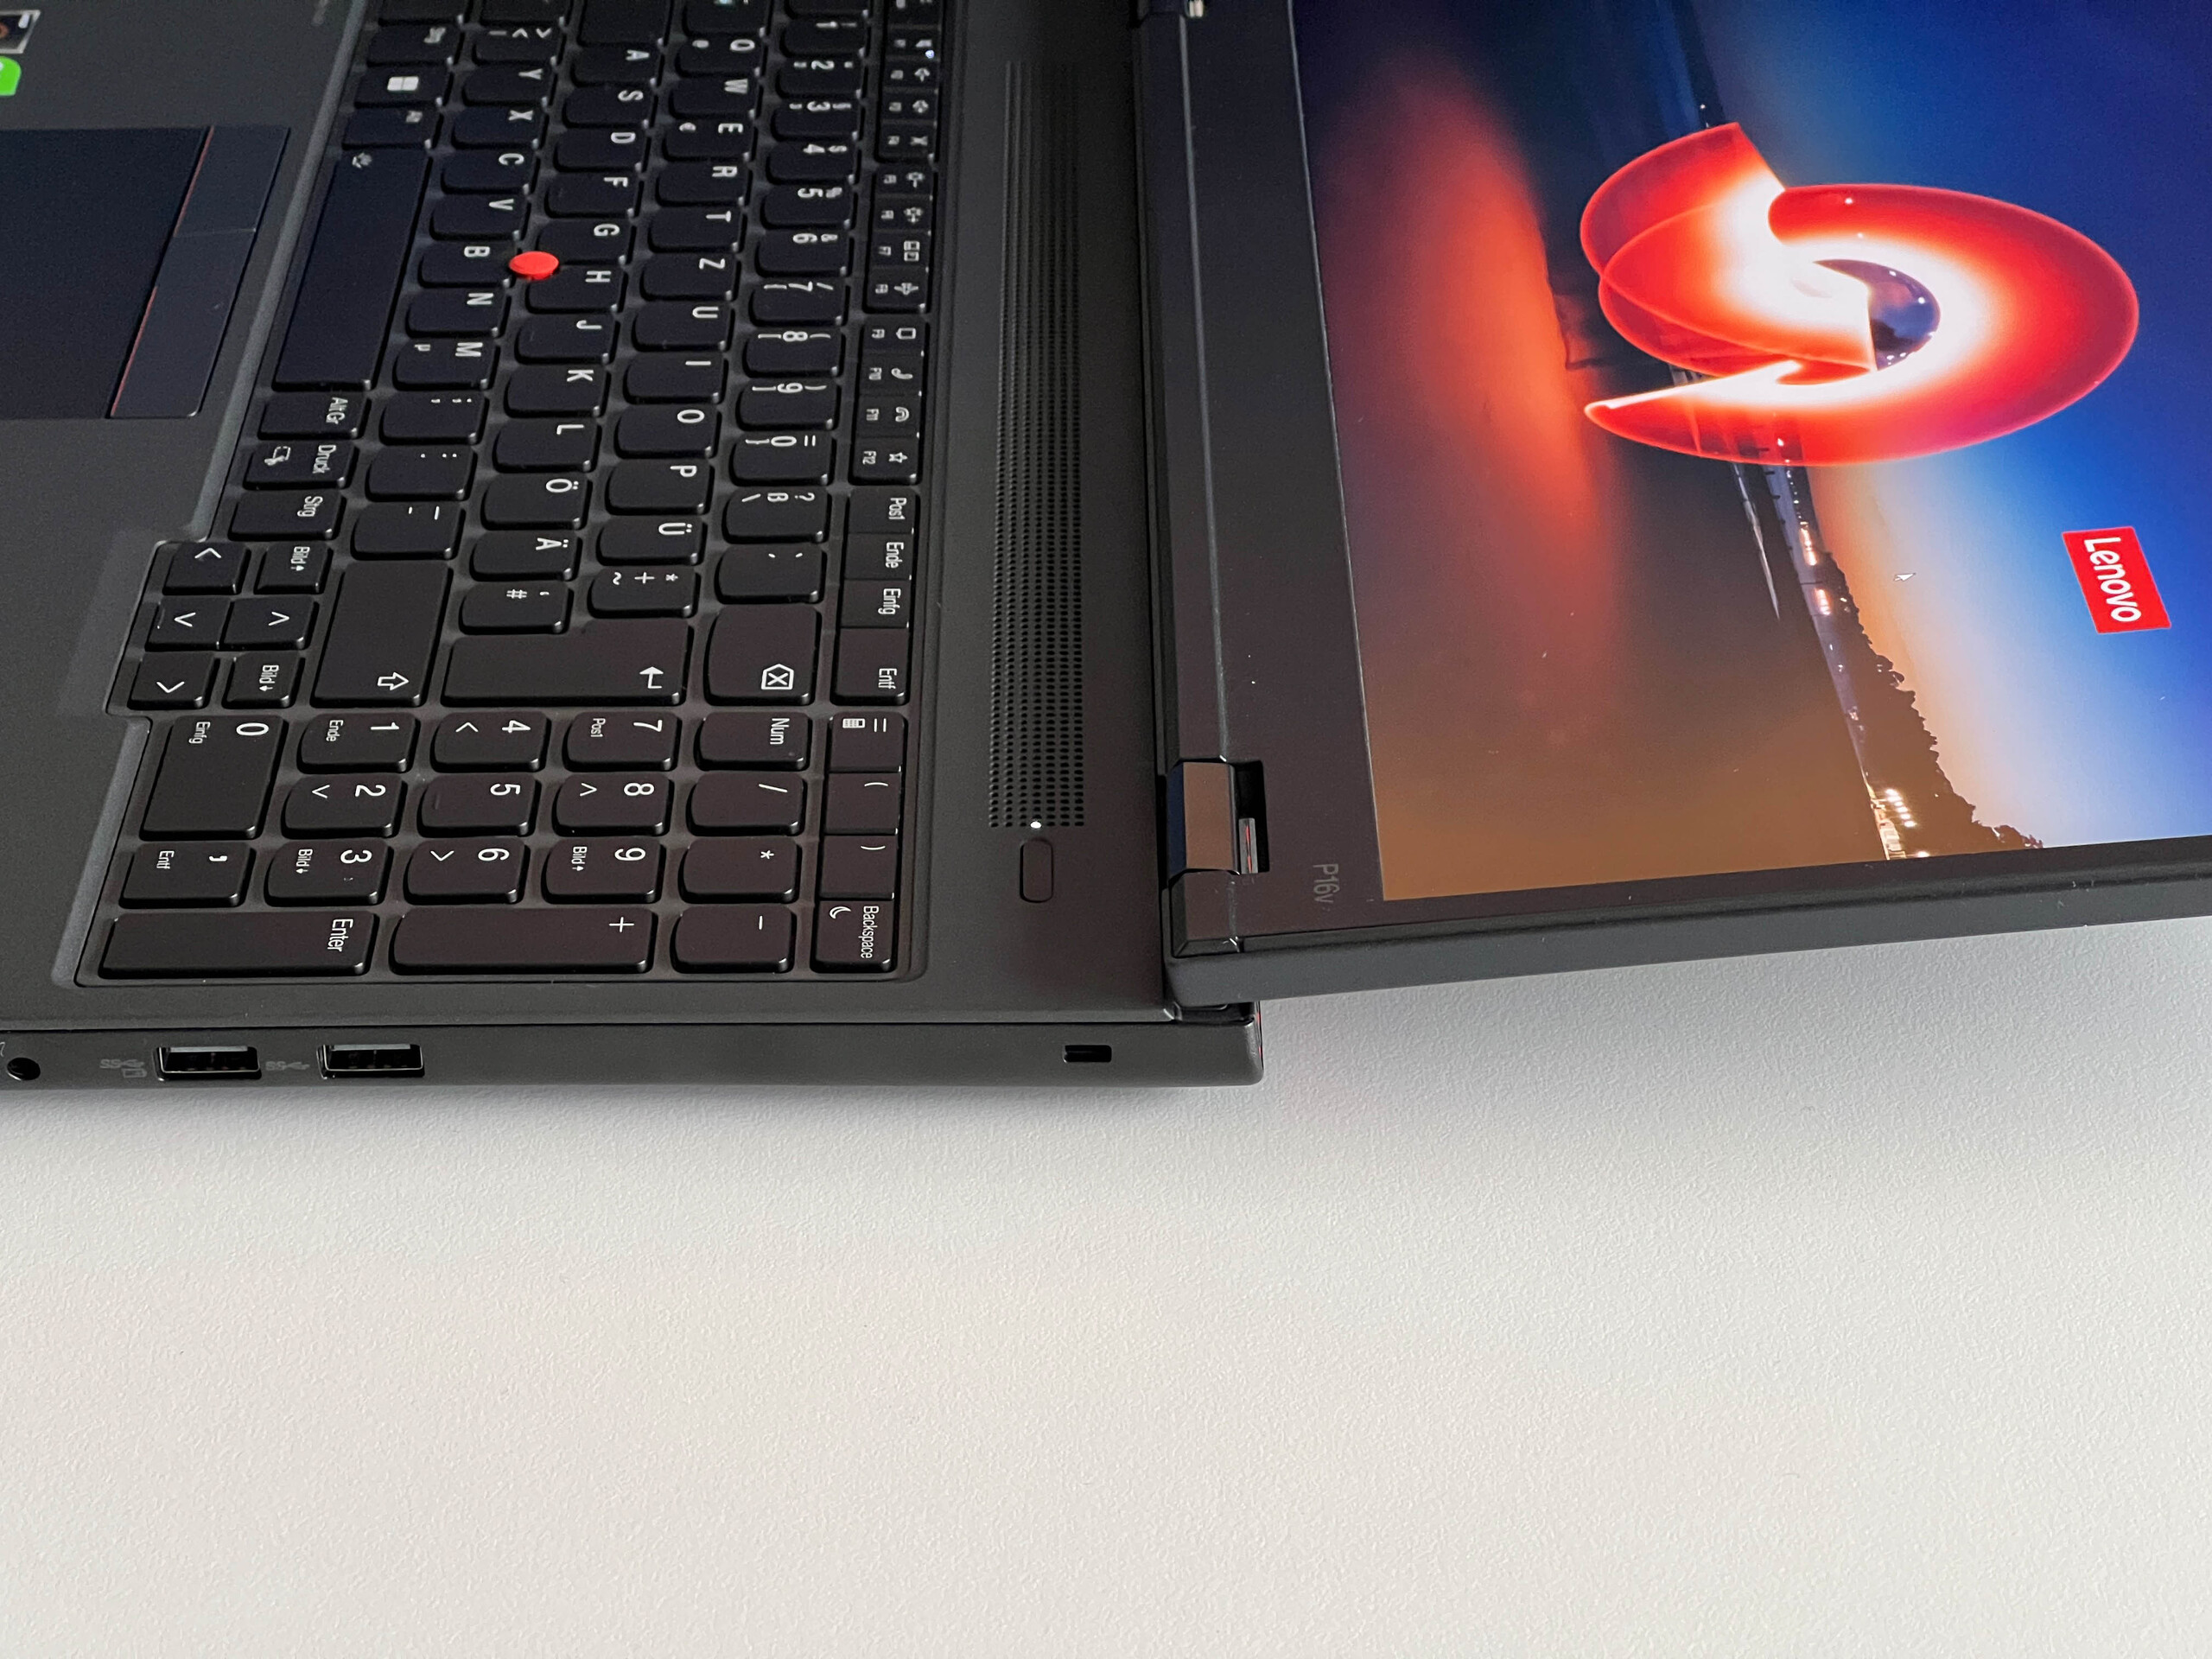
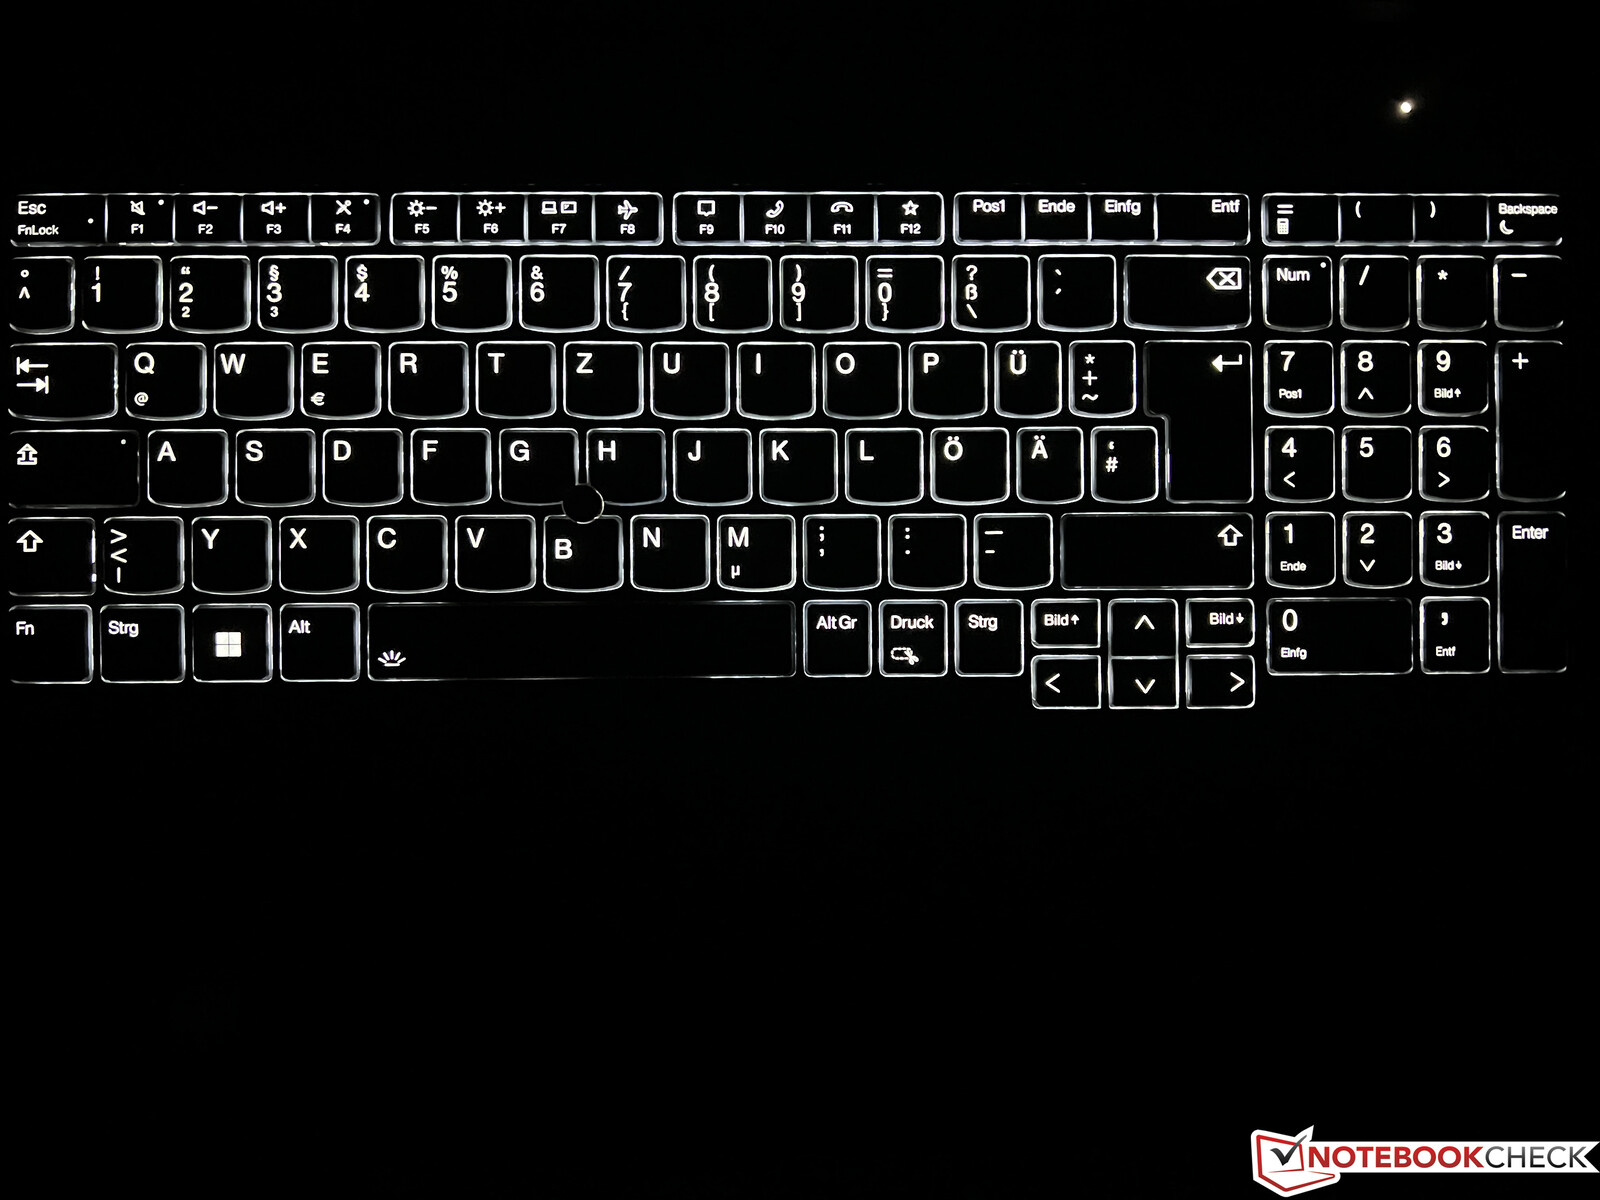
Dispositivos de entrada - curso de 1,5 mm e teclado numérico
Os dispositivos de entrada no P16v G1 são similares aos do P16 normal no que se refere ao layout e ao mecanismo, além do fato de que o teclado do P16v é preto em vez de cinza escuro. O deslocamento das teclas mede aproximadamente 1,5 mm e, portanto, está de acordo com o padrão atual do ThinkPad. Dito isso, é uma pena que a Lenovo tenha deixado de usar os teclados muito superiores com 1,8 mm de deslocamento, inclusive em grandes estações de trabalho. Em geral, o teclado não é de forma alguma horrível, mas em última análise, o P16v G1 já não tem nenhuma vantagem sobre os dispositivos concorrentes, como o HP ZBook Power G10 neste aspecto. O teclado do ThinkPad tem uma luz de fundo branca com dois níveis de brilho; o botão de energia (canto superior direito) também serve como um scanner de impressões digitais.
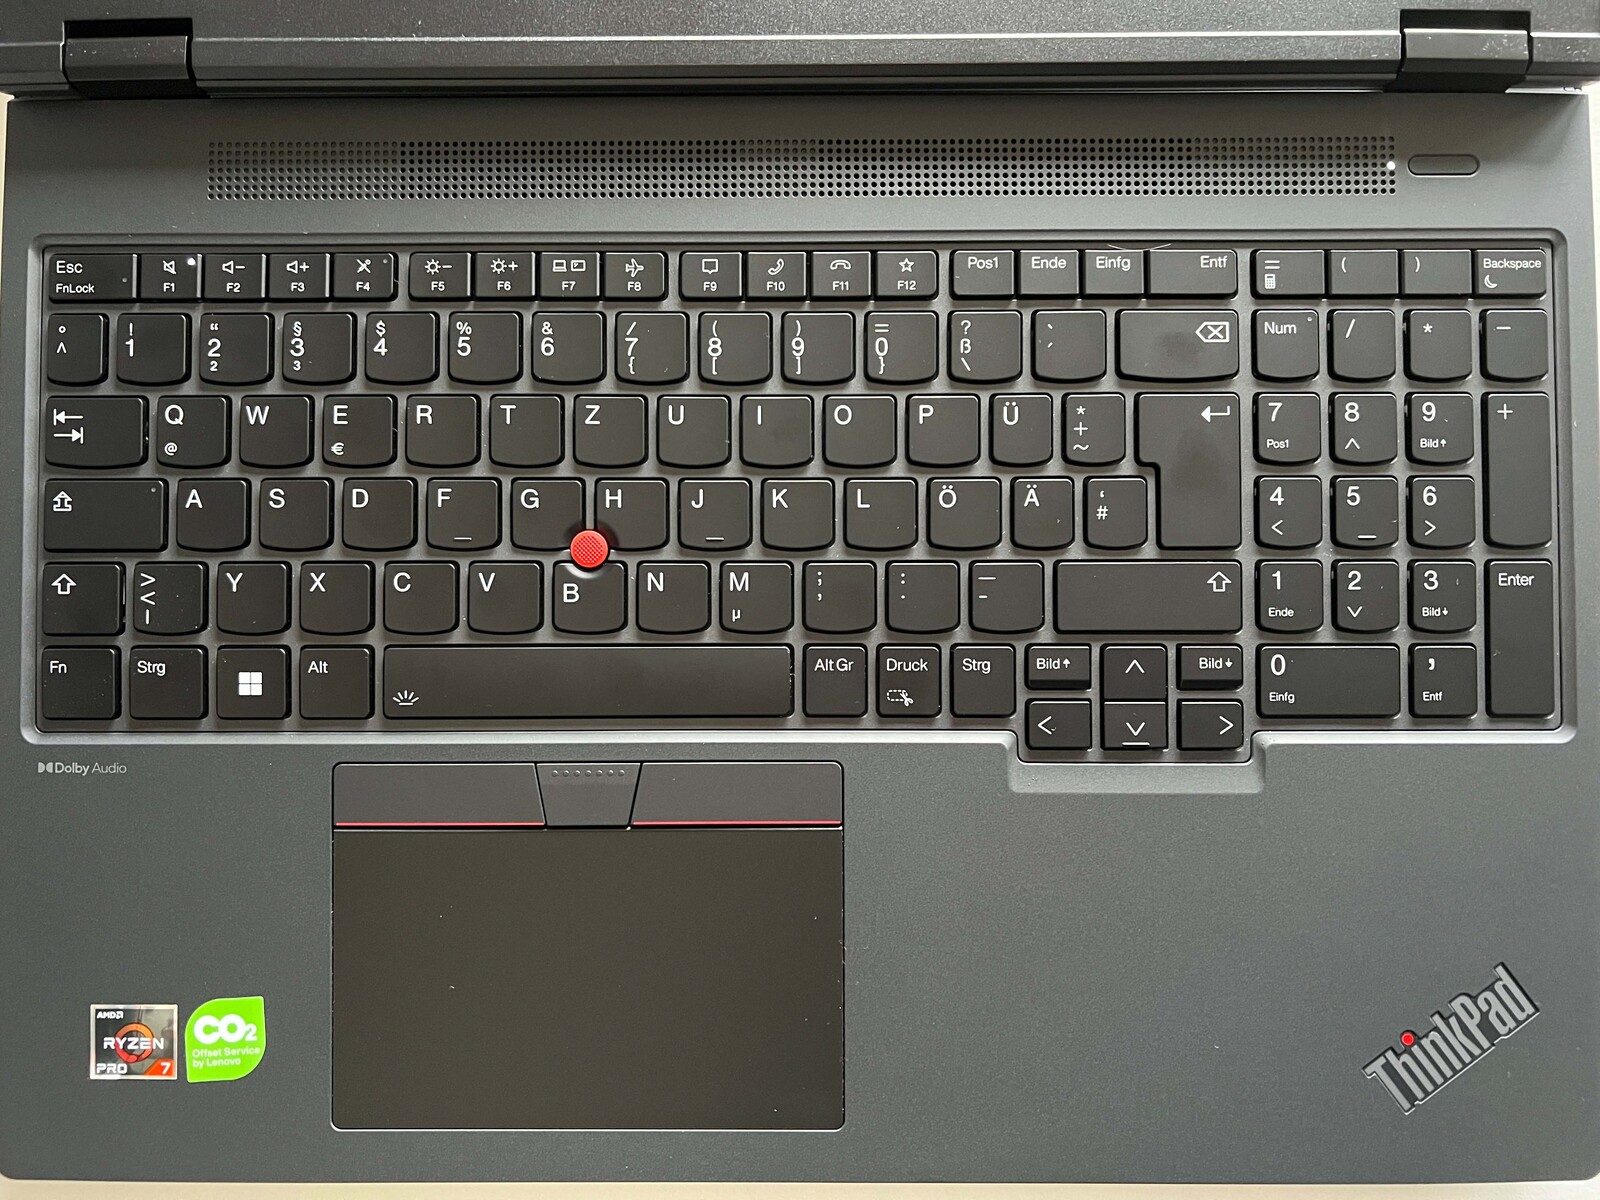
Os usuários podem mover o ponteiro do mouse usando o ClickPad ou o TrackPoint. O ClickPad está ligeiramente deslocado para a esquerda e oferece espaço suficiente para entradas (11,5 x 6,8 cm, ou 4,5 x 2,7 pol.), mas é de se esperar que algum espaço tenha sido reservado para os botões dedicados do TrackPoint. O pad em si funciona bem e não nos causou problemas, embora os sons de clique sejam um pouco altos. Isso também se aplica aos botões do TrackPoint mencionados anteriormente, que pareceram muito baratos. Mas o TrackPoint em si funciona perfeitamente bem quando o usuário se acostuma com ele.
Tela - Painel IPS mate

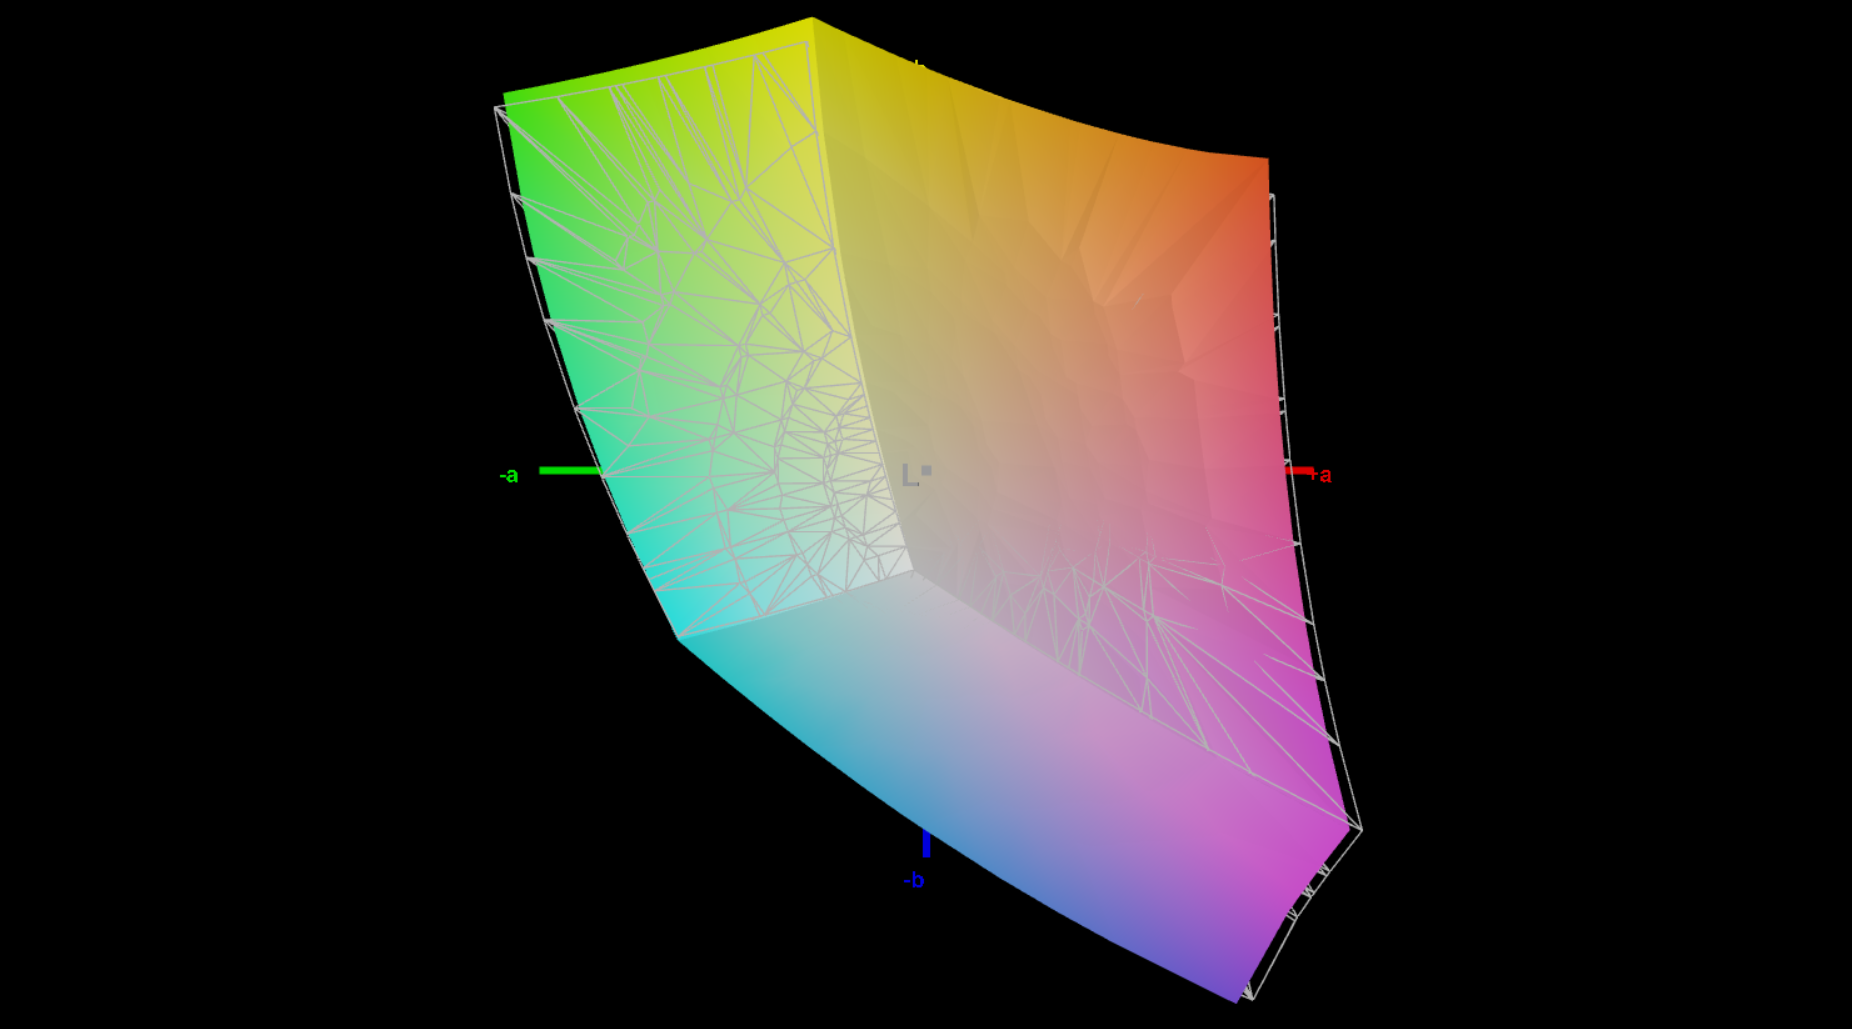
A Lenovo oferece um total de quatro opções de tela para o ThinkPad P16v G1. Por padrão, o laptop vem com um painel IPS fosco com uma resolução de 1.920 x 1.200, um brilho máximo de 300 nits e 45% de cobertura NTSC. O senhor também tem a opção de obter esse monitor com capacidade de tela sensível ao toque. Nossa unidade de análise está equipada com o modelo Full HD opcional com 100% de cobertura sRGB. Há também uma opção de painel 4K com 800 nits de brilho máximo, cobertura total de DCI-P3, calibração de fábrica e suporte a HDR.
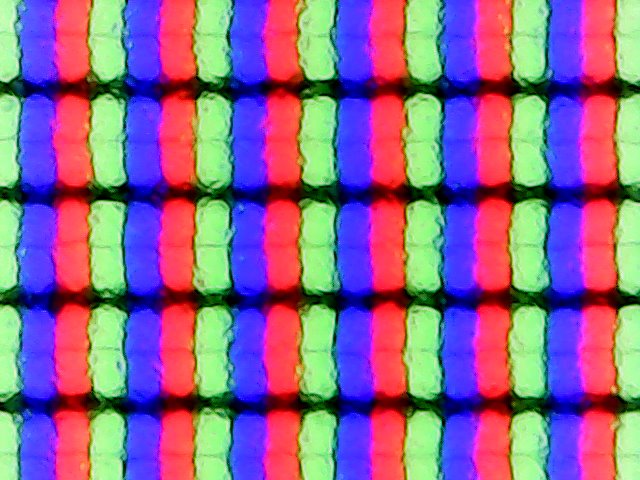
O painel de 60 Hz da nossa unidade de análise é fabricado pela BOE e oferece uma qualidade de imagem respeitável aos nossos olhos. As cores são adequadamente vibrantes e o conteúdo parece suficientemente nítido na tela de 16 polegadas. As áreas claras também não parecem granuladas. No entanto, os tempos de resposta são um pouco lentos e o senhor também notará pequenos fantasmas no monitor no uso diário, por exemplo, ao mover o cursor do mouse. O painel não usa PWM e apresenta apenas um mínimo de vazamento de luz de fundo com brilho total e em um fundo escuro.
Nossa unidade de análise conseguiu atingir um pico médio de brilho ligeiramente acima de 340 cd/m², excedendo assim o brilho anunciado de 300 cd/m². Isso, junto com o baixo nível de preto, resulta em uma excelente relação de contraste máximo de mais de 2.000:1.
| |||||||||||||||||||||||||
iluminação: 92 %
iluminação com acumulador: 354 cd/m²
Contraste: 2088:1 (Preto: 0.17 cd/m²)
ΔE ColorChecker Calman: 2.9 | ∀{0.5-29.43 Ø4.71}
calibrated: 1
ΔE Greyscale Calman: 4.7 | ∀{0.09-98 Ø4.96}
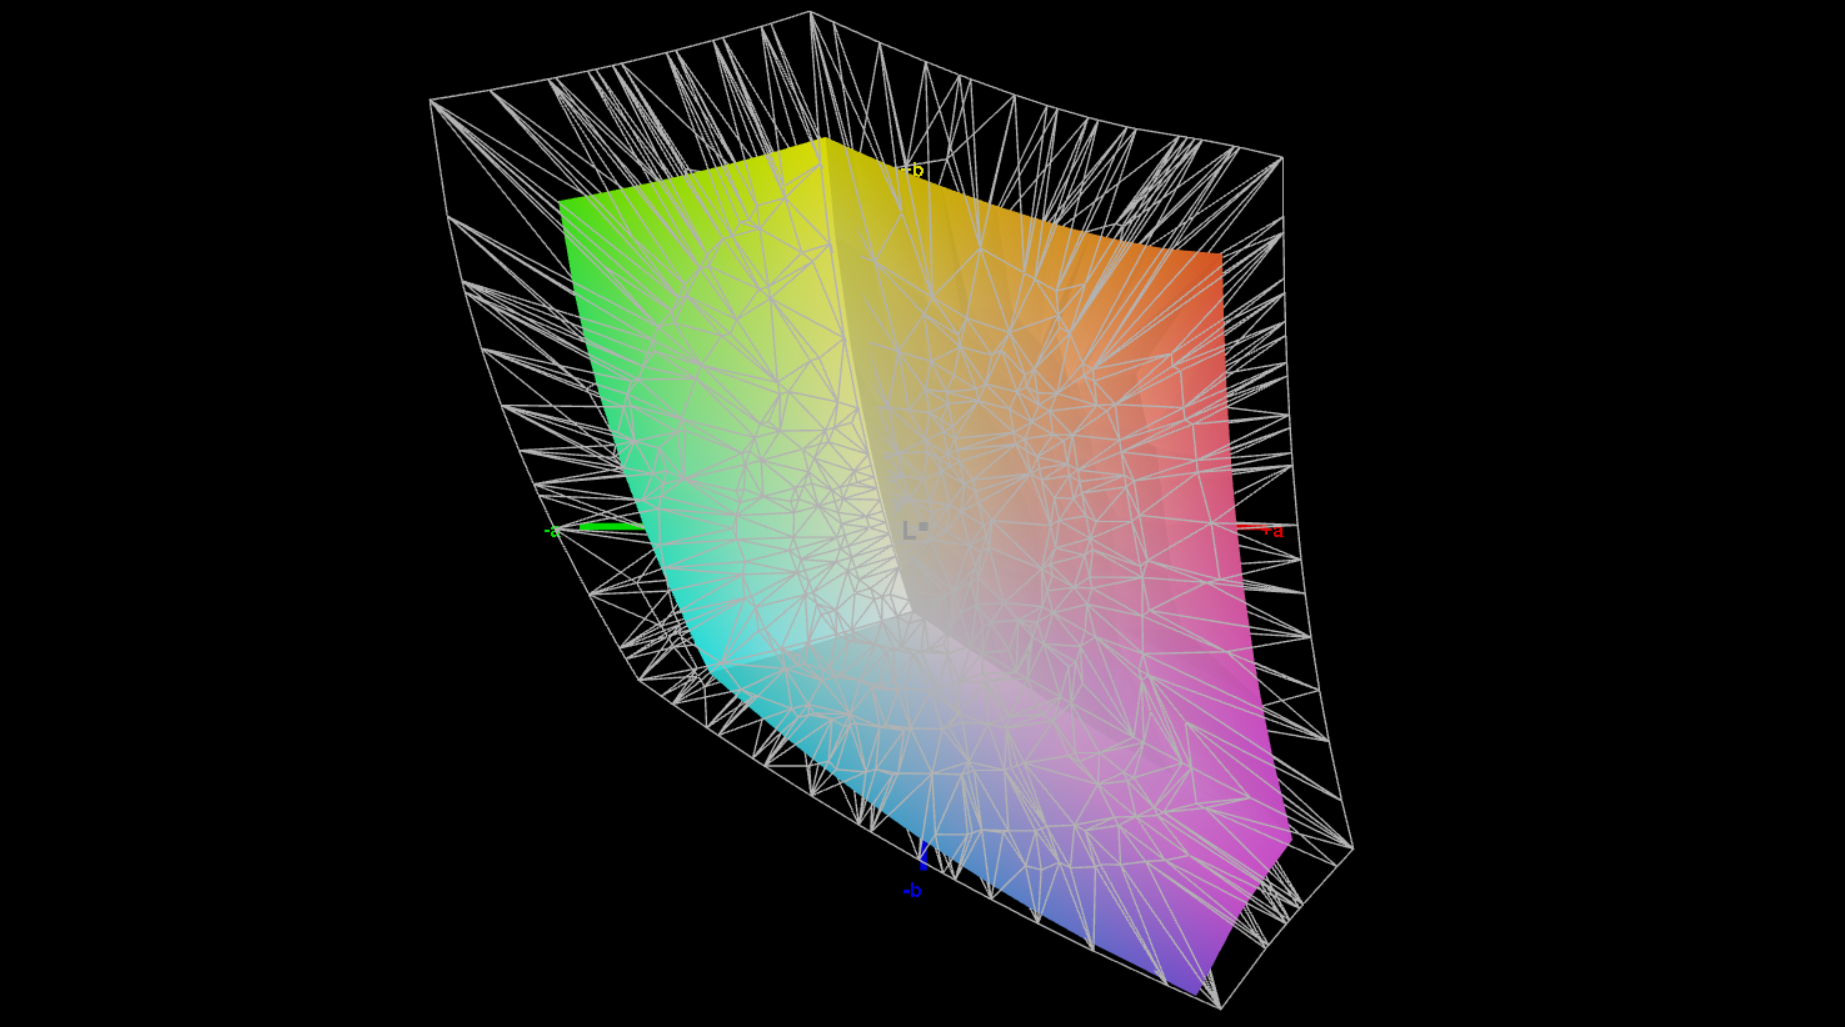
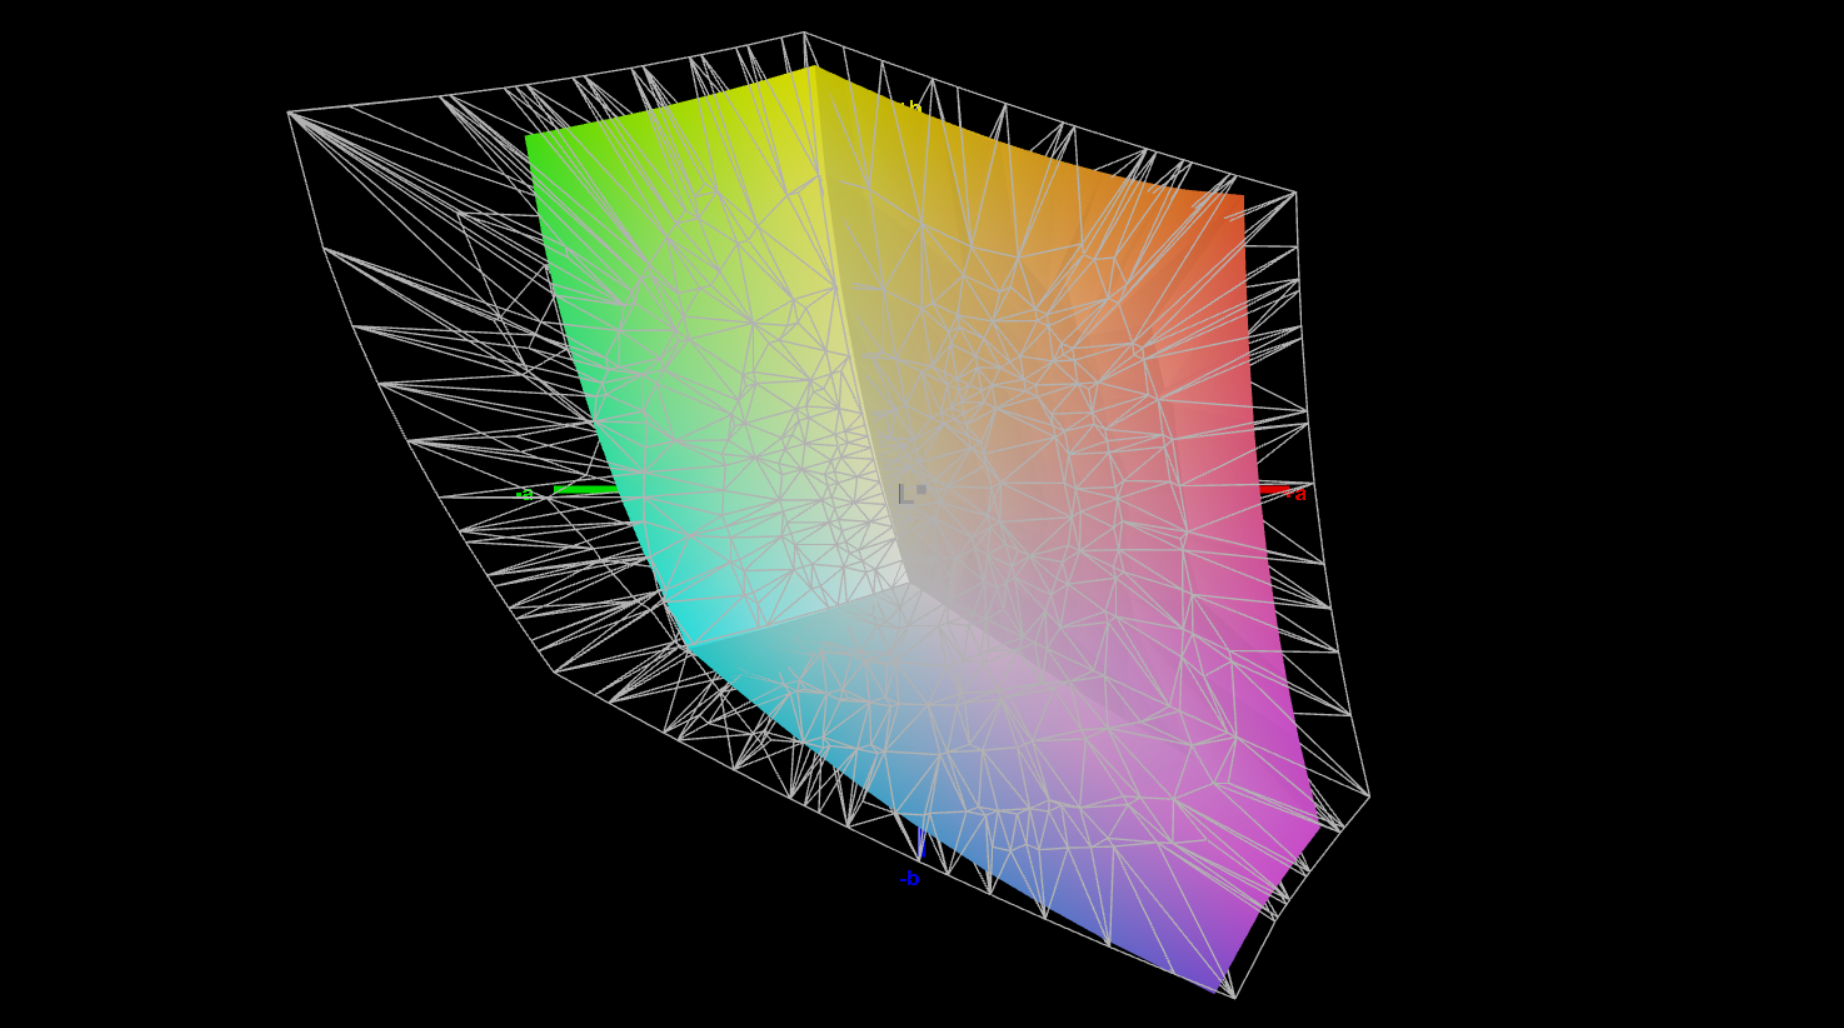
69.8% AdobeRGB 1998 (Argyll 3D)
97.7% sRGB (Argyll 3D)
67.8% Display P3 (Argyll 3D)
Gamma: 2.12
CCT: 6356 K
| Lenovo ThinkPad P16v G1 AMD NE160WUM-N64, IPS, 1920x1200, 16" | HP ZBook Power 15 G10 BOE0B6A, IPS, 2560x1440, 15.6" | Lenovo ThinkPad P15v G3 21EM001AGE NE156QUM-N6C, IPS LED, 3840x2160, 15.6" | Dell Precision 7670 Samsung 160YV03, OLED, 3840x2400, 16" | Lenovo ThinkPad P1 G6-21FV000DGE NE160QDM-NY1, IPS, 2560x1600, 16" | Lenovo ThinkPad P16 G1 21D6001DMB NE160QDM-N63 , IPS LED, 2560x1600, 16" | |
|---|---|---|---|---|---|---|
| Display | 0% | 26% | 30% | 0% | 4% | |
| Display P3 Coverage (%) | 67.8 | 68.2 1% | 89.9 33% | 99.9 47% | 68.1 0% | 71.5 5% |
| sRGB Coverage (%) | 97.7 | 95.6 -2% | 100 2% | 100 2% | 97.5 0% | 100 2% |
| AdobeRGB 1998 Coverage (%) | 69.8 | 70.5 1% | 99.9 43% | 97.5 40% | 70.2 1% | 73.3 5% |
| Response Times | 67% | 2% | 94% | 68% | 12% | |
| Response Time Grey 50% / Grey 80% * (ms) | 50.6 ? | 13 ? 74% | 46.7 ? 8% | 1.9 ? 96% | 13.7 ? 73% | 37.7 ? 25% |
| Response Time Black / White * (ms) | 26 ? | 10.4 ? 60% | 27.3 ? -5% | 2 ? 92% | 9.6 ? 63% | 26.3 ? -1% |
| PWM Frequency (Hz) | 59.5 ? | |||||
| Screen | -21% | -20% | -1% | 14% | 4% | |
| Brightness middle (cd/m²) | 355 | 313.8 -12% | 588 66% | 340.1 -4% | 521 47% | 424 19% |
| Brightness (cd/m²) | 344 | 302 -12% | 536 56% | 342 -1% | 484 41% | 398 16% |
| Brightness Distribution (%) | 92 | 83 -10% | 83 -10% | 98 7% | 89 -3% | 90 -2% |
| Black Level * (cd/m²) | 0.17 | 0.29 -71% | 0.38 -124% | 0.36 -112% | 0.24 -41% | |
| Contrast (:1) | 2088 | 1082 -48% | 1547 -26% | 1447 -31% | 1767 -15% | |
| Colorchecker dE 2000 * | 2.9 | 3.27 -13% | 3.9 -34% | 2.5 14% | 1.2 59% | 2.6 10% |
| Colorchecker dE 2000 max. * | 5.6 | 7.81 -39% | 8.8 -57% | 8.19 -46% | 2.5 55% | 4.9 12% |
| Colorchecker dE 2000 calibrated * | 1 | 0.56 44% | 1 -0% | 1 -0% | 0.8 20% | |
| Greyscale dE 2000 * | 4.7 | 5.9 -26% | 7.1 -51% | 3.5 26% | 1.4 70% | 4.1 13% |
| Gamma | 2.12 104% | 2.18 101% | 2.12 104% | 2.12 104% | 2.25 98% | 2.13 103% |
| CCT | 6356 102% | 6323 103% | 7268 89% | 6704 97% | 6682 97% | 7252 90% |
| Média Total (Programa/Configurações) | 15% /
-4% | 3% /
-7% | 41% /
25% | 27% /
19% | 7% /
5% |
* ... menor é melhor
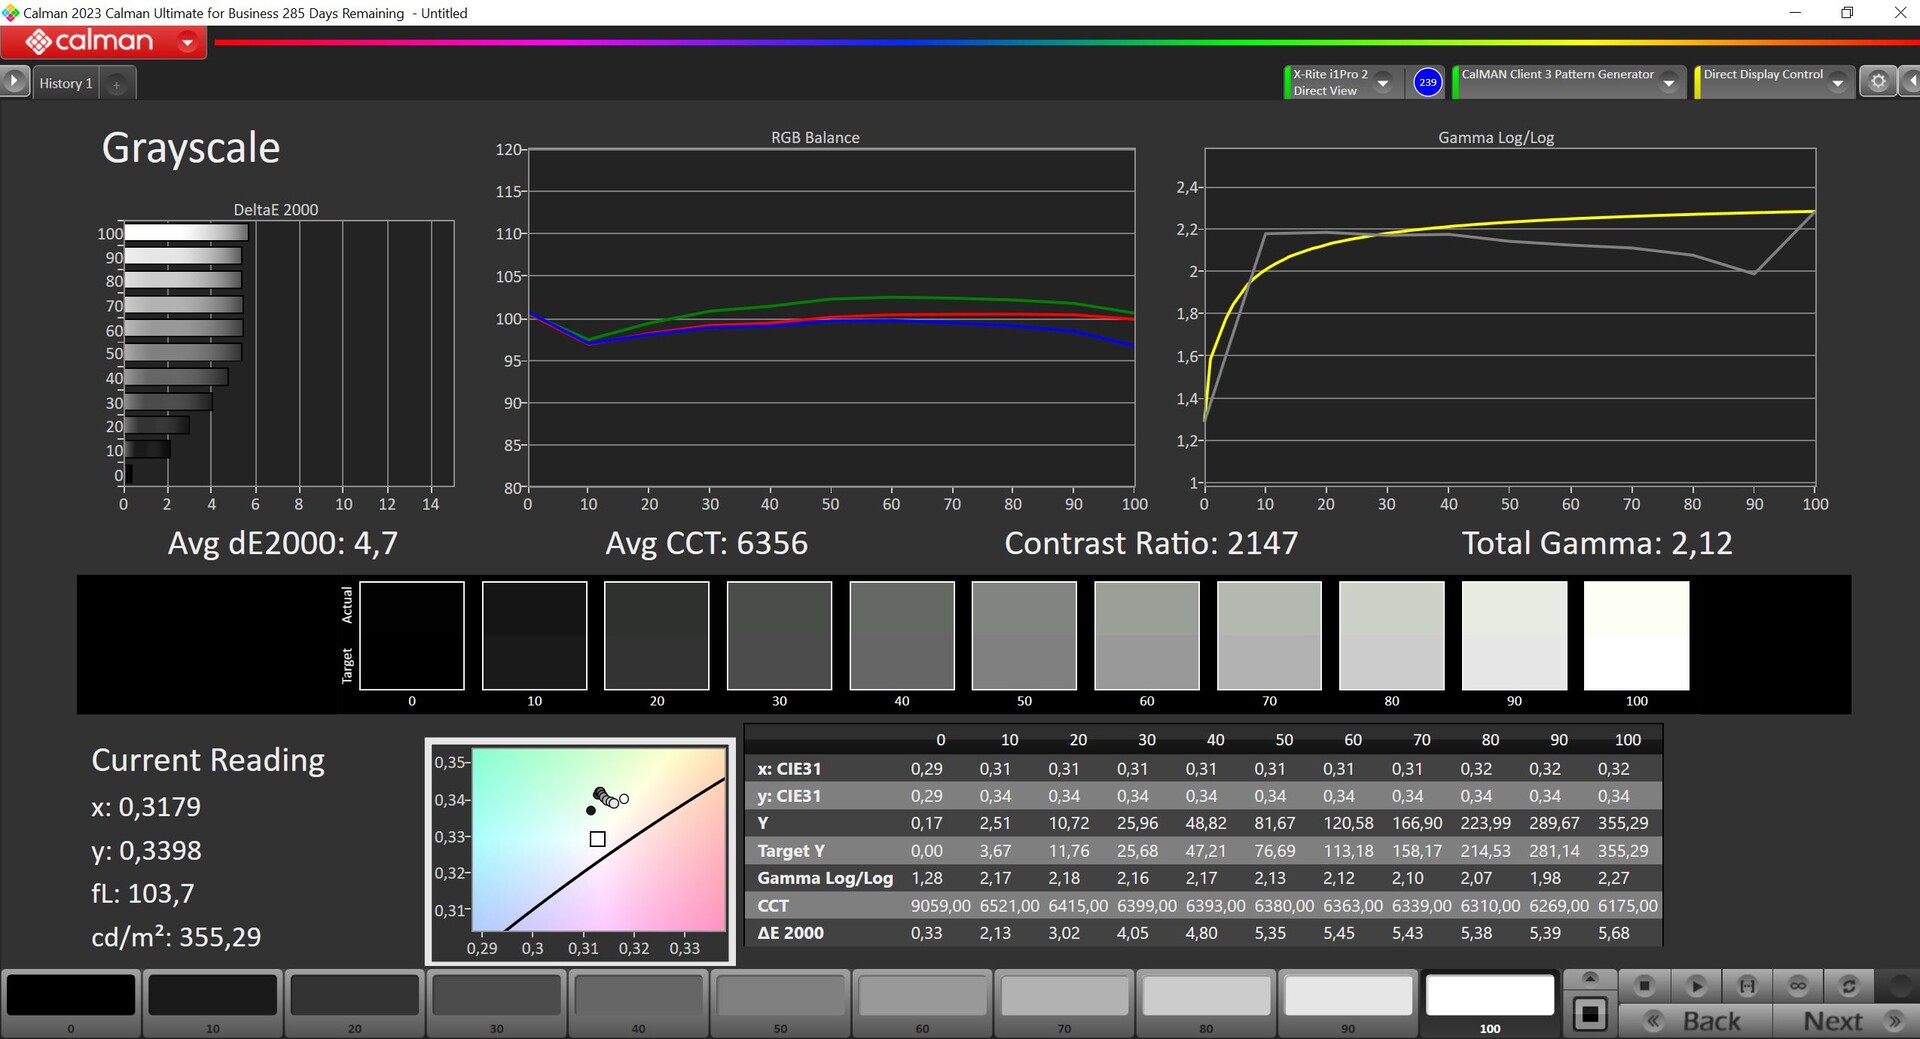
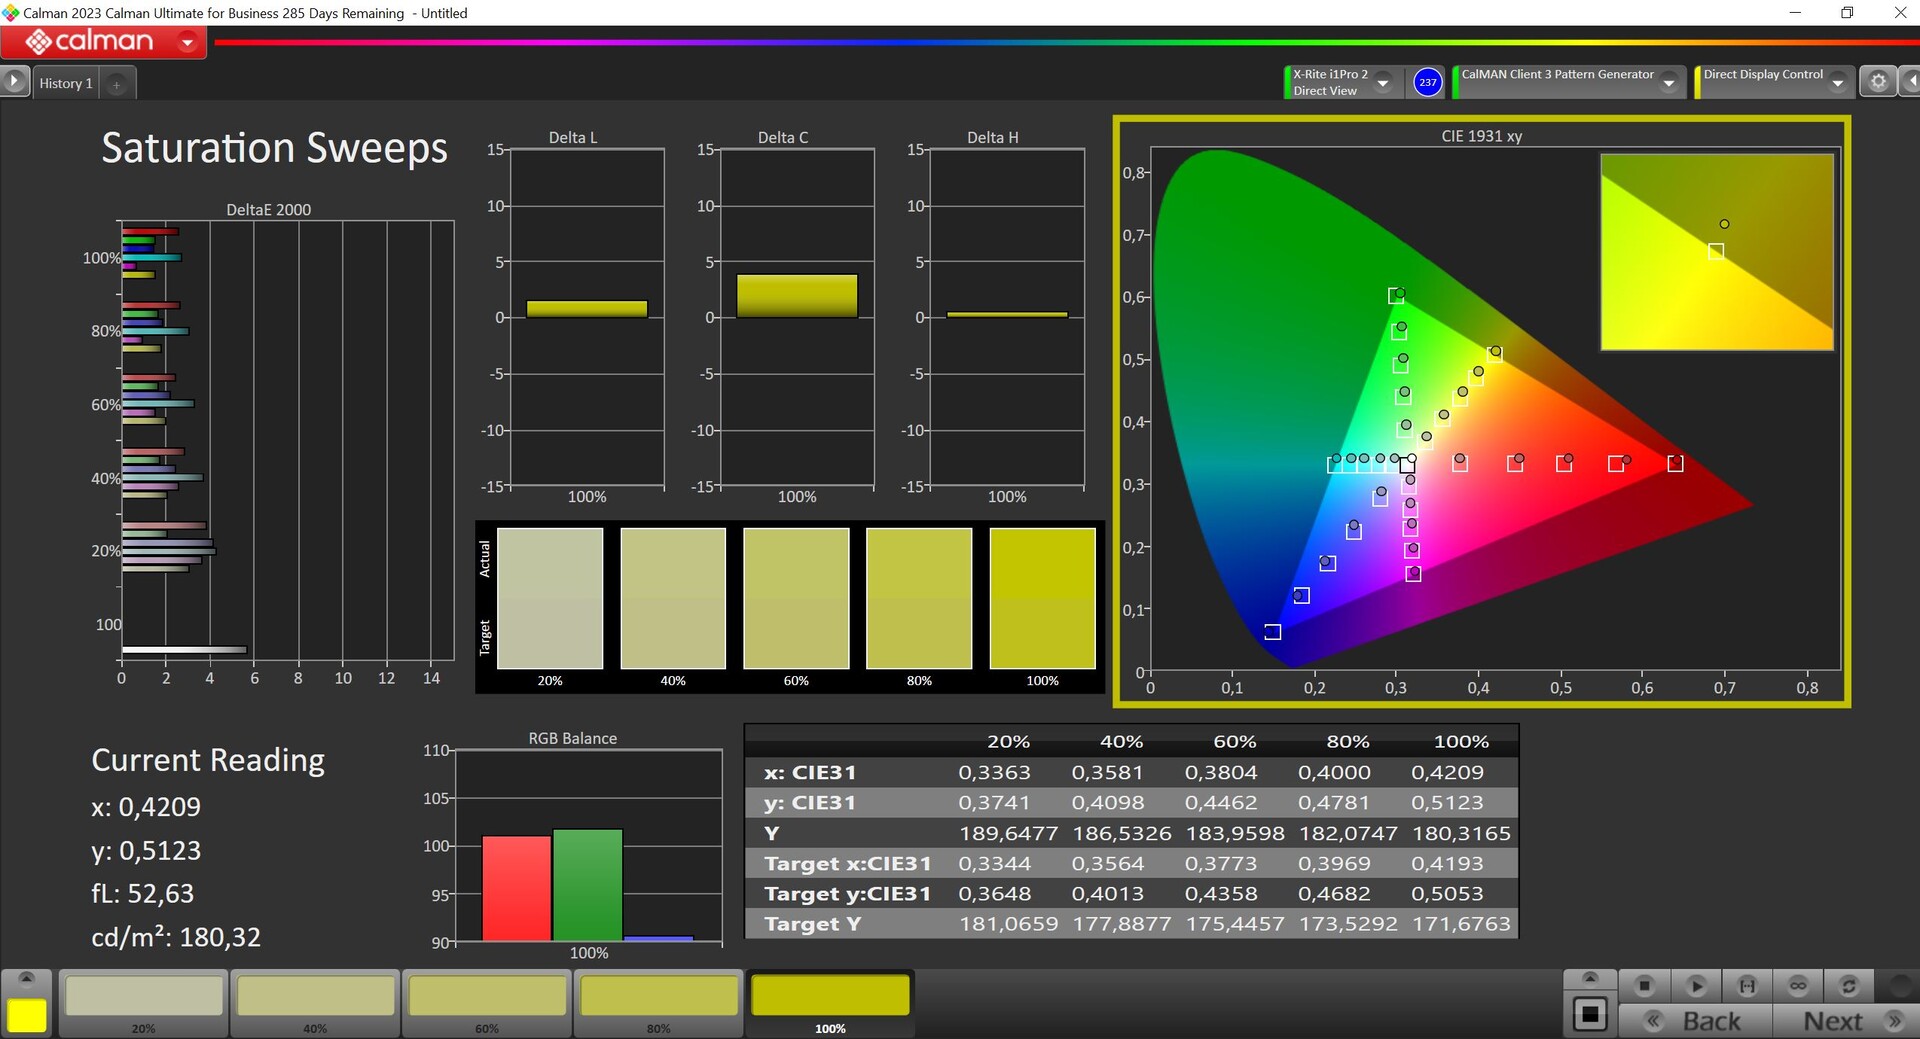
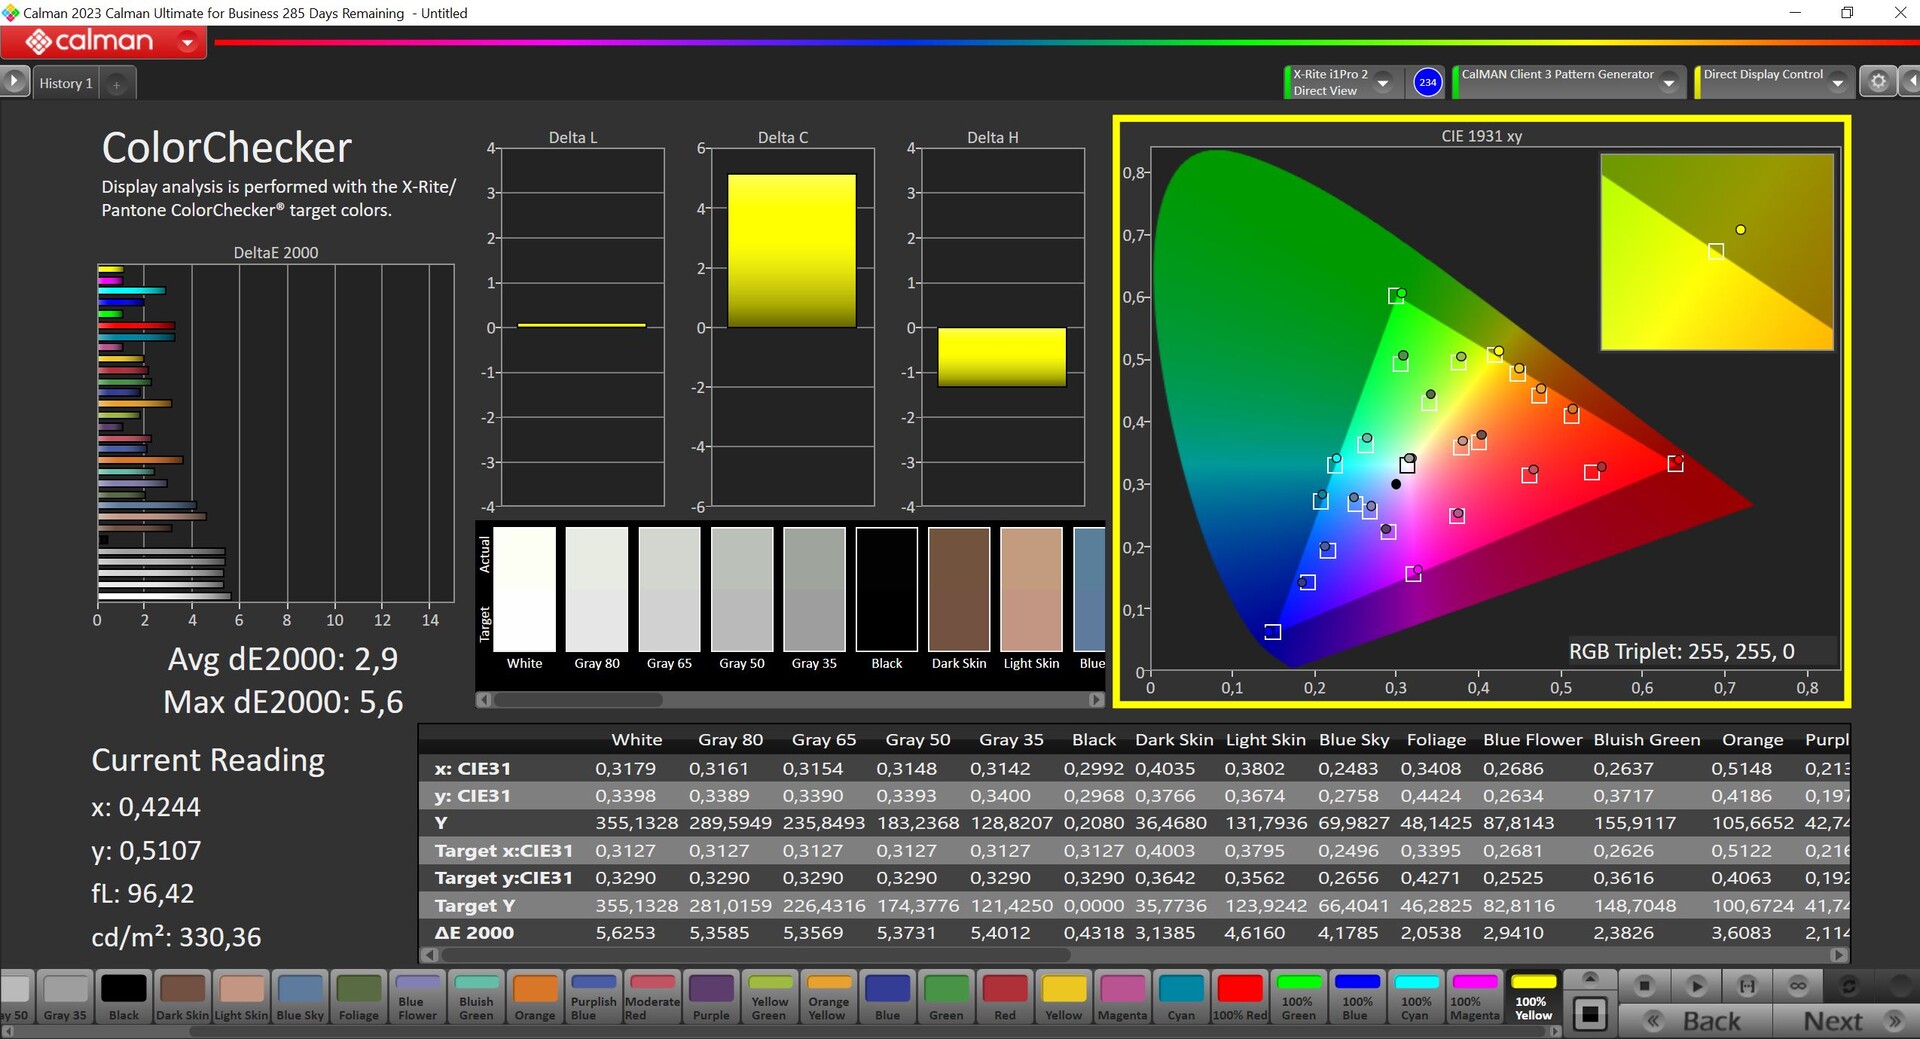
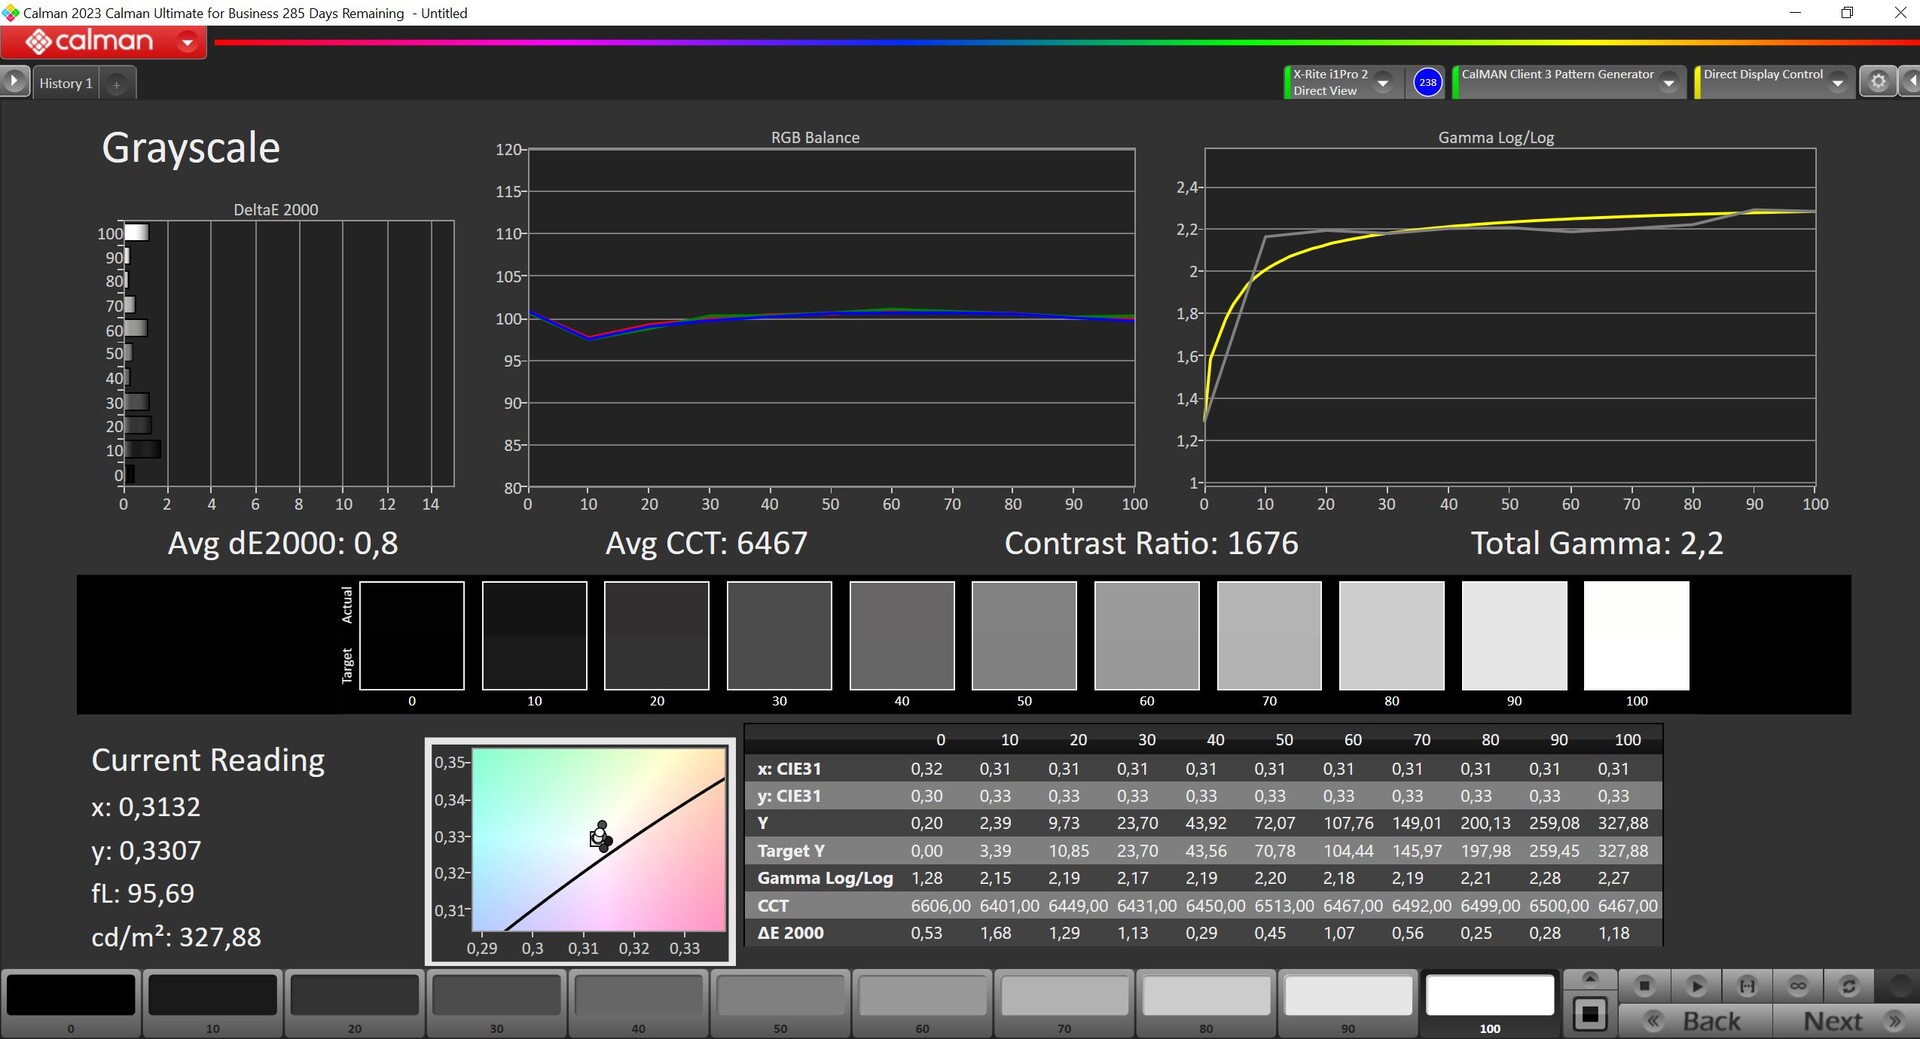
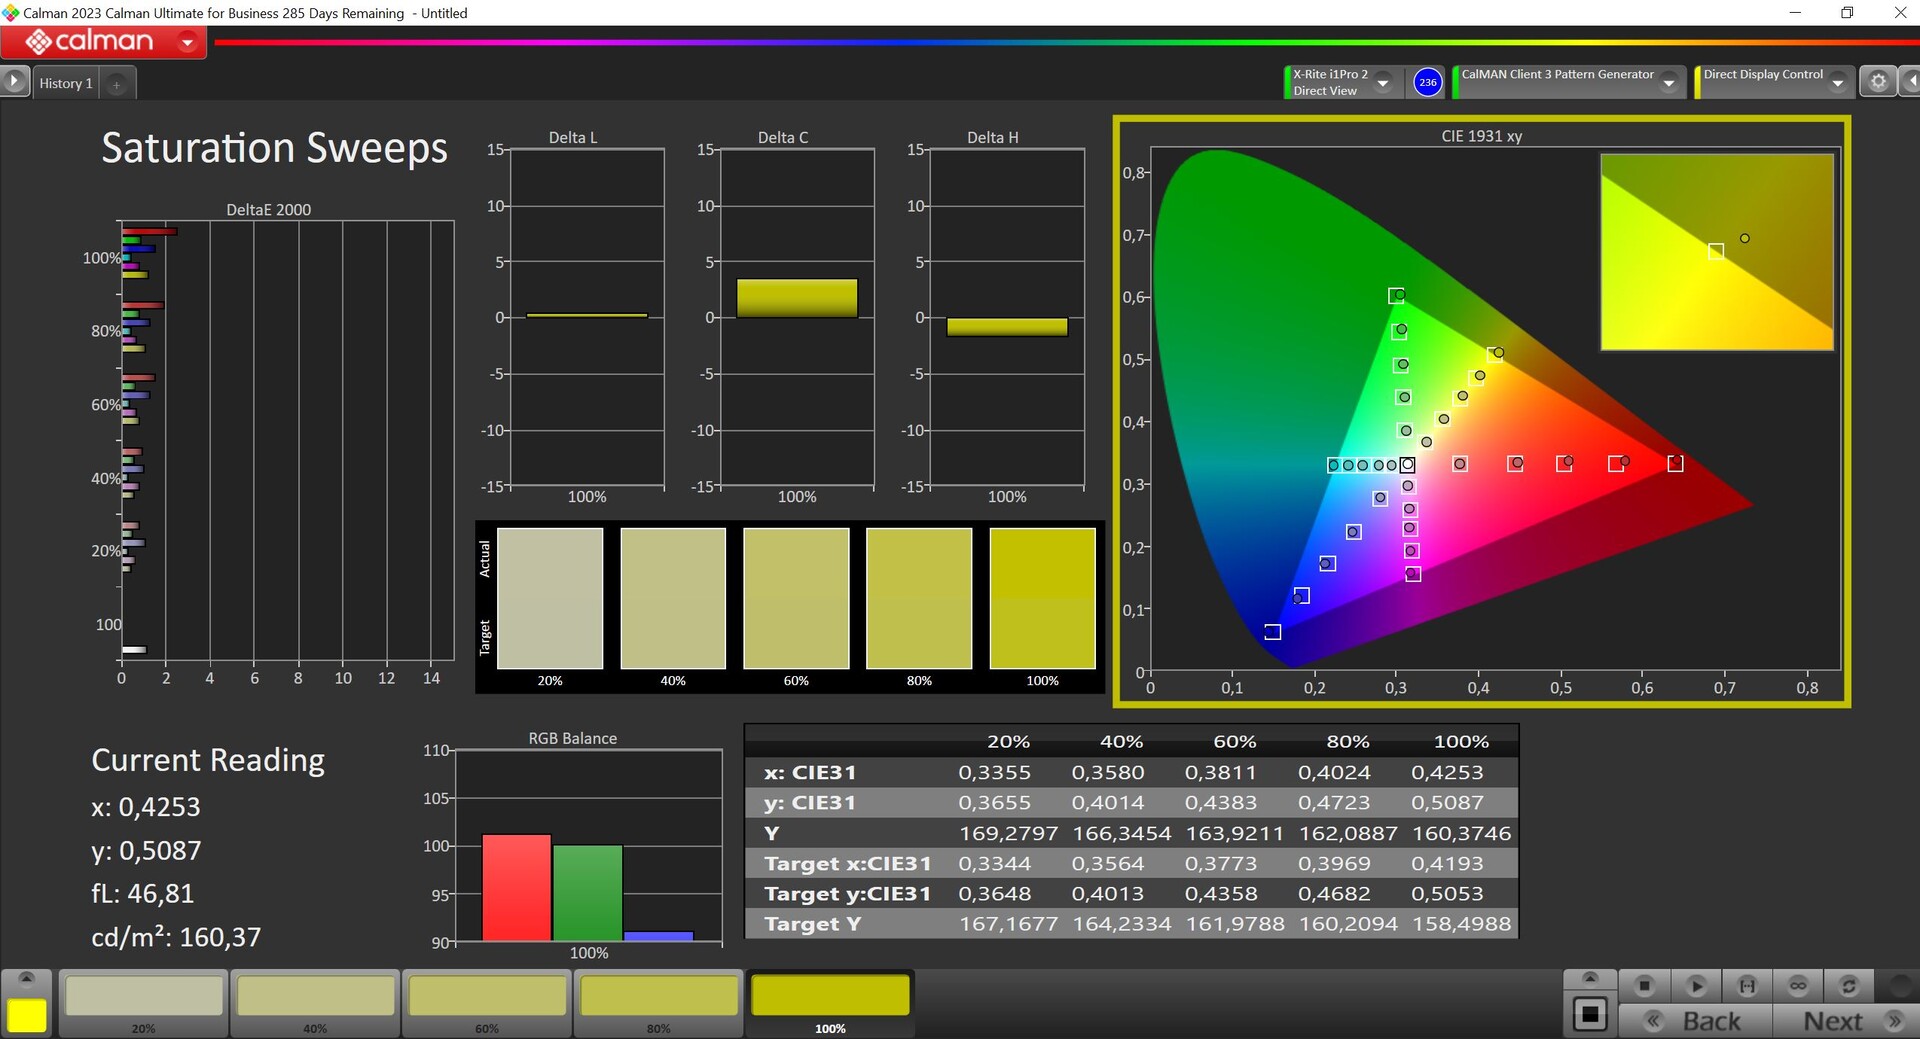
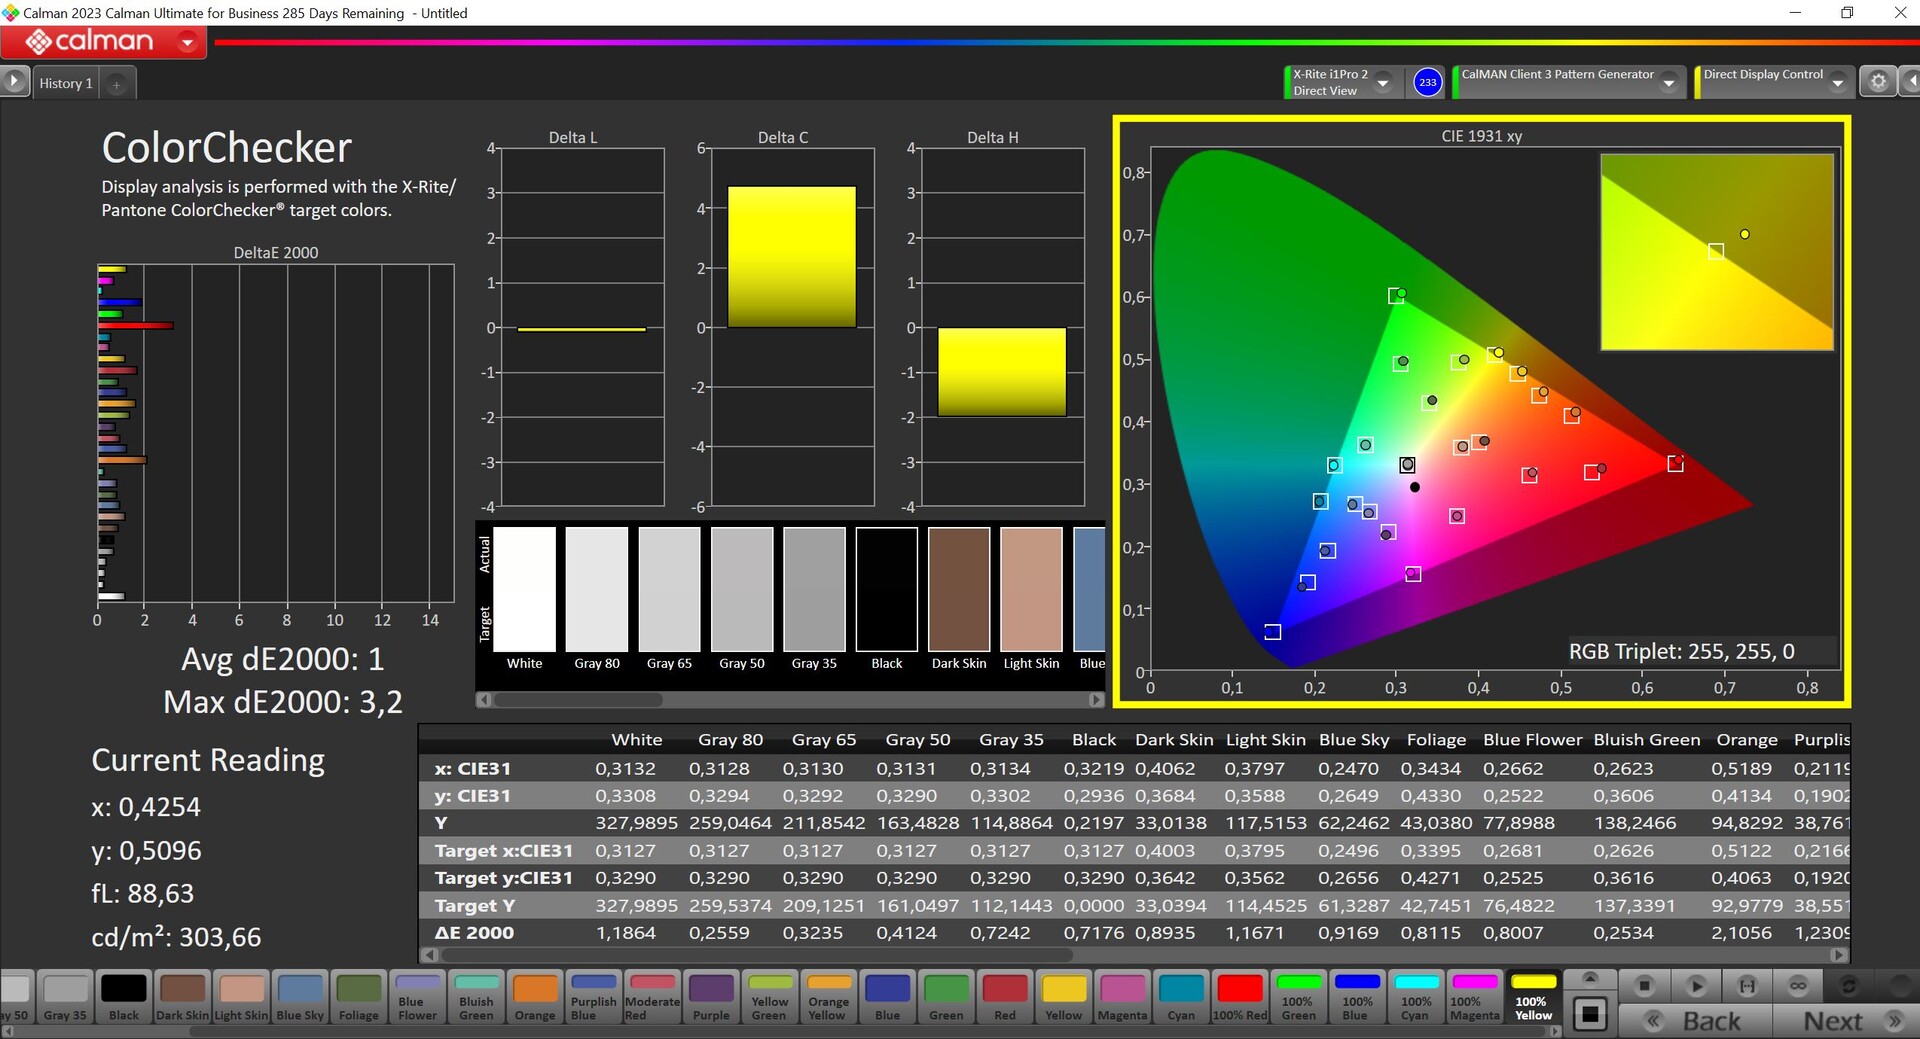
Medimos o painel usando o software profissional CalMAN (X-Rite i1 Pro2) e descobrimos que ainda há espaço para melhorias logo que ele sai da caixa. Identificamos uma leve tonalidade verde e desvios na escala de cinza acima do nosso valor-alvo de 3. Também houve algumas exceções no que diz respeito às cores. Após realizar a calibração (o perfil correspondente está disponível para download gratuito acima), conseguimos melhorar consideravelmente a reprodução de cores da tela. Apenas 100% do vermelho ficou ligeiramente acima do valor desejado, com um DeltaE 2000 de 3,2. No entanto, em combinação com a cobertura sRGB quase total, ainda é possível editar fotos e vídeos no monitor.
Exibir tempos de resposta
| ↔ Tempo de resposta preto para branco | ||
|---|---|---|
| 26 ms ... ascensão ↗ e queda ↘ combinadas | ↗ 12.7 ms ascensão | 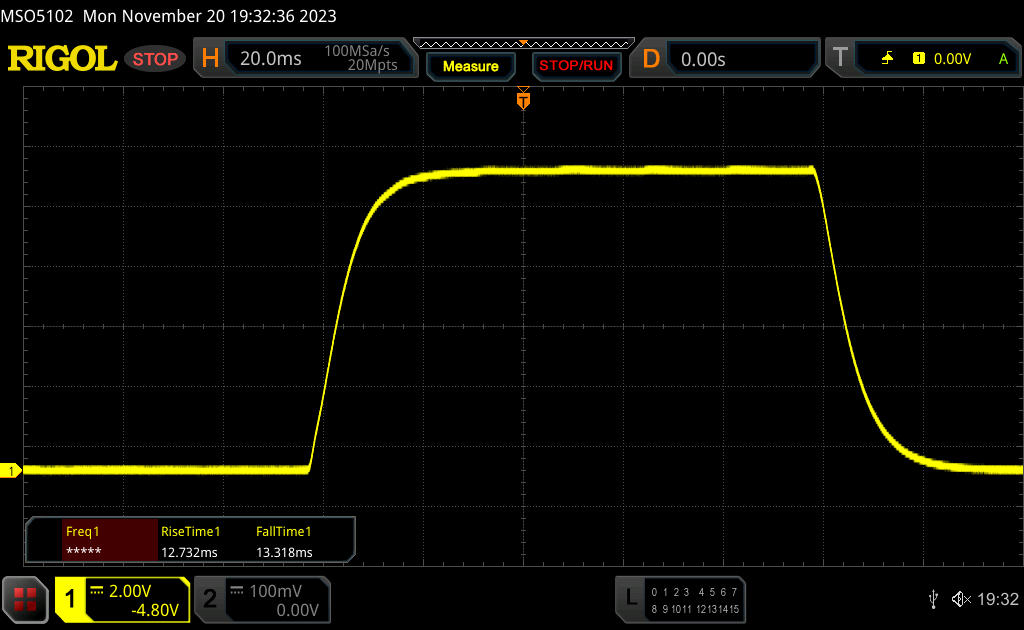 |
| ↘ 13.3 ms queda | ||
| A tela mostra taxas de resposta relativamente lentas em nossos testes e pode ser muito lenta para os jogadores. Em comparação, todos os dispositivos testados variam de 0.1 (mínimo) a 240 (máximo) ms. » 63 % de todos os dispositivos são melhores. Isso significa que o tempo de resposta medido é pior que a média de todos os dispositivos testados (19.8 ms). | ||
| ↔ Tempo de resposta 50% cinza a 80% cinza | ||
| 50.6 ms ... ascensão ↗ e queda ↘ combinadas | ↗ 23 ms ascensão | 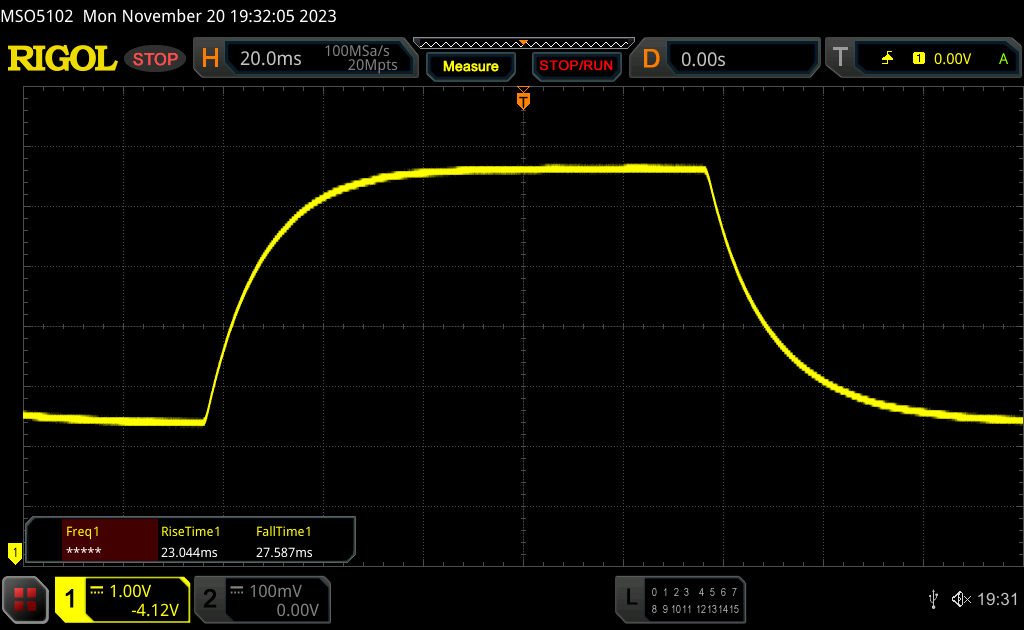 |
| ↘ 27.6 ms queda | ||
| A tela mostra taxas de resposta lentas em nossos testes e será insatisfatória para os jogadores. Em comparação, todos os dispositivos testados variam de 0.165 (mínimo) a 636 (máximo) ms. » 87 % de todos os dispositivos são melhores. Isso significa que o tempo de resposta medido é pior que a média de todos os dispositivos testados (31 ms). | ||
Cintilação da tela / PWM (modulação por largura de pulso)
| Tela tremeluzindo / PWM não detectado | 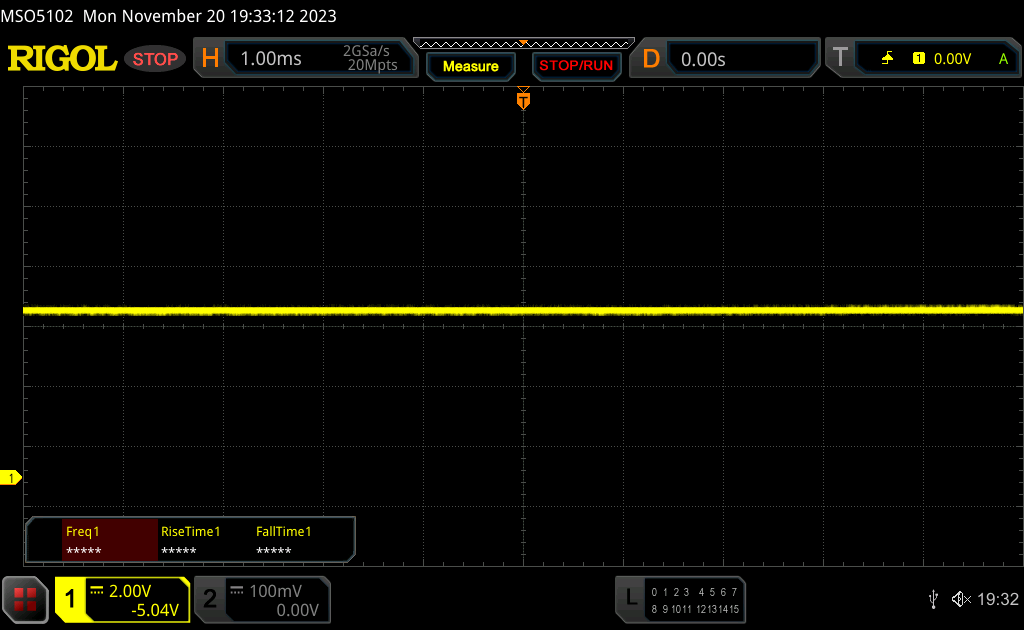 | ||
[pwm_comparison] Em comparação: 52 % de todos os dispositivos testados não usam PWM para escurecer a tela. Se PWM foi detectado, uma média de 7754 (mínimo: 5 - máximo: 343500) Hz foi medida. | |||
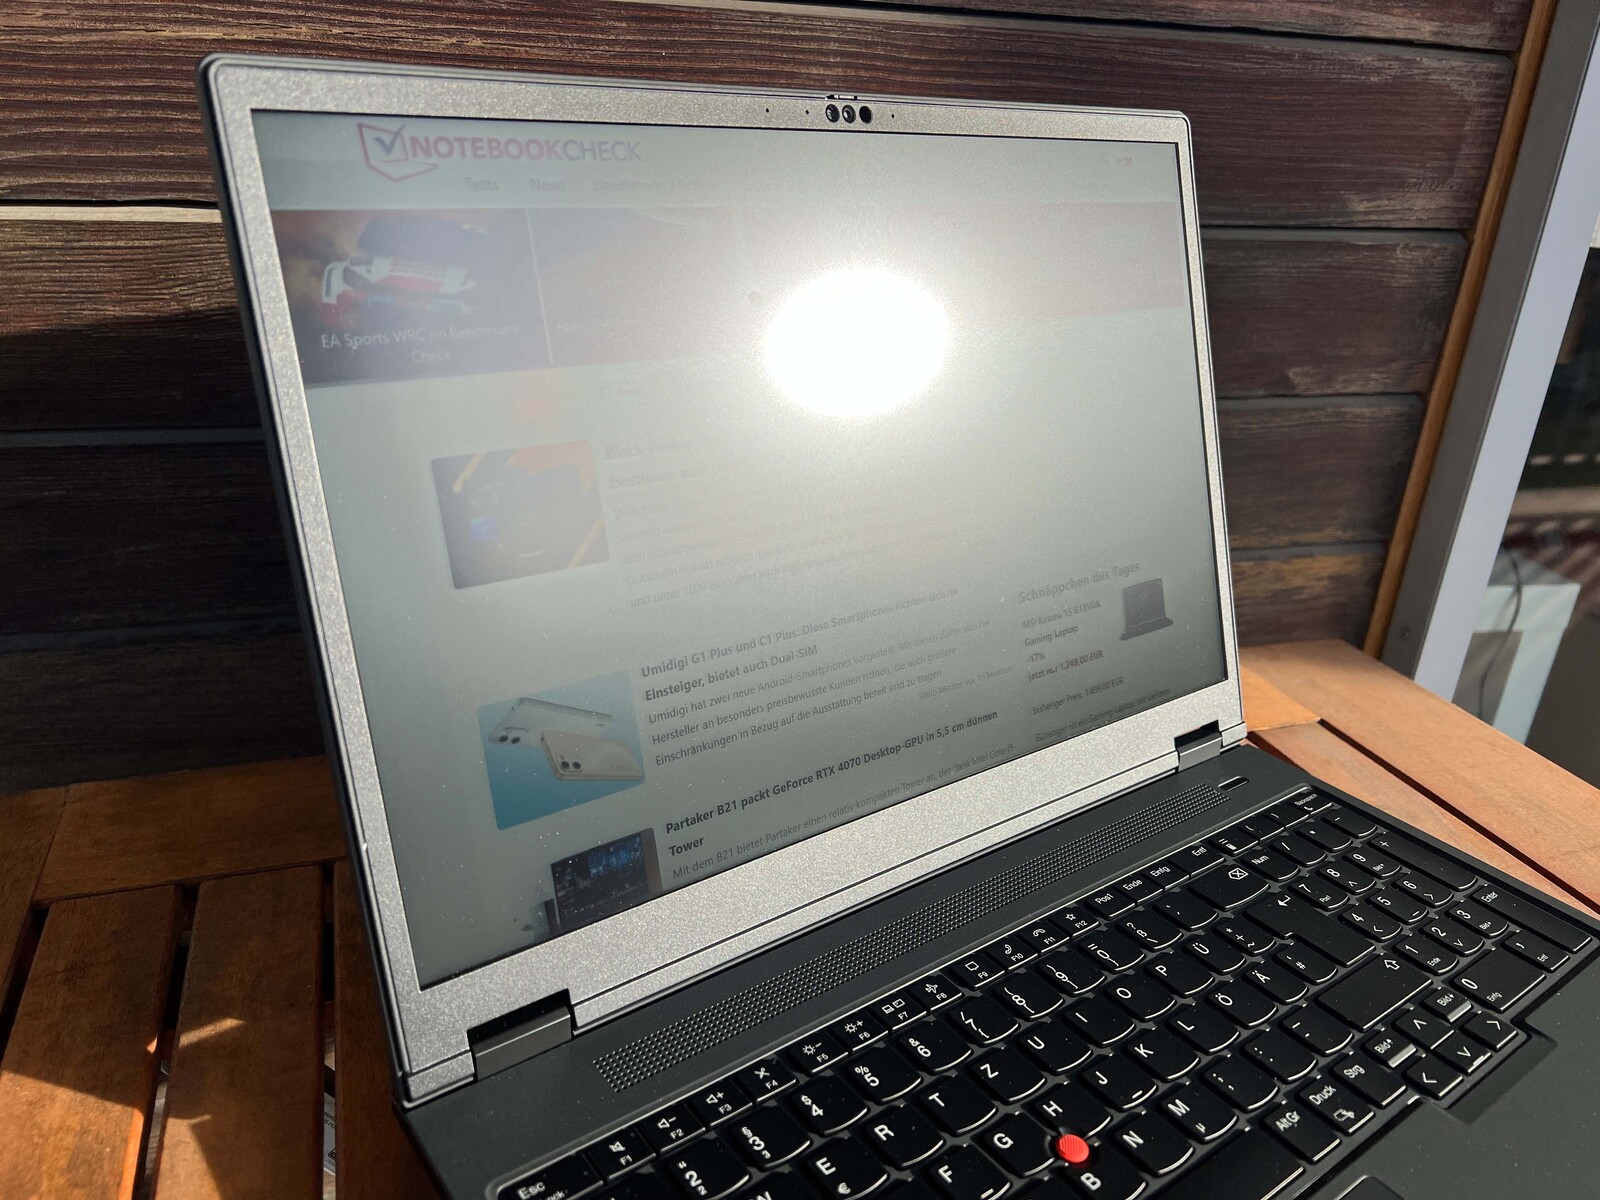
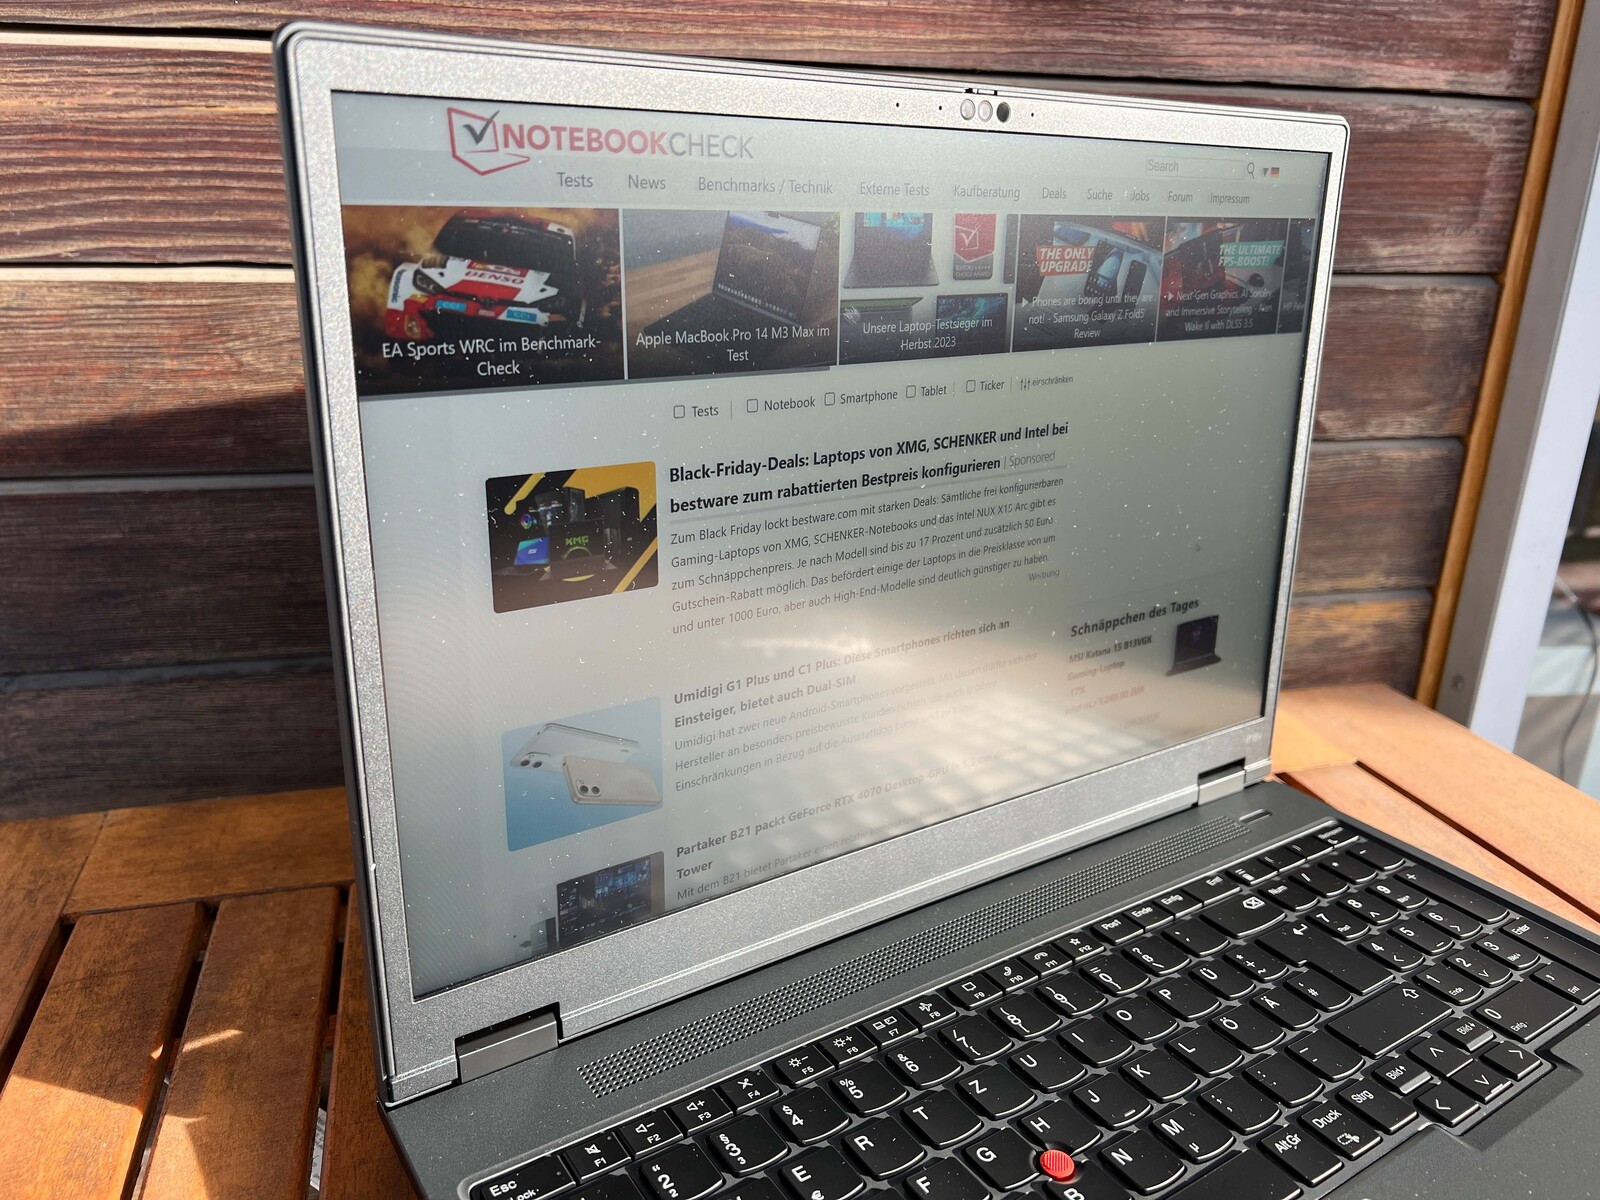

Usar a tela fosca em ambientes externos geralmente não é um problema. O brilho da tela só é levado ao limite em ambientes muito claros ou sob luz solar direta. O painel IPS tem um ângulo de visão decente.

Desempenho - Ryzen Pro e RTX A1000
Condições de teste
A Lenovo não oferece modos de desempenho adicionais em seus ThinkPads há muito tempo, optando por integrar suas próprias configurações diretamente nos modos de energia do Windows, o que é muito conveniente para os usuários. Realizamos as seguintes medições e benchmarks com o laptop no modo de melhor desempenho.
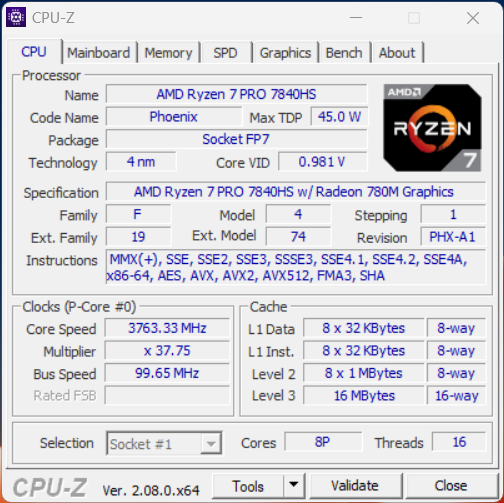
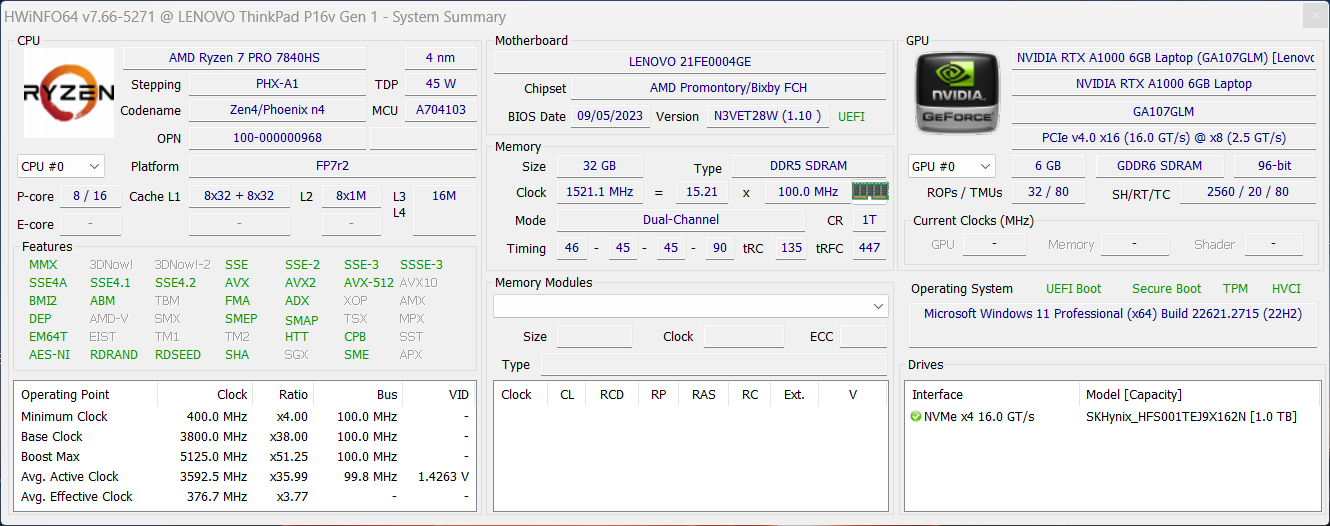
Processador - Ryzen 7 PRO 7840HS
O Ryzen 7 PRO 7840HS oferece recursos de segurança aprimorados (comparáveis aos do Intel vPro), mas é semelhante ao Ryzen 7 7840HS normal. Isso significa que a CPU apresenta 8 núcleos Zen4 (máx. 16 threads) com uma frequência máxima de 5,1 GHz. Seus limites de energia são definidos em 64/54 watts, muito parecido com o processador do ZBook Power 15 G10 (da mesma forma, um Ryzen 7 PRO 7840HS). As CPUs concorrentes da Intel requerem muito mais energia. De modo geral, o processador AMD oferece excelente desempenho e está até mesmo um pouco à frente do Core i7-12850HX no Dell Precision 7670. Os outros dispositivos em nossa comparação oferecem mais desempenho da CPU como um todo. Dito isso, o P16v G1 teve um aumento impressionante de 35% no desempenho em relação ao ThinkPad P15v G3 com um Ryzen 7 PRO 6850H.
O desempenho permanece estável sob carga, mas o processador tem apenas 18 watts à sua disposição quando está funcionando com a energia da bateria. Portanto, o desempenho é significativamente limitado nos testes de vários núcleos (queda de 40% no CB R23 Multi). Mais resultados de benchmark da CPU estão disponíveis em aqui.
Cinebench R15 Multi sustained load
Cinebench R23: Multi Core | Single Core
Cinebench R20: CPU (Multi Core) | CPU (Single Core)
Cinebench R15: CPU Multi 64Bit | CPU Single 64Bit
Blender: v2.79 BMW27 CPU
7-Zip 18.03: 7z b 4 | 7z b 4 -mmt1
Geekbench 5.5: Multi-Core | Single-Core
HWBOT x265 Benchmark v2.2: 4k Preset
LibreOffice : 20 Documents To PDF
R Benchmark 2.5: Overall mean
| CPU Performance rating | |
| Média da turma Workstation | |
| Lenovo ThinkPad P1 G6-21FV000DGE | |
| Lenovo ThinkPad P16 G1 21D6001DMB | |
| HP ZBook Power 15 G10 | |
| Média AMD Ryzen 7 PRO 7840HS | |
| Lenovo ThinkPad P16v G1 AMD | |
| Dell Precision 7670 | |
| Lenovo ThinkPad P15v G3 21EM001AGE | |
| Cinebench R23 / Multi Core | |
| Média da turma Workstation (14621 - 38520, n=23, últimos 2 anos) | |
| Lenovo ThinkPad P1 G6-21FV000DGE | |
| Lenovo ThinkPad P16 G1 21D6001DMB | |
| HP ZBook Power 15 G10 | |
| Dell Precision 7670 | |
| Média AMD Ryzen 7 PRO 7840HS (14240 - 15863, n=2) | |
| Lenovo ThinkPad P16v G1 AMD | |
| Lenovo ThinkPad P15v G3 21EM001AGE | |
| Cinebench R23 / Single Core | |
| Lenovo ThinkPad P1 G6-21FV000DGE | |
| Média da turma Workstation (1712 - 2228, n=23, últimos 2 anos) | |
| Lenovo ThinkPad P16 G1 21D6001DMB | |
| HP ZBook Power 15 G10 | |
| Média AMD Ryzen 7 PRO 7840HS (1691 - 1774, n=2) | |
| Lenovo ThinkPad P16v G1 AMD | |
| Dell Precision 7670 | |
| Lenovo ThinkPad P15v G3 21EM001AGE | |
| Cinebench R20 / CPU (Multi Core) | |
| Média da turma Workstation (5760 - 15043, n=23, últimos 2 anos) | |
| Lenovo ThinkPad P1 G6-21FV000DGE | |
| Lenovo ThinkPad P16 G1 21D6001DMB | |
| HP ZBook Power 15 G10 | |
| Dell Precision 7670 | |
| Média AMD Ryzen 7 PRO 7840HS (5327 - 6235, n=2) | |
| Lenovo ThinkPad P16v G1 AMD | |
| Lenovo ThinkPad P15v G3 21EM001AGE | |
| Lenovo ThinkPad P15v G3 21EM001AGE | |
| Cinebench R20 / CPU (Single Core) | |
| Lenovo ThinkPad P1 G6-21FV000DGE | |
| Média da turma Workstation (671 - 857, n=23, últimos 2 anos) | |
| Lenovo ThinkPad P16 G1 21D6001DMB | |
| HP ZBook Power 15 G10 | |
| Dell Precision 7670 | |
| Média AMD Ryzen 7 PRO 7840HS (651 - 693, n=2) | |
| Lenovo ThinkPad P16v G1 AMD | |
| Lenovo ThinkPad P15v G3 21EM001AGE | |
| Lenovo ThinkPad P15v G3 21EM001AGE | |
| Cinebench R15 / CPU Multi 64Bit | |
| Média da turma Workstation (2489 - 5810, n=23, últimos 2 anos) | |
| Lenovo ThinkPad P16 G1 21D6001DMB | |
| Lenovo ThinkPad P1 G6-21FV000DGE | |
| HP ZBook Power 15 G10 | |
| Média AMD Ryzen 7 PRO 7840HS (2361 - 2519, n=2) | |
| Dell Precision 7670 | |
| Lenovo ThinkPad P16v G1 AMD | |
| Lenovo ThinkPad P15v G3 21EM001AGE | |
| Cinebench R15 / CPU Single 64Bit | |
| Média da turma Workstation (191.4 - 328, n=23, últimos 2 anos) | |
| Lenovo ThinkPad P1 G6-21FV000DGE | |
| HP ZBook Power 15 G10 | |
| Média AMD Ryzen 7 PRO 7840HS (262 - 276, n=2) | |
| Lenovo ThinkPad P16 G1 21D6001DMB | |
| Lenovo ThinkPad P16v G1 AMD | |
| Dell Precision 7670 | |
| Lenovo ThinkPad P15v G3 21EM001AGE | |
| Blender / v2.79 BMW27 CPU | |
| Lenovo ThinkPad P15v G3 21EM001AGE | |
| Dell Precision 7670 | |
| Lenovo ThinkPad P16v G1 AMD | |
| Média AMD Ryzen 7 PRO 7840HS (201 - 205, n=2) | |
| HP ZBook Power 15 G10 | |
| Lenovo ThinkPad P1 G6-21FV000DGE | |
| Lenovo ThinkPad P16 G1 21D6001DMB | |
| Média da turma Workstation (91 - 222, n=23, últimos 2 anos) | |
| 7-Zip 18.03 / 7z b 4 | |
| Média da turma Workstation (60489 - 116969, n=23, últimos 2 anos) | |
| Lenovo ThinkPad P1 G6-21FV000DGE | |
| HP ZBook Power 15 G10 | |
| Lenovo ThinkPad P16 G1 21D6001DMB | |
| Média AMD Ryzen 7 PRO 7840HS (62497 - 70387, n=2) | |
| Lenovo ThinkPad P16v G1 AMD | |
| Dell Precision 7670 | |
| Lenovo ThinkPad P15v G3 21EM001AGE | |
| 7-Zip 18.03 / 7z b 4 -mmt1 | |
| Lenovo ThinkPad P1 G6-21FV000DGE | |
| Lenovo ThinkPad P16v G1 AMD | |
| Média AMD Ryzen 7 PRO 7840HS (6493 - 6498, n=2) | |
| HP ZBook Power 15 G10 | |
| Média da turma Workstation (5126 - 6960, n=23, últimos 2 anos) | |
| Lenovo ThinkPad P16 G1 21D6001DMB | |
| Dell Precision 7670 | |
| Lenovo ThinkPad P15v G3 21EM001AGE | |
| Geekbench 5.5 / Multi-Core | |
| Média da turma Workstation (11542 - 25554, n=23, últimos 2 anos) | |
| Lenovo ThinkPad P16 G1 21D6001DMB | |
| HP ZBook Power 15 G10 | |
| Lenovo ThinkPad P1 G6-21FV000DGE | |
| Dell Precision 7670 | |
| Média AMD Ryzen 7 PRO 7840HS (10034 - 12039, n=2) | |
| Lenovo ThinkPad P16v G1 AMD | |
| Lenovo ThinkPad P15v G3 21EM001AGE | |
| Geekbench 5.5 / Single-Core | |
| Média da turma Workstation (1783 - 2183, n=23, últimos 2 anos) | |
| Lenovo ThinkPad P1 G6-21FV000DGE | |
| HP ZBook Power 15 G10 | |
| Média AMD Ryzen 7 PRO 7840HS (1822 - 1953, n=2) | |
| Lenovo ThinkPad P16v G1 AMD | |
| Lenovo ThinkPad P16 G1 21D6001DMB | |
| Dell Precision 7670 | |
| Lenovo ThinkPad P15v G3 21EM001AGE | |
| HWBOT x265 Benchmark v2.2 / 4k Preset | |
| Média da turma Workstation (17.8 - 40.5, n=23, últimos 2 anos) | |
| HP ZBook Power 15 G10 | |
| Lenovo ThinkPad P1 G6-21FV000DGE | |
| Média AMD Ryzen 7 PRO 7840HS (18.1 - 19.9, n=2) | |
| Lenovo ThinkPad P16v G1 AMD | |
| Dell Precision 7670 | |
| Lenovo ThinkPad P16 G1 21D6001DMB | |
| Lenovo ThinkPad P15v G3 21EM001AGE | |
| LibreOffice / 20 Documents To PDF | |
| Lenovo ThinkPad P15v G3 21EM001AGE | |
| HP ZBook Power 15 G10 | |
| Média AMD Ryzen 7 PRO 7840HS (45.9 - 54.7, n=2) | |
| Dell Precision 7670 | |
| Média da turma Workstation (37.1 - 74.7, n=23, últimos 2 anos) | |
| Lenovo ThinkPad P1 G6-21FV000DGE | |
| Lenovo ThinkPad P16 G1 21D6001DMB | |
| Lenovo ThinkPad P16v G1 AMD | |
| R Benchmark 2.5 / Overall mean | |
| Lenovo ThinkPad P15v G3 21EM001AGE | |
| Dell Precision 7670 | |
| Lenovo ThinkPad P16 G1 21D6001DMB | |
| HP ZBook Power 15 G10 | |
| Média AMD Ryzen 7 PRO 7840HS (0.44 - 0.4487, n=2) | |
| Lenovo ThinkPad P16v G1 AMD | |
| Média da turma Workstation (0.3825 - 0.603, n=23, últimos 2 anos) | |
| Lenovo ThinkPad P1 G6-21FV000DGE | |
* ... menor é melhor
AIDA64: FP32 Ray-Trace | FPU Julia | CPU SHA3 | CPU Queen | FPU SinJulia | FPU Mandel | CPU AES | CPU ZLib | FP64 Ray-Trace | CPU PhotoWorxx
| Performance rating | |
| Média da turma Workstation | |
| HP ZBook Power 15 G10 | |
| Média AMD Ryzen 7 PRO 7840HS | |
| Lenovo ThinkPad P16v G1 AMD | |
| Lenovo ThinkPad P16 G1 21D6001DMB | |
| Lenovo ThinkPad P15v G3 21EM001AGE | |
| Lenovo ThinkPad P1 G6-21FV000DGE | |
| Dell Precision 7670 | |
| AIDA64 / FP32 Ray-Trace | |
| Média da turma Workstation (16730 - 61611, n=23, últimos 2 anos) | |
| HP ZBook Power 15 G10 | |
| Média AMD Ryzen 7 PRO 7840HS (25606 - 25776, n=2) | |
| Lenovo ThinkPad P16v G1 AMD | |
| Lenovo ThinkPad P16 G1 21D6001DMB | |
| Lenovo ThinkPad P1 G6-21FV000DGE | |
| Lenovo ThinkPad P15v G3 21EM001AGE | |
| Dell Precision 7670 | |
| AIDA64 / FPU Julia | |
| Média da turma Workstation (89597 - 186971, n=23, últimos 2 anos) | |
| HP ZBook Power 15 G10 | |
| Média AMD Ryzen 7 PRO 7840HS (107907 - 109059, n=2) | |
| Lenovo ThinkPad P16v G1 AMD | |
| Lenovo ThinkPad P15v G3 21EM001AGE | |
| Lenovo ThinkPad P16 G1 21D6001DMB | |
| Lenovo ThinkPad P1 G6-21FV000DGE | |
| Dell Precision 7670 | |
| AIDA64 / CPU SHA3 | |
| Média da turma Workstation (4178 - 8975, n=23, últimos 2 anos) | |
| HP ZBook Power 15 G10 | |
| Média AMD Ryzen 7 PRO 7840HS (4631 - 4656, n=2) | |
| Lenovo ThinkPad P16v G1 AMD | |
| Lenovo ThinkPad P16 G1 21D6001DMB | |
| Lenovo ThinkPad P1 G6-21FV000DGE | |
| Lenovo ThinkPad P15v G3 21EM001AGE | |
| Dell Precision 7670 | |
| AIDA64 / CPU Queen | |
| Lenovo ThinkPad P1 G6-21FV000DGE | |
| HP ZBook Power 15 G10 | |
| Média da turma Workstation (60778 - 144411, n=23, últimos 2 anos) | |
| Média AMD Ryzen 7 PRO 7840HS (97729 - 115640, n=2) | |
| Lenovo ThinkPad P15v G3 21EM001AGE | |
| Lenovo ThinkPad P16v G1 AMD | |
| Lenovo ThinkPad P16 G1 21D6001DMB | |
| Dell Precision 7670 | |
| AIDA64 / FPU SinJulia | |
| HP ZBook Power 15 G10 | |
| Média AMD Ryzen 7 PRO 7840HS (14693 - 14742, n=2) | |
| Lenovo ThinkPad P16v G1 AMD | |
| Média da turma Workstation (8165 - 29343, n=23, últimos 2 anos) | |
| Lenovo ThinkPad P15v G3 21EM001AGE | |
| Lenovo ThinkPad P16 G1 21D6001DMB | |
| Lenovo ThinkPad P1 G6-21FV000DGE | |
| Dell Precision 7670 | |
| AIDA64 / FPU Mandel | |
| Média da turma Workstation (44497 - 98153, n=23, últimos 2 anos) | |
| HP ZBook Power 15 G10 | |
| Média AMD Ryzen 7 PRO 7840HS (57502 - 58181, n=2) | |
| Lenovo ThinkPad P16v G1 AMD | |
| Lenovo ThinkPad P15v G3 21EM001AGE | |
| Lenovo ThinkPad P16 G1 21D6001DMB | |
| Lenovo ThinkPad P1 G6-21FV000DGE | |
| Dell Precision 7670 | |
| AIDA64 / CPU AES | |
| Lenovo ThinkPad P15v G3 21EM001AGE | |
| Média da turma Workstation (73133 - 187841, n=23, últimos 2 anos) | |
| HP ZBook Power 15 G10 | |
| Média AMD Ryzen 7 PRO 7840HS (84454 - 85341, n=2) | |
| Lenovo ThinkPad P16v G1 AMD | |
| Lenovo ThinkPad P16 G1 21D6001DMB | |
| Lenovo ThinkPad P1 G6-21FV000DGE | |
| Dell Precision 7670 | |
| AIDA64 / CPU ZLib | |
| Média da turma Workstation (929 - 2148, n=23, últimos 2 anos) | |
| Lenovo ThinkPad P1 G6-21FV000DGE | |
| Lenovo ThinkPad P16 G1 21D6001DMB | |
| HP ZBook Power 15 G10 | |
| Média AMD Ryzen 7 PRO 7840HS (1032 - 1043, n=2) | |
| Lenovo ThinkPad P16v G1 AMD | |
| Dell Precision 7670 | |
| Lenovo ThinkPad P15v G3 21EM001AGE | |
| AIDA64 / FP64 Ray-Trace | |
| Média da turma Workstation (8545 - 32891, n=23, últimos 2 anos) | |
| HP ZBook Power 15 G10 | |
| Média AMD Ryzen 7 PRO 7840HS (13545 - 13800, n=2) | |
| Lenovo ThinkPad P16v G1 AMD | |
| Lenovo ThinkPad P16 G1 21D6001DMB | |
| Lenovo ThinkPad P1 G6-21FV000DGE | |
| Lenovo ThinkPad P15v G3 21EM001AGE | |
| Dell Precision 7670 | |
| AIDA64 / CPU PhotoWorxx | |
| Média da turma Workstation (37151 - 93684, n=23, últimos 2 anos) | |
| HP ZBook Power 15 G10 | |
| Dell Precision 7670 | |
| Média AMD Ryzen 7 PRO 7840HS (24325 - 42810, n=2) | |
| Lenovo ThinkPad P16 G1 21D6001DMB | |
| Lenovo ThinkPad P1 G6-21FV000DGE | |
| Lenovo ThinkPad P16v G1 AMD | |
| Lenovo ThinkPad P15v G3 21EM001AGE | |
Desempenho do sistema
Com base em nossa impressão, o ThinkPad P16v G1 tem um desempenho fantástico, como esperado, e responde muito bem a todos os tipos de entradas. Os resultados de benchmark são bons como um todo e não encontramos nenhum problema de estabilidade do sistema durante nossos testes.
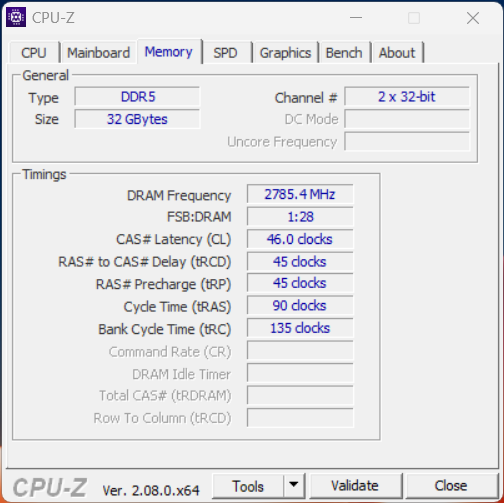
Como nossa unidade de análise veio com um módulo de RAM, a memória do sistema funciona apenas em configuração de canal único. Dessa forma, o laptop não produziu resultados excelentes em nossos benchmarks de memória.
CrossMark: Overall | Productivity | Creativity | Responsiveness
WebXPRT 3: Overall
WebXPRT 4: Overall
Mozilla Kraken 1.1: Total
| PCMark 10 / Score | |
| Média da turma Workstation (6563 - 10409, n=19, últimos 2 anos) | |
| HP ZBook Power 15 G10 | |
| Lenovo ThinkPad P1 G6-21FV000DGE | |
| Lenovo ThinkPad P16v G1 AMD | |
| Média AMD Ryzen 7 PRO 7840HS, NVIDIA RTX A1000 Laptop GPU (n=1) | |
| Dell Precision 7670 | |
| Lenovo ThinkPad P15v G3 21EM001AGE | |
| Lenovo ThinkPad P16 G1 21D6001DMB | |
| PCMark 10 / Essentials | |
| Lenovo ThinkPad P1 G6-21FV000DGE | |
| HP ZBook Power 15 G10 | |
| Dell Precision 7670 | |
| Média da turma Workstation (9622 - 11157, n=19, últimos 2 anos) | |
| Lenovo ThinkPad P16v G1 AMD | |
| Média AMD Ryzen 7 PRO 7840HS, NVIDIA RTX A1000 Laptop GPU (n=1) | |
| Lenovo ThinkPad P16 G1 21D6001DMB | |
| Lenovo ThinkPad P15v G3 21EM001AGE | |
| PCMark 10 / Productivity | |
| Média da turma Workstation (8789 - 20616, n=19, últimos 2 anos) | |
| Lenovo ThinkPad P1 G6-21FV000DGE | |
| Lenovo ThinkPad P16v G1 AMD | |
| Média AMD Ryzen 7 PRO 7840HS, NVIDIA RTX A1000 Laptop GPU (n=1) | |
| HP ZBook Power 15 G10 | |
| Lenovo ThinkPad P16 G1 21D6001DMB | |
| Dell Precision 7670 | |
| Lenovo ThinkPad P15v G3 21EM001AGE | |
| PCMark 10 / Digital Content Creation | |
| Média da turma Workstation (8108 - 15631, n=19, últimos 2 anos) | |
| HP ZBook Power 15 G10 | |
| Lenovo ThinkPad P1 G6-21FV000DGE | |
| Lenovo ThinkPad P16v G1 AMD | |
| Média AMD Ryzen 7 PRO 7840HS, NVIDIA RTX A1000 Laptop GPU (n=1) | |
| Lenovo ThinkPad P15v G3 21EM001AGE | |
| Dell Precision 7670 | |
| Lenovo ThinkPad P16 G1 21D6001DMB | |
| CrossMark / Overall | |
| Média da turma Workstation (1307 - 2267, n=22, últimos 2 anos) | |
| Lenovo ThinkPad P1 G6-21FV000DGE | |
| Lenovo ThinkPad P16 G1 21D6001DMB | |
| HP ZBook Power 15 G10 | |
| Lenovo ThinkPad P16v G1 AMD | |
| Média AMD Ryzen 7 PRO 7840HS, NVIDIA RTX A1000 Laptop GPU (n=1) | |
| Dell Precision 7670 | |
| Lenovo ThinkPad P15v G3 21EM001AGE | |
| CrossMark / Productivity | |
| Lenovo ThinkPad P1 G6-21FV000DGE | |
| Média da turma Workstation (1130 - 2122, n=22, últimos 2 anos) | |
| Lenovo ThinkPad P16 G1 21D6001DMB | |
| HP ZBook Power 15 G10 | |
| Lenovo ThinkPad P16v G1 AMD | |
| Média AMD Ryzen 7 PRO 7840HS, NVIDIA RTX A1000 Laptop GPU (n=1) | |
| Dell Precision 7670 | |
| Lenovo ThinkPad P15v G3 21EM001AGE | |
| CrossMark / Creativity | |
| Média da turma Workstation (1657 - 2725, n=22, últimos 2 anos) | |
| Lenovo ThinkPad P1 G6-21FV000DGE | |
| Lenovo ThinkPad P16 G1 21D6001DMB | |
| HP ZBook Power 15 G10 | |
| Dell Precision 7670 | |
| Lenovo ThinkPad P16v G1 AMD | |
| Média AMD Ryzen 7 PRO 7840HS, NVIDIA RTX A1000 Laptop GPU (n=1) | |
| Lenovo ThinkPad P15v G3 21EM001AGE | |
| CrossMark / Responsiveness | |
| Média da turma Workstation (993 - 2096, n=22, últimos 2 anos) | |
| Lenovo ThinkPad P1 G6-21FV000DGE | |
| Lenovo ThinkPad P16 G1 21D6001DMB | |
| Lenovo ThinkPad P16v G1 AMD | |
| Média AMD Ryzen 7 PRO 7840HS, NVIDIA RTX A1000 Laptop GPU (n=1) | |
| HP ZBook Power 15 G10 | |
| Lenovo ThinkPad P15v G3 21EM001AGE | |
| Dell Precision 7670 | |
| WebXPRT 3 / Overall | |
| Lenovo ThinkPad P16v G1 AMD | |
| Média AMD Ryzen 7 PRO 7840HS, NVIDIA RTX A1000 Laptop GPU (n=1) | |
| Lenovo ThinkPad P1 G6-21FV000DGE | |
| Média da turma Workstation (260 - 360, n=23, últimos 2 anos) | |
| HP ZBook Power 15 G10 | |
| Dell Precision 7670 | |
| Lenovo ThinkPad P16 G1 21D6001DMB | |
| Lenovo ThinkPad P15v G3 21EM001AGE | |
| WebXPRT 4 / Overall | |
| Lenovo ThinkPad P1 G6-21FV000DGE | |
| Média da turma Workstation (189.2 - 326, n=23, últimos 2 anos) | |
| Lenovo ThinkPad P16v G1 AMD | |
| Média AMD Ryzen 7 PRO 7840HS, NVIDIA RTX A1000 Laptop GPU (n=1) | |
| Dell Precision 7670 | |
| HP ZBook Power 15 G10 | |
| Lenovo ThinkPad P16 G1 21D6001DMB | |
| Lenovo ThinkPad P15v G3 21EM001AGE | |
| Mozilla Kraken 1.1 / Total | |
| Lenovo ThinkPad P15v G3 21EM001AGE | |
| HP ZBook Power 15 G10 | |
| Lenovo ThinkPad P16v G1 AMD | |
| Média AMD Ryzen 7 PRO 7840HS, NVIDIA RTX A1000 Laptop GPU (n=1) | |
| Dell Precision 7670 | |
| Lenovo ThinkPad P16 G1 21D6001DMB | |
| Lenovo ThinkPad P1 G6-21FV000DGE | |
| Média da turma Workstation (411 - 538, n=23, últimos 2 anos) | |
* ... menor é melhor
| PCMark 10 Score | 6999 pontos | |
Ajuda | ||
| AIDA64 / Memory Copy | |
| Média da turma Workstation (56003 - 164795, n=23, últimos 2 anos) | |
| HP ZBook Power 15 G10 | |
| Dell Precision 7670 | |
| Lenovo ThinkPad P16 G1 21D6001DMB | |
| Média AMD Ryzen 7 PRO 7840HS (34323 - 67943, n=2) | |
| Lenovo ThinkPad P1 G6-21FV000DGE | |
| Lenovo ThinkPad P16v G1 AMD | |
| Lenovo ThinkPad P15v G3 21EM001AGE | |
| AIDA64 / Memory Read | |
| Média da turma Workstation (55795 - 121563, n=23, últimos 2 anos) | |
| Dell Precision 7670 | |
| HP ZBook Power 15 G10 | |
| Lenovo ThinkPad P16 G1 21D6001DMB | |
| Média AMD Ryzen 7 PRO 7840HS (30787 - 61660, n=2) | |
| Lenovo ThinkPad P1 G6-21FV000DGE | |
| Lenovo ThinkPad P15v G3 21EM001AGE | |
| Lenovo ThinkPad P16v G1 AMD | |
| AIDA64 / Memory Write | |
| Média da turma Workstation (55663 - 214520, n=23, últimos 2 anos) | |
| HP ZBook Power 15 G10 | |
| Dell Precision 7670 | |
| Média AMD Ryzen 7 PRO 7840HS (39362 - 83167, n=2) | |
| Lenovo ThinkPad P16 G1 21D6001DMB | |
| Lenovo ThinkPad P16v G1 AMD | |
| Lenovo ThinkPad P1 G6-21FV000DGE | |
| Lenovo ThinkPad P15v G3 21EM001AGE | |
| AIDA64 / Memory Latency | |
| Média da turma Workstation (84.5 - 165.2, n=23, últimos 2 anos) | |
| Lenovo ThinkPad P16v G1 AMD | |
| Média AMD Ryzen 7 PRO 7840HS (99.6 - 101.2, n=2) | |
| HP ZBook Power 15 G10 | |
| Lenovo ThinkPad P16 G1 21D6001DMB | |
| Lenovo ThinkPad P15v G3 21EM001AGE | |
| Dell Precision 7670 | |
| Lenovo ThinkPad P1 G6-21FV000DGE | |
* ... menor é melhor
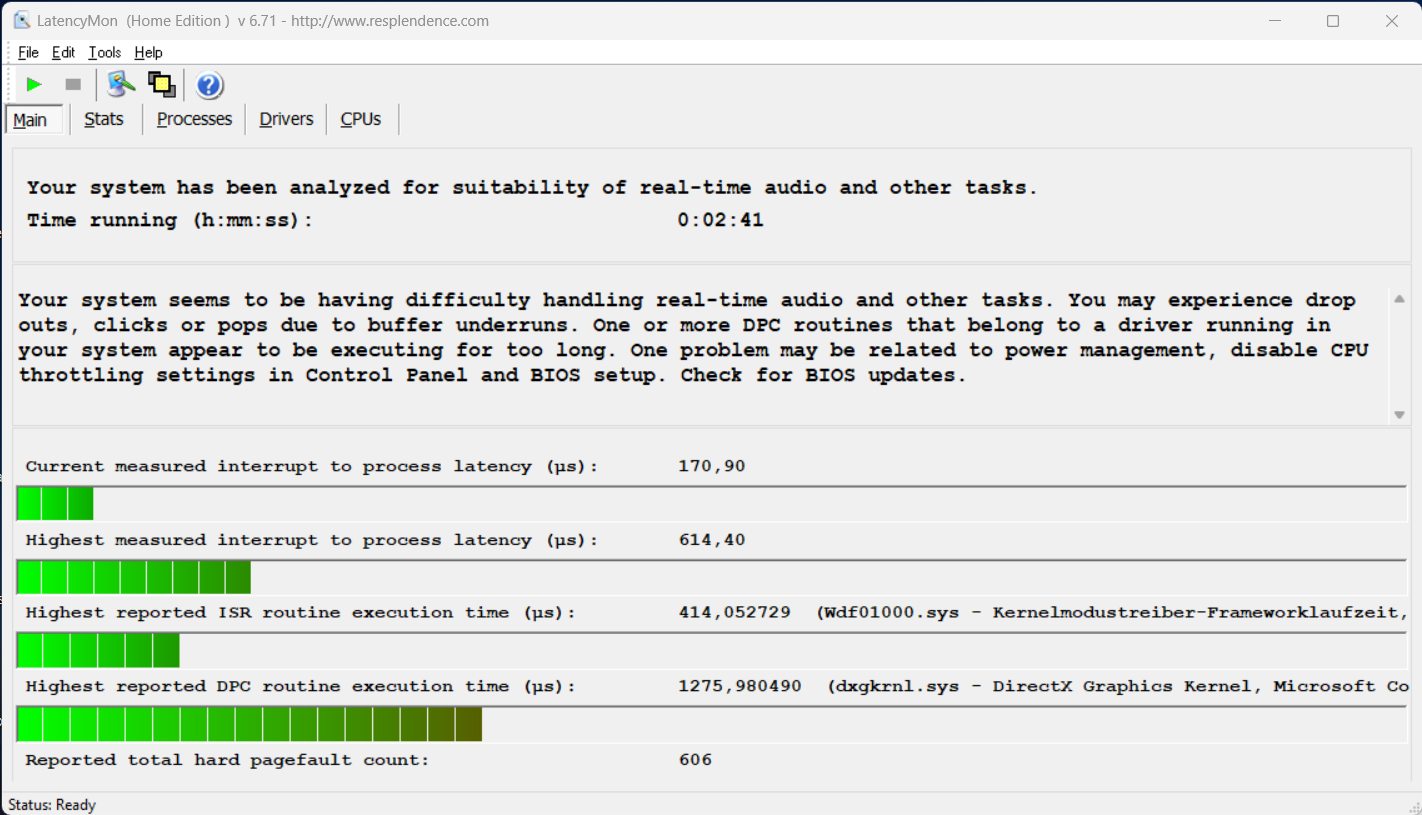
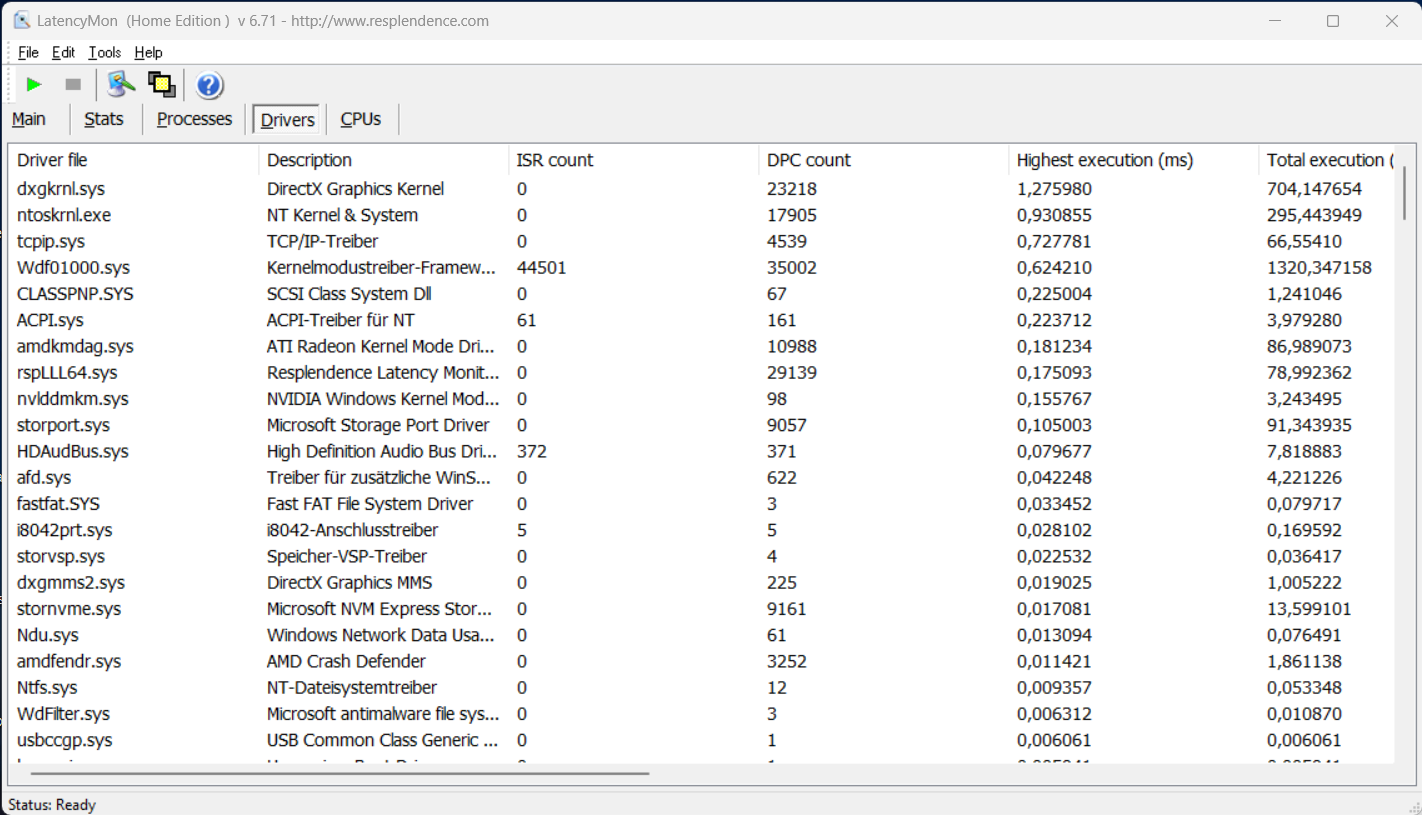
Latência DPC
Em nosso teste de latência padronizado (navegação na Web, reprodução em 4K no YouTube, carga da CPU), a unidade de análise não apresentou nenhum problema ao ser executada na versão existente do BIOS. Apenas um driver apresentou um pequeno desvio, mas isso não deve ser um problema quando o senhor estiver usando aplicativos de áudio em tempo real.
| DPC Latencies / LatencyMon - interrupt to process latency (max), Web, Youtube, Prime95 | |
| Lenovo ThinkPad P1 G6-21FV000DGE | |
| HP ZBook Power 15 G10 | |
| Dell Precision 7670 | |
| Lenovo ThinkPad P16 G1 21D6001DMB | |
| Lenovo ThinkPad P16v G1 AMD | |
| Lenovo ThinkPad P15v G3 21EM001AGE | |
* ... menor é melhor
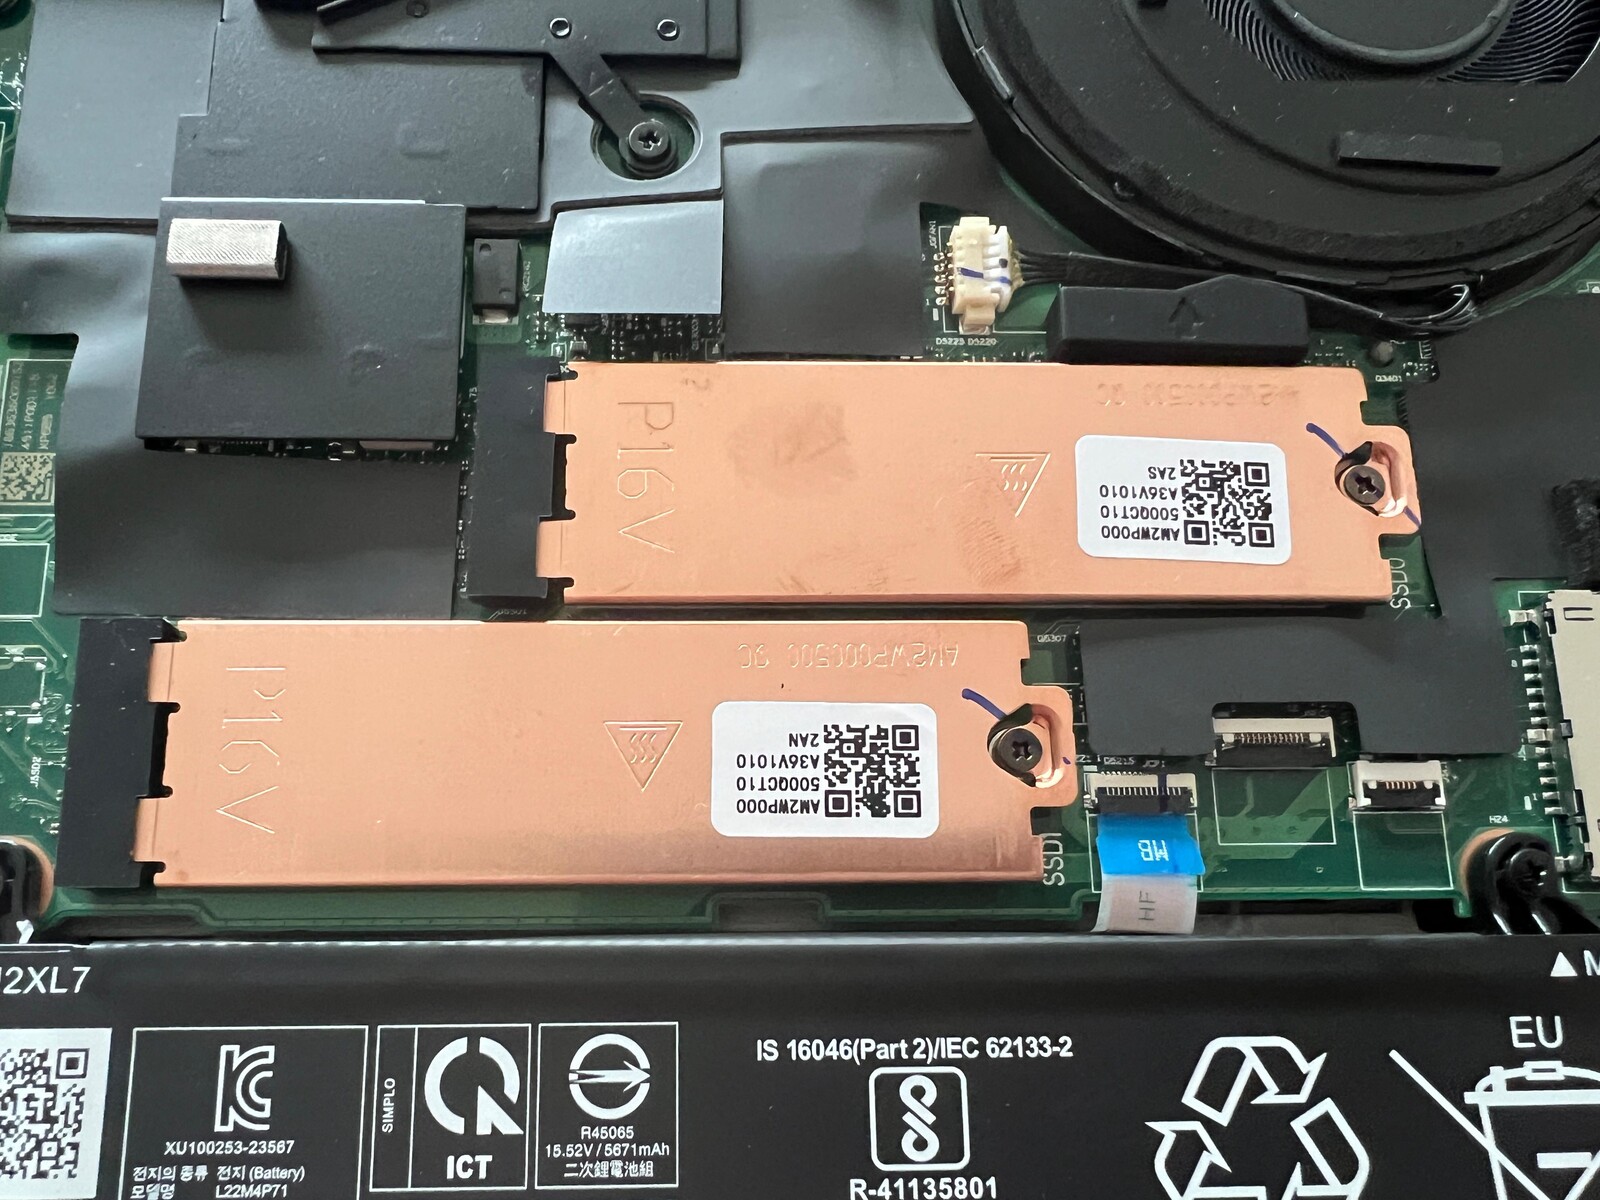
Armazenamento em massa
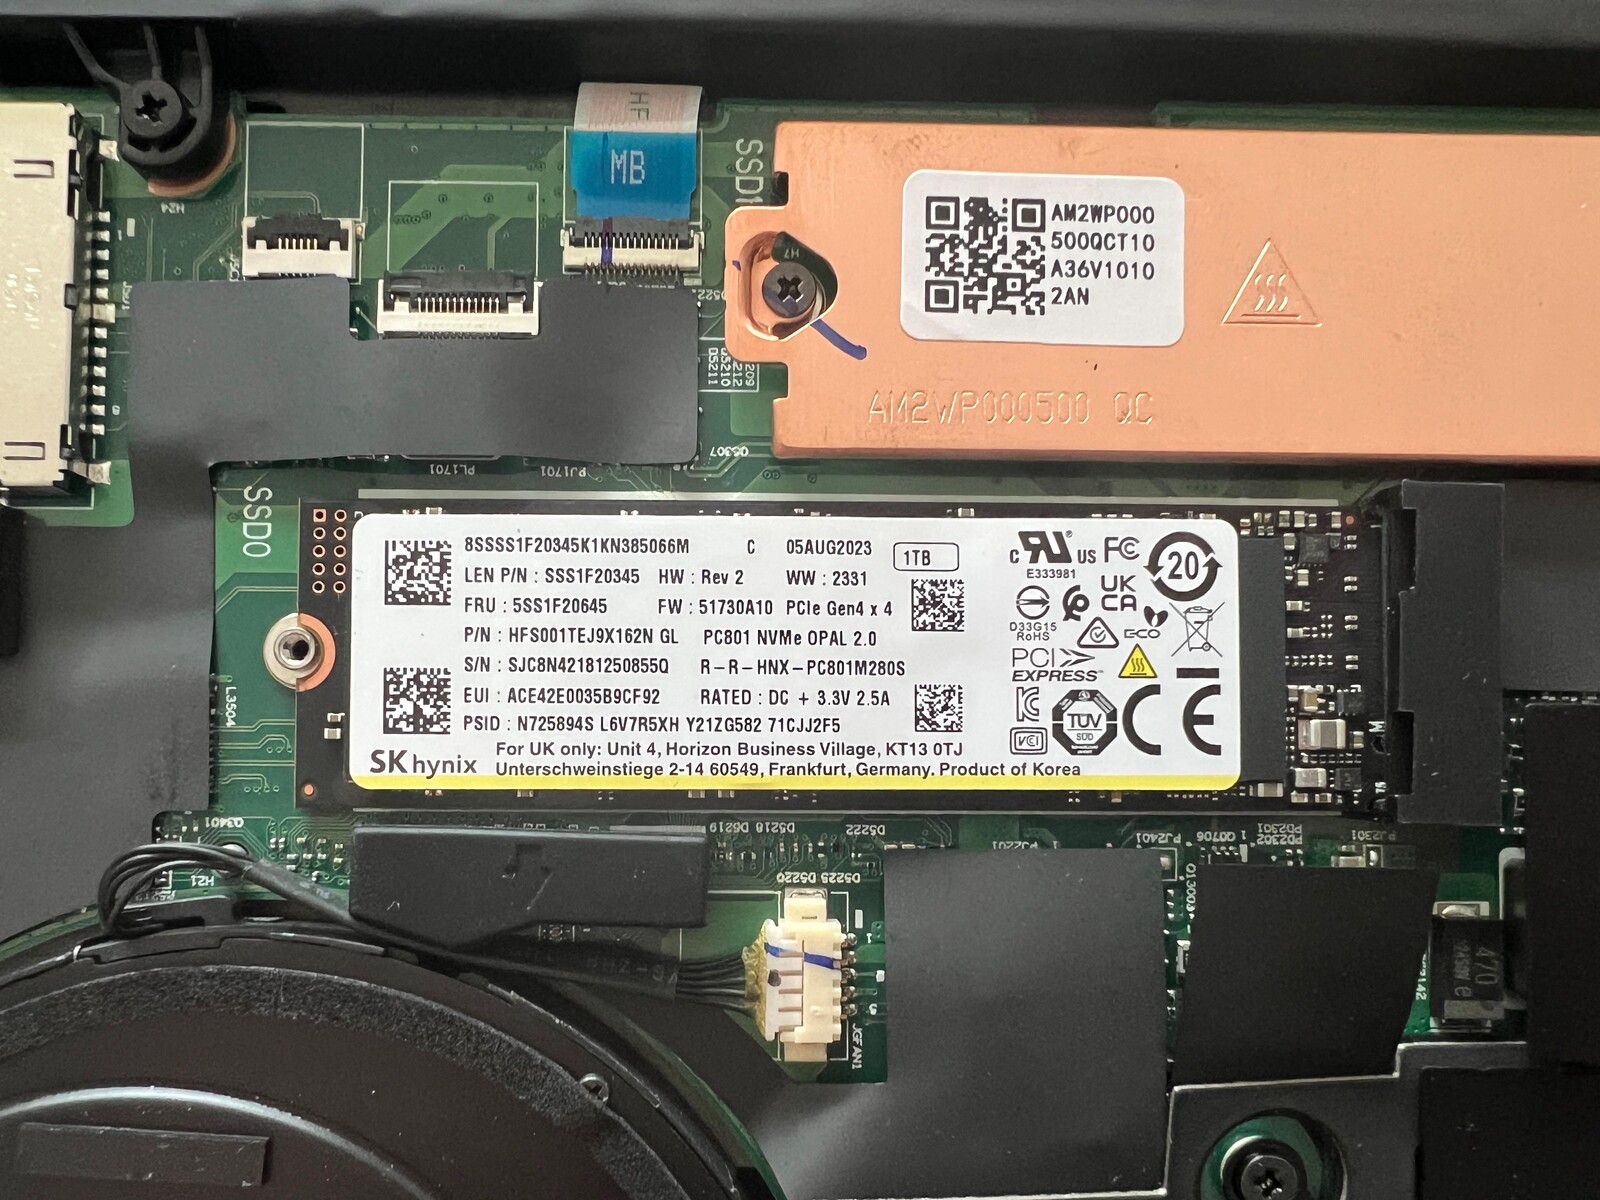
O ThinkPad P16v G1 oferece dois slots PCIe 4.0 velozes para SSDs M.2 2280. Nossa unidade de análise é fornecida com a versão de 1 TB do SK Hynix PC801. Restam cerca de 899 GB de espaço útil após a configuração inicial. Com mais de 7 GB/s, as velocidades máximas de transferência são excelentes. Graças ao dissipador de calor adicional, o desempenho da unidade também permanece perfeitamente estável, mesmo sob carga prolongada. O senhor pode encontrar mais resultados de benchmark de SSD listados aqui.

* ... menor é melhor
Sustained load read: DiskSpd Read Loop, Queue Depth 8
Placa de vídeo
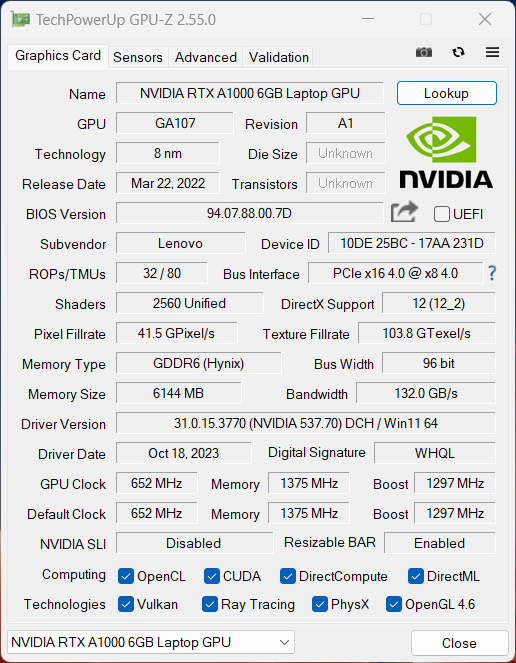
A placa de vídeo integrada Radeon 780M no chip AMD lida com o processamento gráfico durante tarefas simples. Para trabalhos mais exigentes, o sistema mudará automaticamente para a placa de vídeo dedicada Laptop RTX A1000 dedicado. Essa placa é uma GPU profissional da Nvidia que, infelizmente, ainda não se baseia na atual arquitetura Ada Lovelace. Em vez disso, ela usa o mesmo chip GA107 também encontrado na GPU para consumidores GeForce RTX 3050.
A RTX A1000 no laptop tem 6 GB de VRAM e um TGP de 45 watts, o que significa que é uma variante relativamente lenta (o TGP pode variar de 35 a 95 watts para a A1000). Ela tem aproximadamente o mesmo nível de desempenho que a anterior RTX A2000 com 4 GB de VRAM e TGP semelhante (consulte P15v G3 com 40 watts), mas é muito mais lento que o novo RTX 2000 Ada (comparável ao GeForce Laptop RTX 4060).
O desempenho da GPU permanece absolutamente estável sob carga contínua, embora a placa gráfica tenha que se contentar com 40 watts de energia quando o laptop está funcionando com bateria. Isso faz com que o desempenho gráfico caia cerca de 7%. Mais resultados de benchmark de GPU estão disponíveis em em nossa seção de tecnologia.
| 3DMark 11 - 1280x720 Performance GPU | |
| Média da turma Workstation (12535 - 69594, n=23, últimos 2 anos) | |
| Lenovo ThinkPad P1 G6-21FV000DGE | |
| HP ZBook Power 15 G10 | |
| Dell Precision 7670 | |
| Lenovo ThinkPad P16 21D6001DMB A2000 Retest | |
| Lenovo ThinkPad P16v G1 AMD | |
| Média NVIDIA RTX A1000 Laptop GPU (14402 - 15867, n=2) | |
| Lenovo ThinkPad P15v G3 21EM001AGE | |
| 3DMark | |
| 1920x1080 Fire Strike Graphics | |
| Média da turma Workstation (8293 - 52560, n=23, últimos 2 anos) | |
| Lenovo ThinkPad P1 G6-21FV000DGE | |
| HP ZBook Power 15 G10 | |
| Lenovo ThinkPad P16 21D6001DMB A2000 Retest | |
| Dell Precision 7670 | |
| Lenovo ThinkPad P16v G1 AMD | |
| Média NVIDIA RTX A1000 Laptop GPU (10914 - 11728, n=2) | |
| Lenovo ThinkPad P15v G3 21EM001AGE | |
| 2560x1440 Time Spy Graphics | |
| Média da turma Workstation (2725 - 24806, n=23, últimos 2 anos) | |
| Lenovo ThinkPad P1 G6-21FV000DGE | |
| HP ZBook Power 15 G10 | |
| Dell Precision 7670 | |
| Lenovo ThinkPad P16 21D6001DMB A2000 Retest | |
| Lenovo ThinkPad P16v G1 AMD | |
| Média NVIDIA RTX A1000 Laptop GPU (4101 - 4410, n=2) | |
| Lenovo ThinkPad P15v G3 21EM001AGE | |
| 3DMark 06 Standard Score | 48018 pontos | |
| 3DMark Vantage P Result | 58312 pontos | |
| 3DMark 11 Performance | 15795 pontos | |
| 3DMark Fire Strike Score | 10679 pontos | |
| 3DMark Time Spy Score | 4835 pontos | |
Ajuda | ||
| Blender / v3.3 Classroom HIP/AMD | |
| Lenovo ThinkPad P15v G3 21EM001AGE | |
| Blender / v3.3 Classroom OPTIX/RTX | |
| Lenovo ThinkPad P16v G1 AMD | |
| Média NVIDIA RTX A1000 Laptop GPU (61 - 65, n=2) | |
| Lenovo ThinkPad P16 G1 21D6001DMB | |
| Lenovo ThinkPad P15v G3 21EM001AGE | |
| Lenovo ThinkPad P16 21D6001DMB A2000 Retest | |
| Dell Precision 7670 | |
| Lenovo ThinkPad P1 G6-21FV000DGE | |
| HP ZBook Power 15 G10 | |
| Média da turma Workstation (10 - 43, n=17, últimos 2 anos) | |
| Blender / v3.3 Classroom CUDA | |
| Média NVIDIA RTX A1000 Laptop GPU (108 - 112, n=2) | |
| Lenovo ThinkPad P16v G1 AMD | |
| Lenovo ThinkPad P15v G3 21EM001AGE | |
| Lenovo ThinkPad P16 G1 21D6001DMB | |
| Dell Precision 7670 | |
| Lenovo ThinkPad P16 21D6001DMB A2000 Retest | |
| Lenovo ThinkPad P1 G6-21FV000DGE | |
| HP ZBook Power 15 G10 | |
| Média da turma Workstation (16 - 74, n=17, últimos 2 anos) | |
| Blender / v3.3 Classroom CPU | |
| Lenovo ThinkPad P15v G3 21EM001AGE | |
| Média NVIDIA RTX A1000 Laptop GPU (329 - 448, n=2) | |
| Dell Precision 7670 | |
| Lenovo ThinkPad P1 G6-21FV000DGE | |
| Lenovo ThinkPad P16v G1 AMD | |
| HP ZBook Power 15 G10 | |
| Lenovo ThinkPad P16 21D6001DMB A2000 Retest | |
| Lenovo ThinkPad P16 G1 21D6001DMB | |
| Média da turma Workstation (148 - 364, n=23, últimos 2 anos) | |
* ... menor é melhor
Desempenho em jogos
Da mesma forma, o senhor não terá nenhum problema para jogar com os drivers profissionais da Nvidia; não encontramos nenhum problema durante nossos testes. O desempenho em jogos do RTX A1000 está mais ou menos no mesmo nível de um RTX 3050 com 6 GB de VRAM ou de um RTX 3050 Ti. Assim, muitos títulos mais antigos podem ser executados sem problemas em 1080p e configurações altas ou máximas. Entretanto, aqueles que também desejam jogar jogos mais exigentes devem optar pelo RTX 2000 Ada opcional.
| Performance rating - Percent | |
| Média da turma Workstation | |
| Lenovo ThinkPad P1 G6-21FV000DGE | |
| Lenovo ThinkPad P16 21D6001DMB A2000 Retest | |
| HP ZBook Power 15 G10 | |
| Dell Precision 7670 | |
| Lenovo ThinkPad P16 G1 21D6001DMB -1! | |
| Lenovo ThinkPad P16v G1 AMD | |
| Lenovo ThinkPad P15v G3 21EM001AGE | |
| The Witcher 3 - 1920x1080 Ultra Graphics & Postprocessing (HBAO+) | |
| Média da turma Workstation (n=1últimos 2 anos) | |
| Lenovo ThinkPad P1 G6-21FV000DGE | |
| HP ZBook Power 15 G10 | |
| Lenovo ThinkPad P16 21D6001DMB A2000 Retest | |
| Dell Precision 7670 | |
| Lenovo ThinkPad P15v G3 21EM001AGE | |
| Lenovo ThinkPad P16 G1 21D6001DMB | |
| Lenovo ThinkPad P16v G1 AMD | |
| GTA V - 1920x1080 Highest AA:4xMSAA + FX AF:16x | |
| Lenovo ThinkPad P1 G6-21FV000DGE | |
| Média da turma Workstation (18.1 - 156.1, n=23, últimos 2 anos) | |
| HP ZBook Power 15 G10 | |
| Lenovo ThinkPad P16 21D6001DMB A2000 Retest | |
| Dell Precision 7670 | |
| Lenovo ThinkPad P16v G1 AMD | |
| Lenovo ThinkPad P15v G3 21EM001AGE | |
| Final Fantasy XV Benchmark - 1920x1080 High Quality | |
| Média da turma Workstation (26.4 - 197.6, n=23, últimos 2 anos) | |
| Lenovo ThinkPad P1 G6-21FV000DGE | |
| HP ZBook Power 15 G10 | |
| Dell Precision 7670 | |
| Lenovo ThinkPad P16 21D6001DMB A2000 Retest | |
| Lenovo ThinkPad P16v G1 AMD | |
| Lenovo ThinkPad P15v G3 21EM001AGE | |
| Lenovo ThinkPad P16 G1 21D6001DMB | |
| Strange Brigade - 1920x1080 ultra AA:ultra AF:16 | |
| Média da turma Workstation (93.2 - 418, n=17, últimos 2 anos) | |
| Lenovo ThinkPad P1 G6-21FV000DGE | |
| HP ZBook Power 15 G10 | |
| Lenovo ThinkPad P16 21D6001DMB A2000 Retest | |
| Dell Precision 7670 | |
| Lenovo ThinkPad P16v G1 AMD | |
| Lenovo ThinkPad P15v G3 21EM001AGE | |
| Lenovo ThinkPad P16 G1 21D6001DMB | |
| Dota 2 Reborn - 1920x1080 ultra (3/3) best looking | |
| Lenovo ThinkPad P16 21D6001DMB A2000 Retest | |
| Lenovo ThinkPad P16 G1 21D6001DMB | |
| Lenovo ThinkPad P1 G6-21FV000DGE | |
| Média da turma Workstation (50.7 - 178.4, n=23, últimos 2 anos) | |
| HP ZBook Power 15 G10 | |
| Dell Precision 7670 | |
| Lenovo ThinkPad P16v G1 AMD | |
| Lenovo ThinkPad P15v G3 21EM001AGE | |
| X-Plane 11.11 - 1920x1080 high (fps_test=3) | |
| Lenovo ThinkPad P16 21D6001DMB A2000 Retest | |
| Lenovo ThinkPad P1 G6-21FV000DGE | |
| Lenovo ThinkPad P16 G1 21D6001DMB | |
| Dell Precision 7670 | |
| Média da turma Workstation (30.5 - 139.7, n=23, últimos 2 anos) | |
| Lenovo ThinkPad P16v G1 AMD | |
| Lenovo ThinkPad P15v G3 21EM001AGE | |
| HP ZBook Power 15 G10 | |
| The Witcher 3 - 1920x1080 Ultra Graphics & Postprocessing (HBAO+) | |
| Média da turma Workstation (n=1últimos 2 anos) | |
| Lenovo ThinkPad P1 G6-21FV000DGE | |
| HP ZBook Power 15 G10 | |
| Lenovo ThinkPad P16 21D6001DMB A2000 Retest | |
| Dell Precision 7670 | |
| Lenovo ThinkPad P15v G3 21EM001AGE | |
| Lenovo ThinkPad P16 G1 21D6001DMB | |
| Lenovo ThinkPad P16v G1 AMD | |
| Média NVIDIA RTX A1000 Laptop GPU (42.7 - 43.2, n=2) | |
| Far Cry 5 - 1920x1080 Ultra Preset AA:T | |
| Lenovo ThinkPad P1 G6-21FV000DGE | |
| Média da turma Workstation (37 - 128, n=9, últimos 2 anos) | |
| HP ZBook Power 15 G10 | |
| Lenovo ThinkPad P16v G1 AMD | |
| Média NVIDIA RTX A1000 Laptop GPU (n=1) | |
| F1 22 - 1920x1080 Ultra High Preset AA:T AF:16x | |
| Média da turma Workstation (46.2 - 95.5, n=5, últimos 2 anos) | |
| Lenovo ThinkPad P1 G6-21FV000DGE | |
| HP ZBook Power 15 G10 | |
| Lenovo ThinkPad P16 21D6001DMB A2000 Retest | |
| Lenovo ThinkPad P16v G1 AMD | |
| Lenovo ThinkPad P15v G3 21EM001AGE | |
| Média NVIDIA RTX A1000 Laptop GPU (22 - 30.6, n=2) | |
| F1 23 - 1920x1080 Ultra High Preset AA:T AF:16x | |
| Lenovo ThinkPad P1 G6-21FV000DGE | |
| Lenovo ThinkPad P16v G1 AMD | |
| Média NVIDIA RTX A1000 Laptop GPU (n=1) | |
Witcher 3 FPS chart
| baixo | média | alto | ultra | |
|---|---|---|---|---|
| GTA V (2015) | 168.2 | 129.4 | 62.7 | |
| The Witcher 3 (2015) | 257 | 165 | 87 | 43.2 |
| Dota 2 Reborn (2015) | 139.4 | 128.7 | 125 | 118.2 |
| Final Fantasy XV Benchmark (2018) | 129.2 | 67.9 | 48.3 | |
| X-Plane 11.11 (2018) | 99.8 | 88.6 | 71.9 | |
| Far Cry 5 (2018) | 132 | 85 | 79 | 73 |
| Strange Brigade (2018) | 261 | 111.4 | 90.2 | 78.4 |
| F1 2021 (2021) | 288 | 163.1 | 128.9 | 62.1 |
| F1 22 (2022) | 160.7 | 145.8 | 104.3 | 30.6 |
| F1 23 (2023) | 154.7 | 139.3 | 93.8 | 27 |
| Cyberpunk 2077 (2023) | 66.4 | 49.8 | 41.6 | 34.7 |
Emissões - Estação de trabalho com alto-falantes ruins
Emissões de ruído
As duas ventoinhas do ThinkPad P16v G1 geralmente permanecem ociosas durante as tarefas básicas. O ruído da ventoinha permanece agradavelmente baixo (36 dB(A) com base em nossa medição) quando o senhor coloca apenas o processador ou a placa de vídeo sob carga. Medimos cerca de 44 dB(A) de ruído durante os jogos, mas as ventoinhas tendem a começar a chacoalhar levemente a partir de 40 dB(A). A estação de trabalho móvel ficou muito barulhenta durante o teste de estresse, atingindo cerca de 50 dB(A). Nossa unidade de análise não produziu nenhum outro ruído eletrônico.
Barulho
| Ocioso |
| 24.3 / 24.3 / 24.3 dB |
| Carga |
| 35.7 / 50.2 dB |
 | ||
30 dB silencioso 40 dB(A) audível 50 dB(A) ruidosamente alto |
||
min: | ||
| Lenovo ThinkPad P16v G1 AMD RTX A1000 Laptop GPU, R7 PRO 7840HS, SK hynix PC801 HFS001TEJ9X101N | HP ZBook Power 15 G10 RTX 2000 Ada Generation Laptop, R7 PRO 7840HS, WDC PC SN810 2TB | Lenovo ThinkPad P15v G3 21EM001AGE RTX A2000 Laptop GPU, R7 PRO 6850H, SK Hynix PC711 1TB HFS001TDE9X081N | Dell Precision 7670 RTX A2000 Laptop GPU, i7-12850HX, SK Hynix HFS001TEJ9X115N | Lenovo ThinkPad P1 G6-21FV000DGE RTX 2000 Ada Generation Laptop, i9-13900H, SK Hynix PC711 1TB HFS001TDE9X084N | Lenovo ThinkPad P16 21D6001DMB A2000 Retest RTX A2000 Laptop GPU, i7-12850HX, Micron 3400 1TB MTFDKBA1T0TFH | |
|---|---|---|---|---|---|---|
| Noise | 4% | 9% | -4% | -4% | -14% | |
| desligado / ambiente * (dB) | 24.3 | 24.2 -0% | 23.2 5% | 22.7 7% | 24.5 -1% | 24.7 -2% |
| Idle Minimum * (dB) | 24.3 | 24.4 -0% | 23.2 5% | 22.9 6% | 24.5 -1% | 24.7 -2% |
| Idle Average * (dB) | 24.3 | 24.4 -0% | 23.2 5% | 22.9 6% | 24.5 -1% | 26.2 -8% |
| Idle Maximum * (dB) | 24.3 | 24.4 -0% | 23.2 5% | 24.5 -1% | 24.5 -1% | 31.2 -28% |
| Load Average * (dB) | 35.7 | 27.4 23% | 35 2% | 48.7 -36% | 48 -34% | 48.3 -35% |
| Witcher 3 ultra * (dB) | 43.7 | 43.3 1% | 37.9 13% | 45.2 -3% | 40.7 7% | 52.7 -21% |
| Load Maximum * (dB) | 50.2 | 46.8 7% | 37.5 25% | 52.1 -4% | 48 4% | 52.7 -5% |
* ... menor é melhor
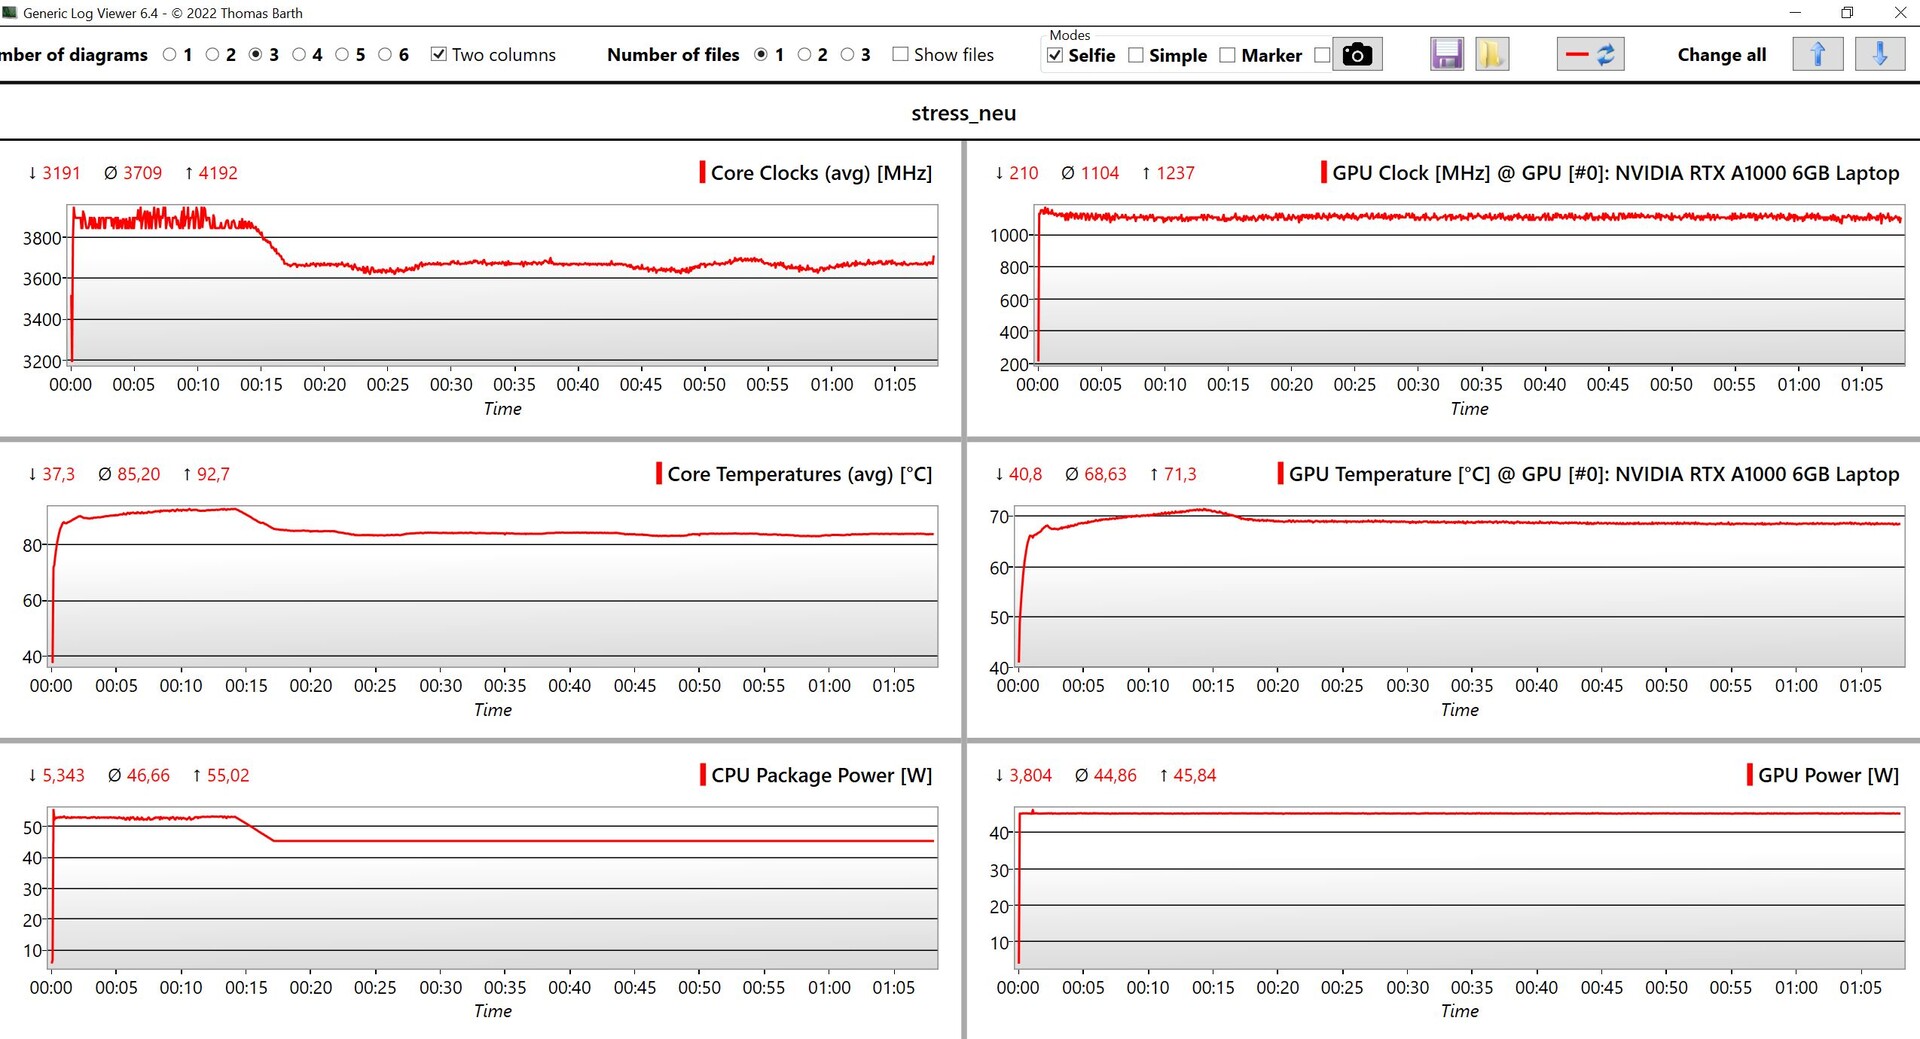
Temperatura
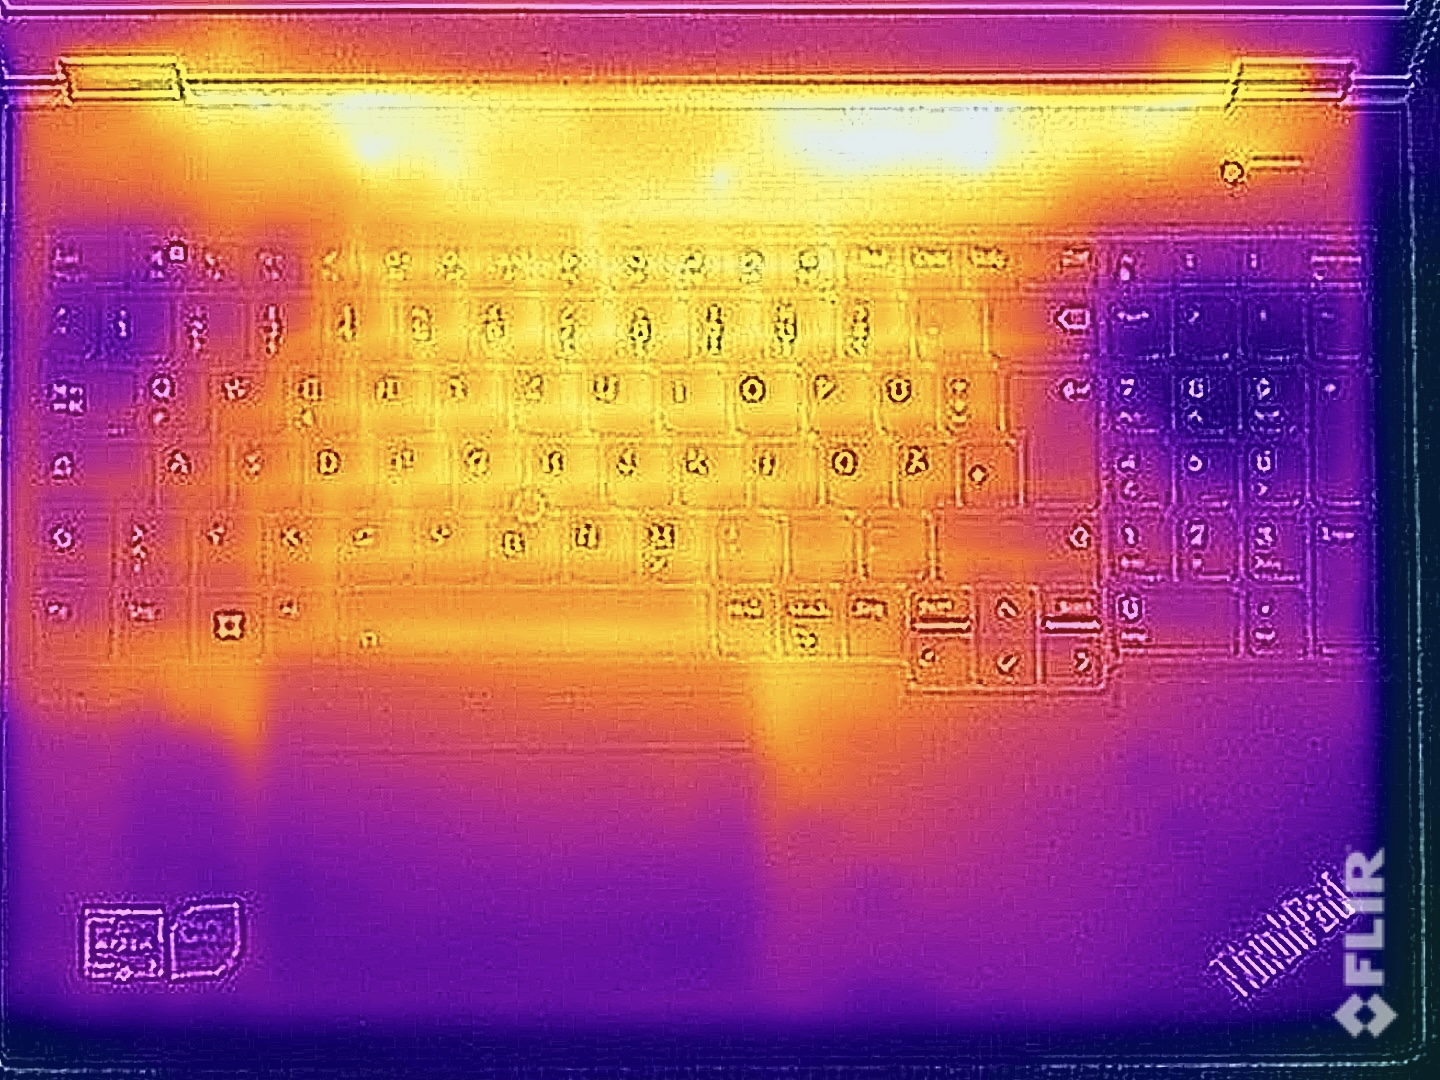
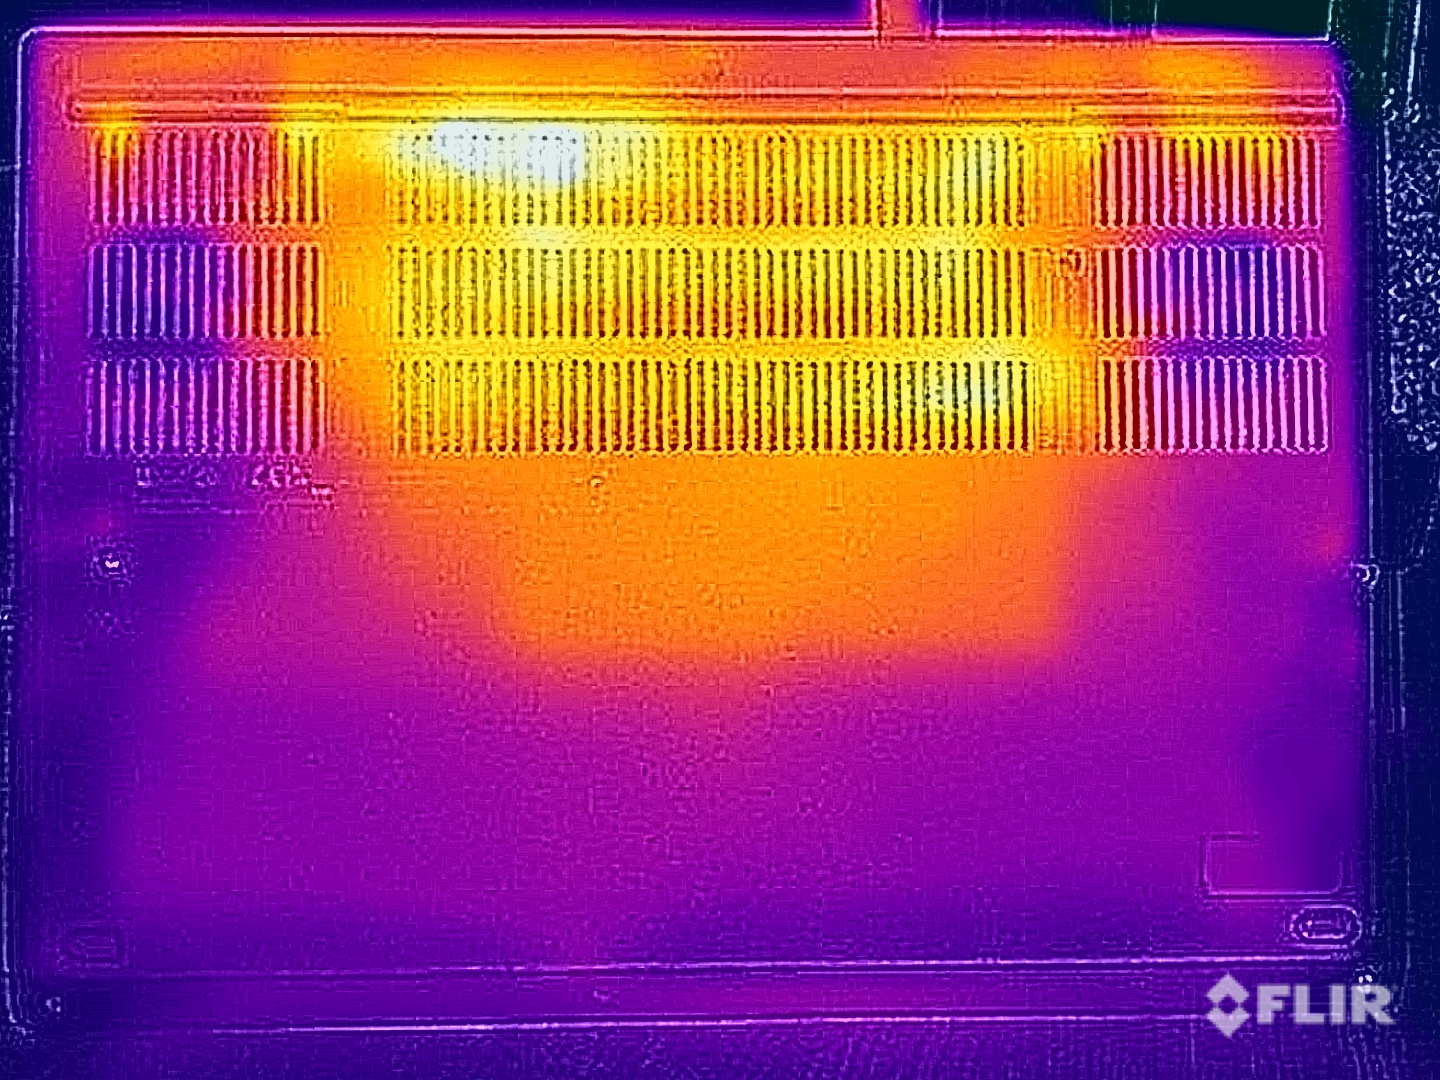
Não há problemas com as temperaturas da superfície em carga baixa. Entretanto, isso muda quando o senhor aplica carga à CPU e à GPU. Especialmente na parte inferior do dispositivo, medimos temperaturas acima de 55°C (131°F) em alguns pontos, o que significa que o senhor deve definitivamente evitar o contato direto da pele com essas áreas. Dito isso, a parte superior da seção da base permaneceu mais fria e as temperaturas foram mantidas abaixo da marca de 40°C (104°F) em quase todo o teclado. Portanto, é possível digitar corretamente no teclado, mesmo sob carga total.
A potência da GPU se manteve estável em 45 watts durante o teste de estresse, enquanto o processador funcionou a 54 watts por aproximadamente 12 minutos antes de se estabilizar em 45 watts. Com a bateria, a GPU ainda consumiu 40 watts de energia, mas o processador caiu ainda mais para 18 watts.
(±) A temperatura máxima no lado superior é 40.9 °C / 106 F, em comparação com a média de 38.2 °C / 101 F , variando de 22.2 a 69.8 °C para a classe Workstation.
(-) A parte inferior aquece até um máximo de 57.9 °C / 136 F, em comparação com a média de 41.1 °C / 106 F
(+) Em uso inativo, a temperatura média para o lado superior é 23.9 °C / 75 F, em comparação com a média do dispositivo de 32 °C / ### class_avg_f### F.
(±) Jogando The Witcher 3, a temperatura média para o lado superior é 32.7 °C / 91 F, em comparação com a média do dispositivo de 32 °C / ## #class_avg_f### F.
(+) Os apoios para as mãos e o touchpad estão atingindo a temperatura máxima da pele (34.3 °C / 93.7 F) e, portanto, não estão quentes.
(-) A temperatura média da área do apoio para as mãos de dispositivos semelhantes foi 27.8 °C / 82 F (-6.5 °C / -11.7 F).
| Lenovo ThinkPad P16v G1 AMD AMD Ryzen 7 PRO 7840HS, NVIDIA RTX A1000 Laptop GPU | HP ZBook Power 15 G10 AMD Ryzen 7 PRO 7840HS, NVIDIA RTX 2000 Ada Generation Laptop | Lenovo ThinkPad P15v G3 21EM001AGE AMD Ryzen 7 PRO 6850H, NVIDIA RTX A2000 Laptop GPU | Dell Precision 7670 Intel Core i7-12850HX, NVIDIA RTX A2000 Laptop GPU | Lenovo ThinkPad P1 G6-21FV000DGE Intel Core i9-13900H, NVIDIA RTX 2000 Ada Generation Laptop | Lenovo ThinkPad P16 21D6001DMB A2000 Retest Intel Core i7-12850HX, NVIDIA RTX A2000 Laptop GPU | |
|---|---|---|---|---|---|---|
| Heat | -1% | -2% | -16% | -9% | -13% | |
| Maximum Upper Side * (°C) | 40.9 | 42.4 -4% | 48.7 -19% | 51 -25% | 47.1 -15% | 44 -8% |
| Maximum Bottom * (°C) | 57.9 | 47.8 17% | 50.5 13% | 45.8 21% | 56.5 2% | 46.8 19% |
| Idle Upper Side * (°C) | 24.5 | 26.8 -9% | 25 -2% | 31.8 -30% | 28.1 -15% | 31.8 -30% |
| Idle Bottom * (°C) | 25.5 | 27.2 -7% | 25.4 -0% | 32.6 -28% | 27.6 -8% | 33.5 -31% |
* ... menor é melhor
Alto-falantes
Em geral, os dois alto-falantes estéreo são péssimos. Embora os sons médios e agudos sejam limpos, o que é útil para reproduzir vozes, os módulos de alto-falante simplesmente não têm potência e dinâmica. Além disso, os graves são praticamente inexistentes.
Lenovo ThinkPad P16v G1 AMD análise de áudio
(±) | o volume do alto-falante é médio, mas bom (###valor### dB)
Graves 100 - 315Hz
(-) | quase nenhum baixo - em média 19.8% menor que a mediana
(±) | a linearidade dos graves é média (8.8% delta para a frequência anterior)
Médios 400 - 2.000 Hz
(+) | médios equilibrados - apenas 3.8% longe da mediana
(+) | médios são lineares (5.4% delta para frequência anterior)
Altos 2 - 16 kHz
(+) | agudos equilibrados - apenas 3.3% longe da mediana
(+) | os máximos são lineares (5% delta da frequência anterior)
Geral 100 - 16.000 Hz
(±) | a linearidade do som geral é média (18.6% diferença em relação à mediana)
Comparado com a mesma classe
» 63% de todos os dispositivos testados nesta classe foram melhores, 7% semelhantes, 30% piores
» O melhor teve um delta de 7%, a média foi 17%, o pior foi 35%
Comparado com todos os dispositivos testados
» 42% de todos os dispositivos testados foram melhores, 8% semelhantes, 50% piores
» O melhor teve um delta de 4%, a média foi 23%, o pior foi 134%
HP ZBook Power 15 G10 análise de áudio
(±) | o volume do alto-falante é médio, mas bom (###valor### dB)
Graves 100 - 315Hz
(-) | quase nenhum baixo - em média 24.9% menor que a mediana
(±) | a linearidade dos graves é média (11.1% delta para a frequência anterior)
Médios 400 - 2.000 Hz
(+) | médios equilibrados - apenas 1.8% longe da mediana
(+) | médios são lineares (4.6% delta para frequência anterior)
Altos 2 - 16 kHz
(+) | agudos equilibrados - apenas 2.9% longe da mediana
(+) | os máximos são lineares (4.3% delta da frequência anterior)
Geral 100 - 16.000 Hz
(±) | a linearidade do som geral é média (19.6% diferença em relação à mediana)
Comparado com a mesma classe
» 70% de todos os dispositivos testados nesta classe foram melhores, 6% semelhantes, 25% piores
» O melhor teve um delta de 7%, a média foi 17%, o pior foi 35%
Comparado com todos os dispositivos testados
» 49% de todos os dispositivos testados foram melhores, 7% semelhantes, 44% piores
» O melhor teve um delta de 4%, a média foi 23%, o pior foi 134%
Gerenciamento de energia - Bateria de longa duração
Consumo de energia
O uso de energia em modo inativo não excedeu 6,7 watts, o que é extremamente baixo para um dispositivo de 16 polegadas. Por outro lado, não é de surpreender que o ThinkPad tenha exigido cerca de 150 watts durante o teste de estresse, embora isso tenha caído rapidamente para cerca de 135 watts. O adaptador de 170 watts incluído é, portanto, suficientemente potente para o laptop.
| desligado | |
| Ocioso | |
| Carga |
|
Key:
min: | |
| Lenovo ThinkPad P16v G1 AMD R7 PRO 7840HS, RTX A1000 Laptop GPU, SK hynix PC801 HFS001TEJ9X101N, IPS, 1920x1200, 16" | HP ZBook Power 15 G10 R7 PRO 7840HS, RTX 2000 Ada Generation Laptop, WDC PC SN810 2TB, IPS, 2560x1440, 15.6" | Lenovo ThinkPad P15v G3 21EM001AGE R7 PRO 6850H, RTX A2000 Laptop GPU, SK Hynix PC711 1TB HFS001TDE9X081N, IPS LED, 3840x2160, 15.6" | Dell Precision 7670 i7-12850HX, RTX A2000 Laptop GPU, SK Hynix HFS001TEJ9X115N, OLED, 3840x2400, 16" | Lenovo ThinkPad P1 G6-21FV000DGE i9-13900H, RTX 2000 Ada Generation Laptop, SK Hynix PC711 1TB HFS001TDE9X084N, IPS, 2560x1600, 16" | Lenovo ThinkPad P16 G1 21D6001DMB i7-12850HX, RTX A2000 Laptop GPU, Micron 3400 1TB MTFDKBA1T0TFH, IPS LED, 2560x1600, 16" | Média NVIDIA RTX A1000 Laptop GPU | Média da turma Workstation | |
|---|---|---|---|---|---|---|---|---|
| Power Consumption | -40% | -52% | -115% | -74% | -39% | -26% | -94% | |
| Idle Minimum * (Watt) | 4.1 | 5.3 -29% | 6.3 -54% | 7.5 -83% | 8.3 -102% | 5.1 -24% | 4.2 ? -2% | 9.11 ? -122% |
| Idle Average * (Watt) | 6.5 | 9.9 -52% | 13.9 -114% | 9.5 -46% | 14.5 -123% | 9.2 -42% | 7.7 ? -18% | 13.8 ? -112% |
| Idle Maximum * (Watt) | 6.7 | 16.7 -149% | 14.5 -116% | 28.4 -324% | 15.3 -128% | 9.9 -48% | 12.8 ? -91% | 17.9 ? -167% |
| Load Average * (Watt) | 65.2 | 61.3 6% | 82.8 -27% | 139.1 -113% | 91.8 -41% | 124.1 -90% | 79.6 ? -22% | 96 ? -47% |
| Witcher 3 ultra * (Watt) | 77.2 | 87.9 -14% | 88.8 -15% | 134 -74% | 104.7 -36% | 87.7 -14% | ||
| Load Maximum * (Watt) | 147 | 145.3 1% | 124.8 15% | 220.8 -50% | 164.5 -12% | 168.9 -15% | 142.3 ? 3% | 180.3 ? -23% |
* ... menor é melhor
Power consumption Witcher 3 / Stresstest
Power consumption with external monitor
Duração da bateria
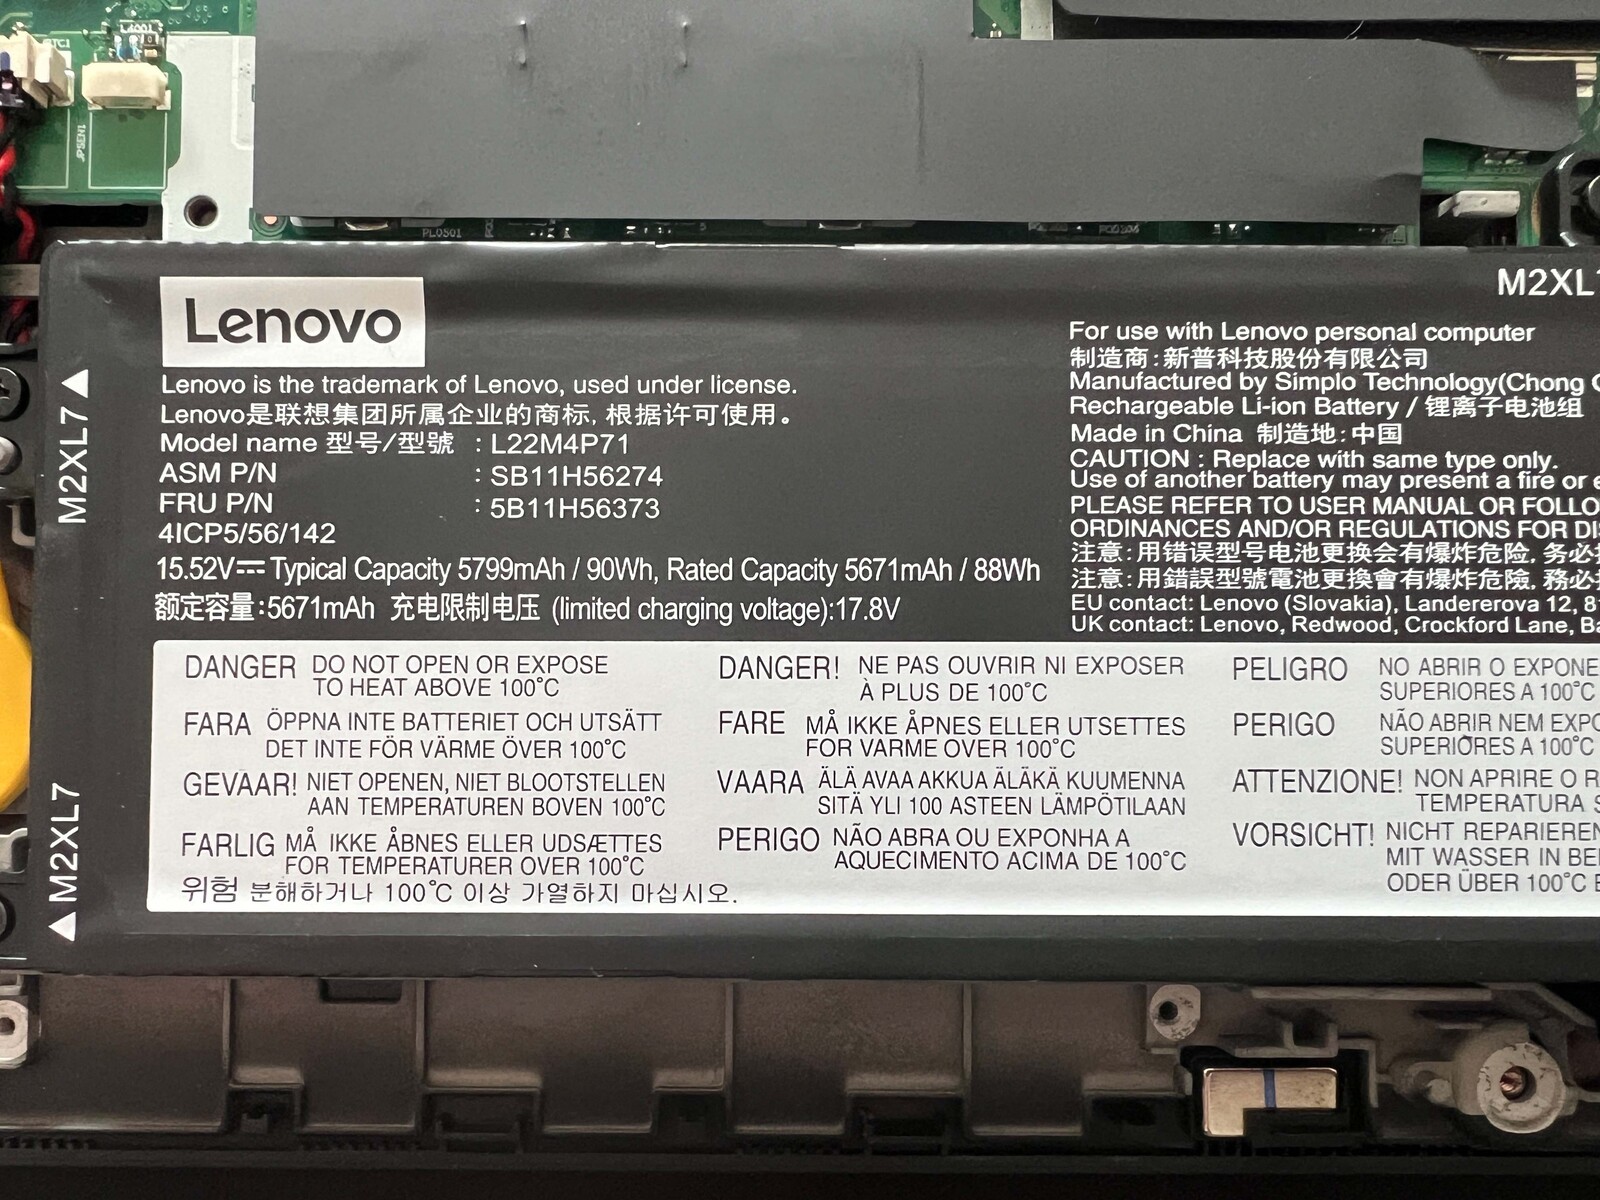
A combinação de baixo consumo de energia e uma bateria de 90 Wh permitiu uma vida útil muito longa da bateria durante nossos testes. O ThinkPad durou quase 18 horas em nosso teste de vídeo a 150 cd/m² (equivalente a 71% do brilho máximo em nossa unidade de análise) e quase 15 horas em nosso teste de Wi-Fi. Mesmo com o brilho da tela totalmente aumentado, ainda conseguimos obter 12 horas do dispositivo. Esses são resultados excelentes que os dispositivos concorrentes não conseguem acompanhar. Com carga máxima, a bateria foi totalmente descarregada em pouco mais de uma hora. Foram necessárias cerca de 2 horas para recarregar totalmente o laptop quando ele estava em funcionamento, com a bateria recuperando 80% da carga após 65 minutos.
| Lenovo ThinkPad P16v G1 AMD R7 PRO 7840HS, RTX A1000 Laptop GPU, 90 Wh | HP ZBook Power 15 G10 R7 PRO 7840HS, RTX 2000 Ada Generation Laptop, 83 Wh | Lenovo ThinkPad P15v G3 21EM001AGE R7 PRO 6850H, RTX A2000 Laptop GPU, 68 Wh | Dell Precision 7670 i7-12850HX, RTX A2000 Laptop GPU, 83 Wh | Lenovo ThinkPad P1 G6-21FV000DGE i9-13900H, RTX 2000 Ada Generation Laptop, 90 Wh | Lenovo ThinkPad P16 G1 21D6001DMB i7-12850HX, RTX A2000 Laptop GPU, 94 Wh | Média da turma Workstation | |
|---|---|---|---|---|---|---|---|
| Duração da bateria | -33% | -10% | -22% | -25% | 14% | -18% | |
| H.264 (h) | 17.8 | 10.7 -40% | 11.2 -37% | 10.1 ? -43% | |||
| WiFi v1.3 (h) | 15 | 10 -33% | 6.9 -54% | 5.9 -61% | 9.5 -37% | 9.4 -37% | 8.55 ? -43% |
| Load (h) | 1.1 | 1.8 64% | 1.3 18% | 1.1 0% | 1.8 64% | 1.441 ? 31% |
Pro
Contra
Veredicto - O ThinkPad P16v G1 é uma excelente estação de trabalho


A Lenovo lançou o ThinkPad P16v G1 para substituir o antigo ThinkPad P15v por um modelo de 16 polegadas um pouco maior. A ideia básica por trás da estação de trabalho de nível básico permanece a mesma: a intenção é que ela seja uma porta de entrada relativamente acessível para o mundo do trabalho profissional. O desempenho necessário da CPU é fornecido por um chip AMD Zen4 atual, que oferece excelente desempenho apesar dos limites de energia um tanto baixos de no máximo 64 watts. Mas as estações de trabalho de alta gama como o ThinkPad P16 com CPUs HX da Intel oferecem ainda mais potência de processamento. Outro ponto de crítica é que o desempenho da CPU é bastante reduzido quando o laptop está funcionando com a bateria.
Da mesma forma, as únicas opções de placa de vídeo disponíveis são os modelos de baixo custo da Nvidia (RTX A500, RTX A1000 ou RTX 2000 Ada). Mas o senhor também pode renunciar completamente a uma GPU dedicada. O desempenho do RTX A1000 com 6 GB de RAM é decente no geral, embora seja uma variante relativamente lenta com um TGP de 45 watts. Dado o formato grande do notebook de 16 polegadas, o senhor certamente poderia ter aproveitado mais.
O ThinkPad P16v G1 é o novo modelo de nível básico da Lenovo no segmento de estações de trabalho. Seu desempenho é adequado, embora, não é preciso dizer, o senhor tenha que aceitar compromissos em algumas áreas (por exemplo, qualidade do chassi, desempenho de resfriamento) em comparação com o ThinkPad P16, mais caro.
Sendo totalmente feito de plástico, o chassi mostra claramente que o P16v G1 é um dispositivo de nível básico. O dispositivo tem uma boa capacidade de serviço para o usuário e conta com dois slots SO-DIMM e espaço para dois SSDs M.2 2280. No entanto, não é possível adicionar um módulo WWAN porque a Lenovo não pré-instalou as antenas necessárias ou o leitor de cartão SIM. O teclado oferece a qualidade moderna do ThinkPad, e a tela Full HD apresenta cobertura total sRGB e é uma escolha decente para tarefas normais. Também há uma opção de painel 4K (800 cd/m², P3 e HDR) se o senhor quiser algo melhor.
O maior concorrente do ThinkPad P16v G1 é, sem dúvida, o HP ZBook Power G10que parece mais premium devido ao seu chassi de metal. Os dois notebooks podem ser equipados com especificações semelhantes, mas não diferem muito entre si. No entanto, o HP ainda usa uma tela 16:9 e também não consegue acompanhar o ThinkPad em termos de duração da bateria. A Dell oferece o Precision 3581 nessa faixa de preço, mas ainda não tivemos a oportunidade de experimentar esse dispositivo.
Preço e disponibilidade
Na Alemanha, o ThinkPad P16v G1, conforme especificado, está disponível em Campuspoint por €2.099 (US$2.298). O senhor também pode acessar o site Lenovo Germany ou Lenovo US para configurar seu próprio ThinkPad P16v G1. O desconto para estudantes e professores também está disponível para esse laptop.
Lenovo ThinkPad P16v G1 AMD
- 01/03/2024 v7 (old)
Andreas Osthoff
Transparência
A seleção dos dispositivos a serem analisados é feita pela nossa equipe editorial. A amostra de teste foi fornecida ao autor como empréstimo pelo fabricante ou varejista para fins desta revisão. O credor não teve influência nesta revisão, nem o fabricante recebeu uma cópia desta revisão antes da publicação. Não houve obrigação de publicar esta revisão. Como empresa de mídia independente, a Notebookcheck não está sujeita à autoridade de fabricantes, varejistas ou editores.
É assim que o Notebookcheck está testando
Todos os anos, o Notebookcheck analisa de forma independente centenas de laptops e smartphones usando procedimentos padronizados para garantir que todos os resultados sejam comparáveis. Desenvolvemos continuamente nossos métodos de teste há cerca de 20 anos e definimos padrões da indústria no processo. Em nossos laboratórios de teste, equipamentos de medição de alta qualidade são utilizados por técnicos e editores experientes. Esses testes envolvem um processo de validação em vários estágios. Nosso complexo sistema de classificação é baseado em centenas de medições e benchmarks bem fundamentados, o que mantém a objetividade.Price comparison

