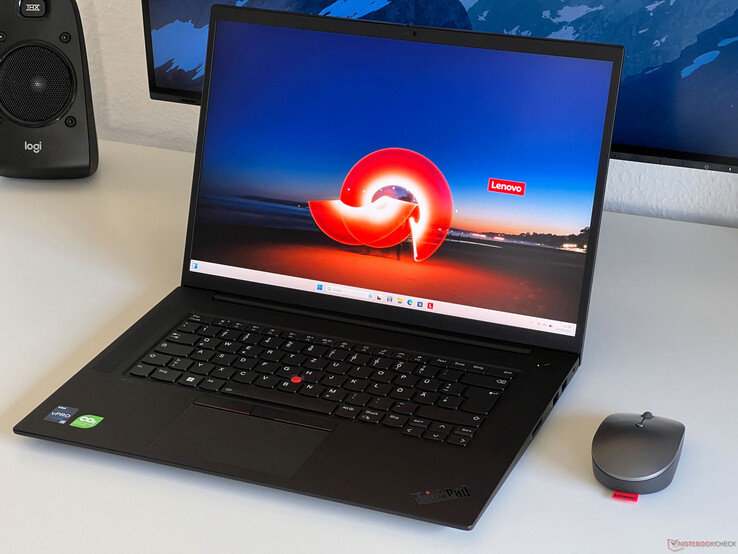
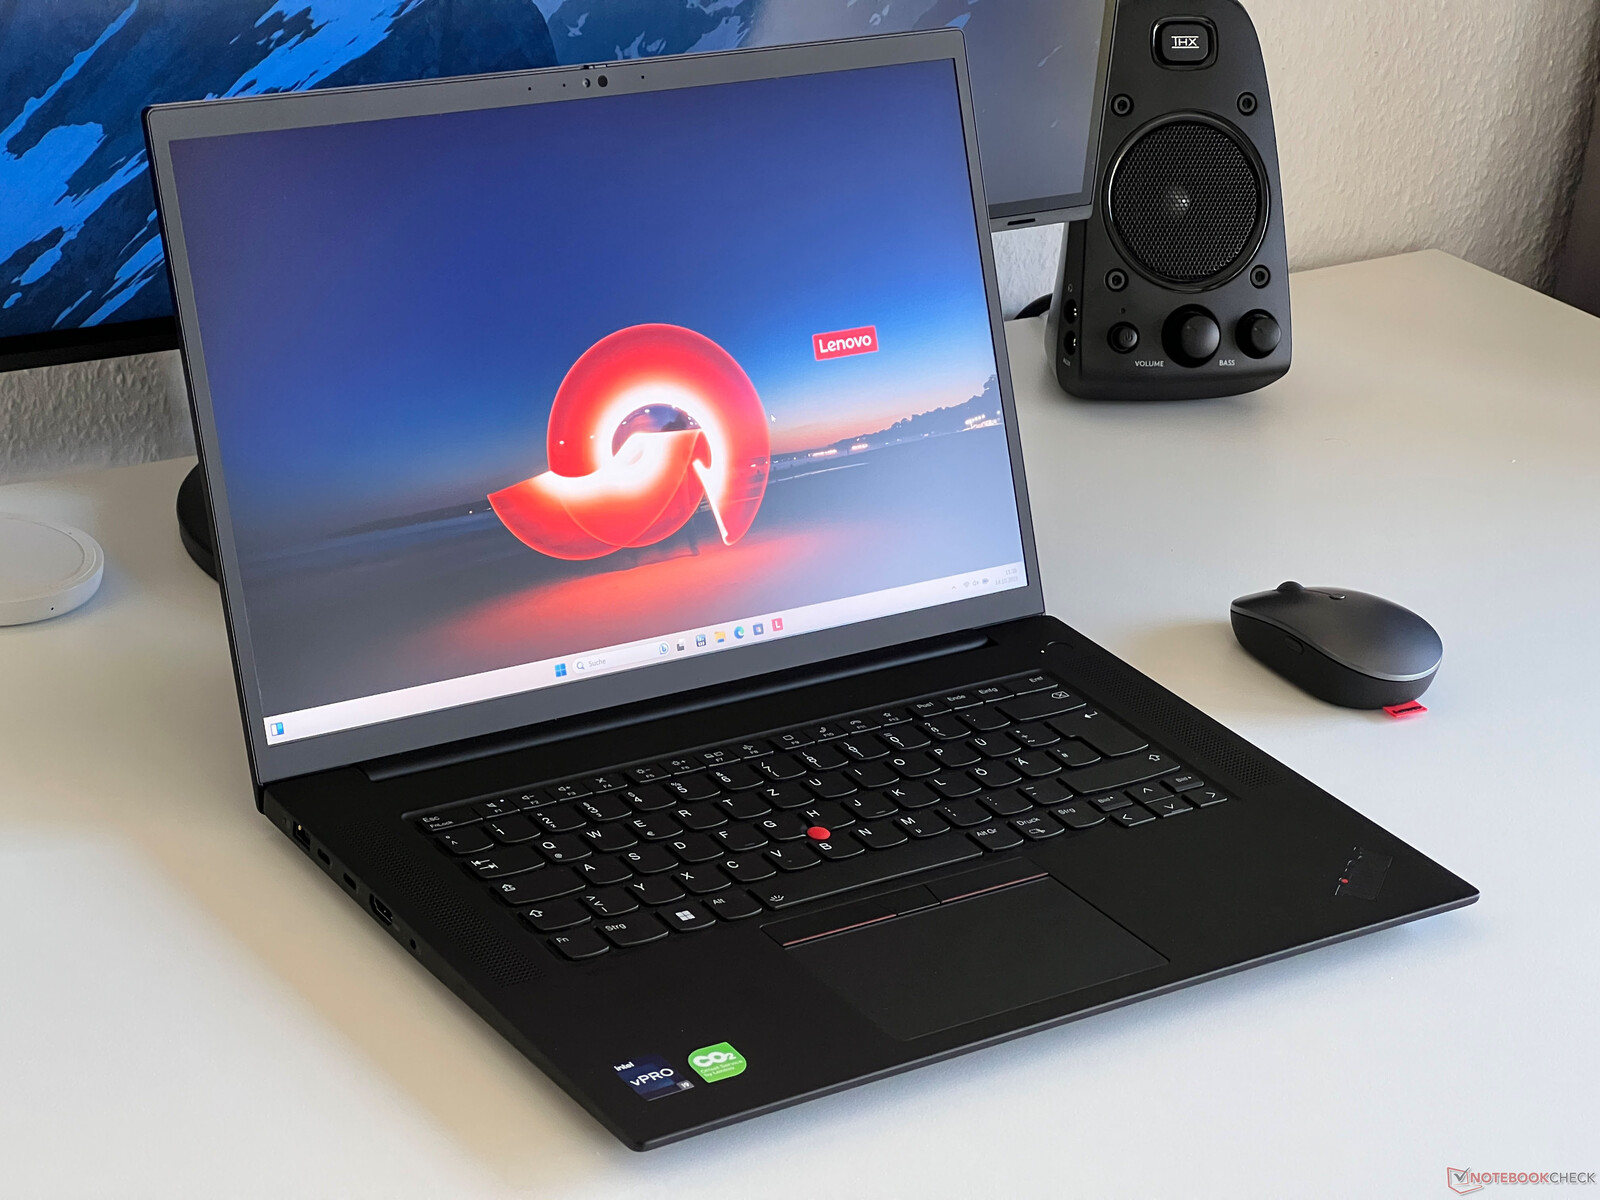
Análise do laptop Lenovo ThinkPad P1 G6 - A estação de trabalho móvel substitui o ThinkPad X1 Extreme
Durante anos, a Lenovo teve dois modelos grandes de 16 polegadas em sua linha: o Lenovo ThinkPad X1 Extreme e sua estação de trabalho com estrutura idêntica, o ThinkPad P1. Agora, o portfólio foi simplificado, e o novo ThinkPad P1 Gen 6 assume as duas funções imediatamente. Não há sucessor para o ThinkPad X1 Extreme Gen 6 do ano passado ThinkPad X1 Extreme Gen 5 do ano passado do ano passado. O novo ThinkPad P1 Gen 6 está disponível com GPUs GeForce para consumidores e adaptadores gráficos de nível profissional, oferecendo versatilidade na escolha. Notavelmente, o design do gabinete permanece praticamente inalterado, e dois modelos básicos ainda são oferecidos. Dependendo da placa de vídeo escolhida, o resfriamento convencional ou uma câmara de vapor (para GeForce RTX 4060/RTX 3500 Ada) estão sendo usados.
A gama de componentes do ThinkPad P1 Gen 6 é extensa. Ele sempre usa as mais novas CPUs Raptor-Lake de 45 watts da Intel, e as opções de placas de vídeo variam de RTX 1000 Ada a RTX 5000 Ada (ou GeForce RTX 4060, 4080 ou 4090). Essa grande variedade resulta em variações consideráveis de preço. O modelo básico, equipado com Core i7-13700H, 32 GB de RAM e RTX 1000 Ada, atualmente começa em cerca de US$ 2850. No entanto, os preços podem facilmente ultrapassar US$ 6.350 para configurações de ponta com Core i9, RTX 5000 Ada, 96 GB de RAM e tela OLED.
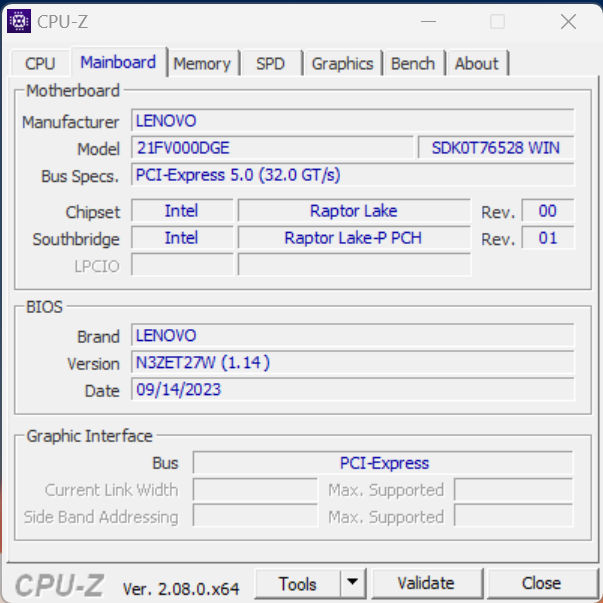
Nosso dispositivo de teste, identificado pelo número de produto 21FV000DGE, tem preço atual de aproximadamente US$ 3.400. Ele apresenta o Core i9-13900HrTX 2000 Ada, 32 GB de RAM e um SSD de 1 TB. Além disso, ele também inclui o painel IPS WQHD opcional com uma taxa de atualização de 165 Hz. Aqueles com acesso ao programa Campus da Lenovo podem obter esse modelo por aproximadamente US$ 3.000.
Possíveis concorrentes em comparação
Avaliação | Data | Modelo | Peso | Altura | Size | Resolução | Preço |
|---|---|---|---|---|---|---|---|
| 91.7 % v7 (old) | 10/2023 | Lenovo ThinkPad P1 G6-21FV000DGE i9-13900H, RTX 2000 Ada Generation Laptop | 1.9 kg | 17.5 mm | 16.00" | 2560x1600 | |
| 89 % v7 (old) | 08/2023 | Dell Precision 5000 5680 i9-13900H, RTX 5000 Ada Generation Laptop | 2.3 kg | 22.17 mm | 16.00" | 3840x2400 | |
| 88.8 % v7 (old) | 05/2023 | Samsung Galaxy Book3 Ultra 16, i9-13900H RTX 4070 i9-13900H, GeForce RTX 4070 Laptop GPU | 1.8 kg | 16.8 mm | 16.00" | 2880x1800 | |
| 90.1 % v7 (old) | 11/2022 | HP ZBook Studio 16 G9 62U04EA i7-12800H, RTX A2000 Laptop GPU | 1.8 kg | 19 mm | 16.00" | 3840x2400 | |
| 84.3 % v7 (old) | 11/2022 | MSI CreatorPro Z16P B12UKST i7-12700H, RTX A3000 Laptop GPU | 2.4 kg | 19 mm | 16.00" | 2560x1600 | |
| 88.6 % v7 (old) | 07/2023 | Schenker VISION 16 Pro (M23) i7-13700H, GeForce RTX 4070 Laptop GPU | 1.6 kg | 17.1 mm | 16.00" | 2560x1600 |
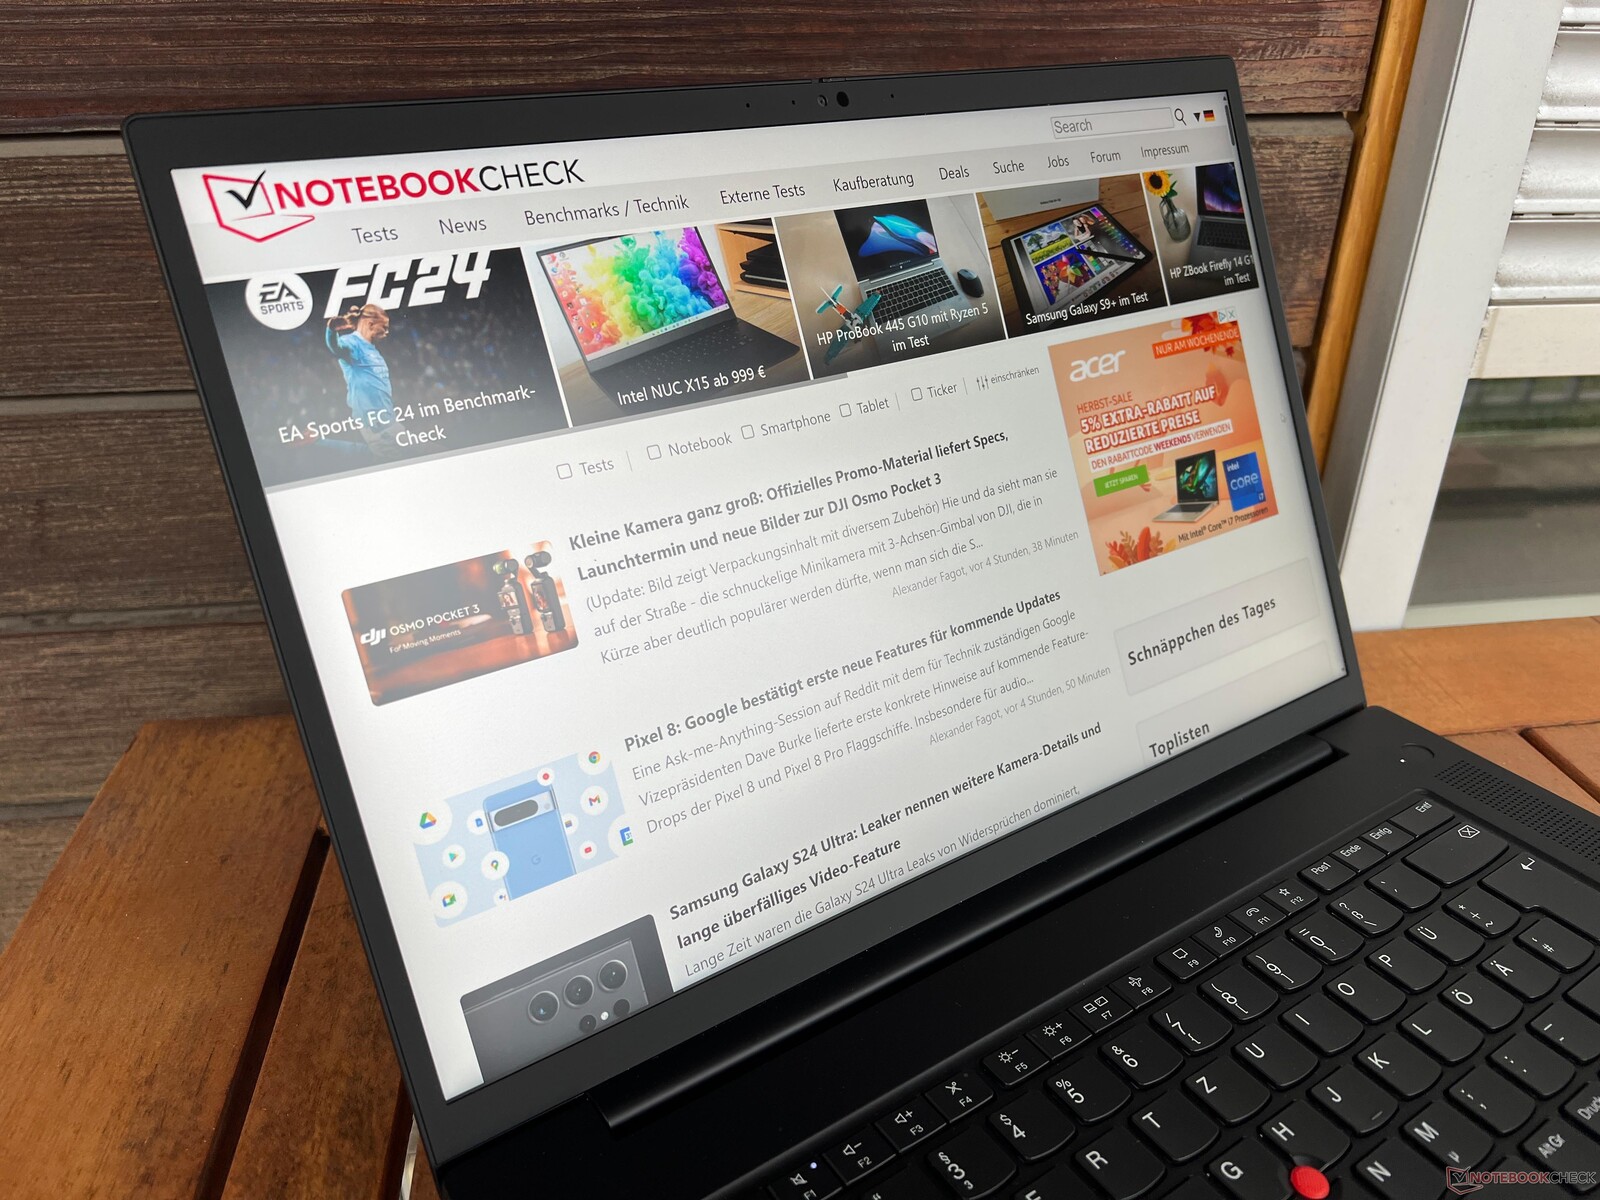
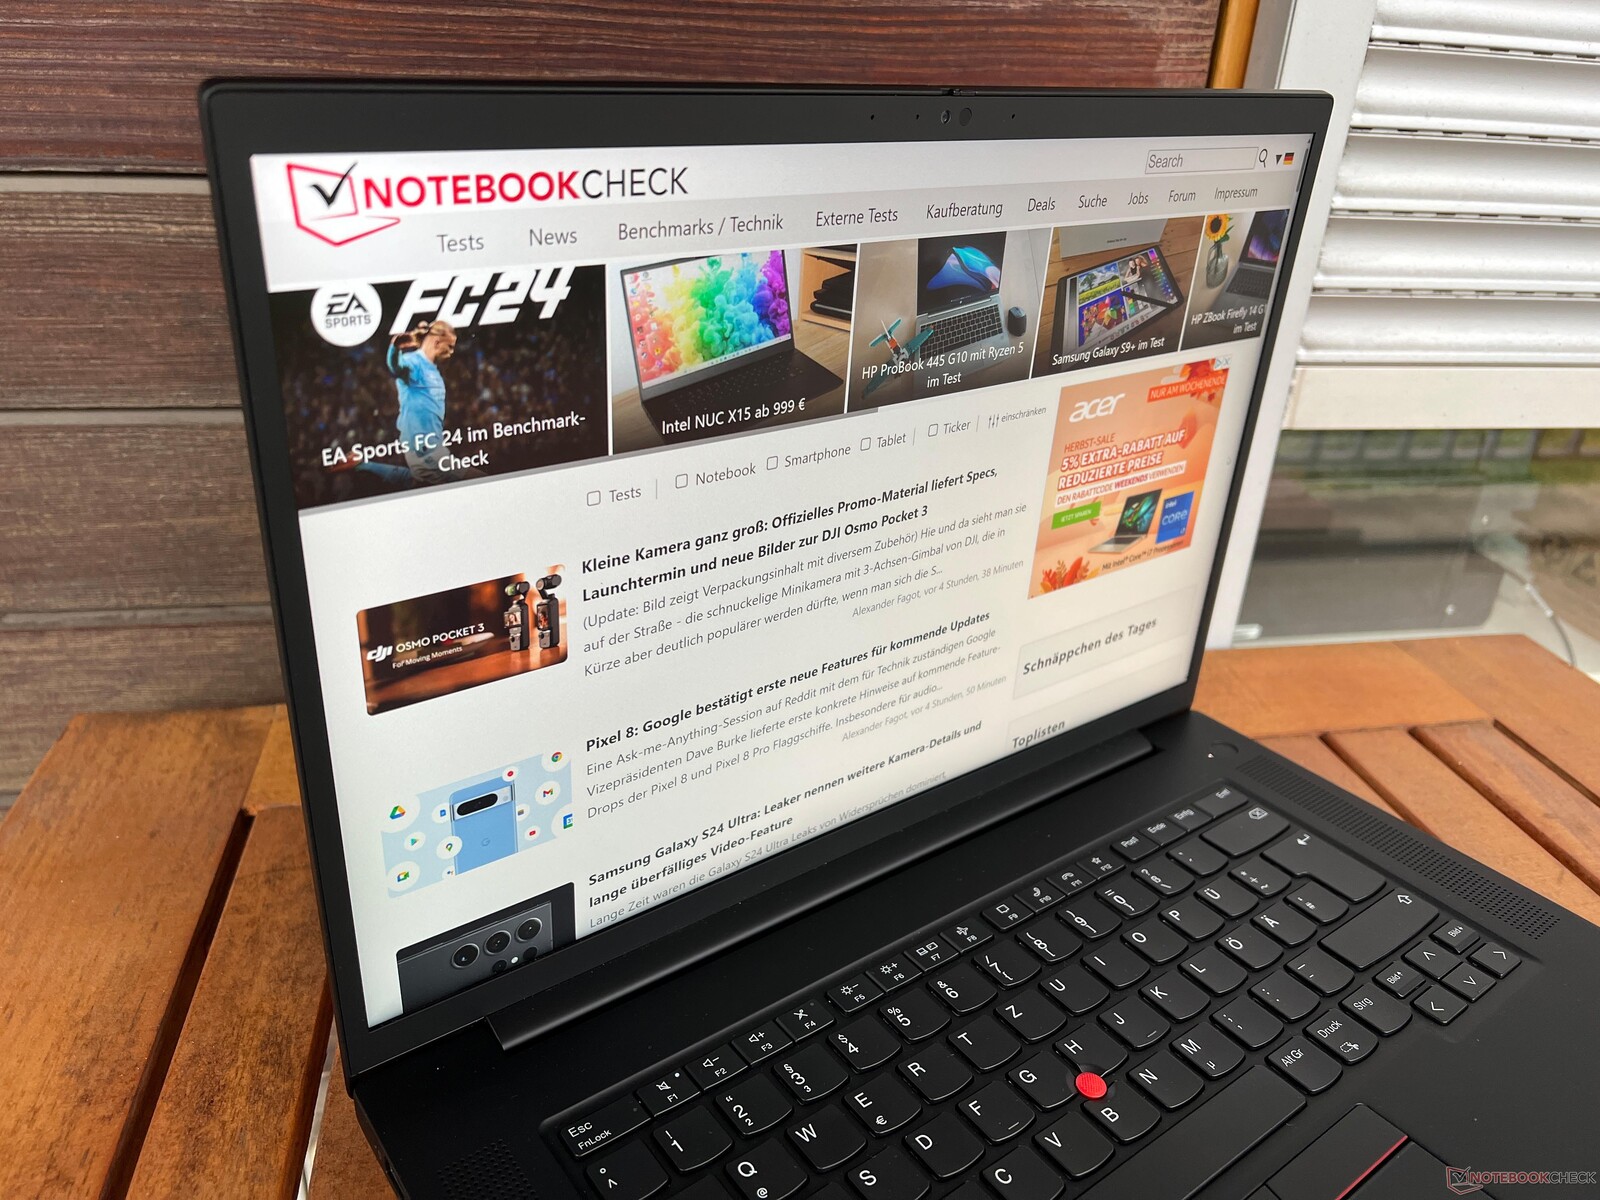
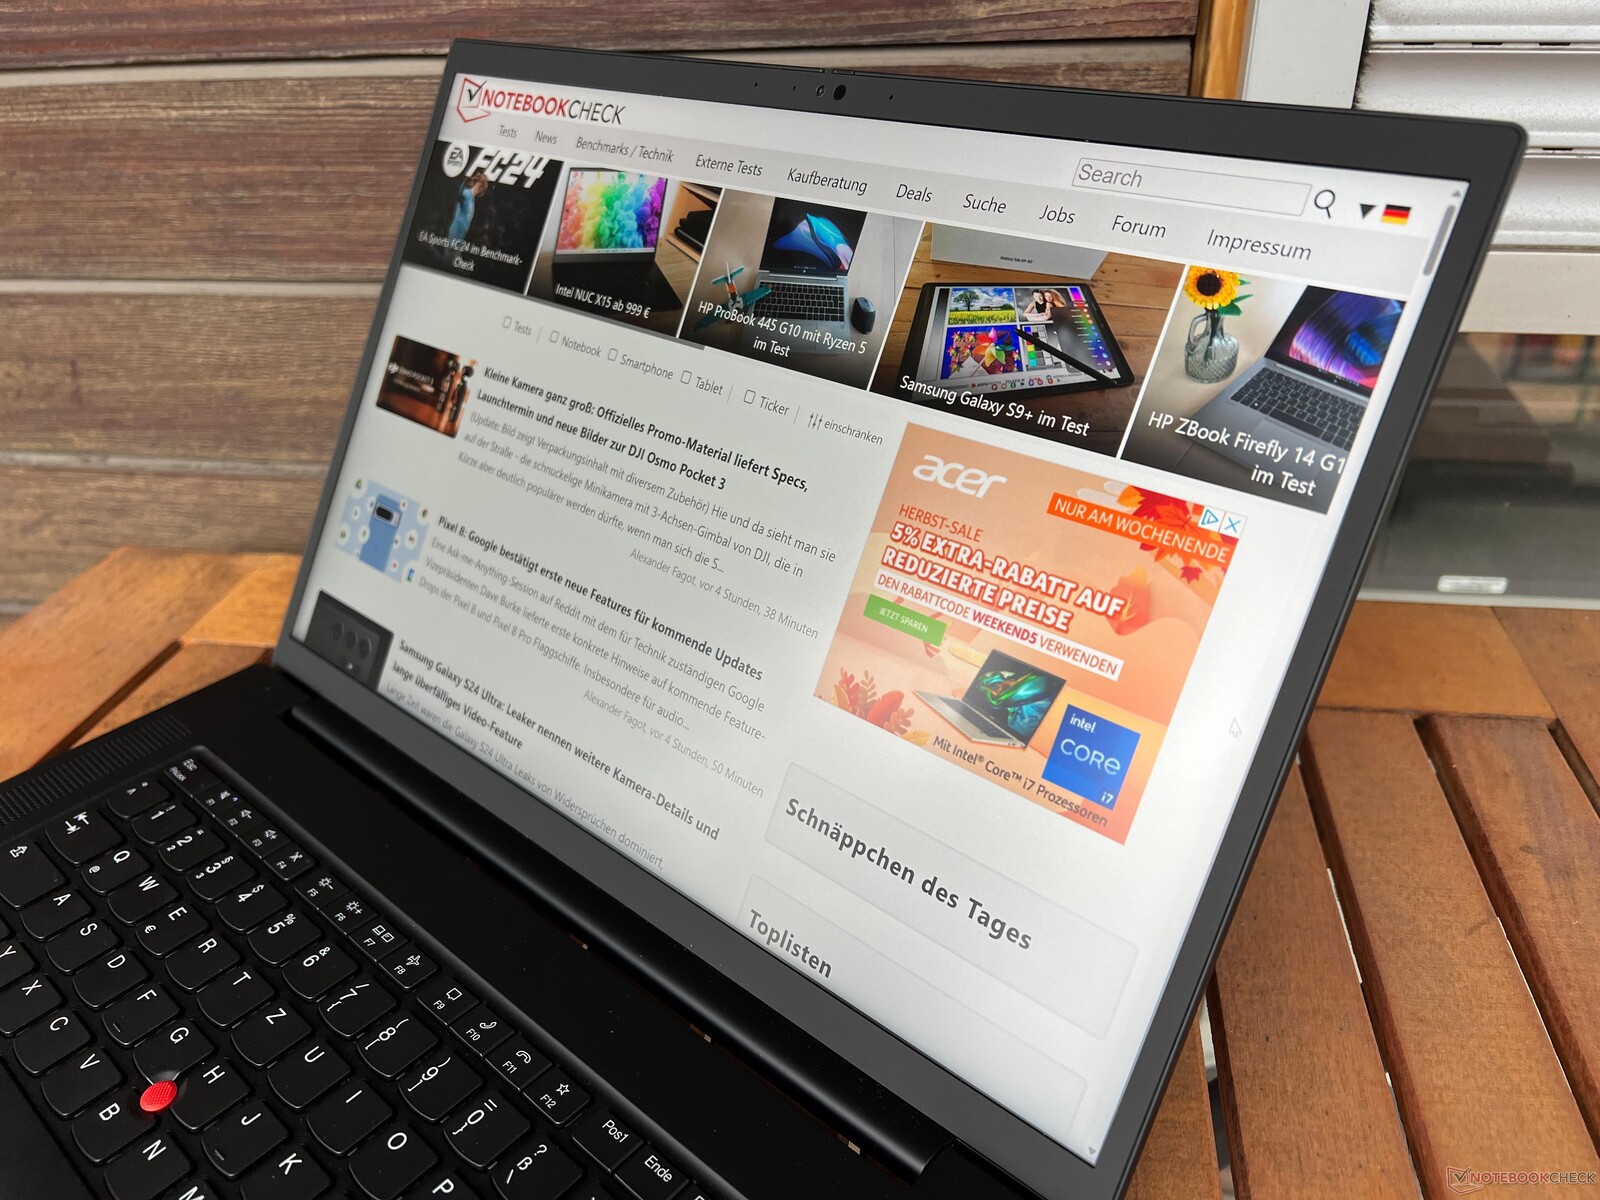
Case - A estabilidade é proporcionada pela fibra de carbono e pelo magnésio
A Lenovo mantém o conhecido design do ThinkPad P1 Gen 6, mantendo a consistência com seus antecessores, as gerações G4 e G5. O design em preto pode ser percebido como simples ou pouco atraente, dependendo das perspectivas individuais. No entanto, a identidade distinta do ThinkPad permanece inconfundível. Os modelos com tela OLED continuam a exibir uma tampa de tela com um padrão de fibra de carbono, embora seja um design impresso em vez de fibra de carbono real. De modo geral, o design mantém uma aparência contemporânea, mas as superfícies lisas são suscetíveis ao acúmulo de sujeira e gordura com o tempo, exigindo limpeza regular.
A construção combina fibra de carbono e magnésio, garantindo uma estabilidade excepcional. Tanto a unidade de base quanto a tampa do monitor são robustas, sem torções ou pontos de pressão perceptíveis. Não há problemas com distorções de imagem ou ruídos de rangidos. As duas dobradiças (ângulo máximo de abertura de 180 graus) permitem que a tampa seja aberta com uma mão, mantendo a tensão suficiente para evitar qualquer oscilação perceptível.
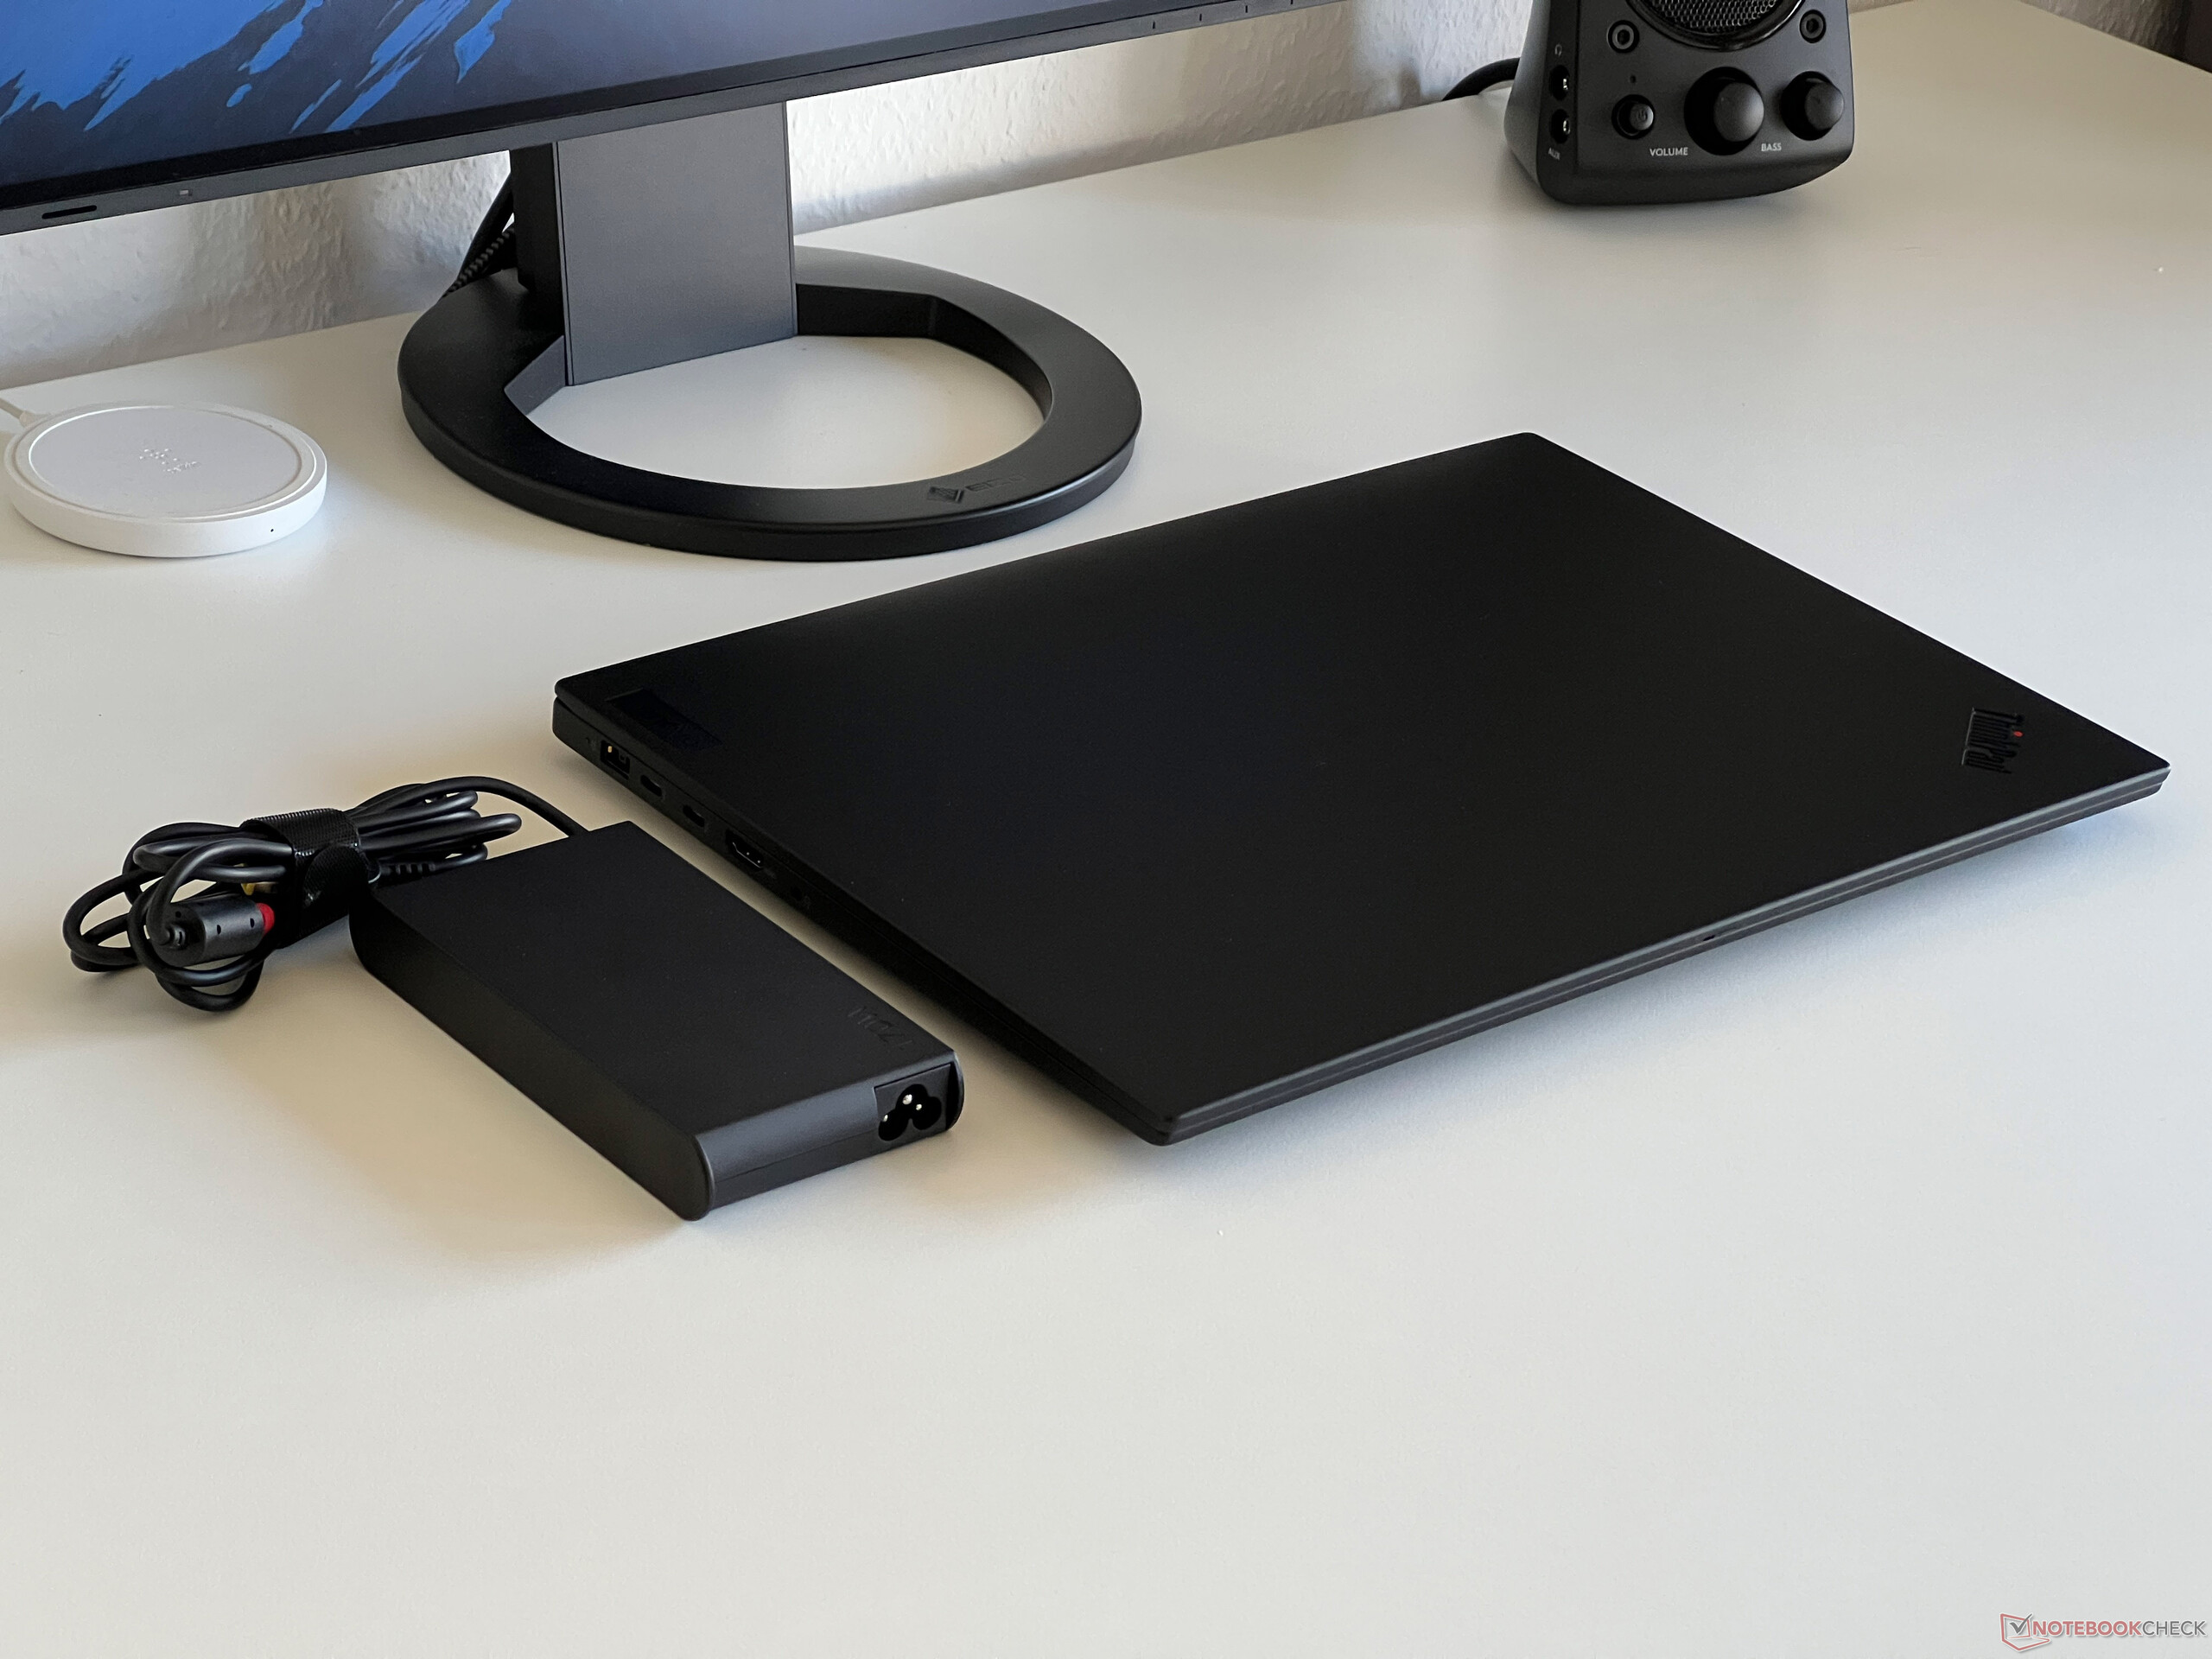
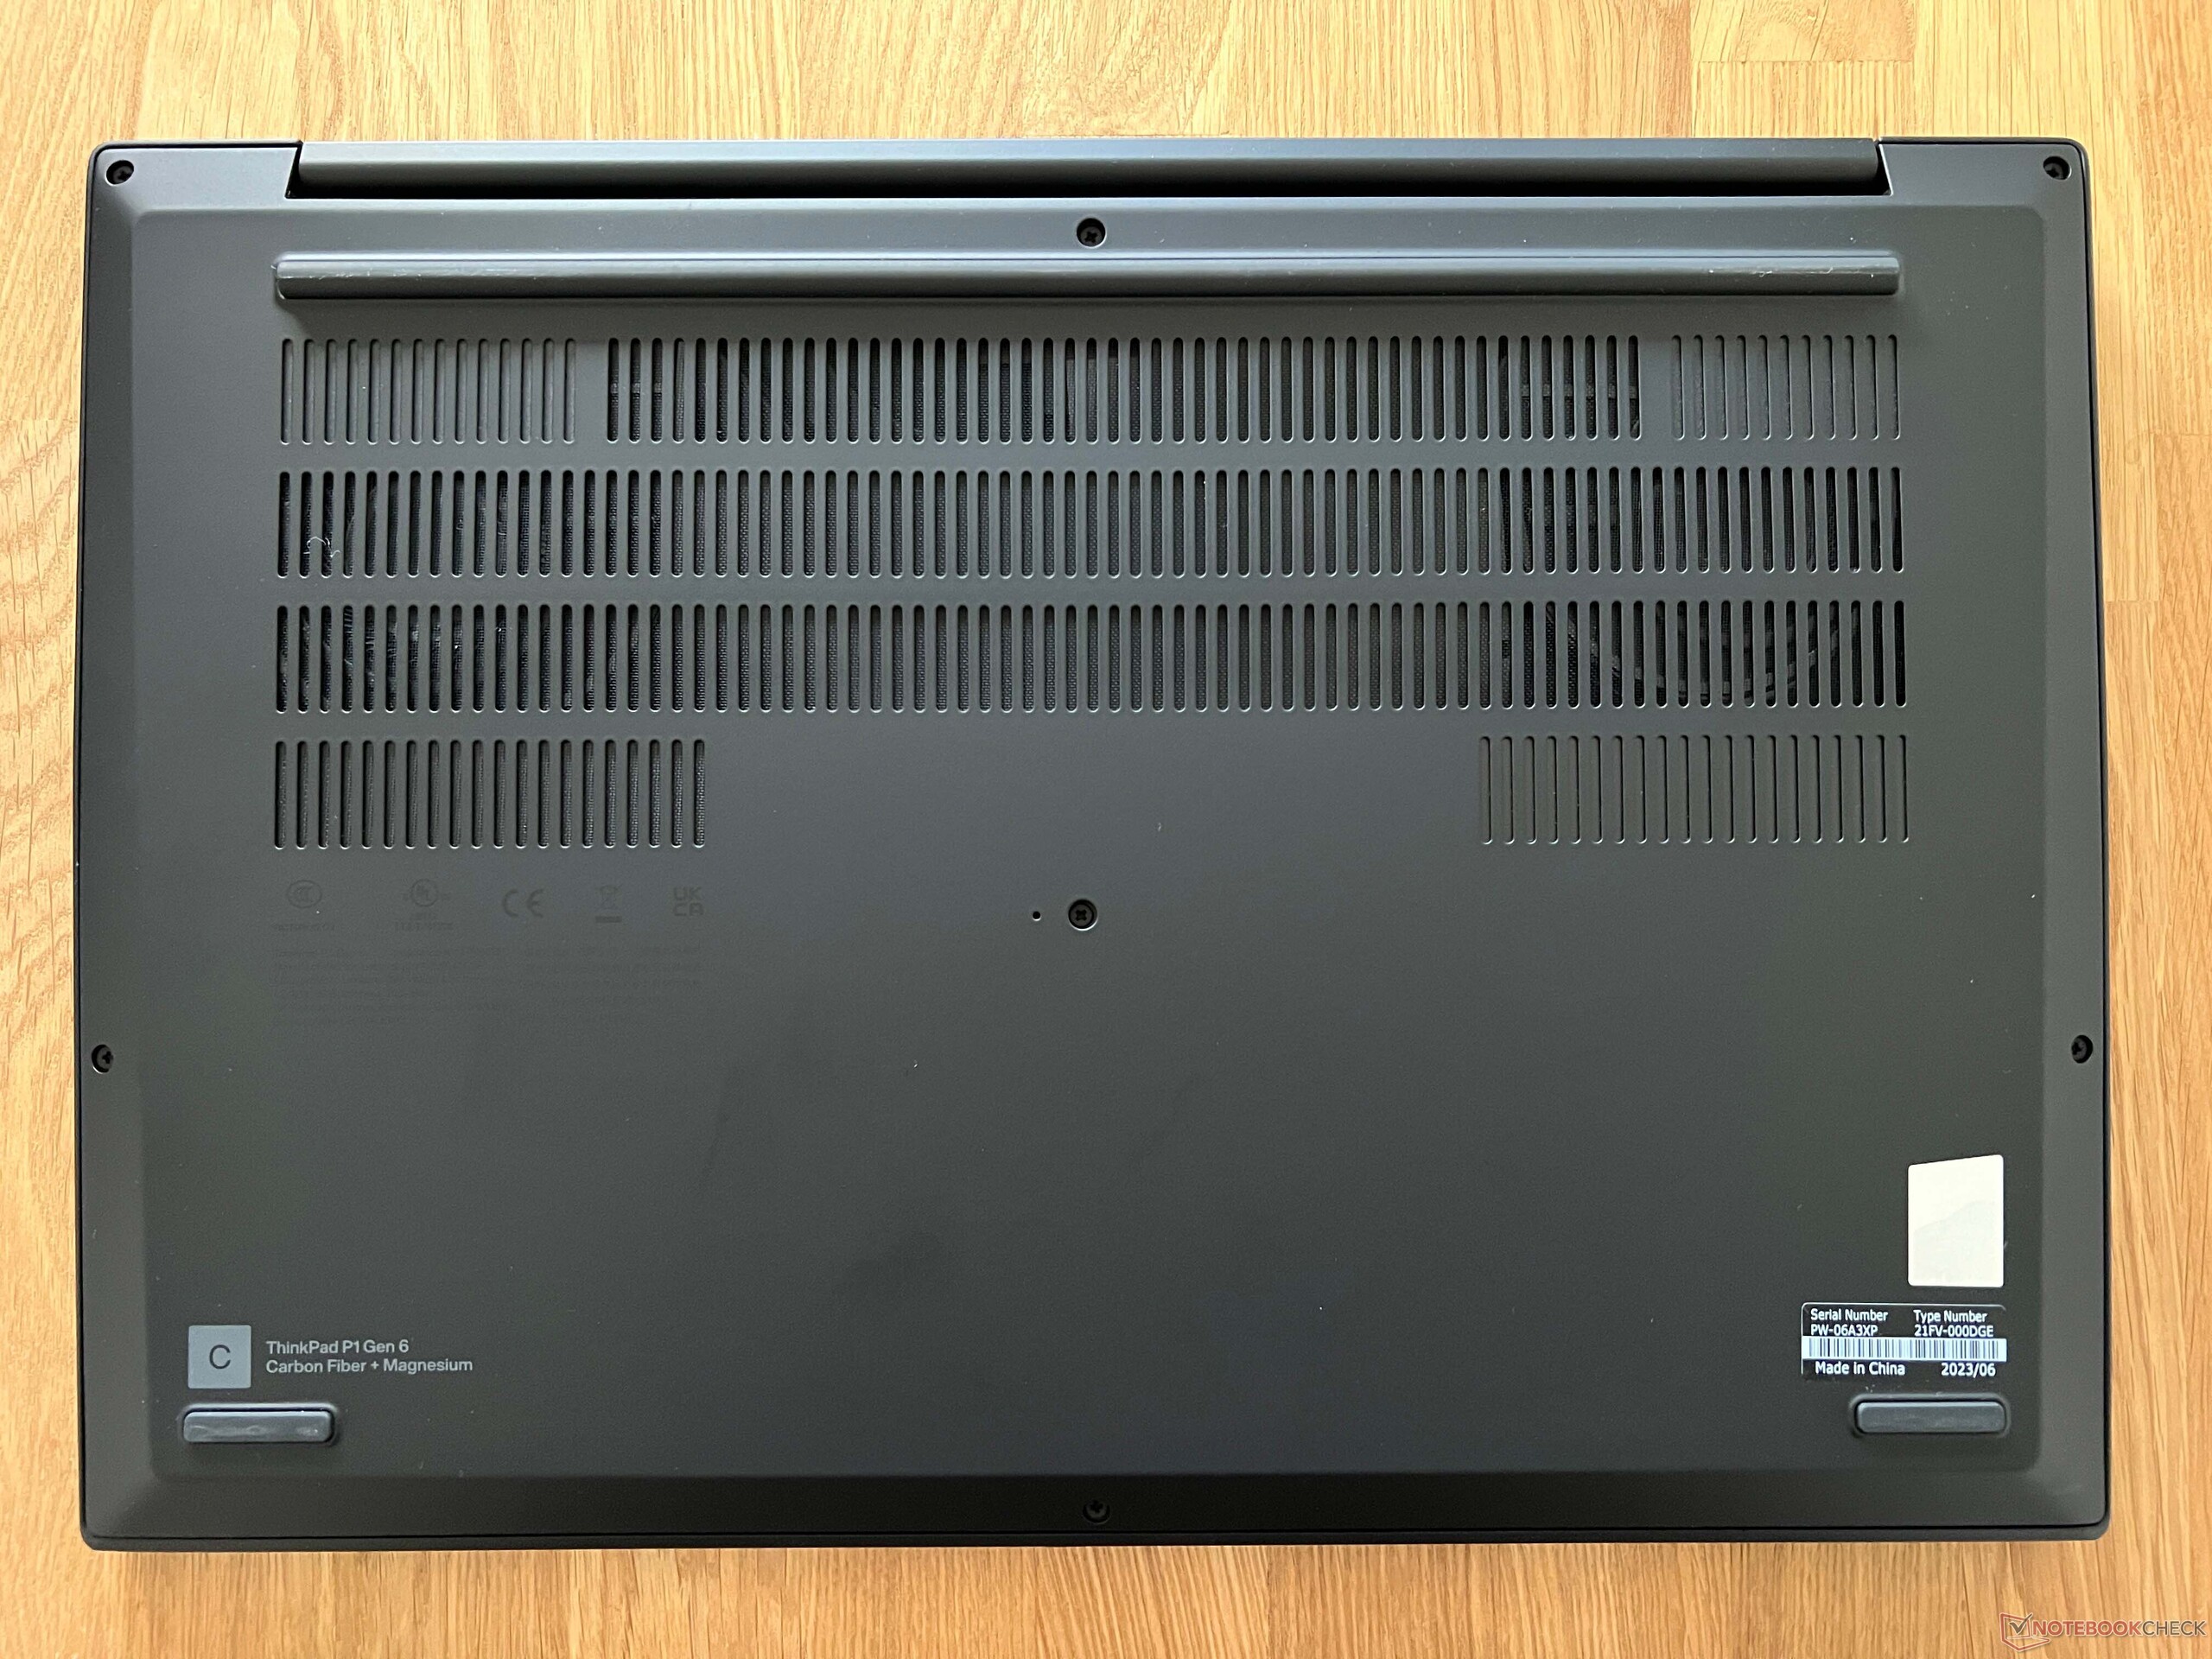
Os gadgets comparáveis têm um tamanho semelhante, mas são significativamente mais pesados. O ThinkPad P1 Gen 6 é uma das variantes mais leves, pesando pouco menos de 4,19 lbs e sendo superado apenas pelo Schenker Vision 16. A fonte de alimentação de 170 watts acrescenta mais 1,23 lb ao peso total.
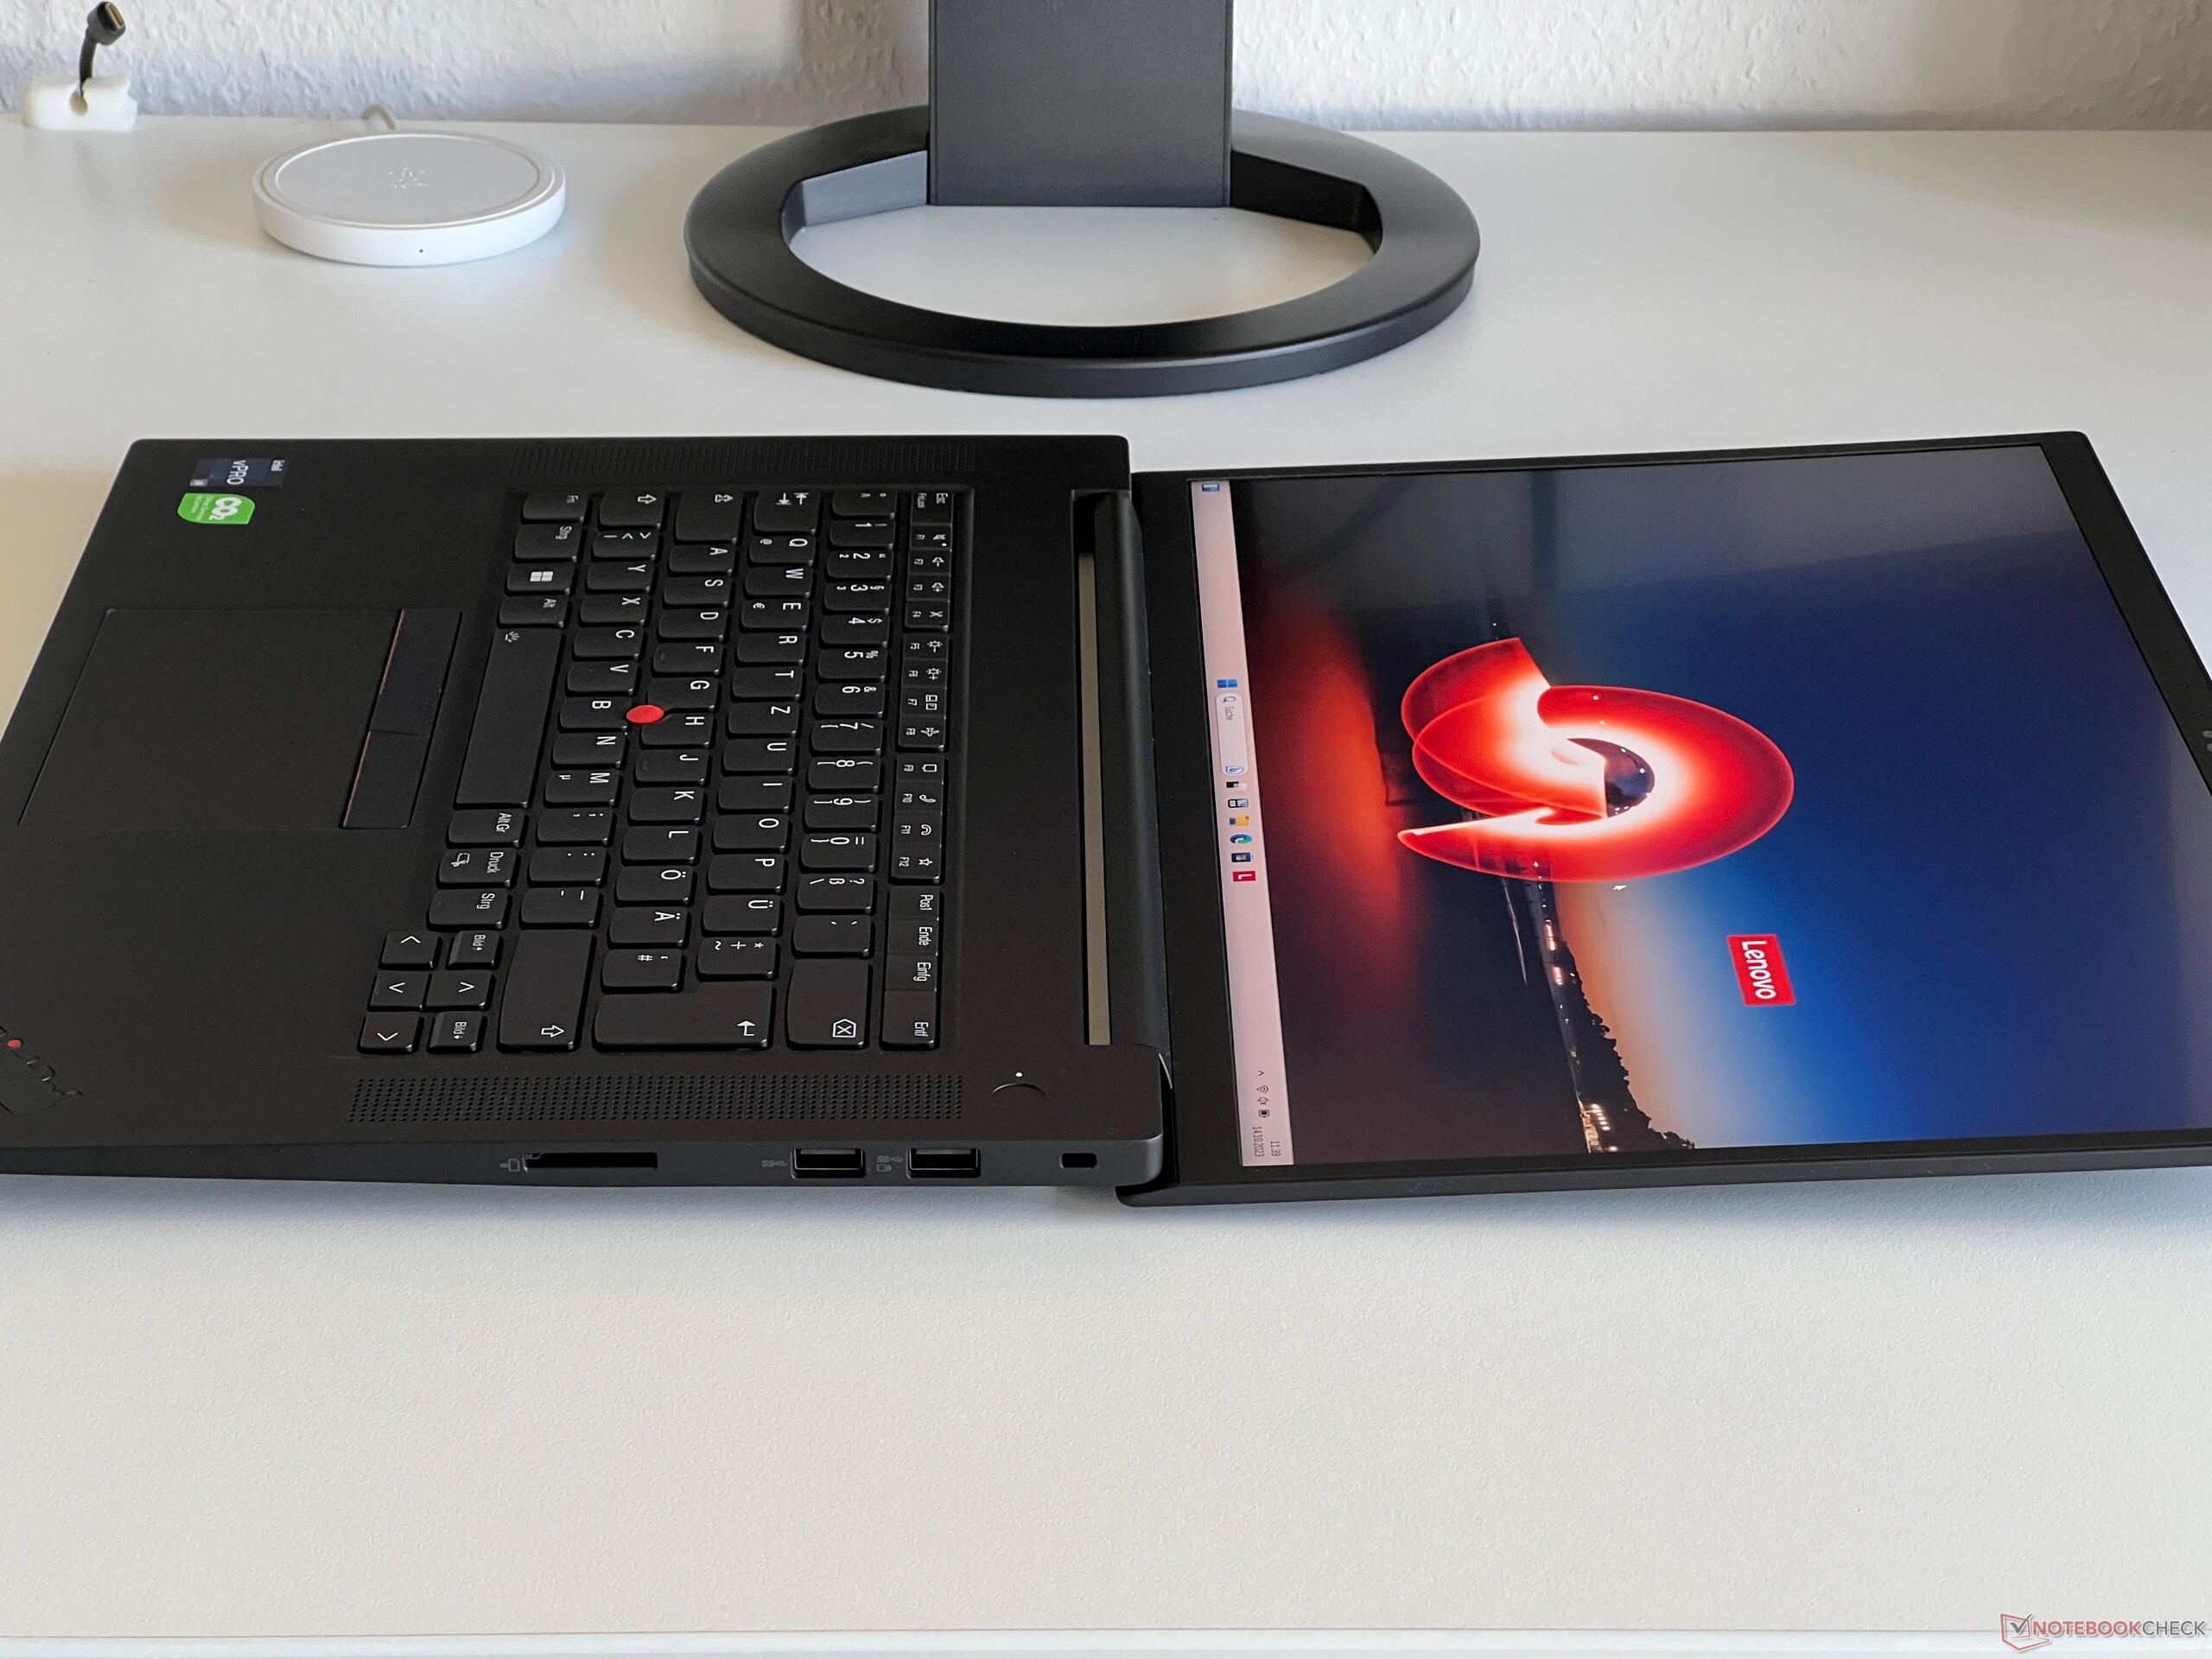
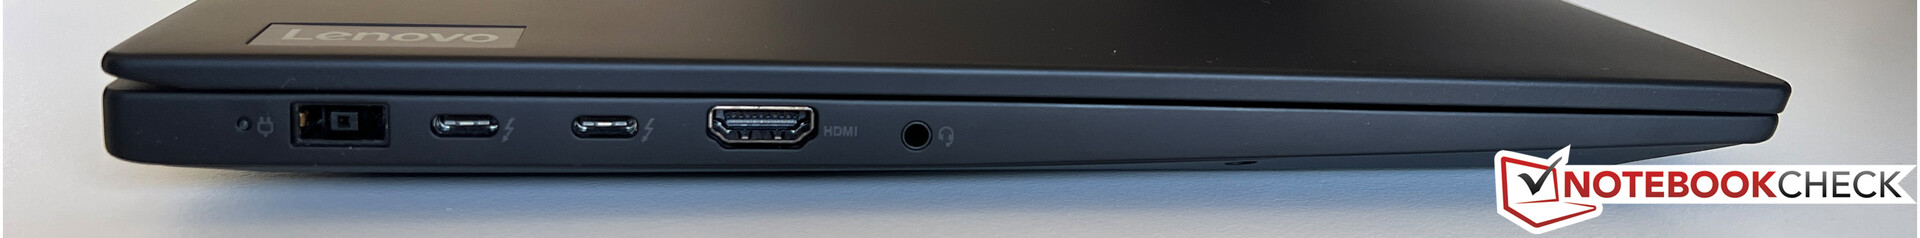
Conectividade - Thunderbolt e Wi-Fi 6E
Não houve alterações nas portas, e todos os padrões essenciais continuam disponíveis. Além disso, as duas portas USB-C com Thunderbolt 4 podem ser usadas para carregamento, fornecendo um mínimo de 90 watts de potência.
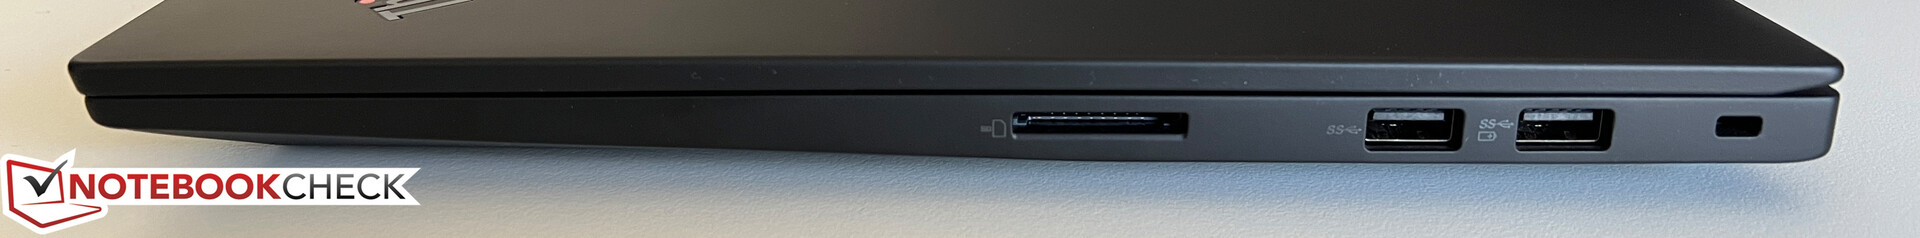
Leitor de cartão SD
O leitor de cartão correto fornece apenas taxas de transferência médias. As taxas de transferência são de aproximadamente 80 MB/s quando combinadas com nosso cartão de referência (Angelbird AV Pro V60).
| SD Card Reader | |
| average JPG Copy Test (av. of 3 runs) | |
| Dell Precision 5000 5680 (Toshiba Exceria Pro SDXC 64 GB UHS-II) | |
| Média da turma Workstation (49.6 - 681, n=14, últimos 2 anos) | |
| MSI CreatorPro Z16P B12UKST (AV Pro V60) | |
| Lenovo ThinkPad P1 G6-21FV000DGE (Angelbird AV Pro V60) | |
| Samsung Galaxy Book3 Ultra 16, i9-13900H RTX 4070 (AV Pro SD microSD 128 GB V60) | |
| HP ZBook Studio 16 G9 62U04EA (Angelbird AV PRO V60) | |
| Lenovo ThinkPad X1 Extreme G5-21DE003RGE (AV Pro V60) | |
| Schenker VISION 16 Pro (M23) (Angelbird AV Pro V60) | |
| maximum AS SSD Seq Read Test (1GB) | |
| Média da turma Workstation (87.6 - 1455, n=14, últimos 2 anos) | |
| Dell Precision 5000 5680 (Toshiba Exceria Pro SDXC 64 GB UHS-II) | |
| Samsung Galaxy Book3 Ultra 16, i9-13900H RTX 4070 (AV Pro SD microSD 128 GB V60) | |
| Lenovo ThinkPad P1 G6-21FV000DGE (Angelbird AV Pro V60) | |
| MSI CreatorPro Z16P B12UKST (AV Pro V60) | |
| Lenovo ThinkPad X1 Extreme G5-21DE003RGE (AV Pro V60) | |
| HP ZBook Studio 16 G9 62U04EA (Angelbird AV PRO V60) | |
| Schenker VISION 16 Pro (M23) (Angelbird AV Pro V60) | |
Comunicação
Não há mudanças com relação ao módulo WLAN; a placa Intel AX211 ainda é utilizada, suportando redes modernas de 6 GHz. As taxas de transferência são excelentes e, durante nossos testes, não encontramos problemas de conexão. Embora não haja porta Ethernet, ela pode ser adicionada por meio de um adaptador USB-C compatível. No interior do gabinete, há um slot M.2-2242 para um módulo WWAN; no entanto, as antenas necessárias não estão pré-instaladas, impedindo adaptações para a conectividade WWAN.
| Networking | |
| Lenovo ThinkPad P1 G6-21FV000DGE | |
| iperf3 transmit AXE11000 | |
| iperf3 receive AXE11000 | |
| Dell Precision 5000 5680 | |
| iperf3 transmit AXE11000 | |
| iperf3 receive AXE11000 | |
| iperf3 transmit AXE11000 6GHz | |
| iperf3 receive AXE11000 6GHz | |
| Samsung Galaxy Book3 Ultra 16, i9-13900H RTX 4070 | |
| iperf3 transmit AXE11000 | |
| iperf3 receive AXE11000 | |
| iperf3 transmit AXE11000 6GHz | |
| iperf3 receive AXE11000 6GHz | |
| HP ZBook Studio 16 G9 62U04EA | |
| iperf3 transmit AXE11000 6GHz | |
| iperf3 receive AXE11000 6GHz | |
| MSI CreatorPro Z16P B12UKST | |
| iperf3 transmit AXE11000 6GHz | |
| iperf3 receive AXE11000 6GHz | |
| Schenker VISION 16 Pro (M23) | |
| iperf3 transmit AXE11000 | |
| iperf3 receive AXE11000 | |
| Lenovo ThinkPad X1 Extreme G5-21DE003RGE | |
| iperf3 transmit AXE11000 6GHz | |
| iperf3 receive AXE11000 6GHz | |
Webcam
A câmera de 1080p tira fotos decentes em boas condições de iluminação e há um obturador mecânico. Além disso, há uma câmera IR disponível para reconhecimento facial via Windows Hello.


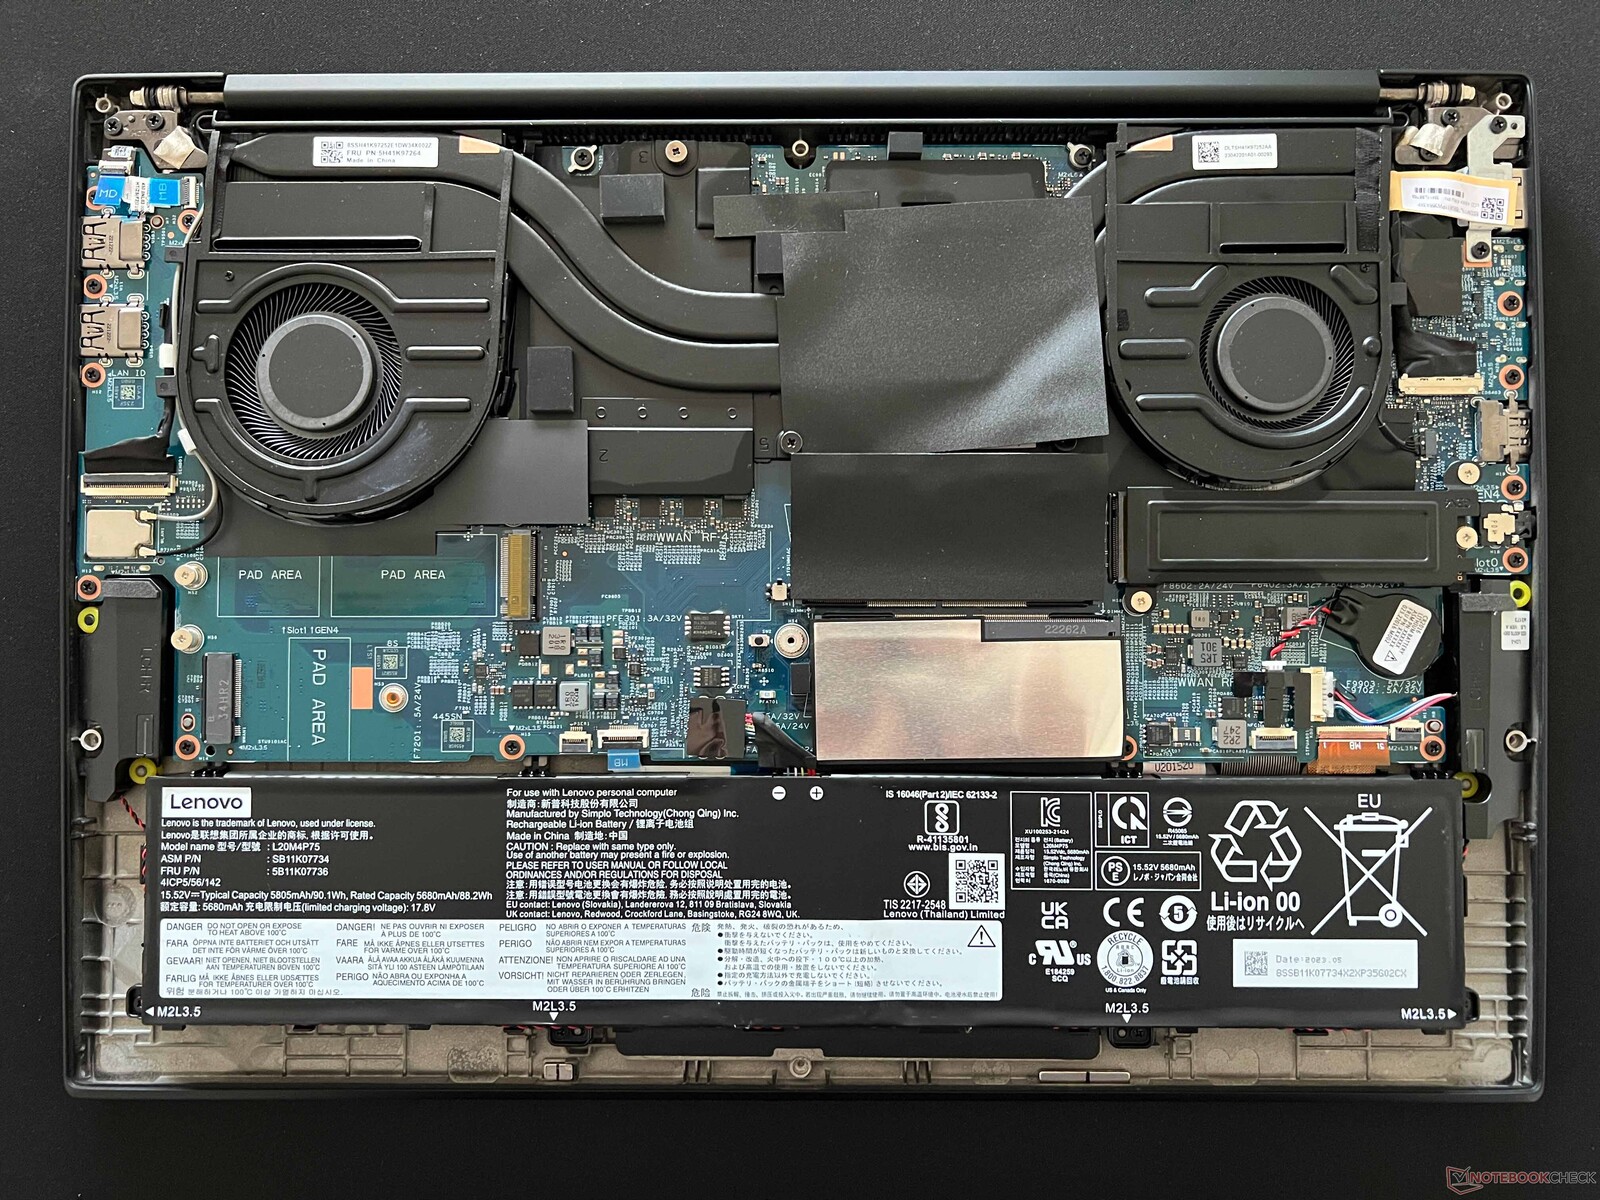
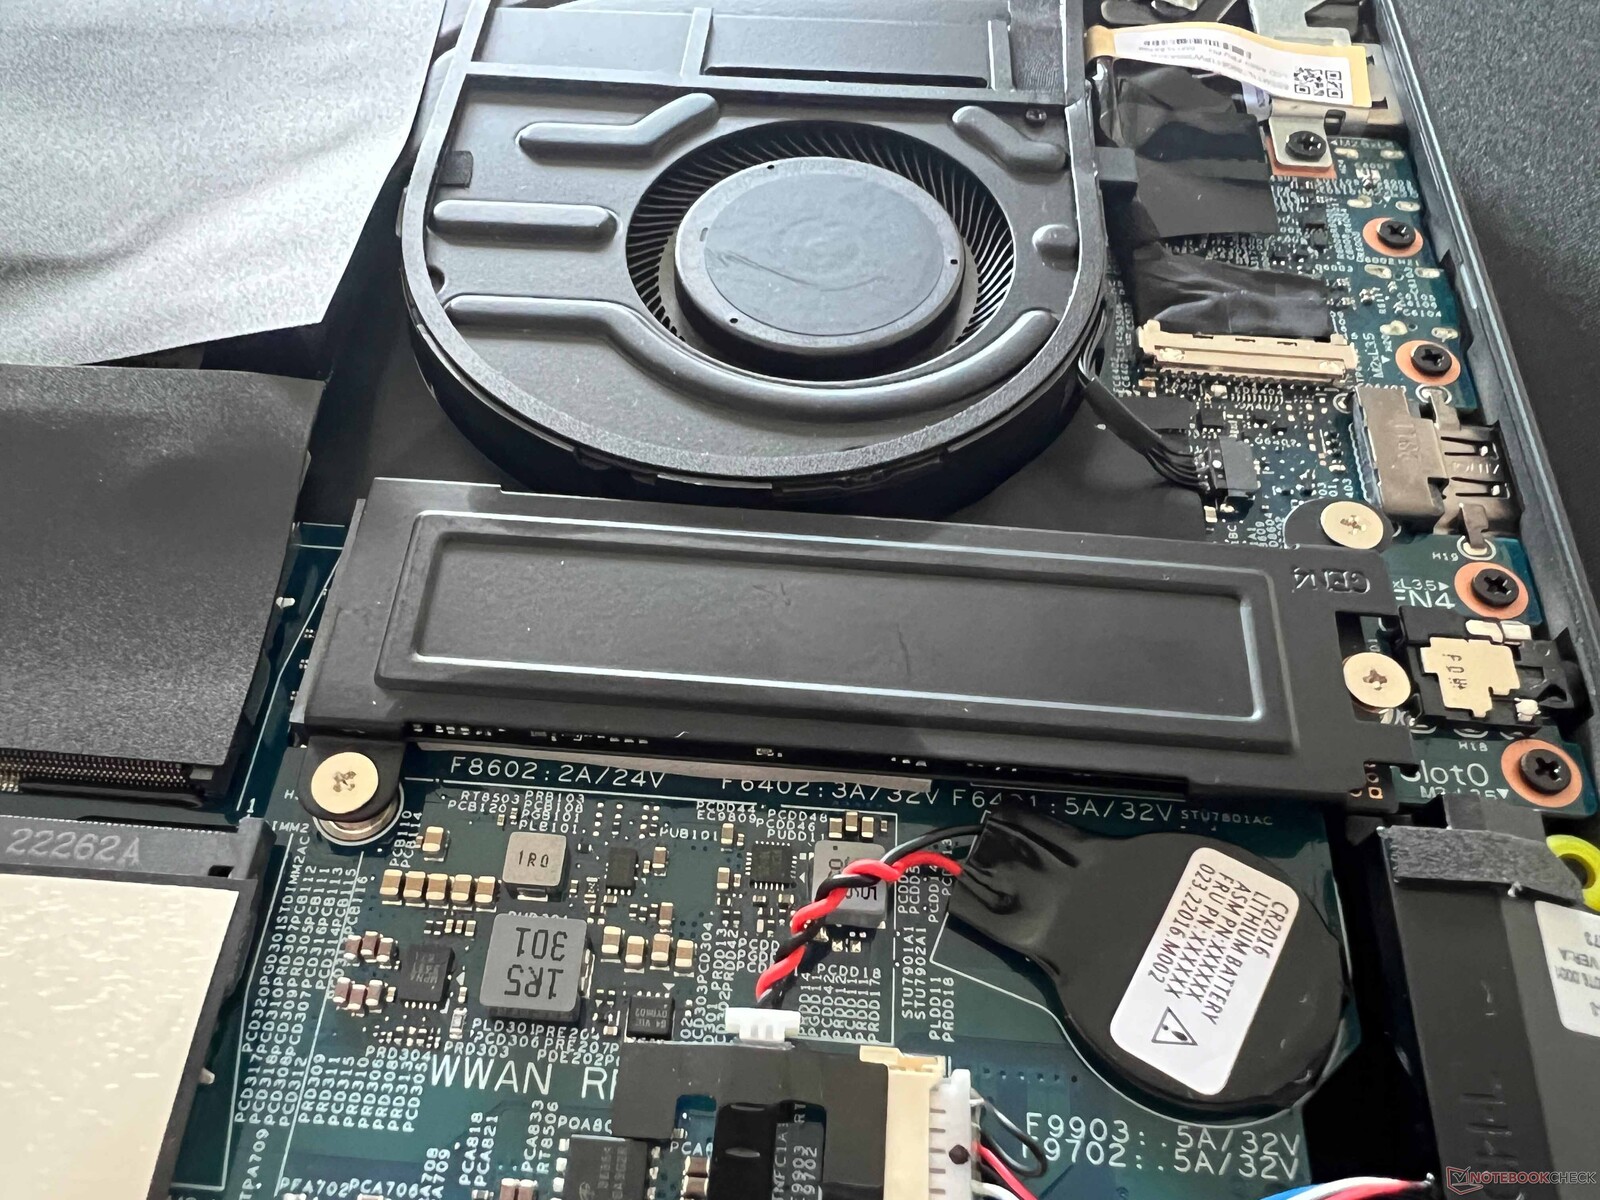
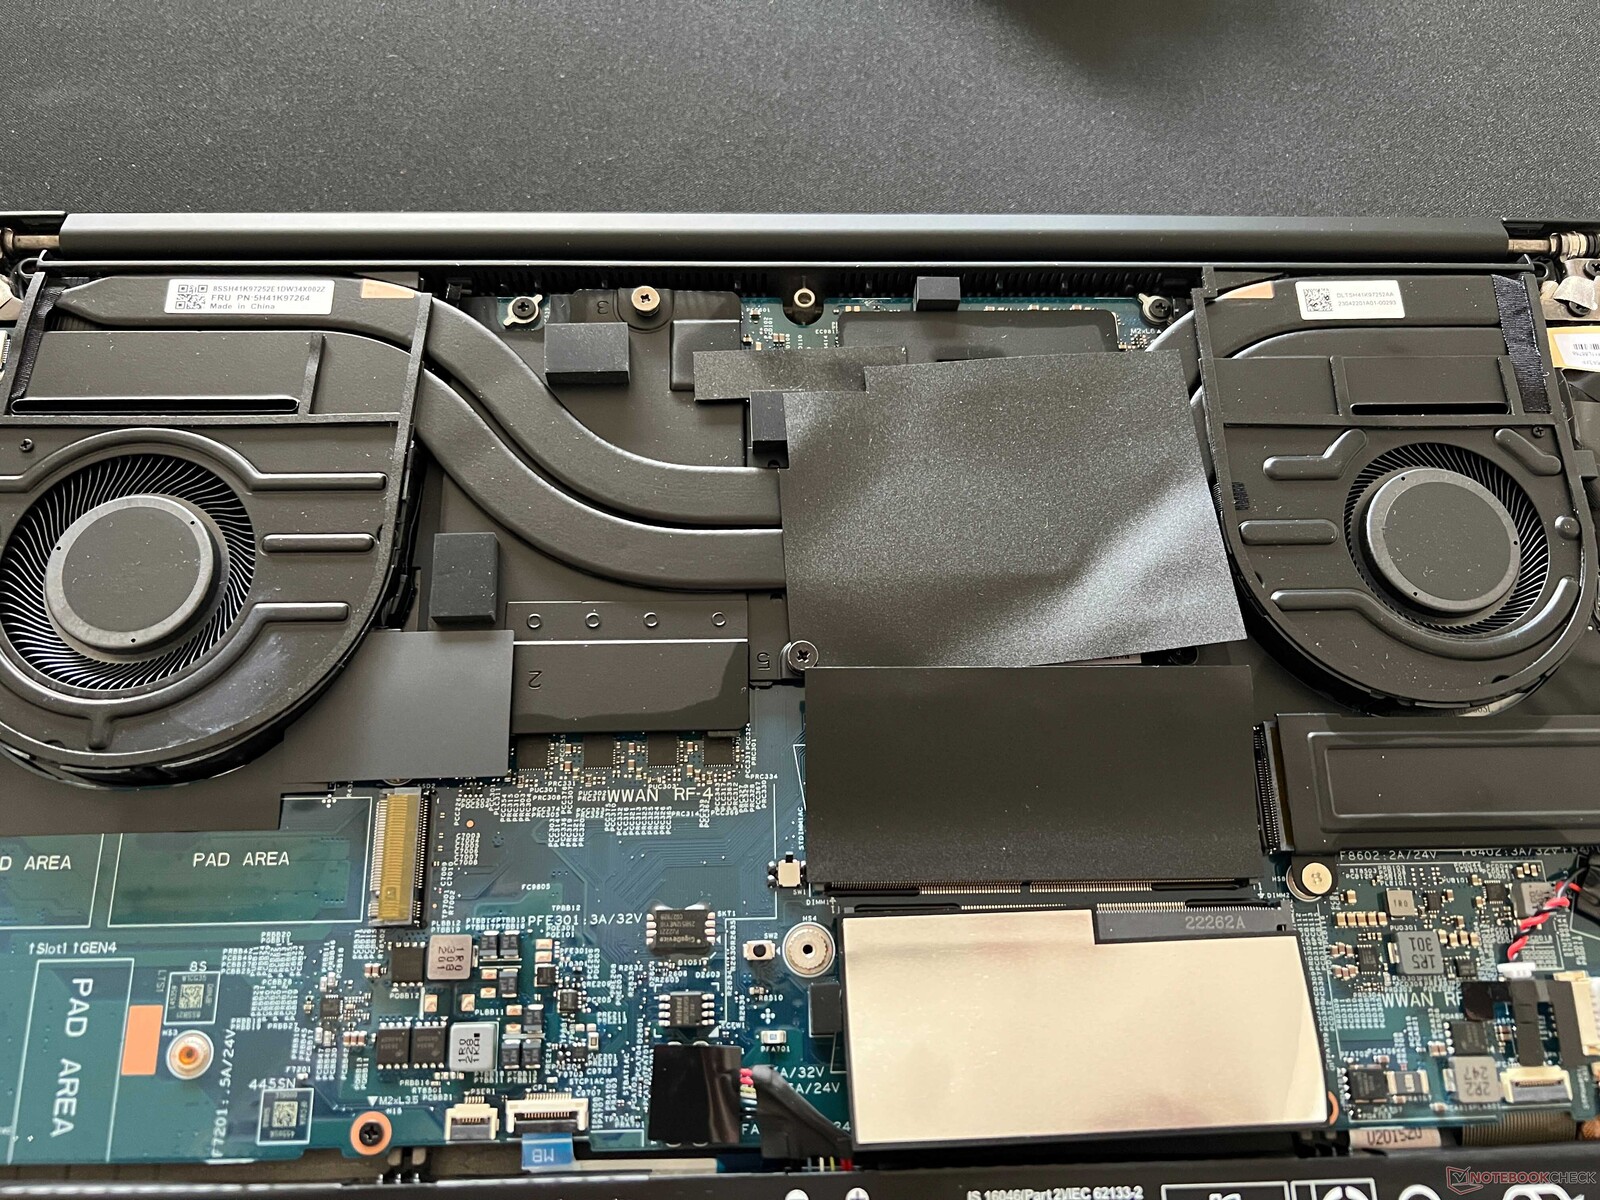
Manutenção
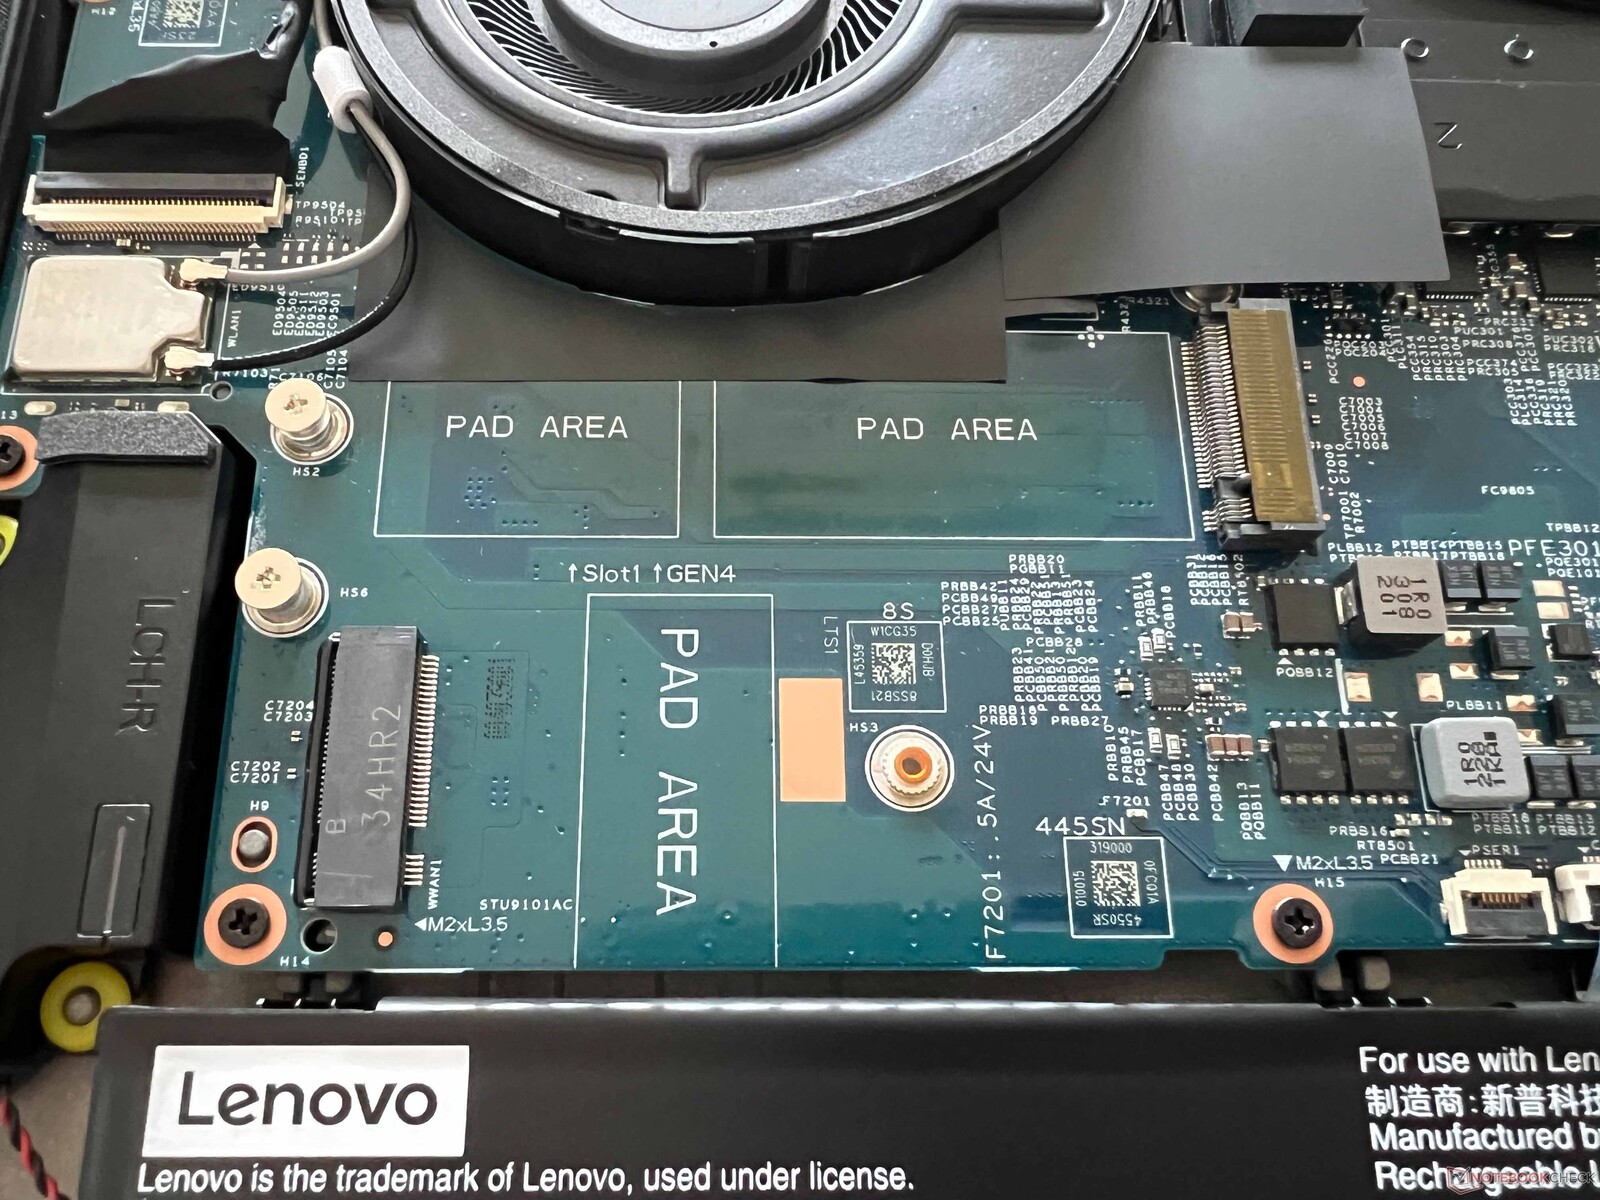
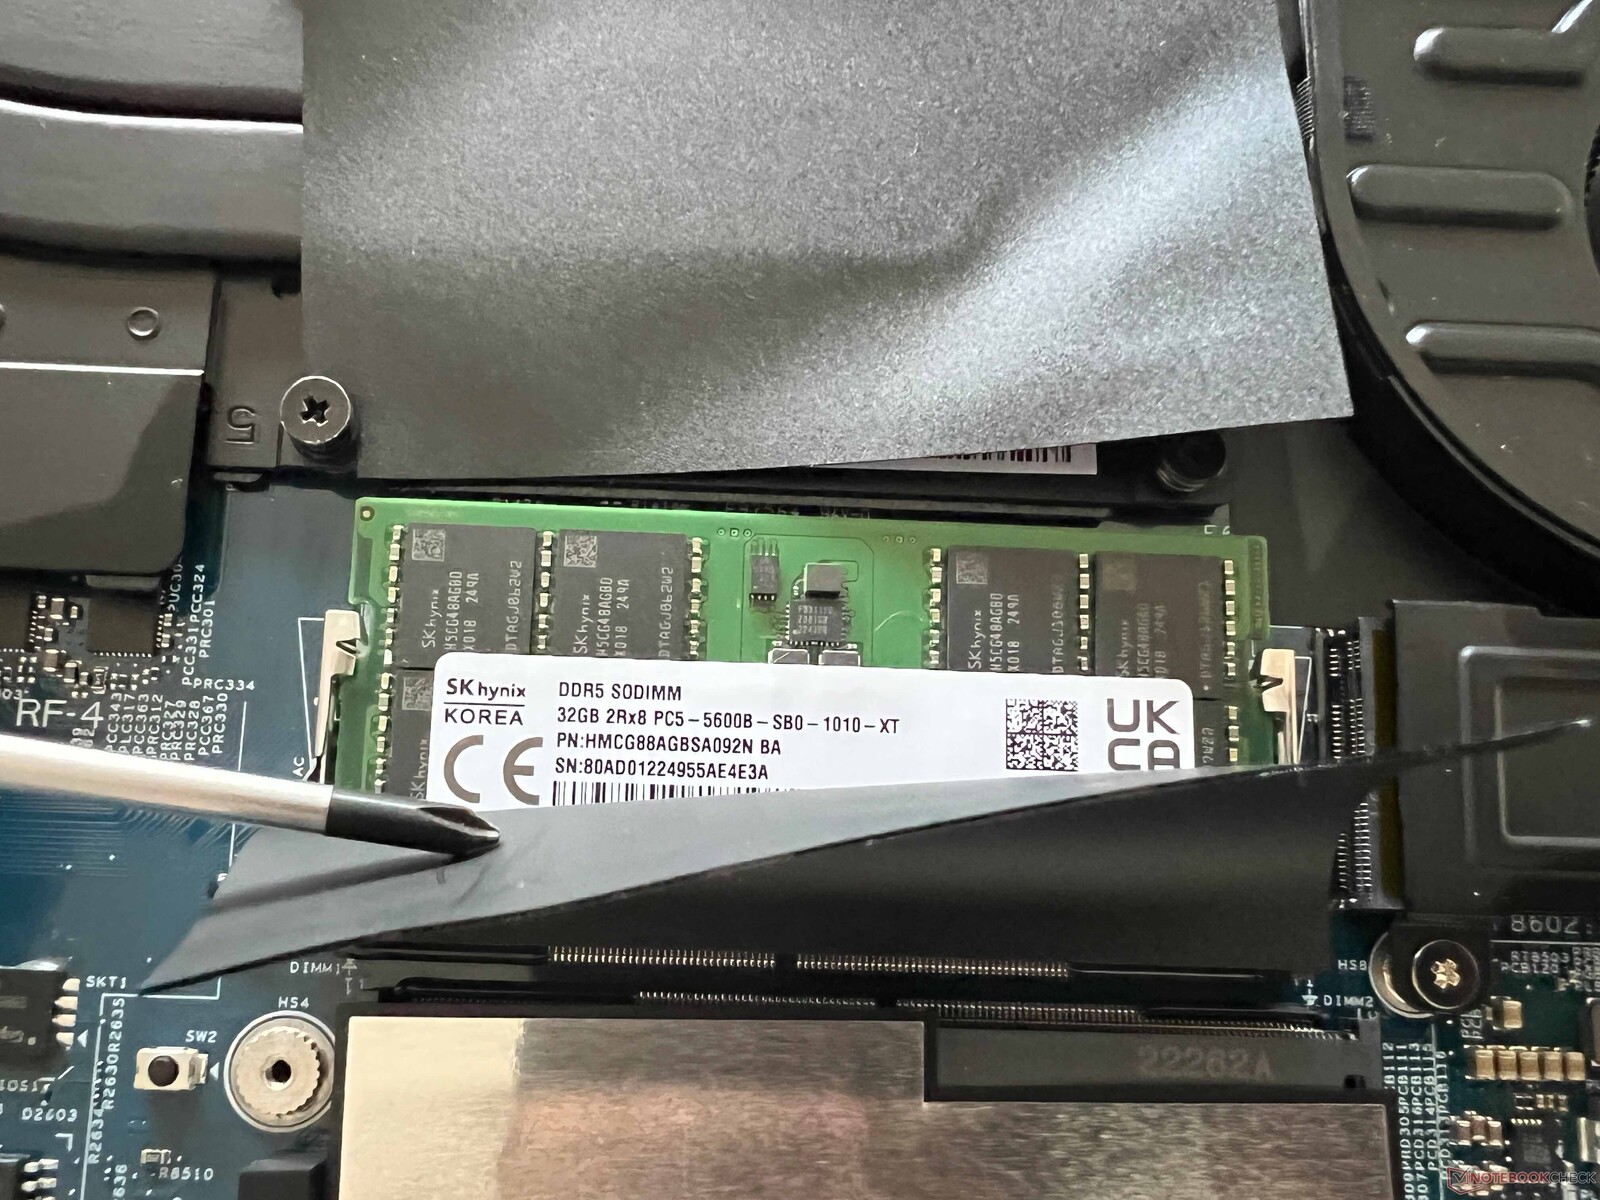
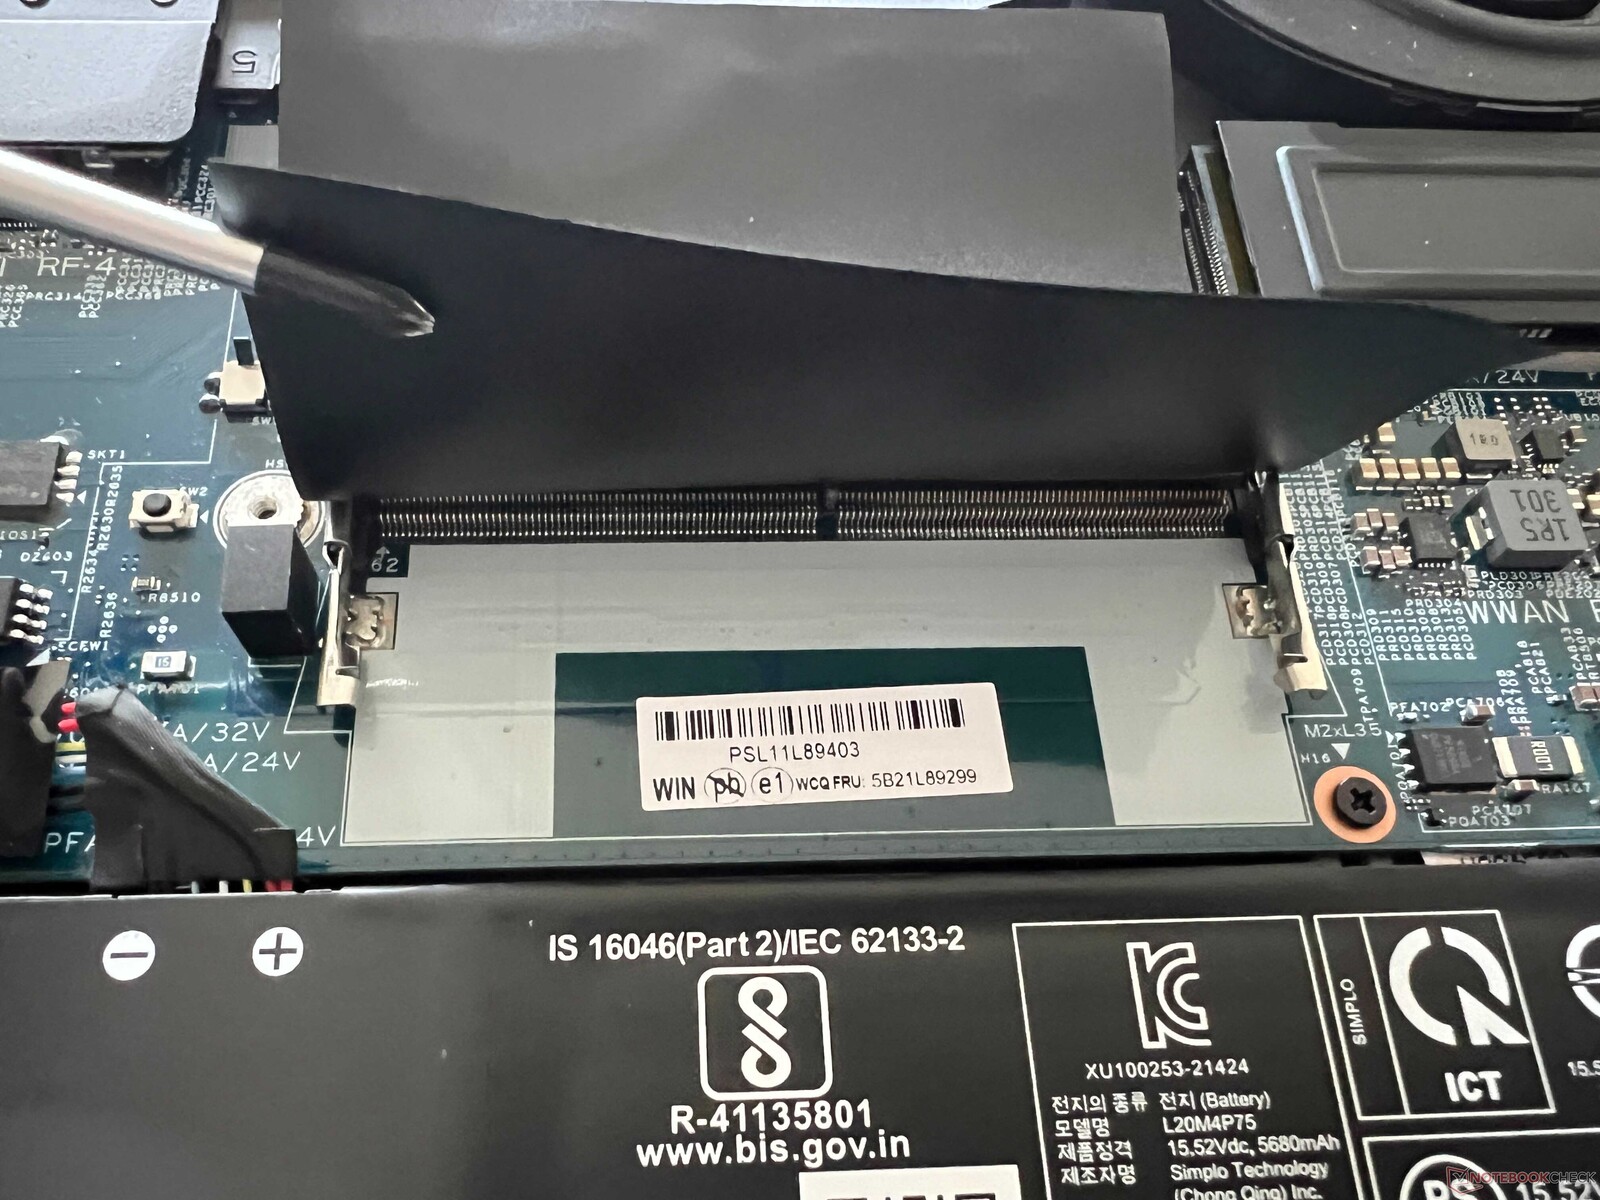
A tampa inferior da caixa pode ser facilmente removida. Nosso dispositivo de teste apresenta resfriamento convencional com aletas de resfriamento, permitindo dois slots para SSDs M.2-2280. Além disso, há dois slots SODIMM para módulos de RAM, mas o módulo WLAN não pode ser trocado.
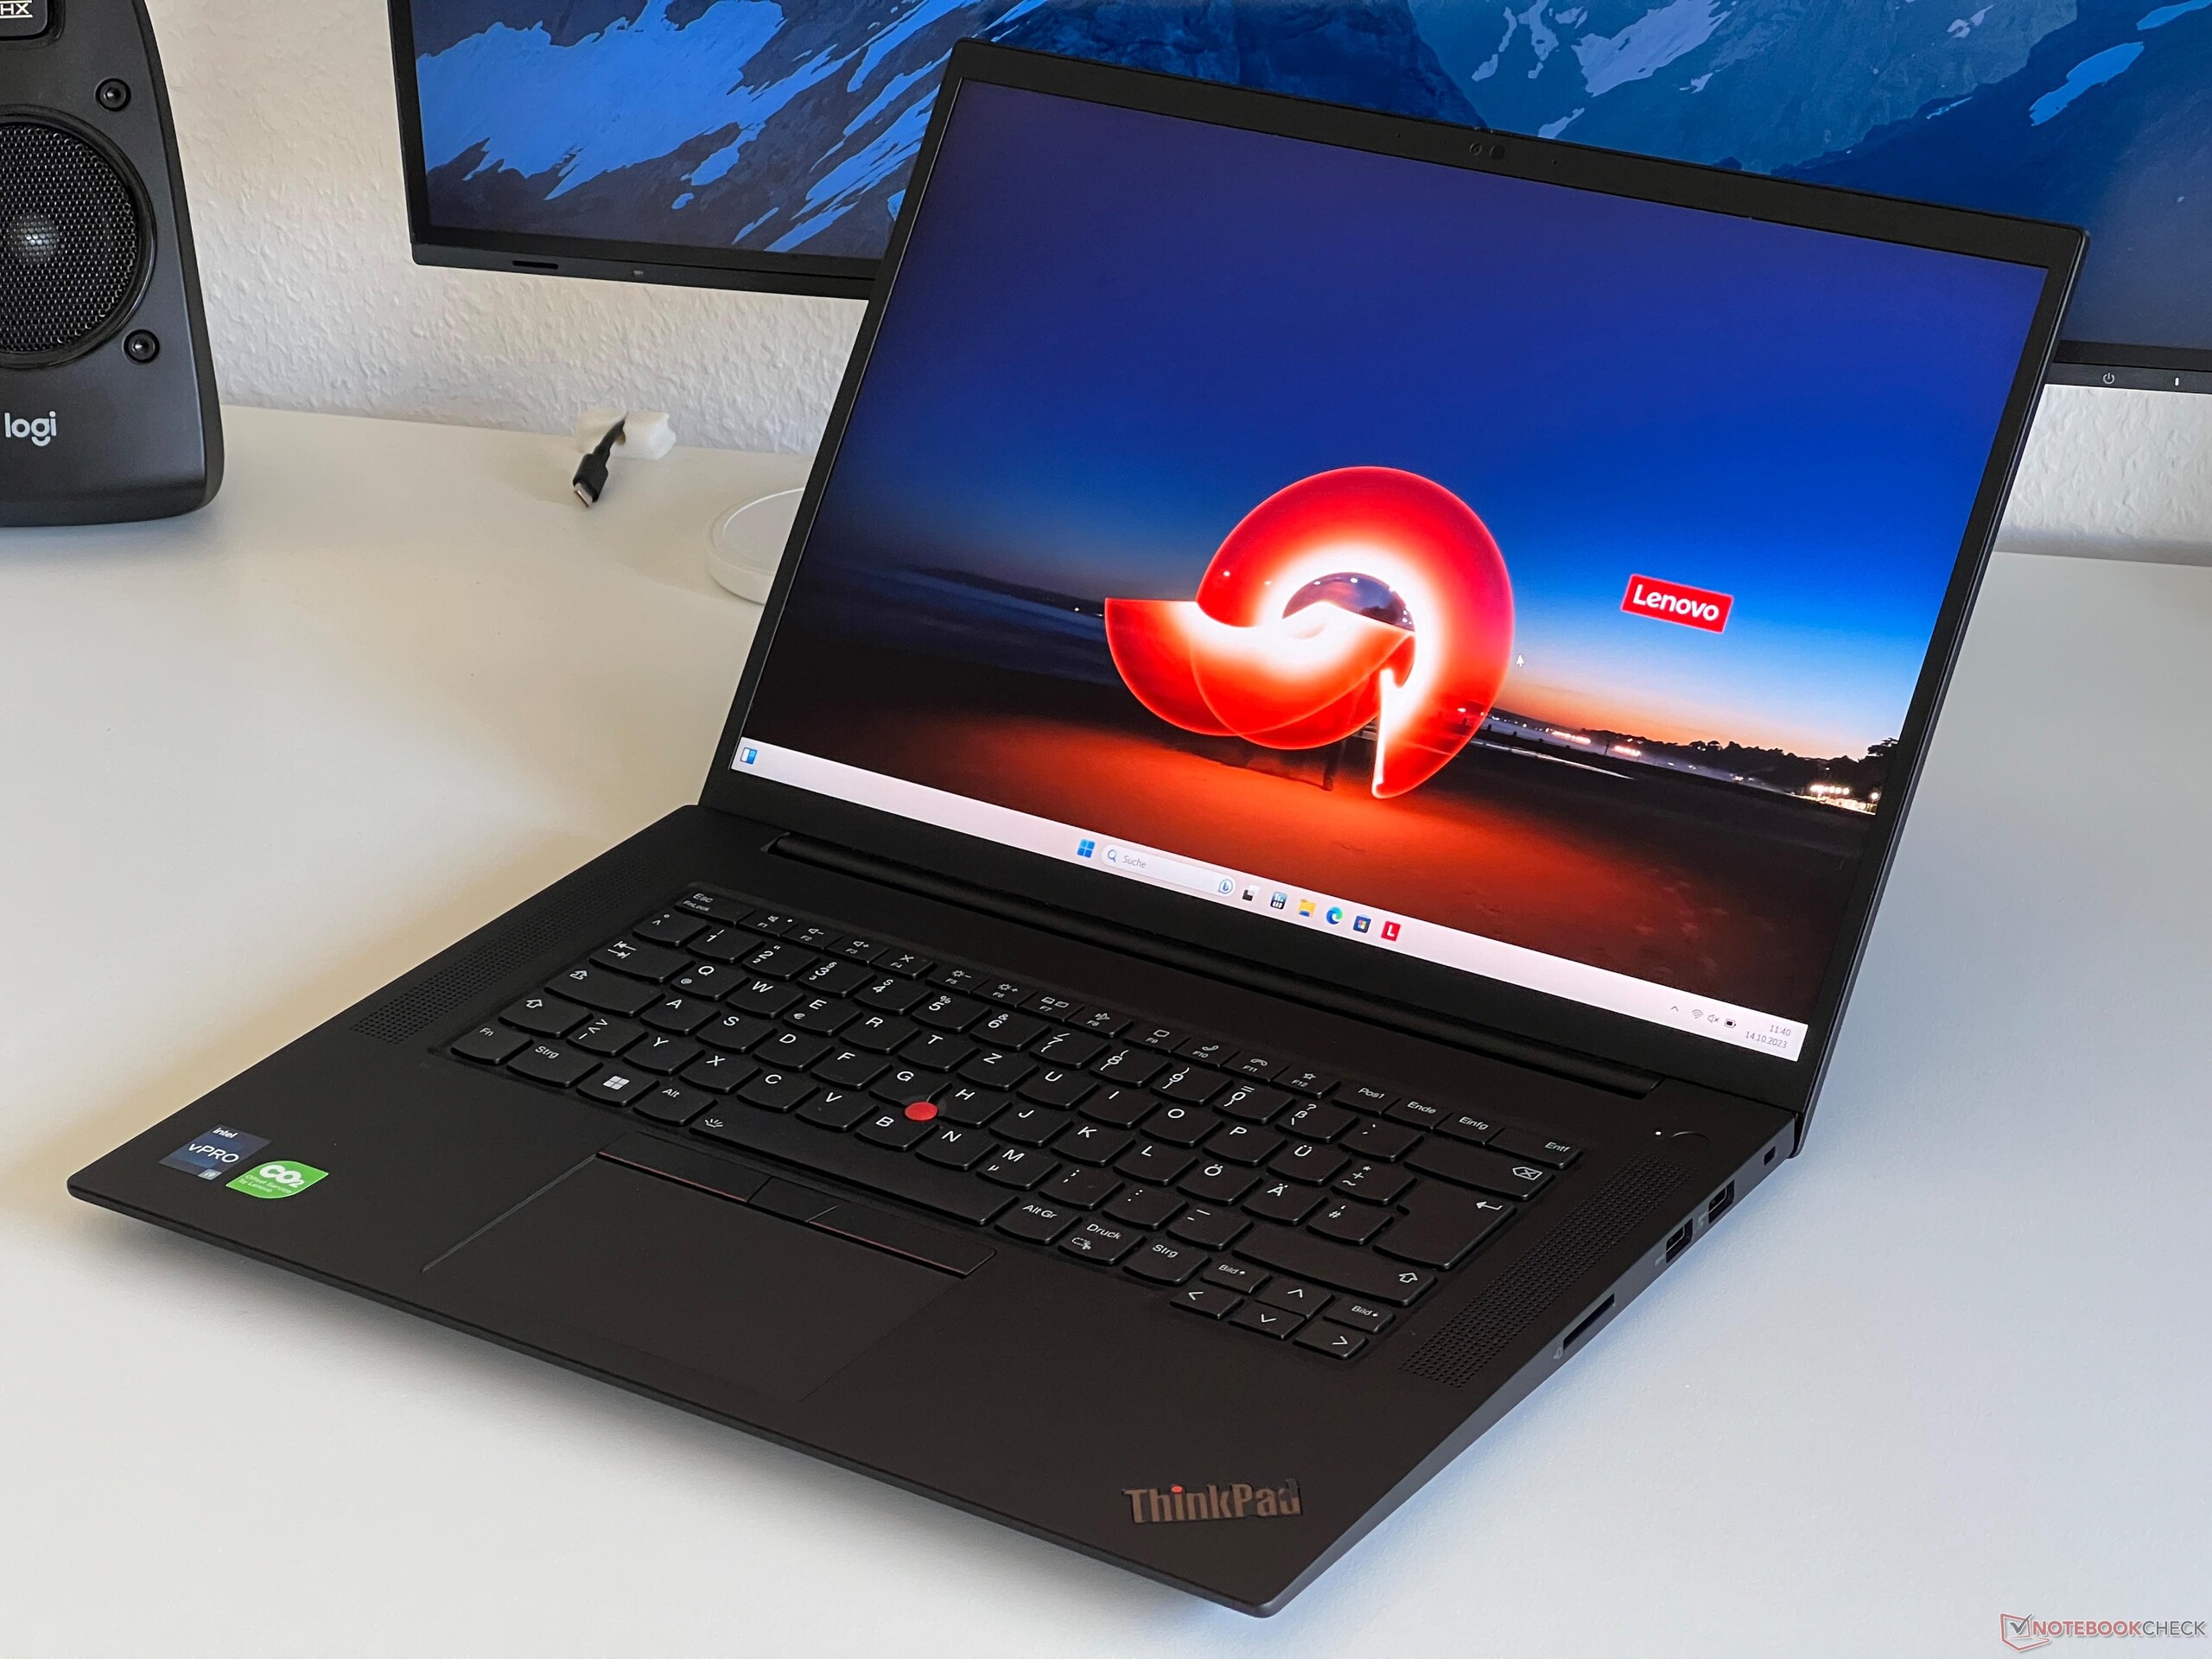
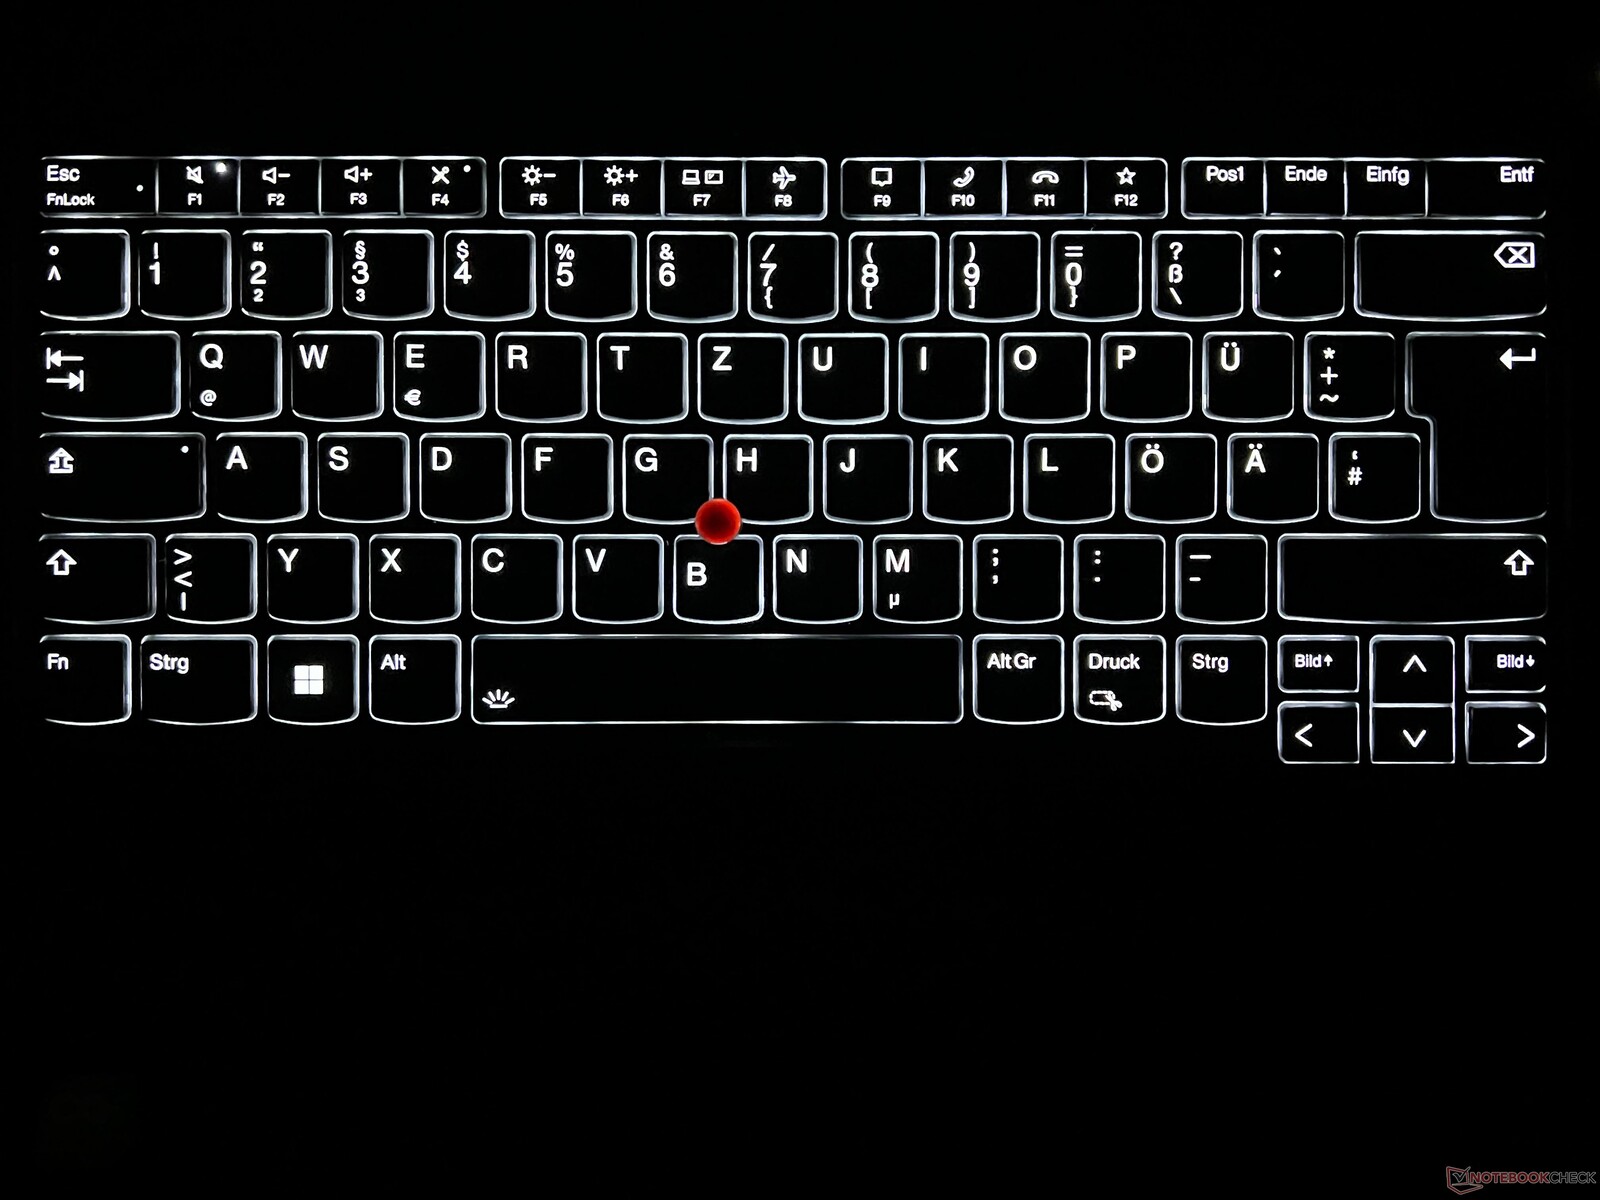
Dispositivos de entrada - curso de 1,5 mm
A Lenovo tem usado um teclado com curso de 0,06 polegadas para o ThinkPad P1 nos últimos dois anos, sem alterações no modelo atual. Embora o teclado ofereça uma experiência de digitação confortável, permitindo textos extensos sem problemas, ele já não corresponde à qualidade dos modelos anteriores. A luz de fundo branca de dois estágios é benéfica em condições de pouca luz, embora não tenha ativação automática por meio de um sensor.
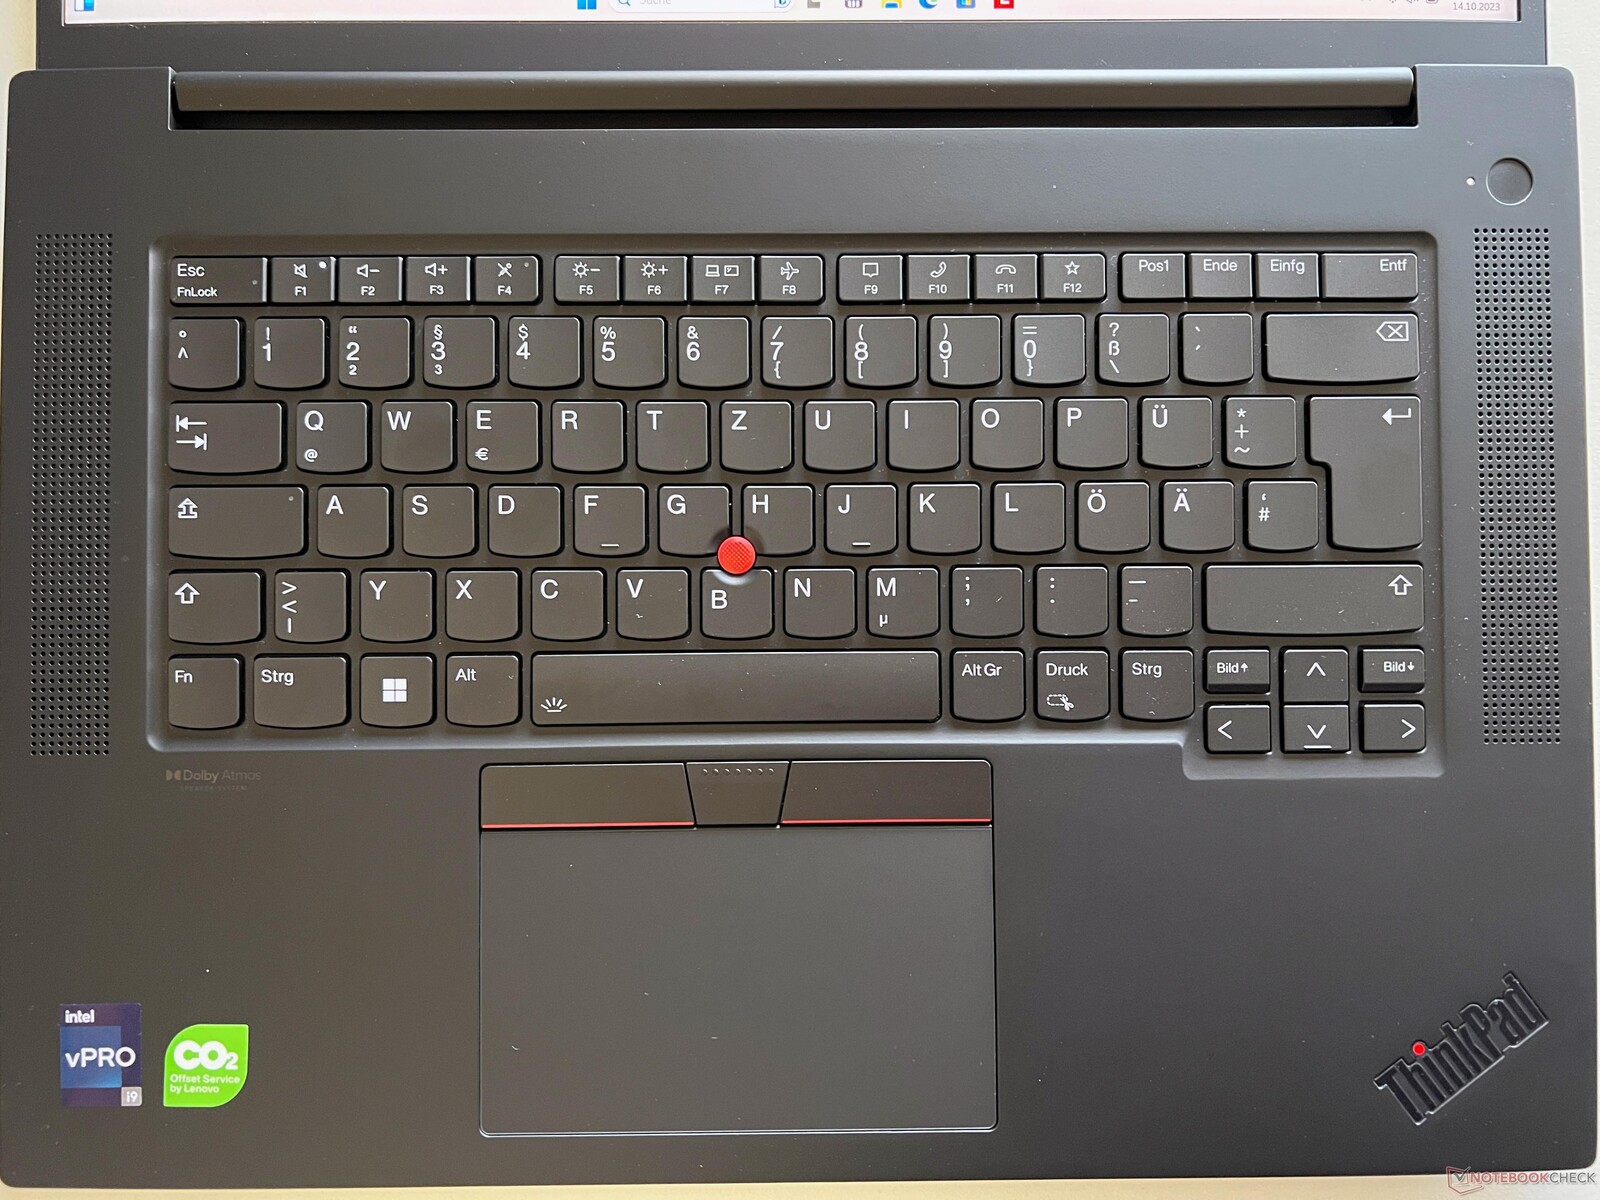
O ClickPad oferece excelentes propriedades de deslizamento e um mecanismo de alta qualidade, proporcionando ruídos de clique silenciosos e suaves. Além disso, para o controle do mouse, o TrackPoint e os botões dedicados estão disponíveis. As teclas planas oferecem uma experiência de digitação boa e silenciosa, funcionando sem problemas, embora as teclas do nosso dispositivo de teste pareçam um pouco barulhentas.
Tela - Painel IPS fosco com 165 Hz e 500 cd/m²
A Lenovo introduziu a tela opcional de 165 Hz com resolução WQHD na geração G5 do ano passado, mas só agora podemos testá-la. A configuração padrão inclui um painel Full HD fosco com 300 cd/m² de brilho. Além disso, há uma opção para uma tela OLED 4K com cobertura P3 total. Vale a pena observar que o modelo IPS 4K com cobertura AdobeRGB, que testamos no ThinkPad X1 Extremedo ano passado, não está disponível nesta versão.
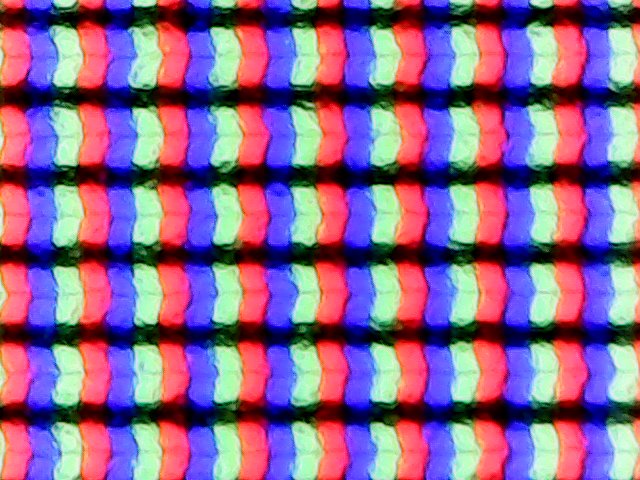
A tela IPS opcional em nossa unidade de análise se destaca por sua excelente qualidade de imagem subjetiva. As cores parecem vibrantes e os movimentos são incrivelmente suaves devido à alta taxa de atualização, tornando todo o conteúdo excepcionalmente nítido. Mesmo em áreas claras, não há granulação e a tela não apresenta nenhum problema de oscilação de PWM. Além disso, os tempos de resposta são impressionantemente rápidos e não há efeitos fantasmas perceptíveis. Em altos níveis de brilho, halos leves são visíveis em um fundo escuro, mas isso não é um problema significativo no uso prático.
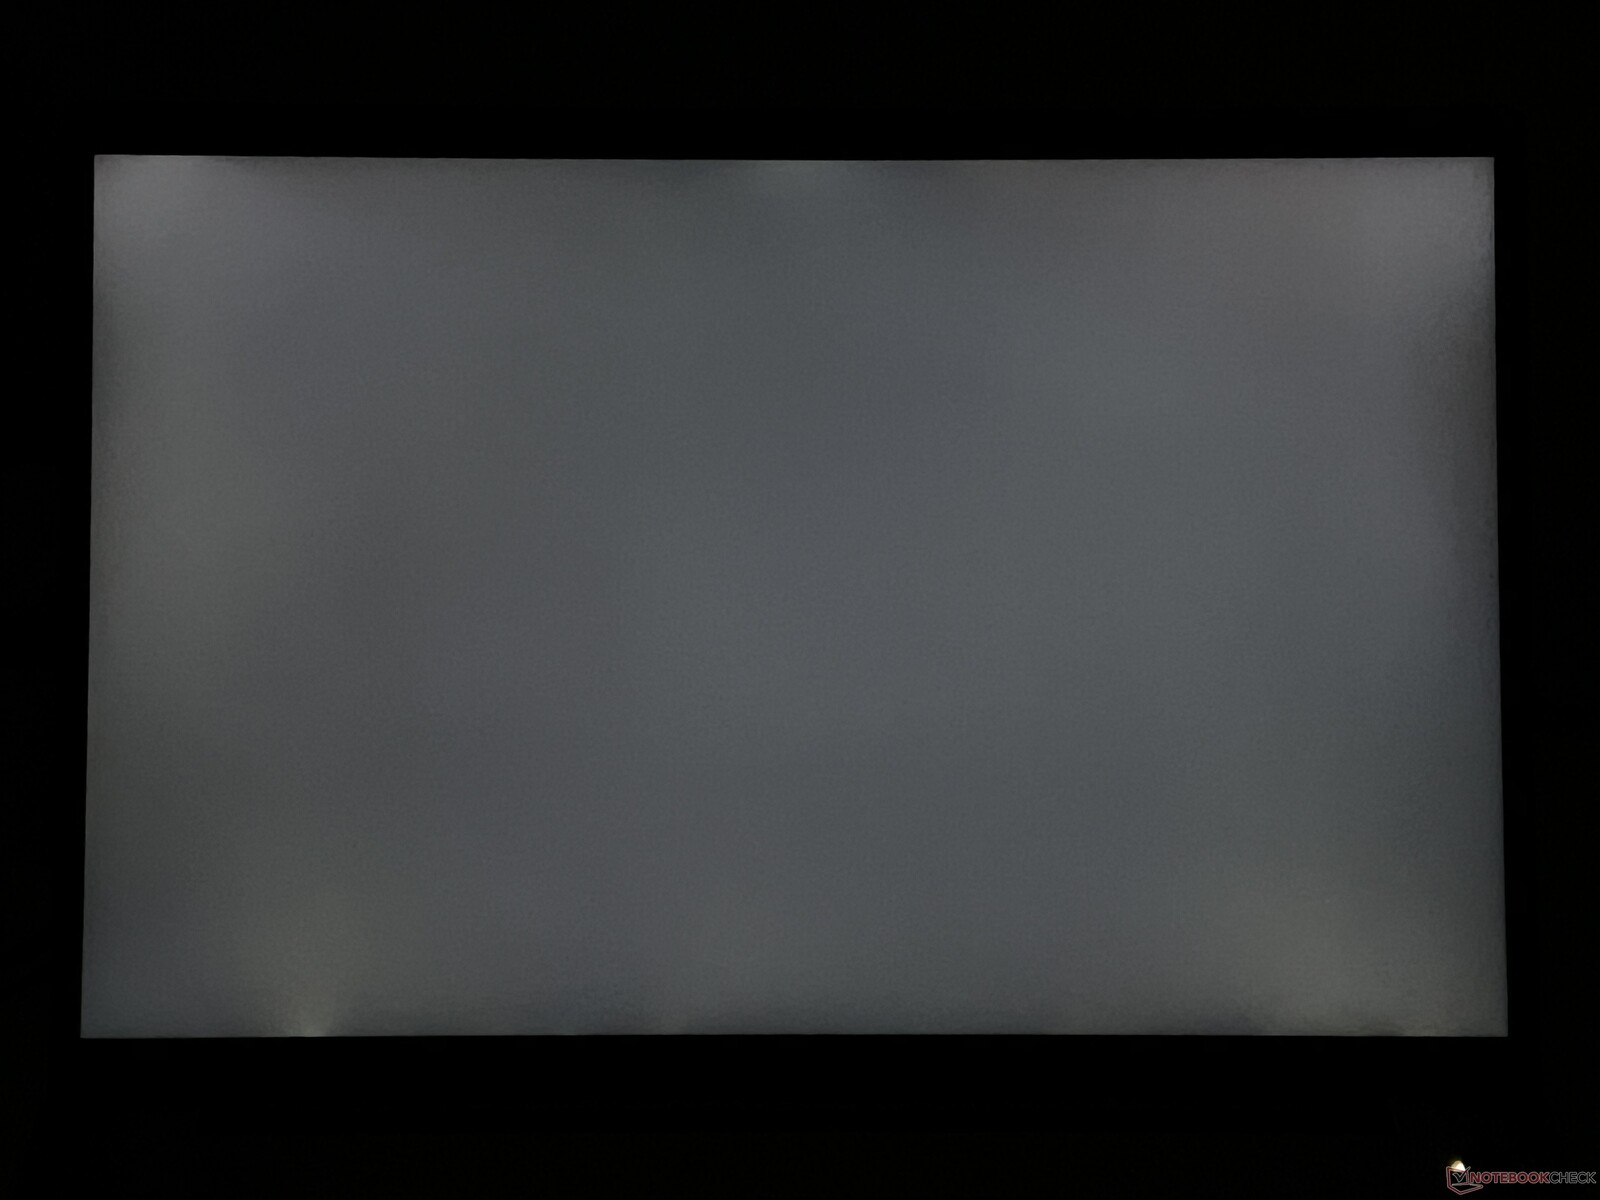
A Lenovo reivindica um brilho de 500 cd/m², um número que podemos confirmar, pelo menos no centro da tela. O brilho médio de nossa amostra de análise mede um pouco menos de 485 cd/m², representando uma melhoria substancial em relação ao painel padrão. O valor de preto (0,36 cd/m²) é um pouco afetado pelo alto brilho. No entanto, a taxa de contraste máxima ainda excede 1400:1.
| |||||||||||||||||||||||||
iluminação: 89 %
iluminação com acumulador: 520 cd/m²
Contraste: 1447:1 (Preto: 0.36 cd/m²)
ΔE ColorChecker Calman: 1.2 | ∀{0.5-29.43 Ø4.71}
calibrated: 1
ΔE Greyscale Calman: 1.4 | ∀{0.09-98 Ø4.96}
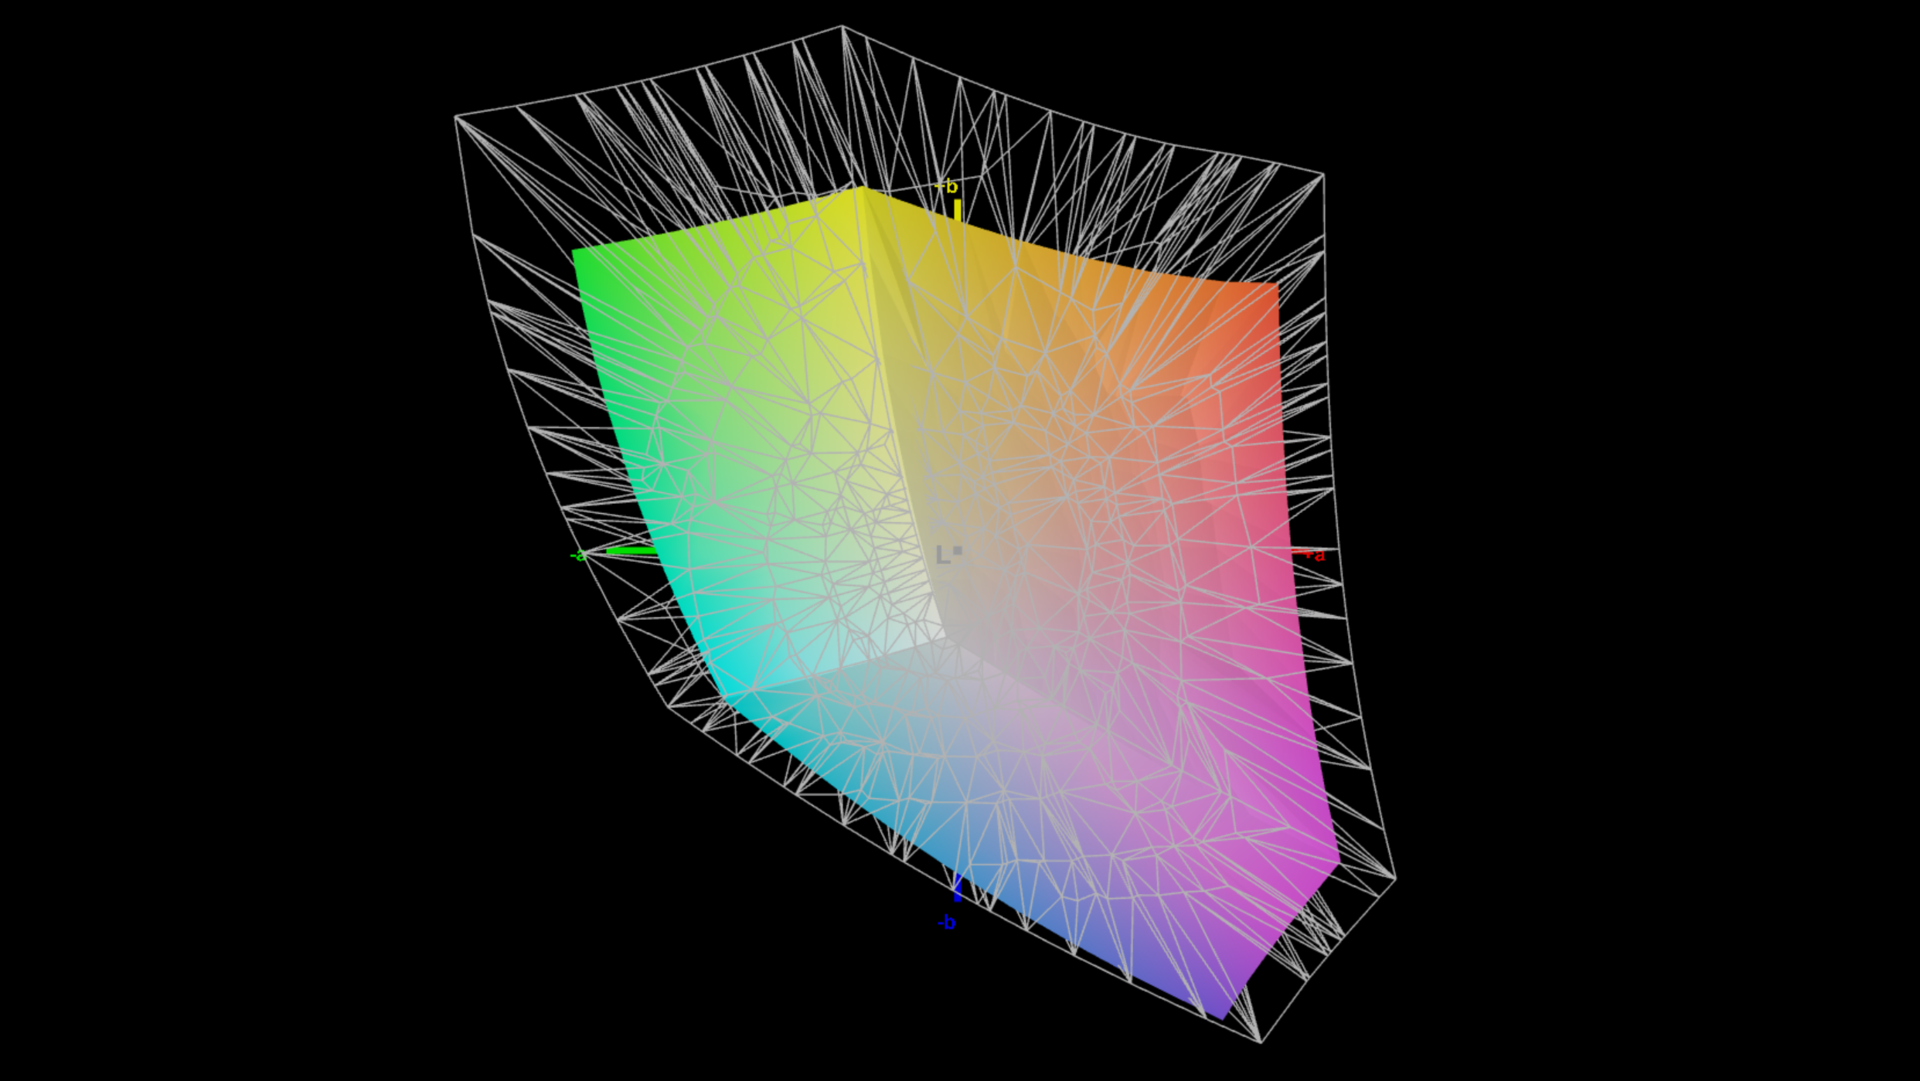
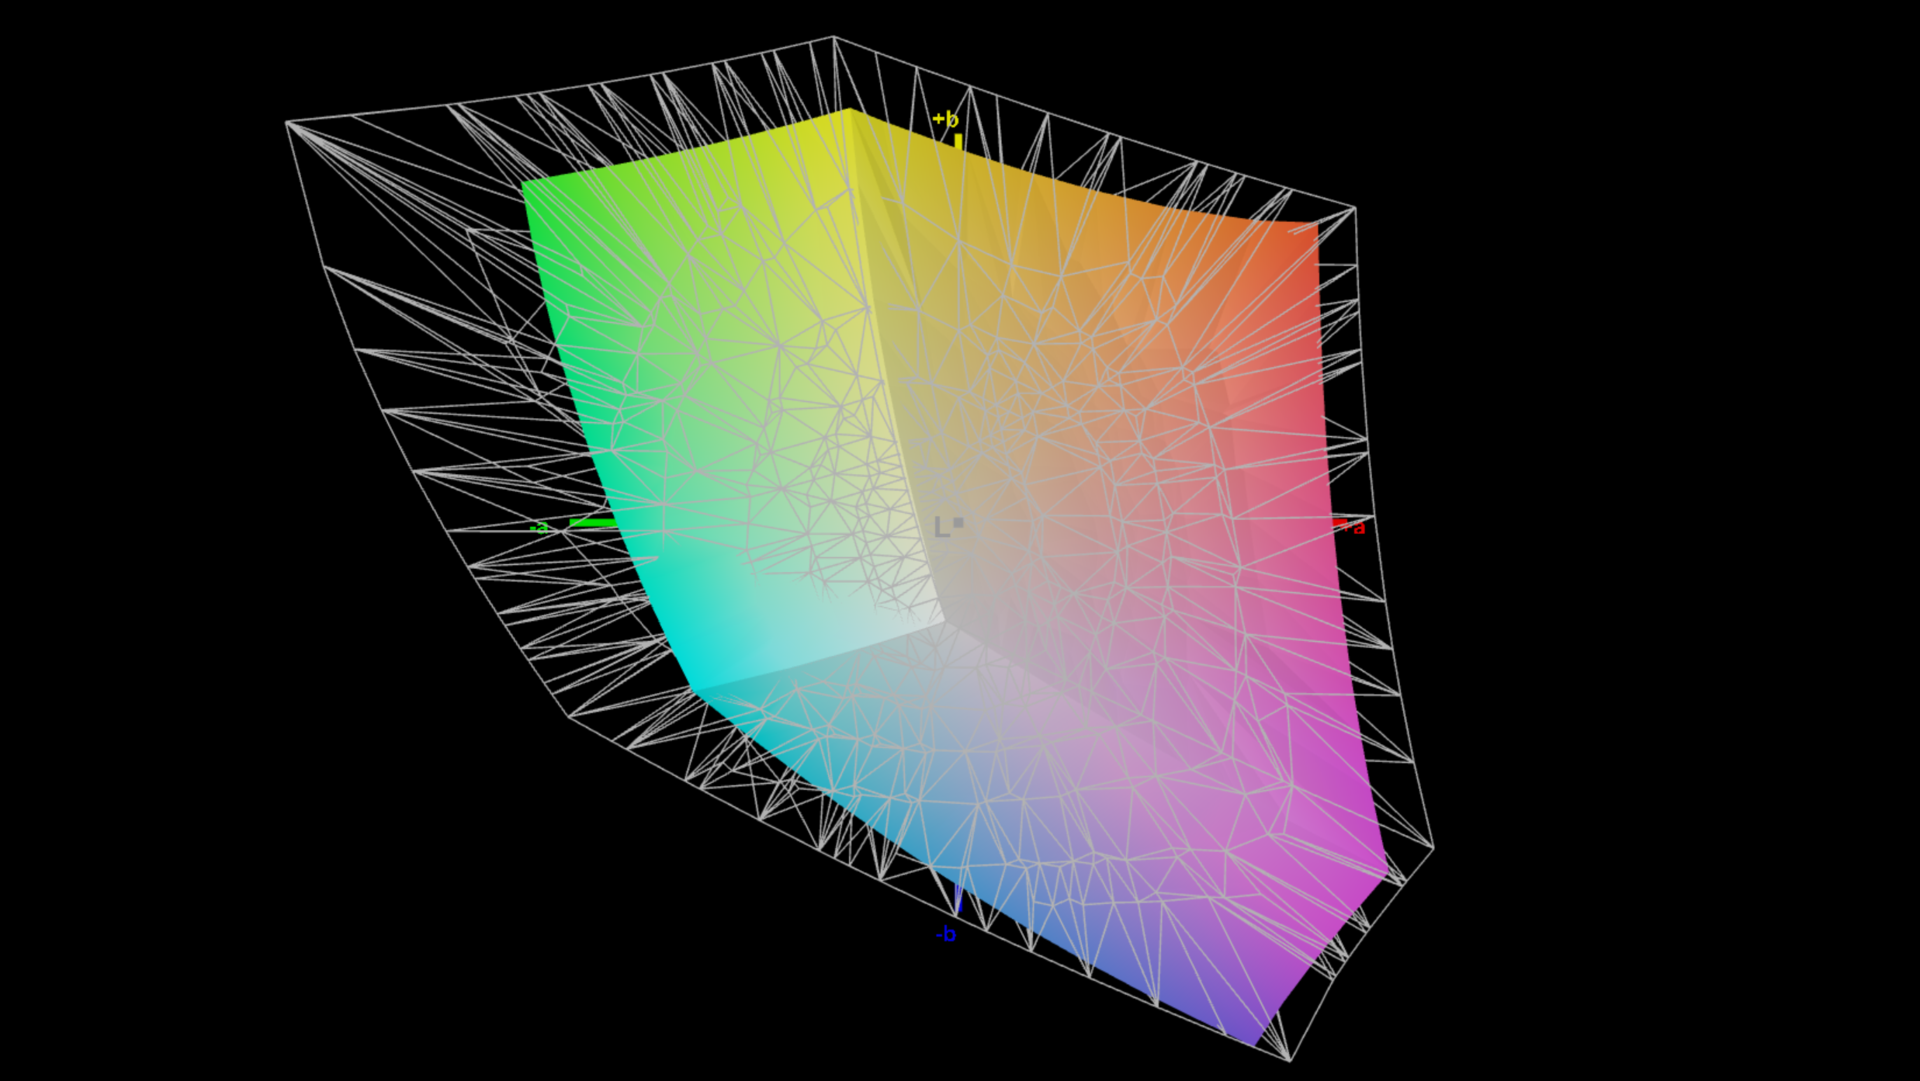
70.2% AdobeRGB 1998 (Argyll 3D)
97.5% sRGB (Argyll 3D)
68.1% Display P3 (Argyll 3D)
Gamma: 2.25
CCT: 6682 K
| Lenovo ThinkPad P1 G6-21FV000DGE NE160QDM-NY1, IPS, 2560x1600, 16" | Dell Precision 5000 5680 Samsung 160YV03, OLED, 3840x2400, 16" | Samsung Galaxy Book3 Ultra 16, i9-13900H RTX 4070 Samsung SDC4185 ATNA60CL03-0, OLED / AMOLED, 2880x1800, 16" | HP ZBook Studio 16 G9 62U04EA BOE0A52, IPS, 3840x2400, 16" | MSI CreatorPro Z16P B12UKST B160QAN02.N, IPS, 2560x1600, 16" | Schenker VISION 16 Pro (M23) NE160QDM-NZ1, IPS, 2560x1600, 16" | Lenovo ThinkPad X1 Extreme G5-21DE003RGE LP160UQ1-SPB1, IPS, 3840x2400, 16" | |
|---|---|---|---|---|---|---|---|
| Display | 30% | 27% | 23% | 23% | 1% | 22% | |
| Display P3 Coverage (%) | 68.1 | 99.9 47% | 95.3 40% | 97.5 43% | 97.6 43% | 68.8 1% | 84.6 24% |
| sRGB Coverage (%) | 97.5 | 100 3% | 99.1 2% | 99.9 2% | 99.9 2% | 98.8 1% | 99.2 2% |
| AdobeRGB 1998 Coverage (%) | 70.2 | 97.5 39% | 97.4 39% | 86.3 23% | 87.4 25% | 70 0% | 97.7 39% |
| Response Times | 85% | 82% | 12% | 15% | 8% | -168% | |
| Response Time Grey 50% / Grey 80% * (ms) | 13.7 ? | 1.68 ? 88% | 2 ? 85% | 15.3 ? -12% | 12.8 ? 7% | 13.7 ? -0% | 46 ? -236% |
| Response Time Black / White * (ms) | 9.6 ? | 1.77 ? 82% | 2 ? 79% | 6.1 ? 36% | 7.4 ? 23% | 8.1 ? 16% | 19.2 ? -100% |
| PWM Frequency (Hz) | 60 ? | 250 ? | |||||
| Screen | -79% | -51% | 0% | -10% | -74% | -29% | |
| Brightness middle (cd/m²) | 521 | 345.7 -34% | 403 -23% | 554 6% | 407 -22% | 384 -26% | 476 -9% |
| Brightness (cd/m²) | 484 | 349 -28% | 408 -16% | 516 7% | 388 -20% | 371 -23% | 470 -3% |
| Brightness Distribution (%) | 89 | 98 10% | 98 10% | 84 -6% | 88 -1% | 88 -1% | 90 1% |
| Black Level * (cd/m²) | 0.36 | 0.47 -31% | 0.36 -0% | 0.3 17% | 0.35 3% | ||
| Contrast (:1) | 1447 | 1179 -19% | 1131 -22% | 1280 -12% | 1360 -6% | ||
| Colorchecker dE 2000 * | 1.2 | 3.59 -199% | 2.63 -119% | 1 17% | 1.3 -8% | 3.4 -183% | 1.9 -58% |
| Colorchecker dE 2000 max. * | 2.5 | 7.02 -181% | 4.07 -63% | 2.4 4% | 2.5 -0% | 9.2 -268% | 4.7 -88% |
| Colorchecker dE 2000 calibrated * | 1 | 0.99 1% | 0.6 40% | 0.7 30% | 1.3 -30% | 1.3 -30% | |
| Greyscale dE 2000 * | 1.4 | 3.1 -121% | 2.69 -92% | 1.6 -14% | 2.1 -50% | 3.4 -143% | 2.4 -71% |
| Gamma | 2.25 98% | 2.13 103% | 2.48 89% | 2.29 96% | 2.26 97% | 2.16 102% | 2.24 98% |
| CCT | 6682 97% | 6448 101% | 6907 94% | 6458 101% | 6437 101% | 7462 87% | 6377 102% |
| Média Total (Programa/Configurações) | 12% /
-24% | 19% /
-5% | 12% /
7% | 9% /
1% | -22% /
-47% | -58% /
-38% |
* ... menor é melhor
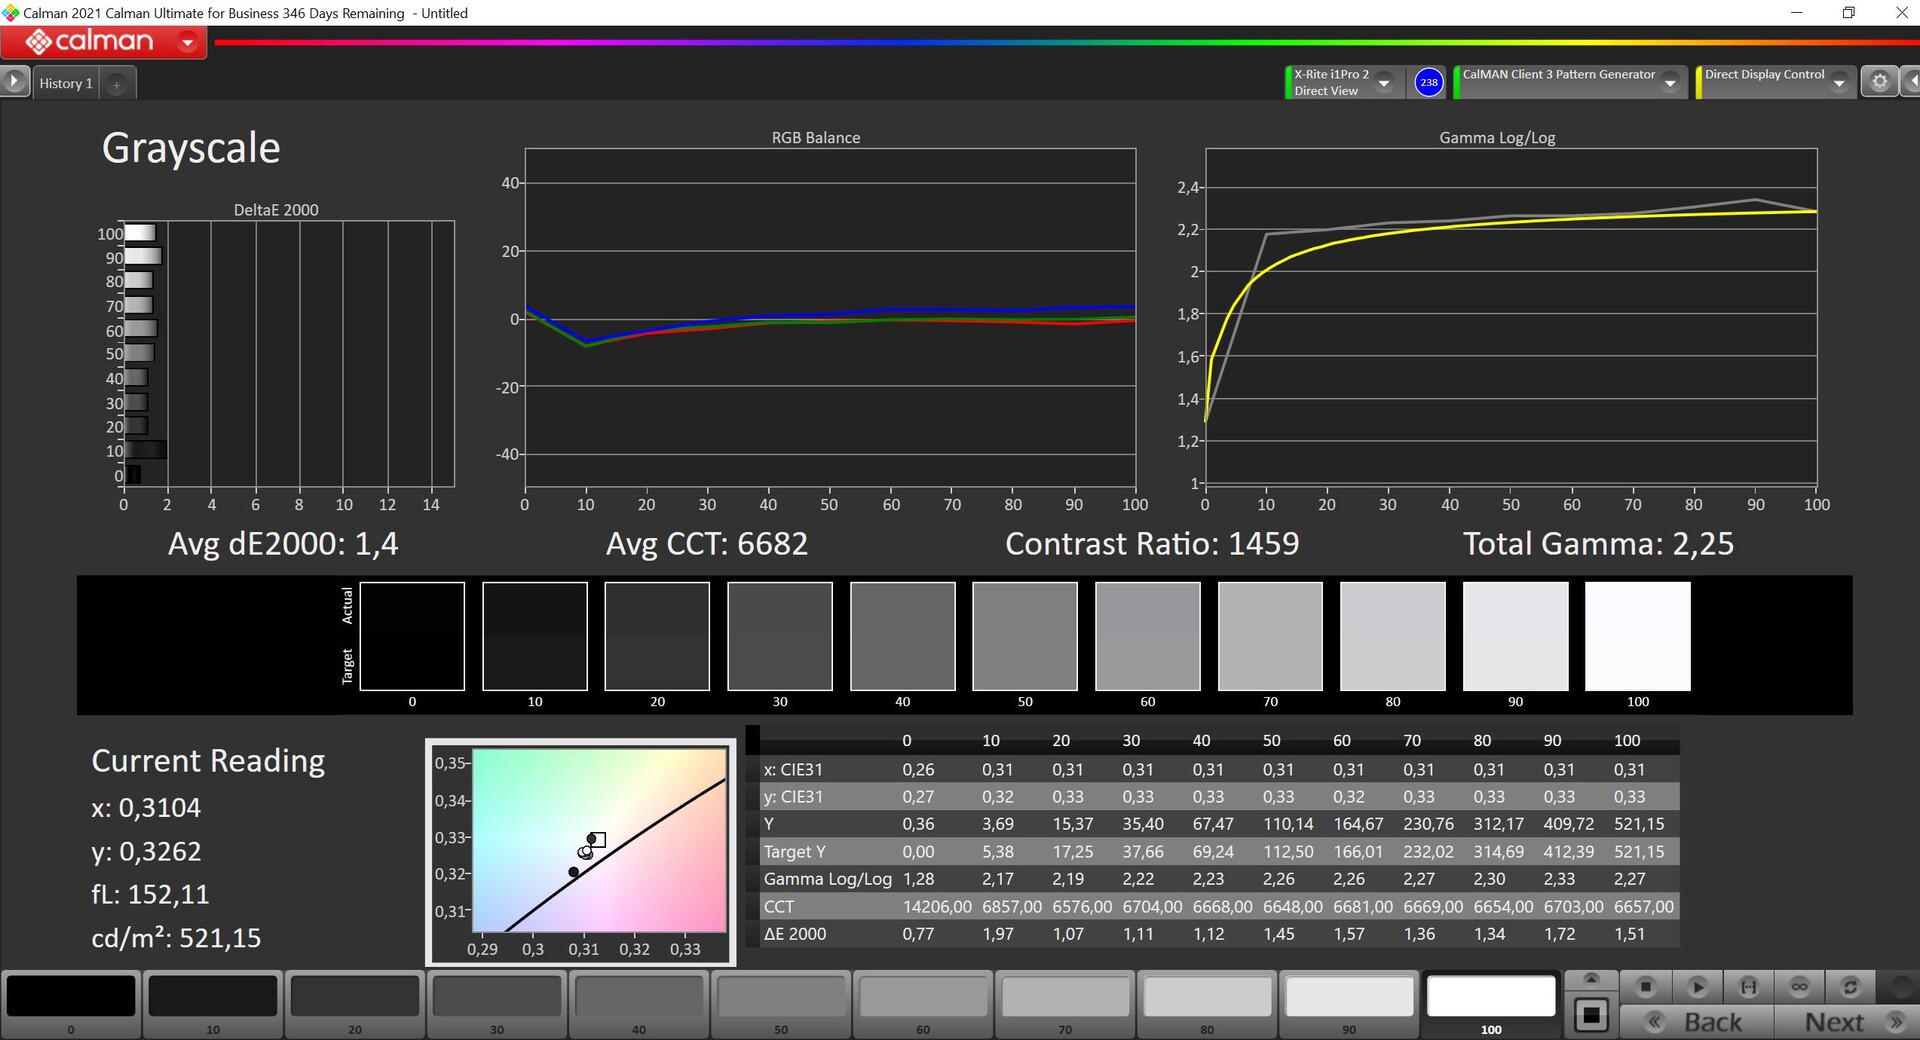
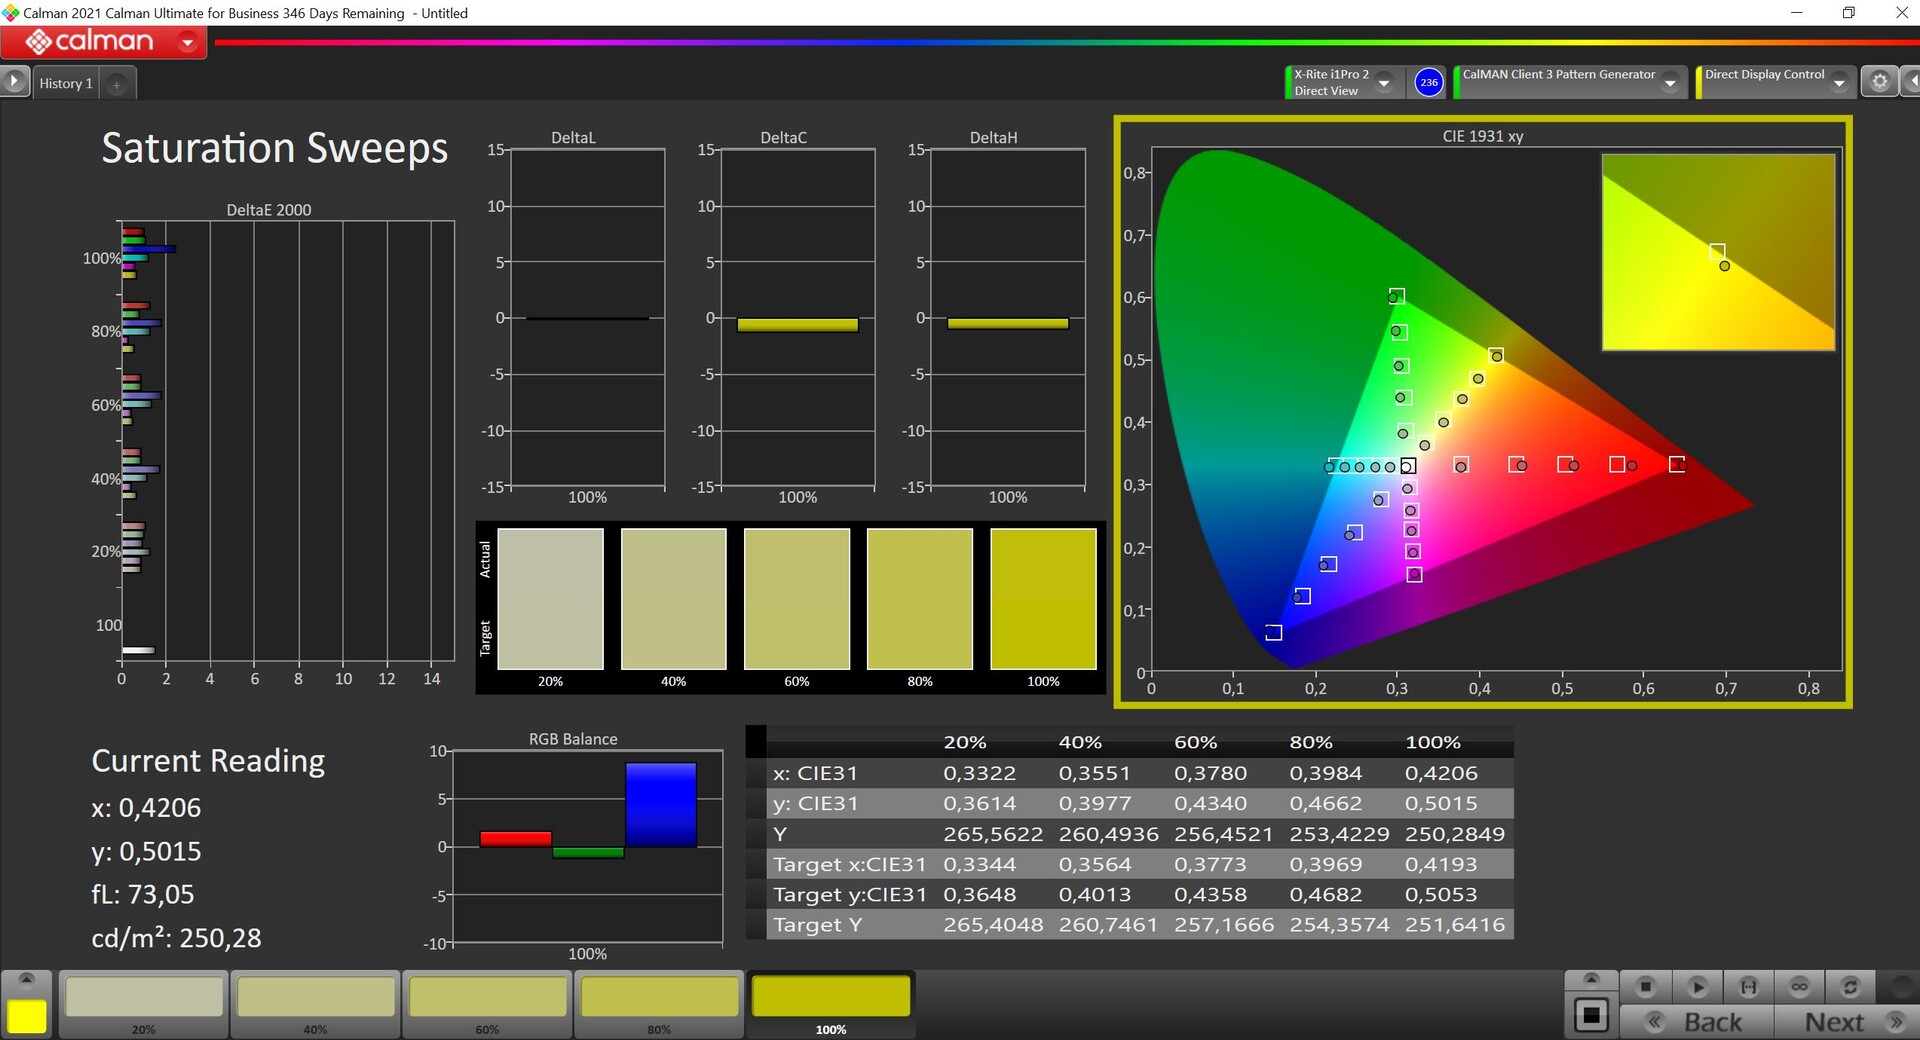
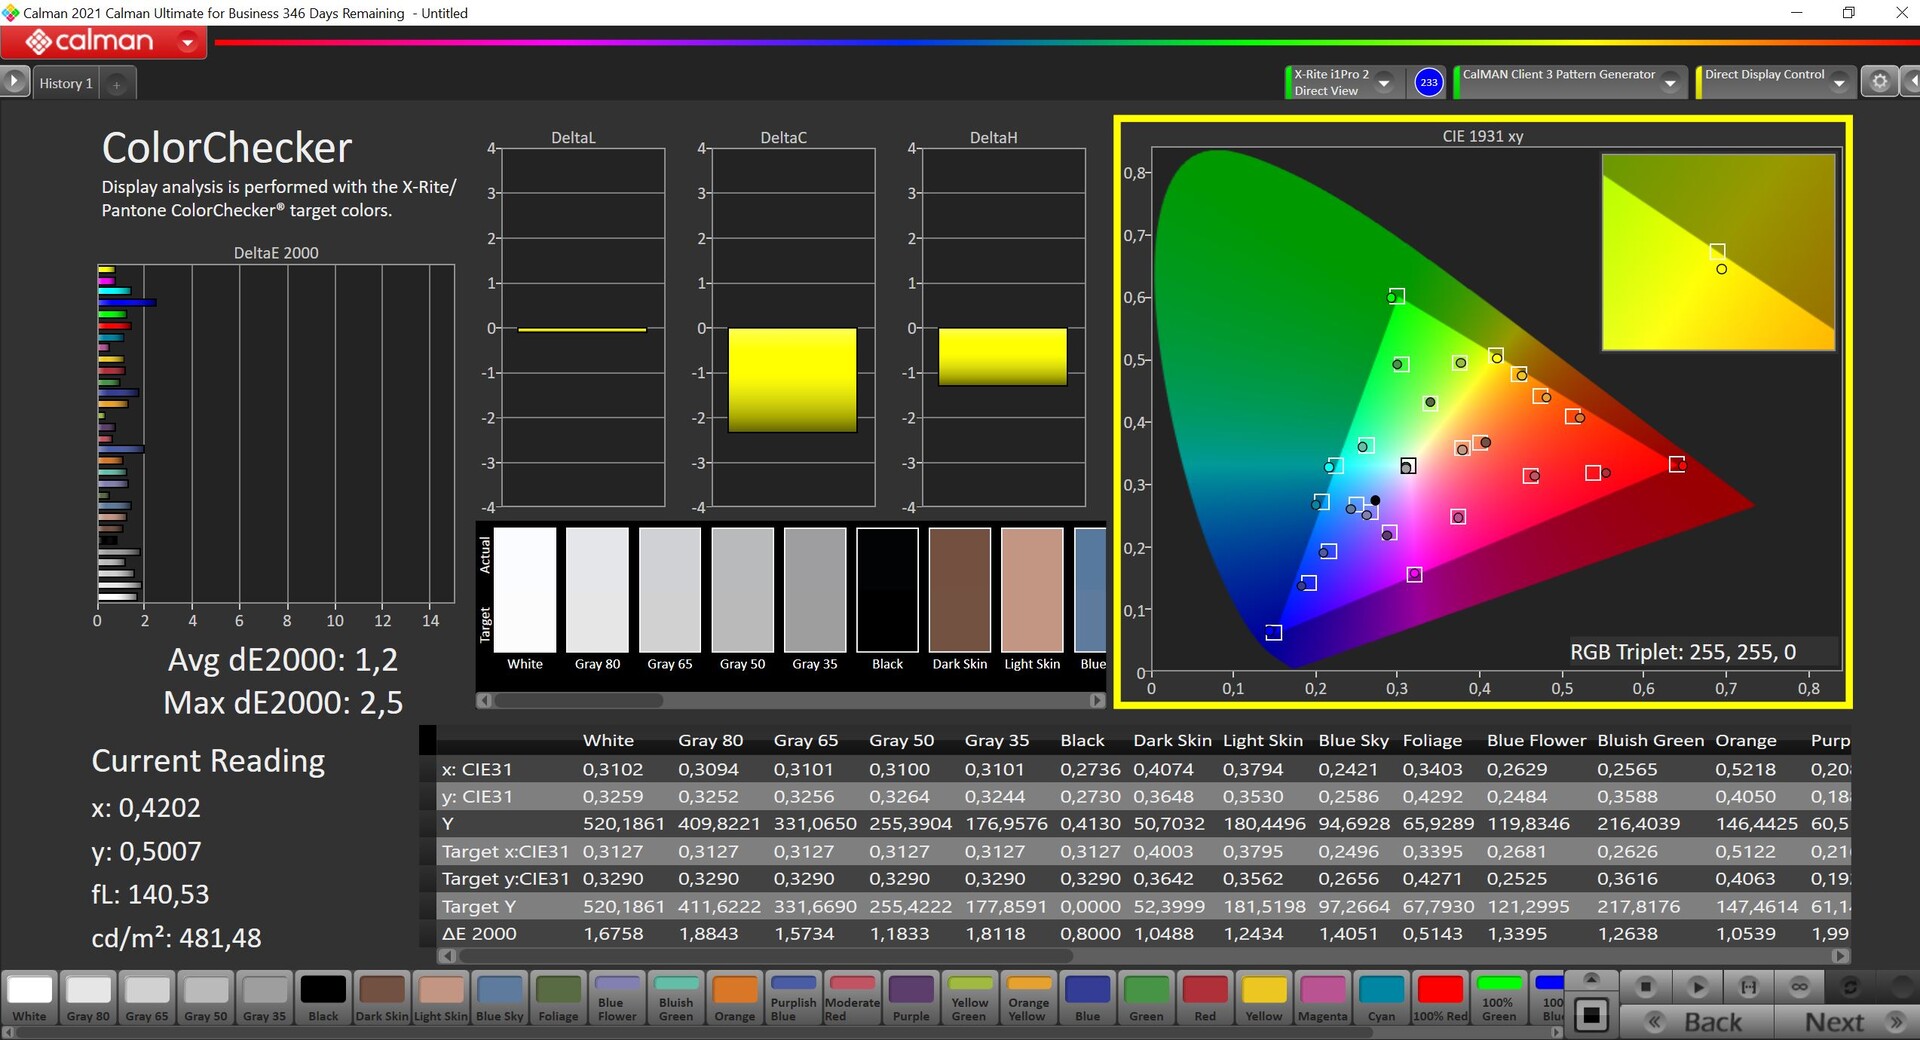
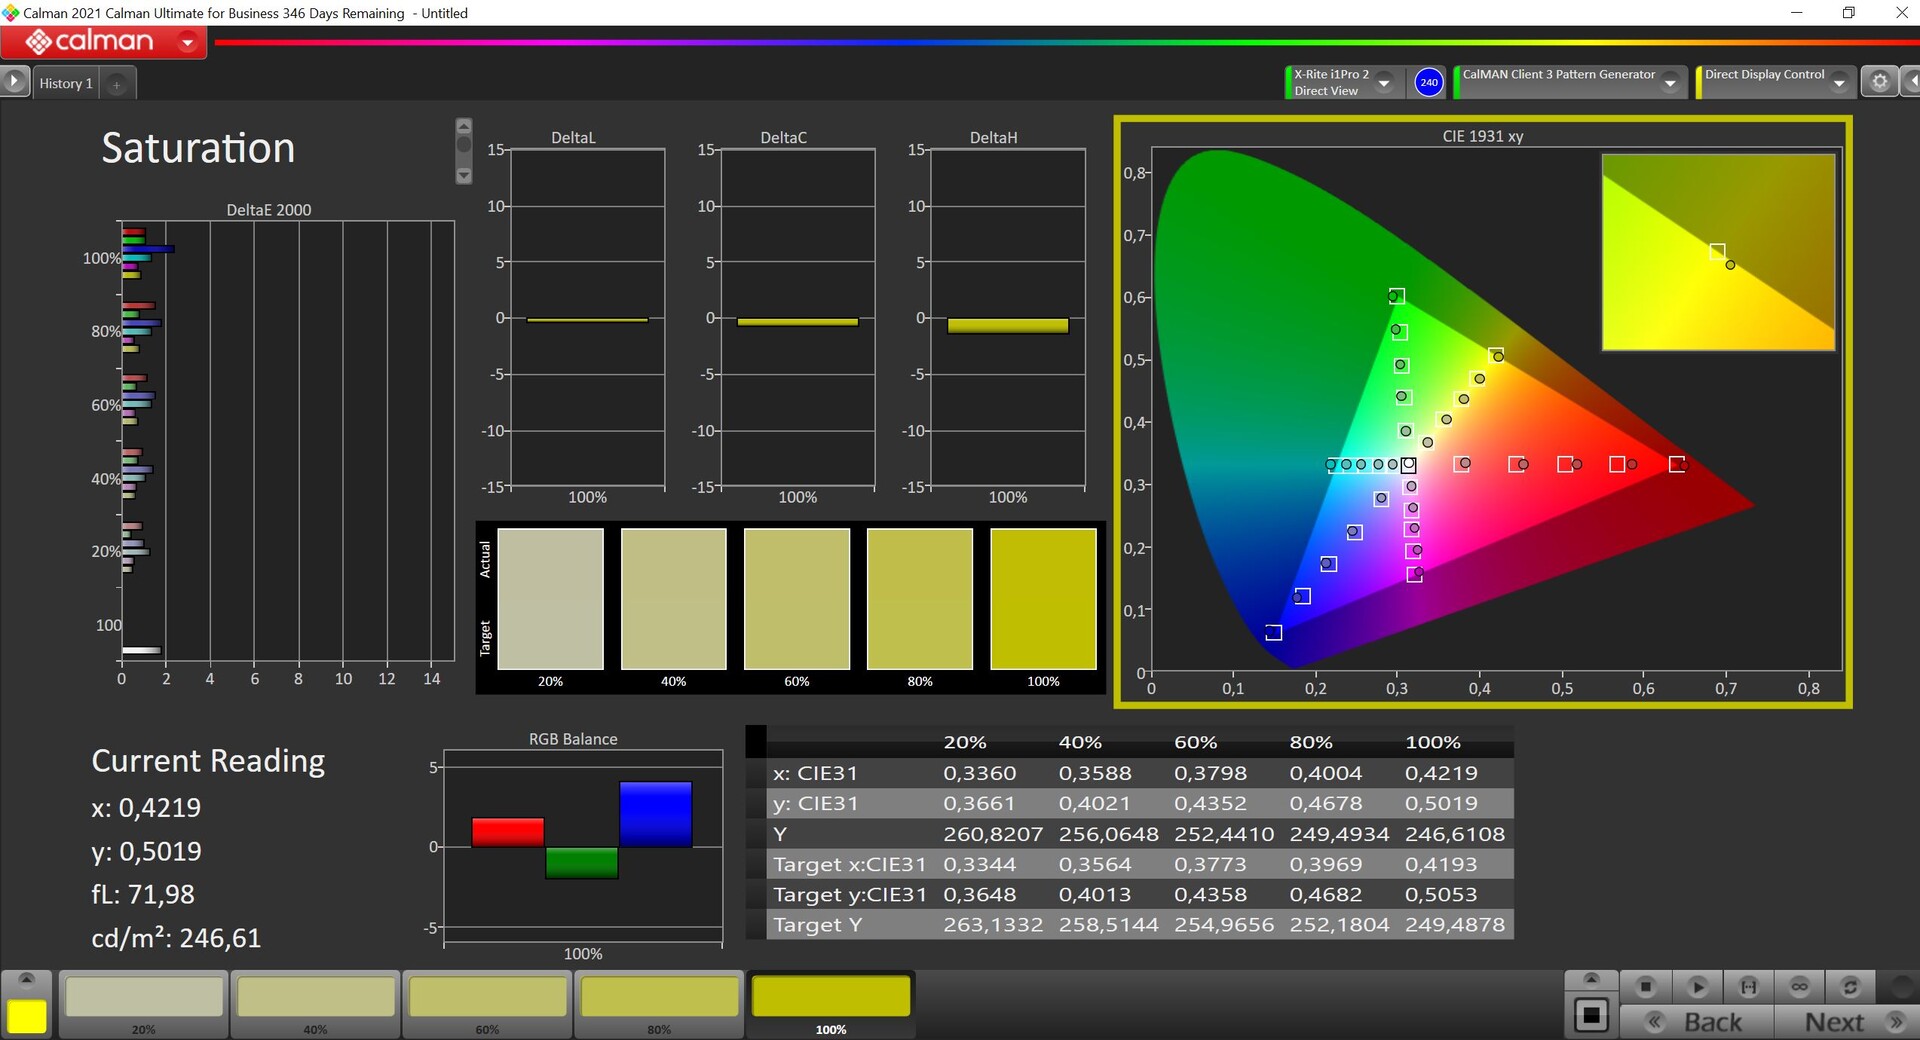
Todas as telas do ThinkPad P1 Gen 6 são calibradas na fábrica e os clientes podem escolher entre uma variedade de perfis de cores. O perfil padrão apresenta valores excelentes, conforme mostrado em nossa análise usando o software profissional CalMAN. Esses valores já são muito impressionantes, sem desvios DeltaE-2000 superiores a 3 na escala de cinza ou nas cores. A única pequena desvantagem é a temperatura da cor na escala de cinza, que poderia ser um pouco mais quente. Esse é um problema insignificante, e os usuários não precisam fazer nenhuma calibração adicional. Conseguimos minimizar um pouco as discrepâncias de cor e aproximar a temperatura da cor do valor ideal usando nossa própria calibração (o perfil relevante está disponível para download gratuito acima).


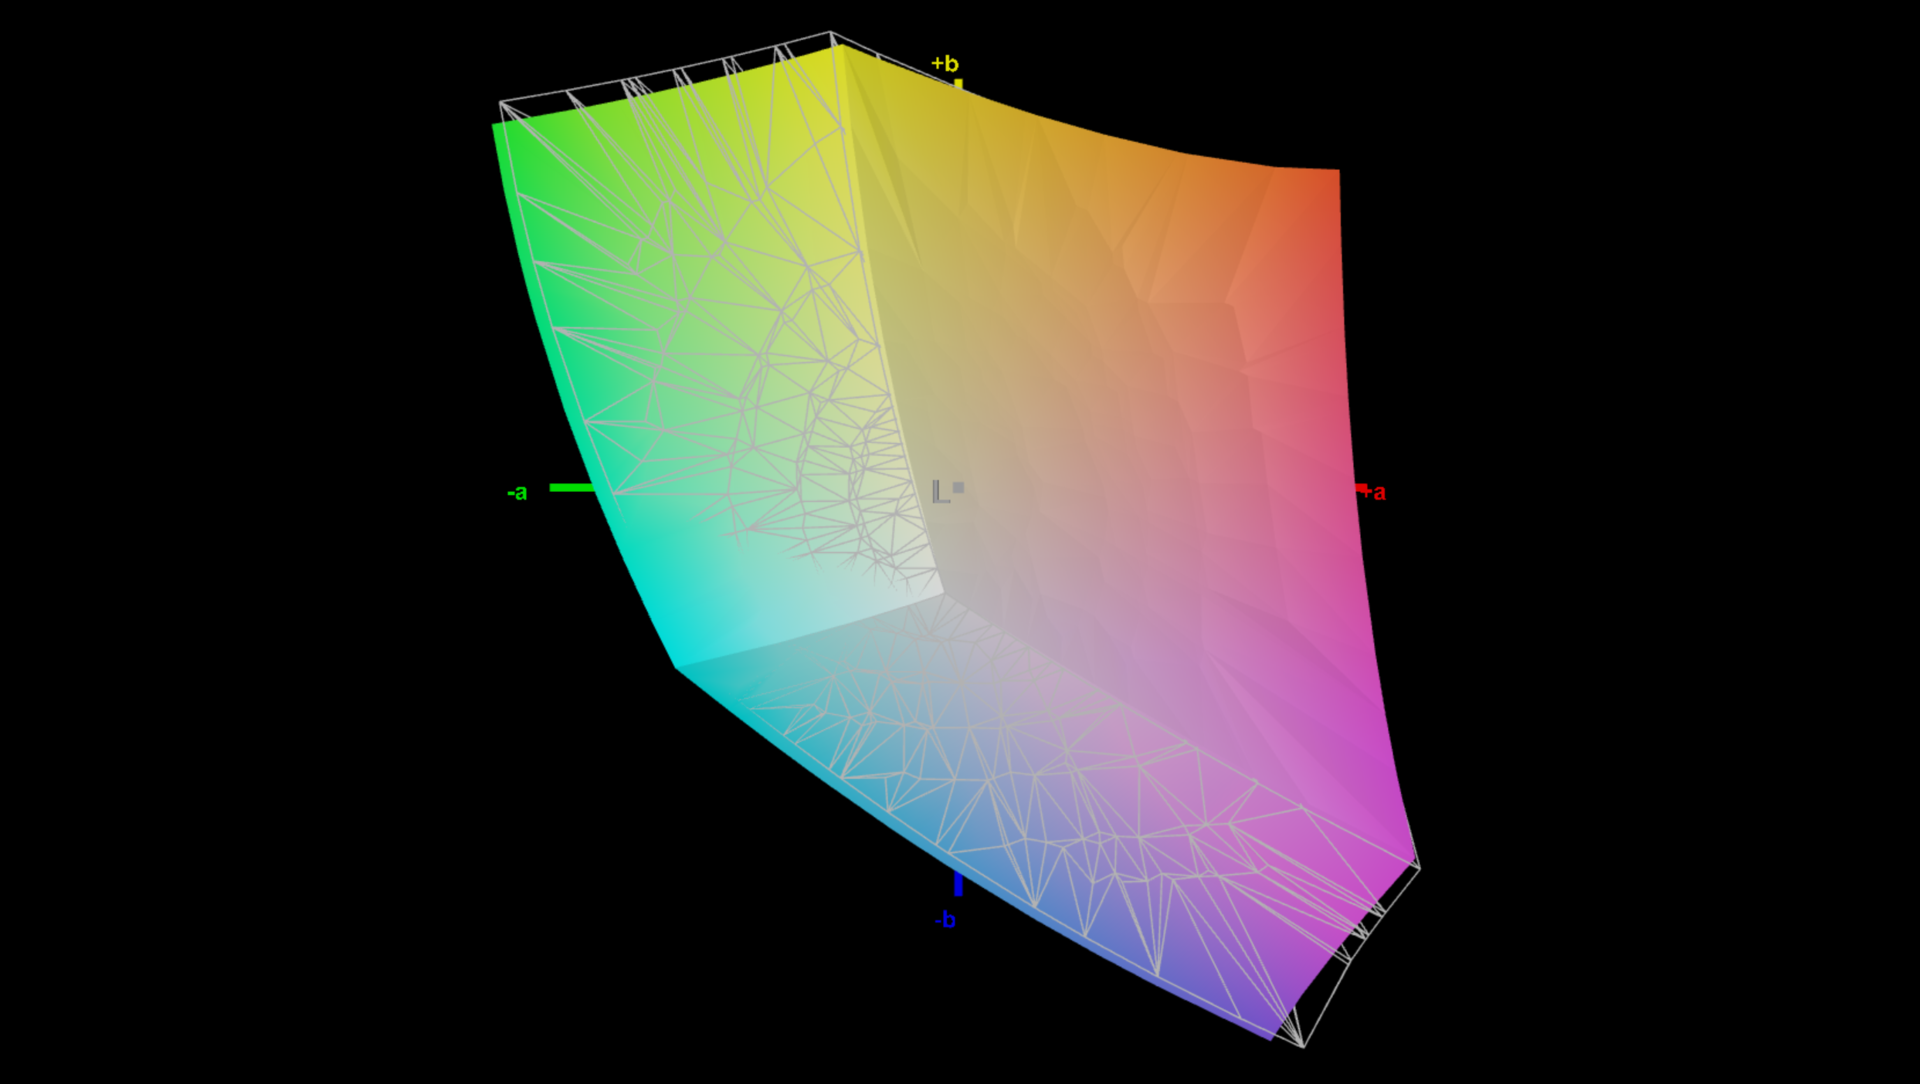
O monitor cobre totalmente o espaço de cores sRGB menor, o que é adequado para muitas aplicações. Se o senhor precisar do espaço de cores P3 maior, precisará usar o painel OLED, mas normalmente recomendamos o painel de 165 Hz devido às desvantagens do OLED, como PWM e maior consumo de energia.
Exibir tempos de resposta
| ↔ Tempo de resposta preto para branco | ||
|---|---|---|
| 9.6 ms ... ascensão ↗ e queda ↘ combinadas | ↗ 4.8 ms ascensão | 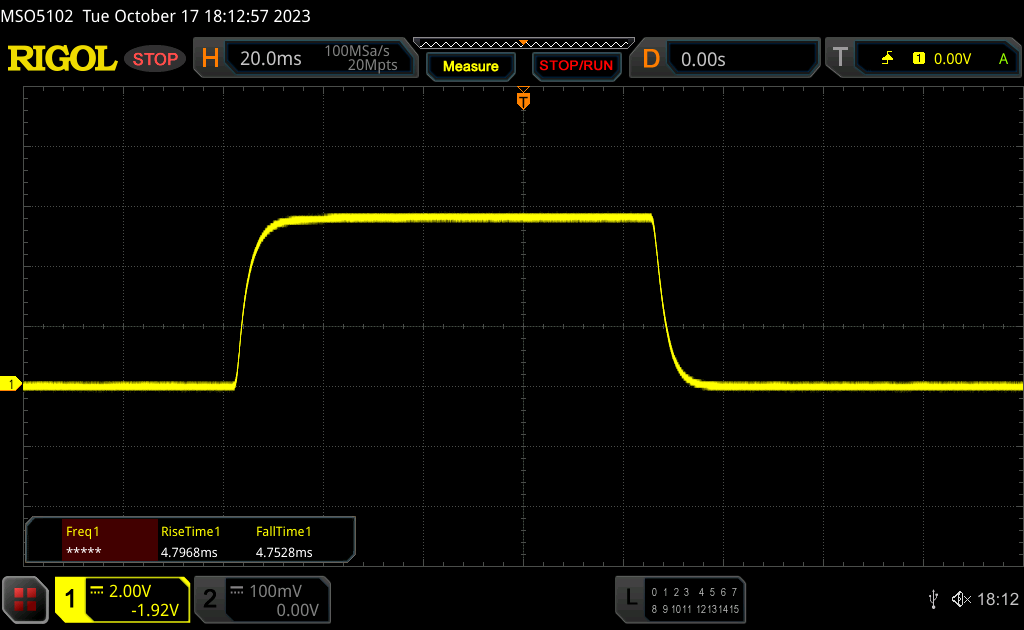 |
| ↘ 4.8 ms queda | ||
| A tela mostra taxas de resposta rápidas em nossos testes e deve ser adequada para jogos. Em comparação, todos os dispositivos testados variam de 0.1 (mínimo) a 240 (máximo) ms. » 26 % de todos os dispositivos são melhores. Isso significa que o tempo de resposta medido é melhor que a média de todos os dispositivos testados (19.8 ms). | ||
| ↔ Tempo de resposta 50% cinza a 80% cinza | ||
| 13.7 ms ... ascensão ↗ e queda ↘ combinadas | ↗ 6.7 ms ascensão | 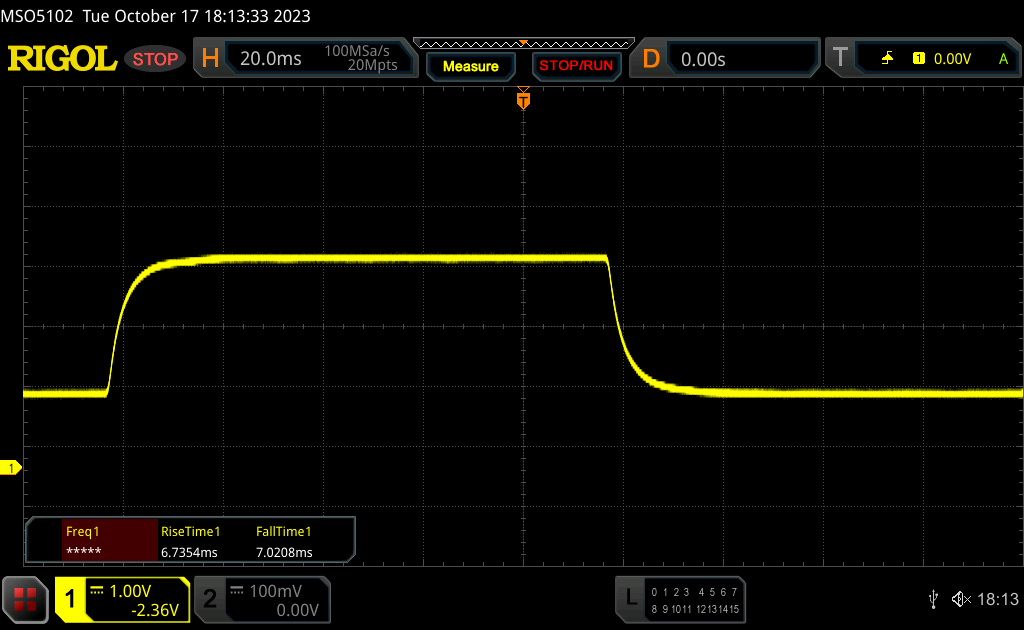 |
| ↘ 7 ms queda | ||
| A tela mostra boas taxas de resposta em nossos testes, mas pode ser muito lenta para jogadores competitivos. Em comparação, todos os dispositivos testados variam de 0.165 (mínimo) a 636 (máximo) ms. » 28 % de todos os dispositivos são melhores. Isso significa que o tempo de resposta medido é melhor que a média de todos os dispositivos testados (31 ms). | ||
Cintilação da tela / PWM (modulação por largura de pulso)
| Tela tremeluzindo / PWM não detectado |  | ||
[pwm_comparison] Em comparação: 52 % de todos os dispositivos testados não usam PWM para escurecer a tela. Se PWM foi detectado, uma média de 7754 (mínimo: 5 - máximo: 343500) Hz foi medida. | |||
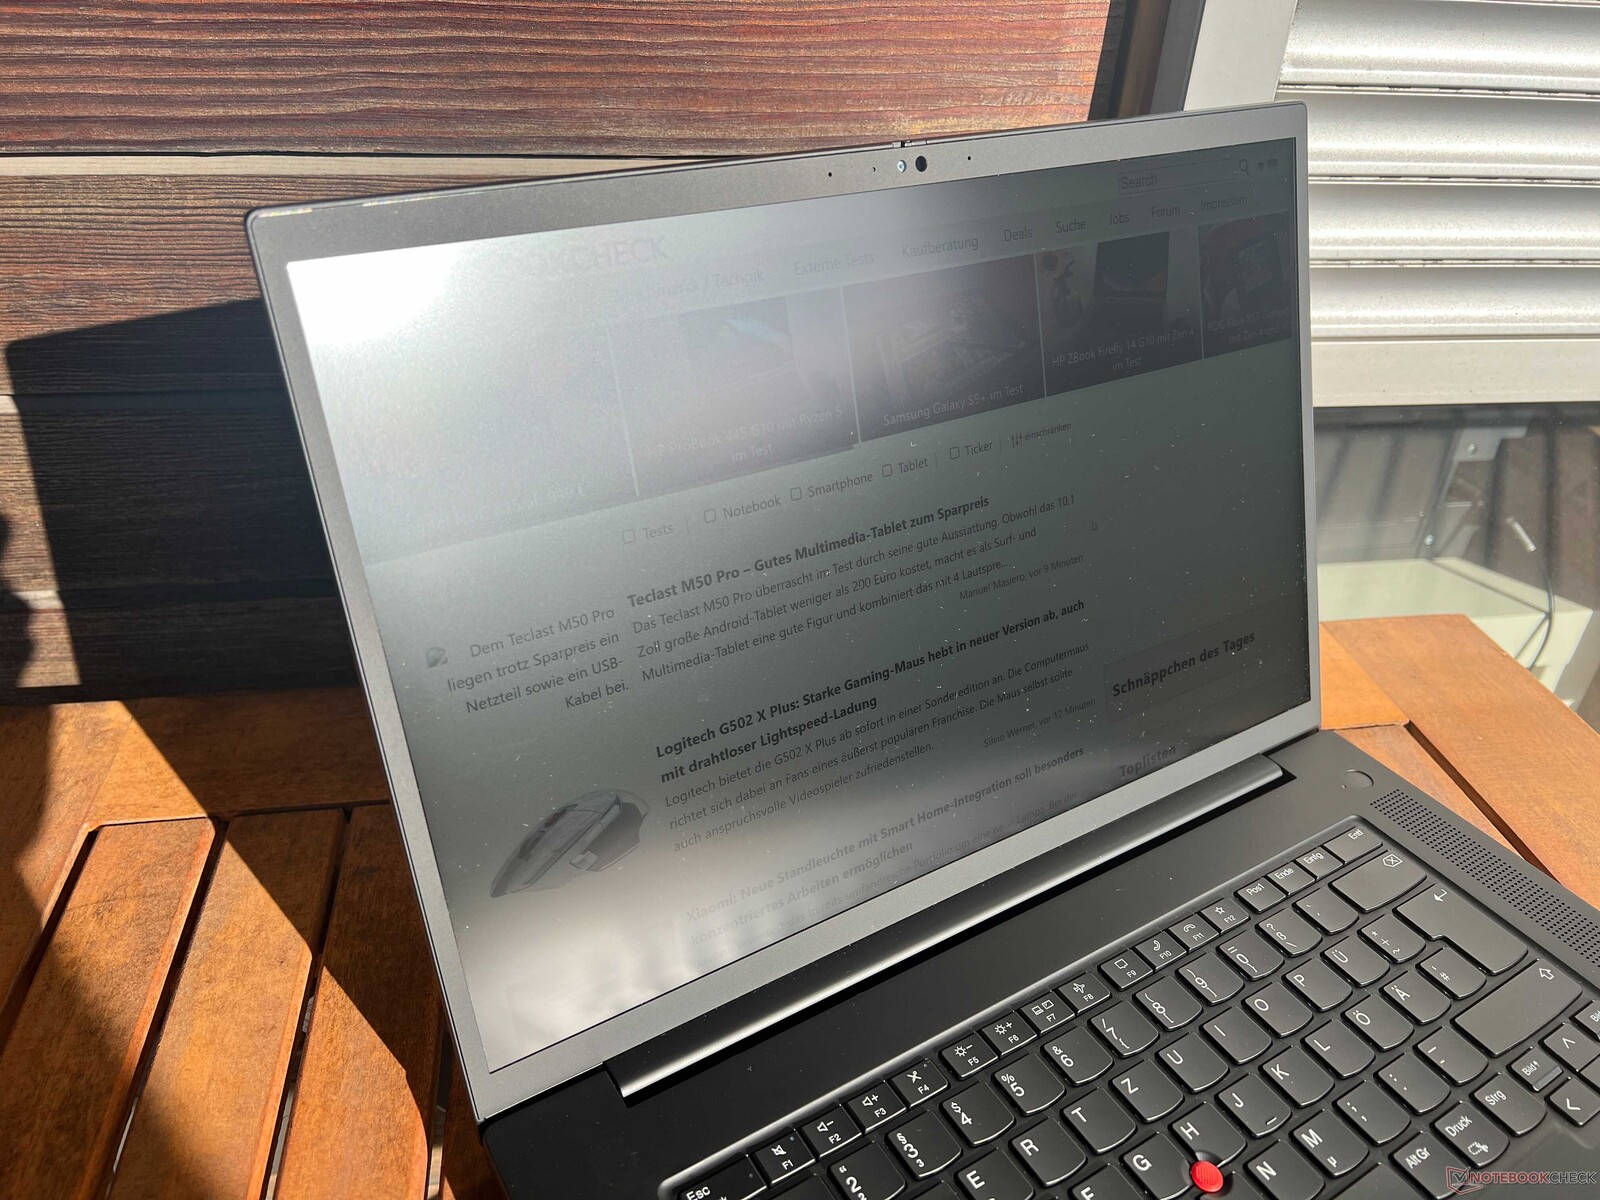
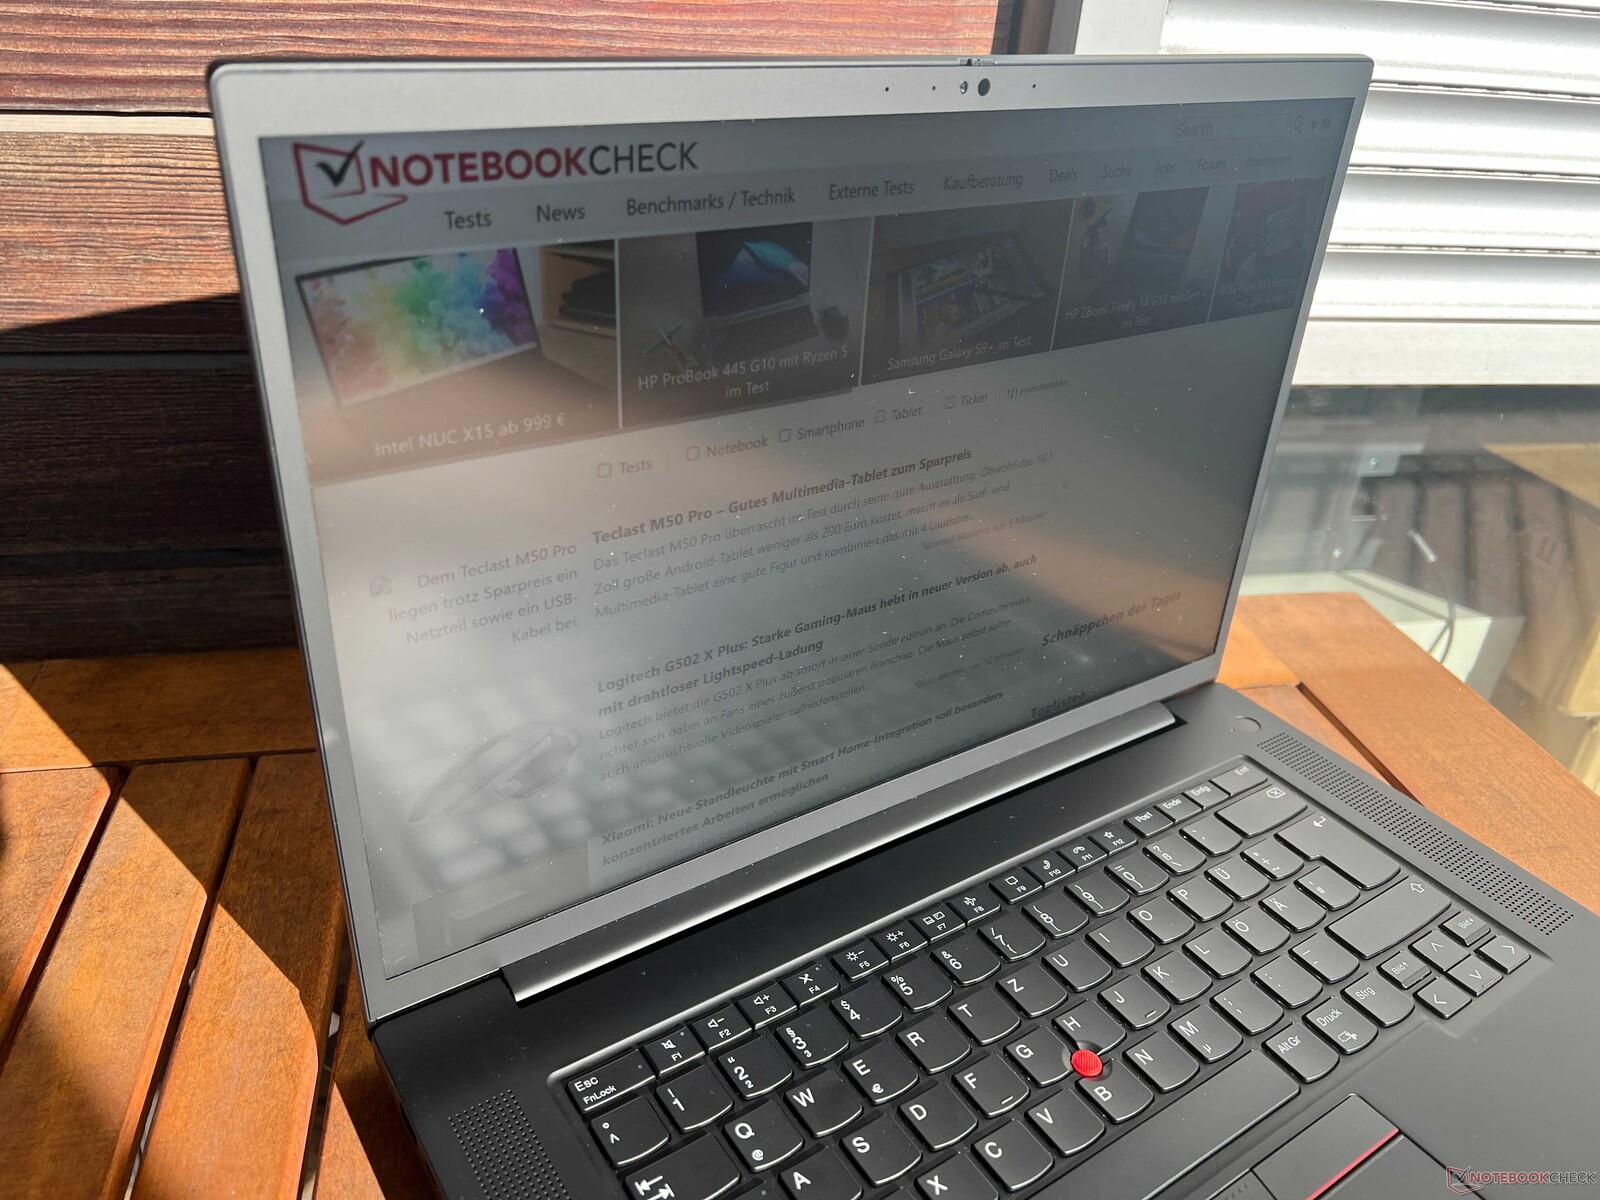
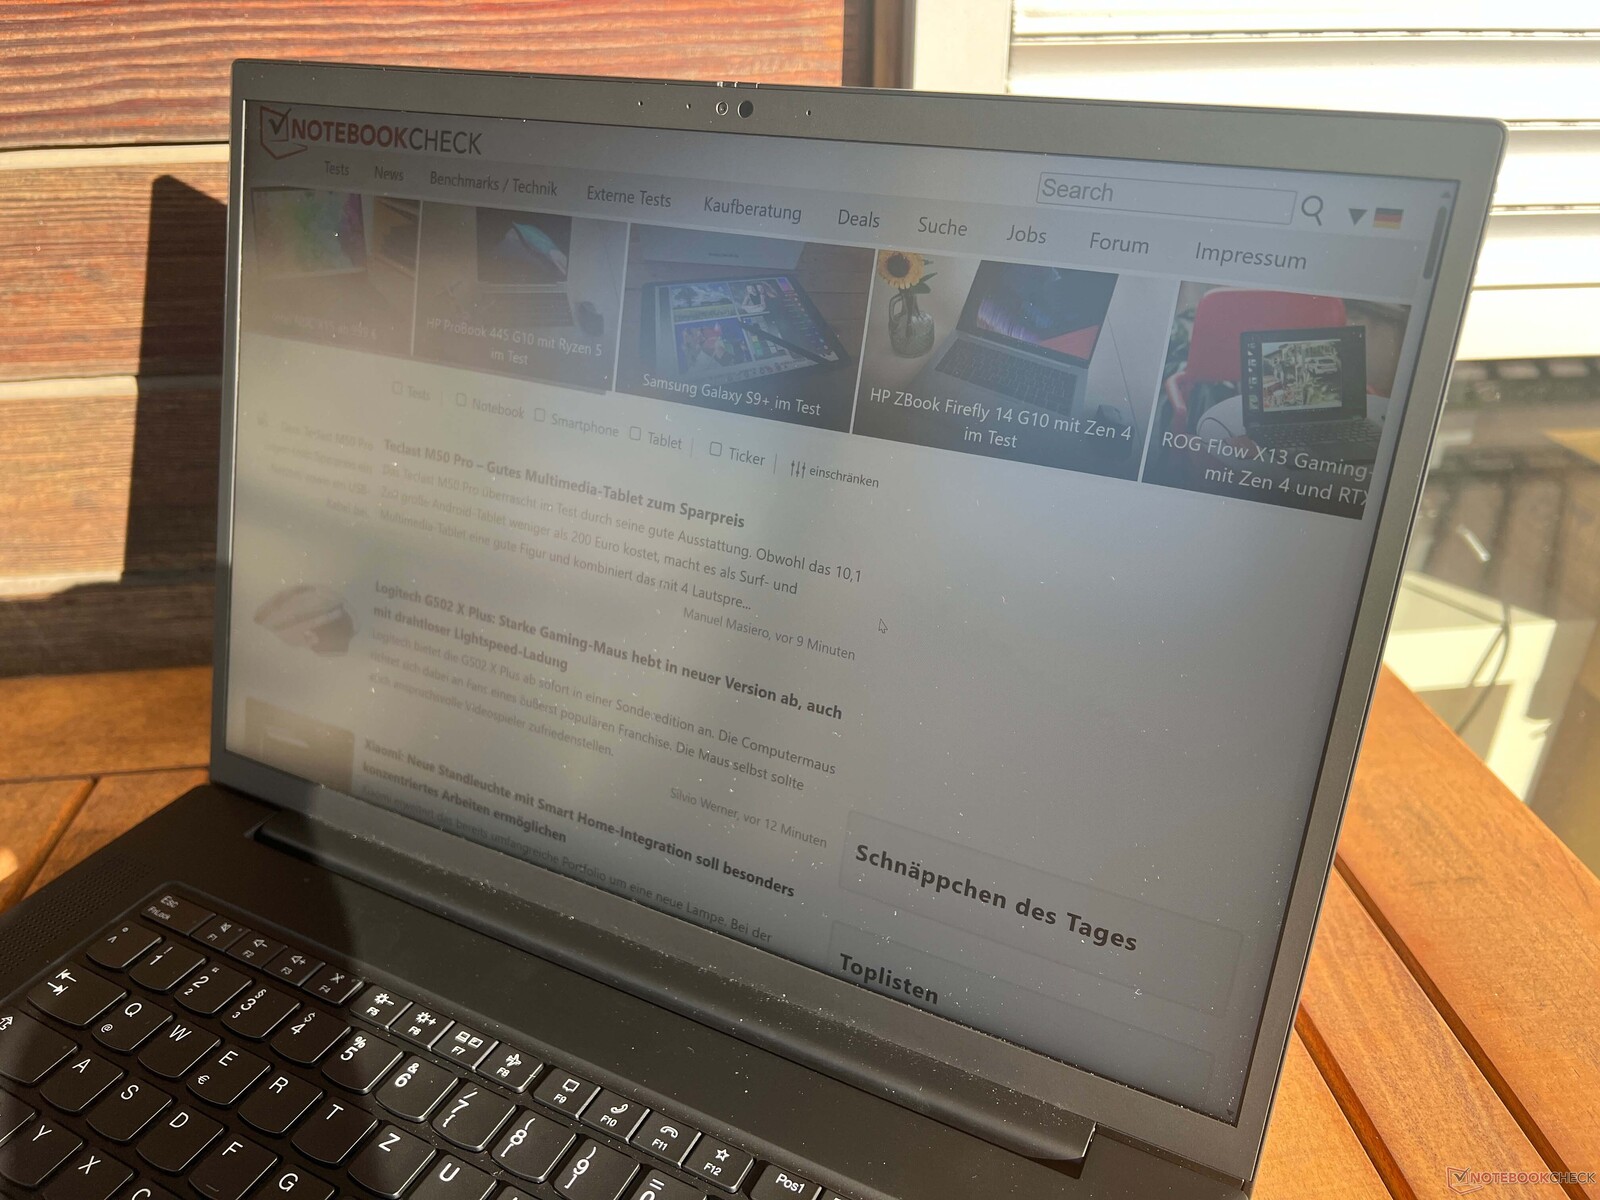
A tela fosca pode ser usada em ambientes externos, embora se torne difícil sob luz solar direta. O painel IPS oferece excelente estabilidade do ângulo de visão.

Desempenho - Raptor Lake e Ada Lovelace
Condições de teste
A Lenovo não tem usado perfis de energia separados nos modelos ThinkPad há algum tempo. As configurações do Smart Cooling estão diretamente ligadas aos perfis de energia padrão do Windows. Para os seguintes benchmarks e medições, usamos o perfil de Melhor Desempenho como a configuração padrão.
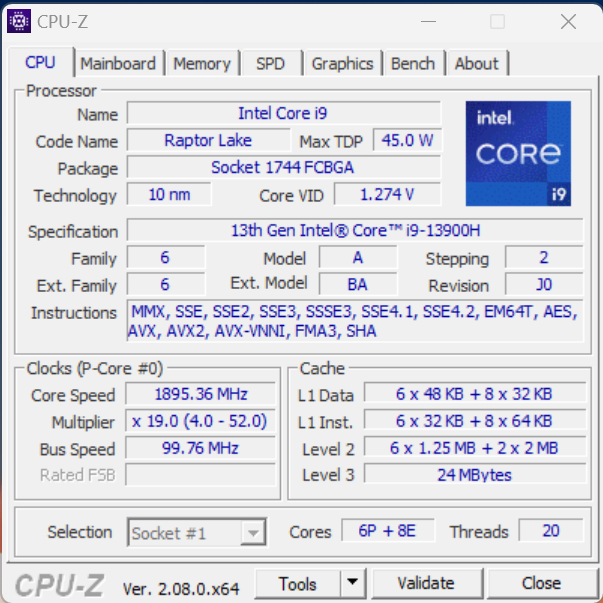
Processador - Core i7-13900H
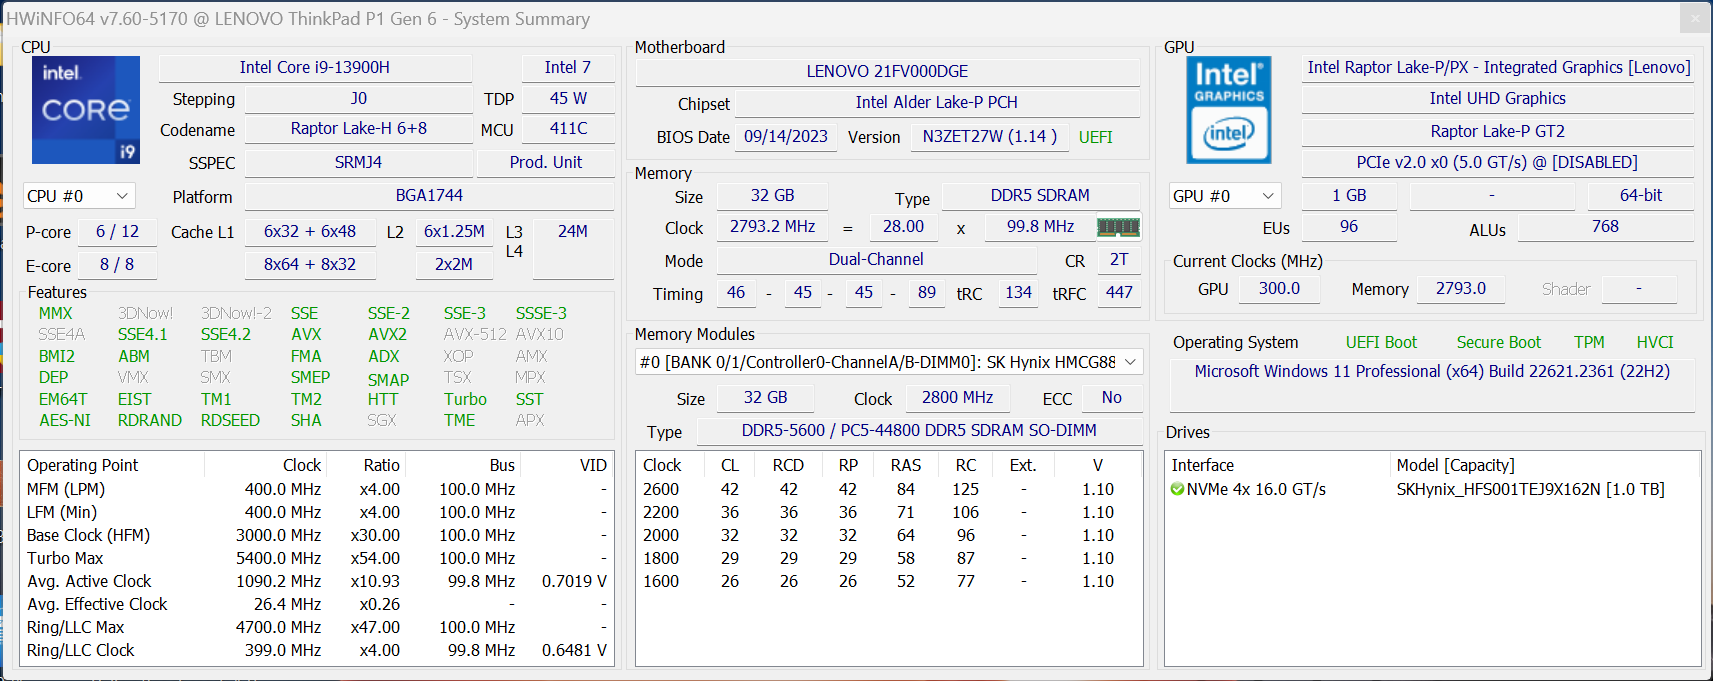
O Intel Core i9-13900H da geração Raptor-Lake tem 6 núcleos de alto desempenho e 8 núcleos de eficiência e pode lidar com até 20 threads. Ele tem velocidades máximas de clock significativamente mais altas do que o Core i7-13700H e suporta recursos vPro. Embora tenha havido pequenas alterações em nosso teste de loop Cinebench, a CPU em nosso ThinkPad P1 Gen 6 pode consumir até 96 watts temporariamente e cerca de 84 watts continuamente. De modo geral, as pontuações de núcleo único são boas, mas o desempenho de vários núcleos tem mais potencial. É possível que as CPUs com a câmara de vapor ofereçam melhor desempenho. Ao funcionar com baterias, a CPU é limitada a 57 watts de uso máximo de energia, resultando em um desempenho de vários núcleos cerca de 25% inferior. Mais benchmarks de CPU estão listados em nossaseção técnica.
Cinebench R15 Multi Loop
Cinebench R23: Multi Core | Single Core
Cinebench R20: CPU (Multi Core) | CPU (Single Core)
Cinebench R15: CPU Multi 64Bit | CPU Single 64Bit
Blender: v2.79 BMW27 CPU
7-Zip 18.03: 7z b 4 | 7z b 4 -mmt1
Geekbench 5.5: Multi-Core | Single-Core
HWBOT x265 Benchmark v2.2: 4k Preset
LibreOffice : 20 Documents To PDF
R Benchmark 2.5: Overall mean
| CPU Performance rating | |
| Média da turma Workstation | |
| Dell Precision 5000 5680 | |
| Lenovo ThinkPad P1 G6-21FV000DGE | |
| HP ZBook Studio 16 G9 62U04EA | |
| Lenovo ThinkPad X1 Extreme G5-21DE003RGE | |
| Média Intel Core i9-13900H | |
| MSI CreatorPro Z16P B12UKST | |
| Schenker VISION 16 Pro (M23) | |
| Samsung Galaxy Book3 Ultra 16, i9-13900H RTX 4070 | |
| Cinebench R23 / Multi Core | |
| Média da turma Workstation (14621 - 38520, n=23, últimos 2 anos) | |
| Dell Precision 5000 5680 | |
| Lenovo ThinkPad P1 G6-21FV000DGE | |
| Lenovo ThinkPad X1 Extreme G5-21DE003RGE | |
| MSI CreatorPro Z16P B12UKST | |
| Média Intel Core i9-13900H (11997 - 20385, n=28) | |
| HP ZBook Studio 16 G9 62U04EA | |
| Schenker VISION 16 Pro (M23) | |
| Samsung Galaxy Book3 Ultra 16, i9-13900H RTX 4070 | |
| Cinebench R23 / Single Core | |
| Lenovo ThinkPad P1 G6-21FV000DGE | |
| Média da turma Workstation (1712 - 2228, n=23, últimos 2 anos) | |
| Dell Precision 5000 5680 | |
| Média Intel Core i9-13900H (1297 - 2054, n=26) | |
| Schenker VISION 16 Pro (M23) | |
| HP ZBook Studio 16 G9 62U04EA | |
| Lenovo ThinkPad X1 Extreme G5-21DE003RGE | |
| MSI CreatorPro Z16P B12UKST | |
| Samsung Galaxy Book3 Ultra 16, i9-13900H RTX 4070 | |
| Cinebench R20 / CPU (Multi Core) | |
| Média da turma Workstation (5760 - 15043, n=23, últimos 2 anos) | |
| Dell Precision 5000 5680 | |
| Lenovo ThinkPad P1 G6-21FV000DGE | |
| Lenovo ThinkPad X1 Extreme G5-21DE003RGE | |
| MSI CreatorPro Z16P B12UKST | |
| Média Intel Core i9-13900H (4935 - 7716, n=25) | |
| HP ZBook Studio 16 G9 62U04EA | |
| Schenker VISION 16 Pro (M23) | |
| Samsung Galaxy Book3 Ultra 16, i9-13900H RTX 4070 | |
| Cinebench R20 / CPU (Single Core) | |
| Lenovo ThinkPad P1 G6-21FV000DGE | |
| Dell Precision 5000 5680 | |
| Média da turma Workstation (671 - 857, n=23, últimos 2 anos) | |
| Schenker VISION 16 Pro (M23) | |
| Média Intel Core i9-13900H (428 - 792, n=25) | |
| HP ZBook Studio 16 G9 62U04EA | |
| Lenovo ThinkPad X1 Extreme G5-21DE003RGE | |
| MSI CreatorPro Z16P B12UKST | |
| Samsung Galaxy Book3 Ultra 16, i9-13900H RTX 4070 | |
| Cinebench R15 / CPU Multi 64Bit | |
| Média da turma Workstation (2489 - 5810, n=23, últimos 2 anos) | |
| Lenovo ThinkPad X1 Extreme G5-21DE003RGE | |
| Média Intel Core i9-13900H (2061 - 3100, n=26) | |
| Lenovo ThinkPad P1 G6-21FV000DGE | |
| HP ZBook Studio 16 G9 62U04EA | |
| Dell Precision 5000 5680 | |
| Schenker VISION 16 Pro (M23) | |
| MSI CreatorPro Z16P B12UKST | |
| Samsung Galaxy Book3 Ultra 16, i9-13900H RTX 4070 | |
| Cinebench R15 / CPU Single 64Bit | |
| Média da turma Workstation (191.4 - 328, n=23, últimos 2 anos) | |
| Dell Precision 5000 5680 | |
| Lenovo ThinkPad P1 G6-21FV000DGE | |
| Schenker VISION 16 Pro (M23) | |
| HP ZBook Studio 16 G9 62U04EA | |
| Média Intel Core i9-13900H (211 - 297, n=26) | |
| Lenovo ThinkPad X1 Extreme G5-21DE003RGE | |
| MSI CreatorPro Z16P B12UKST | |
| Samsung Galaxy Book3 Ultra 16, i9-13900H RTX 4070 | |
| Blender / v2.79 BMW27 CPU | |
| Samsung Galaxy Book3 Ultra 16, i9-13900H RTX 4070 | |
| Schenker VISION 16 Pro (M23) | |
| Média Intel Core i9-13900H (166 - 268, n=24) | |
| MSI CreatorPro Z16P B12UKST | |
| Dell Precision 5000 5680 | |
| Lenovo ThinkPad P1 G6-21FV000DGE | |
| HP ZBook Studio 16 G9 62U04EA | |
| Lenovo ThinkPad X1 Extreme G5-21DE003RGE | |
| Média da turma Workstation (91 - 222, n=23, últimos 2 anos) | |
| 7-Zip 18.03 / 7z b 4 | |
| Média da turma Workstation (60489 - 116969, n=23, últimos 2 anos) | |
| Lenovo ThinkPad P1 G6-21FV000DGE | |
| Dell Precision 5000 5680 | |
| HP ZBook Studio 16 G9 62U04EA | |
| MSI CreatorPro Z16P B12UKST | |
| Média Intel Core i9-13900H (45045 - 79032, n=25) | |
| Lenovo ThinkPad X1 Extreme G5-21DE003RGE | |
| Schenker VISION 16 Pro (M23) | |
| Samsung Galaxy Book3 Ultra 16, i9-13900H RTX 4070 | |
| 7-Zip 18.03 / 7z b 4 -mmt1 | |
| Lenovo ThinkPad P1 G6-21FV000DGE | |
| Média da turma Workstation (5126 - 6960, n=23, últimos 2 anos) | |
| Schenker VISION 16 Pro (M23) | |
| Dell Precision 5000 5680 | |
| Média Intel Core i9-13900H (3665 - 6600, n=25) | |
| HP ZBook Studio 16 G9 62U04EA | |
| Lenovo ThinkPad X1 Extreme G5-21DE003RGE | |
| MSI CreatorPro Z16P B12UKST | |
| Samsung Galaxy Book3 Ultra 16, i9-13900H RTX 4070 | |
| Geekbench 5.5 / Multi-Core | |
| Média da turma Workstation (11542 - 25554, n=23, últimos 2 anos) | |
| Dell Precision 5000 5680 | |
| HP ZBook Studio 16 G9 62U04EA | |
| Média Intel Core i9-13900H (9094 - 15410, n=26) | |
| MSI CreatorPro Z16P B12UKST | |
| Schenker VISION 16 Pro (M23) | |
| Lenovo ThinkPad X1 Extreme G5-21DE003RGE | |
| Lenovo ThinkPad P1 G6-21FV000DGE | |
| Samsung Galaxy Book3 Ultra 16, i9-13900H RTX 4070 | |
| Geekbench 5.5 / Single-Core | |
| Média da turma Workstation (1783 - 2183, n=23, últimos 2 anos) | |
| Dell Precision 5000 5680 | |
| Lenovo ThinkPad P1 G6-21FV000DGE | |
| Média Intel Core i9-13900H (1140 - 2043, n=26) | |
| Schenker VISION 16 Pro (M23) | |
| HP ZBook Studio 16 G9 62U04EA | |
| Lenovo ThinkPad X1 Extreme G5-21DE003RGE | |
| MSI CreatorPro Z16P B12UKST | |
| Samsung Galaxy Book3 Ultra 16, i9-13900H RTX 4070 | |
| HWBOT x265 Benchmark v2.2 / 4k Preset | |
| Média da turma Workstation (17.8 - 40.5, n=23, últimos 2 anos) | |
| Dell Precision 5000 5680 | |
| HP ZBook Studio 16 G9 62U04EA | |
| MSI CreatorPro Z16P B12UKST | |
| Lenovo ThinkPad P1 G6-21FV000DGE | |
| Média Intel Core i9-13900H (14.1 - 22.3, n=25) | |
| Lenovo ThinkPad X1 Extreme G5-21DE003RGE | |
| Schenker VISION 16 Pro (M23) | |
| Samsung Galaxy Book3 Ultra 16, i9-13900H RTX 4070 | |
| LibreOffice / 20 Documents To PDF | |
| Samsung Galaxy Book3 Ultra 16, i9-13900H RTX 4070 | |
| Média da turma Workstation (37.1 - 74.7, n=23, últimos 2 anos) | |
| Schenker VISION 16 Pro (M23) | |
| Média Intel Core i9-13900H (34.4 - 82.8, n=25) | |
| Lenovo ThinkPad P1 G6-21FV000DGE | |
| HP ZBook Studio 16 G9 62U04EA | |
| Lenovo ThinkPad X1 Extreme G5-21DE003RGE | |
| Dell Precision 5000 5680 | |
| MSI CreatorPro Z16P B12UKST | |
| R Benchmark 2.5 / Overall mean | |
| Samsung Galaxy Book3 Ultra 16, i9-13900H RTX 4070 | |
| Lenovo ThinkPad X1 Extreme G5-21DE003RGE | |
| MSI CreatorPro Z16P B12UKST | |
| Média Intel Core i9-13900H (0.4052 - 0.723, n=25) | |
| HP ZBook Studio 16 G9 62U04EA | |
| Média da turma Workstation (0.3825 - 0.603, n=23, últimos 2 anos) | |
| Schenker VISION 16 Pro (M23) | |
| Lenovo ThinkPad P1 G6-21FV000DGE | |
| Dell Precision 5000 5680 | |
* ... menor é melhor
AIDA64: FP32 Ray-Trace | FPU Julia | CPU SHA3 | CPU Queen | FPU SinJulia | FPU Mandel | CPU AES | CPU ZLib | FP64 Ray-Trace | CPU PhotoWorxx
| Performance rating | |
| Média da turma Workstation | |
| MSI CreatorPro Z16P B12UKST | |
| Dell Precision 5000 5680 | |
| Lenovo ThinkPad P1 G6-21FV000DGE | |
| Média Intel Core i9-13900H | |
| HP ZBook Studio 16 G9 62U04EA | |
| Lenovo ThinkPad X1 Extreme G5-21DE003RGE | |
| Schenker VISION 16 Pro (M23) | |
| Samsung Galaxy Book3 Ultra 16, i9-13900H RTX 4070 | |
| AIDA64 / FP32 Ray-Trace | |
| Média da turma Workstation (16730 - 61611, n=23, últimos 2 anos) | |
| Lenovo ThinkPad P1 G6-21FV000DGE | |
| Lenovo ThinkPad X1 Extreme G5-21DE003RGE | |
| Dell Precision 5000 5680 | |
| HP ZBook Studio 16 G9 62U04EA | |
| Média Intel Core i9-13900H (6788 - 19557, n=25) | |
| Samsung Galaxy Book3 Ultra 16, i9-13900H RTX 4070 | |
| MSI CreatorPro Z16P B12UKST | |
| Schenker VISION 16 Pro (M23) | |
| AIDA64 / FPU Julia | |
| Média da turma Workstation (89597 - 186971, n=23, últimos 2 anos) | |
| Lenovo ThinkPad P1 G6-21FV000DGE | |
| Lenovo ThinkPad X1 Extreme G5-21DE003RGE | |
| HP ZBook Studio 16 G9 62U04EA | |
| Dell Precision 5000 5680 | |
| Média Intel Core i9-13900H (22551 - 95579, n=25) | |
| MSI CreatorPro Z16P B12UKST | |
| Schenker VISION 16 Pro (M23) | |
| Samsung Galaxy Book3 Ultra 16, i9-13900H RTX 4070 | |
| AIDA64 / CPU SHA3 | |
| Média da turma Workstation (4178 - 8975, n=23, últimos 2 anos) | |
| Lenovo ThinkPad X1 Extreme G5-21DE003RGE | |
| Lenovo ThinkPad P1 G6-21FV000DGE | |
| HP ZBook Studio 16 G9 62U04EA | |
| MSI CreatorPro Z16P B12UKST | |
| Média Intel Core i9-13900H (2491 - 4270, n=25) | |
| Dell Precision 5000 5680 | |
| Samsung Galaxy Book3 Ultra 16, i9-13900H RTX 4070 | |
| Schenker VISION 16 Pro (M23) | |
| AIDA64 / CPU Queen | |
| Dell Precision 5000 5680 | |
| Lenovo ThinkPad P1 G6-21FV000DGE | |
| Média da turma Workstation (60778 - 144411, n=23, últimos 2 anos) | |
| HP ZBook Studio 16 G9 62U04EA | |
| Média Intel Core i9-13900H (65121 - 120936, n=25) | |
| Lenovo ThinkPad X1 Extreme G5-21DE003RGE | |
| MSI CreatorPro Z16P B12UKST | |
| Schenker VISION 16 Pro (M23) | |
| Samsung Galaxy Book3 Ultra 16, i9-13900H RTX 4070 | |
| AIDA64 / FPU SinJulia | |
| Média da turma Workstation (8165 - 29343, n=23, últimos 2 anos) | |
| Lenovo ThinkPad P1 G6-21FV000DGE | |
| Dell Precision 5000 5680 | |
| Lenovo ThinkPad X1 Extreme G5-21DE003RGE | |
| Média Intel Core i9-13900H (6108 - 11631, n=25) | |
| HP ZBook Studio 16 G9 62U04EA | |
| MSI CreatorPro Z16P B12UKST | |
| Schenker VISION 16 Pro (M23) | |
| Samsung Galaxy Book3 Ultra 16, i9-13900H RTX 4070 | |
| AIDA64 / FPU Mandel | |
| Média da turma Workstation (44497 - 98153, n=23, últimos 2 anos) | |
| Lenovo ThinkPad P1 G6-21FV000DGE | |
| Lenovo ThinkPad X1 Extreme G5-21DE003RGE | |
| Dell Precision 5000 5680 | |
| HP ZBook Studio 16 G9 62U04EA | |
| Média Intel Core i9-13900H (11283 - 48474, n=25) | |
| Samsung Galaxy Book3 Ultra 16, i9-13900H RTX 4070 | |
| MSI CreatorPro Z16P B12UKST | |
| Schenker VISION 16 Pro (M23) | |
| AIDA64 / CPU AES | |
| MSI CreatorPro Z16P B12UKST | |
| Média da turma Workstation (73133 - 187841, n=23, últimos 2 anos) | |
| Média Intel Core i9-13900H (3691 - 149377, n=25) | |
| Lenovo ThinkPad X1 Extreme G5-21DE003RGE | |
| Lenovo ThinkPad P1 G6-21FV000DGE | |
| HP ZBook Studio 16 G9 62U04EA | |
| Dell Precision 5000 5680 | |
| Schenker VISION 16 Pro (M23) | |
| Samsung Galaxy Book3 Ultra 16, i9-13900H RTX 4070 | |
| AIDA64 / CPU ZLib | |
| Média da turma Workstation (929 - 2148, n=23, últimos 2 anos) | |
| Lenovo ThinkPad P1 G6-21FV000DGE | |
| Lenovo ThinkPad X1 Extreme G5-21DE003RGE | |
| HP ZBook Studio 16 G9 62U04EA | |
| Média Intel Core i9-13900H (789 - 1254, n=25) | |
| MSI CreatorPro Z16P B12UKST | |
| Dell Precision 5000 5680 | |
| Samsung Galaxy Book3 Ultra 16, i9-13900H RTX 4070 | |
| Schenker VISION 16 Pro (M23) | |
| AIDA64 / FP64 Ray-Trace | |
| Média da turma Workstation (8545 - 32891, n=23, últimos 2 anos) | |
| Lenovo ThinkPad P1 G6-21FV000DGE | |
| Lenovo ThinkPad X1 Extreme G5-21DE003RGE | |
| HP ZBook Studio 16 G9 62U04EA | |
| Dell Precision 5000 5680 | |
| Média Intel Core i9-13900H (3655 - 10716, n=25) | |
| MSI CreatorPro Z16P B12UKST | |
| Schenker VISION 16 Pro (M23) | |
| Samsung Galaxy Book3 Ultra 16, i9-13900H RTX 4070 | |
| AIDA64 / CPU PhotoWorxx | |
| Média da turma Workstation (37151 - 93684, n=23, últimos 2 anos) | |
| Samsung Galaxy Book3 Ultra 16, i9-13900H RTX 4070 | |
| Dell Precision 5000 5680 | |
| Schenker VISION 16 Pro (M23) | |
| MSI CreatorPro Z16P B12UKST | |
| Média Intel Core i9-13900H (10871 - 50488, n=25) | |
| HP ZBook Studio 16 G9 62U04EA | |
| Lenovo ThinkPad P1 G6-21FV000DGE | |
| Lenovo ThinkPad X1 Extreme G5-21DE003RGE | |
Desempenho do sistema
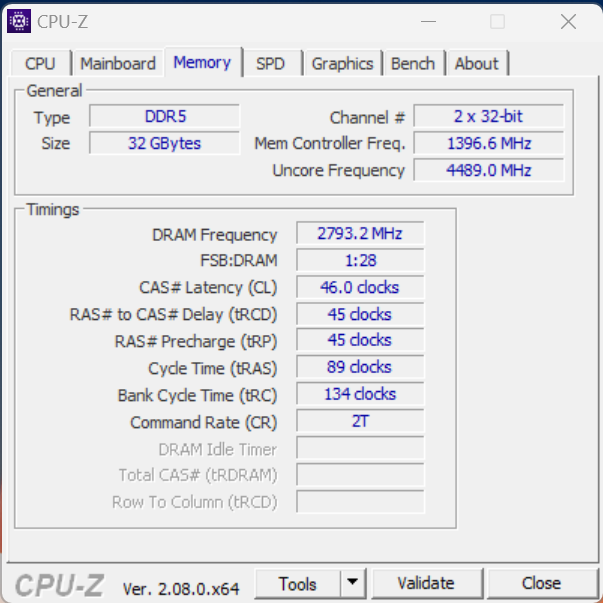
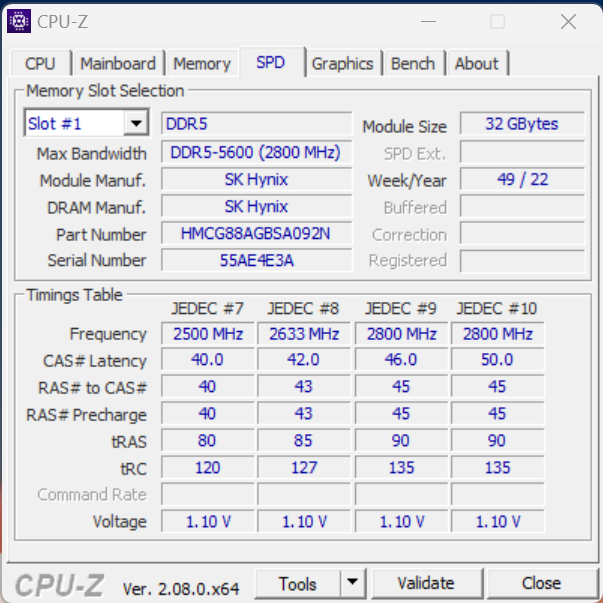
O desempenho do sistema do ThinkPad P1 Gen 6 é excelente, um fato apoiado por benchmarks sintéticos e por nossa avaliação subjetiva de desempenho. Como previsto, os benchmarks de RAM são ligeiramente inferiores devido à configuração de canal único da memória, em comparação com os modelos com RAM de canal duplo. Durante todo o teste, não houve problemas de congelamento ou gagueira.
CrossMark: Overall | Productivity | Creativity | Responsiveness
| PCMark 10 / Score | |
| Dell Precision 5000 5680 | |
| Média da turma Workstation (6563 - 10409, n=19, últimos 2 anos) | |
| Lenovo ThinkPad P1 G6-21FV000DGE | |
| Média Intel Core i9-13900H, NVIDIA RTX 2000 Ada Generation Laptop (n=1) | |
| Schenker VISION 16 Pro (M23) | |
| Lenovo ThinkPad X1 Extreme G5-21DE003RGE | |
| MSI CreatorPro Z16P B12UKST | |
| HP ZBook Studio 16 G9 62U04EA | |
| Samsung Galaxy Book3 Ultra 16, i9-13900H RTX 4070 | |
| PCMark 10 / Essentials | |
| Dell Precision 5000 5680 | |
| Lenovo ThinkPad P1 G6-21FV000DGE | |
| Média Intel Core i9-13900H, NVIDIA RTX 2000 Ada Generation Laptop (n=1) | |
| Schenker VISION 16 Pro (M23) | |
| MSI CreatorPro Z16P B12UKST | |
| Lenovo ThinkPad X1 Extreme G5-21DE003RGE | |
| Média da turma Workstation (9622 - 11157, n=19, últimos 2 anos) | |
| HP ZBook Studio 16 G9 62U04EA | |
| Samsung Galaxy Book3 Ultra 16, i9-13900H RTX 4070 | |
| PCMark 10 / Productivity | |
| Média da turma Workstation (8789 - 20616, n=19, últimos 2 anos) | |
| Dell Precision 5000 5680 | |
| Lenovo ThinkPad P1 G6-21FV000DGE | |
| Média Intel Core i9-13900H, NVIDIA RTX 2000 Ada Generation Laptop (n=1) | |
| Schenker VISION 16 Pro (M23) | |
| Lenovo ThinkPad X1 Extreme G5-21DE003RGE | |
| MSI CreatorPro Z16P B12UKST | |
| Samsung Galaxy Book3 Ultra 16, i9-13900H RTX 4070 | |
| HP ZBook Studio 16 G9 62U04EA | |
| PCMark 10 / Digital Content Creation | |
| Dell Precision 5000 5680 | |
| Média da turma Workstation (8108 - 15631, n=19, últimos 2 anos) | |
| Schenker VISION 16 Pro (M23) | |
| Lenovo ThinkPad P1 G6-21FV000DGE | |
| Média Intel Core i9-13900H, NVIDIA RTX 2000 Ada Generation Laptop (n=1) | |
| Lenovo ThinkPad X1 Extreme G5-21DE003RGE | |
| MSI CreatorPro Z16P B12UKST | |
| HP ZBook Studio 16 G9 62U04EA | |
| Samsung Galaxy Book3 Ultra 16, i9-13900H RTX 4070 | |
| CrossMark / Overall | |
| MSI CreatorPro Z16P B12UKST | |
| Média da turma Workstation (1307 - 2267, n=22, últimos 2 anos) | |
| Dell Precision 5000 5680 | |
| Schenker VISION 16 Pro (M23) | |
| Lenovo ThinkPad P1 G6-21FV000DGE | |
| Média Intel Core i9-13900H, NVIDIA RTX 2000 Ada Generation Laptop (n=1) | |
| HP ZBook Studio 16 G9 62U04EA | |
| Lenovo ThinkPad X1 Extreme G5-21DE003RGE | |
| Samsung Galaxy Book3 Ultra 16, i9-13900H RTX 4070 | |
| CrossMark / Productivity | |
| MSI CreatorPro Z16P B12UKST | |
| Schenker VISION 16 Pro (M23) | |
| Dell Precision 5000 5680 | |
| Lenovo ThinkPad P1 G6-21FV000DGE | |
| Média Intel Core i9-13900H, NVIDIA RTX 2000 Ada Generation Laptop (n=1) | |
| Média da turma Workstation (1130 - 2122, n=22, últimos 2 anos) | |
| HP ZBook Studio 16 G9 62U04EA | |
| Lenovo ThinkPad X1 Extreme G5-21DE003RGE | |
| Samsung Galaxy Book3 Ultra 16, i9-13900H RTX 4070 | |
| CrossMark / Creativity | |
| Média da turma Workstation (1657 - 2725, n=22, últimos 2 anos) | |
| Dell Precision 5000 5680 | |
| HP ZBook Studio 16 G9 62U04EA | |
| MSI CreatorPro Z16P B12UKST | |
| Lenovo ThinkPad P1 G6-21FV000DGE | |
| Média Intel Core i9-13900H, NVIDIA RTX 2000 Ada Generation Laptop (n=1) | |
| Schenker VISION 16 Pro (M23) | |
| Lenovo ThinkPad X1 Extreme G5-21DE003RGE | |
| Samsung Galaxy Book3 Ultra 16, i9-13900H RTX 4070 | |
| CrossMark / Responsiveness | |
| MSI CreatorPro Z16P B12UKST | |
| Schenker VISION 16 Pro (M23) | |
| Média da turma Workstation (993 - 2096, n=22, últimos 2 anos) | |
| Lenovo ThinkPad P1 G6-21FV000DGE | |
| Média Intel Core i9-13900H, NVIDIA RTX 2000 Ada Generation Laptop (n=1) | |
| Dell Precision 5000 5680 | |
| HP ZBook Studio 16 G9 62U04EA | |
| Lenovo ThinkPad X1 Extreme G5-21DE003RGE | |
| Samsung Galaxy Book3 Ultra 16, i9-13900H RTX 4070 | |
| PCMark 10 Score | 7522 pontos | |
Ajuda | ||
| AIDA64 / Memory Copy | |
| Média da turma Workstation (56003 - 164795, n=23, últimos 2 anos) | |
| Dell Precision 5000 5680 | |
| Samsung Galaxy Book3 Ultra 16, i9-13900H RTX 4070 | |
| Schenker VISION 16 Pro (M23) | |
| MSI CreatorPro Z16P B12UKST | |
| HP ZBook Studio 16 G9 62U04EA | |
| Média Intel Core i9-13900H (37448 - 74486, n=25) | |
| Lenovo ThinkPad P1 G6-21FV000DGE | |
| Lenovo ThinkPad X1 Extreme G5-21DE003RGE | |
| AIDA64 / Memory Read | |
| Média da turma Workstation (55795 - 121563, n=23, últimos 2 anos) | |
| Schenker VISION 16 Pro (M23) | |
| Samsung Galaxy Book3 Ultra 16, i9-13900H RTX 4070 | |
| Dell Precision 5000 5680 | |
| MSI CreatorPro Z16P B12UKST | |
| HP ZBook Studio 16 G9 62U04EA | |
| Média Intel Core i9-13900H (41599 - 75433, n=25) | |
| Lenovo ThinkPad P1 G6-21FV000DGE | |
| Lenovo ThinkPad X1 Extreme G5-21DE003RGE | |
| AIDA64 / Memory Write | |
| Samsung Galaxy Book3 Ultra 16, i9-13900H RTX 4070 | |
| Média da turma Workstation (55663 - 214520, n=23, últimos 2 anos) | |
| Dell Precision 5000 5680 | |
| Schenker VISION 16 Pro (M23) | |
| MSI CreatorPro Z16P B12UKST | |
| Média Intel Core i9-13900H (36152 - 88505, n=25) | |
| HP ZBook Studio 16 G9 62U04EA | |
| Lenovo ThinkPad P1 G6-21FV000DGE | |
| Lenovo ThinkPad X1 Extreme G5-21DE003RGE | |
| AIDA64 / Memory Latency | |
| Média da turma Workstation (84.5 - 165.2, n=23, últimos 2 anos) | |
| Samsung Galaxy Book3 Ultra 16, i9-13900H RTX 4070 | |
| MSI CreatorPro Z16P B12UKST | |
| Dell Precision 5000 5680 | |
| HP ZBook Studio 16 G9 62U04EA | |
| Média Intel Core i9-13900H (75.8 - 102.3, n=25) | |
| Lenovo ThinkPad X1 Extreme G5-21DE003RGE | |
| Schenker VISION 16 Pro (M23) | |
| Lenovo ThinkPad P1 G6-21FV000DGE | |
* ... menor é melhor
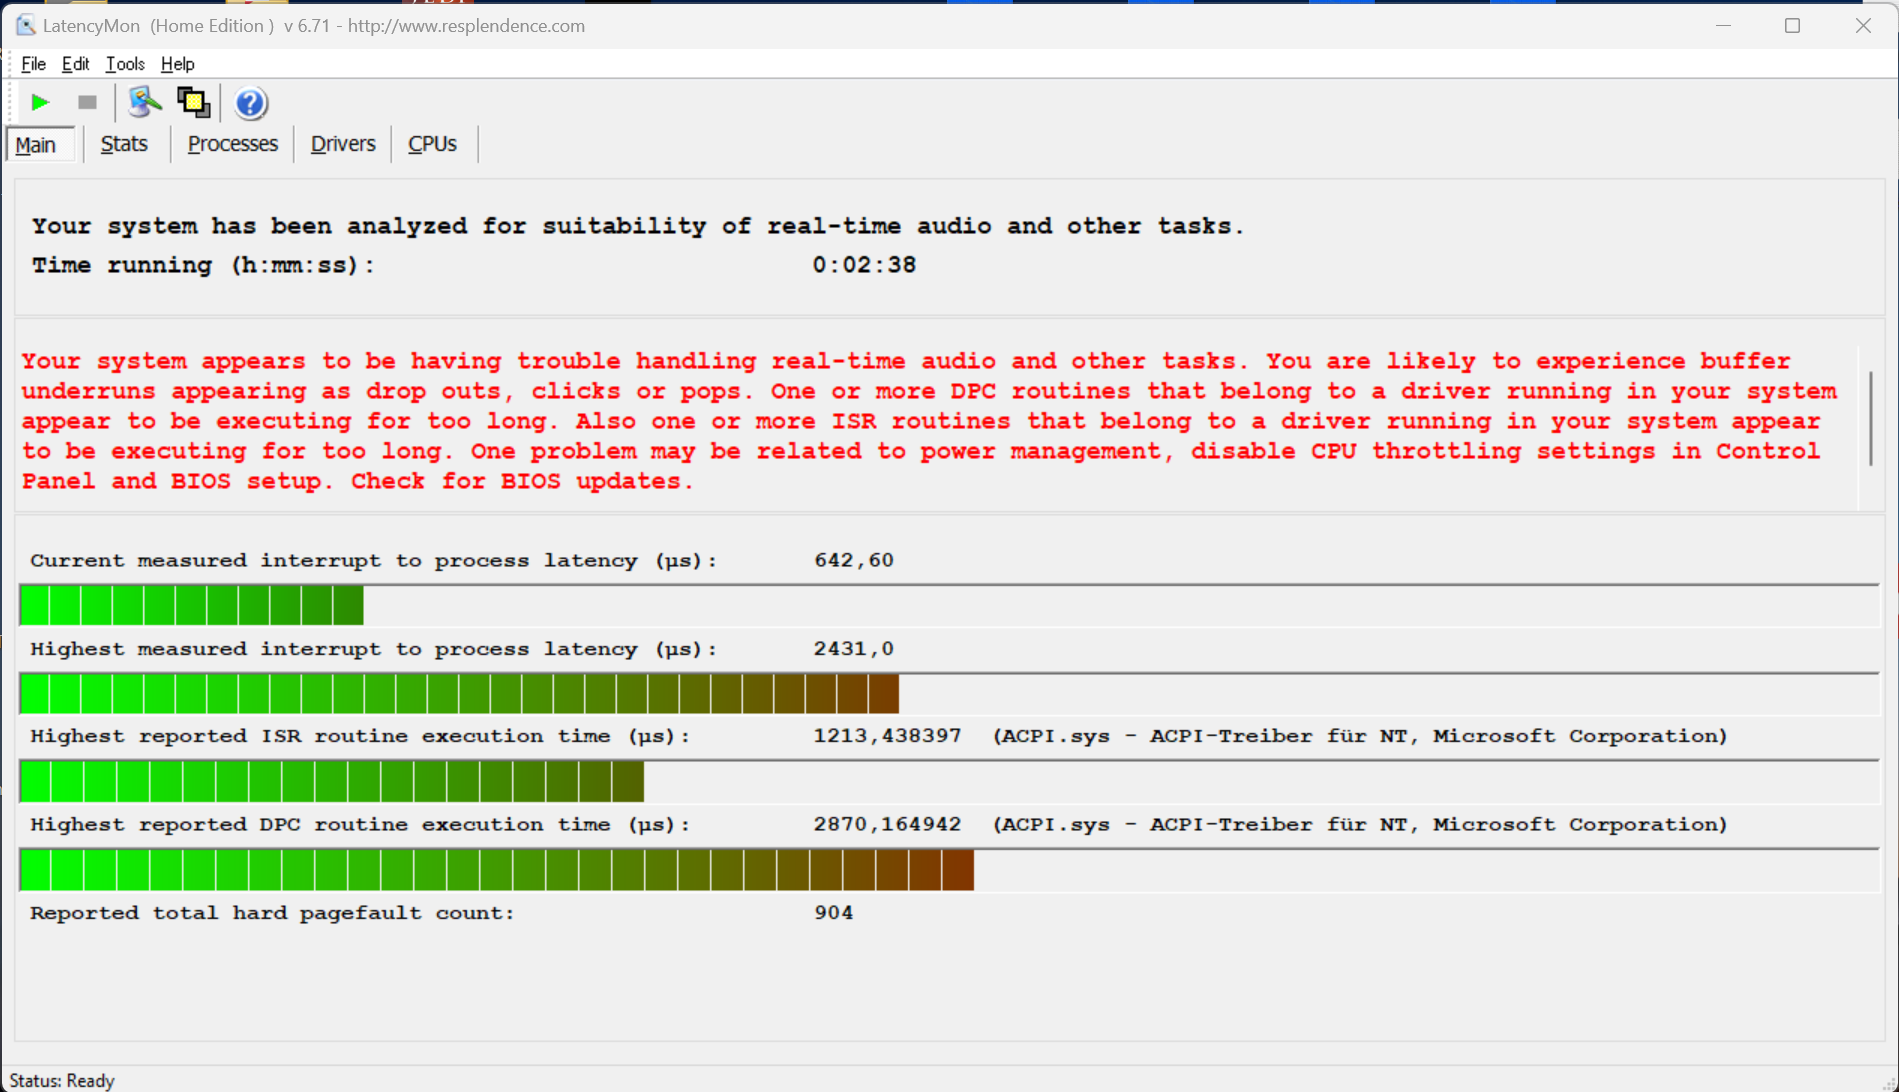
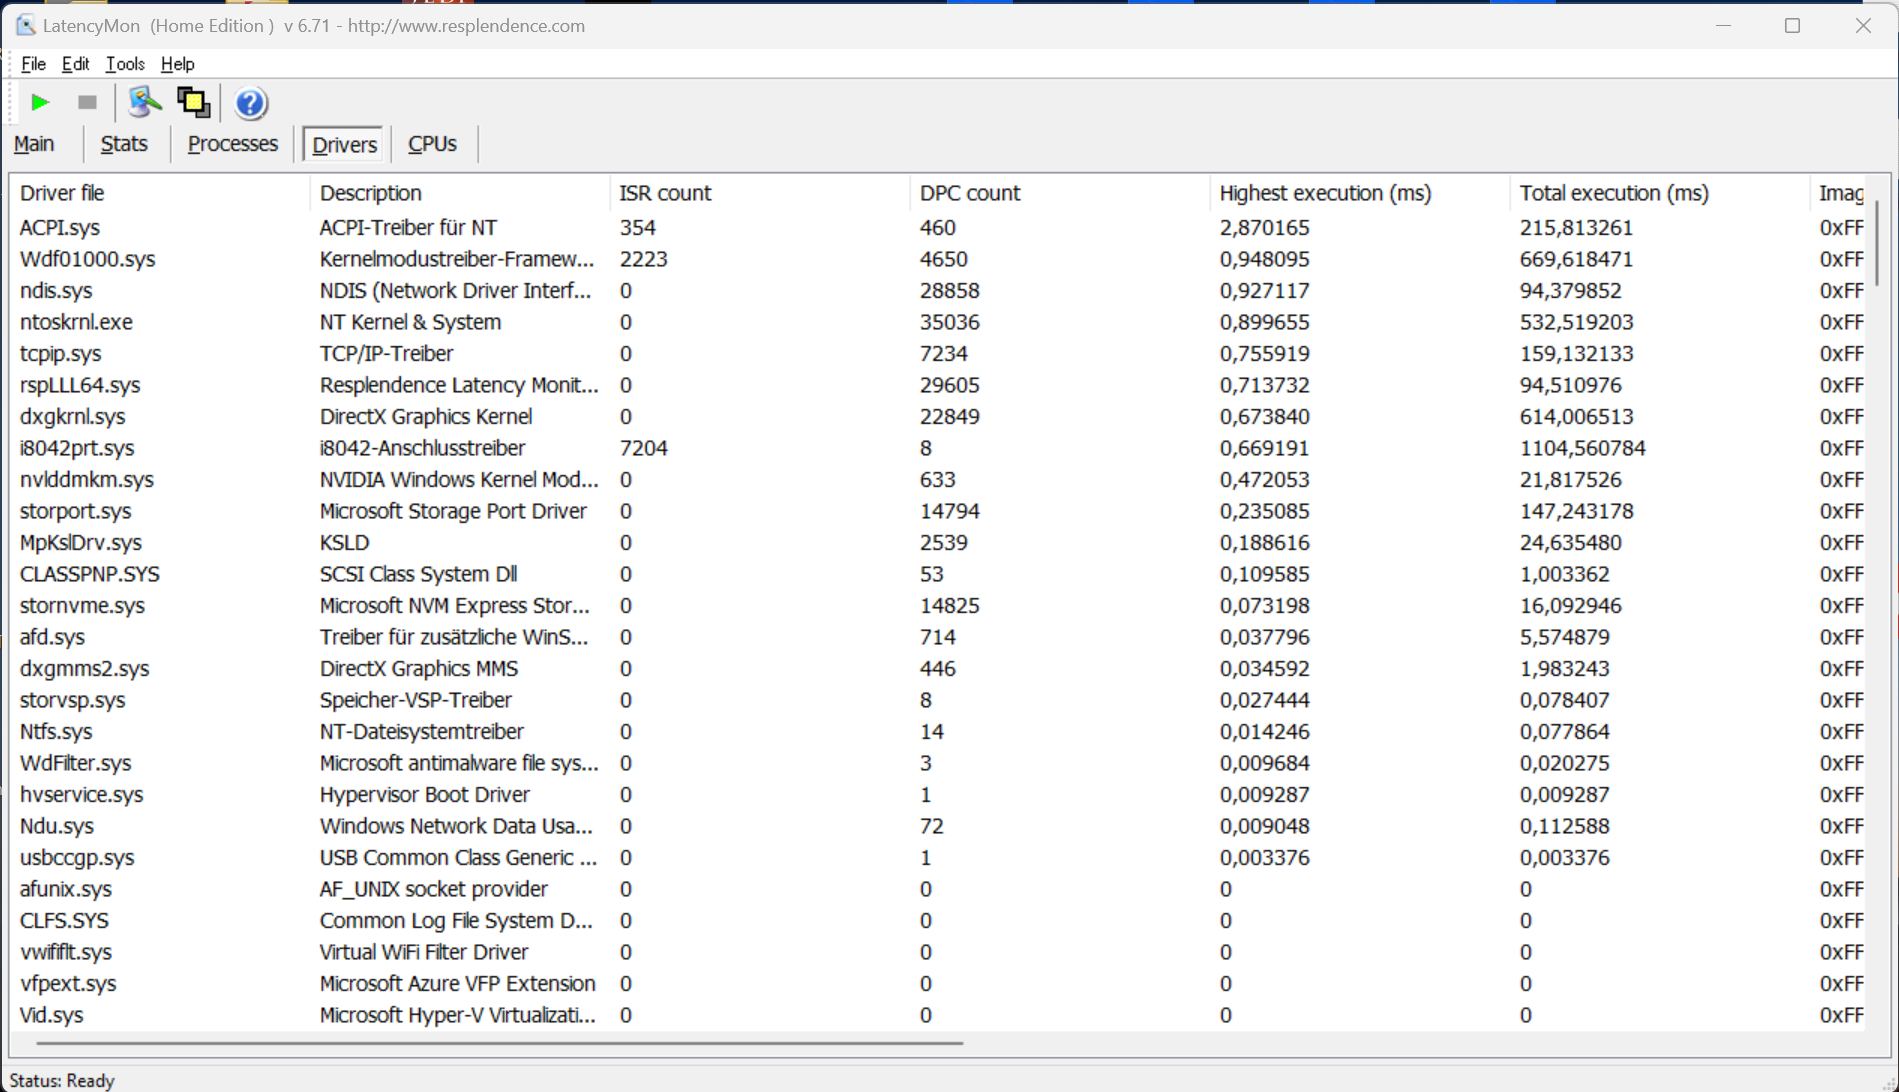
Latência DPC
Nosso dispositivo de teste apresentou dificuldades em aplicativos de áudio em tempo real com a versão atual do BIOS (1.14) em nosso teste de latência padronizado, que incluiu navegação na Web, streaming 4K do YouTube e carga da CPU. Entretanto, durante a reprodução de vídeo, não houve perda de quadros.
| DPC Latencies / LatencyMon - interrupt to process latency (max), Web, Youtube, Prime95 | |
| Samsung Galaxy Book3 Ultra 16, i9-13900H RTX 4070 | |
| Lenovo ThinkPad P1 G6-21FV000DGE | |
| Dell Precision 5000 5680 | |
| Lenovo ThinkPad X1 Extreme G5-21DE003RGE | |
| HP ZBook Studio 16 G9 62U04EA | |
| Schenker VISION 16 Pro (M23) | |
| MSI CreatorPro Z16P B12UKST | |
* ... menor é melhor
Dispositivos de armazenamento
Dois slots PCIe 4.0 rápidos estão disponíveis nas configurações do P1 G6 com resfriamento convencional. Nosso dispositivo de teste está equipado com o SK Hynix PC711 de 1 TB, que fornece 897 GB de RAM livre após a primeira configuração. O SSD PCIe 4.0 tem taxas de transferência excepcionais, atingindo mais de 7 GB/s no desempenho máximo. A Lenovo também adiciona uma placa de metal ao SSD para proporcionar um desempenho consistente, mesmo sob uso constante. Há mais benchmarks de SSD acessíveis aqui.

* ... menor é melhor
Continuous power read: DiskSpd Read Loop, Queue Depth 8
Placa de vídeo - RTX 2000 Ada
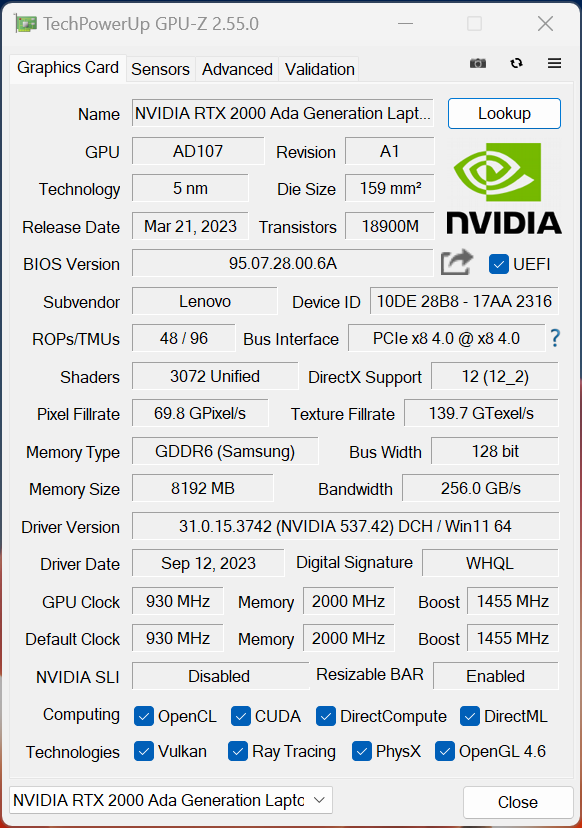
A Lenovo agora inclui as mais novas GPUs Ada Lovelace da Nvidia. Além dos modelos GeForce Laptop RTX 4060, Laptop RTX 4080e RTX 4090 Laptop (cada um com uma variante de 80 watts, conforme indicado na folha de especificações), ela também oferece novos modelos profissionais, como o RTX 1000 Ada (65 watts), RTX 2000 Ada (65 watts), RTX 3500 Ada, RTX 4000 Adae o carro-chefe RTX 5000 Ada (80 watts TGP).
Surpreendentemente, o RTX 2000 Ada em nossa amostra de análise é baseado no laptop GeForce RTX 4060, e a Lenovo optou pelo resfriamento convencional. Como resultado, ele funciona com "apenas" 65 watts (incluindo 15 watts de Dynamic Boost). Nos testes 3DMark, a RTX 2000 Ada supera o desempenho do laptop GeForce RTX 4060 no ROG Flow Z13 da Asus em alguns pontos percentuais, onde a GPU também pode consumir 65 watts (incluindo 15 watts de Dynamic Boost). Em termos de desempenho puro, a GPU representa um avanço significativo, superando o antigo RTX A3000 e o laptop RTX 3060 no ThinkPad X1 Extreme anterior. Além disso, a vantagem sobre o antigo RTX A2000 é de quase 70%.
Em benchmarks profissionais, o RTX 2000 Ada supera consistentemente o antigo
RTX A3000e, muitas vezes, deixa para trás a versão de 50 watts do RTX 3000 Ada no modelo mais compacto Dell Precision 5480.O desempenho consistente da GPU, mesmo sob estresse contínuo, é uma grande vantagem. Quando alimentado por uma bateria, o RTX 2000 Ada é limitado a um uso máximo de 45 watts, o que resulta em um desempenho gráfico cerca de 15% inferior (7.107 pontos em Time Spy Graphics). Mais benchmarks de GPU estão listados aqui.
| 3DMark 06 Standard Score | 53707 pontos | |
| 3DMark Vantage P Result | 37844 pontos | |
| 3DMark 11 Performance | 27558 pontos | |
| 3DMark Fire Strike Score | 19987 pontos | |
| 3DMark Time Spy Score | 8849 pontos | |
Ajuda | ||
| Geekbench 6.7 - GPU OpenCL | |
| HP ZBook Fury 16 G10 | |
| Dell Precision 5000 5680 | |
| Dell Precision 5480 | |
| Lenovo ThinkPad P1 G6-21FV000DGE | |
| Blender / v3.3 Classroom OPTIX/RTX | |
| HP ZBook Studio 16 G9 62U04EA | |
| Lenovo ThinkPad X1 Extreme G5-21DE003RGE | |
| MSI CreatorPro Z16P B12UKST | |
| Lenovo ThinkPad P1 G6-21FV000DGE | |
| Média NVIDIA RTX 2000 Ada Generation Laptop (25 - 31, n=4) | |
| Samsung Galaxy Book3 Ultra 16, i9-13900H RTX 4070 | |
| Schenker VISION 16 Pro (M23) | |
| Média da turma Workstation (10 - 43, n=17, últimos 2 anos) | |
| Dell Precision 5000 5680 | |
| Blender / v3.3 Classroom CUDA | |
| HP ZBook Studio 16 G9 62U04EA | |
| Média NVIDIA RTX 2000 Ada Generation Laptop (51 - 155, n=4) | |
| Lenovo ThinkPad X1 Extreme G5-21DE003RGE | |
| MSI CreatorPro Z16P B12UKST | |
| Lenovo ThinkPad P1 G6-21FV000DGE | |
| Samsung Galaxy Book3 Ultra 16, i9-13900H RTX 4070 | |
| Média da turma Workstation (16 - 74, n=17, últimos 2 anos) | |
| Schenker VISION 16 Pro (M23) | |
| Dell Precision 5000 5680 | |
| Blender / v3.3 Classroom CPU | |
| Samsung Galaxy Book3 Ultra 16, i9-13900H RTX 4070 | |
| Schenker VISION 16 Pro (M23) | |
| Dell Precision 5000 5680 | |
| MSI CreatorPro Z16P B12UKST | |
| HP ZBook Studio 16 G9 62U04EA | |
| Lenovo ThinkPad P1 G6-21FV000DGE | |
| Lenovo ThinkPad X1 Extreme G5-21DE003RGE | |
| Média NVIDIA RTX 2000 Ada Generation Laptop (291 - 347, n=4) | |
| Média da turma Workstation (148 - 364, n=23, últimos 2 anos) | |
* ... menor é melhor
Desempenho em jogos
Não encontramos problemas com o driver profissional durante nossos benchmarks de jogos, e o desempenho está alinhado com o de um laptop GeForce Laptop RTX 4060 com taxas de TGP comparáveis. Consequentemente, os jogos atuais, como Star Wars Jedi Survivor, Assassins' Creed Mirage ou Cyberpunk, podem ser jogados sem problemas nas configurações máximas e na resolução de 1080p. Para a resolução WQHD nativa, os usuários talvez precisem recorrer a métodos de upscaling como o DLSS da Nvidia. É importante ressaltar que o desempenho permanece estável mesmo durante sessões prolongadas de jogos.
| The Witcher 3 - 1920x1080 Ultra Graphics & Postprocessing (HBAO+) | |
| Dell Precision 5000 5680 | |
| Schenker VISION 16 Pro (M23) | |
| Média da turma Workstation (n=1últimos 2 anos) | |
| Lenovo ThinkPad P1 G6-21FV000DGE | |
| Samsung Galaxy Book3 Ultra 16, i9-13900H RTX 4070 | |
| Lenovo ThinkPad X1 Extreme G5-21DE003RGE | |
| MSI CreatorPro Z16P B12UKST | |
| HP ZBook Studio 16 G9 62U04EA | |
| Far Cry 6 | |
| 1920x1080 High Graphics Quality AA:T | |
| Lenovo ThinkPad P1 G6-21FV000DGE | |
| Média NVIDIA RTX 2000 Ada Generation Laptop (n=1) | |
| 1920x1080 Ultra Graphics Quality + HD Textures AA:T | |
| Lenovo ThinkPad P1 G6-21FV000DGE | |
| Média NVIDIA RTX 2000 Ada Generation Laptop (n=1) | |
| Star Wars Jedi Survivor | |
| 1920x1080 High Preset | |
| Schenker VISION 16 Pro (M23) | |
| Lenovo ThinkPad P1 G6-21FV000DGE | |
| Média NVIDIA RTX 2000 Ada Generation Laptop (n=1) | |
| 1920x1080 Epic Preset | |
| Schenker VISION 16 Pro (M23) | |
| Lenovo ThinkPad P1 G6-21FV000DGE | |
| Média NVIDIA RTX 2000 Ada Generation Laptop (n=1) | |
| Hogwarts Legacy | |
| 1920x1080 High Preset AA:High T | |
| Lenovo ThinkPad P1 G6-21FV000DGE | |
| Média NVIDIA RTX 2000 Ada Generation Laptop (n=1) | |
| Samsung Galaxy Book3 Ultra 16, i9-13900H RTX 4070 | |
| 1920x1080 Ultra Preset AA:High T | |
| Lenovo ThinkPad P1 G6-21FV000DGE | |
| Média NVIDIA RTX 2000 Ada Generation Laptop (n=1) | |
| Samsung Galaxy Book3 Ultra 16, i9-13900H RTX 4070 | |
| F1 23 | |
| 1920x1080 High Preset AA:T AF:16x | |
| Média NVIDIA RTX 2000 Ada Generation Laptop (142.1 - 147, n=2) | |
| Lenovo ThinkPad P1 G6-21FV000DGE | |
| 1920x1080 Ultra High Preset AA:T AF:16x | |
| Média NVIDIA RTX 2000 Ada Generation Laptop (44.4 - 49.2, n=2) | |
| Lenovo ThinkPad P1 G6-21FV000DGE | |

Witcher 3 FPS chart
| baixo | média | alto | ultra | QHD | |
|---|---|---|---|---|---|
| GTA V (2015) | 173 | 101.6 | 74.6 | ||
| The Witcher 3 (2015) | 390 | 261 | 164 | 79.6 | 65 |
| Dota 2 Reborn (2015) | 178.4 | 153.1 | 143.9 | 133.4 | |
| Final Fantasy XV Benchmark (2018) | 111.2 | 83.5 | 63.7 | ||
| X-Plane 11.11 (2018) | 149.2 | 131.6 | 108.9 | ||
| Far Cry 5 (2018) | 175 | 130 | 120 | 113 | 81 |
| Strange Brigade (2018) | 459 | 228 | 182.5 | 158.2 | 107.5 |
| F1 2021 (2021) | 353 | 230 | 186.6 | 99.2 | 74.9 |
| Far Cry 6 (2021) | 157 | 121 | 104 | 87 | 63 |
| Cyberpunk 2077 1.6 (2022) | 101 | 81 | 72 | 65 | 41 |
| F1 22 (2022) | 213 | 193.2 | 138.5 | 52.8 | 34.2 |
| Hogwarts Legacy (2023) | 101 | 80 | 64 | 53 | 38 |
| Star Wars Jedi Survivor (2023) | 49 | 45 | 42 | 40 | 27 |
| F1 23 (2023) | 202 | 192.1 | 142.1 | 44.4 | 27.6 |
| Assassin's Creed Mirage (2023) | 113 | 103 | 97 | 76 | 58 |
Emissões - O ThinkPad geralmente permanece silencioso no uso diário
Ruído do sistema
Durante as tarefas básicas, as duas ventoinhas do ThinkPad geralmente permanecem completamente inativas. Elas só se tornam audíveis quando o processador ou a placa de vídeo dedicada é acionada. Vale a pena observar que, quando ativadas, as ventoinhas operam em alta velocidade instantaneamente, sem um acúmulo gradual. Em cenários de jogos, medimos os níveis de ruído que variam de aproximadamente 41 a 48 dB(A), sendo que 48 dB(A) representa o volume máximo da ventoinha durante o teste de estresse. Nos dois modos de desempenho mais eficientes, o nível de ruído atinge um máximo de 40,7 dB(A). Notavelmente, não foram detectados outros ruídos eletrônicos em nosso dispositivo de teste.
Barulho
| Ocioso |
| 24.5 / 24.5 / 24.5 dB |
| Carga |
| 48 / 48 dB |
 | ||
30 dB silencioso 40 dB(A) audível 50 dB(A) ruidosamente alto |
||
min: | ||
| Lenovo ThinkPad P1 G6-21FV000DGE RTX 2000 Ada Generation Laptop, i9-13900H, SK Hynix PC711 1TB HFS001TDE9X084N | Dell Precision 5000 5680 RTX 5000 Ada Generation Laptop, i9-13900H, 2x SK hynix PC801 HFS512GEJ9X101N RAID 0 | Samsung Galaxy Book3 Ultra 16, i9-13900H RTX 4070 GeForce RTX 4070 Laptop GPU, i9-13900H, Samsung PM9A1 MZVL21T0HCLR | HP ZBook Studio 16 G9 62U04EA RTX A2000 Laptop GPU, i7-12800H, Micron 3400 1TB MTFDKBA1T0TFH | MSI CreatorPro Z16P B12UKST RTX A3000 Laptop GPU, i7-12700H, Samsung PM9A1 MZVL21T0HCLR | Schenker VISION 16 Pro (M23) GeForce RTX 4070 Laptop GPU, i7-13700H, Samsung 990 Pro 1 TB | Lenovo ThinkPad X1 Extreme G5-21DE003RGE GeForce RTX 3060 Laptop GPU, i7-12700H, Micron 3400 1TB MTFDKBA1T0TFH | |
|---|---|---|---|---|---|---|---|
| Noise | 2% | -4% | -2% | -4% | -13% | 3% | |
| desligado / ambiente * (dB) | 24.5 | 22.8 7% | 25.2 -3% | 24 2% | 24.1 2% | 25.9 -6% | 23.2 5% |
| Idle Minimum * (dB) | 24.5 | 23 6% | 25.2 -3% | 24 2% | 27.1 -11% | 25.9 -6% | 23.2 5% |
| Idle Average * (dB) | 24.5 | 23 6% | 25.2 -3% | 27.7 -13% | 27.1 -11% | 25.9 -6% | 23.2 5% |
| Idle Maximum * (dB) | 24.5 | 23 6% | 31.3 -28% | 27.7 -13% | 27.1 -11% | 32 -31% | 23.2 5% |
| Load Average * (dB) | 48 | 37.2 22% | 38.8 19% | 39.8 17% | 42.9 11% | 47.2 2% | 45.5 5% |
| Witcher 3 ultra * (dB) | 40.7 | 51 -25% | 44.3 -9% | 44 -8% | 53.1 -30% | 45.5 -12% | |
| Load Maximum * (dB) | 48 | 51 -6% | 51.2 -7% | 47.7 1% | 47 2% | 53.1 -11% | 45.5 5% |
* ... menor é melhor
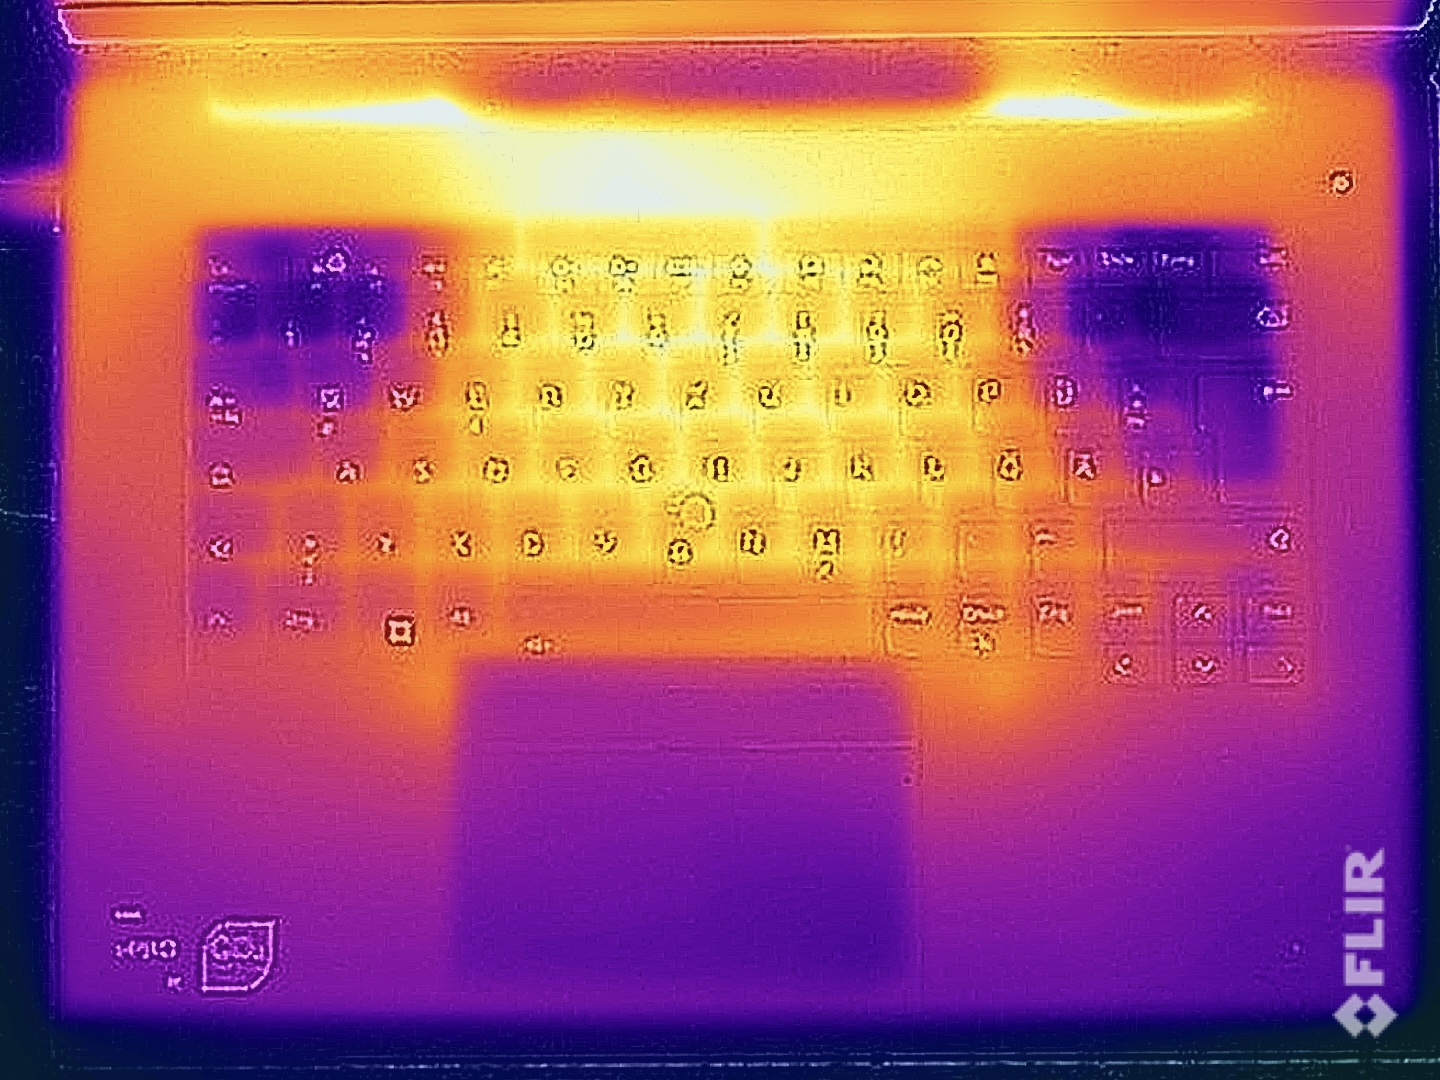
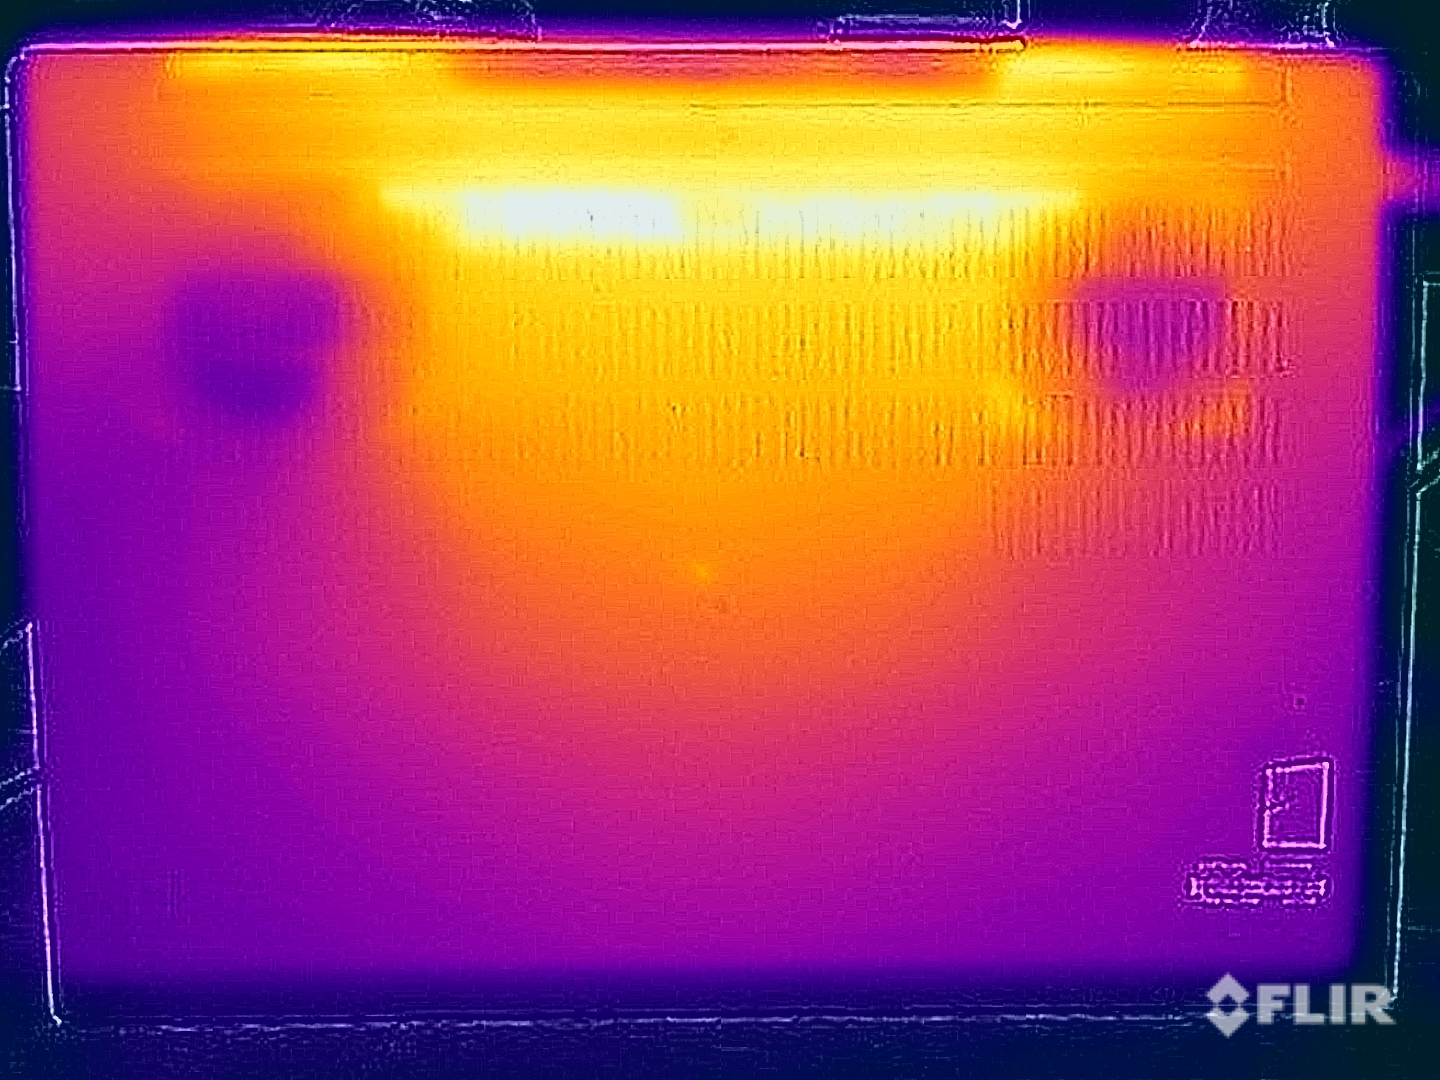
Temperatura
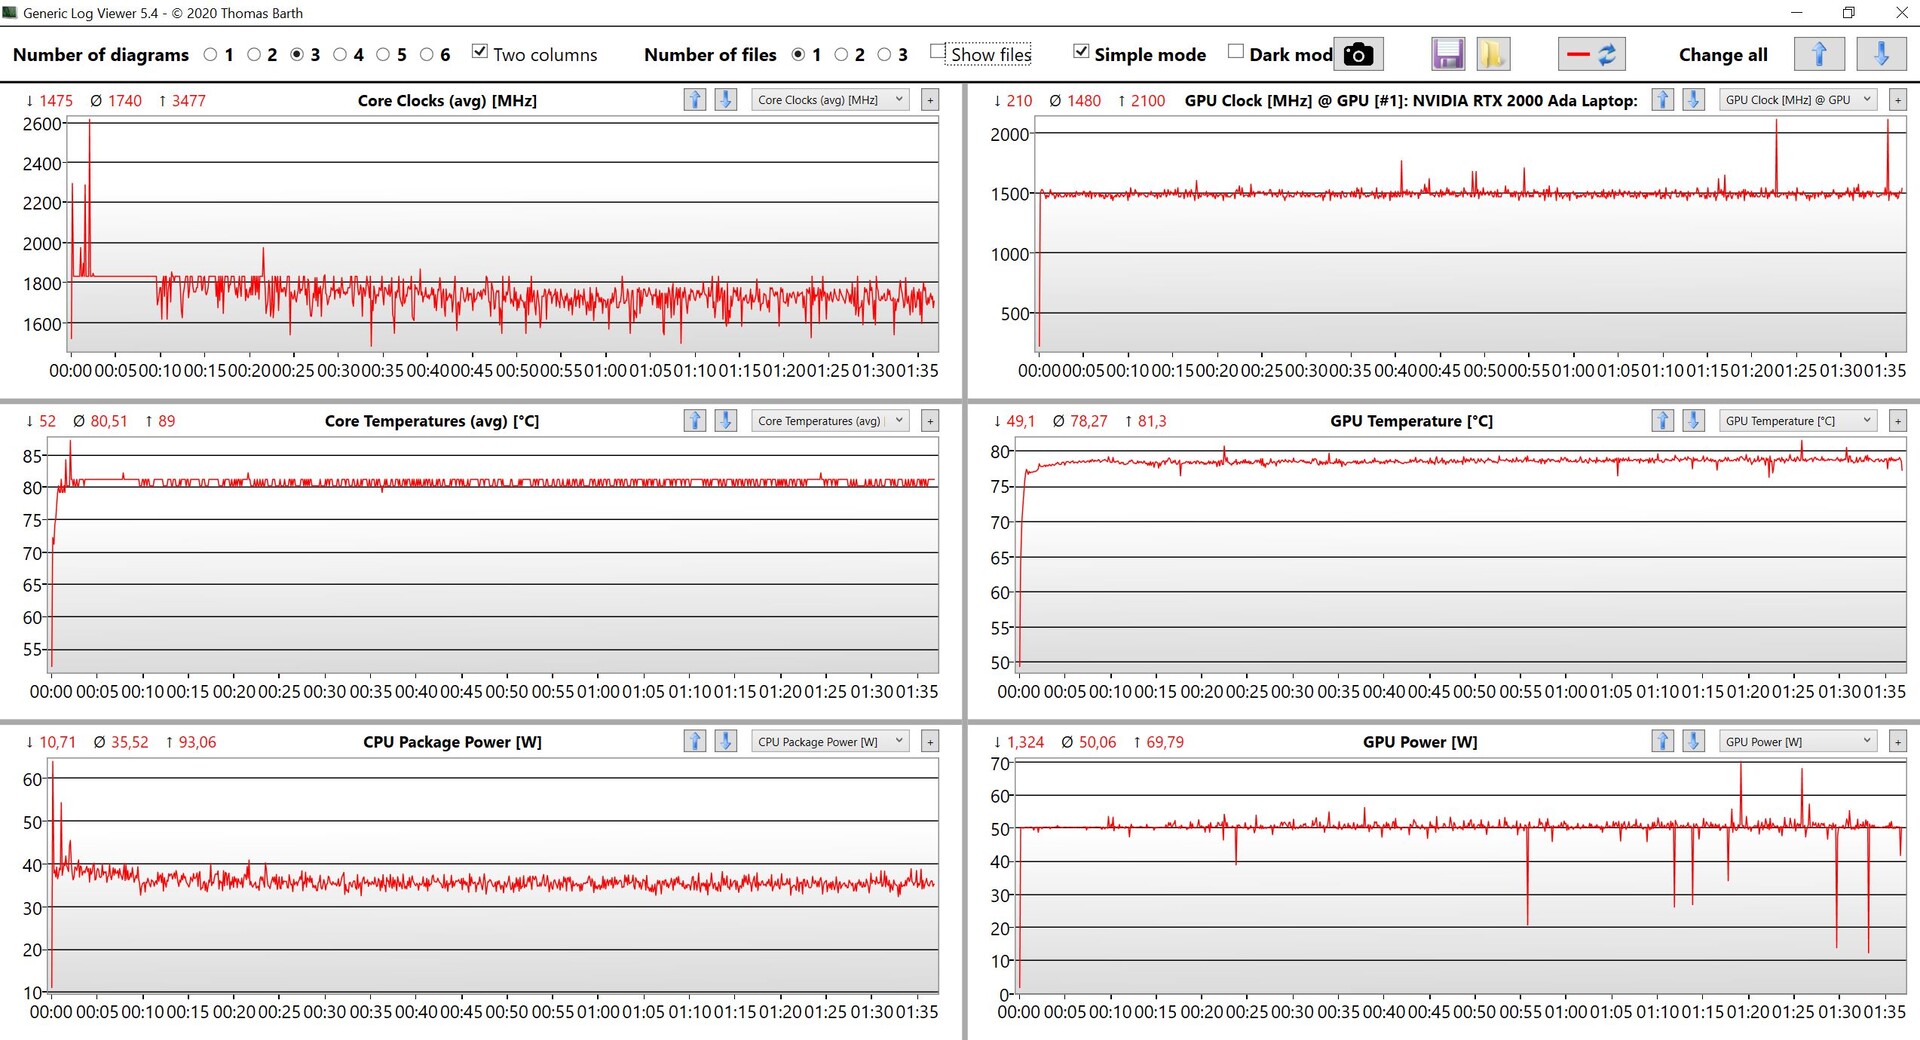
As temperaturas da superfície permanecem completamente seguras durante tarefas simples, e o gabinete mal esquenta. Semelhante ao modelo anteriorsob carga pesada, as temperaturas excedem 50°C na parte inferior. É aconselhável não colocar o dispositivo sobre as coxas durante esses períodos, embora, devido ao seu tamanho, esse cenário seja improvável. A área do teclado também pode atingir temperaturas de até 47 °C, embora tenhamos registrado temperaturas ainda mais altas no modelo anterior. Digitar sob carga (ou durante jogos) pode resultar em dedos quentes, mas não há desconforto significativo.
Durante o teste de estresse, a placa de vídeo dedicada funciona com os 50 watts especificados, enquanto o processador se estabiliza em cerca de 35 watts. O sistema pode suportar uma carga de resfriamento total de 85 watts continuamente. Para fins de comparação, a geração G5 com a câmara de vapor gerenciava cerca de 100 watts no total (60 watts para a GPU e 40 watts para a CPU).
(-) A temperatura máxima no lado superior é 47.1 °C / 117 F, em comparação com a média de 38.2 °C / 101 F , variando de 22.2 a 69.8 °C para a classe Workstation.
(-) A parte inferior aquece até um máximo de 56.5 °C / 134 F, em comparação com a média de 41.1 °C / 106 F
(+) Em uso inativo, a temperatura média para o lado superior é 26.4 °C / 80 F, em comparação com a média do dispositivo de 32 °C / ### class_avg_f### F.
(-) Jogando The Witcher 3, a temperatura média para o lado superior é 39.1 °C / 102 F, em comparação com a média do dispositivo de 32 °C / ## #class_avg_f### F.
(+) Os apoios para as mãos e o touchpad estão atingindo a temperatura máxima da pele (35.1 °C / 95.2 F) e, portanto, não estão quentes.
(-) A temperatura média da área do apoio para as mãos de dispositivos semelhantes foi 27.8 °C / 82 F (-7.3 °C / -13.2 F).
| Lenovo ThinkPad P1 G6-21FV000DGE Intel Core i9-13900H, NVIDIA RTX 2000 Ada Generation Laptop | Dell Precision 5000 5680 Intel Core i9-13900H, NVIDIA RTX 5000 Ada Generation Laptop | Samsung Galaxy Book3 Ultra 16, i9-13900H RTX 4070 Intel Core i9-13900H, NVIDIA GeForce RTX 4070 Laptop GPU | HP ZBook Studio 16 G9 62U04EA Intel Core i7-12800H, NVIDIA RTX A2000 Laptop GPU | MSI CreatorPro Z16P B12UKST Intel Core i7-12700H, NVIDIA RTX A3000 Laptop GPU | Schenker VISION 16 Pro (M23) Intel Core i7-13700H, NVIDIA GeForce RTX 4070 Laptop GPU | Lenovo ThinkPad X1 Extreme G5-21DE003RGE Intel Core i7-12700H, NVIDIA GeForce RTX 3060 Laptop GPU | |
|---|---|---|---|---|---|---|---|
| Heat | -3% | -6% | 3% | -6% | 4% | -1% | |
| Maximum Upper Side * (°C) | 47.1 | 50.2 -7% | 45.9 3% | 38.7 18% | 56.3 -20% | 46.7 1% | 52 -10% |
| Maximum Bottom * (°C) | 56.5 | 32 43% | 50.9 10% | 53.4 5% | 68.3 -21% | 54.1 4% | 56.4 -0% |
| Idle Upper Side * (°C) | 28.1 | 37.4 -33% | 31.6 -12% | 27.3 3% | 25.2 10% | 26.5 6% | 26.4 6% |
| Idle Bottom * (°C) | 27.6 | 31.2 -13% | 34.2 -24% | 31.6 -14% | 25.9 6% | 26.8 3% | 27.2 1% |
* ... menor é melhor
Alto-falantes
As características do alto-falante permanecem semelhantes às do modelo antigo, e o volume máximo de quase 82 dB(A) também é comparável. O P1 G6 atual tem um desempenho ligeiramente melhor em nossas medições, possivelmente devido a otimizações de software. É altamente recomendável ativar o aplicativo Dolby pré-carregado para obter uma experiência de áudio aprimorada. Embora os alto-falantes estéreo ofereçam um bom desempenho geral, os rivais com mais alto-falantes ainda mantêm uma vantagem nesse aspecto.
Lenovo ThinkPad P1 G6-21FV000DGE análise de áudio
(±) | o volume do alto-falante é médio, mas bom (###valor### dB)
Graves 100 - 315Hz
(±) | graves reduzidos - em média 8.9% menor que a mediana
(±) | a linearidade dos graves é média (12.3% delta para a frequência anterior)
Médios 400 - 2.000 Hz
(+) | médios equilibrados - apenas 4.7% longe da mediana
(+) | médios são lineares (3.5% delta para frequência anterior)
Altos 2 - 16 kHz
(+) | agudos equilibrados - apenas 4.1% longe da mediana
(+) | os máximos são lineares (6.1% delta da frequência anterior)
Geral 100 - 16.000 Hz
(+) | o som geral é linear (12.2% diferença em relação à mediana)
Comparado com a mesma classe
» 18% de todos os dispositivos testados nesta classe foram melhores, 3% semelhantes, 79% piores
» O melhor teve um delta de 7%, a média foi 17%, o pior foi 35%
Comparado com todos os dispositivos testados
» 10% de todos os dispositivos testados foram melhores, 2% semelhantes, 88% piores
» O melhor teve um delta de 4%, a média foi 23%, o pior foi 134%
MSI CreatorPro Z16P B12UKST análise de áudio
(+) | os alto-falantes podem tocar relativamente alto (###valor### dB)
Graves 100 - 315Hz
(-) | quase nenhum baixo - em média 18.7% menor que a mediana
(±) | a linearidade dos graves é média (7% delta para a frequência anterior)
Médios 400 - 2.000 Hz
(+) | médios equilibrados - apenas 3% longe da mediana
(+) | médios são lineares (6.8% delta para frequência anterior)
Altos 2 - 16 kHz
(+) | agudos equilibrados - apenas 4.6% longe da mediana
(+) | os máximos são lineares (6.4% delta da frequência anterior)
Geral 100 - 16.000 Hz
(±) | a linearidade do som geral é média (15.2% diferença em relação à mediana)
Comparado com a mesma classe
» 33% de todos os dispositivos testados nesta classe foram melhores, 10% semelhantes, 57% piores
» O melhor teve um delta de 7%, a média foi 17%, o pior foi 35%
Comparado com todos os dispositivos testados
» 22% de todos os dispositivos testados foram melhores, 4% semelhantes, 74% piores
» O melhor teve um delta de 4%, a média foi 23%, o pior foi 134%
Gerenciamento de energia - Boa resistência com o painel IPS
Consumo de energia
O ThinkPad P1 G6 com o painel WQHD demonstra uma eficiência significativamente maior em comparação com o antigo ThinkPad X1 Extreme com o painel 4K. A experiência sugere que a tela OLED 4K opcional também exigirá muito mais energia. O consumo máximo em modo inativo a 165 Hz é de 15,3 watts, e o senhor pode economizar aproximadamente 1,5 watts no modo 60 Hz. O notebook continua bastante eficiente sob carga; durante os jogos, medimos pouco mais de 100 watts. No antecessor, ainda eram cerca de 130 watts, apesar do desempenho inferior. Embora tenhamos medido brevemente um máximo de 165 watts no início do teste de estresse, ele se estabilizou rapidamente em torno de 110 watts. A fonte de alimentação de 170 watts incluída é mais do que suficiente para esses requisitos de energia.
| desligado | |
| Ocioso | |
| Carga |
|
Key:
min: | |
| Lenovo ThinkPad P1 G6-21FV000DGE i9-13900H, RTX 2000 Ada Generation Laptop, SK Hynix PC711 1TB HFS001TDE9X084N, IPS, 2560x1600, 16" | Dell Precision 5000 5680 i9-13900H, RTX 5000 Ada Generation Laptop, 2x SK hynix PC801 HFS512GEJ9X101N RAID 0, OLED, 3840x2400, 16" | Samsung Galaxy Book3 Ultra 16, i9-13900H RTX 4070 i9-13900H, GeForce RTX 4070 Laptop GPU, Samsung PM9A1 MZVL21T0HCLR, OLED / AMOLED, 2880x1800, 16" | HP ZBook Studio 16 G9 62U04EA i7-12800H, RTX A2000 Laptop GPU, Micron 3400 1TB MTFDKBA1T0TFH, IPS, 3840x2400, 16" | MSI CreatorPro Z16P B12UKST i7-12700H, RTX A3000 Laptop GPU, Samsung PM9A1 MZVL21T0HCLR, IPS, 2560x1600, 16" | Schenker VISION 16 Pro (M23) i7-13700H, GeForce RTX 4070 Laptop GPU, Samsung 990 Pro 1 TB, IPS, 2560x1600, 16" | Lenovo ThinkPad X1 Extreme G5-21DE003RGE i7-12700H, GeForce RTX 3060 Laptop GPU, Micron 3400 1TB MTFDKBA1T0TFH, IPS, 3840x2400, 16" | Média NVIDIA RTX 2000 Ada Generation Laptop | Média da turma Workstation | |
|---|---|---|---|---|---|---|---|---|---|
| Power Consumption | -14% | 29% | -12% | -21% | -0% | -43% | 9% | -7% | |
| Idle Minimum * (Watt) | 8.3 | 8 4% | 4.3 48% | 7.2 13% | 10.8 -30% | 8.6 -4% | 11.8 -42% | 6.88 ? 17% | 9.11 ? -10% |
| Idle Average * (Watt) | 14.5 | 10.4 28% | 4.6 68% | 18.1 -25% | 16.3 -12% | 12 17% | 22.4 -54% | 12.1 ? 17% | 13.8 ? 5% |
| Idle Maximum * (Watt) | 15.3 | 30.5 -99% | 11.4 25% | 18.5 -21% | 16.9 -10% | 12.4 19% | 23.1 -51% | 14.5 ? 5% | 17.9 ? -17% |
| Load Average * (Watt) | 91.8 | 75.4 18% | 97 -6% | 112.8 -23% | 111.7 -22% | 80 13% | 138 -50% | 86.9 ? 5% | 96 ? -5% |
| Witcher 3 ultra * (Watt) | 104.7 | 134 -28% | 100.9 4% | 106.7 -2% | 152.1 -45% | 147.7 -41% | 129.9 -24% | ||
| Load Maximum * (Watt) | 164.5 | 175 -6% | 107 35% | 186 -13% | 177.4 -8% | 173.1 -5% | 225.6 -37% | 161.1 ? 2% | 180.3 ? -10% |
* ... menor é melhor
Power consumption Witcher 3 / stress test
Power consumption with external monitor
Duração da bateria
A bateria mantém sua capacidade de 90 watts-hora, permitindo uma excelente duração da bateria, especialmente no modo 60 Hz. Durante nosso teste de WLAN, o ThinkPad P1 G6 alcança aproximadamente 9,5 horas a 150 cd/m² (equivalente a 63% do brilho máximo no dispositivo de teste) e 6 horas e 43 minutos com brilho total. Considerando a tela grande e o alto brilho de quase 500 cd/m², esses resultados são bastante impressionantes. Ele dura quase 11 horas durante o teste de vídeo (também a 150 cd/m²), mas os tempos de execução são mais curtos no modo 165 Hz, como pode ser visto na tabela abaixo:
| Modo | Teste de WLAN (150 cd/m²) | Brilho máximo do teste de WLAN | Teste de vídeo (150 cd/m²) |
|---|---|---|---|
| 60 Hz | 567 minutos | 403 minutos | 674 minutos |
| 165 Hz | 500 minutos | 370 minutos | 548 minutos |
Em caso de uso intenso, a bateria pode se esgotar em pouco mais de uma hora e leva aproximadamente 100 minutos para ser totalmente recarregada quando o dispositivo é ligado. Cerca de 45% da carga está disponível após pouco menos de 20 minutos, e 80% é atingida após 50 minutos.
| Lenovo ThinkPad P1 G6-21FV000DGE i9-13900H, RTX 2000 Ada Generation Laptop, 90 Wh | Dell Precision 5000 5680 i9-13900H, RTX 5000 Ada Generation Laptop, 98 Wh | Samsung Galaxy Book3 Ultra 16, i9-13900H RTX 4070 i9-13900H, GeForce RTX 4070 Laptop GPU, 76 Wh | HP ZBook Studio 16 G9 62U04EA i7-12800H, RTX A2000 Laptop GPU, 86 Wh | MSI CreatorPro Z16P B12UKST i7-12700H, RTX A3000 Laptop GPU, 90 Wh | Schenker VISION 16 Pro (M23) i7-13700H, GeForce RTX 4070 Laptop GPU, 80 Wh | Lenovo ThinkPad X1 Extreme G5-21DE003RGE i7-12700H, GeForce RTX 3060 Laptop GPU, 90 Wh | Média da turma Workstation | |
|---|---|---|---|---|---|---|---|---|
| Duração da bateria | 30% | -18% | -19% | -39% | -10% | -3% | 4% | |
| H.264 (h) | 11.2 | 9 -20% | 8.5 -24% | 7.8 -30% | 7.3 -35% | 10.1 ? -10% | ||
| WiFi v1.3 (h) | 9.5 | 9.9 4% | 8 -16% | 6.3 -34% | 5.8 -39% | 7.8 -18% | 6.7 -29% | 8.55 ? -10% |
| Load (h) | 1.1 | 1.7 55% | 0.9 -18% | 1.1 0% | 1.3 18% | 1.7 55% | 1.441 ? 31% |
Pro
Contra
Veredicto - Estação de trabalho móvel muito boa

O novo ThinkPad P1 G6 atende às expectativas, mantendo o design inalterado do gabinete e oferecendo dois tipos diferentes de resfriamento (clássico com tubos de calor ou câmara de vapor), dependendo da placa de vídeo dedicada. A descontinuação do ThinkPad X1 Extreme é apenas uma decisão de marketing, já que os dois modelos eram idênticos. Além das GPUs Nvidia profissionais, a Lenovo também oferece variantes para o consumidor, embora as opções sejam um pouco limitadas ao Laptop RTX 4060, laptop 4080e laptop 4090.
Em termos de desempenho do processador, a potência geral é excelente, com o Core i9 se destacando nos testes de núcleo único. Além disso, suspeita-se que os modelos mais robustos com resfriamento por câmara de vapor possam oferecer um desempenho de CPU ligeiramente melhor. A nova RTX 2000 Ada se destaca como uma atualização significativa, oferecendo desempenho gráfico superior, apesar de sua classificação TGP relativamente baixa de 65 watts. Ele supera o desempenho do antigo RTX A3000 e até mesmo o laptop GeForce RTX 3060. Embora a GPU seja semelhante à do laptop GeForce RTX 4060, ela funciona a 80 watts no ThinkPad P1 G6 com resfriamento de câmara de vapor mais robusto. A diferenciação da Lenovo nesse aspecto não é totalmente clara.
O ThinkPad P1 G6 se destaca como uma estação de trabalho móvel, priorizando a mobilidade em relação ao desempenho bruto. As GPUs Nvidia Ada oferecem um desempenho impressionante, e a tela IPS opcional com 500 nits de brilho e uma taxa de atualização de 165 Hz é altamente recomendada, especialmente se o senhor não precisar de um espaço de cores estendido.
Embora a tela tenha um desempenho excepcionalmente bom, seu ponto fraco está na cobertura do espaço de cores, limitado ao pequeno padrão sRGB. Todos os outros aspectos da tela são excelentes, tornando-a uma escolha preferível em relação ao modelo OLED opcional. O único argumento a favor da tela OLED é sua maior cobertura de espaço de cores. É lamentável que a Lenovo não ofereça mais a tela IPS 4K com o espaço de cores Adobe RGB.
O ThinkPad P1 G6 é um equipamento bem desenvolvido sem grandes falhas. As melhoras poderiam incluir um leitor de cartões mais rápido, a reversão para os antigos teclados com curso de 0,07 polegadas e antenas pré-roteadas para os módulos WWAN. Além disso, a otimização do comportamento do ventilador melhoraria a experiência geral do usuário. O nível de ruído do dispositivo atinge o pico de 48 dB(A) sob carga, o que o torna relativamente barulhento. Em comparação, o resfriamento da câmara de vapor do antecessor era mais silencioso.
Preço e disponibilidade
Nossa amostra de análise do ThinkPad P1 G6 pode ser encomendada na Amazon por ~$3.000 USD. O P1 G6 também pode ser configurado na loja on-line da Lenovo.
Lenovo ThinkPad P1 G6-21FV000DGE
- 10/19/2023 v7 (old)
Andreas Osthoff
Transparência
A seleção dos dispositivos a serem analisados é feita pela nossa equipe editorial. A amostra de teste foi fornecida ao autor como empréstimo pelo fabricante ou varejista para fins desta revisão. O credor não teve influência nesta revisão, nem o fabricante recebeu uma cópia desta revisão antes da publicação. Não houve obrigação de publicar esta revisão. Como empresa de mídia independente, a Notebookcheck não está sujeita à autoridade de fabricantes, varejistas ou editores.
É assim que o Notebookcheck está testando
Todos os anos, o Notebookcheck analisa de forma independente centenas de laptops e smartphones usando procedimentos padronizados para garantir que todos os resultados sejam comparáveis. Desenvolvemos continuamente nossos métodos de teste há cerca de 20 anos e definimos padrões da indústria no processo. Em nossos laboratórios de teste, equipamentos de medição de alta qualidade são utilizados por técnicos e editores experientes. Esses testes envolvem um processo de validação em vários estágios. Nosso complexo sistema de classificação é baseado em centenas de medições e benchmarks bem fundamentados, o que mantém a objetividade.Price comparison

