Análise do Samsung Galaxy Book3 Ultra 16 com RTX 4070: Alto desempenho gráfico em um notebook profissional
Com o Galaxy Book3 Ultra, a Samsung está se aventurando no segmento de notebooks multimídia de alto desempenho. Opcionalmente equipado com um Nvidia GeForce RTX 4050 ou RTX 4070, o foco é o processamento de vídeo e imagem de alto nível. Ao mesmo tempo, o laptop é fino, discreto e quase 1 kg mais leve do que um notebook para jogos com equipamento semelhante.
Graças ao consumo de energia bastante reduzido, um pequeno sistema de resfriamento é suficiente, o que também ocupa menos espaço. Na análise a seguir, veremos o quanto o desempenho gráfico é afetado quando o sistema precisa se contentar com menos de 100 watts em vez de 250 ou 300 watts. Além disso, resta saber se a Samsung conseguiu limitar as emissões de calor e o ruído da ventoinha no pequeno espaço disponível.
Recentemente, analisamos o menor Samsung Galaxy Book3 Ultracom a RTX 4050. Um concorrente para tarefas comparáveis e com hardware comparável é, por exemplo, o Gigabyte AERO 16 OLED. Mas uma olhada no mais bem equipado e mais caro MSI Stealth 17 Studio mais caro e melhor equipado, também não faz mal nenhum. E um MacBook Pro com um chip M2 deve estar mais ou menos no mesmo nível em termos de preço e desempenho, embora uma comparação entre Windows e Mac seja semelhante a comparar maçãs e laranjas.
Possíveis concorrentes em comparação
Avaliação | Data | Modelo | Peso | Altura | Size | Resolução | Preço |
|---|---|---|---|---|---|---|---|
| 88.8 % v7 (old) | 05/2023 | Samsung Galaxy Book3 Ultra 16, i9-13900H RTX 4070 i9-13900H, GeForce RTX 4070 Laptop GPU | 1.8 kg | 16.8 mm | 16.00" | 2880x1800 | |
| 90.3 % v7 (old) | 04/2023 | Dell XPS 15 9530 RTX 4070 i7-13700H, GeForce RTX 4070 Laptop GPU | 1.9 kg | 18 mm | 15.60" | 3456x2160 | |
| 89.2 % v7 (old) | 04/2023 | MSI Stealth 17 Studio A13VH-014 i9-13900H, GeForce RTX 4080 Laptop GPU | 3 kg | 21.3 mm | 17.30" | 3840x2160 | |
| 89 % v7 (old) | 02/2023 | Asus ProArt StudioBook 16 H7600ZW i9-12900H, GeForce RTX 3070 Ti Laptop GPU | 2.4 kg | 19.9 mm | 16.00" | 3840x2400 | |
| 86.2 % v7 (old) | 03/2023 | Gigabyte AERO 16 OLED BSF i9-13900H, GeForce RTX 4070 Laptop GPU | 2.1 kg | 18 mm | 16.00" | 3840x2400 | |
| 89.4 % v7 (old) | 04/2023 | Samsung Galaxy Book3 Ultra 16 i7-13700H, GeForce RTX 4050 Laptop GPU | 1.8 kg | 16.5 mm | 16.00" | 2880x1800 |
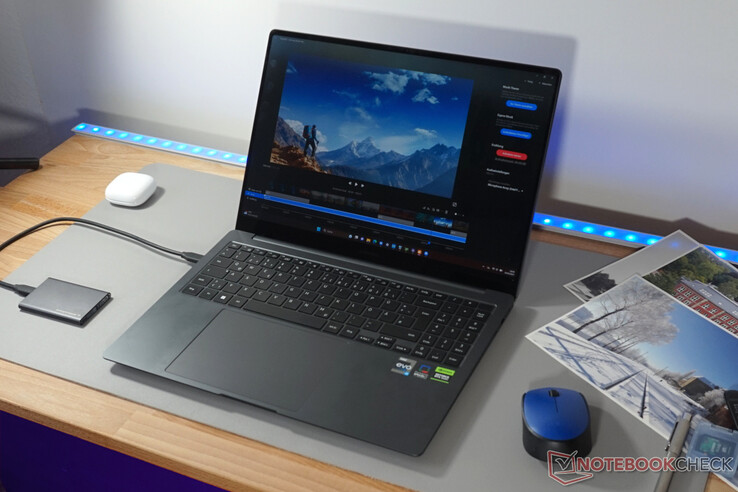
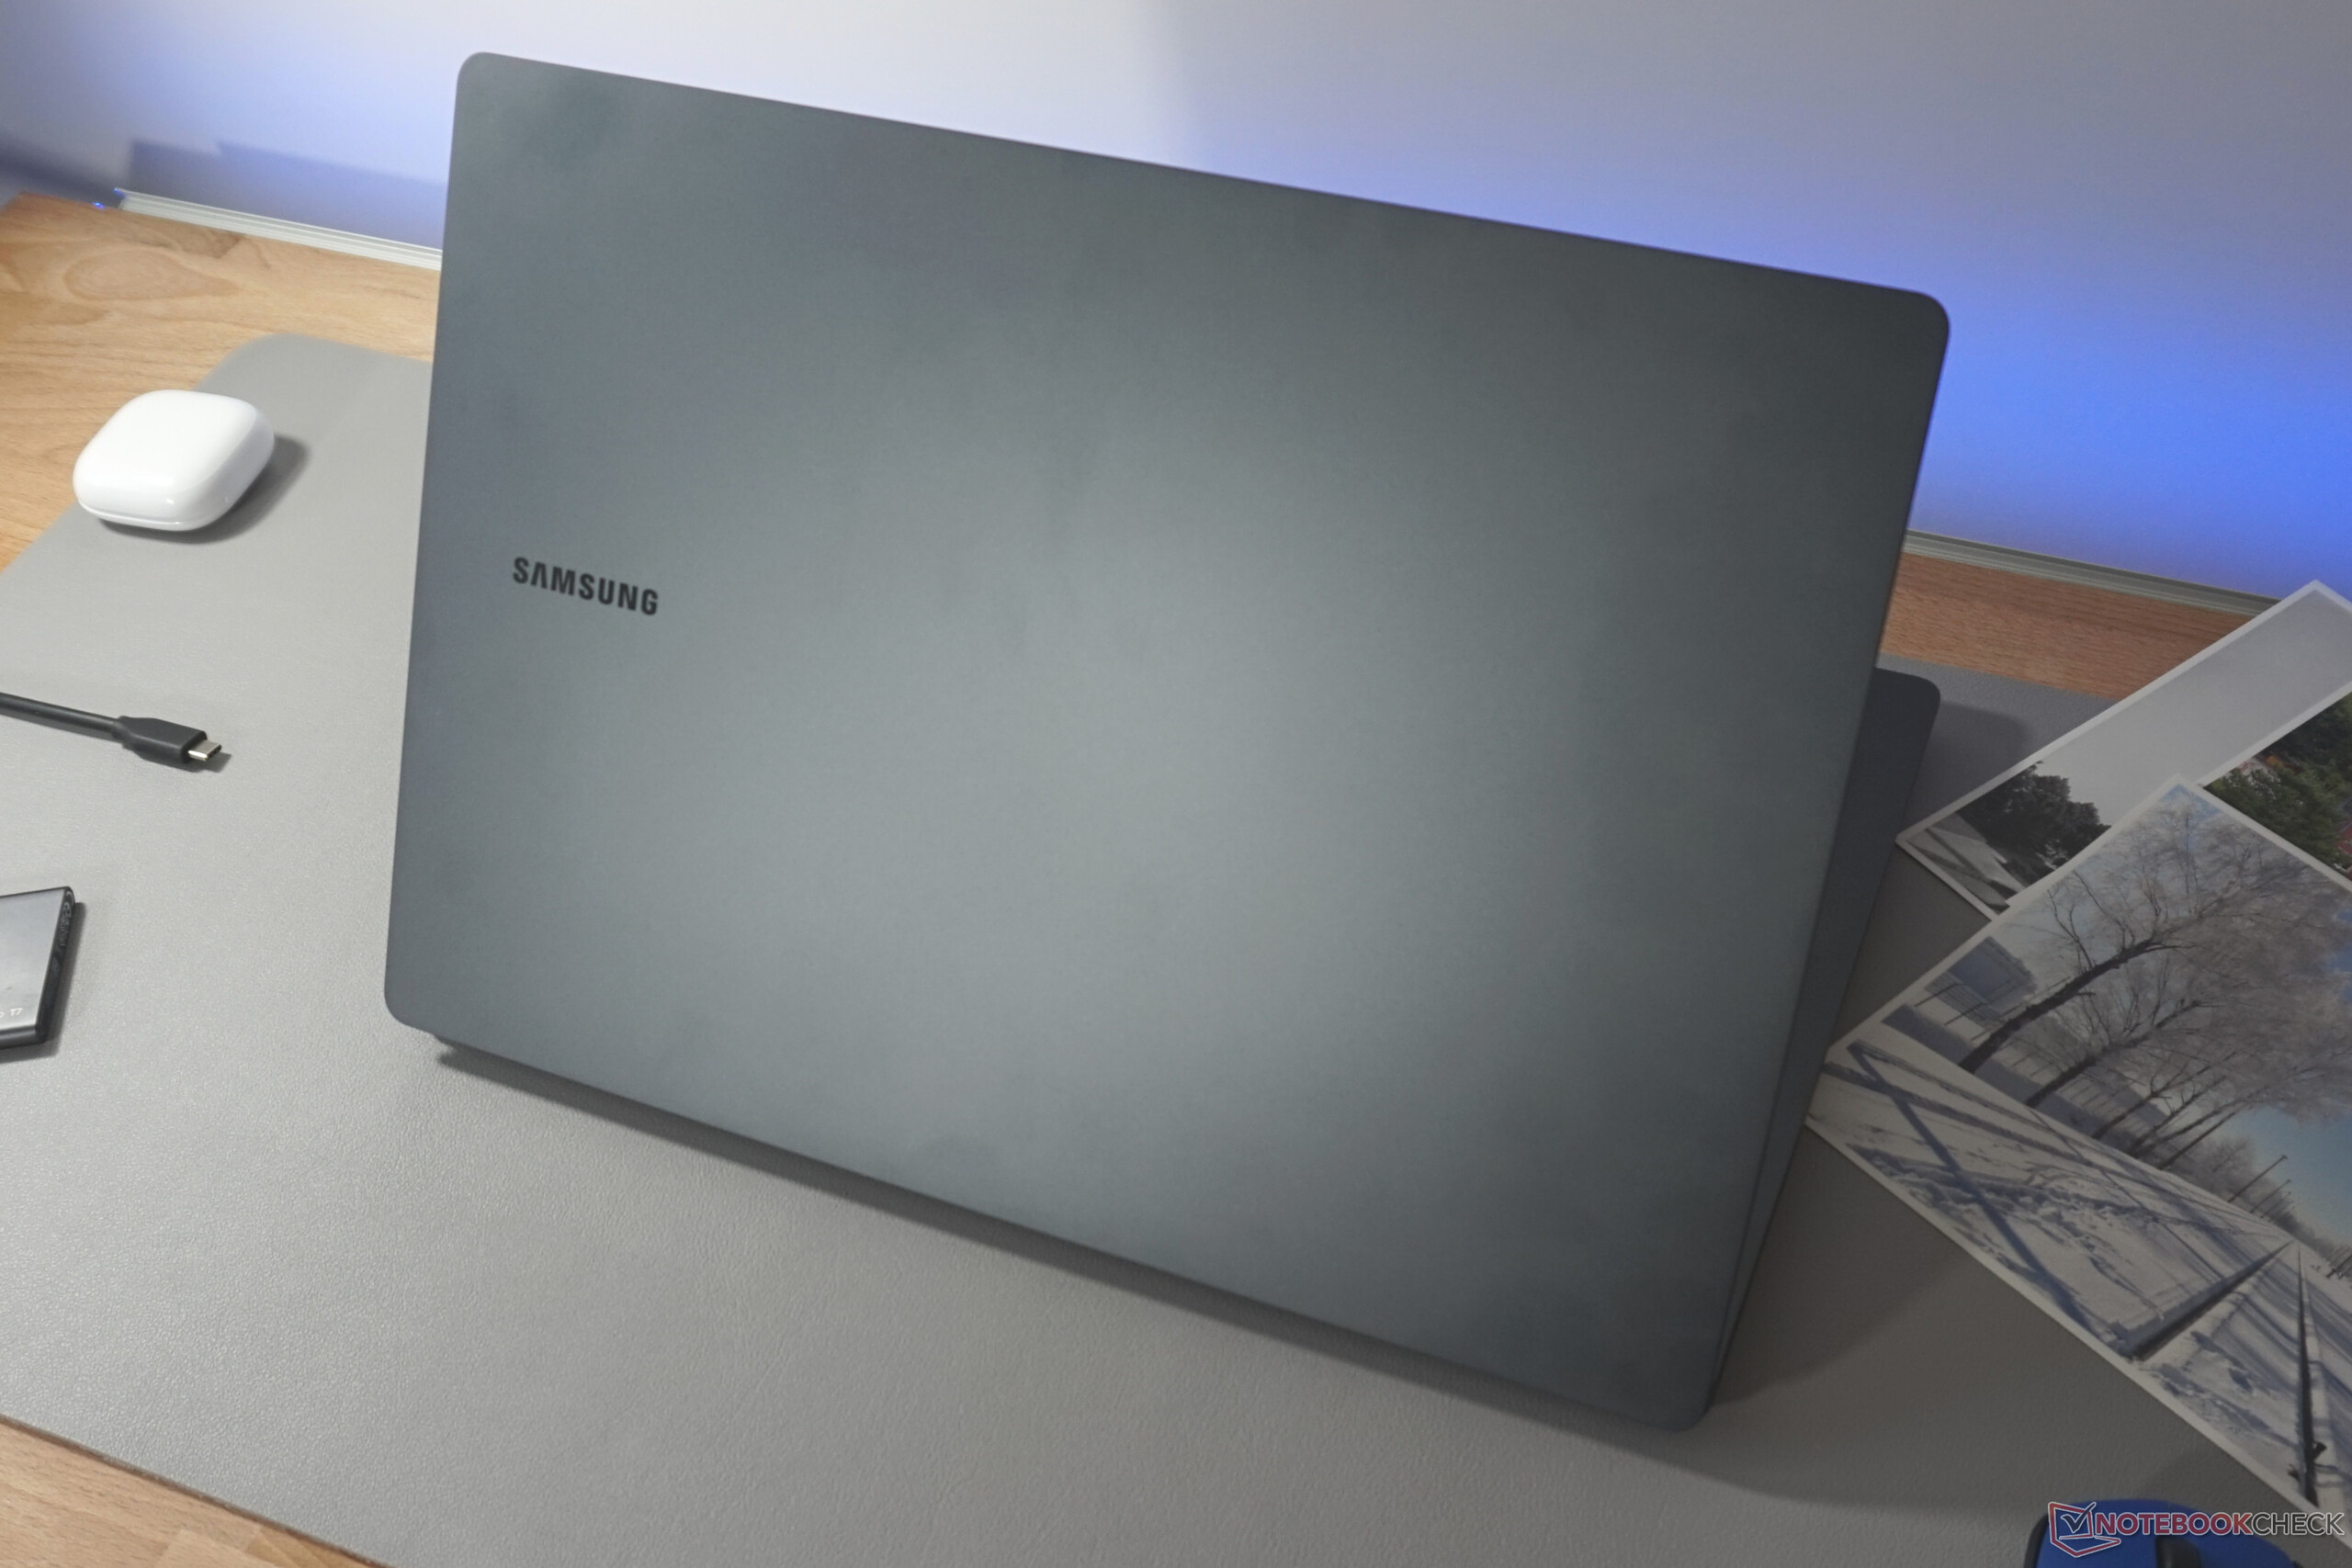
Estojo - Extremamente fino Galaxy Book
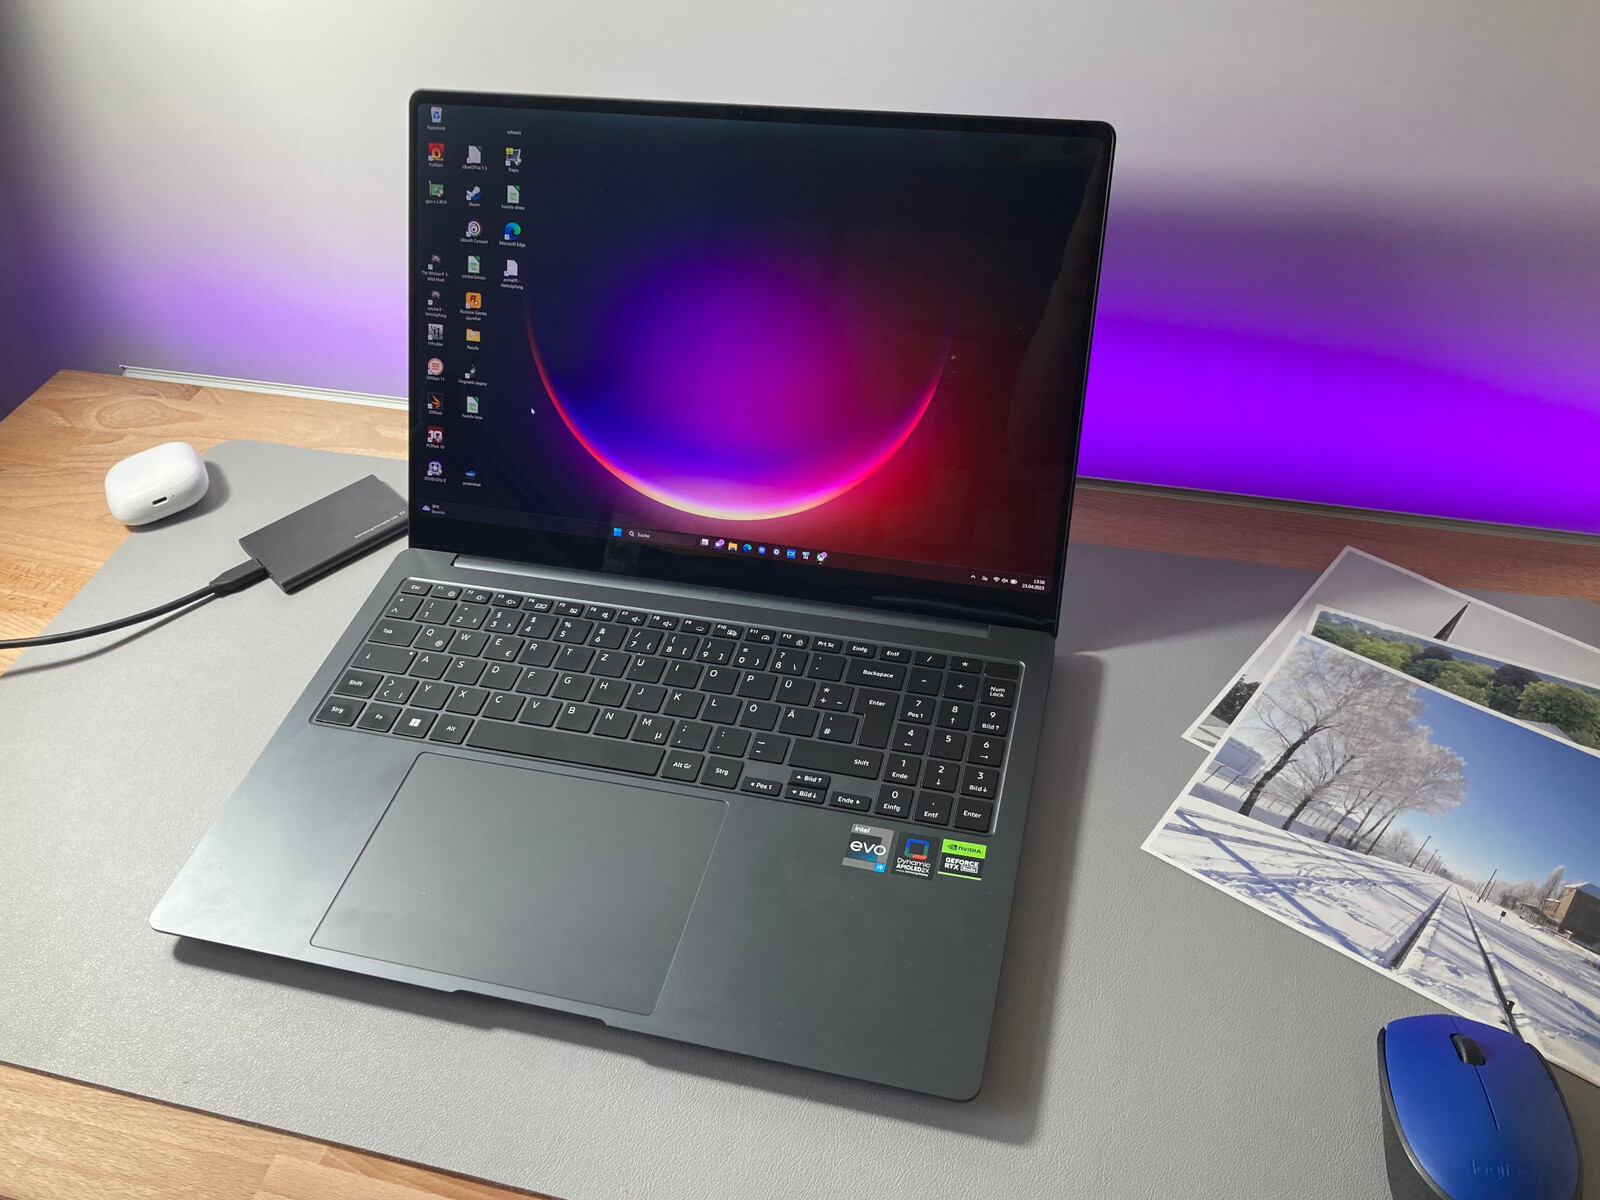
O cinza escuro do Galaxy Book Ultra parece sóbrio e discreto. A parte inferior e a estrutura do teclado, ambas feitas de plástico, são praticamente indistinguíveis da tampa metálica da tela, pelo menos visualmente. Tudo parece se encaixar perfeitamente e não há espaços vazios.
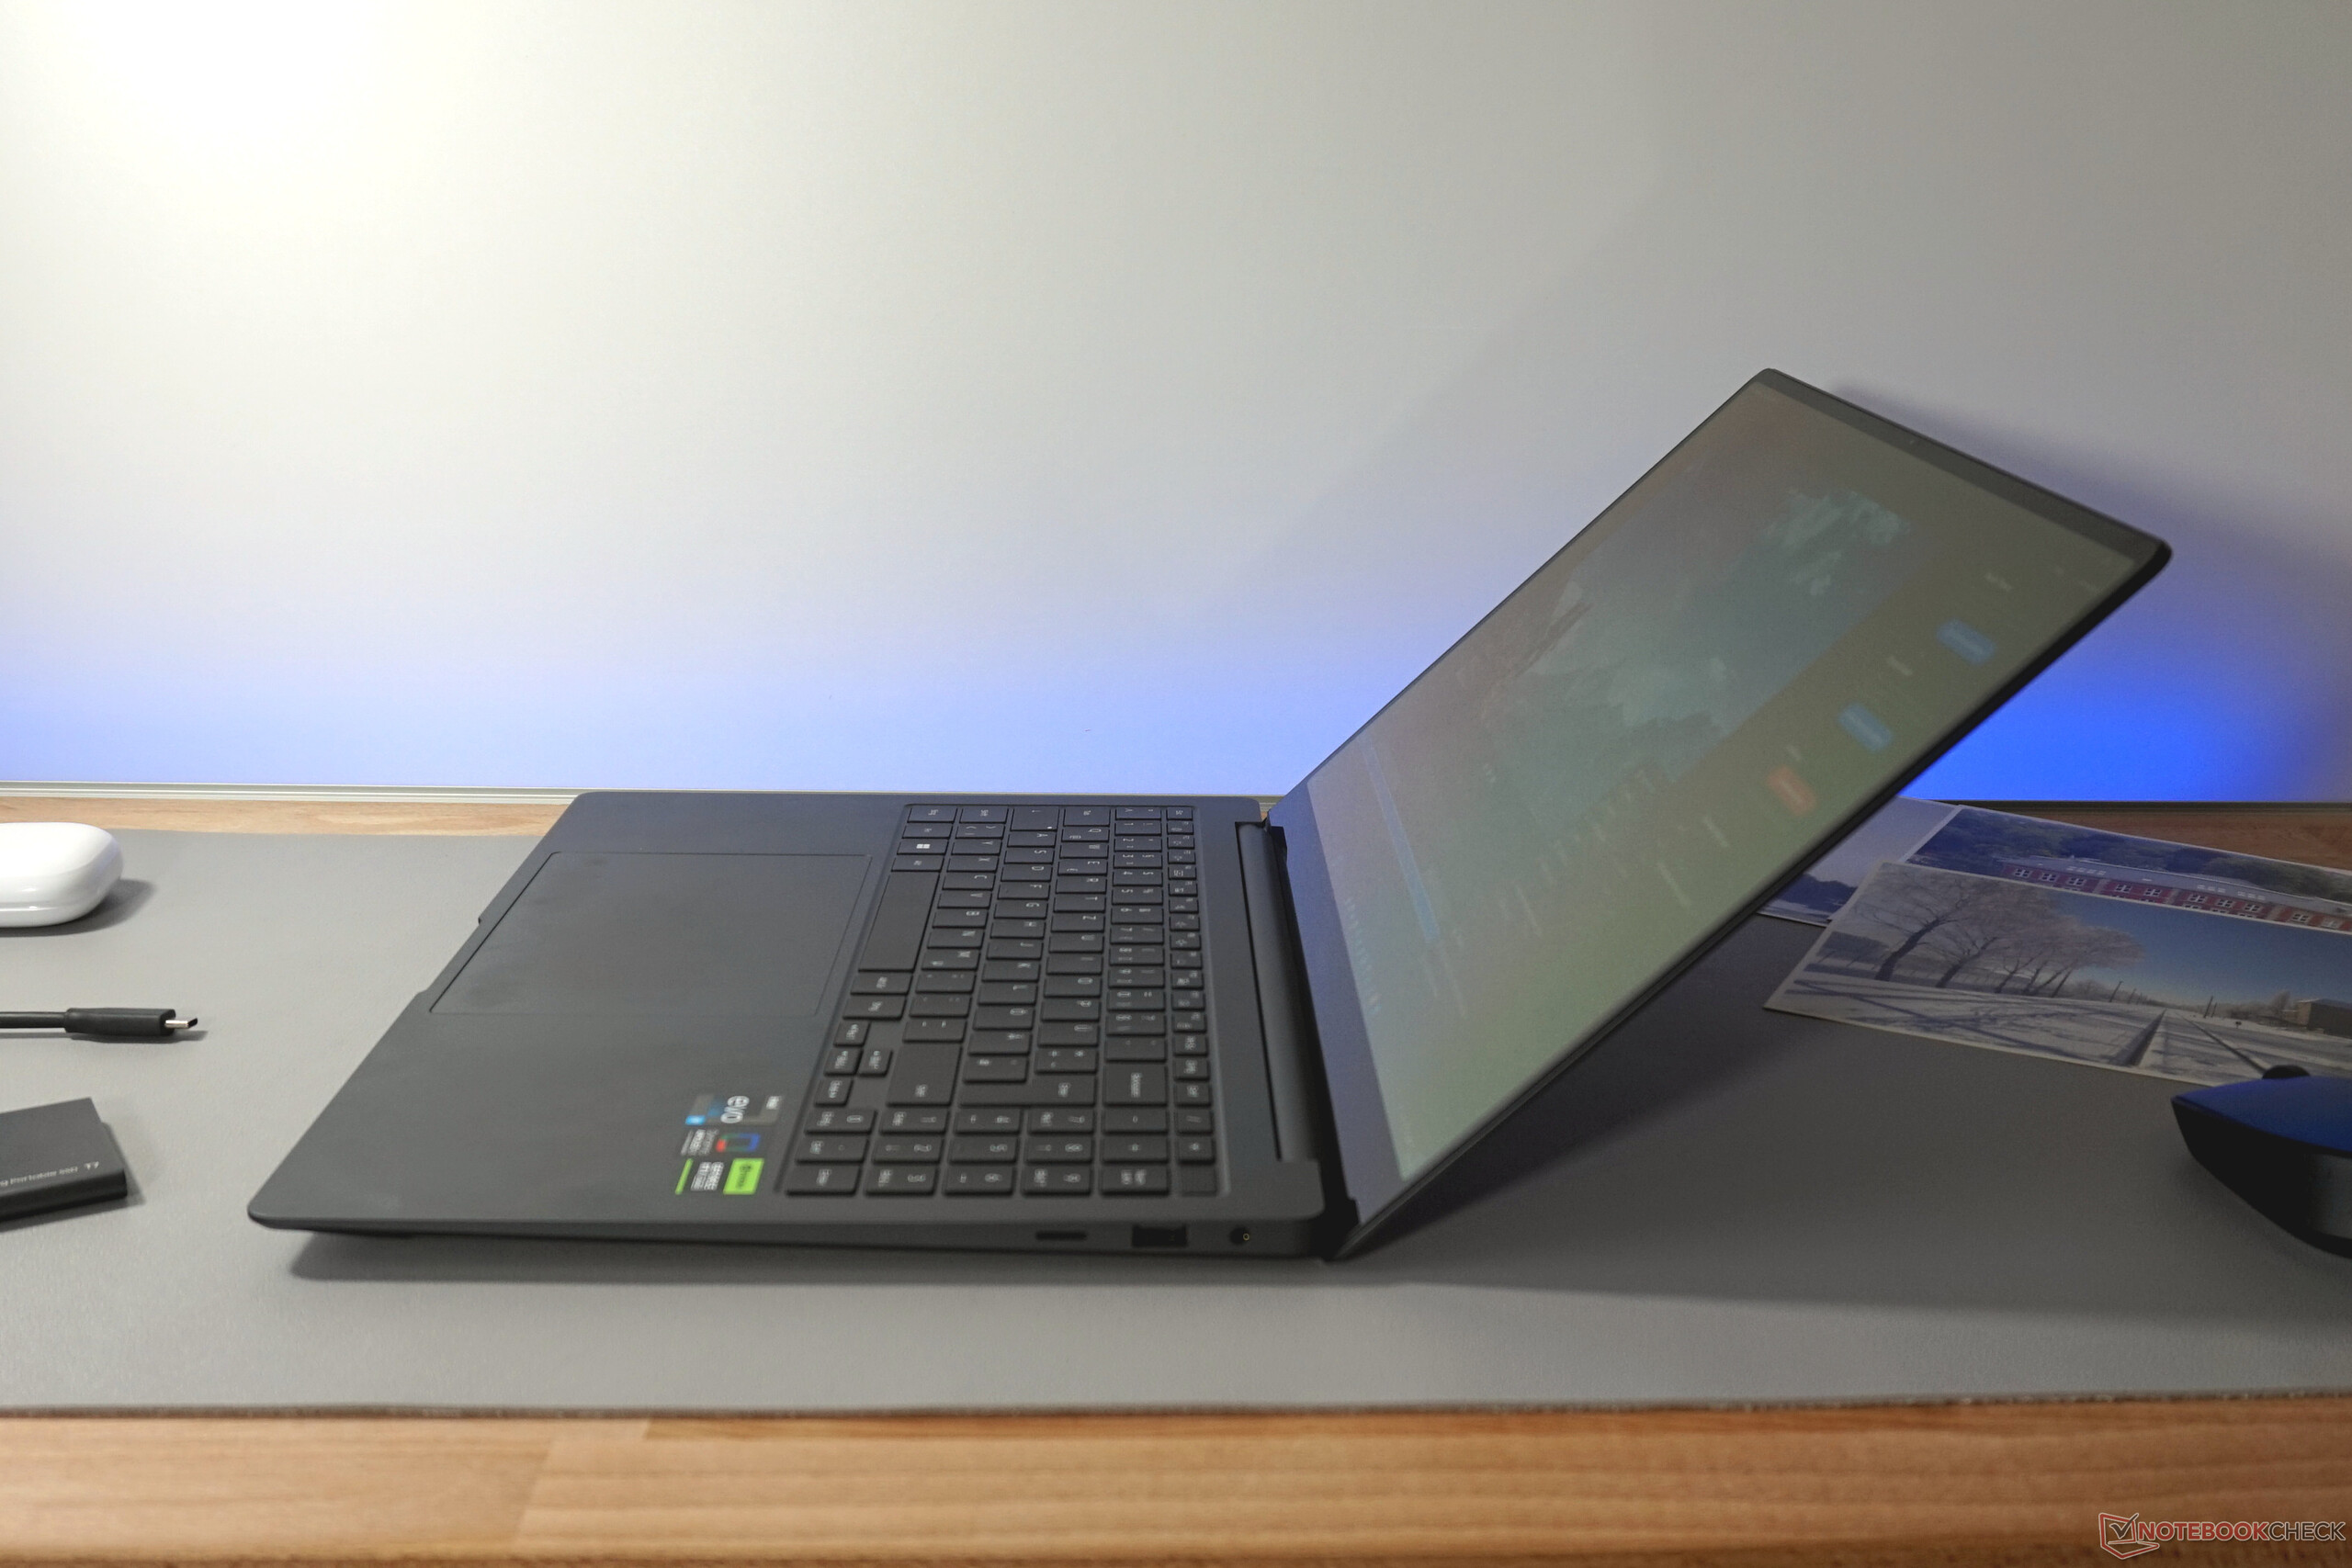
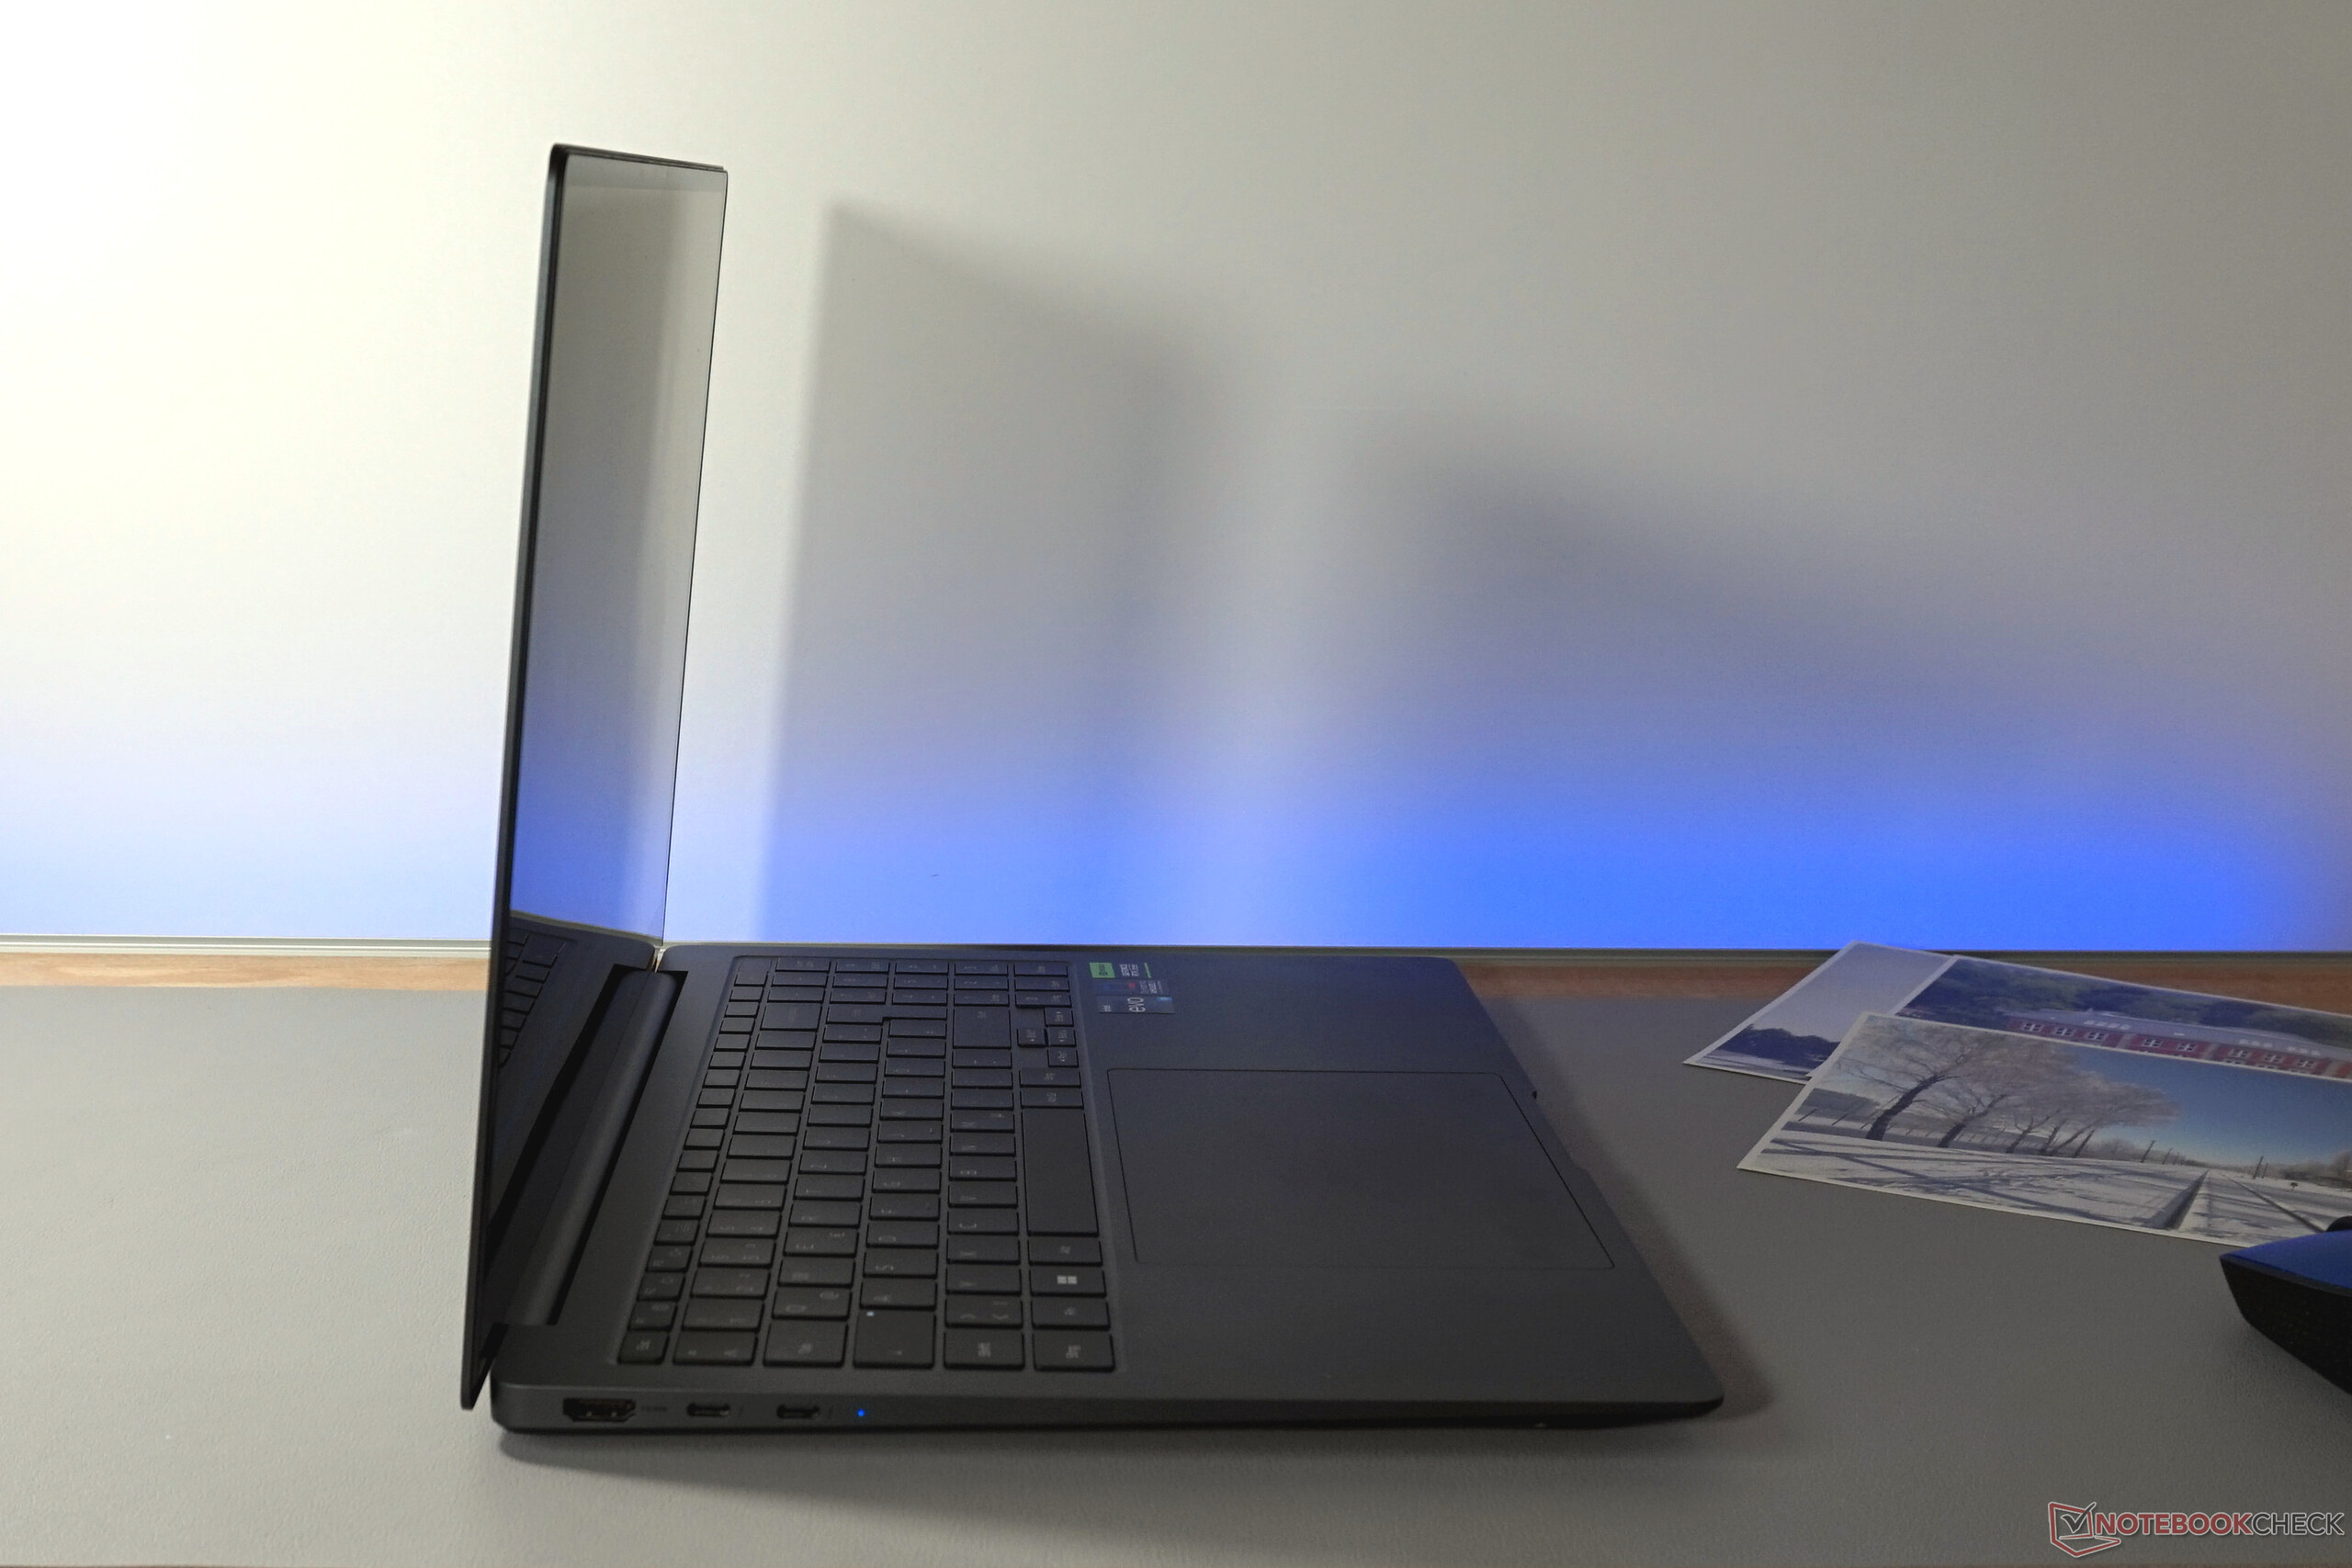
A rigidez torcional é alta. Apenas uma curvatura mínima da caixa muito plana pode ser obtida. A tela, que pode ser facilmente aberta com uma mão graças ao seu peso e em até 135°, também parece extremamente sólida. Apenas as dobradiças balançam um pouco demais.
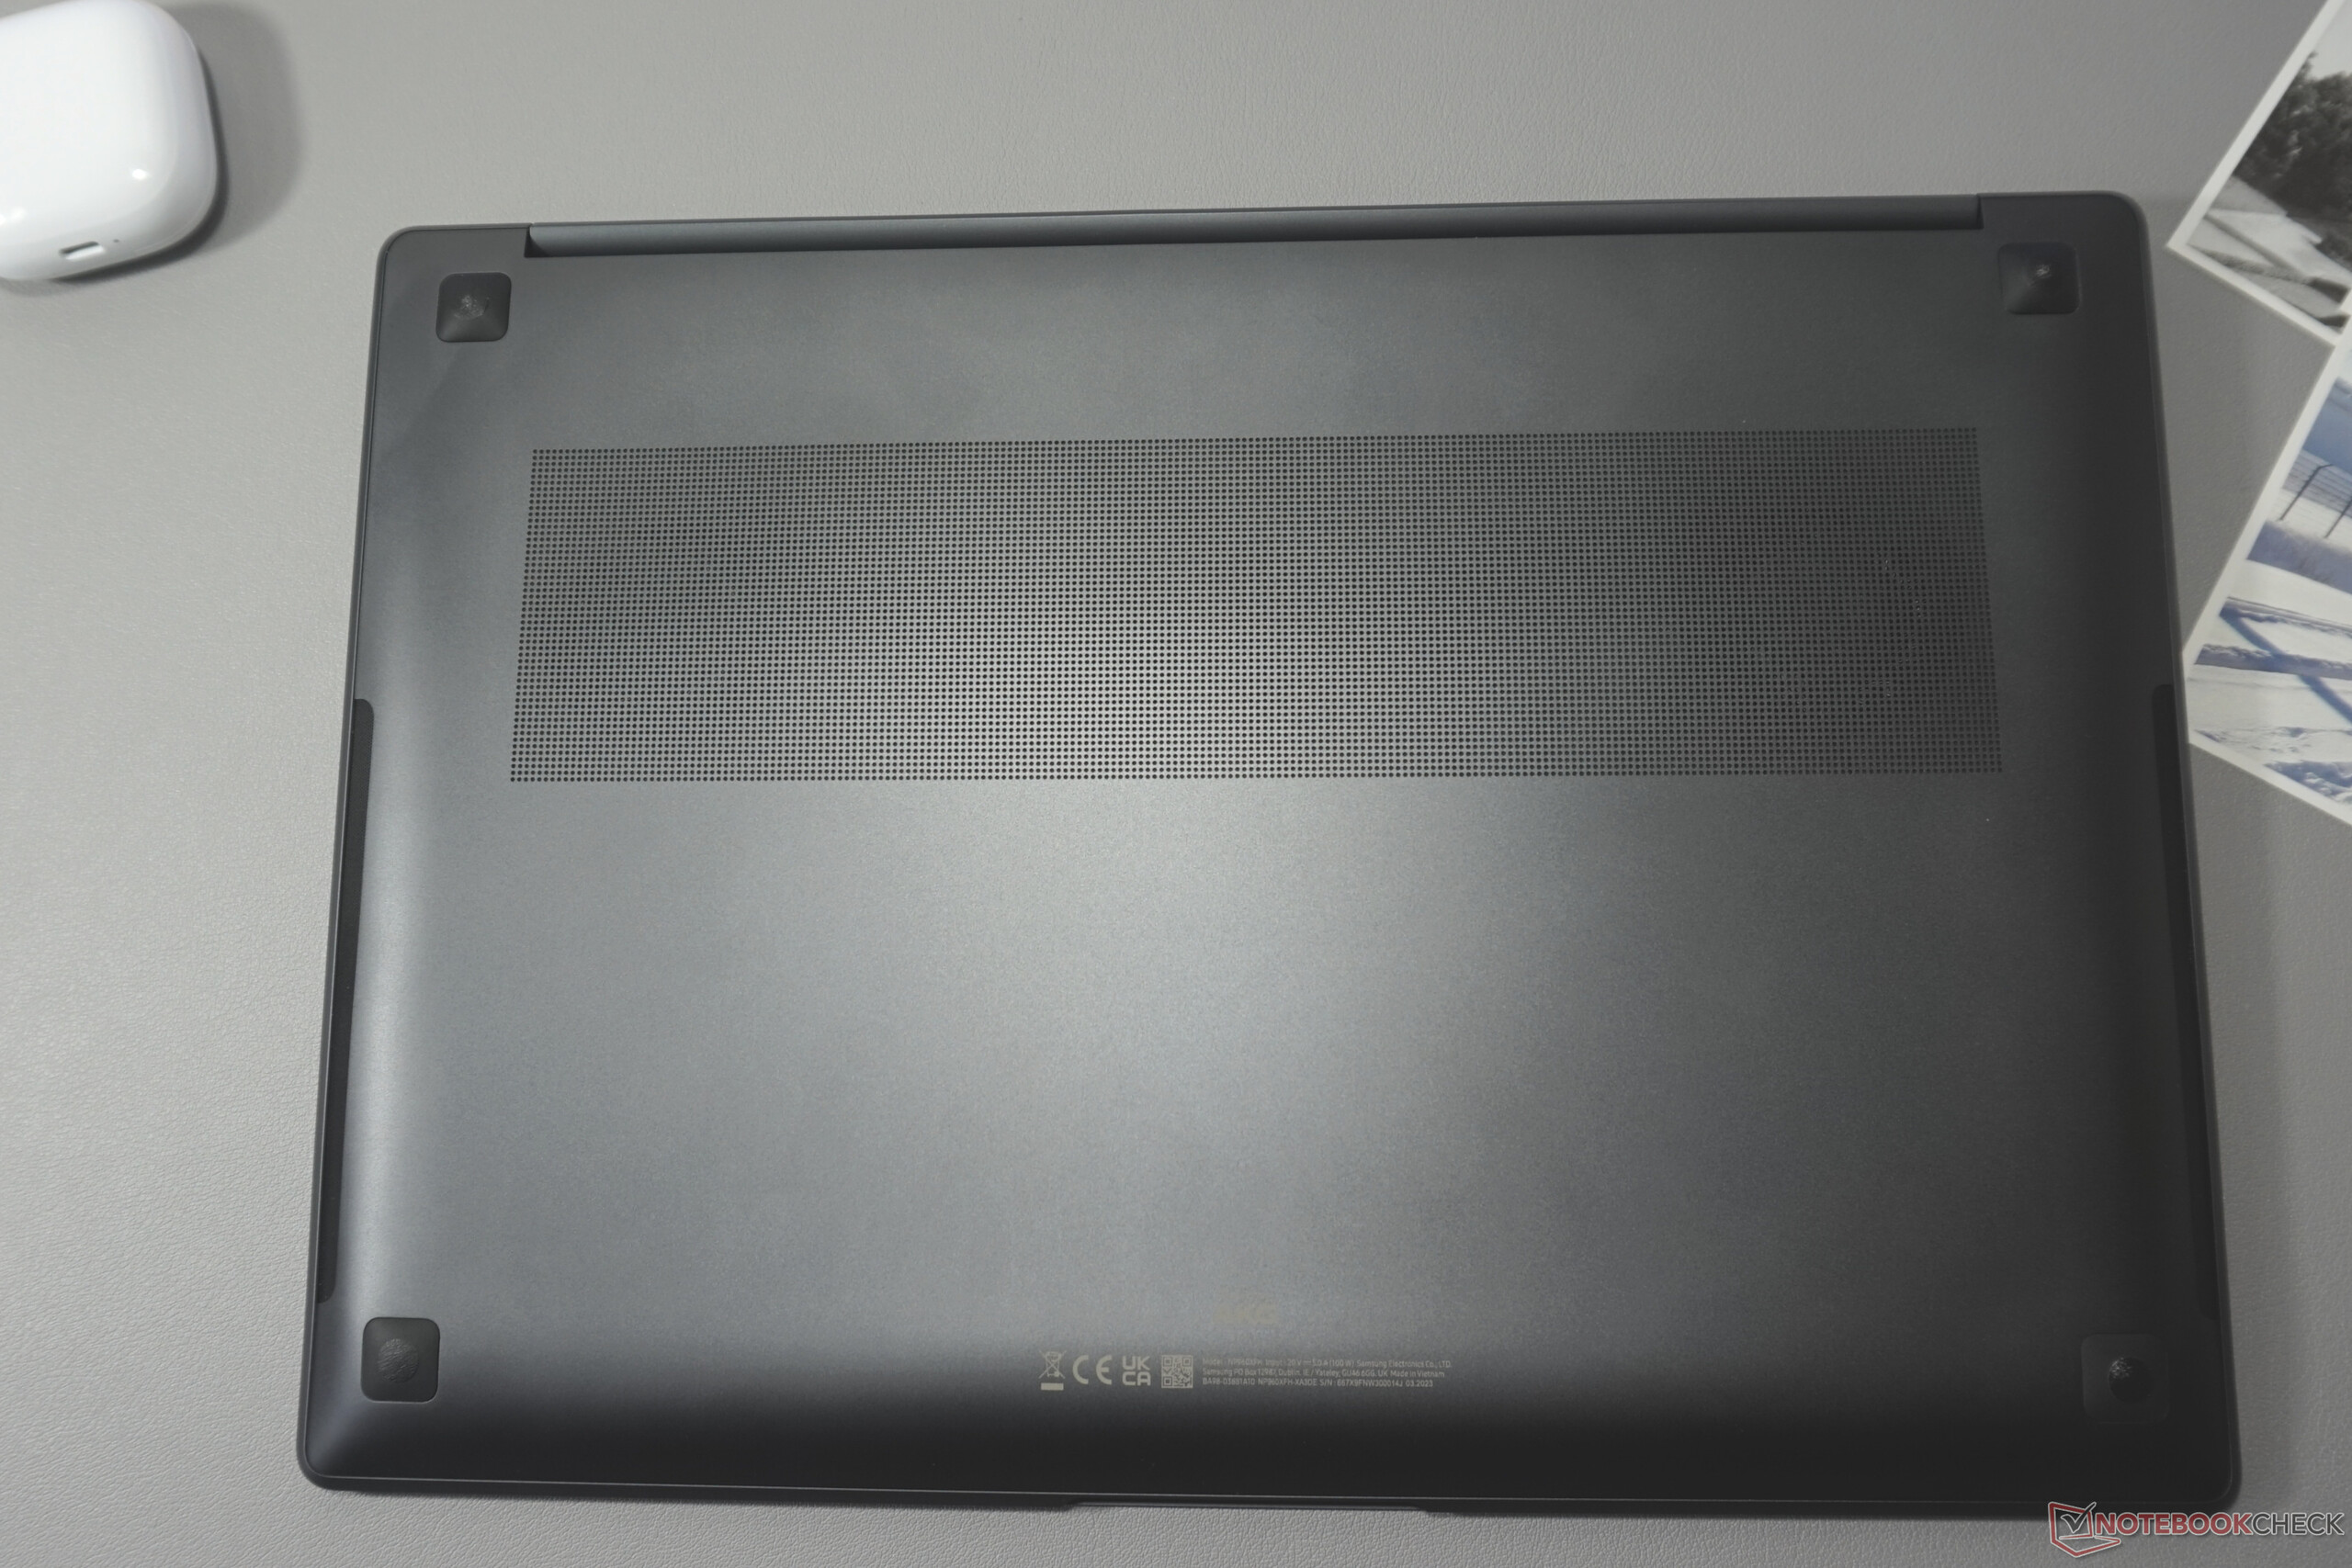
O que realmente chama a atenção é a falta de aberturas de ventilação maiores. A troca de ar só é possível através da placa de base e das grades sutis nas laterais.
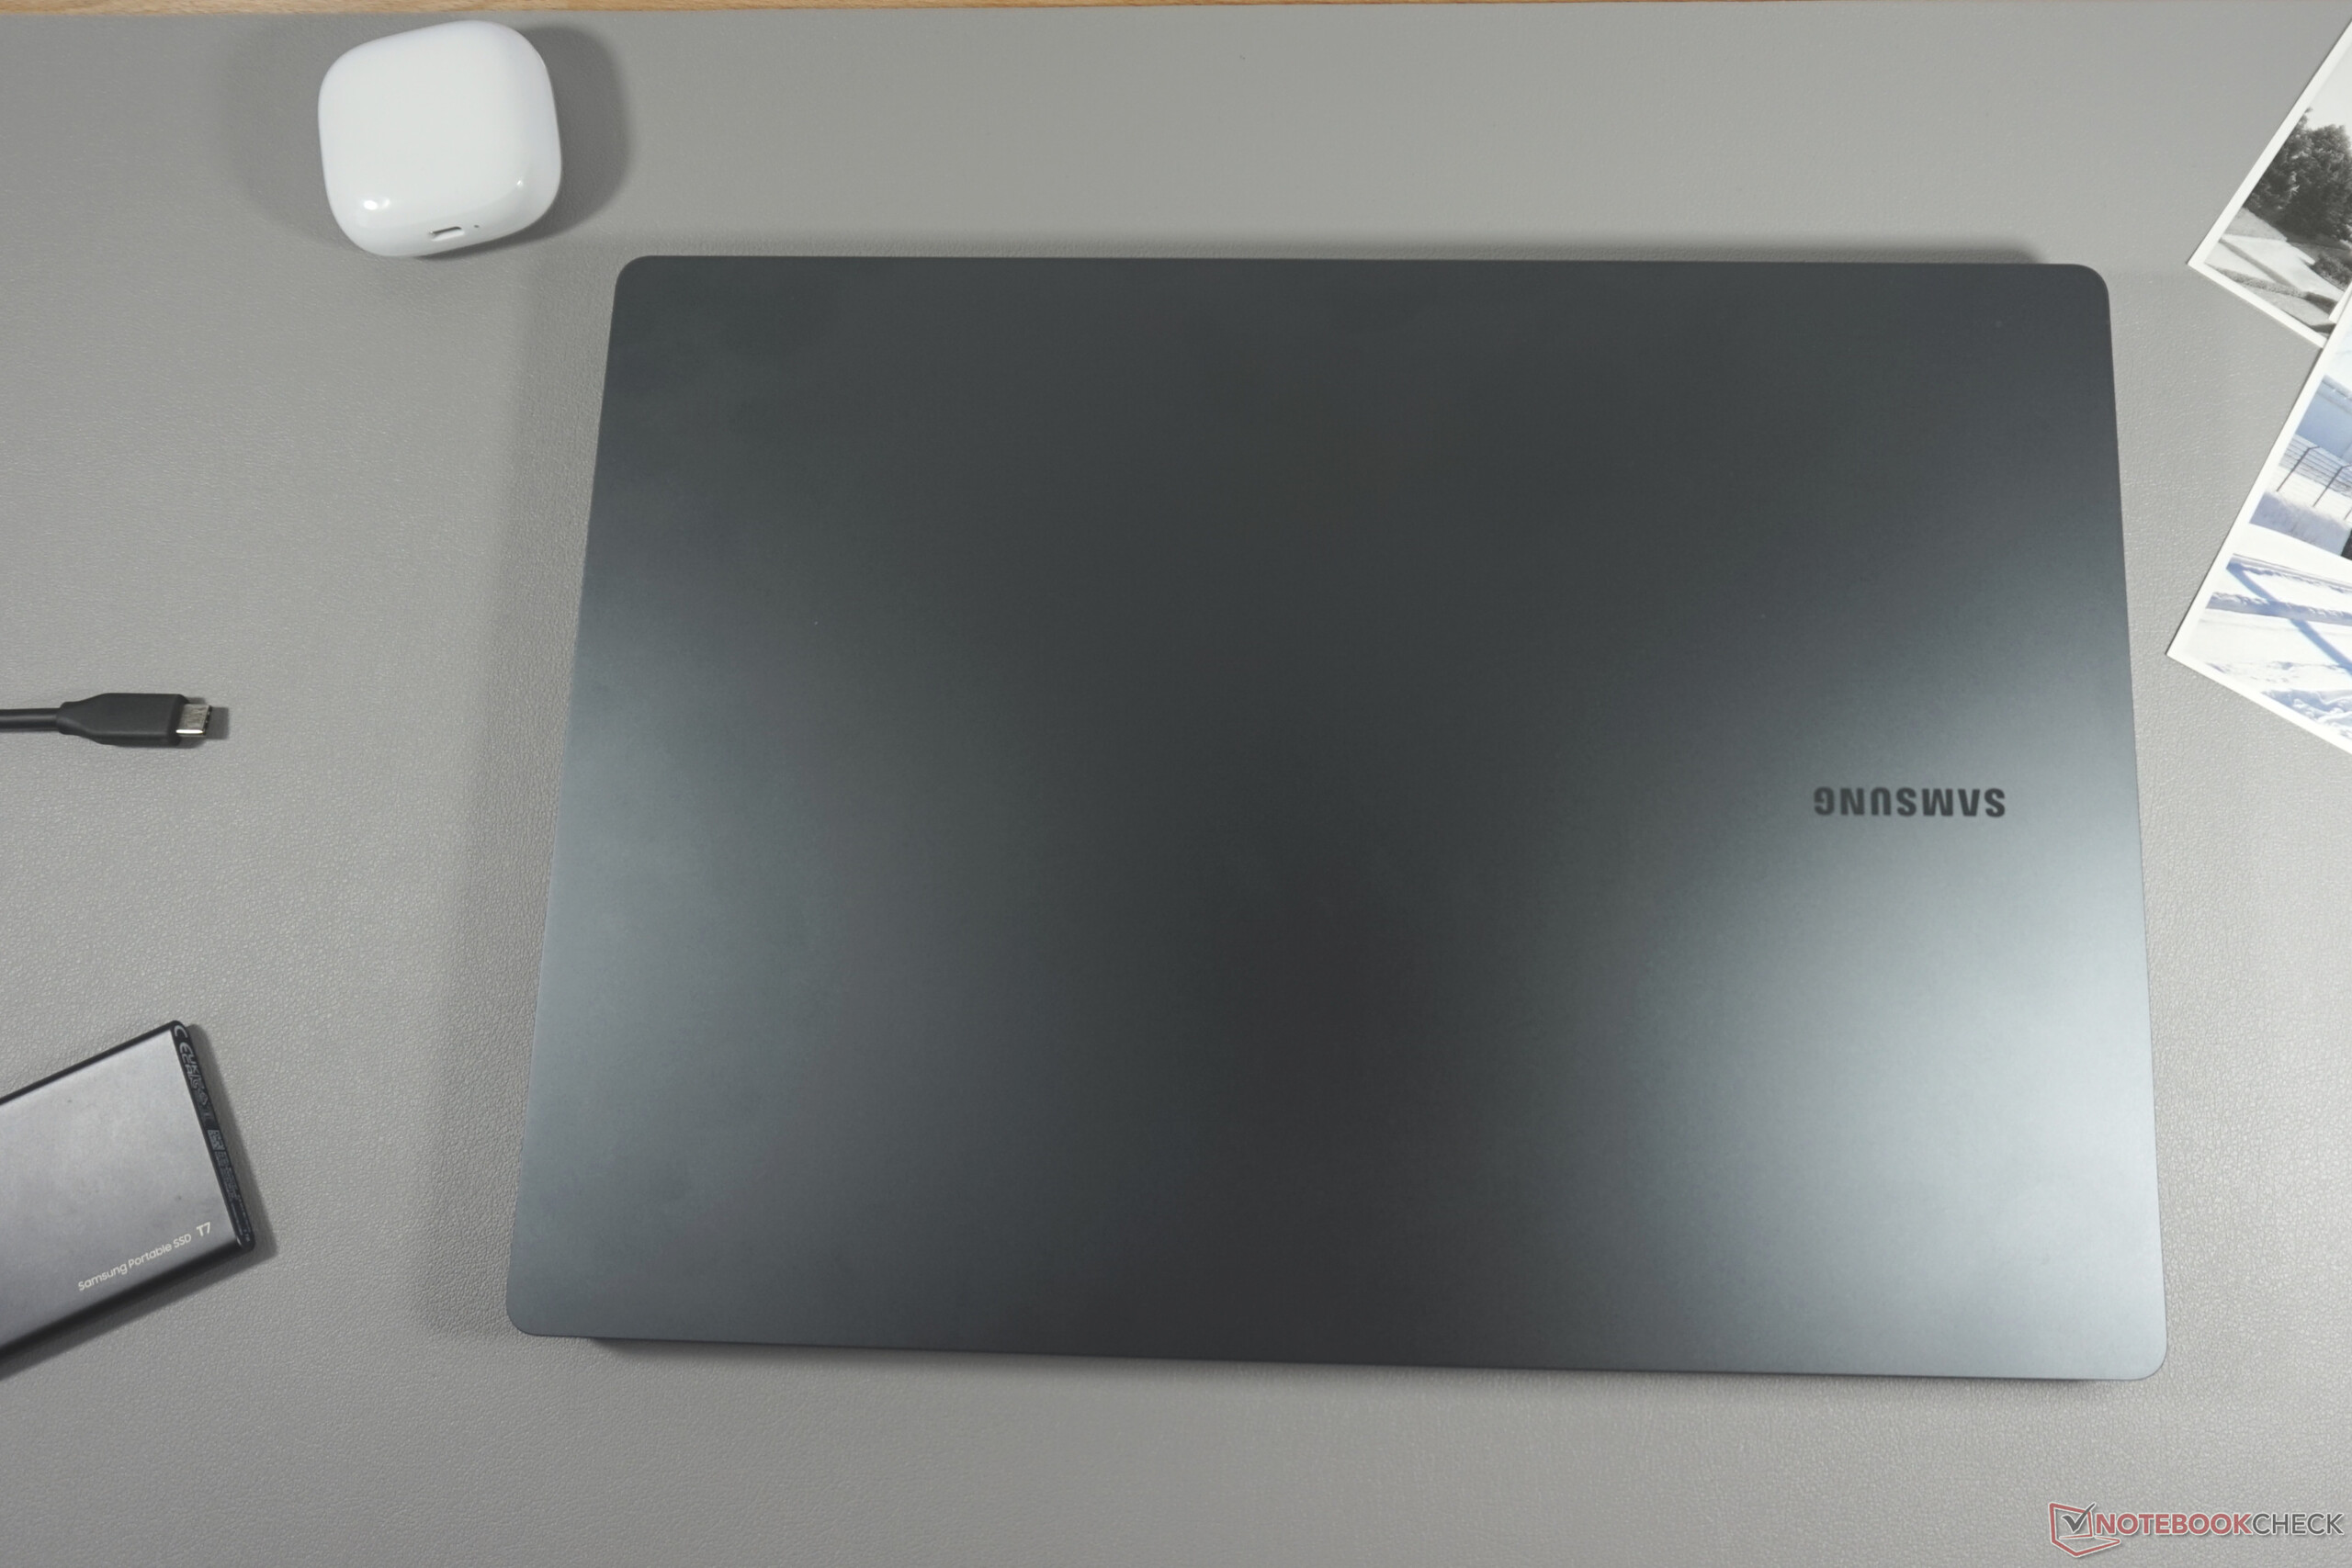
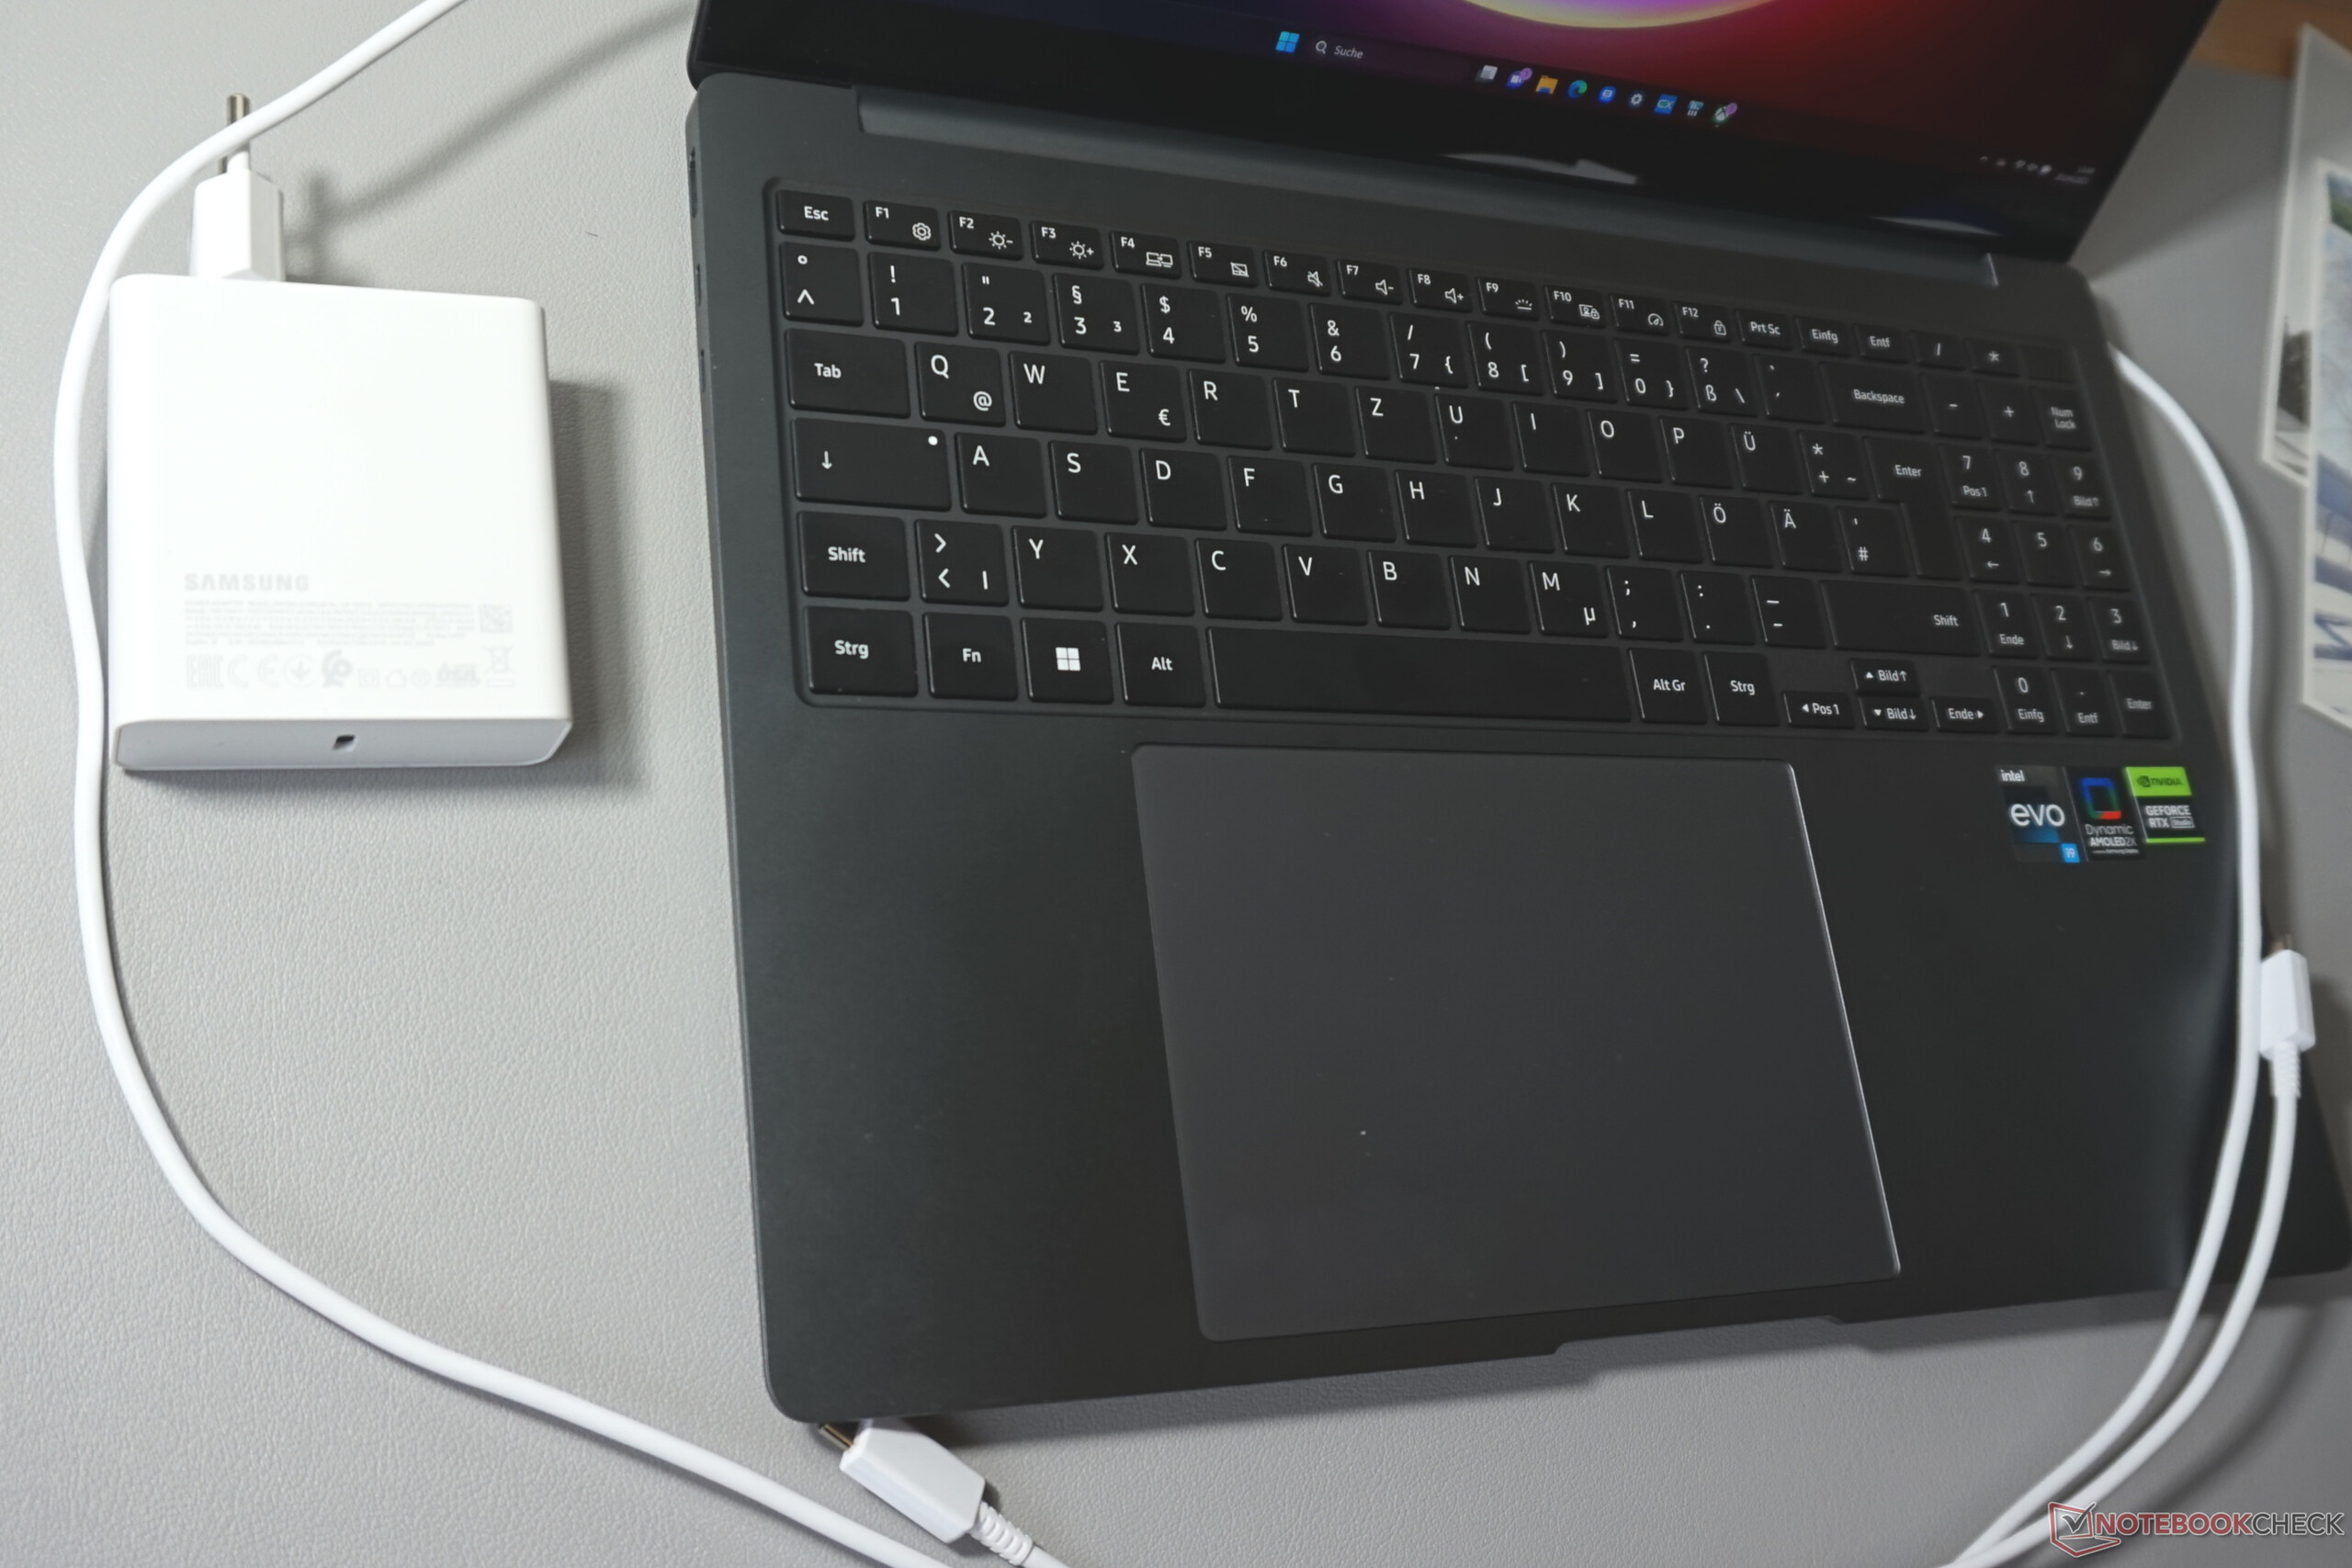
A espessura de 16,8 mm (nosso valor medido) é difícil de ser superada. Essa medida é ainda mais notável em vista do hardware robusto. Nesse sentido, o Galaxy Book3 Ultra também é bastante contido em termos de peso.
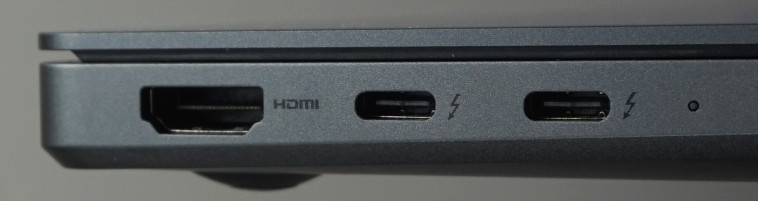
Equipamento - Dois TB4s, não muito mais
O alcance e o número de portas parecem minimalistas, mas combinam com o gabinete igualmente minimalista. Pelo menos as mais importantes estão presentes. Há uma porta HDMI e duas portas Thunderbolt 4 próximas a ela, de modo que todas as saídas de vídeo estão bem próximas umas das outras. Há também um slot para cartão, um USB-A para mouse ou impressora e um conector de áudio.
A variedade e o número de portas parecem minimalistas, mas combinam com o gabinete igualmente minimalista. Pelo menos as mais importantes estão presentes. Há uma porta HDMI e duas portas Thunderbolt 4 próximas a ela, de modo que todas as saídas de vídeo estão bem próximas umas das outras. Há também um slot para cartão, um USB-A para mouse ou impressora e o conector de áudio.
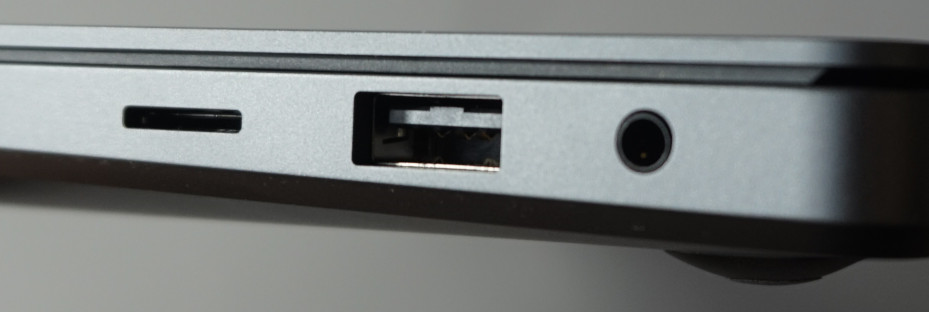
Leitor de cartão SD
As velocidades de transferência por meio do nosso cartão de referência AV PRO microSD 128 GB V60 não são surpreendentes. A maioria dos concorrentes também atinge cerca de 80 MB/s. O cartão Gigabyte AERO 16 e o XPS 15 9530 da Dell mostram que é possível fazer muito melhor aqui. Isso economiza alguns minutos ao copiar um cartão cheio, mas não mais do que isso.
| SD Card Reader | |
| average JPG Copy Test (av. of 3 runs) | |
| Gigabyte AERO 16 OLED BSF | |
| Dell XPS 15 9530 RTX 4070 (Toshiba Exceria Pro SDXC 64 GB UHS-II) | |
| Média da turma Multimedia (23 - 531, n=37, últimos 2 anos) | |
| Samsung Galaxy Book3 Ultra 16, i9-13900H RTX 4070 (AV Pro SD microSD 128 GB V60) | |
| Samsung Galaxy Book3 Ultra 16 (AV PRO microSD 128 GB V60) | |
| Asus ProArt StudioBook 16 H7600ZW (AV PRO microSD 128 GB V60) | |
| MSI Stealth 17 Studio A13VH-014 | |
| maximum AS SSD Seq Read Test (1GB) | |
| Média da turma Multimedia (37.3 - 1455, n=36, últimos 2 anos) | |
| Gigabyte AERO 16 OLED BSF | |
| Dell XPS 15 9530 RTX 4070 (Toshiba Exceria Pro SDXC 64 GB UHS-II) | |
| Samsung Galaxy Book3 Ultra 16, i9-13900H RTX 4070 (AV Pro SD microSD 128 GB V60) | |
| Samsung Galaxy Book3 Ultra 16 (AV PRO microSD 128 GB V60) | |
| Asus ProArt StudioBook 16 H7600ZW (AV PRO microSD 128 GB V60) | |
| MSI Stealth 17 Studio A13VH-014 | |
Comunicação
A falta de uma porta LAN não será necessariamente sentida. Pelo menos nas proximidades do roteador, o Samsung Galaxy Book3 transmite mais de 1 Gbit/s sem um cabo. Nossos valores medidos estão dentro da faixa média para notebooks multimídia e para o módulo WLAN Intel AX211 utilizado.
Somente ao transmitir em 6 GHz via Wi-Fi 6E é que o módulo fica aquém da taxa esperada, apesar dos testes repetidos. Entretanto, esse não foi o caso durante a recepção, portanto, podemos descartar um erro de hardware.
Webcam
Para um laptop tão compacto, a webcam Full HD oferece resultados bastante decentes. As imagens parecem de alta qualidade com luz suficiente. Não foram observados desvios de cor ou ruídos na imagem. Somente em uma sala com pouca iluminação ou na penumbra é que surge o ruído da imagem e a taxa de quadros também parece diminuir.
O microfone de matriz dupla tem bom desempenho quando se trata de adequação para videotelefonia. Ele capta a voz de diferentes direções e a várias distâncias sem alterações no volume. Embora as vozes soem limpas na maior parte do tempo, às vezes elas também soam um pouco distorcidas. No entanto, isso só é perceptível se você prestar muita atenção.


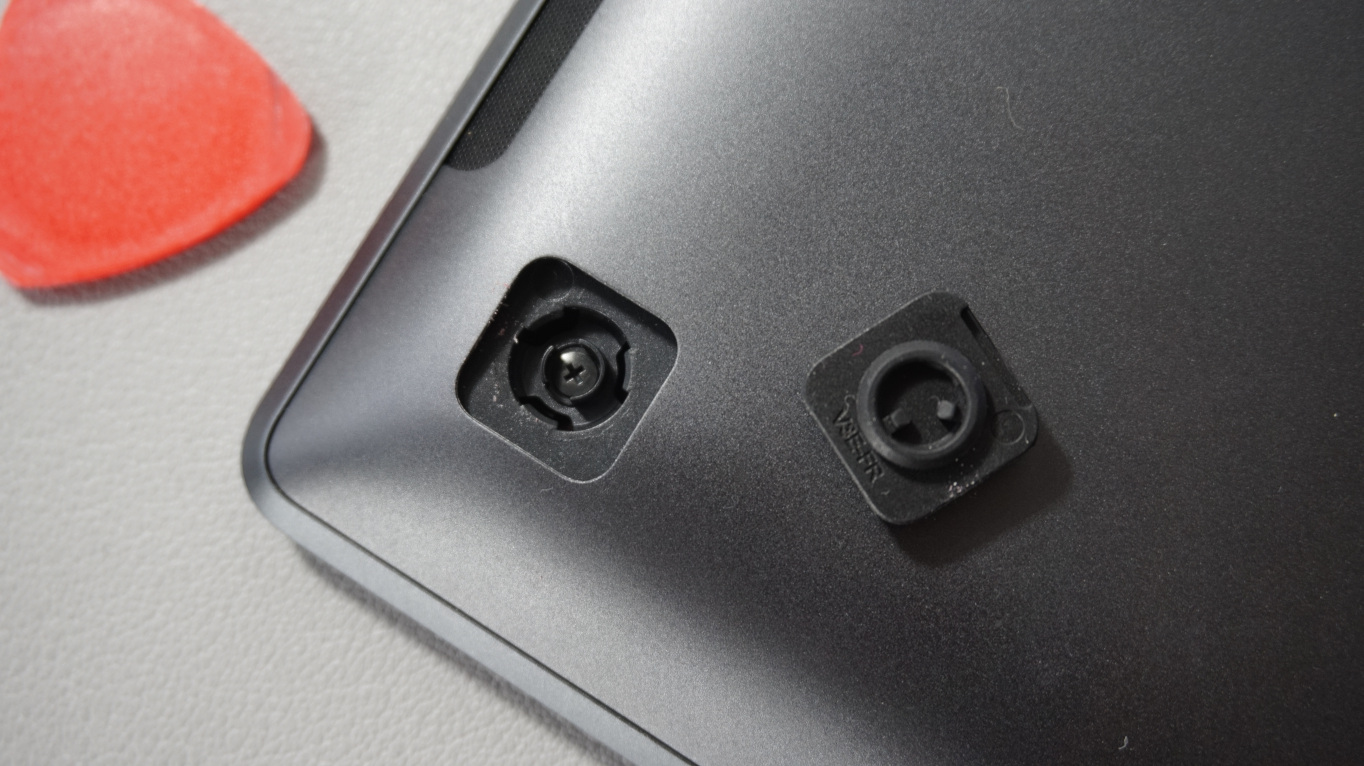
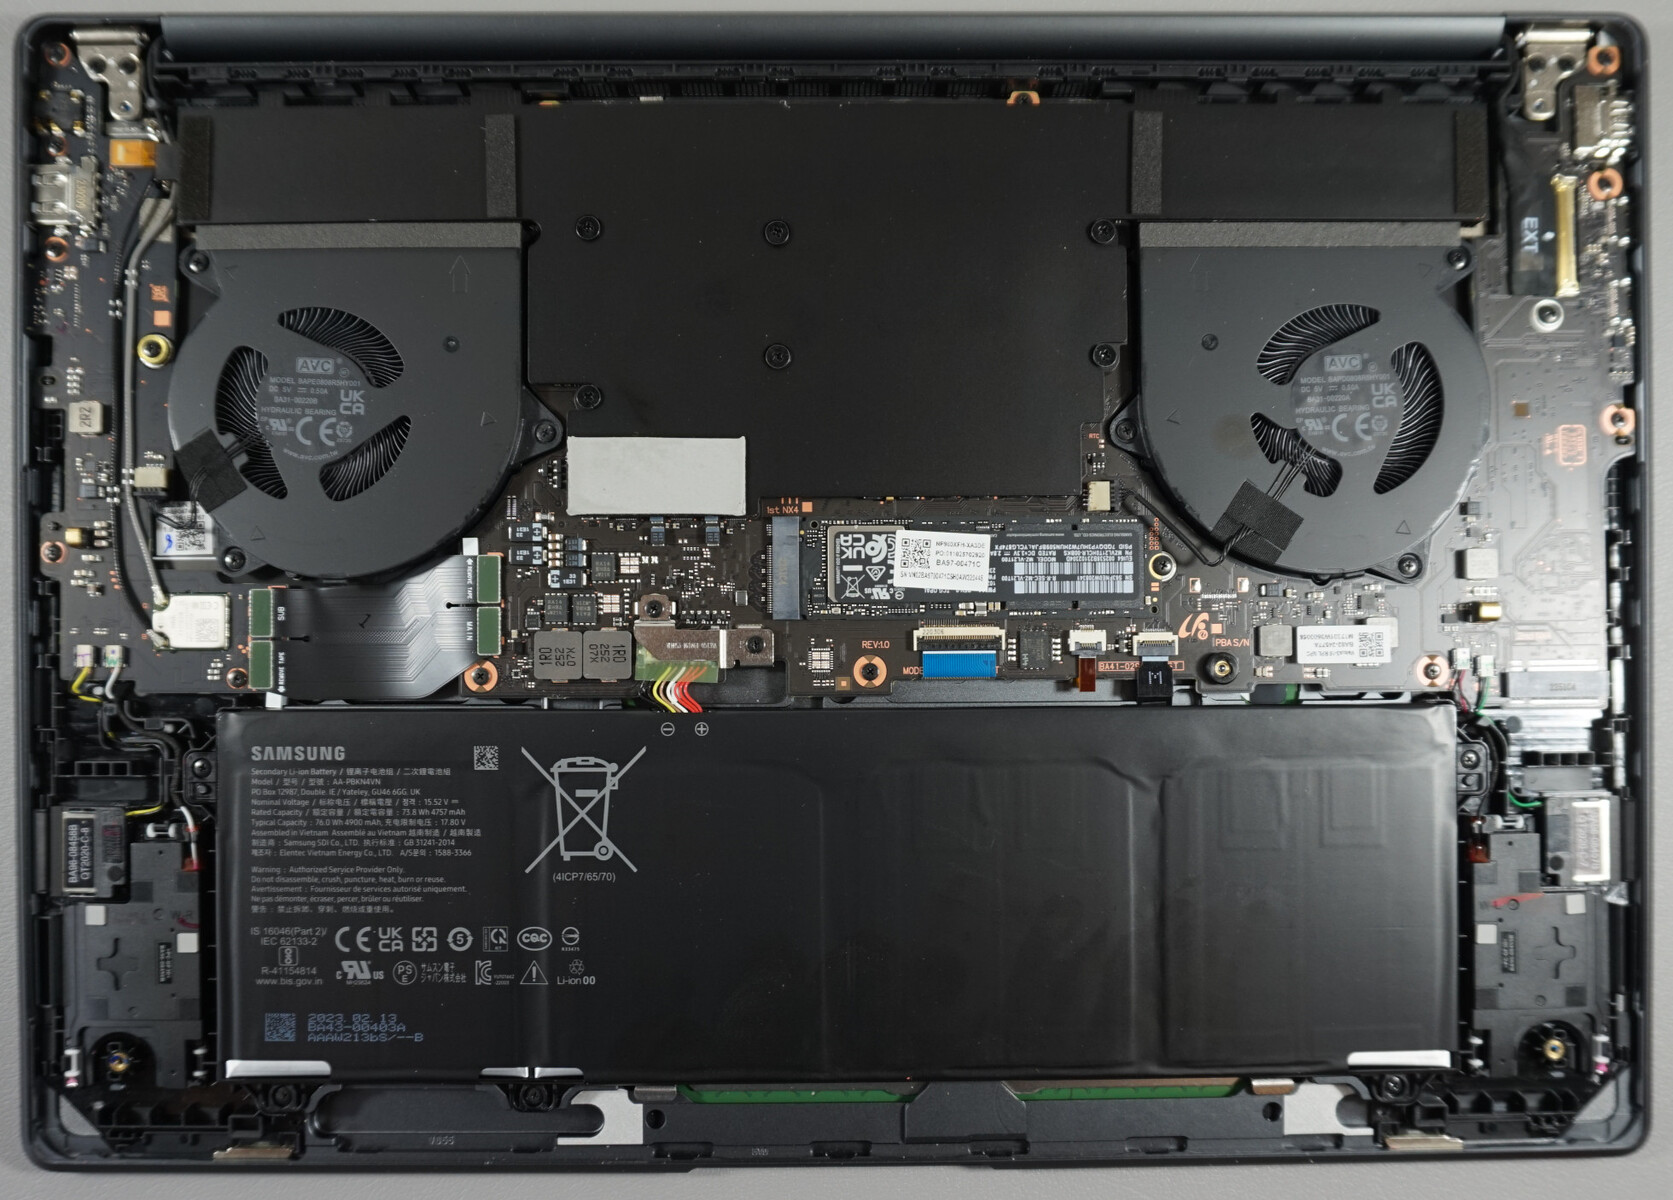
Manutenção
Apenas quatro parafusos Phillips precisam ser desparafusados para remover a placa de base. Eles estão localizados sob os pés de borracha encaixados, que podem ser removidos sem danos com um pouco de delicadeza.
Isso faz parecer que o notebook é fácil de abrir, mas não é. Inúmeros clipes de plástico prendem a placa de base firmemente no lugar. Há também um mecanismo no centro da placa de base que também está conectado ao sistema de resfriamento por meio de uma almofada térmica. O mecanismo só pode ser aberto depois de soltar e dobrar completamente a placa de base e se mostra igualmente complicado ao montar o laptop novamente.
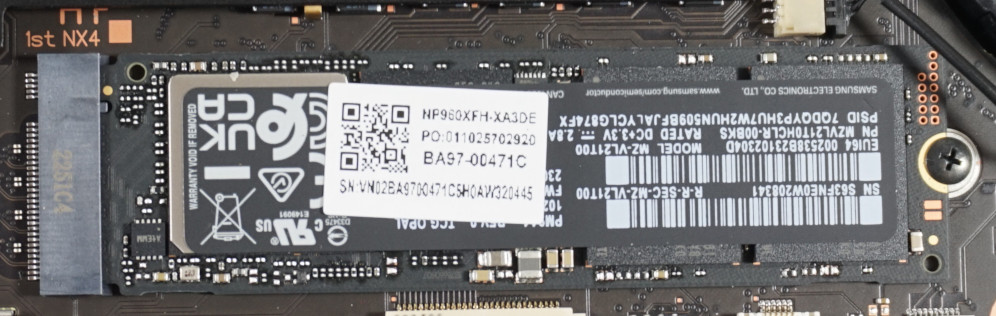
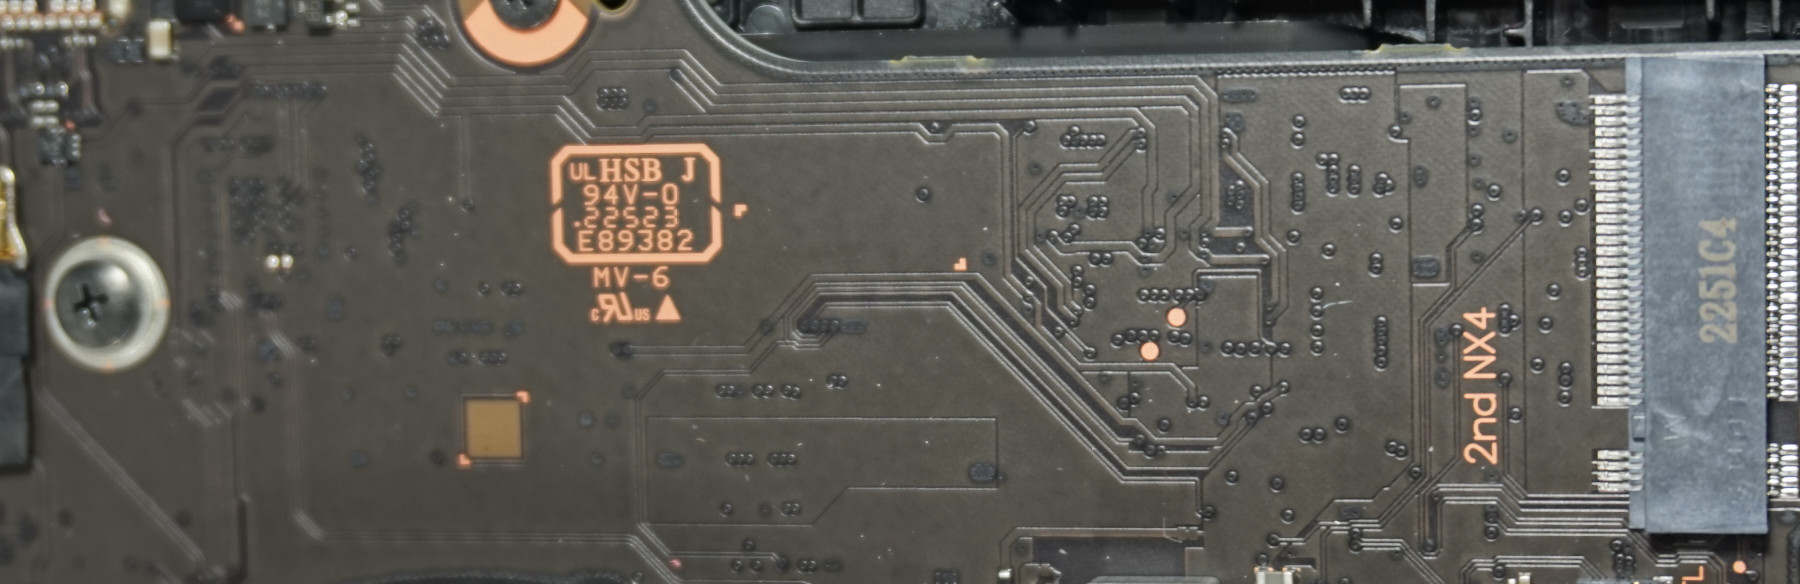
Aqueles que forem persistentes e cuidadosos o suficiente para não dobrar ou quebrar nada encontrarão um slot M.2 livre com PCIe 4 para expansão do armazenamento. O SSD principal e a bateria também podem ser trocados. Os ventiladores podem ser facilmente limpos.
A RAM e o módulo WLAN, por outro lado, são soldados. Em suma, isso não importa, pois a Samsung tornou a abertura extremamente complicada.
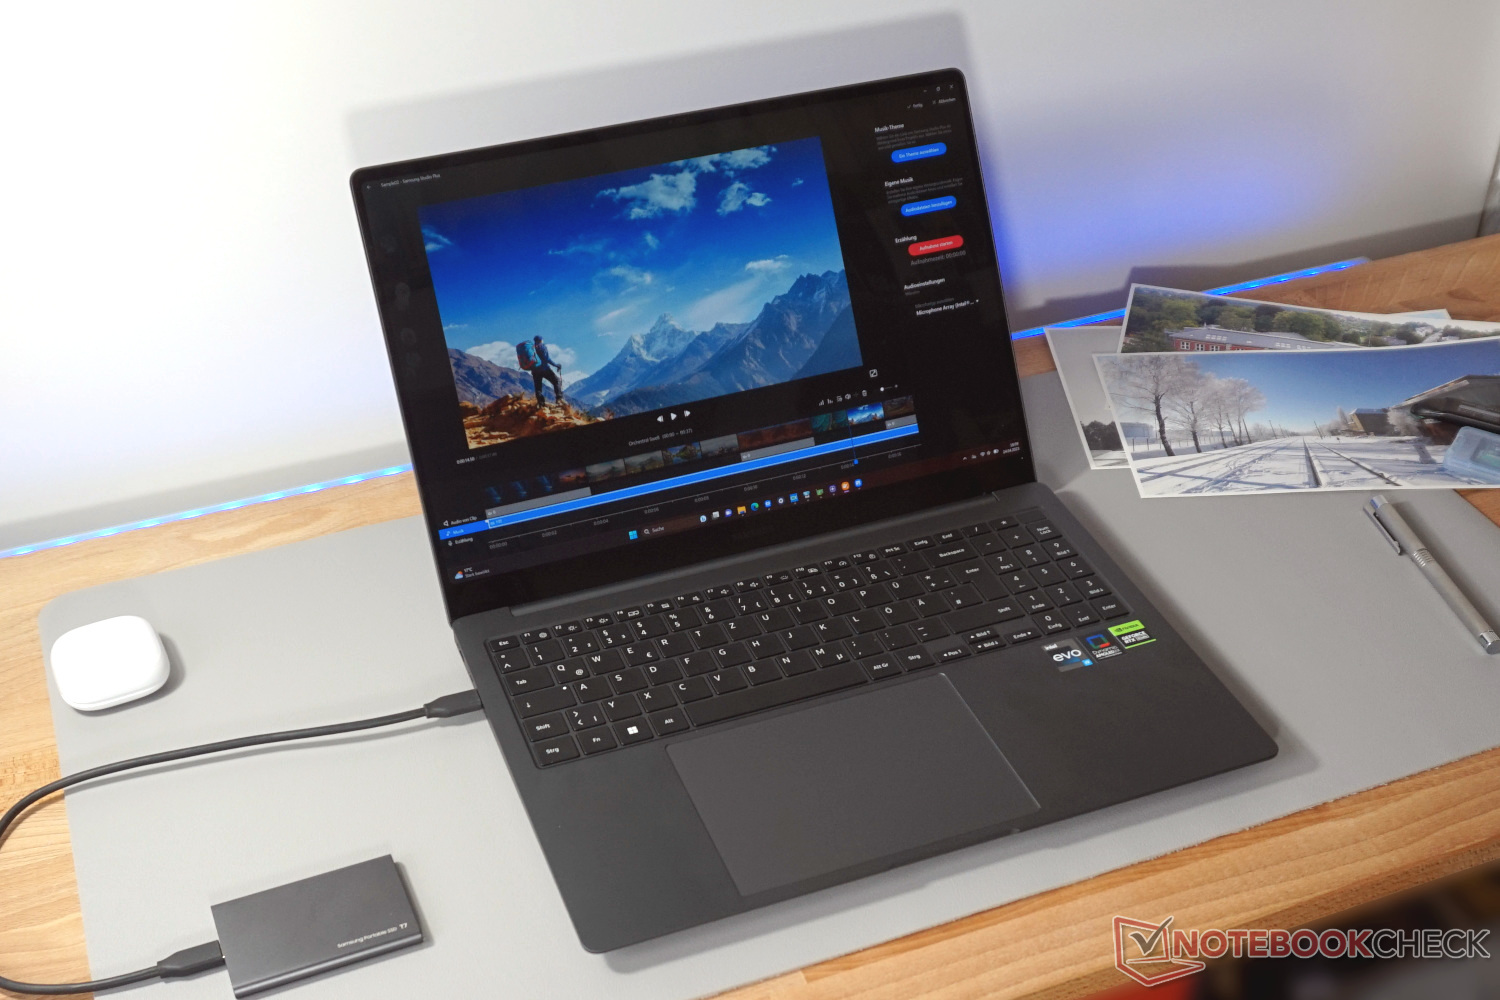
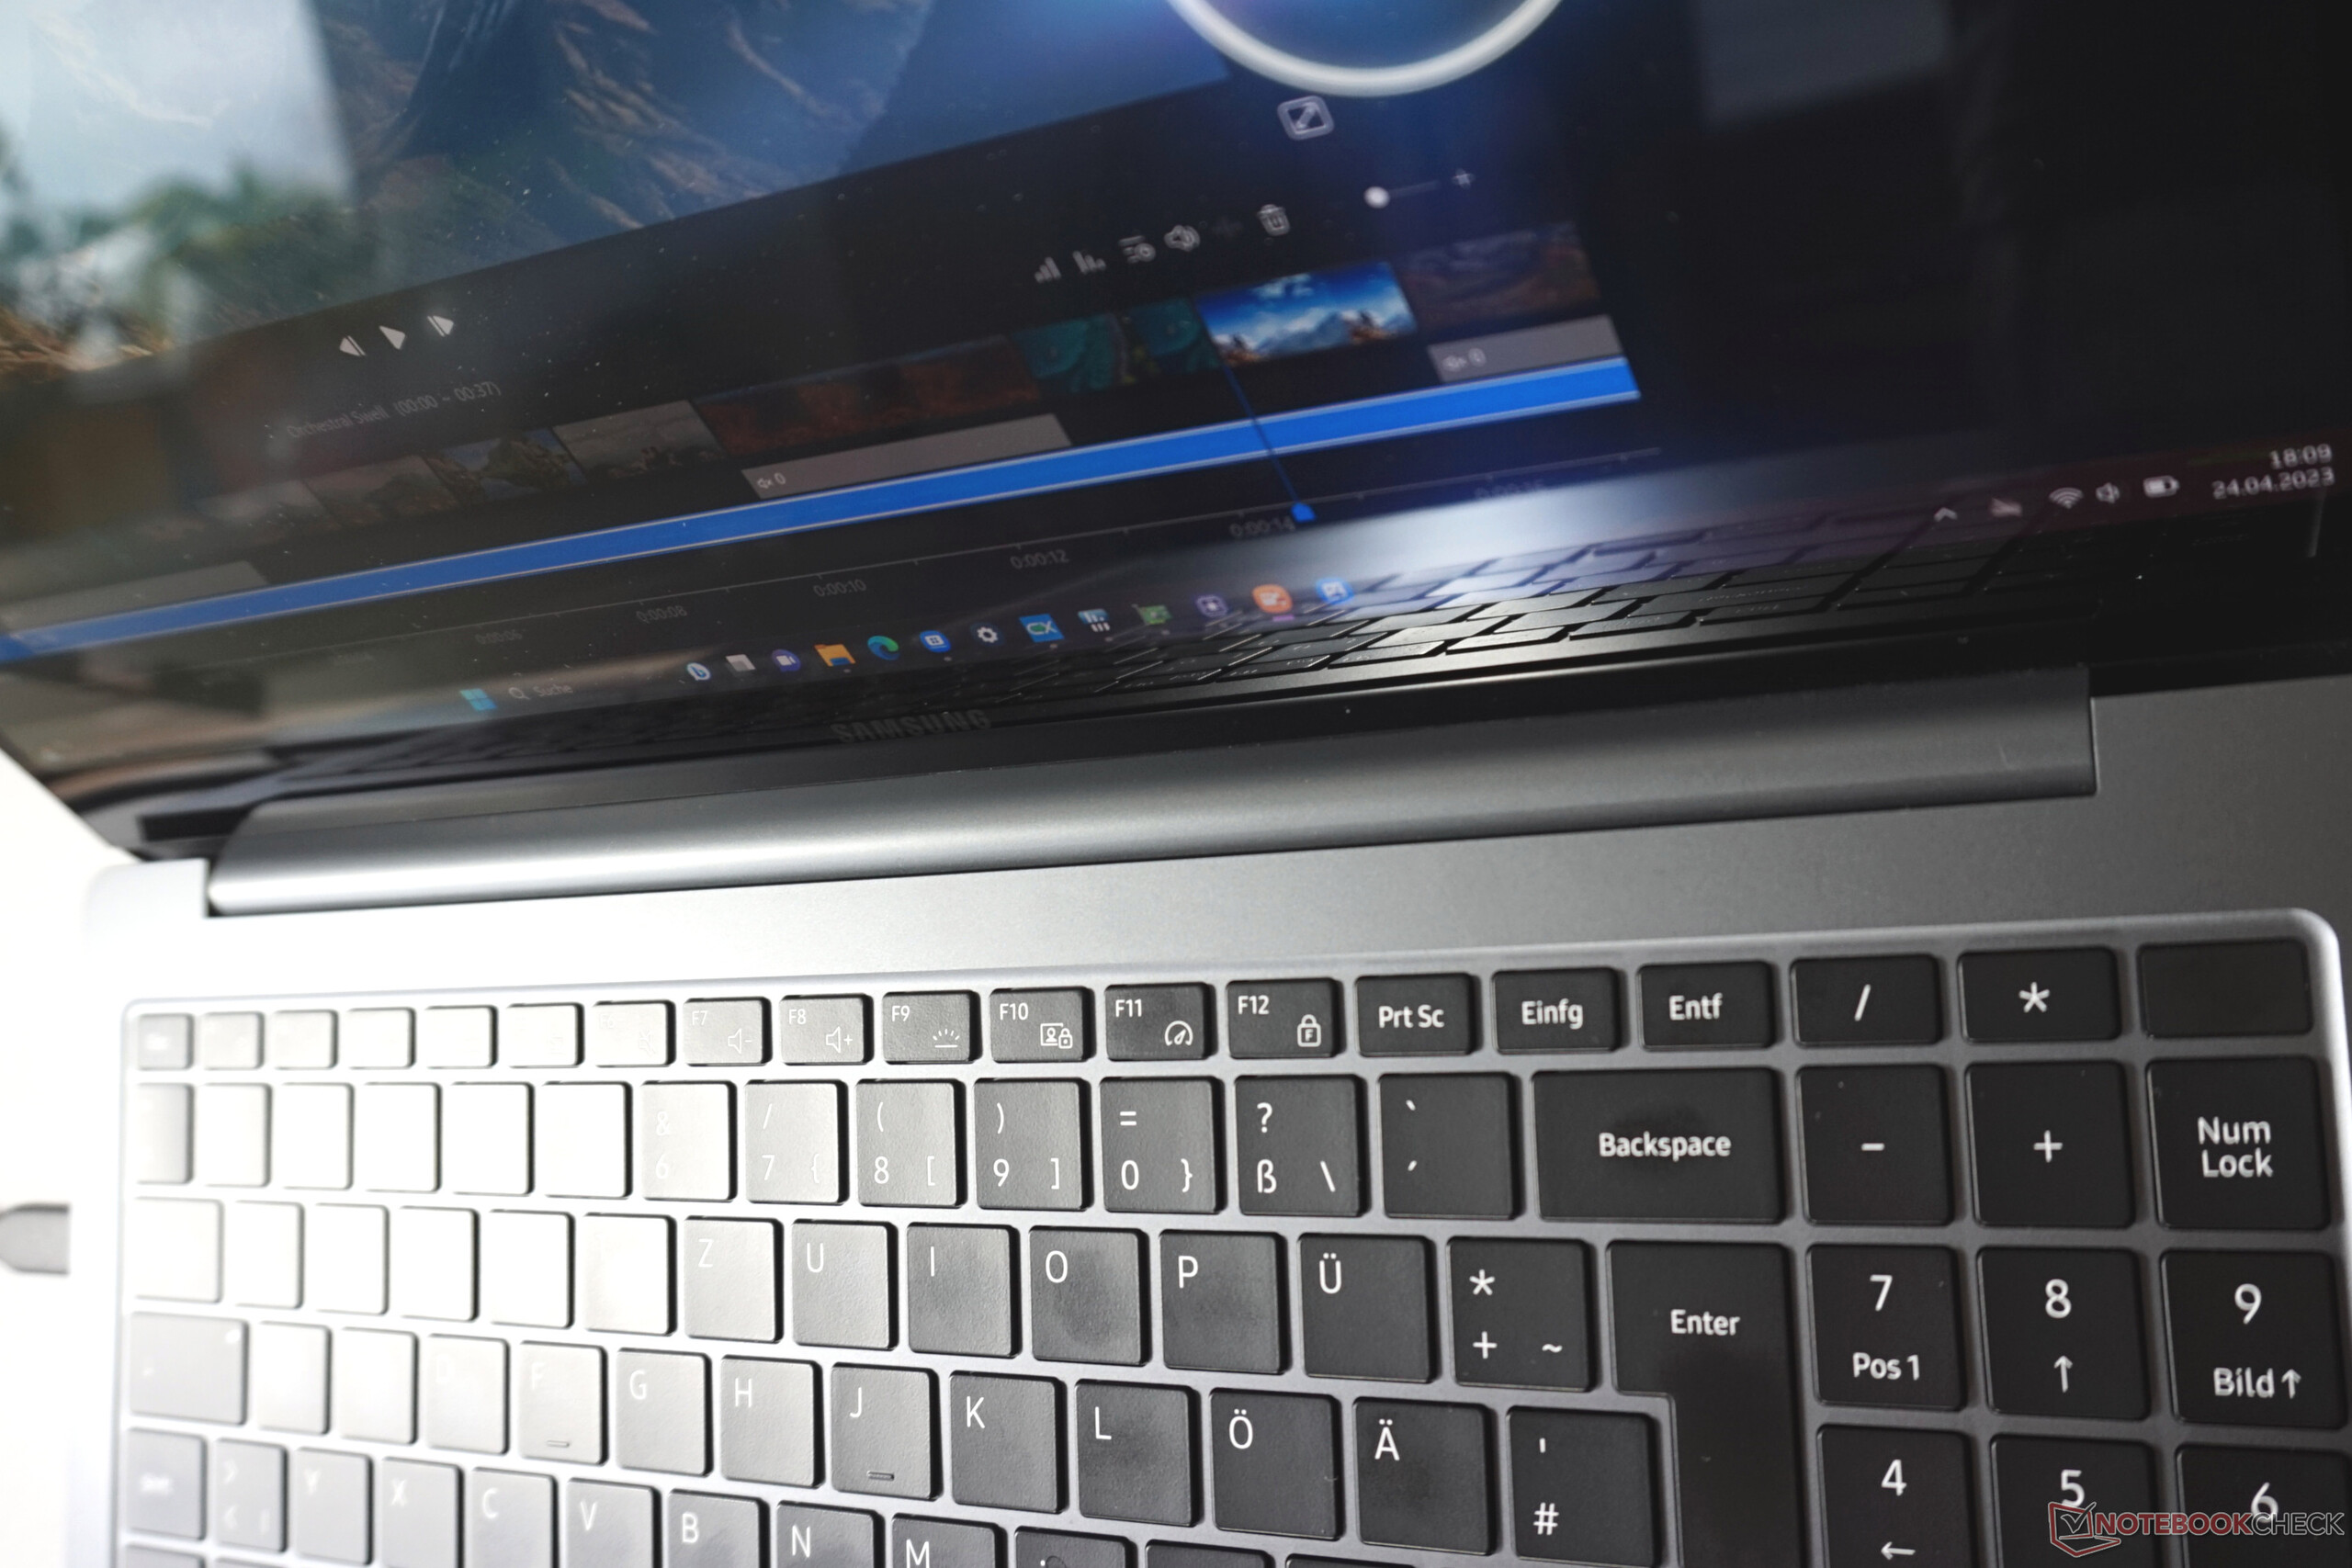
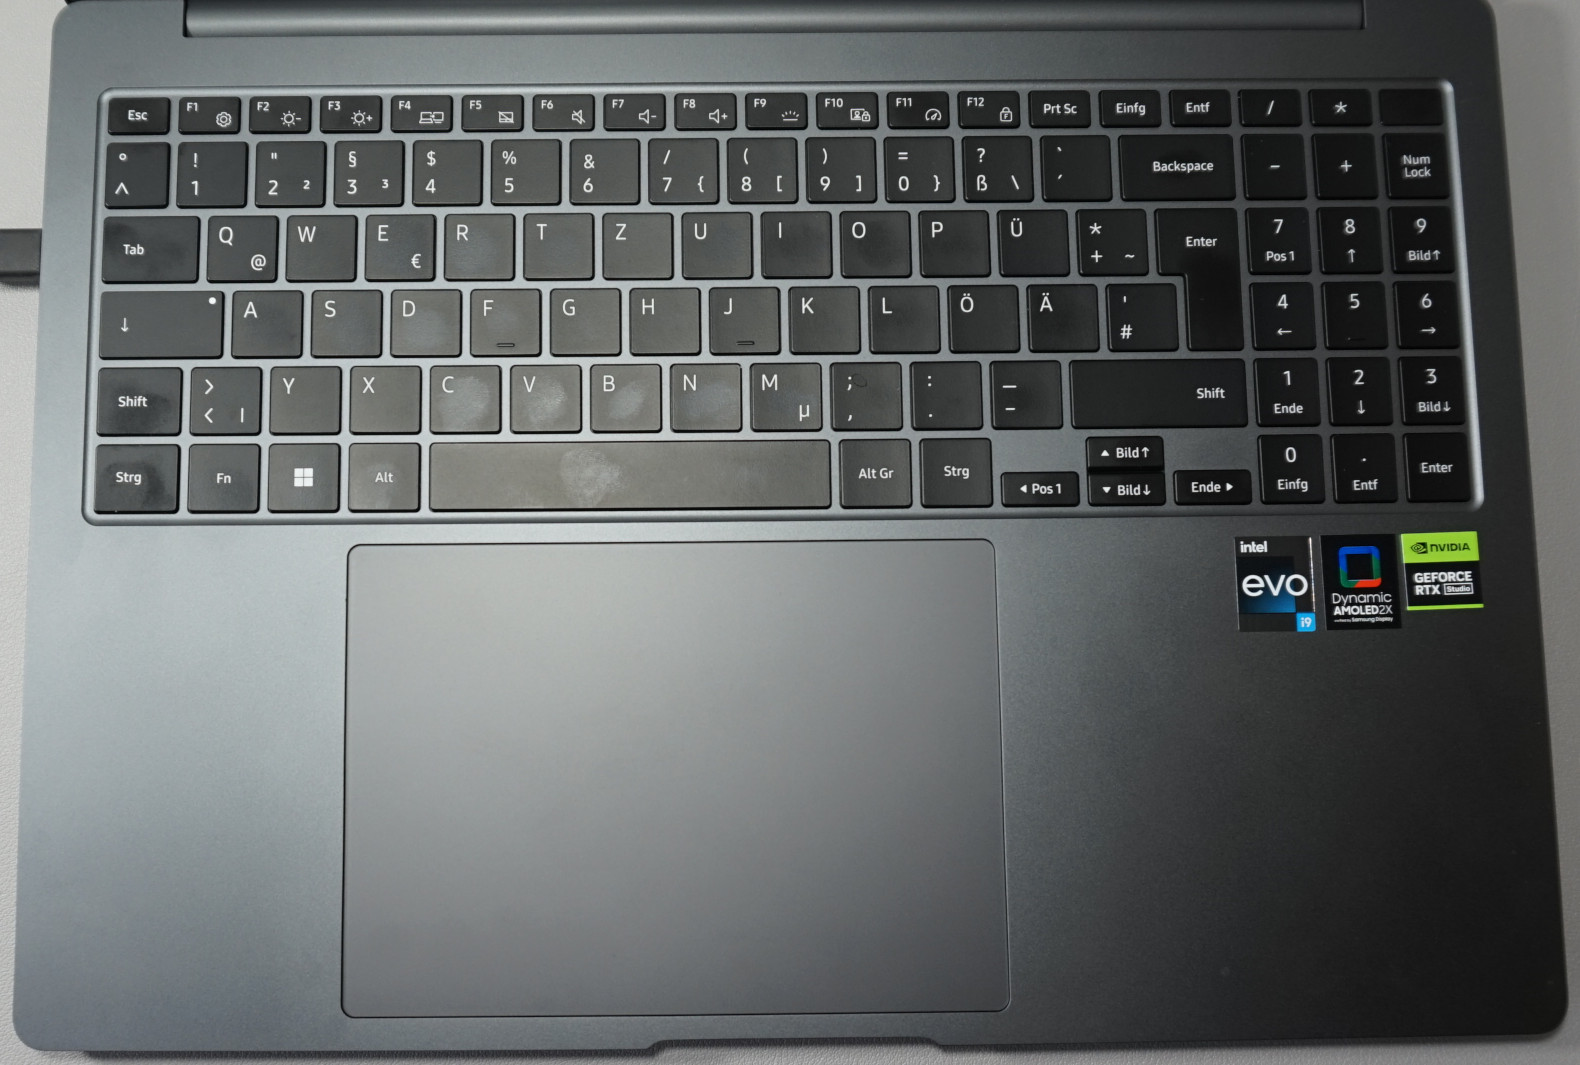
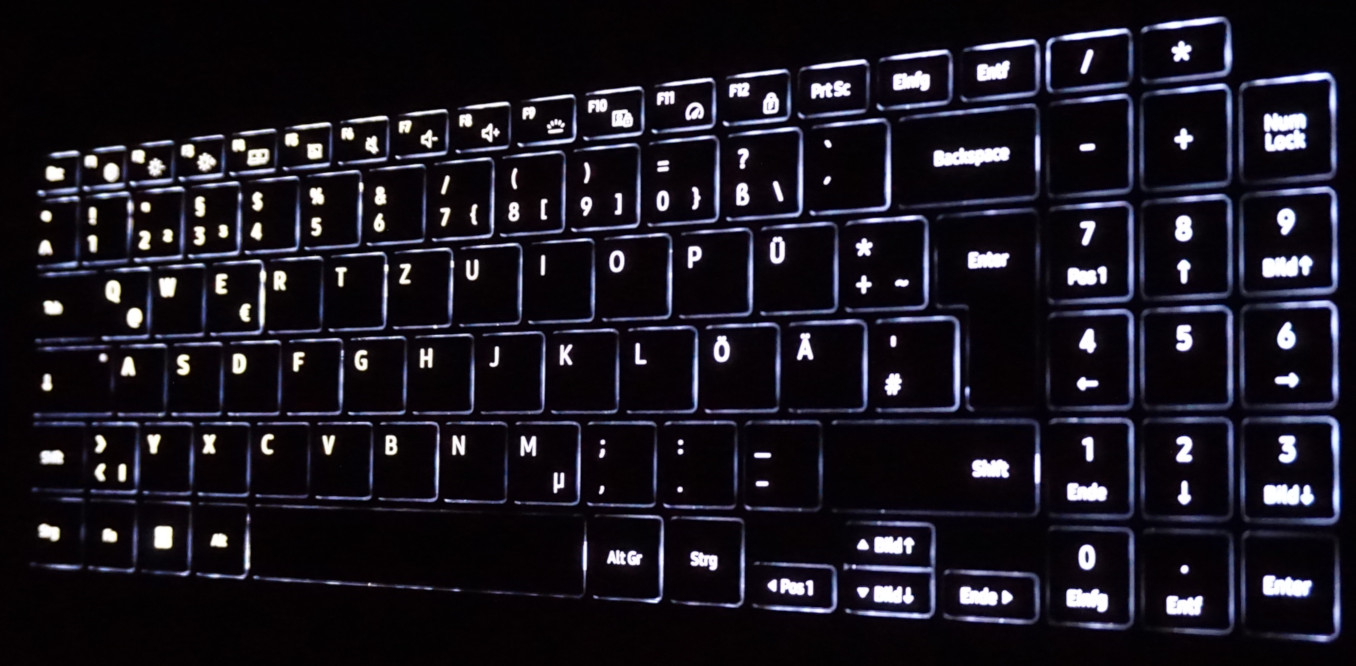
Dispositivos de entrada - Notebook para criadores com um grande extra
As dimensões reduzidas do notebook deixam pouco espaço para brincadeiras, de modo que o deslocamento das teclas é de apenas 1 mm, mas isso não prejudica nossa impressão geral positiva do teclado. Uma estrutura de superfície antiderrapante e uma contrapressão agradavelmente firme garantem uma boa dinâmica de digitação. A Samsung também fez um excelente uso do espaço disponível no teclado de 16 polegadas. O bloco de números tem um tamanho normal e, graças ao pequeno espaço para as teclas de seta, elas podem ser sentidas sem contato visual. Isso certamente facilita o trabalho em tabelas, entre outras coisas.
O destaque, no entanto, é o touchpad superdimensionado. Ele mede 15 x 10 cm, o que é significativamente maior do que em um notebook comercial típico. Os controles são precisos, o deslocamento das teclas é bem dosado e o manuseio com vários dedos também funciona sem problemas. No entanto, é preciso um certo tempo para se acostumar, já que repetidamente tocamos o touchpad com a mão enquanto digitávamos. As entradas são bem-sucedidas na maior parte do tempo, mas às vezes podem ser imprecisas ou não intencionais com dois dedos.
No entanto, o touchpad tem boa aparência e deve tornar o mouse adicional obsoleto, se necessário.
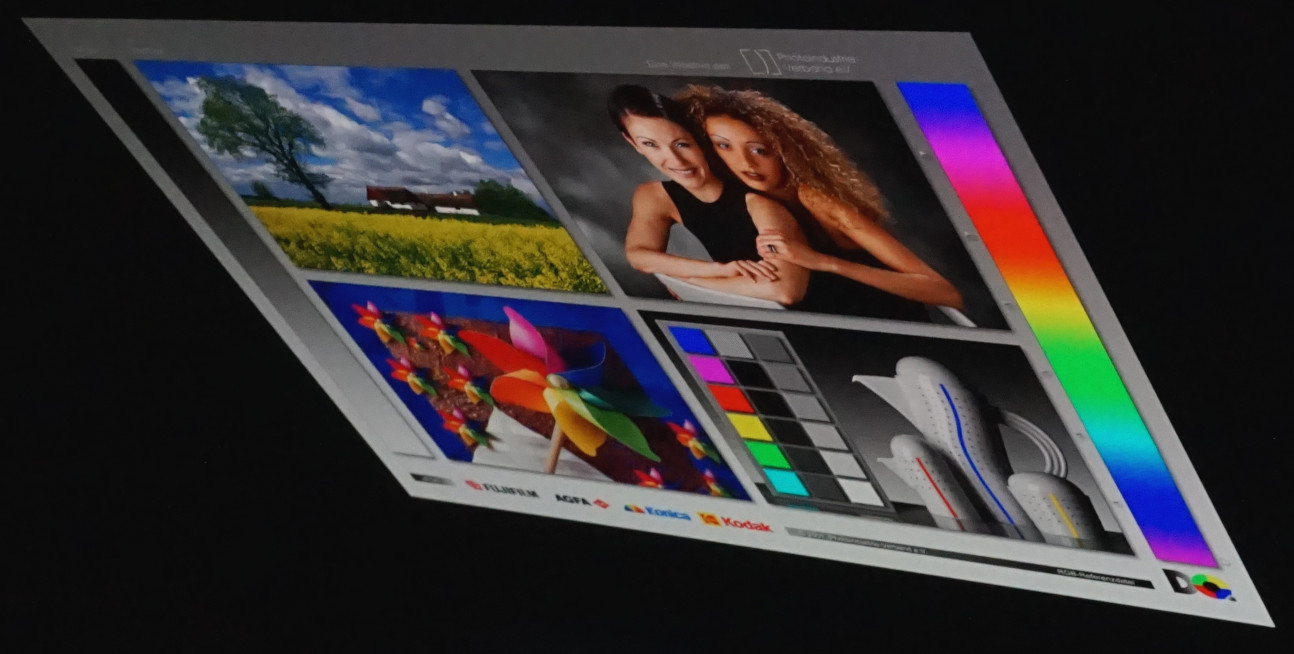
Tela - OLED e 3K no Galaxy Book3 Ultra
Uma resolução de 3K, que nesse caso significa 2.880 x 1.800 pixels, uma tela OLED, 120 Hz e certificação HDR atendem bem à finalidade pretendida do notebook. Graças aos 5 milhões de pixels, as fotos digitais de alta resolução são exibidas muito bem. O aumento da taxa de quadros também atende aos requisitos para a reprodução e edição ideais de vídeo.
Além disso, a tela OLED contribui com sua parte para os fortes valores de imagem. O preto profundo garante contrastes muito bons e faz com que as cores pareçam mais vivas. Além disso, a certificação Vesa Display HDR 500 anuncia a reprodução ideal do conteúdo HDR. A tela brilhante também ajuda a obter uma representação muito boa do conteúdo exibido. Na ausência de granulação da superfície, as imagens e os vídeos parecem consistentemente brilhantes. Entretanto, é preciso aceitar fortes reflexos de superfícies brilhantes no plano de fundo.
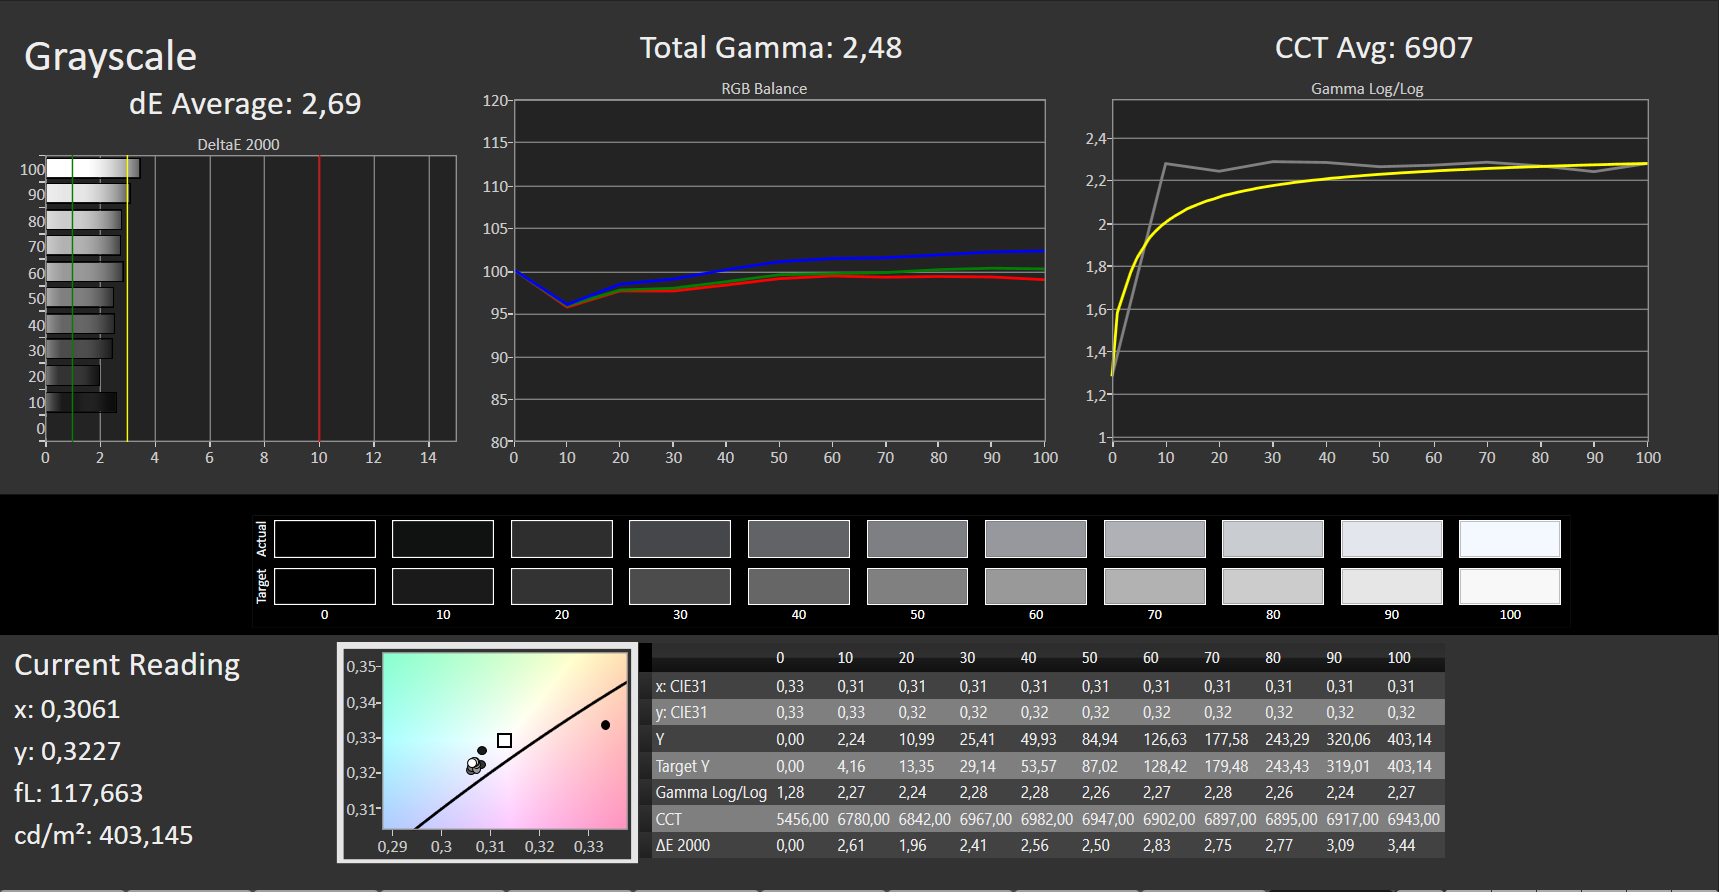
Medimos um bom brilho médio de 408 cd/m². Os dispositivos rivais com telas OLED não atingem esse nível de brilho. Um leve escurecimento pode ser observado quando o adaptador de energia é desconectado, mas o brilho ainda é aceitável em 340 cd/m².
Não é preciso temer o sangramento da tela. Os pixels autoiluminados são desligados quando a cor preta é exibida, o que resulta no valor de preto perfeito do painel.
| |||||||||||||||||||||||||
iluminação: 98 %
iluminação com acumulador: 343 cd/m²
Contraste: ∞:1 (Preto: 0 cd/m²)
ΔE ColorChecker Calman: 2.63 | ∀{0.5-29.43 Ø4.71}
ΔE Greyscale Calman: 2.69 | ∀{0.09-98 Ø4.96}
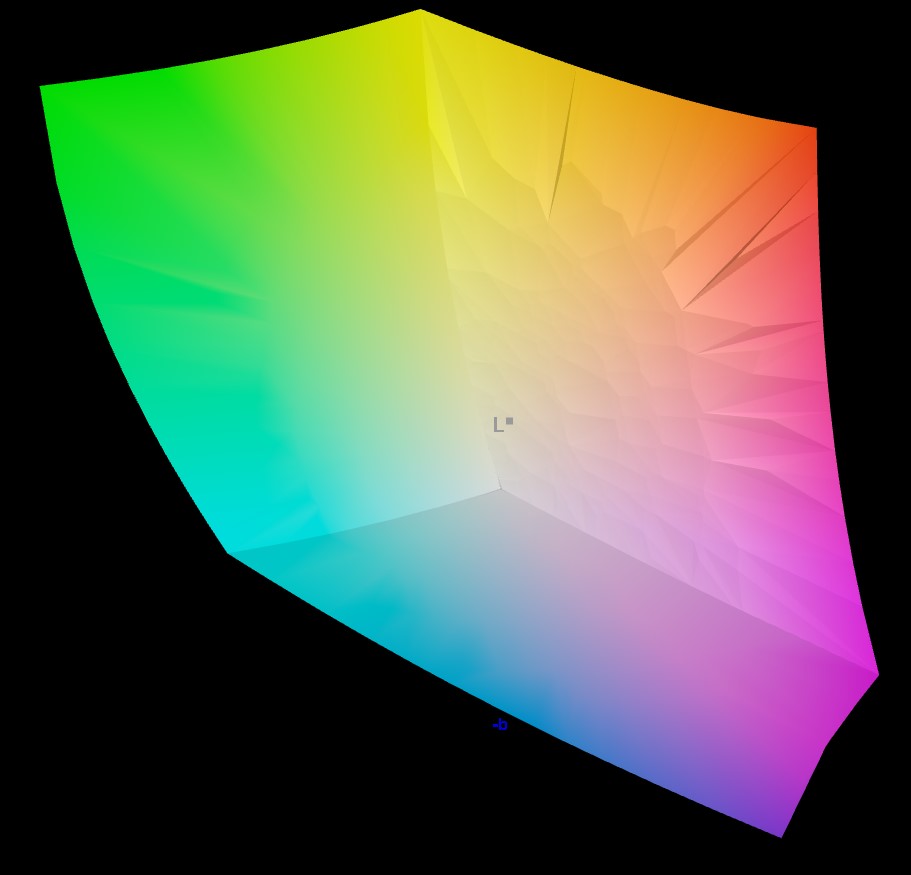
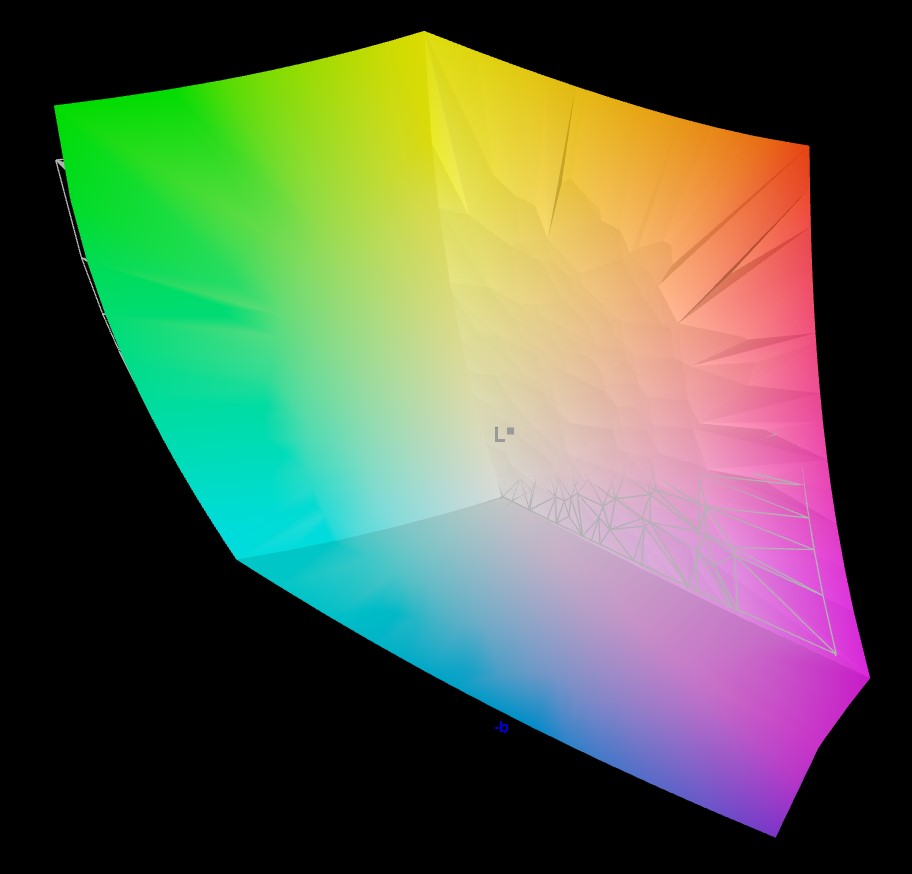
97.4% AdobeRGB 1998 (Argyll 3D)
99.1% sRGB (Argyll 3D)
95.3% Display P3 (Argyll 3D)
Gamma: 2.48
CCT: 6907 K
| Samsung Galaxy Book3 Ultra 16, i9-13900H RTX 4070 Samsung SDC4185 ATNA60CL03-0, OLED / AMOLED, 2880x1800, 16" | Dell XPS 15 9530 RTX 4070 Samsung 156XG01, OLED, 3456x2160, 15.6" | MSI Stealth 17 Studio A13VH-014 AUO41A2 B173ZAN06.C, Mini LED, 3840x2160, 17.3" | Asus ProArt StudioBook 16 H7600ZW Samsung ATNA60YV02, OLED, 3840x2400, 16" | Gigabyte AERO 16 OLED BSF Samsung SDC4191 (ATNA60YV09-0, OLED, 3840x2400, 16" | Samsung Galaxy Book3 Ultra 16 Samsung ATNA60CL03-0, AMOLED, 2880x1800, 16" | |
|---|---|---|---|---|---|---|
| Display | 2% | -2% | 2% | 2% | 2% | |
| Display P3 Coverage (%) | 95.3 | 99.8 5% | 92 -3% | 99.6 5% | 99.9 5% | 99.9 5% |
| sRGB Coverage (%) | 99.1 | 100 1% | 99.1 0% | 100 1% | 100 1% | 100 1% |
| AdobeRGB 1998 Coverage (%) | 97.4 | 98.4 1% | 94.07 -3% | 96.5 -1% | 96.4 -1% | 96.3 -1% |
| Response Times | 10% | -1076% | -398% | 1% | 71% | |
| Response Time Grey 50% / Grey 80% * (ms) | 2 ? | 1.68 ? 16% | 46.4 ? -2220% | 1.6 ? 20% | 2 ? -0% | 0.49 ? 75% |
| Response Time Black / White * (ms) | 2 ? | 1.94 ? 3% | 0.62 ? 69% | 18.32 ? -816% | 1.98 ? 1% | 0.65 ? 67% |
| PWM Frequency (Hz) | 250 ? | 239 | 2400 | 60 ? | 60 | 240 ? |
| Screen | -30% | -1% | -8% | 6% | 1% | |
| Brightness middle (cd/m²) | 403 | 389.5 -3% | 397.29 -1% | 370 -8% | 389.97 -3% | 400 -1% |
| Brightness (cd/m²) | 408 | 392 -4% | 392 -4% | 374 -8% | 395 -3% | 399 -2% |
| Brightness Distribution (%) | 98 | 98 0% | 93 -5% | 98 0% | 97 -1% | 93 -5% |
| Black Level * (cd/m²) | 0.02 | 0.03 | 0.03 | |||
| Colorchecker dE 2000 * | 2.63 | 4.95 -88% | 2.52 4% | 2.97 -13% | 2 24% | 2.3 13% |
| Colorchecker dE 2000 max. * | 4.07 | 8.65 -113% | 3.91 4% | 4.38 -8% | 4.1 -1% | 4.15 -2% |
| Greyscale dE 2000 * | 2.69 | 2 26% | 2.78 -3% | 2.9 -8% | 2.23 17% | 2.7 -0% |
| Gamma | 2.48 89% | 2.27 97% | 2.63 84% | 2.13 103% | 2.41 91% | 2.266 97% |
| CCT | 6907 94% | 6265 104% | 6412 101% | 6636 98% | 6323 103% | 7047 92% |
| Colorchecker dE 2000 calibrated * | 1.53 | 2.52 | 2.15 | 1.68 | 1.66 | |
| Contrast (:1) | 19865 | 12999 | 13333 | |||
| Média Total (Programa/Configurações) | -6% /
-14% | -360% /
-197% | -135% /
-76% | 3% /
4% | 25% /
14% |
* ... menor é melhor
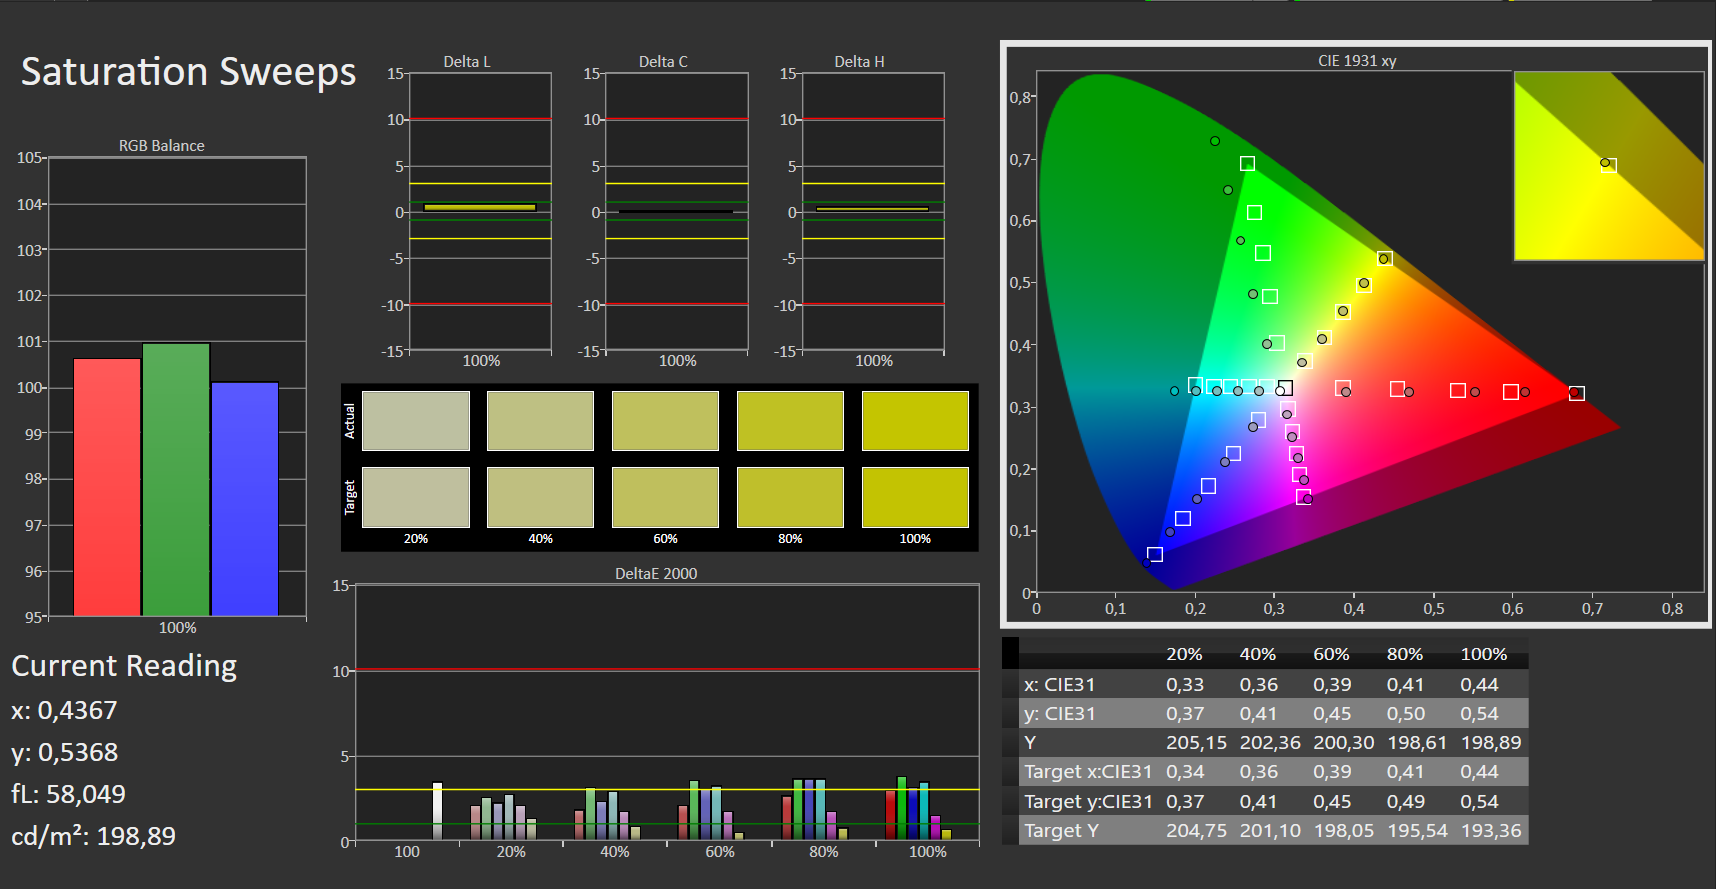
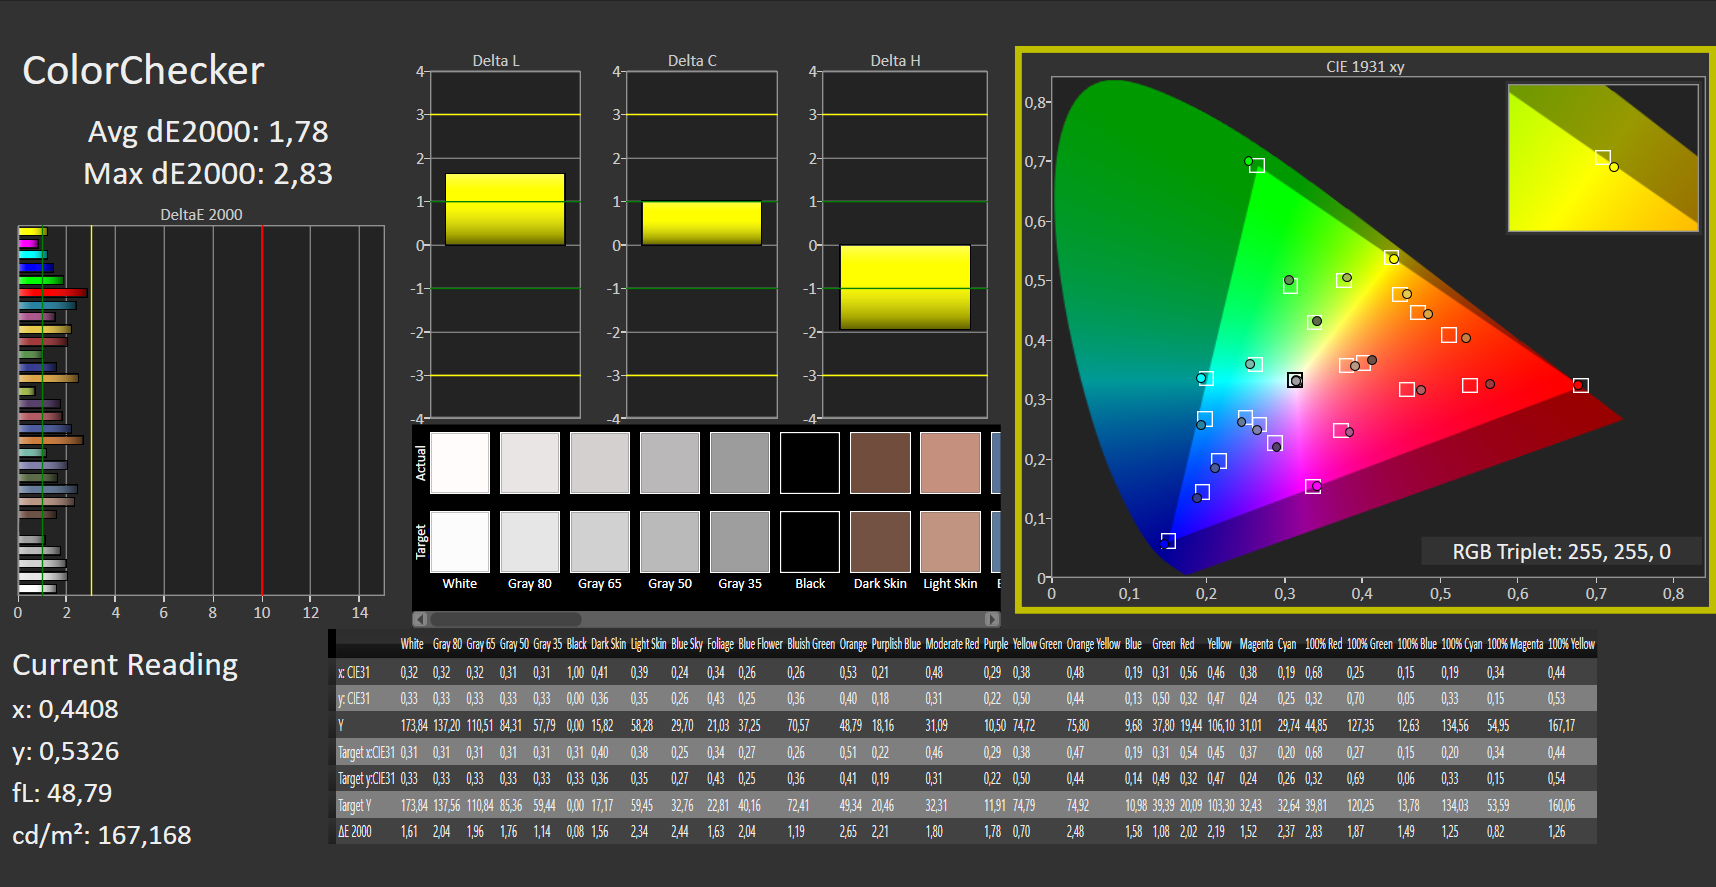
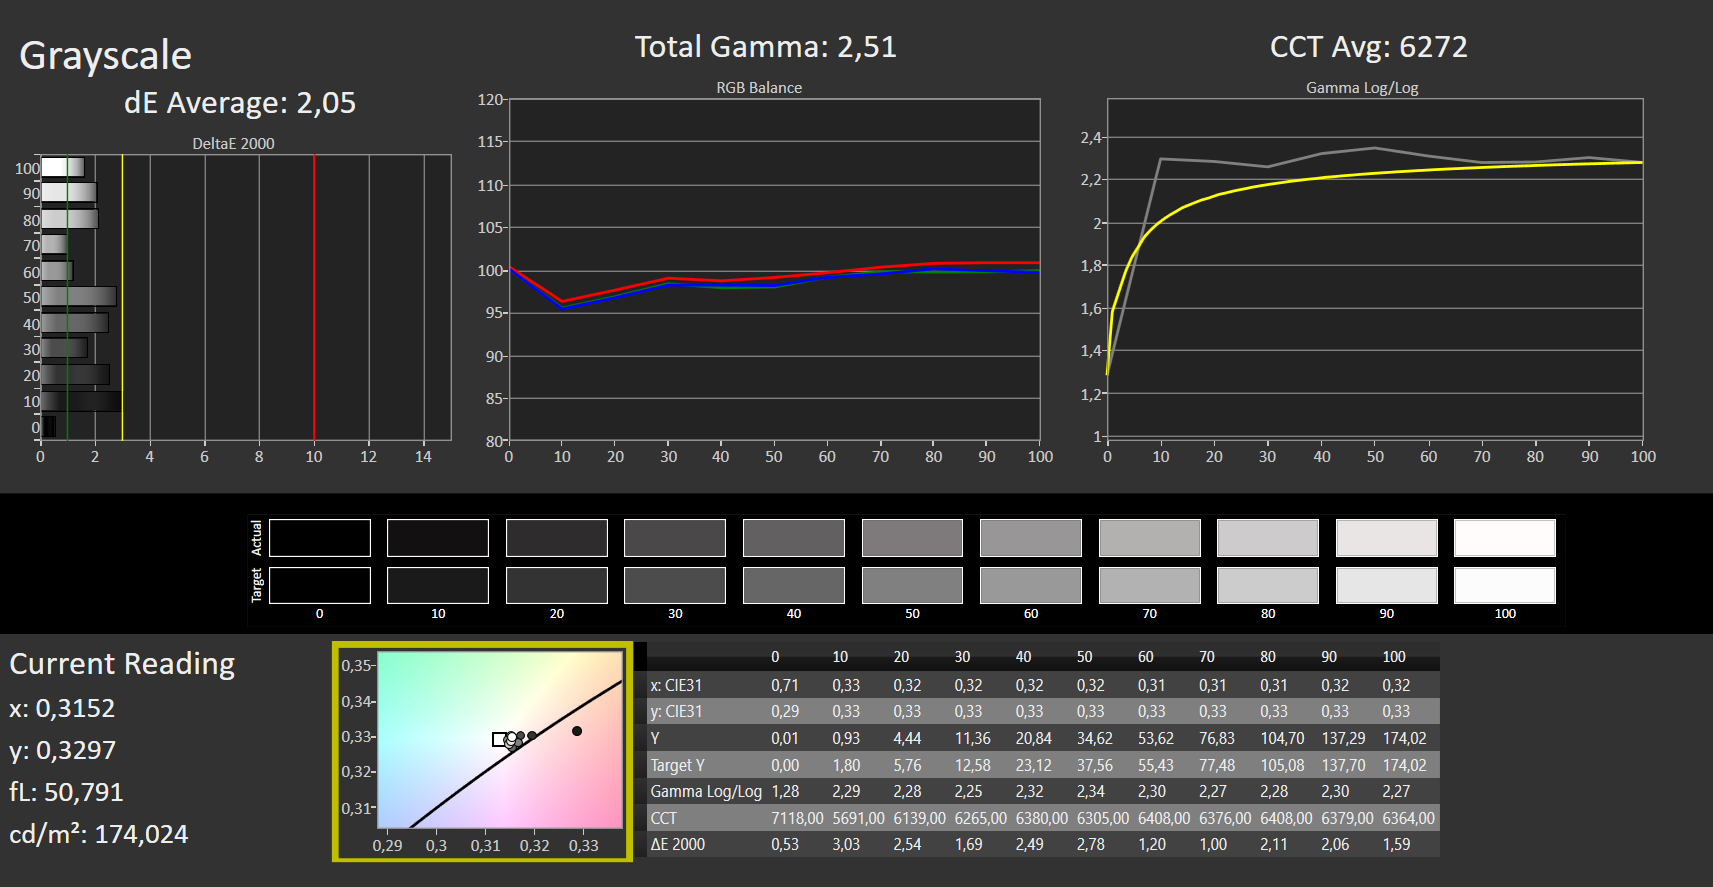
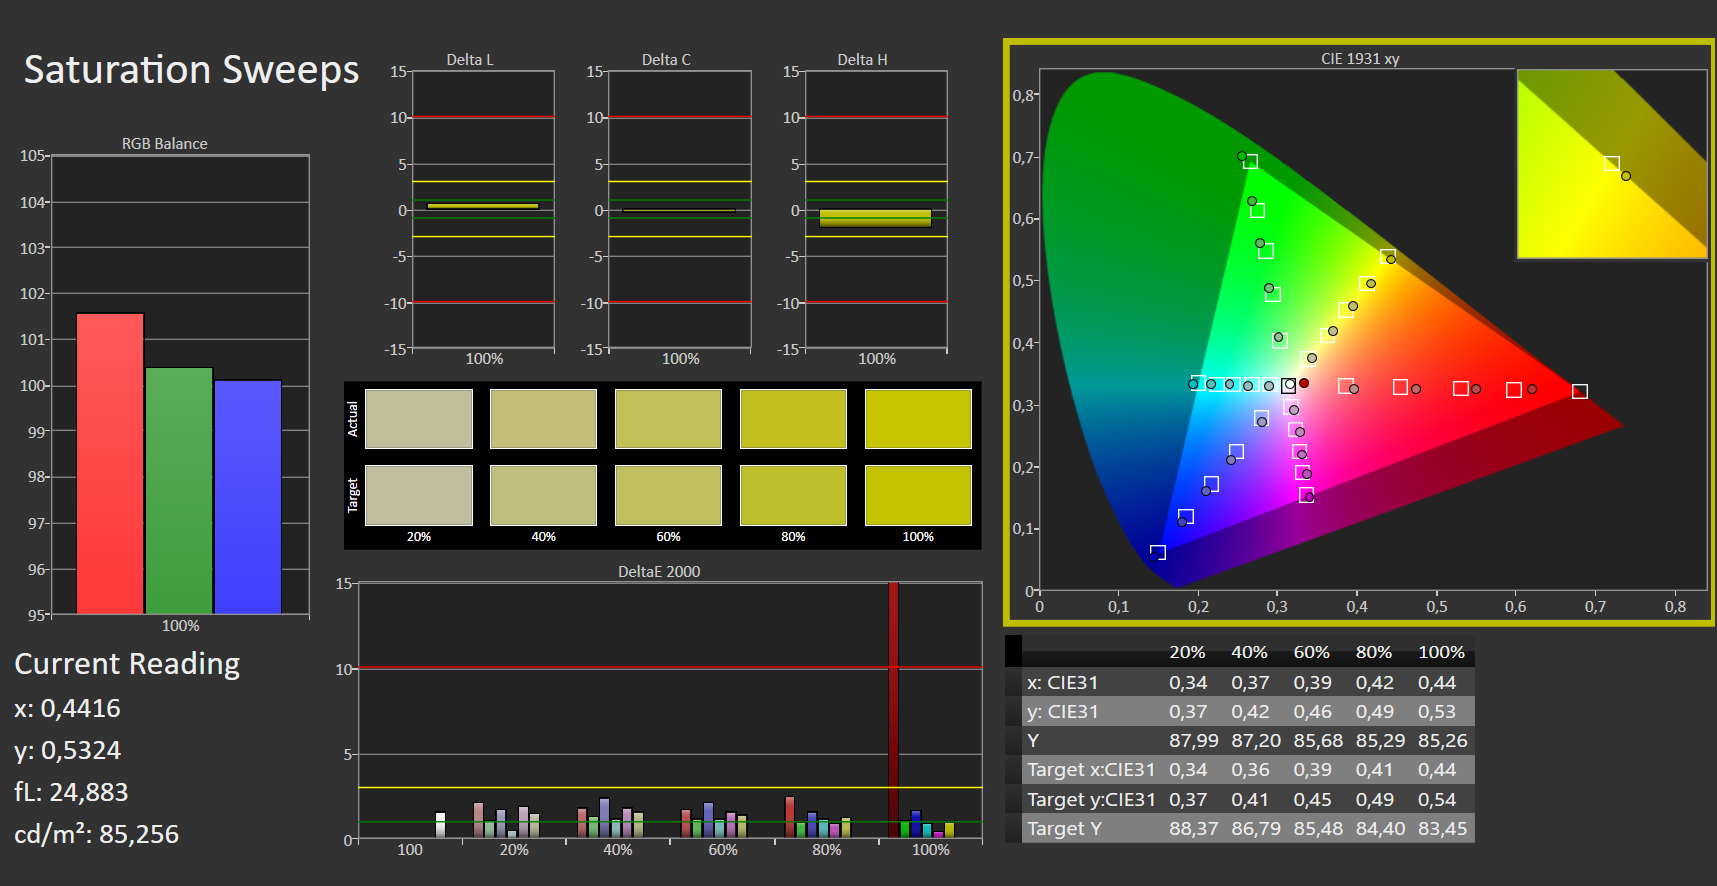
O espaço de cores P3 da tela, que normalmente é usado na edição de vídeo profissional, não é reproduzido com perfeição. A tela OLED não consegue exibir completamente os tons de amarelo e laranja necessários. O fato de a Samsung especificar 120% de cobertura é porque ela simplesmente inclui cores que nem sequer existem no espaço de cores.
Por outro lado, medimos uma das melhores taxas de cobertura para AdobeRGB, que é usado principalmente para edição de imagens profissionais, entre os concorrentes listados. Apenas o Dell XPS 9530, que também é equipado com uma tela OLED da Samsung, tem um desempenho um pouco melhor.
No entanto, como quase sempre trabalhamos no espaço de cores sRGB, a tela é perfeitamente adequada para criação e edição de mídia sem calibração adicional.

O software incluído da Samsung permite a seleção direta de diferentes perfis de cores. Mesmo no modo nativo da tela OLED, o desvio médio de cor que determinamos é praticamente imperceptível. Entretanto, um olho treinado ainda pode notar discrepâncias em alguns tons de cores.
Se, por outro lado, o perfil Display-P3 for selecionado, o que altera visivelmente a tela, todos os desvios ficam em um nível muito baixo e não devem mais ser perceptíveis. Portanto, a representação das cores é quase perfeita sem calibração.

Exibir tempos de resposta
| ↔ Tempo de resposta preto para branco | ||
|---|---|---|
| 2 ms ... ascensão ↗ e queda ↘ combinadas | ↗ 1 ms ascensão |  |
| ↘ 1 ms queda | ||
| A tela mostra taxas de resposta muito rápidas em nossos testes e deve ser muito adequada para jogos em ritmo acelerado. Em comparação, todos os dispositivos testados variam de 0.1 (mínimo) a 240 (máximo) ms. » 11 % de todos os dispositivos são melhores. Isso significa que o tempo de resposta medido é melhor que a média de todos os dispositivos testados (19.8 ms). | ||
| ↔ Tempo de resposta 50% cinza a 80% cinza | ||
| 2 ms ... ascensão ↗ e queda ↘ combinadas | ↗ 1 ms ascensão |  |
| ↘ 1 ms queda | ||
| A tela mostra taxas de resposta muito rápidas em nossos testes e deve ser muito adequada para jogos em ritmo acelerado. Em comparação, todos os dispositivos testados variam de 0.165 (mínimo) a 636 (máximo) ms. » 10 % de todos os dispositivos são melhores. Isso significa que o tempo de resposta medido é melhor que a média de todos os dispositivos testados (31 ms). | ||
Cintilação da tela / PWM (modulação por largura de pulso)
| Tela tremeluzindo/PWM detectado | 250 Hz | ≤ 70 % configuração de brilho |    |
A luz de fundo da tela pisca em 250 Hz (pior caso, por exemplo, utilizando PWM) Cintilação detectada em uma configuração de brilho de 70 % e abaixo. Não deve haver cintilação ou PWM acima desta configuração de brilho. A frequência de 250 Hz é relativamente baixa, portanto, usuários sensíveis provavelmente notarão cintilação e sentirão fadiga ocular na configuração de brilho indicada e abaixo. [pwm_comparison] Em comparação: 52 % de todos os dispositivos testados não usam PWM para escurecer a tela. Se PWM foi detectado, uma média de 7757 (mínimo: 5 - máximo: 343500) Hz foi medida. | |||
Como de costume com os painéis OLED, detectamos cintilação de imagem induzida por PWM. A frequência de 240 Hz está em uma faixa que pode ser perceptível para pessoas sensíveis. Os sensores da câmera também não têm problemas em exibir esse efeito.
Entretanto, o efeito é muito menos pronunciado do que em um monitor clássico com luz de fundo de LED. Em um painel desse tipo, áreas maiores são desativadas. Em uma tela OLED, por outro lado, é sempre apenas uma área muito pequena de pixels que fica preta por um curto período. Isso serve para aumentar a vida útil da tela, entre outras coisas.
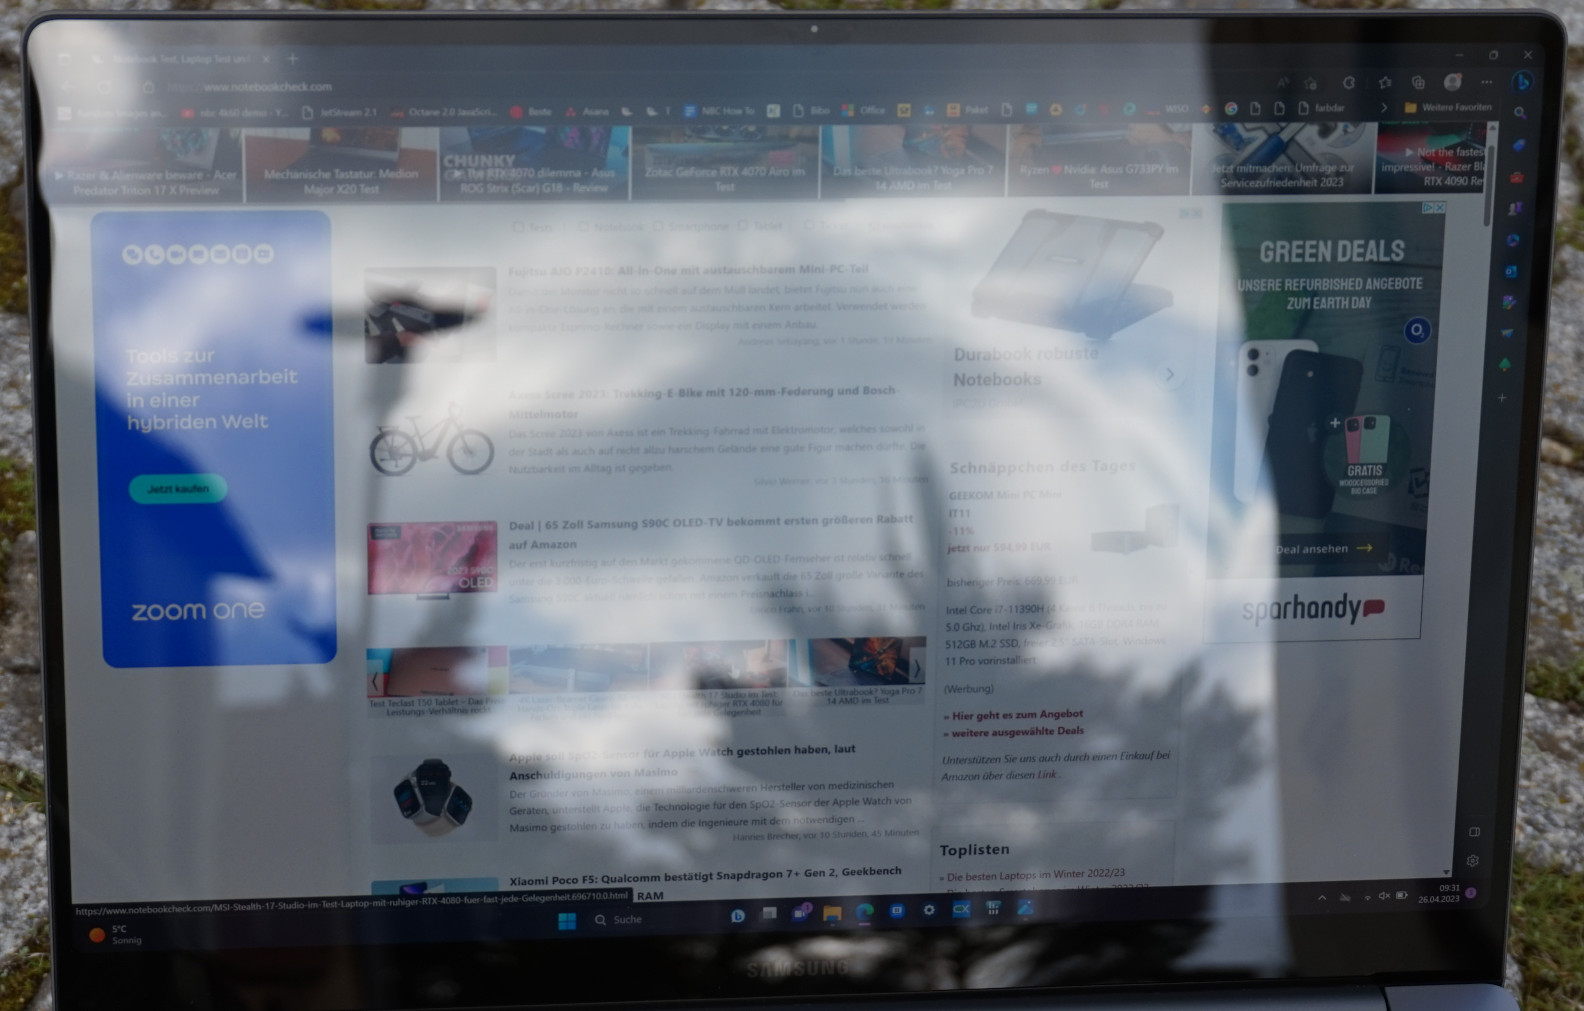
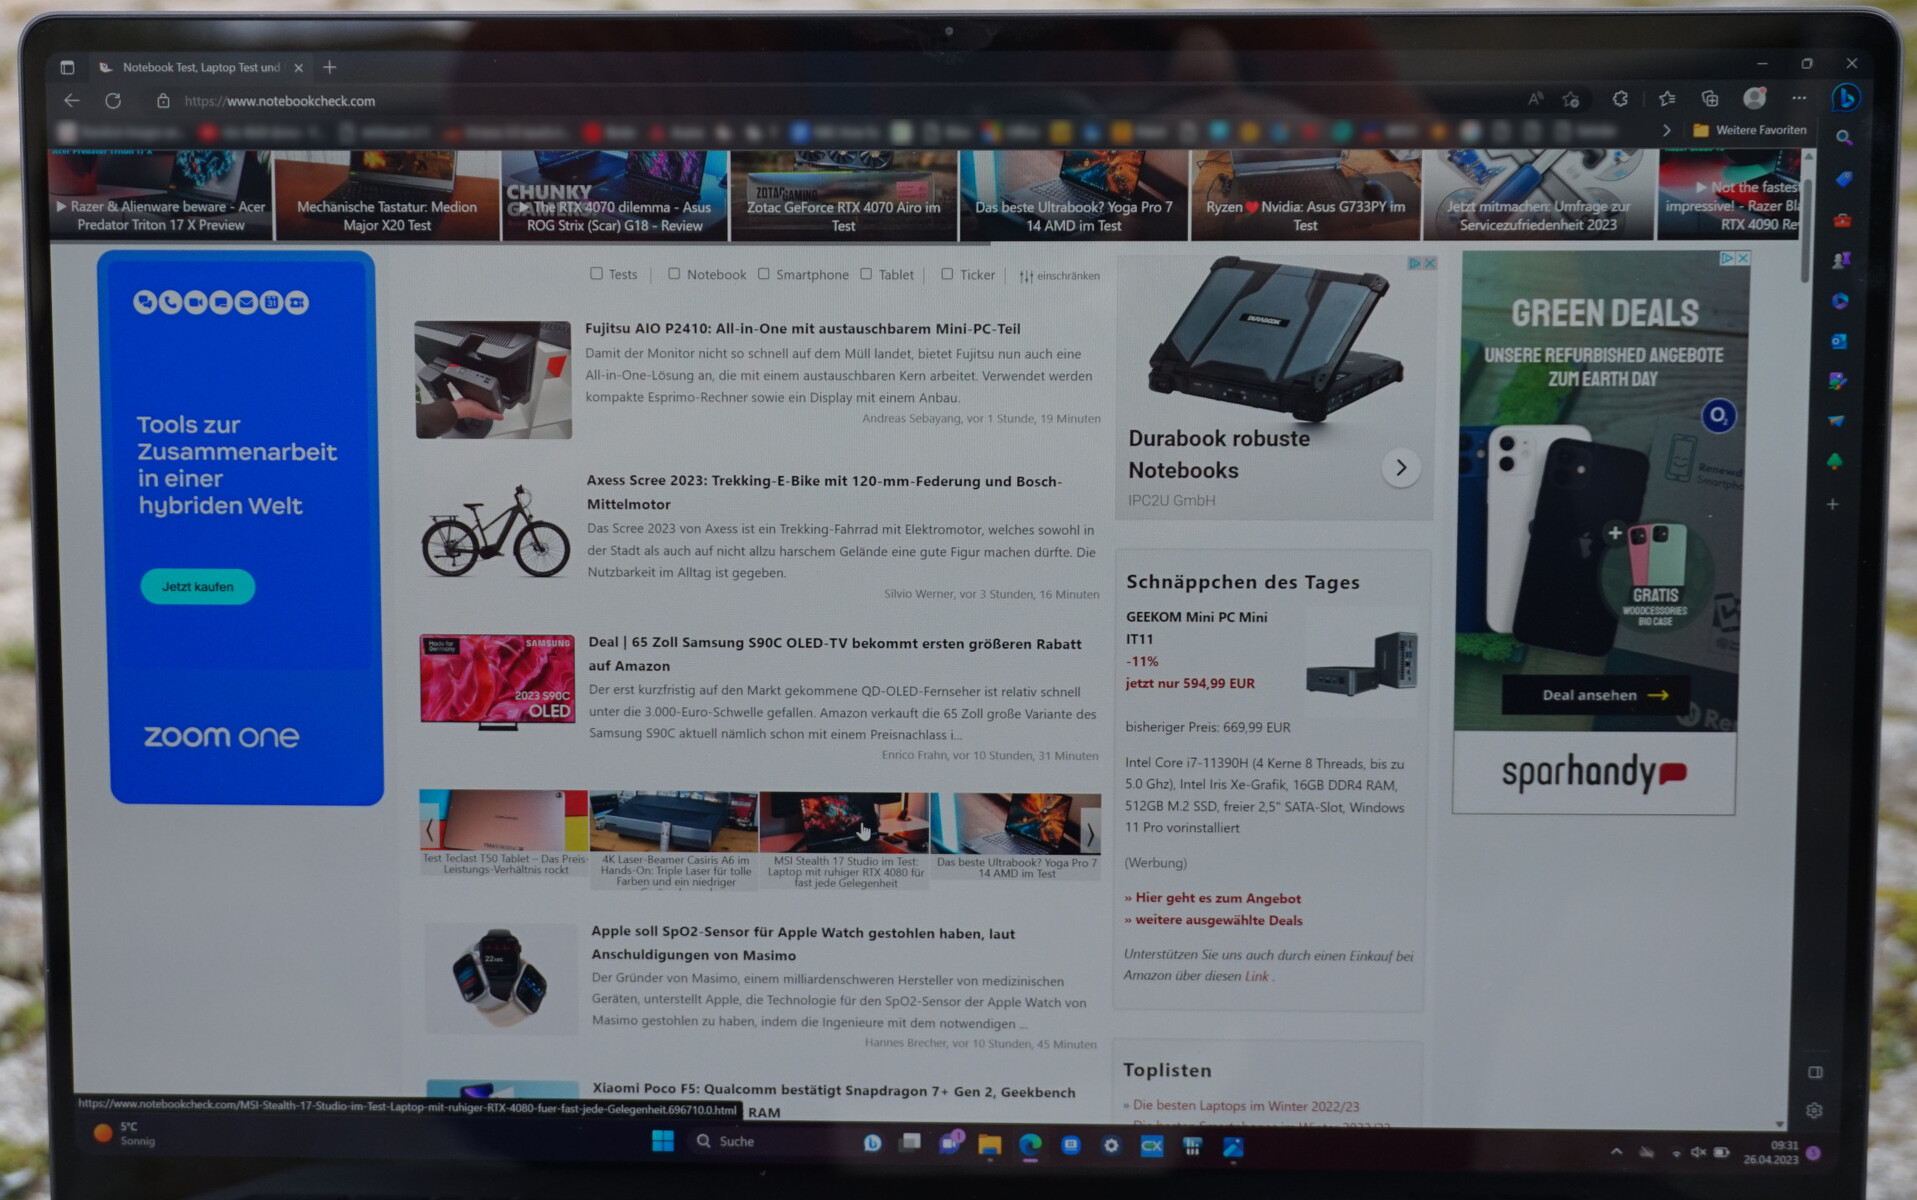
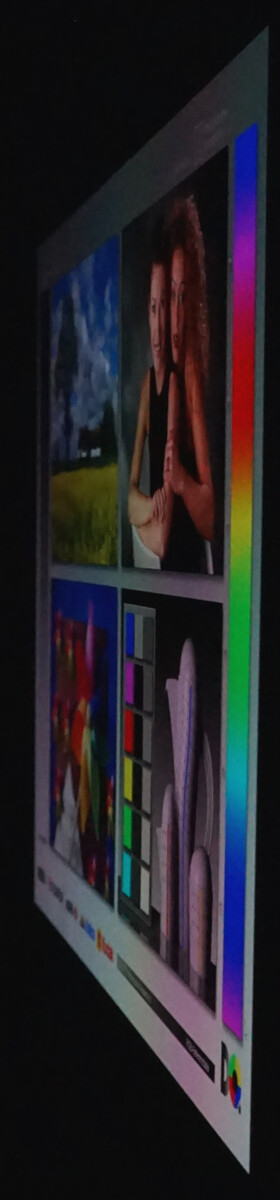
Apesar do brilho suficiente, a tela brilhante impede o uso em ambientes externos. Mesmo em dias nublados, há fortes reflexos que tornam a visualização da tela muito mais difícil.
Somente na sombra e contra a luz o texto e as imagens são bem reconhecíveis.
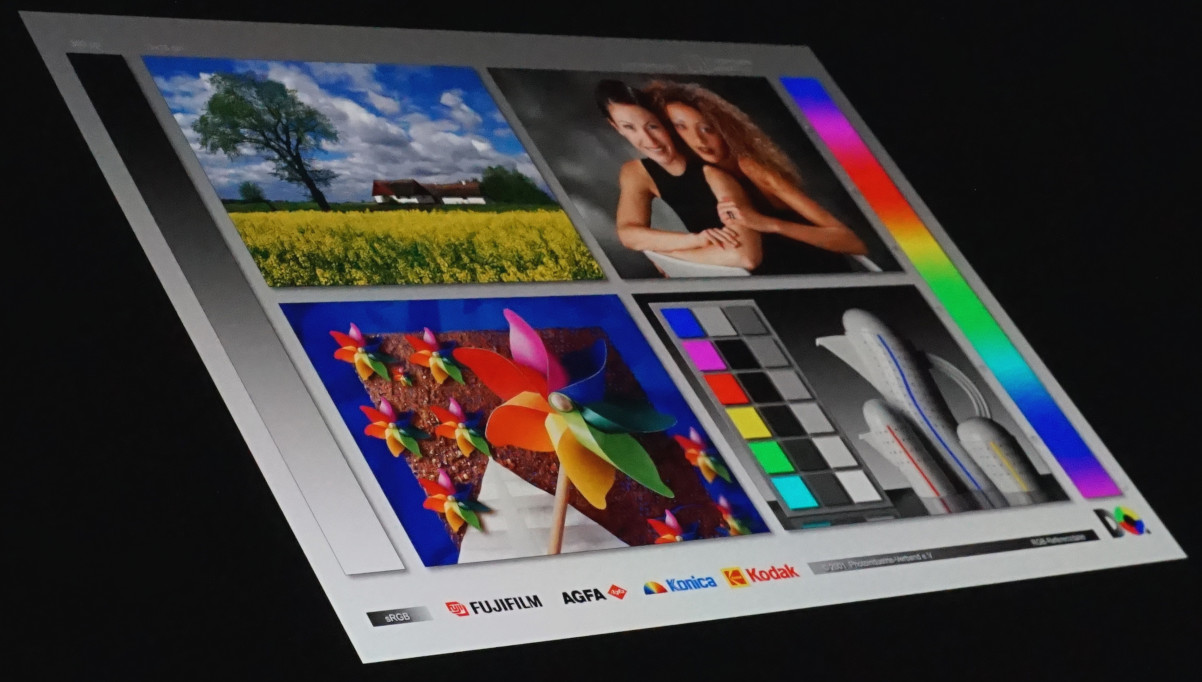
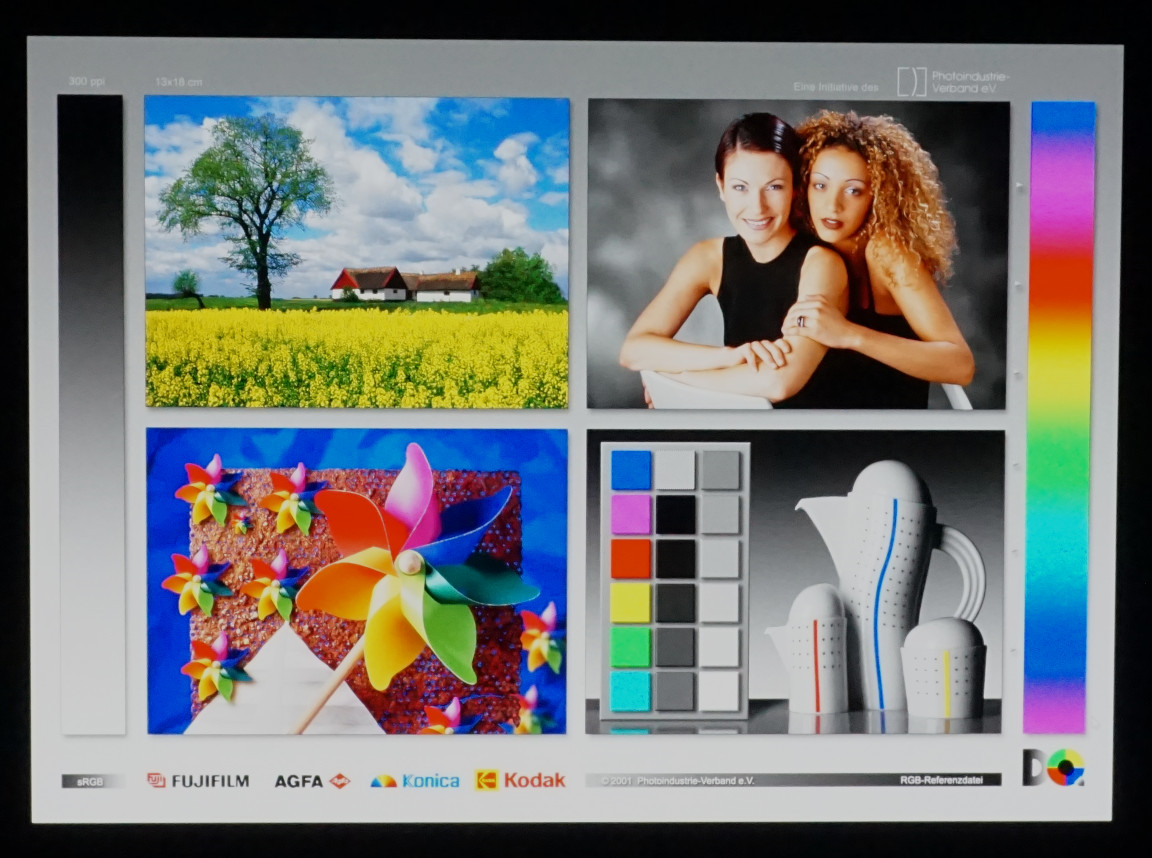
Os desvios na reprodução de cores só podem ser observados em ângulos de visão extremamente acentuados. O brilho e a reprodução de cores permanecem impecáveis dentro do campo de visão normal e além de 45°.
Desempenho - A eficiência é o foco do Galaxy Book3 Ultra
O hardware avançado permite que você trabalhe rapidamente, mesmo com aplicativos complexos e multitarefa intensa. O processador Intel Core Intel Core i9-13900H raramente é totalmente desafiado em tarefas simples, assim como a RTX 4070a placa de vídeo, em particular, só atinge seus limites nos títulos de jogos atuais devido ao consumo de energia muito limitado. No entanto, observamos taxas de quadros quase consistentemente jogáveis no mais alto nível de detalhes.
Entretanto, o sistema está predestinado à edição de imagens e vídeos. a renderização em 3D também não apresenta grandes problemas. O Galaxy Book3 Ultra pode ser executado de forma muito silenciosa, mas depois perde um pouco do desempenho. O comportamento no modo de bateria também é notável, pois o desempenho em 3D permanece alto. Portanto, a edição de vídeo em trânsito parece viável.
A configuração menor com oIntel Core i7-13700H e o processador Nvidia GeForce RTX 4050 requer mais alguns compromissos. É provável que uma clara diferença de velocidade seja notada em tarefas particularmente complexas. Se você quiser jogar um jogo de vez em quando, a variante mais forte será naturalmente mais vantajosa.
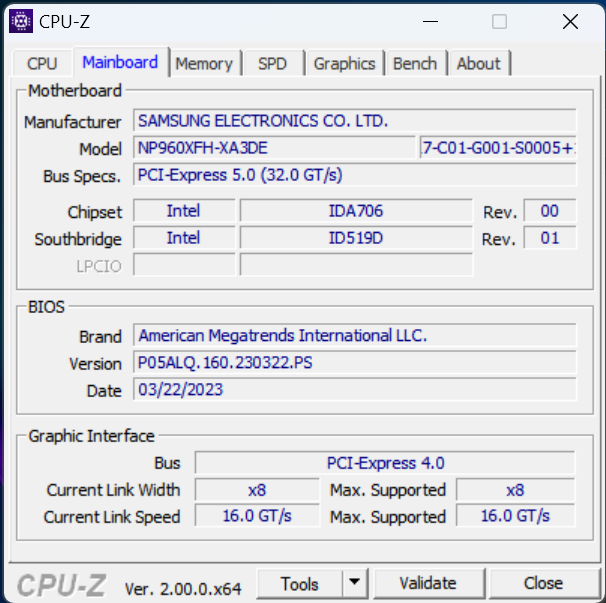
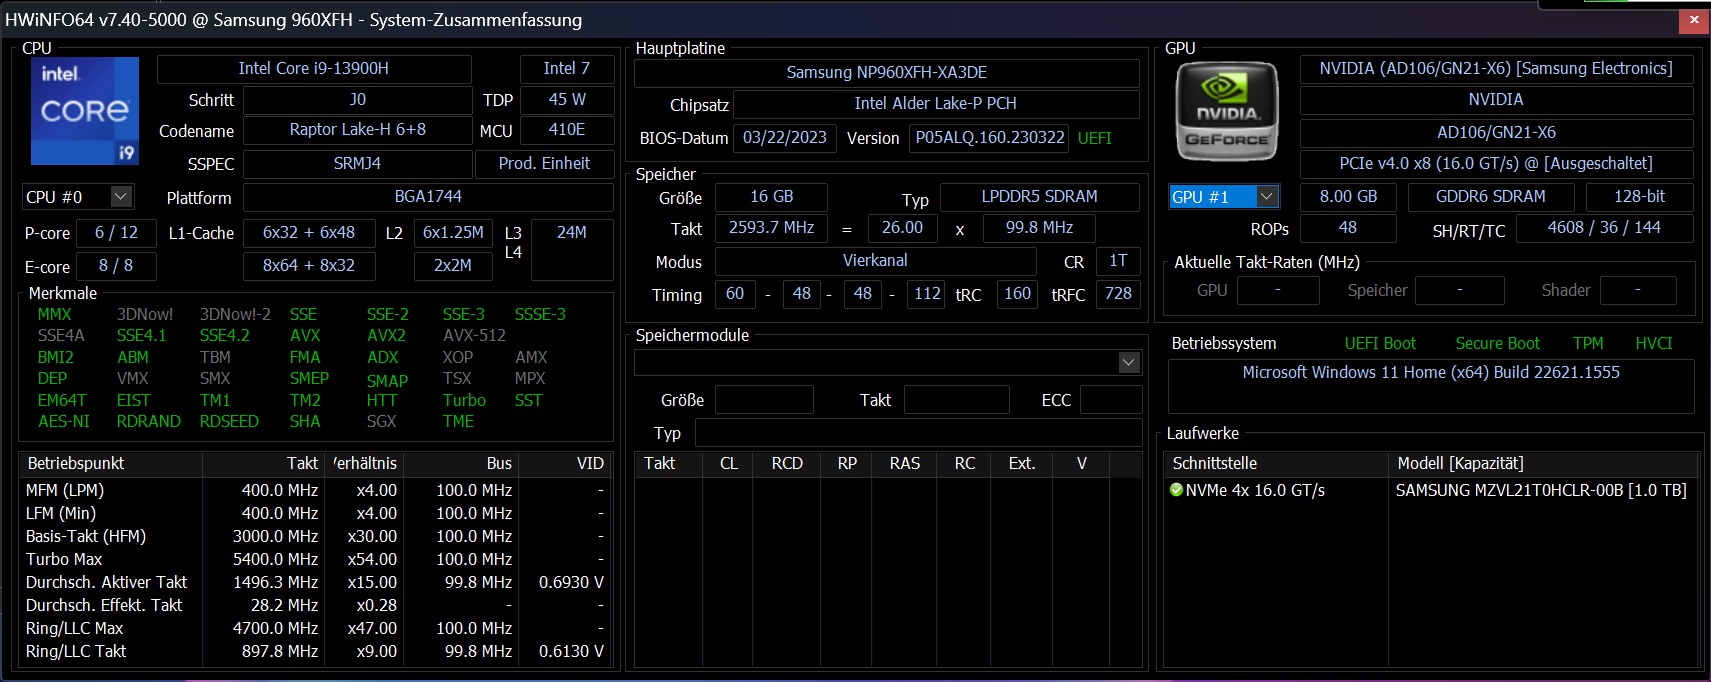
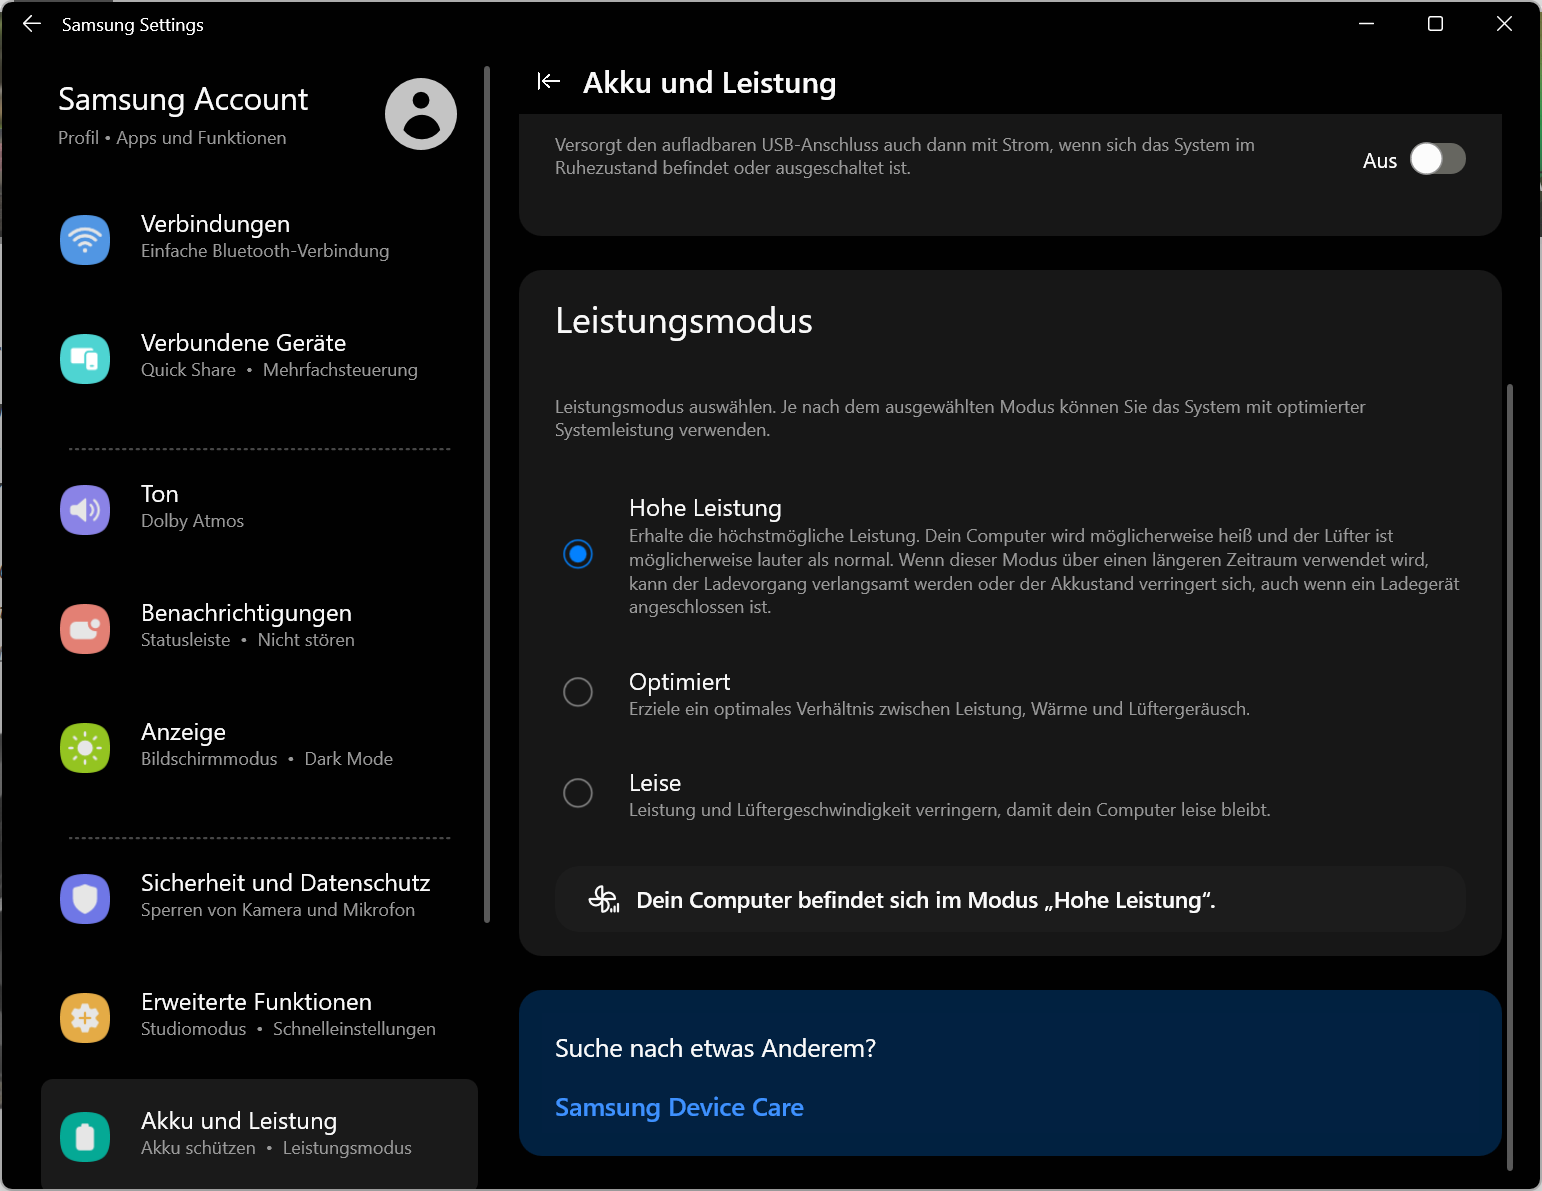
Condições de teste
O Samsung Galaxy Book3 usa o software "Samsung Settings" incluído para definir algumas das configurações básicas e o comportamento do laptop. Há três perfis de desempenho disponíveis para escolha, que também podem ser definidos por meio de "Fn" + "F11".
Selecionamos o modo de alto desempenho para nossos benchmarks. Pouca consideração é dada ao desenvolvimento de calor e ruído. De qualquer forma, o último está bem abaixo do nível exibido regularmente pelos notebooks para jogos.
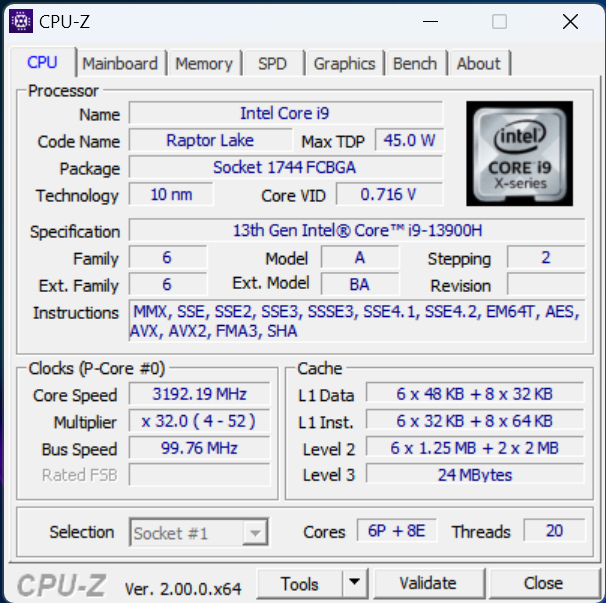
Processador
O Intel Core i9-13900Hpertence ao segmento de ponta e é superada por poucos processadores móveis. Com 14 núcleos, 20 threads, 24 MB de cache L3 e um clock de pico alto, ela certamente é capaz de processar tarefas complexas. No fino Galaxy Book, entretanto, a CPU precisa se contentar com um consumo de energia reduzido de no máximo 75 W. Como resultado, ela fica muito atrás de um Intel Core i9-12900Hda geração anterior, por exemplo, mas é muito mais econômica.
O Apple M2 Pro 10 Core mostra que as coisas podem ser feitas de forma ainda mais eficiente. Ele só precisa de 27 W para uma pontuação marginalmente pior no teste de resistência Cinebench R15. No entanto, o i9 no notebook Creator da Samsung está em um bom nível quando se considera o espaço limitado e as opções de resfriamento.
A comparação com oGalaxy Book3 Ultra com o Intel Core i7-13700H mostra que a CPU é mais potente sob carga de curto prazo. O notebook "menor" dos dois tem um desempenho significativamente melhor em nossa avaliação da CPU em várias medições. Parece que o i7 lida melhor com o consumo de energia mais baixo do que o i9. As CPUs praticamente idênticas diferem principalmente na taxa de clock máxima alcançável, que não pode ser explorada durante o consumo de energia mais baixo. Por exemplo, medimos uma taxa de clock máxima de 3,7 GHz no Cinebench R23. Teoricamente, é possível atingir até 5,4 GHz.
Por outro lado, o processador i9 mais rápido pode mais uma vez se afirmar no teste de resistência Cinebench R15 quando a potência de computação é necessária por um período de tempo mais longo. As vantagens do resfriamento mais forte, mas também mais barulhento (em comparação com a variante i7), tornam-se aparentes.
O uso do modo otimizado pode resultar em algumas dinâmicas incomuns. Por frações de segundo, 75 W são permitidos, assim como no modo Silencioso e até mesmo na operação com bateria. Em contrapartida, o consumo de energia por períodos mais longos é limitado a 45 W. No modo Silencioso , esse valor cai para 30 W.
Os modos de desempenho também estão disponíveis na operação com bateria. O PL1, que define o consumo de energia por até 32 segundos, é reduzido em 10 W. No modo Silencioso, por outro lado, ele permanece em 30 W, o que é de fato suficiente, como será mostrado a seguir.
Mais benchmarks e valores de comparação podem ser encontrados em nossa Lista de benchmarks de CPU.
Cinebench R15 Multi Sustained Load
Cinebench R23: Multi Core | Single Core
Cinebench R20: CPU (Multi Core) | CPU (Single Core)
Cinebench R15: CPU Multi 64Bit | CPU Single 64Bit
Blender: v2.79 BMW27 CPU
7-Zip 18.03: 7z b 4 | 7z b 4 -mmt1
Geekbench 5.5: Multi-Core | Single-Core
HWBOT x265 Benchmark v2.2: 4k Preset
LibreOffice : 20 Documents To PDF
R Benchmark 2.5: Overall mean
| CPU Performance rating | |
| Asus ProArt StudioBook 16 H7600ZW | |
| MSI Stealth 17 Studio A13VH-014 | |
| Gigabyte AERO 16 OLED BSF | |
| Média Intel Core i9-13900H | |
| Média da turma Multimedia | |
| Dell XPS 15 9530 RTX 4070 | |
| Samsung Galaxy Book3 Ultra 16 | |
| Apple MacBook Pro 14 2023 M2 Pro Entry -5! | |
| Lenovo ThinkPad T14 G3-21AJS00400 | |
| Samsung Galaxy Book3 Ultra 16, i9-13900H RTX 4070 | |
| Samsung Galaxy Book Pro 15 NP950XDB-KC5US | |
| Cinebench R20 / CPU (Multi Core) | |
| MSI Stealth 17 Studio A13VH-014 | |
| Asus ProArt StudioBook 16 H7600ZW | |
| Gigabyte AERO 16 OLED BSF | |
| Média Intel Core i9-13900H (4935 - 7716, n=25) | |
| Média da turma Multimedia (1887 - 12912, n=57, últimos 2 anos) | |
| Dell XPS 15 9530 RTX 4070 | |
| Samsung Galaxy Book3 Ultra 16 | |
| Samsung Galaxy Book3 Ultra 16, i9-13900H RTX 4070 | |
| Lenovo ThinkPad T14 G3-21AJS00400 | |
| Apple MacBook Pro 14 2023 M2 Pro Entry | |
| Samsung Galaxy Book Pro 15 NP950XDB-KC5US | |
| Cinebench R20 / CPU (Single Core) | |
| Asus ProArt StudioBook 16 H7600ZW | |
| Média da turma Multimedia (425 - 853, n=57, últimos 2 anos) | |
| Média Intel Core i9-13900H (428 - 792, n=25) | |
| Dell XPS 15 9530 RTX 4070 | |
| Lenovo ThinkPad T14 G3-21AJS00400 | |
| MSI Stealth 17 Studio A13VH-014 | |
| Samsung Galaxy Book3 Ultra 16 | |
| Gigabyte AERO 16 OLED BSF | |
| Samsung Galaxy Book Pro 15 NP950XDB-KC5US | |
| Apple MacBook Pro 14 2023 M2 Pro Entry | |
| Samsung Galaxy Book3 Ultra 16, i9-13900H RTX 4070 | |
| Cinebench R15 / CPU Multi 64Bit | |
| MSI Stealth 17 Studio A13VH-014 | |
| Gigabyte AERO 16 OLED BSF | |
| Asus ProArt StudioBook 16 H7600ZW | |
| Média Intel Core i9-13900H (2061 - 3100, n=26) | |
| Dell XPS 15 9530 RTX 4070 | |
| Média da turma Multimedia (856 - 5224, n=61, últimos 2 anos) | |
| Samsung Galaxy Book3 Ultra 16 | |
| Samsung Galaxy Book3 Ultra 16, i9-13900H RTX 4070 | |
| Lenovo ThinkPad T14 G3-21AJS00400 | |
| Apple MacBook Pro 14 2023 M2 Pro Entry | |
| Samsung Galaxy Book Pro 15 NP950XDB-KC5US | |
| Cinebench R15 / CPU Single 64Bit | |
| MSI Stealth 17 Studio A13VH-014 | |
| Média da turma Multimedia (184.8 - 326, n=59, últimos 2 anos) | |
| Asus ProArt StudioBook 16 H7600ZW | |
| Dell XPS 15 9530 RTX 4070 | |
| Média Intel Core i9-13900H (211 - 297, n=26) | |
| Samsung Galaxy Book3 Ultra 16 | |
| Lenovo ThinkPad T14 G3-21AJS00400 | |
| Gigabyte AERO 16 OLED BSF | |
| Apple MacBook Pro 14 2023 M2 Pro Entry | |
| Samsung Galaxy Book3 Ultra 16, i9-13900H RTX 4070 | |
| Samsung Galaxy Book Pro 15 NP950XDB-KC5US | |
| 7-Zip 18.03 / 7z b 4 -mmt1 | |
| Asus ProArt StudioBook 16 H7600ZW | |
| MSI Stealth 17 Studio A13VH-014 | |
| Dell XPS 15 9530 RTX 4070 | |
| Média Intel Core i9-13900H (3665 - 6600, n=25) | |
| Média da turma Multimedia (3666 - 7545, n=56, últimos 2 anos) | |
| Lenovo ThinkPad T14 G3-21AJS00400 | |
| Gigabyte AERO 16 OLED BSF | |
| Samsung Galaxy Book3 Ultra 16 | |
| Samsung Galaxy Book Pro 15 NP950XDB-KC5US | |
| Samsung Galaxy Book3 Ultra 16, i9-13900H RTX 4070 | |
| HWBOT x265 Benchmark v2.2 / 4k Preset | |
| Asus ProArt StudioBook 16 H7600ZW | |
| MSI Stealth 17 Studio A13VH-014 | |
| Gigabyte AERO 16 OLED BSF | |
| Média da turma Multimedia (5.26 - 36.1, n=56, últimos 2 anos) | |
| Média Intel Core i9-13900H (14.1 - 22.3, n=25) | |
| Dell XPS 15 9530 RTX 4070 | |
| Samsung Galaxy Book3 Ultra 16 | |
| Samsung Galaxy Book3 Ultra 16, i9-13900H RTX 4070 | |
| Lenovo ThinkPad T14 G3-21AJS00400 | |
| Samsung Galaxy Book Pro 15 NP950XDB-KC5US | |
| LibreOffice / 20 Documents To PDF | |
| Samsung Galaxy Book3 Ultra 16, i9-13900H RTX 4070 | |
| Gigabyte AERO 16 OLED BSF | |
| Samsung Galaxy Book Pro 15 NP950XDB-KC5US | |
| MSI Stealth 17 Studio A13VH-014 | |
| Média da turma Multimedia (23.9 - 146.7, n=57, últimos 2 anos) | |
| Samsung Galaxy Book3 Ultra 16 | |
| Média Intel Core i9-13900H (34.4 - 82.8, n=25) | |
| Asus ProArt StudioBook 16 H7600ZW | |
| Dell XPS 15 9530 RTX 4070 | |
| Lenovo ThinkPad T14 G3-21AJS00400 | |
| R Benchmark 2.5 / Overall mean | |
| Samsung Galaxy Book3 Ultra 16, i9-13900H RTX 4070 | |
| Samsung Galaxy Book Pro 15 NP950XDB-KC5US | |
| Gigabyte AERO 16 OLED BSF | |
| Samsung Galaxy Book3 Ultra 16 | |
| Lenovo ThinkPad T14 G3-21AJS00400 | |
| Média da turma Multimedia (0.3604 - 0.947, n=56, últimos 2 anos) | |
| Média Intel Core i9-13900H (0.4052 - 0.723, n=25) | |
| Dell XPS 15 9530 RTX 4070 | |
| Asus ProArt StudioBook 16 H7600ZW | |
| MSI Stealth 17 Studio A13VH-014 | |
* ... menor é melhor
AIDA64: FP32 Ray-Trace | FPU Julia | CPU SHA3 | CPU Queen | FPU SinJulia | FPU Mandel | CPU AES | CPU ZLib | FP64 Ray-Trace | CPU PhotoWorxx
| Performance rating | |
| Asus ProArt StudioBook 16 H7600ZW | |
| Gigabyte AERO 16 OLED BSF | |
| MSI Stealth 17 Studio A13VH-014 | |
| Média da turma Multimedia | |
| Média Intel Core i9-13900H | |
| Samsung Galaxy Book3 Ultra 16 | |
| Dell XPS 15 9530 RTX 4070 | |
| Samsung Galaxy Book3 Ultra 16, i9-13900H RTX 4070 | |
| AIDA64 / FP32 Ray-Trace | |
| MSI Stealth 17 Studio A13VH-014 | |
| Gigabyte AERO 16 OLED BSF | |
| Asus ProArt StudioBook 16 H7600ZW | |
| Média da turma Multimedia (2214 - 50388, n=53, últimos 2 anos) | |
| Média Intel Core i9-13900H (6788 - 19557, n=25) | |
| Samsung Galaxy Book3 Ultra 16, i9-13900H RTX 4070 | |
| Samsung Galaxy Book3 Ultra 16 | |
| Dell XPS 15 9530 RTX 4070 | |
| AIDA64 / FPU Julia | |
| MSI Stealth 17 Studio A13VH-014 | |
| Asus ProArt StudioBook 16 H7600ZW | |
| Gigabyte AERO 16 OLED BSF | |
| Média da turma Multimedia (12867 - 201874, n=54, últimos 2 anos) | |
| Média Intel Core i9-13900H (22551 - 95579, n=25) | |
| Samsung Galaxy Book3 Ultra 16 | |
| Dell XPS 15 9530 RTX 4070 | |
| Samsung Galaxy Book3 Ultra 16, i9-13900H RTX 4070 | |
| AIDA64 / CPU SHA3 | |
| MSI Stealth 17 Studio A13VH-014 | |
| Asus ProArt StudioBook 16 H7600ZW | |
| Gigabyte AERO 16 OLED BSF | |
| Média da turma Multimedia (626 - 8623, n=54, últimos 2 anos) | |
| Média Intel Core i9-13900H (2491 - 4270, n=25) | |
| Samsung Galaxy Book3 Ultra 16, i9-13900H RTX 4070 | |
| Samsung Galaxy Book3 Ultra 16 | |
| Dell XPS 15 9530 RTX 4070 | |
| AIDA64 / CPU Queen | |
| Asus ProArt StudioBook 16 H7600ZW | |
| Média Intel Core i9-13900H (65121 - 120936, n=25) | |
| Dell XPS 15 9530 RTX 4070 | |
| Samsung Galaxy Book3 Ultra 16 | |
| MSI Stealth 17 Studio A13VH-014 | |
| Gigabyte AERO 16 OLED BSF | |
| Samsung Galaxy Book3 Ultra 16, i9-13900H RTX 4070 | |
| Média da turma Multimedia (13483 - 181505, n=41, últimos 2 anos) | |
| AIDA64 / FPU SinJulia | |
| MSI Stealth 17 Studio A13VH-014 | |
| Gigabyte AERO 16 OLED BSF | |
| Asus ProArt StudioBook 16 H7600ZW | |
| Média Intel Core i9-13900H (6108 - 11631, n=25) | |
| Samsung Galaxy Book3 Ultra 16 | |
| Média da turma Multimedia (886 - 28794, n=54, últimos 2 anos) | |
| Dell XPS 15 9530 RTX 4070 | |
| Samsung Galaxy Book3 Ultra 16, i9-13900H RTX 4070 | |
| AIDA64 / FPU Mandel | |
| MSI Stealth 17 Studio A13VH-014 | |
| Asus ProArt StudioBook 16 H7600ZW | |
| Gigabyte AERO 16 OLED BSF | |
| Média da turma Multimedia (6395 - 105740, n=53, últimos 2 anos) | |
| Média Intel Core i9-13900H (11283 - 48474, n=25) | |
| Samsung Galaxy Book3 Ultra 16, i9-13900H RTX 4070 | |
| Samsung Galaxy Book3 Ultra 16 | |
| Dell XPS 15 9530 RTX 4070 | |
| AIDA64 / CPU AES | |
| Asus ProArt StudioBook 16 H7600ZW | |
| Gigabyte AERO 16 OLED BSF | |
| Média Intel Core i9-13900H (3691 - 149377, n=25) | |
| MSI Stealth 17 Studio A13VH-014 | |
| Samsung Galaxy Book3 Ultra 16 | |
| Média da turma Multimedia (8171 - 126790, n=54, últimos 2 anos) | |
| Dell XPS 15 9530 RTX 4070 | |
| Samsung Galaxy Book3 Ultra 16, i9-13900H RTX 4070 | |
| AIDA64 / CPU ZLib | |
| MSI Stealth 17 Studio A13VH-014 | |
| Gigabyte AERO 16 OLED BSF | |
| Asus ProArt StudioBook 16 H7600ZW | |
| Média Intel Core i9-13900H (789 - 1254, n=25) | |
| Samsung Galaxy Book3 Ultra 16 | |
| Samsung Galaxy Book3 Ultra 16, i9-13900H RTX 4070 | |
| Média da turma Multimedia (143.8 - 2022, n=54, últimos 2 anos) | |
| Dell XPS 15 9530 RTX 4070 | |
| AIDA64 / FP64 Ray-Trace | |
| MSI Stealth 17 Studio A13VH-014 | |
| Asus ProArt StudioBook 16 H7600ZW | |
| Gigabyte AERO 16 OLED BSF | |
| Média da turma Multimedia (1014 - 26875, n=54, últimos 2 anos) | |
| Média Intel Core i9-13900H (3655 - 10716, n=25) | |
| Samsung Galaxy Book3 Ultra 16 | |
| Dell XPS 15 9530 RTX 4070 | |
| Samsung Galaxy Book3 Ultra 16, i9-13900H RTX 4070 | |
| AIDA64 / CPU PhotoWorxx | |
| MSI Stealth 17 Studio A13VH-014 | |
| Média da turma Multimedia (8187 - 88154, n=54, últimos 2 anos) | |
| Samsung Galaxy Book3 Ultra 16, i9-13900H RTX 4070 | |
| Samsung Galaxy Book3 Ultra 16 | |
| Gigabyte AERO 16 OLED BSF | |
| Dell XPS 15 9530 RTX 4070 | |
| Asus ProArt StudioBook 16 H7600ZW | |
| Média Intel Core i9-13900H (10871 - 50488, n=25) | |
Desempenho do sistema
O consumo limitado de energia é quase imperceptível durante o uso normal. Em comparação com os modelos mais potentes, a inicialização dos programas é um pouco atrasada. Em comparação com um notebook comercial rápido, por outro lado, o Samsung Galaxy Book3 Ultra tem uma vantagem. Os vários núcleos da CPU e o suporte fornecido pelo chip gráfico dedicado podem ser totalmente explorados aqui.
O trabalho rápido e a multitarefa não causam nenhum problema ao sistema. Além disso, o fator de eficiência não deve ser ignorado. O equipamento muito semelhante Gigabyte AERO 16 OLEDtem uma vantagem de 40 a 50% na maioria dos benchmarks. Entretanto, ele precisa consumir o dobro de energia para ficar à frente.
O desempenho da CPU do laptop é refletido no desempenho do sistema: o menorSamsung Galaxy Book3 Ultratambém apresenta melhores índices. No entanto, o processador i7-13700Hcontinua demonstrando que pode lidar com a limitação de 75 W muito melhor do que o i9-13900H.
CrossMark: Overall | Productivity | Creativity | Responsiveness
| PCMark 10 / Score | |
| Asus ProArt StudioBook 16 H7600ZW | |
| Gigabyte AERO 16 OLED BSF | |
| Média da turma Multimedia (4325 - 10386, n=52, últimos 2 anos) | |
| Média Intel Core i9-13900H, NVIDIA GeForce RTX 4070 Laptop GPU (5855 - 8538, n=8) | |
| MSI Stealth 17 Studio A13VH-014 | |
| Dell XPS 15 9530 RTX 4070 | |
| Samsung Galaxy Book3 Ultra 16 | |
| Lenovo ThinkPad T14 G3-21AJS00400 | |
| Samsung Galaxy Book3 Ultra 16, i9-13900H RTX 4070 | |
| Samsung Galaxy Book Pro 15 NP950XDB-KC5US | |
| PCMark 10 / Essentials | |
| Asus ProArt StudioBook 16 H7600ZW | |
| Dell XPS 15 9530 RTX 4070 | |
| Gigabyte AERO 16 OLED BSF | |
| Média Intel Core i9-13900H, NVIDIA GeForce RTX 4070 Laptop GPU (8835 - 11940, n=8) | |
| Samsung Galaxy Book3 Ultra 16 | |
| Média da turma Multimedia (8025 - 11664, n=51, últimos 2 anos) | |
| MSI Stealth 17 Studio A13VH-014 | |
| Samsung Galaxy Book Pro 15 NP950XDB-KC5US | |
| Lenovo ThinkPad T14 G3-21AJS00400 | |
| Samsung Galaxy Book3 Ultra 16, i9-13900H RTX 4070 | |
| PCMark 10 / Productivity | |
| Média da turma Multimedia (7323 - 18233, n=51, últimos 2 anos) | |
| Asus ProArt StudioBook 16 H7600ZW | |
| MSI Stealth 17 Studio A13VH-014 | |
| Média Intel Core i9-13900H, NVIDIA GeForce RTX 4070 Laptop GPU (7967 - 10991, n=8) | |
| Gigabyte AERO 16 OLED BSF | |
| Samsung Galaxy Book3 Ultra 16 | |
| Dell XPS 15 9530 RTX 4070 | |
| Lenovo ThinkPad T14 G3-21AJS00400 | |
| Samsung Galaxy Book3 Ultra 16, i9-13900H RTX 4070 | |
| Samsung Galaxy Book Pro 15 NP950XDB-KC5US | |
| PCMark 10 / Digital Content Creation | |
| Gigabyte AERO 16 OLED BSF | |
| Média Intel Core i9-13900H, NVIDIA GeForce RTX 4070 Laptop GPU (7738 - 13575, n=8) | |
| Asus ProArt StudioBook 16 H7600ZW | |
| MSI Stealth 17 Studio A13VH-014 | |
| Dell XPS 15 9530 RTX 4070 | |
| Média da turma Multimedia (3651 - 16240, n=51, últimos 2 anos) | |
| Samsung Galaxy Book3 Ultra 16 | |
| Samsung Galaxy Book3 Ultra 16, i9-13900H RTX 4070 | |
| Lenovo ThinkPad T14 G3-21AJS00400 | |
| Samsung Galaxy Book Pro 15 NP950XDB-KC5US | |
| CrossMark / Overall | |
| Asus ProArt StudioBook 16 H7600ZW | |
| Dell XPS 15 9530 RTX 4070 | |
| Gigabyte AERO 16 OLED BSF | |
| Média da turma Multimedia (866 - 2728, n=60, últimos 2 anos) | |
| Média Intel Core i9-13900H, NVIDIA GeForce RTX 4070 Laptop GPU (1104 - 1974, n=7) | |
| Apple MacBook Pro 14 2023 M2 Pro Entry | |
| MSI Stealth 17 Studio A13VH-014 | |
| Samsung Galaxy Book3 Ultra 16 | |
| Lenovo ThinkPad T14 G3-21AJS00400 | |
| Samsung Galaxy Book3 Ultra 16, i9-13900H RTX 4070 | |
| CrossMark / Productivity | |
| Asus ProArt StudioBook 16 H7600ZW | |
| Gigabyte AERO 16 OLED BSF | |
| Média da turma Multimedia (931 - 2489, n=60, últimos 2 anos) | |
| Dell XPS 15 9530 RTX 4070 | |
| Média Intel Core i9-13900H, NVIDIA GeForce RTX 4070 Laptop GPU (1058 - 1914, n=7) | |
| MSI Stealth 17 Studio A13VH-014 | |
| Apple MacBook Pro 14 2023 M2 Pro Entry | |
| Lenovo ThinkPad T14 G3-21AJS00400 | |
| Samsung Galaxy Book3 Ultra 16 | |
| Samsung Galaxy Book3 Ultra 16, i9-13900H RTX 4070 | |
| CrossMark / Creativity | |
| Apple MacBook Pro 14 2023 M2 Pro Entry | |
| Média da turma Multimedia (907 - 3465, n=60, últimos 2 anos) | |
| Dell XPS 15 9530 RTX 4070 | |
| Asus ProArt StudioBook 16 H7600ZW | |
| Média Intel Core i9-13900H, NVIDIA GeForce RTX 4070 Laptop GPU (1178 - 2254, n=7) | |
| Gigabyte AERO 16 OLED BSF | |
| MSI Stealth 17 Studio A13VH-014 | |
| Samsung Galaxy Book3 Ultra 16 | |
| Lenovo ThinkPad T14 G3-21AJS00400 | |
| Samsung Galaxy Book3 Ultra 16, i9-13900H RTX 4070 | |
| CrossMark / Responsiveness | |
| Gigabyte AERO 16 OLED BSF | |
| Asus ProArt StudioBook 16 H7600ZW | |
| Média Intel Core i9-13900H, NVIDIA GeForce RTX 4070 Laptop GPU (1037 - 1952, n=7) | |
| Dell XPS 15 9530 RTX 4070 | |
| MSI Stealth 17 Studio A13VH-014 | |
| Média da turma Multimedia (605 - 2024, n=60, últimos 2 anos) | |
| Samsung Galaxy Book3 Ultra 16 | |
| Apple MacBook Pro 14 2023 M2 Pro Entry | |
| Lenovo ThinkPad T14 G3-21AJS00400 | |
| Samsung Galaxy Book3 Ultra 16, i9-13900H RTX 4070 | |
| PCMark 10 Score | 5855 pontos | |
Ajuda | ||
| AIDA64 / Memory Copy | |
| Média da turma Multimedia (11299 - 132135, n=54, últimos 2 anos) | |
| MSI Stealth 17 Studio A13VH-014 | |
| Samsung Galaxy Book3 Ultra 16 | |
| Samsung Galaxy Book3 Ultra 16, i9-13900H RTX 4070 | |
| Gigabyte AERO 16 OLED BSF | |
| Dell XPS 15 9530 RTX 4070 | |
| Asus ProArt StudioBook 16 H7600ZW | |
| Média Intel Core i9-13900H (37448 - 74486, n=25) | |
| AIDA64 / Memory Read | |
| Média da turma Multimedia (11624 - 174586, n=54, últimos 2 anos) | |
| MSI Stealth 17 Studio A13VH-014 | |
| Samsung Galaxy Book3 Ultra 16, i9-13900H RTX 4070 | |
| Dell XPS 15 9530 RTX 4070 | |
| Samsung Galaxy Book3 Ultra 16 | |
| Gigabyte AERO 16 OLED BSF | |
| Asus ProArt StudioBook 16 H7600ZW | |
| Média Intel Core i9-13900H (41599 - 75433, n=25) | |
| AIDA64 / Memory Write | |
| Samsung Galaxy Book3 Ultra 16 | |
| Samsung Galaxy Book3 Ultra 16, i9-13900H RTX 4070 | |
| Média da turma Multimedia (11755 - 134998, n=54, últimos 2 anos) | |
| MSI Stealth 17 Studio A13VH-014 | |
| Gigabyte AERO 16 OLED BSF | |
| Dell XPS 15 9530 RTX 4070 | |
| Média Intel Core i9-13900H (36152 - 88505, n=25) | |
| Asus ProArt StudioBook 16 H7600ZW | |
| AIDA64 / Memory Latency | |
| Média da turma Multimedia (7 - 535, n=53, últimos 2 anos) | |
| Samsung Galaxy Book3 Ultra 16, i9-13900H RTX 4070 | |
| Samsung Galaxy Book3 Ultra 16 | |
| Gigabyte AERO 16 OLED BSF | |
| MSI Stealth 17 Studio A13VH-014 | |
| Asus ProArt StudioBook 16 H7600ZW | |
| Média Intel Core i9-13900H (75.8 - 102.3, n=25) | |
| Dell XPS 15 9530 RTX 4070 | |
* ... menor é melhor
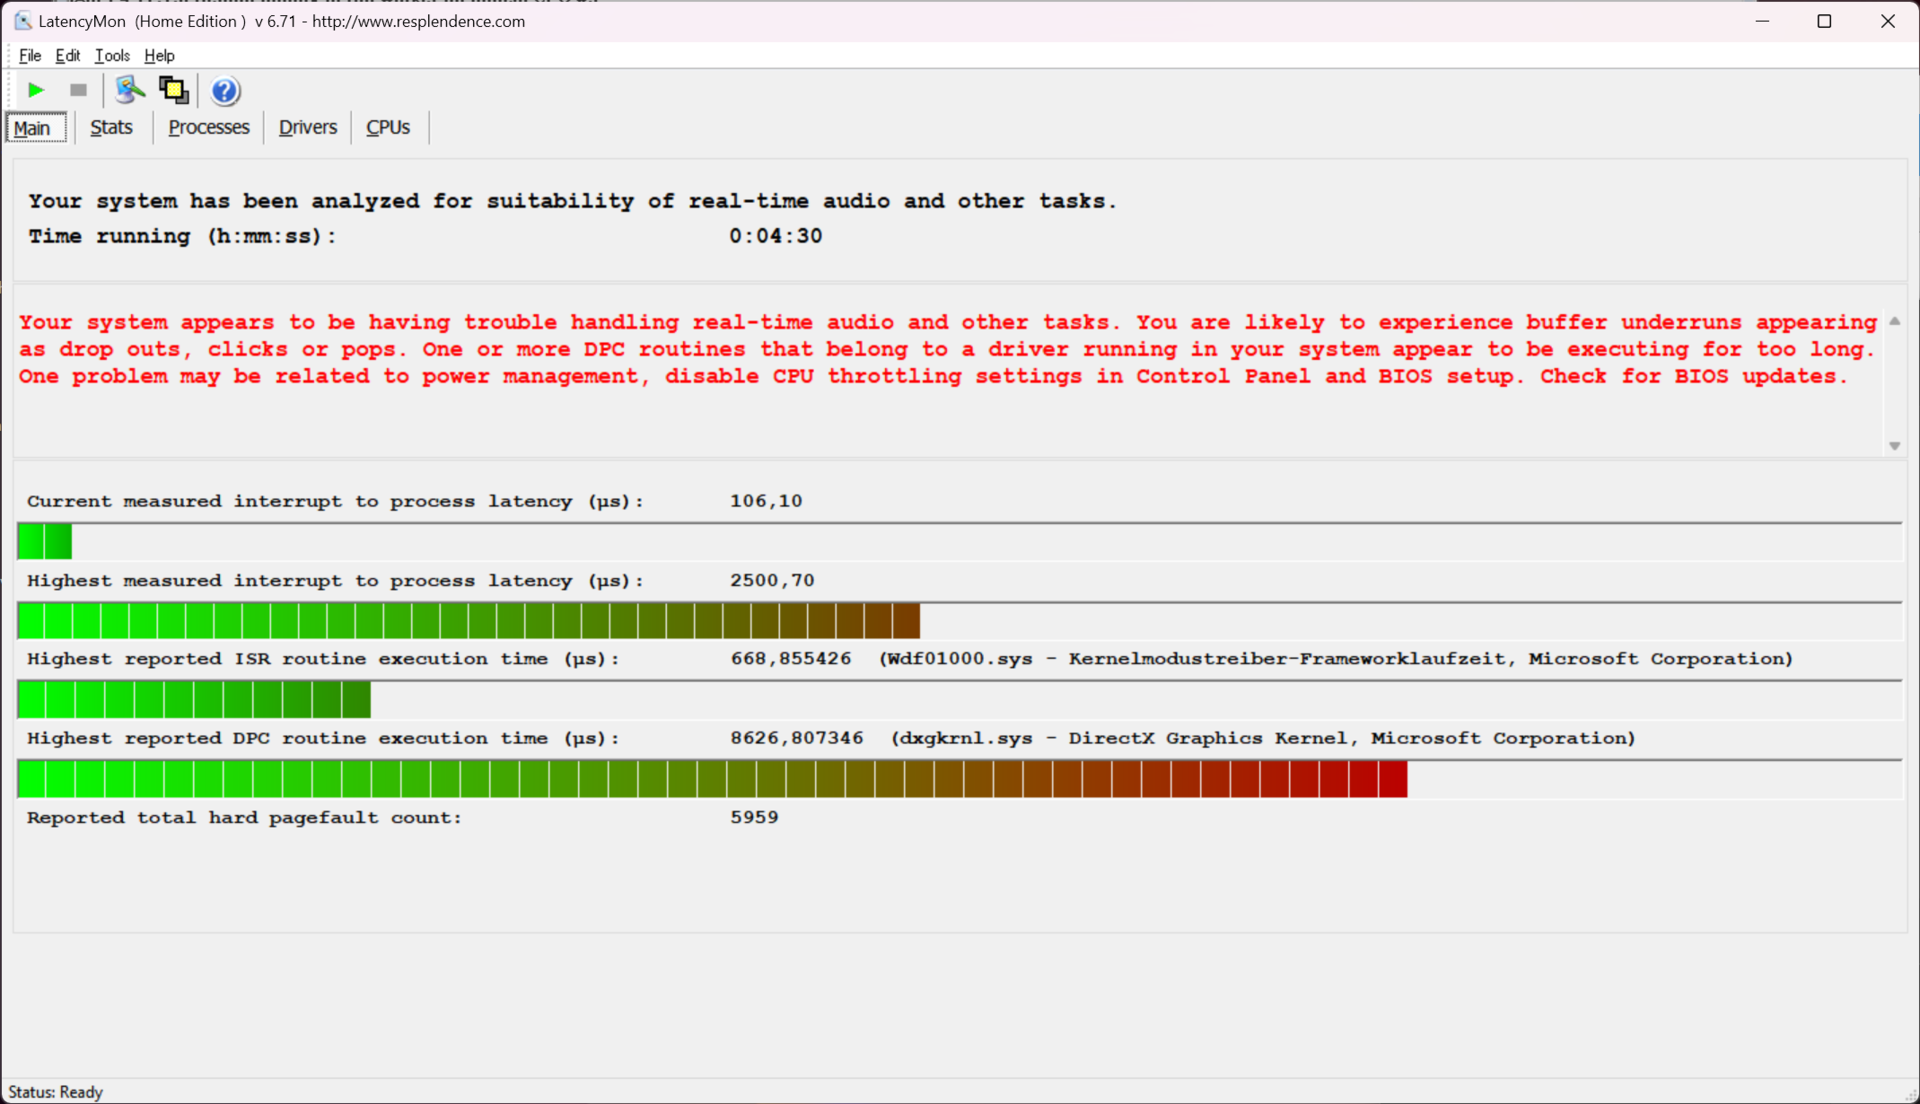
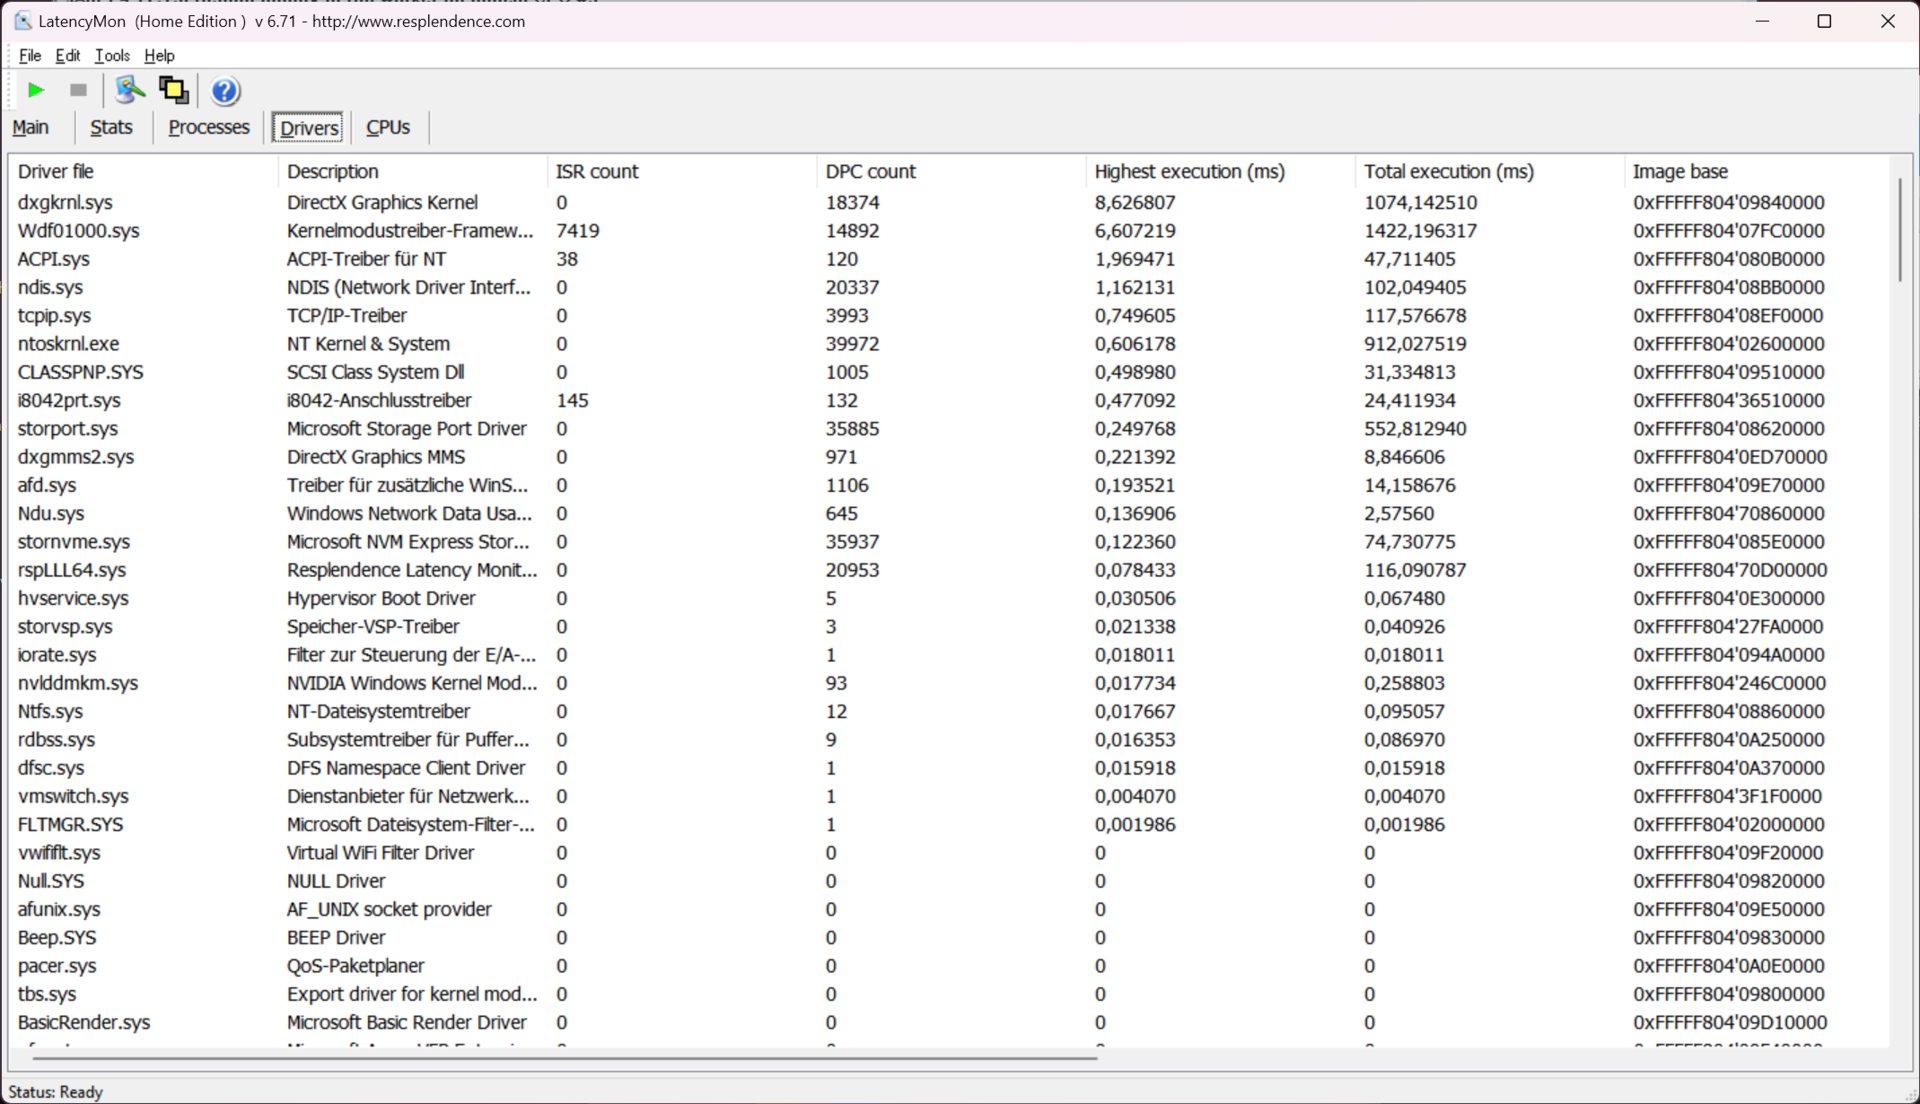
Latência DPC
A latência que medimos com o LatencyMon indica problemas de driver com o driver gráfico Nvidia Studio. No entanto, a estrutura do driver do modo kernel também apresenta atrasos mensuráveis. Portanto, o sistema não é adequado para o processamento de áudio em tempo real. O ajuste do software, bem como as futuras atualizações, podem levar a melhorias consideráveis.
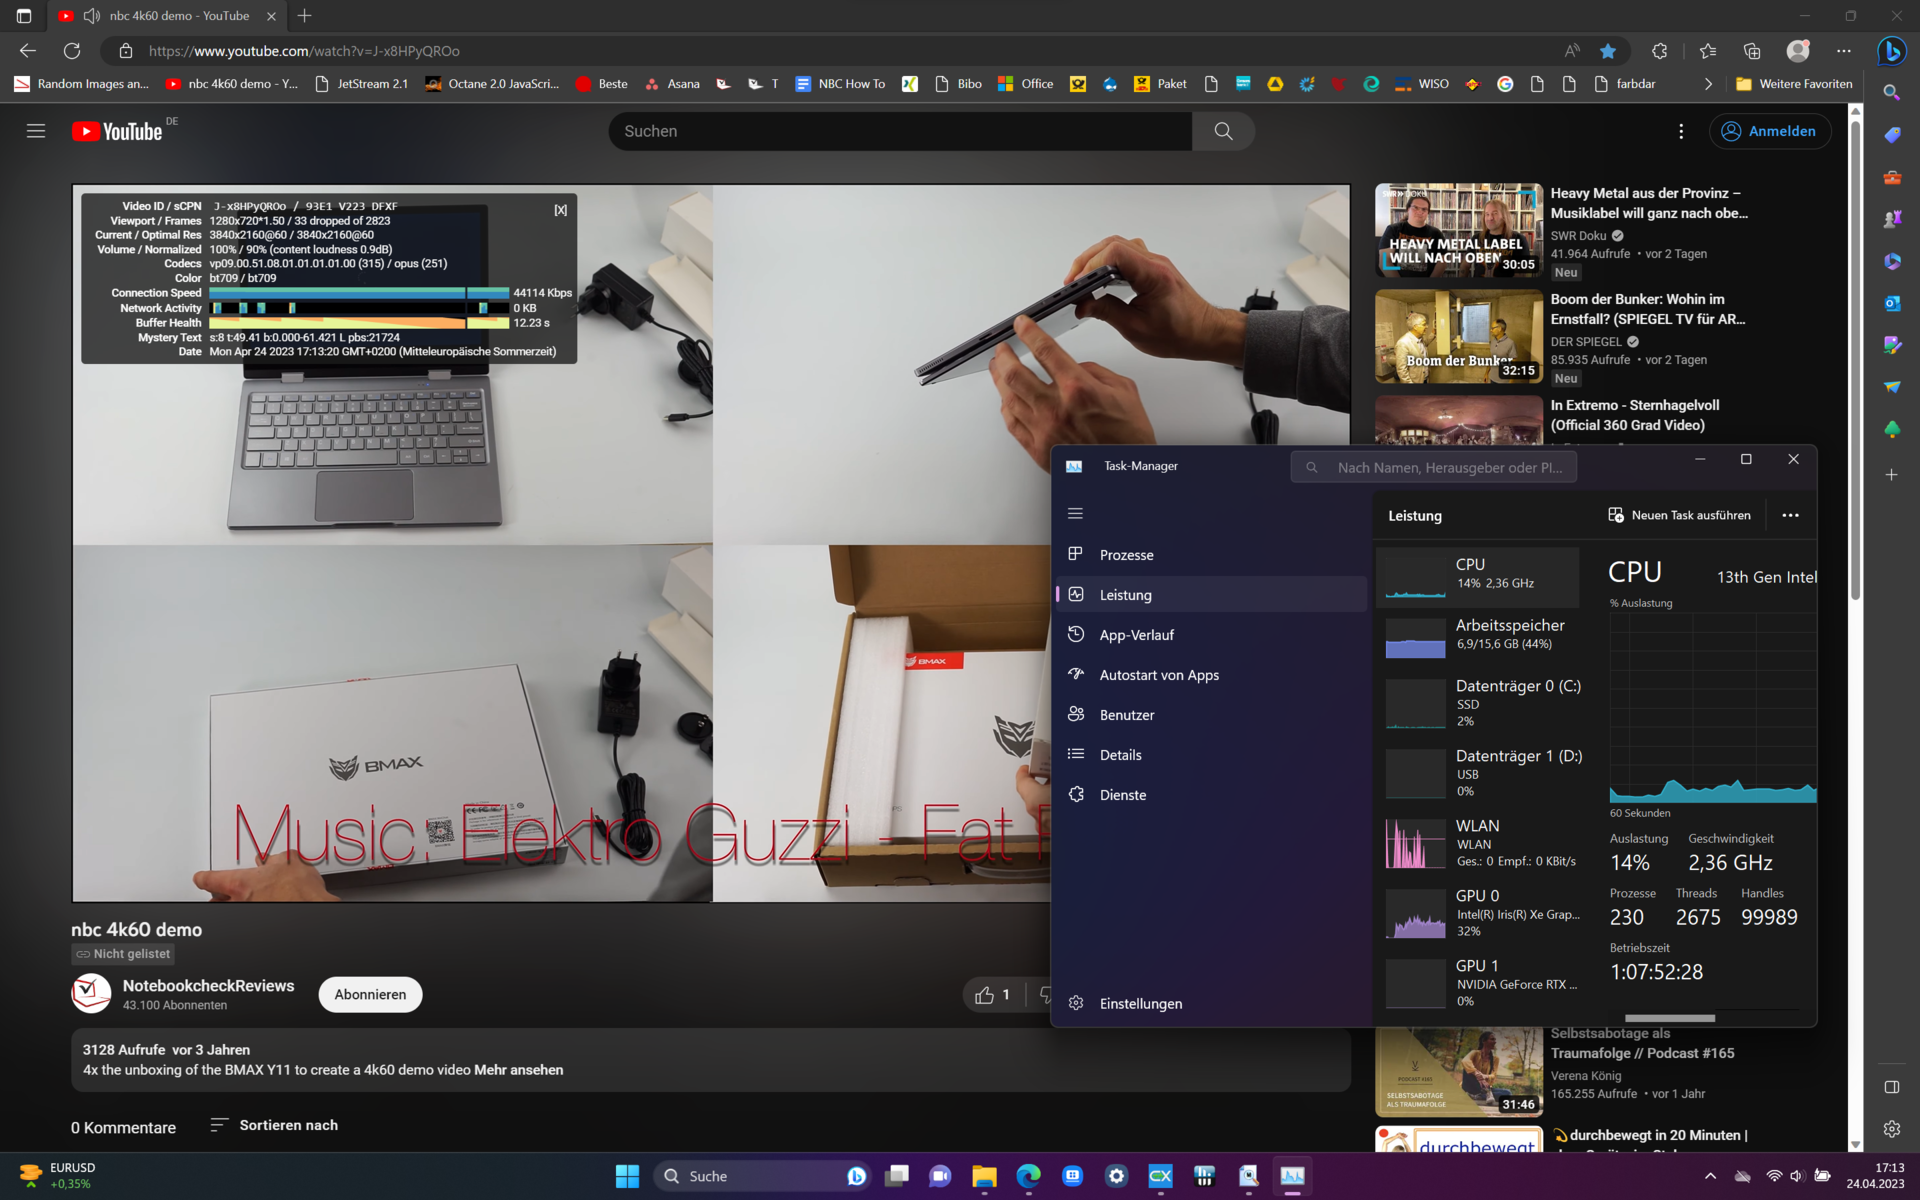
56 quadros perdidos também é um valor abaixo da média para reprodução de vídeo 4K no YouTube, especialmente para um notebook multimídia nessa configuração. Uma atualização de driver no futuro deve corrigir esse problema. No momento da análise, o driver da placa de vídeo mais recente instalado era o Nvidia Studio 531.61.
| DPC Latencies / LatencyMon - interrupt to process latency (max), Web, Youtube, Prime95 | |
| Samsung Galaxy Book3 Ultra 16 | |
| MSI Stealth 17 Studio A13VH-014 | |
| Samsung Galaxy Book3 Ultra 16, i9-13900H RTX 4070 | |
| Asus ProArt StudioBook 16 H7600ZW | |
| Dell XPS 15 9530 RTX 4070 | |
| Gigabyte AERO 16 OLED BSF | |
* ... menor é melhor
Dispositivos de armazenamento
O SSD M.2 não reserva nenhuma surpresa. Sem surpresa, é um modelo da Samsung que atinge regularmente os valores encontrados aqui em nossas medições. A velocidade máxima está acima dos recursos do PCIe 3, mas não pode competir com os melhores SSDs PCIe 4.
Para as tarefas que o Galaxy Book3 Ultra precisa realizar, a SSD não deve ser um gargalo em nenhum momento. Além disso, as velocidades de acesso permanecem em um nível alto sob carga contínua - exatamente o oposto do dispositivo de armazenamento idêntico no Asus ProArt StudioBook 16, que é forçado a limitar severamente a taxa de dados para evitar o superaquecimento.
No máximo, o espaço no disco rígido pode se tornar rapidamente escasso ao editar muito material bruto. Se a placa de base não fosse tão difícil de remover, seria fácil fazer um upgrade. Felizmente, as duas portas Thunderbolt 4 podem ser usadas para SSDs externos.

* ... menor é melhor
Sustained Read Performance: DiskSpd Read Loop, Queue Depth 8
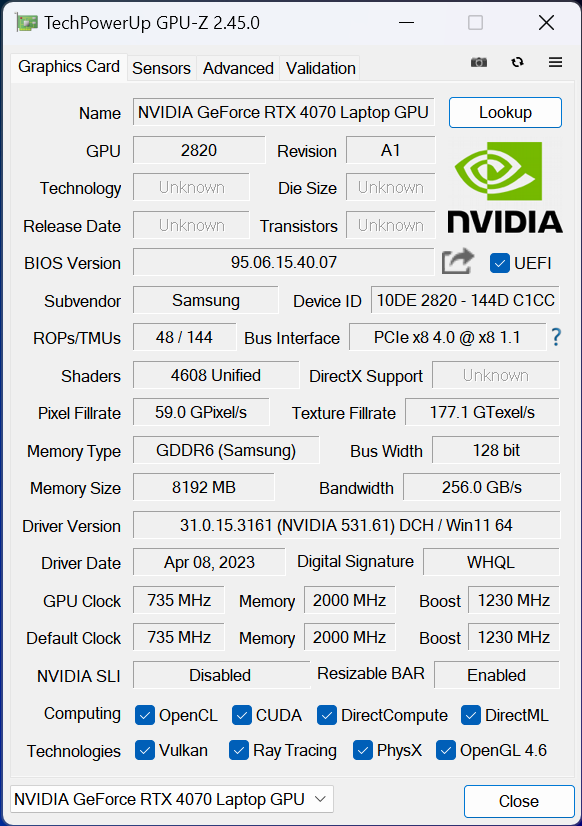
Placa gráfica
A Nvidia GeForce RTX 4070 é normalmente irrepreensível. Ele lida com os jogos atuais no mais alto nível de detalhes e além do Full HD. Ela se mantém regularmente perto de 100 fps. Em um Medion Erazer Major X20,por exemplo, ele pode consumir 115 W para esses valores de desempenho, até mesmo 140 W quando o Boost está ativado.
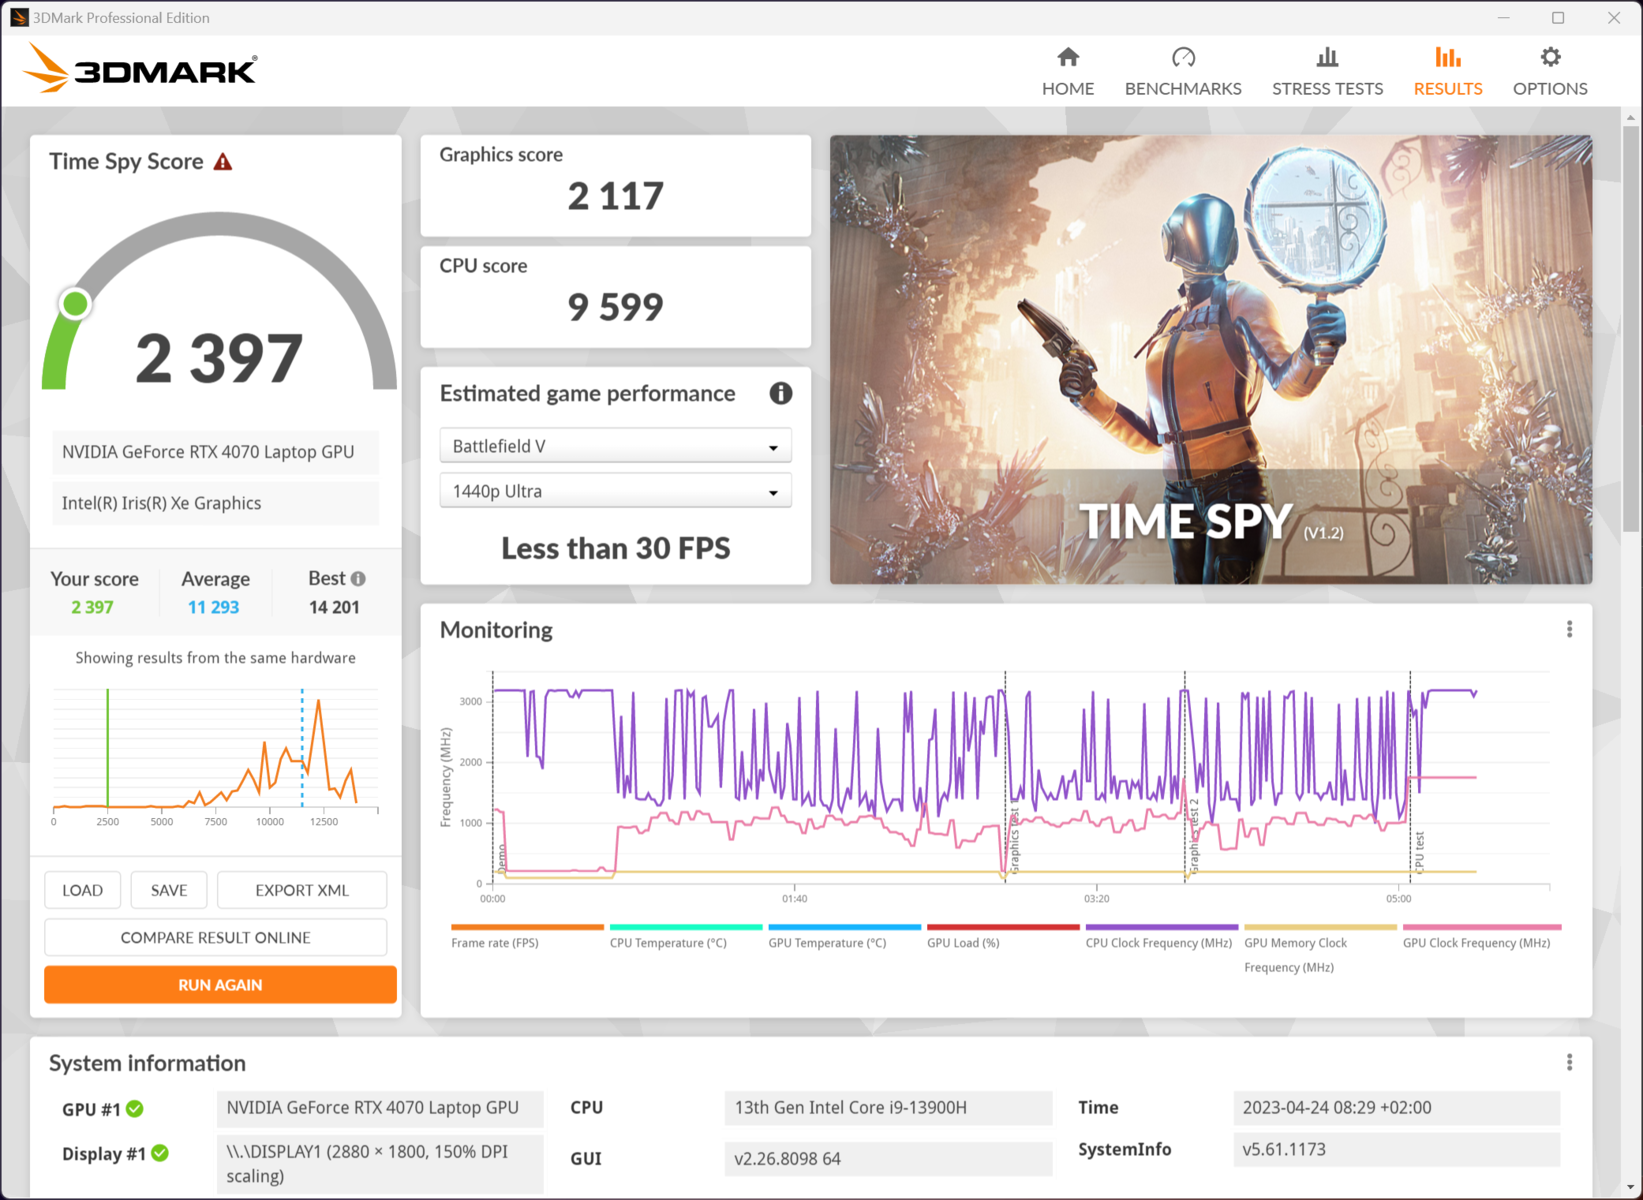
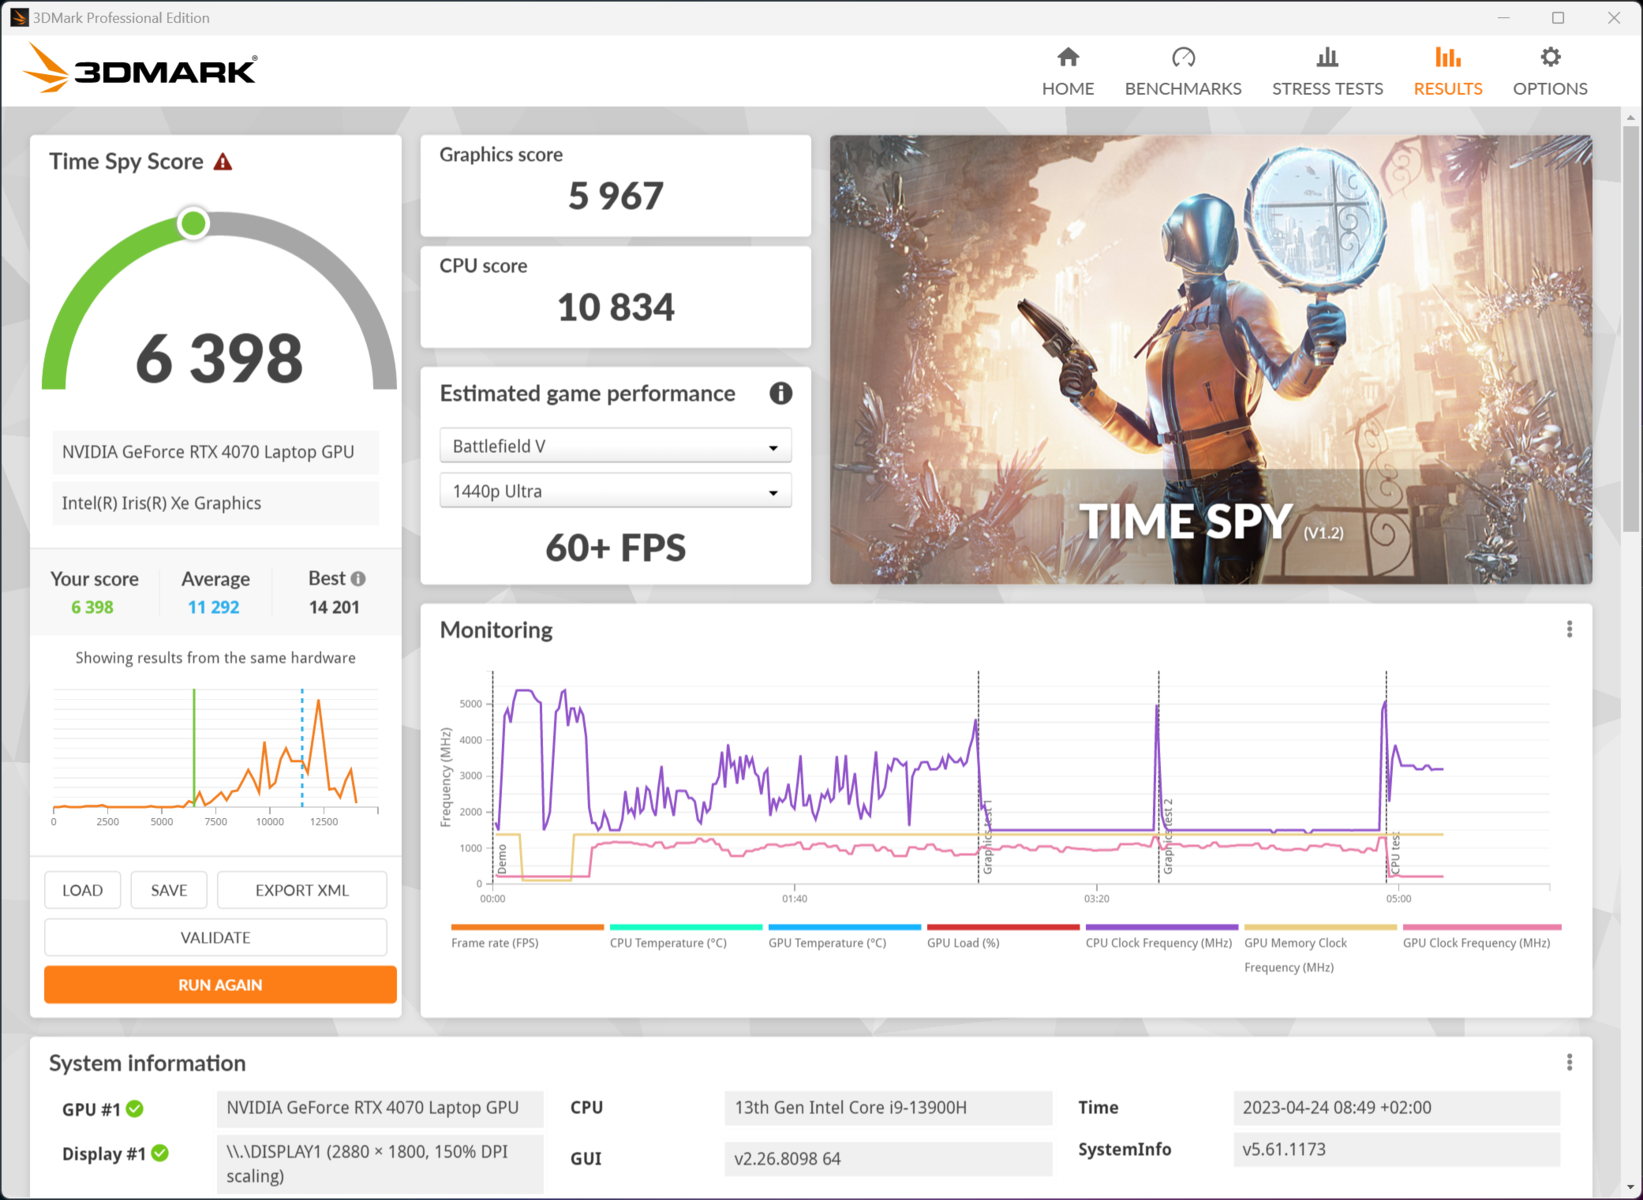
No laptop Samsung Creator, por outro lado, o consumo é limitado a 35 W e a 60 W com o Boost. Como mostram as métricas do site Witcher 3, os 60 watts são totalmente utilizados sob altas cargas, enquanto a CPU parece quase subutilizada com uma taxa de consumo inferior a 15 W. A placa de vídeo não está ajustada para cargas permanentes no nível mais alto.
Por outro lado, os resultados do Galaxy Book Ultra no Blender não estão longe do valor médio da RTX 4070. A tarefa principal, criar e editar conteúdo gráfico, é muito bem executada pelo notebook.
Mais valores medidos, fps e dados podem ser encontrados em nossa Lista de benchmarks de GPU.
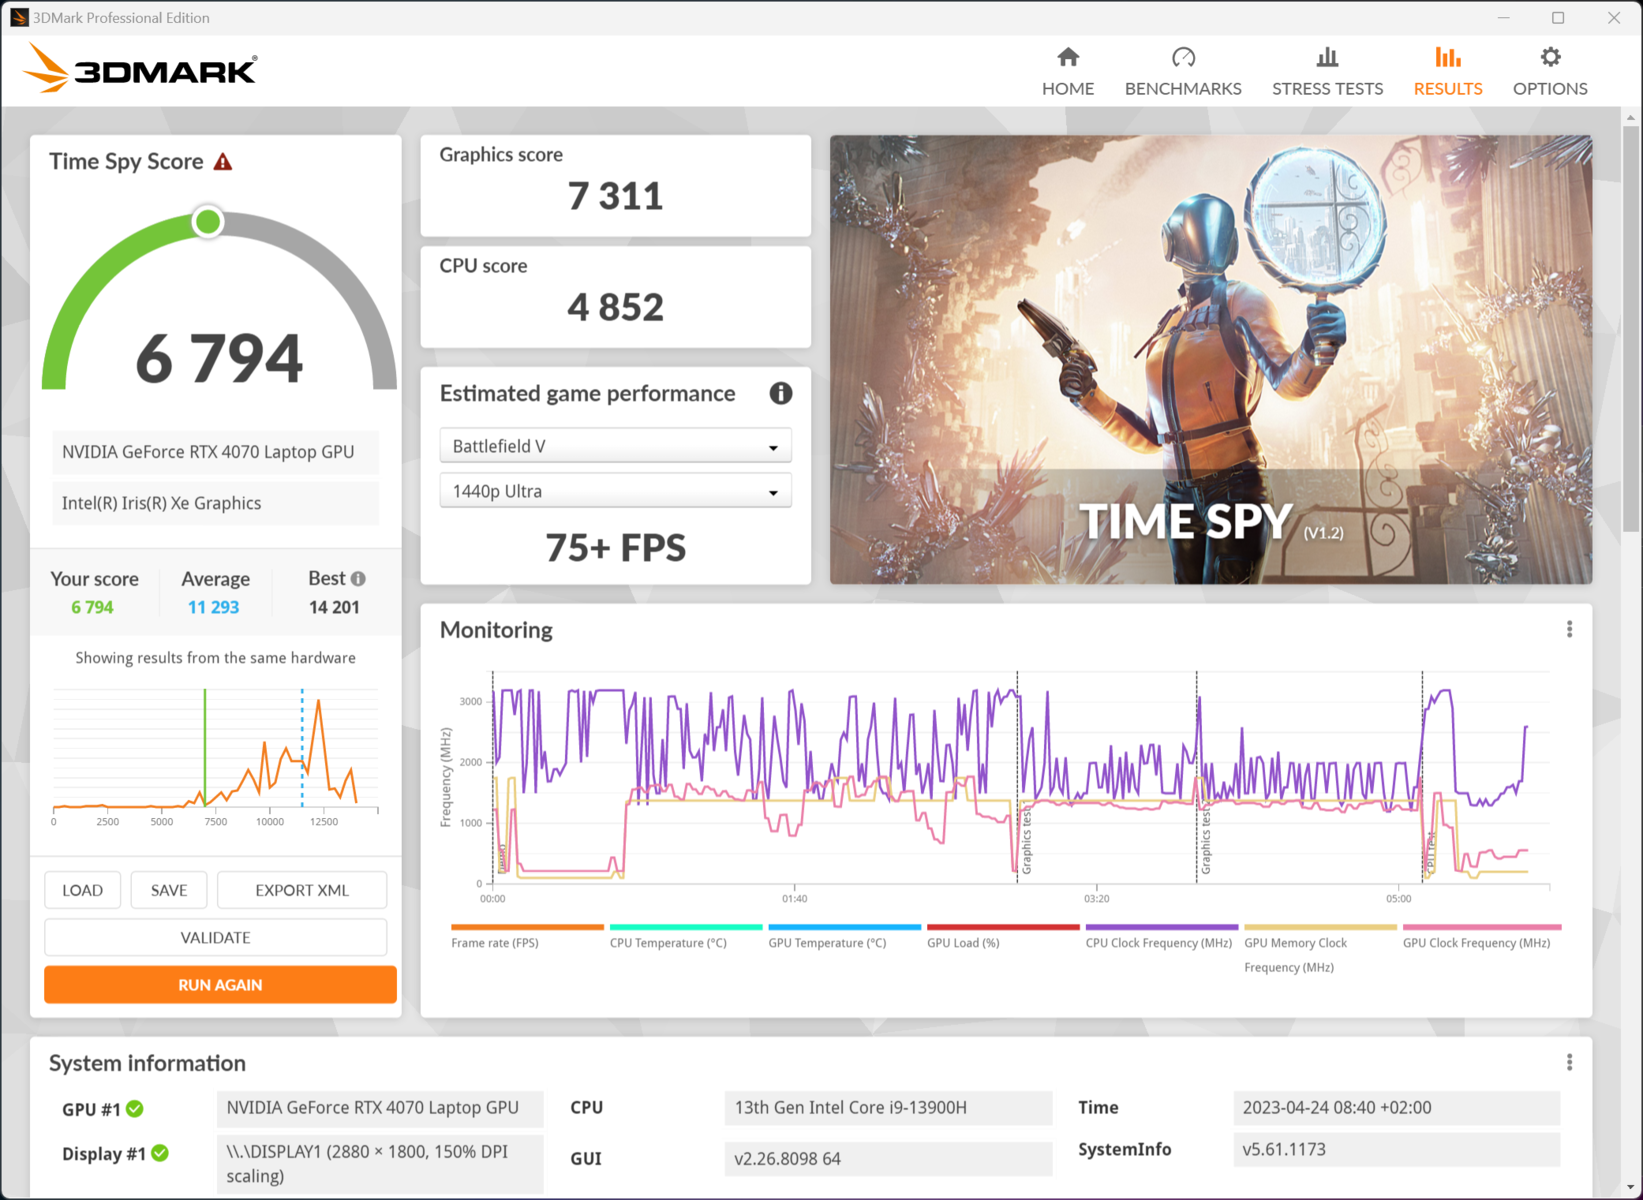
| 3DMark 11 Performance | 25500 pontos | |
| 3DMark Cloud Gate Standard Score | 34191 pontos | |
| 3DMark Fire Strike Score | 18076 pontos | |
| 3DMark Time Spy Score | 8692 pontos | |
Ajuda | ||
* ... menor é melhor
Desempenho em jogos

Os jogos não são, de forma alguma, a principal competência do Galaxy Book. ARTX 4070atinge regularmente seus limites aqui porque não consegue dissipar muito calor no notebook fino e também está limitada a 60 W de consumo de energia. Uma comparação com laptops equipados de forma semelhante seria, portanto, injusta. Por outro lado, o consumo de energia fica regularmente abaixo de 100 W, mesmo sob carga. Em um notebook para jogos como o Medion Erazer Major X20esse consumo fica em torno de 200 a 300 W.
Um HP Victus 16 com uma Nvidia GeForce RTX 3060 tem taxas de consumo semelhantes quando o desempenho está no máximo, portanto, o laptop da Samsung para criativos está praticamente no mesmo nível em termos de jogos. No entanto, o último atinge esses valores em um chassi muito mais fino com metade da energia. Com algumas ressalvas, é possível jogar os títulos mais recentes, mas o laptop simplesmente não foi projetado para isso devido à falta de resfriamento e ao consumo limitado de energia.
O relógio de fps em Witcher 3 sempre permanece estável. 77 quadros em média é um valor respeitável. O fato de esse valor permanecer constante demonstra o resfriamento suficiente dos componentes. Dessa forma, o notebook da Samsung deve ser capaz de processar tarefas de computação mais extensas em níveis estáveis.
Witcher 3 FPS chart
| baixo | média | alto | ultra | QHD | |
|---|---|---|---|---|---|
| GTA V (2015) | 150.1 | 74.7 | 64.5 | ||
| The Witcher 3 (2015) | 161 | 71 | |||
| Dota 2 Reborn (2015) | 99.7 | 97.4 | |||
| Final Fantasy XV Benchmark (2018) | 82 | 60.2 | |||
| X-Plane 11.11 (2018) | 72.2 | ||||
| Far Cry 5 (2018) | 98 | 92 | 79 | ||
| Strange Brigade (2018) | 173.9 | 148.7 | 106.2 | ||
| Cyberpunk 2077 1.6 (2022) | 71 | 65 | 42 | ||
| F1 22 (2022) | 109 | 54 | 36 | ||
| Hogwarts Legacy (2023) | 57 | 41 | 35 |
Emissões - Silencioso, notebook de criador quente
Ruído
Desde que o hardware não esteja muito estressado, o Galaxy Book3 Ultra permanece completamente silencioso. O ruído moderado da ventoinha começa durante o desenvolvimento de calor mais elevado, que permanece em uma faixa muito tolerável de menos de 40 dB.
Somente sob carga máxima a ventoinha é realmente barulhenta. Mais de 50 dB não é um valor em que você pode esperar trabalhar totalmente concentrado. Isso pode ser alterado com o modo Silent. Embora o desempenho do sistema também caia sensivelmente, medimos uma média de 8 dB a menos, o que representa quase a metade do volume.
Ventiladores maiores e um sistema de resfriamento um pouco mais volumoso poderiam ter melhorado significativamente os resultados, mas teriam tornado o notebook maior no geral. O MSI Stealth 17 Studio, por exemplo, com taxas de desempenho significativamente mais altas, demonstra isso de forma impressionante. No entanto, ele é mais pesado e consideravelmente mais espesso.
Barulho
| Ocioso |
| 25.2 / 25.2 / 31.3 dB |
| Carga |
| 38.8 / 51.2 dB |
 | ||
30 dB silencioso 40 dB(A) audível 50 dB(A) ruidosamente alto |
||
min: | ||
| Samsung Galaxy Book3 Ultra 16, i9-13900H RTX 4070 GeForce RTX 4070 Laptop GPU, i9-13900H, Samsung PM9A1 MZVL21T0HCLR | Dell XPS 15 9530 RTX 4070 GeForce RTX 4070 Laptop GPU, i7-13700H, SK hynix PC801 HFS001TEJ9X101N | MSI Stealth 17 Studio A13VH-014 GeForce RTX 4080 Laptop GPU, i9-13900H, Samsung PM9A1 MZVL22T0HBLB | Asus ProArt StudioBook 16 H7600ZW GeForce RTX 3070 Ti Laptop GPU, i9-12900H, Samsung PM9A1 MZVL21T0HCLR | Gigabyte AERO 16 OLED BSF GeForce RTX 4070 Laptop GPU, i9-13900H, Gigabyte AG470S1TB-SI B10 | Samsung Galaxy Book3 Ultra 16 GeForce RTX 4050 Laptop GPU, i7-13700H, Samsung PM9A1 MZVL2512HCJQ | |
|---|---|---|---|---|---|---|
| Noise | 15% | 9% | 19% | -4% | 3% | |
| desligado / ambiente * (dB) | 25.2 | 23.1 8% | 24 5% | 19.55 22% | 23 9% | 25 1% |
| Idle Minimum * (dB) | 25.2 | 23.1 8% | 24 5% | 20.07 20% | 23 9% | 26 -3% |
| Idle Average * (dB) | 25.2 | 23.1 8% | 24 5% | 20.07 20% | 23 9% | 27 -7% |
| Idle Maximum * (dB) | 31.3 | 24.2 23% | 24 23% | 20.07 36% | 33.64 -7% | 28 11% |
| Load Average * (dB) | 38.8 | 27.1 30% | 34.49 11% | 34.53 11% | 51.49 -33% | 40 -3% |
| Load Maximum * (dB) | 51.2 | 44.6 13% | 49.66 3% | 49.21 4% | 55.24 -8% | 41 20% |
| Witcher 3 ultra * (dB) | 40.1 | 48.29 | 49.1 | 55.27 | 39 |
* ... menor é melhor
Temperatura
O Galaxy Book3 fica quente em quase todas as ocasiões. Até mesmo um pouco de navegação é suficiente para aquecer a parte inferior a ponto de tornar desconfortável apoiar o notebook no colo.
Se o desempenho máximo for necessário, o teclado ficará muito quente. Registramos temperaturas mais altas na parte inferior, portanto, é recomendável usar um suporte para notebook, por exemplo, ao renderizar arquivos de vídeo maiores.
(-) A temperatura máxima no lado superior é 45.9 °C / 115 F, em comparação com a média de 36.8 °C / 98 F , variando de 21 a 71 °C para a classe Multimedia.
(-) A parte inferior aquece até um máximo de 50.9 °C / 124 F, em comparação com a média de 39.1 °C / 102 F
(+) Em uso inativo, a temperatura média para o lado superior é 29.7 °C / 85 F, em comparação com a média do dispositivo de 31.3 °C / ### class_avg_f### F.
(-) Jogando The Witcher 3, a temperatura média para o lado superior é 39.2 °C / 103 F, em comparação com a média do dispositivo de 31.3 °C / ## #class_avg_f### F.
(±) Os apoios para as mãos e o touchpad podem ficar muito quentes ao toque, com um máximo de 37.2 °C / 99 F.
(-) A temperatura média da área do apoio para as mãos de dispositivos semelhantes foi 28.7 °C / 83.7 F (-8.5 °C / -15.3 F).
| Samsung Galaxy Book3 Ultra 16, i9-13900H RTX 4070 Intel Core i9-13900H, NVIDIA GeForce RTX 4070 Laptop GPU | Dell XPS 15 9530 RTX 4070 Intel Core i7-13700H, NVIDIA GeForce RTX 4070 Laptop GPU | Gigabyte AERO 16 OLED BSF Intel Core i9-13900H, NVIDIA GeForce RTX 4070 Laptop GPU | MSI Stealth 17 Studio A13VH-014 Intel Core i9-13900H, NVIDIA GeForce RTX 4080 Laptop GPU | Samsung Galaxy Book3 Ultra 16 Intel Core i7-13700H, NVIDIA GeForce RTX 4050 Laptop GPU | Asus ProArt StudioBook 16 H7600ZW Intel Core i9-12900H, NVIDIA GeForce RTX 3070 Ti Laptop GPU | |
|---|---|---|---|---|---|---|
| Heat | 3% | 20% | 1% | 19% | 11% | |
| Maximum Upper Side * (°C) | 45.9 | 45.6 1% | 41 11% | 47 -2% | 41 11% | 41.6 9% |
| Maximum Bottom * (°C) | 50.9 | 42 17% | 47 8% | 54 -6% | 44 14% | 41.4 19% |
| Idle Upper Side * (°C) | 31.6 | 34.4 -9% | 23 27% | 30 5% | 23 27% | 31.8 -1% |
| Idle Bottom * (°C) | 34.2 | 33.2 3% | 23 33% | 32 6% | 26 24% | 29.2 15% |
* ... menor é melhor
Teste de estresse
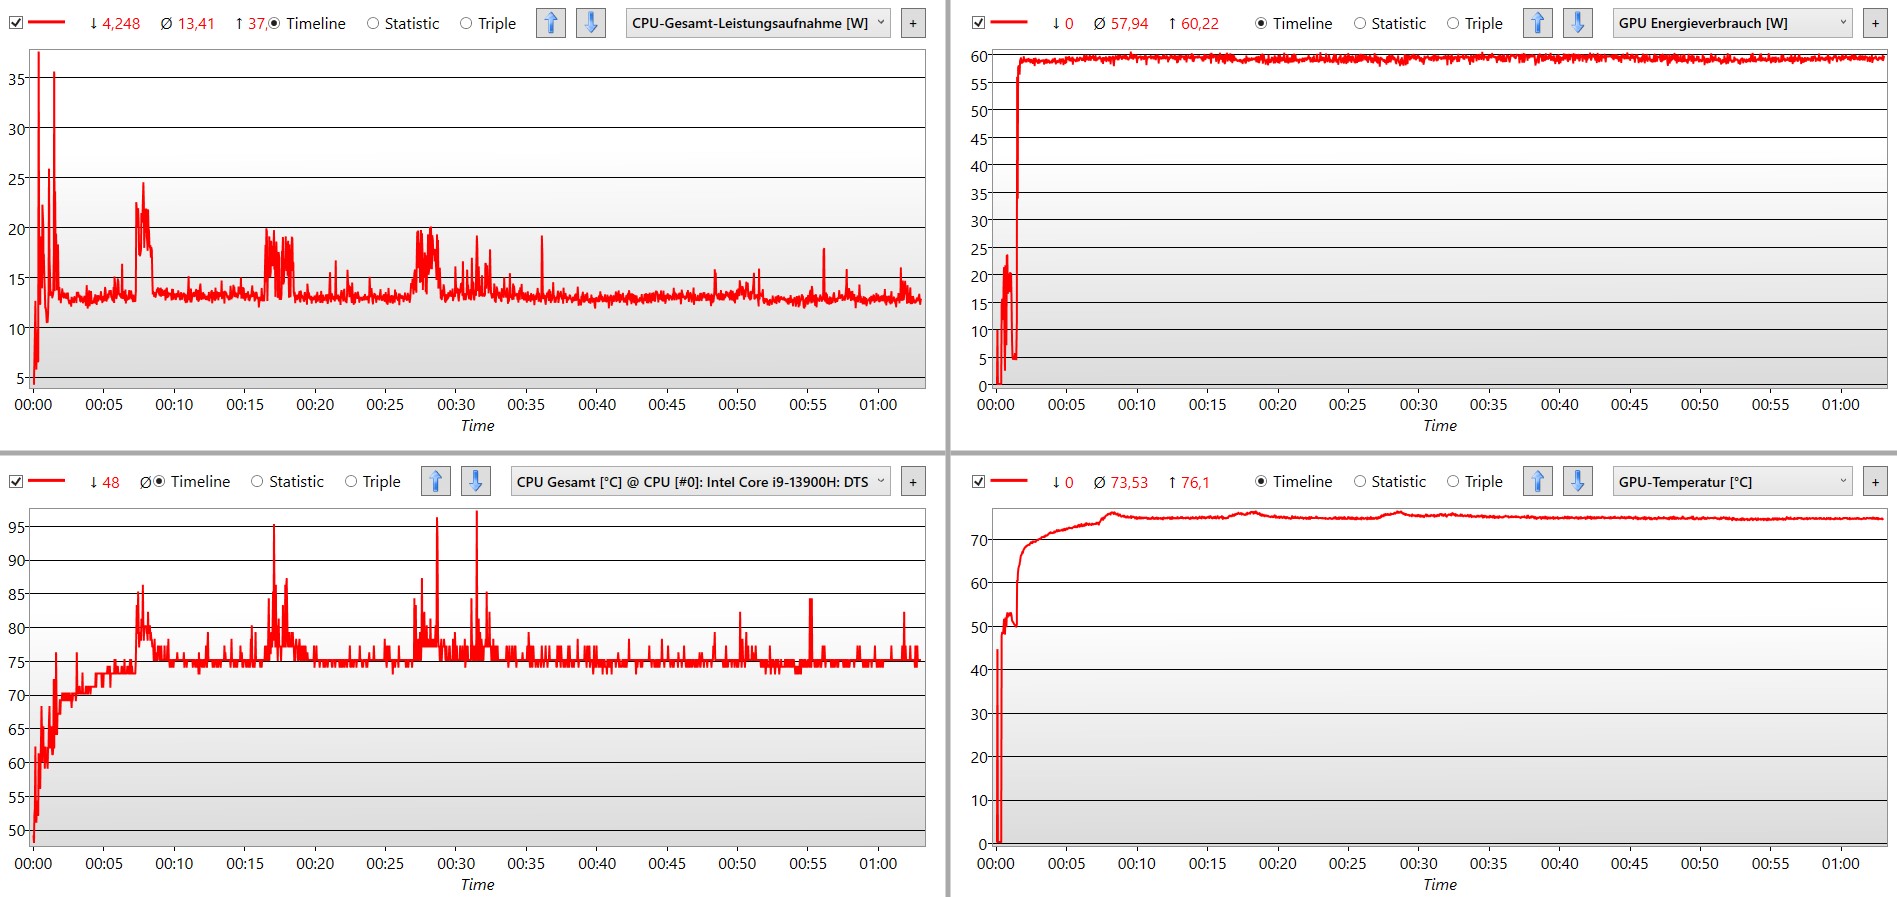
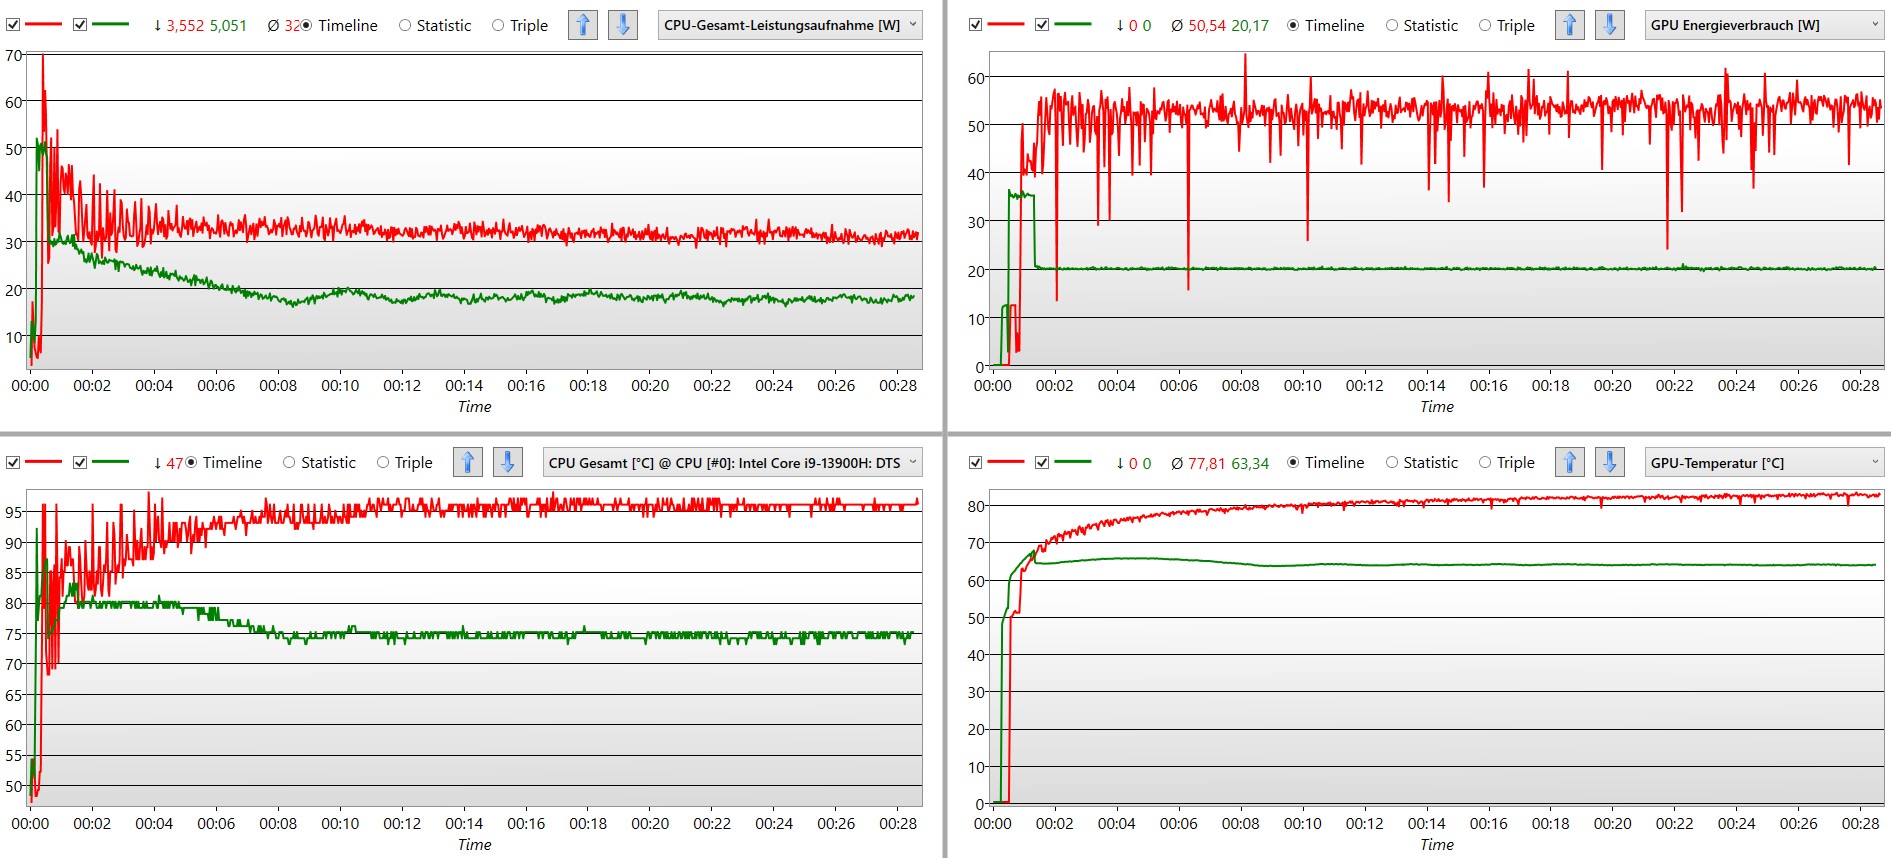
Sob carga máxima, o processador pode consumir pouco menos de 30 W em longo prazo. A placa gráfica, por outro lado, permanece relativamente estável em um nível alto de pouco menos de 50 W. O fato de o Galaxy Book3 Ultra esquentar tanto é demonstrado pelas curvas de temperatura da CPU e da GPU. Embora permaneçam quase niveladas após cerca de 10 minutos, elas atingem impressionantes 95 e 80 °C, respectivamente. Juntamente com o pequeno sistema de resfriamento, isso resulta em um gabinete muito quente. No entanto, o laptop consegue utilizar os 100 W permitidos pela fonte de alimentação durante longos períodos de tempo.
Mudanças significativas podem ser observadas no modo Silencioso . Não apenas as emissões de ruído caem drasticamente, como também o consumo de energia da CPU e da GPU cai de 90 para cerca de 40 W. As temperaturas dos componentes também permanecem em um nível muito mais tolerável. Embora haja perdas significativas de desempenho, especialmente no desempenho gráfico, o modo parece ser adequado para o trabalho silencioso permanente, apesar do aumento das demandas de computação.
Alto-falantes
Os alto-falantes estéreo da AKG podem corresponder apenas parcialmente às expectativas que a marca alimenta com razão. Graves potentes e médios detalhados com alta qualidade de som fazem com que a música, do rock ao eletro, soe bem. Entretanto, como em muitos modelos, os médios mais baixos poderiam ter um pouco mais de potência. No geral, a mixagem é absolutamente boa, especialmente para streaming de vídeo.
Infelizmente, observamos um forte overdrive nos agudos, que também pode ser visto claramente no gráfico de frequência.
Samsung Galaxy Book3 Ultra 16, i9-13900H RTX 4070 análise de áudio
(+) | os alto-falantes podem tocar relativamente alto (###valor### dB)
Graves 100 - 315Hz
(-) | quase nenhum baixo - em média 15.8% menor que a mediana
(-) | graves não são lineares (16.6% delta para frequência anterior)
Médios 400 - 2.000 Hz
(+) | médios equilibrados - apenas 2.9% longe da mediana
(+) | médios são lineares (3.8% delta para frequência anterior)
Altos 2 - 16 kHz
(+) | agudos equilibrados - apenas 4.7% longe da mediana
(±) | a linearidade dos máximos é média (9.5% delta para frequência anterior)
Geral 100 - 16.000 Hz
(+) | o som geral é linear (13.8% diferença em relação à mediana)
Comparado com a mesma classe
» 30% de todos os dispositivos testados nesta classe foram melhores, 4% semelhantes, 65% piores
» O melhor teve um delta de 5%, a média foi 17%, o pior foi 45%
Comparado com todos os dispositivos testados
» 15% de todos os dispositivos testados foram melhores, 4% semelhantes, 81% piores
» O melhor teve um delta de 4%, a média foi 23%, o pior foi 134%
Apple MacBook Pro 16 2021 M1 Pro análise de áudio
(+) | os alto-falantes podem tocar relativamente alto (###valor### dB)
Graves 100 - 315Hz
(+) | bons graves - apenas 3.8% longe da mediana
(+) | o baixo é linear (5.2% delta para a frequência anterior)
Médios 400 - 2.000 Hz
(+) | médios equilibrados - apenas 1.3% longe da mediana
(+) | médios são lineares (2.1% delta para frequência anterior)
Altos 2 - 16 kHz
(+) | agudos equilibrados - apenas 1.9% longe da mediana
(+) | os máximos são lineares (2.7% delta da frequência anterior)
Geral 100 - 16.000 Hz
(+) | o som geral é linear (4.6% diferença em relação à mediana)
Comparado com a mesma classe
» 0% de todos os dispositivos testados nesta classe foram melhores, 0% semelhantes, 100% piores
» O melhor teve um delta de 5%, a média foi 17%, o pior foi 45%
Comparado com todos os dispositivos testados
» 0% de todos os dispositivos testados foram melhores, 0% semelhantes, 100% piores
» O melhor teve um delta de 4%, a média foi 23%, o pior foi 134%
Gerenciamento de energia - notebook para criadores com grande resistência
Consumo de energia
O Galaxy Book é extremamente econômico com pouca carga. Apesar da tela grande e relativamente brilhante, o consumo de energia permanece abaixo de 10 W para a maioria das tarefas simples. Muitos rivais com hardware tão potente usam o dobro disso.
Sob carga, o suprimento máximo possível do adaptador de energia, que fornece 100 W via USB-C, é totalmente utilizado. Como mostram nossas medições no teste de estresse, o notebook pode absorver e usar essa energia por longos períodos de tempo. No entanto, sob tais cargas, é provável que não seja possível carregar a bateria. Pelo menos não observamos o esgotamento da bateria no teste de estresse.
| desligado | |
| Ocioso | |
| Carga |
|
Key:
min: | |
| Samsung Galaxy Book3 Ultra 16, i9-13900H RTX 4070 i9-13900H, GeForce RTX 4070 Laptop GPU, Samsung PM9A1 MZVL21T0HCLR, OLED / AMOLED, 2880x1800, 16" | Dell XPS 15 9530 RTX 4070 i7-13700H, GeForce RTX 4070 Laptop GPU, SK hynix PC801 HFS001TEJ9X101N, OLED, 3456x2160, 15.6" | MSI Stealth 17 Studio A13VH-014 i9-13900H, GeForce RTX 4080 Laptop GPU, Samsung PM9A1 MZVL22T0HBLB, Mini LED, 3840x2160, 17.3" | Asus ProArt StudioBook 16 H7600ZW i9-12900H, GeForce RTX 3070 Ti Laptop GPU, Samsung PM9A1 MZVL21T0HCLR, OLED, 3840x2400, 16" | Gigabyte AERO 16 OLED BSF i9-13900H, GeForce RTX 4070 Laptop GPU, Gigabyte AG470S1TB-SI B10, OLED, 3840x2400, 16" | Samsung Galaxy Book3 Ultra 16 i7-13700H, GeForce RTX 4050 Laptop GPU, Samsung PM9A1 MZVL2512HCJQ, AMOLED, 2880x1800, 16" | Média NVIDIA GeForce RTX 4070 Laptop GPU | Média da turma Multimedia | |
|---|---|---|---|---|---|---|---|---|
| Power Consumption | -135% | -130% | -132% | -102% | 14% | -145% | -27% | |
| Idle Minimum * (Watt) | 4.3 | 20 -365% | 13.9 -223% | 12.6 -193% | 11.8 -174% | 3 30% | 13.2 ? -207% | 5.66 ? -32% |
| Idle Average * (Watt) | 4.6 | 20.7 -350% | 20 -335% | 17.41 -278% | 16.1 -250% | 5 -9% | 18.2 ? -296% | 10.2 ? -122% |
| Idle Maximum * (Watt) | 11.4 | 22.4 -96% | 20.6 -81% | 23.12 -103% | 17 -49% | 11 4% | 24.6 ? -116% | 12.5 ? -10% |
| Load Average * (Watt) | 97 | 77.1 21% | 77 21% | 117.5 -21% | 100.6 -4% | 72 26% | 97 ? -0% | 65.2 ? 33% |
| Witcher 3 ultra * (Watt) | 100.9 | 95.4 5% | 162 -61% | 172.6 -71% | 158 -57% | 69.7 31% | ||
| Load Maximum * (Watt) | 107 | 133.4 -25% | 216 -102% | 241.36 -126% | 192 -79% | 108 -1% | 221 ? -107% | 113.5 ? -6% |
* ... menor é melhor
Power consumption Witcher 3 / Stress test
Power consumption with an external monitor
Duração da bateria
Como já foi indicado pelas baixas taxas de consumo de energia sob carga baixa, o notebook oferece tempos de execução muito respeitáveis. Apesar da bateria de 76 Wh, que é bem pequena em comparação com a concorrência, ela se mostra extremamente resistente ao reproduzir vídeos em Full HD e durante a navegação intensa. A variante mais fraca do Galaxy Book3 Ultra 16 oferece até algumas horas a mais.
9 horas no teste de vídeo e 8 horas de navegação na Web são mais do que impressionantes. A tela OLED tem, naturalmente, um impacto muito grande no tempo de execução. Obtivemos um tempo de execução de menos de 6 horas com brilho máximo. Por outro lado, se o Modo Escuro for ativado no navegador da Web ou forçado para todos os sites, o notebook poderá obter mais duas horas de navegação, ou seja, pouco mais de 10 horas.
| Samsung Galaxy Book3 Ultra 16, i9-13900H RTX 4070 i9-13900H, GeForce RTX 4070 Laptop GPU, 76 Wh | Dell XPS 15 9530 RTX 4070 i7-13700H, GeForce RTX 4070 Laptop GPU, 86 Wh | MSI Stealth 17 Studio A13VH-014 i9-13900H, GeForce RTX 4080 Laptop GPU, 99 Wh | Asus ProArt StudioBook 16 H7600ZW i9-12900H, GeForce RTX 3070 Ti Laptop GPU, 90 Wh | Gigabyte AERO 16 OLED BSF i9-13900H, GeForce RTX 4070 Laptop GPU, 88 Wh | Samsung Galaxy Book3 Ultra 16 i7-13700H, GeForce RTX 4050 Laptop GPU, 76 Wh | Média da turma Multimedia | |
|---|---|---|---|---|---|---|---|
| Duração da bateria | 34% | 3% | 1% | 36% | 56% | 76% | |
| H.264 (h) | 9 | 5.6 -38% | 9.7 8% | 7.4 -18% | 13.4 49% | 17.1 ? 90% | |
| WiFi v1.3 (h) | 8 | 8 0% | 5.6 -30% | 7.5 -6% | 7.5 -6% | 9.6 20% | 12.2 ? 53% |
| Load (h) | 0.9 | 1.5 67% | 1.6 78% | 0.9 0% | 2.1 133% | 1.8 100% | 1.664 ? 85% |
| Witcher 3 ultra (h) | 2.6 | 1.3 |
Pro
Contra
Veredicto - Galaxy Book Ultra projetado para a criação de conteúdo
A Samsung acertou em cheio com o Galaxy Book3 Ultra 16: o notebook oferece muito desempenho e a tela perfeita para trabalhos criativos. O gabinete fino e discreto faz com que o notebook pareça uma ferramenta de trabalho profissional em todos os aspectos, e essa impressão é reforçada por nossas medições e benchmarks. Três saídas de vídeo, o touchpad bem-sucedido e a operação silenciosa sob carga se encaixam perfeitamente no quadro geral.
O Galaxy Book3 Ultra oferece tudo para tarefas criativas. A tela, o desempenho do sistema e a qualidade de construção estão todos em sintonia. No entanto, o desempenho superior precisa ser sacrificado em prol de um gabinete fino.
Ao mesmo tempo, a forte redução no fornecimento de energia para a CPU e a GPU garante um foco intenso puramente no processamento e na renderização de vídeo e imagem. O Galaxy Book3 não se sai bem em jogos, embora tenhamos conseguido jogar os jogos mais recentes nas configurações mais altas. No entanto, a RTX 4070 aqui funciona mais no nível de uma RTX 3060embora seja muito mais econômica e silenciosa.
E há algumas desvantagens. O laptop do criador fica quente quando pressionado por longos períodos de tempo. Durante tarefas menos exigentes, a parte inferior e o teclado também ficam visivelmente quentes, um pouco quentes demais. O slot microSD poderia ter sido um leitor de cartão completo. Além disso, o som dos alto-falantes é excelente. No entanto, o fato de que eles apresentam overdrive em altas frequências não deveria acontecer nesse nível.
Em relação ao seu foco no processamento de mídia, o notebook da Samsung é o concorrente mais próximo de um MacBook Promesmo que o Mac e o Windows só possam ser comparados até certo ponto. Por outro lado, se for necessário mais desempenho gráfico, o que provavelmente significa um gabinete maior e maior consumo de energia, o igualmente silencioso MSI Stealth 17 Studio ou Gigabyte AERO 16 OLED são boas alternativas.
Preço e disponibilidade
Nos EUA, nossa configuração analisada do Samsung Galaxy Book3 Ultra 16 com o i9-13900H e a RTX 4070 está disponível em na página de produtos da Samsung por US$ 2999,99.
Os compradores interessados em outros países podem selecionar sua localização aqui (onde aplicável) e digitar Book3 Ultra 16 na barra de pesquisa para verificar a disponibilidade.
Os preços são válidos a partir de 09.05.2023 e estão sujeitos a alterações.
Samsung Galaxy Book3 Ultra 16, i9-13900H RTX 4070
- 04/27/2023 v7 (old)
Mario Petzold
Transparência
A seleção dos dispositivos a serem analisados é feita pela nossa equipe editorial. A amostra de teste foi fornecida ao autor como empréstimo pelo fabricante ou varejista para fins desta revisão. O credor não teve influência nesta revisão, nem o fabricante recebeu uma cópia desta revisão antes da publicação. Não houve obrigação de publicar esta revisão. Como empresa de mídia independente, a Notebookcheck não está sujeita à autoridade de fabricantes, varejistas ou editores.
É assim que o Notebookcheck está testando
Todos os anos, o Notebookcheck analisa de forma independente centenas de laptops e smartphones usando procedimentos padronizados para garantir que todos os resultados sejam comparáveis. Desenvolvemos continuamente nossos métodos de teste há cerca de 20 anos e definimos padrões da indústria no processo. Em nossos laboratórios de teste, equipamentos de medição de alta qualidade são utilizados por técnicos e editores experientes. Esses testes envolvem um processo de validação em vários estágios. Nosso complexo sistema de classificação é baseado em centenas de medições e benchmarks bem fundamentados, o que mantém a objetividade.Price comparison

