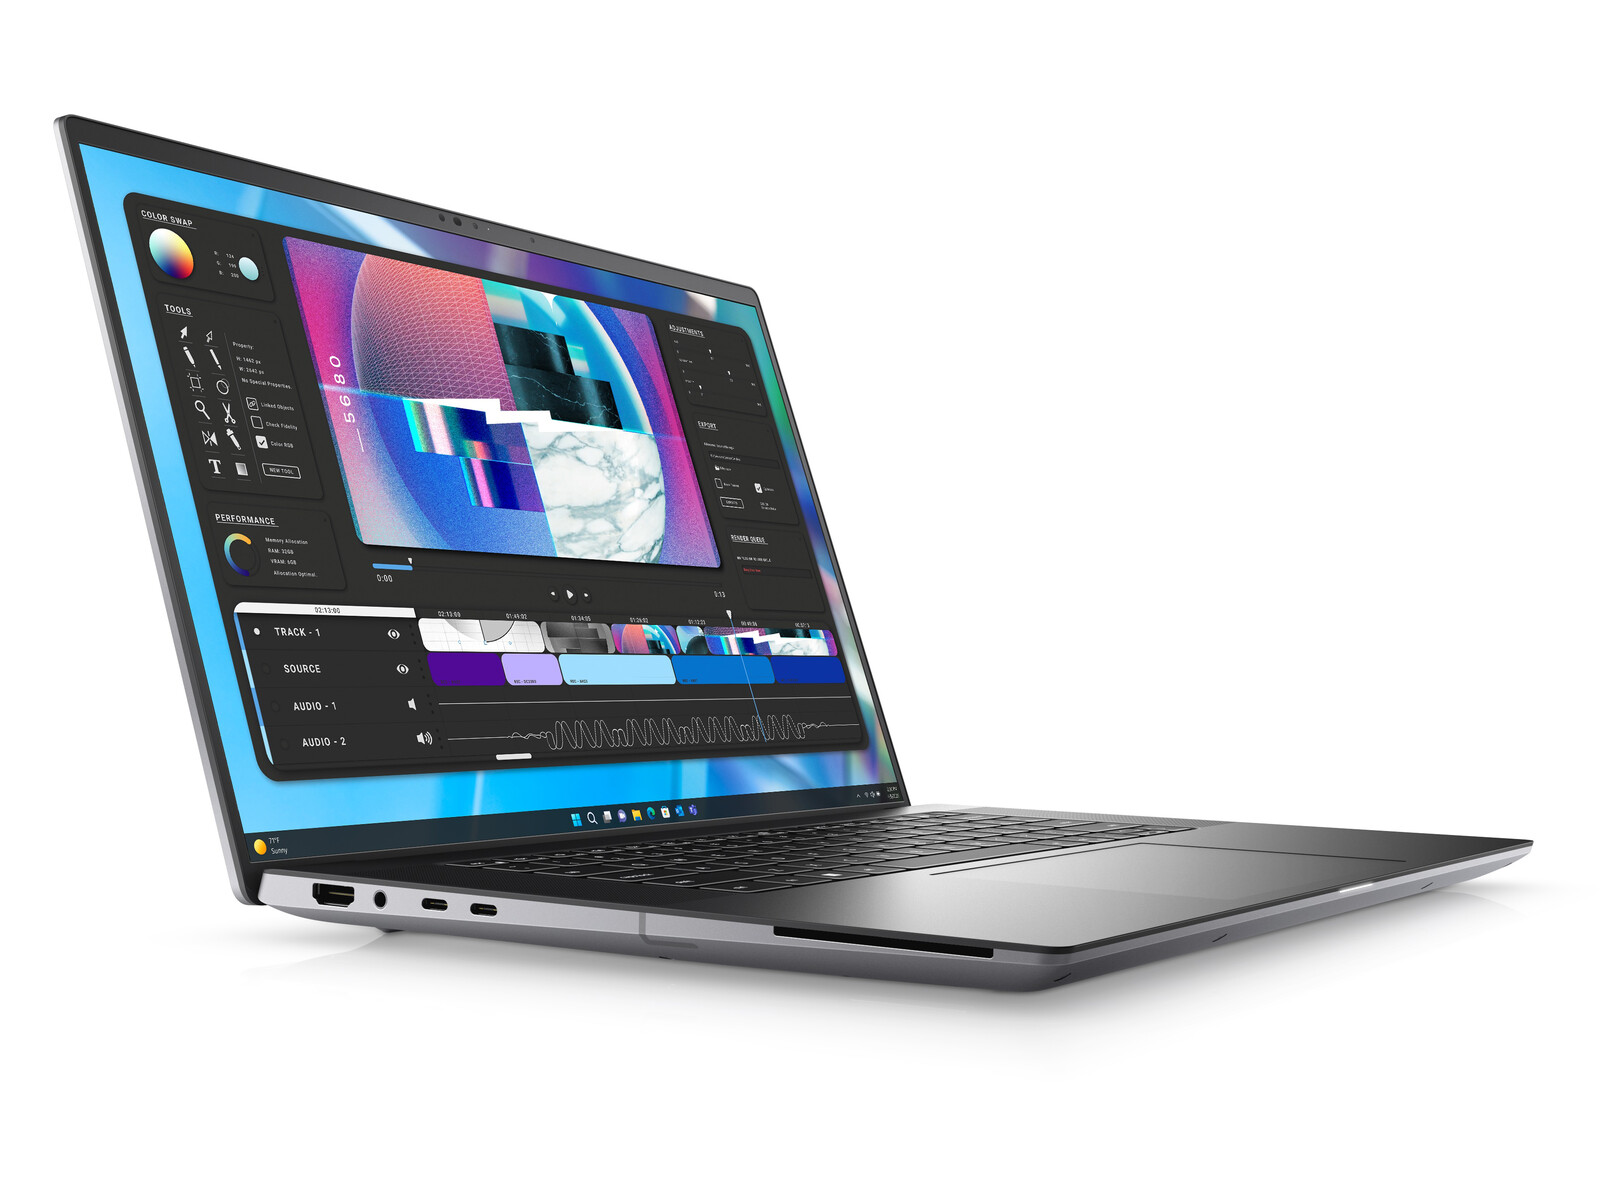
Análise do Dell Precision 5680: Ada Lovelace domina as estações de trabalho

O Precision 5680 é o primeiro modelo de 16 polegadas da série Precision 5000 para complementar o modelo existente de 14 polegadas Precision 5470de 14 polegadas, 15 polegadas Precision 5560e 17 polegadas Precision 5750. É uma estação de trabalho móvel de ponta, mais fina e mais leve do que um modelo Precision modelo 7000 embora com menos recursos auxiliares integrados.
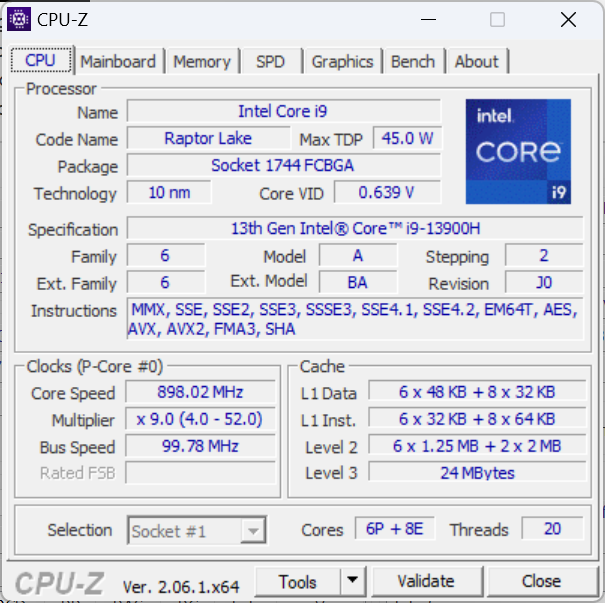
Nossa unidade de teste é uma configuração de ponta com a CPU Raptor Lake-H Core i9-13900H de 13ª geração, GPU Nvidia RTX 5000 de 75 W e tela sensível ao toque OLED de 2400p por aproximadamente US$ 6500. SKUs menores estão disponíveis com o Core i5-13600H, sem GPU discreta e tela IPS de 1200p por um preço inicial mais baixo de cerca de US$ 2.490.
Essa também é uma das primeiras estações de trabalho a ser fornecida com a GPU móvel Ada Lovelace RTX 5000, que não deve ser confundida com a Quadro RTX 5000 ou com a RTX A5000.
Os concorrentes nesse espaço incluem outras estações de trabalho de 16 polegadas, como aHP ZBook Fury 16 G9,Lenovo ThinkPad P16 G1,MSI CreatorPro Z16Pou a Asus ProArt StudioBook série 16.
Mais análises da Dell:
Possíveis concorrentes em comparação
Avaliação | Data | Modelo | Peso | Altura | Size | Resolução | Preço |
|---|---|---|---|---|---|---|---|
| 89 % v7 (old) | 08/2023 | Dell Precision 5000 5680 i9-13900H, RTX 5000 Ada Generation Laptop | 2.3 kg | 22.17 mm | 16.00" | 3840x2400 | |
| 89.1 % v7 (old) | 12/2022 | Dell Precision 7000 7670 Performance i9-12950HX, RTX A5500 Laptop GPU | 2.8 kg | 25.95 mm | 16.00" | 3840x2400 | |
| 91 % v7 (old) | 06/2023 | HP ZBook Fury 16 G9 i9-12950HX, RTX A5500 Laptop GPU | 2.6 kg | 28.5 mm | 16.00" | 3840x2400 | |
| 91 % v7 (old) | 02/2023 | Lenovo ThinkPad P16 G1 RTX A5500 i9-12950HX, RTX A5500 Laptop GPU | 3 kg | 30.23 mm | 16.00" | 3840x2400 | |
| 84.3 % v7 (old) | 11/2022 | MSI CreatorPro Z16P B12UKST i7-12700H, RTX A3000 Laptop GPU | 2.4 kg | 19 mm | 16.00" | 2560x1600 | |
| 89.6 % v7 (old) | 01/2023 | Asus ExpertBook B6 Flip B6602FC2 i9-12950HX, RTX A2000 Laptop GPU | 2.8 kg | 27.2 mm | 16.00" | 2560x1600 |
Estojo - XPS Roots
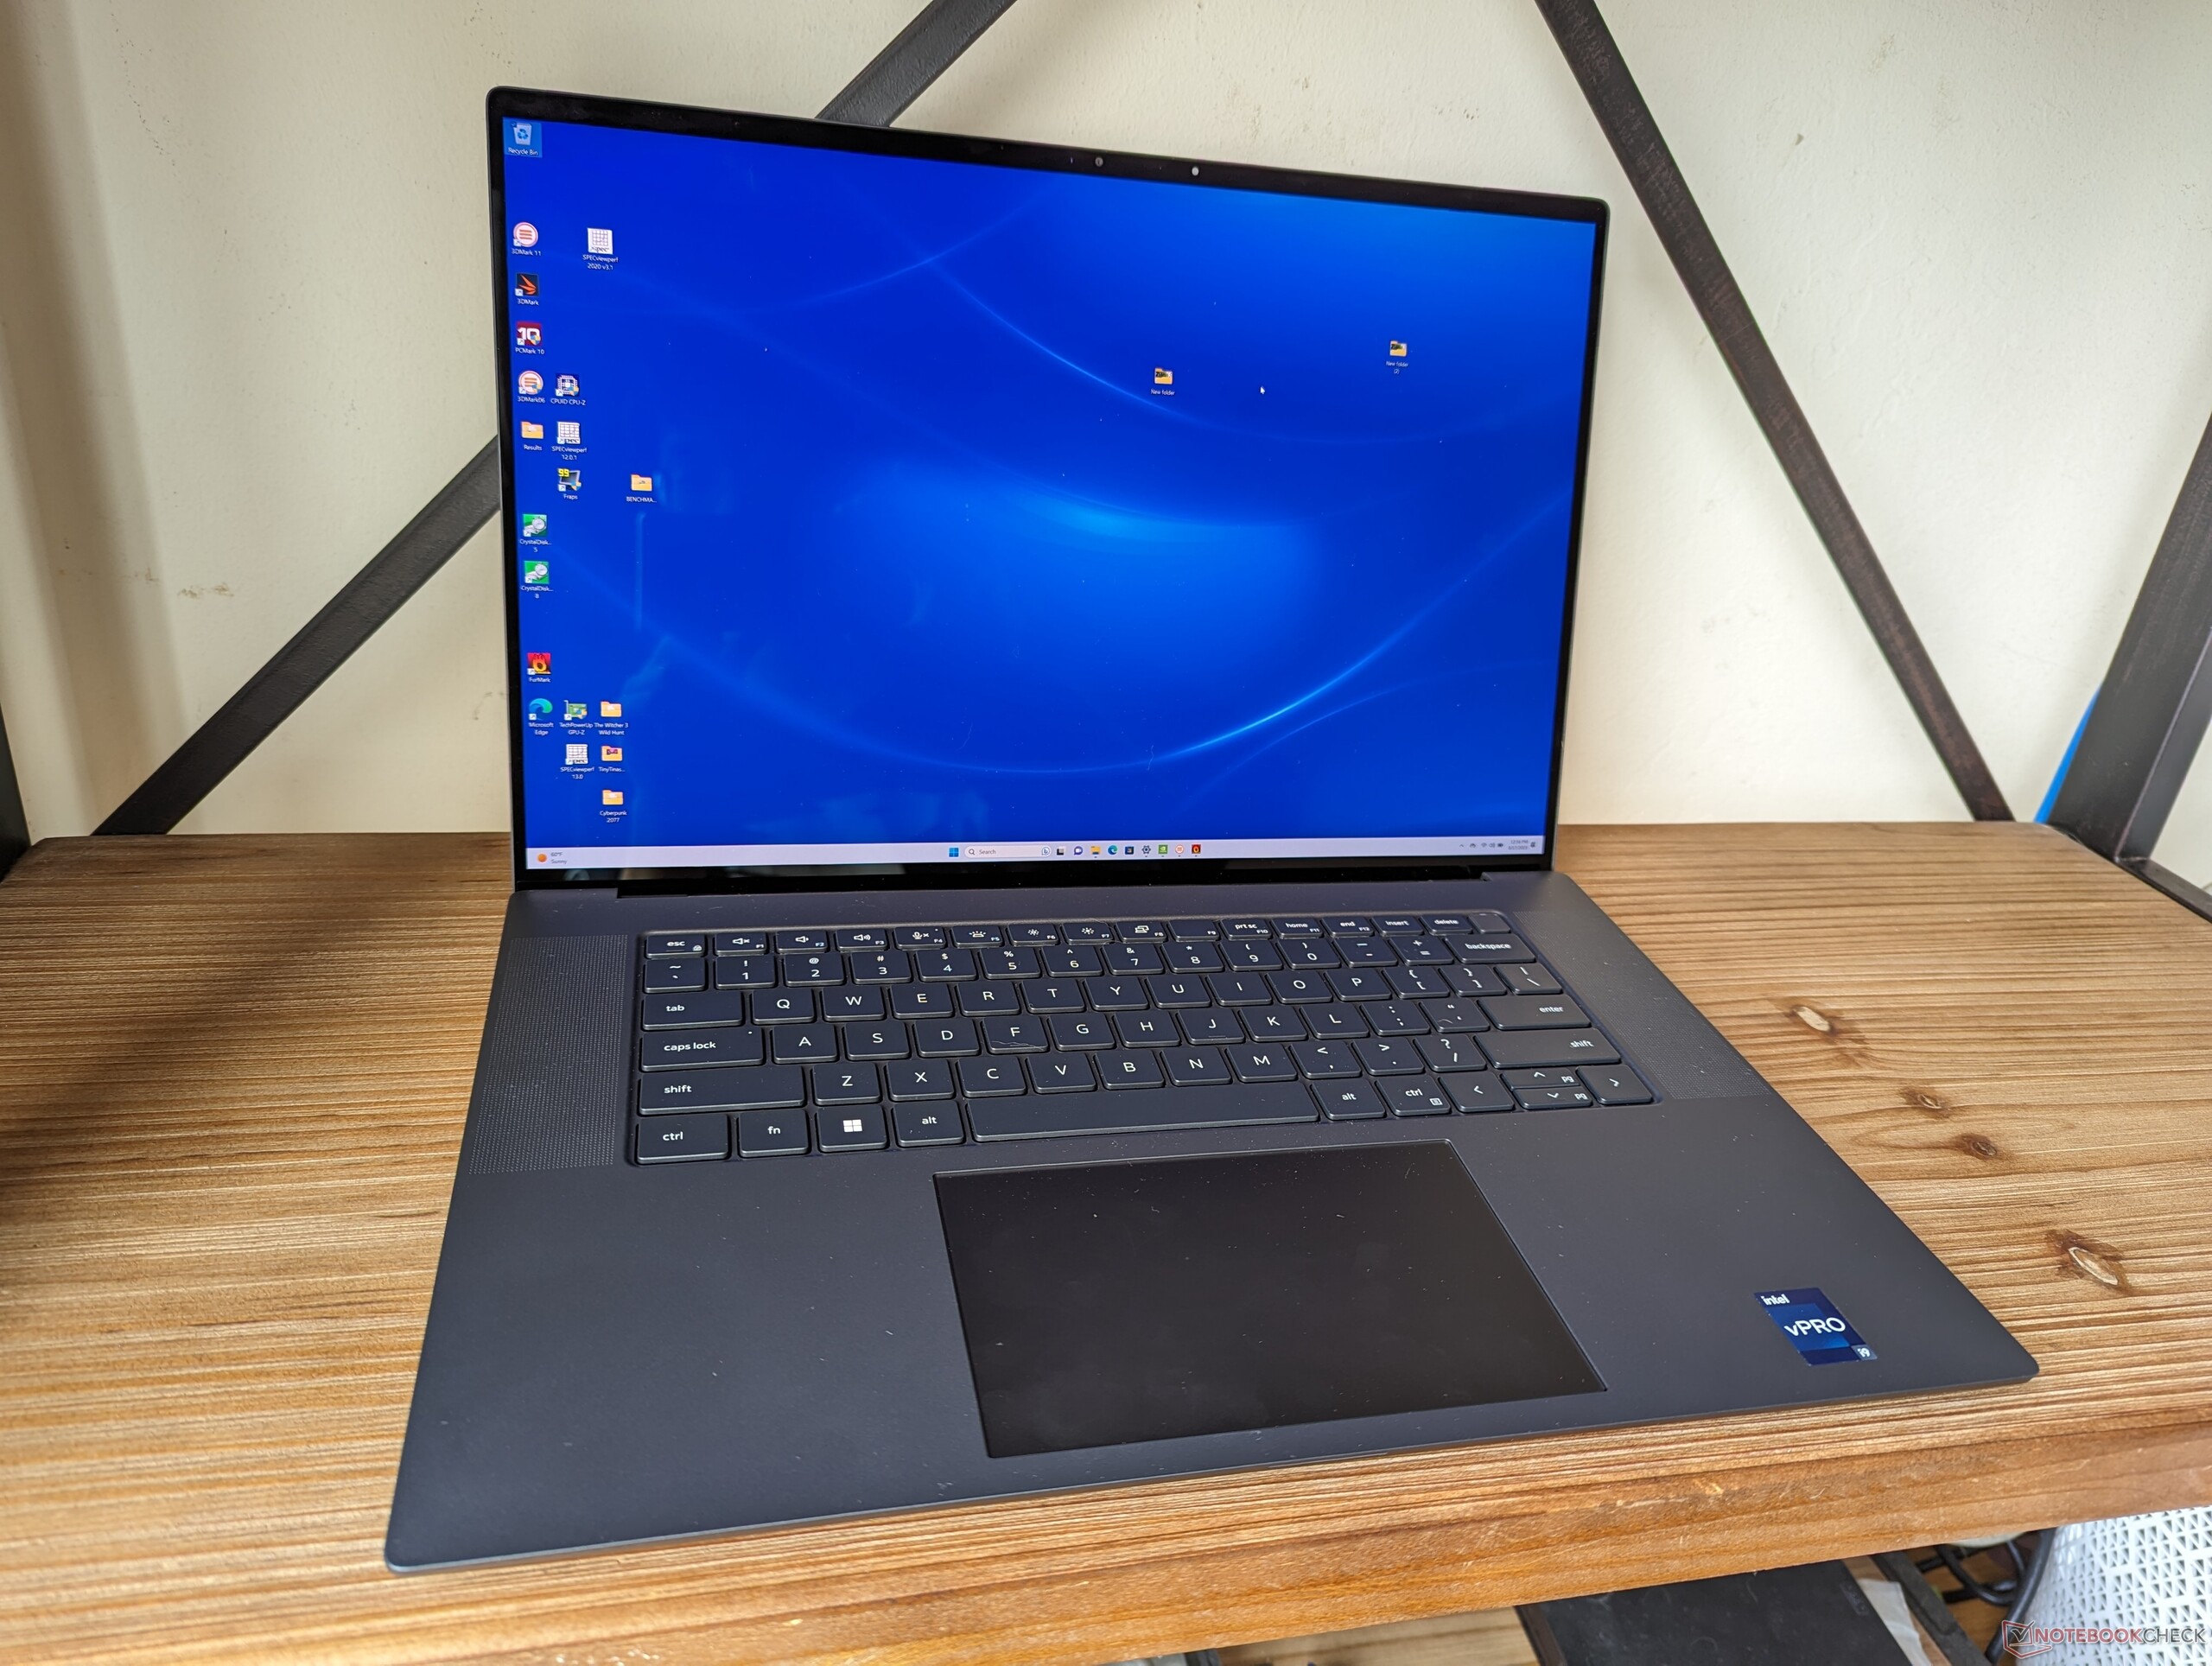
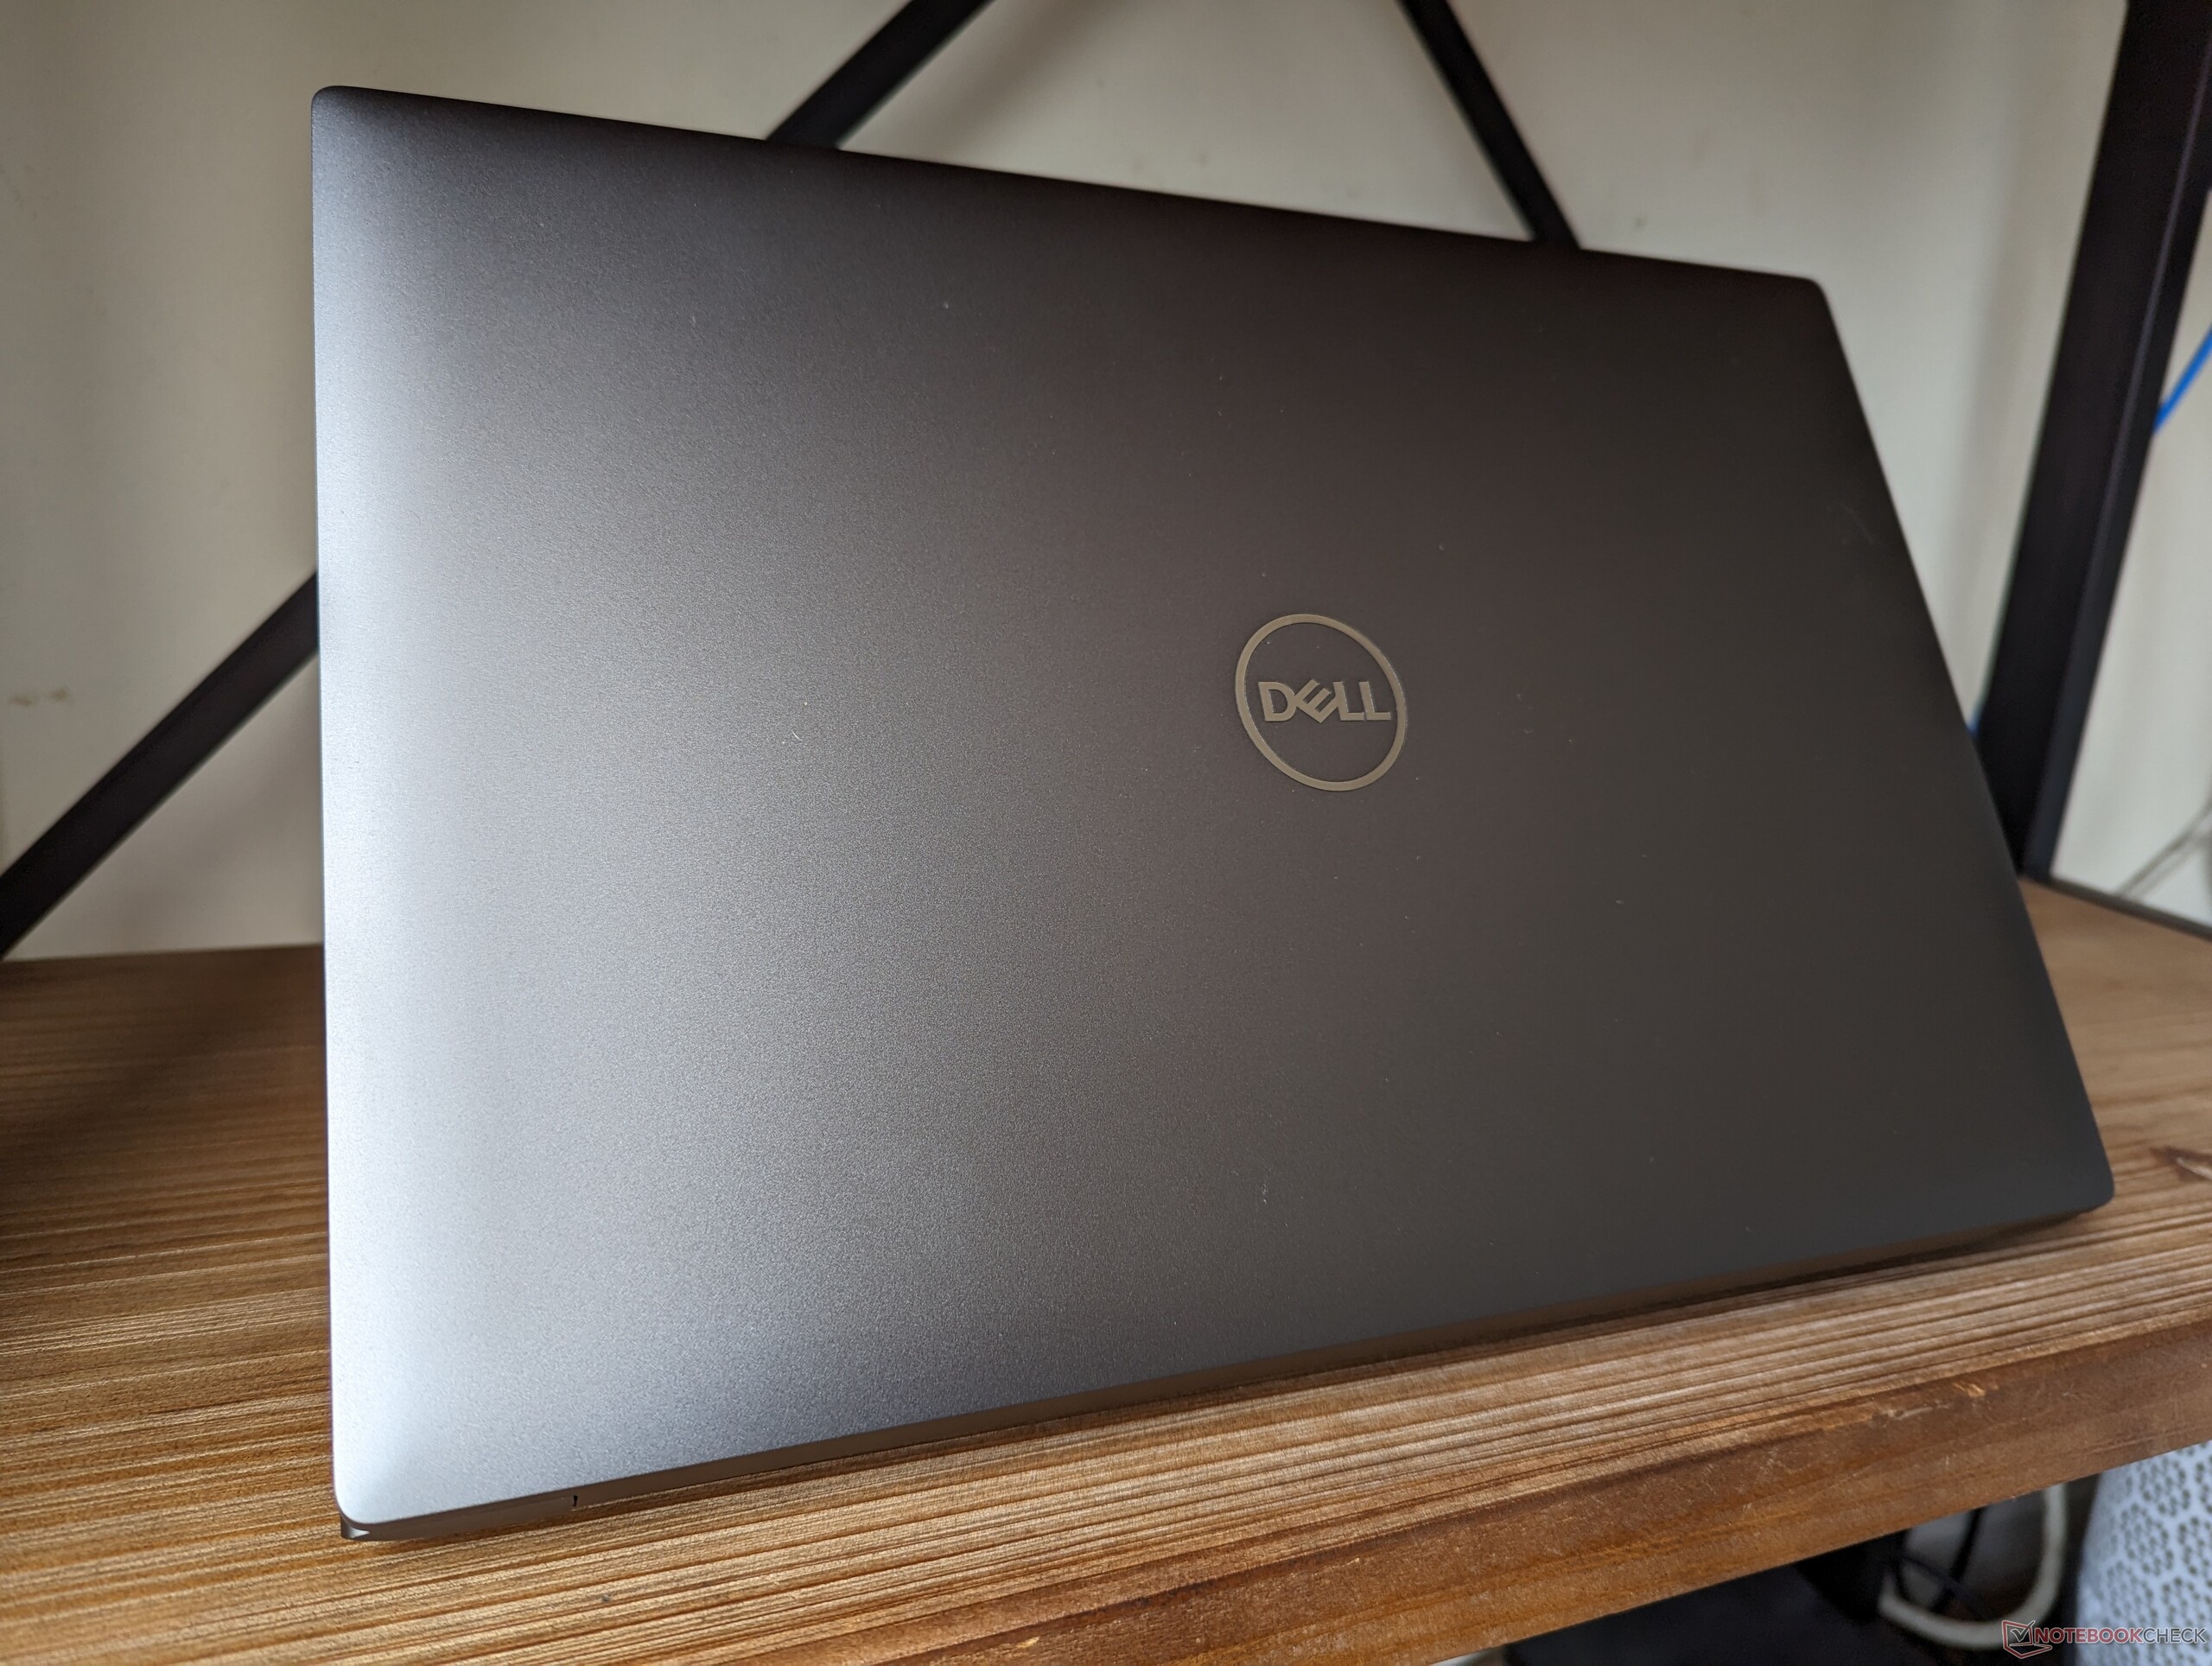
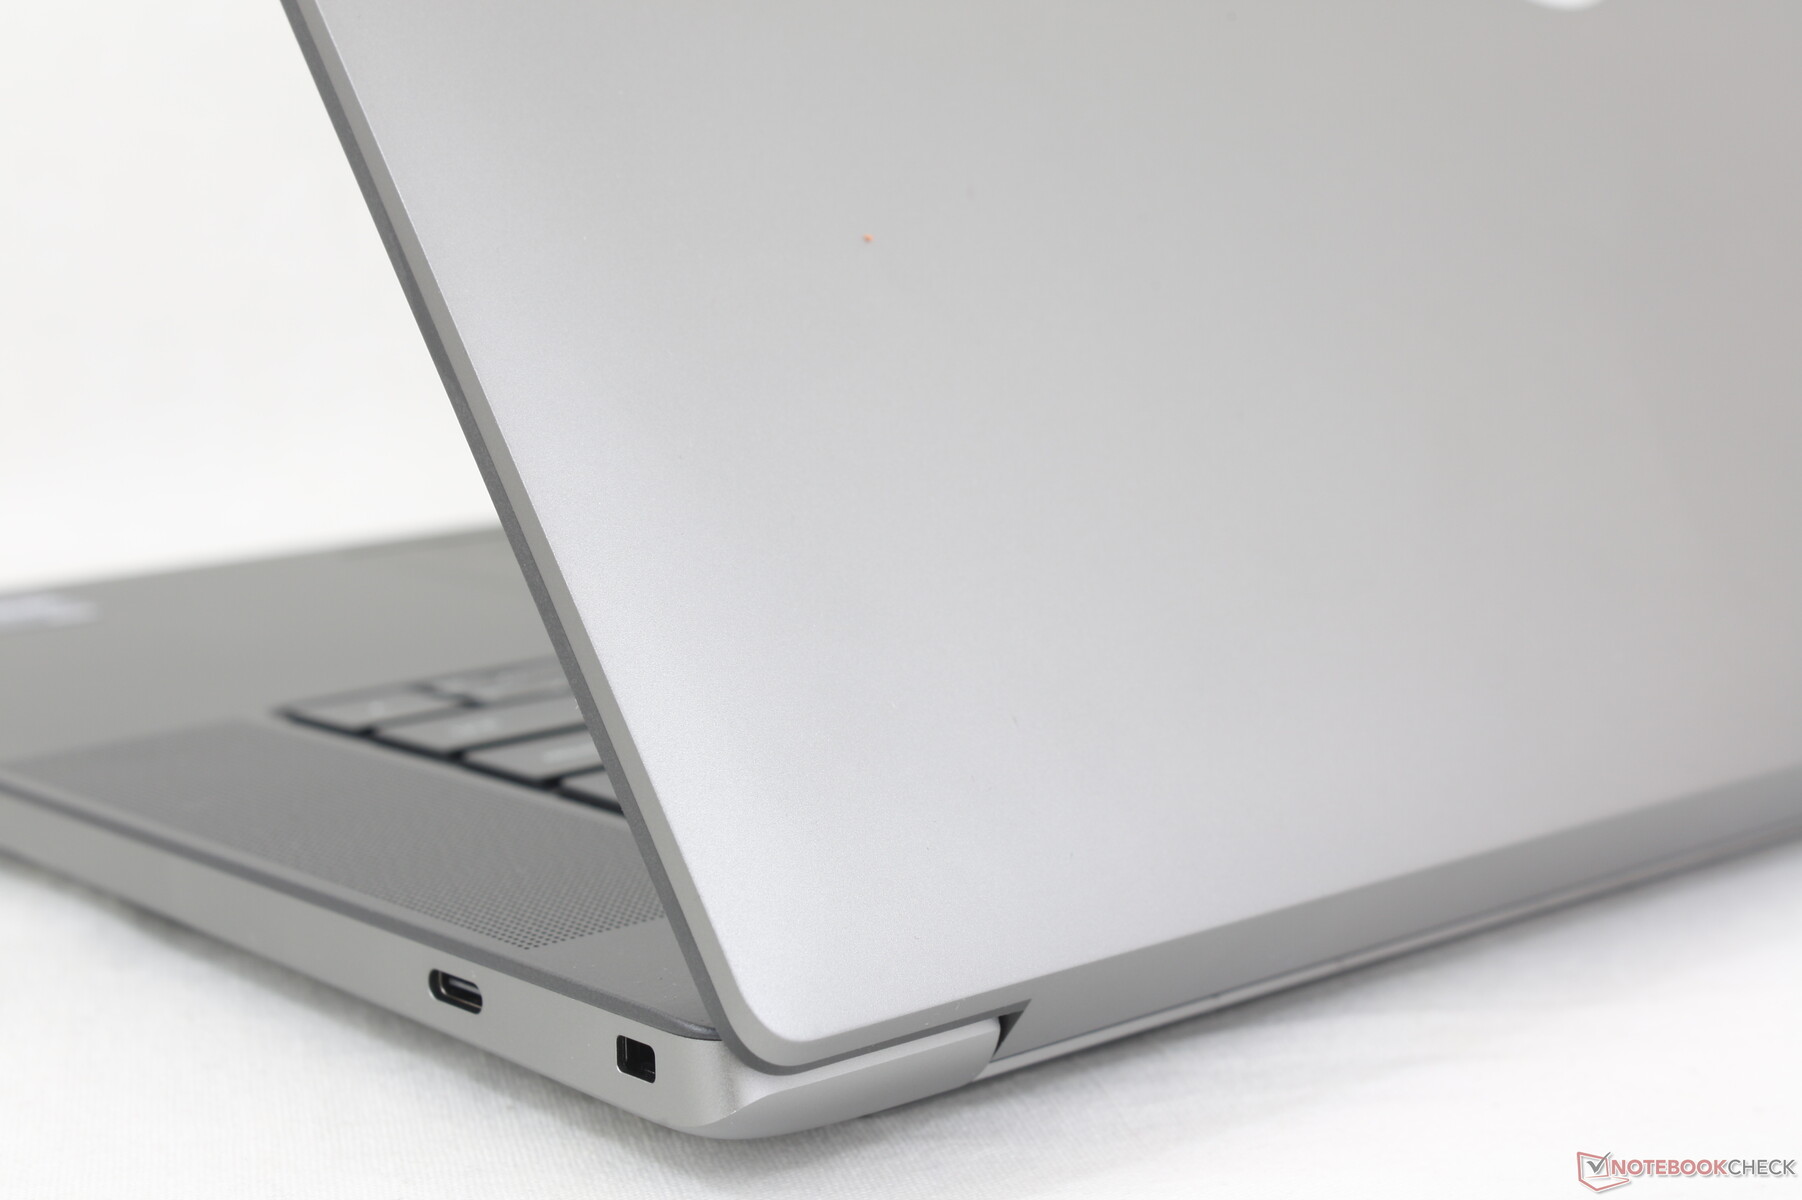
A inspiração para o design do Precision 5680 é óbvia, pois ele é essencialmente a versão de 16 polegadas do XPS 15 e de 17 polegadas do XPS 17. Se você já teve experiência com um modelo XPS antes, então o Precision 5680 deve lhe parecer imediatamente familiar. Aparentemente, ele precede um hipotético "XPS 16" e não ficaríamos surpresos em ver esse modelo em um futuro próximo com um chassi baseado no Precision 5680.
A qualidade de construção se compara favoravelmente a alternativas como o ZBook Fury 16 G9 ou oCreatorPro Z16P que também consistem principalmente em ligas metálicas para uma primeira impressão forte.
Com apenas 2,3 kg, a Precision 5680 é uma das estações de trabalho de 16 polegadas mais leves disponíveis, com uma margem decente. A CreatorPro Z16P e aHP ZBook Fury 16 G9por exemplo, são cerca de 100 g e 300 g mais pesados, respectivamente, e também são maiores do que o nosso Dell. O Precision 5680 é surpreendentemente portátil, considerando seu desempenho.
Conectividade - Pouca coisa para uma estação de trabalho
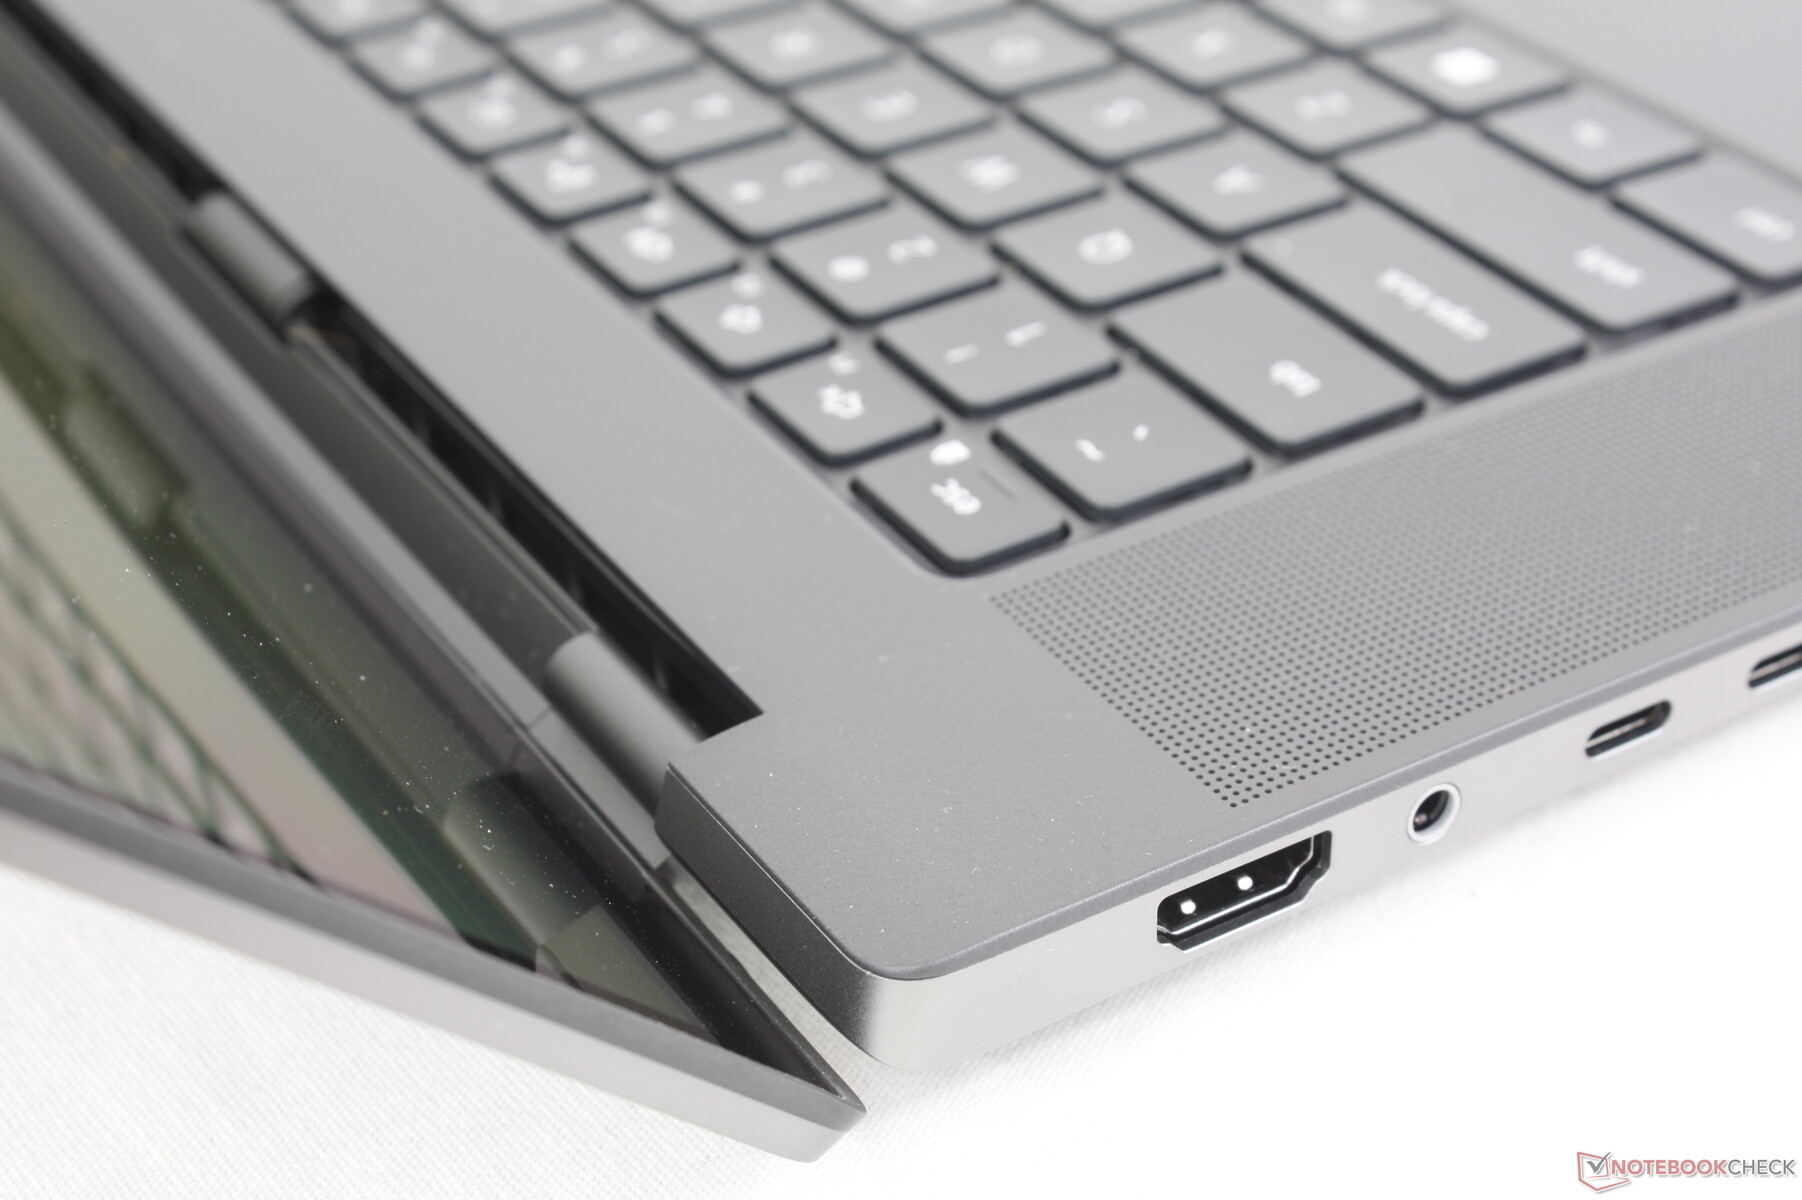
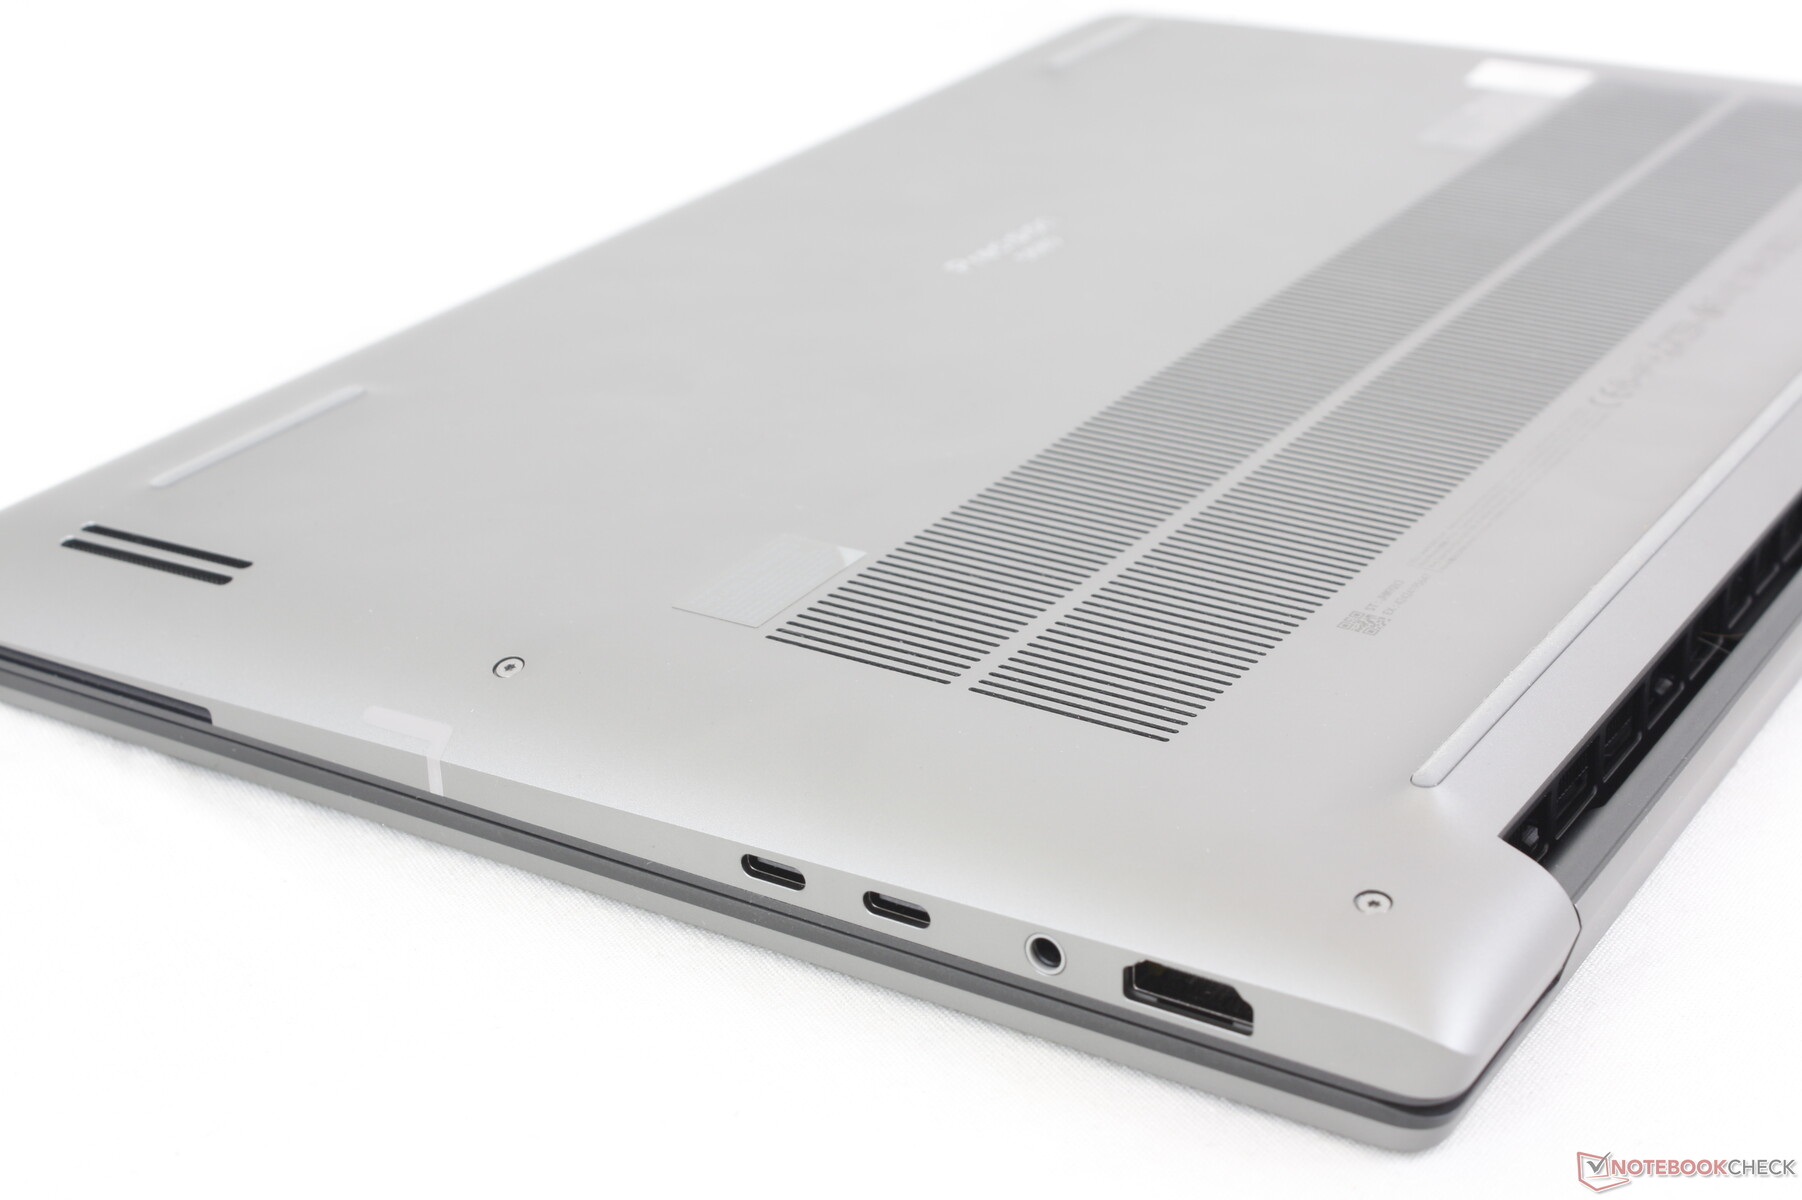
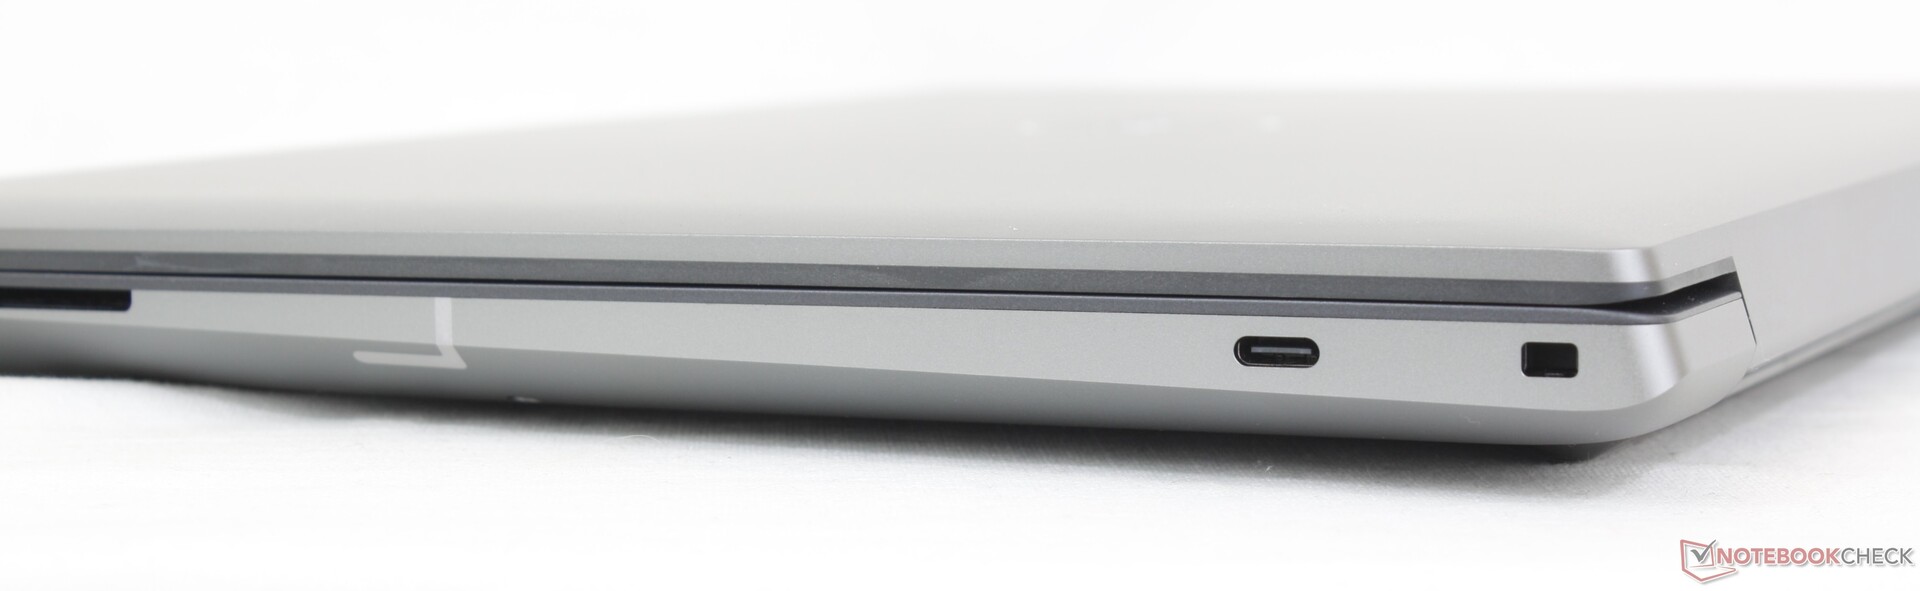
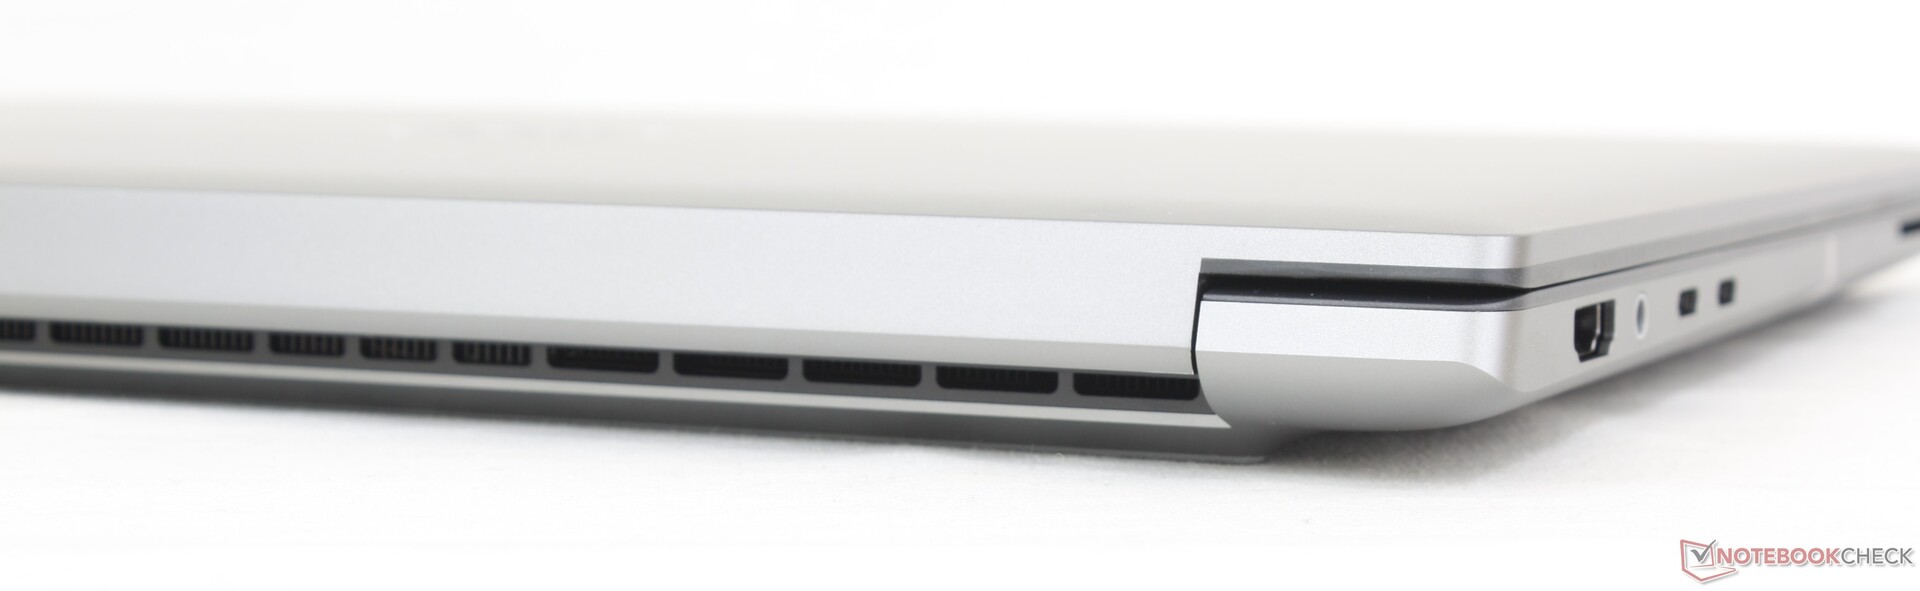
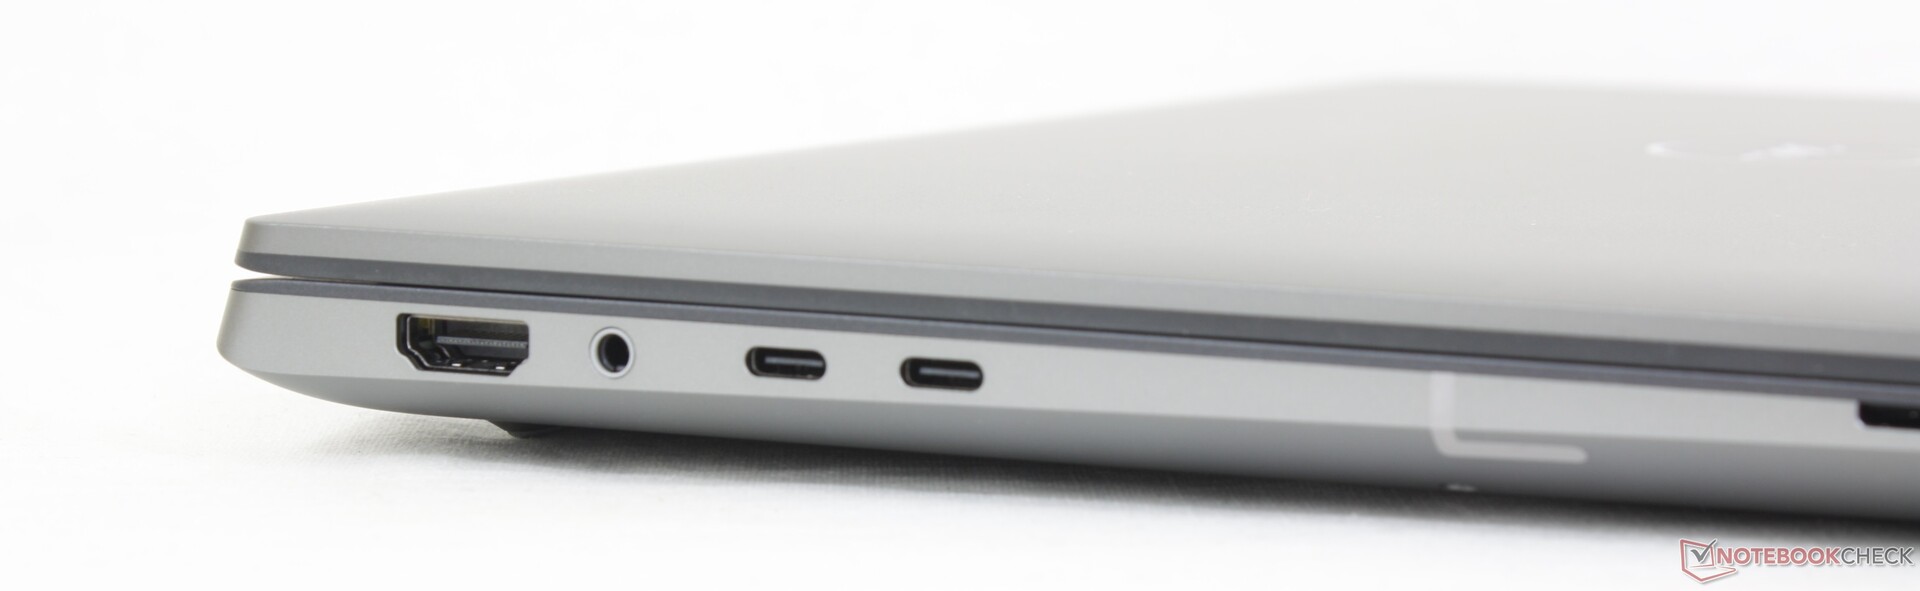
As opções de portas são inovadoras, para o bem e para o mal. É melhor no sentido de que cada porta é altamente versátil quando se trata de adaptadores e periféricos, mas também é pior no sentido de que não há portas básicas, como USB de tamanho normal ou RJ-45. Alternativas como o ThinkPad P1 G4 ou o ExpertBook B6 Flip oferecem uma variedade maior de portas do que o Dell. Portanto, esteja preparado para depender de adaptadores ou estações de acoplamento ao usar o Precision 5680.
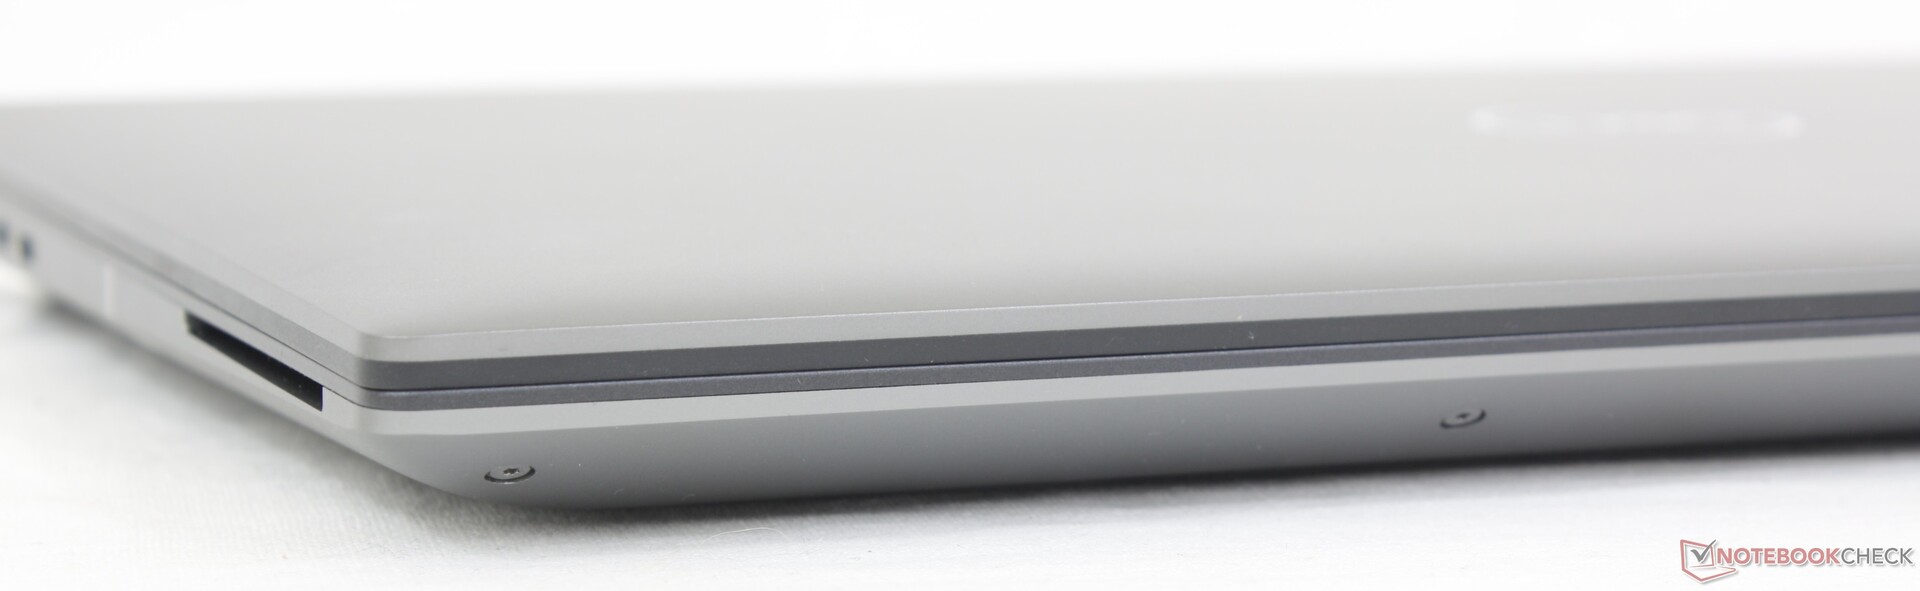
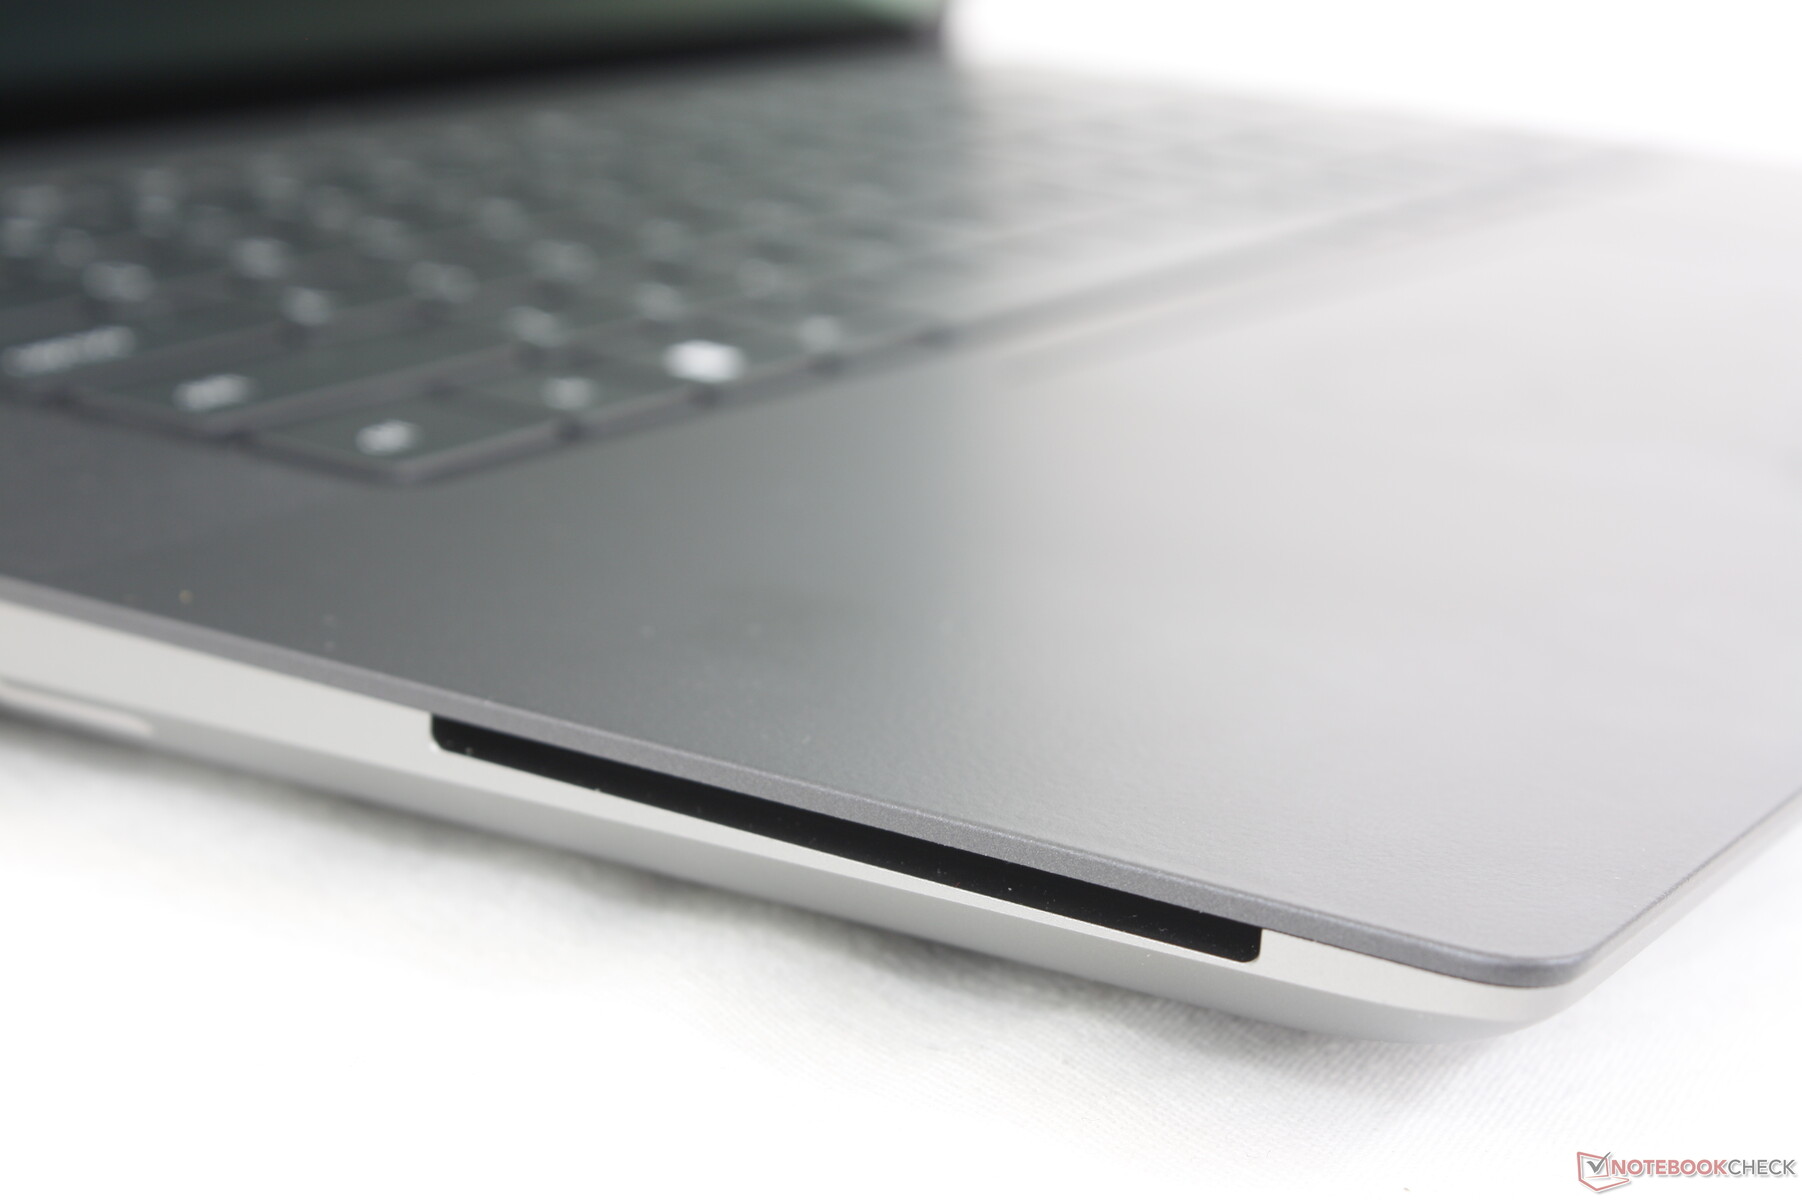
Leitor de cartão SD
Os modelos XPS e Precision têm alguns dos leitores de cartão SD integrados mais rápidos e isso continua a se aplicar ao nosso Precision 5680. As taxas de leitura são mais de duas vezes mais rápidas do que no ZBook Fury 16 G9 ou no ThinkPad P16 G1 e, portanto, seriam necessários apenas 5 a 6 segundos para transferir 1 GB de dados do nosso cartão de teste UHS-II para o desktop.
| SD Card Reader | |
| average JPG Copy Test (av. of 3 runs) | |
| Dell Precision 5000 5680 (Toshiba Exceria Pro SDXC 64 GB UHS-II) | |
| Dell Precision 7000 7670 Performance (Toshiba Exceria Pro SDXC 64 GB UHS-II) | |
| MSI CreatorPro Z16P B12UKST (AV Pro V60) | |
| HP ZBook Fury 16 G9 (PNY EliteX-PRO60) | |
| Lenovo ThinkPad P16 G1 RTX A5500 (Toshiba Exceria Pro SDXC 64 GB UHS-II) | |
| maximum AS SSD Seq Read Test (1GB) | |
| Dell Precision 7000 7670 Performance (Toshiba Exceria Pro SDXC 64 GB UHS-II) | |
| Dell Precision 5000 5680 (Toshiba Exceria Pro SDXC 64 GB UHS-II) | |
| HP ZBook Fury 16 G9 (PNY EliteX-PRO60) | |
| MSI CreatorPro Z16P B12UKST (AV Pro V60) | |
| Lenovo ThinkPad P16 G1 RTX A5500 (Toshiba Exceria Pro SDXC 64 GB UHS-II) | |
Comunicação
Um Intel AX211 vem como padrão para conectividade Wi-Fi 6E e Bluetooth 5.3. As taxas de transferência foram estáveis quando emparelhadas com nossa rede Asus AXE11000 de 6 GHz.
Infelizmente, as opções de WAN não são compatíveis, ao contrário do concorrente ZBook Fury 16 G9.
Webcam
A Dell aumentou a webcam de 1 MP no Precision 5550 para 2 MP no nosso Precision 5680. Mesmo assim, ainda não há um obturador de privacidade integrado, o que é irritante.


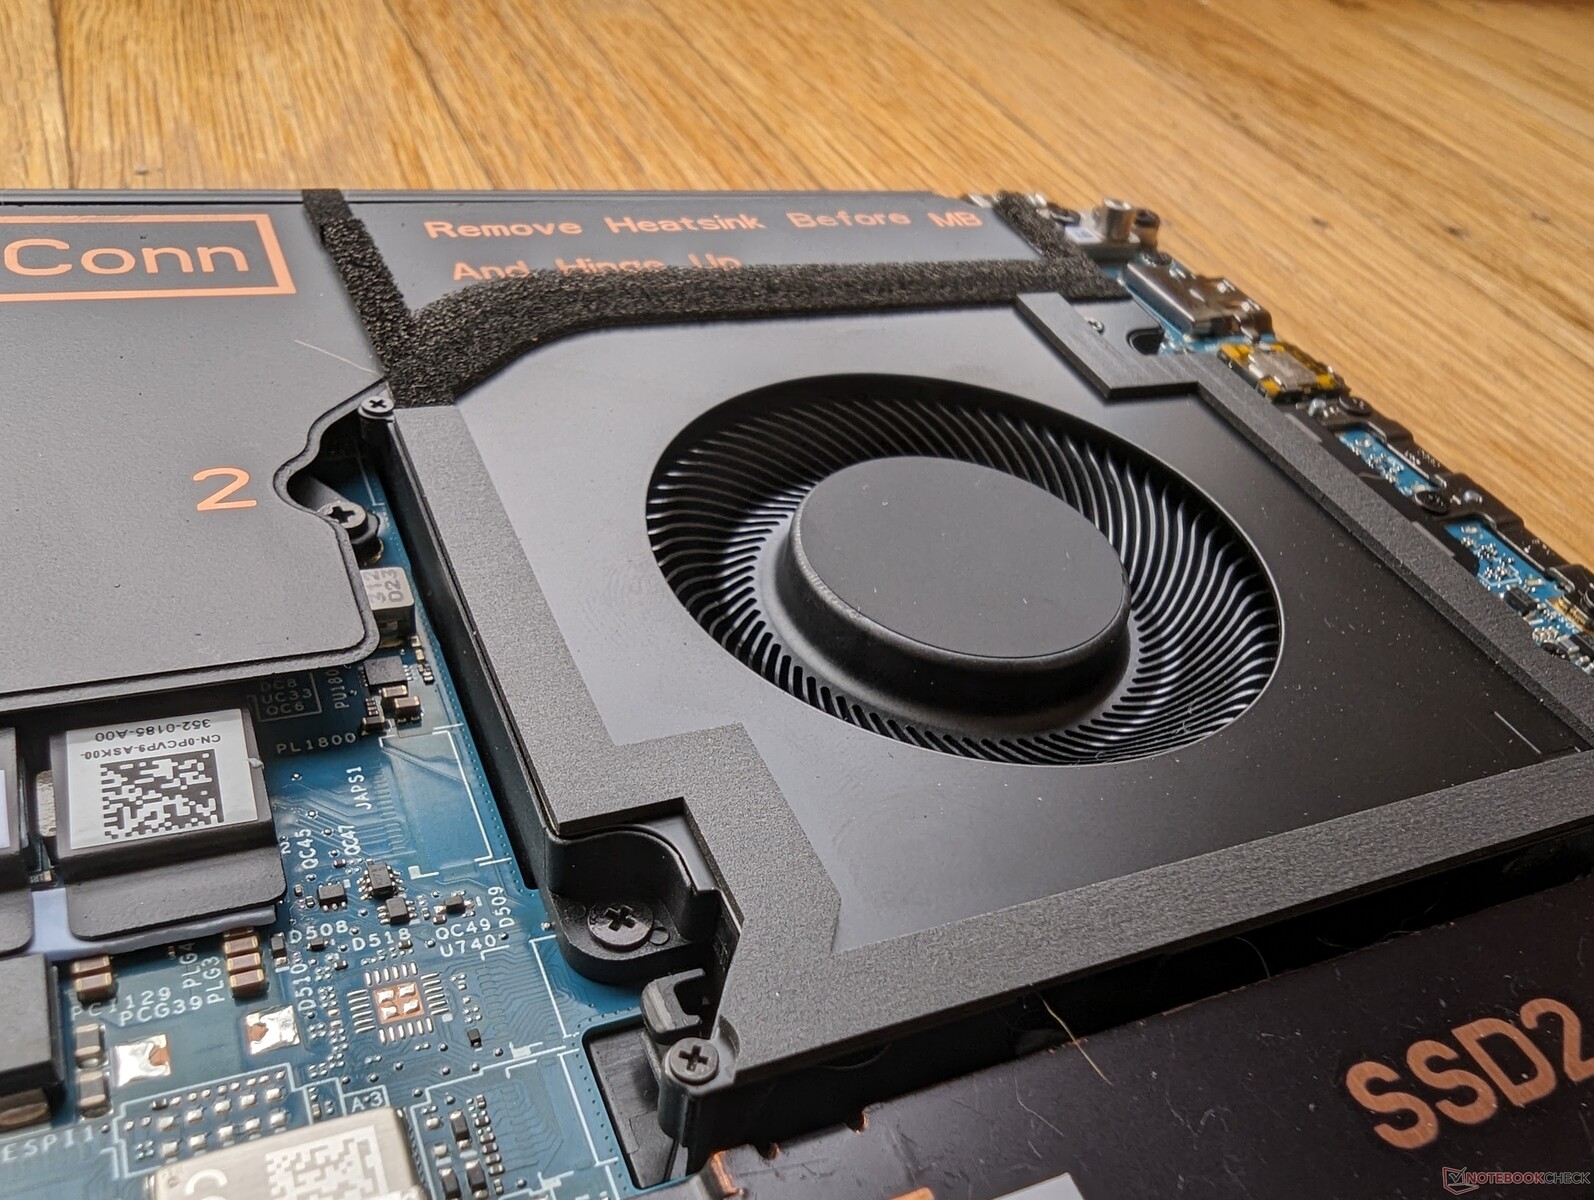
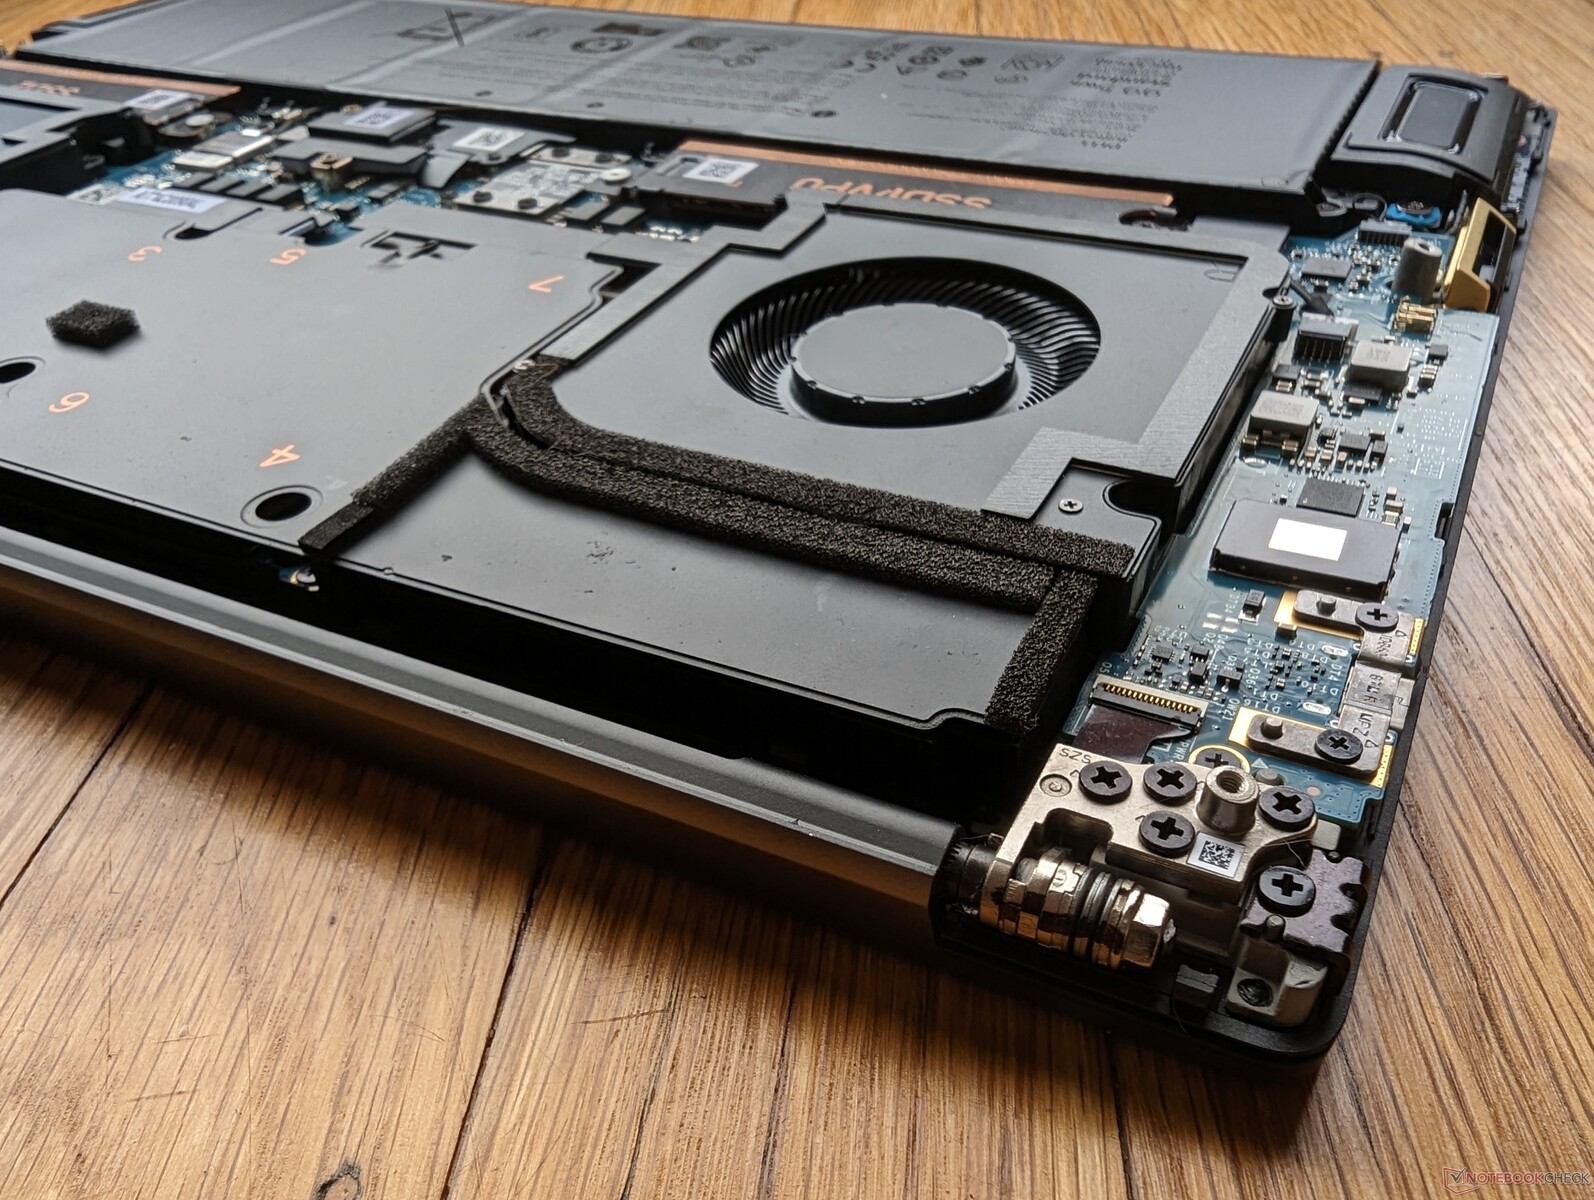
Manutenção
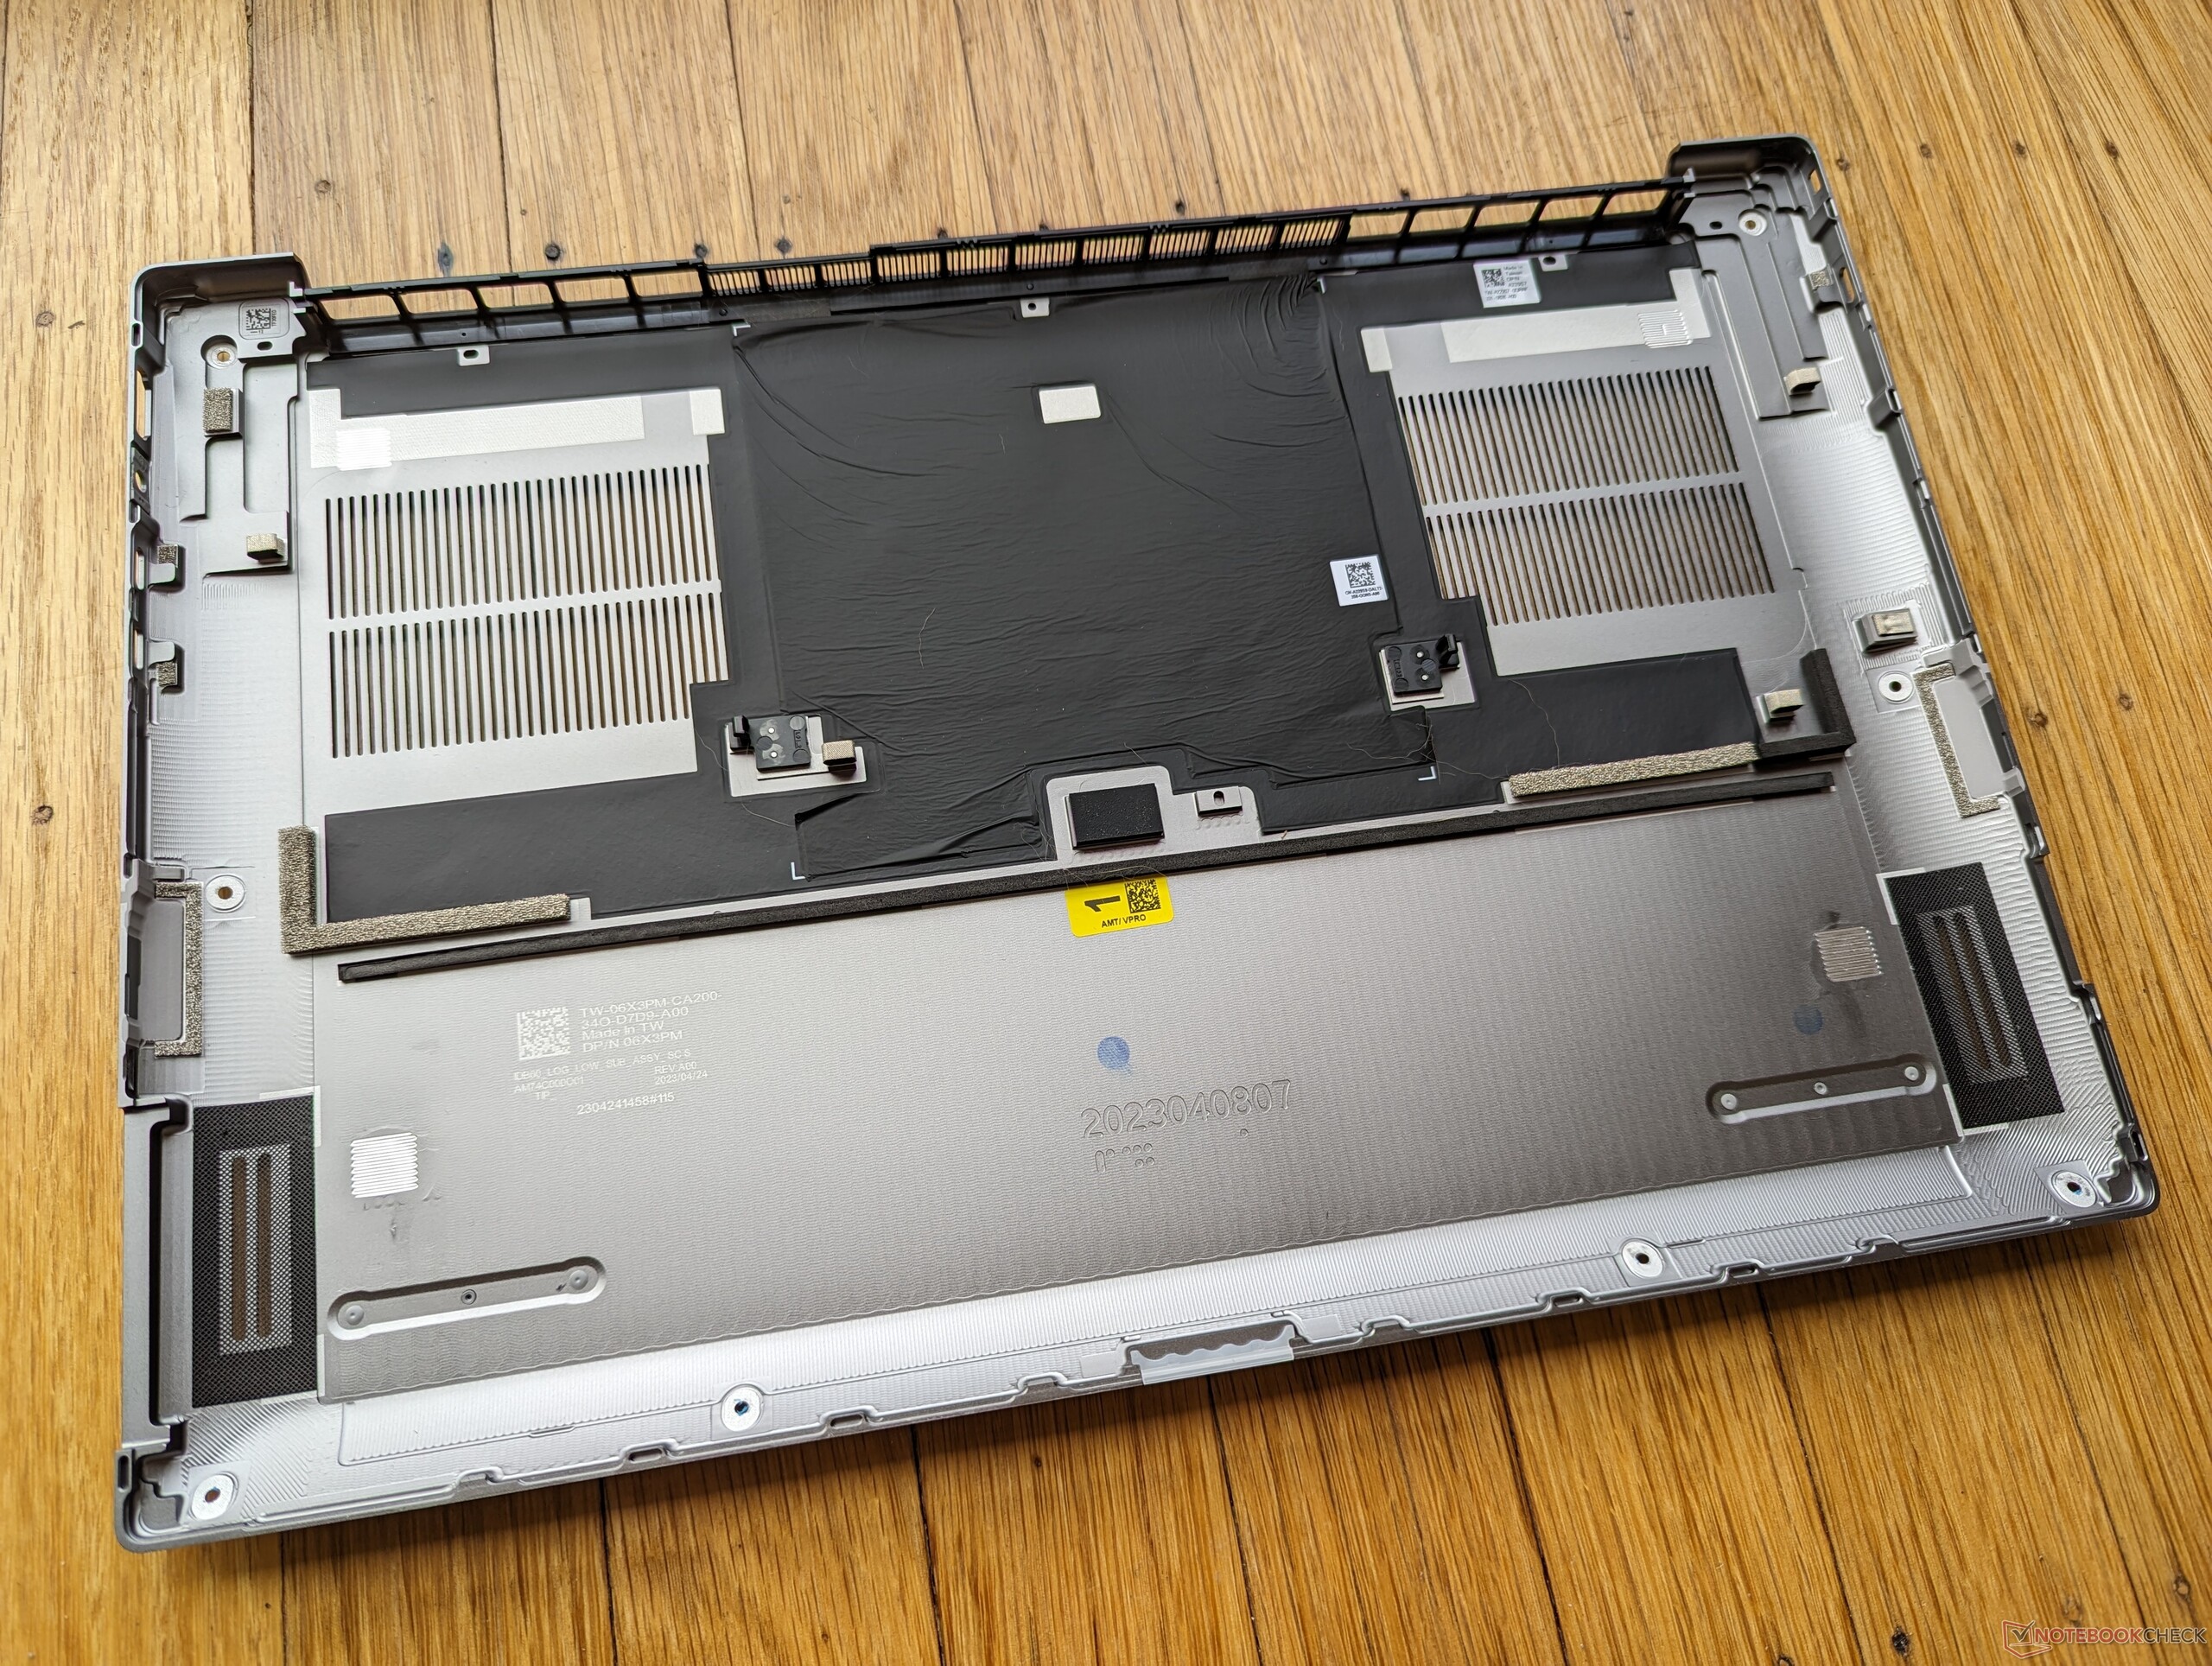
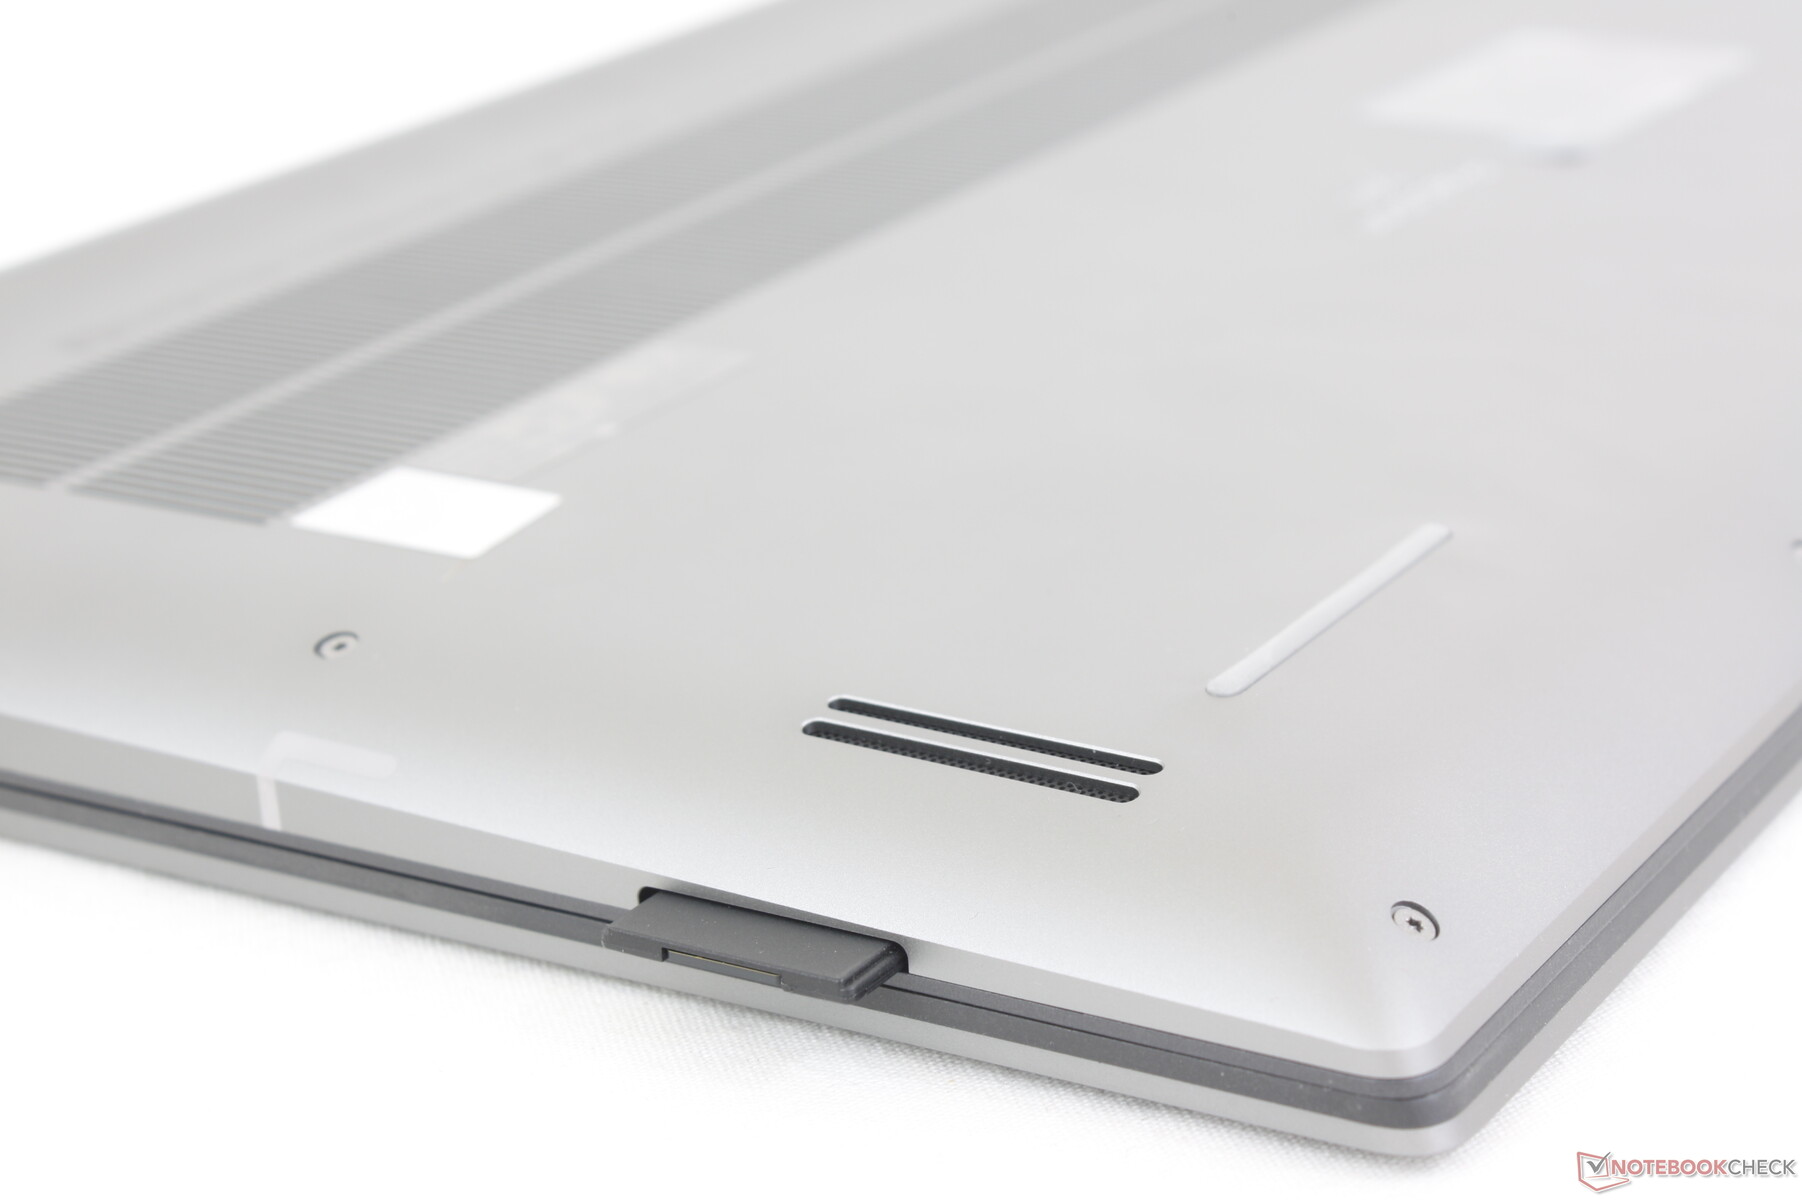
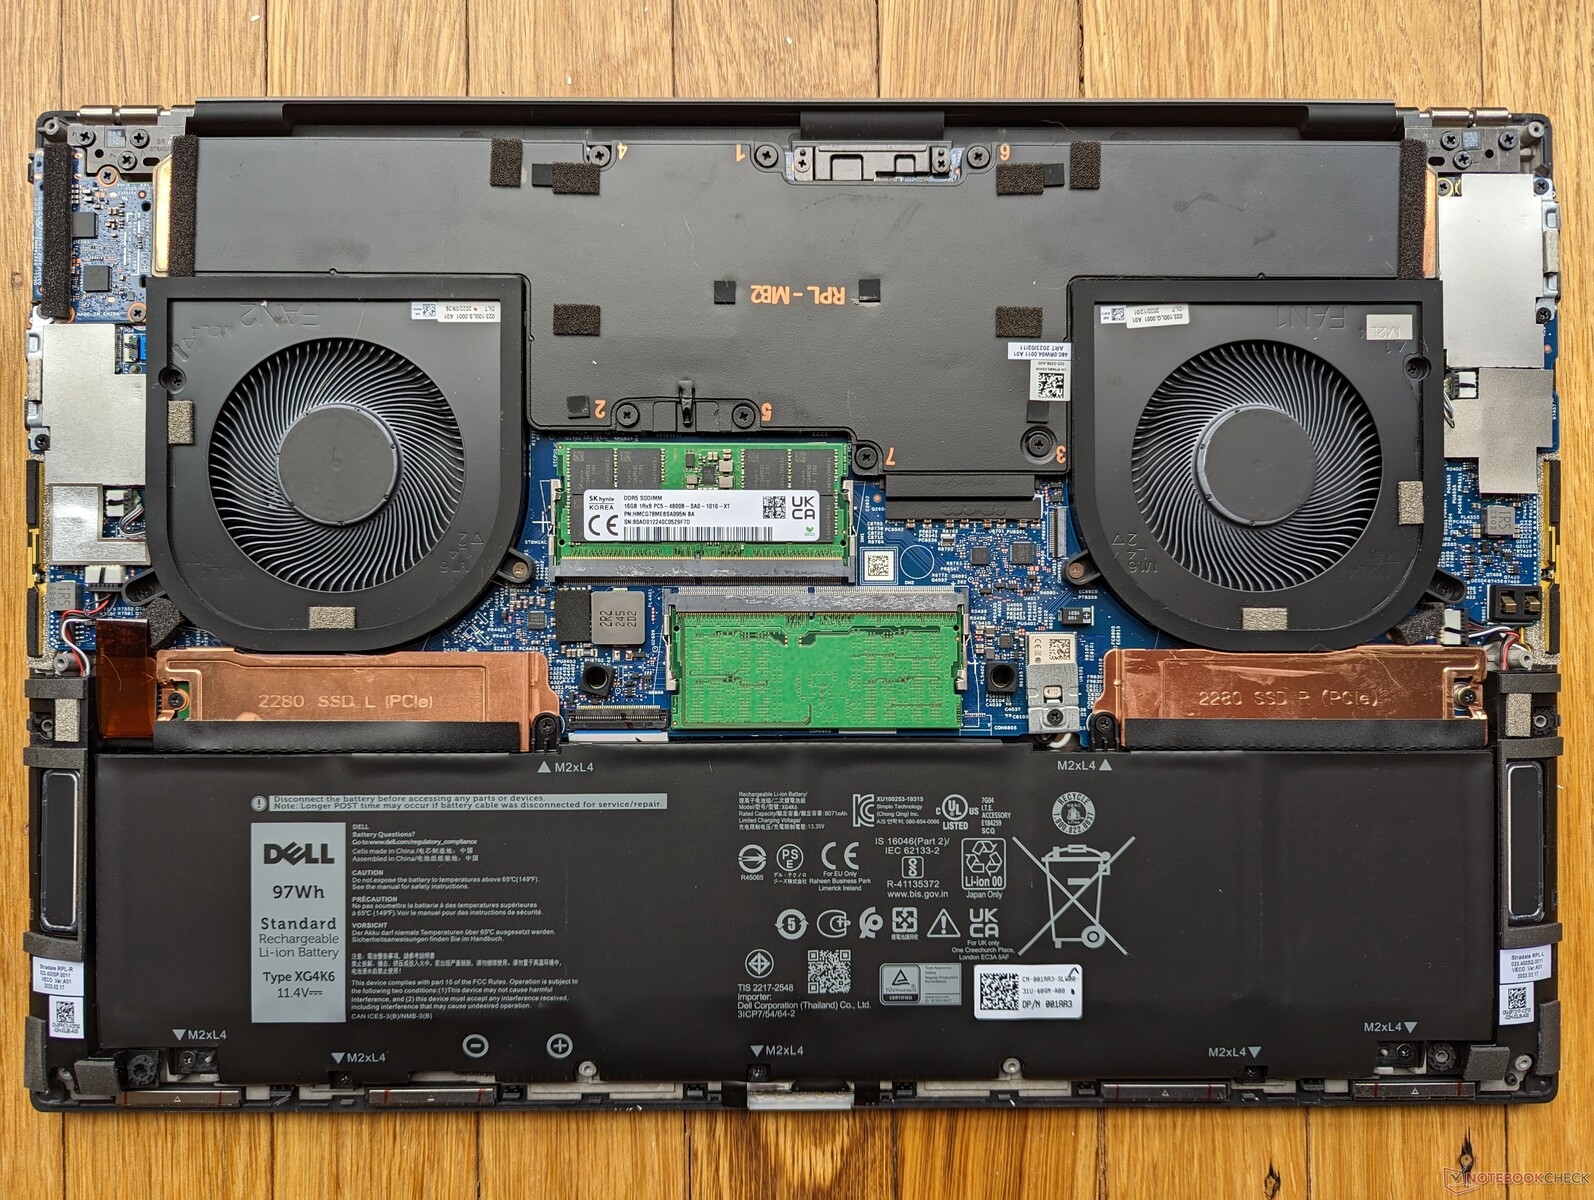
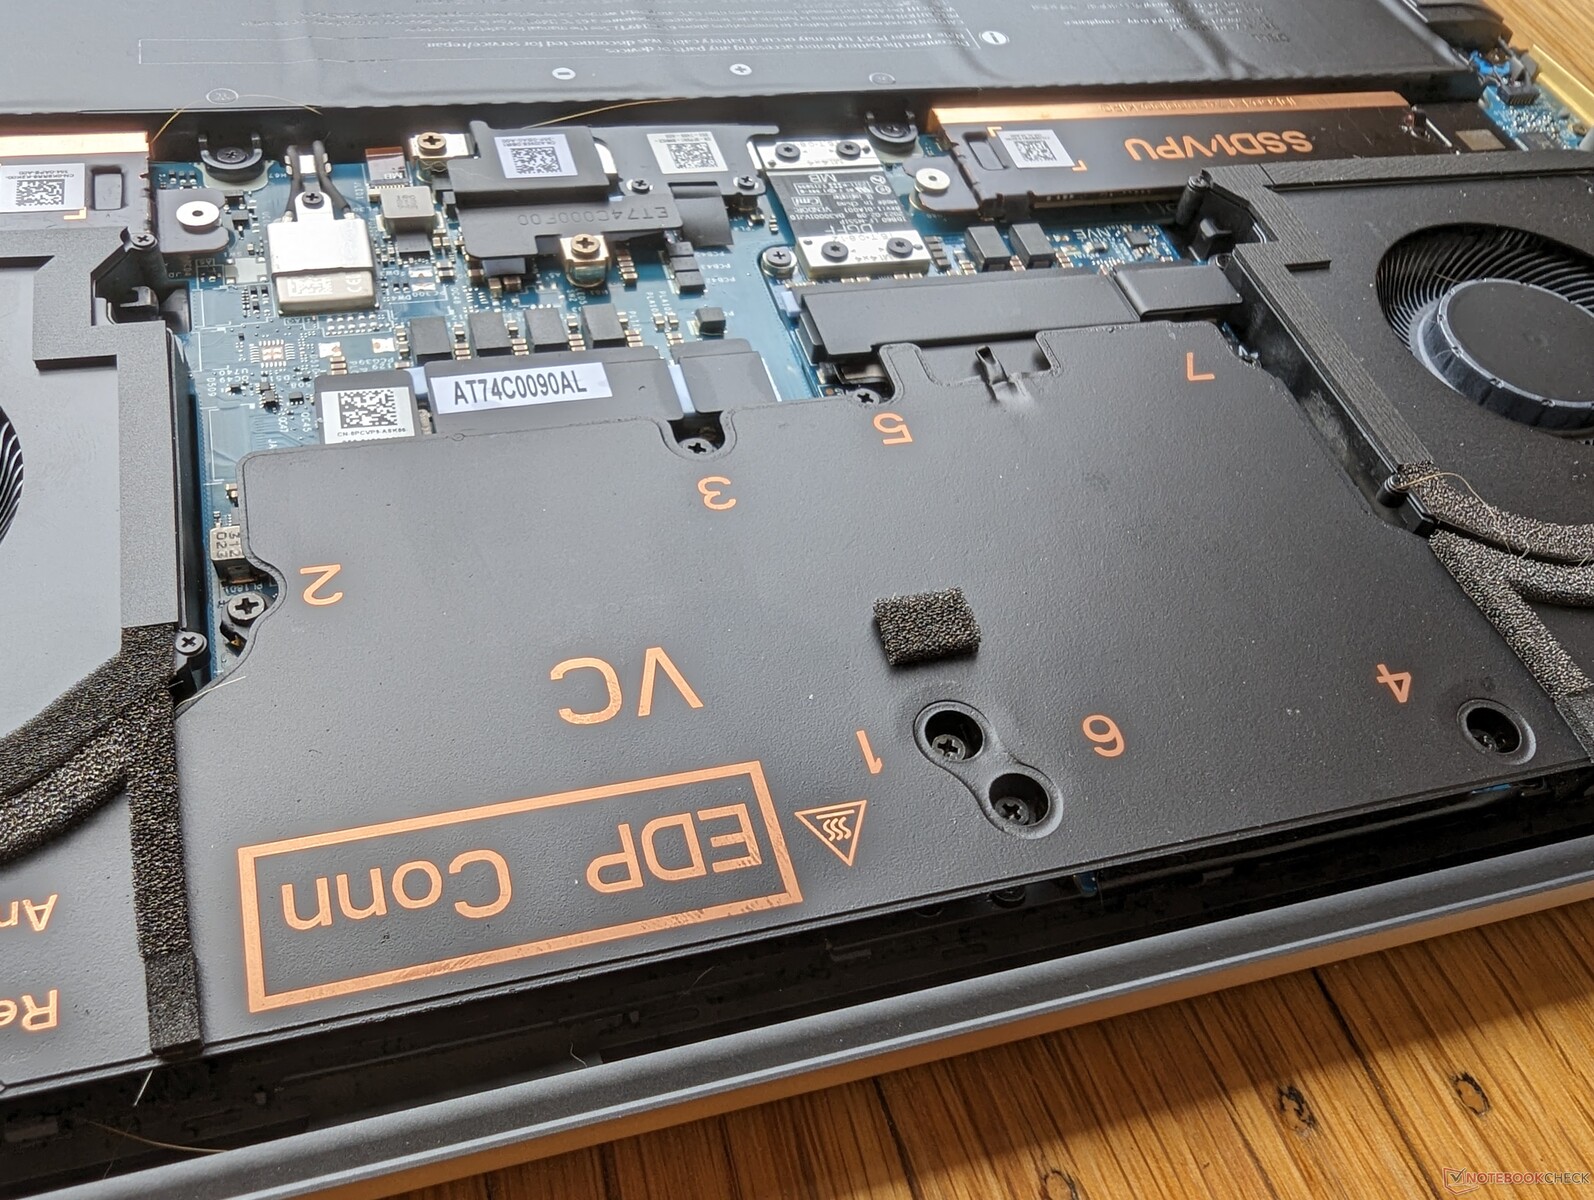
A remoção do painel inferior é um pouco mais difícil do que o esperado, pois as bordas da placa de metal são afiadas e bem presas, como no XPS 15 ou no XPS 17. Recomenda-se usar um parafuso Torx e uma borda plana ao fazer a manutenção do sistema.
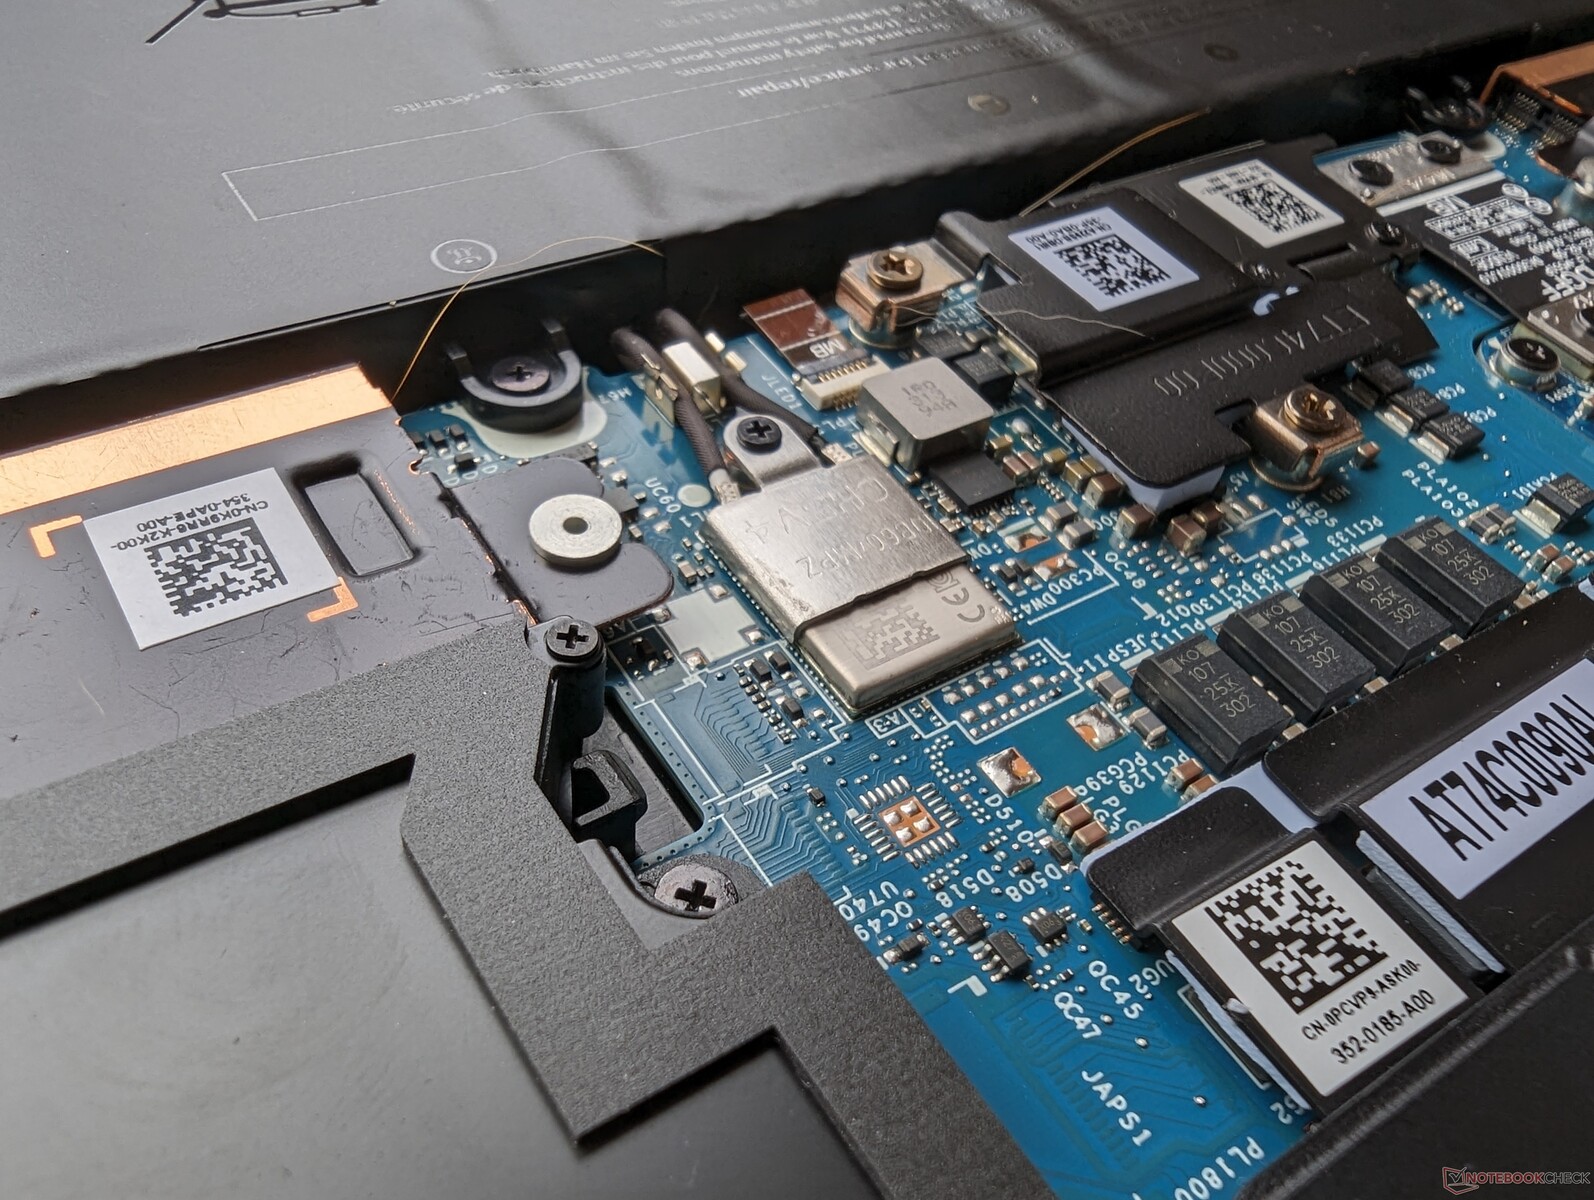
Os módulos de WLAN e RAM são soldados, ao contrário da maioria das outras estações de trabalho desse tamanho de tela. Tanto os módulos altamente integrados quanto as opções limitadas de portas são provavelmente desvantagens do design elegante e do peso relativamente baixo.
Acessórios e garantia
A caixa de varejo inclui um pequeno adaptador USB-C para USB-A para compensar o fato de não haver portas USB de tamanho normal no sistema.
Uma garantia básica limitada de três anos do fabricante com reparo no local se aplica se for comprado nos EUA.
Dispositivos de entrada - ligeiramente diferentes do XPS
Teclado
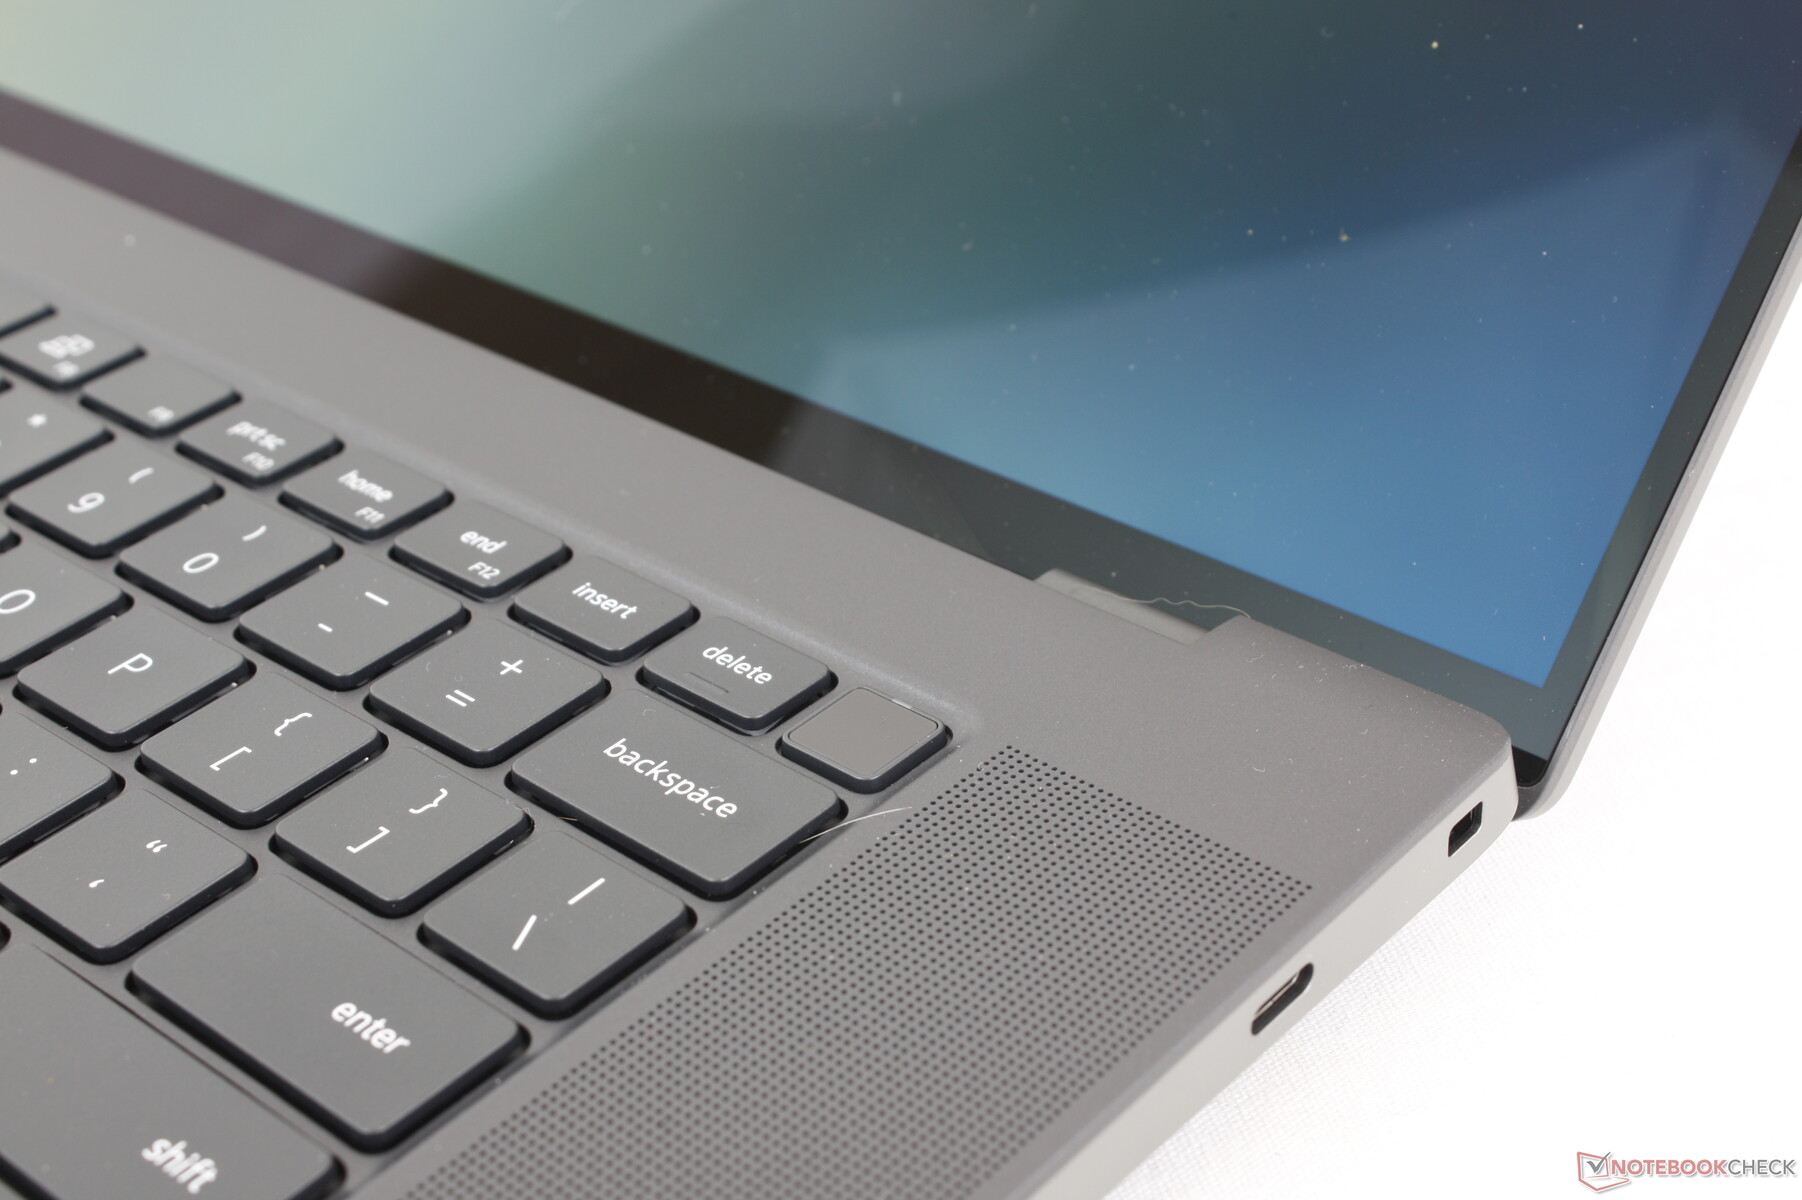
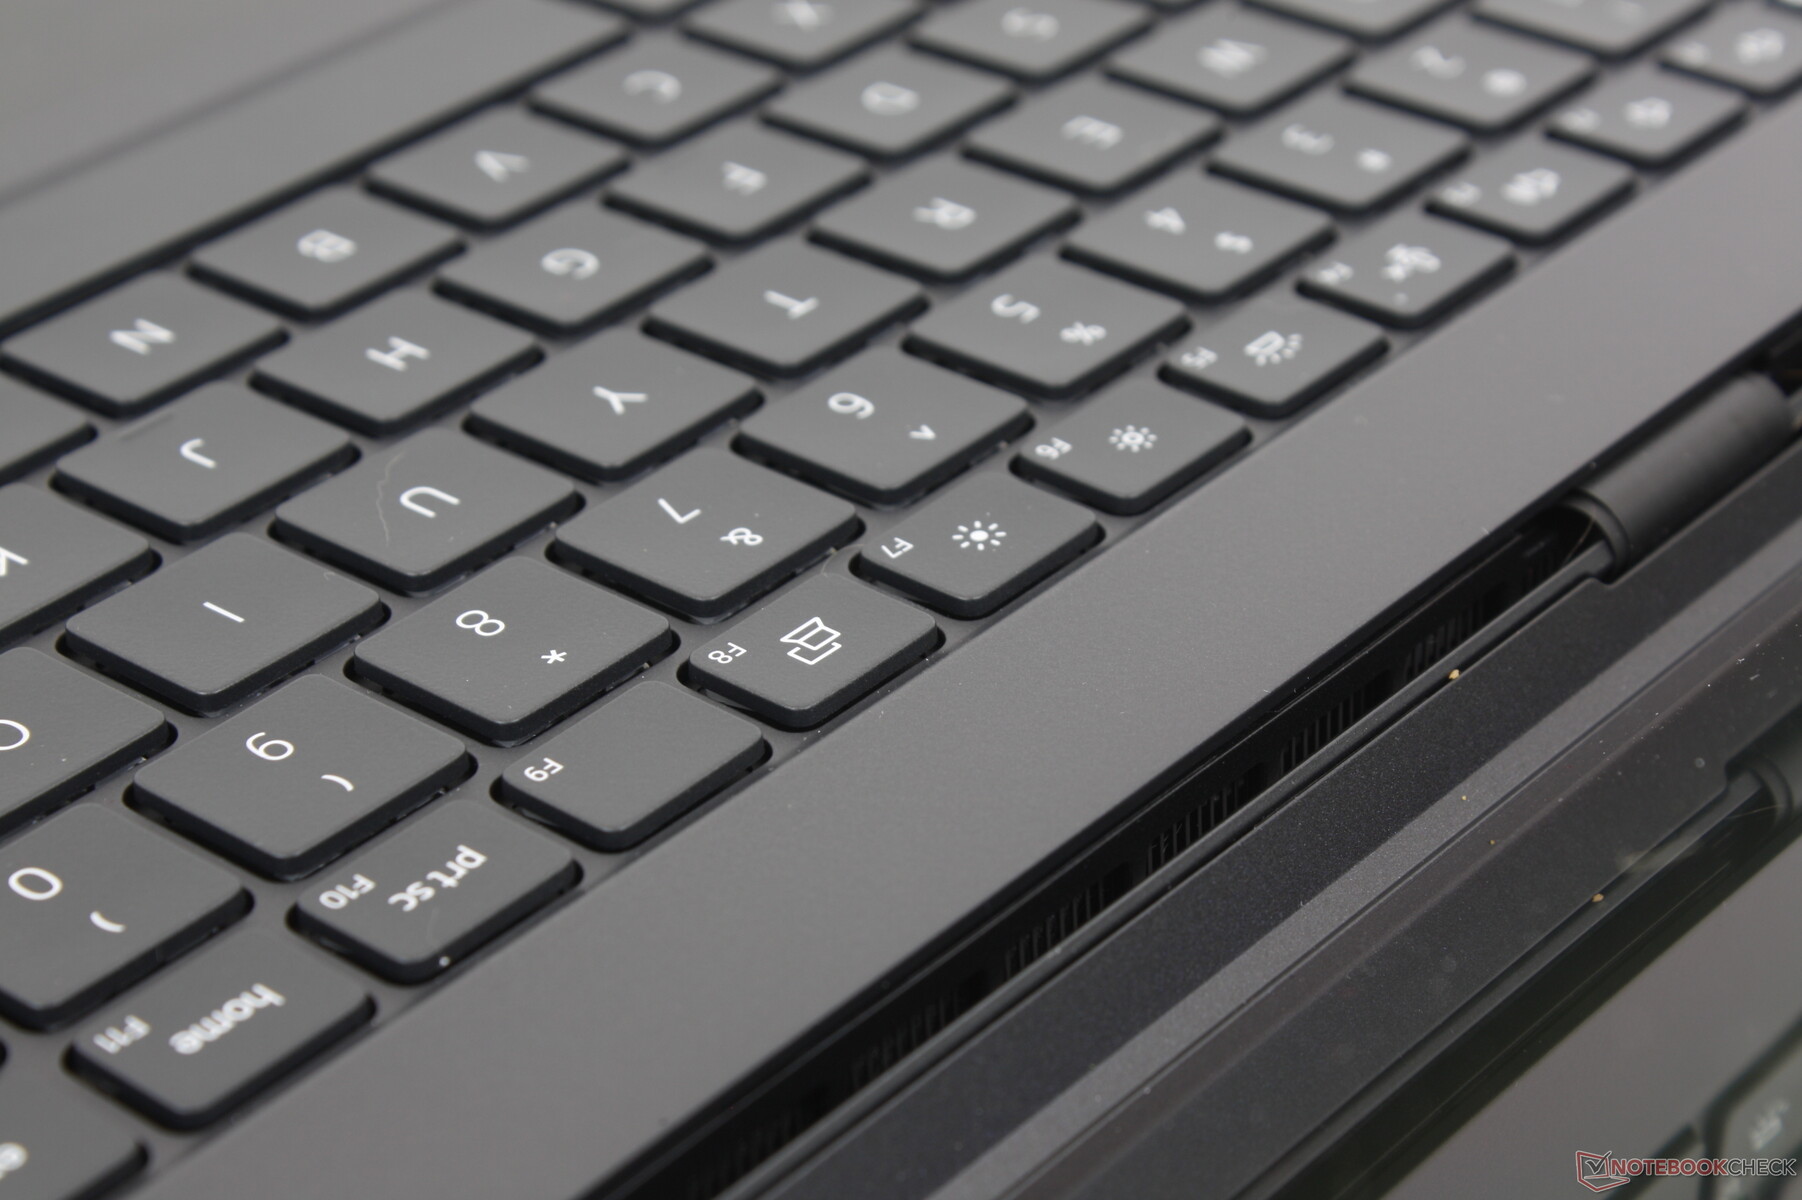
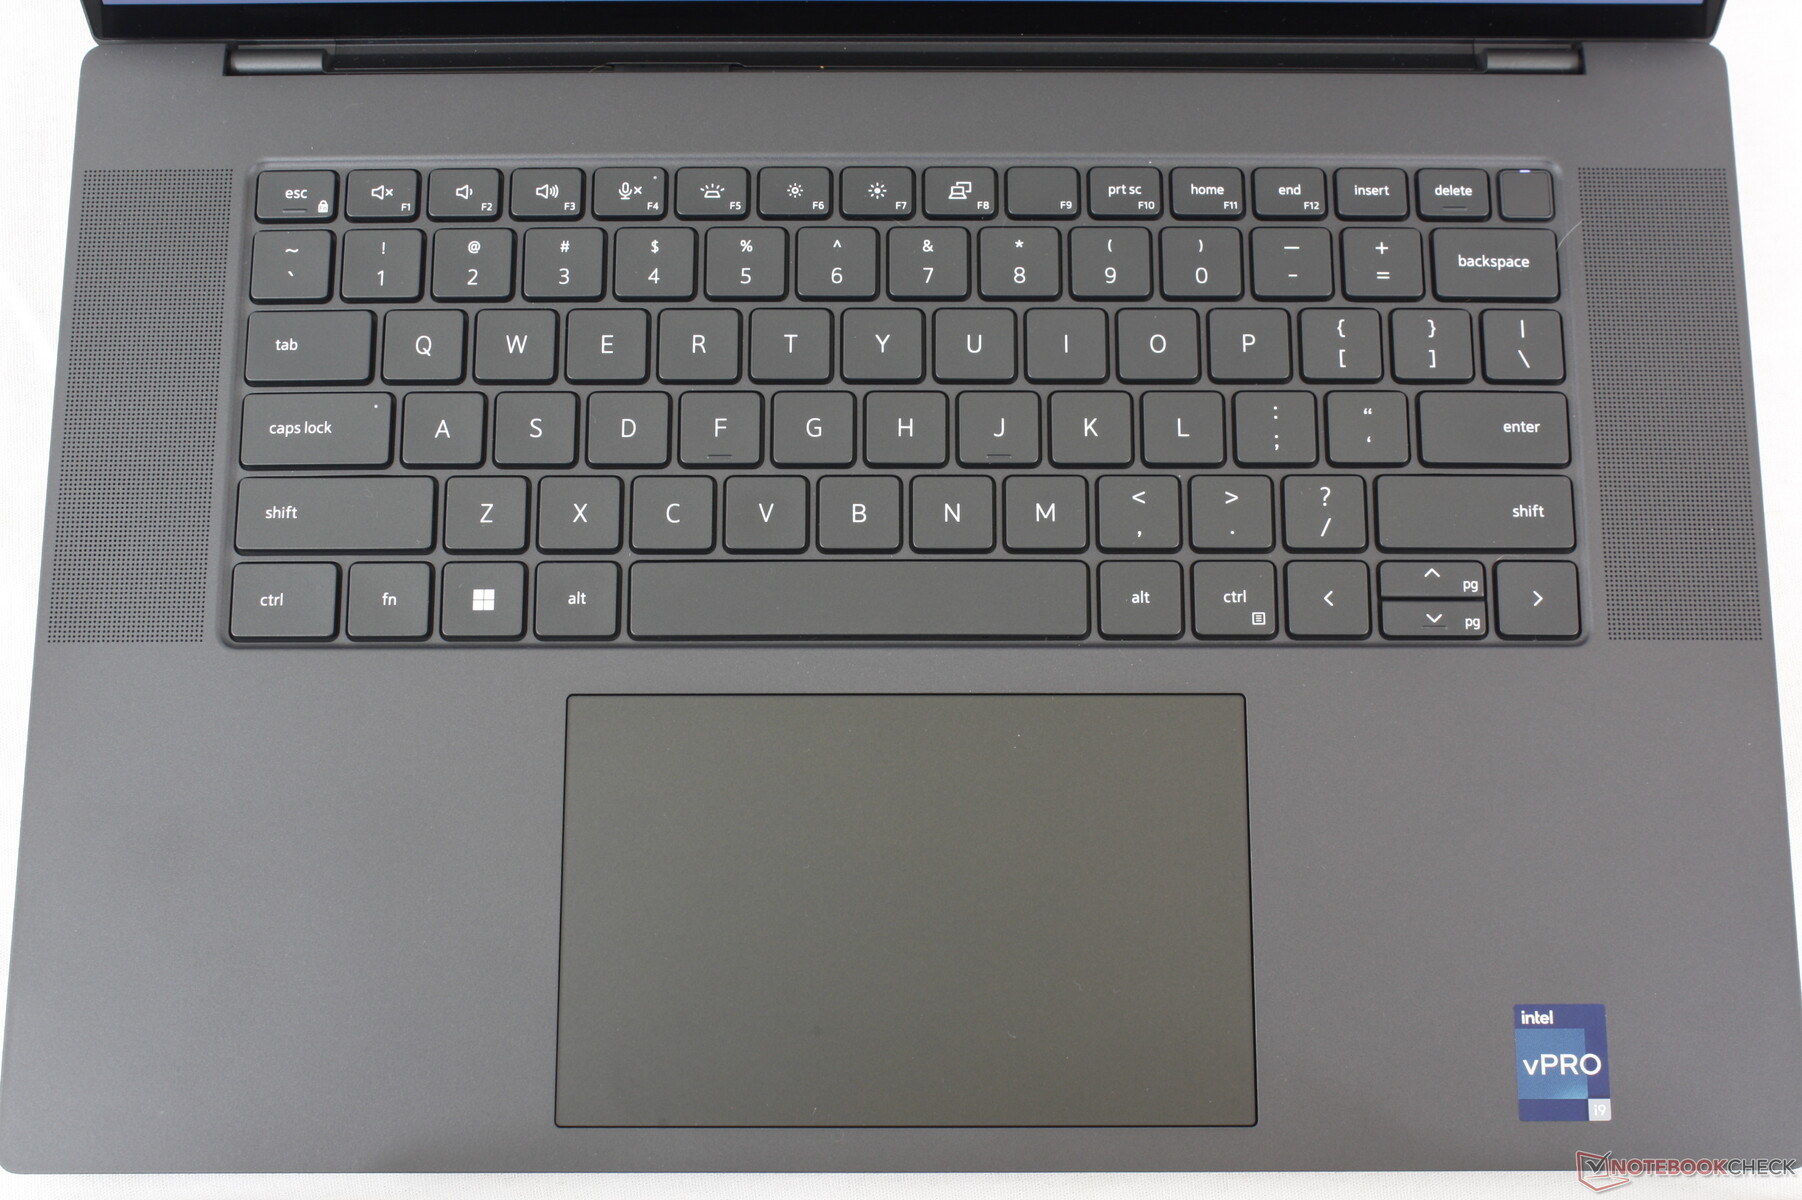
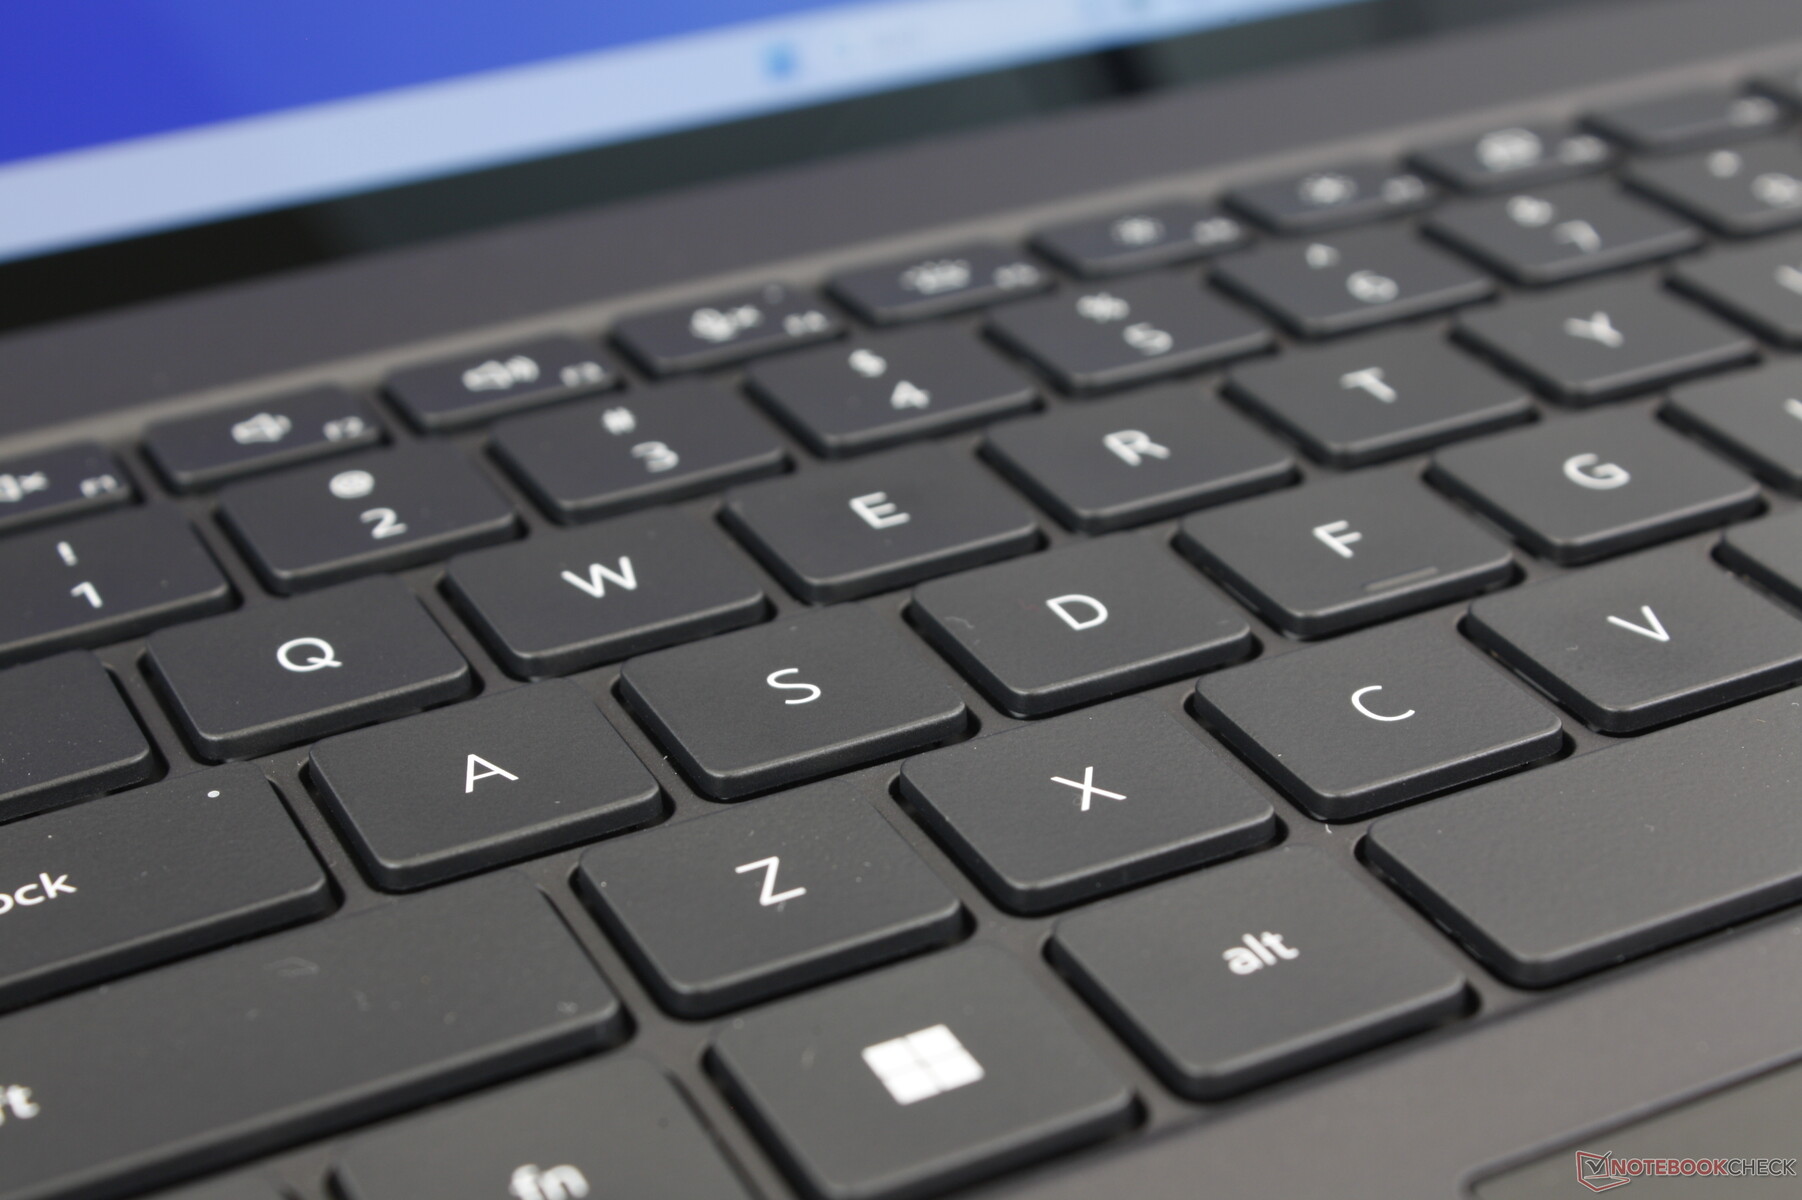
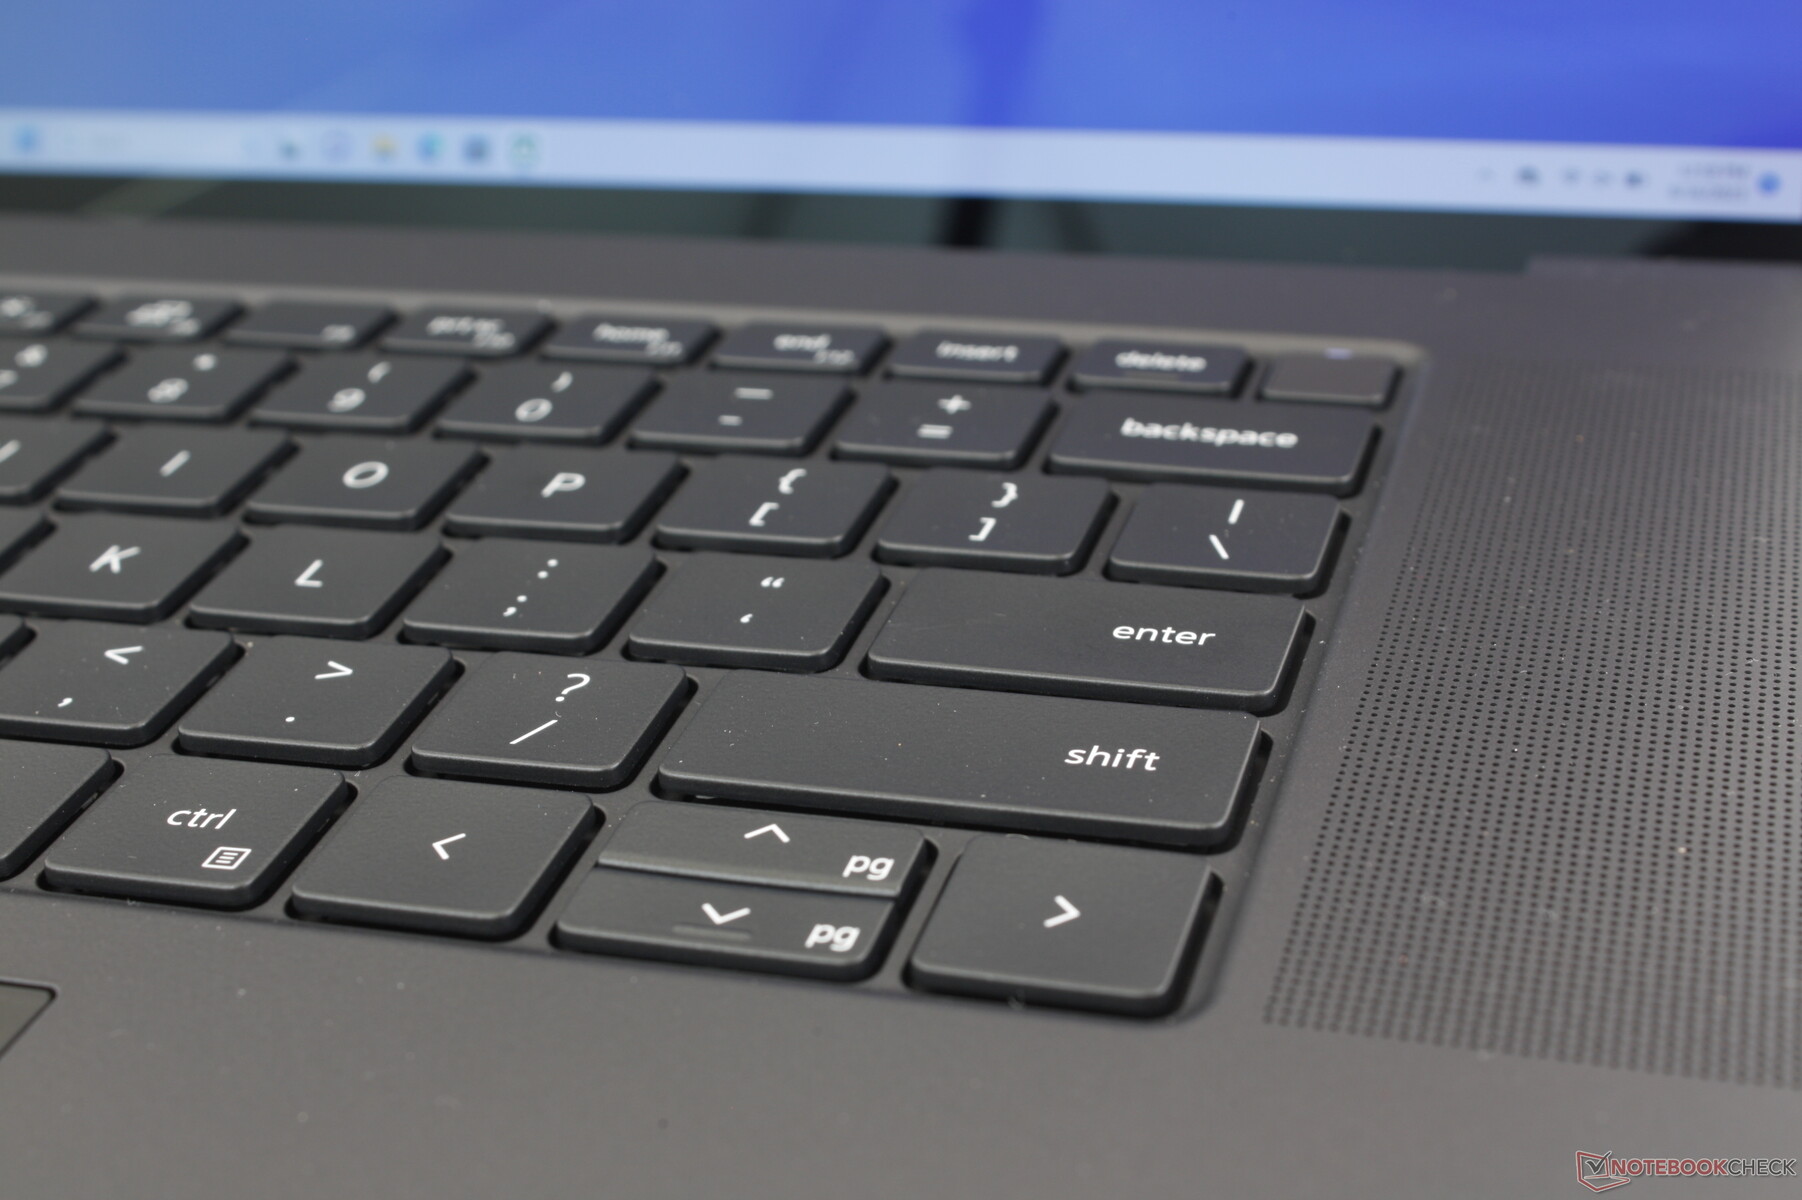
À primeira vista, o teclado pode parecer idêntico aos teclados do XPS 15 ou do Precision 5550, mas há algumas mudanças importantes. Em primeiro lugar, a linha superior das teclas de função agora é maior, pois alguns proprietários do XPS 15 reclamaram que elas eram muito estreitas. E, em segundo lugar, algumas das teclas ao longo das bordas agora são um pouco mais curtas, incluindo as teclas Backspace, Enter, Shift, Tab, Ctrl e Shift. De resto, a experiência de digitação permanece a mesma, com uma sensação familiar do XPS.
Touchpad
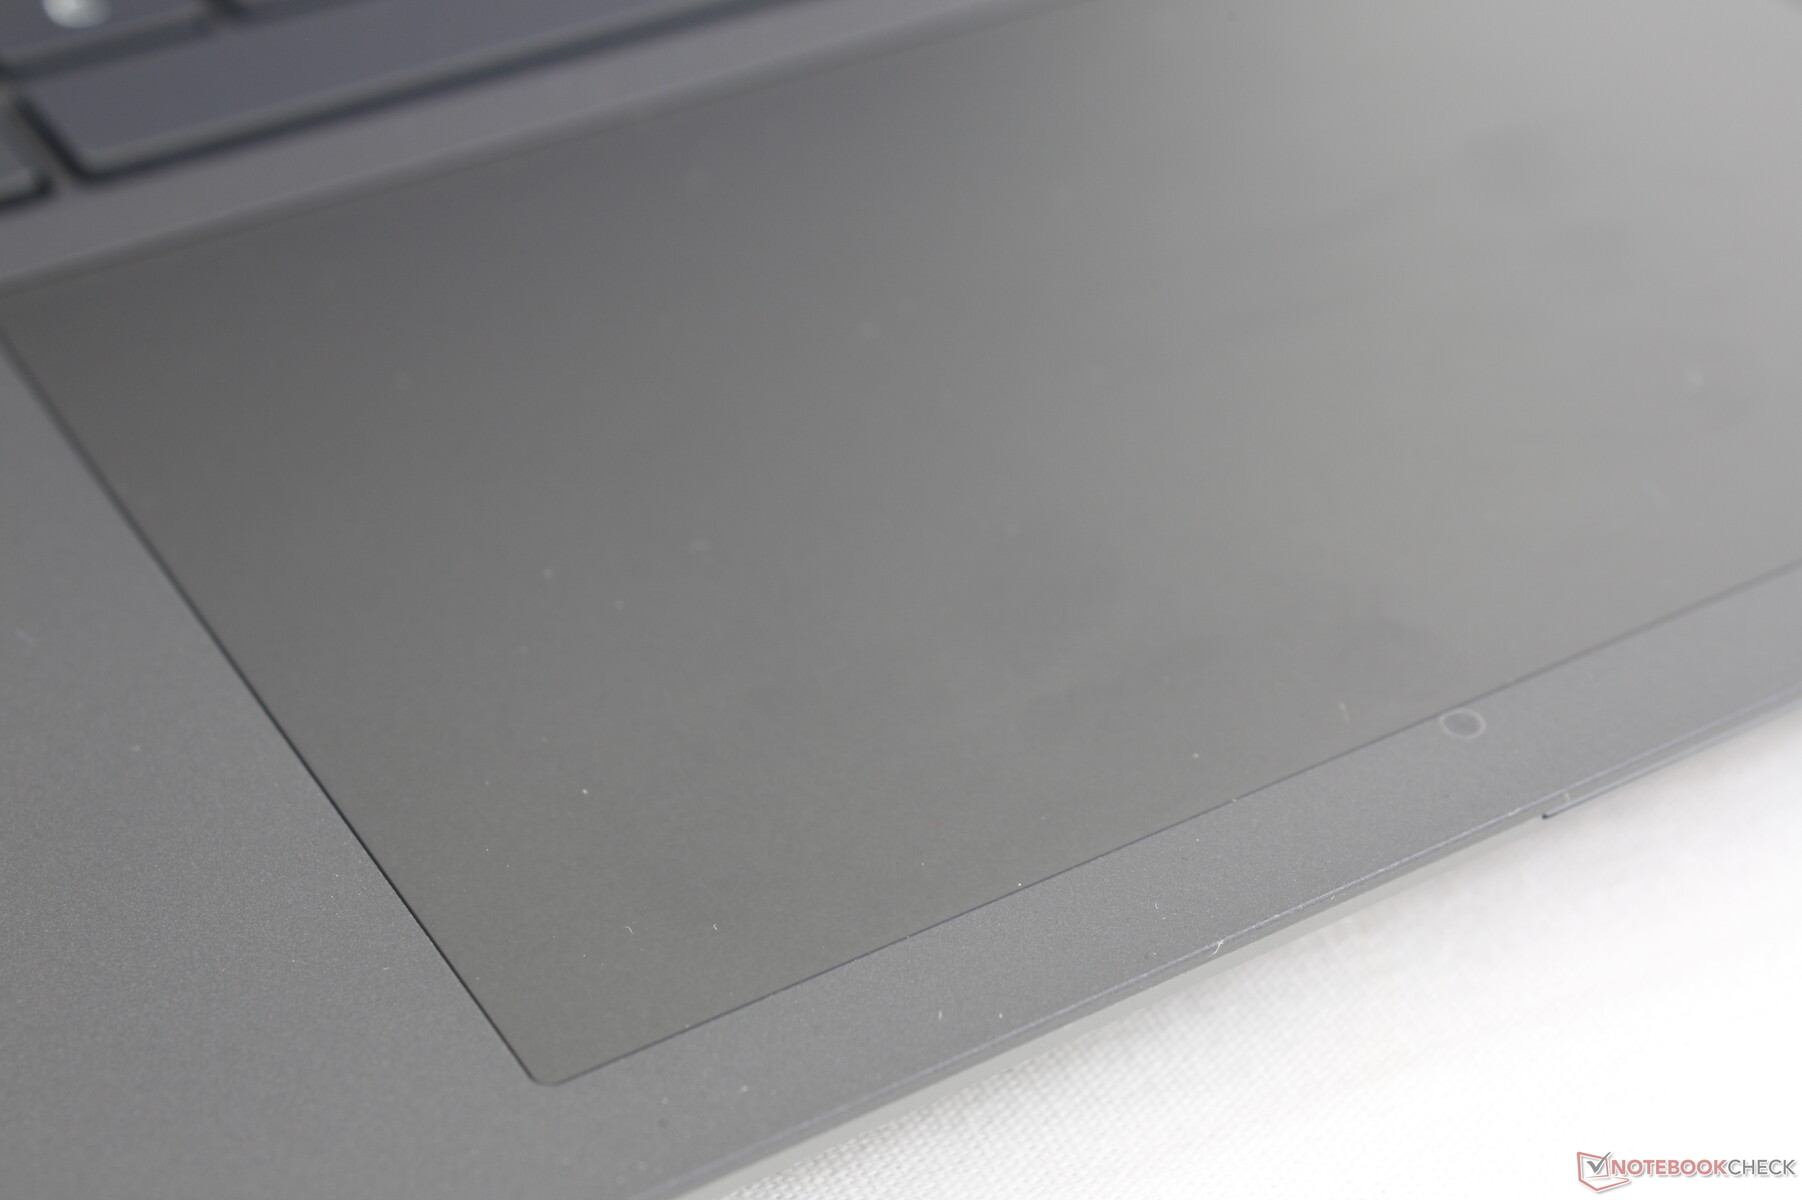
O clickpad é, na verdade, menor do que o clickpad do Precision 5550 de 15 polegadas (13,7 x 8,5 cm vs. 15,1 x 9 cm), apesar do tamanho maior da tela. Mesmo assim, ele ainda parece espaçoso, com propriedades de deslizamento suaves e confiáveis, como em um XPS 15.
Infelizmente, o feedback ao clicar no clickpad háptico é quase inexistente. De fato, não há quase nenhum deslocamento ou feedback audível. É altamente recomendável usar um mouse para ações mais precisas de arrastar e soltar.
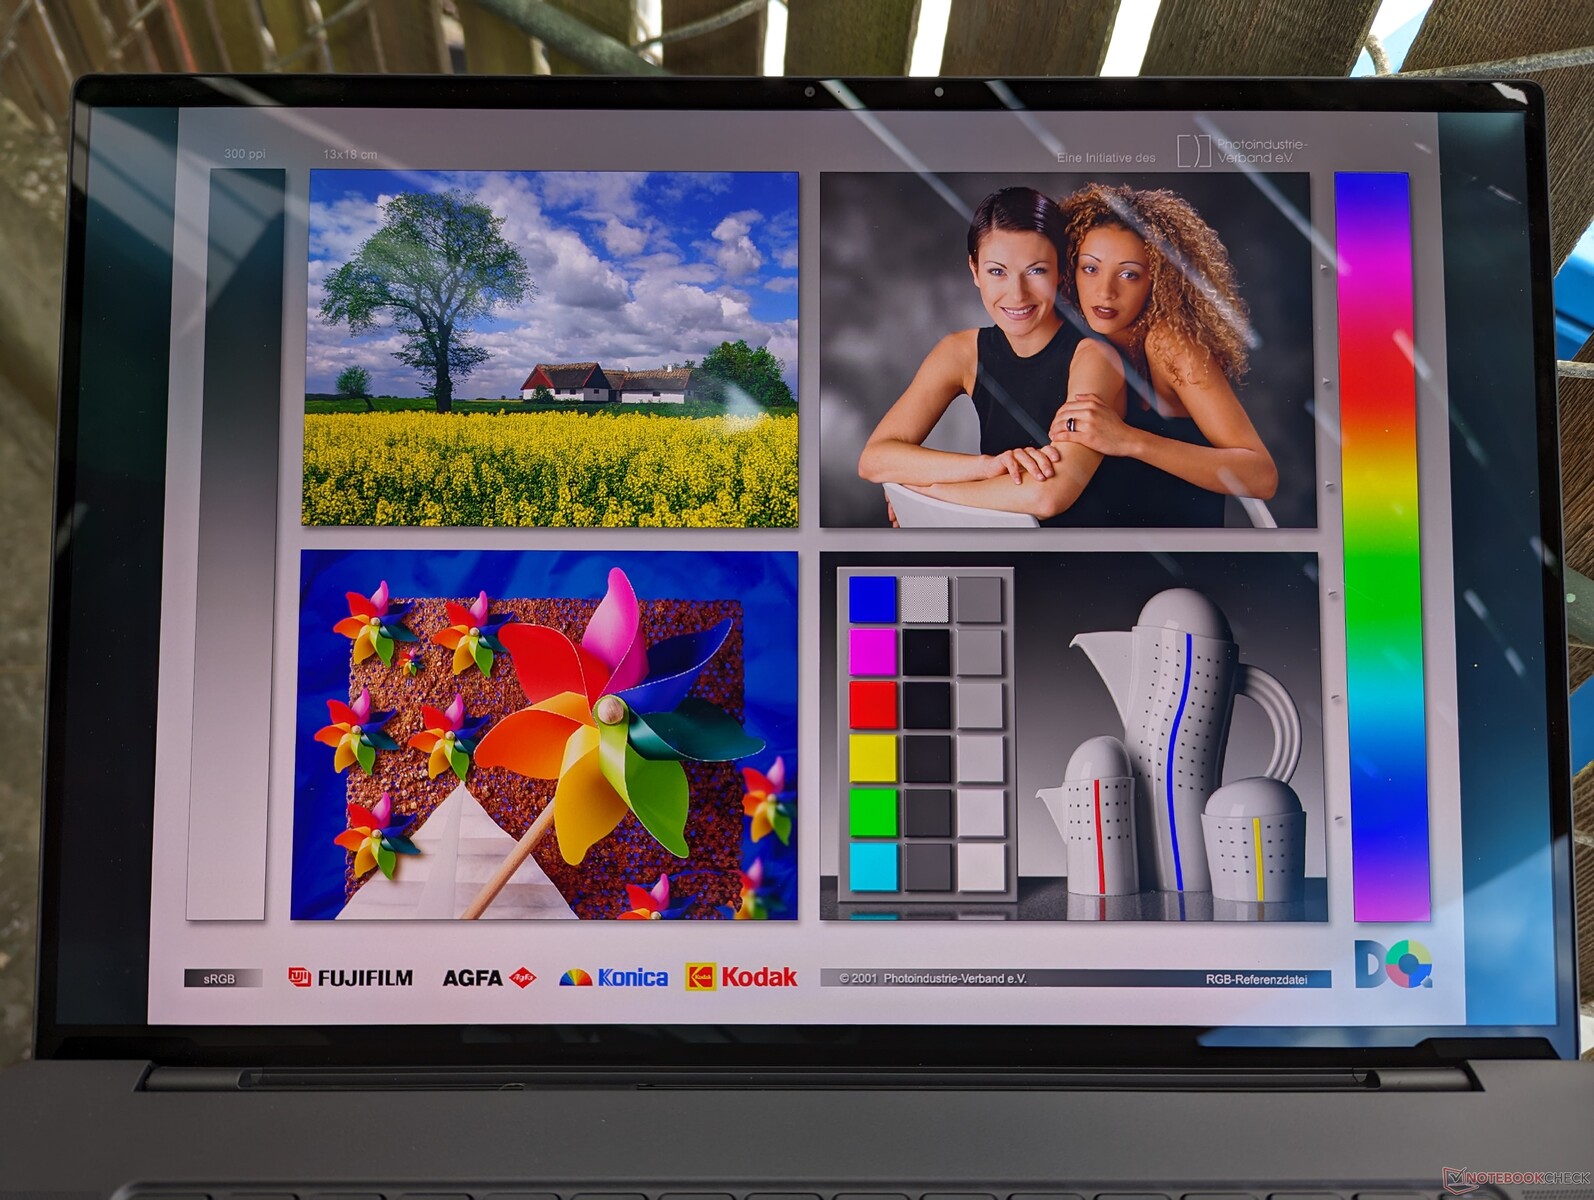
Tela
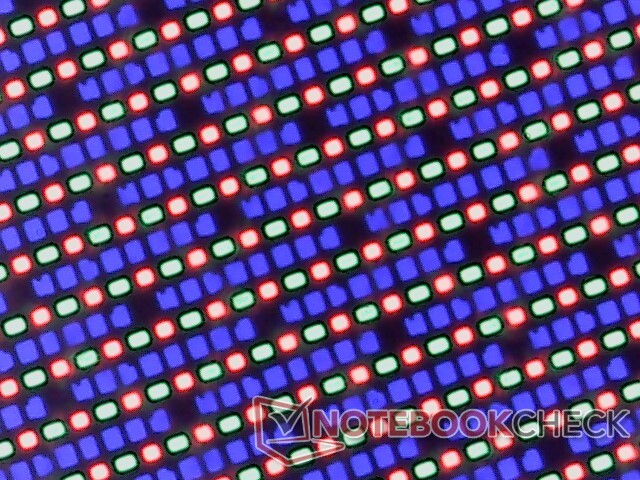
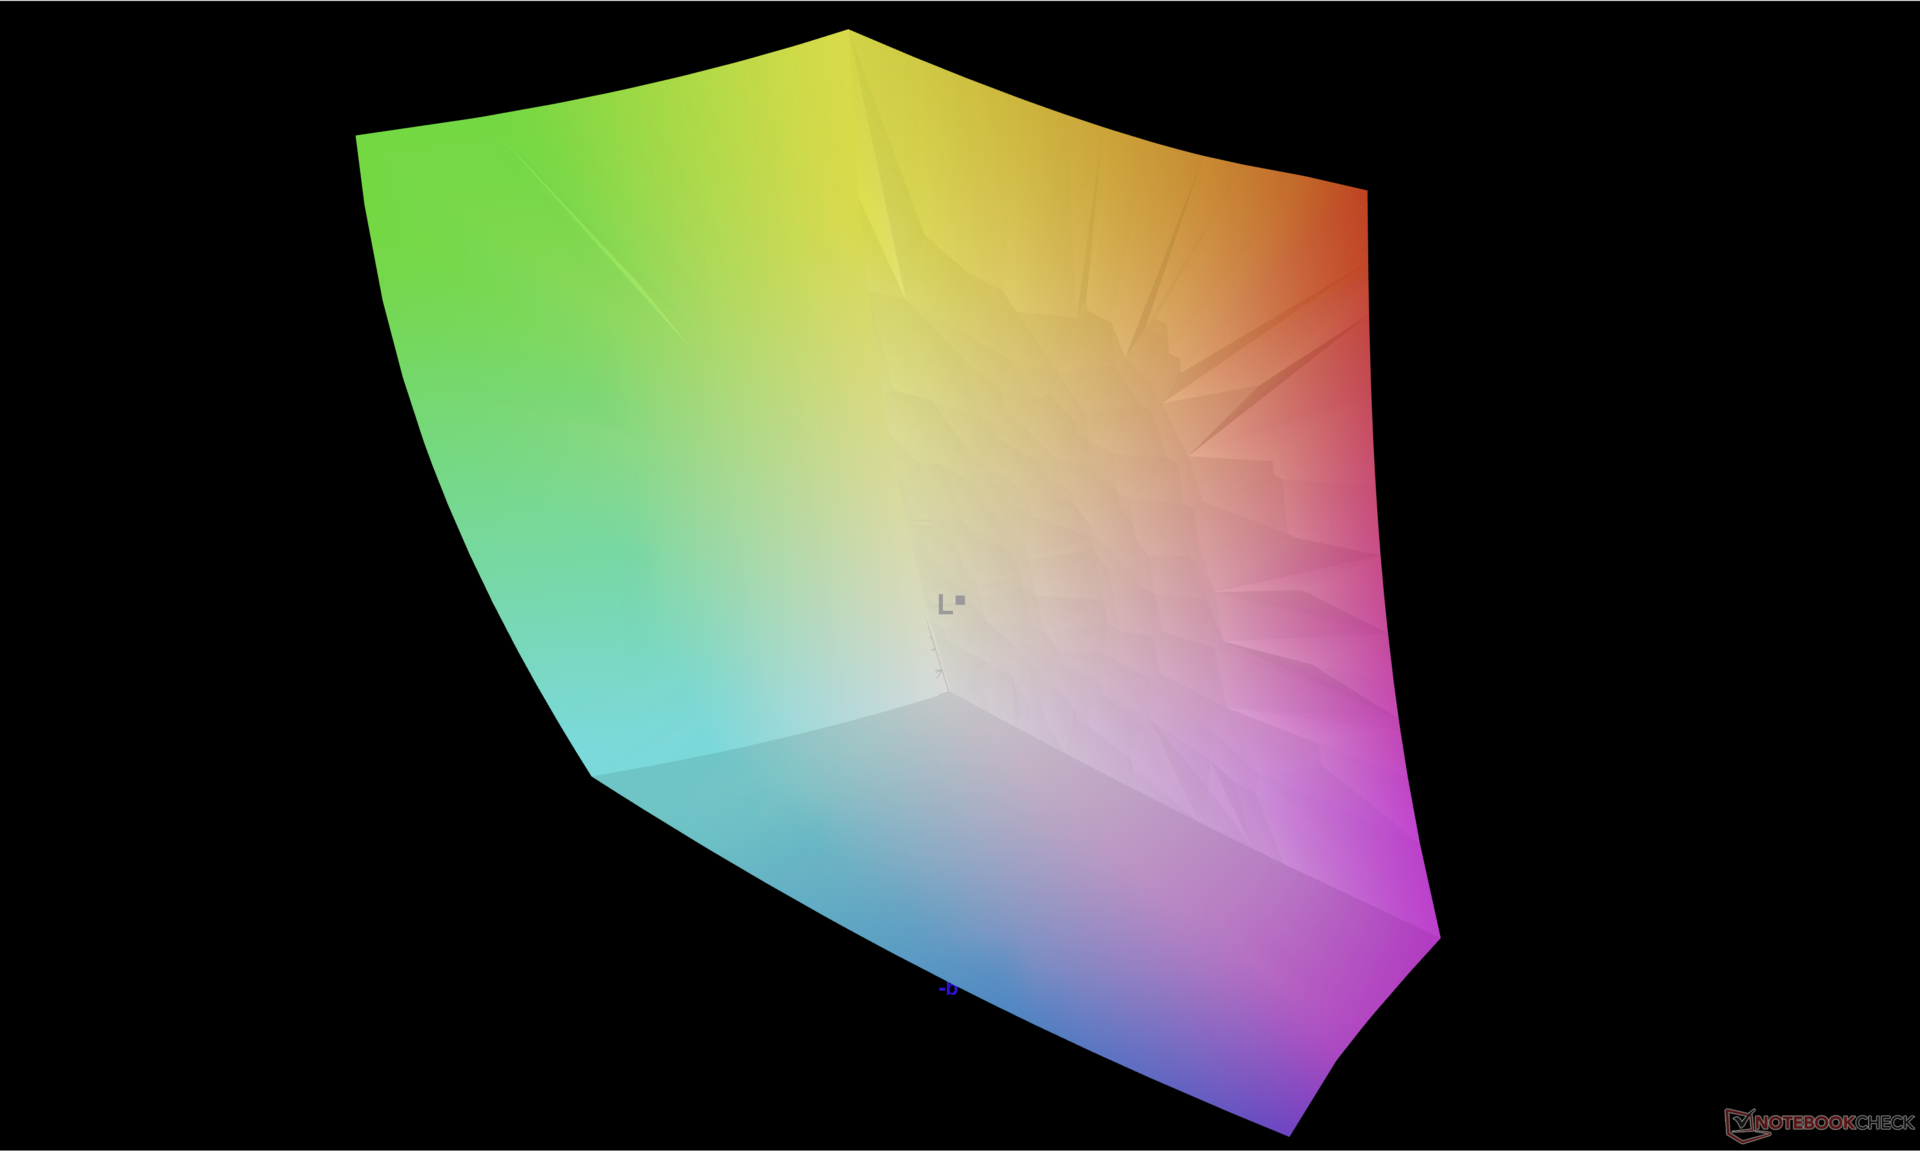
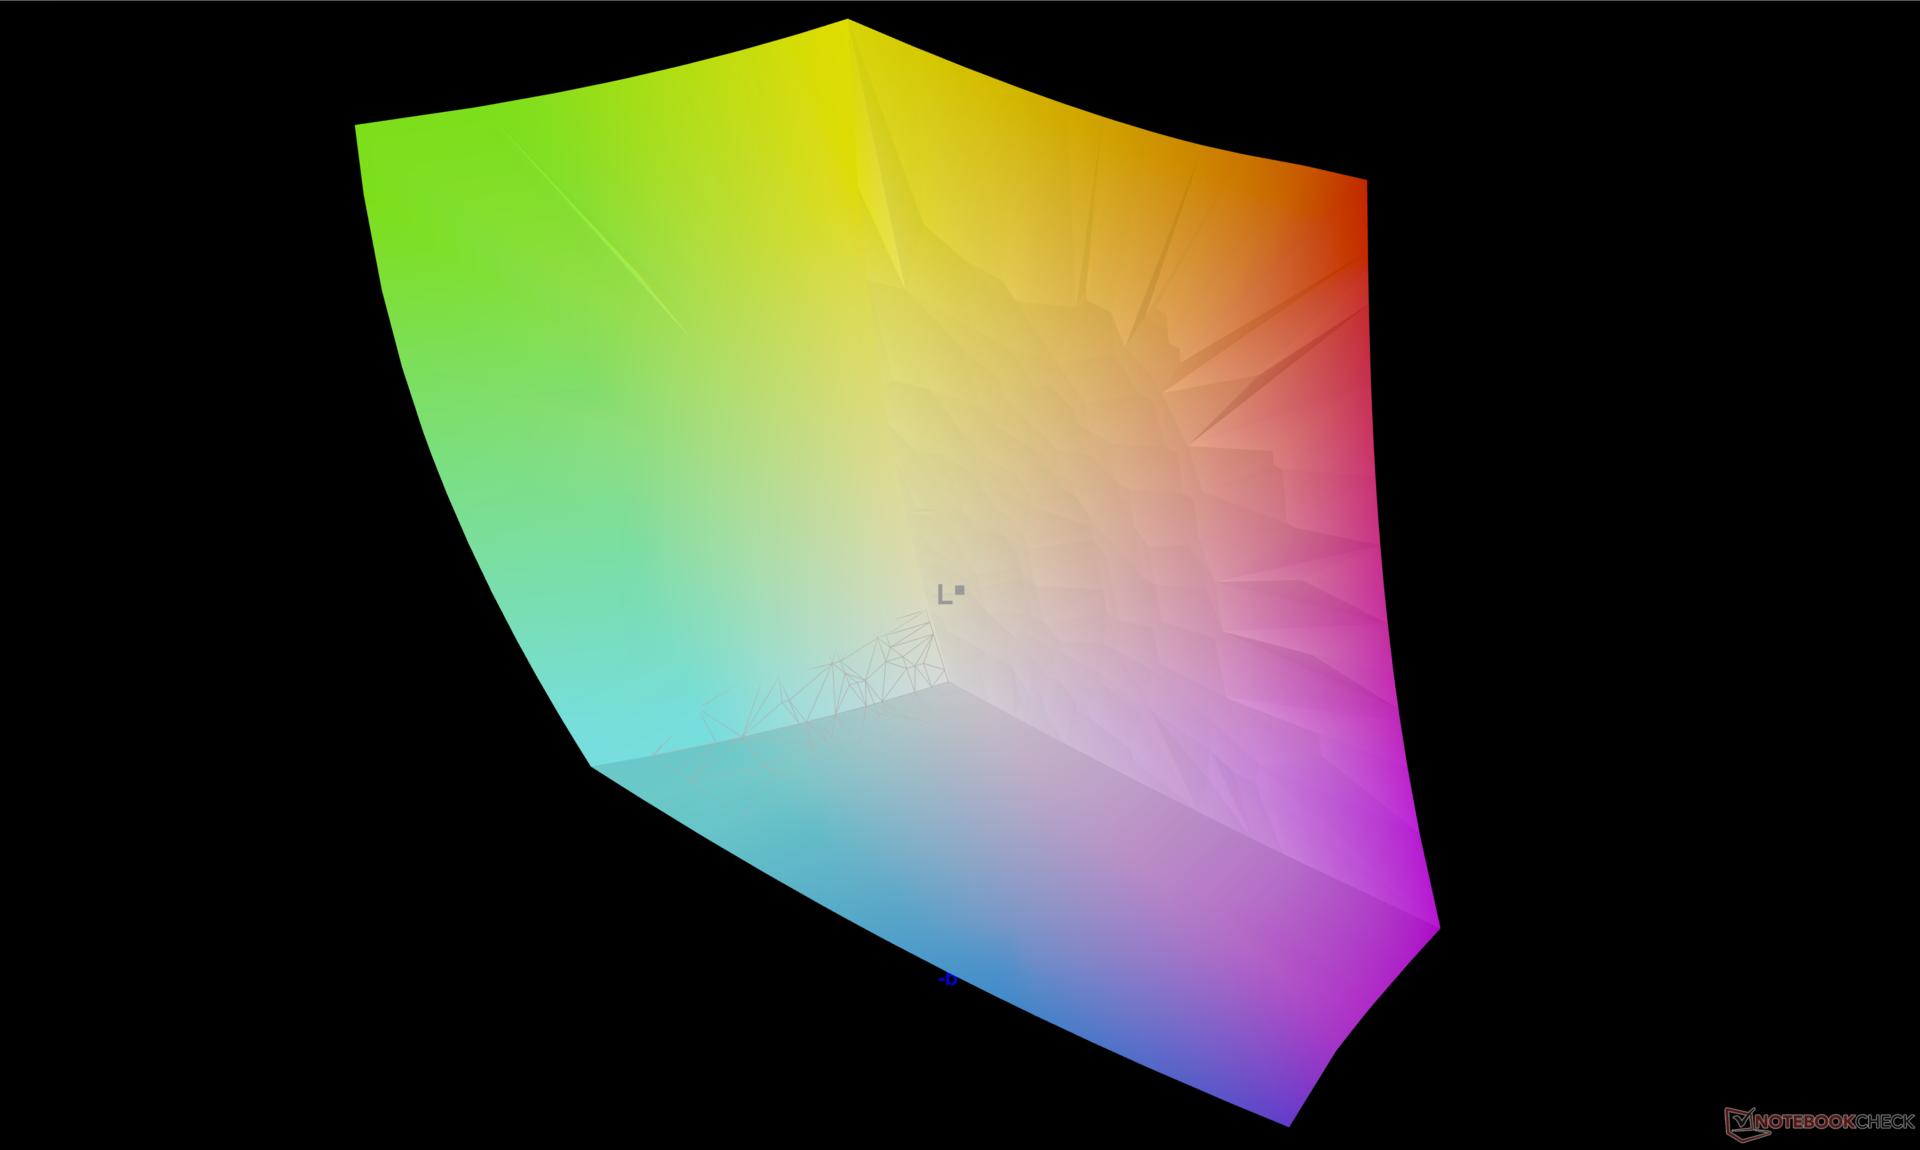
A Dell emprega o mesmo painel OLED Samsung 160YV03 em seus modelos de 16 polegadas Precision 5680 e 16 polegadas Precision 7670. Assim, os dois modelos oferecem a mesma experiência visual, com tempos de resposta semelhantes, cores DCI-P3 completas e até mesmo níveis de brilho, conforme mostrado na tabela de comparação abaixo. Esperamos que possamos ver algumas opções de taxa de atualização mais alta em um futuro próximo.
| |||||||||||||||||||||||||
iluminação: 98 %
iluminação com acumulador: 345.7 cd/m²
Contraste: ∞:1 (Preto: 0 cd/m²)
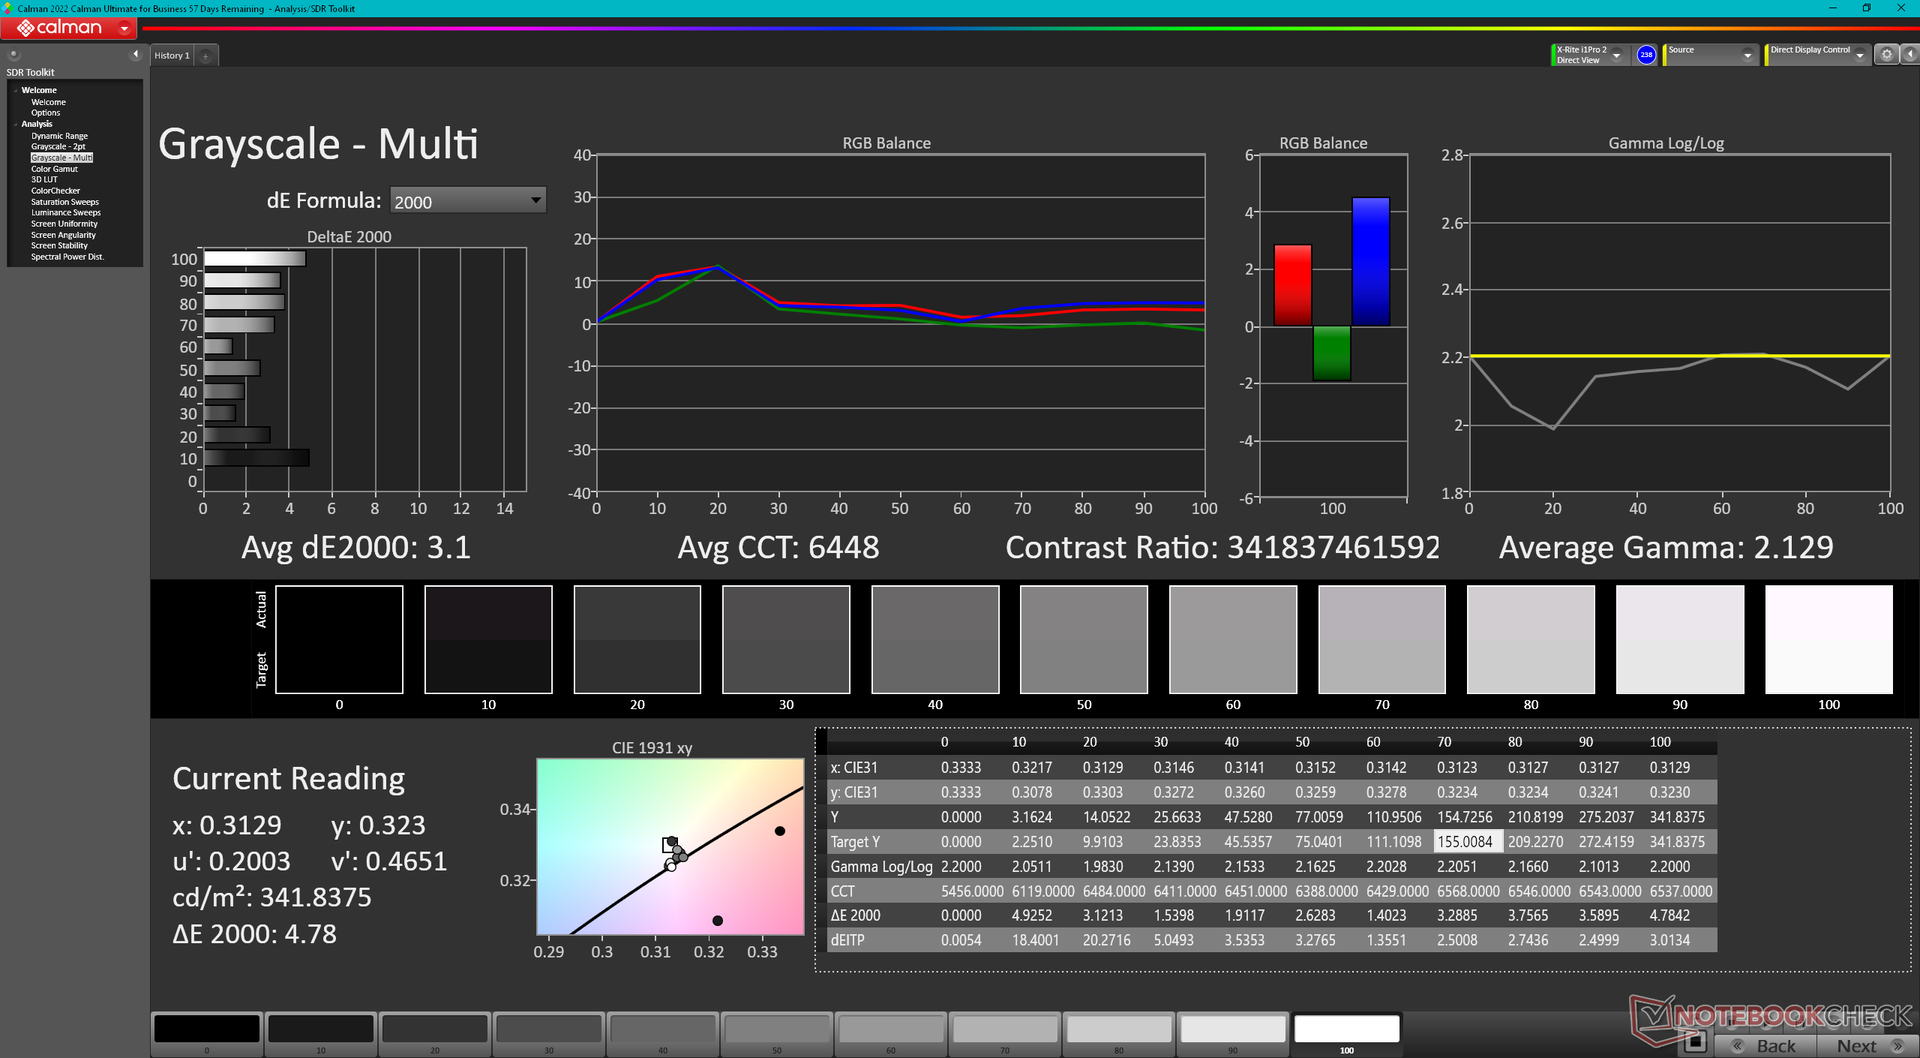
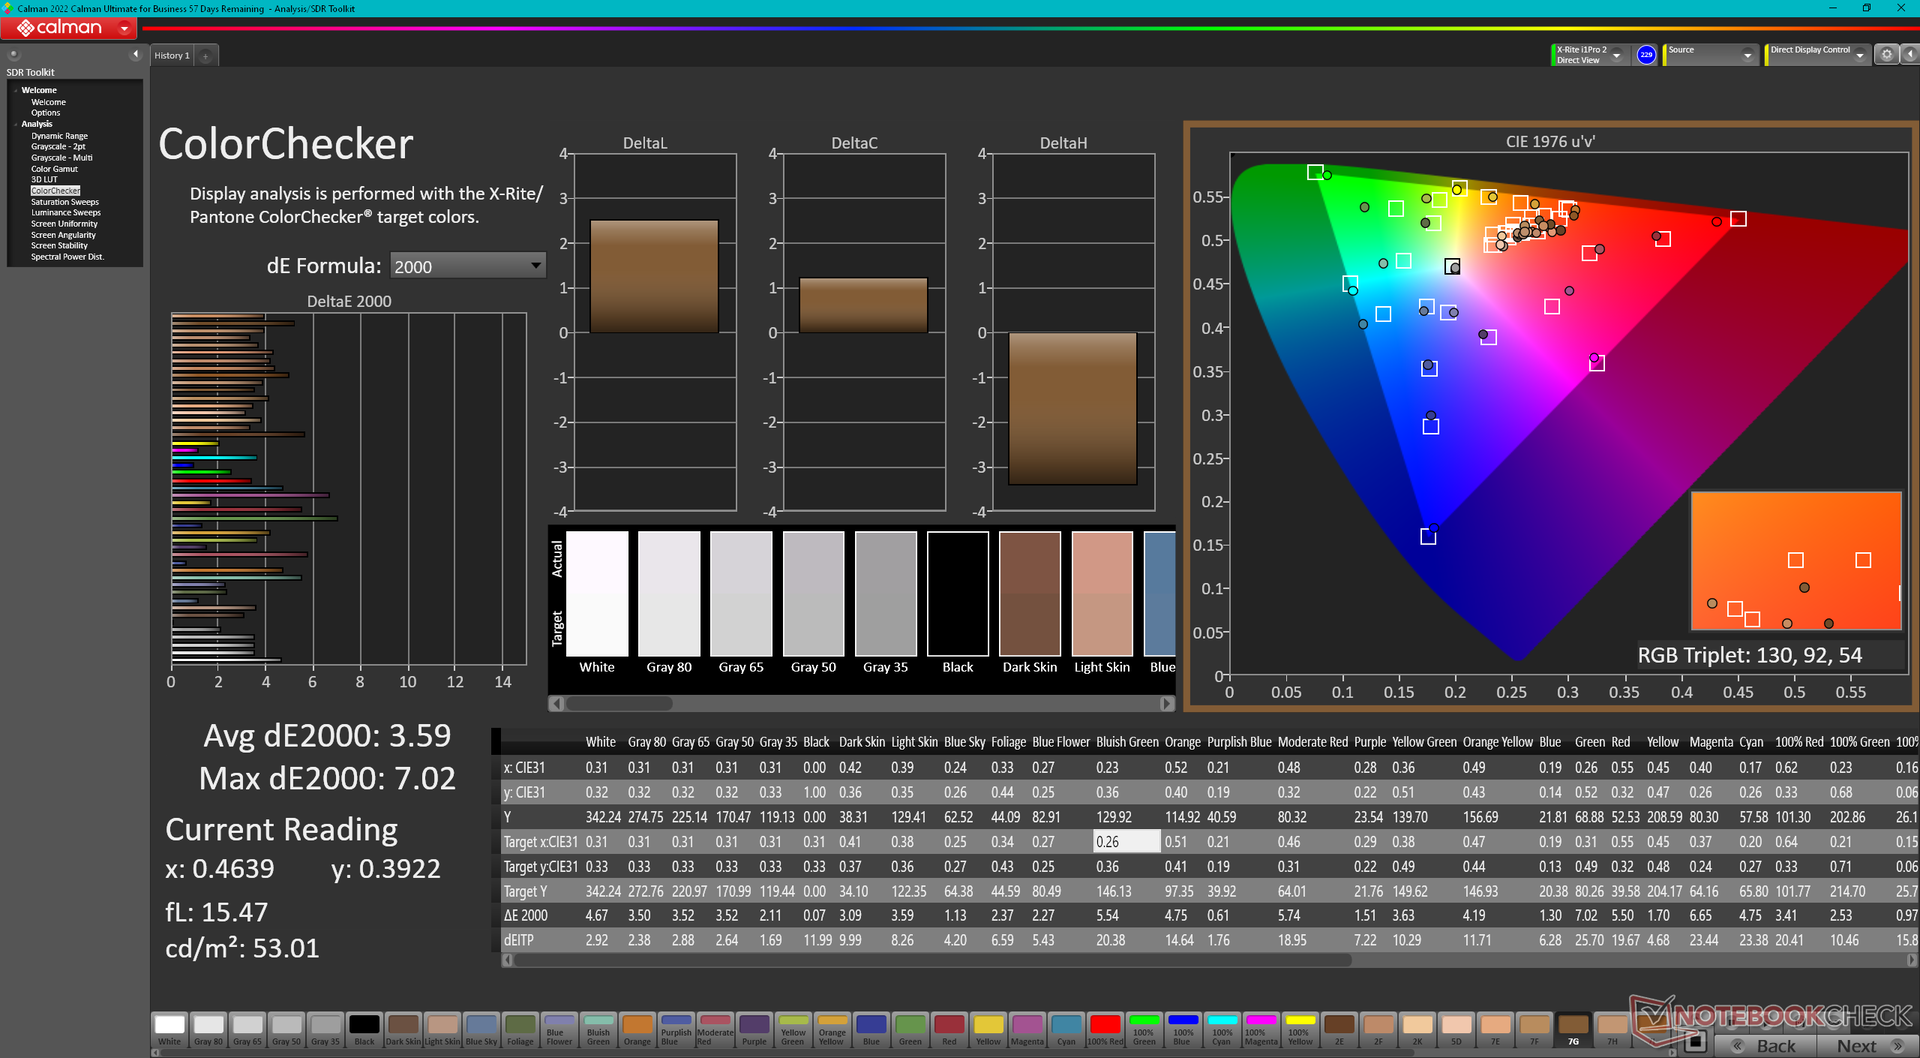
ΔE ColorChecker Calman: 3.59 | ∀{0.5-29.43 Ø4.71}
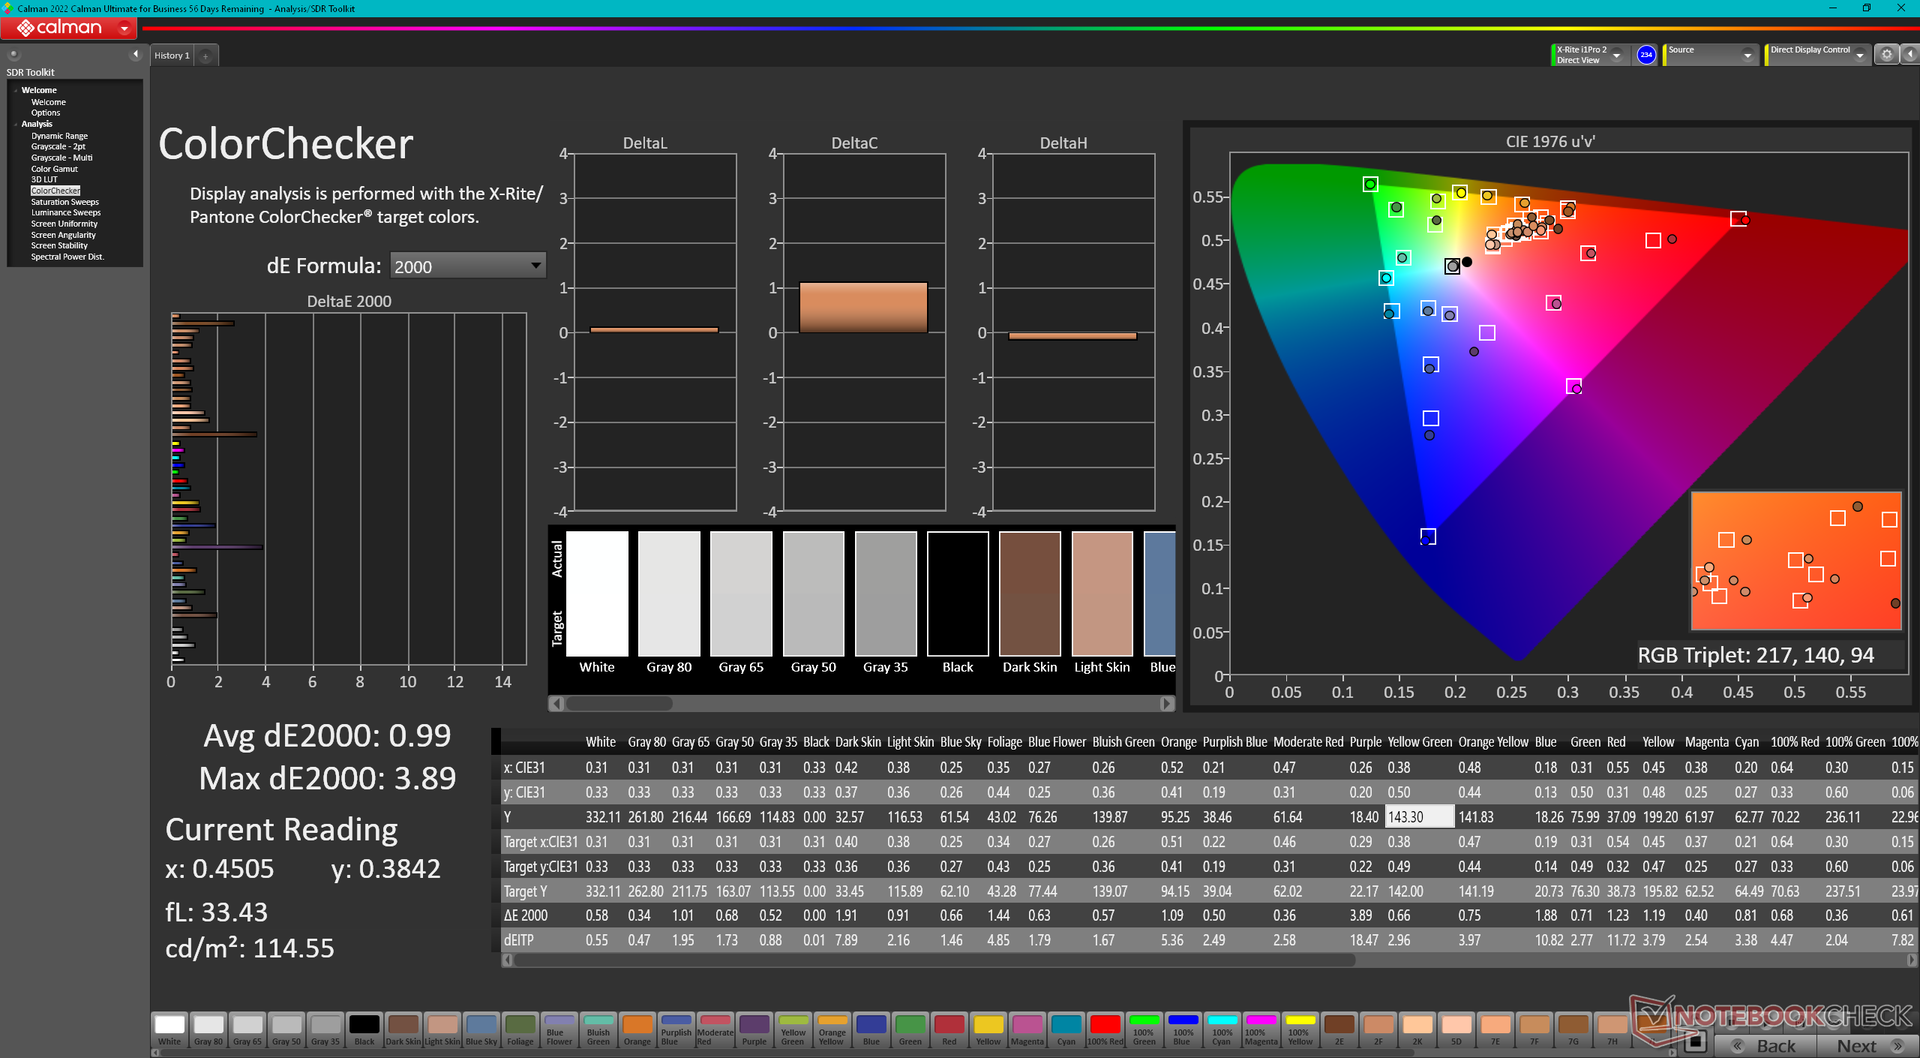
calibrated: 0.99
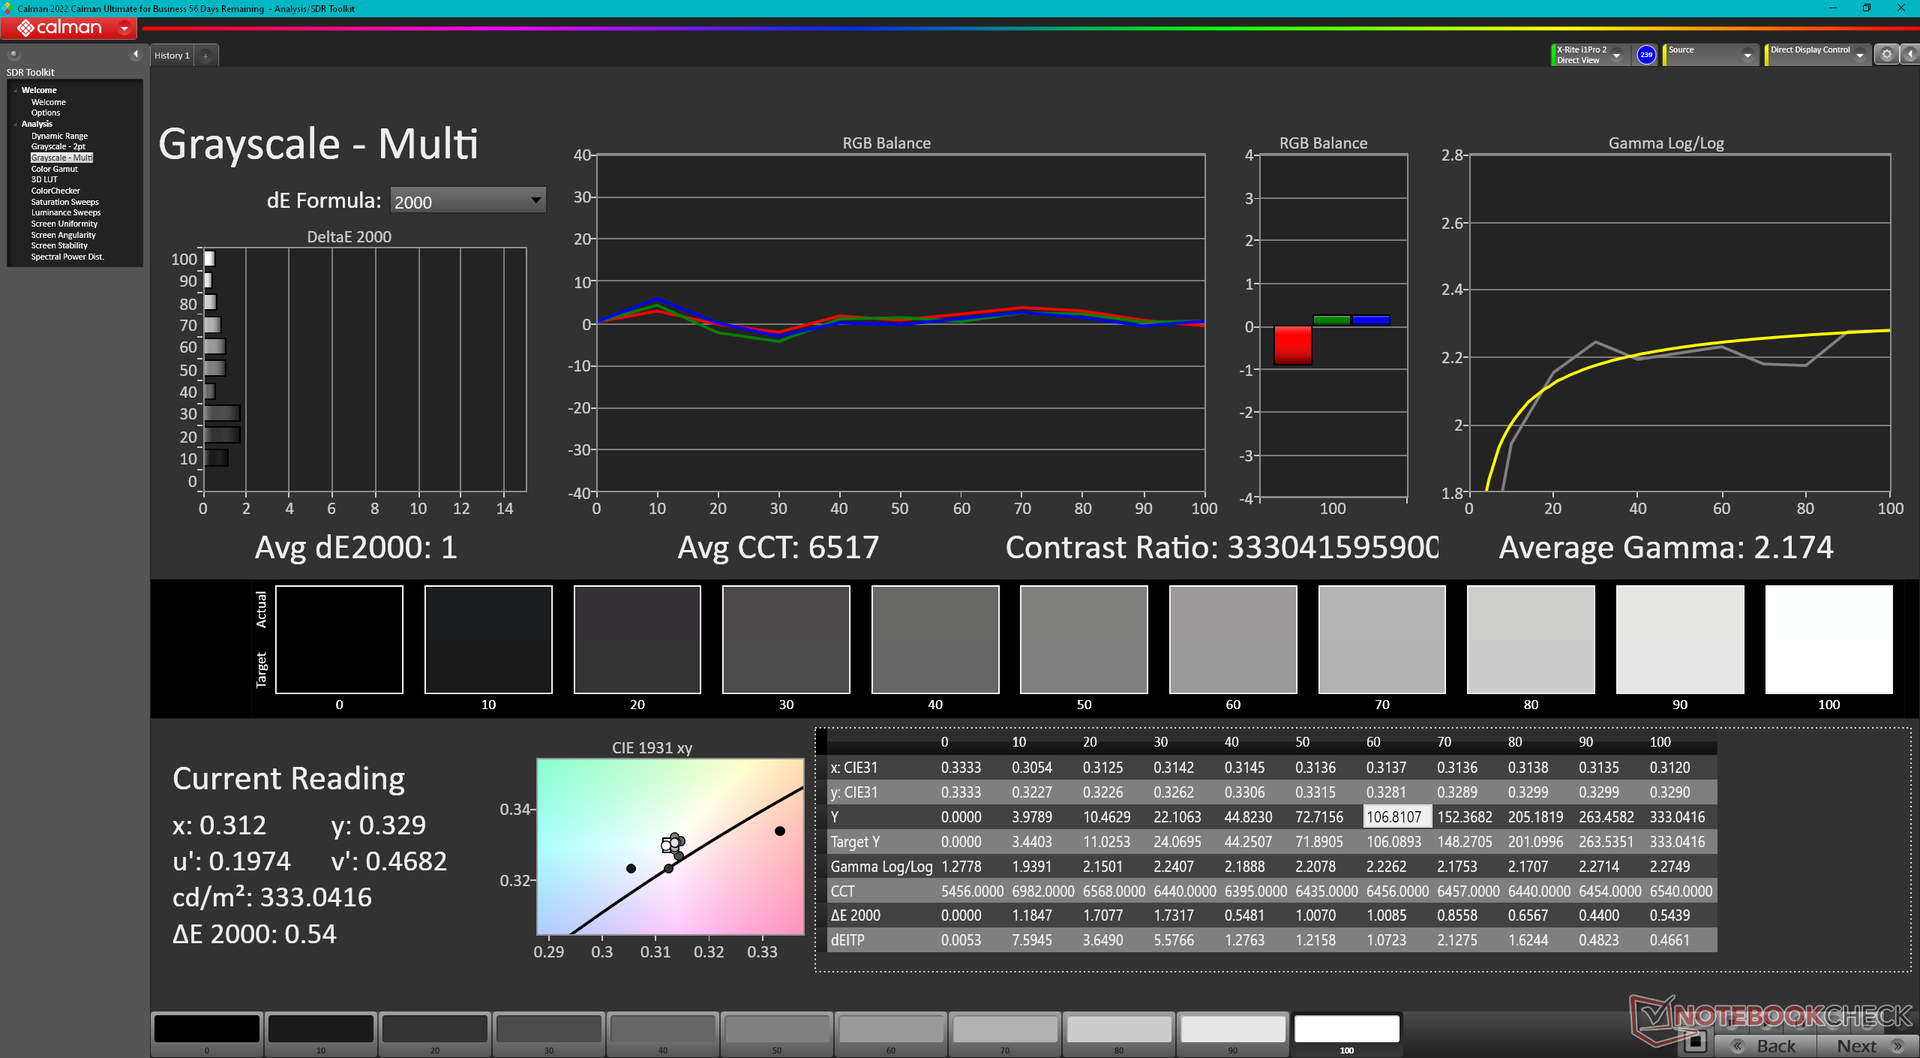
ΔE Greyscale Calman: 3.1 | ∀{0.09-98 Ø4.96}
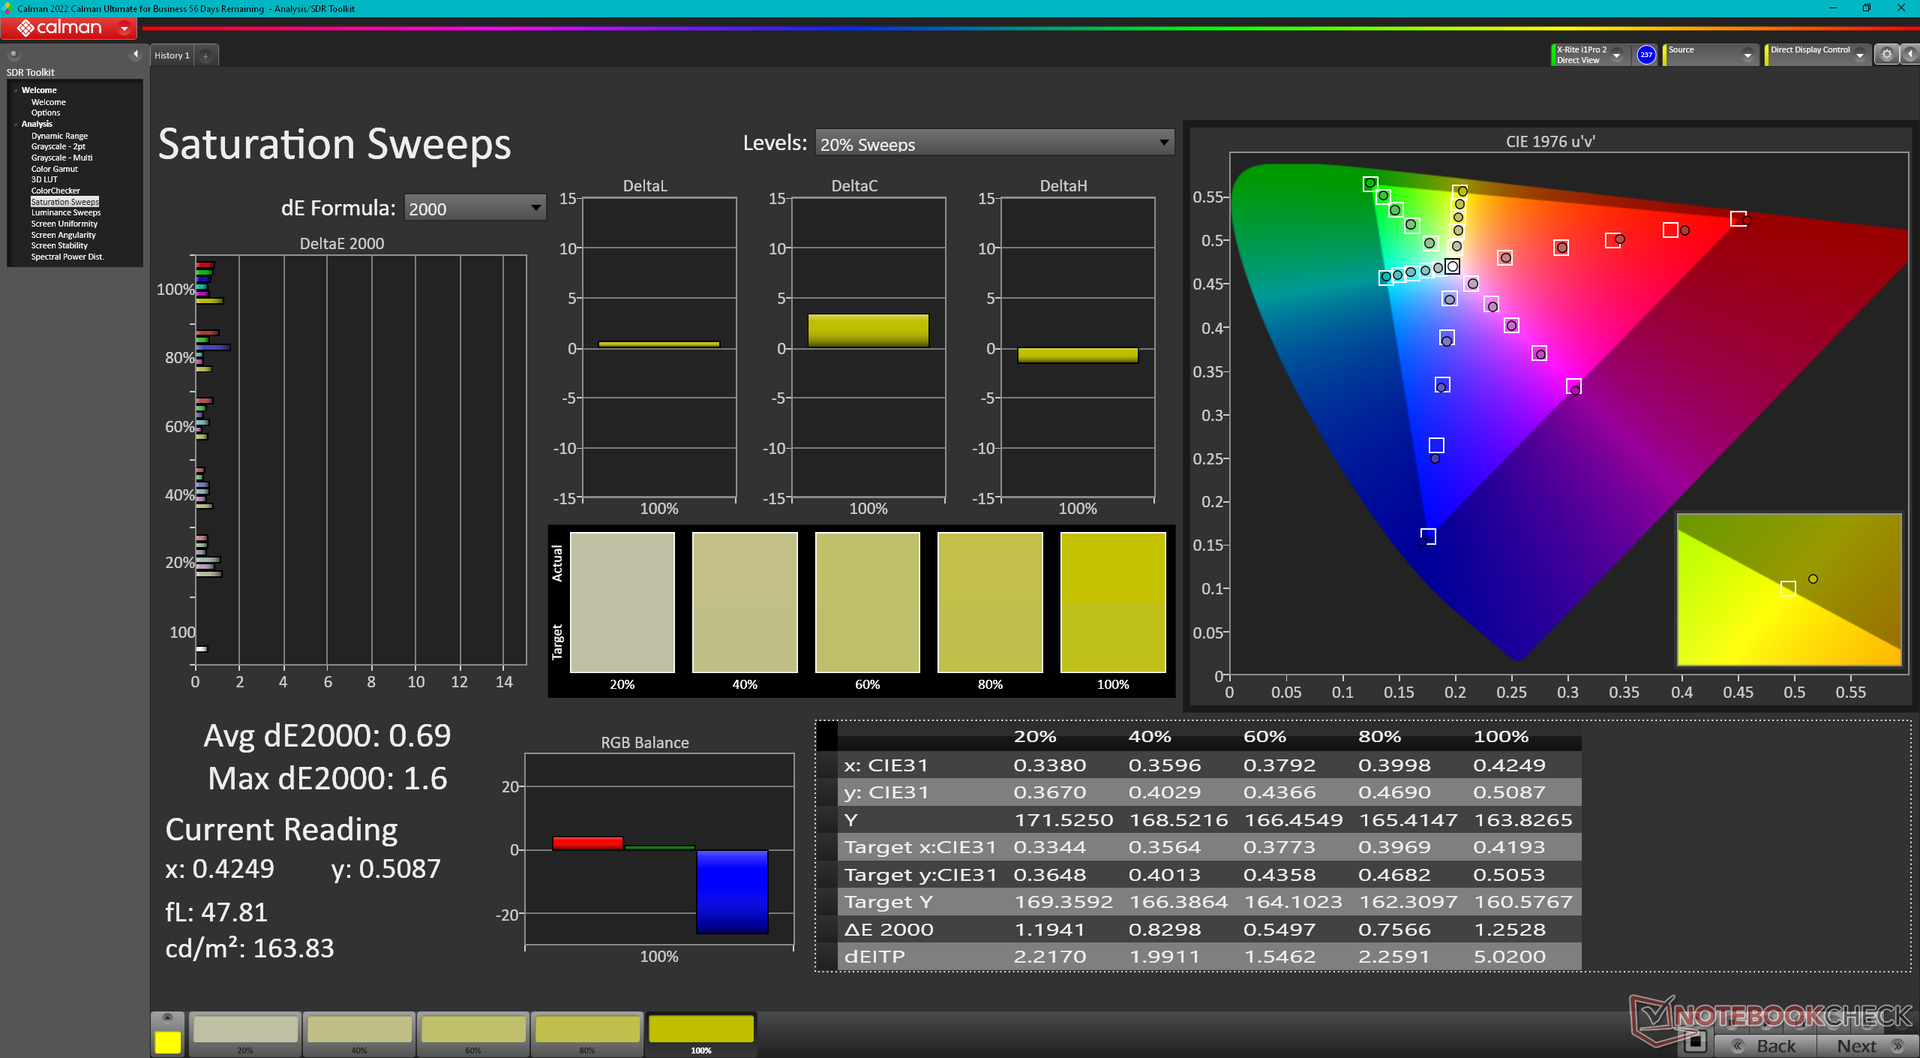
97.5% AdobeRGB 1998 (Argyll 3D)
100% sRGB (Argyll 3D)
99.9% Display P3 (Argyll 3D)
Gamma: 2.13
CCT: 6448 K
| Dell Precision 5000 5680 Samsung 160YV03, OLED, 3840x2400, 16" | Dell Precision 7000 7670 Performance Samsung 160YV03, OLED, 3840x2400, 16" | HP ZBook Fury 16 G9 BOE0A52, IPS, 3840x2400, 16" | Lenovo ThinkPad P16 G1 RTX A5500 LP160UQ1-SPB1, IPS, 3840x2400, 16" | MSI CreatorPro Z16P B12UKST B160QAN02.N, IPS, 2560x1600, 16" | Asus ExpertBook B6 Flip B6602FC2 AU Optronics Model: AUOE495, IPS, 2560x1600, 16" | |
|---|---|---|---|---|---|---|
| Display | 0% | -5% | -7% | -4% | -5% | |
| Display P3 Coverage (%) | 99.9 | 99.9 0% | 97.4 -3% | 82.9 -17% | 97.6 -2% | 97.9 -2% |
| sRGB Coverage (%) | 100 | 100 0% | 99.9 0% | 98.9 -1% | 99.9 0% | 99.89 0% |
| AdobeRGB 1998 Coverage (%) | 97.5 | 98.1 1% | 86.3 -11% | 95.9 -2% | 87.4 -10% | 85.52 -12% |
| Response Times | -9% | -551% | -2297% | -490% | -1452% | |
| Response Time Grey 50% / Grey 80% * (ms) | 1.68 ? | 1.84 ? -10% | 13.7 ? -715% | 45.6 ? -2614% | 12.8 ? -662% | 36 ? -2043% |
| Response Time Black / White * (ms) | 1.77 ? | 1.92 ? -8% | 8.6 ? -386% | 36.8 ? -1979% | 7.4 ? -318% | 17 ? -860% |
| PWM Frequency (Hz) | 60 ? | 59.52 ? | ||||
| Screen | -5% | -33% | 33% | 30% | -6% | |
| Brightness middle (cd/m²) | 345.7 | 325.2 -6% | 530.5 53% | 601.9 74% | 407 18% | 440 27% |
| Brightness (cd/m²) | 349 | 328 -6% | 476 36% | 569 63% | 388 11% | 418 20% |
| Brightness Distribution (%) | 98 | 97 -1% | 83 -15% | 77 -21% | 88 -10% | 82 -16% |
| Black Level * (cd/m²) | 0.57 | 0.47 | 0.36 | 0.3 | ||
| Colorchecker dE 2000 * | 3.59 | 4.59 -28% | 2.26 37% | 2.45 32% | 1.3 64% | 2.81 22% |
| Colorchecker dE 2000 max. * | 7.02 | 7.65 -9% | 4.46 36% | 2.5 64% | 4.62 34% | |
| Colorchecker dE 2000 calibrated * | 0.99 | 4.73 -378% | 0.7 29% | 2.99 -202% | ||
| Greyscale dE 2000 * | 3.1 | 2.5 19% | 1 68% | 2.6 16% | 2.1 32% | 0.91 71% |
| Gamma | 2.13 103% | 2.1 105% | 2.28 96% | 2.3 96% | 2.26 97% | 2.2 100% |
| CCT | 6448 101% | 6541 99% | 6543 99% | 6805 96% | 6437 101% | 6600 98% |
| Contrast (:1) | 931 | 1281 | 1131 | 1467 | ||
| Média Total (Programa/Configurações) | -5% /
-4% | -196% /
-119% | -757% /
-401% | -155% /
-65% | -488% /
-247% |
* ... menor é melhor
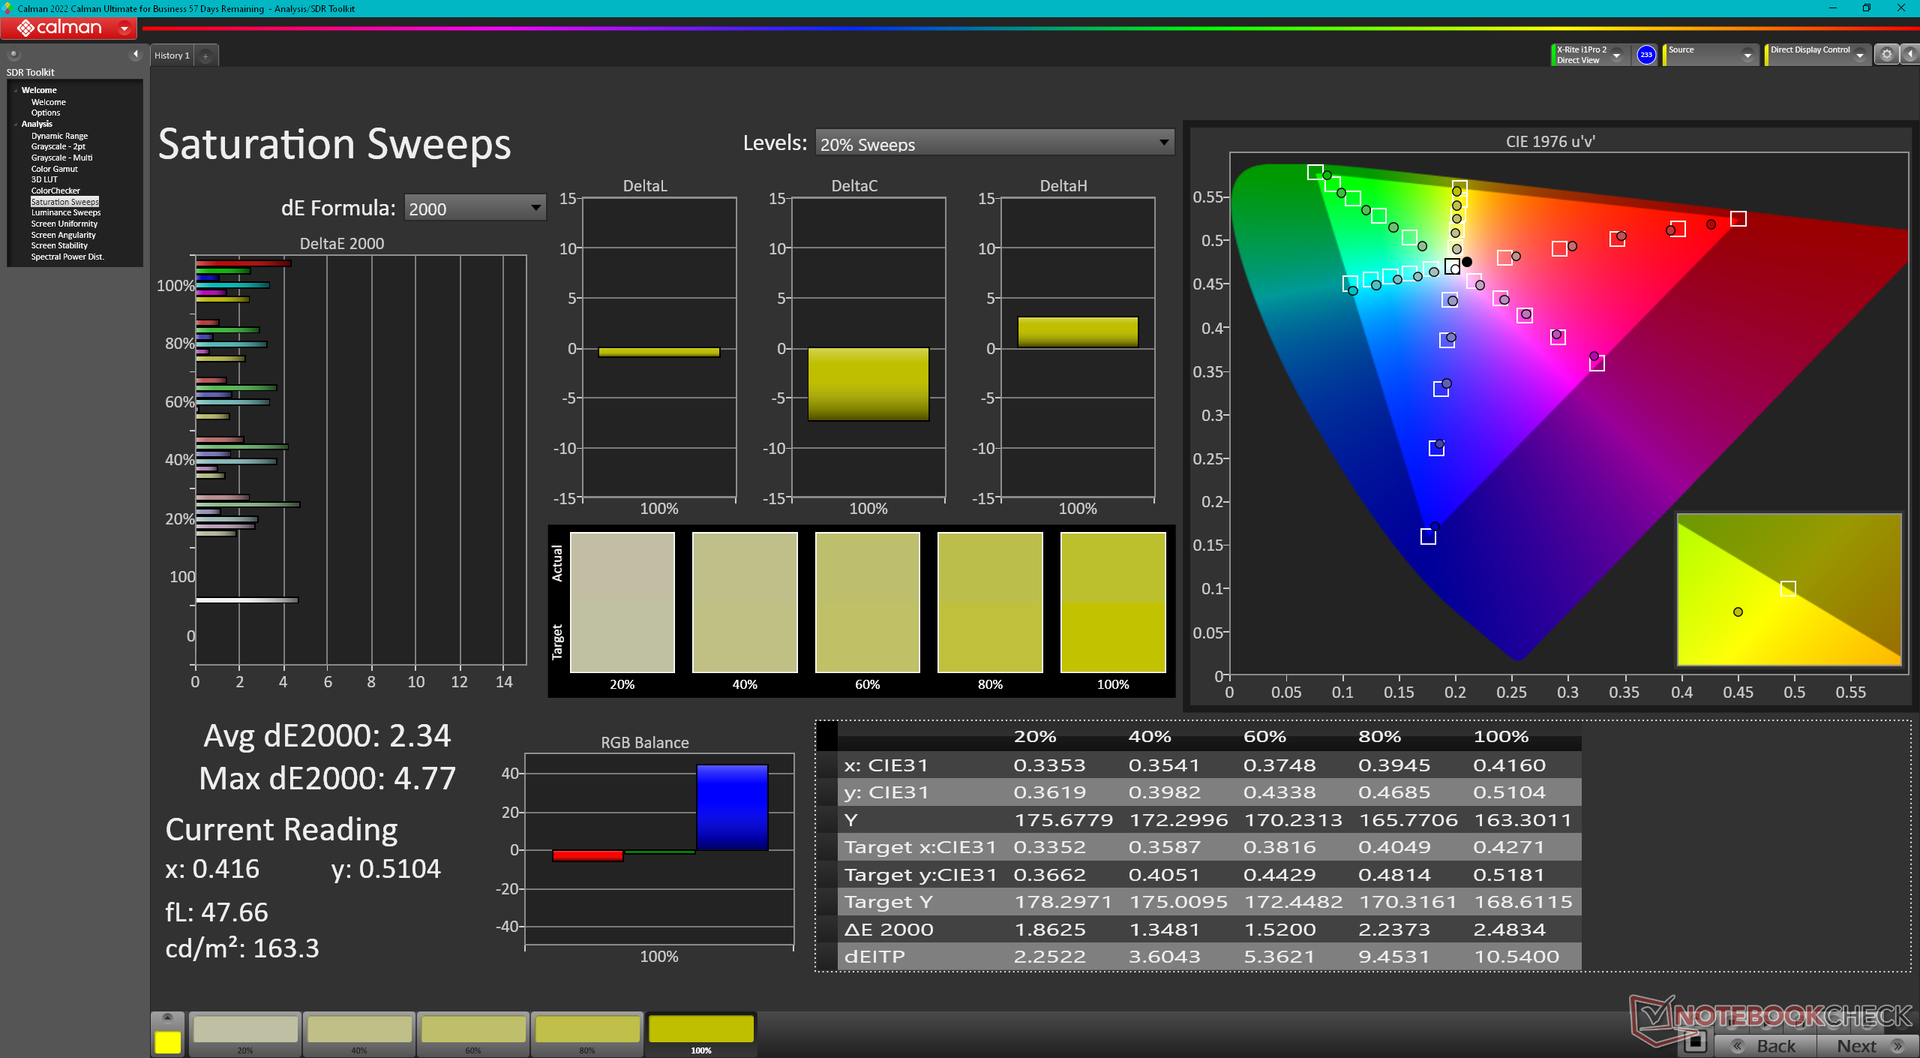
A tela é calibrada de forma decente, com valores médios de deltaE entre 3 e 4. Nosso perfil ICM calibrado está disponível para download gratuito acima.
Exibir tempos de resposta
| ↔ Tempo de resposta preto para branco | ||
|---|---|---|
| 1.77 ms ... ascensão ↗ e queda ↘ combinadas | ↗ 0.8 ms ascensão | 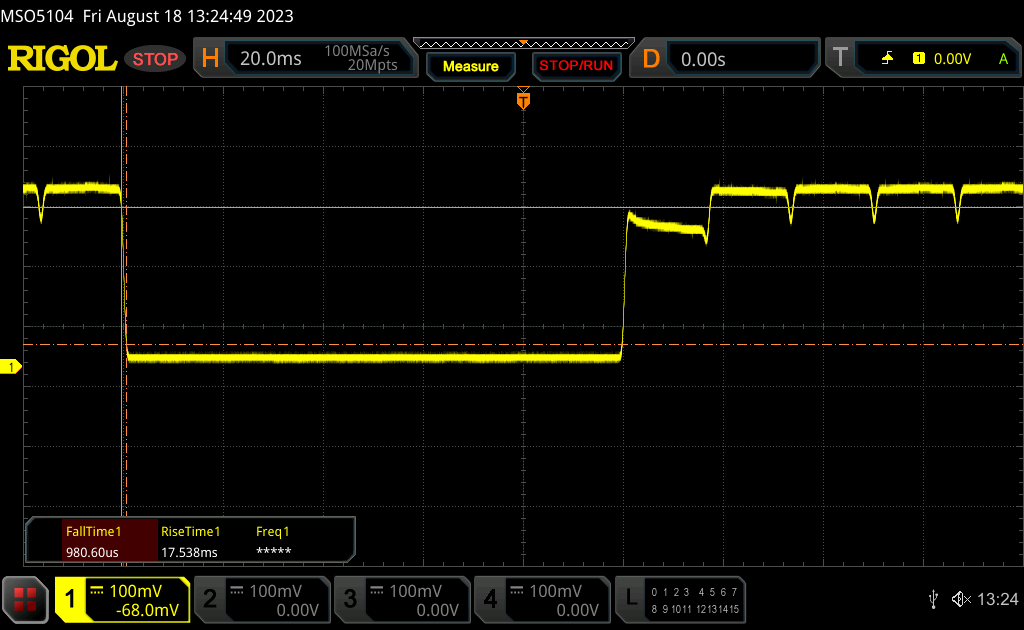 |
| ↘ 0.97 ms queda | ||
| A tela mostra taxas de resposta muito rápidas em nossos testes e deve ser muito adequada para jogos em ritmo acelerado. Em comparação, todos os dispositivos testados variam de 0.1 (mínimo) a 240 (máximo) ms. » 10 % de todos os dispositivos são melhores. Isso significa que o tempo de resposta medido é melhor que a média de todos os dispositivos testados (19.8 ms). | ||
| ↔ Tempo de resposta 50% cinza a 80% cinza | ||
| 1.68 ms ... ascensão ↗ e queda ↘ combinadas | ↗ 0.97 ms ascensão | 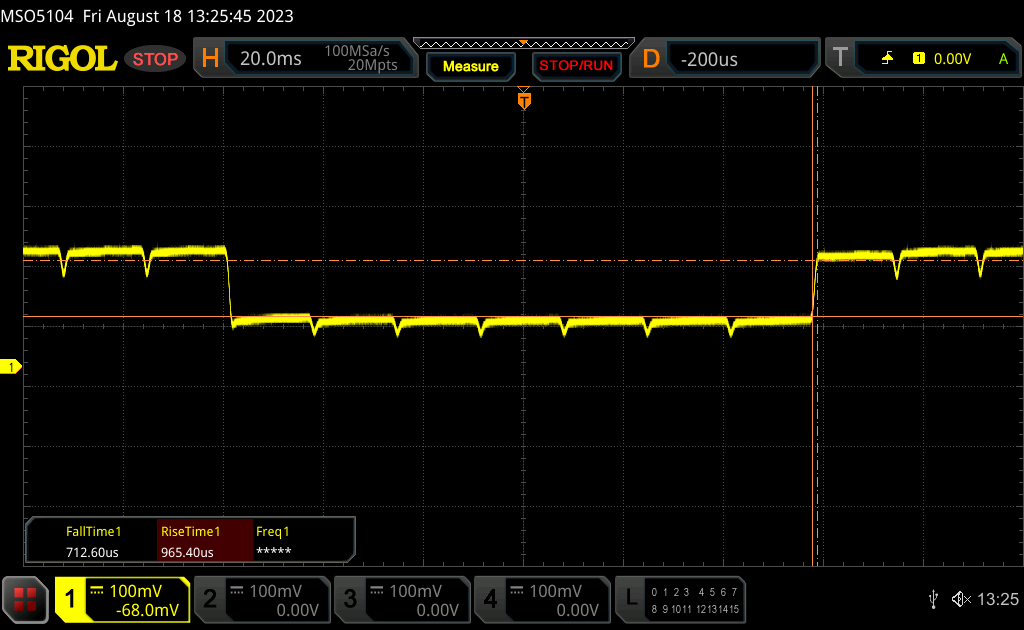 |
| ↘ 0.71 ms queda | ||
| A tela mostra taxas de resposta muito rápidas em nossos testes e deve ser muito adequada para jogos em ritmo acelerado. Em comparação, todos os dispositivos testados variam de 0.165 (mínimo) a 636 (máximo) ms. » 8 % de todos os dispositivos são melhores. Isso significa que o tempo de resposta medido é melhor que a média de todos os dispositivos testados (31 ms). | ||
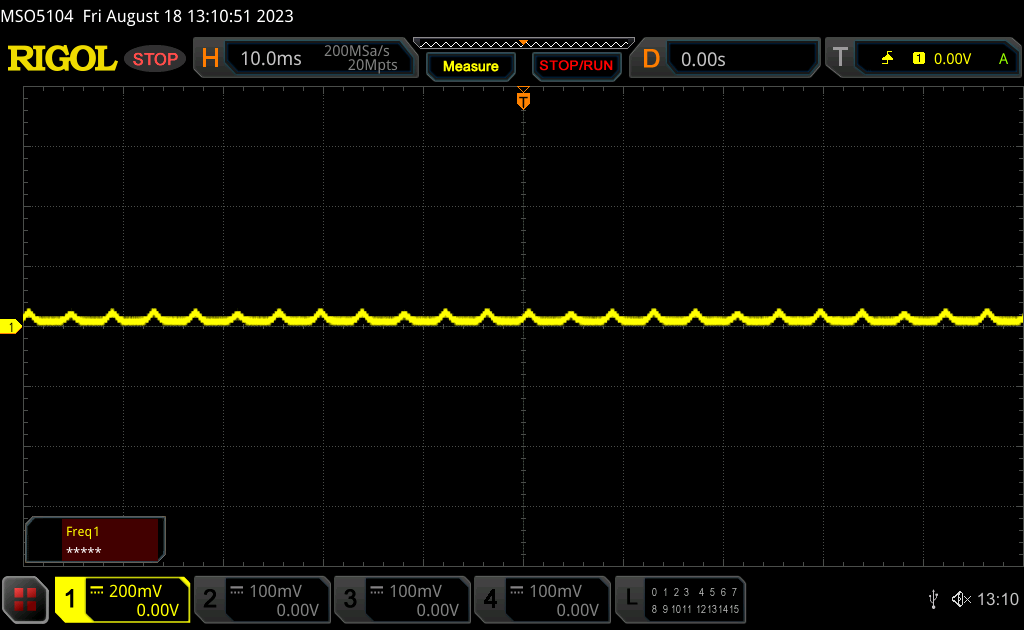
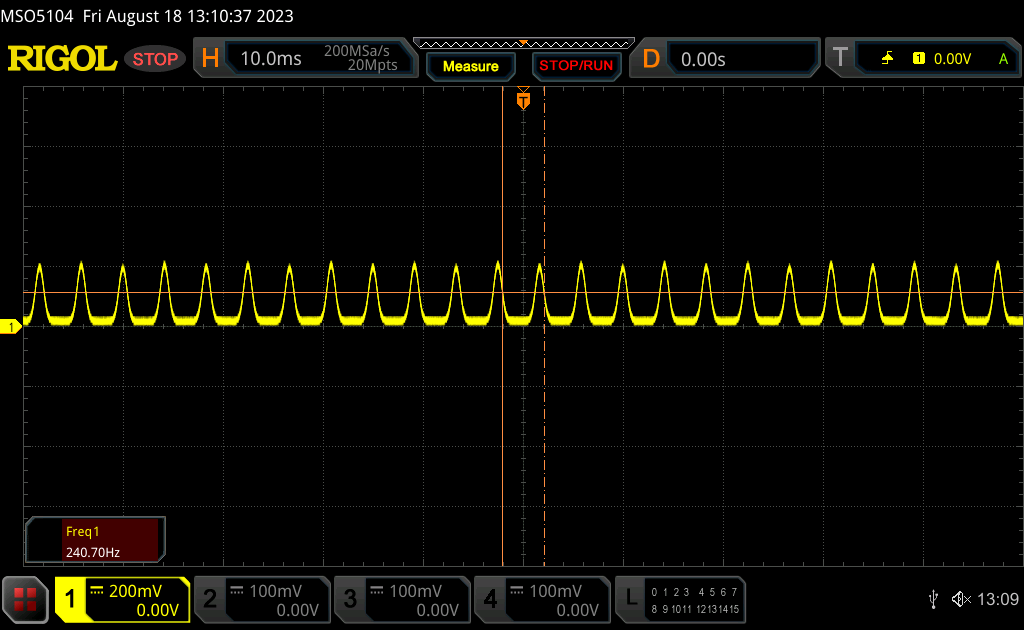
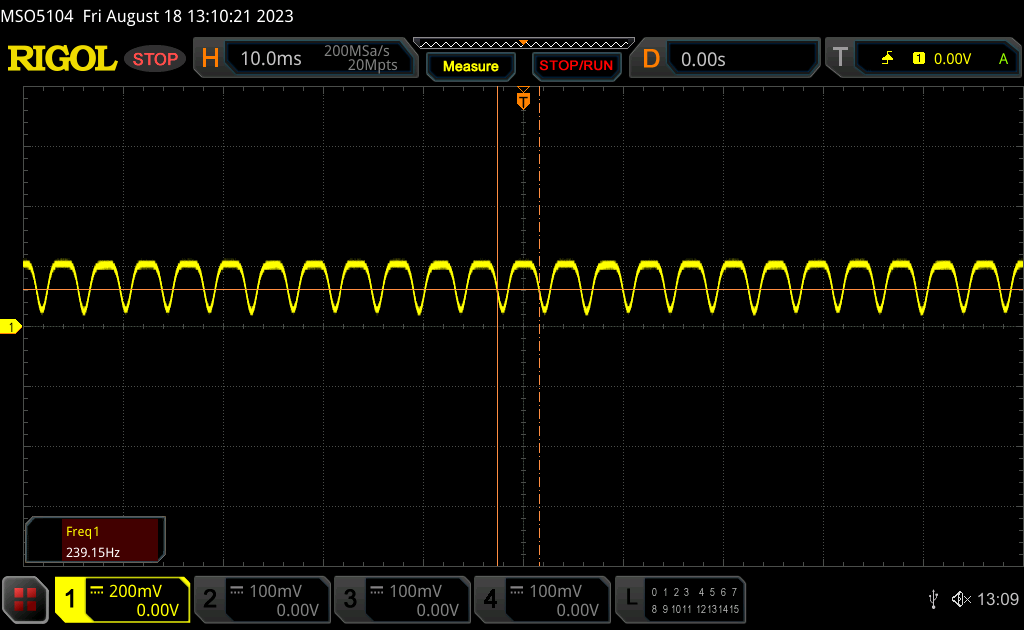
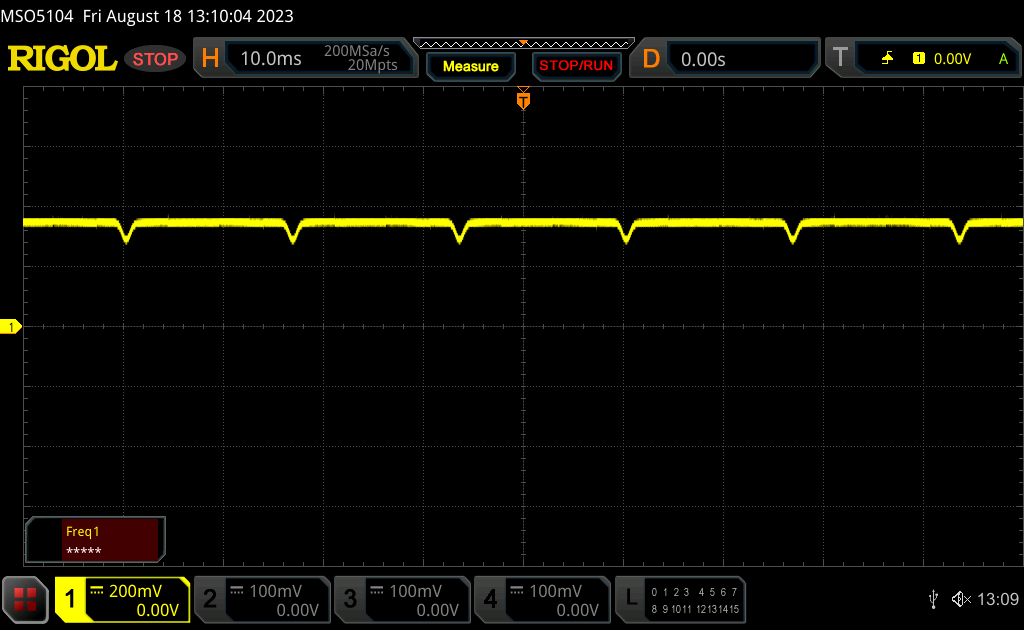
Cintilação da tela / PWM (modulação por largura de pulso)
| Tela tremeluzindo/PWM detectado | 60 Hz | ≤ 100 % configuração de brilho | 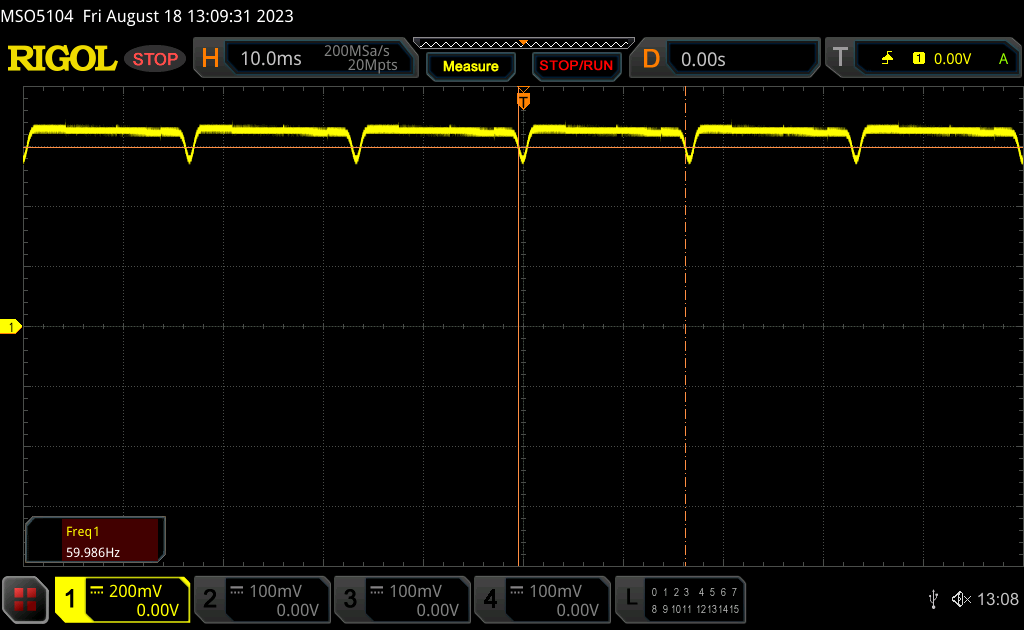 |
A luz de fundo da tela pisca em 60 Hz (pior caso, por exemplo, utilizando PWM) Cintilação detectada em uma configuração de brilho de 100 % e abaixo. Não deve haver cintilação ou PWM acima desta configuração de brilho. A frequência de 60 Hz é muito baixa, portanto a oscilação pode causar fadiga ocular e dores de cabeça após uso prolongado. [pwm_comparison] Em comparação: 52 % de todos os dispositivos testados não usam PWM para escurecer a tela. Se PWM foi detectado, uma média de 7757 (mínimo: 5 - máximo: 343500) Hz foi medida. | |||
A oscilação está presente em todos os níveis de brilho, semelhante à dos smartphones e outros laptops equipados com painéis OLED. A frequência seria estável em 239 Hz de 0 a 54% de brilho e 60 Hz de 55 a 100% de brilho.
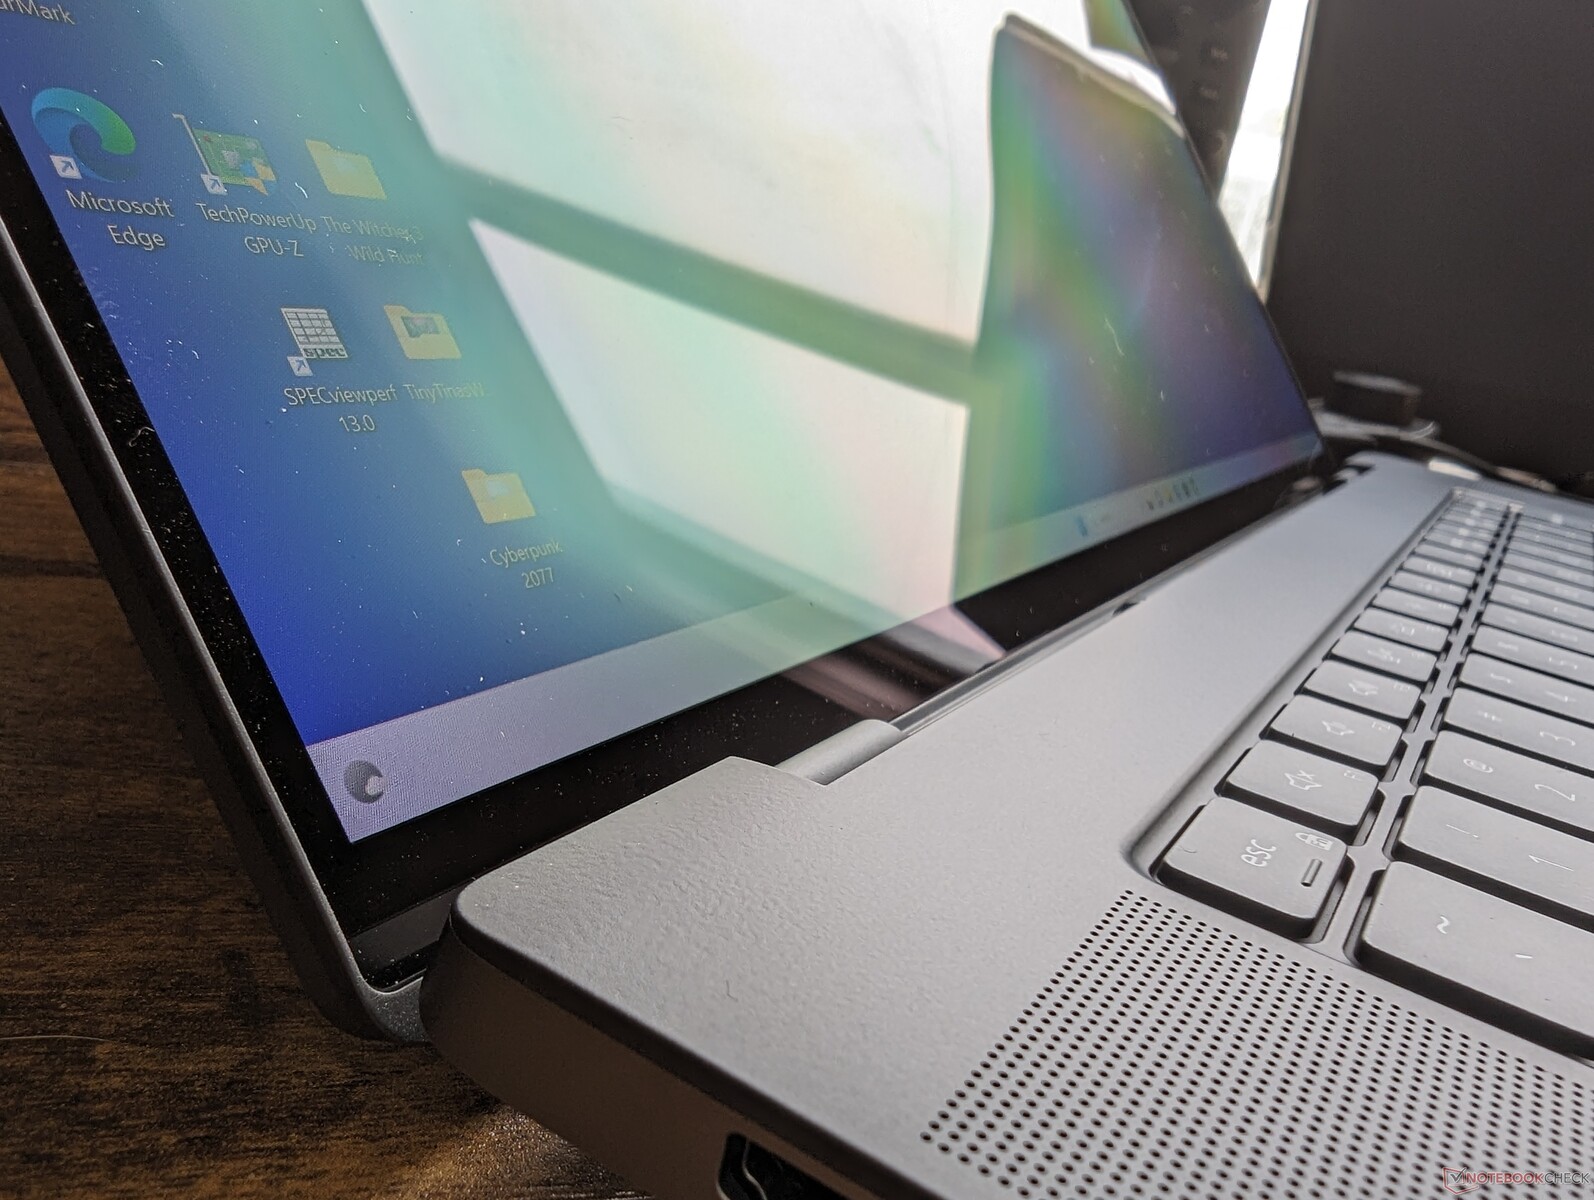
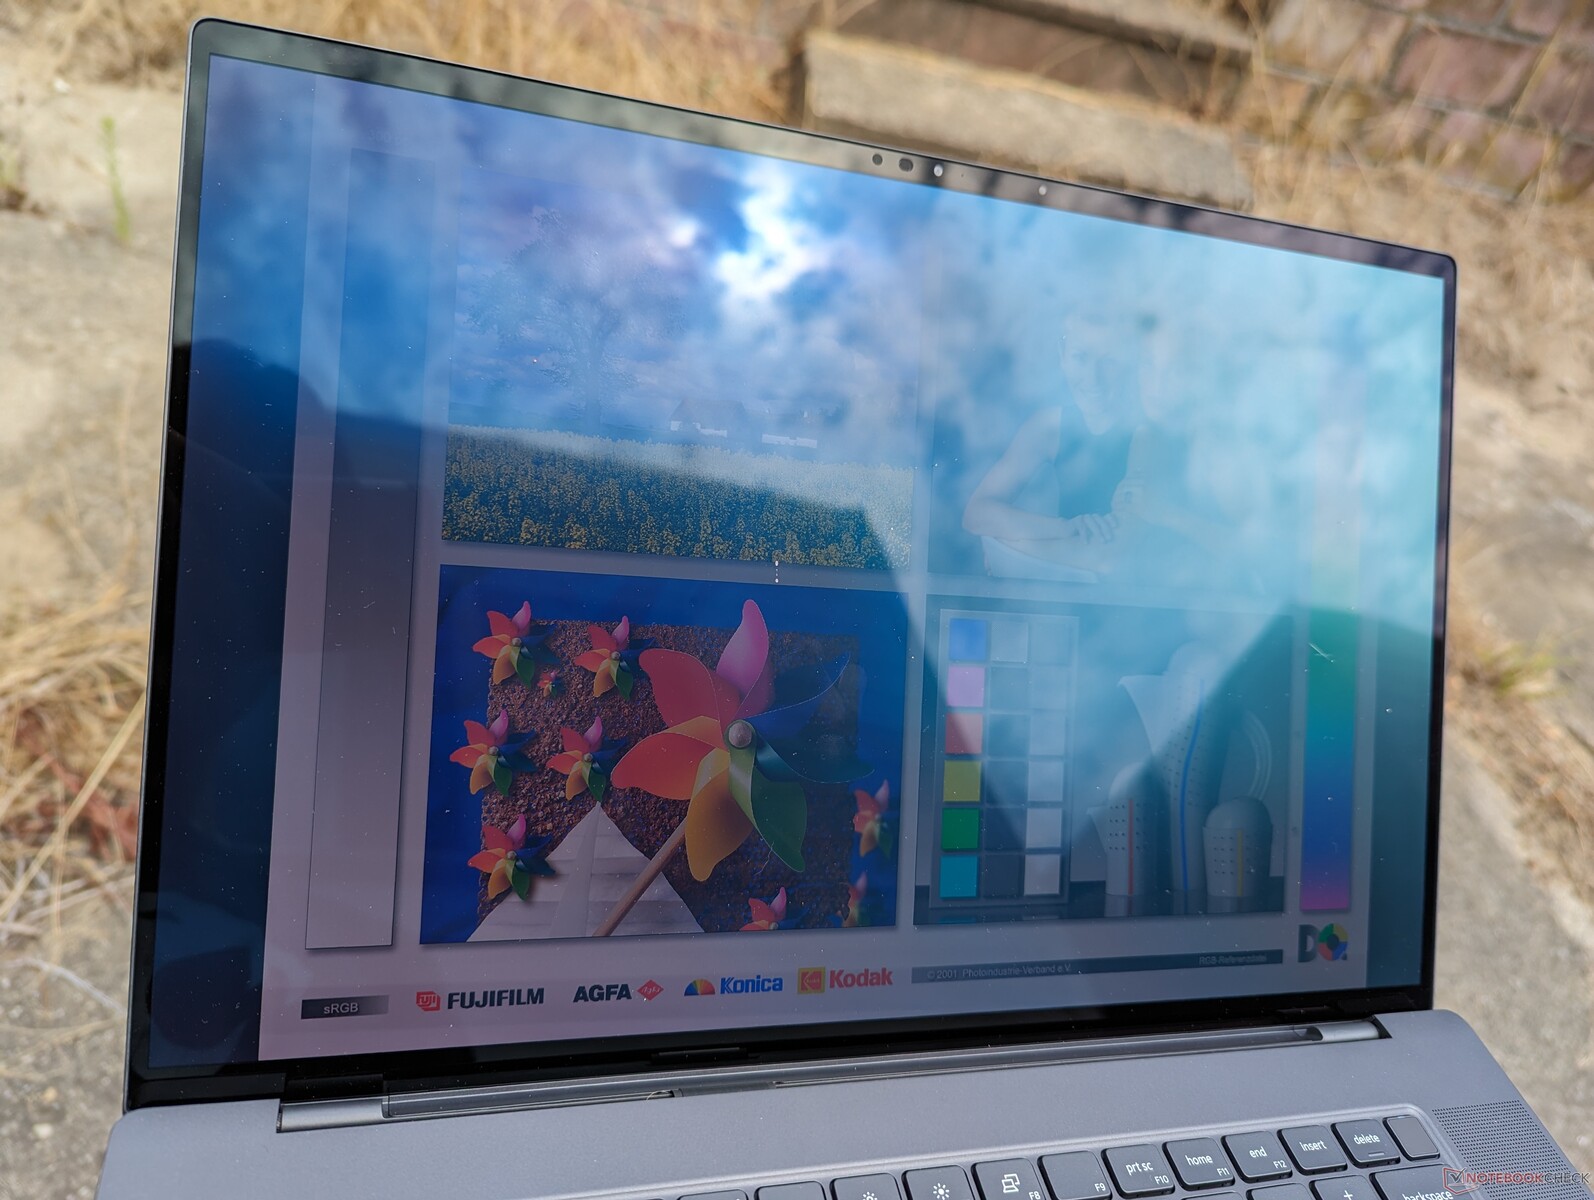
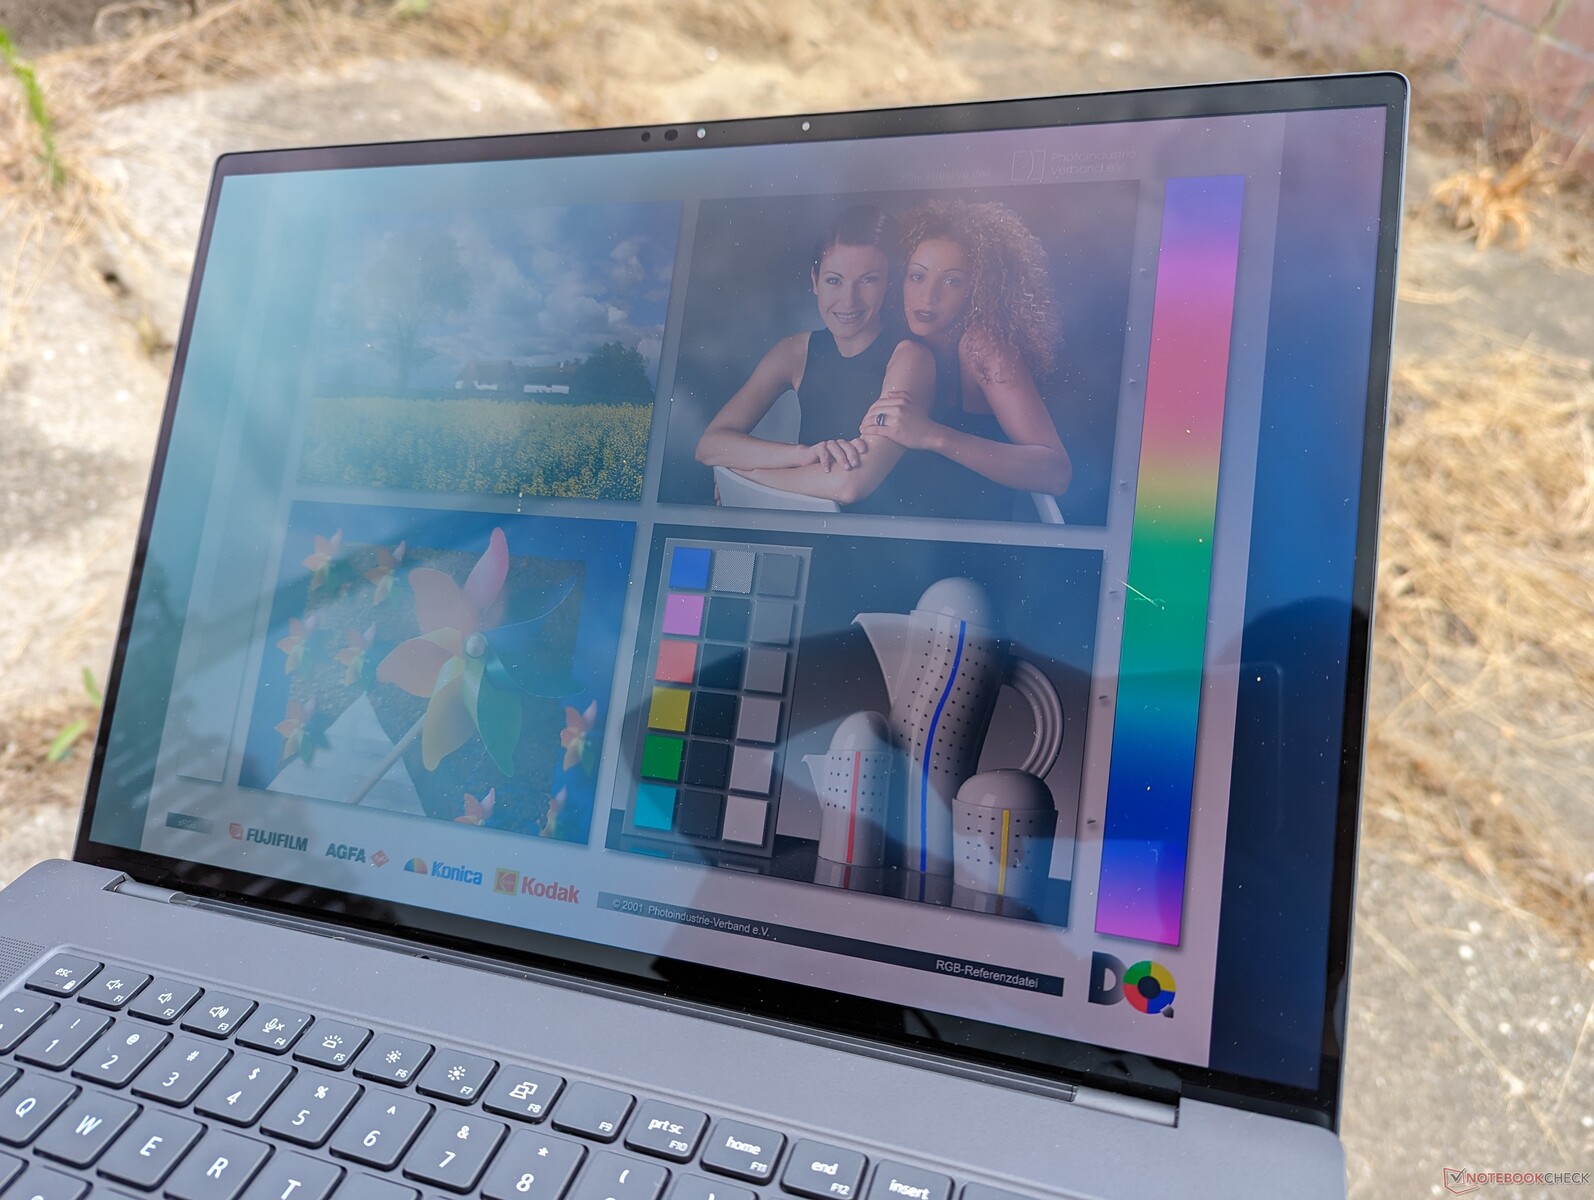
A visibilidade em ambientes externos é mediana, na melhor das hipóteses, pois a tela sensível ao toque OLED brilhante de 350 nit não é tão brilhante quanto as telas IPS do ZBook Fury 16 G9 ou do ThinkPad P16 G1 que pode chegar a 500 a 600 nits.
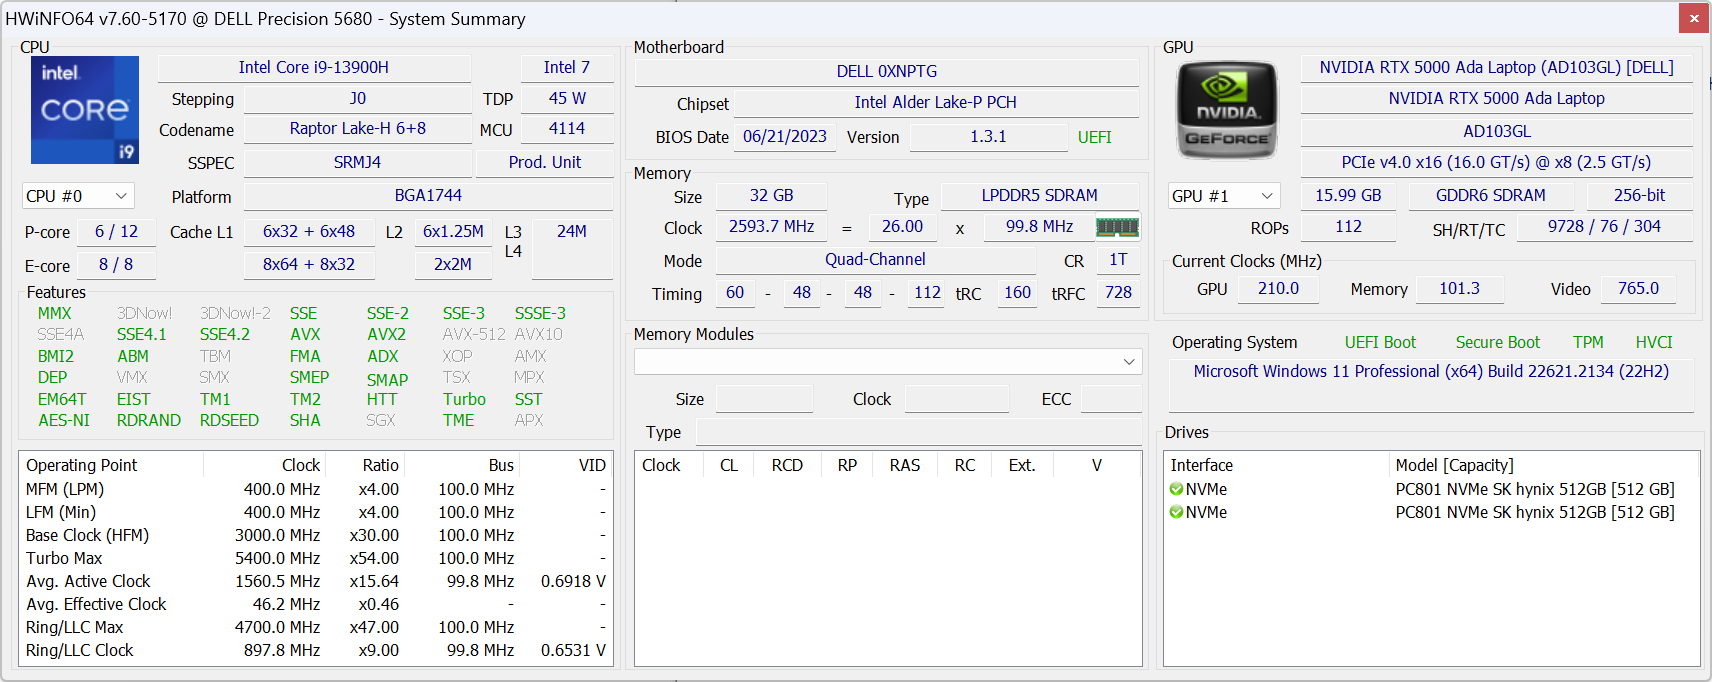
Desempenho - Intel Raptor Lake-H de 13ª geração
Condições de teste
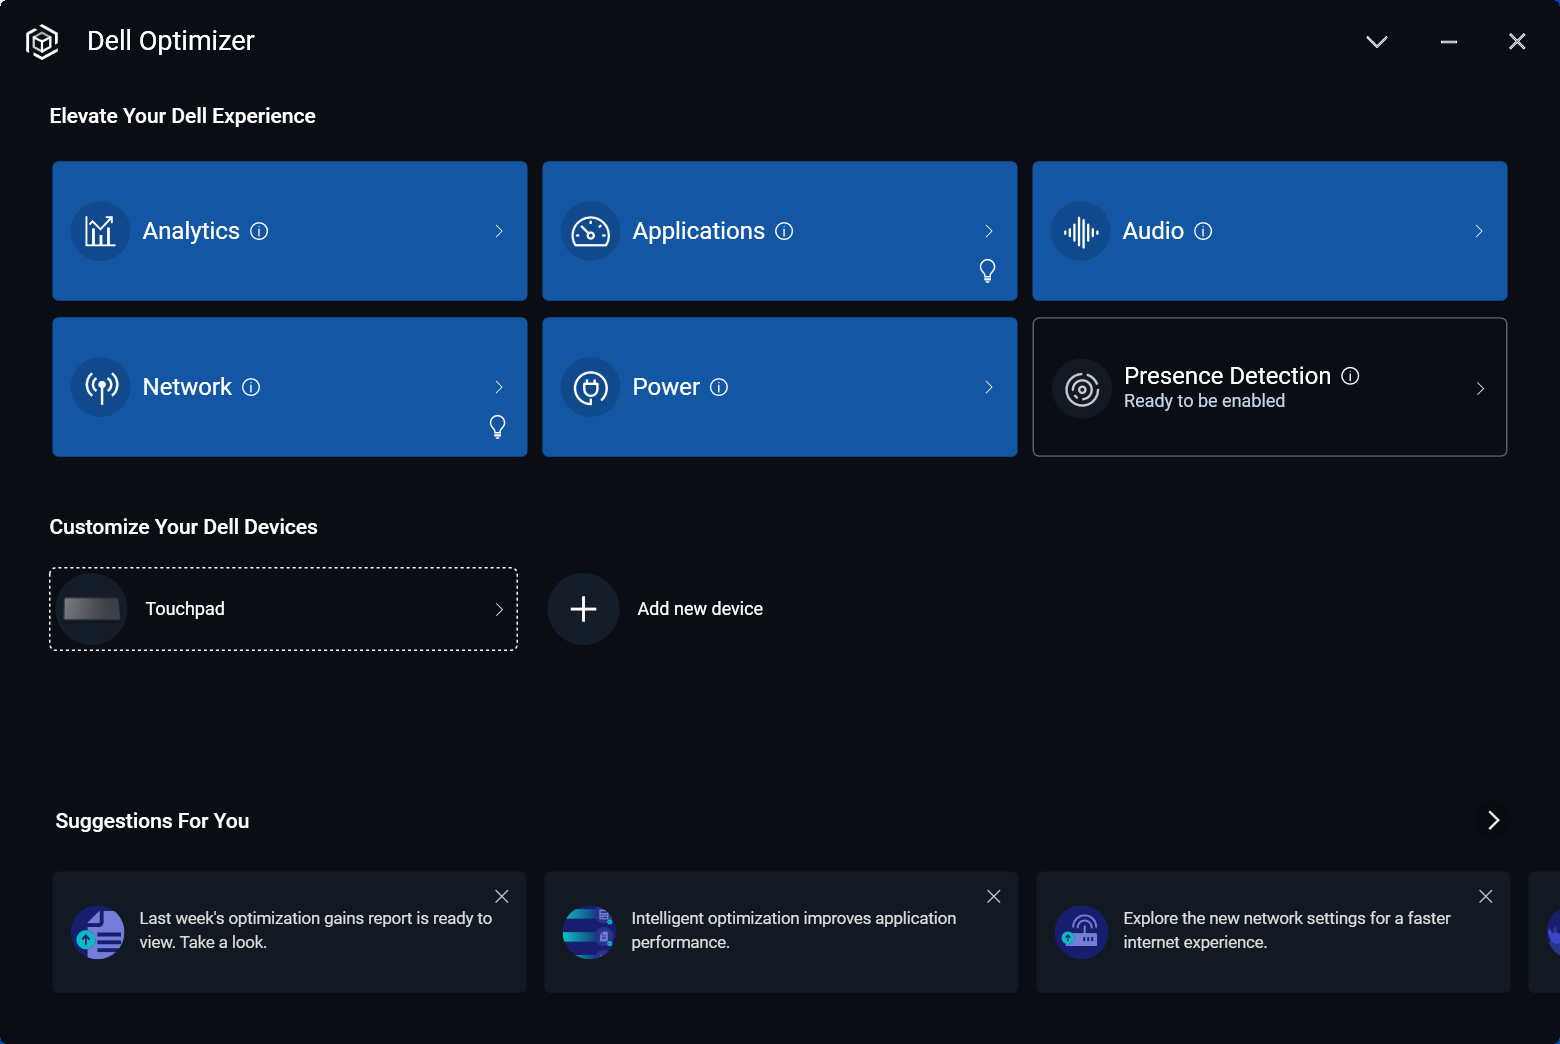
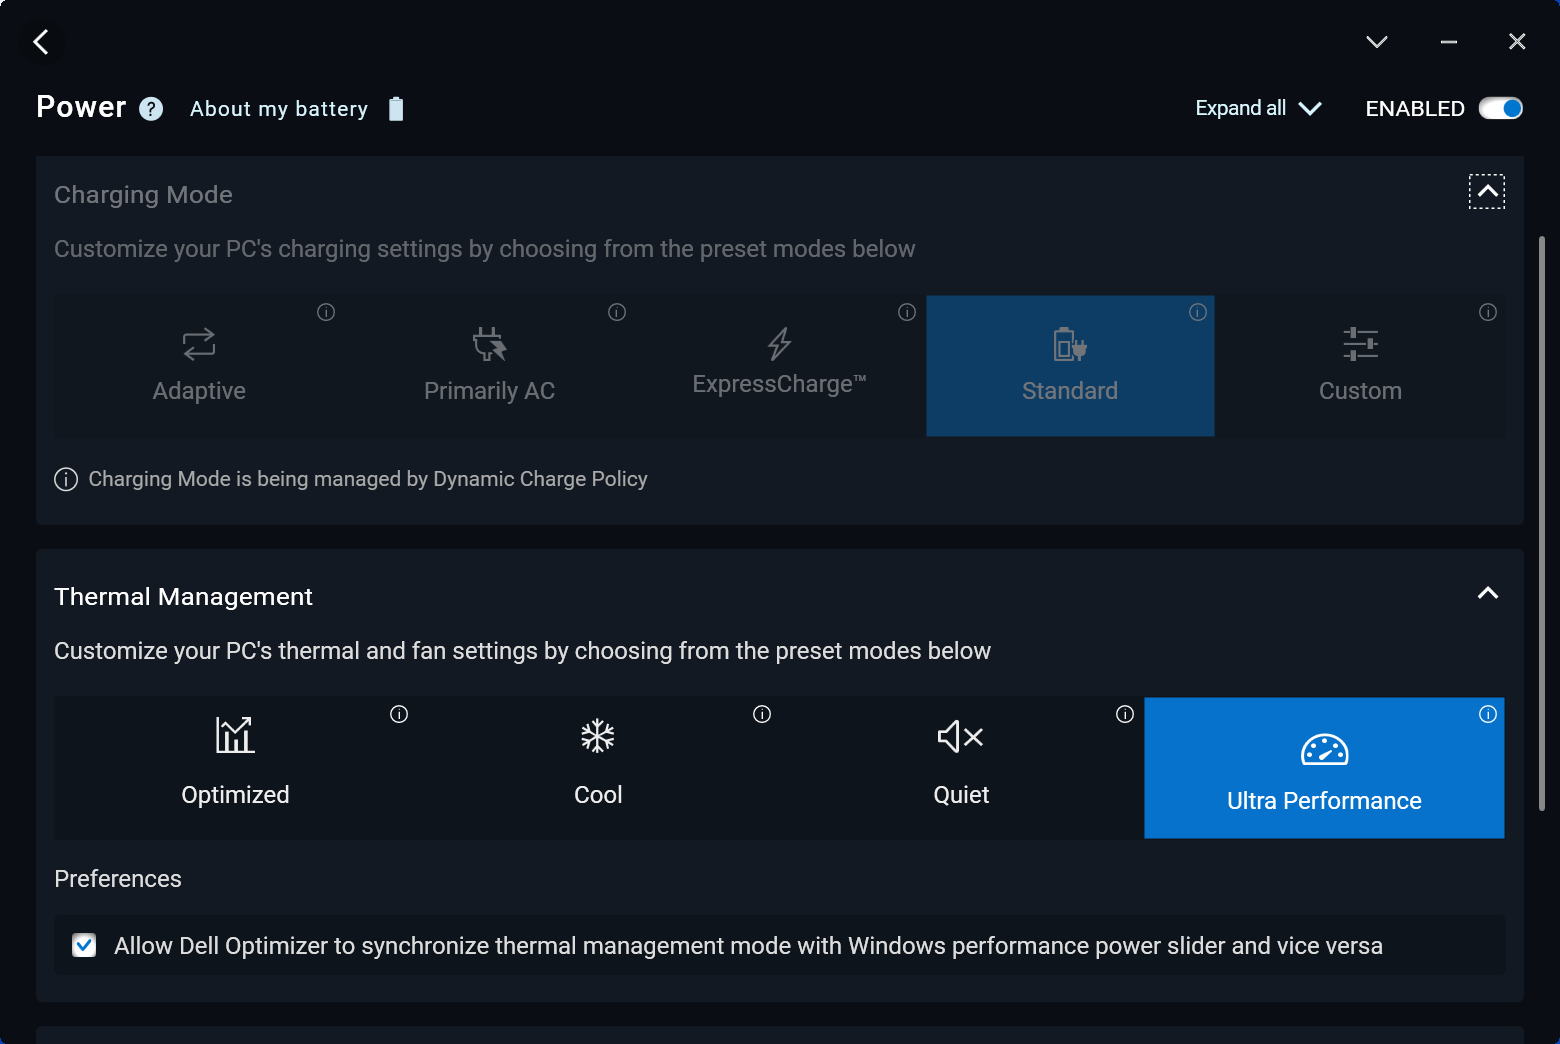
Definimos nossa unidade para o modo Ultra Performance por meio do software Dell Optimizer antes de executar os benchmarks abaixo. Os perfis de energia do Optimizer podem ser convenientemente sincronizados com os perfis de energia do Windows, ao contrário dos perfis de energia especializados da maioria dos outros fabricantes.
O Advanced Optimus ou Optimus 2.0 não é suportado. No entanto, uma novidade nas GPUs para estações de trabalho Ada Lovelace é o modo ECC VRAM, que pode ser ativado ou desativado por meio do Painel de Controle da Nvidia. É necessário reiniciar o computador ao ativar esse recurso.
Processador
O processador de 13ª geração Core i9-13900H é decepcionante no sentido de que não é um avanço notável em relação à 12ª geração do ano passado Core i9-12900H. O desempenho, por exemplo, seria essencialmente idêntico ao doAsus ProArt StudioBook 16 executado com o antigo Core i9-12900H, exceto por um pequeno aumento de 5 a 10% nas operações de thread único. É uma pena que o Precision 5680 não ofereça um Core i9-13900HX que teria proporcionado um aumento muito mais significativo no desempenho em relação a qualquer processador móvel Alder Lake-H.
Observe que também não há opções de processador Xeon ou classe W, o que significa que não há suporte para RAM ECC na série Precision 5680.
Fazer o downgrade para o Core i7-13700H do nosso i9-13900H deverá reduzir o desempenho multi-thread em cerca de 20%, com base em nosso tempo com oSchenker Vision 16 Pro.
Cinebench R15 Multi Loop
Cinebench R23: Multi Core | Single Core
Cinebench R20: CPU (Multi Core) | CPU (Single Core)
Cinebench R15: CPU Multi 64Bit | CPU Single 64Bit
Blender: v2.79 BMW27 CPU
7-Zip 18.03: 7z b 4 | 7z b 4 -mmt1
Geekbench 5.5: Multi-Core | Single-Core
HWBOT x265 Benchmark v2.2: 4k Preset
LibreOffice : 20 Documents To PDF
R Benchmark 2.5: Overall mean
* ... menor é melhor
AIDA64: FP32 Ray-Trace | FPU Julia | CPU SHA3 | CPU Queen | FPU SinJulia | FPU Mandel | CPU AES | CPU ZLib | FP64 Ray-Trace | CPU PhotoWorxx
| Performance rating | |
| Lenovo ThinkPad P16 G1 RTX A5500 | |
| HP ZBook Fury 16 G9 | |
| Dell Precision 5000 5680 | |
| MSI CreatorPro Z16P B12UKST | |
| Asus ExpertBook B6 Flip B6602FC2 | |
| Média Intel Core i9-13900H | |
| Dell Precision 7000 7670 Performance | |
| AIDA64 / FP32 Ray-Trace | |
| Lenovo ThinkPad P16 G1 RTX A5500 | |
| HP ZBook Fury 16 G9 | |
| Asus ExpertBook B6 Flip B6602FC2 | |
| Dell Precision 5000 5680 | |
| Dell Precision 7000 7670 Performance | |
| Média Intel Core i9-13900H (6788 - 19557, n=25) | |
| MSI CreatorPro Z16P B12UKST | |
| AIDA64 / FPU Julia | |
| HP ZBook Fury 16 G9 | |
| Lenovo ThinkPad P16 G1 RTX A5500 | |
| Asus ExpertBook B6 Flip B6602FC2 | |
| Dell Precision 5000 5680 | |
| Dell Precision 7000 7670 Performance | |
| Média Intel Core i9-13900H (22551 - 95579, n=25) | |
| MSI CreatorPro Z16P B12UKST | |
| AIDA64 / CPU SHA3 | |
| Lenovo ThinkPad P16 G1 RTX A5500 | |
| HP ZBook Fury 16 G9 | |
| MSI CreatorPro Z16P B12UKST | |
| Média Intel Core i9-13900H (2491 - 4270, n=25) | |
| Dell Precision 5000 5680 | |
| Asus ExpertBook B6 Flip B6602FC2 | |
| Dell Precision 7000 7670 Performance | |
| AIDA64 / CPU Queen | |
| Dell Precision 5000 5680 | |
| Média Intel Core i9-13900H (65121 - 120936, n=25) | |
| Lenovo ThinkPad P16 G1 RTX A5500 | |
| Dell Precision 7000 7670 Performance | |
| Asus ExpertBook B6 Flip B6602FC2 | |
| HP ZBook Fury 16 G9 | |
| MSI CreatorPro Z16P B12UKST | |
| AIDA64 / FPU SinJulia | |
| Lenovo ThinkPad P16 G1 RTX A5500 | |
| HP ZBook Fury 16 G9 | |
| Asus ExpertBook B6 Flip B6602FC2 | |
| Dell Precision 7000 7670 Performance | |
| Dell Precision 5000 5680 | |
| Média Intel Core i9-13900H (6108 - 11631, n=25) | |
| MSI CreatorPro Z16P B12UKST | |
| AIDA64 / FPU Mandel | |
| HP ZBook Fury 16 G9 | |
| Lenovo ThinkPad P16 G1 RTX A5500 | |
| Asus ExpertBook B6 Flip B6602FC2 | |
| Dell Precision 5000 5680 | |
| Média Intel Core i9-13900H (11283 - 48474, n=25) | |
| Dell Precision 7000 7670 Performance | |
| MSI CreatorPro Z16P B12UKST | |
| AIDA64 / CPU ZLib | |
| Lenovo ThinkPad P16 G1 RTX A5500 | |
| HP ZBook Fury 16 G9 | |
| Média Intel Core i9-13900H (789 - 1254, n=25) | |
| Asus ExpertBook B6 Flip B6602FC2 | |
| MSI CreatorPro Z16P B12UKST | |
| Dell Precision 5000 5680 | |
| Dell Precision 7000 7670 Performance | |
| AIDA64 / FP64 Ray-Trace | |
| Lenovo ThinkPad P16 G1 RTX A5500 | |
| HP ZBook Fury 16 G9 | |
| Asus ExpertBook B6 Flip B6602FC2 | |
| Dell Precision 5000 5680 | |
| Dell Precision 7000 7670 Performance | |
| Média Intel Core i9-13900H (3655 - 10716, n=25) | |
| MSI CreatorPro Z16P B12UKST | |
| AIDA64 / CPU PhotoWorxx | |
| Dell Precision 5000 5680 | |
| MSI CreatorPro Z16P B12UKST | |
| Dell Precision 7000 7670 Performance | |
| Lenovo ThinkPad P16 G1 RTX A5500 | |
| Média Intel Core i9-13900H (10871 - 50488, n=25) | |
| HP ZBook Fury 16 G9 | |
| Asus ExpertBook B6 Flip B6602FC2 | |
Desempenho do sistema
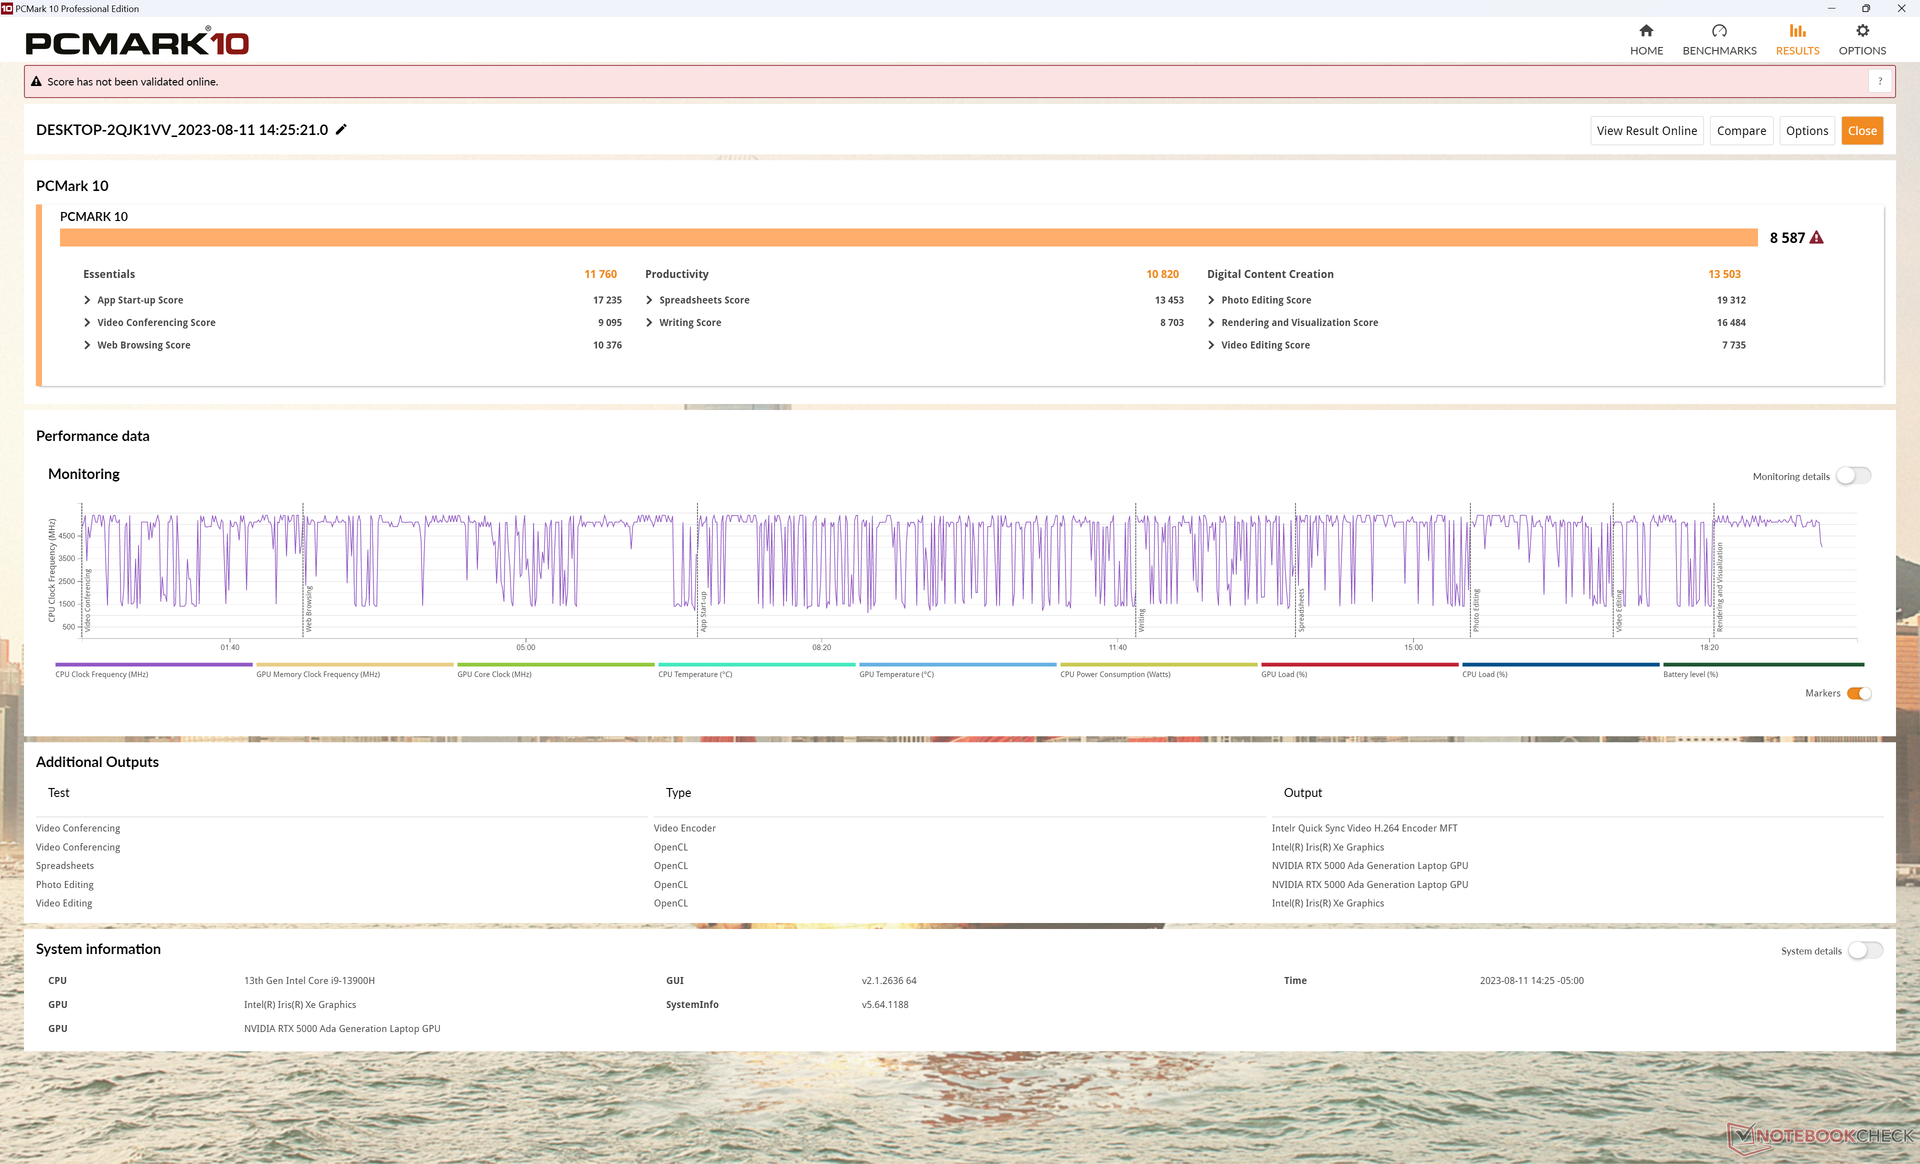
As pontuações do PCMark são mais altas do que na maioria das outras estações de trabalho por margens relativamente grandes, incluindo até mesmo algumas potências como a HP ZBook Fury 16 G9 ou aPrecision desempenho do 7670. Isso pode ser atribuído à nossa configuração de SSD RAID 0 e à GPU RTX 5000, enquanto a maioria das outras estações de trabalho está sendo executada em SSDs únicos e GPUs de geração mais antiga.
CrossMark: Overall | Productivity | Creativity | Responsiveness
| PCMark 10 / Score | |
| Dell Precision 5000 5680 | |
| Média Intel Core i9-13900H, NVIDIA RTX 5000 Ada Generation Laptop (n=1) | |
| Asus ExpertBook B6 Flip B6602FC2 | |
| Lenovo ThinkPad P16 G1 RTX A5500 | |
| MSI CreatorPro Z16P B12UKST | |
| HP ZBook Fury 16 G9 | |
| Dell Precision 7000 7670 Performance | |
| PCMark 10 / Essentials | |
| Dell Precision 5000 5680 | |
| Média Intel Core i9-13900H, NVIDIA RTX 5000 Ada Generation Laptop (n=1) | |
| Dell Precision 7000 7670 Performance | |
| HP ZBook Fury 16 G9 | |
| Lenovo ThinkPad P16 G1 RTX A5500 | |
| Asus ExpertBook B6 Flip B6602FC2 | |
| MSI CreatorPro Z16P B12UKST | |
| PCMark 10 / Productivity | |
| Dell Precision 5000 5680 | |
| Média Intel Core i9-13900H, NVIDIA RTX 5000 Ada Generation Laptop (n=1) | |
| Asus ExpertBook B6 Flip B6602FC2 | |
| Lenovo ThinkPad P16 G1 RTX A5500 | |
| MSI CreatorPro Z16P B12UKST | |
| HP ZBook Fury 16 G9 | |
| Dell Precision 7000 7670 Performance | |
| PCMark 10 / Digital Content Creation | |
| Dell Precision 5000 5680 | |
| Média Intel Core i9-13900H, NVIDIA RTX 5000 Ada Generation Laptop (n=1) | |
| Lenovo ThinkPad P16 G1 RTX A5500 | |
| MSI CreatorPro Z16P B12UKST | |
| Dell Precision 7000 7670 Performance | |
| HP ZBook Fury 16 G9 | |
| Asus ExpertBook B6 Flip B6602FC2 | |
| CrossMark / Overall | |
| Asus ExpertBook B6 Flip B6602FC2 | |
| MSI CreatorPro Z16P B12UKST | |
| Dell Precision 5000 5680 | |
| Média Intel Core i9-13900H, NVIDIA RTX 5000 Ada Generation Laptop (n=1) | |
| HP ZBook Fury 16 G9 | |
| Lenovo ThinkPad P16 G1 RTX A5500 | |
| Dell Precision 7000 7670 Performance | |
| CrossMark / Productivity | |
| Asus ExpertBook B6 Flip B6602FC2 | |
| MSI CreatorPro Z16P B12UKST | |
| Dell Precision 5000 5680 | |
| Média Intel Core i9-13900H, NVIDIA RTX 5000 Ada Generation Laptop (n=1) | |
| HP ZBook Fury 16 G9 | |
| Lenovo ThinkPad P16 G1 RTX A5500 | |
| Dell Precision 7000 7670 Performance | |
| CrossMark / Creativity | |
| Lenovo ThinkPad P16 G1 RTX A5500 | |
| Dell Precision 5000 5680 | |
| Média Intel Core i9-13900H, NVIDIA RTX 5000 Ada Generation Laptop (n=1) | |
| Asus ExpertBook B6 Flip B6602FC2 | |
| HP ZBook Fury 16 G9 | |
| MSI CreatorPro Z16P B12UKST | |
| Dell Precision 7000 7670 Performance | |
| CrossMark / Responsiveness | |
| MSI CreatorPro Z16P B12UKST | |
| Asus ExpertBook B6 Flip B6602FC2 | |
| HP ZBook Fury 16 G9 | |
| Dell Precision 5000 5680 | |
| Média Intel Core i9-13900H, NVIDIA RTX 5000 Ada Generation Laptop (n=1) | |
| Dell Precision 7000 7670 Performance | |
| Lenovo ThinkPad P16 G1 RTX A5500 | |
| PCMark 10 Score | 8587 pontos | |
Ajuda | ||
| AIDA64 / Memory Copy | |
| Dell Precision 5000 5680 | |
| Dell Precision 7000 7670 Performance | |
| Lenovo ThinkPad P16 G1 RTX A5500 | |
| MSI CreatorPro Z16P B12UKST | |
| Média Intel Core i9-13900H (37448 - 74486, n=25) | |
| HP ZBook Fury 16 G9 | |
| Asus ExpertBook B6 Flip B6602FC2 | |
| AIDA64 / Memory Read | |
| Dell Precision 7000 7670 Performance | |
| Dell Precision 5000 5680 | |
| MSI CreatorPro Z16P B12UKST | |
| Lenovo ThinkPad P16 G1 RTX A5500 | |
| Média Intel Core i9-13900H (41599 - 75433, n=25) | |
| Asus ExpertBook B6 Flip B6602FC2 | |
| HP ZBook Fury 16 G9 | |
| AIDA64 / Memory Write | |
| Dell Precision 5000 5680 | |
| MSI CreatorPro Z16P B12UKST | |
| Dell Precision 7000 7670 Performance | |
| Média Intel Core i9-13900H (36152 - 88505, n=25) | |
| Lenovo ThinkPad P16 G1 RTX A5500 | |
| Asus ExpertBook B6 Flip B6602FC2 | |
| HP ZBook Fury 16 G9 | |
| AIDA64 / Memory Latency | |
| MSI CreatorPro Z16P B12UKST | |
| Asus ExpertBook B6 Flip B6602FC2 | |
| Dell Precision 5000 5680 | |
| HP ZBook Fury 16 G9 | |
| Lenovo ThinkPad P16 G1 RTX A5500 | |
| Média Intel Core i9-13900H (75.8 - 102.3, n=25) | |
| Dell Precision 7000 7670 Performance | |
* ... menor é melhor
Latência DPC
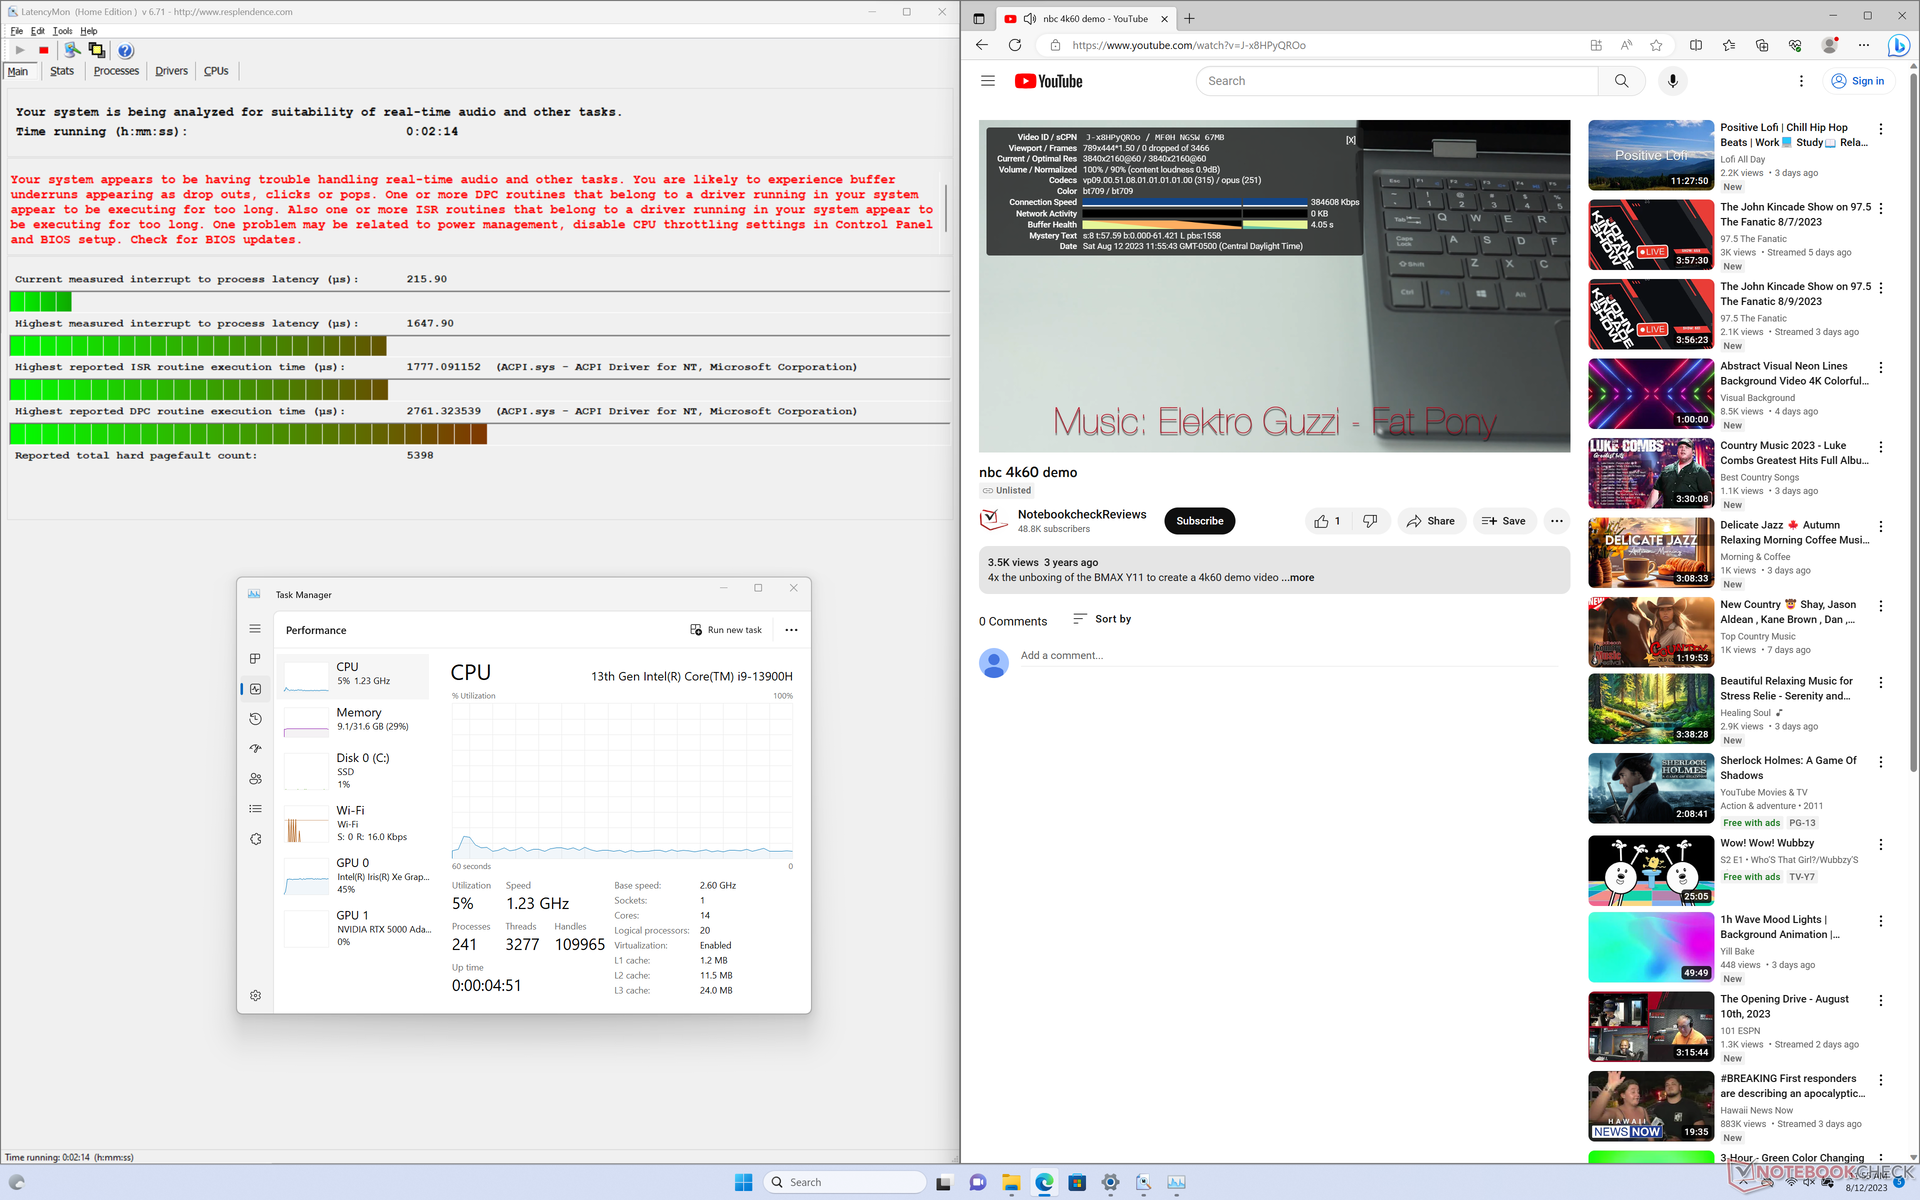
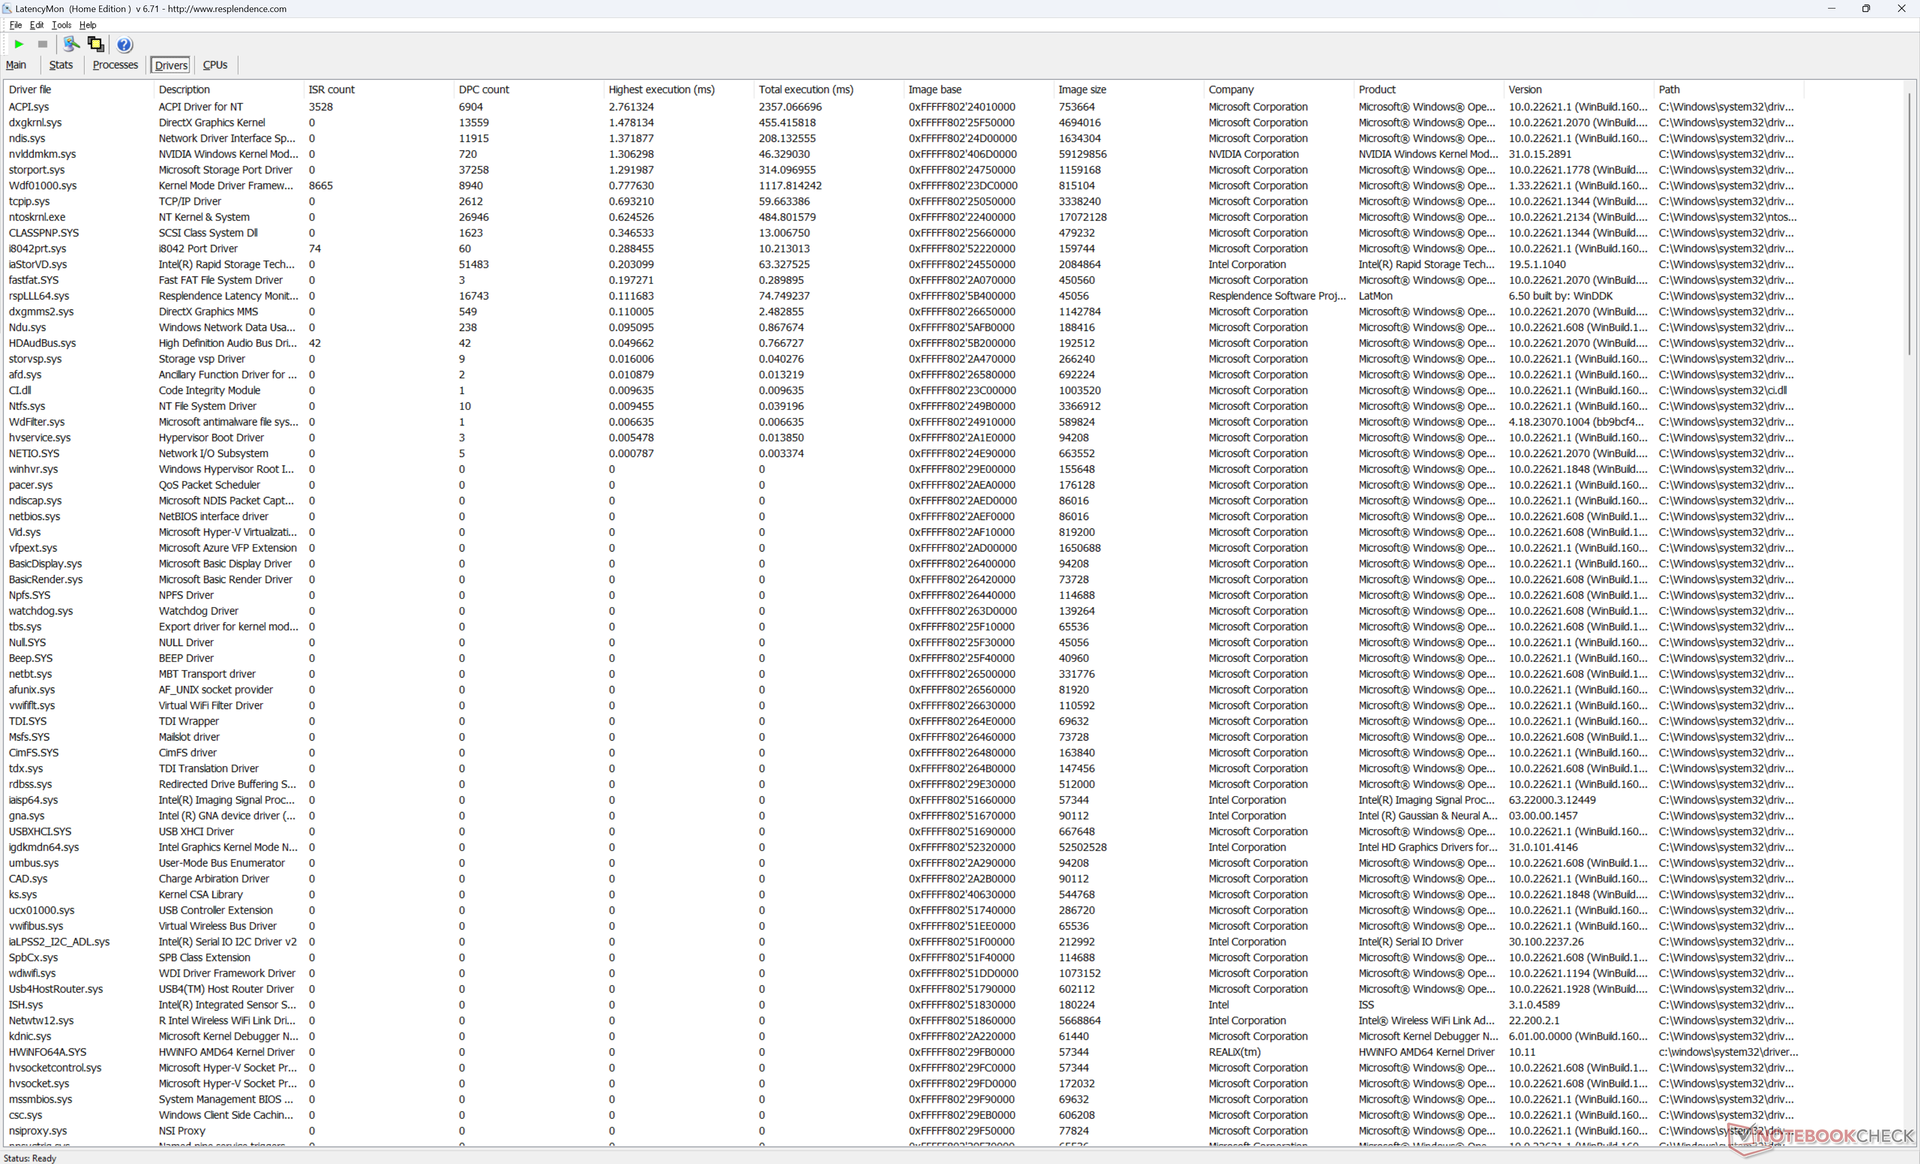
O LatencyMon revela problemas leves de DPC ao abrir várias guias do navegador em nossa página inicial, semelhante ao que observamos no Precision 7670. a reprodução de vídeo 4K a 60 FPS é perfeita, sem registro de queda de quadros.
| DPC Latencies / LatencyMon - interrupt to process latency (max), Web, Youtube, Prime95 | |
| HP ZBook Fury 16 G9 | |
| Asus ExpertBook B6 Flip B6602FC2 | |
| Dell Precision 7000 7670 Performance | |
| Dell Precision 5000 5680 | |
| Lenovo ThinkPad P16 G1 RTX A5500 | |
| MSI CreatorPro Z16P B12UKST | |
* ... menor é melhor
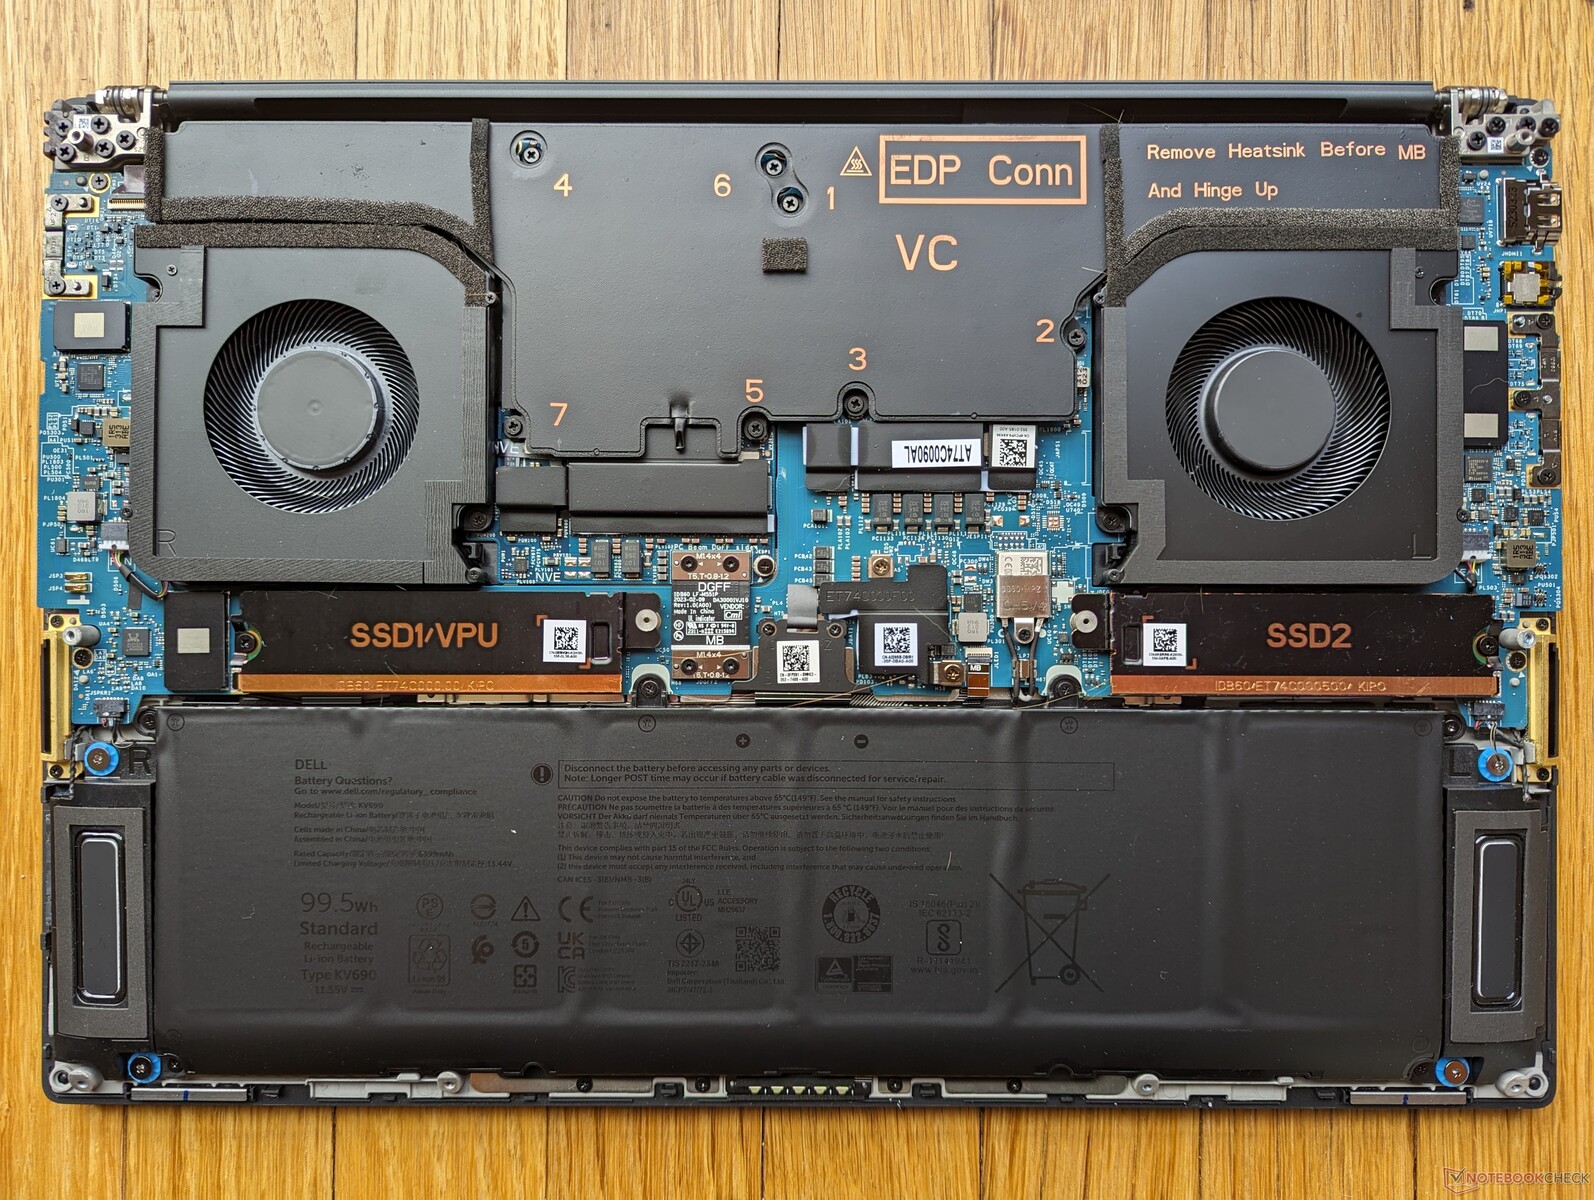
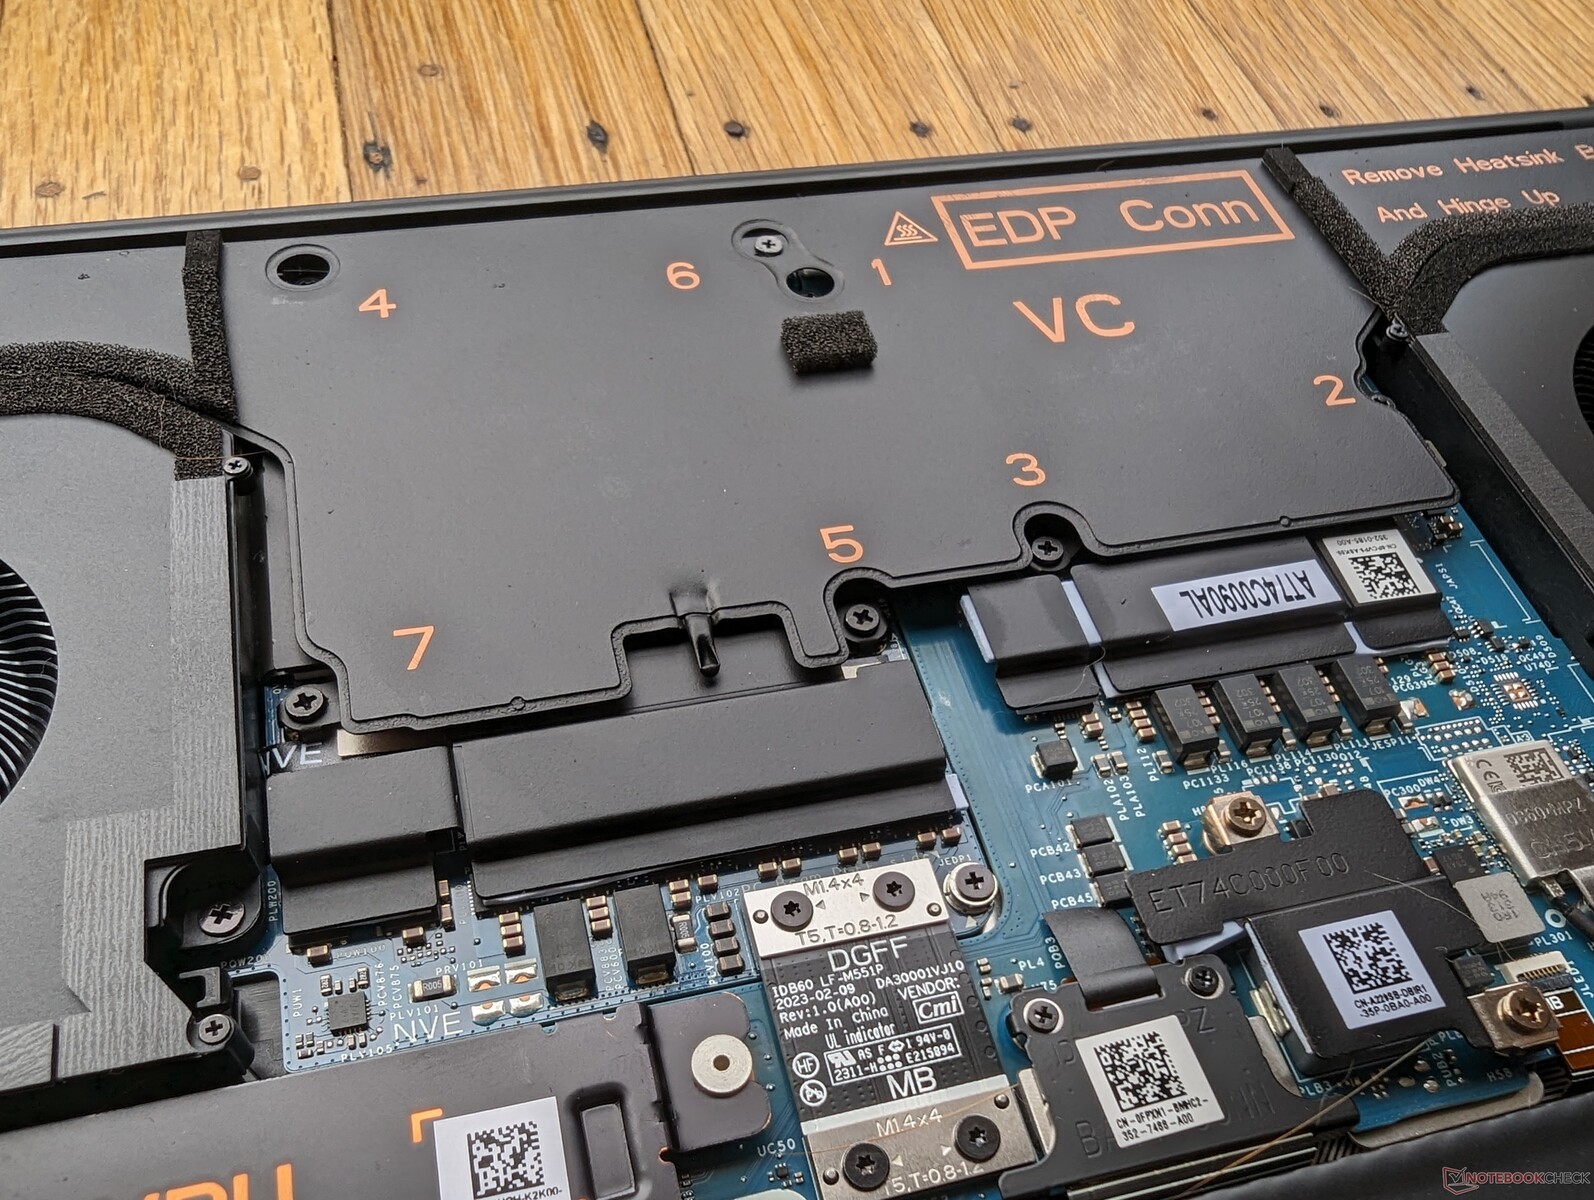
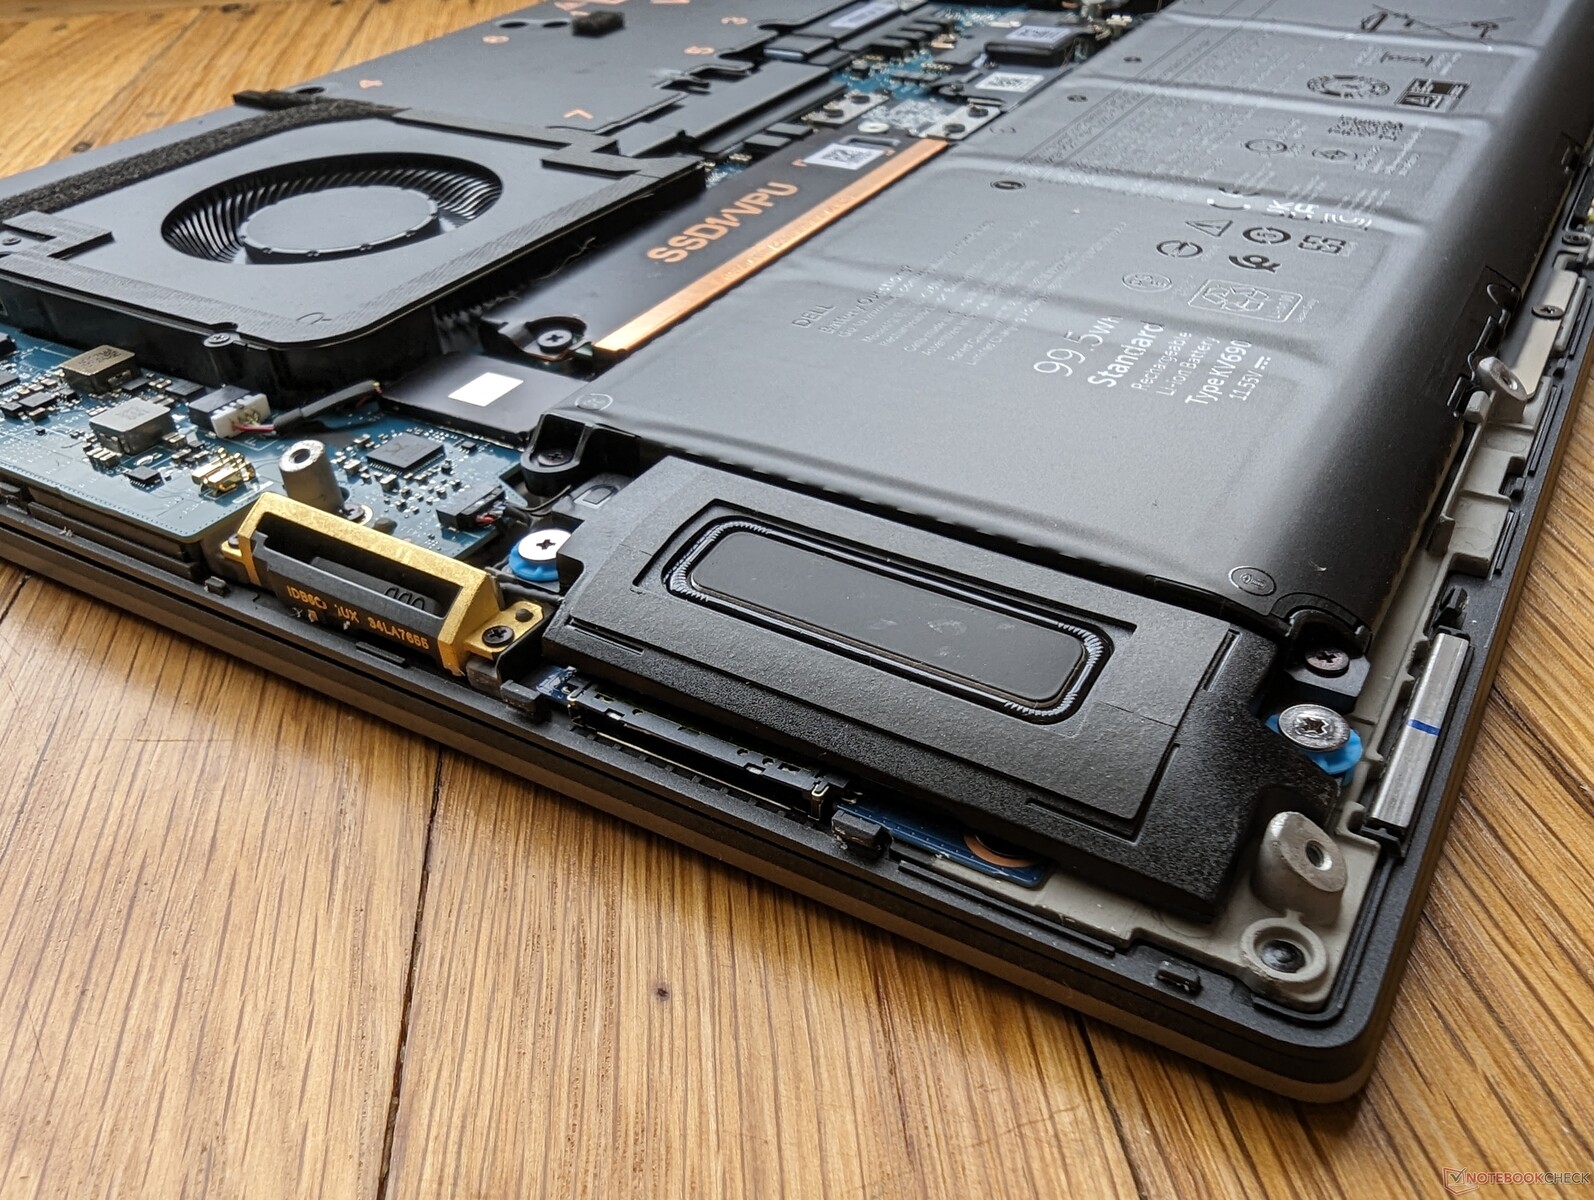
Dispositivos de armazenamento - Até dois SSDs NVMe PCIe4 x4
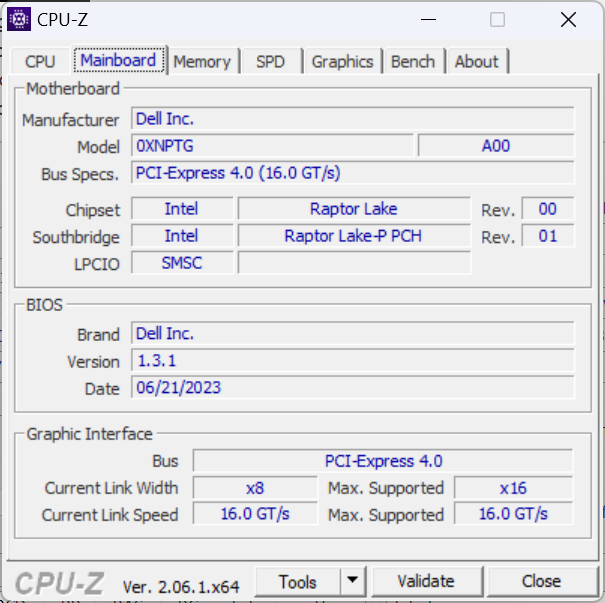
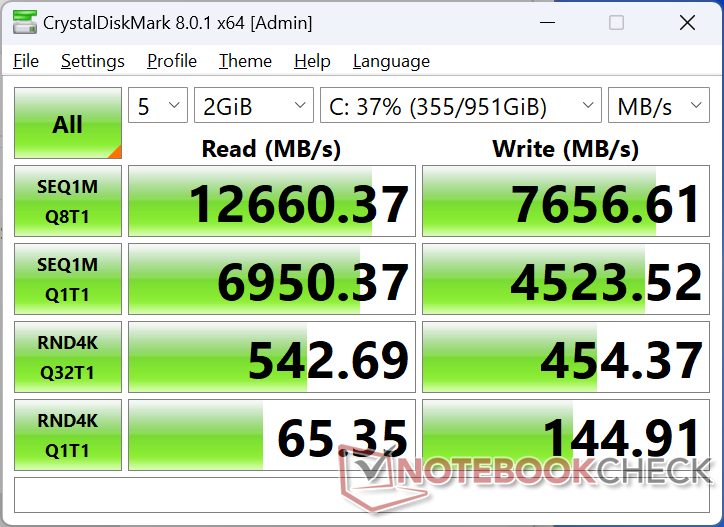
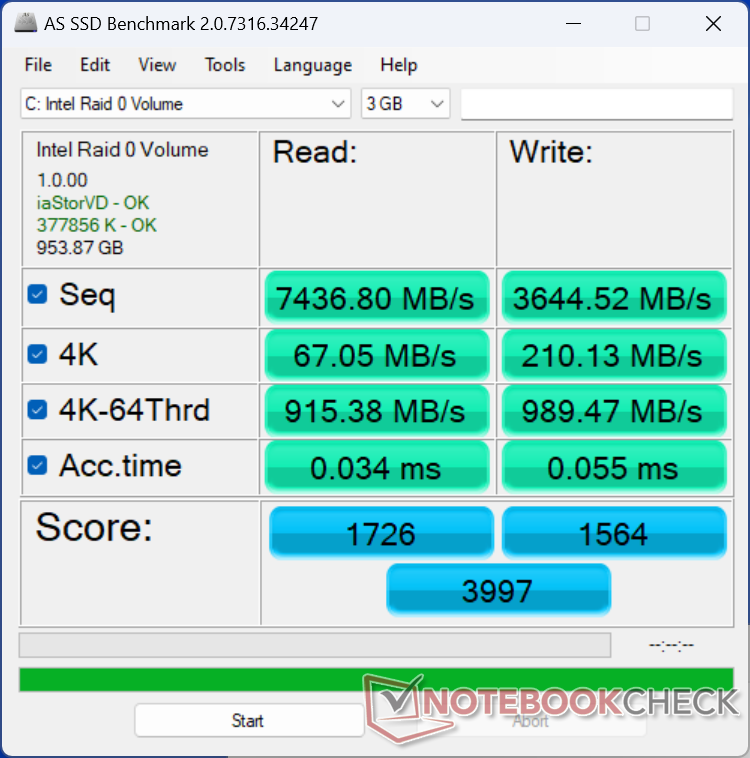
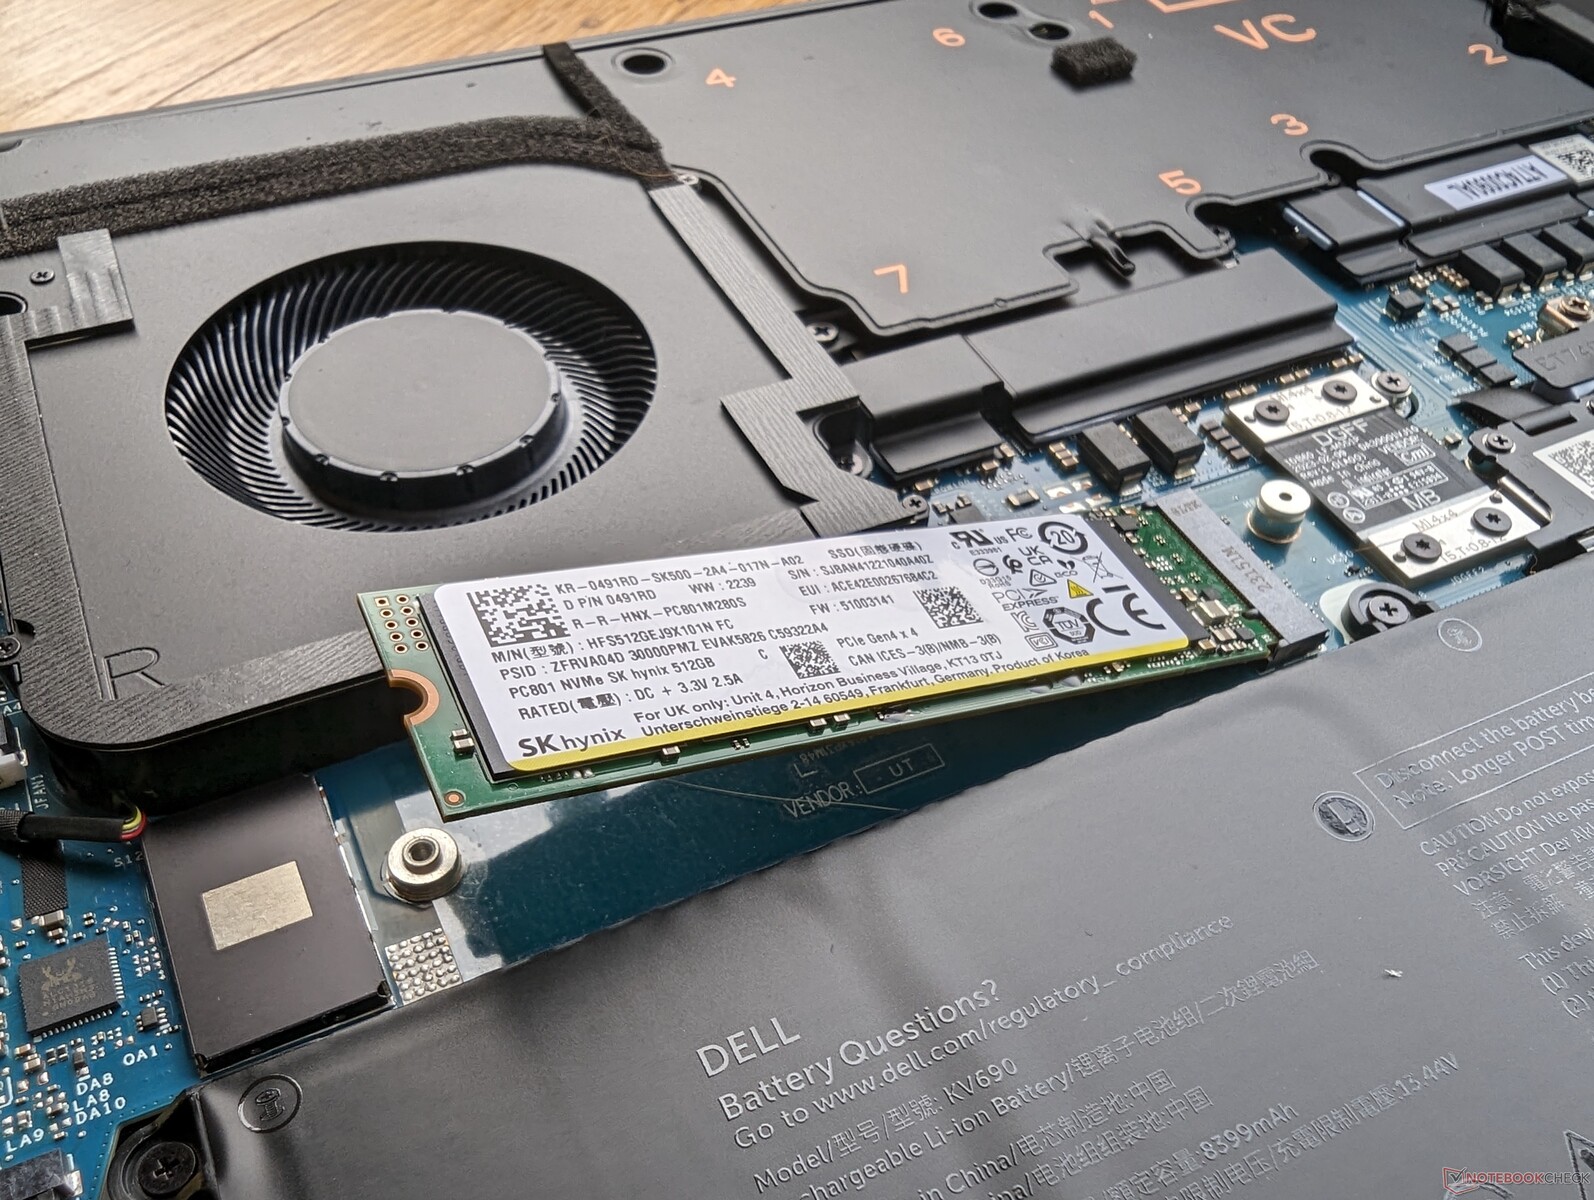
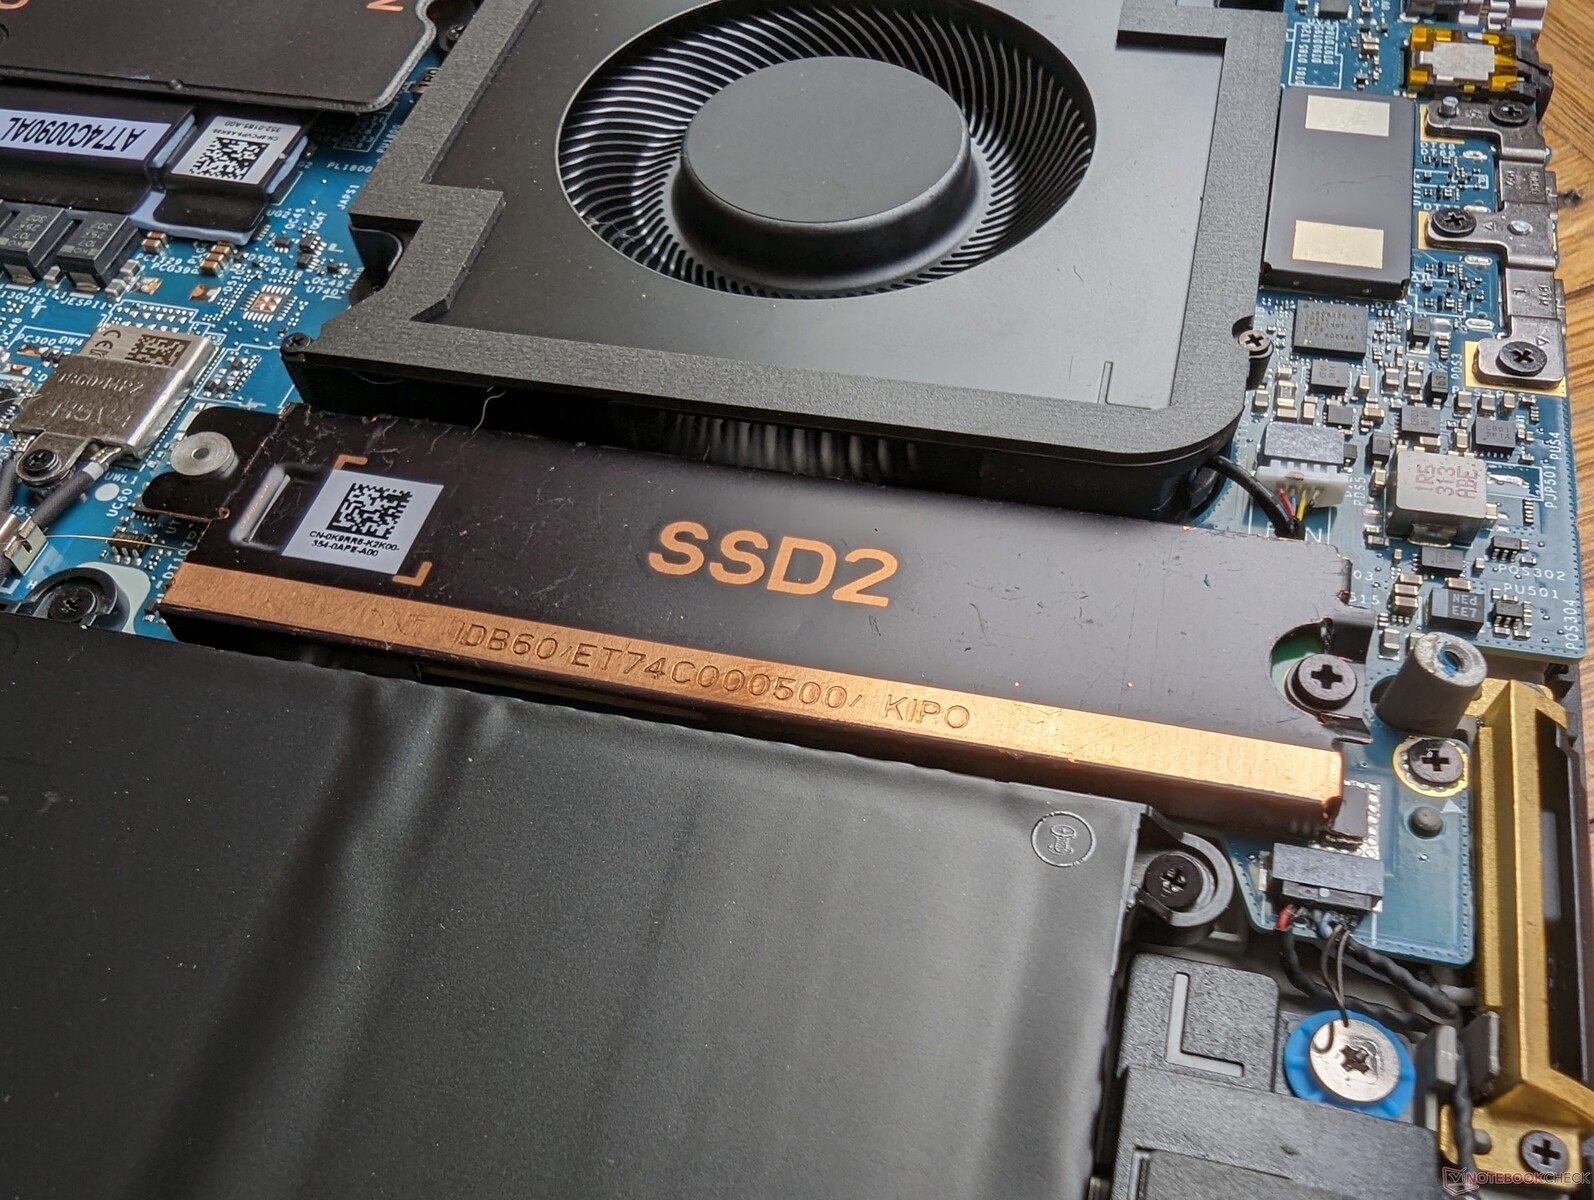
Nossa unidade de teste vem com o mesmo SK hynix PC801 PCIe4 x4 NVMe SSDs na configuração RAID 0 encontrada na série Precision 7670. Embora o suporte a PCIe5, como em alguns laptops para jogos teria sido bom ver, mas não é um recurso importante no momento, dada a raridade dos SSDs PCIe5. A Dell oferece opções de SSD com criptografia automática para segurança adicional.
Cada slot de SSD M.2 vem com um dissipador de calor de cobre, conforme mostrado abaixo, para ajudar no resfriamento. Cada unidade em nossa unidade não teve problemas para manter altas taxas de transferência de ~5400 MB/s durante longos períodos, sem apresentar problemas graves de limitação.

* ... menor é melhor
Disk Throttling: DiskSpd Read Loop, Queue Depth 8
Desempenho da GPU - 70 W Nvidia Ada Lovelace
O novo RTX 5000 oferece vantagens de desempenho notáveis em relação ao RTX A5000 e A5500 especialmente em aplicativos DX12 e na aceleração CUDA do Blender. Time Spy o Blender, por exemplo, teria uma pontuação de 30 a 40 por cento maior em nosso site Precision do que noMSI WE76 ou no Lenovo ThinkPad P16 G1, cada um deles executado em GPUs Ampere mais antigas. As vantagens também se estendem à maioria dos subtestes do Specviewperf.
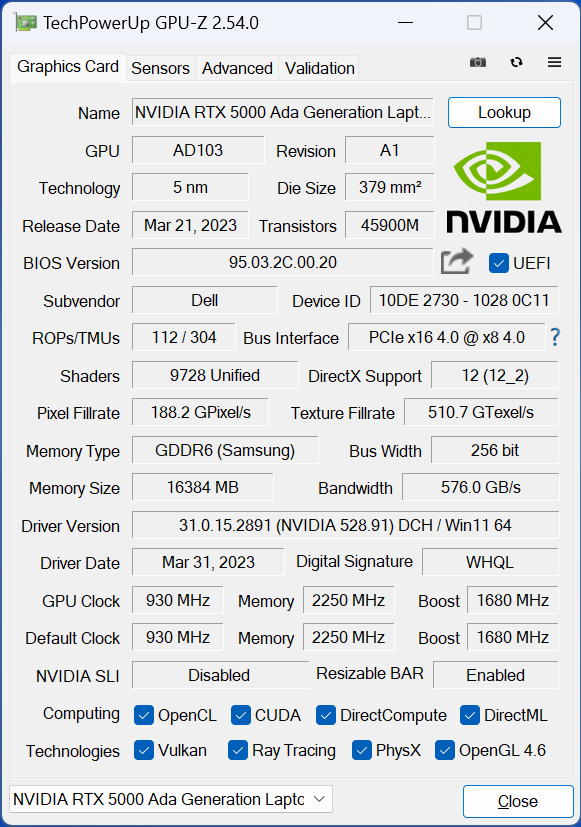
A ativação do modo ECC VRAM não parece afetar as taxas de clock da memória, mas a VRAM máxima disponível diminuiria de 16384 MB para 15360 MB, de acordo com o GPU-Z.
Observe que não há grande impacto no desempenho da GPU quando se muda do modo Performance para o modo Balanced, como mostram os resultados do site Fire Strike abaixo. Em vez disso, o desempenho da CPU sofreria um impacto notável.
| Perfil de energia | Pontuação de física | Pontuação de gráficos | Pontuação combinada |
| Energia da bateria | 20938 (-31%) | 27514 (-10%) | 8910 (-31%) |
| Modo equilibrado | 24828 (-18%) | 30588 (-0%) | 11365 (-12%) |
| Modo de desempenho | 30237 | 30422 | 12907 |
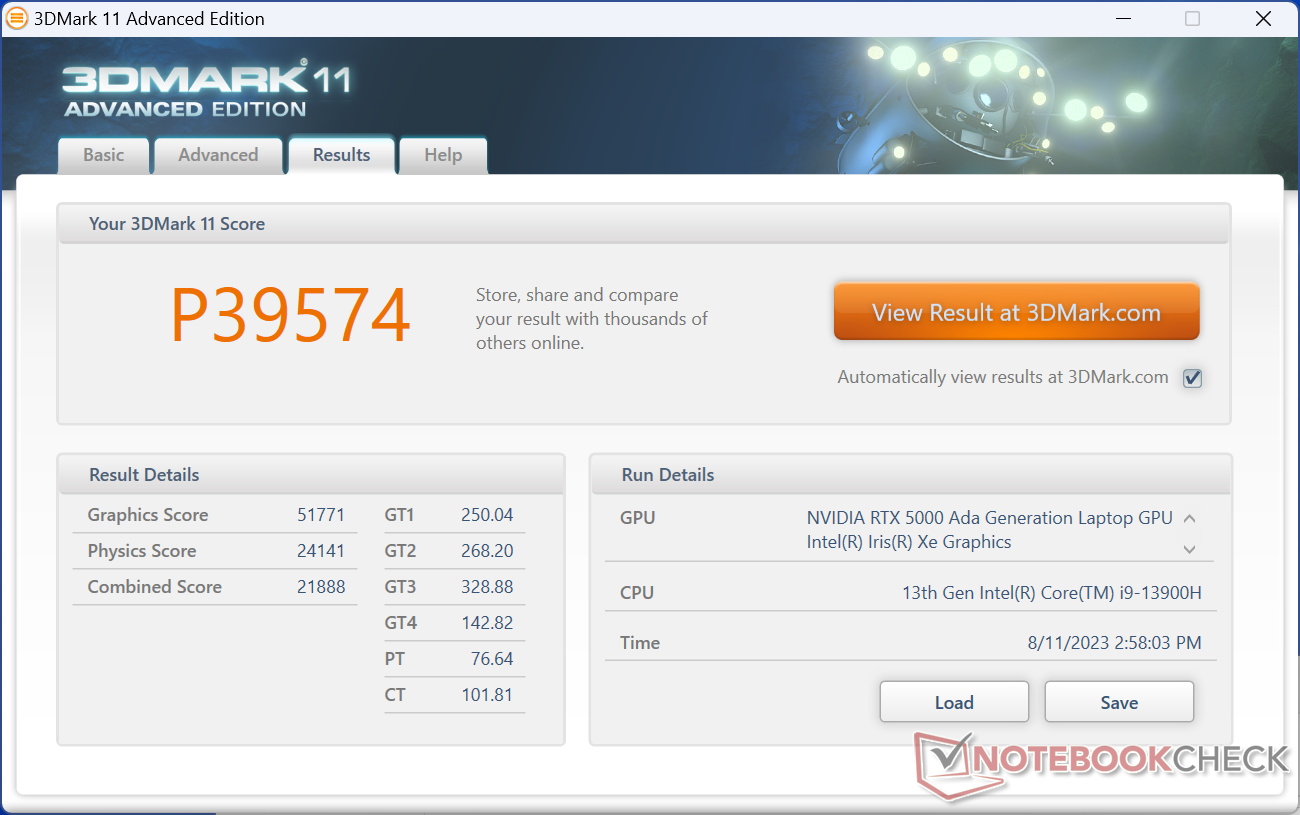
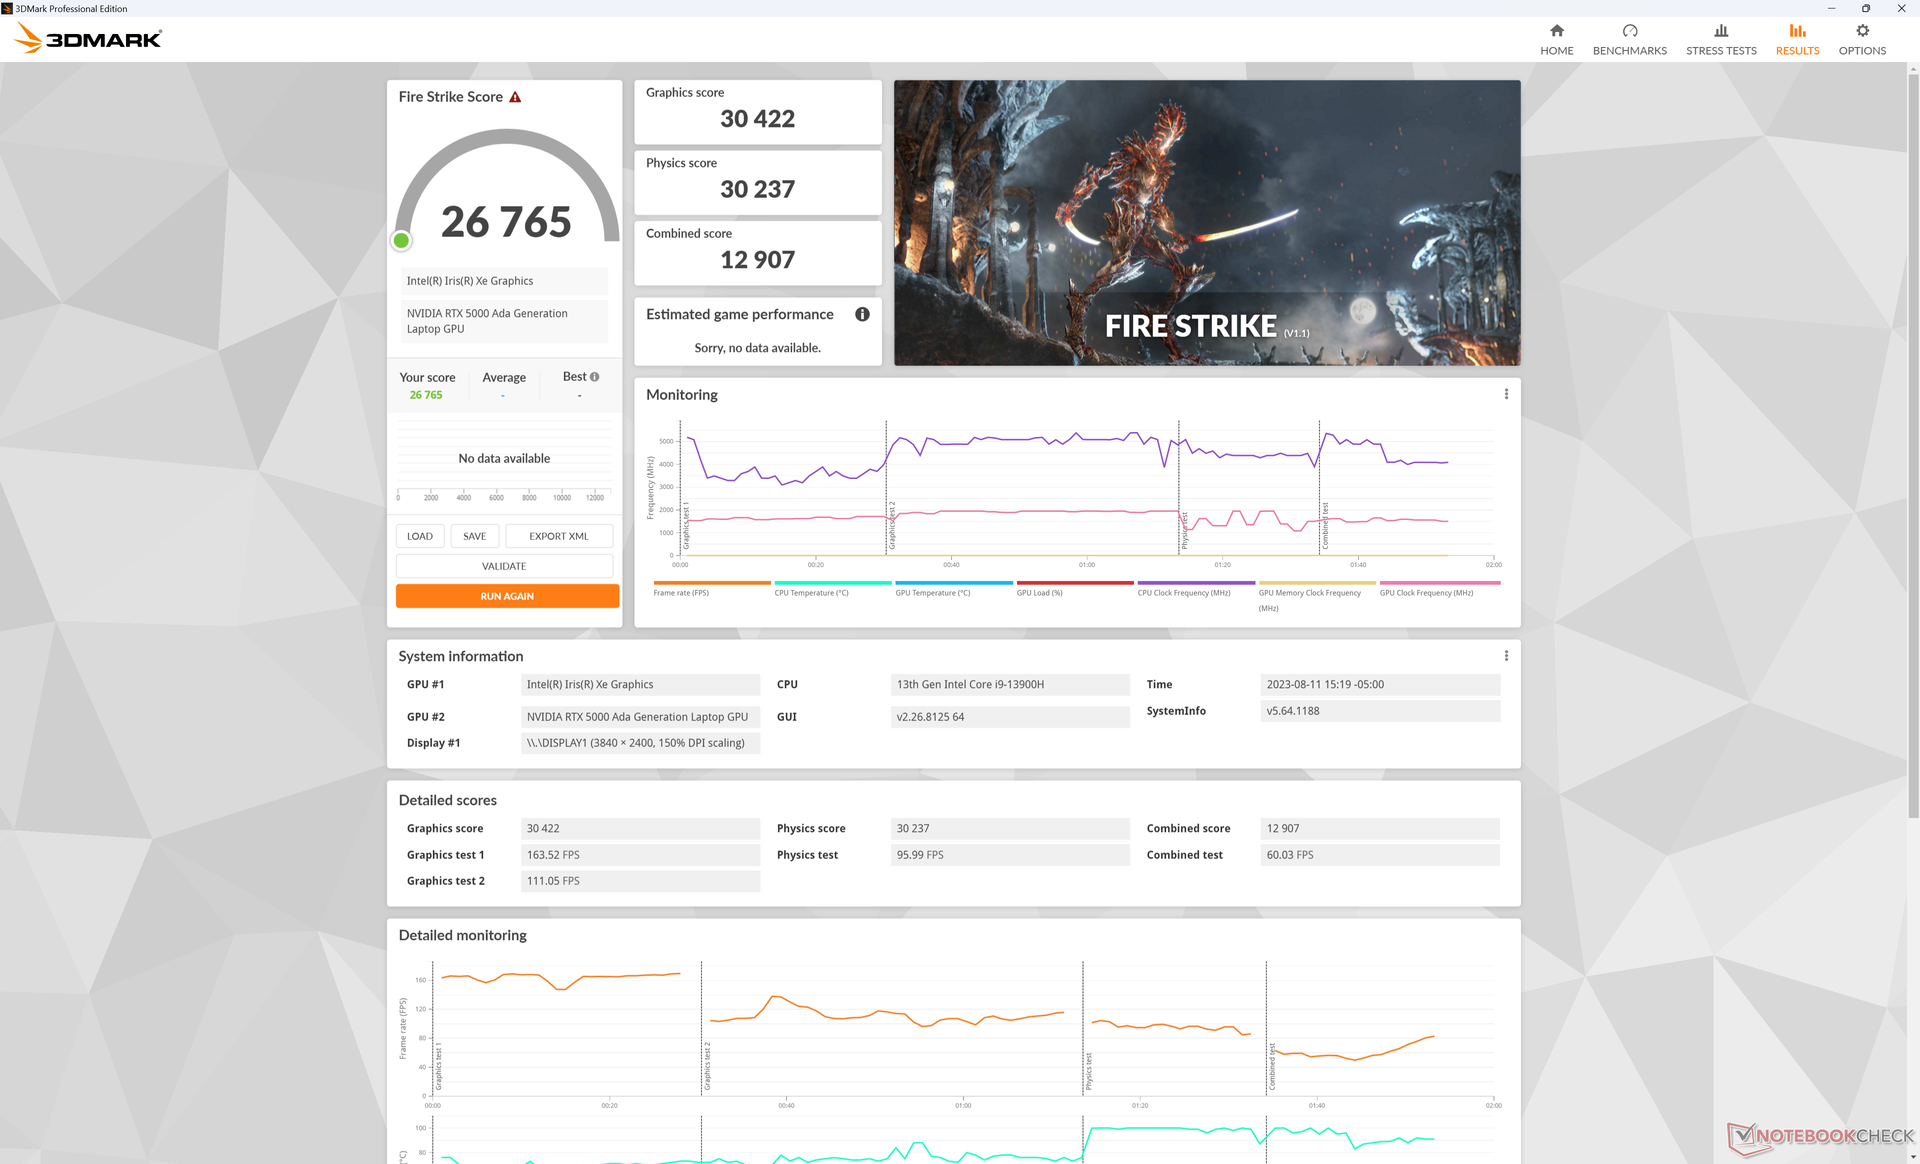
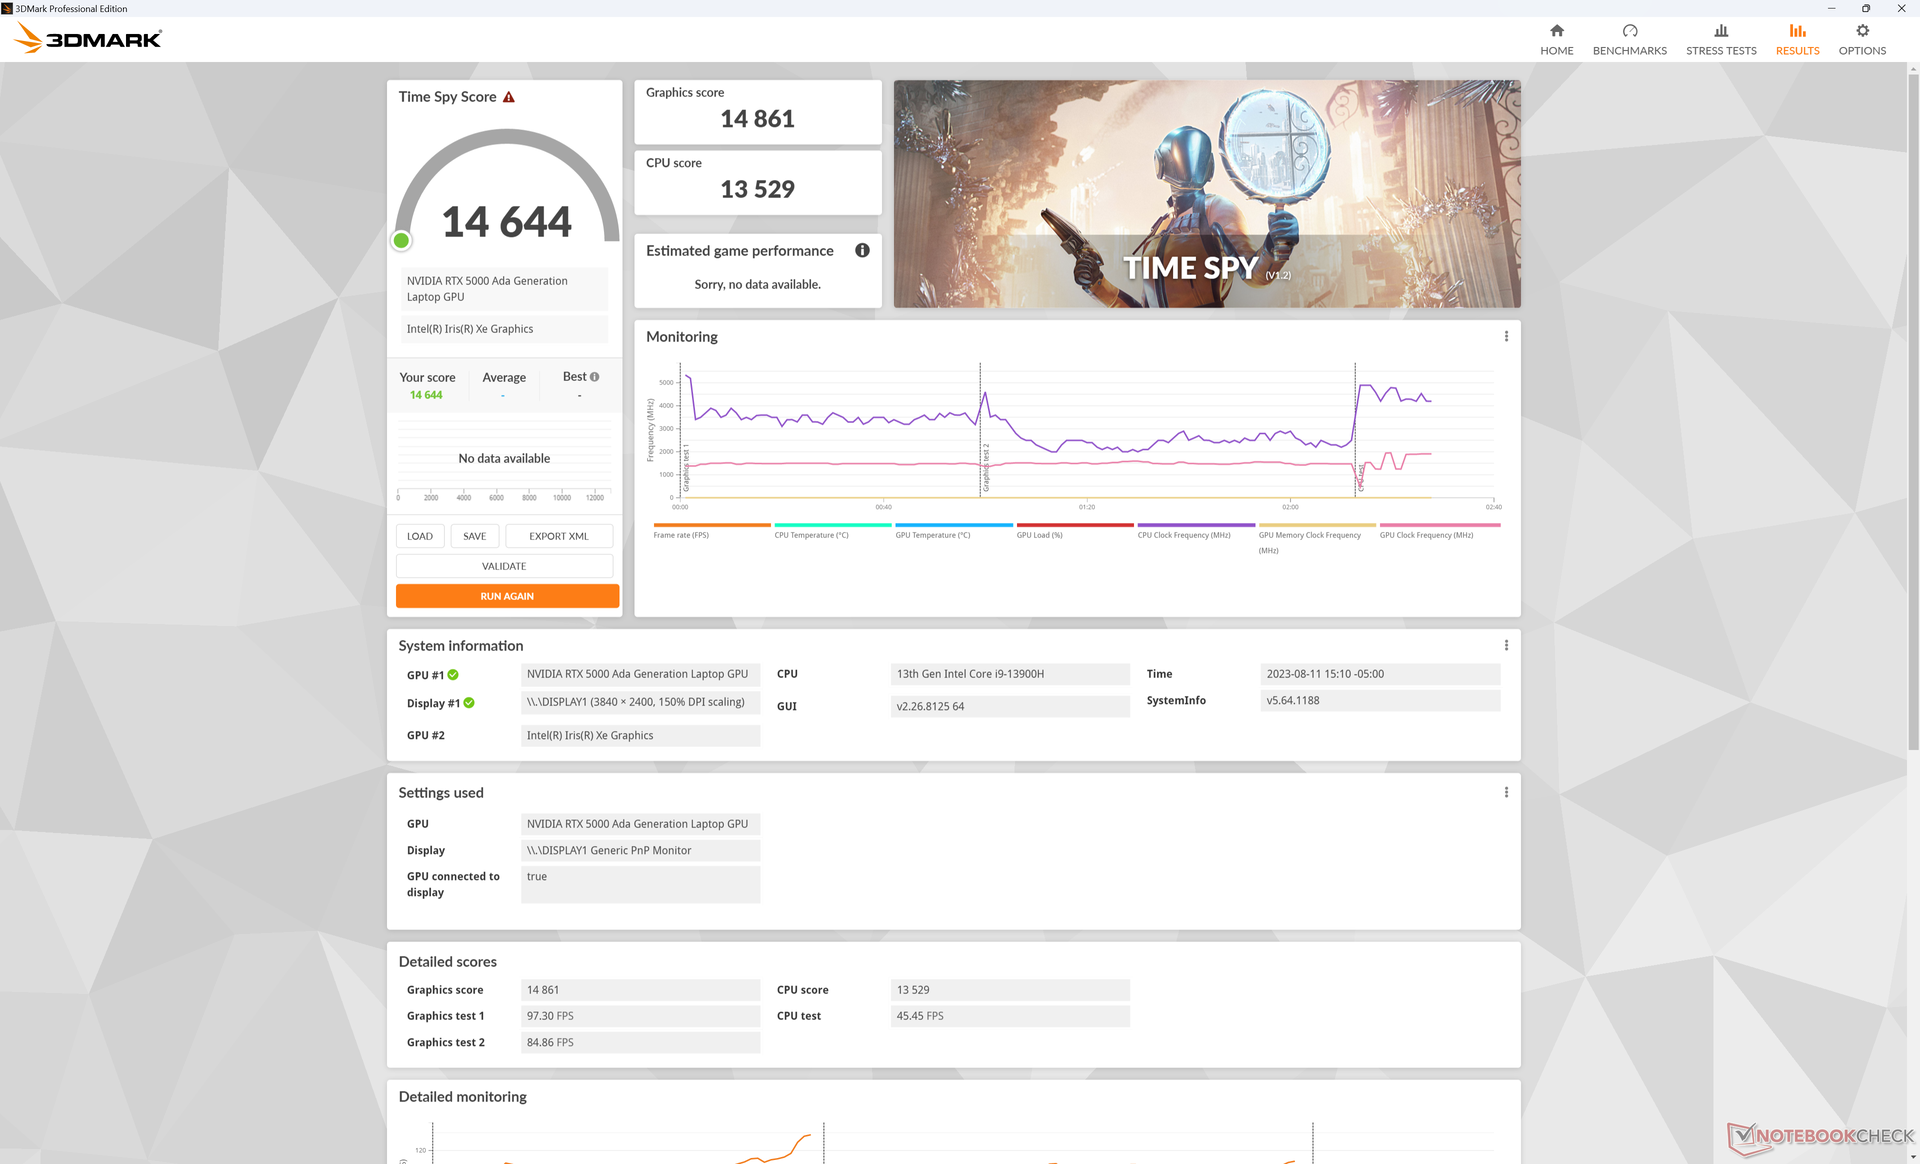
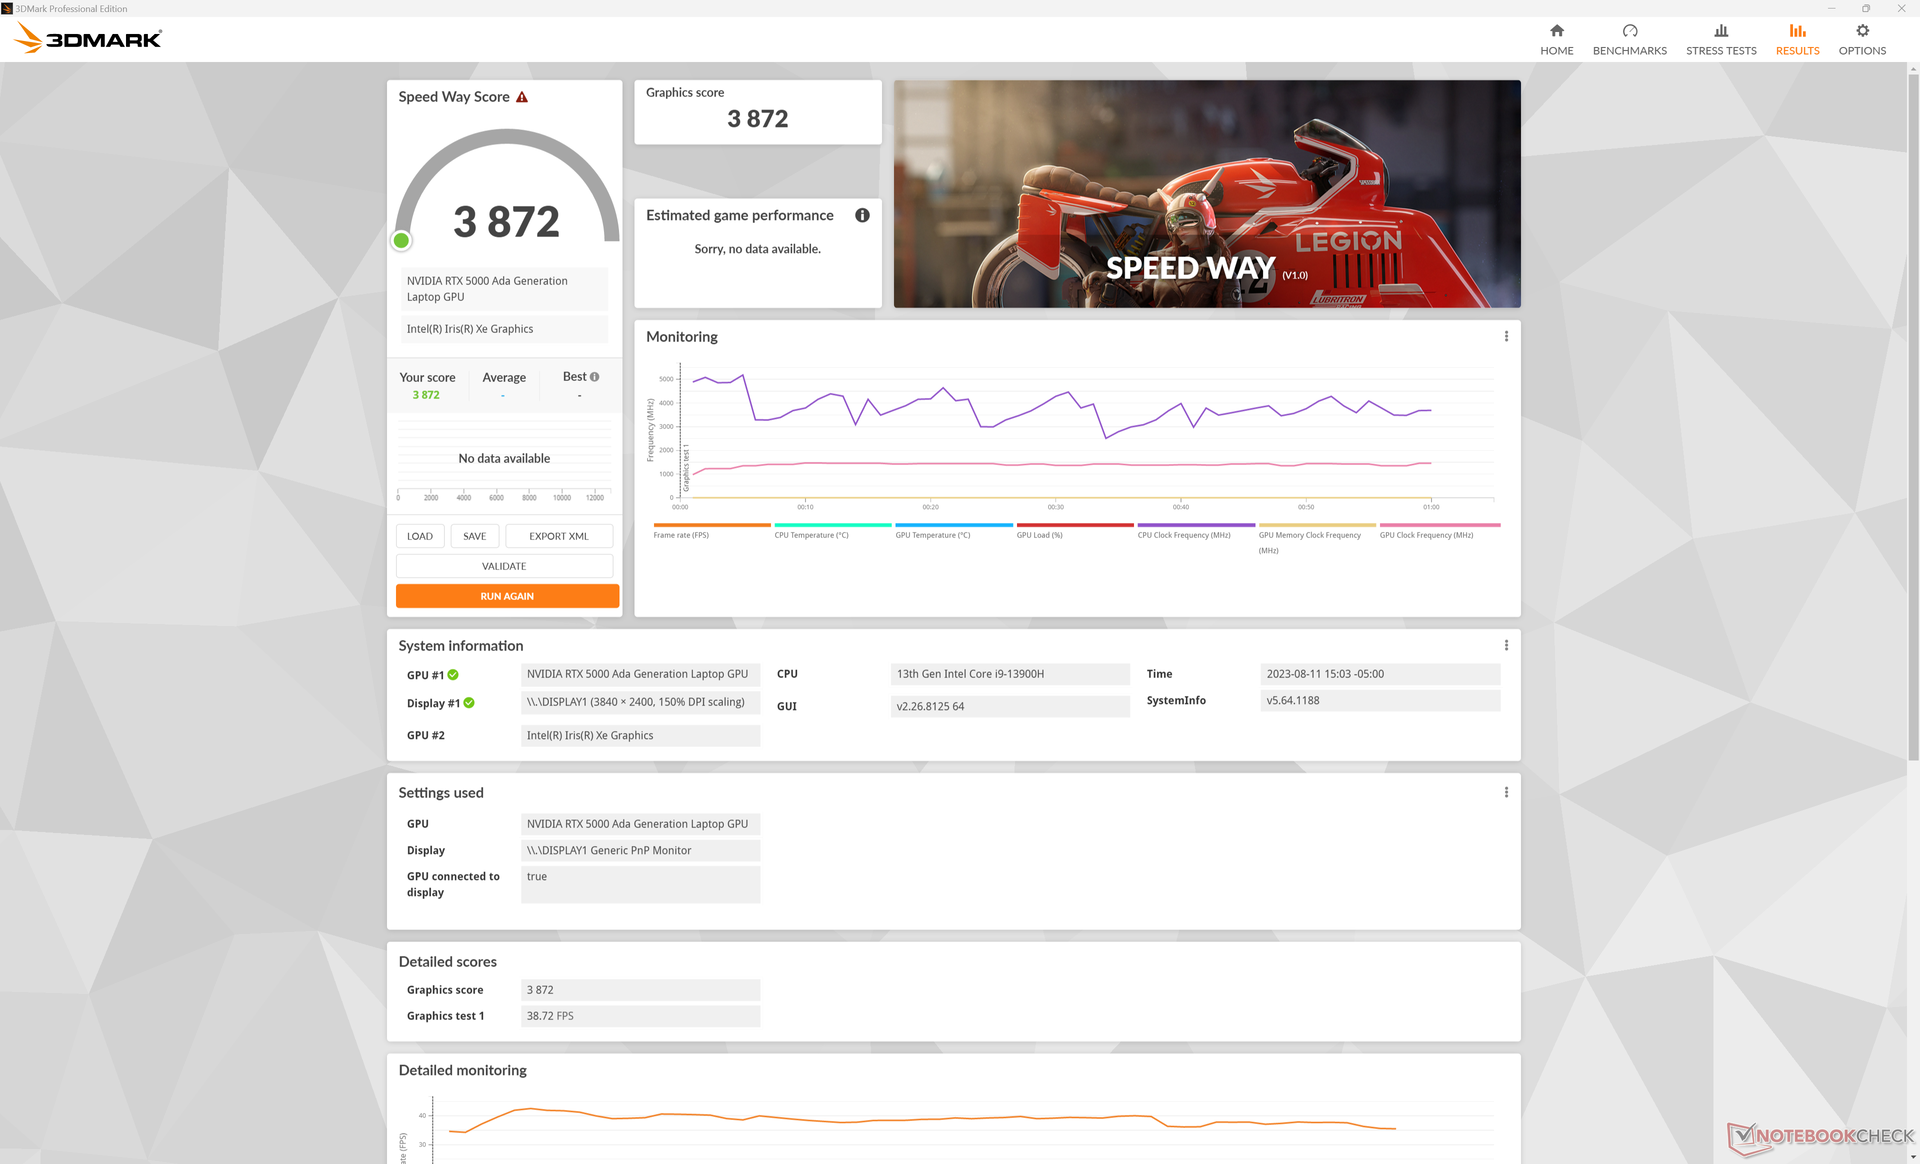
| 3DMark 11 Performance | 39574 pontos | |
| 3DMark Fire Strike Score | 26765 pontos | |
| 3DMark Time Spy Score | 14644 pontos | |
Ajuda | ||
* ... menor é melhor
Desempenho em jogos
Embora não seja um laptop para jogos, o Precision 5680 ainda é totalmente capaz de reproduzir os títulos mais recentes e exigentes sem problemas de compatibilidade durante os testes. O desempenho geral em jogos está entre o GeForce RTX 4060 móvel e o rTX 4070 móvel como os encontrados em laptops dedicados a jogos, como o HP Omen Transcend 16.
Witcher 3 FPS Chart
| baixo | média | alto | ultra | QHD | 4K | |
|---|---|---|---|---|---|---|
| GTA V (2015) | 185.4 | 179.7 | 175.3 | 117.1 | 106.6 | 108 |
| The Witcher 3 (2015) | 412.7 | 329.6 | 256 | 137 | 97 | |
| Dota 2 Reborn (2015) | 178 | 161.7 | 154 | 144 | 142.5 | |
| Final Fantasy XV Benchmark (2018) | 196.3 | 165.6 | 127.4 | 100.8 | 60.4 | |
| X-Plane 11.11 (2018) | 155.3 | 133 | 102.4 | 86.2 | ||
| Far Cry 5 (2018) | 145 | 132 | 129 | 132 | 114 | 70 |
| Cyberpunk 2077 1.6 (2022) | 124.9 | 122.7 | 107.7 | 100 | 66.2 | 32.2 |
| Tiny Tina's Wonderlands (2022) | 220 | 202.3 | 152.6 | 125 | 90.1 | 50.9 |
| F1 22 (2022) | 232 | 218 | 202 | 84.5 | 56.1 | 28.8 |
| Returnal (2023) | 98 | 94 | 90 | 81 | 60 | 34 |
Emissões - Silencioso na maior parte do tempo
Ruído do sistema
Os níveis de ruído são mais semelhantes aos doPrecision 5550 embora o nosso Precision 5680 tenha uma GPU significativamente mais rápida. Os ventiladores tendem a oscilar entre 20 dB(A) e 20 dB(A) ao executar cargas pouco exigentes, como navegadores da Web, enquanto cargas mais exigentes induziriam a um ruído constante de 51 dB(A).
É interessante notar que o nível máximo de ruído do ventilador no modo balanceado é o mesmo que no modo de desempenho.
Barulho
| Ocioso |
| 23 / 23 / 23 dB |
| Carga |
| 37.2 / 51 dB |
 | ||
30 dB silencioso 40 dB(A) audível 50 dB(A) ruidosamente alto |
||
min: | ||
| Dell Precision 5000 5680 RTX 5000 Ada Generation Laptop, i9-13900H, 2x SK hynix PC801 HFS512GEJ9X101N RAID 0 | Dell Precision 7000 7670 Performance RTX A5500 Laptop GPU, i9-12950HX | HP ZBook Fury 16 G9 RTX A5500 Laptop GPU, i9-12950HX, Micron 3400 1TB MTFDKBA1T0TFH | Lenovo ThinkPad P16 G1 RTX A5500 RTX A5500 Laptop GPU, i9-12950HX, WDC PC SN810 2TB | MSI CreatorPro Z16P B12UKST RTX A3000 Laptop GPU, i7-12700H, Samsung PM9A1 MZVL21T0HCLR | Asus ExpertBook B6 Flip B6602FC2 RTX A2000 Laptop GPU, i9-12950HX, Samsung PM9A1 MZVL21T0HCLR | |
|---|---|---|---|---|---|---|
| Noise | -11% | -2% | 3% | -8% | -30% | |
| desligado / ambiente * (dB) | 22.8 | 23.9 -5% | 22.6 1% | 23.1 -1% | 24.1 -6% | 26 -14% |
| Idle Minimum * (dB) | 23 | 24 -4% | 22.7 1% | 23.1 -0% | 27.1 -18% | 32.4 -41% |
| Idle Average * (dB) | 23 | 24 -4% | 22.7 1% | 23.1 -0% | 27.1 -18% | 32.4 -41% |
| Idle Maximum * (dB) | 23 | 38 -65% | 28.8 -25% | 23.1 -0% | 27.1 -18% | 32.4 -41% |
| Load Average * (dB) | 37.2 | 46.3 -24% | 36.2 3% | 28.9 22% | 42.9 -15% | 51.9 -40% |
| Witcher 3 ultra * (dB) | 51 | 41.9 18% | 49.5 3% | 51.6 -1% | 44 14% | |
| Load Maximum * (dB) | 51 | 47.9 6% | 49.3 3% | 51.4 -1% | 47 8% | 52.1 -2% |
* ... menor é melhor
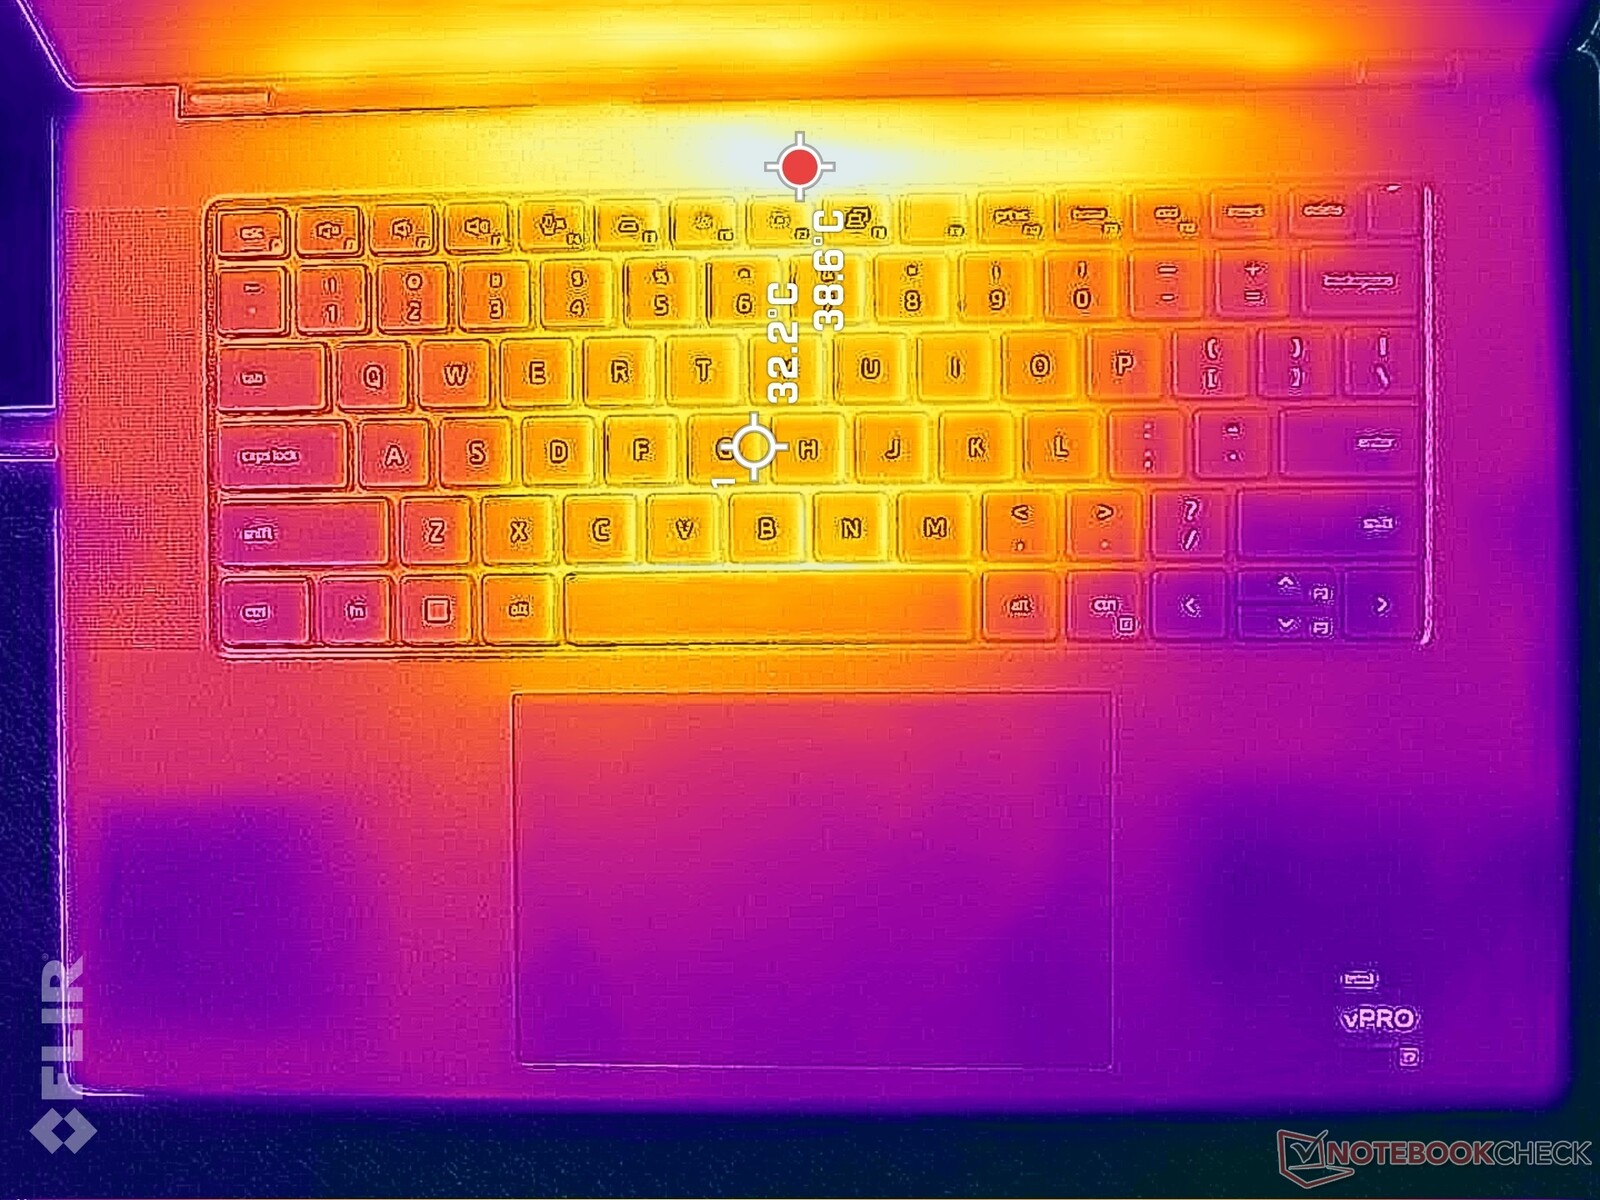
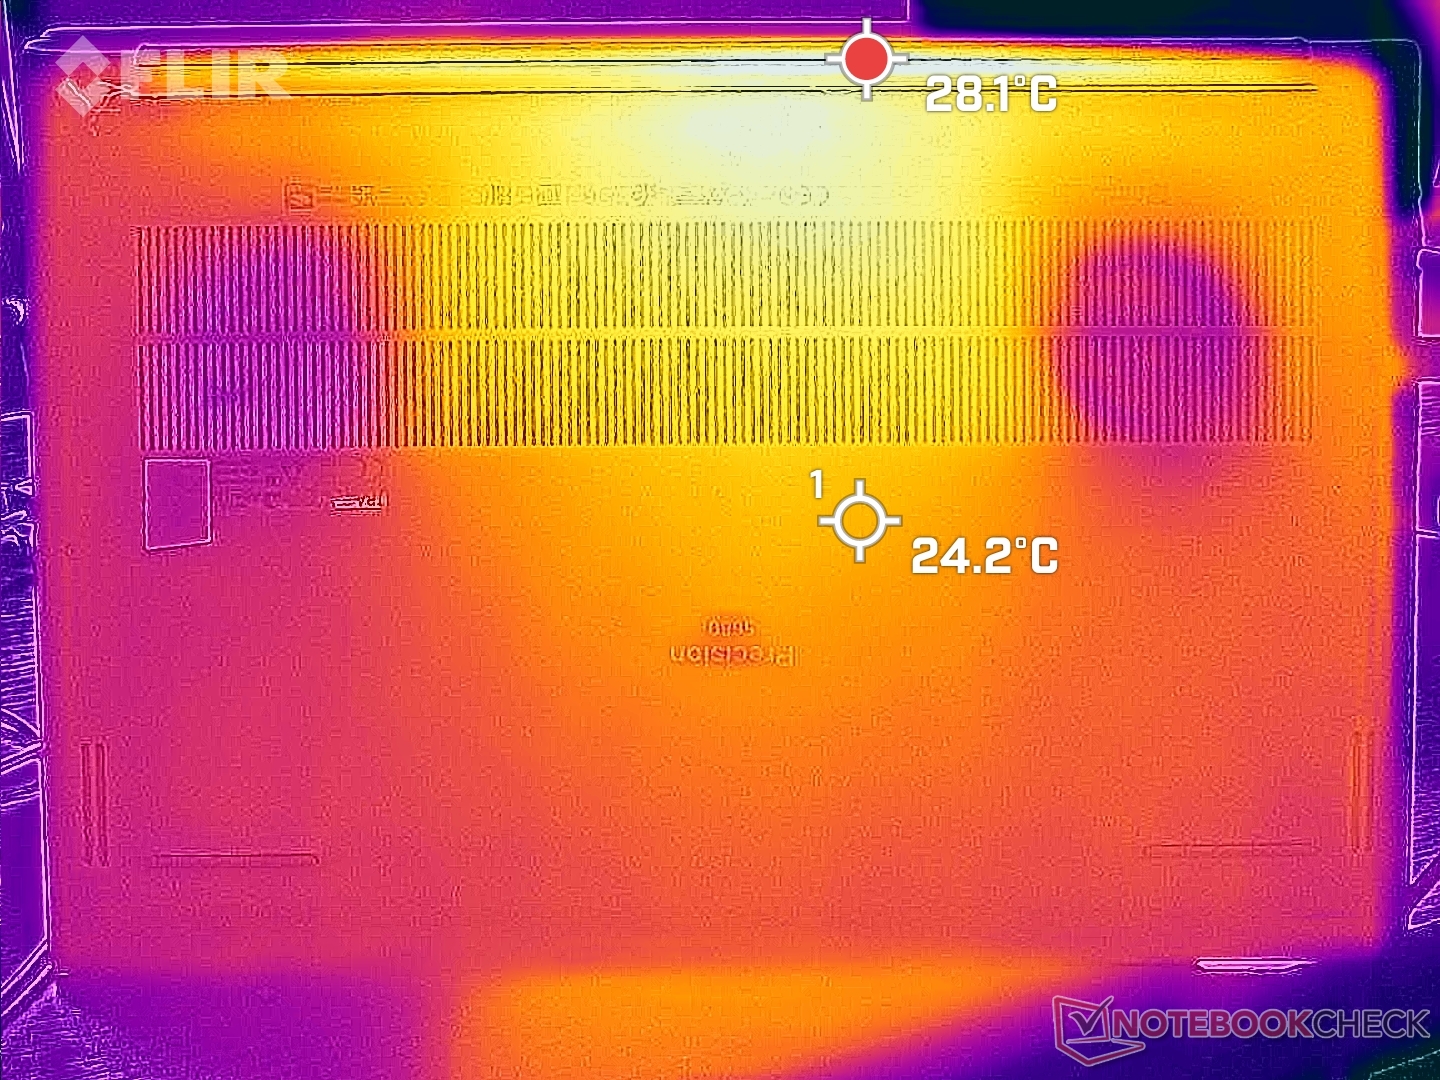
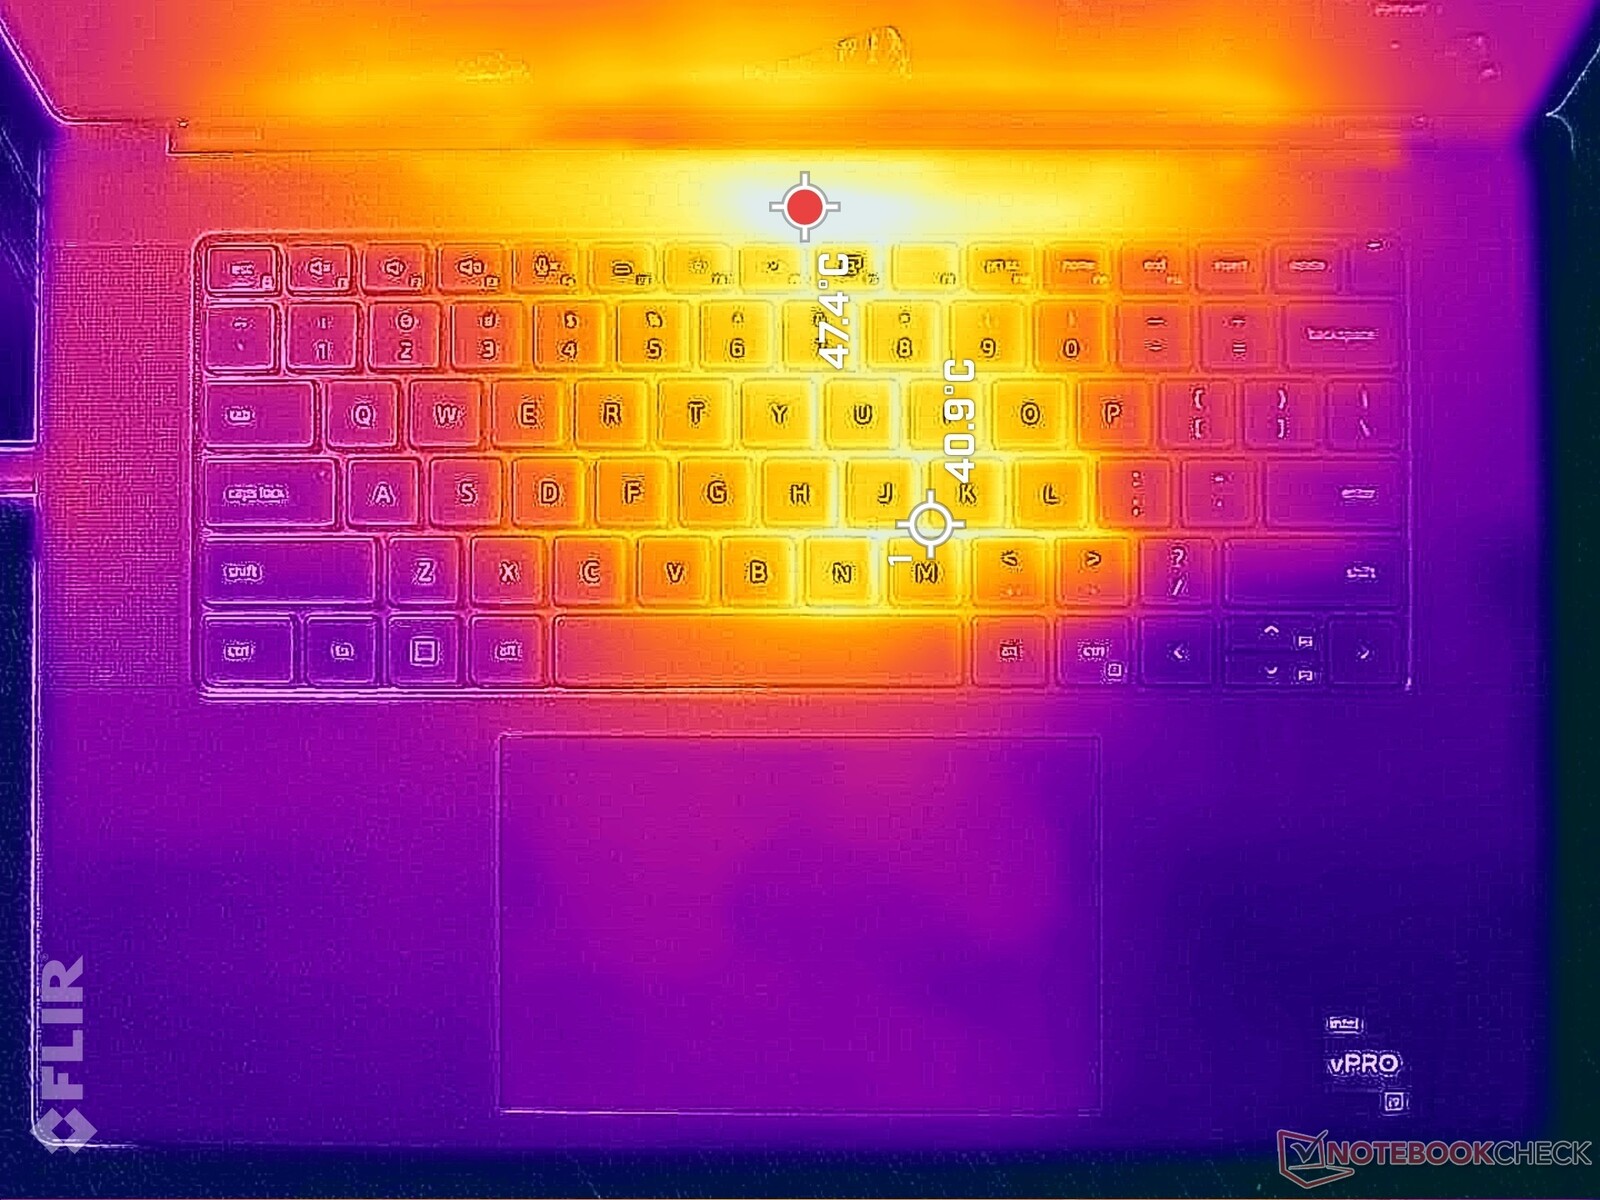
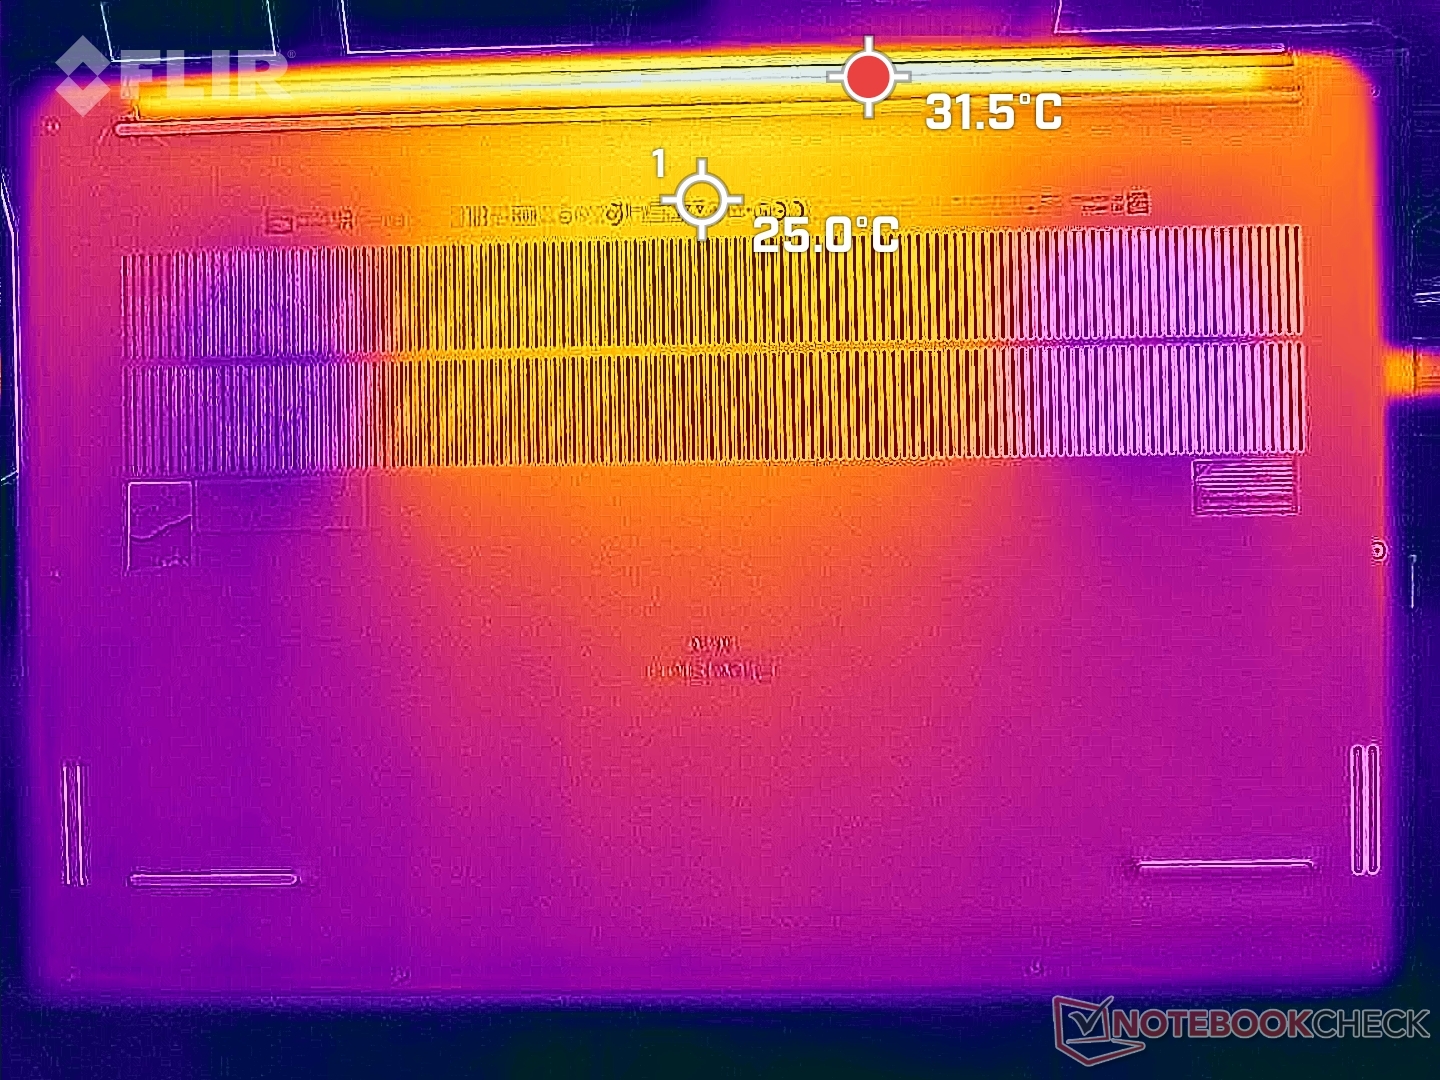
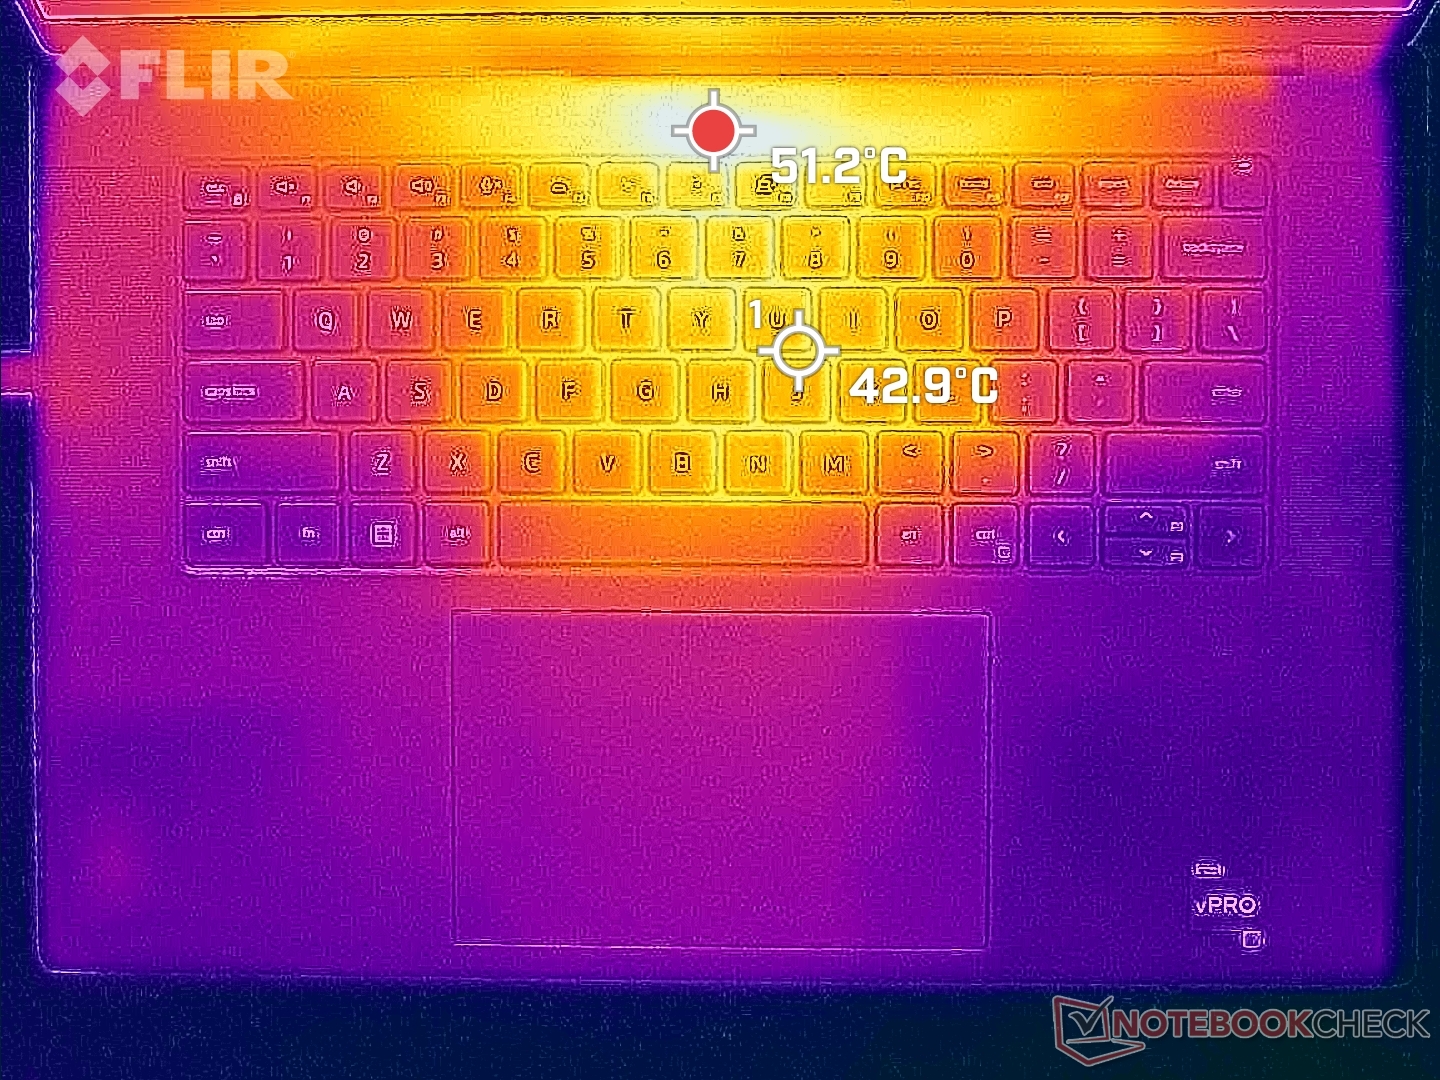
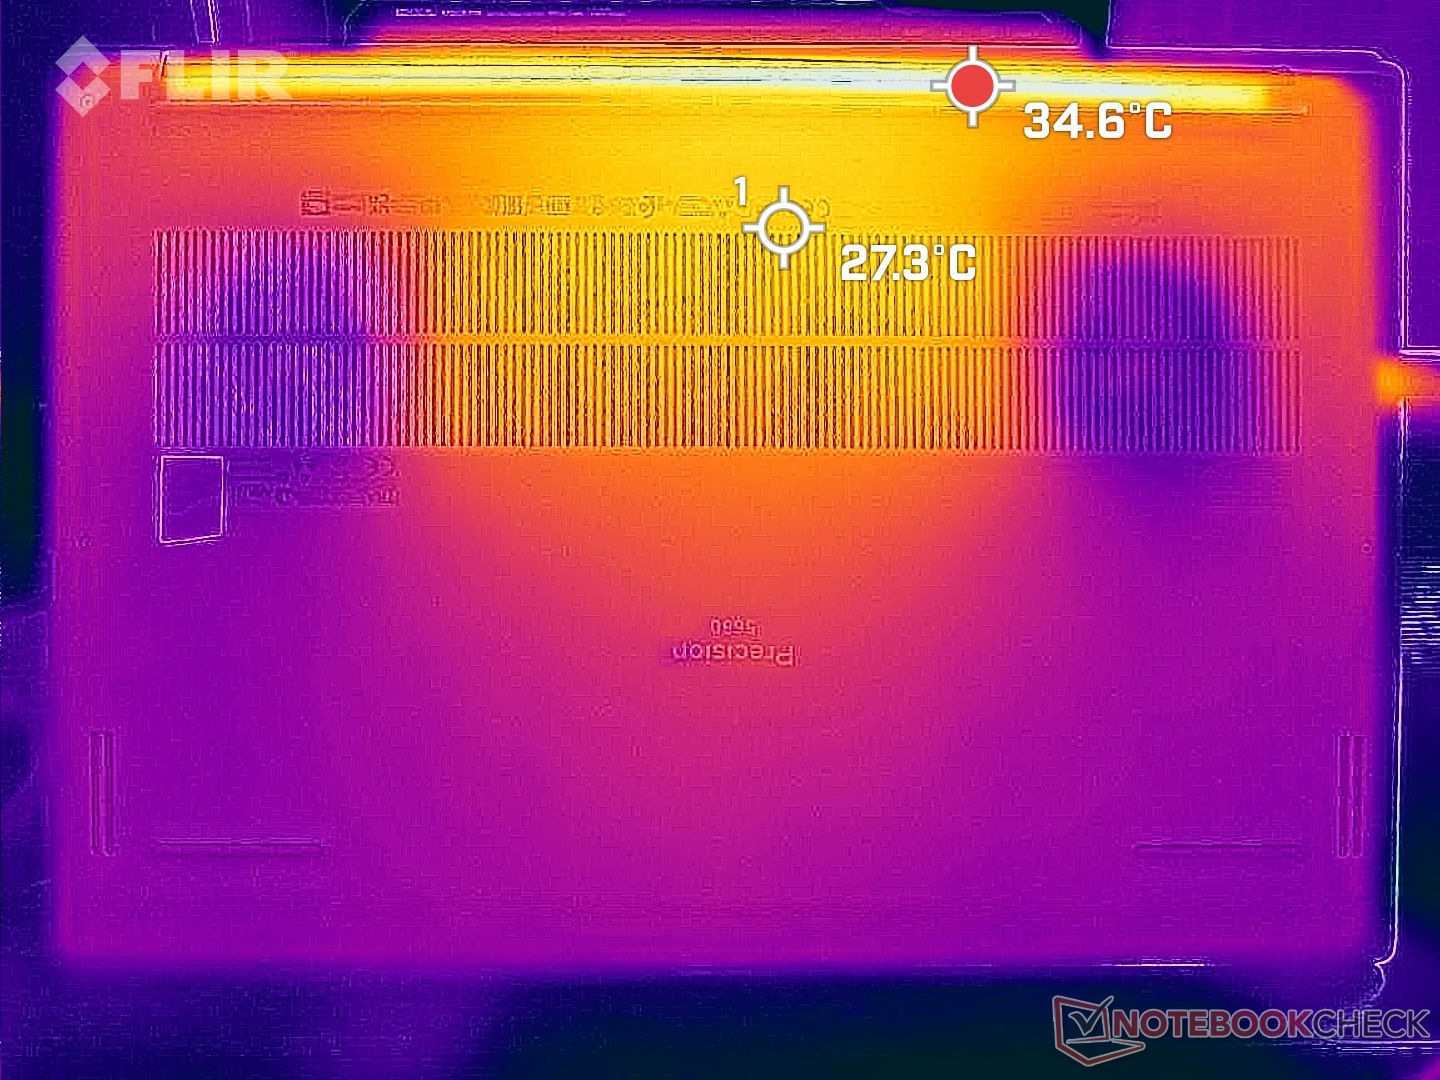
Temperatura
As temperaturas da superfície quando em marcha lenta são mais quentes do que o esperado, pois os ventiladores tendem a ficar em marcha lenta até que seja necessário. Os pontos quentes podem chegar a 37 °C e 32 °C na parte superior e inferior, respectivamente, em comparação com menos de 30 °C na parte inferior doExpertBook B6 Flip.
Ao executar cargas mais exigentes, a parte central do teclado pode chegar a mais de 50 °C, enquanto a superfície inferior quase não esquenta devido, em parte, aos isoladores de Gore. Os dedos e as palmas das mãos só tocam o centro do teclado com pouca frequência e, portanto, os pontos quentes geralmente não afetam o conforto.
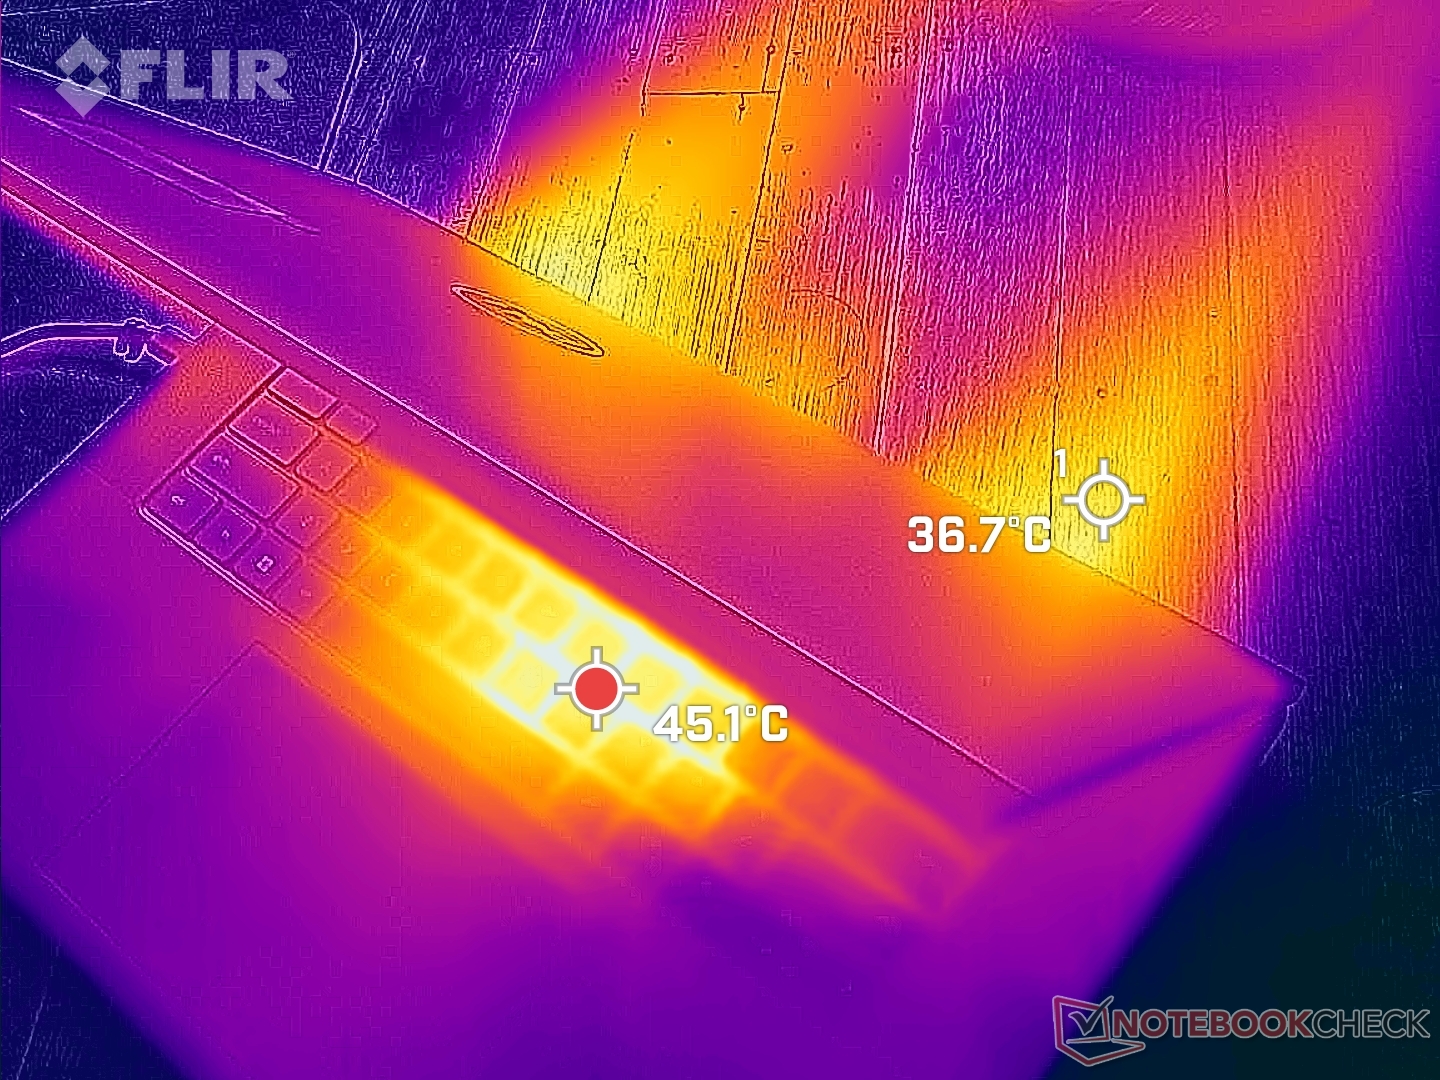
(-) A temperatura máxima no lado superior é 50.2 °C / 122 F, em comparação com a média de 38.2 °C / 101 F , variando de 22.2 a 69.8 °C para a classe Workstation.
(+) A parte inferior aquece até um máximo de 32 °C / 90 F, em comparação com a média de 41.1 °C / 106 F
(+) Em uso inativo, a temperatura média para o lado superior é 30.1 °C / 86 F, em comparação com a média do dispositivo de 32 °C / ### class_avg_f### F.
(±) Jogando The Witcher 3, a temperatura média para o lado superior é 34.6 °C / 94 F, em comparação com a média do dispositivo de 32 °C / ## #class_avg_f### F.
(+) Os apoios para as mãos e o touchpad são mais frios que a temperatura da pele, com um máximo de 27.6 °C / 81.7 F e, portanto, são frios ao toque.
(±) A temperatura média da área do apoio para as mãos de dispositivos semelhantes foi 27.8 °C / 82 F (+0.2 °C / 0.3 F).
| Dell Precision 5000 5680 Intel Core i9-13900H, NVIDIA RTX 5000 Ada Generation Laptop | Dell Precision 7000 7670 Performance Intel Core i9-12950HX, NVIDIA RTX A5500 Laptop GPU | HP ZBook Fury 16 G9 Intel Core i9-12950HX, NVIDIA RTX A5500 Laptop GPU | Lenovo ThinkPad P16 G1 RTX A5500 Intel Core i9-12950HX, NVIDIA RTX A5500 Laptop GPU | MSI CreatorPro Z16P B12UKST Intel Core i7-12700H, NVIDIA RTX A3000 Laptop GPU | Asus ExpertBook B6 Flip B6602FC2 Intel Core i9-12950HX, NVIDIA RTX A2000 Laptop GPU | |
|---|---|---|---|---|---|---|
| Heat | -12% | -3% | -13% | -19% | -8% | |
| Maximum Upper Side * (°C) | 50.2 | 53 -6% | 43.2 14% | 44.8 11% | 56.3 -12% | 48.4 4% |
| Maximum Bottom * (°C) | 32 | 43.2 -35% | 50.4 -58% | 49.8 -56% | 68.3 -113% | 52.3 -63% |
| Idle Upper Side * (°C) | 37.4 | 36.8 2% | 28.6 24% | 30.6 18% | 25.2 33% | 27.8 26% |
| Idle Bottom * (°C) | 31.2 | 33.8 -8% | 28.2 10% | 38.6 -24% | 25.9 17% | 30.3 3% |
* ... menor é melhor
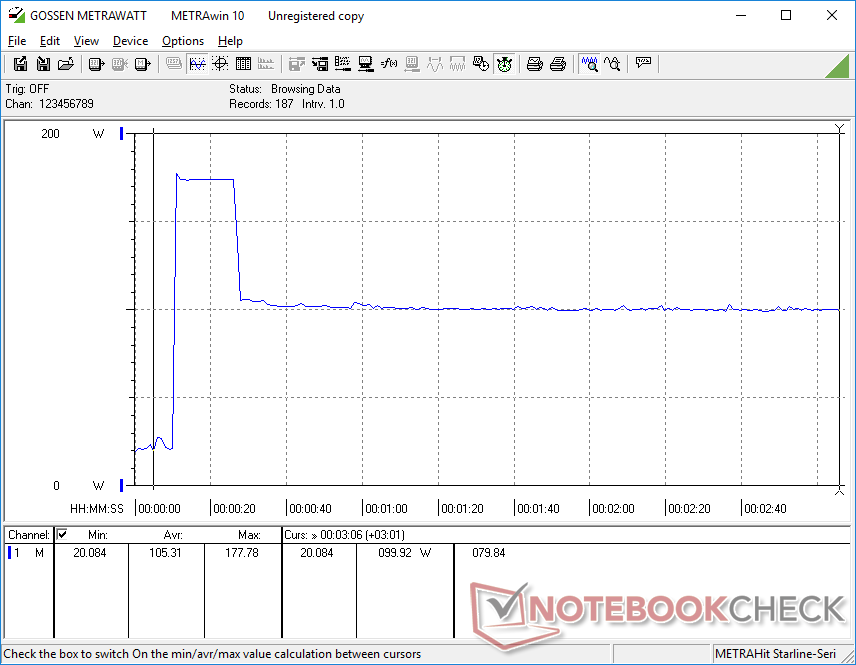
Teste de estresse
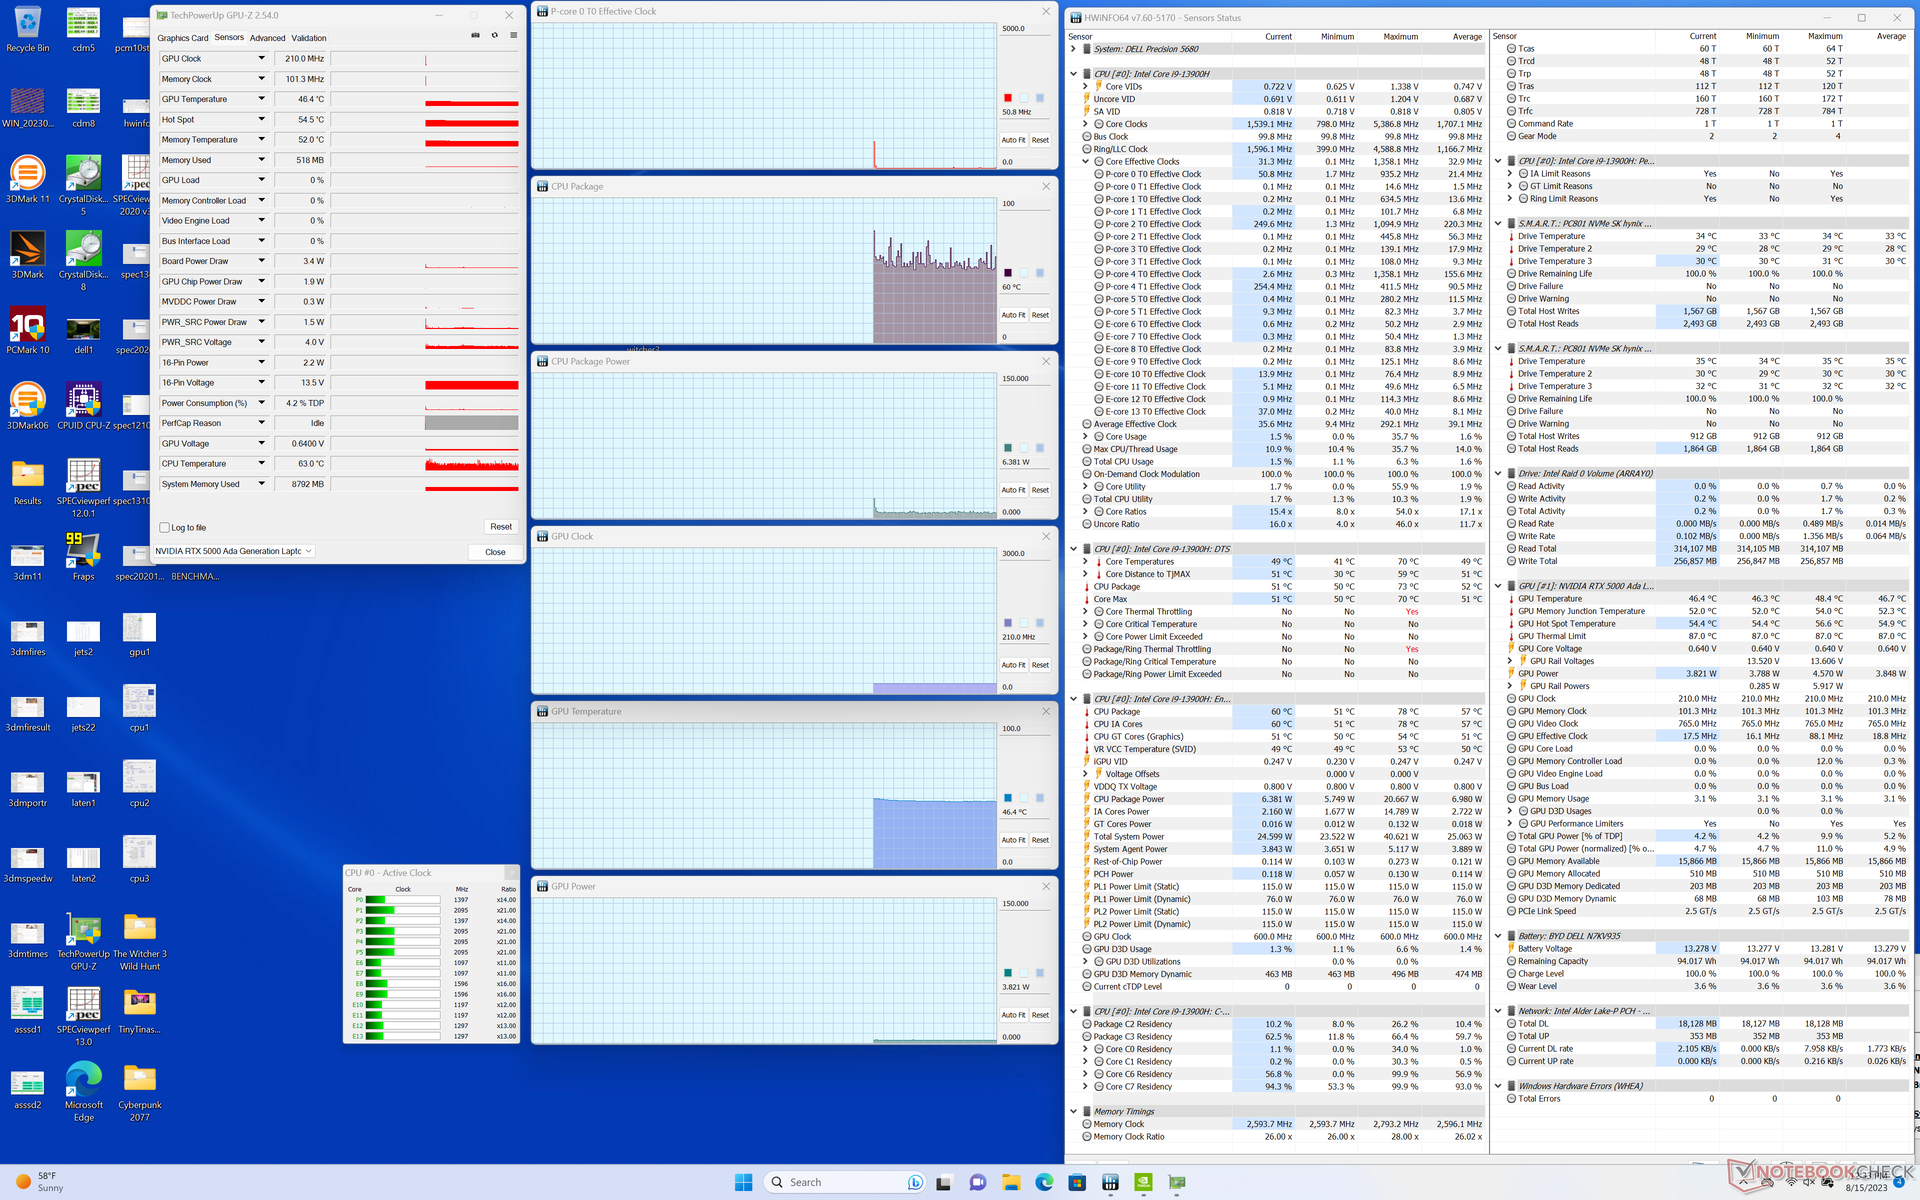
Ao executar o estresse do Prime95, a CPU aumentaria para 3,9 GHz, 117 W e 100 C, com duração de apenas 15 segundos. Depois disso, o potencial do Turbo Boost cairia e, em seguida, se estabilizaria em torno de 2,8 GHz e 56 W para uma temperatura central mais razoável de 75 C. Portanto, o Turbo Boost máximo não é sustentável no Precision 5680, mesmo quando configurado no modo Performance.
A execução no modo balanceado em vez do modo de desempenho não afeta negativamente o desempenho da GPU, conforme mencionado acima. O clock, a temperatura e o consumo de energia da GPU durante a execução Witcher 3 no modo Performance se estabilizariam em 1560 MHz, 72 °C e 63 W, respectivamente, em comparação com 1665 MHz, 65 °C e 69 W no modo Balanced. A maior diferença entre os modos balanceado e de desempenho parece ser a temperatura da CPU, que pode chegar a mais de 100 °C no modo de desempenho para maior potencial do Turbo Boost, em comparação com apenas ~80 °C no modo balanceado.
Observe que só conseguimos atingir um consumo máximo de energia da placa da GPU de 75 W, embora a meta de TGP seja de 95 W, de acordo com o Painel de controle da Nvidia.
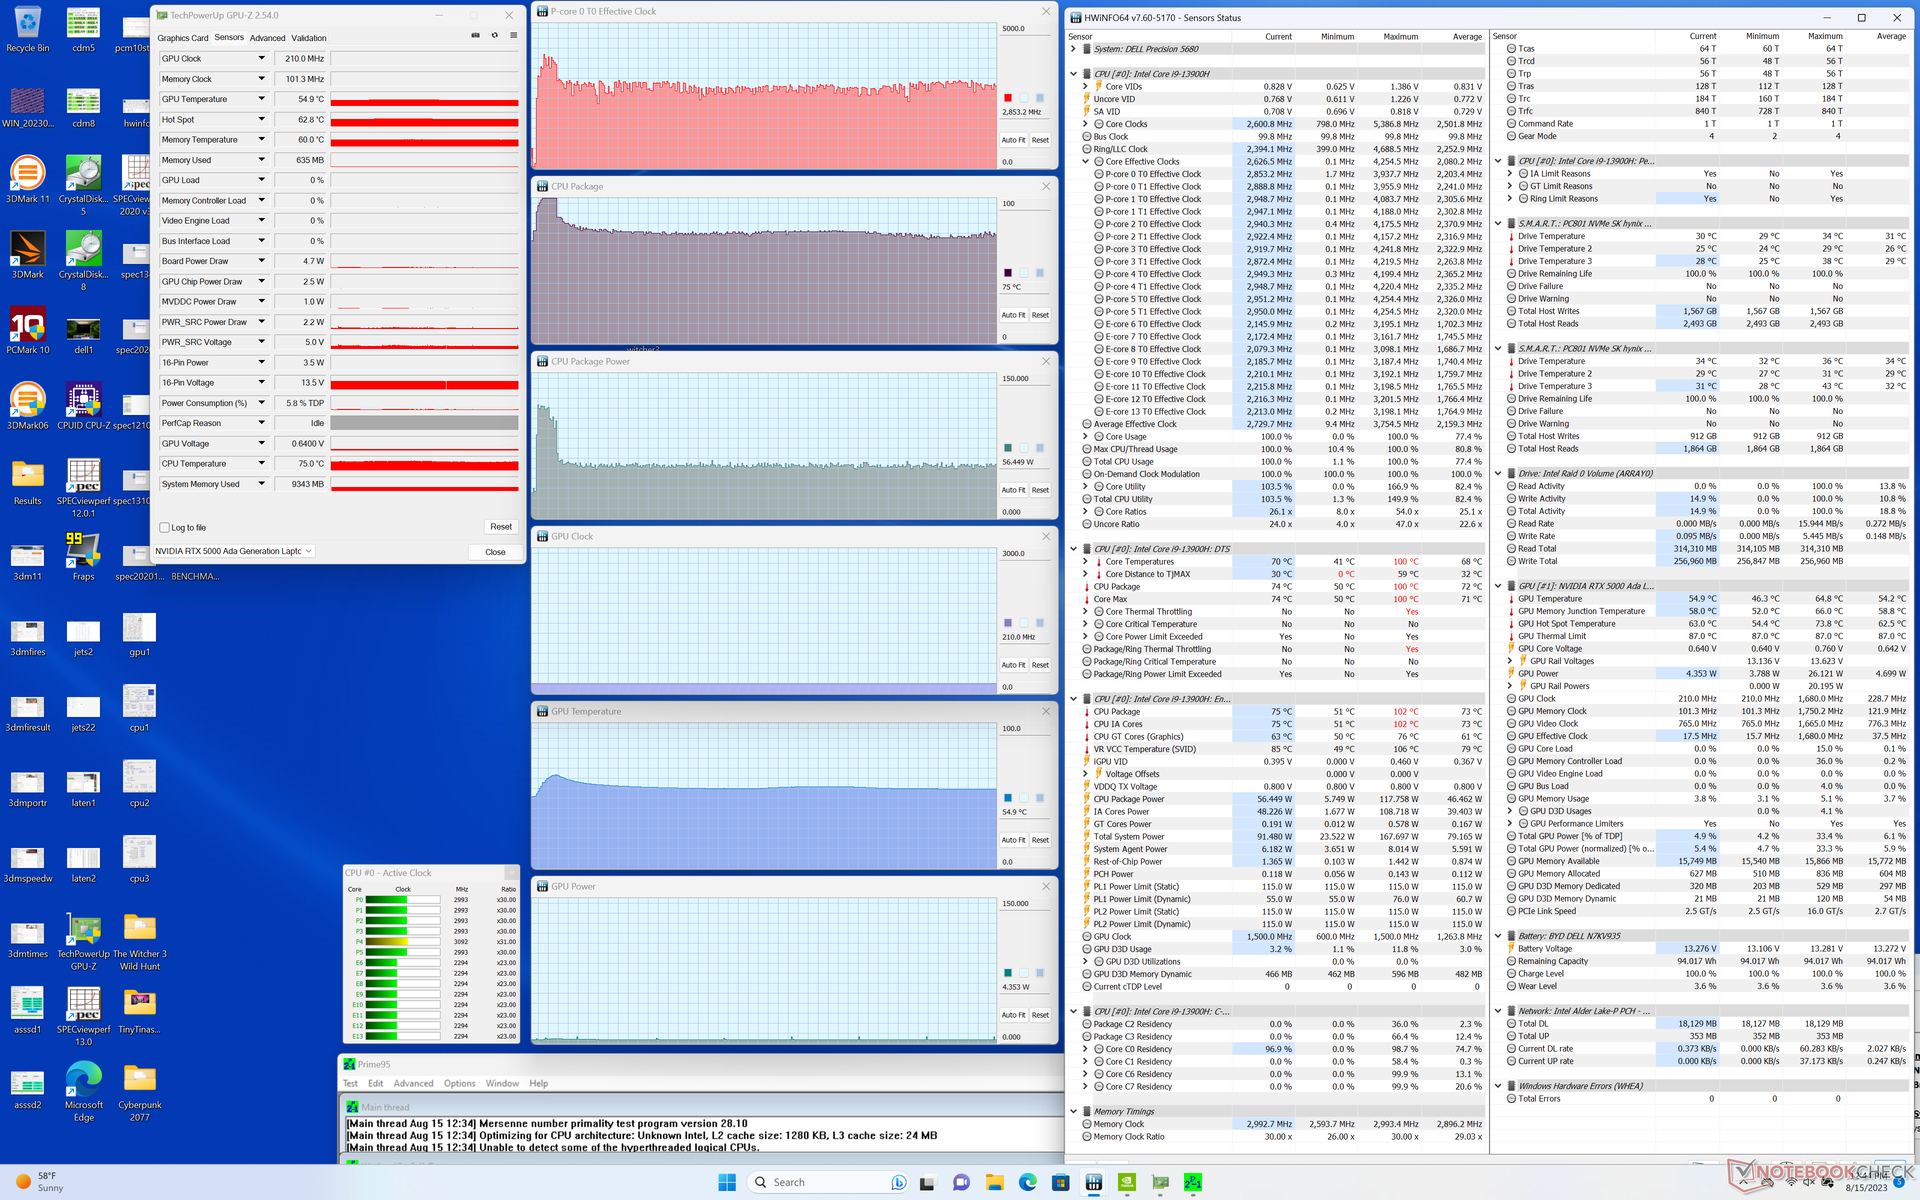
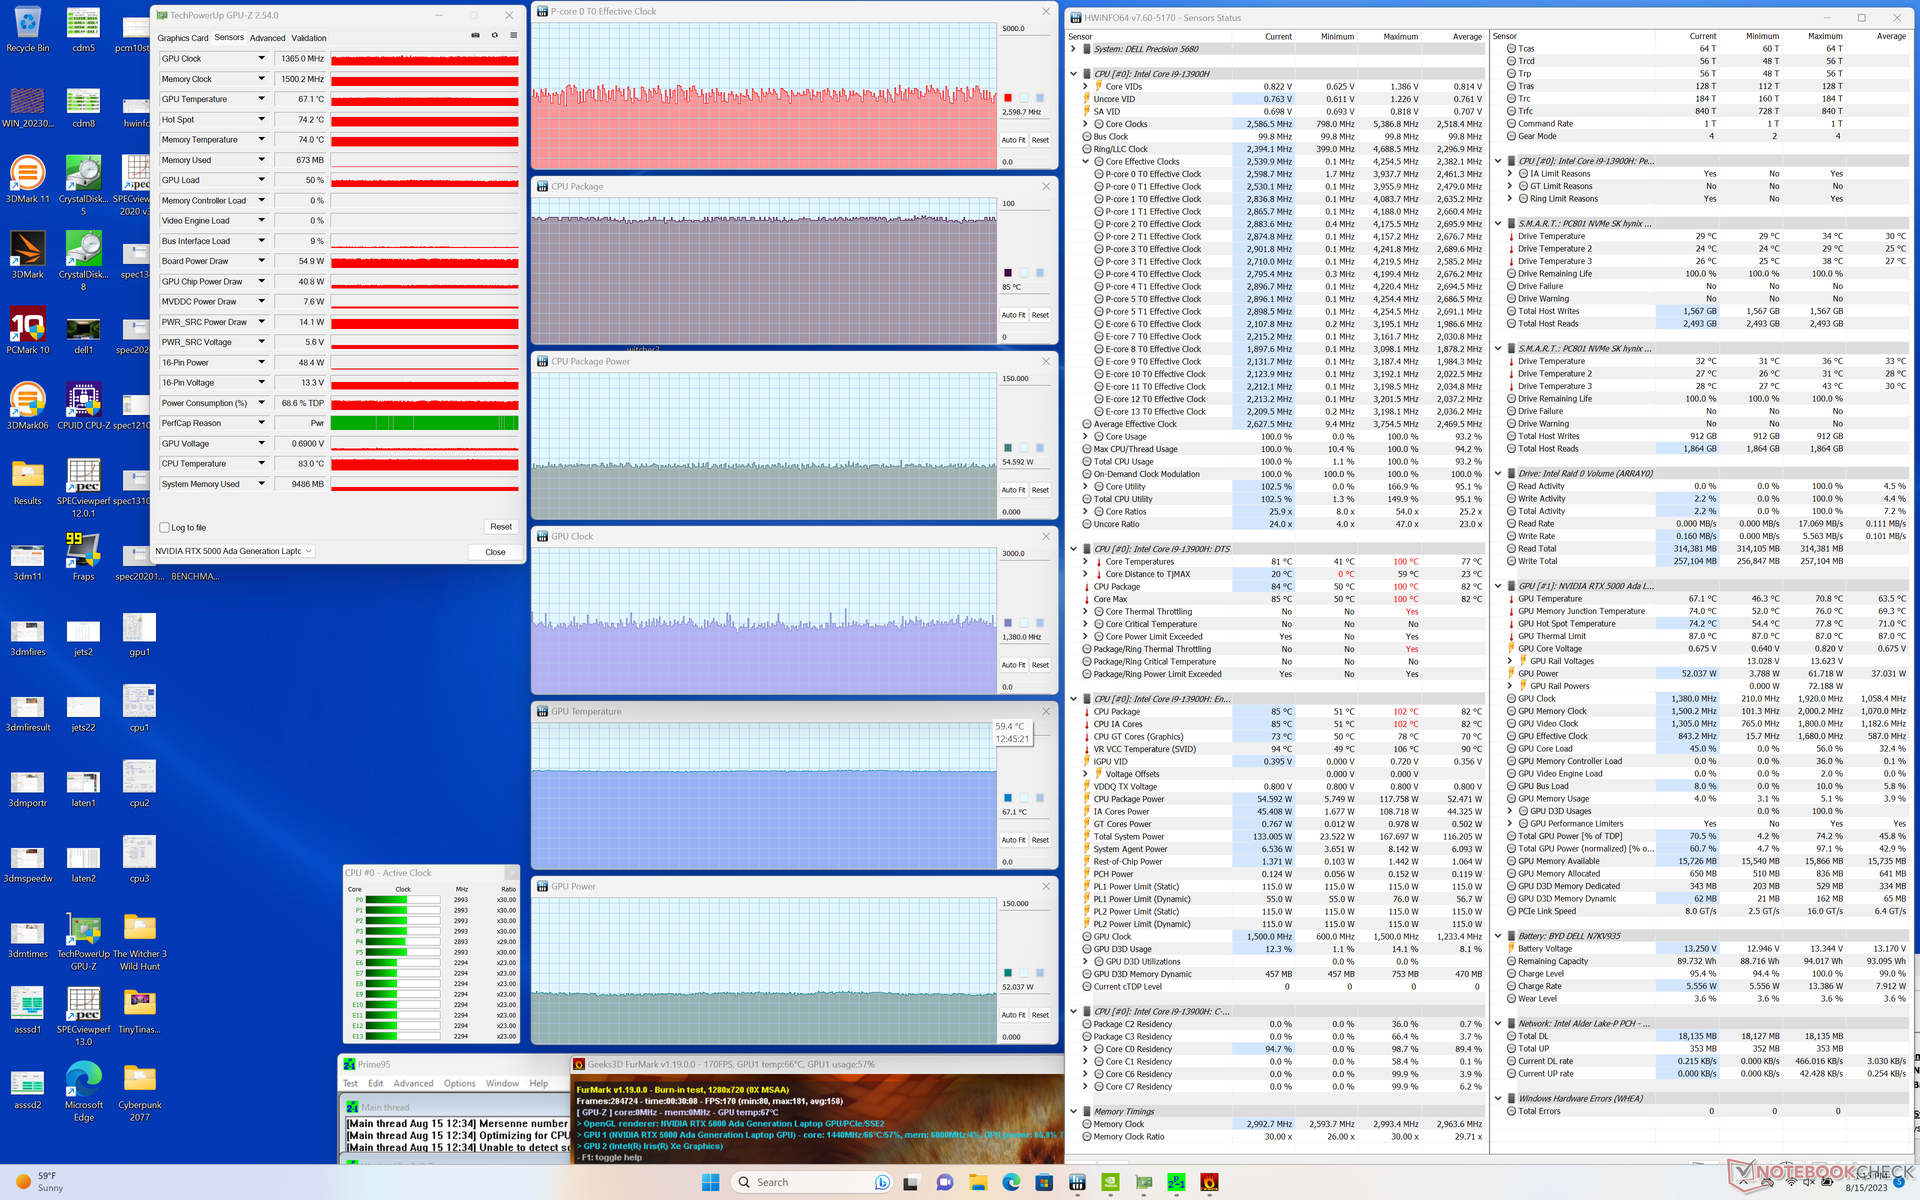
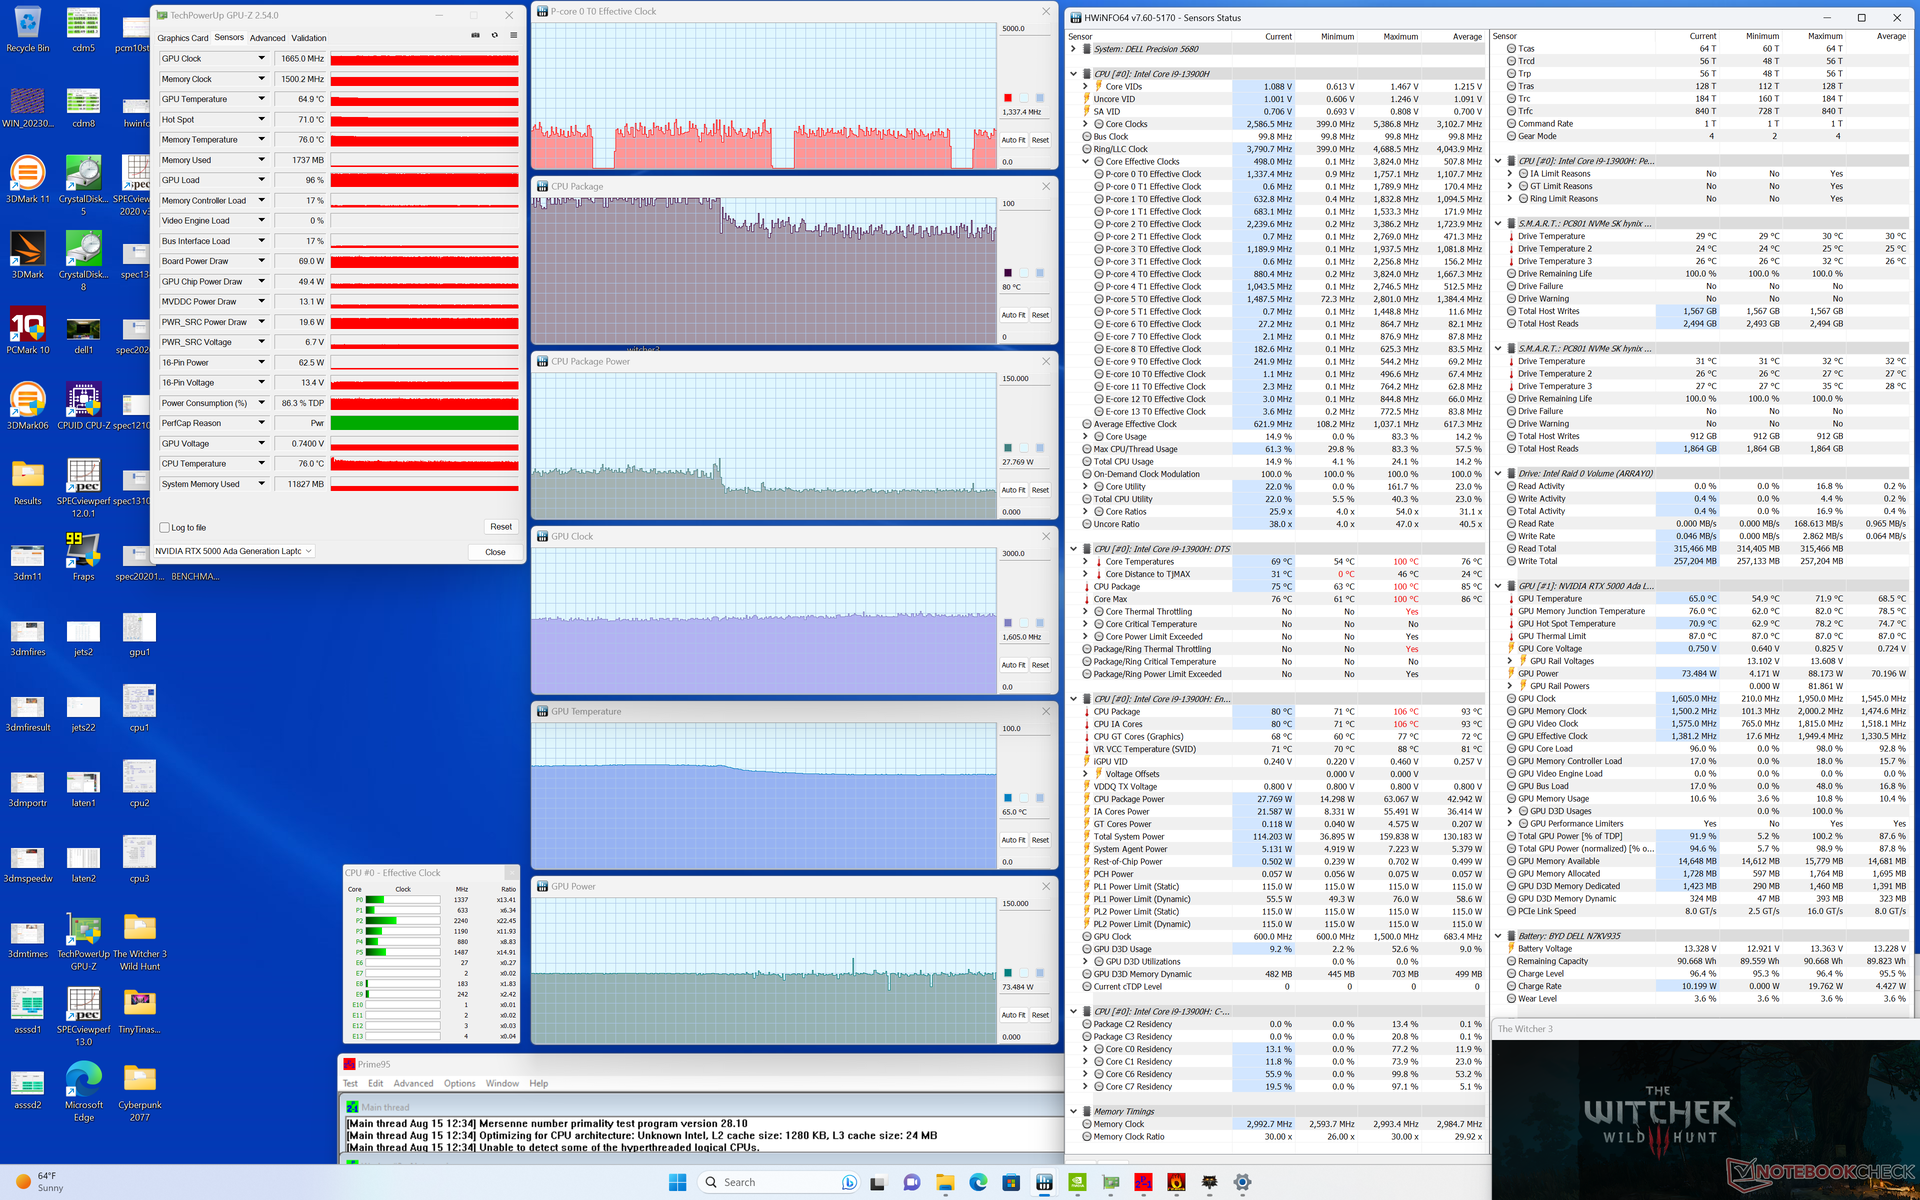
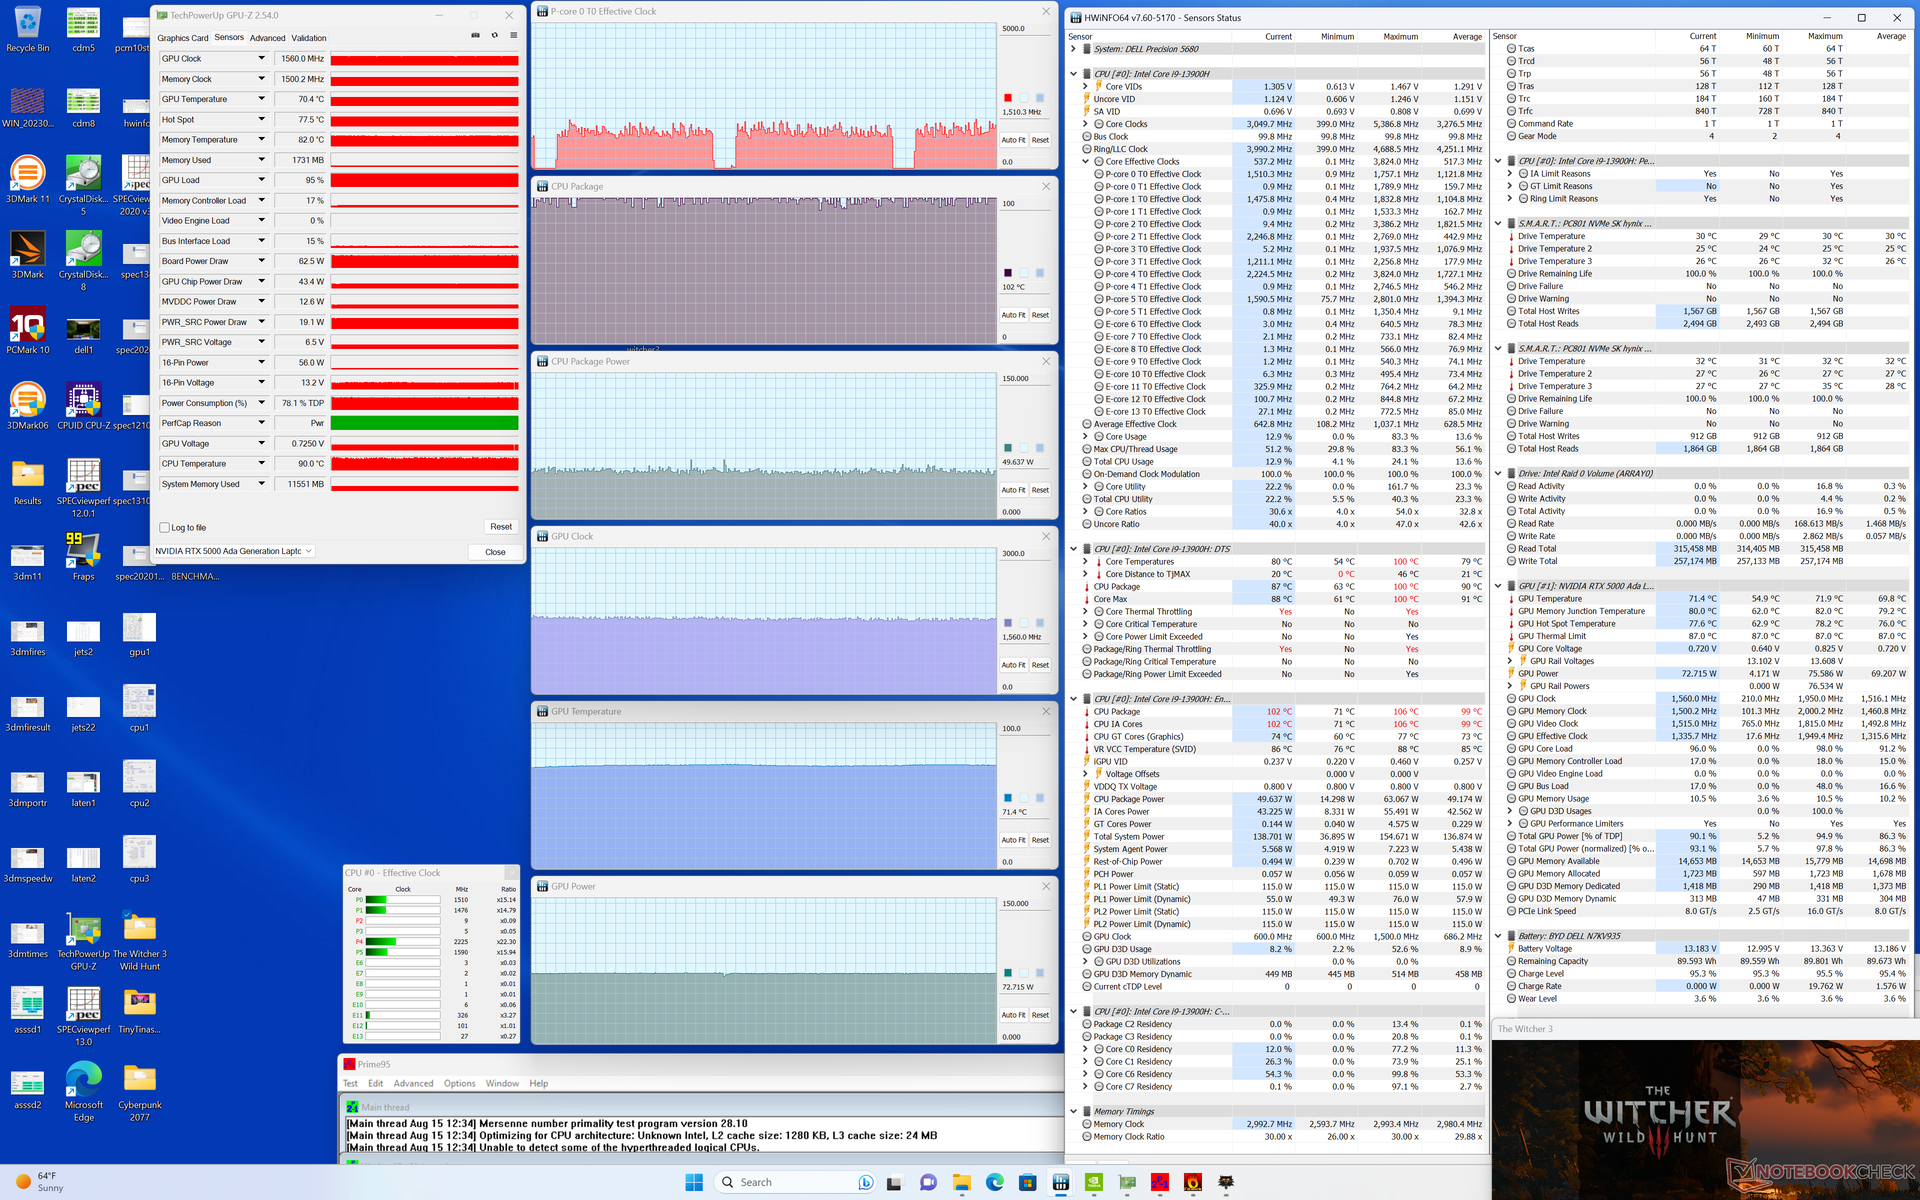
| Clock da CPU (GHz) | Clock da GPU (MHz) | Temperatura média da CPU (°C) | Temperatura média da GPU (°C) | |
| Sistema ocioso | -- | -- | 60 | 46 |
| Estresse doPrime95 | ~2,8 | -- | 75 | 55 |
| Estresse doPrime95 + FurMark | ~2,6 | 1365 | 85 | 67 |
| Witcher 3 Estresse(modo de desempenho) | ~1,5 | 1560 | 100 | 72 |
| Witcher 3 Estresse(modo balanceado) | ~1,3 | 1665 | 80 | 65 |
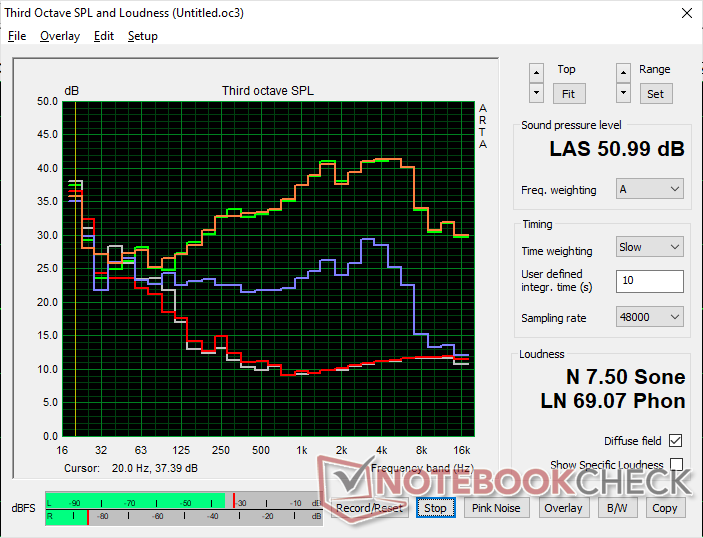
Alto-falantes
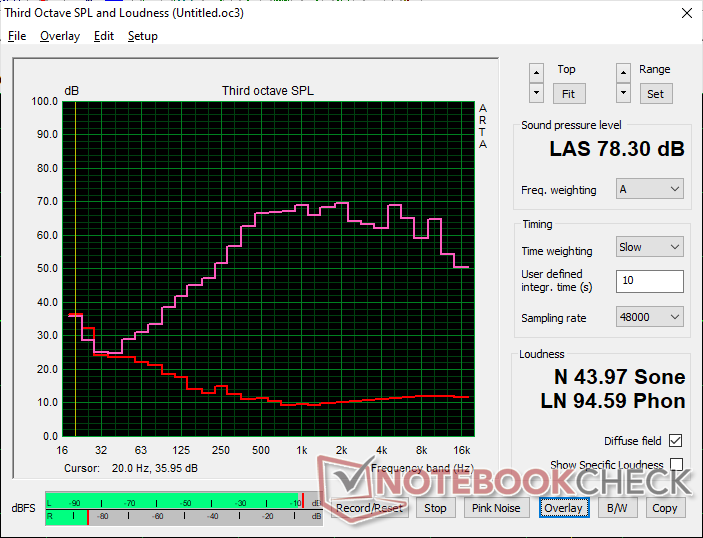
Dell Precision 5000 5680 análise de áudio
(±) | o volume do alto-falante é médio, mas bom (###valor### dB)
Graves 100 - 315Hz
(-) | quase nenhum baixo - em média 16.4% menor que a mediana
(±) | a linearidade dos graves é média (7.5% delta para a frequência anterior)
Médios 400 - 2.000 Hz
(+) | médios equilibrados - apenas 3.9% longe da mediana
(+) | médios são lineares (4.5% delta para frequência anterior)
Altos 2 - 16 kHz
(+) | agudos equilibrados - apenas 2.2% longe da mediana
(±) | a linearidade dos máximos é média (8.3% delta para frequência anterior)
Geral 100 - 16.000 Hz
(±) | a linearidade do som geral é média (15.5% diferença em relação à mediana)
Comparado com a mesma classe
» 35% de todos os dispositivos testados nesta classe foram melhores, 10% semelhantes, 55% piores
» O melhor teve um delta de 7%, a média foi 17%, o pior foi 35%
Comparado com todos os dispositivos testados
» 23% de todos os dispositivos testados foram melhores, 4% semelhantes, 73% piores
» O melhor teve um delta de 4%, a média foi 23%, o pior foi 134%
Apple MacBook Pro 16 2021 M1 Pro análise de áudio
(+) | os alto-falantes podem tocar relativamente alto (###valor### dB)
Graves 100 - 315Hz
(+) | bons graves - apenas 3.8% longe da mediana
(+) | o baixo é linear (5.2% delta para a frequência anterior)
Médios 400 - 2.000 Hz
(+) | médios equilibrados - apenas 1.3% longe da mediana
(+) | médios são lineares (2.1% delta para frequência anterior)
Altos 2 - 16 kHz
(+) | agudos equilibrados - apenas 1.9% longe da mediana
(+) | os máximos são lineares (2.7% delta da frequência anterior)
Geral 100 - 16.000 Hz
(+) | o som geral é linear (4.6% diferença em relação à mediana)
Comparado com a mesma classe
» 0% de todos os dispositivos testados nesta classe foram melhores, 0% semelhantes, 100% piores
» O melhor teve um delta de 5%, a média foi 17%, o pior foi 45%
Comparado com todos os dispositivos testados
» 0% de todos os dispositivos testados foram melhores, 0% semelhantes, 100% piores
» O melhor teve um delta de 4%, a média foi 23%, o pior foi 134%
Gerenciamento de energia - Ada Lovelace brilha
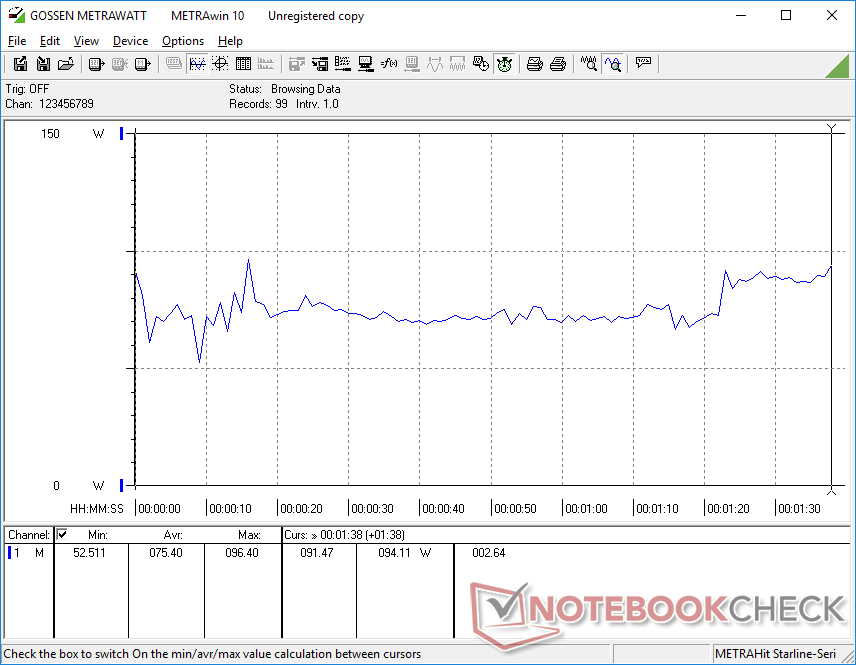
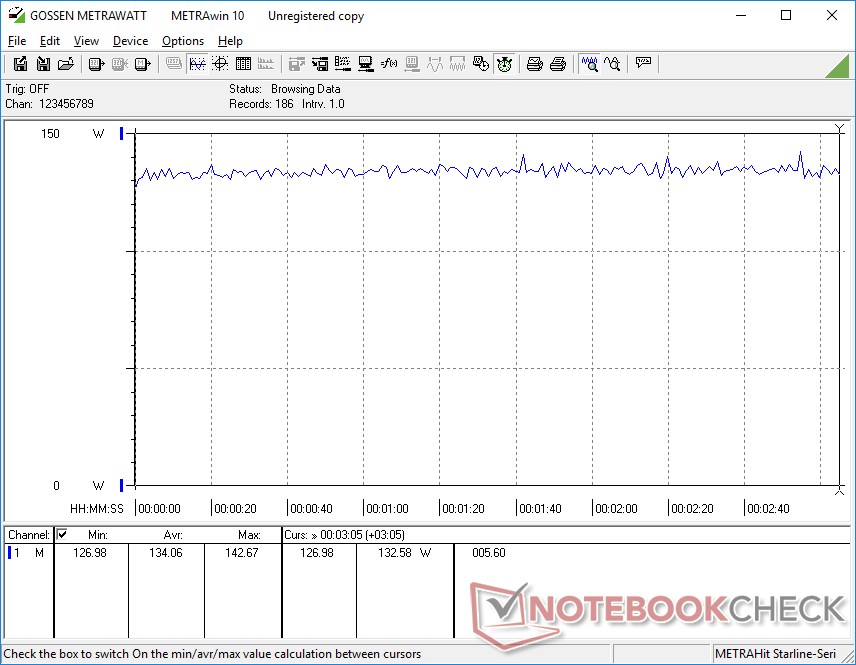
Consumo de energia
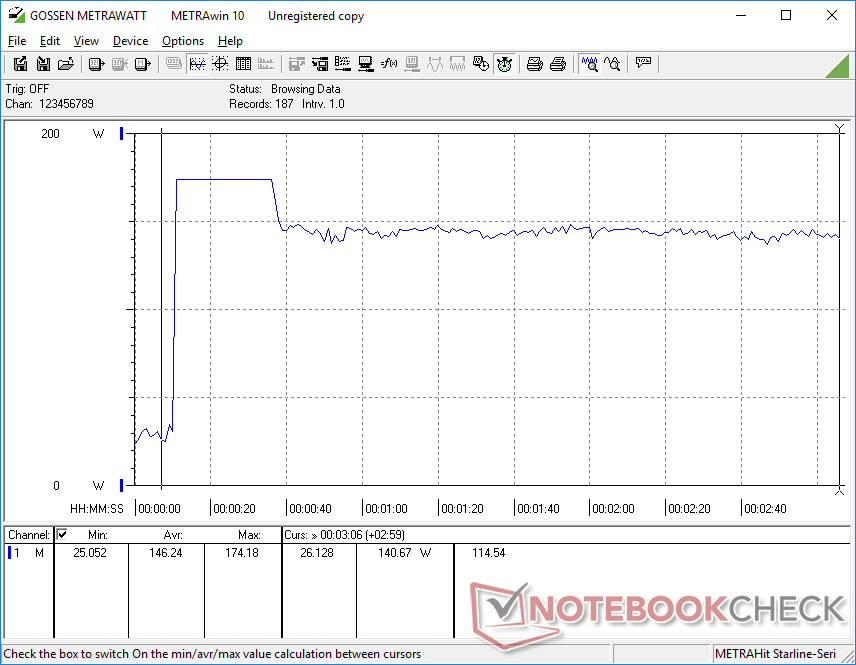
O desempenho por watt é significativamente superior ao da maioria das outras estações de trabalho, pois o nosso Precision está usando uma GPU Ada Lovelace de geração mais recente. A execução de Witcher 3por exemplo, consumiria apenas 134 W em nosso sistema, em comparação com 159 W e 189 W no Precision 7670 Performance e HP ZBook Fury 16 G9, respectivamente, mesmo que nossa GPU RTX 5000 superasse suas GPUs RTX A5500, conforme observado acima.
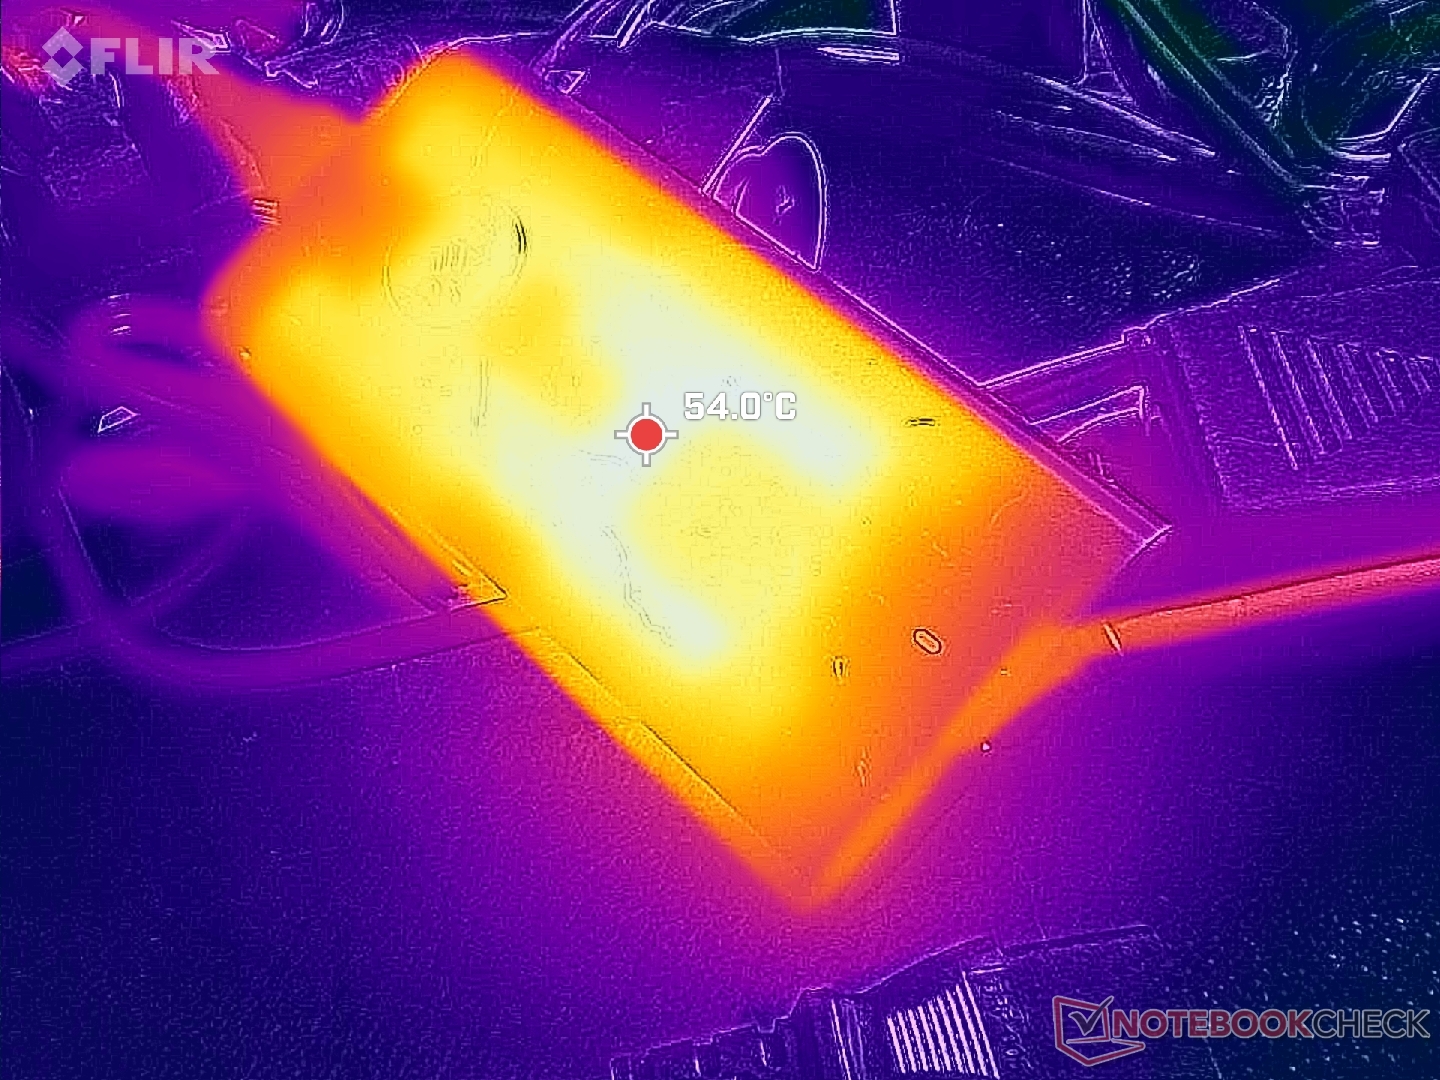
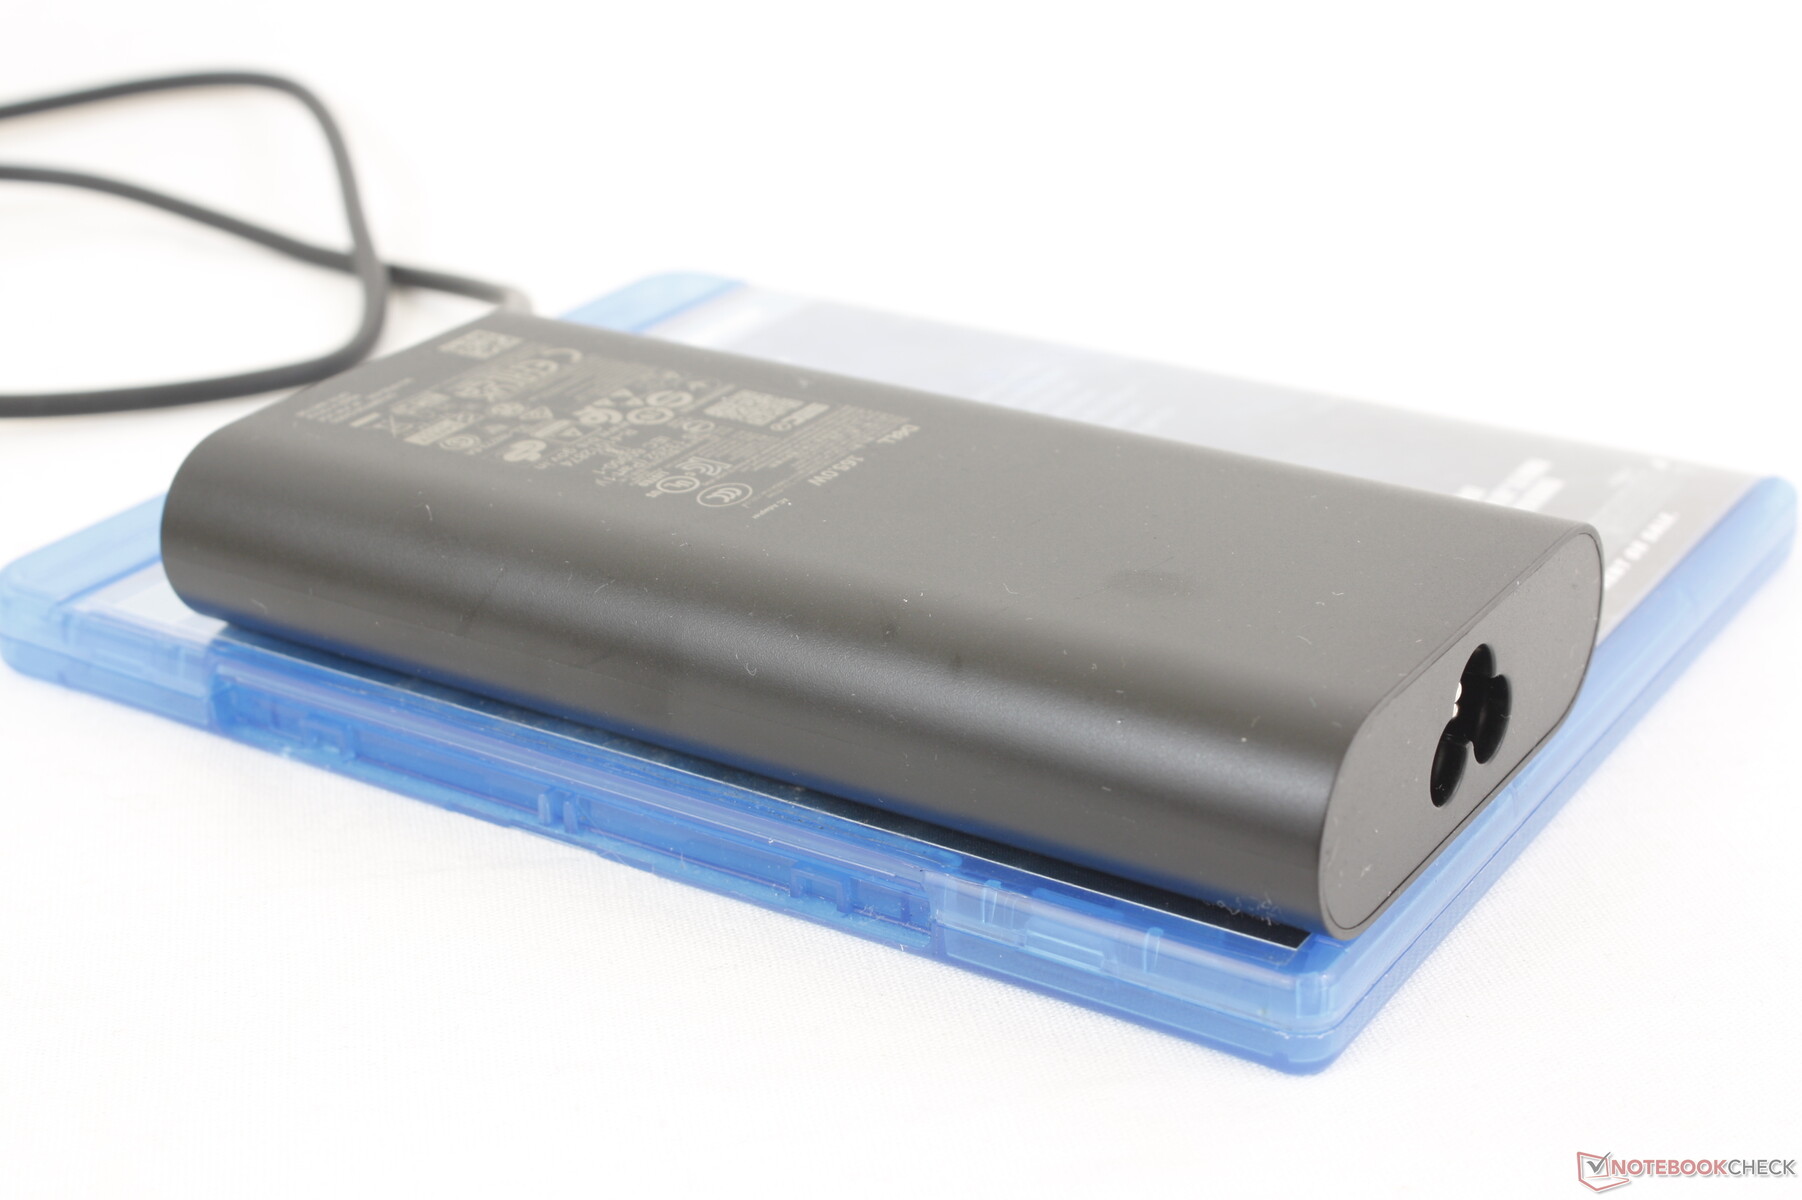
O relativamente pequeno (~13,5 x 6,5 x 2,2 cm) adaptador CA USB-C de 165 W também merece uma menção por sua alta potência de saída. A maioria dos adaptadores USB-C existentes é limitada a apenas 100 W a 140 W, no máximo, o que torna nosso adaptador de 165 W um dos mais versáteis. Esse novo adaptador resolve diretamente os problemas de carregamento da bateria que tivemos com o modelo Precision 7000 mais antigo, que foi enviado com um adaptador USB-C de 130 W menos capaz.
| desligado | |
| Ocioso | |
| Carga |
|
Key:
min: | |
| Dell Precision 5000 5680 i9-13900H, RTX 5000 Ada Generation Laptop, 2x SK hynix PC801 HFS512GEJ9X101N RAID 0, OLED, 3840x2400, 16" | Dell Precision 7000 7670 Performance i9-12950HX, RTX A5500 Laptop GPU, , OLED, 3840x2400, 16" | HP ZBook Fury 16 G9 i9-12950HX, RTX A5500 Laptop GPU, Micron 3400 1TB MTFDKBA1T0TFH, IPS, 3840x2400, 16" | Lenovo ThinkPad P16 G1 RTX A5500 i9-12950HX, RTX A5500 Laptop GPU, WDC PC SN810 2TB, IPS, 3840x2400, 16" | MSI CreatorPro Z16P B12UKST i7-12700H, RTX A3000 Laptop GPU, Samsung PM9A1 MZVL21T0HCLR, IPS, 2560x1600, 16" | Asus ExpertBook B6 Flip B6602FC2 i9-12950HX, RTX A2000 Laptop GPU, Samsung PM9A1 MZVL21T0HCLR, IPS, 2560x1600, 16" | |
|---|---|---|---|---|---|---|
| Power Consumption | -99% | -86% | -53% | -18% | -35% | |
| Idle Minimum * (Watt) | 8 | 16.4 -105% | 19.5 -144% | 7.5 6% | 10.8 -35% | 10.5 -31% |
| Idle Average * (Watt) | 10.4 | 35.9 -245% | 29 -179% | 20.1 -93% | 16.3 -57% | 11.9 -14% |
| Idle Maximum * (Watt) | 30.5 | 47 -54% | 40.7 -33% | 40 -31% | 16.9 45% | 18 41% |
| Load Average * (Watt) | 75.4 | 147.1 -95% | 142.1 -88% | 137 -82% | 111.7 -48% | 182 -141% |
| Witcher 3 ultra * (Watt) | 134 | 158.8 -19% | 188.6 -41% | 208 -55% | 152.1 -14% | 177.5 -32% |
| Load Maximum * (Watt) | 175 | 311 -78% | 224.4 -28% | 285.9 -63% | 177.4 -1% | 229 -31% |
* ... menor é melhor
Power Consumption Witcher 3 / Stresstest
Power Consumption external Monitor
Duração da bateria
A duração da bateria é excelente, considerando o alto desempenho e o exigente painel OLED 4K. Conseguimos registrar quase 10 horas de navegação em WLAN no mundo real quando no perfil Balanced com a iGPU ativa, em comparação com quase metade disso em alternativas como o Lenovo ThinkPad P16 G1 ou oMSI CreatorPro Z16P.
O carregamento da capacidade vazia até a capacidade total leva cerca de 2 horas com o adaptador CA de 165 W incluído. Nosso adaptador USB-C de 65 W de terceiros também pode recarregar o sistema, embora em um ritmo mais lento.
| Dell Precision 5000 5680 i9-13900H, RTX 5000 Ada Generation Laptop, 98 Wh | Dell Precision 7000 7670 Performance i9-12950HX, RTX A5500 Laptop GPU, 93 Wh | HP ZBook Fury 16 G9 i9-12950HX, RTX A5500 Laptop GPU, 95 Wh | Lenovo ThinkPad P16 G1 RTX A5500 i9-12950HX, RTX A5500 Laptop GPU, 94 Wh | MSI CreatorPro Z16P B12UKST i7-12700H, RTX A3000 Laptop GPU, 90 Wh | Asus ExpertBook B6 Flip B6602FC2 i9-12950HX, RTX A2000 Laptop GPU, 90 Wh | |
|---|---|---|---|---|---|---|
| Duração da bateria | -53% | -46% | -41% | -41% | -14% | |
| Reader / Idle (h) | 17.9 | 5.3 -70% | 12.5 -30% | |||
| WiFi v1.3 (h) | 9.9 | 4.7 -53% | 6 -39% | 5.8 -41% | 5.8 -41% | 8.7 -12% |
| Load (h) | 1.7 | 1.2 -29% | 1.7 0% | |||
| H.264 (h) | 5.8 |
Pro
Contra
Veredicto - Mais potente do que parece
A Precision 5680 é, sem dúvida, uma das estações de trabalho móveis mais enxutas e rápidas de toda a linha da Dell. O design portátil, o adaptador USB-C de 165 W, a excelente tela OLED 4K e a poderosa GPU RTX 5000 se destacam como os recursos mais fortes do modelo. A última, em particular, é responsável por grande parte dos aumentos de desempenho e das vantagens de duração da bateria em relação à maioria das outras estações de trabalho, devido à sua arquitetura Ada Lovelace e ao altíssimo desempenho por watt.
O Precision 5680 oferece um dos mais altos níveis de desempenho por watt na crescente categoria de estações de trabalho finas e leves.
Os usuários de estações de trabalho mais exigentes ainda podem preferir modelos maiores e mais espessos, como o HP ZBook Fury 16 ou Precision 7670 já que o design fino do Precision 5680 dispensa alguns recursos importantes, como RAM expansível, WAN, RAM ECC e opções de portas mais amplas. Seu terrível clickpad não é tão preciso quanto os touchpads do HP ou do Lenovo ThinkPad P16 que têm botões de mouse reais para melhor controle.
Preço e disponibilidade
A Dell agora está enviando o Precision 5680 a partir de US$ 2.490 até mais de US$ 6.500, conforme analisado.
Dell Precision 5000 5680
- 08/18/2023 v7 (old)
Allen Ngo
Transparência
A seleção dos dispositivos a serem analisados é feita pela nossa equipe editorial. A amostra de teste foi fornecida ao autor como empréstimo pelo fabricante ou varejista para fins desta revisão. O credor não teve influência nesta revisão, nem o fabricante recebeu uma cópia desta revisão antes da publicação. Não houve obrigação de publicar esta revisão. Como empresa de mídia independente, a Notebookcheck não está sujeita à autoridade de fabricantes, varejistas ou editores.
É assim que o Notebookcheck está testando
Todos os anos, o Notebookcheck analisa de forma independente centenas de laptops e smartphones usando procedimentos padronizados para garantir que todos os resultados sejam comparáveis. Desenvolvemos continuamente nossos métodos de teste há cerca de 20 anos e definimos padrões da indústria no processo. Em nossos laboratórios de teste, equipamentos de medição de alta qualidade são utilizados por técnicos e editores experientes. Esses testes envolvem um processo de validação em vários estágios. Nosso complexo sistema de classificação é baseado em centenas de medições e benchmarks bem fundamentados, o que mantém a objetividade.Price comparison

