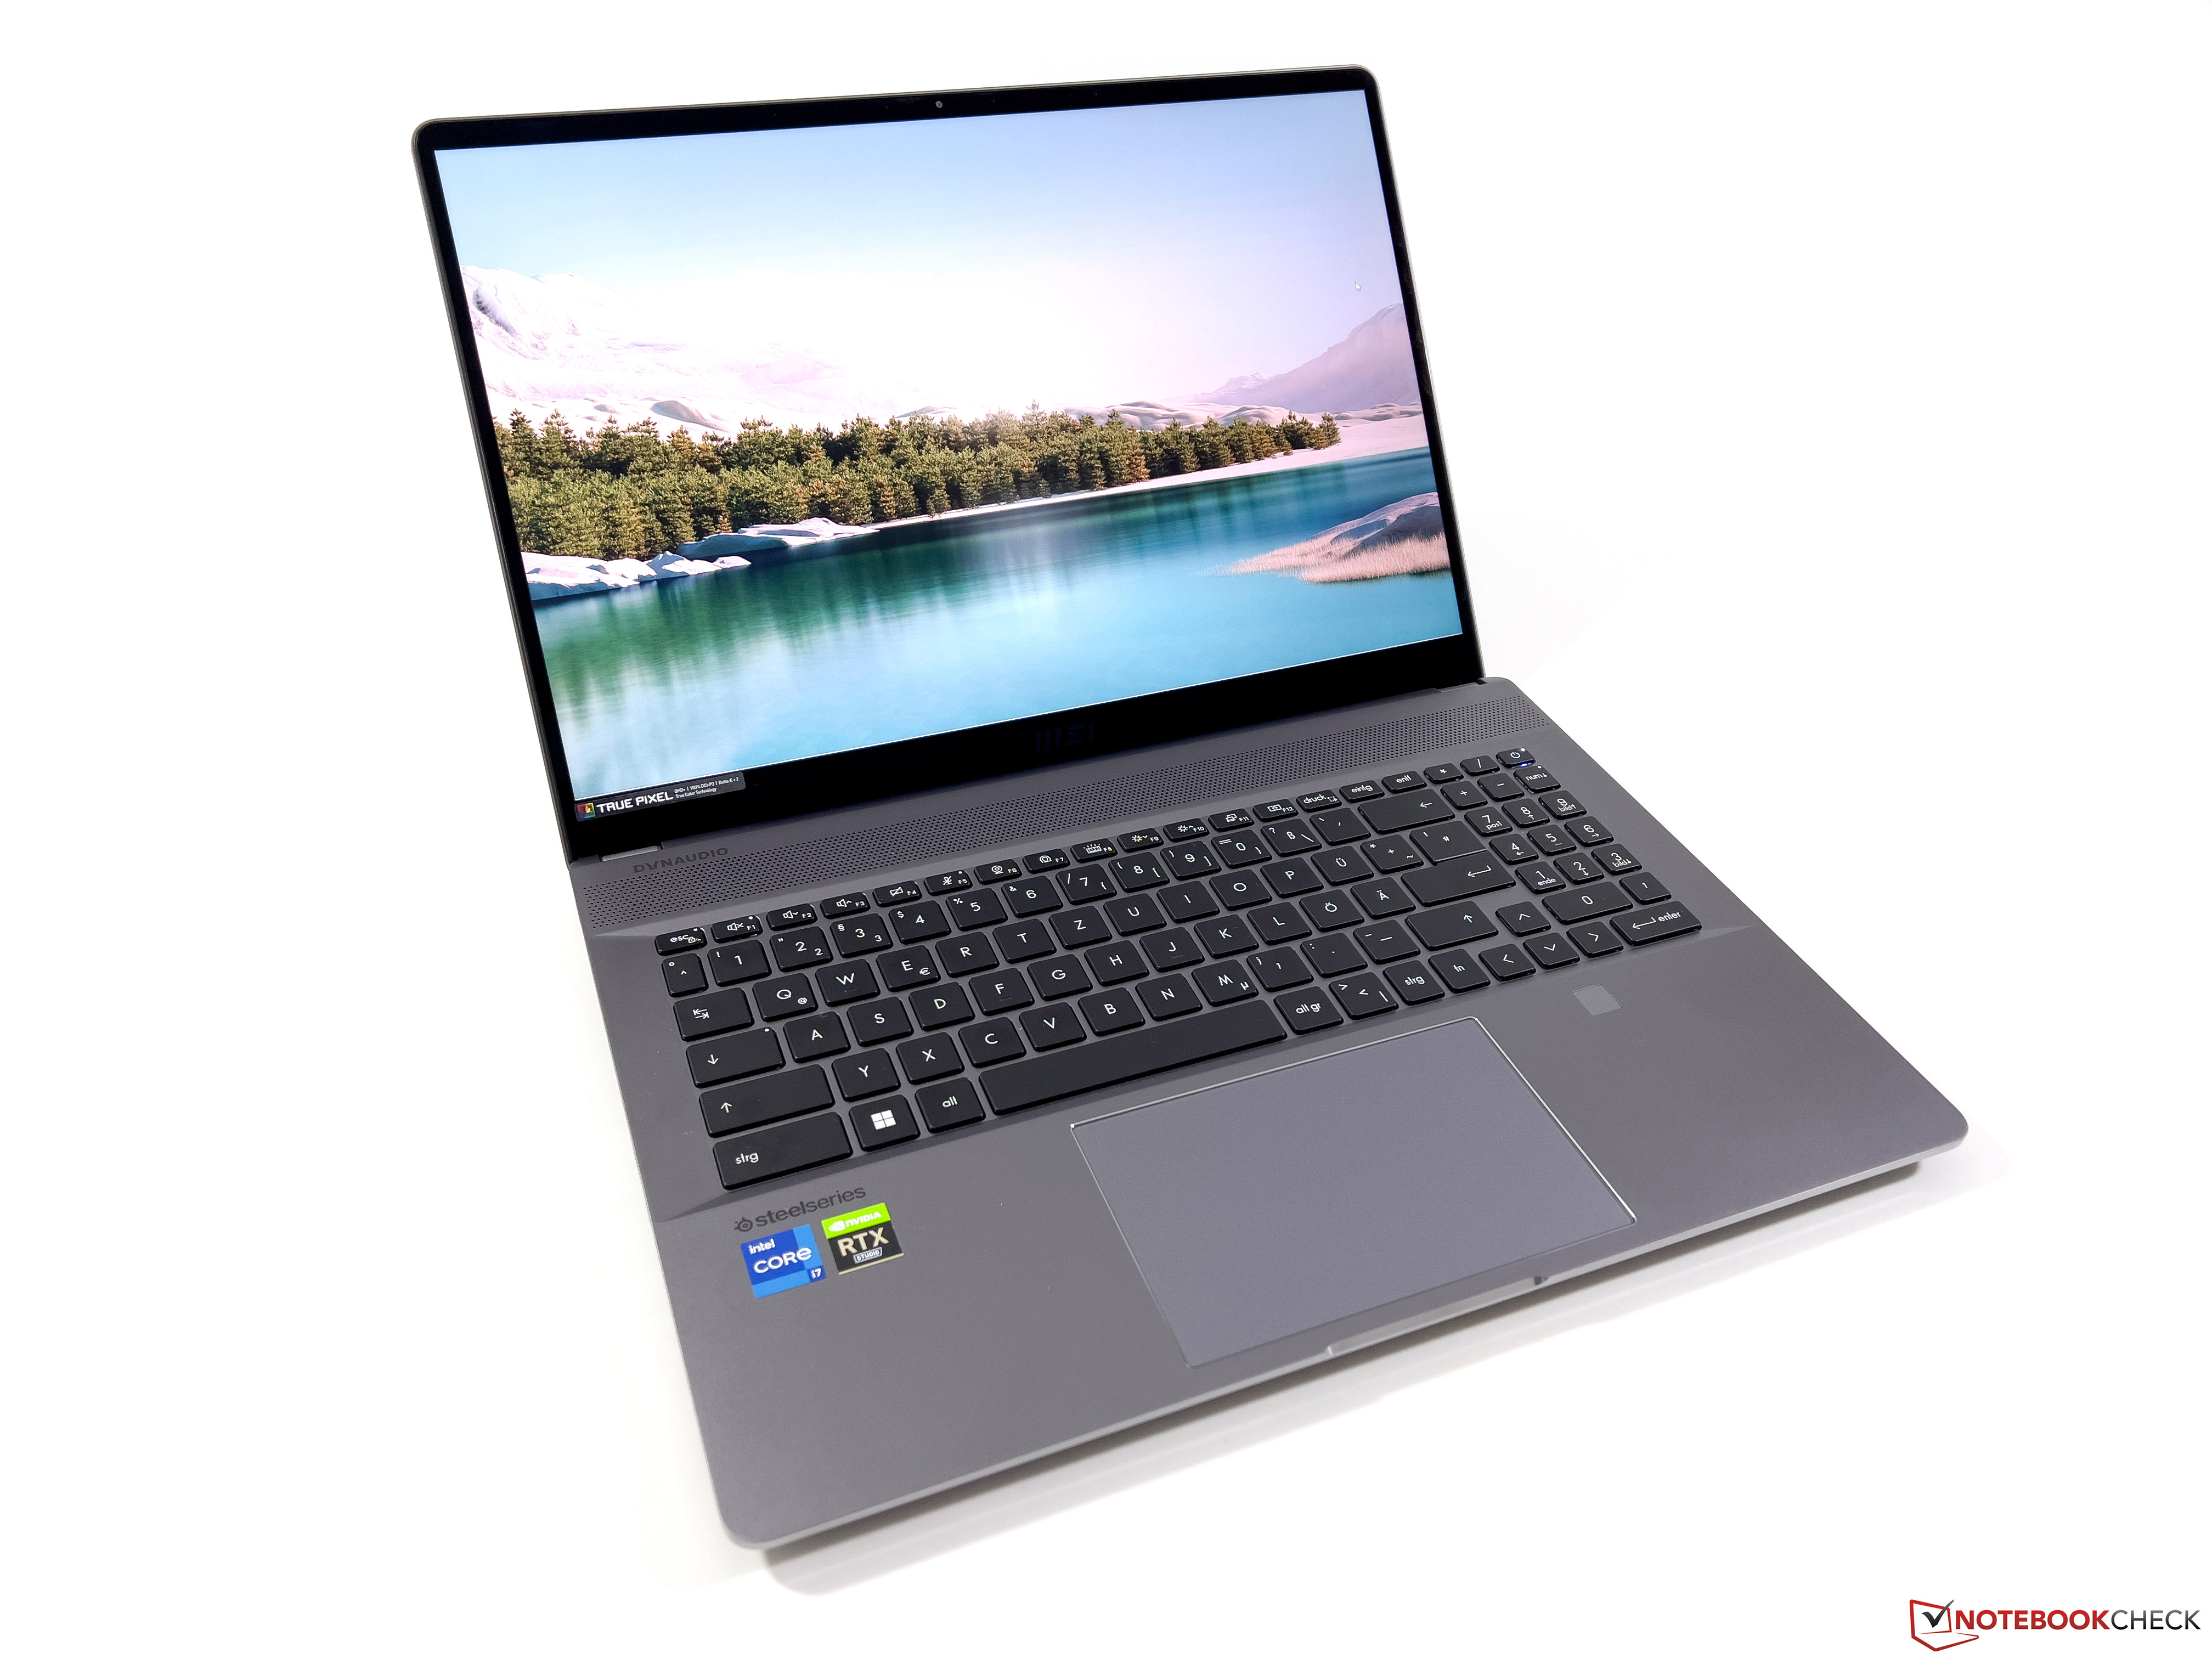
MSI CreatorPro Z16P laptop review - Estação de trabalho móvel com problemas de temperatura
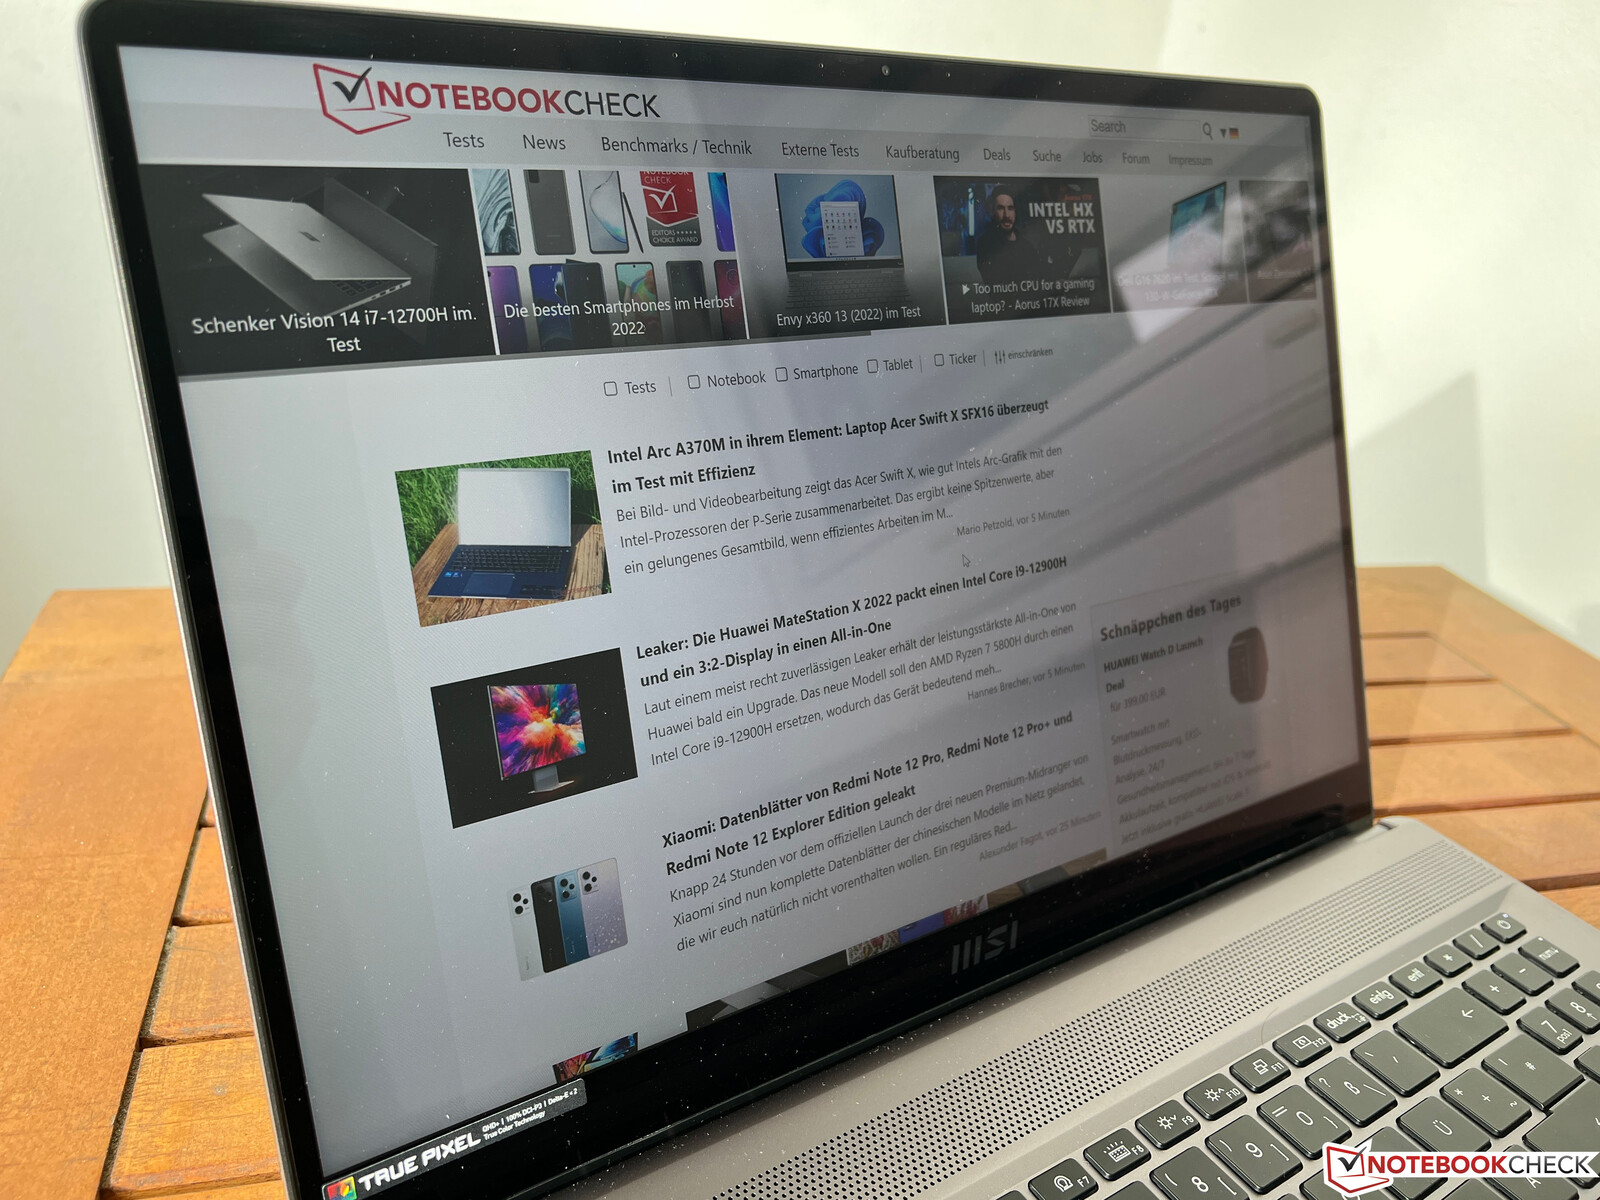
Já testamos oCriador Z16P da MSIextensivamente, que é um laptop fino de 16 polegadas para os criadores de conteúdo. No entanto, o fabricante também oferece o dispositivo com GPUs profissionais da Nvidia usando o nome "CreatorPro Z16P", que examinamos hoje. Estamos testando a configuração rotulada "B12UKST-078" por 3.499 Euros (~$3.620), que combina um Intel Core i7-12700Hcom oNvidia RTX A3000. Além disso, há 32 GB de RAM e um grande SSD de 1 TB, bem como um display IPS de 16 polegadas com resolução WQHD e taxa de atualização de 165-Hz. Neste teste, nós nos concentramos principalmente no desempenho. Você pode encontrar informações detalhadas sobre o estojo, equipamentos, dispositivos de entrada e alto-falantes em nosso teste do Criador Z16P:
Possíveis concorrentes em comparação
Avaliação | Data | Modelo | Peso | Altura | Size | Resolução | Preço |
|---|---|---|---|---|---|---|---|
| 84.3 % v7 (old) | 11/2022 | MSI CreatorPro Z16P B12UKST i7-12700H, RTX A3000 Laptop GPU | 2.4 kg | 19 mm | 16.00" | 2560x1600 | |
| 90.1 % v7 (old) | 11/2022 | HP ZBook Studio 16 G9 62U04EA i7-12800H, RTX A2000 Laptop GPU | 1.8 kg | 19 mm | 16.00" | 3840x2400 | |
| 89.8 % v7 (old) | 11/2021 | Lenovo ThinkPad P1 G4-20Y4S0KS00 i7-11850H, GeForce RTX 3070 Laptop GPU | 2 kg | 17.7 mm | 16.00" | 3840x2400 | |
| 88.3 % v7 (old) | 10/2021 | Dell Precision 5000 5560 i7-11850H, RTX A2000 Laptop GPU | 2 kg | 18 mm | 15.60" | 3840x2400 | |
| 83.7 % v7 (old) | 06/2022 | MSI Creator Z16P B12UHST i9-12900H, GeForce RTX 3080 Ti Laptop GPU | 2.4 kg | 20.4 mm | 16.00" | 2560x1600 |
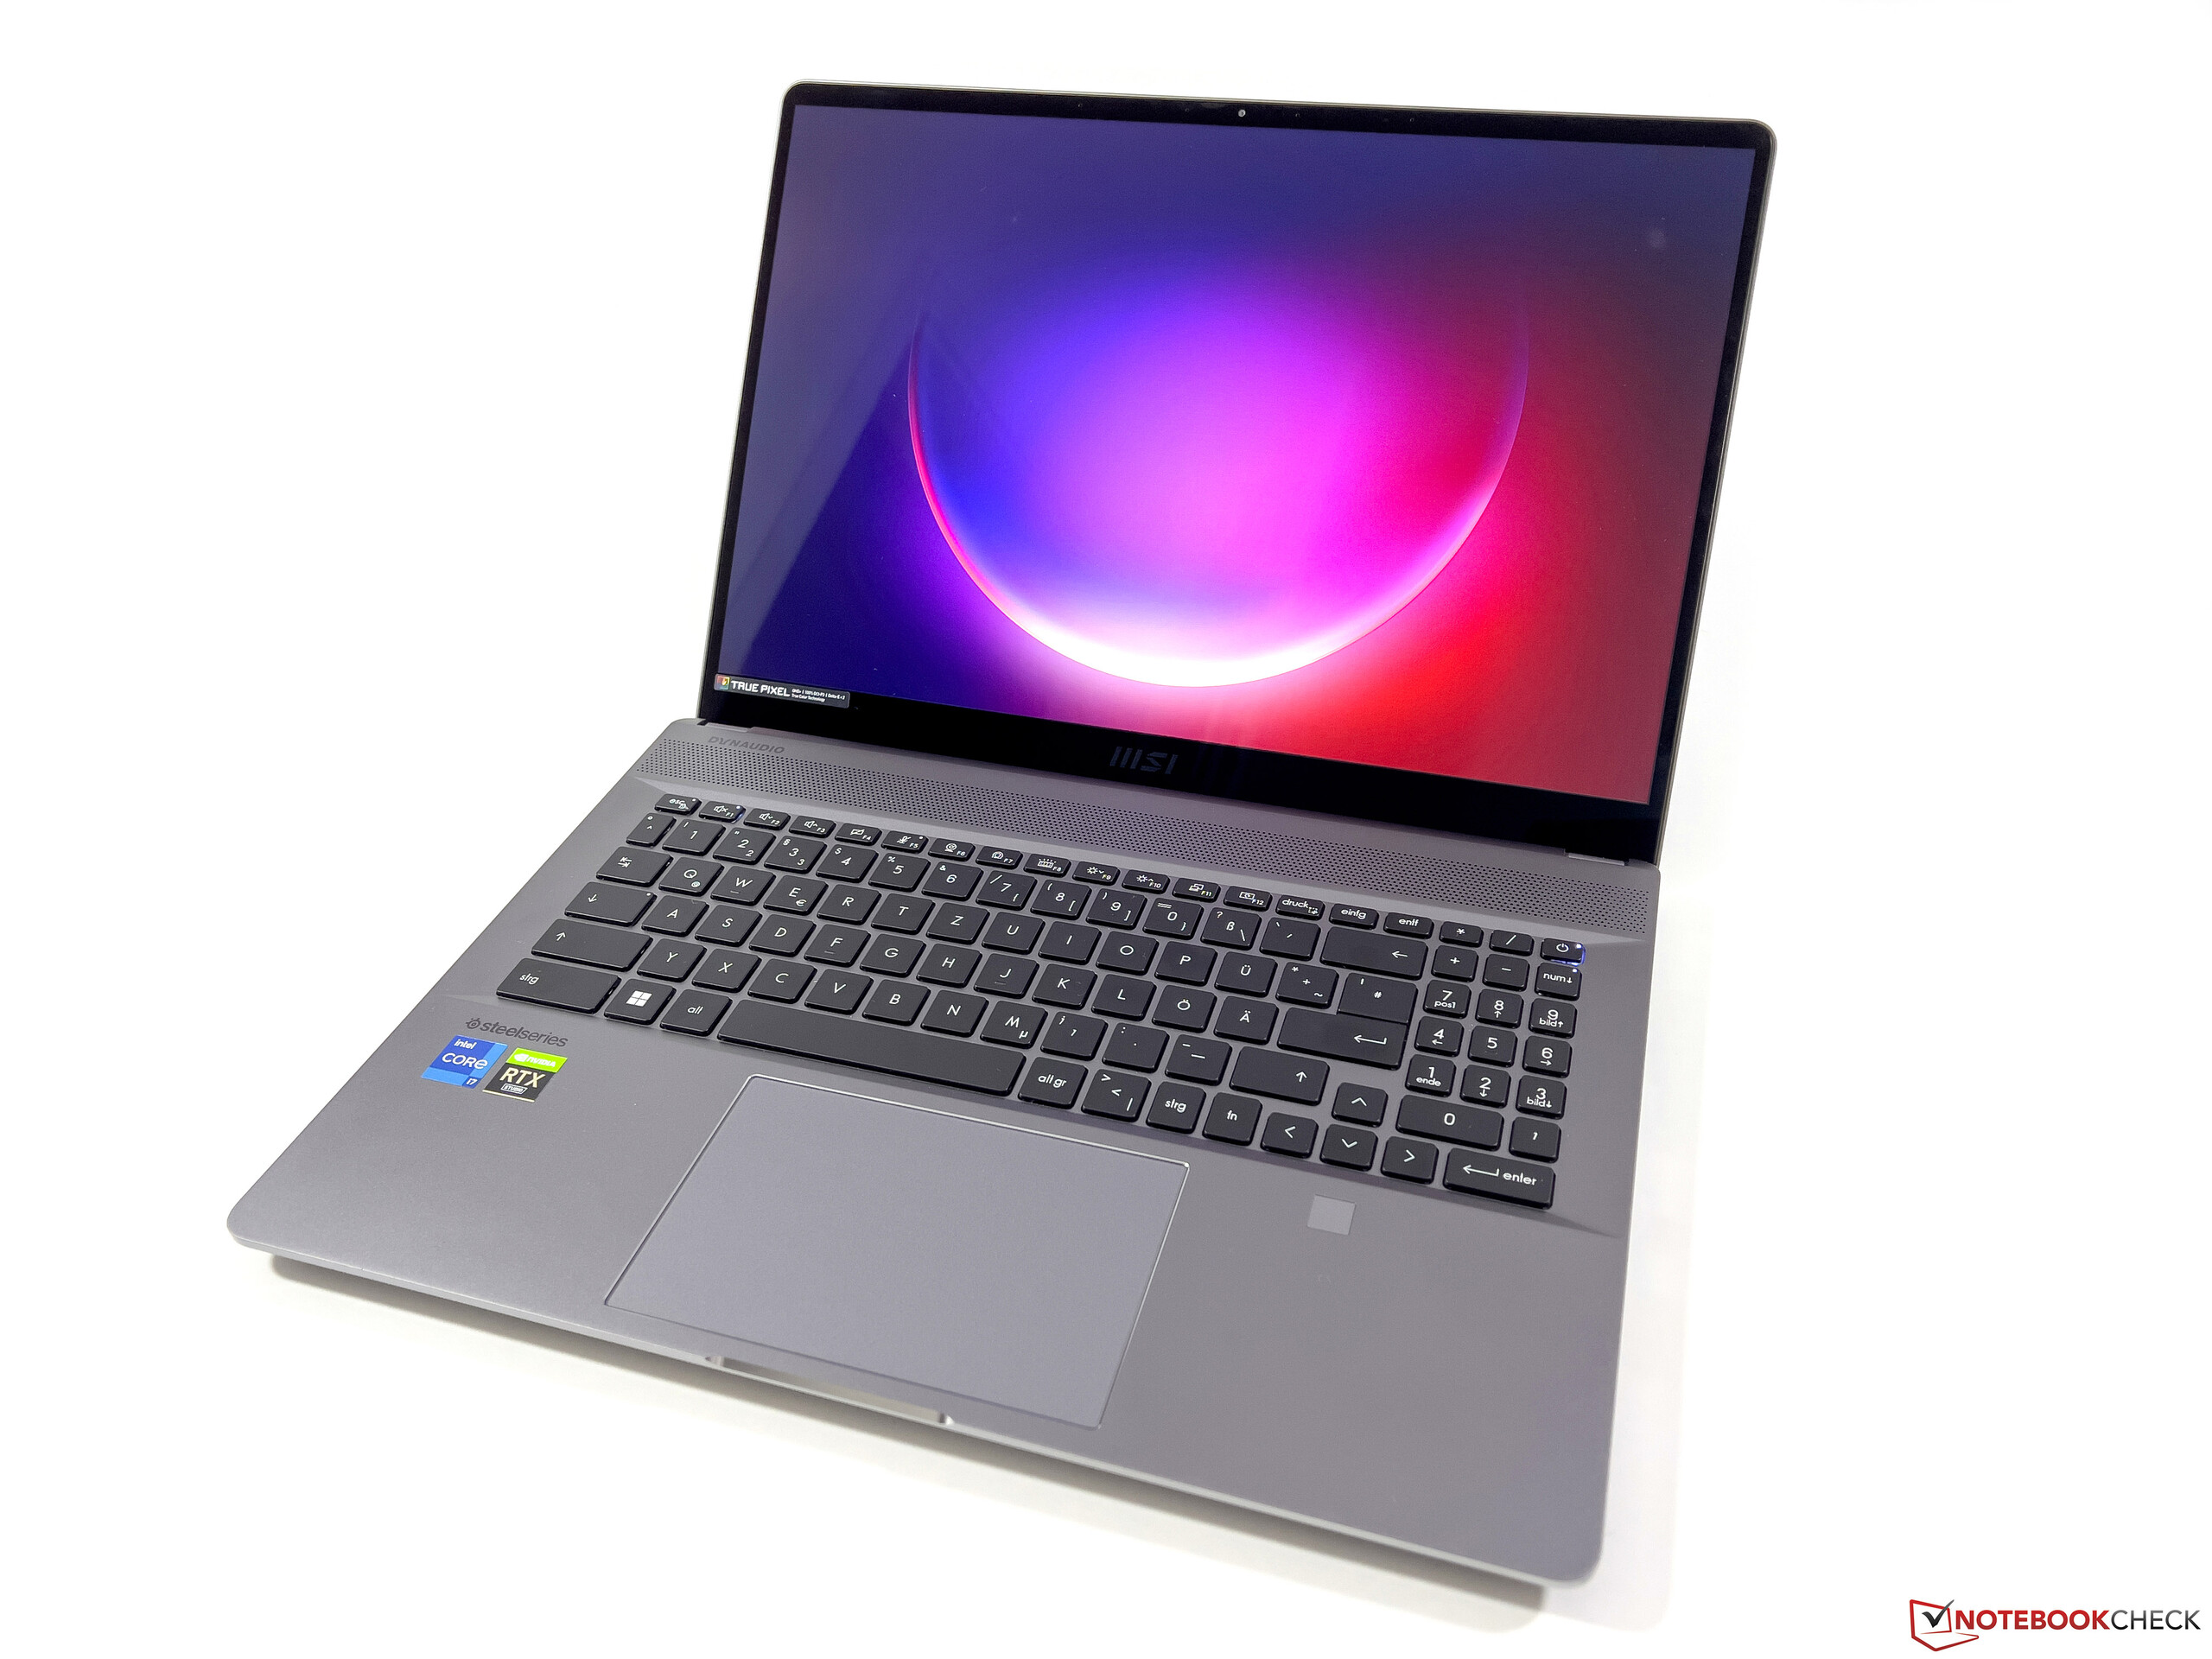
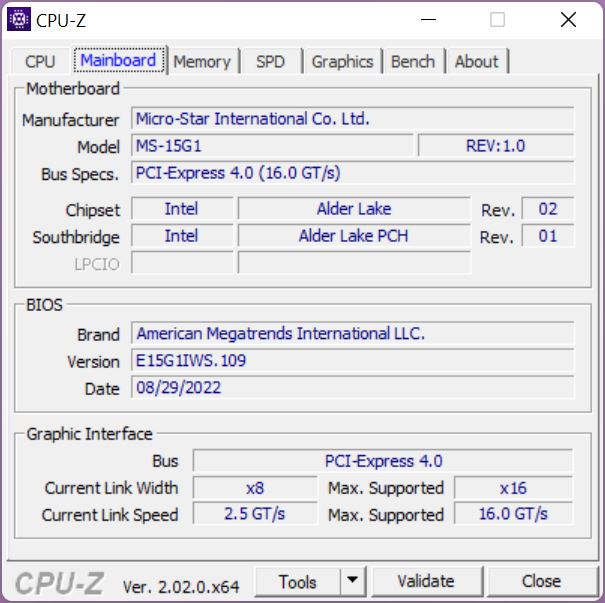
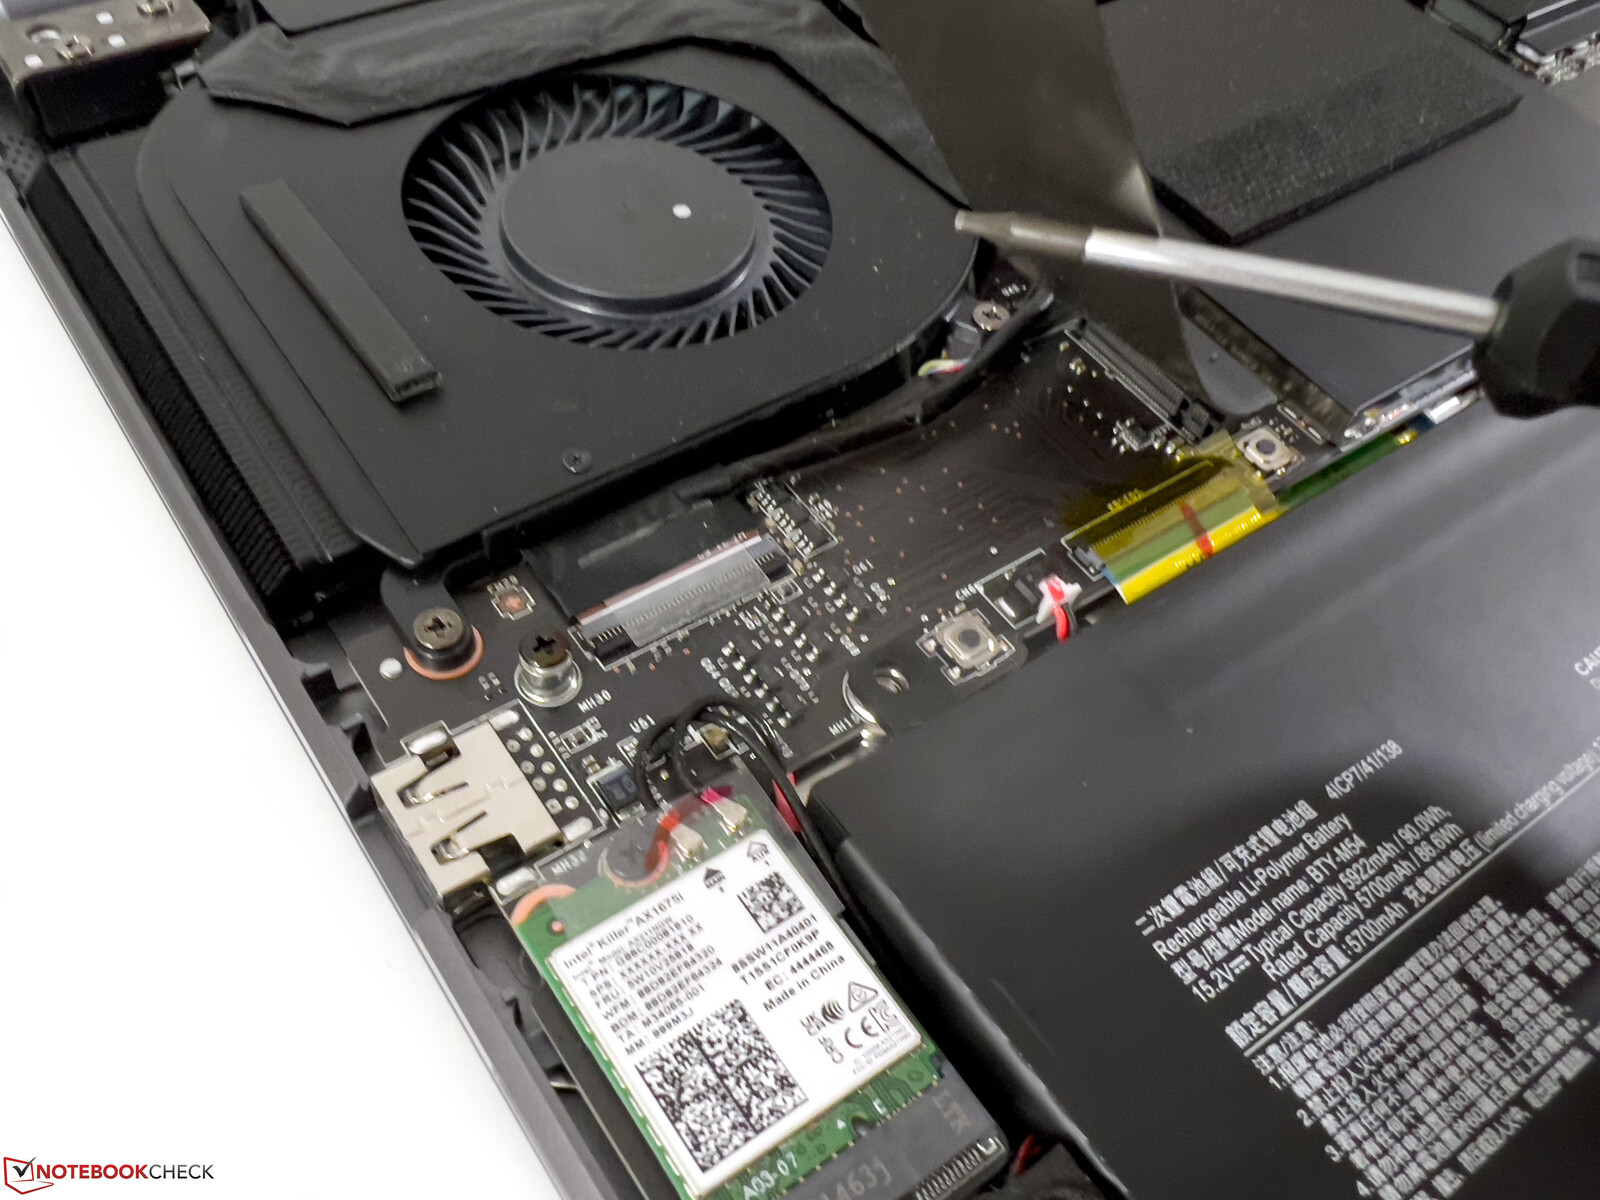
Estojo, equipamento e dispositivos de entrada
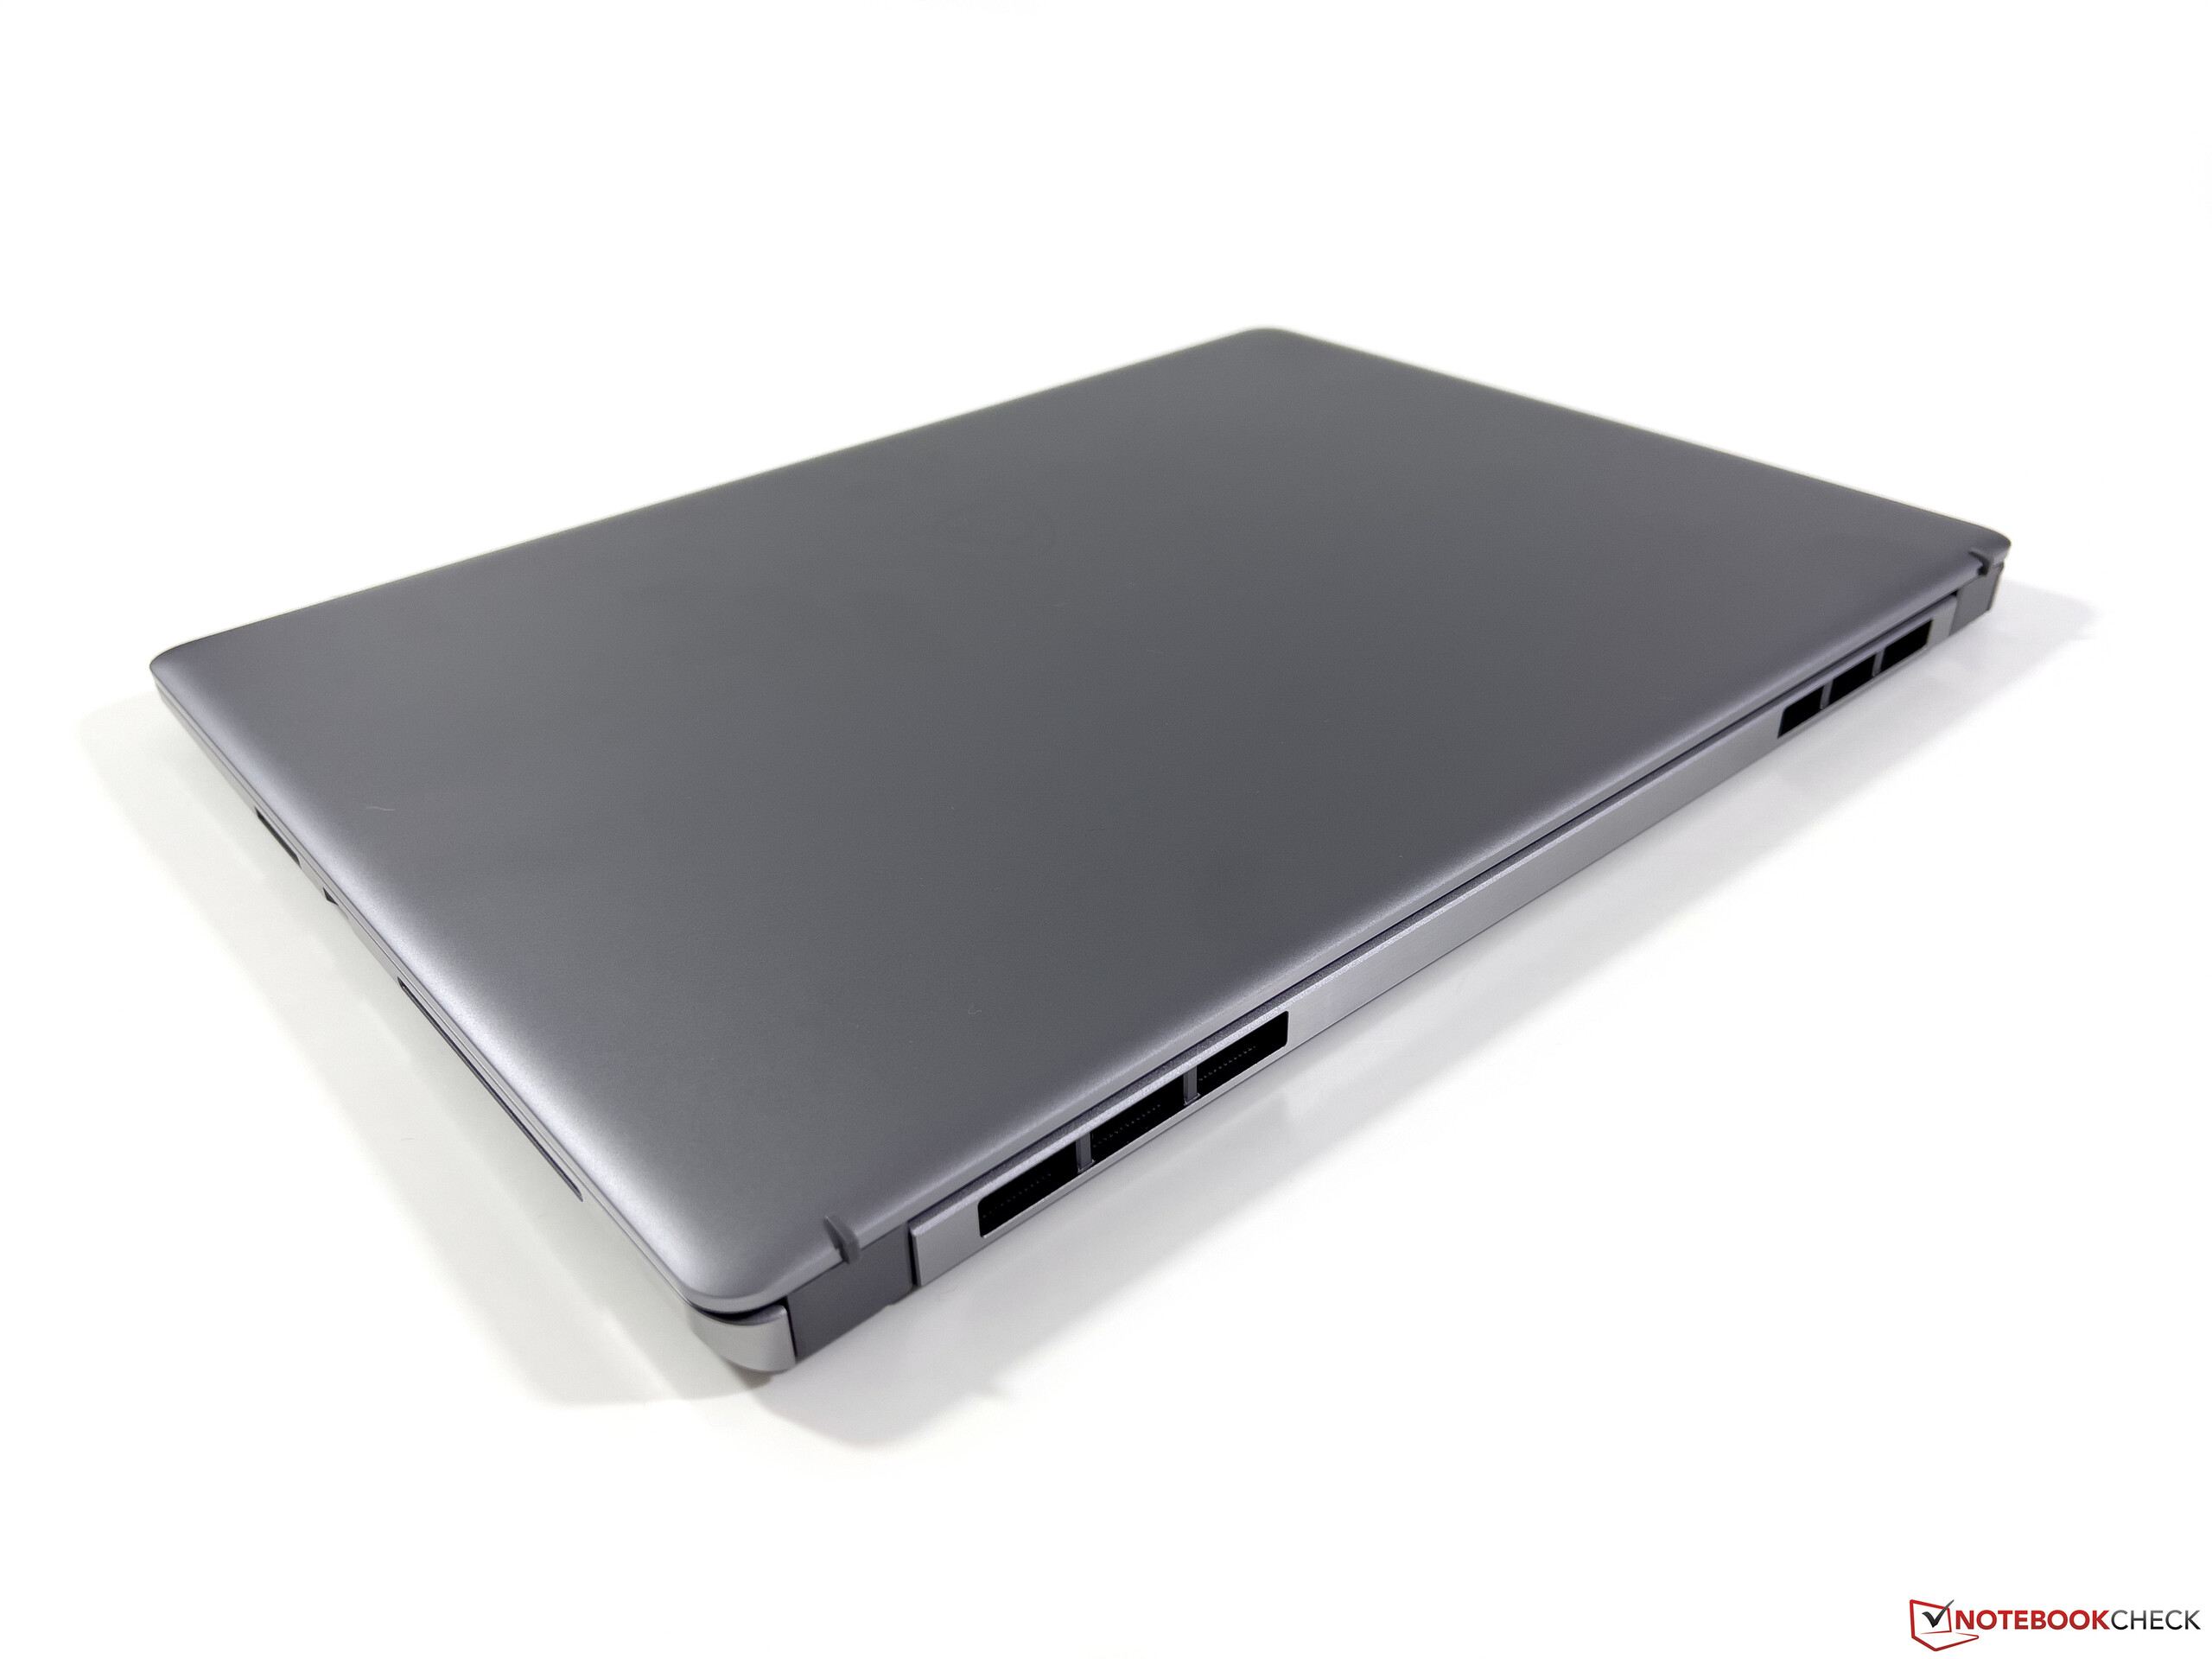
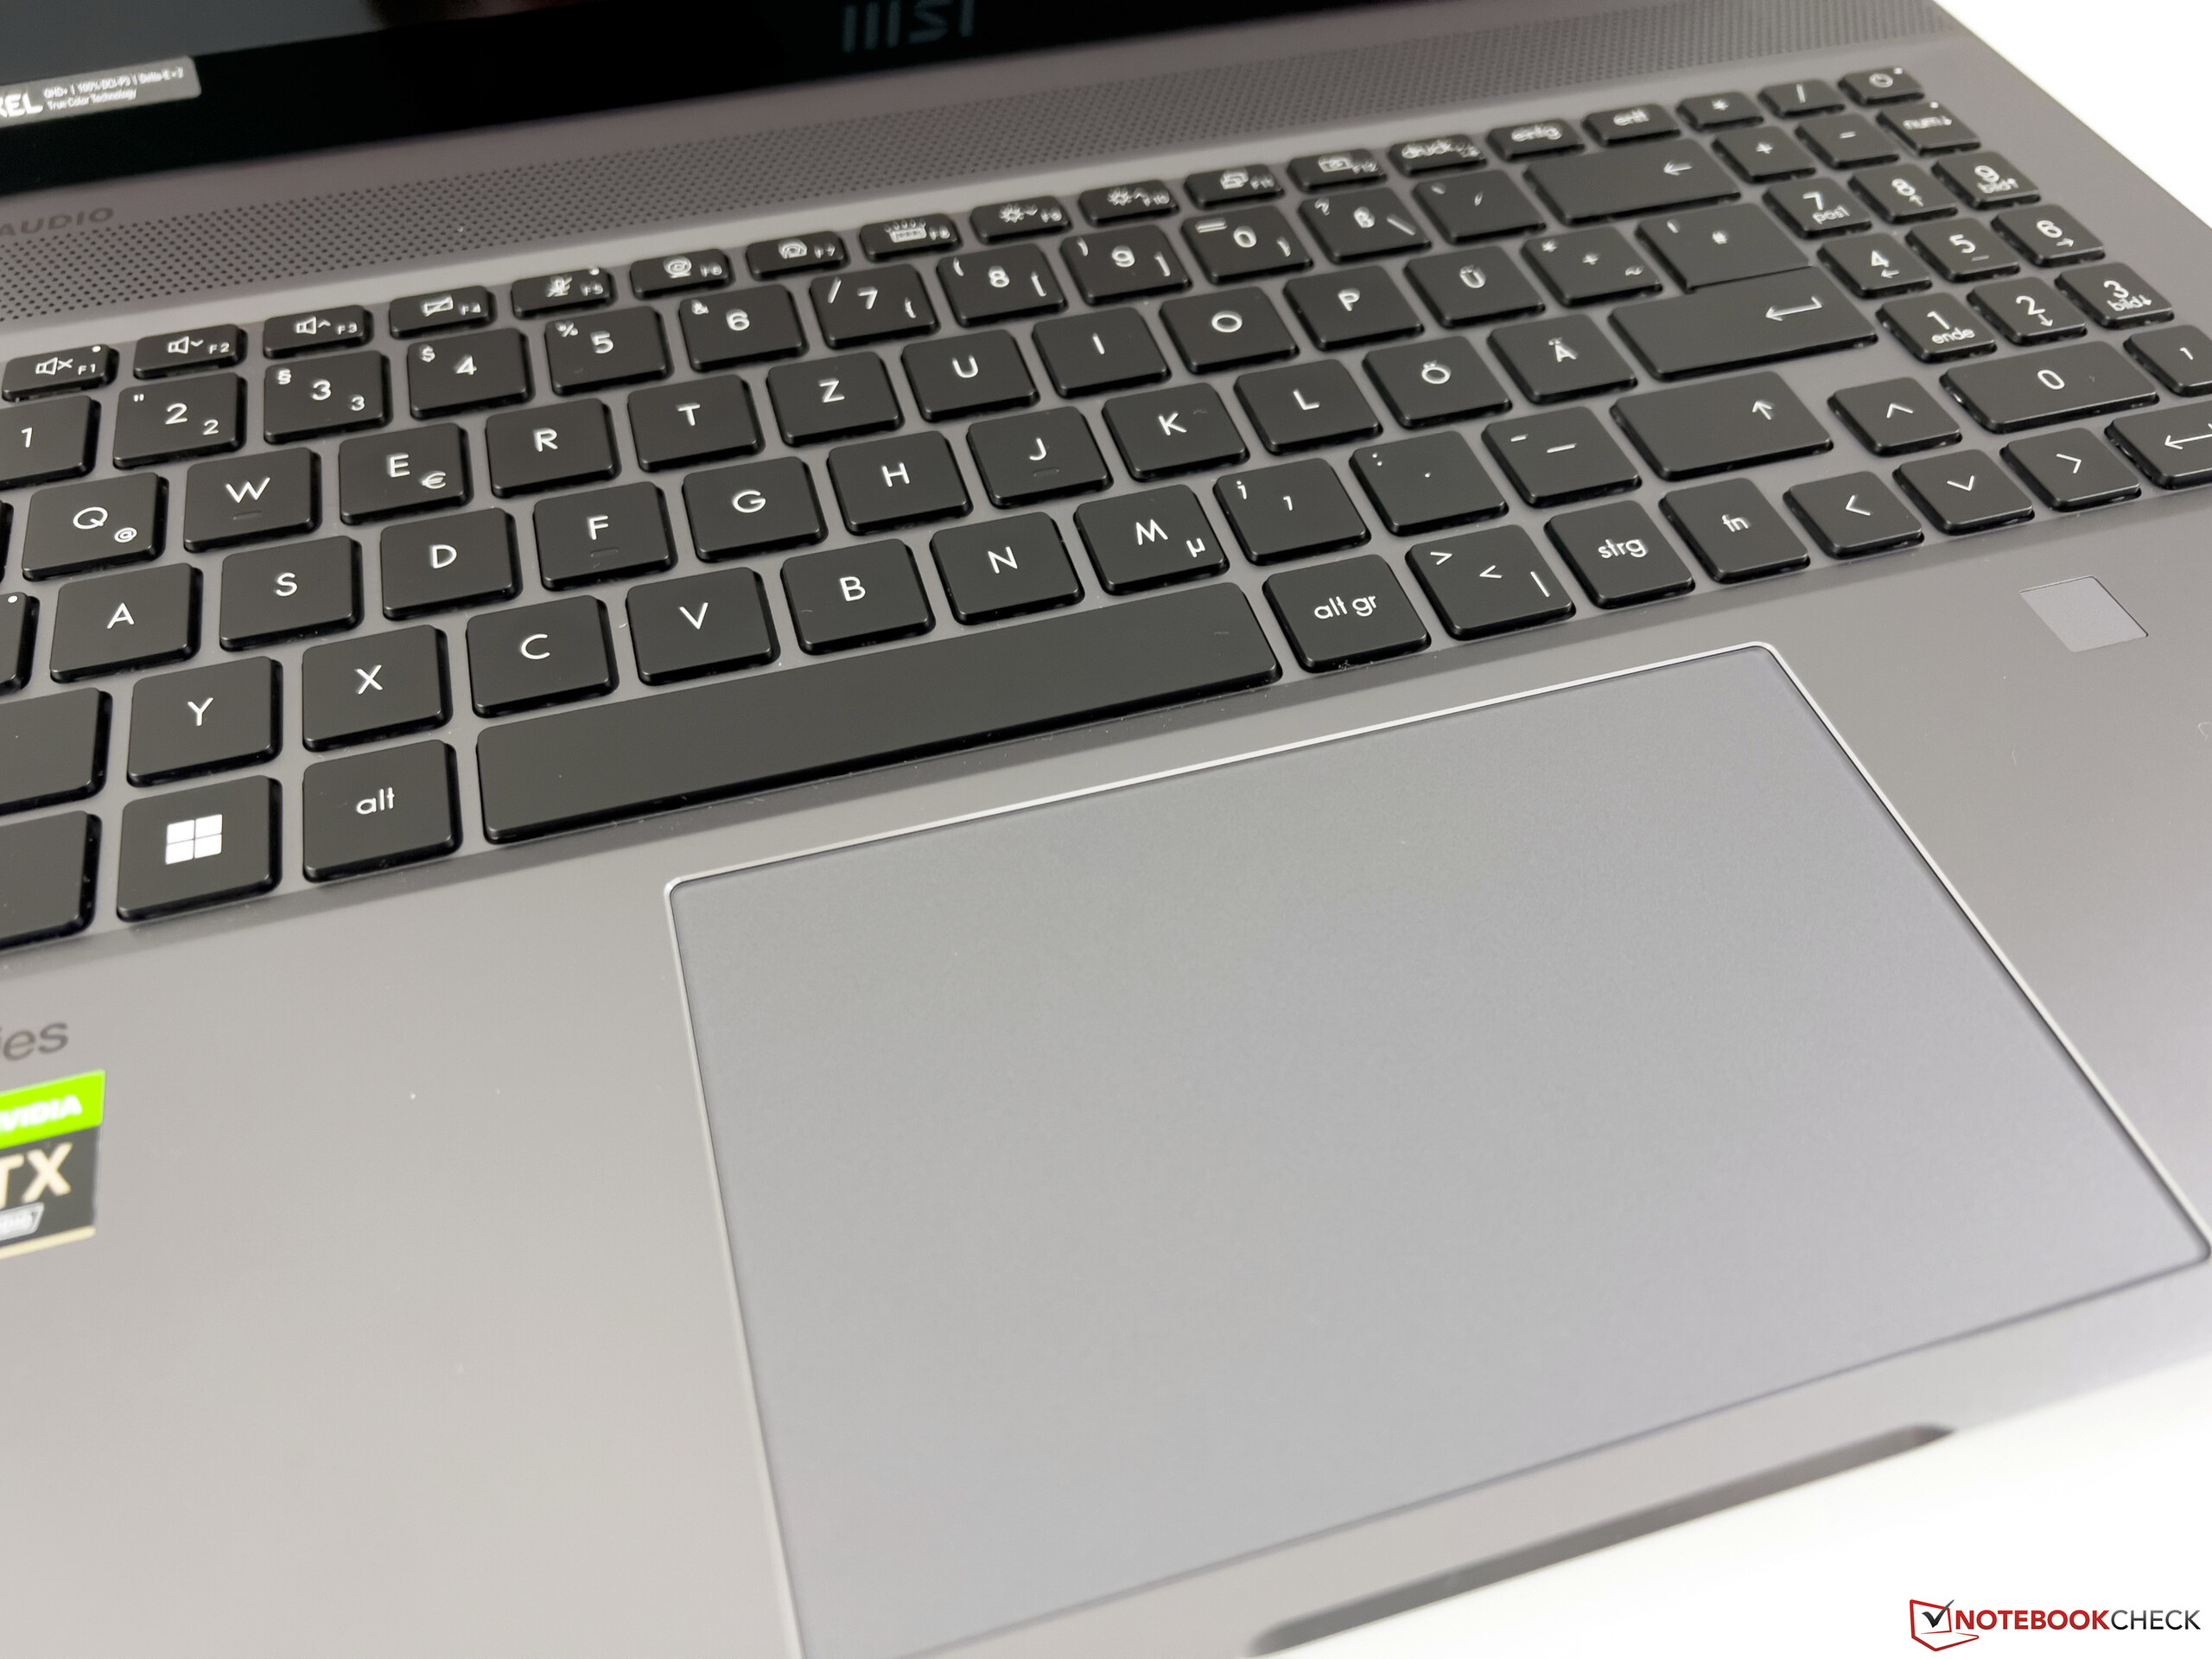
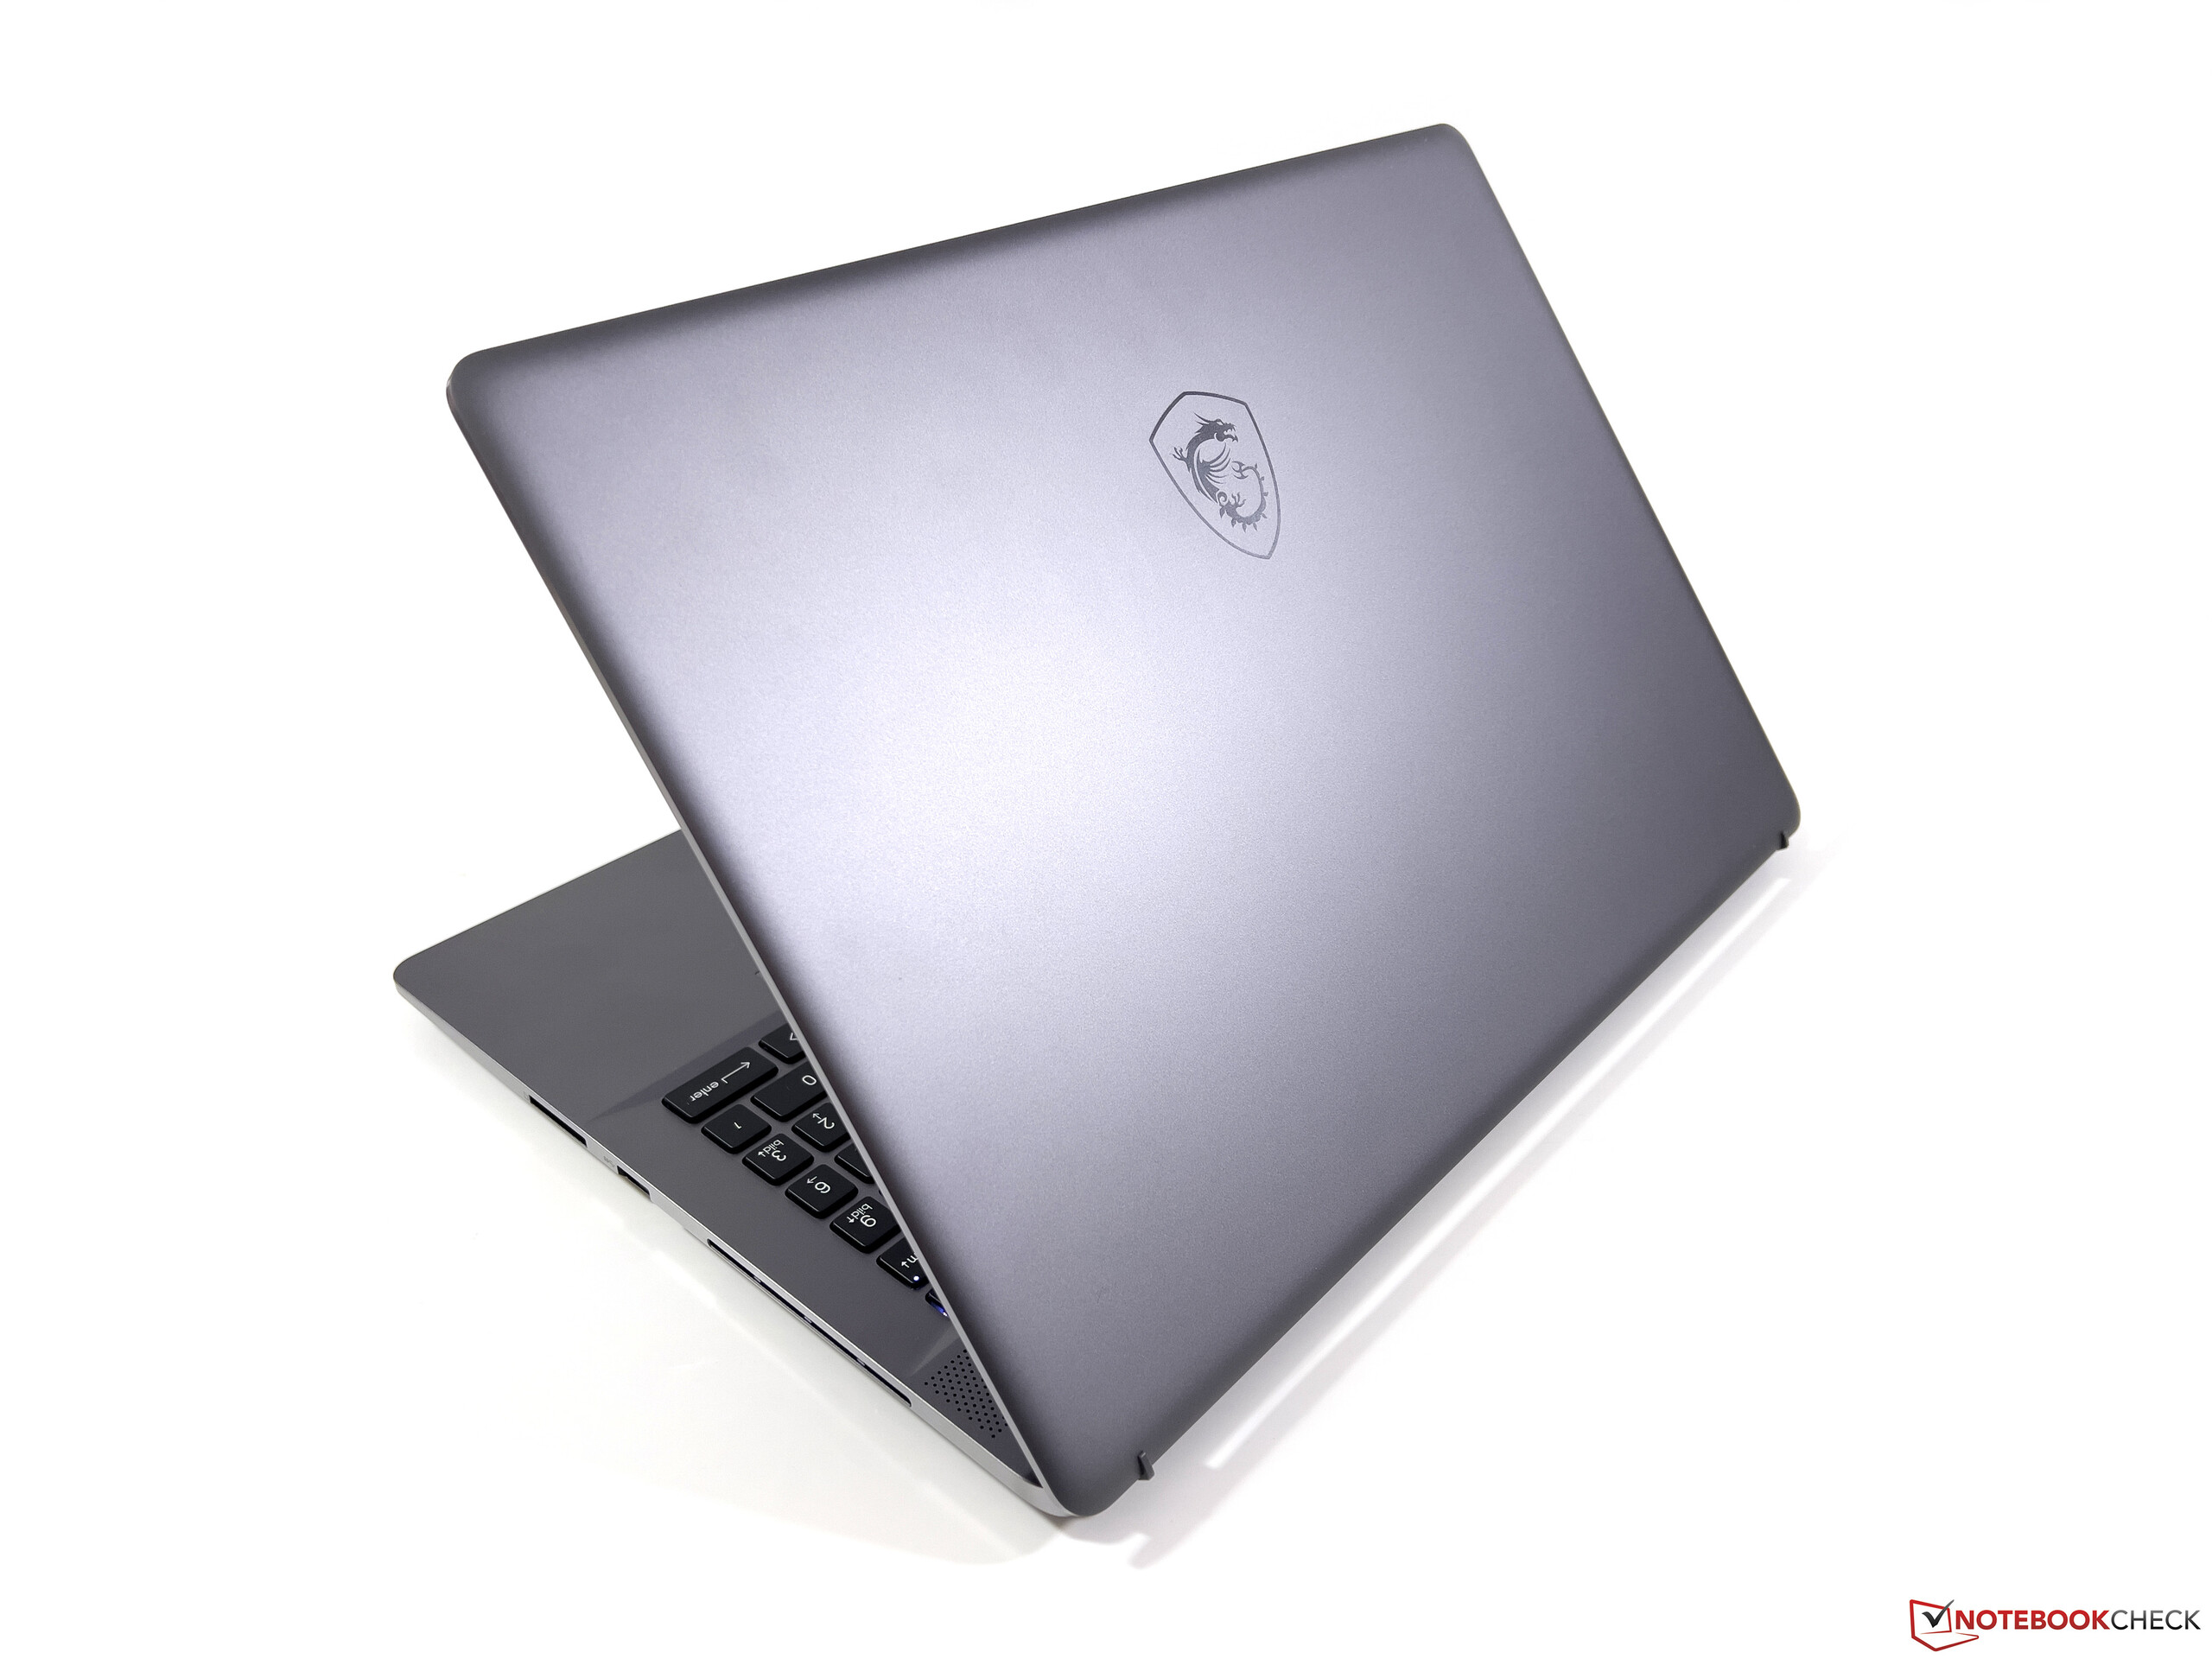
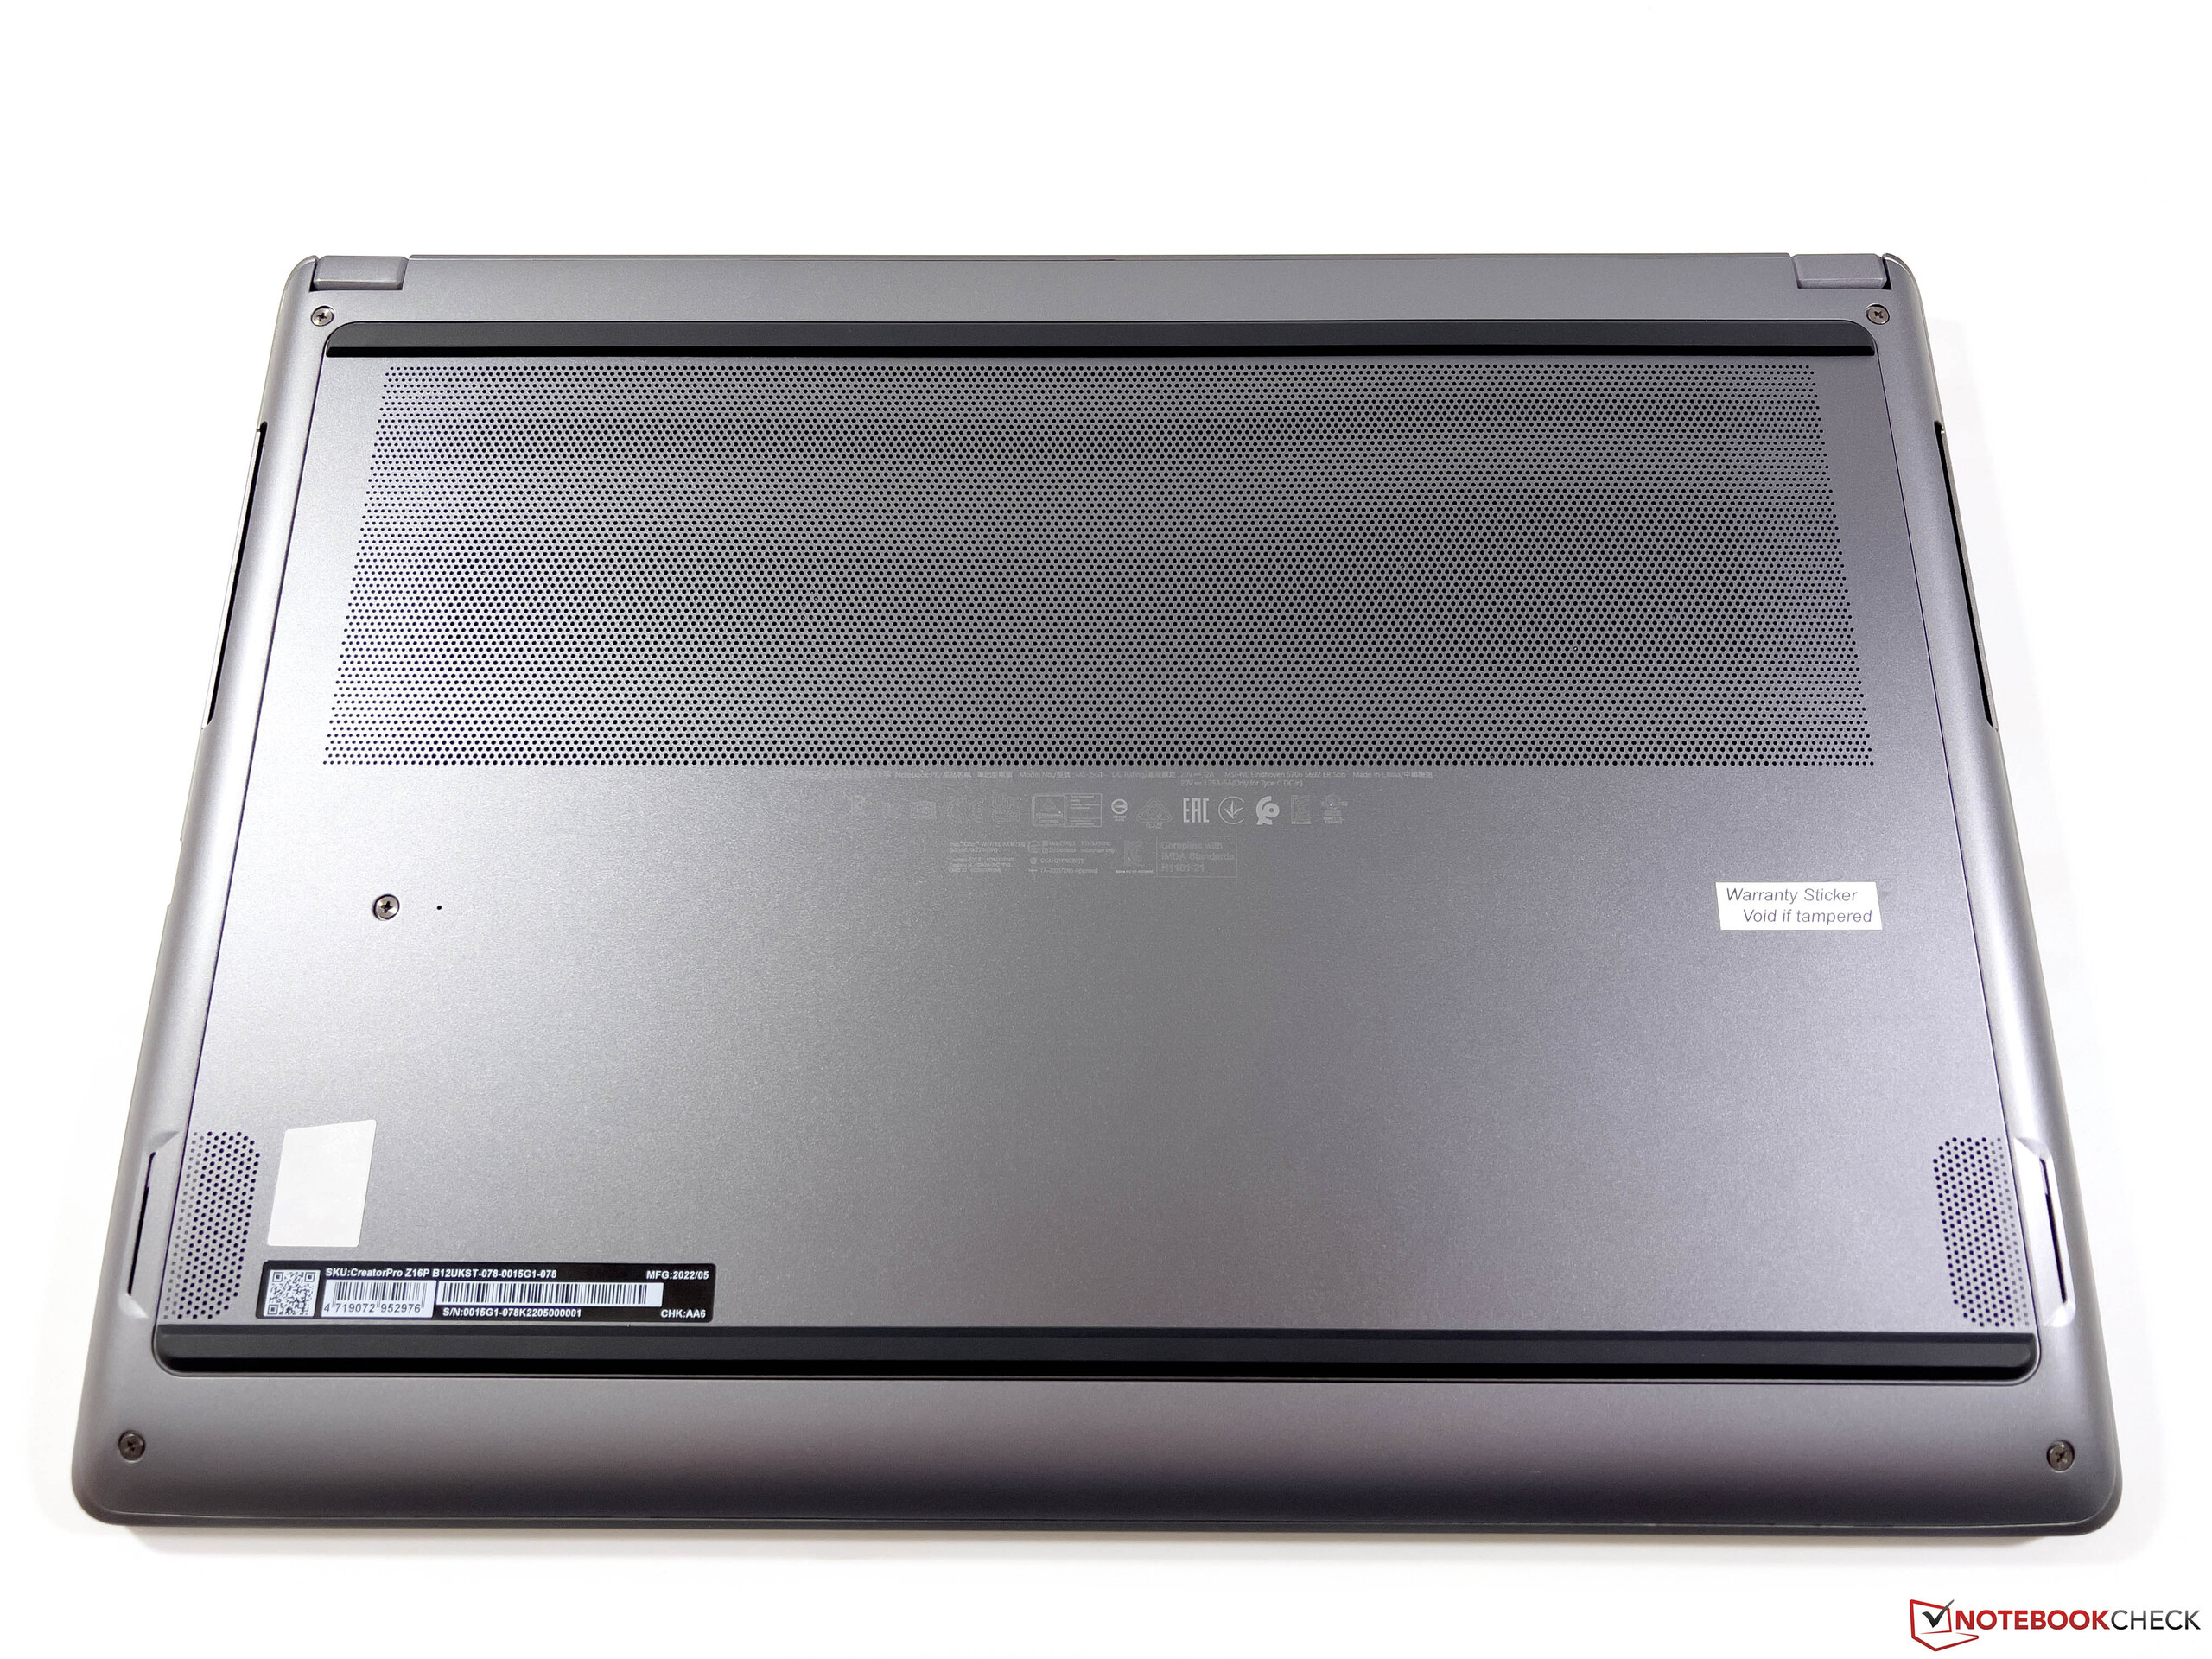
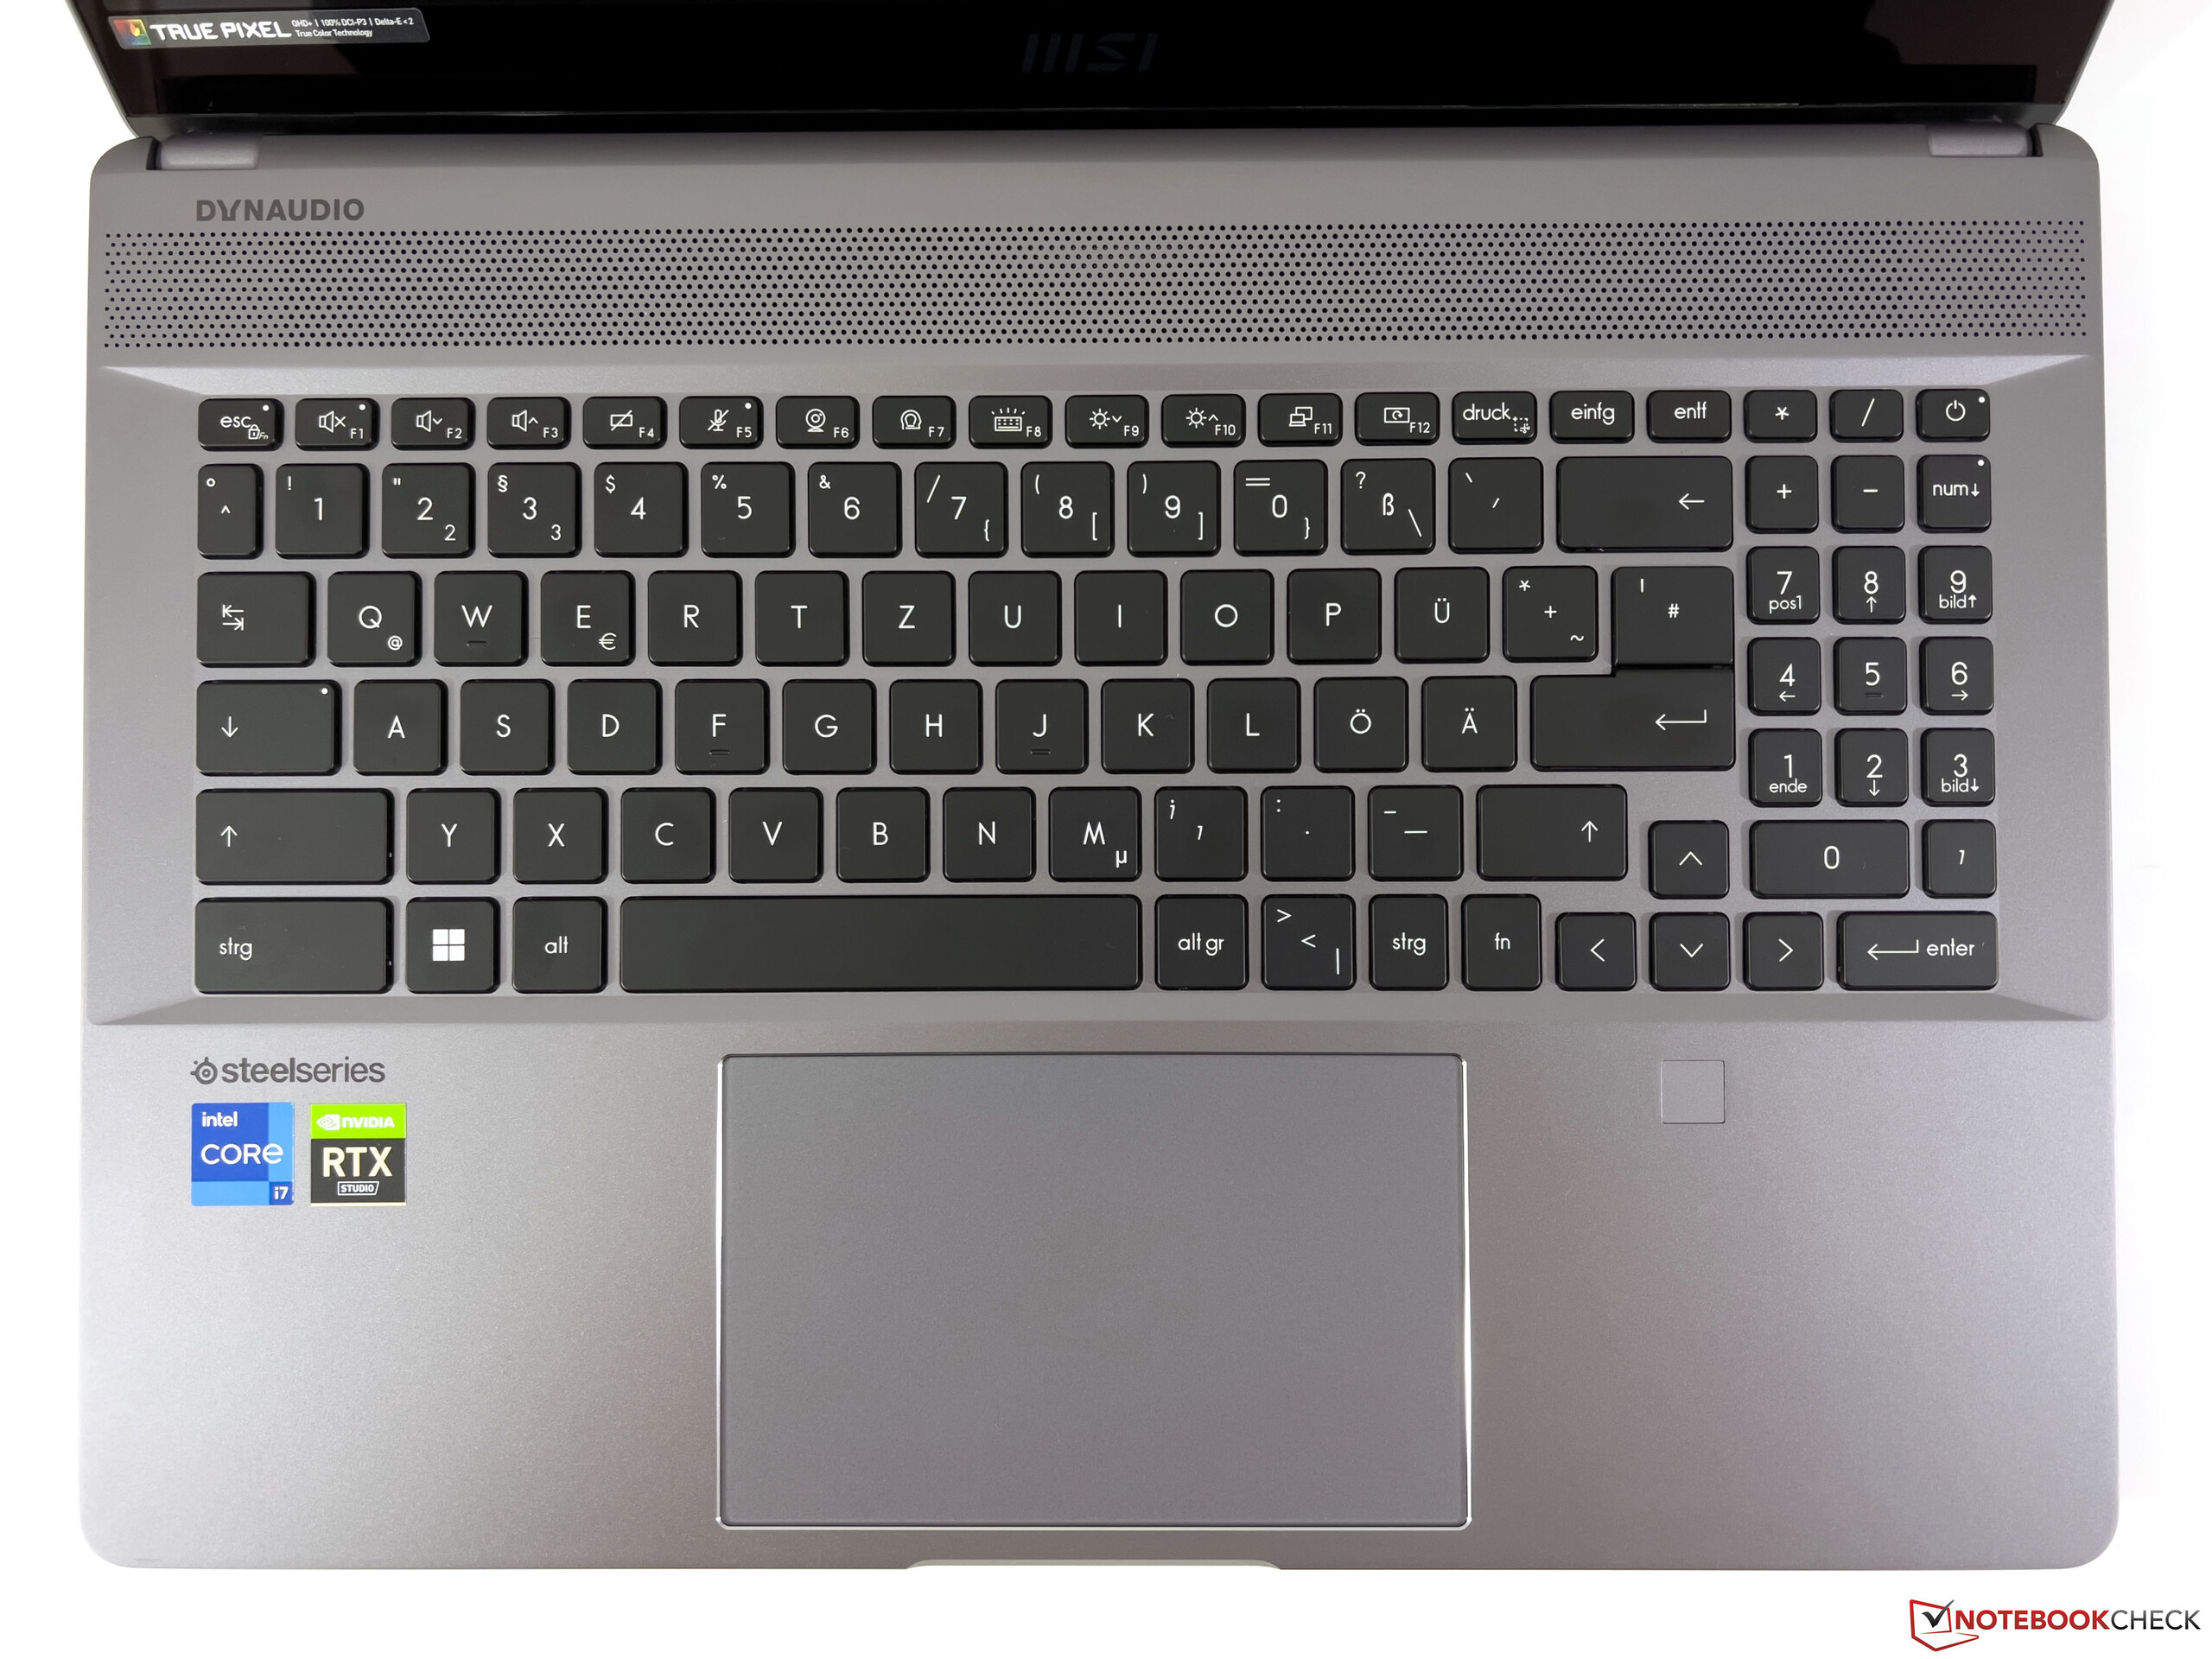
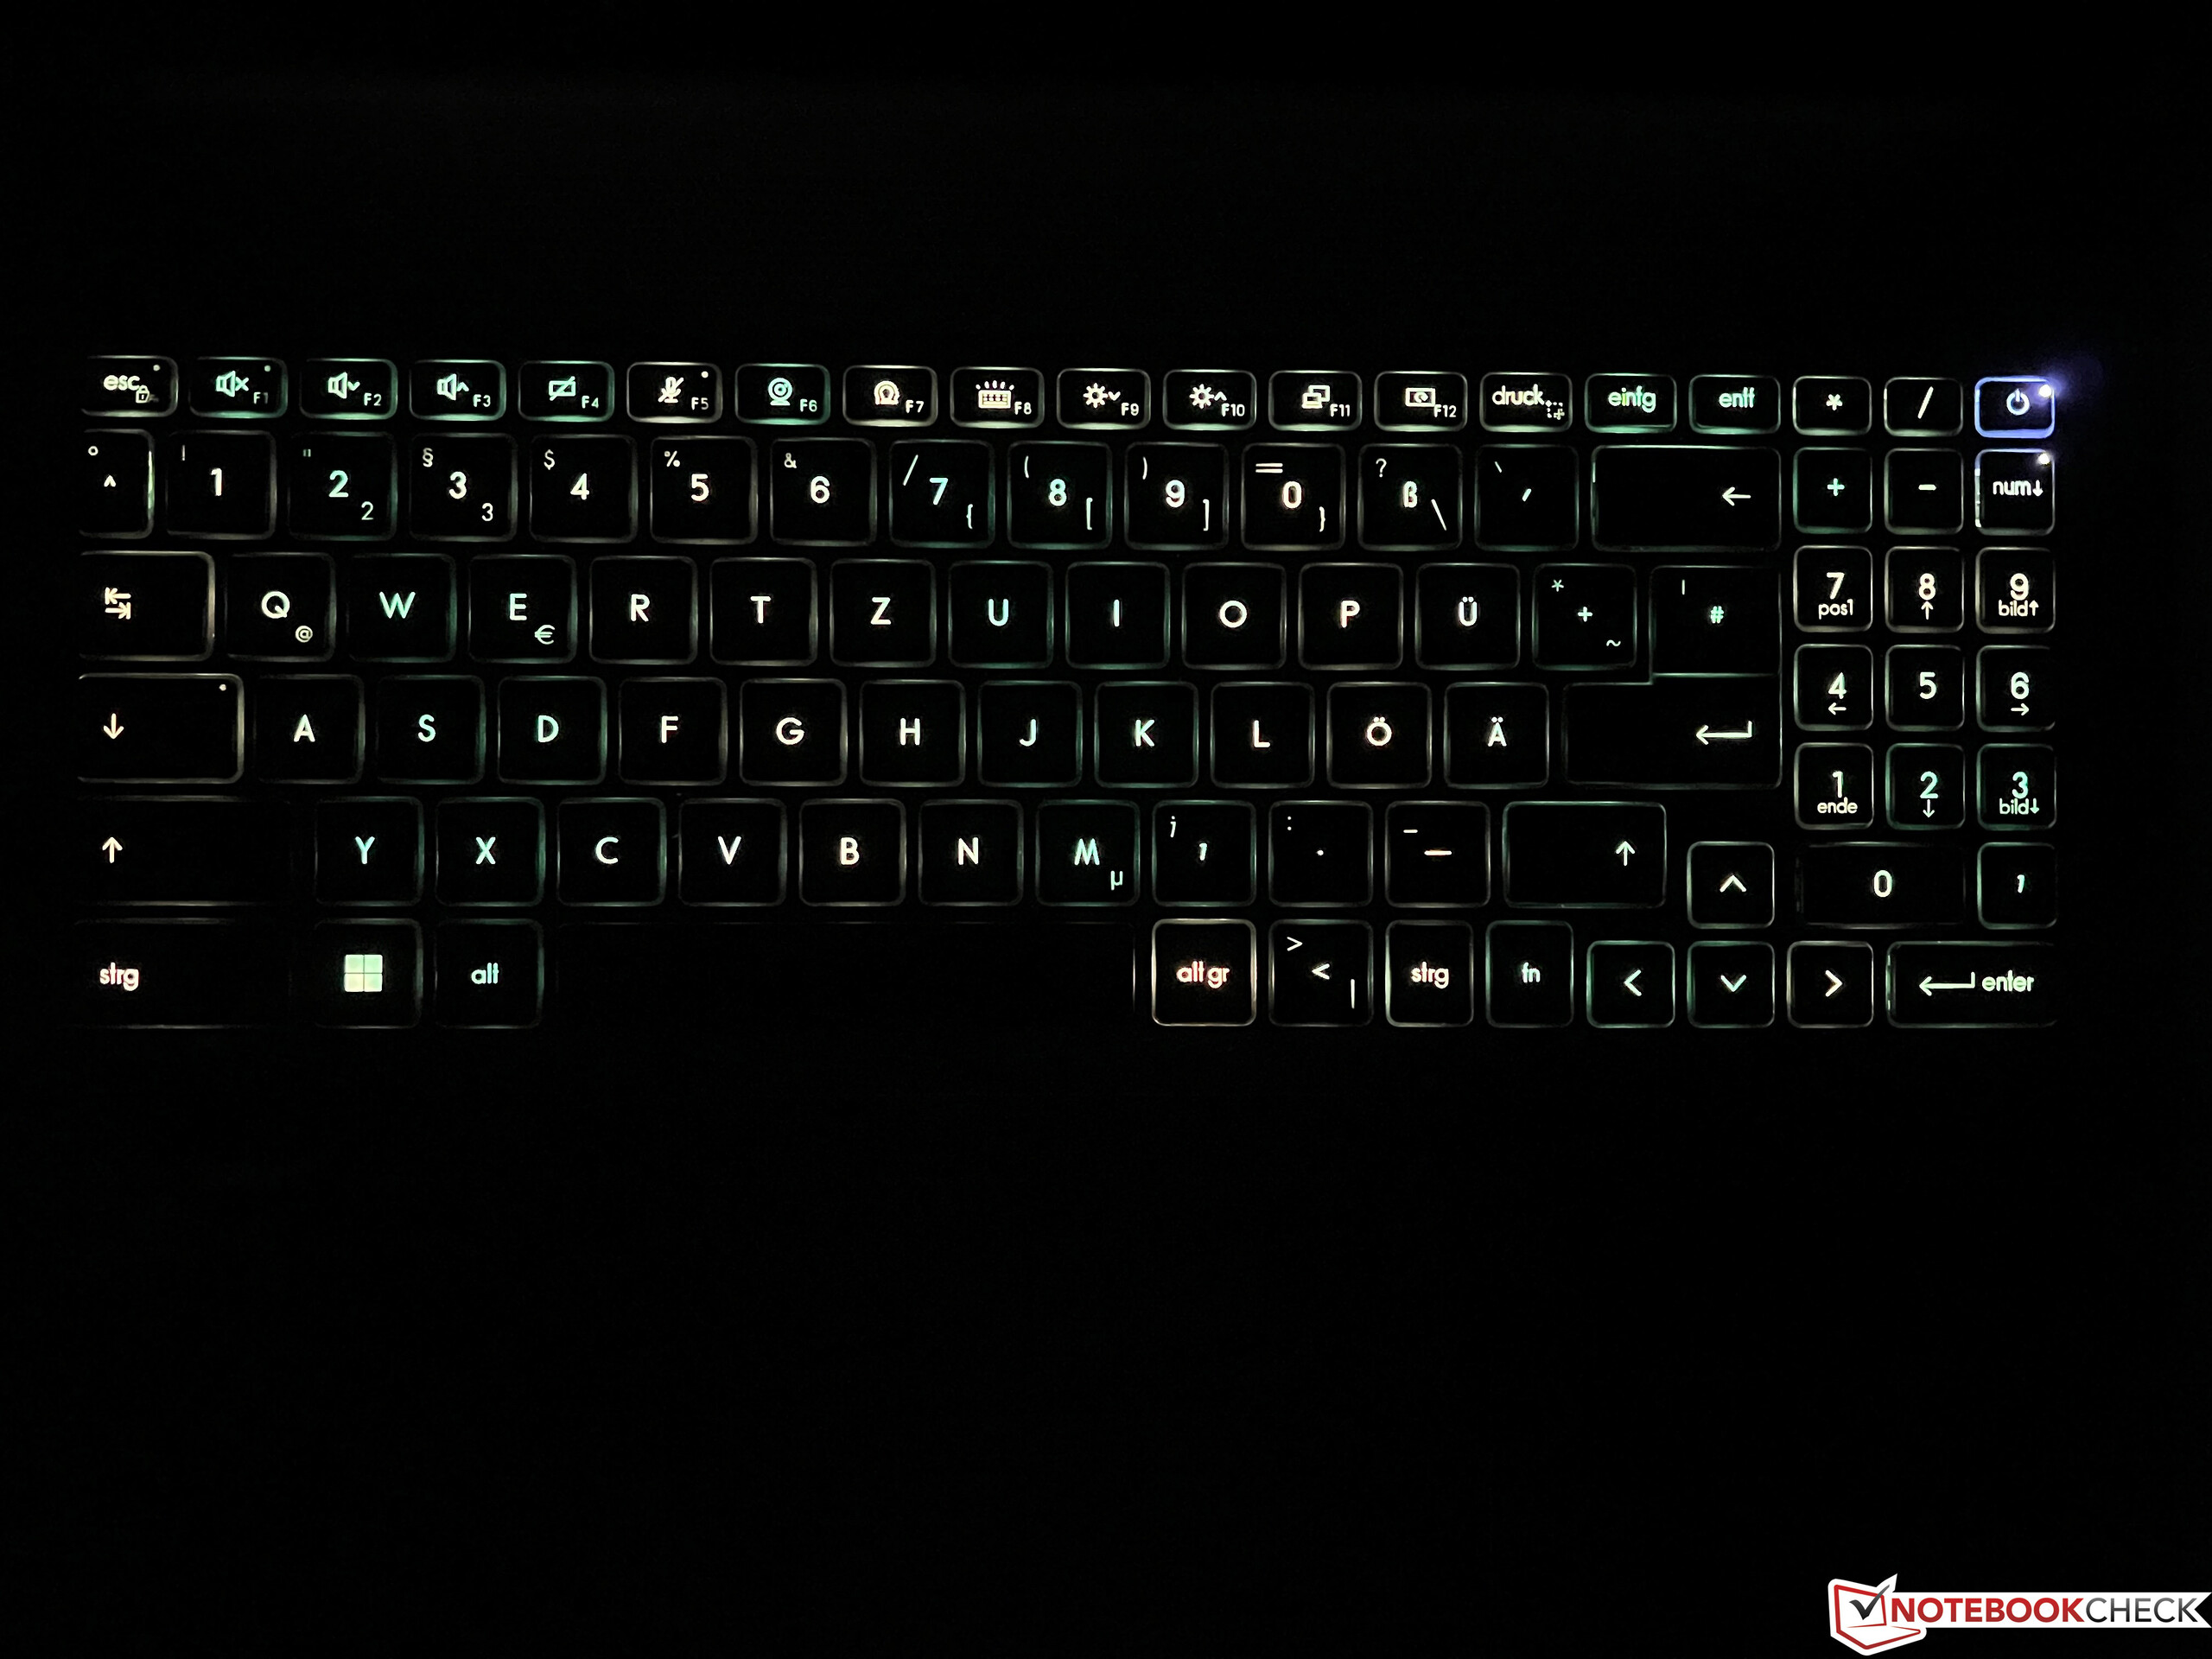
O caso do CreatorPro Z16P não difere do caso do criador regular Z16Pque, naturalmente, também inclui as conexões e os dispositivos de entrada. Você não deve encontrar nenhum problema com o estojo cinza escuro (cinza lunar) mesmo no escritório, desde que você se contenha com a iluminação do teclado, onde a cor pode ser configurada individualmente para cada tecla. O teclado em si oferece uma experiência de digitação muito confortável e se beneficia de um longo traço de tecla. A este respeito, o CreatorPro pode até mesmo acompanhar bons laptops comerciais. O ClickPad também funciona sem nenhum problema.
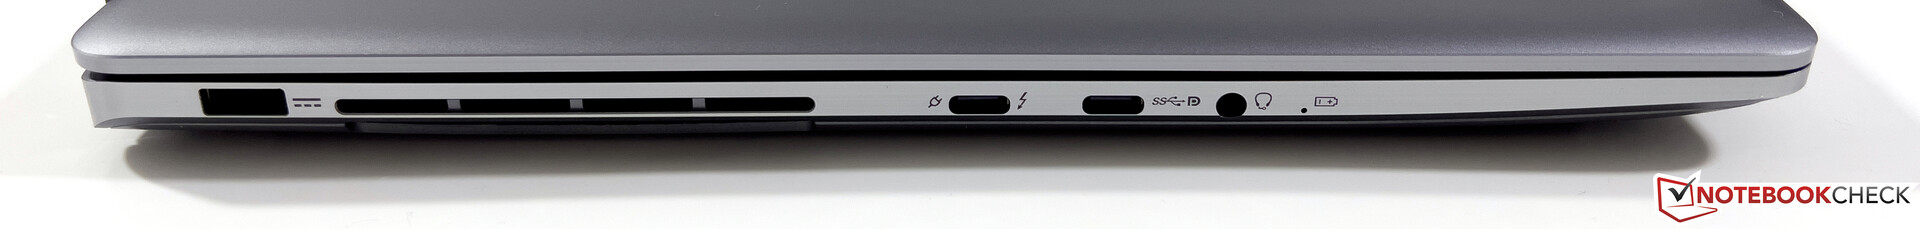
Em termos de conexões, você obtém um total de três portas USB, com uma delas incluindo Thunderbolt 4, e um leitor de cartões SD em tamanho real. Por outro lado, você tem que se contentar sem uma saída gráfica dedicada. Devido ao resfriamento, todas as conexões, exceto a porta de alimentação, estão nas áreas frontais de ambos os lados, o que é menos do que o ideal na operação diária.

| SD Card Reader | |
| average JPG Copy Test (av. of 3 runs) | |
| Dell Precision 5000 5560 (AV Pro V60) | |
| Média da turma Workstation (49.6 - 681, n=14, últimos 2 anos) | |
| MSI CreatorPro Z16P B12UKST (AV Pro V60) | |
| MSI Creator Z16P B12UHST (AV PRO microSD 128 GB V60) | |
| HP ZBook Studio 16 G9 62U04EA (Angelbird AV PRO V60) | |
| maximum AS SSD Seq Read Test (1GB) | |
| Média da turma Workstation (87.6 - 1455, n=14, últimos 2 anos) | |
| Dell Precision 5000 5560 (AV Pro V60) | |
| MSI CreatorPro Z16P B12UKST (AV Pro V60) | |
| HP ZBook Studio 16 G9 62U04EA (Angelbird AV PRO V60) | |
| Networking | |
| MSI CreatorPro Z16P B12UKST | |
| iperf3 receive AXE11000 6GHz | |
| iperf3 transmit AXE11000 6GHz | |
| HP ZBook Studio 16 G9 62U04EA | |
| iperf3 receive AXE11000 6GHz | |
| iperf3 transmit AXE11000 6GHz | |
| Dell Precision 5000 5560 | |
| iperf3 transmit AX12 | |
| iperf3 receive AX12 | |
| MSI Creator Z16P B12UHST | |
| iperf3 receive AXE11000 | |
| Lenovo ThinkPad P1 G4-20Y4Z9DVUS | |
| iperf3 transmit AX12 | |
| iperf3 receive AX12 | |


Display - TrueColor com 165 Hz
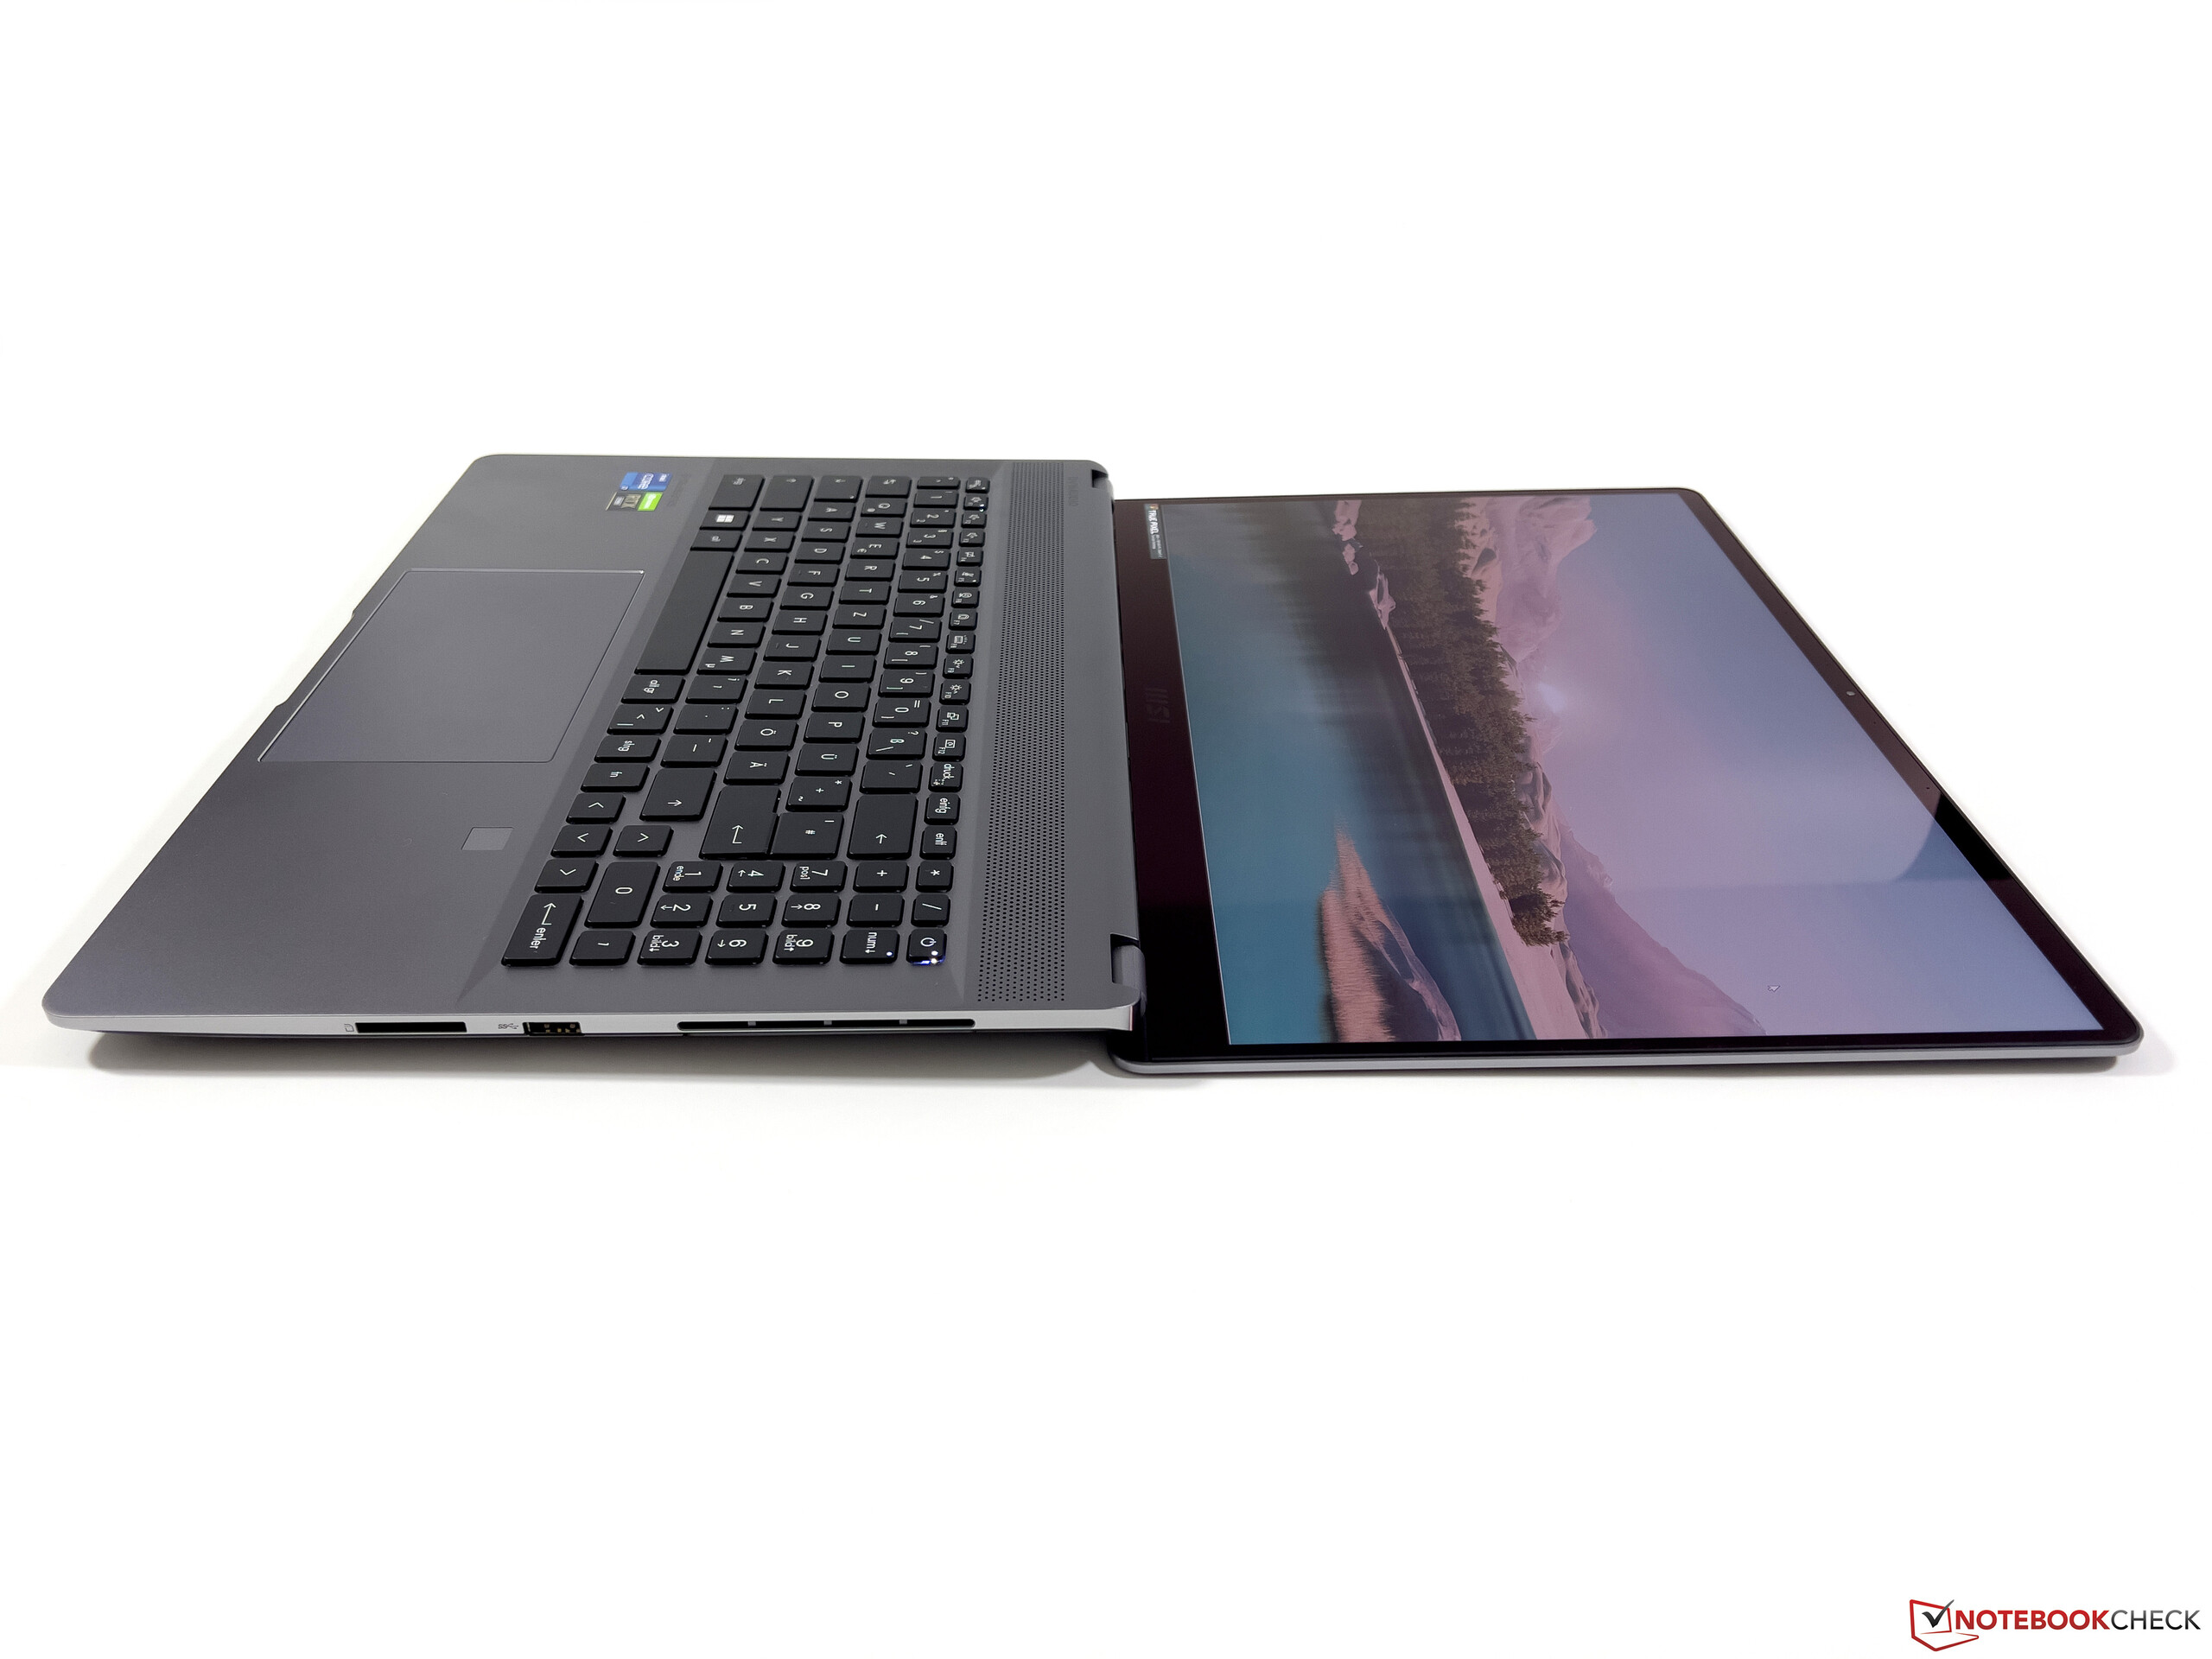
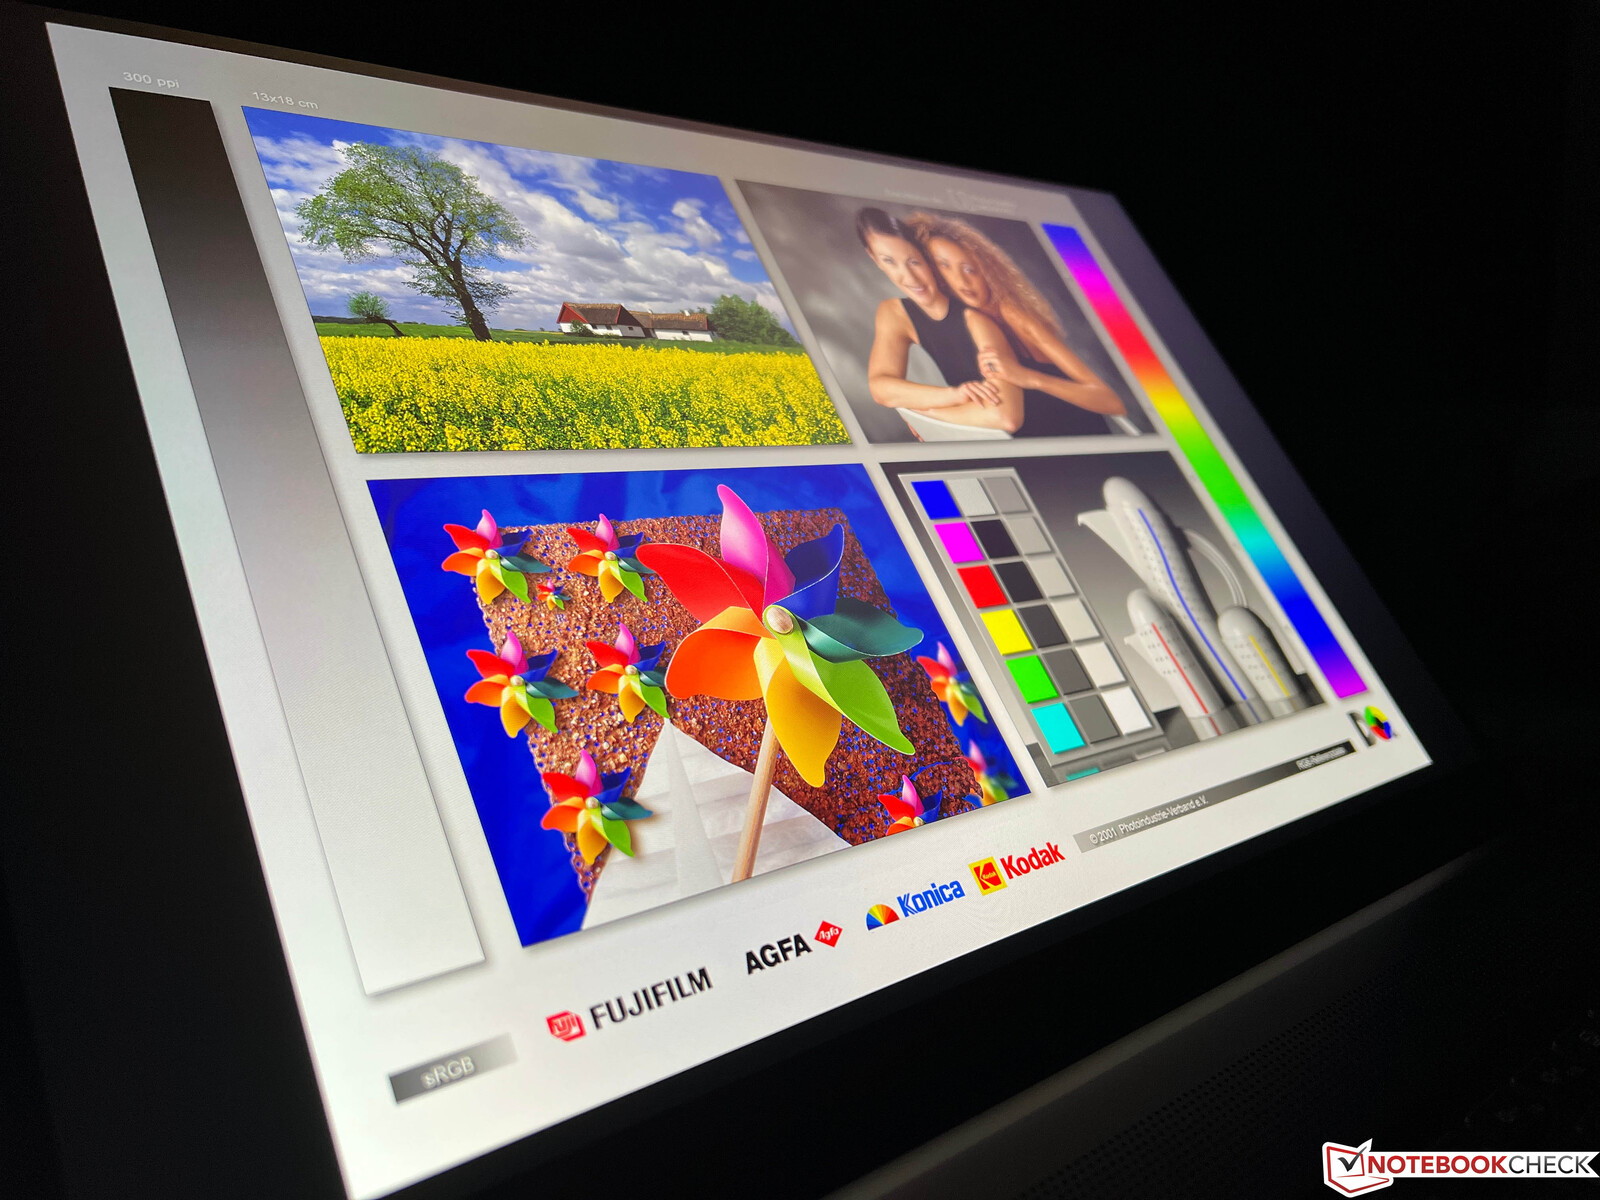
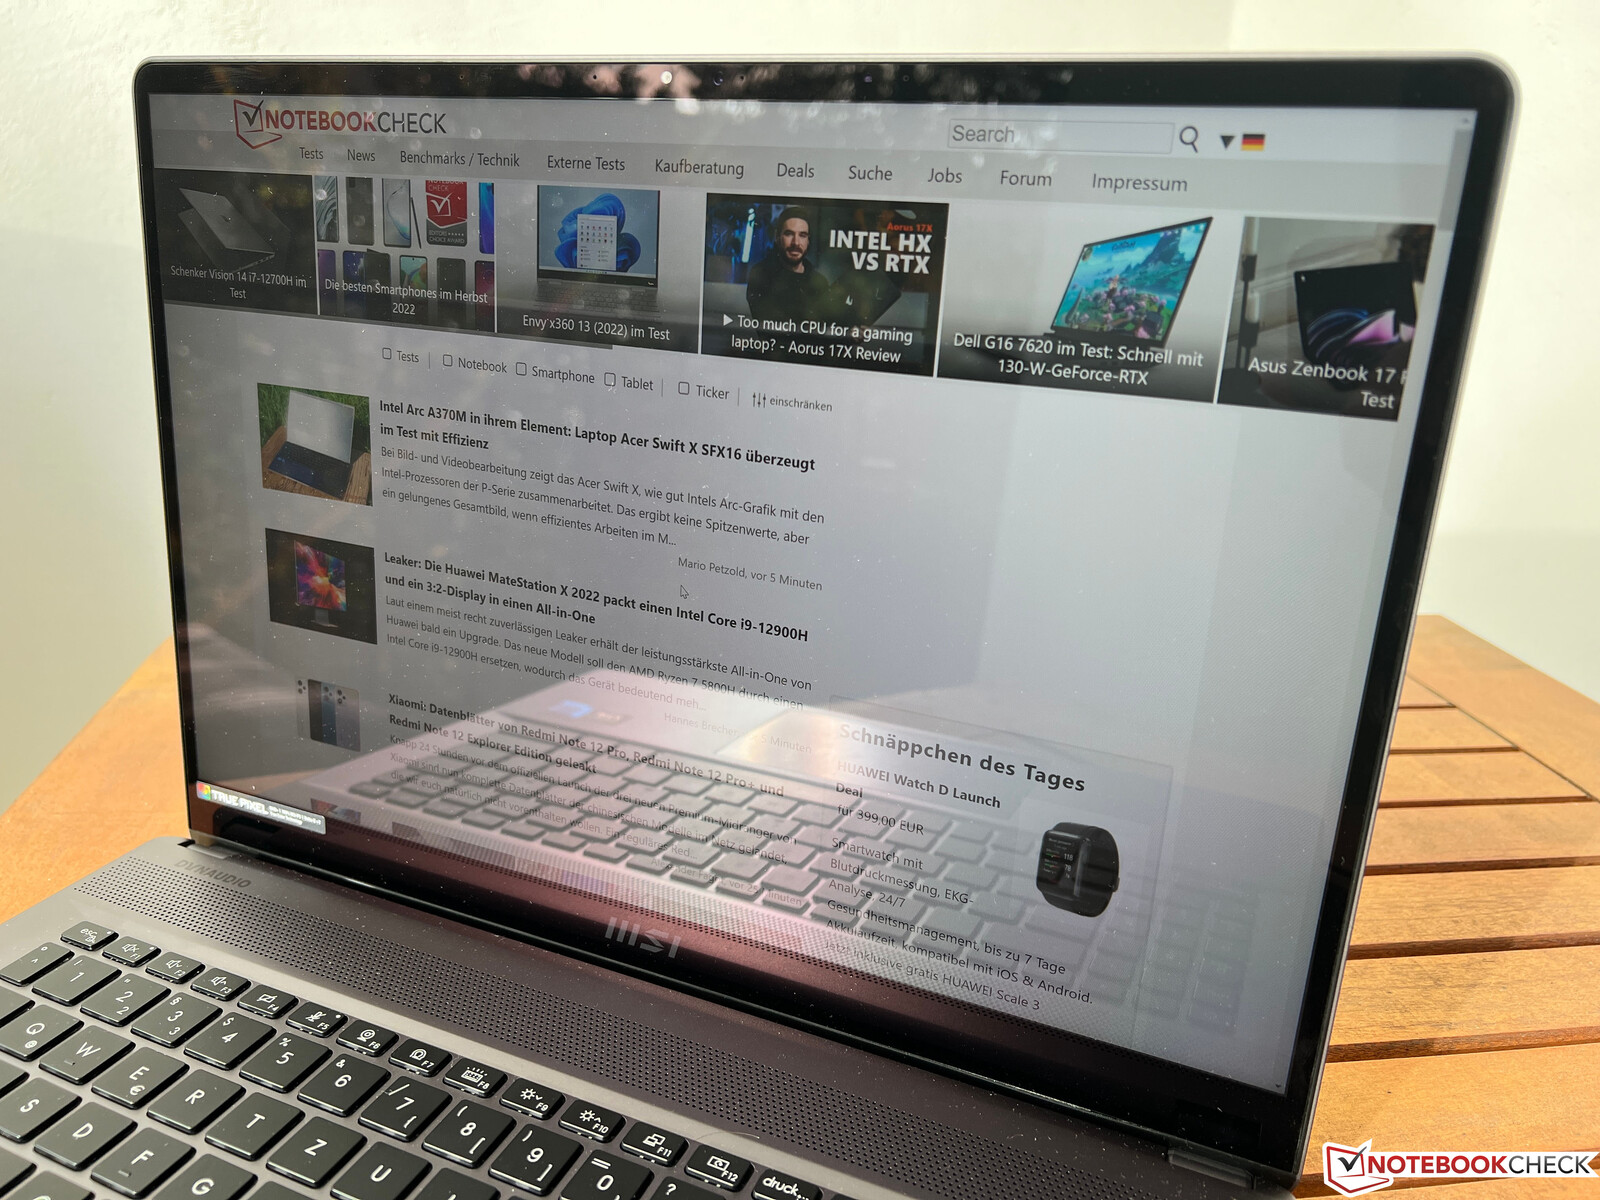
Também podemos ser breves na seção Display, já que também não há diferenças em relação aos ângulos de visão normais Criador Z16Paqui. Embora o design do painel reflexivo TrueColor WQHD (2560 x 1600 pixels, IPS) no formato 16:10 seja mais voltado para um público criador de conteúdo, a qualidade da imagem subjetiva é simplesmente muito boa, e outros usuários também irão gostar muito do painel.
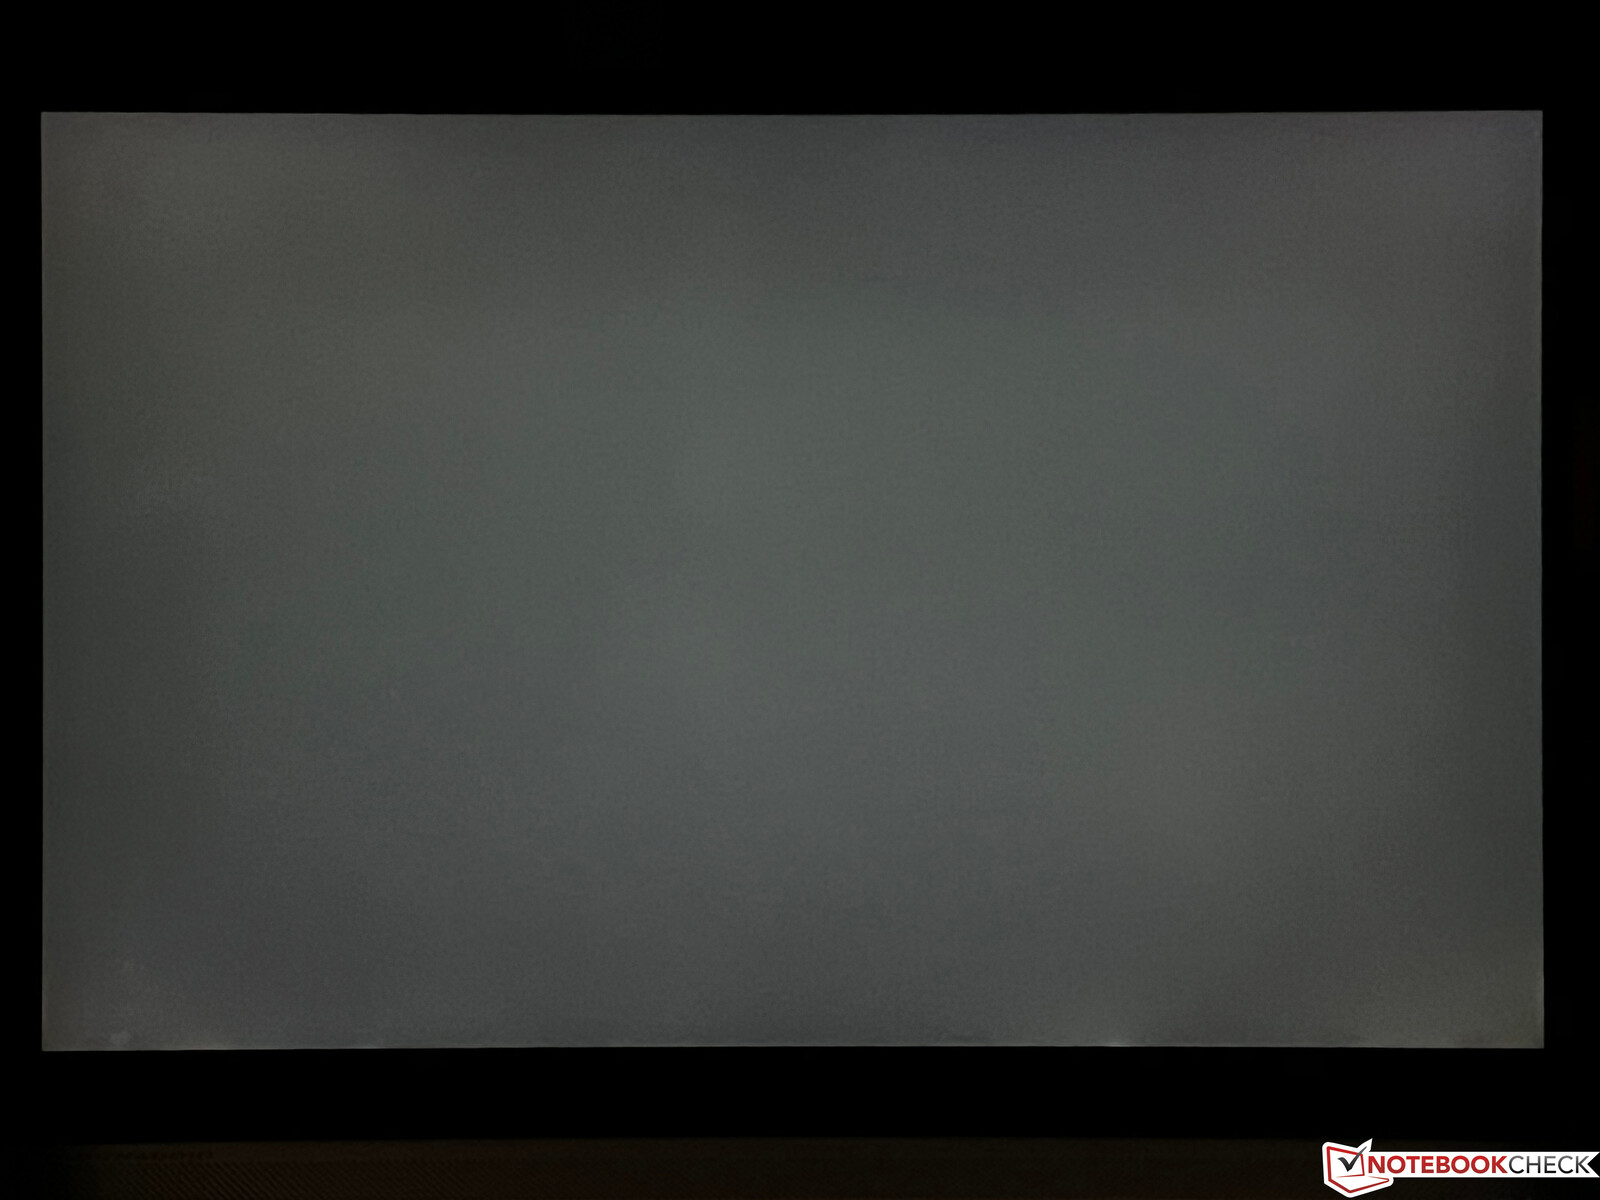
Em nossas medições, o painel fornece valores decentes (brilho médio ~390 cd/m²), embora a relação de contraste de ~1.100:1 ainda poderia ter sido um pouco melhor e o valor de preto poderia ter sido menor. Os tempos de resposta do painel de 165-Hz são excelentes, e o mesmo vale para a estabilidade dos ângulos de visão. Halos leves não serão um grande problema, e PWM também não é usado.
| |||||||||||||||||||||||||
iluminação: 88 %
iluminação com acumulador: 408 cd/m²
Contraste: 1131:1 (Preto: 0.36 cd/m²)
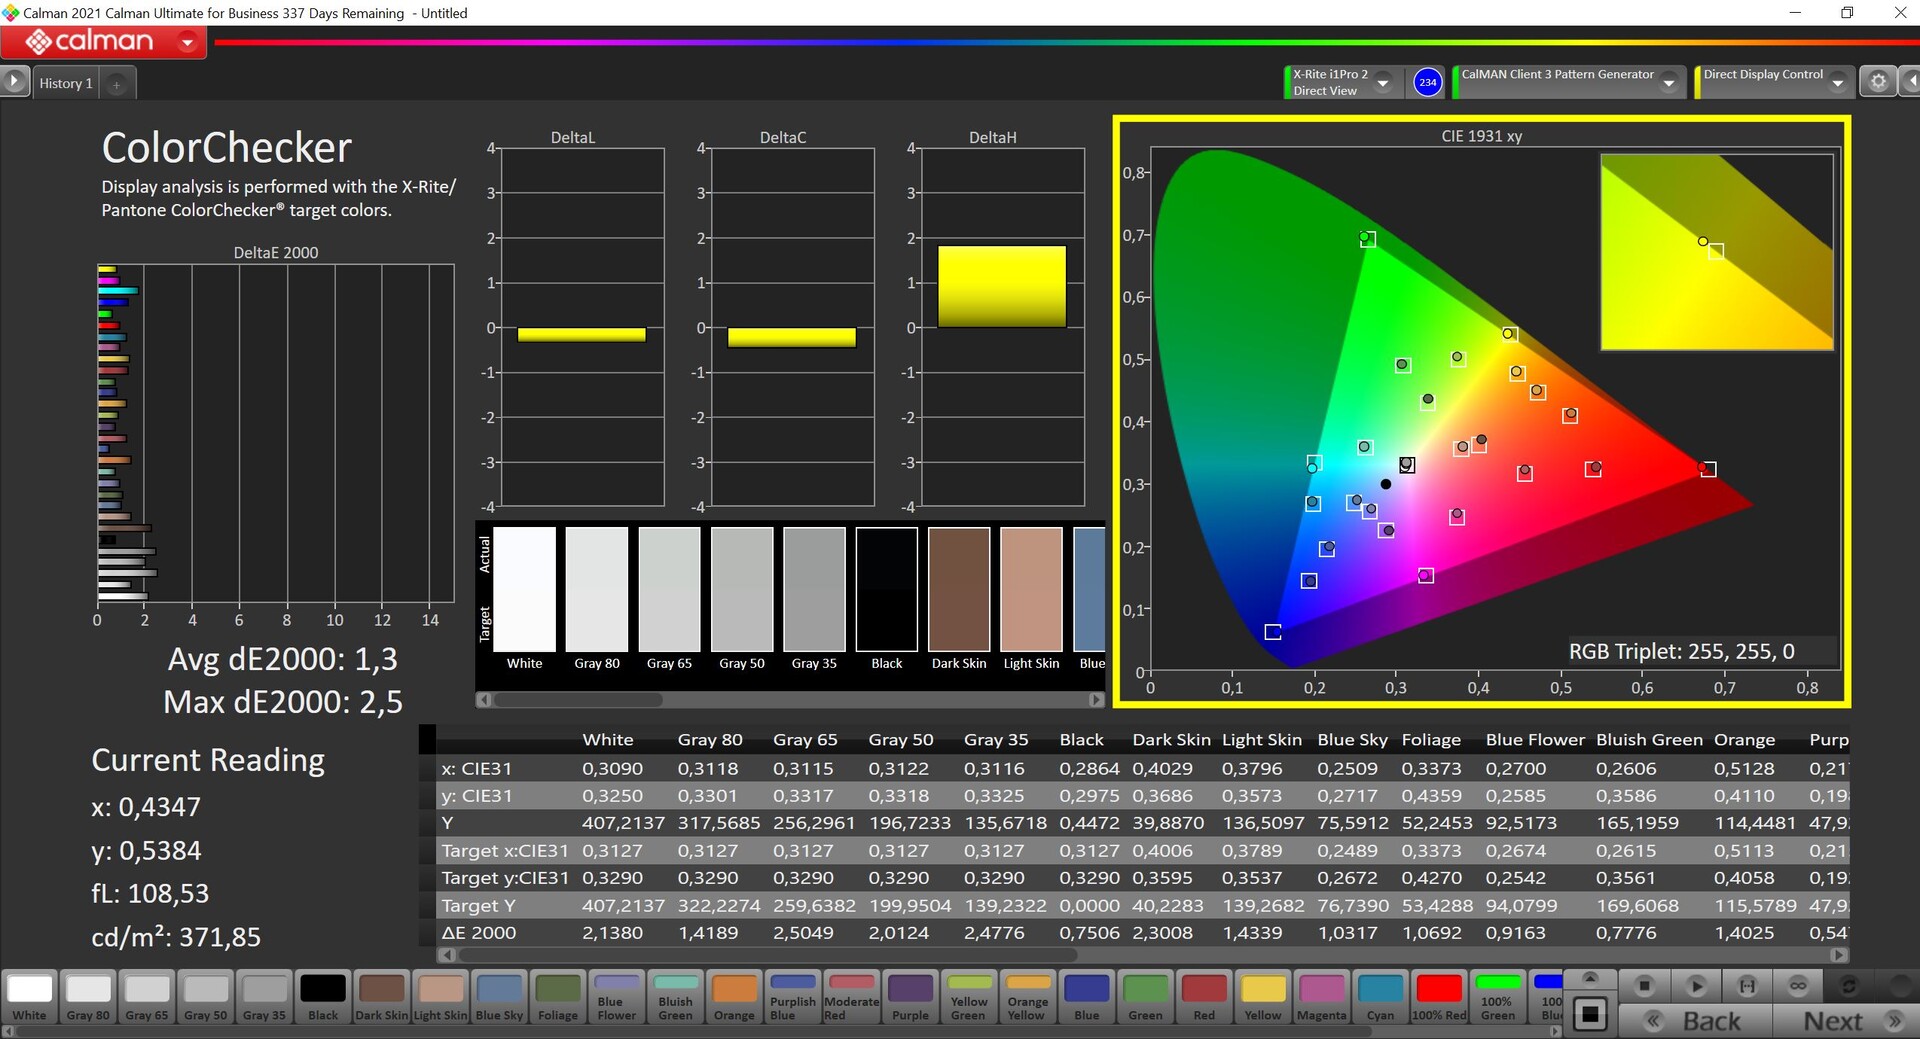
ΔE ColorChecker Calman: 1.3 | ∀{0.5-29.43 Ø4.71}
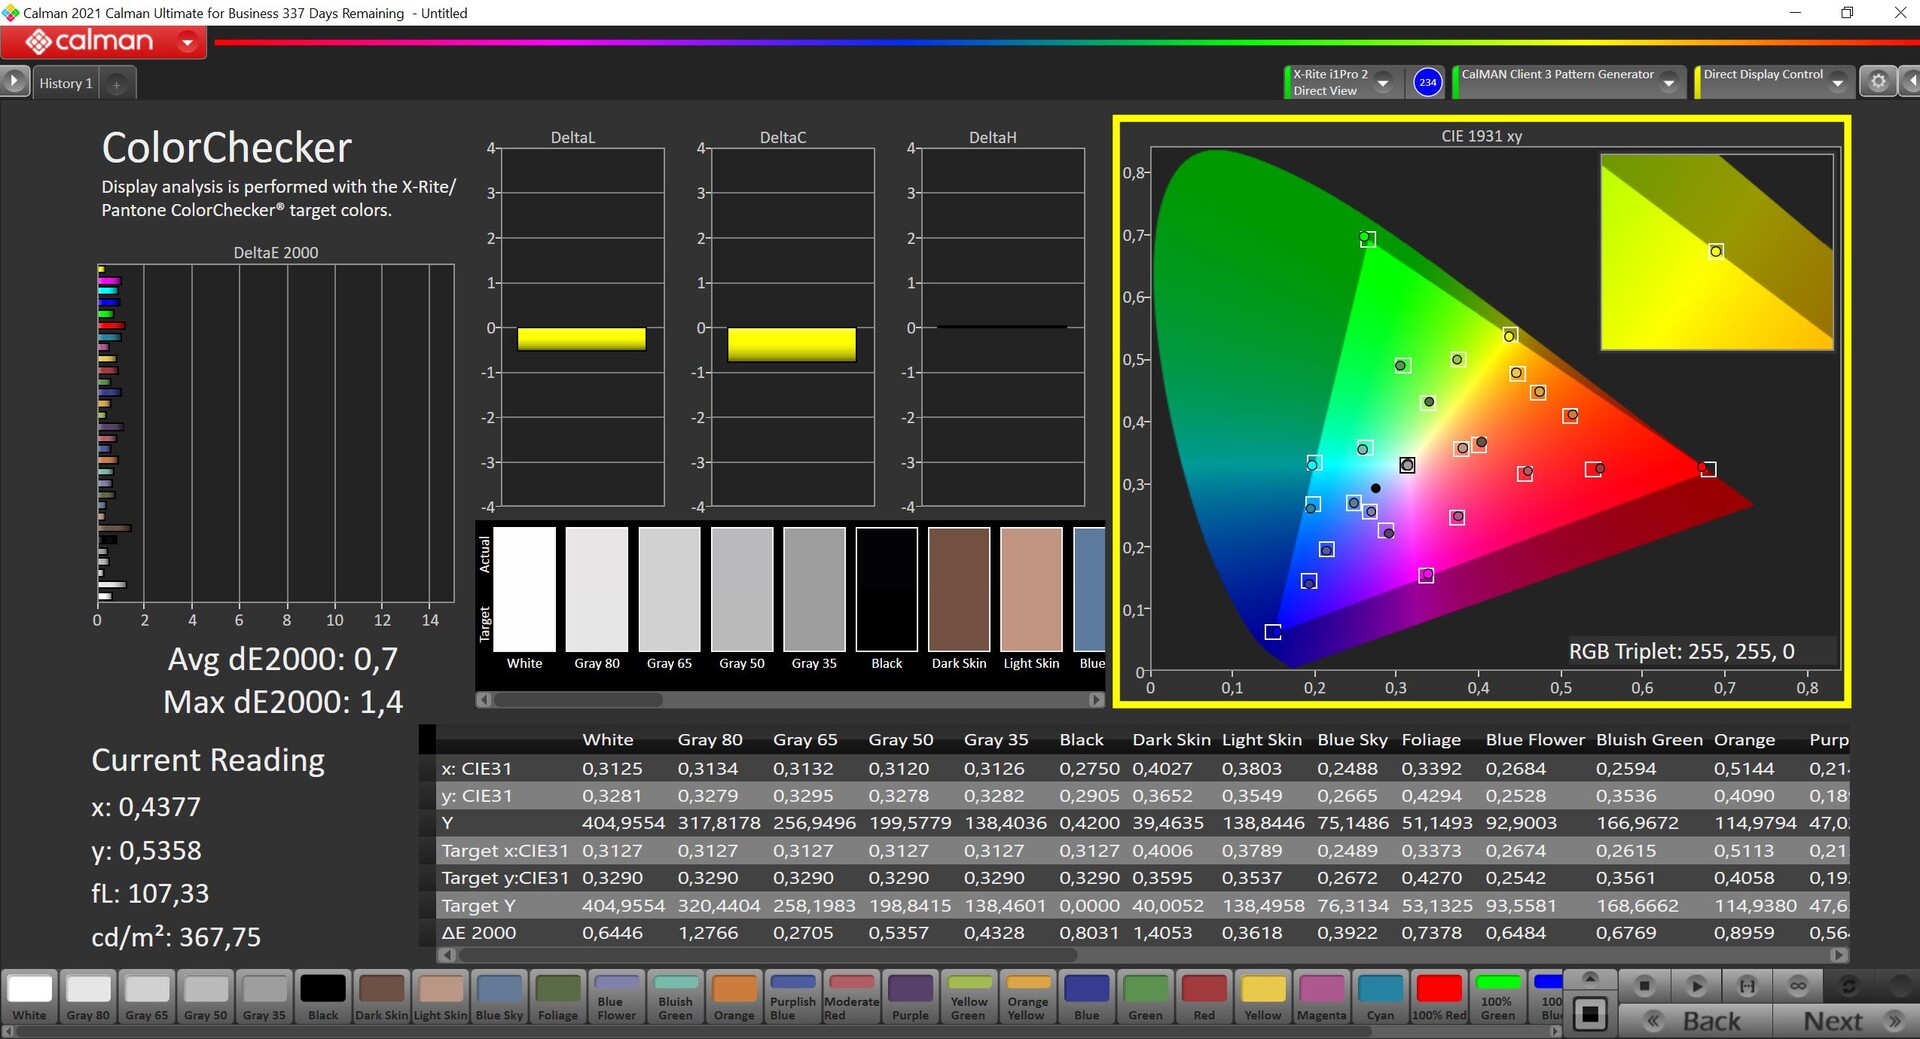
calibrated: 0.7
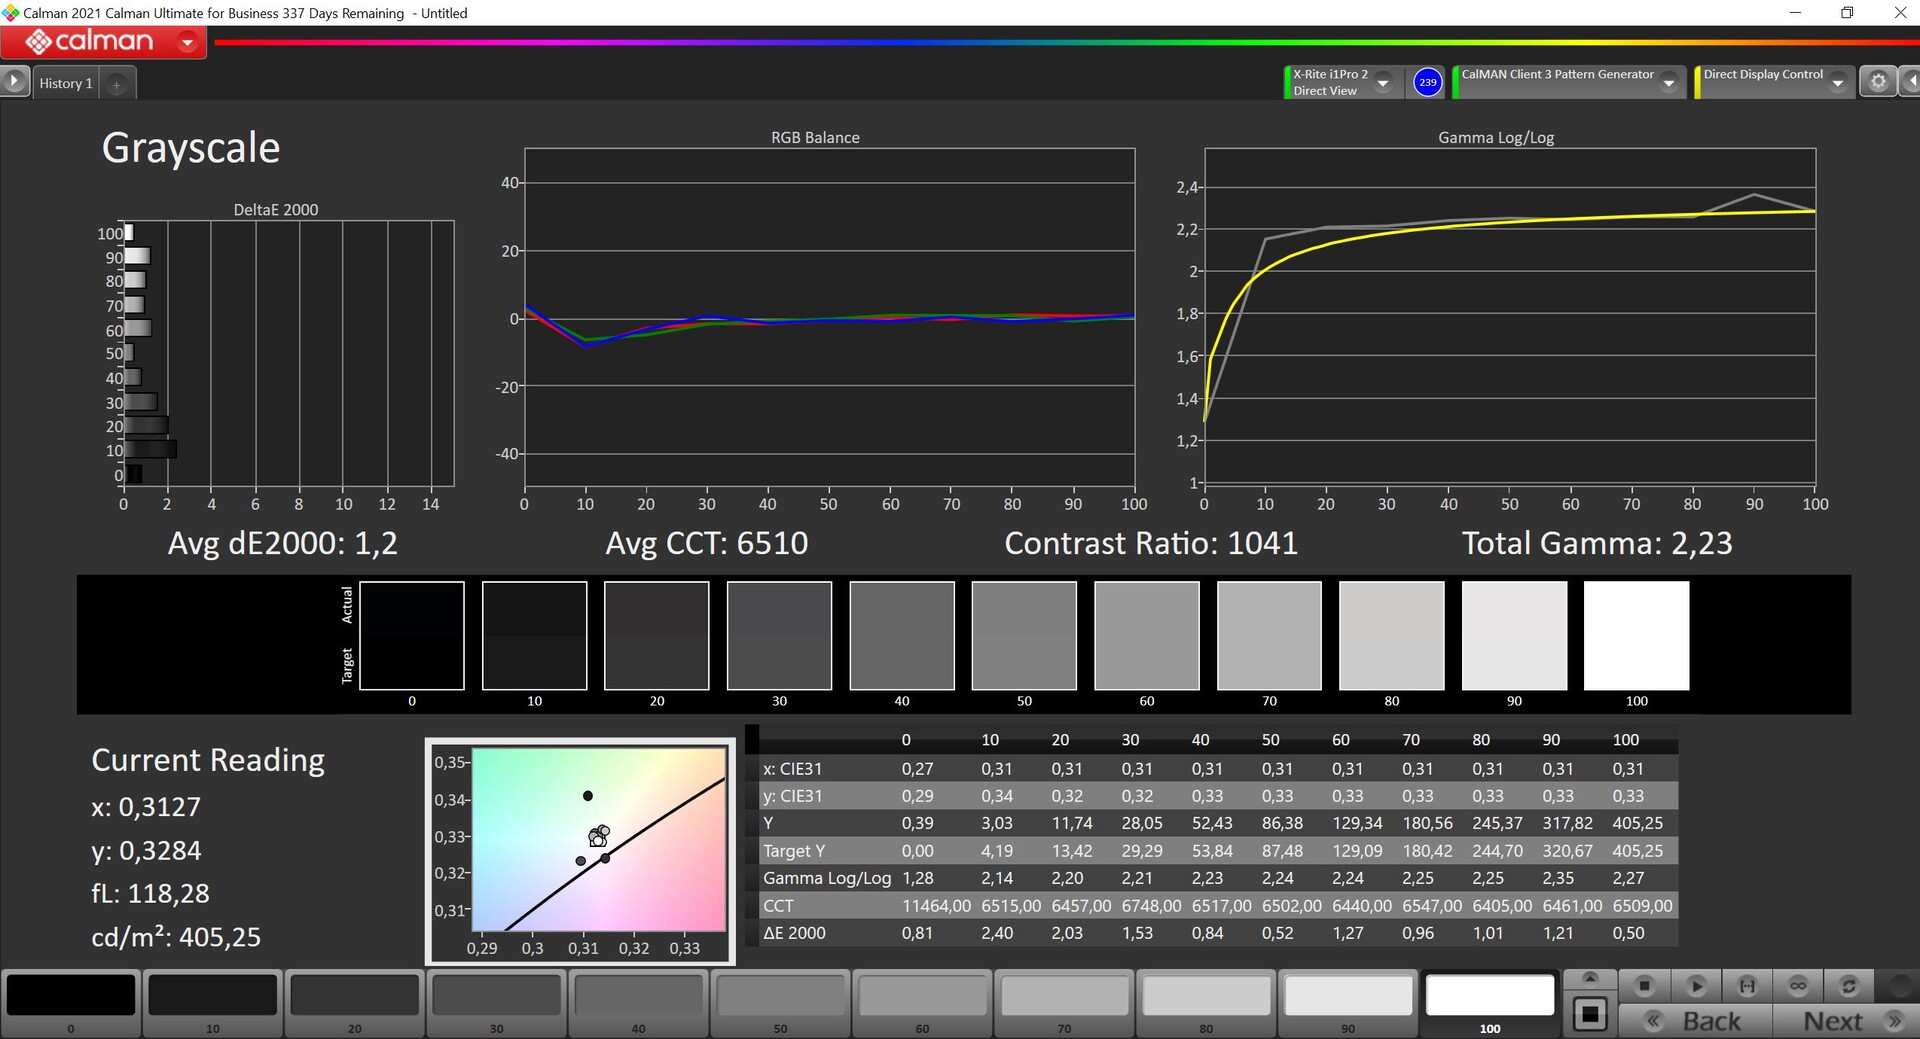
ΔE Greyscale Calman: 2.1 | ∀{0.09-98 Ø4.96}
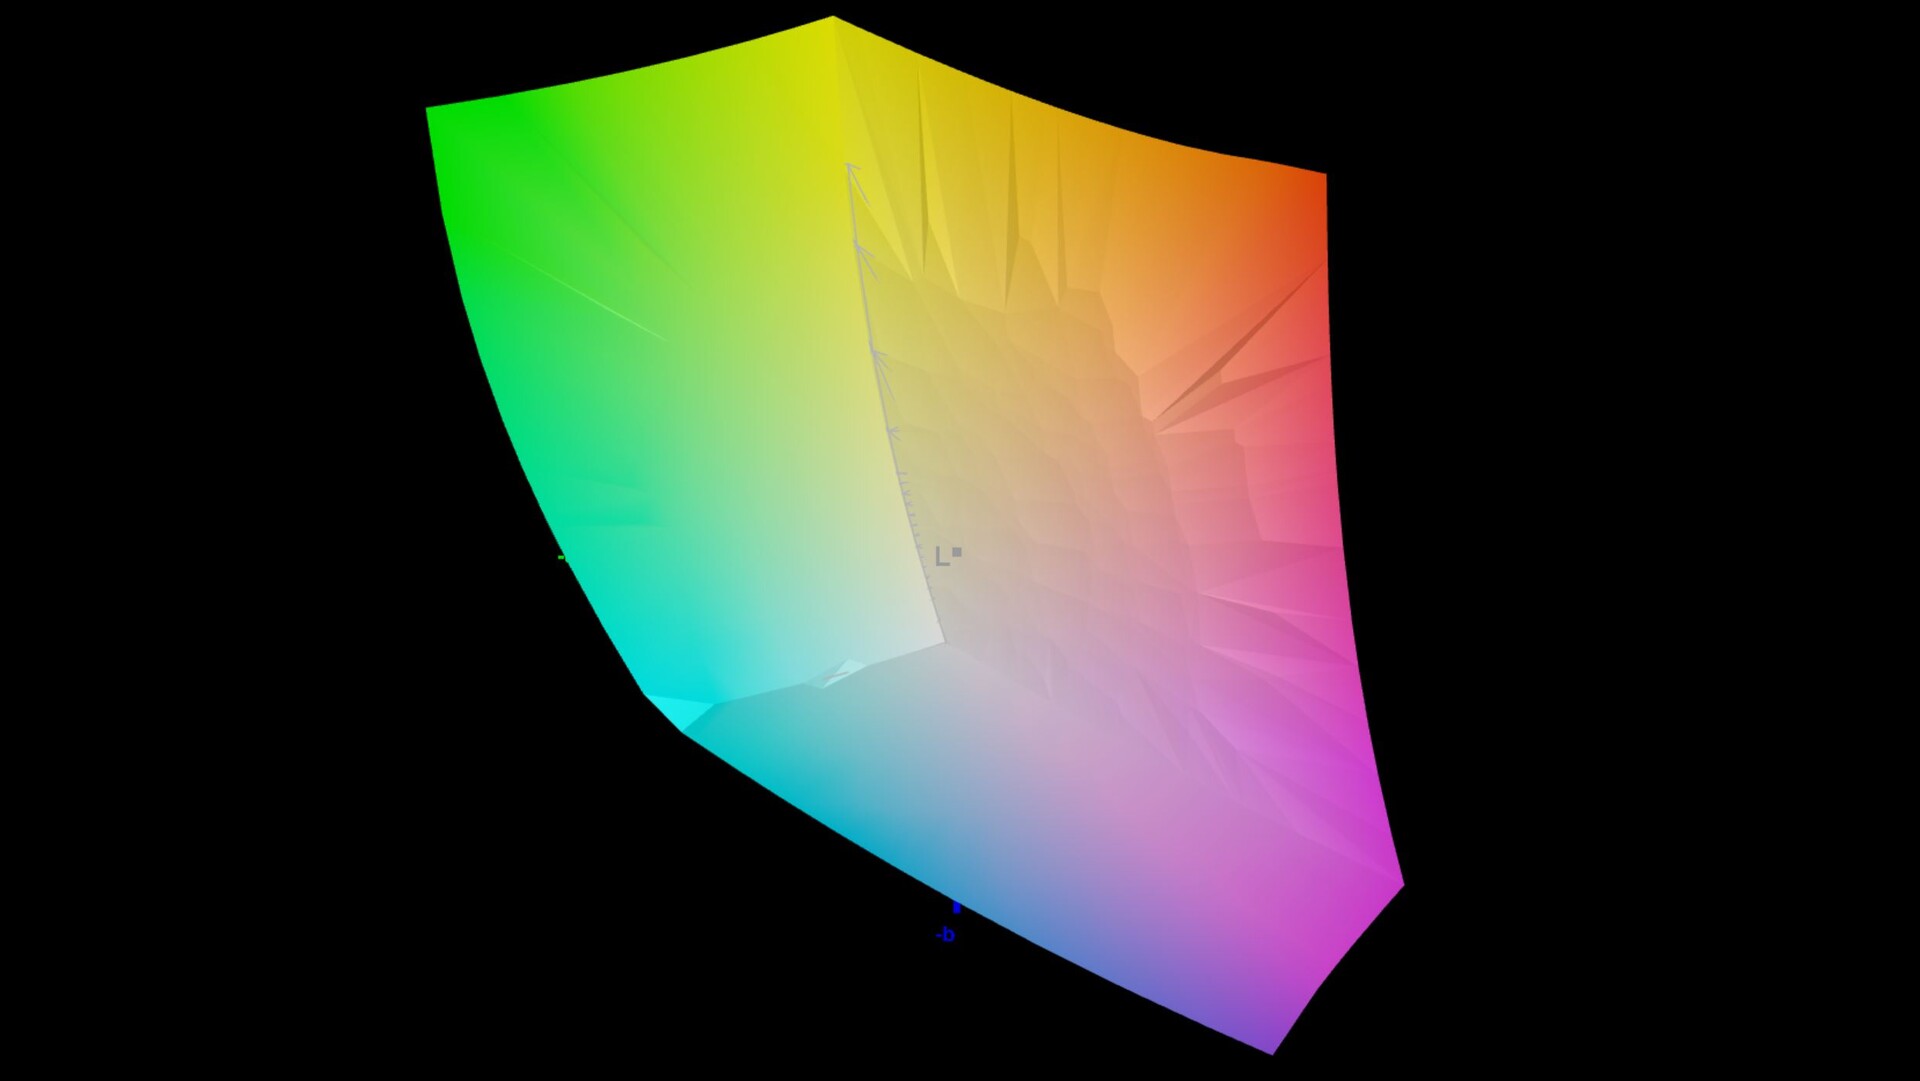
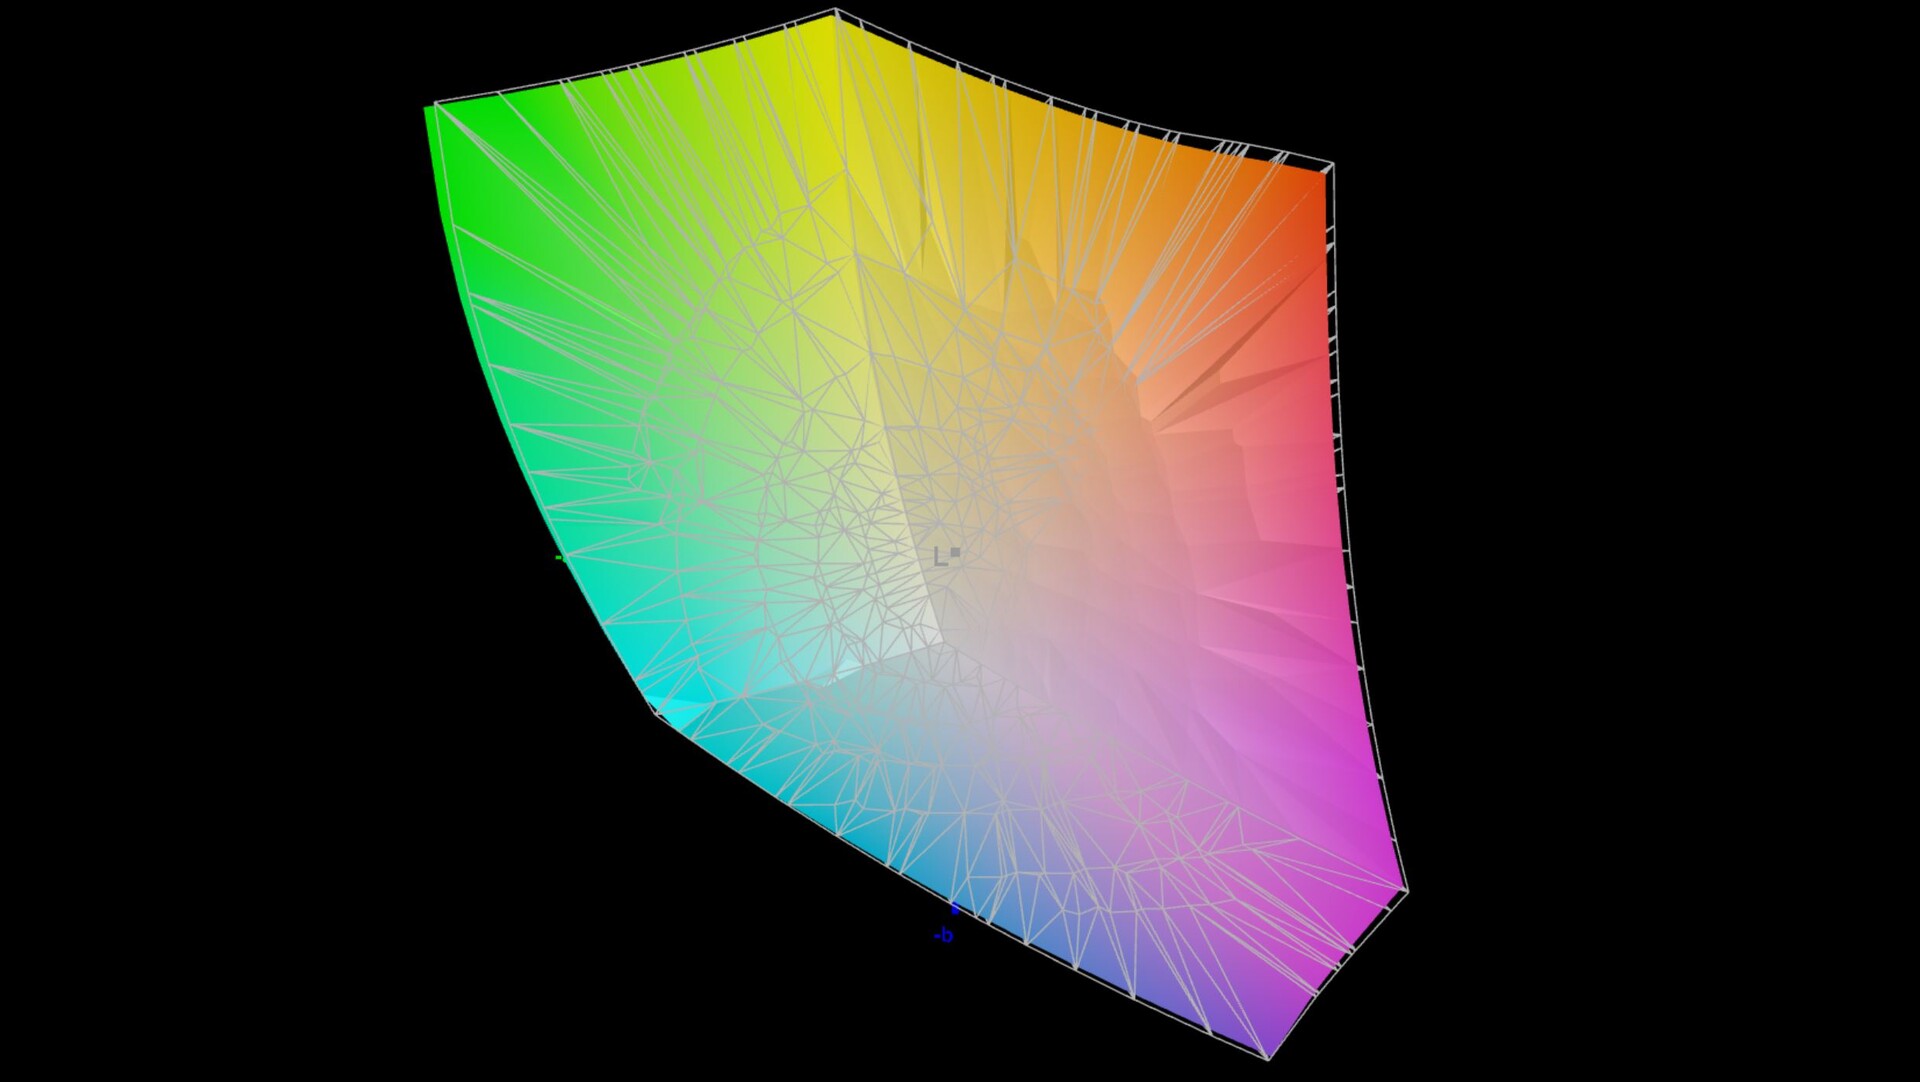
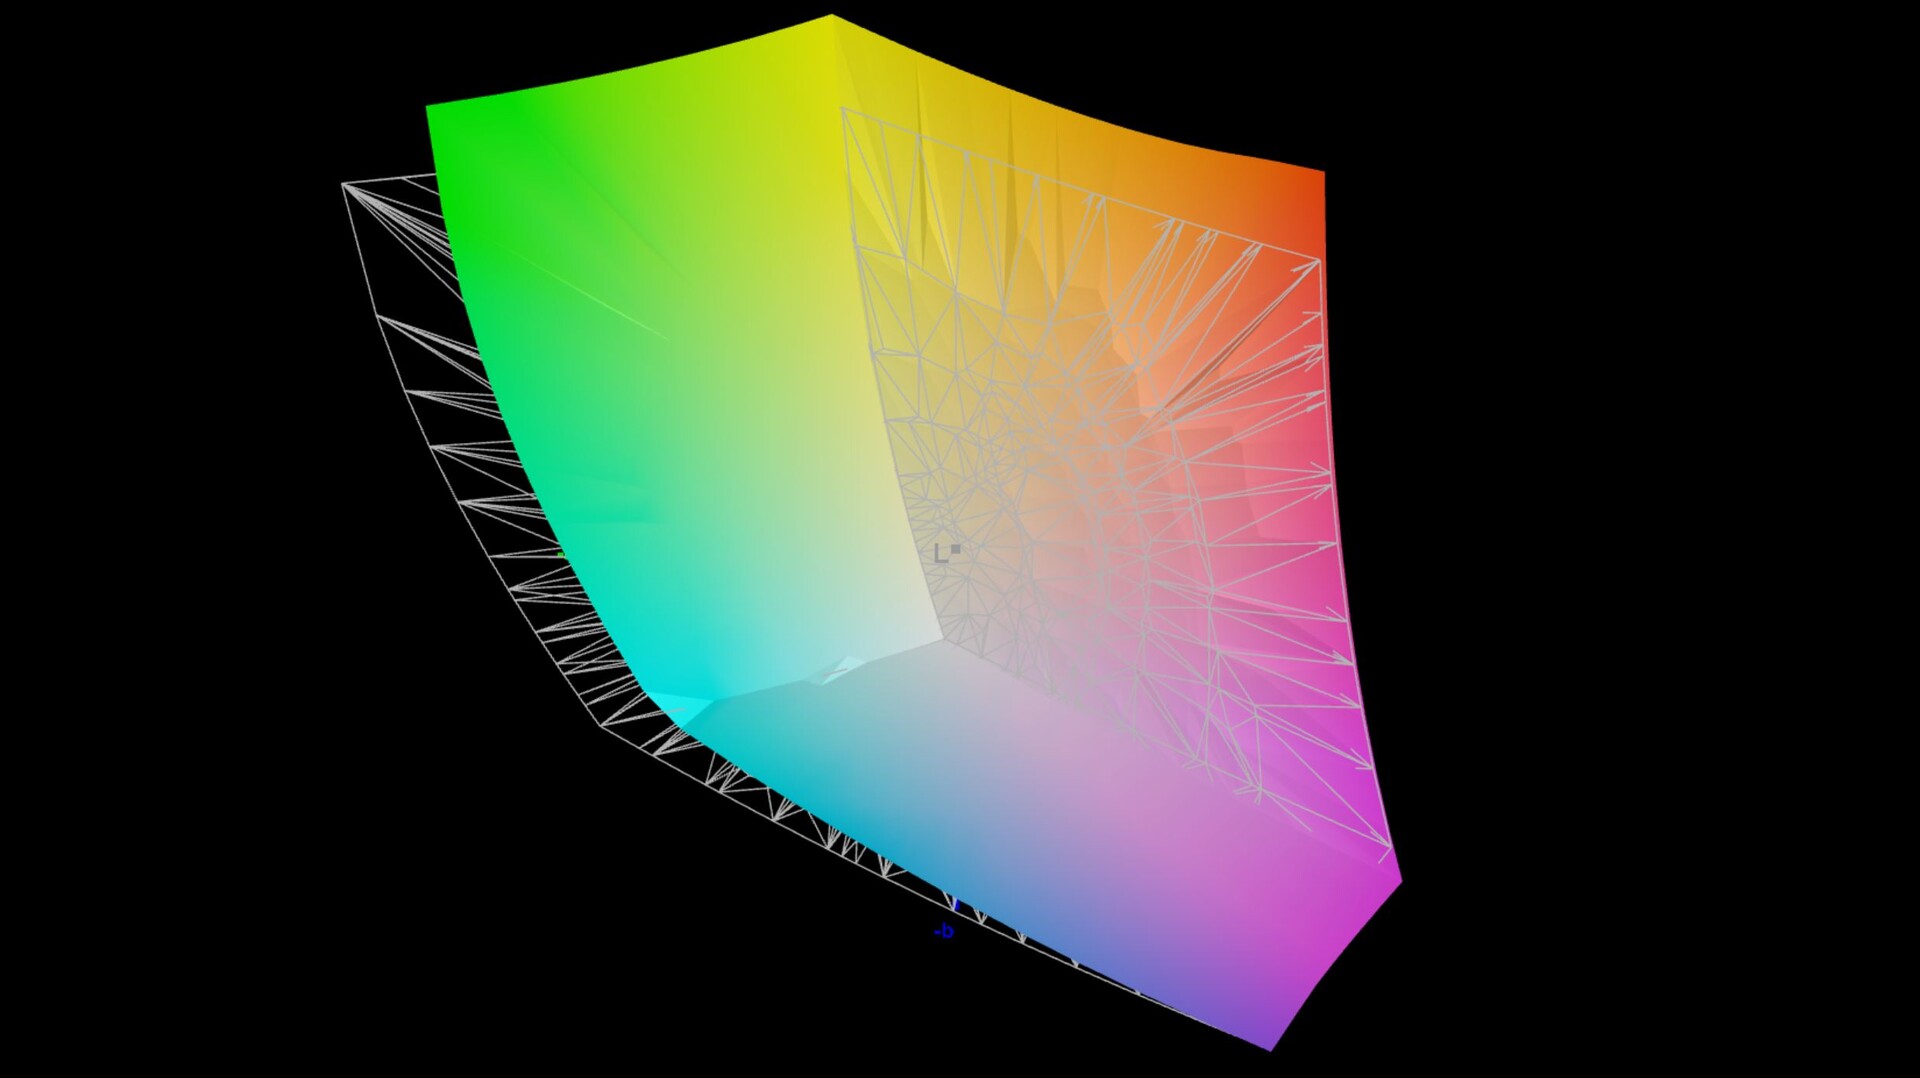
87.4% AdobeRGB 1998 (Argyll 3D)
99.9% sRGB (Argyll 3D)
97.6% Display P3 (Argyll 3D)
Gamma: 2.26
CCT: 6437 K
| MSI CreatorPro Z16P B12UKST B160QAN02.N, IPS, 2560x1600, 16" | HP ZBook Studio 16 G9 62U04EA BOE0A52, IPS, 3840x2400, 16" | Lenovo ThinkPad P1 G4-20Y4S0KS00 LP160UQ1-SPB1, IPS LED, 3840x2400, 16" | Dell Precision 5000 5560 Sharp LQ156R1, IPS, 3840x2400, 15.6" | MSI Creator Z16P B12UHST AUOD298, IPS True Pixel (~100% DCI-P3), 2560x1600, 16" | |
|---|---|---|---|---|---|
| Display | -0% | 0% | 4% | -0% | |
| Display P3 Coverage (%) | 97.6 | 97.5 0% | 85.7 -12% | 94.9 -3% | 97.6 0% |
| sRGB Coverage (%) | 99.9 | 99.9 0% | 99.4 -1% | 100 0% | 99.9 0% |
| AdobeRGB 1998 Coverage (%) | 87.4 | 86.3 -1% | 98.9 13% | 100 14% | 86.8 -1% |
| Response Times | -1% | -327% | -290% | 7% | |
| Response Time Grey 50% / Grey 80% * (ms) | 12.8 ? | 15.3 ? -20% | 55.2 ? -331% | 47.2 ? -269% | 12.9 ? -1% |
| Response Time Black / White * (ms) | 7.4 ? | 6.1 ? 18% | 31.2 ? -322% | 30.4 ? -311% | 6.4 ? 14% |
| PWM Frequency (Hz) | |||||
| Screen | 11% | -11% | -59% | -25% | |
| Brightness middle (cd/m²) | 407 | 554 36% | 630 55% | 501.5 23% | 428 5% |
| Brightness (cd/m²) | 388 | 516 33% | 622 60% | 467 20% | 394 2% |
| Brightness Distribution (%) | 88 | 84 -5% | 90 2% | 83 -6% | 86 -2% |
| Black Level * (cd/m²) | 0.36 | 0.47 -31% | 0.41 -14% | 0.44 -22% | 0.42 -17% |
| Contrast (:1) | 1131 | 1179 4% | 1537 36% | 1140 1% | 1019 -10% |
| Colorchecker dE 2000 * | 1.3 | 1 23% | 2.2 -69% | 4.73 -264% | 1.67 -28% |
| Colorchecker dE 2000 max. * | 2.5 | 2.4 4% | 5 -100% | 8.45 -238% | 5.71 -128% |
| Colorchecker dE 2000 calibrated * | 0.7 | 0.6 14% | 1 -43% | 0.51 27% | 0.71 -1% |
| Greyscale dE 2000 * | 2.1 | 1.6 24% | 2.7 -29% | 3.6 -71% | 3.1 -48% |
| Gamma | 2.26 97% | 2.29 96% | 2.26 97% | 2.08 106% | 2.195 100% |
| CCT | 6437 101% | 6458 101% | 6886 94% | 6447 101% | 6498 100% |
| Média Total (Programa/Configurações) | 3% /
7% | -113% /
-54% | -115% /
-79% | -6% /
-15% |
* ... menor é melhor
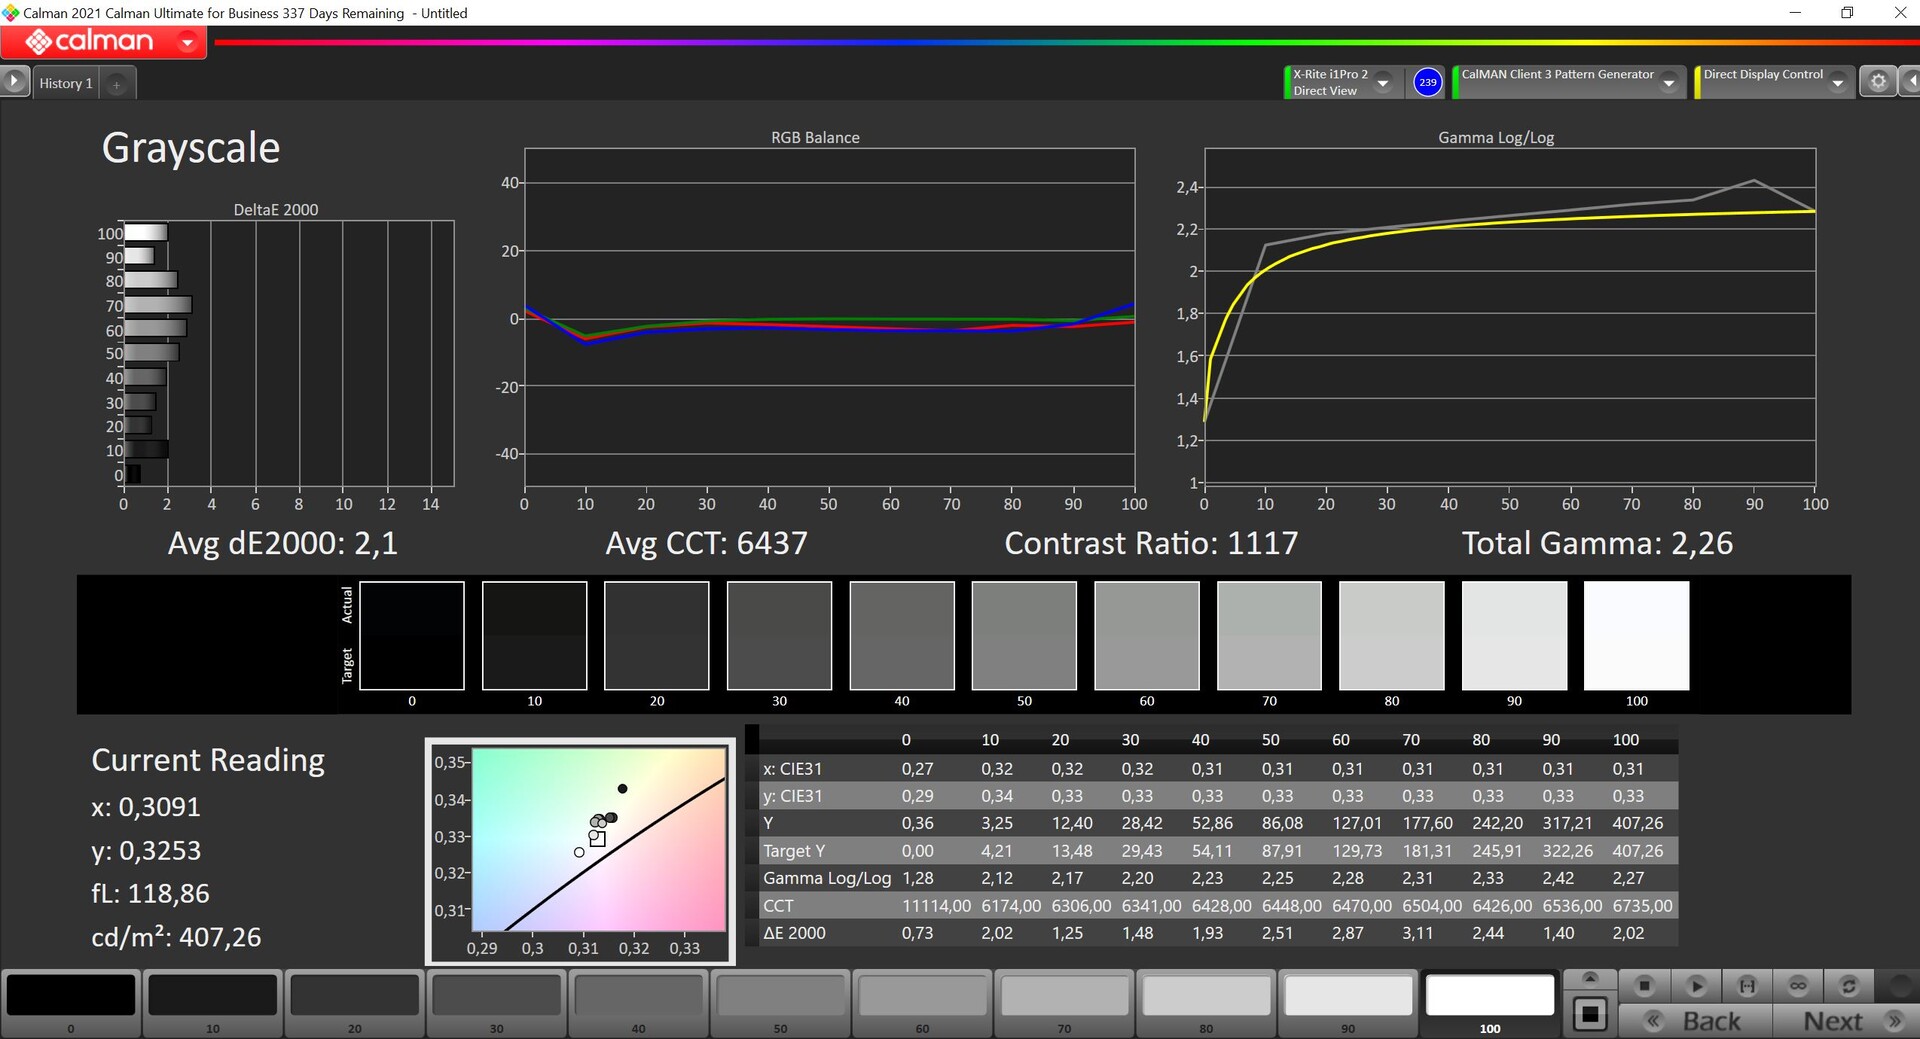
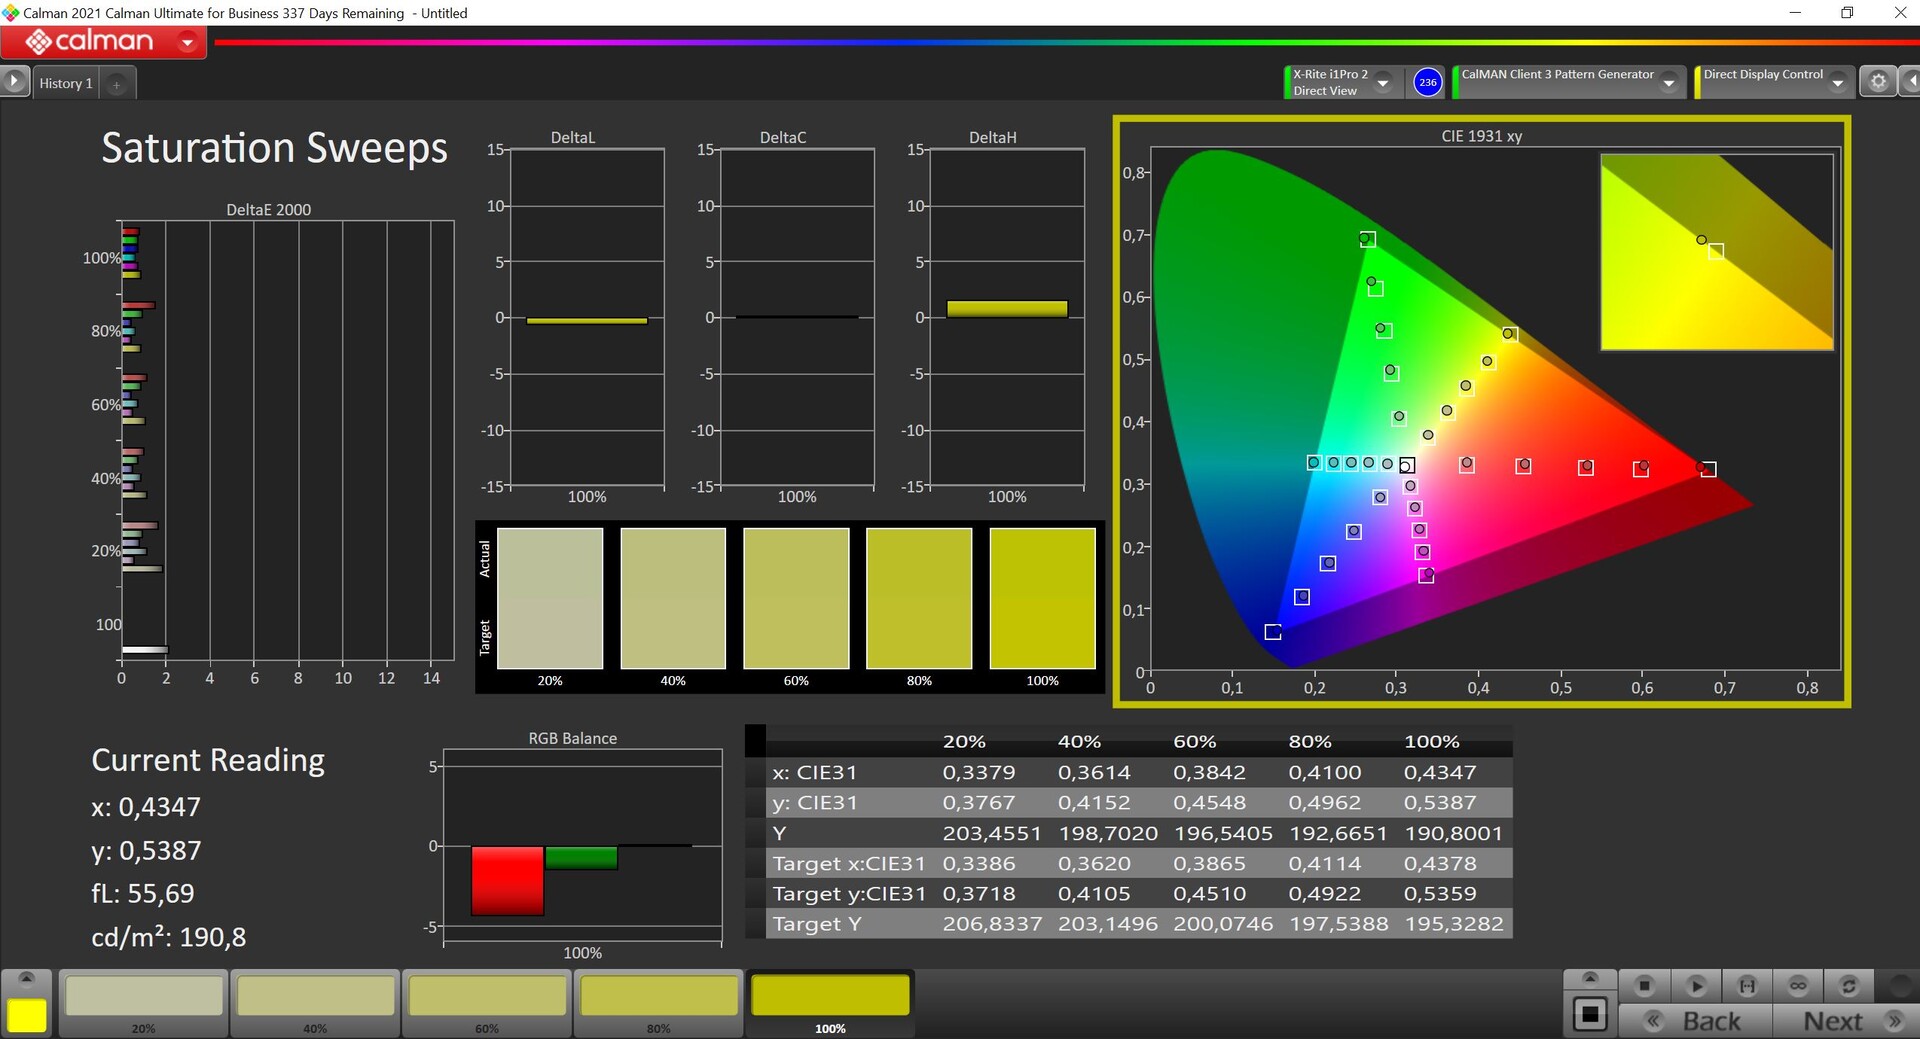
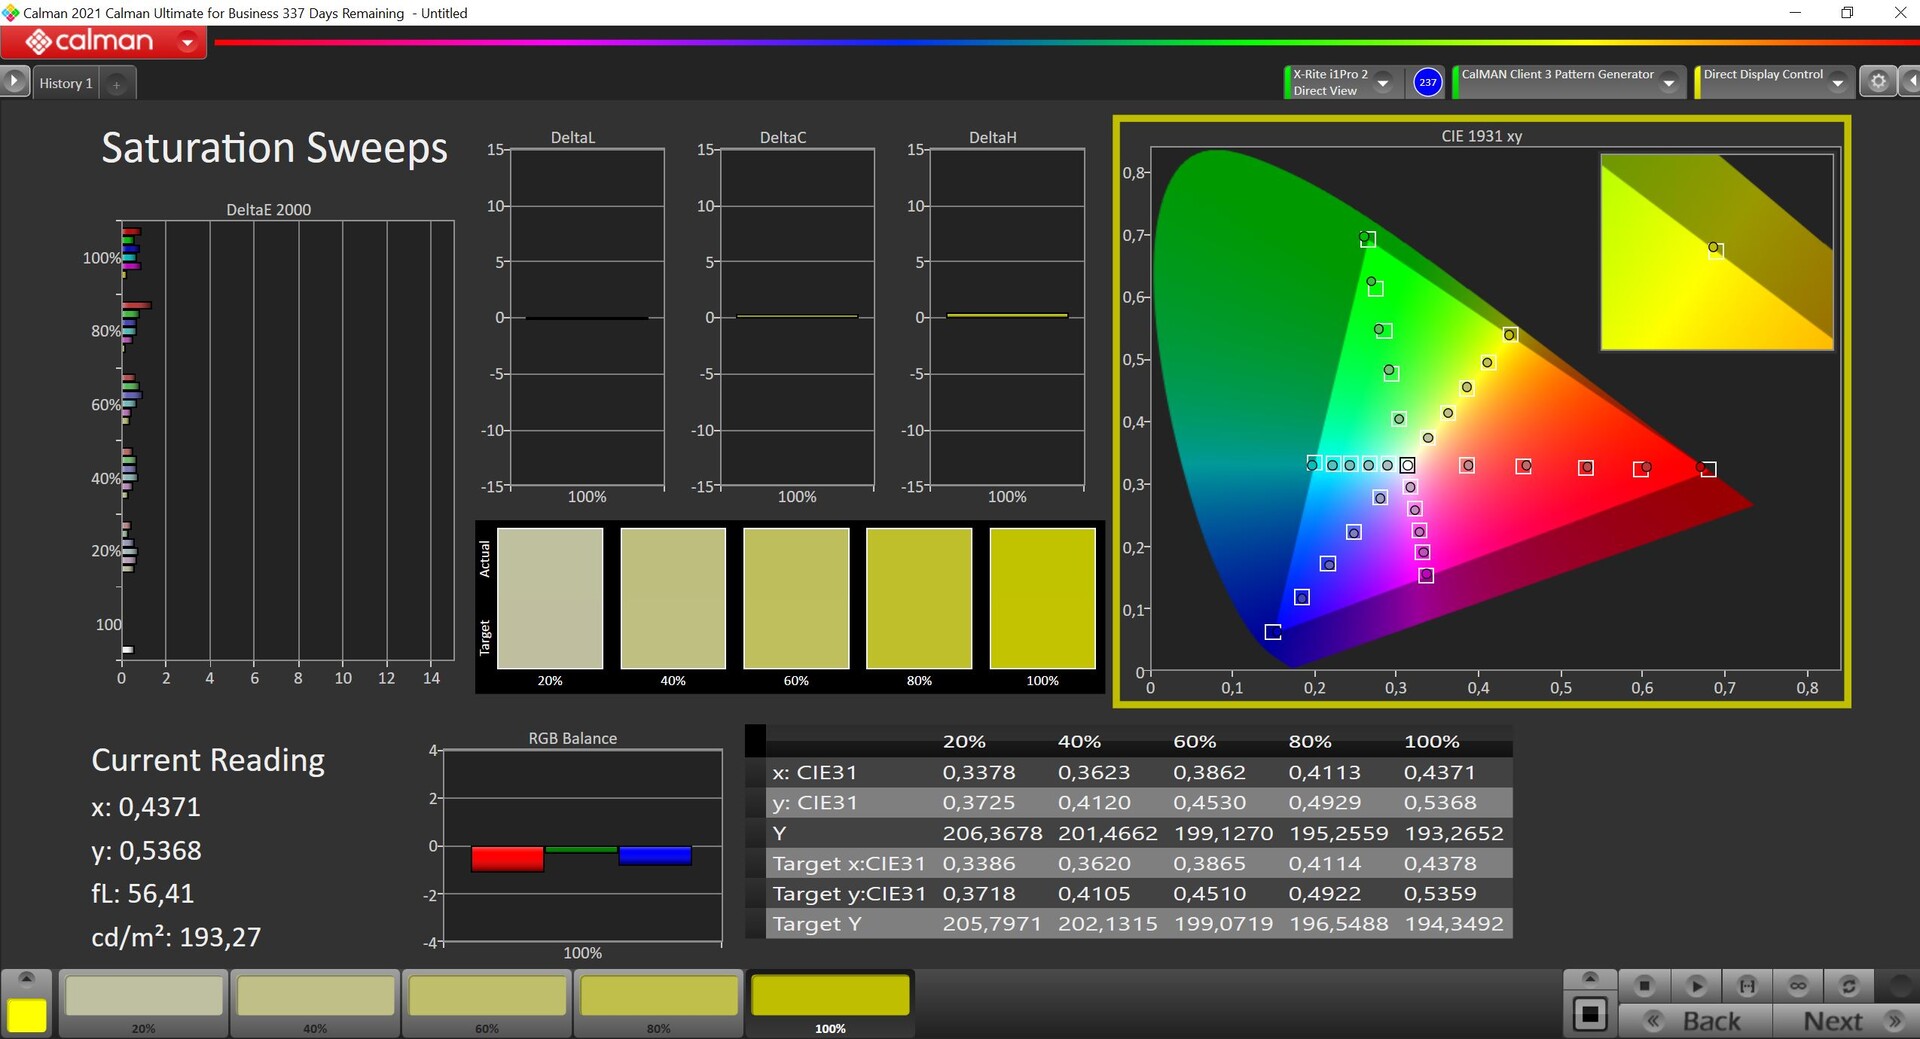
Nossa análise com o software profissional CalMAN (X-Rite i1 Pro 2) mostra que o painel já está muito bem calibrado no estado de entrega, e o desvio DeltaE de menos de 2 anunciados pela MSI em comparação com o espaço de cor de referência DCI-P3 está correto. O desvio também é muito pequeno na escala de cinza, e não há nenhuma tonalidade de cor. Somos capazes de melhorar ainda mais os desvios com nossa própria calibração (disponível para download gratuito no link mais acima), mas isto não é realmente necessário.
O software TrueColor também permite que você troque o espaço de cor, se quiser trabalhar no espaço de cor sRGB, por exemplo. Além disso, o software também permite calibrar o display, e a este respeito, o CreatorPro Z16P oferece até algumas vantagens em comparação com algumas estações de trabalho (tais como Os modelos ZBook da HP com painéis DreamColorque, neste momento, não oferecem mais nenhum software de exibição).
Exibir tempos de resposta
| ↔ Tempo de resposta preto para branco | ||
|---|---|---|
| 7.4 ms ... ascensão ↗ e queda ↘ combinadas | ↗ 3.4 ms ascensão | 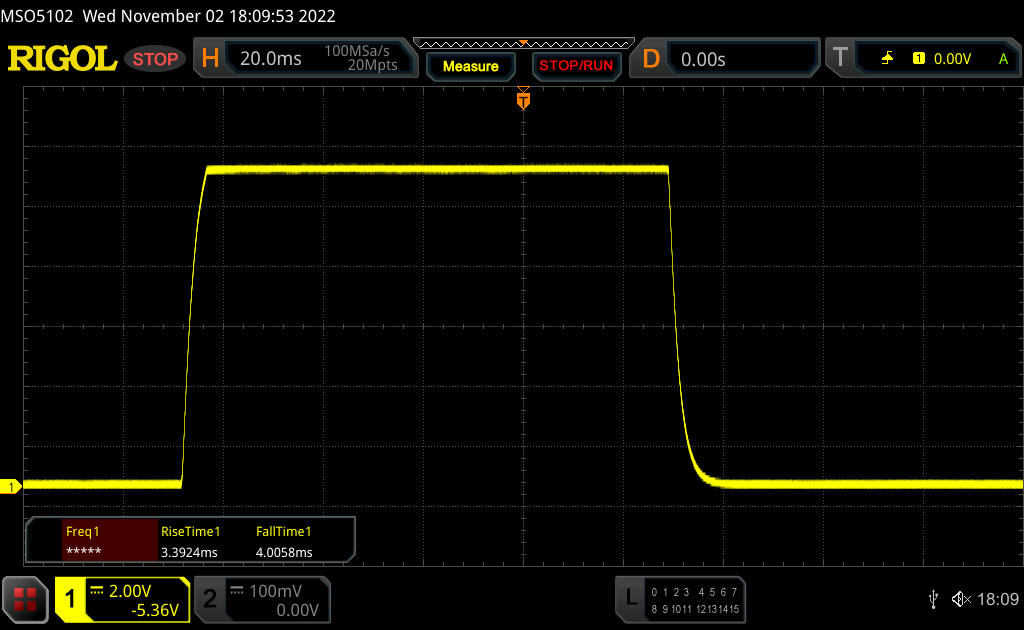 |
| ↘ 4 ms queda | ||
| A tela mostra taxas de resposta muito rápidas em nossos testes e deve ser muito adequada para jogos em ritmo acelerado. Em comparação, todos os dispositivos testados variam de 0.1 (mínimo) a 240 (máximo) ms. » 22 % de todos os dispositivos são melhores. Isso significa que o tempo de resposta medido é melhor que a média de todos os dispositivos testados (19.8 ms). | ||
| ↔ Tempo de resposta 50% cinza a 80% cinza | ||
| 12.8 ms ... ascensão ↗ e queda ↘ combinadas | ↗ 6.2 ms ascensão | 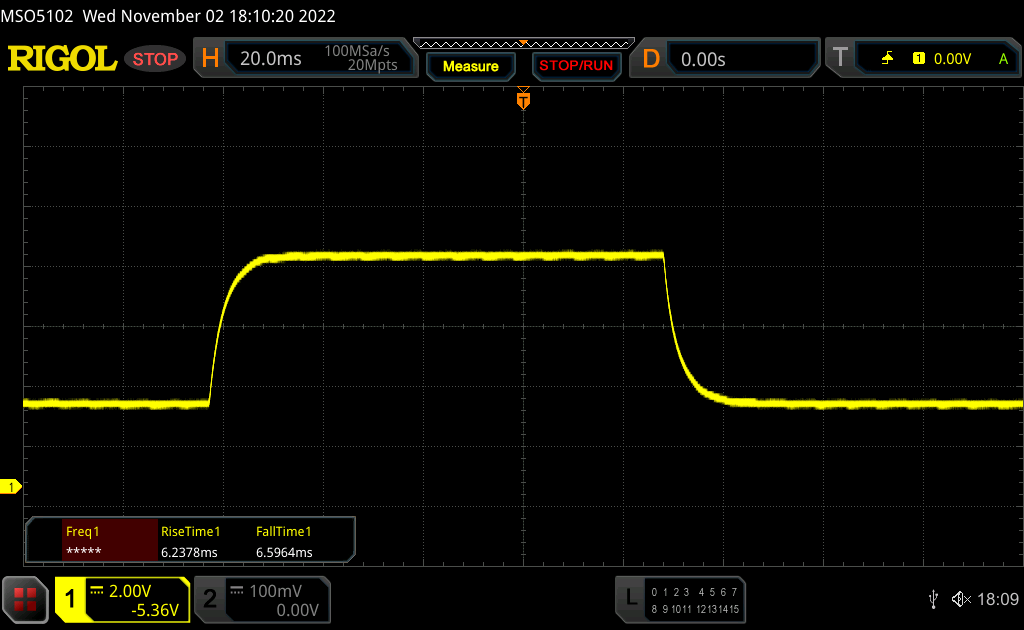 |
| ↘ 6.6 ms queda | ||
| A tela mostra boas taxas de resposta em nossos testes, mas pode ser muito lenta para jogadores competitivos. Em comparação, todos os dispositivos testados variam de 0.165 (mínimo) a 636 (máximo) ms. » 26 % de todos os dispositivos são melhores. Isso significa que o tempo de resposta medido é melhor que a média de todos os dispositivos testados (31 ms). | ||
Cintilação da tela / PWM (modulação por largura de pulso)
| Tela tremeluzindo / PWM não detectado | 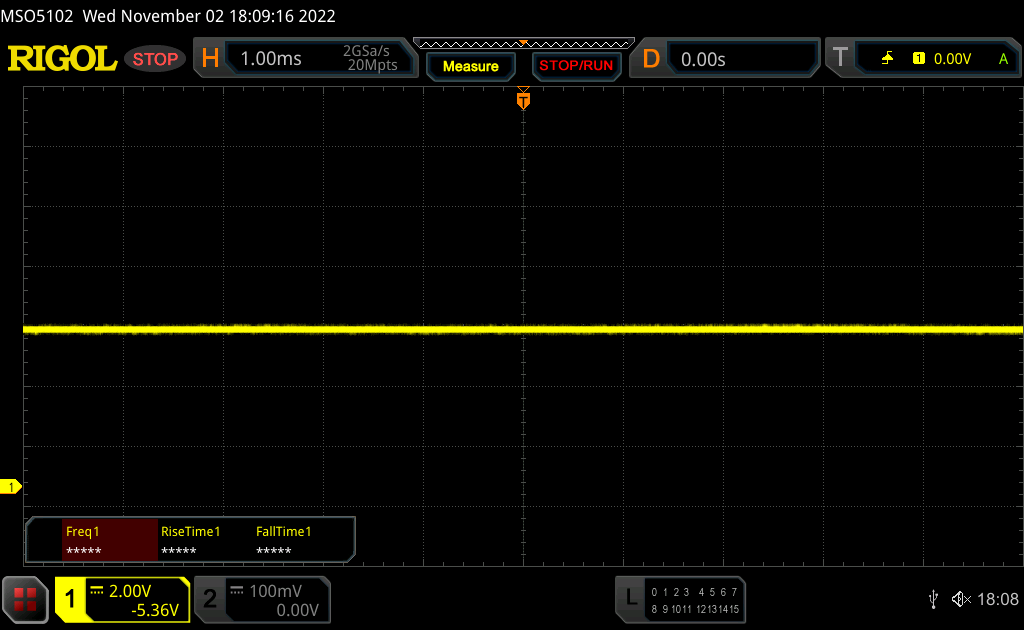 | ||
[pwm_comparison] Em comparação: 52 % de todos os dispositivos testados não usam PWM para escurecer a tela. Se PWM foi detectado, uma média de 7754 (mínimo: 5 - máximo: 343500) Hz foi medida. | |||
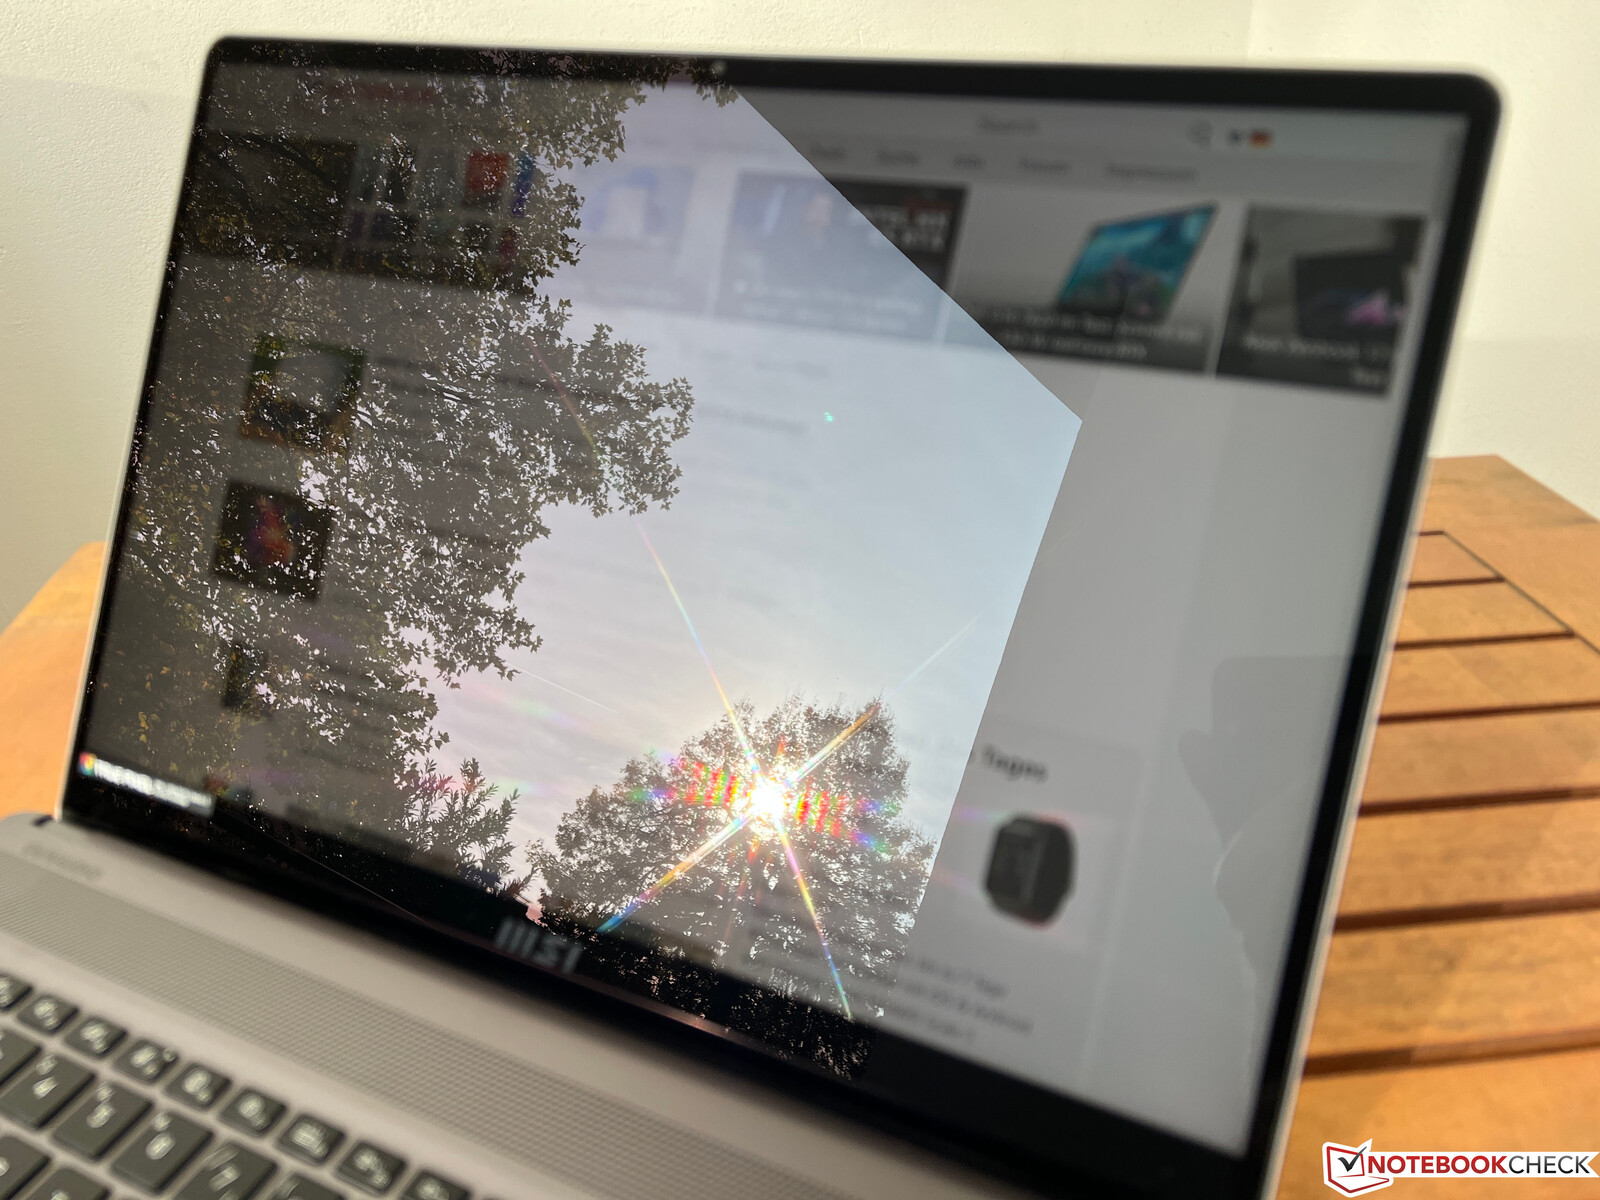
Embora a superfície refletiva da tela ajude na qualidade da imagem, é claro que ela também torna as coisas mais difíceis ao ar livre. Desde que você seja capaz de evitar reflexos de fontes de luz ou áreas brilhantes, o conteúdo ainda pode ser reconhecido com bastante facilidade, mas aqueles que ocasionalmente gostam de fazer trabalhos móveis ou que trabalham em condições de mudança de luz seriam melhor servidos por um display fosco.
Desempenho - MSI usa Intel Alder Lake e Nvidia Studio
Condições de teste
Além das configurações do Windows, a MSI também oferece seus próprios perfis de potência no software CenterPro pré-instalado e também um modo Smart Auto AI, que controla o desempenho independente da carga. Durante nossos testes, recebemos resultados que variaram em partes com os perfis de potência. Recebemos os melhores resultados com o modo Performance, embora também tenha havido algumas variações aqui.
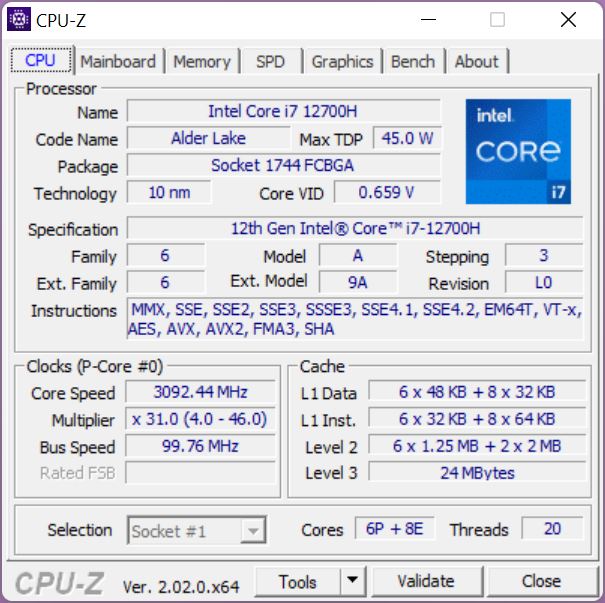
Processador - Core i7-12700H
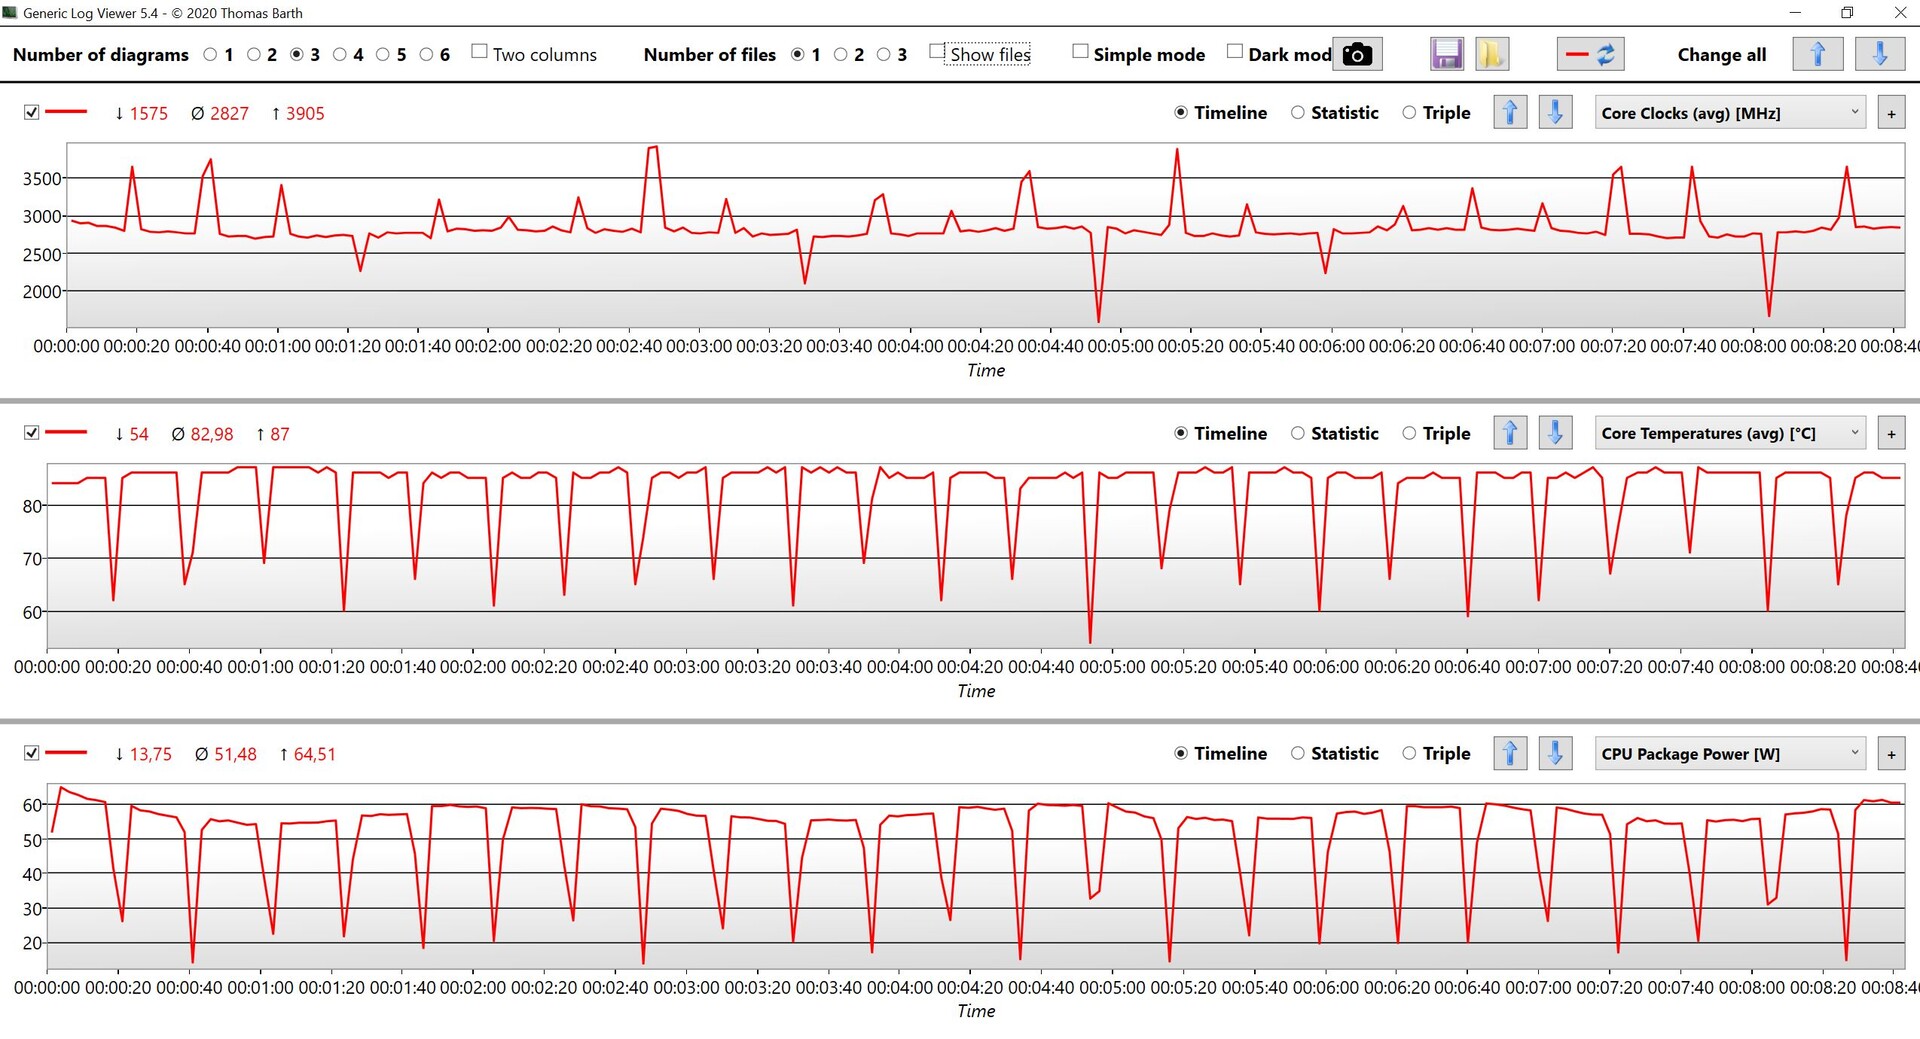
OIntel Core i7-12700Hé usado atualmente em muitos laptops, oferecendo valores de desempenho muito bons com seus 6 Núcleos de Desempenho e 8 Eficiência, mas pode haver algumas grandes diferenças, dependendo da configuração do TDP. No CreatorPro Z16P, os valores são escolhidos de forma bastante conservadora, e nem sempre são estáveis. Às vezes, o processador pode consumir até 76 watts, mas no loop Cinebench, é de apenas 55-60 watts. A MSI deve tomar outra facada para isso e permitir resultados reprodutíveis.
Entretanto, em todos os benchmarks de CPU, o desempenho é muito bom em geral, colocando apenas minimamente atrás do HP ZBook Studio 16 G9com o Núcleo i7-12800H. O regular Criador Z16P na configuração com o Núcleo i9-12900H é cerca de 9% mais rápido, em média. Na operação com bateria, o consumo de energia do processador é limitado a 45 watts, resultando em uma redução de desempenho de cerca de 25% nos testes de múltiplos núcleos. Você pode encontrar referências adicionais de CPU em nossa seção de processadores móveis.
Cinebench R15 Multi Constant Load Test
Cinebench R23: Multi Core | Single Core
Cinebench R20: CPU (Multi Core) | CPU (Single Core)
Cinebench R15: CPU Multi 64Bit | CPU Single 64Bit
Blender: v2.79 BMW27 CPU
7-Zip 18.03: 7z b 4 | 7z b 4 -mmt1
Geekbench 5.5: Multi-Core | Single-Core
HWBOT x265 Benchmark v2.2: 4k Preset
LibreOffice : 20 Documents To PDF
R Benchmark 2.5: Overall mean
| CPU Performance rating | |
| Média da turma Workstation | |
| MSI Creator Z16P B12UHST | |
| HP ZBook Studio 16 G9 62U04EA | |
| MSI CreatorPro Z16P B12UKST | |
| Média Intel Core i7-12700H | |
| Lenovo ThinkPad P1 G4-20Y4S0KS00 | |
| Dell Precision 5000 5560 -2! | |
| Cinebench R23 / Multi Core | |
| Média da turma Workstation (14621 - 38520, n=23, últimos 2 anos) | |
| MSI Creator Z16P B12UHST | |
| MSI CreatorPro Z16P B12UKST | |
| HP ZBook Studio 16 G9 62U04EA | |
| Média Intel Core i7-12700H (4032 - 19330, n=64) | |
| Lenovo ThinkPad P1 G4-20Y4S0KS00 | |
| Dell Precision 5000 5560 | |
| Cinebench R23 / Single Core | |
| Média da turma Workstation (1712 - 2228, n=23, últimos 2 anos) | |
| MSI Creator Z16P B12UHST | |
| HP ZBook Studio 16 G9 62U04EA | |
| Média Intel Core i7-12700H (778 - 1826, n=63) | |
| MSI CreatorPro Z16P B12UKST | |
| Lenovo ThinkPad P1 G4-20Y4S0KS00 | |
| Dell Precision 5000 5560 | |
| Cinebench R20 / CPU (Multi Core) | |
| Média da turma Workstation (5760 - 15043, n=23, últimos 2 anos) | |
| MSI Creator Z16P B12UHST | |
| MSI CreatorPro Z16P B12UKST | |
| HP ZBook Studio 16 G9 62U04EA | |
| Média Intel Core i7-12700H (1576 - 7407, n=64) | |
| Lenovo ThinkPad P1 G4-20Y4S0KS00 | |
| Dell Precision 5000 5560 | |
| Cinebench R20 / CPU (Single Core) | |
| Média da turma Workstation (671 - 857, n=23, últimos 2 anos) | |
| MSI Creator Z16P B12UHST | |
| HP ZBook Studio 16 G9 62U04EA | |
| Média Intel Core i7-12700H (300 - 704, n=64) | |
| MSI CreatorPro Z16P B12UKST | |
| Lenovo ThinkPad P1 G4-20Y4S0KS00 | |
| Dell Precision 5000 5560 | |
| Cinebench R15 / CPU Multi 64Bit | |
| Média da turma Workstation (2489 - 5810, n=23, últimos 2 anos) | |
| MSI Creator Z16P B12UHST | |
| HP ZBook Studio 16 G9 62U04EA | |
| Média Intel Core i7-12700H (1379 - 2916, n=70) | |
| MSI CreatorPro Z16P B12UKST | |
| Lenovo ThinkPad P1 G4-20Y4S0KS00 | |
| Dell Precision 5000 5560 | |
| Cinebench R15 / CPU Single 64Bit | |
| Média da turma Workstation (191.4 - 328, n=23, últimos 2 anos) | |
| MSI Creator Z16P B12UHST | |
| HP ZBook Studio 16 G9 62U04EA | |
| Média Intel Core i7-12700H (113 - 263, n=65) | |
| MSI CreatorPro Z16P B12UKST | |
| Lenovo ThinkPad P1 G4-20Y4S0KS00 | |
| Dell Precision 5000 5560 | |
| Blender / v2.79 BMW27 CPU | |
| Dell Precision 5000 5560 | |
| Lenovo ThinkPad P1 G4-20Y4S0KS00 | |
| Média Intel Core i7-12700H (168 - 732, n=63) | |
| MSI CreatorPro Z16P B12UKST | |
| HP ZBook Studio 16 G9 62U04EA | |
| MSI Creator Z16P B12UHST | |
| Média da turma Workstation (91 - 222, n=23, últimos 2 anos) | |
| 7-Zip 18.03 / 7z b 4 | |
| Média da turma Workstation (60489 - 116969, n=23, últimos 2 anos) | |
| MSI Creator Z16P B12UHST | |
| HP ZBook Studio 16 G9 62U04EA | |
| MSI CreatorPro Z16P B12UKST | |
| Média Intel Core i7-12700H (22844 - 73067, n=63) | |
| Lenovo ThinkPad P1 G4-20Y4S0KS00 | |
| Dell Precision 5000 5560 | |
| 7-Zip 18.03 / 7z b 4 -mmt1 | |
| Média da turma Workstation (5126 - 6960, n=23, últimos 2 anos) | |
| MSI Creator Z16P B12UHST | |
| HP ZBook Studio 16 G9 62U04EA | |
| MSI CreatorPro Z16P B12UKST | |
| Lenovo ThinkPad P1 G4-20Y4S0KS00 | |
| Dell Precision 5000 5560 | |
| Média Intel Core i7-12700H (2743 - 5972, n=63) | |
| Geekbench 5.5 / Multi-Core | |
| Média da turma Workstation (11542 - 25554, n=23, últimos 2 anos) | |
| MSI Creator Z16P B12UHST | |
| HP ZBook Studio 16 G9 62U04EA | |
| MSI CreatorPro Z16P B12UKST | |
| Média Intel Core i7-12700H (5144 - 13745, n=64) | |
| Lenovo ThinkPad P1 G4-20Y4S0KS00 | |
| Geekbench 5.5 / Single-Core | |
| Média da turma Workstation (1783 - 2183, n=23, últimos 2 anos) | |
| MSI Creator Z16P B12UHST | |
| HP ZBook Studio 16 G9 62U04EA | |
| MSI CreatorPro Z16P B12UKST | |
| Média Intel Core i7-12700H (803 - 1851, n=64) | |
| Lenovo ThinkPad P1 G4-20Y4S0KS00 | |
| HWBOT x265 Benchmark v2.2 / 4k Preset | |
| Média da turma Workstation (17.8 - 40.5, n=23, últimos 2 anos) | |
| HP ZBook Studio 16 G9 62U04EA | |
| MSI CreatorPro Z16P B12UKST | |
| MSI Creator Z16P B12UHST | |
| Média Intel Core i7-12700H (4.67 - 21.8, n=64) | |
| Lenovo ThinkPad P1 G4-20Y4S0KS00 | |
| Dell Precision 5000 5560 | |
| LibreOffice / 20 Documents To PDF | |
| Dell Precision 5000 5560 | |
| Média da turma Workstation (37.1 - 74.7, n=23, últimos 2 anos) | |
| Média Intel Core i7-12700H (34.2 - 95.3, n=63) | |
| Lenovo ThinkPad P1 G4-20Y4S0KS00 | |
| HP ZBook Studio 16 G9 62U04EA | |
| MSI Creator Z16P B12UHST | |
| MSI CreatorPro Z16P B12UKST | |
| R Benchmark 2.5 / Overall mean | |
| Dell Precision 5000 5560 | |
| Lenovo ThinkPad P1 G4-20Y4S0KS00 | |
| Média Intel Core i7-12700H (0.4441 - 1.052, n=63) | |
| MSI CreatorPro Z16P B12UKST | |
| HP ZBook Studio 16 G9 62U04EA | |
| Média da turma Workstation (0.3825 - 0.603, n=23, últimos 2 anos) | |
| MSI Creator Z16P B12UHST | |
* ... menor é melhor
AIDA64: FP32 Ray-Trace | FPU Julia | CPU SHA3 | CPU Queen | FPU SinJulia | FPU Mandel | CPU AES | CPU ZLib | FP64 Ray-Trace | CPU PhotoWorxx
| Performance rating | |
| Média da turma Workstation | |
| MSI CreatorPro Z16P B12UKST | |
| HP ZBook Studio 16 G9 62U04EA | |
| Lenovo ThinkPad P1 G4-20Y4Z9DVUS | |
| MSI Creator Z16P B12UHST | |
| Média Intel Core i7-12700H | |
| AIDA64 / FP32 Ray-Trace | |
| Média da turma Workstation (16730 - 61611, n=23, últimos 2 anos) | |
| Lenovo ThinkPad P1 G4-20Y4Z9DVUS | |
| HP ZBook Studio 16 G9 62U04EA | |
| MSI CreatorPro Z16P B12UKST | |
| Média Intel Core i7-12700H (2585 - 17957, n=64) | |
| MSI Creator Z16P B12UHST | |
| AIDA64 / FPU Julia | |
| Média da turma Workstation (89597 - 186971, n=23, últimos 2 anos) | |
| HP ZBook Studio 16 G9 62U04EA | |
| MSI CreatorPro Z16P B12UKST | |
| Lenovo ThinkPad P1 G4-20Y4Z9DVUS | |
| Média Intel Core i7-12700H (12439 - 90760, n=64) | |
| MSI Creator Z16P B12UHST | |
| AIDA64 / CPU SHA3 | |
| Média da turma Workstation (4178 - 8975, n=23, últimos 2 anos) | |
| Lenovo ThinkPad P1 G4-20Y4Z9DVUS | |
| HP ZBook Studio 16 G9 62U04EA | |
| MSI CreatorPro Z16P B12UKST | |
| Média Intel Core i7-12700H (833 - 4242, n=64) | |
| MSI Creator Z16P B12UHST | |
| AIDA64 / CPU Queen | |
| Média da turma Workstation (60778 - 144411, n=23, últimos 2 anos) | |
| HP ZBook Studio 16 G9 62U04EA | |
| MSI Creator Z16P B12UHST | |
| MSI CreatorPro Z16P B12UKST | |
| Média Intel Core i7-12700H (57923 - 103202, n=63) | |
| Lenovo ThinkPad P1 G4-20Y4Z9DVUS | |
| AIDA64 / FPU SinJulia | |
| Média da turma Workstation (8165 - 29343, n=23, últimos 2 anos) | |
| MSI Creator Z16P B12UHST | |
| Lenovo ThinkPad P1 G4-20Y4Z9DVUS | |
| HP ZBook Studio 16 G9 62U04EA | |
| MSI CreatorPro Z16P B12UKST | |
| Média Intel Core i7-12700H (3249 - 9939, n=64) | |
| AIDA64 / FPU Mandel | |
| Média da turma Workstation (44497 - 98153, n=23, últimos 2 anos) | |
| HP ZBook Studio 16 G9 62U04EA | |
| Lenovo ThinkPad P1 G4-20Y4Z9DVUS | |
| MSI CreatorPro Z16P B12UKST | |
| Média Intel Core i7-12700H (7135 - 44760, n=64) | |
| MSI Creator Z16P B12UHST | |
| AIDA64 / CPU AES | |
| MSI CreatorPro Z16P B12UKST | |
| Média da turma Workstation (73133 - 187841, n=23, últimos 2 anos) | |
| MSI Creator Z16P B12UHST | |
| Lenovo ThinkPad P1 G4-20Y4Z9DVUS | |
| Média Intel Core i7-12700H (31839 - 144360, n=64) | |
| HP ZBook Studio 16 G9 62U04EA | |
| AIDA64 / CPU ZLib | |
| Média da turma Workstation (929 - 2148, n=23, últimos 2 anos) | |
| MSI Creator Z16P B12UHST | |
| HP ZBook Studio 16 G9 62U04EA | |
| MSI CreatorPro Z16P B12UKST | |
| Média Intel Core i7-12700H (305 - 1171, n=64) | |
| Lenovo ThinkPad P1 G4-20Y4Z9DVUS | |
| AIDA64 / FP64 Ray-Trace | |
| Média da turma Workstation (8545 - 32891, n=23, últimos 2 anos) | |
| HP ZBook Studio 16 G9 62U04EA | |
| Lenovo ThinkPad P1 G4-20Y4Z9DVUS | |
| MSI CreatorPro Z16P B12UKST | |
| Média Intel Core i7-12700H (1437 - 9692, n=64) | |
| MSI Creator Z16P B12UHST | |
| AIDA64 / CPU PhotoWorxx | |
| Média da turma Workstation (37151 - 93684, n=23, últimos 2 anos) | |
| MSI CreatorPro Z16P B12UKST | |
| MSI Creator Z16P B12UHST | |
| HP ZBook Studio 16 G9 62U04EA | |
| Média Intel Core i7-12700H (12863 - 52207, n=64) | |
| Lenovo ThinkPad P1 G4-20Y4Z9DVUS | |
Desempenho do sistema
Não é muito surpreendente que não haja nenhum problema no desempenho do sistema básico. Em nossos testes, o laptop é sempre muito responsivo e os resultados de referência também se revelam muito bons.
CrossMark: Overall | Productivity | Creativity | Responsiveness
| PCMark 10 / Score | |
| Média da turma Workstation (6563 - 10409, n=19, últimos 2 anos) | |
| MSI Creator Z16P B12UHST | |
| Lenovo ThinkPad P1 G4-20Y4S0KS00 | |
| MSI CreatorPro Z16P B12UKST | |
| Média Intel Core i7-12700H, NVIDIA RTX A3000 Laptop GPU (n=1) | |
| Dell Precision 5000 5560 | |
| HP ZBook Studio 16 G9 62U04EA | |
| PCMark 10 / Essentials | |
| MSI Creator Z16P B12UHST | |
| Lenovo ThinkPad P1 G4-20Y4S0KS00 | |
| Dell Precision 5000 5560 | |
| MSI CreatorPro Z16P B12UKST | |
| Média Intel Core i7-12700H, NVIDIA RTX A3000 Laptop GPU (n=1) | |
| Média da turma Workstation (9622 - 11157, n=19, últimos 2 anos) | |
| HP ZBook Studio 16 G9 62U04EA | |
| PCMark 10 / Productivity | |
| Média da turma Workstation (8789 - 20616, n=19, últimos 2 anos) | |
| MSI Creator Z16P B12UHST | |
| MSI CreatorPro Z16P B12UKST | |
| Média Intel Core i7-12700H, NVIDIA RTX A3000 Laptop GPU (n=1) | |
| Dell Precision 5000 5560 | |
| Lenovo ThinkPad P1 G4-20Y4S0KS00 | |
| HP ZBook Studio 16 G9 62U04EA | |
| PCMark 10 / Digital Content Creation | |
| Média da turma Workstation (8108 - 15631, n=19, últimos 2 anos) | |
| MSI Creator Z16P B12UHST | |
| Lenovo ThinkPad P1 G4-20Y4S0KS00 | |
| MSI CreatorPro Z16P B12UKST | |
| Média Intel Core i7-12700H, NVIDIA RTX A3000 Laptop GPU (n=1) | |
| HP ZBook Studio 16 G9 62U04EA | |
| Dell Precision 5000 5560 | |
| CrossMark / Overall | |
| MSI CreatorPro Z16P B12UKST | |
| Média Intel Core i7-12700H, NVIDIA RTX A3000 Laptop GPU (n=1) | |
| Média da turma Workstation (1307 - 2267, n=22, últimos 2 anos) | |
| HP ZBook Studio 16 G9 62U04EA | |
| Lenovo ThinkPad P1 G4-20Y4S0KS00 | |
| CrossMark / Productivity | |
| MSI CreatorPro Z16P B12UKST | |
| Média Intel Core i7-12700H, NVIDIA RTX A3000 Laptop GPU (n=1) | |
| Média da turma Workstation (1130 - 2122, n=22, últimos 2 anos) | |
| HP ZBook Studio 16 G9 62U04EA | |
| Lenovo ThinkPad P1 G4-20Y4S0KS00 | |
| CrossMark / Creativity | |
| Média da turma Workstation (1657 - 2725, n=22, últimos 2 anos) | |
| HP ZBook Studio 16 G9 62U04EA | |
| MSI CreatorPro Z16P B12UKST | |
| Média Intel Core i7-12700H, NVIDIA RTX A3000 Laptop GPU (n=1) | |
| Lenovo ThinkPad P1 G4-20Y4S0KS00 | |
| CrossMark / Responsiveness | |
| MSI CreatorPro Z16P B12UKST | |
| Média Intel Core i7-12700H, NVIDIA RTX A3000 Laptop GPU (n=1) | |
| Média da turma Workstation (993 - 2096, n=22, últimos 2 anos) | |
| HP ZBook Studio 16 G9 62U04EA | |
| Lenovo ThinkPad P1 G4-20Y4S0KS00 | |
| PCMark 10 Score | 7086 pontos | |
Ajuda | ||
| AIDA64 / Memory Copy | |
| Média da turma Workstation (56003 - 164795, n=23, últimos 2 anos) | |
| MSI Creator Z16P B12UHST | |
| MSI CreatorPro Z16P B12UKST | |
| HP ZBook Studio 16 G9 62U04EA | |
| Média Intel Core i7-12700H (25615 - 80511, n=64) | |
| Lenovo ThinkPad P1 G4-20Y4Z9DVUS | |
| AIDA64 / Memory Read | |
| Média da turma Workstation (55795 - 121563, n=23, últimos 2 anos) | |
| MSI Creator Z16P B12UHST | |
| MSI CreatorPro Z16P B12UKST | |
| HP ZBook Studio 16 G9 62U04EA | |
| Média Intel Core i7-12700H (25586 - 79442, n=64) | |
| Lenovo ThinkPad P1 G4-20Y4Z9DVUS | |
| AIDA64 / Memory Write | |
| Média da turma Workstation (55663 - 214520, n=23, últimos 2 anos) | |
| MSI CreatorPro Z16P B12UKST | |
| MSI Creator Z16P B12UHST | |
| HP ZBook Studio 16 G9 62U04EA | |
| Média Intel Core i7-12700H (23679 - 88660, n=64) | |
| Lenovo ThinkPad P1 G4-20Y4Z9DVUS | |
| AIDA64 / Memory Latency | |
| Média da turma Workstation (84.5 - 165.2, n=23, últimos 2 anos) | |
| MSI CreatorPro Z16P B12UKST | |
| MSI Creator Z16P B12UHST | |
| HP ZBook Studio 16 G9 62U04EA | |
| Lenovo ThinkPad P1 G4-20Y4Z9DVUS | |
| Média Intel Core i7-12700H (76.2 - 133.9, n=62) | |
* ... menor é melhor
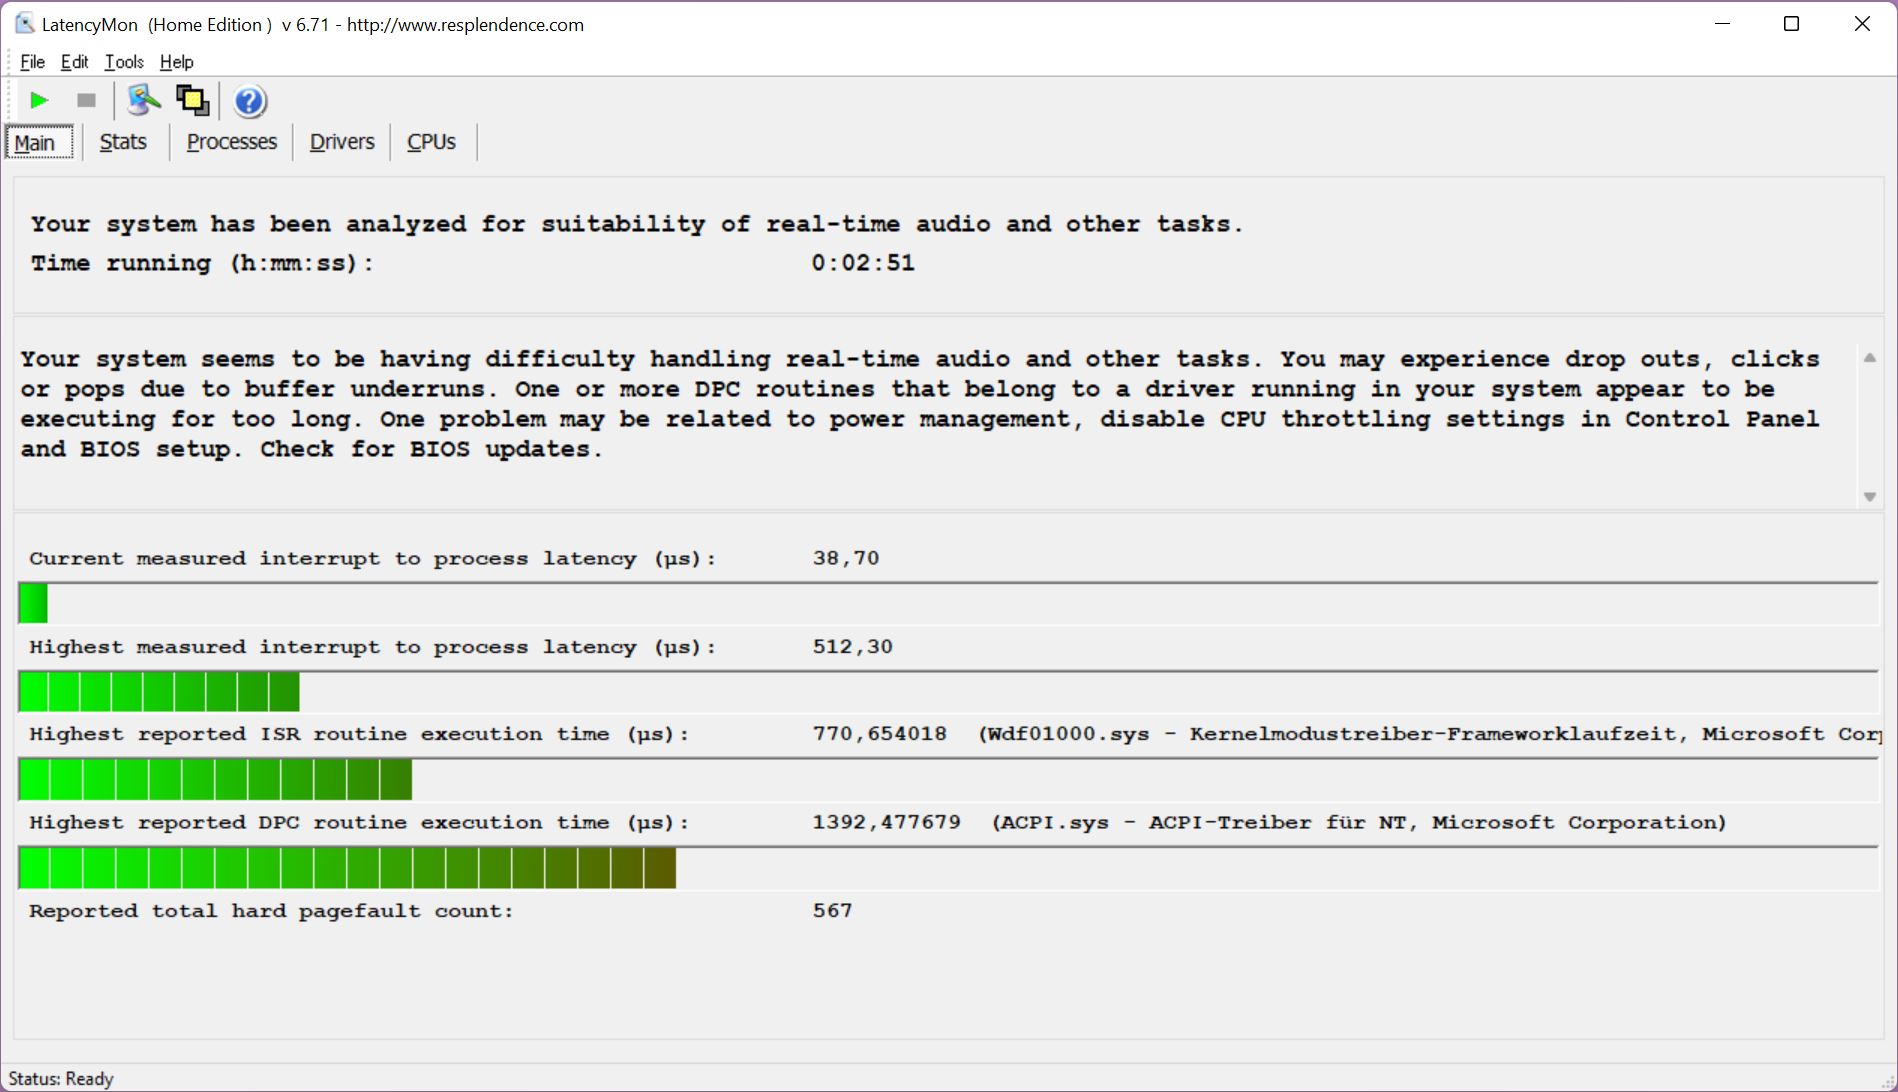
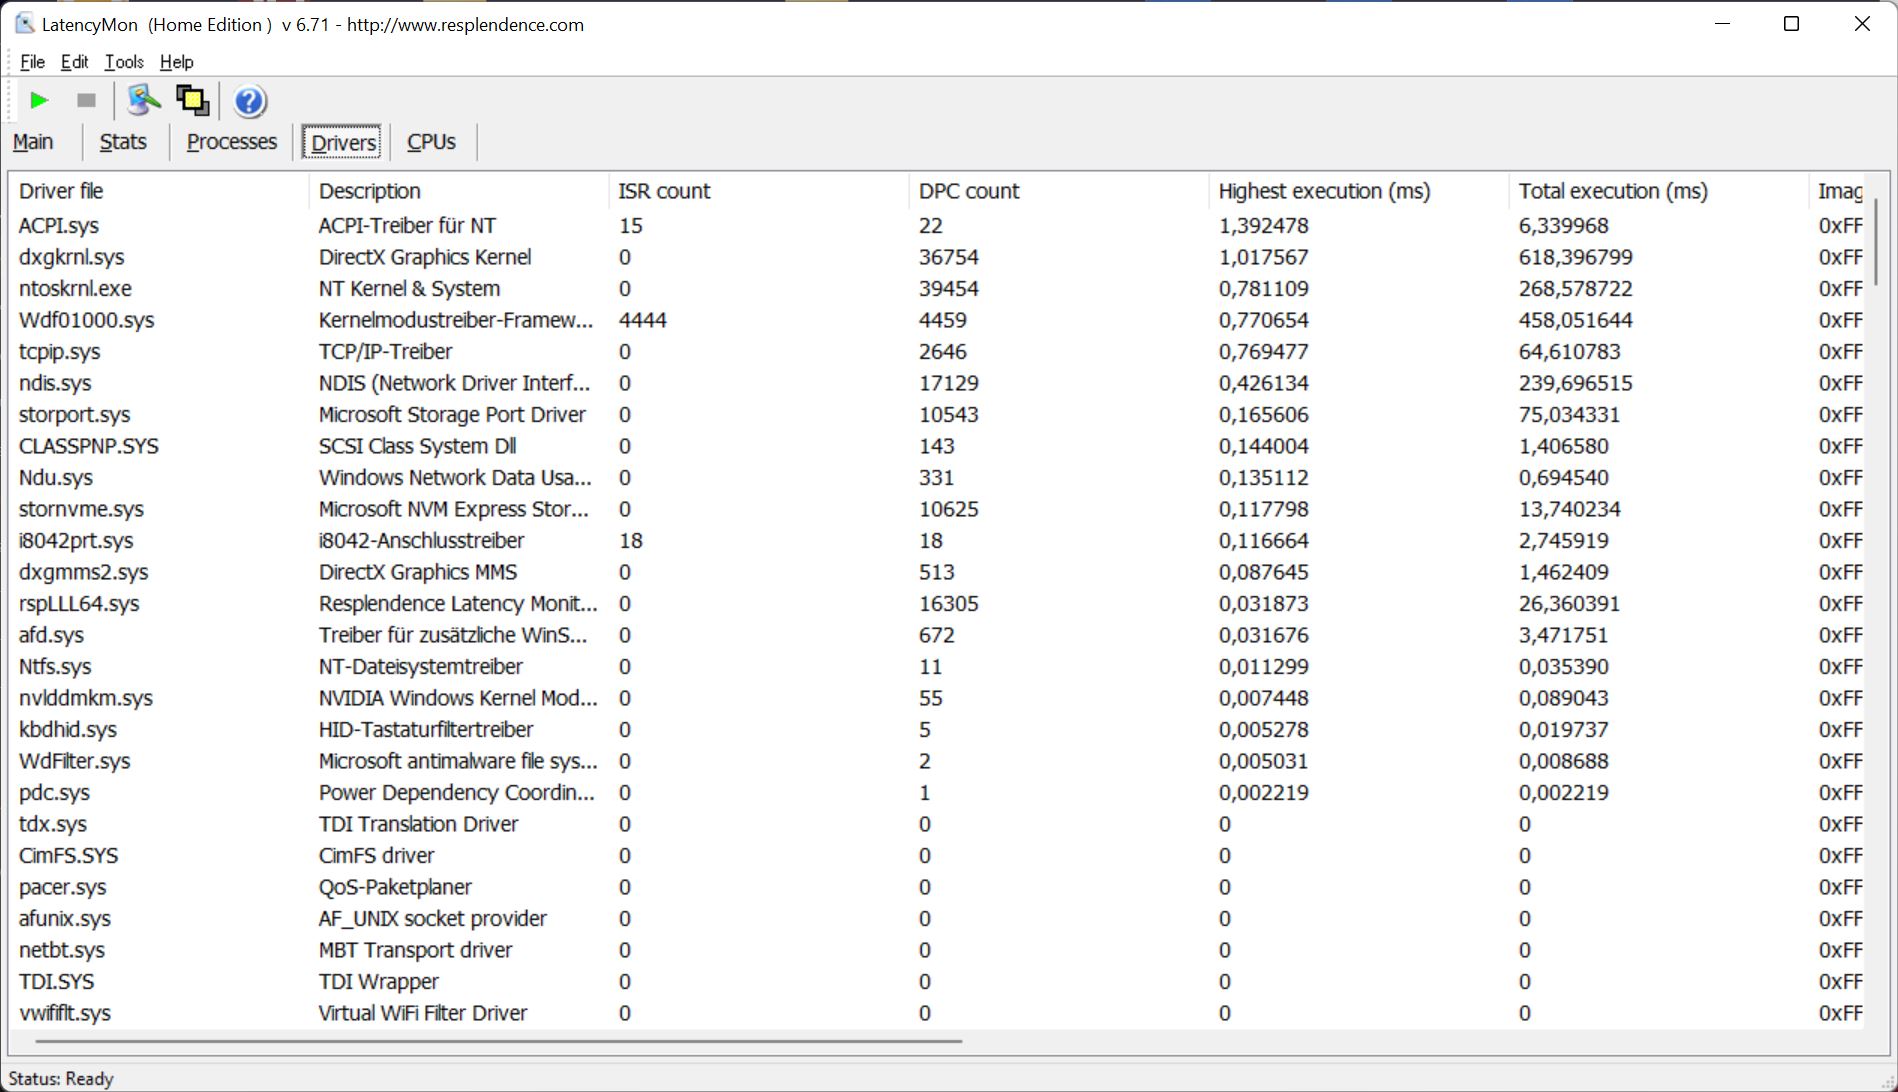
Latências DPC
Com a BIOS no momento de nossos testes, a unidade de teste não apresenta limitações em nosso teste de latência (navegando na Internet, reprodução 4K no YouTube, carga de CPU). Mesmo que um dos drivers cause um ligeiro distúrbio, não deve haver nenhum problema usando aplicações de áudio em tempo real.
| DPC Latencies / LatencyMon - interrupt to process latency (max), Web, Youtube, Prime95 | |
| HP ZBook Studio 16 G9 62U04EA | |
| MSI Creator Z16P B12UHST | |
| Dell Precision 5000 5560 | |
| Lenovo ThinkPad P1 G4-20Y4S0KS00 | |
| MSI CreatorPro Z16P B12UKST | |
* ... menor é melhor
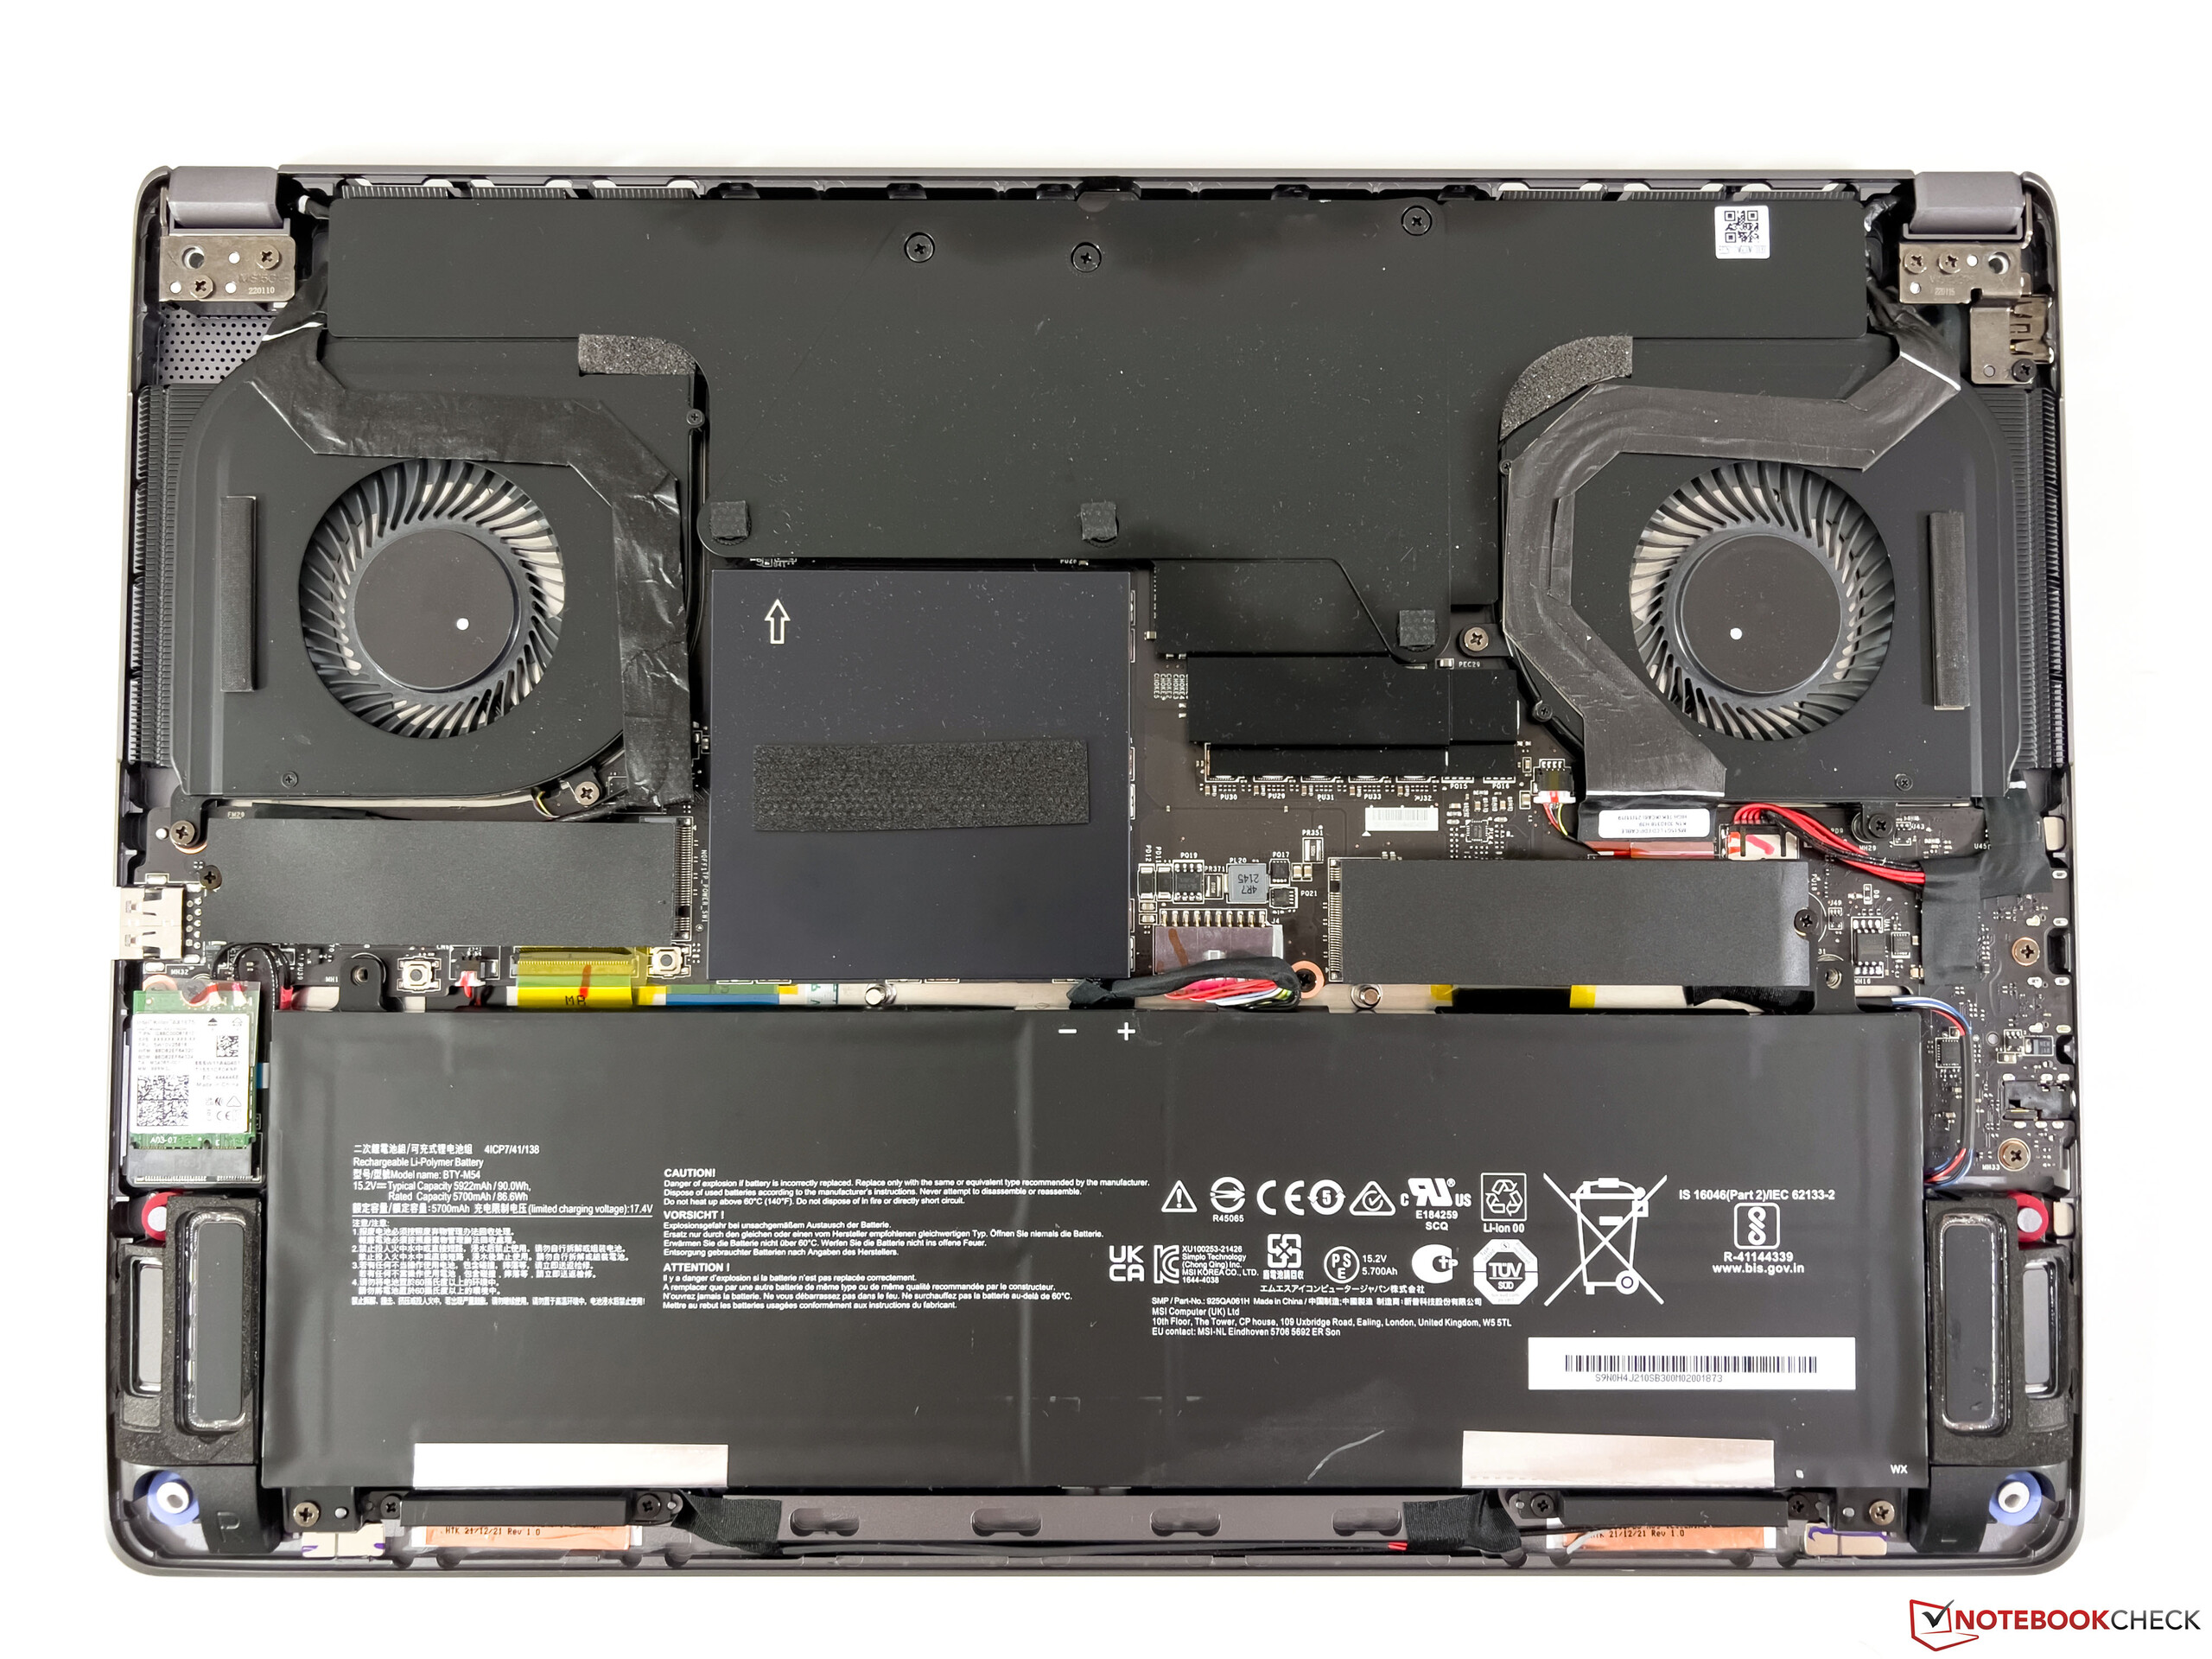
Solução de armazenamento
O MSI CreatorPro Z16P inclui dois slots para M.2-2280 SSDs com a interface rápida PCIe 4.0. Nossa unidade de teste é equipada com o rápido PM9A1 da Samsung (versão OEM de 980 Pro). Sua capacidade de armazenamento é de 1 TB, com 870 GB daquele disponível para o usuário após a primeira inicialização. As taxas de transferência são muito altas, mas devido a problemas de temperatura, o desempenho não permanece estável, caindo de mais de 6 para cerca de 4 GB/s após alguns minutos. Entretanto, isto ainda é rápido, e não deve haver nenhuma limitação na prática. Você pode encontrar referências adicionais de SSD aqui.

* ... menor é melhor
Disk Throttling: DiskSpd Read Loop, Queue Depth 8
Placa Gráfica - Nvidia RTX A3000
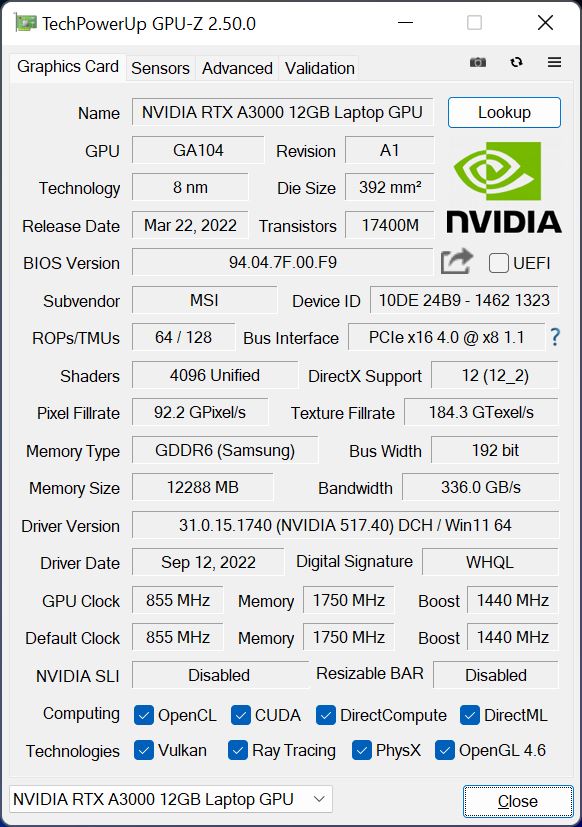
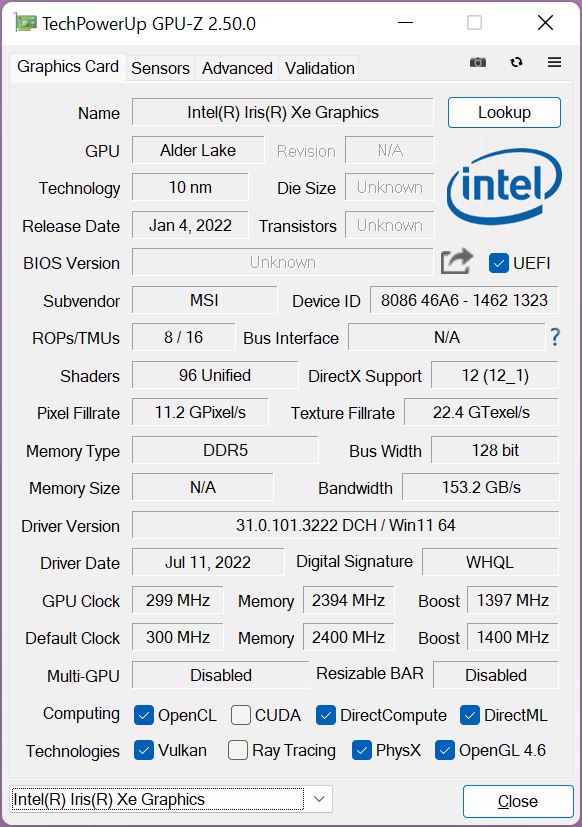
Nossa unidade de teste está equipada com o profissional Nvidia RTX A3000que recebeu uma atualização de 6 para 12 GB de GDDR6-VRAM em 2022. Há muitas semelhanças técnicas com o consumidor GeForce RTX 3060mas o RTX A3000 oferece um adicional de 256 núcleos CUDA. Esta é a versão com um TGP de 80 watts, com um impulso dinâmico adicional de 10 watts que pode ser usado pela CPU
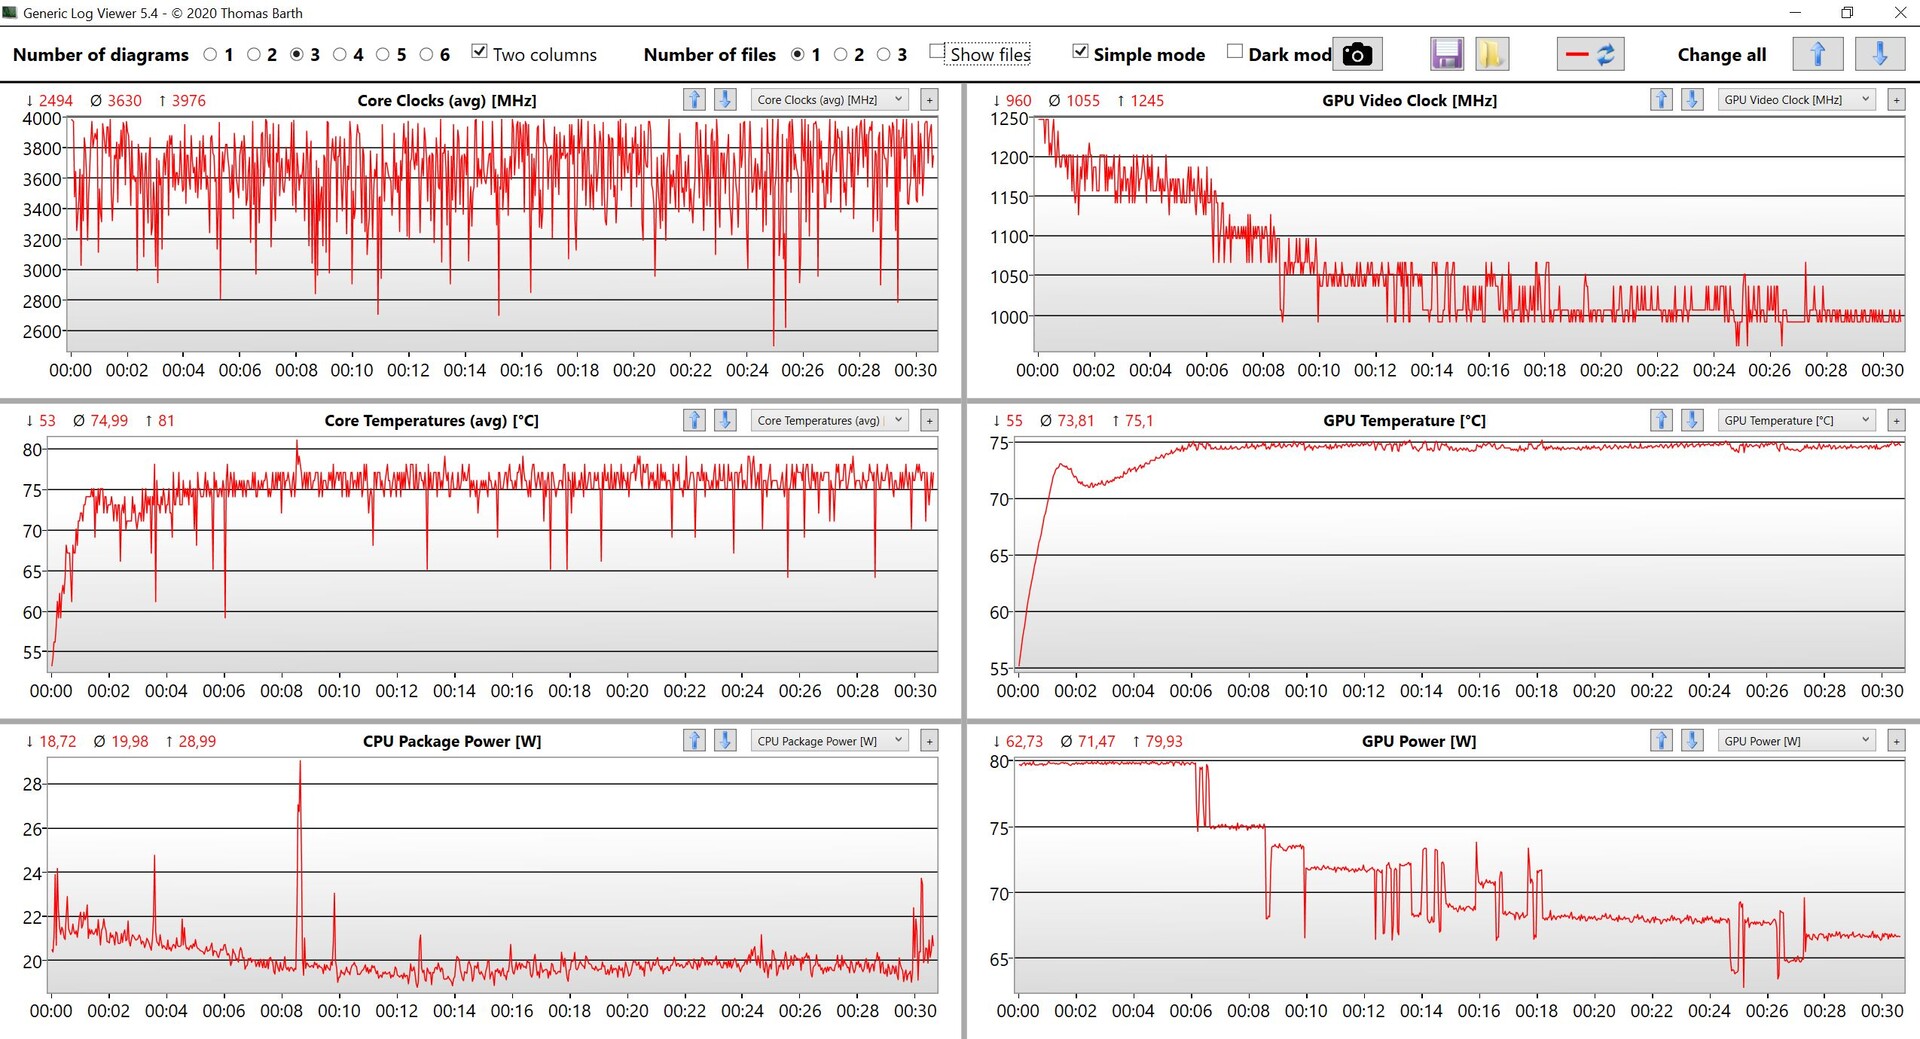
O desempenho gráfico está totalmente dentro do objetivo para o RTX A3000, e também vemos uma vantagem significativa para o menor RTX A2000 no Estúdio ZBook 16 G9. Em termos de desempenho puro, o RTX 3070 ou 3080 Tios GPUs de consumo são naturalmente mais rápidos, mas os testes profissionais também mostram a vantagem das certificações do motorista. O MSI passa no teste de estresse 3DMark Time Spy com 97,9%.
Por outro lado, os benchmarks de jogos mostram um quadro ligeiramente diferente, já que o desempenho cai após alguns minutos aqui, como você também pode ver claramente em nosso teste The Witcher 3. Conseguimos observar um comportamento semelhante no Criador Z16Pcom o RTX 3080 Ti, embora não haja uma razão técnica real para isso, e suspeitamos novamente de alguns problemas com os perfis de desempenho como os culpados aqui
Na operação com bateria, o RTX A3000 pode consumir um máximo de 40 watts, levando a uma redução significativa de desempenho de 75%. Você pode encontrar padrões de referência adicionais da GPU aqui.
| 3DMark 11 Performance | 24865 pontos | |
| 3DMark Fire Strike Score | 18097 pontos | |
| 3DMark Time Spy Score | 7703 pontos | |
Ajuda | ||
| Blender / v3.3 Classroom OPTIX/RTX | |
| HP ZBook Firefly 14 G9-6B8A2EA | |
| Dell Precision 5000 5470 | |
| HP Envy 16 h0112nr | |
| HP ZBook Studio 16 G9 62U04EA | |
| Dell Precision 7670 | |
| MSI CreatorPro Z16P B12UKST | |
| Média NVIDIA RTX A3000 Laptop GPU (n=1) | |
| Média da turma Workstation (10 - 43, n=17, últimos 2 anos) | |
| Blender / v3.3 Classroom CUDA | |
| HP ZBook Firefly 14 G9-6B8A2EA | |
| Dell Precision 5000 5470 | |
| HP ZBook Studio 16 G9 62U04EA | |
| HP Envy 16 h0112nr | |
| Dell Precision 7670 | |
| MSI CreatorPro Z16P B12UKST | |
| Média NVIDIA RTX A3000 Laptop GPU (n=1) | |
| Média da turma Workstation (16 - 74, n=17, últimos 2 anos) | |
| Blender / v3.3 Classroom CPU | |
| HP ZBook Firefly 14 G9-6B8A2EA | |
| HP Envy 16 h0112nr | |
| Dell Precision 5000 5470 | |
| Dell Precision 7670 | |
| MSI CreatorPro Z16P B12UKST | |
| Média NVIDIA RTX A3000 Laptop GPU (n=1) | |
| HP ZBook Studio 16 G9 62U04EA | |
| Média da turma Workstation (148 - 364, n=23, últimos 2 anos) | |
* ... menor é melhor
The Witcher 3 FPS Chart
| baixo | média | alto | ultra | QHD | |
|---|---|---|---|---|---|
| GTA V (2015) | 185.8 | 182.5 | 168.5 | 95.3 | 71.3 |
| The Witcher 3 (2015) | 381 | 262 | 151 | 59.6 | |
| Dota 2 Reborn (2015) | 182 | 166.8 | 155.8 | 147.1 | |
| Final Fantasy XV Benchmark (2018) | 176 | 83.8 | 64.3 | 45.6 | |
| X-Plane 11.11 (2018) | 142.1 | 120.7 | 97.5 | ||
| Far Cry 5 (2018) | 170 | 128 | 117 | 108 | 76 |
| Strange Brigade (2018) | 344 | 152 | 121 | 108 | 85 |
| F1 2021 (2021) | 334 | 187 | 151.1 | 77.5 | 56.3 |
| Cyberpunk 2077 1.6 (2022) | 77 | 66 | 53 | 43 | 27 |
| F1 22 (2022) | 181 | 167.5 | 120.9 | 39 | 26.2 |
Emissões e gerenciamento de energia
Níveis de ruídos
Os dois fãs do CreatorPro Z16P estão sempre correndo, mas você só pode ouvir o zumbido deles ao segurar seu ouvido diretamente no estojo em uma sala silenciosa. Na operação diária, você também se beneficia da curva defensiva dos ventiladores, já que leva cerca de 30 segundos mesmo sob carga total, antes que eles fiquem mais altos. Enquanto jogamos, medimos então cerca de 44 e sob carga total 47 dB(A), sendo o zumbido claramente audível sem ser ofensivo. Não ouvimos nenhum outro ruído eletrônico, como o zumbido da bobina.
Barulho
| Ocioso |
| 27.1 / 27.1 / 27.1 dB |
| Carga |
| 42.9 / 47 dB |
 | ||
30 dB silencioso 40 dB(A) audível 50 dB(A) ruidosamente alto |
||
min: | ||
| MSI CreatorPro Z16P B12UKST RTX A3000 Laptop GPU, i7-12700H, Samsung PM9A1 MZVL21T0HCLR | HP ZBook Studio 16 G9 62U04EA RTX A2000 Laptop GPU, i7-12800H, Micron 3400 1TB MTFDKBA1T0TFH | Lenovo ThinkPad P1 G4-20Y4S0KS00 GeForce RTX 3070 Laptop GPU, i7-11850H, Samsung PM9A1 MZVL21T0HCLR | Dell Precision 5000 5560 RTX A2000 Laptop GPU, i7-11850H, Samsung PM9A1 MZVL22T0HBLB | MSI Creator Z16P B12UHST GeForce RTX 3080 Ti Laptop GPU, i9-12900H, Samsung PM9A1 MZVL22T0HBLB | |
|---|---|---|---|---|---|
| Noise | 2% | 3% | 15% | -4% | |
| desligado / ambiente * (dB) | 24.1 | 24 -0% | 23.8 1% | 23.4 3% | 26 -8% |
| Idle Minimum * (dB) | 27.1 | 24 11% | 23.8 12% | 23.6 13% | 27 -0% |
| Idle Average * (dB) | 27.1 | 27.7 -2% | 23.8 12% | 23.6 13% | 29 -7% |
| Idle Maximum * (dB) | 27.1 | 27.7 -2% | 28.3 -4% | 23.6 13% | 31 -14% |
| Load Average * (dB) | 42.9 | 39.8 7% | 38.6 10% | 25.8 40% | 43 -0% |
| Witcher 3 ultra * (dB) | 44 | 44.3 -1% | 47.4 -8% | 40.1 9% | 43 2% |
| Load Maximum * (dB) | 47 | 47.7 -1% | 47.4 -1% | 41.4 12% | 46 2% |
* ... menor é melhor
Temperaturas
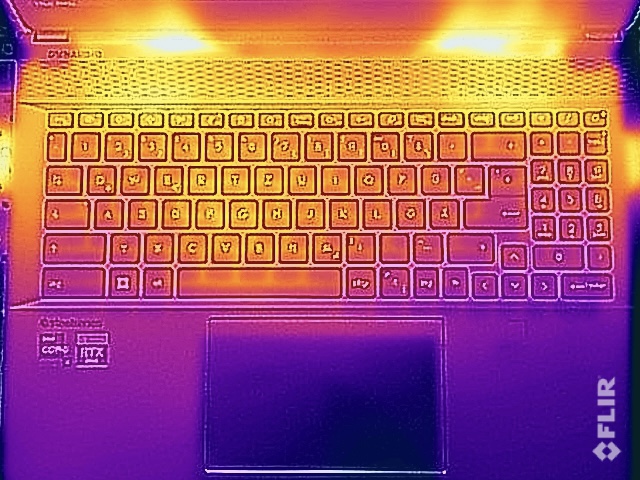
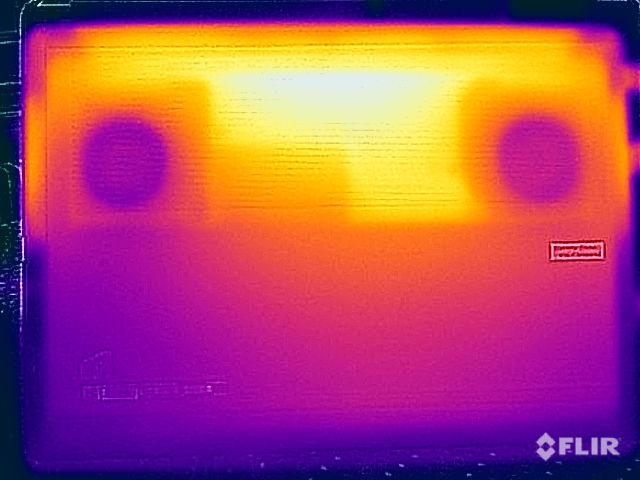
O desenvolvimento da temperatura já era um grande problema em nosso unidade de teste do Criador Z16Pcom o Core i9 e o RTX 3080 Ti. O CreatorPro com o Core i7 mais fraco e o RTX A3000 tem tarifas ligeiramente melhores, mas ainda assim permanece problemático, embora também utilize um sistema de resfriamento por câmara de vapor. Subjetivamente, o problema também é aumentado pela caixa metálica. Com tarefas menos exigentes, não há limitações, mas já após algumas breves fases de carga de apenas alguns minutos, a parte superior da unidade base aquece muito forte, e o uso do teclado na verdade se torna desconfortável. Além disso, em nenhuma circunstância o dispositivo deve funcionar no colo sob carga, já que medimos quase 70 °C (158 °F) na parte inferior da caixa. O sistema de resfriamento é simplesmente muito fraco em geral, mesmo para os componentes mais lentos.
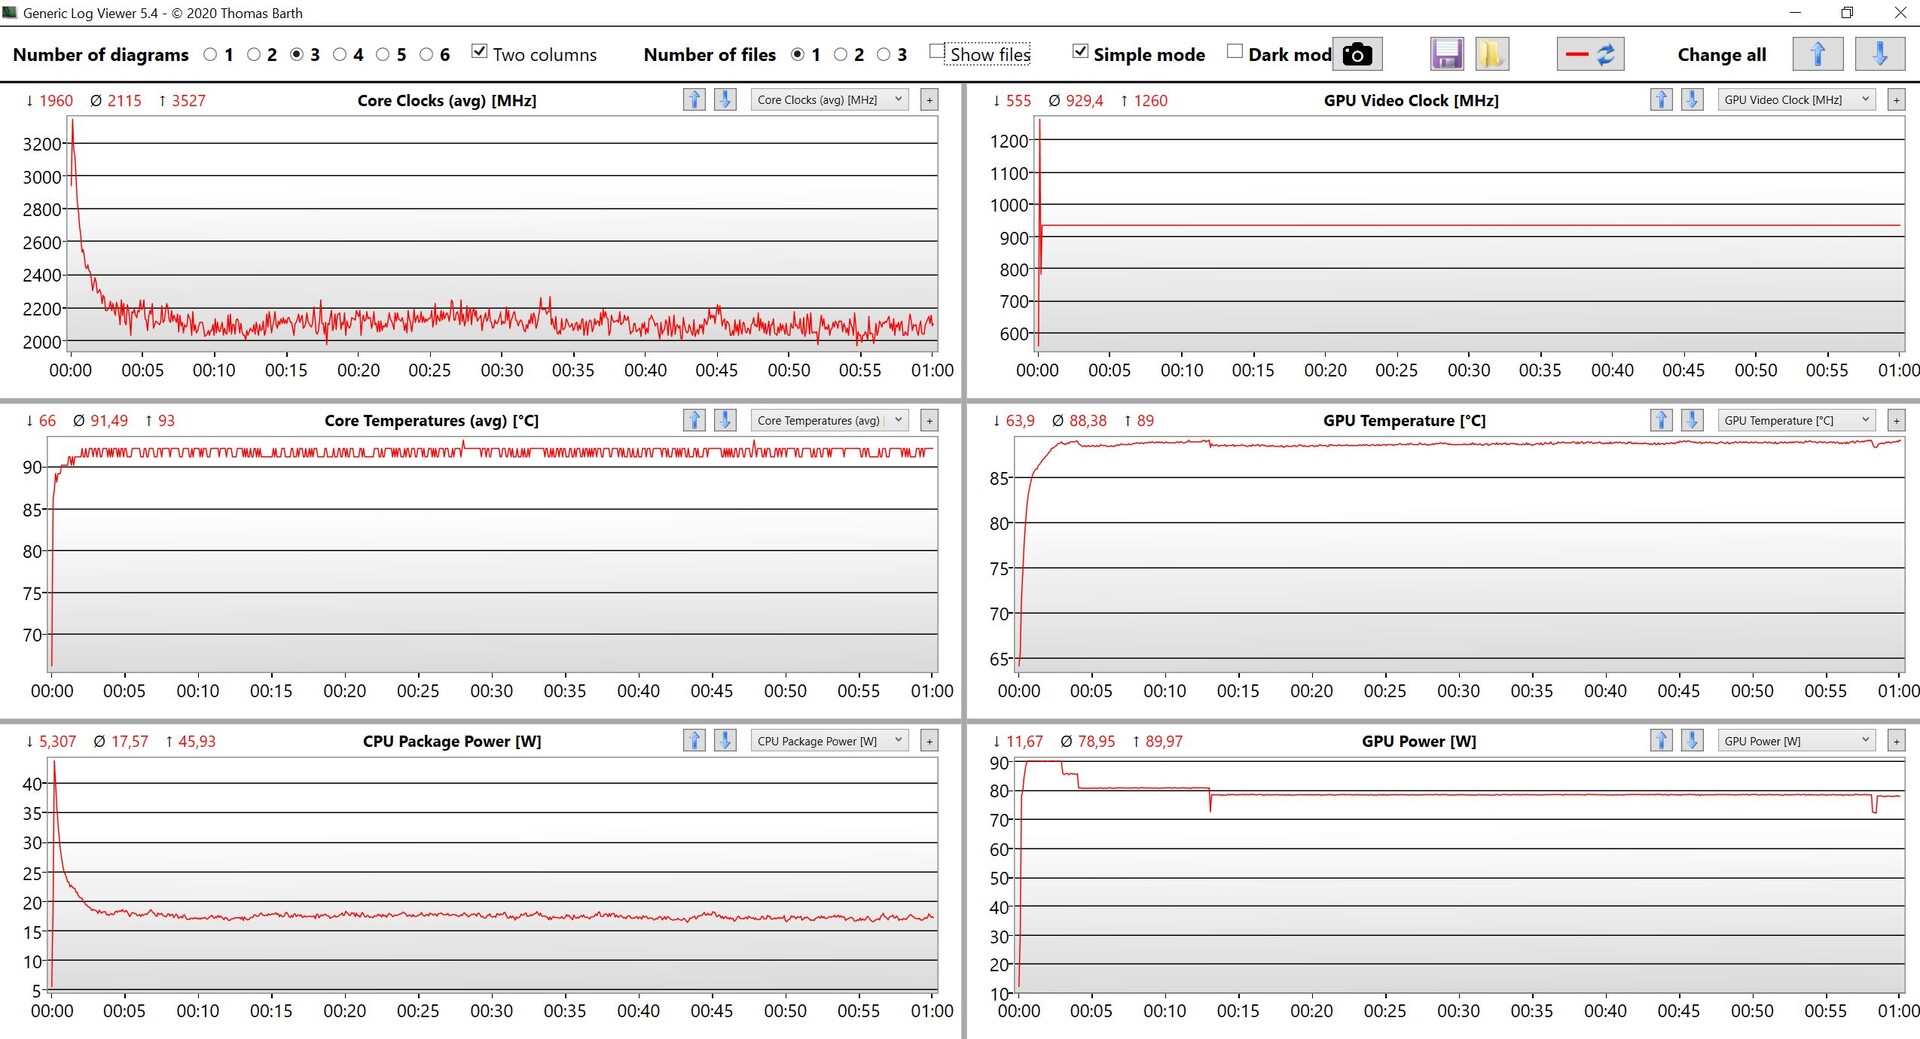
O teste de estresse mostra que o sistema dá preferência à GPU, que permanece bastante estável em torno de 80 watts, enquanto a CPU cai abaixo de 20 watts. Não há reprodução de desempenho após o teste de estresse.
(-) A temperatura máxima no lado superior é 56.3 °C / 133 F, em comparação com a média de 38.2 °C / 101 F , variando de 22.2 a 69.8 °C para a classe Workstation.
(-) A parte inferior aquece até um máximo de 68.3 °C / 155 F, em comparação com a média de 41.1 °C / 106 F
(+) Em uso inativo, a temperatura média para o lado superior é 24.1 °C / 75 F, em comparação com a média do dispositivo de 32 °C / ### class_avg_f### F.
(-) Jogando The Witcher 3, a temperatura média para o lado superior é 44 °C / 111 F, em comparação com a média do dispositivo de 32 °C / ## #class_avg_f### F.
(±) Os apoios para as mãos e o touchpad podem ficar muito quentes ao toque, com um máximo de 38.2 °C / 100.8 F.
(-) A temperatura média da área do apoio para as mãos de dispositivos semelhantes foi 27.8 °C / 82 F (-10.4 °C / -18.8 F).
| MSI CreatorPro Z16P B12UKST Intel Core i7-12700H, NVIDIA RTX A3000 Laptop GPU | HP ZBook Studio 16 G9 62U04EA Intel Core i7-12800H, NVIDIA RTX A2000 Laptop GPU | Lenovo ThinkPad P1 G4-20Y4S0KS00 Intel Core i7-11850H, NVIDIA GeForce RTX 3070 Laptop GPU | Dell Precision 5000 5560 Intel Core i7-11850H, NVIDIA RTX A2000 Laptop GPU | MSI Creator Z16P B12UHST Intel Core i9-12900H, NVIDIA GeForce RTX 3080 Ti Laptop GPU | |
|---|---|---|---|---|---|
| Heat | 6% | 1% | -6% | -12% | |
| Maximum Upper Side * (°C) | 56.3 | 38.7 31% | 51 9% | 48.2 14% | 67 -19% |
| Maximum Bottom * (°C) | 68.3 | 53.4 22% | 53.5 22% | 42.6 38% | 69 -1% |
| Idle Upper Side * (°C) | 25.2 | 27.3 -8% | 28.8 -14% | 34.8 -38% | 29 -15% |
| Idle Bottom * (°C) | 25.9 | 31.6 -22% | 29.3 -13% | 35.2 -36% | 29 -12% |
* ... menor é melhor
Oradores
MSI CreatorPro Z16P B12UKST análise de áudio
(+) | os alto-falantes podem tocar relativamente alto (###valor### dB)
Graves 100 - 315Hz
(-) | quase nenhum baixo - em média 18.7% menor que a mediana
(±) | a linearidade dos graves é média (7% delta para a frequência anterior)
Médios 400 - 2.000 Hz
(+) | médios equilibrados - apenas 3% longe da mediana
(+) | médios são lineares (6.8% delta para frequência anterior)
Altos 2 - 16 kHz
(+) | agudos equilibrados - apenas 4.6% longe da mediana
(+) | os máximos são lineares (6.4% delta da frequência anterior)
Geral 100 - 16.000 Hz
(±) | a linearidade do som geral é média (15.2% diferença em relação à mediana)
Comparado com a mesma classe
» 33% de todos os dispositivos testados nesta classe foram melhores, 10% semelhantes, 57% piores
» O melhor teve um delta de 7%, a média foi 17%, o pior foi 35%
Comparado com todos os dispositivos testados
» 22% de todos os dispositivos testados foram melhores, 4% semelhantes, 74% piores
» O melhor teve um delta de 4%, a média foi 23%, o pior foi 134%
HP ZBook Studio 16 G9 62U04EA análise de áudio
(±) | o volume do alto-falante é médio, mas bom (###valor### dB)
Graves 100 - 315Hz
(±) | graves reduzidos - em média 8.7% menor que a mediana
(±) | a linearidade dos graves é média (10.4% delta para a frequência anterior)
Médios 400 - 2.000 Hz
(+) | médios equilibrados - apenas 3.7% longe da mediana
(+) | médios são lineares (4.6% delta para frequência anterior)
Altos 2 - 16 kHz
(+) | agudos equilibrados - apenas 2.7% longe da mediana
(+) | os máximos são lineares (3.5% delta da frequência anterior)
Geral 100 - 16.000 Hz
(+) | o som geral é linear (10.6% diferença em relação à mediana)
Comparado com a mesma classe
» 9% de todos os dispositivos testados nesta classe foram melhores, 5% semelhantes, 87% piores
» O melhor teve um delta de 7%, a média foi 17%, o pior foi 35%
Comparado com todos os dispositivos testados
» 6% de todos os dispositivos testados foram melhores, 1% semelhantes, 93% piores
» O melhor teve um delta de 4%, a média foi 23%, o pior foi 134%
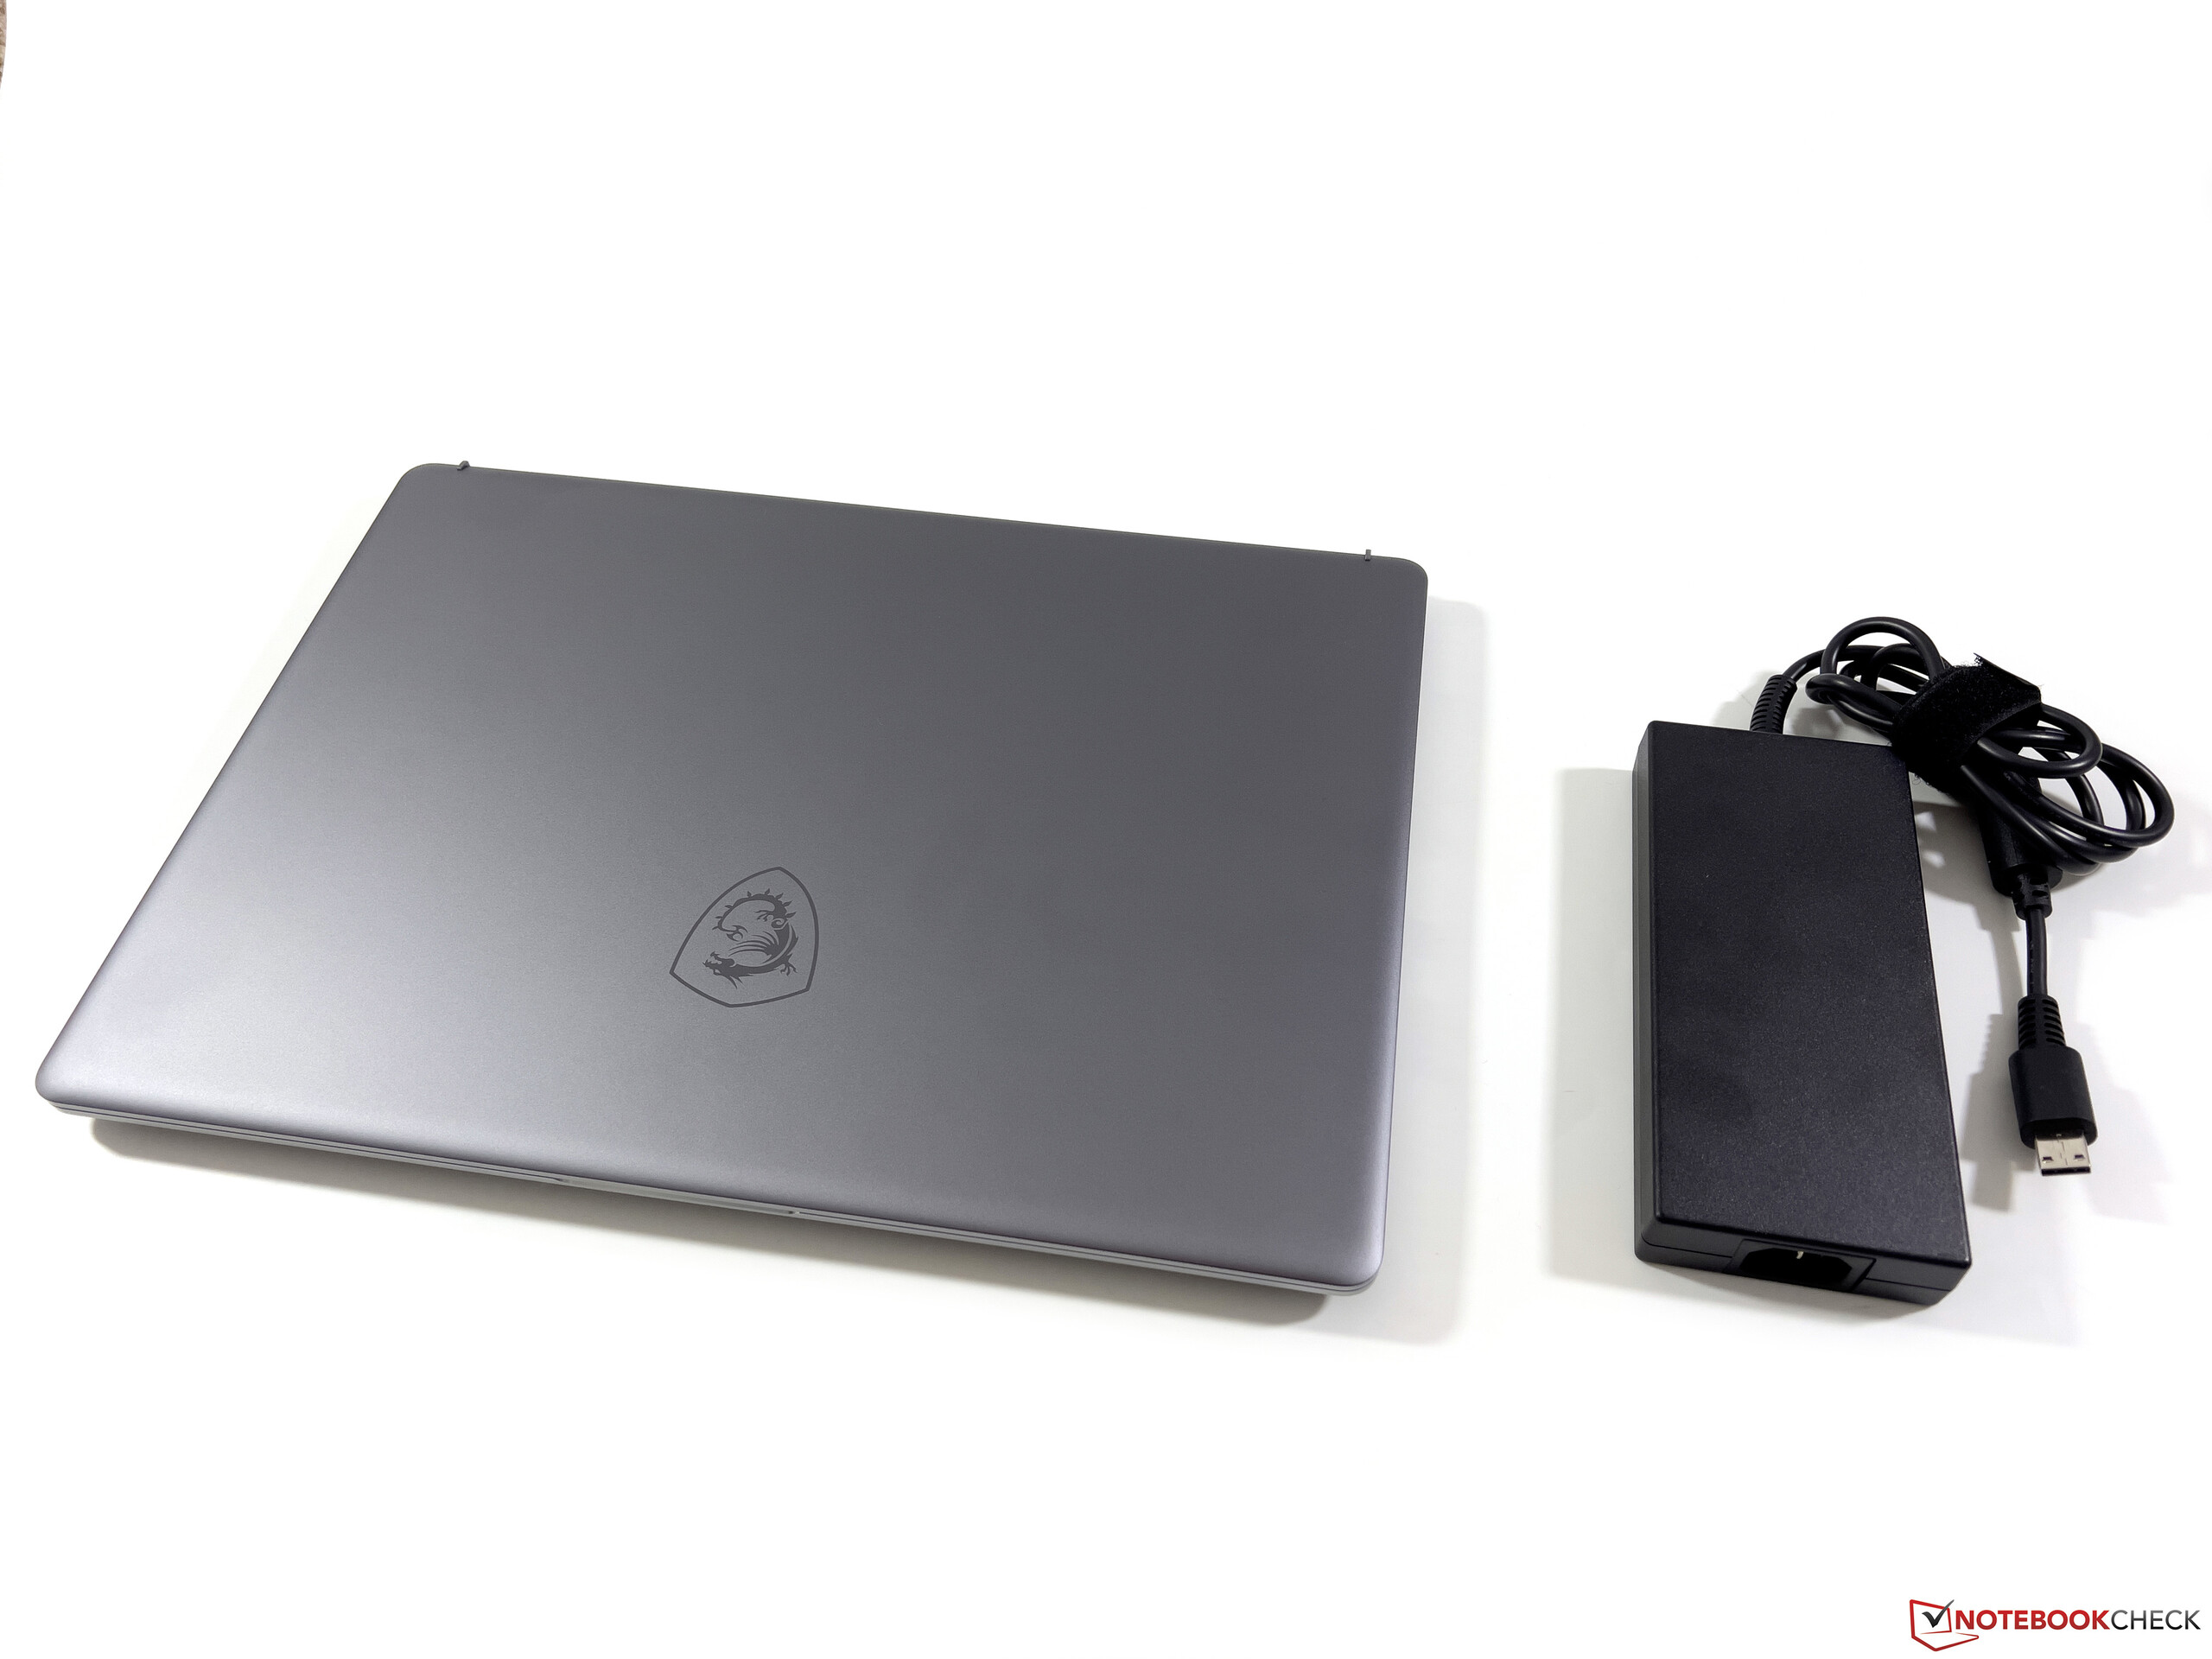
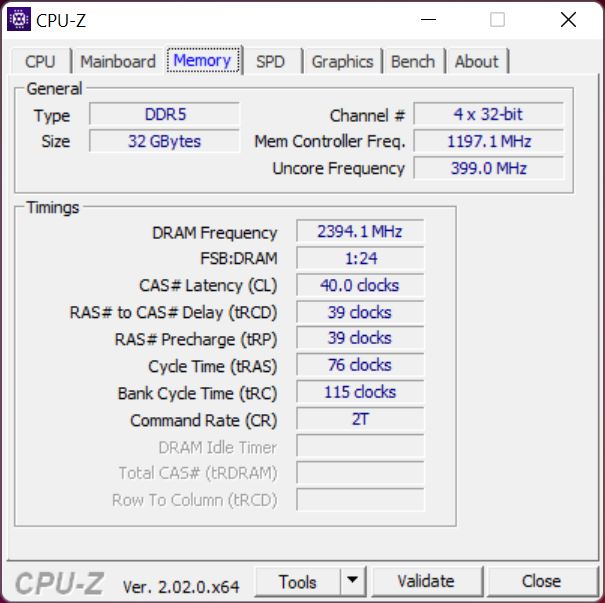
Consumo de energia
Nossas medidas de consumo mostram agora surpresas. Os componentes potentes, incluindo o painel WQHD, simplesmente precisam de energia, e já medimos quase 17 watts de luminosidade total do display durante a operação ociosa. Sob carga, os valores então aumentam significativamente mais e medimos cerca de 150 watts enquanto jogamos. Durante o teste de estresse, há um pico de carga curto com quase 180 watts, mas o valor também se eleva rapidamente para cerca de 157 watts aqui. Como já aconteceu com o Criador Z16Pmodelo irmão, a MSI inclui uma fonte de alimentação de 240 watts com o CreatorPro, ainda que em nossa configuração, uma fonte de alimentação mais compacta de 200 watts (ou até mesmo apenas 180 watts) teria sido completamente suficiente.
| desligado | |
| Ocioso | |
| Carga |
|
Key:
min: | |
Power Consumption The Witcher 3 / Stress Test
Power Consumption With External Monitor
Vida útil da bateria
As estações de trabalho móveis só raramente são capazes de pontuar com uma longa duração da bateria, particularmente em configurações com displays de alta resolução. Embora a bateria de 90-Wh do CreatorPro Z16P seja muito grande, ainda medimos apenas 6 horas em nosso teste WLAN a 150 cd/m², o que corresponde a 39% da luminosidade máxima. Com a luminosidade total, ela dura até mesmo apenas cerca de 4,5 horas
Com o laptop ligado, um processo de carga completa leva 142 minutos, mas 65% da capacidade já são atingidos após quase 37 minutos e cerca de 80% após 54 minutos. A curva de carga só se torna significativamente plana depois disso.
Pro
Contra
Veredicto - O resfriamento do CreatorPro Z16P está sobrecarregado
Enquanto a placa gráfica profissional transforma o MSI Creator Z16P no CreatorPro Z16P, não há outras diferenças. Portanto, não é surpreendente que os dispositivos também compartilhem as vantagens e desvantagens. As vantagens incluem definitivamente o bom estojo, a grande tela e também o bom teclado. Mas também há alguns problemas, já que o desempenho dos componentes nem sempre foi confiável (embora tenhamos usado o perfil de Alto Desempenho). O desenvolvimento da temperatura também continua sendo um enorme problema. O uso do teclado se torna desconfortável já após curtas fases de carga, e sob cargas mais longas, fomos capazes de medir temperaturas de superfície superiores a 65 °C (149°F)
O desempenho do MSI CreatorPro Z16P nem sempre permanece estável, e as temperaturas de superfície se tornam muito altas sob carga. O uso do teclado se torna desconfortável já depois de alguns minutos.
Em geral, estamos tendo algumas dificuldades em recomendar o MSI CreatorPro Z16P como uma estação de trabalho. Embora existam alguns aspectos positivos, os problemas com o desempenho e as temperaturas de superfície extremas não são boas qualificações para uma estação de trabalho. Os recentemente testados HP ZBook Studio 16 G9foi capaz de deixar uma impressão significativamente melhor em geral e também está disponível com GPUs mais potentes. Também testaremos os outros modelos de estações de trabalho atuais dos concorrentes nas próximas semanas.
Preço e Disponibilidade
Uma configuração superior do MSI CreatorPro Z16P com um processador Intel Core i9-12900H, RTX A5500, 64GB de RAM, 1 TB SSD e QHD+ está disponível em Amazon por $4862.
MSI CreatorPro Z16P B12UKST
- 11/14/2022 v7 (old)
Andreas Osthoff
Price comparison

