Análise do Lenovo ThinkPad P1 G6: 80 W GeForce RTX 4080 para estação de trabalho ultrafina

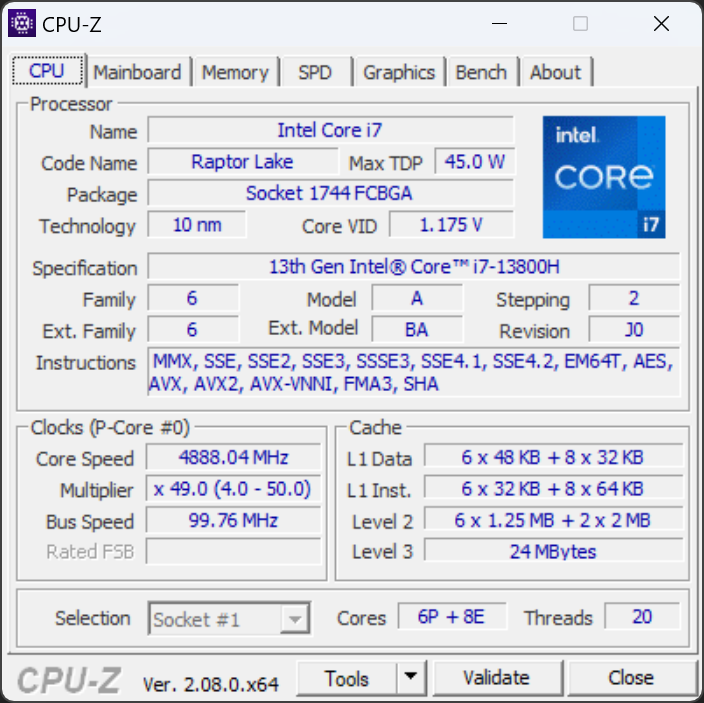
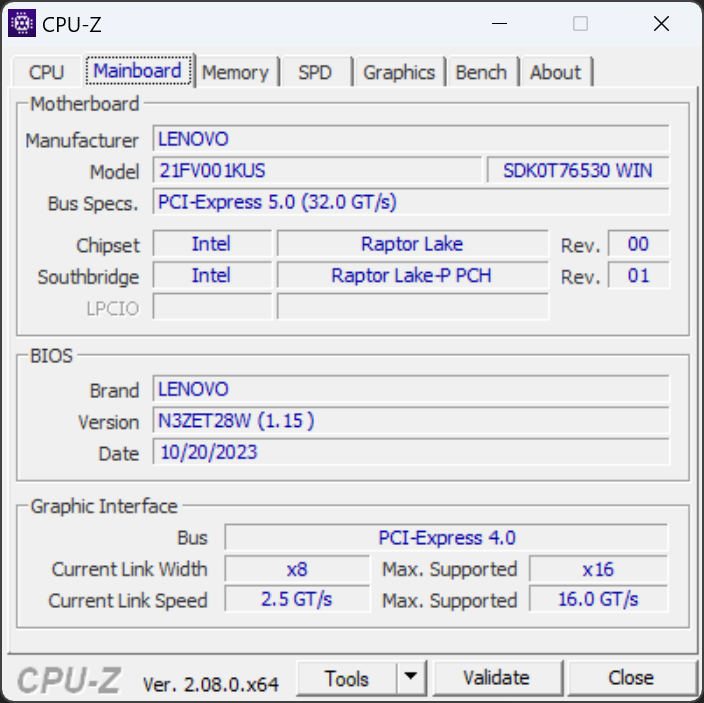
Recentemente, analisamos o ThinkPad P1 G6 com CPU Core i9-13900H, GPU RTX 2000 e tela IPS de 1600p e o consideramos uma estação de trabalho de 16 polegadas muito competitiva. Desta vez, estamos prontos para verificar uma segunda configuração com o Core i7-13800H, a GPU GeForce RTX 4080 e a tela OLED de 2400p para ver como as diferentes especificações podem afetar o desempenho, a duração da bateria, o hardware interno e muito mais.
Observe que o ThinkPad P1 série 16 não deve ser confundido com o Série ThinkPad P16 que consiste em modelos maiores e mais pesados com opções mais rápidas da série Core HX.
Mais análises da Lenovo:
Possíveis concorrentes em comparação
Avaliação | Data | Modelo | Peso | Altura | Size | Resolução | Preço |
|---|---|---|---|---|---|---|---|
| 90.1 % v7 (old) | 12/2023 | Lenovo ThinkPad P1 G6 21FV001KUS i7-13800H, GeForce RTX 4080 Laptop GPU | 1.9 kg | 17.5 mm | 16.00" | 3480x2400 | |
| 91.7 % v7 (old) | 10/2023 | Lenovo ThinkPad P1 G6-21FV000DGE i9-13900H, RTX 2000 Ada Generation Laptop | 1.9 kg | 17.5 mm | 16.00" | 2560x1600 | |
| 89.8 % v7 (old) | 11/2021 | Lenovo ThinkPad P1 G4-20Y4S0KS00 i7-11850H, GeForce RTX 3070 Laptop GPU | 2 kg | 17.7 mm | 16.00" | 3840x2400 | |
| 91 % v7 (old) | 02/2023 | Lenovo ThinkPad P16 G1 RTX A5500 i9-12950HX, RTX A5500 Laptop GPU | 3 kg | 30.23 mm | 16.00" | 3840x2400 | |
| 89 % v7 (old) | 08/2023 | Dell Precision 5000 5680 i9-13900H, RTX 5000 Ada Generation Laptop | 2.3 kg | 22.17 mm | 16.00" | 3840x2400 | |
| 92.3 % v7 (old) | 09/2023 | HP ZBook Fury 16 G10 i9-13950HX, RTX 5000 Ada Generation Laptop | 2.6 kg | 28.5 mm | 16.00" | 3840x2400 |
Leitor de cartão SD
| SD Card Reader | |
| average JPG Copy Test (av. of 3 runs) | |
| Dell Precision 5000 5680 (Toshiba Exceria Pro SDXC 64 GB UHS-II) | |
| Lenovo ThinkPad P1 G6 21FV001KUS (Toshiba Exceria Pro SDXC 64 GB UHS-II) | |
| HP ZBook Fury 16 G10 (Toshiba Exceria Pro SDXC 64 GB UHS-II) | |
| Lenovo ThinkPad P1 G6-21FV000DGE (Angelbird AV Pro V60) | |
| Lenovo ThinkPad P16 G1 RTX A5500 (Toshiba Exceria Pro SDXC 64 GB UHS-II) | |
| maximum AS SSD Seq Read Test (1GB) | |
| Dell Precision 5000 5680 (Toshiba Exceria Pro SDXC 64 GB UHS-II) | |
| Lenovo ThinkPad P1 G6 21FV001KUS (Toshiba Exceria Pro SDXC 64 GB UHS-II) | |
| HP ZBook Fury 16 G10 (Toshiba Exceria Pro SDXC 64 GB UHS-II) | |
| Lenovo ThinkPad P1 G6-21FV000DGE (Angelbird AV Pro V60) | |
| Lenovo ThinkPad P16 G1 RTX A5500 (Toshiba Exceria Pro SDXC 64 GB UHS-II) | |
Comunicação
Embora as taxas de recepção sejam estáveis, as taxas de transmissão tendem a ser mais lentas e com mais flutuações do que o esperado, mesmo após repetidos testes.
Webcam
A unidade foi configurada com uma webcam de 5 MP e 1440p, em comparação com a webcam de 2 MP e 1080p em nossa análise original com a tecnologia RTX 2000, para uma imagem mais nítida.
O IR e um obturador físico são padrão.


Manutenção
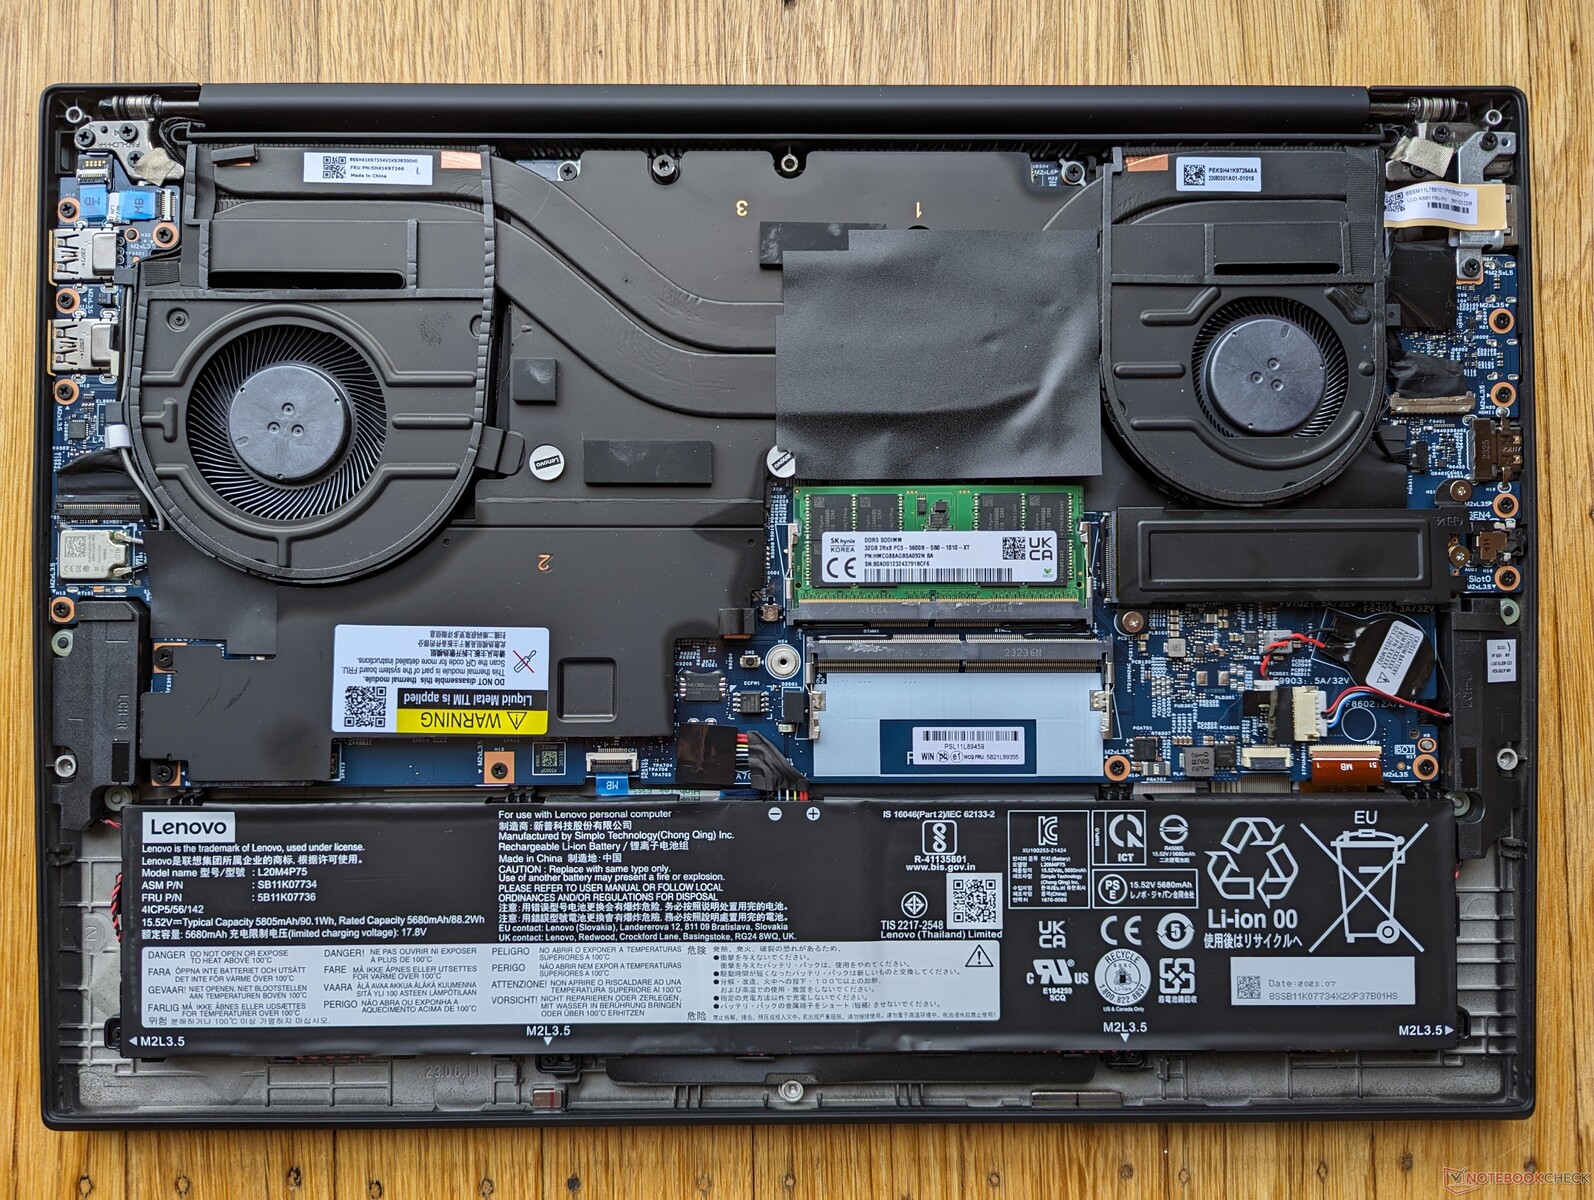
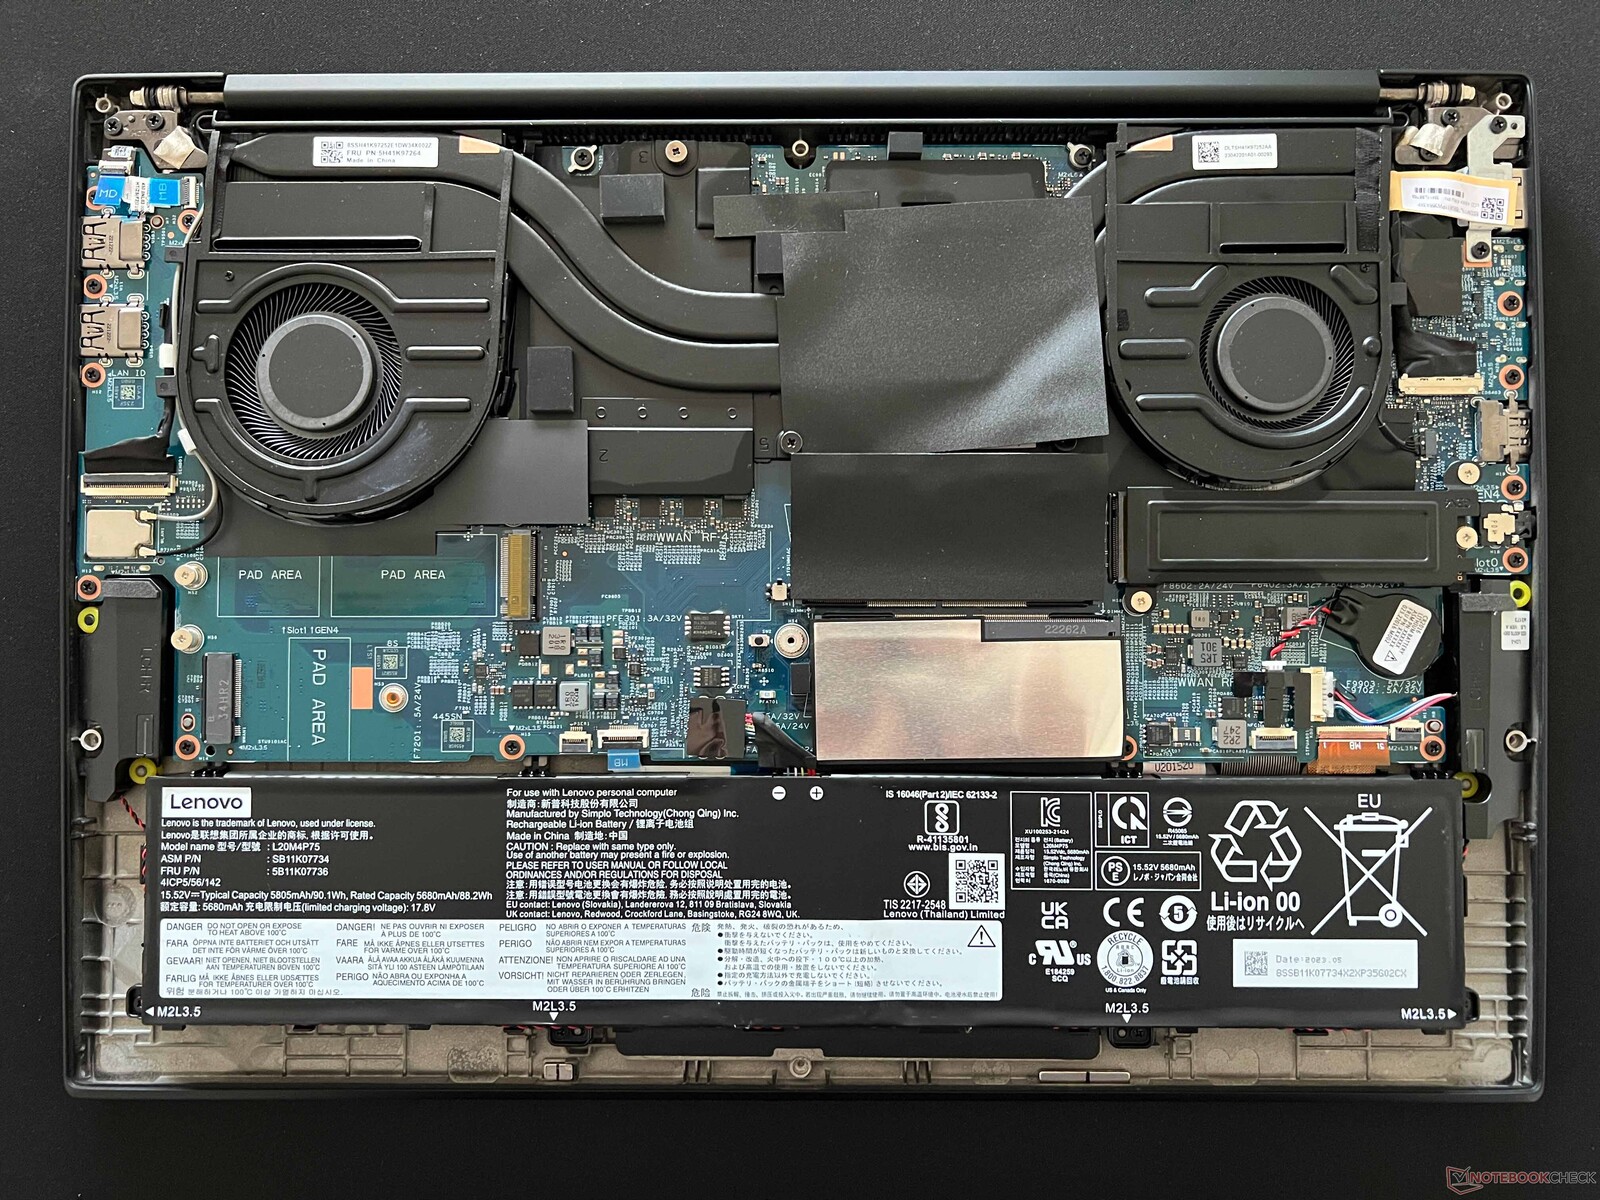
Quando comparada com a configuração do ThinkPad P1 G6 RTX 2000, a configuração do RTX 4080 integra uma solução de resfriamento expandida com uma ventoinha maior para acomodar a GPU mais exigente. Infelizmente, isso tem o custo de dois slots de expansão, conforme mostrado nas imagens de comparação abaixo.
Acessórios e garantia
Não há nenhum extra incluído na caixa além do adaptador CA e da documentação habitual. Decepcionantemente, a garantia limitada padrão é de apenas 12 meses, se comprada nos EUA, em comparação com os 36 meses de muitos modelos da Dell Precision.
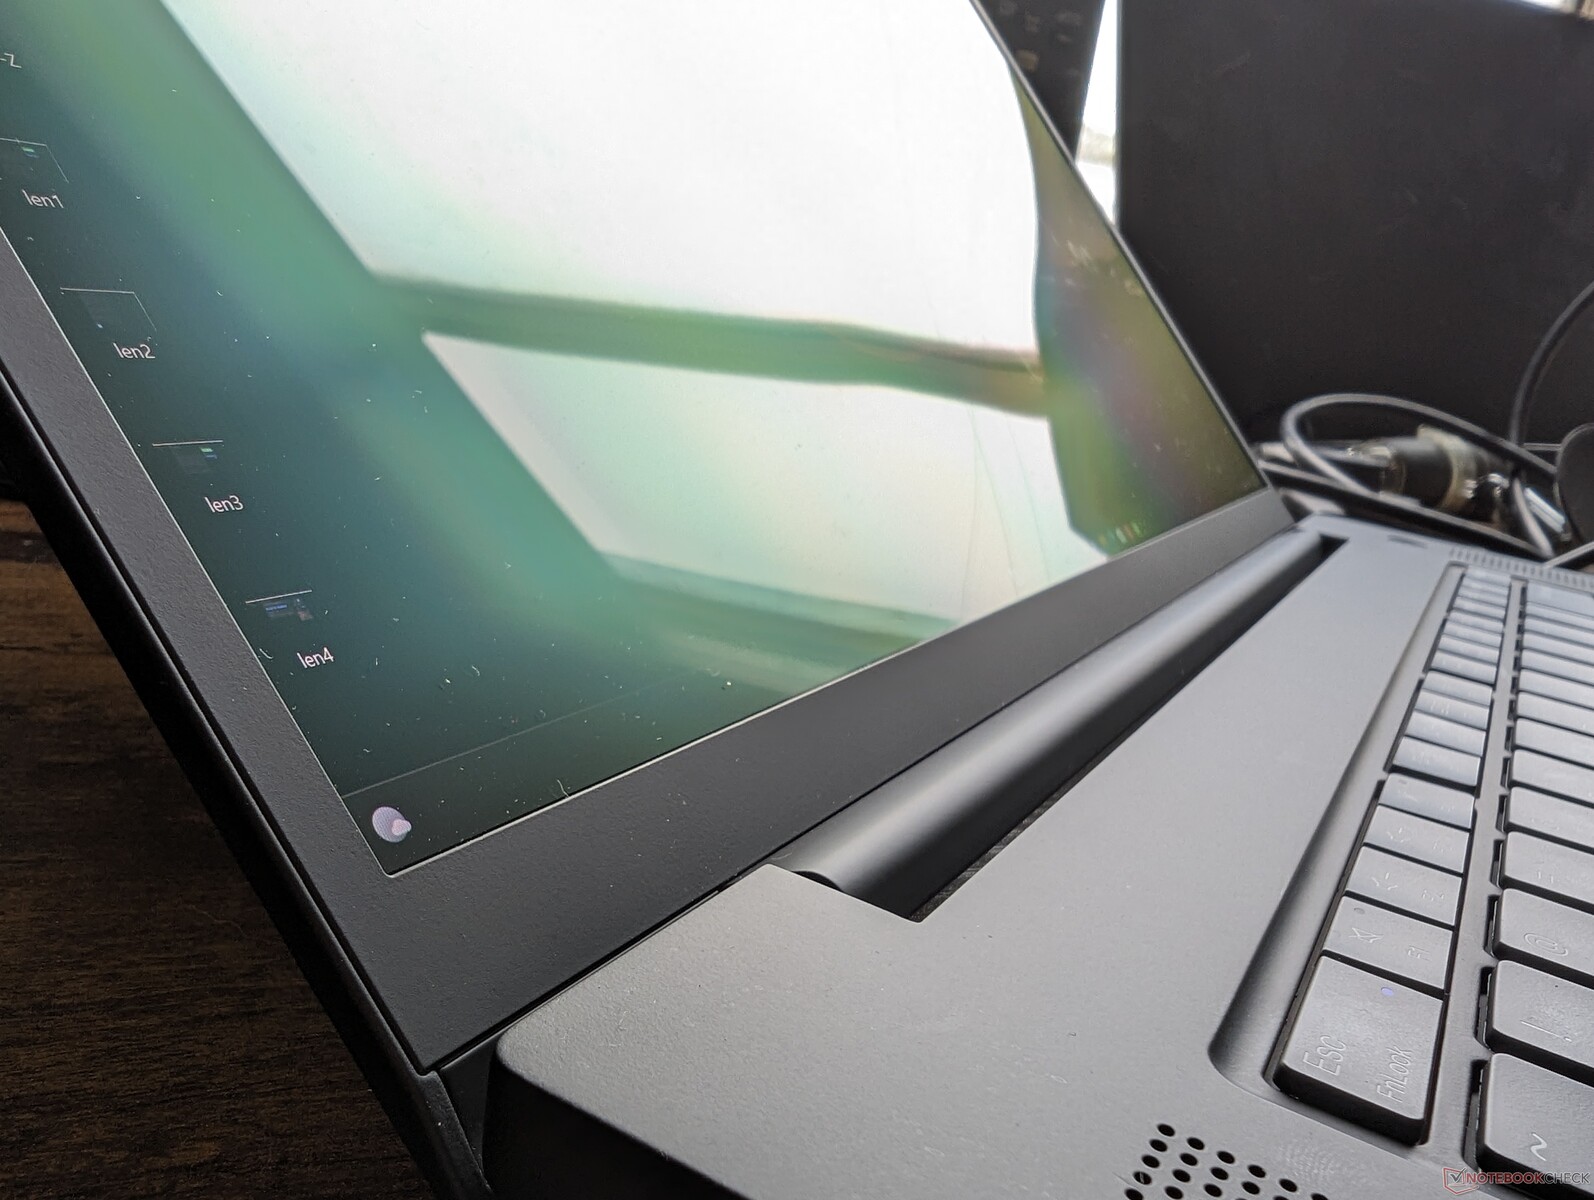
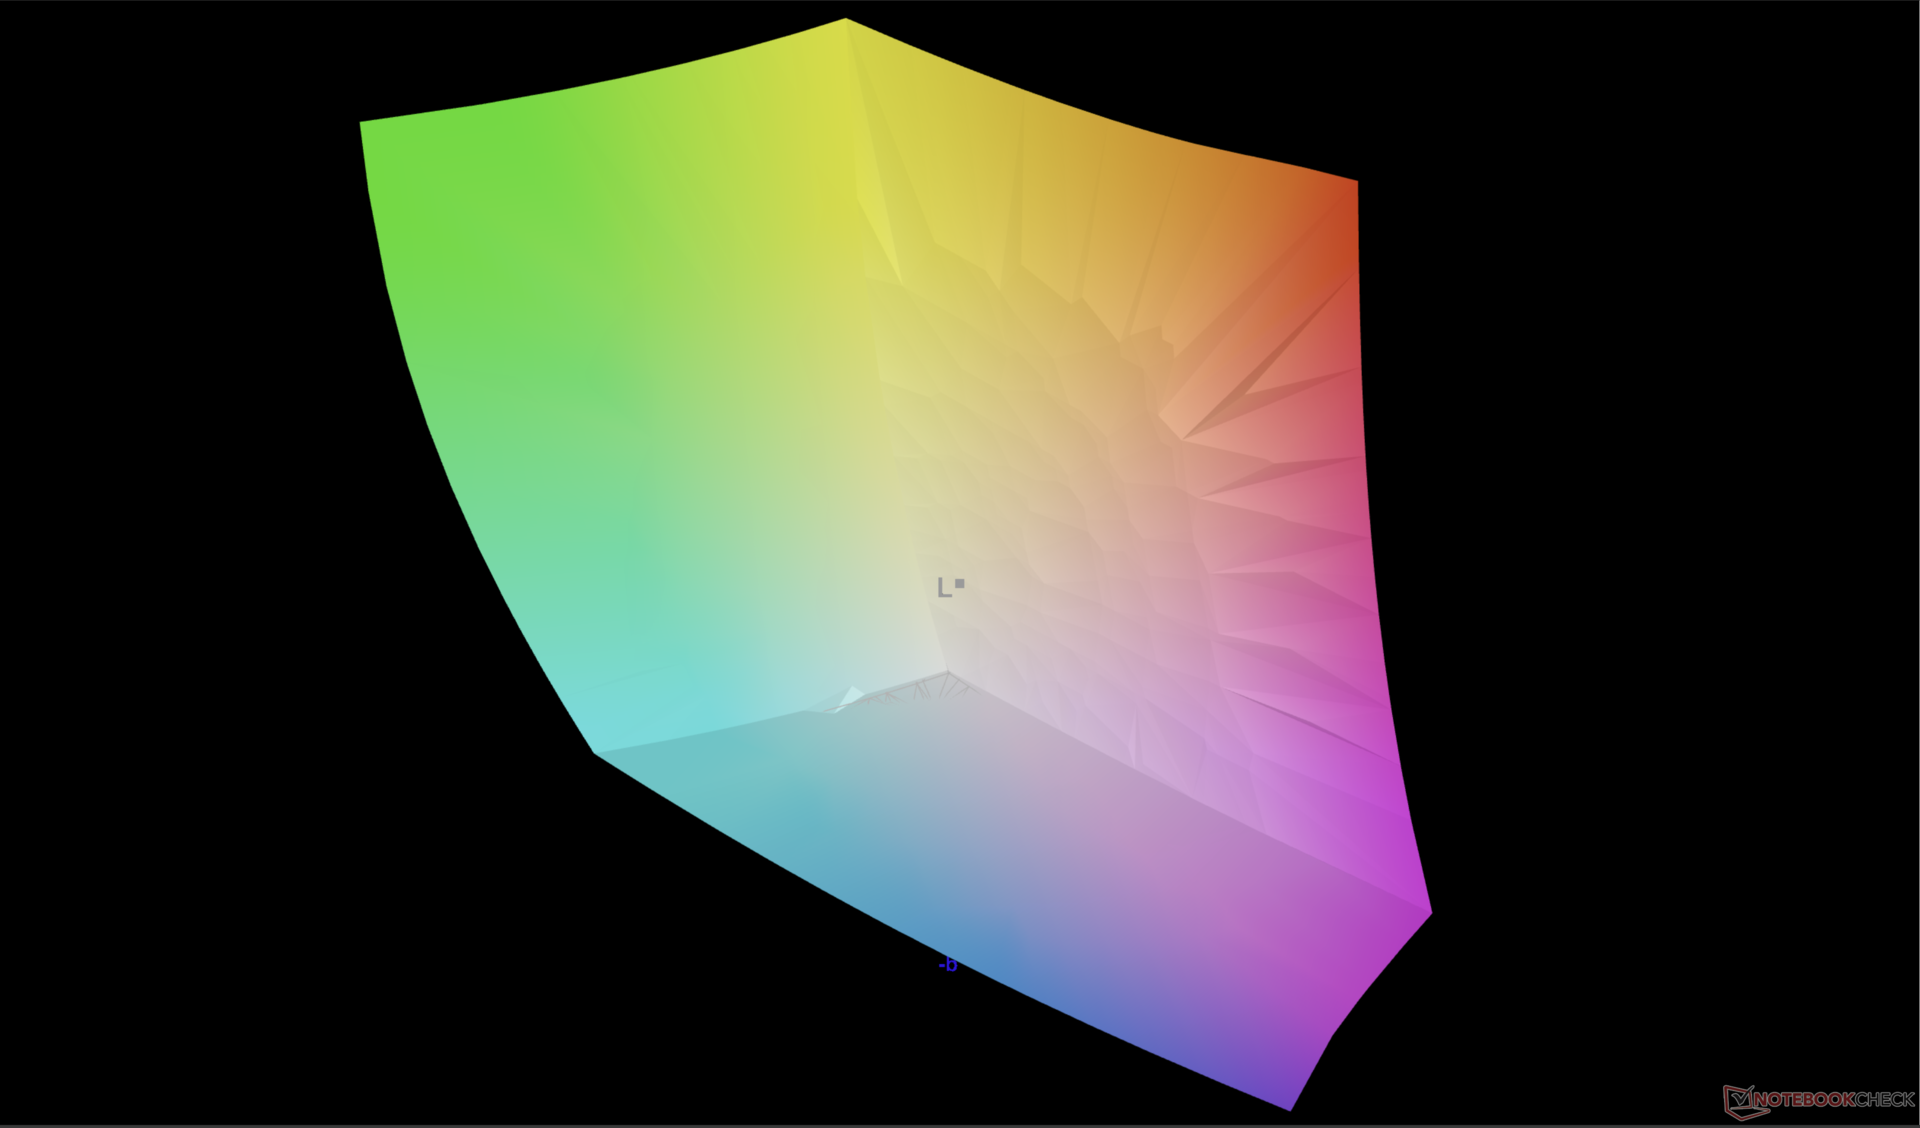
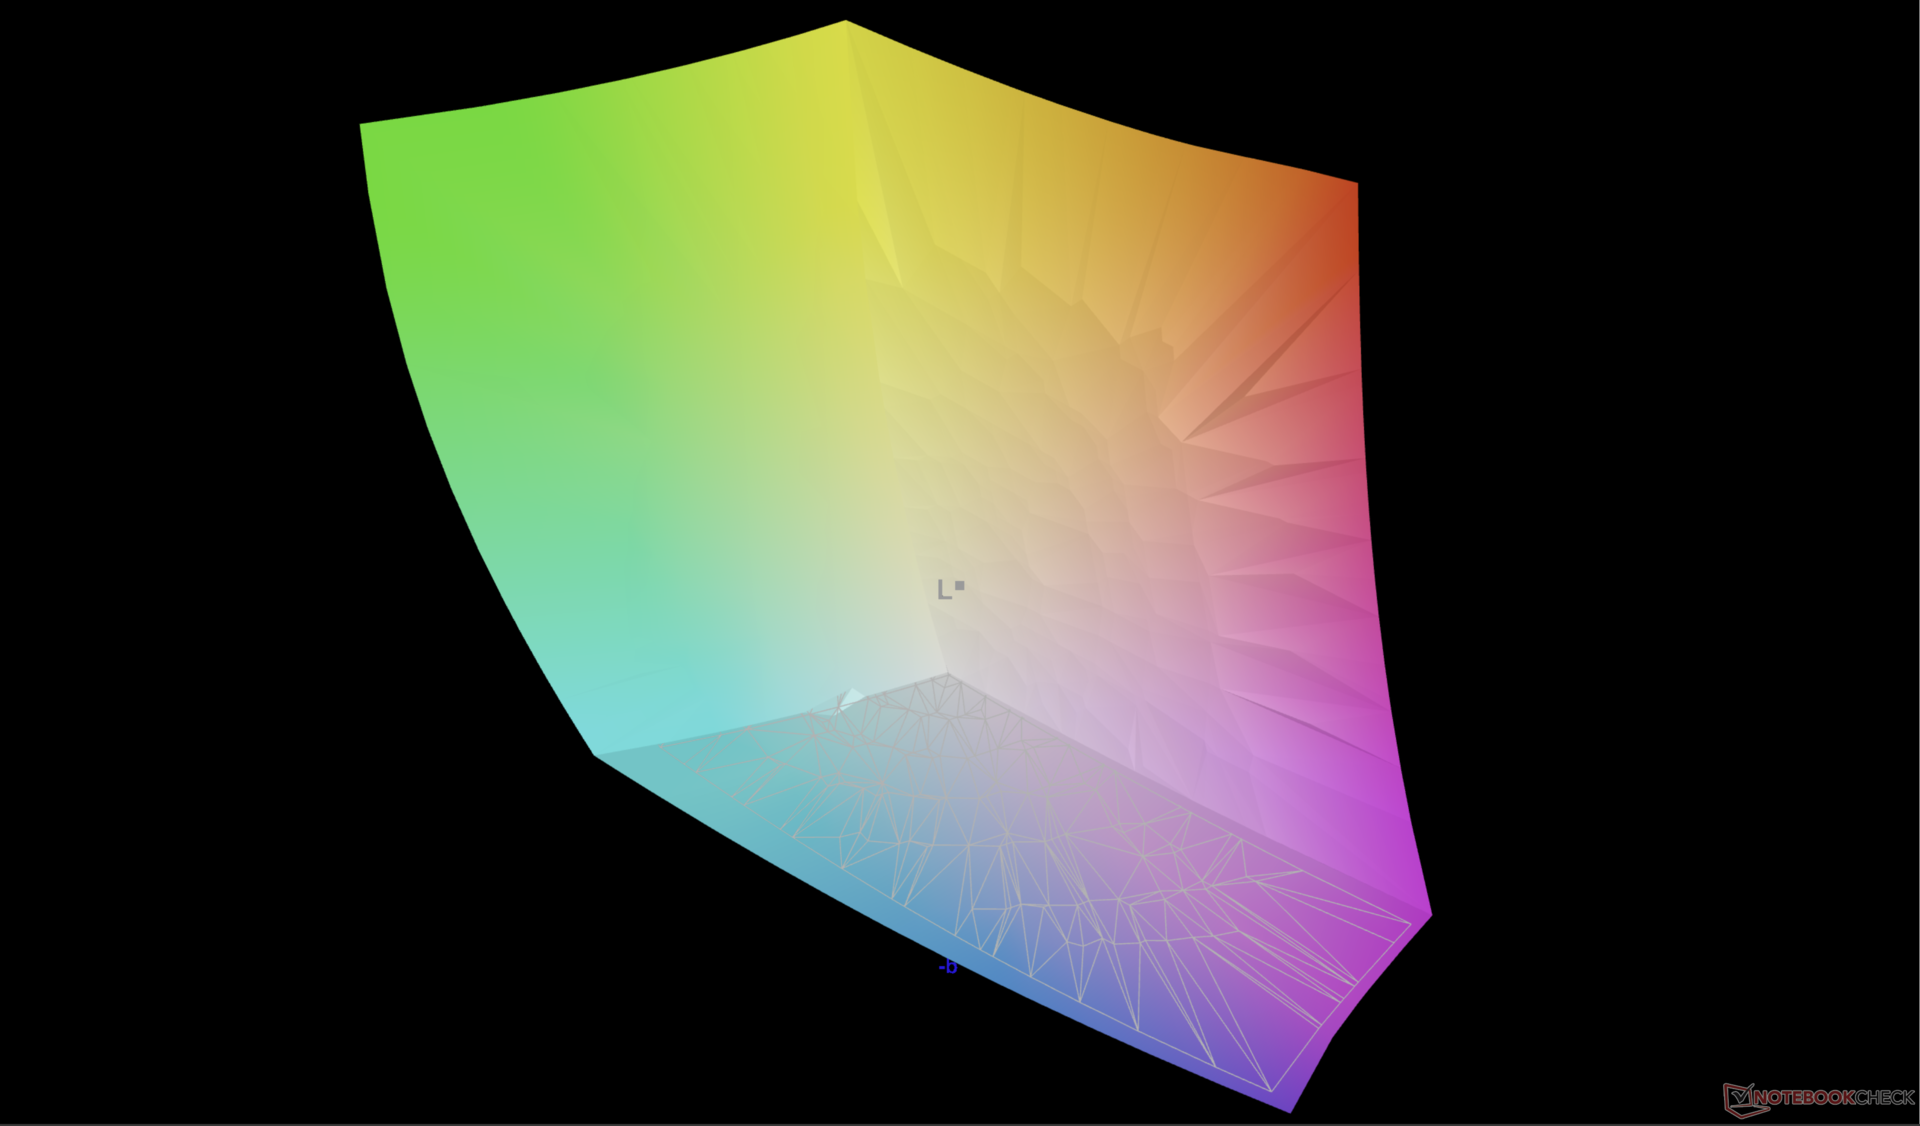
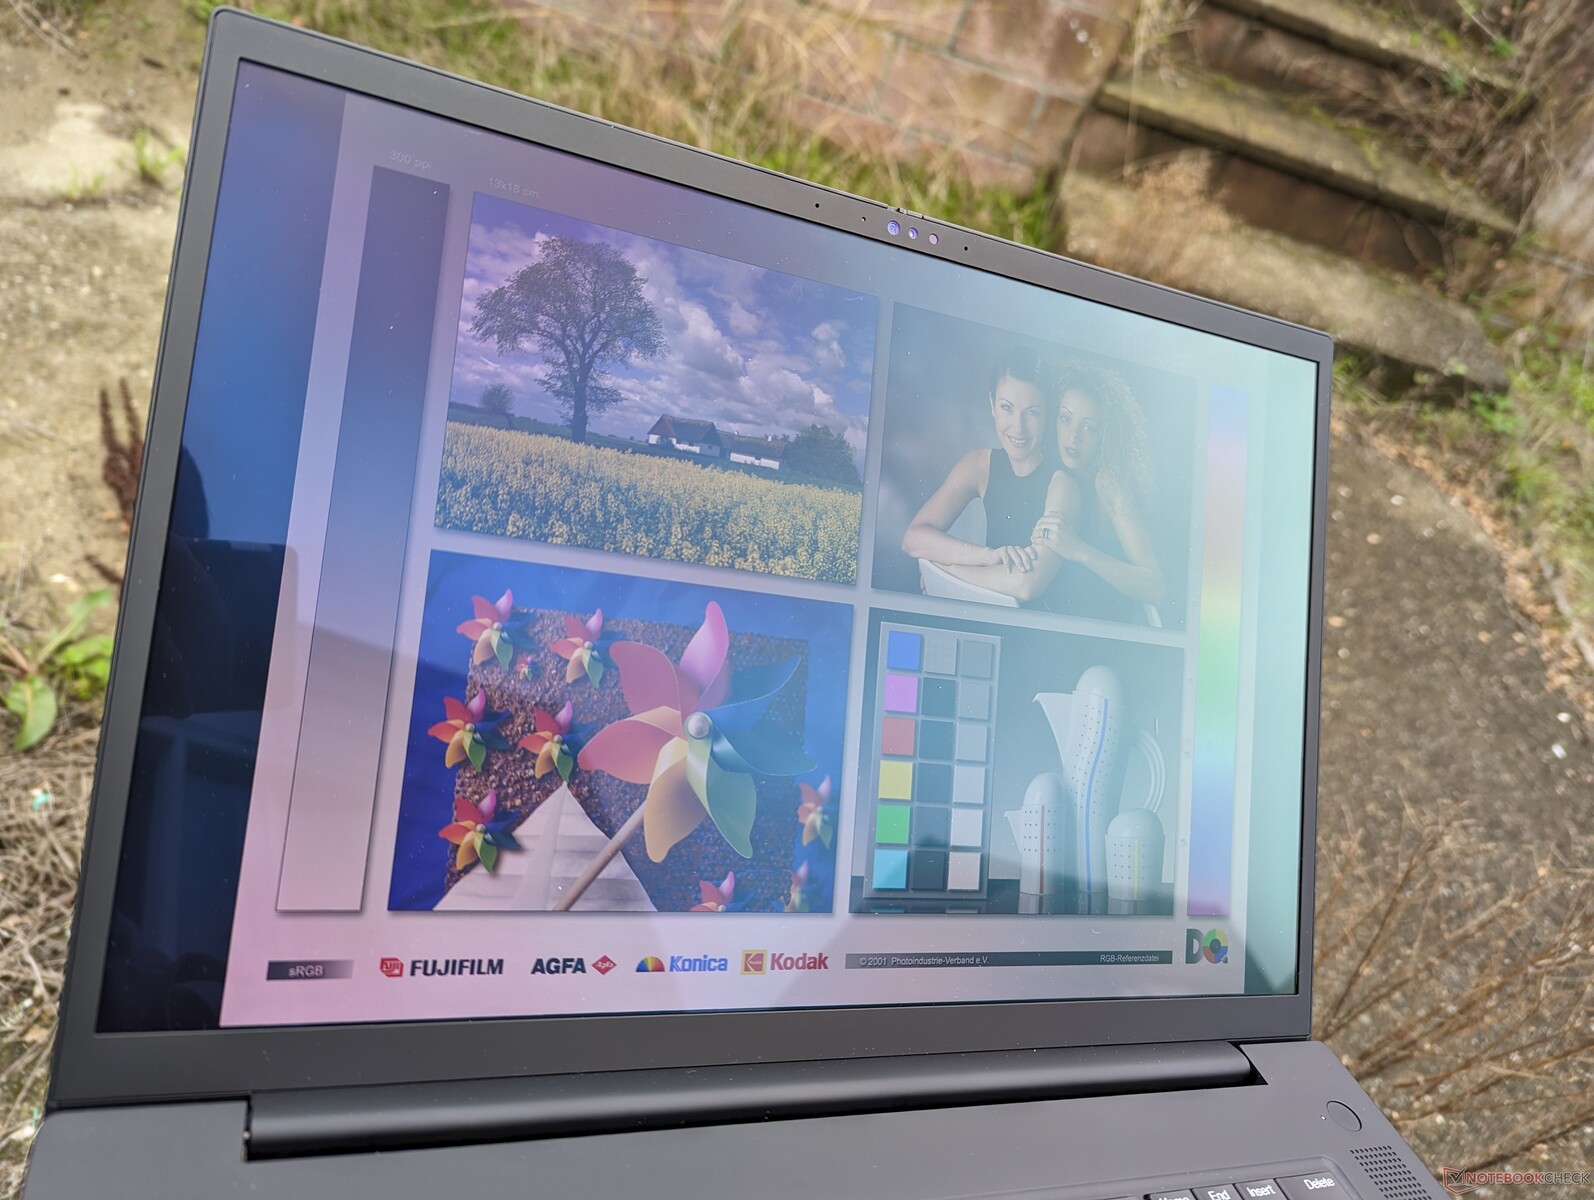
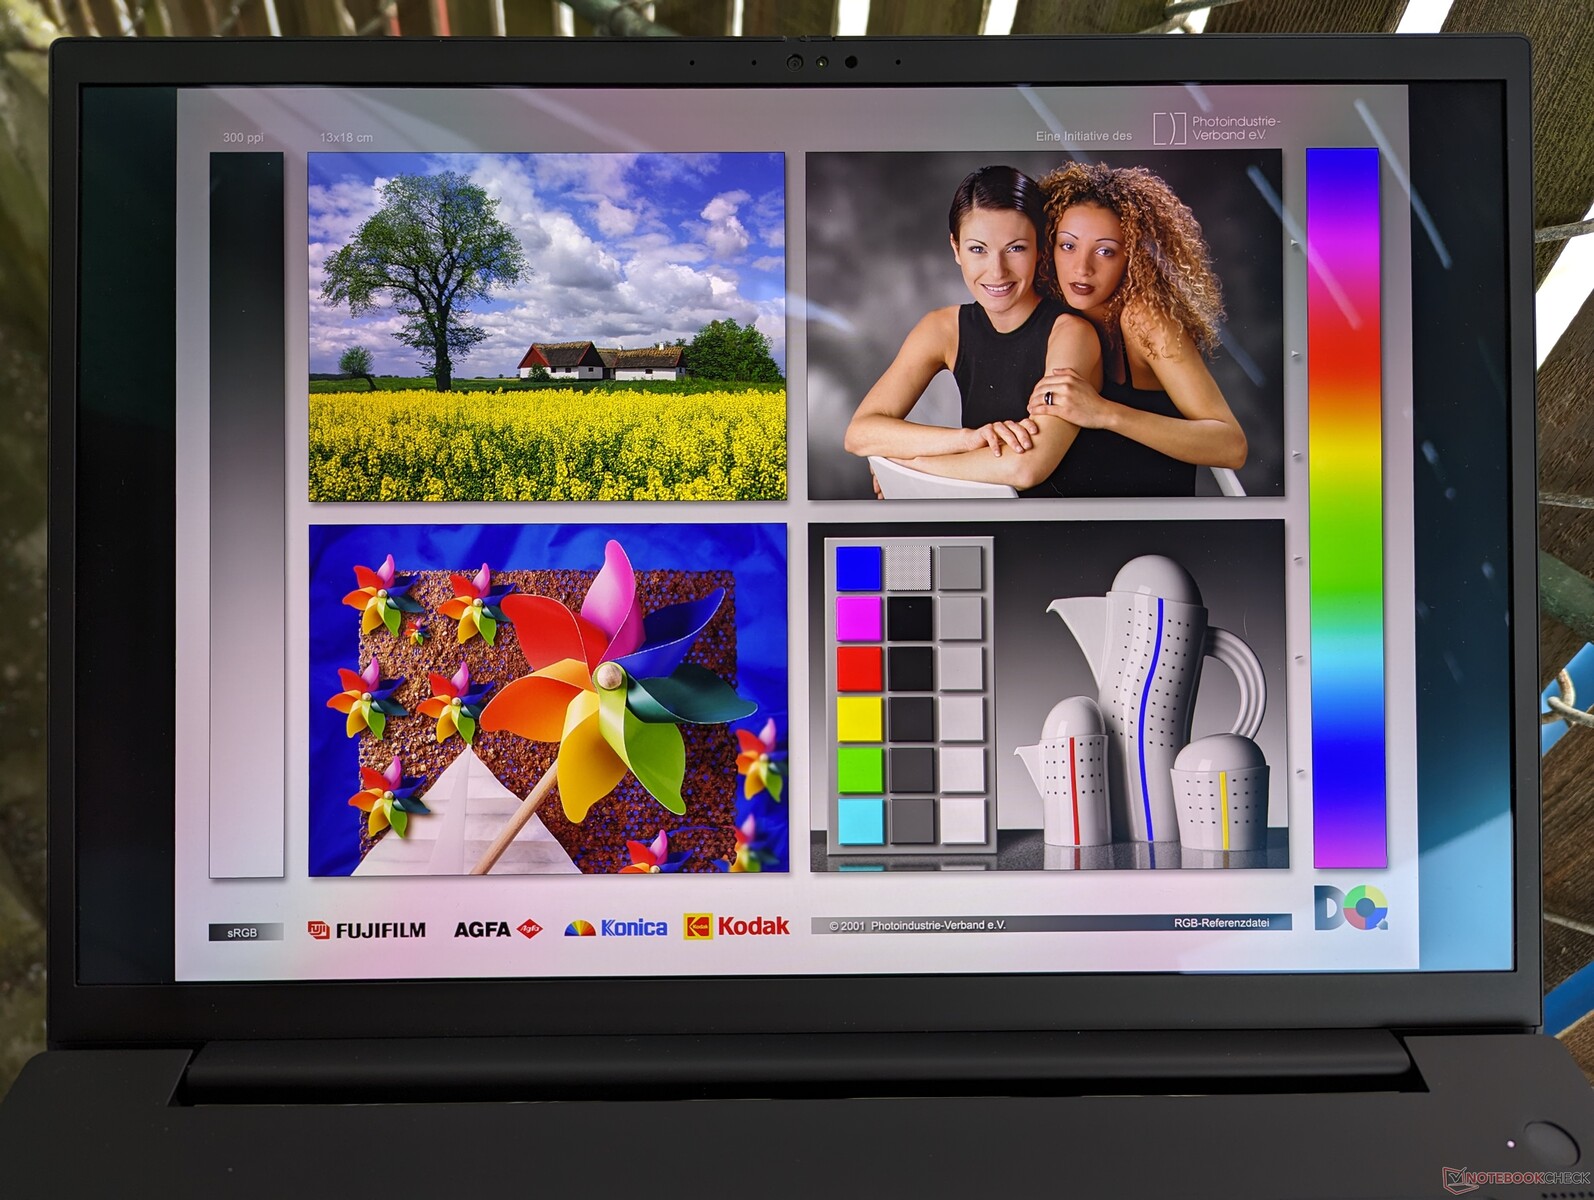
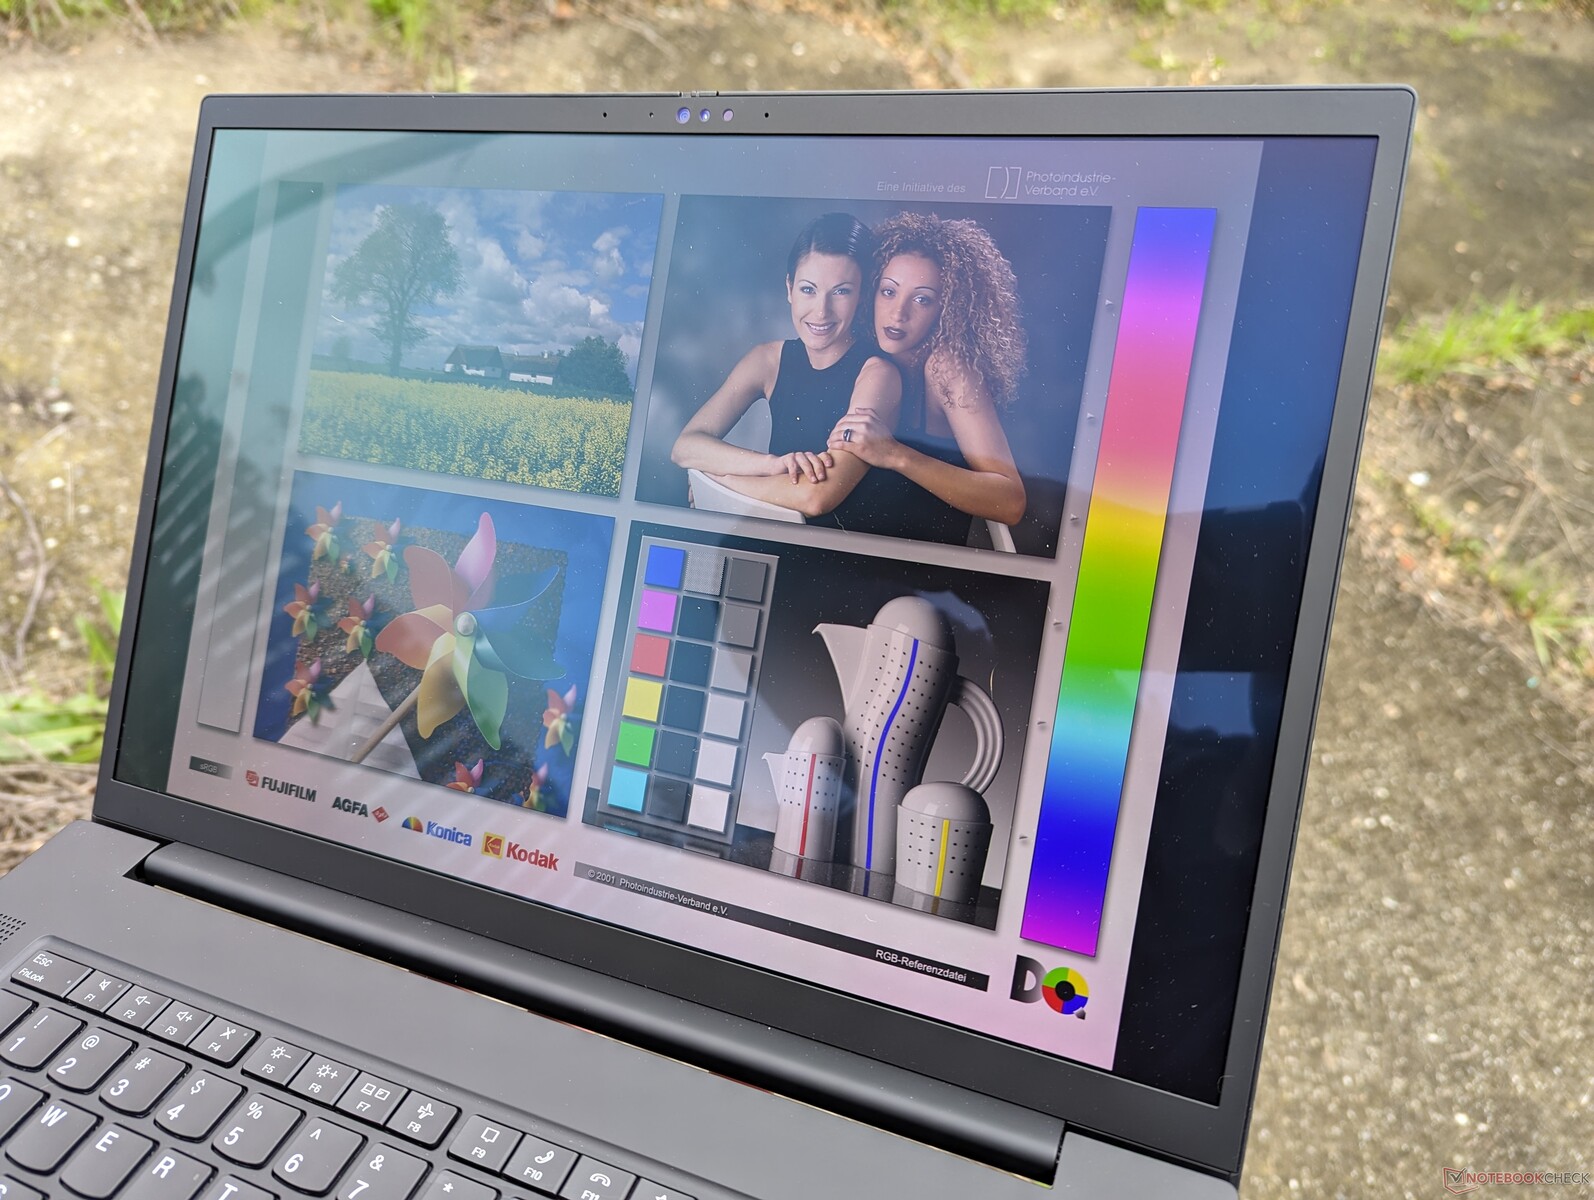
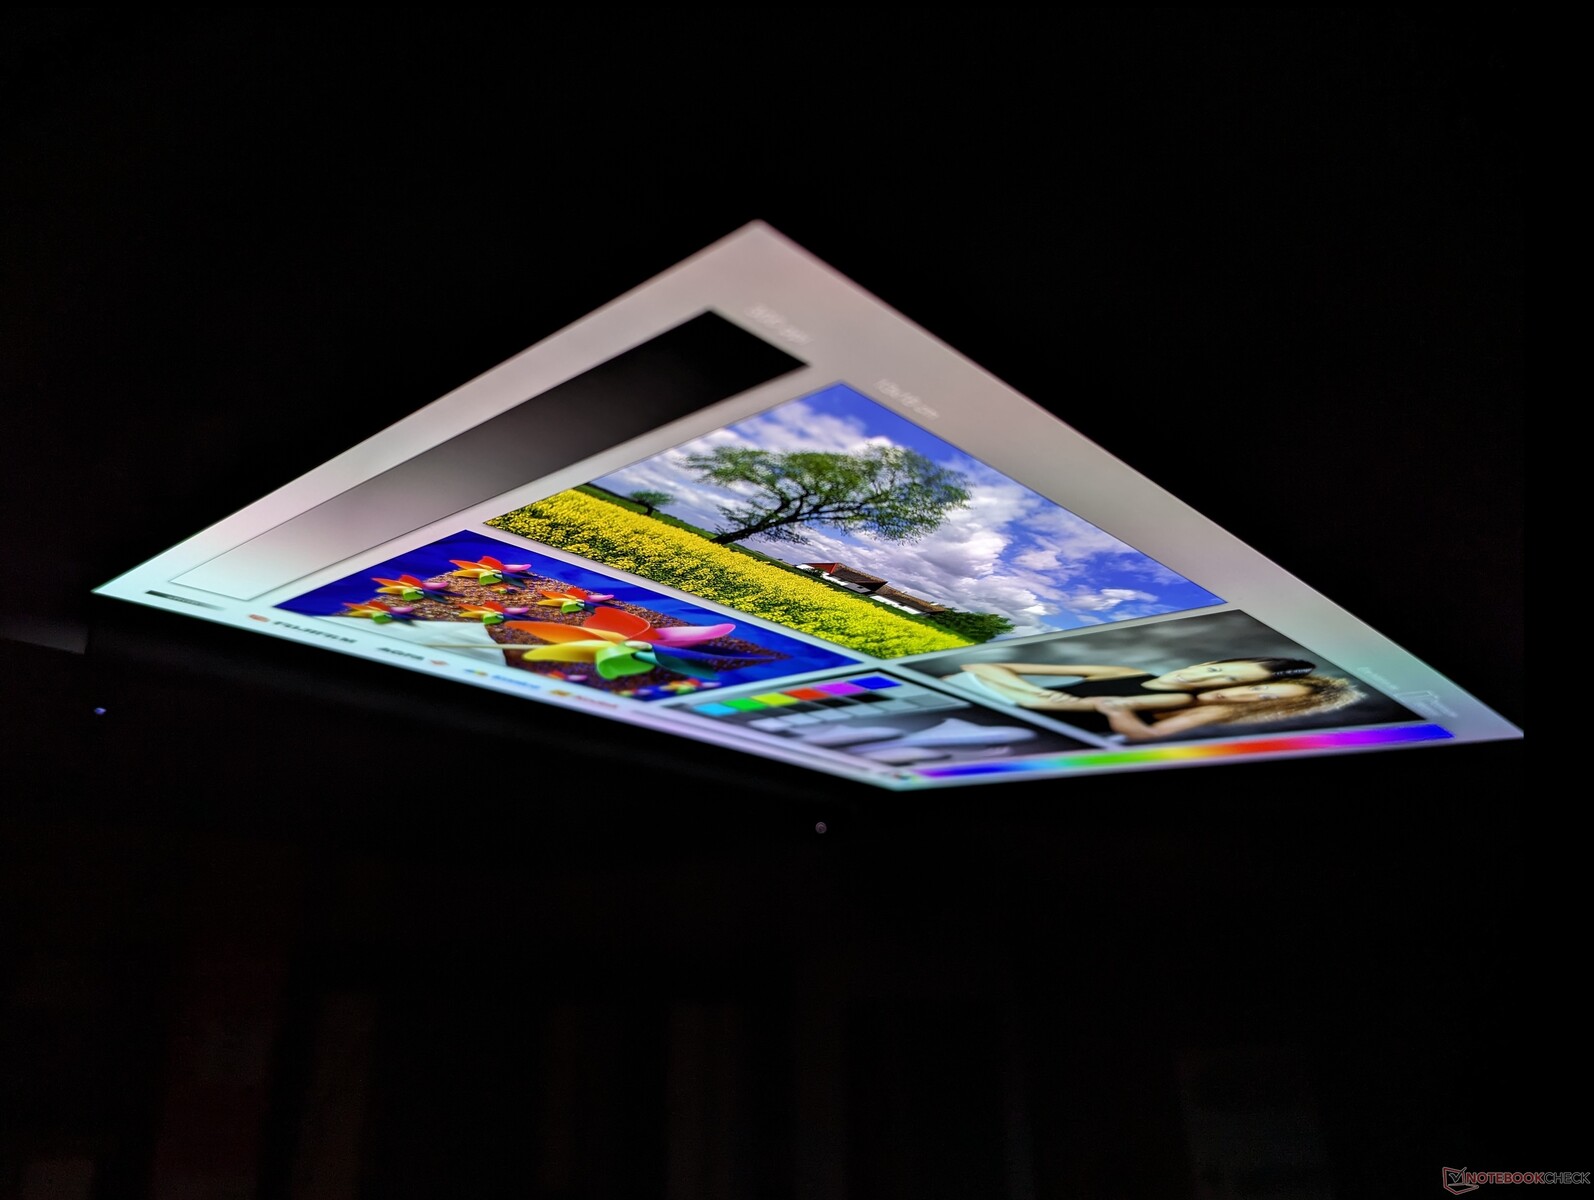
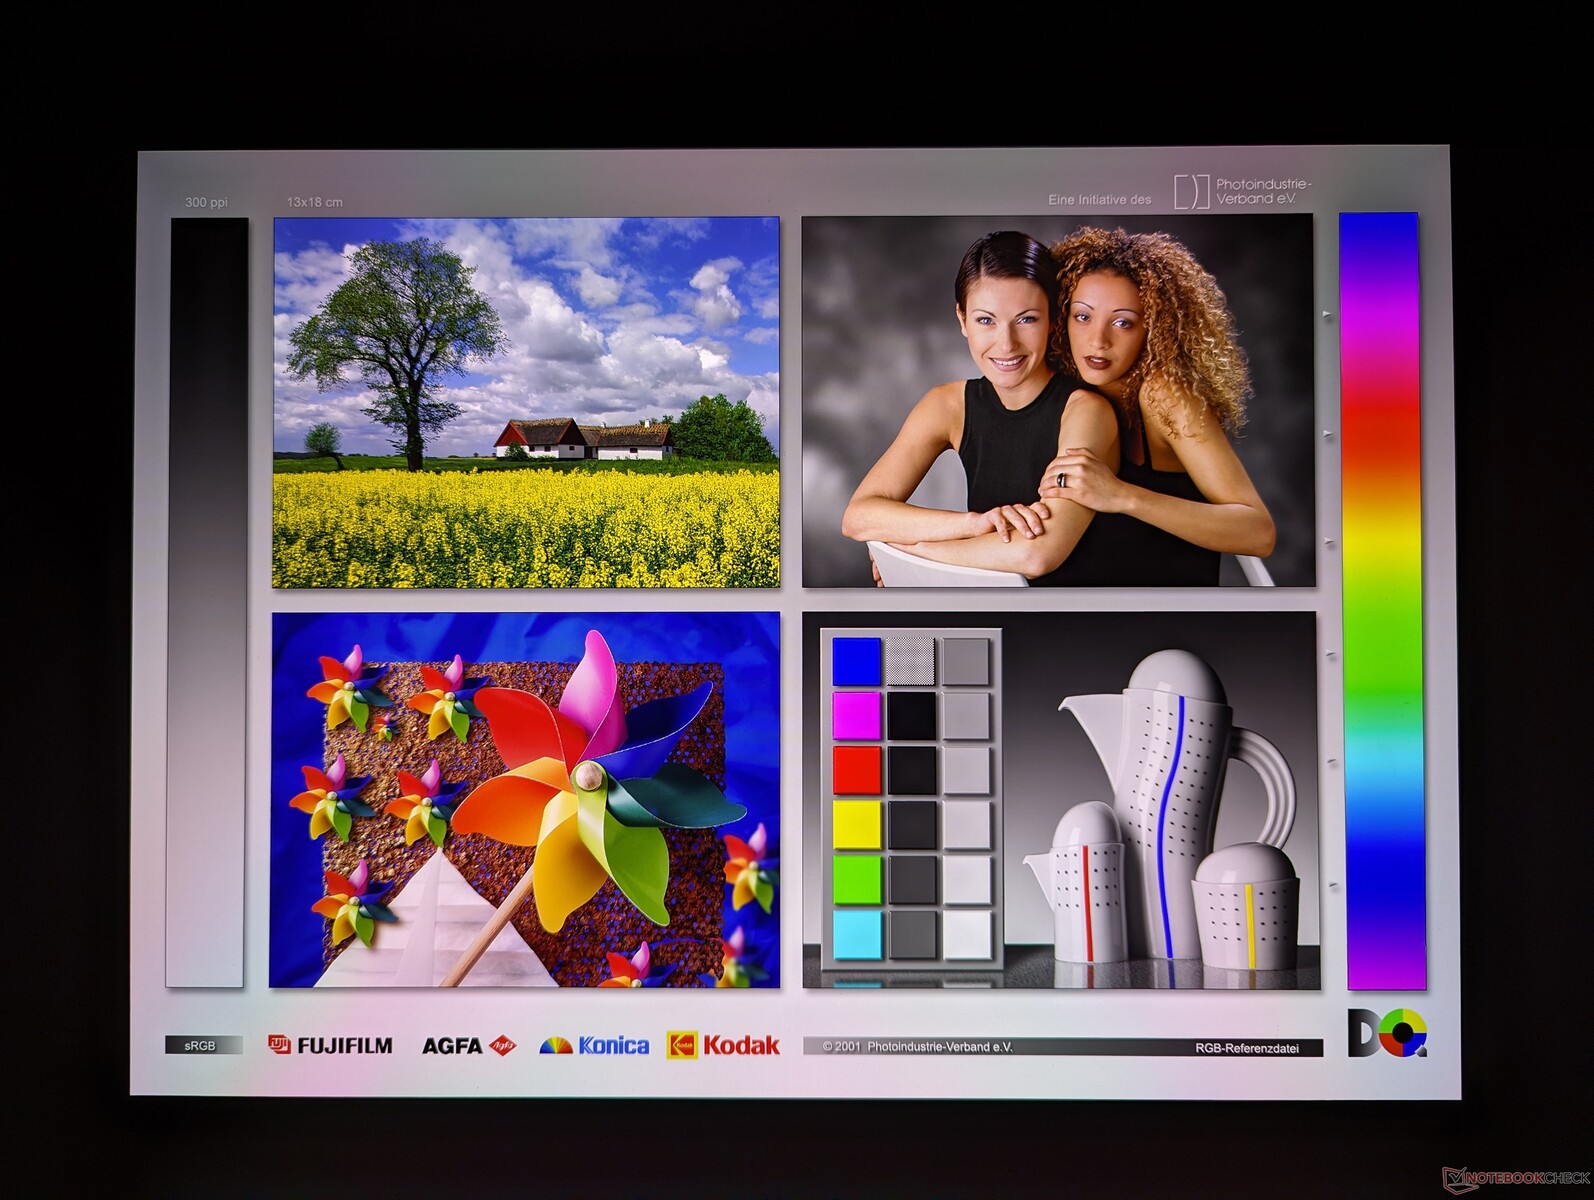
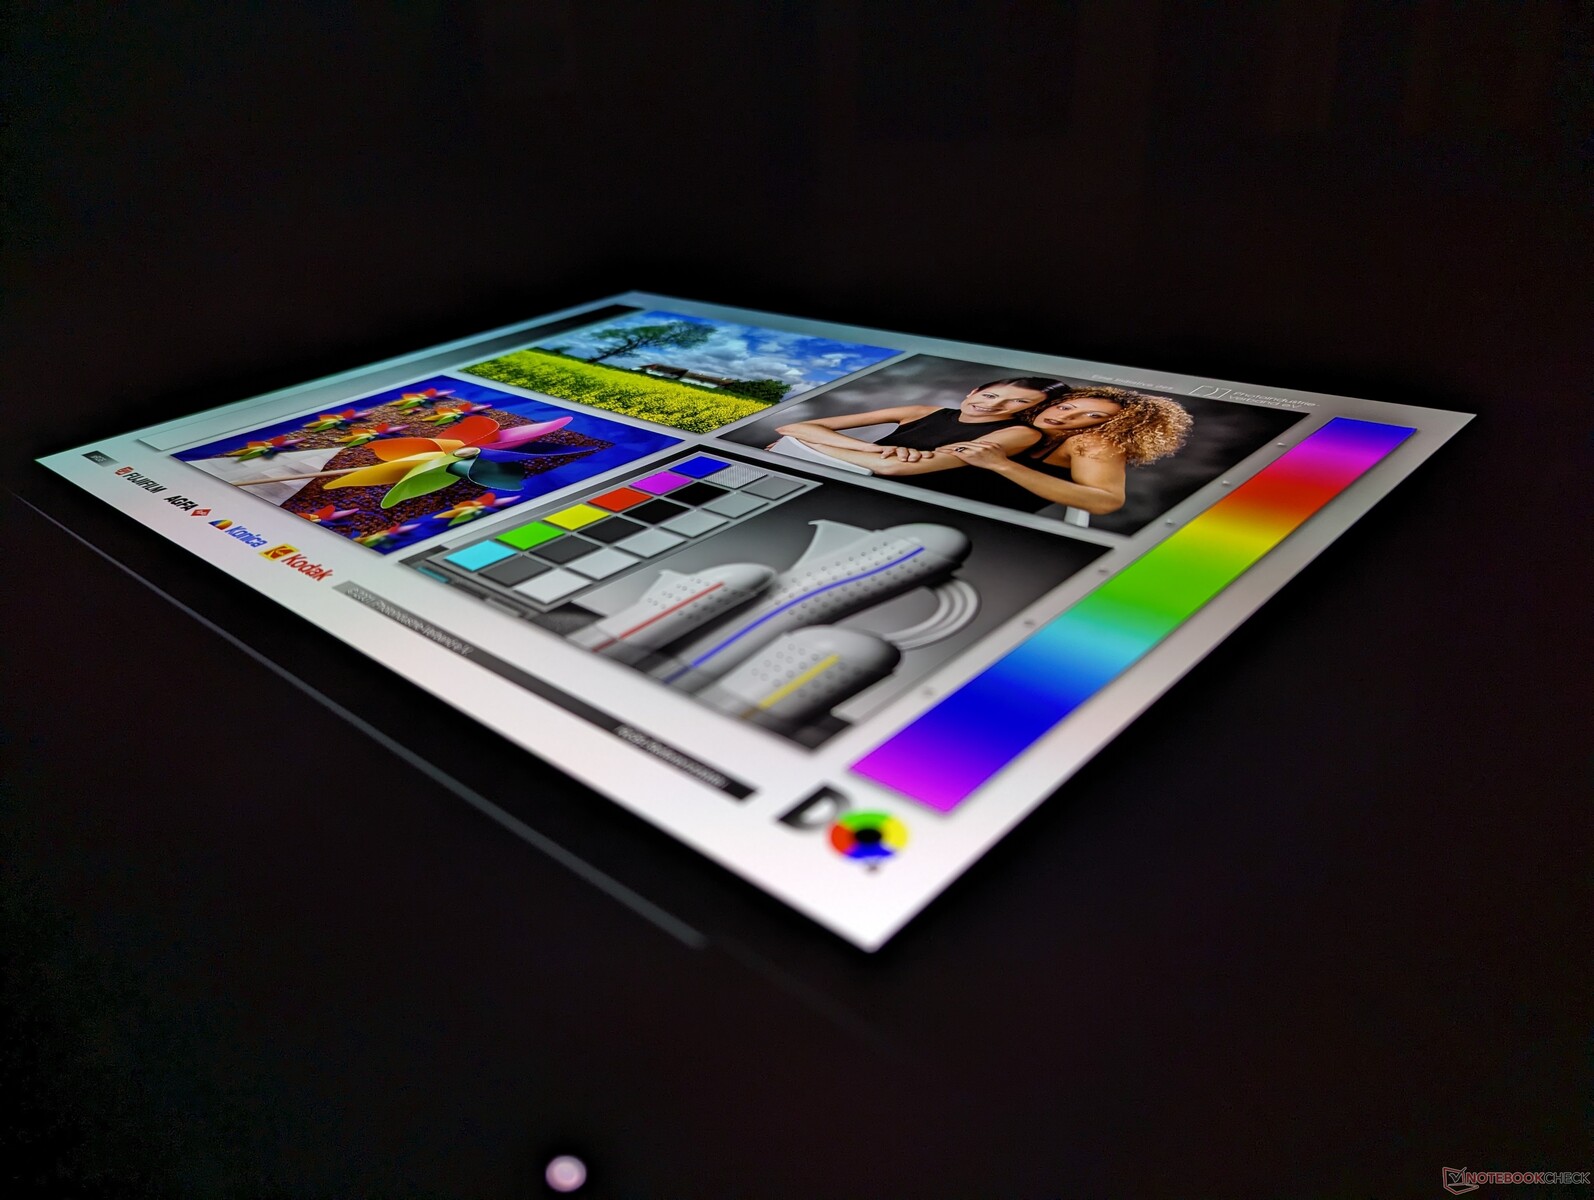
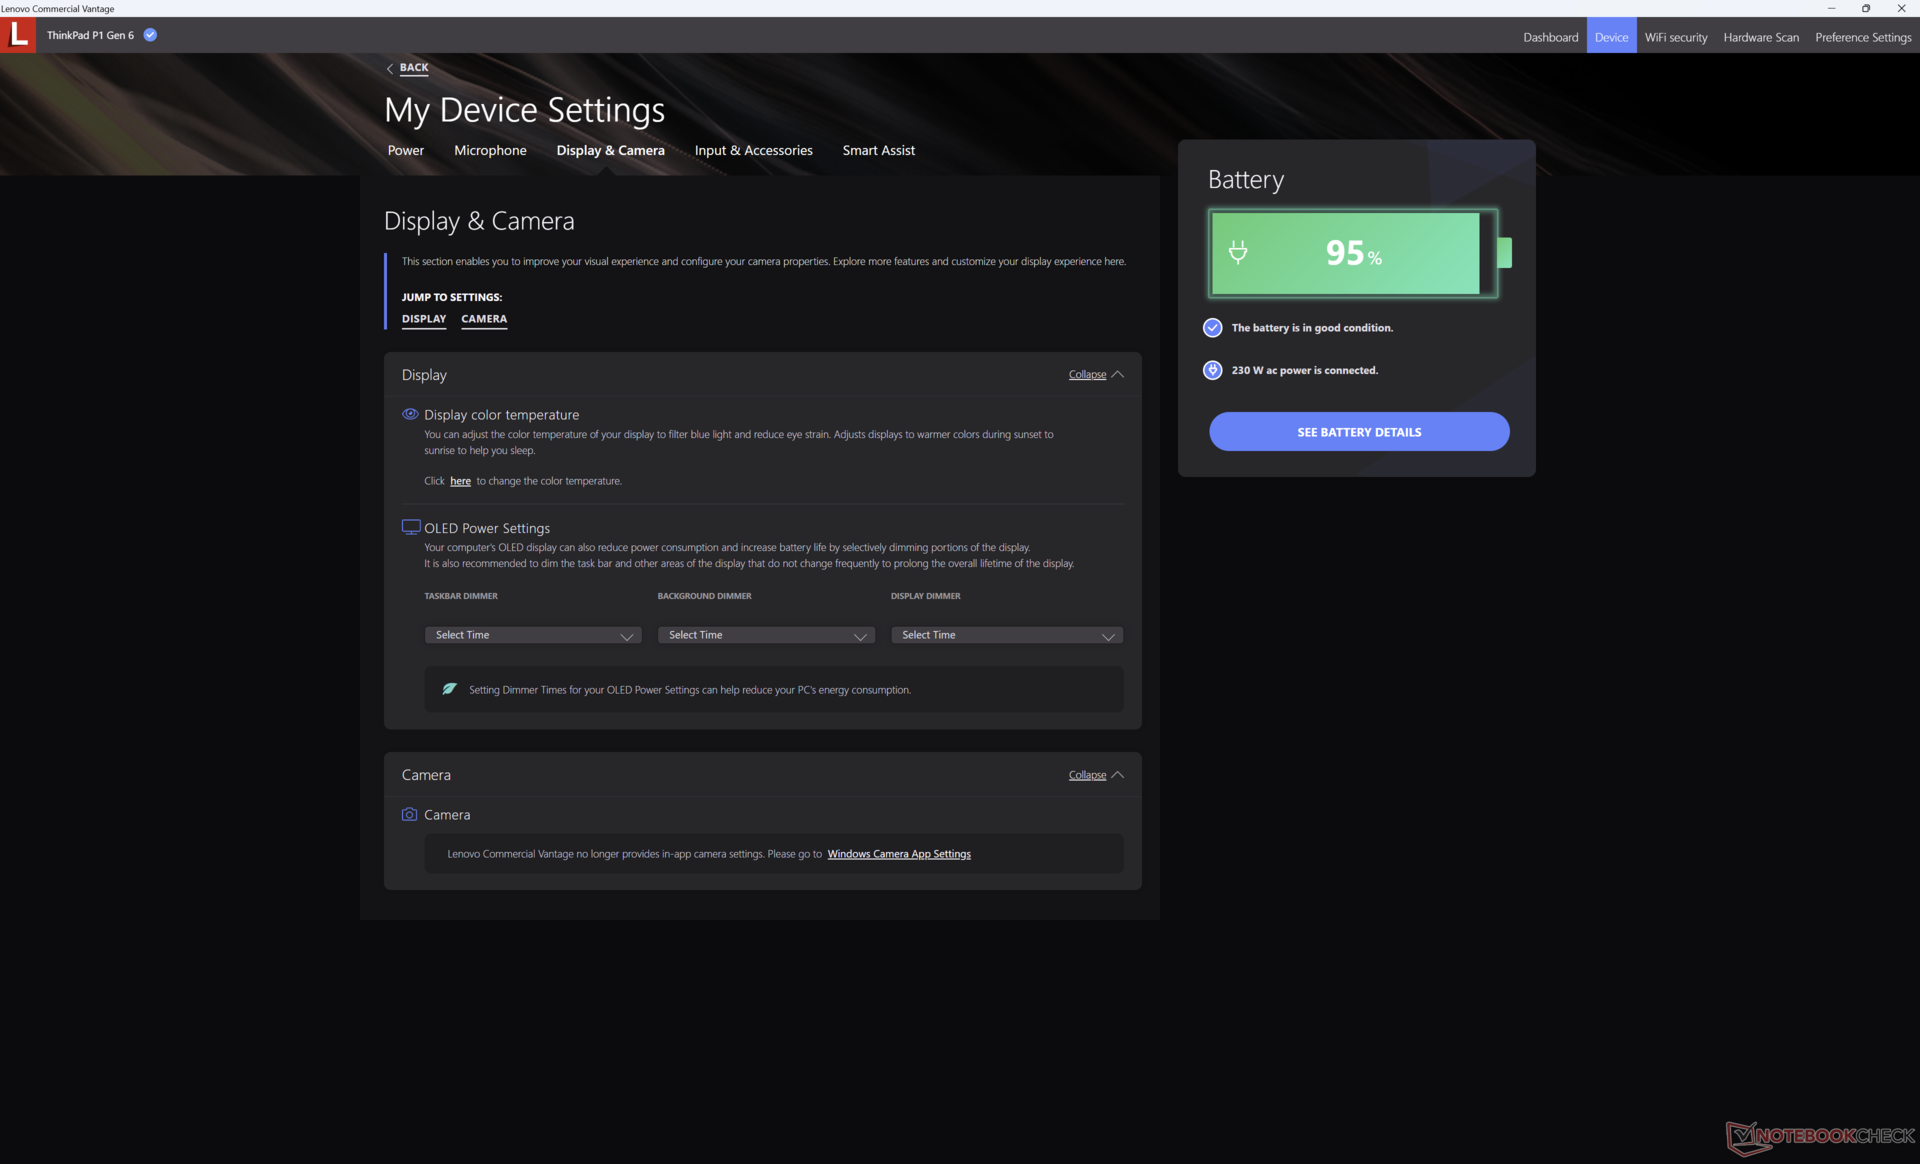
Tela - HDR400 com cores DCI-P3
O painel OLED 4K oferece cores superiores, tempos de resposta mais rápidos, funcionalidade de tela sensível ao toque e uma resolução nativa mais densa do que o painel IPS 2K em nossa configuração anterior com a tecnologia RTX 2000. No entanto, esses benefícios têm o custo de uma taxa de atualização nativa mais lenta, de apenas 60 Hz, e um brilho máximo mais fraco, conforme mostra a tabela abaixo. Portanto, o painel IPS pode ser preferível, dependendo de sua aplicação. É uma pena que a Lenovo não ofereça opções OLED de 120 Hz, como o Vivobook Pro 16X.
| |||||||||||||||||||||||||
iluminação: 98 %
iluminação com acumulador: 375.1 cd/m²
Contraste: ∞:1 (Preto: 0 cd/m²)
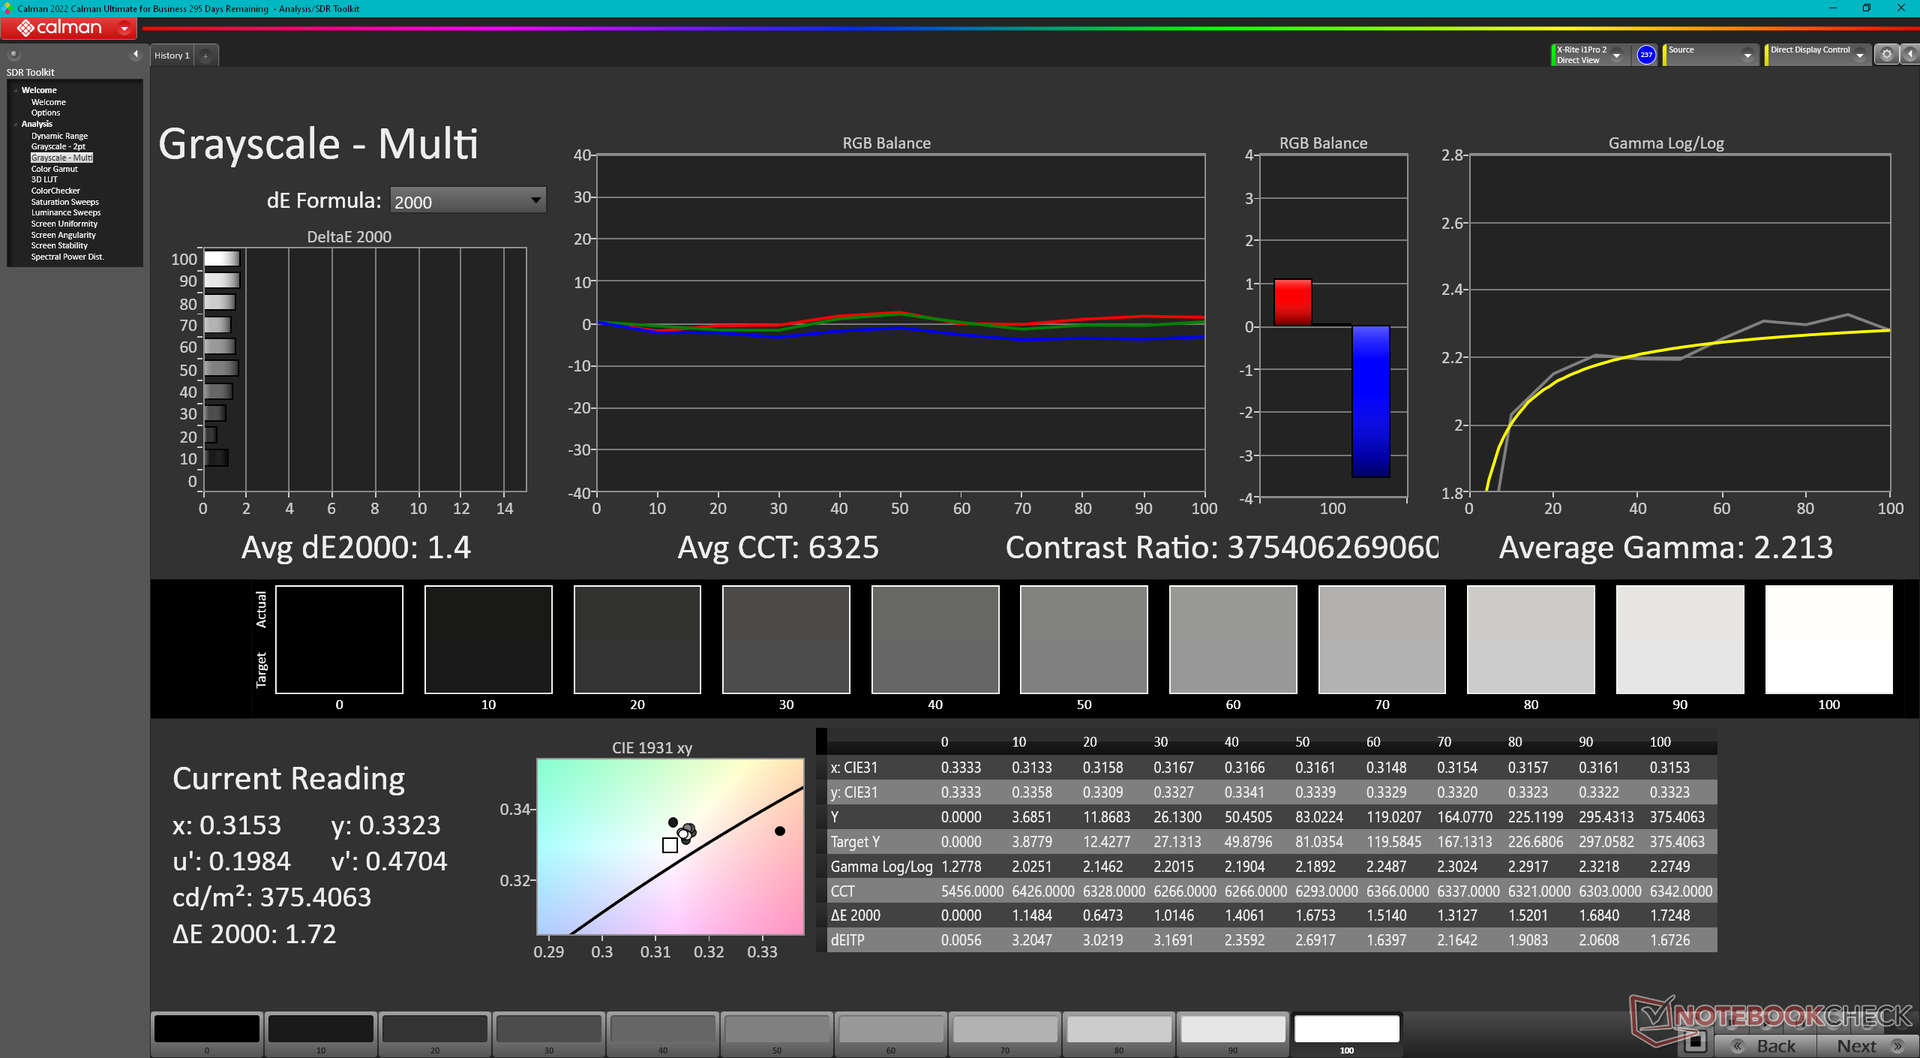
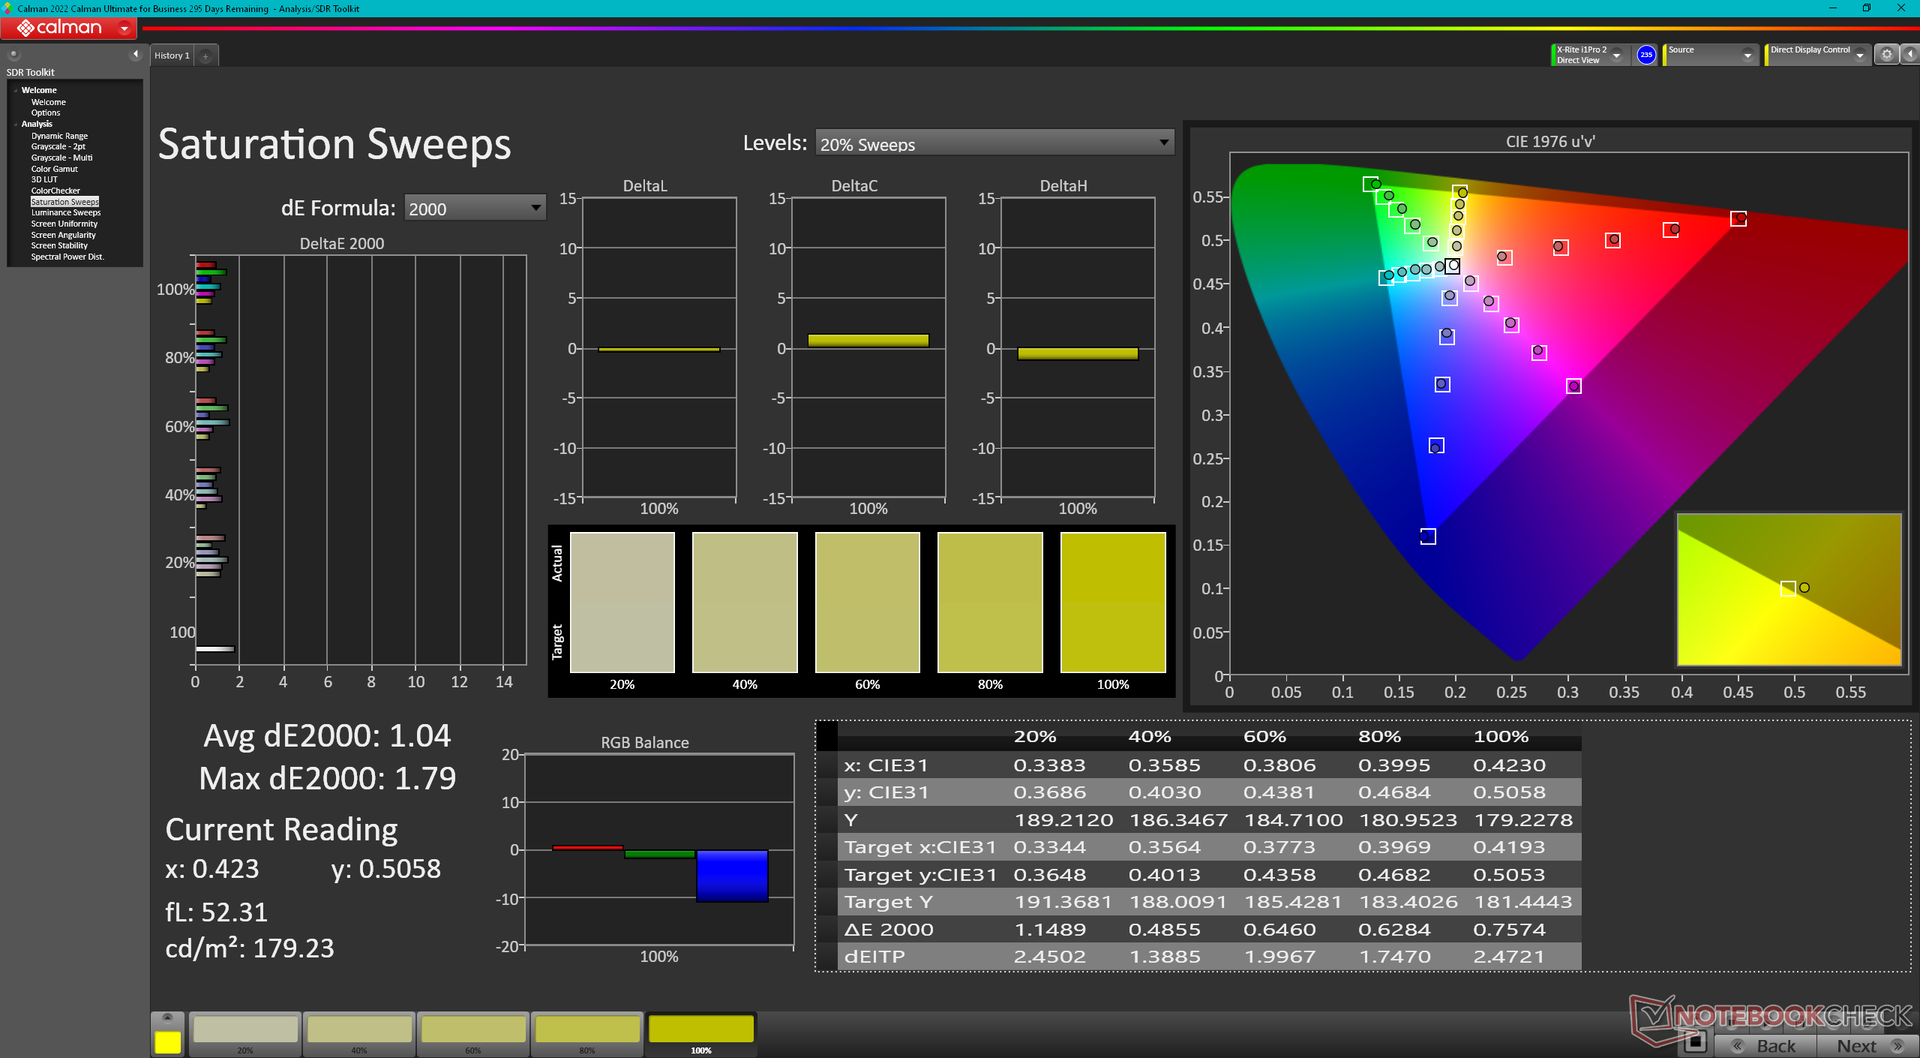
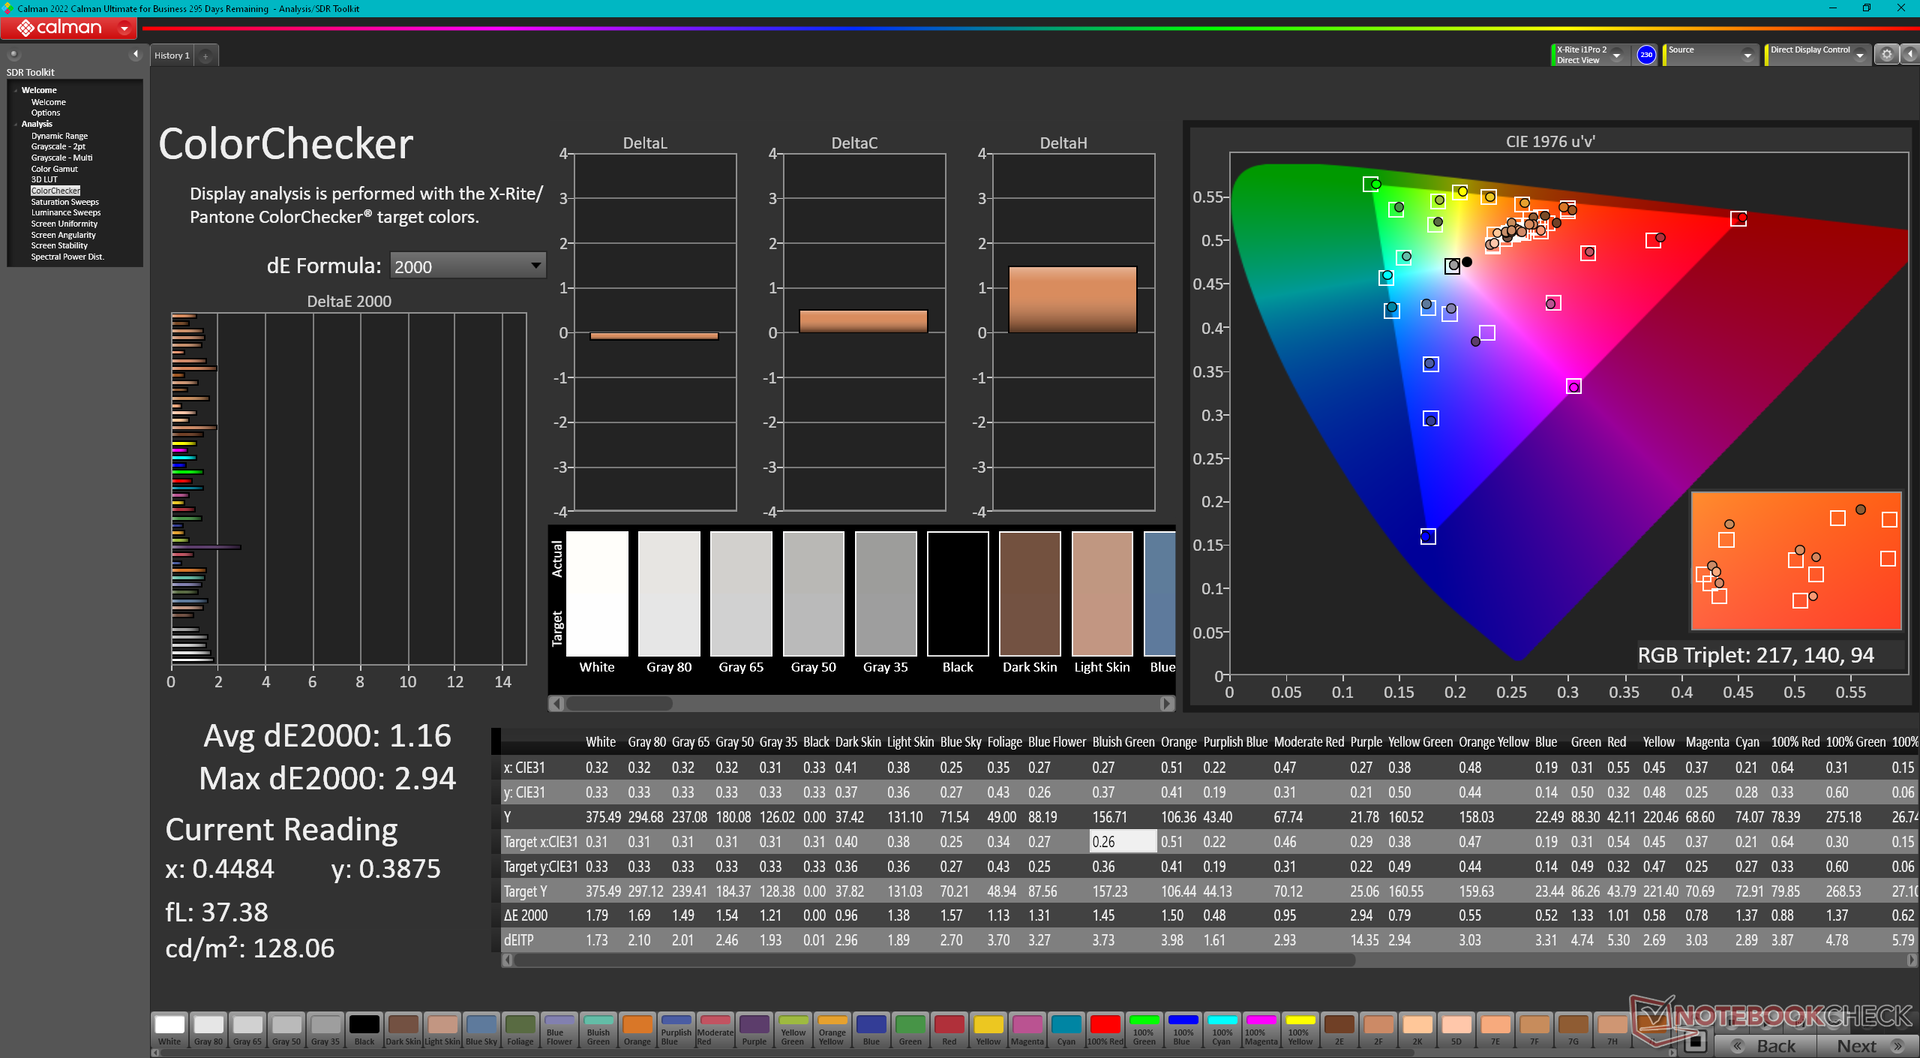
ΔE ColorChecker Calman: 1.16 | ∀{0.5-29.43 Ø4.71}
ΔE Greyscale Calman: 1.4 | ∀{0.09-98 Ø4.96}
97.9% AdobeRGB 1998 (Argyll 3D)
100% sRGB (Argyll 3D)
99.8% Display P3 (Argyll 3D)
Gamma: 2.2
CCT: 6325 K
| Lenovo ThinkPad P1 G6 21FV001KUS Samsung ATNA60YV04-0, OLED, 3480x2400, 16" | Lenovo ThinkPad P1 G6-21FV000DGE NE160QDM-NY1, IPS, 2560x1600, 16" | Lenovo ThinkPad P1 G4-20Y4S0KS00 LP160UQ1-SPB1, IPS LED, 3840x2400, 16" | Lenovo ThinkPad P16 G1 RTX A5500 LP160UQ1-SPB1, IPS, 3840x2400, 16" | Dell Precision 5000 5680 Samsung 160YV03, OLED, 3840x2400, 16" | HP ZBook Fury 16 G10 AUO87A8, IPS, 3840x2400, 16" | |
|---|---|---|---|---|---|---|
| Display | -21% | -5% | -7% | 0% | -5% | |
| Display P3 Coverage (%) | 99.8 | 68.1 -32% | 85.7 -14% | 82.9 -17% | 99.9 0% | 98 -2% |
| sRGB Coverage (%) | 100 | 97.5 -2% | 99.4 -1% | 98.9 -1% | 100 0% | 99.9 0% |
| AdobeRGB 1998 Coverage (%) | 97.9 | 70.2 -28% | 98.9 1% | 95.9 -2% | 97.5 0% | 86.2 -12% |
| Response Times | -583% | -2435% | -2313% | -1% | -530% | |
| Response Time Grey 50% / Grey 80% * (ms) | 1.69 ? | 13.7 ? -711% | 55.2 ? -3166% | 45.6 ? -2598% | 1.68 ? 1% | 11.9 ? -604% |
| Response Time Black / White * (ms) | 1.73 ? | 9.6 ? -455% | 31.2 ? -1703% | 36.8 ? -2027% | 1.77 ? -2% | 9.6 ? -455% |
| PWM Frequency (Hz) | 60 ? | 60 ? | ||||
| Screen | 12% | -22% | -27% | -81% | -14% | |
| Brightness middle (cd/m²) | 375.1 | 521 39% | 630 68% | 601.9 60% | 345.7 -8% | 514.6 37% |
| Brightness (cd/m²) | 379 | 484 28% | 622 64% | 569 50% | 349 -8% | 495 31% |
| Brightness Distribution (%) | 98 | 89 -9% | 90 -8% | 77 -21% | 98 0% | 90 -8% |
| Black Level * (cd/m²) | 0.36 | 0.41 | 0.47 | 0.46 | ||
| Colorchecker dE 2000 * | 1.16 | 1.2 -3% | 2.2 -90% | 2.45 -111% | 3.59 -209% | 2.4 -107% |
| Colorchecker dE 2000 max. * | 2.94 | 2.5 15% | 5 -70% | 4.46 -52% | 7.02 -139% | 4.86 -65% |
| Greyscale dE 2000 * | 1.4 | 1.4 -0% | 2.7 -93% | 2.6 -86% | 3.1 -121% | 1 29% |
| Gamma | 2.2 100% | 2.25 98% | 2.26 97% | 2.3 96% | 2.13 103% | 2.3 96% |
| CCT | 6325 103% | 6682 97% | 6886 94% | 6805 96% | 6448 101% | 6553 99% |
| Contrast (:1) | 1447 | 1537 | 1281 | 1119 | ||
| Colorchecker dE 2000 calibrated * | 1 | 1 | 0.99 | 0.4 | ||
| Média Total (Programa/Configurações) | -197% /
-105% | -821% /
-456% | -782% /
-437% | -27% /
-44% | -183% /
-105% |
* ... menor é melhor
O monitor vem pré-calibrado com valores médios de deltaE de escala de cinza e de cor de apenas 1,4 e 1,16, respectivamente. Portanto, a calibração adicional não é necessária para a maioria dos usuários.
Exibir tempos de resposta
| ↔ Tempo de resposta preto para branco | ||
|---|---|---|
| 1.73 ms ... ascensão ↗ e queda ↘ combinadas | ↗ 0.77 ms ascensão | 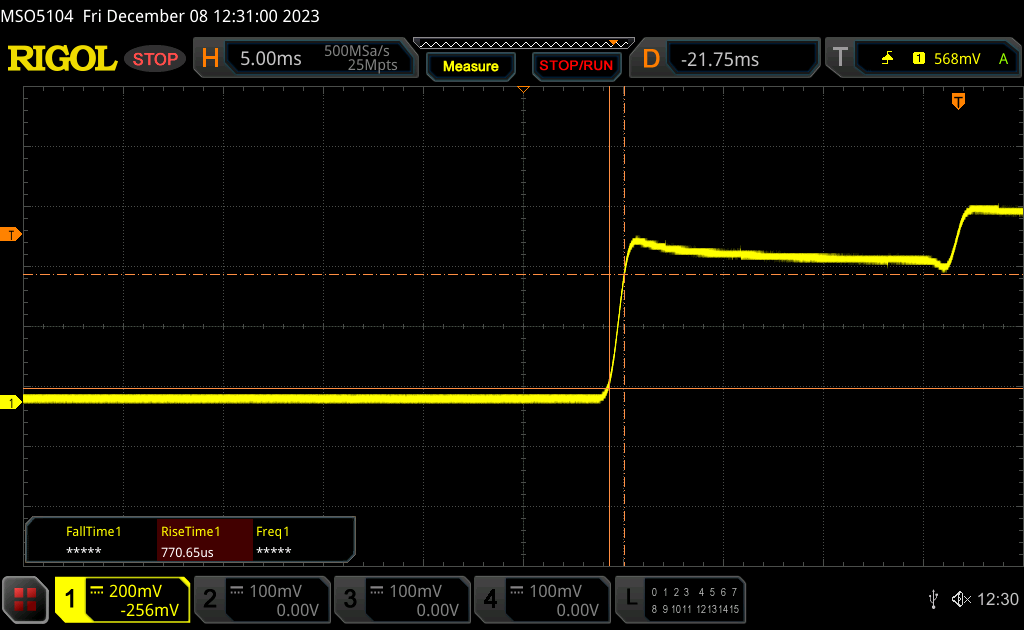 |
| ↘ 0.96 ms queda | ||
| A tela mostra taxas de resposta muito rápidas em nossos testes e deve ser muito adequada para jogos em ritmo acelerado. Em comparação, todos os dispositivos testados variam de 0.1 (mínimo) a 240 (máximo) ms. » 10 % de todos os dispositivos são melhores. Isso significa que o tempo de resposta medido é melhor que a média de todos os dispositivos testados (19.8 ms). | ||
| ↔ Tempo de resposta 50% cinza a 80% cinza | ||
| 1.69 ms ... ascensão ↗ e queda ↘ combinadas | ↗ 0.89 ms ascensão | 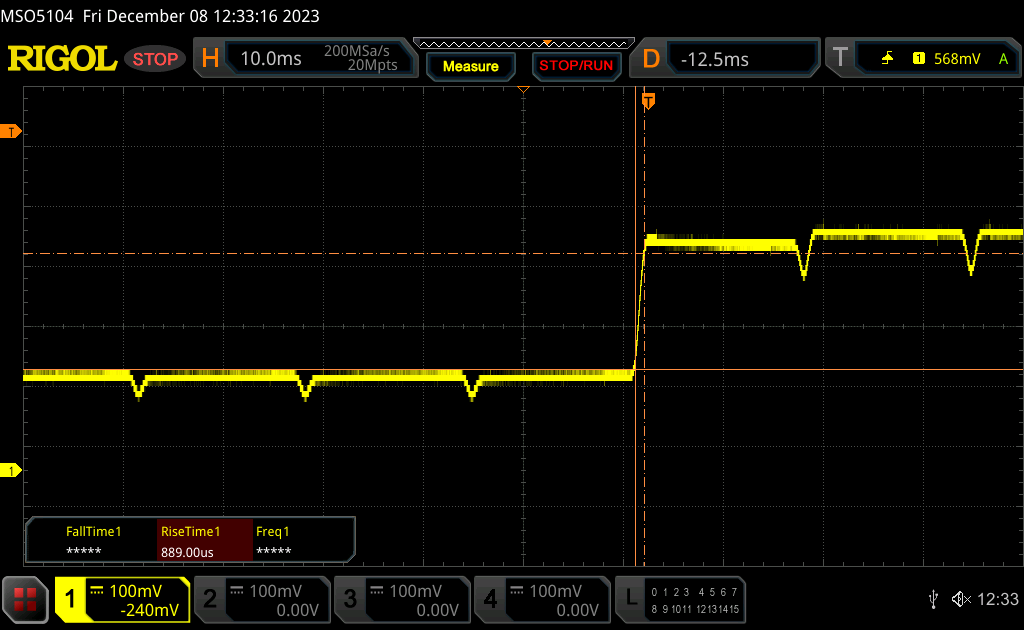 |
| ↘ 0.8 ms queda | ||
| A tela mostra taxas de resposta muito rápidas em nossos testes e deve ser muito adequada para jogos em ritmo acelerado. Em comparação, todos os dispositivos testados variam de 0.165 (mínimo) a 636 (máximo) ms. » 9 % de todos os dispositivos são melhores. Isso significa que o tempo de resposta medido é melhor que a média de todos os dispositivos testados (31 ms). | ||
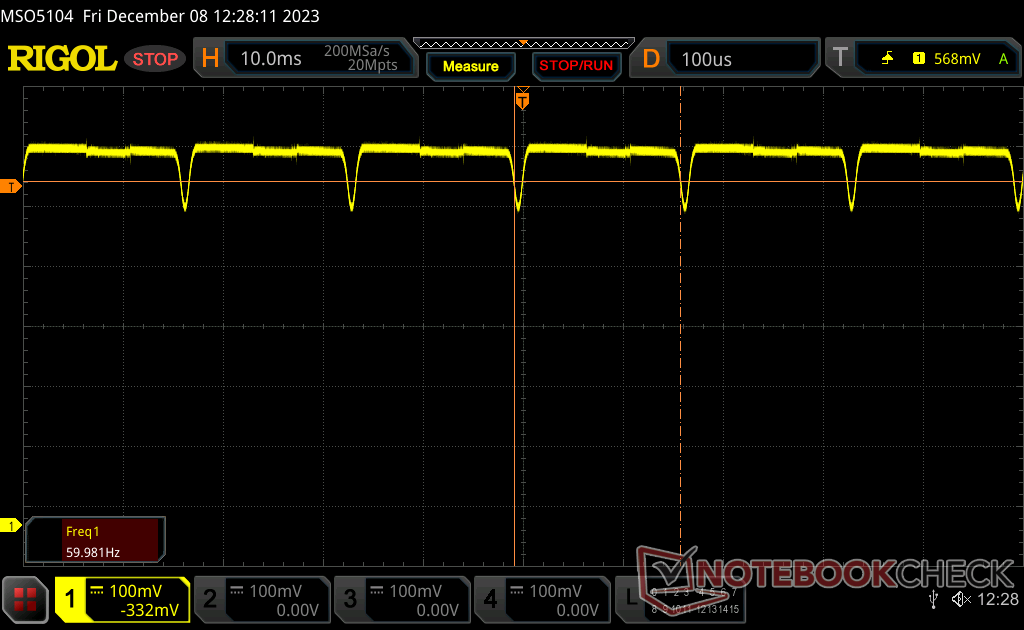
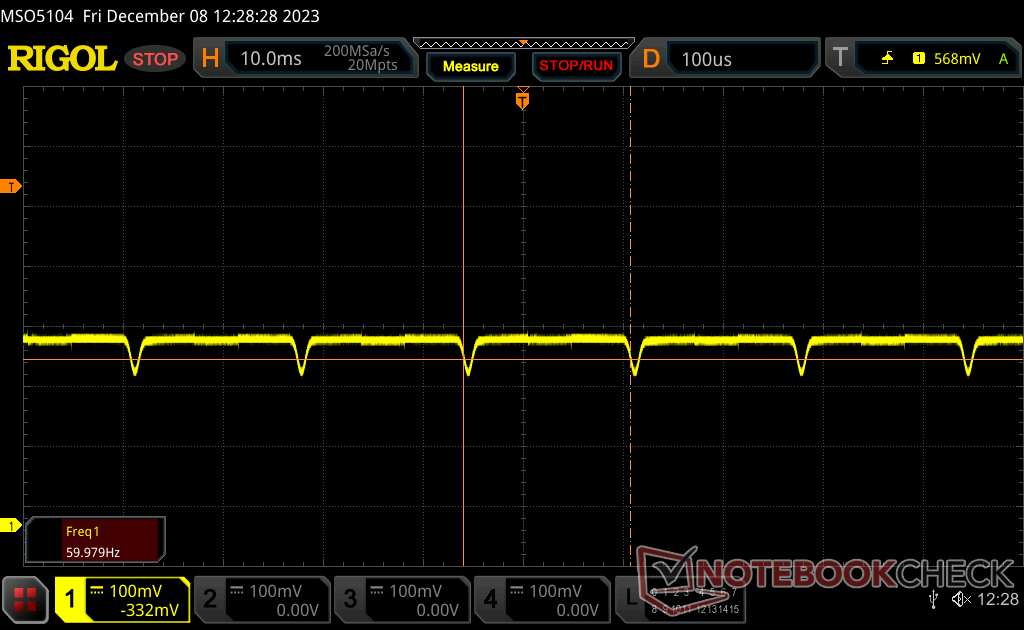
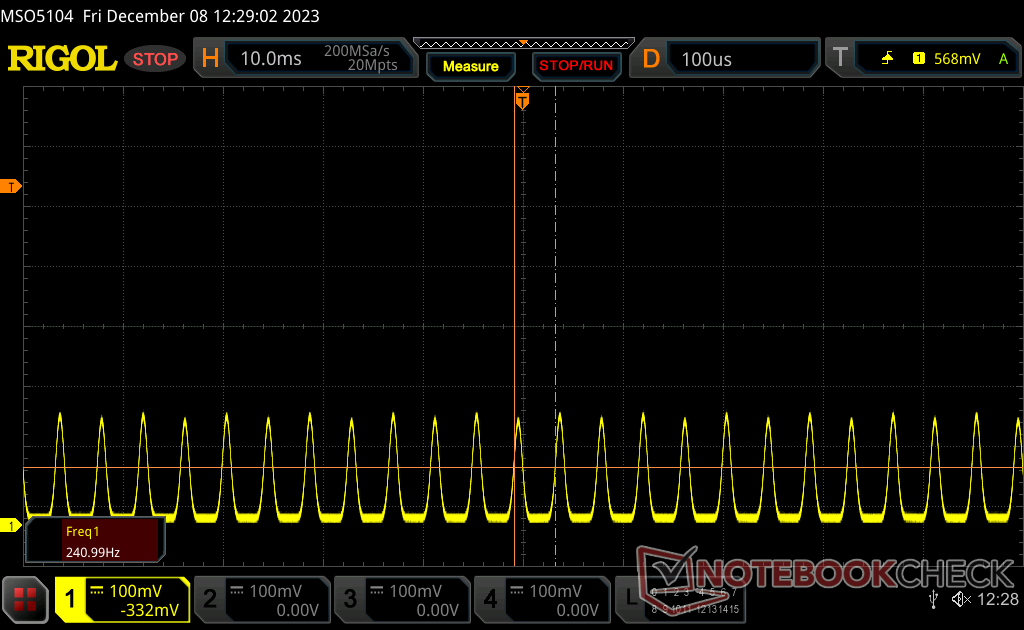
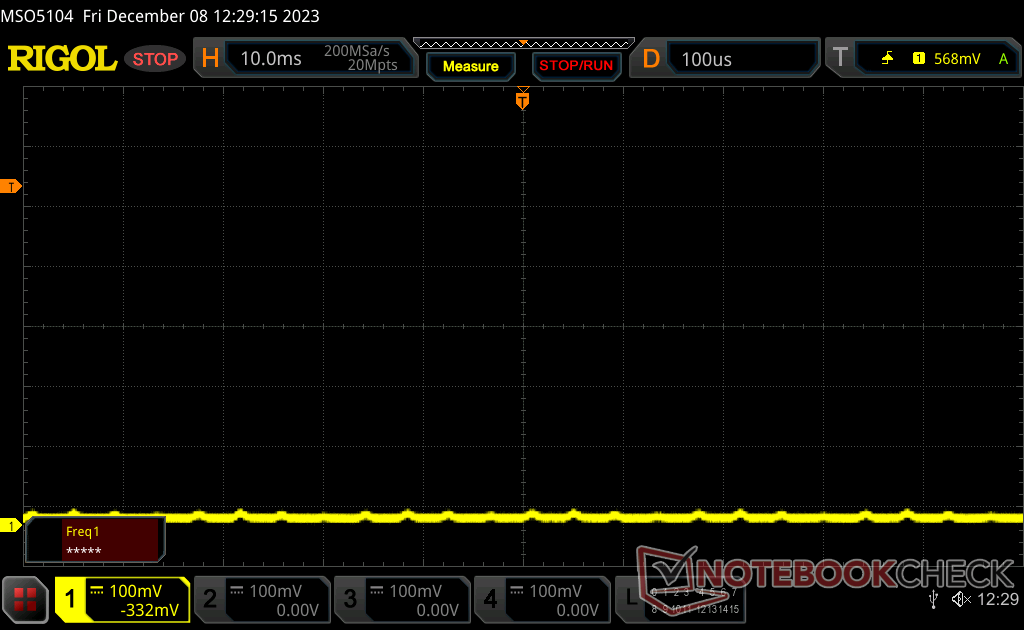
Cintilação da tela / PWM (modulação por largura de pulso)
| Tela tremeluzindo/PWM detectado | 60 Hz | ≤ 100 % configuração de brilho | 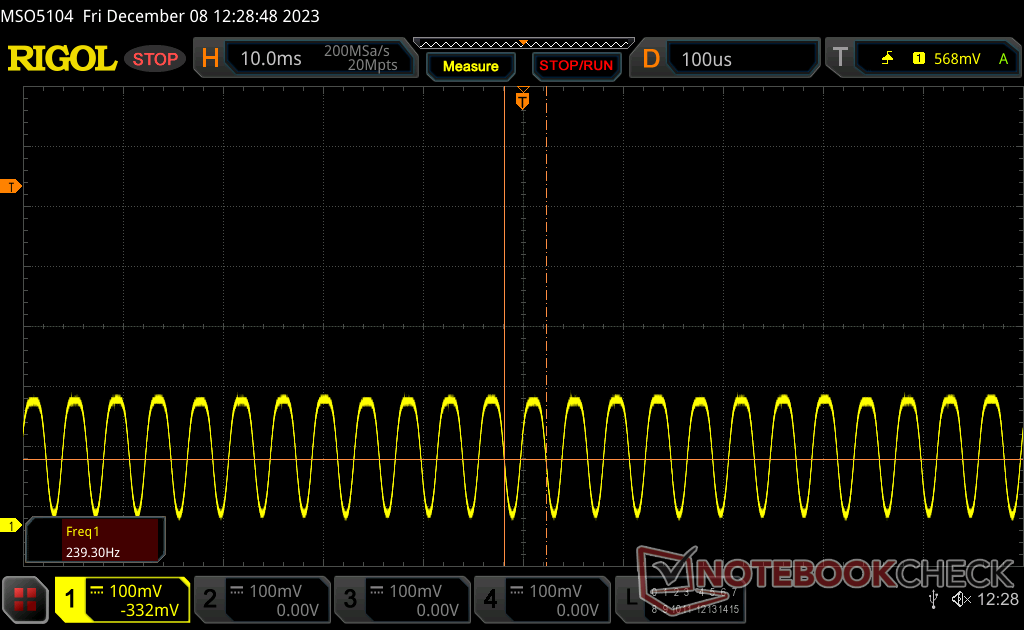 |
A luz de fundo da tela pisca em 60 Hz (pior caso, por exemplo, utilizando PWM) Cintilação detectada em uma configuração de brilho de 100 % e abaixo. Não deve haver cintilação ou PWM acima desta configuração de brilho. A frequência de 60 Hz é muito baixa, portanto a oscilação pode causar fadiga ocular e dores de cabeça após uso prolongado. [pwm_comparison] Em comparação: 52 % de todos os dispositivos testados não usam PWM para escurecer a tela. Se PWM foi detectado, uma média de 7754 (mínimo: 5 - máximo: 343500) Hz foi medida. | |||
A modulação de largura de pulso está presente em todos os níveis de brilho, como é de se esperar de um painel OLED. Conseguimos detectar uma frequência de 239 Hz de 0 a 57% de brilho e 60 Hz de 58 a 100% de brilho.
Desempenho
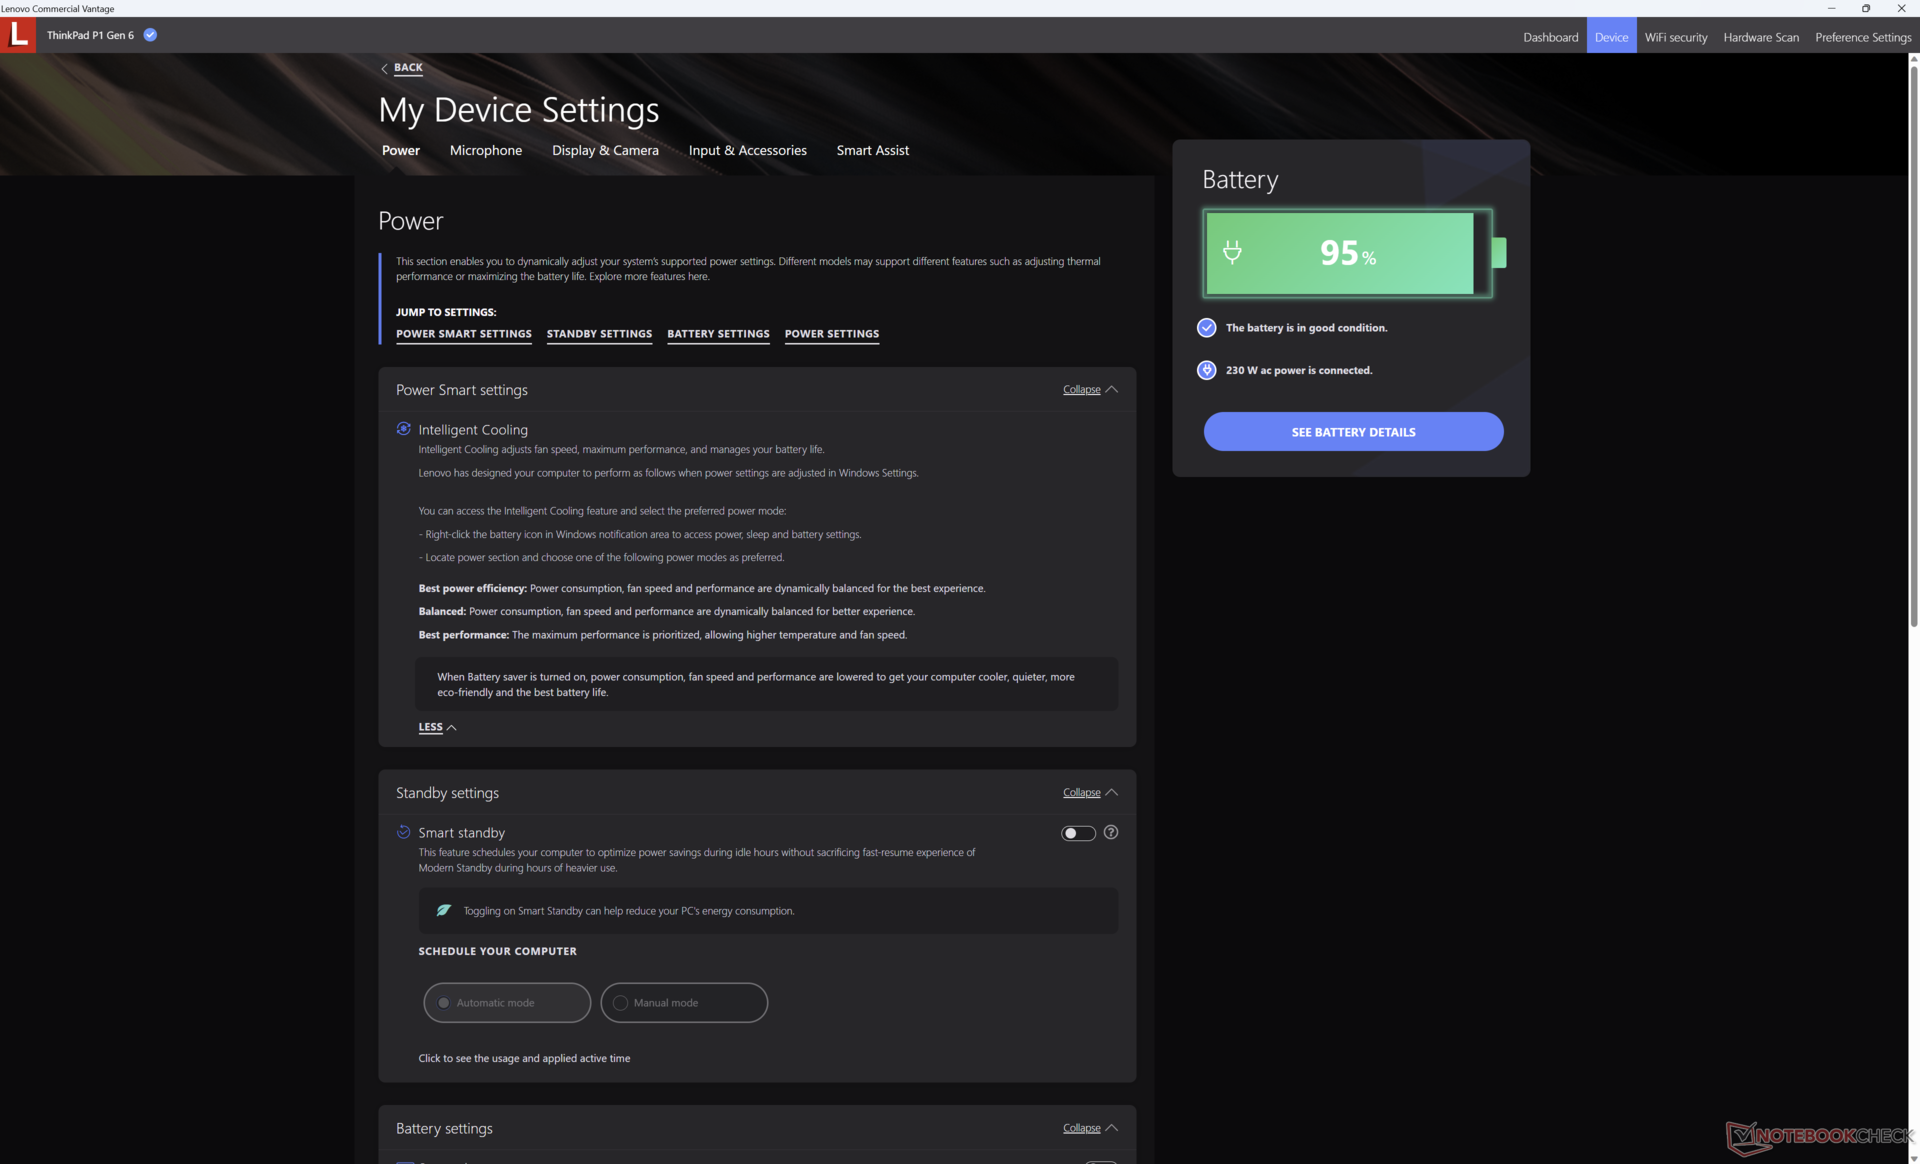
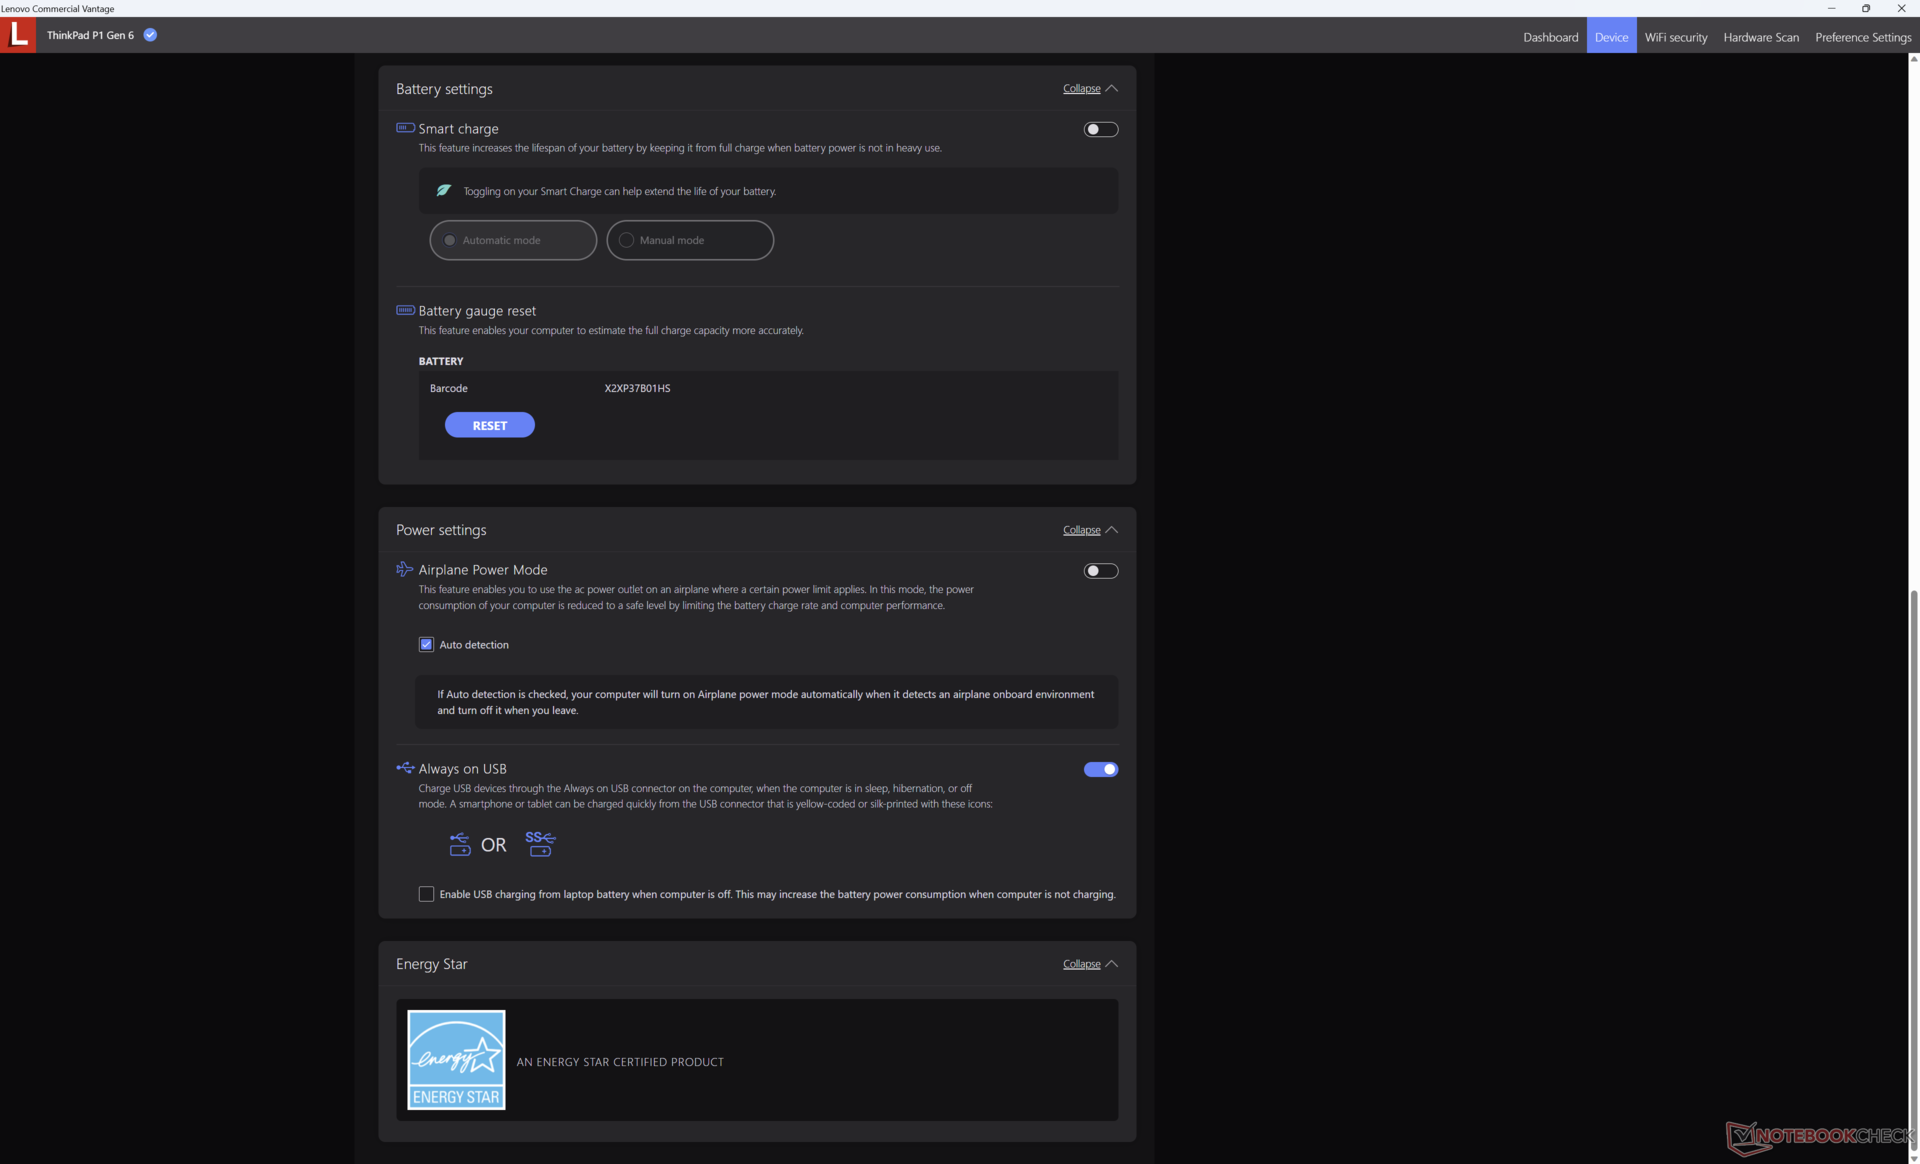
Condições de teste
Definimos o Windows para o modo Desempenho antes de executar os benchmarks abaixo. O Lenovo Vantage não inclui nenhum perfil de energia especializado para manter as coisas simples.
Somente o Optimus 1.0 é suportado, sem opções de Optimus Avançado ou MUX, o que é um pouco decepcionante, considerando a GPU RTX 4080 de ponta.
Processador
O Core i7-13800H em nossa unidade é apenas 3 a 5 por cento mais lento do que o Core i9-13900H mesmo depois de considerar qualquer comportamento de limitação. Essa diferença é essencialmente insignificante para a grande maioria dos usuários. Os compradores que buscam aumentos de desempenho mais tangíveis devem considerar a série ThinkPad P16, que vem com CPUs da série Core HX.
Cinebench R15 Multi Loop
Cinebench R23: Multi Core | Single Core
Cinebench R20: CPU (Multi Core) | CPU (Single Core)
Cinebench R15: CPU Multi 64Bit | CPU Single 64Bit
Blender: v2.79 BMW27 CPU
7-Zip 18.03: 7z b 4 | 7z b 4 -mmt1
Geekbench 5.5: Multi-Core | Single-Core
HWBOT x265 Benchmark v2.2: 4k Preset
LibreOffice : 20 Documents To PDF
R Benchmark 2.5: Overall mean
| Cinebench R20 / CPU (Multi Core) | |
| Asus ProArt Studiobook 16 OLED H7604 | |
| HP ZBook Fury 16 G10 | |
| MSI Raider GE68 HX 13VG, i7-13700HX | |
| Lenovo ThinkPad P16 G1 RTX A5500 | |
| Dell Precision 5000 5680 | |
| Lenovo ThinkPad P1 G6-21FV000DGE | |
| Gigabyte Aero 16 YE5 | |
| Lenovo ThinkPad P1 G6 21FV001KUS | |
| Média Intel Core i7-13800H (n=1) | |
| Lenovo ThinkPad X1 Extreme G4-20Y5CTO1WW (3050 Ti) | |
| Lenovo ThinkPad P1 G4-20Y4S0KS00 | |
| LG Gram 2in1 16 16T90R - G.AA78G | |
| Lenovo ThinkPad E16 G1-21JUS08X00 | |
| Lenovo ThinkPad E16 G1 Core i5-1335U | |
| Cinebench R20 / CPU (Single Core) | |
| HP ZBook Fury 16 G10 | |
| Asus ProArt Studiobook 16 OLED H7604 | |
| Lenovo ThinkPad P1 G6-21FV000DGE | |
| Dell Precision 5000 5680 | |
| Lenovo ThinkPad P1 G6 21FV001KUS | |
| Média Intel Core i7-13800H (n=1) | |
| Lenovo ThinkPad P16 G1 RTX A5500 | |
| MSI Raider GE68 HX 13VG, i7-13700HX | |
| Gigabyte Aero 16 YE5 | |
| Lenovo ThinkPad E16 G1 Core i5-1335U | |
| LG Gram 2in1 16 16T90R - G.AA78G | |
| Lenovo ThinkPad P1 G4-20Y4S0KS00 | |
| Lenovo ThinkPad X1 Extreme G4-20Y5CTO1WW (3050 Ti) | |
| Lenovo ThinkPad E16 G1-21JUS08X00 | |
| Cinebench R15 / CPU Single 64Bit | |
| Asus ProArt Studiobook 16 OLED H7604 | |
| HP ZBook Fury 16 G10 | |
| Dell Precision 5000 5680 | |
| Lenovo ThinkPad P1 G6-21FV000DGE | |
| Lenovo ThinkPad P1 G6 21FV001KUS | |
| Média Intel Core i7-13800H (n=1) | |
| Gigabyte Aero 16 YE5 | |
| Lenovo ThinkPad P16 G1 RTX A5500 | |
| MSI Raider GE68 HX 13VG, i7-13700HX | |
| LG Gram 2in1 16 16T90R - G.AA78G | |
| Lenovo ThinkPad E16 G1 Core i5-1335U | |
| Lenovo ThinkPad P1 G4-20Y4S0KS00 | |
| Lenovo ThinkPad E16 G1-21JUS08X00 | |
| Lenovo ThinkPad X1 Extreme G4-20Y5CTO1WW (3050 Ti) | |
| HWBOT x265 Benchmark v2.2 / 4k Preset | |
| Asus ProArt Studiobook 16 OLED H7604 | |
| HP ZBook Fury 16 G10 | |
| MSI Raider GE68 HX 13VG, i7-13700HX | |
| Lenovo ThinkPad P16 G1 RTX A5500 | |
| Dell Precision 5000 5680 | |
| Lenovo ThinkPad P1 G6 21FV001KUS | |
| Média Intel Core i7-13800H (n=1) | |
| Lenovo ThinkPad P1 G6-21FV000DGE | |
| Gigabyte Aero 16 YE5 | |
| Lenovo ThinkPad P1 G4-20Y4S0KS00 | |
| Lenovo ThinkPad X1 Extreme G4-20Y5CTO1WW (3050 Ti) | |
| Lenovo ThinkPad E16 G1-21JUS08X00 | |
| LG Gram 2in1 16 16T90R - G.AA78G | |
| Lenovo ThinkPad E16 G1 Core i5-1335U | |
| LibreOffice / 20 Documents To PDF | |
| LG Gram 2in1 16 16T90R - G.AA78G | |
| MSI Raider GE68 HX 13VG, i7-13700HX | |
| Lenovo ThinkPad E16 G1 Core i5-1335U | |
| Lenovo ThinkPad E16 G1-21JUS08X00 | |
| Lenovo ThinkPad P1 G6-21FV000DGE | |
| Lenovo ThinkPad P1 G4-20Y4S0KS00 | |
| Lenovo ThinkPad P1 G6 21FV001KUS | |
| Média Intel Core i7-13800H (n=1) | |
| Asus ProArt Studiobook 16 OLED H7604 | |
| HP ZBook Fury 16 G10 | |
| Lenovo ThinkPad X1 Extreme G4-20Y5CTO1WW (3050 Ti) | |
| Dell Precision 5000 5680 | |
| Lenovo ThinkPad P16 G1 RTX A5500 | |
| Gigabyte Aero 16 YE5 | |
| R Benchmark 2.5 / Overall mean | |
| LG Gram 2in1 16 16T90R - G.AA78G | |
| Lenovo ThinkPad X1 Extreme G4-20Y5CTO1WW (3050 Ti) | |
| Lenovo ThinkPad P1 G4-20Y4S0KS00 | |
| Lenovo ThinkPad E16 G1-21JUS08X00 | |
| Lenovo ThinkPad P16 G1 RTX A5500 | |
| MSI Raider GE68 HX 13VG, i7-13700HX | |
| Lenovo ThinkPad P1 G6-21FV000DGE | |
| Gigabyte Aero 16 YE5 | |
| Dell Precision 5000 5680 | |
| Lenovo ThinkPad P1 G6 21FV001KUS | |
| Média Intel Core i7-13800H (n=1) | |
| HP ZBook Fury 16 G10 | |
| Asus ProArt Studiobook 16 OLED H7604 | |
Cinebench R23: Multi Core | Single Core
Cinebench R20: CPU (Multi Core) | CPU (Single Core)
Cinebench R15: CPU Multi 64Bit | CPU Single 64Bit
Blender: v2.79 BMW27 CPU
7-Zip 18.03: 7z b 4 | 7z b 4 -mmt1
Geekbench 5.5: Multi-Core | Single-Core
HWBOT x265 Benchmark v2.2: 4k Preset
LibreOffice : 20 Documents To PDF
R Benchmark 2.5: Overall mean
* ... menor é melhor
AIDA64: FP32 Ray-Trace | FPU Julia | CPU SHA3 | CPU Queen | FPU SinJulia | FPU Mandel | CPU AES | CPU ZLib | FP64 Ray-Trace | CPU PhotoWorxx
| Performance rating | |
| HP ZBook Fury 16 G10 | |
| Lenovo ThinkPad P16 G1 RTX A5500 | |
| Lenovo ThinkPad P1 G6 21FV001KUS | |
| Média Intel Core i7-13800H | |
| Dell Precision 5000 5680 | |
| Lenovo ThinkPad P1 G6-21FV000DGE | |
| Lenovo ThinkPad P1 G4-20Y4S0KS00 -9! | |
| AIDA64 / FP32 Ray-Trace | |
| HP ZBook Fury 16 G10 | |
| Lenovo ThinkPad P16 G1 RTX A5500 | |
| Lenovo ThinkPad P1 G6 21FV001KUS | |
| Média Intel Core i7-13800H (n=1) | |
| Lenovo ThinkPad P1 G6-21FV000DGE | |
| Dell Precision 5000 5680 | |
| AIDA64 / FPU Julia | |
| HP ZBook Fury 16 G10 | |
| Lenovo ThinkPad P16 G1 RTX A5500 | |
| Lenovo ThinkPad P1 G6 21FV001KUS | |
| Média Intel Core i7-13800H (n=1) | |
| Lenovo ThinkPad P1 G6-21FV000DGE | |
| Dell Precision 5000 5680 | |
| AIDA64 / CPU SHA3 | |
| HP ZBook Fury 16 G10 | |
| Lenovo ThinkPad P16 G1 RTX A5500 | |
| Lenovo ThinkPad P1 G6 21FV001KUS | |
| Média Intel Core i7-13800H (n=1) | |
| Lenovo ThinkPad P1 G6-21FV000DGE | |
| Dell Precision 5000 5680 | |
| AIDA64 / CPU Queen | |
| HP ZBook Fury 16 G10 | |
| Dell Precision 5000 5680 | |
| Lenovo ThinkPad P1 G6-21FV000DGE | |
| Lenovo ThinkPad P1 G6 21FV001KUS | |
| Média Intel Core i7-13800H (n=1) | |
| Lenovo ThinkPad P16 G1 RTX A5500 | |
| AIDA64 / FPU SinJulia | |
| HP ZBook Fury 16 G10 | |
| Lenovo ThinkPad P16 G1 RTX A5500 | |
| Lenovo ThinkPad P1 G6 21FV001KUS | |
| Média Intel Core i7-13800H (n=1) | |
| Lenovo ThinkPad P1 G6-21FV000DGE | |
| Dell Precision 5000 5680 | |
| AIDA64 / FPU Mandel | |
| HP ZBook Fury 16 G10 | |
| Lenovo ThinkPad P16 G1 RTX A5500 | |
| Lenovo ThinkPad P1 G6 21FV001KUS | |
| Média Intel Core i7-13800H (n=1) | |
| Lenovo ThinkPad P1 G6-21FV000DGE | |
| Dell Precision 5000 5680 | |
| AIDA64 / CPU AES | |
| HP ZBook Fury 16 G10 | |
| Lenovo ThinkPad P16 G1 RTX A5500 | |
| Lenovo ThinkPad P1 G6 21FV001KUS | |
| Média Intel Core i7-13800H (n=1) | |
| Lenovo ThinkPad P1 G6-21FV000DGE | |
| Dell Precision 5000 5680 | |
| AIDA64 / CPU ZLib | |
| HP ZBook Fury 16 G10 | |
| Lenovo ThinkPad P16 G1 RTX A5500 | |
| Lenovo ThinkPad P1 G6 21FV001KUS | |
| Média Intel Core i7-13800H (n=1) | |
| Lenovo ThinkPad P1 G6-21FV000DGE | |
| Dell Precision 5000 5680 | |
| Lenovo ThinkPad P1 G4-20Y4S0KS00 | |
| AIDA64 / FP64 Ray-Trace | |
| HP ZBook Fury 16 G10 | |
| Lenovo ThinkPad P16 G1 RTX A5500 | |
| Lenovo ThinkPad P1 G6 21FV001KUS | |
| Média Intel Core i7-13800H (n=1) | |
| Lenovo ThinkPad P1 G6-21FV000DGE | |
| Dell Precision 5000 5680 | |
| AIDA64 / CPU PhotoWorxx | |
| Dell Precision 5000 5680 | |
| Lenovo ThinkPad P16 G1 RTX A5500 | |
| HP ZBook Fury 16 G10 | |
| Lenovo ThinkPad P1 G6-21FV000DGE | |
| Lenovo ThinkPad P1 G6 21FV001KUS | |
| Média Intel Core i7-13800H (n=1) | |
Desempenho do sistema
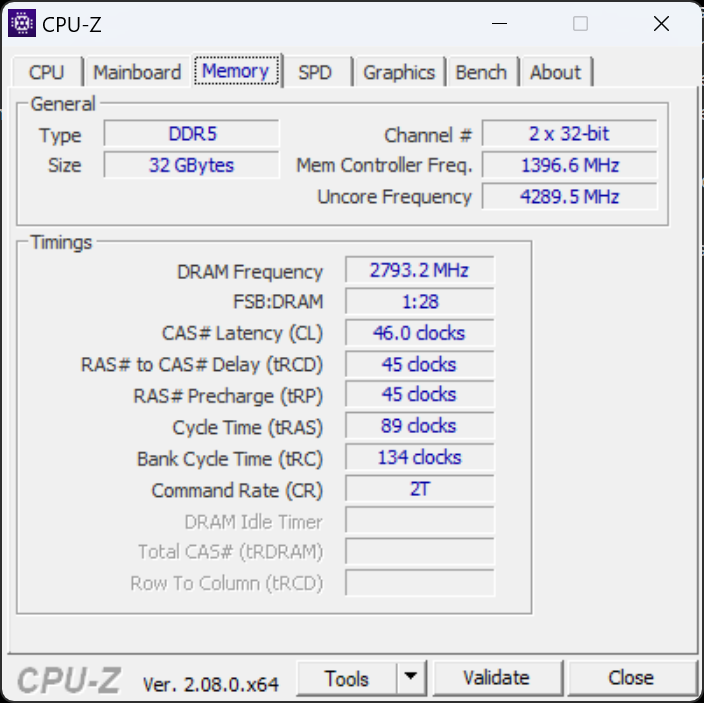
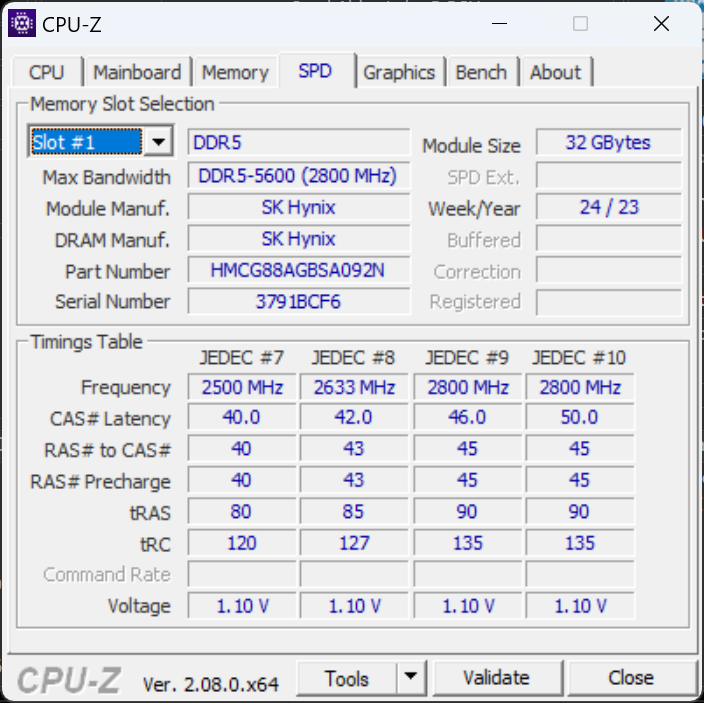
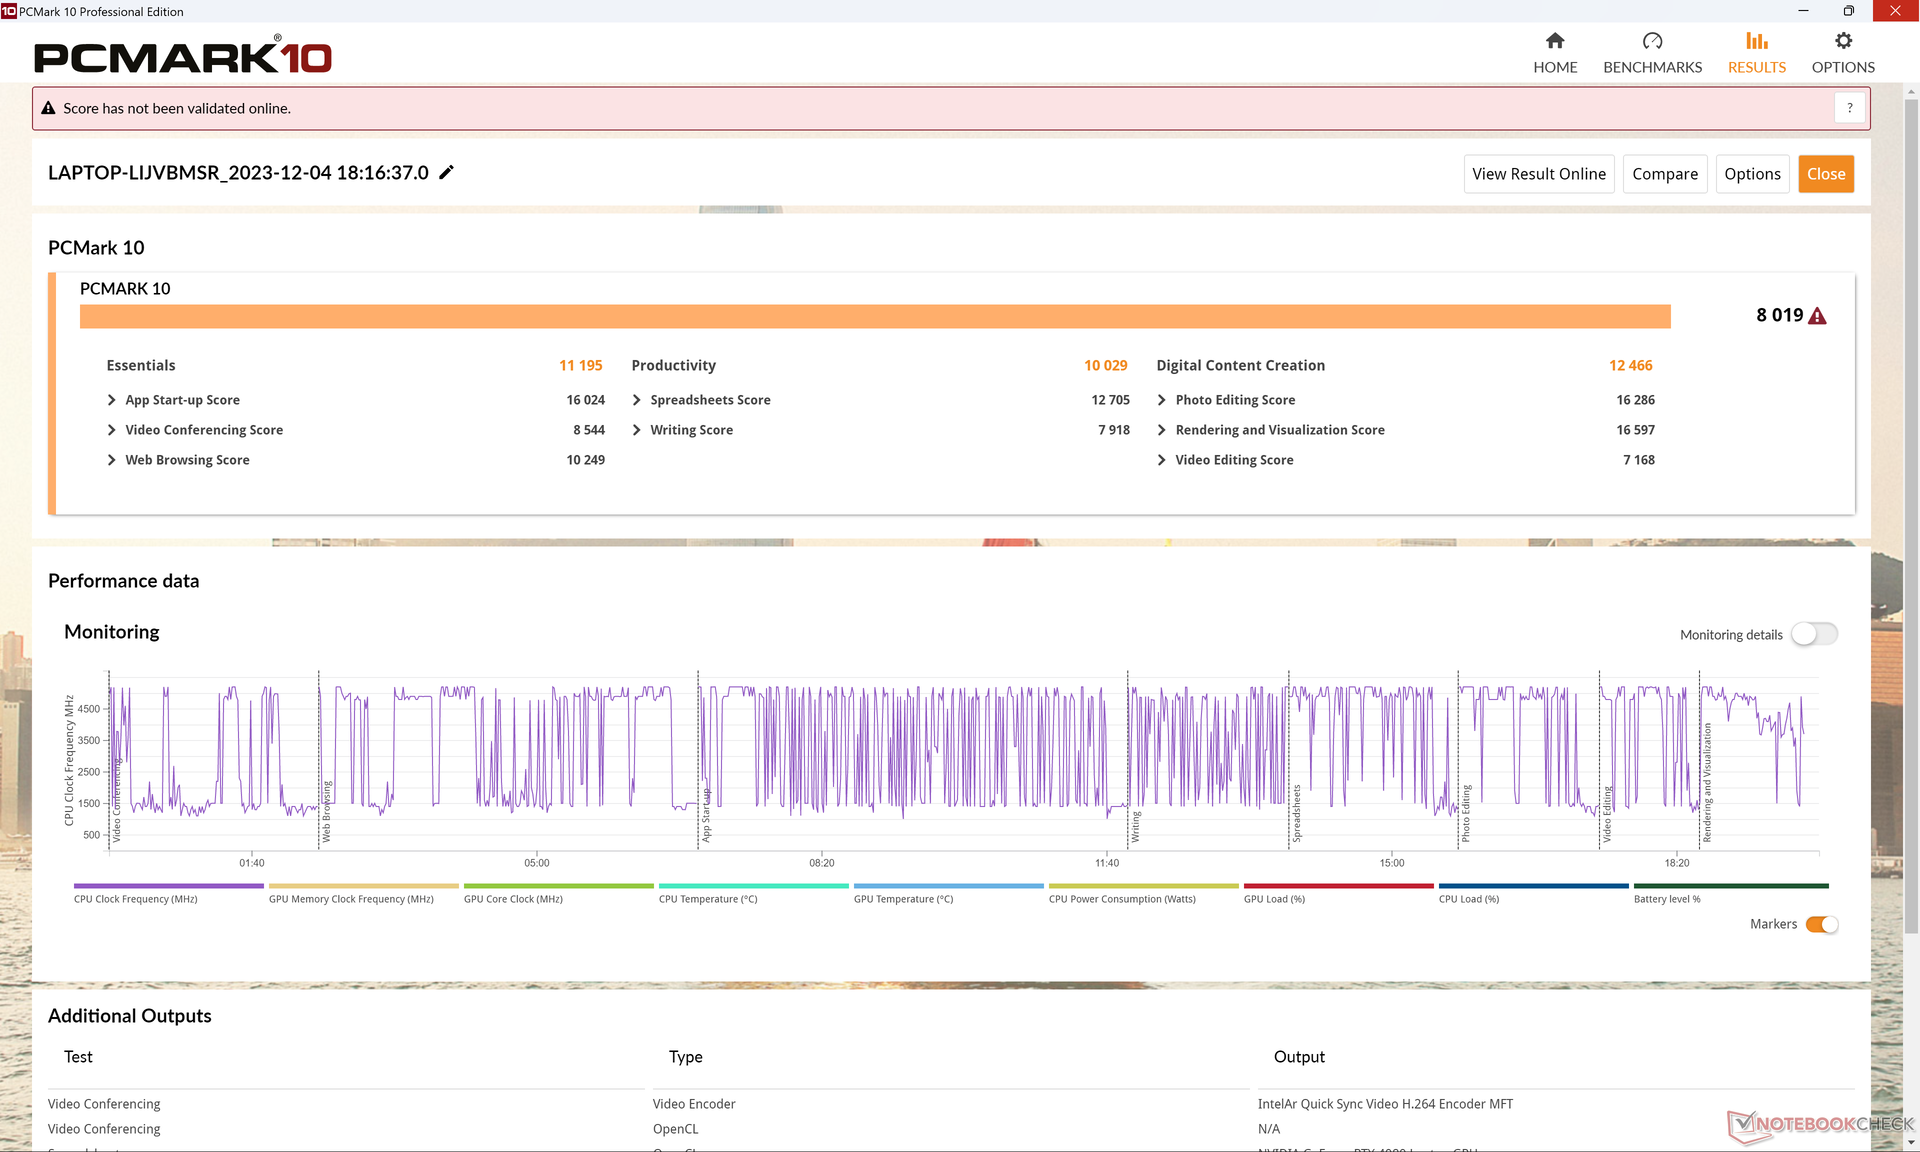
As pontuações do PCMark são comparáveis, se não ligeiramente mais rápidas do que a configuração do ThinkPad P1 G6 com RTX 2000, devido principalmente à GPU RTX 4080 mais rápida. Observe que o desempenho da memória é lento, pois nossa unidade foi configurada com apenas um módulo de RAM no modo de canal único em vez de dois.
CrossMark: Overall | Productivity | Creativity | Responsiveness
WebXPRT 3: Overall
WebXPRT 4: Overall
Mozilla Kraken 1.1: Total
| PCMark 10 / Score | |
| Dell Precision 5000 5680 | |
| HP ZBook Fury 16 G10 | |
| Lenovo ThinkPad P1 G6 21FV001KUS | |
| Média Intel Core i7-13800H, NVIDIA GeForce RTX 4080 Laptop GPU (n=1) | |
| Lenovo ThinkPad P1 G6-21FV000DGE | |
| Lenovo ThinkPad P16 G1 RTX A5500 | |
| Lenovo ThinkPad P1 G4-20Y4S0KS00 | |
| PCMark 10 / Essentials | |
| Dell Precision 5000 5680 | |
| Lenovo ThinkPad P1 G6 21FV001KUS | |
| Média Intel Core i7-13800H, NVIDIA GeForce RTX 4080 Laptop GPU (n=1) | |
| Lenovo ThinkPad P1 G6-21FV000DGE | |
| HP ZBook Fury 16 G10 | |
| Lenovo ThinkPad P16 G1 RTX A5500 | |
| Lenovo ThinkPad P1 G4-20Y4S0KS00 | |
| PCMark 10 / Productivity | |
| Dell Precision 5000 5680 | |
| Lenovo ThinkPad P1 G6 21FV001KUS | |
| Média Intel Core i7-13800H, NVIDIA GeForce RTX 4080 Laptop GPU (n=1) | |
| Lenovo ThinkPad P1 G6-21FV000DGE | |
| Lenovo ThinkPad P16 G1 RTX A5500 | |
| HP ZBook Fury 16 G10 | |
| Lenovo ThinkPad P1 G4-20Y4S0KS00 | |
| PCMark 10 / Digital Content Creation | |
| HP ZBook Fury 16 G10 | |
| Dell Precision 5000 5680 | |
| Lenovo ThinkPad P1 G6 21FV001KUS | |
| Média Intel Core i7-13800H, NVIDIA GeForce RTX 4080 Laptop GPU (n=1) | |
| Lenovo ThinkPad P1 G6-21FV000DGE | |
| Lenovo ThinkPad P1 G4-20Y4S0KS00 | |
| Lenovo ThinkPad P16 G1 RTX A5500 | |
| CrossMark / Overall | |
| Dell Precision 5000 5680 | |
| HP ZBook Fury 16 G10 | |
| Lenovo ThinkPad P16 G1 RTX A5500 | |
| Lenovo ThinkPad P1 G6-21FV000DGE | |
| Lenovo ThinkPad P1 G6 21FV001KUS | |
| Média Intel Core i7-13800H, NVIDIA GeForce RTX 4080 Laptop GPU (n=1) | |
| Lenovo ThinkPad P1 G4-20Y4S0KS00 | |
| CrossMark / Productivity | |
| HP ZBook Fury 16 G10 | |
| Dell Precision 5000 5680 | |
| Lenovo ThinkPad P1 G6-21FV000DGE | |
| Lenovo ThinkPad P16 G1 RTX A5500 | |
| Lenovo ThinkPad P1 G6 21FV001KUS | |
| Média Intel Core i7-13800H, NVIDIA GeForce RTX 4080 Laptop GPU (n=1) | |
| Lenovo ThinkPad P1 G4-20Y4S0KS00 | |
| CrossMark / Creativity | |
| Lenovo ThinkPad P16 G1 RTX A5500 | |
| Dell Precision 5000 5680 | |
| HP ZBook Fury 16 G10 | |
| Lenovo ThinkPad P1 G6 21FV001KUS | |
| Média Intel Core i7-13800H, NVIDIA GeForce RTX 4080 Laptop GPU (n=1) | |
| Lenovo ThinkPad P1 G6-21FV000DGE | |
| Lenovo ThinkPad P1 G4-20Y4S0KS00 | |
| CrossMark / Responsiveness | |
| HP ZBook Fury 16 G10 | |
| Lenovo ThinkPad P1 G6-21FV000DGE | |
| Dell Precision 5000 5680 | |
| Lenovo ThinkPad P1 G6 21FV001KUS | |
| Média Intel Core i7-13800H, NVIDIA GeForce RTX 4080 Laptop GPU (n=1) | |
| Lenovo ThinkPad P1 G4-20Y4S0KS00 | |
| Lenovo ThinkPad P16 G1 RTX A5500 | |
| WebXPRT 3 / Overall | |
| Dell Precision 5000 5680 | |
| HP ZBook Fury 16 G10 | |
| Lenovo ThinkPad P1 G6-21FV000DGE | |
| Lenovo ThinkPad P16 G1 RTX A5500 | |
| Lenovo ThinkPad P1 G6 21FV001KUS | |
| Média Intel Core i7-13800H, NVIDIA GeForce RTX 4080 Laptop GPU (n=1) | |
| Lenovo ThinkPad P1 G4-20Y4S0KS00 | |
| WebXPRT 4 / Overall | |
| Lenovo ThinkPad P1 G6-21FV000DGE | |
| HP ZBook Fury 16 G10 | |
| Dell Precision 5000 5680 | |
| Lenovo ThinkPad P1 G6 21FV001KUS | |
| Média Intel Core i7-13800H, NVIDIA GeForce RTX 4080 Laptop GPU (n=1) | |
| Lenovo ThinkPad P16 G1 RTX A5500 | |
| Mozilla Kraken 1.1 / Total | |
| Lenovo ThinkPad P1 G4-20Y4S0KS00 | |
| Lenovo ThinkPad P16 G1 RTX A5500 | |
| Lenovo ThinkPad P1 G6 21FV001KUS | |
| Média Intel Core i7-13800H, NVIDIA GeForce RTX 4080 Laptop GPU (n=1) | |
| Dell Precision 5000 5680 | |
| Lenovo ThinkPad P1 G6-21FV000DGE | |
| HP ZBook Fury 16 G10 | |
* ... menor é melhor
| PCMark 10 Score | 8019 pontos | |
Ajuda | ||
| AIDA64 / Memory Copy | |
| Dell Precision 5000 5680 | |
| Lenovo ThinkPad P16 G1 RTX A5500 | |
| HP ZBook Fury 16 G10 | |
| Lenovo ThinkPad P1 G6-21FV000DGE | |
| Lenovo ThinkPad P1 G6 21FV001KUS | |
| Média Intel Core i7-13800H (n=1) | |
| AIDA64 / Memory Read | |
| Dell Precision 5000 5680 | |
| Lenovo ThinkPad P16 G1 RTX A5500 | |
| HP ZBook Fury 16 G10 | |
| Lenovo ThinkPad P1 G6 21FV001KUS | |
| Média Intel Core i7-13800H (n=1) | |
| Lenovo ThinkPad P1 G6-21FV000DGE | |
| AIDA64 / Memory Write | |
| Dell Precision 5000 5680 | |
| Lenovo ThinkPad P16 G1 RTX A5500 | |
| HP ZBook Fury 16 G10 | |
| Lenovo ThinkPad P1 G6 21FV001KUS | |
| Média Intel Core i7-13800H (n=1) | |
| Lenovo ThinkPad P1 G6-21FV000DGE | |
| AIDA64 / Memory Latency | |
| HP ZBook Fury 16 G10 | |
| Dell Precision 5000 5680 | |
| Lenovo ThinkPad P16 G1 RTX A5500 | |
| Lenovo ThinkPad P1 G6 21FV001KUS | |
| Média Intel Core i7-13800H (n=1) | |
| Lenovo ThinkPad P1 G6-21FV000DGE | |
| Lenovo ThinkPad P1 G4-20Y4S0KS00 | |
* ... menor é melhor
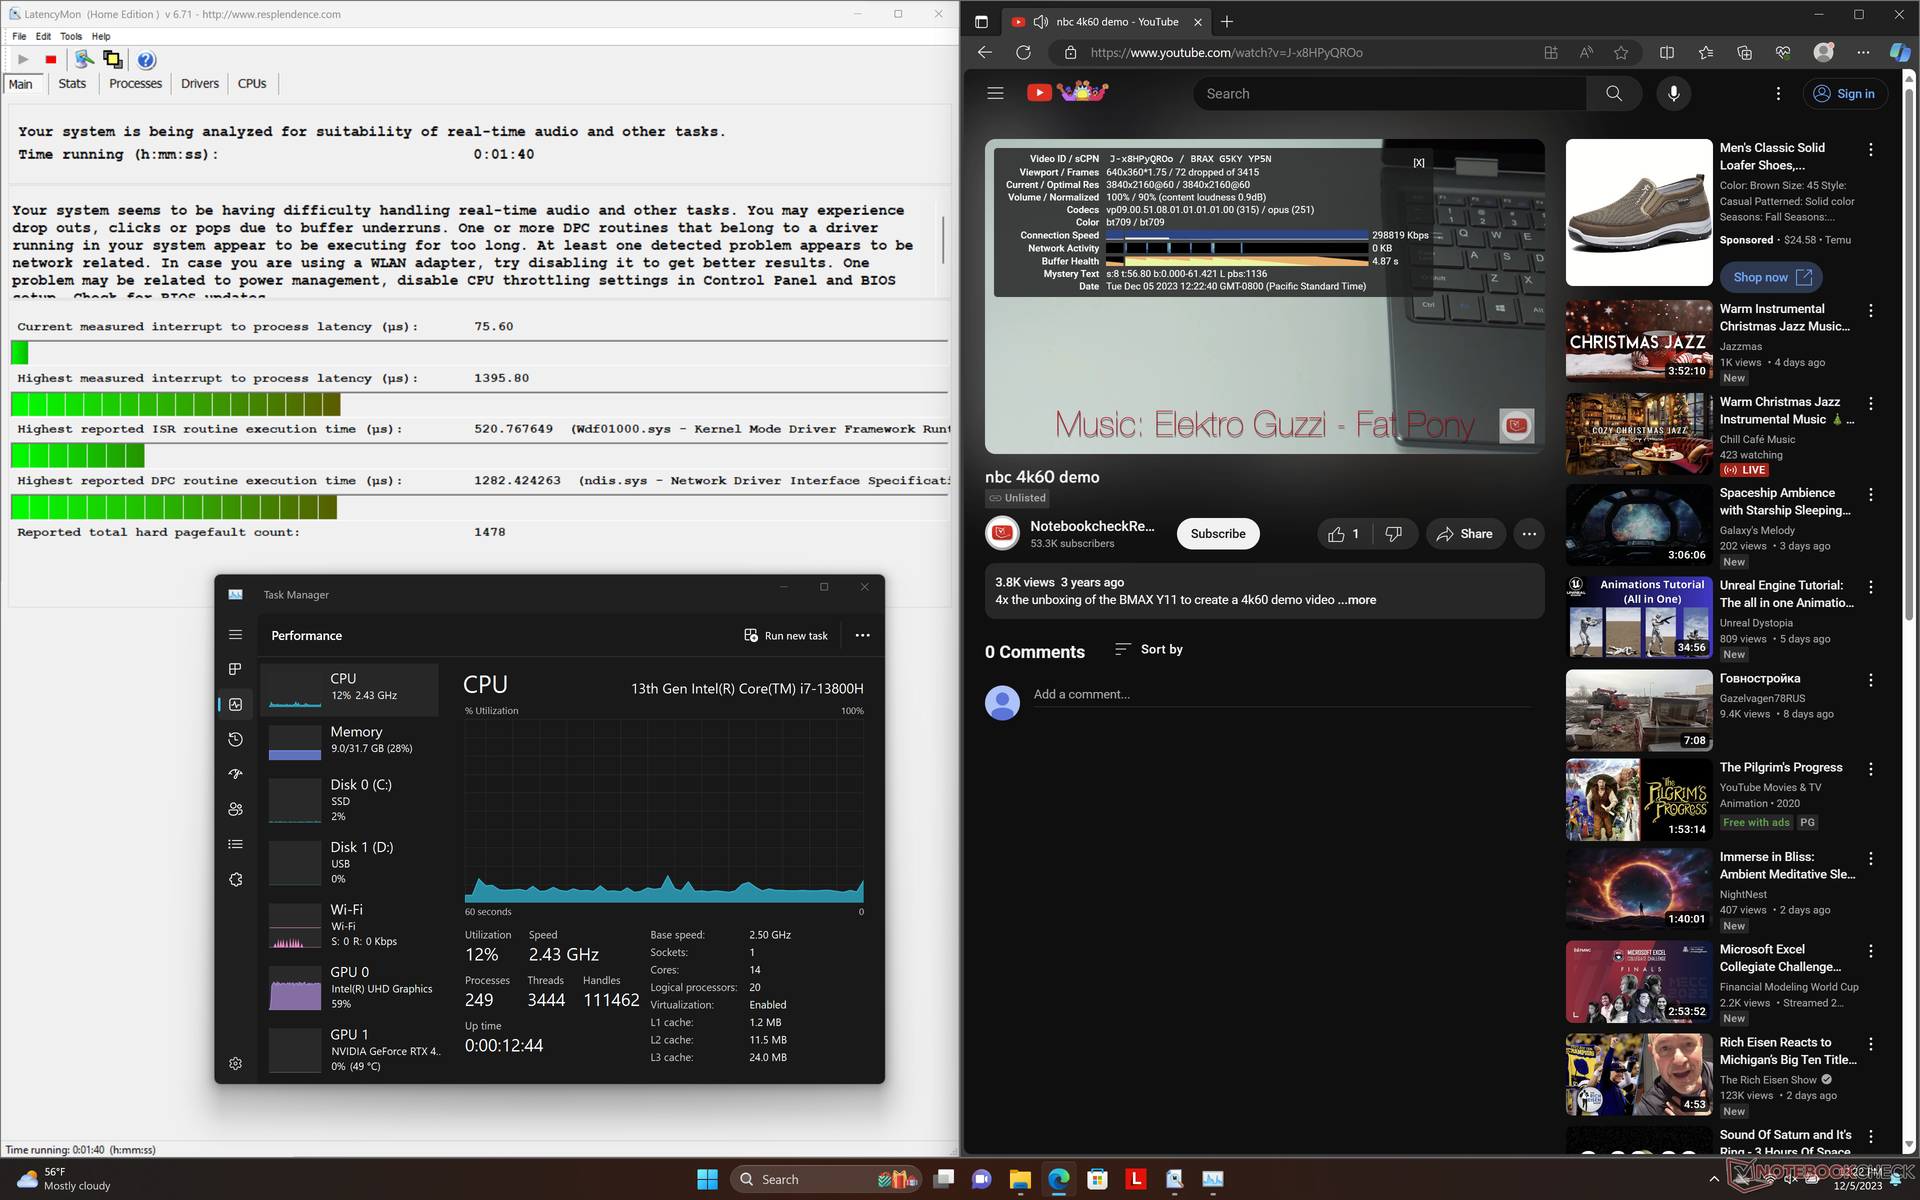
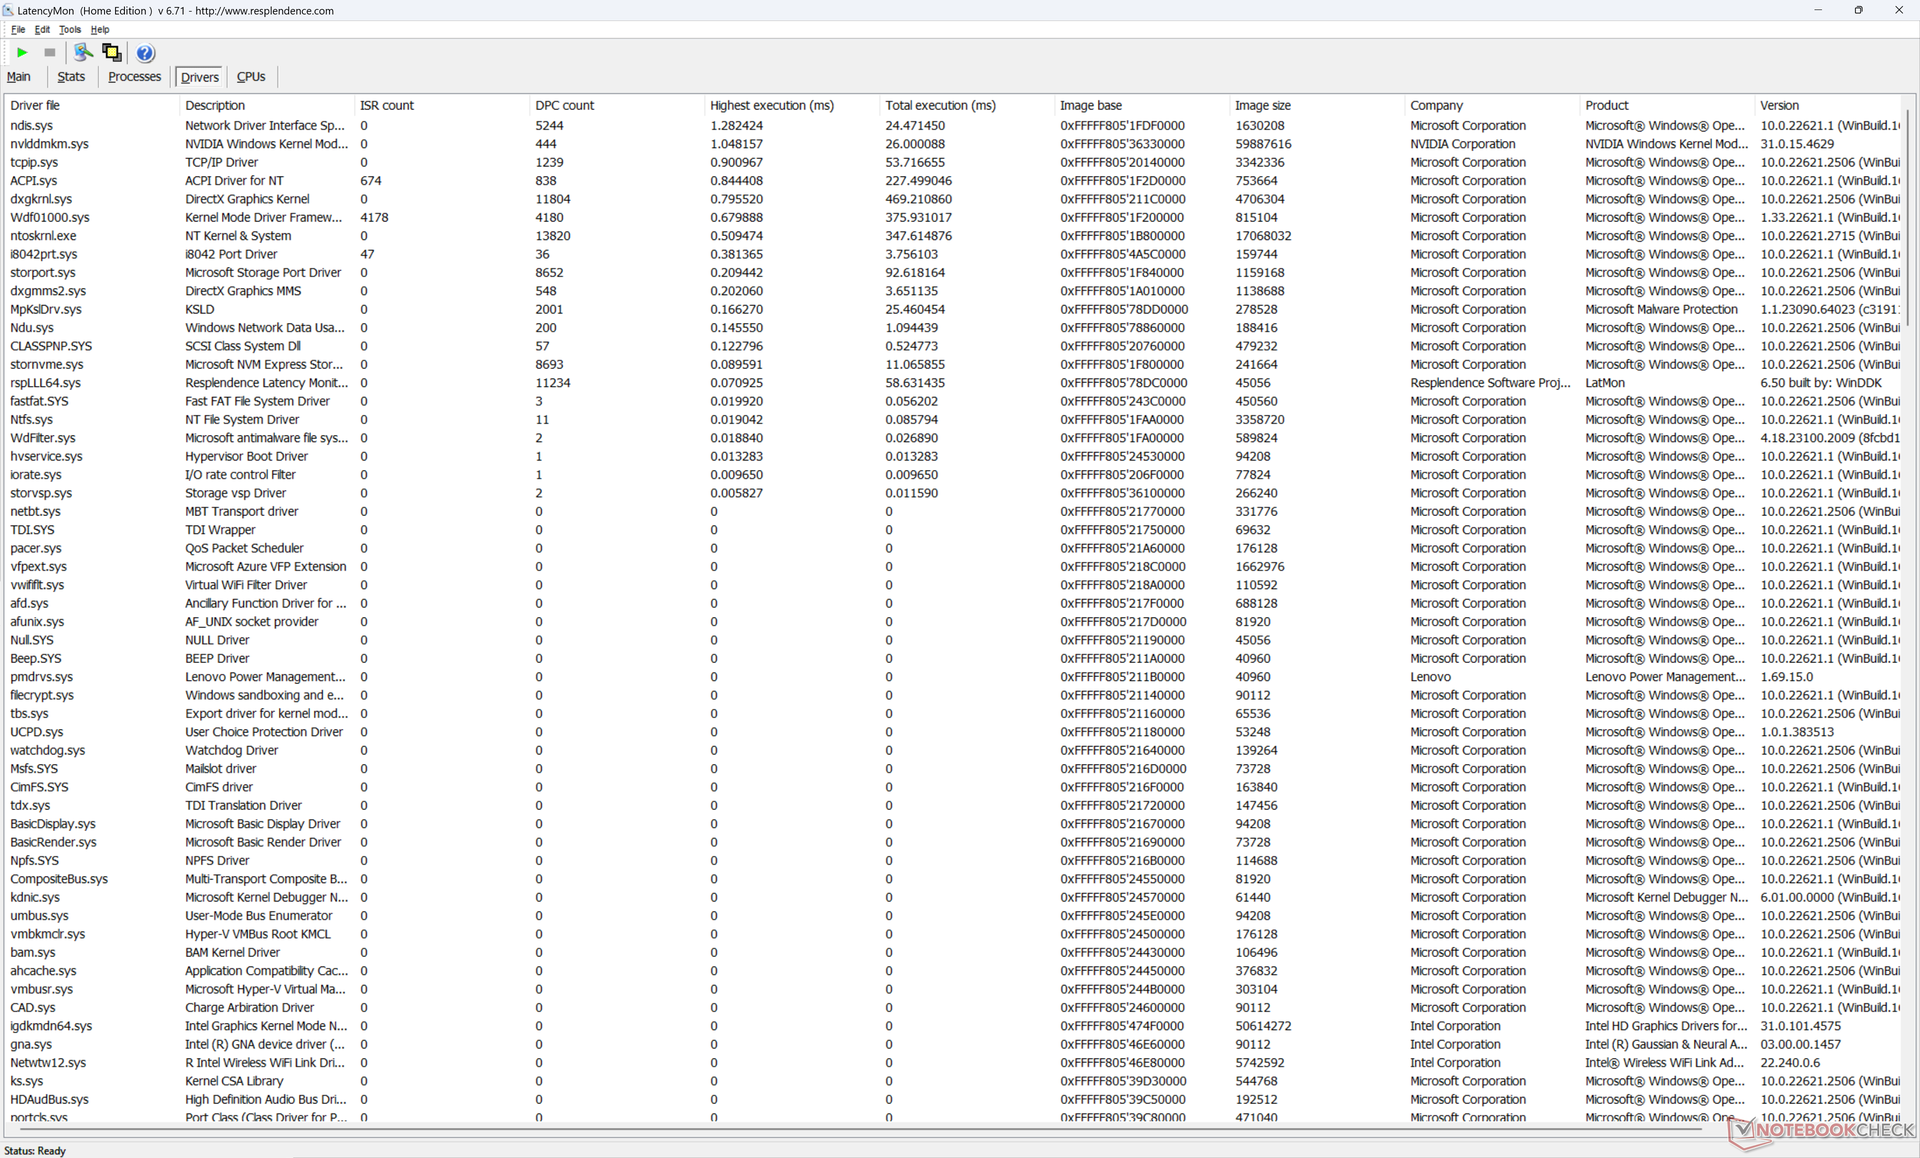
Latência DPC
O LatencyMon revela problemas de DPC ao abrir várias guias do navegador em nossa página inicial e 75 quadros perdidos ao reproduzir um vídeo 4K60 com um minuto de duração. Esse último é particularmente decepcionante, considerando o preço e o aspecto profissional do modelo. Isso também sugere problemas de driver ou manuseio inadequado de aplicativos em segundo plano que poderiam interromper a janela em foco.
| DPC Latencies / LatencyMon - interrupt to process latency (max), Web, Youtube, Prime95 | |
| HP ZBook Fury 16 G10 | |
| Lenovo ThinkPad P1 G6-21FV000DGE | |
| Dell Precision 5000 5680 | |
| Lenovo ThinkPad P16 G1 RTX A5500 | |
| Lenovo ThinkPad P1 G6 21FV001KUS | |
| Lenovo ThinkPad P1 G4-20Y4S0KS00 | |
* ... menor é melhor
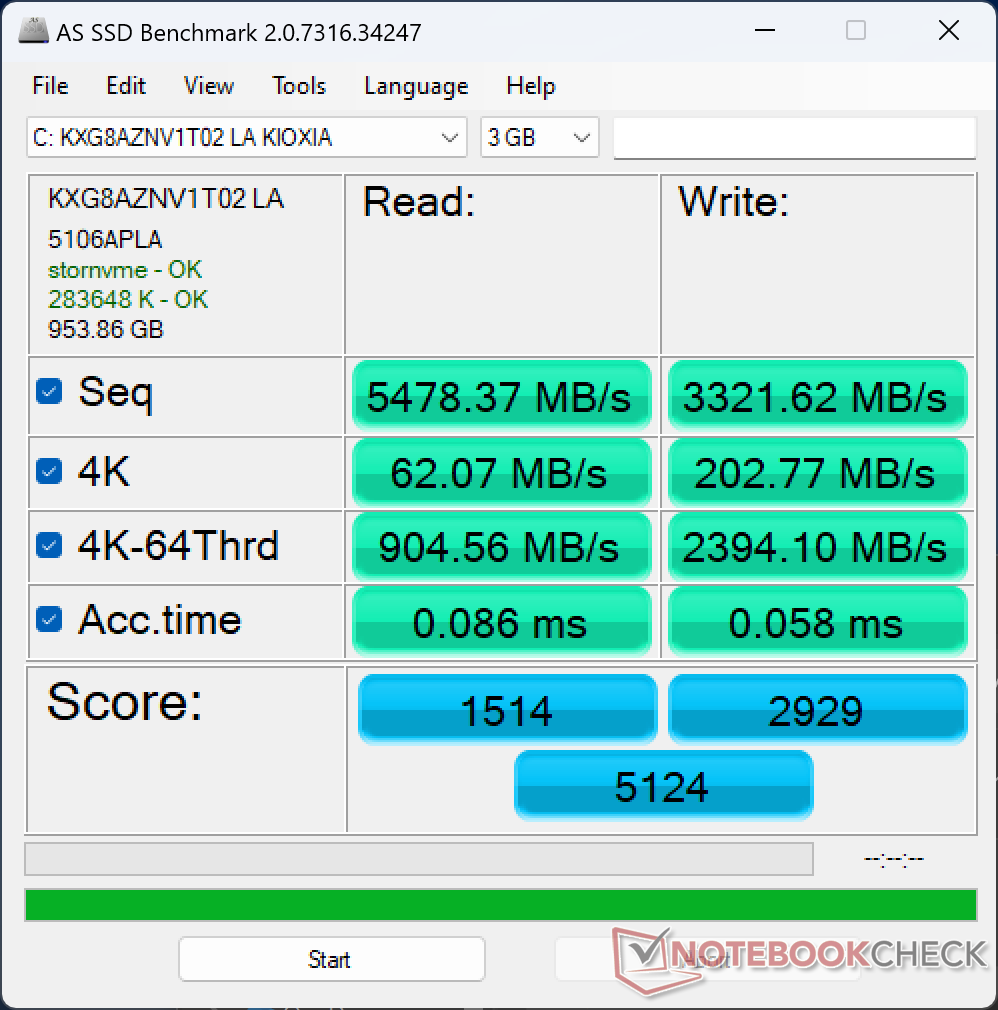
Dispositivos de armazenamento
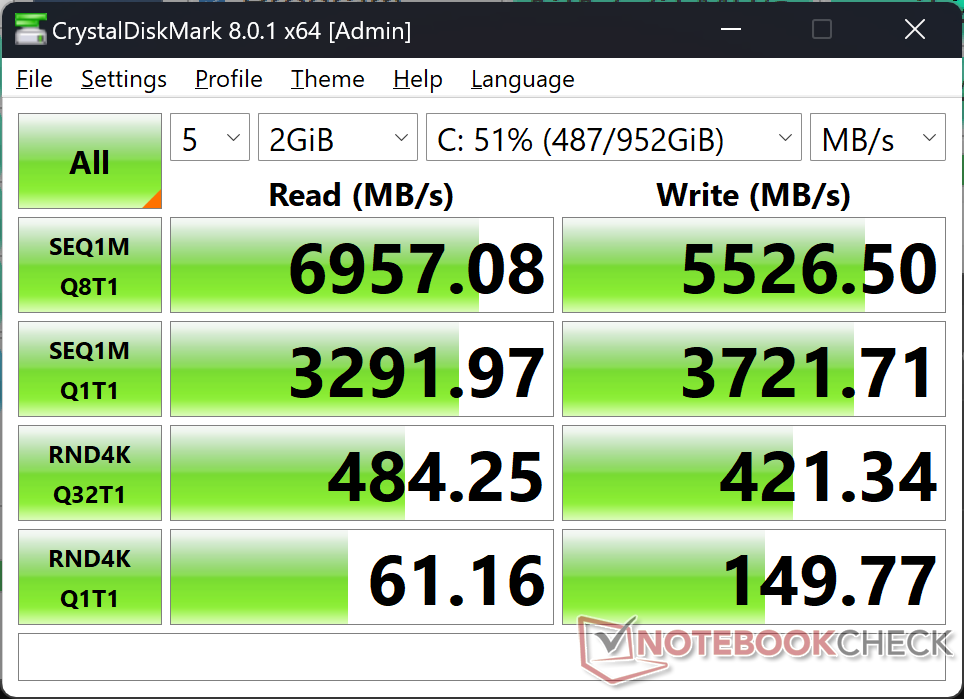
Nossa unidade de teste vem com o Kioxia XG8 KXG8AZNV1T02 em vez do SK Hynix PC711 do nosso ThinkPad P1 G6 original. O desempenho geral é, em geral, mais lento, principalmente ao gravar dados, mas as taxas de leitura são excelentes, com apenas uma leve aceleração após cerca de 3 minutos de estresse.
Observe que determinadas configurações do ThinkPad P1 G6 podem suportar mais de um SSD M.2 interno. No entanto, essa configuração específica de análise suporta apenas uma unidade.

* ... menor é melhor
Disk Throttling: DiskSpd Read Loop, Queue Depth 8
Desempenho da GPU
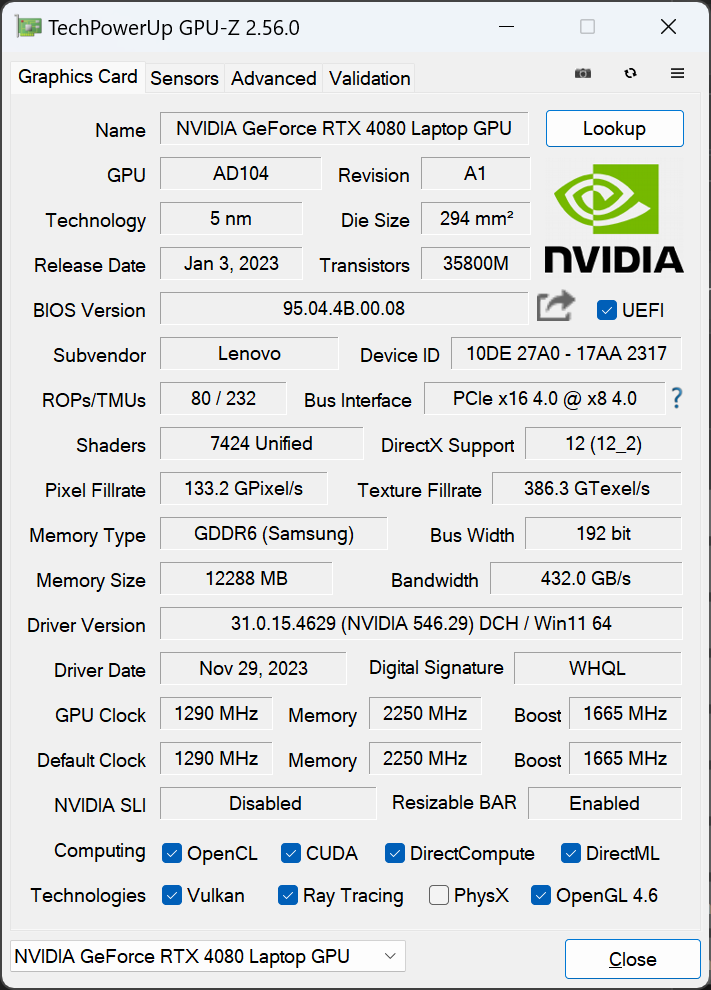
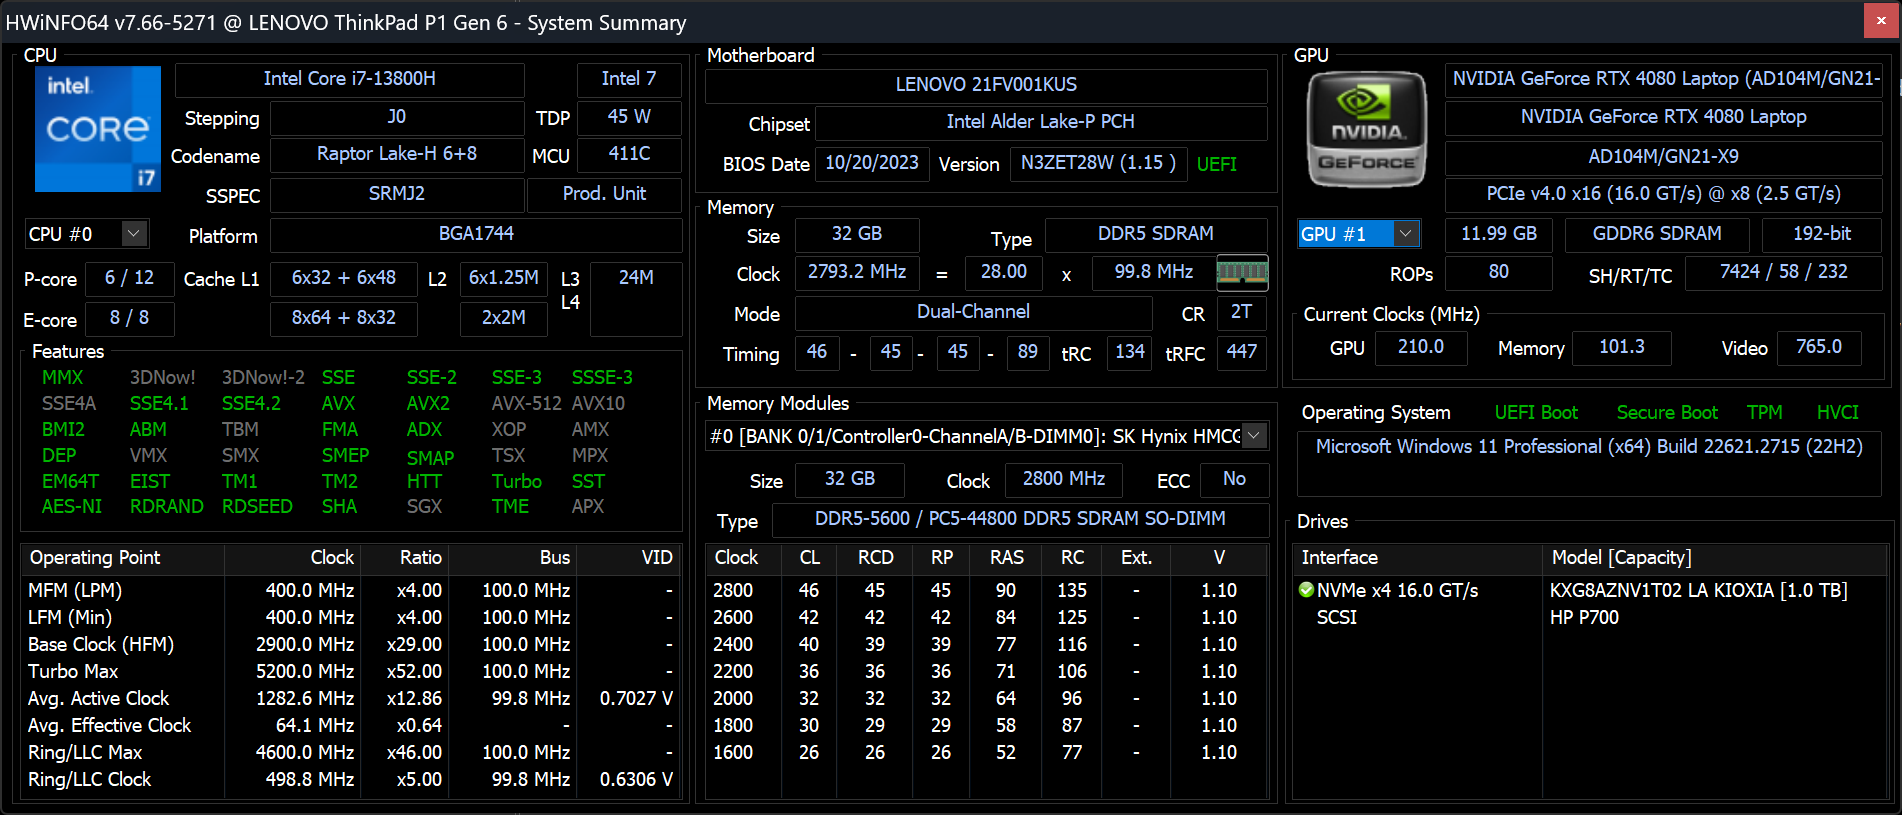
O painel de controle da Nvidia lista uma potência gráfica máxima de 105 W. Na realidade, porém, só conseguimos atingir um máximo de 80 W, de acordo com o GPU-Z. Posteriormente, o desempenho geral é de 15% a 20% mais lento do que o de um laptop médio em nosso banco de dados com a mesma GPU móvel GeForce RTX 4080, pois essa GPU específica é mais comumente executada em limites máximos de potência mais altos.
Independentemente disso, o desempenho gráfico ainda está bem à frente da RTX 2000 na maioria dos benchmarks, exceto nos testes Specviewperf Siemens NX e Medical. Para um desempenho mais rápido, a Lenovo oferece o RTX 5000 na configuração mais alta.
A execução no modo Balanced em vez do modo Performance afeta o desempenho da GPU, enquanto a CPU permanece praticamente inalterada, como mostram os resultados do Fire Strike na tabela abaixo.
| Perfil de potência | Pontuação de física | Pontuação de gráficos | Pontuação combinada |
| Modo de desempenho | 29543 | 33402 | 12423 |
| Modo equilibrado | 30978 (-0%) | 25806 (-23%) | 9616 (-23%) |
| Energia da bateria | 21163 (-28%) | 18870 (-44%) | 4960 (-60%) |
| 3DMark Performance rating - Percent | |
| Razer Blade 16 Early 2023 RTX 4090 -34! | |
| HP ZBook Fury 16 G10 -1! | |
| Lenovo ThinkPad P16 G1 RTX A5500 -1! | |
| Média NVIDIA GeForce RTX 4080 Laptop GPU -1! | |
| Lenovo ThinkPad P1 G6 21FV001KUS -1! | |
| Lenovo ThinkPad P1 G6-21FV000DGE -17! | |
| Asus ProArt Studiobook 16 OLED H7604 -17! | |
| Gigabyte Aero 16 YE5 -2! | |
| Lenovo ThinkPad P1 G4-20Y4S0KS00 -11! | |
| Lenovo ThinkPad X1 Extreme G4-20Y5CTO1WW (3050 Ti) -36! | |
| LG Gram 2in1 16 16T90R - G.AA78G -36! | |
| 3DMark 11 Performance | 38087 pontos | |
| 3DMark Fire Strike Score | 28105 pontos | |
| 3DMark Time Spy Score | 13863 pontos | |
Ajuda | ||
* ... menor é melhor
| F1 22 | |
| 1920x1080 Ultra High Preset AA:T AF:16x | |
| Média NVIDIA GeForce RTX 4080 Laptop GPU (72.3 - 124.2, n=15) | |
| HP ZBook Fury 16 G10 | |
| Lenovo ThinkPad P1 G6 21FV001KUS | |
| Asus ProArt Studiobook 16 OLED H7604 | |
| Lenovo ThinkPad P1 G6-21FV000DGE | |
| 2560x1440 Ultra High Preset AA:T AF:16x | |
| Média NVIDIA GeForce RTX 4080 Laptop GPU (55.4 - 79, n=13) | |
| HP ZBook Fury 16 G10 | |
| Lenovo ThinkPad P1 G6 21FV001KUS | |
| Asus ProArt Studiobook 16 OLED H7604 | |
| Lenovo ThinkPad P1 G6-21FV000DGE | |
| 3840x2160 Ultra High Preset AA:T AF:16x | |
| Média NVIDIA GeForce RTX 4080 Laptop GPU (25.8 - 39.8, n=10) | |
| HP ZBook Fury 16 G10 | |
| Lenovo ThinkPad P1 G6 21FV001KUS | |
| Tiny Tina's Wonderlands | |
| 1920x1080 Badass Preset (DX12) | |
| Média NVIDIA GeForce RTX 4080 Laptop GPU (112.9 - 167.1, n=9) | |
| HP ZBook Fury 16 G10 | |
| Lenovo ThinkPad P1 G6 21FV001KUS | |
| 2560x1440 Badass Preset (DX12) | |
| Média NVIDIA GeForce RTX 4080 Laptop GPU (85 - 114.8, n=9) | |
| HP ZBook Fury 16 G10 | |
| Lenovo ThinkPad P1 G6 21FV001KUS | |
| 3840x2160 Badass Preset (DX12) | |
| Média NVIDIA GeForce RTX 4080 Laptop GPU (46.4 - 60.9, n=9) | |
| HP ZBook Fury 16 G10 | |
| Lenovo ThinkPad P1 G6 21FV001KUS | |
| Baldur's Gate 3 | |
| 1920x1080 Ultra Preset AA:T | |
| Média NVIDIA GeForce RTX 4080 Laptop GPU (111.8 - 181.2, n=7) | |
| Lenovo ThinkPad P1 G6 21FV001KUS | |
| Apple MacBook Pro 16 2023 M3 Pro | |
| 2560x1440 Ultra Preset AA:T | |
| Média NVIDIA GeForce RTX 4080 Laptop GPU (88.3 - 129.3, n=7) | |
| Lenovo ThinkPad P1 G6 21FV001KUS | |
| 3840x2160 Ultra Preset AA:T | |
| Média NVIDIA GeForce RTX 4080 Laptop GPU (48.8 - 68.4, n=5) | |
| Lenovo ThinkPad P1 G6 21FV001KUS | |
| Cyberpunk 2077 | |
| 1920x1080 Ultra Preset (FSR off) | |
| Média NVIDIA GeForce RTX 4080 Laptop GPU (83.9 - 127.1, n=15) | |
| Lenovo ThinkPad P1 G6 21FV001KUS | |
| Apple MacBook Pro 16 2023 M3 Pro | |
| LG Gram 2in1 16 16T90R - G.AA78G | |
| 2560x1440 Ultra Preset (FSR off) | |
| Média NVIDIA GeForce RTX 4080 Laptop GPU (56.2 - 86.3, n=15) | |
| Lenovo ThinkPad P1 G6 21FV001KUS | |
| 3840x2160 Ultra Preset (FSR off) | |
| Média NVIDIA GeForce RTX 4080 Laptop GPU (25.8 - 39.8, n=8) | |
| Lenovo ThinkPad P1 G6 21FV001KUS | |
| 3840x2160 Ray Tracing Ultra Preset + DLSS3 Quality + FG | |
| Média NVIDIA GeForce RTX 4080 Laptop GPU (48.4 - 58.5, n=4) | |
| Lenovo ThinkPad P1 G6 21FV001KUS | |
As taxas de quadros quando em marcha lenta no Witcher 3 se mantiveram estáveis durante todo o tempo, exceto por uma instância em que o desempenho caiu para a faixa de 90 FPS, conforme mostrado no gráfico abaixo. A queda repentina provavelmente se deve ao manuseio inadequado dos aplicativos em segundo plano.
Witcher 3 FPS Chart
| baixo | média | alto | ultra | QHD | 4K | |
|---|---|---|---|---|---|---|
| GTA V (2015) | 120.3 | 106.4 | 120.3 | |||
| The Witcher 3 (2015) | 130.4 | 78.5 | ||||
| Dota 2 Reborn (2015) | 191.8 | 169 | 155.8 | 147.3 | 144.6 | |
| Final Fantasy XV Benchmark (2018) | 135.3 | 102.6 | 61.5 | |||
| X-Plane 11.11 (2018) | 171.1 | 150.8 | 118.6 | 103 | ||
| Far Cry 5 (2018) | 149 | 126 | 71 | |||
| Tiny Tina's Wonderlands (2022) | 118.6 | 85 | 46.4 | |||
| F1 22 (2022) | 202 | 81.5 | 55.4 | 29.7 | ||
| Baldur's Gate 3 (2023) | 124.8 | 88.7 | 48.8 | |||
| Cyberpunk 2077 (2023) | 103.8 | 90.9 | 59.9 | 25.8 |
Emissões
Ruído do sistema
O ruído da ventoinha é mais alto do que na configuração com RTX 2000 ao executar cargas exigentes. Ao executar o Witcher 3, por exemplo, o ruído da ventoinha varia entre 47 e 55 dB(A), em comparação com apenas 41 a 48 dB(A) na configuração menor. Por outro lado, o sistema faz um excelente trabalho em permanecer silencioso por longos períodos ao executar processos mais simples, como navegadores ou streaming de vídeo.
Barulho
| Ocioso |
| 22.5 / 22.5 / 22.5 dB |
| Carga |
| 28.7 / 54.4 dB |
 | ||
30 dB silencioso 40 dB(A) audível 50 dB(A) ruidosamente alto |
||
min: | ||
| Lenovo ThinkPad P1 G6 21FV001KUS GeForce RTX 4080 Laptop GPU, i7-13800H, Kioxia XG8 KXG8AZNV1T02 | Lenovo ThinkPad P1 G6-21FV000DGE RTX 2000 Ada Generation Laptop, i9-13900H, SK Hynix PC711 1TB HFS001TDE9X084N | Lenovo ThinkPad P1 G4-20Y4S0KS00 GeForce RTX 3070 Laptop GPU, i7-11850H, Samsung PM9A1 MZVL21T0HCLR | Lenovo ThinkPad P16 G1 RTX A5500 RTX A5500 Laptop GPU, i9-12950HX, WDC PC SN810 2TB | Dell Precision 5000 5680 RTX 5000 Ada Generation Laptop, i9-13900H, 2x SK hynix PC801 HFS512GEJ9X101N RAID 0 | HP ZBook Fury 16 G10 RTX 5000 Ada Generation Laptop, i9-13950HX, SK hynix PC801 HFS001TEJ9X101N | |
|---|---|---|---|---|---|---|
| Noise | -11% | -9% | -2% | -5% | -7% | |
| desligado / ambiente * (dB) | 22.5 | 24.5 -9% | 23.8 -6% | 23.1 -3% | 22.8 -1% | 22.9 -2% |
| Idle Minimum * (dB) | 22.5 | 24.5 -9% | 23.8 -6% | 23.1 -3% | 23 -2% | 22.9 -2% |
| Idle Average * (dB) | 22.5 | 24.5 -9% | 23.8 -6% | 23.1 -3% | 23 -2% | 22.9 -2% |
| Idle Maximum * (dB) | 22.5 | 24.5 -9% | 28.3 -26% | 23.1 -3% | 23 -2% | 28.5 -27% |
| Load Average * (dB) | 28.7 | 48 -67% | 38.6 -34% | 28.9 -1% | 37.2 -30% | 40.6 -41% |
| Witcher 3 ultra * (dB) | 47.5 | 40.7 14% | 47.4 -0% | 51.6 -9% | 51 -7% | 44.1 7% |
| Load Maximum * (dB) | 54.4 | 48 12% | 47.4 13% | 51.4 6% | 51 6% | 45.8 16% |
* ... menor é melhor
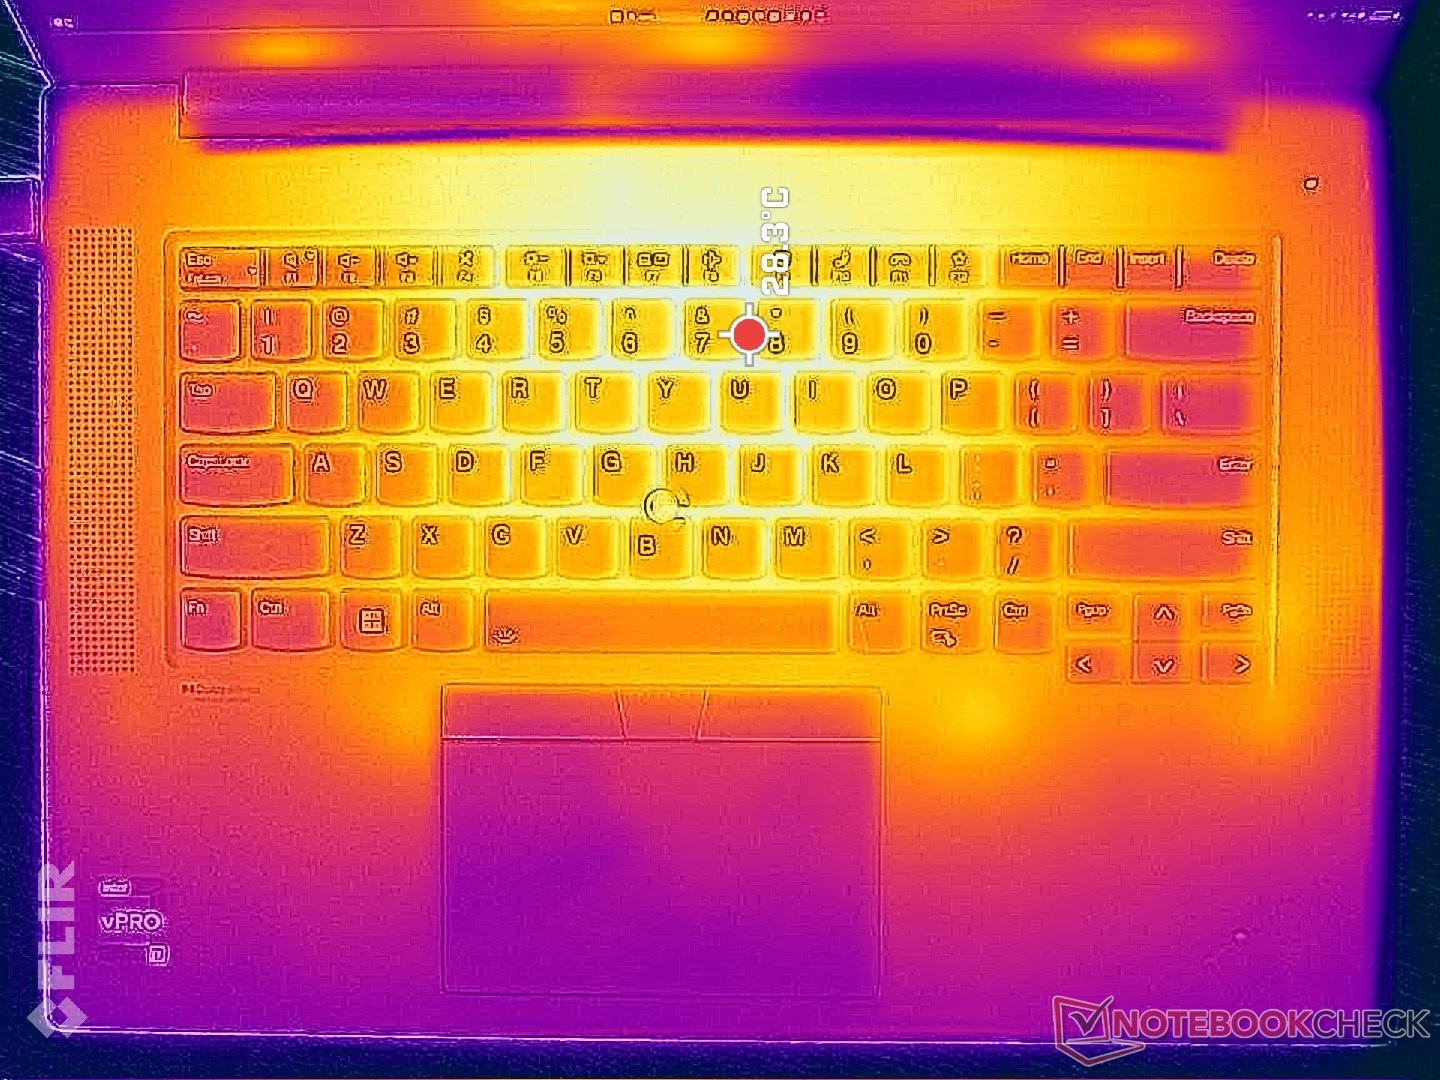
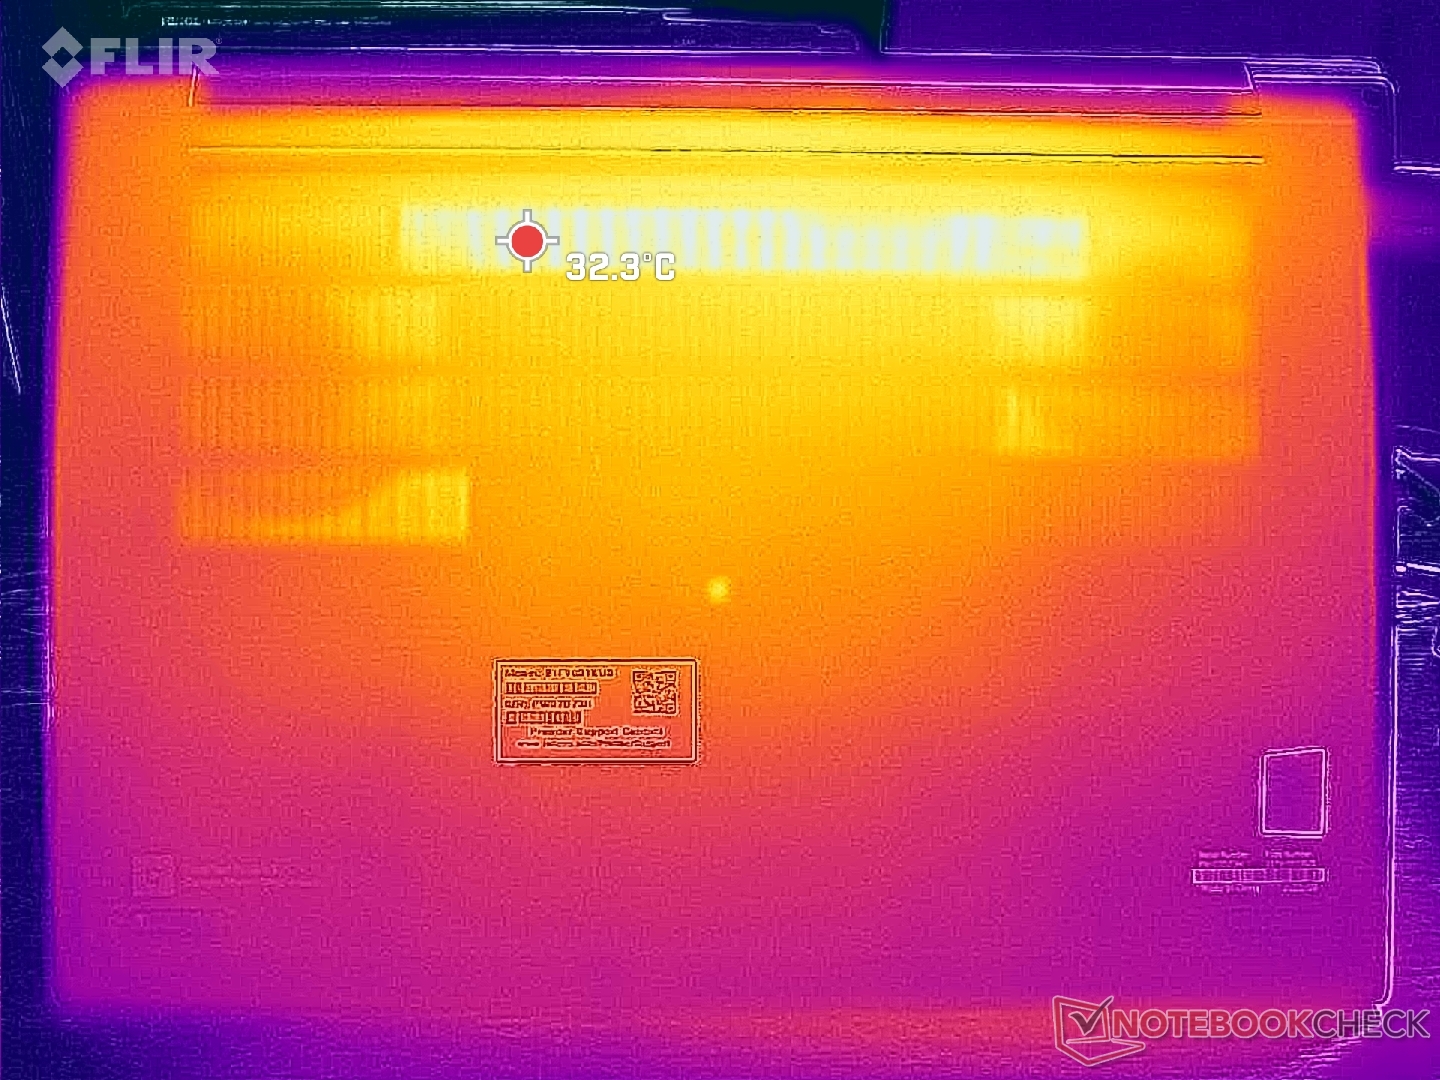
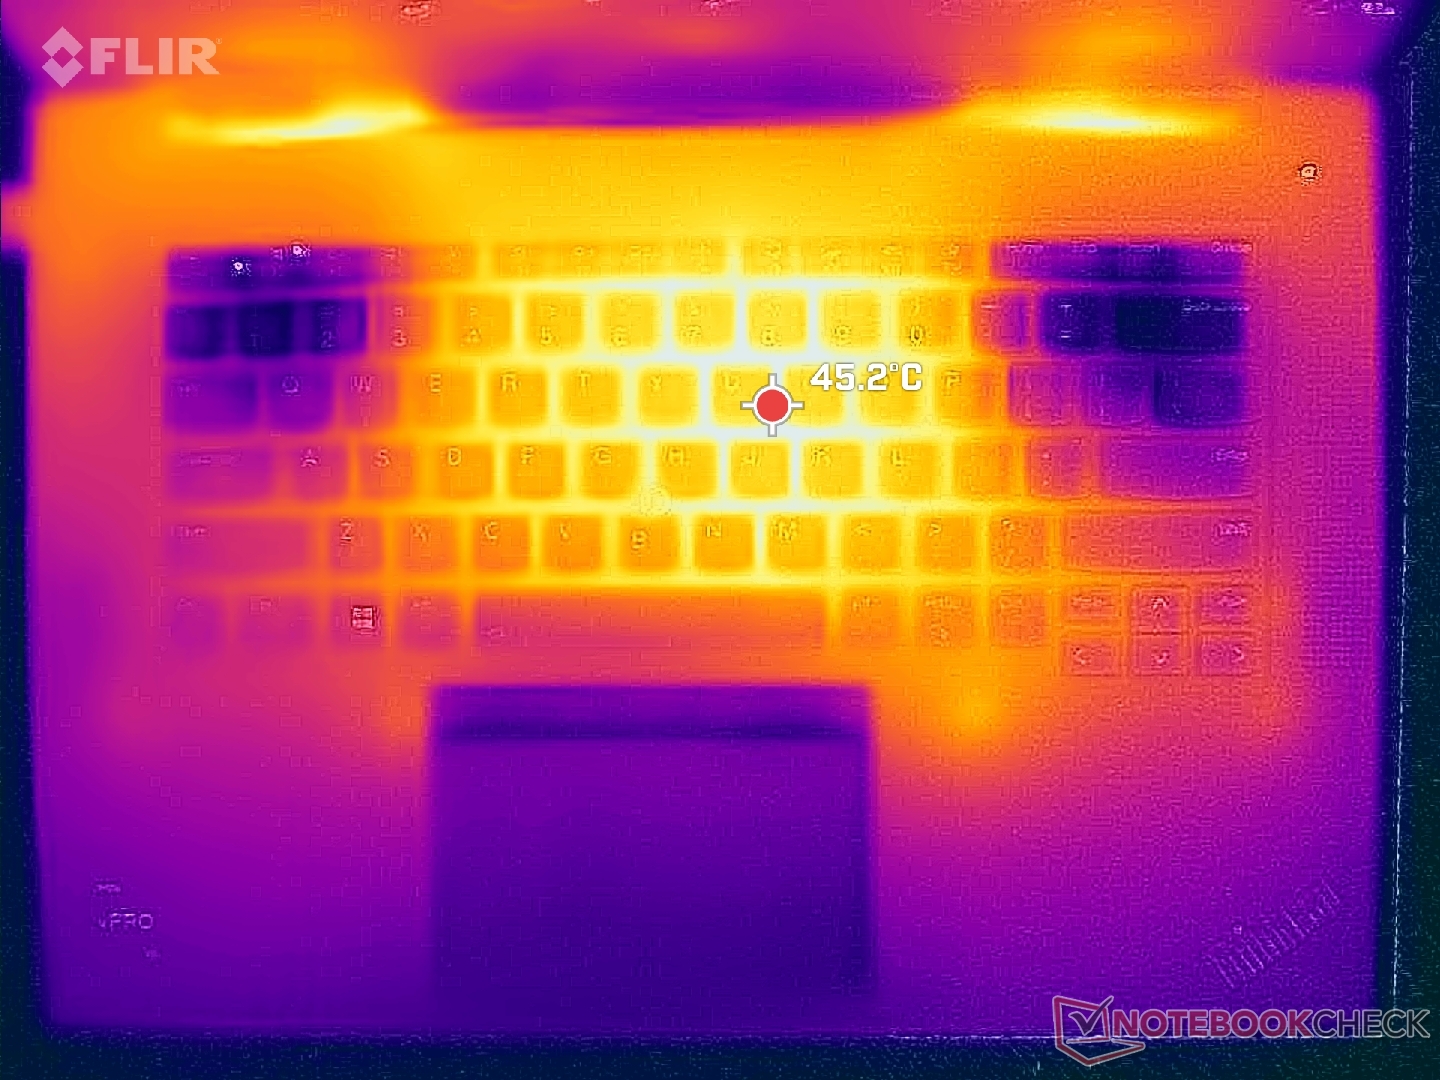
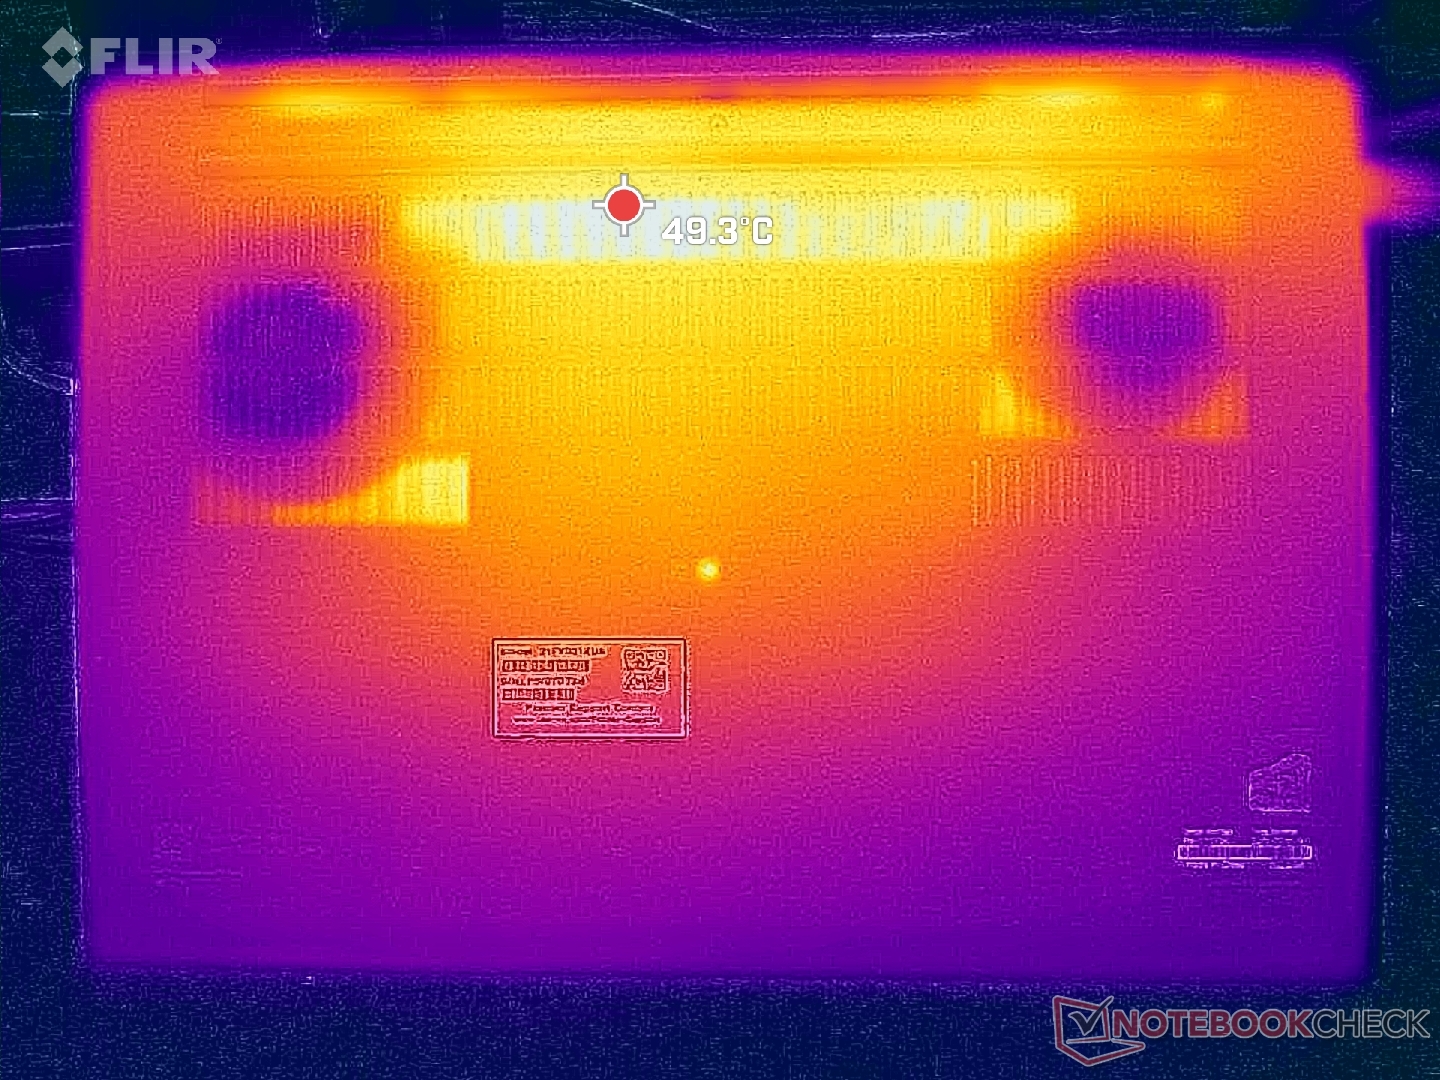
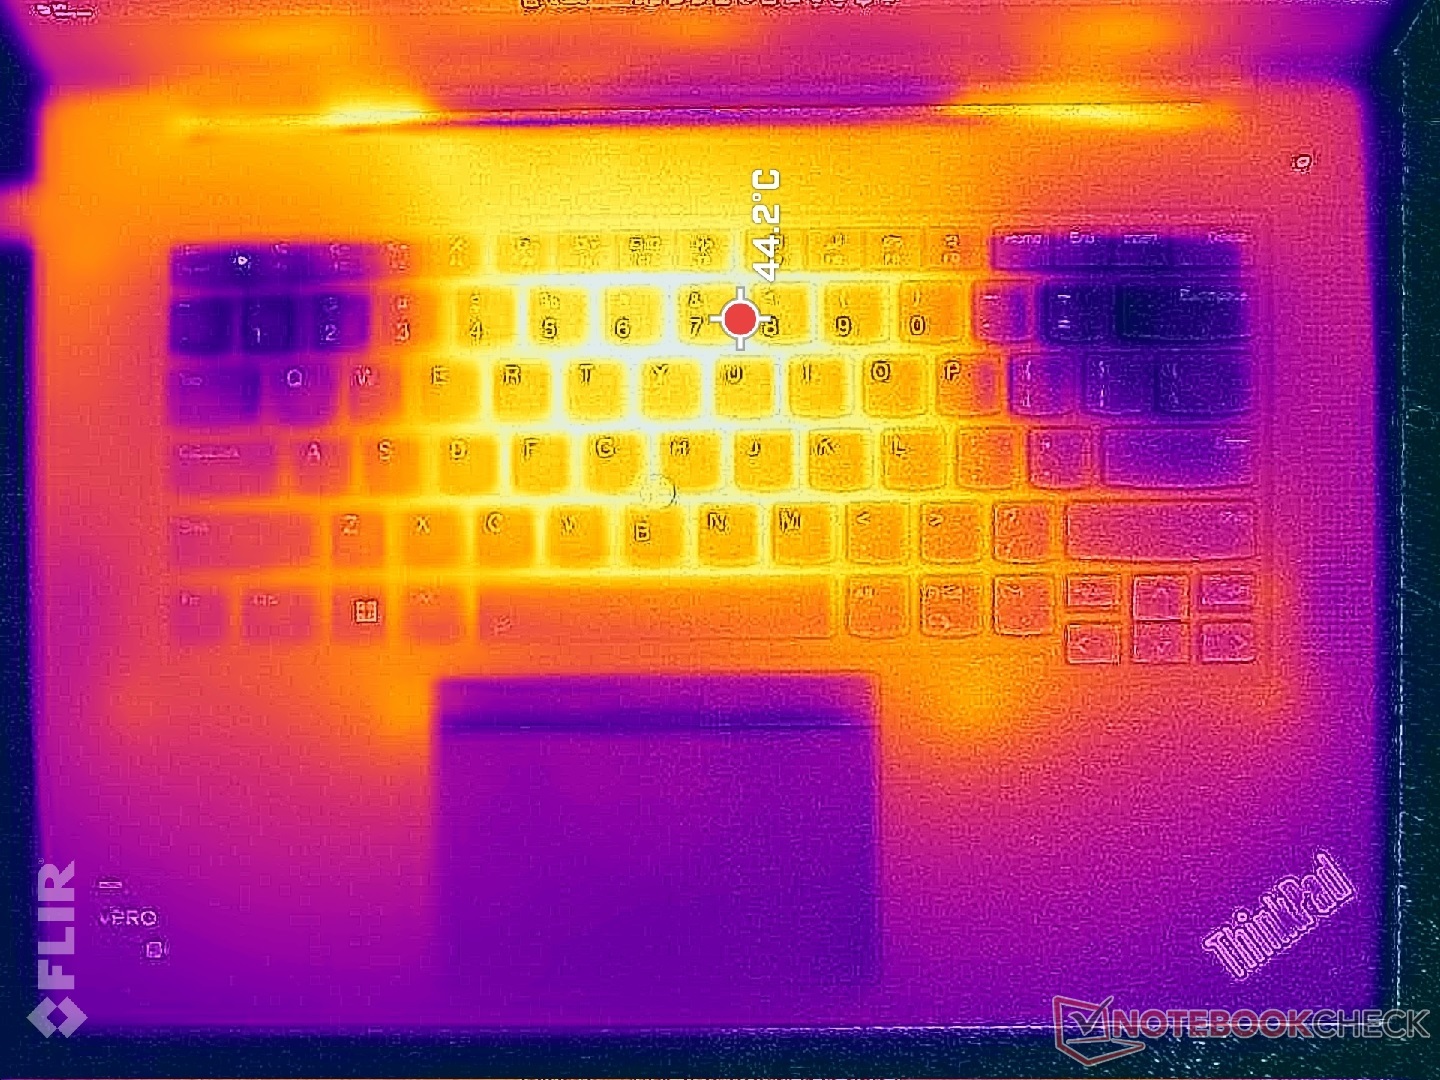
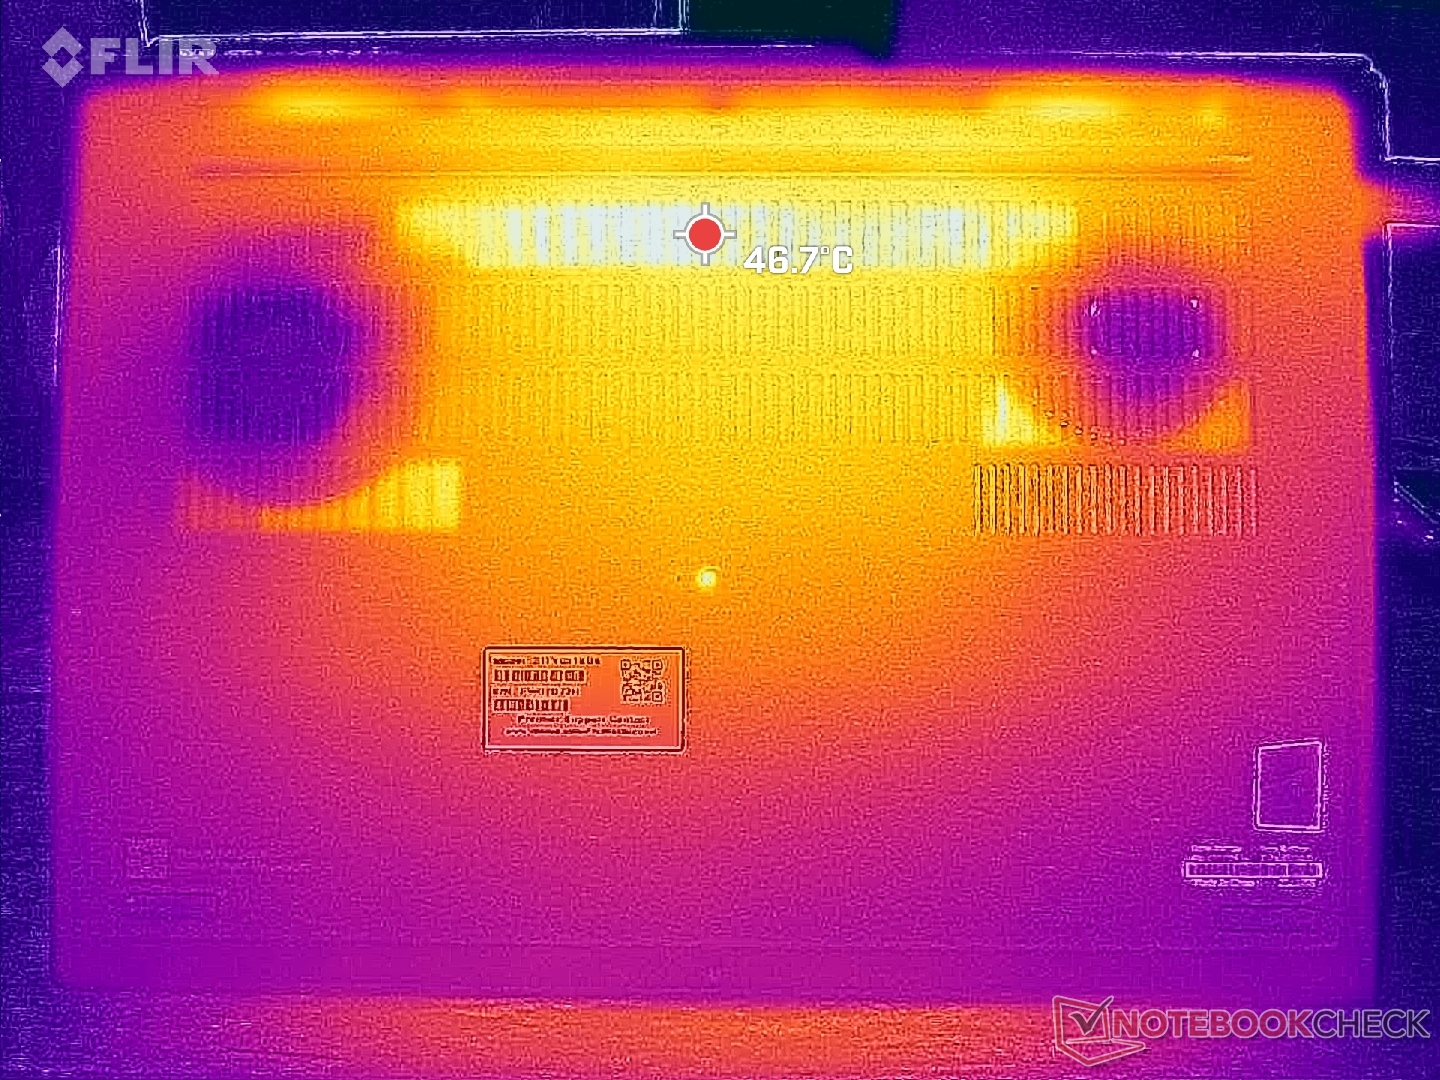
Temperatura
As temperaturas da superfície podem ser bastante altas, mesmo quando o computador está simplesmente em repouso, pois os ventiladores tendem a ser letárgicos até que cargas muito mais altas sejam introduzidas. Os pontos quentes nas superfícies do teclado e da parte inferior podem chegar a 45 C e 49 C, respectivamente, em comparação com 51 C e 32 C nos produtos concorrentes Dell Precision 5680.
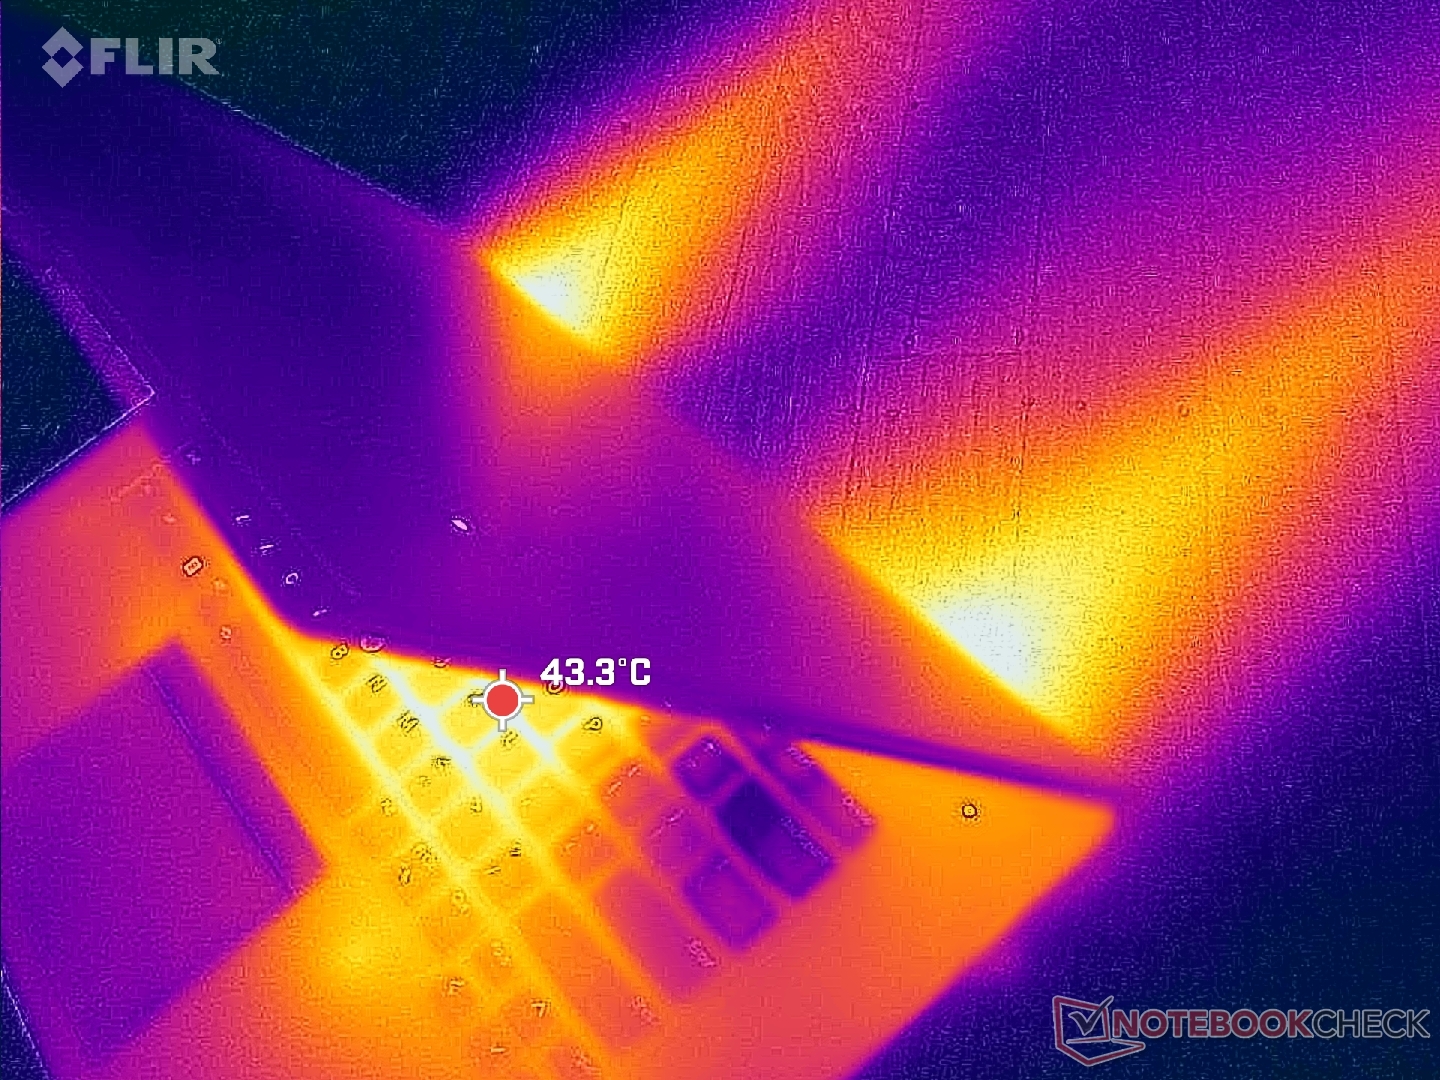
(±) A temperatura máxima no lado superior é 42 °C / 108 F, em comparação com a média de 38.2 °C / 101 F , variando de 22.2 a 69.8 °C para a classe Workstation.
(-) A parte inferior aquece até um máximo de 45.2 °C / 113 F, em comparação com a média de 41.1 °C / 106 F
(+) Em uso inativo, a temperatura média para o lado superior é 29 °C / 84 F, em comparação com a média do dispositivo de 32 °C / ### class_avg_f### F.
(±) Jogando The Witcher 3, a temperatura média para o lado superior é 36.1 °C / 97 F, em comparação com a média do dispositivo de 32 °C / ## #class_avg_f### F.
(+) Os apoios para as mãos e o touchpad são mais frios que a temperatura da pele, com um máximo de 30.8 °C / 87.4 F e, portanto, são frios ao toque.
(-) A temperatura média da área do apoio para as mãos de dispositivos semelhantes foi 27.8 °C / 82 F (-3 °C / -5.4 F).
| Lenovo ThinkPad P1 G6 21FV001KUS Intel Core i7-13800H, NVIDIA GeForce RTX 4080 Laptop GPU | Lenovo ThinkPad P1 G6-21FV000DGE Intel Core i9-13900H, NVIDIA RTX 2000 Ada Generation Laptop | Lenovo ThinkPad P1 G4-20Y4S0KS00 Intel Core i7-11850H, NVIDIA GeForce RTX 3070 Laptop GPU | Lenovo ThinkPad P16 G1 RTX A5500 Intel Core i9-12950HX, NVIDIA RTX A5500 Laptop GPU | Dell Precision 5000 5680 Intel Core i9-13900H, NVIDIA RTX 5000 Ada Generation Laptop | HP ZBook Fury 16 G10 Intel Core i9-13950HX, NVIDIA RTX 5000 Ada Generation Laptop | |
|---|---|---|---|---|---|---|
| Heat | 1% | -1% | -4% | 3% | -2% | |
| Maximum Upper Side * (°C) | 42 | 47.1 -12% | 51 -21% | 44.8 -7% | 50.2 -20% | 44.8 -7% |
| Maximum Bottom * (°C) | 45.2 | 56.5 -25% | 53.5 -18% | 49.8 -10% | 32 29% | 50 -11% |
| Idle Upper Side * (°C) | 33 | 28.1 15% | 28.8 13% | 30.6 7% | 37.4 -13% | 34.4 -4% |
| Idle Bottom * (°C) | 37 | 27.6 25% | 29.3 21% | 38.6 -4% | 31.2 16% | 31.8 14% |
* ... menor é melhor
Teste de estresse
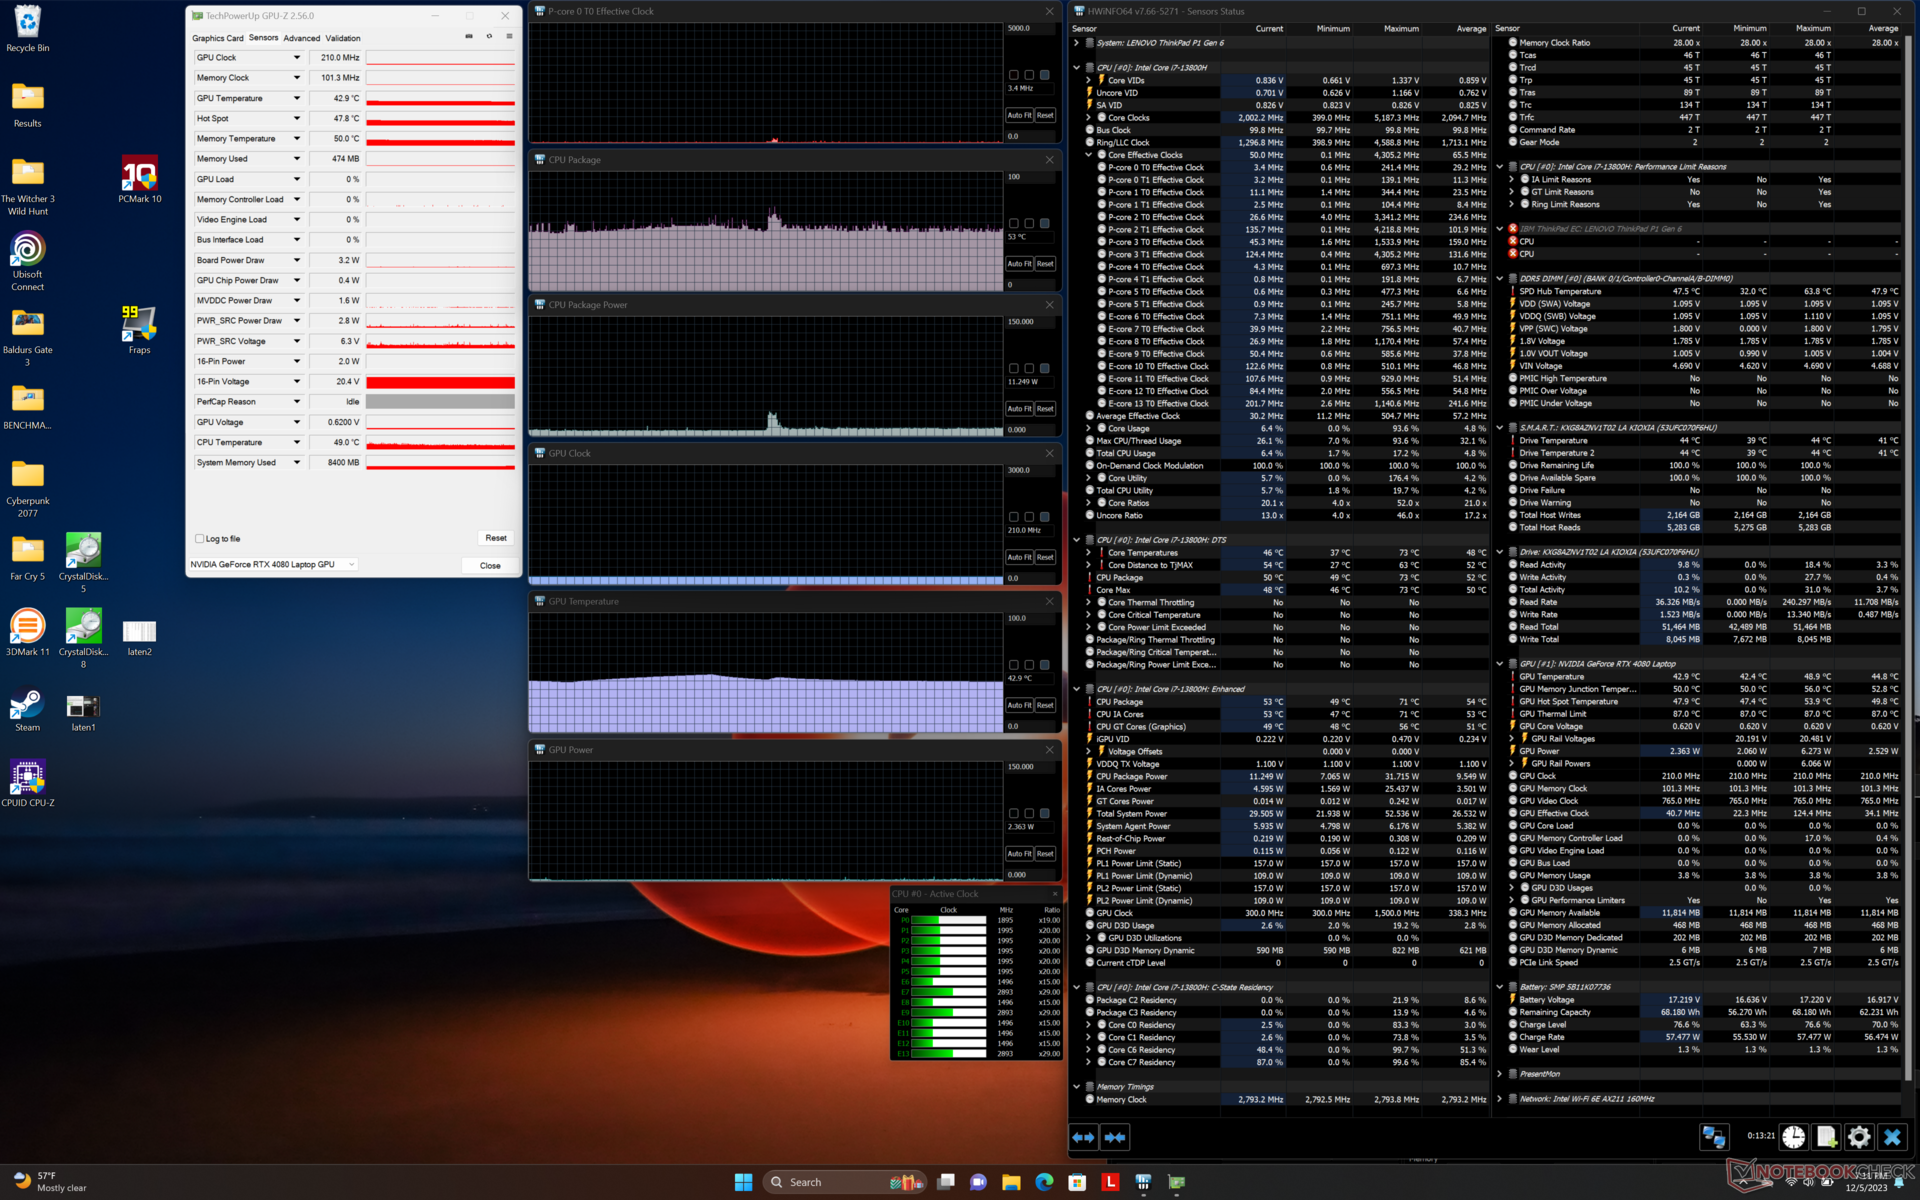
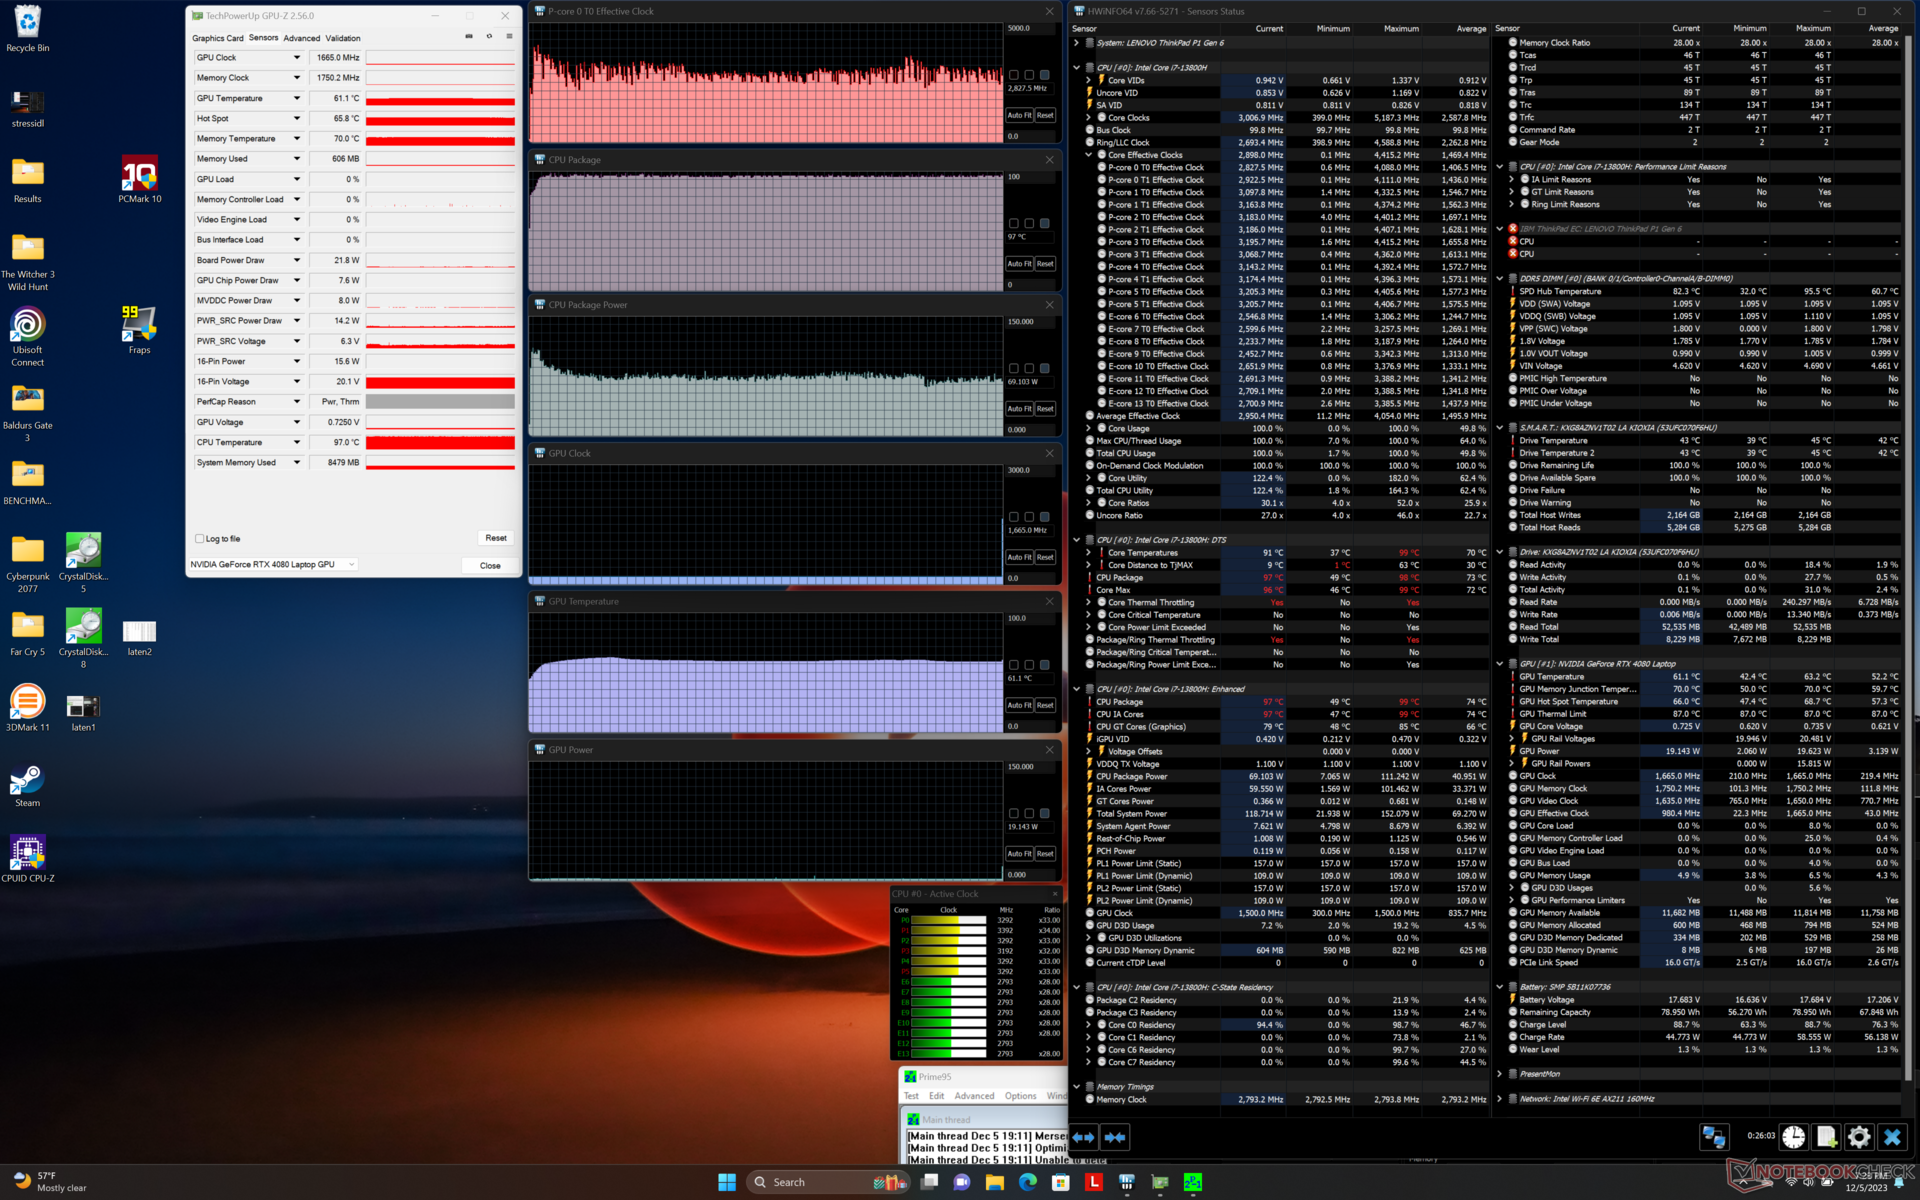
Quando submetida ao estresse do Prime95, a CPU aumentava para 4,1 GHz e 111 W apenas nos primeiros segundos, antes de cair e se estabilizar em 75 W e na faixa de 2,5 a 3,1 GHz. Mais notavelmente, a temperatura do núcleo se estabilizaria em 97 °C, o que sugere que o processador está levando a solução de resfriamento ao limite para maximizar o potencial do Turbo Boost.
O desempenho gráfico é reduzido se o processador for executado no modo Balanced em vez do modo Performance, conforme mencionado acima. Por exemplo, a GPU se estabilizaria em 1890 MHz, 79 W e 77 C durante a execução no modo Witcher 3 no modo Performance em comparação com apenas 1470 MHz, 52 W e 67 C no modo Balanced.
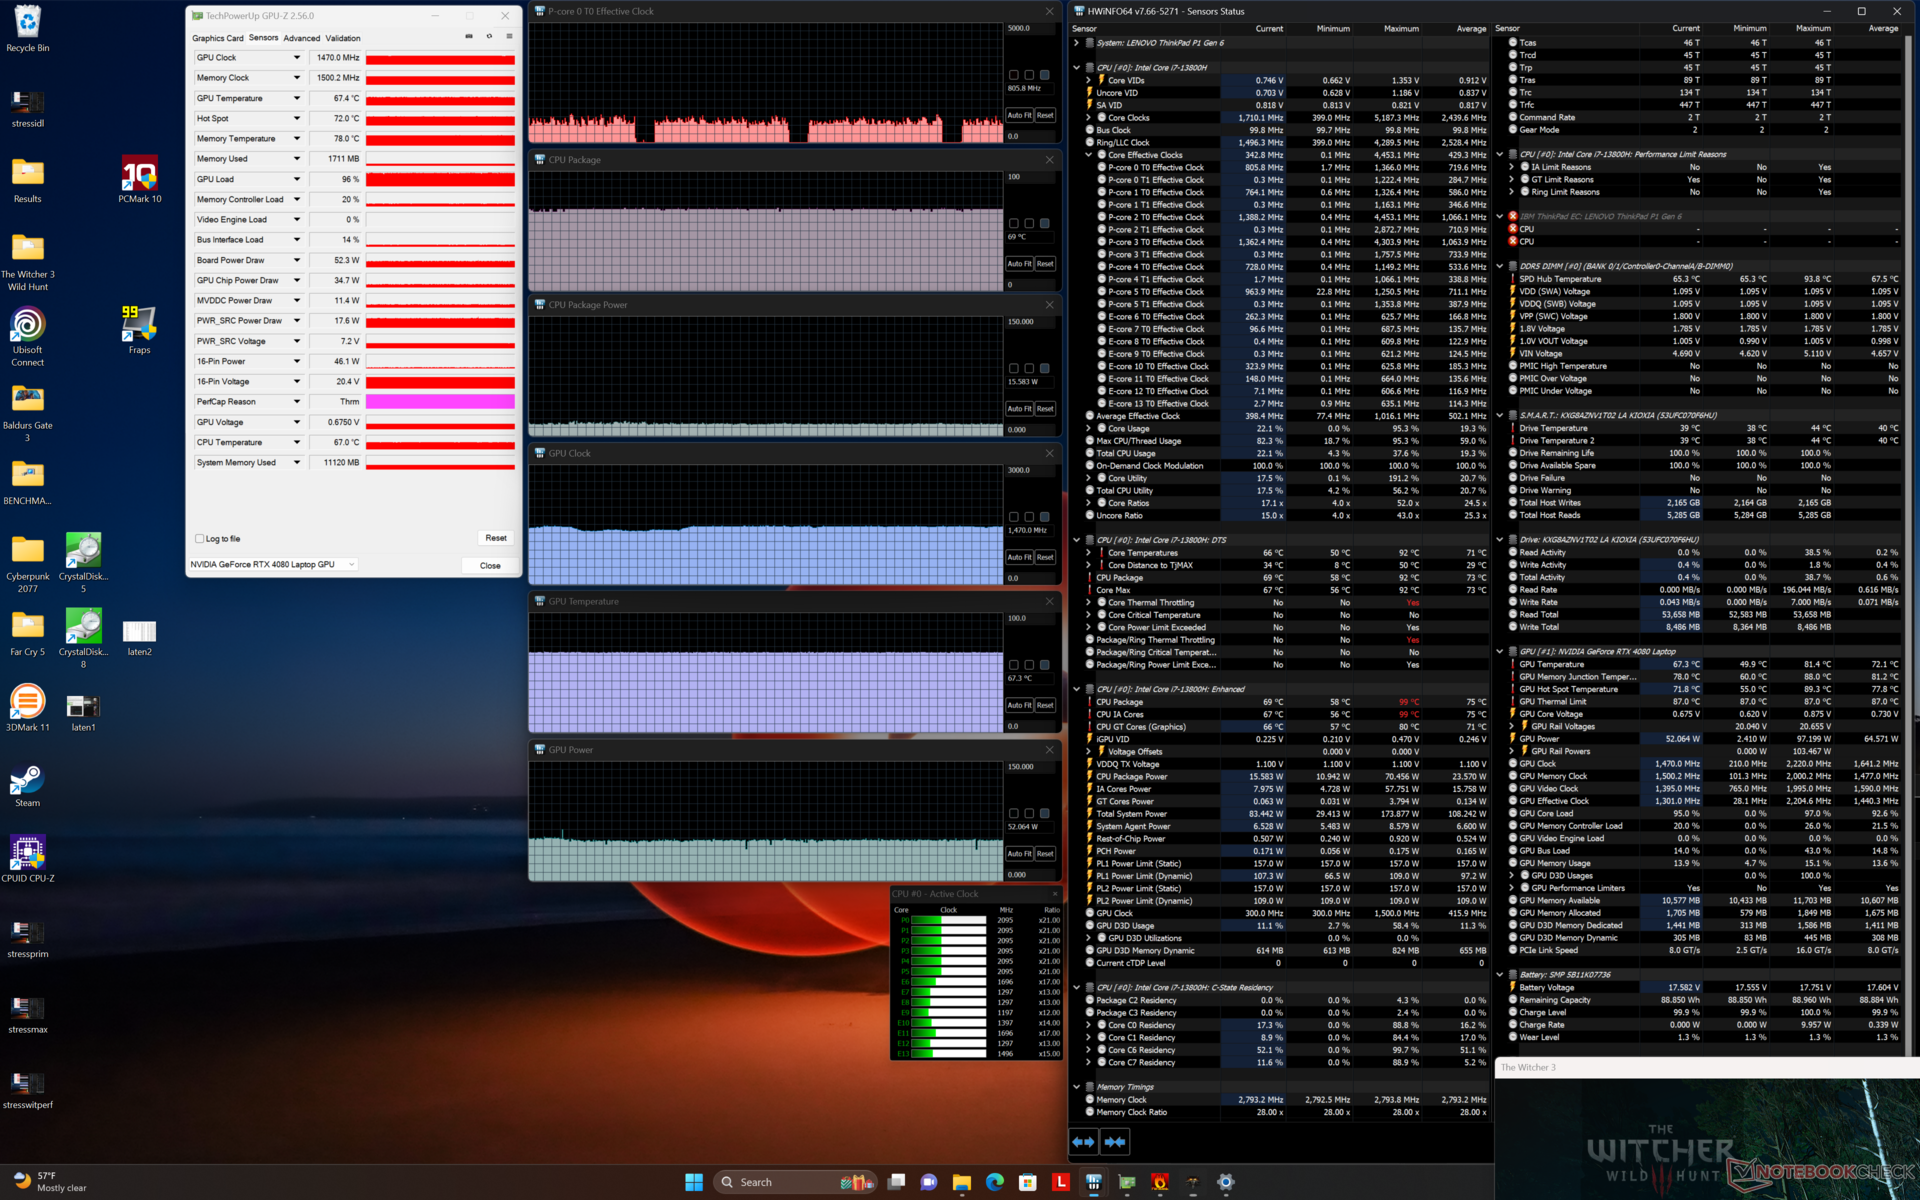
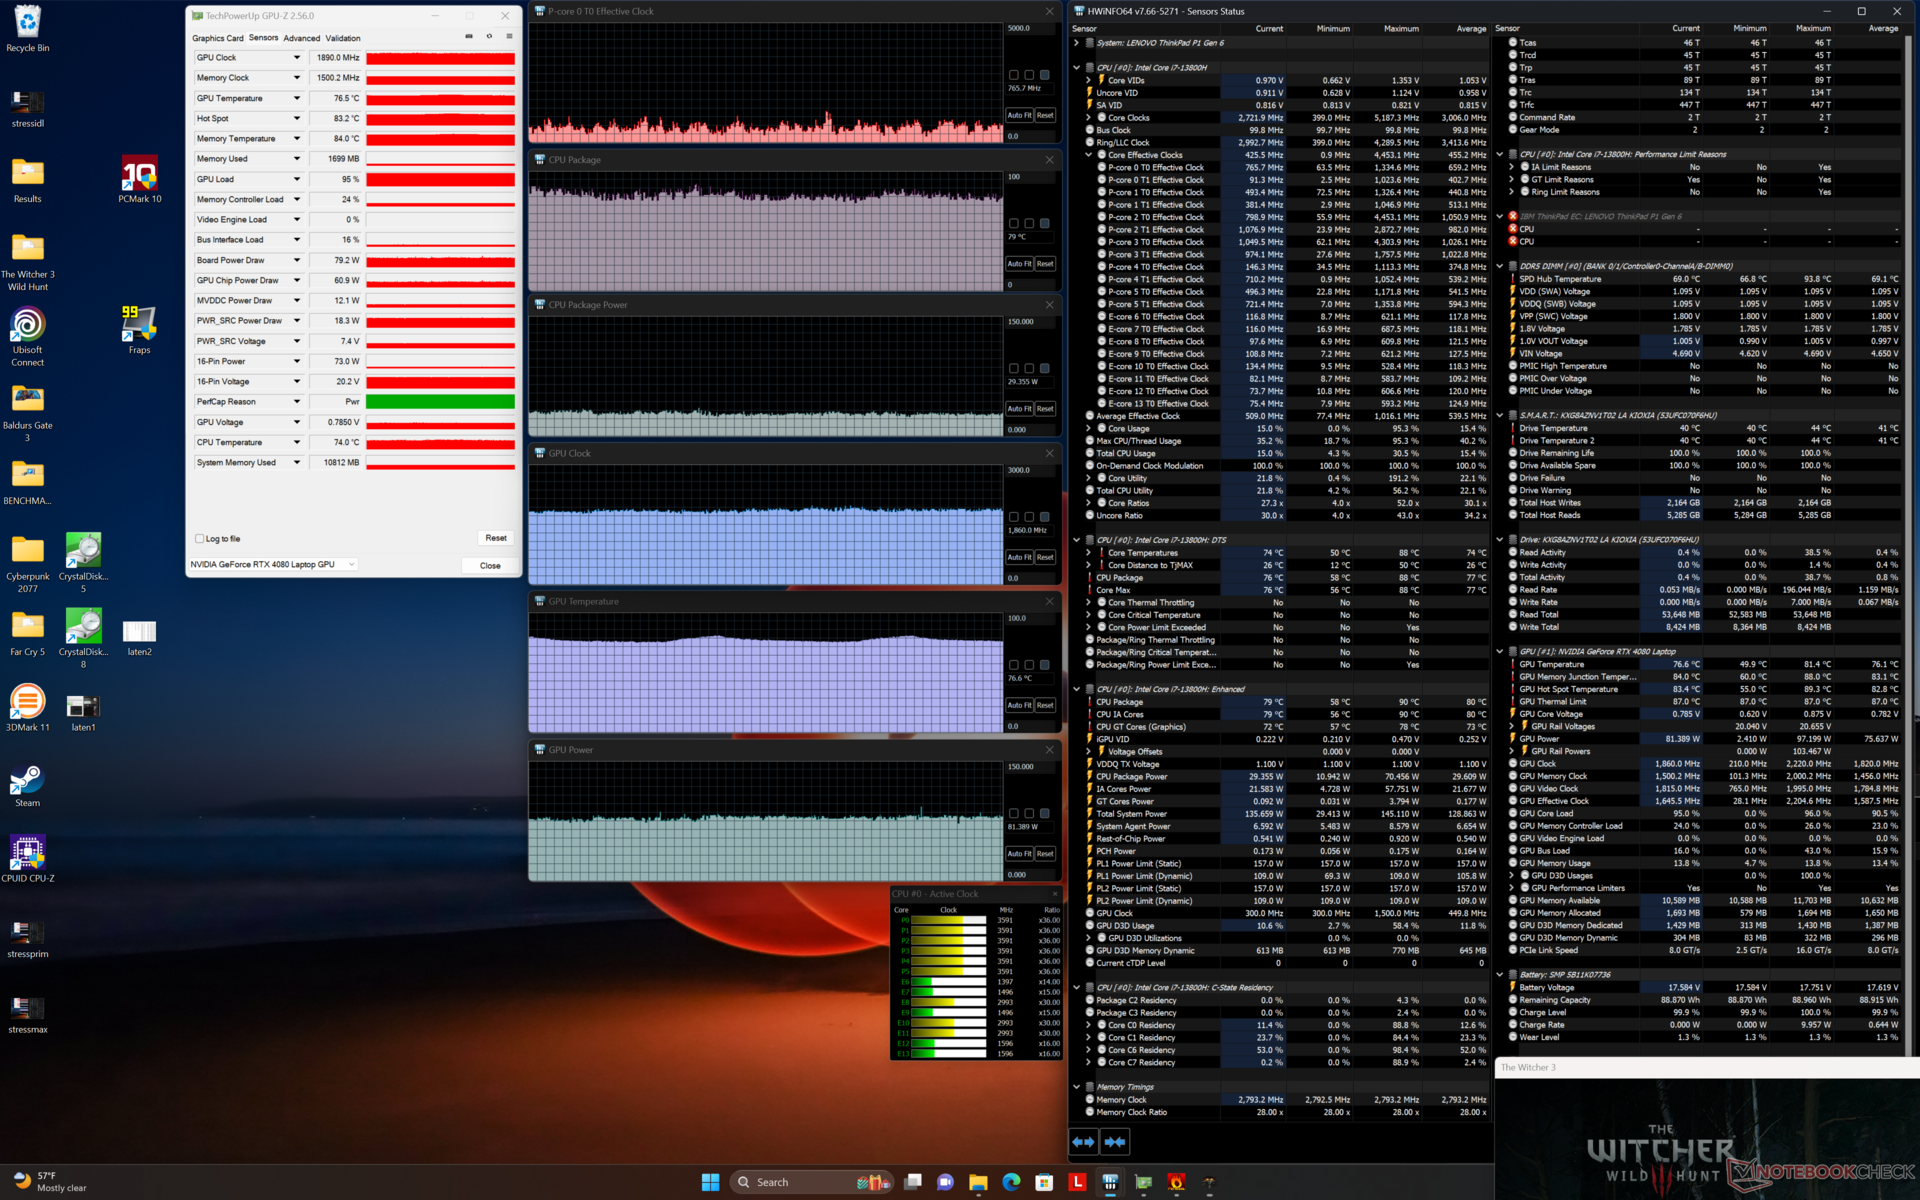
| CPU Clock (GHz) | GPU Clock (MHz) | Temperatura média da CPU (°C) | Temperatura média da GPU (°C) | |
| Sistema ocioso | -- | -- | 53 | 43 |
| Estresse doPrime95 | -- | -- | 2,5 - 3,1 | 97 |
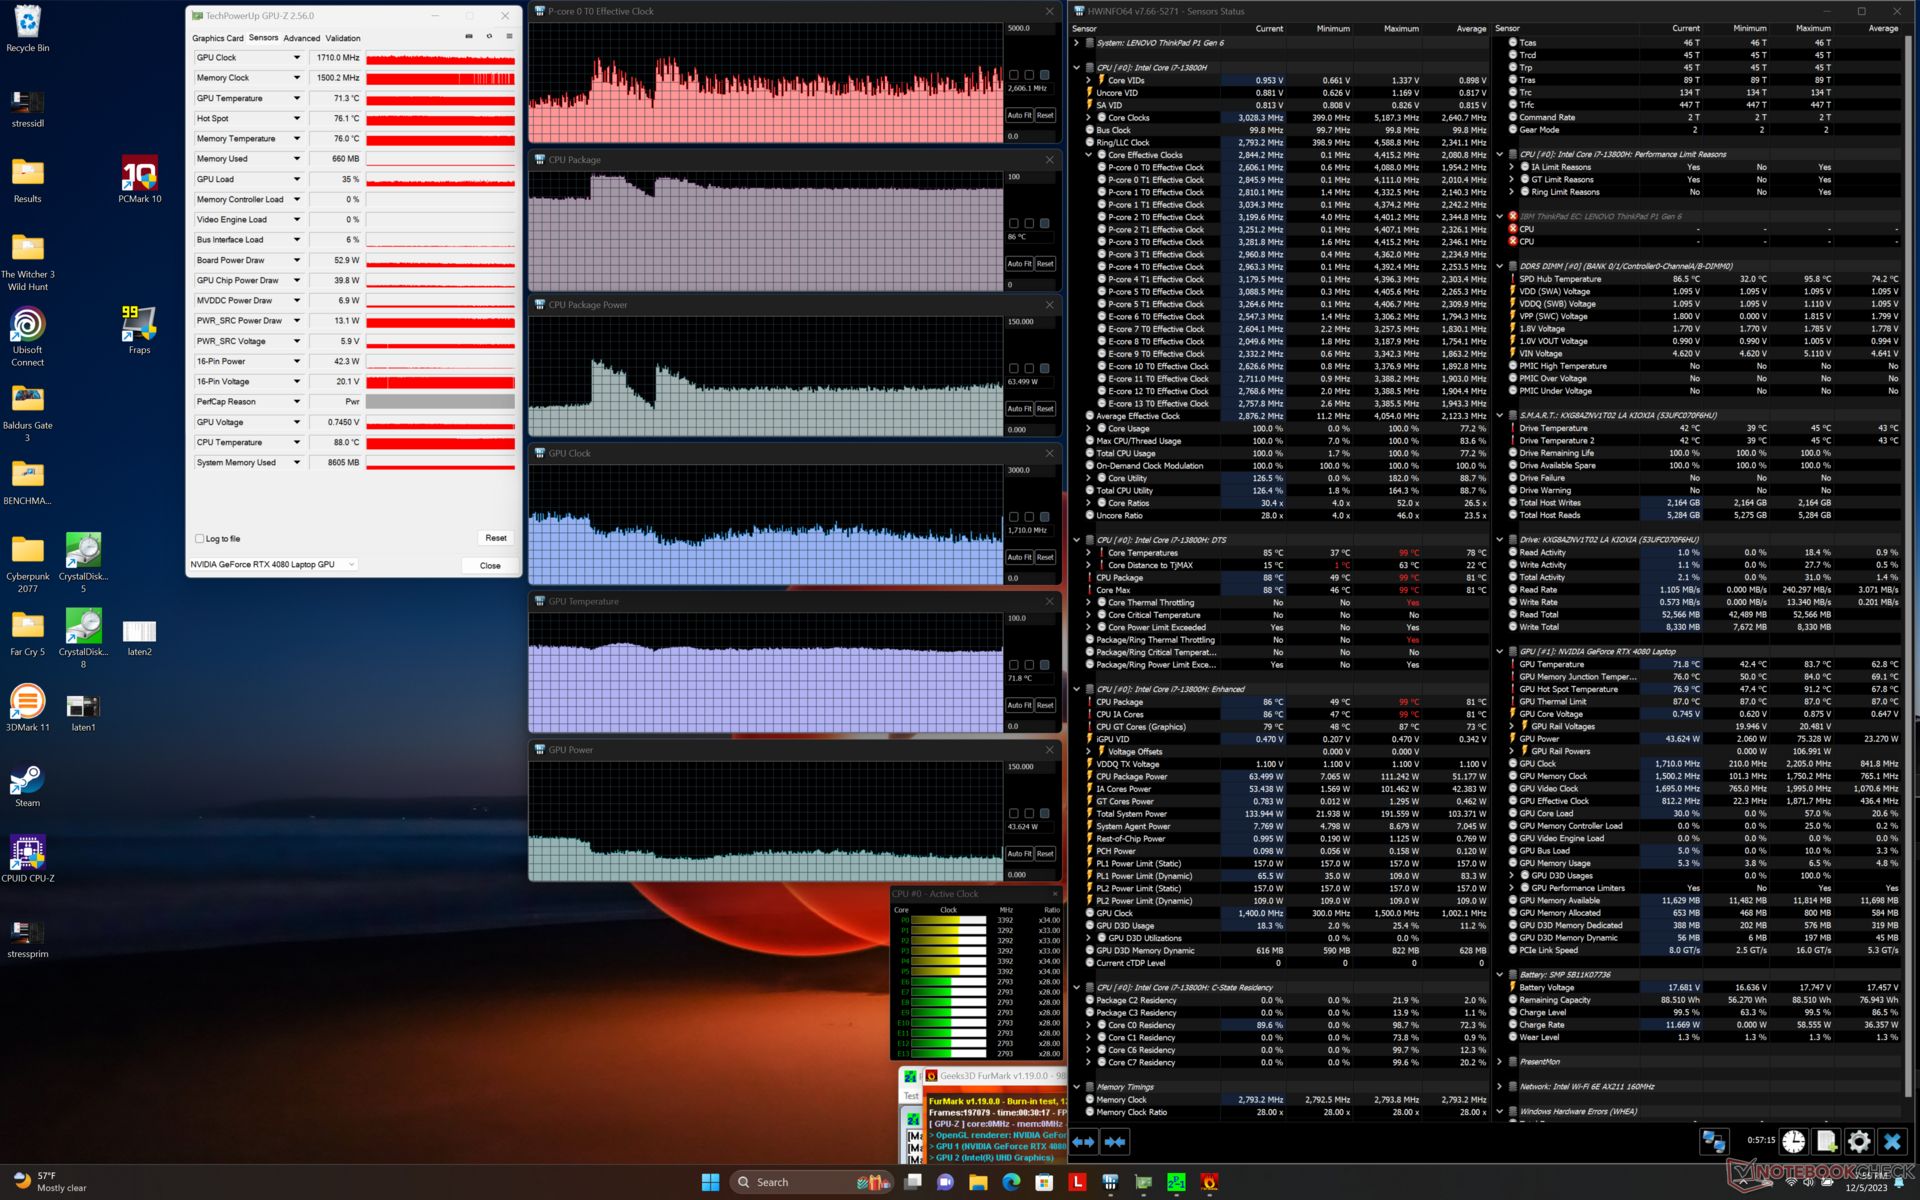
| Estresse doPrime95 + FurMark | ~2,1 - 3,1 | ~1071 | 86 | 72 |
| Witcher 3 Estresse(modo balanceado) | 0,8 | 1470 | 69 | 67 |
| Witcher 3 Estresse(modo de desempenho) | ~0,8 | 1890 | 79 | 77 |
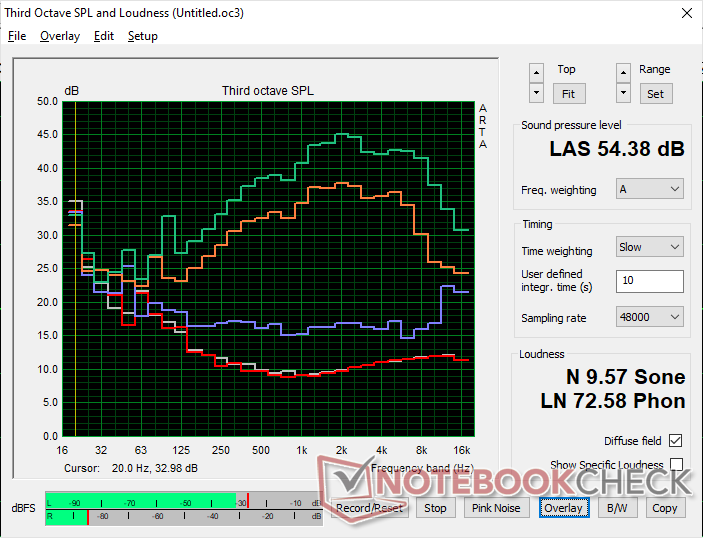
Alto-falantes
Lenovo ThinkPad P1 G6 21FV001KUS análise de áudio
(+) | os alto-falantes podem tocar relativamente alto (###valor### dB)
Graves 100 - 315Hz
(±) | graves reduzidos - em média 8% menor que a mediana
(±) | a linearidade dos graves é média (10.2% delta para a frequência anterior)
Médios 400 - 2.000 Hz
(±) | médios mais altos - em média 7.7% maior que a mediana
(+) | médios são lineares (4.7% delta para frequência anterior)
Altos 2 - 16 kHz
(+) | agudos equilibrados - apenas 4.2% longe da mediana
(+) | os máximos são lineares (6.2% delta da frequência anterior)
Geral 100 - 16.000 Hz
(+) | o som geral é linear (13.2% diferença em relação à mediana)
Comparado com a mesma classe
» 23% de todos os dispositivos testados nesta classe foram melhores, 6% semelhantes, 71% piores
» O melhor teve um delta de 7%, a média foi 17%, o pior foi 35%
Comparado com todos os dispositivos testados
» 13% de todos os dispositivos testados foram melhores, 3% semelhantes, 84% piores
» O melhor teve um delta de 4%, a média foi 23%, o pior foi 134%
Apple MacBook Pro 16 2021 M1 Pro análise de áudio
(+) | os alto-falantes podem tocar relativamente alto (###valor### dB)
Graves 100 - 315Hz
(+) | bons graves - apenas 3.8% longe da mediana
(+) | o baixo é linear (5.2% delta para a frequência anterior)
Médios 400 - 2.000 Hz
(+) | médios equilibrados - apenas 1.3% longe da mediana
(+) | médios são lineares (2.1% delta para frequência anterior)
Altos 2 - 16 kHz
(+) | agudos equilibrados - apenas 1.9% longe da mediana
(+) | os máximos são lineares (2.7% delta da frequência anterior)
Geral 100 - 16.000 Hz
(+) | o som geral é linear (4.6% diferença em relação à mediana)
Comparado com a mesma classe
» 0% de todos os dispositivos testados nesta classe foram melhores, 0% semelhantes, 100% piores
» O melhor teve um delta de 5%, a média foi 17%, o pior foi 45%
Comparado com todos os dispositivos testados
» 0% de todos os dispositivos testados foram melhores, 0% semelhantes, 100% piores
» O melhor teve um delta de 4%, a média foi 23%, o pior foi 134%
Gerenciamento de energia
Consumo de energia
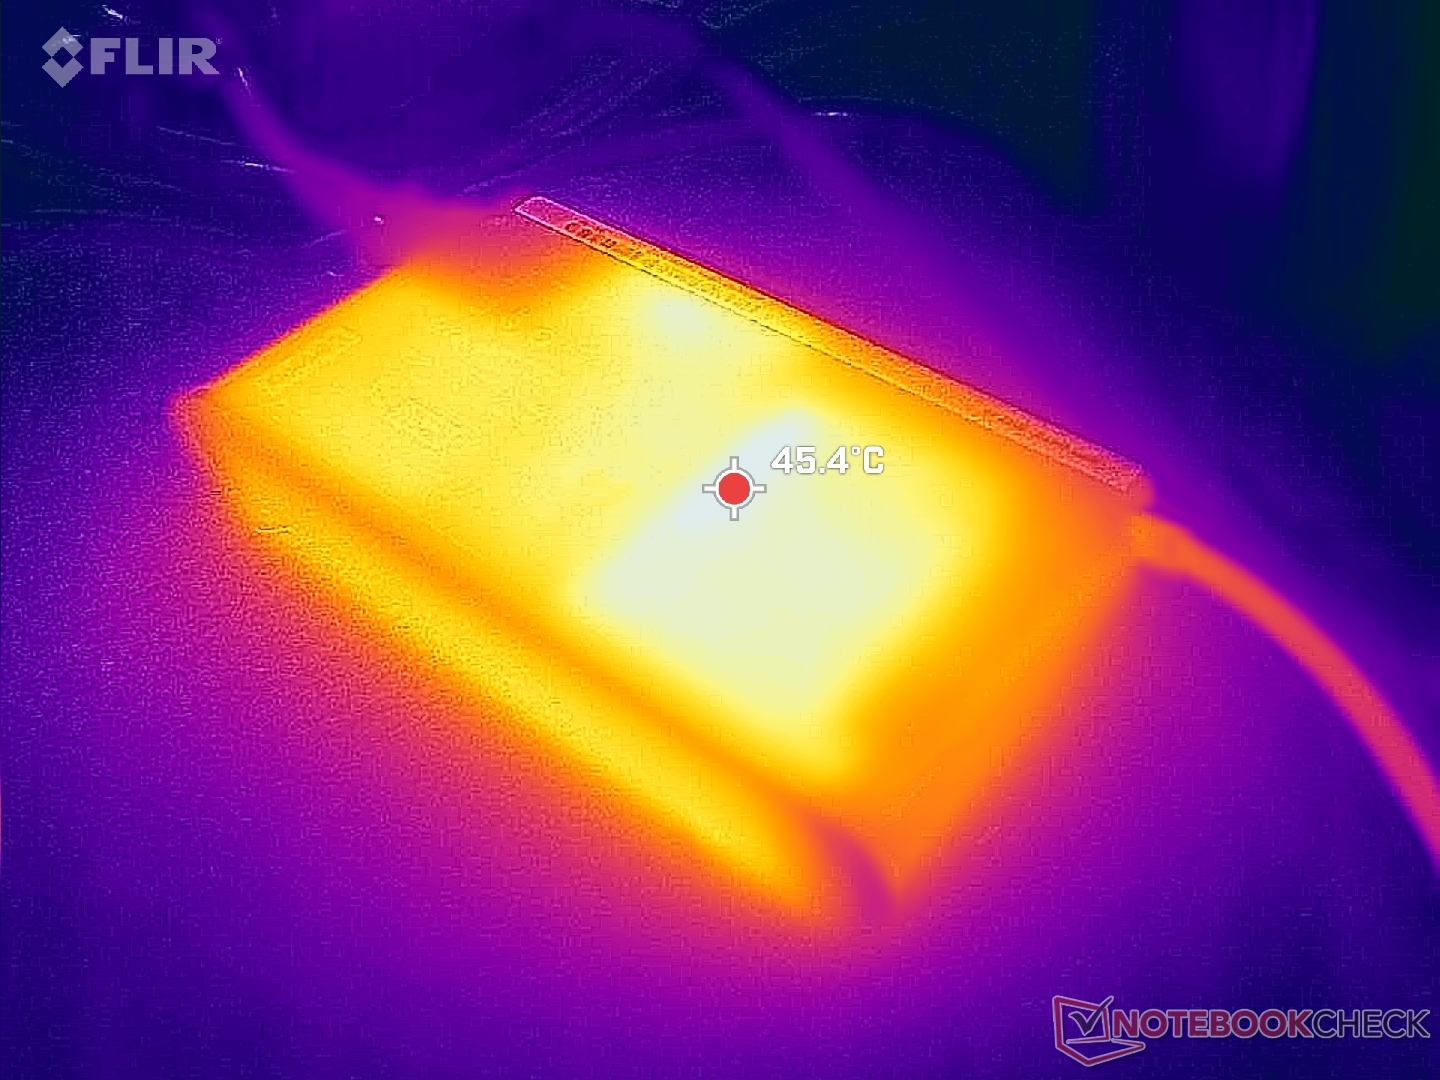
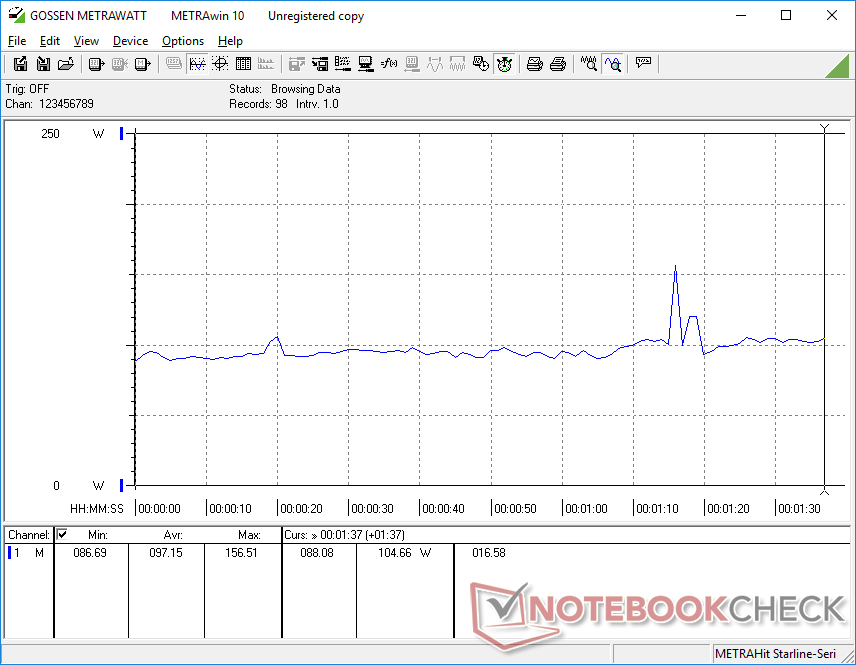
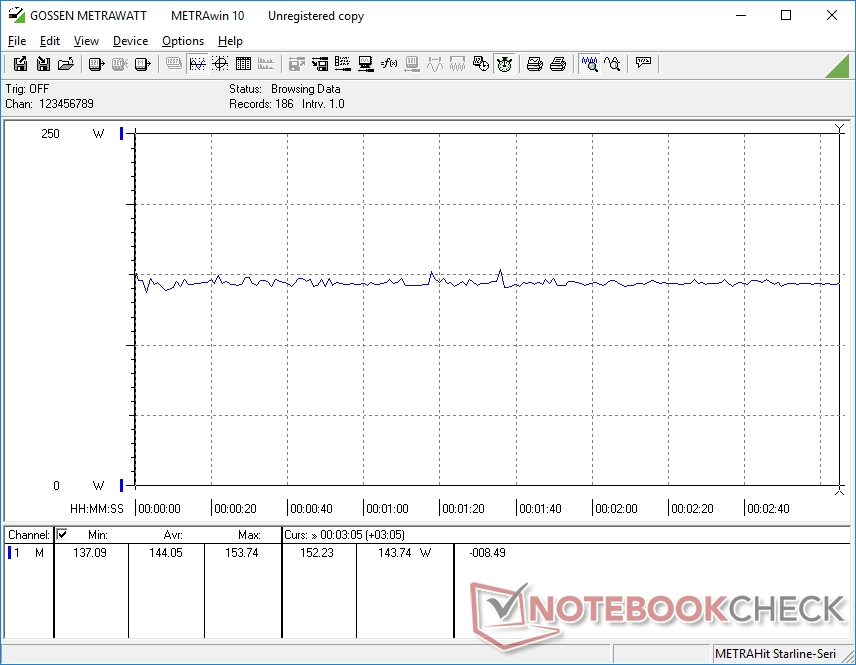
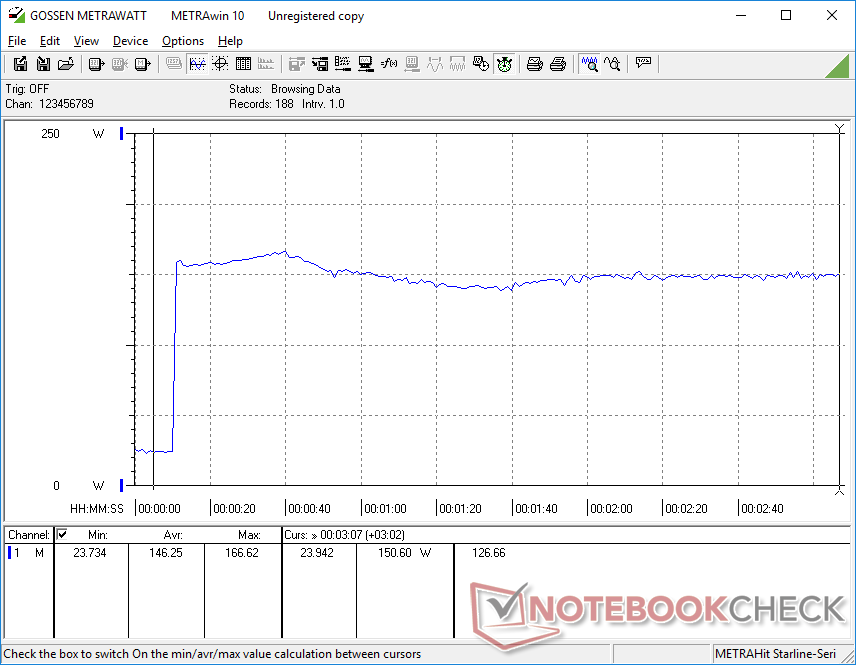
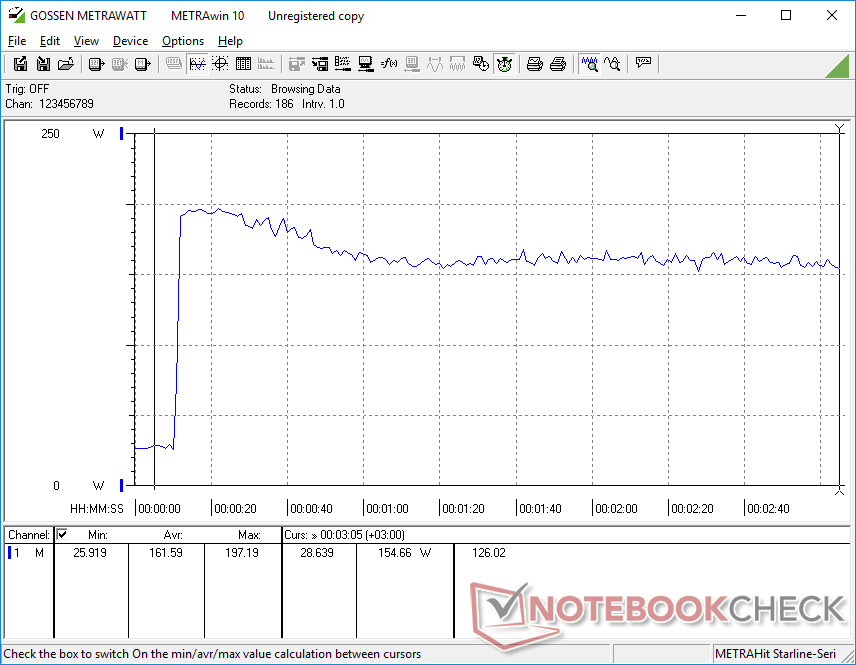
Nossa unidade de teste é, em geral, mais exigente do que a configuração com menor potência RTX 2000, o que explica a menor duração da bateria na próxima seção. Executar Witcher 3 para representar cargas exigentes, por exemplo, consumiria 37% mais energia.
Conseguimos registrar um consumo máximo de 197 W do adaptador CA de 230 W de tamanho médio (~17 x 8,8 x 2,5 cm) quando a CPU e a GPU estão com 100% de utilização.
| desligado | |
| Ocioso | |
| Carga |
|
Key:
min: | |
| Lenovo ThinkPad P1 G6 21FV001KUS i7-13800H, GeForce RTX 4080 Laptop GPU, Kioxia XG8 KXG8AZNV1T02, OLED, 3480x2400, 16" | Lenovo ThinkPad P1 G6-21FV000DGE i9-13900H, RTX 2000 Ada Generation Laptop, SK Hynix PC711 1TB HFS001TDE9X084N, IPS, 2560x1600, 16" | Lenovo ThinkPad P1 G4-20Y4S0KS00 i7-11850H, GeForce RTX 3070 Laptop GPU, Samsung PM9A1 MZVL21T0HCLR, IPS LED, 3840x2400, 16" | Lenovo ThinkPad P16 G1 RTX A5500 i9-12950HX, RTX A5500 Laptop GPU, WDC PC SN810 2TB, IPS, 3840x2400, 16" | Dell Precision 5000 5680 i9-13900H, RTX 5000 Ada Generation Laptop, 2x SK hynix PC801 HFS512GEJ9X101N RAID 0, OLED, 3840x2400, 16" | HP ZBook Fury 16 G10 i9-13950HX, RTX 5000 Ada Generation Laptop, SK hynix PC801 HFS001TEJ9X101N, IPS, 3840x2400, 16" | |
|---|---|---|---|---|---|---|
| Power Consumption | 5% | -15% | -51% | 0% | -46% | |
| Idle Minimum * (Watt) | 8 | 8.3 -4% | 8.1 -1% | 7.5 6% | 8 -0% | 15.3 -91% |
| Idle Average * (Watt) | 9.5 | 14.5 -53% | 20.2 -113% | 20.1 -112% | 10.4 -9% | 18.2 -92% |
| Idle Maximum * (Watt) | 23.7 | 15.3 35% | 21.9 8% | 40 -69% | 30.5 -29% | 28 -18% |
| Load Average * (Watt) | 97.2 | 91.8 6% | 88.2 9% | 137 -41% | 75.4 22% | 137.9 -42% |
| Witcher 3 ultra * (Watt) | 144 | 104.7 27% | 149 -3% | 208 -44% | 134 7% | 189.4 -32% |
| Load Maximum * (Watt) | 197.2 | 164.5 17% | 170.6 13% | 285.9 -45% | 175 11% | 202 -2% |
* ... menor é melhor
Power Consumption Witcher 3 / Stresstest
Power Consumption external Monitor
Duração da bateria
Os tempos de execução são significativamente mais curtos do que na configuração com a RTX 2000, em mais da metade, devido à tela OLED mais exigente e à GPU mais rápida. Só conseguimos registrar pouco mais de 4 horas de navegação em WLAN no mundo real, mesmo com o perfil de energia balanceado.
| Lenovo ThinkPad P1 G6 21FV001KUS i7-13800H, GeForce RTX 4080 Laptop GPU, 90 Wh | Lenovo ThinkPad P1 G6-21FV000DGE i9-13900H, RTX 2000 Ada Generation Laptop, 90 Wh | Lenovo ThinkPad P1 G4-20Y4S0KS00 i7-11850H, GeForce RTX 3070 Laptop GPU, 90 Wh | Lenovo ThinkPad P16 G1 RTX A5500 i9-12950HX, RTX A5500 Laptop GPU, 94 Wh | Dell Precision 5000 5680 i9-13900H, RTX 5000 Ada Generation Laptop, 98 Wh | HP ZBook Fury 16 G10 i9-13950HX, RTX 5000 Ada Generation Laptop, 95 Wh | |
|---|---|---|---|---|---|---|
| Duração da bateria | 126% | 67% | 38% | 136% | 74% | |
| WiFi v1.3 (h) | 4.2 | 9.5 126% | 7 67% | 5.8 38% | 9.9 136% | 7.3 74% |
| H.264 (h) | 11.2 | 7.2 | ||||
| Load (h) | 1.1 | 1.2 | 1.7 | |||
| Reader / Idle (h) | 17.9 |
Pro
Contra
Veredicto - Desempenho mais rápido à custa da duração da bateria
O ThinkPad P1 G6 oferece uma ampla gama de níveis de configuração, incluindo IPS, OLED, Core i7, Core i9 e opções de GPU GeForce RTX ou RTX Ada. Com base no tempo que passamos com duas configurações muito diferentes, as duas opções de processador (Core i7-13800H vs. Core i9-13900H) têm diferenças mínimas entre si, o que significa que seria sensato optar pelo Core i7 mais barato e depois gastar os dólares extras em outro lugar.
Quanto à tela, é uma disputa entre IPS de 1600p e OLED de 2400p. A primeira oferece uma taxa de atualização nativa mais rápida e um brilho máximo mais intenso, enquanto a segunda oferece tela sensível ao toque, cores DCI-P3, fantasmas mínimos e suporte a HDR400. Os modelos futuros poderão incorporar painéis OLED de 120 Hz, que estão se tornando mais comuns em modelos como o Asus VivoBook.
O ThinkPad P1 G6 oferece alto desempenho por volume, embora ao custo da duração da bateria, ventoinhas mais barulhentas e atualizações limitadas em comparação com suas configurações menores.
A configuração de opções de GPU mais rápidas, como a RTX 5000 ou nossa RTX 4080, em vez da RTX 2000, acarreta algumas desvantagens. Os upgrades de armazenamento interno tornam-se mais limitados, o ruído da ventoinha torna-se mais alto sob carga e a duração da bateria sofre um impacto perceptível. Também temos que mencionar as falhas na taxa de quadros durante o streaming de vídeo e o teto relativamente baixo de 80 W do TGP. Mesmo assim, o ThinkPad P1 G6 é uma das estações de trabalho móveis mais rápidas de seu tamanho e peso. Para algo razoavelmente mais rápido, o senhor teria que considerar a série mais robusta do Série ThinkPad P16 em vez disso.
Preço e disponibilidade
A Lenovo agora está enviando o ThinkPad P1 G6 em várias configurações a partir de $1680 USD para a configuração básica Core i7/RTX A1000/1200p IPS até $2700 ou mais se configurado com a RTX 4080.
Lenovo ThinkPad P1 G6 21FV001KUS
- 12/08/2023 v7 (old)
Allen Ngo
Transparência
A seleção dos dispositivos a serem analisados é feita pela nossa equipe editorial. A amostra de teste foi fornecida ao autor como empréstimo pelo fabricante ou varejista para fins desta revisão. O credor não teve influência nesta revisão, nem o fabricante recebeu uma cópia desta revisão antes da publicação. Não houve obrigação de publicar esta revisão. Como empresa de mídia independente, a Notebookcheck não está sujeita à autoridade de fabricantes, varejistas ou editores.
É assim que o Notebookcheck está testando
Todos os anos, o Notebookcheck analisa de forma independente centenas de laptops e smartphones usando procedimentos padronizados para garantir que todos os resultados sejam comparáveis. Desenvolvemos continuamente nossos métodos de teste há cerca de 20 anos e definimos padrões da indústria no processo. Em nossos laboratórios de teste, equipamentos de medição de alta qualidade são utilizados por técnicos e editores experientes. Esses testes envolvem um processo de validação em vários estágios. Nosso complexo sistema de classificação é baseado em centenas de medições e benchmarks bem fundamentados, o que mantém a objetividade.Price comparison

