Veredicto - O Beast 18 X1 é bom, mas pode ser melhorado
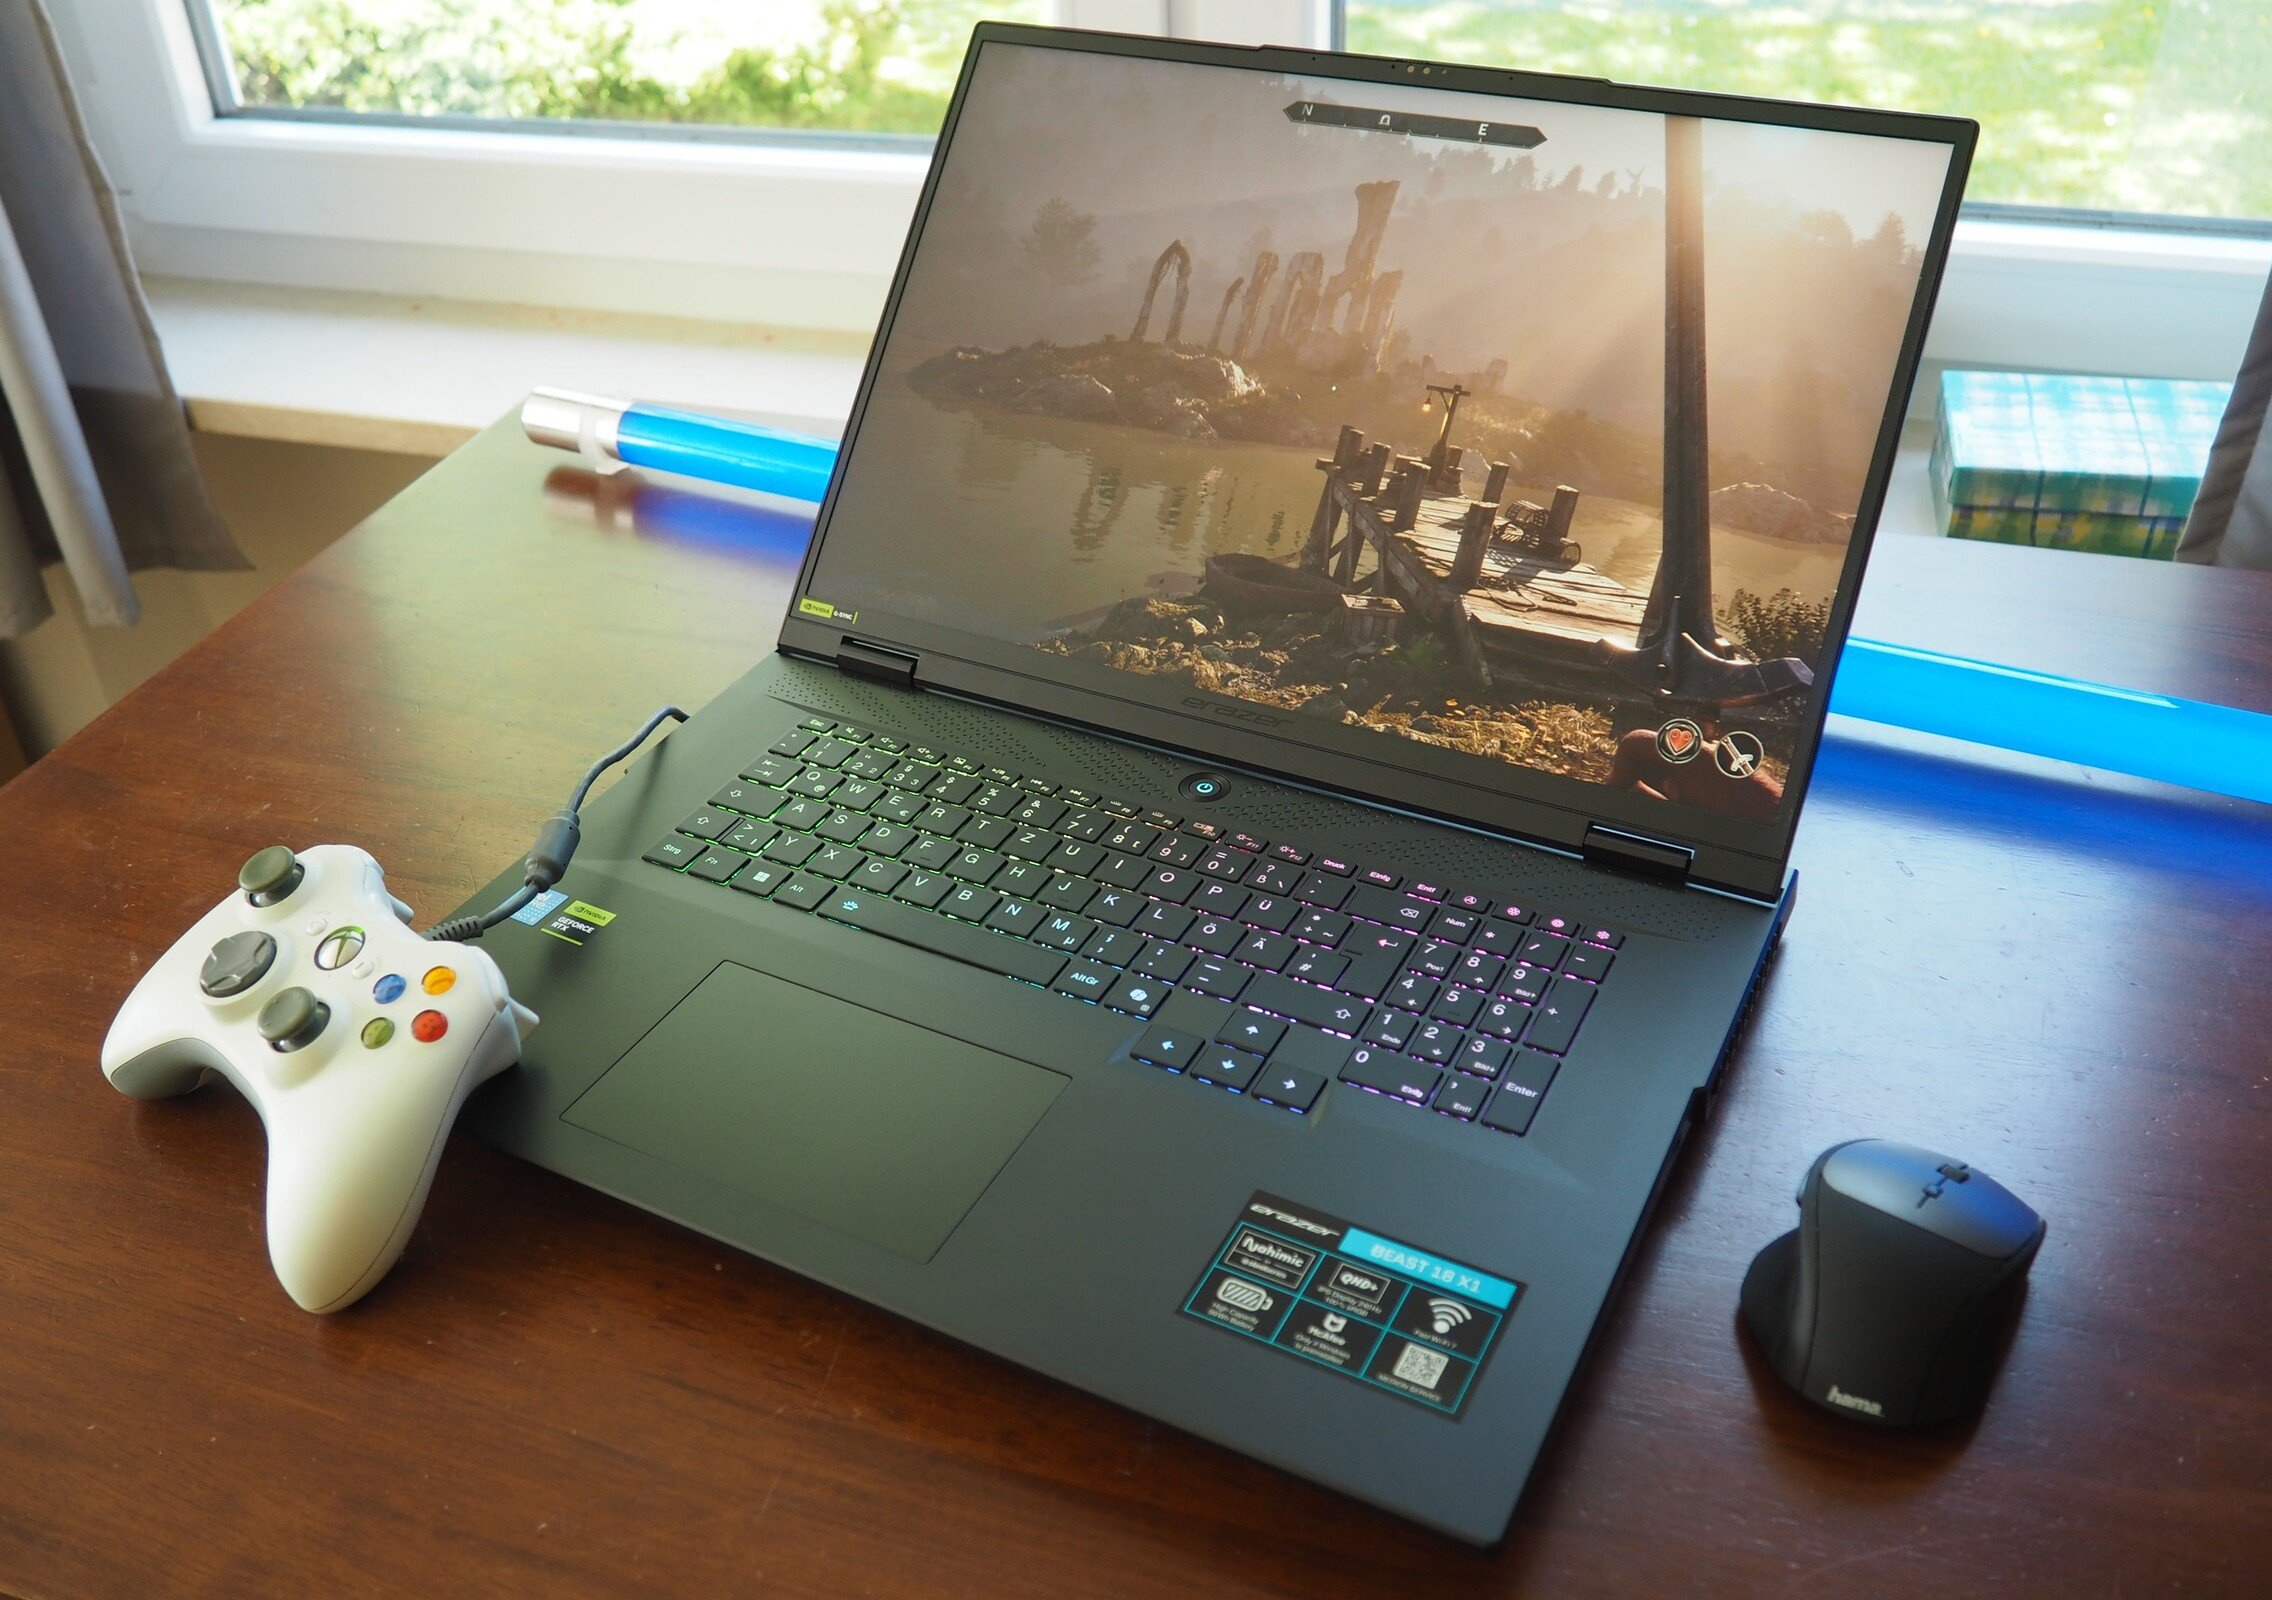
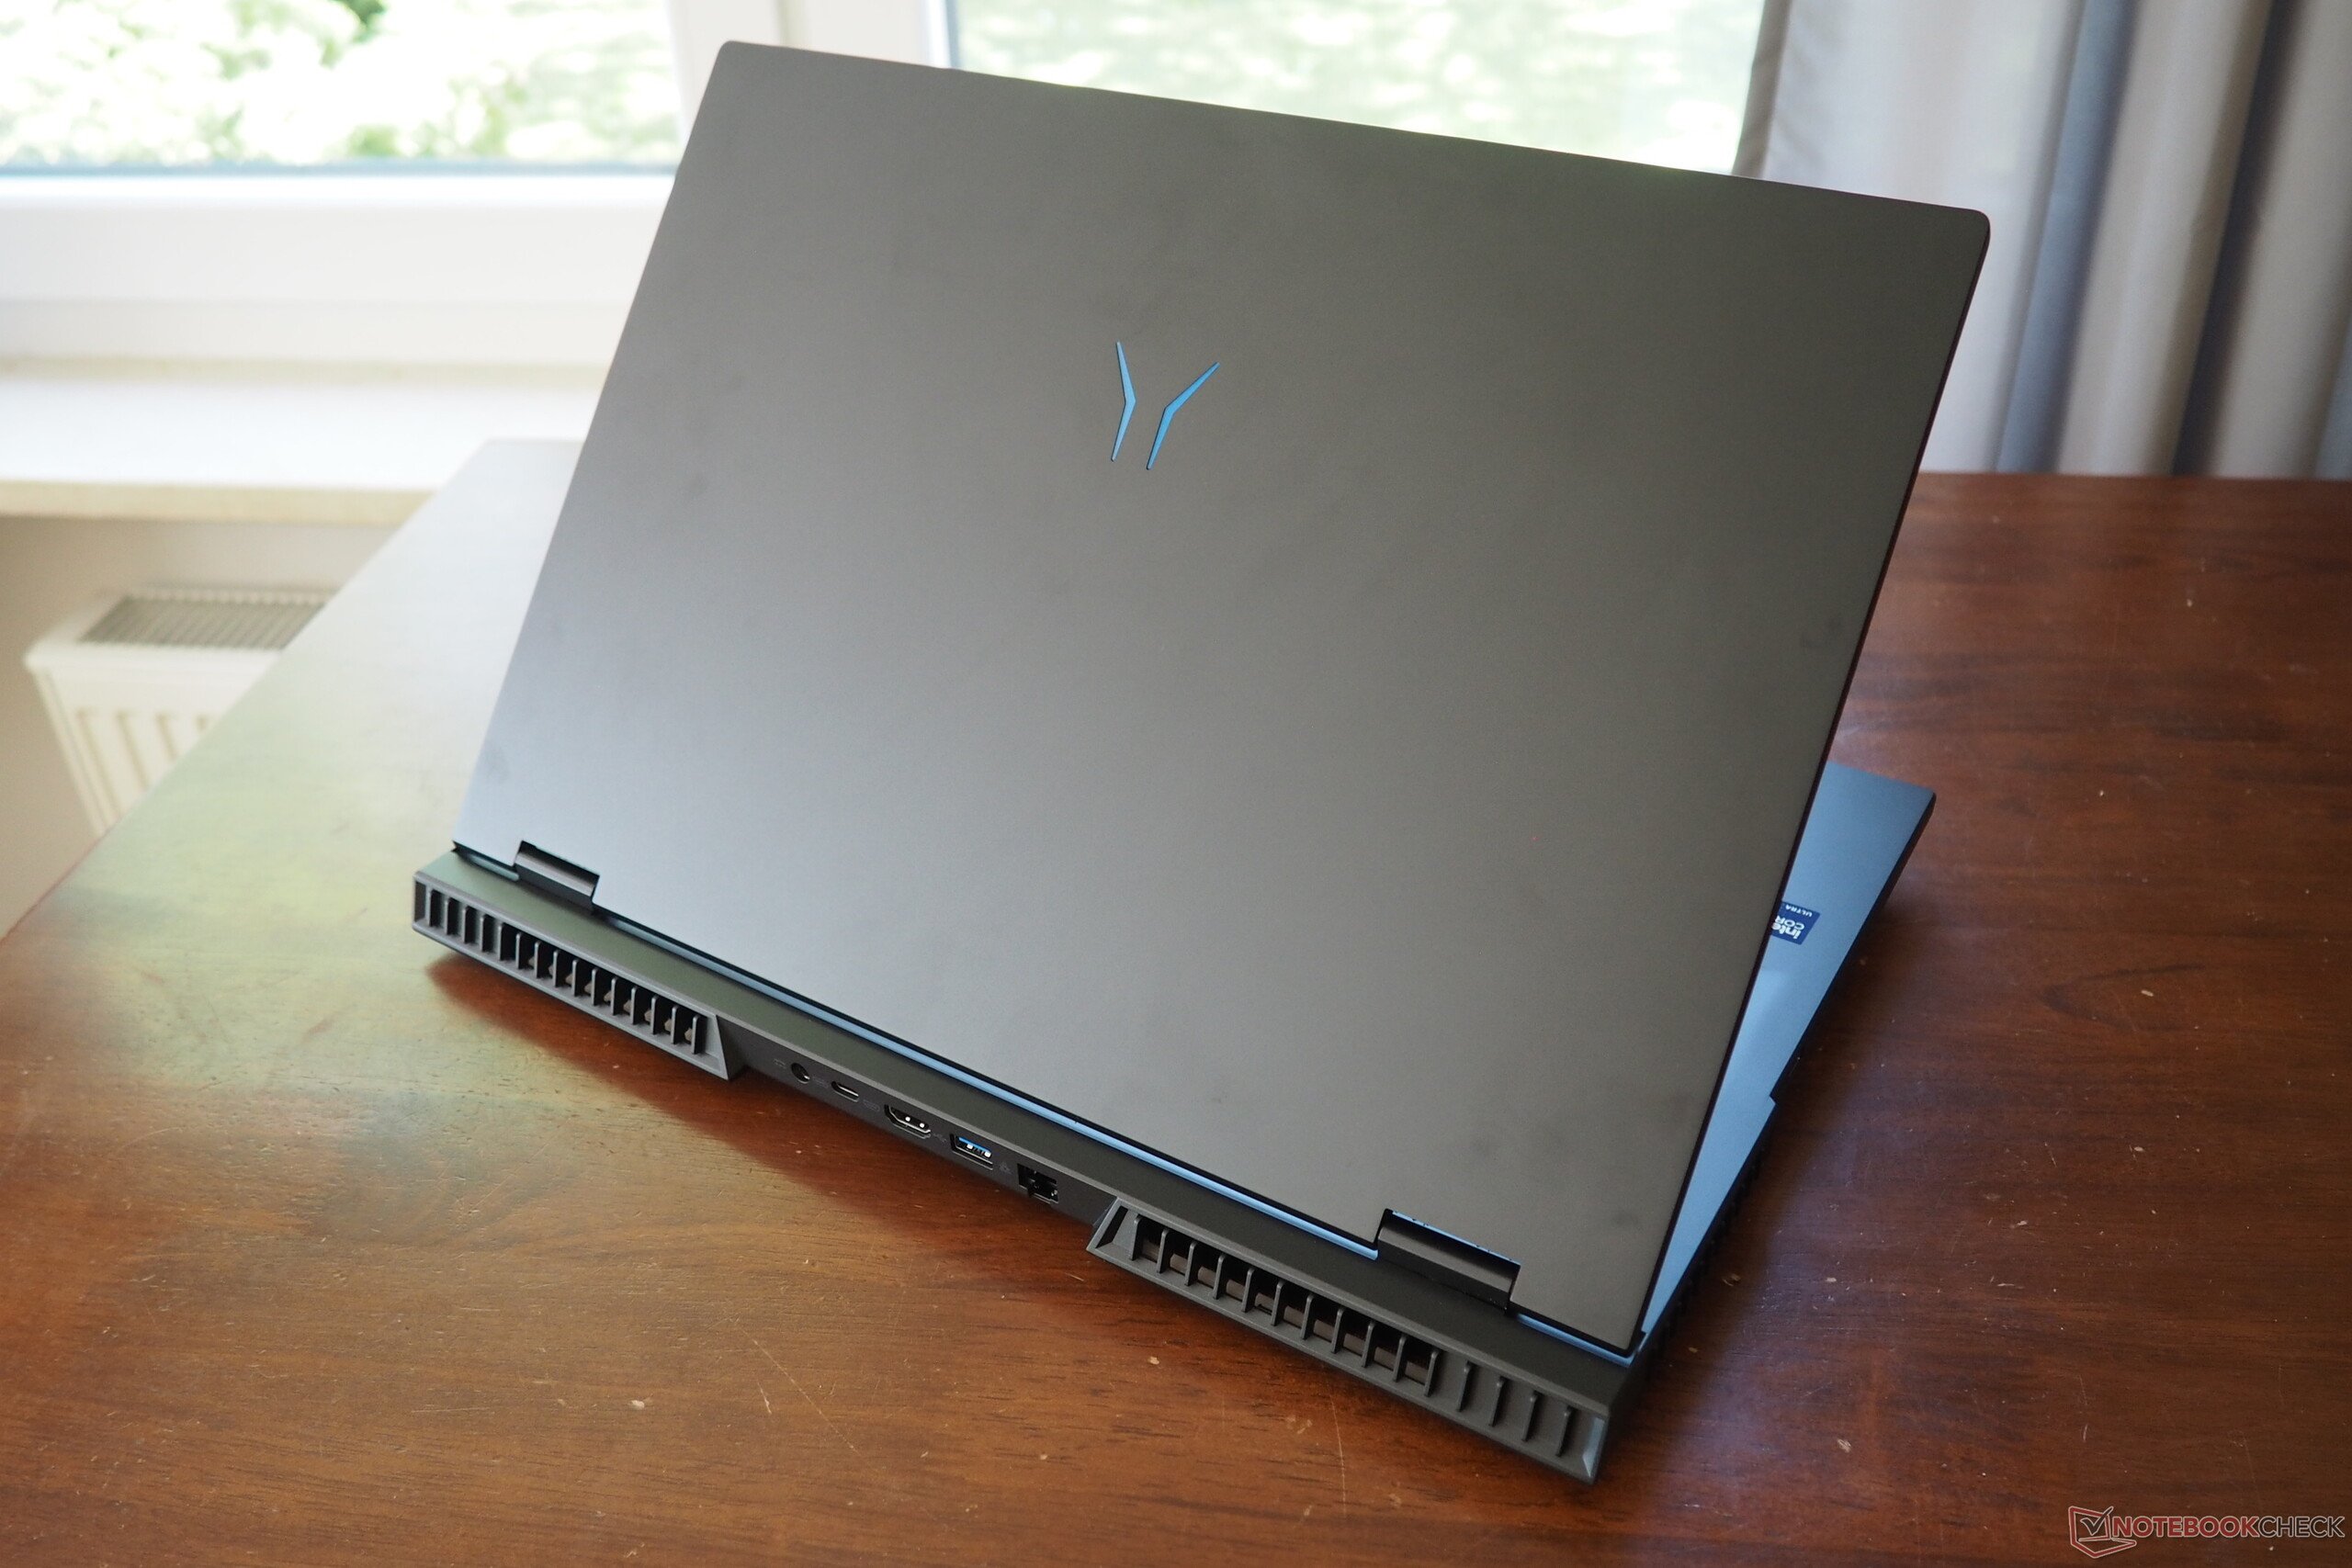
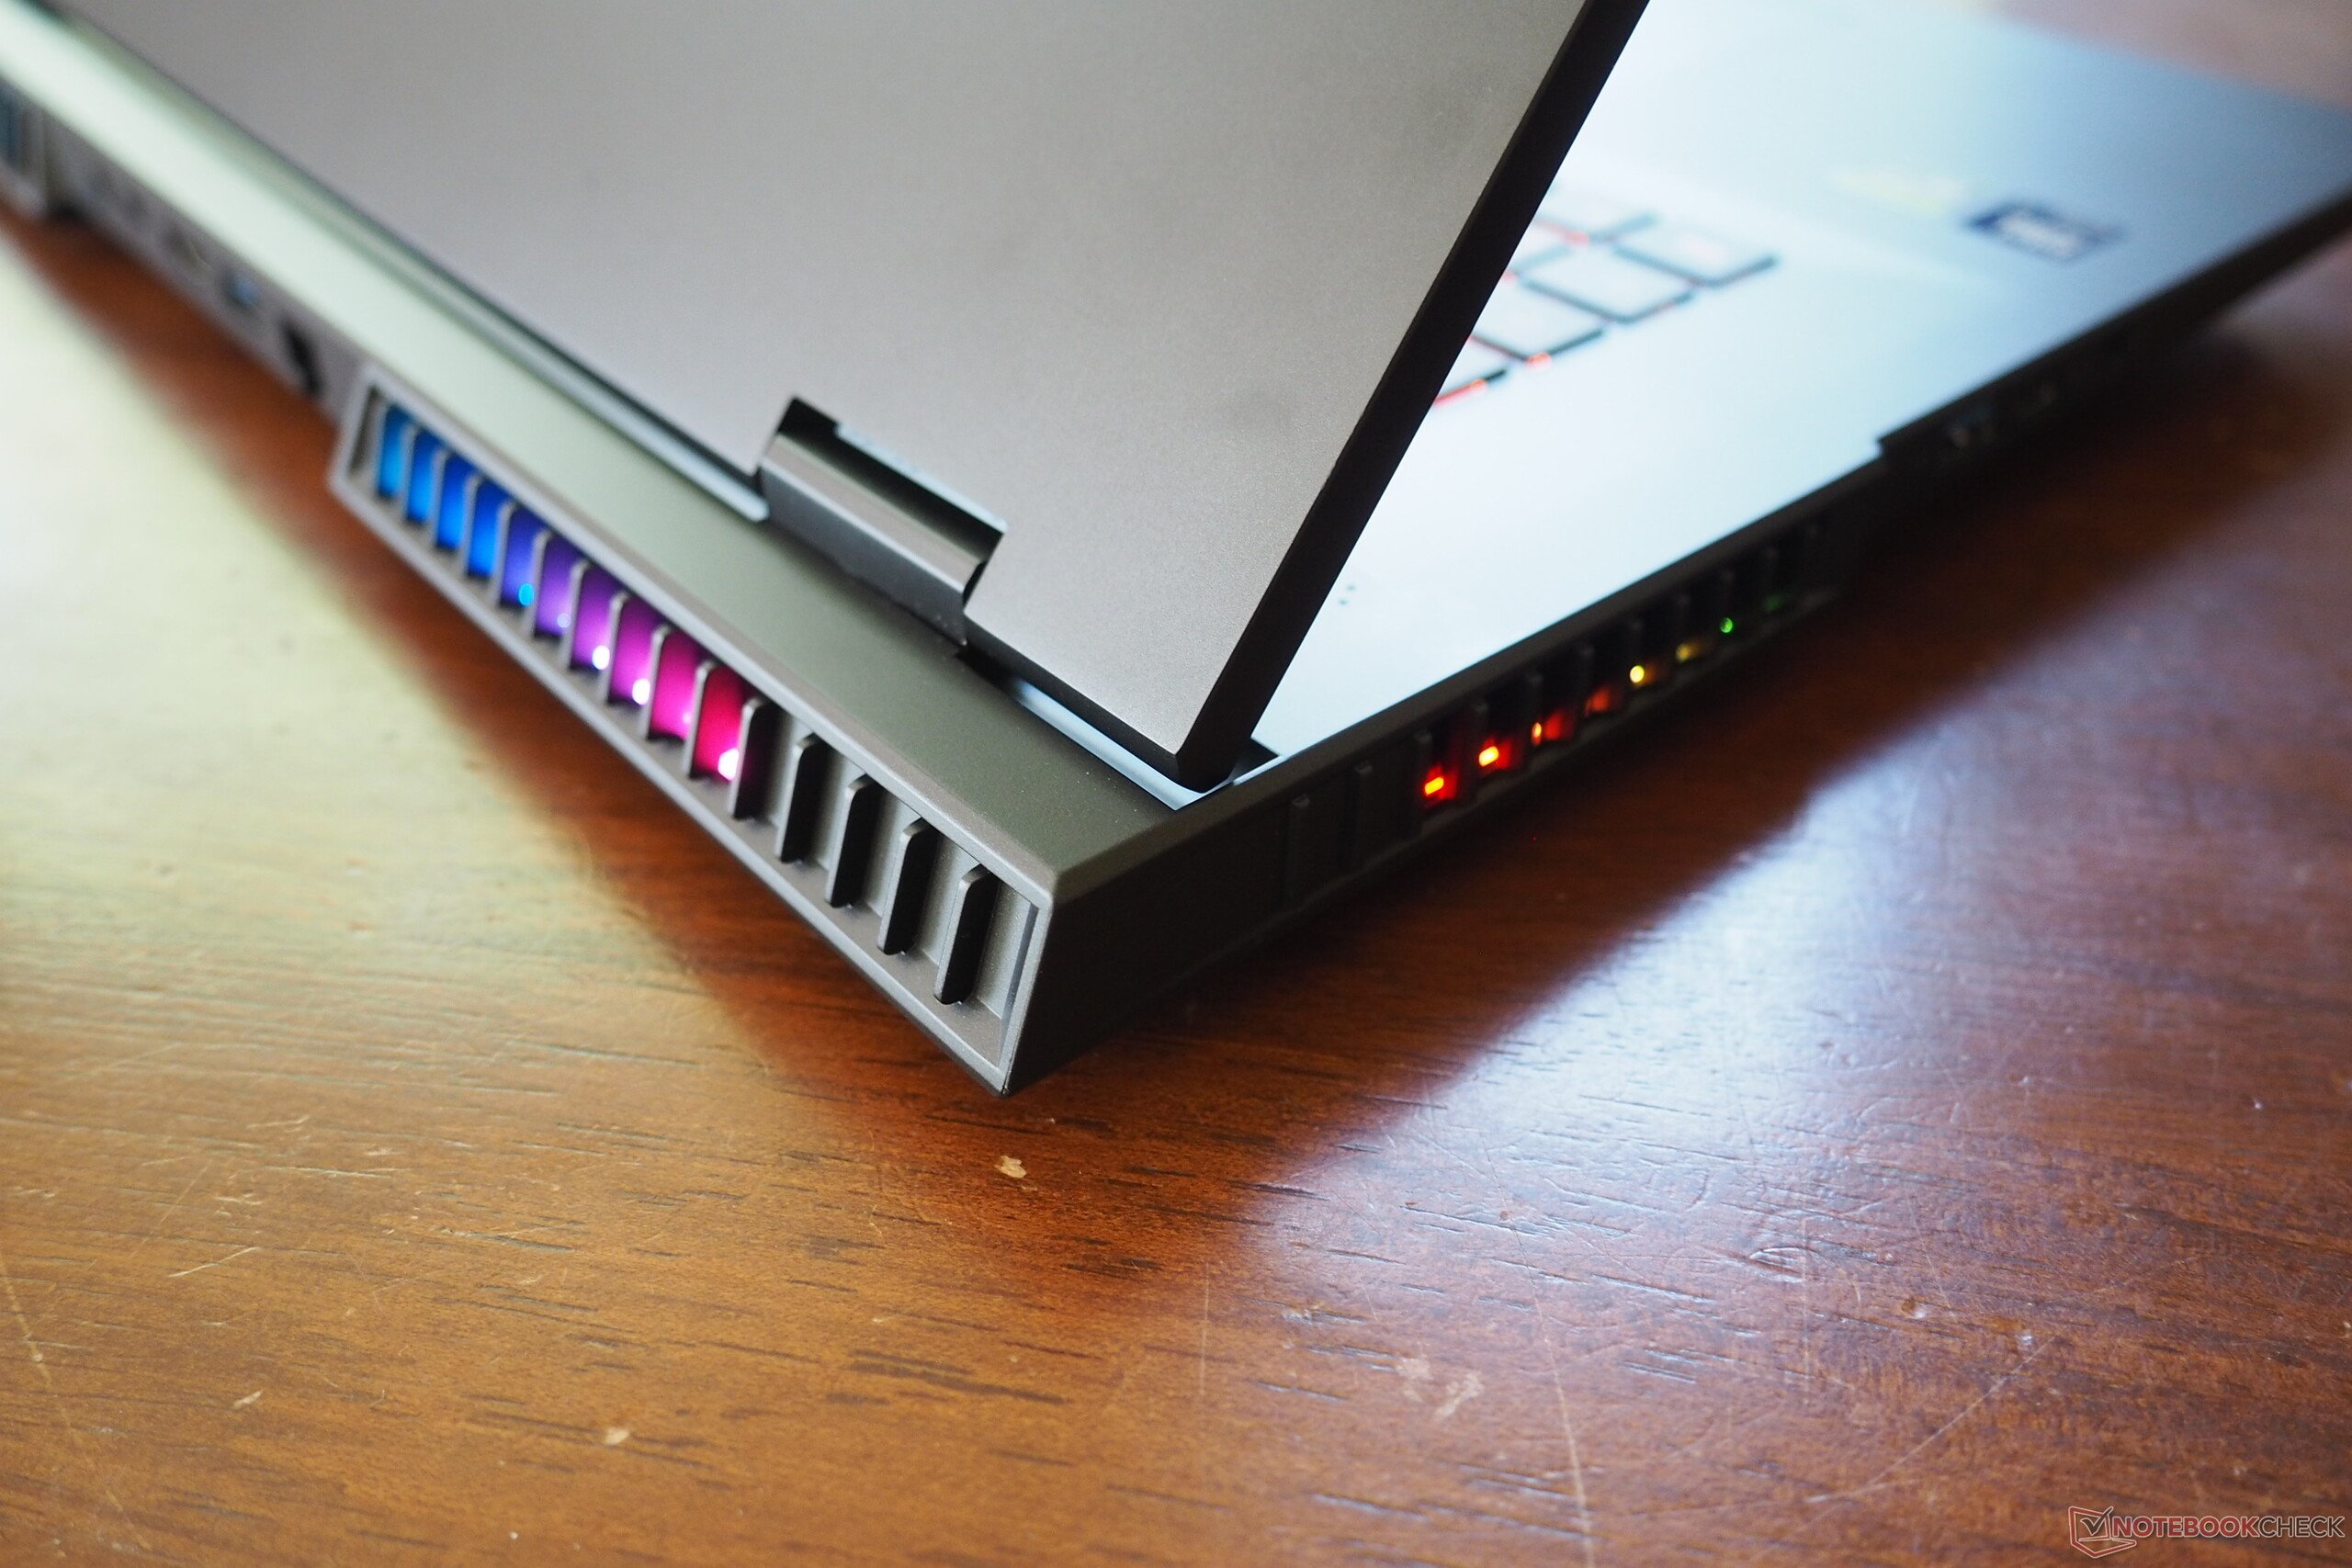
Se o senhor quiser um substituto potente para o desktop, talvez goste do Erazer Beast 18 X1. Embora o computador de 18 polegadas possa ficar extremamente barulhento sob carga (mesmo no modo balanceado), como muitos outros notebooks para jogos, os usuários que não são muito sensíveis a ruídos e/ou que jogam com um headset poderão suportar o volume. O enorme dispositivo tem uma aparência sólida e ganha pontos com uma conectividade bastante generosa, incluindo Thunderbolt 5, um teclado RGB e faixas de luz elegantes na lateral e na traseira (veja as fotos). Os dispositivos de entrada são de decentes a bons, mas o modelo realmente não consegue impressionar aqui.
O laptop GeForce RTX 5080 da Nvidia tem desempenho dentro da faixa esperada, enquanto o Core Ultra 9 275HX da Intel perde um pouco de desempenho sob carga prolongada (falaremos mais sobre isso daqui a pouco). A concorrência inclui o Aorus Master 18 e o Asus ROG Strix Scar 18que testamos com o laptop RTX 5090 mais potente.
Pro
Contra
Preço e disponibilidade
O Medion Erazer Beast 18 X1 MD62731 está listado por cerca de 3.700 euros na página inicial da Medion em https://www.medion.com/de/shop/p/high-end-gaming-notebooks-medion-erazer-beast-18-x1-high-end-gaming-laptop-intel-core-ultra-9-prozessor-275hx-windows-11-home-45-7-cm-18--qhd-display-100-srgb-mit-240-hz-rtx-5080-2-tb-pcie-ssd-32-gb-ram-30039669A1 listado.
Especificações
Caso
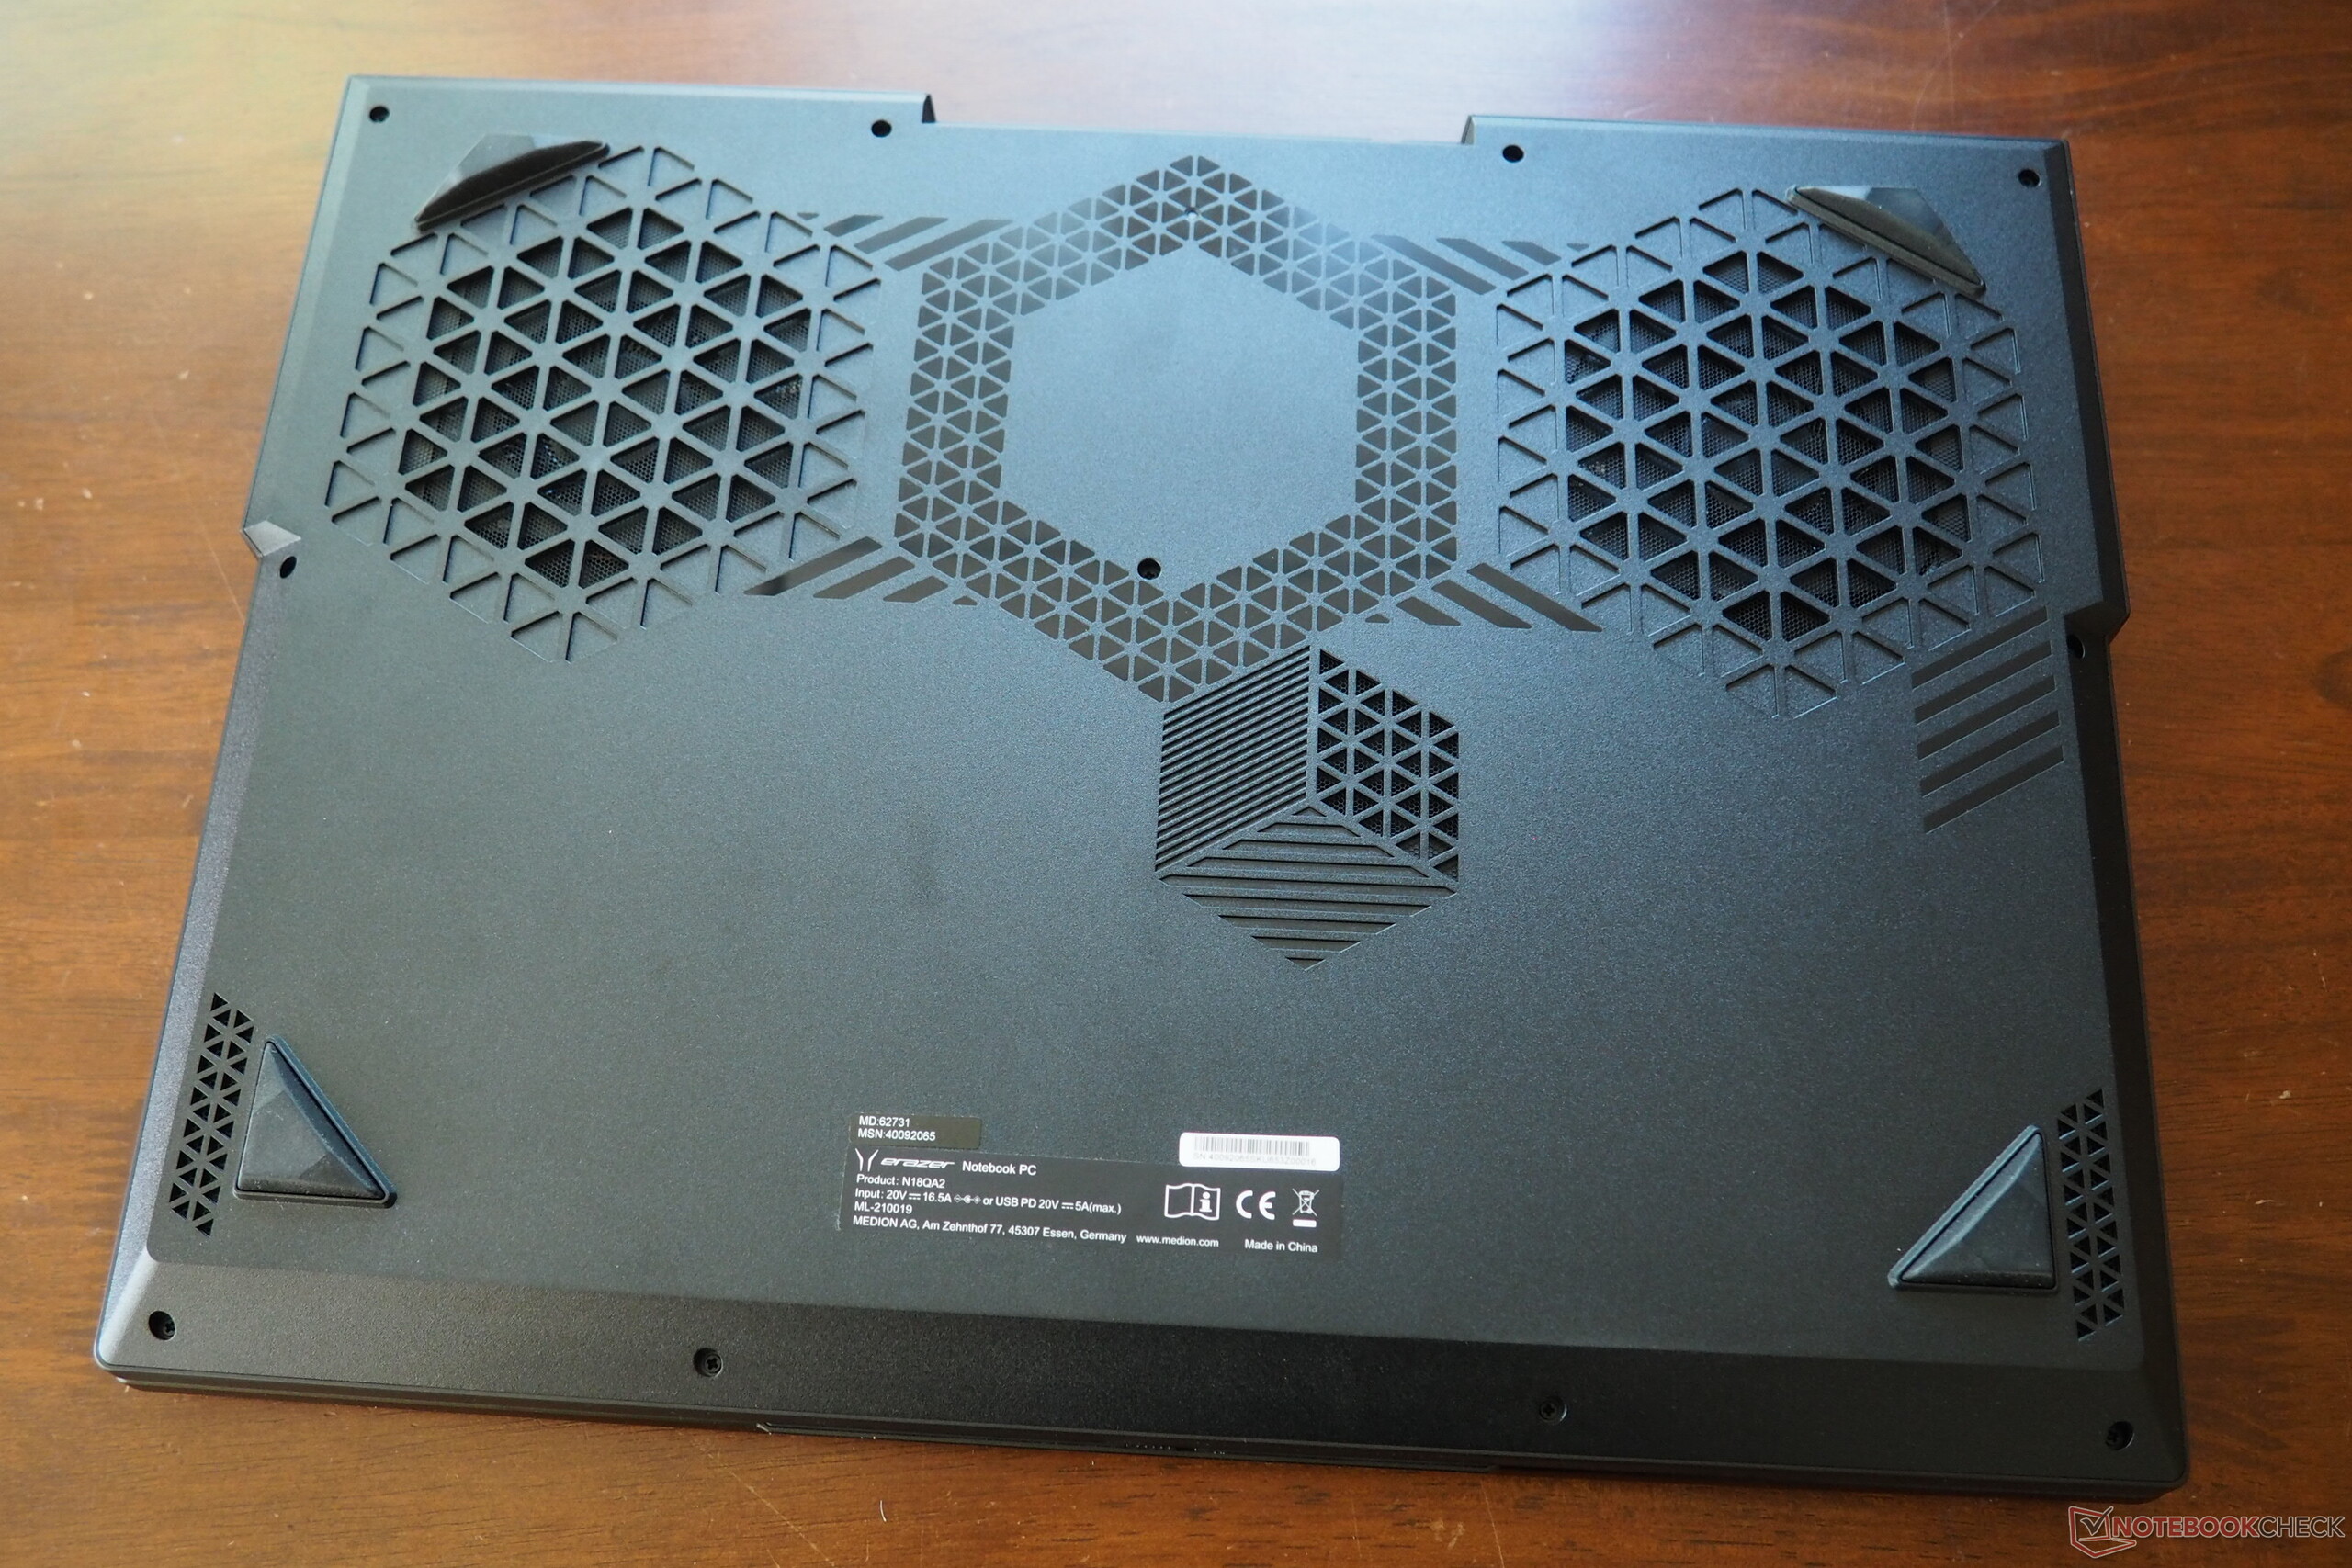
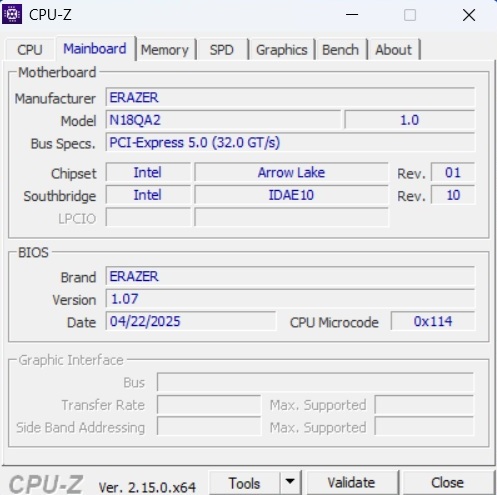
Em termos de qualidade, a Medion oferece a média habitual. Enquanto a tampa do aparelho de 18 polegadas é feita de alumínio, a unidade de base é feita de plástico. Apesar da construção relativamente mais espessa, a última pode ser levemente dobrada em alguns lugares, mas isso só acontece quando é aplicada mais pressão. Por outro lado, o generoso ângulo de abertura de 150° merece elogios, embora as dobradiças pudessem ser um pouco mais apertadas. Com uma altura total de pouco menos de 3 cm (sem os pés do gabinete), o Beast 18 X1 se alinha com seus equivalentes da Aorus e Asusembora o peso seja um pouco maior, de 3,6 a 3,3-3,4 kg.

Equipamentos
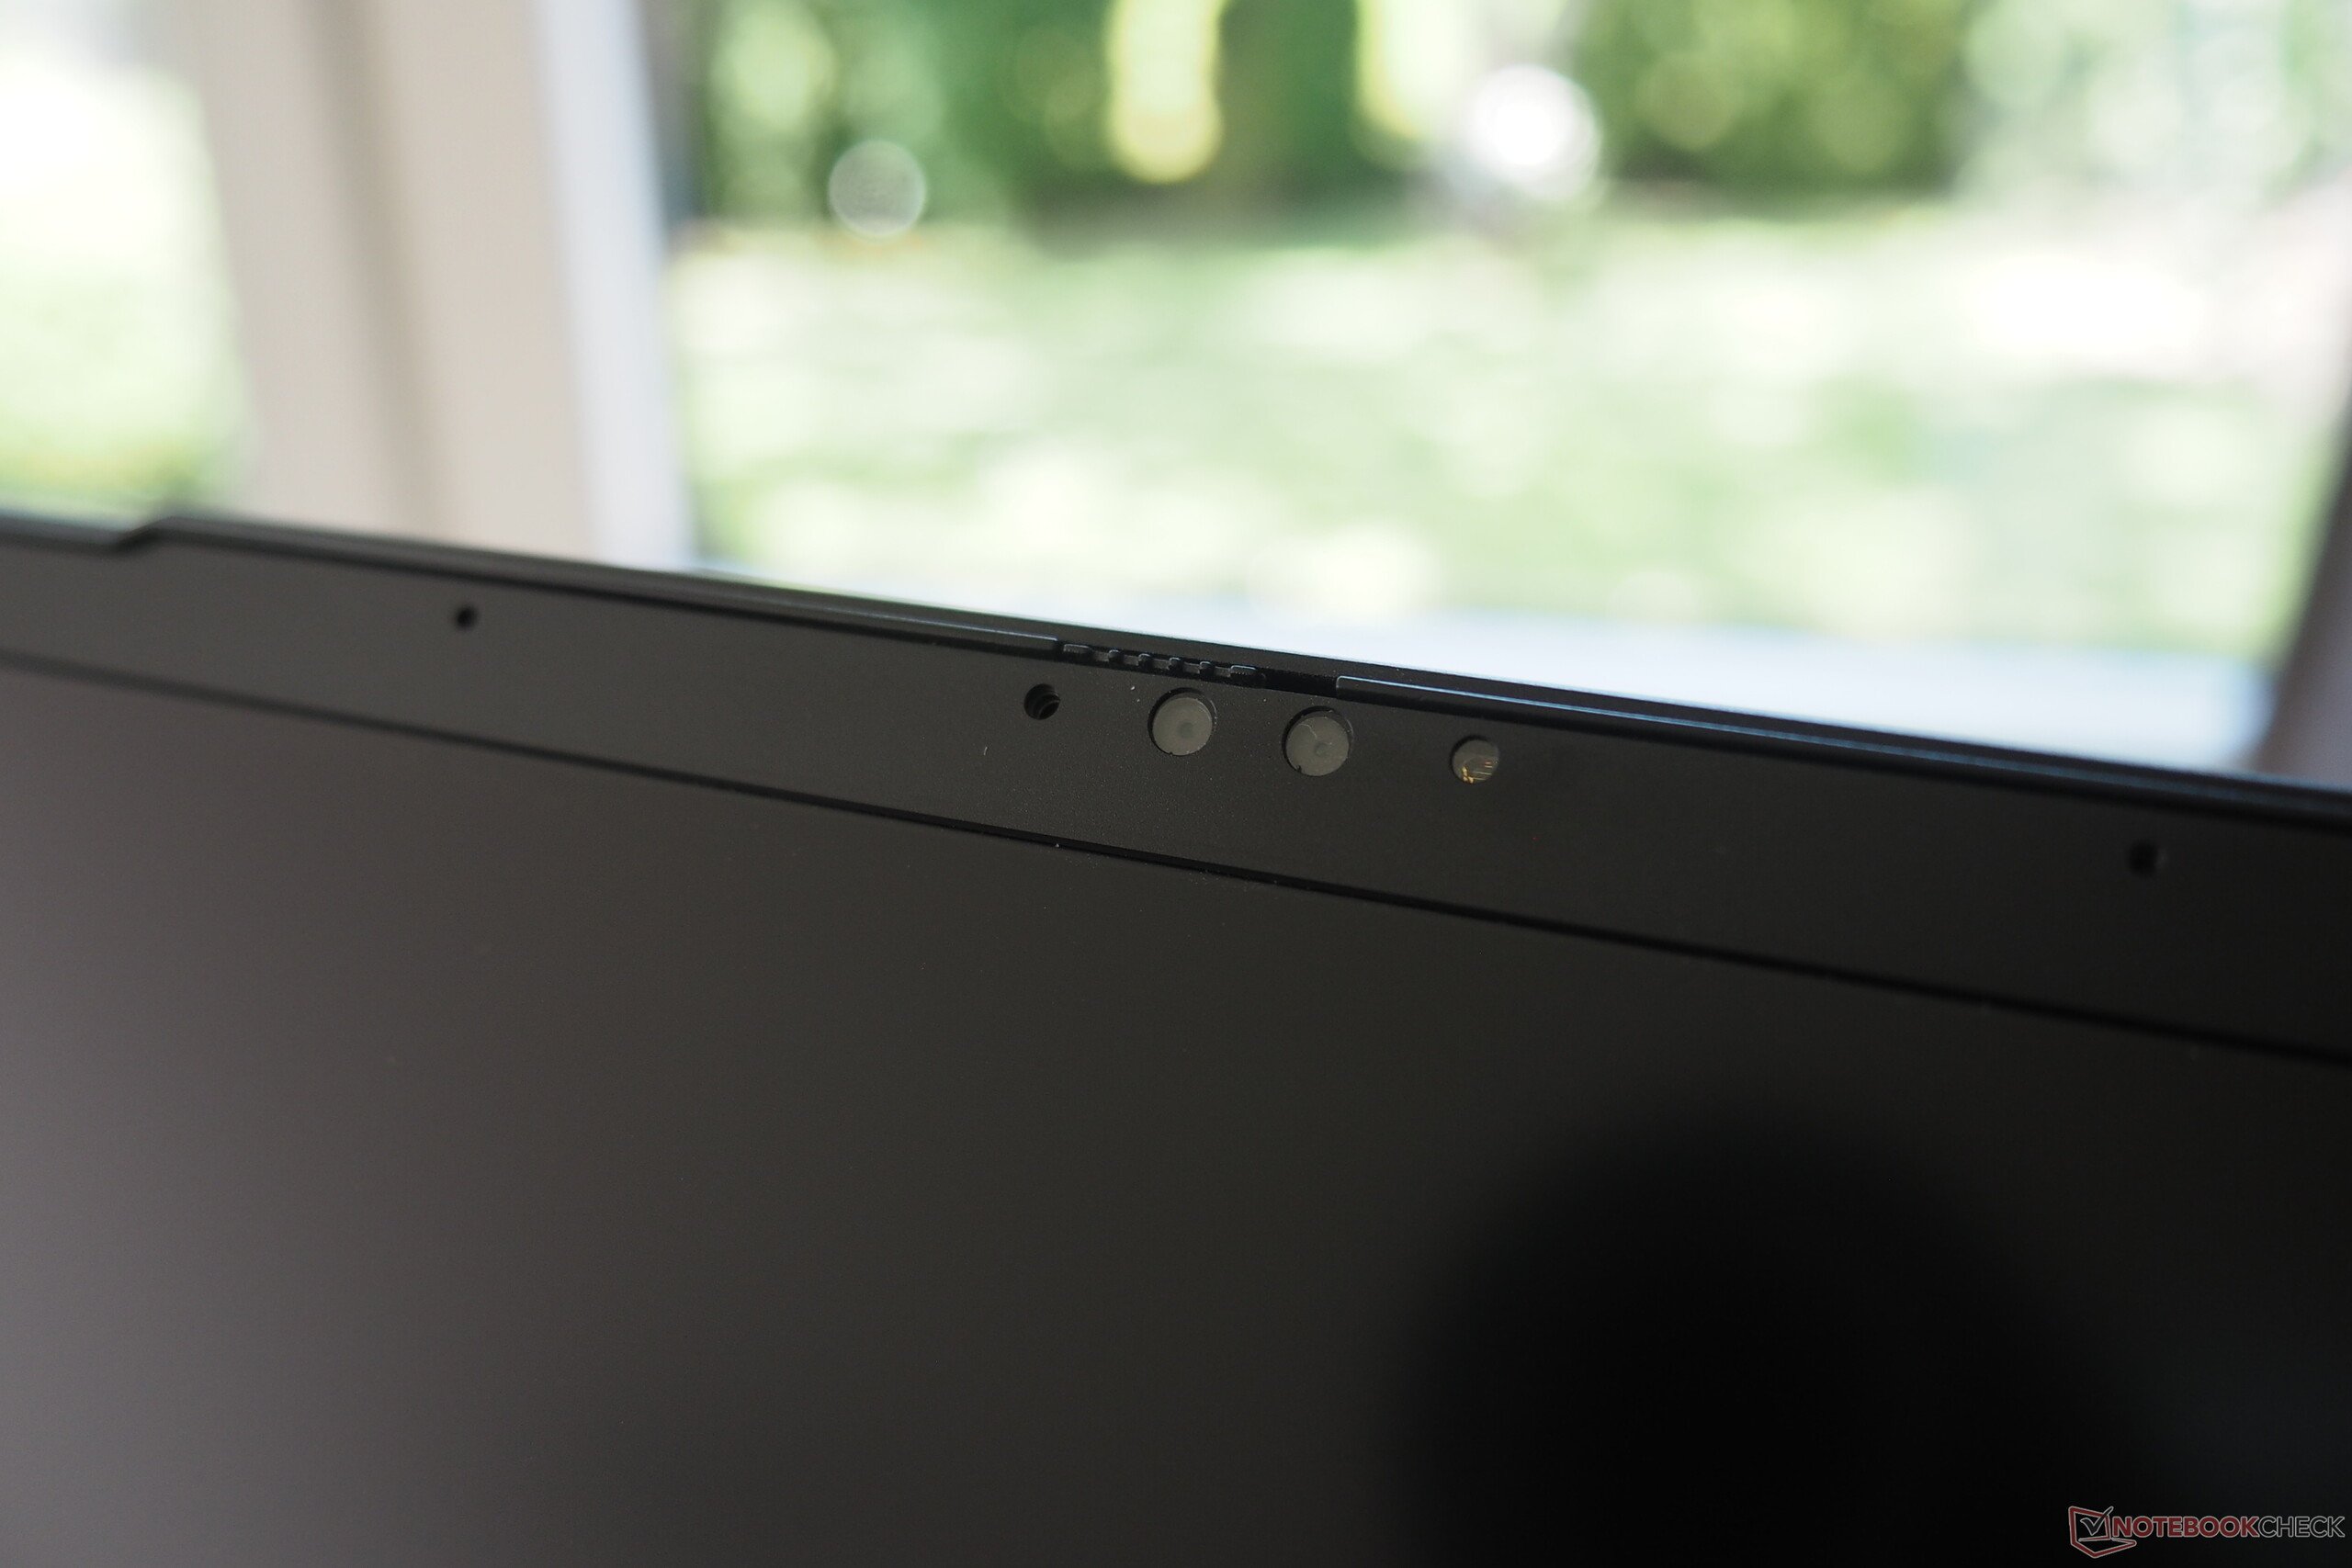
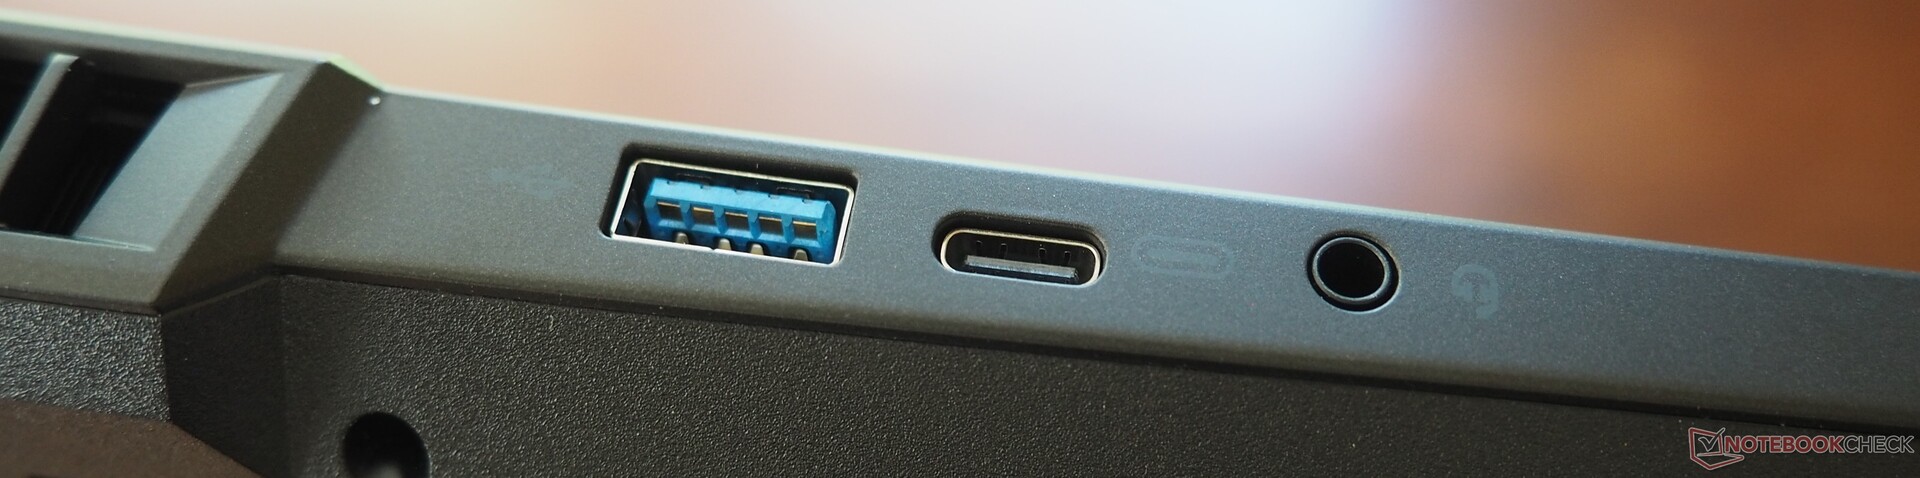
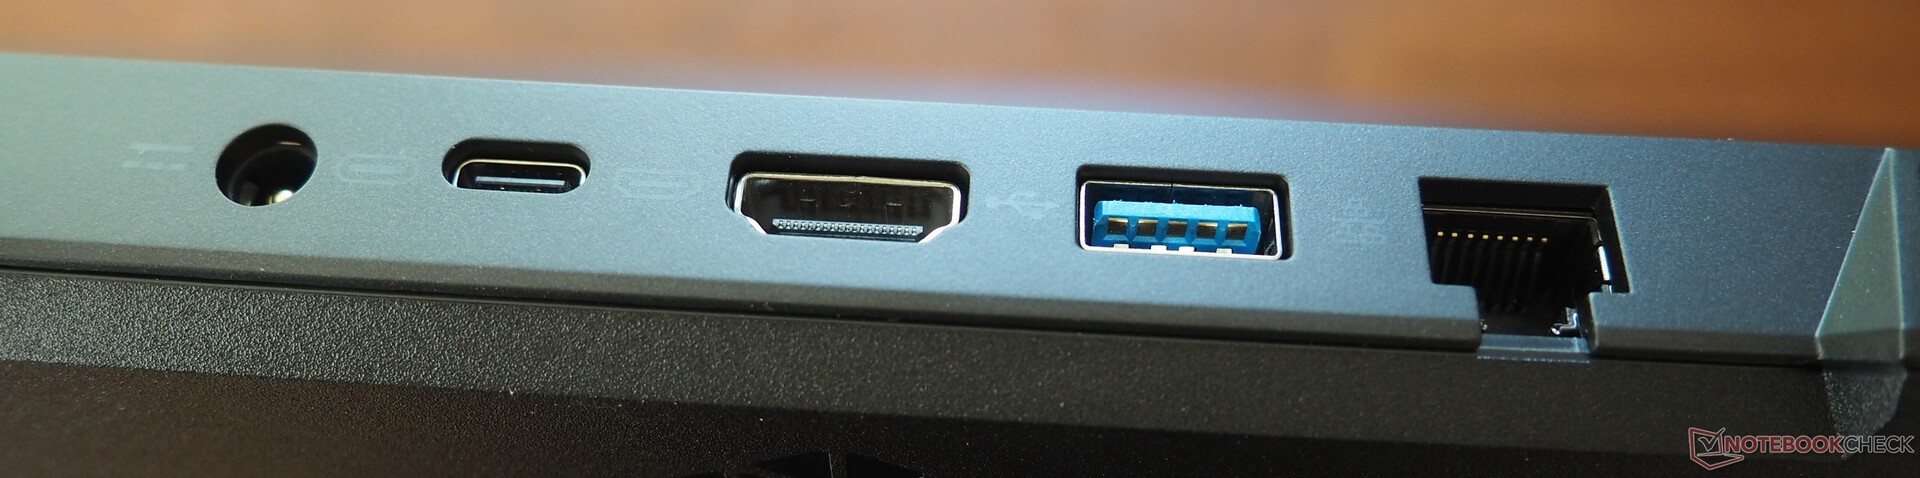
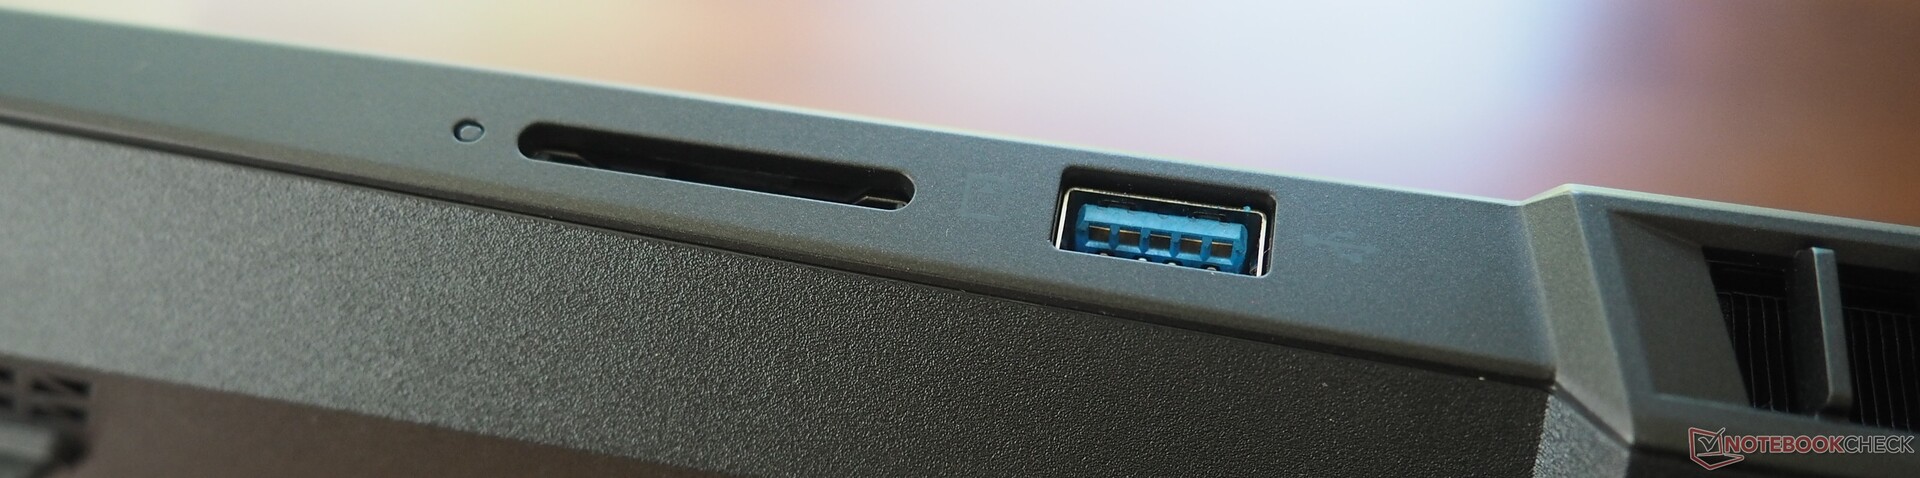
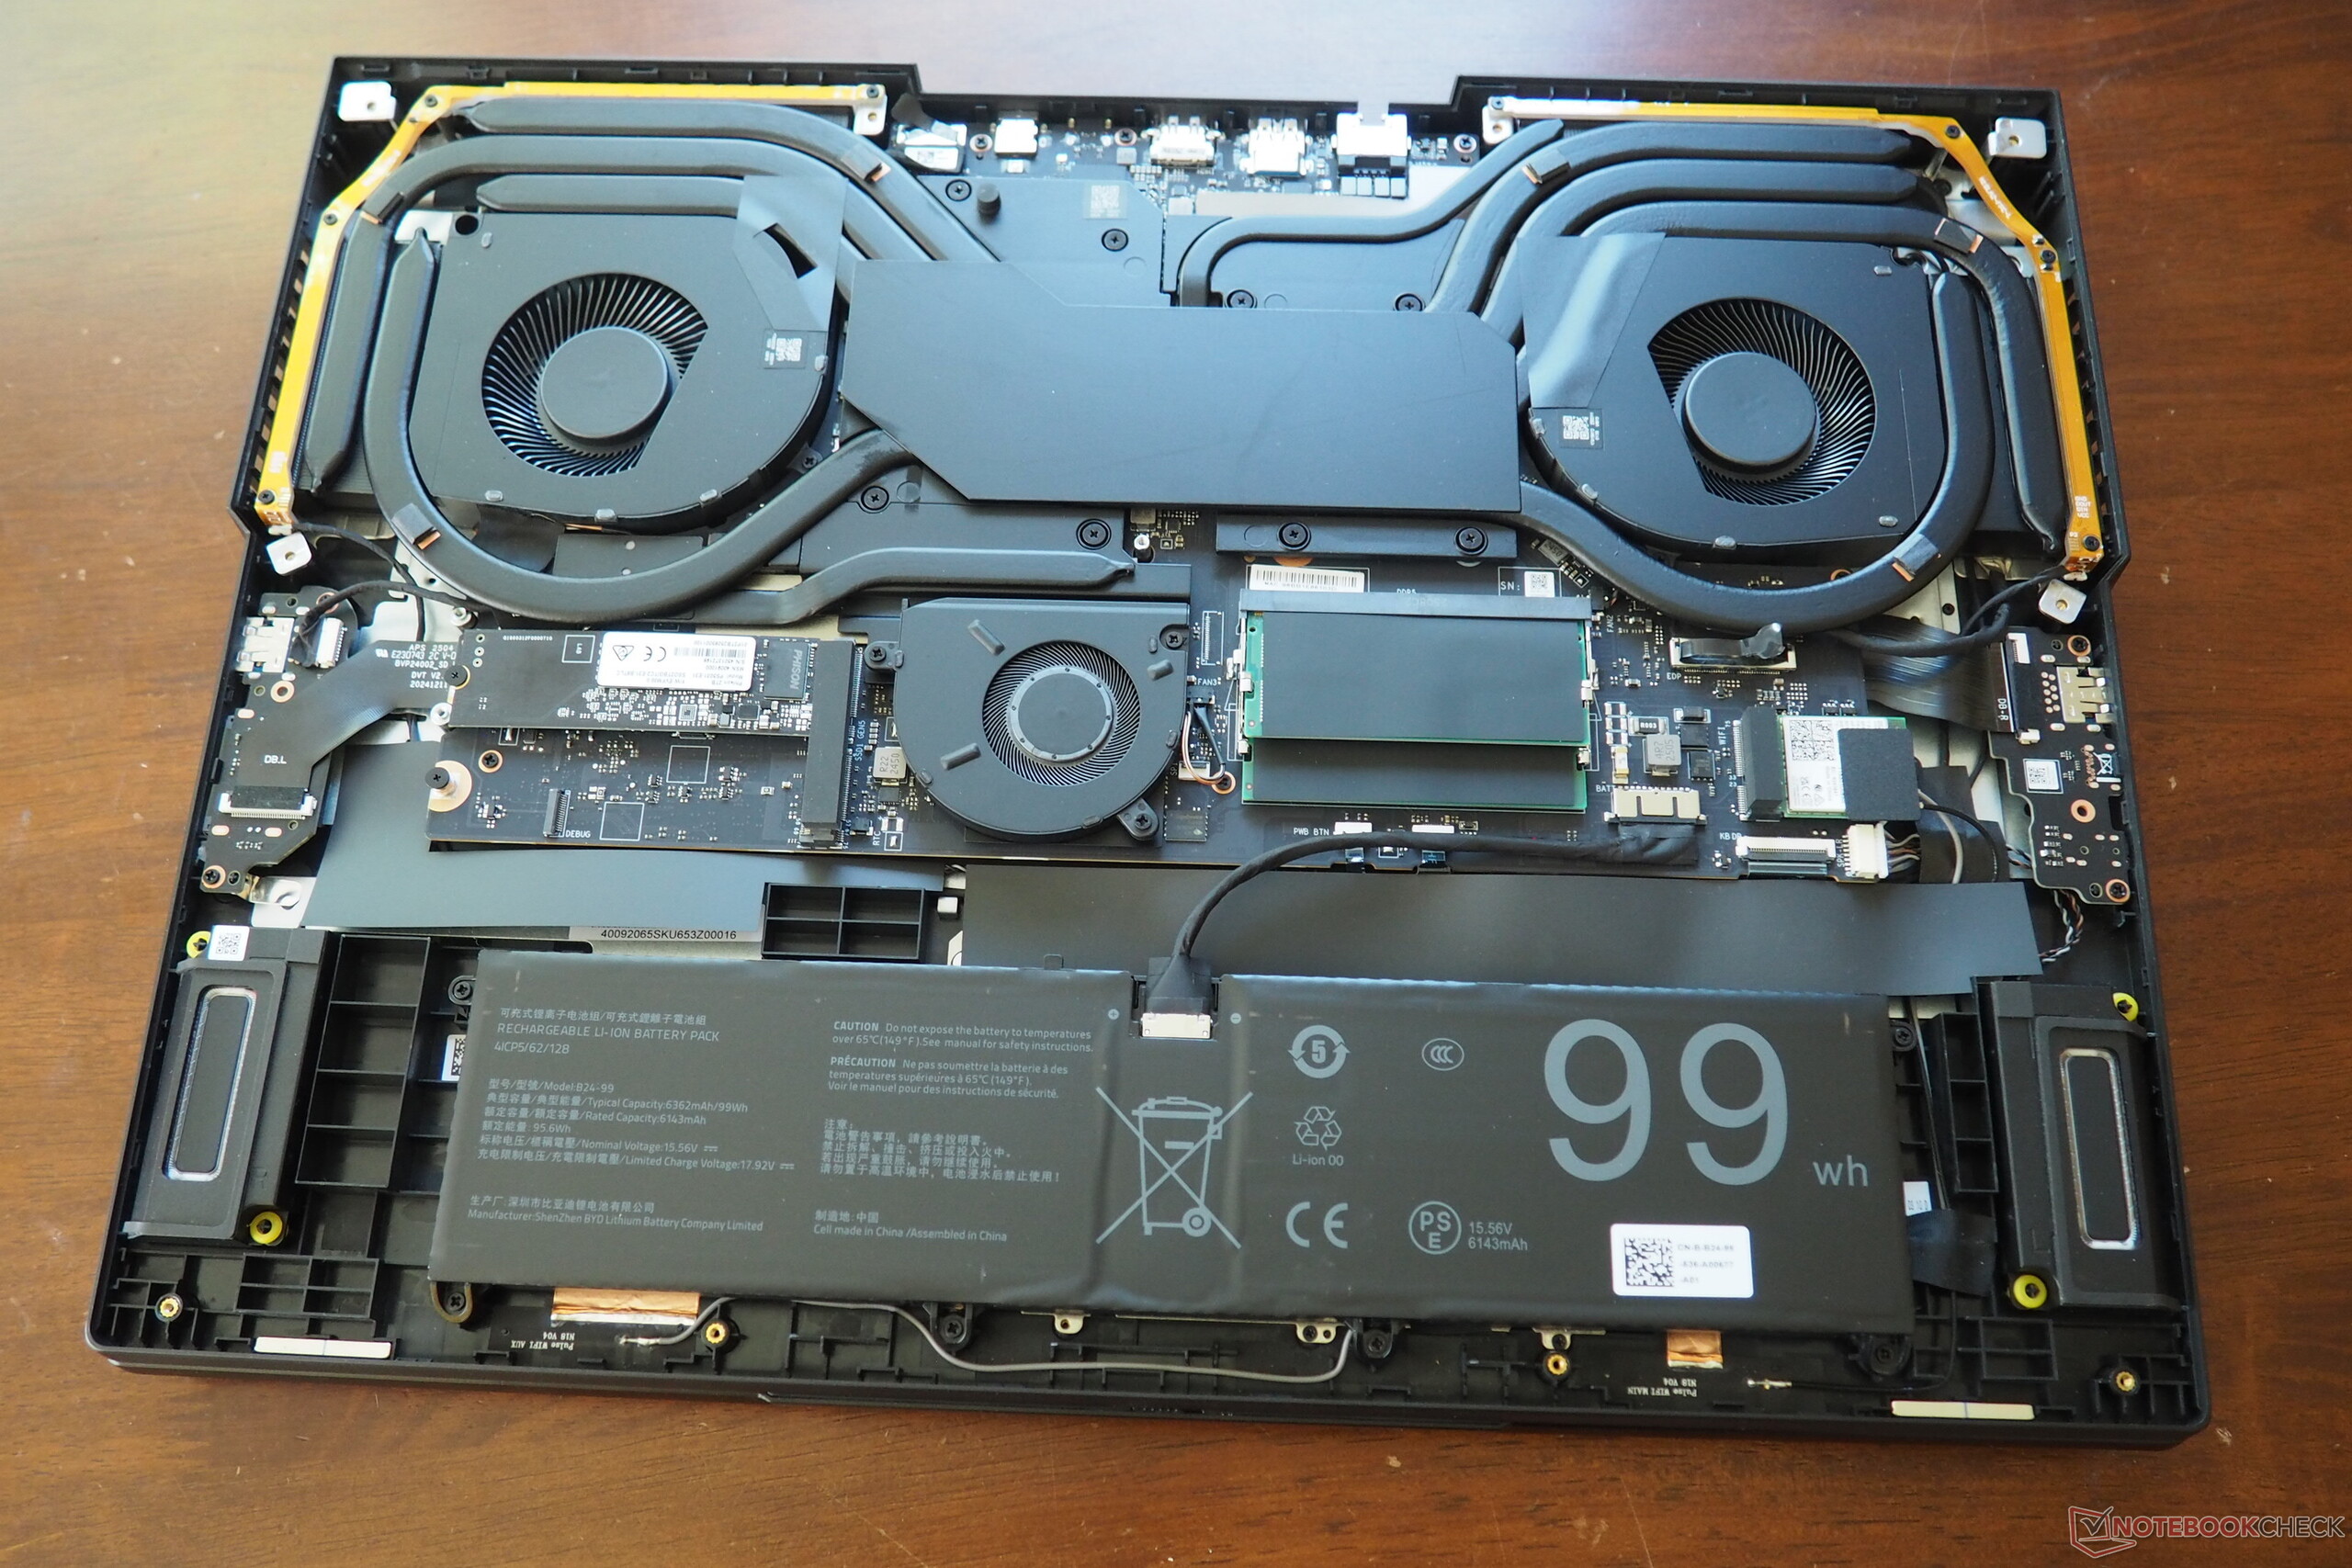
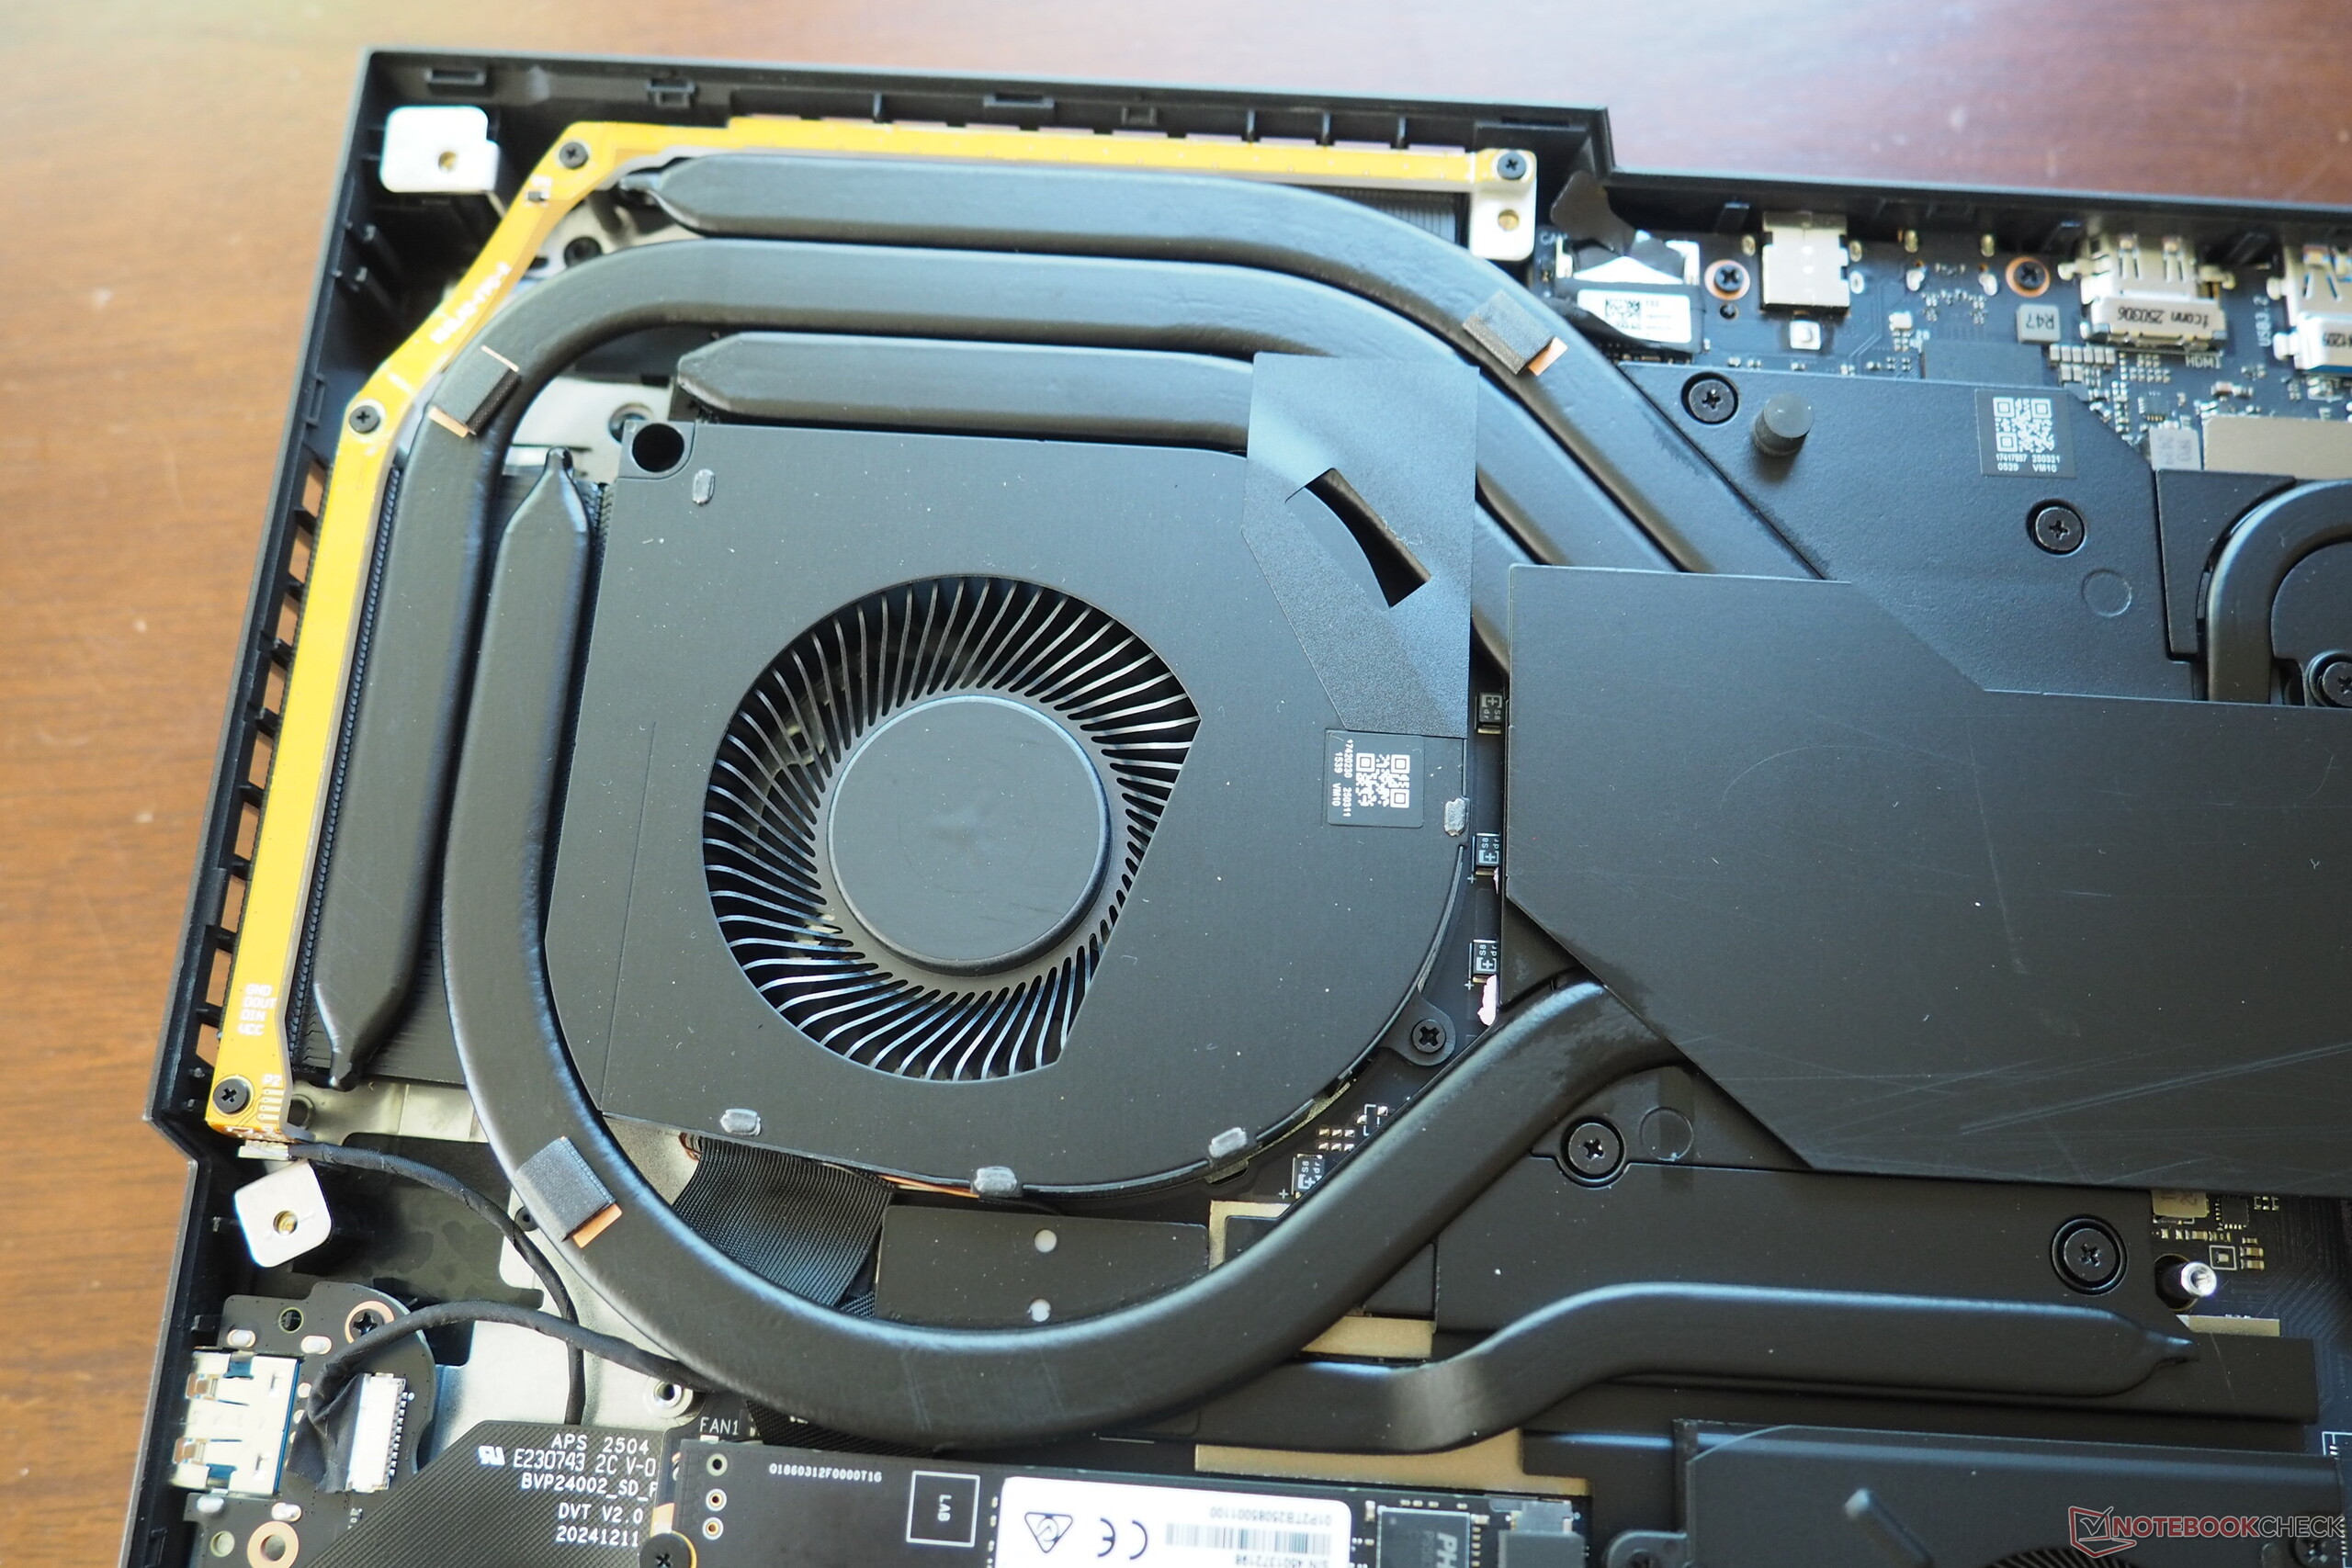
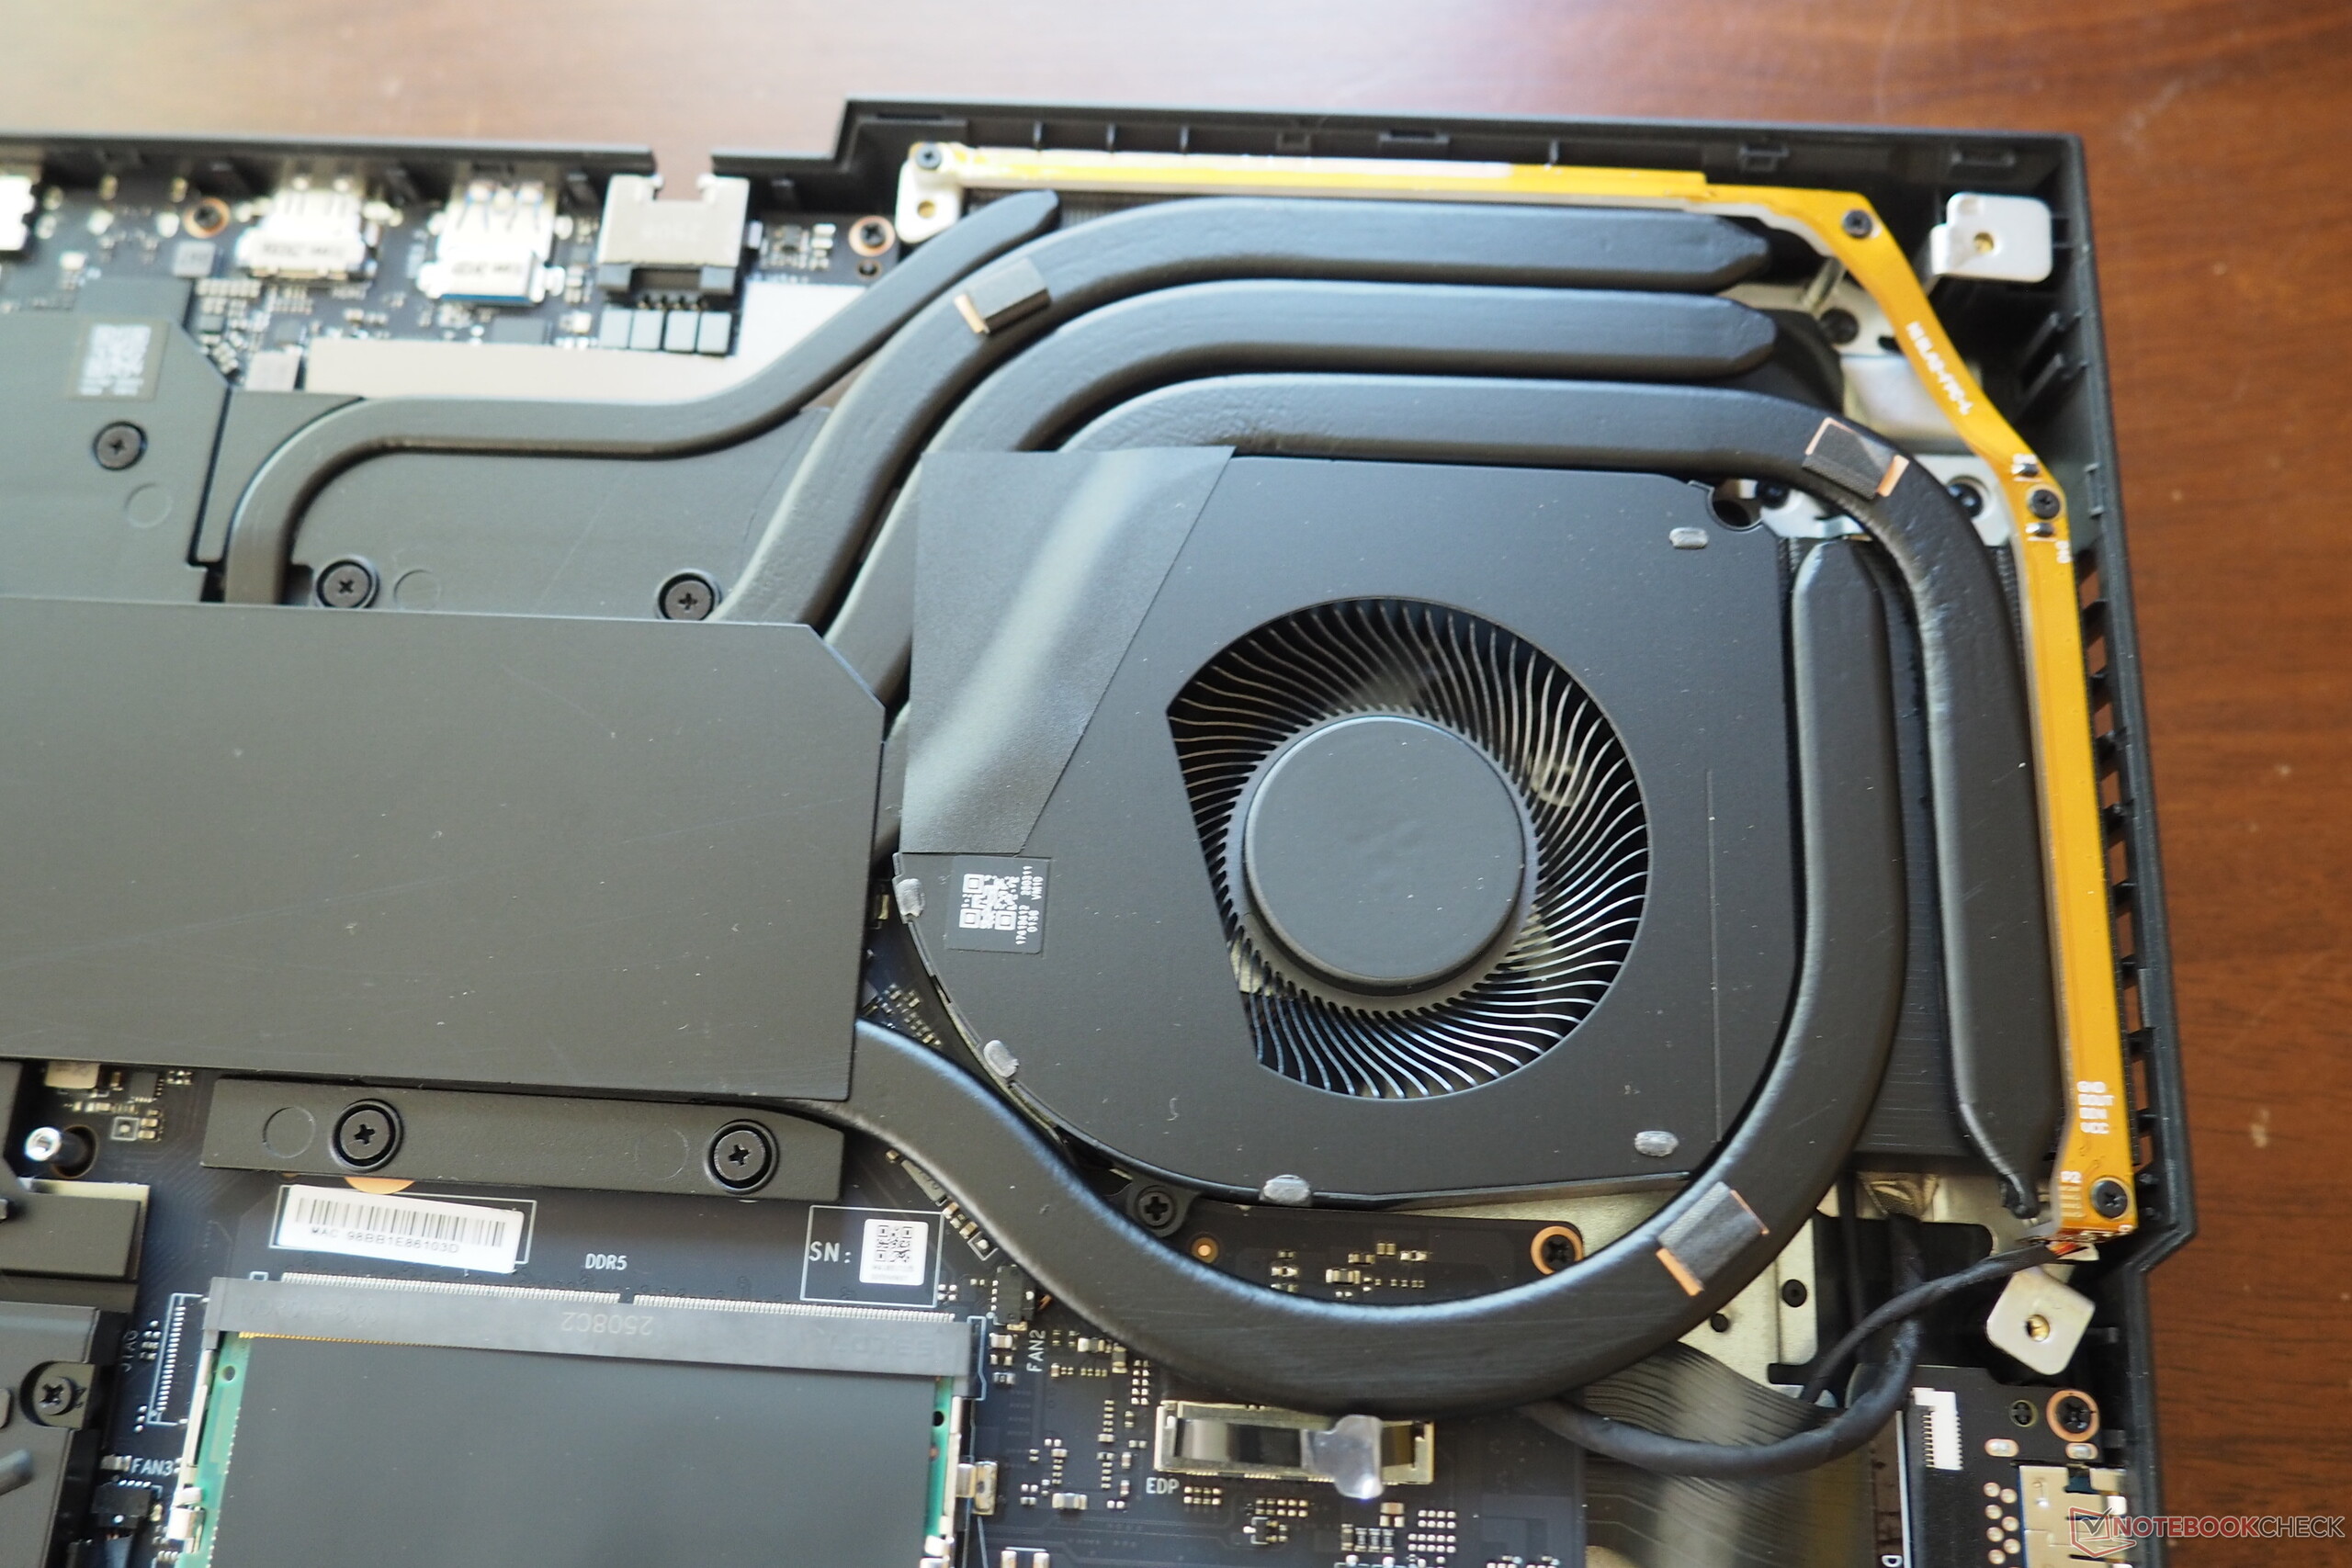
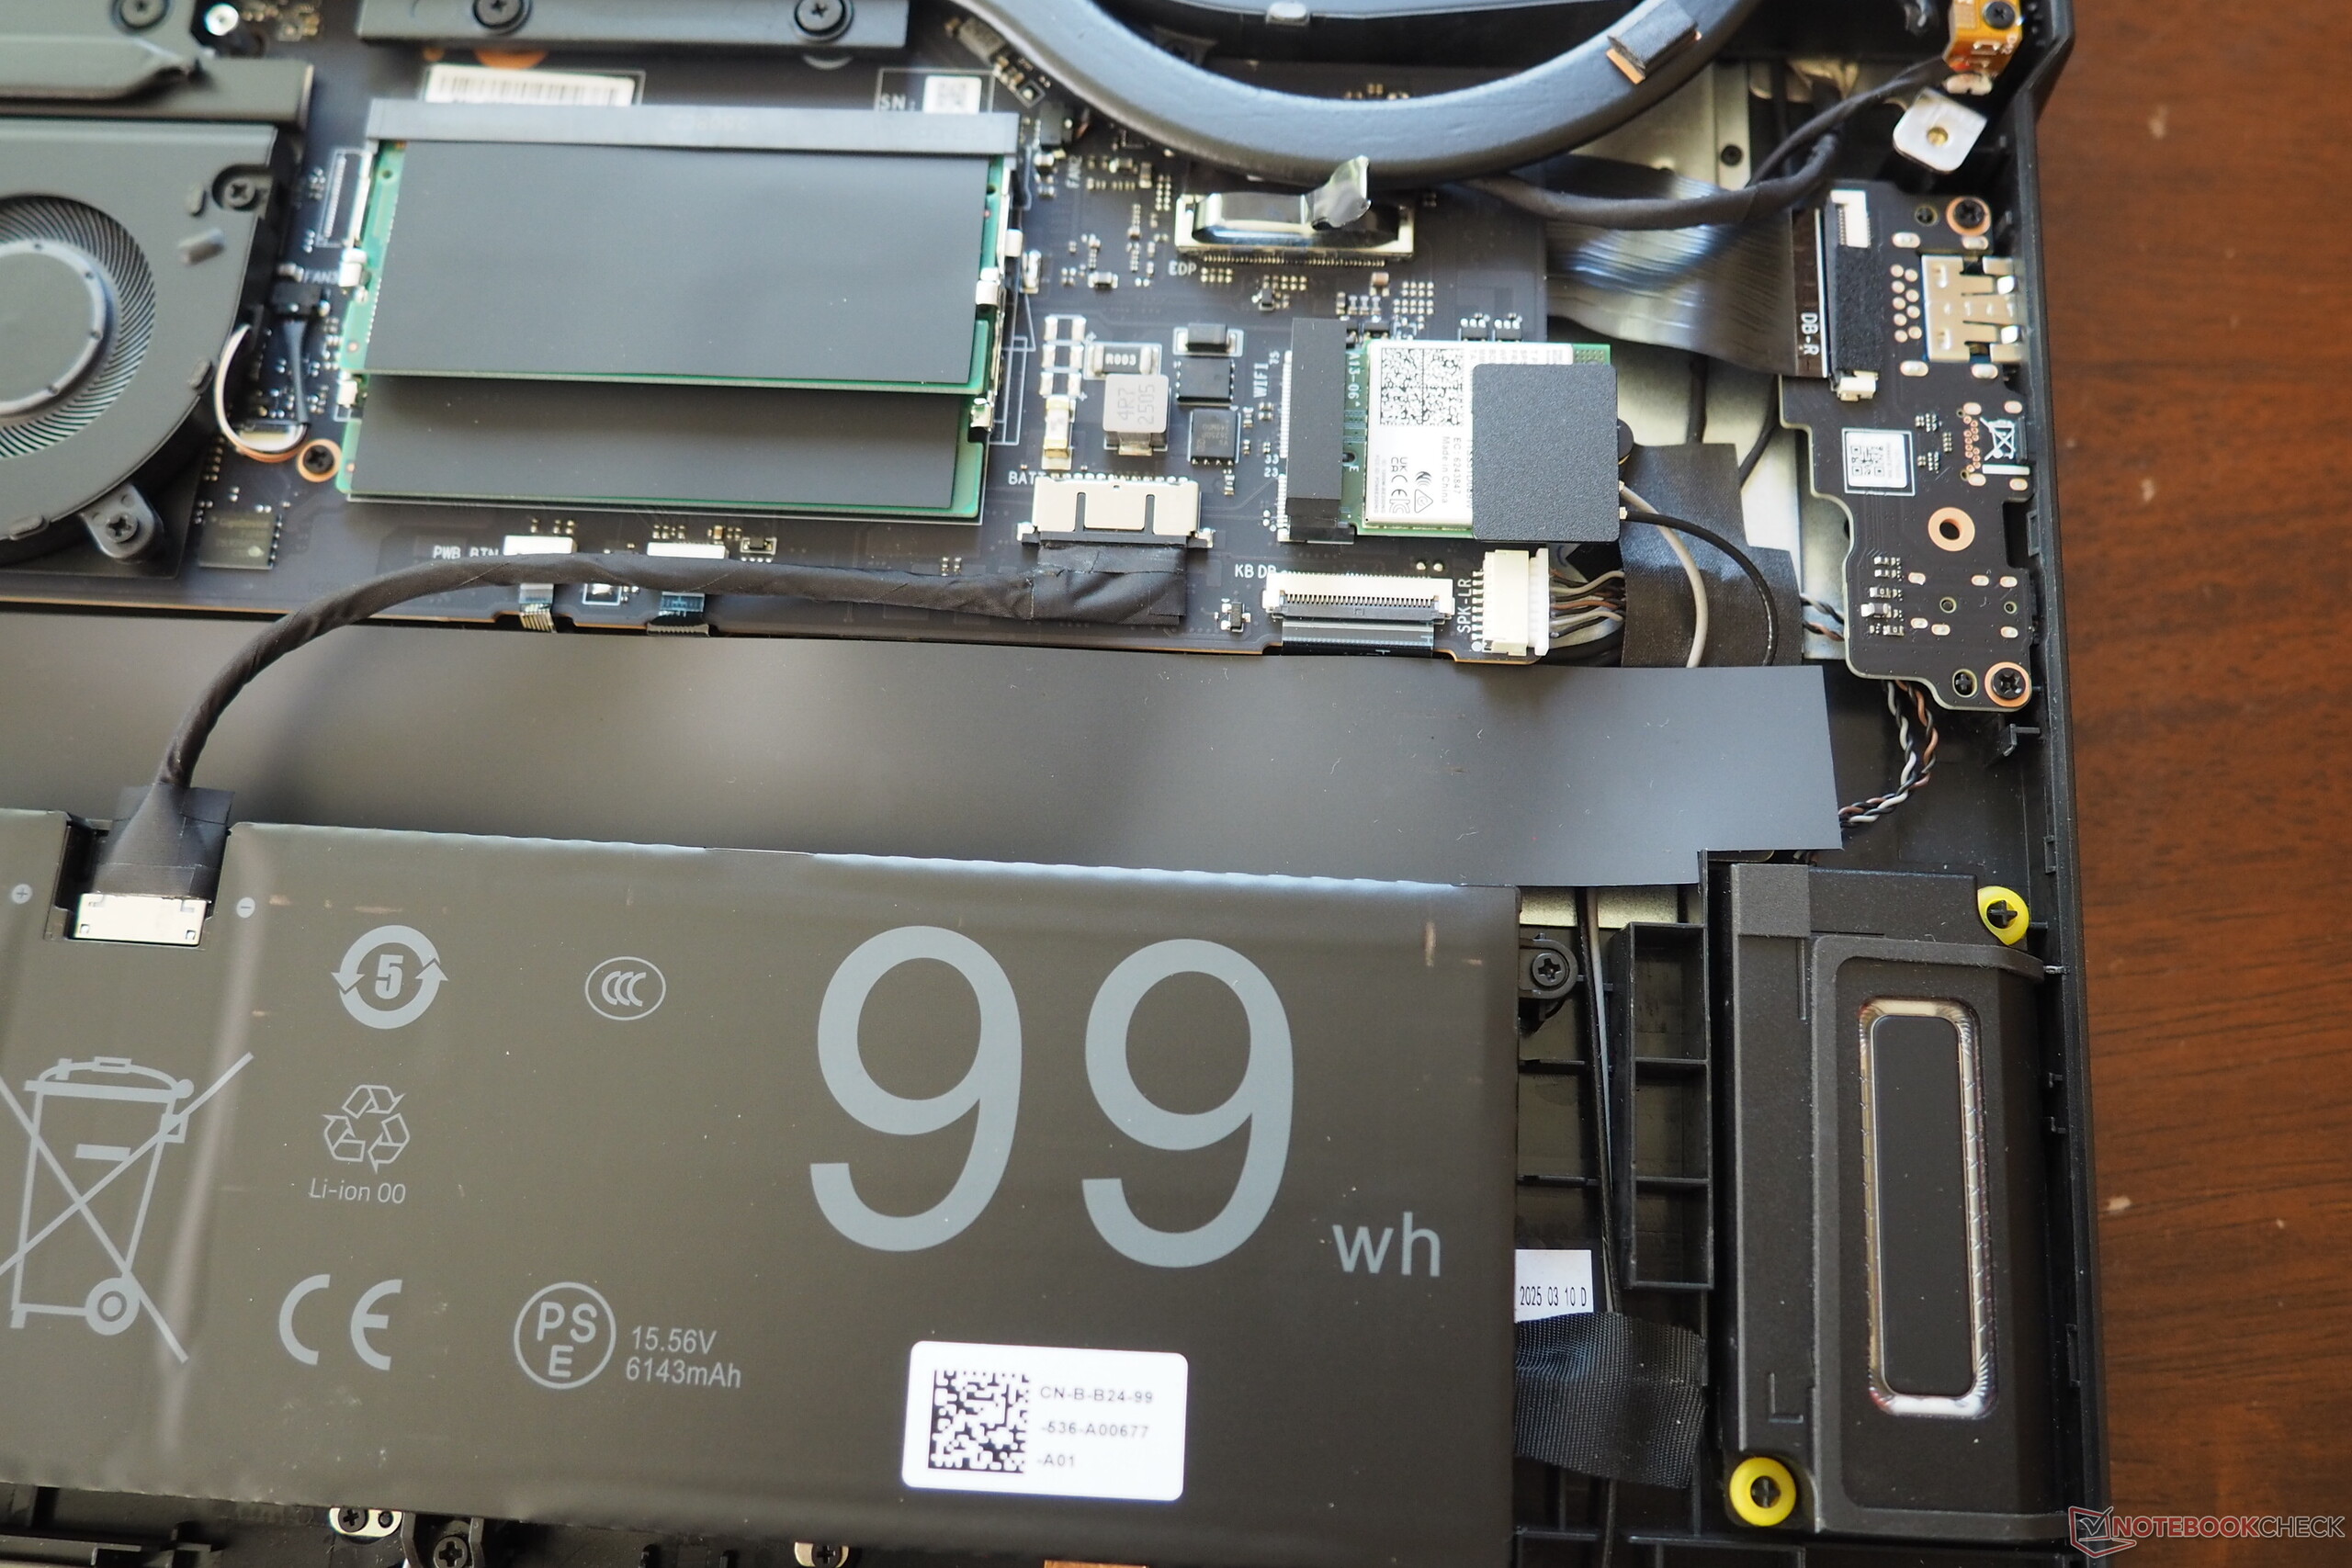
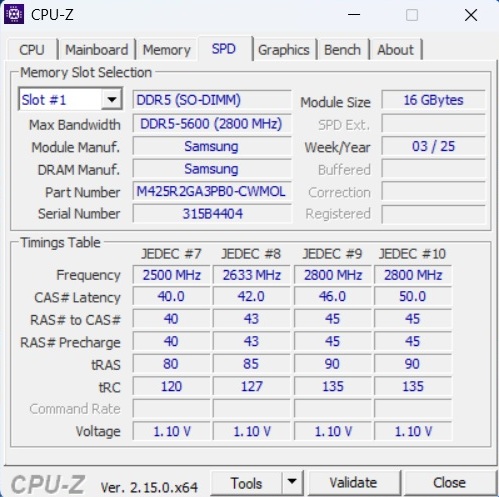
A seleção de interfaces é impressionante, como convém a um substituto de desktop. Além de duas portas USB-A (3.2 Gen1), há também duas portas Tipo C, uma das quais é compatível com a interface Thunderbolt 5. Há também um soquete de áudio, uma saída HDMI 2.1, um leitor de cartões agradavelmente rápido e uma porta de rede de 2,5 Gbit. As conexões sem fio são gerenciadas por um chip Intel Wi-Fi 7 (BE200), que obteve uma pontuação particularmente boa no teste com sua velocidade. Enquanto isso, a webcam FHD não gera nenhum ruído, mas oferece cobertura física, o que não é um dado adquirido. A manutenção do Erazer Beast 18 X1 é moderadamente fácil ou difícil: Depois de remover 11 parafusos Phillips, a placa de base pode ser retirada de sua fixação, revelando um sistema de resfriamento com três ventiladores. Os dois slots de RAM estão ocupados, mas ainda há espaço para os slots M.2.
Leitor de cartão SD
| SD Card Reader | |
| average JPG Copy Test (av. of 3 runs) | |
| Medion Erazer Beast 18 X1 MD62731 (AV PRO microSD 128 GB V60) | |
| Aorus Master 18 AM8H (AV PRO microSD 128 GB V60) | |
| Média da turma Gaming (20.9 - 210, n=54, últimos 2 anos) | |
| Acer Predator Helios 18 N23Q2 | |
| MSI GE78HX 13VH-070US (Angelibird AV Pro V60) | |
| maximum AS SSD Seq Read Test (1GB) | |
| Aorus Master 18 AM8H (AV PRO microSD 128 GB V60) | |
| Medion Erazer Beast 18 X1 MD62731 (AV PRO microSD 128 GB V60) | |
| Média da turma Gaming (25.5 - 261, n=51, últimos 2 anos) | |
| MSI GE78HX 13VH-070US (Angelibird AV Pro V60) | |
| Acer Predator Helios 18 N23Q2 | |
Comunicação
Webcam


Dispositivos de entrada
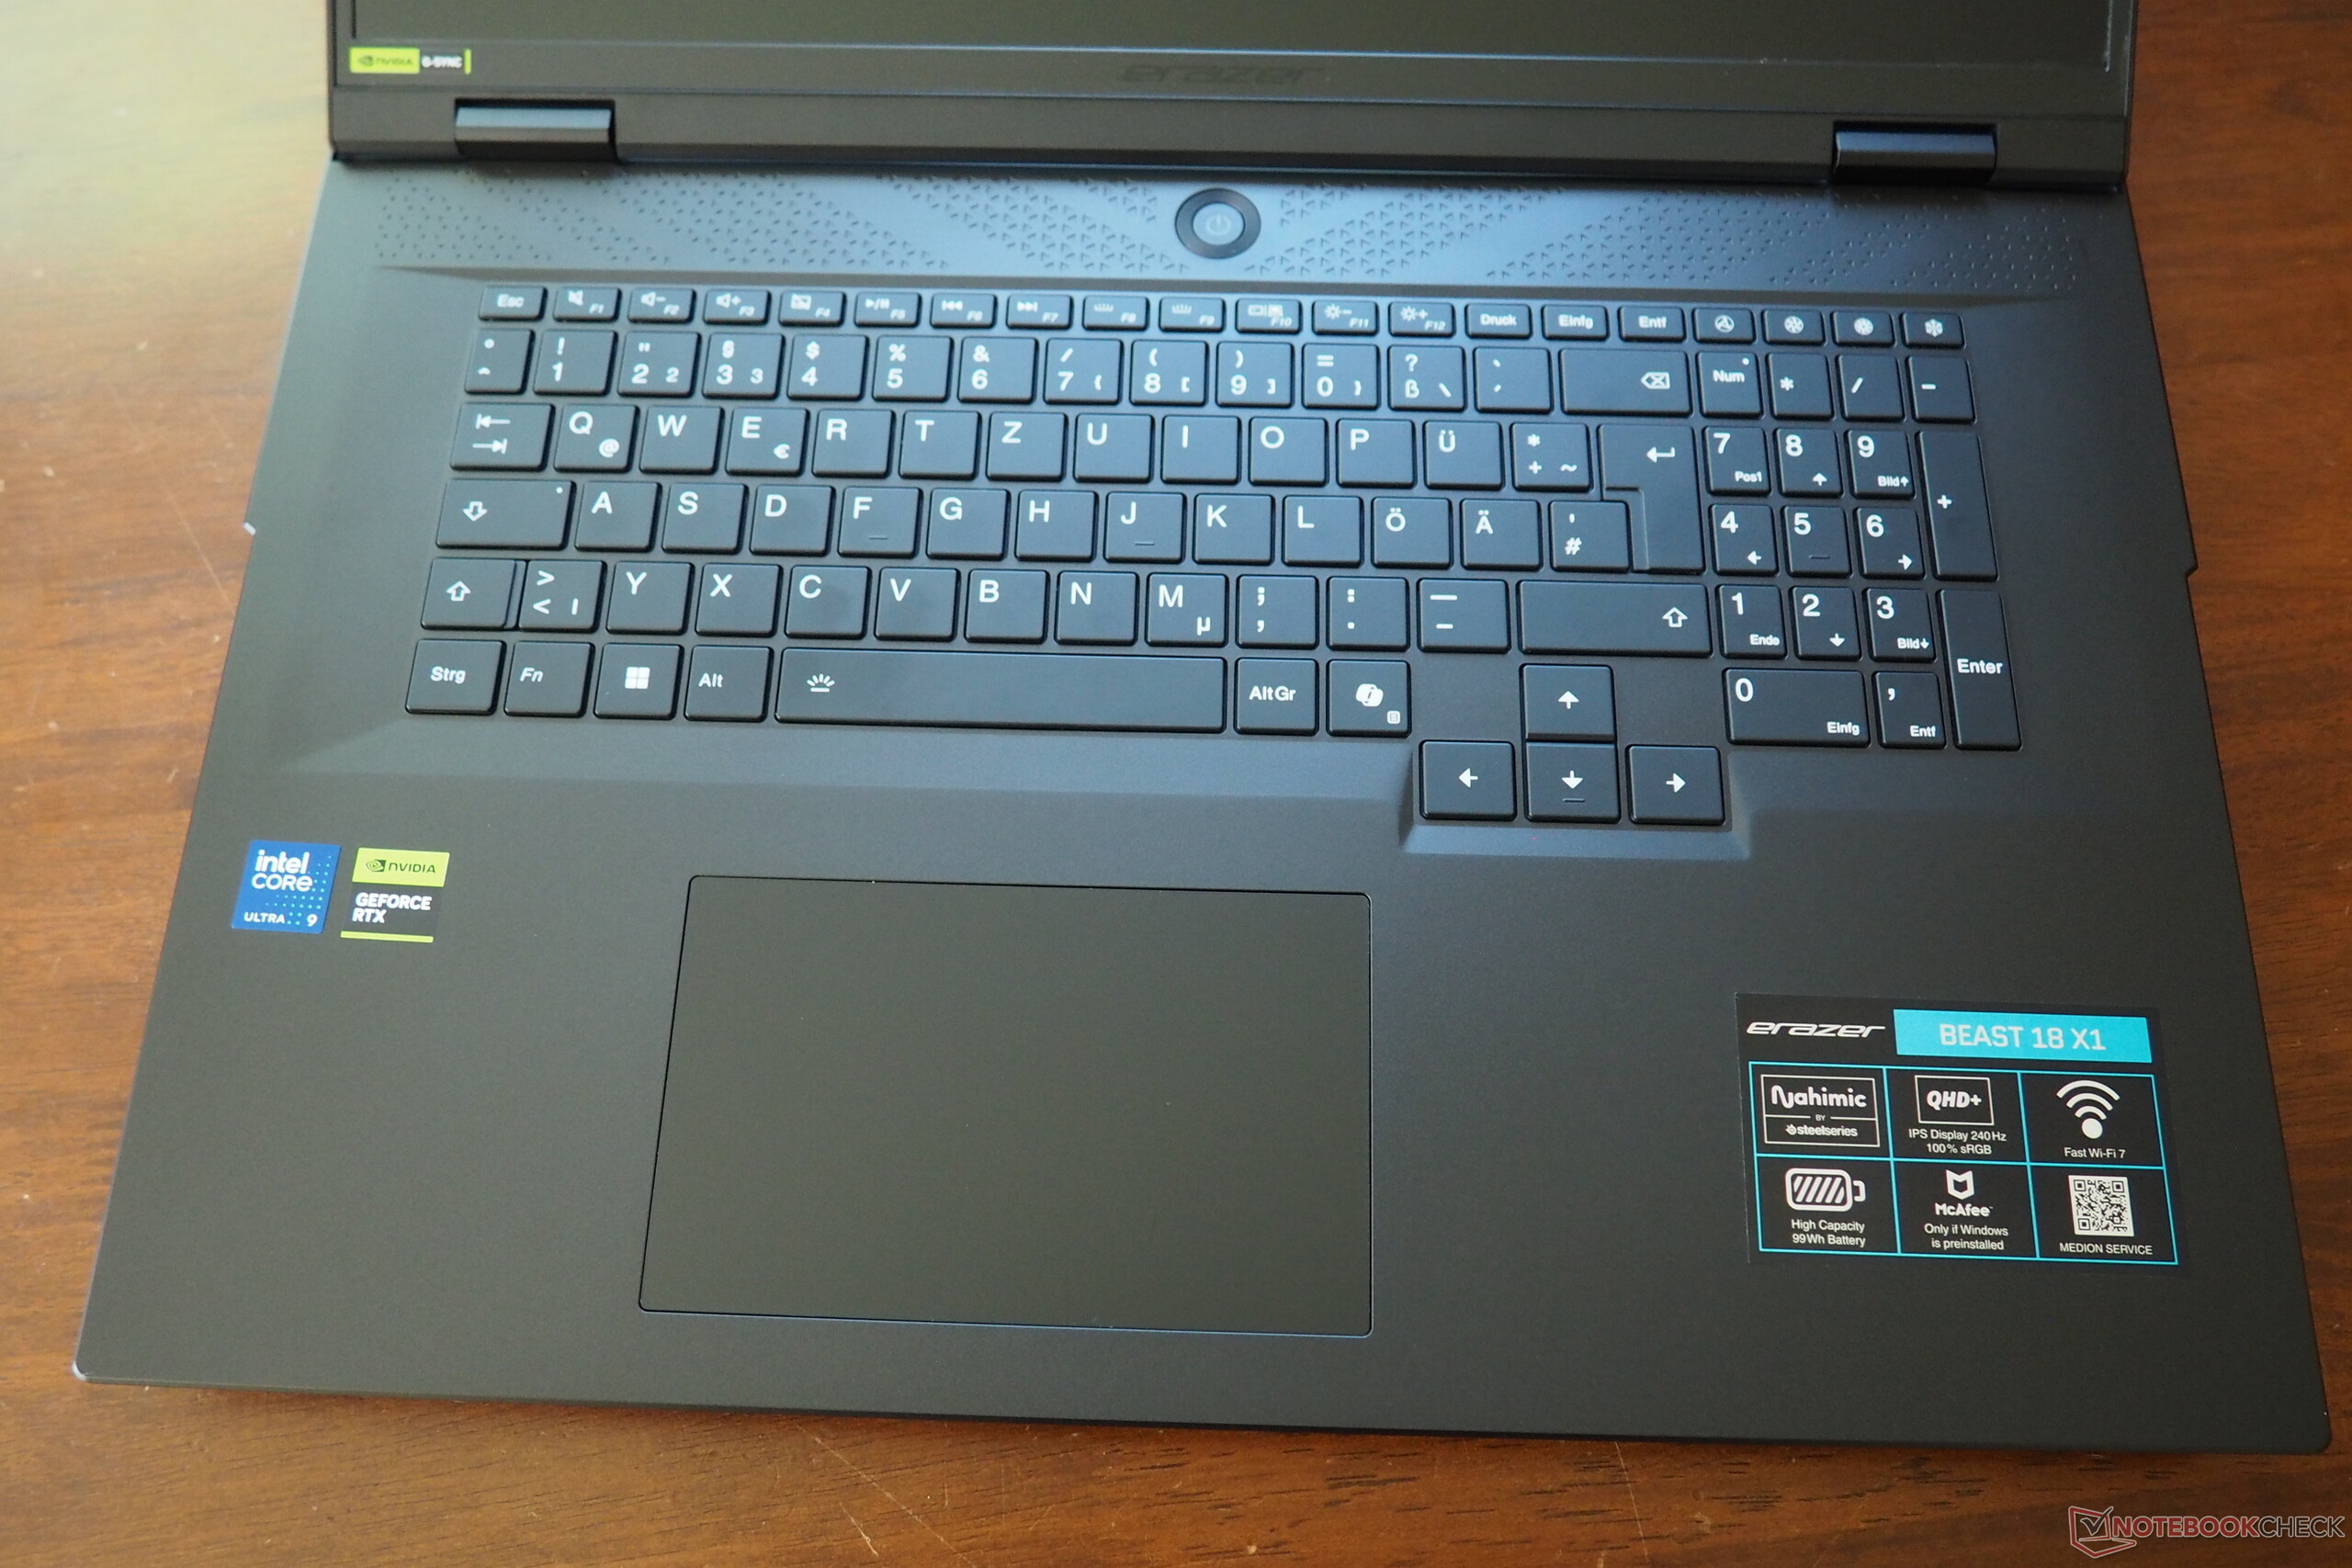
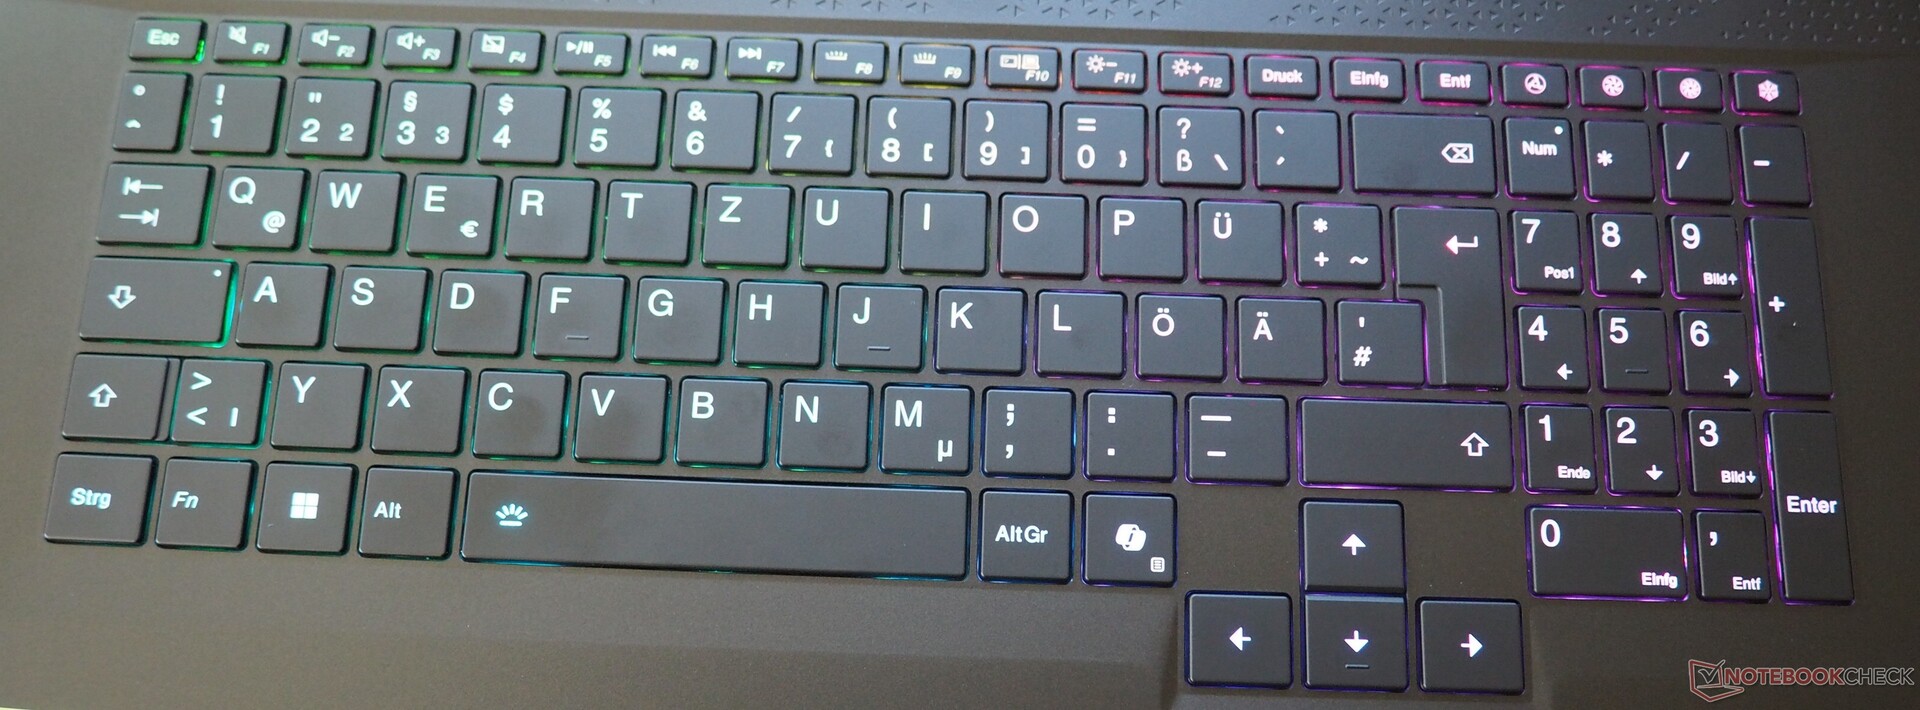
O teclado chiclet tem um teclado numérico dedicado e impressiona com as setas direcionais de tamanho normal e (no canto superior direito) teclas especiais práticas para controle da ventoinha. O feedback e a sensação das teclas parecem aceitáveis para nós; o Aorus Master 18, por exemplo, tem um desempenho ainda melhor aqui. O clickpad poderia ser mais estável aqui e ali, mas com um tamanho de cerca de 13 x 8 cm, ele tem o tamanho adequado para um produto de 18 polegadas.
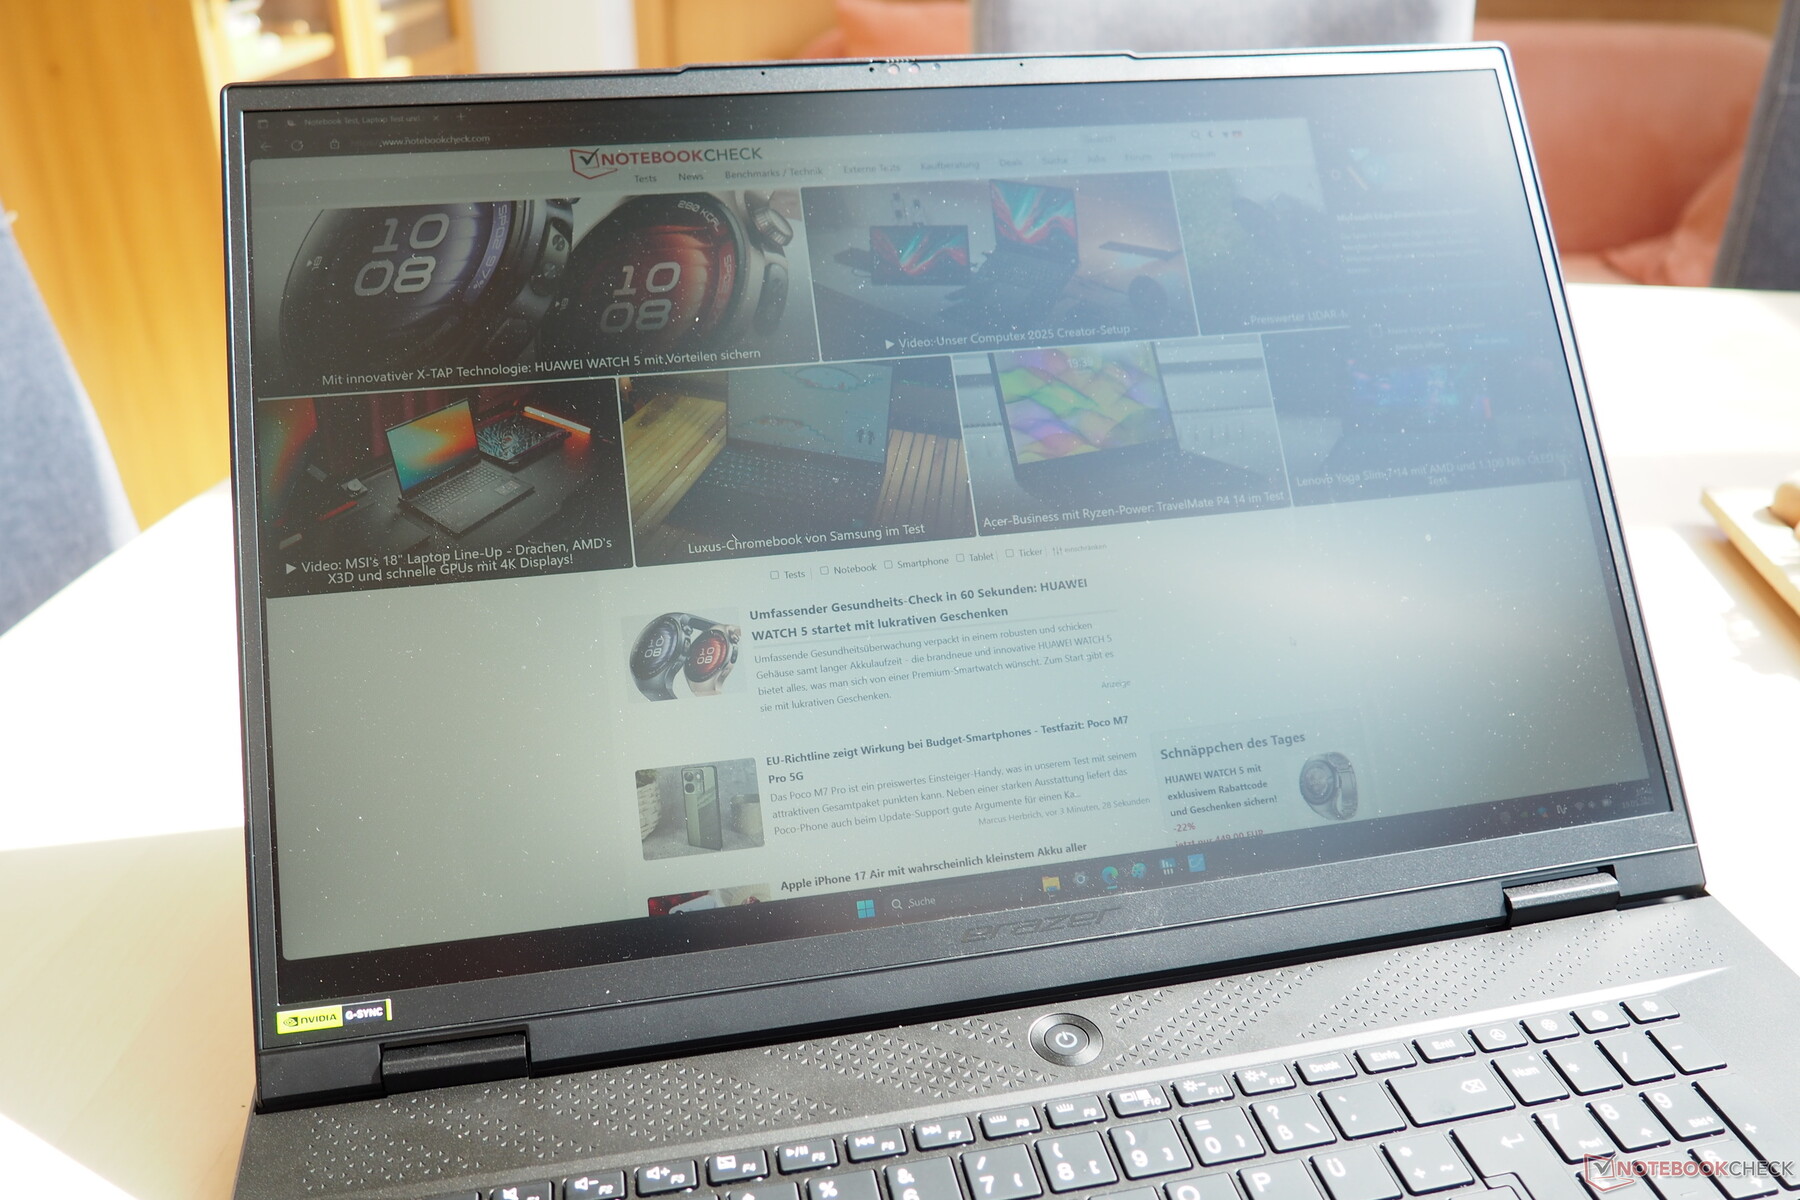
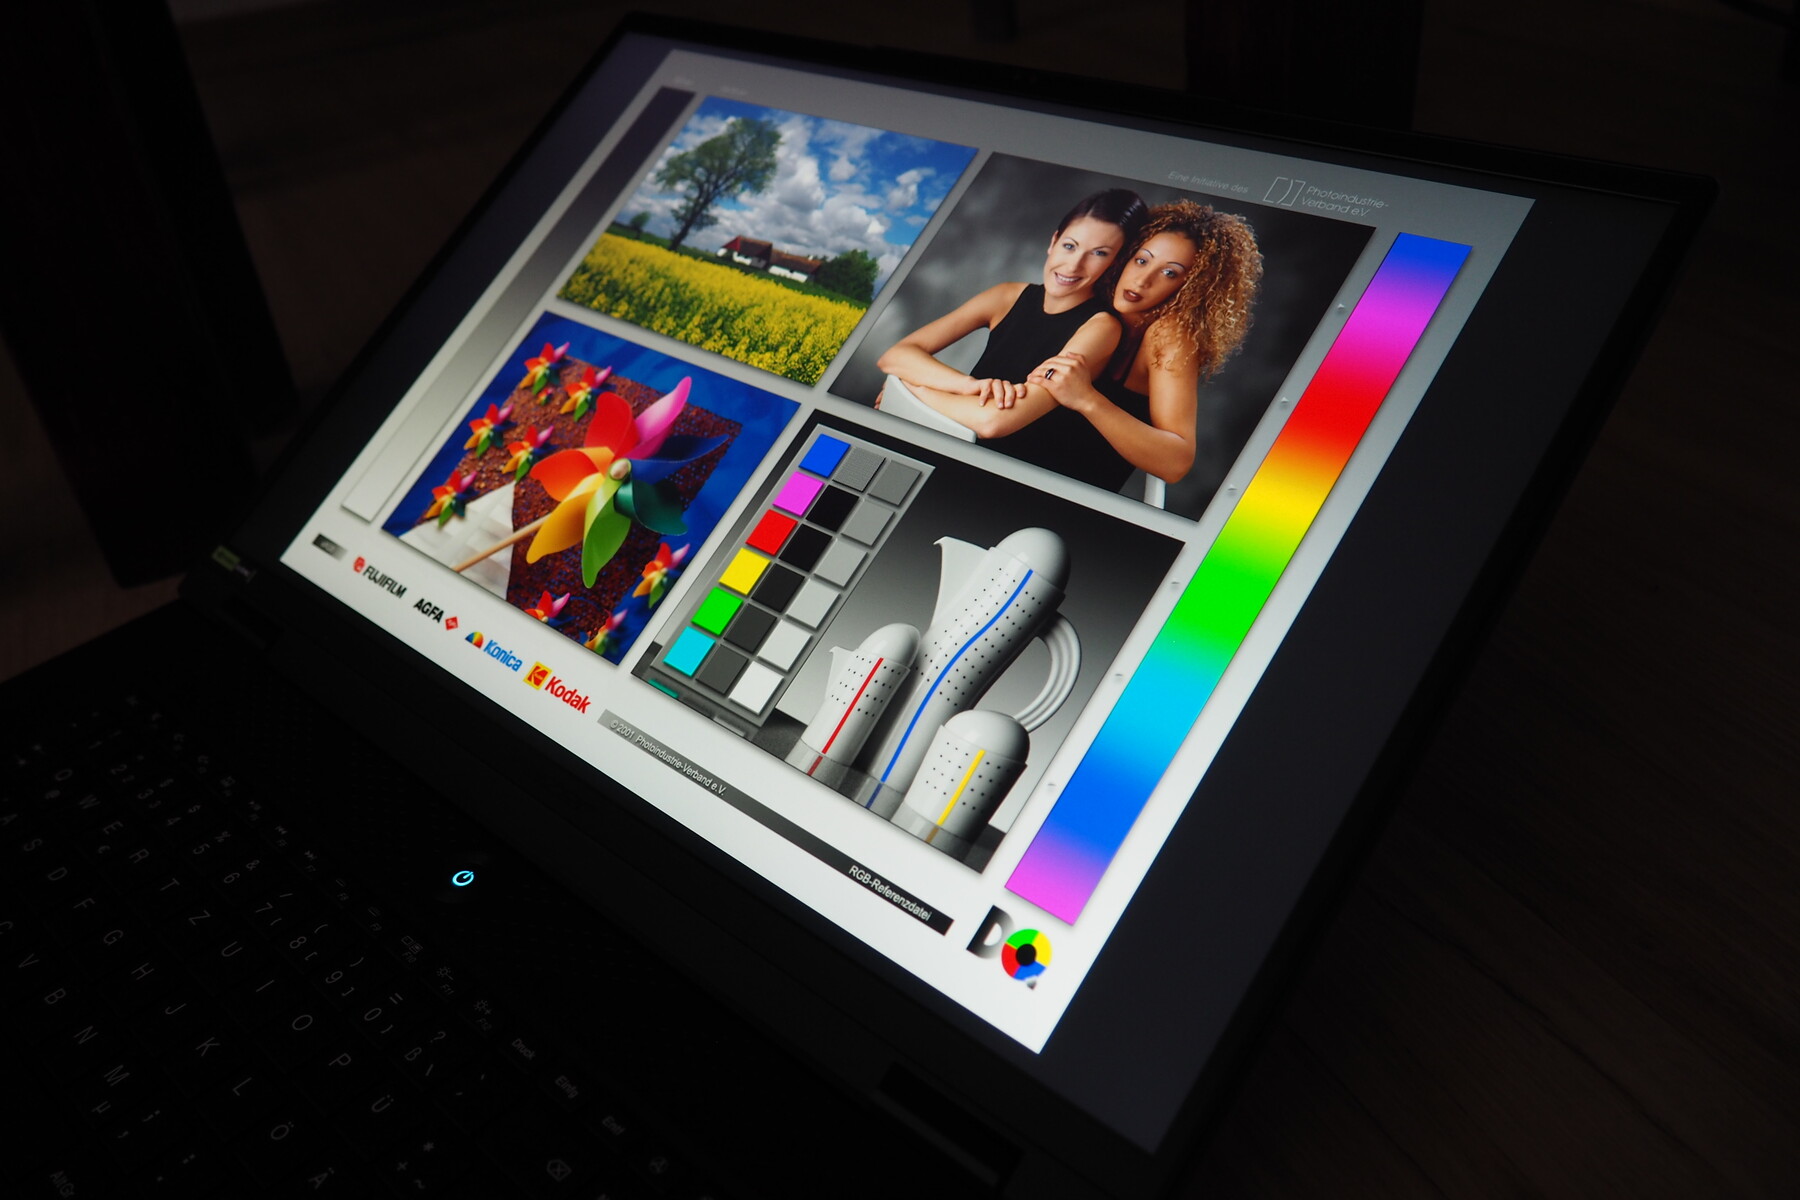
Tela
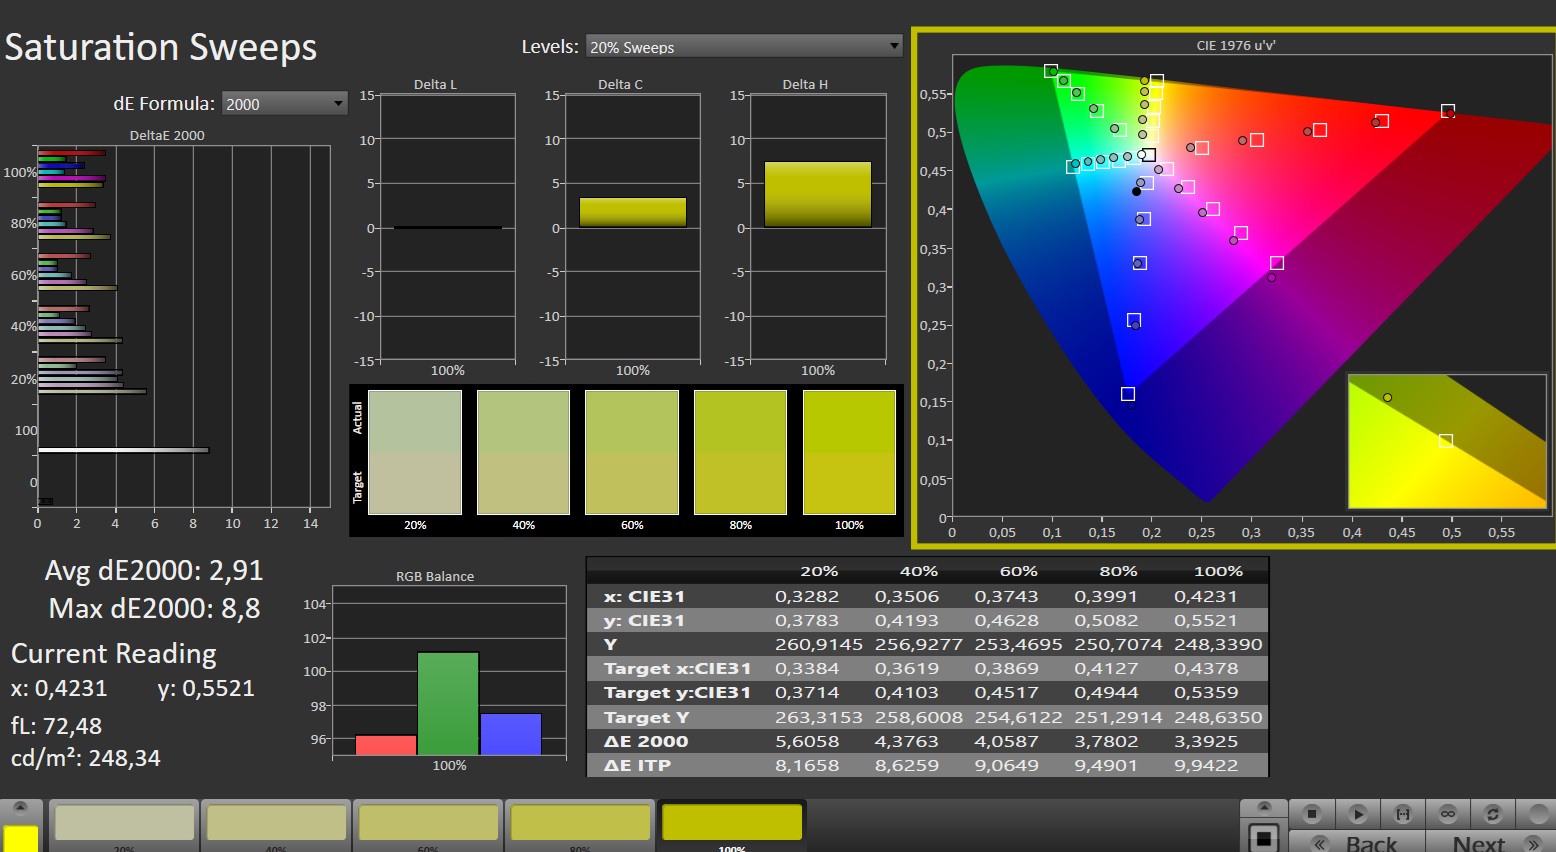
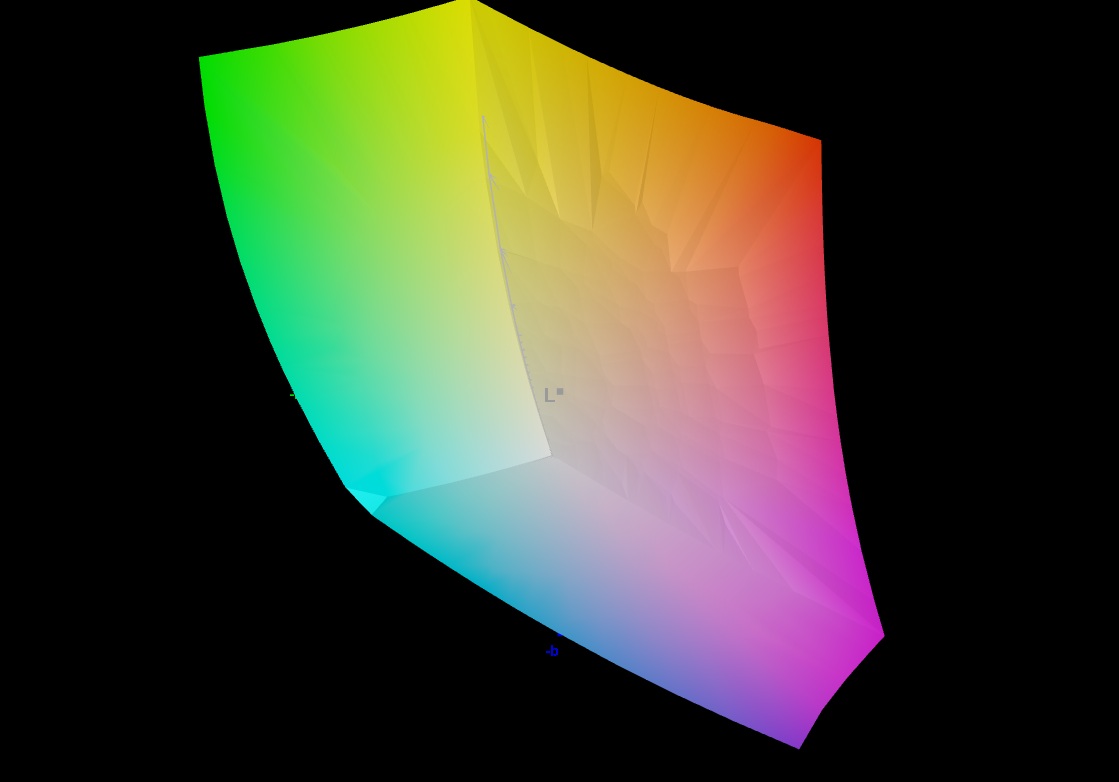
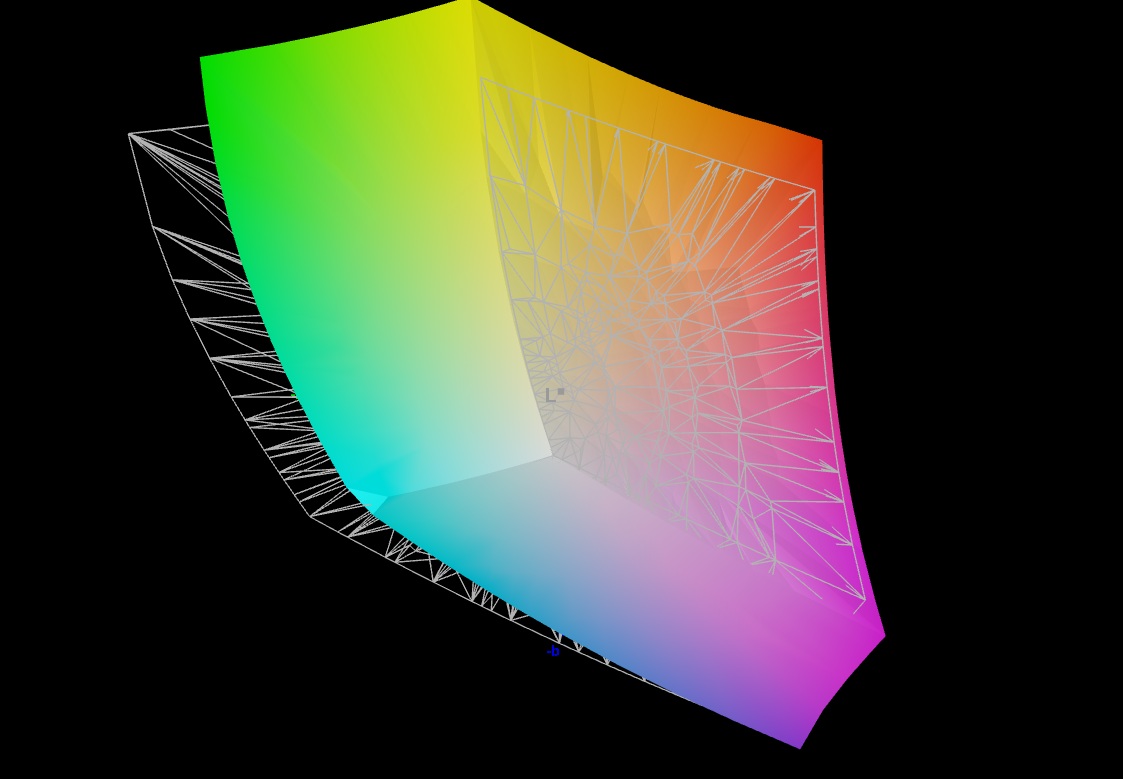
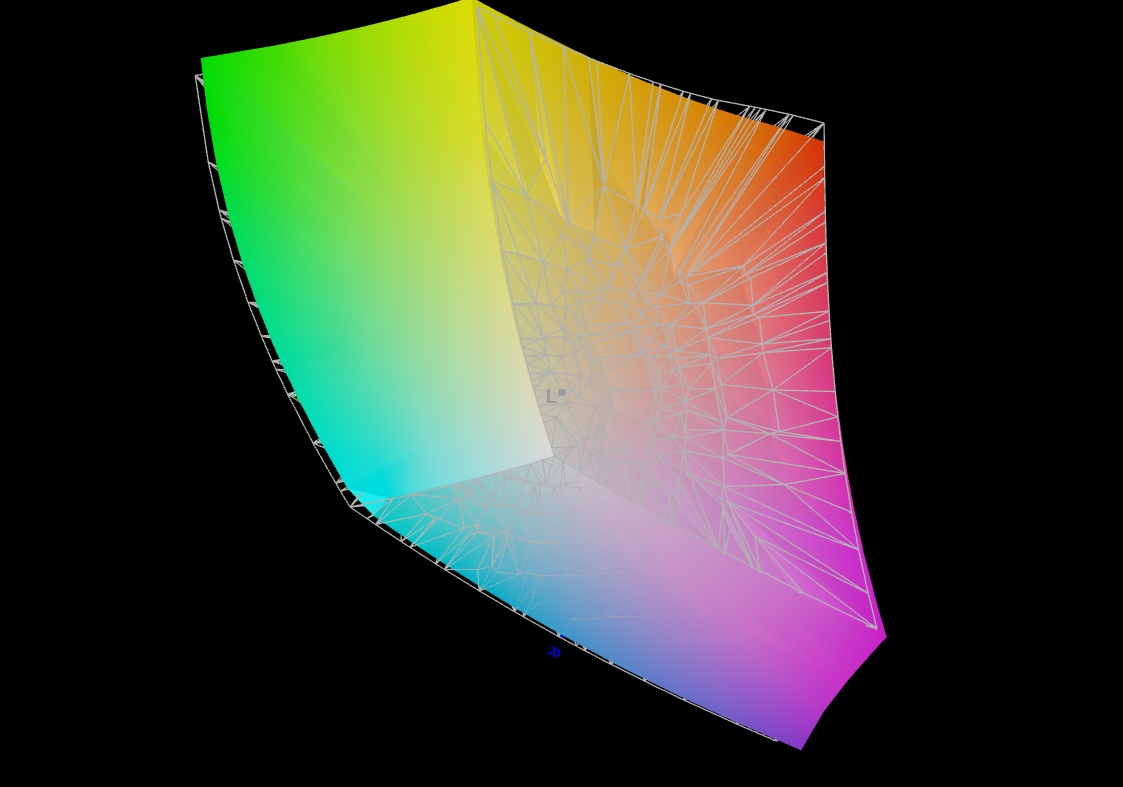
A Medion não usa um painel OLED ou mini-LED, mas sim uma tela IPS clássica, que, no entanto, oferece um bom desempenho na maioria das disciplinas.
| |||||||||||||||||||||||||
iluminação: 89 %
iluminação com acumulador: 478 cd/m²
Contraste: 1195:1 (Preto: 0.4 cd/m²)
ΔE ColorChecker Calman: 3.94 | ∀{0.5-29.43 Ø4.72}
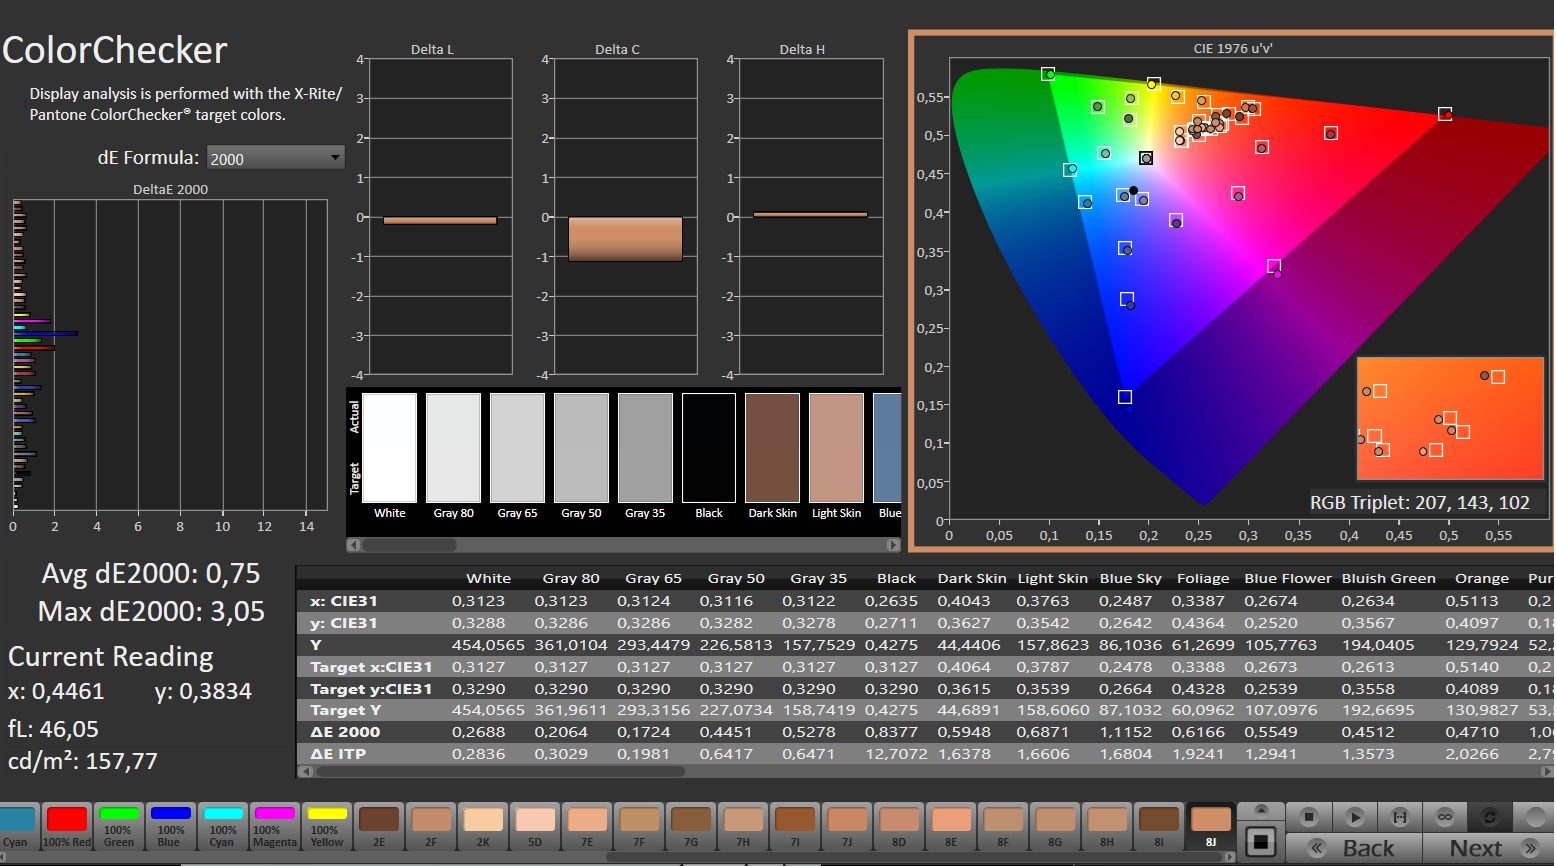
calibrated: 0.75
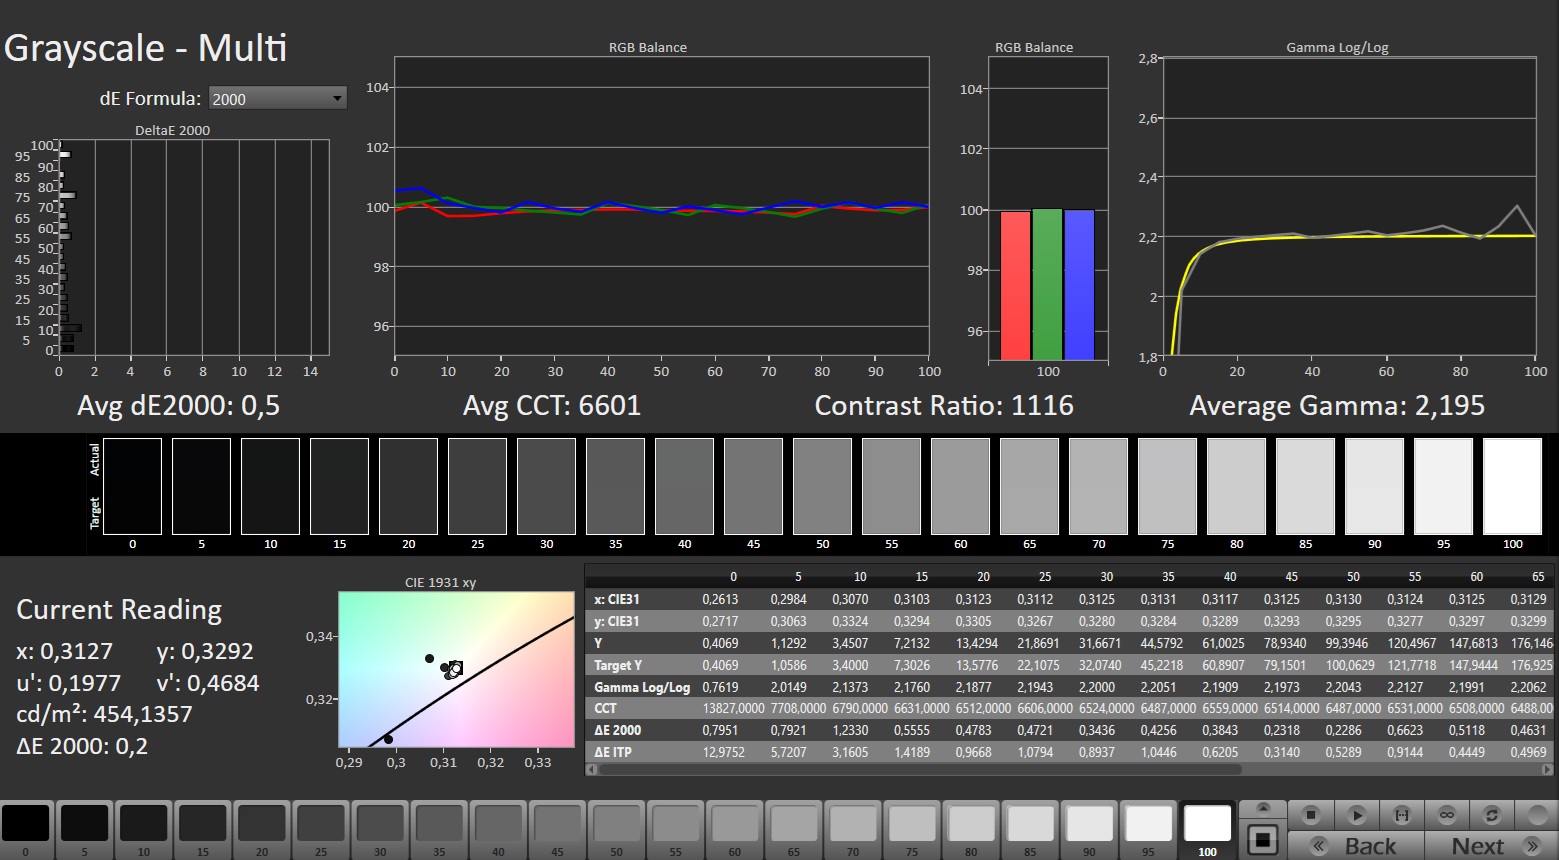
ΔE Greyscale Calman: 5.5 | ∀{0.09-98 Ø4.97}
84.7% AdobeRGB 1998 (Argyll 3D)
99.9% sRGB (Argyll 3D)
97.1% Display P3 (Argyll 3D)
Gamma: 2.212
CCT: 7059 K
| Medion Erazer Beast 18 X1 MD62731 BOEhydis NE180QDM-NZ2, IPS, 2560x1600, 18", 240 Hz | MSI GE78HX 13VH-070US AU Optronics B170QAN01.2, IPS, 2560x1600, 17", 240 Hz | Acer Predator Helios 18 N23Q2 AUO45A8 (B180QAN01.2), IPS, 2560x1600, 18", 250 Hz | Asus Strix Scar 18 G835LX N180QDM-NM2, Mini-LED, 2560x1600, 18", 240 Hz | Aorus Master 18 AM8H NE180QDM-NM1 (BOE0C58), Mini-LED, 2560x1600, 18", 240 Hz | Lenovo Legion Pro 7i 16 Gen 10 Samsung ATNA60HU01-0, OLED, 2560x1600, 16", 240 Hz | |
|---|---|---|---|---|---|---|
| Display | 1% | 4% | 2% | 2% | 4% | |
| Display P3 Coverage (%) | 97.1 | 97.6 1% | 99.8 3% | 99 2% | 99.9 3% | 99.5 2% |
| sRGB Coverage (%) | 99.9 | 99.9 0% | 100 0% | 100 0% | 100 0% | 100 0% |
| AdobeRGB 1998 Coverage (%) | 84.7 | 86.5 2% | 91.8 8% | 87.2 3% | 87.7 4% | 94.4 11% |
| Response Times | 19% | -90% | -37% | -102% | 95% | |
| Response Time Grey 50% / Grey 80% * (ms) | 5.6 ? | 4.2 ? 25% | 7.6 ? -36% | 7.4 ? -32% | 16.4 ? -193% | 0.28 ? 95% |
| Response Time Black / White * (ms) | 7.3 ? | 6.4 ? 12% | 17.8 ? -144% | 10.4 ? -42% | 8.1 ? -11% | 0.43 ? 94% |
| PWM Frequency (Hz) | 2509 | 20610 ? | 1398 ? | 1438 ? | ||
| PWM Amplitude * (%) | 100 | 100 | 29 | |||
| Screen | -15% | -14% | 119% | 53% | 20% | |
| Brightness middle (cd/m²) | 478 | 398.6 -17% | 360 -25% | 764 60% | 438 -8% | 490.4 3% |
| Brightness (cd/m²) | 456 | 384 -16% | 355 -22% | 747 64% | 451 -1% | 498 9% |
| Brightness Distribution (%) | 89 | 89 0% | 92 3% | 93 4% | 90 1% | 97 9% |
| Black Level * (cd/m²) | 0.4 | 0.46 -15% | 0.21 48% | 0.1 75% | 0.13 67% | |
| Contrast (:1) | 1195 | 867 -27% | 1714 43% | 7640 539% | 3369 182% | |
| Colorchecker dE 2000 * | 3.94 | 4.05 -3% | 3.82 3% | 1.2 70% | 1.25 68% | 3.2 19% |
| Colorchecker dE 2000 max. * | 8.6 | 8.68 -1% | 7.38 14% | 2.8 67% | 4.93 43% | 6.04 30% |
| Colorchecker dE 2000 calibrated * | 0.75 | 1.02 -36% | 2.24 -199% | 0.84 -12% | ||
| Greyscale dE 2000 * | 5.5 | 6.5 -18% | 5.06 8% | 1.5 73% | 1.7 69% | 1 82% |
| Gamma | 2.212 99% | 2.11 104% | 2.52 87% | 2.17 101% | 2.173 101% | 2.24 98% |
| CCT | 7059 92% | 7518 86% | 5657 115% | 6556 99% | 6518 100% | 6373 102% |
| Média Total (Programa/Configurações) | 2% /
-7% | -33% /
-21% | 28% /
68% | -16% /
17% | 40% /
29% |
* ... menor é melhor
A começar pelo espaço de cores, que cobre quase 100% do sRGB e do DCI-P3 (o AdobeRGB é coberto em 85%). A luminosidade também é boa, com uma média de 456 cd/m² disponível.
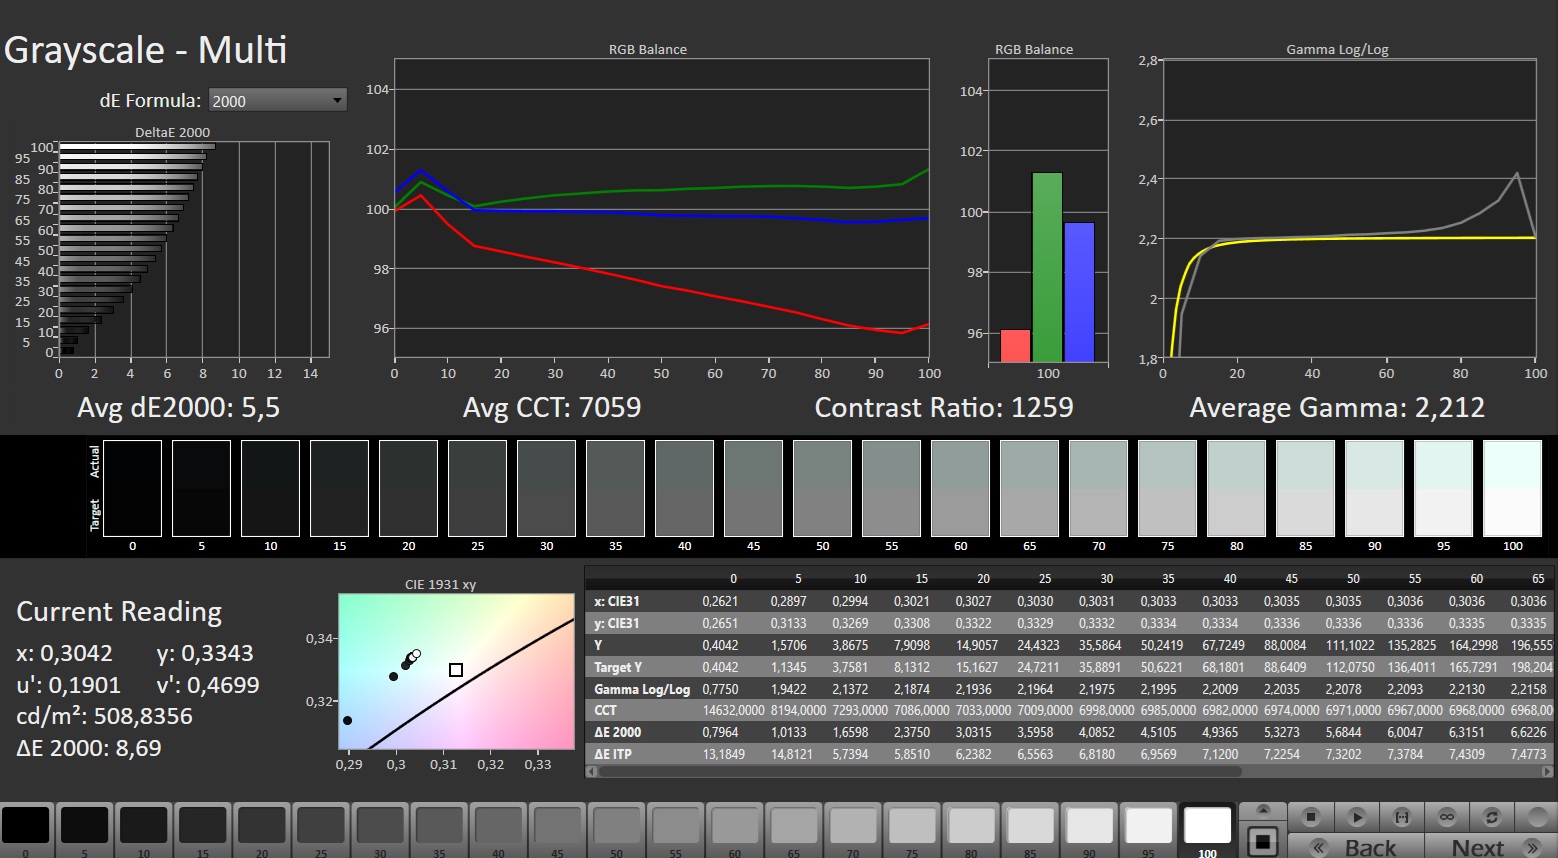
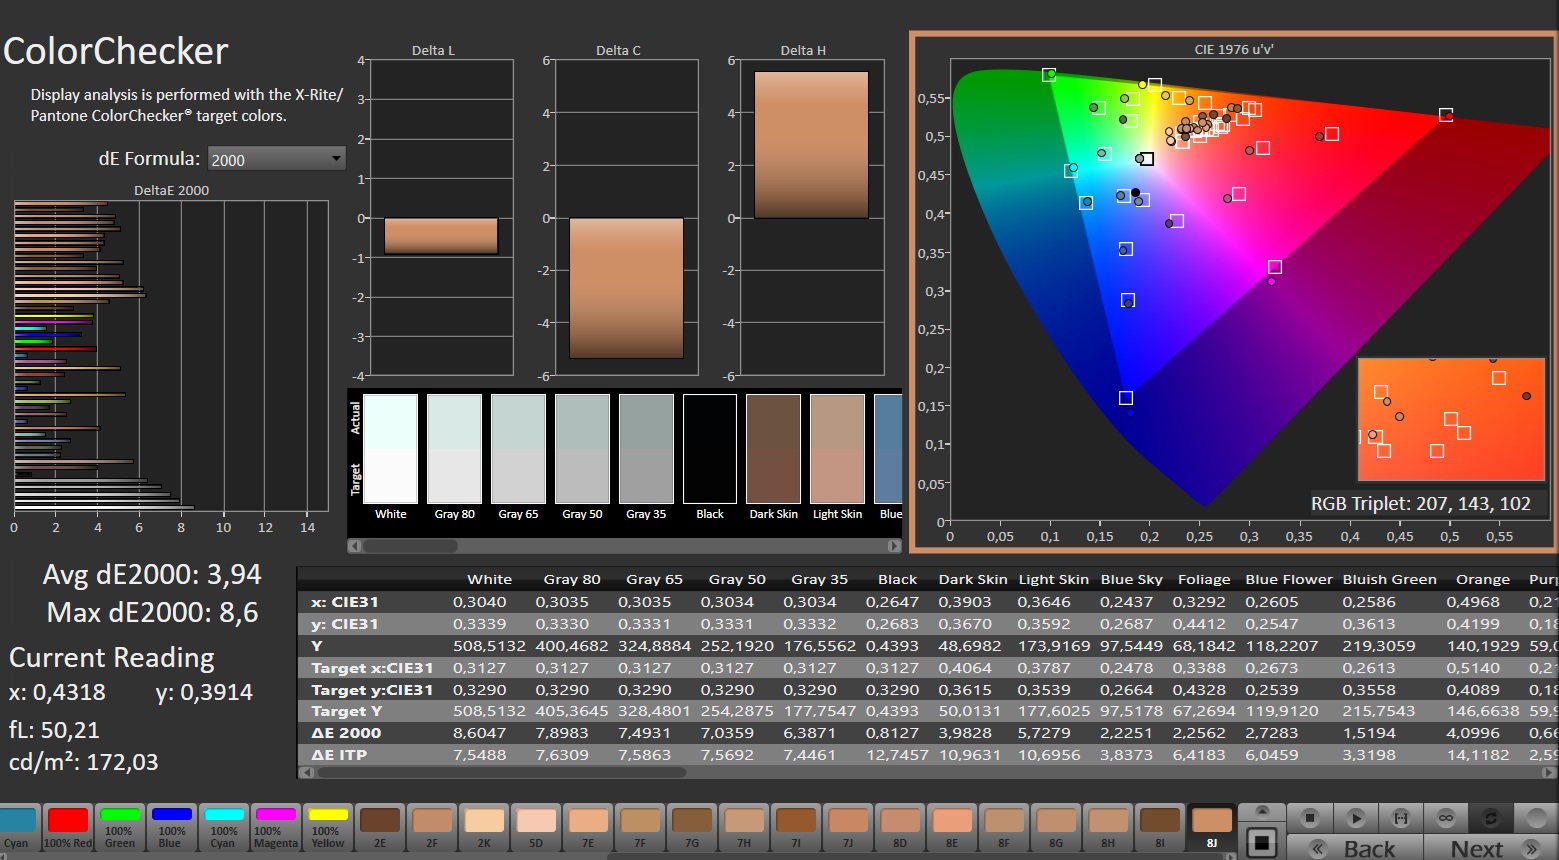
O contraste é apenas decente devido ao valor de preto medíocre de 0,4 cd/m², mas 1.195:1 ainda está dentro da faixa IPS usual. O mesmo se aplica aos ângulos de visão e ao tempo de resposta, que, de acordo com nossas medições, é de cerca de 5 a 7 ms.
De acordo com as especificações, a tela de 18 polegadas também suporta uma taxa de atualização de 240 Hz. Ela tem uma resolução de 2.560 x 1.600 pixels (formato 16:10), que não é baixa nem particularmente alta em relação à diagonal da tela.
Exibir tempos de resposta
| ↔ Tempo de resposta preto para branco | ||
|---|---|---|
| 7.3 ms ... ascensão ↗ e queda ↘ combinadas | ↗ 2.2 ms ascensão | 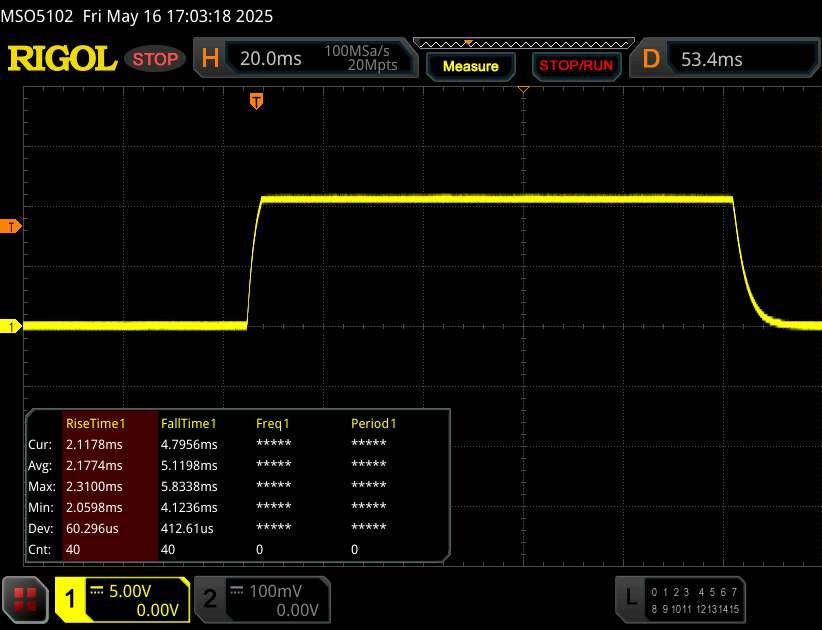 |
| ↘ 5.1 ms queda | ||
| A tela mostra taxas de resposta muito rápidas em nossos testes e deve ser muito adequada para jogos em ritmo acelerado. Em comparação, todos os dispositivos testados variam de 0.1 (mínimo) a 240 (máximo) ms. » 22 % de todos os dispositivos são melhores. Isso significa que o tempo de resposta medido é melhor que a média de todos os dispositivos testados (19.8 ms). | ||
| ↔ Tempo de resposta 50% cinza a 80% cinza | ||
| 5.6 ms ... ascensão ↗ e queda ↘ combinadas | ↗ 2.7 ms ascensão | 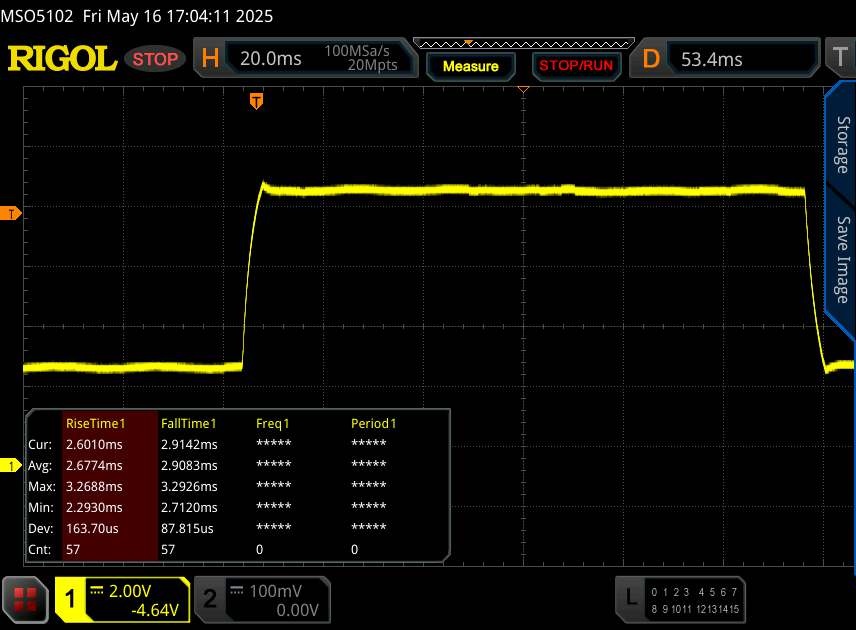 |
| ↘ 2.9 ms queda | ||
| A tela mostra taxas de resposta muito rápidas em nossos testes e deve ser muito adequada para jogos em ritmo acelerado. Em comparação, todos os dispositivos testados variam de 0.165 (mínimo) a 636 (máximo) ms. » 18 % de todos os dispositivos são melhores. Isso significa que o tempo de resposta medido é melhor que a média de todos os dispositivos testados (31 ms). | ||
Cintilação da tela / PWM (modulação por largura de pulso)
| Tela tremeluzindo / PWM não detectado | 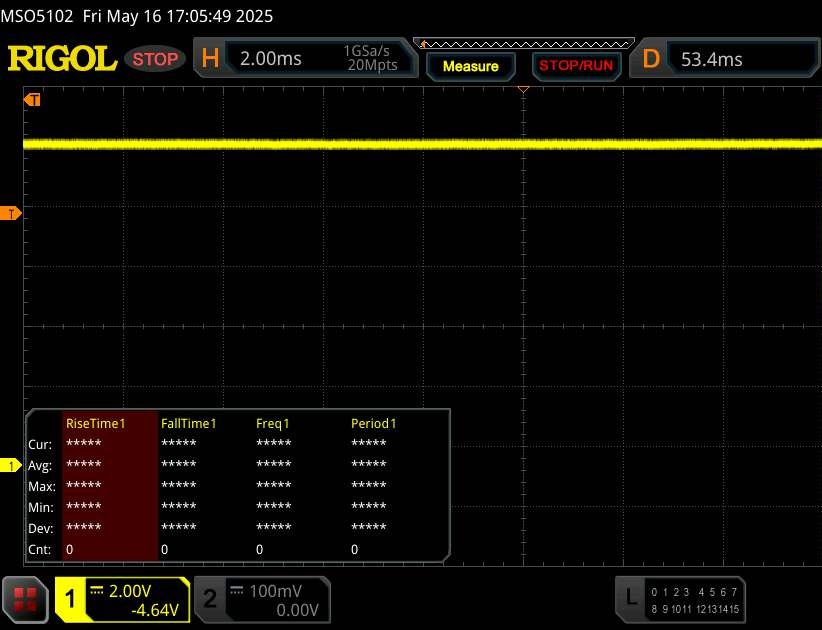 | ||
[pwm_comparison] Em comparação: 52 % de todos os dispositivos testados não usam PWM para escurecer a tela. Se PWM foi detectado, uma média de 7778 (mínimo: 5 - máximo: 343500) Hz foi medida. | |||

Desempenho
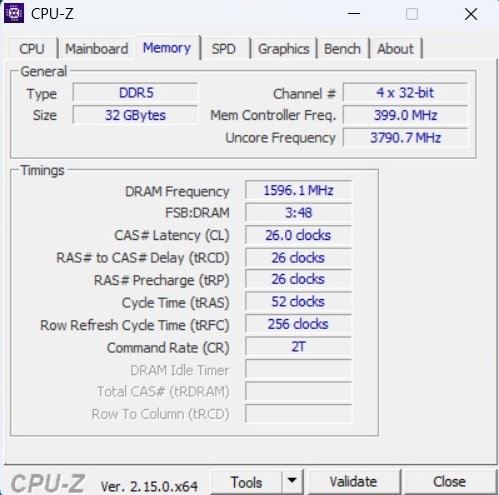
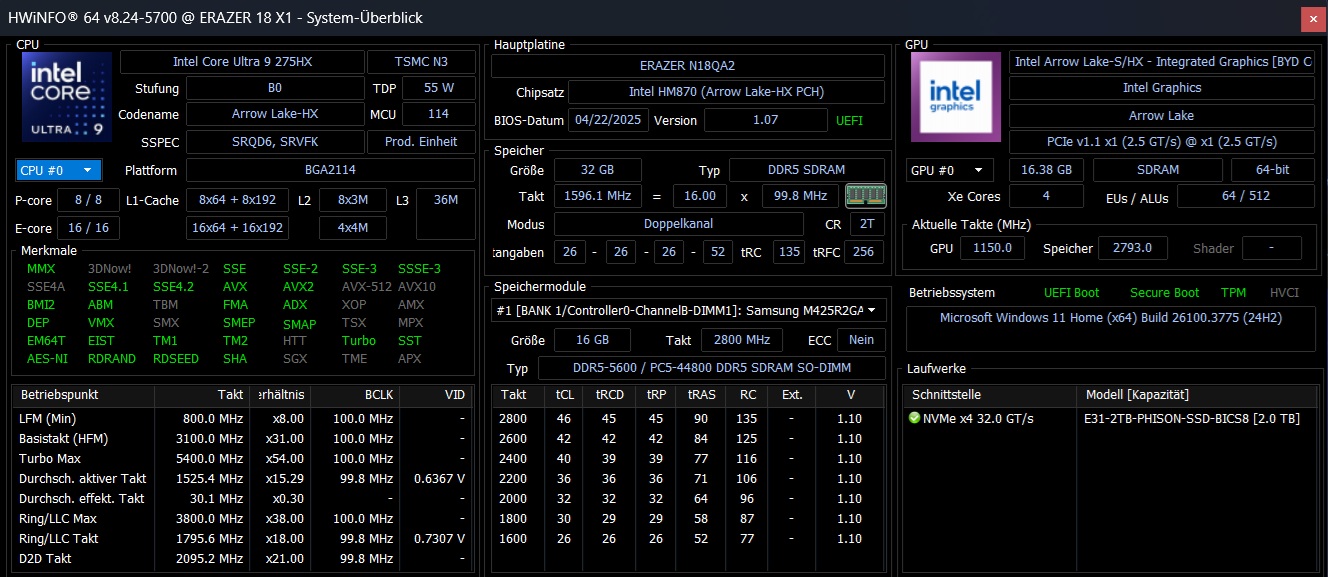
O Beast 18 X1 não só pertence ao segmento de ponta em termos de preço, mas também em termos de desempenho. 32 GB de RAM são tão adequados em 2025 quanto um SSD de 2 TB, embora o senhor possa esperar (ainda) mais por mais de US$ 4.000. A propósito, a Medion também oferece o Beast 18 X1 com a RTX 5090 móvel por aproximadamente US$ 5.650.
Condições de teste
Há três modos de operação no Erazer Control Center, alguns dos quais afetam significativamente as emissões e a velocidade. Como o dispositivo de 18 polegadas é quase absurdamente barulhento no modo Desempenho, com mais de 60 dB(A) em alguns pontos, nos limitamos ao modo Equilibrado, igualmente audível, para as medições, que consome um pouco mais de energia da CPU do que da GPU (consulte a tabela).
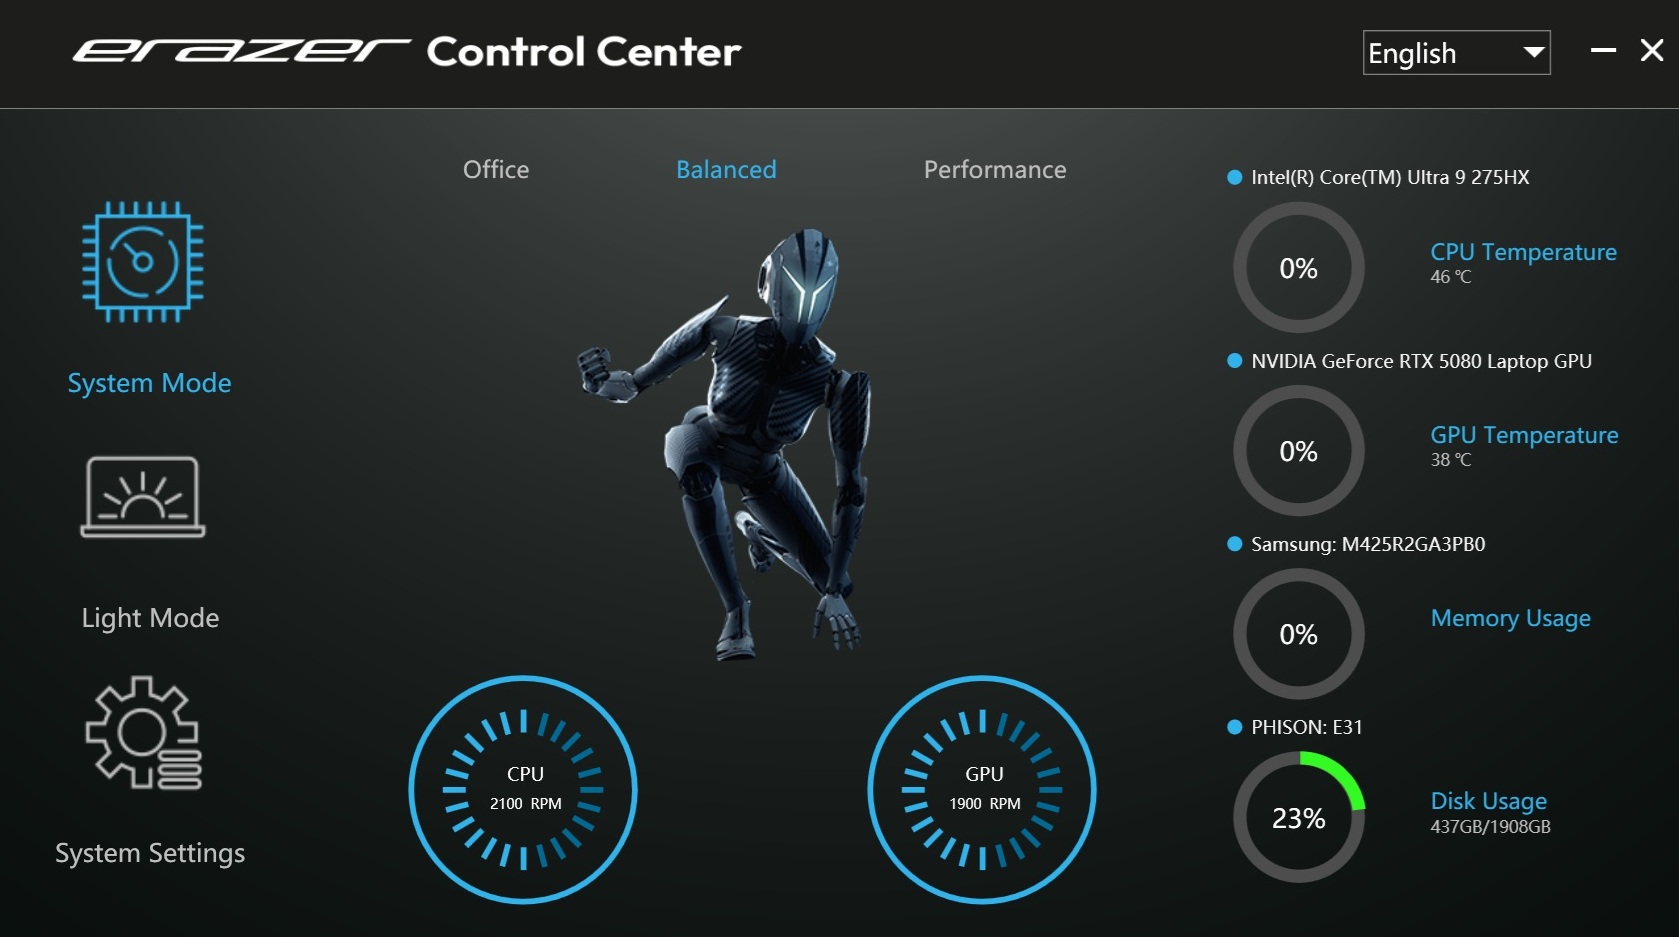
| Erazer Control Center Mode | Office | Balanced | Performance |
| Cyberpunk 2077 Noise | max. 46 dB(A) | max. 53 dB(A) | max. 61 dB(A) |
| Desempenho do Cyberpunk 2077 (FHD/Ultra) | 78,8 fps | 139,8 fps | 146,5 fps |
| Cinebench R15 Multi Score | 3596 pontos | 4871 pontos | 6154 pontos |
Processador
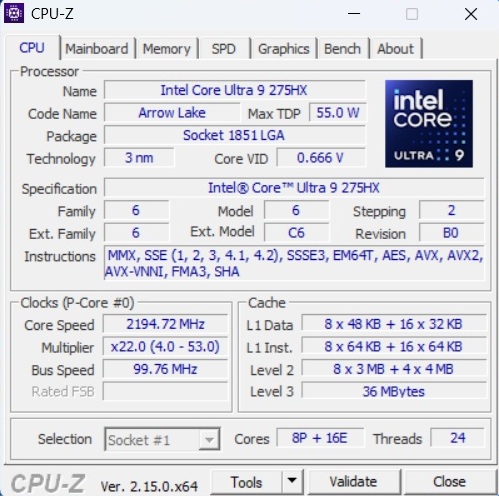
Se o senhor tomar como base o modo balanceado, o Core Ultra 9 275HXinstalado, que contém 8 núcleos de desempenho e 16 núcleos de eficiência (cada um sem Hyper-Threading), tem um desempenho um pouco abaixo do valor médio determinado até agora para essa CPU e atinge aproximadamente o nível do Aorus Master 18 (também não foi testado no modo máximo por causa do ruído de fundo intenso). É particularmente lamentável que os resultados no loop do Cinebench caiam em vários por cento com o passar do tempo, o que não aconteceu com os dispositivos concorrentes.
Cinebench R15 Multi loop
* ... menor é melhor
AIDA64: FP32 Ray-Trace | FPU Julia | CPU SHA3 | CPU Queen | FPU SinJulia | FPU Mandel | CPU AES | CPU ZLib | FP64 Ray-Trace | CPU PhotoWorxx
| Performance rating | |
| Asus Strix Scar 18 G835LX | |
| Lenovo Legion Pro 7i 16 Gen 10 | |
| Média Intel Core Ultra 9 275HX | |
| Acer Predator Helios 18 N23Q2 | |
| Aorus Master 18 AM8H | |
| MSI GE78HX 13VH-070US | |
| Média da turma Gaming | |
| Medion Erazer Beast 18 X1 MD62731 | |
| AIDA64 / FP32 Ray-Trace | |
| Asus Strix Scar 18 G835LX | |
| Lenovo Legion Pro 7i 16 Gen 10 | |
| Média Intel Core Ultra 9 275HX (28039 - 39895, n=30) | |
| Aorus Master 18 AM8H | |
| Média da turma Gaming (10227 - 85542, n=109, últimos 2 anos) | |
| Medion Erazer Beast 18 X1 MD62731 | |
| MSI GE78HX 13VH-070US | |
| Acer Predator Helios 18 N23Q2 | |
| AIDA64 / FPU Julia | |
| Asus Strix Scar 18 G835LX | |
| Lenovo Legion Pro 7i 16 Gen 10 | |
| Média Intel Core Ultra 9 275HX (140254 - 200744, n=30) | |
| Aorus Master 18 AM8H | |
| MSI GE78HX 13VH-070US | |
| Medion Erazer Beast 18 X1 MD62731 | |
| Acer Predator Helios 18 N23Q2 | |
| Média da turma Gaming (51376 - 238426, n=109, últimos 2 anos) | |
| AIDA64 / CPU SHA3 | |
| Asus Strix Scar 18 G835LX | |
| Lenovo Legion Pro 7i 16 Gen 10 | |
| Média Intel Core Ultra 9 275HX (6710 - 9817, n=30) | |
| Aorus Master 18 AM8H | |
| Medion Erazer Beast 18 X1 MD62731 | |
| MSI GE78HX 13VH-070US | |
| Acer Predator Helios 18 N23Q2 | |
| Média da turma Gaming (2180 - 9817, n=109, últimos 2 anos) | |
| AIDA64 / CPU Queen | |
| MSI GE78HX 13VH-070US | |
| Asus Strix Scar 18 G835LX | |
| Lenovo Legion Pro 7i 16 Gen 10 | |
| Acer Predator Helios 18 N23Q2 | |
| Média Intel Core Ultra 9 275HX (113887 - 140937, n=30) | |
| Aorus Master 18 AM8H | |
| Média da turma Gaming (49785 - 173351, n=98, últimos 2 anos) | |
| Medion Erazer Beast 18 X1 MD62731 | |
| AIDA64 / FPU SinJulia | |
| MSI GE78HX 13VH-070US | |
| Acer Predator Helios 18 N23Q2 | |
| Média da turma Gaming (4424 - 33636, n=109, últimos 2 anos) | |
| Asus Strix Scar 18 G835LX | |
| Lenovo Legion Pro 7i 16 Gen 10 | |
| Média Intel Core Ultra 9 275HX (11172 - 14425, n=30) | |
| Aorus Master 18 AM8H | |
| Medion Erazer Beast 18 X1 MD62731 | |
| AIDA64 / FPU Mandel | |
| Asus Strix Scar 18 G835LX | |
| Lenovo Legion Pro 7i 16 Gen 10 | |
| Média Intel Core Ultra 9 275HX (72596 - 104508, n=30) | |
| Aorus Master 18 AM8H | |
| Medion Erazer Beast 18 X1 MD62731 | |
| Média da turma Gaming (25115 - 128721, n=109, últimos 2 anos) | |
| MSI GE78HX 13VH-070US | |
| Acer Predator Helios 18 N23Q2 | |
| AIDA64 / CPU AES | |
| Acer Predator Helios 18 N23Q2 | |
| Asus Strix Scar 18 G835LX | |
| MSI GE78HX 13VH-070US | |
| Lenovo Legion Pro 7i 16 Gen 10 | |
| Média Intel Core Ultra 9 275HX (105608 - 247074, n=30) | |
| Aorus Master 18 AM8H | |
| Medion Erazer Beast 18 X1 MD62731 | |
| Média da turma Gaming (39258 - 247074, n=109, últimos 2 anos) | |
| AIDA64 / CPU ZLib | |
| Asus Strix Scar 18 G835LX | |
| MSI GE78HX 13VH-070US | |
| Lenovo Legion Pro 7i 16 Gen 10 | |
| Média Intel Core Ultra 9 275HX (1582 - 2263, n=30) | |
| Acer Predator Helios 18 N23Q2 | |
| Aorus Master 18 AM8H | |
| Medion Erazer Beast 18 X1 MD62731 | |
| Média da turma Gaming (574 - 2531, n=109, últimos 2 anos) | |
| AIDA64 / FP64 Ray-Trace | |
| Asus Strix Scar 18 G835LX | |
| Lenovo Legion Pro 7i 16 Gen 10 | |
| Média Intel Core Ultra 9 275HX (14847 - 21854, n=30) | |
| Aorus Master 18 AM8H | |
| Média da turma Gaming (5509 - 45446, n=109, últimos 2 anos) | |
| MSI GE78HX 13VH-070US | |
| Acer Predator Helios 18 N23Q2 | |
| Medion Erazer Beast 18 X1 MD62731 | |
| AIDA64 / CPU PhotoWorxx | |
| Asus Strix Scar 18 G835LX | |
| Lenovo Legion Pro 7i 16 Gen 10 | |
| Acer Predator Helios 18 N23Q2 | |
| MSI GE78HX 13VH-070US | |
| Média Intel Core Ultra 9 275HX (37482 - 62916, n=30) | |
| Aorus Master 18 AM8H | |
| Medion Erazer Beast 18 X1 MD62731 | |
| Média da turma Gaming (12271 - 89891, n=109, últimos 2 anos) | |
Desempenho do sistema
Quando se trata do desempenho do sistema, a diferença entre os concorrentes é limitada. Subjetivamente, às vezes notamos travamentos ao abrir programas, o que, como acontece com frequência, provavelmente se deve à troca de gráficos. A geração Blackwell da Nvidia, ou seu driver atual, tem um problema maior aqui do que Ada Lovelace (também notamos o mesmo com o Aorus Master 18).
PCMark 10: Score | Essentials | Productivity | Digital Content Creation
CrossMark: Overall | Productivity | Creativity | Responsiveness
WebXPRT 3: Overall
WebXPRT 4: Overall
Mozilla Kraken 1.1: Total
| Performance rating | |
| Aorus Master 18 AM8H | |
| Asus Strix Scar 18 G835LX | |
| Lenovo Legion Pro 7i 16 Gen 10 | |
| Média Intel Core Ultra 9 275HX, NVIDIA GeForce RTX 5080 Laptop | |
| Acer Predator Helios 18 N23Q2 -1! | |
| MSI GE78HX 13VH-070US | |
| Média da turma Gaming | |
| Medion Erazer Beast 18 X1 MD62731 | |
| PCMark 10 / Score | |
| Lenovo Legion Pro 7i 16 Gen 10 | |
| MSI GE78HX 13VH-070US | |
| Média Intel Core Ultra 9 275HX, NVIDIA GeForce RTX 5080 Laptop (7805 - 10409, n=9) | |
| Asus Strix Scar 18 G835LX | |
| Aorus Master 18 AM8H | |
| Acer Predator Helios 18 N23Q2 | |
| Medion Erazer Beast 18 X1 MD62731 | |
| Média da turma Gaming (5828 - 11574, n=96, últimos 2 anos) | |
| PCMark 10 / Essentials | |
| MSI GE78HX 13VH-070US | |
| Lenovo Legion Pro 7i 16 Gen 10 | |
| Aorus Master 18 AM8H | |
| Acer Predator Helios 18 N23Q2 | |
| Asus Strix Scar 18 G835LX | |
| Média Intel Core Ultra 9 275HX, NVIDIA GeForce RTX 5080 Laptop (10206 - 11472, n=9) | |
| Média da turma Gaming (8810 - 12600, n=100, últimos 2 anos) | |
| Medion Erazer Beast 18 X1 MD62731 | |
| PCMark 10 / Productivity | |
| Média da turma Gaming (6845 - 21327, n=98, últimos 2 anos) | |
| Média Intel Core Ultra 9 275HX, NVIDIA GeForce RTX 5080 Laptop (8319 - 20616, n=9) | |
| Acer Predator Helios 18 N23Q2 | |
| MSI GE78HX 13VH-070US | |
| Medion Erazer Beast 18 X1 MD62731 | |
| Lenovo Legion Pro 7i 16 Gen 10 | |
| Asus Strix Scar 18 G835LX | |
| Aorus Master 18 AM8H | |
| PCMark 10 / Digital Content Creation | |
| Lenovo Legion Pro 7i 16 Gen 10 | |
| Asus Strix Scar 18 G835LX | |
| Aorus Master 18 AM8H | |
| Média Intel Core Ultra 9 275HX, NVIDIA GeForce RTX 5080 Laptop (10505 - 19351, n=9) | |
| Medion Erazer Beast 18 X1 MD62731 | |
| MSI GE78HX 13VH-070US | |
| Acer Predator Helios 18 N23Q2 | |
| Média da turma Gaming (7602 - 19657, n=98, últimos 2 anos) | |
| CrossMark / Overall | |
| Aorus Master 18 AM8H | |
| Asus Strix Scar 18 G835LX | |
| Acer Predator Helios 18 N23Q2 | |
| Média Intel Core Ultra 9 275HX, NVIDIA GeForce RTX 5080 Laptop (1857 - 2244, n=9) | |
| Lenovo Legion Pro 7i 16 Gen 10 | |
| Média da turma Gaming (1366 - 2409, n=97, últimos 2 anos) | |
| MSI GE78HX 13VH-070US | |
| Medion Erazer Beast 18 X1 MD62731 | |
| CrossMark / Productivity | |
| Aorus Master 18 AM8H | |
| Acer Predator Helios 18 N23Q2 | |
| Asus Strix Scar 18 G835LX | |
| Média Intel Core Ultra 9 275HX, NVIDIA GeForce RTX 5080 Laptop (1764 - 2122, n=9) | |
| Lenovo Legion Pro 7i 16 Gen 10 | |
| Média da turma Gaming (1386 - 2254, n=97, últimos 2 anos) | |
| MSI GE78HX 13VH-070US | |
| Medion Erazer Beast 18 X1 MD62731 | |
| CrossMark / Creativity | |
| Asus Strix Scar 18 G835LX | |
| Aorus Master 18 AM8H | |
| Acer Predator Helios 18 N23Q2 | |
| Média Intel Core Ultra 9 275HX, NVIDIA GeForce RTX 5080 Laptop (2115 - 2498, n=9) | |
| Lenovo Legion Pro 7i 16 Gen 10 | |
| Média da turma Gaming (1343 - 2729, n=97, últimos 2 anos) | |
| Medion Erazer Beast 18 X1 MD62731 | |
| MSI GE78HX 13VH-070US | |
| CrossMark / Responsiveness | |
| Aorus Master 18 AM8H | |
| Acer Predator Helios 18 N23Q2 | |
| Média Intel Core Ultra 9 275HX, NVIDIA GeForce RTX 5080 Laptop (1466 - 2096, n=9) | |
| Asus Strix Scar 18 G835LX | |
| Média da turma Gaming (1226 - 2334, n=97, últimos 2 anos) | |
| MSI GE78HX 13VH-070US | |
| Lenovo Legion Pro 7i 16 Gen 10 | |
| Medion Erazer Beast 18 X1 MD62731 | |
| WebXPRT 3 / Overall | |
| Lenovo Legion Pro 7i 16 Gen 10 | |
| Asus Strix Scar 18 G835LX | |
| Média Intel Core Ultra 9 275HX, NVIDIA GeForce RTX 5080 Laptop (306 - 378, n=9) | |
| Medion Erazer Beast 18 X1 MD62731 | |
| Acer Predator Helios 18 N23Q2 | |
| Média da turma Gaming (242 - 532, n=101, últimos 2 anos) | |
| MSI GE78HX 13VH-070US | |
| Aorus Master 18 AM8H | |
| WebXPRT 4 / Overall | |
| Asus Strix Scar 18 G835LX | |
| Lenovo Legion Pro 7i 16 Gen 10 | |
| Medion Erazer Beast 18 X1 MD62731 | |
| Média Intel Core Ultra 9 275HX, NVIDIA GeForce RTX 5080 Laptop (285 - 336, n=9) | |
| Aorus Master 18 AM8H | |
| MSI GE78HX 13VH-070US | |
| Média da turma Gaming (176.4 - 354, n=101, últimos 2 anos) | |
| Mozilla Kraken 1.1 / Total | |
| MSI GE78HX 13VH-070US | |
| Média da turma Gaming (391 - 590, n=106, últimos 2 anos) | |
| Acer Predator Helios 18 N23Q2 | |
| Aorus Master 18 AM8H | |
| Medion Erazer Beast 18 X1 MD62731 | |
| Média Intel Core Ultra 9 275HX, NVIDIA GeForce RTX 5080 Laptop (405 - 432, n=9) | |
| Asus Strix Scar 18 G835LX | |
| Lenovo Legion Pro 7i 16 Gen 10 | |
* ... menor é melhor
| PCMark 10 Score | 8378 pontos | |
Ajuda | ||
| AIDA64 / Memory Copy | |
| Lenovo Legion Pro 7i 16 Gen 10 | |
| Asus Strix Scar 18 G835LX | |
| Média Intel Core Ultra 9 275HX (56003 - 94460, n=30) | |
| Acer Predator Helios 18 N23Q2 | |
| Medion Erazer Beast 18 X1 MD62731 | |
| MSI GE78HX 13VH-070US | |
| Aorus Master 18 AM8H | |
| Média da turma Gaming (21750 - 129946, n=109, últimos 2 anos) | |
| AIDA64 / Memory Read | |
| Lenovo Legion Pro 7i 16 Gen 10 | |
| Acer Predator Helios 18 N23Q2 | |
| Medion Erazer Beast 18 X1 MD62731 | |
| Asus Strix Scar 18 G835LX | |
| MSI GE78HX 13VH-070US | |
| Média Intel Core Ultra 9 275HX (55795 - 97151, n=30) | |
| Aorus Master 18 AM8H | |
| Média da turma Gaming (22956 - 118858, n=109, últimos 2 anos) | |
| AIDA64 / Memory Write | |
| Lenovo Legion Pro 7i 16 Gen 10 | |
| Asus Strix Scar 18 G835LX | |
| Média Intel Core Ultra 9 275HX (55663 - 116129, n=30) | |
| Medion Erazer Beast 18 X1 MD62731 | |
| MSI GE78HX 13VH-070US | |
| Média da turma Gaming (22297 - 135096, n=109, últimos 2 anos) | |
| Acer Predator Helios 18 N23Q2 | |
| Aorus Master 18 AM8H | |
| AIDA64 / Memory Latency | |
| Aorus Master 18 AM8H | |
| Média Intel Core Ultra 9 275HX (105.8 - 161.6, n=30) | |
| Medion Erazer Beast 18 X1 MD62731 | |
| Lenovo Legion Pro 7i 16 Gen 10 | |
| Asus Strix Scar 18 G835LX | |
| Média da turma Gaming (75.3 - 259, n=109, últimos 2 anos) | |
| MSI GE78HX 13VH-070US | |
| Acer Predator Helios 18 N23Q2 | |
* ... menor é melhor
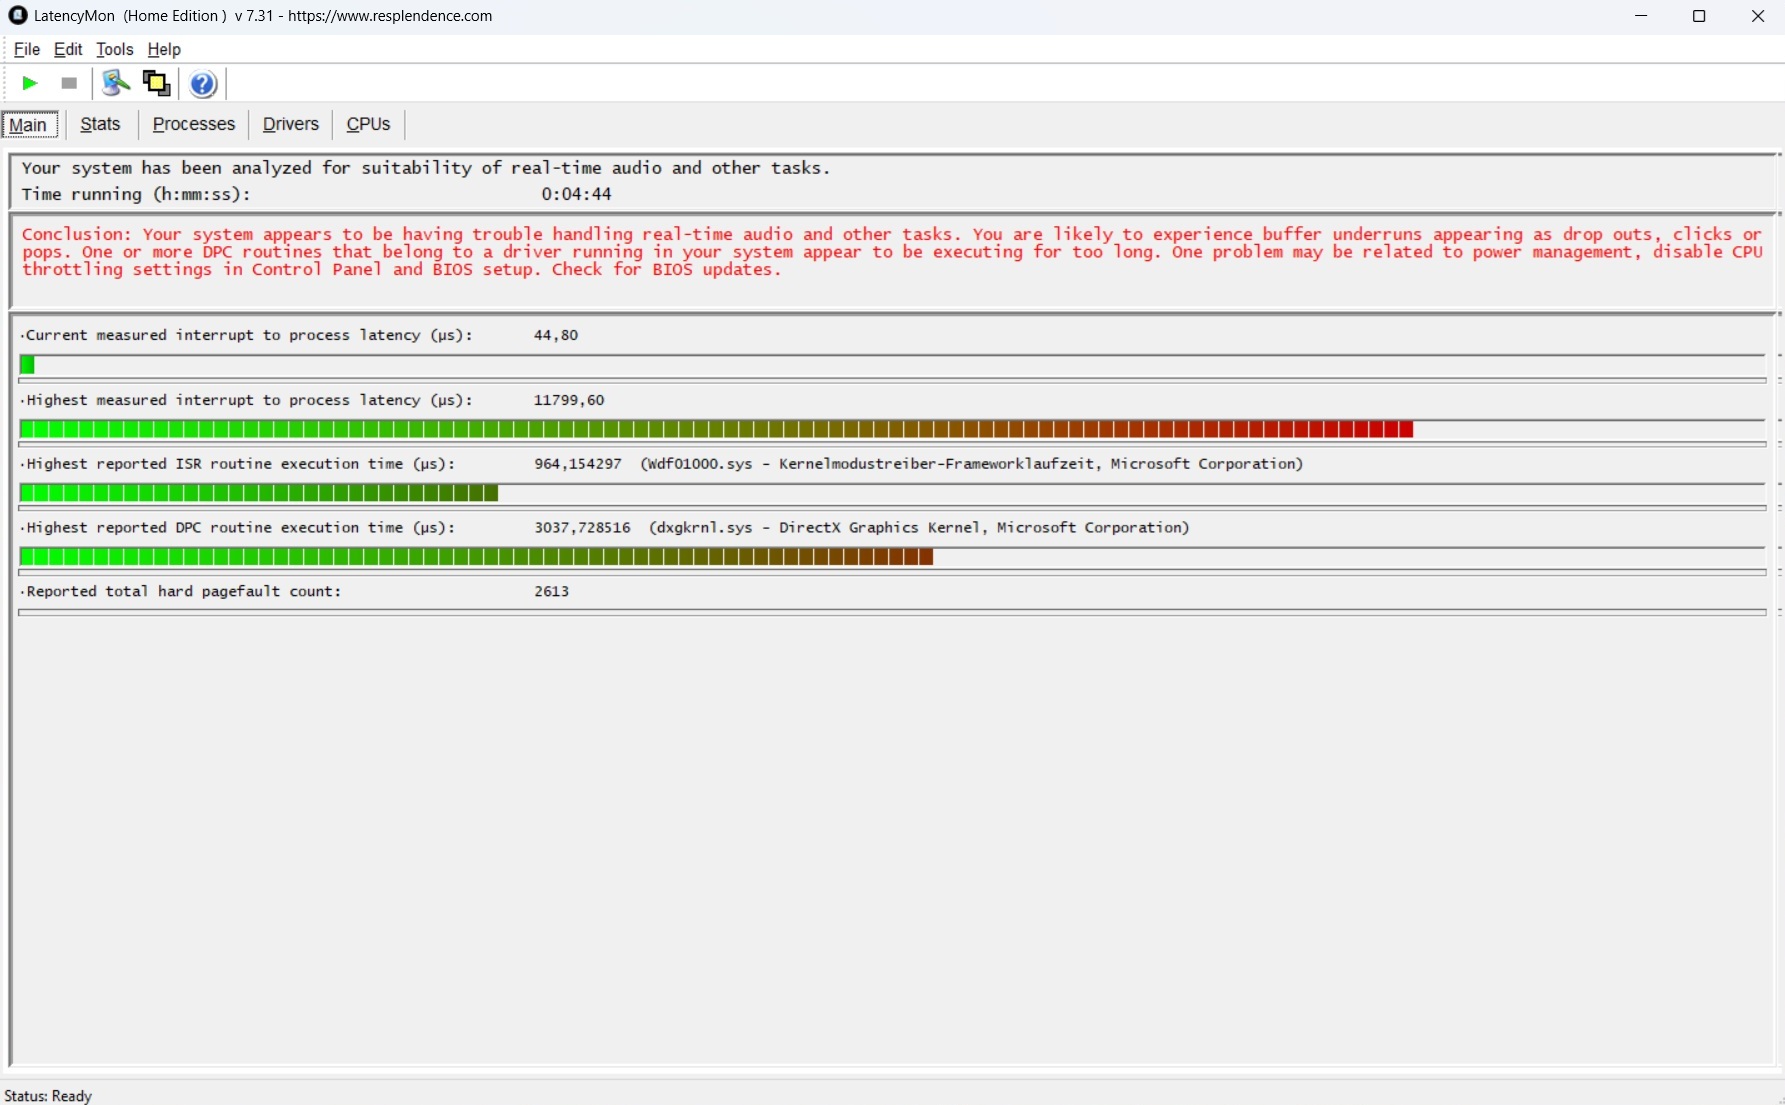
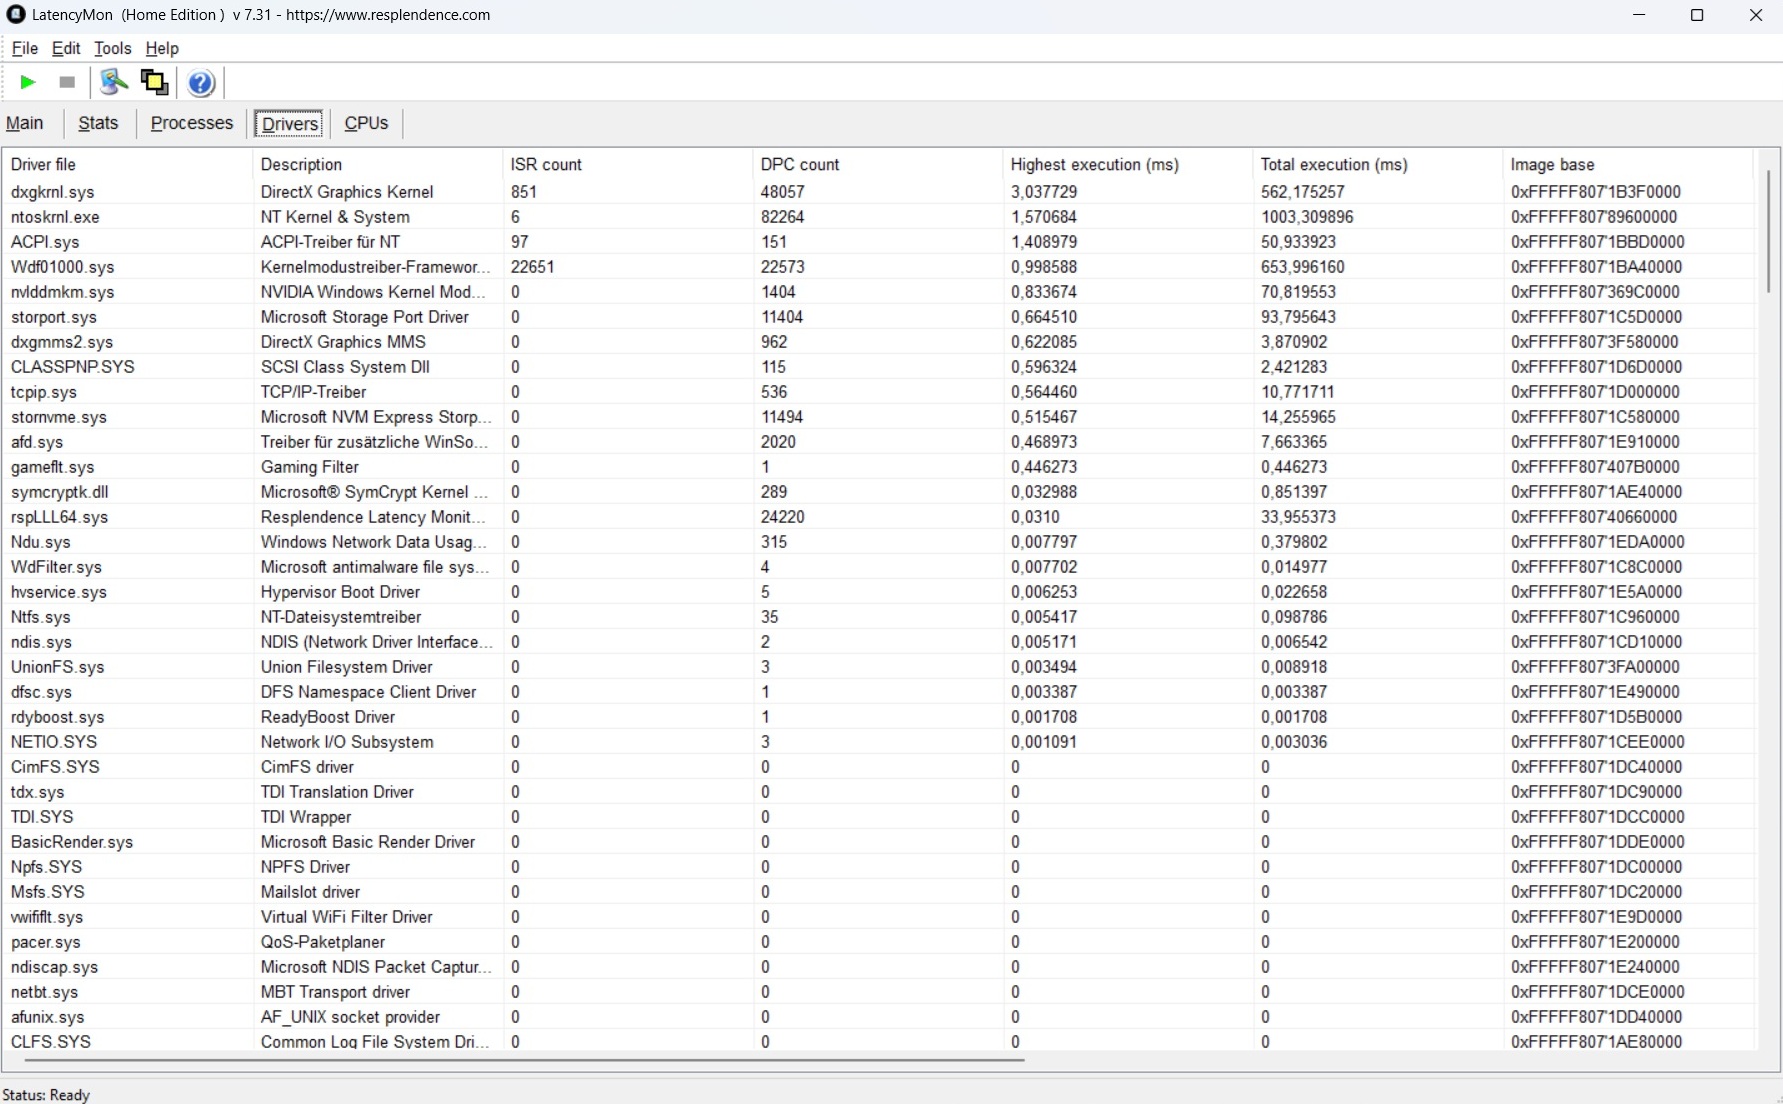
Latências de DPC
Em geral, as latências não são o destaque do Beast 18 X1: um máximo de 11.799 µs é ainda pior do que o Acer Predator Helios 18 (8.290 µs).
| DPC Latencies / LatencyMon - interrupt to process latency (max), Web, Youtube, Prime95 | |
| Medion Erazer Beast 18 X1 MD62731 | |
| Acer Predator Helios 18 N23Q2 | |
| MSI GE78HX 13VH-070US | |
| Aorus Master 18 AM8H | |
| Asus Strix Scar 18 G835LX | |
| Lenovo Legion Pro 7i 16 Gen 10 | |
* ... menor é melhor
Armazenamento em massa
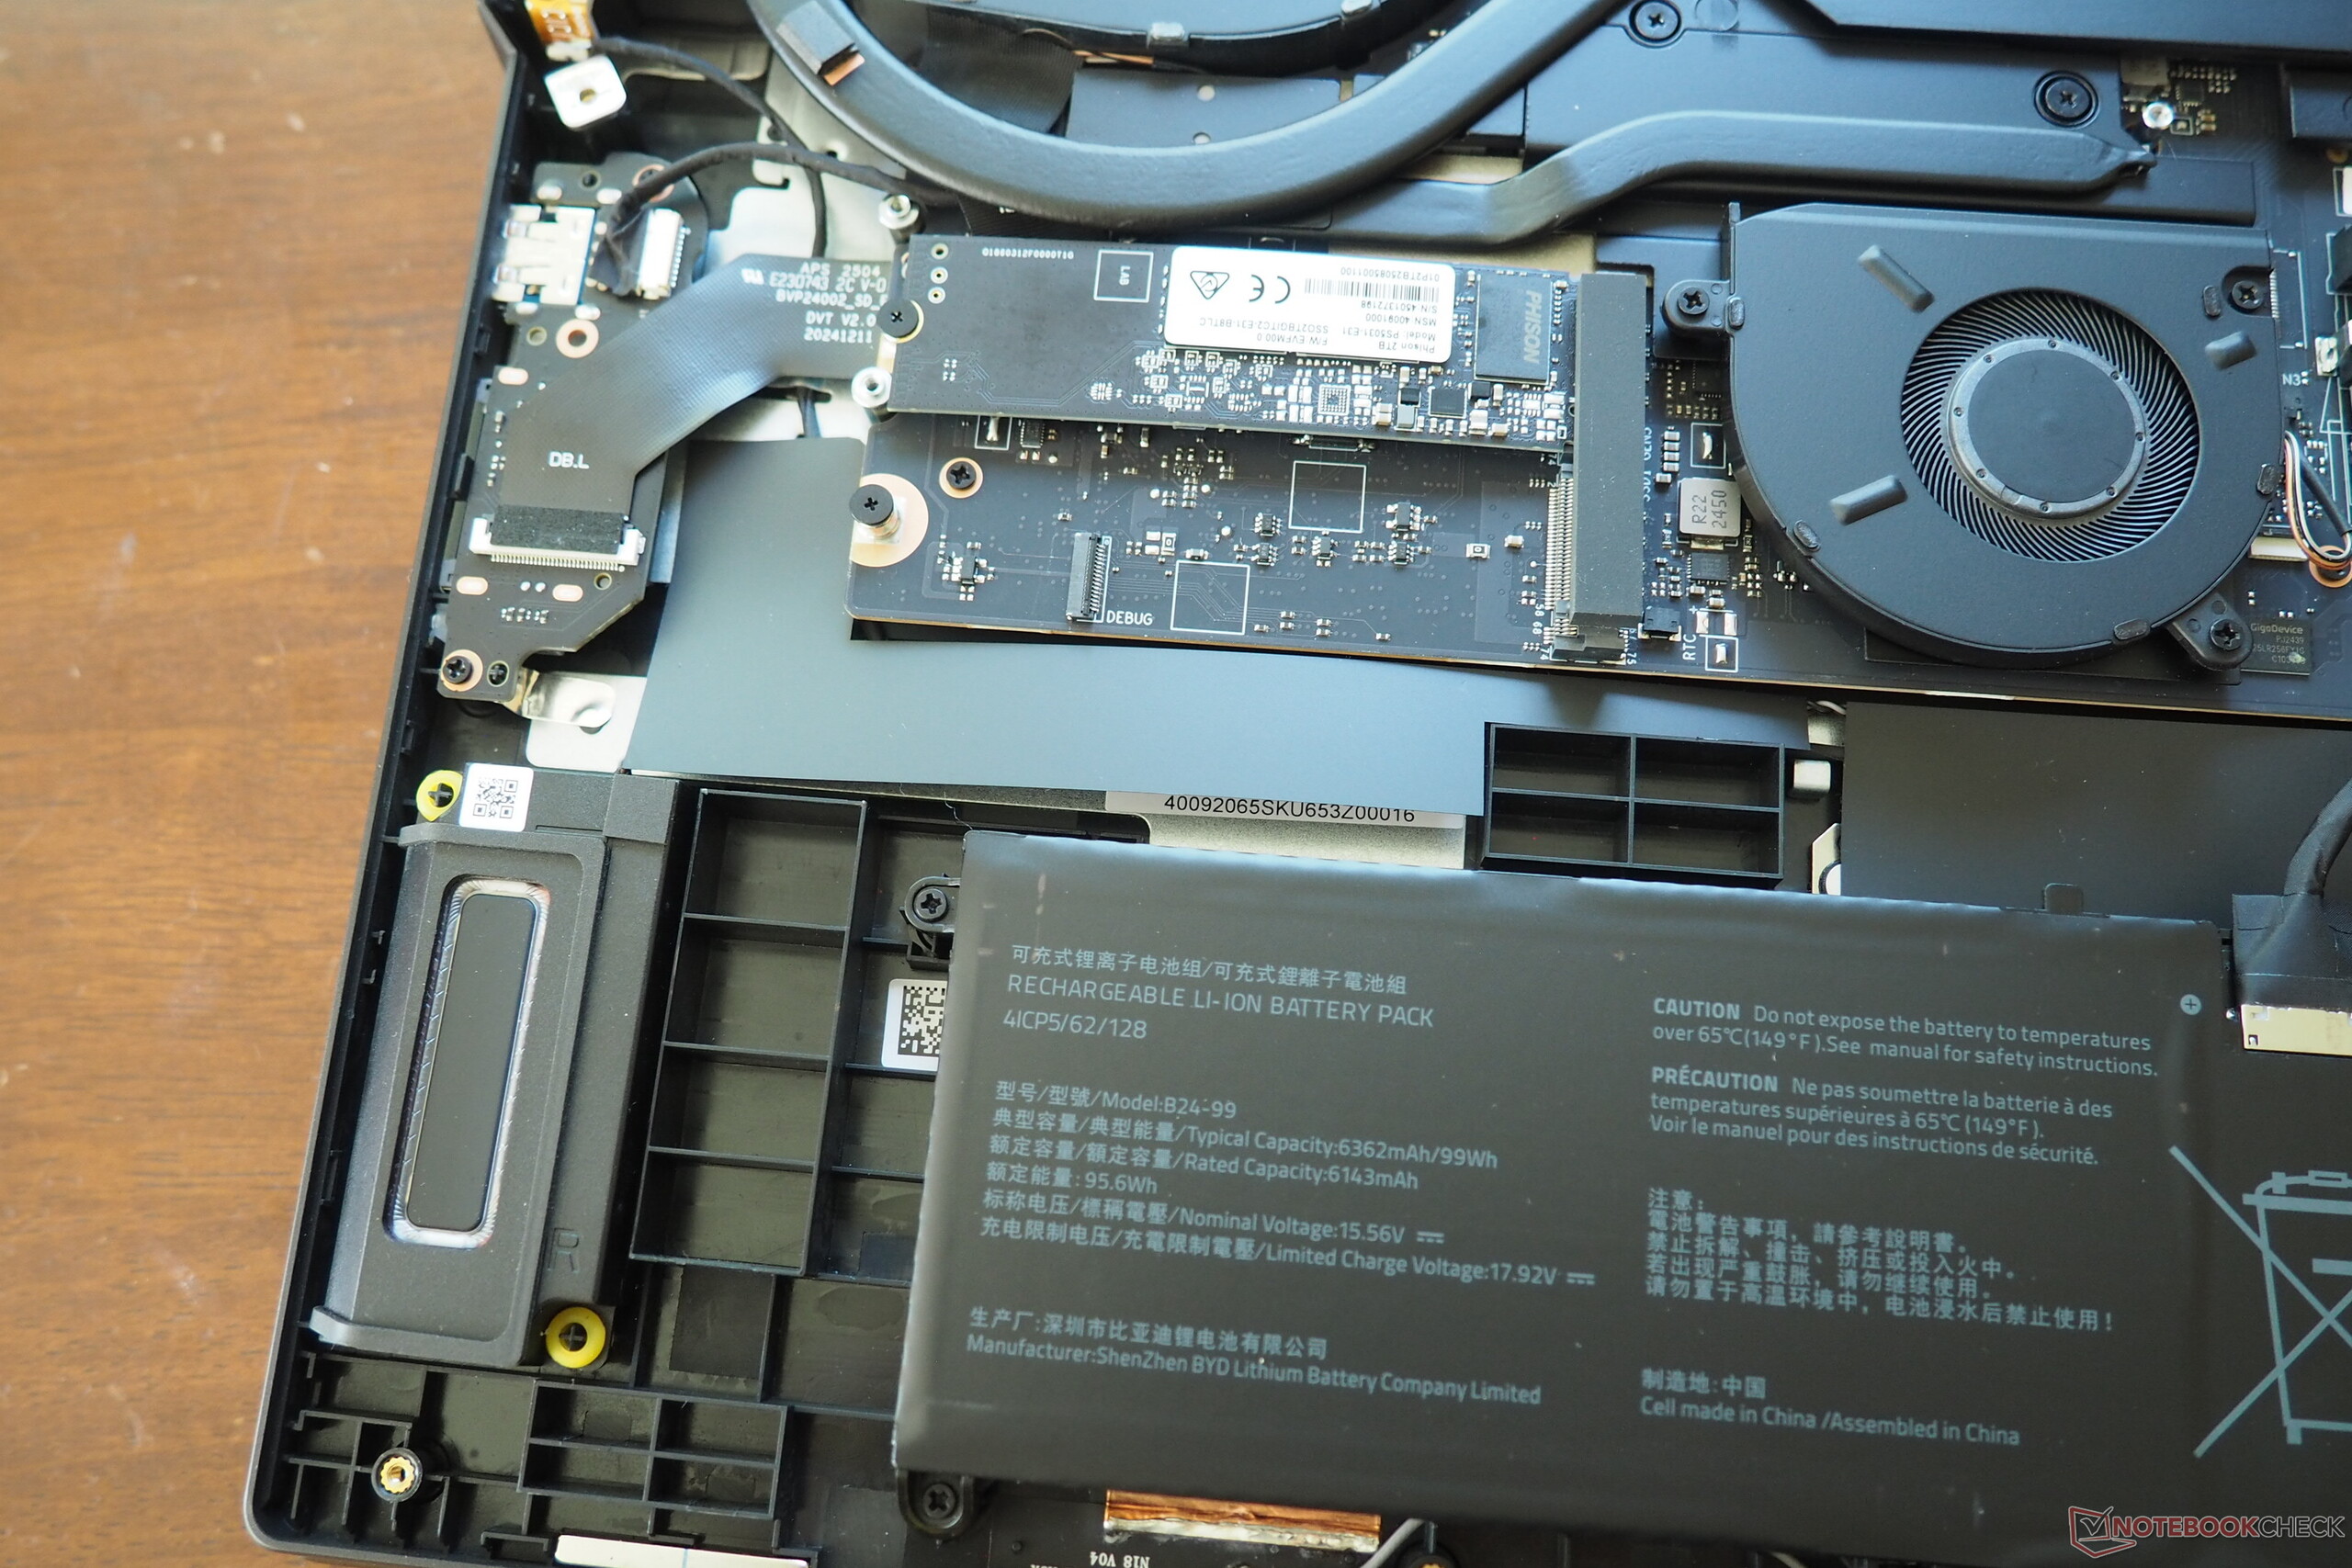
No entanto, o veloz SSD PCIe Gen. 5x4 merece respeito. A unidade de 2 TB ultrapassa a marca de 10.000 MB/s em testes sequenciais e pode até mesmo ser executada sem estrangulamento a longo prazo.

* ... menor é melhor
Continuous read: DiskSpd Read Loop, Queue Depth 8
Placa de vídeo
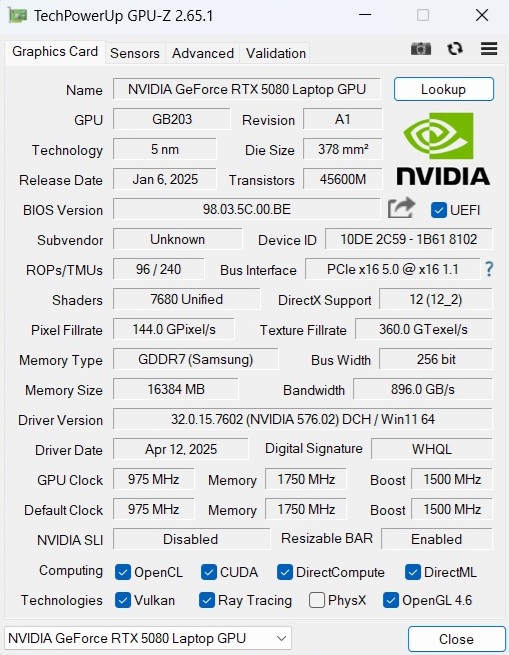
O laptop GeForce Laptop RTX 5080 é atualmente o segundo modelo de notebook mais poderoso da Nvidia da série Blackwell, depois do Laptop RTX 5090. No entanto, este último tem apenas uma vantagem limitada em nosso curso 3DMark quando o senhor olha para a concorrência. Por outro lado, o RTX 5080 não é muito mais rápido do que o antigo laptop Laptop RTX 4080que, pelo menos, consegue se manter bem em testes sintéticos. Enquanto isso, a VRAM GDDR7 de 16 GB não é uma revelação para a faixa de preço, mas ainda é melhor do que a GDDR6X de 12 GB do antecessor. O nível de TGP pode atingir um máximo de 175 watts.
| 3DMark 11 Performance | 44491 pontos | |
| 3DMark Ice Storm Standard Score | 245418 pontos | |
| 3DMark Cloud Gate Standard Score | 61468 pontos | |
| 3DMark Fire Strike Score | 30780 pontos | |
| 3DMark Time Spy Score | 20170 pontos | |
Ajuda | ||
* ... menor é melhor
Desempenho em jogos
Nos benchmarks de jogos, as diferenças entre os dispositivos da concorrência são um pouco maiores, mas, na prática, o senhor geralmente não perceberá muito isso. Basicamente, a RTX 5080 móvel é rápida o suficiente para executar a maioria dos jogos modernos sem problemas com o máximo de detalhes e a resolução QHD+ nativa. As coisas só ficam difíceis com títulos muito exigentes ou moderadamente otimizados, como The Elder Scrolls: Oblivion Remastered. O uso de upscaling (palavra-chave DLSS) e/ou geração de (vários) quadros é recomendado aqui. Com o Stalker 2a taxa de quadros em QHD dobra como resultado (consulte a tabela).
| Stalker 2 | |
| 2560x1440 Epic Preset | |
| Aorus Master 18 AM8H | |
| Medion Erazer Beast 18 X1 MD62731 | |
| Média NVIDIA GeForce RTX 5080 Laptop (41.5 - 58.5, n=2) | |
| Média da turma Gaming (29 - 110.7, n=13, últimos 2 anos) | |
| 2560x1440 Epic Preset + Quality DLSS + FG | |
| Aorus Master 18 AM8H | |
| Medion Erazer Beast 18 X1 MD62731 | |
| Média NVIDIA GeForce RTX 5080 Laptop (80.7 - 122.1, n=2) | |
| Média da turma Gaming (58.3 - 134.6, n=12, últimos 2 anos) | |
| Horizon Forbidden West | |
| 2560x1440 Very High Preset AA:T | |
| Aorus Master 18 AM8H | |
| Medion Erazer Beast 18 X1 MD62731 | |
| Média NVIDIA GeForce RTX 5080 Laptop (n=1) | |
| Média da turma Gaming (39.6 - 100.9, n=10, últimos 2 anos) | |
| 2560x1440 Very High Preset + DLSS Quality | |
| Aorus Master 18 AM8H | |
| Medion Erazer Beast 18 X1 MD62731 | |
| Média NVIDIA GeForce RTX 5080 Laptop (n=1) | |
| Média da turma Gaming (58.4 - 116.6, n=8, últimos 2 anos) | |
| Ghost of Tsushima | |
| 2560x1440 Very High Preset AA:T | |
| Aorus Master 18 AM8H | |
| Medion Erazer Beast 18 X1 MD62731 | |
| Média NVIDIA GeForce RTX 5080 Laptop (n=1) | |
| Média da turma Gaming (22.7 - 100.3, n=13, últimos 2 anos) | |
| 2560x1440 Very High Preset + Quality DLSS | |
| Aorus Master 18 AM8H | |
| Medion Erazer Beast 18 X1 MD62731 | |
| Média NVIDIA GeForce RTX 5080 Laptop (n=1) | |
| Média da turma Gaming (55.2 - 105.2, n=10, últimos 2 anos) | |
| Senua's Saga Hellblade 2 | |
| 2560x1440 High Preset | |
| Aorus Master 18 AM8H | |
| Medion Erazer Beast 18 X1 MD62731 | |
| Média NVIDIA GeForce RTX 5080 Laptop (n=1) | |
| Média da turma Gaming (24.2 - 63.1, n=11, últimos 2 anos) | |
| 2560x1440 High Preset + Quality DLSS | |
| Aorus Master 18 AM8H | |
| Medion Erazer Beast 18 X1 MD62731 | |
| Média NVIDIA GeForce RTX 5080 Laptop (n=1) | |
| Média da turma Gaming (39.6 - 81.9, n=9, últimos 2 anos) | |
| Star Wars Outlaws | |
| 2560x1440 cinem. ultra | |
| Aorus Master 18 AM8H | |
| Medion Erazer Beast 18 X1 MD62731 | |
| Média NVIDIA GeForce RTX 5080 Laptop (51.2 - 51.4, n=2) | |
| Média da turma Gaming (23.2 - 61, n=13, últimos 2 anos) | |
| 2560x1440 cinem. ultra DLSS | |
| Aorus Master 18 AM8H | |
| Média NVIDIA GeForce RTX 5080 Laptop (64.8 - 67.6, n=2) | |
| Medion Erazer Beast 18 X1 MD62731 | |
| Média da turma Gaming (32.6 - 70.9, n=12, últimos 2 anos) | |
| Space Marine 2 | |
| 2560x1440 Ultra Preset AA:T | |
| Aorus Master 18 AM8H | |
| Medion Erazer Beast 18 X1 MD62731 | |
| Média NVIDIA GeForce RTX 5080 Laptop (n=1) | |
| Média da turma Gaming (48.2 - 107.4, n=11, últimos 2 anos) | |
| 2560x1440 Ultra Preset + Quality DLSS | |
| Aorus Master 18 AM8H | |
| Medion Erazer Beast 18 X1 MD62731 | |
| Média NVIDIA GeForce RTX 5080 Laptop (n=1) | |
| Média da turma Gaming (58.5 - 100.8, n=10, últimos 2 anos) | |
| Until Dawn | |
| 2560x1440 Ultra Preset | |
| Aorus Master 18 AM8H | |
| Medion Erazer Beast 18 X1 MD62731 | |
| Média NVIDIA GeForce RTX 5080 Laptop (n=1) | |
| Média da turma Gaming (30.4 - 76.6, n=11, últimos 2 anos) | |
| 2560x1440 Ultra Preset + Quality DLSS + Ray Tracing | |
| Aorus Master 18 AM8H | |
| Medion Erazer Beast 18 X1 MD62731 | |
| Média NVIDIA GeForce RTX 5080 Laptop (n=1) | |
| Média da turma Gaming (39.5 - 86.3, n=10, últimos 2 anos) | |
| Kingdom Come Deliverance 2 | |
| 2560x1440 Ultra Preset | |
| Aorus Master 18 AM8H | |
| Medion Erazer Beast 18 X1 MD62731 | |
| Média NVIDIA GeForce RTX 5080 Laptop (n=1) | |
| Média da turma Gaming (36.8 - 97.2, n=13, últimos 2 anos) | |
| 2560x1440 Ultra Preset + Quality DLSS | |
| Medion Erazer Beast 18 X1 MD62731 | |
| Média NVIDIA GeForce RTX 5080 Laptop (n=1) | |
| Aorus Master 18 AM8H | |
| Média da turma Gaming (50.3 - 115.5, n=13, últimos 2 anos) | |
| The Elder Scrolls IV Oblivion Remastered | |
| 2560x1440 Ultra Preset AA:T | |
| Medion Erazer Beast 18 X1 MD62731 | |
| Média NVIDIA GeForce RTX 5080 Laptop (17.9 - 36.6, n=3) | |
| Média da turma Gaming (12.7 - 45.9, n=14, últimos 2 anos) | |
| 2560x1440 Ultra Preset + Quality DLSS | |
| Medion Erazer Beast 18 X1 MD62731 | |
| Média NVIDIA GeForce RTX 5080 Laptop (51 - 53.2, n=2) | |
| Média da turma Gaming (25.3 - 59.7, n=12, últimos 2 anos) | |
| baixo | média | alto | ultra | QHD DLSS | QHD | |
|---|---|---|---|---|---|---|
| GTA V (2015) | 185.4 | 170.6 | 139.5 | 137.4 | ||
| Dota 2 Reborn (2015) | 211 | 186.4 | 175.1 | 162.3 | ||
| Final Fantasy XV Benchmark (2018) | 218 | 189.9 | 152.1 | |||
| X-Plane 11.11 (2018) | 143 | 132.2 | 108.9 | |||
| Strange Brigade (2018) | 434 | 403 | 371 | 281 | ||
| Baldur's Gate 3 (2023) | 202 | 181.6 | 179.6 | 130.5 | ||
| Cyberpunk 2077 (2023) | 157.8 | 148.1 | 139.8 | 96.4 | ||
| Counter-Strike 2 (2023) | 345 | 290 | 255 | 205 | ||
| Prince of Persia The Lost Crown (2024) | 356 | 356 | 356 | 356 | ||
| Helldivers 2 (2024) | 135.9 | 134.5 | 131.9 | 127.8 | ||
| Dragon's Dogma 2 (2024) | 84.8 | 82.3 | ||||
| Horizon Forbidden West (2024) | 148.2 | 117.7 | 115.5 | 110.6 | 90.7 | |
| Ghost of Tsushima (2024) | 110.7 | 105.7 | 97.5 | 96.1 | 76.7 | |
| Senua's Saga Hellblade 2 (2024) | 99.3 | 76 | 81 | 55.1 | ||
| Star Wars Outlaws (2024) | 79.8 | 72.7 | 67.8 | 64.8 | 51.4 | |
| Space Marine 2 (2024) | 90 | 89.7 | 88.7 | 86.9 | 86.2 | |
| Until Dawn (2024) | 92.9 | 91 | 81.6 | 74.4 | 59 | |
| Stalker 2 (2024) | 90.7 | 78.1 | 72.6 | 122.1 | 58.5 | |
| Kingdom Come Deliverance 2 (2025) | 173.8 | 145.6 | 101.6 | 98.9 | 74.5 | |
| Civilization 7 (2025) | 173.4 | 165.5 | 158 | |||
| The Elder Scrolls IV Oblivion Remastered (2025) | 106.3 | 94.1 | 50.6 | 53.2 | 36.6 | |
| Doom: The Dark Ages (2025) | 113 | 104 | 101 | 97 | 72 |
Testamos como o desempenho 3D se comporta em um período de tempo mais longo com o Cyberpunk 2077 testado. No decorrer do teste, houve breves quedas ocasionais de FPS, mas foram sutis e não enormes.
Cyberpunk 2077 Ultra FPS chart
Emissões
Emissões de ruído
Uma das maiores críticas ao Beast 18 X1 é o modesto controle da ventoinha. Mesmo ao usar o modo Balanced, o sistema de resfriamento às vezes atinge desagradáveis 40 dB(A) ou até mais no modo inativo, o que pode incomodar muitos usuários a longo prazo. Sob carga, os valores de ruído já são atingidos com o perfil Balanced, que alguns concorrentes geram apenas no modo Performance (compare o Strix Scar 18, por exemplo).
Barulho
| Ocioso |
| 25 / 39 / 42 dB |
| Carga |
| 52 / 55 dB |
 | ||
30 dB silencioso 40 dB(A) audível 50 dB(A) ruidosamente alto |
||
min: | ||
| Medion Erazer Beast 18 X1 MD62731 Ultra 9 275HX, GeForce RTX 5080 Laptop | MSI GE78HX 13VH-070US i9-13950HX, GeForce RTX 4080 Laptop GPU | Acer Predator Helios 18 N23Q2 i9-13900HX, GeForce RTX 4080 Laptop GPU | Asus Strix Scar 18 G835LX Ultra 9 275HX, GeForce RTX 5090 Laptop | Aorus Master 18 AM8H Ultra 9 275HX, GeForce RTX 5090 Laptop | Lenovo Legion Pro 7i 16 Gen 10 Ultra 9 275HX, GeForce RTX 5080 Laptop | |
|---|---|---|---|---|---|---|
| Noise | 13% | 18% | 8% | 7% | 20% | |
| desligado / ambiente * (dB) | 25 | 23.4 6% | 23 8% | 23.3 7% | 25 -0% | 22.9 8% |
| Idle Minimum * (dB) | 25 | 24.2 3% | 23 8% | 29.8 -19% | 26 -4% | 22.9 8% |
| Idle Average * (dB) | 39 | 25.6 34% | 23 41% | 29.8 24% | 29 26% | 22.9 41% |
| Idle Maximum * (dB) | 42 | 31 26% | 23 45% | 29.8 29% | 34 19% | 26.3 37% |
| Load Average * (dB) | 52 | 43.3 17% | 45.26 13% | 42.9 17% | 50 4% | 27.8 47% |
| Cyberpunk 2077 ultra * (dB) | 53 | 53.7 -1% | 52 2% | 54.2 -2% | ||
| Load Maximum * (dB) | 55 | 59.1 -7% | 59.94 -9% | 53.7 2% | 53 4% | 53.9 2% |
| Witcher 3 ultra * (dB) | 56.3 | 59.82 |
* ... menor é melhor
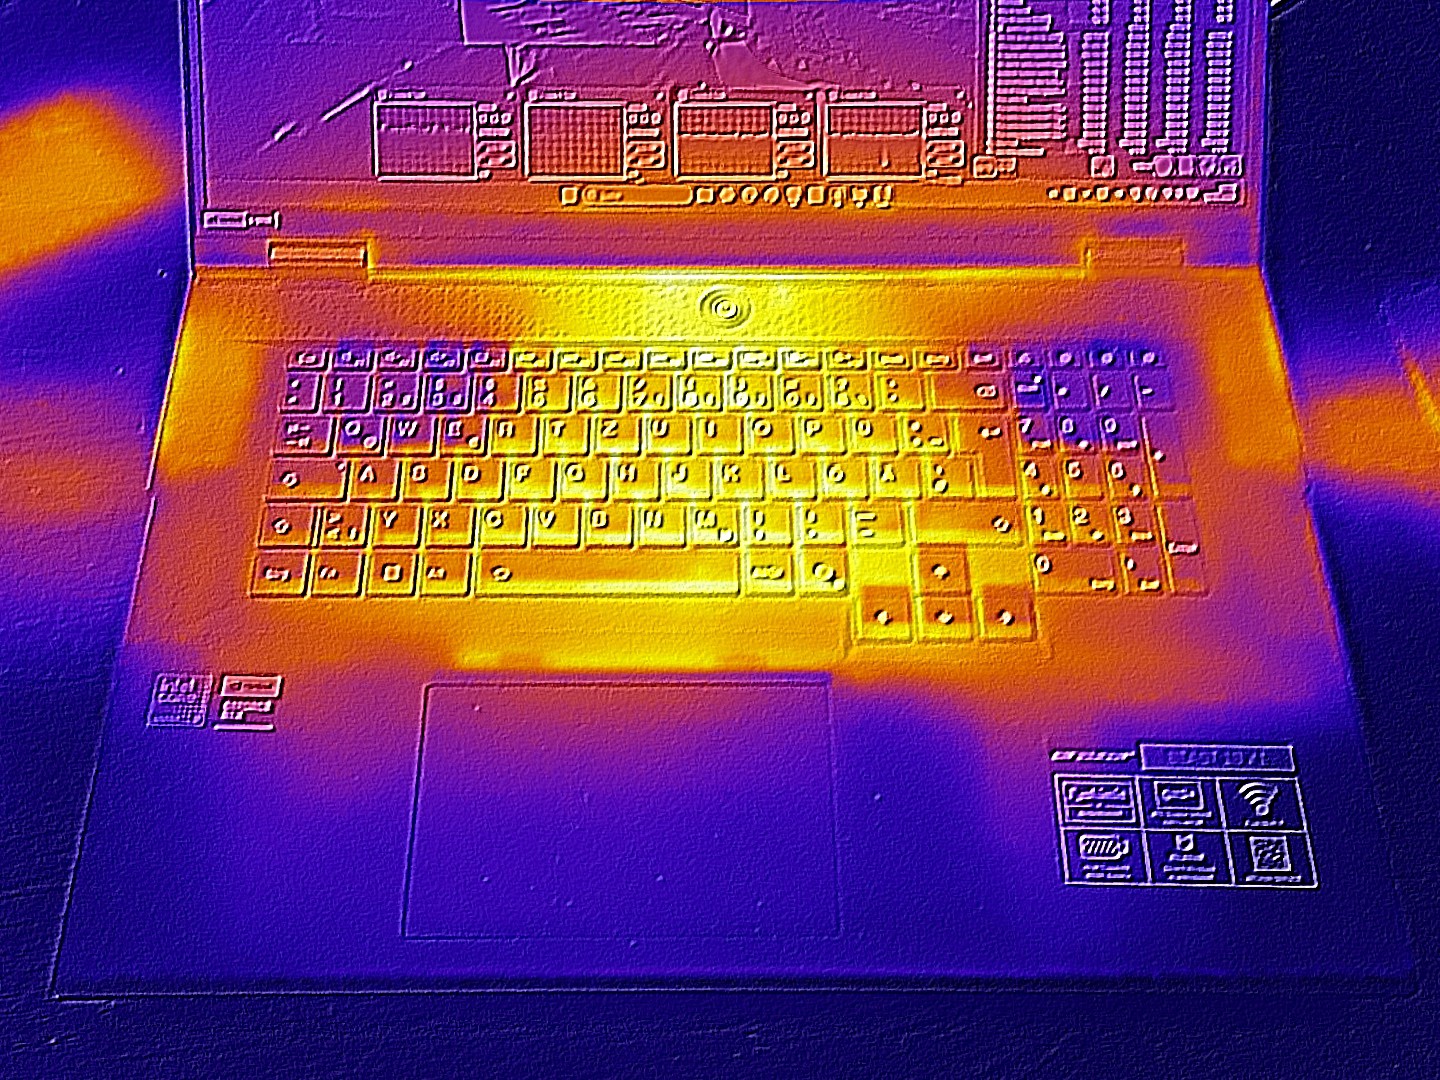
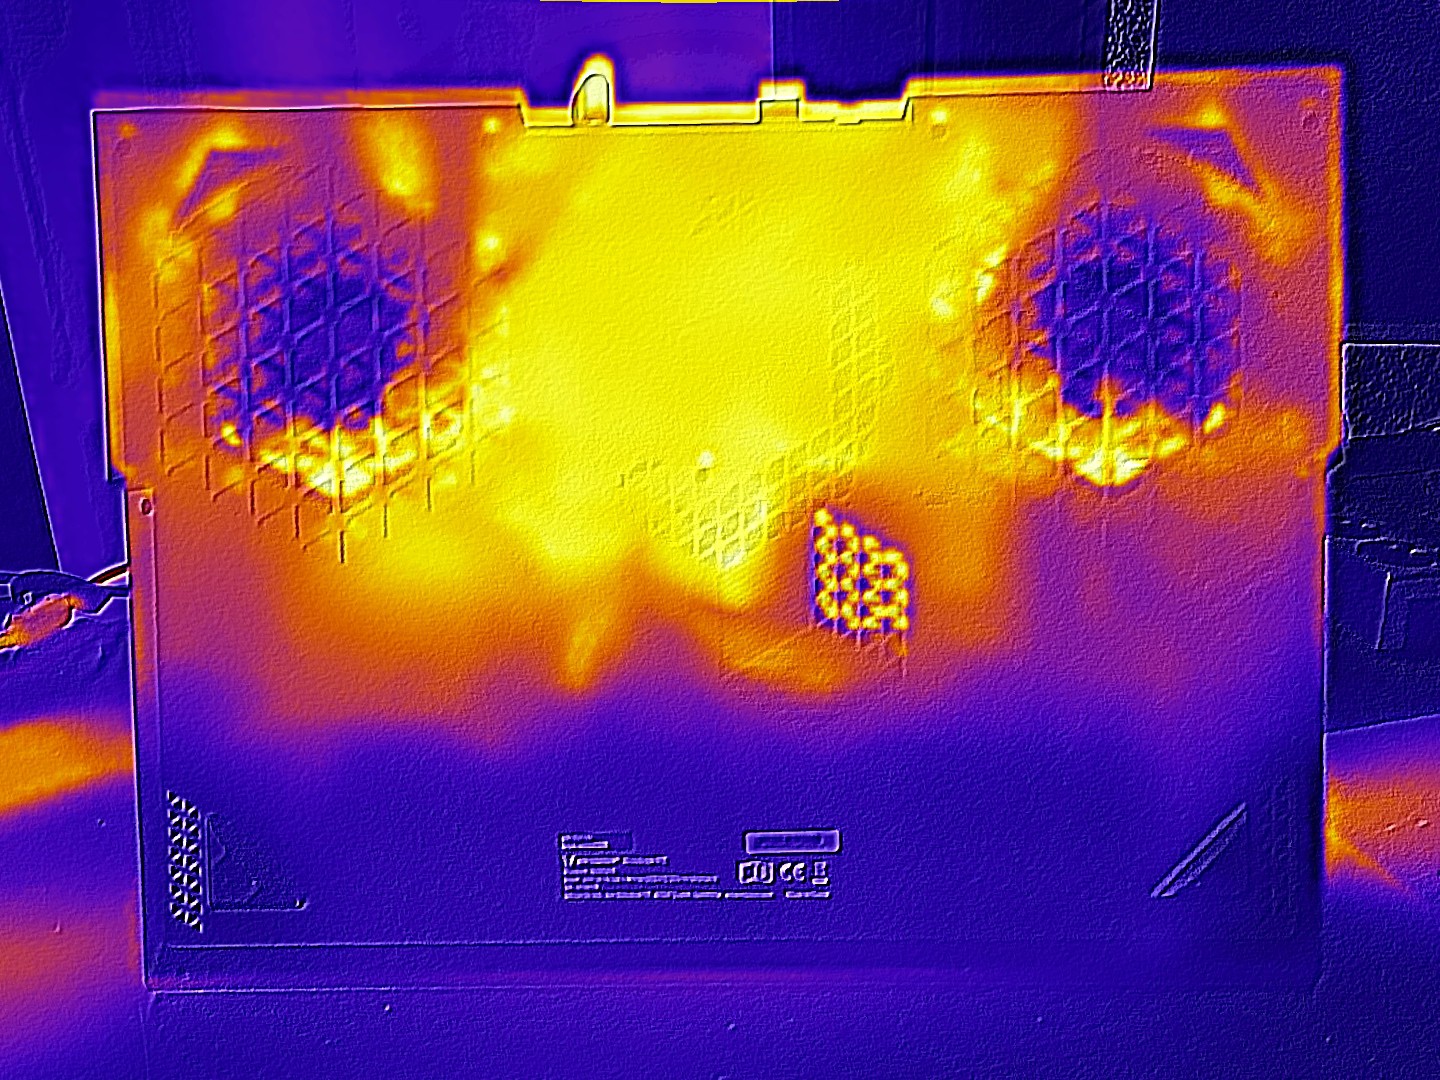
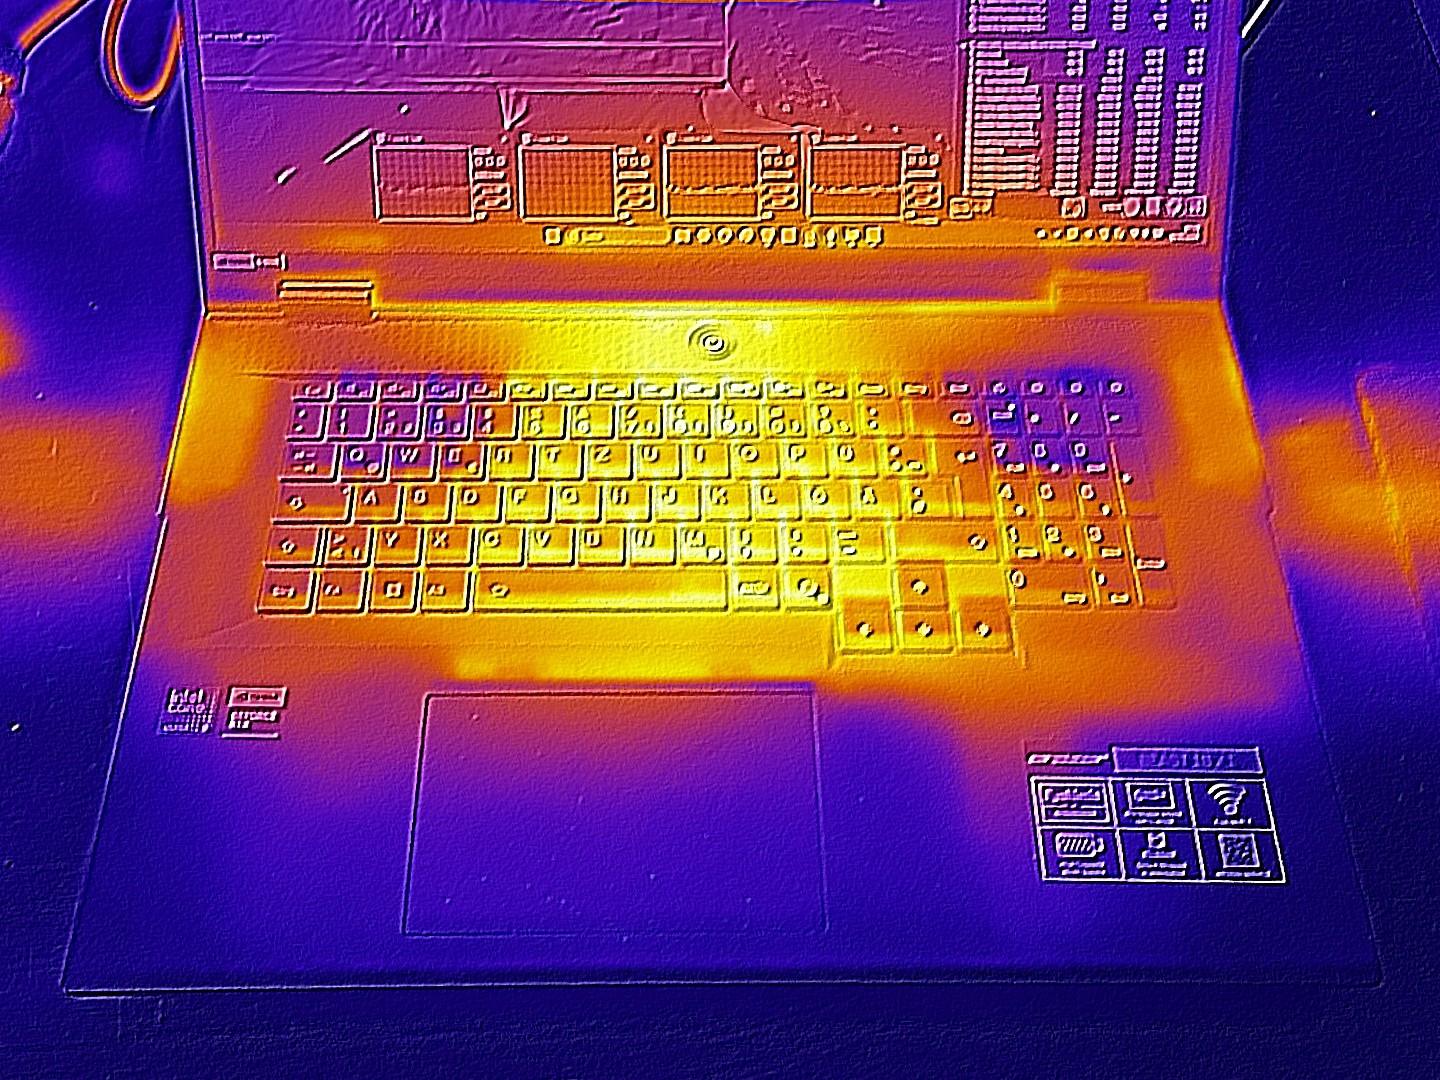
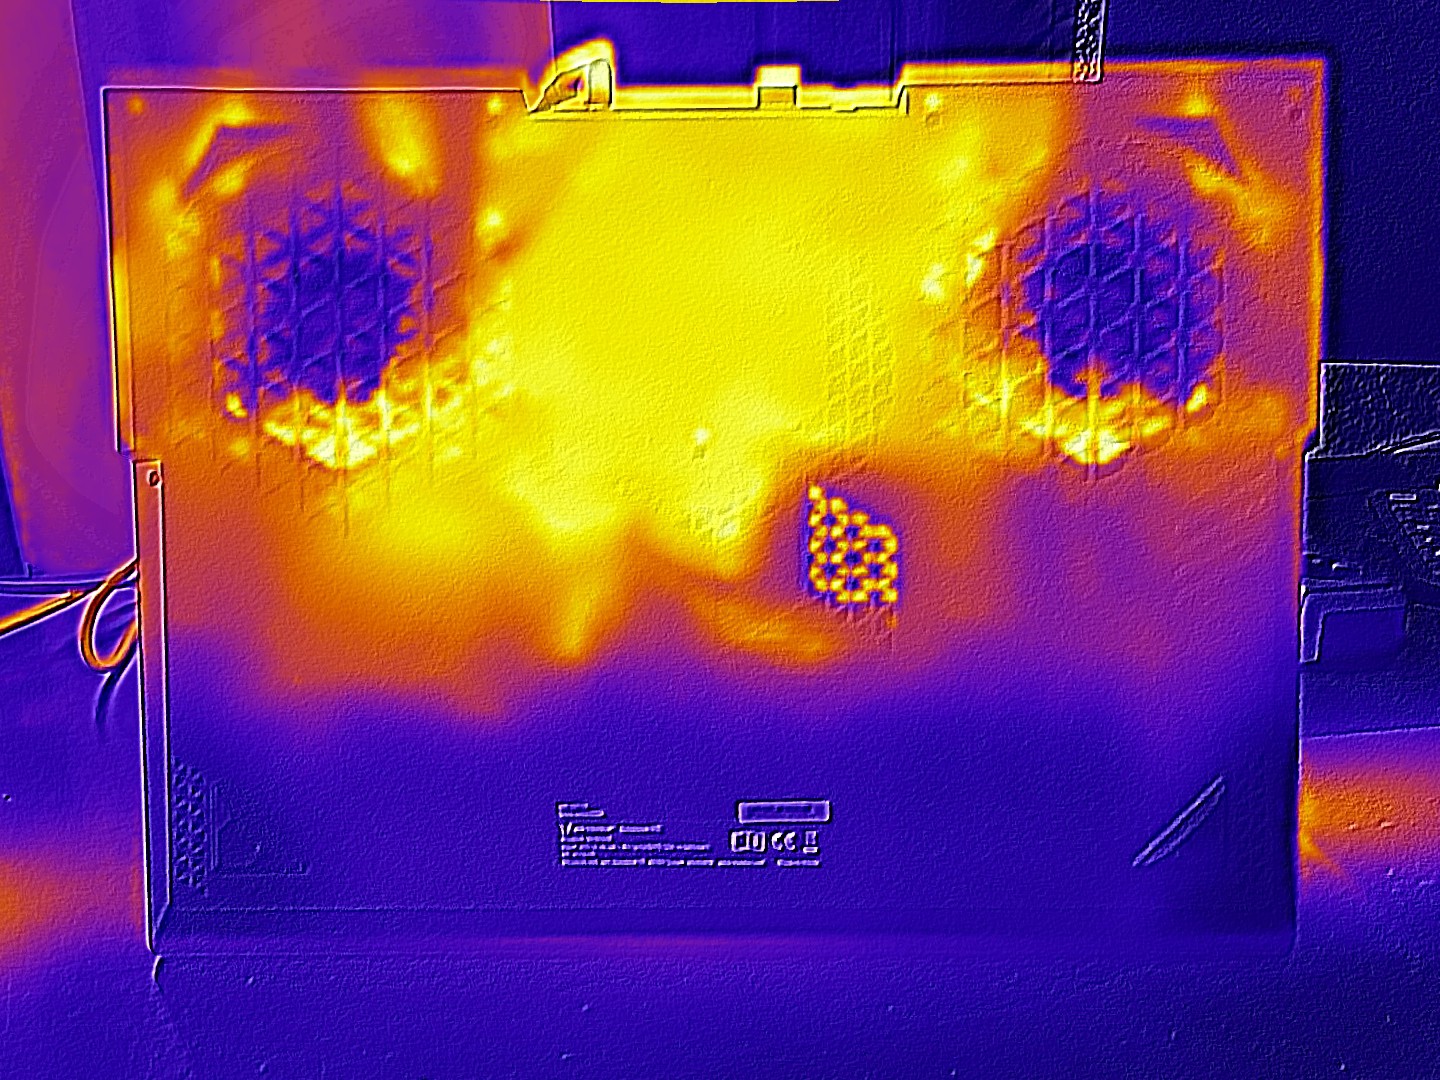
Temperatura
As temperaturas do gabinete são menos preocupantes. Um máximo de 47 °C na parte superior e 48 °C na parte inferior é típico de um laptop de última geração. No modo inativo, as superfícies ficam, em sua maioria, abaixo da marca de 30 °C, mantendo-as agradavelmente frias.
(-) A temperatura máxima no lado superior é 47 °C / 117 F, em comparação com a média de 40.4 °C / 105 F , variando de 21.2 a 68.8 °C para a classe Gaming.
(-) A parte inferior aquece até um máximo de 48 °C / 118 F, em comparação com a média de 43.2 °C / 110 F
(+) Em uso inativo, a temperatura média para o lado superior é 27.9 °C / 82 F, em comparação com a média do dispositivo de 33.9 °C / ### class_avg_f### F.
(-) 3: The average temperature for the upper side is 42 °C / 108 F, compared to the average of 33.9 °C / 93 F for the class Gaming.
(-) Os apoios para as mãos e o touchpad podem ficar muito quentes ao toque, com um máximo de 41 °C / 105.8 F.
(-) A temperatura média da área do apoio para as mãos de dispositivos semelhantes foi 28.8 °C / 83.8 F (-12.2 °C / -22 F).
| Medion Erazer Beast 18 X1 MD62731 Ultra 9 275HX, GeForce RTX 5080 Laptop | MSI GE78HX 13VH-070US i9-13950HX, GeForce RTX 4080 Laptop GPU | Acer Predator Helios 18 N23Q2 i9-13900HX, GeForce RTX 4080 Laptop GPU | Asus Strix Scar 18 G835LX Ultra 9 275HX, GeForce RTX 5090 Laptop | Aorus Master 18 AM8H Ultra 9 275HX, GeForce RTX 5090 Laptop | Lenovo Legion Pro 7i 16 Gen 10 Ultra 9 275HX, GeForce RTX 5080 Laptop | |
|---|---|---|---|---|---|---|
| Heat | 6% | -7% | 5% | -8% | 3% | |
| Maximum Upper Side * (°C) | 47 | 37.4 20% | 35 26% | 45.6 3% | 50 -6% | 42.6 9% |
| Maximum Bottom * (°C) | 48 | 45 6% | 56 -17% | 46 4% | 46 4% | 41.2 14% |
| Idle Upper Side * (°C) | 29 | 29.8 -3% | 34 -17% | 28.9 -0% | 36 -24% | 32.6 -12% |
| Idle Bottom * (°C) | 33 | 32.4 2% | 39 -18% | 29.2 12% | 35 -6% | 32.4 2% |
* ... menor é melhor
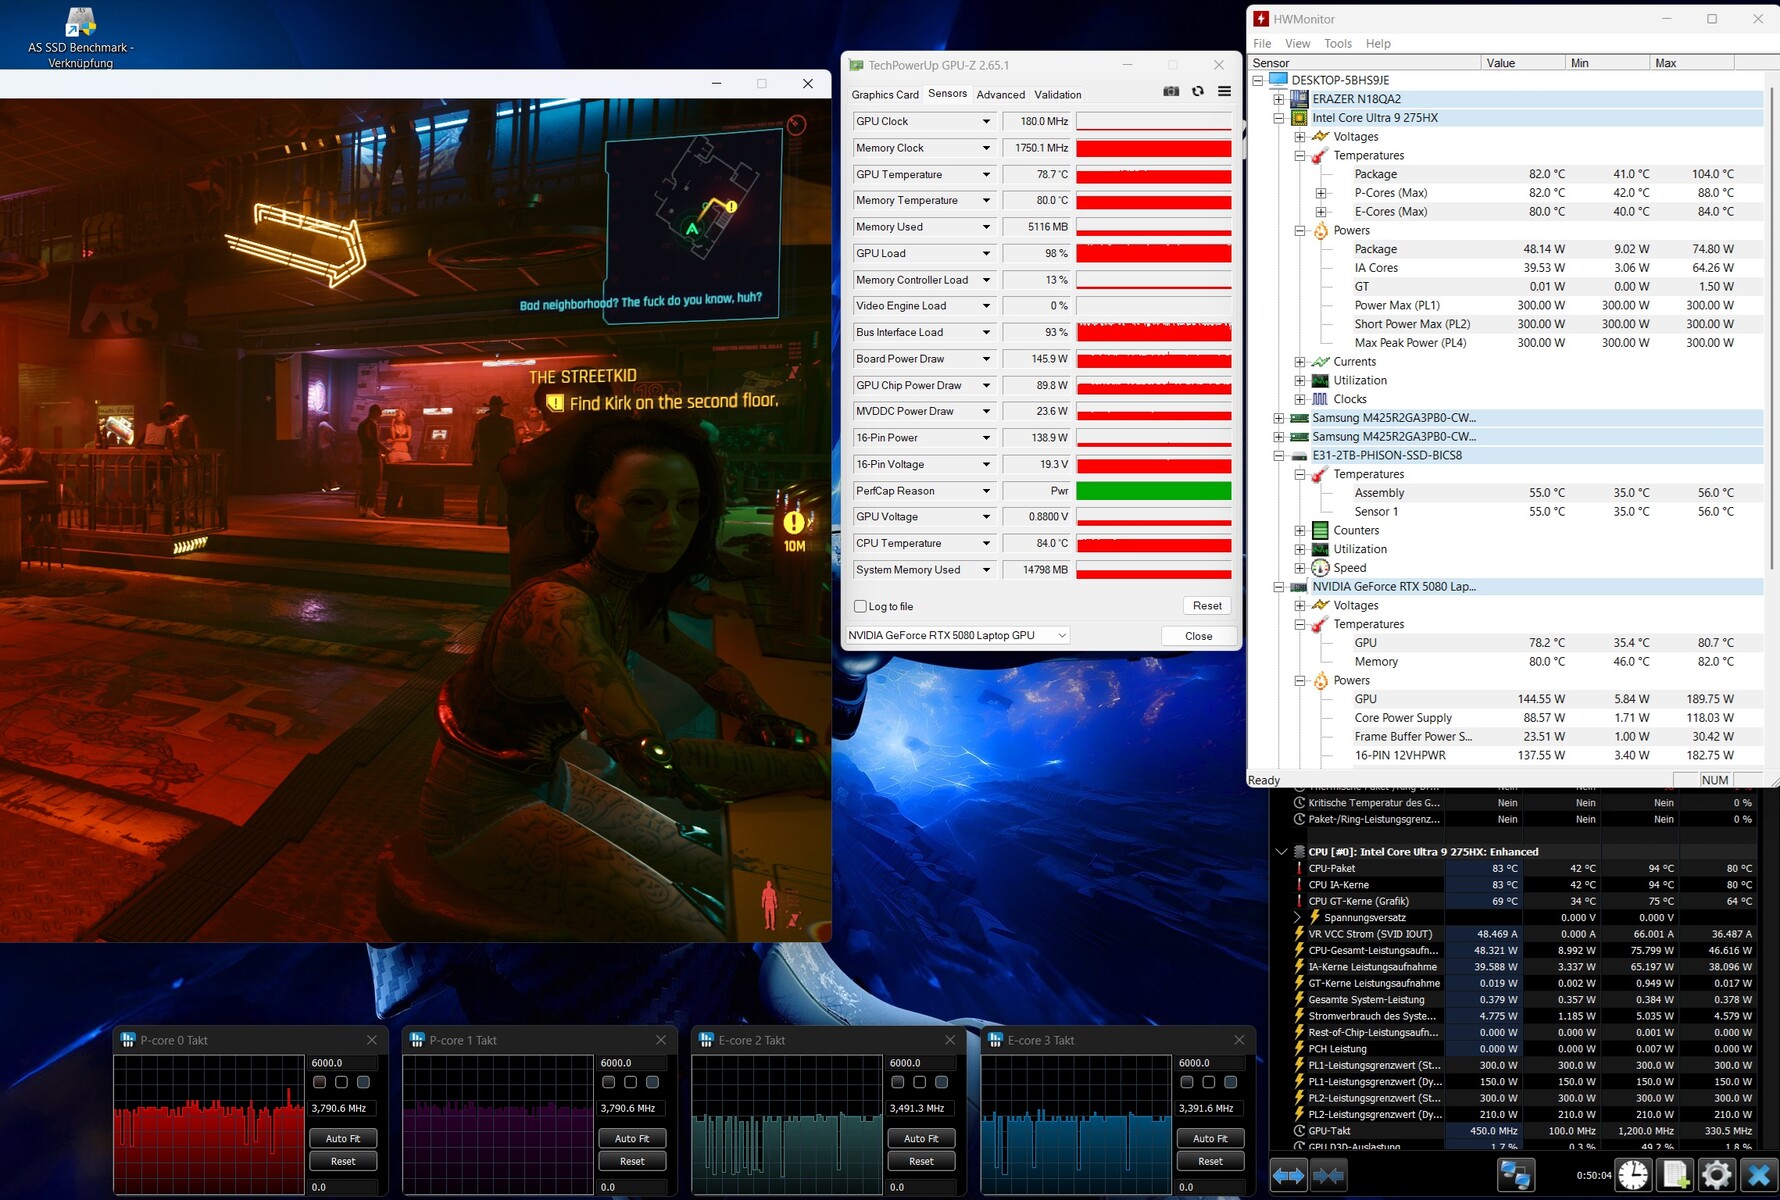
Teste de estresse
Nosso teste de estresse com Furmark e Prime95 não fez com que os componentes suassem muito. Cerca de 80 °C para a CPU e a GPU é aceitável.

Alto-falante
O sistema de som também pode preencher salas maiores com um volume máximo de 89 dB(A). De acordo com a análise de áudio, a qualidade do som está um pouco abaixo da do Aorus Master 18, mas continua relativamente boa para um notebook, apesar das habituais deficiências nos graves.
Medion Erazer Beast 18 X1 MD62731 análise de áudio
(+) | os alto-falantes podem tocar relativamente alto (###valor### dB)
Graves 100 - 315Hz
(-) | quase nenhum baixo - em média 18.6% menor que a mediana
(±) | a linearidade dos graves é média (13% delta para a frequência anterior)
Médios 400 - 2.000 Hz
(+) | médios equilibrados - apenas 2.8% longe da mediana
(+) | médios são lineares (4.5% delta para frequência anterior)
Altos 2 - 16 kHz
(±) | máximos mais altos - em média 5.3% maior que a mediana
(+) | os máximos são lineares (6.4% delta da frequência anterior)
Geral 100 - 16.000 Hz
(+) | o som geral é linear (14.2% diferença em relação à mediana)
Comparado com a mesma classe
» 25% de todos os dispositivos testados nesta classe foram melhores, 7% semelhantes, 68% piores
» O melhor teve um delta de 6%, a média foi 18%, o pior foi 132%
Comparado com todos os dispositivos testados
» 17% de todos os dispositivos testados foram melhores, 4% semelhantes, 79% piores
» O melhor teve um delta de 4%, a média foi 24%, o pior foi 134%
Aorus Master 18 AM8H análise de áudio
(±) | o volume do alto-falante é médio, mas bom (###valor### dB)
Graves 100 - 315Hz
(±) | graves reduzidos - em média 8.7% menor que a mediana
(±) | a linearidade dos graves é média (10.3% delta para a frequência anterior)
Médios 400 - 2.000 Hz
(+) | médios equilibrados - apenas 3% longe da mediana
(+) | médios são lineares (4.3% delta para frequência anterior)
Altos 2 - 16 kHz
(+) | agudos equilibrados - apenas 2.8% longe da mediana
(+) | os máximos são lineares (5.4% delta da frequência anterior)
Geral 100 - 16.000 Hz
(+) | o som geral é linear (11.9% diferença em relação à mediana)
Comparado com a mesma classe
» 12% de todos os dispositivos testados nesta classe foram melhores, 4% semelhantes, 84% piores
» O melhor teve um delta de 6%, a média foi 18%, o pior foi 132%
Comparado com todos os dispositivos testados
» 9% de todos os dispositivos testados foram melhores, 2% semelhantes, 89% piores
» O melhor teve um delta de 4%, a média foi 24%, o pior foi 134%
Gerenciamento de energia
Consumo de energia
No modo inativo, o consumo de energia flutua de forma semelhante ao nível de ruído. Idealmente, ele é de apenas 7,9 a 16,6 watts, o que é melhor do que todos os dispositivos de comparação (a dGPU é ativada automaticamente quando um monitor externo é conectado). No modo 3D, o consumo de energia é de até 330 watts, e a fonte de alimentação fornecida também é especificada em 330 watts.
| desligado | |
| Ocioso | |
| Carga |
|
Key:
min: | |
| Medion Erazer Beast 18 X1 MD62731 Ultra 9 275HX, GeForce RTX 5080 Laptop | MSI GE78HX 13VH-070US i9-13950HX, GeForce RTX 4080 Laptop GPU | Acer Predator Helios 18 N23Q2 i9-13900HX, GeForce RTX 4080 Laptop GPU | Asus Strix Scar 18 G835LX Ultra 9 275HX, GeForce RTX 5090 Laptop | Aorus Master 18 AM8H Ultra 9 275HX, GeForce RTX 5090 Laptop | Lenovo Legion Pro 7i 16 Gen 10 Ultra 9 275HX, GeForce RTX 5080 Laptop | Média da turma Gaming | |
|---|---|---|---|---|---|---|---|
| Power Consumption | -60% | -38% | -75% | -97% | -107% | -27% | |
| Idle Minimum * (Watt) | 7.9 | 16.1 -104% | 16 -103% | 11.4 -44% | 29 -267% | 28.5 -261% | 13.1 ? -66% |
| Idle Average * (Watt) | 11.5 | 24 -109% | 19 -65% | 39.2 -241% | 33 -187% | 38.8 -237% | 18.7 ? -63% |
| Idle Maximum * (Watt) | 16.6 | 34 -105% | 21.3 -28% | 40.2 -142% | 48 -189% | 45.6 -175% | 24.4 ? -47% |
| Load Average * (Watt) | 130 | 123.6 5% | 124 5% | 161.2 -24% | 141 -8% | 132.2 -2% | 108.1 ? 17% |
| Cyberpunk 2077 ultra * (Watt) | 253 | 303 -20% | 283 -12% | 318 -26% | |||
| Cyberpunk 2077 ultra external monitor * (Watt) | 245 | 295 -20% | 283 -16% | 319 -30% | |||
| Load Maximum * (Watt) | 330 | 285.7 13% | 319 3% | 430.9 -31% | 340 -3% | 384 -16% | 254 ? 23% |
| Witcher 3 ultra * (Watt) | 286 | 289 |
* ... menor é melhor
Power consumption Cyberpunk / Stress test
Power consumption with external monitor
Duração da bateria
Graças ao seu consumo moderado de energia durante o modo inativo, o Erazer Beast 18 X1 oferece a maior duração da bateria entre os dispositivos testados. Aproximadamente 8 horas de navegação na Internet com o brilho definido para 150 cd/m² é um número mais do que respeitável.
| Medion Erazer Beast 18 X1 MD62731 Ultra 9 275HX, GeForce RTX 5080 Laptop, 99 Wh | MSI GE78HX 13VH-070US i9-13950HX, GeForce RTX 4080 Laptop GPU, 99 Wh | Acer Predator Helios 18 N23Q2 i9-13900HX, GeForce RTX 4080 Laptop GPU, 90 Wh | Asus Strix Scar 18 G835LX Ultra 9 275HX, GeForce RTX 5090 Laptop, 90 Wh | Aorus Master 18 AM8H Ultra 9 275HX, GeForce RTX 5090 Laptop, 99 Wh | Lenovo Legion Pro 7i 16 Gen 10 Ultra 9 275HX, GeForce RTX 5080 Laptop, 99 Wh | Média da turma Gaming | |
|---|---|---|---|---|---|---|---|
| Duração da bateria | -23% | -44% | -30% | -38% | -32% | -11% | |
| WiFi v1.3 (h) | 7.9 | 6.1 -23% | 4.4 -44% | 5.5 -30% | 4.9 -38% | 5.4 -32% | 7.04 ? -11% |
| Reader / Idle (h) | 7.3 | 5.8 | 8.71 ? | ||||
| Load (h) | 1.5 | 1.7 | 1.2 | 1.9 | 0.8 | 1.47 ? | |
| H.264 (h) | 4.8 | 5.8 | 8.26 ? | ||||
| Cyberpunk 2077 ultra 150cd (h) | 0.7 |
Avaliação geral do Notebookcheck
O Medion Erazer Beast 18 X1 se destaca da concorrência de 18 polegadas com sua respeitável duração da bateria, mas tende a ser mais barulhento sob carga (no mesmo modo de desempenho) do que seus equivalentes.
Medion Erazer Beast 18 X1 MD62731
- 05/21/2025 v8
Florian Glaser
 Total Sustainability Score:
 Comparação de alternativas possíveis
Imagem | Modelo / Análises | Preço | Peso | Altura | Tela |
|---|---|---|---|---|---|
1. 82.5%  | Medion Erazer Beast 18 X1 MD62731 Intel Core Ultra 9 275HX ⎘ NVIDIA GeForce RTX 5080 Laptop ⎘ 32 GB Memória, SSD | Amazon: Preço de tabela: 3700 EUR | 3.6 kg | 30.4 mm | 18.00" 2560x1600 168 PPI IPS |
2. 88.3% v7 (old)  | MSI GE78HX 13VH-070US Intel Core i9-13950HX ⎘ NVIDIA GeForce RTX 4080 Laptop GPU ⎘ 32 GB Memória, 2048 GB SSD | Amazon: 1. $136.99 LCDOLED Compatible with MSI ... 2. $127.77 17.3" 240Hz Screen Replaceme... 3. $52.99 Replacement Backlit Keyboard... Preço de tabela: 3600 USD | 3 kg | 23 mm | 17.00" 2560x1600 178 PPI IPS |
3. 88.3% v7 (old) 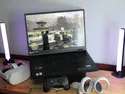 | Acer Predator Helios 18 N23Q2 Intel Core i9-13900HX ⎘ NVIDIA GeForce RTX 4080 Laptop GPU ⎘ 32 GB Memória, 2048 GB SSD | Amazon: 1. $2,770.36 Acer Predator Helios Neo 18 ... 2. $165.98 New KrystalPix LCD Display F... 3. $1,999.99 Acer Predator Helios Neo 18 ... Preço de tabela: 3699 Euro | 3.2 kg | 29.15 mm | 18.00" 2560x1600 168 PPI IPS |
4. 88%  | Asus Strix Scar 18 G835LX Intel Core Ultra 9 275HX ⎘ NVIDIA GeForce RTX 5090 Laptop ⎘ 64 GB Memória, 2048 GB SSD | Amazon: Preço de tabela: 5799€ | 3.3 kg | 32 mm | 18.00" 2560x1600 168 PPI Mini-LED |
5. 86.8%  | Aorus Master 18 AM8H Intel Core Ultra 9 275HX ⎘ NVIDIA GeForce RTX 5090 Laptop ⎘ 64 GB Memória, 2048 GB SSD | Amazon: Preço de tabela: 5000 EUR | 3.4 kg | 31 mm | 18.00" 2560x1600 168 PPI Mini-LED |
6. 87.5%  | Lenovo Legion Pro 7i 16 Gen 10 Intel Core Ultra 9 275HX ⎘ NVIDIA GeForce RTX 5080 Laptop ⎘ 32 GB Memória, 1024 GB SSD | Amazon: Preço de tabela: 4200 USD | 2.6 kg | 26.65 mm | 16.00" 2560x1600 189 PPI OLED |
Transparência
A seleção dos dispositivos a serem analisados é feita pela nossa equipe editorial. A amostra de teste foi fornecida ao autor como empréstimo pelo fabricante ou varejista para fins desta revisão. O credor não teve influência nesta revisão, nem o fabricante recebeu uma cópia desta revisão antes da publicação. Não houve obrigação de publicar esta revisão. Como empresa de mídia independente, a Notebookcheck não está sujeita à autoridade de fabricantes, varejistas ou editores.
É assim que o Notebookcheck está testando
Todos os anos, o Notebookcheck analisa de forma independente centenas de laptops e smartphones usando procedimentos padronizados para garantir que todos os resultados sejam comparáveis. Desenvolvemos continuamente nossos métodos de teste há cerca de 20 anos e definimos padrões da indústria no processo. Em nossos laboratórios de teste, equipamentos de medição de alta qualidade são utilizados por técnicos e editores experientes. Esses testes envolvem um processo de validação em vários estágios. Nosso complexo sistema de classificação é baseado em centenas de medições e benchmarks bem fundamentados, o que mantém a objetividade.