Análise do Medion Erazer Beast X40 (2024): Laptop para jogos de alto nível com RTX 4090 e teclado mecânico

O Medion Beast X40 é um dos laptops mais potentes disponíveis atualmente. O Intel Raptor Lake, a Nvidia Ada Lovelace, 2 TB de espaço de armazenamento e 32 GB de RAM se somam muito bem para equipar o laptop para streaming, renderização e jogos, ao mesmo tempo em que custa uma bomba, cerca de 4.000 euros.
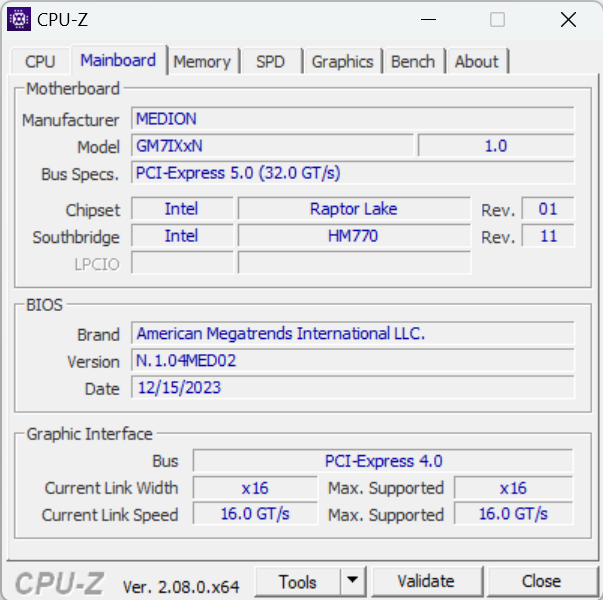
Como foi o caso de seu antecessorum chassi barebone (GM7IX9N) da Tongfang serve de base para a construção do Beast X40. A concorrência inclui laptops para jogos, como o Asus ROG Strix Scar 17 G733PYVe o Schenker Key 17 Pro (Early 23)e o MSI Titan 18 HX A14VIG.
Possíveis concorrentes em comparação
Avaliação | Data | Modelo | Peso | Altura | Size | Resolução | Preço |
|---|---|---|---|---|---|---|---|
| 89.2 % v7 (old) | 02/2024 | Medion Erazer Beast X40 2024 i9-14900HX, GeForce RTX 4090 Laptop GPU | 2.9 kg | 36 mm | 17.00" | 2560x1600 | |
| 87.2 % v7 (old) | 08/2023 | Asus ROG Strix Scar 17 G733PYV-LL053X R9 7945HX3D, GeForce RTX 4090 Laptop GPU | 2.9 kg | 28.3 mm | 17.30" | 2560x1440 | |
| 85.5 % v7 (old) | 06/2023 | Schenker Key 17 Pro (Early 23) i9-13900HX, GeForce RTX 4090 Laptop GPU | 3.4 kg | 24.9 mm | 17.30" | 3840x2160 | |
| 88.3 % v7 (old) | 02/2024 | Asus ROG Strix Scar 18 G834JYR (2024) i9-14900HX, GeForce RTX 4090 Laptop GPU | 3.1 kg | 30.8 mm | 18.00" | 2560x1600 | |
| 88.8 % v7 (old) | 01/2024 | MSI Titan 18 HX A14VIG i9-14900HX, GeForce RTX 4090 Laptop GPU | 3.6 kg | 32.1 mm | 18.00" | 3840x2400 |
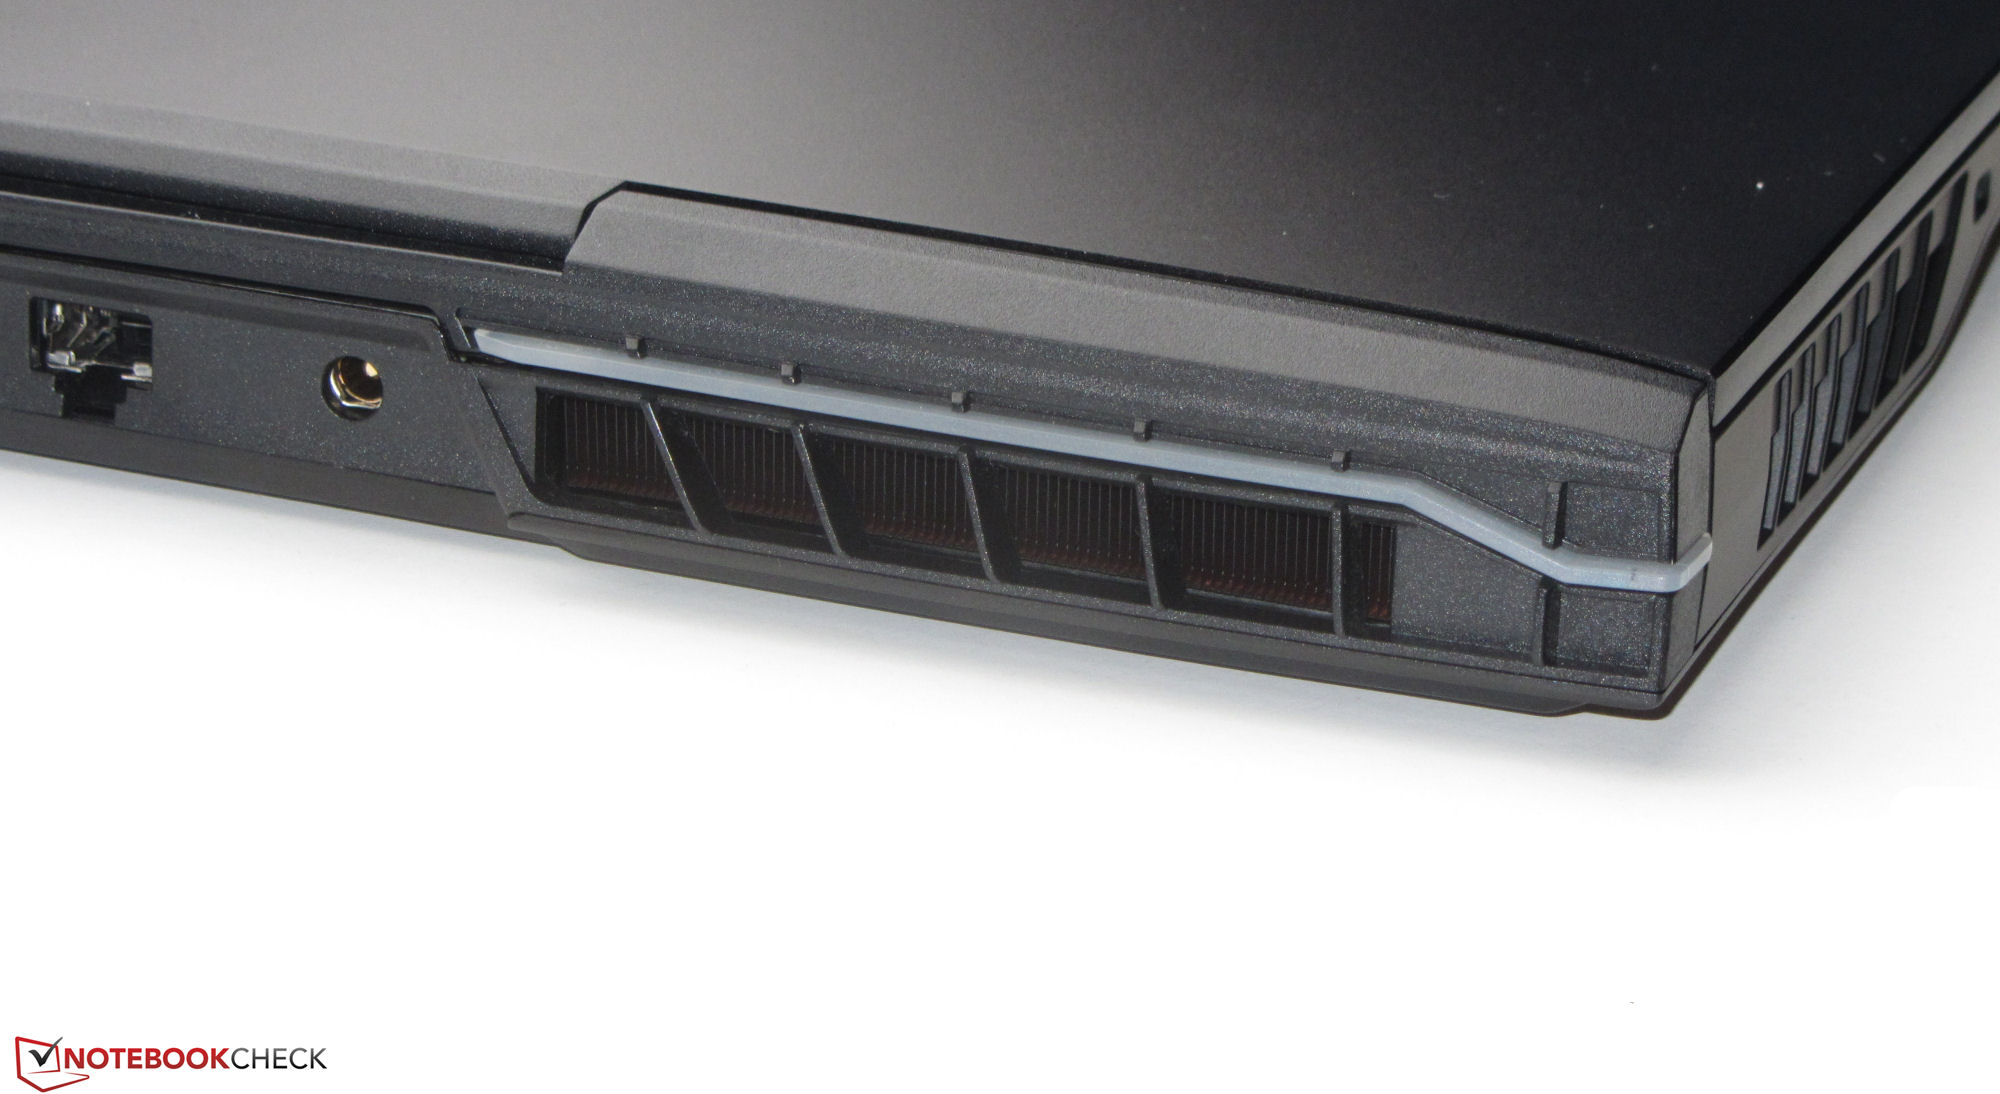
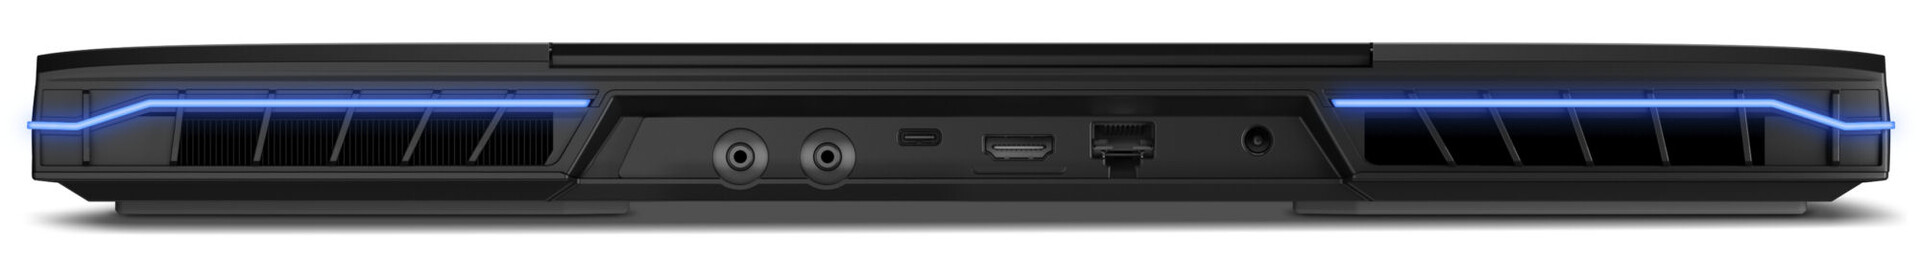
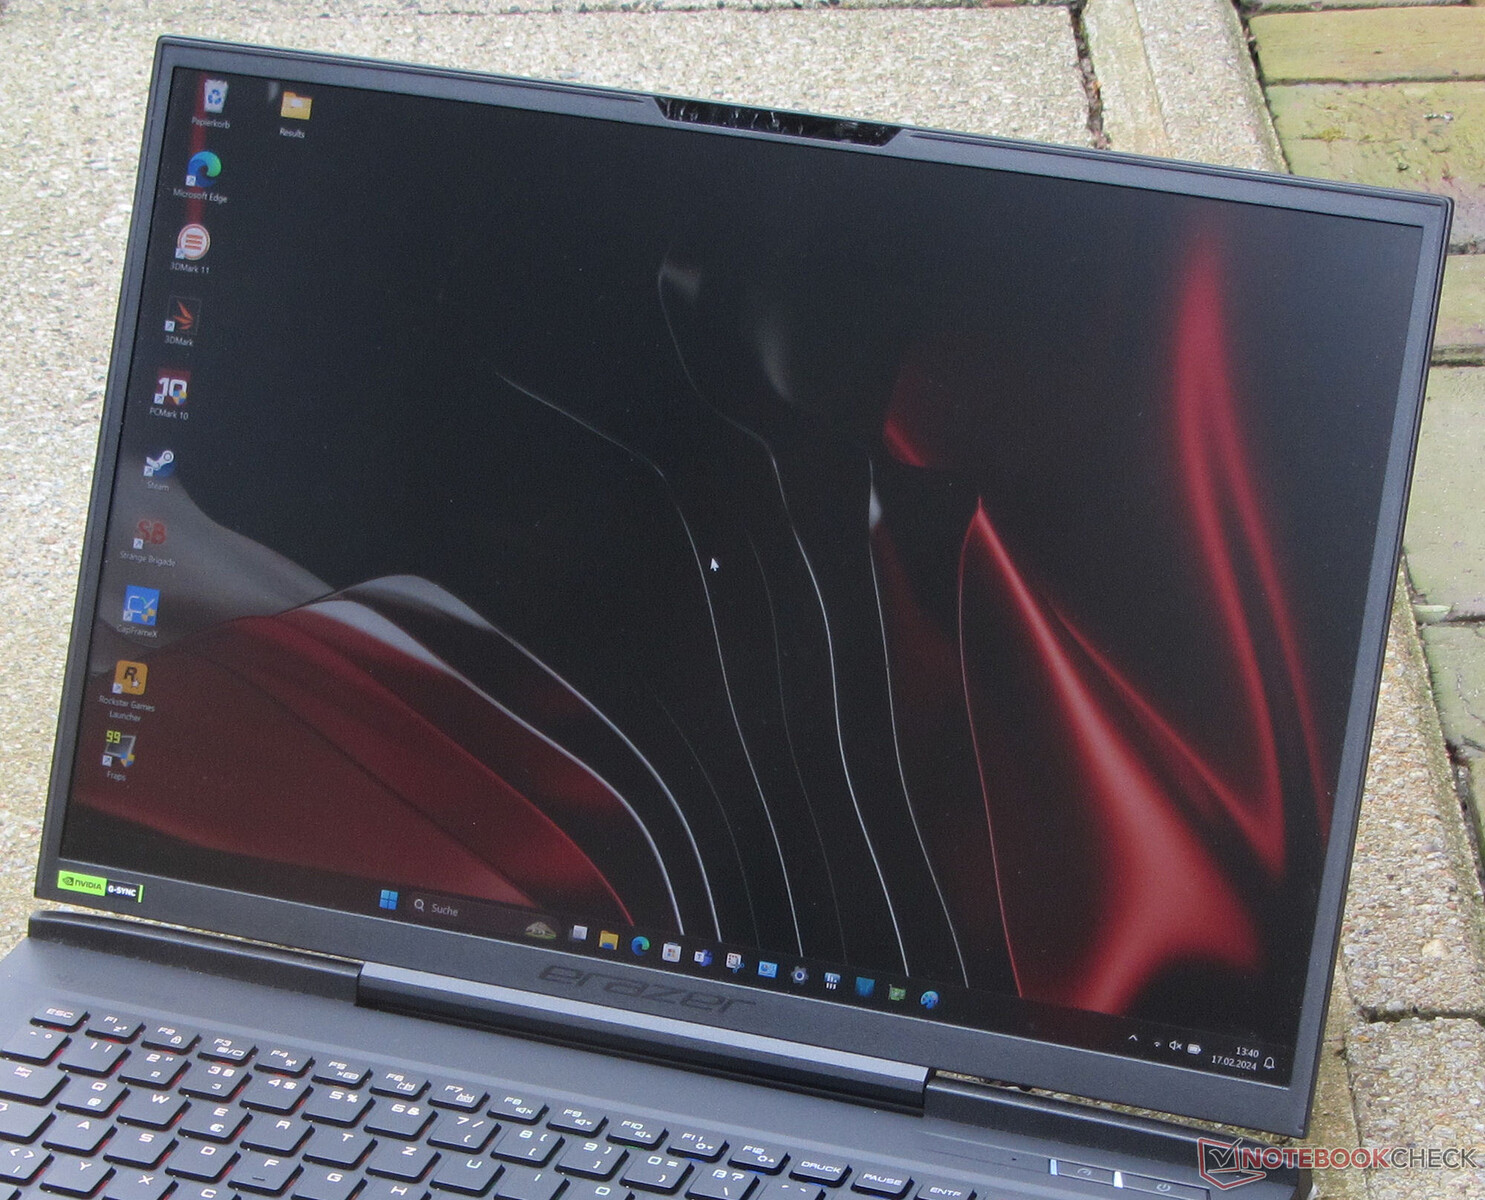
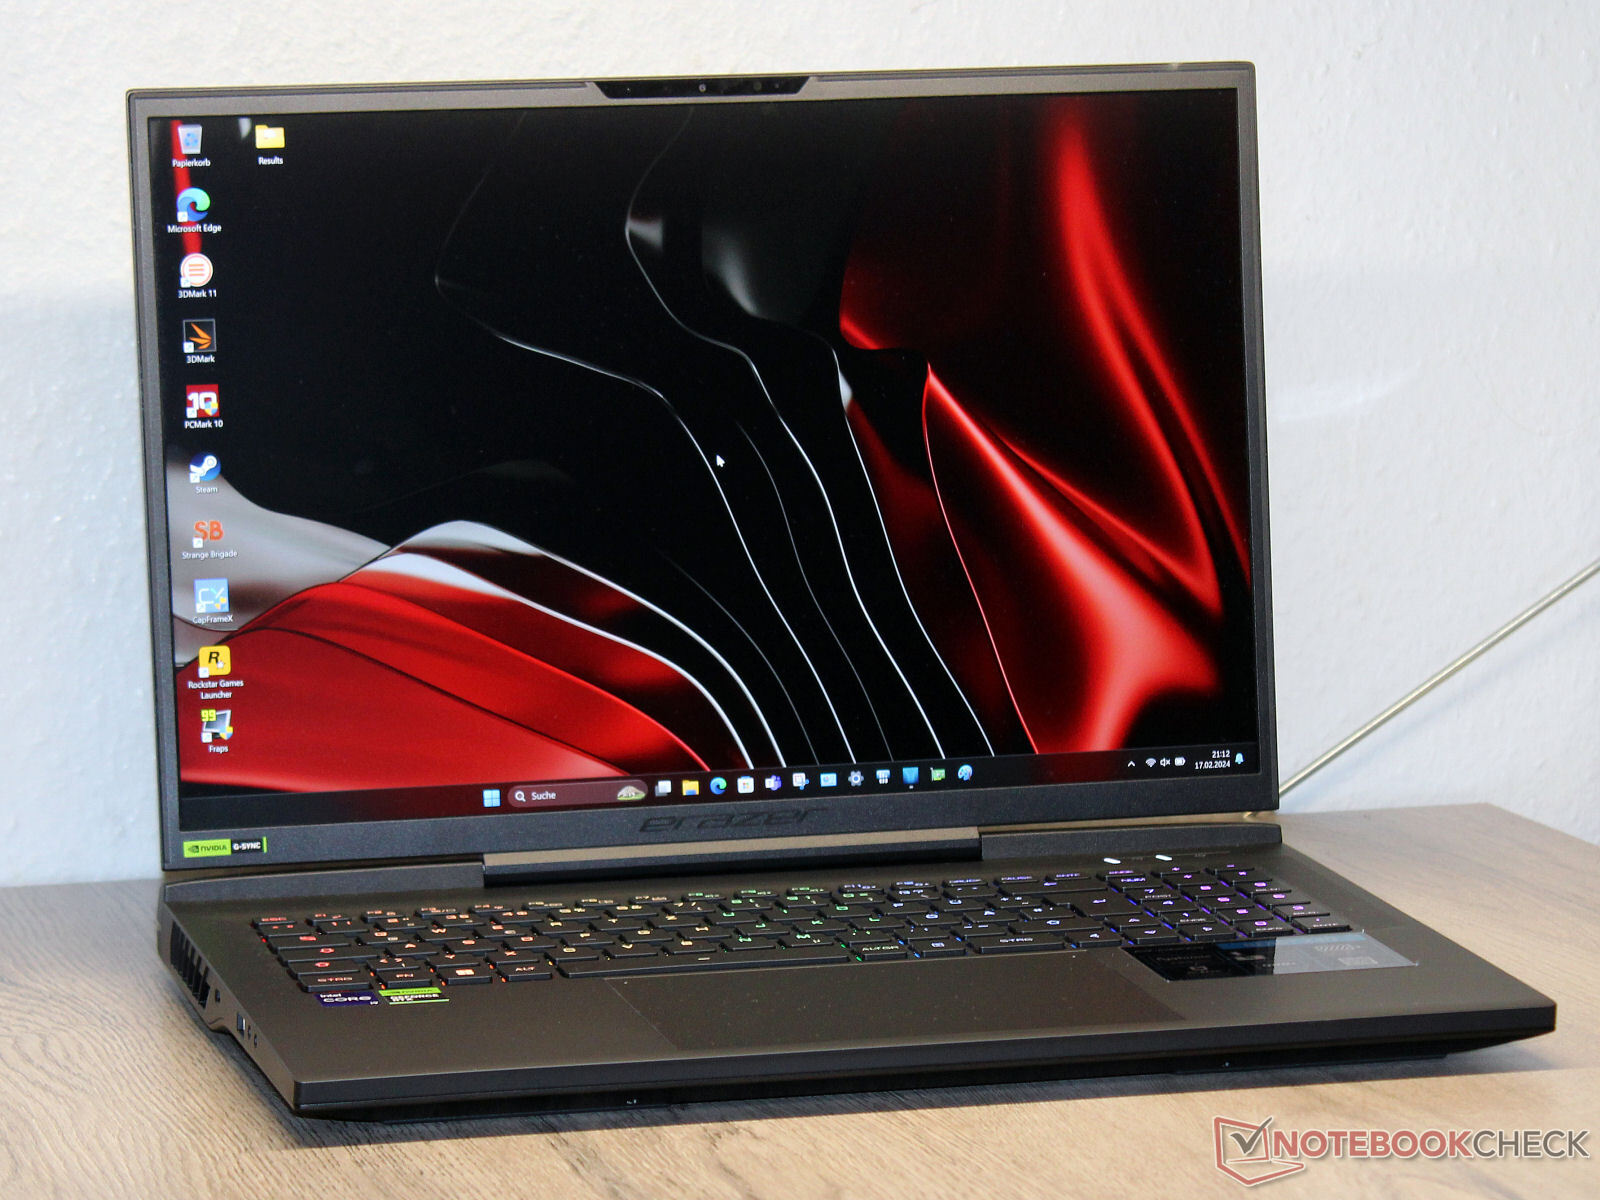
Chassi e recursos: O Beast X40 oferece Thunderbolt 4
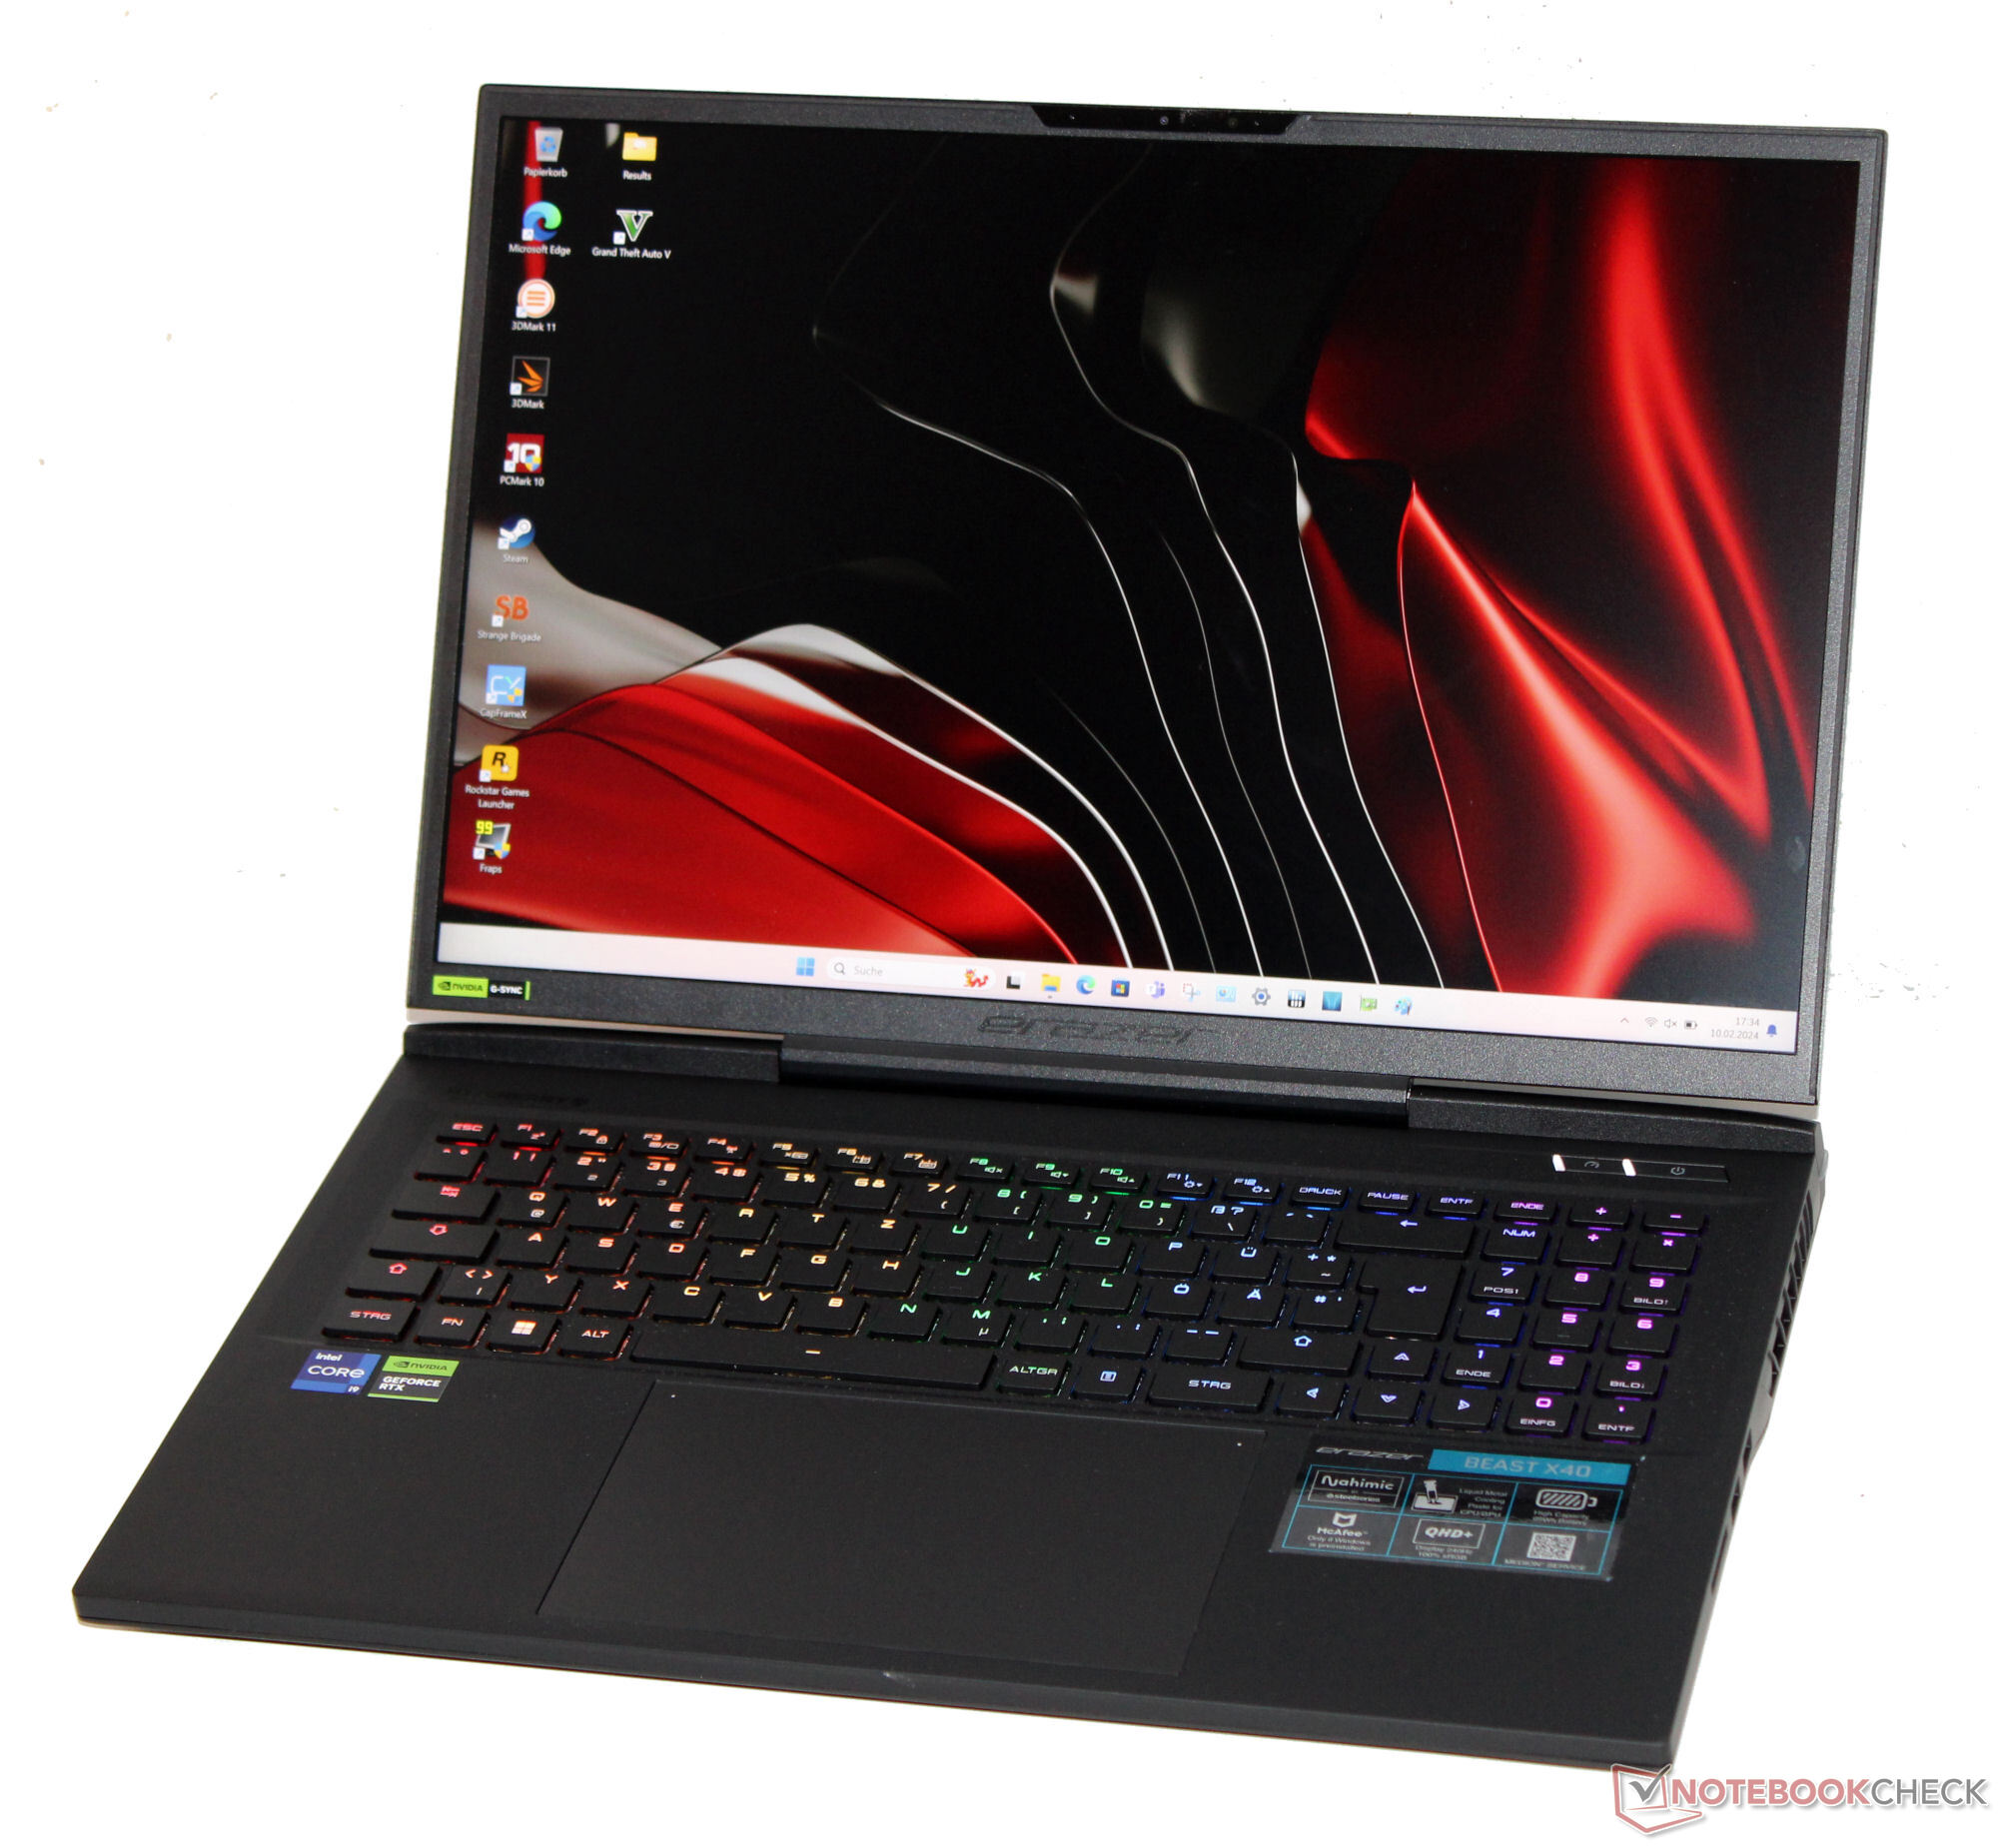
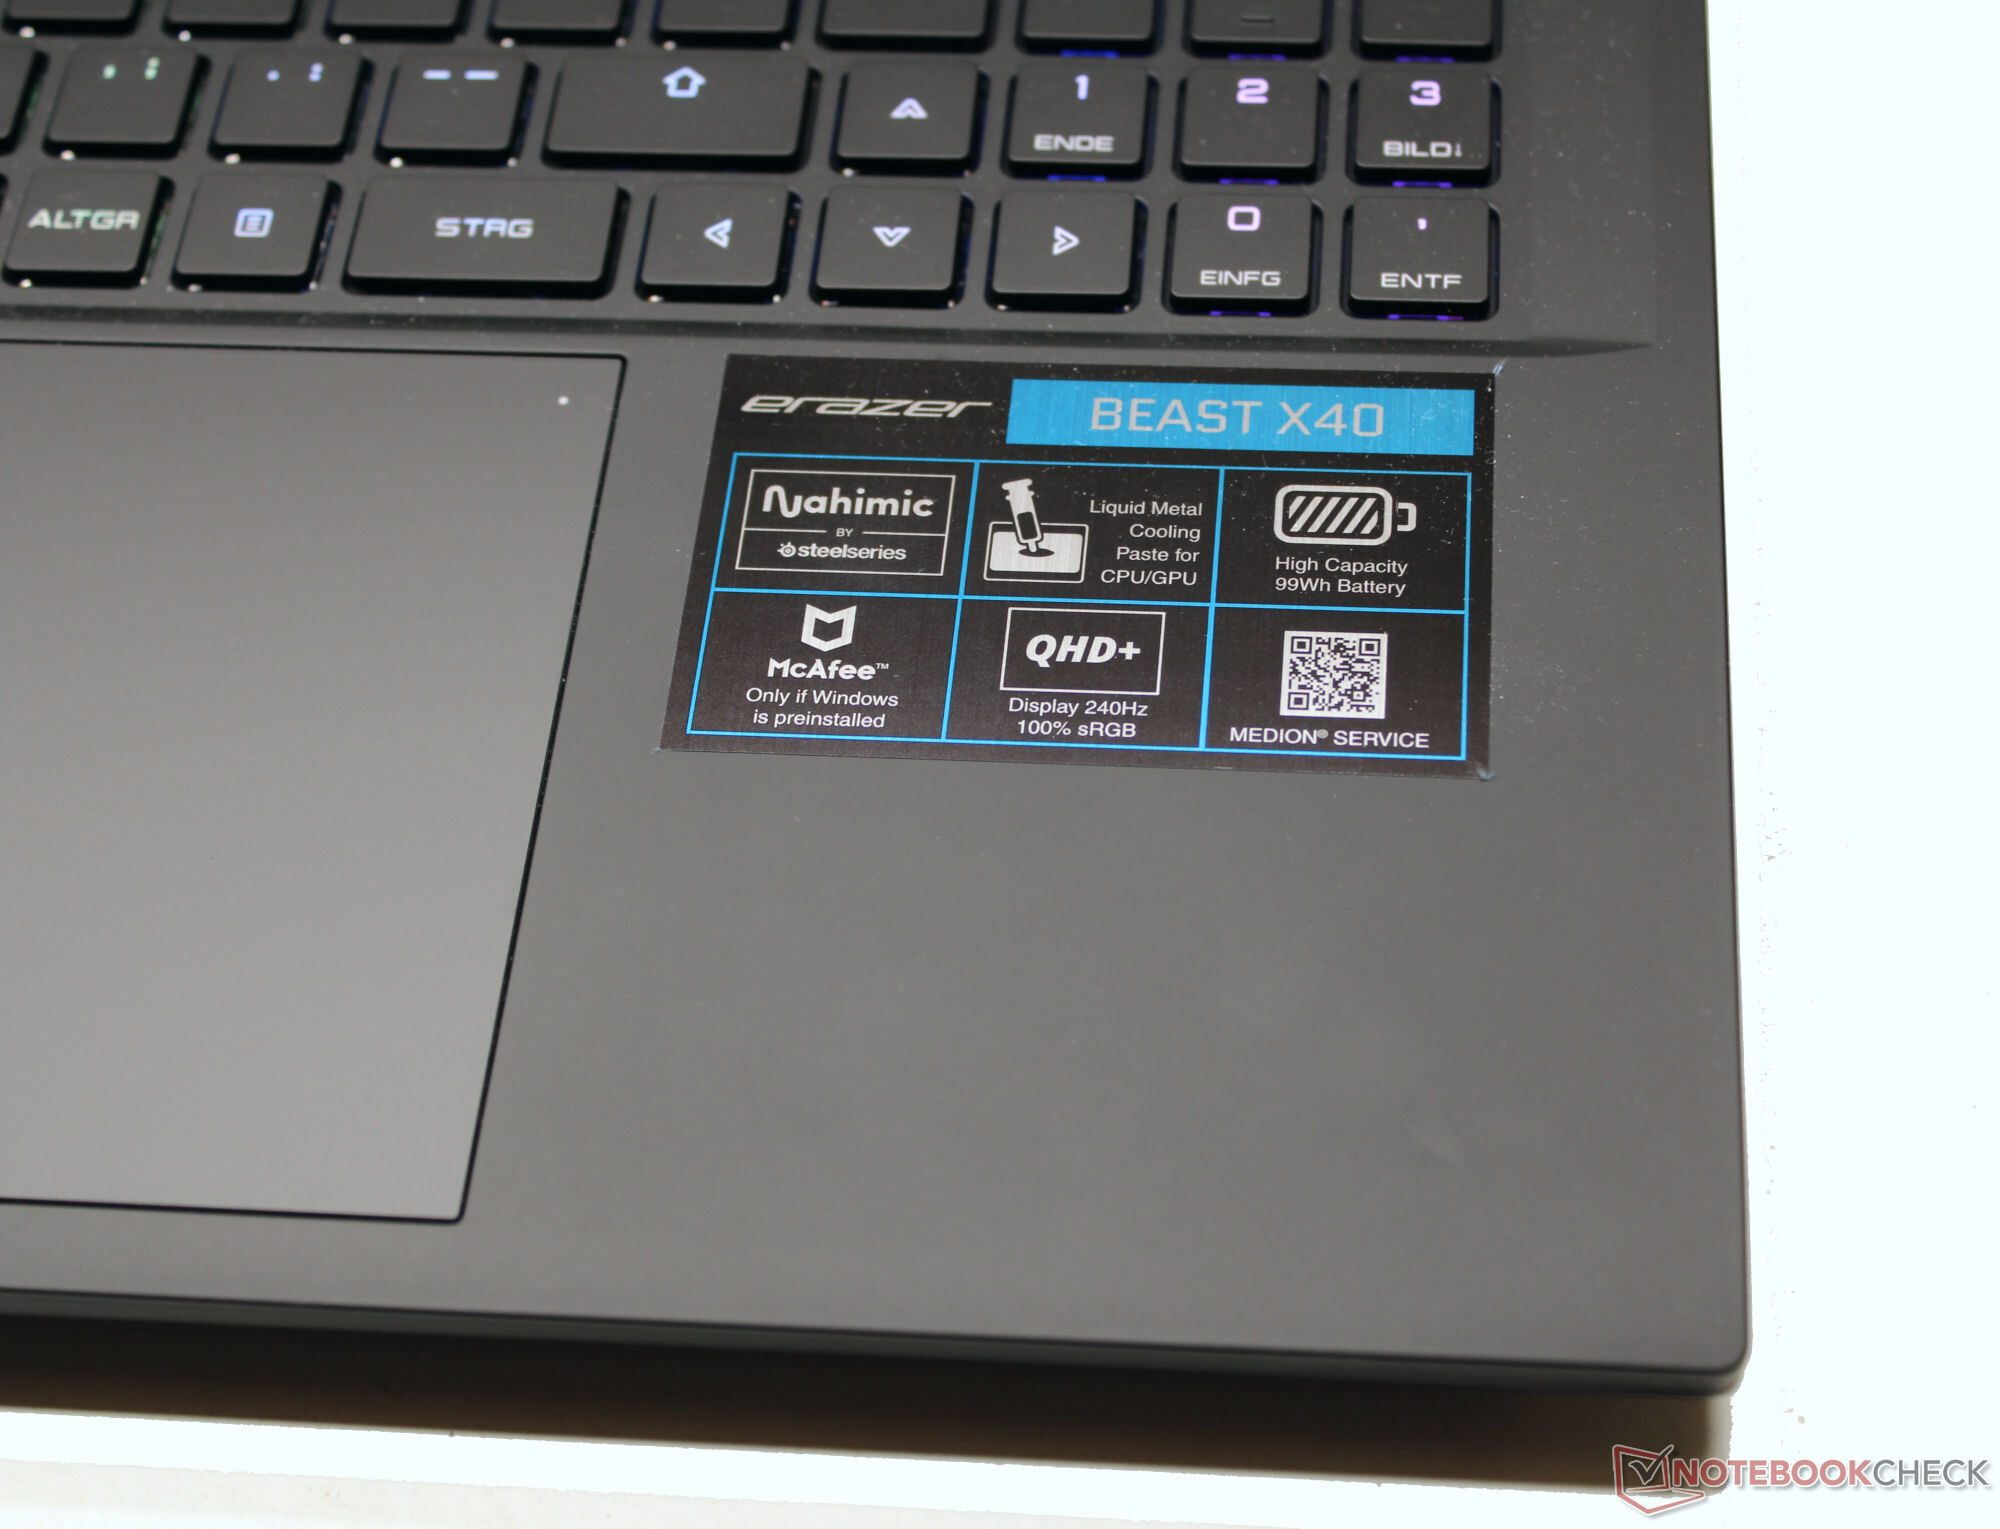
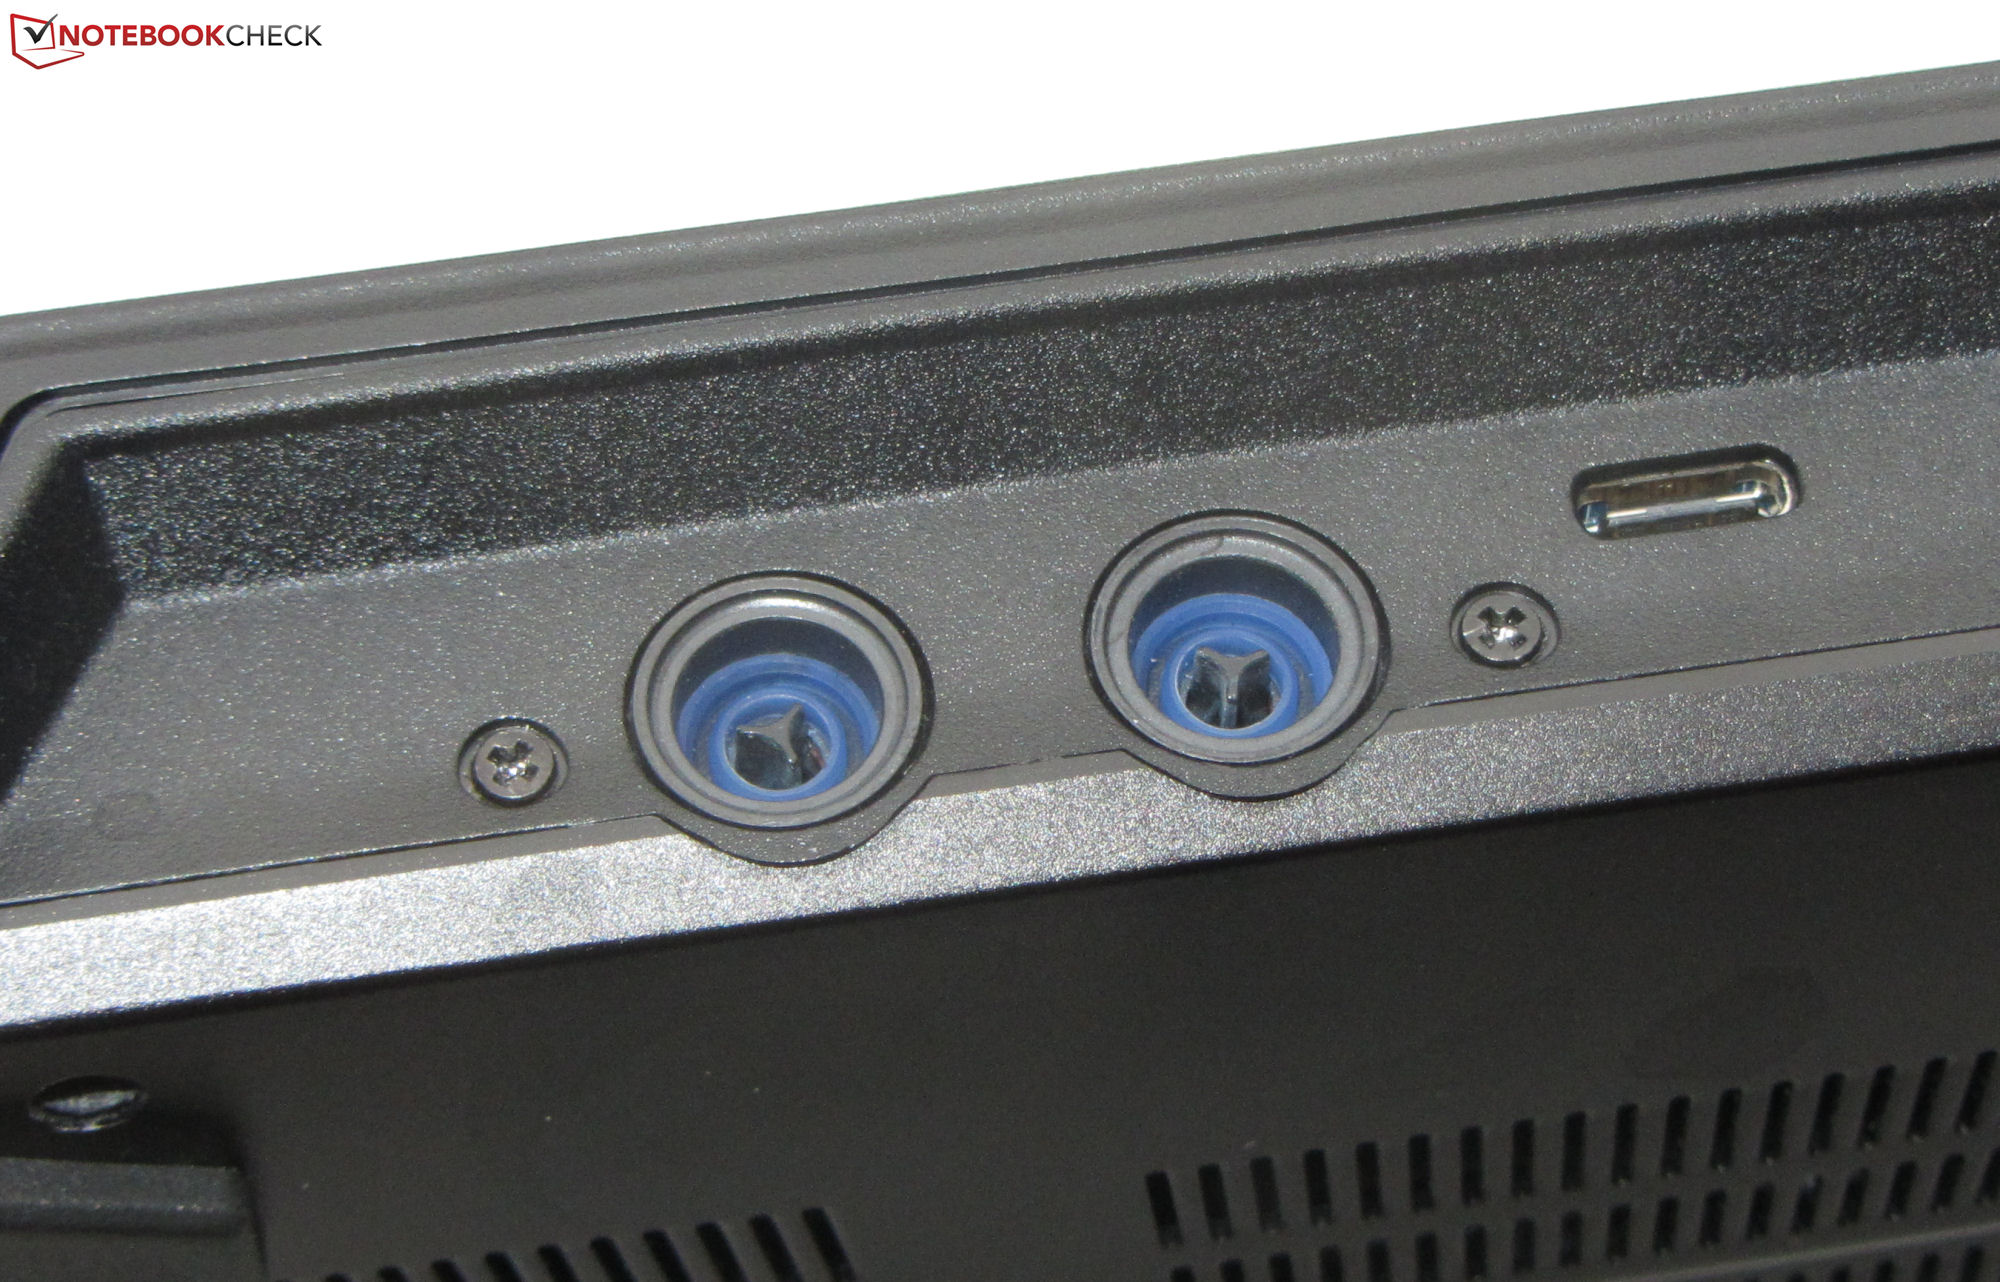
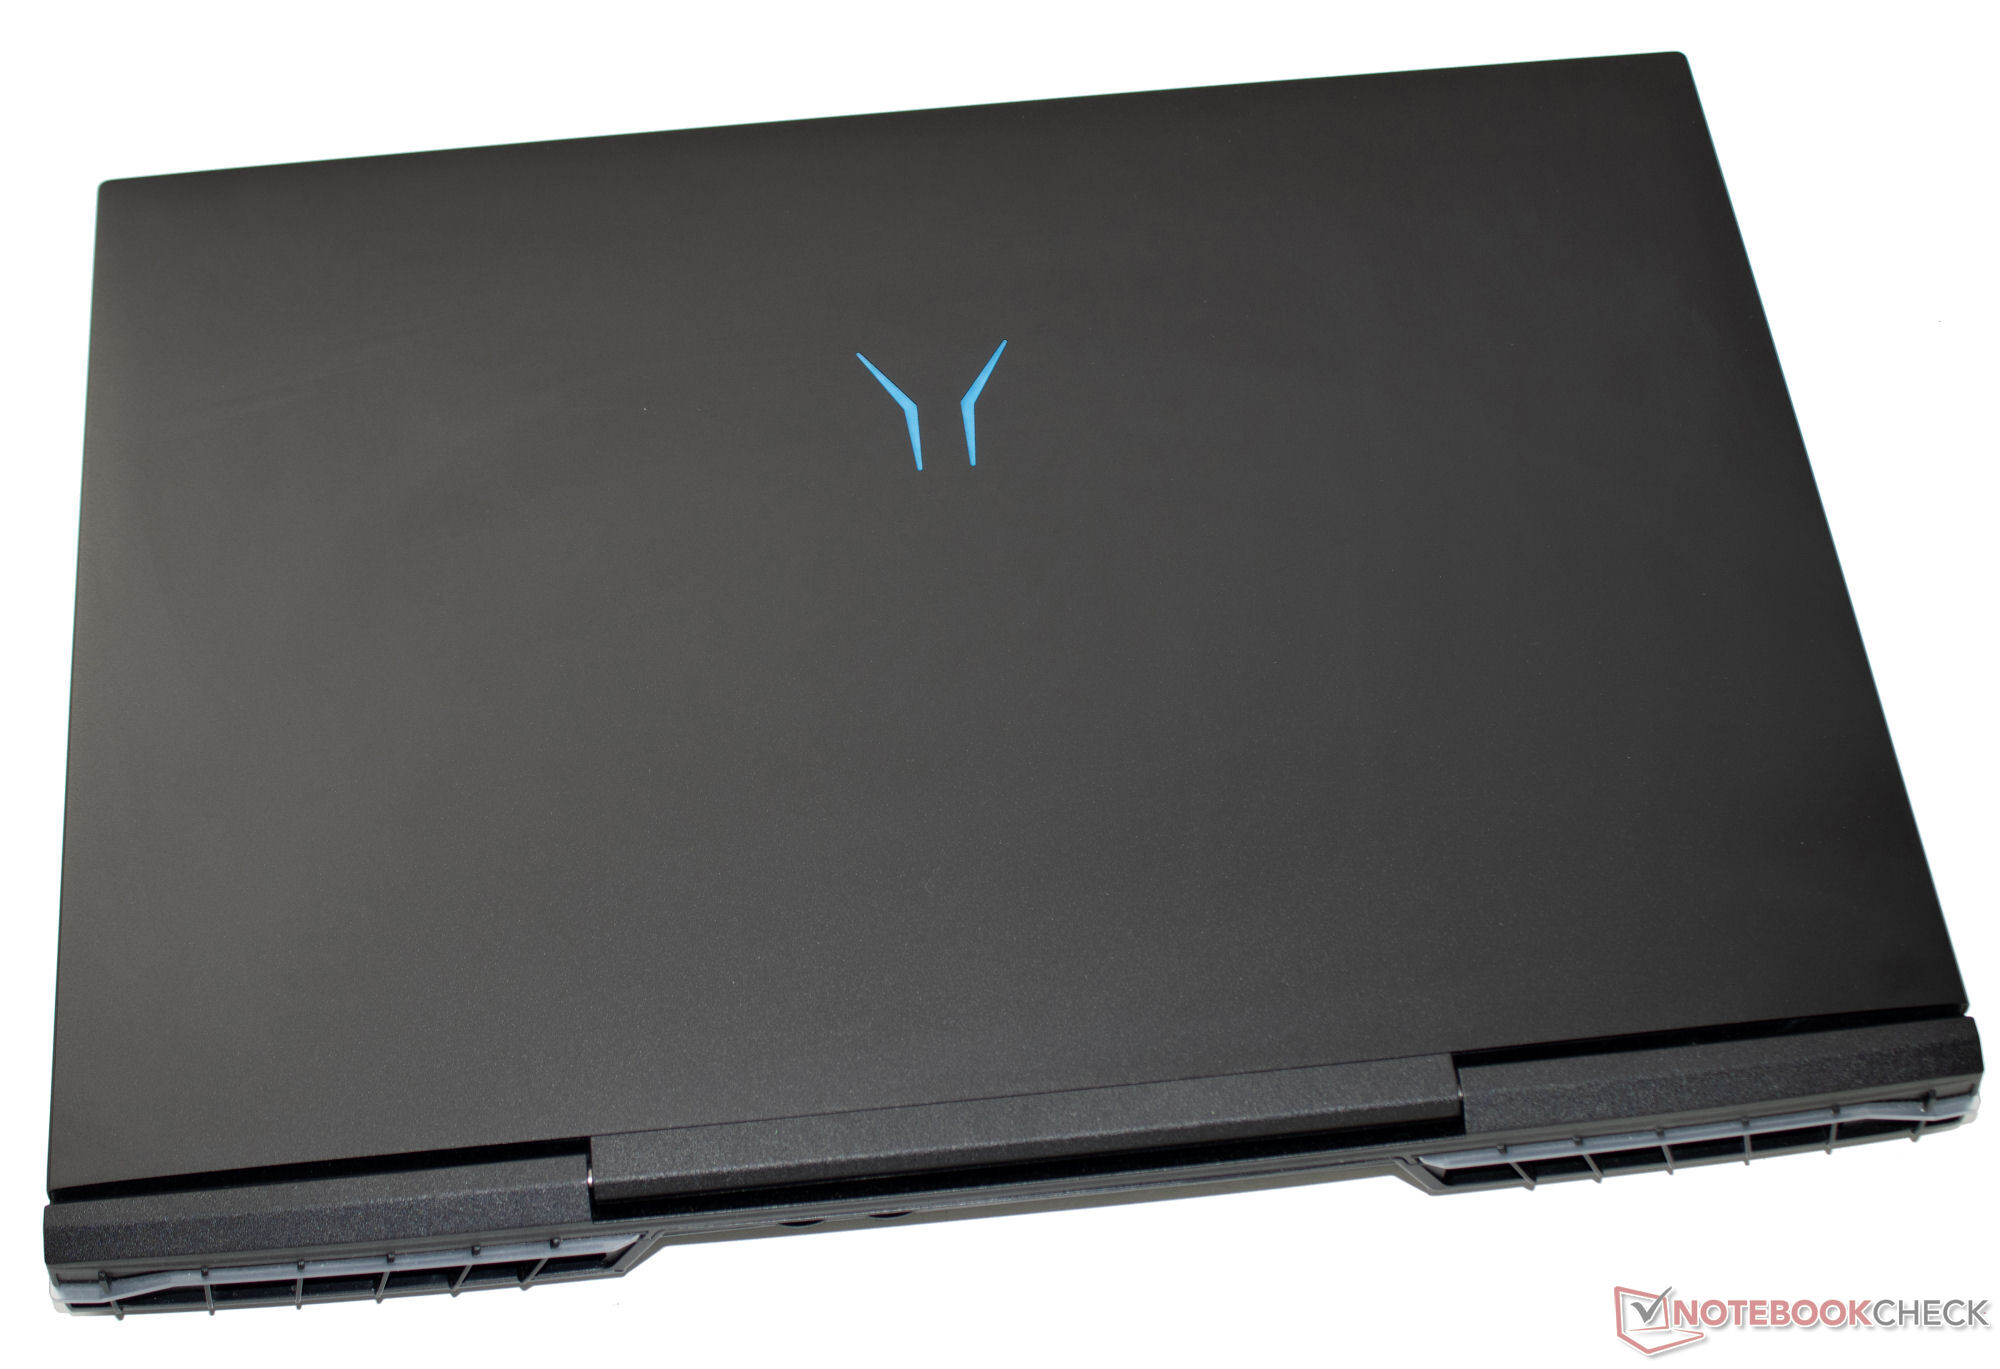
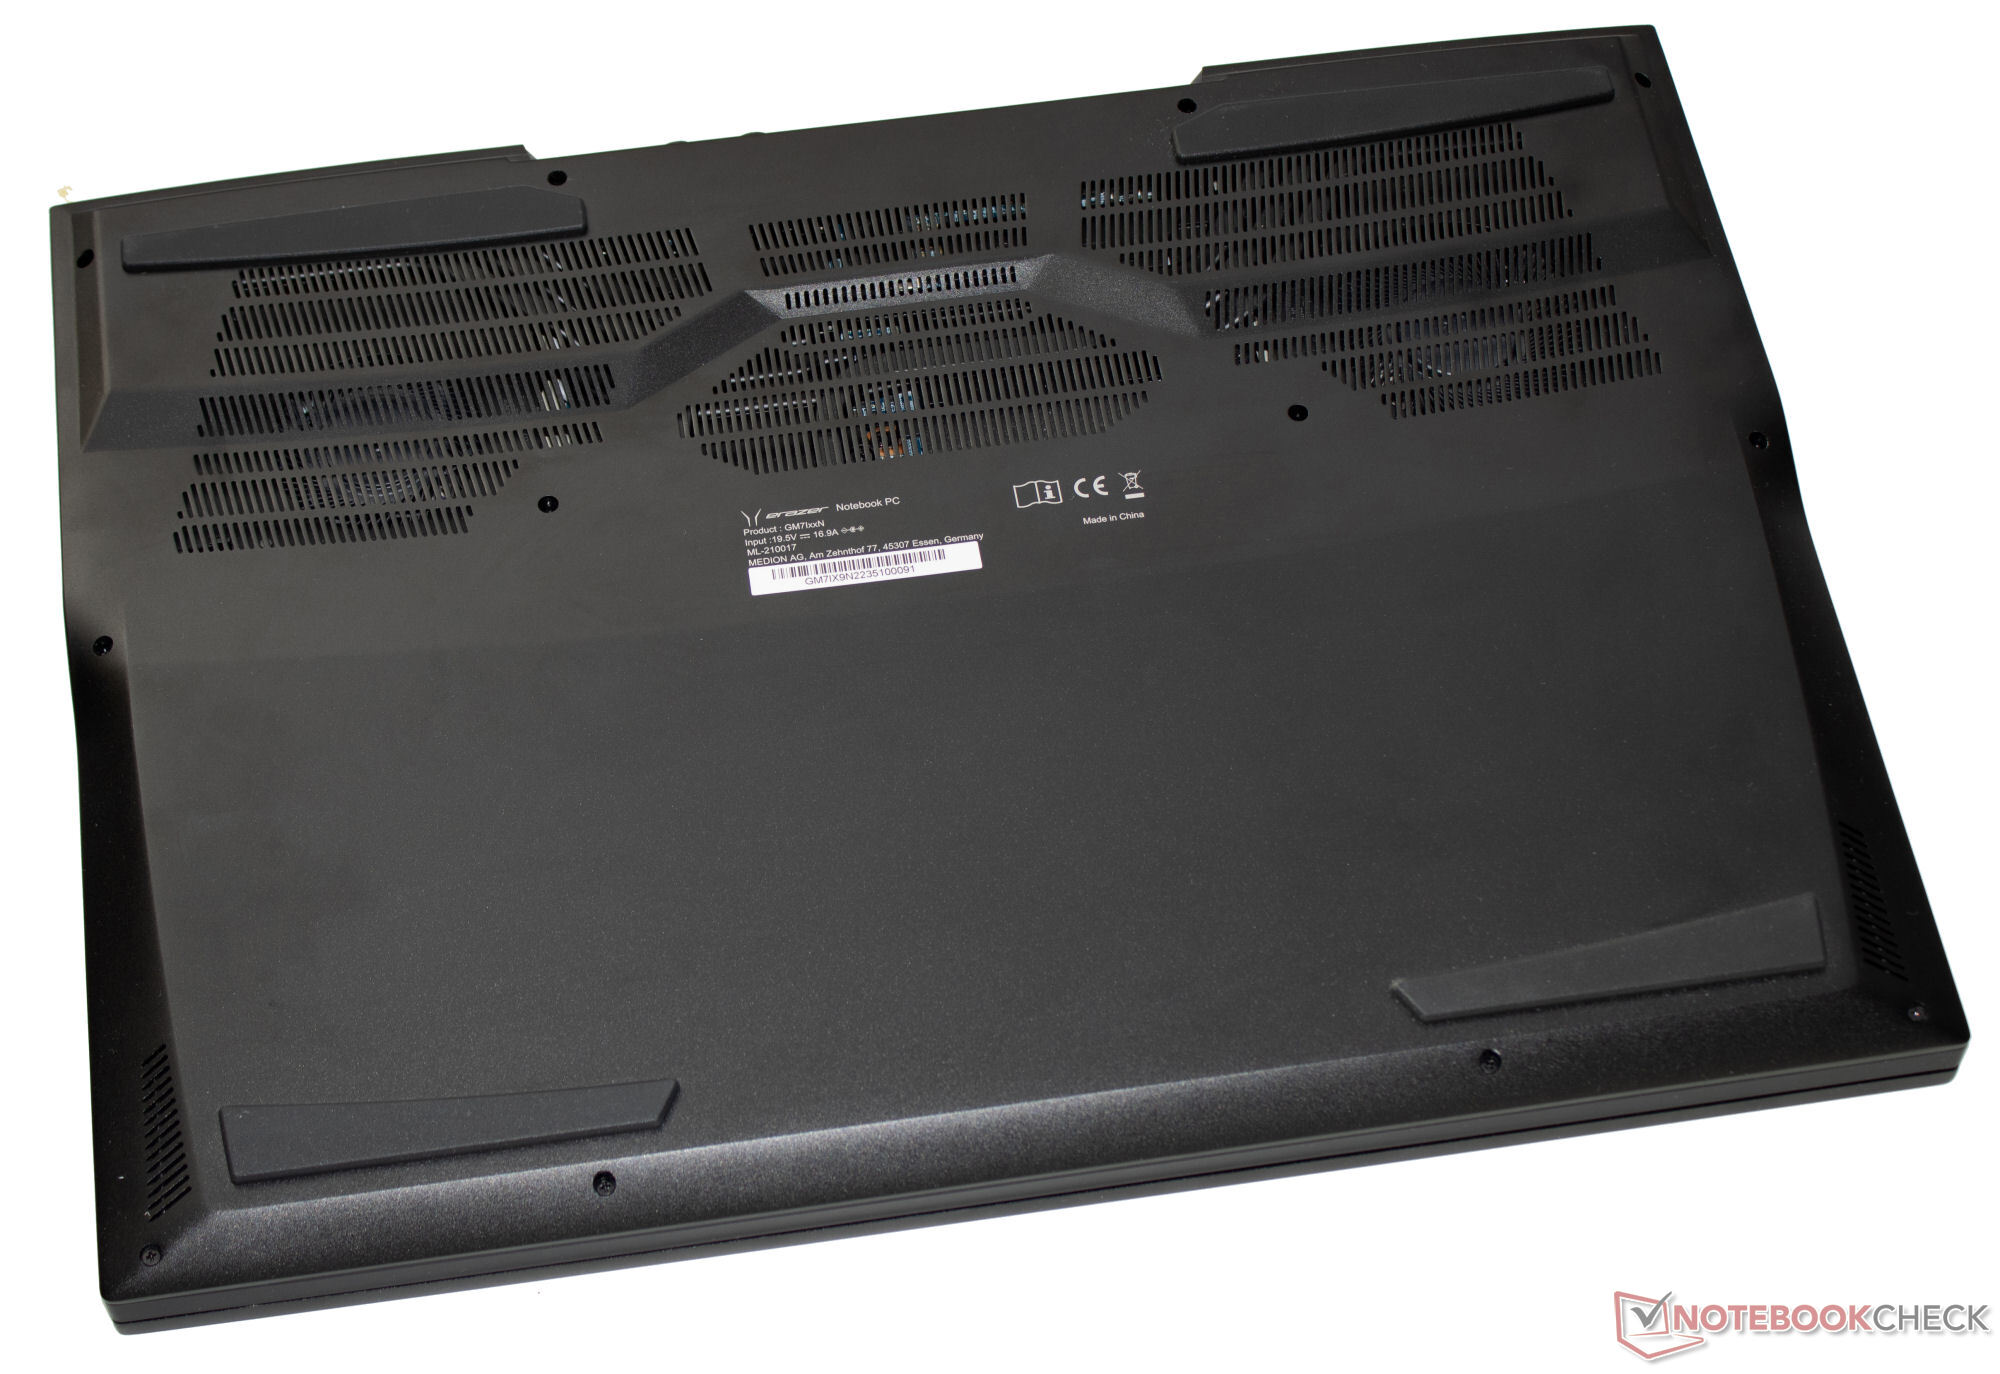
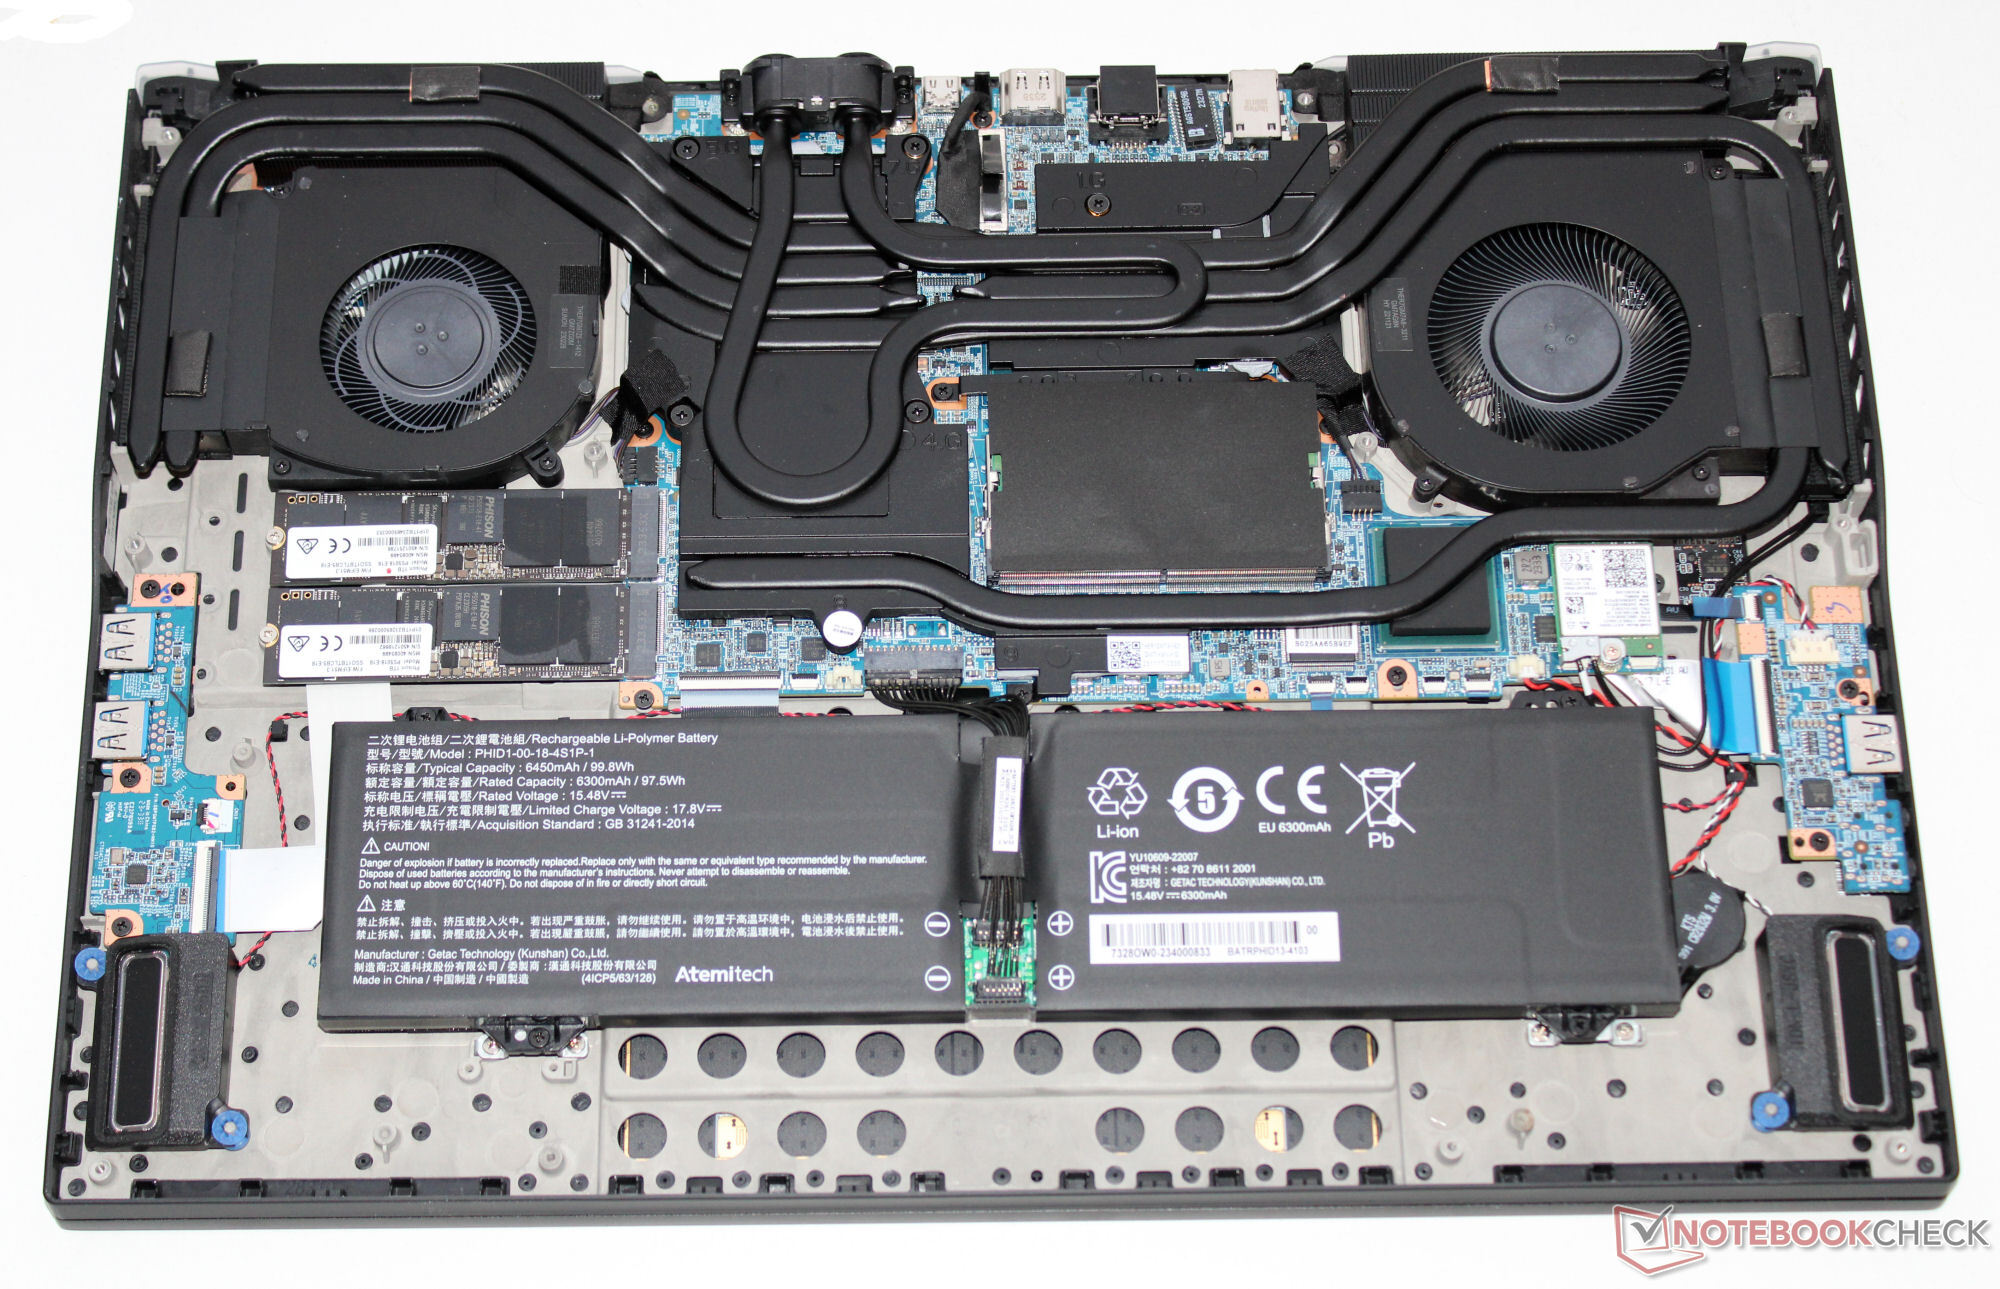
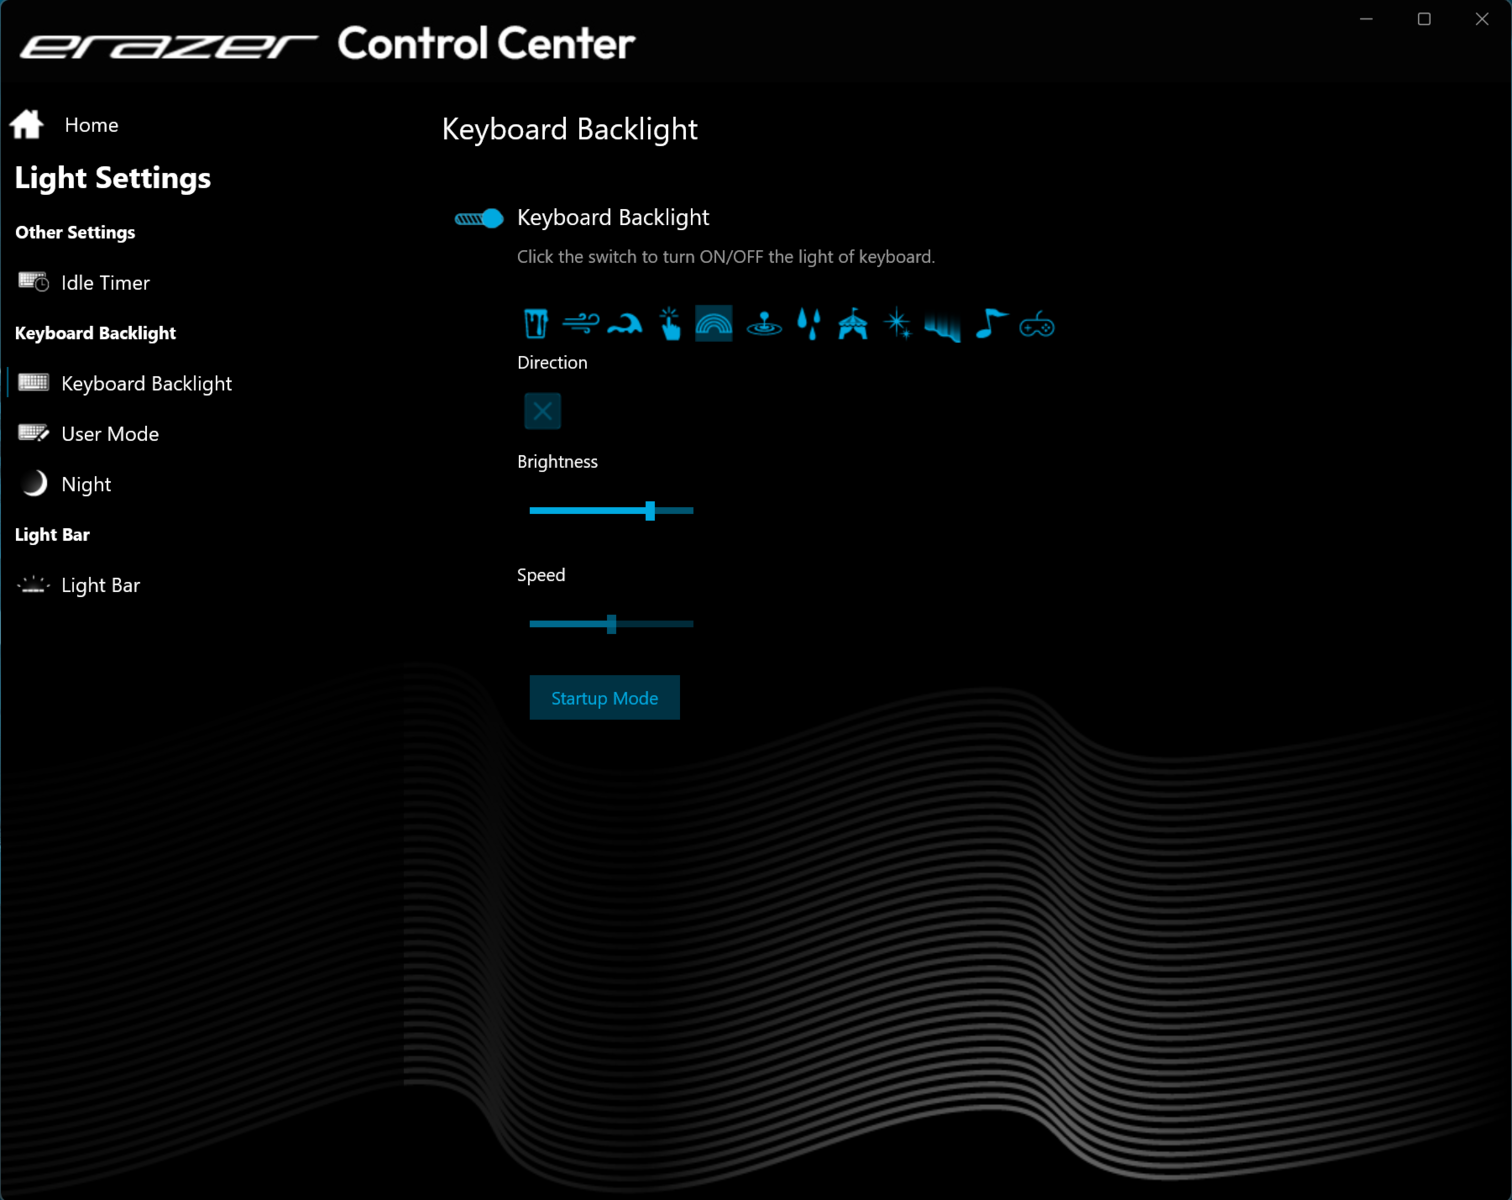
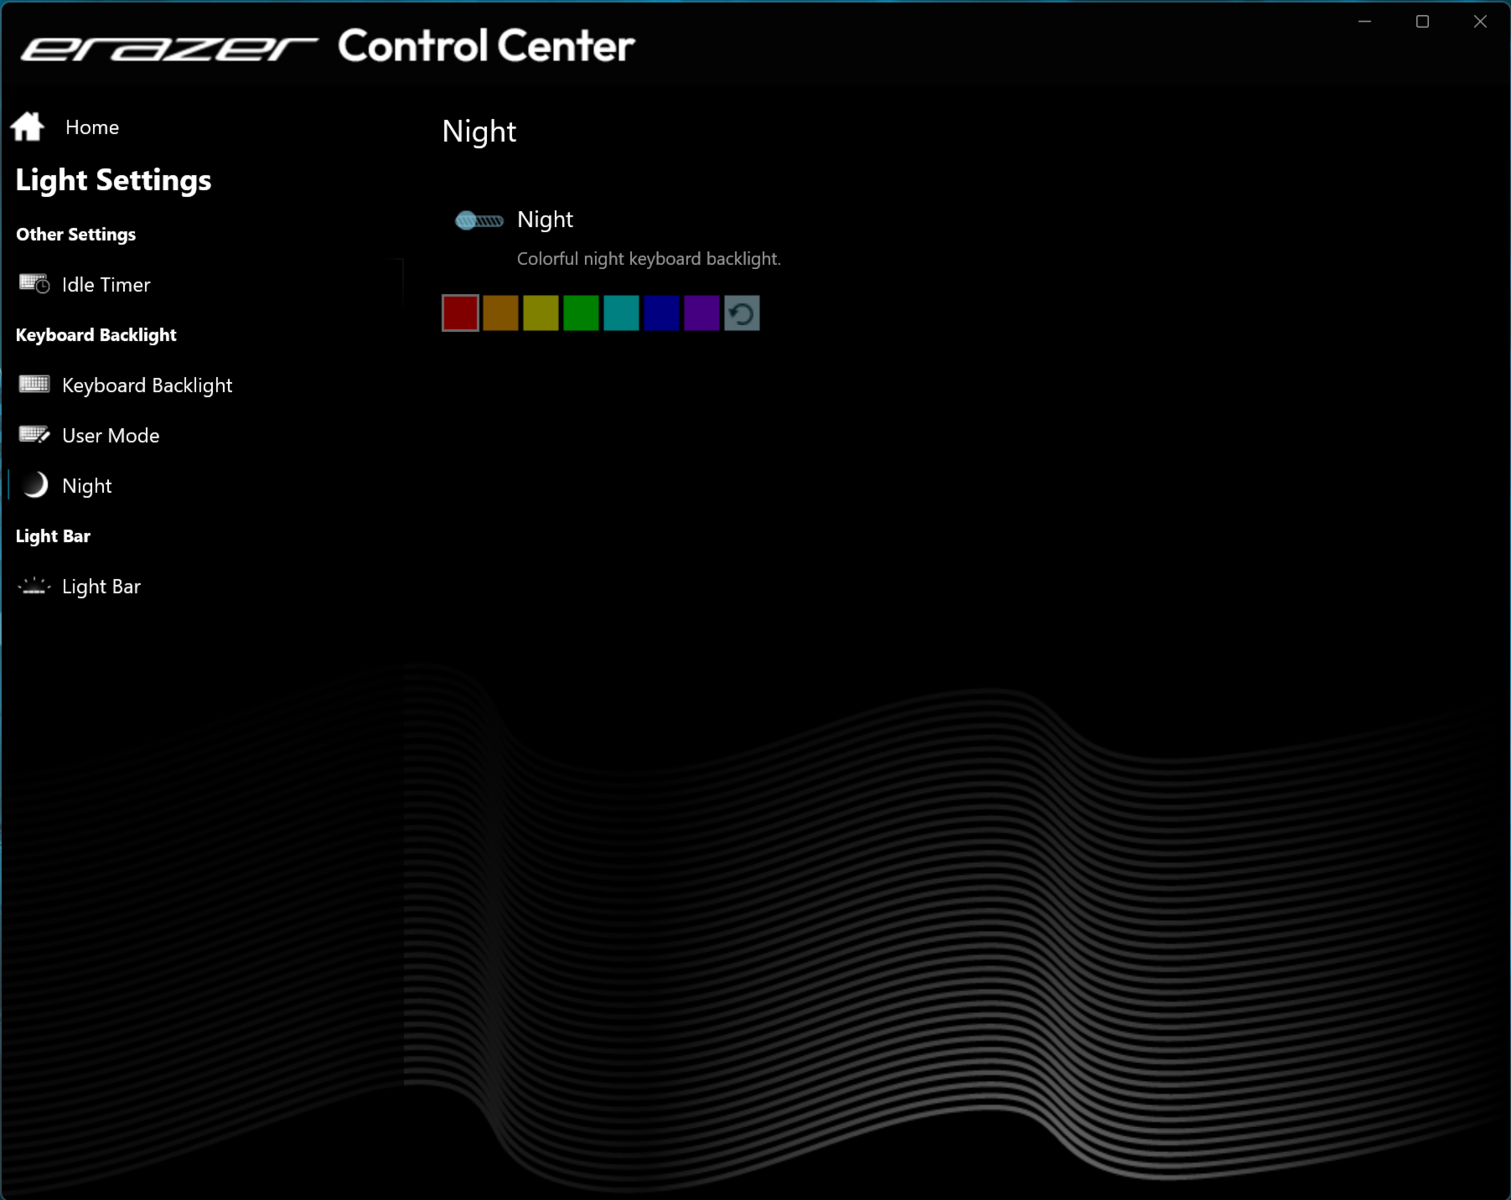
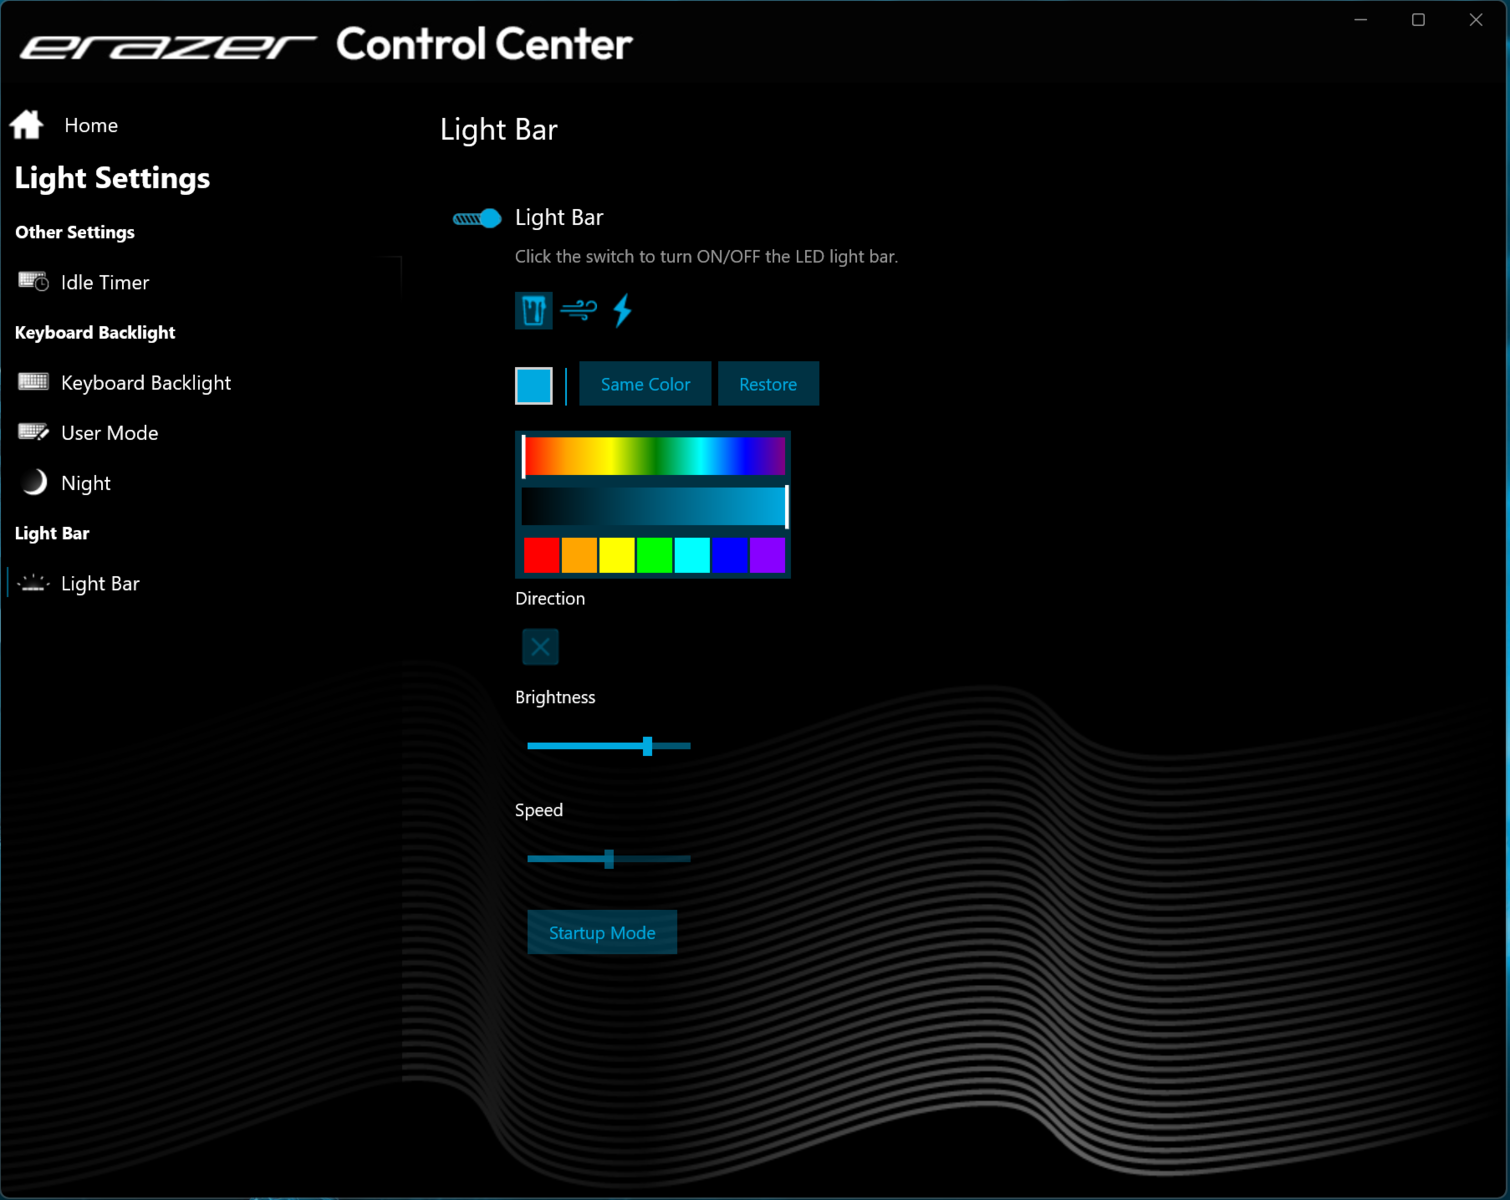
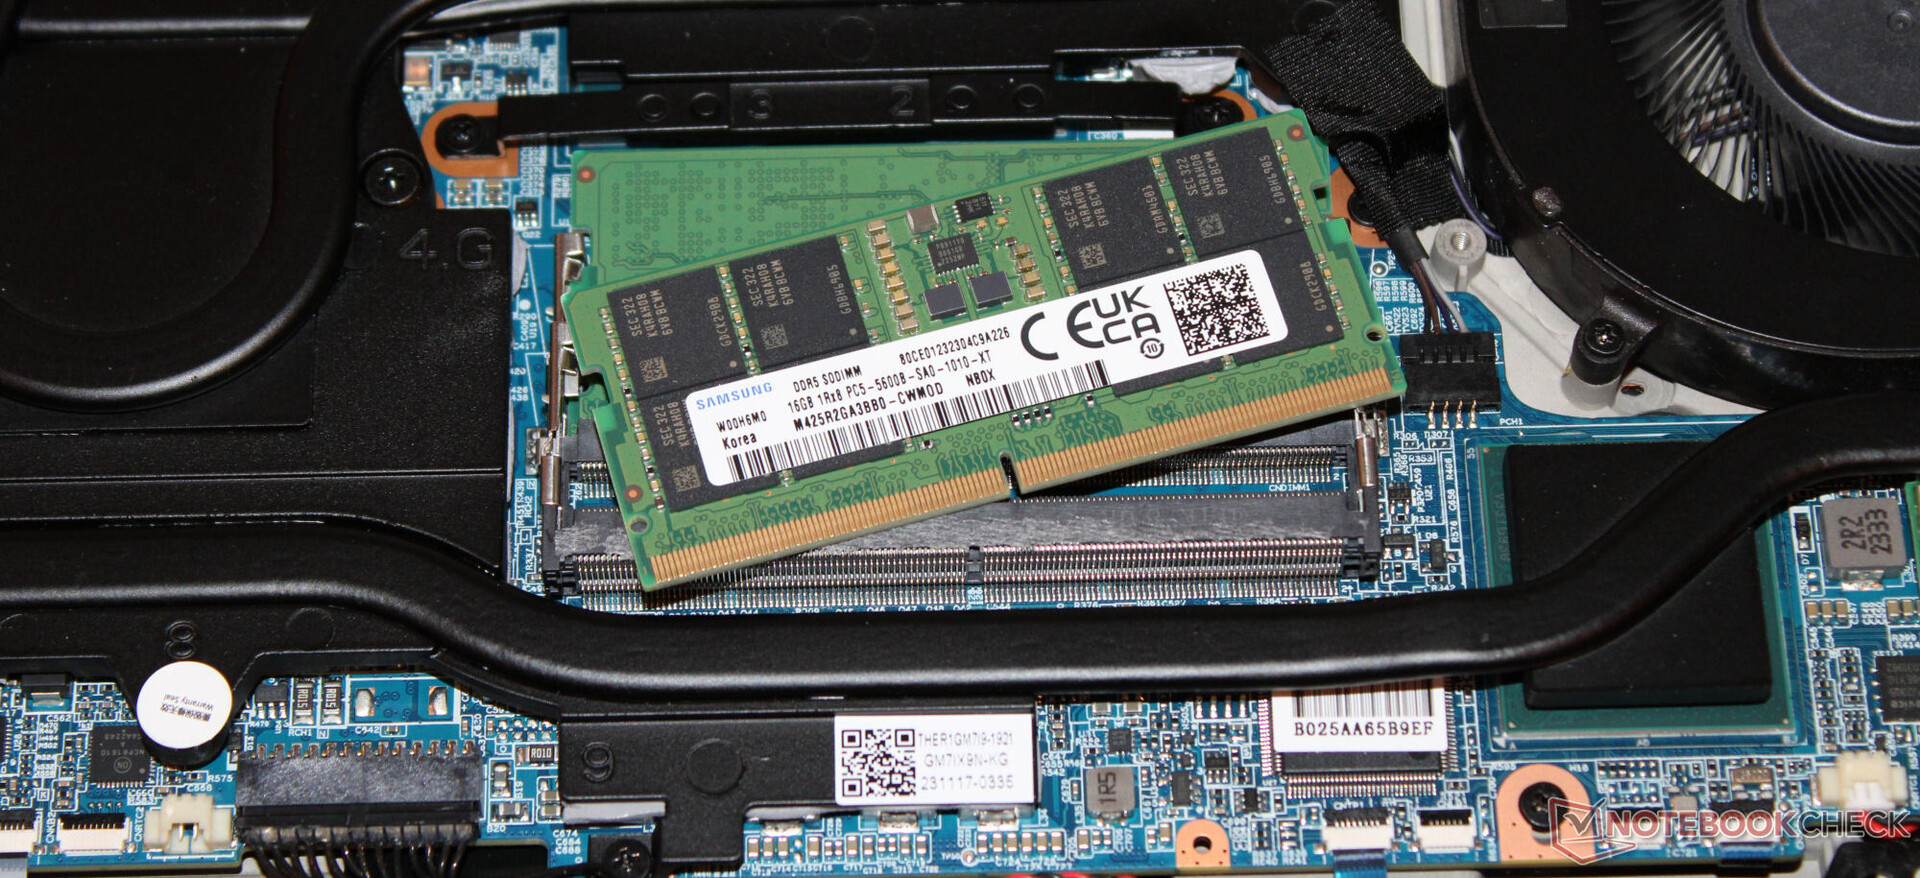
A tecnologia do Beast X40 está alojada em um invólucro de metal preto fosco, robusto e de design elegante, com superfícies lisas. A unidade de base é coberta com um revestimento de borracha antiderrapante. Duas faixas de LED RGB acima das saídas de ar traseiras, o logotipo iluminado da tampa e a iluminação RGB das teclas adicionam um toque de cor. A bateria (parafusada, não colada) e os outros componentes internos podem ser acessados após a remoção do painel inferior.
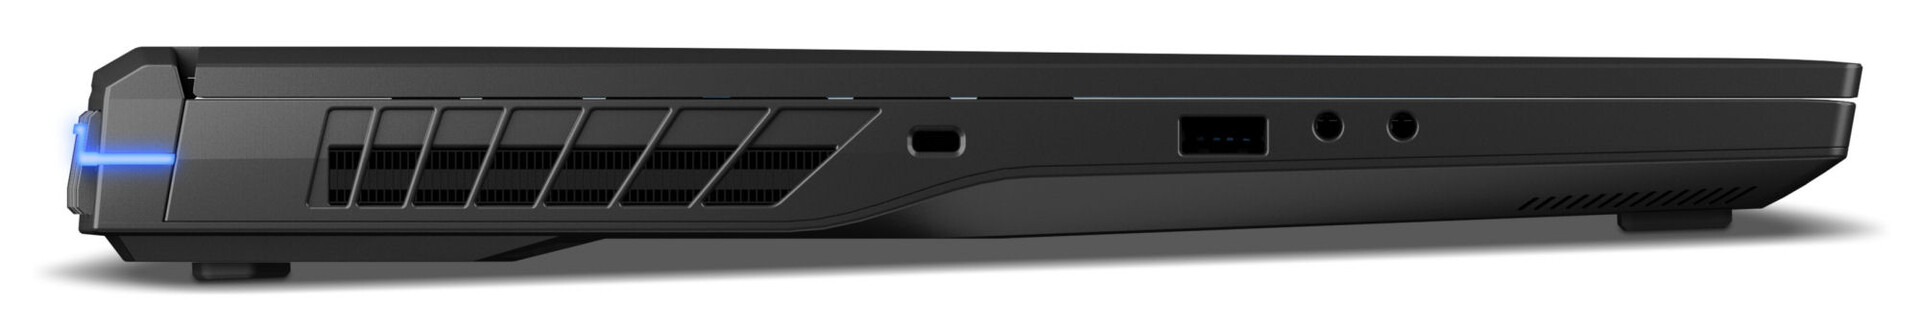
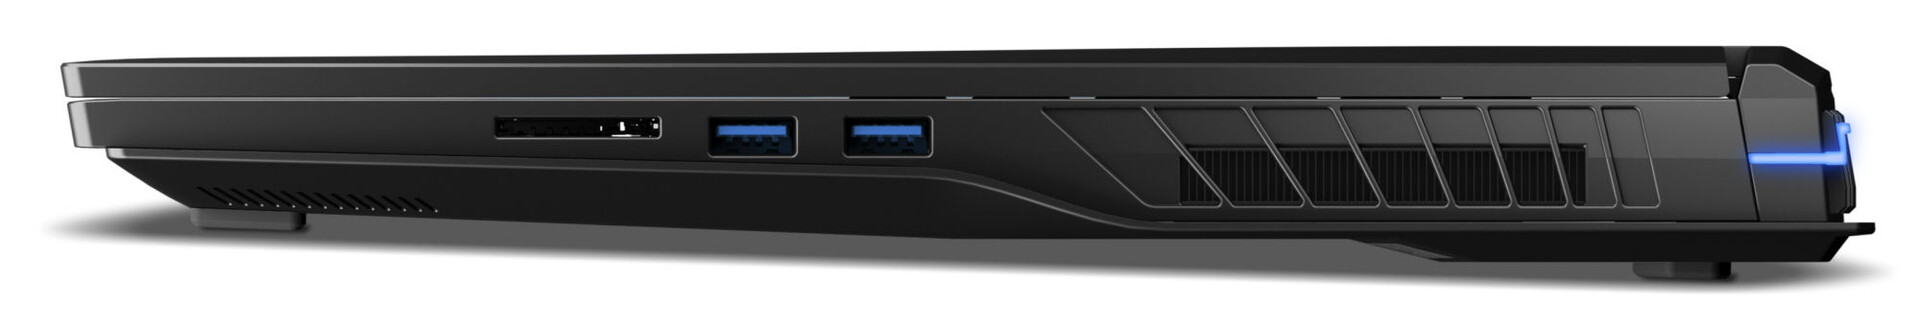
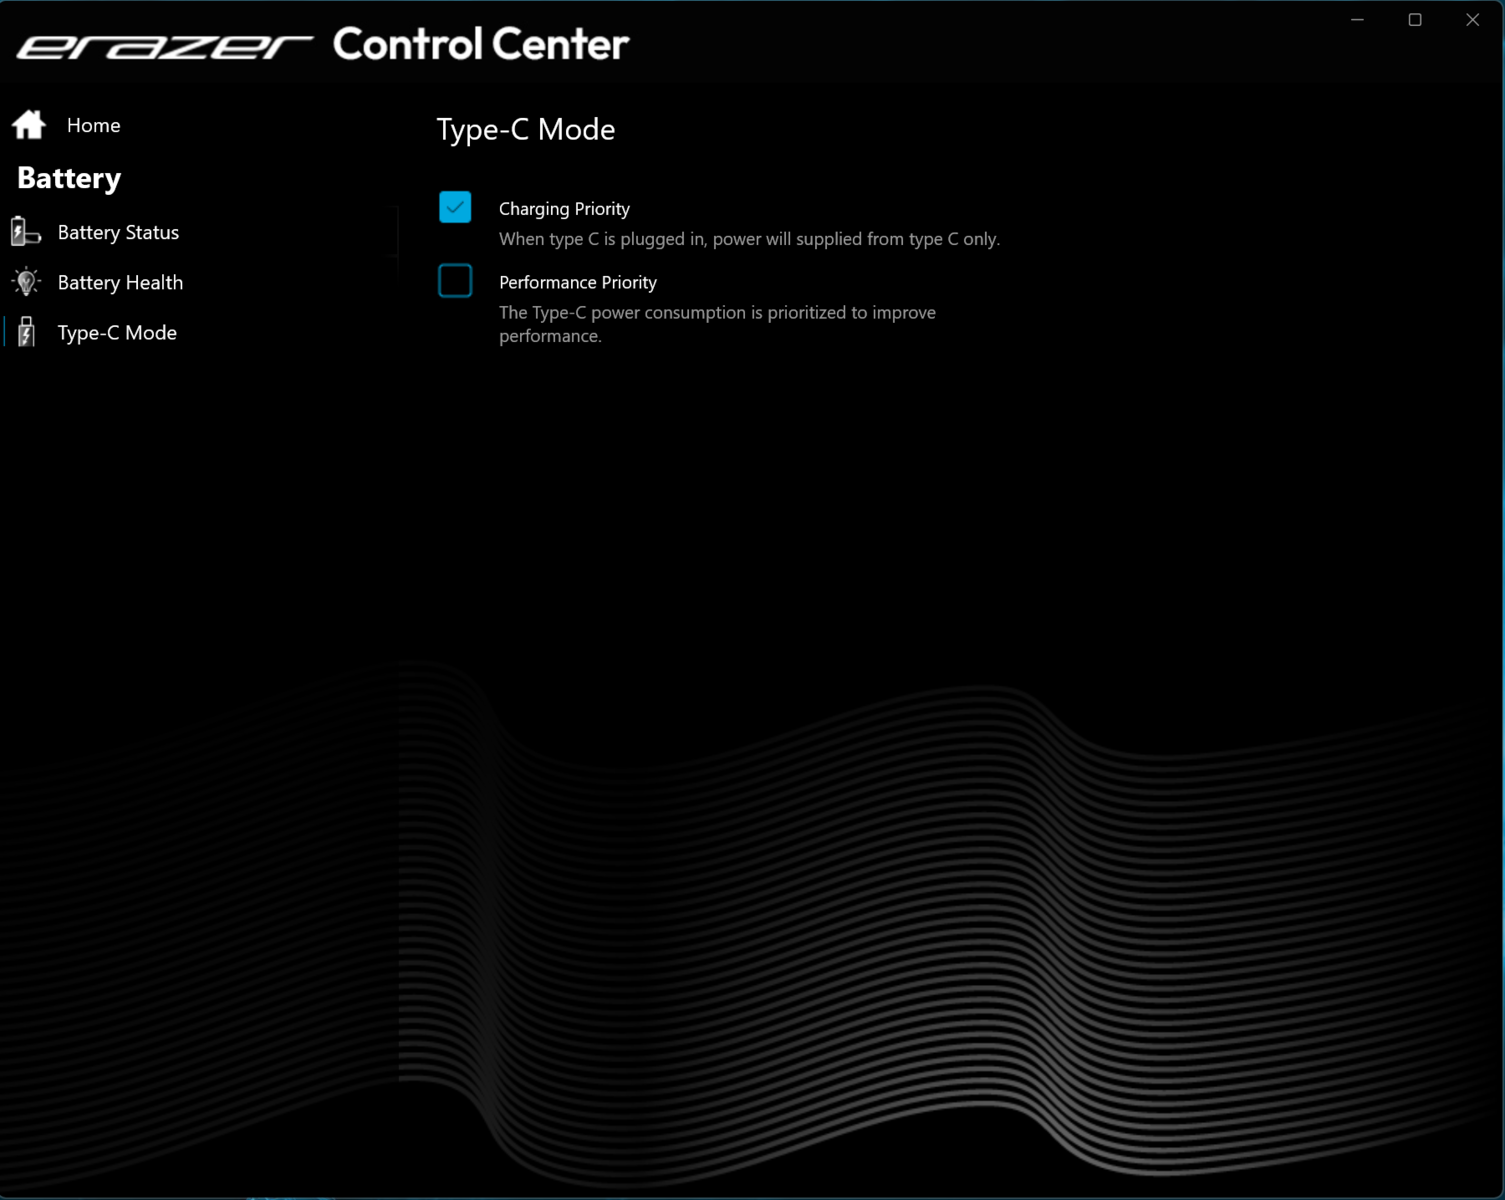
O Erazer tem três portas USB-A (2x USB 3.2 Gen 1 e 1x USB 3.2 Gen 2) e uma porta USB Type-C na forma de Thunderbolt 4. Pudemos confirmar que ela pode emitir um sinal DisplayPort e suporta Power Delivery. No total, o laptop tem duas saídas de vídeo (HDMI 2.1 e DisplayPort).
Testamos o leitor de cartão de memória SD com nosso cartão de referência AV Pro SD microSD 128 GB V60 e descobrimos que ele oferece velocidades de leitura acima da média. A webcam de 1080p é um item padrão.
O Erazer Beast X40 usa um chip Intel Wi-Fi 6E AX211, enquanto as conexões com fio são gerenciadas por um controlador Realtek RTL8125 2.5 GbE. O laptop oferece um sólido desempenho Wi-Fi em nossos testes usando o roteador de referência Asus ROG Rapture GT-AXE11000 sem outros dispositivos Wi-Fi nas imediações e a uma curta distância entre o laptop e o PC servidor.
| SD Card Reader | |
| average JPG Copy Test (av. of 3 runs) | |
| Média da turma Gaming (20.9 - 210, n=54, últimos 2 anos) | |
| MSI Titan 18 HX A14VIG (Toshiba Exceria Pro SDXC 64 GB UHS-II) | |
| Medion Erazer Beast X40 (AV PRO microSD 128 GB V60) | |
| Medion Erazer Beast X40 2024 (AV PRO microSD 128 GB V60) | |
| maximum AS SSD Seq Read Test (1GB) | |
| Média da turma Gaming (25.5 - 261, n=51, últimos 2 anos) | |
| MSI Titan 18 HX A14VIG (Toshiba Exceria Pro SDXC 64 GB UHS-II) | |
| Medion Erazer Beast X40 2024 (AV PRO microSD 128 GB V60) | |
| Medion Erazer Beast X40 (AV PRO microSD 128 GB V60) | |


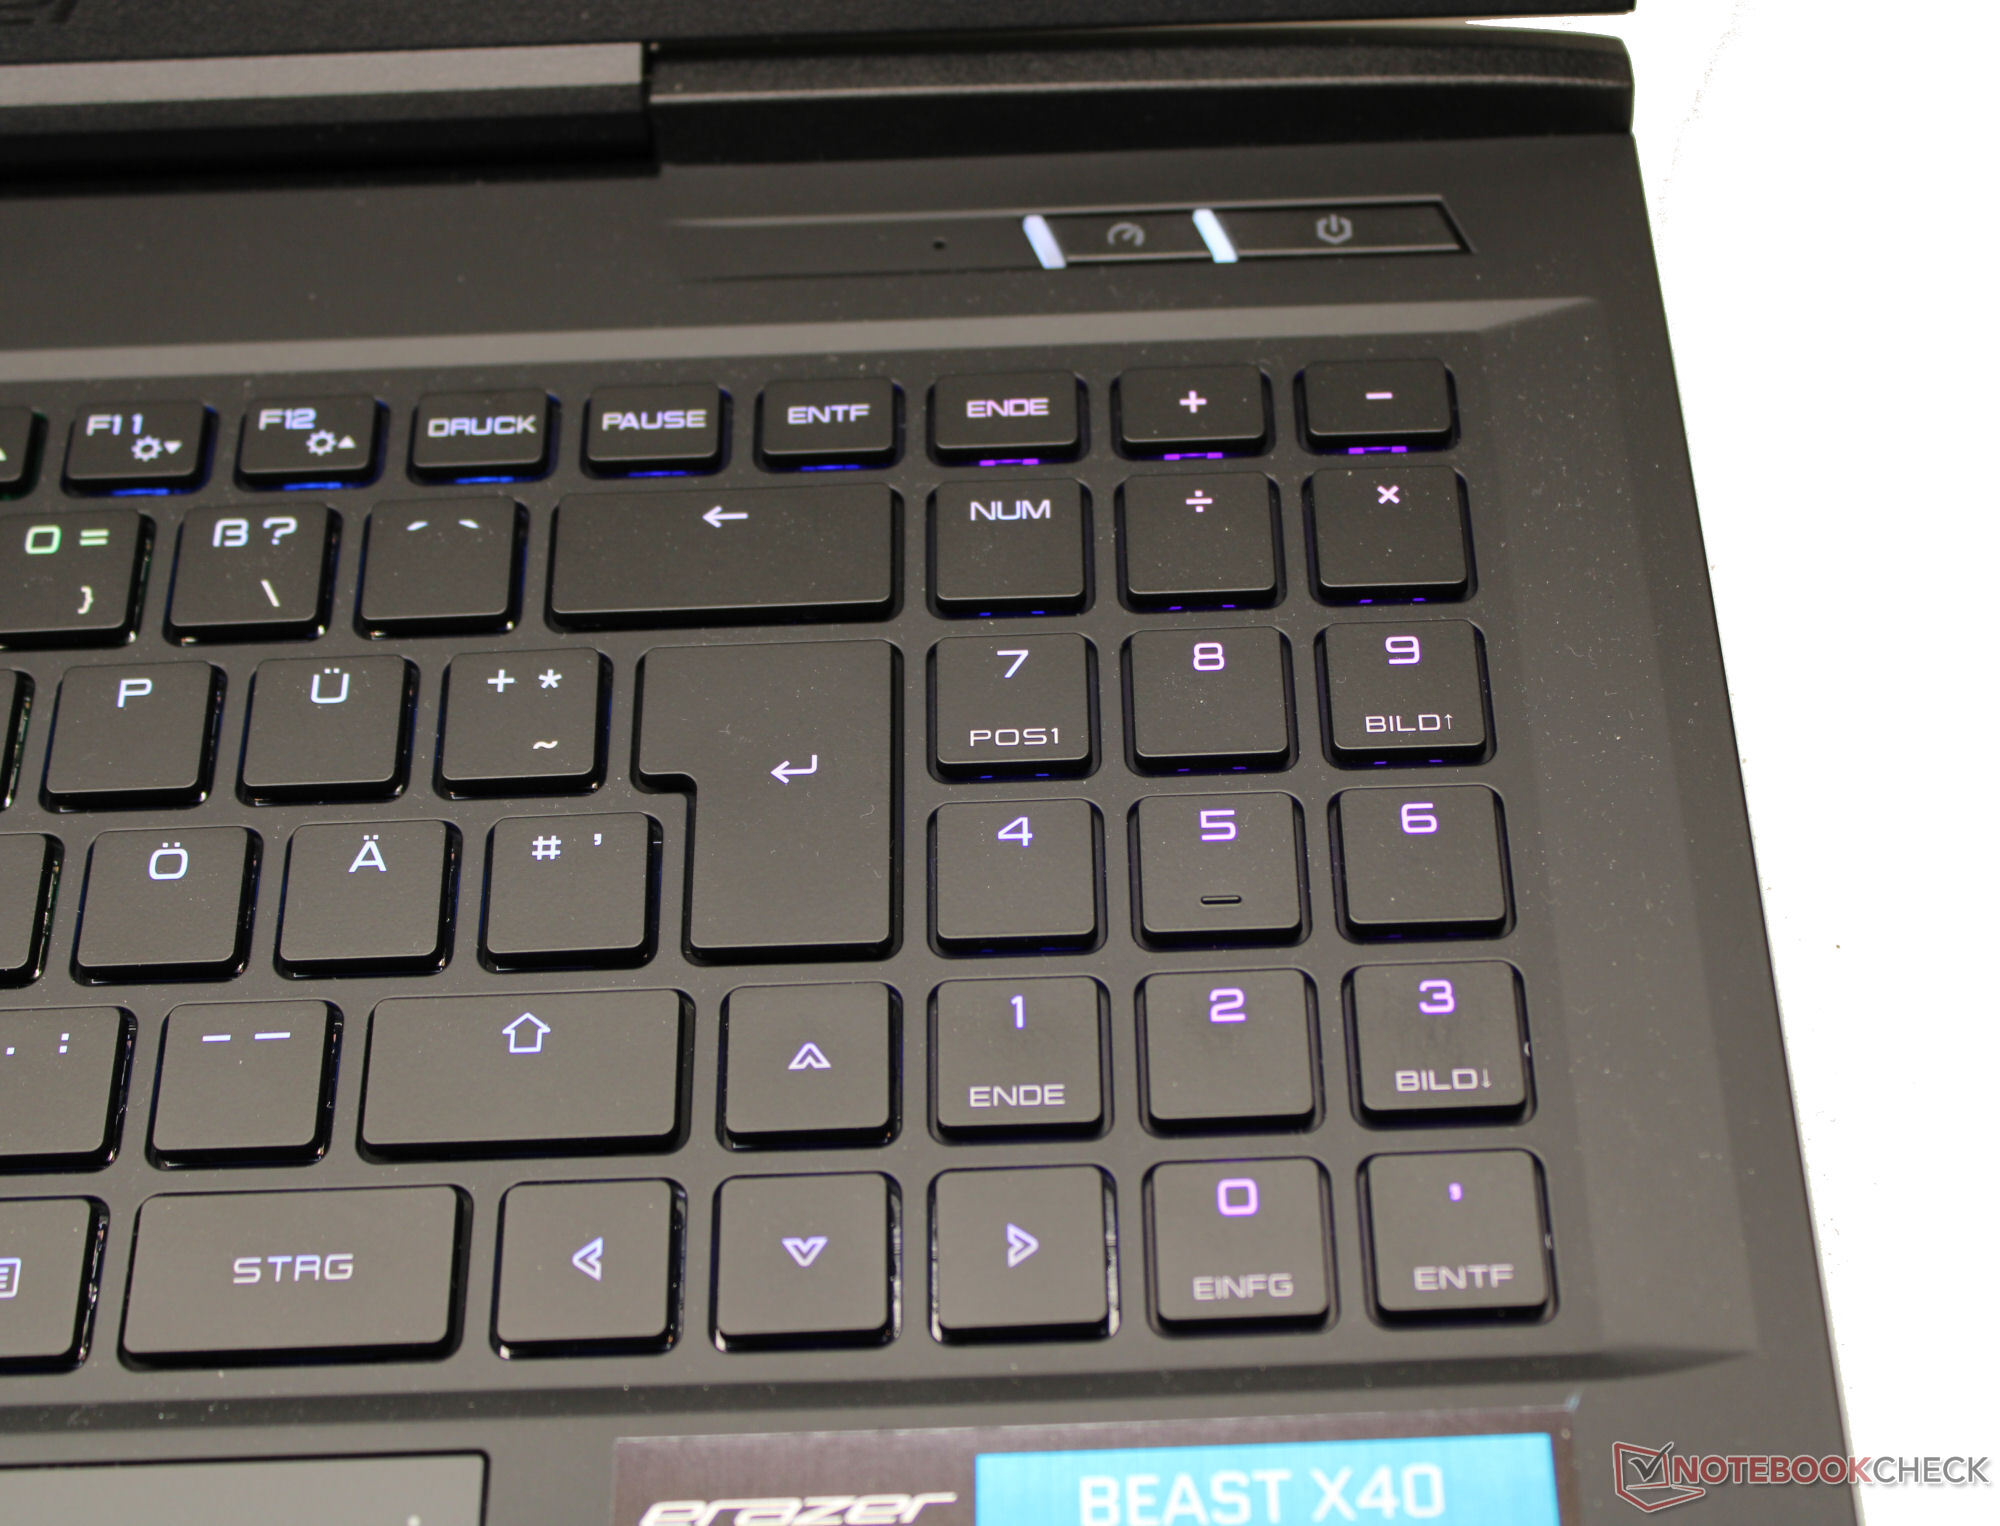
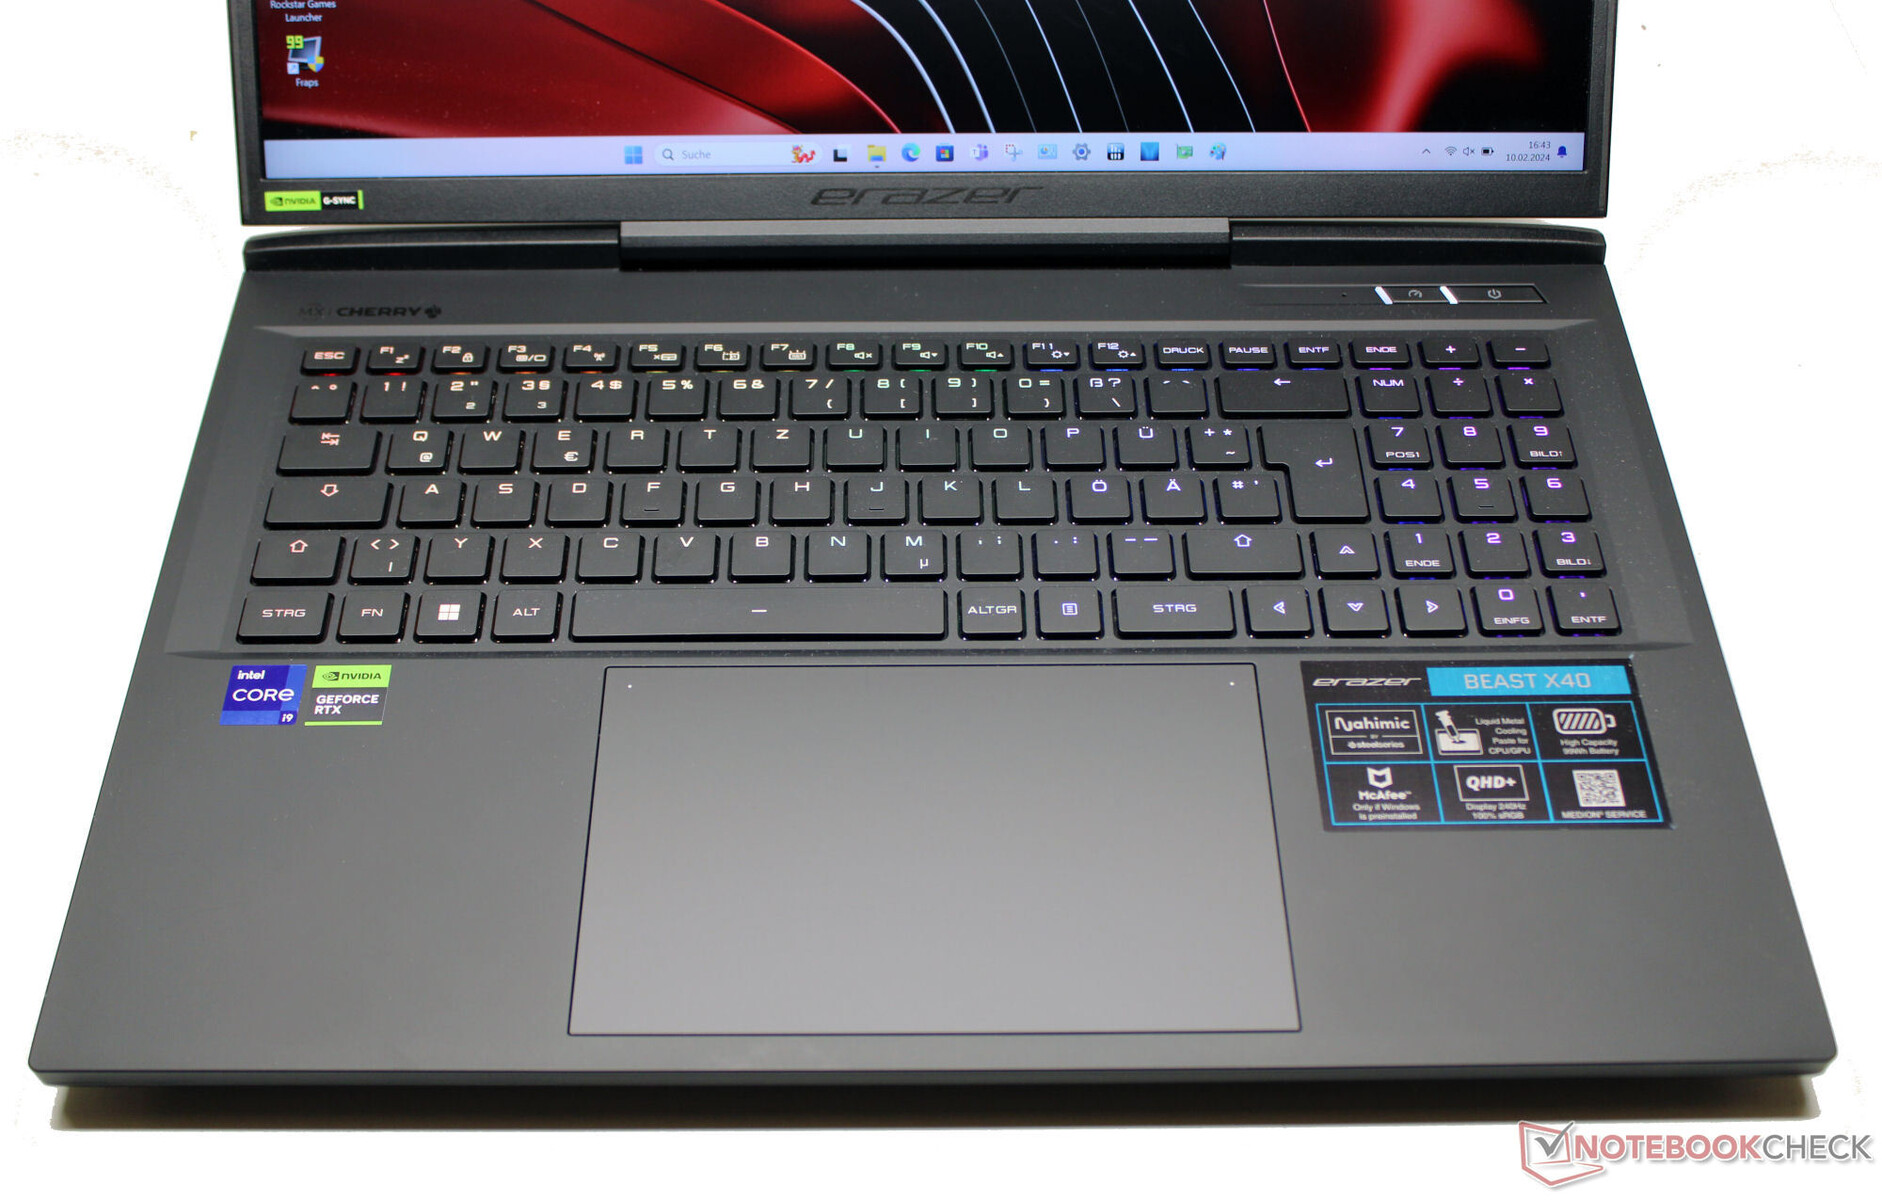
Dispositivos de entrada: Teclado mecânico com interruptores Cherry MX
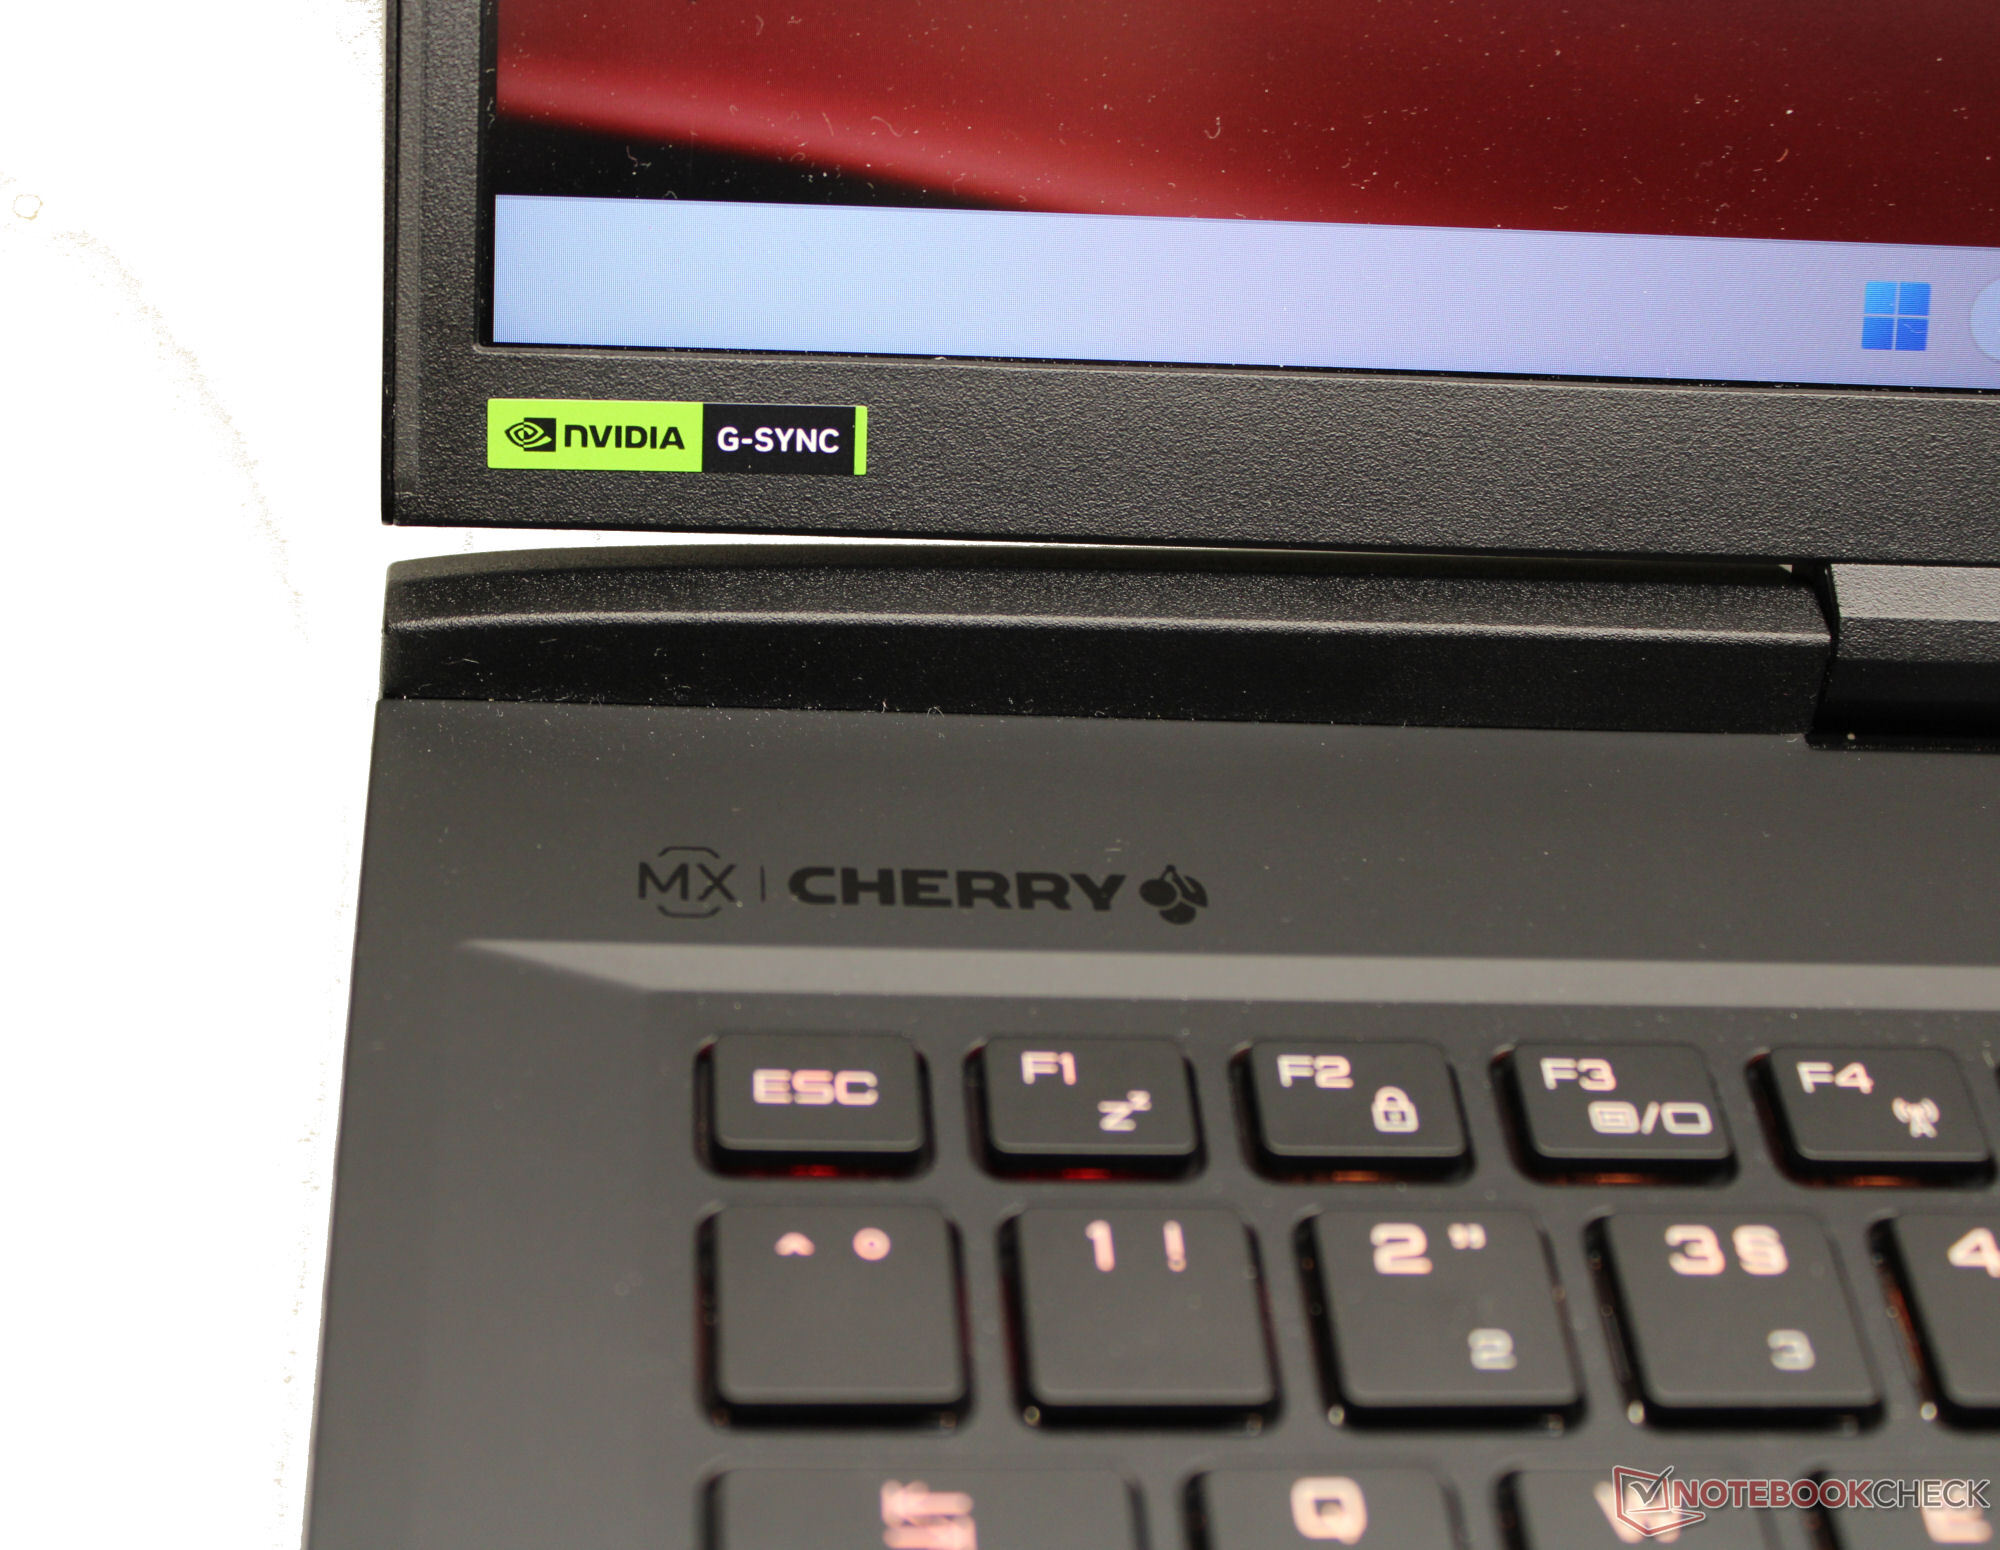
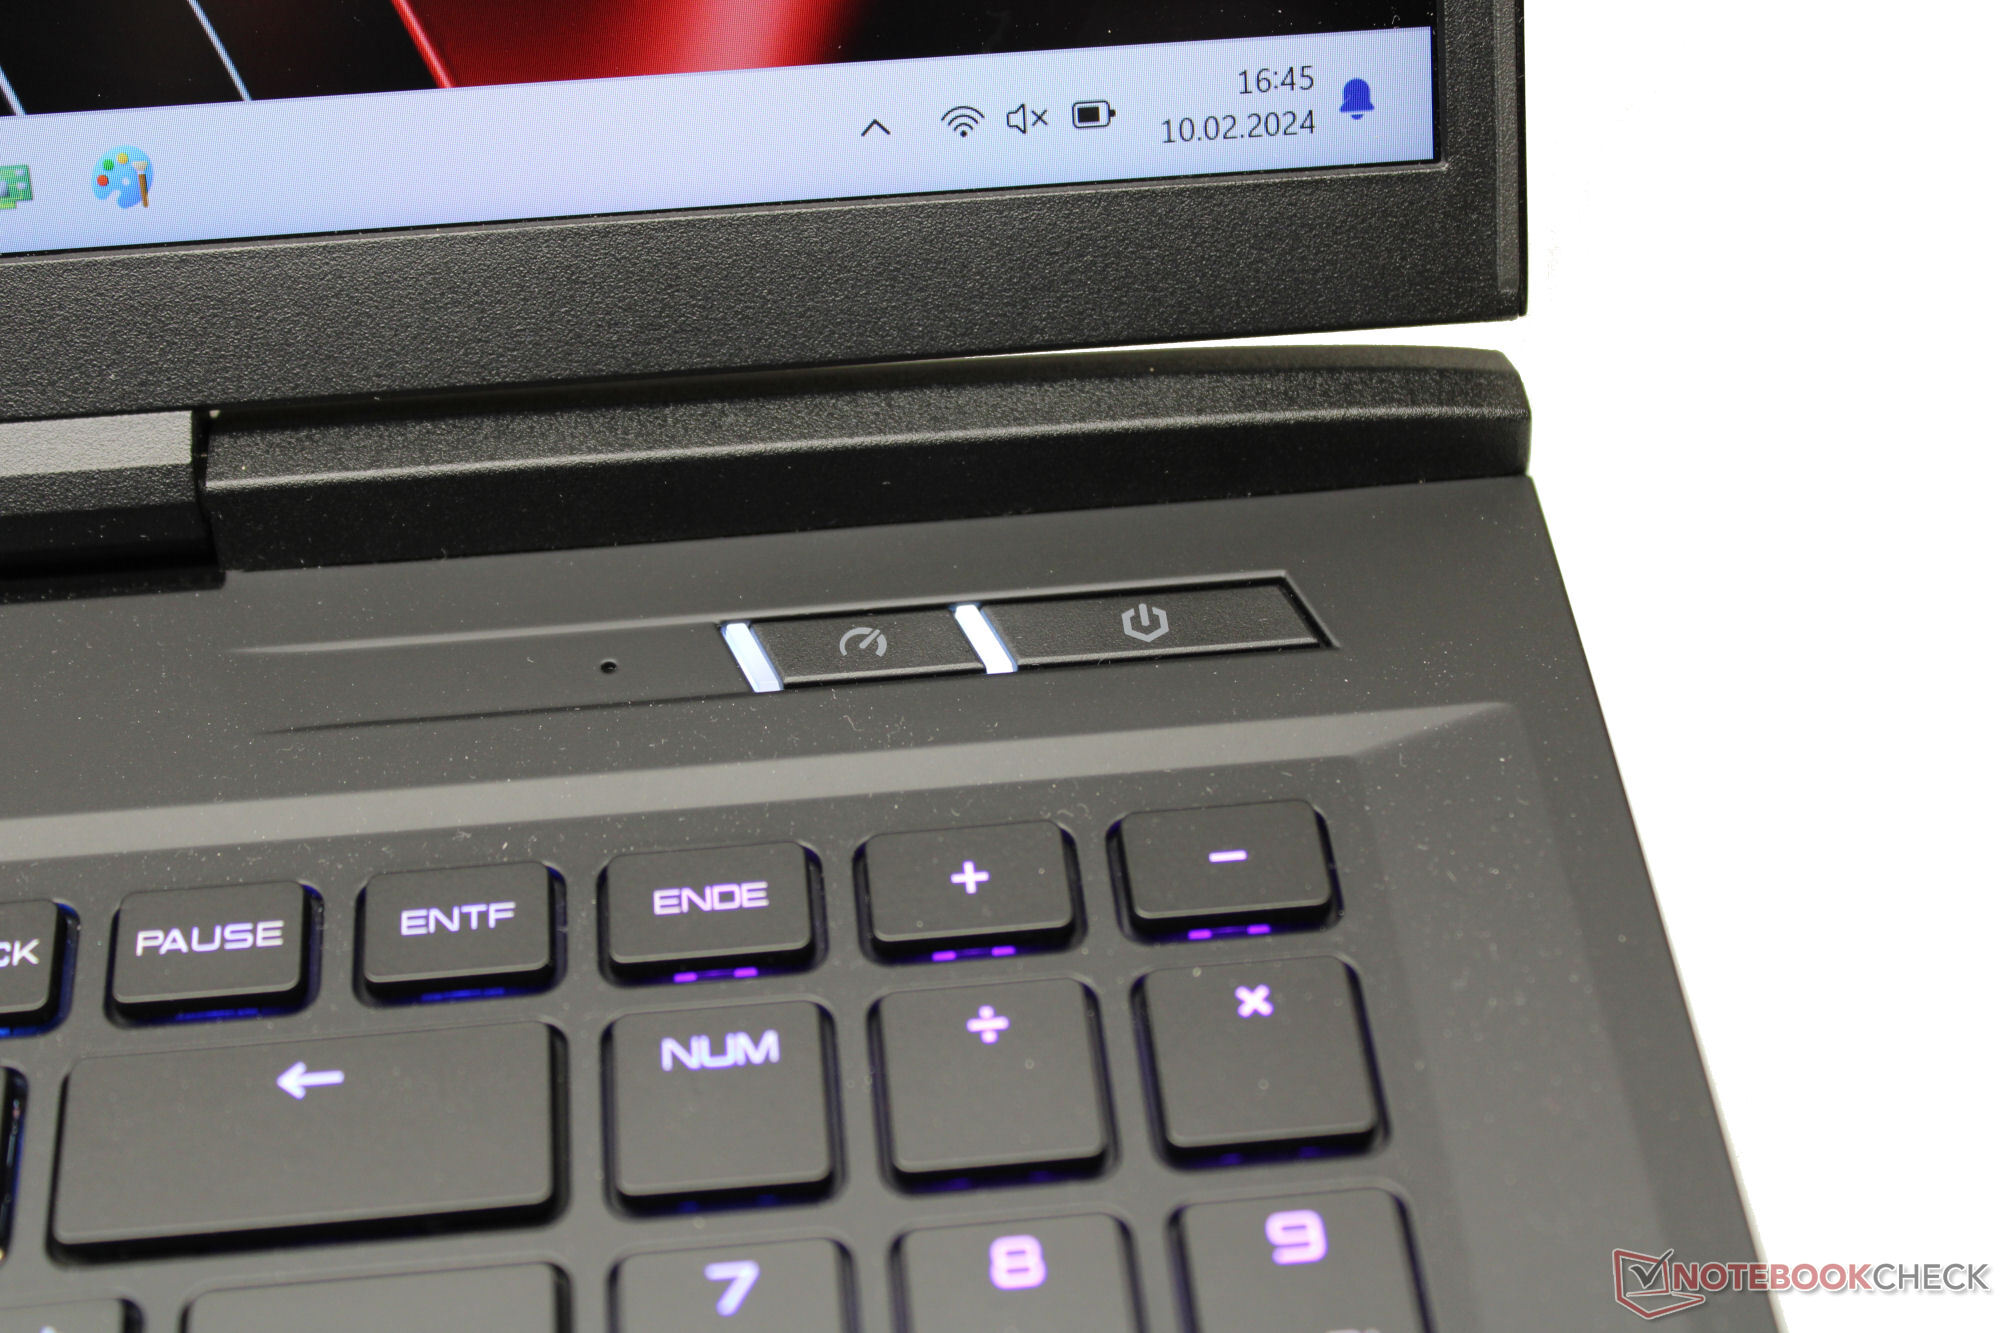
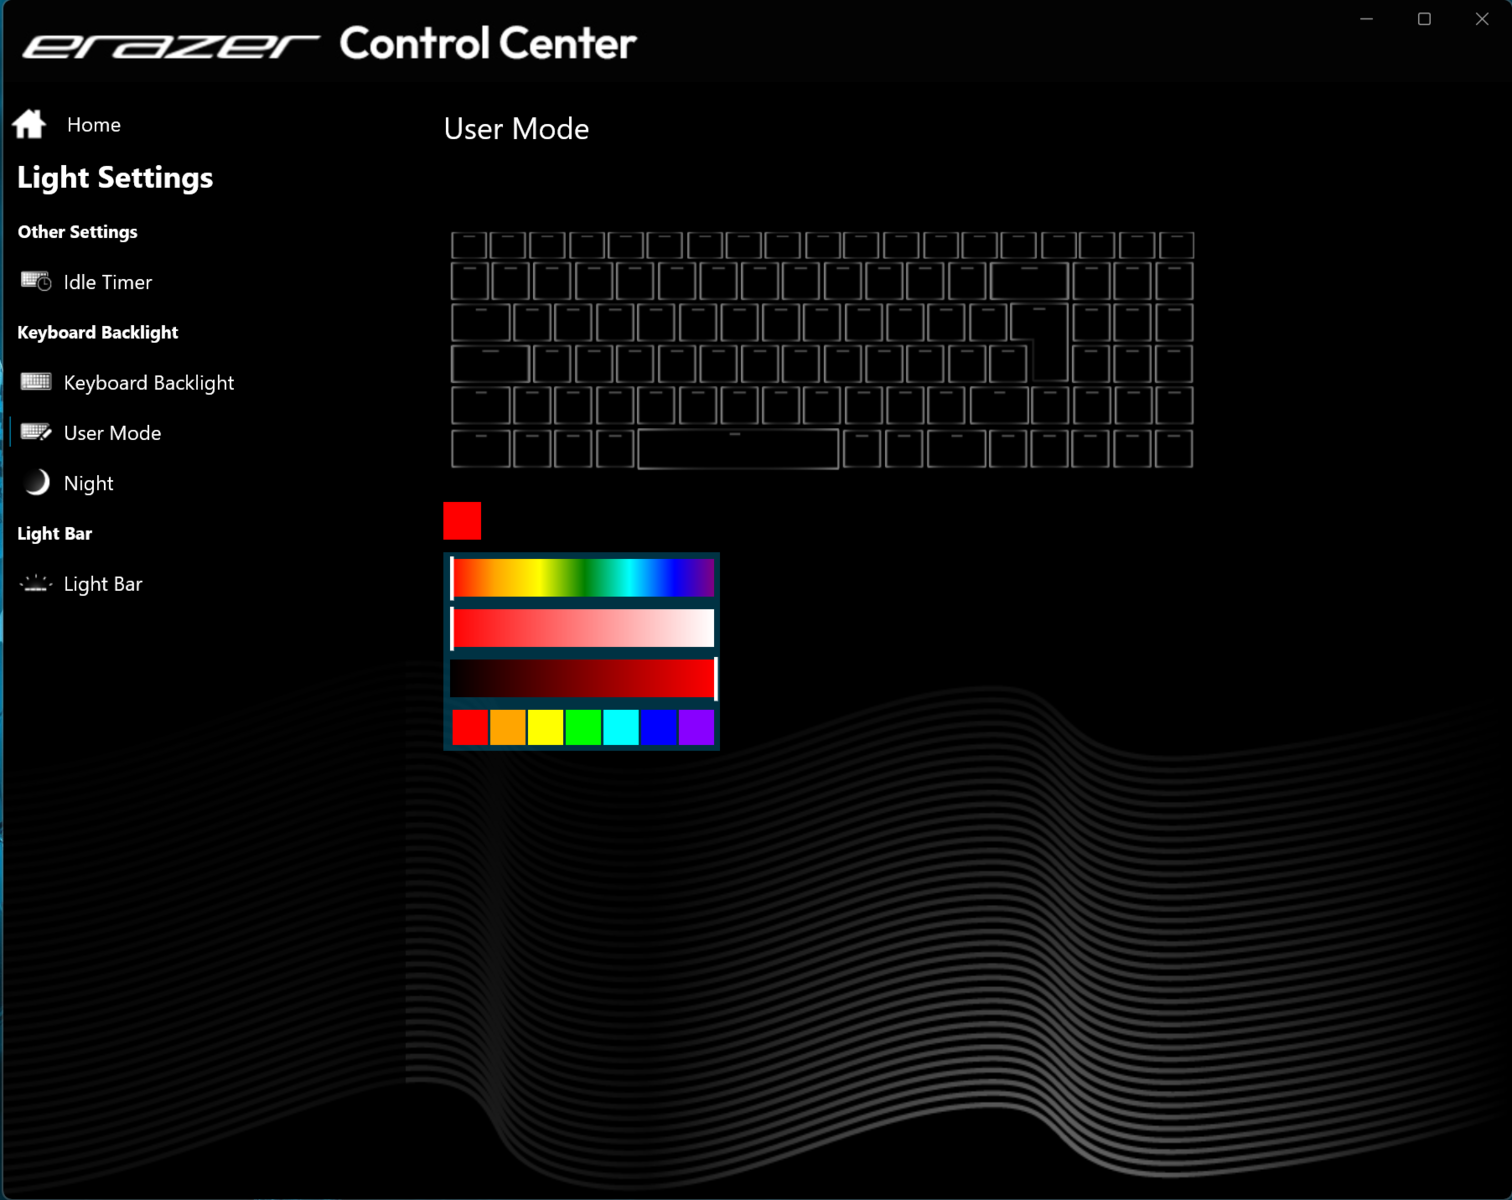
O teclado mecânico do Beast X40 ganha pontos com sua rica sensação de digitação e entradas precisas. Seus switches Cherry MX oferecem um curso médio e um ponto de pressão claramente audível e perceptível. O teclado numérico e a iluminação RGB individual das teclas completam a harmonia geral do teclado.
O touchpad multitoque (15,5 x 10 cm) tem um curso curto e um ponto de pressão claro. Ele pode ser desativado completamente ou apenas em um lado (direito).
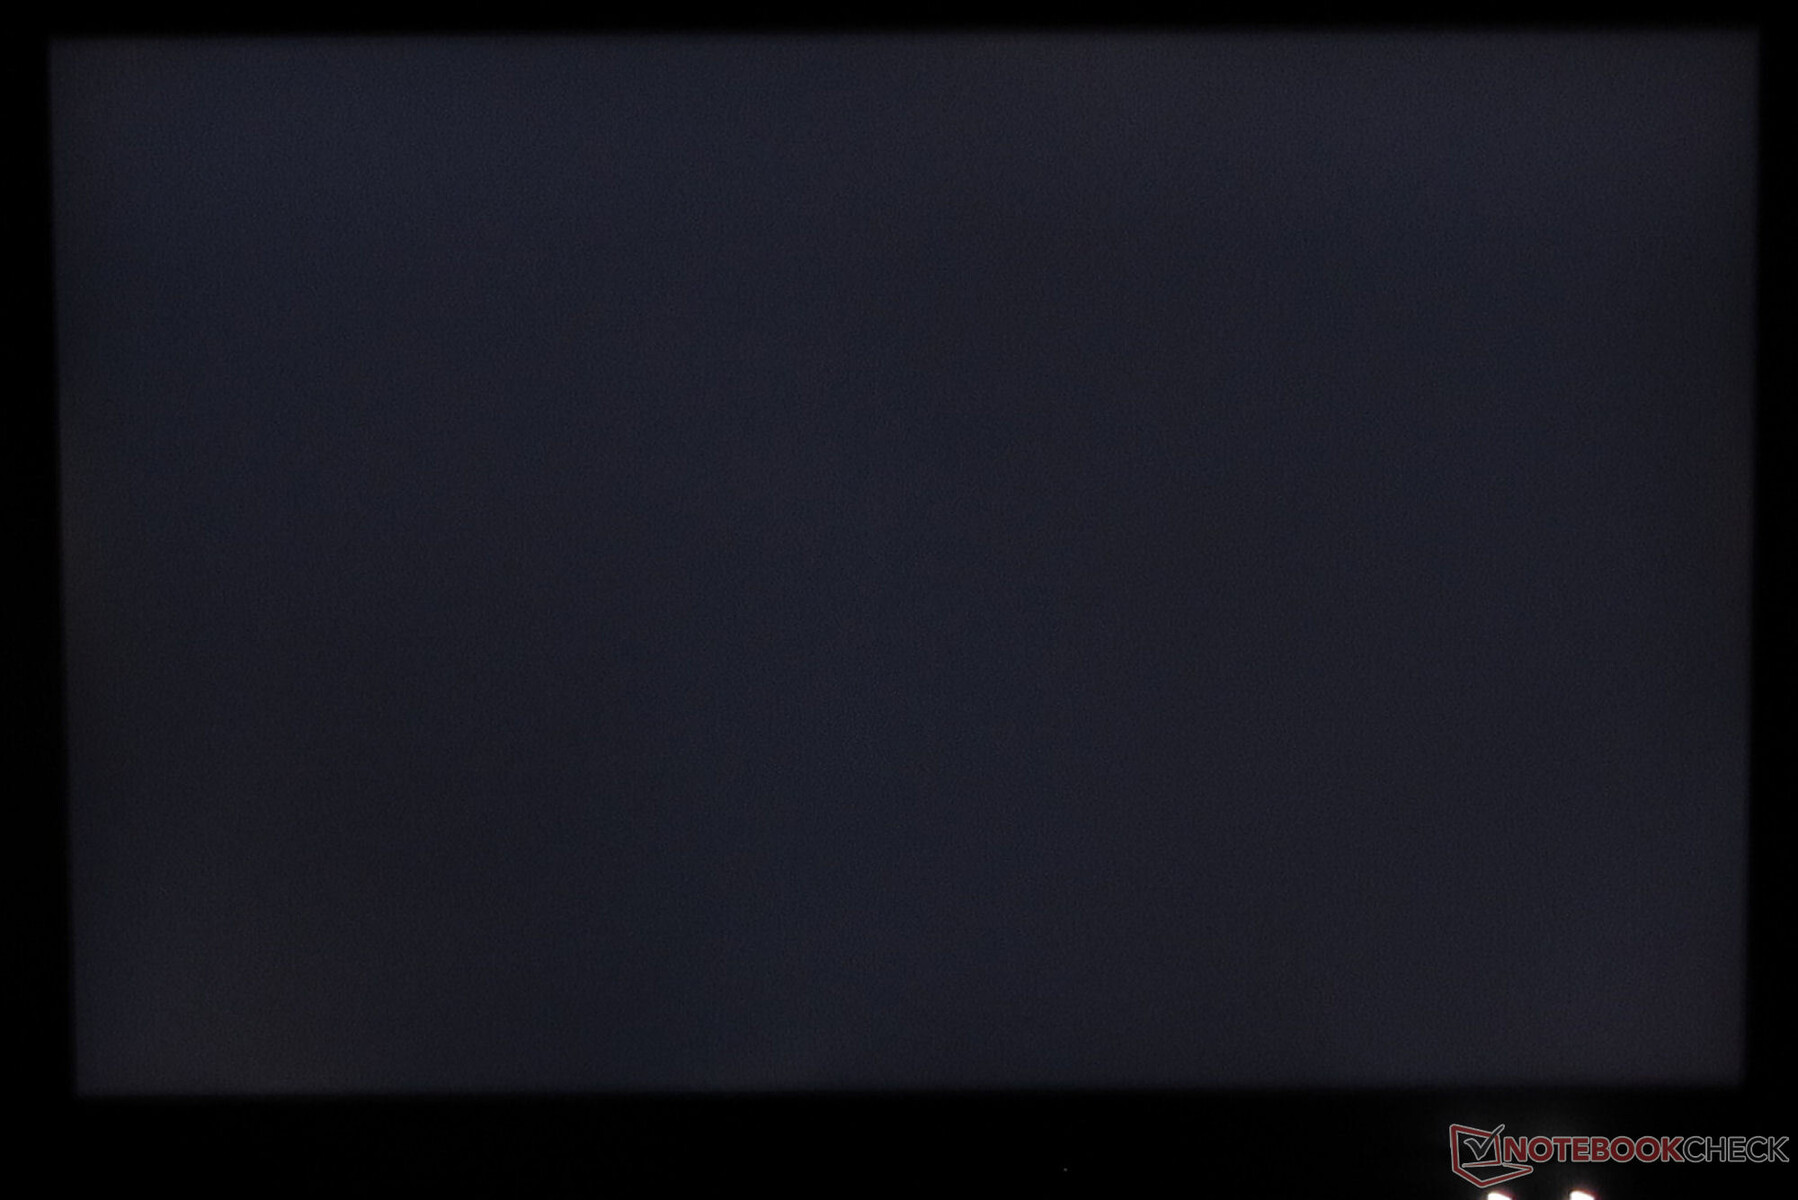
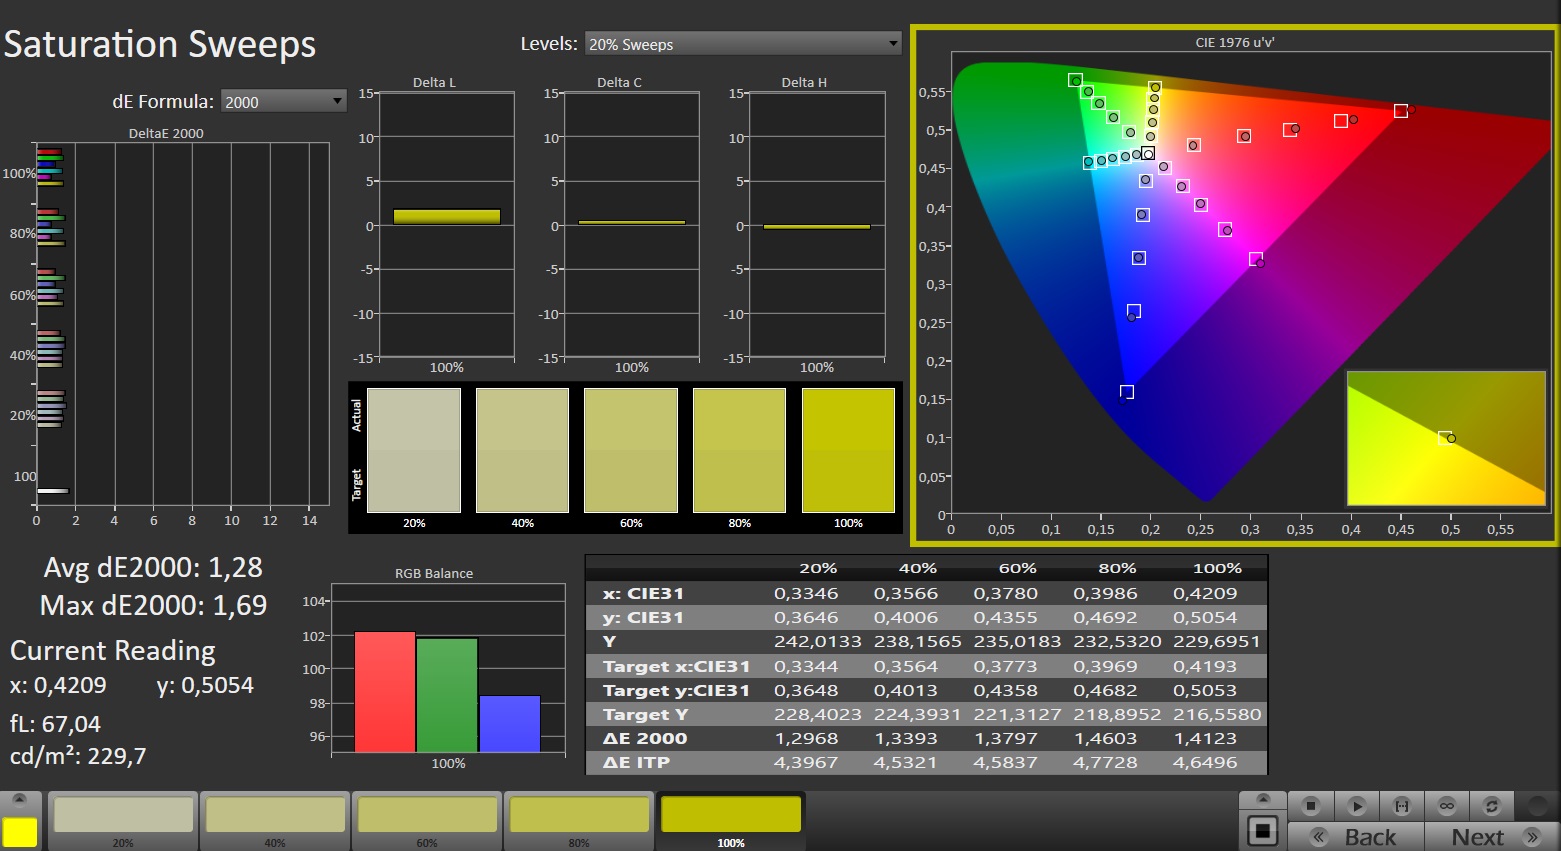
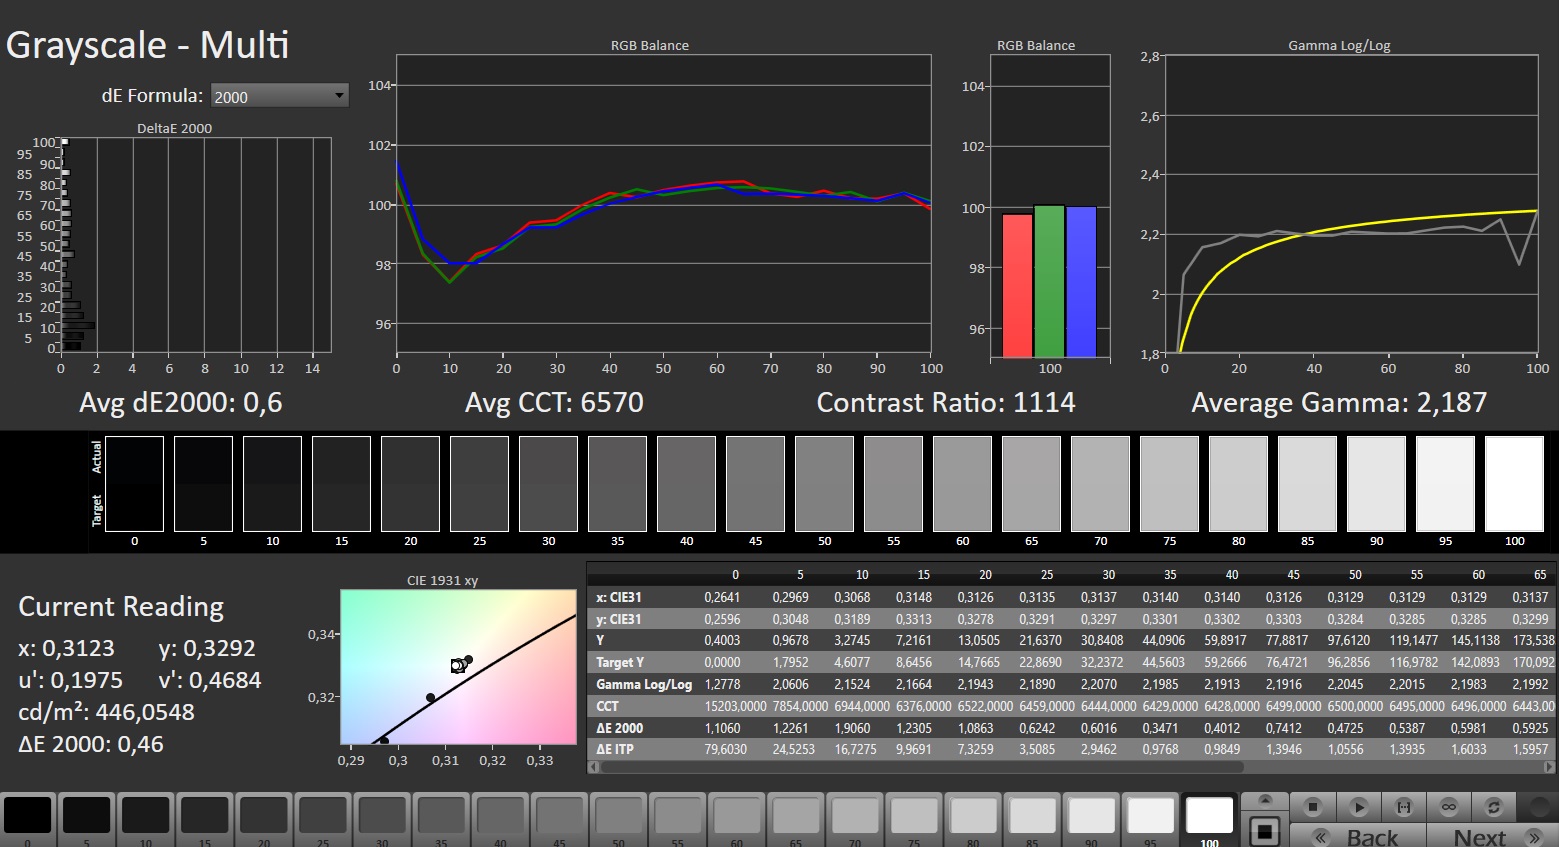
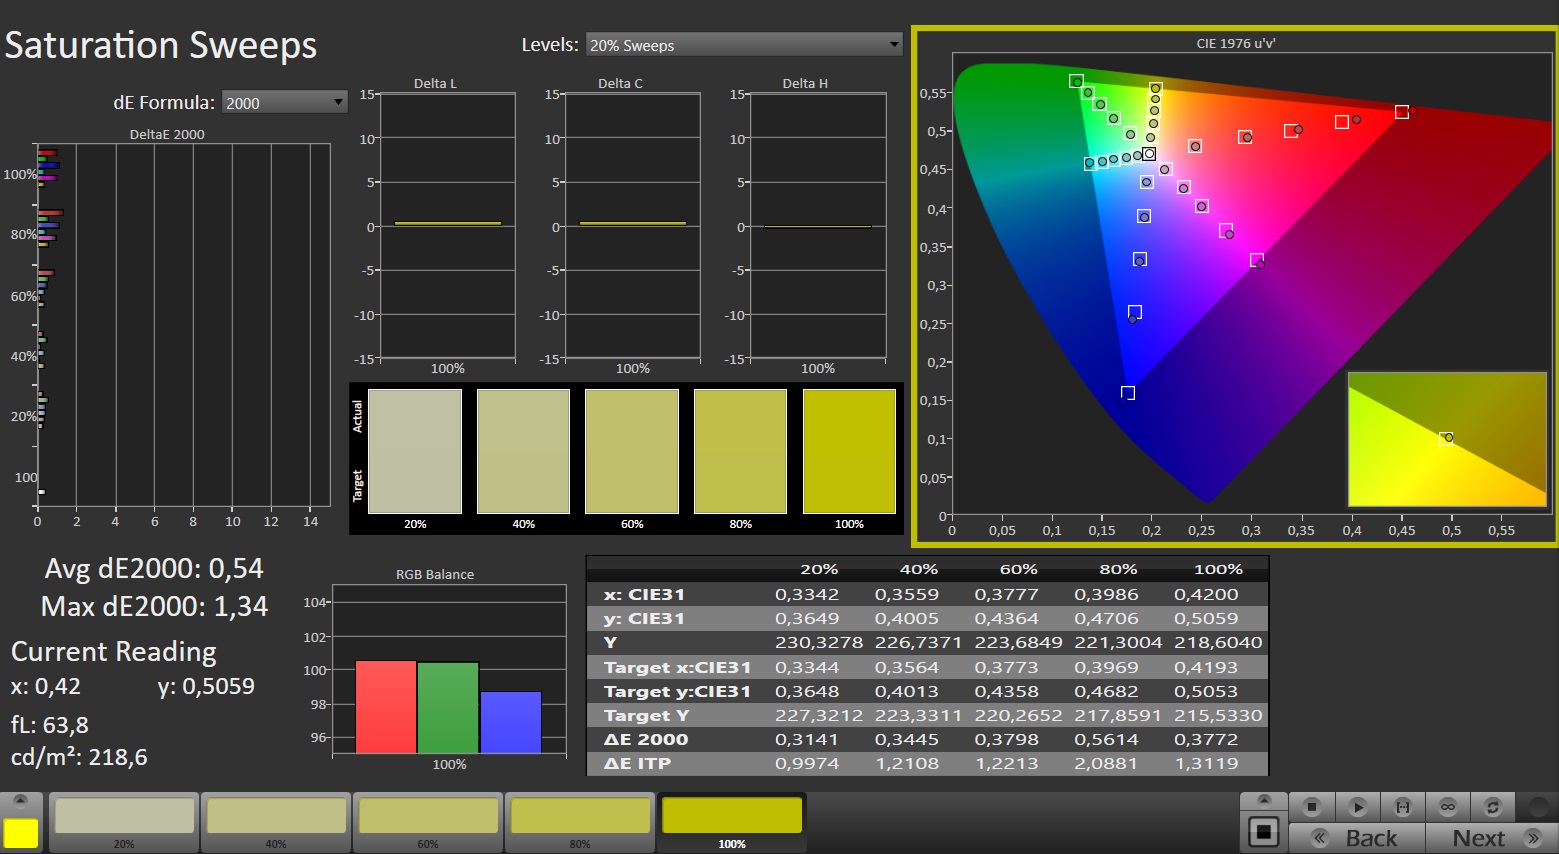
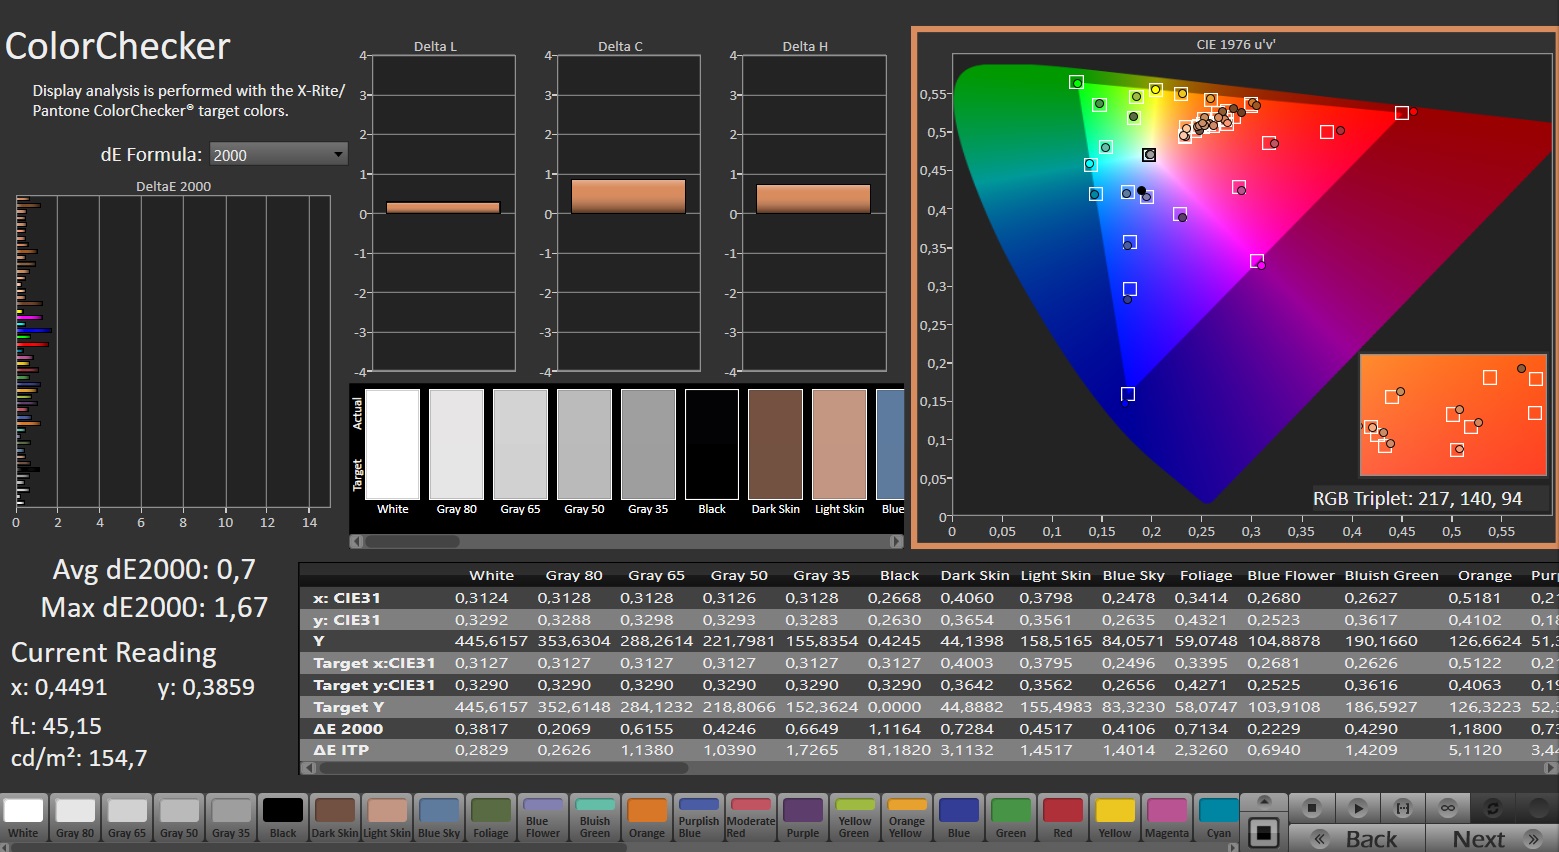
Tela: QHD+ com cobertura sRGB decente
O Beast X40 2024 usa a mesma tela QHD+ fosca de 240 Hz (2.560 x 1.600 pixels) desenvolvida pela BOE, semelhante à do 2023 Beast X40. O painel tem bons níveis de brilho, tempos de resposta curtos, altas taxas de quadros e não apresenta oscilação de PWM.
Atualmente, a Medion não oferece outras opções de tela para o senhor escolher.
| |||||||||||||||||||||||||
iluminação: 87 %
iluminação com acumulador: 422 cd/m²
Contraste: 1005:1 (Preto: 0.42 cd/m²)
ΔE ColorChecker Calman: 1.42 | ∀{0.5-29.43 Ø4.71}
calibrated: 0.7
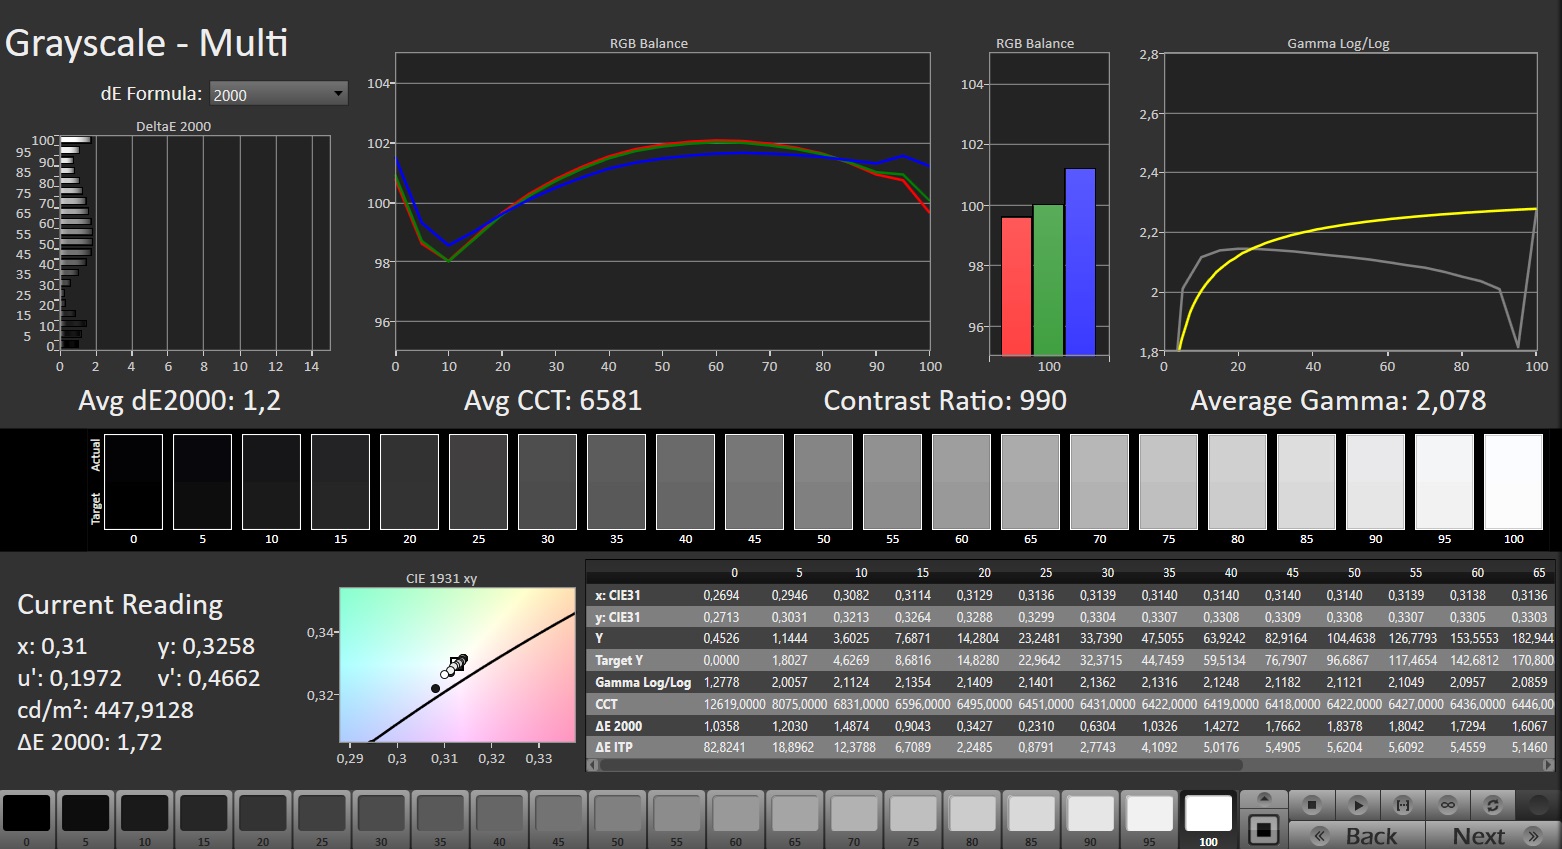
ΔE Greyscale Calman: 1.2 | ∀{0.09-98 Ø4.96}
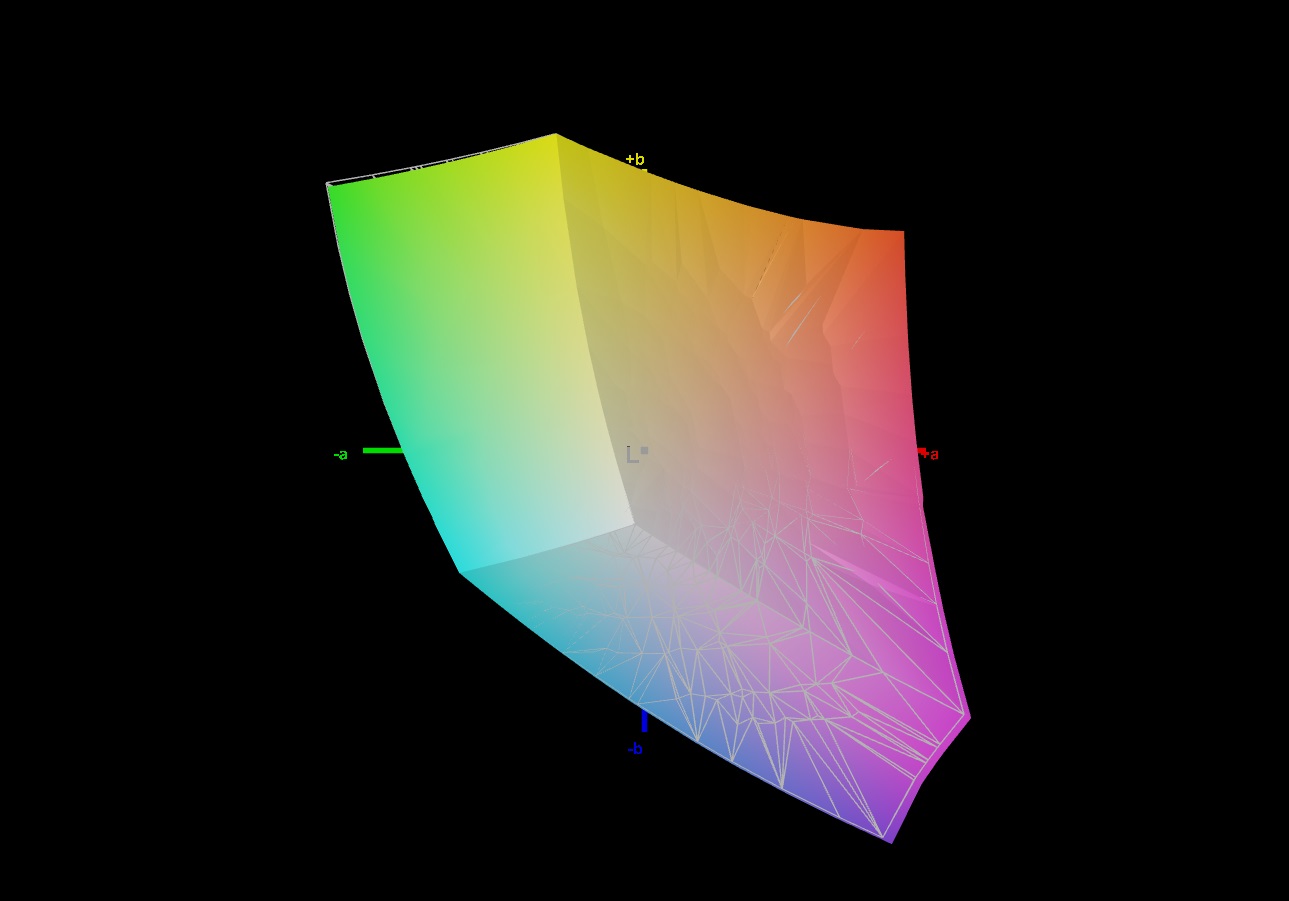
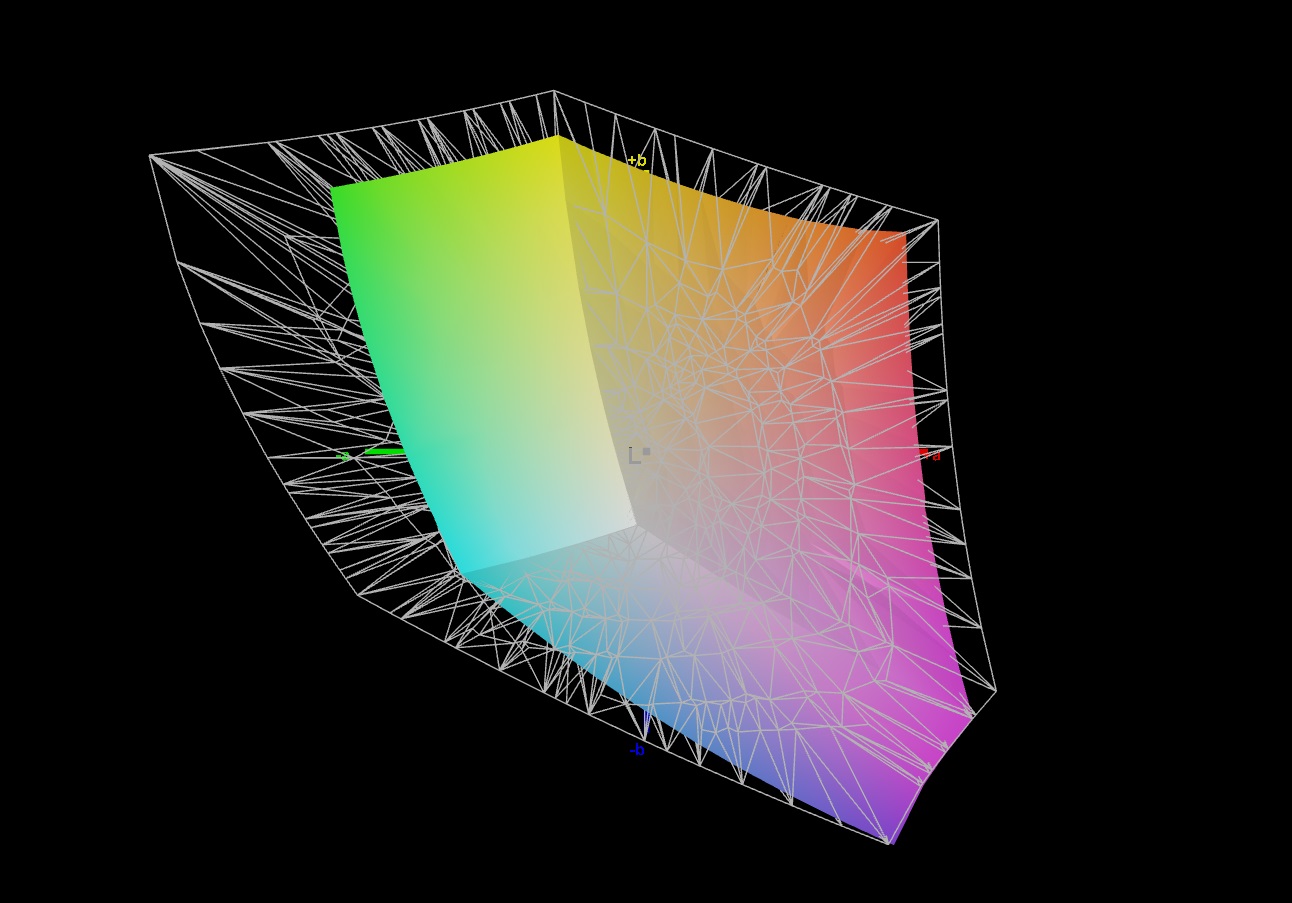
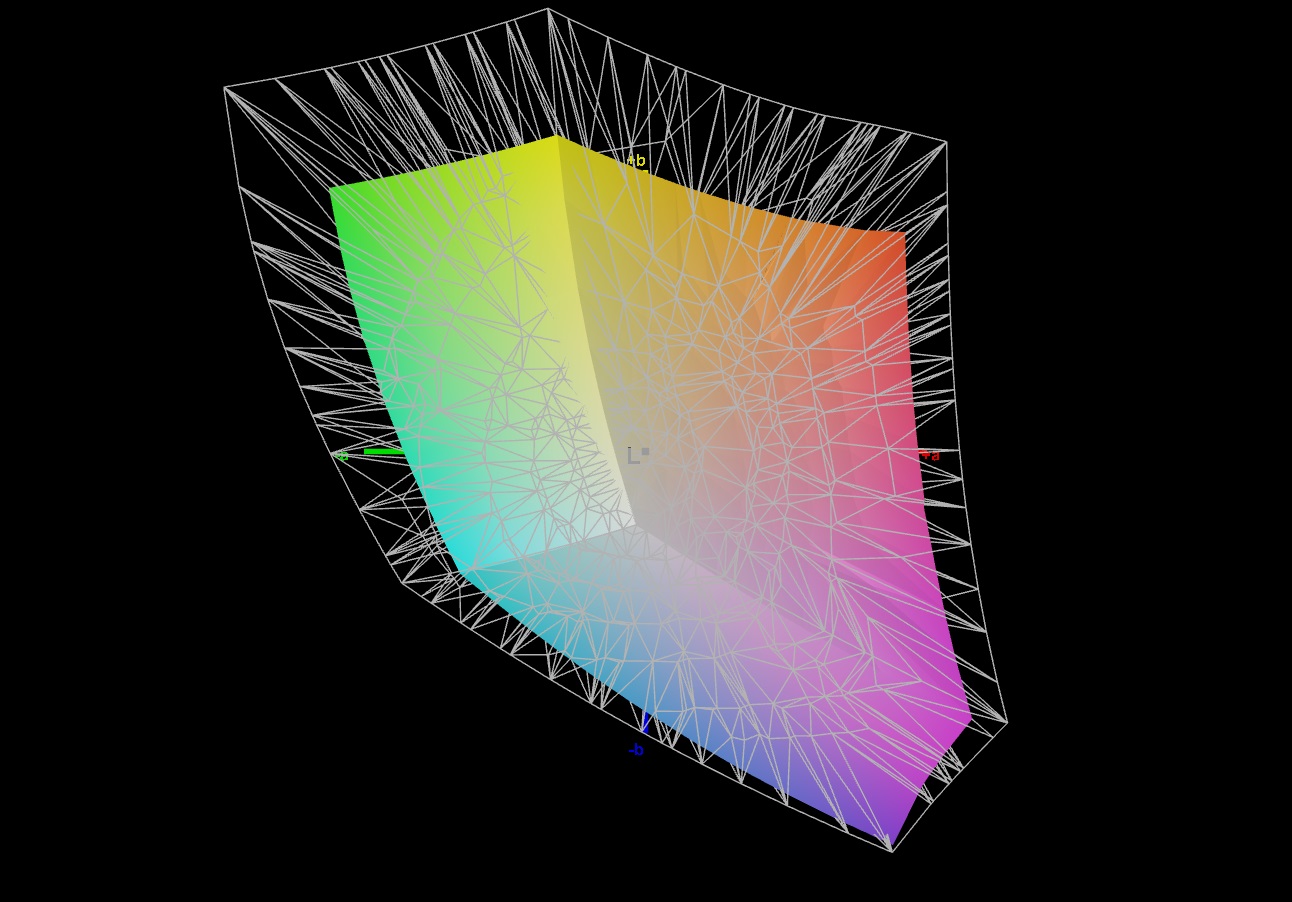
69% AdobeRGB 1998 (Argyll 3D)
99.5% sRGB (Argyll 3D)
68.1% Display P3 (Argyll 3D)
Gamma: 2.078
CCT: 6581 K
| Medion Erazer Beast X40 2024 BOE NE170QDM-NZ1, IPS, 2560x1600, 17" | Schenker Key 17 Pro (Early 23) BOE CQ NE173QUM-NY1, IPS, 3840x2160, 17.3" | Asus ROG Strix Scar 17 G733PY-XS96 NE173QHM-NZ2, IPS, 2560x1440, 17.3" | Asus ROG Strix Scar 18 G834JYR (2024) BOE NE180QDM-NM1, Mini LED, 2560x1600, 18" | MSI Titan 18 HX A14VIG AU Optronics B180ZAN01.0, Mini-LED, 3840x2400, 18" | Medion Erazer Beast X40 BOE NE170QDM-NZ1, IPS, 2560x1600, 17" | |
|---|---|---|---|---|---|---|
| Display | 21% | 23% | 26% | 23% | 1% | |
| Display P3 Coverage (%) | 68.1 | 96.4 42% | 98 44% | 99.9 47% | 98.1 44% | 68.6 1% |
| sRGB Coverage (%) | 99.5 | 99.9 0% | 100 1% | 100 1% | 99.8 0% | 99.8 0% |
| AdobeRGB 1998 Coverage (%) | 69 | 84.3 22% | 85.6 24% | 90 30% | 86.2 25% | 69.4 1% |
| Response Times | -15% | -9% | -29% | -530% | -3% | |
| Response Time Grey 50% / Grey 80% * (ms) | 11.7 ? | 14.8 ? -26% | 6.2 ? 47% | 12 ? -3% | 8.6 ? 26% | 11.3 ? 3% |
| Response Time Black / White * (ms) | 6.9 ? | 7.2 ? -4% | 11.4 ? -65% | 10.7 ? -55% | 81.8 ? -1086% | 7.5 ? -9% |
| PWM Frequency (Hz) | 5733 ? | 2592 ? | ||||
| Screen | -0% | -6% | 166% | -119% | -29% | |
| Brightness middle (cd/m²) | 422 | 487 15% | 322.5 -24% | 937 122% | 467.5 11% | 384 -9% |
| Brightness (cd/m²) | 388 | 485 25% | 317 -18% | 934 141% | 459 18% | 377 -3% |
| Brightness Distribution (%) | 87 | 87 0% | 86 -1% | 89 2% | 90 3% | 90 3% |
| Black Level * (cd/m²) | 0.42 | 0.51 -21% | 0.29 31% | 0.066 84% | 0.45 -7% | |
| Contrast (:1) | 1005 | 955 -5% | 1112 11% | 14197 1313% | 853 -15% | |
| Colorchecker dE 2000 * | 1.42 | 1.51 -6% | 1.15 19% | 1.52 -7% | 3.77 -165% | 2.05 -44% |
| Colorchecker dE 2000 max. * | 1.97 | 2.19 -11% | 3.03 -54% | 2.82 -43% | 6.12 -211% | 3.64 -85% |
| Colorchecker dE 2000 calibrated * | 0.7 | 0.56 20% | 1.21 -73% | 2.94 -320% | 0.74 -6% | |
| Greyscale dE 2000 * | 1.2 | 1.2 -0% | 1.7 -42% | 1.7 -42% | 3.2 -167% | 2.3 -92% |
| Gamma | 2.078 106% | 2.273 97% | 2.27 97% | 2.042 108% | 2.43 91% | 2.017 109% |
| CCT | 6581 99% | 6451 101% | 6299 103% | 6578 99% | 6478 100% | 6546 99% |
| Média Total (Programa/Configurações) | 2% /
2% | 3% /
-1% | 54% /
108% | -209% /
-152% | -10% /
-19% |
* ... menor é melhor
A tela mostra uma boa representação de cores ex works: Com um desvio de cerca de 1,4, a meta (DeltaE < 3) é atingida. A calibração reduz o desvio para 0,7 e garante escalas de cinza mais equilibradas.
O painel pode reproduzir completamente o espaço de cores sRGB, mas não os espaços de cores AdobeRGB e DCI P3. Os monitores dos concorrentes oferecem mais aqui.

Exibir tempos de resposta
| ↔ Tempo de resposta preto para branco | ||
|---|---|---|
| 6.9 ms ... ascensão ↗ e queda ↘ combinadas | ↗ 2.8 ms ascensão | 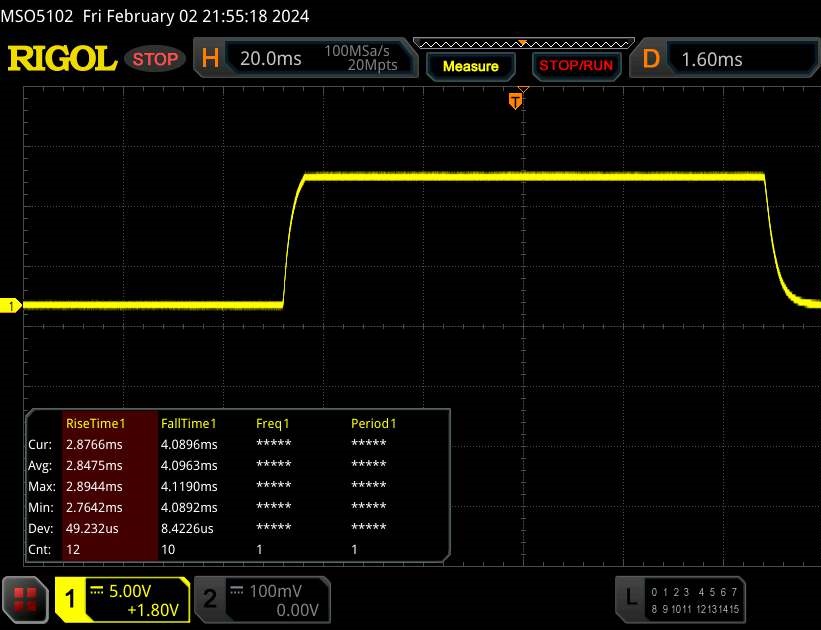 |
| ↘ 4.1 ms queda | ||
| A tela mostra taxas de resposta muito rápidas em nossos testes e deve ser muito adequada para jogos em ritmo acelerado. Em comparação, todos os dispositivos testados variam de 0.1 (mínimo) a 240 (máximo) ms. » 21 % de todos os dispositivos são melhores. Isso significa que o tempo de resposta medido é melhor que a média de todos os dispositivos testados (19.8 ms). | ||
| ↔ Tempo de resposta 50% cinza a 80% cinza | ||
| 11.7 ms ... ascensão ↗ e queda ↘ combinadas | ↗ 5.7 ms ascensão | 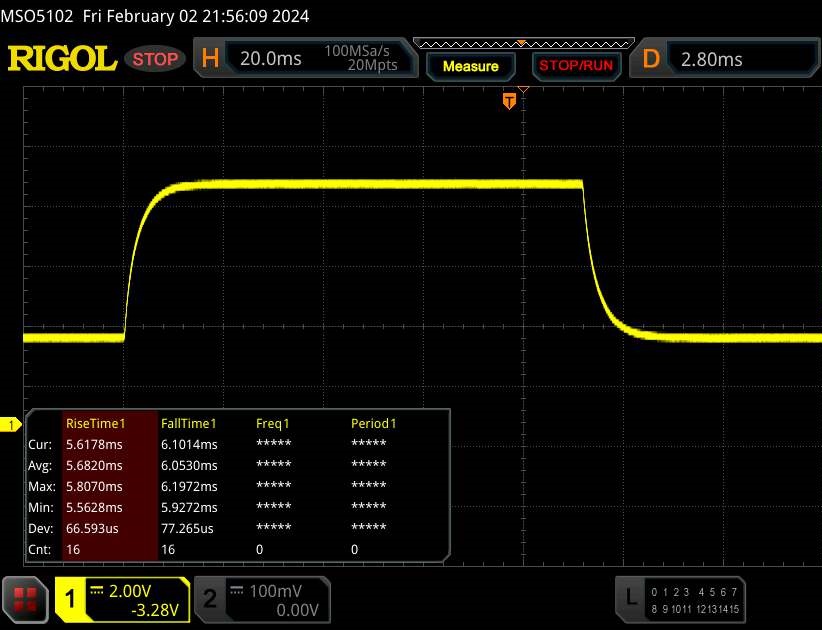 |
| ↘ 6 ms queda | ||
| A tela mostra boas taxas de resposta em nossos testes, mas pode ser muito lenta para jogadores competitivos. Em comparação, todos os dispositivos testados variam de 0.165 (mínimo) a 636 (máximo) ms. » 25 % de todos os dispositivos são melhores. Isso significa que o tempo de resposta medido é melhor que a média de todos os dispositivos testados (31 ms). | ||
Cintilação da tela / PWM (modulação por largura de pulso)
| Tela tremeluzindo / PWM não detectado | 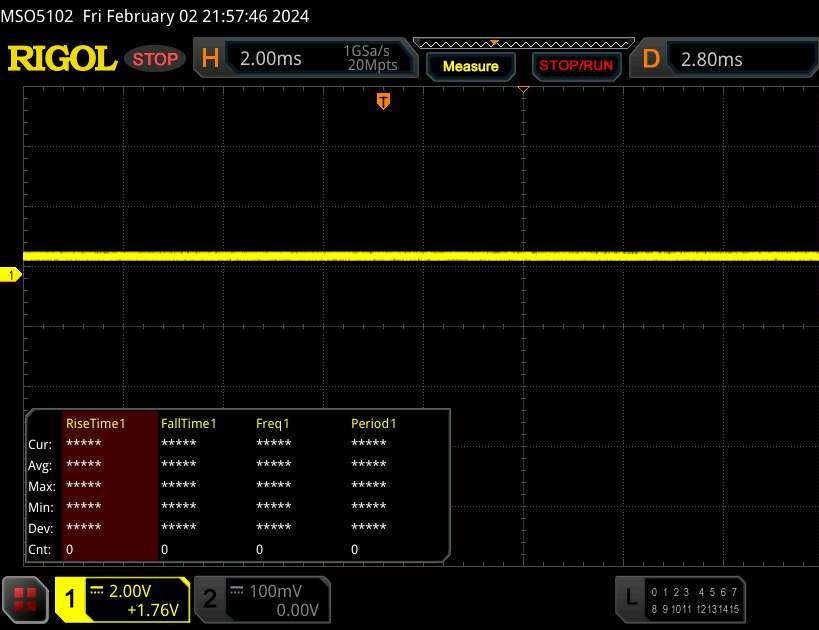 | ||
[pwm_comparison] Em comparação: 52 % de todos os dispositivos testados não usam PWM para escurecer a tela. Se PWM foi detectado, uma média de 7747 (mínimo: 5 - máximo: 343500) Hz foi medida. | |||
O painel IPS com ângulo de visão estável pode ser lido de qualquer posição. É possível ler a tela em ambientes externos se o sol não estiver muito forte.
Desempenho: O Medion Beast X40 vem com hardware de ponta
O notebook high-end da Medion é excelente em todas as áreas de aplicativos que exigem muito desempenho (por exemplo, jogos, renderização). O poder de computação necessário é fornecido pelo Raptor Lake e Ada Lovelace. Esse modelo X40 está disponível por cerca de 4.000 euros. Versões mais baratas estão disponíveis a partir de 2.500 euros. Como acessório opcional, a Medion oferece um sistema de resfriamento a água (aprox. 200 euros), o que pode resultar em um pequeno aumento no desempenho e em emissões mais baixas.
Condições de teste
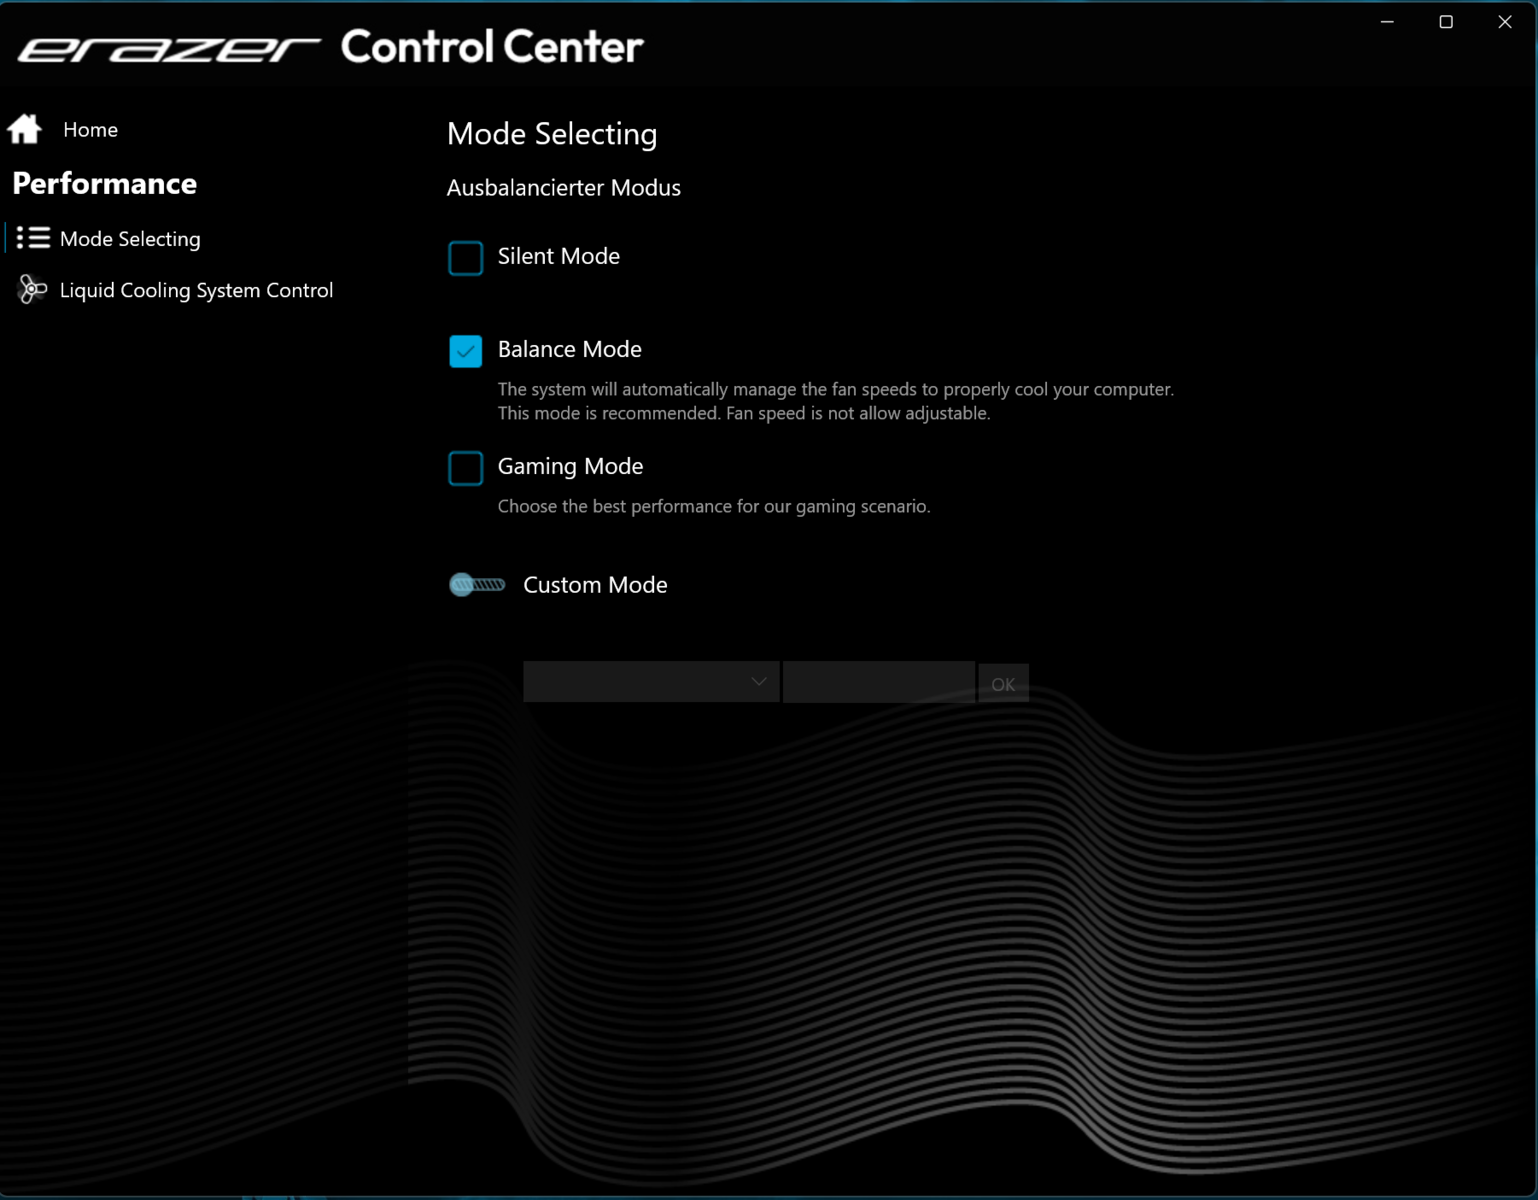
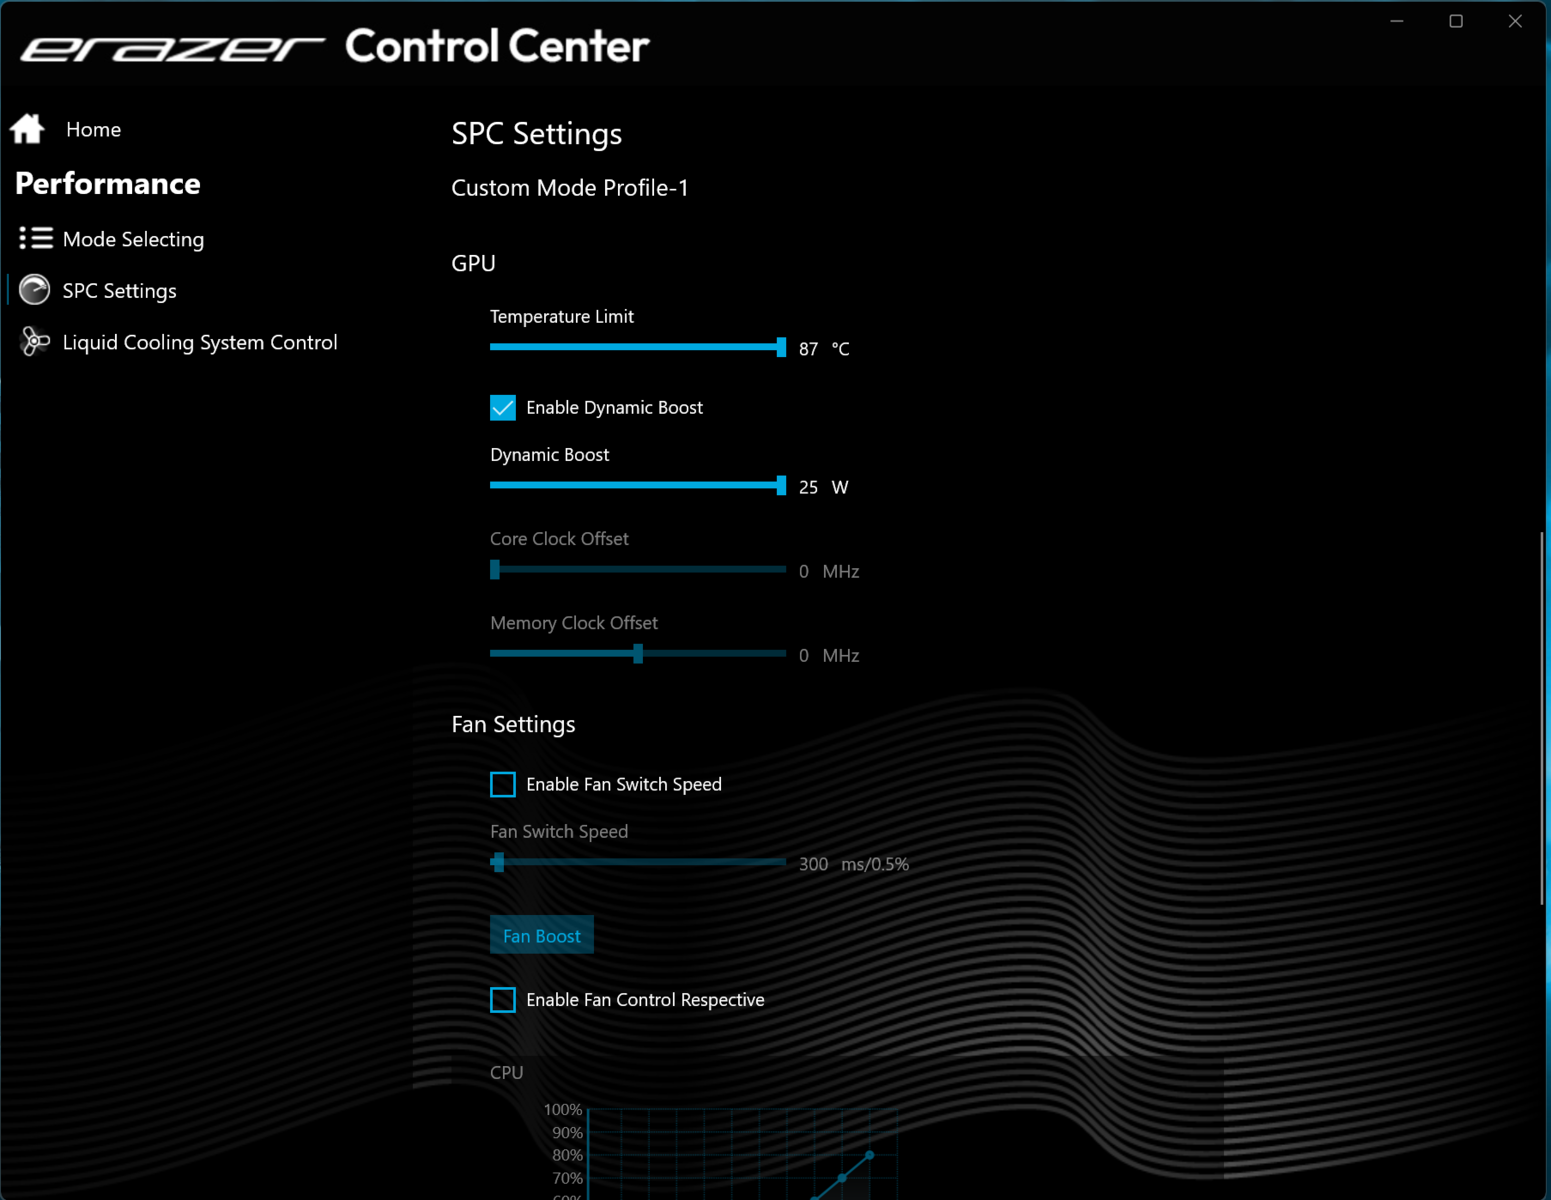
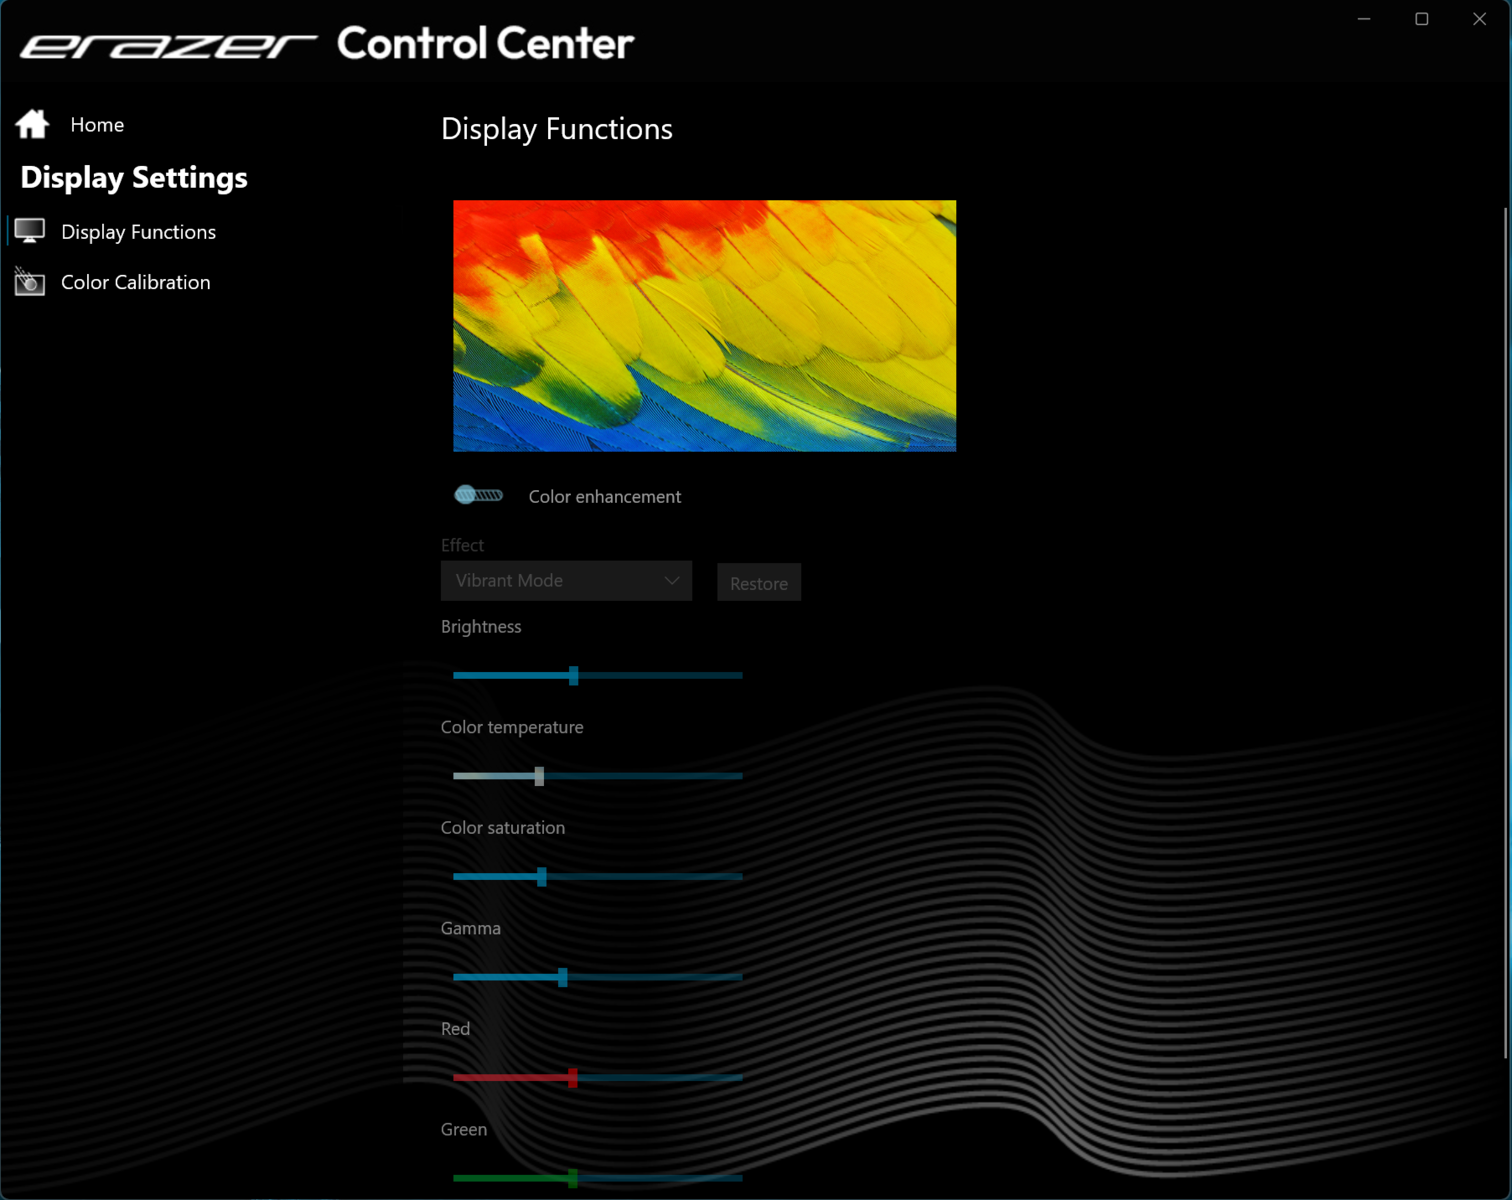
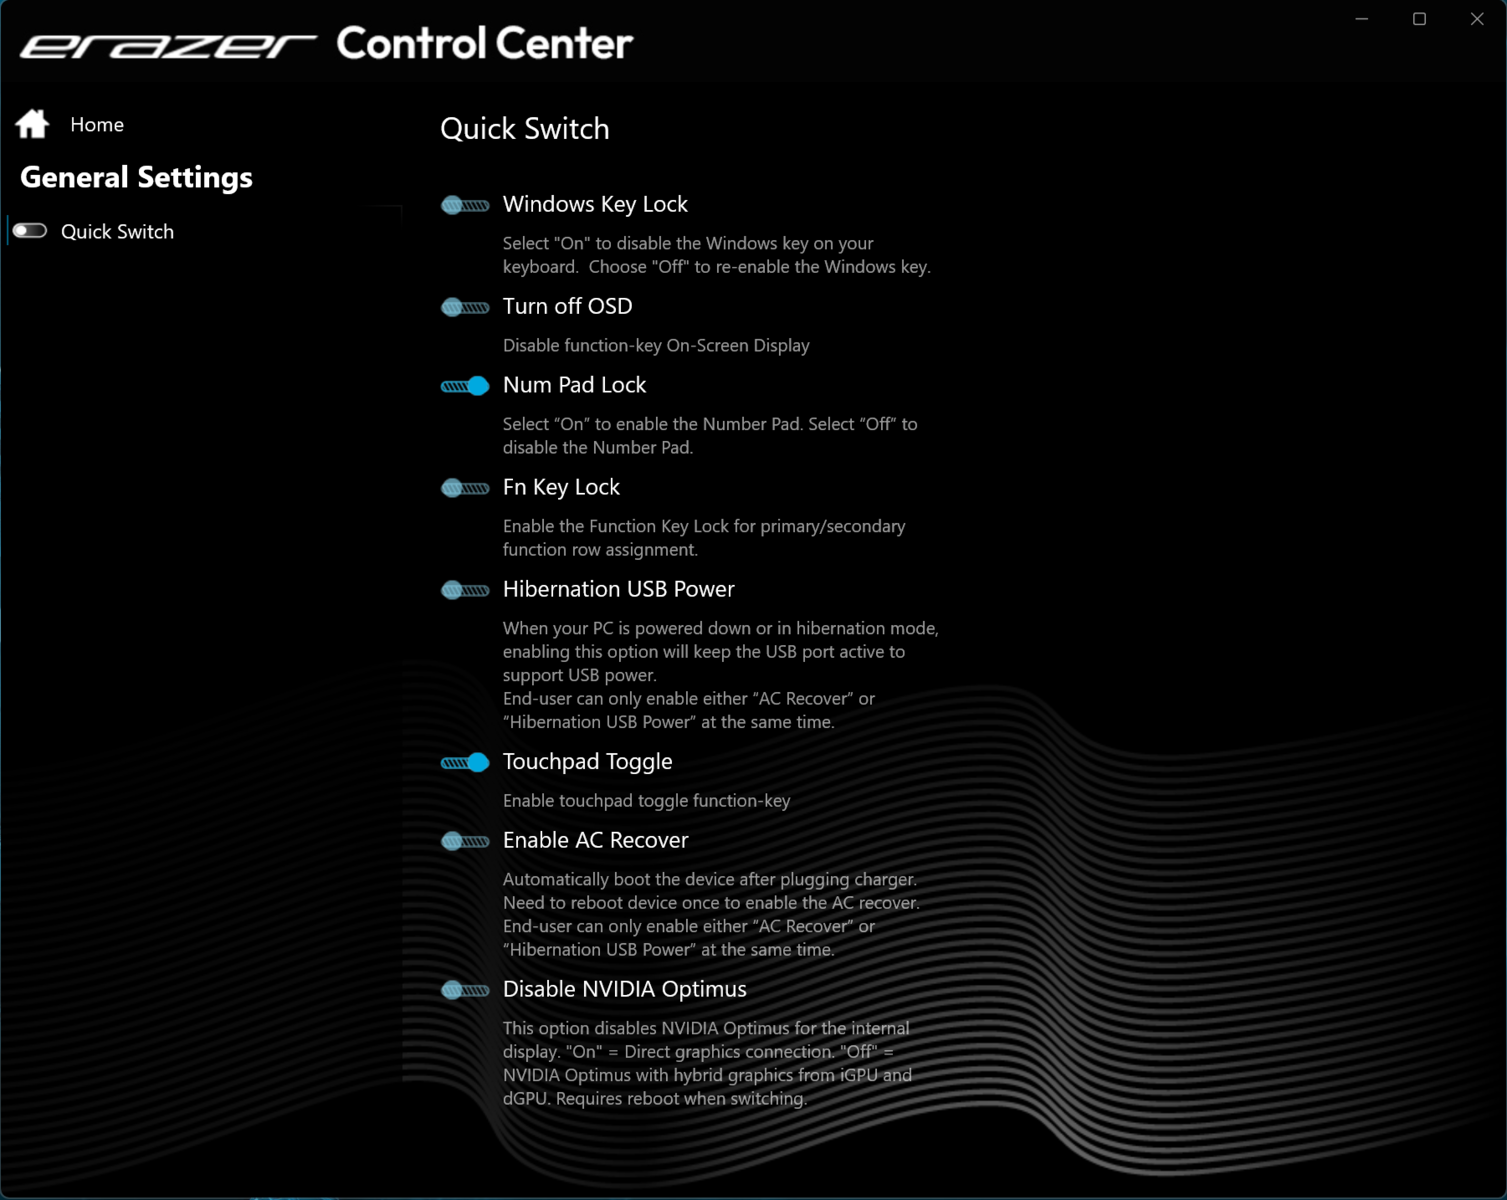
Uma tecla dedicada ao lado do botão liga/desliga permite alternar rapidamente entre os três modos de desempenho específicos do fabricante (consulte a tabela abaixo). Foram usados os modos "Balance Mode" (benchmarks) e "Silent Mode" (testes de bateria).
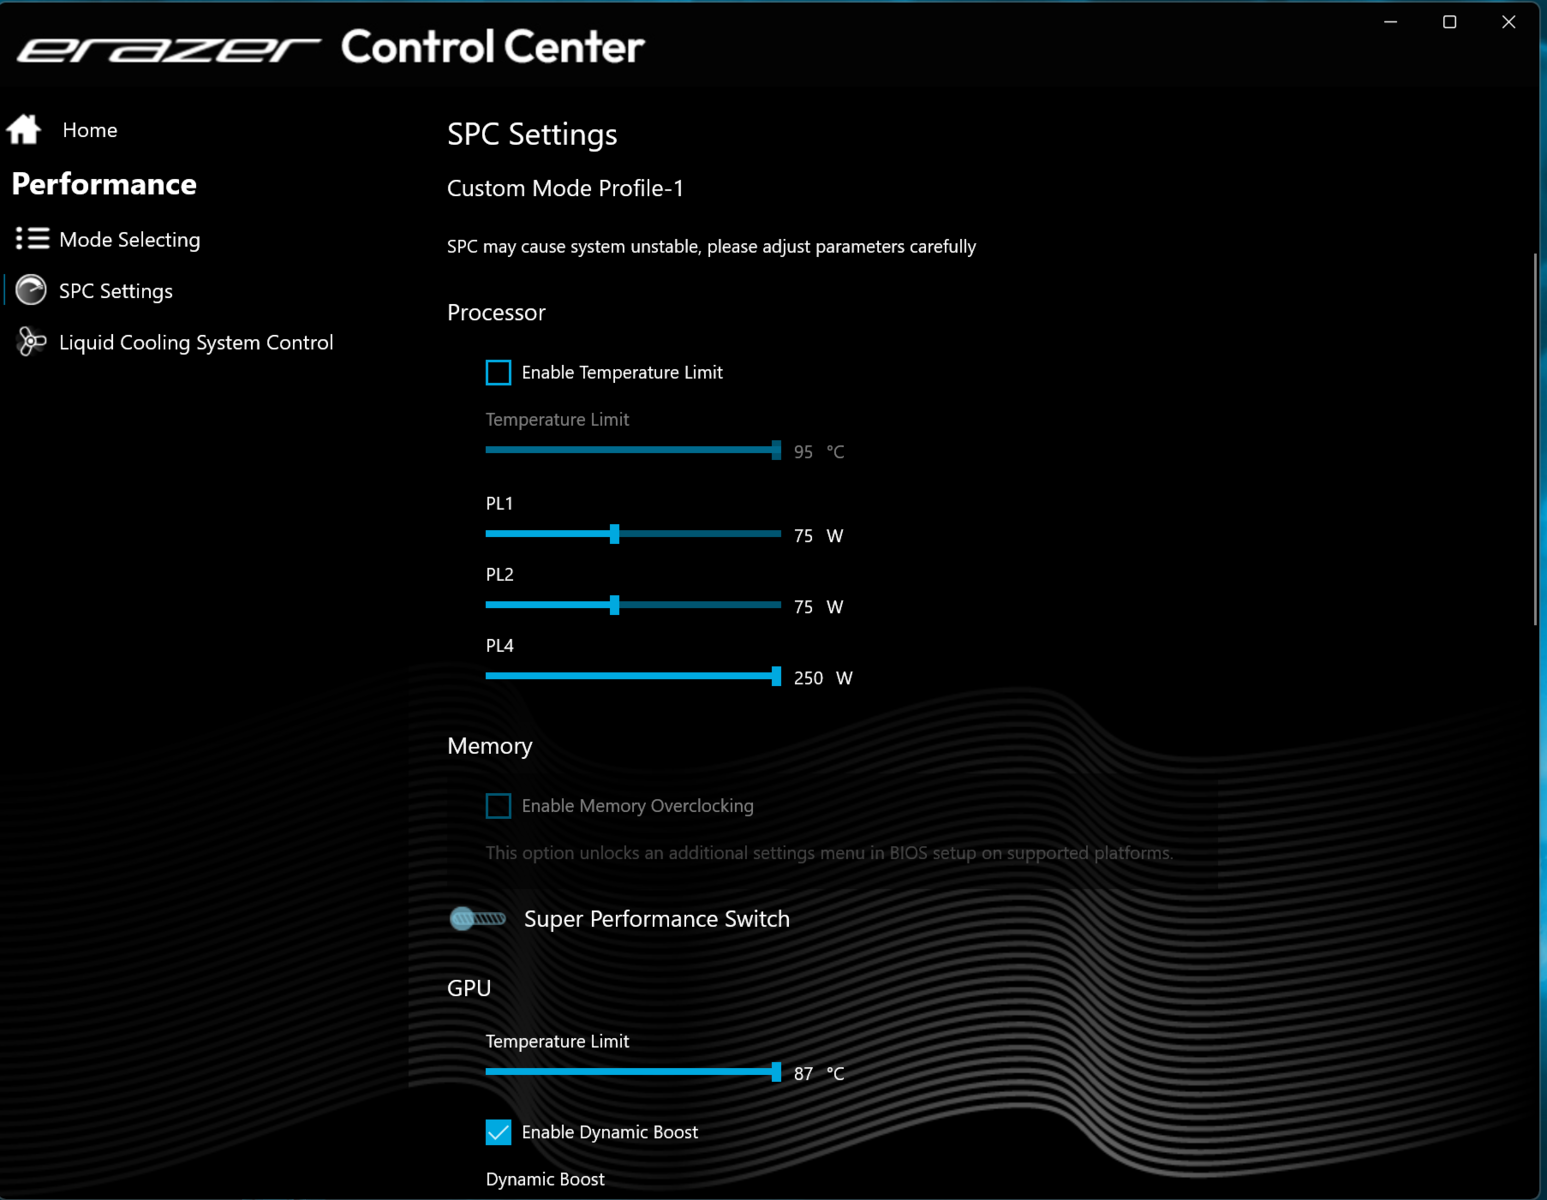
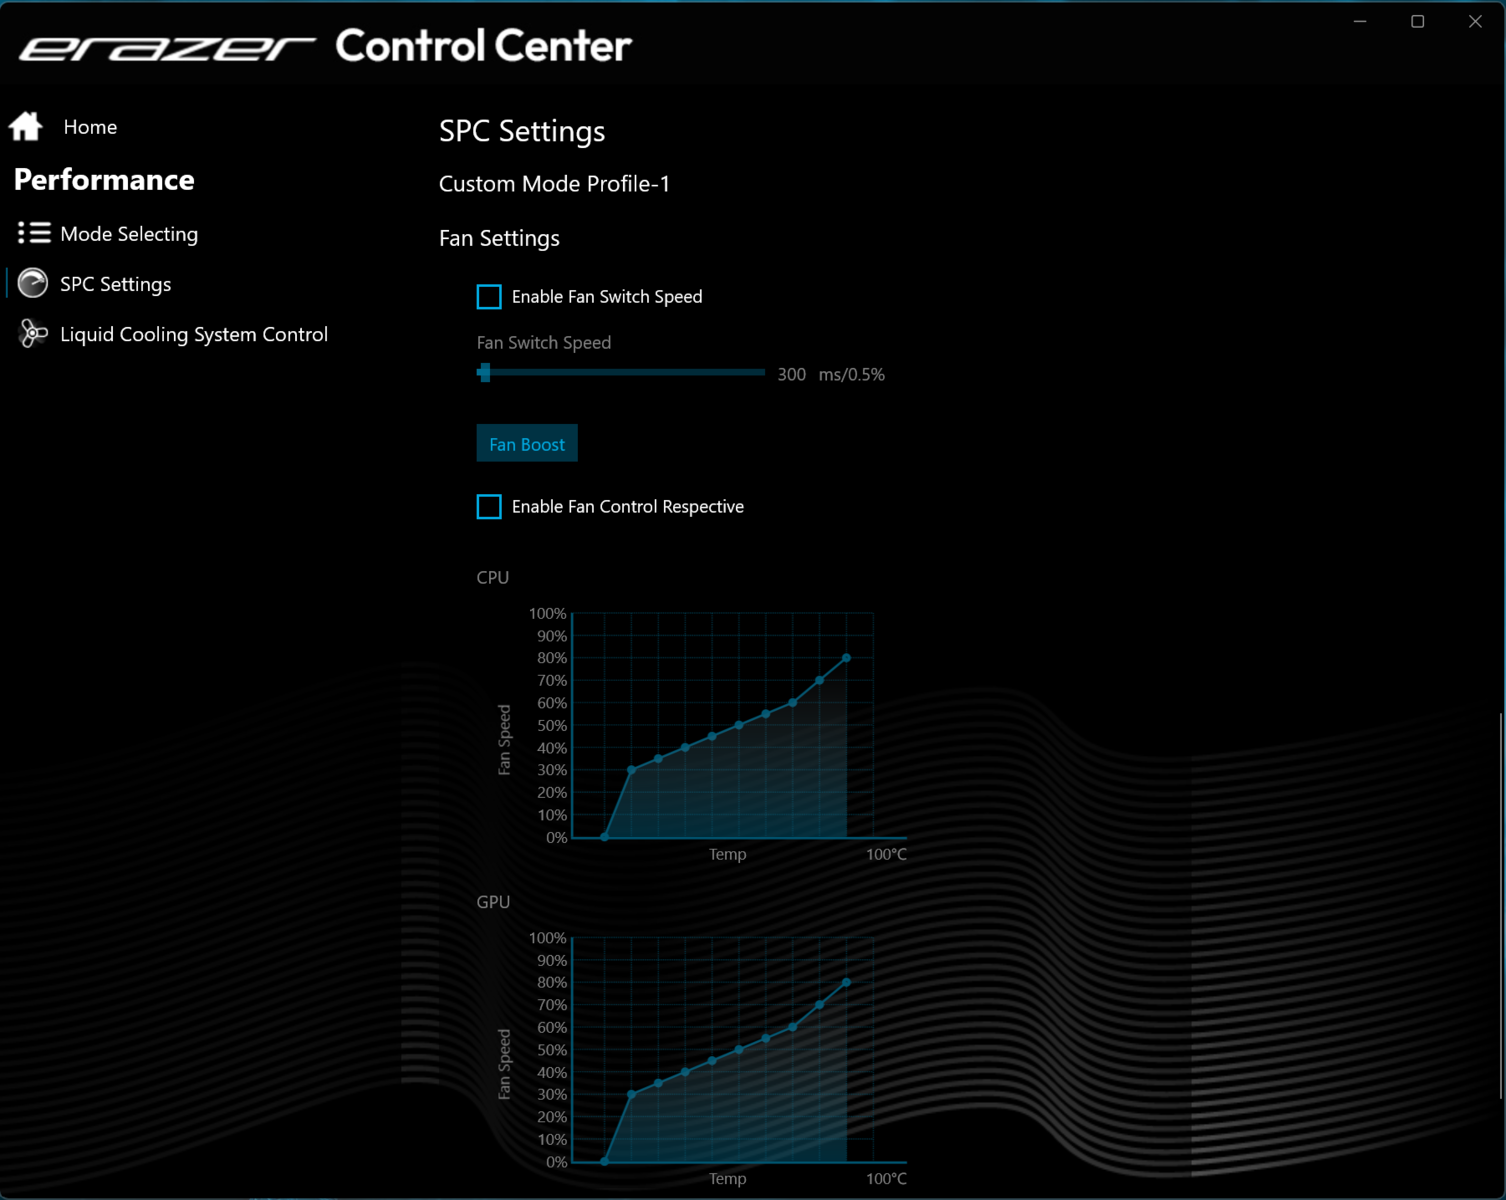
Perfis individuais podem ser criados usando o software Control Center pré-instalado, no qual os limites de energia da CPU, o TGP da GPU e/ou os limites superiores de temperatura podem ser ajustados.
| Modo de jogo | Modo de equilíbrio | Modo silencioso | |
|---|---|---|---|
| Limite de potência 1 (HWInfo) | 160 watts | 160 watts | 160 watts |
| Limite de potência 2 (HWInfo) | 160 Watt | 160 Watt | 160 Watt |
| Ruído (Witcher 3) | 52 dB(A) | 50 dB(A) | 34 dB(A) |
| Desempenho (Witcher 3) | ~214 fps | ~204 fps | 30 fps (bloqueado) |
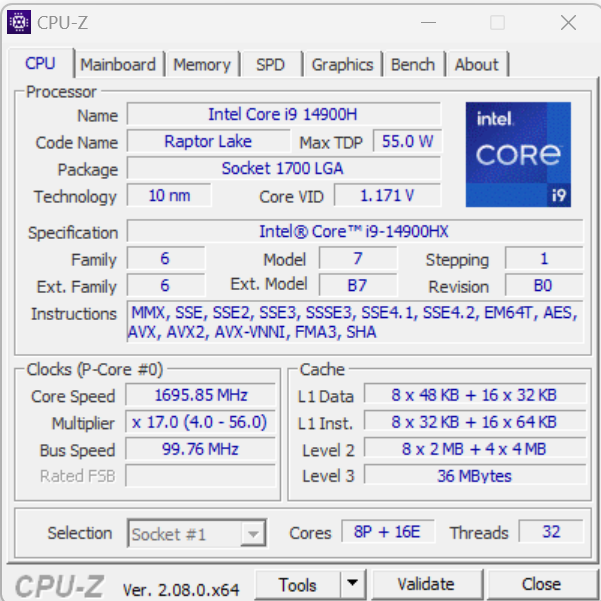
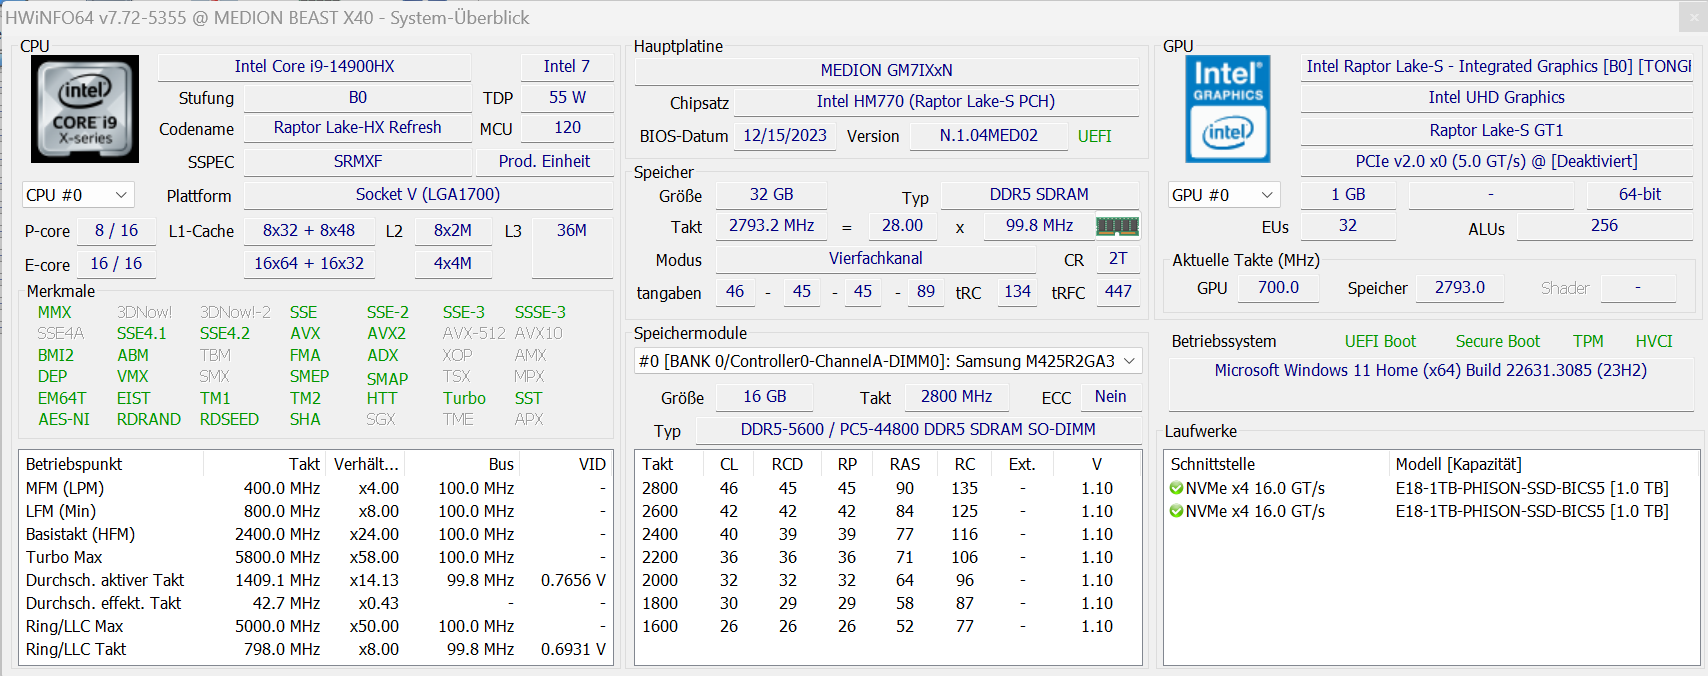
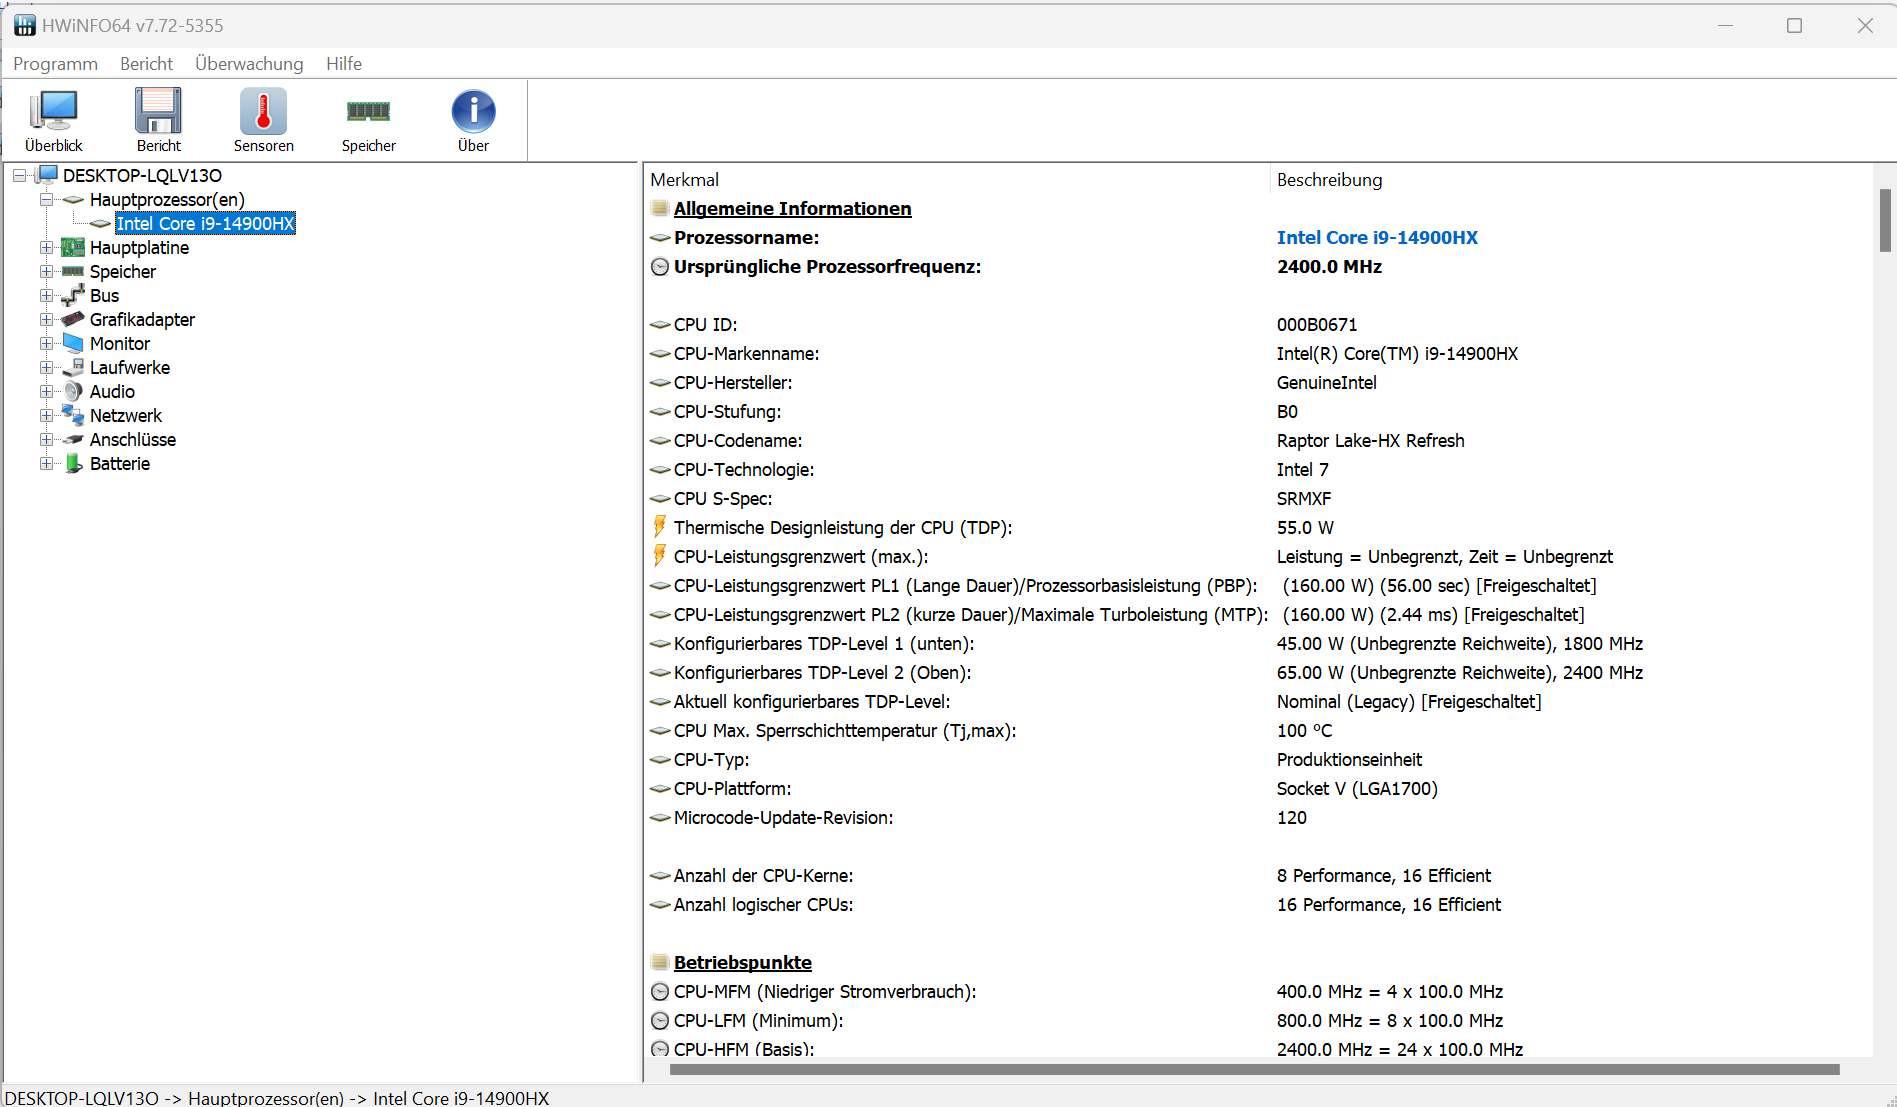
Processador
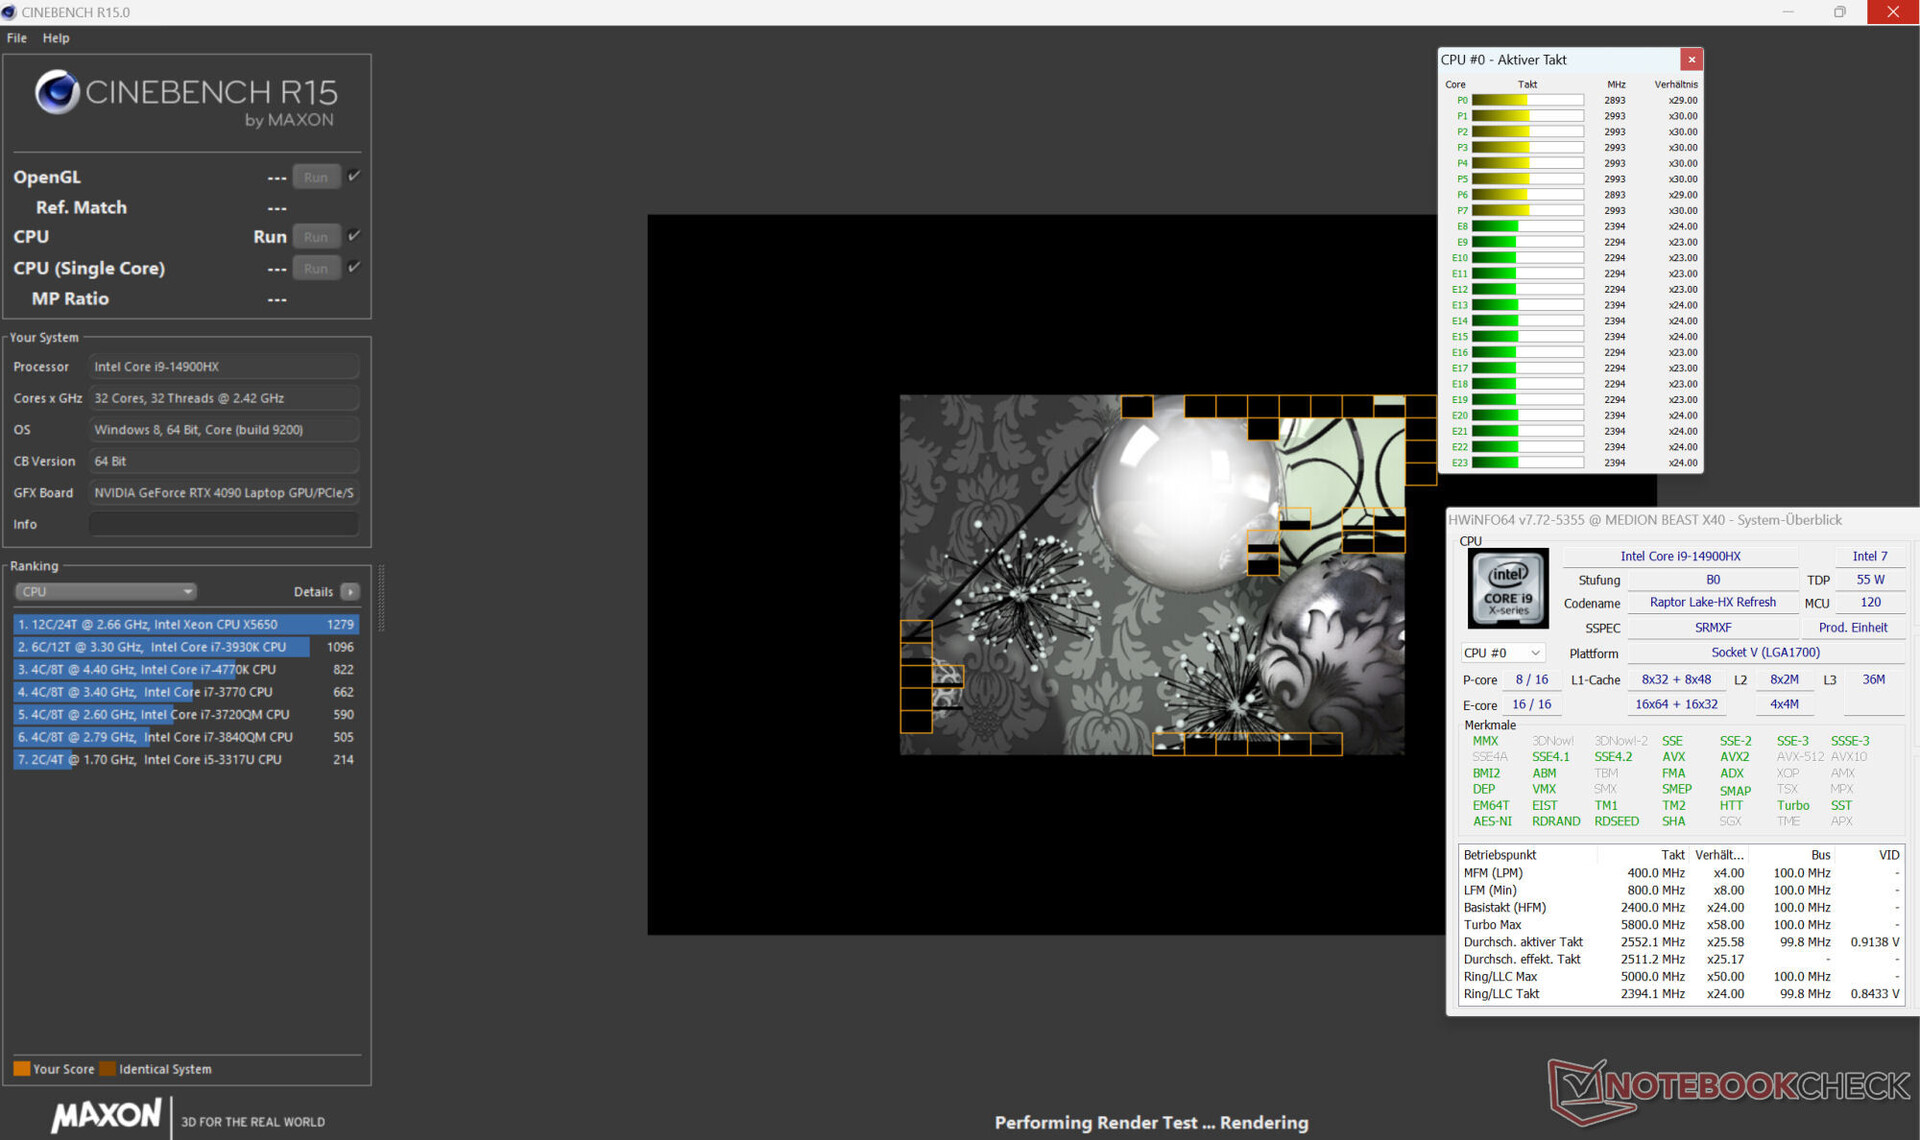
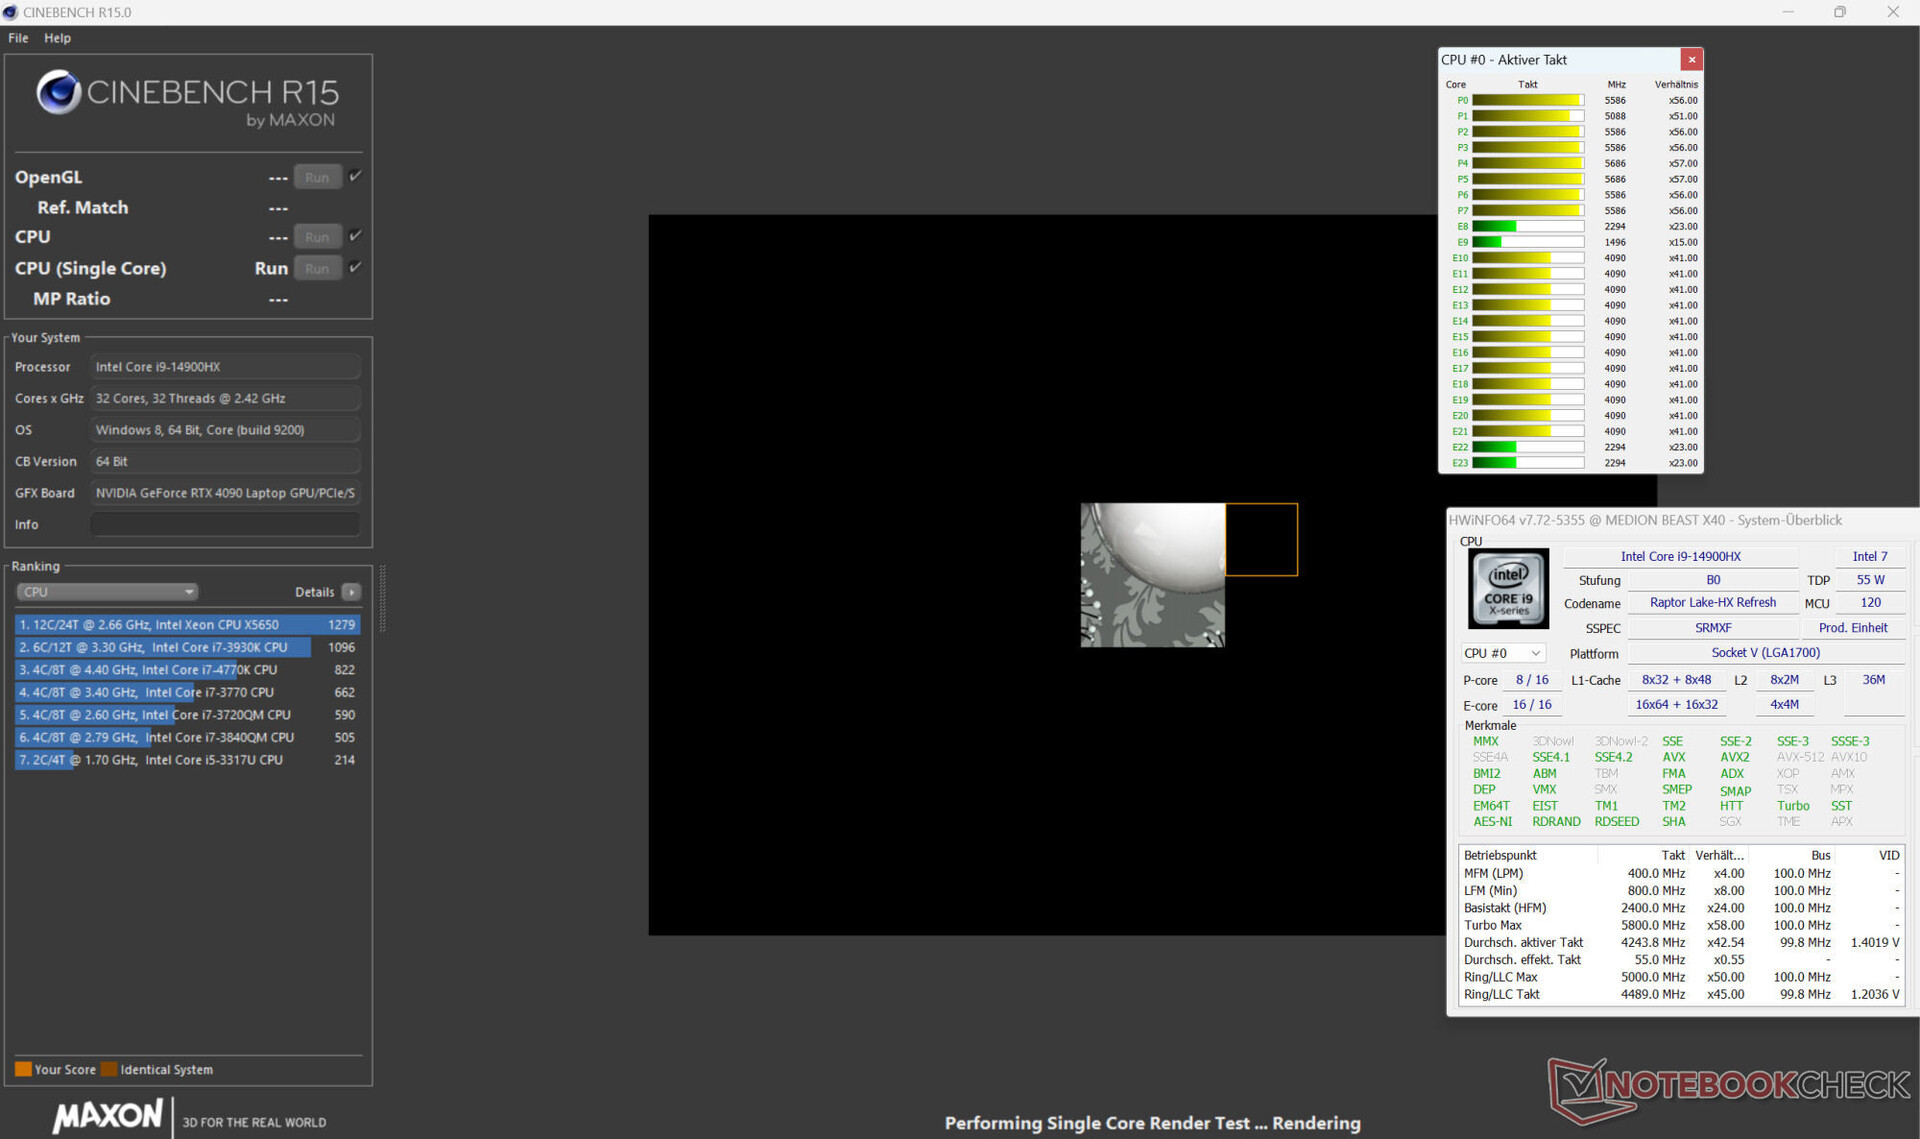
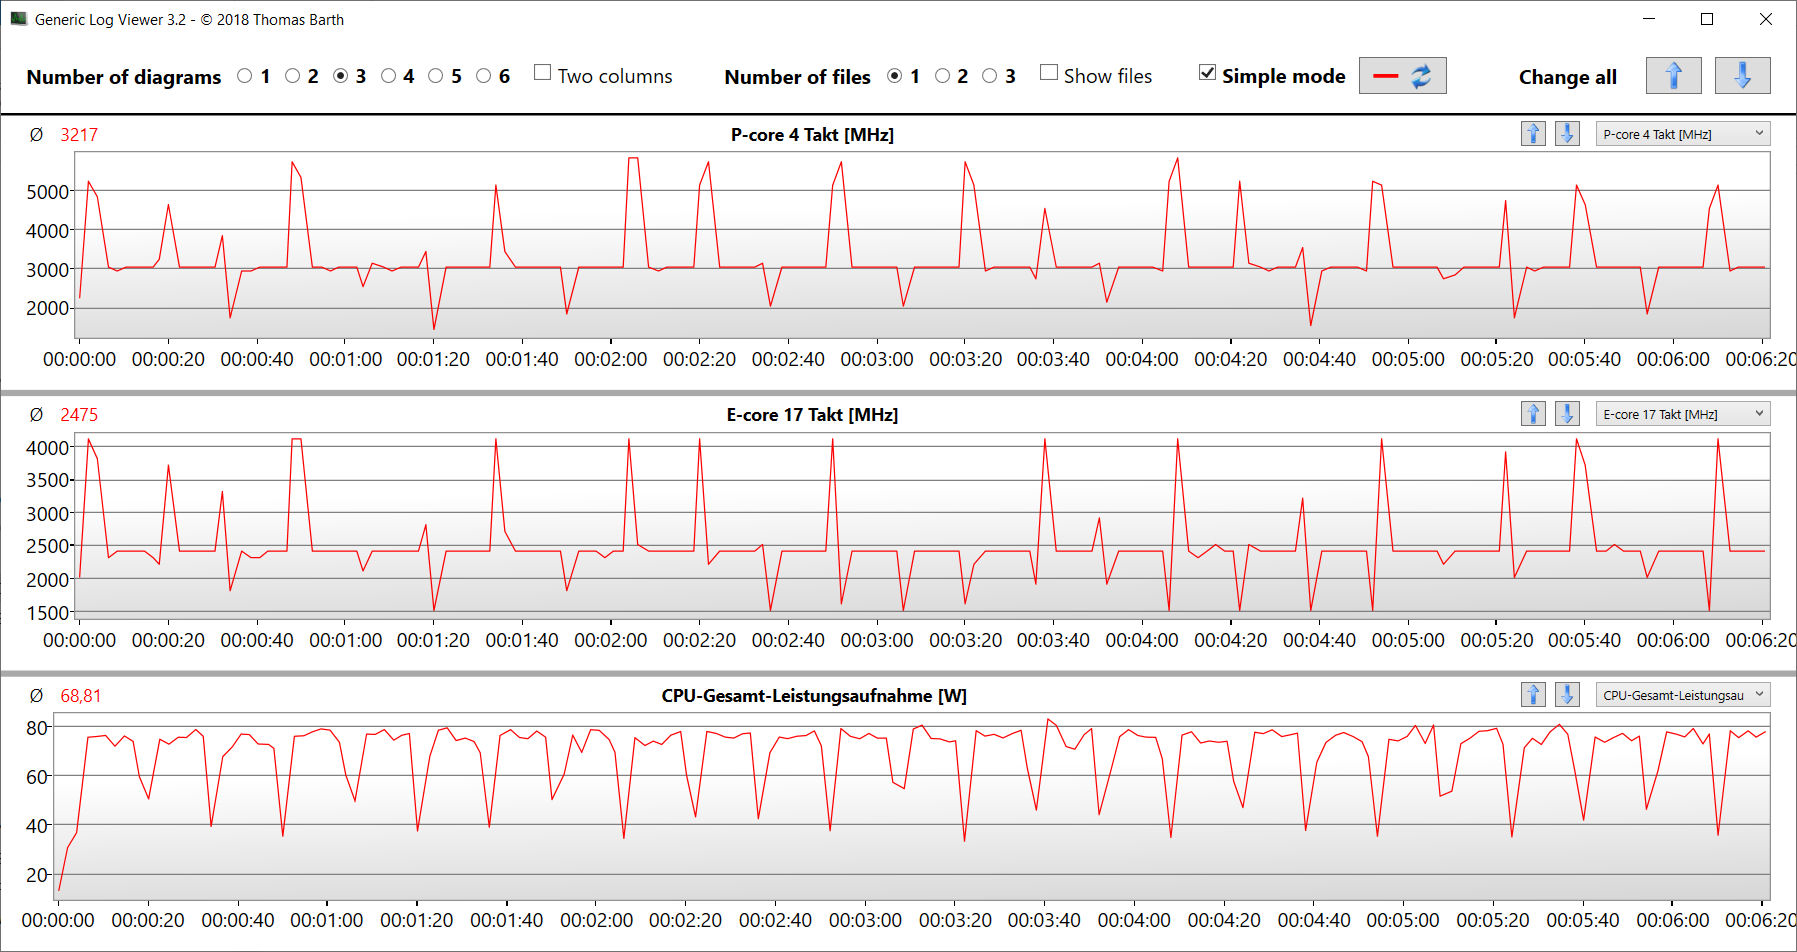
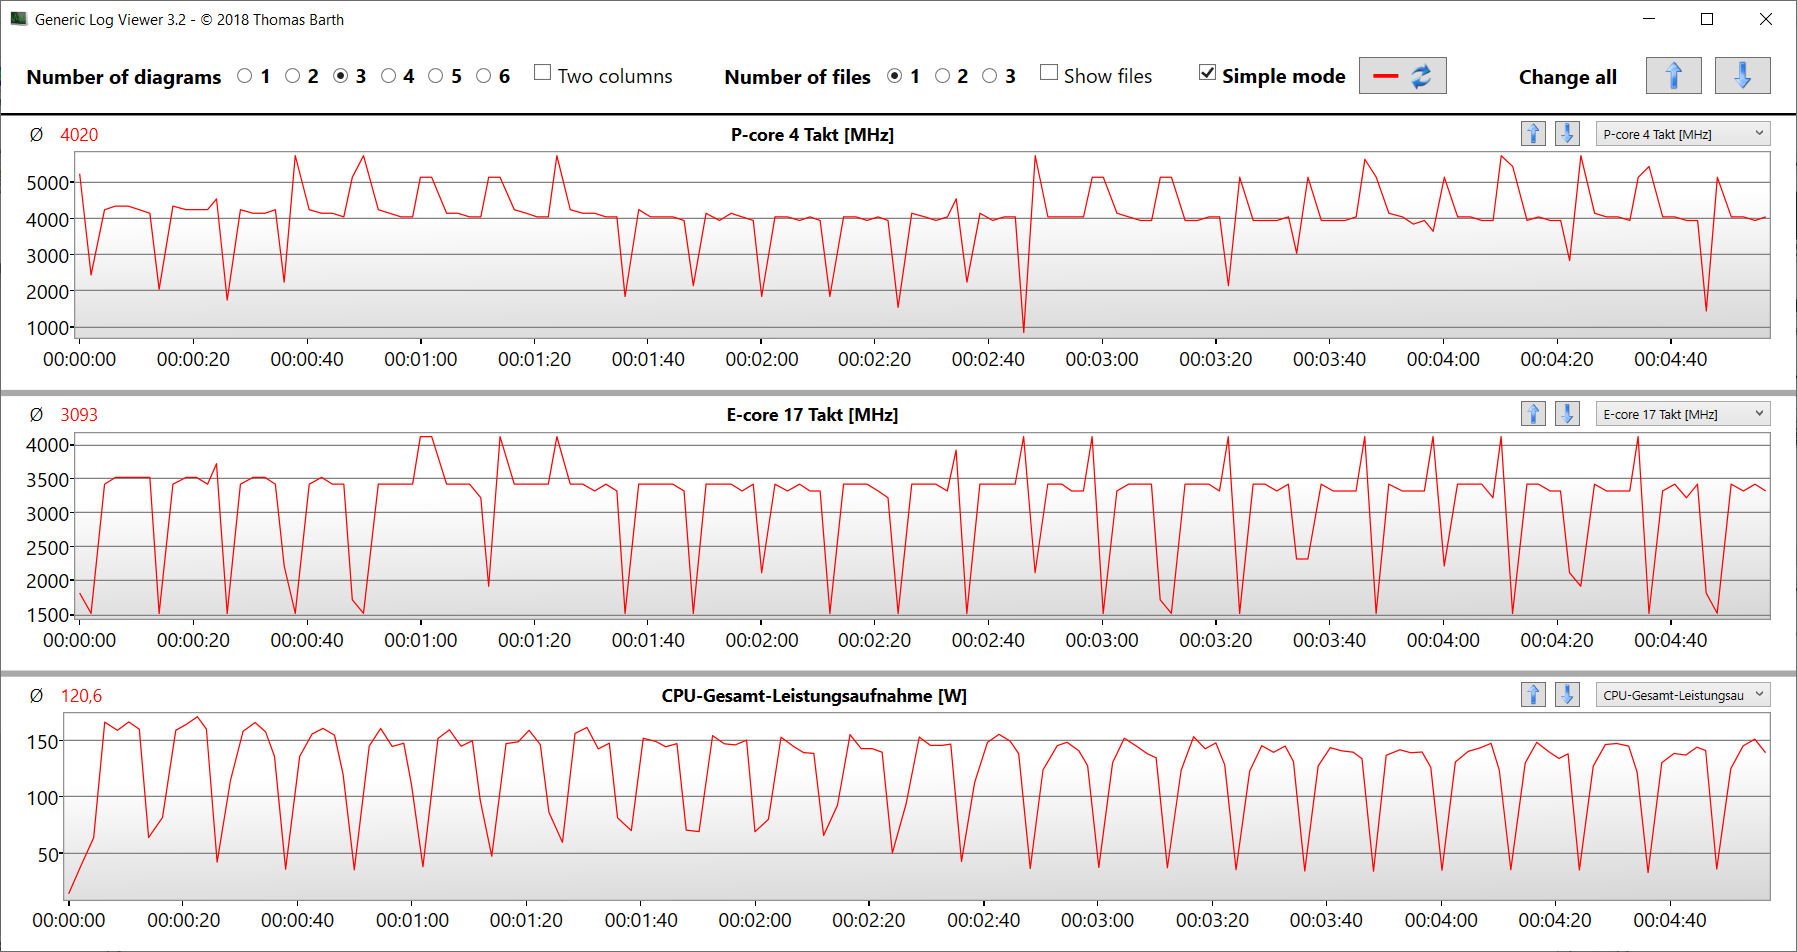
Os 24 núcleos de CPU (8P + 16E e 32 threads) do Raptor Lake-HX Core i9-14900HX atingem velocidades máximas de clock de 5,8 GHz (núcleo P) e 4,1 GHz (núcleo E). Graças às taxas de clock ligeiramente mais altas, a CPU oferece um pouco mais de desempenho do que a CPU do 2023 Beast X40 antecessor com um Core i9-13900HX.
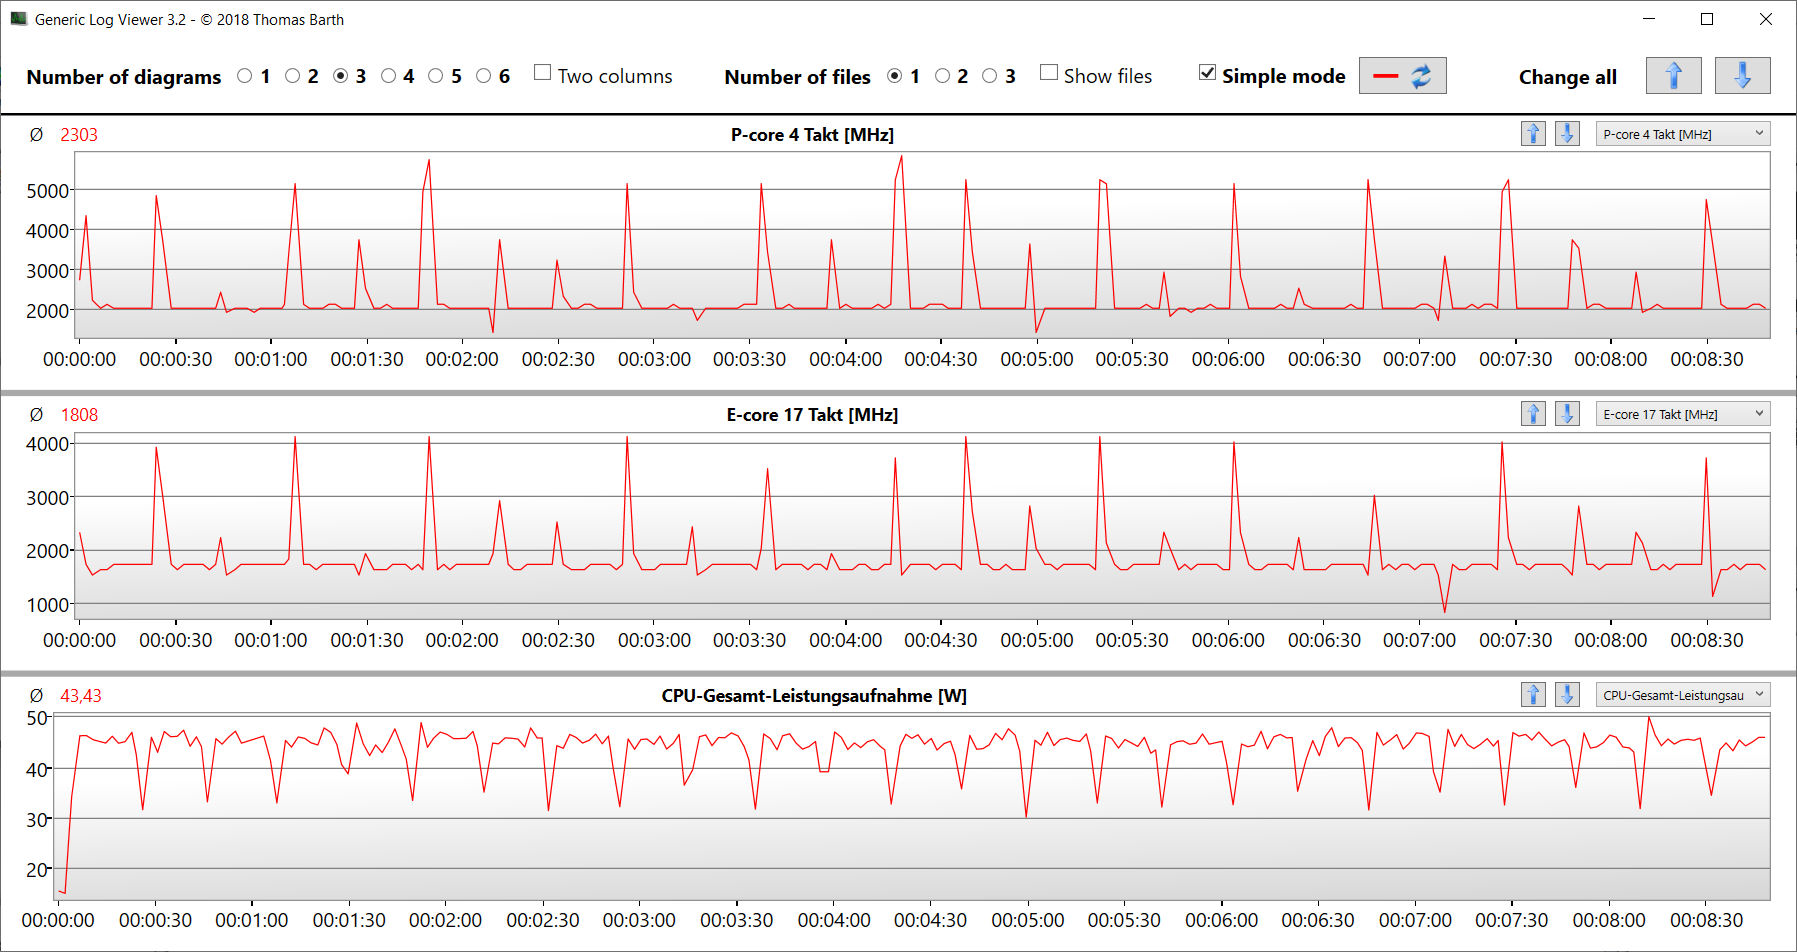
A carga contínua de vários threads (loop CB15) é reconhecida com uma taxa de clock constante - o nível depende do modo de energia. o "Balance Mode" fornece valores de benchmark abaixo da média da CPU, enquanto o "Gaming Mode" os eleva acima dela. O desempenho de thread único é diferente: ele está em um nível alto e quase idêntico em todos os três perfis.
Mais informações sobre o Core i9-14900HX podem ser encontradas em nosso artigo de análise Análise da atualização do Intel Raptor Lake-HX - Core i9-14900HX com mais desempenho de núcleo único .
Cinebench R15 Multi Dauertest
| CPU Performance rating - Percent | |
| Asus ROG Strix Scar 17 G733PYV-LL053X | |
| Medion Erazer Beast X40 2024 | |
| MSI Titan 18 HX A14VIG | |
| Asus ROG Strix Scar 18 G834JYR (2024) | |
| Média Intel Core i9-14900HX | |
| Medion Erazer Beast X40 -2! | |
| Schenker Key 17 Pro (Early 23) -2! | |
| Medion Erazer Beast X40 2024 | |
| Média da turma Gaming | |
| Cinebench R20 | |
| CPU (Multi Core) | |
| Asus ROG Strix Scar 17 G733PYV-LL053X | |
| MSI Titan 18 HX A14VIG | |
| Medion Erazer Beast X40 2024 (Gaming Mode) | |
| Medion Erazer Beast X40 | |
| Média Intel Core i9-14900HX (6579 - 13832, n=37) | |
| Asus ROG Strix Scar 18 G834JYR (2024) | |
| Schenker Key 17 Pro (Early 23) | |
| Média da turma Gaming (4029 - 16433, n=106, últimos 2 anos) | |
| Medion Erazer Beast X40 2024 | |
| CPU (Single Core) | |
| Medion Erazer Beast X40 2024 | |
| Asus ROG Strix Scar 18 G834JYR (2024) | |
| Medion Erazer Beast X40 2024 (Gaming Mode) | |
| Média Intel Core i9-14900HX (657 - 859, n=37) | |
| MSI Titan 18 HX A14VIG | |
| Schenker Key 17 Pro (Early 23) | |
| Medion Erazer Beast X40 | |
| Média da turma Gaming (442 - 913, n=106, últimos 2 anos) | |
| Asus ROG Strix Scar 17 G733PYV-LL053X | |
| Cinebench R15 | |
| CPU Multi 64Bit | |
| Asus ROG Strix Scar 17 G733PYV-LL053X | |
| Medion Erazer Beast X40 | |
| MSI Titan 18 HX A14VIG | |
| Medion Erazer Beast X40 2024 (Gaming Mode) | |
| Média Intel Core i9-14900HX (3263 - 5589, n=38) | |
| Schenker Key 17 Pro (Early 23) | |
| Asus ROG Strix Scar 18 G834JYR (2024) | |
| Média da turma Gaming (1578 - 6330, n=105, últimos 2 anos) | |
| Medion Erazer Beast X40 2024 | |
| CPU Single 64Bit | |
| Medion Erazer Beast X40 2024 (Gaming Mode) | |
| Medion Erazer Beast X40 2024 | |
| Asus ROG Strix Scar 17 G733PYV-LL053X | |
| Média Intel Core i9-14900HX (247 - 323, n=37) | |
| Asus ROG Strix Scar 18 G834JYR (2024) | |
| MSI Titan 18 HX A14VIG | |
| Medion Erazer Beast X40 | |
| Média da turma Gaming (188.8 - 350, n=106, últimos 2 anos) | |
| Schenker Key 17 Pro (Early 23) | |
| Blender - v2.79 BMW27 CPU | |
| Média da turma Gaming (79 - 330, n=104, últimos 2 anos) | |
| Medion Erazer Beast X40 2024 | |
| Média Intel Core i9-14900HX (91 - 206, n=37) | |
| Schenker Key 17 Pro (Early 23) | |
| Asus ROG Strix Scar 18 G834JYR (2024) | |
| Medion Erazer Beast X40 2024 (Gaming Mode) | |
| Medion Erazer Beast X40 | |
| MSI Titan 18 HX A14VIG | |
| Asus ROG Strix Scar 17 G733PYV-LL053X | |
| Geekbench 6.7 | |
| Multi-Core | |
| Medion Erazer Beast X40 2024 (6.2.1, Gaming Mode) | |
| Asus ROG Strix Scar 18 G834JYR (2024) (6.2.1) | |
| Média Intel Core i9-14900HX (13158 - 19665, n=37) | |
| Asus ROG Strix Scar 17 G733PYV-LL053X | |
| MSI Titan 18 HX A14VIG (6.2.1) | |
| Média da turma Gaming (6625 - 22850, n=106, últimos 2 anos) | |
| Medion Erazer Beast X40 2024 (6.2.1) | |
| Single-Core | |
| Medion Erazer Beast X40 2024 (6.2.1, Gaming Mode) | |
| Medion Erazer Beast X40 2024 (6.2.1) | |
| Asus ROG Strix Scar 18 G834JYR (2024) (6.2.1) | |
| Média Intel Core i9-14900HX (2419 - 3129, n=37) | |
| Asus ROG Strix Scar 17 G733PYV-LL053X | |
| Média da turma Gaming (1490 - 3259, n=106, últimos 2 anos) | |
| MSI Titan 18 HX A14VIG (6.2.1) | |
| HWBOT x265 Benchmark v2.2 - 4k Preset | |
| Asus ROG Strix Scar 17 G733PYV-LL053X | |
| Medion Erazer Beast X40 2024 (Gaming Mode) | |
| MSI Titan 18 HX A14VIG | |
| Medion Erazer Beast X40 | |
| Média Intel Core i9-14900HX (16.8 - 38.9, n=37) | |
| Asus ROG Strix Scar 18 G834JYR (2024) | |
| Média da turma Gaming (11.5 - 44.4, n=105, últimos 2 anos) | |
| Schenker Key 17 Pro (Early 23) | |
| Medion Erazer Beast X40 2024 | |
| LibreOffice - 20 Documents To PDF | |
| Média da turma Gaming (33.2 - 88.8, n=105, últimos 2 anos) | |
| MSI Titan 18 HX A14VIG (6.3.4.2) | |
| Asus ROG Strix Scar 18 G834JYR (2024) (6.3.4.2) | |
| Medion Erazer Beast X40 | |
| Medion Erazer Beast X40 2024 (6.3.4.2) | |
| Média Intel Core i9-14900HX (19 - 85.1, n=37) | |
| Schenker Key 17 Pro (Early 23) | |
| Medion Erazer Beast X40 2024 (6.3.4.2, Gaming Mode) | |
| Asus ROG Strix Scar 17 G733PYV-LL053X | |
| R Benchmark 2.5 - Overall mean | |
| Média da turma Gaming (0.3439 - 0.759, n=106, últimos 2 anos) | |
| Asus ROG Strix Scar 17 G733PYV-LL053X | |
| Medion Erazer Beast X40 | |
| Schenker Key 17 Pro (Early 23) | |
| Asus ROG Strix Scar 18 G834JYR (2024) | |
| MSI Titan 18 HX A14VIG | |
| Média Intel Core i9-14900HX (0.3604 - 0.4859, n=37) | |
| Medion Erazer Beast X40 2024 | |
| Medion Erazer Beast X40 2024 (Gaming Mode) | |
* ... menor é melhor
AIDA64: FP32 Ray-Trace | FPU Julia | CPU SHA3 | CPU Queen | FPU SinJulia | FPU Mandel | CPU AES | CPU ZLib | FP64 Ray-Trace | CPU PhotoWorxx
| Performance rating | |
| Asus ROG Strix Scar 17 G733PYV-LL053X | |
| Medion Erazer Beast X40 2024 | |
| MSI Titan 18 HX A14VIG | |
| Medion Erazer Beast X40 | |
| Asus ROG Strix Scar 18 G834JYR (2024) | |
| Schenker Key 17 Pro (Early 23) | |
| Média da turma Gaming | |
| Média Intel Core i9-14900HX | |
| Medion Erazer Beast X40 2024 | |
| AIDA64 / FP32 Ray-Trace | |
| Asus ROG Strix Scar 17 G733PYV-LL053X (v6.88.6413 Beta) | |
| Média da turma Gaming (10227 - 85542, n=105, últimos 2 anos) | |
| MSI Titan 18 HX A14VIG (v6.92.6600) | |
| Medion Erazer Beast X40 2024 (v6.92.6600, Gaming Mode) | |
| Medion Erazer Beast X40 (v6.75.6100) | |
| Asus ROG Strix Scar 18 G834JYR (2024) (v6.92.6600) | |
| Média Intel Core i9-14900HX (13098 - 33474, n=36) | |
| Schenker Key 17 Pro (Early 23) (v6.75.6100) | |
| Medion Erazer Beast X40 2024 (v6.92.6600) | |
| AIDA64 / FPU Julia | |
| Asus ROG Strix Scar 17 G733PYV-LL053X (v6.88.6413 Beta) | |
| MSI Titan 18 HX A14VIG (v6.92.6600) | |
| Medion Erazer Beast X40 2024 (v6.92.6600, Gaming Mode) | |
| Média da turma Gaming (51376 - 238426, n=105, últimos 2 anos) | |
| Medion Erazer Beast X40 (v6.75.6100) | |
| Asus ROG Strix Scar 18 G834JYR (2024) (v6.92.6600) | |
| Média Intel Core i9-14900HX (67573 - 166040, n=36) | |
| Schenker Key 17 Pro (Early 23) (v6.75.6100) | |
| Medion Erazer Beast X40 2024 (v6.92.6600) | |
| AIDA64 / CPU SHA3 | |
| Asus ROG Strix Scar 17 G733PYV-LL053X (v6.88.6413 Beta) | |
| MSI Titan 18 HX A14VIG (v6.92.6600) | |
| Medion Erazer Beast X40 2024 (v6.92.6600, Gaming Mode) | |
| Medion Erazer Beast X40 (v6.75.6100) | |
| Média da turma Gaming (2180 - 10115, n=105, últimos 2 anos) | |
| Asus ROG Strix Scar 18 G834JYR (2024) (v6.92.6600) | |
| Média Intel Core i9-14900HX (3589 - 7979, n=36) | |
| Schenker Key 17 Pro (Early 23) (v6.75.6100) | |
| Medion Erazer Beast X40 2024 (v6.92.6600) | |
| AIDA64 / CPU Queen | |
| Asus ROG Strix Scar 17 G733PYV-LL053X (v6.88.6413 Beta) | |
| MSI Titan 18 HX A14VIG (v6.92.6600) | |
| Medion Erazer Beast X40 2024 (v6.92.6600, Gaming Mode) | |
| Asus ROG Strix Scar 18 G834JYR (2024) (v6.92.6600) | |
| Média Intel Core i9-14900HX (118405 - 148966, n=36) | |
| Schenker Key 17 Pro (Early 23) (v6.75.6100) | |
| Medion Erazer Beast X40 (v6.75.6100) | |
| Medion Erazer Beast X40 2024 (v6.92.6600) | |
| Média da turma Gaming (49785 - 173351, n=90, últimos 2 anos) | |
| AIDA64 / FPU SinJulia | |
| Asus ROG Strix Scar 17 G733PYV-LL053X (v6.88.6413 Beta) | |
| MSI Titan 18 HX A14VIG (v6.92.6600) | |
| Medion Erazer Beast X40 2024 (v6.92.6600, Gaming Mode) | |
| Asus ROG Strix Scar 18 G834JYR (2024) (v6.92.6600) | |
| Medion Erazer Beast X40 (v6.75.6100) | |
| Média Intel Core i9-14900HX (10475 - 18517, n=36) | |
| Schenker Key 17 Pro (Early 23) (v6.75.6100) | |
| Média da turma Gaming (4424 - 33636, n=105, últimos 2 anos) | |
| Medion Erazer Beast X40 2024 (v6.92.6600) | |
| AIDA64 / FPU Mandel | |
| Asus ROG Strix Scar 17 G733PYV-LL053X (v6.88.6413 Beta) | |
| Média da turma Gaming (25115 - 128721, n=105, últimos 2 anos) | |
| MSI Titan 18 HX A14VIG (v6.92.6600) | |
| Medion Erazer Beast X40 2024 (v6.92.6600, Gaming Mode) | |
| Medion Erazer Beast X40 (v6.75.6100) | |
| Asus ROG Strix Scar 18 G834JYR (2024) (v6.92.6600) | |
| Média Intel Core i9-14900HX (32543 - 83662, n=36) | |
| Schenker Key 17 Pro (Early 23) (v6.75.6100) | |
| Medion Erazer Beast X40 2024 | |
| AIDA64 / CPU AES | |
| Asus ROG Strix Scar 17 G733PYV-LL053X (v6.88.6413 Beta) | |
| Schenker Key 17 Pro (Early 23) (v6.75.6100) | |
| Média Intel Core i9-14900HX (86964 - 241777, n=36) | |
| MSI Titan 18 HX A14VIG (v6.92.6600) | |
| Medion Erazer Beast X40 2024 (v6.92.6600, Gaming Mode) | |
| Medion Erazer Beast X40 (v6.75.6100) | |
| Asus ROG Strix Scar 18 G834JYR (2024) (v6.92.6600) | |
| Média da turma Gaming (39258 - 247074, n=105, últimos 2 anos) | |
| Medion Erazer Beast X40 2024 (v6.92.6600) | |
| AIDA64 / CPU ZLib | |
| MSI Titan 18 HX A14VIG (v6.92.6600) | |
| Medion Erazer Beast X40 2024 (v6.92.6600, Gaming Mode) | |
| Asus ROG Strix Scar 17 G733PYV-LL053X (v6.88.6413 Beta) | |
| Medion Erazer Beast X40 (v6.75.6100) | |
| Média Intel Core i9-14900HX (1054 - 2292, n=36) | |
| Asus ROG Strix Scar 18 G834JYR (2024) | |
| Schenker Key 17 Pro (Early 23) (v6.75.6100) | |
| Média da turma Gaming (574 - 2531, n=105, últimos 2 anos) | |
| Medion Erazer Beast X40 2024 (v6.92.6600) | |
| AIDA64 / FP64 Ray-Trace | |
| Asus ROG Strix Scar 17 G733PYV-LL053X (v6.88.6413 Beta) | |
| Média da turma Gaming (5509 - 45446, n=105, últimos 2 anos) | |
| MSI Titan 18 HX A14VIG (v6.92.6600) | |
| Medion Erazer Beast X40 2024 (v6.92.6600, Gaming Mode) | |
| Medion Erazer Beast X40 (v6.75.6100) | |
| Asus ROG Strix Scar 18 G834JYR (2024) (v6.92.6600) | |
| Média Intel Core i9-14900HX (6809 - 18349, n=36) | |
| Schenker Key 17 Pro (Early 23) (v6.75.6100) | |
| Medion Erazer Beast X40 2024 (v6.92.6600) | |
| AIDA64 / CPU PhotoWorxx | |
| Schenker Key 17 Pro (Early 23) (v6.75.6100) | |
| Asus ROG Strix Scar 18 G834JYR (2024) (v6.92.6600) | |
| Medion Erazer Beast X40 2024 (v6.92.6600) | |
| Medion Erazer Beast X40 2024 (v6.92.6600, Gaming Mode) | |
| Média Intel Core i9-14900HX (23903 - 54702, n=36) | |
| Média da turma Gaming (12271 - 89891, n=105, últimos 2 anos) | |
| Medion Erazer Beast X40 (v6.75.6100) | |
| Asus ROG Strix Scar 17 G733PYV-LL053X (v6.88.6413 Beta) | |
| MSI Titan 18 HX A14VIG (v6.92.6600) | |
Desempenho do sistema
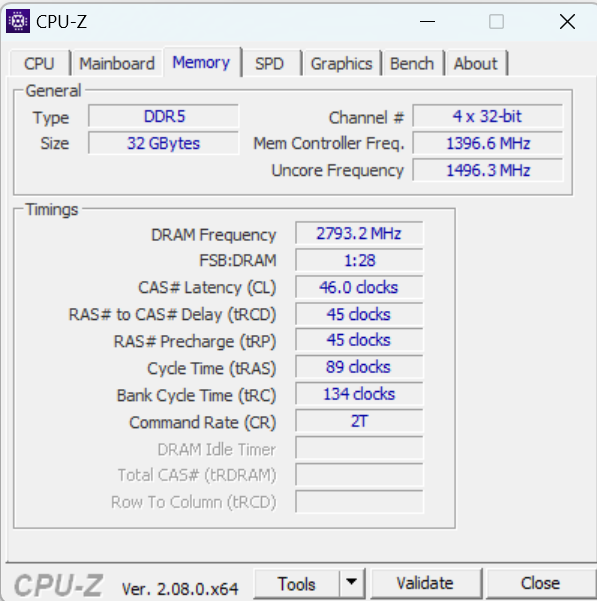
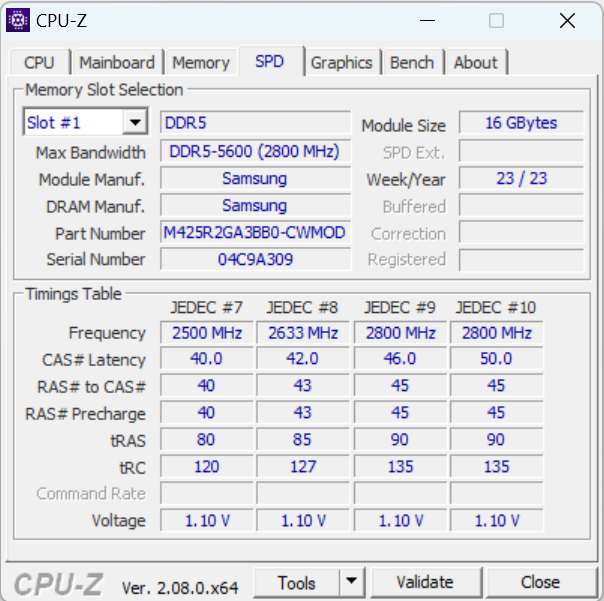
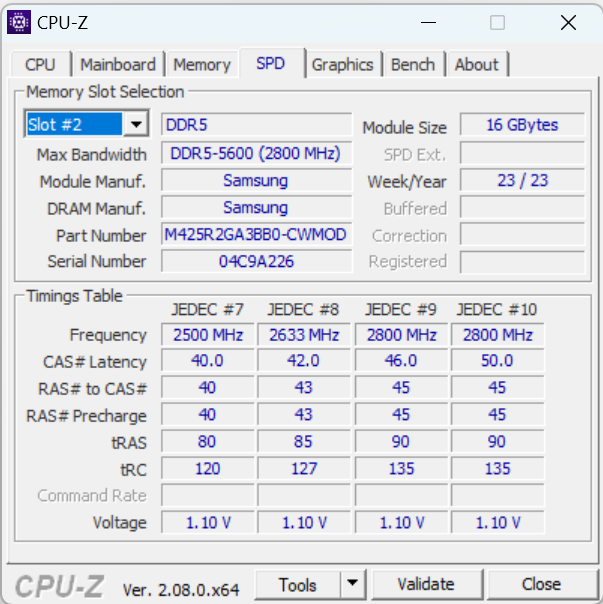
Uma rápida olhada na folha de especificações é suficiente para confirmar que o sistema oferece potência suficiente para executar sem problemas aplicativos exigentes, como jogos, renderização e streaming. As taxas de transferência da RAM estão em um nível normal para a RAM DDR5-5600.
CrossMark: Overall | Productivity | Creativity | Responsiveness
WebXPRT 3: Overall
WebXPRT 4: Overall
Mozilla Kraken 1.1: Total
| PCMark 10 / Score | |
| Asus ROG Strix Scar 17 G733PYV-LL053X | |
| MSI Titan 18 HX A14VIG | |
| Medion Erazer Beast X40 2024 | |
| Schenker Key 17 Pro (Early 23) | |
| Asus ROG Strix Scar 18 G834JYR (2024) | |
| Média Intel Core i9-14900HX, NVIDIA GeForce RTX 4090 Laptop GPU (8230 - 9234, n=13) | |
| Média da turma Gaming (5828 - 12414, n=93, últimos 2 anos) | |
| Medion Erazer Beast X40 | |
| PCMark 10 / Essentials | |
| MSI Titan 18 HX A14VIG | |
| Asus ROG Strix Scar 17 G733PYV-LL053X | |
| Asus ROG Strix Scar 18 G834JYR (2024) | |
| Schenker Key 17 Pro (Early 23) | |
| Medion Erazer Beast X40 | |
| Média Intel Core i9-14900HX, NVIDIA GeForce RTX 4090 Laptop GPU (10778 - 11628, n=13) | |
| Medion Erazer Beast X40 2024 | |
| Média da turma Gaming (8810 - 11935, n=97, últimos 2 anos) | |
| PCMark 10 / Productivity | |
| Medion Erazer Beast X40 2024 | |
| Medion Erazer Beast X40 | |
| Schenker Key 17 Pro (Early 23) | |
| Média da turma Gaming (6845 - 25323, n=95, últimos 2 anos) | |
| Asus ROG Strix Scar 17 G733PYV-LL053X | |
| Média Intel Core i9-14900HX, NVIDIA GeForce RTX 4090 Laptop GPU (9458 - 11759, n=13) | |
| Asus ROG Strix Scar 18 G834JYR (2024) | |
| MSI Titan 18 HX A14VIG | |
| PCMark 10 / Digital Content Creation | |
| MSI Titan 18 HX A14VIG | |
| Asus ROG Strix Scar 17 G733PYV-LL053X | |
| Asus ROG Strix Scar 18 G834JYR (2024) | |
| Medion Erazer Beast X40 2024 | |
| Média Intel Core i9-14900HX, NVIDIA GeForce RTX 4090 Laptop GPU (13219 - 16462, n=13) | |
| Schenker Key 17 Pro (Early 23) | |
| Média da turma Gaming (7602 - 19954, n=95, últimos 2 anos) | |
| Medion Erazer Beast X40 | |
| CrossMark / Overall | |
| Schenker Key 17 Pro (Early 23) | |
| Asus ROG Strix Scar 18 G834JYR (2024) | |
| Medion Erazer Beast X40 2024 | |
| Medion Erazer Beast X40 | |
| Média Intel Core i9-14900HX, NVIDIA GeForce RTX 4090 Laptop GPU (1877 - 2344, n=10) | |
| Asus ROG Strix Scar 17 G733PYV-LL053X | |
| Média da turma Gaming (1366 - 2409, n=94, últimos 2 anos) | |
| MSI Titan 18 HX A14VIG | |
| CrossMark / Productivity | |
| Schenker Key 17 Pro (Early 23) | |
| Medion Erazer Beast X40 2024 | |
| Asus ROG Strix Scar 18 G834JYR (2024) | |
| Medion Erazer Beast X40 | |
| Média Intel Core i9-14900HX, NVIDIA GeForce RTX 4090 Laptop GPU (1738 - 2162, n=10) | |
| Asus ROG Strix Scar 17 G733PYV-LL053X | |
| Média da turma Gaming (1386 - 2254, n=94, últimos 2 anos) | |
| MSI Titan 18 HX A14VIG | |
| CrossMark / Creativity | |
| Asus ROG Strix Scar 18 G834JYR (2024) | |
| Schenker Key 17 Pro (Early 23) | |
| Asus ROG Strix Scar 17 G733PYV-LL053X | |
| Medion Erazer Beast X40 | |
| Média Intel Core i9-14900HX, NVIDIA GeForce RTX 4090 Laptop GPU (2195 - 2660, n=10) | |
| Medion Erazer Beast X40 2024 | |
| Média da turma Gaming (1343 - 2786, n=94, últimos 2 anos) | |
| MSI Titan 18 HX A14VIG | |
| CrossMark / Responsiveness | |
| Schenker Key 17 Pro (Early 23) | |
| Asus ROG Strix Scar 18 G834JYR (2024) | |
| Medion Erazer Beast X40 2024 | |
| Média Intel Core i9-14900HX, NVIDIA GeForce RTX 4090 Laptop GPU (1478 - 2327, n=10) | |
| Medion Erazer Beast X40 | |
| Média da turma Gaming (1226 - 2334, n=94, últimos 2 anos) | |
| Asus ROG Strix Scar 17 G733PYV-LL053X | |
| MSI Titan 18 HX A14VIG | |
| WebXPRT 3 / Overall | |
| Asus ROG Strix Scar 17 G733PYV-LL053X | |
| MSI Titan 18 HX A14VIG | |
| Medion Erazer Beast X40 2024 | |
| Média Intel Core i9-14900HX, NVIDIA GeForce RTX 4090 Laptop GPU (279 - 339, n=10) | |
| Medion Erazer Beast X40 | |
| Asus ROG Strix Scar 18 G834JYR (2024) | |
| Média da turma Gaming (220 - 532, n=98, últimos 2 anos) | |
| Schenker Key 17 Pro (Early 23) | |
| WebXPRT 4 / Overall | |
| Asus ROG Strix Scar 17 G733PYV-LL053X | |
| Asus ROG Strix Scar 18 G834JYR (2024) | |
| Medion Erazer Beast X40 2024 | |
| Schenker Key 17 Pro (Early 23) | |
| Média Intel Core i9-14900HX, NVIDIA GeForce RTX 4090 Laptop GPU (246 - 309, n=8) | |
| MSI Titan 18 HX A14VIG | |
| Média da turma Gaming (165 - 354, n=98, últimos 2 anos) | |
| Mozilla Kraken 1.1 / Total | |
| Schenker Key 17 Pro (Early 23) | |
| Medion Erazer Beast X40 | |
| Média da turma Gaming (391 - 590, n=100, últimos 2 anos) | |
| Média Intel Core i9-14900HX, NVIDIA GeForce RTX 4090 Laptop GPU (428 - 535, n=11) | |
| MSI Titan 18 HX A14VIG | |
| Asus ROG Strix Scar 18 G834JYR (2024) | |
| Medion Erazer Beast X40 2024 | |
| Asus ROG Strix Scar 17 G733PYV-LL053X | |
* ... menor é melhor
| PCMark 10 Score | 8963 pontos | |
Ajuda | ||
| AIDA64 / Memory Copy | |
| Asus ROG Strix Scar 18 G834JYR (2024) | |
| Schenker Key 17 Pro (Early 23) | |
| Medion Erazer Beast X40 2024 | |
| Média Intel Core i9-14900HX (38028 - 83392, n=36) | |
| Média da turma Gaming (21750 - 129946, n=105, últimos 2 anos) | |
| Medion Erazer Beast X40 | |
| MSI Titan 18 HX A14VIG | |
| Asus ROG Strix Scar 17 G733PYV-LL053X | |
| AIDA64 / Memory Read | |
| Asus ROG Strix Scar 18 G834JYR (2024) | |
| Medion Erazer Beast X40 2024 | |
| Schenker Key 17 Pro (Early 23) | |
| Média Intel Core i9-14900HX (43306 - 87568, n=36) | |
| Medion Erazer Beast X40 | |
| Média da turma Gaming (22956 - 118858, n=105, últimos 2 anos) | |
| Asus ROG Strix Scar 17 G733PYV-LL053X | |
| MSI Titan 18 HX A14VIG | |
| AIDA64 / Memory Write | |
| Asus ROG Strix Scar 18 G834JYR (2024) | |
| Medion Erazer Beast X40 2024 | |
| Schenker Key 17 Pro (Early 23) | |
| Média da turma Gaming (22297 - 135096, n=105, últimos 2 anos) | |
| Média Intel Core i9-14900HX (37146 - 80589, n=36) | |
| Medion Erazer Beast X40 | |
| Asus ROG Strix Scar 17 G733PYV-LL053X | |
| MSI Titan 18 HX A14VIG | |
| AIDA64 / Memory Latency | |
| Média da turma Gaming (75.3 - 259, n=105, últimos 2 anos) | |
| MSI Titan 18 HX A14VIG | |
| Schenker Key 17 Pro (Early 23) | |
| Medion Erazer Beast X40 | |
| Asus ROG Strix Scar 17 G733PYV-LL053X | |
| Média Intel Core i9-14900HX (76.1 - 105, n=36) | |
| Asus ROG Strix Scar 18 G834JYR (2024) | |
| Medion Erazer Beast X40 2024 | |
* ... menor é melhor
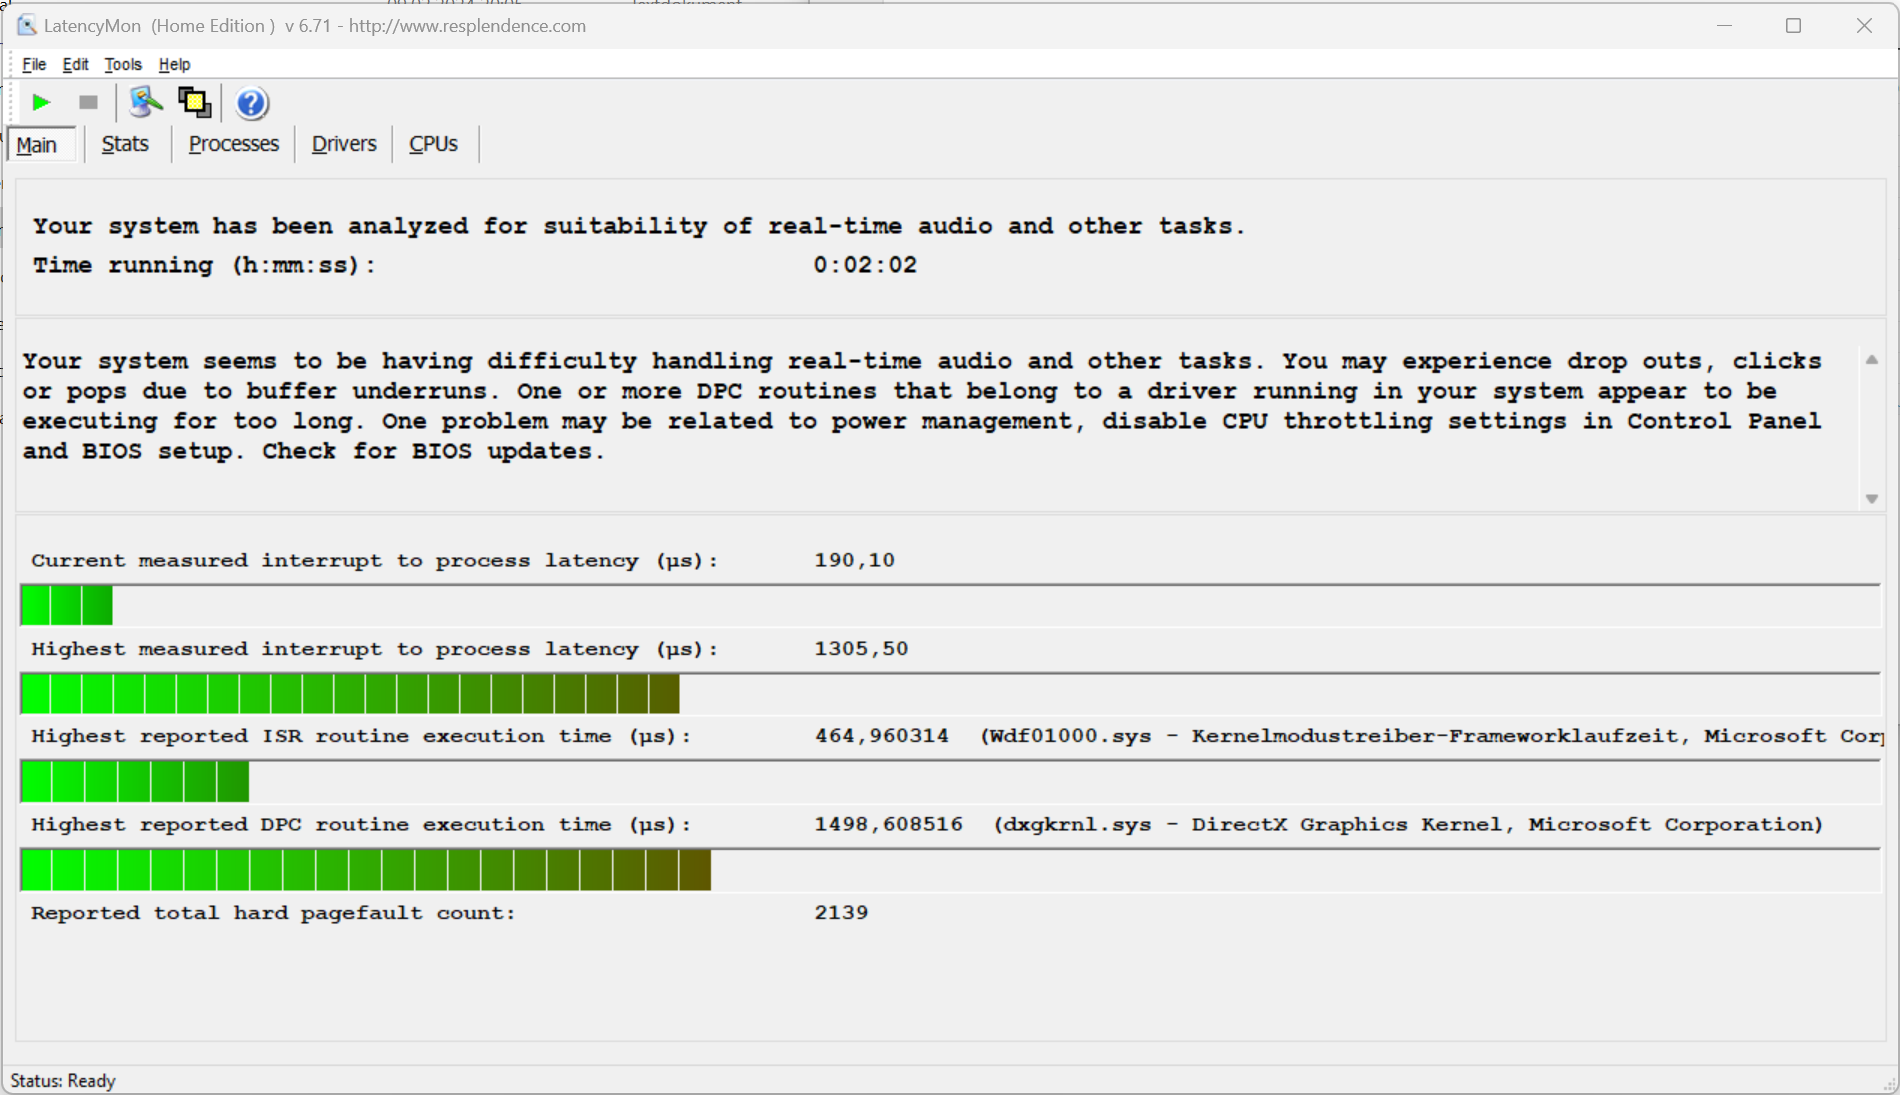
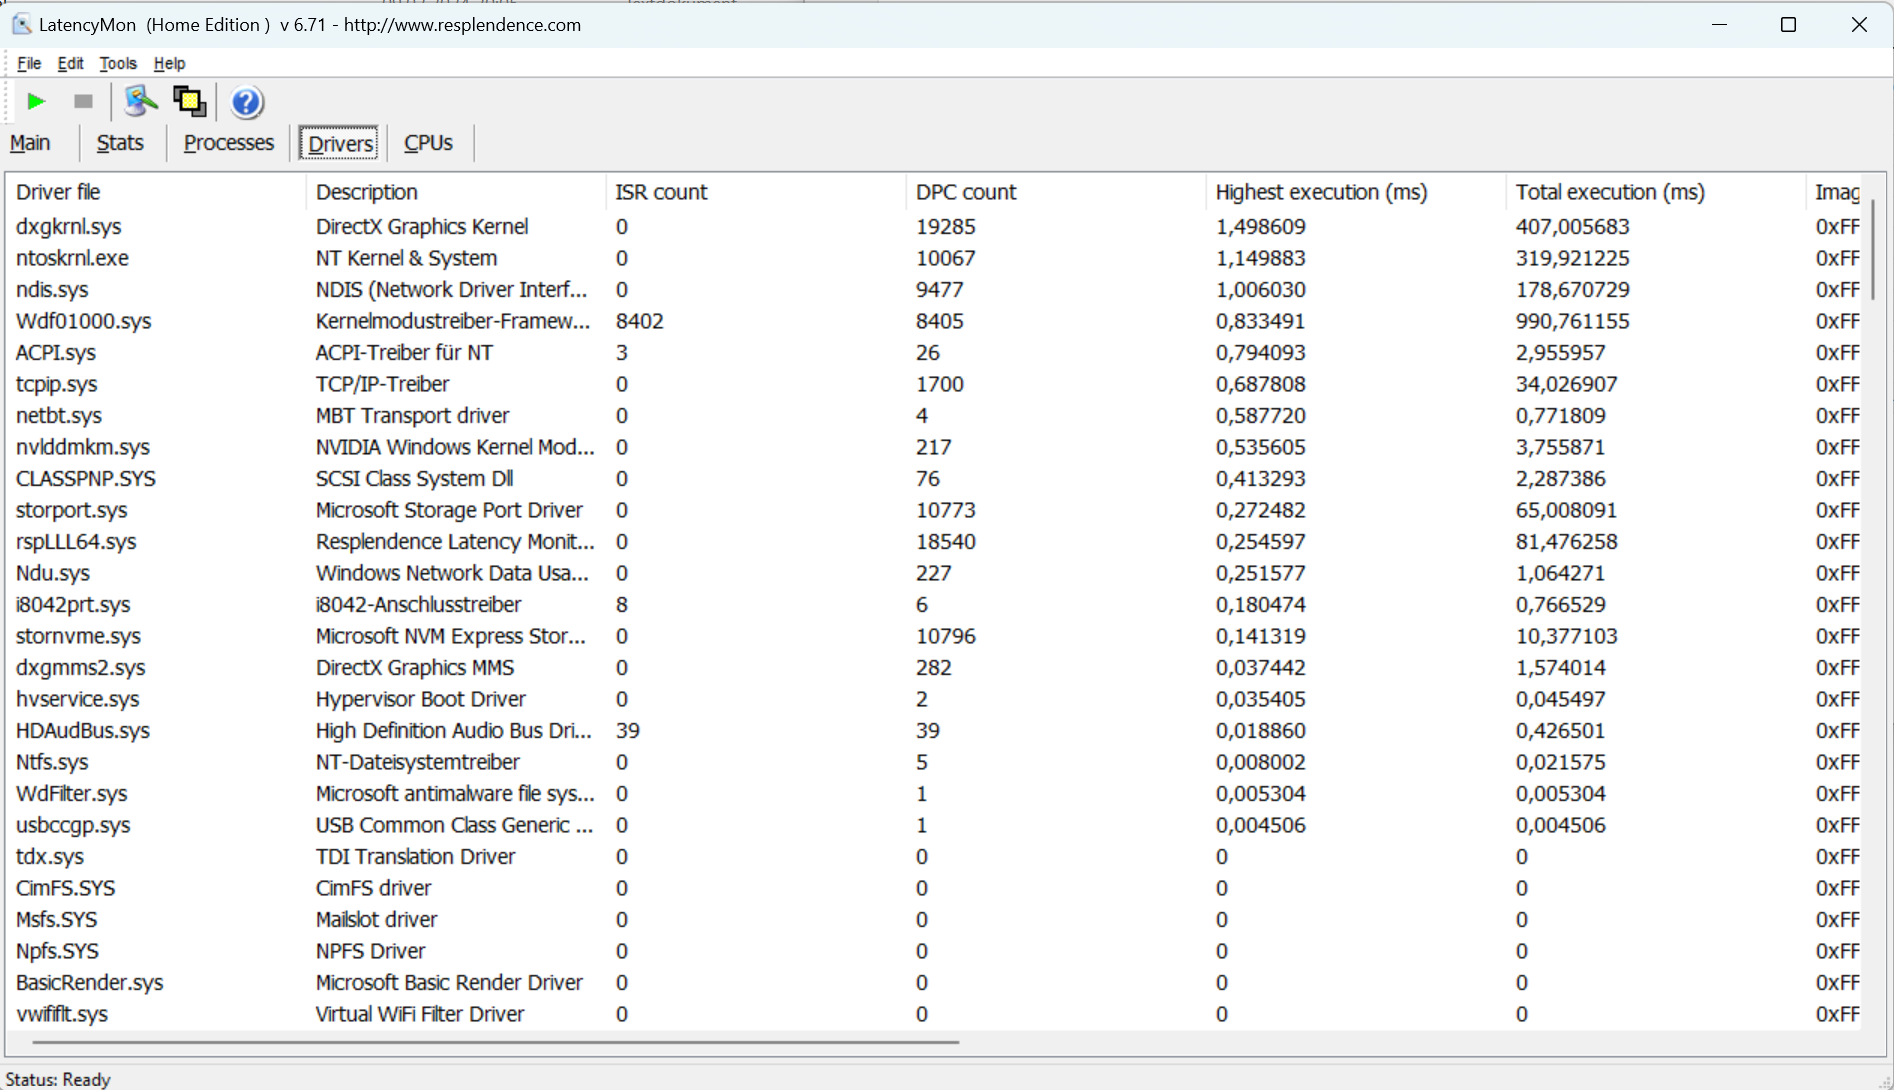
Latência DPC
O Latency Monitor revela anomalias durante o teste de latência (navegação na Web, reprodução de vídeo 4k e alta carga do Prime95). O sistema não parece ser adequado para edição de vídeo e áudio em tempo real. Futuras atualizações de software e drivers podem levar a possíveis melhorias ou até mesmo a deteriorações.
| DPC Latencies / LatencyMon - interrupt to process latency (max), Web, Youtube, Prime95 | |
| Schenker Key 17 Pro (Early 23) | |
| MSI Titan 18 HX A14VIG | |
| Medion Erazer Beast X40 | |
| Medion Erazer Beast X40 2024 | |
| Asus ROG Strix Scar 18 G834JYR (2024) | |
| Asus ROG Strix Scar 17 G733PYV-LL053X | |
* ... menor é melhor
Armazenamento em massa
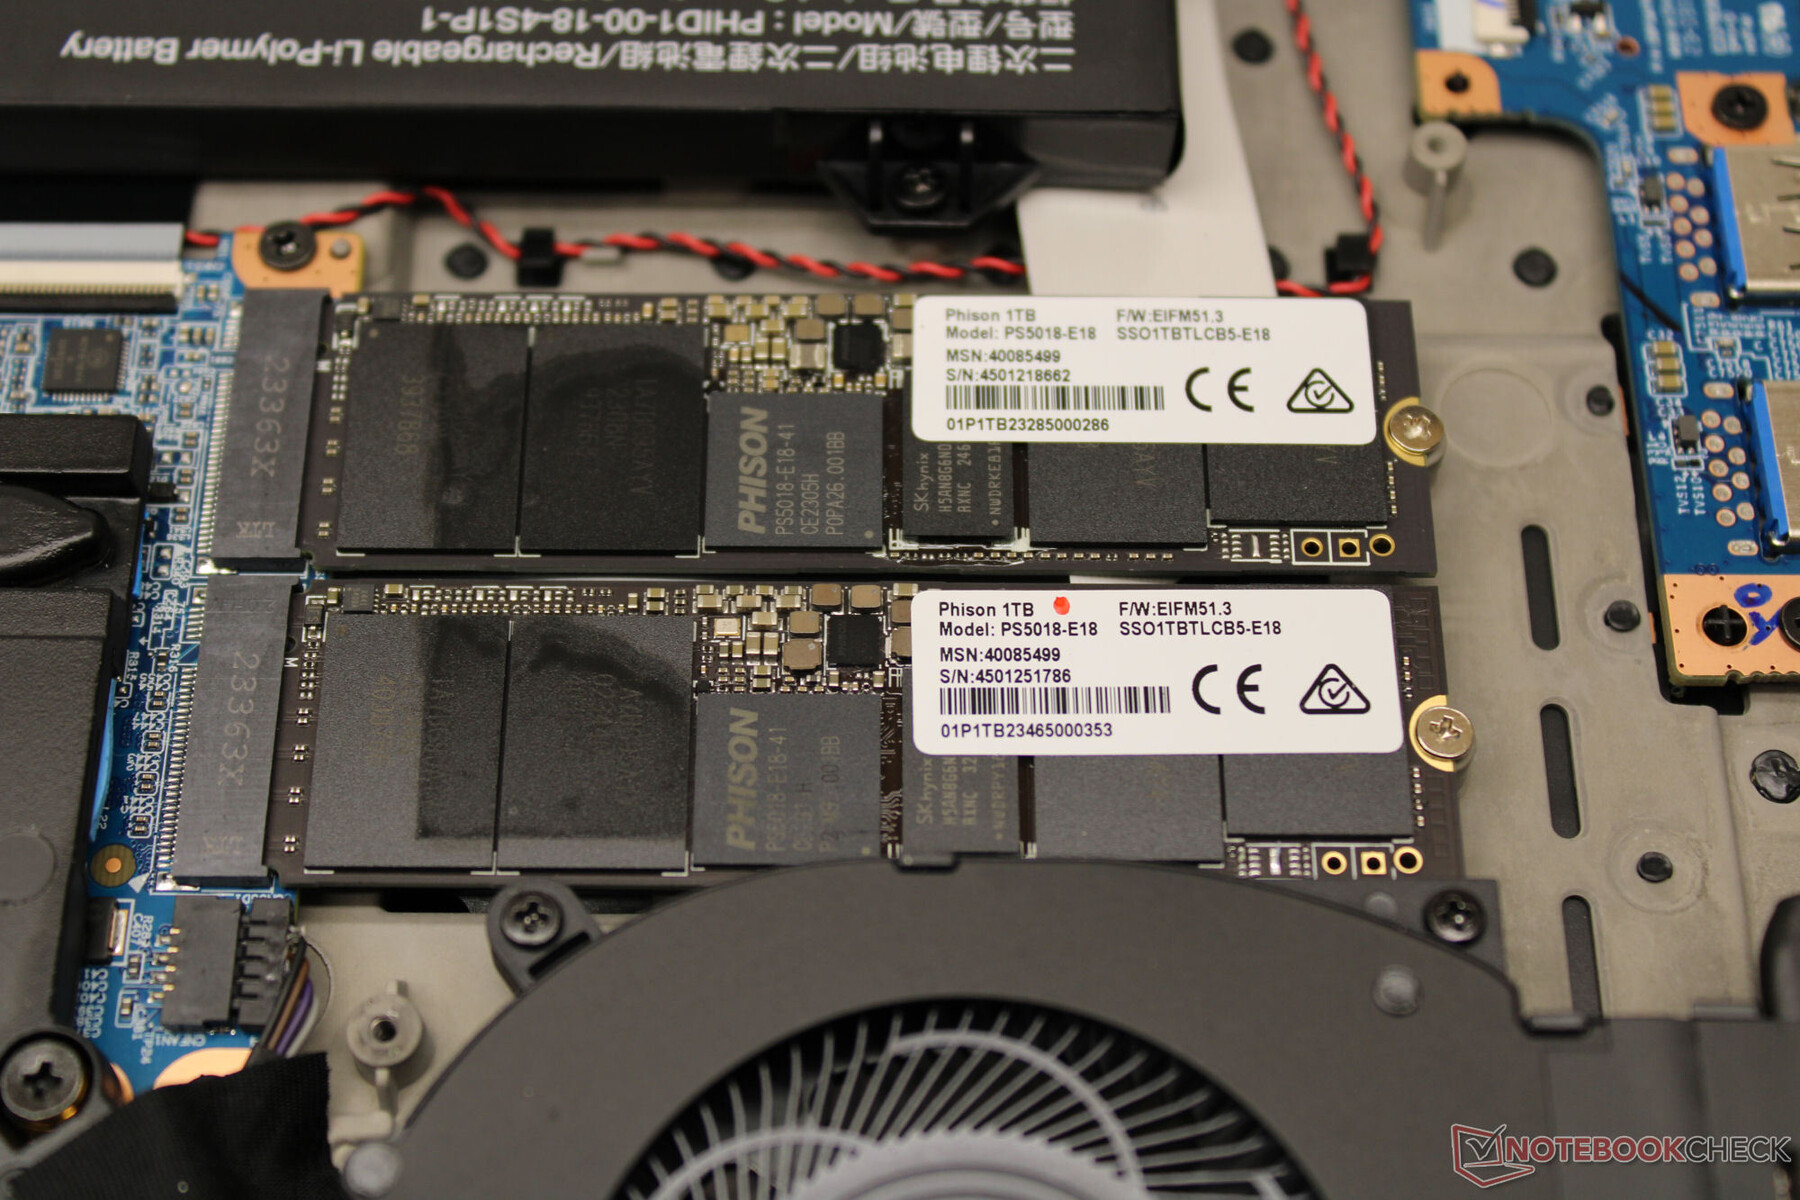
O X40 tem dois SSDs PCIe Gen 4 M.2 2280 de 1 TB cada, mas eles não estão configurados em uma matriz RAID. Um SSD serve como unidade de sistema e o outro como armazenamento de dados. As taxas de dados alcançadas são muito boas. Não há quedas de desempenho devido ao estrangulamento térmico.
Em geral, o X40 suporta RAID-0/1, mas a opção correspondente deve ser ativada primeiro no BIOS e, em seguida, o Windows precisa ser reinstalado. Esse procedimento não é recomendado para os não iniciados.

* ... menor é melhor
Disk throttling: DiskSpd Read Loop, Queue Depth 8
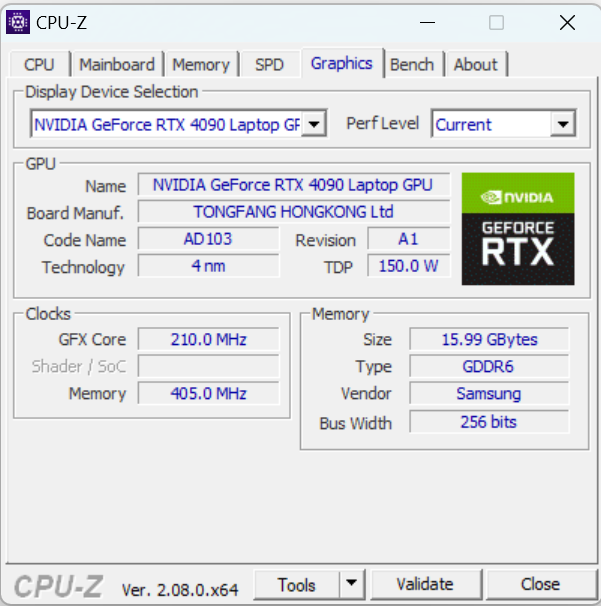
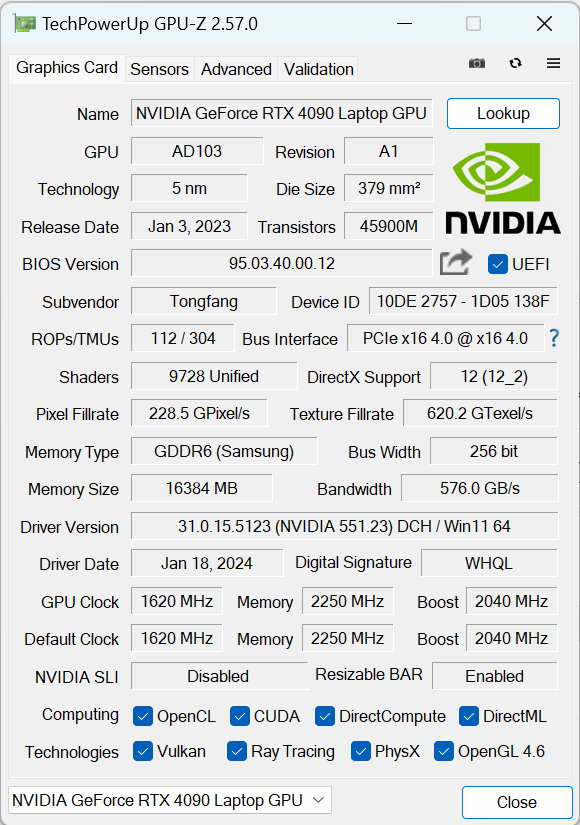
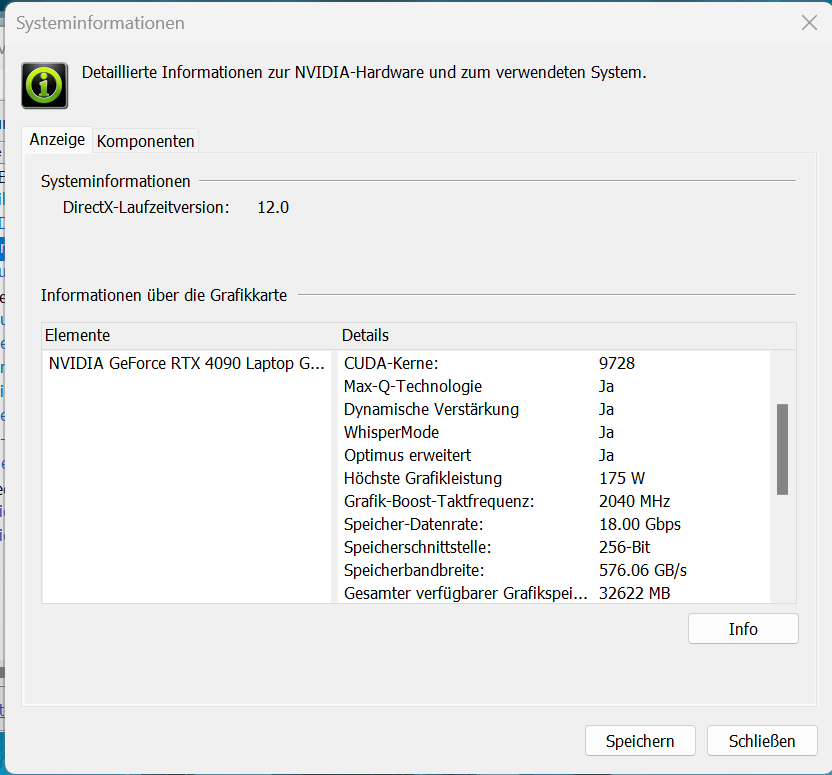
Placa de vídeo
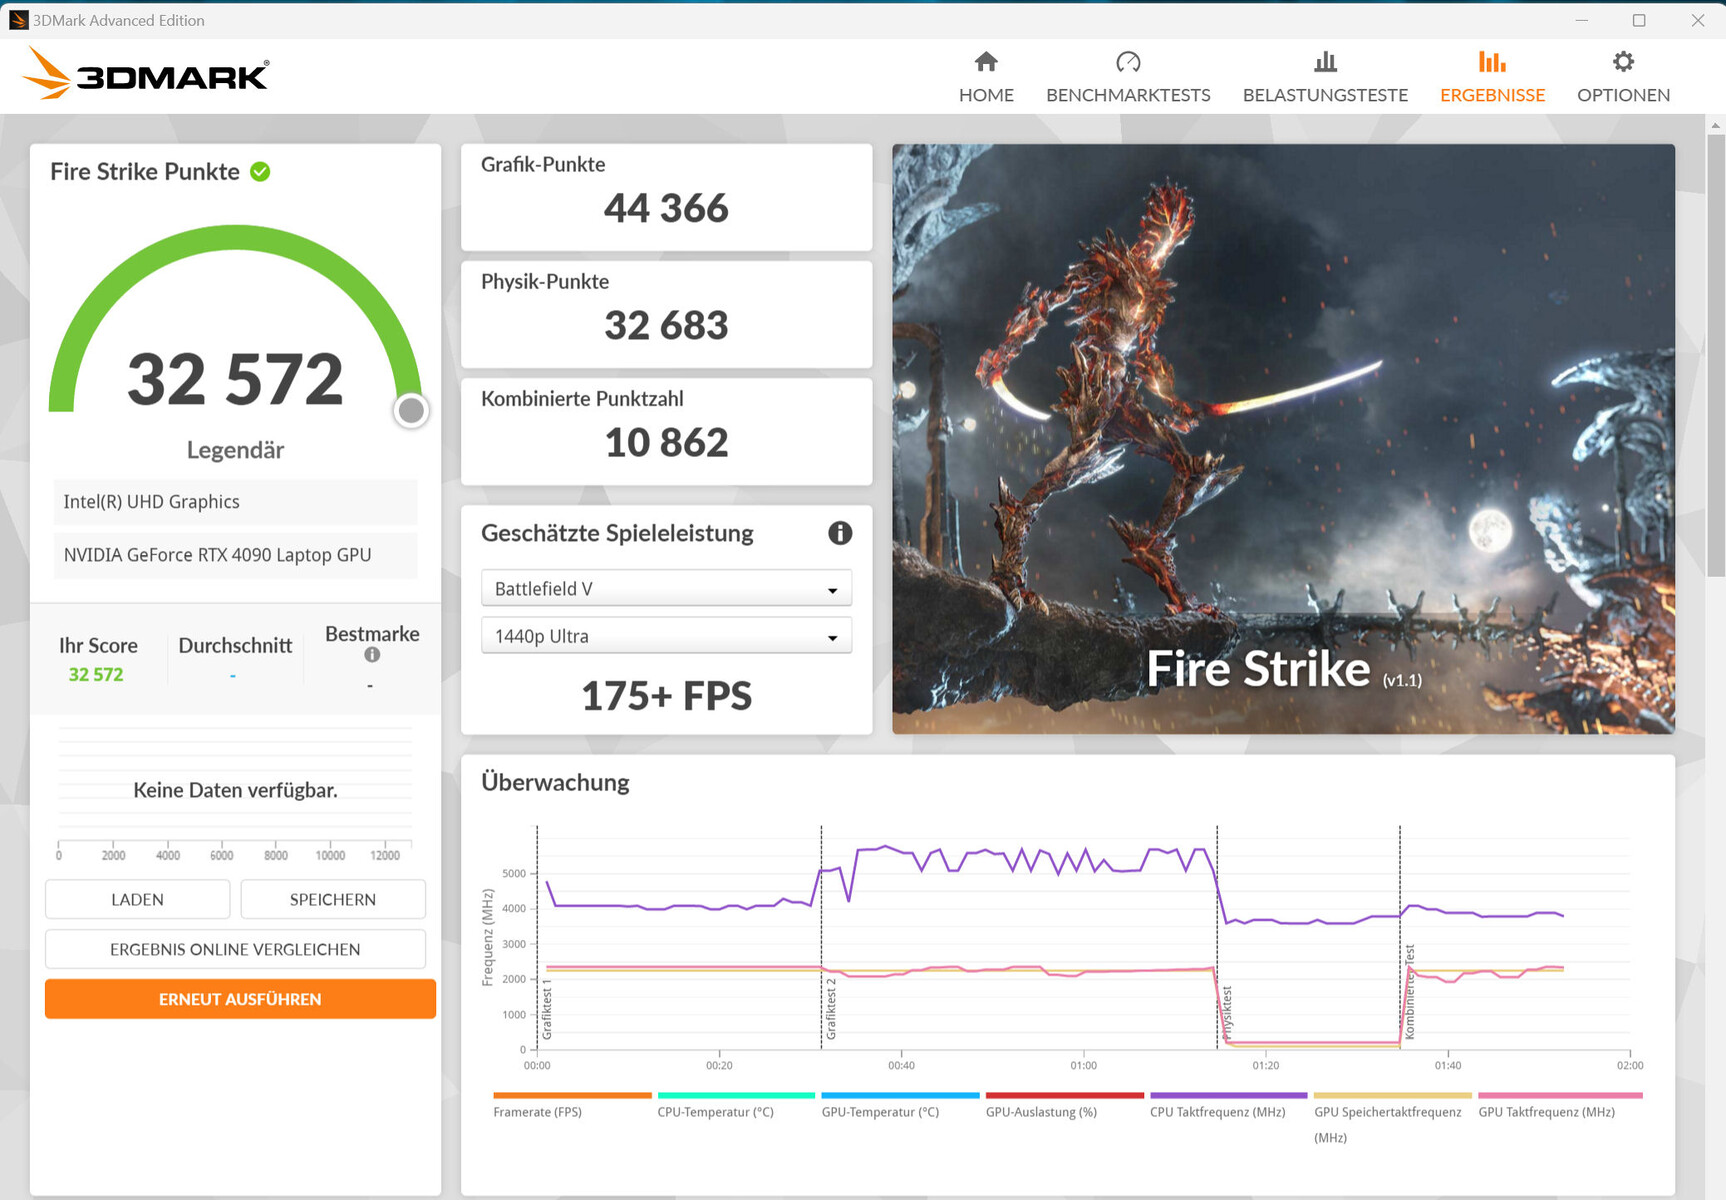
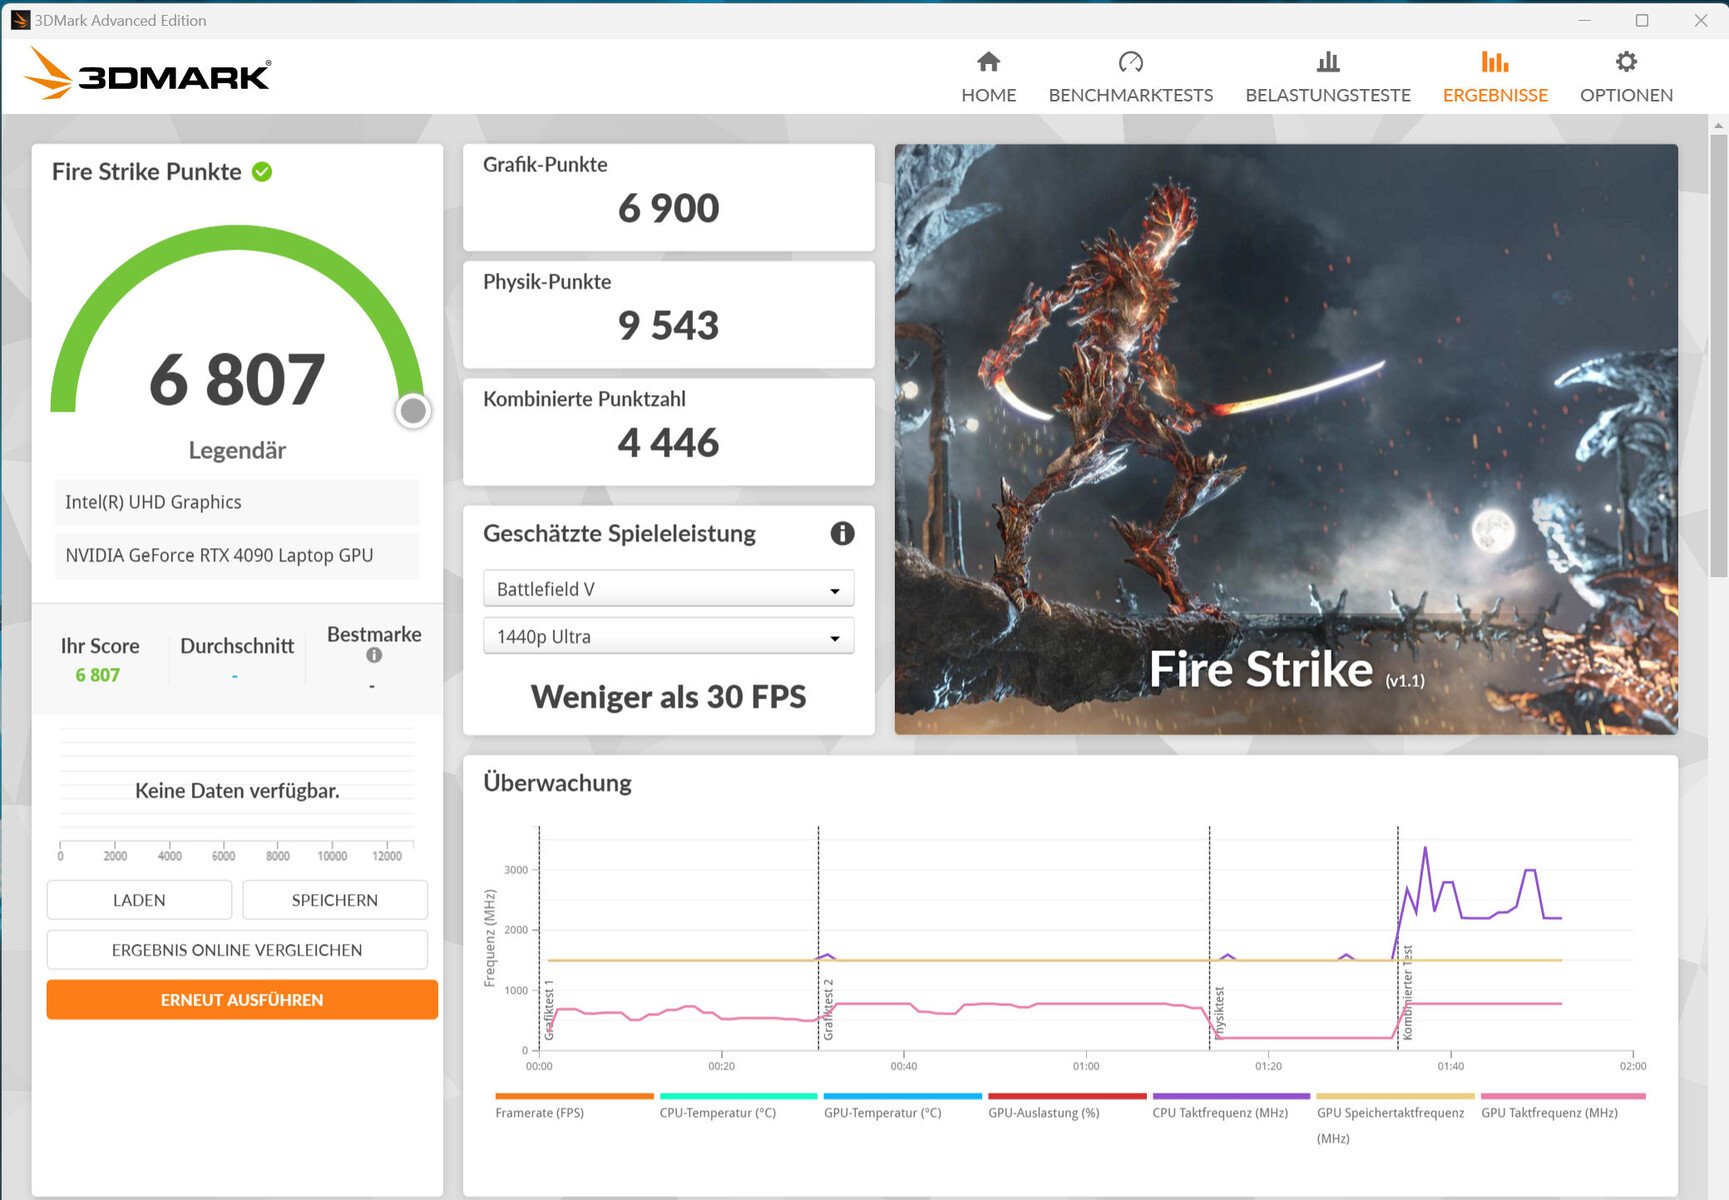
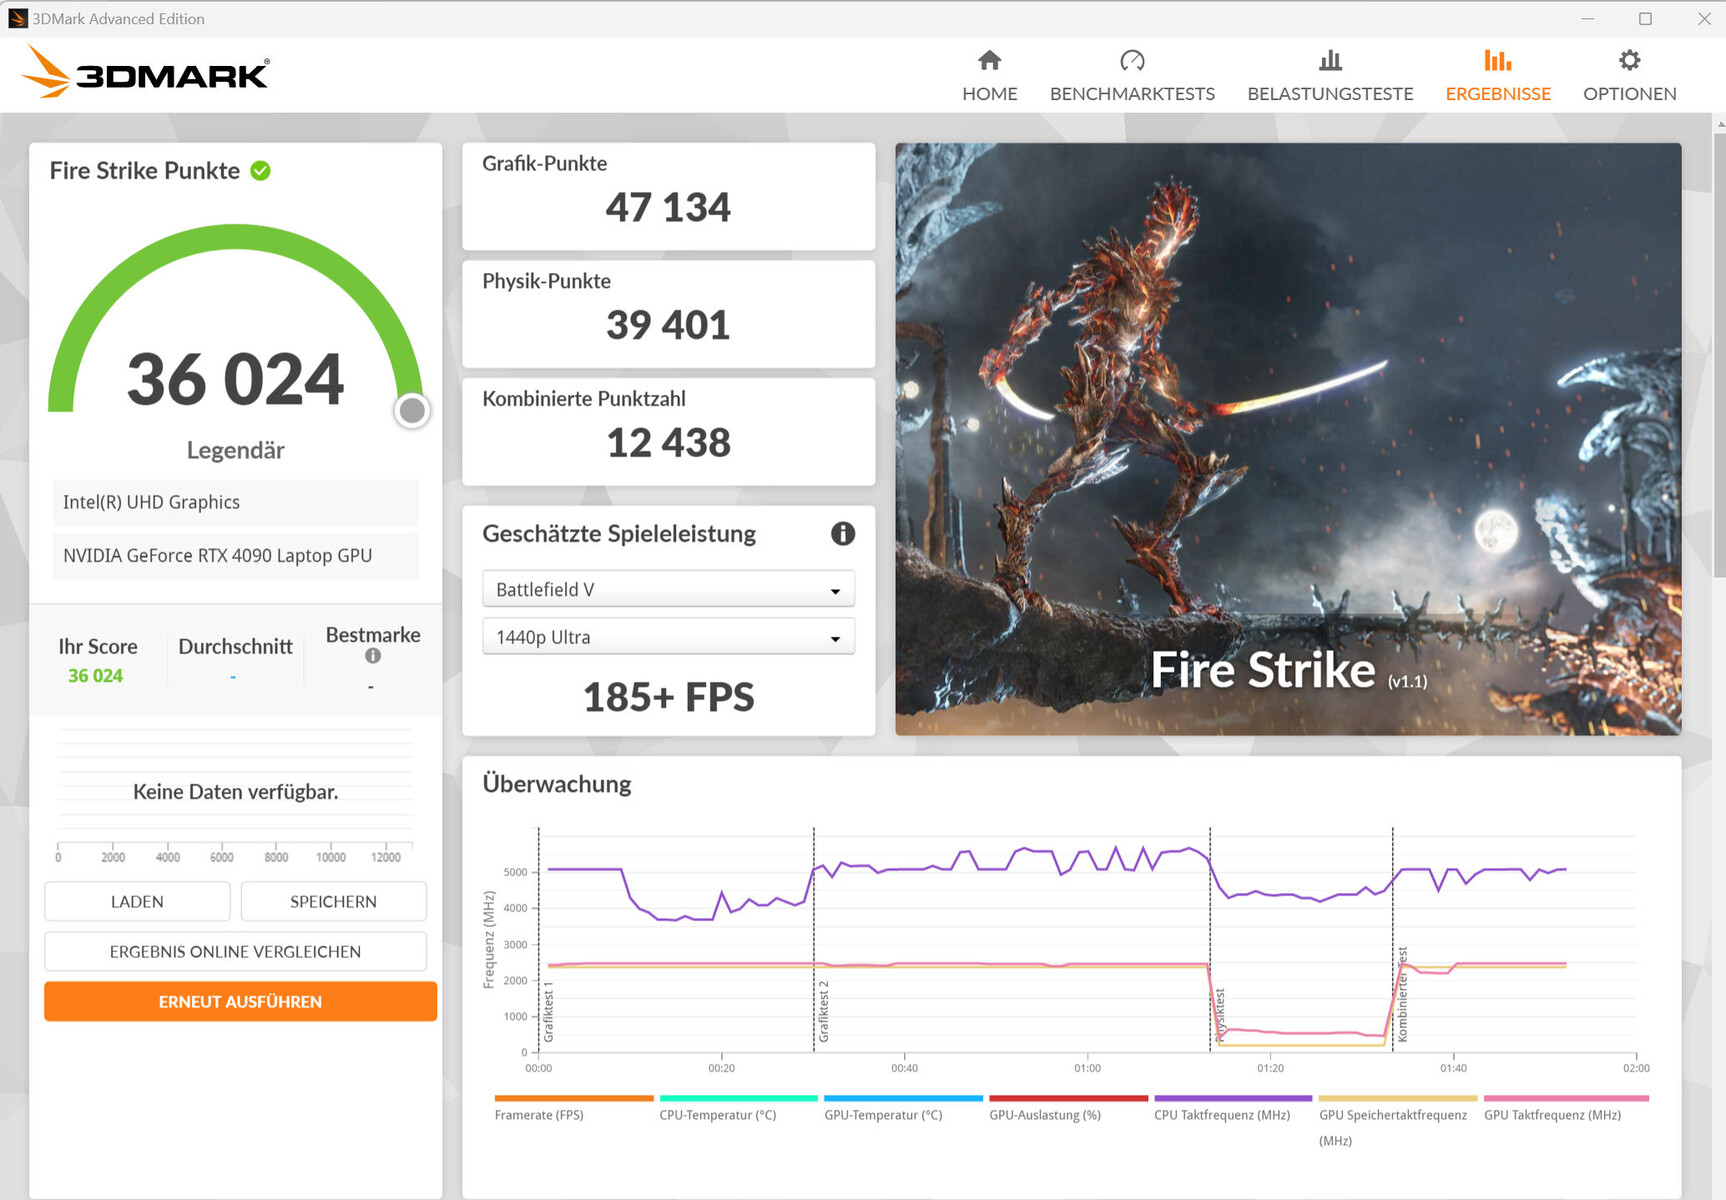
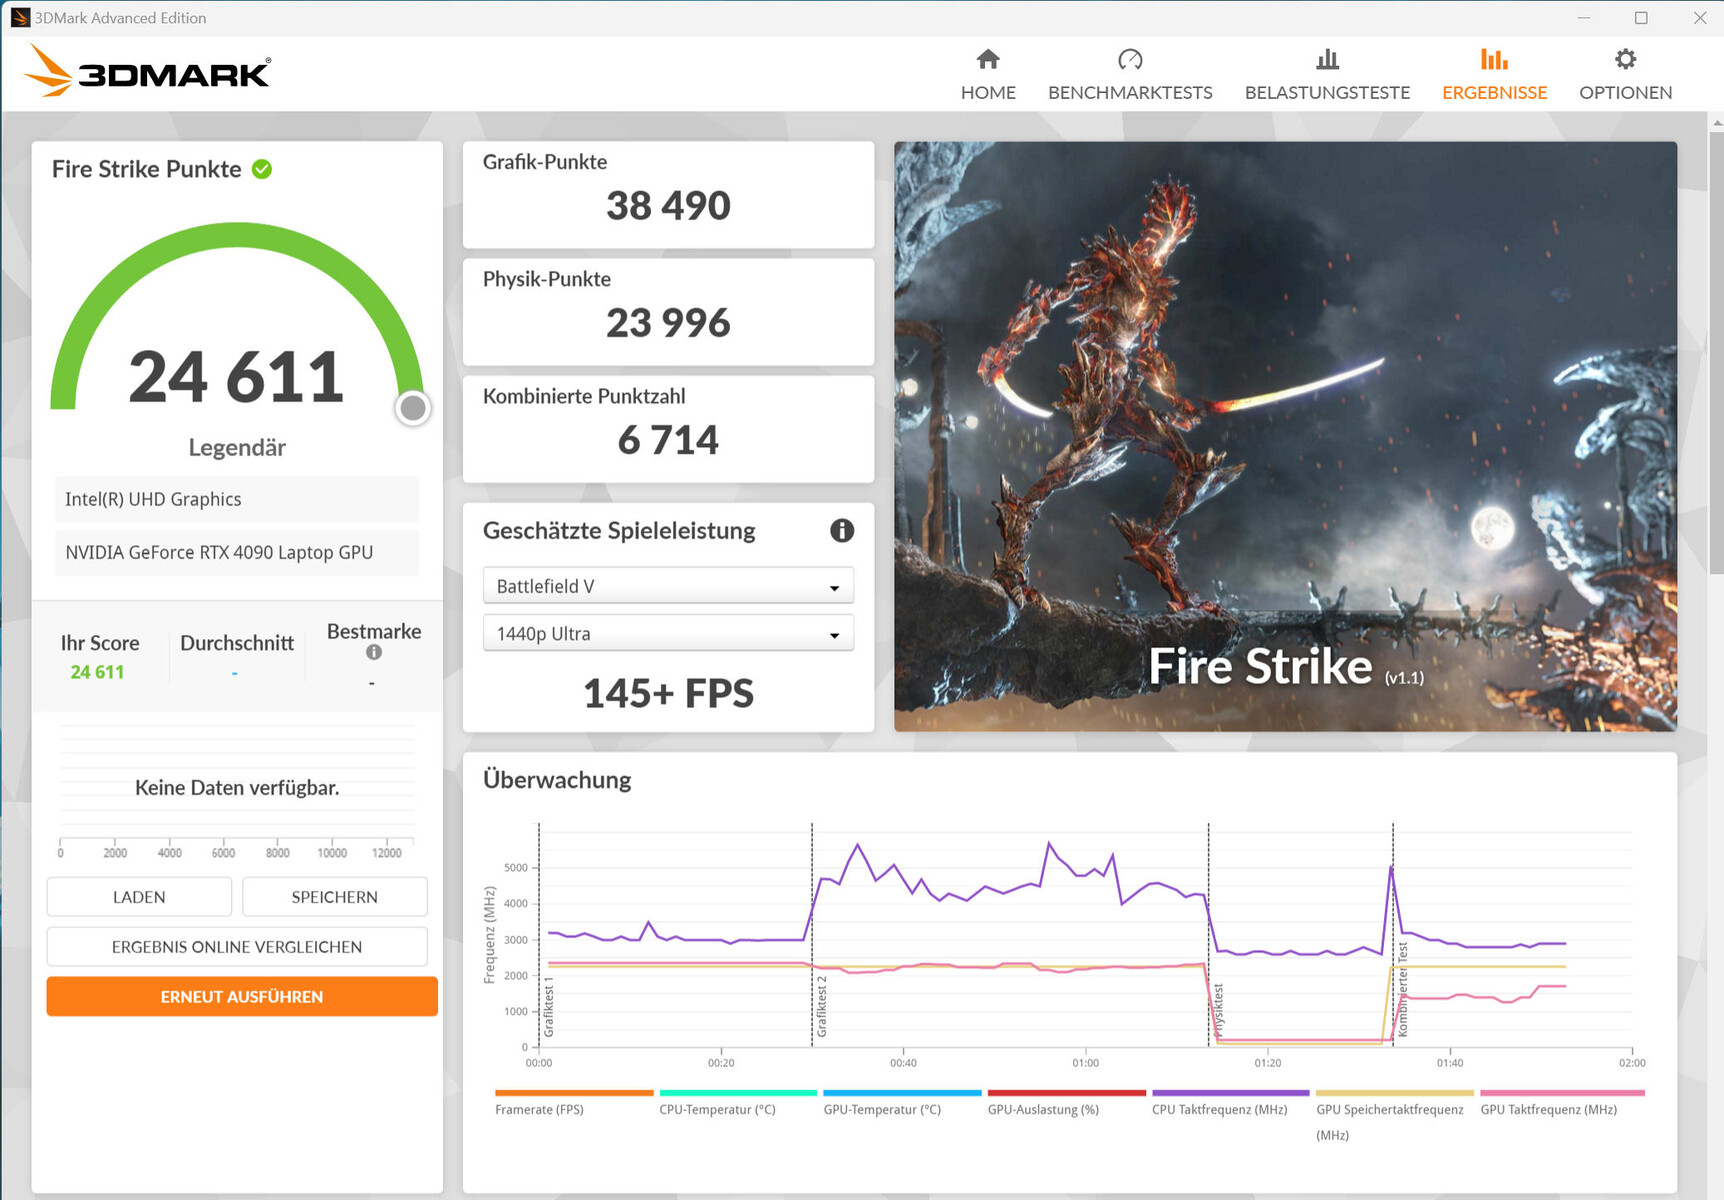
O Medion Erazer Beast X40 conta com a GeForce RTX 4090 - atualmente a GPU móvel mais potente da Nvidia. Ela tem 9.728 shaders, um barramento de memória de 256 bits de largura e memória GDDR6 de 16 GB. A RTX 4090 tem um TGP máximo de 175 W (150 watts + 25 watts de Dynamic Boost) - não há como ir além desse limite.
Os resultados de benchmark estão no mesmo nível (modo Balance) ou acima (modo Gaming) da média da RTX 4090 anterior. No entanto, a situação é diferente nos jogos.
As taxas de quadros acima da média da GPU são alcançadas em ambos os casos. O Optimus avançado é compatível, portanto, a alternância entre dGPU e Optimus não requer uma reinicialização.
| 3DMark Performance rating - Percent | |
| Medion Erazer Beast X40 2024 | |
| MSI Titan 18 HX A14VIG | |
| Asus ROG Strix Scar 17 G733PYV-LL053X | |
| Medion Erazer Beast X40 | |
| Schenker Key 17 Pro (Early 23) | |
| Média NVIDIA GeForce RTX 4090 Laptop GPU | |
| Medion Erazer Beast X40 2024 | |
| Asus ROG Strix Scar 18 G834JYR (2024) | |
| Média da turma Gaming | |
| 3DMark 11 - 1280x720 Performance GPU | |
| Medion Erazer Beast X40 2024 (Gaming Mode) | |
| Schenker Key 17 Pro (Early 23) | |
| Medion Erazer Beast X40 | |
| Média NVIDIA GeForce RTX 4090 Laptop GPU (54073 - 73027, n=42) | |
| Medion Erazer Beast X40 2024 | |
| Asus ROG Strix Scar 17 G733PYV-LL053X | |
| MSI Titan 18 HX A14VIG | |
| Asus ROG Strix Scar 18 G834JYR (2024) | |
| Média da turma Gaming (21841 - 80022, n=104, últimos 2 anos) | |
| 3DMark | |
| 1920x1080 Fire Strike Graphics | |
| MSI Titan 18 HX A14VIG | |
| Asus ROG Strix Scar 17 G733PYV-LL053X | |
| Medion Erazer Beast X40 2024 (Gaming Mode) | |
| Média NVIDIA GeForce RTX 4090 Laptop GPU (40259 - 53059, n=41) | |
| Medion Erazer Beast X40 | |
| Medion Erazer Beast X40 2024 | |
| Asus ROG Strix Scar 18 G834JYR (2024) | |
| Schenker Key 17 Pro (Early 23) | |
| Média da turma Gaming (12242 - 62849, n=115, últimos 2 anos) | |
| 2560x1440 Time Spy Graphics | |
| Medion Erazer Beast X40 2024 (Gaming Mode) | |
| MSI Titan 18 HX A14VIG | |
| Schenker Key 17 Pro (Early 23) | |
| Asus ROG Strix Scar 17 G733PYV-LL053X | |
| Medion Erazer Beast X40 | |
| Média NVIDIA GeForce RTX 4090 Laptop GPU (16950 - 23292, n=43) | |
| Medion Erazer Beast X40 2024 | |
| Asus ROG Strix Scar 18 G834JYR (2024) | |
| Média da turma Gaming (5012 - 26212, n=115, últimos 2 anos) | |
| 3DMark 11 Performance | 41974 pontos | |
| 3DMark Fire Strike Score | 32572 pontos | |
| 3DMark Time Spy Score | 19655 pontos | |
Ajuda | ||
| Geekbench 5.5 | |
| OpenCL Score | |
| Medion Erazer Beast X40 2024 (Gaming Mode) | |
| Asus ROG Strix Scar 18 G834JYR (2024) | |
| Schenker Key 17 Pro (Early 23) | |
| Asus ROG Strix Scar 17 G733PYV-LL053X | |
| Medion Erazer Beast X40 2024 | |
| Média NVIDIA GeForce RTX 4090 Laptop GPU (6841 - 237138, n=39) | |
| MSI Titan 18 HX A14VIG | |
| Medion Erazer Beast X40 | |
| Média da turma Gaming (80702 - 277970, n=101, últimos 2 anos) | |
| Vulkan Score 5.5 | |
| Medion Erazer Beast X40 2024 (Gaming Mode) | |
| Medion Erazer Beast X40 2024 | |
| MSI Titan 18 HX A14VIG | |
| Asus ROG Strix Scar 18 G834JYR (2024) | |
| Asus ROG Strix Scar 17 G733PYV-LL053X | |
| Média da turma Gaming (18857 - 246759, n=76, últimos 2 anos) | |
| Média NVIDIA GeForce RTX 4090 Laptop GPU (49663 - 163089, n=28) | |
| Geekbench 6.7 | |
| GPU Vulkan | |
| Medion Erazer Beast X40 2024 (6.2.1, Gaming Mode) | |
| Medion Erazer Beast X40 2024 (6.2.1) | |
| Asus ROG Strix Scar 18 G834JYR (2024) (6.2.1) | |
| Asus ROG Strix Scar 17 G733PYV-LL053X | |
| MSI Titan 18 HX A14VIG (6.2.1) | |
| Média NVIDIA GeForce RTX 4090 Laptop GPU (128748 - 196201, n=16) | |
| Média da turma Gaming (7562 - 244348, n=59, últimos 2 anos) | |
| GPU OpenCL | |
| Medion Erazer Beast X40 2024 (6.2.1) | |
| Medion Erazer Beast X40 2024 (6.2.1, Gaming Mode) | |
| Asus ROG Strix Scar 17 G733PYV-LL053X | |
| Asus ROG Strix Scar 18 G834JYR (2024) (6.2.1) | |
| Média NVIDIA GeForce RTX 4090 Laptop GPU (159127 - 209521, n=20) | |
| MSI Titan 18 HX A14VIG (6.2.1) | |
| Média da turma Gaming (67235 - 253130, n=103, últimos 2 anos) | |
| V-Ray Benchmark Next 4.10 | |
| GPU | |
| Medion Erazer Beast X40 2024 (v4.10.07, Gaming Mode) | |
| Asus ROG Strix Scar 17 G733PYV-LL053X (v4.10.07 ) | |
| Schenker Key 17 Pro (Early 23) (v4.10.07 ) | |
| Medion Erazer Beast X40 (v4.10.07 ) | |
| Média NVIDIA GeForce RTX 4090 Laptop GPU (873 - 1334, n=30) | |
| Asus ROG Strix Scar 18 G834JYR (2024) (v4.10.07 ) | |
| Medion Erazer Beast X40 2024 (v4.10.07 ) | |
| Média da turma Gaming (427 - 1627, n=99, últimos 2 anos) | |
| CPU | |
| Asus ROG Strix Scar 17 G733PYV-LL053X (v4.10.07 ) | |
| Medion Erazer Beast X40 2024 (v4.10.07, Gaming Mode) | |
| Medion Erazer Beast X40 (v4.10.07 ) | |
| Média NVIDIA GeForce RTX 4090 Laptop GPU (18206 - 37629, n=30) | |
| Asus ROG Strix Scar 18 G834JYR (2024) (v4.10.07 ) | |
| Schenker Key 17 Pro (Early 23) (v4.10.07 ) | |
| Média da turma Gaming (10048 - 45327, n=97, últimos 2 anos) | |
| Medion Erazer Beast X40 2024 (v4.10.07 ) | |
* ... menor é melhor
| The Witcher 3 - 1920x1080 Ultra Graphics & Postprocessing (HBAO+) | |
| Medion Erazer Beast X40 2024 (Gaming Mode) | |
| MSI Titan 18 HX A14VIG | |
| Asus ROG Strix Scar 17 G733PYV-LL053X | |
| Schenker Key 17 Pro (Early 23) | |
| Medion Erazer Beast X40 2024 | |
| Média NVIDIA GeForce RTX 4090 Laptop GPU (139.2 - 216, n=35) | |
| Medion Erazer Beast X40 | |
| Média da turma Gaming (104.7 - 240, n=6, últimos 2 anos) | |
| Asus ROG Strix Scar 18 G834JYR (2024) | |
| GTA V - 1920x1080 Highest AA:4xMSAA + FX AF:16x | |
| Asus ROG Strix Scar 17 G733PYV-LL053X | |
| Medion Erazer Beast X40 2024 (Gaming Mode) | |
| Medion Erazer Beast X40 | |
| Schenker Key 17 Pro (Early 23) | |
| Medion Erazer Beast X40 2024 | |
| MSI Titan 18 HX A14VIG | |
| Média NVIDIA GeForce RTX 4090 Laptop GPU (91.1 - 167.7, n=40) | |
| Asus ROG Strix Scar 18 G834JYR (2024) | |
| Média da turma Gaming (48.3 - 186.9, n=93, últimos 2 anos) | |
| Final Fantasy XV Benchmark - 1920x1080 High Quality | |
| Medion Erazer Beast X40 2024 (1.3, Gaming Mode) | |
| MSI Titan 18 HX A14VIG (1.3) | |
| Schenker Key 17 Pro (Early 23) (1.3) | |
| Medion Erazer Beast X40 2024 (1.3) | |
| Asus ROG Strix Scar 17 G733PYV-LL053X (1.3) | |
| Medion Erazer Beast X40 (1.3) | |
| Média NVIDIA GeForce RTX 4090 Laptop GPU (122.2 - 201, n=40) | |
| Asus ROG Strix Scar 18 G834JYR (2024) (1.3) | |
| Média da turma Gaming (41 - 215, n=95, últimos 2 anos) | |
| Strange Brigade - 1920x1080 ultra AA:ultra AF:16 | |
| Asus ROG Strix Scar 17 G733PYV-LL053X (1.47.22.14 D3D12) | |
| MSI Titan 18 HX A14VIG (1.47.22.14 D3D12) | |
| Schenker Key 17 Pro (Early 23) (1.47.22.14 D3D12) | |
| Medion Erazer Beast X40 2024 (1.47.22.14 D3D12, Gaming Mode) | |
| Medion Erazer Beast X40 2024 (1.47.22.14 D3D12) | |
| Medion Erazer Beast X40 (1.47.22.14 D3D12) | |
| Média NVIDIA GeForce RTX 4090 Laptop GPU (233 - 421, n=39) | |
| Asus ROG Strix Scar 18 G834JYR (2024) (1.47.22.14 D3D12) | |
| Média da turma Gaming (76.3 - 456, n=86, últimos 2 anos) | |
| Dota 2 Reborn - 1920x1080 ultra (3/3) best looking | |
| Asus ROG Strix Scar 17 G733PYV-LL053X | |
| Medion Erazer Beast X40 2024 | |
| Medion Erazer Beast X40 2024 (Gaming Mode) | |
| Schenker Key 17 Pro (Early 23) | |
| Média NVIDIA GeForce RTX 4090 Laptop GPU (115.7 - 220, n=42) | |
| MSI Titan 18 HX A14VIG | |
| Medion Erazer Beast X40 | |
| Asus ROG Strix Scar 18 G834JYR (2024) | |
| Média da turma Gaming (84.8 - 248, n=107, últimos 2 anos) | |
| X-Plane 11.11 - 1920x1080 high (fps_test=3) | |
| Asus ROG Strix Scar 17 G733PYV-LL053X | |
| Medion Erazer Beast X40 2024 | |
| Medion Erazer Beast X40 2024 (Gaming Mode) | |
| Asus ROG Strix Scar 18 G834JYR (2024) | |
| Schenker Key 17 Pro (Early 23) | |
| Média NVIDIA GeForce RTX 4090 Laptop GPU (77.8 - 166.2, n=46) | |
| Medion Erazer Beast X40 | |
| MSI Titan 18 HX A14VIG | |
| Média da turma Gaming (55.5 - 143.5, n=109, últimos 2 anos) | |
| Helldivers 2 | |
| 1920x1080 Ultra Preset | |
| Medion Erazer Beast X40 2024 | |
| Média NVIDIA GeForce RTX 4090 Laptop GPU (130.2 - 141.2, n=2) | |
| Asus ROG Zephyrus M16 | |
| Média da turma Gaming (18.4 - 153.8, n=5, últimos 2 anos) | |
| 2560x1440 Ultra Preset | |
| Medion Erazer Beast X40 2024 | |
| Média da turma Gaming (81.3 - 140.1, n=5, últimos 2 anos) | |
| Média NVIDIA GeForce RTX 4090 Laptop GPU (105.5 - 122.6, n=2) | |
| Asus ROG Zephyrus M16 | |
| Enshrouded | |
| 1920x1080 Max. Quality AA:FX | |
| Medion Erazer Beast X40 2024 | |
| Média NVIDIA GeForce RTX 4090 Laptop GPU (79 - 101.5, n=3) | |
| Asus ROG Strix Scar 18 G834JYR (2024) | |
| Asus ROG Zephyrus M16 | |
| Média da turma Gaming (n=1últimos 2 anos) | |
| 2560x1440 Max. Quality AA:FX | |
| Medion Erazer Beast X40 2024 | |
| Asus ROG Strix Scar 18 G834JYR (2024) | |
| Média NVIDIA GeForce RTX 4090 Laptop GPU (61.8 - 76, n=3) | |
| Asus ROG Zephyrus M16 | |
| Ready or Not | |
| 1920x1080 Epic Preset | |
| Asus ROG Zephyrus M16 | |
| Média NVIDIA GeForce RTX 4090 Laptop GPU (155.1 - 203, n=2) | |
| Medion Erazer Beast X40 2024 | |
| 2560x1440 Epic Preset | |
| Medion Erazer Beast X40 2024 | |
| Média NVIDIA GeForce RTX 4090 Laptop GPU (141.1 - 144.3, n=2) | |
| Asus ROG Zephyrus M16 | |
| Immortals of Aveum | |
| 1920x1080 Ultra AF:16x | |
| Medion Erazer Beast X40 2024 | |
| Média NVIDIA GeForce RTX 4090 Laptop GPU (90.6 - 106.3, n=2) | |
| 2560x1440 Ultra AF:16x | |
| Medion Erazer Beast X40 2024 | |
| Média NVIDIA GeForce RTX 4090 Laptop GPU (62.9 - 76.5, n=2) | |
The Witcher 3 FPS chart
| baixo | média | alto | ultra | QHD | |
|---|---|---|---|---|---|
| GTA V (2015) | 187.3 | 186.7 | 183 | 141.5 | 139.8 |
| The Witcher 3 (2015) | 555 | 518 | 394 | 204 | 157.6 |
| Dota 2 Reborn (2015) | 241 | 214 | 205 | 189.9 | |
| Final Fantasy XV Benchmark (2018) | 225 | 210 | 181.1 | 147.7 | |
| X-Plane 11.11 (2018) | 207 | 182.2 | 143.9 | ||
| Strange Brigade (2018) | 484 | 401 | 387 | 371 | 289 |
| Immortals of Aveum (2023) | 119.3 | 109.6 | 106.3 | 76.5 | |
| Cyberpunk 2077 (2023) | 133.2 | 131 | 120.9 | 118.9 | 87.5 |
| Ready or Not (2023) | 289 | 166.6 | 158 | 155.1 | 144.3 |
| Enshrouded (2024) | 150.5 | 134.5 | 116.2 | 101.5 | 76 |
| Helldivers 2 (2024) | 146.8 | 143.8 | 143.3 | 141.2 | 122.6 |
Emissões e energia: O Beast X40 pode trabalhar silenciosamente
Emissões de ruído
O estresse com carga total revela que níveis de pressão sonora de até 52 dB(A) são possíveis com o Beast X40. O laptop é apenas um pouco mais silencioso no modo Gaming.
O "Silent Mode" garante um nível de ruído muito baixo, mas ainda fornece energia mais do que suficiente para as tarefas diárias, como escritório e Internet. Também é possível jogar nesse modo. Entretanto, a taxa de quadros é travada em 30 fps pelo sistema em nosso teste Witcher 3.
Em determinadas circunstâncias, é possível ouvir um zumbido eletrônico no interior do laptop durante o teste Witcher 3, por exemplo, ou ao executar o benchmark Specviewperf.
Barulho
| Ocioso |
| 28 / 29 / 32 dB |
| Carga |
| 48 / 52 dB |
 | ||
30 dB silencioso 40 dB(A) audível 50 dB(A) ruidosamente alto |
||
min: | ||
| Medion Erazer Beast X40 2024 i9-14900HX, GeForce RTX 4090 Laptop GPU | Asus ROG Strix Scar 17 G733PYV-LL053X R9 7945HX3D, GeForce RTX 4090 Laptop GPU | Schenker Key 17 Pro (Early 23) i9-13900HX, GeForce RTX 4090 Laptop GPU | Asus ROG Strix Scar 18 G834JYR (2024) i9-14900HX, GeForce RTX 4090 Laptop GPU | MSI Titan 18 HX A14VIG i9-14900HX, GeForce RTX 4090 Laptop GPU | Medion Erazer Beast X40 i9-13900HX, GeForce RTX 4090 Laptop GPU | |
|---|---|---|---|---|---|---|
| Noise | 0% | -17% | 1% | 6% | -1% | |
| desligado / ambiente * (dB) | 25 | 23 8% | 26 -4% | 24 4% | 22.8 9% | 24 4% |
| Idle Minimum * (dB) | 28 | 23 18% | 26 7% | 27 4% | 23.8 15% | 25 11% |
| Idle Average * (dB) | 29 | 27.7 4% | 33 -14% | 28 3% | 23.8 18% | 29 -0% |
| Idle Maximum * (dB) | 32 | 34.7 -8% | 46 -44% | 32 -0% | 28 12% | 35 -9% |
| Load Average * (dB) | 48 | 53.4 -11% | 56 -17% | 50 -4% | 38 21% | 51 -6% |
| Witcher 3 ultra * (dB) | 50 | 53.4 -7% | 62 -24% | 50 -0% | 57.3 -15% | 51 -2% |
| Load Maximum * (dB) | 52 | 53.4 -3% | 64 -23% | 52 -0% | 62.8 -21% | 53 -2% |
* ... menor é melhor
Temperatura
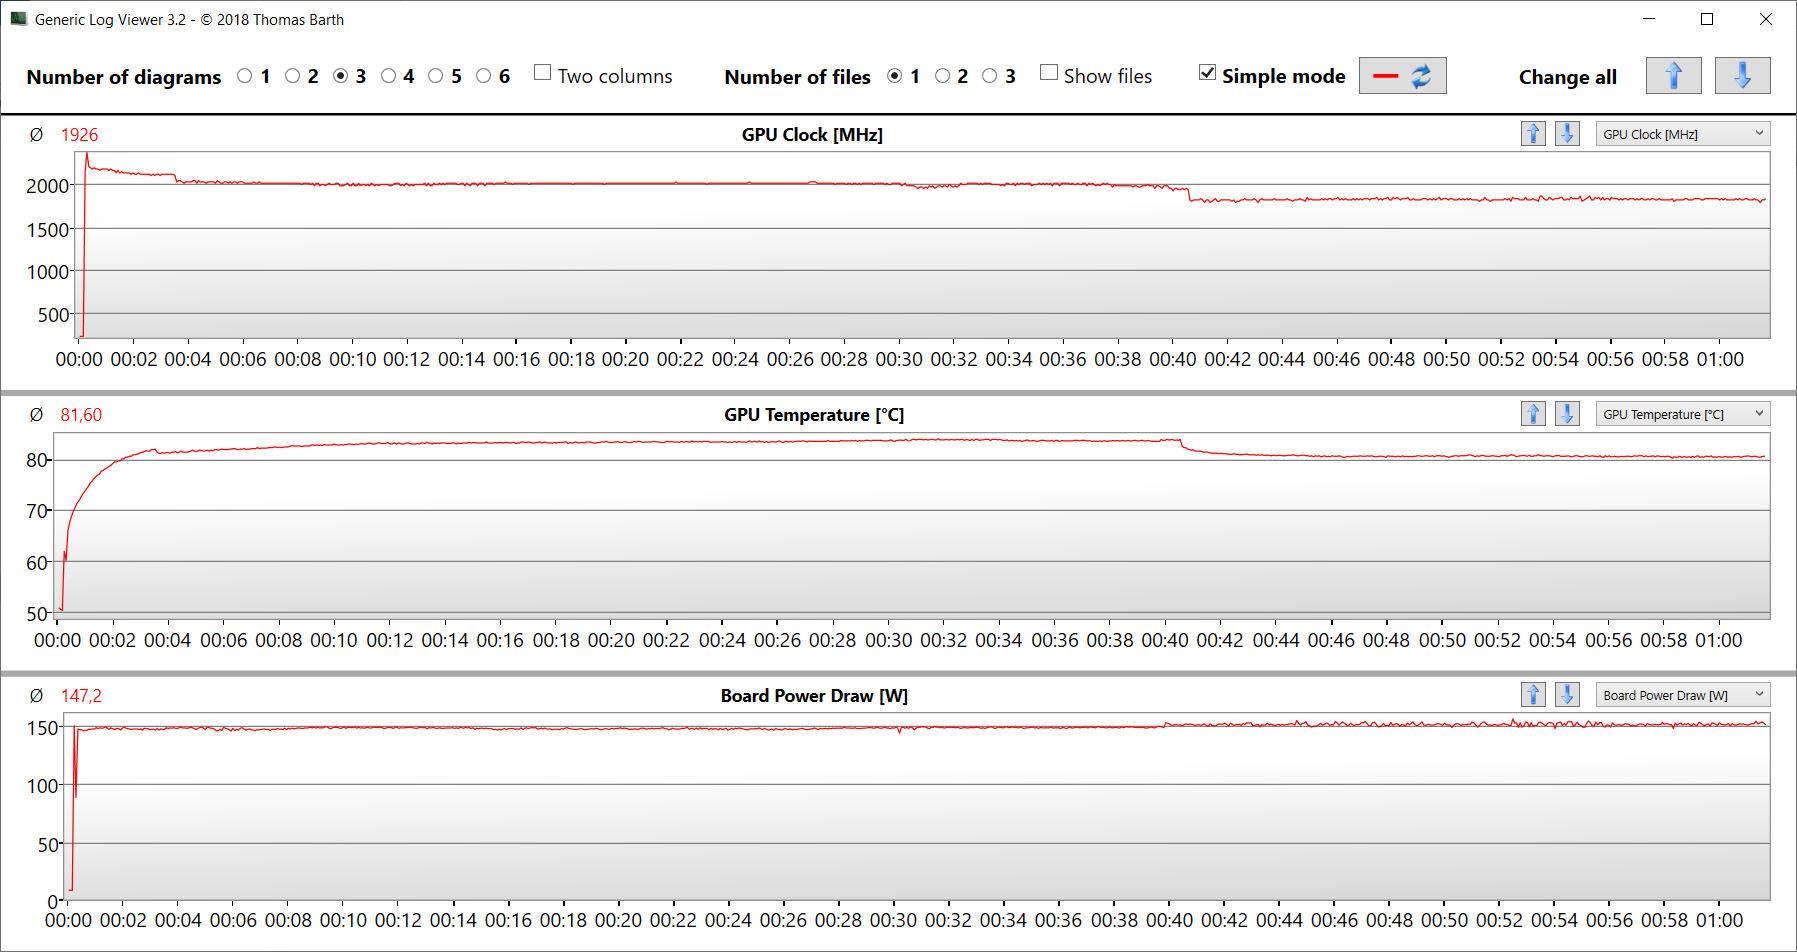
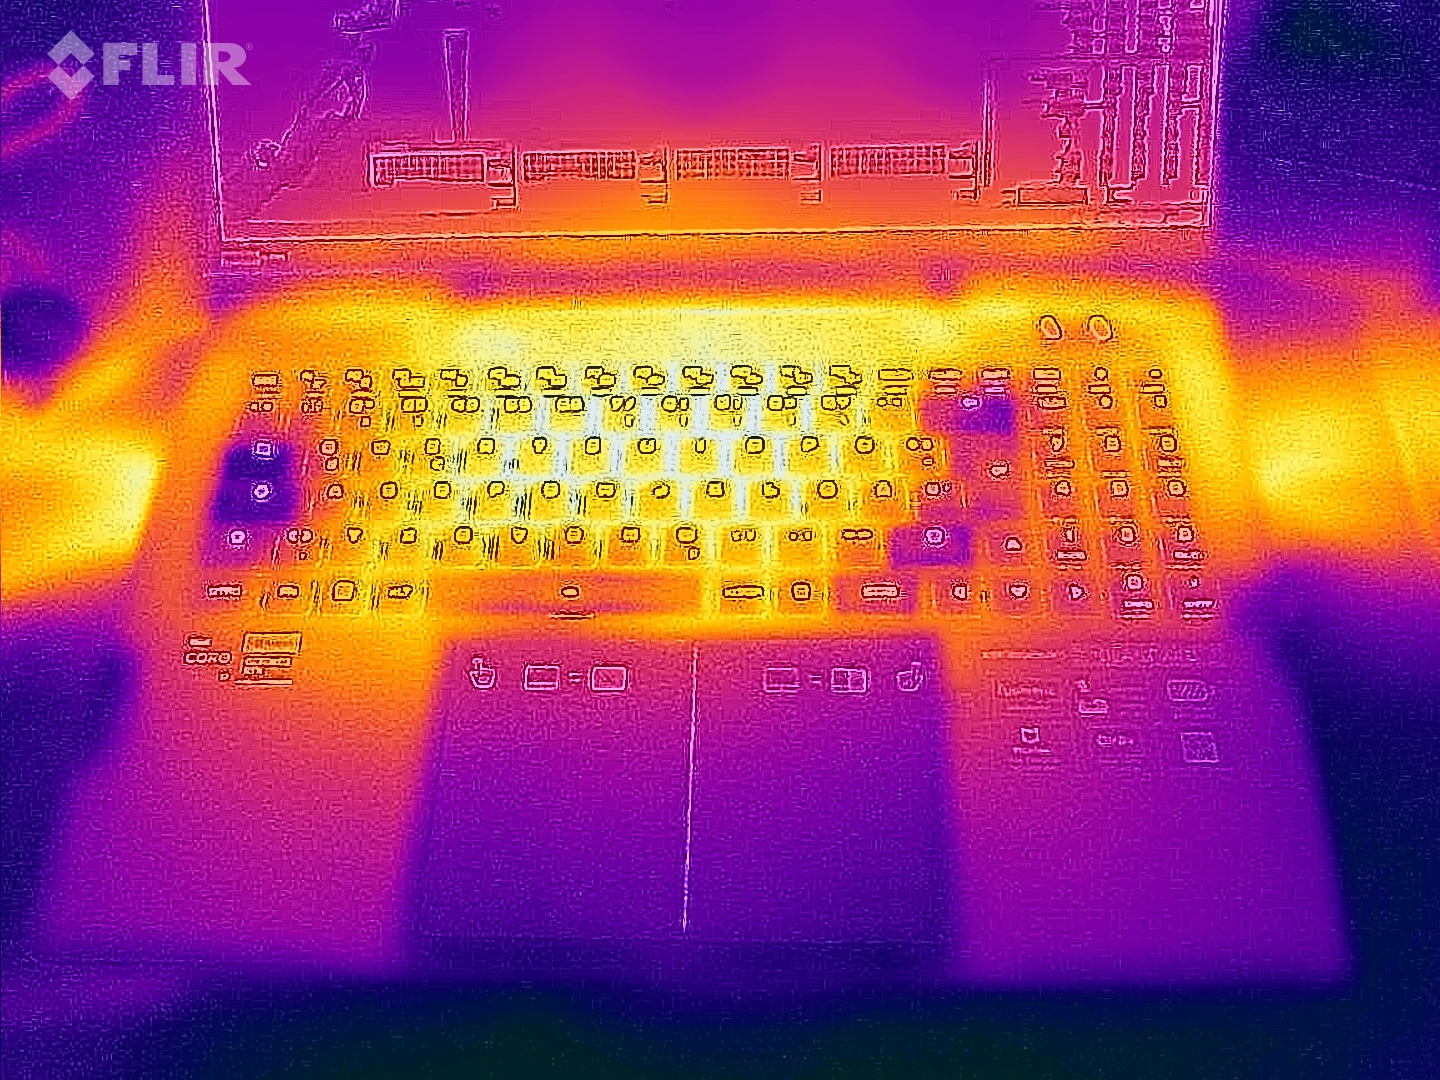
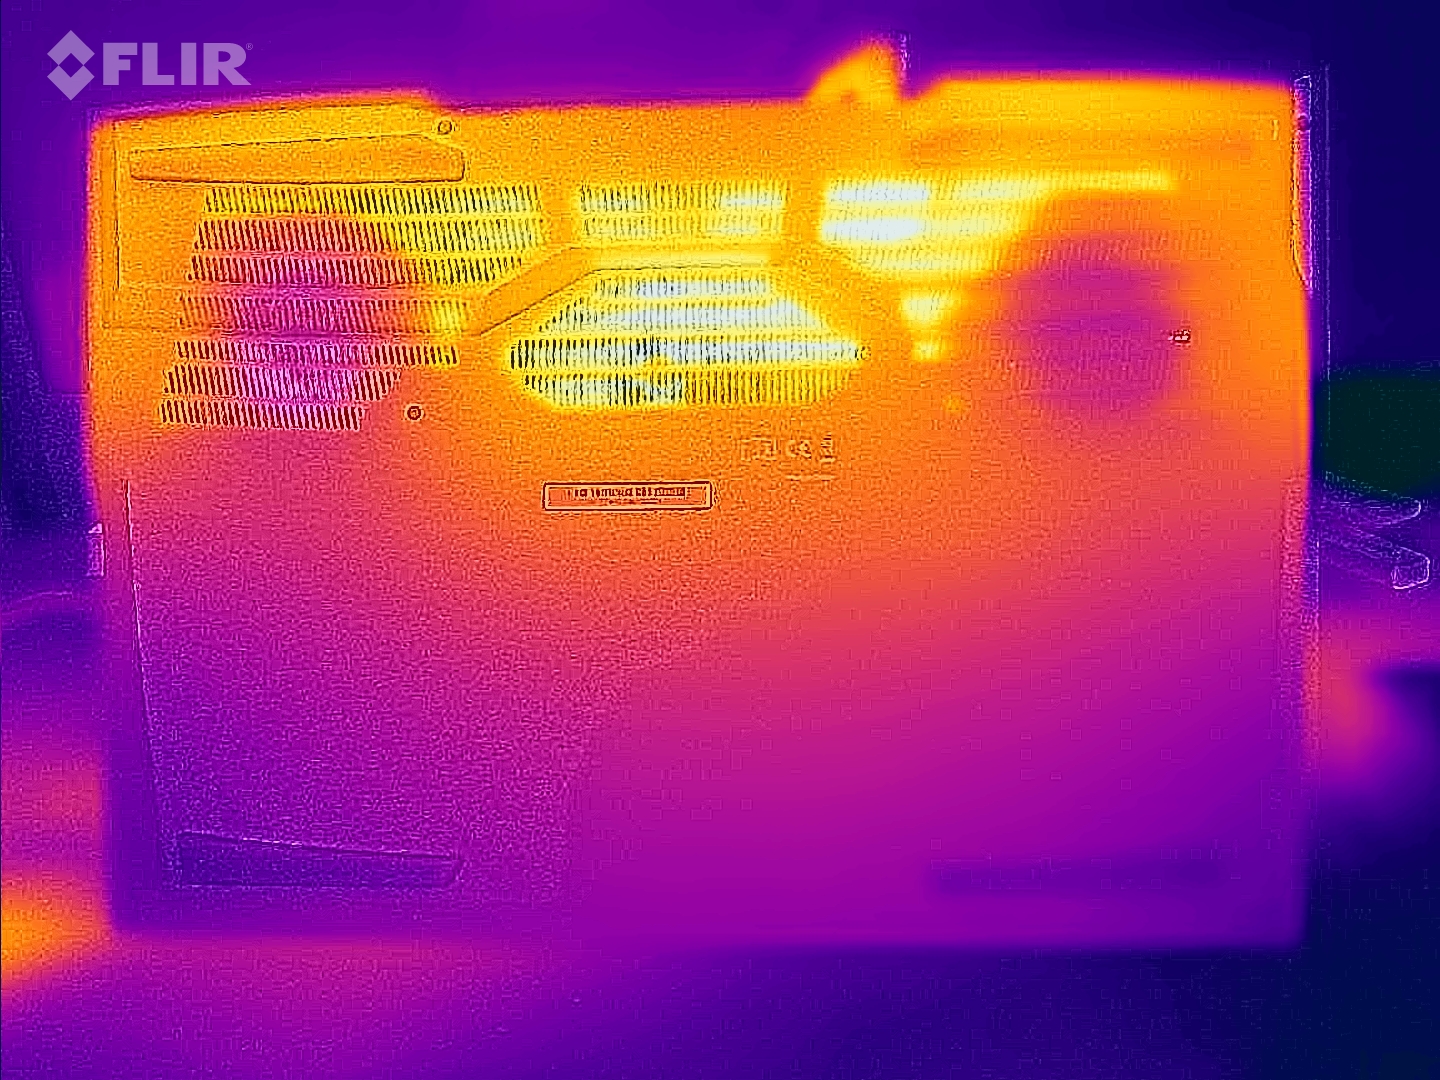
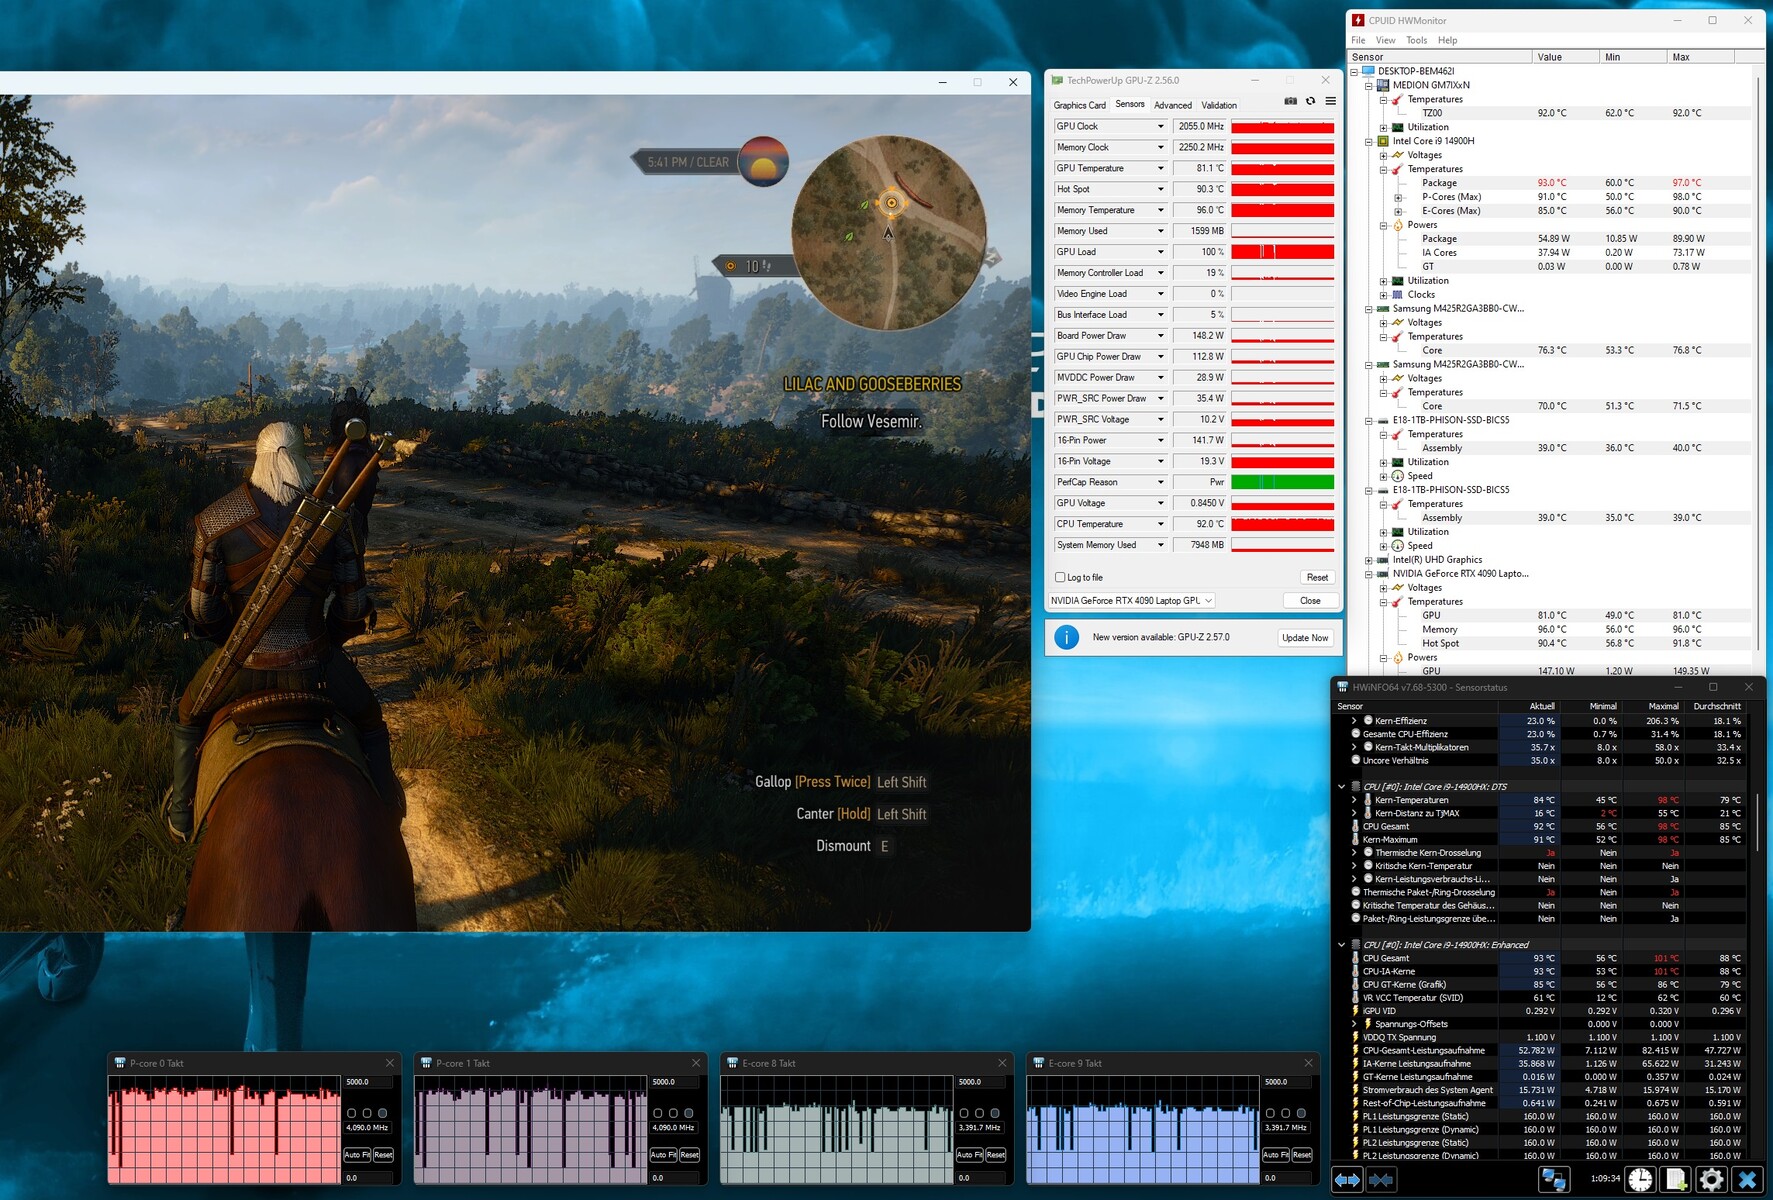
O teste de estresse e o teste Witcher 3 fazem com que o notebook aqueça visivelmente, mas não excessivamente. Valores acima de 50 graus Celsius são atingidos em determinados pontos. No uso diário (Office, Internet), os valores permanecem na faixa verde.
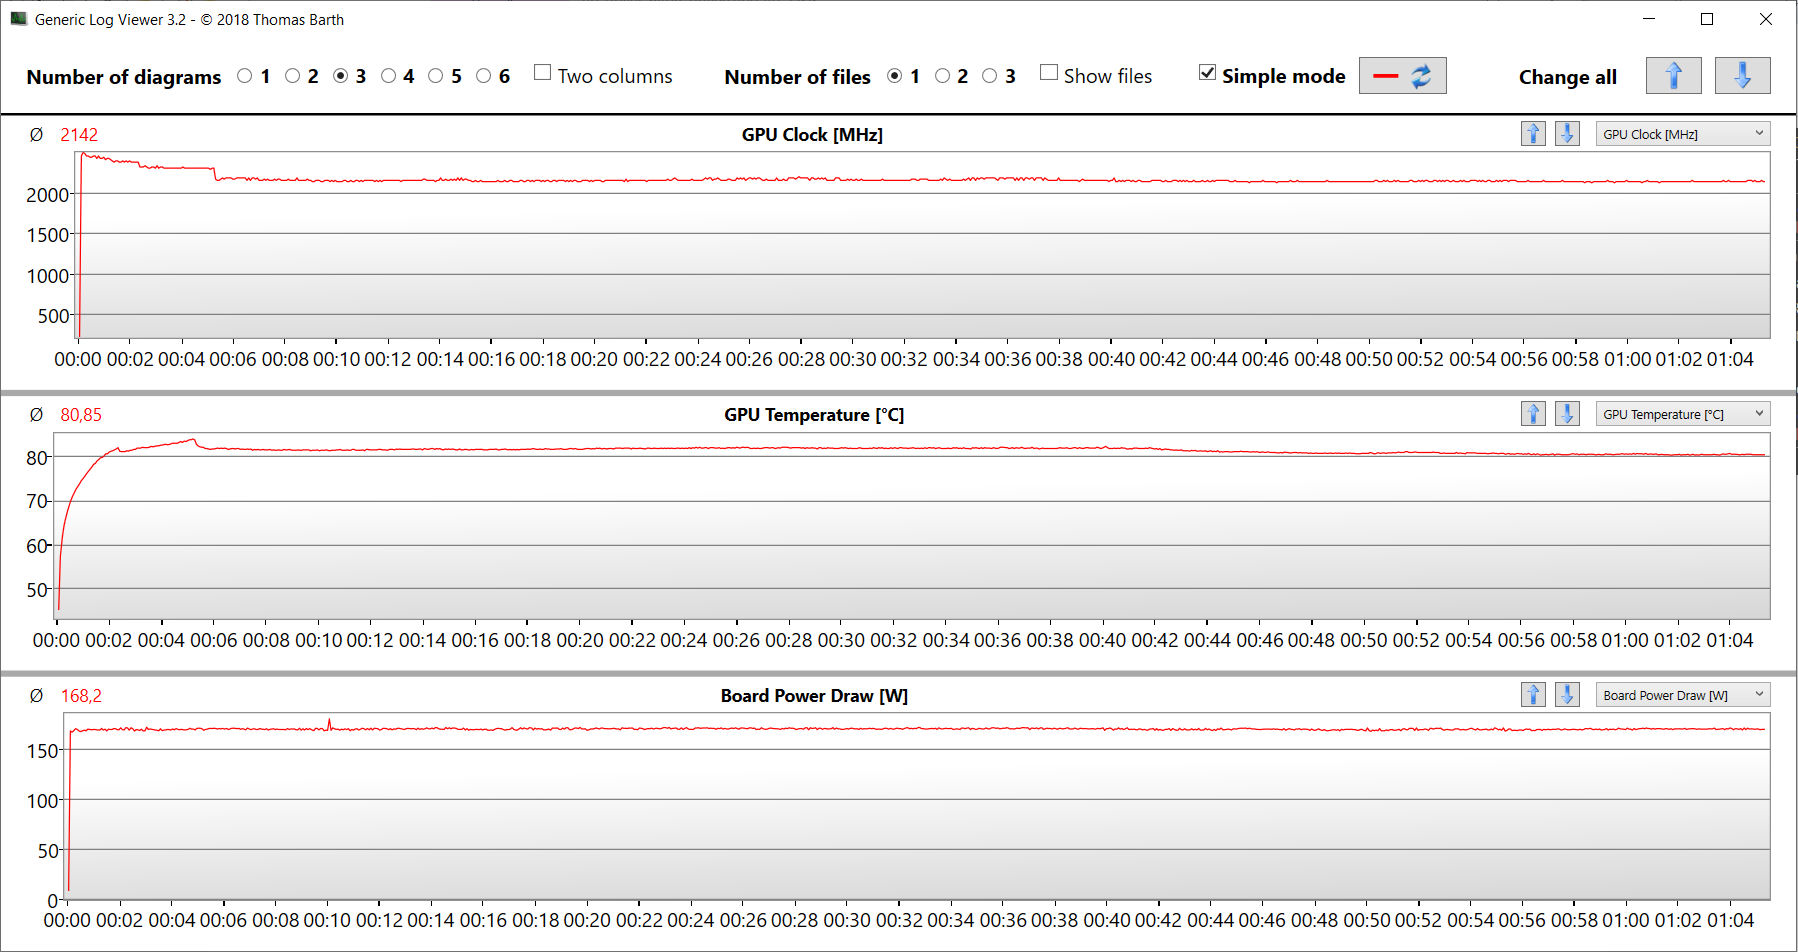
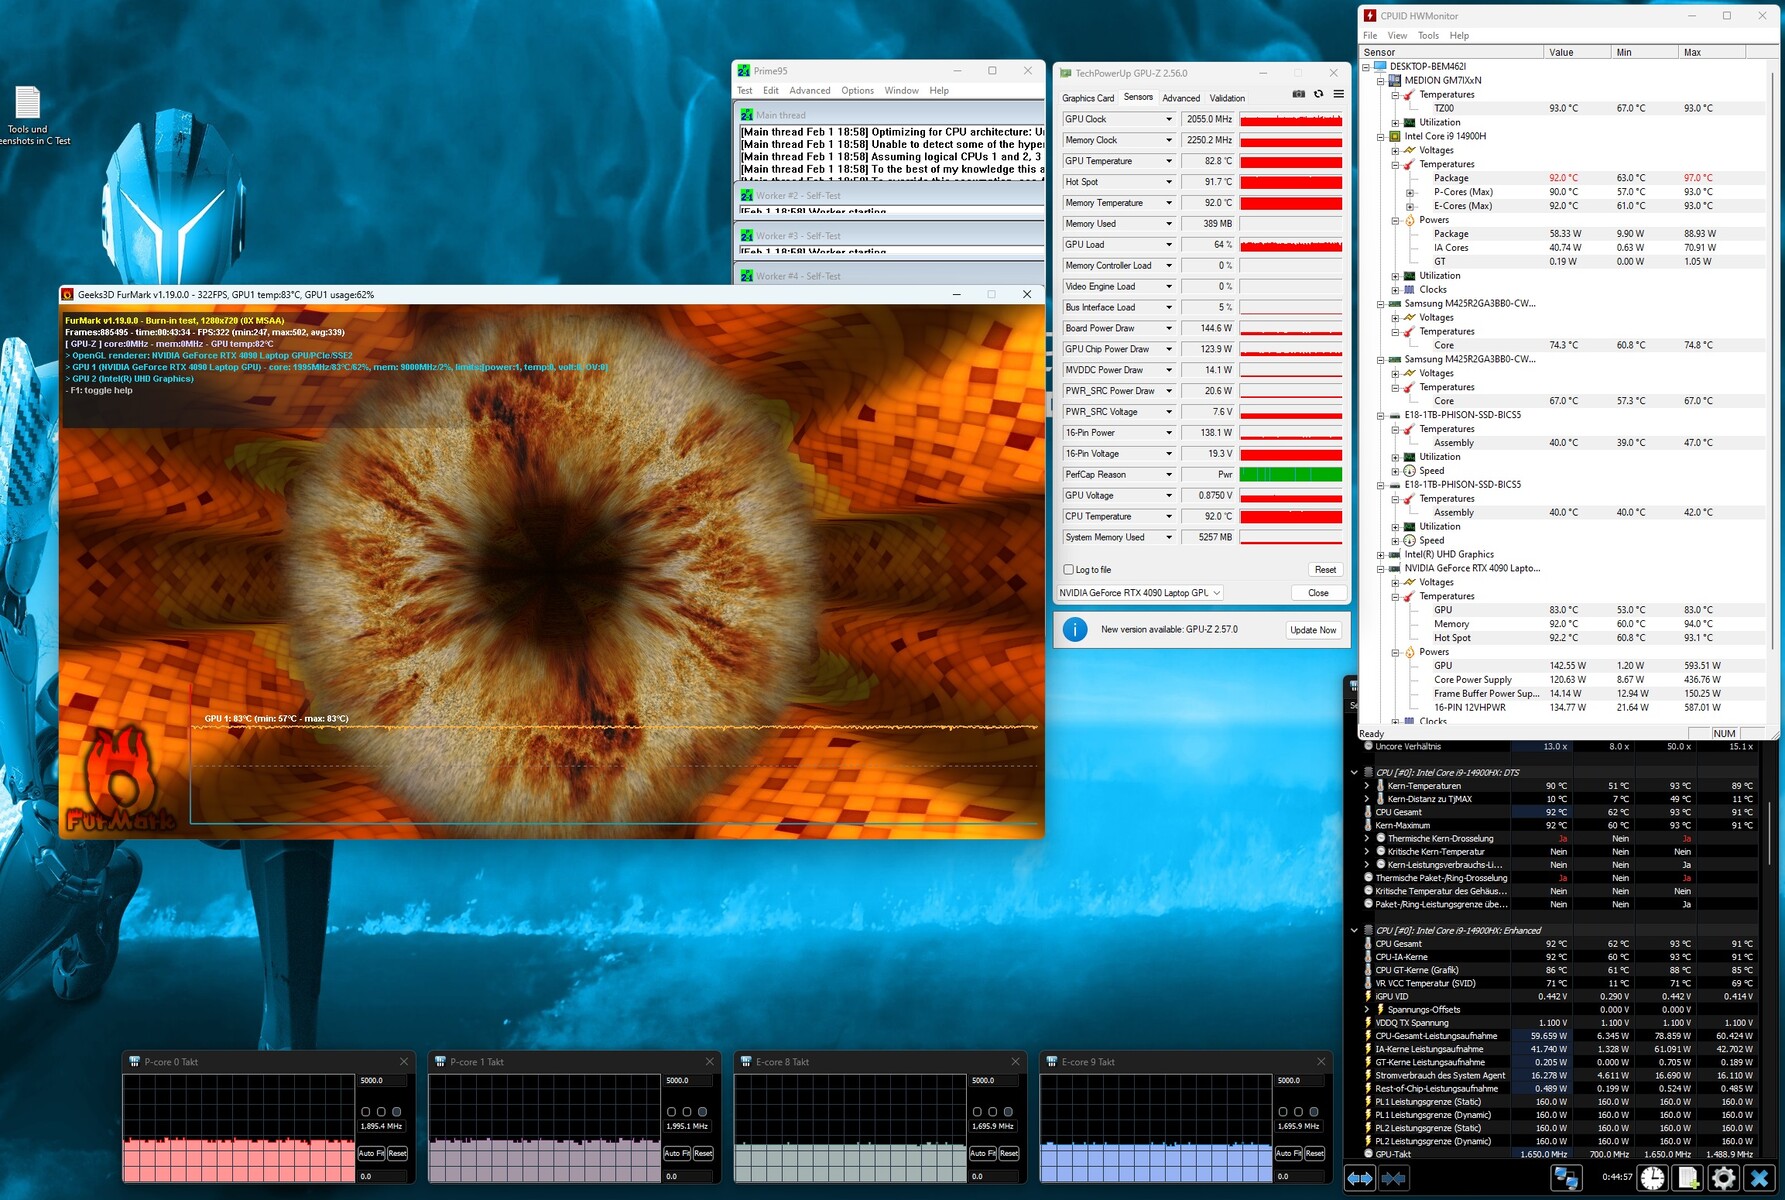
O teste de estresse (Prime95 e Furmark em operação contínua) é um cenário extremo para testar a estabilidade do sistema sob carga total. A taxa de clock da CPU cai para 1,9 a 2 GHz (núcleos P) ou 1,7 GHz (núcleos E) nos primeiros minutos e permanece nesse nível. A GPU opera em velocidades entre 2 e 2,1 GHz.
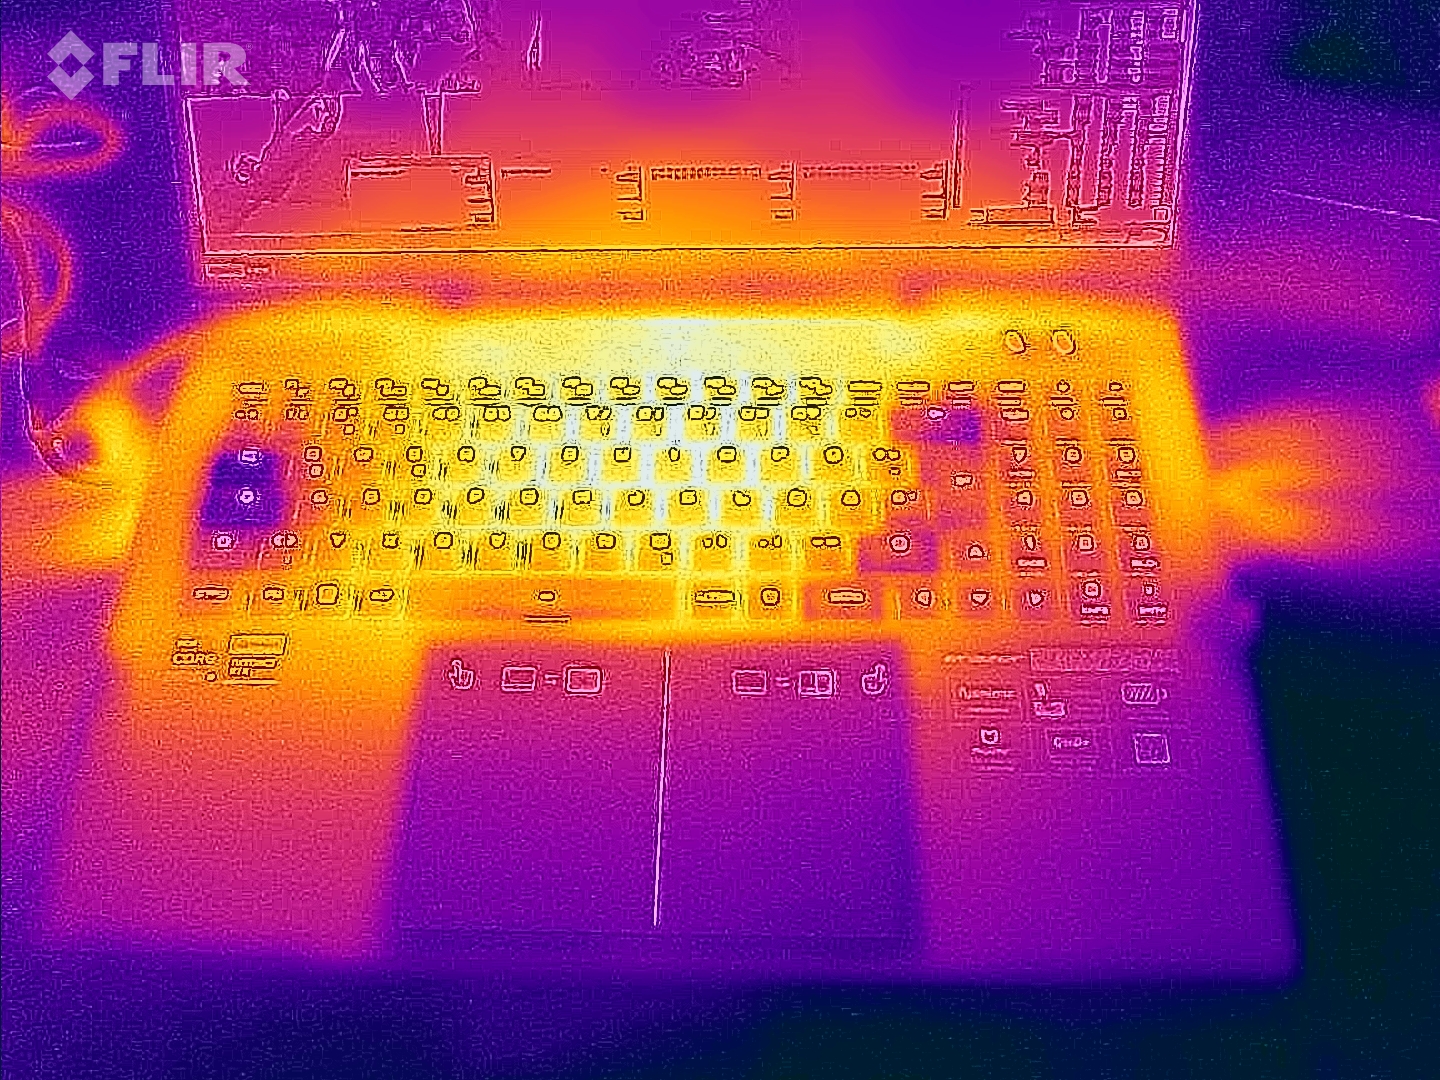
(-) A temperatura máxima no lado superior é 47 °C / 117 F, em comparação com a média de 40.4 °C / 105 F , variando de 21.2 a 68.8 °C para a classe Gaming.
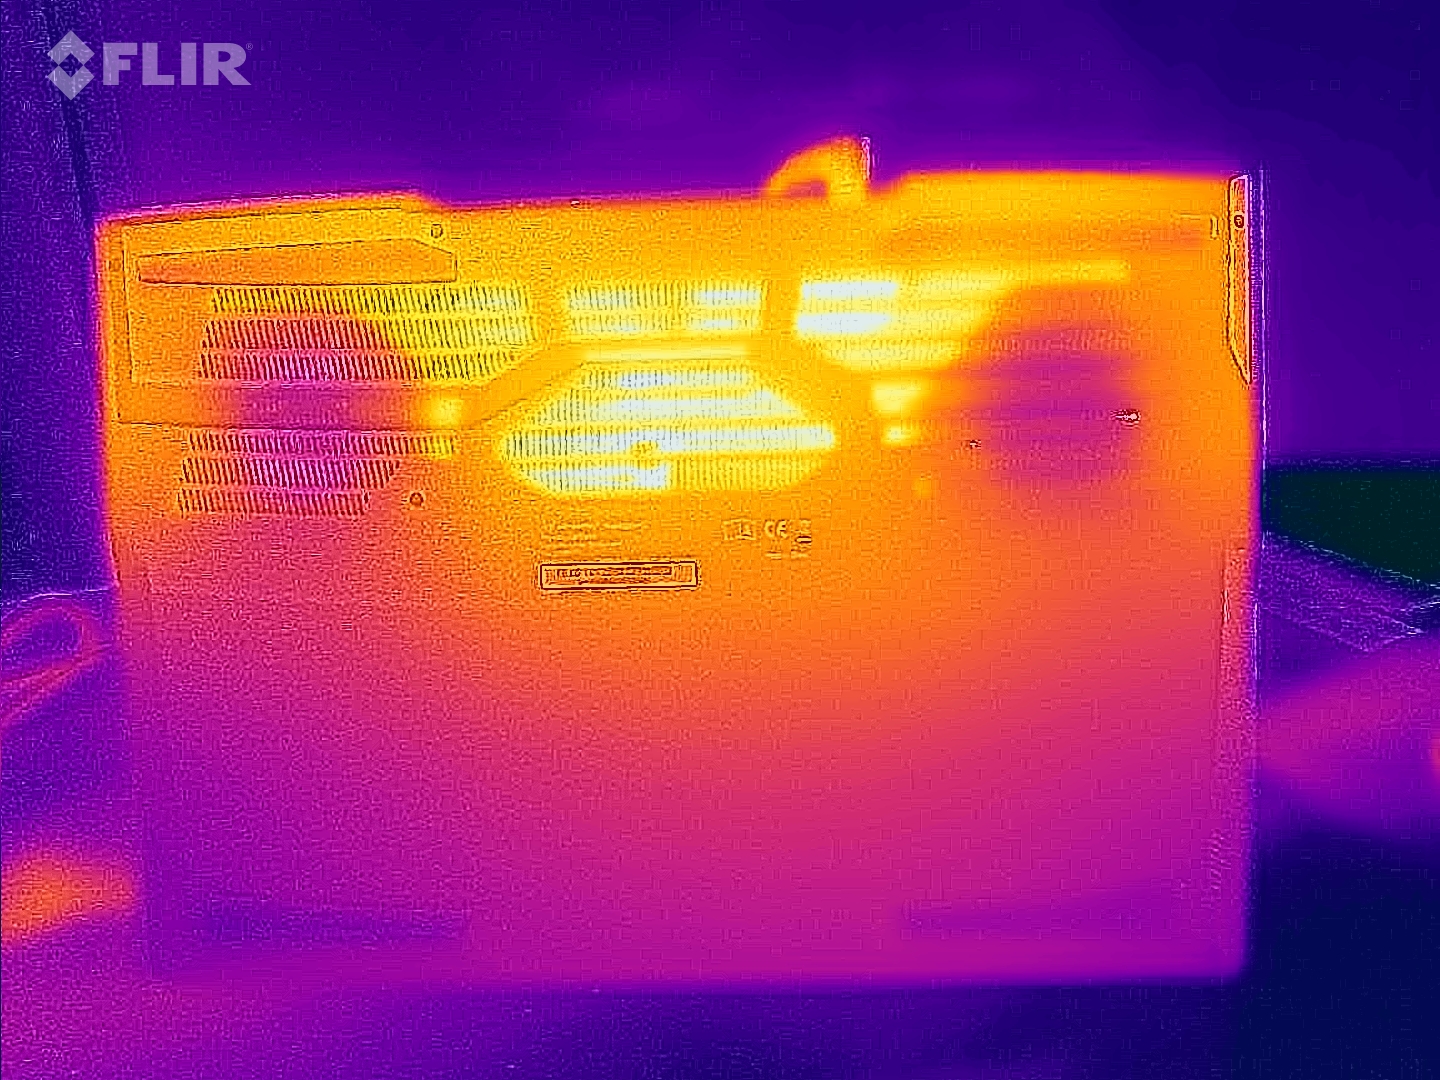
(-) A parte inferior aquece até um máximo de 54 °C / 129 F, em comparação com a média de 43.2 °C / 110 F
(+) Em uso inativo, a temperatura média para o lado superior é 28.1 °C / 83 F, em comparação com a média do dispositivo de 33.9 °C / ### class_avg_f### F.
(-) Jogando The Witcher 3, a temperatura média para o lado superior é 39.1 °C / 102 F, em comparação com a média do dispositivo de 33.9 °C / ## #class_avg_f### F.
(+) Os apoios para as mãos e o touchpad estão atingindo a temperatura máxima da pele (34 °C / 93.2 F) e, portanto, não estão quentes.
(-) A temperatura média da área do apoio para as mãos de dispositivos semelhantes foi 28.8 °C / 83.8 F (-5.2 °C / -9.4 F).
| Medion Erazer Beast X40 2024 Intel Core i9-14900HX, NVIDIA GeForce RTX 4090 Laptop GPU | Asus ROG Strix Scar 17 G733PYV-LL053X AMD Ryzen 9 7945HX3D, NVIDIA GeForce RTX 4090 Laptop GPU | Schenker Key 17 Pro (Early 23) Intel Core i9-13900HX, NVIDIA GeForce RTX 4090 Laptop GPU | Asus ROG Strix Scar 18 G834JYR (2024) Intel Core i9-14900HX, NVIDIA GeForce RTX 4090 Laptop GPU | MSI Titan 18 HX A14VIG Intel Core i9-14900HX, NVIDIA GeForce RTX 4090 Laptop GPU | Medion Erazer Beast X40 Intel Core i9-13900HX, NVIDIA GeForce RTX 4090 Laptop GPU | |
|---|---|---|---|---|---|---|
| Heat | 14% | -11% | 4% | 5% | 1% | |
| Maximum Upper Side * (°C) | 47 | 40.1 15% | 57 -21% | 49 -4% | 37.8 20% | 48 -2% |
| Maximum Bottom * (°C) | 54 | 46.7 14% | 60 -11% | 47 13% | 37.6 30% | 52 4% |
| Idle Upper Side * (°C) | 30 | 26.5 12% | 32 -7% | 29 3% | 34.8 -16% | 30 -0% |
| Idle Bottom * (°C) | 32 | 27.7 13% | 34 -6% | 31 3% | 36 -13% | 31 3% |
* ... menor é melhor
Alto-falante
Os alto-falantes estéreo produzem um som bastante decente em geral.
Medion Erazer Beast X40 2024 análise de áudio
(+) | os alto-falantes podem tocar relativamente alto (###valor### dB)
Graves 100 - 315Hz
(±) | graves reduzidos - em média 14.7% menor que a mediana
(±) | a linearidade dos graves é média (7.2% delta para a frequência anterior)
Médios 400 - 2.000 Hz
(+) | médios equilibrados - apenas 3.7% longe da mediana
(+) | médios são lineares (5.8% delta para frequência anterior)
Altos 2 - 16 kHz
(+) | agudos equilibrados - apenas 2.8% longe da mediana
(+) | os máximos são lineares (6.4% delta da frequência anterior)
Geral 100 - 16.000 Hz
(+) | o som geral é linear (12.1% diferença em relação à mediana)
Comparado com a mesma classe
» 12% de todos os dispositivos testados nesta classe foram melhores, 4% semelhantes, 84% piores
» O melhor teve um delta de 6%, a média foi 18%, o pior foi 132%
Comparado com todos os dispositivos testados
» 10% de todos os dispositivos testados foram melhores, 2% semelhantes, 88% piores
» O melhor teve um delta de 4%, a média foi 23%, o pior foi 134%
Consumo de energia
O Beast X40 não traz nenhuma surpresa em termos de consumo de energia. Os valores estão em um nível normal para o hardware instalado.
O teste Witcher 3 e o teste de estresse são executados com um consumo de energia ligeiramente menor. A fonte de alimentação de 330 W demonstra ser adequada durante o estresse.
| desligado | |
| Ocioso | |
| Carga |
|
Key:
min: | |
Power consumption: The Witcher 3 / Stress test
Power consumption: External monitor
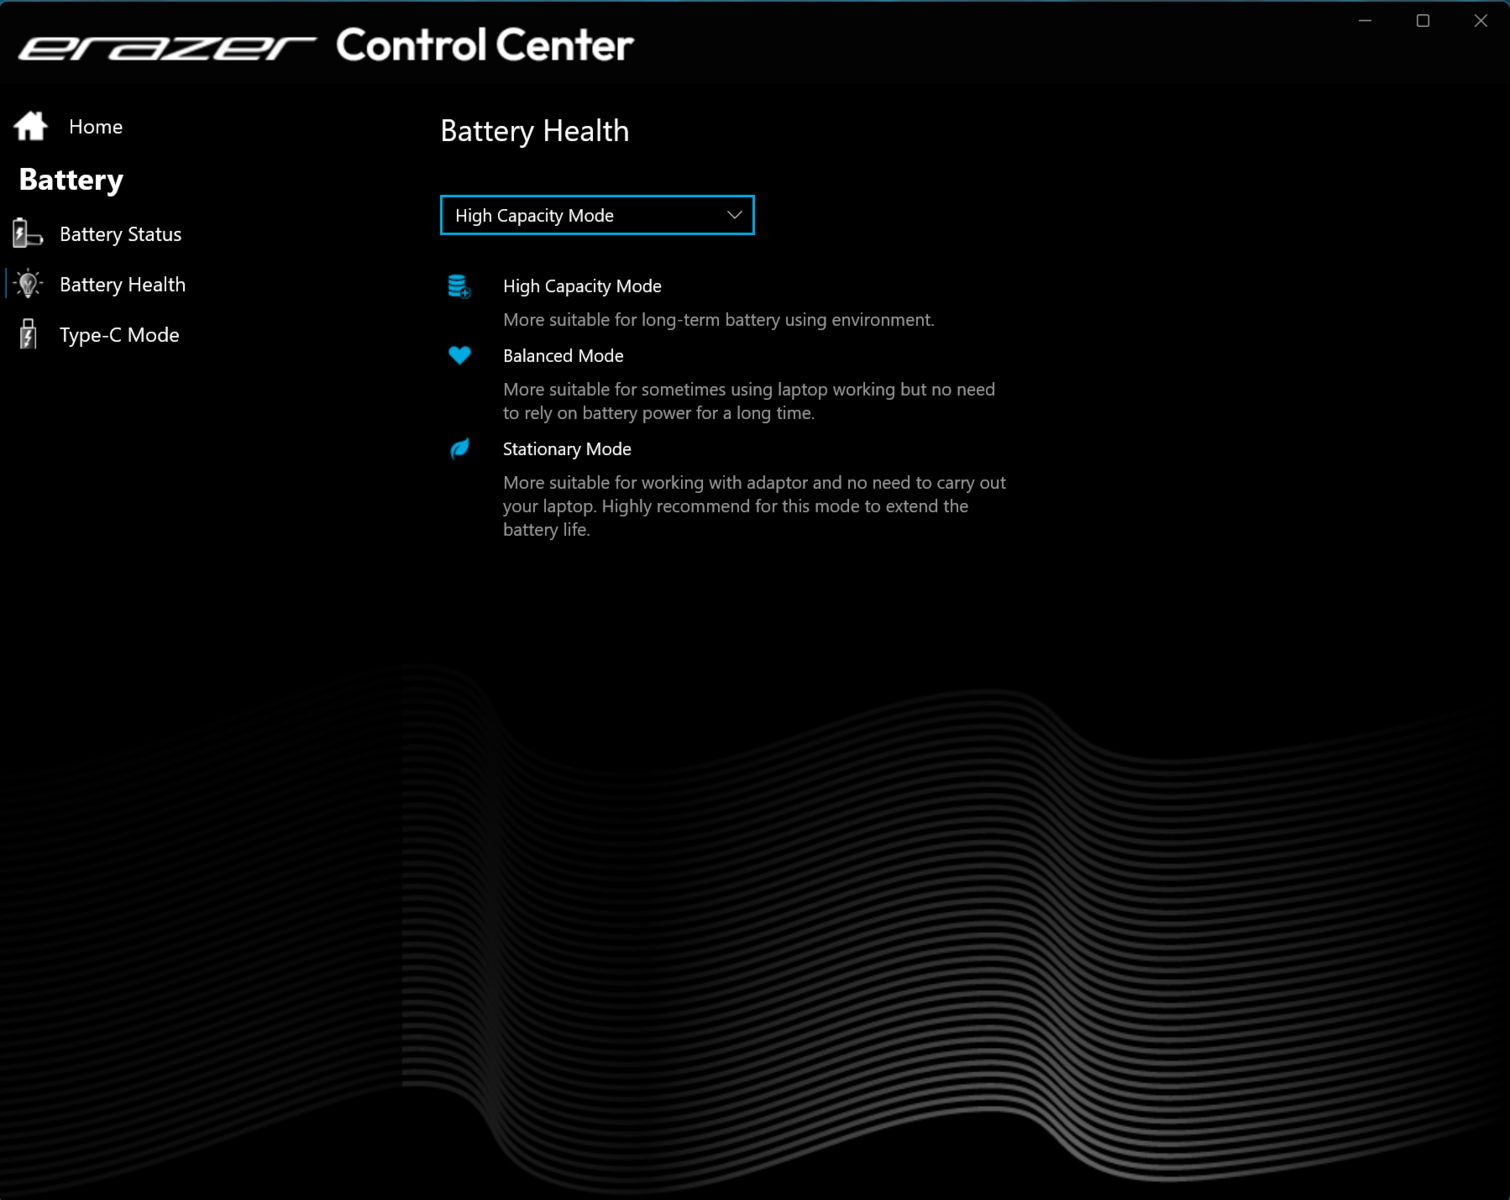
Duração da bateria
O Beast X40 atinge um tempo de execução de 6:14 h no teste prático de WLAN (ilustração da carga ao acessar sites usando um script), o que é um valor decente.
Isso coloca o X40 no mesmo nível de seu antecessor.
Pro
Contra
Veredicto: Potência de ponta
O Medion Erazer Beast X40 vem da extremidade superior da escala de desempenho: a GeForce RTX 4090 e o Core i9-14900HX fornecem a potência necessária para jogos, streaming, renderização e edição de vídeo. É possível fazer um compromisso entre desempenho e ruído. Com um sistema opcional de resfriamento a água (aprox. 200 euros), é possível obter um pequeno aumento no desempenho e emissões gerais mais baixas.
A Medion oferece um notebook para jogos extremamente potente com o Erazer Beast X40.
Como pontos positivos, há uma tela de 17 polegadas de alta qualidade (2.560 x 1.600 pixels, 240 Hz, G-Sync, sRGB) no formato 16:10, um teclado mecânico tátil e uma porta Thunderbolt 4. Essa última abre opções de expansão (GPU externa, solução de encaixe), suporta Power Delivery e pode emitir um sinal DisplayPort. Ele também tem uma bateria de boa duração.
As diferenças entre o atual e o do ano passado x40 do ano passado do ano passado não são substanciais. Graças às velocidades de clock ligeiramente mais altas, o Core i9-14900HX oferece um desempenho ligeiramente superior com o mesmo número de núcleos e threads do que o Core i9-13900HX do modelo do ano anterior. Este último seria uma alternativa (mais barata): A Medion o vende atualmente por pouco menos de 3.500 euros.
Outra alternativa seria o Asus ROG Strix Scar 17 X3D. Ele oferece um nível comparável de desempenho e uma tela com cobertura DCI-P3. No entanto, o laptop da Asus não oferece Thunderbolt 4. Ele também é inferior em termos de duração da bateria.
Preço e disponibilidade
O Medion Erazer Beast X40 (2024) está disponível na loja da Medion e na Cyberport.de por um preço abaixo de 4.000 euros.
Medion Erazer Beast X40 2024
- 02/21/2024 v7 (old)
Sascha Mölck
Transparência
A seleção dos dispositivos a serem analisados é feita pela nossa equipe editorial. A amostra de teste foi fornecida ao autor como empréstimo pelo fabricante ou varejista para fins desta revisão. O credor não teve influência nesta revisão, nem o fabricante recebeu uma cópia desta revisão antes da publicação. Não houve obrigação de publicar esta revisão. Como empresa de mídia independente, a Notebookcheck não está sujeita à autoridade de fabricantes, varejistas ou editores.
É assim que o Notebookcheck está testando
Todos os anos, o Notebookcheck analisa de forma independente centenas de laptops e smartphones usando procedimentos padronizados para garantir que todos os resultados sejam comparáveis. Desenvolvemos continuamente nossos métodos de teste há cerca de 20 anos e definimos padrões da indústria no processo. Em nossos laboratórios de teste, equipamentos de medição de alta qualidade são utilizados por técnicos e editores experientes. Esses testes envolvem um processo de validação em vários estágios. Nosso complexo sistema de classificação é baseado em centenas de medições e benchmarks bem fundamentados, o que mantém a objetividade.Price comparison
