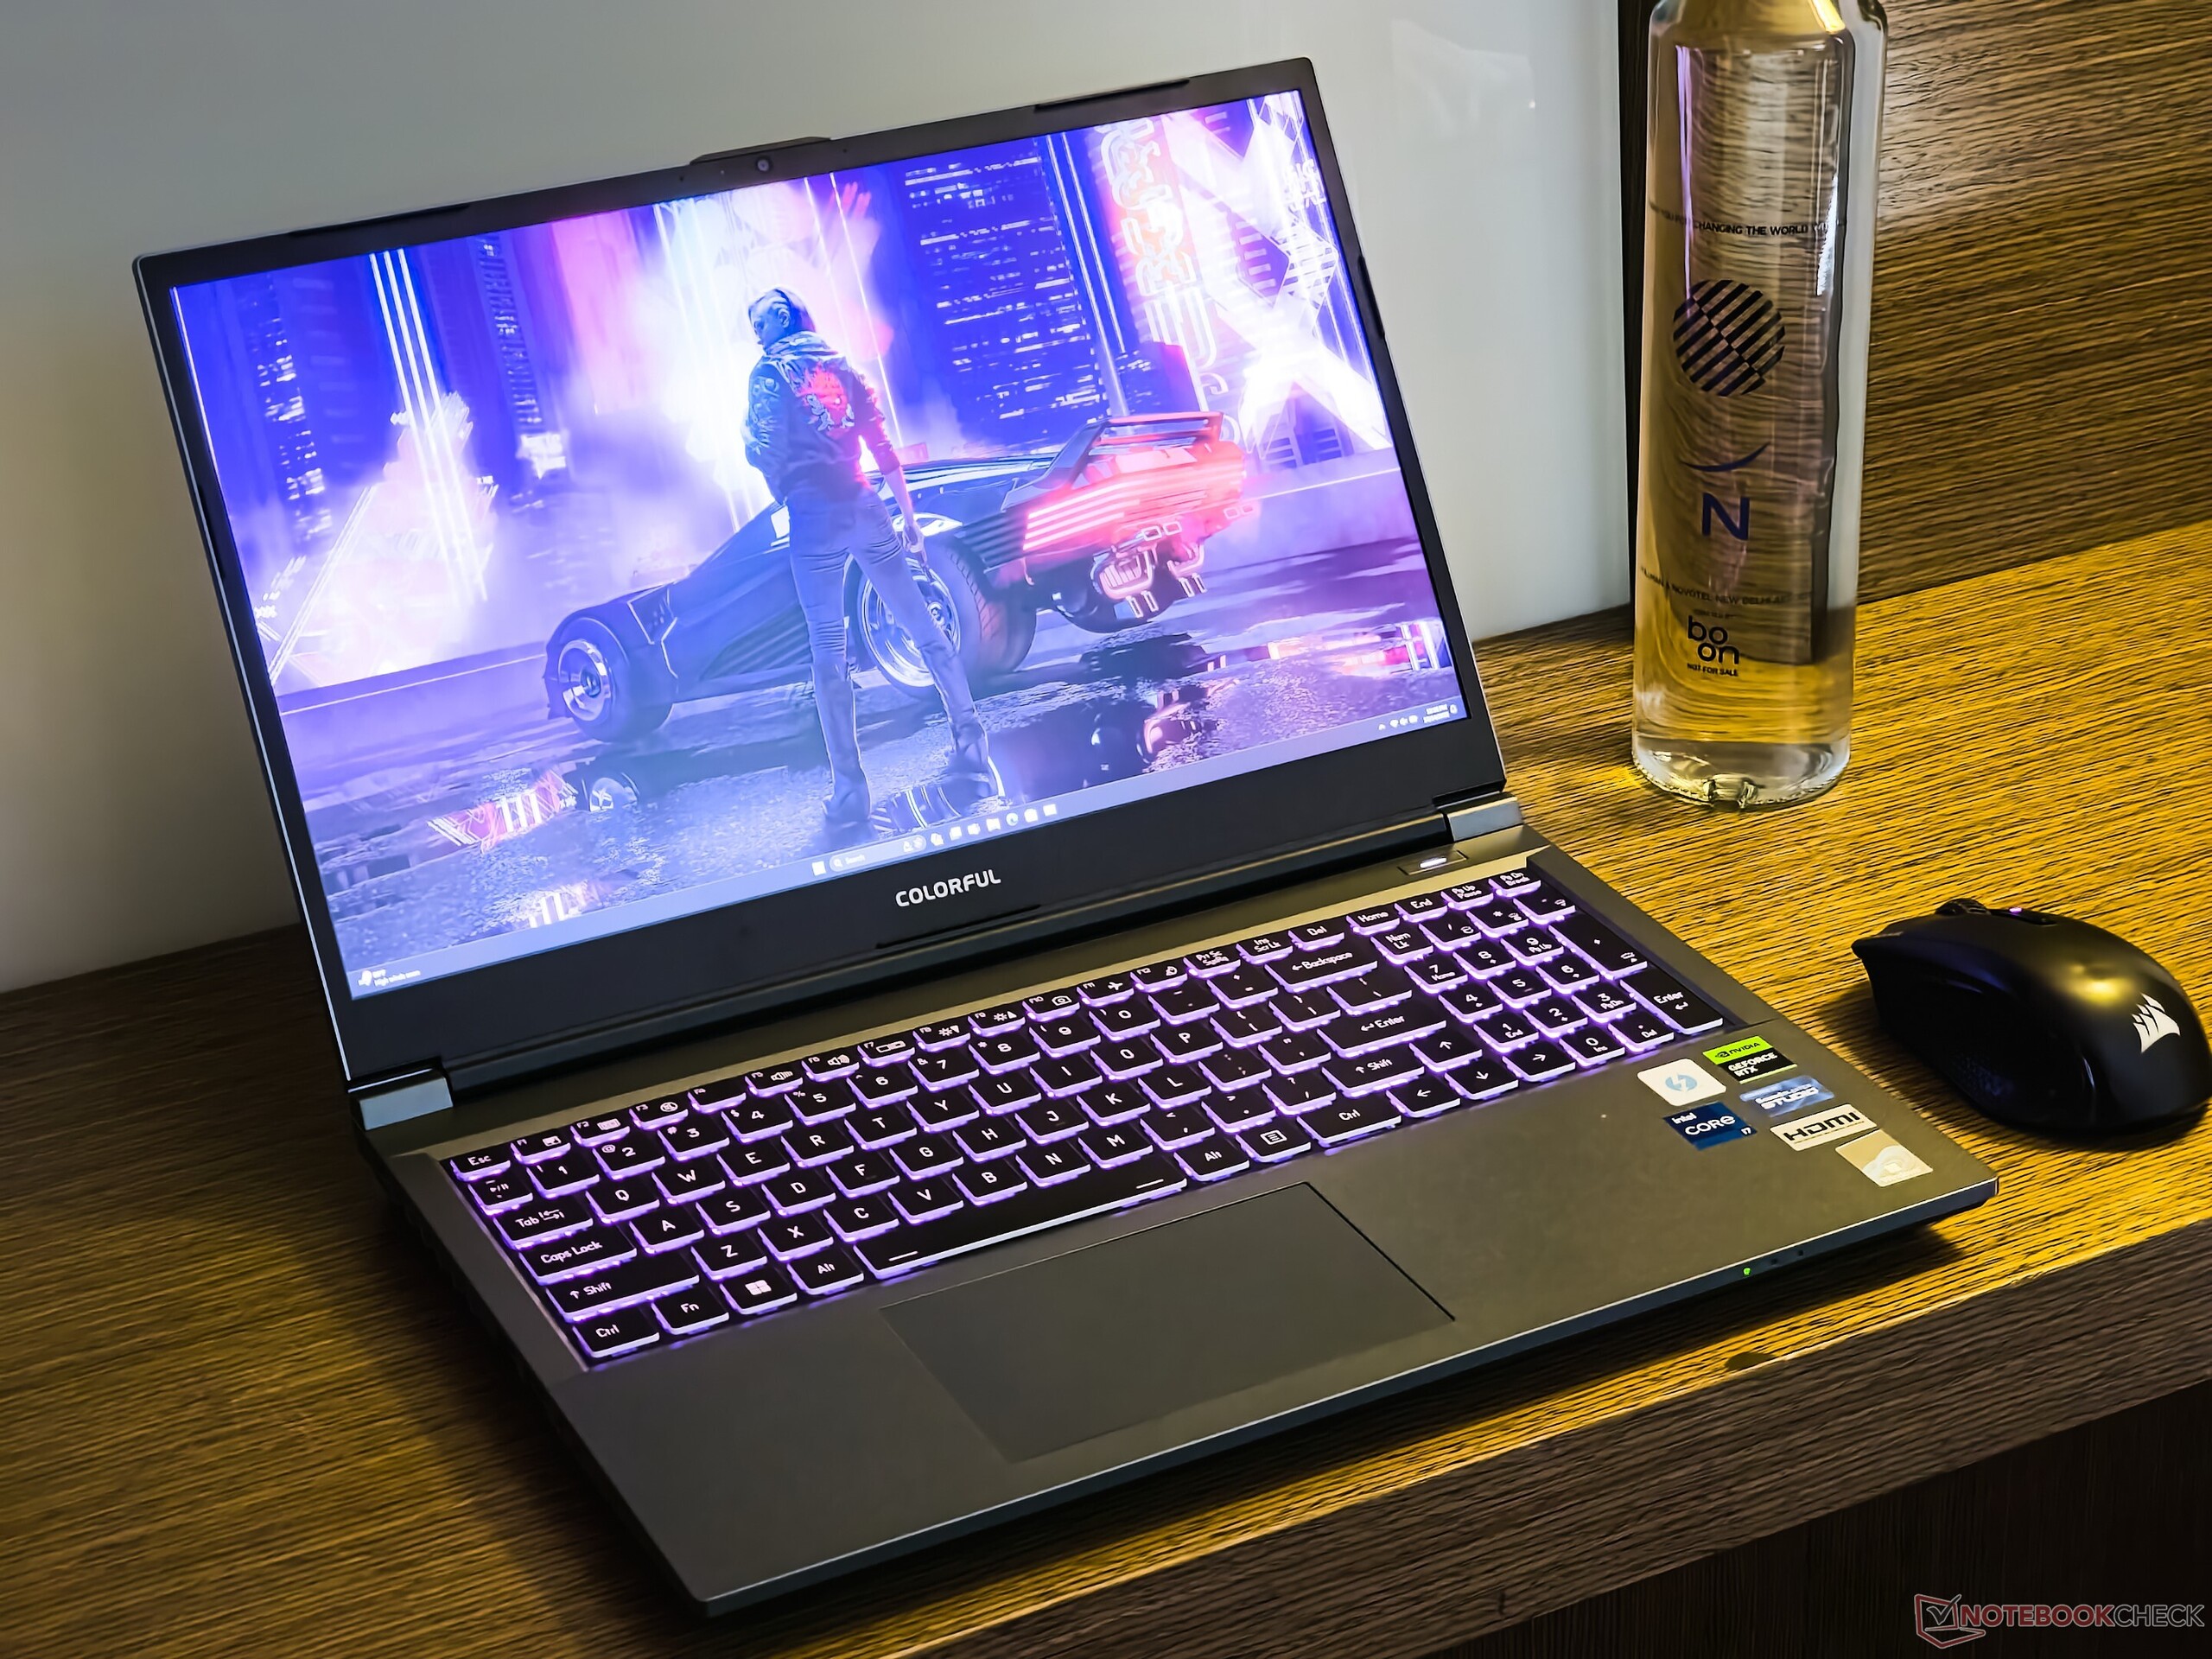
Avaliação do Colorful EVOL X15 AT 23: Impressionante gamer QHD com Raptor Lake-HX e algumas peculiaridades imperdíveis

Mais popular por sua linha de placas-mãe e GPUs para PC, a Colorful começou a expandir seus horizontes para incluir laptops Intel Alder Lake de 12ª geração. Este ano, a gigante chinesa da tecnologia atualizou sua linha para oferecer várias ofertas Raptor Lake de 13ª geração.
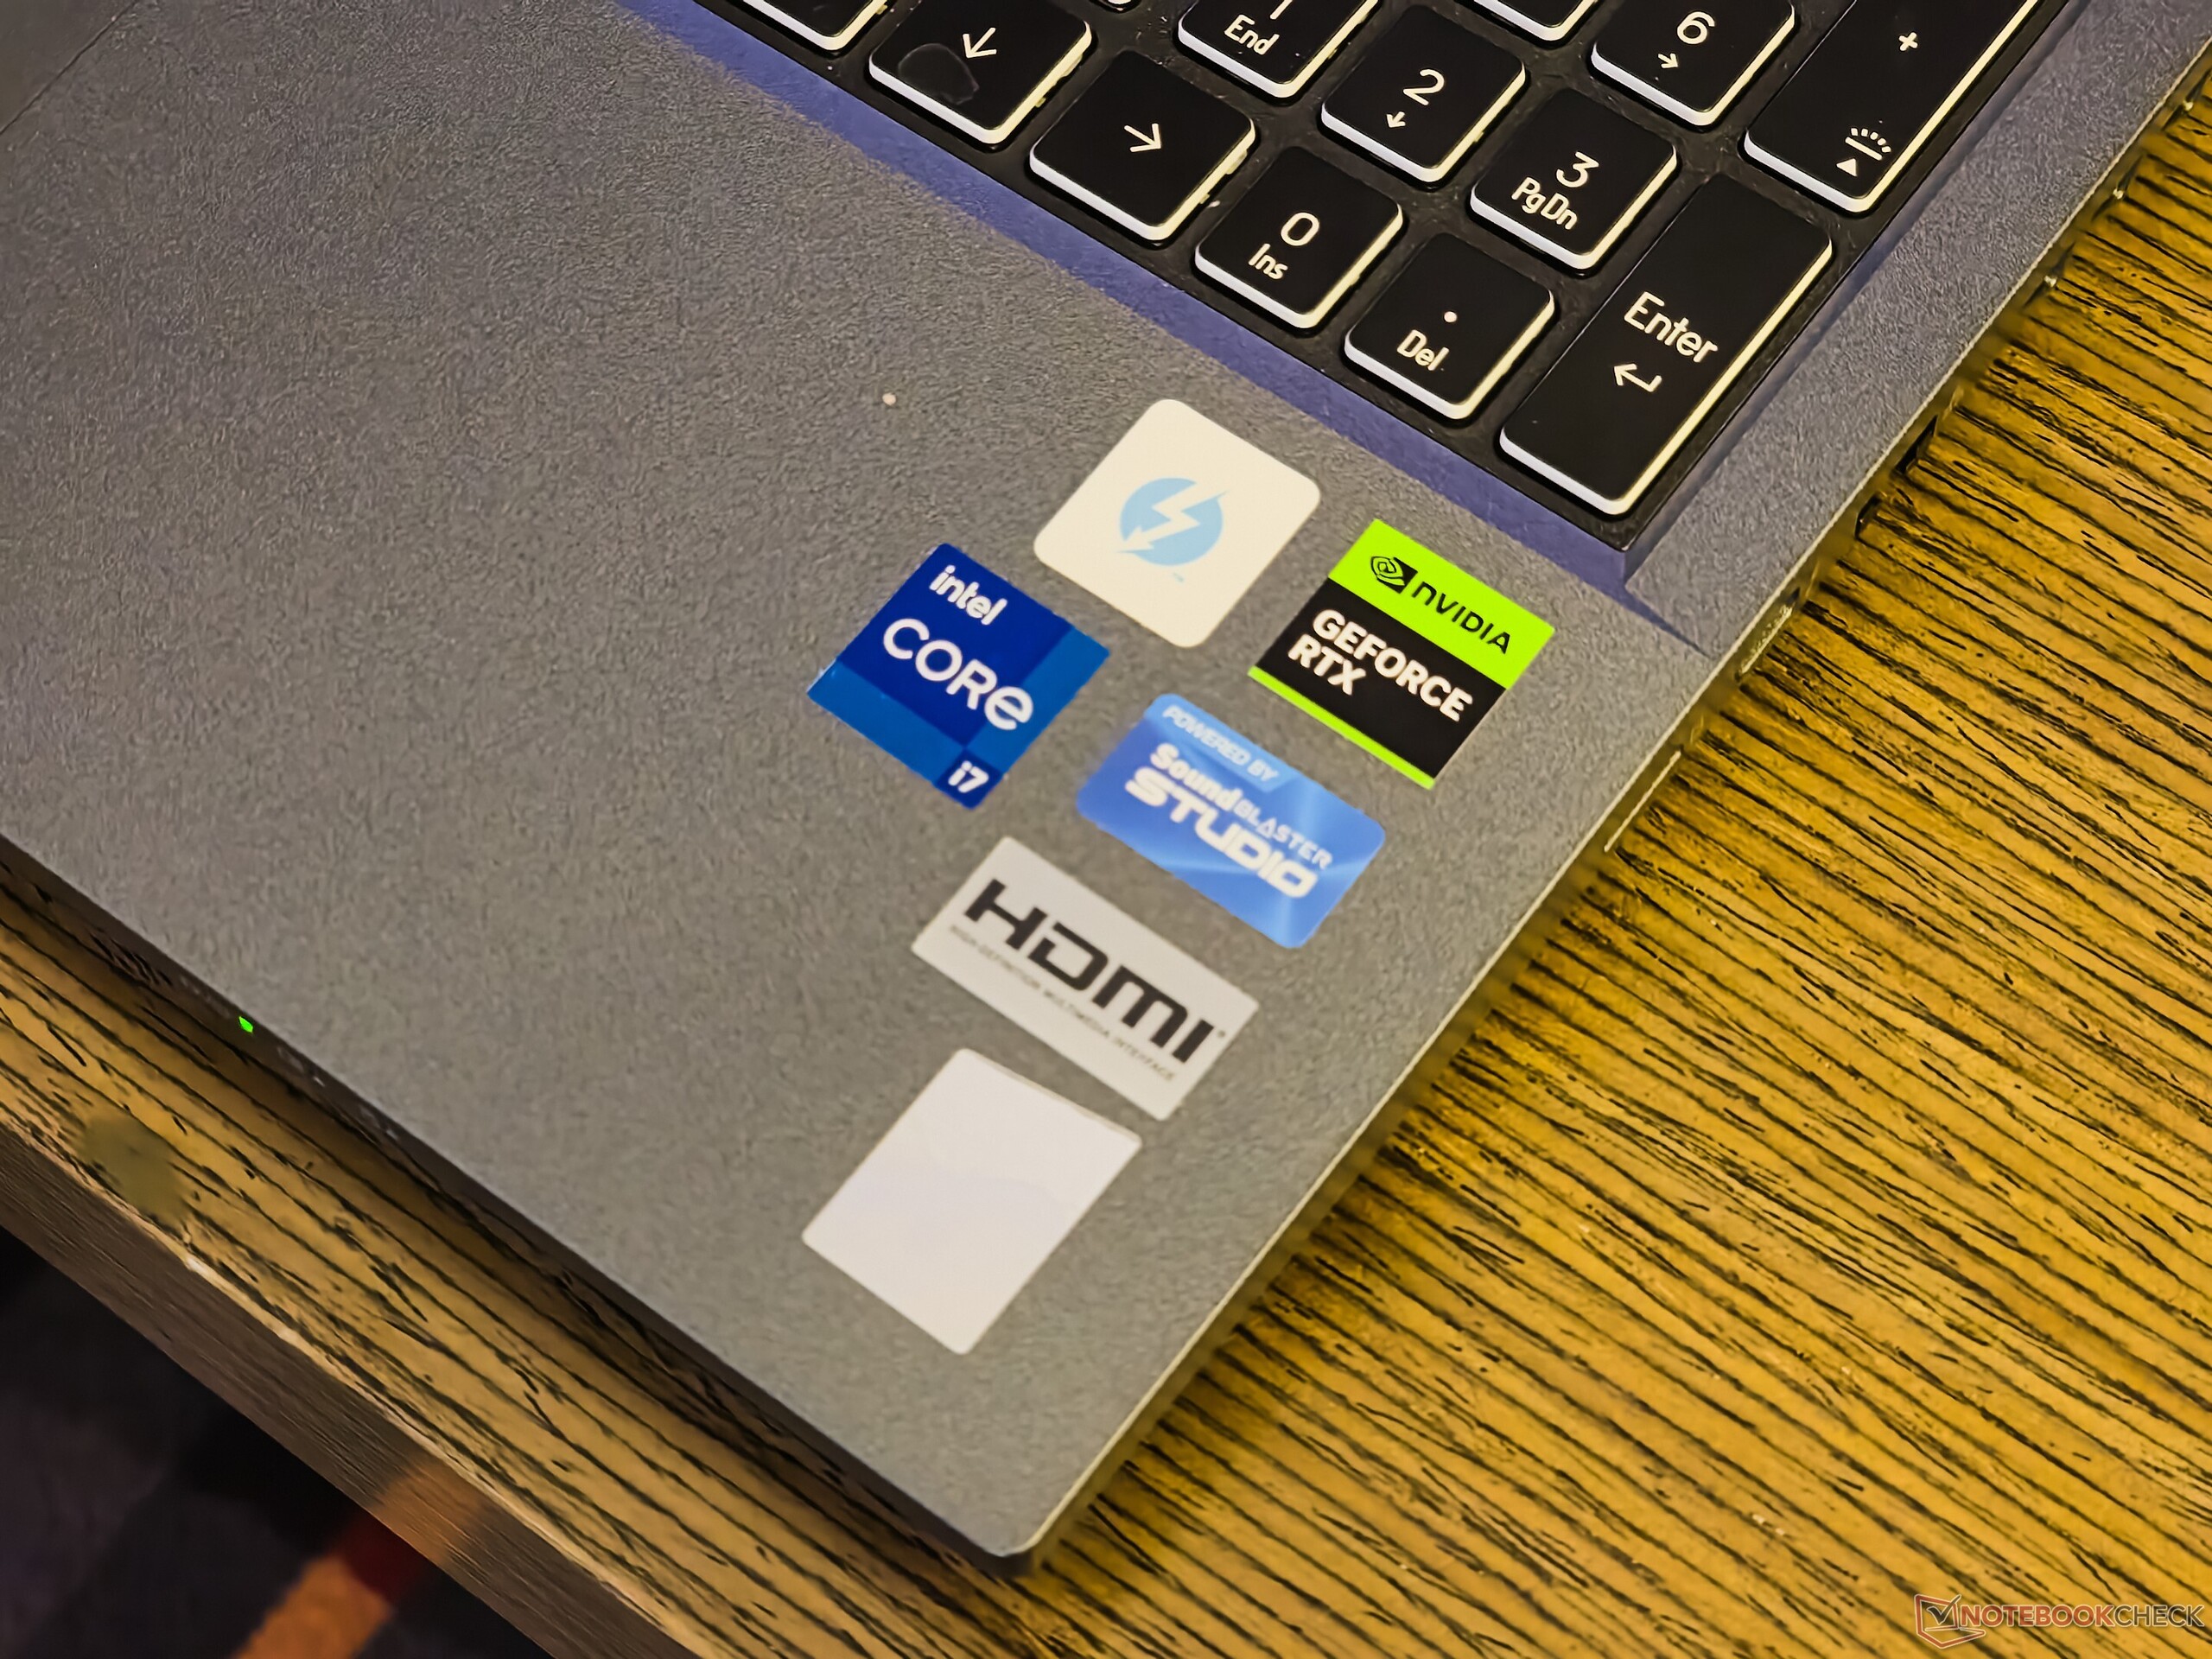
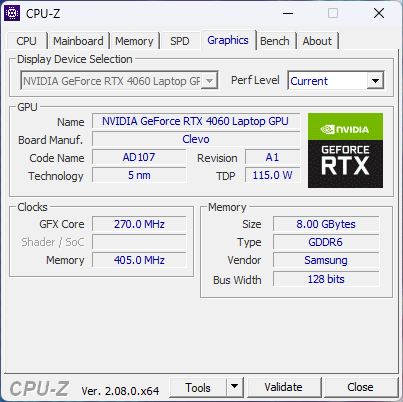
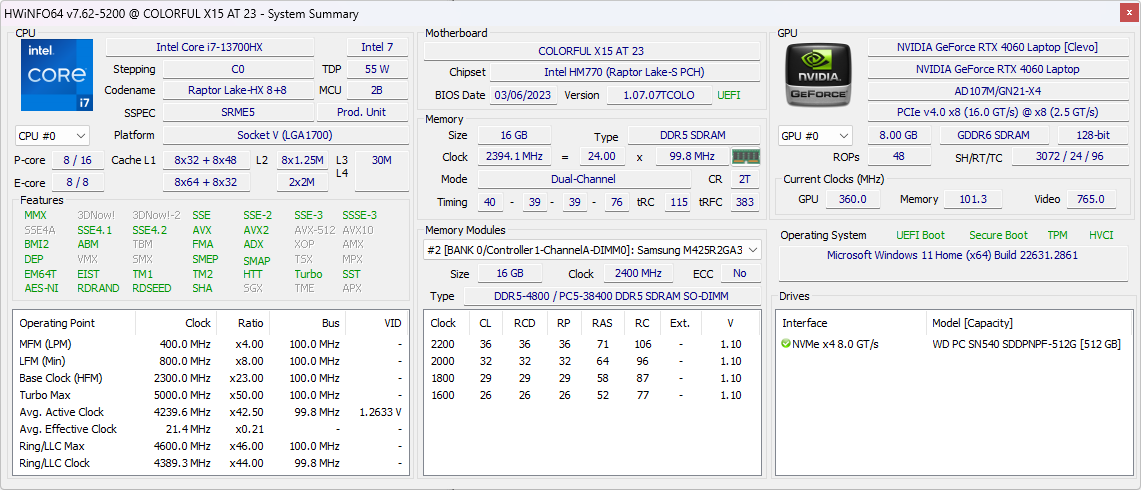
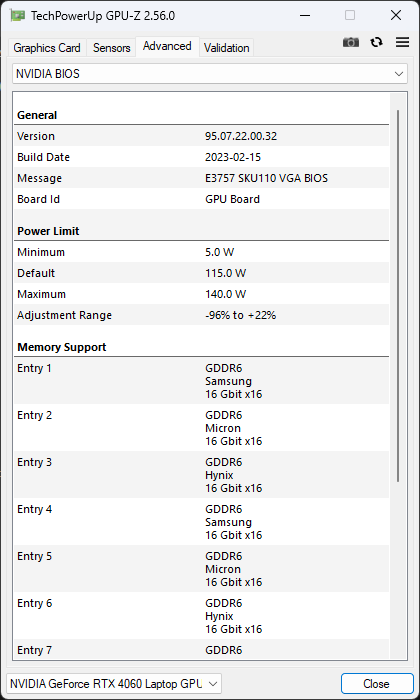
A propósito disso, o novo Colorful EVOL X15 AT 23 chegou recentemente aos nossos laboratórios de teste. Nossa amostra do EVOL X15 AT é equipada com o Intel Core i7-13700HX, GPU para laptop Nvidia GeForce RTX 406016 GB de memória DDR5-4800 (single stick) e um SSD NVMe de 512 GB.
O dispositivo oferece especificações impressionantes, incluindo uma tela QHD de 165 Hz e uma bateria de 73 WHr, e está disponível em mercados asiáticos selecionados, como China, Tailândia, Malásia, Indonésia, Filipinas e na Rússia, na Ozon, por cerca de US$ 969. A Newegg está vendendo esse SKU nos EUA com uma margem de lucro de US$ 1.759.
Nesta análise, vamos dar uma olhada no novo Colorful EVOL X15 AT e ver se ele pode enfrentar alguns de seus concorrentes mais consolidados.
Possíveis concorrentes em comparação
Avaliação | Data | Modelo | Peso | Altura | Size | Resolução | Preço |
|---|---|---|---|---|---|---|---|
| 84.9 % v7 (old) | 12/2023 | Colorful EVOL X15 AT 23 i7-13700HX, GeForce RTX 4060 Laptop GPU | 2.3 kg | 26.9 mm | 15.60" | 2560x1440 | |
| 88.3 % v7 (old) | 09/2023 | Alienware m16 R1 Intel i7-13700HX, GeForce RTX 4060 Laptop GPU | 3 kg | 25.4 mm | 16.00" | 2560x1600 | |
| 87.4 % v7 (old) | 07/2023 | HP Omen 16-wf000 i7-13700HX, GeForce RTX 4080 Laptop GPU | 2.4 kg | 23.6 mm | 16.10" | 2560x1440 | |
| 89.5 % v7 (old) | 07/2023 | Acer Predator Helios 16 PH16-71-731Q i7-13700HX, GeForce RTX 4060 Laptop GPU | 2.6 kg | 26.9 mm | 16.00" | 2560x1600 | |
| 84.2 % v7 (old) | 06/2023 | Dell G15 5530 i7-13650HX, GeForce RTX 4060 Laptop GPU | 3 kg | 26.95 mm | 15.60" | 1920x1080 | |
| 86.2 % v7 (old) | 07/2023 | Schenker XMG Pro 15 (E23) i9-13900HX, GeForce RTX 4060 Laptop GPU | 2.4 kg | 24.9 mm | 15.60" | 2560x1440 | |
| 89.2 % v7 (old) | 08/2023 | Alienware m16 R1 AMD R9 7845HX, GeForce RTX 4080 Laptop GPU | 3.1 kg | 25.4 mm | 16.00" | 2560x1600 | |
| 88.2 % v7 (old) | 03/2023 | Uniwill GM6PX7X RTX 4070 i7-13700HX, GeForce RTX 4070 Laptop GPU | 2.2 kg | 22 mm | 16.00" | 2560x1600 |
Chassi: Função sobre forma na estética plástica da Clevo
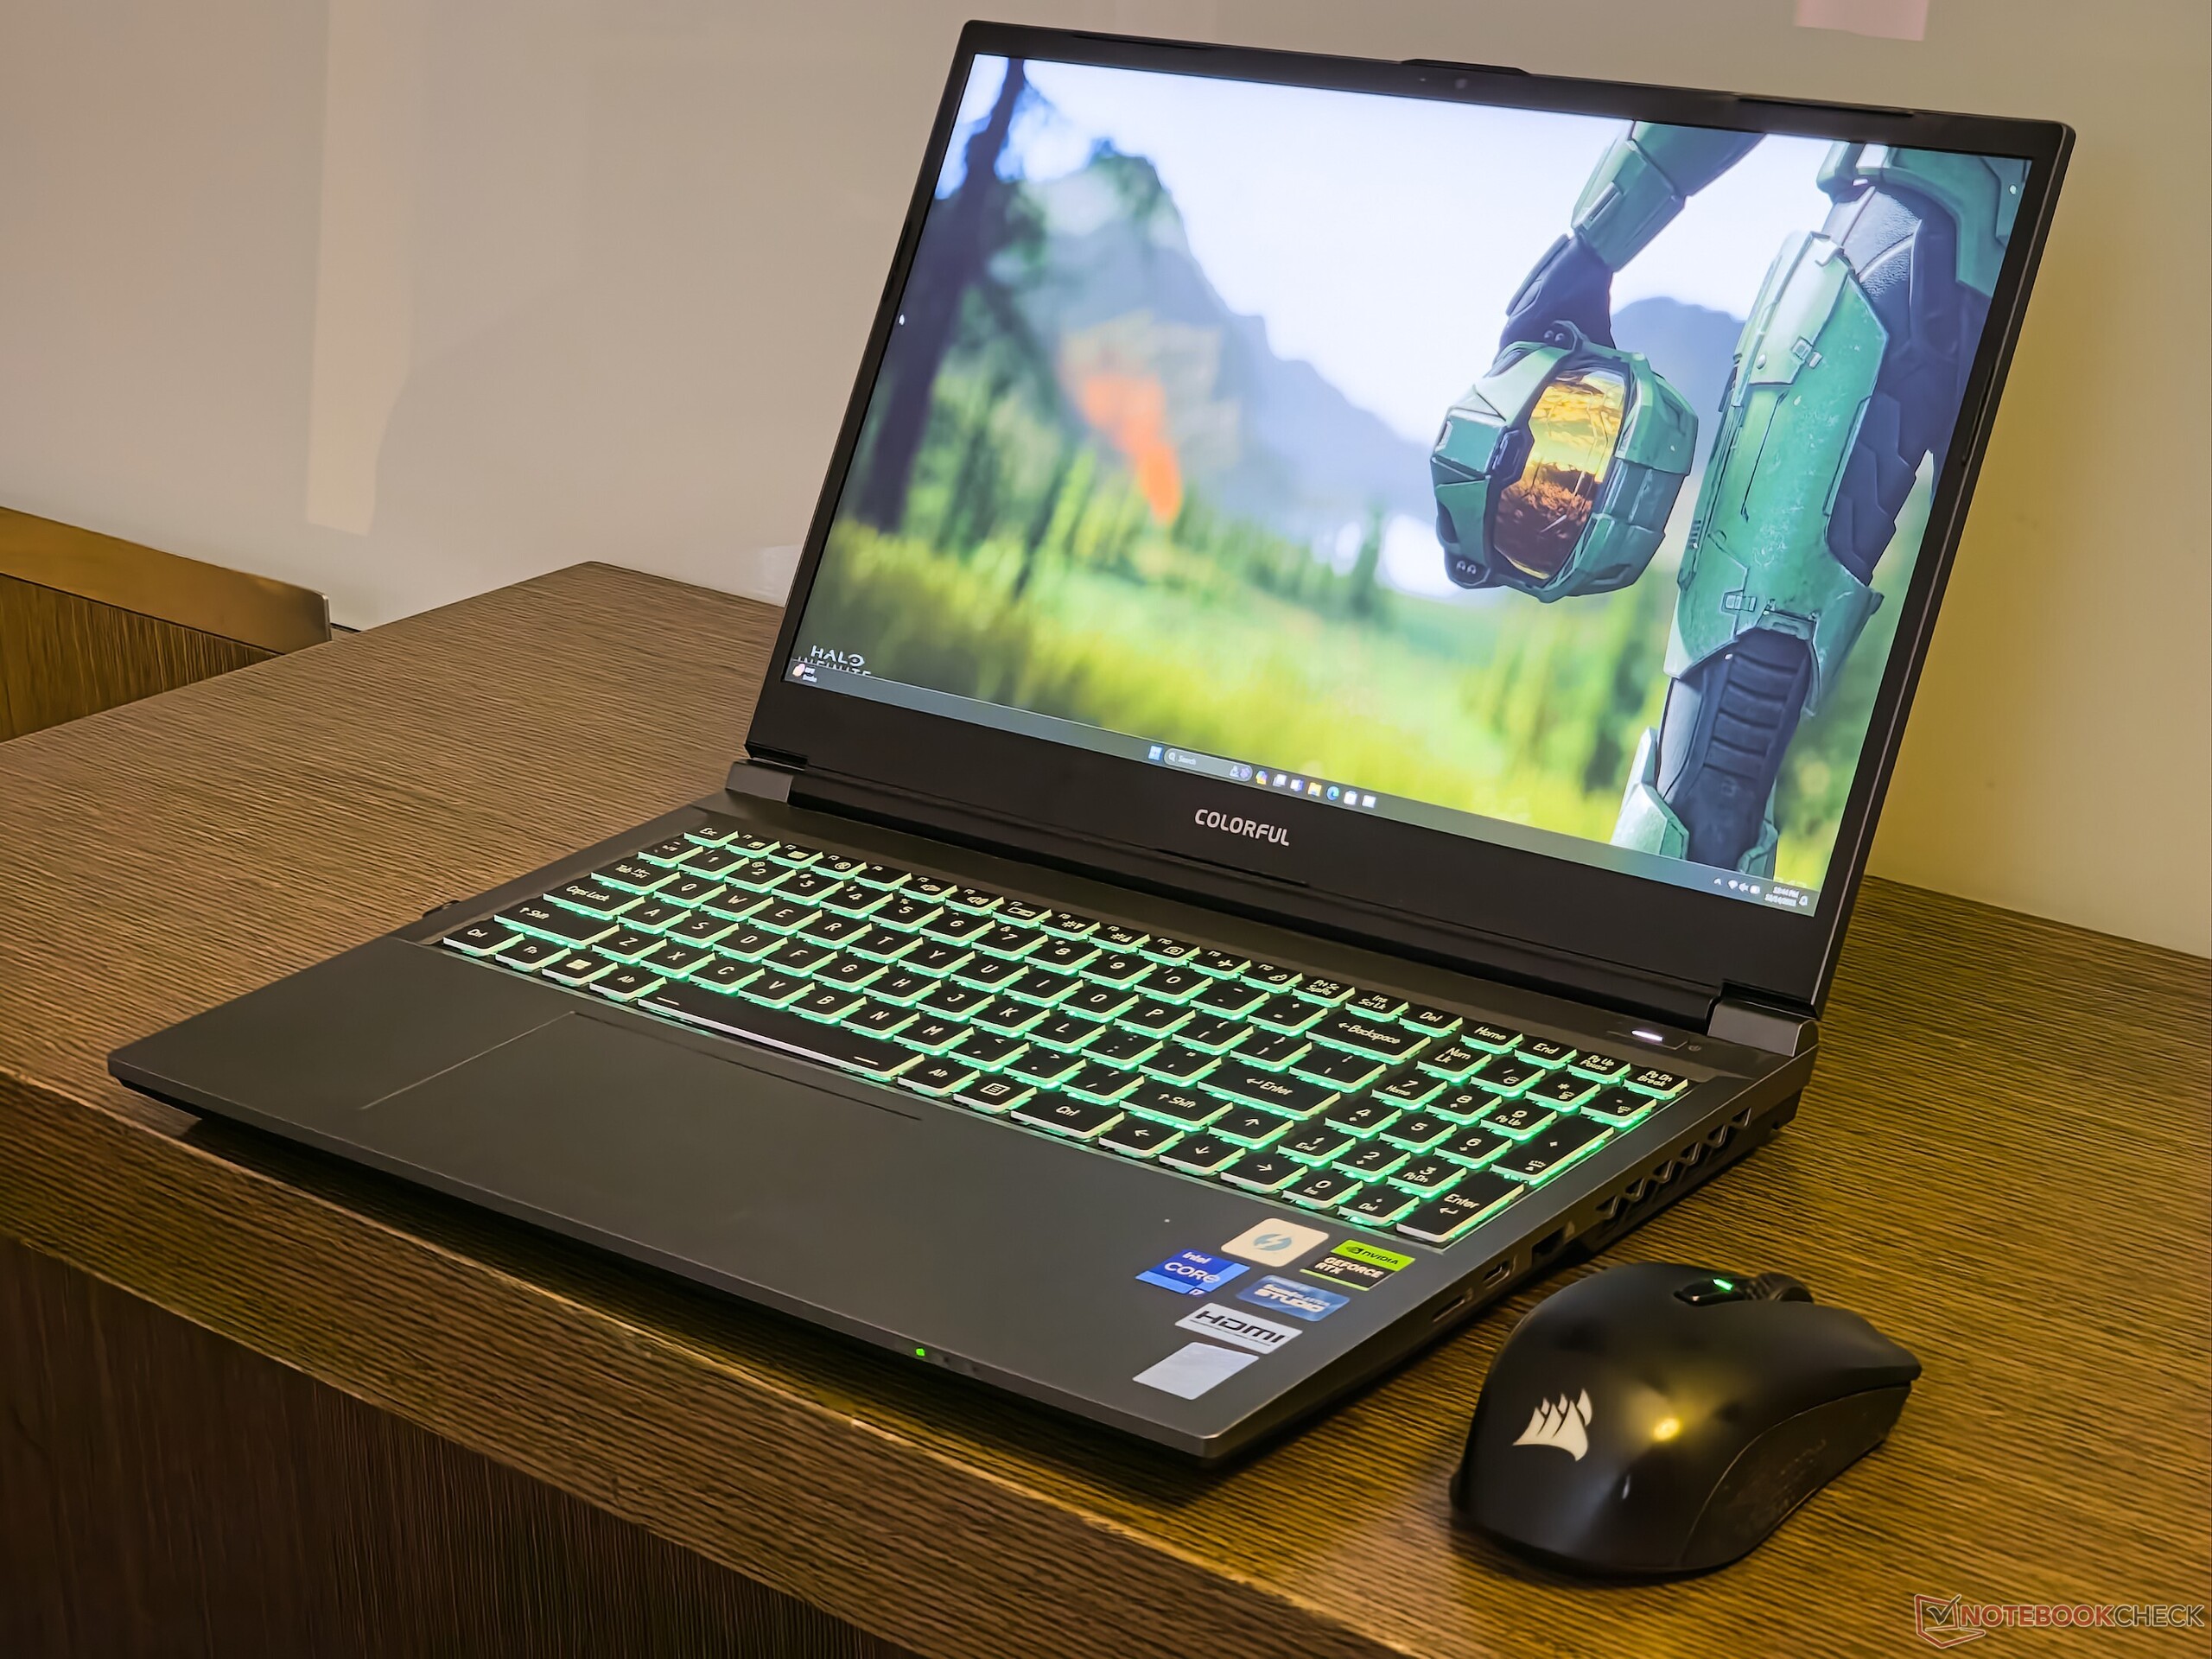
A Colorful oferece o EVOL X15 AT em três tonalidades: Grape Purple, Pine Blue e Mist Grey (nossa unidade de análise). Com uma espessura de 27,1 mm e um peso de 2,3 kg, o EVOL XT15 AT não ganhará nenhum prêmio por sua leveza. Ainda assim, ele é significativamente mais portátil do que o Dell G15 5530 e o Alienware m16 R1.
O EVOL X15 AT, sendo um design da Clevo, apresenta principalmente um chassi de plástico robusto. A construção lembra muito o Gigabyte G5 KE, que também é uma reformulação da Clevo. Apesar da robustez da construção, observamos uma flexibilidade considerável na plataforma do teclado.
A tampa da tela é feita de metal e não balança muito. As dobradiças têm a tensão ideal, permitindo que a tampa seja aberta com um único dedo sem fazer com que a base deslize
De modo geral, o EVOL X15 AT não pretende seduzir os senhores com uma linguagem de design suave, mas é suficientemente utilitário como laptop para jogos.
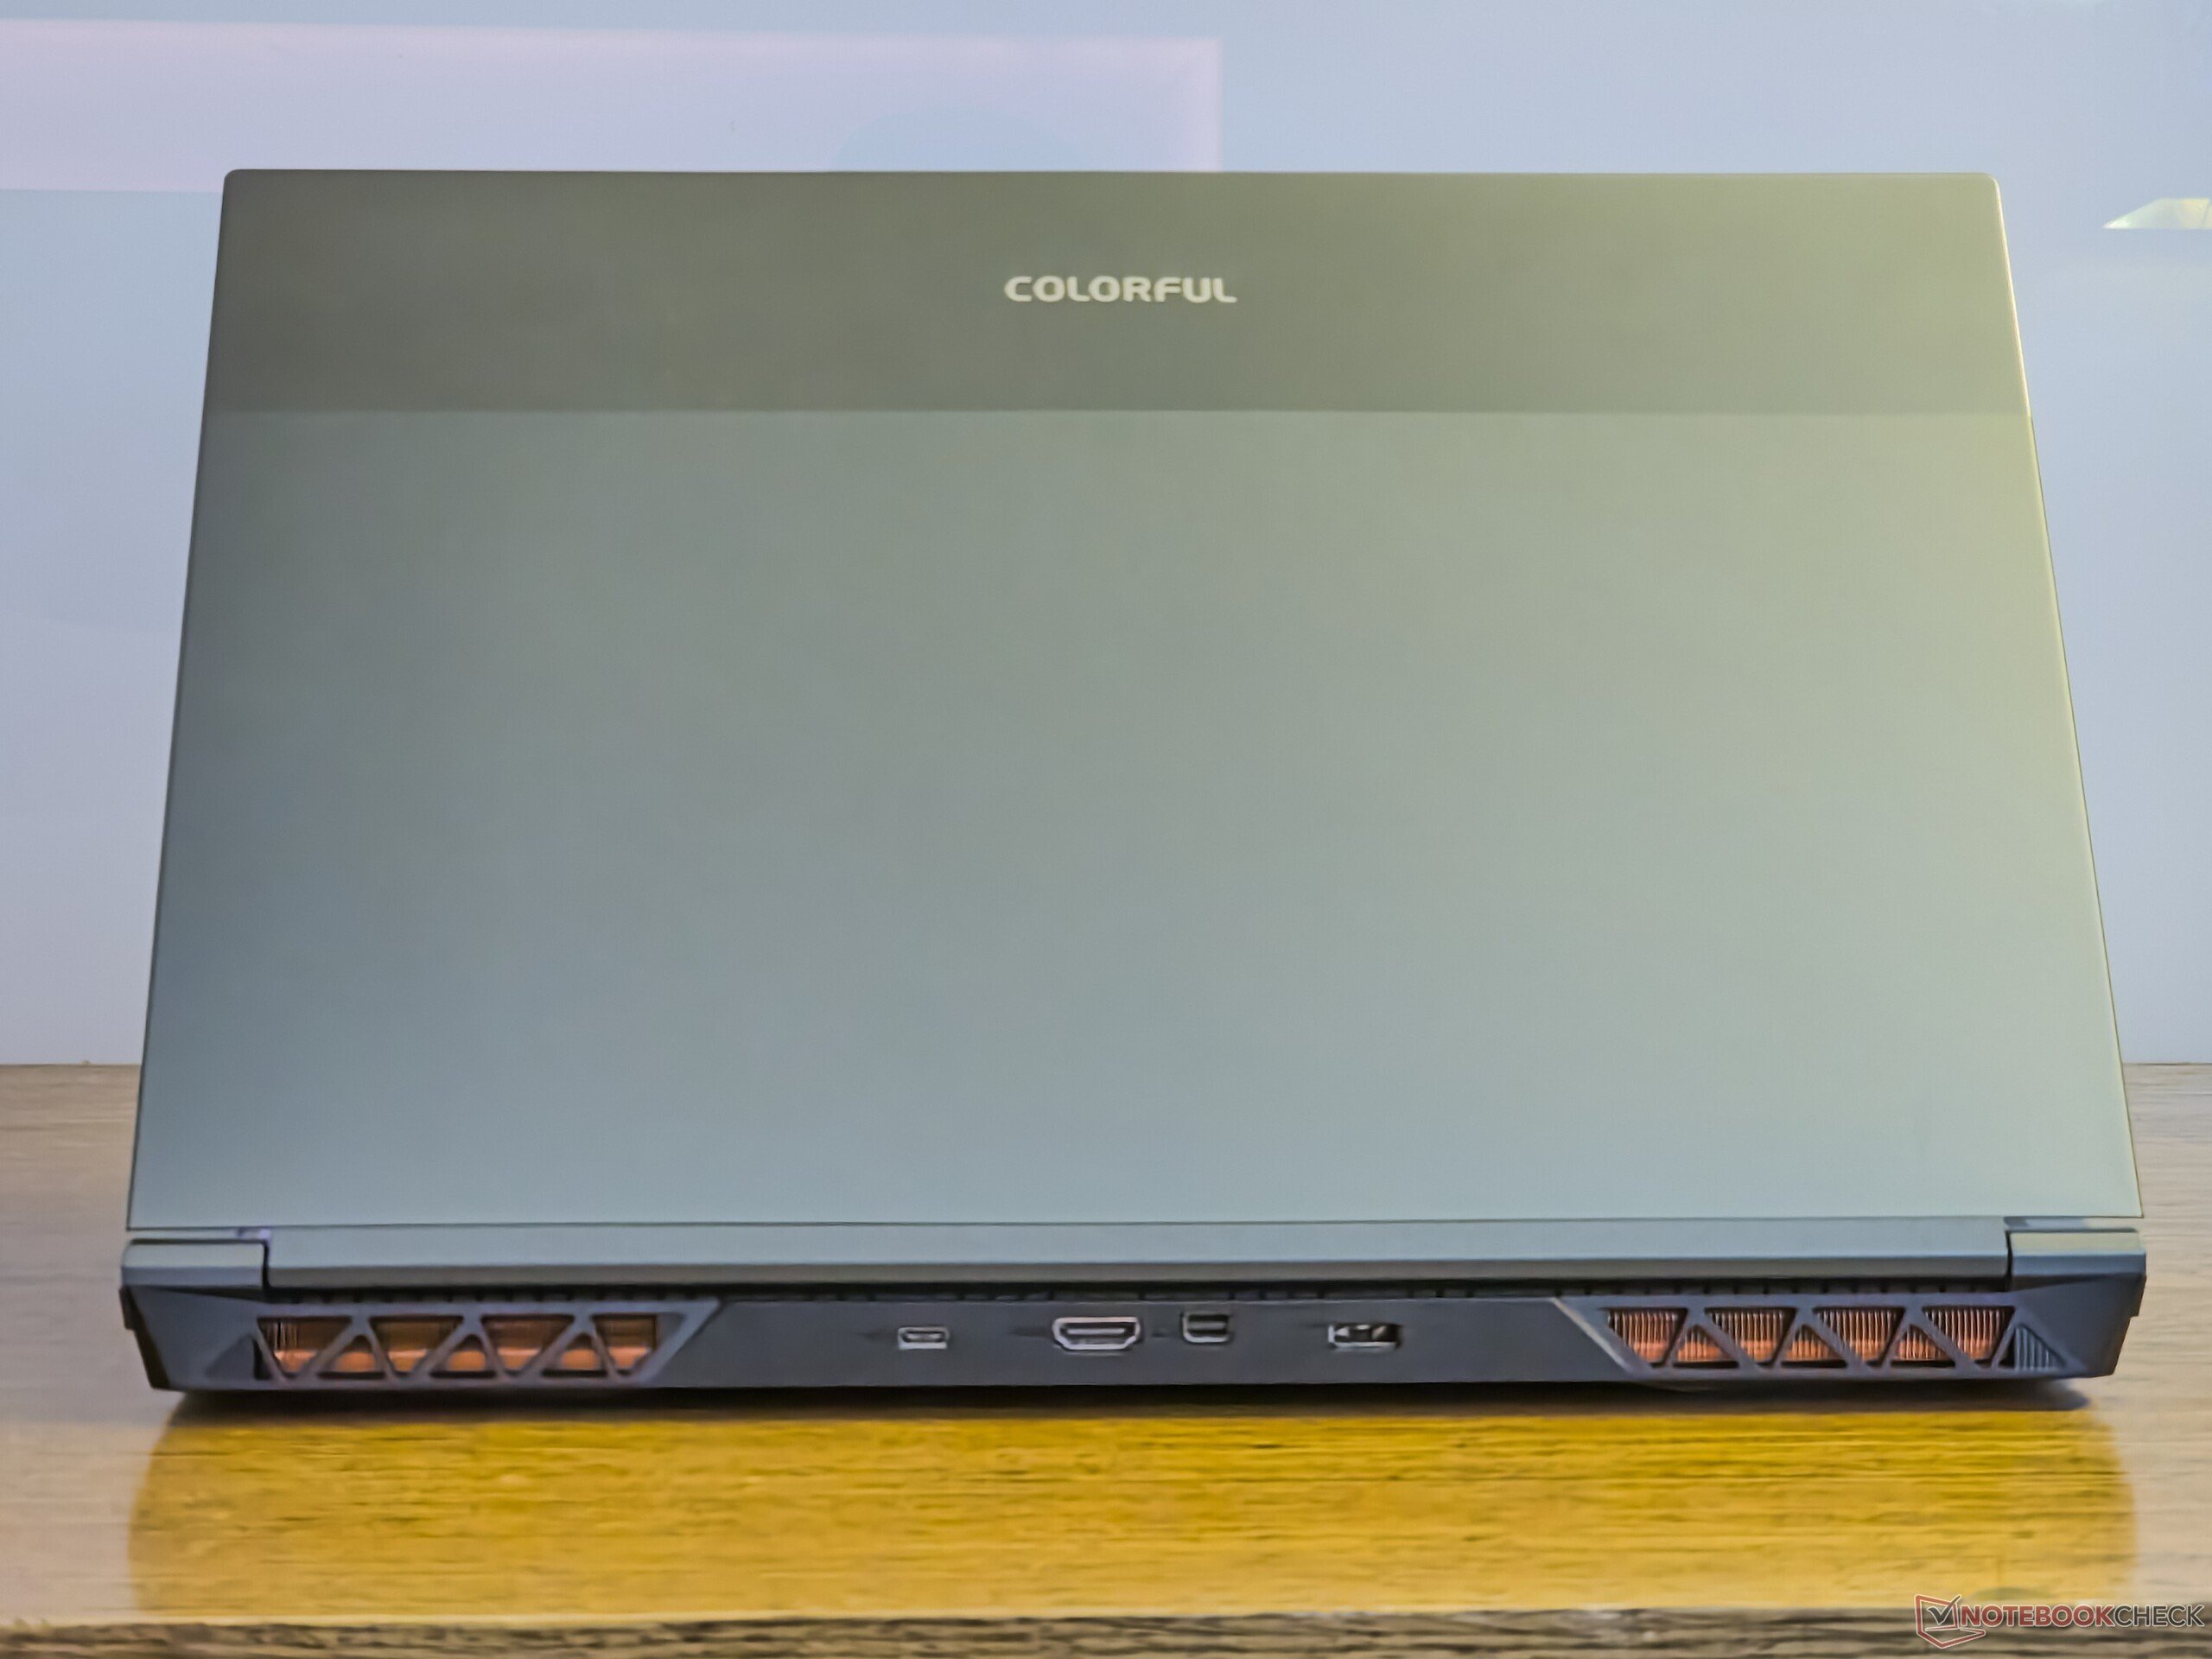
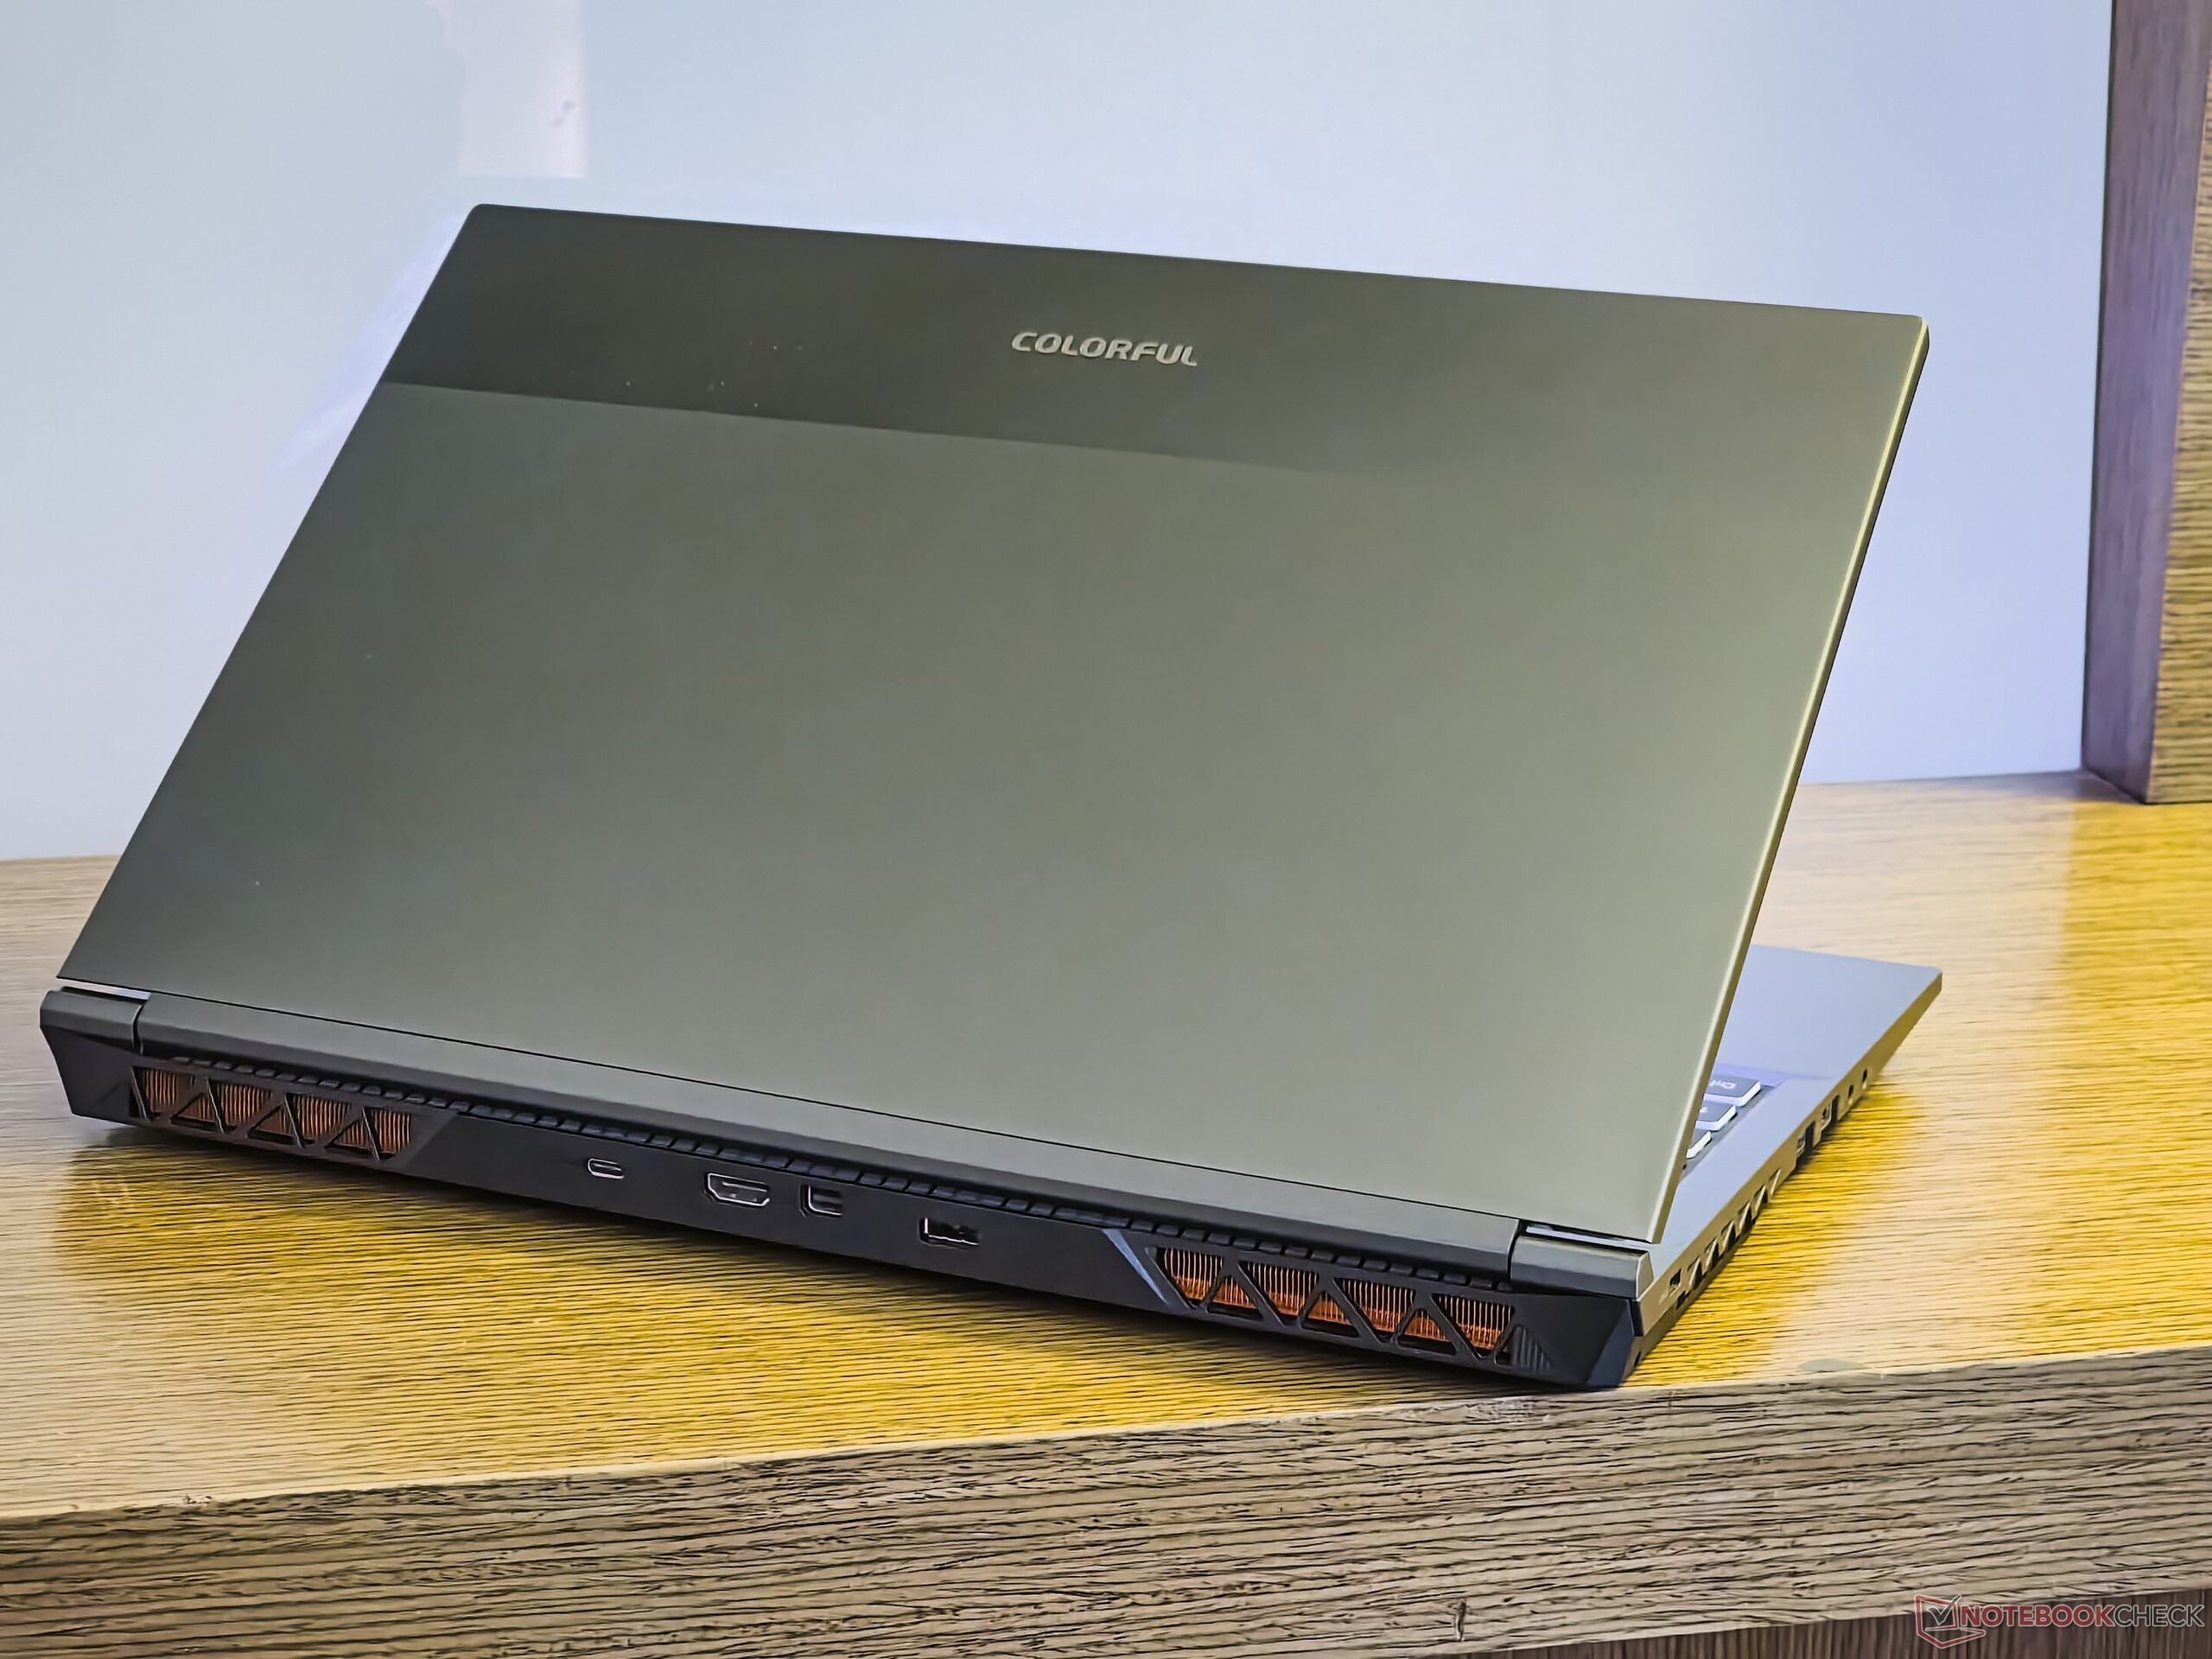
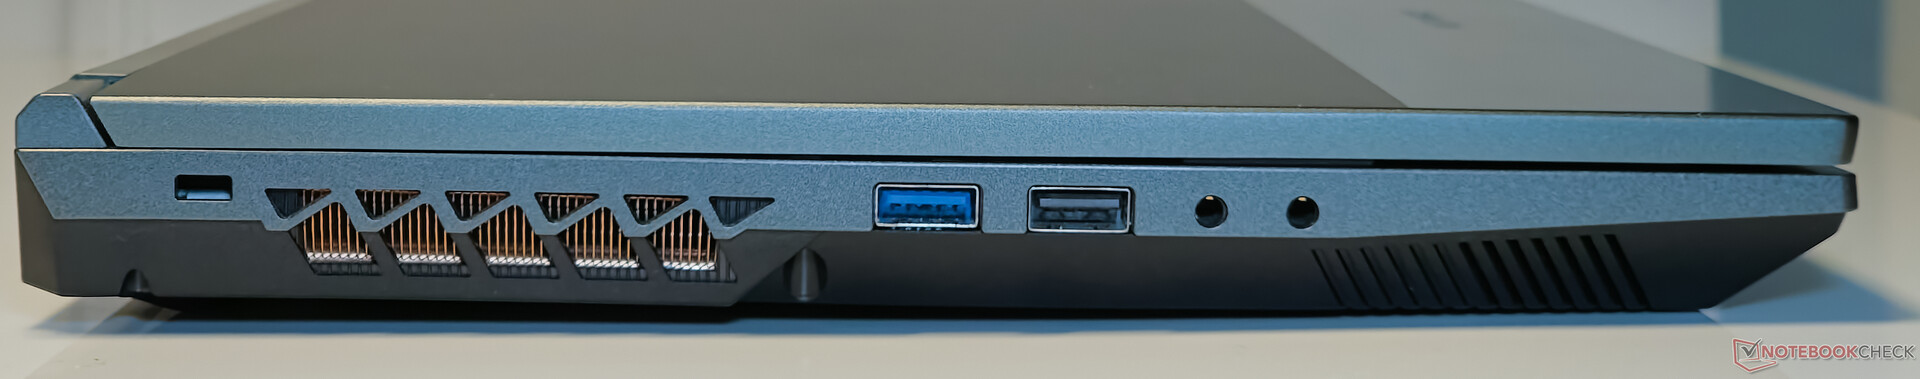
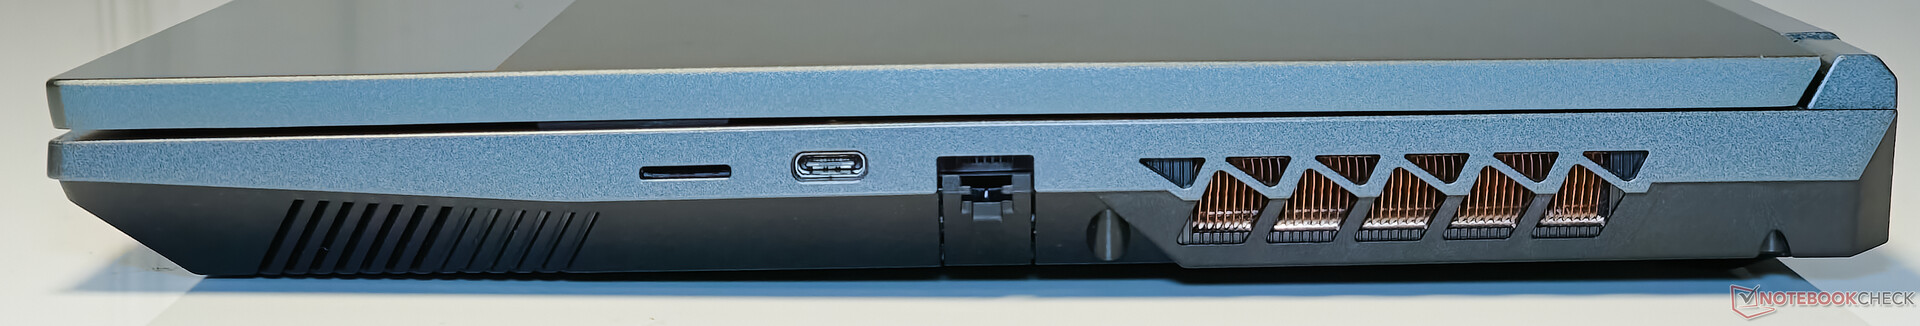
Conectividade: Portas Type-C sem entrada de energia
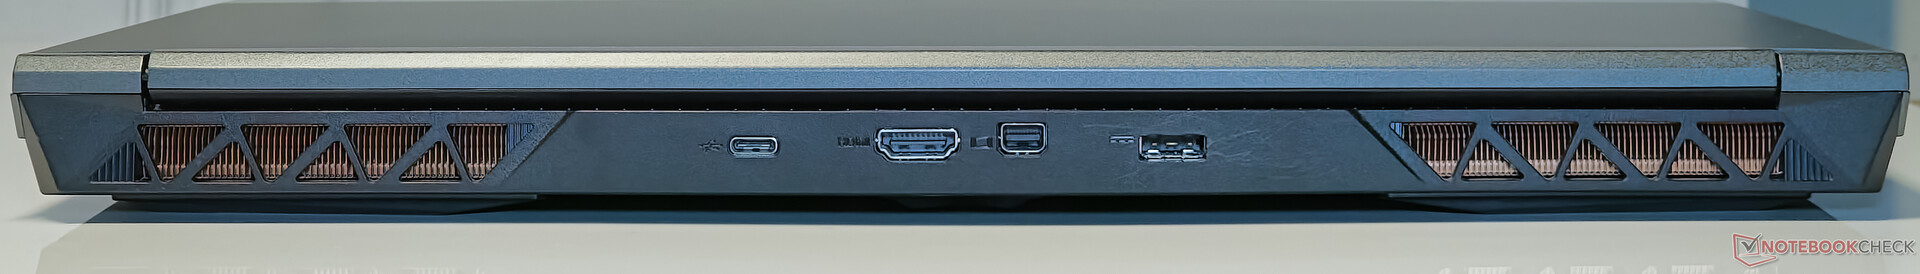
A Colorful dotou o EVOL X15 AT de uma seleção de portas bastante decente. O lado esquerdo abriga duas opções USB-A (USB 2.0 e USB 3.2 Gen 1), além de um conector de entrada de linha dedicado para entrada de áudio analógico. No lado direito, há um slot microSD, Thunderbolt 4 e Gigabit LAN.
À direita, temos um leitor de cartão microSD, Thunderbolt 4 e Gigabit LAN. Por fim, a parte traseira abriga USB 3.2 Gen2 Type-C, mini-DisplayPort-out e saída HDMI.
Infelizmente, as portas Type-C suportam apenas a saída de alimentação, portanto, o senhor terá que carregar inevitavelmente o bloco de alimentação de quase 1 kg por toda parte para manter o laptop alimentado.
Leitor de cartão SD
O leitor de cartão microSD do EVOL X15 não bate nenhum recorde de velocidade e é cerca de 28% mais lento do que a média da classe nos testes de leitura sequencial de cópia de JPG e AS SSD.
| SD Card Reader | |
| average JPG Copy Test (av. of 3 runs) | |
| Alienware m16 R1 AMD (Toshiba Exceria Pro SDXC 64 GB UHS-II) | |
| Alienware m16 R1 Intel (AV PRO microSD 128 GB V60) | |
| Média da turma Gaming (20.9 - 210, n=54, últimos 2 anos) | |
| Schenker XMG Pro 15 (E23) | |
| Colorful EVOL X15 AT 23 (AV PRO microSD 128 GB V60) | |
| Acer Predator Helios 16 PH16-71-731Q | |
| Uniwill GM6PX7X RTX 4070 (AV PRO microSD 128 GB V60) | |
| maximum AS SSD Seq Read Test (1GB) | |
| Alienware m16 R1 AMD (Toshiba Exceria Pro SDXC 64 GB UHS-II) | |
| Alienware m16 R1 Intel (AV PRO microSD 128 GB V60) | |
| Média da turma Gaming (25.5 - 261, n=51, últimos 2 anos) | |
| Schenker XMG Pro 15 (E23) | |
| Colorful EVOL X15 AT 23 (AV PRO microSD 128 GB V60) | |
| Uniwill GM6PX7X RTX 4070 (AV PRO microSD 128 GB V60) | |
| Acer Predator Helios 16 PH16-71-731Q | |
Comunicação
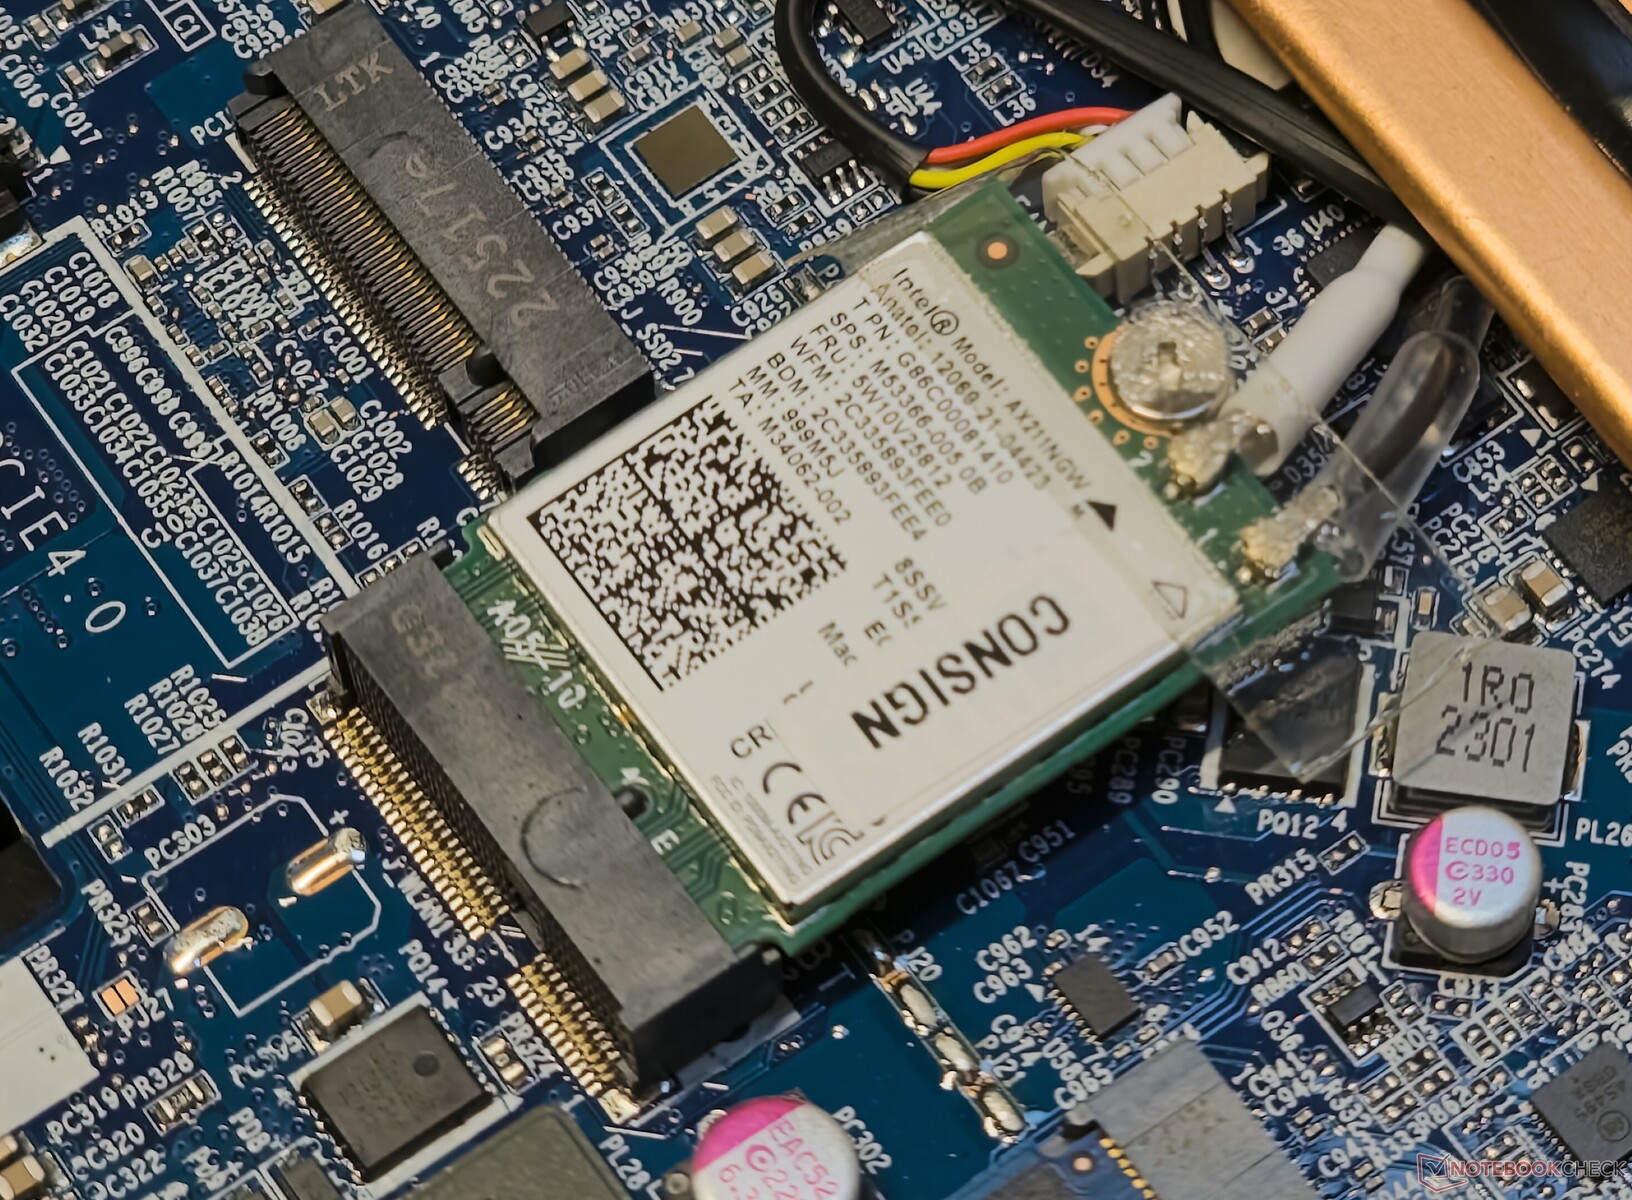
O EVOL X15 AT possui um chip WLAN Intel Wi-Fi 6E AX211. As taxas de transferência são bastante consistentes nas bandas de 5 GHz e 6 GHz quando testadas com nosso roteador de referência Asus ROG Rapture GT-AXE11000.
O laptop oferece excelente taxa de transmissão e recepção na banda de 5 GHz. Na faixa de 6 GHz, o EVOL X15 fica aquém do Alienware m16 R1 AMD nos testes de transmissão iPerf3, mas compensa a deficiência nos testes de recepção com uma taxa de transferência de pico de 1,7 Gbps.
| Networking / iperf3 transmit AXE11000 | |
| Colorful EVOL X15 AT 23 | |
| Dell G15 5530 | |
| Alienware m16 R1 AMD | |
| Acer Predator Helios 16 PH16-71-731Q | |
| Alienware m16 R1 Intel | |
| Média da turma Gaming (560 - 1862, n=87, últimos 2 anos) | |
| Média Intel Wi-Fi 6E AX211 (64 - 1921, n=276) | |
| Uniwill GM6PX7X RTX 4070 | |
| HP Omen 16-wf000 | |
| Schenker XMG Pro 15 (E23) | |
| Networking / iperf3 receive AXE11000 | |
| Colorful EVOL X15 AT 23 | |
| Alienware m16 R1 Intel | |
| Dell G15 5530 | |
| Média da turma Gaming (680 - 1745, n=87, últimos 2 anos) | |
| Acer Predator Helios 16 PH16-71-731Q | |
| Alienware m16 R1 AMD | |
| Média Intel Wi-Fi 6E AX211 (582 - 1890, n=276) | |
| HP Omen 16-wf000 | |
| Uniwill GM6PX7X RTX 4070 | |
| Schenker XMG Pro 15 (E23) | |
| Networking / iperf3 transmit AXE11000 6GHz | |
| Alienware m16 R1 AMD | |
| Acer Predator Helios 16 PH16-71-731Q | |
| Schenker XMG Pro 15 (E23) | |
| Colorful EVOL X15 AT 23 | |
| Média da turma Gaming (723 - 1868, n=36, últimos 2 anos) | |
| Média Intel Wi-Fi 6E AX211 (385 - 1851, n=226) | |
| HP Omen 16-wf000 | |
| Networking / iperf3 receive AXE11000 6GHz | |
| Colorful EVOL X15 AT 23 | |
| Schenker XMG Pro 15 (E23) | |
| Média da turma Gaming (975 - 1775, n=35, últimos 2 anos) | |
| Alienware m16 R1 AMD | |
| Média Intel Wi-Fi 6E AX211 (700 - 1857, n=226) | |
| Acer Predator Helios 16 PH16-71-731Q | |
| HP Omen 16-wf000 | |
Webcam
Devido ao seu foco principal em jogos, o EVOL X15 se contenta com uma webcam convencional de 720p. A webcam é adequada para bate-papos rápidos com vídeo, mas peca na precisão das cores, na reprodução de detalhes e na nitidez geral.


Segurança
Não há recursos de segurança dedicados, como logins biométricos incorporados. Um módulo TPM 2.0 está presente para atender aos requisitos de segurança do Windows 11.
Acessórios e garantia
Não há acessórios separados na caixa, exceto o adaptador de 280 W e a documentação normal. O Colorful EVOL X15 AT é fornecido com uma garantia padrão de dois anos.
Manutenção
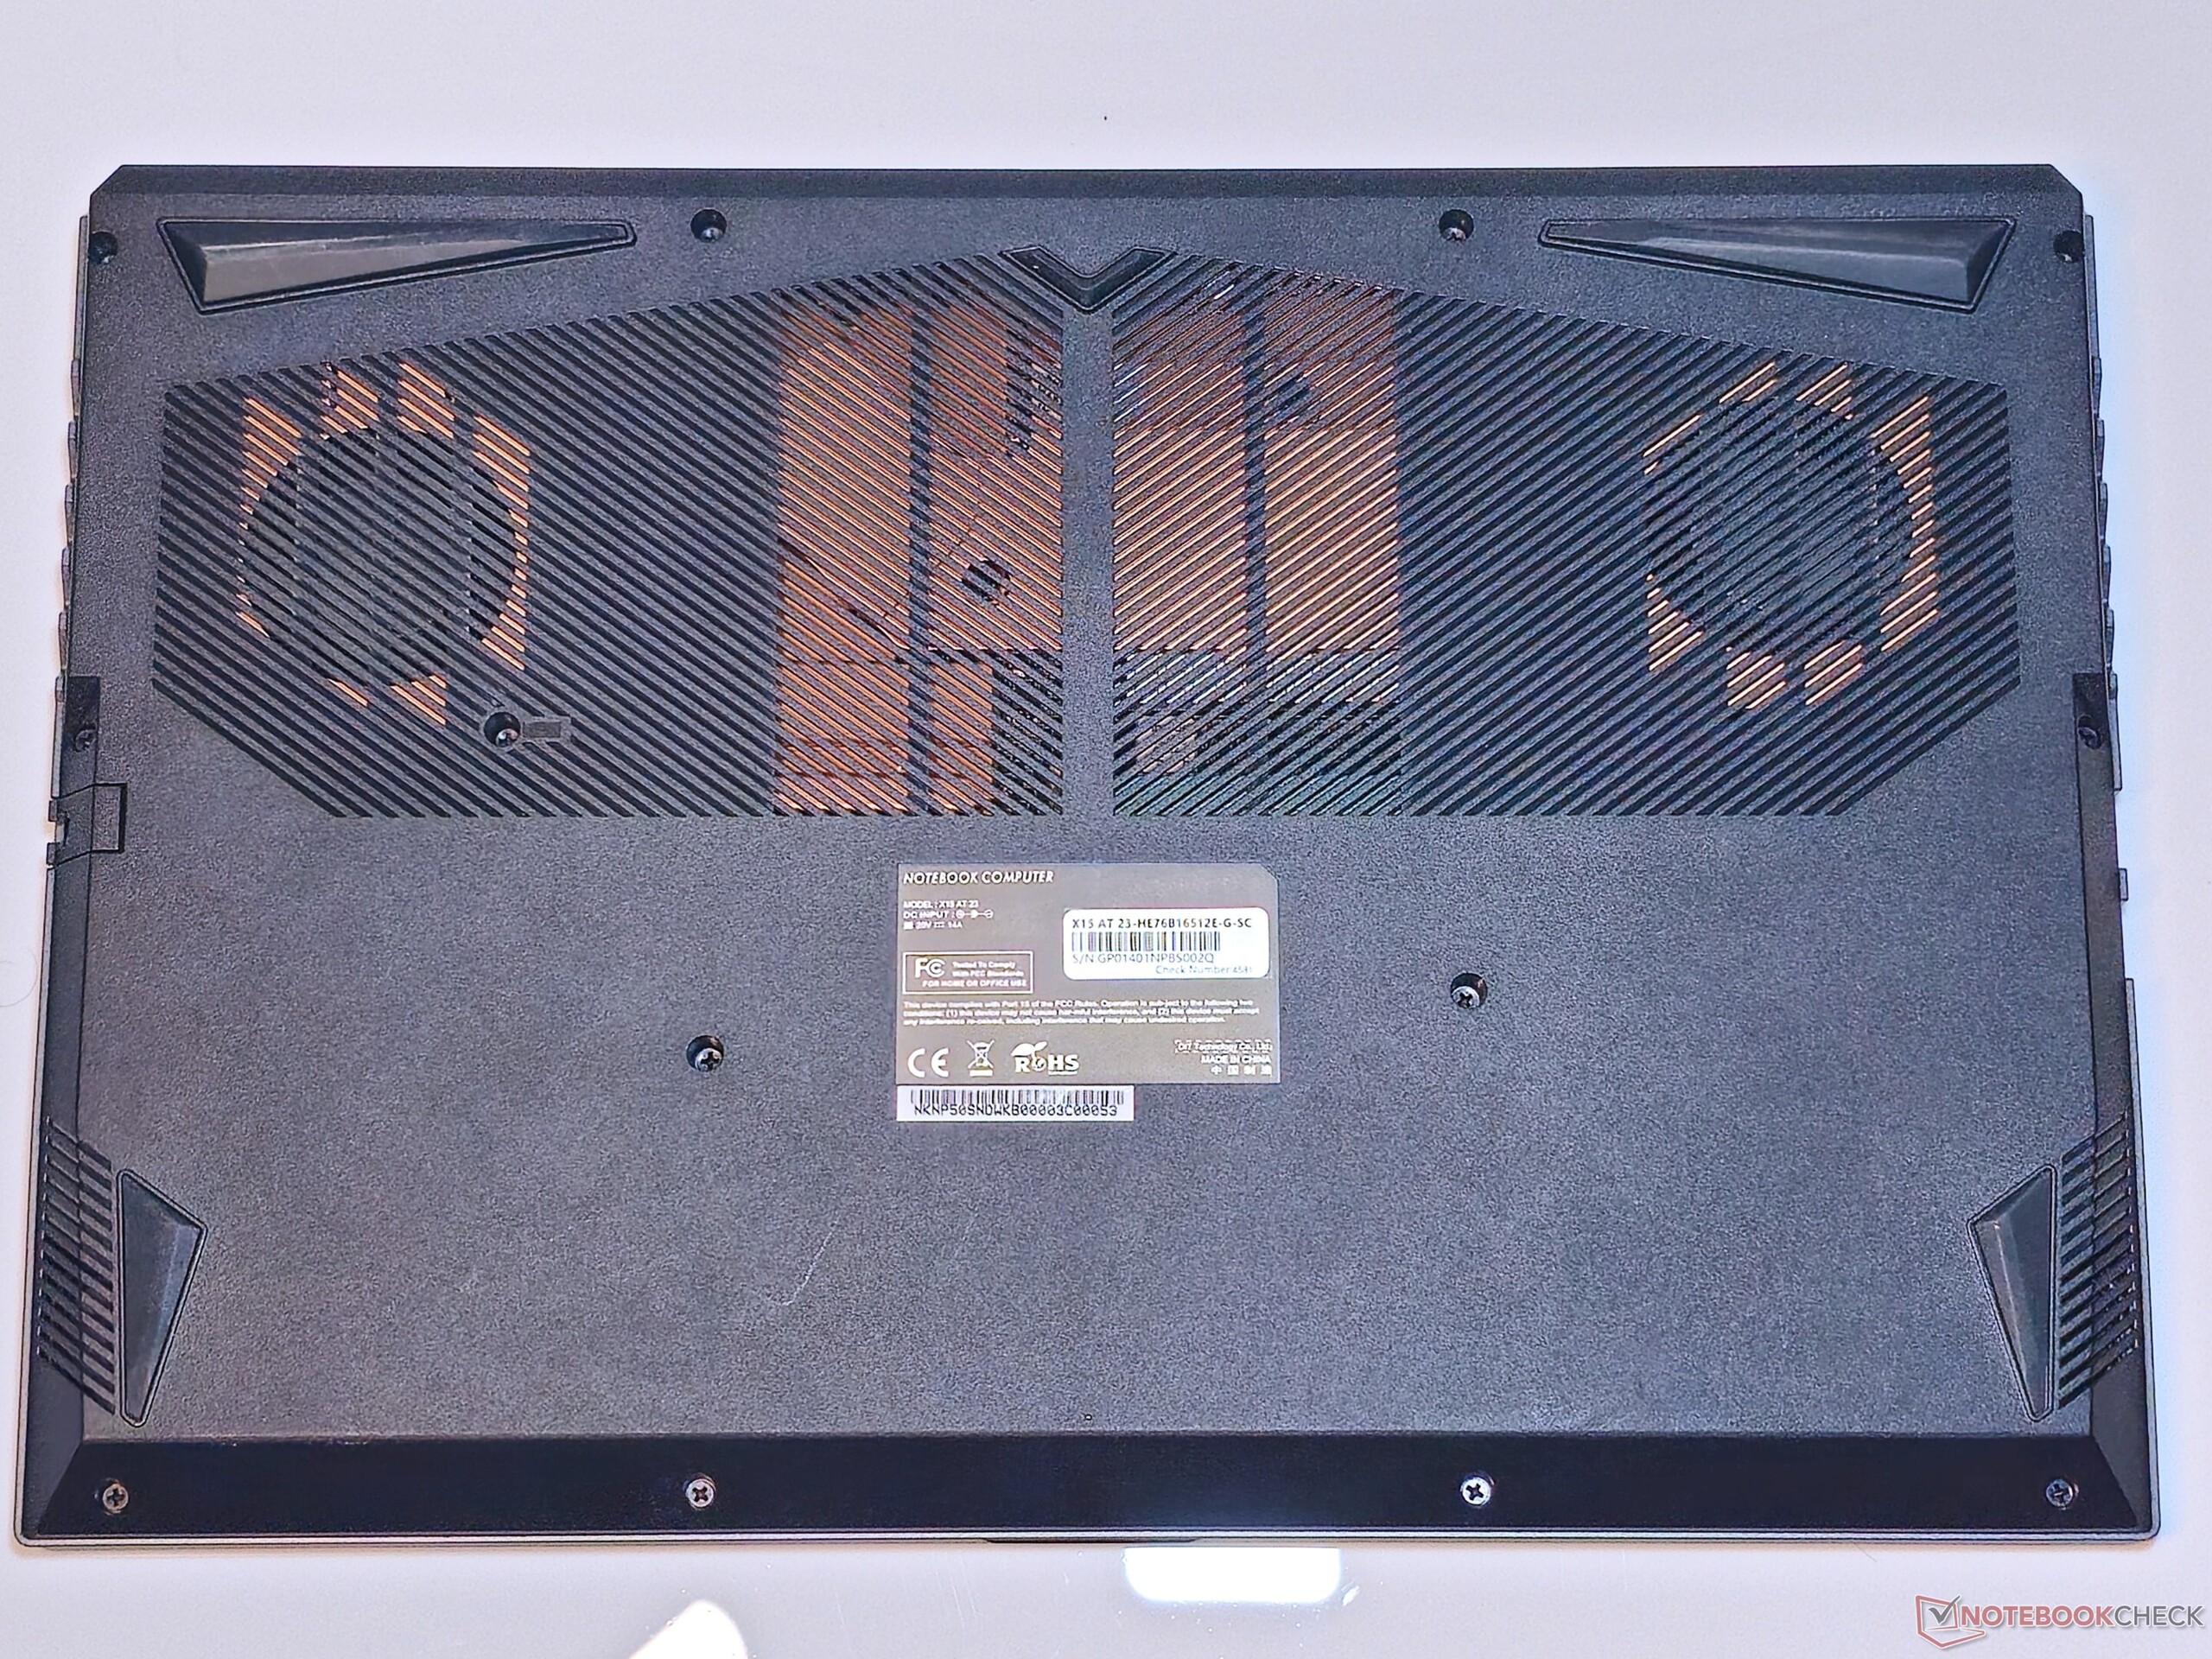
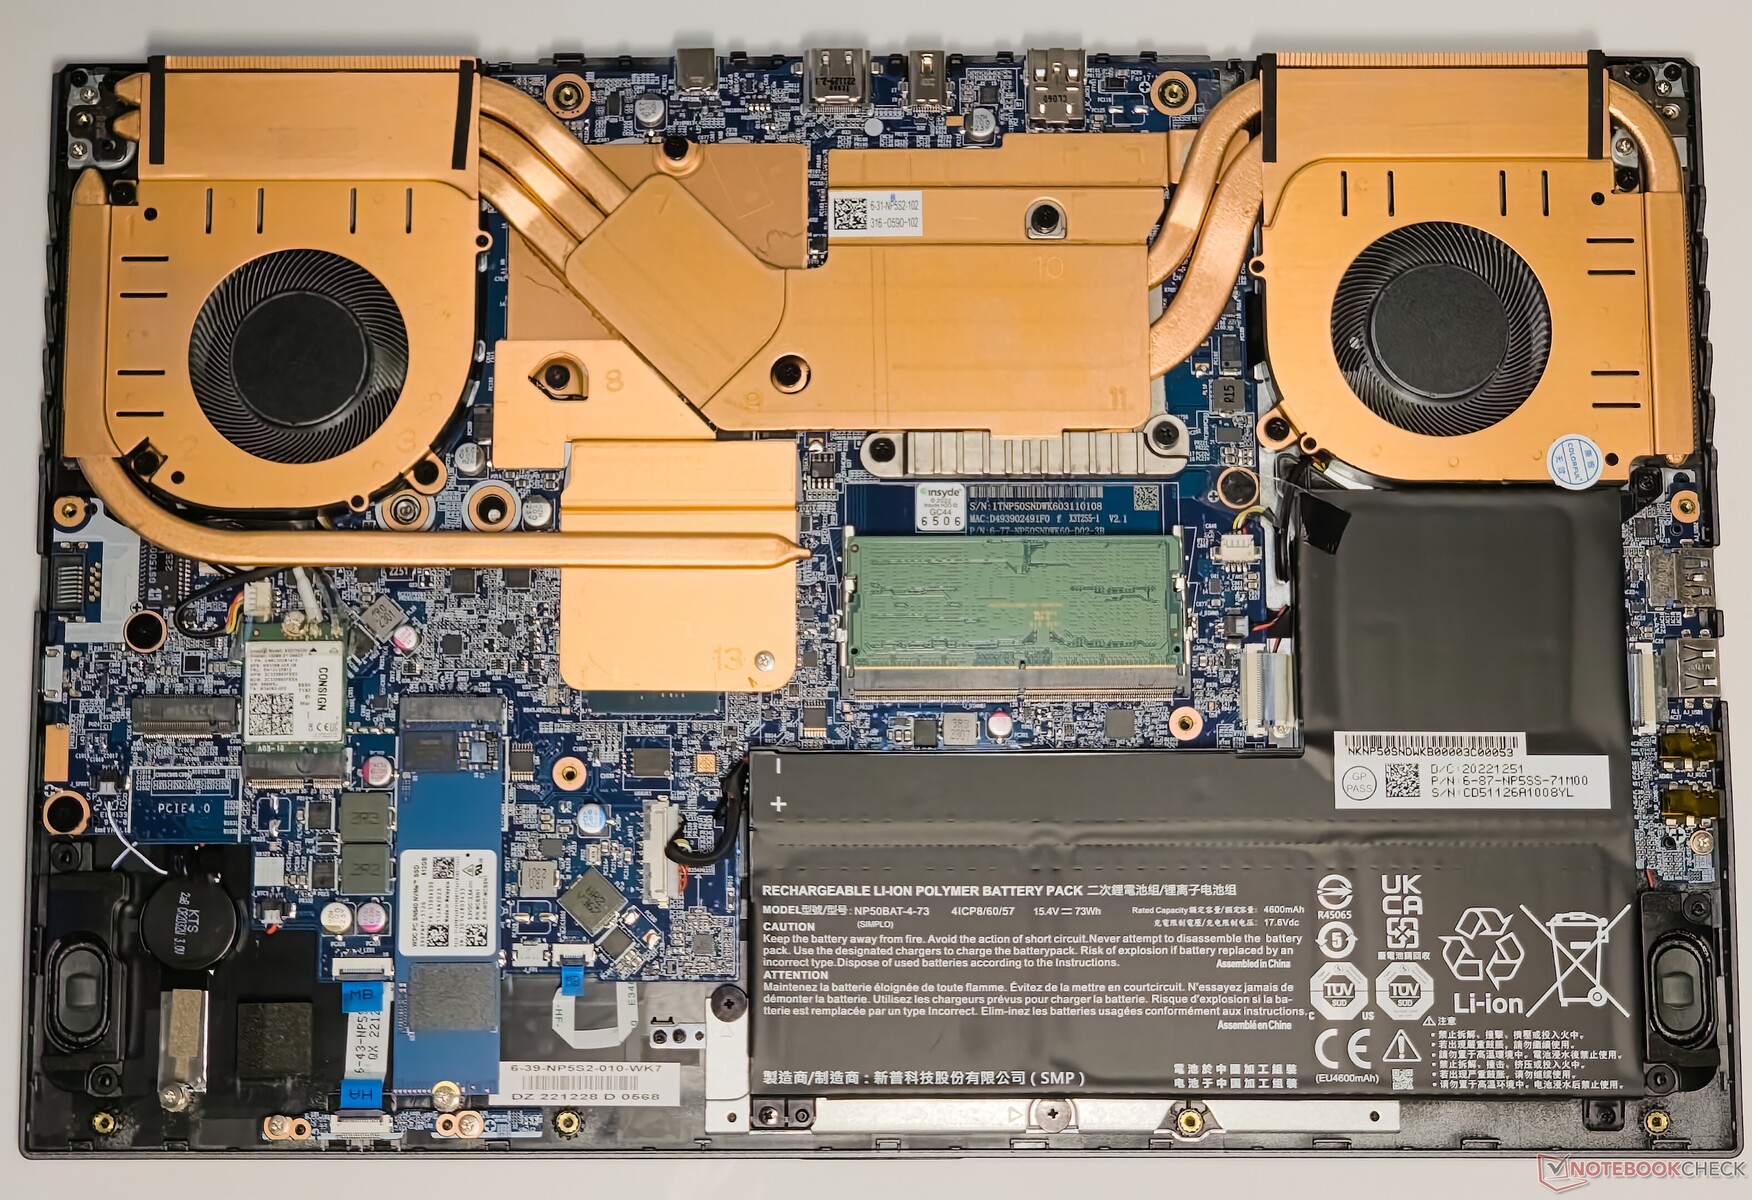
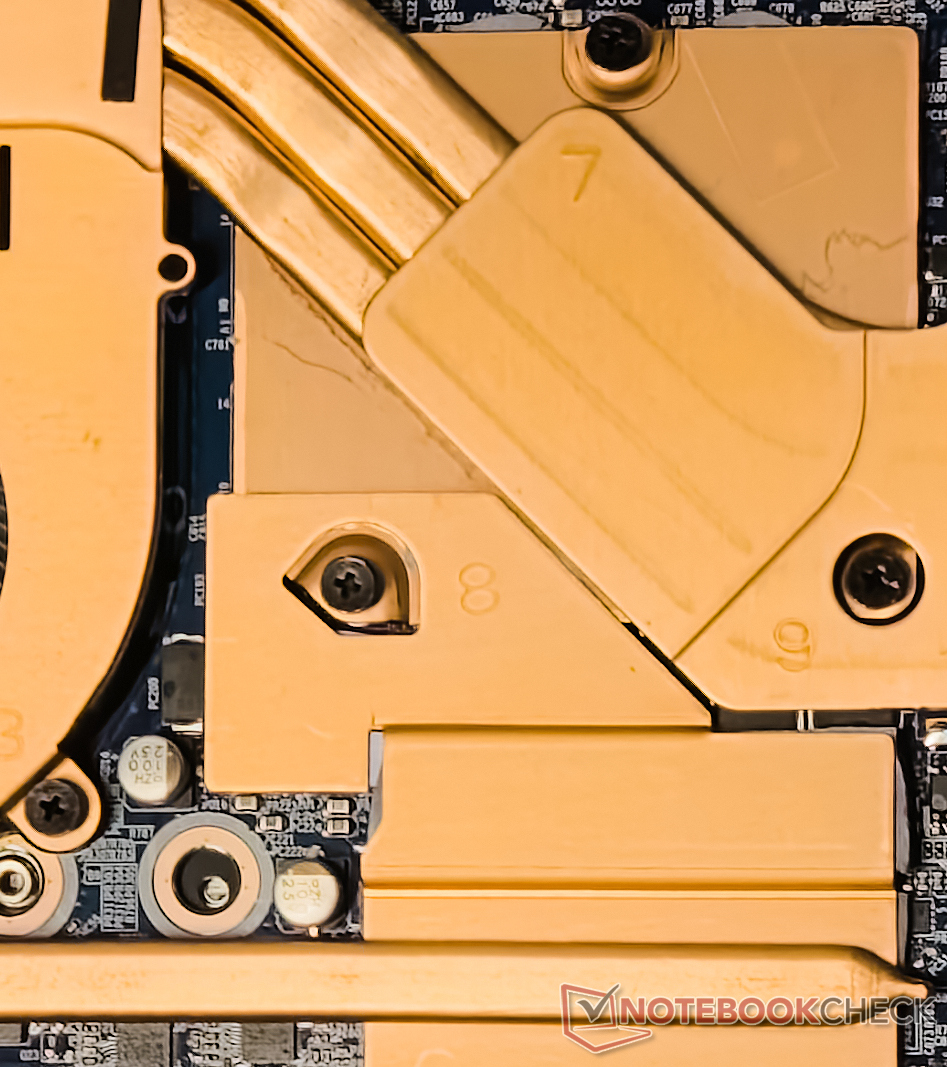
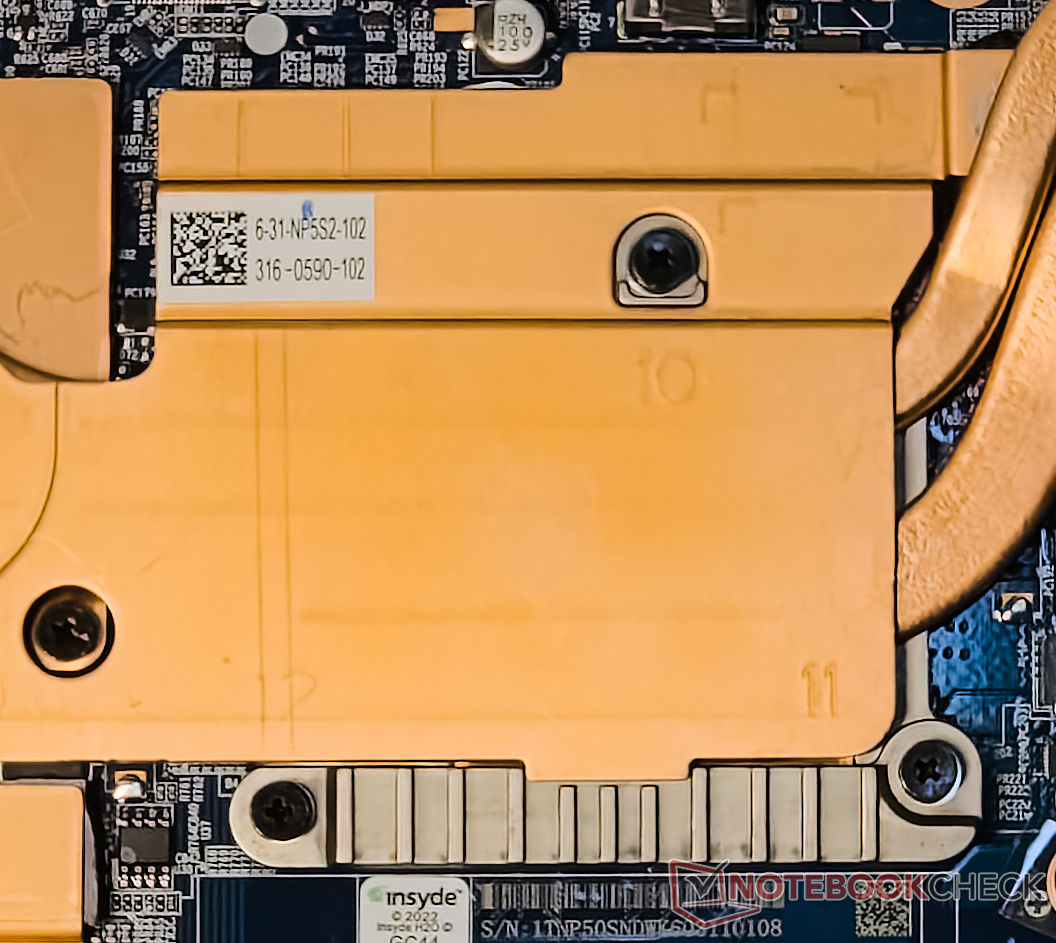
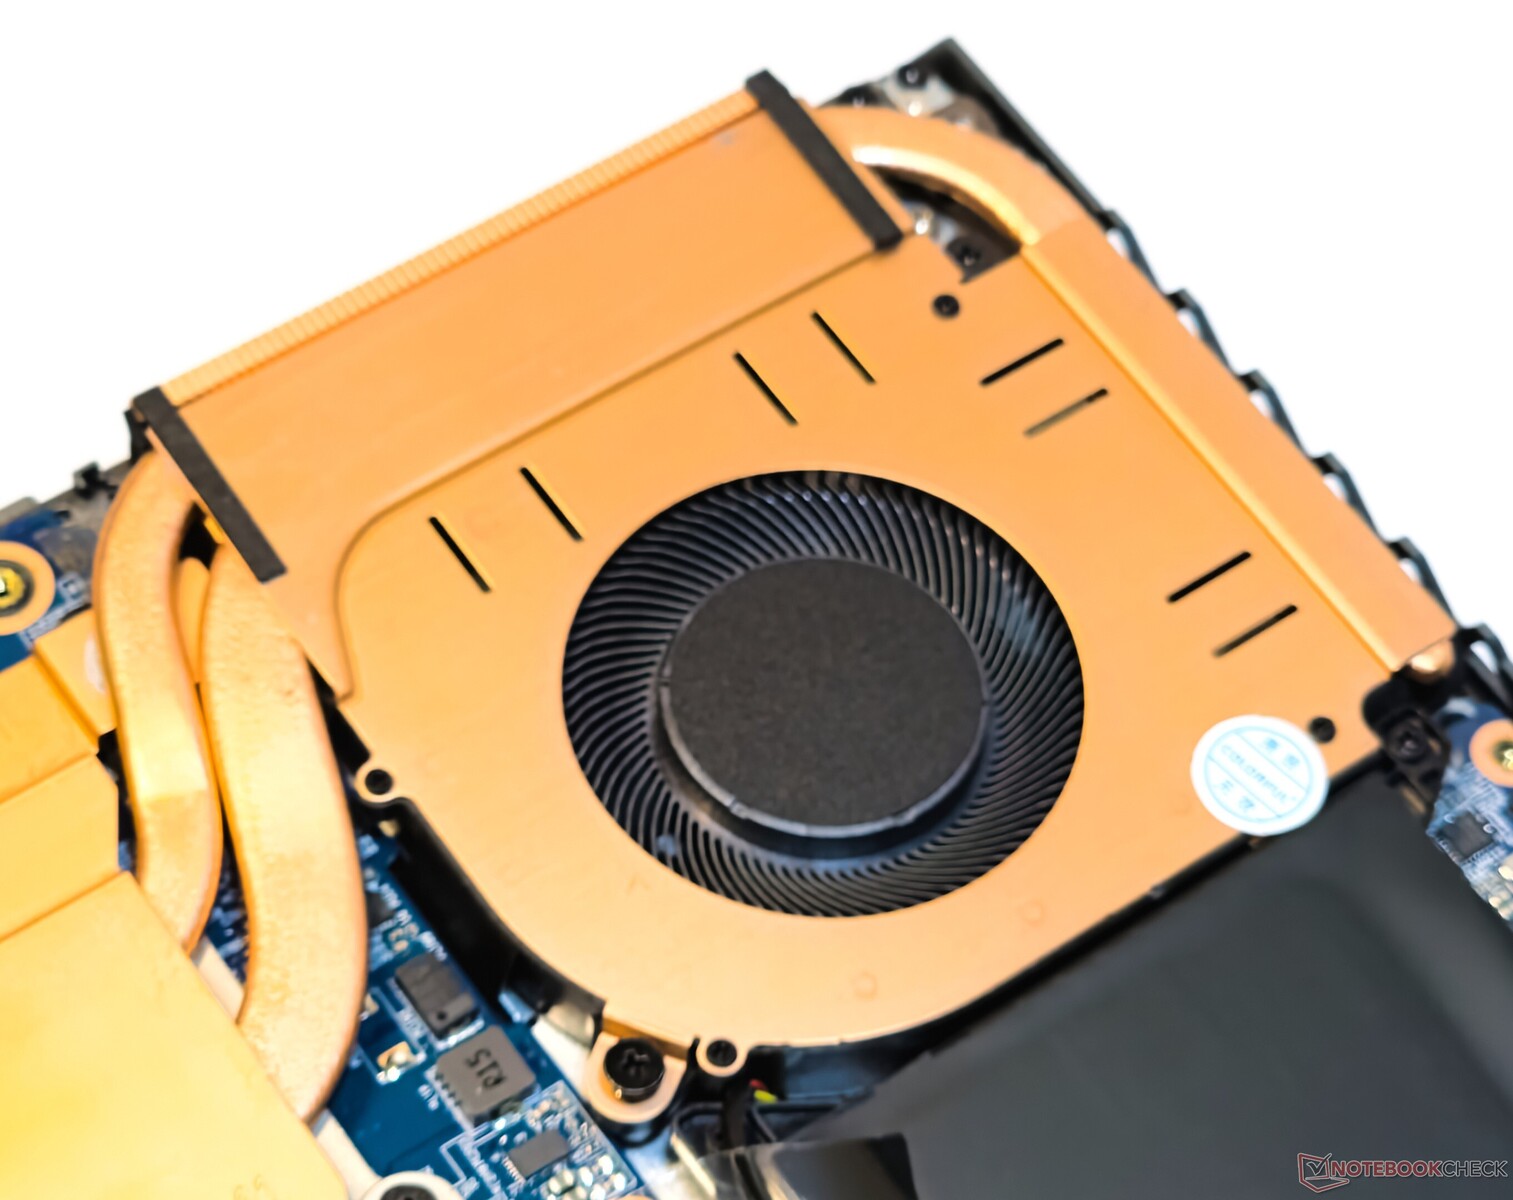
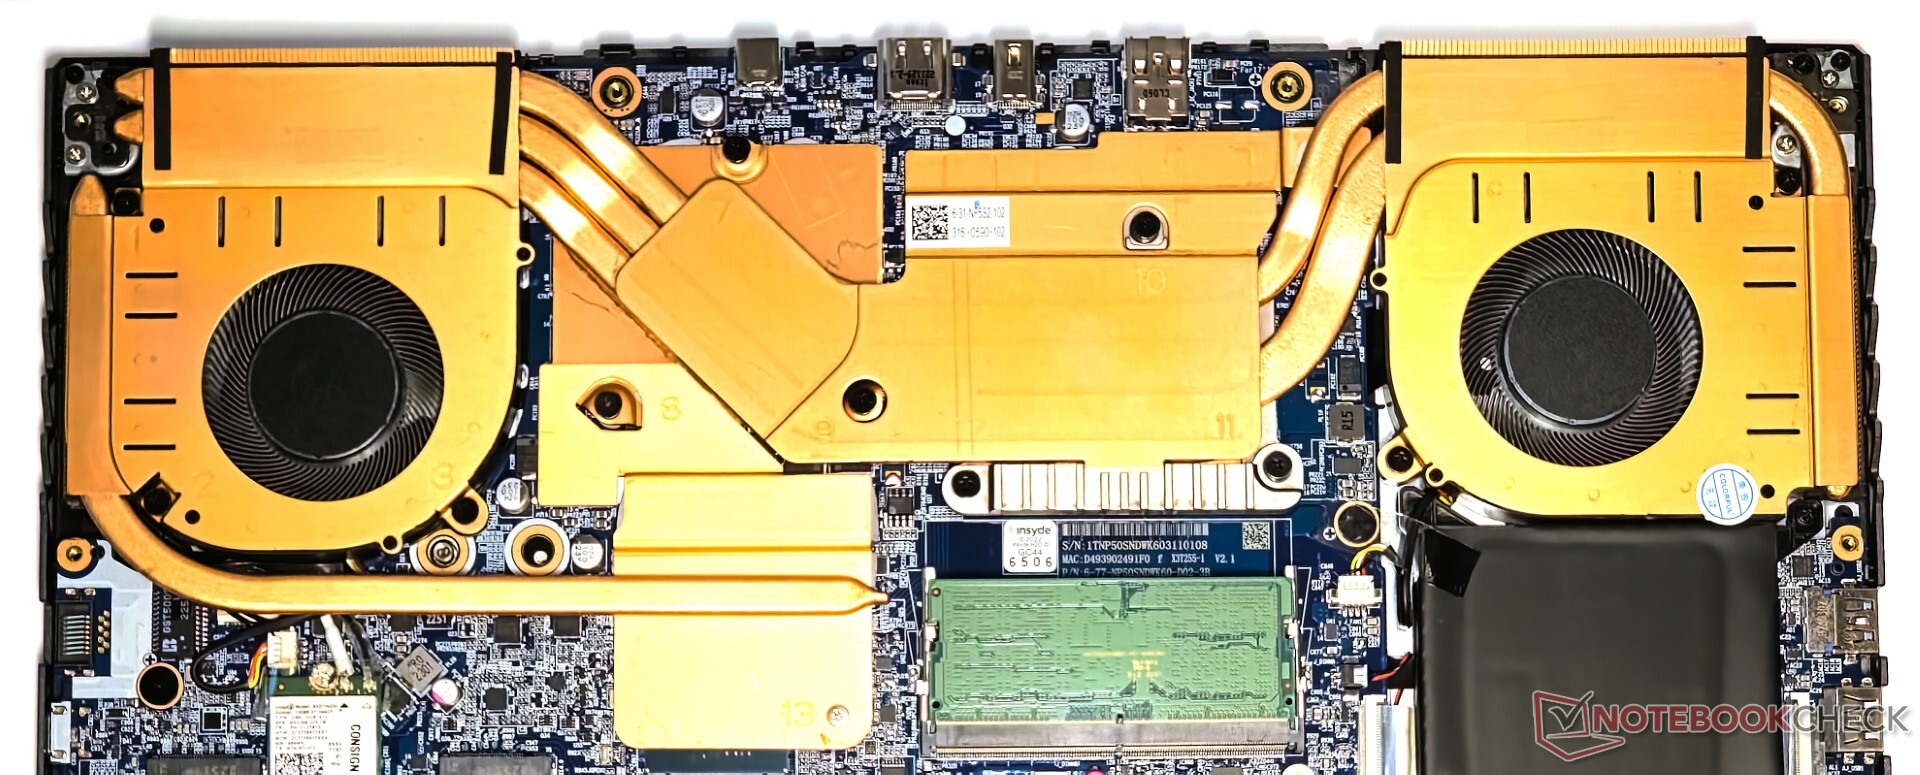
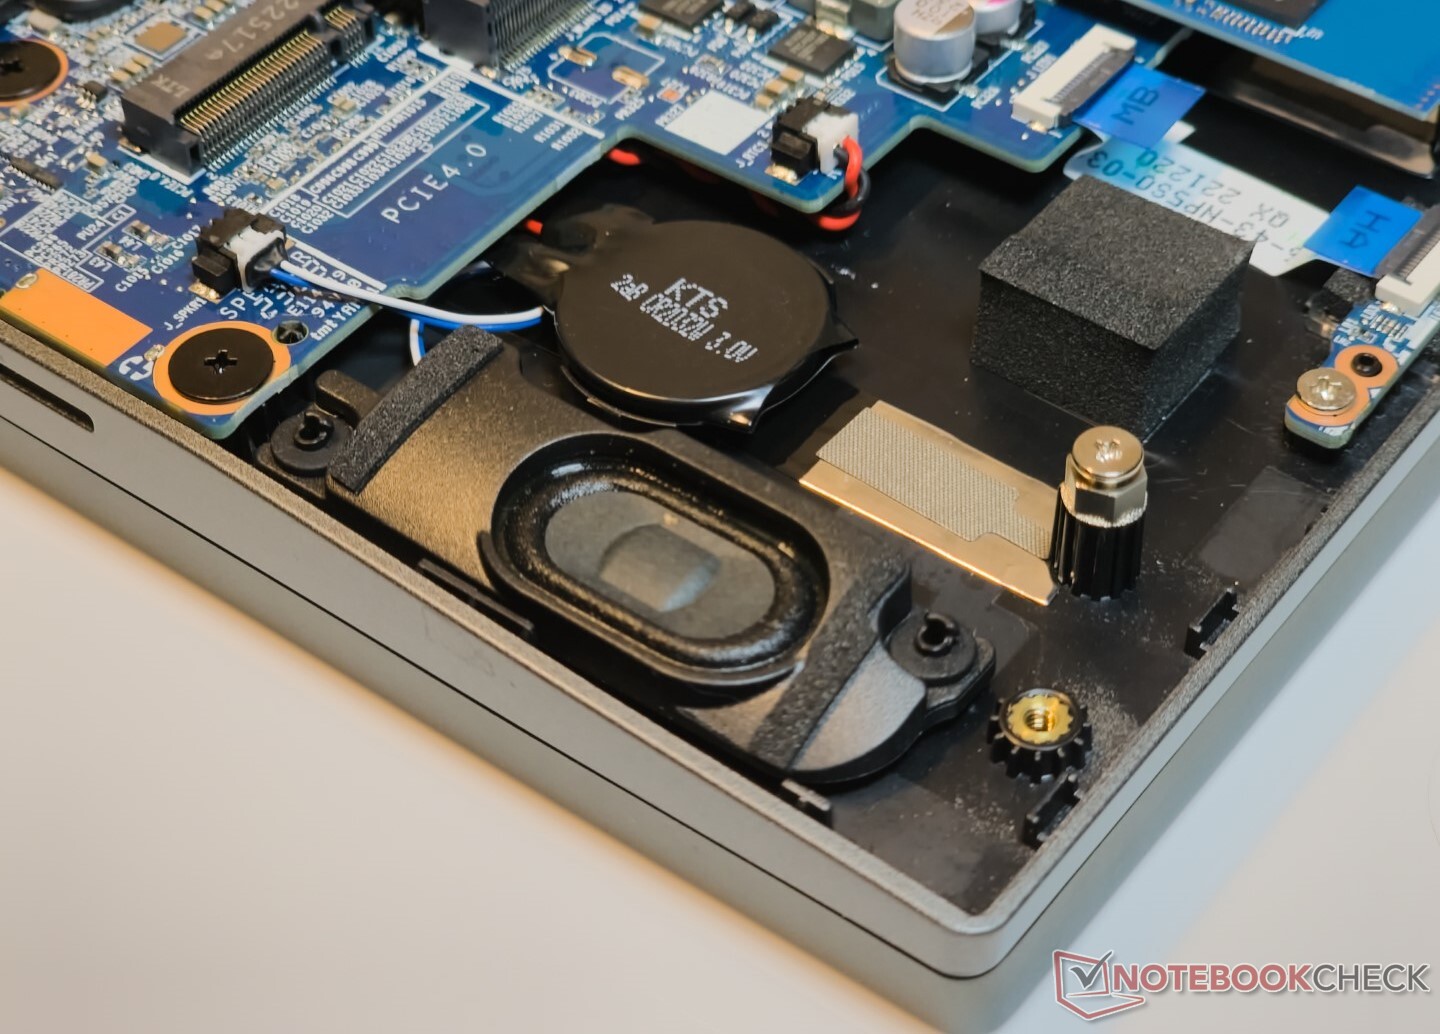
O painel traseiro sai facilmente após a remoção dos 13 parafusos PH0. O EVOL X15 mostra um layout interno movimentado, juntamente com um extenso sistema de resfriamento totalmente em cobre para a CPU e a GPU.
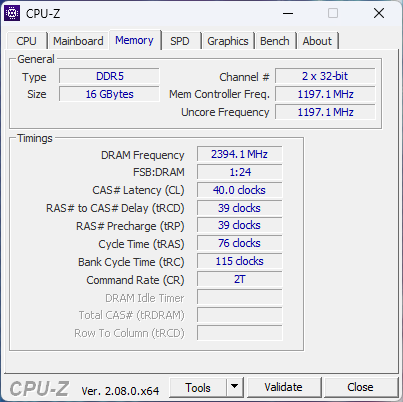
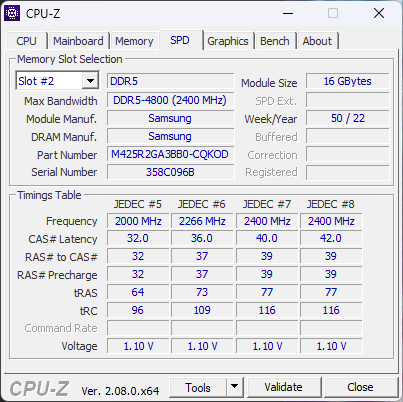
Nossa unidade veio com apenas um único stick de 16 GB DDR5-4800 configurado no modo de canal duplo. A placa WLAN, a RAM e o SSD NVMe podem ser substituídos ou atualizados conforme necessário, e a bateria em forma de L pode ser desparafusada.
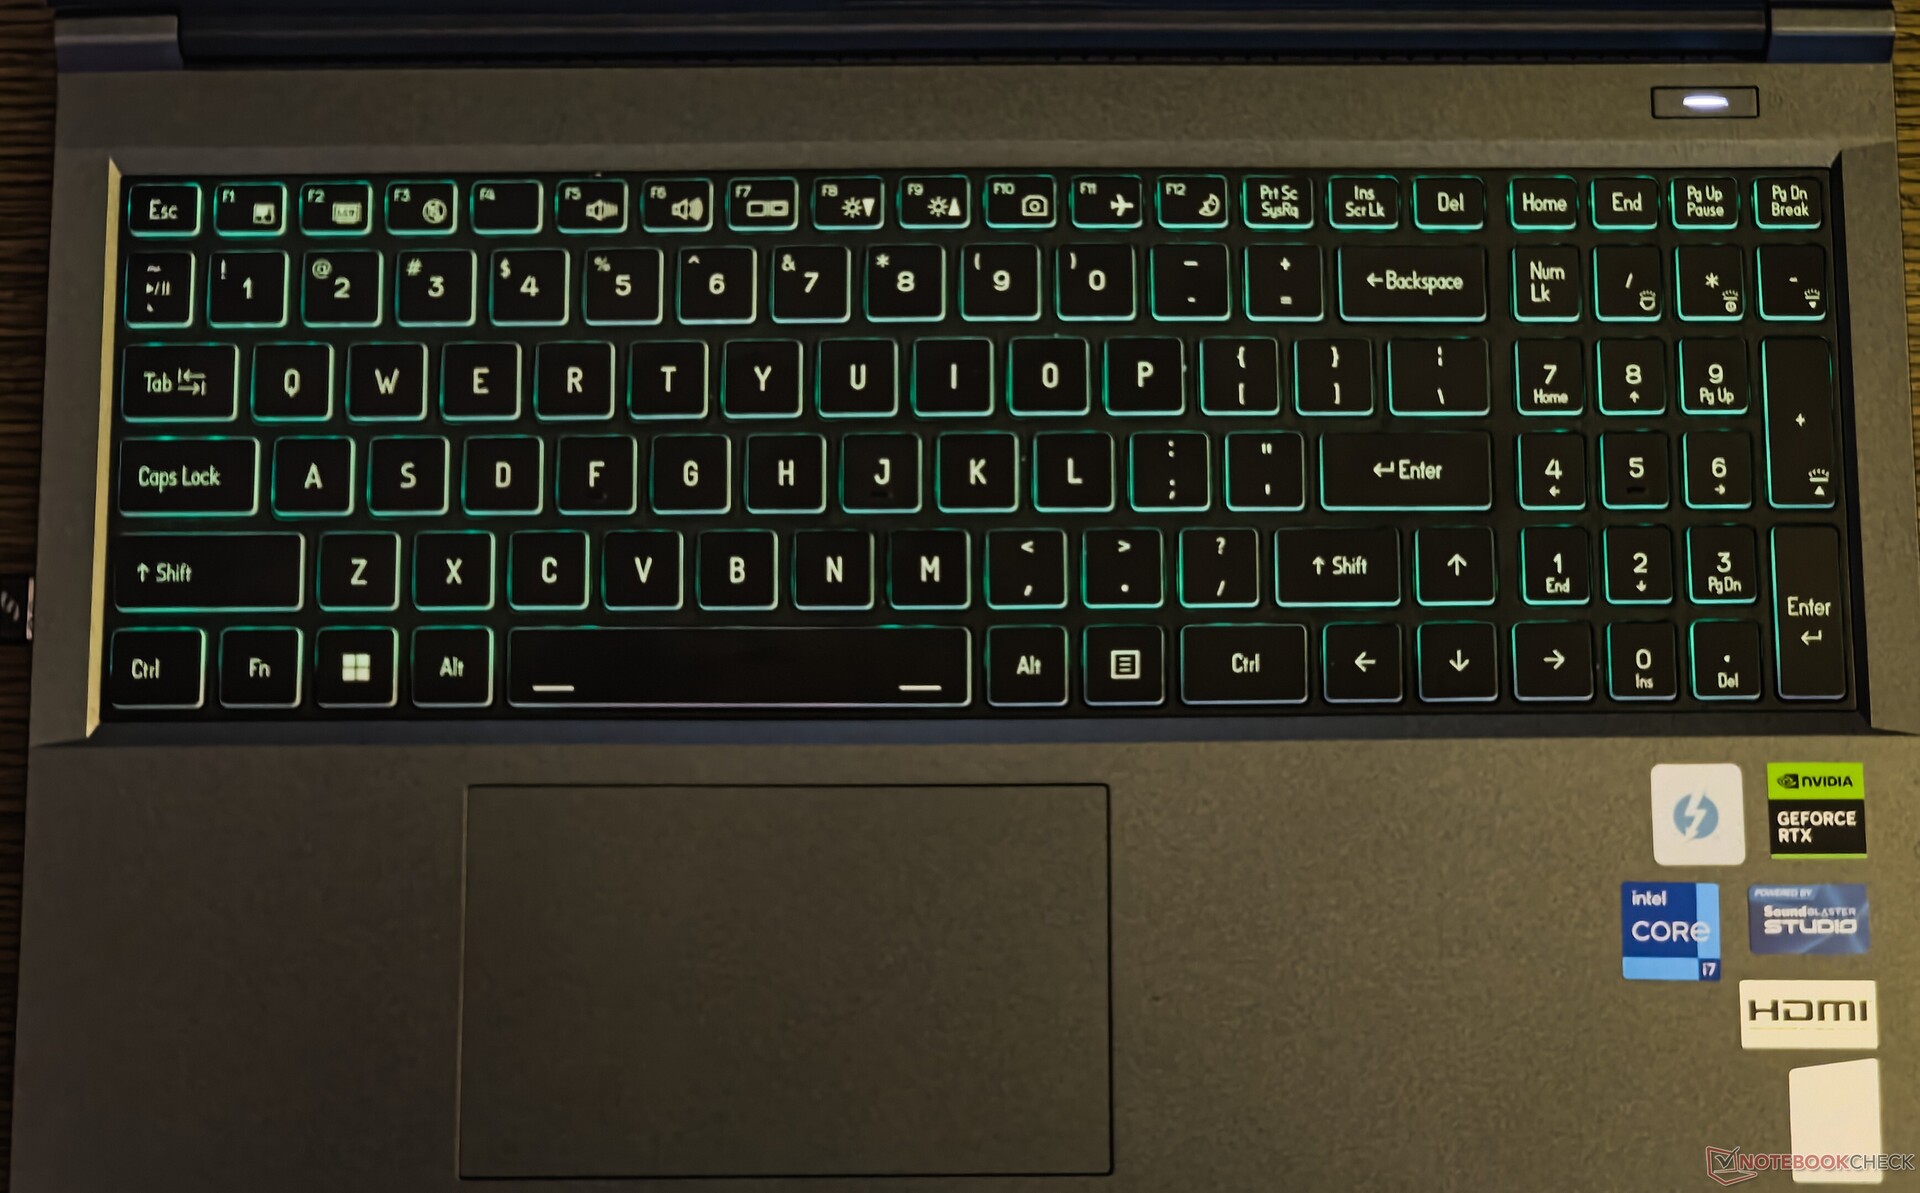
Dispositivos de entrada: Teclas macias com tato decente
Teclado
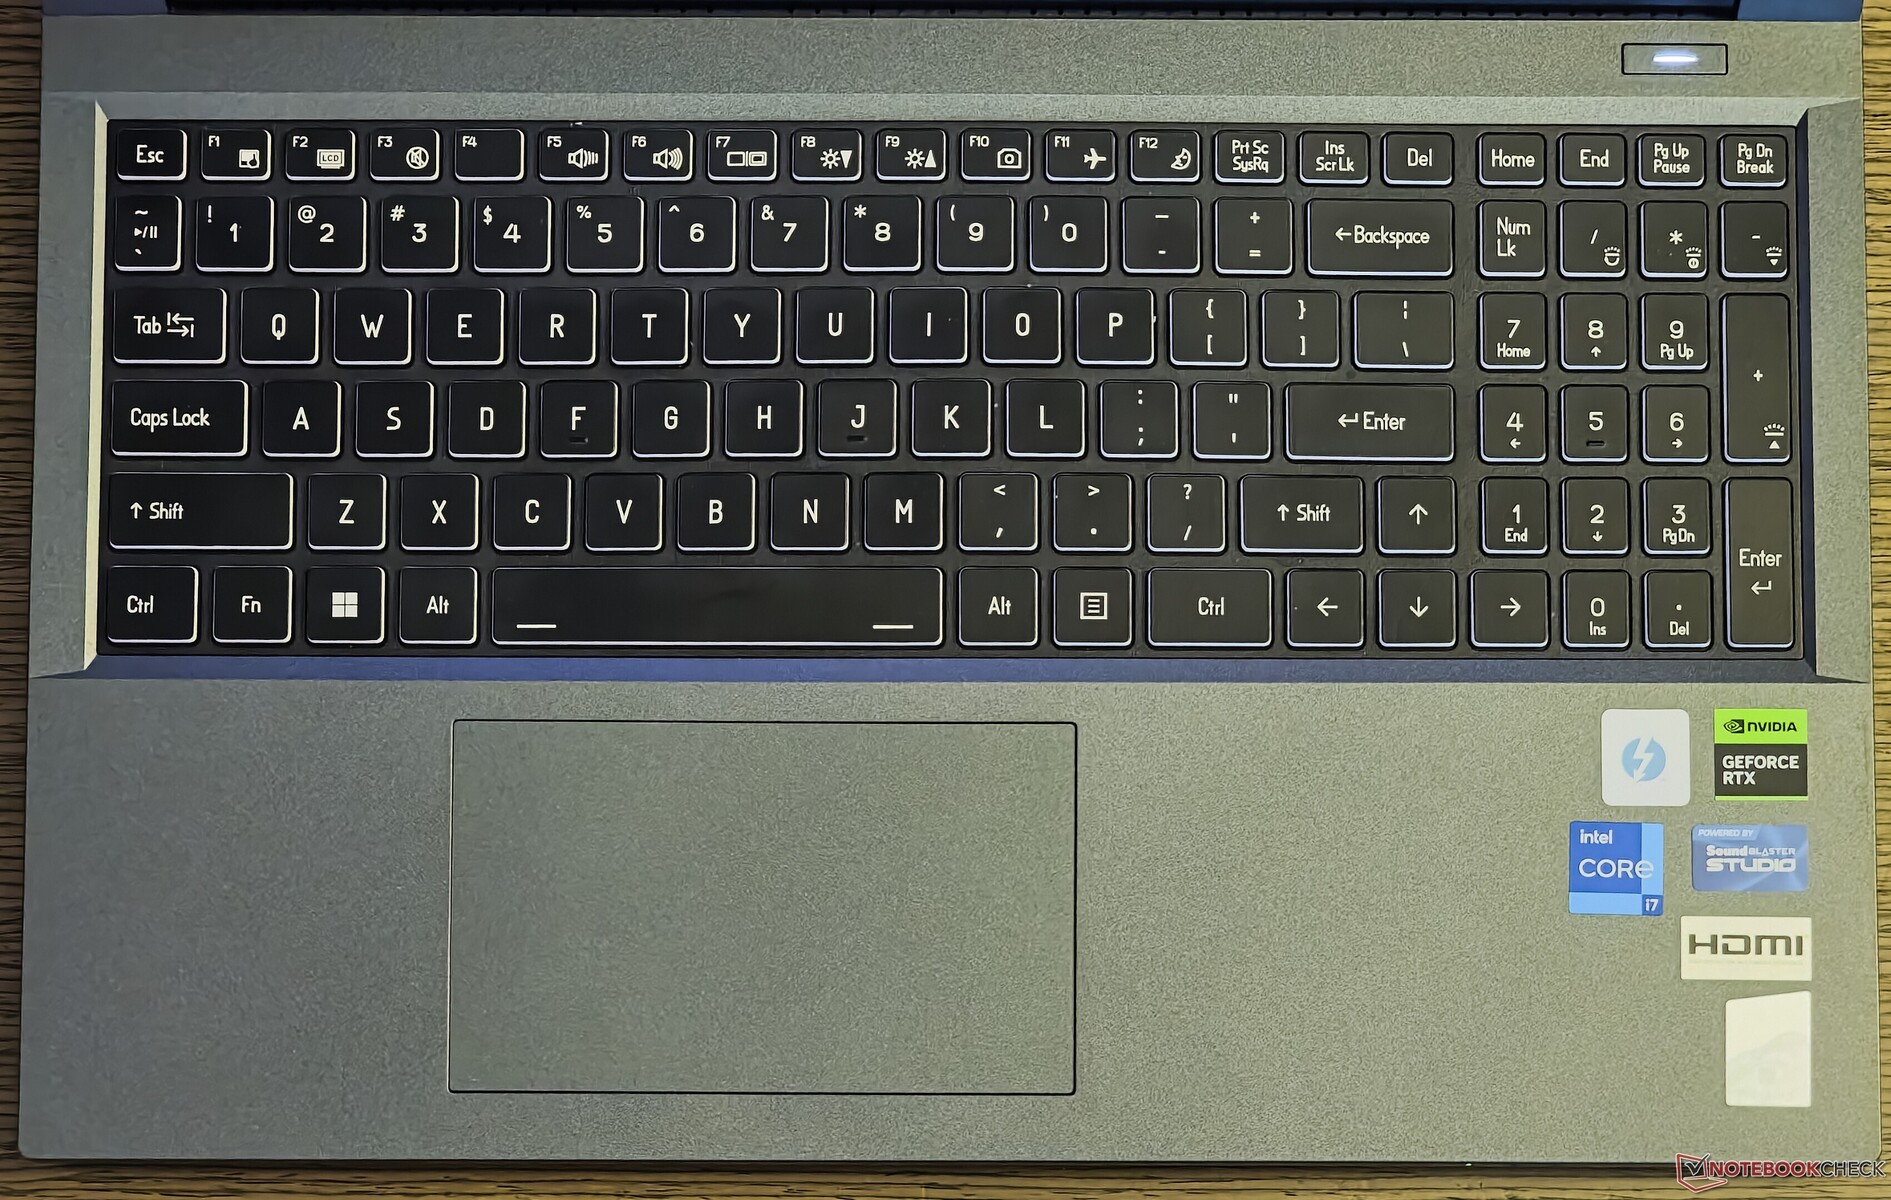
O teclado de tamanho normal do EVOL X15 inclui um teclado numérico e espaço para teclas de seta de tamanho adequado, o que é uma vantagem para títulos de corrida. Uma desvantagem desse layout é a tecla Shift direita mais curta, que pode atrapalhar os usuários que fazem a transição de um teclado típico de desktop ou mesmo de um laptop.
No início, o deslocamento das teclas parece um pouco mole, mas há tato suficiente para jogos e digitação. O aplicativo Control Center da Colorful (leia-se Clevo) permite a gravação de macros de teclado e mouse, o que deve ser útil para os jogadores de MMORPG e MOBA.
Não há luz de fundo RGB multizona ou por tecla, portanto, o usuário terá que lidar com uma paleta de cores limitada no aplicativo Control Center. A luz de fundo pode ser ajustada em quatro estágios, mas as teclas filtram uma boa quantidade de luz que passa por elas.
Touchpad
O touchpad de 12 cm x 7 cm não é o maior que vimos em laptops para jogos este ano, mas oferece uma experiência de deslizamento relativamente suave e suporta totalmente os gestos do Windows Precision.
Toda a superfície do touchpad funciona como um botão esquerdo do mouse. No entanto, os cliques são mais fáceis e menos ruidosos nas regiões central e inferior do touchpad em comparação com os cantos superiores.
Tela: painel QHD de 165 Hz sem PWM
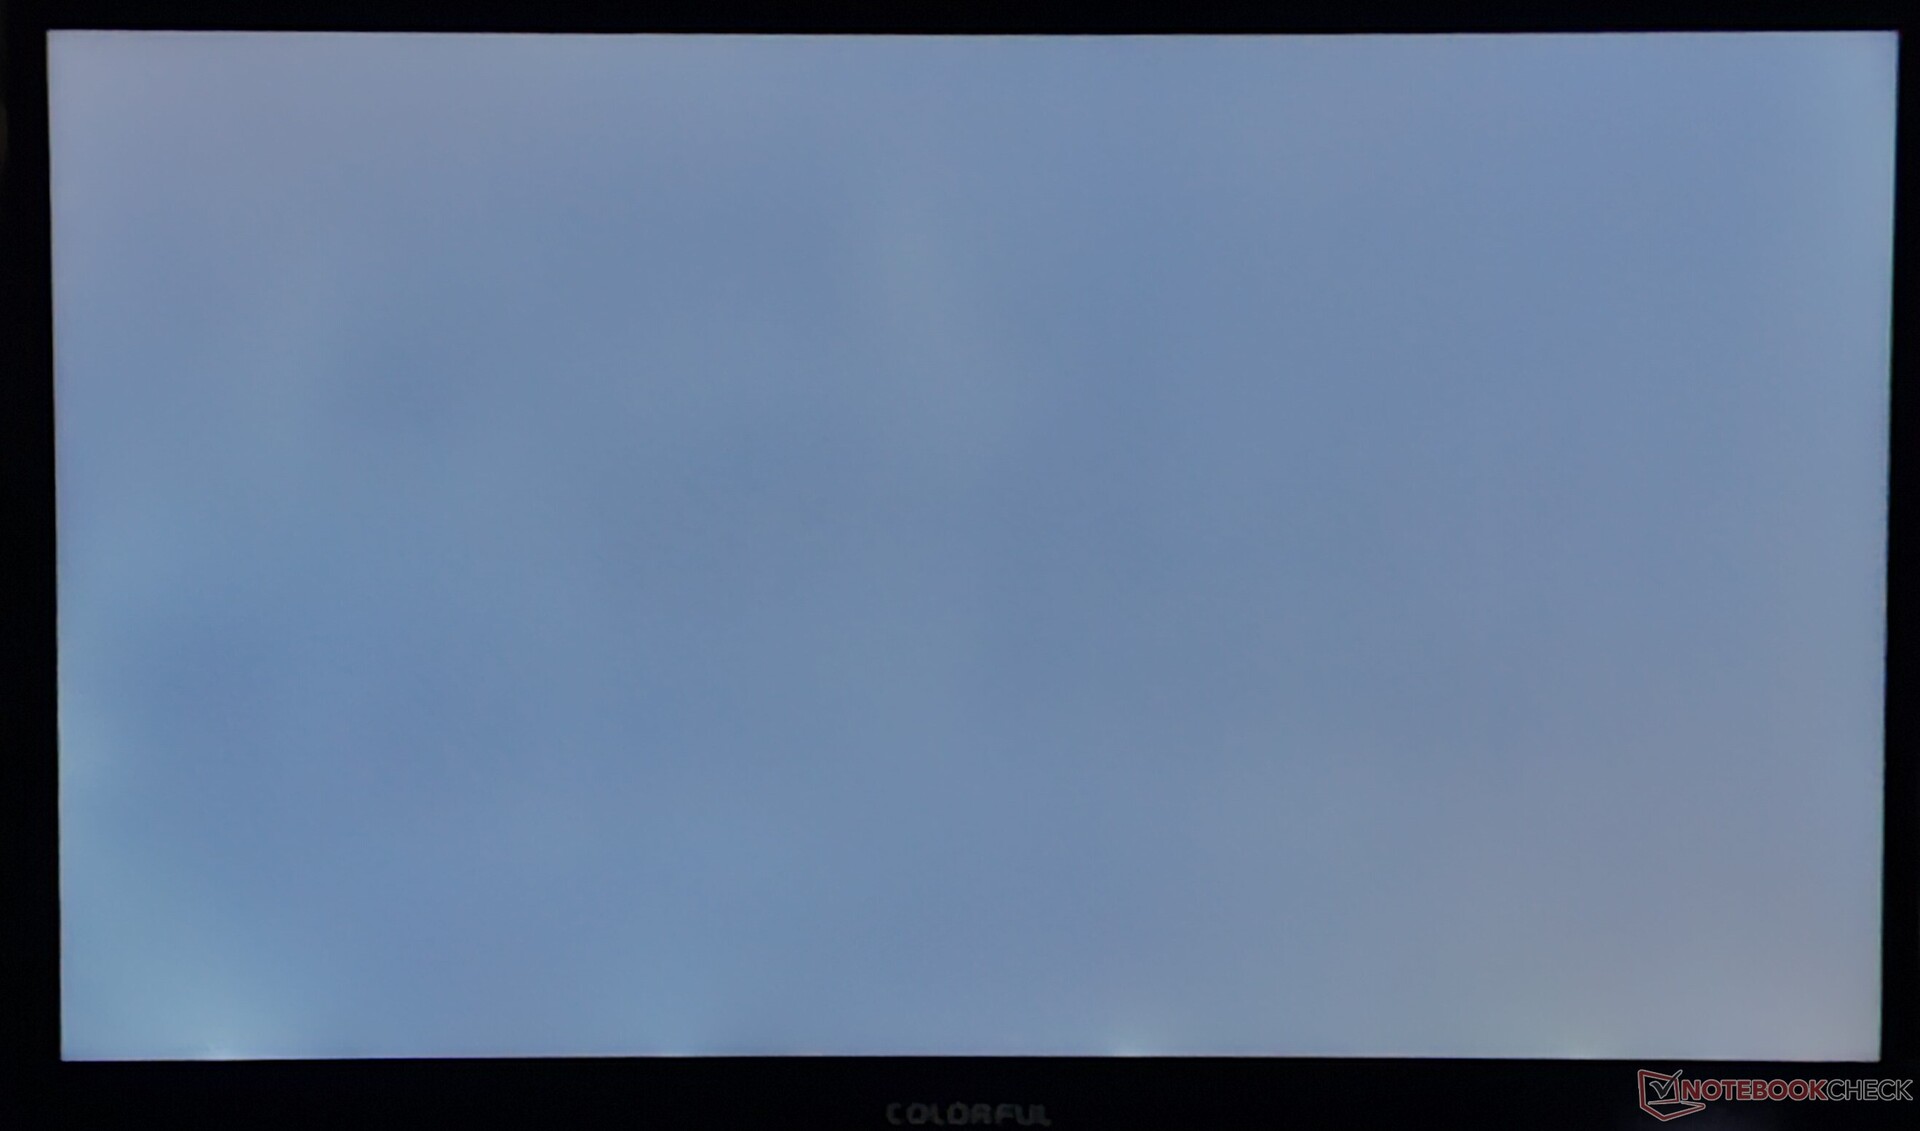
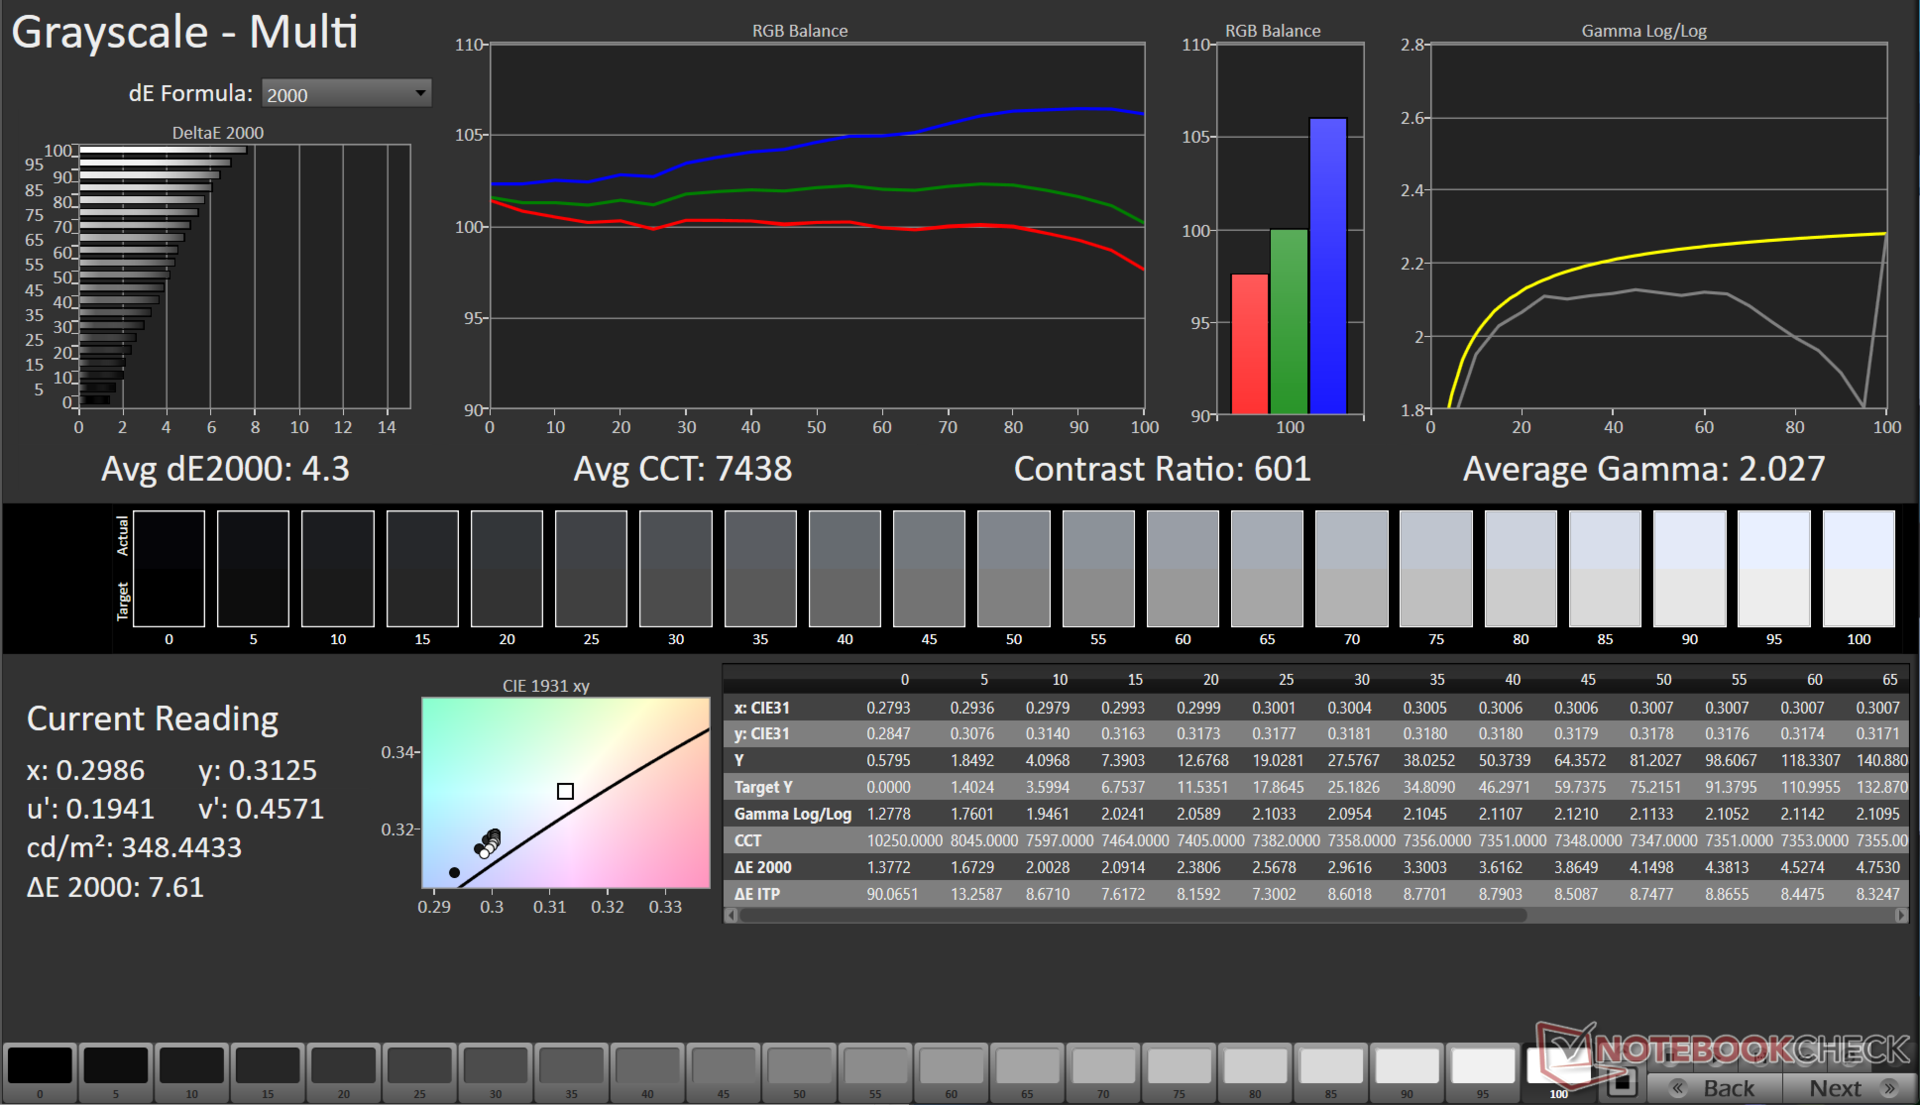
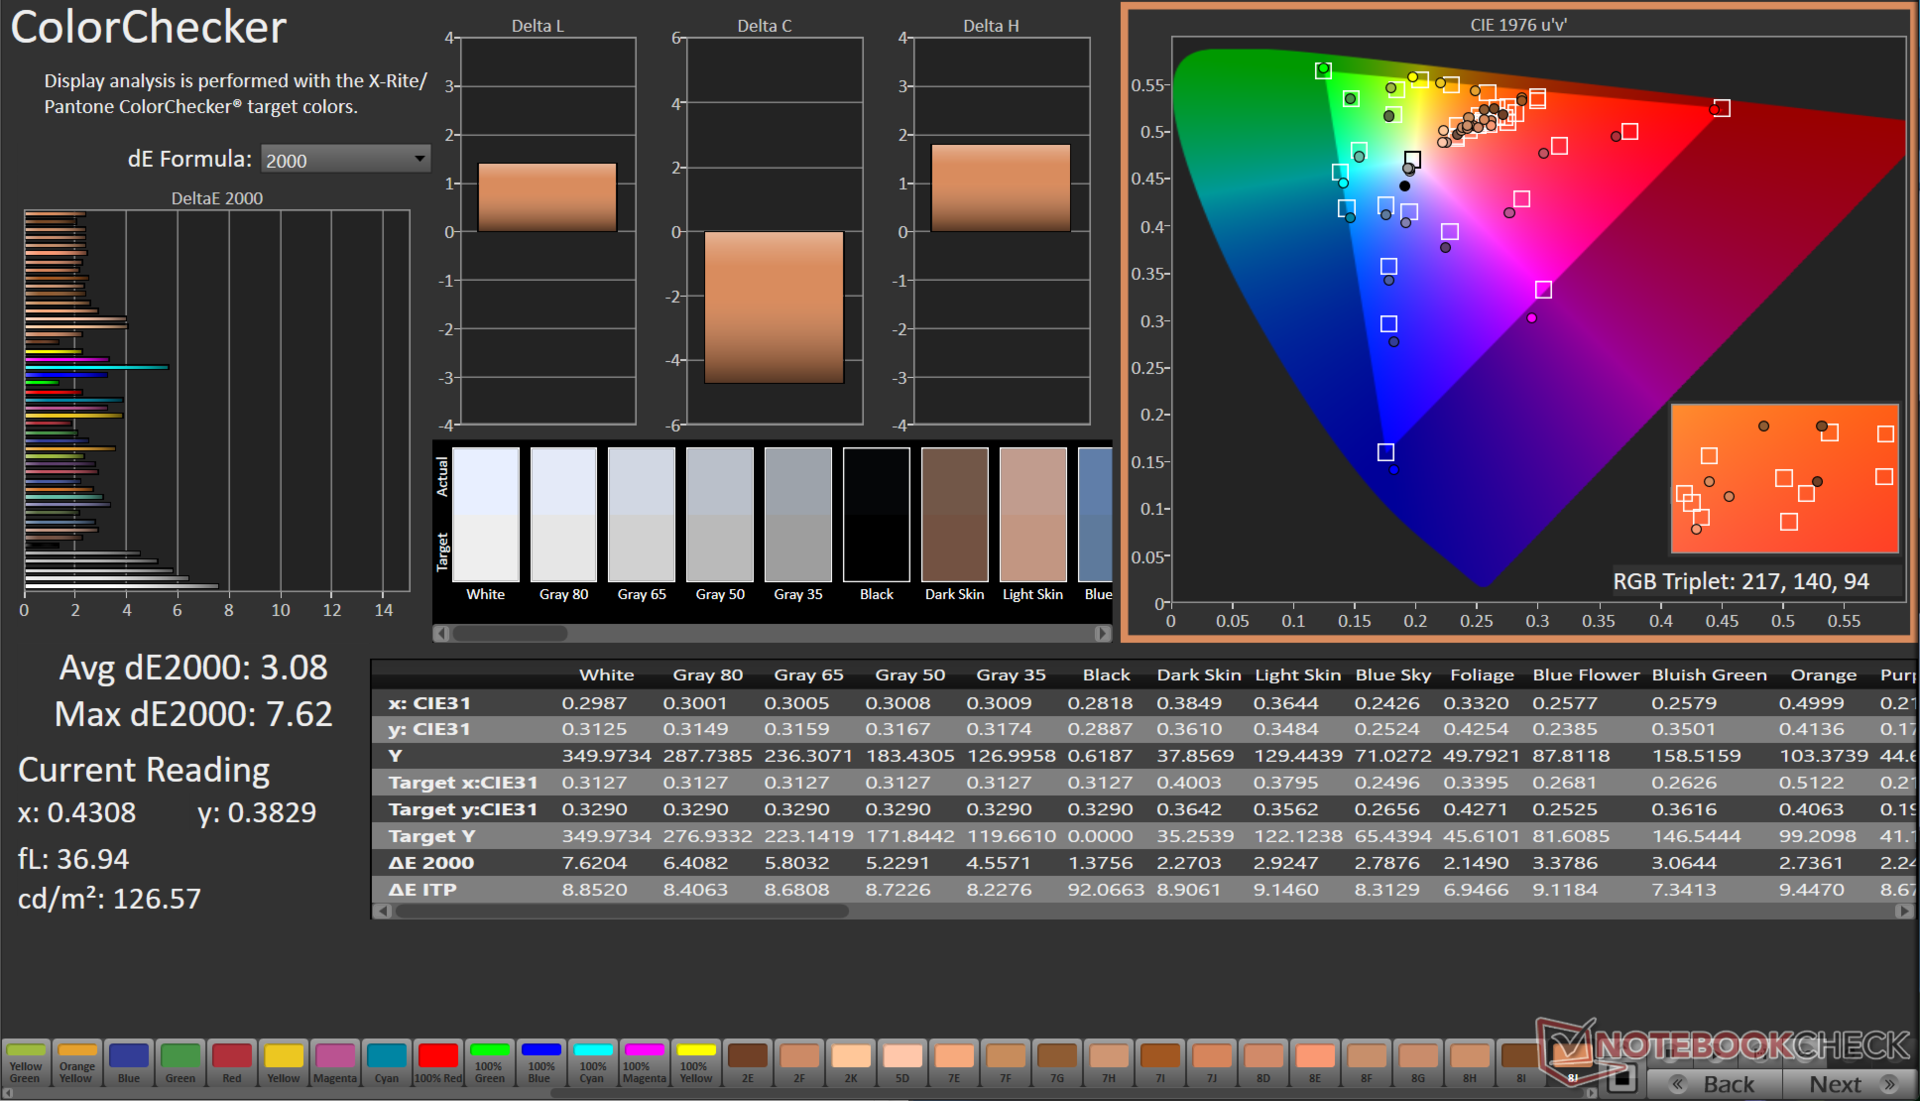
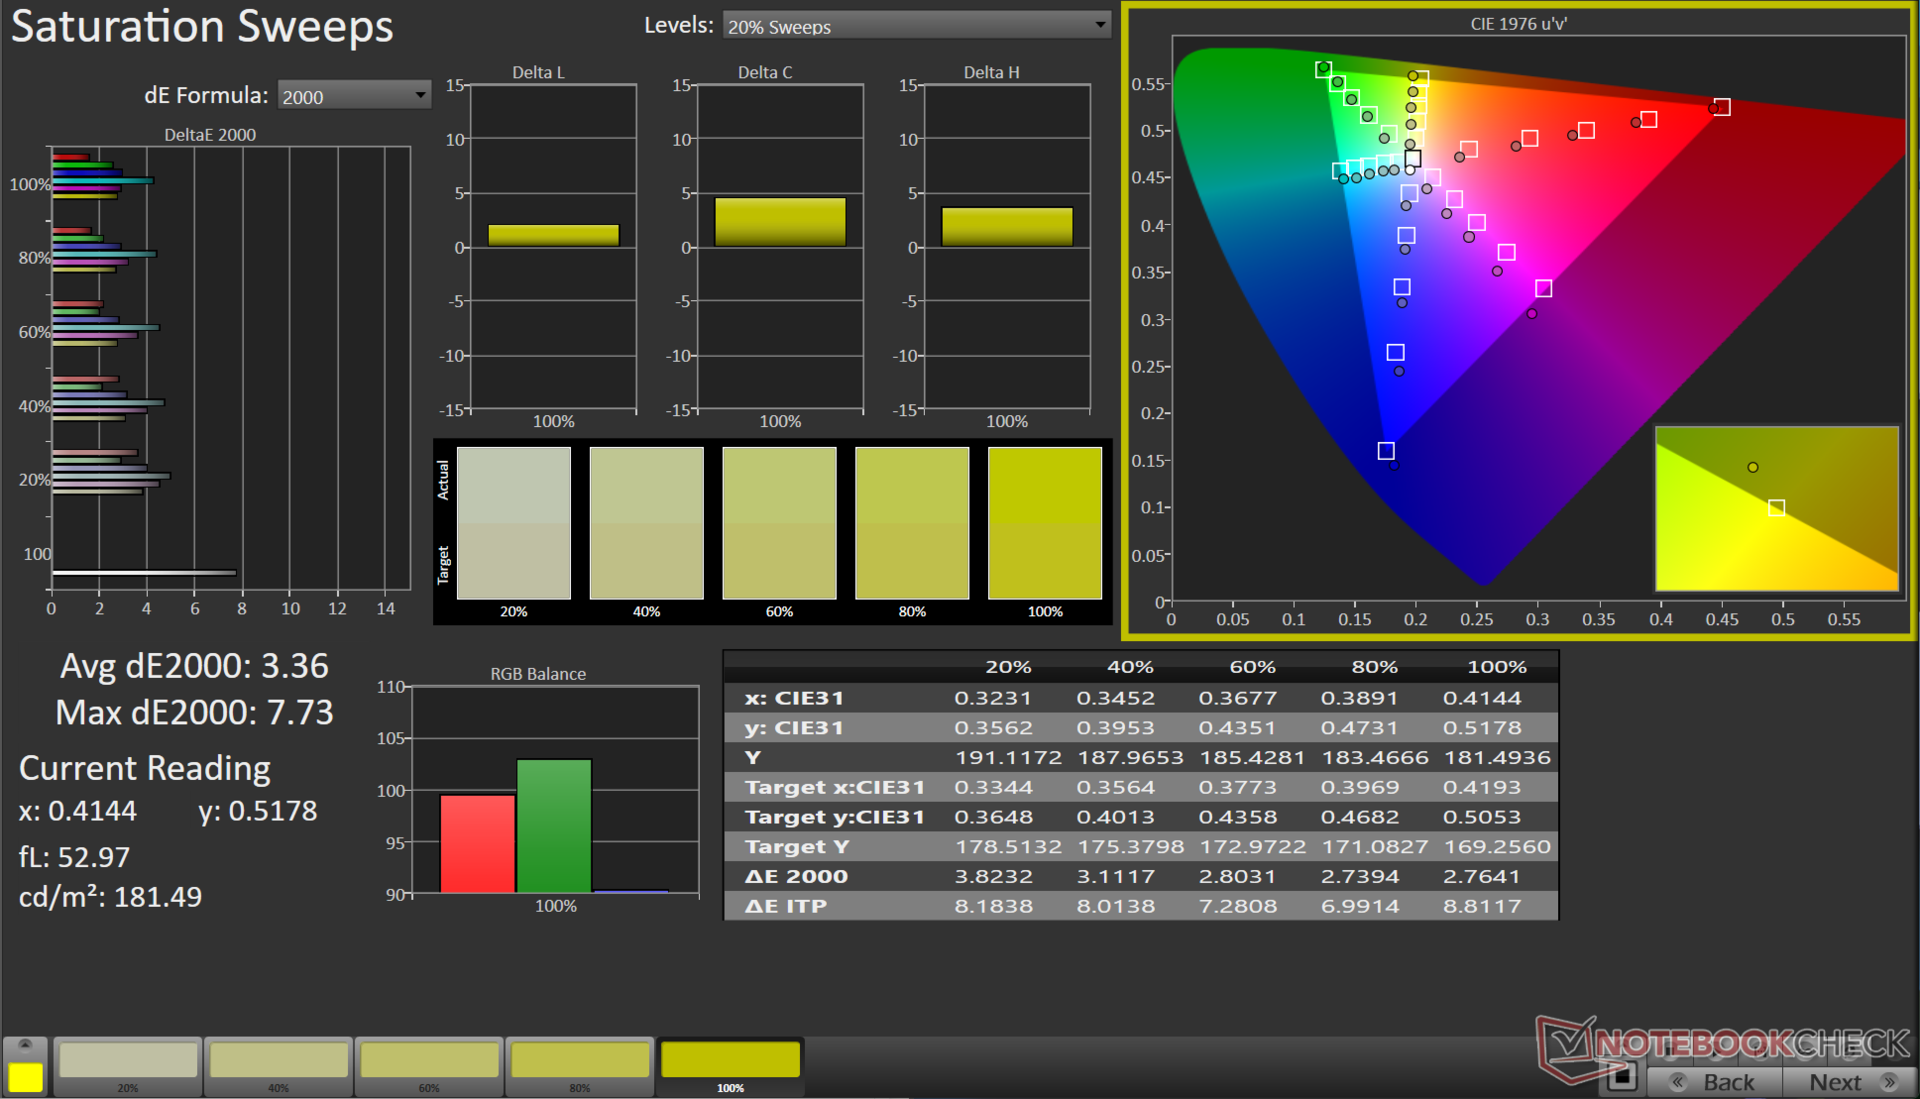
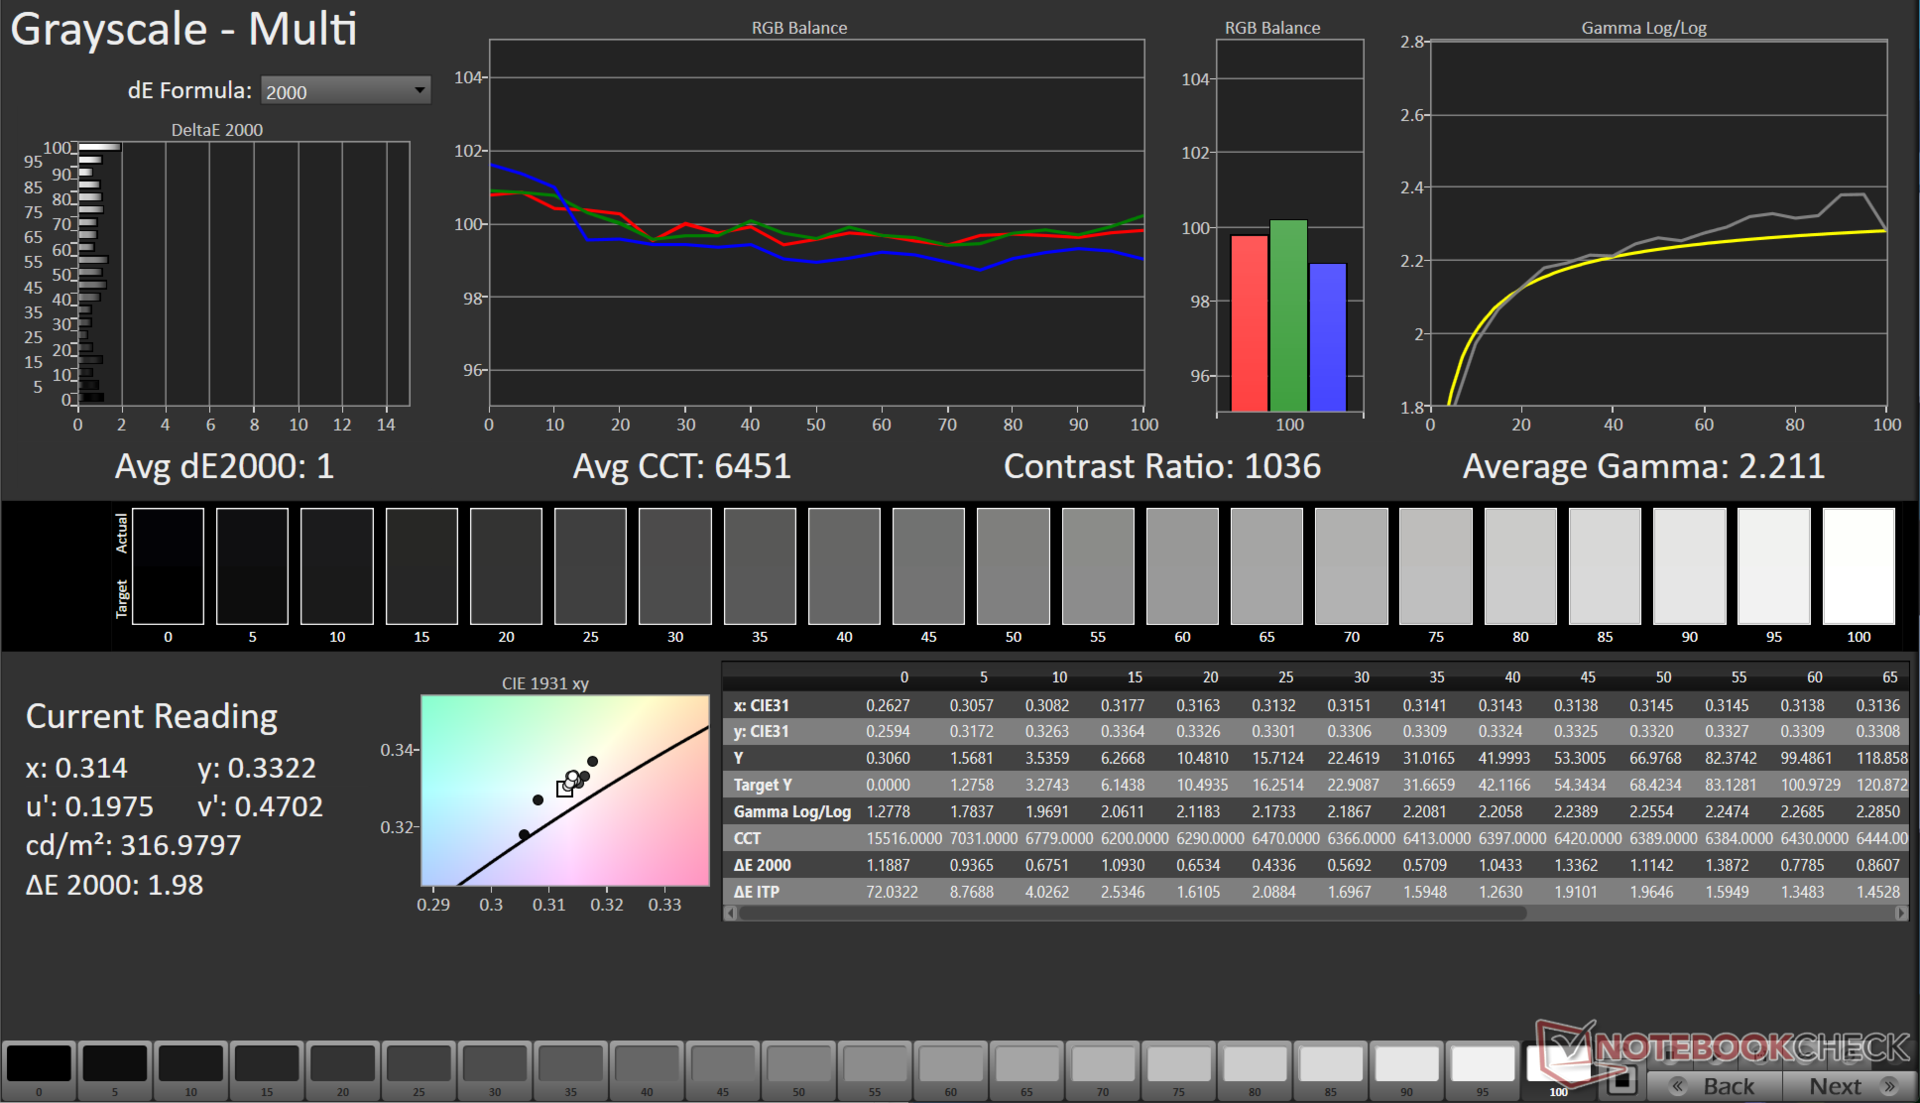
O EVOL X15 AT vem equipado com um painel BOE QHD 165 Hz de 15,6 polegadas. A tela não impressiona exatamente com seu pico de 345 nits e luminância média de 318 nits, mas está no mesmo nível da maioria dos notebooks para jogos desse preço. Observa-se um sangramento mínimo da luz de fundo nos cantos.
O painel apresenta uma distribuição de brilho decente de 81%, mas a taxa de contraste medida de 607:1 está na extremidade inferior, especialmente quando comparada com outros painéis BOE nesta comparação.

| |||||||||||||||||||||||||
iluminação: 81 %
iluminação com acumulador: 251 cd/m²
Contraste: 607:1 (Preto: 0.57 cd/m²)
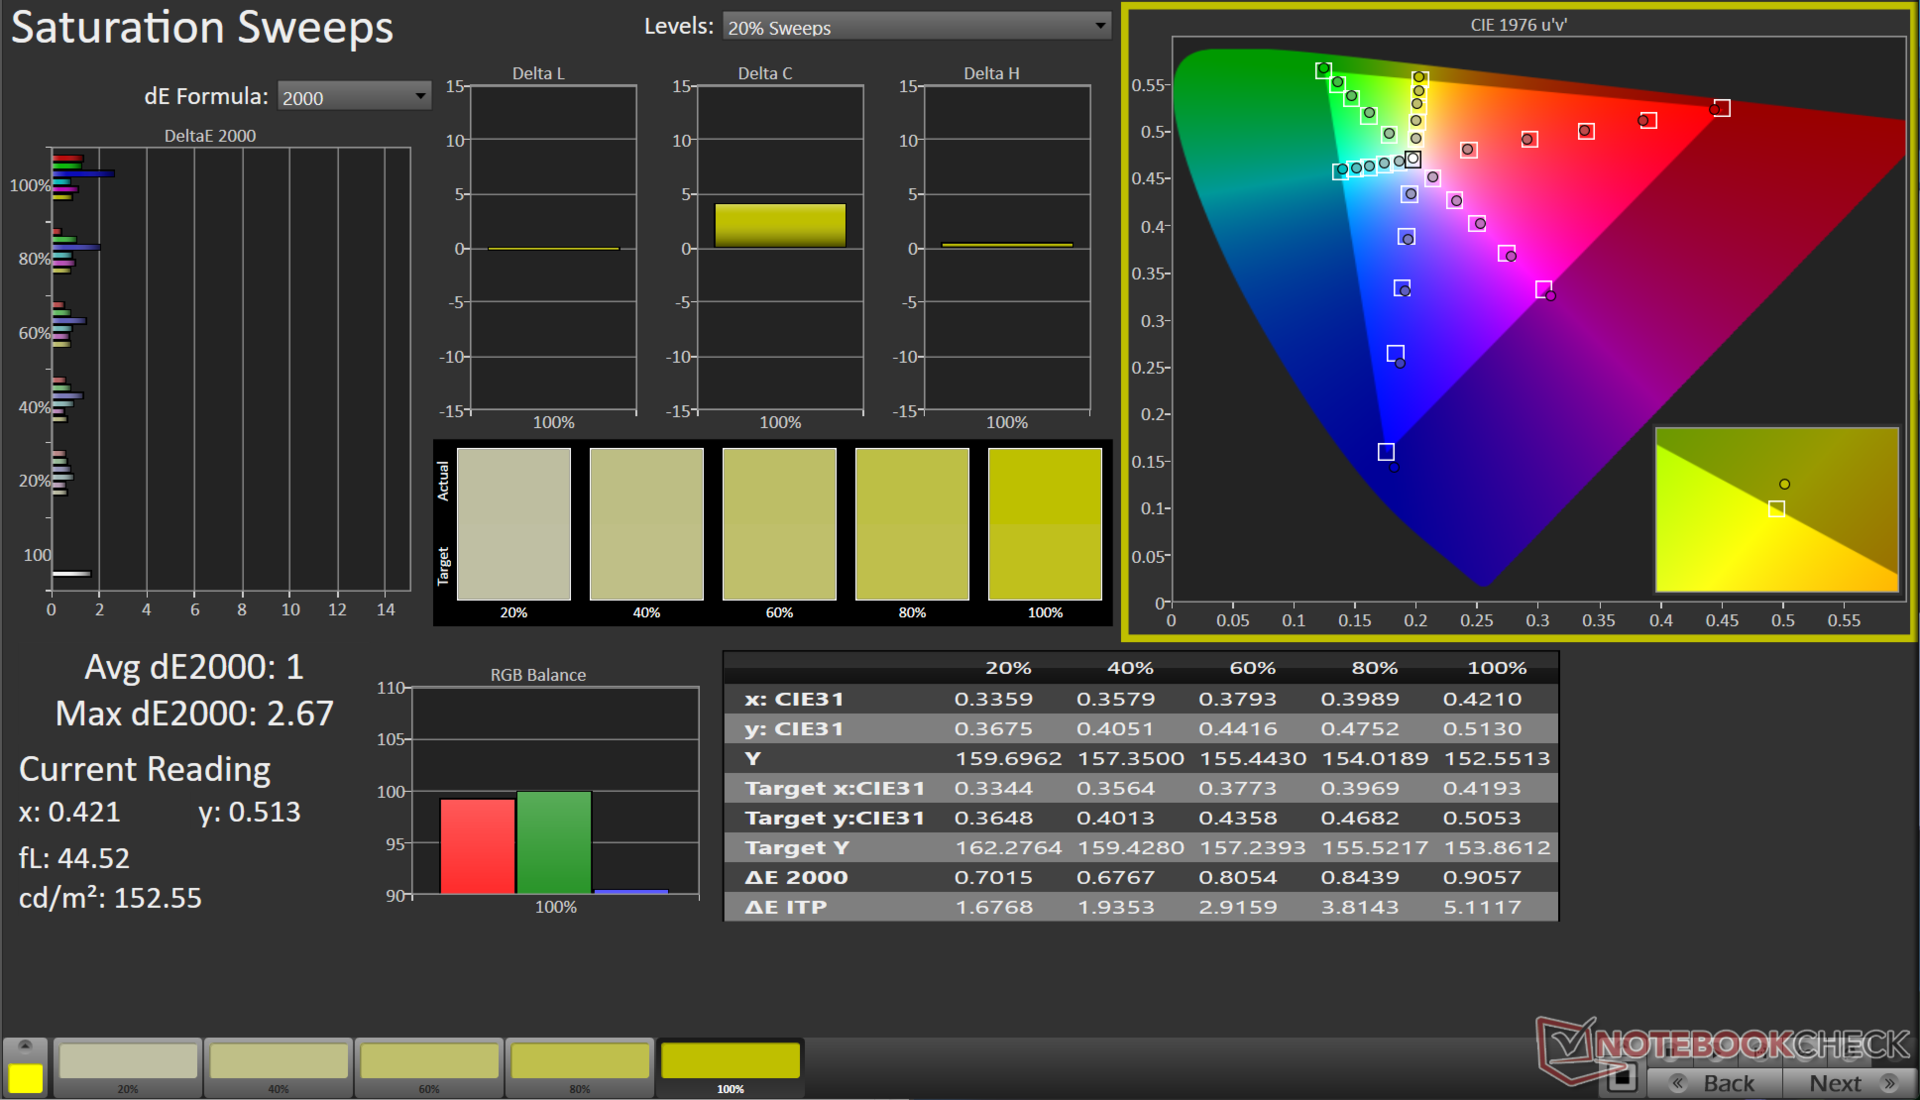
ΔE ColorChecker Calman: 3.08 | ∀{0.5-29.43 Ø4.71}
calibrated: 1.12
ΔE Greyscale Calman: 4.3 | ∀{0.09-98 Ø4.96}
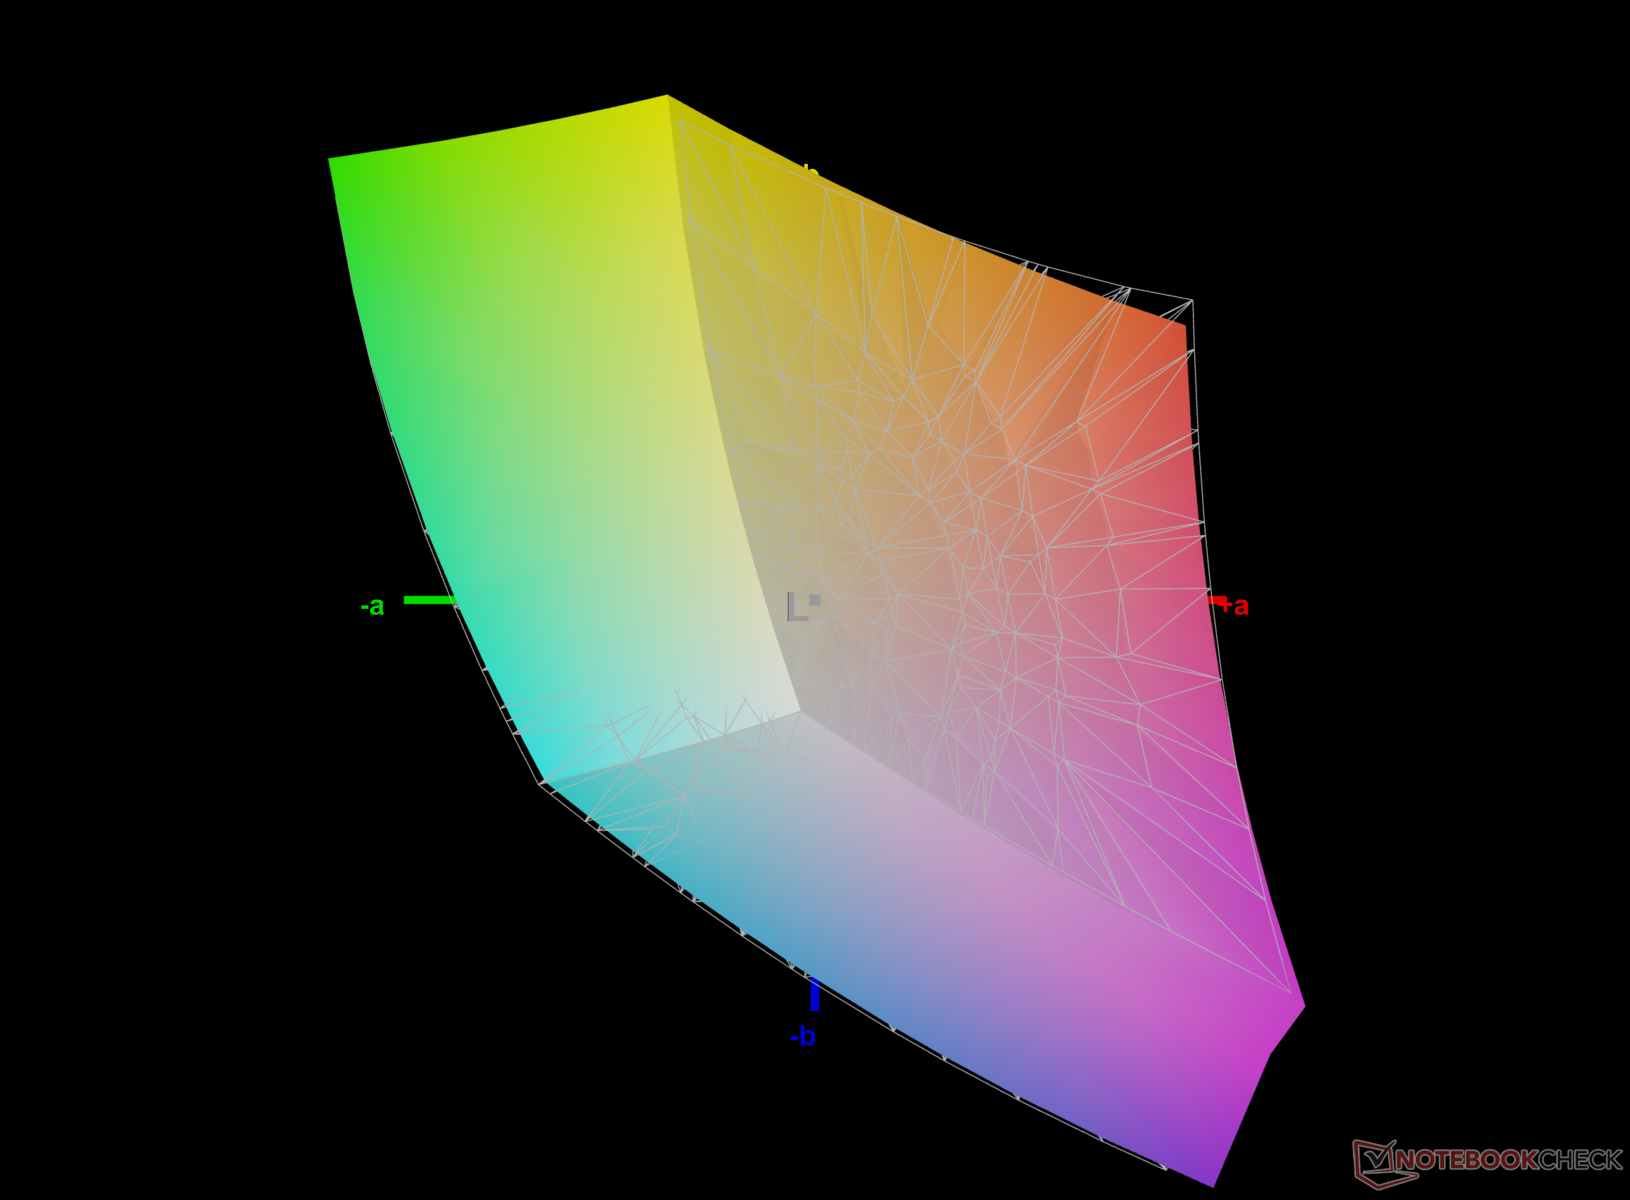
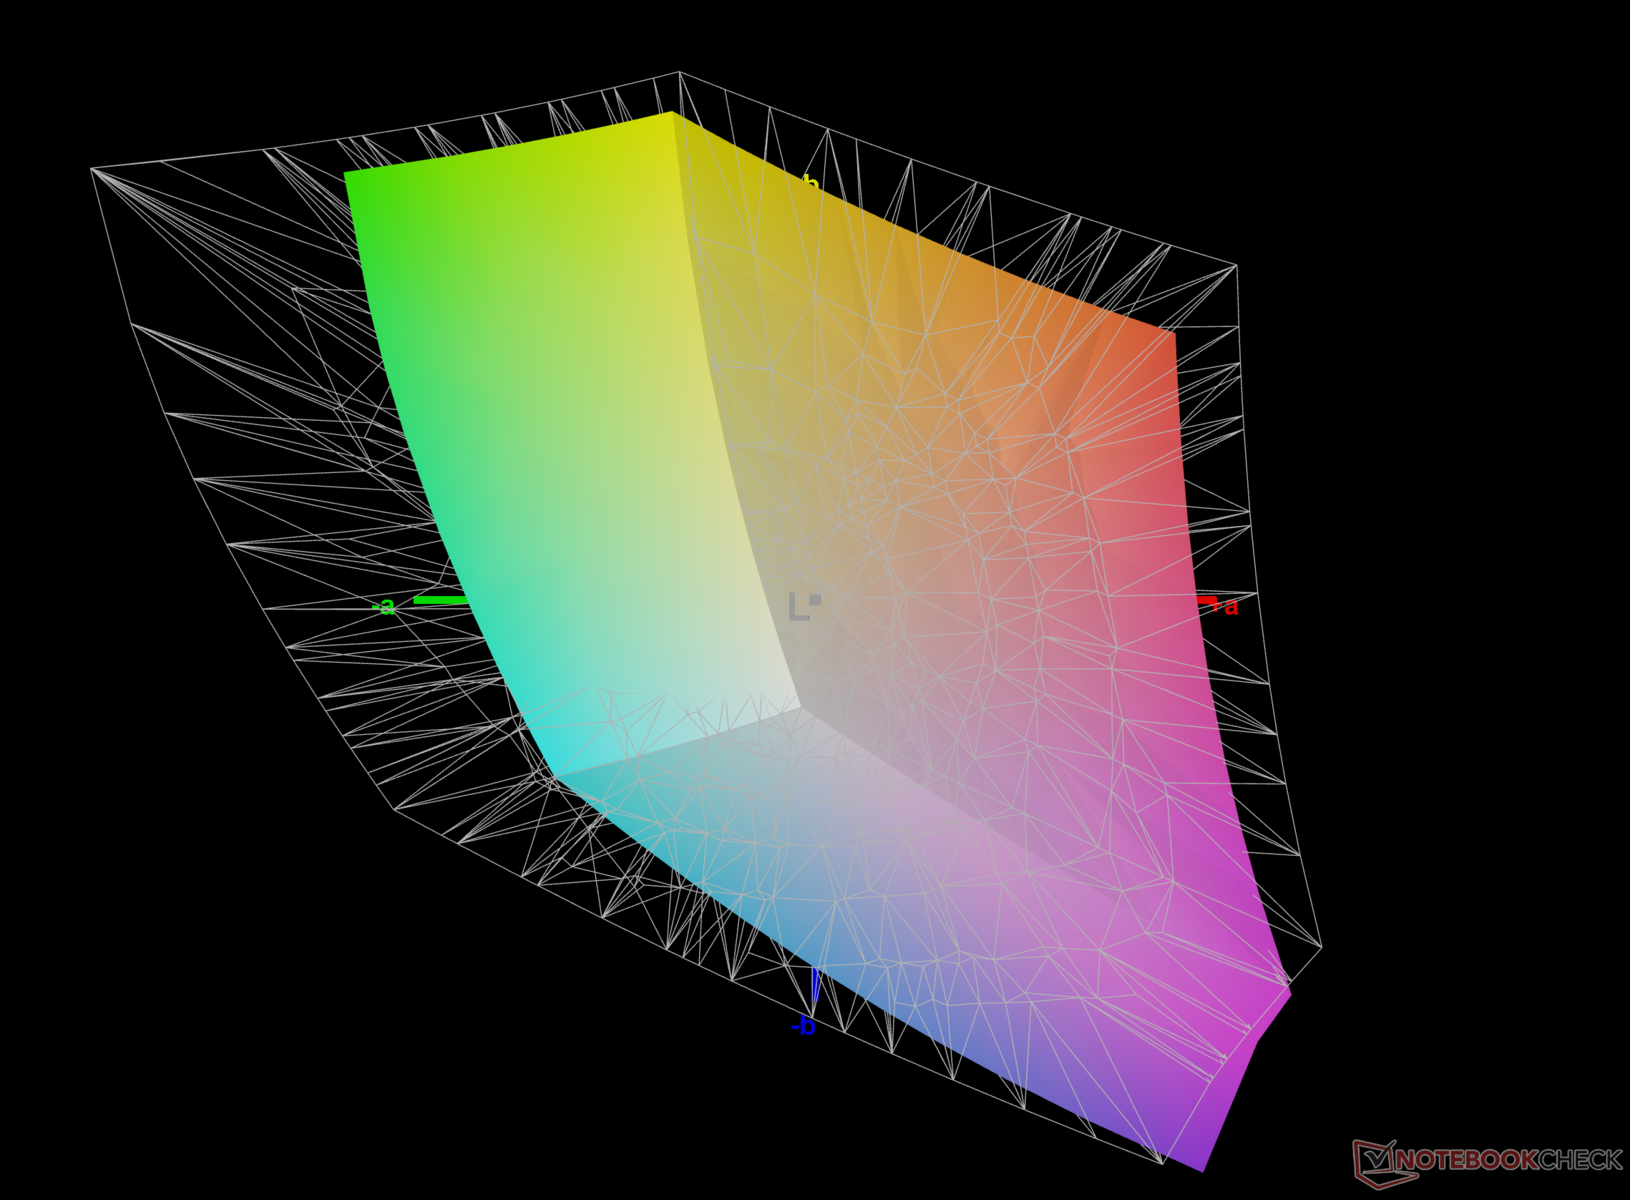
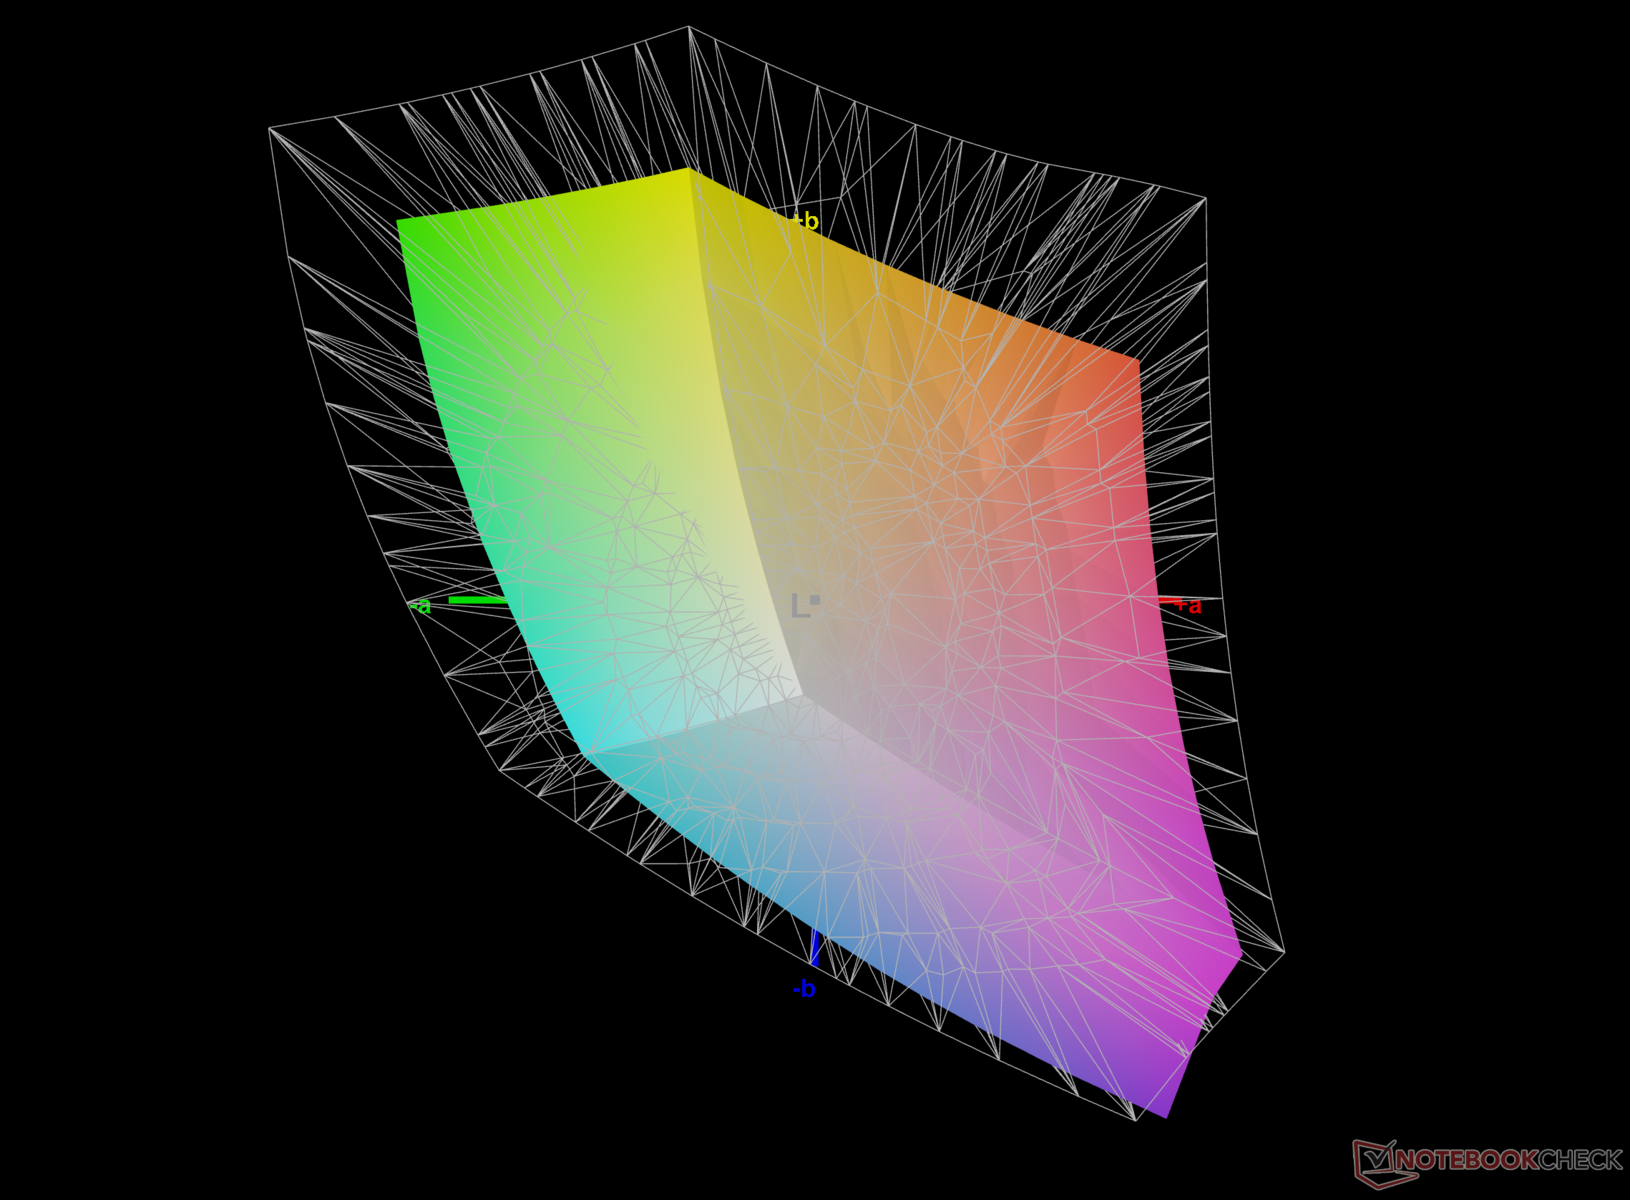
68.2% AdobeRGB 1998 (Argyll 3D)
97.4% sRGB (Argyll 3D)
66.9% Display P3 (Argyll 3D)
Gamma: 2.02
CCT: 7438 K
| Colorful EVOL X15 AT 23 BOE CQ NE156QHM-NY2, IPS, 2560x1440, 15.6" | Alienware m16 R1 Intel BOE NE16NYB, IPS, 2560x1600, 16" | HP Omen 16-wf000 BOE0B7D, IPS, 2560x1440, 16.1" | Acer Predator Helios 16 PH16-71-731Q BOE NE160QDM-NZ2, IPS-LED, 2560x1600, 16" | Dell G15 5530 AUO B156HAN, IPS, 1920x1080, 15.6" | Schenker XMG Pro 15 (E23) BOE0AD1, IPS, 2560x1440, 15.6" | Alienware m16 R1 AMD BOE NE16NZ4, IPS, 2560x1600, 16" | Uniwill GM6PX7X RTX 4070 BOE CQ NE160QDM-NZ1, IPS, 2560x1600, 16" | |
|---|---|---|---|---|---|---|---|---|
| Display | 1% | 3% | 24% | 6% | 25% | 27% | 0% | |
| Display P3 Coverage (%) | 66.9 | 67.7 1% | 69 3% | 97.1 45% | 73.1 9% | 97.8 46% | 98.6 47% | 67.5 1% |
| sRGB Coverage (%) | 97.4 | 97.2 0% | 99.2 2% | 100 3% | 98.4 1% | 99.9 3% | 99.9 3% | 96.4 -1% |
| AdobeRGB 1998 Coverage (%) | 68.2 | 70 3% | 71.2 4% | 84.7 24% | 74.4 9% | 85.4 25% | 88.9 30% | 68.6 1% |
| Response Times | 35% | 16% | -7% | 49% | -29% | 18% | -23% | |
| Response Time Grey 50% / Grey 80% * (ms) | 10.42 ? | 4 ? 62% | 4.6 ? 56% | 13.6 ? -31% | 3.39 ? 67% | 14 ? -34% | 5.1 ? 51% | 12.6 ? -21% |
| Response Time Black / White * (ms) | 7.81 ? | 7.3 ? 7% | 9.7 ? -24% | 6.4 ? 18% | 5.35 ? 31% | 9.6 ? -23% | 9 ? -15% | 9.8 ? -25% |
| PWM Frequency (Hz) | 21620 ? | |||||||
| Screen | 24% | 28% | 42% | 7% | 12% | 0% | 22% | |
| Brightness middle (cd/m²) | 346 | 306 -12% | 310.9 -10% | 511 48% | 320 -8% | 322 -7% | 329 -5% | 338.6 -2% |
| Brightness (cd/m²) | 318 | 302 -5% | 296 -7% | 498 57% | 316 -1% | 301 -5% | 317 0% | 328 3% |
| Brightness Distribution (%) | 81 | 89 10% | 91 12% | 94 16% | 94 16% | 85 5% | 89 10% | 89 10% |
| Black Level * (cd/m²) | 0.57 | 0.3 47% | 0.35 39% | 0.36 37% | 0.21 63% | 0.36 37% | 0.32 44% | 0.32 44% |
| Contrast (:1) | 607 | 1020 68% | 888 46% | 1419 134% | 1524 151% | 894 47% | 1028 69% | 1058 74% |
| Colorchecker dE 2000 * | 3.08 | 2.57 17% | 2.18 29% | 1.76 43% | 4.55 -48% | 1.98 36% | 3.71 -20% | 2.18 29% |
| Colorchecker dE 2000 max. * | 7.62 | 4.26 44% | 3.58 53% | 3.7 51% | 9.83 -29% | 5.24 31% | 7.23 5% | 7.14 6% |
| Colorchecker dE 2000 calibrated * | 1.12 | 0.85 24% | 0.52 54% | 1.56 -39% | 1.51 -35% | 1.98 -77% | 2.82 -152% | 0.93 17% |
| Greyscale dE 2000 * | 4.3 | 3.3 23% | 2.8 35% | 3 30% | 6.2 -44% | 2.44 43% | 2.2 49% | 3.7 14% |
| Gamma | 2.02 109% | 1.997 110% | 2.18 101% | 2.33 94% | 2.07 106% | 2.42 91% | 2.3 96% | 2.18 101% |
| CCT | 7438 87% | 6895 94% | 6002 108% | 6341 103% | 6479 100% | 6984 93% | 6270 104% | 7245 90% |
| Média Total (Programa/Configurações) | 20% /
21% | 16% /
21% | 20% /
31% | 21% /
13% | 3% /
9% | 15% /
8% | -0% /
11% |
* ... menor é melhor
O EVOL X15 não se destina a criadores de conteúdo, mas a cobertura sRGB de 97% é um bom augúrio para jogos, web e edições básicas. Os criadores que desejarem usar o hardware capaz do EVOL X15 podem usar um monitor externo para aumentar o desempenho das cores.
A reprodução de cores da tela pronta para uso é útil em sua maior parte, com valores médios de escala de cinza e ColorChecker Delta E 2000 de 4,3 e 3,08, respectivamente.
Nossa rotina de calibração, usando o espectrofotômetro X-Rite i1Basic Pro 3 e o software Calman Ultimate da Portrait Display, melhora consideravelmente esses valores correspondentes para 1 e 1,12.
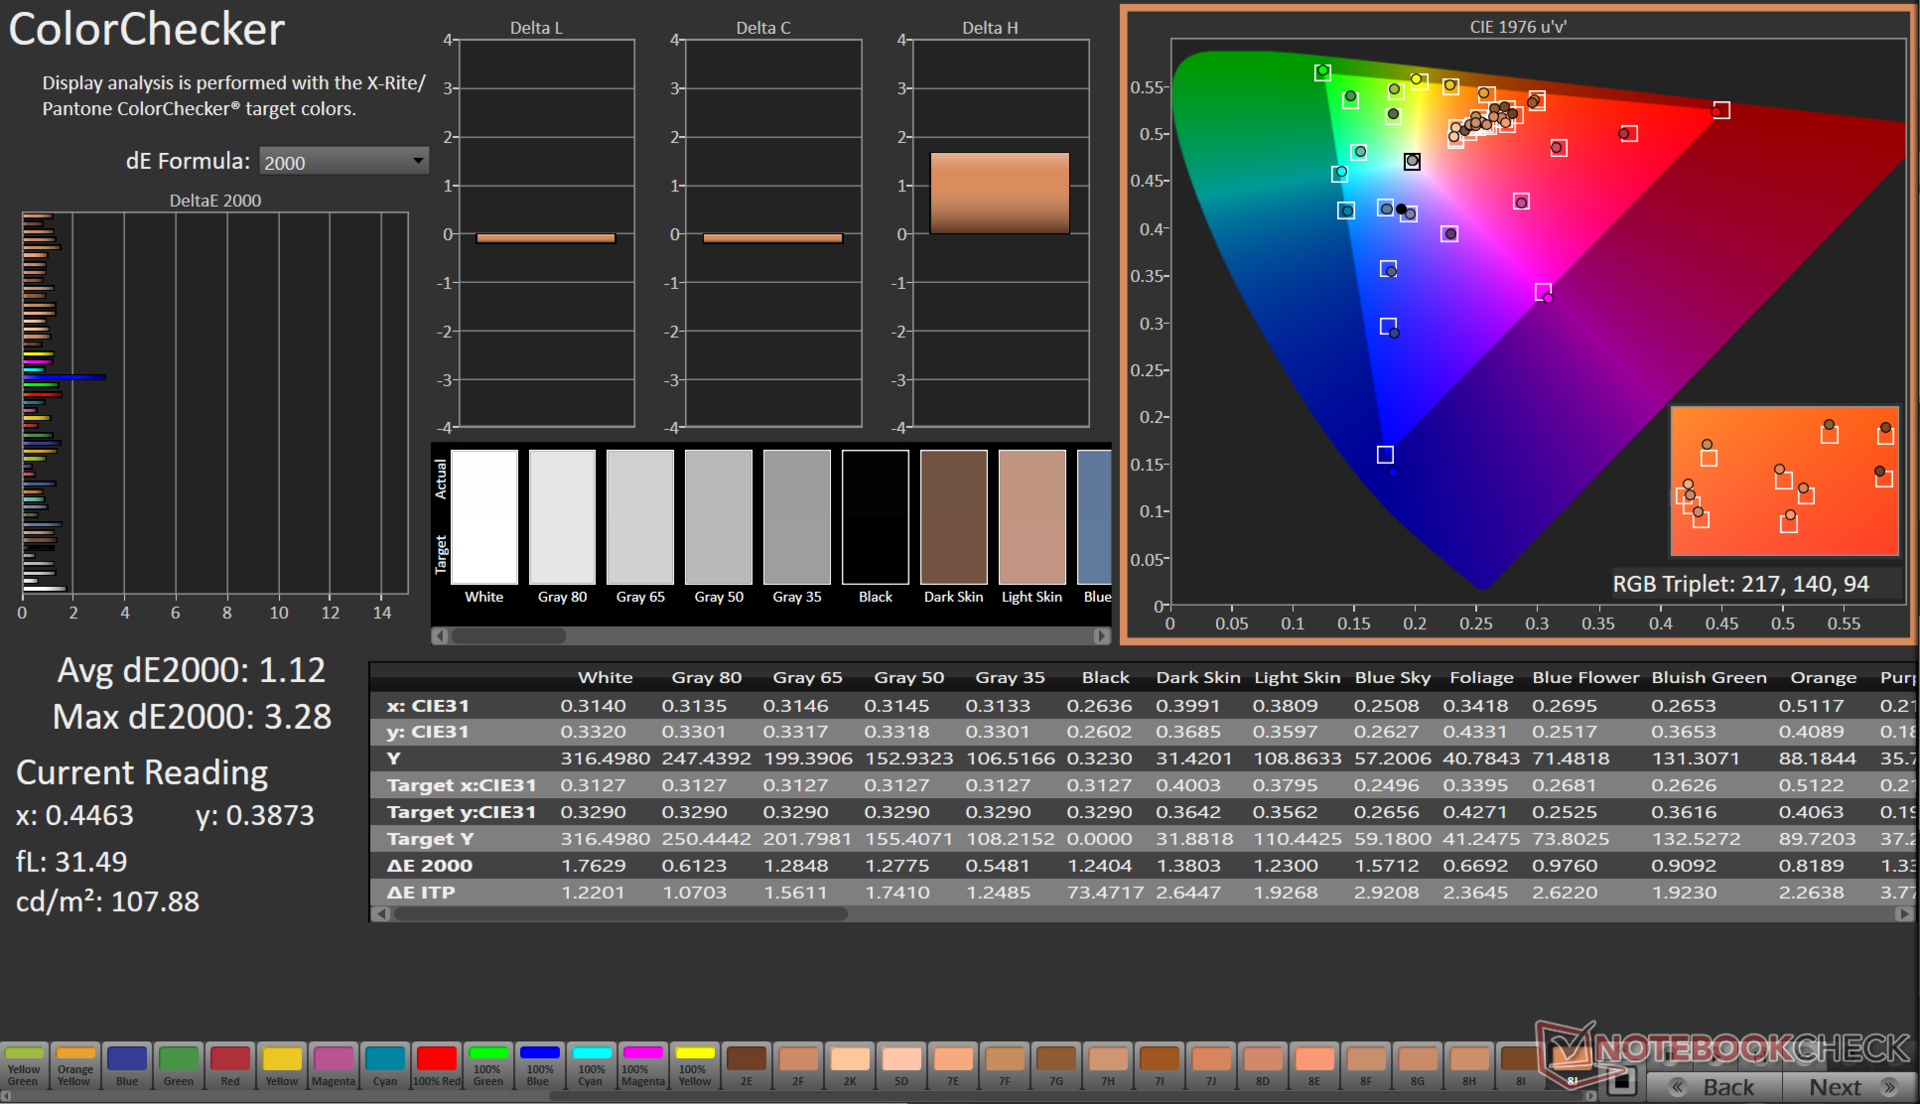
O arquivo ICC calibrado pode ser baixado no link acima.
Exibir tempos de resposta
| ↔ Tempo de resposta preto para branco | ||
|---|---|---|
| 7.81 ms ... ascensão ↗ e queda ↘ combinadas | ↗ 4.01 ms ascensão | 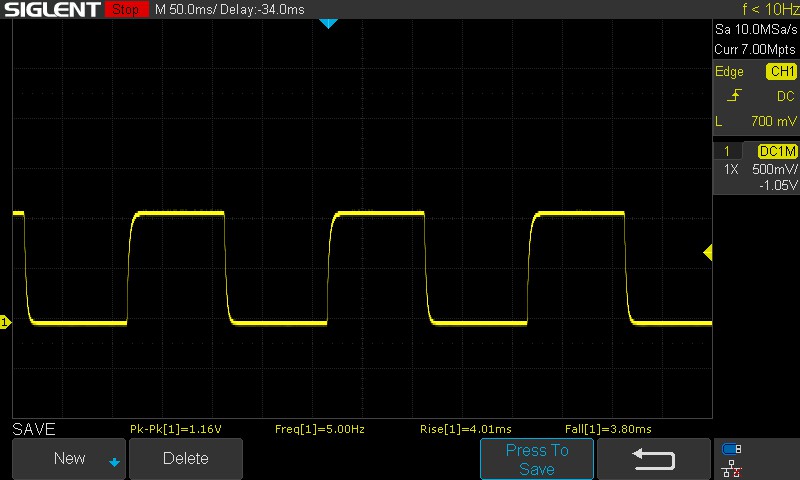 |
| ↘ 3.8 ms queda | ||
| A tela mostra taxas de resposta muito rápidas em nossos testes e deve ser muito adequada para jogos em ritmo acelerado. Em comparação, todos os dispositivos testados variam de 0.1 (mínimo) a 240 (máximo) ms. » 22 % de todos os dispositivos são melhores. Isso significa que o tempo de resposta medido é melhor que a média de todos os dispositivos testados (19.8 ms). | ||
| ↔ Tempo de resposta 50% cinza a 80% cinza | ||
| 10.42 ms ... ascensão ↗ e queda ↘ combinadas | ↗ 4.73 ms ascensão | 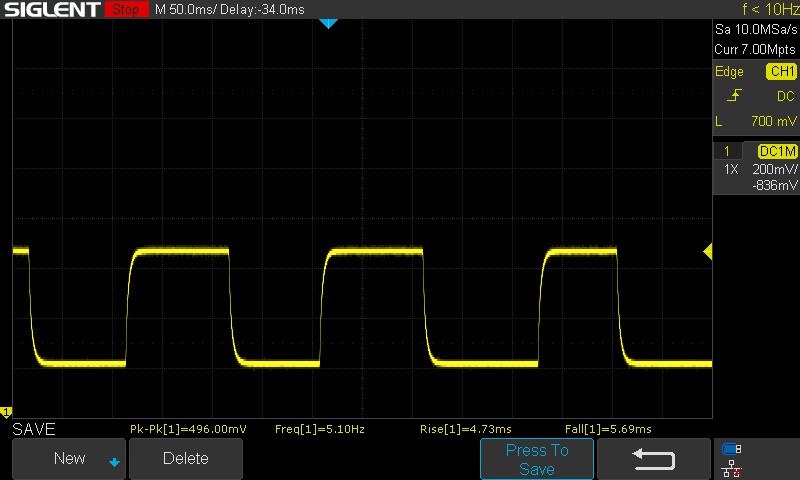 |
| ↘ 5.69 ms queda | ||
| A tela mostra boas taxas de resposta em nossos testes, mas pode ser muito lenta para jogadores competitivos. Em comparação, todos os dispositivos testados variam de 0.165 (mínimo) a 636 (máximo) ms. » 24 % de todos os dispositivos são melhores. Isso significa que o tempo de resposta medido é melhor que a média de todos os dispositivos testados (30.9 ms). | ||
Os tempos de resposta são decentes para a maioria das necessidades de jogos. O painel do EVOL X15 AT não usa overdrive e não há opção para ativá-lo, o que teria ajudado a reduzir ainda mais os tempos de transição de 50% de cinza para 80% de cinza.
Cintilação da tela / PWM (modulação por largura de pulso)
| Tela tremeluzindo / PWM não detectado | ≤ 100 % configuração de brilho | 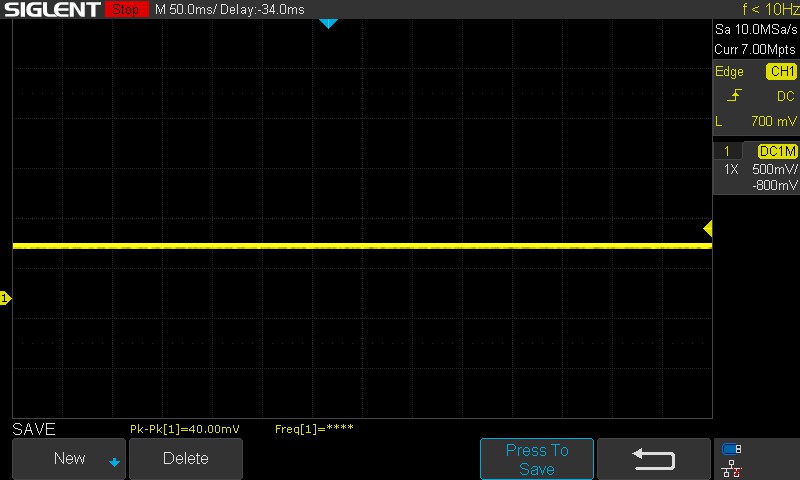 | |
[pwm_comparison] Em comparação: 52 % de todos os dispositivos testados não usam PWM para escurecer a tela. Se PWM foi detectado, uma média de 7744 (mínimo: 5 - máximo: 343500) Hz foi medida. | |||
Não detectamos PWM ou cintilação em nenhum dos níveis de brilho testados.
Para obter mais informações, consulte nosso artigo, "Por que o PWM é uma dor de cabeça", e também nossa Tabela de classificação de PWM.
A visualização em ambientes externos é boa, mas o brilho da tela pode não ser adequado para uso sob luz solar direta e intensa. Os ângulos de visão são relativamente estáveis, com apenas uma pequena perda de brilho nos extremos.

Desempenho: Core i7-13700HX e RTX 4060 são um bom presságio para jogos AAA de médio porte
O Colorful EVOL X15 AT está disponível com Intel Core i5-13500HX e Core i7-13700HX, com as opções de GPU correspondentes sendo a GPU para laptop Nvidia GeForce RTX 4050 e a GPU para laptop RTX 4060.
Condições de teste
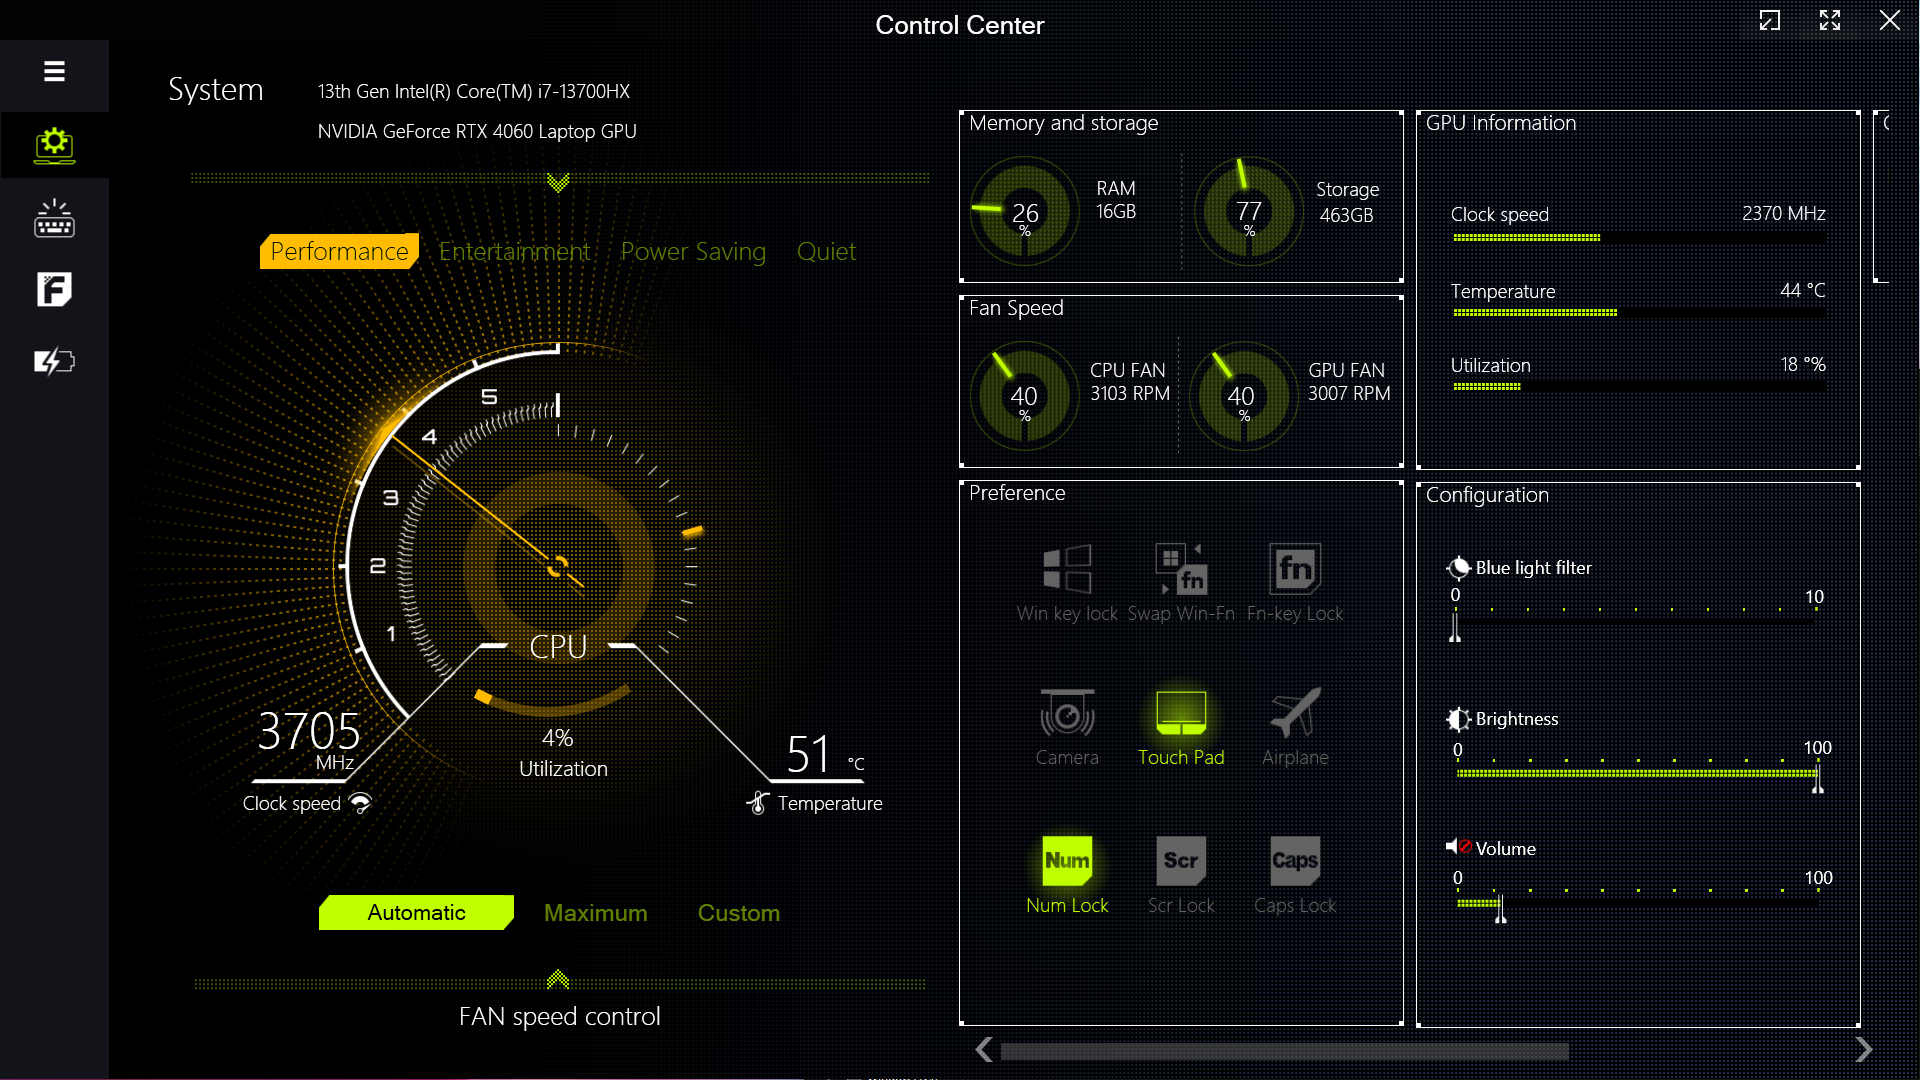
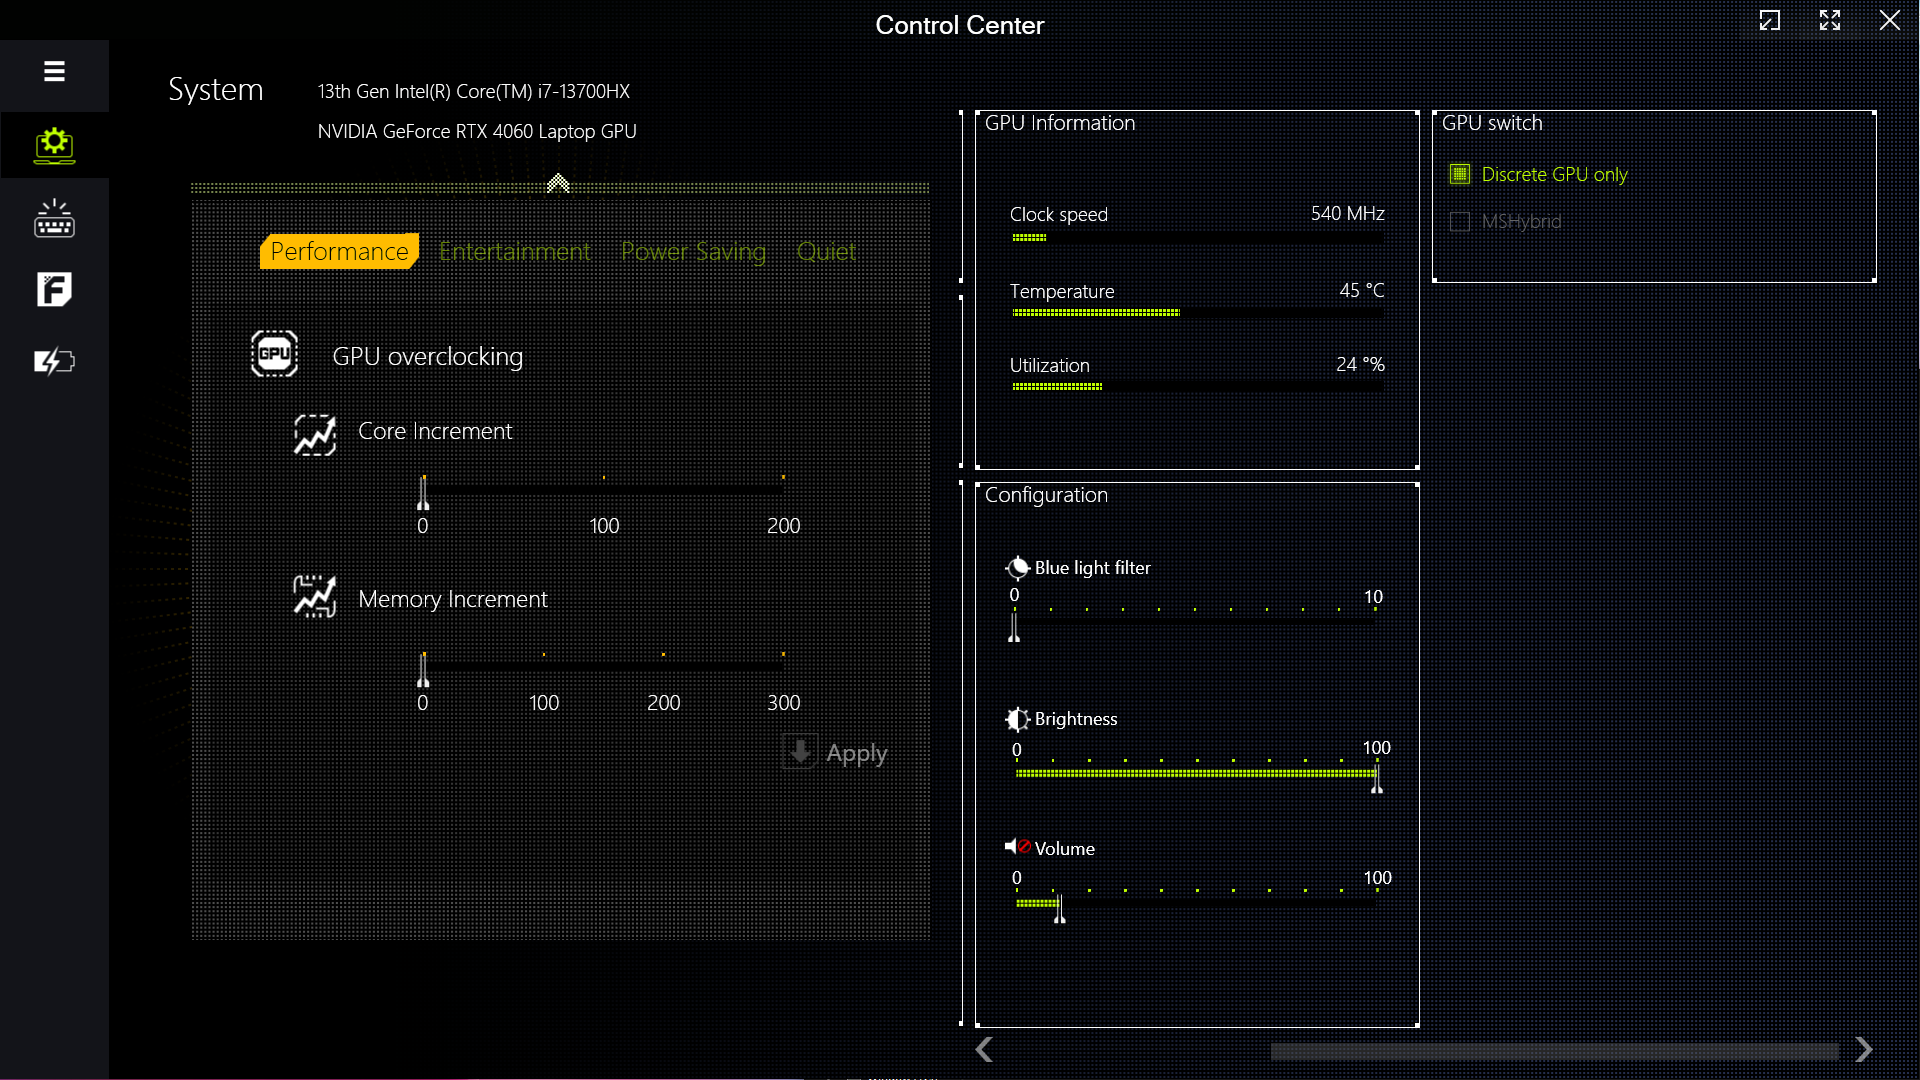
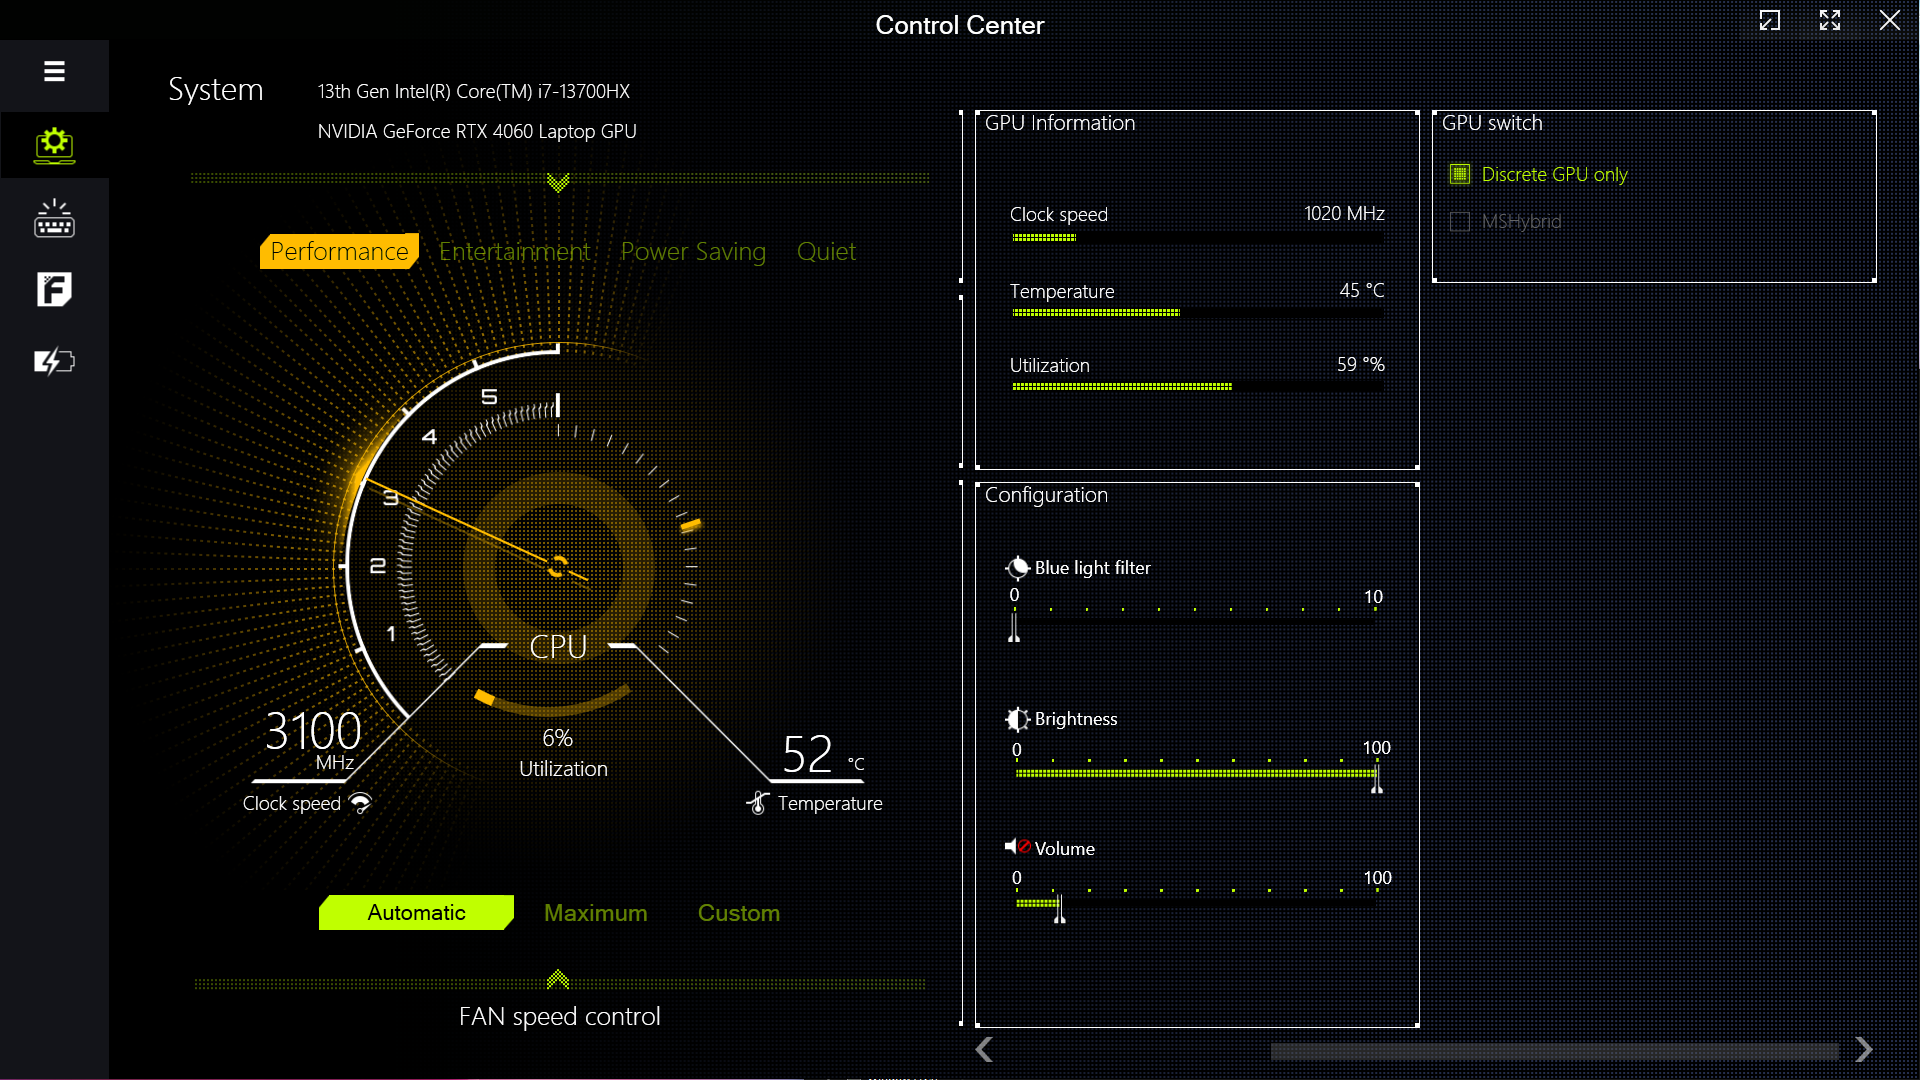
O Colorful oferece o aplicativo Control Center da Clevo para ajuste de desempenho e de vários efeitos RGB. No total, são oferecidos quatro modos de desempenho.
Todos os benchmarks foram realizados no modo Desempenho, que permite que o Core i7-13700HX exercite totalmente seus músculos. O modo Discrete GPU foi usado para testes de gráficos e jogos.
Os testes de bateria foram realizados no perfil Silencioso com o MSHybrid ativado.
O Colorful limita o PL2 a 30 W nos modos Silencioso e Economia de energia, o que representa uma redução significativa de energia em comparação com os outros modos. Isso se reflete na queda drástica das pontuações do Cinebench R15, conforme ilustrado na tabela abaixo.
| Modo de desempenho | PL1 (PBP) / Tau | PL2 (MTP) / Tau | Cinebench R15 Multi score | Cinebench R15 Multi score (30 loops) |
|---|---|---|---|---|
| Silencioso | 15 W / 8 s | 30 W / 2,44 ms | 567 (-83%) | 542 (-82,28%) |
| Economia de energia | 45 W / 8 s | 30 W / 2.44 ms | 557 (-84%) | 548 (-82.08%) |
| Entretenimento | 65 W / 56 s | 130 W / 2,44 ms | 2814 (-19,18%) | 2168 (-29,12%) |
| Desempenho | 135 W / 96 s | 162 W / 2.44 ms | 3482 (100%) | 3059 (100%) |
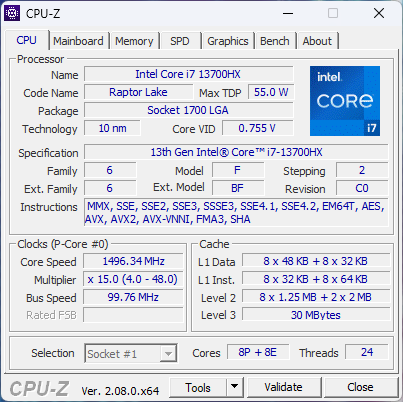
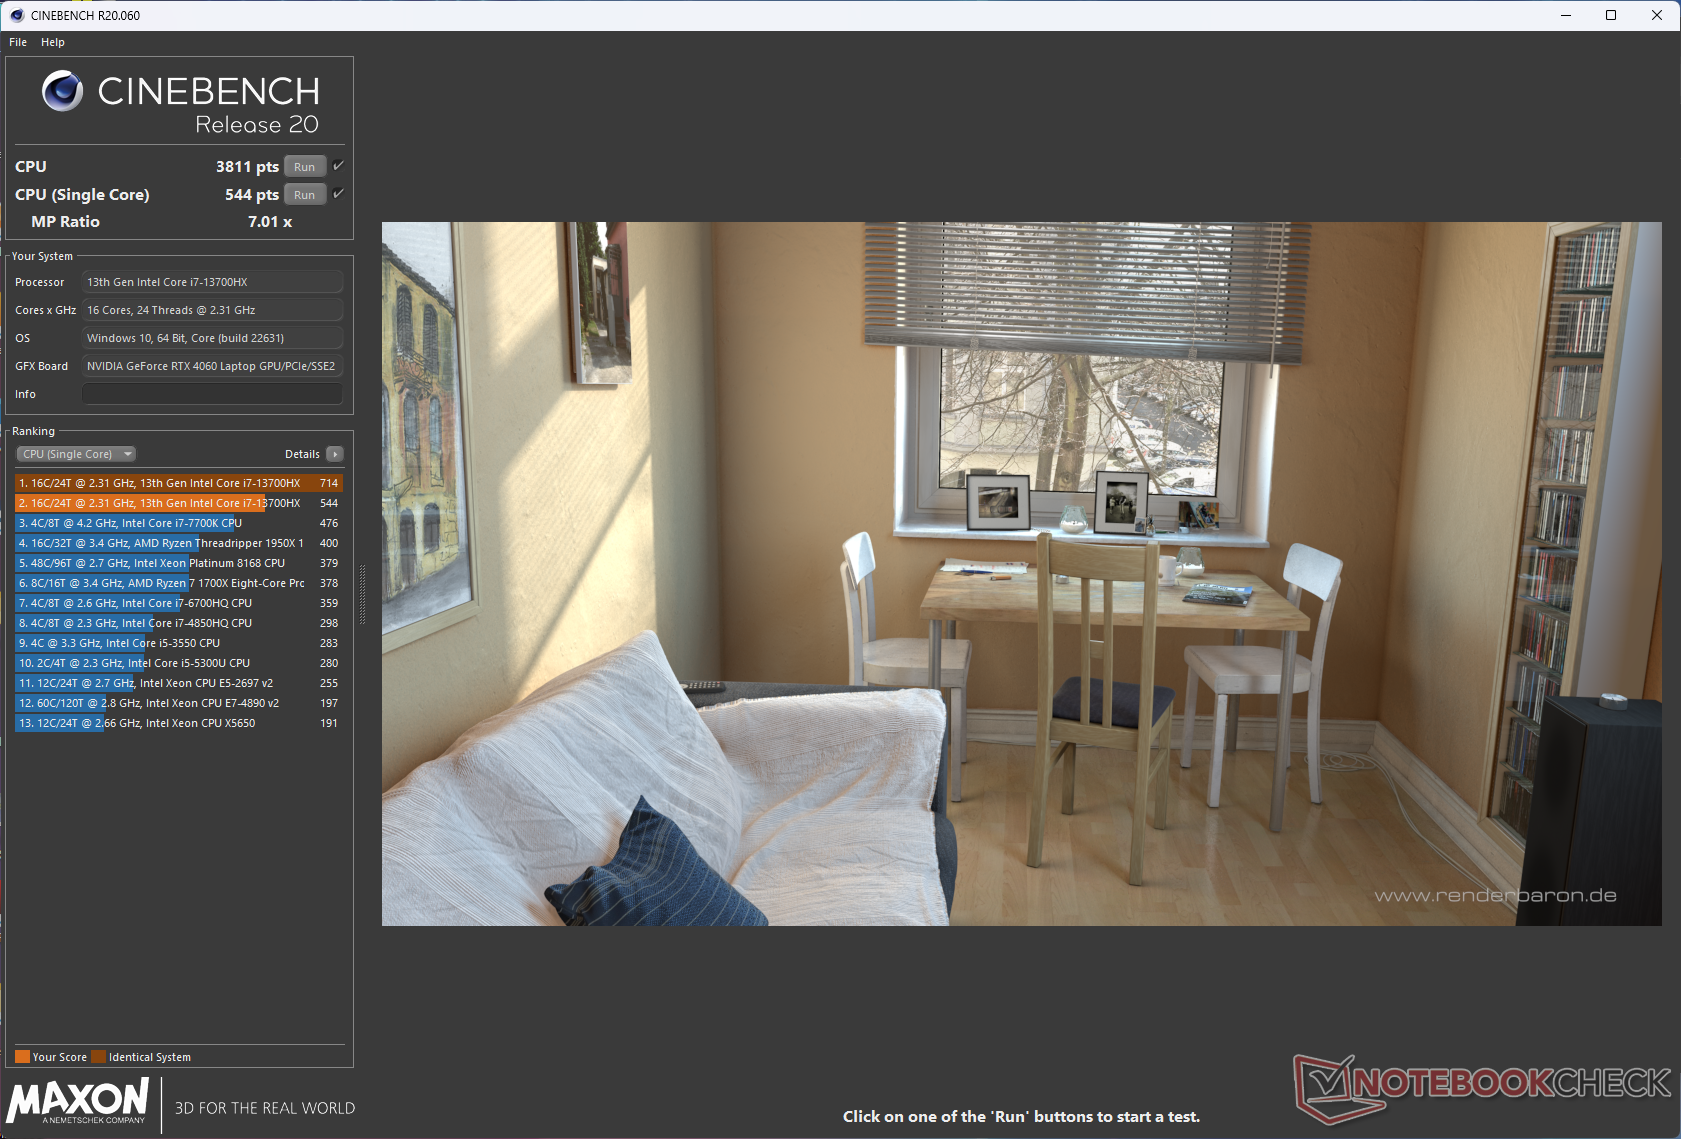
Processador
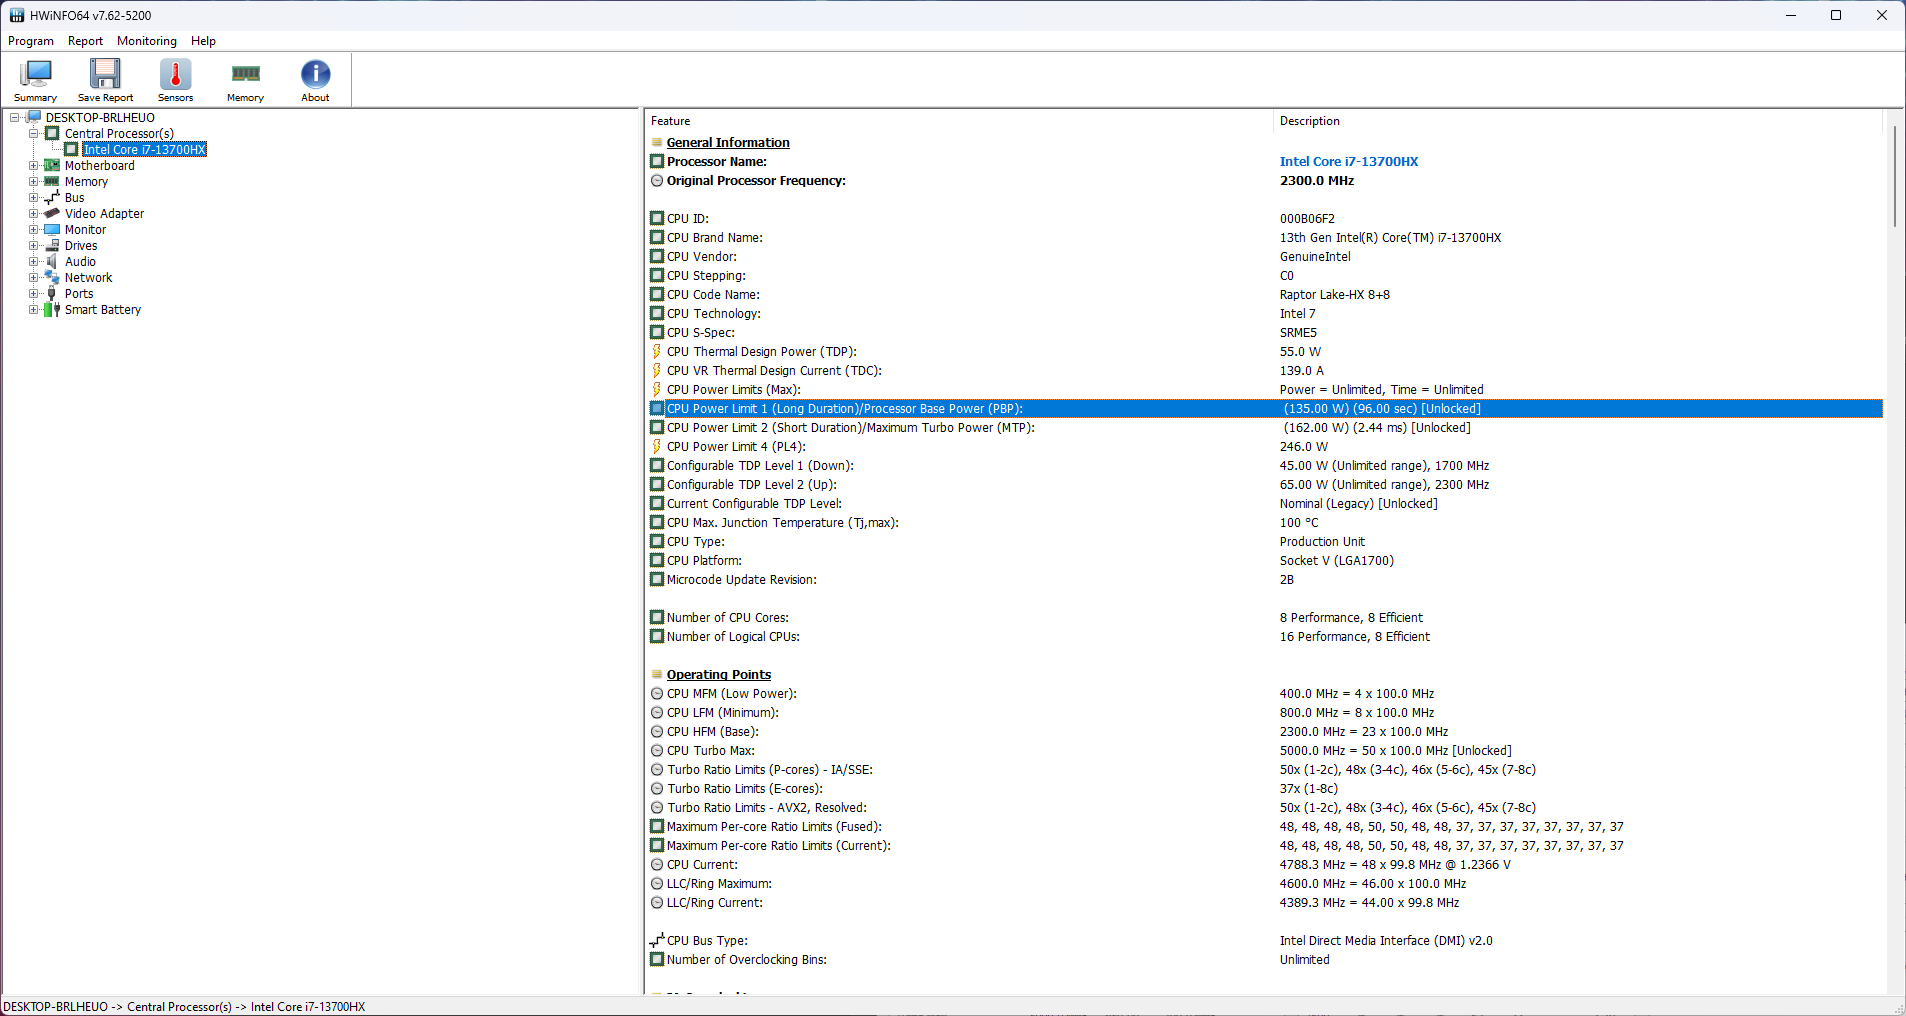
O Core i7-13700HX possui 16 núcleos e 24 threads com um clock de aumento de até 5 GHz. Essa CPU no EVOL X15 AT geralmente tem um desempenho equivalente ao de sua contraparte no Alienware m16 R1 e em outros laptops em geral. No entanto, ela fica significativamente atrás da CPU de 12 núcleos e 24 threads AMD Ryzen 9 7845HX de 12 núcleos e 24 threads nos testes de vários núcleos.
Embora classificado com 162 W, o Core i7-13700HX pode utilizar até 145 W no modo Desempenho. No entanto, isso oferece apenas uma vantagem mínima no desempenho de núcleo único em relação ao PL2 de 115 W do HP Omen 16.
Além da diminuição gradual inicial das pontuações, não há percepção de estrangulamento durante o teste de loop de vários núcleos do Cinebench R15.
Cinebench R15 Multi Loop
Cinebench R23: Multi Core | Single Core
Cinebench R20: CPU (Multi Core) | CPU (Single Core)
Cinebench R15: CPU Multi 64Bit | CPU Single 64Bit
Blender: v2.79 BMW27 CPU
7-Zip 18.03: 7z b 4 | 7z b 4 -mmt1
Geekbench 5.5: Multi-Core | Single-Core
HWBOT x265 Benchmark v2.2: 4k Preset
LibreOffice : 20 Documents To PDF
R Benchmark 2.5: Overall mean
| CPU Performance rating | |
| Alienware m16 R1 AMD | |
| Média da turma Gaming | |
| Schenker XMG Pro 15 (E23) | |
| Acer Predator Helios 16 PH16-71-731Q | |
| HP Omen 16-wf000 -1! | |
| Uniwill GM6PX7X RTX 4070 | |
| Alienware m16 R1 Intel | |
| Dell G15 5530 | |
| Colorful EVOL X15 AT 23 | |
| Média Intel Core i7-13700HX | |
| Cinebench R23 / Multi Core | |
| Alienware m16 R1 AMD | |
| Média da turma Gaming (10488 - 42661, n=104, últimos 2 anos) | |
| Schenker XMG Pro 15 (E23) | |
| Acer Predator Helios 16 PH16-71-731Q | |
| Colorful EVOL X15 AT 23 | |
| Alienware m16 R1 Intel | |
| Uniwill GM6PX7X RTX 4070 | |
| Dell G15 5530 | |
| Média Intel Core i7-13700HX (15558 - 22598, n=11) | |
| HP Omen 16-wf000 | |
| Cinebench R23 / Single Core | |
| Média da turma Gaming (1601 - 2415, n=104, últimos 2 anos) | |
| Alienware m16 R1 Intel | |
| Colorful EVOL X15 AT 23 | |
| Acer Predator Helios 16 PH16-71-731Q | |
| Schenker XMG Pro 15 (E23) | |
| HP Omen 16-wf000 | |
| Alienware m16 R1 AMD | |
| Dell G15 5530 | |
| Média Intel Core i7-13700HX (1666 - 1933, n=11) | |
| Uniwill GM6PX7X RTX 4070 | |
| Cinebench R20 / CPU (Multi Core) | |
| Alienware m16 R1 AMD | |
| Média da turma Gaming (4029 - 16433, n=103, últimos 2 anos) | |
| Schenker XMG Pro 15 (E23) | |
| Acer Predator Helios 16 PH16-71-731Q | |
| Colorful EVOL X15 AT 23 | |
| Uniwill GM6PX7X RTX 4070 | |
| Alienware m16 R1 Intel | |
| Dell G15 5530 | |
| Média Intel Core i7-13700HX (6160 - 8610, n=11) | |
| HP Omen 16-wf000 | |
| Cinebench R20 / CPU (Single Core) | |
| Média da turma Gaming (622 - 913, n=103, últimos 2 anos) | |
| Colorful EVOL X15 AT 23 | |
| Alienware m16 R1 Intel | |
| Acer Predator Helios 16 PH16-71-731Q | |
| Schenker XMG Pro 15 (E23) | |
| HP Omen 16-wf000 | |
| Alienware m16 R1 AMD | |
| Dell G15 5530 | |
| Uniwill GM6PX7X RTX 4070 | |
| Média Intel Core i7-13700HX (644 - 740, n=11) | |
| Cinebench R15 / CPU Multi 64Bit | |
| Alienware m16 R1 AMD | |
| Média da turma Gaming (1578 - 6330, n=102, últimos 2 anos) | |
| Schenker XMG Pro 15 (E23) | |
| Colorful EVOL X15 AT 23 | |
| Acer Predator Helios 16 PH16-71-731Q | |
| Acer Predator Helios 16 PH16-71-731Q | |
| Uniwill GM6PX7X RTX 4070 | |
| Média Intel Core i7-13700HX (2548 - 3482, n=12) | |
| Alienware m16 R1 Intel | |
| Dell G15 5530 | |
| HP Omen 16-wf000 | |
| Cinebench R15 / CPU Single 64Bit | |
| Média da turma Gaming (188.8 - 350, n=103, últimos 2 anos) | |
| Alienware m16 R1 AMD | |
| Alienware m16 R1 Intel | |
| Colorful EVOL X15 AT 23 | |
| Dell G15 5530 | |
| Acer Predator Helios 16 PH16-71-731Q | |
| Média Intel Core i7-13700HX (243 - 279, n=11) | |
| HP Omen 16-wf000 | |
| Uniwill GM6PX7X RTX 4070 | |
| Schenker XMG Pro 15 (E23) | |
| Blender / v2.79 BMW27 CPU | |
| Média Intel Core i7-13700HX (138 - 207, n=10) | |
| Dell G15 5530 | |
| Acer Predator Helios 16 PH16-71-731Q | |
| Alienware m16 R1 Intel | |
| Colorful EVOL X15 AT 23 | |
| Uniwill GM6PX7X RTX 4070 | |
| Schenker XMG Pro 15 (E23) | |
| Média da turma Gaming (79 - 330, n=101, últimos 2 anos) | |
| Alienware m16 R1 AMD | |
| 7-Zip 18.03 / 7z b 4 | |
| Alienware m16 R1 AMD | |
| Média da turma Gaming (33491 - 148086, n=102, últimos 2 anos) | |
| Schenker XMG Pro 15 (E23) | |
| Uniwill GM6PX7X RTX 4070 | |
| Alienware m16 R1 Intel | |
| Acer Predator Helios 16 PH16-71-731Q | |
| HP Omen 16-wf000 | |
| Dell G15 5530 | |
| Média Intel Core i7-13700HX (58912 - 89294, n=11) | |
| Colorful EVOL X15 AT 23 | |
| 7-Zip 18.03 / 7z b 4 -mmt1 | |
| Alienware m16 R1 AMD | |
| Média da turma Gaming (4824 - 7436, n=102, últimos 2 anos) | |
| Alienware m16 R1 Intel | |
| Colorful EVOL X15 AT 23 | |
| Schenker XMG Pro 15 (E23) | |
| Acer Predator Helios 16 PH16-71-731Q | |
| Média Intel Core i7-13700HX (5552 - 6409, n=11) | |
| Uniwill GM6PX7X RTX 4070 | |
| HP Omen 16-wf000 | |
| Dell G15 5530 | |
| Geekbench 5.5 / Multi-Core | |
| Schenker XMG Pro 15 (E23) | |
| Média da turma Gaming (6460 - 28263, n=102, últimos 2 anos) | |
| Acer Predator Helios 16 PH16-71-731Q | |
| Uniwill GM6PX7X RTX 4070 | |
| Alienware m16 R1 AMD | |
| HP Omen 16-wf000 | |
| Alienware m16 R1 Intel | |
| Dell G15 5530 | |
| Média Intel Core i7-13700HX (10156 - 15850, n=12) | |
| Colorful EVOL X15 AT 23 | |
| Geekbench 5.5 / Single-Core | |
| Média da turma Gaming (1403 - 2474, n=102, últimos 2 anos) | |
| Alienware m16 R1 AMD | |
| Acer Predator Helios 16 PH16-71-731Q | |
| HP Omen 16-wf000 | |
| Dell G15 5530 | |
| Alienware m16 R1 Intel | |
| Colorful EVOL X15 AT 23 | |
| Uniwill GM6PX7X RTX 4070 | |
| Schenker XMG Pro 15 (E23) | |
| Média Intel Core i7-13700HX (1666 - 1899, n=12) | |
| HWBOT x265 Benchmark v2.2 / 4k Preset | |
| Alienware m16 R1 AMD | |
| Média da turma Gaming (11.5 - 44.4, n=102, últimos 2 anos) | |
| Uniwill GM6PX7X RTX 4070 | |
| Acer Predator Helios 16 PH16-71-731Q | |
| Schenker XMG Pro 15 (E23) | |
| Dell G15 5530 | |
| Alienware m16 R1 Intel | |
| Média Intel Core i7-13700HX (17.1 - 25.5, n=11) | |
| Colorful EVOL X15 AT 23 | |
| HP Omen 16-wf000 | |
| LibreOffice / 20 Documents To PDF | |
| Colorful EVOL X15 AT 23 | |
| Schenker XMG Pro 15 (E23) | |
| Média da turma Gaming (33.2 - 88.8, n=102, últimos 2 anos) | |
| Dell G15 5530 | |
| HP Omen 16-wf000 | |
| Alienware m16 R1 Intel | |
| Média Intel Core i7-13700HX (36.5 - 52.9, n=11) | |
| Alienware m16 R1 AMD | |
| Uniwill GM6PX7X RTX 4070 | |
| Acer Predator Helios 16 PH16-71-731Q | |
| R Benchmark 2.5 / Overall mean | |
| Uniwill GM6PX7X RTX 4070 | |
| Média Intel Core i7-13700HX (0.4274 - 0.513, n=11) | |
| Schenker XMG Pro 15 (E23) | |
| HP Omen 16-wf000 | |
| Colorful EVOL X15 AT 23 | |
| Alienware m16 R1 Intel | |
| Acer Predator Helios 16 PH16-71-731Q | |
| Dell G15 5530 | |
| Alienware m16 R1 AMD | |
| Média da turma Gaming (0.3439 - 0.59, n=102, últimos 2 anos) | |
* ... menor é melhor
O Core i7-13700HX do EVOL X15 pode usar um máximo de 145 W com aumentos de até 4,2 GHz durante a execução do loop de vários núcleos do Cinebench R15 no modo Desempenho. No modo Entretenimento, o Core i7-13700HX ainda consegue atingir 4,2 GHz a 113 W, mas a potência média cai para apenas 21 W durante a execução.
No modo Silencioso, o EVOL X15 atinge o pico de 4 GHz e consome apenas 30 W. No entanto, os clocks médios caem para pouco menos de 1 GHz e consomem 15 W.
As pontuações do Cinebench R20 na bateria caem 26,5% e 54% em single-core e multi-core, respectivamente.
AIDA64: FP32 Ray-Trace | FPU Julia | CPU SHA3 | CPU Queen | FPU SinJulia | FPU Mandel | CPU AES | CPU ZLib | FP64 Ray-Trace | CPU PhotoWorxx
| Performance rating | |
| Alienware m16 R1 AMD | |
| Média da turma Gaming | |
| Uniwill GM6PX7X RTX 4070 | |
| Alienware m16 R1 Intel | |
| Acer Predator Helios 16 PH16-71-731Q | |
| Schenker XMG Pro 15 (E23) | |
| Média Intel Core i7-13700HX | |
| HP Omen 16-wf000 | |
| Colorful EVOL X15 AT 23 | |
| Dell G15 5530 | |
| AIDA64 / FP32 Ray-Trace | |
| Alienware m16 R1 AMD | |
| Média da turma Gaming (10227 - 85542, n=102, últimos 2 anos) | |
| Uniwill GM6PX7X RTX 4070 | |
| Alienware m16 R1 Intel | |
| Acer Predator Helios 16 PH16-71-731Q | |
| Colorful EVOL X15 AT 23 | |
| Média Intel Core i7-13700HX (14261 - 21999, n=11) | |
| HP Omen 16-wf000 | |
| Dell G15 5530 | |
| Schenker XMG Pro 15 (E23) | |
| AIDA64 / FPU Julia | |
| Alienware m16 R1 AMD | |
| Média da turma Gaming (51376 - 372155, n=102, últimos 2 anos) | |
| Uniwill GM6PX7X RTX 4070 | |
| Alienware m16 R1 Intel | |
| Colorful EVOL X15 AT 23 | |
| Acer Predator Helios 16 PH16-71-731Q | |
| HP Omen 16-wf000 | |
| Média Intel Core i7-13700HX (74636 - 109364, n=11) | |
| Schenker XMG Pro 15 (E23) | |
| Dell G15 5530 | |
| AIDA64 / CPU SHA3 | |
| Alienware m16 R1 AMD | |
| Média da turma Gaming (2180 - 10115, n=102, últimos 2 anos) | |
| Uniwill GM6PX7X RTX 4070 | |
| Alienware m16 R1 Intel | |
| Schenker XMG Pro 15 (E23) | |
| Colorful EVOL X15 AT 23 | |
| Acer Predator Helios 16 PH16-71-731Q | |
| Dell G15 5530 | |
| Média Intel Core i7-13700HX (3359 - 5053, n=11) | |
| HP Omen 16-wf000 | |
| AIDA64 / CPU Queen | |
| Alienware m16 R1 AMD | |
| Schenker XMG Pro 15 (E23) | |
| Média da turma Gaming (49785 - 173351, n=86, últimos 2 anos) | |
| Alienware m16 R1 Intel | |
| Acer Predator Helios 16 PH16-71-731Q | |
| Colorful EVOL X15 AT 23 | |
| Uniwill GM6PX7X RTX 4070 | |
| Média Intel Core i7-13700HX (86532 - 114717, n=11) | |
| Dell G15 5530 | |
| HP Omen 16-wf000 | |
| AIDA64 / FPU SinJulia | |
| Alienware m16 R1 AMD | |
| Média da turma Gaming (4424 - 33636, n=102, últimos 2 anos) | |
| Alienware m16 R1 Intel | |
| Uniwill GM6PX7X RTX 4070 | |
| Acer Predator Helios 16 PH16-71-731Q | |
| Colorful EVOL X15 AT 23 | |
| Schenker XMG Pro 15 (E23) | |
| Média Intel Core i7-13700HX (9290 - 13519, n=11) | |
| HP Omen 16-wf000 | |
| Dell G15 5530 | |
| AIDA64 / FPU Mandel | |
| Alienware m16 R1 AMD | |
| Média da turma Gaming (25115 - 196829, n=102, últimos 2 anos) | |
| Uniwill GM6PX7X RTX 4070 | |
| Alienware m16 R1 Intel | |
| Acer Predator Helios 16 PH16-71-731Q | |
| Colorful EVOL X15 AT 23 | |
| HP Omen 16-wf000 | |
| Média Intel Core i7-13700HX (35751 - 53484, n=11) | |
| Schenker XMG Pro 15 (E23) | |
| Dell G15 5530 | |
| AIDA64 / CPU AES | |
| Uniwill GM6PX7X RTX 4070 | |
| Alienware m16 R1 Intel | |
| Acer Predator Helios 16 PH16-71-731Q | |
| Média Intel Core i7-13700HX (67846 - 182575, n=11) | |
| Média da turma Gaming (39258 - 247074, n=102, últimos 2 anos) | |
| Alienware m16 R1 AMD | |
| Colorful EVOL X15 AT 23 | |
| Schenker XMG Pro 15 (E23) | |
| HP Omen 16-wf000 | |
| Dell G15 5530 | |
| AIDA64 / CPU ZLib | |
| Alienware m16 R1 AMD | |
| Média da turma Gaming (574 - 2531, n=102, últimos 2 anos) | |
| Acer Predator Helios 16 PH16-71-731Q | |
| Schenker XMG Pro 15 (E23) | |
| Uniwill GM6PX7X RTX 4070 | |
| Alienware m16 R1 Intel | |
| HP Omen 16-wf000 | |
| Colorful EVOL X15 AT 23 | |
| Dell G15 5530 | |
| Média Intel Core i7-13700HX (981 - 1451, n=11) | |
| AIDA64 / FP64 Ray-Trace | |
| Alienware m16 R1 AMD | |
| Média da turma Gaming (5509 - 45446, n=102, últimos 2 anos) | |
| Uniwill GM6PX7X RTX 4070 | |
| Alienware m16 R1 Intel | |
| Colorful EVOL X15 AT 23 | |
| Acer Predator Helios 16 PH16-71-731Q | |
| Média Intel Core i7-13700HX (7728 - 11837, n=11) | |
| HP Omen 16-wf000 | |
| Dell G15 5530 | |
| Schenker XMG Pro 15 (E23) | |
| AIDA64 / CPU PhotoWorxx | |
| Schenker XMG Pro 15 (E23) | |
| Média da turma Gaming (12271 - 89891, n=102, últimos 2 anos) | |
| Uniwill GM6PX7X RTX 4070 | |
| HP Omen 16-wf000 | |
| Dell G15 5530 | |
| Alienware m16 R1 Intel | |
| Acer Predator Helios 16 PH16-71-731Q | |
| Média Intel Core i7-13700HX (19678 - 42415, n=11) | |
| Alienware m16 R1 AMD | |
| Colorful EVOL X15 AT 23 | |
Mais informações podem ser encontradas em nosso site dedicado ao Intel Core i7-13700HX dedicada.
Desempenho do sistema
O EVOL X15 AT tem um desempenho melhor no PCMark 10 em comparação com o CrossMark. As pontuações de memória do AIDA64 são mais baixas devido à unidade DDR5-4800 de canal duplo no EVOL X15 em comparação com a implementação de canal quádruplo duplo em seus concorrentes.
Dito isso, não enfrentamos nenhum problema ao usar o EVOL X15 para tarefas rotineiras de produtividade e navegação na Web.
CrossMark: Overall | Productivity | Creativity | Responsiveness
AIDA64: Memory Copy | Memory Read | Memory Write | Memory Latency
| PCMark 10 / Score | |
| Alienware m16 R1 AMD | |
| Média da turma Gaming (5828 - 12414, n=93, últimos 2 anos) | |
| Uniwill GM6PX7X RTX 4070 | |
| HP Omen 16-wf000 | |
| Acer Predator Helios 16 PH16-71-731Q | |
| Colorful EVOL X15 AT 23 | |
| Schenker XMG Pro 15 (E23) | |
| Média Intel Core i7-13700HX, NVIDIA GeForce RTX 4060 Laptop GPU (6909 - 7743, n=5) | |
| Alienware m16 R1 Intel | |
| Dell G15 5530 | |
| PCMark 10 / Essentials | |
| Uniwill GM6PX7X RTX 4070 | |
| Alienware m16 R1 AMD | |
| Schenker XMG Pro 15 (E23) | |
| Acer Predator Helios 16 PH16-71-731Q | |
| Dell G15 5530 | |
| Alienware m16 R1 Intel | |
| Média da turma Gaming (8810 - 11935, n=97, últimos 2 anos) | |
| Média Intel Core i7-13700HX, NVIDIA GeForce RTX 4060 Laptop GPU (9760 - 11313, n=5) | |
| Colorful EVOL X15 AT 23 | |
| HP Omen 16-wf000 | |
| PCMark 10 / Productivity | |
| Média da turma Gaming (6845 - 25323, n=95, últimos 2 anos) | |
| Acer Predator Helios 16 PH16-71-731Q | |
| Uniwill GM6PX7X RTX 4070 | |
| Schenker XMG Pro 15 (E23) | |
| Alienware m16 R1 AMD | |
| Dell G15 5530 | |
| Média Intel Core i7-13700HX, NVIDIA GeForce RTX 4060 Laptop GPU (9131 - 11018, n=5) | |
| Alienware m16 R1 Intel | |
| Colorful EVOL X15 AT 23 | |
| HP Omen 16-wf000 | |
| PCMark 10 / Digital Content Creation | |
| Alienware m16 R1 AMD | |
| Média da turma Gaming (7602 - 19954, n=95, últimos 2 anos) | |
| Uniwill GM6PX7X RTX 4070 | |
| HP Omen 16-wf000 | |
| Colorful EVOL X15 AT 23 | |
| Média Intel Core i7-13700HX, NVIDIA GeForce RTX 4060 Laptop GPU (9393 - 12434, n=5) | |
| Acer Predator Helios 16 PH16-71-731Q | |
| Alienware m16 R1 Intel | |
| Schenker XMG Pro 15 (E23) | |
| Dell G15 5530 | |
| CrossMark / Overall | |
| Acer Predator Helios 16 PH16-71-731Q | |
| Alienware m16 R1 Intel | |
| Alienware m16 R1 AMD | |
| Média da turma Gaming (1366 - 2409, n=94, últimos 2 anos) | |
| Uniwill GM6PX7X RTX 4070 | |
| Schenker XMG Pro 15 (E23) | |
| Média Intel Core i7-13700HX, NVIDIA GeForce RTX 4060 Laptop GPU (1663 - 2105, n=5) | |
| Dell G15 5530 | |
| Colorful EVOL X15 AT 23 | |
| HP Omen 16-wf000 | |
| CrossMark / Productivity | |
| Acer Predator Helios 16 PH16-71-731Q | |
| Alienware m16 R1 Intel | |
| Alienware m16 R1 AMD | |
| Média da turma Gaming (1386 - 2254, n=94, últimos 2 anos) | |
| Uniwill GM6PX7X RTX 4070 | |
| Schenker XMG Pro 15 (E23) | |
| Média Intel Core i7-13700HX, NVIDIA GeForce RTX 4060 Laptop GPU (1618 - 1989, n=5) | |
| Dell G15 5530 | |
| Colorful EVOL X15 AT 23 | |
| HP Omen 16-wf000 | |
| CrossMark / Creativity | |
| Acer Predator Helios 16 PH16-71-731Q | |
| Média da turma Gaming (1343 - 2786, n=94, últimos 2 anos) | |
| Alienware m16 R1 Intel | |
| Schenker XMG Pro 15 (E23) | |
| Alienware m16 R1 AMD | |
| Uniwill GM6PX7X RTX 4070 | |
| Dell G15 5530 | |
| Média Intel Core i7-13700HX, NVIDIA GeForce RTX 4060 Laptop GPU (1710 - 2274, n=5) | |
| HP Omen 16-wf000 | |
| Colorful EVOL X15 AT 23 | |
| CrossMark / Responsiveness | |
| Acer Predator Helios 16 PH16-71-731Q | |
| Alienware m16 R1 Intel | |
| Uniwill GM6PX7X RTX 4070 | |
| Schenker XMG Pro 15 (E23) | |
| Alienware m16 R1 AMD | |
| Média da turma Gaming (1226 - 2334, n=94, últimos 2 anos) | |
| Média Intel Core i7-13700HX, NVIDIA GeForce RTX 4060 Laptop GPU (1269 - 1983, n=5) | |
| Dell G15 5530 | |
| HP Omen 16-wf000 | |
| Colorful EVOL X15 AT 23 | |
| AIDA64 / Memory Copy | |
| Schenker XMG Pro 15 (E23) | |
| Média da turma Gaming (21750 - 129946, n=102, últimos 2 anos) | |
| Uniwill GM6PX7X RTX 4070 | |
| HP Omen 16-wf000 | |
| Dell G15 5530 | |
| Alienware m16 R1 Intel | |
| Acer Predator Helios 16 PH16-71-731Q | |
| Média Intel Core i7-13700HX, NVIDIA GeForce RTX 4060 Laptop GPU (36504 - 58458, n=5) | |
| Alienware m16 R1 AMD | |
| Colorful EVOL X15 AT 23 | |
| AIDA64 / Memory Read | |
| Schenker XMG Pro 15 (E23) | |
| Média da turma Gaming (22956 - 118858, n=102, últimos 2 anos) | |
| Uniwill GM6PX7X RTX 4070 | |
| Dell G15 5530 | |
| Alienware m16 R1 Intel | |
| HP Omen 16-wf000 | |
| Acer Predator Helios 16 PH16-71-731Q | |
| Média Intel Core i7-13700HX, NVIDIA GeForce RTX 4060 Laptop GPU (36510 - 67644, n=5) | |
| Alienware m16 R1 AMD | |
| Colorful EVOL X15 AT 23 | |
| AIDA64 / Memory Write | |
| Acer Predator Helios 16 PH16-71-731Q | |
| Média da turma Gaming (22297 - 135096, n=102, últimos 2 anos) | |
| Schenker XMG Pro 15 (E23) | |
| HP Omen 16-wf000 | |
| Uniwill GM6PX7X RTX 4070 | |
| Média Intel Core i7-13700HX, NVIDIA GeForce RTX 4060 Laptop GPU (33598 - 85675, n=5) | |
| Dell G15 5530 | |
| Alienware m16 R1 Intel | |
| Alienware m16 R1 AMD | |
| Colorful EVOL X15 AT 23 | |
| AIDA64 / Memory Latency | |
| Média da turma Gaming (75.3 - 165.4, n=102, últimos 2 anos) | |
| Alienware m16 R1 AMD | |
| Dell G15 5530 | |
| Alienware m16 R1 Intel | |
| Uniwill GM6PX7X RTX 4070 | |
| HP Omen 16-wf000 | |
| Média Intel Core i7-13700HX, NVIDIA GeForce RTX 4060 Laptop GPU (81.9 - 93, n=5) | |
| Acer Predator Helios 16 PH16-71-731Q | |
| Schenker XMG Pro 15 (E23) | |
| Colorful EVOL X15 AT 23 | |
* ... menor é melhor
| PCMark 8 Home Score Accelerated v2 | 5769 pontos | |
| PCMark 8 Work Score Accelerated v2 | 5995 pontos | |
| PCMark 10 Score | 7655 pontos | |
Ajuda | ||
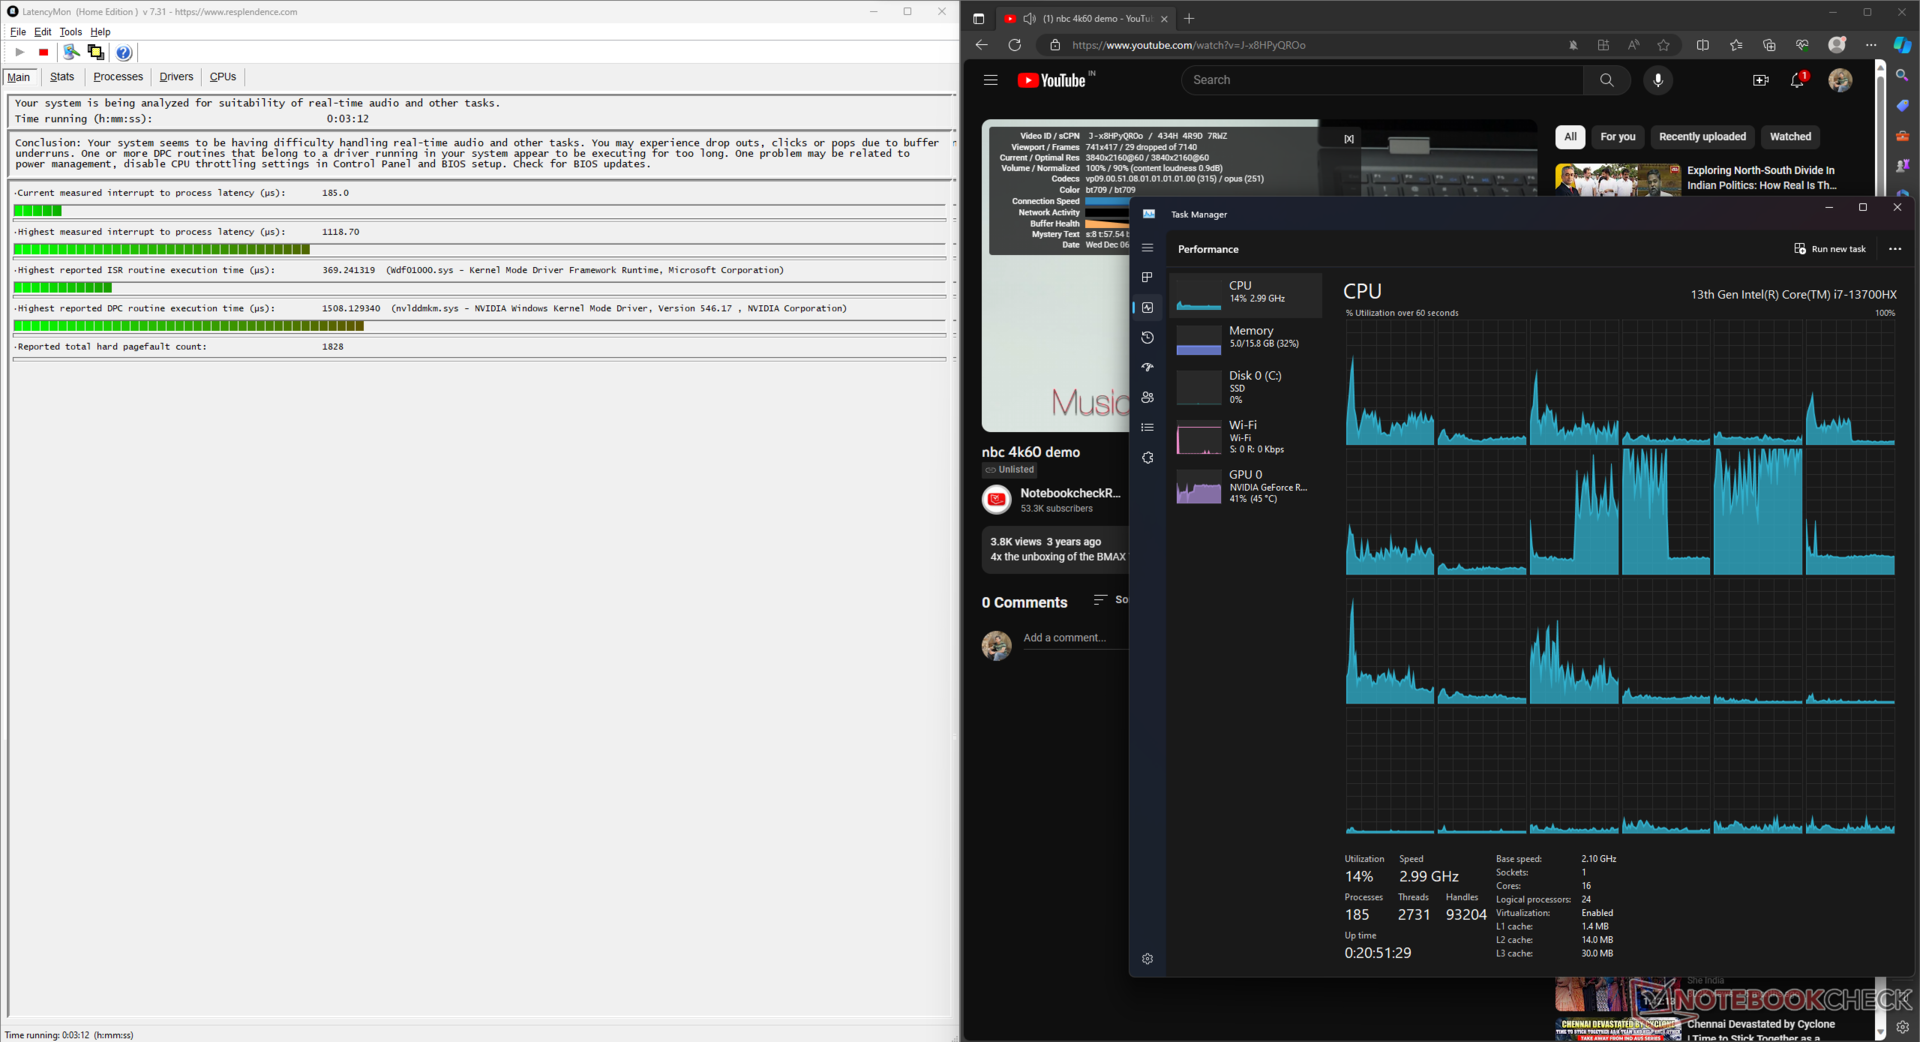
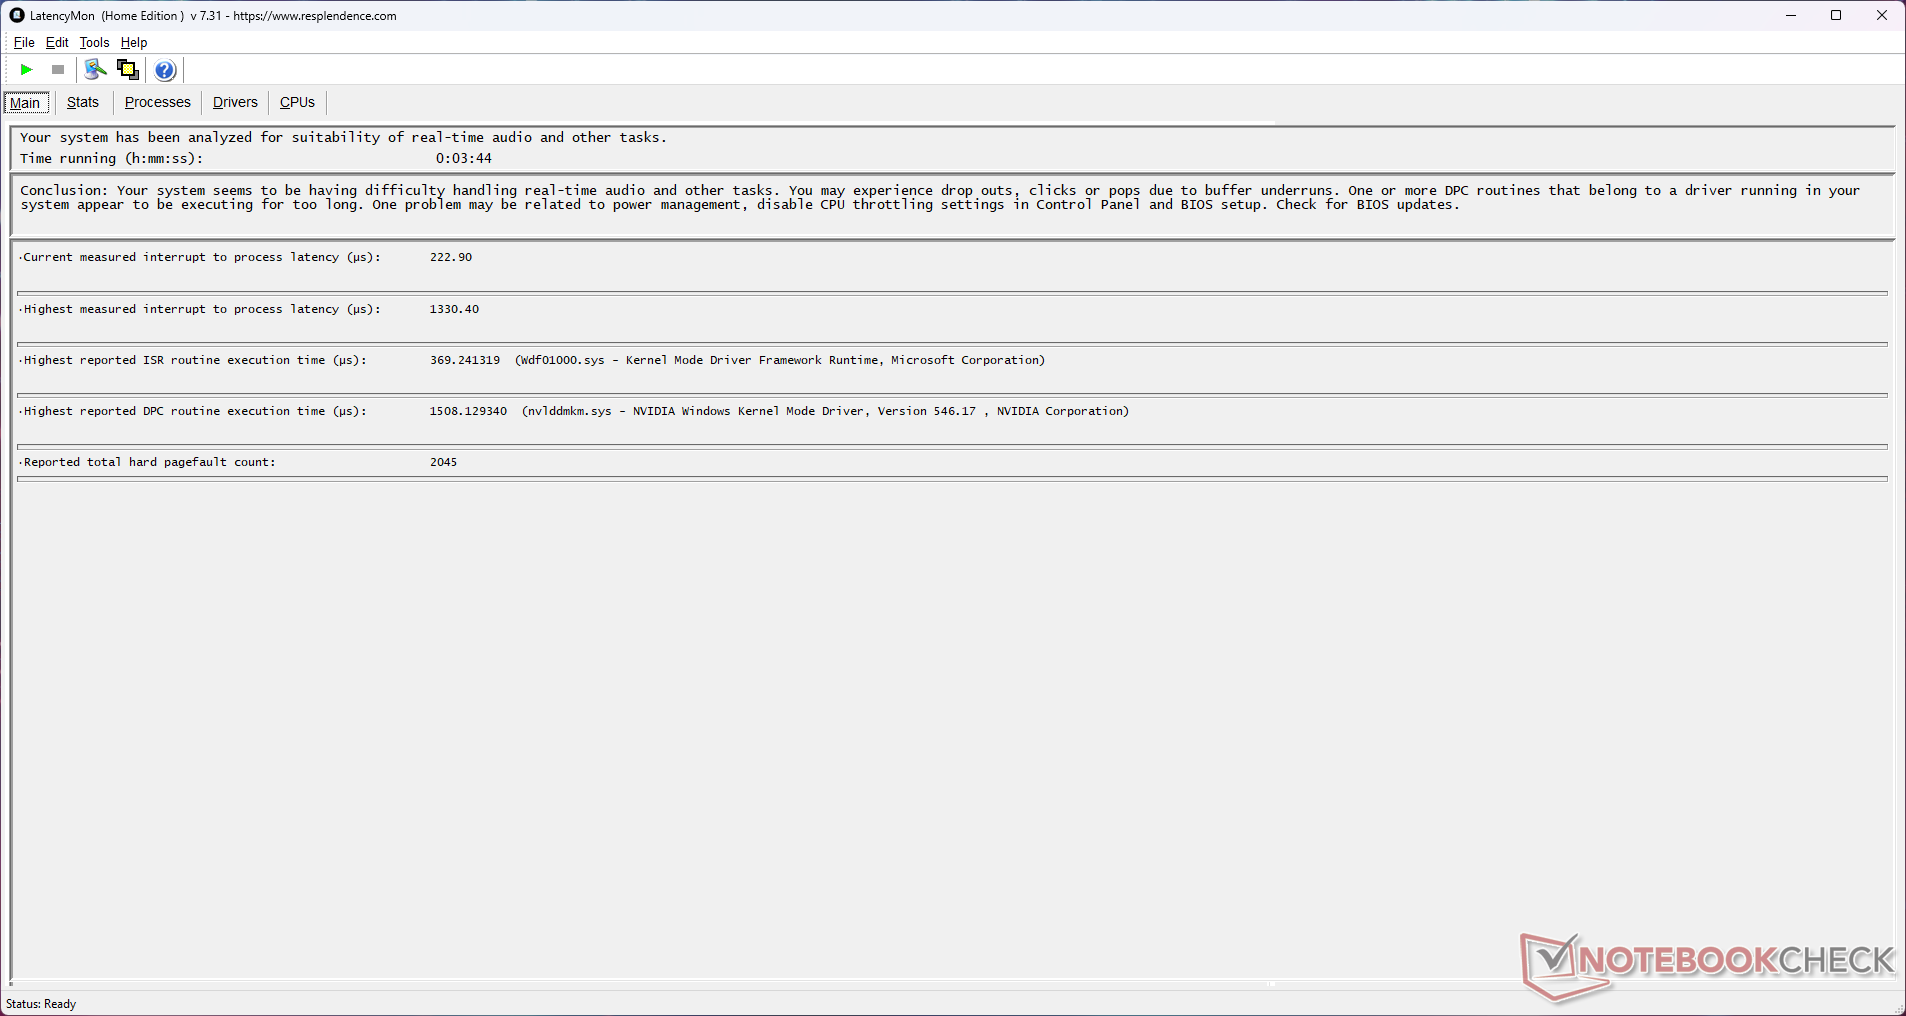
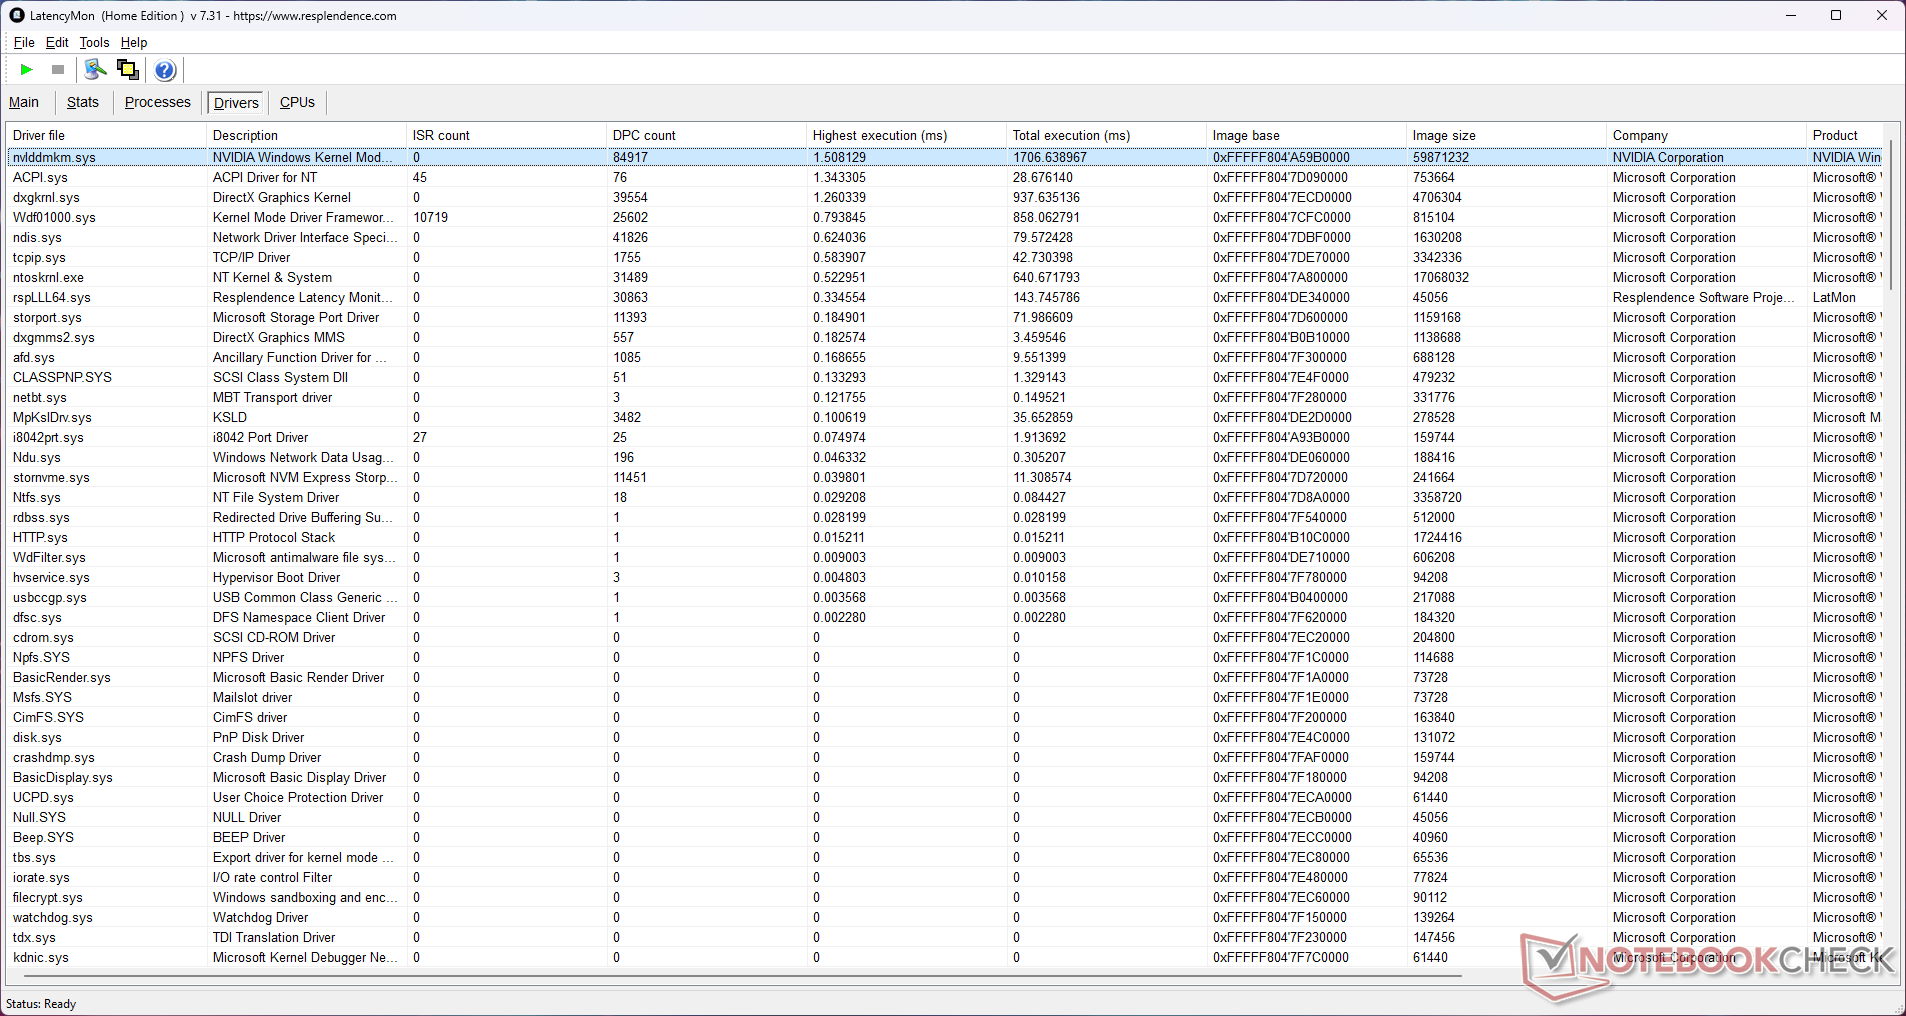
Latência DPC
A alta latência de DPC é um problema conhecido em notebooks com placas Nvidia, e o EVOL X15 não é exceção, embora se saia melhor do que seus concorrentes.
Registramos uma latência de interrupção para processo de 1.330,4 µs usando o LatencyMon, seguindo uma amostra de reprodução de 4K60 do YouTube e um estresse de 10 segundos do Prime95. A estrutura do driver do modo kernel do Windows da Nvidia (nvlddmkm.sys) contribui para essa alta latência.
| DPC Latencies / LatencyMon - interrupt to process latency (max), Web, Youtube, Prime95 | |
| Dell G15 5530 | |
| Alienware m16 R1 Intel | |
| HP Omen 16-wf000 | |
| Alienware m16 R1 AMD | |
| Acer Predator Helios 16 PH16-71-731Q | |
| Colorful EVOL X15 AT 23 | |
| Uniwill GM6PX7X RTX 4070 | |
| Schenker XMG Pro 15 (E23) | |
* ... menor é melhor
Nosso Classificação de latência DPC fornece mais comparações do LatencyMon entre os dispositivos testados.
Dispositivos de armazenamento
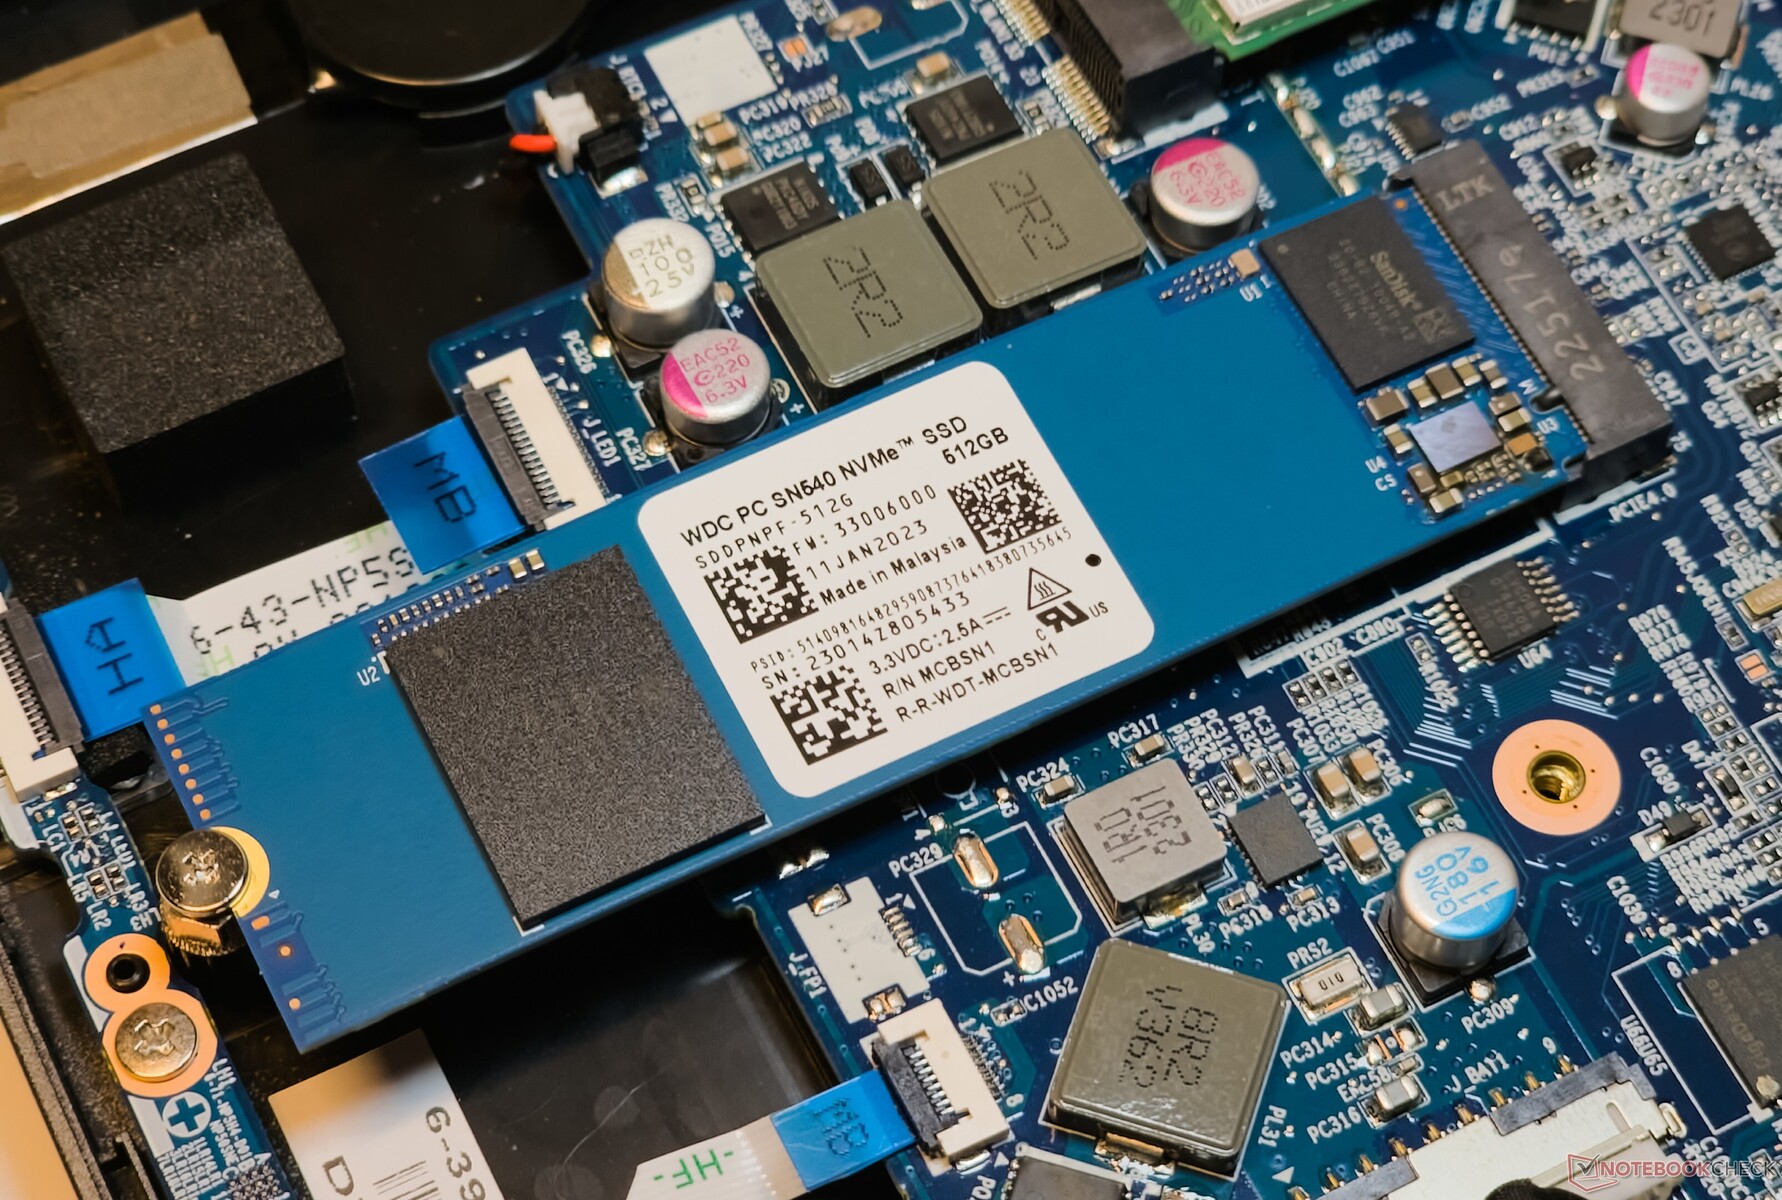
O SSD Western Digital SN540 NVMe de 512 GB do EVOL X15 não é páreo para as unidades Kioxia e SK Hynix usadas por seus concorrentes. No entanto, as leituras 4k q1 t1 e as gravações 4k q1 t1 superam as do Kioxia XG8 no Alienware m16 R1 AMD.
O Colorful permite que o senhor adicione outra unidade PCIe Gen4 NVMe. No entanto, não há espaço para adicionar armazenamento em massa SATA de 2,5 polegadas.

* ... menor é melhor
Limitação de disco: Loop de leitura do DiskSpd, profundidade da fila 8
A unidade começa a ser estrangulada após o 17º loop durante o teste de loop de leitura do DiskSpd em uma profundidade de fila de 8. Não há cobertura térmica ou acolchoamento na unidade.
Desempenho da GPU
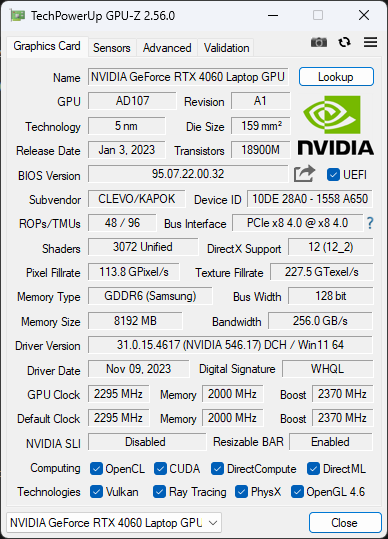
A GPU para laptop Nvidia GeForce RTX 4060 no EVOL X15 AT opera com um TGP de 140 W. Seu desempenho geral no 3DMark é comparável ao de outros notebooks que usam a mesma GPU.
Também vemos que a RTX 4060 está a uma distância impressionante da GPU para laptop RTX 4070 de 140 W GPU para laptop RTX 4070 no Uniwill GM6PX7Xmas fica 31% abaixo quando comparada com a GPU para laptop RTX 4080 de 175 W GPU para laptop RTX 4080 de 175 W que alimenta o Alienware m16 R1 AMD.
as pontuações gráficas do 3DMark Time Spy podem cair em quase 54% com a energia da bateria.
| 3DMark 11 Performance | 30245 pontos | |
| 3DMark Ice Storm Standard Score | 278340 pontos | |
| 3DMark Cloud Gate Standard Score | 63582 pontos | |
| 3DMark Fire Strike Score | 24674 pontos | |
| 3DMark Fire Strike Extreme Score | 12089 pontos | |
| 3DMark Time Spy Score | 10590 pontos | |
Ajuda | ||
| Blender / v3.3 Classroom OPTIX/RTX | |
| Schenker XMG Pro 15 (E23) | |
| Colorful EVOL X15 AT 23 | |
| Alienware m16 R1 Intel | |
| Média NVIDIA GeForce RTX 4060 Laptop GPU (19 - 28, n=53) | |
| Acer Predator Helios 16 PH16-71-731Q | |
| Dell G15 5530 | |
| Uniwill GM6PX7X RTX 4070 | |
| Média da turma Gaming (9 - 32, n=103, últimos 2 anos) | |
| HP Omen 16-wf000 | |
| Alienware m16 R1 AMD | |
| Blender / v3.3 Classroom CUDA | |
| Schenker XMG Pro 15 (E23) | |
| Média NVIDIA GeForce RTX 4060 Laptop GPU (39 - 53, n=53) | |
| Colorful EVOL X15 AT 23 | |
| Acer Predator Helios 16 PH16-71-731Q | |
| Dell G15 5530 | |
| Alienware m16 R1 Intel | |
| Uniwill GM6PX7X RTX 4070 | |
| Média da turma Gaming (15 - 228, n=103, últimos 2 anos) | |
| Alienware m16 R1 AMD | |
| HP Omen 16-wf000 | |
| Blender / v3.3 Classroom CPU | |
| Média NVIDIA GeForce RTX 4060 Laptop GPU (189 - 452, n=53) | |
| HP Omen 16-wf000 | |
| Dell G15 5530 | |
| Acer Predator Helios 16 PH16-71-731Q | |
| Colorful EVOL X15 AT 23 | |
| Schenker XMG Pro 15 (E23) | |
| Alienware m16 R1 Intel | |
| Uniwill GM6PX7X RTX 4070 | |
| Média da turma Gaming (122 - 565, n=99, últimos 2 anos) | |
| Alienware m16 R1 AMD | |
* ... menor é melhor
Desempenho em jogos
O EVOL X15 consegue pequenas vantagens sobre os laptops concorrentes com especificações semelhantes, incluindo o Acer Predator Helios 16 e o Alienware m16 R1 Intel em desempenho geral para jogos em 1080p Ultra.
Os jogos em QHD 60 fps são possíveis em muitos títulos AAA, e há potencial para obter taxas de quadros ainda mais altas com a ajuda de upscalers como Nvidia DLSS, AMD FSR ou Intel XeSS.
| The Witcher 3 - 1920x1080 Ultra Graphics & Postprocessing (HBAO+) | |
| Média da turma Gaming (104.7 - 240, n=7, últimos 2 anos) | |
| Alienware m16 R1 AMD | |
| HP Omen 16-wf000 | |
| Schenker XMG Pro 15 (E23) | |
| Uniwill GM6PX7X RTX 4070 | |
| Alienware m16 R1 Intel | |
| Dell G15 5530 | |
| Colorful EVOL X15 AT 23 | |
| Acer Predator Helios 16 PH16-71-731Q | |
| GTA V - 1920x1080 Highest AA:4xMSAA + FX AF:16x | |
| Média da turma Gaming (67.1 - 186.9, n=90, últimos 2 anos) | |
| Uniwill GM6PX7X RTX 4070 | |
| Colorful EVOL X15 AT 23 | |
| HP Omen 16-wf000 | |
| Acer Predator Helios 16 PH16-71-731Q | |
| Dell G15 5530 | |
| Schenker XMG Pro 15 (E23) | |
| Final Fantasy XV Benchmark - 1920x1080 High Quality | |
| Alienware m16 R1 AMD | |
| HP Omen 16-wf000 | |
| Média da turma Gaming (64.2 - 215, n=91, últimos 2 anos) | |
| Uniwill GM6PX7X RTX 4070 | |
| Alienware m16 R1 Intel | |
| Colorful EVOL X15 AT 23 | |
| Acer Predator Helios 16 PH16-71-731Q | |
| Dell G15 5530 | |
O gráfico Witcher 3 FPS
O resfriamento do subsistema gráfico do EVOL X15 parece ser bastante eficiente, como evidenciado pelas taxas de quadros estáveis observadas sob estresse com The Witcher 3 a 1080p Ultra.
| baixo | média | alto | ultra | QHD | |
|---|---|---|---|---|---|
| GTA V (2015) | 185.6 | 182.3 | 177.3 | 114.6 | 85.6 |
| The Witcher 3 (2015) | 450 | 333 | 205 | 103.4 | 75.7 |
| Dota 2 Reborn (2015) | 192.2 | 169.7 | 164.6 | 153.1 | |
| Final Fantasy XV Benchmark (2018) | 206 | 143.9 | 101 | 74 | |
| X-Plane 11.11 (2018) | 176.1 | 155.9 | 116.4 | ||
| Far Cry 5 (2018) | 162 | 146 | 141 | 135 | 101 |
| Strange Brigade (2018) | 480 | 288 | 225 | 192 | 127.4 |
| F1 22 (2022) | 253 | 253 | 194.5 | 65.8 | 42.3 |
| F1 23 (2023) | 248 | 250 | 184.1 | 58.3 | 37 |
| Cyberpunk 2077 (2023) | 119.4 | 96.5 | 82.8 | 71.1 | 42.8 |
| Assassin's Creed Mirage (2023) | 137 | 125 | 116 | 89 | 65 |
| Call of Duty Modern Warfare 3 2023 (2023) | 128 | 114 | 86 | 65 | 56 |
| Avatar Frontiers of Pandora (2023) | 77.3 | 71.1 | 60.8 | 45.2 | 29.8 |
Consulte nosso site dedicado à GPU para laptop Nvidia GeForce RTX 4060 para obter mais informações e comparações de desempenho.
Emissões: Baixas temperaturas de superfície acompanhadas de alto ruído do ventilador
Ruído do sistema
A Colorful limita o ruído da ventoinha do EVOL X15 AT a menos de 30 db(A) no modo Quiet.
No entanto, os modos Entretenimento e Desempenho apresentam níveis de ruído próximos à marca de 55 db(A), mesmo com cargas médias do 3DMark 06.
Os perfis de energia fornecidos têm um impacto perceptível no desempenho dos jogos. Por exemplo, observamos que as taxas médias de quadros caíram 33% no The Witcher 3 a 1080p Ultra ao mudar do modo Performance para o modo Silencioso.
Barulho
| Ocioso |
| 33.16 / 33.16 / 33.16 dB |
| Carga |
| 54.62 / 54.53 dB |
 | ||
30 dB silencioso 40 dB(A) audível 50 dB(A) ruidosamente alto |
||
min: | ||
| Modo de desempenho | Idle dB(A) | Load average dB(A) | Load maximum dB(A) | The Witcher 3 1080p Ultra dB(A) |
|---|---|---|---|---|
| Silencioso | 24,73 | 26,61 | 26,08 | 26,82 / 67 fps |
| Economia de energia | 24.85 | 26.02 | 41.05 | 46.10 / 75 fps |
| Entretenimento | 25.07 | 54.06 | 54.56 | 53.29 / 97 fps |
| Desempenho | 33.16 | 54.62 | 54.53 | 54.62 / 100 fps |
| Colorful EVOL X15 AT 23 i7-13700HX, GeForce RTX 4060 Laptop GPU | Alienware m16 R1 Intel i7-13700HX, GeForce RTX 4060 Laptop GPU | HP Omen 16-wf000 i7-13700HX, GeForce RTX 4080 Laptop GPU | Acer Predator Helios 16 PH16-71-731Q i7-13700HX, GeForce RTX 4060 Laptop GPU | Dell G15 5530 i7-13650HX, GeForce RTX 4060 Laptop GPU | Schenker XMG Pro 15 (E23) i9-13900HX, GeForce RTX 4060 Laptop GPU | Alienware m16 R1 AMD R9 7845HX, GeForce RTX 4080 Laptop GPU | Uniwill GM6PX7X RTX 4070 i7-13700HX, GeForce RTX 4070 Laptop GPU | |
|---|---|---|---|---|---|---|---|---|
| Noise | 9% | 7% | 14% | 19% | 11% | 13% | 13% | |
| desligado / ambiente * (dB) | 21.32 | 25 -17% | 23 -8% | 24 -13% | 20.41 4% | 24 -13% | 22.9 -7% | 22.4 -5% |
| Idle Minimum * (dB) | 33.16 | 25 25% | 29.6 11% | 24 28% | 26.85 19% | 24 28% | 22.9 31% | 22.9 31% |
| Idle Average * (dB) | 33.16 | 26 22% | 29.8 10% | 24 28% | 26.85 19% | 24 28% | 29.7 10% | 29 13% |
| Idle Maximum * (dB) | 33.16 | 27 19% | 30.4 8% | 32.32 3% | 26.85 19% | 24 28% | 29.7 10% | 29 13% |
| Load Average * (dB) | 54.62 | 52 5% | 33.8 38% | 36.66 33% | 27.65 49% | 53.65 2% | 29.8 45% | 40.2 26% |
| Witcher 3 ultra * (dB) | 54.6 | 51 7% | 57 -4% | 49.06 10% | 47.9 12% | 53.53 2% | 54.7 -0% | 48.7 11% |
| Load Maximum * (dB) | 54.53 | 53 3% | 58.3 -7% | 49.49 9% | 47.86 12% | 53.65 2% | 54.7 -0% | 55 -1% |
* ... menor é melhor
Temperatura
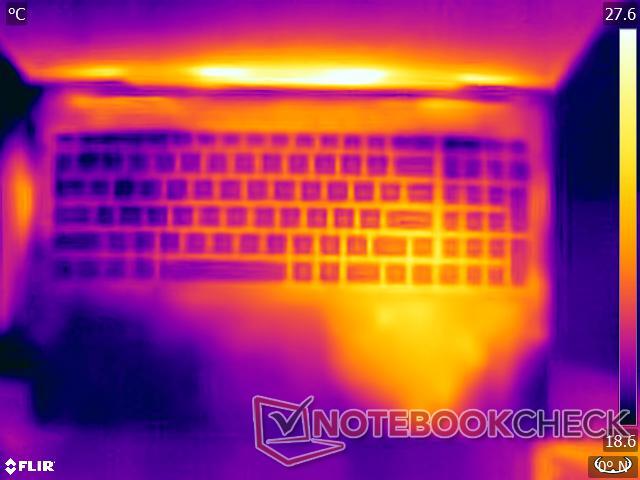
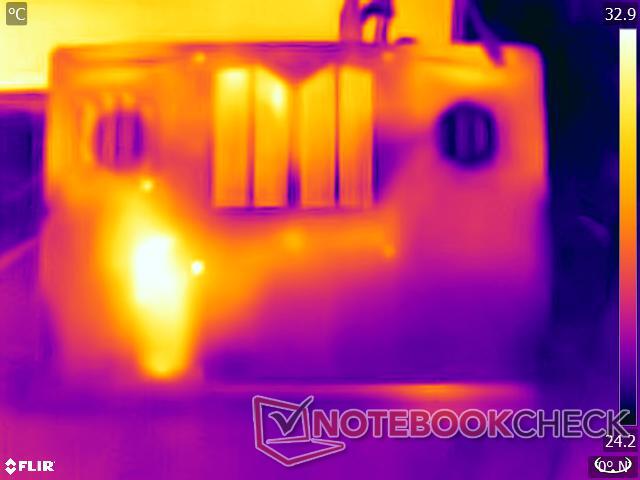
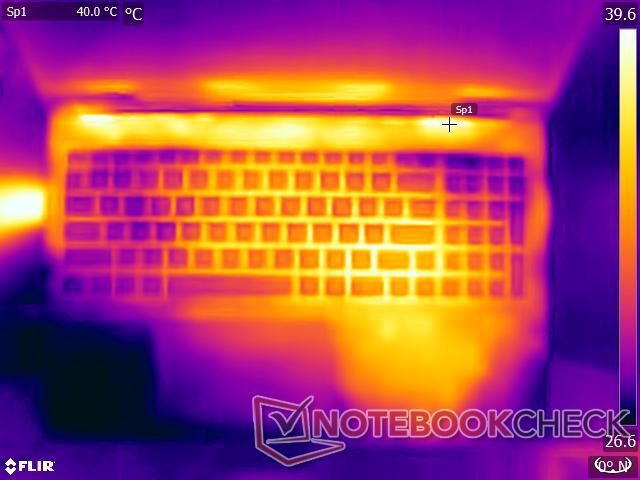
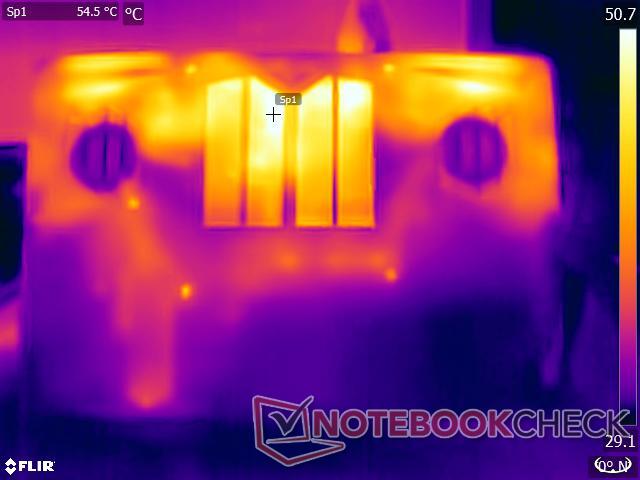
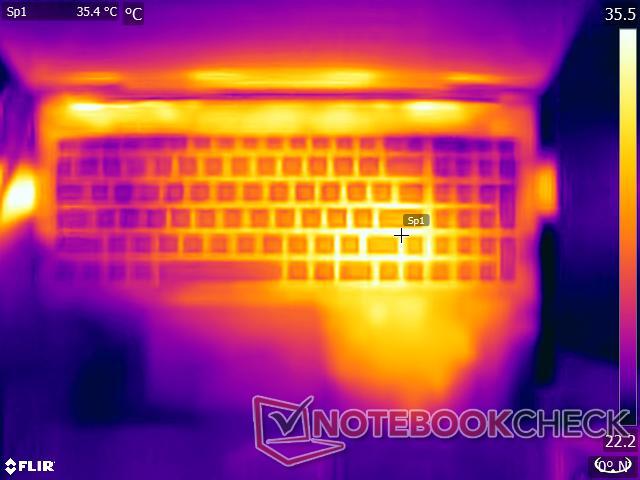
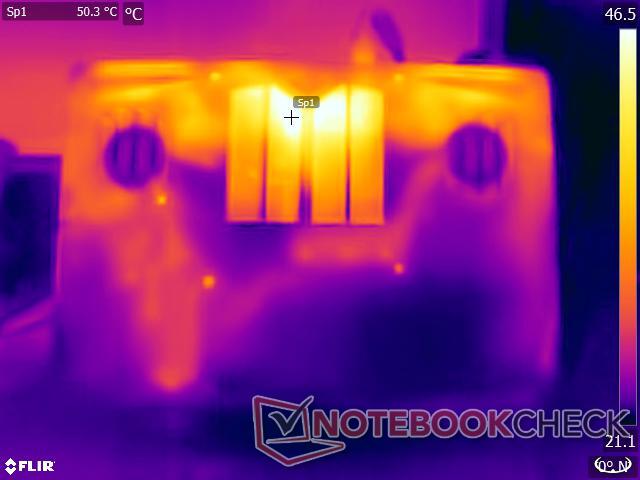
O EVOL X15 apresenta um sistema de resfriamento robusto que cobre totalmente a CPU, a GPU e o chipset. As temperaturas de superfície são controláveis sob carga pesada graças à sólida construção de plástico e à ampla folga do painel traseiro em relação à placa-mãe. Apenas um ponto de acesso na parte inferior atinge 51 °C.
Apesar de seu peso, o EVOL X15 pode ser usado no colo, desde que o senhor não faça muita força. As áreas do touchpad e do apoio para as mãos permanecem relativamente frias, aquecendo apenas um pouco sob carga extrema.
(+) A temperatura máxima no lado superior é 37 °C / 99 F, em comparação com a média de 40.4 °C / 105 F , variando de 21.2 a 68.8 °C para a classe Gaming.
(-) A parte inferior aquece até um máximo de 51.2 °C / 124 F, em comparação com a média de 43.2 °C / 110 F
(+) Em uso inativo, a temperatura média para o lado superior é 29.3 °C / 85 F, em comparação com a média do dispositivo de 33.9 °C / ### class_avg_f### F.
(+) Jogando The Witcher 3, a temperatura média para o lado superior é 31.7 °C / 89 F, em comparação com a média do dispositivo de 33.9 °C / ## #class_avg_f### F.
(+) Os apoios para as mãos e o touchpad estão atingindo a temperatura máxima da pele (34.8 °C / 94.6 F) e, portanto, não estão quentes.
(-) A temperatura média da área do apoio para as mãos de dispositivos semelhantes foi 28.8 °C / 83.8 F (-6 °C / -10.8 F).
| Colorful EVOL X15 AT 23 Intel Core i7-13700HX, NVIDIA GeForce RTX 4060 Laptop GPU | Alienware m16 R1 Intel Intel Core i7-13700HX, NVIDIA GeForce RTX 4060 Laptop GPU | HP Omen 16-wf000 Intel Core i7-13700HX, NVIDIA GeForce RTX 4080 Laptop GPU | Acer Predator Helios 16 PH16-71-731Q Intel Core i7-13700HX, NVIDIA GeForce RTX 4060 Laptop GPU | Dell G15 5530 Intel Core i7-13650HX, NVIDIA GeForce RTX 4060 Laptop GPU | Schenker XMG Pro 15 (E23) Intel Core i9-13900HX, NVIDIA GeForce RTX 4060 Laptop GPU | Alienware m16 R1 AMD AMD Ryzen 9 7845HX, NVIDIA GeForce RTX 4080 Laptop GPU | Uniwill GM6PX7X RTX 4070 Intel Core i7-13700HX, NVIDIA GeForce RTX 4070 Laptop GPU | |
|---|---|---|---|---|---|---|---|---|
| Heat | -18% | 0% | -17% | -19% | -9% | -9% | -5% | |
| Maximum Upper Side * (°C) | 37 | 49 -32% | 45 -22% | 41 -11% | 54 -46% | 50 -35% | 48 -30% | 38.2 -3% |
| Maximum Bottom * (°C) | 51.2 | 48 6% | 48.8 5% | 66 -29% | 62.2 -21% | 50 2% | 39 24% | 45 12% |
| Idle Upper Side * (°C) | 31.2 | 40 -28% | 29.2 6% | 36 -15% | 33.4 -7% | 33 -6% | 37 -19% | 33.6 -8% |
| Idle Bottom * (°C) | 32.8 | 39 -19% | 28.8 12% | 37 -13% | 33.4 -2% | 32 2% | 36.2 -10% | 39.6 -21% |
* ... menor é melhor
Teste de estresse
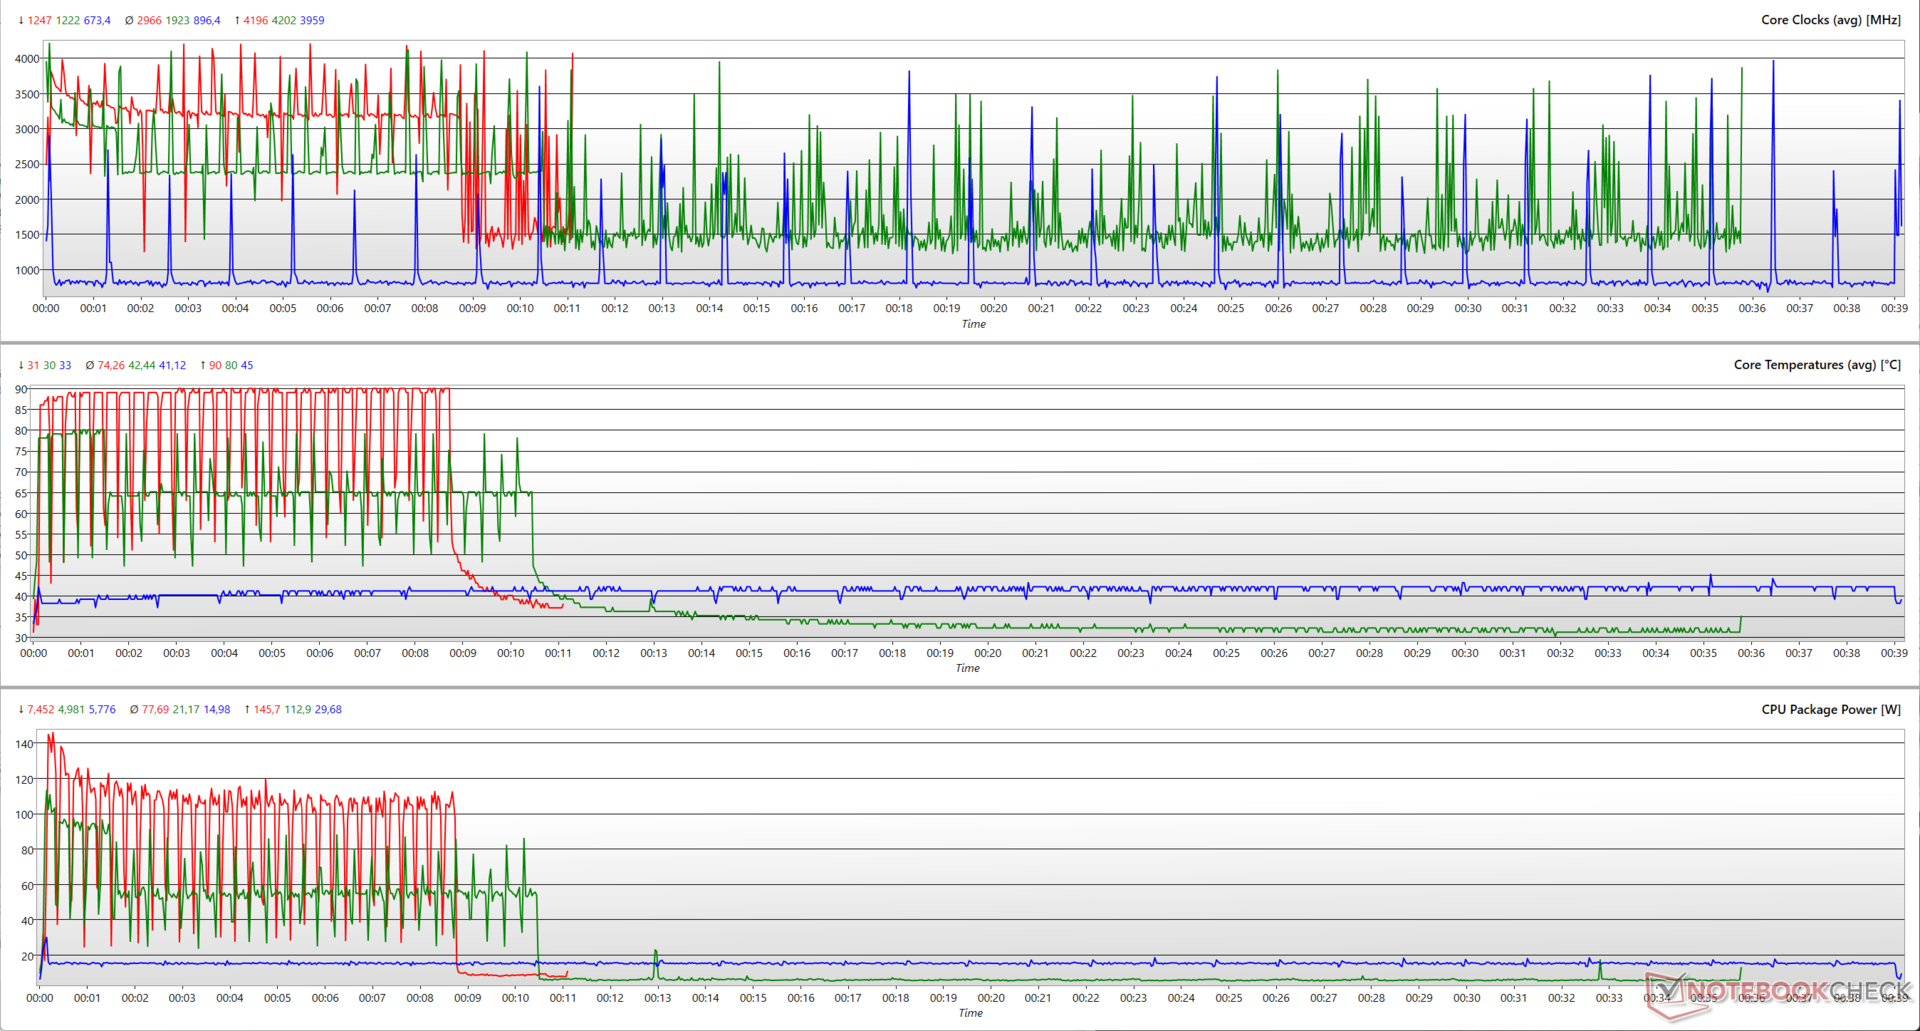
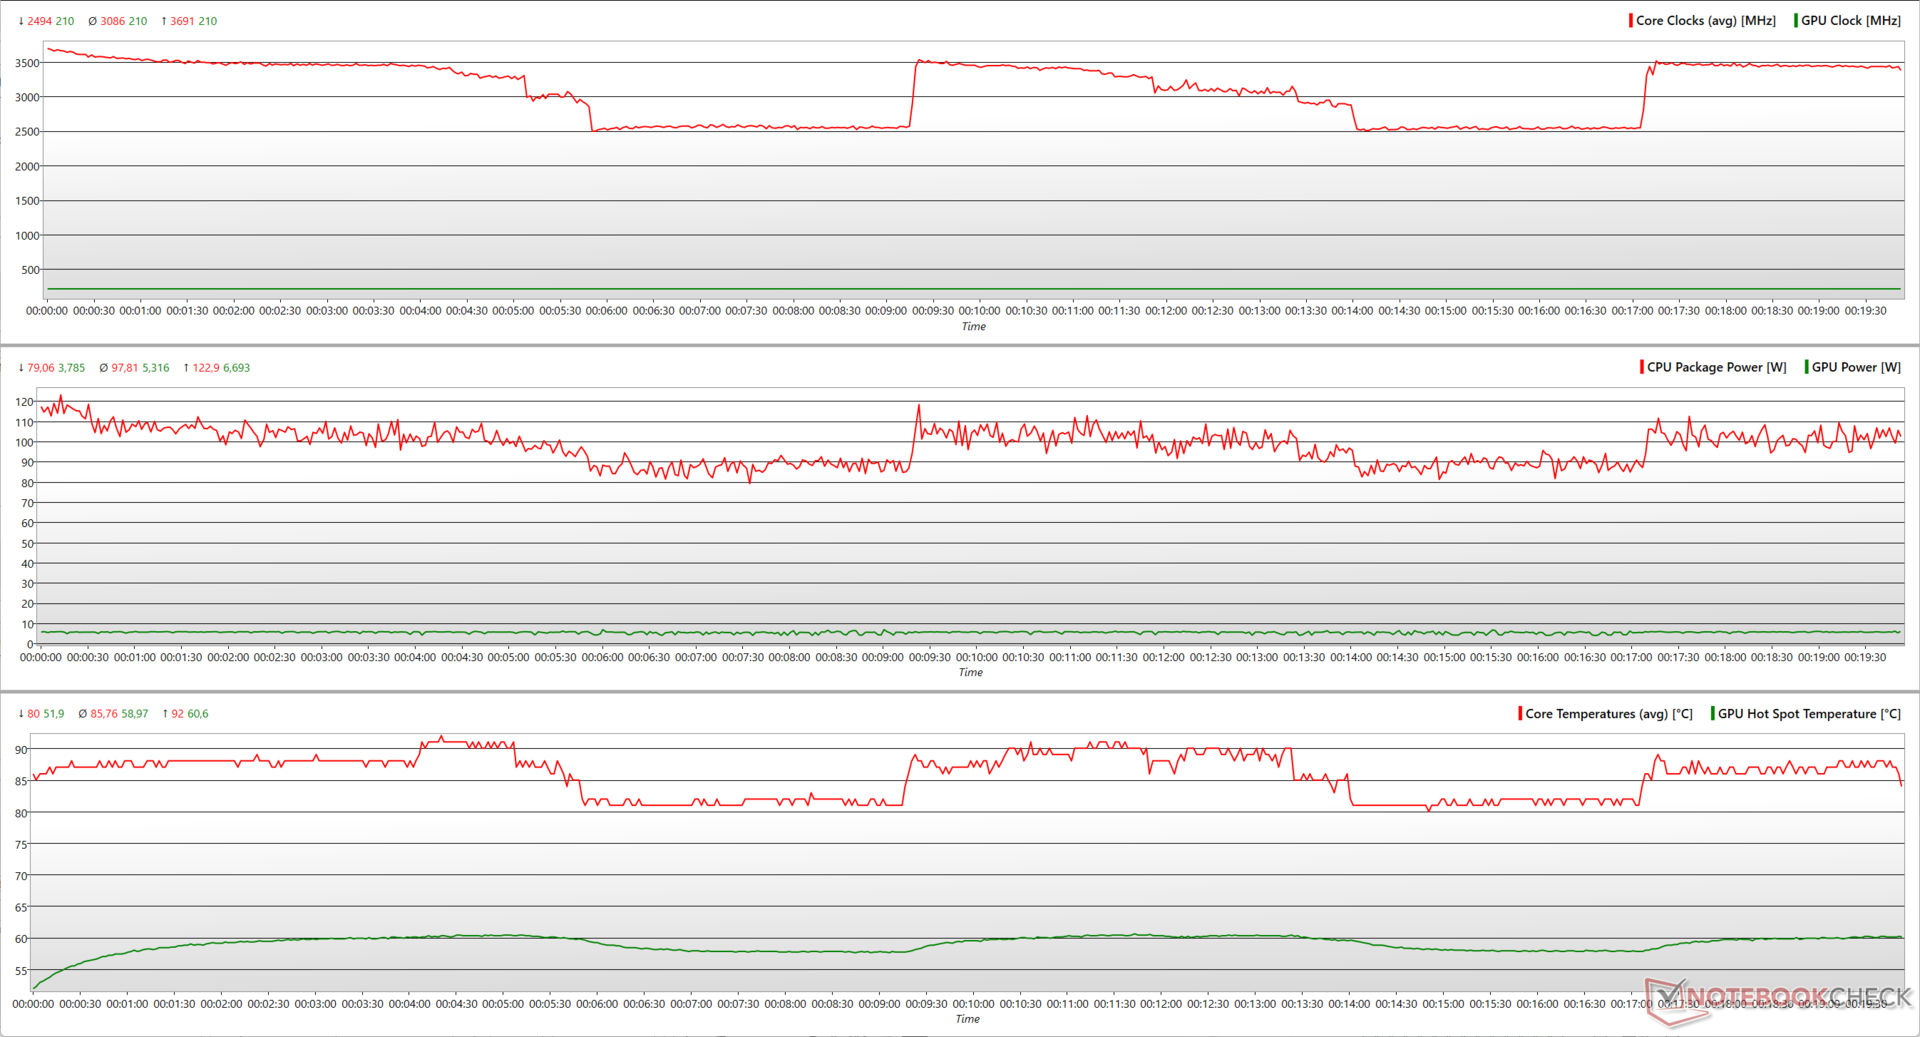
Ao enfatizar o EVOL X15 com FFTs grandes no local do Prime95, o Core i7-13700HX atinge picos de aumento de até 3,7 GHz enquanto utiliza 123 W. Apesar do resfriamento abrangente, a CPU cai periodicamente para 2,5 GHz a 80 W antes de tentar voltar a 3,7 GHz.
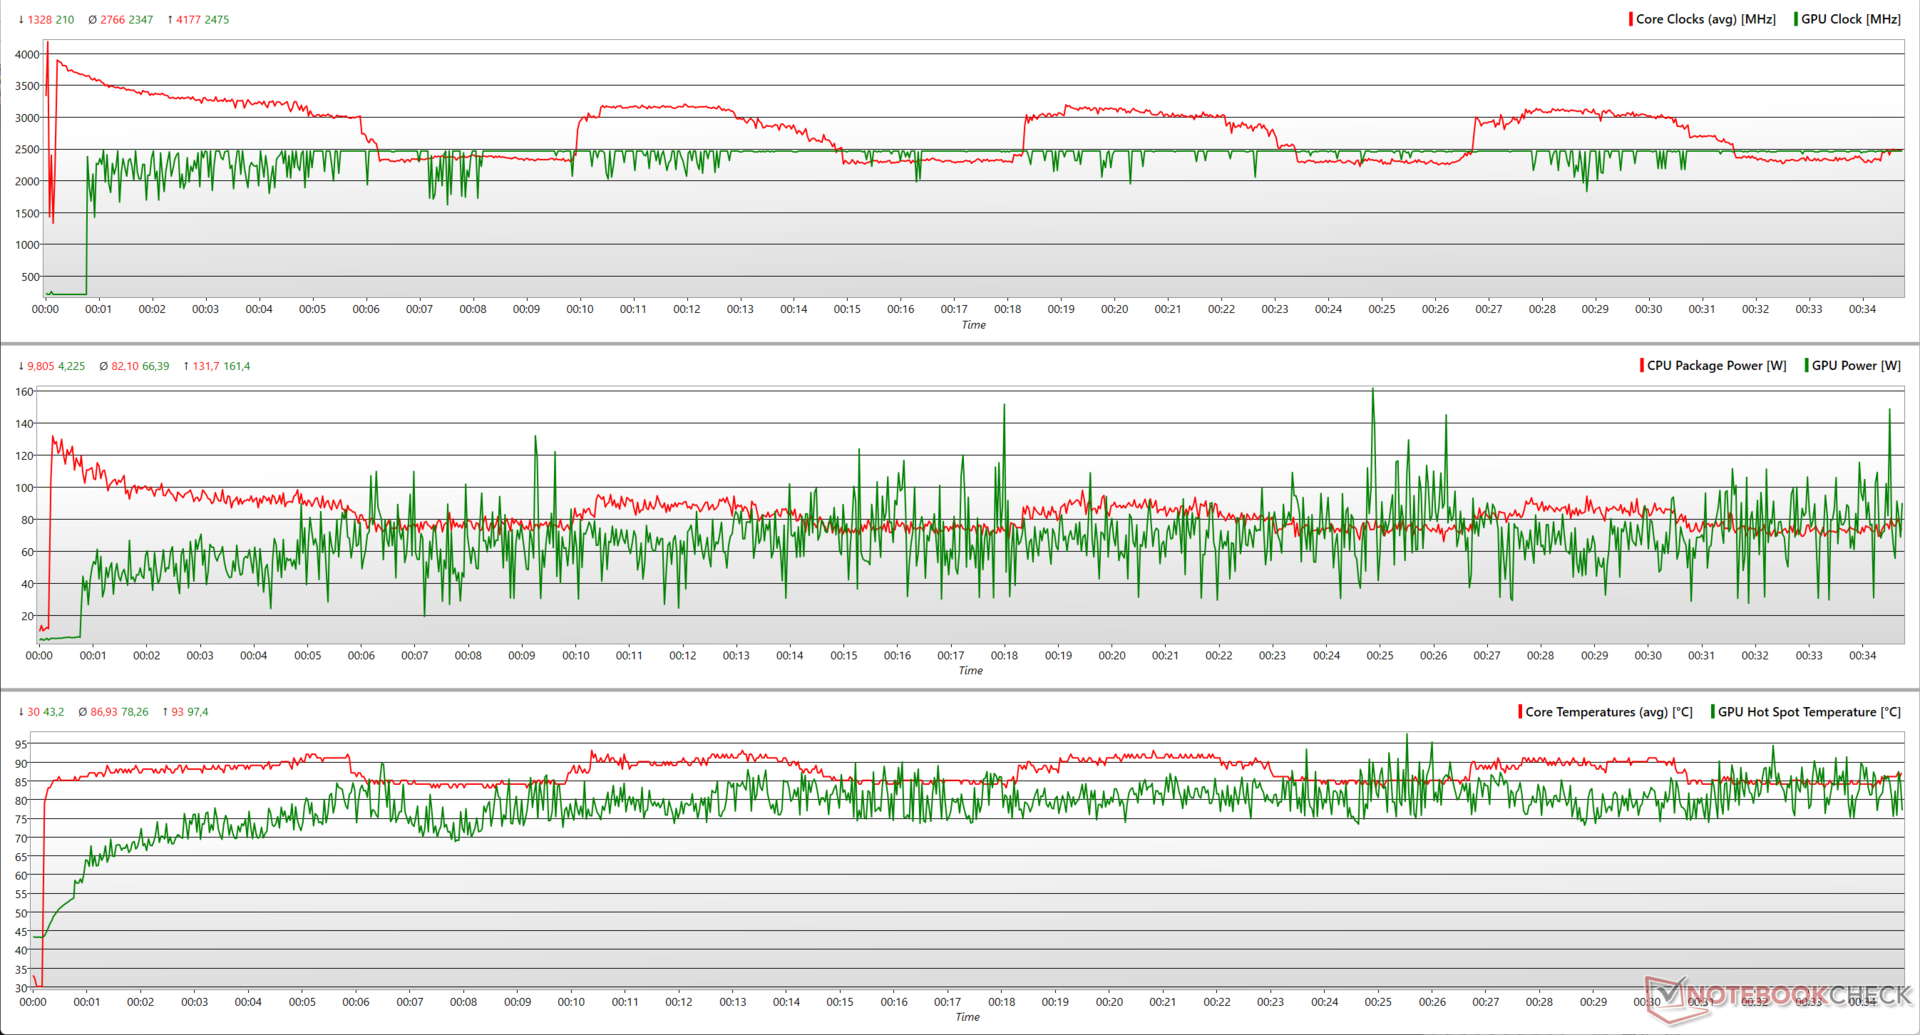
Ao adicionar o FurMark, o Core i7-13700HX agora pode usar até 132 W para atingir 4,2 GHz, mas ainda se acelera intermitentemente perto da marca de 2,5 GHz. O RTX 4060 pode usar o headroom de energia e atingir o pico de 2.475 MHz enquanto utiliza 161 W.
| Teste de estresse | Clock da CPU (GHz) | Clock da GPU (MHz) | Temperatura média da CPU (°C) | Temperatura média da GPU (°C) |
| Sistema ocioso | 1,42 | 210 | 31 | 37,1 |
| Prime95 | 3.42 | 210 | 85 | 50.8 |
| Prime95 + FurMark | 2.99 | 2,460 | 86 | 70.8 |
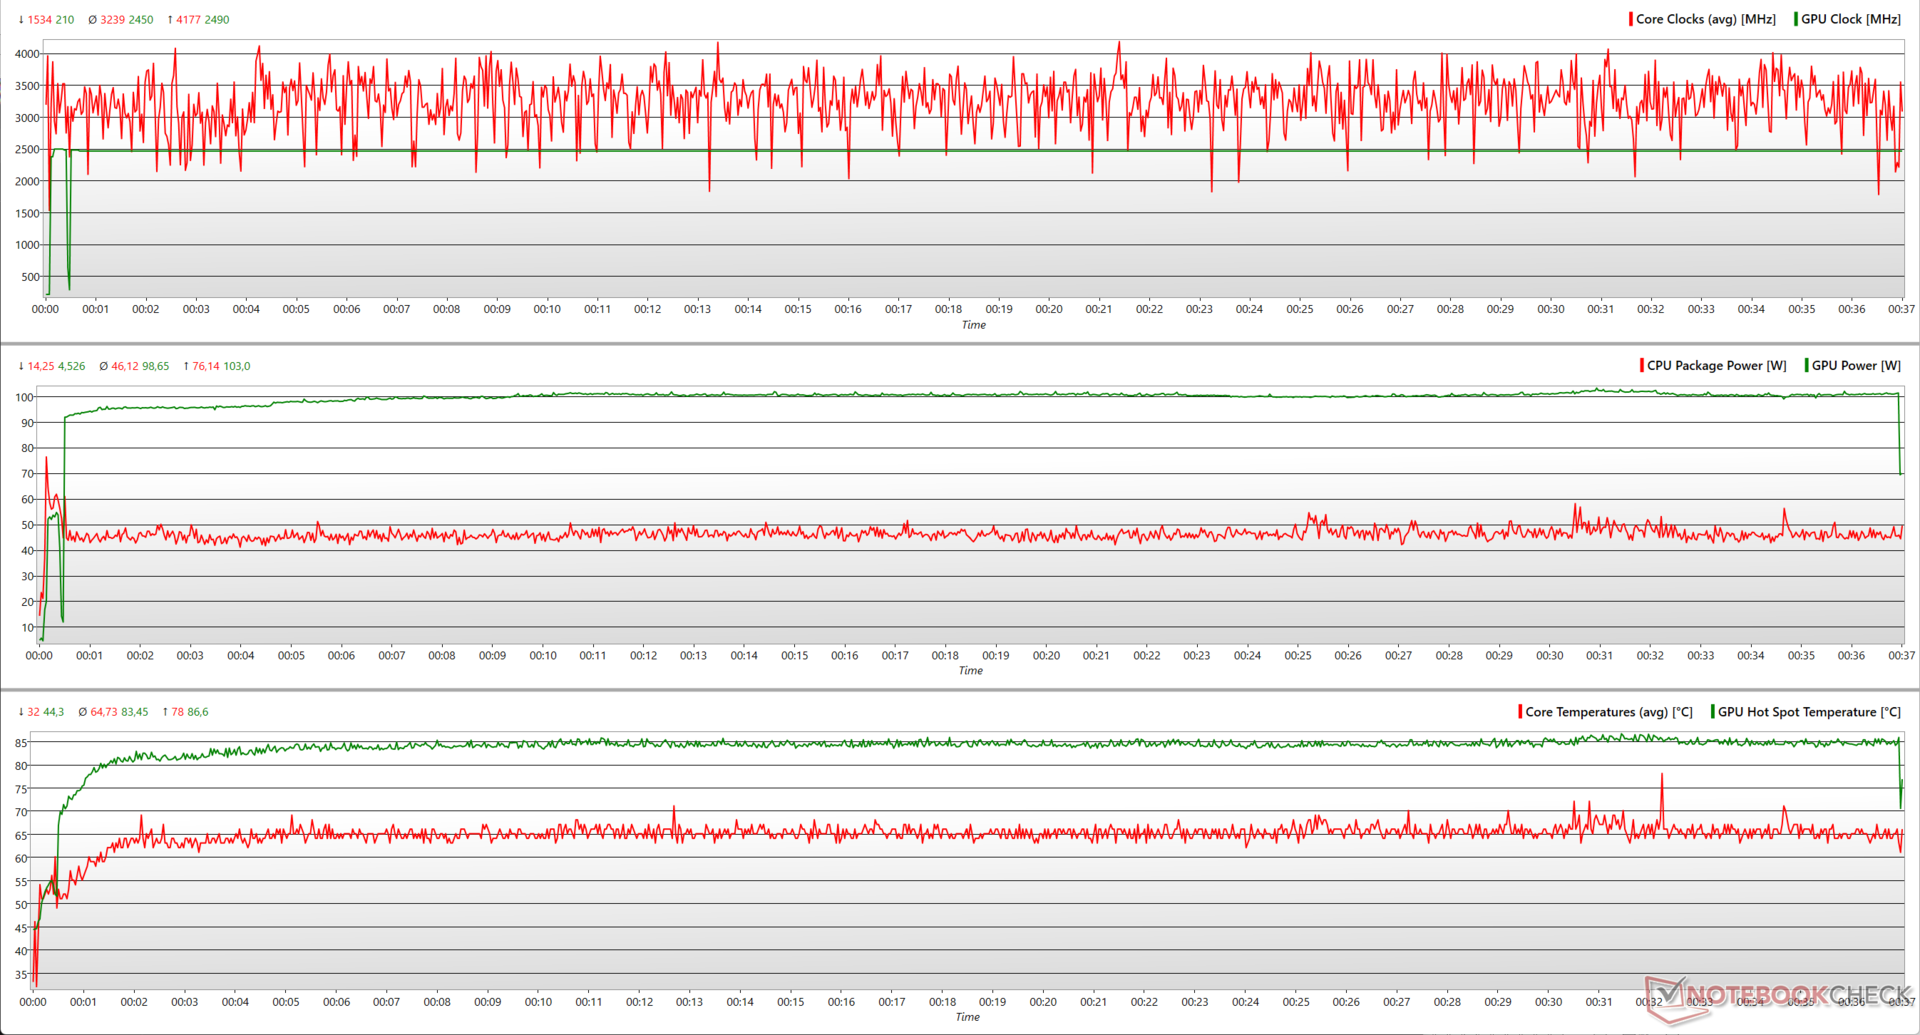
| O Witcher 3 1080p Ultra | 3.12 | 2,460 | 64 | 73.7 |
Com o Witcher 3 em 1080p Ultra, o Core i7-13700HX consegue atingir o pico de 4,2 GHz usando apenas 76 W, enquanto mantém clocks médios de 3,2 GHz a 46 W. Isso permite espaço suficiente para a RTX 4060 atingir um aumento quase consistente de 2.490 MHz a 103 W.
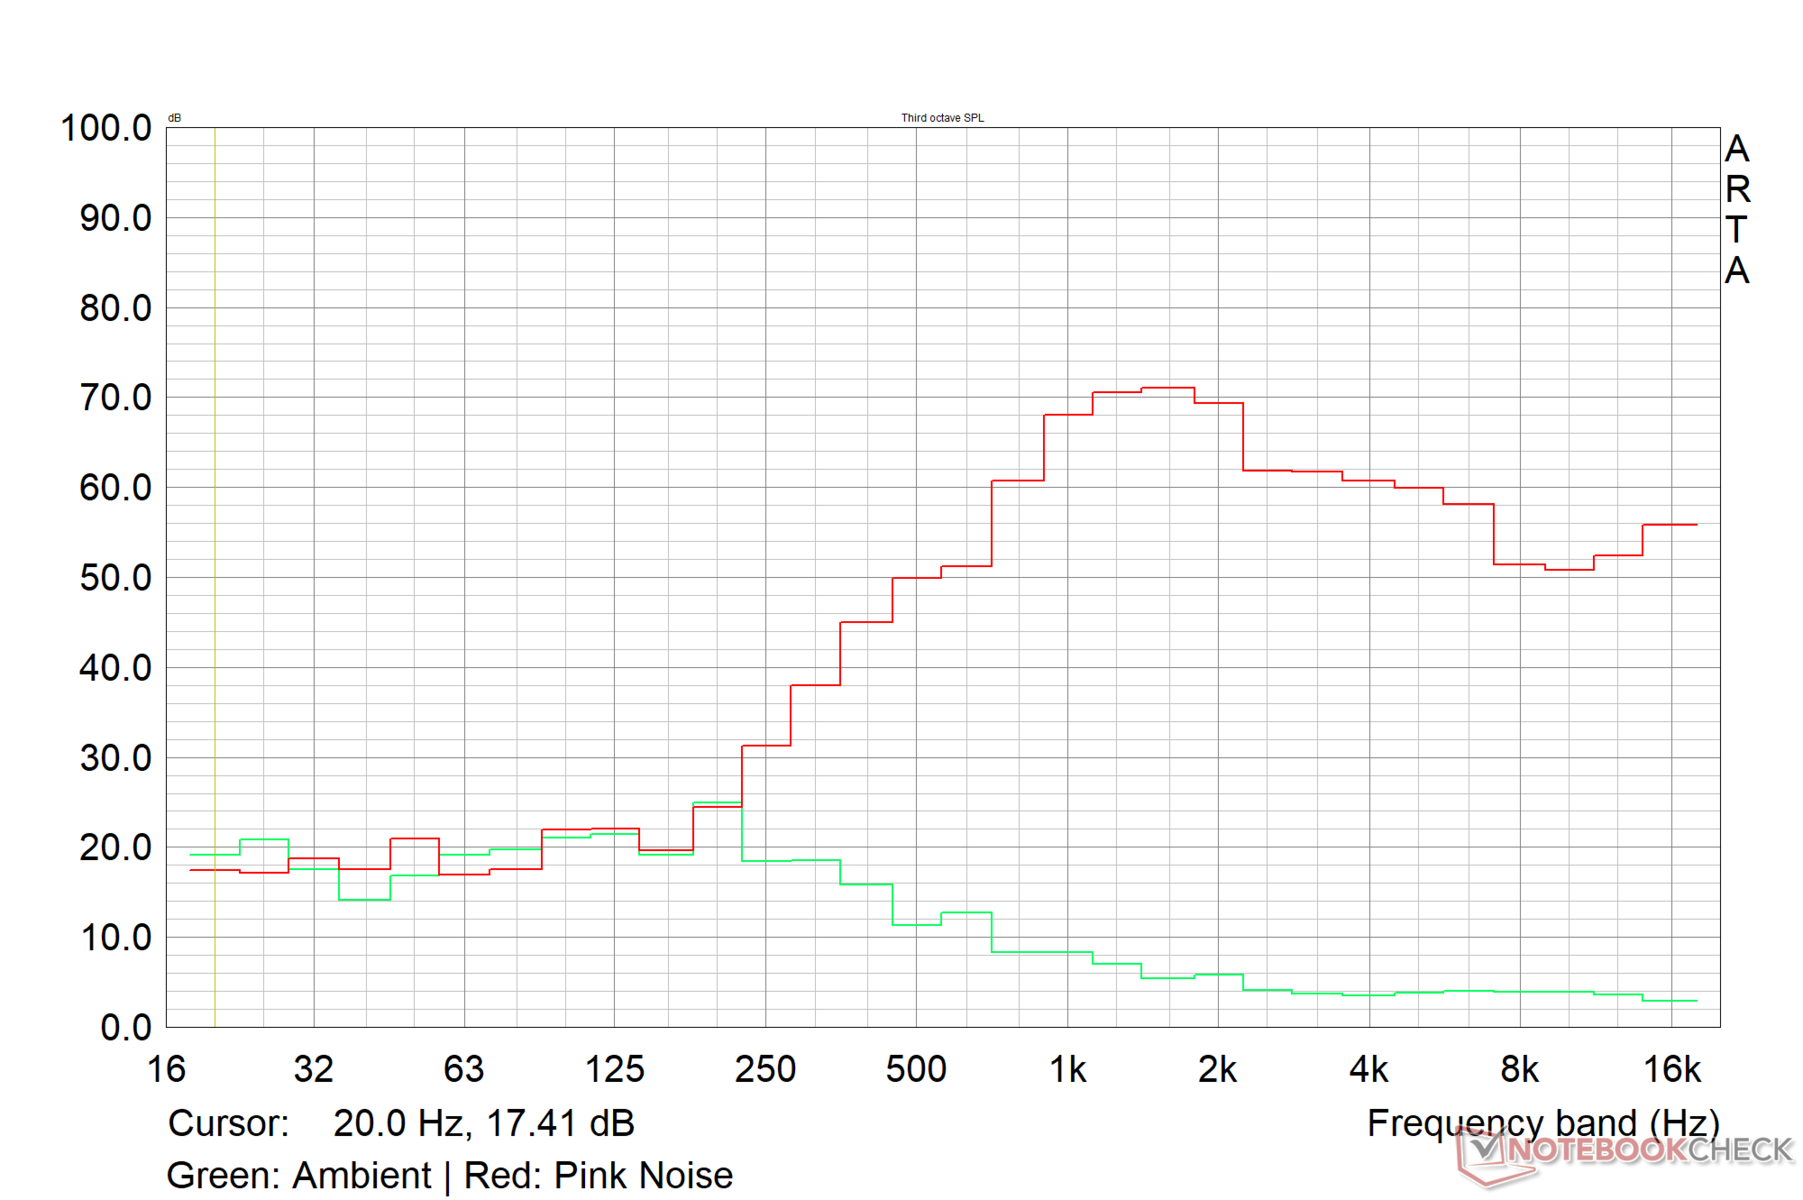
Alto-falantes
Os alto-falantes estéreo do EVOL X15 são altos o suficiente para uma sala de tamanho moderado. A Colorful anuncia o ajuste da Creative SoundBlaster Studio, mas o áudio soa fraco devido à falta de resposta dos graves e aos médios médios. As frequências mais altas, por outro lado, são reproduzidas razoavelmente bem.
Idealmente, a Colorful poderia ter aproveitado o chassi grande para incluir radiadores passivos mais potentes. No entanto, os usuários podem obter melhor qualidade de áudio por meio do conector de áudio combinado de 3,5 mm ou do Bluetooth 5.2.
Colorful EVOL X15 AT 23 análise de áudio
(±) | o volume do alto-falante é médio, mas bom (###valor### dB)
Graves 100 - 315Hz
(-) | quase nenhum baixo - em média 26.2% menor que a mediana
(±) | a linearidade dos graves é média (9.2% delta para a frequência anterior)
Médios 400 - 2.000 Hz
(±) | médios mais altos - em média 11.1% maior que a mediana
(±) | a linearidade dos médios é média (9.6% delta para frequência anterior)
Altos 2 - 16 kHz
(±) | máximos mais altos - em média 6.1% maior que a mediana
(+) | os máximos são lineares (5.8% delta da frequência anterior)
Geral 100 - 16.000 Hz
(±) | a linearidade do som geral é média (29.7% diferença em relação à mediana)
Comparado com a mesma classe
» 95% de todos os dispositivos testados nesta classe foram melhores, 2% semelhantes, 3% piores
» O melhor teve um delta de 6%, a média foi 18%, o pior foi 132%
Comparado com todos os dispositivos testados
» 88% de todos os dispositivos testados foram melhores, 3% semelhantes, 10% piores
» O melhor teve um delta de 4%, a média foi 23%, o pior foi 134%
Apple MacBook Pro 16 2021 M1 Pro análise de áudio
(+) | os alto-falantes podem tocar relativamente alto (###valor### dB)
Graves 100 - 315Hz
(+) | bons graves - apenas 3.8% longe da mediana
(+) | o baixo é linear (5.2% delta para a frequência anterior)
Médios 400 - 2.000 Hz
(+) | médios equilibrados - apenas 1.3% longe da mediana
(+) | médios são lineares (2.1% delta para frequência anterior)
Altos 2 - 16 kHz
(+) | agudos equilibrados - apenas 1.9% longe da mediana
(+) | os máximos são lineares (2.7% delta da frequência anterior)
Geral 100 - 16.000 Hz
(+) | o som geral é linear (4.6% diferença em relação à mediana)
Comparado com a mesma classe
» 0% de todos os dispositivos testados nesta classe foram melhores, 0% semelhantes, 100% piores
» O melhor teve um delta de 5%, a média foi 17%, o pior foi 45%
Comparado com todos os dispositivos testados
» 0% de todos os dispositivos testados foram melhores, 0% semelhantes, 100% piores
» O melhor teve um delta de 4%, a média foi 23%, o pior foi 134%
Gerenciamento de energia: Econômico sob carga máxima
Consumo de energia
O consumo de energia ocioso do EVOL X15 é mais alto em comparação com a concorrência que usa o Core i7-13700HX e a RTX 4060. Dito isso, o consumo de energia sob carga máxima é relativamente menor, 224 W.
O Uniwill GM6PX7X com uma RTX 4070 apresenta consumo de energia 33% maior sob carga máxima, mas ainda assim consegue ser 16% mais econômico do que o EVOL X15.
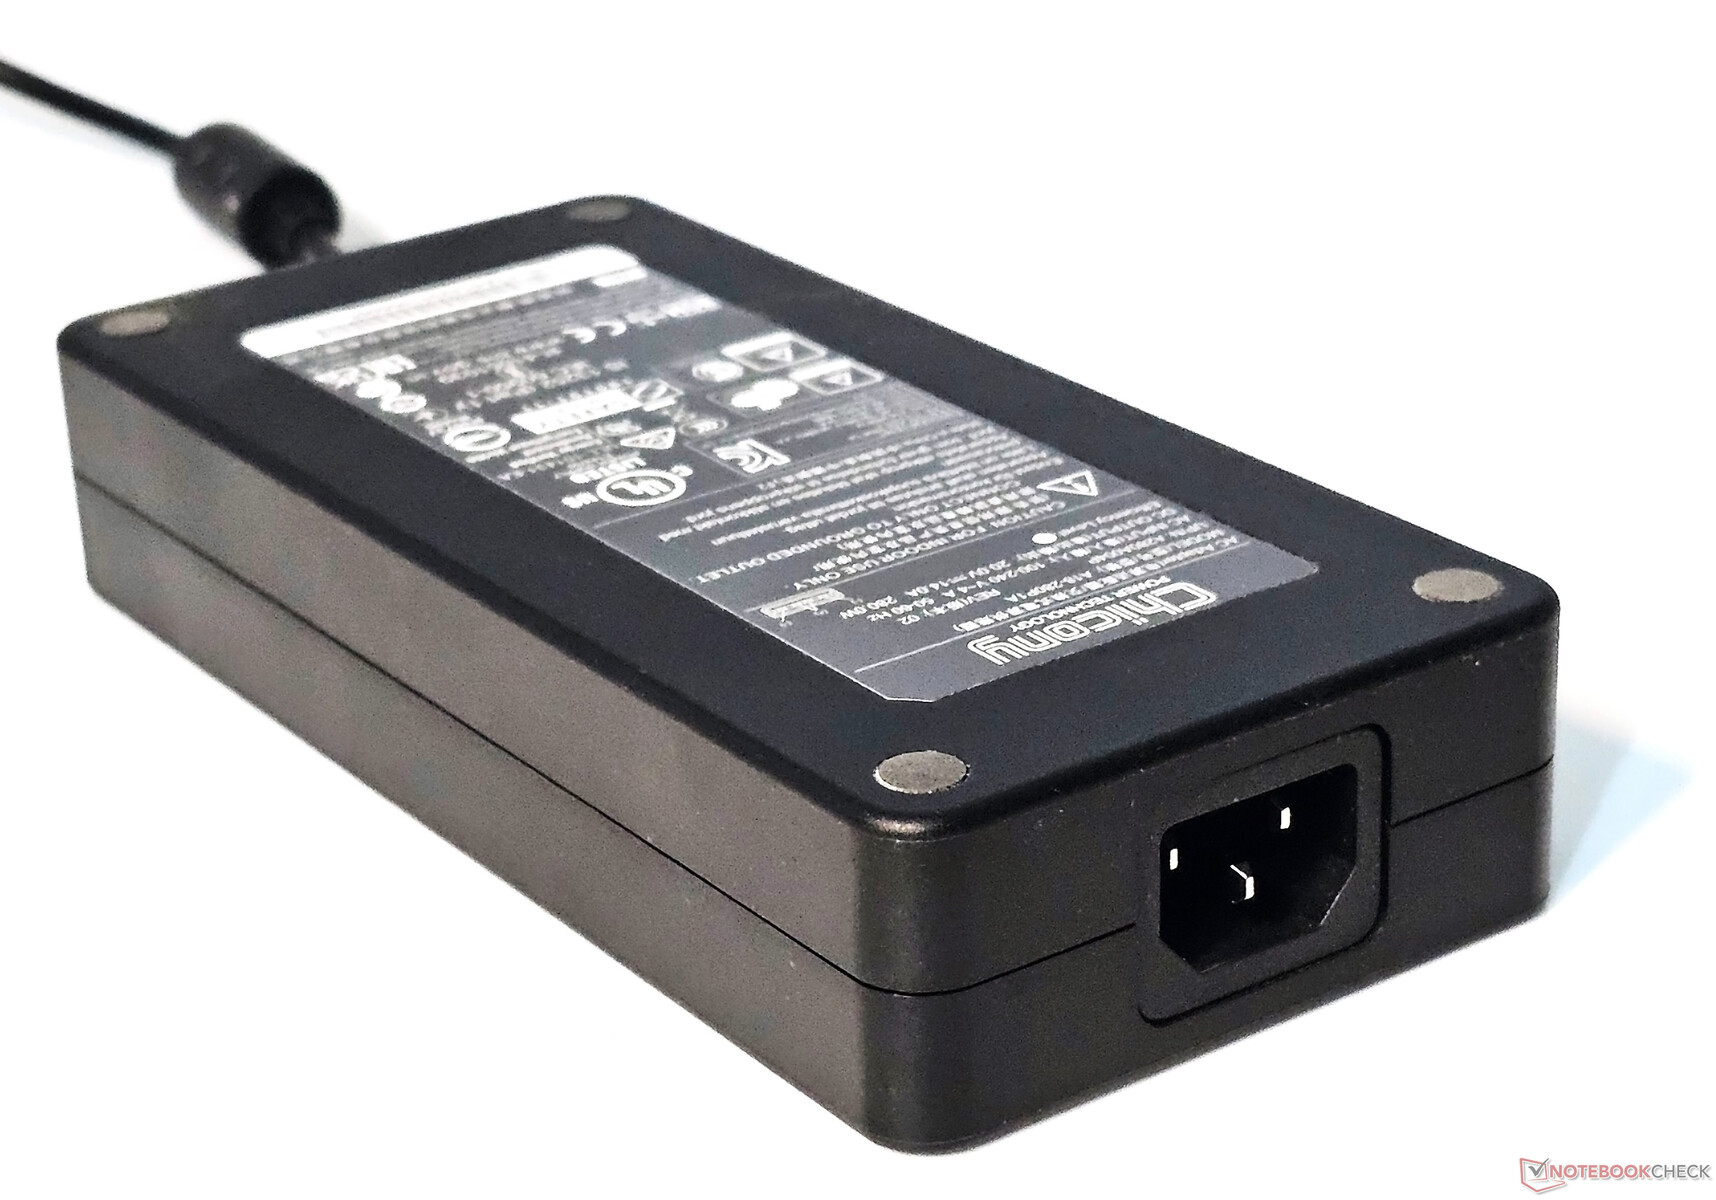
A fonte de alimentação de 280 W fornecida pode alimentar adequadamente o laptop sob estresse.
| desligado | |
| Ocioso | |
| Carga |
|
Key:
min: | |
| Colorful EVOL X15 AT 23 i7-13700HX, GeForce RTX 4060 Laptop GPU, IPS, 2560x1440, 15.6" | Alienware m16 R1 Intel i7-13700HX, GeForce RTX 4060 Laptop GPU, IPS, 2560x1600, 16" | HP Omen 16-wf000 i7-13700HX, GeForce RTX 4080 Laptop GPU, IPS, 2560x1440, 16.1" | Acer Predator Helios 16 PH16-71-731Q i7-13700HX, GeForce RTX 4060 Laptop GPU, IPS-LED, 2560x1600, 16" | Dell G15 5530 i7-13650HX, GeForce RTX 4060 Laptop GPU, IPS, 1920x1080, 15.6" | Schenker XMG Pro 15 (E23) i9-13900HX, GeForce RTX 4060 Laptop GPU, IPS, 2560x1440, 15.6" | Alienware m16 R1 AMD R9 7845HX, GeForce RTX 4080 Laptop GPU, IPS, 2560x1600, 16" | Uniwill GM6PX7X RTX 4070 i7-13700HX, GeForce RTX 4070 Laptop GPU, IPS, 2560x1600, 16" | Média NVIDIA GeForce RTX 4060 Laptop GPU | Média da turma Gaming | |
|---|---|---|---|---|---|---|---|---|---|---|
| Power Consumption | 20% | 2% | 20% | 30% | -11% | -45% | 16% | 36% | 24% | |
| Idle Minimum * (Watt) | 28.3 | 10 65% | 21.8 23% | 15.9 44% | 8.4 70% | 21.6 24% | 39 -38% | 12.6 55% | 11.5 ? 59% | 13.1 ? 54% |
| Idle Average * (Watt) | 32.2 | 14 57% | 26 19% | 20.5 36% | 14.98 53% | 29 10% | 44.6 -39% | 17.7 45% | 16 ? 50% | 19 ? 41% |
| Idle Maximum * (Watt) | 36.5 | 21 42% | 36 1% | 20.9 43% | 15.56 57% | 42.7 -17% | 68.1 -87% | 31.8 13% | 20.3 ? 44% | 24.6 ? 33% |
| Load Average * (Watt) | 119 | 119 -0% | 115.5 3% | 106 11% | 96.8 19% | 190 -60% | 129.8 -9% | 101.4 15% | 92.9 ? 22% | 111.3 ? 6% |
| Witcher 3 ultra * (Watt) | 189.6 | 186.7 2% | 214 -13% | 175 8% | 186 2% | 189 -0% | 285 -50% | 185.3 2% | ||
| Load Maximum * (Watt) | 224.3 | 323 -44% | 269.7 -20% | 276 -23% | 271.42 -21% | 269 -20% | 327.3 -46% | 298 -33% | 210 ? 6% | 260 ? -16% |
* ... menor é melhor
Power Consumption: The Witcher 3 / Stress test
Power Consumption: External monitor
Duração da bateria
Considerando os componentes internos bastante potentes do EVOL X15, a bateria de 73 WHr pode oferecer apenas tempos de funcionamento médios. Com 150 nits de brilho, o laptop pode durar cerca de 5,5 horas em nosso teste padrão de navegação na Web por Wi-Fi e aproximadamente 6,5 horas durante a reprodução de vídeo H.264 1080p.
| Colorful EVOL X15 AT 23 i7-13700HX, GeForce RTX 4060 Laptop GPU, 73 Wh | Alienware m16 R1 Intel i7-13700HX, GeForce RTX 4060 Laptop GPU, 86 Wh | HP Omen 16-wf000 i7-13700HX, GeForce RTX 4080 Laptop GPU, 83 Wh | Acer Predator Helios 16 PH16-71-731Q i7-13700HX, GeForce RTX 4060 Laptop GPU, 90 Wh | Dell G15 5530 i7-13650HX, GeForce RTX 4060 Laptop GPU, 86 Wh | Schenker XMG Pro 15 (E23) i9-13900HX, GeForce RTX 4060 Laptop GPU, 80 Wh | Alienware m16 R1 AMD R9 7845HX, GeForce RTX 4080 Laptop GPU, 86 Wh | Uniwill GM6PX7X RTX 4070 i7-13700HX, GeForce RTX 4070 Laptop GPU, 62 Wh | Média da turma Gaming | |
|---|---|---|---|---|---|---|---|---|---|
| Duração da bateria | -15% | -11% | 5% | -11% | 26% | -35% | -26% | 26% | |
| H.264 (h) | 6.3 | 5.6 -11% | 4.8 -24% | 6.8 8% | 8.27 ? 31% | ||||
| WiFi v1.3 (h) | 5.4 | 4.8 -11% | 5.1 -6% | 5.6 4% | 6.5 20% | 5.7 6% | 3.7 -31% | 4 -26% | 7.08 ? 31% |
| Witcher 3 ultra (h) | 1.2 | 1.5 25% | 0.8 -33% | ||||||
| Load (h) | 1.3 | 1 -23% | 1.1 -15% | 1.5 15% | 0.8 -38% | 1.9 46% | 0.8 -38% | 1.496 ? 15% | |
| Reader / Idle (h) | 6.4 | 5.5 | 4 | 7.84 ? |
Pro
Contra
Veredicto: Boa escolha se o senhor puder comprá-la por menos de US$ 1.000

A Colorful tem como objetivo oferecer um laptop para jogos QHD capaz por menos de US$ 1.000 e tem grande sucesso com o EVOL X15 AT 23. Construído principalmente com plástico Clevo, há alguma flexibilidade no teclado; no entanto, o EVOL X15 permanece estruturalmente sólido em geral.
O EVOL X15 AT tem muitas vantagens. Os possíveis compradores apreciarão a seleção decente de portas, as velocidades rápidas do Wi-Fi 6E e o fácil acesso às partes internas.
A combinação de um processador Intel Core i7-13700HX de classe desktop e o processador GPU para laptop Nvidia GeForce RTX 4060 permite que o EVOL X15 AT concorra efetivamente com modelos de preço mais alto, como o Alienware m16 R1 e o Acer Predator Helios 16.
O Colorful EVOL X15 AT pode não oferecer todos os recursos encontrados na concorrência bem estabelecida, mas consegue, em grande parte, fazer o básico sem nenhuma limitação perceptível de desempenho."
Dito isso, há várias áreas de crítica também. Aspectos como a falta de fornecimento de energia com as portas Type-C e os tempos de resposta um pouco mais altos precisam ser abordados. A Colorful também precisa se concentrar no ajuste fino das curvas da ventoinha com os perfis de desempenho padrão e também trabalhar para melhorar o consumo de energia em modo inativo.
De modo geral, o Colorful EVOL X15 AT é digno de consideração, desde que o senhor consiga adquiri-lo por menos de US$ 1.000 e não tenha que pagar uma margem de lucro.
Dito isso, os notebooks equipados com a GPU para laptop RTX 3070 Tiou até mesmo a Radeon RX 6800Mpodem oferecer um pacote geral melhor a preços semelhantes se o senhor não se importar em perder a geração de quadros DLSS 3 e os ganhos de eficiência com Ada Lovelace.
Preço e disponibilidade
O Colorful EVOL X15 AT 23 está disponível diretamente nos distribuidores locais dos produtos Colorful. A configuração testada do EVOL X15 AT tem um preço oficial de US$ 969, mas atualmente é vendida no site Newegg a um preço substancialmente alto de US$ 1.759.
Como alternativa, uma variante QHD do Acer Nitro 5 com um AMD Ryzen 7 6800H e GPU para laptop RTX 3070 Ti pode ser adquirida na Amazon US por menos de US$ 1.200.
Se o desempenho bruto da CPU não for uma prioridade, o Asus ROG Strix G15 com um AMD Ryzen 9 5900HX e Radeon RX 6800M é uma boa opção por menos de US$ 1.300 na Amazon US e menos de US$ 1.200 na Best Buy US.
Colorful EVOL X15 AT 23
- 12/20/2023 v7 (old)
Vaidyanathan Subramaniam
Transparência
A seleção dos dispositivos a serem analisados é feita pela nossa equipe editorial. A amostra de teste foi fornecida gratuitamente ao autor pelo fabricante para fins de revisão. Não houve influência de terceiros nesta revisão, nem o fabricante recebeu uma cópia desta revisão antes da publicação. Não houve obrigação de publicar esta revisão. Como empresa de mídia independente, a Notebookcheck não está sujeita à autoridade de fabricantes, varejistas ou editores.
É assim que o Notebookcheck está testando
Todos os anos, o Notebookcheck analisa de forma independente centenas de laptops e smartphones usando procedimentos padronizados para garantir que todos os resultados sejam comparáveis. Desenvolvemos continuamente nossos métodos de teste há cerca de 20 anos e definimos padrões da indústria no processo. Em nossos laboratórios de teste, equipamentos de medição de alta qualidade são utilizados por técnicos e editores experientes. Esses testes envolvem um processo de validação em vários estágios. Nosso complexo sistema de classificação é baseado em centenas de medições e benchmarks bem fundamentados, o que mantém a objetividade.Price comparison

